Anisotropic clustering of inertial particles in homogeneous shear flow
Aeolian sediment transport through large patches of roughness in the
atmospheric inertial sublayer
John A. Gillies,1 William G. Nickling,2 and James King2
Received 2 November 2005; revised 13 February 2006; accepted 23 February 2006; published 4 May 2006.
[1] Roughness influences the flux of wind-driven sand transport. In this paper, we reporton sediment transport measurements for four different surface roughness configurationscomposed of the same size (solid) roughness elements in the atmospheric inertialsublayer. Results of these tests indicate that sediment transport rates through patches ofroughness in the atmospheric inertial sublayer are to a large extent controlled and scaleproportionally with the roughness density (l = n b h/S, where n is number of elements ofbreadth b and height h in area S) of the surface. However, element size apparentlyincreases the magnitude of the reduction beyond that attributable to l. A sedimenttransport model that incorporates the effect of shear stress partitioning appears to predictreasonably well the effect of roughness on sand transport in the cases where the roughnesselements are �0.10 m in height. However, when the dimensions of the roughnessitself are equivalent to or are greater than the range of saltation lengths (vertical andhorizontal), additional interactions of the elements with the saltation cloud appear toreduce the transport efficiency.
Citation: Gillies, J. A., W. G. Nickling, and J. King (2006), Aeolian sediment transport through large patches of roughness in the
atmospheric inertial sublayer, J. Geophys. Res., 111, F02006, doi:10.1029/2005JF000434.
1. Introduction
[2] The entrainment and transport of sediment by windresults from the horizontal shearing stress (t) generated atthe surface by boundary layer winds. If t is of sufficientmagnitude to overcome the inertial and bonding forces ofthe surface-bound particles they can be entrained and trans-ported by the wind. Over a flat surface with no largeroughness elements, the time-averaged t is normally as-sumed to be relatively uniform and directly related to thewind profile characteristics. However, in the presence ofroughness elements (pebbles to boulders or vegetation) thesurface shearing stress is neither spatially nor temporallyuniform because of the sheltering of the surface by theroughness elements and the generation of turbulent wakesthat are shed from individual elements. In addition to theeffect roughness can have on the modulation of shearingstress among the elements, the process is also affected bythe interaction of the saltating particles with the roughnesselements themselves [Bagnold, 1941; McKenna Neumanand Nickling, 1995].[3] Understanding the controls of roughness on aeolian
sediment transport has important ramifications for success-fully predicting how it affects the entrainment and transportof sediment by wind on Earth. This is even more importantfor Mars because aeolian processes are affecting the evolu-
tion of the Martian surface to a much greater degree than theydo on Earth [Malin et al., 1998; Wilson and Zimbelman,2004].[4] In this paper, we report on sediment transport mea-
surements for four different surface roughness configura-tions composed of the same size (solid) roughness elementsin the atmospheric inertial sublayer (ISL). The ISL isdefined as the region in the atmosphere where the logarith-mic law applies.[5] The rough surfaces constructed for this experiment
are conceptualized as being large patches in which sedimenttransport may be initiated and through which sand may betransported by the wind. This situation of alternatingpatches of smooth and roughened surfaces over or throughwhich wind blown sand is transported is often observed interrestrial deserts and on the surface of Mars (see forexample, http://marsrovers.jpl.nasa.gov/home/).[6] Although the transport of sand by wind has been
investigated in wind tunnel experiments [e.g., Lyles et al.,1974; Logie, 1981; Buckley, 1987; Gillette and Stockton,1989; McKenna Neuman and Nickling, 1995; Nickling andMcKenna Neuman, 1995; Al-Awadhi and Willetts, 1999]there are some concerns over scaling issues (e.g., elementheights, saltation path lengths, and maximum trajectoryheights) that may limit the direct comparison of wind tunneltests to field situations. White and Mounla [1991] discusshow wind tunnels, due to Froude number effects, canconstrain the saltation system. In addition to these effects,differences between the size of the elements and cross-sectional area of a wind tunnel can enforce a height limit onthe elements due to flow blocking and the creation ofadverse pressure gradients.
JOURNAL OF GEOPHYSICAL RESEARCH, VOL. 111, F02006, doi:10.1029/2005JF000434, 2006
1Particle Emissions Measurement Laboratory, Division of AtmosphericSciences, Desert Research Institute, Reno, Nevada, USA.
2Wind Erosion Laboratory, Department of Geography, University ofGuelph, Guelph, Ontario, Canada.
Copyright 2006 by the American Geophysical Union.0148-0227/06/2005JF000434
F02006 1 of 13
[7] Field studies [e.g., Greeley et al., 1995; Lancaster andBaas, 1998] of sand transport in the presence of roughnesshave been limited. Previously in field experiments there hasbeen limited control on the range of roughness tested andthere was a reliance on preexisting roughness, which makessampling over many different surfaces logistically difficultand the development of general relationships problematic.In our study the amount and size of the roughness wasstrictly controlled. A unique aspect of this field study is thatthe size of the roughness elements is approximately an orderof magnitude larger than elements that have been used inwind tunnel experiments to examine the effect of roughnesson aeolian transport of sand. In addition, because our studywas conducted in a field setting there were no constraints onthe saltation system, the boundary layer flow, or the size ofthe roughness elements that were used.[8] The study presented in this paper describes the effect
that large solid roughness elements arranged in varyingroughness densities have on the transport of sediment bywind in a field situation. Sediment transport rates in front ofand within different arrays of staggered roughness elementswere measured with active sediment traps, which collectsand entering into them through a vertical slot and Safirepiezoelectric saltation sensors [Baas, 2004], which monitorsaltation activity. In addition, the total shear stress (t) in theISL, the shear stress on the intervening surface (tS), and theforce of drag on the elements were measured simultaneously,along with the sediment transport measurements. The mea-surement of t, tS, and drag on the elements were accom-plished with measurements of the vertical wind speedprofile using anemometers, skin friction meters (Irwinsensors), and drag balances, respectively. The roughnessconfigurations were also under strict control in this exper-iment as they were constructed to fairly rigorous dimen-sional standards.[9] It is important to note that in this study, the roughness
elements were positioned on a relatively hard, supplylimited surface that for the most part did not supply grainsto the air stream during the transport events. Rather, sandtransported through the system was almost totally derivedfrom small dunes upwind of the element array. As a result,grains moving through the array were transported in salta-tion (high-energy transport) with few grains being ejectedand transported in reptation (low-energy transport). Thisdiffers from transport on a sand sheet where a largeproportion of the sediment flux consists of reptation drivenby saltation impacts. Results of our field experimentssuggest that this difference does not result in a significantdifference in the pattern of transport and distribution ofstresses.
2. Background
[10] Nonerodible roughness elements whether by virtueof their size, as in the case of pebbles, cobbles, or boulders,or by virtue of their being anchored in the soil (e.g.,vegetation), reduce sediment loss by wind in four ways:(1) roughness elements shelter the surface by covering aportion of it, (2) the presence of a sufficient number of themwill reduce the shear stress in the intervening area byextracting momentum from the wind at a height above thesurface, (3) they provide, in the case of solid and porous
elements a zone of reduced shear stress in their lee and inaddition porous elements such as vegetation can trapparticles within their structure, and (4) the presence ofnonerodible elements can effect the number and efficiencyof grain/bed collisions.[11] The role of roughness elements in the reduction of
shearing stress on the intervening surface among roughnesselements and its effect on the threshold of entrainment hasbeen an important area of research for increasing knowledgeof aeolian sediment transport processes [e.g., Wooding etal., 1973; Gillette and Stockton, 1989; Raupach et al.,1993]. Shear stress partitioning theory [Schlichting, 1936]has proved to be a useful framework in which to evaluateroughness effects on sediment transport processes. Thetheory states simply that as roughness increases, t increases,but a greater percentage of the stress is taken up by thenonerodible elements leaving less stress on the interveningsurface (ts) to mobilize erodible particles. Raupach [1992]and Raupach et al. [1993] proposed a predictive physicallybased model for the partitioning of wind shear betweensolid elements having well-defined wakes and the interven-ing bare surface.[12] The model allows the user to specify available inputs
to describe most environments and generate the ratio thatcharacterizes the erosion threshold of an initially bareerodible surface with the threshold once nonerodible ele-ments are present. This relationship is expressed in terms ofthe threshold wind shear velocity ratio (Rt), that defines theratio between the threshold wind shear velocity over asmooth surface and a similar surface covered with non-erodible roughness elements. This may be generalizedfurther to the shear velocity ratio (R) that simply character-izes the ratio for simultaneous shear velocities (or shearstresses) of the bare soil and a rough surface, irrespective ofthreshold conditions. In this study, we determined R frommeasurements and consider it synonymous with Rt whencomparing with data from other sources.[13] The Raupach et al. [1993] model is expressed as:
Rt ¼u*tS
u*tR¼ 1
1� mslð Þ0:5 1þ mblð Þ0:5ð1Þ
where, u*tS is threshold shear velocity of bare surface(m s�1), u*tR is threshold wind shear velocity withroughness elements (m s�1), s is the roughness elementbasal area to frontal area ratio, l is roughness density, b isthe ratio of element to surface drag coefficients, and m is anempirical constant ranging from 0 to 1 that accounts for thespatial heterogeneity of surface shear stress.[14] The roughness density (l) is defined as:
l ¼ n b h=S ð2Þ
where n is the number of roughness elements occupying theground area S (m2), b is element breadth (m), and h elementheight (m).[15] Recent analysis by King et al. [2005] has shown that
this model is very robust in its ability to predict Rt for asurface using appropriate input parameters and predictedvalues of Rt show good agreement with measured Rt valuesfor both wind tunnel and field data. J. A. Gillies et al. (Shear
F02006 GILLIES ET AL.: AEOLIAN SEDIMENT TRANSPORT IN THE ATMOSPHERE
2 of 13
F02006
stress partitioning in large patches of roughness in theatmospheric inertial sublayer, submitted to Boundary-LayerMeteorology 2005, hereinafter referred to as Gillies et al.,submitted manuscript, 2005) have also demonstrated thatthe model can predict the shear stress partitioning in largepatches of roughness in the ISL. Orndorff [1998] hassuggested this model can also be applied to evaluatepartitioning effects on sediment transport rates. InOrndorff’s [1998] model the transport of sediment iscontrolled by the link between t and the horizontal saltationflux Q (kg m�1 s�1) as initially theorized by Bagnold[1941], and subsequently demonstrated in numerous studies[e.g., Anderson and Willetts, 1991; McEwan and Willetts,1994; Sørensen, 2004]. In Orndorff’s [1998] model, Qwithin the roughness scales with tS, which is predictedusing Raupach et al.’s [1993] model (i.e., equation (1)).Several authors have suggested that under conditionswhere l � 0.5 sediment transport by wind will not occurfor the typical range of expected boundary layer shearstresses associated with the terrestrial ISL.[16] Low-density arrays have been shown by Logie
[1981] and others [e.g., Nickling and McKenna Neuman,1995] to increase sediment transport rates. This increase isattributed to several factors: (1) a higher t due to theincrease in roughness, (2) the increase in the number ofhighly elastic collisions between saltating sand grains andthe roughness elements, which promotes grain ejection andtransport, and (3) an increase in localized shear stress aboveentrainment threshold associated with the generation ofturbulent eddies from the roughness elements that frequentlyresults in scour around the elements.[17] In sufficient numbers, roughness will work to the
detriment of sediment transport due to the interaction that
affects the number and effectiveness of grain/bed collisionson the erodible surface. Al-Sudairawi [1992] in a windtunnel study concluded that the nonerodible elements shel-ter a portion of the erodible surface preventing saltating grainsfrom impacting and splashing up new grains. Al-Awadhi andWilletts [1999] also noted that this sheltering can be conceivedas a shadow downwind of the nonerodible elements and is afunction of the approach angle of the saltating grains (9–14�)and the aspect area of the elements.
3. Experimental Procedures
[18] In the spring of 2004 the sediment transport fieldexperiment was established at the Jornada ExperimentalRange (JER) of the U.S. Department of Agriculture nearLas Cruces, NM. A large barren area was selected withinthe JER known as the Scrape site [Gillette and Chen, 2001](total area � 10,000 m2) in that it possessed several criticalattributes. This particular site was of special interest becauseit provided: (1) an extensive bare surface area where a rangeof roughness configurations could be deployed withouthaving to move locations, (2) an upwind fetch of �60 mof smooth surface for the prevailing wind direction before itwould encounter a roughness array, (3) frequent wind ofconsistent direction, (4) an upwind coppice dune field thatprovided a source of sand, and (5) it provided a safe andsecure environment for personnel and the scientific instru-ments at all times.
3.1. Roughness Arrays
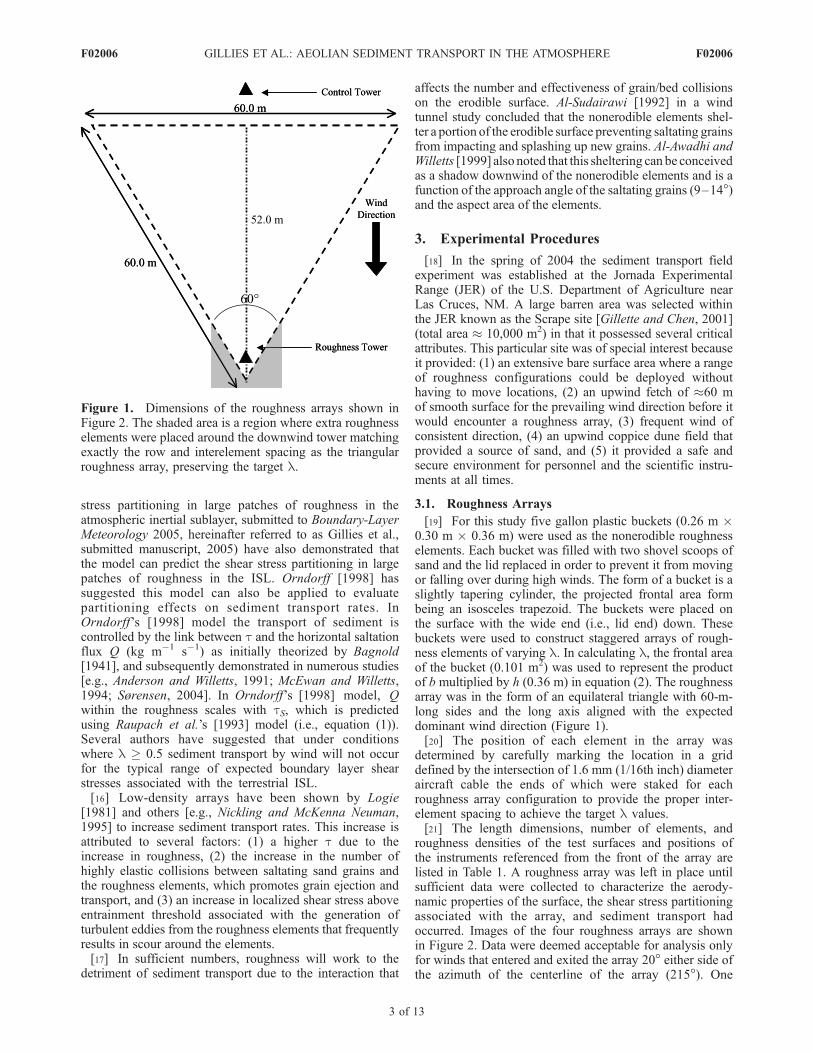
[19] For this study five gallon plastic buckets (0.26 m 0.30 m 0.36 m) were used as the nonerodible roughnesselements. Each bucket was filled with two shovel scoops ofsand and the lid replaced in order to prevent it from movingor falling over during high winds. The form of a bucket is aslightly tapering cylinder, the projected frontal area formbeing an isosceles trapezoid. The buckets were placed onthe surface with the wide end (i.e., lid end) down. Thesebuckets were used to construct staggered arrays of rough-ness elements of varying l. In calculating l, the frontal areaof the bucket (0.101 m2) was used to represent the productof b multiplied by h (0.36 m) in equation (2). The roughnessarray was in the form of an equilateral triangle with 60-m-long sides and the long axis aligned with the expecteddominant wind direction (Figure 1).[20] The position of each element in the array was
determined by carefully marking the location in a griddefined by the intersection of 1.6 mm (1/16th inch) diameteraircraft cable the ends of which were staked for eachroughness array configuration to provide the proper inter-element spacing to achieve the target l values.[21] The length dimensions, number of elements, and
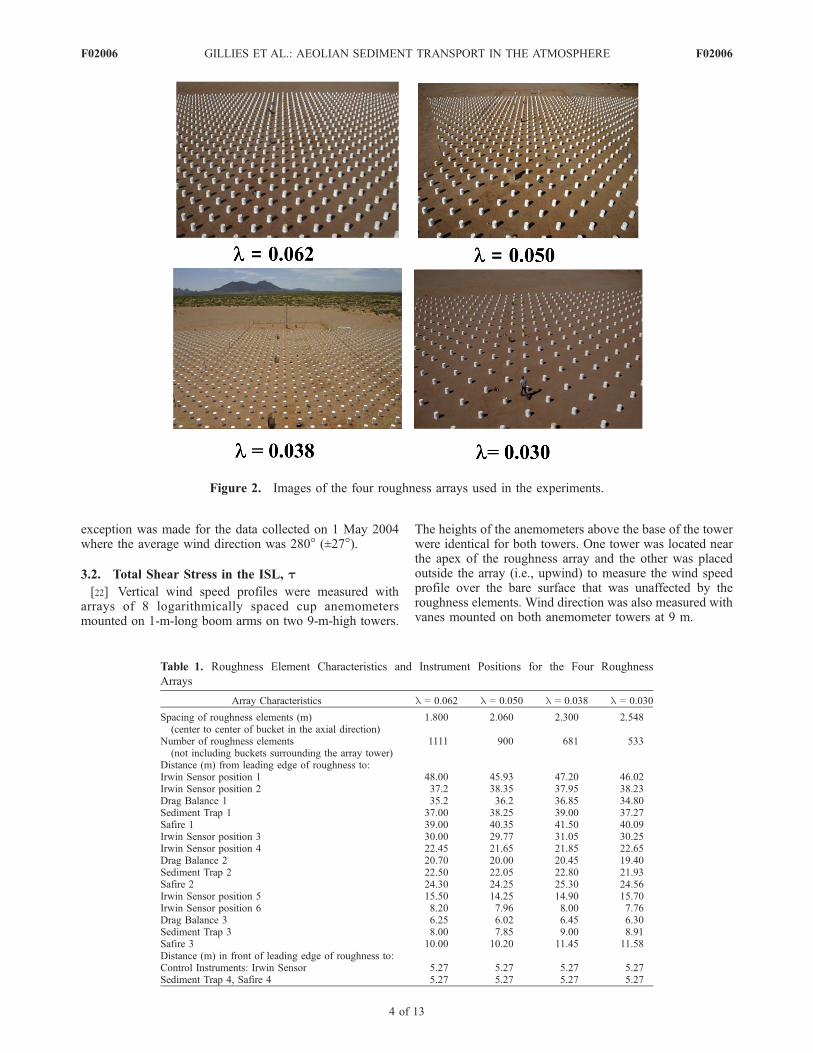
roughness densities of the test surfaces and positions ofthe instruments referenced from the front of the array arelisted in Table 1. A roughness array was left in place untilsufficient data were collected to characterize the aerody-namic properties of the surface, the shear stress partitioningassociated with the array, and sediment transport hadoccurred. Images of the four roughness arrays are shownin Figure 2. Data were deemed acceptable for analysis onlyfor winds that entered and exited the array 20� either side ofthe azimuth of the centerline of the array (215�). One
Figure 1. Dimensions of the roughness arrays shown inFigure 2. The shaded area is a region where extra roughnesselements were placed around the downwind tower matchingexactly the row and interelement spacing as the triangularroughness array, preserving the target l.
F02006 GILLIES ET AL.: AEOLIAN SEDIMENT TRANSPORT IN THE ATMOSPHERE
3 of 13
F02006
exception was made for the data collected on 1 May 2004where the average wind direction was 280� (±27�).
3.2. Total Shear Stress in the ISL, T
[22] Vertical wind speed profiles were measured witharrays of 8 logarithmically spaced cup anemometersmounted on 1-m-long boom arms on two 9-m-high towers.
The heights of the anemometers above the base of the towerwere identical for both towers. One tower was located nearthe apex of the roughness array and the other was placedoutside the array (i.e., upwind) to measure the wind speedprofile over the bare surface that was unaffected by theroughness elements. Wind direction was also measured withvanes mounted on both anemometer towers at 9 m.
Figure 2. Images of the four roughness arrays used in the experiments.
Table 1. Roughness Element Characteristics and Instrument Positions for the Four Roughness
Arrays
Array Characteristics l = 0.062 l = 0.050 l = 0.038 l = 0.030
Spacing of roughness elements (m)(center to center of bucket in the axial direction)
1.800 2.060 2.300 2.548
Number of roughness elements(not including buckets surrounding the array tower)
1111 900 681 533
Distance (m) from leading edge of roughness to:Irwin Sensor position 1 48.00 45.93 47.20 46.02Irwin Sensor position 2 37.2 38.35 37.95 38.23Drag Balance 1 35.2 36.2 36.85 34.80Sediment Trap 1 37.00 38.25 39.00 37.27Safire 1 39.00 40.35 41.50 40.09Irwin Sensor position 3 30.00 29.77 31.05 30.25Irwin Sensor position 4 22.45 21.65 21.85 22.65Drag Balance 2 20.70 20.00 20.45 19.40Sediment Trap 2 22.50 22.05 22.80 21.93Safire 2 24.30 24.25 25.30 24.56Irwin Sensor position 5 15.50 14.25 14.90 15.70Irwin Sensor position 6 8.20 7.96 8.00 7.76Drag Balance 3 6.25 6.02 6.45 6.30Sediment Trap 3 8.00 7.85 9.00 8.91Safire 3 10.00 10.20 11.45 11.58Distance (m) in front of leading edge of roughness to:Control Instruments: Irwin Sensor 5.27 5.27 5.27 5.27Sediment Trap 4, Safire 4 5.27 5.27 5.27 5.27
F02006 GILLIES ET AL.: AEOLIAN SEDIMENT TRANSPORT IN THE ATMOSPHERE
4 of 13
F02006
[23] Shear velocity (u*) was determined by fitting the10-min average vertical wind speed data using leastsquares regression to the ‘‘law of the wall.’’ The ‘‘lawof the wall’’ describes the logarithmic wind speed profileobserved in the ISL and is represented by the equation:
uz
u*¼ 1
kln
z
zo
� �ð3Þ
where uz (m s�1) is mean wind speed at height z (m), k isthe von Karman constant (0.4), and zo is aerodynamicroughness length (m).[24] Numerous studies show that when wind encounters
and flows over a rough surface the wind profile may bedisplaced upward requiring the addition of a displacementheight term (d) in the Prandtl-von Karman equation (i.e.,equation (3)). Unfortunately there are few guidelines in theliterature as to when a displacement is required with regardto the height, width and distribution of the roughnesselements. As noted by Gillies et al. (submitted manuscript),it was not possible to resolve a measure of d [Jackson,1981] for these surface roughness configurations as theiterative procedure they used to estimate d did not resultin an appreciable improvement in the fit of the 10-minaverage wind profiles to the ‘‘law of the wall’’ and in many
instances produced values of d that did not make physicalsense (i.e., d was negative).[25] According to MacDonald et al. [1998] for the
surfaces tested, d should range between �0.02 m for theleast dense and �0.07 m for the most dense array. A valuefor d was not used in the calculation of u* in this study.Estimates of the total shear stress (t) were determined forboth towers using the relationship:
t ¼ rau*2 ð4Þ
where ra is air density (kg m�3).
3.3. Surface Shear Stress, TS, and Element Drag Force
[26] Shear stress on the surface within an array wasmeasured with Irwin sensors. The Irwin sensor is a simple,omni-directional skin friction meter that measures the nearsurface vertical pressure gradient [Irwin, 1980]. Once cal-ibrated, the Irwin sensor can be used to measure surfaceshear stress at frequencies greater than 10 Hz [Irwin, 1980;Wu and Stathopoulos, 1994] and has been used successfullyin a variety field and wind tunnel studies with varyingflow conditions and surface roughness configurations[Irwin, 1980; Wu and Stathopoulos, 1994; Monteiro andViegas, 1996; Wyatt and Nickling, 1997; Crawley andNickling, 2003]. The dynamic pressure differential is mea-sured between two ports, one at the surface and the other ata height of 0.00175 m above the surface. The details of thecalibration of the Irwin sensors and the subsequent calcu-lation of tS are described in detail by Gillies et al. (submit-ted manuscript, 2005).[27] Drag force on individual elements at three locations
within the array and one position external to the array (i.e.,upwind of the array) was measured using drag balancesto which buckets were fixed (Gillies et al., submittedmanuscript, 2005).
3.4. Sediment Transport
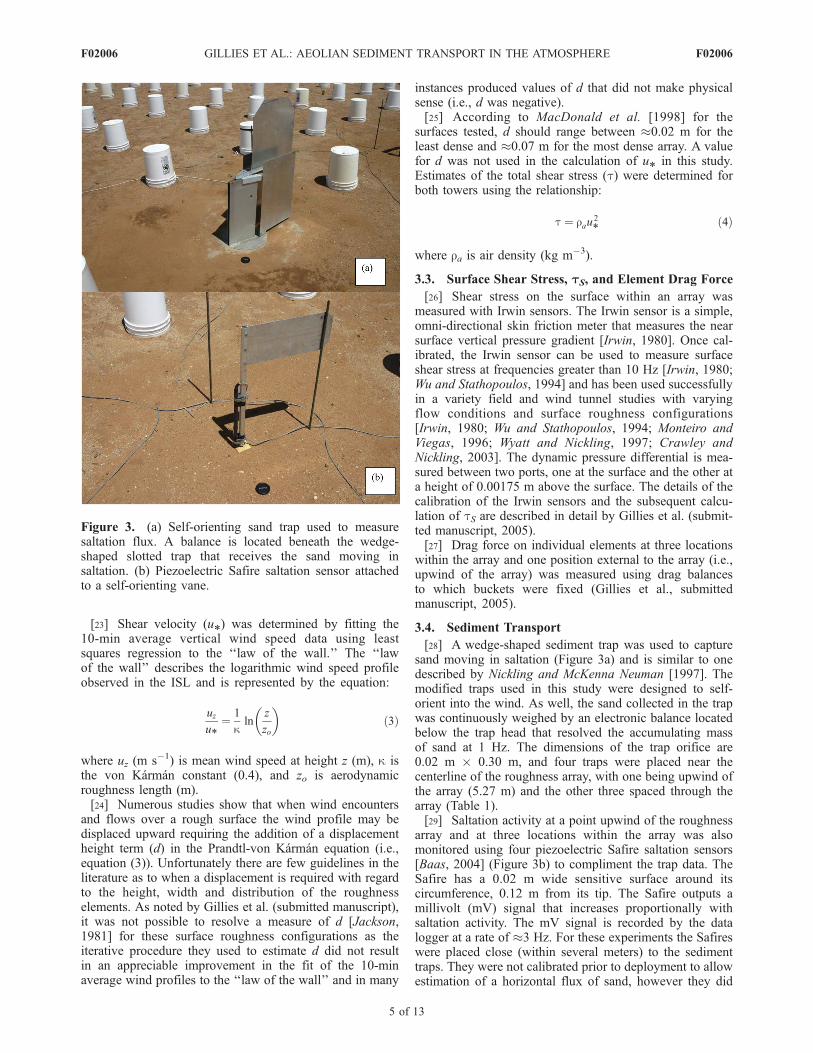
[28] A wedge-shaped sediment trap was used to capturesand moving in saltation (Figure 3a) and is similar to onedescribed by Nickling and McKenna Neuman [1997]. Themodified traps used in this study were designed to self-orient into the wind. As well, the sand collected in the trapwas continuously weighed by an electronic balance locatedbelow the trap head that resolved the accumulating massof sand at 1 Hz. The dimensions of the trap orifice are0.02 m 0.30 m, and four traps were placed near thecenterline of the roughness array, with one being upwind ofthe array (5.27 m) and the other three spaced through thearray (Table 1).[29] Saltation activity at a point upwind of the roughness
array and at three locations within the array was alsomonitored using four piezoelectric Safire saltation sensors[Baas, 2004] (Figure 3b) to compliment the trap data. TheSafire has a 0.02 m wide sensitive surface around itscircumference, 0.12 m from its tip. The Safire outputs amillivolt (mV) signal that increases proportionally withsaltation activity. The mV signal is recorded by the datalogger at a rate of �3 Hz. For these experiments the Safireswere placed close (within several meters) to the sedimenttraps. They were not calibrated prior to deployment to allowestimation of a horizontal flux of sand, however they did
Figure 3. (a) Self-orienting sand trap used to measuresaltation flux. A balance is located beneath the wedge-shaped slotted trap that receives the sand moving insaltation. (b) Piezoelectric Safire saltation sensor attachedto a self-orienting vane.
F02006 GILLIES ET AL.: AEOLIAN SEDIMENT TRANSPORT IN THE ATMOSPHERE
5 of 13
F02006
provide a complimentary method to quantify saltationactivity.
4. Results
[30] During the 2004 field measurement period severalsediment transport events lasting from �6 hours to over12 hours were recorded for the four roughness arrays. Thesesampling periods were frequently characterized by intermit-tent sand transport. The dates of the sediment transportevents for each of the roughness densities are listed inTable 2. The average 9 m wind speed and wind directionvalues in Table 2 are based on all the acceptable 10-minaveraged data (based on 1 Hz acquisition) during the statedintervals. For transport of sand to occur, mean wind speed at9mhadtogenerallyexceed8.5ms�1.Onthebasisofestimatedaerodynamic roughness lengths presented by Gillies et al.(submitted manuscript) for these surfaces, an averagethreshold shear velocity can be calculated for the smoothupwind surface as well as the rough surfaces (Table 2). Theu*tS associated with sand entrainment and transport on theupwind surface was approximately 0.40 m s�1.[31] The intermittent nature of the sand transport and the
small amounts being transported over short time intervalsmade it difficult to assess the dynamics of the sedimenttransport system. However, the amounts of accumulated sandfor the entire periods of time over which transport occurred atthe different measurement locations clearly demonstrate theinfluence of the roughness elements on the sediment transportsystem.[32] To compare the relative amounts of sediment flux at
each measurement location in a roughness array, the sum ofthe sand mass in each trap was calculated and then normal-ized by dividing by the total mass of sediment collected inthe upwind out-of-array trap. The normalized saltation flux(NSF) was calculated for each trap for each period whensediment transport occurred.[33] A similar procedure was also carried out for the
Safire data. The saltation activity for an individual Safirewas calculated by subtracting the modal millivolt (mV)value for the time series data from each individual SafiremV reading in the time series. During the intermittenttransport experienced during these measurements, the modalvalue effectively represents the zero transport off-set mVvalue for a Safire. If the measured value minus the modalvalue was < 0 it was subsequently removed from the series.The remaining mV readings were summed and then nor-malized by dividing by the sum of the mV for the Safire infront of the roughness array. This provides a dimensionlessmeasure of the saltation activity within the array at a given
point compared with the activity at the same location in theabsence of roughness. In this regard, the Safire data arecomparable to the NSF measured with the traps.[34] The relationship between NSF as function of nor-
malized downwind distance (NDD) for each of the rough-ness arrays including both the trap and Safire data, andcombining data from all measurement periods is shown inFigure 4. NDD is expressed as the ratio of the distanceupwind or downwind of the leading edge of the roughnessarray to a sediment trap or Safire divided by the roughnesselement height (i.e., NDD = x/h). Distance downwind of theleading edge of the roughness is expressed as a negativevalue in this paper. The positions of the traps and Safireschanged between the four l configurations due to changesin row spacing, so the NDD designated positions of theinstruments differ slightly between different l (Table 1).[35] The change in NSF as a function of NDD is well
described by an exponential function of the form NSF = ae(bNDD) (Figure 4). In this function the rate of change ofsediment flux as a function of downwind distance in thearray is characterized by the b coefficient. The b coefficientis plotted as a function of l in Figure 5. The relationshipshown in Figure 5 suggests that l affects the rate at whichthe sediment flux adjusts to the roughness configuration.The denser the roughness array, the greater is the reductionin transport as a function of NDD.[36] At the monitoring locations farthest downwind in the
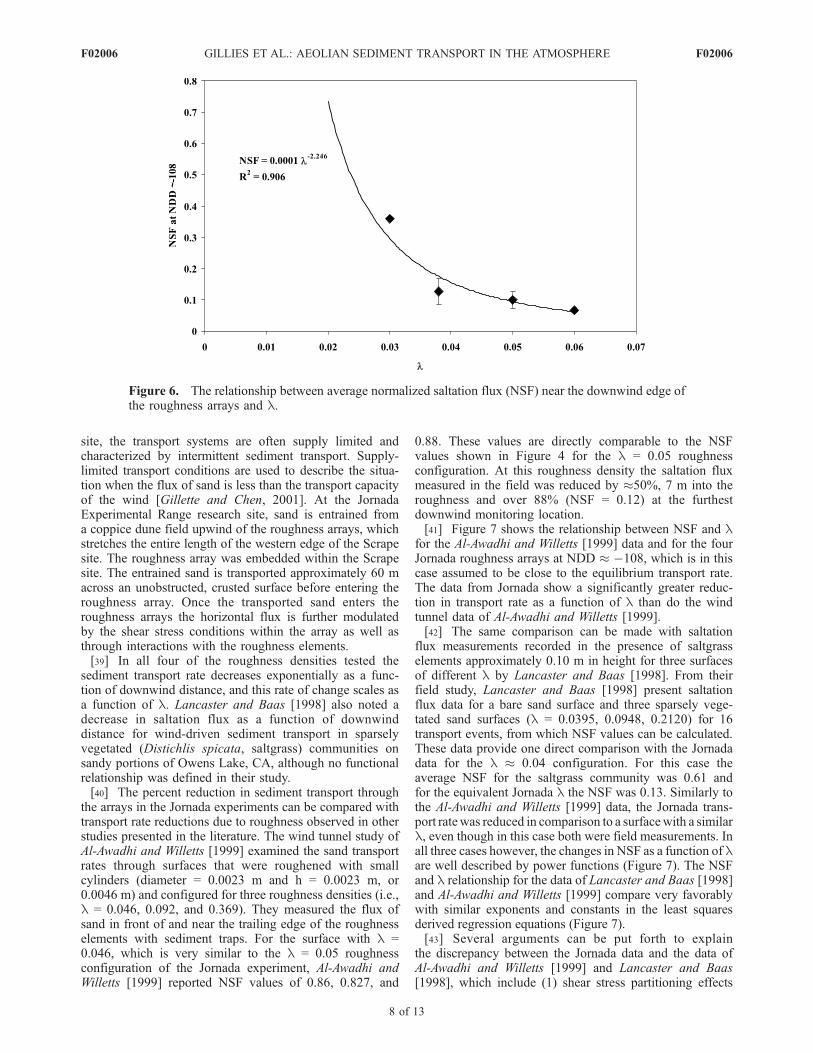
roughness arrays the average percent reduction at the leastdense array (l = 0.03) is �64% compared with the out ofarray flux and �93% for the most dense array. This percentreduction observed at NDD � �108 also scales with l asshown in Figure 6 and is best described by a powerfunction.[37] Considering the intermittent nature of the fluxes, the
supply limited transport conditions, and the complexitiesassociated with the presence of roughness elements, therelationships are remarkably strong and consistent withtransport data measured in much less complex situations(i.e., flat, transport limited surfaces) presented by otherinvestigators [e.g., Nickling and McKenna Neuman, 1995,1997; McKenna Neuman, 1998; Al-Awahdi and Willetts,1999].
5. Discussion
[38] A large proportion of sediment transport studiespresented in the literature deal with relatively simple sys-tems where sediment supply is not limited (e.g., sedimenttransport on sand dunes and sand sheets). In many arid andsemiarid environments such as those found at the Jornada
Table 2. Dates, Durations, and Wind Speed Conditions for the Sediment Transport Events
l DateEvent
Duration, hours
AverageWind Directionat 9 m, deg
AverageWind Speedat 9 m, m s�1
Average Shear Velocity, m s�1
Smooth Surface Rough Surface
0.030 23/5/2004 10 235 9.04 0.41 0.450.038 30/4/2004 12.5 216 10.07 0.45 0.580.050 01/5/2004 6.2 280 9.91 0.44 0.570.050 12/5/2004 9.9 230 8.85 0.40 0.510.050 13/5/2004 9.5 227 9.30 0.42 0.530.062 22/4/2004 9.0 235 9.43 0.42 0.570.062 23/4/2004 7.5 232 9.50 0.43 0.57
F02006 GILLIES ET AL.: AEOLIAN SEDIMENT TRANSPORT IN THE ATMOSPHERE
6 of 13
F02006
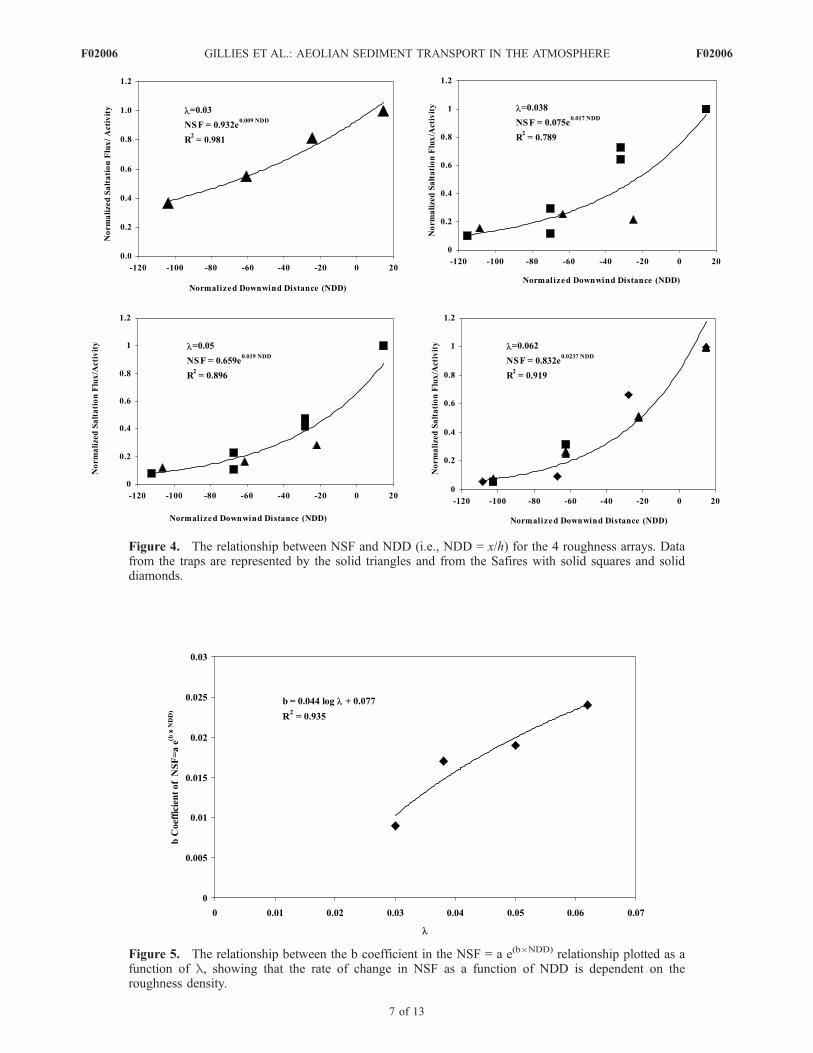
Figure 4. The relationship between NSF and NDD (i.e., NDD = x/h) for the 4 roughness arrays. Datafrom the traps are represented by the solid triangles and from the Safires with solid squares and soliddiamonds.
Figure 5. The relationship between the b coefficient in the NSF = a e(bNDD) relationship plotted as afunction of l, showing that the rate of change in NSF as a function of NDD is dependent on theroughness density.
F02006 GILLIES ET AL.: AEOLIAN SEDIMENT TRANSPORT IN THE ATMOSPHERE
7 of 13
F02006
site, the transport systems are often supply limited andcharacterized by intermittent sediment transport. Supply-limited transport conditions are used to describe the situa-tion when the flux of sand is less than the transport capacityof the wind [Gillette and Chen, 2001]. At the JornadaExperimental Range research site, sand is entrained froma coppice dune field upwind of the roughness arrays, whichstretches the entire length of the western edge of the Scrapesite. The roughness array was embedded within the Scrapesite. The entrained sand is transported approximately 60 macross an unobstructed, crusted surface before entering theroughness array. Once the transported sand enters theroughness arrays the horizontal flux is further modulatedby the shear stress conditions within the array as well asthrough interactions with the roughness elements.[39] In all four of the roughness densities tested the
sediment transport rate decreases exponentially as a func-tion of downwind distance, and this rate of change scales asa function of l. Lancaster and Baas [1998] also noted adecrease in saltation flux as a function of downwinddistance for wind-driven sediment transport in sparselyvegetated (Distichlis spicata, saltgrass) communities onsandy portions of Owens Lake, CA, although no functionalrelationship was defined in their study.[40] The percent reduction in sediment transport through
the arrays in the Jornada experiments can be compared withtransport rate reductions due to roughness observed in otherstudies presented in the literature. The wind tunnel study ofAl-Awadhi and Willetts [1999] examined the sand transportrates through surfaces that were roughened with smallcylinders (diameter = 0.0023 m and h = 0.0023 m, or0.0046 m) and configured for three roughness densities (i.e.,l = 0.046, 0.092, and 0.369). They measured the flux ofsand in front of and near the trailing edge of the roughnesselements with sediment traps. For the surface with l =0.046, which is very similar to the l = 0.05 roughnessconfiguration of the Jornada experiment, Al-Awadhi andWilletts [1999] reported NSF values of 0.86, 0.827, and
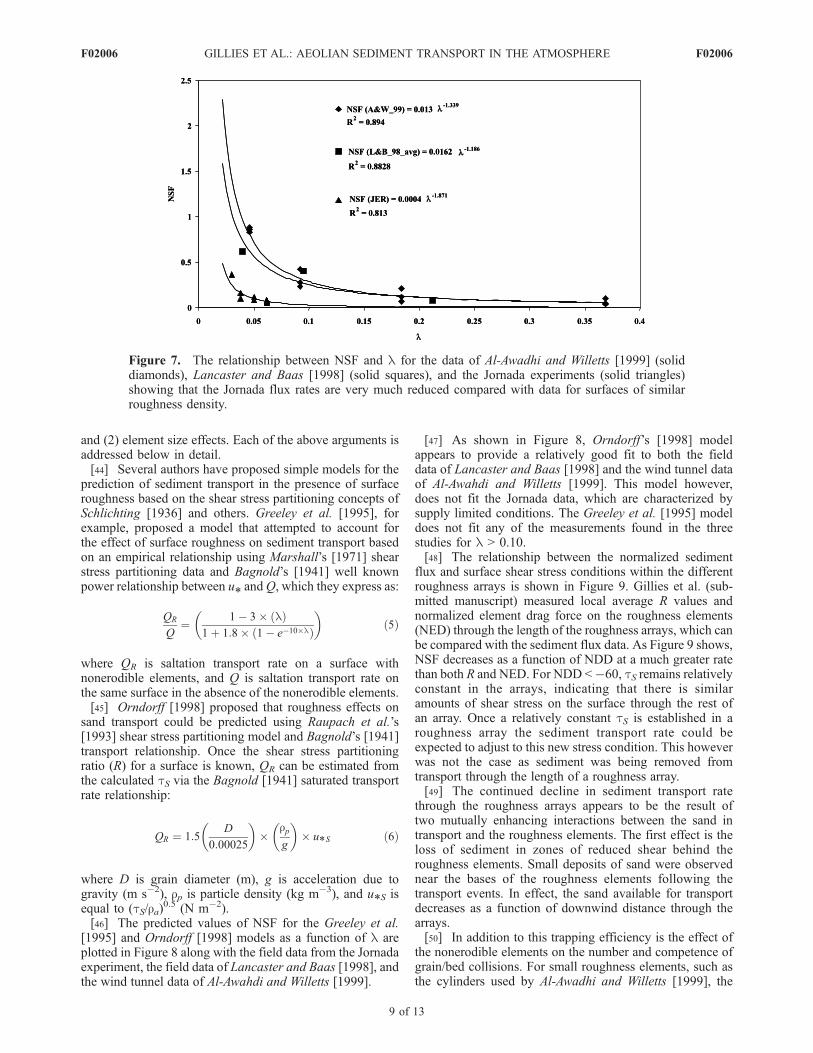
0.88. These values are directly comparable to the NSFvalues shown in Figure 4 for the l = 0.05 roughnessconfiguration. At this roughness density the saltation fluxmeasured in the field was reduced by �50%, 7 m into theroughness and over 88% (NSF = 0.12) at the furthestdownwind monitoring location.[41] Figure 7 shows the relationship between NSF and l
for the Al-Awadhi and Willetts [1999] data and for the fourJornada roughness arrays at NDD � �108, which is in thiscase assumed to be close to the equilibrium transport rate.The data from Jornada show a significantly greater reduc-tion in transport rate as a function of l than do the windtunnel data of Al-Awadhi and Willetts [1999].[42] The same comparison can be made with saltation
flux measurements recorded in the presence of saltgrasselements approximately 0.10 m in height for three surfacesof different l by Lancaster and Baas [1998]. From theirfield study, Lancaster and Baas [1998] present saltationflux data for a bare sand surface and three sparsely vege-tated sand surfaces (l = 0.0395, 0.0948, 0.2120) for 16transport events, from which NSF values can be calculated.These data provide one direct comparison with the Jornadadata for the l � 0.04 configuration. For this case theaverage NSF for the saltgrass community was 0.61 andfor the equivalent Jornada l the NSF was 0.13. Similarly tothe Al-Awadhi and Willetts [1999] data, the Jornada trans-port ratewas reduced in comparison to a surfacewith a similarl, even though in this case both were field measurements. Inall three cases however, the changes in NSF as a function of lare well described by power functions (Figure 7). The NSFand l relationship for the data of Lancaster and Baas [1998]and Al-Awadhi and Willetts [1999] compare very favorablywith similar exponents and constants in the least squaresderived regression equations (Figure 7).[43] Several arguments can be put forth to explain
the discrepancy between the Jornada data and the data ofAl-Awadhi and Willetts [1999] and Lancaster and Baas[1998], which include (1) shear stress partitioning effects
Figure 6. The relationship between average normalized saltation flux (NSF) near the downwind edge ofthe roughness arrays and l.
F02006 GILLIES ET AL.: AEOLIAN SEDIMENT TRANSPORT IN THE ATMOSPHERE
8 of 13
F02006
and (2) element size effects. Each of the above arguments isaddressed below in detail.[44] Several authors have proposed simple models for the
prediction of sediment transport in the presence of surfaceroughness based on the shear stress partitioning concepts ofSchlichting [1936] and others. Greeley et al. [1995], forexample, proposed a model that attempted to account forthe effect of surface roughness on sediment transport basedon an empirical relationship using Marshall’s [1971] shearstress partitioning data and Bagnold’s [1941] well knownpower relationship between u* andQ, which they express as:
QR
Q¼ 1� 3 lð Þ
1þ 1:8 1� e�10lð Þ
� �ð5Þ
where QR is saltation transport rate on a surface withnonerodible elements, and Q is saltation transport rate onthe same surface in the absence of the nonerodible elements.[45] Orndorff [1998] proposed that roughness effects on
sand transport could be predicted using Raupach et al.’s[1993] shear stress partitioning model and Bagnold’s [1941]transport relationship. Once the shear stress partitioningratio (R) for a surface is known, QR can be estimated fromthe calculated tS via the Bagnold [1941] saturated transportrate relationship:
QR ¼ 1:5D
0:00025
� �
rpg
� � u*S ð6Þ
where D is grain diameter (m), g is acceleration due togravity (m s�2), rp is particle density (kg m�3), and u*S isequal to (tS/ra)
0.5 (N m�2).[46] The predicted values of NSF for the Greeley et al.
[1995] and Orndorff [1998] models as a function of l areplotted in Figure 8 along with the field data from the Jornadaexperiment, the field data of Lancaster and Baas [1998], andthe wind tunnel data of Al-Awahdi and Willetts [1999].
[47] As shown in Figure 8, Orndorff’s [1998] modelappears to provide a relatively good fit to both the fielddata of Lancaster and Baas [1998] and the wind tunnel dataof Al-Awahdi and Willetts [1999]. This model however,does not fit the Jornada data, which are characterized bysupply limited conditions. The Greeley et al. [1995] modeldoes not fit any of the measurements found in the threestudies for l > 0.10.[48] The relationship between the normalized sediment
flux and surface shear stress conditions within the differentroughness arrays is shown in Figure 9. Gillies et al. (sub-mitted manuscript) measured local average R values andnormalized element drag force on the roughness elements(NED) through the length of the roughness arrays, which canbe compared with the sediment flux data. As Figure 9 shows,NSF decreases as a function of NDD at a much greater ratethan both R and NED. For NDD <�60, tS remains relativelyconstant in the arrays, indicating that there is similaramounts of shear stress on the surface through the rest ofan array. Once a relatively constant tS is established in aroughness array the sediment transport rate could beexpected to adjust to this new stress condition. This howeverwas not the case as sediment was being removed fromtransport through the length of a roughness array.[49] The continued decline in sediment transport rate
through the roughness arrays appears to be the result oftwo mutually enhancing interactions between the sand intransport and the roughness elements. The first effect is theloss of sediment in zones of reduced shear behind theroughness elements. Small deposits of sand were observednear the bases of the roughness elements following thetransport events. In effect, the sand available for transportdecreases as a function of downwind distance through thearrays.[50] In addition to this trapping efficiency is the effect of
the nonerodible elements on the number and competence ofgrain/bed collisions. For small roughness elements, such asthe cylinders used by Al-Awadhi and Willetts [1999], the
Figure 7. The relationship between NSF and l for the data of Al-Awadhi and Willetts [1999] (soliddiamonds), Lancaster and Baas [1998] (solid squares), and the Jornada experiments (solid triangles)showing that the Jornada flux rates are very much reduced compared with data for surfaces of similarroughness density.
F02006 GILLIES ET AL.: AEOLIAN SEDIMENT TRANSPORT IN THE ATMOSPHERE
9 of 13
F02006
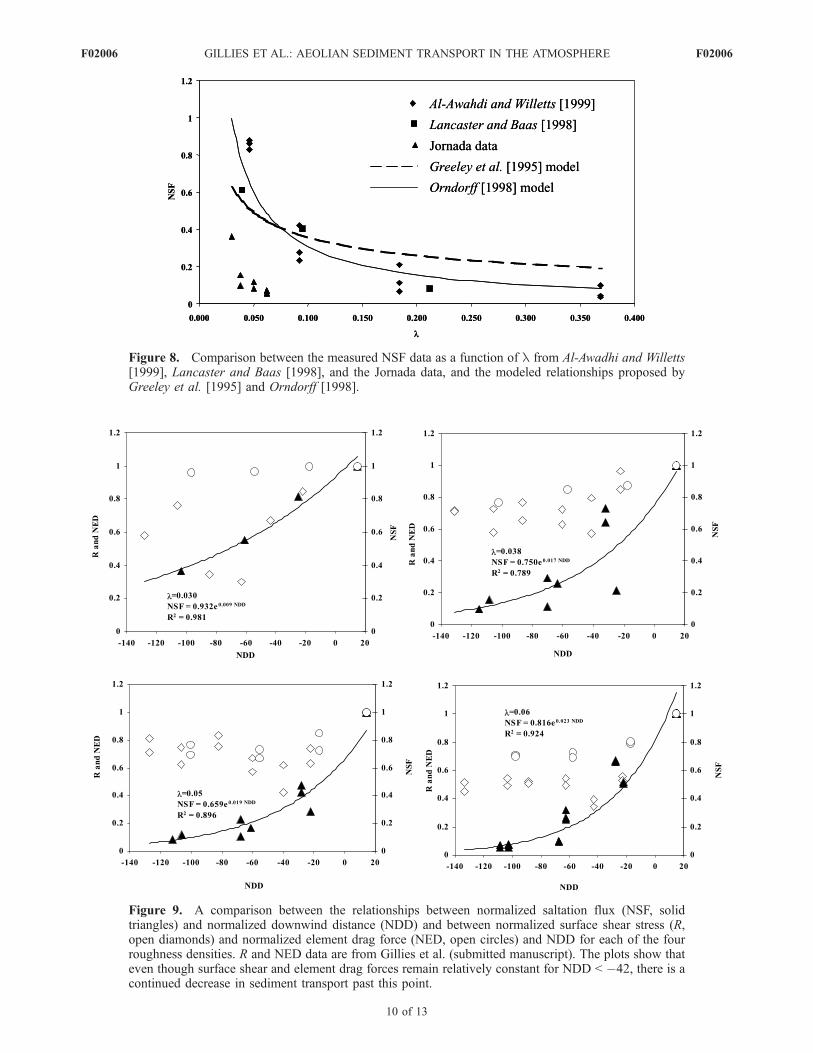
Figure 8. Comparison between the measured NSF data as a function of l from Al-Awadhi and Willetts[1999], Lancaster and Baas [1998], and the Jornada data, and the modeled relationships proposed byGreeley et al. [1995] and Orndorff [1998].
Figure 9. A comparison between the relationships between normalized saltation flux (NSF, solidtriangles) and normalized downwind distance (NDD) and between normalized surface shear stress (R,open diamonds) and normalized element drag force (NED, open circles) and NDD for each of the fourroughness densities. R and NED data are from Gillies et al. (submitted manuscript). The plots show thateven though surface shear and element drag forces remain relatively constant for NDD < �42, there is acontinued decrease in sediment transport past this point.
F02006 GILLIES ET AL.: AEOLIAN SEDIMENT TRANSPORT IN THE ATMOSPHERE
10 of 13
F02006
heights of saltation trajectories for some sand particles canfar exceed the height of the roughness elements. Onceabove the roughness the saltating particles receive momen-tum from the wind, accelerate and subsequently impact theerodible surface helping to drive the saltation system,maintaining a more efficient system in the presence of smallroughness elements. Bagnold [1941] also suggested thatsand grains moving over certain types of surfaces (e.g.,pebble-covered) conserves momentum because of highlyelastic collisions with the roughness, resulting in the morerapid transport of the grains and the transfer of additionalmomentum to the surface upon impact with the interveningsurface.[51] Typically most saltating particles travel below 0.30 m
with a large percentage of the grains moving between 0 and0.10 m [Sørensen, 1991; Cooke et al., 1993]. For theJornada experiments the saltation trajectory heights interactwith the roughness elements throughout the portion of thesaltation cloud height where most of the flux occurs. Theinteraction between the large Jornada roughness elementsand saltating sand grains creates conditions that are muchmore restrictive to the downwind movement of sand thanfor smaller elements. The ratio of saltation cloud height toroughness element height is near one (assuming a 0.30 mdeep saltation cloud) for the Jornada experiments comparedwith 3 for the conditions measured by Lancaster and Baas[1998] and 8–15 for the wind tunnel study of Al-Awadhiand Willetts [1999].[52] Other processes that may cause diminution of flux
with downwind distance is the dispersion of the sand due tothe three-dimensional character of the saltation granularsplash and the variability in wind direction. This could beespecially significant if the source of sand had been essen-tially a point source. In this field setting, however, the sandentrained from the coppice dune field moved across theentire Scrape site passing on either side of the roughnessarrays. In this situation, dispersion would not likely be adominant process causing grains to move laterally throughthe sides of the roughness arrays, where they would be lostfrom the system.[53] A second component of roughness form may also
contribute to the reduced efficiency of sediment transport inthe Jornada experiment. The frontal area of these largeroughness elements (�0.101 m2) occupies considerablespace across the area defined by the length of a row timesthe height of elements. In effect the (horizontal) porosity,defined as open area divided by total area [Cornelis andGabriels, 2005] for each roughness density can be calcu-lated. Because of the staggered array form, the open area isdefined in this case as the total area minus the sum of allelement frontal area in two sequential rows. For the mostdense array (l = 0.062), 30% of the unit area through whichthe sand is passing is occupied by solid elements, whichdrops to only 16% in the most open array (l = 0.03).[54] The exposed upwind surfaces of the roughness
elements will be a zone of impact for some of the saltatinggrains. Particles striking the roughness elements on theirwindward side will rebound most often in an upwinddirection, moving in opposition to the wind flow direction.This should reduce the overall the downwind flux ofparticles and create a population of rebounding grains withreduced energy for splashing up new grains as opposed to
those moving with the wind. This condition is opposite tothe Bagnold [1941] argument for increased momentumtransfer under certain roughness conditions (i.e., small,hard, highly elastic elements). These rebounding grainsmay also find themselves landing in the zone of reducedshear stress created by the row of elements immediatelyupwind to their point of impact. These processes wouldappear to work in concert to deplete the sediment transportrate incrementally through the array.[55] Both the effects of element height and width on
sediment transport rates at Jornada are directly related tothe similar length scales associated with the size of theelements and typical saltation length units (path lengths andtrajectory heights). It is unlikely that sand flux through aroughness patch would reach zero, as long as tS remainedabove threshold, for the same reason cited by Nickling andMckenna Neuman [1995], who argued that localized, spa-tially and temporally variable points of high instantaneousshear stress at the bed created by eddies shed from individualelements are sufficient to keep some particles in motion. Inaddition to these localized zones where transport can beinitiated or sustained at some reduced level, it is also possiblethat higher-magnitude stress events (turbulent eddies) gener-ated in the flow above the elements may on occasion reachthe surface and help to sustain sediment transport.[56] Although the sediment transport system was supply
limited during the experiments described in this study, webelieve that with the removal or relaxation of this limitationthe results would be comparable. The processes leading tothe diminution of flux through the roughness arrays that wehave described will occur even in the presence of increasedsediment loads. The reduction in the relative amount ofsediment in transport may in fact be further reduced due toless elastic collisions between the saltating sand and a softerbed of sand, compared with the harder bounding surface atthe Scrape site. However, this may be counteracted by thelarger number of grains that would be set in motion bythe impacting saltating grains. Further research is needed toascertain the magnitude of the influence of sediment supplyduring aeolian transport occurring over rough surfaces.
6. Conclusions
[57] Results of these tests indicate that sediment transportrates through patches of roughness in the atmospheric ISLare controlled to a large extent by the roughness density ofthe surface. This was also illustrated by the use of datagleaned from publications by Lancaster and Baas [1998]and Al-Awadhi and Willetts [1999]. The data presented inthis paper shows that knowledge of the roughness density ofa surface can be used to predict the effect roughness has onreducing saltation flux compared with a similar surface inthe absence of nonerodible roughness elements. However, itappears that element size plays an important role in influ-encing the magnitude of the reduction that cannot beaccounted for based solely on knowledge of l. Thisdimensionless parameter has proven to be a good descriptorof roughness to predict how the shear stress of the boundarylayer will be partitioned between roughness elements andthe surface, and as demonstrated by King et al. [2005] theRaupach et al. [1993] relationship holds over a wide rangeof element sizes.
F02006 GILLIES ET AL.: AEOLIAN SEDIMENT TRANSPORT IN THE ATMOSPHERE
11 of 13
F02006
[58] On the basis of a limited data set presented in thispaper, the Raupach et al. [1993] shear stress partitioningmodel as it is incorporated into Orndorff ’s [1998]sediment transport model, appears to work reasonably wellfor predicting the effect of roughness on sand transport inthe cases where the roughness elements are � 0.10 m inheight (Figure 8). However, when the dimensions of theroughness itself are equivalent to the full range of saltationlength units it appears that additional effects caused by theinteraction of the elements with the saltation cloud reducethe transport efficiency to a much greater extent than forsurfaces with smaller roughness elements of equivalentroughness density (Figure 8). This limits the applicabilityof the Orndorff’s [1998] model. On the basis of the resultspresented in this paper a sediment transport model that usesa shear stress partitioning approach as a framework mustincorporate a scale dependency effect linked to the physicaldimensions of the roughness.[59] For terrestrial aeolian sand transport the saltation unit
lengths are fairly well understood [e.g., Anderson andHallet, 1986; Shao and Li, 1999] and the results from thisstudy can form the basis for modifying sediment transportmodels that incorporate roughness effects. In applying theseresults and developing models for the Martian aeoliantransport system, consideration must be given to the differ-ent saltation unit lengths in that environment. For Mars,with its reduced gravity and atmospheric density, thesaltation path length has been estimated between 12.5 m[Cooper and Mustard, 1998] and 41.7 m [Greeley andIversen, 1985]. Because the saltation trajectory path lengthsare long, the incident angles of the impacting particlesshould also be lower than those on Earth [Greeley andIversen, 1985]. These properties of the Martian saltationsystem would suggest the constraints that element size haveon terrestrial saltation may be relaxed somewhat as theroughness elements on erodible surfaces on Mars are withinthe same size range as terrestrial roughness. The resultsfrom this work can form the basis for evaluating andmodeling roughness effects on aeolian sediment transporton Mars in a shear stress partitioning framework.
Notation
b element breadth, md displacement height, mD grain diameter, mg acceleration due to gravity, m s�2
h element height, mISL inertial sublayerm empirical constant between 0 and 1n number of roughness elements occupying the
ground area of the roughness arrayNDD normalized downwind distance, x/h, dimensionlessNSF normalized saltation flux, dimensionless
Q horizontal saltation flux on a surface withoutroughness elements, kg m�1 s�1
QR horizontal saltation flux on a surface with non-erodible elements, kg m�1 s�1
R shear velocity ratio, dimensionlessRt threshold wind shear velocity ratio, dimensionlessu wind speed, m s�1
u* wind shear velocity, m s�1
u*S wind shear velocity based on the relationship (tS/ra)
0.5, m s�1
u*tR threshold wind shear velocity with roughnesselements, m s�1
u*tS threshold shear velocity of bare surface, m s�1
x downwind distance, mz reference height above surface, mzo aerodynamic roughness length, mb ratio of element to surface drag coefficients,
dimensionlessk von Karman constant, 0.4l roughness density, dimensionlessra air density, kg m�3
rp particle density, kg m�3
s roughness element basal area to frontal area ratio,dimensionless
t total surface shear stress, N m�2
tS surface shear stress on the area not covered by theroughness elements, N m�2
[60] Acknowledgments. This work was funded in part through theNASA, Mars Fundamental Research Program (grant NAG5-12759). W. G.Nickling also gratefully acknowledges the financial support of the NaturalSciences and Engineering Research Council of Canada (grant 7427-02).Logistical support from the USDA Jornada Experimental Range Personnelwas greatly appreciated and instrumental in the success of this project. Theauthors would like to thank Shannon Brown and Jennifer Bryant from theUniversity of Guelph for their assistance in instrument set-up and diligencein keeping the field site in operation. Kurt Cupp of the Desert ResearchInstitute ably assisted in the instrument fabrication, set-up, and program-ming of the data acquisition systems as part of this project. Mario Finoroand Sandy McLaren of the University of Guelph also contributed to theinstrument design and fabrication. Thanks finally to Torin Macpherson,Matt Alexander, Andrew Torcoletti, Jennifer Booth, and Laura Brown fromthe University of Guelph who participated as part of the JER field studiesand to Dale and Jane Gillette for their support while at the JER. Theinsightful comments of the JGR editors and reviewers are also gratefullyacknowledged.
ReferencesAl-Awadhi, J. M., and B. B. Willetts (1999), Sand transport and depositionwithin arrays of non-erodible cylindrical elements, Earth Surf. ProcessesLandforms, 24, 423–435.
Al-Sudairawi, M. (1992), The effect of non-erodible elements on sandtransport rate, Ph.D. thesis, Univ. of Aberdeen, Aberdeen, Scotland.
Anderson, R. A., and B. Hallet (1986), Sediment transport by wind: Towarda general model, Geol. Soc. Am. Bull., 97, 523–535.
Anderson, R. S., and B. B. Willetts (1991), A review of recent progress inour understanding of aeolian sediment transport, Acta Mech., 1, 1–19.
Baas, A. (2004), Evaluation of Saltation Flux Impact Responders (Safires)for measuring instantaneous aeolian sand transport rates, Geomorphol-ogy, 59(1–4), 99–118.
Bagnold, R. A. (1941), The Physics of Blown Sand and Desert Dunes, 265pp., CRC Press, Boca Raton, Fla.
Buckley, R. (1987), The effect of sparse vegetation cover on the transport ofdune sand by wind, Nature, 325(6103), 426–428.
Cooke, R. U., A. S. Goudie, and A. Warren (1993), Desert Geomorphology,526 pp., UCL Press, London.
Cooper, C. D., and J. F. Mustard (1998), Rates of erosion in Oxia Palus,Mars, Lunar Planet. Sci. Conf. Abstr., XXIX, Abstract 1164.
Cornelis, W. M., and D. Gabriels (2005), Optimal windbreak design forwind erosion control, J. Arid Environ., 61, 315–332.
Crawley, D., and W. G. Nickling (2003), Drag partition for regularly-arrayed rough surfaces, Boundary Layer Meteorol., 107, 445–468.
Gillette, D. A., and W. Chen (2001), Particle production and aeolian trans-port from a ‘‘supply-limited’’ source area in the Chihuahuan Desert, NewMexico, United States, J. Geophys. Res., 106, 5267–5278.
Gillette, D. A., and P. H. Stockton (1989), The effect of nonerodible par-ticles on the wind erosion of erodible surfaces, J. Geophys. Res., 94,12,885–12,893.
Greeley, R., D. Blumberg, A. Dobrovolskis, L. Gaddis, J. D. Iversen,N. Lancaster, K. R. Rasmussen, R. S. Saunders, S. Wall, and B. R. White(1995), Potential transport of windblown sand: Influence of surface
F02006 GILLIES ET AL.: AEOLIAN SEDIMENT TRANSPORT IN THE ATMOSPHERE
12 of 13
F02006
roughness and assessment with radar data, in Desert Aeolian Processes,edited by V. P. Tchakerian, pp. 75–100, CRC Press, Boca Raton, Fla.
Greeley, R., and J. D. Iversen, (1985), Wind as a Geological Process onEarth, Mars, Venus and Titan, 333 pp., Cambridge Univ. Press, NewYork.
Irwin, H. P. A. H. (1980), A simple omnidirectional sensor for wind tunnelstudies of pedestrian level winds, J. Wind Eng. Ind. Aerodyn., 7, 219–239.
Jackson, P. S. (1981), On the displacement height in the logarithmic velo-city profile, J. Fluid Mech., 111, 15–25.
King, J., W. G. Nickling, and J. A. Gillies (2005), Representation of vege-tation and other non-erodible elements in aeolian shear stress partitioningmodels for predicting transport threshold, J. Geophys. Res., 110, F04015,doi:10.1029/2004JF000281.
Lancaster, N., and A. Baas (1998), Influence of vegetation cover on sandtransport by wind: Field studies at Owens Lake California, Earth Surf.Processes Landforms, 25, 68–82.
Logie, M. (1981), Wind tunnel experiments on dune sands, Earth Surf.Processes Landforms, 6, 365–374.
Lyles, L., R. L. Schrandt, and N. F. Schneidler (1974), How aerodynamicroughness elements control sand movement, Trans. ASAE, 17, 134–139.
MacDonald, R. W., R. F. Griffiths, and D. J. Hall (1998), An improvedmethod for the estimation of surface roughness of obstacle arrays, Atmos.Environ., 32(11), 1857–1864.
Malin, M. C., et al. (1998), Early views of the Martian surface from theMars Orbiter Camera of Mars Global Surveyor, Science, 279(5357),1681–1685.
Marshall, J. K. (1971), Drag measurements in roughness arrays of varyingdensity and distribution, Agric. Meteorol., 8, 269–292.
McEwan, I. K., and B. B. Willetts (1994), On the prediction of the bedloadsand transport rate in air, Sedimentology, 41(6), 1241–1251.
McKenna Neuman, C. (1998), Sediment flux and boundary layer adjust-ments over rough surfaces with an unrestricted, upwind sediment supply,Geomorphology, 25, 1–17.
McKenna Neuman, C. L., and W. G. Nickling (1995), Aeolian sedimentflux decay: Non-linear behaviour on developing deflation lag surfaces,Earth Surf. Processes Landforms, 20, 423–435.
Monteiro, J. P., and D. X. Viegas (1996), On the use of Irwin and Prestonwall shear stress probes in turbulent incompressible flows with pressuregradients, J. Wind Eng. Ind. Aerodyn., 64, 15–29.
Nickling, W. G., and C. McKenna Neuman (1995), Development of defla-tion lag surfaces, Sedimentology, 42(3), 403–414.
Nickling, W. G., and C. McKenna Neuman (1997), Wind tunnel evalua-tion of a wedge-shaped aeolian transport trap, Geomorphology, 18,333–345.
Orndorff, R. (1998), A stochastic model of wind-induced shear stress par-titioning between an erodible soil surface and roughness elements, inDust Aerosols, Loess Soils and Global Changes, edited by A. J. Busacca,pp. 75–78, Wash. State Univ. Coll. Agric. and Home Econ., Pullman.
Raupach, M. R. (1992), Drag and drag partition on rough surfaces, Bound-ary Layer Meteorol., 60, 375–395.
Raupach, M. R., D. A. Gillette, and J. F. Leys (1993), The effect of rough-ness elements on wind erosion threshold, J. Geophys. Res., 98, 3023–3029.
Schlichting, H. (1936), Experimentelle untersuchungen zum rauhigkeit-sproblem, Ing. Arch., 7, 1–34.
Shao, Y., and A. Li (1999), Numerical modelling of saltation in the atmo-spheric surface layer, Boundary Layer Meteorol., 91(2), 199–225.
Sørensen, M. (1991), Estimation of some aeolian saltation transport para-meters from transport rate profiles, Acta Mech., 1, 141–190.
Sørensen, M. (2004), On the rate of aeolian sand transport, Geomorphology,59, 53–62.
White, B. R., and H. Mounla (1991), An experimental study of Froudenumber effect on wind-tunnel saltation, Acta Mech. Suppl., 1, 145–157.
Wilson, S. A., and J. R. Zimbelman (2004), Latitude-dependent nature andphysical characteristics of transverse aeolian ridges on Mars, J. Geophys.Res., 109, E10003, doi:10.1029/2004JE002247.
Wooding, R. A., E. F. Bradley, and J. K. Marshall (1973), Drag due toregular arrays of roughness elements of varying geometry, BoundaryLayer Meteorol., 5, 285–308.
Wu, H., and T. Stathopoulos (1994), Further experiments on Irwin’s surfacewind sensor, J. Wind Eng. Ind. Aerodyn., 53, 441–452.
Wyatt, V., and W. G. Nickling (1997), Drag and shear stress partitioningin sparse desert creosote communities, Can. J. Earth Sci., 34, 1486–1498.
�����������������������J. A. Gillies, Particle Emissions Measurement Laboratory, Division of
Atmospheric Sciences, Desert Research Institute, 2215 Raggio Parkway,Reno, NV 89512, USA. ([email protected])J. King and W. G. Nickling, Wind Erosion Laboratory, Department of
Geography, University of Guelph, Guelph, ON, Canada N1G 2W1.
F02006 GILLIES ET AL.: AEOLIAN SEDIMENT TRANSPORT IN THE ATMOSPHERE
13 of 13
F02006
Copyright © 2022 FDOKUMEN