HDAC6 Modulates Cell Motility by Altering the Acetylation Level of Cortactin
Upload
independentCategory
view
1download
0
Electrochemical Push−Pull Probe: From Scanning ElectrochemicalMicroscopy to Multimodal Altering of Cell Microenvironment
Alexandra Bondarenko,† Fernando Cortes-Salazar,† Mihaela Gheorghiu,‡ Szilveszter Gaspar,‡
Dmitry Momotenko,† Luciana Stanica,‡,§ Andreas Lesch,† Eugen Gheorghiu,‡,§ and Hubert H. Girault*,†
†Laboratoire d’Electrochimie Physique et Analytique, Ecole Polytechnique Federale de Lausanne, CH-1015 Lausanne, Switzerland‡International Centre of Biodynamics, 1B Intrarea Portocalelor Street, 060101 Bucharest, Romania§Faculty of Biology, University of Bucharest, 91−95 Splaiul Independentei, 050095 Bucharest, Romania
*S Supporting Information
ABSTRACT: To understand biological processes at the cellular level, a general approach is to alter the cells’ environment and tostudy their chemical responses. Herein, we present the implementation of an electrochemical push−pull probe, which combines amicrofluidic system with a microelectrode, as a tool for locally altering the microenvironment of few adherent living cells byworking in two different perturbation modes, namely electrochemical (i.e., electrochemical generation of a chemical effectorcompound) and microfluidic (i.e., infusion of a chemical effector compound from the pushing microchannel, whilesimultaneously aspirating it through the pulling channel, thereby focusing the flow between the channels). The effect of severalparameters such as flow rate, working distance, and probe inclination angle on the affected area of adherently growing cells wasinvestigated both theoretically and experimentally. As a proof of concept, localized fluorescent labeling and pH changes werepurposely introduced to validate the probe as a tool for studying adherent cancer cells through the control over the chemicalcomposition of the extracellular space with high spatiotemporal resolution. A very good agreement between experimental andsimulated results showed that the electrochemical perturbation mode enables to affect precisely only a few living cells localized ina high-density cell culture.
E ssential cellular behaviors such as proliferation, apoptosis,toxicity, cytokinesis, chemotaxis, asymmetric cell division,
or changes in synaptic strength are hallmark processes thatrequire well-orchestrated, spatially localized, and dynamicbiochemical strategies. Typically, investigating biochemicalchanges requires (i) the manipulation of cells in a fixed volumespace, (ii) the perturbation of the system by introducing anexternal agent (e.g., drug) or a new condition (e.g., pH ortemperature), and (iii) the detection of the cell response.Despite all the optical imaging techniques that can reveal withina minute details of living cells’ interior,1−4 it remainschallenging to image and modify simultaneously the chemicalenvironment around cells with a high sensitivity andresolution.1 Microfabrication techniques opened new ways ofstudying biological processes by providing devices withcapacities for growing, seeding, or sorting cells and by providingmicrofluidic networks for controlling the extracellular environ-
ment, in a manner either fully compatible with or capable ofintegrating various current powerful detection techniques.5−9
For instance, multipurpose scanning microfluidic probes10,11
were suggested for the local assessment and perturbation ofcellular environments. Similarly, new microfluidic probesconsisting of three open microchannels,12−14 two for aspiratingand one for infusing, were introduced for single-cellmanipulations to analyze the enzymatic activity of kinase andhouse-keeping proteins present in a single cell extract.13
Scanning electrochemical microscopy (SECM) is ananalytical technique for characterization of chemical surfacereactivity and topography based on the collection of anelectrochemical signal at an ultramicroelectrode (UME), which
Received: February 3, 2015Accepted: April 2, 2015Published: April 2, 2015
Article
pubs.acs.org/ac
© 2015 American Chemical Society 4479 DOI: 10.1021/acs.analchem.5b00455Anal. Chem. 2015, 87, 4479−4486

is scanned over a specimen in the presence of an electrolytesolution.15 Thanks to its high spatial resolution and versatility,SECM has allowed nanoscale electrochemical imaging of singlehuman breast epithelial cells as well as accessing intracellularmedia in order to measure the rate of transmembrane transport,membrane potential, or simply probing redox properties of theintracellular space.16−20 Therefore, several SECM studies ofmammalian living cells, such as HeLa cells,21−25 breast cancercells, hepatocytes,26 human liver cells,26 human erythroleuke-mia cells,27 mouse embryonic stem cells,28 human neutro-phils,29 and human prostate cancer cells30 have been reported.Furthermore, by combining SECM with other analyticaltechniques such as optical microscopy (SECM-OM), shearforce distance regulation, or scanning ion conductivemicroscopy (SICM), it has been made possible to extractadditional useful chemical or topographic information on livingcells.31−33
While most SECM experiments are devoted to the “reading”of adherent cells, the perturbation of the cell environmentthrough electrochemical reactions can also be implemented asshown by Bergner et al.34 While this task seems to becomplicated for classic glass-encapsulated UMEs, it can beeasily solved by employing the soft polymeric probes initiallydeveloped to carry out SECM experiments on tilted, rough, andlarge surfaces in a contact mode.35−41 Indeed, these probes canbe combined with microfluidics to release locally electrolytesolutions in the gap between the sensing UME and the samplearea under study, as in case of the fountain pen42 or additionallyto aspirate the delivered solution, as in case of the microfluidicpush−pull probe.43 As a result, the readout of surface reactivityat metal-on-glass structures, human fingerprints, immobilizedenzymes, and self-assembled monolayers has been demon-strated.42−44 Furthermore, the electrochemical push−pullscanner (the modified version of the microfluidic push−pullprobe) has enabled the coupling of SECM with massspectrometry for the extraction of chemical and electrochemicalsurface information.44 Finally, because of their softness, the softprobes proved to be ideal for scanning delicate substrates, suchas self-assembled monolayers.40
Herein, we introduced the electrochemical push−pull probeand characterized the new electrochemical push−pull probe asa precise perturbation tool for adherent cancer cells in a dualelectrochemical and microfluidic mode. More specifically, thecontrol of the chemical composition of the extracellular space isachieved by using a microfluidic mode (i.e., the infusion of achemical effector from the pushing microchannel, whileaspirating it through the pulling channel) and/or an electro-chemical mode (i.e., the electrochemical generation of achemical effector). As a proof of concept, fluorescent labelingof adherently growing cancer cells in the microfluidic mode andtheir response under a locally induced pH change in theelectrochemical mode were demonstrated. Finite elementanalysis of coupled Navier−Stokes and diffusion−convectiondifferential equations showed good agreement with theexperimental data, confirming the unique dual electrochemicalpush−pull probe capabilities as a writing tool of biologicalsamples.
■ EXPERIMENTAL SECTION
Chemicals. Acridine orange hydrochloride hydrate (AO), 4-(2-hydroxyethyl)piperazine-1-ethanesulfonic acid (HEPES),ferrocene methanol (FcCH2OH, ≥ 97%), sodium chloride,and sodium hydroxide were purchased from Sigma-Aldrich
(Munich, Germany). All chemical reagents were of analyticalgrade and were used without further purification. Ultrapurewater (Milli-Q) was used as a solvent.
Cell Culture Preparation. A549 cells (human lung cancercell line) were grown on Dulbecco’s modified Eagle’s medium(DMEM) supplemented with 10% fetal bovine serum (FBS)and penicillin−streptomycin (100 IU/mL) at 37 °C in a 5%CO2 humidified incubator (Sanyo). Cells were split at 70%confluence using Trypsin-EDTA (0.5%) and seeded in glass-bottomed cell culture dishes (World Precision Instruments) ata concentration of 1.8 × 10⁵ cells/mL and grown to 80%confluency prior to experiments in DMEM. All culture mediaand supplements were purchased from Gibco/Invitrogen.Before the experiments, the adherent cells were washed, and
the growth medium was replaced with Ringer solution thatincludes 130 mM NaCl, 1 mM KCl, 1 mM MgCl2, 2 mMCaCl2, 10 mM HEPES, and 10 mM glucose (pH 7.4, adjustedwith NaOH). The cell line was chosen on the basis of its goodresilience to environmental perturbations, in order to avoidnonspecific cellular changes during the operations with theelectrochemical push−pull probe.
Electrochemical Push−Pull Probe Fabrication. Theelectrochemical push−pull probe was manufactured by UV-photoablation of 100 μm thick polyethylene terephthalatesubstrate (PET, MelinexDupont, Wilmington, DE, USA), usinga 193 nm ArF excimer laser beam (Lambda Physik, Gottingen,Germany, frequency = 50 Hz, energy = 350 mJ) as it has beenreported previously.36,43 Briefly, two parallel microchannels(100 μm width, 30 μm depth, 60 μm distance betweenchannels) were fabricated on one side of a PET film. A thirdparallel microchannel (30 μm width, 20 μm depth) was ablatedin-between the previous two channels but on the opposite sideof the PET film. The latter microchannel was manually filledwith a carbon ink (Electra Polymer and Chemicals Ltd.,Roughway Mill, Dunk Green, England) and cured at 80 °C for1 h to create a carbon UME. Furthermore, the side with twoopen microchannels was laminated with a polyethylene (PE)/PET film (Payne, Wildmere Road, Banbury, England) to createtwo microfluidic channels. Thereafter, the UME was coated bya 2 μm thick Parylene C film, using a parylene depositionsystem (Comelec SA, La Chaux-de-Fonds, Switzerland). Beforeeach experiment, the probe was cut manually with a surgicalscalpel blade to obtain a fresh electrode surface and a V-shapedtip (0.5−2 mm wide). The electrochemical response of thecarbon microelectrode was verified by cyclic voltammetry in asolution of 2 mM FcCH2OH in 0.1 M KNO3 and 10 mMHEPES (see Supporting Information Section SI-I).
Computational Model and Numerical Simulations. Toestimate the size and the shape of the areas affected by theelectrochemical push−pull probe operating in the microfluidicand electrochemical modes, finite element analysis of coupledNavier−Stokes and diffusion−convection differential equationsin steady-state conditions were carried out in a manner similarto that reported previously.43 The computational model of theprobe assumes that the probe (parallel-piped with dimensions =125 μm thickness × 500 μm width × 1000 μm height) in a box-shaped domain (2000 μm length × 2000 μm width × (1000 +d μm) height, where d is the distance between the probe andthe substrate) that represents the bulk solution (Figure 1a,b).The active area of the UME was approximated to a half-discshape with a 20 μm radius, and the simulated microchannelshad the shape of an isosceles trapezium located in the oppositeside of the probe (i.e., 70 and 100 μm base length, 30 μm
Analytical Chemistry Article
DOI: 10.1021/acs.analchem.5b00455Anal. Chem. 2015, 87, 4479−4486
4480

height, and center-to-center separation of 160 μm, Figure 1a).When the finite element analysis is employed, one importantfactor to be considered is the mesh size. Here, the Navier−Stokes equation was solved with a fine mesh size between 10−5
and 10−6 m at the substrate plane, the microchannels, and theelectrode edge, which corresponds to the most relevant regionsin the present system. To optimize the calculation time, themesh employed to map the bulk solution was on the range of7.5 × 10−5 m, which still allows a precise characterization of theconvection−diffusion process within the simulated system. It isimportant to notice that the above-mentioned mesh sizes werefound to be the optimum ones after carrying out severalsimulations with different mesh sizes and obtaining areproducible and mesh-independent solution to the system.Numerical simulations were carried out for both microfluidicand electrochemical operation modes at different flow rates,inclination angles (α = 90 or 70°) and working distances (d)between the tip and the substrate surface (Figure 1b,c). Thetwo inclination angles employed for the simulation correspondto the most common experimental conditions under which theelectrochemical push−pull probe is used for SECM experi-ments.43 For instance, working with an inclination angle of 70°allows an easier positioning of the probe in a closer proximityto the substrate without scratching adherent cells. In contrast,working at 90° assures a more oriented perturbation. In eachcase, the affected substrate area was determined on the basis ofthe concentration profile of a given chemical effector B (whichcan perturb cells in different manners) delivered from an openmicrochannel or electrochemically generated from a nonactivecompound A (which cannot perturb cells) at the micro-electrode and transported to the substrate surface by diffusiononly. All simulations were run by using an initial normalizedconcentration of B and A equal to unity for microfluidic andelectrochemical modes, respectively. ImageJ software (WayneRasband, Research Services Branch, National Institute ofMental Health, Bethesda, Maryland, USA) was employed todetermine the whole affected area in each case. Furthermore, tocorroborate that the employed set of equations was solvedappropriately, the well-known wall−jet electrode (WJE)system45 was solved numerically and compared with the
analytical solution. (For more details, see SupportingInformation Section SI-II,)
Local Perturbation of Adherent Cells. For eachexperiment, a Petri dish containing adherently growing cancercells was positioned on top of an AxioObserver Z1 invertedmicroscope (Zeiss, Germany) combined with an XYZ position-ing system (consisting of a DC-3K micromanipulator and anSTM 3 controller from MarzhauserWetzlar GmbH & Co. KG).The electrochemical push−pull probe was mounted on ahomemade plexiglass holder with a predefined inclination angleof 70 or 90° and fixed on the above-mentioned positioningsystem. The microchannels were connected to a computer-controlled syringe pump (Cavro XLP 6000 from TecanSystems, Inc.) and valve (Model M6 liquid handling pumpfrom VICI AG International) through silica capillaries (TSPFS-Tubing, 100 μm inner diameter (ID), 363 μm outerdiameter (OD) from BGB Analytik AG, Switzerland) andfittings (NanoPort Assemblies from IDEX Health & ScienceLLC, USA). The positioning of the probe over the adherentcancer cells at a working distance (e.g., 2.5, 50, 100, or 250 μm)was verified by using the optical focusing of the invertedmicroscope. Specifically, the objective of the microscope wasfocused on the cells surface and its absolute position wasrecorded. Thereafter, the objective was moved up by a definedvalue equivalent to the desired working distance (e.g., 2.5, 50,100, or 250 μm) and the electrochemical push−pull probe wasmoved down until the plane of the microelectrode and theopen microchannels were in the focus of the objective.Furthermore, the objective was refocused on the cell surfaceto confirm the working distance value. Then, the probe wasemployed to affect the cell culture by using one of the operatingmodes. For instance, in the microfluidic mode, cancer cells werelabeled by fluorescent AO species delivered from theelectrochemical push−pull probe at a nominal pushing flowrate of 1 μL/min (during 2 min) and a nominal aspirating flowrate of 0, 20, or 50 μL/min. The final image of the cell surfaceafter perturbation was obtained by employing a band-pass filterfor excitation (BP 450−490 nm) and a long-pass filter (>515nm) for emission, in conjunction with the monochromatic iXonDU-885 K EMCCD camera from Andor and analyzed byImageJ software in order to determine the affected area (on thebasis of the pixel size, calculated taking into account allmagnifications). A similar procedure was followed to determinethe area of the cell-covered surface affected by the electro-chemical push−pull probe operated in the electrochemicalmode. In such cases, the probe was positioned above adherentcells previously labeled with AO and a constant potential of −2V was applied at the UME (vs an Ag quasi-reference electrode,Ag-QRE) for a given time by using an Autolab potentiostat(Autolab PGSTAT101, MetrohmAutolab B.V., The Nether-lands). This procedure induced a drastic increase of the localpH value, which decreased the fluorescence in the cells at thedetection wavelength (vide infra). The electrochemicaloperation mode was further employed to generate a Morsecode S−O−S signal (i.e., three short signals, or dots, for S,three long signals, or dashes, for O, followed by three shortsignals for S) by purposely controlling the fluorescenceintensity of adherent cells. With this aim, the probe waspositioned 7 μm above the cell-covered surface with aninclination angle of 70° and the following potential stepprogram was applied: a potential of −2 V was applied during 30s to generate the dots, whereas the dash lines were generated bybiasing the electrode at −2 V during 60 s. A potential of 0 V
Figure 1. (a) Grid for the numerical simulations of the area affected bythe electrochemical push−pull probe when it is positioned above thesubstrate at an inclination angle α at the working distance d. Insetshows a microscopic cross-sectional image of the probe. (b) Schematicrepresentation (with dimensions) of the electrochemical push−pullprobe. Illustrations of the (c) microfluidic focusing mode and (d) theelectrochemical mode for the localized perturbation of living cells arealso presented.
Analytical Chemistry Article
DOI: 10.1021/acs.analchem.5b00455Anal. Chem. 2015, 87, 4479−4486
4481

was applied for 60 s in between dots and dashes and for 120 sin between characters. The Ag-QRE electrode was additionallycharacterized versus standard Ag/AgCl/3 M KCl electrode.Additionally, a 10 mM NaOH solution was delivered over
AO-labeled cells to confirm that changes in the fluorescence,observed while using the electrochemical push−pull probe inthe electrochemical operation mode, were caused by local pHchanges. The NaOH solution was consequently delivered overthe fluorescent AO-labeled cells with a flow rate equal to 0.5μL/min over 50 s.
■ RESULTS AND DISCUSSION
Computational Model and Numerical Simulations.Microfluidic Mode. To estimate theoretically the area affectedby the electrochemical push−pull probe operated in themicrofluidic mode (Figure 1b), the computational modelassumed a probe positioned with an inclination angle of 90or 70° at a distance of 50, 100, or 250 μm above the substrate.Furthermore, a chemical effector B was delivered through thepushing channel with a flow rate equal to 1 μL/min, whereasthe aspirating flow rate was varied from 0 to 10 μL/min. Thesystem of Navier−Stokes and diffusion−convection equationswas then solved to estimate the influence of the inclinationangle, probe−substrate distance, and aspirating flow rate on thesample affected area (Supporting Information Section SI-III).The results of the numerical simulations demonstrated the
significant influence of the aspirating rate on the affected area(Figure 2 and Supporting Information Section SI-III).Implementing the aspiration focuses the flow of the chemicaleffector B delivered by the electrochemical push−pull probe.Indeed, the affected areas shown in Figure 2 have a shape of anelongated oval that is sharpened on the side of the pulling
microchannel. Varying the value of the pulling flow ratechanges the shape of the global concentration gradients, whichis reflected on the affected area. For instance, increasing thepulling flow rate from 1 to 5 μL/min for the 70° inclinationangle and 50 μm working distance decreases the affected areadrastically from ca. 2 × 10⁶ to 4.5 × 105 μm2 (Figure 2a,b,respectively). The influence of the working distance on theaffected area is more significant at high aspirating flow rates.For instance, with a 5 μL/min aspirating flow rate, the increaseof the working distance from 50 to 100 μm generates a decreaseof the affected area by about three-fold (Figure 2c, sampleaffected area ca. 1.5 × 105 μm2). As expected, the subsequentincrease of the working distance up to 250 μm leads to thefurther decrease of the concentration of the active compound Bon the substrate (Figure 2d, less than 10% from the initialconcentration of B reaches the surface). In contrast, when theaspirating flow rate is equal to 1 μL/min, the affected area isvery similar for all working distances (see SupportingInformation Section SI-III). Moreover, changing the inclinationangle from 70 to 90° generates slightly wider affected areas witha behavior similar to that observed when the working distancewas constant (for more details, see Supporting InformationSection SI-III).
Electrochemical Mode. The electrochemical operationmode of the probe (Figure 1c) is based on the in situelectrochemical generation of species that can perturb adherentcells locally. The computational model in this case assumes thatthe nonactive compound A present in the solution is convertedinto the chemical effector B at the UME, which then diffuses tothe substrate. As in the previous case, the probe was positionedwith an inclination angle of 90 or 70° but at working distancesfrom 2 to 25 μm above the substrate. For the numericalsimulations, a fast reaction rate constant for the conversion of Ainto B was assumed (i.e., k = 106 m s−1, for more details, seeSupporting Information Section SI-IV).As in the case of the microfluidic operation mode, a similar
behavior was observed when the working distance was variedfor both inclination angles; therefore, only the results obtainedwith the 70° inclination angle will be further discussed (formore details, see Supporting Information Section SI-IV).Indeed, the working distance has a significant influence onthe concentration profile of the active compound B over thesubstrate and on the whole affected area. For example,increasing d from 2 to 15 μm decreases the maximumconcentration of B that reaches the substrate from 1 to 0.46M (Figure 2e,f). Accordingly, the whole affected area increasesfrom 104 to 4 × 104 μm2 because of the broader diffusion fieldgenerated, but the area affected with a concentration of activecompound higher than 95% is approximately 70 μm2, whichcoincides to the size of a single or a few living cells.Furthermore, the affected area for the same working distanceis smaller when the probe is positioned with an inclinationangle equal to 70°, as compared to the case when this angle is90°. The latter is mainly due to the diffusion profiles that isdeveloped toward the sample plane in comparison with anangle equal to 90° (Supporting Information Section SI-IV).
Experimental Perturbation of Adherent Cancer Cells.Microfluidic Mode. The electrochemical push−pull probe wasused in the microfluidic mode to label adherent A549 cancercells with AO. AO is a fluorescent dye that has found wideapplication in cellular biology because of its capability topenetrate cell membranes and bind both DNA and RNA.46
Because A549 cancer cells do not have an intrinsic fluorescence,
Figure 2. Concentration profiles of the active compound B deliveredover the sample surface by the electrochemical push−pull probeoperated in (a−d) microfluidic and (e−f) electrochemical modesunder different conditions. For the microfluidic mode for all thesimulations, the pushing flow rate was 1 μL/min and the inclinationangle was 70°. Aspirating flow rate and the working distance d were,respectively, (a) 1 μL/min and 50 μm, (b) 5 μL/min and 50 μm, (c) 5μL/min and 100 μm, and (d) 5 μL/min and 250 μm. For theelectrochemical mode, the inclination angle was equal to 70° and theworking distance d was (e) 15 μm and (f) 2 μm.
Analytical Chemistry Article
DOI: 10.1021/acs.analchem.5b00455Anal. Chem. 2015, 87, 4479−4486
4482
only the adherent cells that capture AO will be clearlyhighlighted in the fluorescence image. With this aim, a solutionof AO (0.002% in Ringer buffer) was delivered by using theelectrochemical push−pull probe in order to study theinfluence of different parameters (e.g., working distance,inclination angle, and aspiration rate) on the affected cellarea. For each experiment, AO was only delivered during thefirst 2 min, whereas the aspiration rate was kept constant for thecomplete duration of the experiment (i.e., 10 min). To avoidany interference from the autofluorescence of the probematerials (i.e., PET and PE, see Supporting InformationSection SI-V), the probe was moved away from the field of viewof the microscope before the final image of the perturbed cellswas obtained. A period of 8 min between stopping the pushingchannel and taking the final image was necessary to preventadditional cell staining when moving away the probe. The latterwas required to avoid any perturbation because of theconvection generated by the probe repositioning and thepressure remaining in the microfluidic system even after thepump was turned off (Supporting Information Section SI-V).The most representative results for the perturbation of cells
by the electrochemical push−pull probe operating in amicrofluidic mode are presented in Figure 3. When the probe
is employed without aspiration, the dimension of the affectedarea is defined mainly by the time of the assay (2 min in thepresent case). For instance, when AO was delivered at aworking distance of 50 μm and with an inclination angle of 90°,the area of the affected cells occupied almost the entire field ofview of the microscope (i.e., square millimeter scale, Figure 3a).By carrying out the same experiment but with a nominalaspiration flow rate of 20 μL/min, the labeled area presented adeformed oval shape, which was sharpened below the locationof the aspirating microchannel (Figure 3b). Moreover, theaffected area in this case corresponds to approximately 3.1 ×
105 μm2, which was reached and kept almost constant after aperiod of 60 s of injection, thanks to the achievement of steady-state conditions (see Supporting Information Sections SI-V andSI-VI). To investigate whether the efficiency of the aspiratingmicrochannel can be further improved, a higher pulling flowrate was also employed while labeling cells with AO (i.e., 50μL/min, Figure 3c). However, no significant differencescompared to the previous experiments were observed (Figure3b,c). This confirms that a maximum effective aspiration rate
was already achieved at the nominal pulling flow rate of 20 μL/min. Indeed, depending on the microchannel dimensions, thepresence of air bubbles in the microchannels, and the deadvolumes of the microfluidic connections, the effective aspirationrate does not necessarily correspond to the nominal one (i.e.,effective aspiration rate < nominal aspiration rate).As predicted from the numerical simulations, changing the
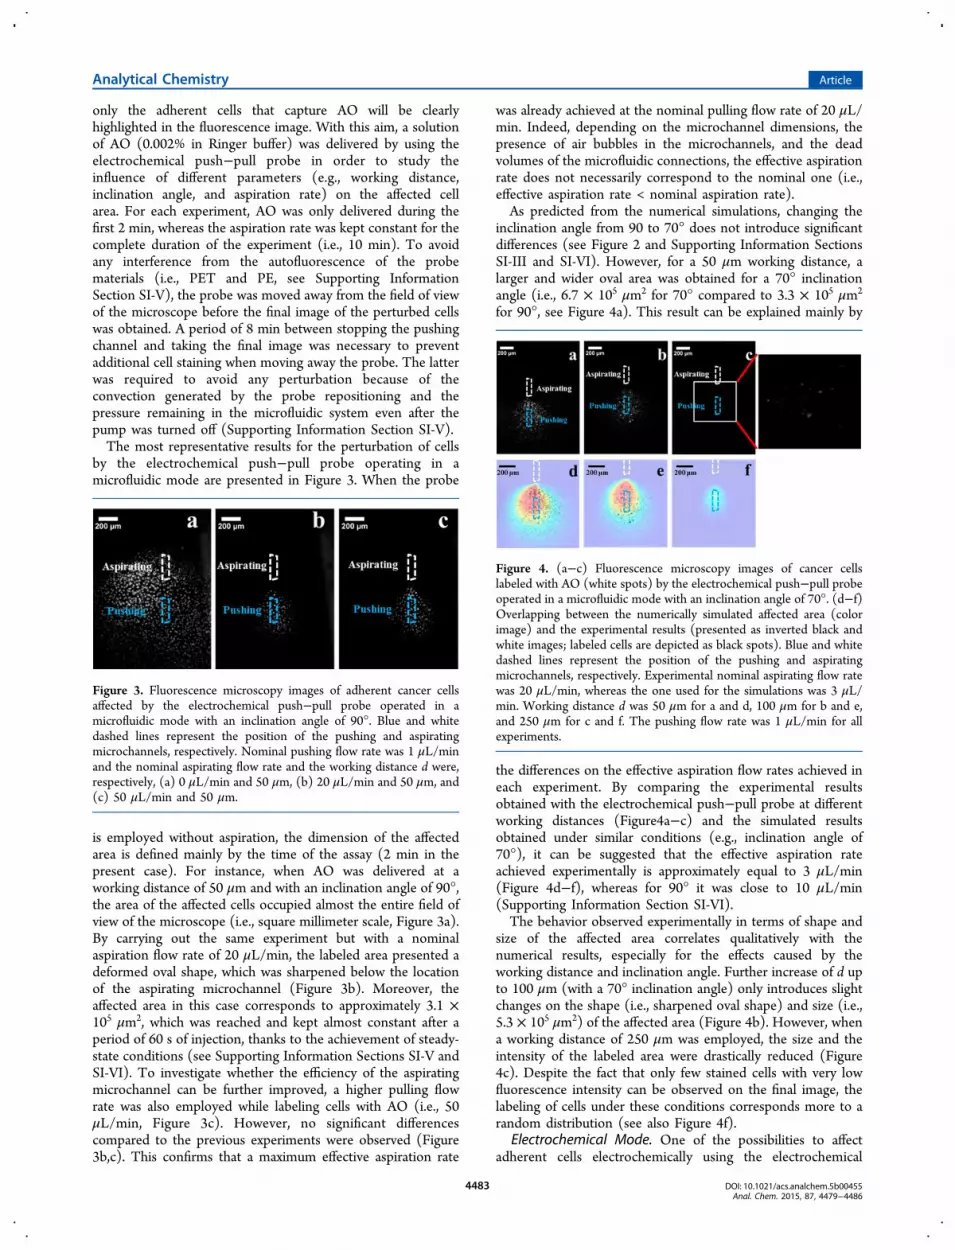
inclination angle from 90 to 70° does not introduce significantdifferences (see Figure 2 and Supporting Information SectionsSI-III and SI-VI). However, for a 50 μm working distance, alarger and wider oval area was obtained for a 70° inclinationangle (i.e., 6.7 × 105 μm2 for 70° compared to 3.3 × 105 μm2
for 90°, see Figure 4a). This result can be explained mainly by
the differences on the effective aspiration flow rates achieved ineach experiment. By comparing the experimental resultsobtained with the electrochemical push−pull probe at differentworking distances (Figure4a−c) and the simulated resultsobtained under similar conditions (e.g., inclination angle of70°), it can be suggested that the effective aspiration rateachieved experimentally is approximately equal to 3 μL/min(Figure 4d−f), whereas for 90° it was close to 10 μL/min(Supporting Information Section SI-VI).The behavior observed experimentally in terms of shape and
size of the affected area correlates qualitatively with thenumerical results, especially for the effects caused by theworking distance and inclination angle. Further increase of d upto 100 μm (with a 70° inclination angle) only introduces slightchanges on the shape (i.e., sharpened oval shape) and size (i.e.,5.3 × 105 μm2) of the affected area (Figure 4b). However, whena working distance of 250 μm was employed, the size and theintensity of the labeled area were drastically reduced (Figure4c). Despite the fact that only few stained cells with very lowfluorescence intensity can be observed on the final image, thelabeling of cells under these conditions corresponds more to arandom distribution (see also Figure 4f).
Electrochemical Mode. One of the possibilities to affectadherent cells electrochemically using the electrochemical
Figure 3. Fluorescence microscopy images of adherent cancer cellsaffected by the electrochemical push−pull probe operated in amicrofluidic mode with an inclination angle of 90°. Blue and whitedashed lines represent the position of the pushing and aspiratingmicrochannels, respectively. Nominal pushing flow rate was 1 μL/minand the nominal aspirating flow rate and the working distance d were,respectively, (a) 0 μL/min and 50 μm, (b) 20 μL/min and 50 μm, and(c) 50 μL/min and 50 μm.
Figure 4. (a−c) Fluorescence microscopy images of cancer cellslabeled with AO (white spots) by the electrochemical push−pull probeoperated in a microfluidic mode with an inclination angle of 70°. (d−f)Overlapping between the numerically simulated affected area (colorimage) and the experimental results (presented as inverted black andwhite images; labeled cells are depicted as black spots). Blue and whitedashed lines represent the position of the pushing and aspiratingmicrochannels, respectively. Experimental nominal aspirating flow ratewas 20 μL/min, whereas the one used for the simulations was 3 μL/min. Working distance d was 50 μm for a and d, 100 μm for b and e,and 250 μm for c and f. The pushing flow rate was 1 μL/min for allexperiments.
Analytical Chemistry Article
DOI: 10.1021/acs.analchem.5b00455Anal. Chem. 2015, 87, 4479−4486
4483

push−pull probe is to change locally the pH of the extracellularspace, for instance by carrying out the electrolysis of water atthe integrated carbon UME. Moreover, local pH changes canbe monitored optically by taking advantage of the pHdependence of the AO fluorescence. The fluorescence of AOloaded into cells presents a red shift when the pH of the mediais increased or decreased.47−49 Indeed, Figure S10 inSupporting Information Section SI-VII shows the quenchingof the AO fluorescence by a local pH change when a solution ofNaOH (i.e., 0.01 M, flow rate = 0.6 μL/min during 50 s) isdelivered over fluorescent AO-labeled cells. The decrease of thefluorescence intensity was followed by a recovery on the edgeof the affected area only, whereas for the cells located justbelow the NaOH delivery zone, slight or negligible recoverywas observed most likely because of the longer exposure to ahigh NaOH concentration that can irreversibly affect the pHcell status (Supporting Information Section SI-VII). All theseobservations are in good agreement with the use of AO as a pHindicator within the cellular environment.47−49 Thus, if theUME of the probe is biased to a potential of −2 V, then a localpH increase will be induced because of OH− generation (2H2O+ 2e− → H2 + 2OH−). This can then be monitored by thequenching of AO fluorescence of the labeled cells. As shown byCannan et al., drastic pH changes (i.e., between 3 to 6 pHunits) can be observed in the vicinities of an electrode wherethe consumption of H+ (or generation of OH−) is takingplace.50 In our specific case, it was expected to observe similarbut slightly compressed pH profiles caused by the presence ofthe Ringer buffer that acts as a chemical lens to constrain thelocalized pH change.51 Additionally, it is important to note thatwhen applying −2 V at the microelectrode not only waterreduction but also oxygen reduction can take place (for moredetails, see Supporting Information Section SI-I). This processcan locally decrease the concentration of the dissolved oxygen,which can lead to apoptosis and possible morphologicalchanges of adherent cells. However, no morphological marksof cell apoptosis were detected during the experiment.Probably, oxygen diffusion was fast enough and the timeduring which the local oxygen concentration was influenced bythe probe was short enough not to affect irreversibly the livecells.The affected area can be thus determined by the decrease of
the fluorescence intensity of AO-labeled cells. With this aim,after the electrochemical push−pull probe was employed tolabel the adherent cells with AO, it was brought in a closeproximity of the cells (e.g., from a working distance of 20 μm toa working distance of 2.5 μm), and a potential of −2 V wasapplied for 180 s. The applied potential allowed a perturbationof AO-labeled adherent cells, without generation of H2 bubbles.The latter was confirmed optically by the inverted microscopeand by the stable current profiles recorded during the appliedpotential steps.The experimental results obtained for the perturbation of
adherent cells with the electrochemical push−pull probeoperating in an electrochemical mode with an inclinationangle of 70° are shown in Figure 5. Similar results wereobtained when using the probe with an inclination angle of 90°(see Supporting Information Section SI-VIII). However, aneasier and therefore closer positioning of the probe over the cellsurface was achieved when using the probe with an inclinationangle of 70° (because aligning an edge of the probe to the cellsis easier than aligning the whole cross section). As it can beseen in Figure 5a,b, when operating the probe at a working
distance of 2.5 μm, only few cells (i.e., 6 cells, sample affectedarea ≈ 9000 μm2) present a decrease of their fluorescentintensity. However, only the adherent cancer cells located justbelow the microelectrode present a drastic decrease of their AOfluorescence intensity (Movie 1, Supporting Information). Asdiscussed previously, the electrochemical operation modemight enable affecting areas as small as 70 μm2 with localizedconcentration profiles of up to 95% of the maximum reachableconcentration of an electrogenerated compound. The latterresults demonstrate the capabilities of the electrochemicalpush−pull probe for the precise and localized perturbation ofliving cells in an electrochemical operation mode. As expected,with the increase of the working distance, an increase of theaffected area is observed (Figure 5c,d). For instance, whenincreasing the working distance to 15 μm, approximately 30cells are clearly affected, corresponding to an area equal to 2 ×
104 μm2. The dependency of the affected areas on the workingdistance can be interpreted in terms of the different extensionof the truncated diffusion fields created between the probe andthe substrate. Thus, a smaller distance between the probe andthe substrate will generate a smaller perturbation area. Thelatter is in a very good agreement with the numericalsimulations, where similar behavior was observed for bothinclination angles (Figure 2 and Supporting InformationSection SI-IV). Moreover, the numerical results reproducedqualitatively the truncated round shape of the affected areascaused by the probe position and inclination. Indeed, in Figure5a, cell 3, just below the edge of the UME, is not drasticallyaffected because the diffusion of electrogenerated species is alsotruncated in this direction.It is important to note that after the applied voltage was
switched off, the fluorescence intensity of the AO species insidethe affected cells was substantially recovered. The lattersuggests the possibility to perform reversible (temporal) cellperturbations by working in an electrochemical mode that in
Figure 5. Fluorescence microscopy images (a and c) before and (band d) after the perturbation of adherent cancer cells labeled with AOby using the electrochemical push−pull probe in an electrochemicalmode. For a better visualization, all obtained images were convertedinto black and white, the colors were inverted, and the brightnessadjusted. Working distance d was 2.5 μm for a and b and 15 μm for cand d; the inclination angle was equal to 70°. Working electrode,integrated carbon paste UME; QRE, Ag; CE, Pt; applied potential =−2 V. Cells marked with green were significantly affected during theexperiment.
Analytical Chemistry Article
DOI: 10.1021/acs.analchem.5b00455Anal. Chem. 2015, 87, 4479−4486
4484

addition can be precisely localized in a small number of cells(spatially). To demonstrate the dynamic perturbation providedby the electrochemical push−pull probe operating in anelectrochemical mode, a Morse code S−O−S signal wasgenerated by applying a potential step program to induce localpH changes over AO-labeled cells (Experimental Section). Avideo (Movie 2, Supporting Information) shows the possibilityto control precisely and in a reversible way the intracellular pHand thus the intensity of the intracellular fluorescence given byAO. The recorded video was further analyzed using ImageJsoftware to read the fluorescence intensity profile of the cellspositioned under the UME as a function of time (Figure 6 and
inset of the same). The first and the last three peaks of theimage correspond to the three dots that generate the S letter inMorse code. The next three broader peaks stand for the threedashes that generate the letter O. The results of theexperiments showed good reproducibility of the signal duringthe first three cycles; however starting from the sixth cycle, asignificant decrease of the fluorescence was observed. The latteris most likely due to the long exposure of the cells to aconsiderable concentration of OH− that can affect drasticallythe cell status and does not allow the fluorescence to recovercompletely before the next potential pulse is applied (i.e., −2V), as was also observed when delivering NaOH through theprobe (Supporting Information Section SI-VII).
■ CONCLUSIONS
We demonstrated the precise spatiotemporal perturbation ofadherent living cells by taking advantage of the integratedelectrochemical and microfluidic modes inside a soft electro-chemical push−pull probe. Numerical simulations of theimplemented probe and the influence of different parameters,such as aspiration rate, working distance, and probe inclination
angle, indicated the possibility to perturb only few cells via theelectrochemical mode and a group of a few hundred cells byusing the microfluidic mode. The latter possibility wasthoroughly verified experimentally. With this aim, localizedfluorescent labeling of adherently growing cells was achieved byflowing AO out from one of the open microchannels whilepulling it into the other open microchannel. Furthermore,highly localized pH changes were induced by the integratedmicroelectrode in areas covering only few cells. Finally, thecapability of our system for localized, dynamic, and reversiblecell perturbation was illustrated with a cell-emitted S−O−Ssignal obtained by purposely tuning the fluorescent intensity ofAO-labeled cells via electrochemically induced spatiotemporalpH changes. This study paves the way for further applicationsof multiparametric cell stimulation to study pH influence on thegrowth and proliferation of malignant cancer cells as well as toanalyze the samples collected from the extracellular spacethrough the pulling channel.Moreover, the developed soft electrochemical push−pull
probe can be used for imaging. Work is in progress to imagecells, alter them, and visualize electrochemically the effects ofthe alteration.
■ ASSOCIATED CONTENT
*S Supporting Information
Electrochemical characterization of the electrochemical push−pull probe, numerical simulations of the probe operated in amicrofluidic and an electrochemical mode, and results for theexperimental perturbation of cancer adherent cells in amicrofluidic and electrochemical operating mode, includingtwo videos. This material is available free of charge via theInternet at http://pubs.acs.org.
■ AUTHOR INFORMATION
Corresponding Author
*E-mail: [email protected]. Tel.: +41-21-693-3145. Fax:+41-21-693-3667.
Notes
The authors declare no competing financial interest.
■ ACKNOWLEDGMENTS
The authors are thankful to the SNSF from Switzerland and theUEFISCDI from Romania for their support through the jointproject no. IZERZO_142236/1.
■ REFERENCES
(1) Toomre, D.; Bewersdorf, J. Annu. Rev. Cell Dev. Biol. 2010, 26,285−314.(2) Lang, P.; Yeow, K.; Nichols, A.; Scheer, A. Nat. Rev. DrugDiscovery 2006, 5, 343−356.(3) Fletcher, J. S. Analyst 2009, 134, 2204−2215.(4) Bulte, J. W. M.; Kraitchman, D. L. NMR Biomed. 2004, 17, 484−499.(5) Servant, G.; Weiner, O. D.; Herzmark, P.; Balla, T.; Sedat, J. W.;Bourne, H. R. Science 2000, 287, 1037−1040.(6) Kim, B. J.; Wu, M. Ann. Biomed. Eng. 2012, 40, 1316−1327.(7) Cimetta, E.; Figallo, E.; Cannizzaro, C.; Elvassore, N.; Vunjak-Novakovic, G. Methods 2009, 47, 81−89.(8) Torisawa, Y.-S.; Kaya, T.; Takii, Y.; Oyamatsu, D.; Nishizawa, M.;Matsue, T. Anal. Chem. 2003, 75, 2154−2158.(9) Taylor, R. J.; Falconnet, D.; Niemisto, A.; Ramsey, S. A.; Prinz, S.;Shmulevich, I.; Galitski, T.; Hansen, C. L. Proc. Natl. Acad. Sci. U.S.A.2009, 106, 3758−3763.
Figure 6. Reversed fluorescence intensity profile of the AO-labeledcells during the electrochemically induced Morse code S−O−S signal.Working electrode, integrated carbon paste UME; QRE, Ag; CE, Pt;applied potential = −2 V; working distance d = 10 μm. Inset:microscopic image of AO-labeled adherent cells with the electro-chemical push−pull probe positioned above them. White squarewithin the inset shows the area of which fluorescence intensity wasanalyzed.
Analytical Chemistry Article
DOI: 10.1021/acs.analchem.5b00455Anal. Chem. 2015, 87, 4479−4486
4485

(10) Juncker, D.; Schmid, H.; Delamarche, E. Nat. Mater. 2005, 4,622−628.(11) Kaigala, G. V.; Lovchik, R. D.; Drechsler, U.; Delamarche, E.Langmuir 2011, 27, 5686−5693.(12) Ainla, A.; Jeffries, G. D. M.; Brune, R.; Orwar, O.; Jesorka, A.Lab Chip 2012, 12, 1255−1261.(13) Sarkar, A.; Kolitz, S.; Lauffenburger, D. A.; Han, J. Nat.Commun. 2014, 5, 3421.(14) Ainla, A.; Gozen, I.; Hakonen, B.; Jesorka, A. Sci. Rep. 2013, 3,2743.(15) Amemiya, S.; Bard, A. J.; Fan, F.-R. F.; Mirkin, M. V.; Unwin, P.R. Annu. Rev. Anal. Chem. 2008, 1, 95−131.(16) Amemiya, S.; Guo, J.; Xiong, H.; Gross, D. A. Anal. Bioanal.Chem. 2006, 386, 458−471.(17) Bergner, S.; Vatsyayan, P.; Matysik, F.-M. Anal. Chim. Acta2013, 775, 1−13.(18) Liu, B.; Rotenberg, S. A.; Mirkin, M. V. Proc. Natl. Acad. Sci.U.S.A. 2000, 97, 9855−9860.(19) Sun, P.; Laforge, F. O.; Abeyweera, T. P.; Rotenberg, S. A.;Carpino, J.; Mirkin, M. V. Proc. Natl. Acad. Sci. U.S.A. 2008, 105, 443−448.(20) Roberts, W. S.; Lonsdale, D. J.; Griffiths, J.; Higson, S. P. J.Biosens. Bioelectron. 2007, 23, 301−318.(21) Chen, Z.; Xie, S.; Shen, L.; Du, Y.; He, S.; Li, Q.; Liang, Z.;Meng, X.; Li, B.; Xu, X.; Ma, H.; Huang, Y.; Shao, Y. Analyst 2008,133, 1221−1228.(22) Li, X.; Bard, A. J. J. Electroanal. Chem. 2009, 628, 35−42.(23) Koley, D.; Bard, A. J. Proc. Natl. Acad. Sci. U.S.A. 2012, 109,11522−11527.(24) Kuss, S.; Polcari, D.; Geissler, M.; Brassard, D.; Mauzeroll, J.Proc. Natl. Acad. Sci. U.S.A. 2013, 110, 9249−9254.(25) Kuss, S.; Kuss, C.; Trinh, D.; Schougaard, S. B.; Mauzeroll, J.Electrochim. Acta 2013, 110, 42−48.(26) Mauzeroll, J.; Bard, A. J.; Owhadian, O.; Monks, T. J. Proc. Natl.Acad. Sci. U.S.A. 2004, 101, 17582−17587.(27) Torisawa, Y.-S.; Kaya, T.; Takii, Y.; Oyamatsu, D.; Nishizawa,M.; Matsue, T. Anal. Chem. 2003, 75, 2154−2158.(28) Matsumae, Y.; Arai, T.; Takahashi, Y.; Ino, K.; Shiku, H.;Matsue, T. Chem. Commun. (Cambridge, U.K.) 2013, 49, 6498−6500.(29) Gao, N.; Wang, X.; Li, L.; Zhang, X.; Jin, W. Analyst 2007, 132,1139−1146.(30) Salamifar, S. E.; Lai, R. Y. Anal. Chem. 2013, 85, 9417−9421.(31) Takahashi, Y.; Shiku, H.; Murata, T.; Yasukawa, T.; Matsue, T.Anal. Chem. 2009, 81, 9674−9681.(32) Takahashi, Y.; Shevchuk, A. I.; Novak, P.; Murakami, Y.; Shiku,H.; Korchev, Y. E.; Matsue, T. J. Am. Chem. Soc. 2010, 132, 10118−10126.(33) Takahashi, Y.; Shevchuk, A. I.; Novak, P.; Zhang, Y.; Ebejer, N.;Macpherson, J. V.; Unwin, P. R.; Pollard, A. J.; Roy, D.; Clifford, C. A.;Shiku, H.; Matsue, T.; Klenerman, D.; Korchev, Y. E. Angew. Chem.,Int. Ed. 2011, 50, 9638−9642.(34) Bergner, S.; Wegener, J.; Matysik, F. M. Anal. Chem. 2011, 83,169−174.(35) Kranz, C. Analyst 2014, 139, 336−352.(36) Cortes-Salazar, F.; Trauble, M.; Li, F.; Busnel, J.; Gassner, A.;Hojeij, M.; Wittstock, G.; Girault, H. H. Anal. Biochem. 2009, 81,6889−6896.(37) Cortes-Salazar, F.; Momotenko, D.; Lesch, A.; Wittstock, G.;Girault, H. H. Anal. Chem. 2010, 82, 10037−10044.(38) Cortes-Salazar, F.; Momotenko, D.; Girault, H. H.; Lesch, A.;Wittstock, G. Anal. Chem. 2011, 83, 1493−1499.(39) Lesch, A.; Momotenko, D.; Cortes-Salazar, F.; Wirth, I.;Tefashe, U. M.; Meiners, F.; Vaske, B.; Girault, H. H.; Wittstock, G. J.Electroanal. Chem. 2012, 666, 52−61.(40) Lesch, A.; Vaske, B.; Meiners, F.; Momotenko, D.; Cortes-Salazar, F.; Girault, H. H.; Wittstock, G. Angew. Chem., Int. Ed. 2012,51, 10413−10416.(41) Lesch, A.; Momotenko, D.; Cortes-Salazar, F.; Roelfs, F.;Girault, H. H.; Wittstock, G. Electrochim. Acta 2013, 110, 30−41.
(42) Cortes-Salazar, F.; Lesch, A.; Momotenko, D.; Busnel, J.-M.;Wittstock, G.; Girault, H. H. Anal. Methods 2010, 2, 817.(43) Momotenko, D.; Cortes-Salazar, F.; Lesch, A.; Wittstock, G.;Girault, H. H. Anal. Chem. 2011, 83, 5275−5282.(44) Momotenko, D.; Qiao, L.; Cortes-Salazar, F.; Lesch, A.;Wittstock, G.; Girault, H. H. Anal. Chem. 2012, 84, 6630−6637.(45) Compton, R. G.; Greaves, C. R.; Waller, A. M. J. Appl.Electrochem. 1990, 20, 586−589.(46) Zoccarato, F.; Cavallini, L.; Alexandre, A. J. Neurochem. 1999,72, 625−633.(47) Kapuscinski, J.; Darzynkiewicz, Z. J. Biomol. Struct. Dyn. 1987, 5,127−143.(48) Lyles, M. B.; Cameron, I. L. Biophys. Chem. 2002, 96, 53−76.(49) Han, J.; Burgess, K. Chem. Rev. 2010, 110, 2709−2728.(50) Cannan, S.; Douglas Macklam, I.; Unwin, P. R. Electrochem.Commun. 2002, 4, 886−892.(51) Borgwarth, K.; Heinze, J. J. Electrochem. Soc. 1999, 146, 3285−3289.
Analytical Chemistry Article
DOI: 10.1021/acs.analchem.5b00455Anal. Chem. 2015, 87, 4479−4486
4486
Copyright © 2022 FDOKUMEN