Electrochemical Unit Operations in Industrial Wastewater
107
Electrochemical Unit Operations in Industrial Wastewater Treatment: The Development of Electrocoagulation and Photo Electrochemical Oxidation Reactors Based on Novel Nanocomposite Electrode Report to the Water Research Commission by L.D. Makgae, E.H. Umukoro, M.G. Peleyeju, N. Mabuba, O.S. Oluwafemi & O.A. Arotiba Department of Applied Chemistry, University of Johannesburg, South Africa WRC Report No. 2567/1/19 ISBN 978-0-6392-0099-6 January 2020
-
Upload
khangminh22 -
Category
Documents
-
view
3 -
download
0
Transcript of Electrochemical Unit Operations in Industrial Wastewater

Electrochemical Unit Operations in Industrial Wastewater Treatment: The Development of Electrocoagulation and
Photo Electrochemical Oxidation Reactors Based on Novel Nanocomposite Electrode
Report to the Water Research Commission
by
L.D. Makgae, E.H. Umukoro, M.G. Peleyeju, N. Mabuba, O.S. Oluwafemi & O.A. Arotiba
Department of Applied Chemistry, University of Johannesburg, South Africa
WRC Report No. 2567/1/19 ISBN 978-0-6392-0099-6
January 2020

Obtainable from Water Research Commission Private Bag X03 Gezina, 0031 [email protected] or download from www.wrc.org.za
DISCLAIMER
This report has been reviewed by the Water Research Commission (WRC) and approved for
publication. Approval does not signify that the contents necessarily reflect the views and policies of the WRC, nor does mention of trade names or commercial products constitute endorsement or
recommendation for use.
© Water Research Commission

<<Electrochemical Unit Operations in Industrial Wastewater Treatment>> ¯¯¯¯¯¯¯¯¯¯¯¯¯¯¯¯¯¯¯¯¯¯¯¯¯¯¯¯¯¯¯¯¯¯¯¯¯¯¯¯¯¯¯¯¯¯¯¯¯¯¯¯¯¯¯¯¯¯¯¯¯¯¯¯¯¯¯¯¯¯¯¯¯¯¯¯¯¯¯¯¯¯¯¯¯¯¯
______________________________________________________________________________________ i
EXECUTIVE SUMMARY ______________________________________________________________________________________
Wastewater treatment by conventional methods is becoming inefficient owing to the increase in the
quantity and complexity of the pollutants present in wastewater (especially industrial wastewater). The
presence of pollutants has been reported in treated waters owing to their recalcitrant nature. The burden
of pollution by surface water and water bodies used as feed water stock in wastewater treatment plants
are on the increase owing to the discharge of untreated industrial effluents. Thus, there is need to seek
alternative and/or complementary methods that will effectively remove recalcitrant pollutants from
wastewater. These methods should be environmentally benign, relatively low cost with the capacity to
harness solar energy (sustainability) either directly on the electrode (the reactor) or as a source of
generating potential or white light. These envisaged methods will add to the water treatment mix of South
Africa which is still about 80% conventional treatment approach based.
This project explored the possibilities of applying electrochemical technologies to industrial wastewater
treatment. Photoelectrochemical oxidation (or photoelectrocatalysis) is a subset of advanced oxidation
processes (AOP). Photoelectrochemical oxidation or photoelectrocatalytic oxidation (PEC), just like the
more known photocatalysis, involves the use of in situ generated hydroxyl radical for the breaking down
of complex organic molecules to non-toxic molecules with water and carbon dioxide envisaged as final
products. It, however, has the added advantage (over photocatalysis) of improved efficiency owing to the
reduction in the rate of recombination of electron-hole pairs on the semiconductor surface.
Electrocoagulation (EC), on the other hand, is an electrochemical technology that generates coagulating
ions in situ from a sacrificial anode. This technique has been shown to be cheaper and more
environmentally friendly than the conventional chemical coagulation.
Literature survey on photoelectrochemical and electrocoagulation technologies for wastewater treatment
were carried out. The survey showed the global need and relevance of this research to our water-stressed
world, especially South Africa. Currently, research in electrochemical technologies for water treatment is
at its infancy in South Africa (SA) with our research team arguably leading the way. The advantages of
PEC and EC which include low cost, reduced environmental burden, improved efficiency towards the
removal of recalcitrant pollutants and so on can be harnessed and introduced into South African
wastewater treatment mix. Furthermore, the understanding of the individual PEC and EC systems can
lead to the design of hybrid reactors which can be used on industrials sites and this will markedly reduce
the pollution load discharged into SA’s stressed water bodies.
In the PEC studies, different types of materials such as exfoliated graphite (EG), reduced graphene oxide,
carbon nanoparticle, titanium dioxide (TiO2), zinc oxide (ZnO), tungsten trioxide (WO3), bismuth vanadate
(BiViO4), molybdenum disulphide (MoS2), etc. were prepared and applied. EG was prepared by the
exfoliation of intercalated natural graphite using temperature shock. The semiconductors were prepared
primarily by hydrothermal techniques. The photoanodes were fabricated by compositing the carbon
support with the semiconductors. Dopants such as silver and palladium were added in some cases to
improve the photoactivity of the anode. The different composites were compresses at high pressure into

<<Electrochemical Unit Operations in Industrial Wastewater Treatment>> ¯¯¯¯¯¯¯¯¯¯¯¯¯¯¯¯¯¯¯¯¯¯¯¯¯¯¯¯¯¯¯¯¯¯¯¯¯¯¯¯¯¯¯¯¯¯¯¯¯¯¯¯¯¯¯¯¯¯¯¯¯¯¯¯¯¯¯¯¯¯¯¯¯¯¯¯¯¯¯¯¯¯¯¯¯¯¯
______________________________________________________________________________________ ii
sheets which were fabricated into electrodes by using a conducting copper wire. The materials before after
fabrication into anodes were characterised by different techniques such as electron microscopy, Raman
spectroscopy, UV/VIS spectroscopy, X-ray diffractometry, thermogravimetry, voltammetry, impedimetry,
chronoamperometry, etc. Photoelectrochemical degradation experiments were conducted in the presence
of a solar simulator, which mimics radiation from sunlight. The photoanodes were used in the treatment of
water containing dyes and pharmaceuticals organic molecules in water. Techniques such as visible
spectroscopy, chemical oxygen demand, total organic carbon, and chromatography were used to
determine the extent of pollutant removal or degradation/treatment.
It has been shown that photoanodes based on exfoliated graphite support can be used for PEC for the
first time. The enhanced performances of the various photoanode in combination with selected
semiconductors have been demonstrated. This work further showed that the alignment of semiconductors
as heterojunctions can have better photoelectrocatalytic responses and thus improved the rate of pollutant
degradation. The kinetics of degradation were studied and attempts to qualitatively analyse degradation
products were made. This work has produced novel semiconductor photoanodes which can be used for
the solar-photelectrochemical treatment of industrial wastewater.
Electrocoagulation (EC) studies involved the use materials such as iron, aluminium and other metals as
sacrificial anodes in order to generate coagulants in situ for the removal of colloids in polluted water. In
the EC studies, a comparison between chemical coagulation (CC) and EC was carried out. The
performances of aluminium and iron as electrodes were compared for the removal of metal and dye.
Furthermore, two different types of steels and a hybrid electrode was used for EC experiments.
Electrocoagulation studies showed the better performance of EC over chemical coagulation (CC) using
conventional Al and Fe anodes for the treatment of a dye and Pb ion. Furthermore, the work revealed that
the performance of EC depends on the nature of the anode. It was shown that two different types of
stainless steel gave different EC performance profiles. This is an interesting result for optimisation of an
EC process.
The overarching concept of this research is the design of a flow-through reactor that will be used for the
pre-treatment of industrial wastewater. In this regard, we have acquired preliminary data for the design of
a prototype reactor for the fabrication of a hybrid process of PEC and EC. Research on this prototype and
its optimisation is ongoing.

<<Electrochemical Unit Operations in Industrial Wastewater Treatment>> ¯¯¯¯¯¯¯¯¯¯¯¯¯¯¯¯¯¯¯¯¯¯¯¯¯¯¯¯¯¯¯¯¯¯¯¯¯¯¯¯¯¯¯¯¯¯¯¯¯¯¯¯¯¯¯¯¯¯¯¯¯¯¯¯¯¯¯¯¯¯¯¯¯¯¯¯¯¯¯¯¯¯¯¯¯¯¯
______________________________________________________________________________________ iii
ACKNOWLEDGEMENTS ______________________________________________________________________________________ Firstly, the project team would like to acknowledge the Water Research Commission as an institution for the kind funding. Sincere thanks to the WRC manager, Dr John Zvimba, for his patience, guidance and understanding throughout this project. Gratitude to Mr Bennie Mokgonyana for bearing the WRC administrative burden. Many thanks to our industrial collaborator Mr Philip Nel of Radical Waters. We still have a lot to do in the future. This work will not have gone this far if not for the hardworking students (PhD, MSc, BTech and in-service trainees) who gave their commitment and intellectual energy. Of course, to the academic team, Dr N Mabuba, Prof SO Oluwafemi, Dr D Nkosi, we say thank you. Our gratitude goes to the Centre for Nanomaterials Science Research, University of Johannesburg (UJ), the Department of Applied Chemistry (now Chemical Sciences) UJ and the Faculty of Science UJ for their support. We thank the following Reference Group members for their invaluable contributions/suggestions/comments – your comments truly added value to this work.
Reference Group Affiliation Dr JN Zvimba Water Research Commission
Dr G Gericke ESKOM
Dr S Malinga University of Johannesburg
Dr J Nathoo ESKOM
Prof RF Ajayi University of the Western Cape
Prof M Matoetoe Cape Peninsula University of Technology

<<Electrochemical Unit Operations in Industrial Wastewater Treatment>> ¯¯¯¯¯¯¯¯¯¯¯¯¯¯¯¯¯¯¯¯¯¯¯¯¯¯¯¯¯¯¯¯¯¯¯¯¯¯¯¯¯¯¯¯¯¯¯¯¯¯¯¯¯¯¯¯¯¯¯¯¯¯¯¯¯¯¯¯¯¯¯¯¯¯¯¯¯¯¯¯¯¯¯¯¯¯¯
______________________________________________________________________________________ iv
This page was intentionally left blank

<<Electrochemical Unit Operations in Industrial Wastewater Treatment>> ¯¯¯¯¯¯¯¯¯¯¯¯¯¯¯¯¯¯¯¯¯¯¯¯¯¯¯¯¯¯¯¯¯¯¯¯¯¯¯¯¯¯¯¯¯¯¯¯¯¯¯¯¯¯¯¯¯¯¯¯¯¯¯¯¯¯¯¯¯¯¯¯¯¯¯¯¯¯¯¯¯¯¯¯¯¯¯
______________________________________________________________________________________ v
CONTENTS ______________________________________________________________________________________
CONTENTS .................................................................................................................................................. v
CHAPTER 1: BACKGROUND ....................................................................................................................... 1
1.1 INTRODUCTION .................................................................................................................................... 1 1.2 PROJECT AIMS ..................................................................................................................................... 2
CHAPTER 2: LITERATURE REVIEW: ELECTROCOAGULATION AND ELECTROCHEMICAL ADVANCED OXIDATION PROCESSES IN WATER TREATMENT ................................................................ 4
2.1 INTRODUCTION .................................................................................................................................... 4 2.2 CHALLENGES WITH CONVENTIONAL TREATMENT METHODS ...................................................... 5 2.3 ELECTROCOAGULATION ..................................................................................................................... 5
2.3.1 Coagulation and Electrocoagulation ......................................................................................... 5 2.3.2 Electrocoagulation .................................................................................................................... 6 2.3.3 Anodic and cathodic materials in EC ........................................................................................ 6
2.4 ELECTROCHEMICAL ADVANCED OXIDATION PROCESSES (EAOPS) ........................................... 7 2.5 COMBINATION OF EC AND EAOP ....................................................................................................... 8
CHAPTER 3: SYNTHESIS, CHARACTERISATION AND PHOTOELECTROCHEMICAL DEGRADATION STUDIES OF CARBON BASED SEMICONDUCTOR PHOTOANODES ....................................................... 10
3.1 INTRODUCTION .................................................................................................................................. 10 3.2 METHODOLOGY ................................................................................................................................. 12
3.2.1 Materials and Instrumentation ................................................................................................ 12 3.2.2 Preparation of exfoliated graphite ........................................................................................... 12 3.2.3 Preparation of reduced graphene oxide (rGO) ....................................................................... 13 3.2.4 Preparation of EG-ZnO nanocomposite ................................................................................. 13 3.2.5 Preparation of Ag-ZnO nanoparticles ..................................................................................... 13 3.2.6 Preparation of Ag-ZnO-rGO composite photoanode .............................................................. 13 3.2.7 Preparation of WO3 nanoparticles .......................................................................................... 14 3.2.8 Preparation of WO3-EG composite ......................................................................................... 14 3.2.9 Fabrication of WO3-EG composite electrode .......................................................................... 14 3.2.10 Electrochemical and photoelectrochemical experiments ........................................................ 15
3.3 RESULT AND DISCUSSION ................................................................................................................ 15 3.3.1 Spectroscopic characterisation for EG-ZnO ........................................................................... 15 3.3.2 Spectroscopic characterisation for Ag-ZnO-rGO .................................................................... 16 3.3.3 Electron Microscopy characterisation for Ag-ZnO-rGO .......................................................... 18 3.3.4 Pore size and surface area analyses ...................................................................................... 20 3.3.5 Spectroscopic Characterisation of EG-WO3 ........................................................................... 20 3.3.6 Morphological studies of EG, WO3 and WO3-EG ................................................................... 22 3.3.7 Electrochemical and photoelectrochemical characterisation of rGO and Ag-ZnO-rGO ......... 23 3.3.8 Electrochemical and photoelectrochemical studies of EG and WO3-EG................................ 24 3.3.9 Electrochemical and Photoelectrochemical degradation of organic pollutants ...................... 25
CHAPTER 4: ELECTROCOAGULATION FOR THE TREATMENT OF ORANGE II DYE COMBINED WITH HEAVY METALS IN WASTEWATER.............................................................................................................. 50
4.1 INTRODUCTION .................................................................................................................................. 50 4.2 METHODOLOGY ON CC VS EC ......................................................................................................... 52
4.2.1 Materials, analytical measurements and experimental equipment ......................................... 52

<<Electrochemical Unit Operations in Industrial Wastewater Treatment>> ¯¯¯¯¯¯¯¯¯¯¯¯¯¯¯¯¯¯¯¯¯¯¯¯¯¯¯¯¯¯¯¯¯¯¯¯¯¯¯¯¯¯¯¯¯¯¯¯¯¯¯¯¯¯¯¯¯¯¯¯¯¯¯¯¯¯¯¯¯¯¯¯¯¯¯¯¯¯¯¯¯¯¯¯¯¯¯
______________________________________________________________________________________ vi
4.2.2 Preparation of the synthetic effluent ....................................................................................... 54 4.2.3 Chemical coagulation optimization ......................................................................................... 55
4.3 RESULT AND DISCUSSION ................................................................................................................ 55 4.3.1 Simulated wastewater characterisation .................................................................................. 55 4.3.2 Chemical coagulation using alum as a coagulant .................................................................. 56 4.3.3 Electrocoagulation experiments .............................................................................................. 59
4.4 THE APPLICATION OF SS 316L AND SS 304 ELECTRODES IN ELECTROCOAGULATION FOR THE TREATMENT OF SIMULATED WASTEWATER: A COMPARATIVE STUDY. ........................... 60 4.5 METHODOLOGY: COMPARATIVE STUDY ........................................................................................ 60
4.5.1 Materials.................................................................................................................................. 60 4.5.2 Analytical measurements ........................................................................................................ 60 4.5.3 Experimental ........................................................................................................................... 61
4.6 RESULTS AND DISCUSSION ............................................................................................................. 62 4.6.1 Effect of initial conductivity on pollutant removal and corresponding operational costs ......... 62 4.6.2 Effect of current density on pollutant removal......................................................................... 64 4.6.3 Electrocoagulation time studies (tEC) ...................................................................................... 67 4.6.4 Sub Conclusion ....................................................................................................................... 68
CHAPTER 5: PHOTOELECTROCHEMICAL SYSTEMS ON TITANIUM SHEET BASED PHOTOANODES FOR THE DEGRADATION OF DYE IN WASTEWATER................................................................................ 70
5.1 MOTIVATION........................................................................................................................................ 70 5.2 INTRODUCTION .................................................................................................................................. 70 5.3 METHODOLOGY ................................................................................................................................. 72
5.3.1 Materials and Equipment ........................................................................................................ 72 5.3.2 Electrochemical Reactor design and measurements: ............................................................ 72 5.3.3 Synthesis of WO3 nanorods .................................................................................................... 73 5.3.4 Preparation of carbon nanoparticles, BiVO4 and CNP/B-BiVO4 ............................................. 73 5.3.5 Fabrication of the photoanode ................................................................................................ 74
5.4 RESULT AND DISCUSSION ................................................................................................................ 74 5.4.1 Morphology investigation, EDS analysis and elemental mapping .......................................... 74 5.4.2 Diffuse reflectance spectroscopy ............................................................................................ 76 5.4.3 Linear sweep voltammetry and photo-current response ........................................................ 77 5.4.4 Photoelectrocatalytic degradation experiments ...................................................................... 78
CHAPTER 6: FLOW-THROUGH REACTOR DESIGN ................................................................................ 80
6.1 INTRODUCTION .................................................................................................................................. 80 6.1.1 About Radical Waters ............................................................................................................. 80 6.1.2 The flow-through reactor design ............................................................................................. 80
CHAPTER 7: CONCLUSIONS & RECOMMENDATIONS .......................................................................... 82
7.1 CONCLUSIONS.................................................................................................................................... 82 7.1.1 Photoelectrochemical catalytic degradation ........................................................................... 82 7.1.2 Electrocoagulation .................................................................................................................. 83
7.2 RECOMMENDATIONS ........................................................................................................................ 84 7.2.1 Photoelectrochemical catalytic degradation ........................................................................... 84 7.2.2 Electrocoagulation .................................................................................................................. 84 7.2.3 Combination of Photoelectrochemical catalytic degradation (PEC) with Electrocoagulation (EC) ......................................................................................................................................... 84

<<Electrochemical Unit Operations in Industrial Wastewater Treatment>> ¯¯¯¯¯¯¯¯¯¯¯¯¯¯¯¯¯¯¯¯¯¯¯¯¯¯¯¯¯¯¯¯¯¯¯¯¯¯¯¯¯¯¯¯¯¯¯¯¯¯¯¯¯¯¯¯¯¯¯¯¯¯¯¯¯¯¯¯¯¯¯¯¯¯¯¯¯¯¯¯¯¯¯¯¯¯¯
______________________________________________________________________________________ vii
LIST OF FIGURES ______________________________________________________________________________________
Figure 3.1. XRD patterns of (a) EG, (b) ZnO, and (c) EG-ZnO. (d) TGA thermograms of EG, ZnO and EG-SiOx-ZnO nanocomposites ............................................................................................................................. 16
Figure 3.2. (a) Raman spectra of the prepared (i) GO and (ii) rGO; (b) XRD patterns of (i) GO, (ii) ZnO, (iii) ZnO-rGO, (iv) Ag-ZnO and (v) Ag-ZnO-rGO; (c) UV-vis diffuse reflectance spectra of (i) ZnO, (ii) Ag-ZnO, and (iii) Ag-ZnO-rGO; (d) FTIR spectra of (i) rGO and (ii) Ag-ZnO-rGO ................................................................ 18
Figure 3.3. SEM images of (a) exfoliated graphite; (b) ZnO nanoparticles; (c) reduced graphene oxide (rGO); (d) the as-synthesised Ag-ZnO-rGO material. (e) EDX spectrum of the as-prepared composite. TEM images of the as-synthesised (f) rGO; (g) ZnO-rGO and (h) Ag-ZnO-rGO material. ................................................... 19
Figure 3.4. (a) Raman result of WO3-EG and EG (inset); (b) X-ray diffraction patterns of EG, (I) WO3, (II) WO3-EG and (III) EG; (c) FTIR results of (I) EG and (II) WO3-EG composite; and (d) UV-Visible diffuse reflectance spectra of (I) EG and (II) WO3-EG ................................................................................................................... 22
Figure 3.5. (a) WO3, (b) EG and (c) WO3-EG composite images of SEM. (d) EDS spectrum of WO3-EG composite ........................................................................................................................................................ 23
Figure 3.6. Cyclic voltammograms of (a)(i) rGO and (ii) Ag-ZnO-rGO electrodes in 5mM [Fe(CN)6]-3/-4 in 0.1 M KCl at 50 mVs-1; (b) Photoelectrochemical response of Ag-ZnO-rGO electrode in 0.1 M Na2SO4 in the dark (off) and under illumination (on) at 0.3 V. ........................................................................................................ 24
Figure 3.7. (a) CVs of (I) EG and (II) WO3-EG composite electrodes using 5mM [Fe(CN)6]-3/-4 in 0.1 M KCl solution at a scan rate of 20 mVs-1; (b) CVs of WO3-EG composite electrodes at different scan rate and the plot of peak currents vs square root of scan rates. (c) Linear sweep voltammograms of EG and WO3-EG composite electrodes with (light) and without (dark) xenon lamp; and (d) responses from photocurrent of EG ((I) black) and WO3-EG ((II) red) composite electrodes in the dark (off) and under irradiation (on) ............... 25
Figure 3.8. (a) UV-Vis spectra for the degradation of orange II dye at Ag-ZnO-rGO electrode using photoelectrochemical oxidation; Normalised decay plots of the photoelectrochemical degradation of orange II dye (b) at rGO, ZnO-rGO and Ag-ZnO-rGO electrodes; (c) using photoelectrochemical oxidation, electrochemical oxidation and photocatalysis at Ag-ZnO-rGO electrode; and effects of (d) pH and (e) current density on the photoelectrochemical degradation of orange II dye. ................................................................ 28
Figure 3.9. (a) Kinetic plots of photoelectrochemical degradation of orange II dye at pH 5 and 15 mAcm-2 using rGO, ZnO-rGO and Ag-ZnO-rGO electrodes; (b) photoelectrochemical set-up for the degradation of orange II dye (c) a proposed mechanism for the photoelectrochemical activity of the as-prepared Ag-ZnO-rGO for the degradation of orange II dye. ........................................................................................................................... 30
Figure 3.10. Normalised concentration decay versus time plots of the photo-assisted electrochemical degradation of 2-nitrophenol (a) at EG and WO3-EG composite electrodes, (b) under electrochemical and photo-assisted electrochemical degradation processes.................................................................................. 31
Figure 3.11. a) UV-Vis spectra of oxidised SMX solution and normalised plots of concentration abatement for b) electrochemical and photoelectrocatalytic degradation of SMX at TiO2-EG photoelectrode c) electrochemical degradation of SMX at EG and TiO2-EG anodes (experiments carried out at pH 6.3, j = 10 mAcm-2, [SMX]0 = 25 mgL-1, supporting electrolyte = Na2SO4) d) current-dependence of SMX degradation e) effect of bulk solution pH on SMX degradation. .............................................................................................. 34
Figure 3.12. A) Chromatogram of SMX solution B) Mass spectrum of SMX solution C) Chromatogram of degraded SMX solution D) Proposed degradation route of SMX by photoelectrochemical process .............. 36

<<Electrochemical Unit Operations in Industrial Wastewater Treatment>> ¯¯¯¯¯¯¯¯¯¯¯¯¯¯¯¯¯¯¯¯¯¯¯¯¯¯¯¯¯¯¯¯¯¯¯¯¯¯¯¯¯¯¯¯¯¯¯¯¯¯¯¯¯¯¯¯¯¯¯¯¯¯¯¯¯¯¯¯¯¯¯¯¯¯¯¯¯¯¯¯¯¯¯¯¯¯¯
______________________________________________________________________________________ viii
Figure 3.13. Kinetics curves of (a) electrochemical and photoelectrocatalytic removal of 4-nitrophenol at Pd-ZnO-EG electrode. (b) Photoelectrocatalytic removal of 4-nitrophenol at EG, ZnO-EG and Pd-ZnO-EG electrodes. ....................................................................................................................................................... 38
Figure 3.14. Degradation kinetics curves of ciprofloxacin of (a) Electrocatalytic and photo-electrocatalytic on MoS2-SnO2/EG electrode, and (b) photo-electrocatalytic removal on EG, SnO2-EG, MoS2-EG and MoS2-SnO2/EG electrodes. c) Proposed plausible charge transfer mechanism. ...................................................... 41
Figure 3.15. (a) CVs of EG, EG-BiVO4, EG-ZnO, EG-BiVO4/ZnO composite electrodes using 5 mM [Fe(CN)6]-3/-4 in 0.1 M KCl solution at a scan rate of 20 mVs-1; (b) LSV and (c) Photocurrent responses of EG, EG-BiVO4, EG-ZnO and EG-BiVO4/ZnO in 0.1 M Na2SO4. ............................................................................................... 43
Figure 3.16. (a) UV-Vis spectra of PEC degradation of rhodamine B. (b) Normalised concentration decay versus time plot for photocatalytic, electrocatalytic and photoelectrocatalytic degradation of rhodamine B dye on EG-BiVO4/ZnO electrode and (c) corresponding kinetics plots. (d) Normalised concentration decay versus time plot for PEC degradation of rhodamine B dye on EG-ZnO, EG-BiVO4, EG-BiVO4/ZnO electrodes. (e) Effects of current density and (f) pH on degradation of rhodamine B dye. (g) Cycle experiments for the degradation of rhodamine B dye on EG-BiVO4/ZnO electrode. ...................................................................... 46
Figure 3.17. (a) Scavenger studies of the PEC degradation of rhodamine B dye on EG-BiVO4/ZnO. (b) Band alignment between ZnO and BiVO4. ................................................................................................................ 48
Figure 4.1. Jar test apparatus .......................................................................................................................... 53
Figure 4.2. EC experimental setup .................................................................................................................. 54
Figure 4.3. Bulk sample characterisation over time ........................................................................................ 56
Figure 4.4. a) Optimum coagulant dosage and settling time determination. b) Pb removal at different settling times and coagulant dosage ............................................................................................................................ 57
Figure 4.5. a) COD removal at different settling times and coagulant dosages. b) Turbidity removal at different settling times and coagulant dosage. c) Effect of initial pH of the bulk sample (Experimental conditions: Dye [] = 38.4 ppm, Pb [] = 25.51 ppm, COD [] = 103 ppm, turbidity of 207 NTU and settling time = 1 h) .............. 58
Figure 4.6. a) EC using Al-Al electrodes (Experimental conditions: Voltage 30 V. Current density = 0.65 mA/ cm2, inter-electrode spacing = 3.3 cm, tEC = 30 min). b) Visual change of colour before and after treatment (EC using Al-Al electrodes) ..................................................................................................................................... 59
Figure 4.7. At operating parameters: i= 0.65 mA/cm2, tEC= 30min, inter-electrode spacing = 3.3 cm: a) Removal of orange II dye as function of initial conductivity of sample. b) Removal of Pb as function of initial conductivity of sample. c) Removal of COD as function of initial conductivity of sample. .................................................. 63
Figure 4.8. Voltage variation at different initial conductivities and Operational costs in (R/m3) ...................... 64
Figure 4.9. Effect of current density on decolorisation yield (Operating parameters: tEC = 30 min, k = 3.8 mS/cm). Graph 2 is an expansion from 95%. .................................................................................................. 65
Figure 4.10. Effect of current density on Pb removal (Operational parameters: tEC = 30 min, k = 3.8 mS/cm) ......................................................................................................................................................................... 65
Figure 4.11. Effect of current density on COD removal (Operational parameters: tEC = 30 min, k = 3.8 mS/cm) ......................................................................................................................................................................... 66
Figure 4.12. a) Voltage variation at different current densities and Operational costs in (R/m3). b) Effect of current density on electrode consumption (Operational parameters: tEC = 30 min, k = 3.8 mS/cm) .............. 67
Figure 4.13. a) Effect of electrolysis time on the decolourisation yield. b) Effect of electrolysis time on the removal of Pb (operating parameters: i = 8 mA/cm2, k = 3.8 mS/cm) ............................................................. 68
Figure 5.1. a) A schematic diagram of a single cell reactor for photoelectrochemical degradation. b) Picture of the actual photoelectrochemical reactor .......................................................................................................... 73

<<Electrochemical Unit Operations in Industrial Wastewater Treatment>> ¯¯¯¯¯¯¯¯¯¯¯¯¯¯¯¯¯¯¯¯¯¯¯¯¯¯¯¯¯¯¯¯¯¯¯¯¯¯¯¯¯¯¯¯¯¯¯¯¯¯¯¯¯¯¯¯¯¯¯¯¯¯¯¯¯¯¯¯¯¯¯¯¯¯¯¯¯¯¯¯¯¯¯¯¯¯¯
______________________________________________________________________________________ ix
Figure 5.2. SEM images of a) BiVO4 and b) CNP/B-BiVO4 , c) EDS spectrum of CNP/B-BiVO4, Elemental maps for d) Boron and e) Carbon, TEM images of f) WO3 at 1 µm scale, g) WO3 at 50 nm scale, h) CNP ... 76
Figure 5.3. UV-Vis absorption spectra of BiVO4, WO3 and CNP/B-BiVO4 ...................................................... 76
Figure 5.4. a) Linear sweep voltammograms of photoanodes measured in 0.1 M Na2SO4, b) Photocurrent response of CNP/B-BiVO4 and CNP/B-BiVO4/WO3 obtained in 5 mgL-1 orange II dye (prepared in 0.1 M Na2SO4) at a potential of 1.2 V ........................................................................................................................ 77
Figure 5.5. a) Degradation profiles of orange II sodium salt a) at different photoanodes, b) by different oxidation processes. ....................................................................................................................................................... 79
Figure 6.1. Part of the process design for the flow-through photoelectrochemical reactor ............................. 81
Figure 7.1. Photocurrent responses of photoanodes in the dark and in the presence of solar light (a) Pd-ZnO-EG (b) WO3-EG and (c) EG-BiVO4/ZnO .......................................................................................................... 83

<<Electrochemical Unit Operations in Industrial Wastewater Treatment>> ¯¯¯¯¯¯¯¯¯¯¯¯¯¯¯¯¯¯¯¯¯¯¯¯¯¯¯¯¯¯¯¯¯¯¯¯¯¯¯¯¯¯¯¯¯¯¯¯¯¯¯¯¯¯¯¯¯¯¯¯¯¯¯¯¯¯¯¯¯¯¯¯¯¯¯¯¯¯¯¯¯¯¯¯¯¯¯
______________________________________________________________________________________ x
LIST OF TABLES ______________________________________________________________________________________
Table 3-1. BET data of EG, ZnO and EG-SiOx-ZnO ....................................................................................... 20
Table 3-2. Summary of photoanodes and pollutants degraded in this project ................................................ 26
Table 3-3. Summary of results for degradation studies with WO3-EG photoanode ........................................ 32
Table 3-4. Summary of results for degradation studies with TiO2-EG photoanode ........................................ 37
Table 3-5. Summary of results for Degradation studies of orange II dye on Pd g-ZnO-rGO photoanode ...... 39
Table 3-6. Summary of results for degradation studies with MoS2-SnO2/EG photoanode ............................. 41
Table 3-7. Summary of results for degradation studies with EG-BiVO4/ZnO photoanode .............................. 48
Table 4-1. Orange II dye characteristics (de Deus Rodrigues, 2013) ............................................................. 52
Table 4-2. Coagulant dosages ........................................................................................................................ 55
Table 4-3. pH variations .................................................................................................................................. 55
Table 4-4. Bulk sample characteristics (no dilution) ........................................................................................ 56
Table 7-1. Summary of photoanodes and pollutants degraded in this project ................................................ 82

<<Electrochemical Unit Operations in Industrial Wastewater Treatment>> ¯¯¯¯¯¯¯¯¯¯¯¯¯¯¯¯¯¯¯¯¯¯¯¯¯¯¯¯¯¯¯¯¯¯¯¯¯¯¯¯¯¯¯¯¯¯¯¯¯¯¯¯¯¯¯¯¯¯¯¯¯¯¯¯¯¯¯¯¯¯¯¯¯¯¯¯¯¯¯¯¯¯¯¯¯¯¯
______________________________________________________________________________________ xi
ACRONYMS & ABBREVIATIONS ______________________________________________________________________________________
AOP Advanced Oxidation Processes
CC Chemical coagulation
COD Chemical oxygen demand
DC Direct current
EAOP Electrochemical Advanced Oxidation Process
EC Electrocoagulation
EG Exfoliated Graphite
EO Electrochemical Oxidation
PEC Photoelectrocatalysis
PEC Photoelectrochemical oxidation
rGO Reduced graphene oxide
TOC Total organic carbon

<<Electrochemical Unit Operations in Industrial Wastewater Treatment>> ¯¯¯¯¯¯¯¯¯¯¯¯¯¯¯¯¯¯¯¯¯¯¯¯¯¯¯¯¯¯¯¯¯¯¯¯¯¯¯¯¯¯¯¯¯¯¯¯¯¯¯¯¯¯¯¯¯¯¯¯¯¯¯¯¯¯¯¯¯¯¯¯¯¯¯¯¯¯¯¯¯¯¯¯¯¯¯
______________________________________________________________________________________ xii
This page was intentionally left blank

<<Electrochemical Unit Operations in Industrial Wastewater Treatment>> ¯¯¯¯¯¯¯¯¯¯¯¯¯¯¯¯¯¯¯¯¯¯¯¯¯¯¯¯¯¯¯¯¯¯¯¯¯¯¯¯¯¯¯¯¯¯¯¯¯¯¯¯¯¯¯¯¯¯¯¯¯¯¯¯¯¯¯¯¯¯¯¯¯¯¯¯¯¯¯¯¯¯¯¯¯¯¯
______________________________________________________________________________________ 1
CHAPTER 1: BACKGROUND ______________________________________________________________________________________
1.1 INTRODUCTION
South Africa is classified as a semi-arid country with an annual average rainfall of 490 mm, which is far less
than the world average of 860 mm per annum. The country is ranked the 30th driest country in the world with
a highly seasonal and variable rainfall. The recent drought (especially in Cape Town) attests to the vulnerability
of SA to water crises and may be a pointer to the challenges ahead. While rainfall is a natural phenomenon
which may be out of our control, the water management issues in South Africa is also not as impressive.
The water quality of most South African rivers and dams has significantly deteriorated over the past 20 years.
These deteriorations, according to a report by World Wide Fund-SA in 2016 (WWF-SA, 2016), have been
traced to the following leading causes of fresh water pollution:
1. Poorly treated sewage effluent from failing sewage treatment works; 2. Poor sanitation in informal settlements and rural areas; 3. Mining and ore processing activities, particularly acid mine drainage (AMD); 4. Industrial effluents containing pharmaceutical endocrine-disrupting chemicals in the manufacturing of
products such as shampoo, pesticides, dyes and plastics; and 5. Agricultural runoff including fertilisers, sediment and pesticides.
It is not a surprise that industrial effluents and mining activities are leading contributors to the pollution of SA’s
water pollution. Industrial and mining activities introduce a wide range of pollutants into SA’s water bodies. The
polluted water is a huge burden to the water treatment processes in many ways. Firstly, the pollution load
demands higher need of chemicals especially coagulants and this increases the cost of water treatment.
Secondly, the use of higher dosage of coagulants generates more sludge which is a menace to the
environment. Thirdly, the efficiency of the treatment reduces because of the recalcitrant nature of some of the
organic pollutants in the water. The current or conventional methods were not developed with these newer and
stubborn compounds in mind. The poor efficiency is further heightened by the fact that over 35% of SA’s
wastewater treatment plants are ageing (WWF-SA, 2016)!
There is need to look into complementary and alternative treatment methods for industrial water. There is a
need to further diversify the wastewater treatment methods in SA by introducing newer, cheaper, more
efficient, more environmentally friendly technologies into SA’s water treatment mix. These newer methods do
not need to replace the conventional methods but they can be tailored to industrial applications, industrial
pretreatment before discharge, industrial water re-use, community or low volume treatment and so on.
This project explored the possibilities of applying electrochemical technologies – photoelectrochemical
oxidation and electrocoagulation – to industrial wastewater treatment. Photoelectrochemical oxidation (or
photoelectrocatalysis) is a subset of advanced oxidation processes (AOP). Photoelectrochemical oxidation
(PEC), just like the more known photocatalysis, involves the use of in situ generated hydroxyl radical for the
breaking down of complex organic molecules to non-toxic molecules with water and carbon dioxide envisaged
as final products. In addition to the excitation of semiconductor by light, PEC uses electrical energy (potential)
to drive the electron generated to minimise the recombination of electron-hole pairs on the semiconductor

<<Electrochemical Unit Operations in Industrial Wastewater Treatment>> ¯¯¯¯¯¯¯¯¯¯¯¯¯¯¯¯¯¯¯¯¯¯¯¯¯¯¯¯¯¯¯¯¯¯¯¯¯¯¯¯¯¯¯¯¯¯¯¯¯¯¯¯¯¯¯¯¯¯¯¯¯¯¯¯¯¯¯¯¯¯¯¯¯¯¯¯¯¯¯¯¯¯¯¯¯¯¯
______________________________________________________________________________________ 2
surface. Electrocoagulation (EC), on the other hand, is an electrochemical technology that generates
coagulating ions in situ from a sacrificial anode. This technique has been shown to be cheaper and more
environmentally friendly than the conventional chemical coagulation.
The major challenges in AOP include the recombination of the electron-hole pair of the semiconductor and the
recovery of the catalyst. These challenges are mitigated in PEC because the addition of potential to the
photocatalysts further drives away the electron from the valance band holes. This allows more time and
catalytic sites for the generation of hydroxyl radical and the degradation of the pollutant. The challenge of
catalyst recovery is absent in PEC because the catalyst has already been immobilised on a solid support – the
electrode. PEC is thus potentially a better approach then photocatalysis.
In order to improve the performance of PEC, the use of solar light in the place of uv light needs to be sought
after. Furthermore, percentage removal of the pollutants should be increased. The aforementioned need are
largely dependent on the materials used in PEC. Thus, there is need to quest for newer materials or tune the
existing materials towards white (solar) light excitation and improved performance.
Electrocoagulation is generally based on the use of two types of anodes – iron and aluminium. There is need
to explore other types of materials and also hybrid materials so as to make the EC process more robust.
Traditionally, EC is used for metal removal but it can also be used for the removal of organic pollutants. There
is also a possibility of assisting EC process with light.
It is believed that the introduction of newer technologies for wastewater treatment will alleviate the challenge
of water pollution in South Africa−this work is a step in this direction.
1.2 PROJECT AIMS
The general aim of this proposal is to develop and integrate electrocoagulation and photoelectrochemical
oxidation unit operations based on novel mixed nanomaterials into a reactor system for the treatment of
industrial wastewater.
Specific objectives were as follows:
1. To incorporate electrocoagulation as a unit operation into water treatment in a jar test experiment.
2. To evaluate the performance (metal removal, COD removal, turbidity removal, etc.) of
electrocoagulation over coagulation using simple electrode configuration and novel carbon cathode.
3. To understand the morphology, chemical and electrochemical behaviours of novel nano carbon
materials and composites for photoelectrochemical oxidation.
4. To understand the applicability of these materials as photoanodes and cathodes under various
conditions as it relates to wastewater treatment.
5. To evaluate the performance of photoelectrochemical oxidation unit operation in a jar test experiment
for wastewater treatment.
6. To evaluate the efficiency of (solar) photoelectrochemical reactors developed from these materials in
the presence of selected standard dye/organic polluted water and real sample wastewater.

<<Electrochemical Unit Operations in Industrial Wastewater Treatment>> ¯¯¯¯¯¯¯¯¯¯¯¯¯¯¯¯¯¯¯¯¯¯¯¯¯¯¯¯¯¯¯¯¯¯¯¯¯¯¯¯¯¯¯¯¯¯¯¯¯¯¯¯¯¯¯¯¯¯¯¯¯¯¯¯¯¯¯¯¯¯¯¯¯¯¯¯¯¯¯¯¯¯¯¯¯¯¯
______________________________________________________________________________________ 3
7. To interrogate the kinetics, degradation products and mechanism of the degradation processes.
8. To generate data that can explain the performance of a pre-pilot (prototype) reactor consisting of both
electrocoagulation and photoelectrochemical unit operations towards different types of wastewater.
9. To study the effect of different reactor configurations based on different material combinations

<<Electrochemical Unit Operations in Industrial Wastewater Treatment>> ¯¯¯¯¯¯¯¯¯¯¯¯¯¯¯¯¯¯¯¯¯¯¯¯¯¯¯¯¯¯¯¯¯¯¯¯¯¯¯¯¯¯¯¯¯¯¯¯¯¯¯¯¯¯¯¯¯¯¯¯¯¯¯¯¯¯¯¯¯¯¯¯¯¯¯¯¯¯¯¯¯¯¯¯¯¯¯
______________________________________________________________________________________ 4
CHAPTER 2: LITERATURE REVIEW: ELECTROCOAGULATION AND ELECTROCHEMICAL ADVANCED OXIDATION PROCESSES IN
WATER TREATMENT ______________________________________________________________________________________
2.1 INTRODUCTION
Water is a necessity for life and therefore the need to effectively manage the limited water resources cannot
be overemphasised. Water management involves a lot of activities or processes such as water use, water
harvesting, water distribution, wastewater release, water treatment and a lot more. Conventional water
treatment unit operations consist mainly of coagulation, sedimentation, filtration, disinfection and storage. The
efficiency and cost of conventional treatment method are being challenged by the chemical complexity arising
from the feed water (influent) which consists of a cocktail of organic, inorganic and pathogenic pollutants from
different sources. One of such feed water are industrial effluents, which can consist of a heavy dose of
pollutants of which some are resistant to normal wastewater treatment. These pollutants have negative impacts
on water quality and the safety of the plants and animals in the environment. Industrial effluents are sometimes
released into water bodies untreated and unfortunately, these heavily polluted water bodies do not only
endanger lives; but they also create extra burden to the municipal wastewater treatment plants. For example,
dye effluents and some other organic pollutants have been shown to be resistant to the current treatment
methodologies (Vogelpohl & Kim, 2004). Furthermore, the cost of water treatment increases owing to the
pollutant load which fouls membrane/filters and necessitates for more frequent replacements and higher
dosage of chemicals. In coagulation unit operation for example, a heavily polluted water will require a higher
amount of coagulant, which leads to the production of more sludge. Sludge is becoming a menace to our
environment.
To avert or minimise the challenges posed by industrial wastewater, pre-treatment before discharge is very
important. There is a need to develop new or improved methods that can be used to pre-treat and/or treat
industrial wastewater before discharge. Such methods can be developed and applied on-site by industries
before discharge and/or incorporated into the process operations of water treatment plant. These methods
must i) use less chemicals (coagulants and disinfectants); ii) lead to less sludge formation; iii) be able to remove
recalcitrant pollutants and metals iv) be environmental friendly; v) be easy to design and used at industrial or
power plant locations; vi) be easy to design and incorporated into the treatment process. One set of methods
that fits into these listed conditions are electrochemical methods and in general, electrochemical advanced
oxidation processes. The two electrochemical unit operation of interests are electrocoagulation (Khandegar &
Saroha, 2013) and photoelectrochemical oxidation (Brillas & Martínez-Huitle, 2015; M. G. Peleyeju & Arotiba,
2018; Shannon et al., 2008).

<<Electrochemical Unit Operations in Industrial Wastewater Treatment>> ¯¯¯¯¯¯¯¯¯¯¯¯¯¯¯¯¯¯¯¯¯¯¯¯¯¯¯¯¯¯¯¯¯¯¯¯¯¯¯¯¯¯¯¯¯¯¯¯¯¯¯¯¯¯¯¯¯¯¯¯¯¯¯¯¯¯¯¯¯¯¯¯¯¯¯¯¯¯¯¯¯¯¯¯¯¯¯
______________________________________________________________________________________ 5
2.2 CHALLENGES WITH CONVENTIONAL TREATMENT METHODS
The increase in the chemical complexities and pollution load of feed water or wastewater has become a huge
challenge to conventional water treatment methods. Thus, these methods are becoming more chemically,
more operationally, and more energy intensive (Vogelpohl & Kim, 2004). Conventional system tend to form
toxic secondary by-product resulting from the pre-concentration and phase changes of some pollutants leading
to difficulties in disposal (Shannon et al., 2008). In addition to these shortcomings, some pollutants are resistant
to these conventional treatments and continue to persist in the environment.
Organic pollutants form a major category of water pollutants and typical examples include detergents,
insecticides and herbicides, pharmaceutical wastes, dyes, petroleum residues and so on. Some of these
organic pollutants are very difficult to remove from wastewater and they have been shown to persist in the
environment – hence the name persistent organic pollutants (POPs). Organic pollutants present many health
hazards such as endocrine disruption, cardiovascular disease, cancer and a lot more. The removal of metals
such as arsenic, lead, selenium, etc. from industrial wastewater is also very necessary to reduce the inorganic
load of the feed water into the treatment plant.
2.3 ELECTROCOAGULATION
2.3.1 Coagulation and Electrocoagulation
Generally, a water treatment plant consists of the following unit operations: coagulation/flocculation,
sedimentation, filtration and disinfection. Chemical coagulation is the use of chemicals to destabilise the
electrical forces that stabilises colloidal particles in an aqueous phase. Coagulation is a very important unit
operation in water treatment (either drinking water or wastewater). Coagulation (which is usually followed by
flocculation) is used mainly for the removal of turbidity (sedimentation of suspended and colloidal particles)
from water. Furthermore, coagulation helps in the decolourisation of water and in the removal bacteria.
Coagulants (the chemicals used in coagulation) are usually based on Al or Fe and other polymers such as
polyaluminium chloride.
The use of chemical coagulants in the traditional coagulation system is impeded by a) the high cost of
chemicals especially when the pollution load is high, b) its sensitivity to important water parameters such as
pH, alkalinity, zeta potential, c) its sensitivity to temperature (winter and summer present different challenges)
and d) its generation of high amount of sludge. A heavily polluted wastewater influent will require a higher
dosage of coagulants, which increases cost and sludge formation. Furthermore, if coagulation is impeded,
turbidity will be a problem. A water with a high turbidity is an indication of pollution and such water is difficult
to disinfect and pose problems downstream. These challenges can be mitigated by electrocoagulation
(Khandegar & Saroha, 2013) which has the following advantages over coagulation: a) simple configuration, b)
more reduced turbidity, c) lower sludge amount, d) sludge formed are easier to handle and de-water, e)
removes smaller and wider range of particles, d) requires less maintenance and a lot more, e) better metal,
organic and pathogen removal.

<<Electrochemical Unit Operations in Industrial Wastewater Treatment>> ¯¯¯¯¯¯¯¯¯¯¯¯¯¯¯¯¯¯¯¯¯¯¯¯¯¯¯¯¯¯¯¯¯¯¯¯¯¯¯¯¯¯¯¯¯¯¯¯¯¯¯¯¯¯¯¯¯¯¯¯¯¯¯¯¯¯¯¯¯¯¯¯¯¯¯¯¯¯¯¯¯¯¯¯¯¯¯
______________________________________________________________________________________ 6
2.3.2 Electrocoagulation
Electrocoagulation (EC) is the process of destabilising suspended, emulsified, or dissolved contaminants in
an aqueous medium by introducing an electric current into the medium (Emamjomeh & Sivakumar, 2009)
(Emamjomeh and Sivakumar, 2009). Electrocoagulation is the electrochemical production of destabilising
agents or ions such as Fe and Al that results in the neutralisation of the electric charges for pollutant removal.
A search in ISI web of knowledge database using the keywords ‘electrocoagulation’ and ‘wastewater’ returned
the following publications: 13 (1990-2000); 331 (2001-2010); 551 (2011-April 2016). The upsurge of research
in electrocoagulation suggests the potential of this method for water treatment. Detailed information on
electrocoagulation process and its application to textile effluents, natural organic matter, metals (chromium,
arsenic, selenium), and its advantages over coagulation have been reported (Demirbas & Kobya, 2017;
Emamjomeh & Sivakumar, 2009; Khandegar & Saroha, 2013; Mohora et al., 2014; Ulu, Barışçı, Kobya &
Sillanpää, 2015). Electrocoagulation has the potential of improving the coagulation and flocculation of colloids
and suspended solids in wastewater. The fact that colloid stability is electrical in nature suggests that
electrochemical system may be more appropriate than chemical process.
Electrocoagulation has the following advantages over coagulation (Khandegar & Saroha, 2013; Kruthika,
Karthika, Raju & Prabhakar, 2013): a) simple configuration, b) more reduced turbidity, c) lower sludge amount,
d) sludge formed are easier to handle and de-water, e) removes smaller and wider range of particles, d)
requires less maintenance and a lot more, e) better metal, organic and pathogen removal.
2.3.3 Anodic and cathodic materials in EC
Electrocoagulation (EC) usually consists of a sacrificial anode and the same or different metallic cathode. The
two most commonly used anodes are Al (Chellam & Sari, 2016; Harif, Khai & Adin, 2012) and Fe (Kobya,
Ozyonar, Demirbas, Si & Oncel, 2015; Patel, Ruparelia & Patel, 2011). More recently new anodes such as Zn
(Fajardo, Rodrigues, Martins, Castro & Quinta-Ferreira, 2015; Y. Wang et al., 2016) and Cu (Prajapati,
Chaudhari, Pal, Chandrakar & Choudhary, 2016) have been introduced. Wang et al. attempted to use zinc
anode in the electrocoagulation of perfluorooctanoate. In their work, they results obtained suggested that Zn
can be a suitable anodic material in electrocoagulation (Y. Wang et al., 2016). The most commonly used
cathodic materials are Al and Fe. However, the use of other cathodes such as stainless steel (Harif et al.,
2012) and carbon (Y. Tian et al., 2016) have been reported. Tian et al. (Y. Tian et al., 2016) used air breathing
carbon cathode (with Al anode) to remove nutrients from wastewater. An exhaustive list of publications (over
50) where the anode-cathode materials are listed can be consulted in the excellent review article on EC by
Khendegar and Saroha (Khandegar & Saroha, 2013).
Recent developments in EC focus on the use of other types of anodic and cathodic materials, cell configuration
and mechanistic studies. Aoudj et al. (Aoudj, Khelifa, Drouiche, Belkada & Miroud, 2015) used a combination
of Al and Fe in the anode compartment of an electrocoagulation cell for the removal of Cr(VI) and F-. Other
reports on hybrid electrodes are now emerging though very scanty (Ozyonar, 2016; Ulu et al., 2015). EC has
been used in the removal of a myriad of pollutants from different sources or industries. The application of EC
for the removal of metal, natural organic matters, nutrient and a wide range of organic pollutants in water or

<<Electrochemical Unit Operations in Industrial Wastewater Treatment>> ¯¯¯¯¯¯¯¯¯¯¯¯¯¯¯¯¯¯¯¯¯¯¯¯¯¯¯¯¯¯¯¯¯¯¯¯¯¯¯¯¯¯¯¯¯¯¯¯¯¯¯¯¯¯¯¯¯¯¯¯¯¯¯¯¯¯¯¯¯¯¯¯¯¯¯¯¯¯¯¯¯¯¯¯¯¯¯
______________________________________________________________________________________ 7
wastewater has been reported. Recent reviews (An, Huang, Yao & Zhao, 2017; Garcia-Segura, Eiband, de
Melo & Martínez-Huitle, 2017; Hakizimana et al., 2017; Moussa, El-Naas, Nasser & Al-Marri, 2017) on EC
have highlighted these applications.
2.4 ELECTROCHEMICAL ADVANCED OXIDATION PROCESSES (EAOPS)
One of the upcoming water treatment methodologies is a group of methods called advanced oxidation
processes (AOPs). Advanced oxidation processes (AOPs) have been widely recognised as highly efficient
treatments for wastewaters. AOPs are known to degrade organic pollutants which are resistant to traditional
technologies (Hai, Yamamoto & Fukushi, 2007). A subset of AOP that involves electrochemical oxidation is
now referred to as electrochemical advanced oxidation processes EAOPs (Moreira, Boaventura, Brillas & Vilar,
2015). Advanced oxidation processes are environmentally friendly chemical, photochemical, photocatalytic,
electrochemical and photoelectrochemical technologies based on the production of hydroxyl radical (OH • )
(Moreira, Boaventura, Brillas & Vilar, 2017). After fluorine, hydroxyl radical is the strongest known oxidant.
These radicals are able to oxidise almost any organic molecule yielding CO2 and inorganic ions at rate
constants in the range 106-109 Ms-1 for most reactions in aqueous solutions (Garza-Campos et al., 2014).
Electrochemical oxidation is one of the widely used EAOPs. The process is generally accompanied by side
reactions such as oxygen or chlorine evolution, which reduce its efficiency. Also, heterogeneous
photocatalysis, which involves the use of a semiconducting photocatalyst (e.g. TiO2), suffers from low photo
efficiency resulting from slow rate of electron transport and high rate of recombination between photo-
generated electron/hole pairs. These shortcomings can be improved by the combination of electrochemical
oxidation systems with photocatalysis. The combination of these processes can alleviate the problems
associated with electron/hole recombination by driving away the photoelectrons from the
semiconductor/electrolyte interface, leading to more efficient degradation of organics upon application of
electrical energy (Brillas & Martínez-Huitle, 2015). The combination of these processes, generally termed
photoelectrochemical processes, is fast becoming a plausible route to organic waste degradation in water
treatment (Brillas & Martínez-Huitle, 2015). In recent times, the application of electrochemical advanced
oxidation processes such as photoelectrochemical oxidation and photoelectro-Fenton (PEF) for an effective,
efficient and fast mineralisation of toxic organic pollutants in wastewater treatment have been the focus of
many researchers (C.-F. Liu, Huang, Hu, Juang & Huang, 2016; Neumann-Spallart, Shinde, Mahadik &
Bhosale, 2013; M. G. Peleyeju et al., 2017; Salazar, Garcia-Segura, Ureta-Zañartu & Brillas, 2011; Umukoro,
Peleyeju, Ngila & Arotiba, 2017).
A typical photoelectrochemical oxidation process involves the immobilisation of TiO2 powder (a photoactive
material) on a conductive material upon which a bias anodic potential is applied (Butterfield et al., 1997). The
main advantages of the immobilisation of the catalyst are the avoidance of losses in the recovery process and
enhanced photocatalytic efficiency through the use of an external electric field (Moreira, Garcia-Segura, Vilar,
Boaventura & Brillas, 2013). We have used EAOP in our laboratory for the degradation of organic pollutants
such as nitrophenol (B Ntsendwana, Sampath, Mamba & Arotiba, 2013), trichloroethylene (B. Ntsendwana,
Mamba, Sampath & Arotiba, 2013), and industrial dye (Ama, Mabuba & Arotiba, 2015). Our studies revealed

<<Electrochemical Unit Operations in Industrial Wastewater Treatment>> ¯¯¯¯¯¯¯¯¯¯¯¯¯¯¯¯¯¯¯¯¯¯¯¯¯¯¯¯¯¯¯¯¯¯¯¯¯¯¯¯¯¯¯¯¯¯¯¯¯¯¯¯¯¯¯¯¯¯¯¯¯¯¯¯¯¯¯¯¯¯¯¯¯¯¯¯¯¯¯¯¯¯¯¯¯¯¯
______________________________________________________________________________________ 8
that degradation efficiency increases when electrochemical oxidation is photochemically enhanced. We have
also demonstrated the effect of materials such as TiO2, ZnO and diamond (B. Ntsendwana, Peleyeju & Arotiba,
2016; B. Ntsendwana, Sampath, Mamba, Oluwafemi & Arotiba, 2016).
The nature of electrodes significantly influences electrochemical processes. A suitable electrode material for
electrochemical oxidation should exhibit properties such as high physical and chemical stability, resistance to
corrosion, high electrical conductivity, catalytic activity and selectivity, and low cost/life ratio. Carbon-based
electrodes represent an attractive electrode material for electrochemical and photoelectrochemical oxidation.
They exhibit superior electrochemical properties to those of noble metals towards oxidation and reduction of
organic and biological molecules in both aqueous and non-aqueous media (Neumann-Spallart et al., 2013).
The choice of semiconductors for photoelectrochemical systems are equally important. Such semiconductors
should be photoactive, biologically and chemically inert, stable toward photo-corrosion and suitable towards
visible or near UV light. Such semiconductors should also be inexpensive and non-toxic. Various
semiconductors such as metal oxides, sulphides, nitrides and selenides have been investigated in this regard.
TiO2 and ZnO photocatalysts have been extensively studied and applied for the removal of organic compounds
from contaminated air and water and for microbial disinfection. In particular, ZnO is known to be an efficient
photocatalyst material compared to other metal oxides (Kansal, Singh & Sud, 2007). More recently,
semiconductors such as WO3, BiVO4 are being investigated as anodic component in photoelectrochemical
degradation (M. G. Peleyeju & Arotiba, 2018).
As seen from the discussions above, photoelectrochemical methods (which includes solar and electro-fenton)
have great potentials in wastewater treatment. This method is still at its infancy and there a lot that can be
done. Since this technology depends heavily on the nature of the electrode, new or improved cathodic and
anodic materials can be prepared. Such material should exhibit better performance in terms of robustness,
stability, over-potential, photocatalysis, solar light harvesting, more efficient radical generation, cost and so on.
The preparation, characterisation and application of novel carbon materials such as carbon nanodots
(Katherine Lawrence et al., 2014), carbon nanoparticle (Tshwenya & Arotiba, 2017), various carbon mix
(nanodots, diamond) and new carbon semiconductor composites in the design of solar photoelectrochemical
reactors for wastewater treatment can be plausible approaches in the design of photoelectrochemical reactors.
Furthermore, the design of photoanodes based on nanocomposites of ZnO, WO3 and other quantum dot doped
semiconductors are areas that can be explored for photoanode performance improvements.
2.5 COMBINATION OF EC AND EAOP
A recent trend in the application of EC is its combination with other advanced oxidation processes. The most
common is the combination of EC with electrochemical oxidation (Bhagawan, Poodari, Golla, Himabindu &
Vidyavathi, 2016; El-Ashtoukhy, Amin, El-Latif, Bassyouni & Hamad, 2017; Esfandyari et al., 2015; García-
García et al., 2015; Rubí-Juárez, Barrera-Díaz, Linares-Hernández, Fall & Bilyeu, 2015; Thiam, Zhou, Brillas
& Sirés, 2014; Unal, Dizge, Karagunduz & Keskinler, 2019). Garcia-Garcia et al. (García-García et al., 2015)
combined EC with EO to treat industrial wastewater. In their report, they used solar cell as the source of current

<<Electrochemical Unit Operations in Industrial Wastewater Treatment>> ¯¯¯¯¯¯¯¯¯¯¯¯¯¯¯¯¯¯¯¯¯¯¯¯¯¯¯¯¯¯¯¯¯¯¯¯¯¯¯¯¯¯¯¯¯¯¯¯¯¯¯¯¯¯¯¯¯¯¯¯¯¯¯¯¯¯¯¯¯¯¯¯¯¯¯¯¯¯¯¯¯¯¯¯¯¯¯
______________________________________________________________________________________ 9
and used a copper anode for electrocoagulation. Suarez-Escobar (Suárez-Escobar, Pataquiva-Mateus &
López-Vasquez, 2016) combined EC with photocatalysis using a monopolar arrangement of iron electrodes
for EC and TiO2 semiconductor and uv light for photocatalysis. A combination of EO and peroxi-
electrocoagulation was enhanced by the addition of H2O2 in a report by Esfandyari et al. (Esfandyari et al.,
2015). Investigations and reports on the combination of EC with other methods are bound to continue as
researchers look into different ways of combining these very important techniques.

<<Electrochemical Unit Operations in Industrial Wastewater Treatment>> ¯¯¯¯¯¯¯¯¯¯¯¯¯¯¯¯¯¯¯¯¯¯¯¯¯¯¯¯¯¯¯¯¯¯¯¯¯¯¯¯¯¯¯¯¯¯¯¯¯¯¯¯¯¯¯¯¯¯¯¯¯¯¯¯¯¯¯¯¯¯¯¯¯¯¯¯¯¯¯¯¯¯¯¯¯¯¯
______________________________________________________________________________________ 10
CHAPTER 3: SYNTHESIS, CHARACTERISATION AND PHOTOELECTROCHEMICAL DEGRADATION STUDIES OF CARBON
BASED SEMICONDUCTOR PHOTOANODES ______________________________________________________________________________________
3.1 INTRODUCTION
The availability of clean water for industrial and domestic use is a well-known global challenge owing to
increase in dosage and complexity of water pollutants. The discharge of organic waste into water bodies is on
the increase and these organic wastes pose a lot of health and environmental risk to living organism (Davey
& Schäfer, 2009; Schwarzenbach et al., 2006). Dyes are a typical group of organic pollutants, which can
originate from industrial effluents generated by paints, textiles, leathers, and printing industries. The presence
of dye in water or wastewater is hazardous to human and aquatic lives and because dyes are recalcitrant
during treatment by the conventional water treatment methods, they may persist even in treated water. The
toxic and recalcitrant characteristics of dyes necessitate the need to develop other treatment methods as
alternatives and complements to the existing conventional techniques. Largely, the development of these
alternative water treatment approaches depends on the nature of the material used in the design. The quest
for new material or the improvement of currently existing materials has been the focus of many researchers in
their bid to provide alternative methods for water treatment. Some of these materials include carbon, metal
oxide semiconductors, polymers and a lot more. Carbon has been a material of interest in the fabrication of
electrodes owing to their unique properties and wide applicability. Examples of such carbon include graphite,
carbon nanotubes, graphene and others that are not well known such as exfoliated graphite, carbon
nanoparticle, etc.
Exfoliated graphite (EG), a carbonaceous material that possesses low density, large surface area,
compressibility, high temperature resistance, and high electrical conductivity. Its porous nature enhances the
trapping of photocatalyst, and thus, reduces the loss of the photocatalyst (B. Ntsendwana et al., 2013; B
Ntsendwana et al., 2013; M. Peleyeju, Umukoro, Babalola & Arotiba, 2016). It is very stable and can be
prepared in large scale (J.-h. Li, Liu & Da, 2007). In addition, EG has been reported for its electrocatalytic
property which made it viable for the electrochemical sensing and the electrochemical oxidation of pollutants
(Ndlovu, Arotiba, Sampath, Krause & Mamba, 2011; B. Ntsendwana et al., 2013). Furthermore, its application
in vibration damping, thermal insulation, shielding of electrochemical interference and gaskets have been
reviewed (Q. Zhao, Cheng, Wu & Yu, 2014).
Graphene/graphene oxide/reduced graphene oxide, made by exfoliating graphite, is a form of exfoliated
graphite which comprises of sp2-bonded carbon atoms packed tightly into 2-D planar honeycomb lattices with
special properties like high surface area, high mechanical stability, high thermal and electrical conductivities,
and very good electron mobility (Umukoro, Peleyeju, Ngila & Arotiba, 2016b).
Carbon nanoparticles (CNPs), another form of carbon, are slowly attracting attention owing to their ease of
synthesis, fluorescent nature, relatively low/non-toxicity, high surface area and functionalisability (Watkins

<<Electrochemical Unit Operations in Industrial Wastewater Treatment>> ¯¯¯¯¯¯¯¯¯¯¯¯¯¯¯¯¯¯¯¯¯¯¯¯¯¯¯¯¯¯¯¯¯¯¯¯¯¯¯¯¯¯¯¯¯¯¯¯¯¯¯¯¯¯¯¯¯¯¯¯¯¯¯¯¯¯¯¯¯¯¯¯¯¯¯¯¯¯¯¯¯¯¯¯¯¯¯
______________________________________________________________________________________ 11
et al., 2010). These materials are referred to as carbon nanoparticles (CNPs) because they consist primarily
of carbon in the form of nearly spherical particles that are between 10 and 100 nm in size (K. Lawrence et al.,
2014). Additionally, they usually contain oxygen and hydrogen which makes them hydrophilic, and soluble in
aqueous solutions (K. Lawrence et al., 2014).
The modification of CNPs (and other nanocarbons) either by physical or chemical treatments, is known to
induce new properties or enhance some already existing properties (Q. Li, Yu, Qiu, Zhou & Wu, 2008). Surface
modification is best needed to break the strong cohesive forces that cause aggregation, thus promoting
dispersibility and stability of the particles (Trostová, Stibor, Karpíšková, Kolská & Švorčík, 2013).
Functionalisation of amide-amine type is considered as one of the best methods to introduce these desirable
properties (K. Lawrence et al., 2014), making CNPs ideal for various applications including catalysis, medicine,
and water purification (Tshwenya & Arotiba, 2017). Thus, studies on alternative synthesis routes (especially
low cost and high yield) and functionalisation of CNPs will be plausible so as to widen the applicability of this
relatively new nanocarbon.
While carbon are versatile conducting support, the fabrication of a photoanode necessitates the use of
photocatalytic semiconductors. These semiconductors possess band gaps that can be activated by uv or
visible light resulting in electron-hole pair needed for radical generation. Titania (TiO2) is the most applied
semiconductor in photocatalysis. However, zinc oxide has also been found as an alternative semiconductor to
TiO2 as a result of its low cost, non-toxicity, chemical inertness, good optoelectronic and catalytic properties
(Di Paola, García-López, Marcì & Palmisano, 2012; Ma, Xue, Zhou & Zhang, 2014); but its wide band gap
(3.37 eV) limits its utilisation of visible light. The absorption of light in the visible spectrum by ZnO can be
improved by the introduction of Ag due to its surface plasmon resonance effect (Feitai Chen, Liu, Liu, Fang &
Dai, 2013; S. Liu et al., 2015). Moreover, Ag can be incorporated as an electron sink for the generated
electrons. Hence, it enhances the generation of more hydroxyl radicals by the electrons and holes, and
therefore, improves the degradation process of the pollutants (Qin et al., 2015; Umukoro, Peleyeju, Ngila &
Arotiba, 2016a). Furthermore, the mobility of both holes and electrons can be enhanced by the Dirac cone of
the band structure of a carbon material such as EG or its other form like graphene oxide/reduced graphene
oxide. Hence the photogenerated electrons and holes from the ZnO can be transported to the EG or the
graphene material (Fenghua Chen et al., 2014; Umukoro, Peleyeju et al., 2018). Consequently, the rate of
recombination of the electron-hole pairs would be minimised and the efficiency of ZnO in the composite
electrode would be enhanced.
It can be hypothesised that the combined properties of ZnO and EG will yield an improved material with good
excitation and enhanced photocatalysis. In addition, a nanocomposite of Ag, ZnO and reduced graphene (rGO)
called Ag-ZnO-rGO, can result in improved photoelectrochemical performance. It was earlier reported that n-
ZnO/p-Cu2O/n-TiO2 nanotube arrays was prepared and applied as electrode for the photoelectrocatalytic
degradation of tetracycline. The results showed an excellent photoelectrocatalytic activity due to the ternary
heterojunction of the material (J. Li et al., 2013). Photoelectrochemical oxidation of salicylic acid and
salicylaldehyde has been carried out on titanium dioxide nanotube arrays, giving over 83% removal of both
organics (M. Tian, Adams, Wen, Asmussen & Chen, 2009). The use of Zn-Co-layered double hydroxides
nanowalls has been reported as electrocatalyst for the electrochemical oxidation of water (Y. Li, Zhang, Xiang,

<<Electrochemical Unit Operations in Industrial Wastewater Treatment>> ¯¯¯¯¯¯¯¯¯¯¯¯¯¯¯¯¯¯¯¯¯¯¯¯¯¯¯¯¯¯¯¯¯¯¯¯¯¯¯¯¯¯¯¯¯¯¯¯¯¯¯¯¯¯¯¯¯¯¯¯¯¯¯¯¯¯¯¯¯¯¯¯¯¯¯¯¯¯¯¯¯¯¯¯¯¯¯
______________________________________________________________________________________ 12
Yan & Li, 2014). Few studies have been carried out on Ag/ZnO/rGO and some of these involve the use of
Ag/ZnO/rGO as gas sensor (Uddin, Phan & Chung, 2015) and as a photocatalysts for dyes removal (Meng,
Shao, Fan, Wang & Li, 2014; Qin et al., 2015). However, to the best of our knowledge, Ag-ZnO-rGO composite
electrode has not been employed as a photoanode for the photoelectrochemical degradation of dyes. This
project has produced water treatment data based on ZnO anodes modified with graphene, palladium and silver
(Umukoro, Madyibi et al., 2017; Umukoro, Peleyeju et al., 2018; Umukoro et al., 2016a, 2016b). This chapter
discusses the synthesis and characterisation of the different anodic components used in PEC degradation.
Such materials include exfoliated graphite (EG), reduced graphene oxide (rGO), EG-ZnO, Ag-ZnO composite,
Ag-ZnO-rGO composite, WO3 nanoparticles, WO3-EG composite, TiO2-EG electrode, Pd-ZnO-EG, EG, SnO2-
EG, MoS2-EG, etc. Discussions on the phototelectrochemical degradation profiles of the photoanodes
prepared from these materials are presented. The results around each of the photoanodes systems are
summarised and presented as sub-conclusions and tables.
3.2 METHODOLOGY
3.2.1 Materials and Instrumentation
Potassium hydroxide, silver nitrate, ascorbic acid, natural graphite flakes, sulphuric acid (98%), sodium nitrate,
potassium permanganate, hydrogen peroxide, zinc nitrate hexahydrate, absolute ethanol (99.9%) and orange
II dye. All reagents were purchased from Sigma Aldrich, Germany, and were of analytical grade and they were
used without further purifications. Reduced graphene oxide (rGO), ZnO and the composites were
characterised using x-ray diffractometer (Rigagu Ultima IV, Japan) at 40 kV and 30 mA with Cu Kα radiation
(λ=0.15406) with K-beta filter. This was carried out using scintillation counter ranging from 5-90° at a speed
of a 2°/min. The studies of surface morphology of the as-synthesized materials were done using transmission
electron microscopy (JEOL 2100 HRTEM 200V, Japan), scanning electron microscopy (SEM) (TESCAN, Vega
3 XMU, Czech Republic). The surface elemental composition was obtained using energy-disperse x-ray
spectrometer (EDS) (TESCAN, Czech Republic) which was attached to the SEM. Spectroscopic studies were
carried out using Perkin Elmer FTIR spectrometer (Spectrum 100, USA) and Perkin Elmer Raman microscope
(Raman micro 200, USA) to obtain the FTIR and Raman spectra, respectively. Decolourisation of the dye was
investigated using UV-Visible spectrophotometer (Cary 60, Agilent technologies, Australia). New Port 9600
Full Spectrum Solar Simulator equipped with 150 W ozone free xenon lamp which produces a collimated beam
of 33 mm diameter (equivalent to 1.3 sun) was used as the light source. All characterisation experiments were
performed at the University of Johannesburg.
3.2.2 Preparation of exfoliated graphite
Exfoliated graphite (EG) was prepared from natural graphite as follows: Intercalation of natural graphite
particles (300-400 µm) were carried out by immersing the particles in a mixture of concentrated H2SO4/HNO3
(3:1 v/v) for 24 hrs at ambient conditions. The graphite intercalated material was then washed with water and
air-dried. Exfoliation was then carried out by subjecting the graphite intercalated material to a temperature
shock at 800°C in a furnace for a minute in air resulting in puffed-up EG material.

<<Electrochemical Unit Operations in Industrial Wastewater Treatment>> ¯¯¯¯¯¯¯¯¯¯¯¯¯¯¯¯¯¯¯¯¯¯¯¯¯¯¯¯¯¯¯¯¯¯¯¯¯¯¯¯¯¯¯¯¯¯¯¯¯¯¯¯¯¯¯¯¯¯¯¯¯¯¯¯¯¯¯¯¯¯¯¯¯¯¯¯¯¯¯¯¯¯¯¯¯¯¯
______________________________________________________________________________________ 13
3.2.3 Preparation of reduced graphene oxide (rGO)
Graphene oxide was prepared by exfoliating graphite using a modified Hummer’s method (Poh et al., 2012),
and then reduced using ascorbic acid by a method described by Zhang et al. (Jiali Zhang et al., 2010). In brief,
5 g of graphite flakes were added to 2.5 g of sodium nitrate and 115 mL of sulphuric acid. The mixture was
mixed and stirred vigorously. The mixture was allowed to cool in an ice-bath and 15 g of potassium
permanganate was added to the mixture over a period of 2 h. The mixture was allowed to cool in an ice-bath
to room temperature and then heated to 35°C for 30 min. Then, it was poured into 250 mL of de-ionised water
in a flask and heated to 70°C. The mixture was poured into 1 L of de-ionized water after keeping the
temperature constant for about 15 min. A 30 mL volume of 3% hydrogen peroxide was added to remove any
unreacted KMnO4 and manganese dioxide in the mixture. Then, it was washed several times by centrifugation
and filtration using de-ionised water until a pH of 6 was obtained. The resulting graphite oxide was then
ultrasonicated for 2 h to obtain graphene oxide and then dried in an oven at 60°C for 48 h. Furthermore, 5 g
of ascorbic acid was added to an aqueous suspension which contained 0.1 g of the prepared graphene oxide
in 50 mL of deionised water and sonicated for 30 min. The resultant suspension was stirred at 90°C for 48 h.
Then, the product – reduced graphene oxide – was filtered and dried at 60°C overnight before use.
3.2.4 Preparation of EG-ZnO nanocomposite
For the preparation of the EG-ZnO nanocomposite, methanol (about 10 mL), ZnO (80 mg), and
methyltrimethoxysilane (MTMOS) (100 mg) were mixed in a vial (20 mL) and sonicated for 15 min to ensure
uniform dispersion of ZnO. EG (100 mg) was subsequently added and the mixture shaken for 5 min. After the
addition of 1 M HCl (0.1 mL), the mixture was allowed to hydrolyse for 3 h in a closed vessel and poured in a
Petri dish to dry. The contents of the Petri dish were constantly mixed for uniform distribution of ZnO on the
EG. After drying for 24 h at room temperature, the floating catalyst was incubated at 90°C for 24 h to remove
residual methanol (B. Ntsendwana, Sampath et al., 2016).
3.2.5 Preparation of Ag-ZnO nanoparticles
The Ag-ZnO composite was synthesised using a modified co-precipitation method (Umukoro et al., 2016b). In
brief, a solution containing 14.87 g of zinc nitrate hexahydrate and 0.149 g of silver nitrate dissolved in 100 mL
of de-ionised water was prepared. A 3 M KOH solution was added drop-wise while stirring vigorous until the
pH of the solution reached 10. Then, it was further stirred for 2 h at a very high speed. It was observed that
the viscosity of the mixture increased with increase in the amount of KOH solution added. The product obtained
was centrifuged, and washed with de-ionised water and ethanol several times. Subsequently, it was dried in
an oven at 60°C for 12 h and calcined at 400°C for 2 h. The ZnO was prepared in a similar way without the
addition of silver nitrate.
3.2.6 Preparation of Ag-ZnO-rGO composite photoanode
A sample of 100 mg of the as-prepared Ag-ZnO was dispersed in about 10 mL methanol and sonicated for 20
min to obtain a uniform dispersion. A 100 mg mass of rGO was added to the dispersion and stirred vigorously

<<Electrochemical Unit Operations in Industrial Wastewater Treatment>> ¯¯¯¯¯¯¯¯¯¯¯¯¯¯¯¯¯¯¯¯¯¯¯¯¯¯¯¯¯¯¯¯¯¯¯¯¯¯¯¯¯¯¯¯¯¯¯¯¯¯¯¯¯¯¯¯¯¯¯¯¯¯¯¯¯¯¯¯¯¯¯¯¯¯¯¯¯¯¯¯¯¯¯¯¯¯¯
______________________________________________________________________________________ 14
for another 10 min. Then, the mixture was poured into a dish and dried in the oven at 90°C for about 48 h for
the complete removal of the methanol to obtain the Ag-ZnO-rGO composite. The as-prepared Ag-ZnO-rGO
composite was compressed into pellet of 1.3 cm in diameter using a press machine at a very high pressure.
Then the pellet was used to fabricate a photoanode with the aid of a glass rod, conduction silver paint, copper
wire and epoxy resin. One end of the copper wire in the glass tube was coiled to form a flat surface. The pellet
was placed on the surface using the conductive silver paint which enabled the conduction between the copper
wire and the composite (B Ntsendwana et al., 2013). It was allowed to dry in the air for about 1 h. The edge of
the pellet was covered with epoxy resin so that electron flow is mainly from the basal plane.
3.2.7 Preparation of WO3 nanoparticles
WO3 nanoparticles were prepared by a precipitation method in the presence of citric acid (Sánchez-Martínez,
Martínez-De La Cruz & López-Cuéllar, 2013). Precisely, 6.9079 g of ammonium metatungstate hydrate was
dissolved in 30% v/v, nitric acid solution (50ml) at 70°C while stirring. The temperature was maintained while
the solution was being stirred until a yellow precipitate was formed. Heating was continued at that temperature
until the water was completed evaporated. The solid obtained was subjected to thermal treatment at 600°C for
3 h to produce the WO3 nanoparticles.
3.2.8 Preparation of WO3-EG composite
Natural graphite was sieved using a 300 µm sieve mesh and intercalated by being soaked in concentrated
nitric acid and sulphuric acid mixture in a ratio of 1:3 by volume for 48 hours at room temperature. The
intercalated material was then washed to pH 7 and air-dried. It was further exfoliated by subjecting it to
temperature of 800°C for about a minute to obtained a puffed up exfoliated graphite material.
For the preparation of the WO3-EG composite, a known amount of the as-prepared WO3 was dispersed in
absolute ethanol and sonicated for 30 min to obtain uniformity of suspension of the nanoparticles. Then, an
equal amount of EG was added and further sonicated for 10 min after which the mixture was put in an oven to
dry at 100°C overnight to achieve complete evaporation of the ethanol.
3.2.9 Fabrication of WO3-EG composite electrode
The as-prepared WO3-EG composite was compacted into a pellet that is 1.3 cm in diameter by a hydraulic
press at a high pressure of 10000 psi. The pellet was employed for the construction of an electrode with the
use of a copper wire, non-conductive epoxy resin and conductive silver paint. The WO3-EG composite pellet
was placed on the coiled part of the copper wire with the assistance of the conductive silver paint and allowed
to dry. The edge of the composite pellet was sealed with the resin to allow the flow of electricity from only the
basal plane. Furthermore, it was put in a glass rod before being used for the experiment.

<<Electrochemical Unit Operations in Industrial Wastewater Treatment>> ¯¯¯¯¯¯¯¯¯¯¯¯¯¯¯¯¯¯¯¯¯¯¯¯¯¯¯¯¯¯¯¯¯¯¯¯¯¯¯¯¯¯¯¯¯¯¯¯¯¯¯¯¯¯¯¯¯¯¯¯¯¯¯¯¯¯¯¯¯¯¯¯¯¯¯¯¯¯¯¯¯¯¯¯¯¯¯
______________________________________________________________________________________ 15
3.2.10 Electrochemical and photoelectrochemical experiments
Electrochemical and photoelectrochemical studies were conducted using [Fe(CN)6]-3/-4 in 0.1 M KCl solution
as the redox probe and 0.1 M Na2SO4 as the supporting electrolyte on an Autolab (302N)
potentiostat/galvanostat electrochemical station with a three- electrode system having Ag-ZnO-rGO (1.3 cm)
as working electrode, Ag/AgCl (3.0 M KCl) as the reference electrode and platinum foil as the counter
electrode. The degradation experiments were conducted in a 100 mL quartz cell photoreactor which contained
the orange II dye solution and the electrodes. The working electrode was positioned to receive the light coming
from the source of light. The potentiostat/galvanostatic was utilised as the source of power for the
electrochemical degradation of the dye in a 0.1 M sodium sulphate solution as a supporting electrolyte. The
source of light was a New Port 9600. The distance between the simulator and the reactor is 10 cm so as to
produce a beam power equivalent to 1 sun. In the case of electrochemical oxidation of the dye, only potential
was applied. For photocatalytic degradation, only light was utilised, while both potential and light were applied
for the photoelectrochemical degradation of the dye. At intervals of 30 min, an aliquot (5 mL) of solution was
withdrawn from the cell using a disposable syringe and filtered using a 0.4 µm PVDF membrane filter for a
period of 210 min. The degradation was measured using a UV-Vis spectrophotometer (Cary 60, Agilent) at an
absorption band of λ = 483 nm, and with the aid of TOC analyzer (Teledyne Tekmar TOC fusion).
3.3 RESULT AND DISCUSSION
3.3.1 Spectroscopic characterisation for EG-ZnO
X-ray diffractometry for EG-ZnO. The X-ray diffraction pattern of the EG exhibits characteristic peak at 2θ=
26.7° assigned to 200 diffraction plane of hexagonal phase graphitic structure which confirms complete
exfoliation of graphite as shown in Fig. 3.1a. The X-ray diffraction pattern of ZnO nanostructures (Fig. 3.1b)
shows diffraction peak at 2θ values of 31.78°, 34.44°, 36.33°, 47.56°, 56.61°, 62.88°, 67.97°, and 69.11° and
89.86° corresponding respectively to 100, 002, 101,102,110,103,112, 201 and 203 crystalline planes of
hexagonal wurtzite ZnO (space group: P63mc) with lattice constants 𝑎𝑎 = 𝑏𝑏 = 0. 324 nm and 𝑐𝑐 = 0.521 nm
(JPCDS card number: 36-1451) (J. Zhou, Zhao, Wang, Zhang & Yang, 2007). The XRD pattern of the EG-
ZnO nanocomposite material exhibits characteristic peaks of the individual materials with decrease in the ZnO
diffraction peaks (Fig. 3.1c). This decrease has been attributed to the interaction between the EG and ZnO to
produce EG-ZnO nanocomposite (B Ntsendwana et al., 2013).
Thermogravimetric analysis. A photoanode is expected to display good thermal stability throughout the
reaction process and cycles hence, the thermal stability of the composite was studied. The TG curve of the
exfoliated graphite (Fig. 3.1d) shows that about 86% of the total weight was lost. The decomposition of EG
above 800°C is characteristic of all carbon materials. On the other hand, about 2.9% of the total weight of the
bare ZnO nanopowder was lost. The weight loss of bare ZnO nanopowder may be due to the evaporation of
adsorbed water on the surface of ZnO nanoparticles. The TG curve of EG-ZnO composite material reveals
that about 77% of the total weight of EG-SiOx-ZnO material is reserved in comparison with EG alone. This
increase in thermal stability is attributed to the presence of ZnO nanostructures in the composite.

<<Electrochemical Unit Operations in Industrial Wastewater Treatment>> ¯¯¯¯¯¯¯¯¯¯¯¯¯¯¯¯¯¯¯¯¯¯¯¯¯¯¯¯¯¯¯¯¯¯¯¯¯¯¯¯¯¯¯¯¯¯¯¯¯¯¯¯¯¯¯¯¯¯¯¯¯¯¯¯¯¯¯¯¯¯¯¯¯¯¯¯¯¯¯¯¯¯¯¯¯¯¯
______________________________________________________________________________________ 16
a) b)
c) d)
Figure 3.1. XRD patterns of (a) EG, (b) ZnO, and (c) EG-ZnO. (d) TGA thermograms of EG, ZnO and EG-SiOx-ZnO nanocomposites
3.3.2 Spectroscopic characterisation for Ag-ZnO-rGO
Raman spectroscopy. Raman spectroscopic study was carried out to determine the formation of rGO from
GO. Fig 3.2a shows the Raman spectra of (i) GO and (ii) rGO. The Raman spectra display two peaks at ~1600
cm-1 and ~1350 cm-1 which correspond to the G and D bands respectively. The G band is due to the in-plane
phonon vibration mode of the sp2-bonded carbon atoms in graphene while the D band is due to defects or
disorder in the hexagonal graphitic sheets resulting from the intercalation of oxygen-containing functional
groups or presence of sp3 bonding (Penghua Wang, Tang, Dong, Chen & Lim, 2013). The higher intensity of
the D band in relation to the G band in the rGO would give a higher D/G intensity ratio compare to the lower
D/G intensity ratio in the GO. This indicates the extent of the defects in the graphitic layers (Das et al., 2014).
Thus, it can be inferred that the graphene oxide was successfully reduced by the ascorbic acid, leaving few
oxygen-containing functional groups that resulted in the defects in the GO.
X-ray diffractometry. XRD analyses were conducted on the as-synthesised rGO, ZnO and Ag-ZnO-rGO and
the XRD patterns of the different materials are shown in Fig. 3.2b. In Fig. 3.2b(i), the observed diffraction peak

<<Electrochemical Unit Operations in Industrial Wastewater Treatment>> ¯¯¯¯¯¯¯¯¯¯¯¯¯¯¯¯¯¯¯¯¯¯¯¯¯¯¯¯¯¯¯¯¯¯¯¯¯¯¯¯¯¯¯¯¯¯¯¯¯¯¯¯¯¯¯¯¯¯¯¯¯¯¯¯¯¯¯¯¯¯¯¯¯¯¯¯¯¯¯¯¯¯¯¯¯¯¯
______________________________________________________________________________________ 17
at 2θ = 26.4° is attributed to the 002 crystal plane of rGO (JCPDS Card no. 75-1621). The diffraction peaks of
hexagonal wurzite structure of ZnO (JCPDS Card no. 36-1451) were observed at 31.8° (100), 34.6° (002),
36.4°(101), 47.7° (102), 56.7° (110), 63.0° (103), 66.5° (200), 68.1° (112), 69.2° (201) and 72.6° (004).
However, there are very low intensity peaks observed in Fig. 3.2b(iv) at 38.1° (111) and 44.2° (200) which
indicated the presence of Ag in the as-synthesized Ag-ZnO-rGO composite (JCPDS Card no. 04-0783).
Furthermore, the rGO peak at 2θ = 26.4° (002) appeared broadened and lower in intensity in the as-
synthesised Ag-ZnO-rGO composite. This could be due to little destruction of the crystalline structure of rGO
resulting from the presence of Ag-ZnO nanostructures (Qin et al., 2015).
The crystallite size of the as-prepared sample was determined using the Debye-Scherrer’s equation- D = Kλ /
β Cosθ, where D is the crystal size, K is a constant (0.9), λ is the x-ray wavelength, β is the full width of half
maximum (FWHM) (radian) and θ is the diffraction angle at the maximum. The average calculated crystalline
size of the ZnO was ca 21.8 nm.
UV-Vis diffuse reflectance spectroscopy. UV-Vis diffuse reflectance study was carried out on the samples
to determine the effects of Ag and rGO on the optical properties of the as-prepared ZnO nanoparticles (Fig.
3.2c). It can be observed from the UV-Vis spectra that Ag-ZnO displayed a slightly stronger visible light
absorption in comparison to ZnO. This is due to the surface plasmon resonance effects of Ag nanoparticles
(Peng Wang et al., 2010; P. Wang et al., 2013). Figure 3.2c shows that there is an intense visible light
absorption from λ = 430-800 nm for the Ag-ZnO-rGO composite resulting from the presence of rGO which
serves as a photosensitizer for the visible light absorption. This enhanced visible light harvesting ability of the
Ag-ZnO-rGO material can be ascribed to the synergistic effects of the SPR effect of Ag nanoparticles and
enhanced visible light absorption of rGO (Qin et al., 2015). Thus, the visible light absorption capacity of the
composite is a necessity for its enhanced photoelectrochemical degradation efficiency using solar energy
Fourier transform infrared spectroscopy. FTIR analyses were performed to investigate the functional
groups present in the as-synthesised materials. The FTIR spectra of rGO and Ag-ZnO-rGO are presented in
Fig. 2d. In Fig. 3.2d(i), the absorption band at 3400 cm-1 can be attributed to O-H stretching vibration from the
hydroxyl groups in rGO and the absorbed water on the surface of the rGO. The bands at 1620 cm-1 and 1720
cm-1 can be attributed to C=C bond stretching vibration and the stretching vibration of C=O bond of carboxyl
group in rGO respectively. The broad absorption peak at 1150 cm-1 is attributed to C-O stretching vibration
which usually occurs around 1260-1000 cm-1. In the spectra of Ag-ZnO-rGO (Fig. 3.2d(ii)), the broad peak at
510 cm-1 accounts for Zn-O bond stretching vibration. Also, the weak peak at 1224 cm-1 can be associated to
C-O-H bending vibration (1440-1220 cm-1) (Tang et al., 2014). The broad band observed at 3400 cm-1 can be
assigned to O-H stretching vibration of rGO which probably overlaps with the stretching vibration of hydroxyl
groups from the absorbed water on the ZnO surface (Uddin et al., 2015). These characteristics peaks were
used as indications of a successful preparation of the Ag-ZnO-rGO composite.

<<Electrochemical Unit Operations in Industrial Wastewater Treatment>> ¯¯¯¯¯¯¯¯¯¯¯¯¯¯¯¯¯¯¯¯¯¯¯¯¯¯¯¯¯¯¯¯¯¯¯¯¯¯¯¯¯¯¯¯¯¯¯¯¯¯¯¯¯¯¯¯¯¯¯¯¯¯¯¯¯¯¯¯¯¯¯¯¯¯¯¯¯¯¯¯¯¯¯¯¯¯¯
______________________________________________________________________________________ 18
a) b)
c) d)
Figure 3.2. (a) Raman spectra of the prepared (i) GO and (ii) rGO; (b) XRD patterns of (i) GO, (ii) ZnO, (iii) ZnO-rGO, (iv) Ag-ZnO and (v) Ag-ZnO-rGO; (c) UV-vis diffuse reflectance spectra of (i) ZnO, (ii) Ag-ZnO, and (iii) Ag-ZnO-rGO; (d) FTIR spectra of (i) rGO and (ii) Ag-ZnO-rGO
3.3.3 Electron Microscopy characterisation for Ag-ZnO-rGO
The surface morphology of the as-synthesised materials was studied using scanning electron microscopy
coupled with energy dispersed x-ray spectroscopy and transmission electron microscopy (Fig 3.3). Figure 3.3a
displays the graphitic layers of the exfoliated graphite. The as-prepared ZnO nanoparticles are presented in
Fig. 3.3b having a uniform flower-like structures. Figure 3.3c reveals the graphitic sheets of the rGO, while the
presence of Ag-ZnO dispersed within and on the layers of the rGO sheets is seen in Fig 3.3d. The presence
of silver in the dispersed Ag-ZnO was confirmed by EDS which also shows the presence of Zn, O and C (Fig
3.3e). The very low intensity of Ag confirmed the presence of a very minute percentage of Ag in comparison
with ZnO and rGO in the Ag-ZnO-rGO nanocomposite. The TEM image (Fig 3.3(f-h)) shows the irregular sizes
of the as-prepared nanocomposite ranging from 36.86 nm to 42.65 nm.

<<Electrochemical Unit Operations in Industrial Wastewater Treatment>> ¯¯¯¯¯¯¯¯¯¯¯¯¯¯¯¯¯¯¯¯¯¯¯¯¯¯¯¯¯¯¯¯¯¯¯¯¯¯¯¯¯¯¯¯¯¯¯¯¯¯¯¯¯¯¯¯¯¯¯¯¯¯¯¯¯¯¯¯¯¯¯¯¯¯¯¯¯¯¯¯¯¯¯¯¯¯¯
______________________________________________________________________________________ 19
a) b)
c) d)
e) f)
g) h)
Figure 3.3. SEM images of (a) exfoliated graphite; (b) ZnO nanoparticles; (c) reduced graphene oxide (rGO); (d) the as-synthesised Ag-ZnO-rGO material. (e) EDX spectrum of the as-prepared composite. TEM images of the as-synthesised (f) rGO; (g) ZnO-rGO and (h) Ag-ZnO-rGO material.

<<Electrochemical Unit Operations in Industrial Wastewater Treatment>> ¯¯¯¯¯¯¯¯¯¯¯¯¯¯¯¯¯¯¯¯¯¯¯¯¯¯¯¯¯¯¯¯¯¯¯¯¯¯¯¯¯¯¯¯¯¯¯¯¯¯¯¯¯¯¯¯¯¯¯¯¯¯¯¯¯¯¯¯¯¯¯¯¯¯¯¯¯¯¯¯¯¯¯¯¯¯¯
______________________________________________________________________________________ 20
3.3.4 Pore size and surface area analyses
The pore volumes and BET specific surface areas of EG, ZnO, and EG-SiOx-ZnO samples are represented
in Table 3.1. The EG material exhibits a higher pore volume than ZnO nanostructure; and this allows ease of
penetration of the ZnO into the EG porous matrix. The interpenetration was confirmed by the decrease in the
pore volume of the EG-ZnO composite.
Table 3-1 BET data of EG, ZnO and EG-SiOx-ZnO Sample BET surface area / m2 g-1 Pore volume / cm3 g-1
EG 14.66 0.06584
ZnO 12.31 0.05010
EG-SiOx-ZnO (MTMOS) 9.174 0.02595
3.3.5 Spectroscopic Characterisation of EG-WO3
Raman spectroscopy. Raman spectroscopic technique was employed for the structural investigation of the
prepared WO3-EG sample. Figure 3.4a shows the spectrum of EG before the addition of the WO3 having a
peak around 1598 cm-1 which corresponds to the G band of graphite (inset). The G band results from the in-
plane mode of vibration of the sp2 bonded carbon of the prepared EG. The D band which normally results from
defects was not absent, confirming the production of a highly crystalline EG. Upon the addition of the WO3 to
the EG, an additional peak with low intensity appeared at 1354 cm-1 corresponding to the D band of EG (Kumar,
Nidhi & Srivastava, 2015). This is as a result of disorder in the graphitic sheets because of the presence of sp3
bonding caused by the presence of WO3 (Fig. 3.4a). Additional characteristic peaks of WO3 with different
intensities are displayed at 806.7, 716.7, 326.8, 269.3, 131.8 and 74.3 cm-1. This indicates the interaction
between the EG and the WO3. The peaks at 326.8 and 269.3 could be attributed to the bending vibrations of
WO3 monoclinic structure while the peaks at 131.8 and 74.3 cm-1 can be allotted to the lattice modes (Grbić
et al., 2014; Hunge et al., 2016). The high intensity peaks at 806.7 and 716.7 cm-1 result from the stretching of
O-W-O of a monoclinic structure of WO3, respectively.
X-ray diffractometry EG-WO3. Figure 3.4b displays the X-ray diffraction patterns of EG, WO3 and WO3-EG.
In Fig. 3.4b(III), the characteristic diffraction peak of EG is observed at 2θ = 26.6° (002) crystal plane (B.
Ntsendwana et al., 2013), however, the observed feature around 37.5° is as a result of cosmic rays. The
diffraction peaks of a typical monoclinic polymorph of WO3 (JPCDS Card number 01-083-0950) were observed
at 23.2° (002), 23.7 (020), and 24.4 (200) with high intensities. Additional peaks were obtained at 26.7 (120),
29.1 (112), 33.4 (202), 34.2 (202) and 42.1 (220) as shown in Fig. 3.4b(I). Furthermore, the increase in intensity
observed at 26.7° in Fig. 3.4b(II) is due to the presence of EG in the WO3 material. This indicates the co-
existence of EG and WO3 in the as-prepared WO3-EG material. The estimated crystallite size of the prepared
material has an average value of 24.69 nm. This was estimated by employing the Debye-Scherrer’s equation:

<<Electrochemical Unit Operations in Industrial Wastewater Treatment>> ¯¯¯¯¯¯¯¯¯¯¯¯¯¯¯¯¯¯¯¯¯¯¯¯¯¯¯¯¯¯¯¯¯¯¯¯¯¯¯¯¯¯¯¯¯¯¯¯¯¯¯¯¯¯¯¯¯¯¯¯¯¯¯¯¯¯¯¯¯¯¯¯¯¯¯¯¯¯¯¯¯¯¯¯¯¯¯
______________________________________________________________________________________ 21
D = Kλ / β Cosθ; K is a constant ( 0.9), λ is x-ray wavelength (nm), β is the full width of half maximum of the
diffraction peak (radian), and θ is the angle of diffraction (radian).
FTIR analysis EG-WO3. The presence of functional groups and chemical interactions between the prepared
WO3 and EG materials were investigated using FTIR analysis. The FTIR spectra of EG and WO3-EG are
presented in Fig. 3.4c(I and II). The peak at 3420-3550 cm-1 could be assigned to O-H vibrations of the
chemisorbed water on the EG surface. Weak bands at 2850 and 2920 cm-1 could be due to C-H mode. The
aromatic C=C vibration of the EG are observed at 1628 cm-1 (strong) and 1468 cm-1 (weak). The absorption
band at 1100 cm-1 could be allocated to C-O mode. Moreover, the observed small band at 1378 cm-1 is linked
to C-O-H bending mode which occurs around 1440-1220 cm-1 (Tang et al., 2014). The additional peak at 750
and 830 cm-1 (Fig. 3.4c(II)) can be assigned to W-O-W out of plane deformation mode and W-O-W bridging
mode respectively (Khan, Khan & Cho, 2016). This is an indication of the presence of the WO3 in the WO3-EG
material.
UV-Visible spectroscopy EG-WO3. Optical studies were carried out on the WO3 and WO3-EG samples using
UV-Vis diffuse reflectance (Fig. 3.4d). It is clear that the WO3-EG portrayed a stronger photoabsorbance in the
visible region relatively to WO3 from λ = 430-800 nm. This results from the addition of the photosensitizing EG.
The solar light harvesting could probably be ascribed to the formation of W-O-C bonds between the WO3 and
EG interfaces. Consequently, the capability of the WO3-EG to absorb visible light is of importance for its
improved photoelectrochemical degradation efficiency in the presence of solar energy.

<<Electrochemical Unit Operations in Industrial Wastewater Treatment>> ¯¯¯¯¯¯¯¯¯¯¯¯¯¯¯¯¯¯¯¯¯¯¯¯¯¯¯¯¯¯¯¯¯¯¯¯¯¯¯¯¯¯¯¯¯¯¯¯¯¯¯¯¯¯¯¯¯¯¯¯¯¯¯¯¯¯¯¯¯¯¯¯¯¯¯¯¯¯¯¯¯¯¯¯¯¯¯
______________________________________________________________________________________ 22
a) b)
c) d) Figure 3.4. (a) Raman result of WO3-EG and EG (inset); (b) X-ray diffraction patterns of EG, (I) WO3, (II) WO3-EG and (III) EG; (c) FTIR results of (I) EG and (II) WO3-EG composite; and (d) UV-Visible diffuse reflectance spectra of (I) EG and (II) WO3-EG
3.3.6 Morphological studies of EG, WO3 and WO3-EG
The surface morphology of EG, WO3 and WO3-EG samples was investigated by SEM joined to EDX
spectroscopy. Figure 3.5a depicted the WO3 nanoparticles with irregular rhombic structures. The graphitic
sheets of the EG can be observed with open pore-like cavities for the entrapment of the WO3 nanostructures
(Fig. 3.5b). In Fig. 3.5c, it can be observed that the WO3 nanoparticles are well distributed in the interlayers
and edges of the graphitic sheets, thus, minimising aggregation of the WO3 particles. This indicated that WO3
nanoparticles were uniformly dispersed in the WO3-EG composite material. The presence of W and O in the
synthesised material was confirmed by EDS spectrum, indicating the presence of WO3 in the EG (Fig. 3.5d).

<<Electrochemical Unit Operations in Industrial Wastewater Treatment>> ¯¯¯¯¯¯¯¯¯¯¯¯¯¯¯¯¯¯¯¯¯¯¯¯¯¯¯¯¯¯¯¯¯¯¯¯¯¯¯¯¯¯¯¯¯¯¯¯¯¯¯¯¯¯¯¯¯¯¯¯¯¯¯¯¯¯¯¯¯¯¯¯¯¯¯¯¯¯¯¯¯¯¯¯¯¯¯
______________________________________________________________________________________ 23
a) b)
c) d)
Figure 3.5. (a) WO3, (b) EG and (c) WO3-EG composite images of SEM. (d) EDS spectrum of WO3-EG composite
3.3.7 Electrochemical and photoelectrochemical characterisation of rGO and Ag-ZnO-rGO
The electrochemical properties of rGO and Ag-ZnO-rGO electrodes were investigated in [Fe(CN)6]-3/-4 redox
probe (Fig. 3.6a). It was observed that Ag-ZnO-rGO electrode exhibited an increase in current in relation to
rGO. The faradaic current expected from the redox probe must have been impeded by the oxygen functional
groups around the graphene backbone of the rGO. The enhanced current in the Ag-ZnO-rGO resulted from
the Ag dopant which increased the conductivity of the electrode. For this electrode to be applicable in
photoelectrochemical oxidation, the production of photocurrent when irradiated with light is expected. This
property was investigated and presented in Fig 3.6b. The increase in the photocurrent response of the
electrode after illumination suggests that the Ag-ZnO-rGO is photoactive and can thus be used as a
photoanode (Fig 3.6b). This photoelectrochemical activity is expected to aid in the production of more hydroxyl
radicals responsible for the degradation of organic pollutants in water.

<<Electrochemical Unit Operations in Industrial Wastewater Treatment>> ¯¯¯¯¯¯¯¯¯¯¯¯¯¯¯¯¯¯¯¯¯¯¯¯¯¯¯¯¯¯¯¯¯¯¯¯¯¯¯¯¯¯¯¯¯¯¯¯¯¯¯¯¯¯¯¯¯¯¯¯¯¯¯¯¯¯¯¯¯¯¯¯¯¯¯¯¯¯¯¯¯¯¯¯¯¯¯
______________________________________________________________________________________ 24
a) b)
Figure 3.6. Cyclic voltammograms of (a)(i) rGO and (ii) Ag-ZnO-rGO electrodes in 5mM [Fe(CN)6]-3/-4 in 0.1 M KCl at 50 mVs-1; (b) Photoelectrochemical response of Ag-ZnO-rGO electrode in 0.1 M Na2SO4 in the dark (off) and under illumination (on) at 0.3 V.
3.3.8 Electrochemical and photoelectrochemical studies of EG and WO3-EG
Electrochemical studies were carried on the EG and WO3-EG electrodes in a redox probe which contains a
solution of 0.5 mM [Fe(CN)6]-3/-4 in 0.1 M KCl, and the cyclic voltammograms were recorded at a scan rate of
20 mVs-1 (Fig. 3.7a). It was noted that the WO3-EG electrode displayed an increment in peak current when
compared to that of the EG electrode. The increased faradaic current observed from the redox probe showed
that the electrode reaction rate is higher (Kusmierek & Chrzescijanska, 2015). This is due to increase in the
electrode active surface area which enhanced the conductivity of the WO3-EG electrode due to the presence
of WO3 in the EG. The electroactive surface area was calculated using the Randles-Sevcik equation, ip =
kn3/2AD1/2 v1/2C; where k is a constant, 2.69×10⁵, n is the number of exchanged electrons, D is the diffusion
co-efficient (7.6 × 10⁻⁶ for ferrocyanide), C is the solution concentration, v is the scan rate and A is the electrode
active surface area. The electrode active surface area was calculated to be 0.035 and 0.085mm2 for the EG
and WO3-EG electrodes respectively. This indicates an increment in the electrochemical active sites in the
WO3-EG electrode compared to the EG electrode (Ndlovu, Mamba, Sampath, Krause & Arotiba, 2014). A
kinetic study on ferrocyanide was conducted using different scan rates. It was observed that the plot of the
peak currents versus the square root of the scan rates was linear (Fig. 3b), suggesting that the process of the
electrochemical kinetics of the ferrocyanide was diffusion controlled (Ndlovu et al., 2014).
Linear sweep voltammetry in the presence and absence of light, was used to test the photoelectrochemical
behaviour of the electrodes in the presence of 30 ppm of orange II dye in 0.1 M Na2SO4. Figure 3c showed
the linear voltammograms of the EG and WO3-EG electrodes with and without irradiation. The anodic
photocurrent was seen to start around 0.23 V, and the photocurrent response increased. It was observed that
the intensity of the current generated by the WO3-EG electrode under the xenon lamp irradiation was higher
than that of EG electrode without the xenon lamp irradiation. This implied that there was a flow of
photogenerated electrons in the WO3 under irradiation, and the electron transport was enhanced by the
conductivity of the EG, indicating the photoactivity of the electrode (Monfort, Sfaelou et al., 2017b). The
photocurrent response of EG and WO3-EG was studied (Fig. 3d). The magnitude of the photogenerated current

<<Electrochemical Unit Operations in Industrial Wastewater Treatment>> ¯¯¯¯¯¯¯¯¯¯¯¯¯¯¯¯¯¯¯¯¯¯¯¯¯¯¯¯¯¯¯¯¯¯¯¯¯¯¯¯¯¯¯¯¯¯¯¯¯¯¯¯¯¯¯¯¯¯¯¯¯¯¯¯¯¯¯¯¯¯¯¯¯¯¯¯¯¯¯¯¯¯¯¯¯¯¯
______________________________________________________________________________________ 25
by an electrode under irradiation is an indication of the charge separation efficiency of the photogenerated
holes and electrons (N. Yang, Zhai, Wang, Chen & Jiang, 2010; Yu, Zhang & Cheng, 2014). The sharp
increment in the photocurrent response of the WO3-EG electrode during irradiation suggested that the
electrode is photoelectrochemically active. The photogenerated electrons from the WO3 can be accepted and
transported by the EG to the external circuit (Yu et al., 2014). This observation is corroborated by the results
obtained from the linear sweep voltammetry. Consequently, the WO3-EG can be employed as a photoanode
due to its higher photoelectrocatalytic activity for the degradation of organics in water treatment process.
a) b)
c) d)
Figure 3.7. (a) CVs of (I) EG and (II) WO3-EG composite electrodes using 5mM [Fe(CN)6]-3/-4 in 0.1 M KCl solution at a scan rate of 20 mVs-1; (b) CVs of WO3-EG composite electrodes at different scan rate and the plot of peak currents vs square root of scan rates. (c) Linear sweep voltammograms of EG and WO3-EG composite electrodes with (light) and without (dark) xenon lamp; and (d) responses from photocurrent of EG ((I) black) and WO3-EG ((II) red) composite electrodes in the dark (off) and under irradiation (on)
3.3.9 Electrochemical and Photoelectrochemical degradation of organic pollutants
In this project, different types of electrodes were prepared and used for the degradation of organic dyes,
phenolics and pharmaceutical. Table 3-2 shows the different types of electrodes prepared and the pollutants
degraded.

<<Electrochemical Unit Operations in Industrial Wastewater Treatment>> ¯¯¯¯¯¯¯¯¯¯¯¯¯¯¯¯¯¯¯¯¯¯¯¯¯¯¯¯¯¯¯¯¯¯¯¯¯¯¯¯¯¯¯¯¯¯¯¯¯¯¯¯¯¯¯¯¯¯¯¯¯¯¯¯¯¯¯¯¯¯¯¯¯¯¯¯¯¯¯¯¯¯¯¯¯¯¯
______________________________________________________________________________________ 26
Table 3-2. Summary of photoanodes and pollutants degraded in this project S/N Photoanode Organic pollutants degraded Reference 1 Ag-ZnO-rGO Orange II dye (Umukoro et al., 2016a, 2016b)
2 EG-WO3 Orange II dye, 2-nitrophenol (Umukoro, Peleyeju et al., 2017)
3 EG-TiO2 sulfamethoxazole (M. G. Peleyeju et al., 2017)
4 Pd-ZnO-EG 4-nitrophenol (Umukoro, Madyibi et al., 2017)
5 MoS2-SnO2/EG ciprofloxacin (Umukoro, Kumar, Ngila & Arotiba, 2018)
6 EG-BiVO4/ZnO Rhodamine B dye (Orimolade et al., 2019)
7 CNP/B-BiVO4/WO3/Ti Orange II dye Manuscript in preparation
Detailed results on these photoanodes can be found in the published papers referenced. The experimental
protocols for the photodegradation or photoelectrocatalytic studies are very similar in all cases. The following
sections show some of the results obtained.
3.3.9.1 Degradation studies of orange II dye on Ag-ZnO-rGO photoanode
Abstract of the full study (Umukoro et al., 2016b). In the search for novel and efficient electrochemical
materials as electrodes for photoelectrochemical degradation and mineralisation of organic pollutants in water
treatment, a photoanode consisting of a composite of silver (Ag), zinc oxide (ZnO) and reduced graphene
oxide (rGO) was synthesized, characterised and photoelectrochemically applied in the degradation and
possible mineralisation of organic pollutants in water treatment process. The ZnO and Ag-ZnO nanoparticles
were synthesised by a facile one-step co-precipitation method followed by calcination at 400°C. The
nanoparticles were further used to dope reduced graphene oxide by dispersion in methanol, sonicated and
dried. The prepared materials were characterised using Fourier transformed infrared spectroscopy (FTIR),
Raman spectroscopy, X-ray diffraction (XRD), UV-visible spectroscopy (UV-Vis), transmission electron
microscopy (TEM), scanning electron microscopy (SEM) and energy dispersive X-ray spectrometry (EDX).
The obtained Ag-ZnO-rGO nanocomposite was compressed and fabricated into an electrode. The
photoelectrochemical applicability of the Ag-ZnO-rGO as a photoanode material was tested by the
photoelectrochemical degradation of orange II dye as target organic pollutant in 0.1 M Na2SO4 solution at a
current density of 15 mAcm-2. The results revealed that the photoelectrochemical process was pH and current
density dependent and that Ag-ZnO-rGO electrode has a higher photoelectrochemical performance (93%
removal efficiency) compared to ZnO-rGO electrode (87% removal efficiency) and rGO (73% removal
efficiency) respectively. The degree of mineralisation of the dye was determined using total organic carbon
(TOC) which gave better removal efficiency for Ag-ZnO-rGO electrode (67.9%) in relation to ZnO-rGO (58.7%)
and rGO (45.3%) electrodes, respectively.
Photoelectrochemical degradation. The degradation of orange II dye as a model of organic pollutant was
conducted using different electrodes as photoanodes and under different degradation processes such as
electrochemical oxidation, photocatalytic degradation and photoelectrochemical oxidation in which a 0.1 M
Na2SO4 solution was used as the supporting electrolyte (Fig. 3.8). A decline in absorbance at the λmax of 483
nm of the dye was used as the extent of degradation (or decolourisation) in the electrochemical cell (Fig 3.8a).

<<Electrochemical Unit Operations in Industrial Wastewater Treatment>> ¯¯¯¯¯¯¯¯¯¯¯¯¯¯¯¯¯¯¯¯¯¯¯¯¯¯¯¯¯¯¯¯¯¯¯¯¯¯¯¯¯¯¯¯¯¯¯¯¯¯¯¯¯¯¯¯¯¯¯¯¯¯¯¯¯¯¯¯¯¯¯¯¯¯¯¯¯¯¯¯¯¯¯¯¯¯¯
______________________________________________________________________________________ 27
The photoelectrochemical studies of the rGO, ZnO-rGO and Ag-ZnO-rGO electrodes were carried out for the
degradation of orange II dye. The percentage removal for the as-prepared rGO electrode after 210 min was
73%. The introduction of ZnO and Ag-ZnO increased the photoelectrochemical oxidation efficiency to a
percentage removal of 87% (ZnO-rGO) and 93% (Ag-ZnO-rGO) respectively. This is due to the photoactive
ability of ZnO and its enhancement of visible light absorption by the surface plasmon resonance effect of Ag.
In addition, Ag can act as an electron sink, reducing the recombination rate of the electron-hole pairs.
Consequently, there is an increase in the production of hydroxyl radicals for the degradation process.
Furthermore, Ag-ZnO-rGO electrode was investigated for the degradation of the orange II dye under
electrochemical oxidation, photocatalytic degradation and photoelectrochemical oxidation processes.
Electrochemical oxidation displayed lower removal efficiency when compared to the photoelectrochemical
oxidation. In electrochemical oxidation, the absorbed hydroxyl groups on the electrode surface combine to
form hydroxyl radicals for the oxidation of the organic pollutants and they could also combine to give oxygen
molecules. Thus, evolution of oxygen can occur at the electrode as a result of the combination of these hydroxyl
groups (B Ntsendwana et al., 2013). This leads to competition between the oxygen molecules and the
production of hydroxyl radicals, and consequently, could results in low oxidation efficiency. However, the
photogenerated electrons in photocatalytic process can be utilised in the reduction of the oxygen molecules to
produce superoxide radicals and then generate more hydroxyl radicals in addition to the production of hydroxyl
radicals by ZnO when irradiated with light. An enhanced performance was achieved in the
photoelectrochemical process giving a removal efficiency of 93% in comparison to electrochemical oxidation
(87%) and photocatalysis (47%) after 210 min. Hence, it suggests a synergistic combination of photocatalytic
and electrochemical oxidation processes. Fig. 3.8(b-c) outline the plots of the normalised concentration with
time using rGO, ZnO-rGO and Ag-ZnO-rGO electrodes for photoelectrochemical oxidation (Fig 3.8b); and Ag-
ZnO-rGO electrode for electrochemical oxidation, photocatalysis and photoelectrochemical oxidation (Fig
3.8c).
The dependence of decolourisation on pH and current density was investigated and presented in Fig. 3.8(d-
e). The removal efficiency decreased as the pH of the solution was increased from pH 5 to 10 as shown in
Fig.3.8d. The high percentage removal at pH 5 is due to the electrostatic interactions between the negatively-
charged orange II dye (pH 2-9.6) (Abramian & El-Rassy, 2009) and the positively-charged surface of the
electrode containing ZnO (pH < pHpzc = 6.9-9.8) (Chamjangali & Boroumand, 2013). Studies at extreme acidic
pH of 1-3 and basic pH of 11-14 were not carried out because of the application at a higher scale where it may
not be cost effective and realistic to do pH adjustment. The effect of current density is shown in Fig. 3.8d. The
removal efficiency increased as the current density was increased. This is as a result of the production of more
hydroxyl radicals as the current was increasing. However, it was observed that the electrode began to leach
at current densities higher than 15 mAcm-2. Hence, a current density of 15 mAcm-2 was chosen as the optimal
current density. The ability of the Ag-ZnO-rGO photoanode to withstand a current density of 15 mAcm-2 is an
indication that the electrode possesses high stability to an extent and hence could be utilised in practical
applications.

<<Electrochemical Unit Operations in Industrial Wastewater Treatment>> ¯¯¯¯¯¯¯¯¯¯¯¯¯¯¯¯¯¯¯¯¯¯¯¯¯¯¯¯¯¯¯¯¯¯¯¯¯¯¯¯¯¯¯¯¯¯¯¯¯¯¯¯¯¯¯¯¯¯¯¯¯¯¯¯¯¯¯¯¯¯¯¯¯¯¯¯¯¯¯¯¯¯¯¯¯¯¯
______________________________________________________________________________________ 28
The degree of mineralisation of the dye was determined using total organic carbon (TOC) which gave a better
removal for Ag-ZnO-rGO electrode (67.9%) in relation to ZnO-rGO (58.7%) and rGO (45.3%) electrodes
respectively.
a) b)
c) d)
e)
Figure 3.8. (a) UV-Vis spectra for the degradation of orange II dye at Ag-ZnO-rGO electrode using photoelectrochemical oxidation; Normalised decay plots of the photoelectrochemical degradation of orange II dye (b) at rGO, ZnO-rGO and Ag-ZnO-rGO electrodes; (c) using photoelectrochemical oxidation, electrochemical oxidation and photocatalysis at Ag-ZnO-rGO electrode; and effects of (d) pH and (e) current density on the photoelectrochemical degradation of orange II dye.
Degradation kinetics. The kinetics of the degradation of the orange II dye was studied using the pseudo-first
order kinetics equation ln Co/Ct = kappt, where Co is the initial concentration of the dye and Ct is the concentration
at time, t, t is the reaction time, and k is the apparent reaction rate constant. This equation is usually applied

<<Electrochemical Unit Operations in Industrial Wastewater Treatment>> ¯¯¯¯¯¯¯¯¯¯¯¯¯¯¯¯¯¯¯¯¯¯¯¯¯¯¯¯¯¯¯¯¯¯¯¯¯¯¯¯¯¯¯¯¯¯¯¯¯¯¯¯¯¯¯¯¯¯¯¯¯¯¯¯¯¯¯¯¯¯¯¯¯¯¯¯¯¯¯¯¯¯¯¯¯¯¯
______________________________________________________________________________________ 29
for the kinetics of electrochemical degradation of organics (B Ntsendwana et al., 2013; Jing Zhang, Li, Feng,
Chen & Li, 2006). The data obtained for the photoelectrochemical degradation processes using the as-
prepared electrodes were fitted into the pseudo-first order kinetics and linear plots of ln Co / Ct against t were
obtained which suggested that the degradation kinetics is pseudo-first order kinetics. The kapp values for the
as-prepared electrodes are; 12.26 × 10⁻³ min-1 (Ag-ZnO-rGO) > 9.38 × 10⁻³ min-1 (ZnO-rGO) > 6.63 × 10⁻³ min-
1 (rGO) with correlation coefficients (R2) of 0.9750, 0.9479 and 0.9787 respectively. Fig. 3.9a shows the kinetics
of the photoelectrochemical degradation of orange II dye in 0.1 M Na2SO4 at pH 5 and 15 mAcm-2.
A plausible mechanism (Fig 3.9b) and the necessary reactions involved in the production of the •OH radicals
for the dye degradation are shown in Eqns [1.0]-[13.0].
E + H2O → E (•OH) + H+ + e‾ (at the surface of the electrode) [1.0]
Where E is the electrode
The nature of material used for the fabrication of the electrode determines whether the activity of the electrode.
An active electrode will interact strongly with the generated hydroxyl radical to produce a higher oxide referred
to as EO which then oxidises the pollutant, orange II dye.
E (•OH) → EO + H+ + e‾ [2.0]
EO + orange II dye → E + CO2 + H2O [3.0]
Or
•OH + orange II dye → CO2 + H2O [4.0]
In addition, the evolution of oxygen as a result of the decomposition of the higher oxide may compete with the
oxidation of the organic pollutant, thereby, leading to incomplete oxidation of the organic pollutant (B
Ntsendwana et al., 2013; Umukoro et al., 2016b).
EO → E + ½ O2 [5.0]
Upon the absorption of light;
hv + ZnO → ZnO + h+ + e- [6.0]
h+ + H2O → H+ + •OH [7.0]
e− + O2 → •O2− [8.0]
•O2− + H+ → HO2• [9.0]
HO2• + H2O → H2O2 + •OH [10.0]
H2O2 → 2 •OH [11.0]
•OH + Orange II (dye) → CO2 + H2O [12.0]
h+ + Orange II (dye) → CO2 + H2O [13.0]
The photogenerated electrons can be driven from the conduction band of ZnO to the Ag and rGO by the
application of a bias potential or electrical energy, and thereby reducing the recombination of the charges
within the ZnO (A. Zhu, Zhao, Li & Shi, 2013). The holes react with water molecules to form a proton and
hydroxyl radical (•OH) while the oxygen molecules released in the wastewater react with the photogenerated
electrons to form a superoxide oxygen radical (•O2−). The •O2− reacts with a proton to form hydroperoxide
radical (H2O•) which can react with water to give hydrogen peroxide which in turn generates hydroxyl radicals.

<<Electrochemical Unit Operations in Industrial Wastewater Treatment>> ¯¯¯¯¯¯¯¯¯¯¯¯¯¯¯¯¯¯¯¯¯¯¯¯¯¯¯¯¯¯¯¯¯¯¯¯¯¯¯¯¯¯¯¯¯¯¯¯¯¯¯¯¯¯¯¯¯¯¯¯¯¯¯¯¯¯¯¯¯¯¯¯¯¯¯¯¯¯¯¯¯¯¯¯¯¯¯
______________________________________________________________________________________ 30
Consequently, these radicals and the holes are involved in reactions with the orange II dye molecules
repeatedly to degrade and possibly mineralised them into less toxic substances such as CO2 and H2O (Hua
et al., 2013).
The improved photoelectrochemical performance of the Ag-ZnO-rGO can be attributed to: (i) the surface
plasmon resonance of Ag (P. Wang et al., 2013), (ii) reduced electron-hole pair recombination by enhanced
interfacial electron transport between Ag and ZnO (Ma et al., 2014; Sarkar, Ghosh, Mukherjee &
Chattopadhyay, 2012), (iii) the outstanding electron mobility/conductivity of reduced graphene oxide which
enhanced the transfer of photogenerated electrons and holes from ZnO to the graphene, thus, minimizing the
rate of recombination of the electron-hole pairs (Fenghua Chen et al., 2014).
a) b)
Figure 3.9. (a) Kinetic plots of photoelectrochemical degradation of orange II dye at pH 5 and 15 mAcm-2 using rGO, ZnO-rGO and Ag-ZnO-rGO electrodes; (b) photoelectrochemical set-up for the degradation of orange II dye (c) a proposed mechanism for the photoelectrochemical activity of the as-prepared Ag-ZnO-rGO for the degradation of orange II dye.
Sub-Conclusion. A novel photoanode of Ag-ZnO-GO nanocomposite was synthesised and characterised
using various spectroscopic, electron microscopic and electrochemical techniques. The photoanode was used
in the photoelectrochemical degradation of orange II dye with a percentage removal of 93%. The presence of
Ag-ZnO improved the photoelectrochemical performance of the photoanode due to the production of hydroxyl
radicals upon the irradiation of ZnO by visible light, and the surface plasmon resonance effect of Ag. The
degradation kinetics followed a pseudo first order reaction. Hence Ag-ZnO-rGO photoanode can be employed
in the photoelectrochemical degradation of dyes in water treatment process.
3.3.9.2 Degradation studies of 2 nitro phenol and orange II dye on EG-WO3 photoanode
Abstract of the full study (Umukoro, Peleyeju et al., 2017). There is an ongoing quest for cheap, efficient
and novel electrochemical materials for the construction of electrodes used for electrochemical and photo-
assisted electrochemical degradation (probably, mineralisation) of organics in wastewater treatment. In this
regard, a composite of tungsten trioxide (WO3) and exfoliated graphite (EG) was synthesised, characterised,
fabricated into an electrode and employed in the electrochemical and photo-assisted electrochemical
degradation of organics in water treatment. WO3 nanoparticles were synthesised using a modified simple
chemical method followed by calcinations at 600°C. Then the composite was prepared by a wet chemical
method after the exfoliation of the graphite. The WO3-EG nanocomposite was characterised using cyclic
0 50 100 150 200
0.0
0.5
1.0
1.5
2.0
2.5
ln(C
o/C t
)
Time (min)
rGO ZnO-rGOAg-ZnO-rGO

<<Electrochemical Unit Operations in Industrial Wastewater Treatment>> ¯¯¯¯¯¯¯¯¯¯¯¯¯¯¯¯¯¯¯¯¯¯¯¯¯¯¯¯¯¯¯¯¯¯¯¯¯¯¯¯¯¯¯¯¯¯¯¯¯¯¯¯¯¯¯¯¯¯¯¯¯¯¯¯¯¯¯¯¯¯¯¯¯¯¯¯¯¯¯¯¯¯¯¯¯¯¯
______________________________________________________________________________________ 31
voltammetry, linear sweep voltammetry, X-ray diffractometry, Raman and Fourier transformed infrared
spectroscopy, and scanning electron microscopy connected to energy dispersive X-ray spectrometry. The
electrochemical and photo-assisted electrochemical applicability of the WO3-EG as photo-electrode material
was investigated by the degradation of 2-nitrophenol and orange II dye as model organic pollutants in a 0.1 M
Na2SO4 solution, using a 10 mAcm-2 current density. Decolourisation and removal of the dye and 2-nitrophenol
were monitored using a UV-Visible spectrophotometer and the mineralisation level was investigated using a
TOC analyser. The EG-WO3 nanocomposite electrode gave a higher degree by 28% 2-nitrophenol and 24%
orange II dye of decolourisation (82% for 2-nitrophenol and 95% for orange II dye) and by 34.4% 2-nitrophenol
and 18% orange II dye of mineralisation (69% for 2-nitrophenol and 67% for orange II dye) in comparison to
the EG electrode. Furthermore, the presence of WO3 rendered the electrode a good photoanode owing to its
higher degradation efficiency.
Photoelectrochemical degradation. The performance of the EG and WO3-EG electrodes were tested on the
degradation of 2-nitrophenol. It was found that WO3-EG electrode showed a higher removal efficiency in the
electrochemical degradation of 2-nitrophenol (52%) in comparison with the EG electrode (39%). Furthermore,
WO3-EG electrode gave a better removal in the photo-assisted electrochemical degradation process (82%)
than the EG electrode (54%) as seen in Fig. 4a. This can be construed to result from the low electron transfer
resistance of the WO3-EG composite electrode which could enhance its charge separation efficiency (Yu et
al., 2014). As shown in Fig. 4b, the WO3-EG composite electrode showed an enhanced removal performance
in the photo-assisted electrochemical degradation process than the electrochemical degradation. This is
attributed to the photosensitive nature of WO3, leading to a flow of photogenerated holes and electrons upon
irradiation, and the electron transport was enhanced due to the presence of EG that is very conductive. This
argument can be buttressed with the results from the LSV and photocurrent responses of the electrodes. Thus,
it suggests there is a synergistic combination of EG and WO3 in the composite electrode which aided the
degradation process.
The degradation of 2 nitrophenols was found to be possible in the pH range of 3 to 8 demonstrating the
robustness of this system.
a) b)
Figure 3.10. Normalised concentration decay versus time plots of the photo-assisted electrochemical degradation of 2-nitrophenol (a) at EG and WO3-EG composite electrodes, (b) under electrochemical and photo-assisted electrochemical degradation processes

<<Electrochemical Unit Operations in Industrial Wastewater Treatment>> ¯¯¯¯¯¯¯¯¯¯¯¯¯¯¯¯¯¯¯¯¯¯¯¯¯¯¯¯¯¯¯¯¯¯¯¯¯¯¯¯¯¯¯¯¯¯¯¯¯¯¯¯¯¯¯¯¯¯¯¯¯¯¯¯¯¯¯¯¯¯¯¯¯¯¯¯¯¯¯¯¯¯¯¯¯¯¯
______________________________________________________________________________________ 32
Table 3-3. Summary of results for degradation studies with WO3-EG photoanode Photoanode Pollutant Key results WO3-EG 2 nitrophenol Time of degradation = 180 min
Electrochemical degradation: EG (39%); WO3-EG (52%) Photoelectrochemical degradation: EG (54%); WO3-EG (82%) pH range: 3-8 Optimum Current density: 10 mAcm-2 Total Organic Carbon removal: Electrochemical = 34.6%; Photoelectrochemical degradation = 69%
Kinetics (kapp): Electrochemical degradation = 4.5 × 10⁻³ min-1;
Photoelectrochemical degradation = 9.54 × 10⁻³ min-1.
Orange II dye Time of degradation = 120 min
Electrochemical degradation: WO3-EG (71%) Photoelectrochemical degradation: WO3-EG (95%) pH optimum: 5.5 Optimum Current density: 10 mAcm-2 Total Organic Carbon removal: Electrochemical = 49%; Photoelectrochemical degradation = 67%
Kinetics (kapp): Electrochemical degradation = 6.89 × 10⁻³ min-
1; Photoelectrochemical degradation = 16.87 × 10⁻³ min-1.
Sub Conclusion. In this work, WO3-EG nanocomposite electrode was fabricated and employed successfully
for the electrochemical and photo-assisted electrochemical degradation of 2-nitrophenol and orange II dye in
water treatment. The WO3 nanoparticles with average sizes of 24.69 nm were uniformly dispersed on the
exfoliated graphite sheets. The removal efficiencies were 82% and 95% for the photo-assisted electrochemical
degradation of 2-nitrophenol and orange II dye after 180 and 120 minutes respectively. The utilisation of a low
current density (10 mAcm-2) by the WO3-EG composite electrode for the photo-assisted electrochemical
degradation process is an indication of energy cost effectiveness. The synergy between WO3 and EG in the
WO3-EG composite is obvious from the improved photo-assisted electrochemical performance portrayed by
WO3-EG electrode compared to its electrochemical performance. Thus, WO3-EG composite electrode renders
itself a good photoanode in water treatment process due to its higher degradation efficiency.
3.3.9.3 Degradation of sulfamethoxazole (SMX) at EG and TiO2-EG electrodes
Abstract of the full study (Moses G Peleyeju et al., 2017). Sulfamethoxazole is an antibacterial agent which
is commonly prescribed for the treatment of infections in man and animals. The detection of this drug in the
aqueous environment has raised considerable health concerns. Herein, we report the photoelectrocatalytic
degradation of sulfamethoxazole at a TiO2-exfoliated graphite (TiO2-EG) anode. The TiO2-EG nanocomposite,
synthesised by sol-gel and microwave methods, was characterised by XRD, Raman and FTIR spectroscopies,
SEM and TEM. The cyclic voltammograms of the fabricated electrodes were obtained in [Fe(CN)6]3- redox
probe. Concentration abatement of the antibiotic was monitored on UV-Vis spectrophotometer and the possible
intermediates were investigated using LCMS. After 6 h of the photoelectrocatalytic process, Almost 100% of

<<Electrochemical Unit Operations in Industrial Wastewater Treatment>> ¯¯¯¯¯¯¯¯¯¯¯¯¯¯¯¯¯¯¯¯¯¯¯¯¯¯¯¯¯¯¯¯¯¯¯¯¯¯¯¯¯¯¯¯¯¯¯¯¯¯¯¯¯¯¯¯¯¯¯¯¯¯¯¯¯¯¯¯¯¯¯¯¯¯¯¯¯¯¯¯¯¯¯¯¯¯¯
______________________________________________________________________________________ 33
the drug has been degraded and a 90% COD decay was achieved. The photoelectrocatalytic degradation of
sulfamethoxazole entailed γ-, β-, δ- and ε- cleavages, hydroxylation and rings opening. The outcome of this
study shows that the EG-TiO2 anode can be applied for the photoelectrocatalytic remediation of water
contaminated by pharmaceuticals.
Photoelectrochemical degradation. Oxidation of the analyte was monitored on UV-Vis spectrophotometer
at its wavelength of maximum absorption (λmax = 257 nm). In both electrochemical and photoelectrochemical
processes at the TiO2-EG electrode, there was a gradual but very significant reduction (with time) in the
absorbance of the antibiotic at the λmax (Fig. 3.11a). This confirmed its degradation in the processes. However,
a much higher degradation efficiency was obtained in the photo-assisted process (Fig. 3.11b). It is also
noteworthy that the composite electrode exhibited a higher removal efficiency of the analyte than the pristine
electrode in the electrochemical process (Fig. 3.11c). The improved degradation obtained in the
photoelectrochemical process at the TiO2 based electrode can be attributed to the photocatalytic behaviour of
the semiconductor and the combined effect of electrical energy and solar energy which are beneficial for
generating the hydroxyl radicals required to destroy the pollutant. Upon irradiation with light, the photo-
generated holes in TiO2 reacts with water to produce hydroxyl radicals, this powerful oxidant attacks and
degrades the pollutant molecules until they are mineralised. Similarly, the holes also act as oxidant, attacking
the organic specie until it is completely broken down. Furthermore, when the applied potential is sufficiently
high, oxidation of water on the surface of the anode to form the hydroxyl radicals takes place. The enhanced
performance of EG-TiO2 compared to EG in the electrochemical process can be related to the higher electro-
active surface area of the EG-TiO2 which provides for greater number of sites for the oxidation of water to
generate the oxidant. In addition, since direct electron transfer from the contaminant to the anode often occurs
simultaneously with the indirect oxidation (Donaghue & Chaplin, 2013; Zhi, Wang, Nakashima, Rao &
Fujishima, 2003), a larger electro-active surface area favours the oxidation of SMX at the anode. This
observation is in agreement with the results of the cyclic voltammetry experiments in which higher current was
obtained at the composite electrode.
The influence of current density on the degradation process was investigated. Oxidation of the analyte was
achieved at the initial current density of 7 mAcm-2. There was however improvement in the process when the
value was increased to 10 mAcm-2. Further increase to 13 mAcm-2 did not lead to appreciable increase in the
degradation efficiency (Fig. 3.11d). This trend suggests that the oxidation of SMX is mainly achieved by holes
and hydroxyl radicals in the photoelectrochemical process. It is also believed that the anodic potential at 10
mAcm-2 is optimal to prevent recombination of photogenerated charges and that further increase in potential
is unutilised.
The effect of pH of the bulk solution on the degradation of SMX was studied. It can be observed that the rate
of oxidation is higher at acidic pH (Fig. 3.11e), with the rate at pH 3 being slightly higher than the rate at pH 6.
The Pka1 and Pka2 values of SMX are 1.7 and 5.6 respectively (H. Chen, Gao, Li & Ma, 2011). Below and above
these values SMX is either positively or negatively charged. The proportion of cationic or anionic form of SMX
present in a solution at a time depends on the pH of the solution. At pH 3, SMX molecules are expected to be
in neutral form and since the degradation efficiency at this pH is higher than at the other two pH values, it can
be said that the degradation of the analyte in this process is favoured when the molecules are uncharged. The

<<Electrochemical Unit Operations in Industrial Wastewater Treatment>> ¯¯¯¯¯¯¯¯¯¯¯¯¯¯¯¯¯¯¯¯¯¯¯¯¯¯¯¯¯¯¯¯¯¯¯¯¯¯¯¯¯¯¯¯¯¯¯¯¯¯¯¯¯¯¯¯¯¯¯¯¯¯¯¯¯¯¯¯¯¯¯¯¯¯¯¯¯¯¯¯¯¯¯¯¯¯¯
______________________________________________________________________________________ 34
difference between the rates at pH 3 and pH 6 is not very large, thus it can be asserted that there is still a
considerable amount of the neutral molecules at pH 6. Furthermore, although the degradation of SMX at pH
6.3 is a little slower, the pH of the electrolytic solution can still be maintained at 6.3 since it is milder.
a) b)
c) d)
e)
Figure 3.11. a) UV-Vis spectra of oxidised SMX solution and normalised plots of concentration abatement for b) electrochemical and photoelectrocatalytic degradation of SMX at TiO2-EG photoelectrode c) electrochemical degradation of SMX at EG and TiO2-EG anodes (experiments carried out at pH 6.3, j = 10 mAcm-2, [SMX]0 = 25 mgL-1, supporting electrolyte = Na2SO4) d) current-dependence of SMX degradation e) effect of bulk solution pH on SMX degradation.

<<Electrochemical Unit Operations in Industrial Wastewater Treatment>> ¯¯¯¯¯¯¯¯¯¯¯¯¯¯¯¯¯¯¯¯¯¯¯¯¯¯¯¯¯¯¯¯¯¯¯¯¯¯¯¯¯¯¯¯¯¯¯¯¯¯¯¯¯¯¯¯¯¯¯¯¯¯¯¯¯¯¯¯¯¯¯¯¯¯¯¯¯¯¯¯¯¯¯¯¯¯¯
______________________________________________________________________________________ 35
Kinetics of SMX degradation, COD decay and current efficiency at TiO2-EG photoanode. An efficient
wastewater treatment technique is expected to lead to a significant reduction in the chemical oxygen demand
(COD) of the water at a reasonable energy input. The removal of COD in this investigation was calculated
using the relations:
COD decay (%) = (COD0 - CODt)/COD0 * 100%
where COD0 and CODt are the values (in mgL-1) of chemical oxygen demand at time, t = 0 and t = t respectively.
After 6 hr of electrolysis and light irradiation at the optimum conditions, a 90% COD removal was obtained at
the photoanode.
Using the COD approach, the current efficiency for the degradation of SMX was calculated using the following
equation (M. Zhou, Dai, Lei, Ma & Wang, 2005):
Total Current Efficiency (TCE) = FV. (COD0 - CODt)/8I∆t
where COD0 and CODt are the COD (in gL-1) at time t = 0 and t = t, F is the Faraday constant (96487
Cmol-1), V is the volume of the electrolytic solution (in Litre), I is the current (A) and t is the electrolysis time
(s). The TCE calculated for the degradation of SMX at optimum conditions was 0.674. This value indicates that
a fairly high proportion of the electrical energy applied was utilised for the decay of the contaminant.
Identification of intermediate products during the degradation of SMX. LCMS analysis of standard sample
and aliquots of degraded SMX solution were carried out. The chromatograms obtained are in Fig. 3.12 The
major aromatic intermediates identified are m/z = 94, 157, 172. These species can result from the γ-, β-, δ-
and ε- cleavages of the sulfamethoxazole molecules (de Amorim, Romualdo & Andrade, 2013). The peak at
m/z = 94 can be considered as protonated aniline, it has been reported in a number of studies dealing with
oxidation of SMX by hydroxyl radicals (de Amorim et al., 2013; Hussain, Gul, Steter, Miwa & Motheo, 2015; G.
Liu et al., 2017). It can be thought to be formed by the attack of hydroxyl radicals on sulfonated moiety, leading
to release of SO42- (G. Liu et al., 2017). The formation of a product having m/z = 157 has been attributed to
the cleavage of the S-N bond in the parent molecule (W. Zhu, Sun, Goei & Zhou, 2017), and the m/z = 172
may be a sulfanilamide or ionic form of sulfanilic acid resulting from ε- cleavage (de Amorim et al., 2013; Hu,
Flanders, Miller & Strathmann, 2007). The peaks at m/z = 270 and 286 have been indicated to result from the
mono- and di-hydroxylated products of SMX (Ioannidou et al., 2017; Radjenovic & Petrovic, 2017). It can
therefore be reasonably suggested that the photoelectrocatalytic oxidation of SMX is by cleavage of the S-N
bond and hydroxylation and opening of ring systems in the molecule. A schematic representation of the
degradation route of SMX is presented in Fig. 3.12D.

<<Electrochemical Unit Operations in Industrial Wastewater Treatment>> ¯¯¯¯¯¯¯¯¯¯¯¯¯¯¯¯¯¯¯¯¯¯¯¯¯¯¯¯¯¯¯¯¯¯¯¯¯¯¯¯¯¯¯¯¯¯¯¯¯¯¯¯¯¯¯¯¯¯¯¯¯¯¯¯¯¯¯¯¯¯¯¯¯¯¯¯¯¯¯¯¯¯¯¯¯¯¯
______________________________________________________________________________________ 36
D) Figure 3.12. A) Chromatogram of SMX solution B) Mass spectrum of SMX solution C) Chromatogram of degraded SMX solution D) Proposed degradation route of SMX by photoelectrochemical process
0.0 2.5 5.0 7.5 min
0
2500000
5000000
7500000
10000000
12500000
15000000
17500000
200000001:Sulfamethoxazole 254.00(+)1:Sulfamethoxazole TIC(+)
5.3
42
/70
77
70
10
/25
45
.49
8/7
38
41
7/2
54
253.9925 253.9950 253.9975 254.0000 254.0025 254.0050 254.0075 m/z0.00
0.25
0.50
0.75
1.00
1.25
1.50
1.75
2.00
2.25
2.50Inten. (x10,000,000)
254
0.0 2.5 5.0 7.5 min0
500000
1000000
1500000
2000000
2500000
3000000
3500000
1:Sulfamethoxazole TIC(+)
9 172
253
270
157 286
A B
C

<<Electrochemical Unit Operations in Industrial Wastewater Treatment>> ¯¯¯¯¯¯¯¯¯¯¯¯¯¯¯¯¯¯¯¯¯¯¯¯¯¯¯¯¯¯¯¯¯¯¯¯¯¯¯¯¯¯¯¯¯¯¯¯¯¯¯¯¯¯¯¯¯¯¯¯¯¯¯¯¯¯¯¯¯¯¯¯¯¯¯¯¯¯¯¯¯¯¯¯¯¯¯
______________________________________________________________________________________ 37
Table 3-4. Summary of results for degradation studies with TiO2-EG photoanode Photoanode Pollutant Key results TiO2 - EG Sulfamethoxazole Time of degradation = 240 min to 360 min
Photoelectrochemical degradation: ca 100% @ 360 min pH range: 3-6.3. Optimum pH 6 Optimum Current density: 10 mAcm-2 Chemical oxygen removal (COD) = 90%
Kinetics (kapp): Photoelectrochemical degradation = 5.74 x 10⁻³
min-1.
Sub-Conclusion. The applicability of TiO2-EG electrode for the oxidation of SMX via photoelectrocatalytic process was demonstrated in this study. The performance of the photoanode was enhanced in the presence of simulated sunlight, with a fourfold increase in the removal efficiency of the contaminant. The degradation of SMX at the electrode was dependent on pH of the solution and applied current, pH 6.3 and current density 10 mAcm-2 were taken as optimum. After 6 h of the process at the optimum conditions, 90% of the COD of the solution was removed. LC-MS analysis of the degraded SMX revealed the formation of aniline and other by-products which are believed to result from the interaction of the photoelectrochemically generated hydroxyl radicals and electrons with the parent molecule. Given the ease of preparation, low cost and performance of the TiO2-EG anode, it can be further explored for the removal of pharmaceuticals from wastewater.
3.3.9.4 Degradation studies of orange II dye on Pd g-ZnO-EG photoanode
Abstract of the full study. A novel Pd-ZnO-expanded graphite (EG) photoelectrode was constructed from a
Pd-ZnO-EG nanocomposite synthesised by a hydrothermal method and characterised using various
techniques such as X-ray diffractometry (XRD), Raman spectroscopy, UV-Vis diffuse reflectance
spectroscopy, nitrogen adsorption-desorption analysis, transmission electron microscopy (TEM), scanning
electron microscopy (SEM) and energy dispersive spectrometry (EDS). Cyclic voltammetry and photocurrent
response measurements were also carried out on the electrode. The Pd-ZnO-EG electrode was employed in
the photoelectrocatalytic removal of 4-nitrophenol as a target water pollutant at a neutral pH and current density
of 7 mAcm-2. Optical studies revealed that the Pd-ZnO-EG absorbed strongly in the visible light region. The
Pd-ZnO-EG electrode showed improved photoelectrocatalytic activity in relation to ZnO-EG and EG electrodes
for the removal of the 4-nitrophenol. The photocurrent responses showed that the Pd-ZnO-EG nanocomposite
electrode could be employed as a good photoelectrode for photoelectrocatalytic processes and environmental
remediation such as treatment of industrial wastewaters. Density functional theory method was used to model
the oxidative degradation of 4-nitrophenol by hydroxyl radical which generate hydroquinone, benzoquinone,
4-nitrocatechol, 4-nitroresorcinol and the opening of the 4-nitrophenol ring. Furthermore, the hydroxyl radical
is regenerated and can further oxidise the ring structure and initiates a new degradation process. Degradation studies. The photoelectrocatalytic activities of the EG, ZnO-EG and Pd-ZnO-EG electrodes were
evaluated by the rate of removal of 4-nitrophenol as a target organic pollutant. The removal rate was monitored
using UV-Visible spectroscopy and total organic carbon (TOC) analysis. For control experiments, photolytic,
photocatalytic and electrocatalytic removal of 4-nitrophenol were carried out and compared with the
photoelectrocatalytic process using the Pd-ZnO-EG material (Fan, Yang, Pu & Zhang, 2014). The results
revealed that the removal of 4-nitrophenol was 20% for photolysis, 31% for photocatalysis, 69% for

<<Electrochemical Unit Operations in Industrial Wastewater Treatment>> ¯¯¯¯¯¯¯¯¯¯¯¯¯¯¯¯¯¯¯¯¯¯¯¯¯¯¯¯¯¯¯¯¯¯¯¯¯¯¯¯¯¯¯¯¯¯¯¯¯¯¯¯¯¯¯¯¯¯¯¯¯¯¯¯¯¯¯¯¯¯¯¯¯¯¯¯¯¯¯¯¯¯¯¯¯¯¯
______________________________________________________________________________________ 38
electrocatalysis and 94% for the photoelectrocatalytic process (Fig. 3.13a). Furthermore, the EG and ZnO-EG
electrodes were used as control experiments for the photoelectrocatalytic removal of 4-nitrophenol. As
presented in Fig. 3.13b, the kinetics curves show that the ZnO-EG electrode gave a better removal efficiency
compared to that of the EG electrode. This is attributed to the photoactive nature of ZnO in the ZnO-EG
material. Moreover, after the addition of Pd to the ZnO-EG material, an enhanced photoelectrocatalytic removal
performance (94%) was found.
The improved removal efficiency is as a result of the photoactive nature of ZnO and the enhanced absorption
of visible light caused by the surface plasma resonance ability of Pd in the composite. The Pd can also behave
as electron sink for the photoinduced electrons, thereby minimising the recombination of the electron-hole
pairs generated (Long Zhang et al., 2014; W. Zhao et al., 2016). In addition, the ability of the EG to act as
electron sink as well as its electron transport nature must have aided in inhibiting the recombination of the
photoinduced holes and electrons which led to the improved photoelectrocatalytic performance of the Pd-ZnO-
EG electrode. The synergic combination of ZnO, EG and Pd that led to improved photocatalytic degradation
can be buttressed with photocurrent responses in Fig. 3.13b which was highest for the Pd-ZnO-EG electrode.
The extent of mineralisation of the 4-nitrophenol was evaluated on a TOC analyser after a period of 150 min.
The TOC results showed a removal percentage of 58% for Pd-ZnO-EG electrode which is better in comparison
with that of EG (32%) and ZnO-EG (40%) electrodes.
a) b)
Figure 3.13. Kinetics curves of (a) electrochemical and photoelectrocatalytic removal of 4-nitrophenol at Pd-ZnO-EG electrode. (b) Photoelectrocatalytic removal of 4-nitrophenol at EG, ZnO-EG and Pd-ZnO-EG electrodes.

<<Electrochemical Unit Operations in Industrial Wastewater Treatment>> ¯¯¯¯¯¯¯¯¯¯¯¯¯¯¯¯¯¯¯¯¯¯¯¯¯¯¯¯¯¯¯¯¯¯¯¯¯¯¯¯¯¯¯¯¯¯¯¯¯¯¯¯¯¯¯¯¯¯¯¯¯¯¯¯¯¯¯¯¯¯¯¯¯¯¯¯¯¯¯¯¯¯¯¯¯¯¯
______________________________________________________________________________________ 39
Computational modelling of the degradation of 4-nitrophenol was carried out to understand the
degradation mechanism and to predict the degradation products (Umukoro, Peleyeju et al., 2018).
Table 3-5. Summary of results for Degradation studies of orange II dye on Pd g-ZnO-rGO photoanode Photoanode Pollutant Key results Pd-ZnO-EG 4-nitrophenol Time of degradation = 150 min
The results revealed that the removal of 4-nitrophenol was 20% for photolysis, 31% for photocatalysis, 69% for electrocatalysis and 94% for the photoelectrocatalytic process Photolysis: 20%; Electrochemical degradation: 69%; Photoelectrochemical degradation: 94% Optimum pH: 7 Optimum Current density: 5-7.5 mAcm-2 Kinetics: EG = 5.53 × 10⁻³ min-1. ZnO-EG = 6.97 × 10⁻³ min-1 and Pd-ZnO-EG = 18.52 × 10⁻³ min-1. Total Organic Carbon removal: EG = 32%; ZnO-EG = 40%; Pd-ZnO-EG = 58%
Sub Conclusion. In summary, Pd-ZnO-EG electrode was constructed from a Pd-ZnO-EG nanocomposite,
synthesised by a hydrothermal method and characterised using various techniques. The Pd-ZnO-EG
nanomaterials have large surface area, pore size and volume, and strong absorption in the visible light region.
The electrode was used for the photoelectrocatalytic removal of 4-nitrophenol as a target water pollutant. The
Pd-ZnO-EG electrode showed improved photoelectrocatalytic activity in relation to ZnO-EG and EG electrodes
for the removal of the 4-nitrophenol. This is as a result of the Pd nanoparticles and the conducting EG acting
as collectors for the photoexcited electrons, thereby aiding charge transfer and reducing recombination of
charges. In addition, the photocurrent responses showed that the Pd-ZnO-EG nanocomposite electrode could
be employed as a good photo-electrode for the benefits of photoelectrocatalytic processes and environmental
remediation such as treatment of industrial wastewaters. The oxidative degradation of 4-nitrophenol by
hydroxyl radical was predicted using DFT method which led to the generation of hydroquinone, benzoquinone,
4-nitrocatechol, 4-nitroresorcinol and the ring opening of the 4-nitrophenol. This was obtained by DFT
computations of plausible reaction mechanism and pathways resulting from hydroxyl radical attacks on
different positions on the molecule of 4-nitrophenol, accompanied by hydrogen abstraction by ground state
oxygen reactions. Furthermore, hydroxyl radical was regenerated which can further oxidised the ring structure
and initiates a new degradation process.
3.3.9.5 Degradation studies of ciprofloxacin on expanded graphite supported p-n MoS2-SnO2 heterojunction nanocomposite electrode
Abstract of the full study (Umukoro, Kumar et al., 2018). Wastewater treatment challenges by conventional
methods have necessitated the need for alternative/complementary methods that are environmentally benign
and efficient especially toward recalcitrant organic pollutants. In this regard, a novel photoanode consisting of
a p-n MoS2-SnO2 heterojunction anchored on expanded graphite (EG) was fabricated and employed in the
photo-electrocatalytic degradation of ciprofloxacin, a pharmaceutical pollutant, in water using a current density
of 0.010 Acm-2. The photoanode material was characterised with transmission electron microscopy (TEM),

<<Electrochemical Unit Operations in Industrial Wastewater Treatment>> ¯¯¯¯¯¯¯¯¯¯¯¯¯¯¯¯¯¯¯¯¯¯¯¯¯¯¯¯¯¯¯¯¯¯¯¯¯¯¯¯¯¯¯¯¯¯¯¯¯¯¯¯¯¯¯¯¯¯¯¯¯¯¯¯¯¯¯¯¯¯¯¯¯¯¯¯¯¯¯¯¯¯¯¯¯¯¯
______________________________________________________________________________________ 40
scanning electron microscopy (SEM), energy dispersive spectrometry (EDS), Raman spectroscopy and X-ray
diffraction (XRD) to confirm that the nanocomposite was successfully prepared. Photoelectrochemical studies
were carried out with cyclic/linear sweep voltammetry and chronoamperometry. The removal efficiency of the
photo-electrocatalytic cell was determined on a UV-Visible spectrophotometer and the extent of mineralisation
was measured by a total organic carbon analyser. The results obtained revealed that the SnO2 particles are
nanosheets while the MoS2 particles are hierarchical microspheres having nanosheets of MoS2, and they were
anchored on the interlayers of the EG sheets. Also, the p-n MoS2-SnO2 heterojunction anchored on expanded
graphite (EG) was found to be photoactive and displayed a better removal efficiency and mineralisation in
comparison to EG, SnO2-EG and MoS2-EG electrodes. This may be due to the formation of the MoS2-SnO2 p-
n heterojunction in the MoS2-SnO2/EG nanocomposite which enhanced the light harvesting ability of the
material resulting in its improved photo-electrocatalytic performance. Hence the MoS2-SnO2/EG is potentially
a good photoelectrode which may be beneficial for a photo-electrocatalytic treatment of industrial wastewaters
and other photo-electrocatalytic applications.
Degradation studies. The application of the EG, MoS2-EG, SnO2-EG and MoS2-SnO2/EG electrodes for the
photo-electrocatalytic removal of ciprofloxacin as a typical pharmaceutical pollutant was investigated, and this
was monitored using UV-Visible spectroscopy and TOC analysis. At a current density of 0.010 Acm-2 and a
small electrode geometric area of 1.33cm2, the obtained results showed that the MoS2-SnO2/EG electrode
displayed a photo-electrocatalytic removal efficiency of 78.5% and an electrocatalytic removal efficiency of
55.5% (Figure 3.14a). Furthermore, as a control experiment, EG electrode was used for the photo-
electrocatalytic removal of ciprofloxacin and it gave a removal efficiency of 50.5%. Upon the separate addition
of MoS2 and SnO2 to the EG, 68.5 and 64.5% were obtained for the MoS2-EG and SnO2-EG electrodes
respectively. This is due to the photosensitivity of MoS2 and SnO2. Moreover, the addition of the MoS2-SnO2
nanohybrid to the EG gave 78.5% for the MoS2-SnO2/EG electrode. This is due to the light harvesting nature
of the nanocomposite and the formation of heterojunction between the MoS2 and SnO2 which led to an
improved charge separation and transport, thereby resulting in an improved photo-electrocatalytic
performance of the MoS2-SnO2/EG nanocomposite. Thus, as shown in Figure 3.14b, the kinetic curves
revealed a better photo-electrocatalytic removal of the ciprofloxacin compared to the EG, MoS2-EG and SnO2-
EG electrodes (Ke et al., 2017; Yan et al., 2016). These can be corroborated by the results from the
photocurrent and linear sweep voltammetry measurements of the different fabricated electrodes.
TOC analysis was carried out to investigate the mineralisation process of the ciprofloxacin after 2 h 30 min.
The conversion of the organic carbon gave a removal of 39.7% for MoS2-SnO2/EG nanocomposite electrode
which is higher when compared to that of EG (25%), MoS2-EG (32%) and SnO2-EG (30%) electrodes. This is
in agreement with results obtained for removal efficiency and TOC measurements reported in literatures (Giri
& Golder, 2014; Ji, Ferronato, Salvador, Yang & Chovelon, 2014).

<<Electrochemical Unit Operations in Industrial Wastewater Treatment>> ¯¯¯¯¯¯¯¯¯¯¯¯¯¯¯¯¯¯¯¯¯¯¯¯¯¯¯¯¯¯¯¯¯¯¯¯¯¯¯¯¯¯¯¯¯¯¯¯¯¯¯¯¯¯¯¯¯¯¯¯¯¯¯¯¯¯¯¯¯¯¯¯¯¯¯¯¯¯¯¯¯¯¯¯¯¯¯
______________________________________________________________________________________ 41
A possible mechanism based on band gap alignment for the photo-electrocatalytic process is presented in Fig.
3.14c.
a) b)
c)
Figure 3.14. Degradation kinetics curves of ciprofloxacin of (a) Electrocatalytic and photo-electrocatalytic on
MoS2-SnO2/EG electrode, and (b) photo-electrocatalytic removal on EG, SnO2-EG, MoS2-EG and MoS2-
SnO2/EG electrodes. c) Proposed plausible charge transfer mechanism.
Table 3-6. Summary of results for degradation studies with MoS2-SnO2/EG photoanode Photoanode Pollutant Key results MoS2-SnO2/EG ciprofloxacin Time of degradation = 150 min
ON MoS2-SnO2/EG electrode: Electrochemical degradation = 55.5%; Photoelectrochemical degradation = 78.5% Photoelectrochemical degradation: EG = 50.5%; MoS2-EG = 68.5%; SnO2-EG = 64.5% and MoS2-SnO2/EG = 78.5% Optimum pH: 5.4 Optimum Current density: 10 mAcm-2 Total Organic Carbon removal: EG = 25%; MoS2-EG = 32%; SnO2-EG = 30% and MoS2-SnO2/EG = 39.7% Kinetics: EG = 4.06 × 10⁻³ min-1; MoS2-EG = ; 5.97 × 10⁻³ min-1; SnO2-EG = 5.47 × 10⁻³ min-1 and MoS2-SnO2/EG = 8.63 × 10⁻³ min-1.

<<Electrochemical Unit Operations in Industrial Wastewater Treatment>> ¯¯¯¯¯¯¯¯¯¯¯¯¯¯¯¯¯¯¯¯¯¯¯¯¯¯¯¯¯¯¯¯¯¯¯¯¯¯¯¯¯¯¯¯¯¯¯¯¯¯¯¯¯¯¯¯¯¯¯¯¯¯¯¯¯¯¯¯¯¯¯¯¯¯¯¯¯¯¯¯¯¯¯¯¯¯¯
______________________________________________________________________________________ 42
Sub-Conclusion. This work reports the synthesis and characterisation of a novel photo-electrode consisting
of a p-n MoS2-SnO2 heterojunction anchored on expanded graphite (EG). This was applied in the photo-
electrocatalytic degradation of ciprofloxacin as a target pharmaceutical pollutant in water. The fabricated
electrode exhibited a better photo-electrocatalytic performance compared to MoS2-EG, SnO2-EG and EG
electrodes for the removal of the ciprofloxacin. This could be attributed to the formation of the MoS2-SnO2 p-n
heterojunction in the nanocomposite which aided charge separation and transfer, thereby resulting in the
minimisation of the recombination rate of the photoinduced electrons and holes. Furthermore, the linear sweep
voltammetry and photocurrent measurements revealed that the nanocomposite electrode is rendered a good
photo-electrode which can be beneficial for photo-electrocatalytic treatment of industrial wastewaters and other
photo-electrocatalytic reactions.
3.3.9.6 Degradation studies of Rhodamine B on an exfoliated graphite-BiVO4/ZnO heterostructured nanocomposite Electrode
Abstract of the full study (Orimolade et al., 2019). A novel photoanode consisting of an exfoliated graphite-
BiVO4/ZnO heterostructured nanocomposite was fabricated. The material was characterised with scanning
electron microscopy (SEM), energy dispersive spectrometry (EDS) and X-ray diffraction (XRD).
Photoelectrochemical studies were carried out with cyclic/linear sweep voltammetry and chronoamperometry.
The solar photoelectrochemical properties of the heterojunction photoanode were investigated through the
degradation of rhodamine B in water. The results revealed that the nanoparticles of BiVO4 and ZnO were well
entrapped within the interlayers of the exfoliated graphite (EG) sheets. Improved charge separation was
achieved in the EG-BiVO4/ZnO composite electrode which resulted in higher photoelectrochemical
performance than individual BiVO4 and ZnO electrodes. Higher degradation efficiency of 91% of rhodamine B
was recorded using the composite electrode with the application of 10 mAcm-2 current density and solution pH
of 7. The highest total organic carbon removal of 74% was also recorded with the EG-BiVO4/ZnO. Data from
scavenger studies were used to support the proposed mechanism of degradation. The electrode has high
stability and reusability and hence lends itself to applications in photoelectrocatalysis especially in water
treatment.
Electrochemical characterisation of electrodes. The cyclic voltammograms of EG, EG-ZnO, EG-BiVO4 and
EG-BiVO4/ZnO were recorded at a scan rate 20 mVs-1 using 0.1 M KCl solution in 5 mM [Fe(CN)6]3-/4- as the
redox probe as shown in Fig. 3.15a. The EG-BiVO4/ZnO electrode showed the highest faradaic peak current
than all the other electrodes which suggested that the electrode reaction rate is higher (Umukoro, Peleyeju et
al., 2017). Both the EG-ZnO and EG-BiVO4 electrode performed better than the bare EG electrode and this
could be attributed to that fact that the addition of ZnO and BiVO4 to the EG resulted in increased electroactive
surface area and thereby increased the conductivity. The electroactive surface area of all the electrodes were
calculated using the Randles-Sevcik equation: 𝑝𝑝 = 𝑘𝑘𝑛𝑛3/2𝐴𝐴𝐷𝐷1/2𝑣𝑣1/2𝐶𝐶. Where A is the electroactive surface
area, ip is the peak current, C is the redox probe concentration, D is the diffusion coefficient (7.6 x 10⁻⁶ for
ferrocyanide), v is the scan rate and k is a constant (2.69 x 10⁵). The electroactive surface areas obtained are
0.196 mm2, 0.239 mm2, 0.248 mm2 and 0.309 mm2 for EG, EG-ZnO, EG-BiVO4 and EG-BiVO4/ZnO electrodes
respectively. The largest surface area of the EG-BiVO4/ZnO justified the highest faradaic current obtained with
the electrode.

<<Electrochemical Unit Operations in Industrial Wastewater Treatment>> ¯¯¯¯¯¯¯¯¯¯¯¯¯¯¯¯¯¯¯¯¯¯¯¯¯¯¯¯¯¯¯¯¯¯¯¯¯¯¯¯¯¯¯¯¯¯¯¯¯¯¯¯¯¯¯¯¯¯¯¯¯¯¯¯¯¯¯¯¯¯¯¯¯¯¯¯¯¯¯¯¯¯¯¯¯¯¯
______________________________________________________________________________________ 43
The linear sweep voltammetry of the EG, EG-ZnO, EG-BiVO4 and EG-BiVO4/ZnO were recorded using 0.1 M
Na2SO4 as supporting electrolyte and was carried out both in the dark and light (Fig. 3.15b). The EG-
BiVO4/ZnO composite electrode gave the highest current as compared to the other electrodes both in the dark
and in the light. The enhanced current observed is due to the formation of heterojunction between the BiVO4
and ZnO which resulted in better separation of the electron-hole pairs. This was further confirmed by the
photocurrent response with the application of 1.5 V bias potential (Fig. 3.15c). The EG-BiVO4 electrode gave
a higher photocurrent (0.049 mAcm-2) than that of EG-ZnO (0.031 mAcm-2) and this is due to the fact that
visible light was used to irradiate the electrode and BiVO4 has higher photoactivity than ZnO in the visible light
region due its lower band gap.
Overall, the EG-BiVO4/ZnO electrode gave the best photocurrent response of 0.069 mAcm-2 and this confirmed
that the heterojunction formed between the BiVO4 and ZnO resulted in increased interfacial charge transfer
and lowered the recombination rate of the charge carriers. Moreover, it is quite interesting to observe that the
BiVO4, ZnO and BiVO4/ZnO electrodes with EG as the conducting substrate gave higher photocurrent
responses than their counterpart electrodes with FTO used as the conducting substrate previously reported
(Feng, Cheng, Zhang, Okoth & Chen, 2018; J.-S. Yang & Wu, 2017). This is mostly due to the fact that EG
also enhanced effective charge separation by acting as a reservoir for the photogenerated charge carriers. In
addition to this, carbon materials can also serve as dopants for semiconductors generating internal electric
field contributing to formation of effective heterojunction (Liping Zhang & Jaroniec, 2018).
(a) (b)
(c)
Figure 3.15. (a) CVs of EG, EG-BiVO4, EG-ZnO, EG-BiVO4/ZnO composite electrodes using 5 mM [Fe(CN)6]-3/-4 in 0.1 M KCl solution at a scan rate of 20 mVs-1; (b) LSV and (c) Photocurrent responses of EG, EG-BiVO4, EG-ZnO and EG-BiVO4/ZnO in 0.1 M Na2SO4.

<<Electrochemical Unit Operations in Industrial Wastewater Treatment>> ¯¯¯¯¯¯¯¯¯¯¯¯¯¯¯¯¯¯¯¯¯¯¯¯¯¯¯¯¯¯¯¯¯¯¯¯¯¯¯¯¯¯¯¯¯¯¯¯¯¯¯¯¯¯¯¯¯¯¯¯¯¯¯¯¯¯¯¯¯¯¯¯¯¯¯¯¯¯¯¯¯¯¯¯¯¯¯
______________________________________________________________________________________ 44
Degradation of Rhodamine B. The prepared electrodes were applied in the solar photoelectrocatalytic (PEC)
degradation of rhodamine B dye with initial concentration of 10 mgL-1. The degradation efficiency was
monitored using UV-Visible spectrophotometer at a wavelength of 554 nm. As shown in Fig. 3.16a, there was
decrease in the intensity of the peak at 554 nm with increase in the reaction time revealing the reduction in the
concentration of the dye. Degradation efficiency of 91% was achieved using the EG-BiVO4/ZnO composite
electrode in the photoelectrocatalytic degradation process. When the composite electrode was applied in
electrochemical (EC) degradation (without the application of solar light), the degradation efficiency dropped to
56% while in photocatalysis (PC), 37% degradation efficiency was recorded (Fig. 3.16b). The total organic
carbon (TOC) removal obtained were 74%, 46% and 35% using PEC, EC and PC respectively. This
observation revealed that application of biased potential plays a vital role in the degradation process.
Additionally, when the electrode is irradiated with the solar light, the electrode absorbs photons and electron-
hole pairs are generated within the BiVO4 and ZnO. The holes act as oxidants for breaking down the dye
molecules and also react with water to generate hydroxyl radicals which are stronger oxidants necessary for
the rapid oxidation of the dye molecules. The combined effect of electrical energy and solar energy accounted
for the highest degradation efficiency achieved in the PEC process. The degradation rate constants for the
three processes (PC, EC and PEC) were obtained by fitting the data into Langmuir-Hinshelwood pseudo first
order kinetic model equation. As shown in Fig. 3.16c, the rate of the PEC process was the fastest with apparent
rate constant of 0.00921 min-1 when compared to both PC and EC processes with rate constants of
0.00154 min-1 and 0.00332 min-1 respectively.
Among all the electrodes prepared, the bared EG electrode performed least with 27% degradation efficiency.
The EG-BiVO4 electrode performed better (61% efficiency) than the EG-ZnO (52%) electrode because the
BiVO4 has higher photocatalytic activity in the visible light region due to its lower band gap (Fig. 3.16d). The
formation of BiVO4/ZnO heterojunction was deduced through the improved photoelectrocatalytic activity of all
the composite electrodes with different ratios of BiVO4 to ZnO. The formation of heterojunction enhanced better
charge separation and lowered the rapid recombination rate of electron-hole pairs resulting in better light
harvesting. The EG-BiVO4/ZnO consisting of BiVO4 and ZnO in ratio 1:1 gave the highest degradation
efficiency and was therefore used for all other studies.
The effects of parameters such as current densities and solution pH on the photoelectrocatalytic process were
as studied. The degradation efficiency increased with increased in the applied current densities from
5 mAcm-2 to 15 mAcm-2 (Fig. 3.16e). The increase from 5 mAcm-2 to 10 mAcm-2 (62% to 91%) was more
pronounced as compared to the increase observed from 10 mAcm-2 to 15 mAcm-2 (91% to 95%). This revealed
the dependence of hydroxyl radicals production on the applied current densities but when too high current
densities are applied, it could result in oxygen evolution which hinder the generation of hydroxyl radical and
thereby limit the degradation efficiency (Qiu et al., 2019). More so, the application of higher current densities
is not cost and energy effective. Increase in pH from 3 to 10 (Fig. 3.16f) resulted in decrease in the degradation
efficiency which confirmed the suitability of acidic medium for degradation of Rhodamine B dye (Baddouh
et al., 2018).
An ideal photoanode for degradation of organics is expected to be stable and reusable. The stability and
reusability of the prepared EG-BiVO4/ZnO in PEC degradation process was also investigated by carrying out

<<Electrochemical Unit Operations in Industrial Wastewater Treatment>> ¯¯¯¯¯¯¯¯¯¯¯¯¯¯¯¯¯¯¯¯¯¯¯¯¯¯¯¯¯¯¯¯¯¯¯¯¯¯¯¯¯¯¯¯¯¯¯¯¯¯¯¯¯¯¯¯¯¯¯¯¯¯¯¯¯¯¯¯¯¯¯¯¯¯¯¯¯¯¯¯¯¯¯¯¯¯¯
______________________________________________________________________________________ 45
repeating experiments (cycles) using the same electrode. The electrode was cleaned with deionized water
after each cycle. As shown in Fig 4g, the degradation efficiency dropped by less than 1% after the third cycle
which implies that the electrode is relative stable and can be reused for PEC degradation.

<<Electrochemical Unit Operations in Industrial Wastewater Treatment>> ¯¯¯¯¯¯¯¯¯¯¯¯¯¯¯¯¯¯¯¯¯¯¯¯¯¯¯¯¯¯¯¯¯¯¯¯¯¯¯¯¯¯¯¯¯¯¯¯¯¯¯¯¯¯¯¯¯¯¯¯¯¯¯¯¯¯¯¯¯¯¯¯¯¯¯¯¯¯¯¯¯¯¯¯¯¯¯
______________________________________________________________________________________ 46
(a) (b)
(c) (d)
(e) (f)
(g)
Figure 3.16. (a) UV-Vis spectra of PEC degradation of rhodamine B. (b) Normalised concentration decay versus time plot for photocatalytic, electrocatalytic and photoelectrocatalytic degradation of rhodamine B dye on EG-BiVO4/ZnO electrode and (c) corresponding kinetics plots. (d) Normalised concentration decay versus time plot for PEC degradation of rhodamine B dye on EG-ZnO, EG-BiVO4, EG-BiVO4/ZnO electrodes. (e) Effects of current density and (f) pH on degradation of rhodamine B dye. (g) Cycle experiments for the degradation of rhodamine B dye on EG-BiVO4/ZnO electrode.

<<Electrochemical Unit Operations in Industrial Wastewater Treatment>> ¯¯¯¯¯¯¯¯¯¯¯¯¯¯¯¯¯¯¯¯¯¯¯¯¯¯¯¯¯¯¯¯¯¯¯¯¯¯¯¯¯¯¯¯¯¯¯¯¯¯¯¯¯¯¯¯¯¯¯¯¯¯¯¯¯¯¯¯¯¯¯¯¯¯¯¯¯¯¯¯¯¯¯¯¯¯¯
______________________________________________________________________________________ 47
Scavenger studies. To get a clearer picture of the roles of the active species in the PEC degradation of
rhodamine B, scavenger study was carried out. This was done by using ethylenediaminetetraacetate salt
(EDTA), t-butanol (t-BuOH) and p-benzoquinone (p-BZQ) to suppress the effect of holes, hydroxyl radicals
and superoxide radicals respectively (Akbarzadeh, Fung, Rather & Lo, 2018; Medel, Ramírez, Cardenas, Sires
& Meas, 2019). The results are shown in Fig. 3.17a. Upon the addition of EDTA, the degradation efficiency
dropped drastically to less than 10% which revealed that the photogenerated holes play a major role in the
degradation of the rhodamine B dye. With the addition of t-BuOH and p-BZQ the degradation efficiencies were
31% and 52% respectively suggesting that both hydroxyl radicals and superoxide radicals play a lesser role in
the degradation of the dye.
The pronounced role of the photogenerated holes in degradation of the dye molecules could be attributed to a
better separation of the electron-hole pairs in the BiVO4/ZnO heterojunction making more holes available to
oxidise the dye molecules. This observation provided a glimpse into the band alignment between ZnO and
BiVO4. Considering the band edge positions of intrinsic BiVO4 and ZnO, a type I heterojunction can be
proposed in which the charge carriers accumulate onto the BiVO4 and this will not result in proper charge
separation as the charge carriers can still recombine in the surface of the BiVO4. This was unlikely to happen
since carbons (from EG) act as dopants for both ZnO and BiVO4 leading to non-negligible internal electric field.
Therefore, Fermi energy levels (EF) of the two semiconductors aligned through the movement of electrons
from the ZnO (higher EF) to BiVO4 (lower EF) and the direction of internal electric field (E) was from ZnO to
BiVO4 preventing the movement of electrons in the same direction after the formation of heterojunction. On
the other hand the direction of the internal electric field favoured the movement of holes in the same direction
and hence holes were most efficient separated onto the valence band of BiVO4 and available for oxidizing the
rhodamine B molecules (Liping Zhang & Jaroniec, 2018). This deduction is illustrated in Fig. 3.17b.

<<Electrochemical Unit Operations in Industrial Wastewater Treatment>> ¯¯¯¯¯¯¯¯¯¯¯¯¯¯¯¯¯¯¯¯¯¯¯¯¯¯¯¯¯¯¯¯¯¯¯¯¯¯¯¯¯¯¯¯¯¯¯¯¯¯¯¯¯¯¯¯¯¯¯¯¯¯¯¯¯¯¯¯¯¯¯¯¯¯¯¯¯¯¯¯¯¯¯¯¯¯¯
______________________________________________________________________________________ 48
(a)
(b)
Figure 3.17. (a) Scavenger studies of the PEC degradation of rhodamine B dye on EG-BiVO4/ZnO. (b) Band alignment between ZnO and BiVO4. Table 3-7. Summary of results for degradation studies with EG-BiVO4/ZnO photoanode Photoanode Pollutant Key results EG-BiVO4/ZnO Rhodamine B dye Time of degradation = 240 min
Degradation efficiency on EG-BiVO4/ZnO photoanode: 91% photoelectrocatalytic (PEC); 56% electrochemical (EC) degradation; 37% photocatalysis (PC). Degradation: 27% EG; 61% EG-BiVO4 electrode; 51% EG-ZnO Kinetics on EG-BiVO4/ZnO: PEC = 0.00921 min-1; EC = 0.00332 min-1; PC = 0.00154 min-1. Total organic carbon (TOC) removal on EG-BiVO4/ZnO: 74% (PEC), 46% (EC) and 35% (PC).
Sub Conclusion. In this work, we have prepared a novel heterojunction photoanode of EG-BiVO4/ZnO. The
formation of BiVO4/ZnO heterojunction with enhanced separation of charge carriers was confirmed through
the photocurrent response of the EG-BiVO4/ZnO composite electrode which was higher than that of both the
EG-BiVO4 and EG-ZnO. The exfoliated graphite, used as the conducting substrate, also improved charge
separations by acting as a sink for the charge carriers. When applied for the photoelectrocatalytic degradation
of rhodamine B, a degradation efficiency of 91% (from visible spectroscopy) and a total organic carbon removal
of 74% were recorded with the EG-BiVO4/ZnO heterostructured photoanode. Scavenger studies revealed that
photogenerated holes played a major role in the degradation of the dye since the band alignment between the

<<Electrochemical Unit Operations in Industrial Wastewater Treatment>> ¯¯¯¯¯¯¯¯¯¯¯¯¯¯¯¯¯¯¯¯¯¯¯¯¯¯¯¯¯¯¯¯¯¯¯¯¯¯¯¯¯¯¯¯¯¯¯¯¯¯¯¯¯¯¯¯¯¯¯¯¯¯¯¯¯¯¯¯¯¯¯¯¯¯¯¯¯¯¯¯¯¯¯¯¯¯¯
______________________________________________________________________________________ 49
BiVO4 and ZnO resulted in better charge separation of the holes. The composite electrode has high stability
and the reaction rate is fast with apparent rate constant of 0.00921 min-1. The electrode has a great potential
for PEC applications in wastewater treatment for the removal of organics.

<<Electrochemical Unit Operations in Industrial Wastewater Treatment>> ¯¯¯¯¯¯¯¯¯¯¯¯¯¯¯¯¯¯¯¯¯¯¯¯¯¯¯¯¯¯¯¯¯¯¯¯¯¯¯¯¯¯¯¯¯¯¯¯¯¯¯¯¯¯¯¯¯¯¯¯¯¯¯¯¯¯¯¯¯¯¯¯¯¯¯¯¯¯¯¯¯¯¯¯¯¯¯
______________________________________________________________________________________ 50
CHAPTER 4: ELECTROCOAGULATION FOR THE TREATMENT OF ORANGE II DYE COMBINED WITH HEAVY METALS IN
WASTEWATER ______________________________________________________________________________________
4.1 INTRODUCTION
Limitation of water resources is a global challenge and South Africa is among the countries that are most
affected. It is therefore necessary to effectively manage the increasingly limited water supply owing to
industrialisation, increase in population, and so on. For example, the textile industry is among the fastest
growing industries in the world due to increasing population (Halimoon & Yin, 2010). A positive aspect of this
growth is the increase in Gross Domestic Product (GDP) of some countries such as India and Sri Lanka. The
downside of industrialisation however, is the increase in water pollution due to the complex, toxic and
recalcitrant chemicals (pollutants) generated during processes. These pollutants present a challenge to the
conventional water treatment methods. This problem necessitates the need for industries producing harmful
effluents to implement alternative/complementary methods that can be developed and applied on site before
discharge and/or for the purpose of re-using the wastewater. Furthermore, these technological designs may
be incorporated into the process operations of water treatment plants to optimise the availability of clean water
for industrial and domestic use (Shannon et al., 2008).
In recent years, great attention has been given to the development of new methods or hybrids of some well-
known technologies for wastewater treatment for cheaper, sustainable and more environmentally friendly
processes. These new developments sometimes require the extension and advancement of methods,
ideas/designs for improved efficiency and cost reduction (Cardoso, Bessegato & Zanoni, 2016). In SA, most
of the wastewater is treated by physical/physicochemical process and biological processes, and only a few
(probably less than 20%) account for other processes such as electrochemical and advanced oxidation
processes (DWA, 2013).The majority of the applied conventional processes, however, faces a challenge in
efficiently removing pollutants from complex wastewaters. Some techniques are either effective in lowering the
concentration of dissolved organics or inorganics, whilst others are sensitive to toward the toxicity of certain
chemicals, requires a lot of operation time, large land area, expensive chemicals, strict operating conditions,
expensive and routine maintenance (Jaafarzadeh, Omidinasab & Ghanbari, 2016).
It is important to explore other water treatment processes and optimise them to adapt to the ever-changing
pollution load of industrial effluents. In this manner, looking towards their implementation to be developed and
applied on site by industries before discharge and/or incorporated into the process operations of water
treatment plants (Jaafarzadeh et al., 2016; Touahria, Hazourli, Touahria, Eulmi & Aitbara, 2016).
Electrocoagulation (EC) is one of the processes that has received a great deal of attention in treating various
wastewaters, because of its versatility, environmental compatibility, its simplicity and suitability to be powered
by renewable electricity sources and it allows for use as a small scale decentralized unit (Bocos, Brillas,
Sanroman & Sirés, 2016; Touahria et al., 2016). It can achieve the removal of toxic heavy metals and the
degradation of organic pollutants without some drawbacks that conventional chemical treatments have

<<Electrochemical Unit Operations in Industrial Wastewater Treatment>> ¯¯¯¯¯¯¯¯¯¯¯¯¯¯¯¯¯¯¯¯¯¯¯¯¯¯¯¯¯¯¯¯¯¯¯¯¯¯¯¯¯¯¯¯¯¯¯¯¯¯¯¯¯¯¯¯¯¯¯¯¯¯¯¯¯¯¯¯¯¯¯¯¯¯¯¯¯¯¯¯¯¯¯¯¯¯¯
______________________________________________________________________________________ 51
(Neelavannan & Basha, 2008). In addition, it may offer an efficient means of controlling pollution without
serious environmental concerns and possibly ensure better service delivery for municipalities, reduced
wastewater treatment costs and increased plant efficiencies.
The EC process involves the destabilisation of emulsified contaminants in an aqueous medium or colloids, by
introducing an electric current into the medium. Coagulants are generated progressively in-situ by dissolving
sacrificial anodes, e.g. (Al/Fe) (Chafi, Gourich, Essadki, Vial & Fabregat, 2011; Oncel, Muhcu, Demirbas &
Kobya, 2013), at appropriate conditions (e.g. pH, conductivity, etc.) via electro-oxidation process to form
insoluble metal hydroxide. The hydroxide is then able to remove suspended particles by surface complexation,
adsorption or electrostatic attraction (Bocos et al., 2016; Hakizimana et al., 2017). This technique solely aims
at: i) Using less chemicals (coagulants and disinfectants) (Chafi et al., 2011), leading to less sludge formation.
ii) Being able to remove recalcitrant pollutants. iii) Simultaneous removal of heavy metals iv) Being easy to
design (requiring minimal start up time) and incorporated into the wastewater treatment process, v) being easy
to operate with shorter retention time and high sedimentation velocities (Khandegar & Saroha, 2013). In
addition to the considerably less sludge formed by EC, the sludge is non-toxic as it can be utilized as a soil
additive and contains metal oxides that pass the leachability test. Most importantly, the cost of disposing the
sludge is reduced considerably.
One of the important parameters to consider in application of the EC process is the material of the electrode,
because it affects mainly the oxidation mechanism and the anodic reactions. In the selection process, electrode
material properties of interest includes; non-toxicity to human, health and environment, cheap, readily
available, its effectiveness, physical and chemical stability under high positive potentials as well as corrosion
resistances. Generally, sacrificial electrode materials are Al and Fe. Iron electrode has been established as
the cheapest material that has good COD and turbidity removal efficiencies. In most studies, stainless steel
(SS) has been used as Fe electrodes, disregarding the other reactions that may occur due to other components
in the SS. SS is an iron based alloy containing ≥ 11% chromium, with excellent corrosion resistances. SS 304
is the most commonly used alloy, with 18% Cr, 8% Ni and 0.08% C, whereas SS 316 has 18% C, 14% Ni,
0.03% C and 3% Mo, making it slightly more corrosion resistant especially in the environments that are inclined
to cause pitting, e.g. chlorides (States, America, Institute, Iron & Institute, 1993).
Research on the combination of electrocoagulation with some other unconventional technologies is gaining
momentum recently (Aziz, Asaithambi & Daud, 2016; García-García et al., 2015; Kruthika et al., 2013; Linares
Hernández et al., 2017; Naje, Chelliapan, Zakaria & Abbas, 2015; Rubí-Juárez et al., 2015; Thiam et al., 2014).
With good understanding of the basic and applied science of EC and photoelectrocatalysis, we envisage a
hybrid system that can be used for the pre-treatment of wastewater.
This chapter focuses on two studies:
1. Treatment of orange II dye and heavy metal in simulated wastewater: Chemical coagulation (CC) versus electrocoagulation. This is a preliminary study towards the understanding of EC.
2. The application of SS 316l and SS 304 electrodes in electrocoagulation for the treatment of simulated wastewater: a comparative study. This a comparative study of three anodic materials.

<<Electrochemical Unit Operations in Industrial Wastewater Treatment>> ¯¯¯¯¯¯¯¯¯¯¯¯¯¯¯¯¯¯¯¯¯¯¯¯¯¯¯¯¯¯¯¯¯¯¯¯¯¯¯¯¯¯¯¯¯¯¯¯¯¯¯¯¯¯¯¯¯¯¯¯¯¯¯¯¯¯¯¯¯¯¯¯¯¯¯¯¯¯¯¯¯¯¯¯¯¯¯
______________________________________________________________________________________ 52
The methodology of this chapter is divided into these two topics with the following short titles: 1. CC vs EC and
2. Comparative study
4.2 METHODOLOGY ON CC VS EC
4.2.1 Materials, analytical measurements and experimental equipment
Orange II dye was used to impact colour into the synthetic wastewater. The characteristics of the dye are
represented in Table 4-1. Heavy metal salts that were used for metal addition in the simulated wastewater
were zinc (II) sulphate heptahydrate (ZnSO4.7H2O) and lead (II) nitrate ( Pb(NO3)2). Aluminium sulphate
(Alum) and ferric chloride (FeCl3) were used as chemical coagulants. Electrode materials that were used are
aluminium (alloy - temper: 1050 - H14, 99.5% purity), stainless steel (SS) (304 and 316 L) and copper. The
pH of the simulated wastewater was adjusted using 0.1 M sodium hydroxide (NaOH) and hydrochloric acid
(HCl), depending on the pH requirement for the coagulation stage and effluent’s initial pH (pHi). NaCl was used
to increase the conductivity of the synthetic effluent in the electrocoagulation studies. In addition, 0.01 M HCl
was prepared and used for electrode cleaning after each experiment (Hussin, Abnisa, Issabayeva & Aroua,
2017). All reagents were of analytical grade, purchased from Sigma Aldrich, Germany, and they were used
without further purifications.
Table 4-1: Orange II dye characteristics (de Deus Rodrigues, 2013)
Decolourisation of the dye was investigated with UV-Visible spectrophotometer at maximum absorption
wavelength of 483 nm (Cary 60, Agilent technologies, Australia). Atomic absorption spectrometry (AAS
CS1330) was used to analyse the metal concentration before and after each experiment. The simulated
wastewater turbidity was measured using a portable Aqua Lytic turbidimeter Al250T-IR with features ranging
from 0.01 to 1100 NTU. The chemical oxygen demand (COD) was measured with a HACH digester (150°C
for 2 h), using digesting solutions of HR (0-1500 ppm) and a HACH spectrophotometer (Model DR/4000). The
pH was measured using pH meter and conductivity meter was used to determine the conductivity of the
samples. A 30 V/5 A direct power supply was used in the electrochemical part of the research for electricity
supply. All characterisation experiments were performed on samples filtered with 0.22 µm pore size filters, at
the University of Johannesburg. The degree of decolourisation and metal removal, the amount (in grams) of
electrode consumed after each run, electrical energy consumption and total operating cost were determined
using the following equations (Ghosh, Medhi & Purkait, 2008);
𝑃𝑃𝑜𝑜𝑜𝑜𝑜𝑜𝑜𝑜𝑜𝑜𝑎𝑎𝑛𝑛𝑜𝑜 𝑟𝑟𝑟𝑟𝑟𝑟𝑜𝑜𝑣𝑣𝑎𝑎𝑜𝑜 (%) =𝐶𝐶𝑜𝑜 − 𝐶𝐶𝑡𝑡𝐶𝐶𝑜𝑜
× 100 … … … … … … … … (1)
Where; Co is the initial (ppm) of the pollutants and Ct is the pollutant concentration after treatment (ppm).

<<Electrochemical Unit Operations in Industrial Wastewater Treatment>> ¯¯¯¯¯¯¯¯¯¯¯¯¯¯¯¯¯¯¯¯¯¯¯¯¯¯¯¯¯¯¯¯¯¯¯¯¯¯¯¯¯¯¯¯¯¯¯¯¯¯¯¯¯¯¯¯¯¯¯¯¯¯¯¯¯¯¯¯¯¯¯¯¯¯¯¯¯¯¯¯¯¯¯¯¯¯¯
______________________________________________________________________________________ 53
𝐶𝐶𝑒𝑒𝑒𝑒𝑒𝑒𝑒𝑒𝑡𝑡𝑒𝑒𝑜𝑜𝑒𝑒𝑒𝑒 �𝑘𝑘𝑘𝑘
𝑟𝑟3� � =𝐼𝐼 × 𝑜𝑜𝐸𝐸𝐸𝐸 × 𝑀𝑀𝑤𝑤
𝑧𝑧 × 𝐹𝐹 × 𝑉𝑉… … … … … … … … … … . (2)
Where, Celectrode is the consumption of metal electrode in kg/m3, I is the current (A), Mw is the molecular of the
electrode material (g/mol), z (unitless) is the number of transferred electrons (e.g. for Al electrode, z = 3), tEC
is the treatment time (s), F is Faraday’s constant (96 487 C/mol) and V is slurry volume (m3).
𝐶𝐶𝑒𝑒𝑒𝑒𝑒𝑒𝑒𝑒𝑡𝑡𝑒𝑒𝑜𝑜𝑒𝑒𝑒𝑒 �𝑘𝑘𝑘𝑘ℎ𝑟𝑟3� � =
𝑈𝑈 × 𝐼𝐼 × 𝑜𝑜𝐸𝐸𝐸𝐸𝑉𝑉
… … … … … … … … … … (3)
Where; Celectrodes is the energy consumption in kWh/m3, U is the voltage (V), I is the current (A), T is the
treatment time (h) and V is the volume of the aqueous solution (m3).
𝑂𝑂𝑝𝑝𝑟𝑟𝑟𝑟𝑎𝑎𝑜𝑜𝑂𝑂𝑛𝑛𝑘𝑘 𝑐𝑐𝑜𝑜𝑐𝑐𝑜𝑜 �𝑅𝑅 𝑟𝑟3� � = 𝑎𝑎𝐶𝐶𝑒𝑒𝑒𝑒𝑒𝑒𝑒𝑒𝑒𝑒𝑒𝑒 + 𝑏𝑏𝐶𝐶𝑒𝑒𝑒𝑒𝑒𝑒𝑡𝑡𝑒𝑒𝑜𝑜𝑒𝑒𝑒𝑒 … … … (4)
Where; a represents the 2017-2018 electricity price in South Africa (97.03 R/kWh), b represents the 2017 retail
metal sheets (Al = 67.88 R/kg). The settleability of the bulk sample was determined by drawing the supernatant
at different time intervals and analysed for different wastewater parameters discussed above.
Chemical coagulation (CC) experiments were carried out in a jar test apparatus (Fig. 4.1). The jar test
apparatus consists of six 1 L cylindrical flasks with mounted steel stirrer of 0.8467 cm long rods and peddles
of size 25.4 cm. The unit is also fitted with a digital RPM indicator and timer (that was used for settling rate
determination). The effective level of slurry in the jars for the CC experiments was determined using different
amounts of deionised water and stirring at maximum speed. All the CC experiments were run at total slurry
volume of 400 mL in the jars to avoid vortexing. In addition, the coagulants were added as salts to the jars and
allowed to dissolve, whilst stirring at 180 rpm for 1 min. The samples were allowed to coagulate for 29 min at
a speed of 30 rpm. This sequence of stirring was done for all CC the experiments.
Figure 4.1. Jar test apparatus
1 L cylindrical flask
0.847 cm stirrer with 25.4 cm paddles
Digital RPM indicator and timer
Coagulant dosages

<<Electrochemical Unit Operations in Industrial Wastewater Treatment>> ¯¯¯¯¯¯¯¯¯¯¯¯¯¯¯¯¯¯¯¯¯¯¯¯¯¯¯¯¯¯¯¯¯¯¯¯¯¯¯¯¯¯¯¯¯¯¯¯¯¯¯¯¯¯¯¯¯¯¯¯¯¯¯¯¯¯¯¯¯¯¯¯¯¯¯¯¯¯¯¯¯¯¯¯¯¯¯
______________________________________________________________________________________ 54
A 600 mL pyrex jar filled with 400 mL working volume of slurry, placed on a magnetic stirrer was used in
conducting EC experiments (Fig. 4.2). The agitation rate was kept at 250 rpm (Hussin et al., 2017). All the EC
experiments were operated at galvanostatic conditions, in a batch mode and at an ambient temperature (Chafi
et al., 2011). The inactive parts of the electrodes were covered with a parafilm to maintain the total effective
electrode surface area of 6 cm × 5 cm × 0.07 cm. Furthermore, the electrodes were cleaned after each process
by immersion into 0.01M HCl for 2 min then rinsed with distilled water. The electrode were air dried and
weighed before and after each use (Chafi et al., 2011).
Figure 4.2. EC experimental setup
4.2.2 Preparation of the synthetic effluent
An amount of 125,00 mg of orange II dye, 1332.14 mg of zinc salt and 199.81 mg of lead salt was added to
2.5 L of deionised water. A sample calculation used to determine the amount of salt to add to achieve 50 ppm
of Pb2+ is as follows;
%wt of Pb2+in Pb(NO3)2 = %wt of [Pb2+]ppm in Pb(NO3)2 Mw (Pb)
Mw (Pb(NO3)2)=
[Pb]ppm[Pb(NO3)2]ppm
207.2331.2
=50
[𝐏𝐏𝐏𝐏(𝐍𝐍𝐎𝐎𝟑𝟑)𝟐𝟐]ppm
∴ [Pb(NO3)2]ppm = 79.92 = 199.81 mg added to 2.5 L Deionised H2O The mixture was stirred until 100% pollutant dissolved. The remainder of the sample was contained and stored
according to method 1060 B.4 and 1060 C respectively (Association & Association, 1989).
600 mL jar
30V 5A DC power supply
Magnetic stirrerConnection: Red-Anode, Black - Cathode
Activated suface area
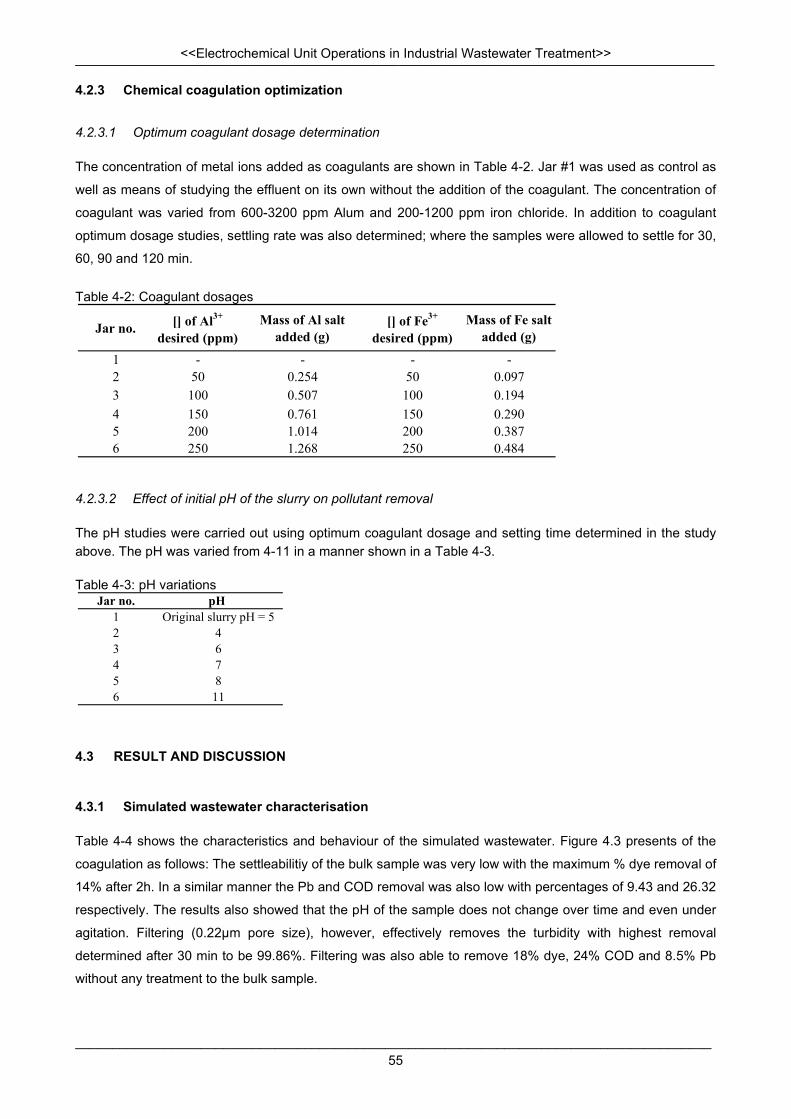
<<Electrochemical Unit Operations in Industrial Wastewater Treatment>> ¯¯¯¯¯¯¯¯¯¯¯¯¯¯¯¯¯¯¯¯¯¯¯¯¯¯¯¯¯¯¯¯¯¯¯¯¯¯¯¯¯¯¯¯¯¯¯¯¯¯¯¯¯¯¯¯¯¯¯¯¯¯¯¯¯¯¯¯¯¯¯¯¯¯¯¯¯¯¯¯¯¯¯¯¯¯¯
______________________________________________________________________________________ 55
4.2.3 Chemical coagulation optimization
4.2.3.1 Optimum coagulant dosage determination
The concentration of metal ions added as coagulants are shown in Table 4-2. Jar #1 was used as control as
well as means of studying the effluent on its own without the addition of the coagulant. The concentration of
coagulant was varied from 600-3200 ppm Alum and 200-1200 ppm iron chloride. In addition to coagulant
optimum dosage studies, settling rate was also determined; where the samples were allowed to settle for 30,
60, 90 and 120 min. Table 4-2: Coagulant dosages
4.2.3.2 Effect of initial pH of the slurry on pollutant removal
The pH studies were carried out using optimum coagulant dosage and setting time determined in the study above. The pH was varied from 4-11 in a manner shown in a Table 4-3. Table 4-3: pH variations
4.3 RESULT AND DISCUSSION
4.3.1 Simulated wastewater characterisation
Table 4-4 shows the characteristics and behaviour of the simulated wastewater. Figure 4.3 presents of the
coagulation as follows: The settleabilitiy of the bulk sample was very low with the maximum % dye removal of
14% after 2h. In a similar manner the Pb and COD removal was also low with percentages of 9.43 and 26.32
respectively. The results also showed that the pH of the sample does not change over time and even under
agitation. Filtering (0.22µm pore size), however, effectively removes the turbidity with highest removal
determined after 30 min to be 99.86%. Filtering was also able to remove 18% dye, 24% COD and 8.5% Pb
without any treatment to the bulk sample.
Jar no. [] of Al3+
desired (ppm)Mass of Al salt
added (g)[] of Fe3+
desired (ppm) Mass of Fe salt
added (g)
1 - - - -2 50 0.254 50 0.0973 100 0.507 100 0.1944 150 0.761 150 0.2905 200 1.014 200 0.3876 250 1.268 250 0.484
Jar no. pH 1 Original slurry pH = 52 43 64 75 86 11

<<Electrochemical Unit Operations in Industrial Wastewater Treatment>> ¯¯¯¯¯¯¯¯¯¯¯¯¯¯¯¯¯¯¯¯¯¯¯¯¯¯¯¯¯¯¯¯¯¯¯¯¯¯¯¯¯¯¯¯¯¯¯¯¯¯¯¯¯¯¯¯¯¯¯¯¯¯¯¯¯¯¯¯¯¯¯¯¯¯¯¯¯¯¯¯¯¯¯¯¯¯¯
______________________________________________________________________________________ 56
Table 4-4: Bulk sample characteristics (no dilution)
Figure 4.3. Bulk sample characterisation over time
4.3.2 Chemical coagulation using alum as a coagulant
The optimum coagulant dosage was found to be 634.06 ppm (50 ppm Al ions) as presented in Fig. 4.4a. At
this dosage the decolourisation yield went from 14% in 2h to 24% in 1 h. Addition of more coagulant increased
the dissolved solids and had little impact in the removal of pollutants. The lowest % dye removals were obtained
at coagulant dosage of 3170.29 ppm (250 ppm Al ions) at 2% after an hour.
In a similar manner for the dye removal, the optimum coagulant dosage was also determined at 50 ppm Al
ions. The acceptable Pb removal was obtained after 60 min of settling at 75%. Contrary to the dye removal,
increment of coagulant dosage, from 50 ppm Al ions to 250 ppm Al ions, to the wastewater, increased the
removal of Pb to 82% after 1 h of settling (Fig. 4.4b).
pH Conductivity (µS/cm)
Dye λmax
(nm)Color Color intensity
(ppm)COD (mg O2/L) Turbidity
(NTU)Pb conc. (ppm)
T (oC)
5.78 1333 483 Orange 39.80 76.00 235 20.65 Ambient T (oC)
0
7
14
0
50
100
0 30 60 90 120
pH
Perc
enta
ge
Settling time (min)
% Decolorization yield % COD removal % Turbidity removal % Pb removal pH final

<<Electrochemical Unit Operations in Industrial Wastewater Treatment>> ¯¯¯¯¯¯¯¯¯¯¯¯¯¯¯¯¯¯¯¯¯¯¯¯¯¯¯¯¯¯¯¯¯¯¯¯¯¯¯¯¯¯¯¯¯¯¯¯¯¯¯¯¯¯¯¯¯¯¯¯¯¯¯¯¯¯¯¯¯¯¯¯¯¯¯¯¯¯¯¯¯¯¯¯¯¯¯
______________________________________________________________________________________ 57
a)
b) Figure 4.4. a) Optimum coagulant dosage and settling time determination. b) Pb removal at different settling times and coagulant dosage COD obtained at optimum coagulant dosage (50 ppm Al ions) was 56 ppm (26% removal). At higher coagulant
dosage COD increased above the bulk reading, i.e. at 150 ppm (Al ions) COD increased by 30% from the bulk
solution to 99 ppm. This is presented in Fig. 4.5a.
Figure 4.5b shows results on turbidity. The turbidity of the samples at different coagulant had similar readings
with the filtered bulk, with values above 90%. The addition of coagulants had no significant effect on the
turbidity removal of the sample.
Increasing the pH of the increased the removal of pollutants tremendously (Fig. 4.5c). At pH 11, the removal
of dye, Pb, COD, was at 91, 78, and 75% respectively. This proved that the CC process is pH dependant and
heavy metal containing wastewaters favour the basic conditions for the efficient removal. Turbidity removal
still remained above 90% at different initial pH of the bulk sample.
0
25
50
0 30 60 90 120
% d
ecol
oriza
tion
yiel
d
Settling time (min)
0 ppm Al ions 50 ppm Al ions 100 ppm Al ions
150 ppm Al ions 200 ppm Al ions 250 ppm ions
0
50
100
0 30 60 90 120
% P
b re
mov
al
Settling time (min)
0 ppm Al ions 50 ppm Al ions 100 ppm Al ions
150 ppm Al ions 200 ppm Al ions 250 ppm ions

<<Electrochemical Unit Operations in Industrial Wastewater Treatment>> ¯¯¯¯¯¯¯¯¯¯¯¯¯¯¯¯¯¯¯¯¯¯¯¯¯¯¯¯¯¯¯¯¯¯¯¯¯¯¯¯¯¯¯¯¯¯¯¯¯¯¯¯¯¯¯¯¯¯¯¯¯¯¯¯¯¯¯¯¯¯¯¯¯¯¯¯¯¯¯¯¯¯¯¯¯¯¯
______________________________________________________________________________________ 58
a)
b)
c) Figure 4.5. a) COD removal at different settling times and coagulant dosages. b) Turbidity removal at different settling times and coagulant dosage. c) Effect of initial pH of the bulk sample (Experimental conditions: Dye [] = 38.4 ppm, Pb [] = 25.51 ppm, COD [] = 103 ppm, turbidity of 207 NTU and settling time = 1 h)
0
50
100
0 30 60 90 120
COD
rem
oval
(ppm
)
Settling time (min)
0 ppm Al ions 50 ppm Al ions 100 ppl Al ions
150 ppm Al ions 200 ppm Al ions 250 ppm ions
0
50
100
0 30 60 90 120
% Tu
rbid
ity r
emov
al
Settling time (min)
0 ppm Al ions 50 ppm Al ions 100 ppm Al ions
150 ppm Al ions 200 ppm Al ions 250 ppm Al ions
0
50
100
0 2 4 6 8 10
% P
ollu
tant
rem
oval
pHi
% decolorization yield % Pb removal % COD removal % turbidity removal

<<Electrochemical Unit Operations in Industrial Wastewater Treatment>> ¯¯¯¯¯¯¯¯¯¯¯¯¯¯¯¯¯¯¯¯¯¯¯¯¯¯¯¯¯¯¯¯¯¯¯¯¯¯¯¯¯¯¯¯¯¯¯¯¯¯¯¯¯¯¯¯¯¯¯¯¯¯¯¯¯¯¯¯¯¯¯¯¯¯¯¯¯¯¯¯¯¯¯¯¯¯¯
______________________________________________________________________________________ 59
4.3.3 Electrocoagulation experiments
4.3.3.1 Electrocoagulation using Al-Al electrodes
EC, after 30 min of operation removed 92.78, 90.23, 41.79, and 99.21% of dye, COD, Pb and turbidity
respectively (Fig 4.6a). The samples were allowed to settle for 30-120 min at and interval of 30 min. The
change in the pollutant removal was insignificant, hence in the further studies, samples will be collected
immediately after tEC. The removal of dye, COD, Pb and turbidity changed to 93.3, 92.48, 39.69, and 99.9%
after 2 h of settling respectively. The filtration, however, was easier after allowing the sample to settle for 2 h.
A typical change in colour during EC is shown in Fig. 4.6b. The operation cost for this system was R 146.58/
m3 of simulated wastewater.
a)
b)
Figure 4.6. a) EC using Al-Al electrodes (Experimental conditions: Voltage 30 V. Current density = 0.65 mA/ cm2, inter-electrode spacing = 3.3 cm, tEC = 30 min). b) Visual change of colour before and after treatment (EC using Al-Al electrodes)
4.3.3.2 Sub conclusion on CC vs EC
Optimum coagulant dosage and settling time after treatment for a sample containing 39.8 ppm orange II dye,
76 ppm COD, turbidity of 207 NTU and 20.65 ppm Pb was 634.06 ppm and 1 h. CC is a pH dependant process,
an initial pH of 11 was found to be the optimum. EC is more efficient in colour removal as compared to CC for
the same concentration of pollutants.
0
50
100
0 30 60 90 120
% P
ollu
tant
rem
oval
Settling time (min)
Color removal COD removal % Pb removsl % Turbidity removal
Before
After

<<Electrochemical Unit Operations in Industrial Wastewater Treatment>> ¯¯¯¯¯¯¯¯¯¯¯¯¯¯¯¯¯¯¯¯¯¯¯¯¯¯¯¯¯¯¯¯¯¯¯¯¯¯¯¯¯¯¯¯¯¯¯¯¯¯¯¯¯¯¯¯¯¯¯¯¯¯¯¯¯¯¯¯¯¯¯¯¯¯¯¯¯¯¯¯¯¯¯¯¯¯¯
______________________________________________________________________________________ 60
4.4 THE APPLICATION OF SS 316L AND SS 304 ELECTRODES IN ELECTROCOAGULATION FOR THE TREATMENT OF SIMULATED WASTEWATER: A COMPARATIVE STUDY.
Abstract. In this study, electrocoagulation was applied for the treatment of wastewater containing 50 ppm of
orange II dye and Pb. Performance of aluminium plates was compared with stainless steel of grade 316L and
304 at the same operating parameters and simulated wastewater working volume of 400 mL. The effect of
initial conductivity (3.8 -16.8 mS/cm), current density (1.6-16.3 mA/cm2) and tEC (10-30 min) on the removal of
pollutant efficiency and operation costs were investigated. Increase in conductivity hindered the COD removal,
however had an effective removal of Pb and orange II dye, with removal efficiencies of greater than 90% for
all electrode materials. It was established that SS 304 can rapidly remove Pb content as compared to SS 316.
After 10 min of electrolysis at a current density of 1.6 mA/cm2, and an initial conductivity of 3.8 mS/cm, 96.6%,
49.8% and 67.5% of Pb was removed using SS 304, SS 316 and Al electrodes respectively. Both SS
electrodes showed rapid removal of colour at percentages > 90% after 10 min of operation. In addition, at
these conditions SS 316 showed to be slightly cheaper than SS 304 electrodes at R 280.4/ m3 and R291.9/m3
respectively.
4.5 METHODOLOGY: COMPARATIVE STUDY
4.5.1 Materials
Orange II dye was used to impact colour in the synthetic effluent. Heavy metal salt that was used for metal
addition in the simulated wastewater was lead (II) nitrate (Pb(NO3)2). Sodium chloride (NaCl) was used to
increase the conductivity of the sample. 0.01 M HCl was used in the cleaning of electrodes before and after
each experiment. All reagents were of analytical grade, purchased from Sigma Aldrich, Germany, and they
were used without further purifications.
4.5.2 Analytical measurements
Decolourisation of the dye was investigated using UV-Visible spectrophotometer at maximum absorption
wavelength of 483 nm (Cary 60, Agilent technologies, Australia). Atomic absorption spectrometry (AAS
CS1330) was used to analyse the Pb concentration before and after each experiment. For the measurement
of dye and Pb removal a linear calibration curve in the range of 0-50 ppm was set up based on absorbance
measurements. The correlation factor (R2) for the calibration curves was 0.9998. The simulated wastewater
turbidity was measured using a portable Aqua Lytic turbidimeter Al250T-IR with features ranging from 0.01 to
1100 NTU. The chemical oxygen demand (COD) was measured with a HACH digester (150°C for 2 h), using
digesting solutions of HR (0-1500 ppm) and a HACH spectrophotometer (Model DR/4000). pH was measured
using Ohaus ST 10 pen pH meter and C6 µS/ TDS was used to determine the conductivity of the samples.
The degree of decolourisation and metal removal was determined using the formula shown below.
𝑃𝑃𝑜𝑜𝑜𝑜𝑜𝑜𝑜𝑜𝑜𝑜𝑎𝑎𝑛𝑛𝑜𝑜 𝑟𝑟𝑟𝑟𝑟𝑟𝑜𝑜𝑣𝑣𝑎𝑎𝑜𝑜 (%) =𝐶𝐶𝑜𝑜 − 𝐶𝐶𝑡𝑡𝐶𝐶𝑜𝑜
× 100 … … … … … … … … (1)

<<Electrochemical Unit Operations in Industrial Wastewater Treatment>> ¯¯¯¯¯¯¯¯¯¯¯¯¯¯¯¯¯¯¯¯¯¯¯¯¯¯¯¯¯¯¯¯¯¯¯¯¯¯¯¯¯¯¯¯¯¯¯¯¯¯¯¯¯¯¯¯¯¯¯¯¯¯¯¯¯¯¯¯¯¯¯¯¯¯¯¯¯¯¯¯¯¯¯¯¯¯¯
______________________________________________________________________________________ 61
Where; Co is the initial concentration of the pollutants and Ct is the pollutant concentration after treatment in
mg/ L. The density of the simulated wastewater was assumed to be equal that of water at 1000 kg/m3.
4.5.3 Experimental
A 600 mL pyrex jar was filled with 400 mL working volume of simulated wastewater, placed on a magnetic
stirrer was used in conducting EC experiments. Model 28305 regulated DC power supply (30V 5A) was used
as a power source. Electrodes (dimensions; 15 cm × 5 cm × 0.07 cm) that were used are aluminium (alloy -
temper: 1050 - H14, 99.5% purity) and stainless steel (SS) (304 and 316 L).
The inactive parts of the electrodes were covered with a parafilm to maintain the total effective electrode
surface area of dimensions; 6 cm × 5 cm × 0.07cm. The agitation rate was kept at 250 rpm (Hussin et al.,
2017). All the EC experiments were operated at galvanostatic conditions, in a batch mode and at an ambient
temperature (Chafi et al., 2011). Furthermore, the electrodes were cleaned after each process by immersion
into 0.01M HCl for 2 min then rinsed with distilled water. The electrodes were air dried and weighed before
and after each use (Chafi et al., 2011). The amount (in grams) of anode consumed after each run and the
amount of electrical energy was determined using formulae 2 and 3 shown below.
𝐶𝐶𝑒𝑒𝑒𝑒𝑒𝑒𝑒𝑒𝑡𝑡𝑒𝑒𝑜𝑜𝑒𝑒𝑒𝑒 �𝑘𝑘𝑘𝑘
𝑟𝑟3� � =𝐼𝐼 × 𝑜𝑜𝐸𝐸𝐸𝐸 × 𝑀𝑀𝑤𝑤
𝑧𝑧 × 𝐹𝐹 × 𝑉𝑉… … … … … … … … … … . (2)
Where, Celectrode is the consumption of metal electrode in kg/m3, I is the current (A), Mw is the molecular of the
electrode material (g/mol), z (unitless) is the number of transferred electrons (e.g. for Al electrode, z = 3), tEC
is the treatment time (s), F is Faraday’s constant (96 487 C/mol) and V is slurry volume (m3).
𝐶𝐶𝑒𝑒𝑒𝑒𝑒𝑒𝑒𝑒𝑒𝑒𝑒𝑒 �𝑘𝑘𝑘𝑘ℎ𝑟𝑟3� � =
𝑈𝑈 × 𝐼𝐼 × 𝑜𝑜𝐸𝐸𝐸𝐸𝑉𝑉
… … … … … … … … … … (3)
Where; Celectrodes is the energy consumption in kWh/m3, U is the voltage (V), I is the current (A), tEC is the
treatment time (h) and V is the volume of the aqueous solution (m3).
EC on simulated wastewater Simulated wastewater with a conductivity of 3.8 mS/cm was electrocoagulated using two Al metal sheets (both
as anode and cathode) with inter-electrode spacing of 3.3 cm. The initial electrolysis time (tEC)was kept at 30
min. An amount of treated wastewater was withdrawn immediately using a syringe and filtered using a 0.22
µm pore size filtering disc and analysed. In a similar manner EC was performed on bulk as is, using SS 316L
as both cathode and anode, then SS 304.
Effect of initial conductivity of simulated wastewater on pollutant removal The conductivity of the simulated wastewater was varied by adding sodium chloride (NaCl) at different
concentrations from 2 g/L to 10 g/L. The conductivity of the simulated wastewater was therefore increased
from 3.8 mS/cm to 17 mS/cm. the current density was kept constant at 0.65 mA/cm2.
The effect of current intensity Studies have shown that the applied current density is an important parameter in EC as it determines coagulant
dosage rate, the bubble production rate and the floc growth and size (Khandegar & Saroha, 2013; Oncel
et al., 2013). In this study, current densities was varied from 0.65-16.2 mA/ cm2 by increasing the current, whilst
other operating conditions (initial pH and operating time) were kept constant.

<<Electrochemical Unit Operations in Industrial Wastewater Treatment>> ¯¯¯¯¯¯¯¯¯¯¯¯¯¯¯¯¯¯¯¯¯¯¯¯¯¯¯¯¯¯¯¯¯¯¯¯¯¯¯¯¯¯¯¯¯¯¯¯¯¯¯¯¯¯¯¯¯¯¯¯¯¯¯¯¯¯¯¯¯¯¯¯¯¯¯¯¯¯¯¯¯¯¯¯¯¯¯
______________________________________________________________________________________ 62
Operating time determination (tEC) Effect of operating time, was determined by varying electrolysis time from 10-30 min at 5 min interval and
measuring the removal of pollutants from synthetic effluent at a current density of 8 mA/cm2.
Operating costs determination Optimisation of operating costs plays an important role in EC process. The cost of operation was determined
using formula 4 below.
𝑂𝑂𝑝𝑝𝑟𝑟𝑟𝑟𝑎𝑎𝑜𝑜𝑂𝑂𝑛𝑛𝑘𝑘 𝑐𝑐𝑜𝑜𝑐𝑐𝑜𝑜 �𝑅𝑅 𝑟𝑟3� � = 𝑎𝑎𝐶𝐶𝑒𝑒𝑒𝑒𝑒𝑒𝑒𝑒𝑒𝑒𝑒𝑒 + 𝑏𝑏𝐶𝐶𝑒𝑒𝑒𝑒𝑒𝑒𝑡𝑡𝑒𝑒𝑜𝑜𝑒𝑒𝑒𝑒 … … … (4)
Where; a represents the 2017-2018 electricity price in South Africa (97.03 R/kWh), b represents the 2017 retail
metal sheets (Al = 67.88 R/kg).
4.6 RESULTS AND DISCUSSION
4.6.1 Effect of initial conductivity on pollutant removal and corresponding operational costs
It is important to study the effect of initial conductivity because it affects the energy consumption and
subsequently the cost of operation. Figure 4.7 shows the effect of initial conductivity on colour, Pb, COD
removal and an estimated cost of operation with applied voltages related for the 3 materials of electrodes
investigated. An increase in conductivity of the simulated wastewater had an insignificant effect on the removal
of orange II dye with highest removal of greater than 90% for all the electrodes materials at different
conductivities. A 91.6%, 96.6% and 96% of dye was removed after 30 min of operation by application of Al-Al,
SS 316-SS 316 and SS 304-SS 304 respectively at a conductivity of 3.8 mS/cm (Fig. 4.7a). It was also
observed that at operating conditions provided, stainless steel electrodes performed better than aluminum
electrodes and SS 304 and SS 316 had similar removal yields.
For Al electrodes, increase in conductivity resulted in the decrease in Pb removal efficiency, with a decrease
of 13.6% at a conductivity of 16.8 mS/cm from the 65.3% obtained at 3.8 mS/cm (Fig. 4.7b). SS 304 electrodes
were able to remove over 90% whereas SS 316 removed 72.3% at a conductivity of 3.8 mS/cm. The two SS
electrodes behaved differently during the removal of Pb. Higher conductivities favoured the removal of Pb
using SS 316 as anode and cathode with the removal of 90.7% at 16.8 mS/cm as compared to SS 304 with a
removal 73.0% at the same conductivity. It was observed that the addition of NaCl for conductivity increase
resulted in COD removal hindrance (Fig. 4.7c). For aluminium and SS 316 electrodes, the COD increased
from the initial COD at conductivities greater than 3.8 mS/cm. SS 304 electrodes were able to remove 55.6%
of COD at a conductivity of 16.8 mS/cm.

<<Electrochemical Unit Operations in Industrial Wastewater Treatment>> ¯¯¯¯¯¯¯¯¯¯¯¯¯¯¯¯¯¯¯¯¯¯¯¯¯¯¯¯¯¯¯¯¯¯¯¯¯¯¯¯¯¯¯¯¯¯¯¯¯¯¯¯¯¯¯¯¯¯¯¯¯¯¯¯¯¯¯¯¯¯¯¯¯¯¯¯¯¯¯¯¯¯¯¯¯¯¯
______________________________________________________________________________________ 63
a)
b)
c)
Figure 4.7. At operating parameters: i= 0.65 mA/cm2, tEC= 30min, inter-electrode spacing = 3.3 cm: a) Removal of orange II dye as function of initial conductivity of sample. b) Removal of Pb as function of initial conductivity of sample. c) Removal of COD as function of initial conductivity of sample.
0
50
100
0 6 12 18% D
ecol
oris
atio
n yi
eld
Conductivity mS/cm
Al - Al SS 316 - SS 316 SS 304 - SS 304
0
50
100
0 6 12 18
% P
b re
mov
al
Conductivity mS/cmAl - Al SS 316 - SS 316 SS 304 - SS 304
0
100
200
300
400
0 6 12 18
[CO
D ] p
pm
Conductivity mS/cm
No treatment Al - Al
SS 316 - SS 316 SS 304 - SS 304

<<Electrochemical Unit Operations in Industrial Wastewater Treatment>> ¯¯¯¯¯¯¯¯¯¯¯¯¯¯¯¯¯¯¯¯¯¯¯¯¯¯¯¯¯¯¯¯¯¯¯¯¯¯¯¯¯¯¯¯¯¯¯¯¯¯¯¯¯¯¯¯¯¯¯¯¯¯¯¯¯¯¯¯¯¯¯¯¯¯¯¯¯¯¯¯¯¯¯¯¯¯¯
______________________________________________________________________________________ 64
At a conductivity of 3.8 mS/cm voltage that was applied to maintain a current density of 0.65 mA/cm2 was 2.2V
for aluminium electrodes and 3.2V for both SS 304 and SS 316 electrodes. The corresponding estimated cost
at this conductivity was, R11.8/m3, R20.6/m3 & R18.0/m3 for aluminium, SS 316 and SS 304 electrodes
respectively. As expected, the higher the conductivity of the sample the lower voltage is required to achieve a
current density of 0.65 mA/cm2. This results in the reduction in operational costs for all electrode materials as
the energy cost is reduced significantly. In addition, aluminium electrodes were cheaper to use at different
initial conductivities of the simulated wastewater.
Contrary to the little effect that the increment in initial conductivity of bulk had on the pollutant removal at
constant applied current density, the operational costs were decreased tremendously. The lowest operational
cost was calculated to be R6.67 / m3 of slurry at the highest conductivity of 16.8 mS/cm. This was attributed to
the fact that less energy (Cenergy, equation 3) was required to obtain the current density of 0.65 mS/ cm2.
Figure 4.8. Voltage variation at different initial conductivities and Operational costs in (R/m3)
4.6.2 Effect of current density on pollutant removal
In this study the experiments were carried out on the simulated wastewater with a conductivity of 3.8 mS/cm.
Figures 4.9-4.11 show the effect of current density on the removal of colour, Pb and COD, the estimated
operational cost associated with different current densities and the anode mass loss in the 30 min of operation
for different material of electrodes respectively.
Increase of current density from 1.6 to 16.3 mA/cm2 had a significant effect on the removal of orange II dye
from the simulated wastewater for different electrode materials (Fig. 4.9). The decolourisation yield increased
by 5.6%, 0.8% and 0.2% for aluminium, SS 316 and SS 304 electrodes respectively at a current density of 1.6
mA/cm2 from 0.65 mA/cm2. As the current density increased, there was no significant change in the
decolourisation yield.
0
2
4
3,8 7,2 10 13,6 16,80
10
20
30
Ope
ratio
n co
st (R
/m3 )
Conductivity mS/cm
Volta
ge (V
)
Al - Al SS 316 - SS 316 SS 304 - SS 304Al - Al SS 316 - SS 316 SS 304 - SS 304

<<Electrochemical Unit Operations in Industrial Wastewater Treatment>> ¯¯¯¯¯¯¯¯¯¯¯¯¯¯¯¯¯¯¯¯¯¯¯¯¯¯¯¯¯¯¯¯¯¯¯¯¯¯¯¯¯¯¯¯¯¯¯¯¯¯¯¯¯¯¯¯¯¯¯¯¯¯¯¯¯¯¯¯¯¯¯¯¯¯¯¯¯¯¯¯¯¯¯¯¯¯¯
______________________________________________________________________________________ 65
Figure 4.9. Effect of current density on decolourisation yield (Operating parameters: tEC = 30 min, k = 3.8
mS/cm). Graph 2 is an expansion from 95%.
Lead removal increased to 89.5% as the current density was increased to 16.3 mA/ cm2 when using the
aluminium electrodes (Fig. 4.10). It was also noticed that at different applied current densities, SS 304 and
SS 316 behaved in a similar manner, where the Pb removal was increased to 97.7% at the same current
density of 16.3 mA/cm2.
Figure 4.10. Effect of current density on Pb removal (Operational parameters: tEC = 30 min, k = 3.8 mS/cm)
For all the electrode materials, there was a significant removal of COD at higher current densities. At 1.63
mA/cm2, the COD removal was 34.7%, 37.8% and 54.1% for aluminium, SS 316 and SS 304 electrodes
respectively (Fig. 4.11). It was established, however, that the current density increased above the 1.63 mA/cm2
caused a decrease in the removal of COD. This may be due to the overdosing of the coagulant, increasing the
inorganic species (TSS) in the simulated wastewater.

<<Electrochemical Unit Operations in Industrial Wastewater Treatment>> ¯¯¯¯¯¯¯¯¯¯¯¯¯¯¯¯¯¯¯¯¯¯¯¯¯¯¯¯¯¯¯¯¯¯¯¯¯¯¯¯¯¯¯¯¯¯¯¯¯¯¯¯¯¯¯¯¯¯¯¯¯¯¯¯¯¯¯¯¯¯¯¯¯¯¯¯¯¯¯¯¯¯¯¯¯¯¯
______________________________________________________________________________________ 66
Figure 4.11. Effect of current density on COD removal (Operational parameters: tEC = 30 min, k = 3.8 mS/cm)
Effect of current density on OC including mass loss of electrodes. As can be expected, the higher the
current density, the more estimated operational costs. This is due to the energy requirement cost increase. SS
304, even though cheaper than SS 316 had the highest costs at a current density of 16.3 mA/cm2 at 3364.3/m3
(Fig. 4.12a).
The mass loss of the electrodes (Fig 4.12b) is in accordance with Faradays Law, the more energy applied, the
more the sacrificial anode corrodes/dissolves.
0
50
100
0 6 12 18
% C
OD
rem
oval
Current density mA/cm2
Al - Al SS 316 - SS 316 SS 304 - SS 304

<<Electrochemical Unit Operations in Industrial Wastewater Treatment>> ¯¯¯¯¯¯¯¯¯¯¯¯¯¯¯¯¯¯¯¯¯¯¯¯¯¯¯¯¯¯¯¯¯¯¯¯¯¯¯¯¯¯¯¯¯¯¯¯¯¯¯¯¯¯¯¯¯¯¯¯¯¯¯¯¯¯¯¯¯¯¯¯¯¯¯¯¯¯¯¯¯¯¯¯¯¯¯
______________________________________________________________________________________ 67
a)
b) Figure 4.12. a) Voltage variation at different current densities and Operational costs in (R/m3). b) Effect of current density on electrode consumption (Operational parameters: tEC = 30 min, k = 3.8 mS/cm)
4.6.3 Electrocoagulation time studies (tEC)
The study of electrolysis time effect on pollutant removal was carried out at a current density of 8.2 mA/cm2
and an initial conductivity of 3.8 mS/cm. Figure 4.13 shows the removal of colour and Pb as a function of tEC
and the corresponding estimated operational cost with the mass loss of the sacrificial anode at a given time of
the treatment for different material of electrodes respectively.
Decolourisation (Fig 4.13a). These results clearly show that, there is a rapid removal of orange II dye in the
first 10 min of the process for all the electrode materials. The percentages of the dye that was removed in 10
min are 81.2%, 89.4% and 88.2% for aluminium, SS 316 and SS 304 electrodes respectively.
Pb removal (Fig. 4.13b). Aluminium and SS 316 showed similar pattern for the removal of Pb in the
wastewater, where maximum Pb removed was obtained after 30 min of operation. SS 304, however, showed
rapid removal of pollutants within 10 min of operation, where 96.6% of Pb was removed at the 10 min mark.
0
10
20
30
1,63 8,17 16,340
2000
4000
6000
Ope
ratio
n co
st (R
/m3 )
Current density (mA/cm2)
Volta
ge (V
)
Al - Al SS 316 - SS 316 SS 304 - SS 304Al - Al SS 316 - SS 316 SS 304 - SS 304
0,0
0,5
1,0
0 6 12 18Anod
e m
ass
loss
(kg/
m3 )
Current density mA/cm2
Al - Al SS 316 - SS 316 SS 304 - SS 304

<<Electrochemical Unit Operations in Industrial Wastewater Treatment>> ¯¯¯¯¯¯¯¯¯¯¯¯¯¯¯¯¯¯¯¯¯¯¯¯¯¯¯¯¯¯¯¯¯¯¯¯¯¯¯¯¯¯¯¯¯¯¯¯¯¯¯¯¯¯¯¯¯¯¯¯¯¯¯¯¯¯¯¯¯¯¯¯¯¯¯¯¯¯¯¯¯¯¯¯¯¯¯
______________________________________________________________________________________ 68
a)
b)
Figure 4.13. a) Effect of electrolysis time on the decolourisation yield. b) Effect of electrolysis time on the removal of Pb (operating parameters: i = 8 mA/cm2, k = 3.8 mS/cm)
4.6.4 Sub Conclusion
Electrocoagulation on simulated wastewater containing initial concentration of orange II dye and Pb of 50 ppm
using different types of electrodes showed positive results. In comparison of Al electrodes and both SS grades,
SS had better pollutant removal efficiencies at different initial conductivities of simulated wastewater, applied
current density and tEC studies, however costs higher than Al electrode material. SS 316 and SS 304 showed
different removal of pollutants properties at the same operating conditions. In conductivity studies, SS 316 and
SS 304 decolourisation yields of 96.6% and ...as opposed to 91.6% yield when using Al electrodes at the
lowest conductivity of 3.8 mS/cm and 30 min of operation. In addition, highest Pb removal was obtained at a
conductivity of 16.8 mS/cm at 90.7% whereas SS 304 was....For wastewaters containing higher concentrations
of electrolyte (higher conductivities) higher current densities are required for the removal of COD for the three
electrode materials investigated. Current densities ranging from 1.63 to 16.3 mA/cm2 had an insignificant effect
on decolourisation yield and Pb removal for both SS materials. SS 304 removed 54.1% of COD at 1.63 mA/
cm2, whereas SS 316 had a removal percentage of 37.8% at the same current density. It was established that

<<Electrochemical Unit Operations in Industrial Wastewater Treatment>> ¯¯¯¯¯¯¯¯¯¯¯¯¯¯¯¯¯¯¯¯¯¯¯¯¯¯¯¯¯¯¯¯¯¯¯¯¯¯¯¯¯¯¯¯¯¯¯¯¯¯¯¯¯¯¯¯¯¯¯¯¯¯¯¯¯¯¯¯¯¯¯¯¯¯¯¯¯¯¯¯¯¯¯¯¯¯¯
______________________________________________________________________________________ 69
SS 316 and SS 304 have different pollutant removal efficacies when applied in an EC system for wastewater
treatment. Based on the results, it can be concluded that SS 304 is better in COD removal at different current
densities and rapid removal of Pb as compared to SS 316 material.

<<Electrochemical Unit Operations in Industrial Wastewater Treatment>> ¯¯¯¯¯¯¯¯¯¯¯¯¯¯¯¯¯¯¯¯¯¯¯¯¯¯¯¯¯¯¯¯¯¯¯¯¯¯¯¯¯¯¯¯¯¯¯¯¯¯¯¯¯¯¯¯¯¯¯¯¯¯¯¯¯¯¯¯¯¯¯¯¯¯¯¯¯¯¯¯¯¯¯¯¯¯¯
______________________________________________________________________________________ 70
CHAPTER 5: PHOTOELECTROCHEMICAL SYSTEMS ON TITANIUM SHEET BASED PHOTOANODES FOR THE DEGRADATION OF DYE
IN WASTEWATER ______________________________________________________________________________________
5.1 MOTIVATION
The PEC processes reported in chapter 3 were all based on the use of carbon materials exfoliated graphite
and reduced graphene oxide – as supports for the preparation of the photoanodes. The carbon based
photoanodes could not withstand high current densities owing to the tendency to oxidise the carbon materials.
Furthermore, the electrodes were not so rigid and thus may not be amenable to machining in the fabrication
of the envisaged flow-through reactor. These challenges motivated the use of a more rigid substrate – titanium
sheet. The titanium metal sheet may be easier to work with in the development of the anodic chamber of
photoelectrocatalytic cell.
5.2 INTRODUCTION
Photoeletrocatalytic process (PEC) has been indicated to hold promise for wastewater remediation and energy
conversion (X. Zhang et al., 2017). In this technique electrical energy is applied to a photocatalytic system to
obtain synergistic benefit. In the last few years, combining electrochemical process and photocatalysis has
been shown to yield improved performance for organic pollutants degradation compared to either electro-
oxidation or photocatalysis alone. This enhanced performance has been attributed to the ability of the applied
bias potential to promote the separation of the photogenerated hole and electron pairs (Bessegato, Cardoso
& Zanoni, 2015; M. G. Peleyeju & Arotiba, 2018; Moses G Peleyeju et al., 2017).
Photocatalysts which are sensitive in the visible region of the solar spectrum have received considerable
attention as anodic materials for PEC. This is because utilising sunlight for the process promotes sustainability.
For instance, BiVO4 and its composites have been used as photoanodes in PEC system for hydrogen
production via water splitting and organic contaminants decomposition (Monfort et al., 2016; Monfort, Raptis
et al., 2017; Monfort, Sfaelou et al., 2017a; Tolod, Hernández & Russo, 2017; Y. Zhou et al., 2017). Having a
narrow band gap of 2.4 eV, BiVO4 is an ideal semiconductor for visible-light driven processes. It is non-toxic,
stable to photocorrosion, inexpensive and can be obtained via simple synthetic routes (T. Ahmed, Zhang, Xu
& Zhang, 2017). However, apart from the rapid recombination of electron-hole pairs (Malathi, Vasanthakumar,
Arunachalam, Madhavan & Ghanem, 2017), BiVO4 also suffers from poor electrical conductivity and low
adsorptive performance (He et al., 2013). These drawbacks make BiVO4 an inefficient photocatalyst for
pollutants degradation. Studies have shown that photocatalytic/photoelectrocatalytic degradation of organic
pollutants at pristine BiVO4 presented low removal efficiency (Geng, Zhang, Li & Sun, 2015; Shang et al.,
2009; J. Sun et al., 2018; Y. Sun et al., 2012).
WO3 (band gap, 2.5-2.8 eV) is another promising material for PEC. It is inexpensive, demonstrates low
susceptibility to photocorrosion, exhibits appreciable stability in acidic and oxidative conditions, and is non-

<<Electrochemical Unit Operations in Industrial Wastewater Treatment>> ¯¯¯¯¯¯¯¯¯¯¯¯¯¯¯¯¯¯¯¯¯¯¯¯¯¯¯¯¯¯¯¯¯¯¯¯¯¯¯¯¯¯¯¯¯¯¯¯¯¯¯¯¯¯¯¯¯¯¯¯¯¯¯¯¯¯¯¯¯¯¯¯¯¯¯¯¯¯¯¯¯¯¯¯¯¯¯
______________________________________________________________________________________ 71
toxic (Dong, Hou, Xi, Shao & Dong, 2017; Hilliard et al., 2017; Sfaelou, Pop, Monfort, Dracopoulos & Lianos,
2016). Importantly, WO3 is being explored as a potential photocatalyst for destruction of organic pollutants
because of the high oxidation power of its valence-bound holes (Weng, Wu, Zhang & Xu, 2014). In spite of its
impressive properties, the photocatalytic activity of WO3 is poor owing to its relatively low conduction band
edge. The position of the conduction band edge is unfavourable for one-electron reduction of adsorbed oxygen
molecules (Sakai et al., 2015). This leads to accumulation of photogenerated electrons, and their consequent
recombination with the holes which are needed for oxidation of target compounds. As a result, improving the
photocatalytic activity of WO3 by modifying its electronic structure has been the focus of many studies. It has
been reported that tuning the morphology/structure of WO3 can yield a catalyst with enhanced charges
separation and improved photoactivity (B. Ahmed, Kumar, Ojha, Donfack & Materny, 2017; Dirany et al., 2016;
Dong et al., 2017; Huang et al., 2015; T. Zhang, Su & Guo, 2016). Theerthagiri et al., Zhang et al. and Yao et
al., in separate studies, showed that WO3 nanorods possesses suitable physico-chemical properties for
enhanced photocatalytic performance (Theerthagiri et al., 2015; Yao, Qu, Wang & Wu, 2017; J. Zhang et al.,
2017).
Fabricating a hybrid of two or more semiconductors has been hinted as one of the plausible approaches to
overcoming the challenges of electron and hole recombination and some other limitations associated with
individual photocatalyst such as the low conduction band edge in WO3 and the poor charge mobility in BiVO4
(Ho-Kimura, Moniz, Handoko & Tang, 2014; Kim et al., 2014; S. Wang et al., 2017; Xia et al., 2016; Yuan et
al., 2015). The resulting nanocomposite catalysts have been reported to display much higher activity than the
individual materials. Xia et al. reported the oxidation of phenol on a Fe2O3/BiVO4 thin film anode via
photoelectrocatalytic process (Xia et al., 2017). The composite photoanode demonstrated superior
performance to the pristine BiVO4 anode. The authors attributed the enhanced degradation performance to
the ultra-thin iron oxide which minimised charge carriers recombination in BiVO4. In another report by Martins
et al. (Martins, Nuñez & de Vasconcelos Lanza, 2017), WO3 modified TiO2 nanotube array (NTAs) exhibited
better mineralisation efficiency than the unmodified TiO2 (NTAs) when both electrodes were employed for the
photoelectrocatalytic degradation of the endocrine disrupting compound propyl paraben. Similarly, Wei et al.
(Wei et al., 2017) reported that decontamination of coking wastewater containing phenolic compounds was
much more efficient at heterostructured TiO2/g-C3N4 than at pure TiO2 and g-C3N4. The improvement in the
photoelectrocatalytic efficiency was attributed partly to the heterojunction that is formed between the two
photocatalysts which suppresses the recombination rate of electrons and holes.
In this work, BiVO4 has been modified with carbon nanoparticles and boron to obtain a photocatalyst denoted
as CNP/B-BiVO4. This catalyst was then coupled to WO3 nanorods and the resulting nanocomposite was
immobilised on Ti plate. The photoanode, CNP/B-BiVO4/WO3 was then employed for the catalytic oxidation of
orange II dye. In this study we hypothesised that modification of BiVO4 with substances such as CNP and B
would impact positively on the photocatalytic performance of the semiconductor. In addition, we envisaged
that coupling this modified material to WO3 nanorods will provide a nanocomposite anode with desirable
properties for photoelectrocatalytic applications.

<<Electrochemical Unit Operations in Industrial Wastewater Treatment>> ¯¯¯¯¯¯¯¯¯¯¯¯¯¯¯¯¯¯¯¯¯¯¯¯¯¯¯¯¯¯¯¯¯¯¯¯¯¯¯¯¯¯¯¯¯¯¯¯¯¯¯¯¯¯¯¯¯¯¯¯¯¯¯¯¯¯¯¯¯¯¯¯¯¯¯¯¯¯¯¯¯¯¯¯¯¯¯
______________________________________________________________________________________ 72
5.3 METHODOLOGY
5.3.1 Materials and Equipment
Sodium tungstate dihydrate (Na2WO4.2H2O), bismuth nitrate pentahydrate (Bi(NO3)3.5H2O), sodium
metavanadate (NaVO3), sodium chloride (NaCl), sodium sulphate (Na2SO4), sodium hydrogen carbonate
(NaHCO3), sodium hydroxide (NaOH), orange II sodium salt, polyethylene glycol (PEG), boric acid (H3BO3)
and ethanol were purchased from Sigma-Aldrich South Africa. All solutions were prepared with deionised
water.
Powder x-ray diffraction analysis of the catalysts was done on Rigaku Smartlab x-ray diffractometer (USA)
equipped with Cu kα radiation and operated at 40 kV and 40 mA. The electron images were obtained on
scanning electron microscope (TESCAN, Vega 3 XMU, Czech Republic) and transmission electron
microscope ((JEOL 2100 HRTEM 200V, Japan). EDX analysis was performed on equipment attached to SEM.
Diffuse reflectance spectroscopy was done on UV/Visible spectrophotometer (Shimadzu 2450, Japan),
Concentration abatement of the dye was monitored on UV/Visible spectrophotometer (Agilent Cary 60,
Malaysia) at its wavelength of maximum absorption. Chemical oxygen demand was determined on HACH
DR3900 spectrophotometer.
5.3.2 Electrochemical Reactor design and measurements:
A computer-controlled potentiostat (autolab PGSTAT 302N) using three-electrode system was used. The
working electrodes used include BiVO4/Ti, B-BiVO4/Ti, CNP-BiVO4/Ti, CNP/B-BiVO4/Ti, WO3/Ti and CNP/B-
BiVO4/WO3/Ti, reference electrode was Ag/AgCl (3M KCl) and counter electrode was coiled platinum wire.
Linear sweep voltammetric measurements were carried out in 0.1 M solution of Na2SO4 and amperometric
measurements in the presence and in the absence of photons were performed in 5 mgL-1 solution of orange II
sodium salt (prepared in 0.1 M Na2SO4). Electrochemical oxidation of the dye was carried out in a quartz
photoelectrochemical cell in the presence and in the absence of light. Typically, 250 mL of the simulated
wastewater (containing 5 mgL-1 of the analyte) was electrolysed in an experiment with continuous stirring of
the electrolytic solution. The solar light source was Oriel solar simulator. The simulator has a xenon lamp of
100 W and a UV cut-off filter (Air Mass 1.5 Global filter), giving 1.0 sun output. The distance between the
photoelectrochemical cell and the light source was about 5 cm. The schematic of the reactor setup and the
actual image of the solar simulator are presented in Fig 5.1a and b respectively.

<<Electrochemical Unit Operations in Industrial Wastewater Treatment>> ¯¯¯¯¯¯¯¯¯¯¯¯¯¯¯¯¯¯¯¯¯¯¯¯¯¯¯¯¯¯¯¯¯¯¯¯¯¯¯¯¯¯¯¯¯¯¯¯¯¯¯¯¯¯¯¯¯¯¯¯¯¯¯¯¯¯¯¯¯¯¯¯¯¯¯¯¯¯¯¯¯¯¯¯¯¯¯
______________________________________________________________________________________ 73
a)
b)
Figure 5.1. a) A schematic diagram of a single cell reactor for photoelectrochemical degradation. b) Picture of the actual photoelectrochemical reactor
5.3.3 Synthesis of WO3 nanorods
The synthesis of WO3 nanorods is as follows: 2.62 g of Na2WO4.2H2O was dissolved in 80 mL of deionised
water and this was followed by addition of 1.0 g of NaCl. The homogeneous mixture obtained was then acidified
with HCl until the pH was 2.06. Upon addition of HCl, the mixture turned white precipitate and this precursor
solution was transferred to a 100 mL teflon-lined autoclave. The autoclave was sealed and maintained at
180°C in an oven for 24 h. After cooling to room temperature, the synthesised material was transferred into
centrifuge tubes and washed by centrifugation repeatedly with deionised water and then ethanol. The material
was then dried at 80°C in air oven for 8 h. The powder material obtained after drying was kept for use.
5.3.4 Preparation of carbon nanoparticles, BiVO4 and CNP/B-BiVO4
Carbon nanoparticles (CNPs) were prepared from oats purchased from a local market in Johannesburg, South
Africa. A 5 g of oats was powdered by grinding. The powder was then put into a crucible and transferred into
a muffle furnace maintained at 400°C for 2 h. The black material formed was allowed to cool to room

<<Electrochemical Unit Operations in Industrial Wastewater Treatment>> ¯¯¯¯¯¯¯¯¯¯¯¯¯¯¯¯¯¯¯¯¯¯¯¯¯¯¯¯¯¯¯¯¯¯¯¯¯¯¯¯¯¯¯¯¯¯¯¯¯¯¯¯¯¯¯¯¯¯¯¯¯¯¯¯¯¯¯¯¯¯¯¯¯¯¯¯¯¯¯¯¯¯¯¯¯¯¯
______________________________________________________________________________________ 74
temperature, pulverised and subsequently dispersed in deionised water. The dispersion was centrifuged and
the supernatant was decanted into a clean beaker. This process was repeated severally to obtain more
supernatants. The water in the supernatant was evaporated and the solid particles left in the beaker were
collected and kept for use.
To synthesise pristine BiVO4, 0.61 g of NaVO3 was dissolved in about 40 mL of deionised water and 2.43 g of
Bi(NO3)3.5H2O were dissolved in 0.1 M HNO3. The NaVO3 solution was then gradually added to the Bi(NO3)3
solution. The yellow precursor solution formed was transferred into a teflon-lined autoclave, sealed and put
into the stainless steel shell. This was then maintained 180°C for 24 h in an oven. Upon cooling, the material
was transferred into centrifuge tubes and washed a few times with water. The yellow substance obtained after
decantation was dried in an air oven at 80°C for 8 h. Preparation of CNP/B-BiVO4 followed the same procedure
except that 1.0 g of H3BO3 and 10 mg of CNP were added to the solution of NaVO3 prior to mixing with
Bi(NO3)3.5H2O solution.
5.3.5 Fabrication of the photoanode
Ti sheets were firstly degreased in 40% m/m NaOH solution heated to 80°C and maintained for 2 h. Etching
of the sheets was then carried out in a 18% v/v HCl solution maintained at 98% for 2 h.
The dispersions of BiVO4, B-BiVO4, CNP/BiVO4, CNP/B-BiVO4 and WO3 were prepared by weighing 0.2 g of
each of the catalysts into an ethanolic solution of polyethylene glycol (PEG) (containing 2 mL of ethanol and 1
mL of PEG). A mixture of both CNP/B-BiVO4 and WO3 was also prepared by dispersing 0.1 g each of the
catalysts in ethanolic solution of PEG. The dispersions were ultrasonicated for 60 min.
A 100 µL of the dispersion was drop cast onto both sides of the prepared Ti sheets with exposed area 4 cm2.
The coated sheets were dried in an air oven at a temperature of 250°C. The coating was repeated once more
and the sheets were sintered at 500°C in a muffle furnace.
5.4 RESULT AND DISCUSSION
5.4.1 Morphology investigation, EDS analysis and elemental mapping
Prior to electron microscopy, XRD was used to confirm the successful synthesis of the BiVO4 and CNP/B-
BiVO4, and b) WO3.
The SEM and TEM images, EDS spectra and element maps are presented in fig. 2. From the SEM image of
pristine BiVO4 (Fig. 2a), it can be observed that the nanoparticles formed, to a large extent, have uniformly
distributed sizes. The particles are seen to be closely packed. The SEM image (Fig. 2b) of the doped BiVO4
shows a morphology characteristic of a composite material. It has no regular structure or shape, but the
constituents can be seen to be well integrated. The EDS spectrum (Fig. 2c) reveals the presence of B, although
it has a very low intensity owing to its very low concentration compared with the other component elements.
The elemental map (Fig. 2d) further confirms the presence of B in the nanocomposite, with the element
uniformly distributed within the material. Similarly, Fig. 2e reveals that carbon particles are present in the
nanocomposite material. The TEM image at 1 µm (Fig. 2f) reveals that the rods are of different lengths, but

<<Electrochemical Unit Operations in Industrial Wastewater Treatment>> ¯¯¯¯¯¯¯¯¯¯¯¯¯¯¯¯¯¯¯¯¯¯¯¯¯¯¯¯¯¯¯¯¯¯¯¯¯¯¯¯¯¯¯¯¯¯¯¯¯¯¯¯¯¯¯¯¯¯¯¯¯¯¯¯¯¯¯¯¯¯¯¯¯¯¯¯¯¯¯¯¯¯¯¯¯¯¯
______________________________________________________________________________________ 75
the diameter can be seen to be essentially the same. The TEM image of the carbon particles is presented in
fig. 2i, the particles appear to be spherical and agglomerated.
a) b)
c) d)
e) f)

<<Electrochemical Unit Operations in Industrial Wastewater Treatment>> ¯¯¯¯¯¯¯¯¯¯¯¯¯¯¯¯¯¯¯¯¯¯¯¯¯¯¯¯¯¯¯¯¯¯¯¯¯¯¯¯¯¯¯¯¯¯¯¯¯¯¯¯¯¯¯¯¯¯¯¯¯¯¯¯¯¯¯¯¯¯¯¯¯¯¯¯¯¯¯¯¯¯¯¯¯¯¯
______________________________________________________________________________________ 76
g) h)
Figure 5.2. SEM images of a) BiVO4 and b) CNP/B-BiVO4, c) EDS spectrum of CNP/B-BiVO4, Elemental maps for d) Boron and e) Carbon, TEM images of f) WO3 at 1 µm scale, g) WO3 at 50 nm scale, h) CNP
5.4.2 Diffuse reflectance spectroscopy
Diffuse reflectance spectroscopy (DRS) is a valuable technique that can be used to gain insights into the
electronic states of semiconducting materials. The UV-Vis absorption spectra of BiVO4, WO3 and CNP/B-
BiVO4 are shown in Fig. 5.3. The intrinsic absorption bands of both the pristine BiVO4 and doped BiVO4 span
over UV and visible light regions. While that of WO3 can be seen to be strong within the UV region, extending
slightly into the visible region. This absorption characteristic of WO3 is in agreement with earlier reports (Cui
et al., 2017; Luo, Zhou, Ma & Xu, 2015). The doped BiVO4 demonstrates superior visible light absorption
compared to pristine BiVO4. In addition, the absorption edge of the CNP and B co-doped BiVO4 can be seen
to exhibit red-shift. The extension of the absorption edge of the doped material may be as a result of band
transitions occurring due to the presence of impurities in the forbidden band (F. Li et al., 2017).
Figure 5.3. UV-Vis absorption spectra of BiVO4, WO3 and CNP/B-BiVO4

<<Electrochemical Unit Operations in Industrial Wastewater Treatment>> ¯¯¯¯¯¯¯¯¯¯¯¯¯¯¯¯¯¯¯¯¯¯¯¯¯¯¯¯¯¯¯¯¯¯¯¯¯¯¯¯¯¯¯¯¯¯¯¯¯¯¯¯¯¯¯¯¯¯¯¯¯¯¯¯¯¯¯¯¯¯¯¯¯¯¯¯¯¯¯¯¯¯¯¯¯¯¯
______________________________________________________________________________________ 77
5.4.3 Linear sweep voltammetry and photo-current response
The linear sweep voltammograms of the fabricated photoanodes were obtained in the dark and in the presence
of light. As shown in Fig. 5.4a, the current responses of both CNP/B-BiVO4 and CNP/B-BiVO4/WO3 in the dark
are not significantly different until reaching the potential of about 1.0 V, with the bi-component electrode
displaying a slightly higher current than the doped BiVO4 electrode (0.16 and 0.15 mA at 1.3 V). Apparently,
the presence of WO3 contributed to the current signal of the bi-component electrode. It is well known that WO3
exhibit better charge-transfer property than BiVO4 (Hong, Lee, Jang & Lee, 2011; Lee et al., 2016). In addition,
in both doped BiVO4 and coupled electrodes, photocurrent can be seen to increase as the anodic potential
increases. In the presence of light, the photoanodes showed markedly higher photocurrent than those recorded
under dark condition (Fig. 5.4b). The significant photocurrent enhancement recorded by the coupled
semiconductors anode can be attributed to synergistic effects of the BiVO4 and WO3 (Fig. 5.4b). The excellent
charge transport property of the WO3 and the high visible light activity of the BiVO4 are beneficial for improved
photoactivity. As evident in Fig. 5.4b, the photocurrent responses at both CNP/B-BiVO4 and CNP/B-
BiVO4/WO3 are stable over the time range shown.
a)
b)
Figure 5.4. a) Linear sweep voltammograms of photoanodes measured in 0.1 M Na2SO4, b) Photocurrent response of CNP/B-BiVO4 and CNP/B-BiVO4/WO3 obtained in 5 mgL-1 orange II dye (prepared in 0.1 M Na2SO4) at a potential of 1.2 V

<<Electrochemical Unit Operations in Industrial Wastewater Treatment>> ¯¯¯¯¯¯¯¯¯¯¯¯¯¯¯¯¯¯¯¯¯¯¯¯¯¯¯¯¯¯¯¯¯¯¯¯¯¯¯¯¯¯¯¯¯¯¯¯¯¯¯¯¯¯¯¯¯¯¯¯¯¯¯¯¯¯¯¯¯¯¯¯¯¯¯¯¯¯¯¯¯¯¯¯¯¯¯
______________________________________________________________________________________ 78
5.4.4 Photoelectrocatalytic degradation experiments
Degradation of orange II sodium salt was carried out at the fabricated electrodes to evaluate their
photoelectrocatalytic performance.
The oxidation process was performed at applied anodic potential of 2.0 V. The removal efficiency of the dye
was calculated from the following relation:
% removal = (A0 - At)/A0 x 100
where A0 and At are the absorbance values at time t = 0 and t = t respectively.
As can be seen in Fig. 5.5a, the CNP/B-BiVO4/WO3 electrode exhibited the highest degradation efficiency with
92% removal of the dye in 3 h of the photoelectrocatalytic process. The performance of the photoanodes
follows the order BiVO4 < B-BiVO4 < WO3 < CNP-BiVO4 < CNP/B-BiVO4 < CNP/B-BiVO4/WO3. Degradation
efficiency at B-doped BiVO4 photoanode is only slightly higher than that obtained at the pristine BiVO4 anode
(data not shown). Wang et al. made similar observation in the photocatalytic performance of BiVO4 and B-
BiVO4 (M. Wang, Che, Niu, Dang & Dong, 2013). The authors reported that boron doping narrows the band
gap energy of the photocatalyst by a magnitude of 0.04 eV, thus increasing its light absorption in the visible
region. It was also suggested that interstitial boron doping can increase the number of oxygen vacancies and
V4+, leading to red-shifting of the absorption edge and consequently improved photocatalytic performance in
the visible light region. It is noteworthy that the performance of pristine BiVO4 is inferior to that of the pure WO3
nanorods despite the former being a better absorber of visible light. The poor conductivity and low adsorption
capability of BiVO4 are some of the factors responsible for its low photoelectrocatalytic performance. On the
other hand, the large surface area of WO3 (BET surface area not shown) and its excellent conductivity are
favourable for the degradation of organic pollutants. However, incorporation of CNP into BiVO4 leads to
significant improvement in its photoelectrocatalytic performance. In essence, the CNP and B co-doped BiVO4
showed much more enhanced performance. Also, incorporation of CNP into the structure of BiVO4 could lead
to improved charge transport property and enhanced adsorption capability of the photocatalyst. Apparently,
the CNP/B-BiVO4/WO3 performed best because of the contributions of the various constituent materials. The
kinetic rate constants obtained by fitting the degradation experimental data into the Langmuir Hinshelwood
kinetic model are 0.0924, 0.1812, 0.254 and 0.845 h-1 for BiVO4, WO3, CNP/B-BiVO4 and CNP/B-BiVO4/WO3
respectively. Figure 5.5b displays the plots of normalised concentration abatement of the dye via photolysis,
electrolysis and photoelectrocatalysis. It can be seen that the coupled process offers a far more efficient
removal of the dye than the individual processes. This observation further affirms the superiority of
photoelectrocatalytic oxidation process to both electrochemical oxidation and photocatalytic oxidation
processes. The COD decay after 3 h of the photoelectrocatalytic process at the preferred anode was 58%.

<<Electrochemical Unit Operations in Industrial Wastewater Treatment>> ¯¯¯¯¯¯¯¯¯¯¯¯¯¯¯¯¯¯¯¯¯¯¯¯¯¯¯¯¯¯¯¯¯¯¯¯¯¯¯¯¯¯¯¯¯¯¯¯¯¯¯¯¯¯¯¯¯¯¯¯¯¯¯¯¯¯¯¯¯¯¯¯¯¯¯¯¯¯¯¯¯¯¯¯¯¯¯
______________________________________________________________________________________ 79
a) b)
Figure 5.5. a) Degradation profiles of orange II sodium salt a) at different photoanodes, b) by different oxidation processes.
Sub conclusion. Two visible-light sensitive semiconductors, namely, BiVO4 and WO3 have been
synthesised, characterised and applied for the degradation of a model organic pollutant, orange II dye. The
results obtained shows that the combination of two semiconductors through band gap alignment can improve
degradation efficiency. The higher performance of this electrode can be linked to the formation of n-n
heterojunction which promotes separation of charges and generation of large amount of the valence-bound
holes which are needed for the oxidation of the pollutant. The doping effect of boron also added to the
performance of this novel photoanode.
We have also used a more rigid platform – a titanium sheet – for the preparation of the BiVO4 and WO3
photoanode. We believe this will fit better into the reactor compartment for a flow-through reactor. The
robustness of the titanium sheet photoanode resumted in the use of a higher current density than our previously
reported exfoliated graphite substrate.

<<Electrochemical Unit Operations in Industrial Wastewater Treatment>> ¯¯¯¯¯¯¯¯¯¯¯¯¯¯¯¯¯¯¯¯¯¯¯¯¯¯¯¯¯¯¯¯¯¯¯¯¯¯¯¯¯¯¯¯¯¯¯¯¯¯¯¯¯¯¯¯¯¯¯¯¯¯¯¯¯¯¯¯¯¯¯¯¯¯¯¯¯¯¯¯¯¯¯¯¯¯¯
______________________________________________________________________________________ 80
CHAPTER 6: FLOW-THROUGH REACTOR DESIGN ______________________________________________________________________________________
6.1 INTRODUCTION
In other to move towards real application or upscale, there is need to design a flow-through reactor that will be
able to treat litres of wastewater on a continuous bases. A milestone towards this long-term realisation is the
design of a prototype reactor the treatment of some volumes of wastewater continuously. In this project, we
have collaborated with a company called Radical Waters.
6.1.1 About Radical Waters
Radical Waters (Pty) Ltd has spent over 20 years focused on developing and commercialising its patented
green Electrochemically Activated Water (ECA) technology. The company has installed operating ECA devices
on 6 continents and in 27 countries primarily for blue chip companies. Their products are used in a wide range
of markets formerly dependent on chemicals for controlling contamination and bacterial infection. Radical
waters manufacture Natural Hygiene Generators for solutions generically known as Anolyte and Catholyte.
These activated waters destabilizes and elevates the electrical charge of the water and creates an
environment in which microbes cannot survive.
6.1.2 The flow-through reactor design
In collaboration with the engineers at Radical Waters, we have designed (on paper) a prototype reactor which we hope to begin its fabrication soon. A part of the schematic is shown in Fig 6.1. Some of the essential parts of the reactor design include:
1. Off Water pump 24V.dc (0-3.8l/min) 2. 10 micron bag filter 3. 5 micron bag filter 4. Visual flow meter for high flow 5. Hydraulic control valves (pinch valves) 6. Transparent 2 cell plate reactor block 7. 4 off level switches 8. Control box 9. 1-16V dc 40A variable PSU for activation 10. 10A 24V.dc PSU for Water pumps 11. Activation switch and indicator lamp 12. 2 off Pump control switch and indicator lamps 13. Power indicator lamp 14. Micro controller, Main board and LCD 15. Analog 0-5A current meter

<<Electrochemical Unit Operations in Industrial Wastewater Treatment>> ¯¯¯¯¯¯¯¯¯¯¯¯¯¯¯¯¯¯¯¯¯¯¯¯¯¯¯¯¯¯¯¯¯¯¯¯¯¯¯¯¯¯¯¯¯¯¯¯¯¯¯¯¯¯¯¯¯¯¯¯¯¯¯¯¯¯¯¯¯¯¯¯¯¯¯¯¯¯¯¯¯¯¯¯¯¯¯
______________________________________________________________________________________ 81
Figure 6.1. Part of the process design for the flow-through photoelectrochemical reactor
The reactor needs to be built and optimised. We envisage the use of titanium plate based anode for this reactor.

<<Electrochemical Unit Operations in Industrial Wastewater Treatment>> ¯¯¯¯¯¯¯¯¯¯¯¯¯¯¯¯¯¯¯¯¯¯¯¯¯¯¯¯¯¯¯¯¯¯¯¯¯¯¯¯¯¯¯¯¯¯¯¯¯¯¯¯¯¯¯¯¯¯¯¯¯¯¯¯¯¯¯¯¯¯¯¯¯¯¯¯¯¯¯¯¯¯¯¯¯¯¯
______________________________________________________________________________________ 82
CHAPTER 7: CONCLUSIONS & RECOMMENDATIONS ______________________________________________________________________________________
7.1 CONCLUSIONS
7.1.1 Photoelectrochemical catalytic degradation
This research has demonstrated the possibilities of the treatment of water polluted with dyes and
pharmaceuticals with PEC. A myriad of carbon and semiconductor materials such as exfoliated graphite,
reduced graphene oxide, carbon nanoparticle, TiO2, ZnO, WO3, and BiVO4, etc. have been succefully
synthesised and characterised. Novel semiconductor photoanodes based on cabon substrates were fabricated
and used in the removal of organic pollutants such as dyes and pharmaceuticals from water.
The photoanodes prepared and the pollutants degraded have been presented in Table 3-2, which is shown
agin as Table 7-1.
Table 7-1. Summary of photoanodes and pollutants degraded in this project S/N Photoanode Organic pollutants degraded Reference 1 Ag-ZnO-rGO Orange II dye (Umukoro et al., 2016a, 2016b)
2 EG-WO3 Orange II dye, 2-nitrophenol (Umukoro, Peleyeju et al., 2017)
3 EG-TiO2 sulfamethoxazole (M. G. Peleyeju et al., 2017)
4 Pd-ZnO-EG 4-nitrophenol (Umukoro, Madyibi et al., 2017)
5 MoS2-SnO2/EG ciprofloxacin (Umukoro, Kumar et al., 2018)
6 EG-BiVO4/ZnO Rhodamine B dye (Orimolade et al., 2019)
7 CNP/B-BiVO4/WO3/Ti Orange II dye Manuscript in preparation
The initial sets of photoanodes prepared (Table 7-1, no. 1-4) were based on single semiconductor or doped
semiconductors. These types of photoanodes yielded good degradation efficiencies. The effect of
semiconductor doping on degradation efficiency has been studied and demonstrated. This project has shown
that exfoliated graphite can be used as a photoanode component to reduce the rate of recombination of
electron-hole in a semiconductor and thus improve degradation effieciency.
In the quest to improve the performance of the photoanodes, we started investigation on the possibilities of
mixed semiconductors or formation of heterojunctions. Though this is still under current investigations, but we
can see that the photocurrent responses can be improved using the concept of heterojunctions. The response
of the photoanode to solar light is a measure of its sustainability as we drive our research towards harnessing
the huge untapped energy from the sun. While it is diffciult to make absolute conclusions on the performances
of these photoanodes when compared, their responses to solar light can give an indication of light harvesting
improvement. As presented in Fig 7.1, the highest photocurrent response was observed for the heterojuntion
photoanodes.

<<Electrochemical Unit Operations in Industrial Wastewater Treatment>> ¯¯¯¯¯¯¯¯¯¯¯¯¯¯¯¯¯¯¯¯¯¯¯¯¯¯¯¯¯¯¯¯¯¯¯¯¯¯¯¯¯¯¯¯¯¯¯¯¯¯¯¯¯¯¯¯¯¯¯¯¯¯¯¯¯¯¯¯¯¯¯¯¯¯¯¯¯¯¯¯¯¯¯¯¯¯¯
______________________________________________________________________________________ 83
a) b)
c) Figure 7.1. Photocurrent responses of photoanodes in the dark and in the presence of solar light (a) Pd-ZnO-EG (b) WO3-EG and (c) EG-BiVO4/ZnO
The exfoliated graphite support, though yielded excellent degrattion efficiencies, was found to not to be strong
mechanically. The flow-through reactor may need a more rigid electrode plate that may need to be screwed to
the reactor chamber. EG based photoanodes may pose a challenge in this regard. Thus, we have prepared
new photoanodes on titanuim sheet (Table 7-1, no. 7).
This work has given us the platform to understand the concept of photoelectrochemical catalysis and the
behaviours of the materials we have prepared. The knowledge gleaned can now be transferred to a more
complex system – the flowthrough reactor.
7.1.2 Electrocoagulation
This work has demonstrated the advantage of electrocoagulation over chemical coagulation using a dye and
heavy metal as case study.
We have shown that the material used for anodes in EC can be a determinant of the efficiency of coagulation.
Particularly, we have shown that stainless steels do not perform alike. In our work, we compared the
performances of two different types of stainless steel. Results showed that each type of steel beahves
differently in the presence of organic pollutant and heavy metal. This is a very important result which suggests
that there is need to optimse EC performance with a particular electrode type.

<<Electrochemical Unit Operations in Industrial Wastewater Treatment>> ¯¯¯¯¯¯¯¯¯¯¯¯¯¯¯¯¯¯¯¯¯¯¯¯¯¯¯¯¯¯¯¯¯¯¯¯¯¯¯¯¯¯¯¯¯¯¯¯¯¯¯¯¯¯¯¯¯¯¯¯¯¯¯¯¯¯¯¯¯¯¯¯¯¯¯¯¯¯¯¯¯¯¯¯¯¯¯
______________________________________________________________________________________ 84
7.2 RECOMMENDATIONS
7.2.1 Photoelectrochemical catalytic degradation
In other to take the research forward, we propose the following recommendations Further study on semiconductor combination as heterojunctions in photoanode fabrication. We encountered many challenges with the preparation of Ti based photoanodes especially in the stability of the semiconductor film. The current method used in our lab is anodisation, thus there is need to explore more sophisticated film deposition techniques to deter the leaching of the semiconductor from the titanium surface. There need to explore other photoanode supports such as conducting glass, etc. The fabrication or design and testing of the flow through prototype reactor should be encouraged to commence. There is need to now commence investigation on the treatment of more complex samples and real sample.
7.2.2 Electrocoagulation
The application of other non-conventional anodic materials for EC should be investigated. Since the performance of an anodic material may vary with organic or metal removal, the use of alloys may present a plausible optimisation approach. There is need to increase the volume of water treated with EC and now commence investigation on the treatment of more complex samples and real sample.
7.2.3 Combination of Photoelectrochemical catalytic degradation (PEC) with Electrocoagulation (EC)
The knowledge gleaned in the study of PEC and EC for wastewater treatment can now be used in the development of a combined reactor, which we could not realise in this project owing to limited time and finance. A combined reactor will involve variables such cell configuration, light penetration, flow rate, retention time, order of arrangement of EC and PEC, etc. These variables need to be considered carefully and optimised for good reactor performance.

<<Electrochemical Unit Operations in Industrial Wastewater Treatment>> ¯¯¯¯¯¯¯¯¯¯¯¯¯¯¯¯¯¯¯¯¯¯¯¯¯¯¯¯¯¯¯¯¯¯¯¯¯¯¯¯¯¯¯¯¯¯¯¯¯¯¯¯¯¯¯¯¯¯¯¯¯¯¯¯¯¯¯¯¯¯¯¯¯¯¯¯¯¯¯¯¯¯¯¯¯¯¯
______________________________________________________________________________________ 85
REFERENCES ______________________________________________________________________________________ Abramian, L. & El-Rassy, H. (2009). Adsorption kinetics and thermodynamics of azo-dye Orange II onto highly
porous titania aerogel. Chemical Engineering Journal, 150(2-3), 403-410. Ahmed, B., Kumar, S., Ojha, A. K., Donfack, P. & Materny, A. (2017). Facile and controlled synthesis of aligned
WO 3 nanorods and nanosheets as an efficient photocatalyst material. Spectrochimica Acta Part A: Molecular and Biomolecular Spectroscopy, 175, 250-261.
Ahmed, T., Zhang, H.-l., Xu, H.-b. & Zhang, Y. (2017). m-BiVO4 hollow spheres coated on carbon fiber with superior reusability as photocatalyst. Colloids and Surfaces A: Physicochemical and Engineering Aspects, 531, 213-220.
Akbarzadeh, R., Fung, C. S., Rather, R. A. & Lo, I. M. (2018). One-pot hydrothermal synthesis of g-C3N4/Ag/AgCl/BiVO4 micro-flower composite for the visible light degradation of ibuprofen. Chemical Engineering Journal, 341, 248-261.
Ama, O., Mabuba, N. & Arotiba, O. (2015). Synthesis, Characterization, and Application of Exfoliated Graphite/Zirconium Nanocomposite Electrode for the Photoelectrochemical Degradation of Organic Dye in Water. Electrocatalysis, 6(4), 390-397.
An, C., Huang, G., Yao, Y. & Zhao, S. (2017). Emerging usage of electrocoagulation technology for oil removal from wastewater: A review. Science of The Total Environment, 579, 537-556.
Aoudj, S., Khelifa, A., Drouiche, N., Belkada, R. & Miroud, D. (2015). Simultaneous removal of chromium (VI) and fluoride by electrocoagulation-electroflotation: application of a hybrid Fe-Al anode. Chemical Engineering Journal, 267, 153-162.
Association, A. P. H. & Association, A. W. W. (1989). Standard methods for the examination of water and wastewater: American public health association.
Aziz, A. R. A., Asaithambi, P. & Daud, W. M. A. B. W. (2016). Combination of electrocoagulation with advanced oxidation processes for the treatment of distillery industrial effluent. Process Safety and Environmental Protection, 99, 227-235.
Baddouh, A., Bessegato, G. G., Rguiti, M. M., El Ibrahimi, B., Bazzi, L., Hilali, M. & Zanoni, M. V. B. (2018). Electrochemical decolorization of Rhodamine B dye: Influence of anode material, chloride concentration and current density. Journal of Environmental Chemical Engineering, 6(2), 2041-2047.
Bessegato, G. G., Cardoso, J. C. & Zanoni, M. V. B. (2015). Enhanced photoelectrocatalytic degradation of an acid dye with boron-doped TiO2 nanotube anodes. Catalysis Today, 240, 100-106.
Bhagawan, D., Poodari, S., Golla, S., Himabindu, V. & Vidyavathi, S. (2016). Treatment of the petroleum refinery wastewater using combined electrochemical methods. Desalination and Water Treatment, 57(8), 3387-3394.
Bocos, E., Brillas, E., Sanroman, M. A. & Sirés, I. (2016). Electrocoagulation: simply a phase separation technology? The case of bronopol compared to its treatment by EAOPs. Environmental science & technology, 50(14), 7679-7686.
Brillas, E. & Martínez-Huitle, C. A. (2015). Decontamination of wastewaters containing synthetic organic dyes by electrochemical methods. An updated review. Applied Catalysis B: Environmental, 166-167, 603-643. doi: 10.1016/j.apcatb.2014.11.016
Butterfield, I. M., Christensen, P. A., Hamnett, A., Shaw, K. E., Walker, G. M., Walker, S. A. & Howarth, C. R. (1997). Applied studies on immobilized titanium dioxide films as catalysts for the photoelectrochemical detoxification of water. Journal of Applied Electrochemistry, 27(4), 385-395.
Cardoso, J. C., Bessegato, G. G. & Zanoni, M. V. B. (2016). Efficiency comparison of ozonation, photolysis, photocatalysis and photoelectrocatalysis methods in real textile wastewater decolorization. Water research, 98, 39-46.
Chafi, M., Gourich, B., Essadki, A., Vial, C. & Fabregat, A. (2011). Comparison of electrocoagulation using iron and aluminium electrodes with chemical coagulation for the removal of a highly soluble acid dye. Desalination, 281, 285-292.
Chamjangali, M. A. & Boroumand, S. (2013). Synthesis of flower-like Ag-ZnO nanostructure and its application in the photodegradation of methyl orange. Journal of the Brazilian Chemical Society, 24(8), 1329-1338.
Chellam, S. & Sari, M. A. (2016). Aluminum electrocoagulation as pretreatment during microfiltration of surface water containing NOM: A review of fouling, NOM, DBP, and virus control. Journal of Hazardous Materials, 304, 490-501.
Chen, F., Liu, Z., Liu, Y., Fang, P. & Dai, Y. (2013). Enhanced adsorption and photocatalytic degradation of high-concentration methylene blue on Ag2O-modified TiO2-based nanosheet. Chemical Engineering Journal, 221, 283-291.

<<Electrochemical Unit Operations in Industrial Wastewater Treatment>> ¯¯¯¯¯¯¯¯¯¯¯¯¯¯¯¯¯¯¯¯¯¯¯¯¯¯¯¯¯¯¯¯¯¯¯¯¯¯¯¯¯¯¯¯¯¯¯¯¯¯¯¯¯¯¯¯¯¯¯¯¯¯¯¯¯¯¯¯¯¯¯¯¯¯¯¯¯¯¯¯¯¯¯¯¯¯¯
______________________________________________________________________________________ 86
Chen, F., Yan, F., Chen, Q., Wang, Y., Han, L., Chen, Z. & Fang, S. (2014). Fabrication of Fe 3 O 4@ SiO 2@ TiO 2 nanoparticles supported by graphene oxide sheets for the repeated adsorption and photocatalytic degradation of rhodamine B under UV irradiation. Dalton Transactions, 43(36), 13537-13544.
Chen, H., Gao, B., Li, H. & Ma, L. Q. (2011). Effects of pH and ionic strength on sulfamethoxazole and ciprofloxacin transport in saturated porous media. Journal of contaminant hydrology, 126(1-2), 29-36.
Cui, L., Ding, X., Wang, Y., Shi, H., Huang, L., Zuo, Y. & Kang, S. (2017). Facile preparation of Z-scheme WO 3/gC 3 N 4 composite photocatalyst with enhanced photocatalytic performance under visible light. Applied Surface Science, 391, 202-210.
Das, A. K., Srivastav, M., Layek, R. K., Uddin, M. E., Jung, D., Kim, N. H. & Lee, J. H. (2014). Iodide-mediated room temperature reduction of graphene oxide: a rapid chemical route for the synthesis of a bifunctional electrocatalyst. Journal of Materials Chemistry A, 2(5), 1332-1340.
Davey, J. & Schäfer, A. (2009). Ultrafiltration to supply drinking water in international development: a review of opportunities Appropriate technologies for environmental protection in the developing world (pp. 151-168): Springer.
de Amorim, K. P., Romualdo, L. L. & Andrade, L. S. (2013). Electrochemical degradation of sulfamethoxazole and trimethoprim at boron-doped diamond electrode: performance, kinetics and reaction pathway. Separation and Purification Technology, 120, 319-327.
de Deus Rodrigues, C. S. (2013). Textile Dyeing Wastewater Treatment by Single and Intregated Processes of Coagulation, Chemical Oxidation and Biological Degradation.
Demirbas, E. & Kobya, M. (2017). Operating cost and treatment of metalworking fluid wastewater by chemical coagulation and electrocoagulation processes. Process Safety and Environmental Protection, 105, 79-90.
Di Paola, A., García-López, E., Marcì, G. & Palmisano, L. (2012). A survey of photocatalytic materials for environmental remediation. Journal of Hazardous Materials, 211, 3-29.
Dirany, N., Arab, M., Leroux, C., Villain, S., Madigou, V. & Gavarri, J. (2016). Effect of WO3 nanoparticles morphology on the catalytic properties. Materials Today: Proceedings, 3(2), 230-234.
Donaghue, A. & Chaplin, B. P. (2013). Effect of select organic compounds on perchlorate formation at boron-doped diamond film anodes. Environmental science & technology, 47(21), 12391-12399.
Dong, P., Hou, G., Xi, X., Shao, R. & Dong, F. (2017). WO 3-based photocatalysts: morphology control, activity enhancement and multifunctional applications. Environmental Science: Nano, 4(3), 539-557.
DWA. (2013). The Green Drop Handbook. Retrieved June, 2019, from http://www.dwa.gov.za/Dir_WS/DWQR/subscr/ViewComDoc.asp?Docid=417
El-Ashtoukhy, E. Z., Amin, N., El-Latif, M. A., Bassyouni, D. & Hamad, H. (2017). New insights into the anodic oxidation and electrocoagulation using a self-gas stirred reactor: A comparative study for synthetic CI Reactive Violet 2 wastewater. Journal of cleaner production, 167, 432-446.
Emamjomeh, M. M. & Sivakumar, M. (2009). Review of pollutants removed by electrocoagulation and electrocoagulation/flotation processes. Journal of environmental management, 90(5), 1663-1679.
Esfandyari, Y., Mahdavi, Y., Seyedsalehi, M., Hoseini, M., Safari, G. H., Ghozikali, M. G., . . . Jaafari, J. (2015). Degradation and biodegradability improvement of the olive mill wastewater by peroxi-electrocoagulation/electrooxidation-electroflotation process with bipolar aluminum electrodes. Environmental Science and Pollution Research, 22(8), 6288-6297.
Fajardo, A. S., Rodrigues, R. F., Martins, R. C., Castro, L. M. & Quinta-Ferreira, R. M. (2015). Phenolic wastewaters treatment by electrocoagulation process using Zn anode. Chemical Engineering Journal, 275, 331-341.
Fan, M., Yang, C., Pu, W. & Zhang, J. (2014). Liquid phase deposition of ZnO film for photoelectrocatalytic degradation of p-nitrophenol. Materials Science in Semiconductor Processing, 17, 104-109.
Feng, J., Cheng, L., Zhang, J., Okoth, O. K. & Chen, F. (2018). Preparation of BiVO4/ZnO composite film with enhanced visible-light photoelectrocatalytic activity. Ceramics International, 44(4), 3672-3677.
García-García, A., Martínez-Miranda, V., Martínez-Cienfuegos, I. G., Almazán-Sánchez, P. T., Castañeda-Juárez, M. & Linares-Hernández, I. (2015). Industrial wastewater treatment by electrocoagulation-electrooxidation processes powered by solar cells. Fuel, 149, 46-54.
Garcia-Segura, S., Eiband, M. M. S., de Melo, J. V. & Martínez-Huitle, C. A. (2017). Electrocoagulation and advanced electrocoagulation processes: A general review about the fundamentals, emerging applications and its association with other technologies. Journal of Electroanalytical Chemistry, 801, 267-299.
Garza-Campos, B. R., Guzmán-Mar, J. L., Reyes, L. H., Brillas, E., Hernández-Ramírez, A. & Ruiz-Ruiz, E. J. (2014). Coupling of solar photoelectro-Fenton with a BDD anode and solar heterogeneous photocatalysis for the mineralization of the herbicide atrazine. Chemosphere, 97, 26-33. doi: 10.1016/j.chemosphere.2013.10.044
Geng, Y., Zhang, P., Li, N. & Sun, Z. (2015). Synthesis of Co doped BiVO4 with enhanced visible-light photocatalytic activities. Journal of Alloys and Compounds, 651, 744-748.

<<Electrochemical Unit Operations in Industrial Wastewater Treatment>> ¯¯¯¯¯¯¯¯¯¯¯¯¯¯¯¯¯¯¯¯¯¯¯¯¯¯¯¯¯¯¯¯¯¯¯¯¯¯¯¯¯¯¯¯¯¯¯¯¯¯¯¯¯¯¯¯¯¯¯¯¯¯¯¯¯¯¯¯¯¯¯¯¯¯¯¯¯¯¯¯¯¯¯¯¯¯¯
______________________________________________________________________________________ 87
Ghosh, D., Medhi, C. & Purkait, M. (2008). Treatment of fluoride containing drinking water by electrocoagulation using monopolar and bipolar electrode connections. Chemosphere, 73(9), 1393-1400.
Giri, A. S. & Golder, A. K. (2014). Ciprofloxacin degradation from aqueous solution by Fenton oxidation: reaction kinetics and degradation mechanisms. RSC Advances, 4(13), 6738-6745.
Grbić, B., Radić, N., Stojadinović, S., Vasilić, R., Dohčević-Mitrović, Z., Šaponjić, Z. & Stefanov, P. (2014). TiO2/WO3 photocatalytic composite coatings prepared by spray pyrolysis. Surface and Coatings Technology, 258, 763-771.
Hai, F. I., Yamamoto, K. & Fukushi, K. (2007). Hybrid treatment systems for dye wastewater. Critical Reviews in Environmental Science and Technology, 37(4), 315-377. doi: 10.1080/10643380601174723
Hakizimana, J. N., Gourich, B., Chafi, M., Stiriba, Y., Vial, C., Drogui, P. & Naja, J. (2017). Electrocoagulation process in water treatment: A review of electrocoagulation modeling approaches. Desalination, 404, 1-21.
Halimoon, N. & Yin, R. G. S. (2010). Removal of heavy metals from textile wastewater using zeolite. Environment Asia, 3(2010), 124-130.
Harif, T., Khai, M. & Adin, A. (2012). Electrocoagulation versus chemical coagulation: coagulation/flocculation mechanisms and resulting floc characteristics. Water research, 46(10), 3177-3188.
He, Z., Shi, Y., Gao, C., Wen, L., Chen, J. & Song, S. (2013). BiOCl/BiVO4 p-n heterojunction with enhanced photocatalytic activity under visible-light irradiation. The Journal of Physical Chemistry C, 118(1), 389-398.
Hilliard, S., Baldinozzi, G., Friedrich, D., Kressman, S., Strub, H., Artero, V. & Laberty-Robert, C. (2017). Mesoporous thin film WO3 photoanode for photoelectrochemical water splitting: a sol-gel dip coating approach. Sustainable Energy & Fuels, 1(1), 145-153.
Ho-Kimura, S., Moniz, S. J., Handoko, A. D. & Tang, J. (2014). Enhanced photoelectrochemical water splitting by nanostructured BiVO 4-TiO 2 composite electrodes. Journal of Materials Chemistry A, 2(11), 3948-3953.
Hong, S. J., Lee, S., Jang, J. S. & Lee, J. S. (2011). Heterojunction BiVO 4/WO 3 electrodes for enhanced photoactivity of water oxidation. Energy & Environmental Science, 4(5), 1781-1787.
Hu, L., Flanders, P. M., Miller, P. L. & Strathmann, T. J. (2007). Oxidation of sulfamethoxazole and related antimicrobial agents by TiO2 photocatalysis. Water research, 41(12), 2612-2626.
Hua, H., Xi, Y., Zhao, Z., Xie, X., Hu, C. & Liu, H. (2013). Gram-scale wet chemical synthesis of Ag2O/TiO2 aggregated sphere heterostructure with high photocatalytic activity. Materials Letters, 91, 81-83.
Huang, Z. F., Song, J., Pan, L., Zhang, X., Wang, L. & Zou, J. J. (2015). Tungsten oxides for photocatalysis, electrochemistry, and phototherapy. Advanced Materials, 27(36), 5309-5327.
Hunge, Y., Mahadik, M., Mohite, V., Kumbhar, S., Deshpande, N., Rajpure, K., . . . Bhosale, C. (2016). Photoelectrocatalytic degradation of methyl blue using sprayed WO 3 thin films. Journal of Materials Science: Materials in Electronics, 27(2), 1629-1635.
Hussain, S., Gul, S., Steter, J. R., Miwa, D. W. & Motheo, A. J. (2015). Route of electrochemical oxidation of the antibiotic sulfamethoxazole on a mixed oxide anode. Environmental Science and Pollution Research, 22(19), 15004-15015.
Hussin, F., Abnisa, F., Issabayeva, G. & Aroua, M. K. (2017). Removal of lead by solar-photovoltaic electrocoagulation using novel perforated zinc electrode. Journal of cleaner production, 147, 206-216.
Ioannidou, E., Frontistis, Z., Antonopoulou, M., Venieri, D., Konstantinou, I., Kondarides, D. I. & Mantzavinos, D. (2017). Solar photocatalytic degradation of sulfamethoxazole over tungsten-Modified TiO2. Chemical Engineering Journal, 318, 143-152.
Jaafarzadeh, N., Omidinasab, M. & Ghanbari, F. (2016). Combined electrocoagulation and UV-based sulfate radical oxidation processes for treatment of pulp and paper wastewater. Process Safety and Environmental Protection, 102, 462-472.
Ji, Y., Ferronato, C., Salvador, A., Yang, X. & Chovelon, J.-M. (2014). Degradation of ciprofloxacin and sulfamethoxazole by ferrous-activated persulfate: implications for remediation of groundwater contaminated by antibiotics. Science of The Total Environment, 472, 800-808.
Kansal, S., Singh, M. & Sud, D. (2007). Studies on photodegradation of two commercial dyes in aqueous phase using different photocatalysts. Journal of Hazardous Materials, 141(3), 581-590.
Ke, J., Liu, J., Sun, H., Zhang, H., Duan, X., Liang, P., . . . Wang, S. (2017). Facile assembly of Bi2O3/Bi2S3/MoS2n-p heterojunction with layered n-Bi2O3 and p-MoS2 for enhanced photocatalytic water oxidation and pollutant degradation. Applied Catalysis B: Environmental, 200, 47-55.
Khan, M. E., Khan, M. M. & Cho, M. H. (2016). Fabrication of WO 3 nanorods on graphene nanosheets for improved visible light-induced photocapacitive and photocatalytic performance. RSC Advances, 6(25), 20824-20833.
Khandegar, V. & Saroha, A. K. (2013). Electrocoagulation for the treatment of textile industry effluent – a review. Journal of environmental management, 128, 949-963.

<<Electrochemical Unit Operations in Industrial Wastewater Treatment>> ¯¯¯¯¯¯¯¯¯¯¯¯¯¯¯¯¯¯¯¯¯¯¯¯¯¯¯¯¯¯¯¯¯¯¯¯¯¯¯¯¯¯¯¯¯¯¯¯¯¯¯¯¯¯¯¯¯¯¯¯¯¯¯¯¯¯¯¯¯¯¯¯¯¯¯¯¯¯¯¯¯¯¯¯¯¯¯
______________________________________________________________________________________ 88
Kim, E. S., Kang, H. J., Magesh, G., Kim, J. Y., Jang, J.-W. & Lee, J. S. (2014). Improved photoelectrochemical activity of CaFe2O4/BiVO4 heterojunction photoanode by reduced surface recombination in solar water oxidation. ACS applied materials & interfaces, 6(20), 17762-17769.
Kobya, M., Ozyonar, F., Demirbas, E., Sik, E. & Oncel, M. (2015). Arsenic removal from groundwater of Sivas-Şarkişla Plain, Turkey by electrocoagulation process: comparing with iron plate and ball electrodes. Journal of Environmental Chemical Engineering, 3(2), 1096-1106.
Kruthika, N. L., Karthika, S., Raju, G. B. & Prabhakar, S. (2013). Efficacy of electrocoagulation and electrooxidation for the purification of wastewater generated from gelatin production plant. Journal of Environmental Chemical Engineering, 1(3), 183-188.
Kumar, M. P., Nidhi, M. & Srivastava, C. (2015). Electrochemical exfoliation of graphite to produce graphene using tetrasodium pyrophosphate. RSC Advances, 5(32), 24846-24852.
Kusmierek, E. & Chrzescijanska, E. (2015). Application of TiO2-RuO2/Ti electrodes modified with WO3 in electro-and photoelectrochemical oxidation of Acid Orange 7 dye. Journal of Photochemistry and Photobiology A: Chemistry, 302, 59-68.
Lawrence, K., Baker, C. L., James, T. D., Bull, S. D., Lawrence, R., Mitchels, J. M., . . . Marken, F. (2014). Functionalized carbon nanoparticles, blacks and soots as electron-transfer building blocks and conduits. Chemistry – An Asian Journal, 9(5), 1226-1241. doi: 10.1002/asia.201301657
Lawrence, K., Xia, F., Arrowsmith, R. L., Ge, H., Nelson, G. W., Foord, J. S., . . . Marken, F. (2014). Hydrothermal Conversion of One-Photon-Fluorescent Poly(4-vinylpyridine) into Two-Photon-Fluorescent Carbon Nanodots. Langmuir, 30(39), 11746-11752. doi: 10.1021/la404866s
Lee, M. G., Kim, D. H., Sohn, W., Moon, C. W., Park, H., Lee, S. & Jang, H. W. (2016). Conformally coated BiVO 4 nanodots on porosity-controlled WO 3 nanorods as highly efficient type II heterojunction photoanodes for water oxidation. Nano Energy, 28, 250-260.
Li, F., Zhang, L., Chen, X., Liu, Y., Xu, S. & Cao, S. (2017). Synergistically enhanced photocatalytic reduction of CO 2 on N-Fe codoped BiVO 4 under visible light irradiation. Physical Chemistry Chemical Physics, 19(32), 21862-21868.
Li, J.-h., Liu, Q. & Da, H.-f. (2007). Preparation of sulfur-free exfoliated graphite at a low exfoliation temperature. Materials Letters, 61(8-9), 1832-1834.
Li, J., Lv, S., Liu, Y., Bai, J., Zhou, B. & Hu, X. (2013). Photoeletrocatalytic activity of an n-ZnO/p-Cu 2 O/n-TNA ternary heterojunction electrode for tetracycline degradation. Journal of Hazardous Materials, 262, 482-488.
Li, Q., Yu, N., Qiu, Z., Zhou, X. & Wu, C. F. (2008). Preparation of modified carbon black with nano-scale size and enhanced stability in organic solvent by solid state method. Colloids and Surfaces A: Physicochemical and Engineering Aspects, 317(1-3), 87-92.
Li, Y., Zhang, L., Xiang, X., Yan, D. & Li, F. (2014). Engineering of ZnCo-layered double hydroxide nanowalls toward high-efficiency electrochemical water oxidation. Journal of Materials Chemistry A, 2(33), 13250-13258.
Linares Hernández, I., Barrera Díaz, C., Valdés Cerecero, M., Almazán Sánchez, P. T., Castañeda Juárez, M. & Lugo Lugo, V. (2017). Soft drink wastewater treatment by electrocoagulation-electrooxidation processes. Environmental technology, 38(4), 433-442.
Liu, C.-F., Huang, C., Hu, C.-C., Juang, Y. & Huang, C. (2016). Photoelectrochemical degradation of dye wastewater on TiO 2-coated titanium electrode prepared by electrophoretic deposition. Separation and Purification Technology, 165, 145-153.
Liu, G., Li, X., Han, B., Chen, L., Zhu, L. & Campos, L. C. (2017). Efficient degradation of sulfamethoxazole by the Fe (II)/HSO5− process enhanced by hydroxylamine: efficiency and mechanism. Journal of Hazardous Materials, 322, 461-468.
Liu, S., Wang, N., Zhang, Y., Li, Y., Han, Z. & Na, P. (2015). Efficient removal of radioactive iodide ions from water by three-dimensional Ag2O-Ag/TiO2 composites under visible light irradiation. Journal of Hazardous Materials, 284, 171-181.
Luo, J., Zhou, X., Ma, L. & Xu, X. (2015). Enhanced visible-light-driven photocatalytic activity of WO 3/BiOI heterojunction photocatalysts. Journal of Molecular Catalysis A: Chemical, 410, 168-176.
Ma, S., Xue, J., Zhou, Y. & Zhang, Z. (2014). Photochemical synthesis of ZnO/Ag 2 O heterostructures with enhanced ultraviolet and visible photocatalytic activity. Journal of Materials Chemistry A, 2(20), 7272-7280.
Malathi, A., Vasanthakumar, V., Arunachalam, P., Madhavan, J. & Ghanem, M. A. (2017). A low cost additive-free facile synthesis of BiFeWO6/BiVO4 nanocomposite with enhanced visible-light induced photocatalytic activity. Journal of Colloid and Interface Science, 506, 553-563.
Martins, A. S., Nuñez, L. & de Vasconcelos Lanza, M. R. (2017). Enhanced photoelectrocatalytic performance of TiO2 nanotube array modified with WO3 applied to the degradation of the endocrine disruptor propyl paraben. Journal of Electroanalytical Chemistry, 802, 33-39.

<<Electrochemical Unit Operations in Industrial Wastewater Treatment>> ¯¯¯¯¯¯¯¯¯¯¯¯¯¯¯¯¯¯¯¯¯¯¯¯¯¯¯¯¯¯¯¯¯¯¯¯¯¯¯¯¯¯¯¯¯¯¯¯¯¯¯¯¯¯¯¯¯¯¯¯¯¯¯¯¯¯¯¯¯¯¯¯¯¯¯¯¯¯¯¯¯¯¯¯¯¯¯
______________________________________________________________________________________ 89
Medel, A., Ramírez, J. A., Cardenas, J., Sires, I. & Meas, Y. (2019). Evaluating the electrochemical and photoelectrochemical production of hydroxyl radical during electrocoagulation process. Separation and Purification Technology, 208, 59-67.
Meng, A., Shao, J., Fan, X., Wang, J. & Li, Z. (2014). Rapid synthesis of a flower-like ZnO/rGO/Ag micro/nano-composite with enhanced photocatalytic performance by a one-step microwave method. RSC Advances, 4(104), 60300-60305.
Mohora, E., Rončević, S., Agbaba, J., Tubić, A., Mitić, M., Klašnja, M. & Dalmacija, B. (2014). Removal of arsenic from groundwater rich in natural organic matter (NOM) by continuous electrocoagulation/flocculation (ECF). Separation and Purification Technology, 136, 150-156.
Monfort, O., Pop, L.-C., Sfaelou, S., Plecenik, T., Roch, T., Dracopoulos, V., . . . Lianos, P. (2016). Photoelectrocatalytic hydrogen production by water splitting using BiVO4 photoanodes. Chemical Engineering Journal, 286, 91-97.
Monfort, O., Raptis, D., Satrapinskyy, L., Roch, T., Plesch, G. & Lianos, P. (2017). Production of hydrogen by water splitting in a photoelectrochemical cell using a BiVO4/TiO2 layered photoanode. Electrochimica Acta, 251, 244-249.
Monfort, O., Sfaelou, S., Satrapinskyy, L., Plecenik, T., Roch, T., Plesch, G. & Lianos, P. (2017a). Comparative study between pristine and Nb-modified BiVO4 films employed for photoelectrocatalytic production of H2 by water splitting and for photocatalytic degradation of organic pollutants under simulated solar light. Catalysis Today, 280, 51-57.
Monfort, O., Sfaelou, S., Satrapinskyy, L., Plecenik, T., Roch, T., Plesch, G. & Lianos, P. (2017b). Comparative study between pristine and Nb-modified BiVO 4 films employed for photoelectrocatalytic production of H 2 by water splitting and for photocatalytic degradation of organic pollutants under simulated solar light. Catalysis Today, 280, 51-57.
Moreira, F. C., Boaventura, R. A., Brillas, E. & Vilar, V. J. (2015). Degradation of trimethoprim antibiotic by UVA photoelectro-Fenton process mediated by Fe (III)-carboxylate complexes. Applied Catalysis B: Environmental, 162, 34-44.
Moreira, F. C., Boaventura, R. A., Brillas, E. & Vilar, V. J. (2017). Electrochemical advanced oxidation processes: a review on their application to synthetic and real wastewaters. Applied Catalysis B: Environmental, 202, 217-261.
Moreira, F. C., Garcia-Segura, S., Vilar, V. J., Boaventura, R. A. & Brillas, E. (2013). Decolorization and mineralization of Sunset Yellow FCF azo dye by anodic oxidation, electro-Fenton, UVA photoelectro-Fenton and solar photoelectro-Fenton processes. Applied Catalysis B: Environmental, 142, 877-890.
Moussa, D. T., El-Naas, M. H., Nasser, M. & Al-Marri, M. J. (2017). A comprehensive review of electrocoagulation for water treatment: Potentials and challenges. Journal of environmental management, 186, 24-41.
Naje, A. S., Chelliapan, S., Zakaria, Z. & Abbas, S. A. (2015). Enhancement of an electrocoagulation process for the treatment of textile wastewater under combined electrical connections using titanium plates. Int. J. Electrochem. Sci, 10(6), 4495-4512.
Ndlovu, T., Arotiba, O. A., Sampath, S., Krause, R. W. & Mamba, B. B. (2011). Electrochemical detection and removal of lead in water using poly(propylene imine) modified re-compressed exfoliated graphite electrodes. Journal of Applied Electrochemistry, 41(12), 1389-1396. doi: 10.1007/s10800-011-0360-6
Ndlovu, T., Mamba, B. B., Sampath, S., Krause, R. W. & Arotiba, O. A. (2014). Voltammetric detection of arsenic on a bismuth modified exfoliated graphite electrode. Electrochimica Acta, 128, 48-53. doi: 10.1016/j.electacta.2013.08.084
Neelavannan, M. & Basha, C. A. (2008). Electrochemical-assisted photocatalytic degradation of textile washwater. Separation and Purification Technology, 61(2), 168-174.
Neumann-Spallart, M., Shinde, S. S., Mahadik, M. & Bhosale, C. H. (2013). Photoelectrochemical degradation of selected aromatic molecules. Electrochimica Acta, 111, 830-836. doi: 10.1016/j.electacta.2013.08.080
Ntsendwana, B., Mamba, B. B., Sampath, S. & Arotiba, O. A. (2013). Synthesis, characterisation and application of an exfoliated graphite-diamond composite electrode in the electrochemical degradation of trichloroethylene. RSC Advances, 3(46), 24473-24483. doi: 10.1039/c3ra44977g
Ntsendwana, B., Peleyeju, M. G. & Arotiba, O. A. (2016). The application of exfoliated graphite electrode in the electrochemical degradation of p-nitrophenol in water. Journal of Environmental Science and Health – Part A Toxic/Hazardous Substances and Environmental Engineering, 51(7), 571-578. doi: 10.1080/10934529.2016.1141623
Ntsendwana, B., Sampath, S., Mamba, B. & Arotiba, O. (2013). Photoelectrochemical oxidation of p-nitrophenol on an expanded graphite-TiO 2 electrode. Photochemical & Photobiological Sciences, 12(6), 1091-1102.
Ntsendwana, B., Sampath, S., Mamba, B. B., Oluwafemi, O. S. & Arotiba, O. A. (2016). Photoelectrochemical degradation of eosin yellowish dye on exfoliated graphite-ZnO nanocomposite electrode. Journal of Materials Science: Materials in Electronics, 27(1), 592-598. doi: 10.1007/s10854-015-3793-6

<<Electrochemical Unit Operations in Industrial Wastewater Treatment>> ¯¯¯¯¯¯¯¯¯¯¯¯¯¯¯¯¯¯¯¯¯¯¯¯¯¯¯¯¯¯¯¯¯¯¯¯¯¯¯¯¯¯¯¯¯¯¯¯¯¯¯¯¯¯¯¯¯¯¯¯¯¯¯¯¯¯¯¯¯¯¯¯¯¯¯¯¯¯¯¯¯¯¯¯¯¯¯
______________________________________________________________________________________ 90
Oncel, M., Muhcu, A., Demirbas, E. & Kobya, M. (2013). A comparative study of chemical precipitation and electrocoagulation for treatment of coal acid drainage wastewater. Journal of Environmental Chemical Engineering, 1(4), 989-995.
Orimolade, B. O., Koiki, B. A., Zwane, B. N., Peleyeju, G. M., Mabuba, N. & Arotiba, O. A. (2019). Interrogating solar photoelectrocatalysis on an exfoliated graphite-BiVO 4/ZnO composite electrode towards water treatment. RSC Advances, 9(29), 16586-16595.
Ozyonar, F. (2016). Treatment of train industry oily wastewater by electrocoagulation with hybrid electrode pairs and different electrode connection modes. Int. J. Electrochem. Sci, 11(2), 1456-1471.
Patel, U. D., Ruparelia, J. & Patel, M. U. (2011). Electrocoagulation treatment of simulated floor-wash containing Reactive Black 5 using iron sacrificial anode. Journal of Hazardous Materials, 197, 128-136.
Peleyeju, M., Umukoro, E., Babalola, J. & Arotiba, O. (2016). Electrochemical Degradation of an Anthraquinonic Dye on an Expanded Graphite-Diamond Composite Electrode. Electrocatalysis, 7(2), 132-139.
Peleyeju, M. G. & Arotiba, O. A. (2018). Recent trend in visible-light photoelectrocatalytic systems for degradation of organic contaminants in water/wastewater. Environmental Science: Water Research and Technology, 4(10), 1389-1411. doi: 10.1039/c8ew00276b
Peleyeju, M. G., Umukoro, E. H., Tshwenya, L., Moutloali, R., Babalola, J. O. & Arotiba, O. A. (2017). Photoelectrocatalytic water treatment systems: degradation, kinetics and intermediate products studies of sulfamethoxazole on a TiO 2-exfoliated graphite electrode. RSC Advances, 7(64), 40571-40580.
Peleyeju, M. G., Umukoro, E. H., Tshwenya, L., Moutloali, R., Babalola, J. O. & Arotiba, O. A. (2017). Photoelectrocatalytic water treatment systems: Degradation, kinetics and intermediate products studies of sulfamethoxazole on a TiO<inf>2</inf>-exfoliated graphite electrode. RSC Advances, 7(64), 40571-40580. doi: 10.1039/c7ra07399b
Poh, H. L., Šaněk, F., Ambrosi, A., Zhao, G., Sofer, Z. & Pumera, M. (2012). Graphenes prepared by Staudenmaier, Hofmann and Hummers methods with consequent thermal exfoliation exhibit very different electrochemical properties. Nanoscale, 4(11), 3515-3522.
Prajapati, A. K., Chaudhari, P. K., Pal, D., Chandrakar, A. & Choudhary, R. (2016). Electrocoagulation treatment of rice grain based distillery effluent using copper electrode. Journal of Water Process Engineering, 11, 1-7.
Qin, J., Li, R., Lu, C., Jiang, Y., Tang, H. & Yang, X. (2015). Ag/ZnO/graphene oxide heterostructure for the removal of rhodamine B by the synergistic adsorption-degradation effects. Ceramics International, 41(3), 4231-4237.
Qiu, L., Cui, Y., Tan, X., Zheng, S., Zhang, H., Xu, J. & Wang, Q. (2019). Construction of Ag3PO4/Ag4P2O7 nanospheres sensitized hierarchical titanium dioxide nanotube mesh for photoelectrocatalytic degradation of methylene blue. Separation and Purification Technology, 215, 619-624.
Radjenovic, J. & Petrovic, M. (2017). Removal of sulfamethoxazole by electrochemically activated sulfate: implications of chloride addition. Journal of Hazardous Materials, 333, 242-249.
Rubí-Juárez, H., Barrera-Díaz, C., Linares-Hernández, I., Fall, C. & Bilyeu, B. (2015). A combined electrocoagulation-electrooxidation process for carwash wastewater reclamation. Int. J. Electrochem. Sci, 10(8), 6754-6767.
Sakai, Y., Shimanaka, A., Shioi, M., Kato, S., Satokawa, S., Kojima, T. & Yamasaki, A. (2015). Fabrication of high-sensitivity palladium loaded tungsten trioxide photocatalyst by photodeposite method. Catalysis Today, 241, 2-7.
Salazar, R., Garcia-Segura, S., Ureta-Zañartu, M. S. & Brillas, E. (2011). Degradation of disperse azo dyes from waters by solar photoelectro-Fenton. Electrochimica Acta, 56(18), 6371-6379. doi: 10.1016/j.electacta.2011.05.021
Sánchez-Martínez, D., Martínez-De La Cruz, A. & López-Cuéllar, E. (2013). Synthesis of WO3 nanoparticles by citric acid-assisted precipitation and evaluation of their photocatalytic properties. Materials Research Bulletin, 48(2), 691-697.
Sarkar, D., Ghosh, C. K., Mukherjee, S. & Chattopadhyay, K. K. (2012). Three dimensional Ag2O/TiO2 type-II (p-n) nanoheterojunctions for superior photocatalytic activity. ACS applied materials & interfaces, 5(2), 331-337.
Schwarzenbach, R. P., Escher, B. I., Fenner, K., Hofstetter, T. B., Johnson, C. A., Von Gunten, U. & Wehrli, B. (2006). The challenge of micropollutants in aquatic systems. Science, 313(5790), 1072-1077.
Sfaelou, S., Pop, L.-C., Monfort, O., Dracopoulos, V. & Lianos, P. (2016). Mesoporous WO3 photoanodes for hydrogen production by water splitting and PhotoFuelCell operation. International Journal of Hydrogen Energy, 41(14), 5902-5907.
Shang, M., Wang, W., Sun, S., Ren, J., Zhou, L. & Zhang, L. (2009). Efficient visible light-induced photocatalytic degradation of contaminant by spindle-like PANI/BiVO4. The Journal of Physical Chemistry C, 113(47), 20228-20233.

<<Electrochemical Unit Operations in Industrial Wastewater Treatment>> ¯¯¯¯¯¯¯¯¯¯¯¯¯¯¯¯¯¯¯¯¯¯¯¯¯¯¯¯¯¯¯¯¯¯¯¯¯¯¯¯¯¯¯¯¯¯¯¯¯¯¯¯¯¯¯¯¯¯¯¯¯¯¯¯¯¯¯¯¯¯¯¯¯¯¯¯¯¯¯¯¯¯¯¯¯¯¯
______________________________________________________________________________________ 91
Shannon, M. A., Bohn, P. W., Elimelech, M., Georgiadis, J. G., Marĩas, B. J. & Mayes, A. M. (2008). Science and technology for water purification in the coming decades. Nature, 452(7185), 301-310. doi: 10.1038/nature06599
States, S. S. I. o. t. U., America, S. S. I. o. N., Institute, N. D., Iron, A. & Institute, S. (1993). Design Guidelines for the Selection and Use of Stainless Steel: Specialty Steel Industry of the United States.
Suárez-Escobar, A., Pataquiva-Mateus, A. & López-Vasquez, A. (2016). Electrocoagulation—photocatalytic process for the treatment of lithographic wastewater. Optimization using response surface methodology (RSM) and kinetic study. Catalysis Today, 266, 120-125.
Sun, J., Guo, Y., Wang, Y., Cao, D., Tian, S., Xiao, K., . . . Zhao, X. (2018). H2O2 assisted photoelectrocatalytic degradation of diclofenac sodium at g-C3N4/BiVO4 photoanode under visible light irradiation. Chemical Engineering Journal, 332, 312-320.
Sun, Y., Qu, B., Liu, Q., Gao, S., Yan, Z., Yan, W., . . . Xie, Y. (2012). Highly efficient visible-light-driven photocatalytic activities in synthetic ordered monoclinic BiVO 4 quantum tubes-graphene nanocomposites. Nanoscale, 4(12), 3761-3767.
Tang, M., Xu, X., Wu, T., Zhang, S., Li, X. & Li, Y. (2014). Polyacrylamide grafting of modified graphene oxides by in situ free radical polymerization. Materials Research Bulletin, 60, 576-583.
Theerthagiri, J., Senthil, R., Malathi, A., Selvi, A., Madhavan, J. & Ashokkumar, M. (2015). Synthesis and characterization of a CuS-WO 3 composite photocatalyst for enhanced visible light photocatalytic activity. RSC Advances, 5(65), 52718-52725.
Thiam, A., Zhou, M., Brillas, E. & Sirés, I. (2014). Two-step mineralization of Tartrazine solutions: study of parameters and by-products during the coupling of electrocoagulation with electrochemical advanced oxidation processes. Applied Catalysis B: Environmental, 150, 116-125.
Tian, M., Adams, B., Wen, J., Asmussen, R. M. & Chen, A. (2009). Photoelectrochemical oxidation of salicylic acid and salicylaldehyde on titanium dioxide nanotube arrays. Electrochimica Acta, 54(14), 3799-3805.
Tian, Y., He, W., Zhu, X., Yang, W., Ren, N. & Logan, B. E. (2016). Energy efficient electrocoagulation using an air-breathing cathode to remove nutrients from wastewater. Chemical Engineering Journal, 292, 308-314.
Tolod, K., Hernández, S. & Russo, N. (2017). Recent advances in the BiVO4 photocatalyst for sun-driven water oxidation: top-performing photoanodes and scale-up challenges. Catalysts, 7(1), 13.
Touahria, S., Hazourli, S., Touahria, K., Eulmi, A. & Aitbara, A. (2016). Clarification of Industrial Mining Wastewater Using Electrocoagulation. Int, J. Electrochem. Sci, 11, 5710-5723.
Trostová, S., Stibor, I., Karpíšková, J., Kolská, Z. & Švorčík, V. (2013). Characterization of surface chemical modified carbon nano-particles. Materials Letters, 102, 83-86.
Tshwenya, L. & Arotiba, O. A. (2017). Ethylenediamine functionalized carbon nanoparticles: Synthesis, characterization, and evaluation for cadmium removal from water. RSC Advances, 7(54), 34226-34235. doi: 10.1039/c7ra04709f
Uddin, A. I., Phan, D.-T. & Chung, G.-S. (2015). Low temperature acetylene gas sensor based on Ag nanoparticles-loaded ZnO-reduced graphene oxide hybrid. Sensors and Actuators B: Chemical, 207, 362-369.
Ulu, F., Barışçı, S., Kobya, M. & Sillanpää, M. (2015). An evaluation on different origins of natural organic matters using various anodes by electrocoagulation. Chemosphere, 125, 108-114.
Umukoro, E. H., Kumar, N., Ngila, J. C. & Arotiba, O. A. (2018). Expanded graphite supported pn MoS2-SnO2 heterojunction nanocomposite electrode for enhanced photo-electrocatalytic degradation of a pharmaceutical pollutant. Journal of Electroanalytical Chemistry, 827, 193-203. doi: 10.1016/j.jelechem.2018.09.027
Umukoro, E. H., Madyibi, S. S., Peleyeju, M. G., Tshwenya, L., Viljoen, E. H., Ngila, J. C. & Arotiba, O. A. (2017). Photocatalytic application of Pd-ZnO-exfoliated graphite nanocomposite for the enhanced removal of acid orange 7 dye in water. Solid State Sciences, 74, 118-124. doi: 10.1016/j.solidstatesciences.2017.11.001
Umukoro, E. H., Peleyeju, M. G., Idris, A. O., Ngila, J. C., Mabuba, N., Rhyman, L., . . . Arotiba, O. A. (2018). Photoelectrocatalytic application of palladium decorated zinc oxide-expanded graphite electrode for the removal of 4-nitrophenol: Experimental and computational studies. RSC Advances, 8(19), 10255-10266. doi: 10.1039/c8ra00180d
Umukoro, E. H., Peleyeju, M. G., Ngila, J. C. & Arotiba, O. A. (2016a). Photocatalytic degradation of acid blue 74 in water using Ag-Ag<inf>2</inf>O-Zno nanostuctures anchored on graphene oxide. Solid State Sciences, 51, 66-73. doi: 10.1016/j.solidstatesciences.2015.11.015
Umukoro, E. H., Peleyeju, M. G., Ngila, J. C. & Arotiba, O. A. (2016b). Photoelectrochemical degradation of orange II dye in wastewater at a silver-zinc oxide/reduced graphene oxide nanocomposite photoanode. RSC Advances, 6(58), 52868-52877. doi: 10.1039/c6ra04156f

<<Electrochemical Unit Operations in Industrial Wastewater Treatment>> ¯¯¯¯¯¯¯¯¯¯¯¯¯¯¯¯¯¯¯¯¯¯¯¯¯¯¯¯¯¯¯¯¯¯¯¯¯¯¯¯¯¯¯¯¯¯¯¯¯¯¯¯¯¯¯¯¯¯¯¯¯¯¯¯¯¯¯¯¯¯¯¯¯¯¯¯¯¯¯¯¯¯¯¯¯¯¯
______________________________________________________________________________________ 92
Umukoro, E. H., Peleyeju, M. G., Ngila, J. C. & Arotiba, O. A. (2017). Towards wastewater treatment: Photo-assisted electrochemical degradation of 2-nitrophenol and orange II dye at a tungsten trioxide-exfoliated graphite composite electrode. Chemical Engineering Journal, 317, 290-301. doi: 10.1016/j.cej.2017.02.084
Unal, B. O., Dizge, N., Karagunduz, A. & Keskinler, B. (2019). Combined electrocoagulation and electrooxidation process in electro membrane bioreactor to improve membrane filtration effectiveness. Bioresource Technology Reports, 100237.
Vogelpohl, A. & Kim, S. M. (2004). Advanced oxidation processes (AOPS) in wastewater treatment. Journal of Industrial and Engineering Chemistry, 10(1), 33-40.
Wang, M., Che, Y., Niu, C., Dang, M. & Dong, D. (2013). Effective visible light-active boron and europium co-doped BiVO4 synthesized by sol-gel method for photodegradion of methyl orange. Journal of Hazardous Materials, 262, 447-455.
Wang, P., Huang, B., Zhang, Q., Zhang, X., Qin, X., Dai, Y., . . . Lou, Z. (2010). Highly efficient visible light plasmonic photocatalyst Ag@ Ag (Br, I). Chemistry – A European Journal, 16(33), 10042-10047.
Wang, P., Tang, Y., Dong, Z., Chen, Z. & Lim, T.-T. (2013). Ag-AgBr/TiO 2/RGO nanocomposite for visible-light photocatalytic degradation of penicillin G. Journal of Materials Chemistry A, 1(15), 4718-4727.
Wang, S., Yun, J.-H., Luo, B., Butburee, T., Peerakiatkhajohn, P., Thaweesak, S., . . . Wang, L. (2017). Recent progress on visible light responsive heterojunctions for photocatalytic applications. Journal of Materials Science & Technology, 33(1), 1-22.
Wang, Y., Lin, H., Jin, F., Niu, J., Zhao, J., Bi, Y. & Li, Y. (2016). Electrocoagulation mechanism of perfluorooctanoate (PFOA) on a zinc anode: Influence of cathodes and anions. Science of The Total Environment, 557, 542-550.
Watkins, J. D., Lawrence, R., Taylor, J. E., Bull, S. D., Nelson, G. W., Foord, J. S., . . . Gascon, S. A. (2010). Carbon nanoparticle surface functionalisation: converting negatively charged sulfonate to positively charged sulfonamide. Physical Chemistry Chemical Physics, 12(18), 4872-4878.
Wei, Z., Liang, F., Liu, Y., Luo, W., Wang, J., Yao, W. & Zhu, Y. (2017). Photoelectrocatalytic degradation of phenol-containing wastewater by TiO 2/gC 3 N 4 hybrid heterostructure thin film. Applied Catalysis B: Environmental, 201, 600-606.
Weng, B., Wu, J., Zhang, N. & Xu, Y.-J. (2014). Observing the role of graphene in boosting the two-electron reduction of oxygen in graphene-WO3 nanorod photocatalysts. Langmuir, 30(19), 5574-5584.
WWF-SA. (2016). Water: Facts and Futures-Rethinking South Africa's Water Future: WWF-SA Cape Town. Xia, L., Bai, J., Li, J., Zeng, Q., Li, L. & Zhou, B. (2017). High-performance BiVO 4 photoanodes cocatalyzed
with an ultrathin α-Fe 2 O 3 layer for photoelectrochemical application. Applied Catalysis B: Environmental, 204, 127-133.
Xia, L., Bai, J., Li, J., Zeng, Q., Li, X. & Zhou, B. (2016). A highly efficient BiVO 4/WO 3/W heterojunction photoanode for visible-light responsive dual photoelectrode photocatalytic fuel cell. Applied Catalysis B: Environmental, 183, 224-230.
Yan, J., Chen, Z., Ji, H., Liu, Z., Wang, X., Xu, Y., . . . Xu, H. (2016). Construction of a 2D Graphene‐Like MoS2/C3N4 Heterojunction with Enhanced Visible‐Light Photocatalytic Activity and Photoelectrochemical Activity. Chemistry – A European Journal, 22(14), 4764-4773.
Yang, J.-S. & Wu, J.-J. (2017). Low-potential driven fully-depleted BiVO4/ZnO heterojunction nanodendrite array photoanodes for photoelectrochemical water splitting. Nano Energy, 32, 232-240.
Yang, N., Zhai, J., Wang, D., Chen, Y. & Jiang, L. (2010). Two-dimensional graphene bridges enhanced photoinduced charge transport in dye-sensitized solar cells. ACS nano, 4(2), 887-894.
Yao, S., Qu, F., Wang, G. & Wu, X. (2017). Facile hydrothermal synthesis of WO3 nanorods for photocatalysts and supercapacitors. Journal of Alloys and Compounds, 724, 695-702.
Yu, X., Zhang, Y. & Cheng, X. (2014). Preparation and photoelectrochemical performance of expanded graphite/TiO2 composite. Electrochimica Acta, 137, 668-675.
Yuan, Y.-J., Wang, F., Hu, B., Lu, H.-W., Yu, Z.-T. & Zou, Z.-G. (2015). Significant enhancement in photocatalytic hydrogen evolution from water using a MoS 2 nanosheet-coated ZnO heterostructure photocatalyst. Dalton Transactions, 44(24), 10997-11003.
Zhang, J., Li, M., Feng, Z., Chen, J. & Li, C. (2006). UV Raman spectroscopic study on TiO2. I. Phase transformation at the surface and in the bulk. The Journal of Physical Chemistry B, 110(2), 927-935.
Zhang, J., Ma, Y., Du, Y., Jiang, H., Zhou, D. & Dong, S. (2017). Carbon nanodots/WO 3 nanorods Z-scheme composites: Remarkably enhanced photocatalytic performance under broad spectrum. Applied Catalysis B: Environmental, 209, 253-264.
Zhang, J., Yang, H., Shen, G., Cheng, P., Zhang, J. & Guo, S. (2010). Reduction of graphene oxide via L-ascorbic acid. Chemical Communications, 46(7), 1112-1114.
Zhang, L., Du, L., Yu, X., Tan, S., Cai, X., Yang, P., . . . Mai, W. (2014). Significantly enhanced photocatalytic activities and charge separation mechanism of Pd-decorated ZnO-graphene oxide nanocomposites. ACS applied materials & interfaces, 6(5), 3623-3629.

<<Electrochemical Unit Operations in Industrial Wastewater Treatment>> ¯¯¯¯¯¯¯¯¯¯¯¯¯¯¯¯¯¯¯¯¯¯¯¯¯¯¯¯¯¯¯¯¯¯¯¯¯¯¯¯¯¯¯¯¯¯¯¯¯¯¯¯¯¯¯¯¯¯¯¯¯¯¯¯¯¯¯¯¯¯¯¯¯¯¯¯¯¯¯¯¯¯¯¯¯¯¯
______________________________________________________________________________________ 93
Zhang, L. & Jaroniec, M. (2018). Toward designing semiconductor-semiconductor heterojunctions for photocatalytic applications. Applied Surface Science, 430, 2-17.
Zhang, T., Su, J. & Guo, L. (2016). Morphology engineering of WO 3/BiVO 4 heterojunctions for efficient photocatalytic water oxidation. CrystEngComm, 18(46), 8961-8970.
Zhang, X., Yang, Y., Ding, S., Que, W., Zheng, Z. & Du, Y. (2017). Construction of High-Quality SnO2@ MoS2 Nanohybrids for Promising Photoelectrocatalytic Applications. Inorganic Chemistry, 56(6), 3386-3393.
Zhao, Q., Cheng, X., Wu, J. & Yu, X. (2014). Sulfur-free exfoliated graphite with large exfoliated volume: Preparation, characterization and its adsorption performance. Journal of Industrial and Engineering Chemistry, 20(6), 4028-4032.
Zhao, W., Liu, Y., Wei, Z., Yang, S., He, H. & Sun, C. (2016). Fabrication of a novel p-n heterojunction photocatalyst n-BiVO4@ p-MoS2 with core-shell structure and its excellent visible-light photocatalytic reduction and oxidation activities. Applied Catalysis B: Environmental, 185, 242-252.
Zhi, J.-F., Wang, H.-B., Nakashima, T., Rao, T. N. & Fujishima, A. (2003). Electrochemical incineration of organic pollutants on boron-doped diamond electrode. Evidence for direct electrochemical oxidation pathway. The Journal of Physical Chemistry B, 107(48), 13389-13395.
Zhou, J., Zhao, F., Wang, Y., Zhang, Y. & Yang, L. (2007). Size-controlled synthesis of ZnO nanoparticles and their photoluminescence properties. Journal of luminescence, 122, 195-197.
Zhou, M., Dai, Q., Lei, L., Ma, C. a. & Wang, D. (2005). Long life modified lead dioxide anode for organic wastewater treatment: electrochemical characteristics and degradation mechanism. Environmental science & technology, 39(1), 363-370.
Zhou, Y., Zhang, L., Lin, L., Wygant, B. R., Liu, Y., Zhu, Y., . . . Zhang, X. (2017). Highly efficient photoelectrochemical water splitting from hierarchical WO3/BiVO4 nanoporous sphere arrays. Nano Letters, 17(12), 8012-8017.
Zhu, A., Zhao, Q., Li, X. & Shi, Y. (2013). BiFeO3/TiO2 nanotube arrays composite electrode: construction, characterization, and enhanced photoelectrochemical properties. ACS applied materials & interfaces, 6(1), 671-679.
Zhu, W., Sun, F., Goei, R. & Zhou, Y. (2017). Facile fabrication of RGO-WO3 composites for effective visible light photocatalytic degradation of sulfamethoxazole. Applied Catalysis B: Environmental, 207, 93-102.