EIG Adaptive Liquid Crystal TV Based - DTIC
168
- EIG Adaptive Liquid Crystal TV Based--joint Transform Correlator as Applied to Real-Time Pattern Recognition- Final -Report By: 'Principal Investigator Department of Electrical an-d Computer Engtineering, The, Pennsyl vantia State-University - University Par~k-, -PA -16802 Prepard for:- Army Res'narchi Of fice - P.0. -Box 122-11 Research Triang le Park, NC 27709-2211- Attentiow -Bobby D-. Guenther Contract DAALO3-87-K-0147 ARO Proposal Number 25146-PH Period Covered: October 1, 1987 to March 31, 1991 Date: May 23, 19091
-
Upload
khangminh22 -
Category
Documents
-
view
2 -
download
0
Transcript of EIG Adaptive Liquid Crystal TV Based - DTIC

- EIG
Adaptive Liquid Crystal TV Based--joint Transform Correlatoras Applied to Real-Time Pattern Recognition-
Final -Report
By:
'Principal Investigator
Department of Electrical an-d Computer Engtineering,The, Pennsyl vantia State-University -
University Par~k-, -PA -16802
Prepard for:-
Army Res'narchi Of fice -
P.0. -Box 122-11Research Triang le Park, NC 27709-2211-
Attentiow -Bobby D-. Guenther
Contract DAALO3-87-K-0147
ARO Proposal Number 25146-PH
Period Covered: October 1, 1987 to March 31, 1991
Date: May 23, 19091

MASTER COPY KEEP TIS COPY FOR REPROLUCTION PUrDOSES
REPRTD~UM NTTIN AG Form ApprovedREOR DCU ETAIO.PG I 0MR No 0704-0 188
Pvolic 'eoort-PQ oi,,oer : ~ ~~o f rfc~rhazior s estrnato -c i3e'aqe I our zie, e~c.rse ni. ,dh te .-me or eve-nq instraConi searching exwr q :ata oarcelpn ,"ana .santaininq the J1ata neteed 3rd commoeting and revier'' ttle ci.~urnf -%rrn'aton 3end C7' r n reqarcing tnis ourden eitimate or any otiser asoecx &f this
%oleiton f! itortyatw, r-a-rng sagetitons 'or ea.ng this ourder tj ,% mnrrqton 'eadcuare,s ,er-m.5ei r.orarte fr rlo'-a; on Qoe'a- or5 and uevots 14 15 etiersonOasr'gi-ay. Suite tiQ4 Arlirqwtn. A 22C2-4302 3.d to tne Offie ;I-.anagemnent and d.Oget Paoer~orn Red,;.cn P in - 5C4-0i88) 4asoingtoo _-C U503
1. AGENCY USE ONLY (Leave blank) 12. REPORT DATE 3. REPORT TYPE AND DATES ':ovERED
I May 23, 1991 lFinal Report - 10/i/87 - 3/31/914. TI TLE AND SUBTITLE 1 5. FUNDING NUMBERS
Adaptive Liquid Crystal TV Based joint Transform
Correlator as Applied to Real-lime Pattern Recognition~6. AUTHOR(S)
Francis T.S. Yu '(347- / /e:L
7. PERFORMING ORGANIZATION NAME(S) AND ADDRESS(ES) 8. PERFORMING ORGANIZATION
Department of Electrical and Computer Engineering REPORT NUMBER
The Peainsylvania State University NA
University Park, PA 16802
9. SPONSORING; MONITORING AGENCY NAME(S) AND ADDRESS(ES) 10. SPONSORING, MONITORING
U. S. Army Research Office AGENCY REPORT NUMBERP. 0. Box 12211Research Triangle Park, NC 27709-2211,A 69.- k
11. SUPPLEMENTARY NOTES
The view, opinions and/or findings conta-Lned in .hls report are those of theauthor(s) and should not be construed as an official Department of the Armyposition,.policy, or decision, unless so designated by other documentation.J
12a. DISTRIBUTION / AVAILABILITY STATEMENT 12b. DISTRIBUTION CODE
Approved for public release; distribution unlimited. I13. ABSTRACT (Maximum 200 words)
The primary goal of this research is to study a programmable joint-transformcorrelator (JTC) using liquid crystal television (LCIV) anels for adaptive real-time pattern recognition applications. The technique can improve the patternrecognition and identification technology that is of interest to the U.S. Army. Thetechnique we studied is a real-time programmable electro-op-tical architecture. TherEare several reasons for selecting the optical technique over their digital andelectronic counterparts, as follows: Optical technique is capable of hand'ing alarge space-bandwidth Image; optical technique is capable of performing parallelOperations; optics can perform massive interconnections; optical transformation canbe operated at high speed, etc. By using the LCTV, the pattern under observationLall UU (UrreIdte(J withI d large number of recallable image memories . Tin addition,the LCTV technique is rather simple and economical to operate. The LCTV1-opticacorrelator, in principle, can be designed into a Compact portable form for insituapplication. Brief outl.-ines of the major research findings and publications areprovided in this report.
14SBETTRSJoint transform correlator, liquid crystal I5 NUMBER OF PAGEStelevision CorrelatIlor, optical pattern recoonitinn I 16A4f16. PRICE CODE
117 SECURITY CLASSIFICAT~iON I 18. SECURITY CLASSiFICATION 19. SECURITY CLASSIFICATION 120. LIMITATION OF ABSTRACOF REPORT OF THIS PAGE OF ASiRACT
I NLSSFE UNCLASSIFIED UNCLASSI.FIED UL15-:03.-011 280-5500 Siiadaro -o-m 298 tRev 2 9
-V-.S .

25146-PH
FINAL REPORT
1. ARO PROPOSAL NUMBER: 25146-PH2. PERIOD COVERED BY REPORT: July 1, 1988 - March 31, 19913. TITLE OF PROPOSAL: Adaptive Liquid Crystal TV Based Joint
Transform Correlator as Applied to Real-TimePattern Recognition
4. CONTRACT OR GRANT NUMBER: DAAL03-87-K-0147U - 2AzUi Opf rNS.MTrnUO; Telyin'le,.1tuf, S VL"L I The Pennsylania State Uni;yrsi.y6 AUTHORS OF REPORT: Francis T.S. Yu
CONTENTS Page
7. List of Publications/Manuscripts ..... .................. . 1
8. Scientific Personnel ...... .... ........................ 5
8.1 Scientific Personnel ............. ................. 538.2 Degrees Awarded. .. .. . ........ ...... ......
9. Brief Outline of Research Findings ...... ................. 5
1 9.1 Rotation Invariant Pattern Recognition ..... ............ 69.2 Effects on Fringe Binarization ...... .............. 79.3 Detection Efficiencies ....... ...................... 79.4 JTC Color Pattern Recognition ....... ........... .. . 79.5 Comparison of Vander Lugt and Joint Transform
Corr.lators ..... ...... ....................... 89.6 LCTV C.lor Encoder ...... ......................... 89.7 Whte &% Ligh JT.. .. .. ........ . ... .. ..... 89.8 High Efficient JTC ...... ....................... . 99.9 Autonomous Tarjet Tracking. . ................. 99.10 Image Deconvolution ...... ..... ................. 10.ll Recontfgurable Interconnections ....... .............. 10
9.12 Binary Phase Correction ...... ................... .. 119.13 Tmage Classification ........ .................... .119.14 IPA Neuiral Network ...... ........................ .129.15 LCTV Neural Network ...... ... .................. ..129.16 Nonconventional JTC ..... ....................... .. 139.17 Multi-Target Tracking ....... .................... .. 139.18 Unsupervised Learning Neural Net ....... ........... .149.19 Color Holography Using LiNbO ...... .............. . 159.20 Compact LCTV Neural Network ................. 159.21 Wavelength Multip'exed Matched Filters .... ......... ..169.22 Space-Ti'je-Sharing Neural Network ..... .............. .179.23 Binary Pha'-e Only JTC ....... ................... .. 179.24 Remarks ..... ..... ........................... .18
3 References ...... ..... ............................. .19
I

ICONTENTS (Cont.) p~t
310. APPENDIX: Publications .. .. ... ....... ......... 22
10.1 Rotation Invariant Pattern Recognition .. .. .... .... 2210.2 Effects on Fringe Binarization .. .. .... ..........I10.3 Detection Efficiencies. .. .. ... ....... ...... 31010.4 jTC Color Pattern Recognition .. .. .... ..........910.5 Comparison Vander Lugt and Joint Transform Correlators. .. ...10. ukTV Color Encoder. .. .. .. ........ ........ 57
10.7 White-Light JTC .. .. ... ....... ....... . .. 6310.8 High-Efficient JTC. .. .. ... ....... ........ 6710.9 Autor~omous Target Tracking. .. .. .. ........ . ... 7110.10 Image Deconvolution .. .. ... ....... ......... 910.11 Reconfigurable Interconnections. .. ..... ........ 9010.12 Binary Phase Correction .. .. ... ....... ...... 99I10.13 Image Classification. .. .. .. ........ ....... 10410.14 IPA Neural Network. .. .. .. ....... ......... 10810.15 LCTV Neural Network .. .. ... ........ ....... 11410.16 Nonconventional JTC .. .. ... ........ ....... 11810.17 Multi-Target Tracking .. .. ... ....... ....... 122
1.8Unsunervised Neural Net .. .. ... ....... ...... 1311.9Color Holography Using LiNb0 . .. .. .... ......... 139
10.20 Compact LCTV Neural Network.. .. .. .. ....... .... 14510.21 Wavelength Multiplexed Matched Filters .. .. ..... . ... 14910.22 Space-Time-Sharing Neural Network. .. ..... ....... 155I10.23 Binary Phase Only JTC .. .. .. ........ ....... 159

" 1
7. LIST OF MANUSCRIPTS'SUBMITTED OR PUBLISHED UNDER ARO SPONSORSHIP DURINGTHIS REPORTING PERIOD, INCLUDING JOURNAL REFERENCES:
F.T.S. Yu and T. Nagata, "Binary Phase only Joint Transform Correlator,"Microwave and Optical Technology Letters, Vol. 2, pp. 15-19, January1989.
F. T. S. Yu, S. Jutamulia, R. V. Yelamarty and D. Gregory, "AdaptiveJoint Transform Correlator for Real-Time Color Pattern Recognition,"Optics and Laser Technology, Vol. 21, pp. 189-192, June 1989.
F.T.S. Yu, C. Zhang, Y. Jin and S. Jutamulia, "Application ofHolographic Associative Memory to a Hybrid Binary Adder," SiELProceedino on Holographic Optics: Design and Application, Vol. 883, pp.254-259, January 1988.
F.T.S. Yu, S. Jutamulia and E. Tam, "Gray Level Pseudocolor Encodingusing a Liquid Crystal Television," Journal of Ontics, Vol. 19, pp.129-123, May-June 1989.
F.T.S. Yu, F. Cheng, T. Nagata, and Don A. Gregory, "Effects of FringeBinarization on Multi-Object Joint Transform Correlation," AppliedOptics, Vol. 28, pp. 2988-2990, August 1989.
D. A. Gregory, J. A. Loudin and F.T.S. Yu, "Illumination Dependence ofthe Joint Transform Correlation," Applied Optics, Vol. 28, pp.3288-3290, August 1989.
F.T.S. Yu, Q. W. Song, Y. S. Cheng and D. A. Gregory, "Comparison ofDetection Efficiencies for Vander Lugt and Joint Transform Correlators,"Applied Optics, Vol. 29, pp. 225-232, January 1990.
F.T.S. Yu, X. Li, E. Tam, S. Jutamulia and D. A. Gregory, "RotationalInvariant Pattern Recognition with a Programmable Joint TransformCorrelator," Proceeding of 1988 Conference on Pattern Recognition forAdvance Missile Systems, November 14-15, 1988.
T. W. Lu, S. D. Wu, X. Xu, and F.T.S. Yu, "A 2-D Programmable OpticalNeural Network," Applied Optics, Vol. 28, pp. 4908-4913, November 1989.
F.T.S. Yu, X. Y. Li, E. Tam, S. Jutamulia and D. A. Gregory, "Rotation-Invariant Pattern Recognition with a Programmable Joint TransformCorrelator," Applied Optics, Vol. 28, pp. 4725-4727, November 1989.
X. J. Lu, F.T.S. Yu and D. A. Gregory, "Analytical Comparison of VanderLugt and Joint Transform Optical Correlators," Applied Physics U, Vol.51, pp. 153-164, August 1990.
F.T.S. Yu, E. Tam, and D. A. Gregory, "High Efficient Joint TransformCorrelator," Optics Letters, Vol. 15, pp. 1029-1031, September 1990.

F.T.S. Yu, C. H. Zhang, Y. Ji and D. A. Gregory, "Nonconventional JointT ransform Correlator. . Optic-s Letters, Vol. 14, pp 2-2,September1989.
F.T.S. Yu, Y. *jin and C. Zh1ai-g, *3ymboiic Logic Processing usingCascaded LCTVs,* Microwave and Optical Technology Letters, pp. 309--1-313,
I T. Lu, S. WU. X. Xii and F.T.S. Nru, "Optical Implementation 01Programmable Neural Netw~ork,- Proceeding of-SPIE on Onti' al PatternRecognition, Vol. 1053, January 1989.II .T.S. iu, ,!'m X. :i, and D. A. Gregory, "Detection of Rotationaland Scale Varying Objects with a Programmable Joint TransformCorrelator," Proceeding of qPiE on ODLical Pattern Recognition. Vol.1053, January 1989.
r% . Tam. F.T.S. Yu and D. A. Gregory, "Target Trackingr with anAdaptive Joint Transform Correlator," Prc%,-eedings on SPIE Conference onAergo pace i _atterv Recognition, Vol. 1098, March 99
5 S. Wu, T. W. Lu, X. Yu and P.T.S. Vu, "~An Adaptive Optical NeuralNetwork using ;i, High Resolution Video M1-nitor, Mi1crowa-e and' OpticalTe chnology Letters, Vol. 2, pp. 252-25-7, July 1989.
IT. W. Lu, X. Xu, S. Wu and F.T.S. Yu , "A Neural Network Mlodel usins:inter-Pattern Association M.PAI -ppl ied ffptics. Vol. 29, pp. 284-288,3 January .1990.T. W. Lu, X. Ya, S. Wu and F.T.S. Vi. 1 A .~- usin
Inter-Pattern Association (IA)*Proceeen oi the international joint3Conference on Neural Netiarks. Vol. 1, p.596, .June 18-22, 1989.
F. Cheng, X. Xu, S. Wu, F.T.S. Yu and D. A. Gregory, *REstoration ofrinarotinrluredimages using a joint Transform Drocessor,"
Proceeding ot tne SPIE Conference on Op~tical Iinformation Processina.-Az11g. ~~* 99
I XY. Li, F.T.S. .and 0. A. Gregory, "'ha mole::nt-a-ion of theKi t tle r Transform - )r Image Cilassification," Pruceeding of -he SPIEConference on Outi ~al information ProcessingAg.91, 99
S. Wu, Q. Song. A. Mayers, F.T.S. Yu andl D. A. 'Gregory, - Recon fi vurabtierconn--t ions I'si-ng Non''inea htrfat Crystal".~ Applied
Opti__cs, .'oi. 9,. 1-P2. March 19390.
FCheng, .Y . S. Wu, ... Y andi 0.. Greg ory, "Restoration ofInaes lured%~ o Lnea Mtio Usnga Joint Transior Procession."
Vic.-owave and Ont;icani TechnoMogy Letters. V.. n n. 2 -27 anuarv.

I
13Tam, S. Wu, A. Tanone. F.T.S. lu and D. A. Grugory, "Closed-Loop
Binary Phase Connection of a LCTV Using a Point Diffractioninterierometer," IEEE Photonics Technology Letters, Vol. 2, pp. 143-146,February i990.
T. Lu, Xu, . ICu and F.T.S. Yu, "IHetero Association Neural Networkfor Pattern Recogitonj'" ProcEedings of 1989 IEEE international
Conference on Svstem-. Ya. and Cybernetics, Lovember 14-17, 1989.
W. C. Tam, F.T.S. Yu, D. t .gor, and 2. D. Juday, "Autonomous Real-time Object Tracking with .. nd.,tr Joint Transform Correiator"
E Optil :ngirzeLifi, Voi. 4j, p. J!4 -_'U, April 1990.
FT.S . V .W .u. N. Y. tang, and 1.A. Gregory, "Compact Size Neural
Network using Liquid Crystal Televisions "" Proceeding of the SPI.Conference on Optical Computing, Vol. 1215, January 1990.
F.T.S. vu, T. W. Lu, X. I. Yang, and D. A. Gregory, "Optical NeuralN etwork r with Pocket-Size Lquid-Crvstal Televisions,- Optics Letters,Vol. 15- Po. no3-r,5 August 1990
D. A. Gregory, J. A. Loudin, J. C irs& , E. C. Tan, and F.7.S. Yu,"Application of F.brid Modulating Properties of the Liquid CrystalTelevision," Applied Optics (in Press).
T. W. Lu. F.T.S. Lu and D. A. Gregory, "Self-Organizing Neura) Networkfor Unsunerviscd Learning," Optical Engineering, Vo,. 29, pp. 107- 1 13,3 September 1990.
C. Tam, F.T.S. Yu, A. Tanone, D_ A. Gregory. and R. Judav, ".ataAssociation Multiple Target Tracking using a Phase-Mostly LCTV.'" Optical3 Engineering, Vol. 29, pp. 114-11.21, September io9r.
F.T.S. Yu, E. C. Tam, D. A. Gregory, and R. juday, "Multi-targetTracking with a Hybrid Joint 'ransform Correlator," Proceedinj of theSPIE Conference on Real-Tie Image Processtne i. Vol. 1295, pp. 128-
137, April 1990.
5 T. LU, F.T.S. VU a-.i . A. Gregory. "Optical Neural Network forUnsupervised Learning," Frceedin. of the SPIE Conference on Advances inOptical information Processins IV, Vol. 1296, .%prJ1 1990.
.T.u. T Lu and X an, "Opticai I-nnni:ntation of fIetero-
Associat-on .Neu.r. Networ w. th .. r-Patter. Associa tio. Mod. "5 irtern' oa 1 .,i .o u... rca ConounrL zin Pres s.V Ttu n
" . 0 t-:. I..... ....
. . -. [u, "a- S ing p'tical N-euralp, N',...wo "" Ott c ;, .! I4 zp. 2-7_= " .9 ...... rv
II

IA
J. C. Kirsch, D. A. Gregory, J. A. Loudin, E. C. Tam and F.T.S. Yu,"Light Efficient Joint Transform OpLical Correlator, Proceedings of the
SPIE Conference on Optical information Processing Systems andArchitectures II, San Diego, CA, July 8-13, 1990.
II F.T.S. Yu, T. Lu and D. A. Gregory, "Compact Optical Neural Networkusing Liquid Crystal Television," Proceeding of the ICO-i5th Conference
* on Optics in Complex Systems, Garmisch, Germany, SPIE Vol. 131z, pp.200-201, August 1990.
F.T.S. Yn and F. ( Tr. "Ai -CicICy ju±. 7L'wl-rm ... orrelatorfor Symbolic Substitution," Proceeding of the ICO-15 Confe-ence onOptics in Complex Systems, Garmisch, Germany, August 5-10, 1990
F.T.S. Yu, "Optical Neural Network: Architecture, Design and M.,dels,"invited Proceedine of IEEE TENCON '90 Conference on Comouter andCommunication Systems, Hong Kong, pp. 12-16, September 24-27, 1990.
I.T.S. Yu and T. Lu, "Adaptive Optical System for Neu ra .....Proceeding of IEEE TENCON '90 Conference on Computer and CommunicationSystems, Hong Kong, September 24-27, 1990.
F.T.S. Yu, S. Wu, A. Mayers, S. Rajan and D. A. Gregry, "ColorHolographic Storage in LiNbO.," Optics Communications, Vl. 81, pp. 348-
352, March 1991.
F.T.S. Yu, S. Wu, A. Mayers, S. Rajan, "Wavelength MultiplexedReflection Matched Spatial Filters using LiNbO," to OpticsCommunications, Vol. 81, pp. 343-347, March !9DI.
F.T.S. Yu, T. h. Lu and D. A. Gregory, "Self-Learning Opticai NeuralNetwork," Proceedings of Spatial Li ght Modulators and Riicat ions,Technical ijgest, Vol. 14, pp. 24-27, September 1993-
F.T.S. Yu, I. Wu, A. Mayers, S. Rajan and D. A. Gregory7 "oiorHolographic Storage in LiNL3.," Proceedings of SpatiAl i.izh Modulator:
and Atplications, Technical bigest, Vol. 14, pp. 15.3-.56. Septeibe .I 1^90.
X. Yang, T. Lu, 1 T.S. Yu -.nd D. A. Gregory, "Redundant .iterconnec.,to.interpattern Asso :iation Net:ra[ Network," Applied Optics (In Preszr.
I F.T.S. Yu, Y. :A, X. Yank. T. Lu and D. A. Gregory, "Applicatio c'
Moment Invariant Pattern Recognition to Optical Nerl Net," slibmittedto Ontik.
II

8. SCIENTIFIC PERSONNEL SUPPORTED BY~ THIS DROJECT AND DEGREES AWARDED-DURING THIS REPORTING PERIOD:
8.1 Scientific_ Personnel
UF.T.S. Yu - Principal InvestigatorAMayers - Research Assistant
E. Tarn - Research AssistantUX. Li - Research AssistantF. Chene - Resparrh Acic--
A. Tanone - Research AssistantS. D. It ccrc sitnS . Rajan - Research issiStantT.W. Lu - Research Assistant
18.2 Degrees Awarded
3"Real-Ti". Opzical Vander [-ugt Ind Jo;-nt Tr-ansfo rm C-orreiationSystems," Xiao-Jing Lu, Ph.D. Degree, completed August 1988.
"Applications of Moment invariants to Neurocomputing for Pattern3 Recognition," Yajun Li, Ph.D., completed June 1990.
"Modulation properties of a twisted nazatic liquid crystal spatial~light modulator and its applications in a joint transform
correlator," E". C. Tam, P-1h.D., completed August 1990.
"Study of an optical neural network... architecture, design andj models..," T. W. LU, Ph.D., coxpleted August 1990.
"Optical iaeclassification using optical/digital hybrid image3 processing system," J. X. Li, completed October 1990.
9. BRIEF OUTLINE OF RESEARCH FINDINGS
in a conventional coherent optical signal processor [11], the processing
3 operation is usually carried out at ithe spatial frequency or Fourier plane
withn a complex spatial filter [21. T[his type of coherent optical pr(-cessor
offers a myriad of complicated processing operations :11. Its success is
3primarily dut: to the profound diffraction phenomena. ilowever, complex Signal
processing can al-o 1e achie-ved by,; the spatial impul1se resrnonse- using aJoint
3 transform irocesco-. There are several inherent adva-tages of usingr the .oiflt
Fourier tran-sform processor as compared with --he conventional coherent
6
processor: (1) spatial filter adjustment is not imposed; (2) a higher input
space-bandwidth product; (3) generally# a higher modulation index of the Joint
transform hologram; (4) lower spatial carrier frequency, etc. In view of
these advantages, a joint transform processor, in principle, is capable of
performing optical signal processing more efficiently, particularly in the
application of real-time pattern recognition. The purpose of this research
program is to investigate an adaptive liquid crystal TV based correlator as
applied to real-time pattern recognition and tracking.
In this period, from July 1, 1988 to March 31, 1991, we have
accomplished several major tasks on the research of real-time pattern
recognition with an LCTV based correlator for which various results have been
reported in the refereed Journals and conference proceedings; with the
approval of the Department of the U.S. Army. Sample copies of these
publications are included in this final technique report in the subsequent
sections, to provide a concise documentation of our findings. In the
following sections, we shall give an overview of our research work done during
this program. We will highlight some of the accomplished works. A list of
publications resulting from this support has been cited in the preceding
section.
9.1 Rotation Invariant Pattern Recognition (APPENDIX 10.1)
During this research program, we have successfully investigated
rotational invariant pattern recognition using a programmable liquid crystal
television (LCTV) based Joint transform correlator (JTC). We have introduced
two methods to recognize targets with different in-plane rotational
orientations. One method is using real value implementation of circular
harmonic expansion techniques for joint transform target detection, the other

isusngan information reducti -on principnle fo-r mult i-reference isagse
I eneratLon such that rotational objects can b ec-tetd. E-Ac Ceedent
3exp-erimental demon ct r-ati ons for these tuo zethodsc hare L-en nerfor-med.A
aner atohi naturve xs oublished in ApDplied 0nticra 141.
9. Efetson F-rire Binarization (APPENDIX 10.2)
~e nav.e also studied the- effect; at _1ruig-e bnrai o
I ji-n tasorm correlation. We hnave shot- thnat binarization joint transform
I neteec ringes tar au 4tiple targets wold produce false alarmsan
s±ses. n- ave concluded that fringe ninarization nay, no t be usefully-
3 aplientarmuiti-t-arge recocnitian. although it --rj be applied successfully.aor noisetre s'nhe eage - 4"at
free snetagtcorrelation1. 1letter to ohe pth of
I :.~ was publishine Aple OpV11 %1 _j tic [J
93 3 Dnetection Efficiencies (AiPPENDIX 10.3)
In this period of research. we investigated thea detectiOn eff-ijr ences3 f.lor- Vander Lugt and j oint transform correaos Weh v on ta h
rebtifve r"nerformance of a "ar-der rug.- creto wulgnerall eti
better in the multi-object an-d under noxsy- envir-onment. Th-ese- effects are
3ca-U-u by the- signal dependent nature ---f the Joint rransifore f.Iter. Unlike
theVa.dr %g~ii ssignal indepndent. a0. eir -las
3advata in real-tim '-n14-a-entatio-n~. llevite the Siatia I synthesis
ana a.Ose! ?robin-- We nav-e a~~ prn aper, oftese n n n
3 9. ;~cTia Paterrnu.i :on nr~
reean' program-we wvo 1'V .- an a ,-a-tit
reI ra-' t --er is n -) 0
s-'ow Uha thsthoesc~-heo

8
spectral content of the target. A paper of this nature is published in the
Optics and Laser Technology [7).
9.5 Comparison of Vander Lugt and Joint Transform Correlator (APPENDIX 10.5)
We completed a theoretical study of comparing the Vander Lugt and joint
transform correlators. Multiplicative noise and differences between input and
reference functions are considered so that their effects on optical
correlation can be estimated. We have found, .n general, the JTCs are easier
to construct, simpler to handle and control and more practical for application
than Vander Lugt correlators. However, the basic distinction between these
two correlators are: the JTC filter is signal dependent, whereas the Vander
Lugt filter is signal independent. A paper of this study is published in
Applied Physics (8].
9.6 LCTV Color Encoder (APPENDIX 10.6)
While studying the polarization properties of the liquid crystal
materials, we have developed a technique to perform real-time gray level
pseudocolor encoding using a LCTV. The LCTV is used under two different
polarizer/analyzer combination to generate a positive and a negative image.
These images are then encoded with two primary colors by positioning the color
filter respectively. The superposition of these images would produce a gray
level pseudocolor encoded image. The result of this study has been published
in Journal of Optics (9).
9.7 White-Light JTC (APPENDIX 10.7)
In this period of research, we have also developed a technique of
performing joint transform correlation using a white-light source. The
temporal and spatial coherence requirement of a joint transform correlator
(JTC) have been studied. Excellent experimental results have been obtained.

!
i 9Since the white-light source emanates ail visible spectra, Lhe white-light JTC
is capable of expioiting the spectral content of the target. A paper of this
3 nature has been published in Optics Letters [10].
S.8 High-Efficient JTC (APPENDIX 10.8)
We have developed a high efficient JTC. By modifying the joint
I transform power spectrum of the input objects, using a spectral sampling
method, the read out light, as well as the physical area, of the square low
3 detector can be fully utilized. As a result, the output correlation intensity
can be substantially increased. This technique would benefit the real-time
3 optical pattern recognition performance. To improve the signal-to-noise, the
read-out can also be done by using partiaily coherent light A paper of this
report is published in Optics Letters [11].
3 9.9 Autonomous Target Tracking (APPENDIX 10.9)
One of the most interesting research tasks we have accomplished in this
I period is the application of liquid crystal TV band JTC to autonomous target
i tracking. The fundamental element of the system is a real-time optical joint
transform correlator using a liquid-crystal television. The parallelism, high
3 processing speed, and adaptive properties of this optical system assure high
correlation between objects in two 3equential frames. The relative position
3 of the object can then be determined based on the location of the correlation
peak. System performance is elevated and experimental demonstrations have
been conducted. We stress that this technique has important applications to
I real-time missile, aircraft and vehicle tracking, which are very significant
for the U.S. Army strategic defense needs in guided eapons and high speed
I target tracking systems. We have reported a paper of this research in Optical
Engineering [12J
• ]
* 109.10. Image Deconvolution (APPENDIX 10.10)
In this phase of research, we have also performed image deconvolution
due to linear motion using a 1-D joint transform correiator. The technique is
basically using a blur function, as the reference object, in a joint transform
5 correlator to reverse the negative phase spectrum of the blurred image. In
other words, the method is equivalent to using a deblurring phase filter in a
conventional coherent processor. The advantages of this technique are
3 simplicity and flexibility, for which blurred images can be corrected by using
real-time devices. A paper reports the image deblurring using a 1-D JTC
3 architecture was published in Optics Communications [13], and a paper deals
with the restoration of linear smeared image is published in Microwave and
Optical Technology Letters [14].
3 9.11 Reconfigurable Interconnections (APPENDIX 10.11)
High speed computing has aroused great interest in optical
3 interconnections. We have. in this period, investigated a reconfigurable
optical interconnection using a nonlinear photorefractive crystal. We have
used the coupled wave theory and law of refraction, to analyze the volume of
3 holograms. ReconfigurAble interconnections are discussed employing either
wavelength tuning or spatial division technique. Reflection type volume
3 holograms can be used for a large number of reconfigurable interconnections in
terms of finite wavelength tunability. Transmission volume holograms encoded
in pinhole holograms can be easily recoafigurated by SLM for optical
£ interconnections. Experimental demonstrations haie also been conducted in
this phase of research. We stress that, the proposed reconfigurable
3 jnterconnection technique, would have significant impact on the future
r.,"earch of high speed optical computing. We have reported a paper to the
I

I
Applied Optics of this study [15].
9.12 Binary Phase Correction (APPENDIX 10.12)
3 In this research program, binary phase correlation of a liquid crystal
television (LCTV) using a point diffraction interferometer has been
3 investigated. The use of a point diffraction interferometer offers the
simplicity and advantages of a common-path interferometer for examining the
phase non-uniformity of the LCTV, while the on-line and closed-loop
3 architecture is capable of generating the optimum phase correction function.
Both computer simulations and experimental results demonstrate the
3 effectiveness of the binary phase correction scheme. The results obtained
from the bipolar phase only joint transform correlation reveals the
feasibility of this phase correction technique in actual applications.
3 Mention must be made that this binary phase correction scheme can be used to
compensate for the phase distortion of a general optical signal processing
3 system. Other phase modulating real-time addressable SLMs which have a higher
contrast ratio and a larger space-bandwidth product, such as the magnetooptic
SLMS or liquid crystal light valves may be employed to produce even better
3 results. A paper reporting these findings is published in the IEEE Photonics
Technology Letters [16].
3 9.13 Image Classification (APPENDIX 10.13)
We have used a joint transform correlator for the study of image
classification by the Kittler-Young transform. The Kittler-Young transform,
5 is a nonparametric method for feature extraction, which can be effectively
applied to image classification. The advantage of using the K-Y transform is
3 that it goes one step further in utilizing the eigenvalues. The eigenvalues
are separated into two parts, which are proportional to the class means and
I
I
* 12
variances respectively. The effects on the feature's discriminative power are
in opposing ways. To overcome the difficulty caused by this contradiction, a
I feature selection criterion based solely on the class means after normalizing
class variances is used with the K-Y transform. Some of the limitations of
I using the first three algorithms can be alleviated using the K-Y transform,
resulting in a more discriminative leature space. Experiments to classify
birds and fish, using the K-Y transform are demonstrated. The results show
5 that the K-Y transform offers a high feaLure selection than using the
Fukunaga-Koontz transform. We have published a paper of these findings in the
3 Micro. Opt. Tech. Lett. [17].
9.14 IPA Neural Network (APPENDIX 10.14)
During this research program, we investigated a neural network model
3 using Inter-Pattern Association (IPA). The IPA model uses basic logical
operations to determine the inter-pattern association (i.e., association
3 between the reference patterns), and simple logical rules are applied to
construct tri-state interconnections in the network. Computer simulations for
the reconstruction of similar English letters embedded in the random noise by
3 IPA model have shown improved performance in comparison with the Hopfield
mor el. A 2-D hybrid optical neural network is used to demonstrate the
3 usefulness of the IPA model. Since there are only three gray levels used in
the Interconnection Weight Matrix (IWM) for IPA model, the dynamic range
imposed on a Spatial Light Modulator (SLM) is rather relaxed, and the
5 interconnections are much simpler than the Hopfield model. A paper of this
study is published in Appl. Optics. [18].
I 9.15 LCTV Neural Network (APPENDIX 10.15)
We have developed an 8x8 neuron optical neural network using pocket size
I

** 13
liquid crystal televisions (LCTVs). The size of the optical neural network is
about 75x15x25 cm . The operation speed of this LCTV neural network, with 8x8
3 neurons is about 1.2x10 interconnection operations/sec. However, for a 16x20
neural work, the operation speed can be as high as 3xlO inter.oper./sec.
3 Experimental results from this LCTV neural network are demonstrated. A paper
of this work is published in Optics Letters [19].
9.16 Nonconventional JTC (APPENDIX 10.16)
3 In this research program, we have also investigated a nonconventional
joint transform correlator (NJTC). The advantages of the NJTC are the
3 efficient use of the light source, the use of smaller transform lenses, higher
correlation peaks, and a higher carrier fringe frequency. Since NJTC can, in
principle, process all the information that a conventional optical processor
3 can offer, we believe that the NJTC would have all the processing capabilities
of a coherent processor. A paper of this study is published in Optics Letters
3 [20.
I 9.17 Multi-Target Tracking (Appendix 10.17)
3 One of the major advantages of optical Iignal processing is the
parailelism in handling high space-bandwidth signals. However, the price paid
3 is the complexity and stringeat a]ignment of an optical system. On the other
hand, its digital counterpart offers flexibility and programmability while
sacrificing full parallelism. we have investigated a technique of uzi-d data
5 association target tracking in a motion sequence via an adaptive join,
transform correlator. The massive data in the field of view can be reduced to
3 , iew correlation peaks. The average velocity of a target during the tracking
cycle is then determined from the location of the correlation peak. We have
II

I
* 14
used a data association algorithm for the analysis of these correlation
signals, for which multiple targets can be tracked. Simplicity in optical
architecture, relaxation of alignment requirements, and the adaptive property
are the major advantages of a hybrid JTC in this mode of operation. The phase
3 modulation property of a LCTV has been investigated and was employed in this
experiment to improve the detection efficiency of a JTC. A motion sequence of
three targets was used as the input scenes to demonstrate the applicability of
3 this technique and satisfactory results were obtained. A paper reporting the
performance of this technique is published in Optical Engineering [21].
£ 9.18 Unsupervised Learning Neural Net (APPENDIX 10.18)
One of the features in neural computing must be the adaptability to
changeable environment and to recognize unknown objects. We h&ve, in this
3 period of research, implemented Kohonon's self-organizing feature map for
unsupervised learning in an optical neural network. A compact optical neural
* network of 64 neurons using liquid crystal televisions is used for this study.
To test the performances of the self-organizing neural network, experimental
demonstrations with computer simulations are conducted. Effects due to
3 unsupervised learning parameters have been analyzed. It is shown that the
optical neural netiork is capable of performing both unsupervised learning and
3 pattern recognition operations simultaneously, by setting twc matching scores
in the learning algorithm. We have also implemented the fast and slower
learning models in the neural networks. We have found that by using a slower
3 learning rate the construction of the memory matrix becomes topologically more
organized. Moreover, by introducing the forbidden regions in the memory
3 space, it would enable the neural network to zearn new patterns without
erasing the old ones. A paper describing these findings is published in
I

3 15
Optical Engineering [22].
9.19 Color Holography Using LiNbO, (APPENDIX 10.19)
Two of the most widely used white-light holograms must be the reflection
hologtam of Denisyuk and the rainbow hologram of Benton. In reflection
3 hologram, a thickness emulsion of about 20pm would have a wavelength
selectivity about AA/A = 1/40, which is high enough to produce color hologram
images without significant color blur. However, the physical requirements for
3constructing a reflection hologram is rather stringent, which prevents itswide spread use of applications. On the other hand, construction of a rainbow
I hologram requires a narrow slit, for which the parallax information of the
hologram image would be partly lost. In this research program, we have also
demonstrated that color holograms can be constructed in a photorefractive
crystal using a thick LiNbO. crystal with a "white-light" laser. Since
photorefractive crystal is much thicker than conventional photographic
emulsion, it provides a higher wavelength selectivity such that the color blur
can be minimized. Furthermore, the construction of photorefractive holograms
is in real-time mode and the shrinkage of the emulsion can be prevented. As
in contra3t with the photographic film, multiplexing c)lor holograms in a
photorefractive crystal is feasible for which we have experimentally
3 demonstrated. We have shown ,hat to minimize the cc" crosstalk, a high
wavelength selectivity (i.e., thick crystal) photorefracj media thanEiormally required should be used. A paper reporting thb color holographic
5 imaging using a white-light laser is published in Optics Communications [231.
9.20 Compact LCTV Neural Network (APPENDIX 10.20)
3 In this research, we have also developed a compact optical neural
network using two tightly cascaded liquid crystal televisions (LCTVs). This
I

I
* 16
new optical architecture offers the compactness in size, easy alignment,
higher light efficiency, better imarr quality, and low cost. The
3 implementation of the auto-associative and hetero-associative memories to this
new architecturr are also tested. The most import .,; -,pect of this new
architecture i. that a large numerical apertur., -s used in the
previous optic,1 neural network can be avoided. 1..t a more compact size
system can be iuilt. Moreover, the lightly cascqde- !r%V of the system also
3 relax the fine alignment problem posed by the opt. .ystem. This proposed
architecture wish experimental demonstration is published in Applied Optics
3 ( 241.
9.21 Wavelength Multiplexed Matched Filters (APPENDIX 10.21)
WP have studied the wavelength multiplexing capability using a thick
3 LiNbO3 for reflection matched spatial filter synthesis. In principle, over
1000 spatial filters can be multiplexed in a 4mm thick photorefraztive
3 crystal. The wavelength multiplexing technique in a crystal filter has the
adantage that neither the object nor the reference boas needs to be changed
in the writing nr reading processes, even though the two processes can be used
3 in conjunction to further increase the multiplexing capabilities. Although
this technique has been used in holographic film which matched filters were
3 multiplexed, the Lhin film emulsion leads to low avelength selectivity, and
the filters are difficult to produce. By referring the coupled-mode analysis,
we have analyzed the wavelength multiplexing capability of reflection type
matched spatial ft.ers. By integrating over the thickness of the cry cal, we
have s Lhat thick crystal filters exhibit high wavelength selectivity as
3 well as retaining a gnnd degree of the shift invariance. Thus, by recording
single wavp l'.enth filters, and reading-out the filters with a multi-wavelength

I
* 17
source, parallel pattern recognition can be performed. A paper on this study
U is published in Optics Communications [251.
9.22 Space-Time-Sharing Neural Network (APPENDIX 10.22)
To provide the neural network with learning ability, spatial light
3 modulators (SLMs), such as liquid crystal television (LCTV), have been used as
the programmable devices. In a fully interconnect neural network, every
neuron at the inpda plane is co.:nected to all the neurons at the output plane.
3 For example, 1000 neurons would require a million interconnections. Thus, a
very high resolution SLM is required for the massive interconnection.
3 However, the resolution of the currently available LCTVs is rather limited,
which poses an obstacle for large scale operation we have, in this phase of
3research, used a space-time sharing technique to alleviate this constraint.3 Since the LCTV neural networ is essentially a white-light prcc ssing system,
by partitioning the interconnection weight matrix into an array of
3 submatrices, a large srace-bandwidth pa .er (SBP) can be processed with a
smaller neural networA. We have shown that to achieve a large SBP of the
system, additional expenditure of processing time is needed. The amount of
3processing time increases as the square function of the SBP of the input
pattern. We have also experimentally demonstrated that a 12x12 and 24x24
3 element pattern cn be indeed on a 6x6 LCTV neuron network. A paper of this
study is published in Optics Letters [26].
9.23 Binary Phase Only JTC (APPENDIX 10.23)
3 We have also in the research investigate a joint transform hybrid
optical -orrelator as applied to binary phase only filtering. The
Ir terference tfinges of the joint Fourier transformation, due to the reference
and the input targets, are captured by a CCD camera feeding into a
I

I* 18
microcomputer for binarization. A binarized phase only filter, in principle,
can be written onto a spatial light modulator (SLM). By simple coherent
illumination of SLM, correlation Cgeration of the reference and the input
targets can be obtained computer simulated results for target embedded in an
3 additive noise is provided. We have shown that high correlation peaks can be
readily achieved under noisy envirt-iment. Since JTC filter is signal
dependent, for multi-target recognition, it would produce false alarms and
3 misses. A paper of this nature is published in Micro. Opt. Tech. Lett. [27].
9.24 Remarks
3 The ability to process a large quantity of information aL a high speed
makes the optical correlator an attractive candidate for applications to
machine vision, target tracking and detection, etc. Although conceptually
simple, the Vander Lugt correlator, which employs a holographic spatial
filtering technique, has inherent filter synthesis and alignment problems,
3 that prevent its wide spread practical application. On the other hand, the
Joint Transform Correlator (JTC) is a simple and practical processor that
overcomes these two major disadvantages. In this report, we have performed
3 the major tasks proposed on the story of the LCTV joint transform correlator
and other LCTV based system, as applied for pattern recognition. We are
3 confident that our goal of realizing a practical adaptive LCTV based JTC for
real-time recognition and identification would happen in the near future.
IIII

I
* 19
References
1. L. J. Cutrona, E. N. Leith, C. J. Palermo, and L. J. Porcello, "Optical
Data Processing and Filtering Systems," IRE Trans. Inform. Theory, IT-6,
386 1o4o).
3 2. A. Vander Lugt, "Signal Detection by Complex Spatial Filtering," IEEE
Trans. Inform. Theory, IT-10, 139 (1964).
3. F.T.S. Yu, Optical Information Processing, Wiley-Interscience, New York,
3 1983.
4. F.T.S. Yu, X. Li, E. Tan, S. Jutamulia and D. A. Gregory, "Rotational
Invariant Pattern Recognition with a Programmable Joint Transform
Correlator," Appl. Opt. 28, 4725 (1989).
5. F.T.S. Yu, F. Cheng, T. Nagata, and D. A. Gregory, "Effects of Fringe
3 Binarization of Mul'iobject Joint Transform Correlation," Appl. Opt.,
28, 2988 (1989).
3 6. F.T.S. Yu, Q. W. Song, Y. S. Cheng and D. A. Gregory, "Comparison of
Detection Efficiencies for Vander Lugt and Joint Transform Correlators,"
I Appl. Opt., 29, 225 (1990).
3 7. F.T.S. Yu, S. Jutamulia, R. V. Yelamarty and D. A. Gregory," Adaptive
Joint Transform Correlator for Real-Time Color Pattern Recognition,"
3 Optics and Laser Technology, 21, 189 (1989).
8. X. J. Lu, F.T.S. Yu, and D. A. Gregory, "Comparison of Vander Lugt and
U Joint Transform Correlators," Appl. Phy. B51, 153 (1990).
3 9. F.T.S. Yu, S. Jutamulia and E. Tam, "Gray Level Pseudocolor Encoding
Using a Liquid Crystal Television," J. Opt., 19, 129 (1988).
3 10. F.T.S. Yu and Y. S. Cheng, "White-Light Joint-Transform Correlator,"
Opt. Lett., 15, 192 (1990).

* 20
11. F.T.S. Yu, E. C. Tan and D. A. Gregory, "High-Efficiency Joint-Transform
U Correlator," Opt. Lett., 15, 1029 (1990).
12. E. C. Taa, F.T.S. Yu, D. A. Gregory and R. D. Juday, "Autonomous Real-
Time Object Tracking with art Adaptive Joint-Transform Correlator," Opt.
3 Eng. 29, 314 (1990).
13. F.T.S. Yu and Y. S. Chen, "Debiurring Using Joint Transform Processor,"
Opt. Commun., 74, 19 (1989).
£14. F. Cheng, X. Xu, S. Wu, F.T.S. Yu, and D. A4. Gregory, "Restoration of
Blurred Images Due to Linear Motion Using a Joint Transform Processor,"
3 Micro. Opt. Tech. Lett., 1, 24 (1990).
15. S. Wu, Q. Song, A. Mayers, D. A. Gregory and F.T.S. Yu, "Reconfigurable
U nterconnections Using Phot..refractive Holograms," Appi. Opt., 99, 1118
1 (1990).
16. E. C. Tam, S. Wu, A. Tanone, F.T.S. Yu and D. A. Gregory, "Closed-Loop
Binary Phase Correc;tion of an LCTV Using a Point Diffraction
Interfcerc,-<:er," IEEE Phot. Tech. Lett., ~,143 (1990).
117. J. X. Li, ' .S. Yu and D. A. Gregory, "Imag~e Classification by the
3 !ittle--Yr Transform Using a Joint-Transform Correlator," Micro. Opt.
lech. Left., 1, 207 (1991).
318. T. Lii X. X- , S. Wu, and F.T.S. Yu, "Neural Network Model Using
Interpttern Association," Appi. Opt. 19, 284 (1990).
I19. F.T.S. Yn, T. Lu, X. Yang and D. A. Gregory, "Optical Neural Network
3 with Pocket-Sized Liquid Crystal Televisions," Opt. Lett., 15, 863
(1990).
20. F.T.S. Yu and C. Zhuang, Y. Jin and D. Gregory, "Nonc-onventional Joint-
Transform Correlator," Opt. Lett., 14, 922 (1989).

* 21
21. E. C. Tan, F.T.S. Yu, A. Tanone, D. A. Gregory and R. D. Juday, "Data
I Association Multiple Target Tracking Using a Phase-Mostly Liquid Crystal
Television," Opt. Eng., 29, 1114 (1990).
22. T. Lu, F.T.S. Yu and D. A. Gregory, "Self-Organizing Optical Neural
Network fcz Unsupervised Learning," Opt. Eng., 29, 110? (1990).
23. F.T.S. Yu, S. Wu, A. Mayers, S. Rajan and D. A. Gregory, "Color
I Holographic Storage in LAWb.," Opt. Connun., Al 348 (1991).
324. X. Yang, T. Lu and F.T.S. Yu, "Compact Optical Neural Network UsingCascaded Liquid Crystal Television," Appl. Opt., 29, 5223 (1990).
25. F.T.S. Yu, S. Wu, A. Mayers, S. Rajan, "Wavelength Multiplexed
Reflection Matched Filters Using LiNbO1 ," Opt. Commun., 81 343 (1991).
126. F.T.S. Yu, X. Yang and T. Lu, "Space-Time-Sharing Optical NeuralNetwork," Opt. Lett., 16, 247 (1991).
27. F.T.S. Yu and T. Nagata, "Binary Phase Only Joint Transform Correlator,"
Micro. Opt. Tech. Lett., 2, 15 (1989).

* 22
II
i Rotation invariant Pattern Recognition
III
IIIIIU

* 23
Reprinted from Applied Optics
I Rotation invariant pattern recognition with a whereF F(r) = IF,,Ar)I exp(i4). In this real value implernen-programmable joint transform correlator tation techniqtie, we define the following two reference func-
tions:Francis T. S. Yu, Xiaoyang Li, Eddy Tam, Suganda Rki(r,O) = 21Fk(r)i cos(kO + 0k), (4)
* Jutamulia, and Don A. GregoryDon Gregory is with U.S. Army Missile Command, Re- Rk2(r,8) = 2!rk(r)l Sin("O + Ok)* (5)earch, Development, & Engineering Center, Research Di- Teera au ucin r aial h eladiairectorate, Redstone Arsenal, Alabama 35898-5248; Su- These pral valuhe fctionsla harembaical te real asndiagi-gaada Jutainulia is with Quantex Corporation, 2 Research nayprso0h iclrhroi kr6.UigRla h
Court, Rockville, Maryland 20850; the other authors are reference image function and f(r,O + a) as the input targetwith Pennsylvania State University, Department of Elec- function, the center value of the cross correlation becomesU wtrical Engineering, University Park, Pennsylvania 16802. 2k f(r,O + a)Rh1rdrd6. (6)Received 7 October 1988. 1o00
* By substituting Eqs. (4) and (5) into Eq. (6), we haveA circular harmonic expansion filter is real value imple-
- mented in a joint transform correlator architecture to per- 2k()= ,'I~)
form rotation invariant pattern recognition. CkI ) Jor)+2 Irl
IOne of the most common problems in pattern recognition X cosjm(o + 0) + .'m1}is to identify objects of different sizes, angular orientationsU and perspectives, Utilizing the architecture of ajoint trans- X 121Fk) 'IcosWk + 4h)IrdrdB. (7)form correlator 'JTC' 1 -3 as shown in Fig. 1, we propose to umethe real value implem3ntation of circular harmonic functions Since all the terms in Eq. (7) v3nish except the m k term,as references in a JTC to perform rotation invariant pattern the above equation can be reduced to
mrecognition.*If a 2-D function f(r,o) is continuous and integrable over Cki(a) =47r cos(ka) Jo rIF,(r)I2dr
*the region (0,22r), it can be expanded into a Fourier series as+. 2Ck(O) cos(ka). (8)
f(r,O) =YF,,(r) exp(ime), (1)
where
~ 2w3Fm,(r) = i (r,8) exp(-imO)dO. (2) E C
Fm(,O) = Fm(r) exp(imO) is called the mth-orcler circularharmonic. -
Previous research'4 -7 has shown that by usi.g a single har- 4nt', Ll LCTV 12 LCLV es LI monic Fkdr,a) as a complex reference function, the intensityof the correlation center is independent of the rotation anglea., Although f(rAO is a complex function in general, it is Q---1 _ CIusually represented by a real quantity in practice. Thus Eq.(1) can be written as L
((r.O) = F,,(r) + 2 \?ReIf,.(r) exp(&mG)j
-&(r) + 2 \'IF,(r)I cos(mo + (3) and L3 are collimating lenses, L2 and L4 are Fourier transformI. ess n I Baba pitr15 Novembter 1989 / Vol. 28. No. 22 / APPLIED OPTICS 4725
24
t I0I
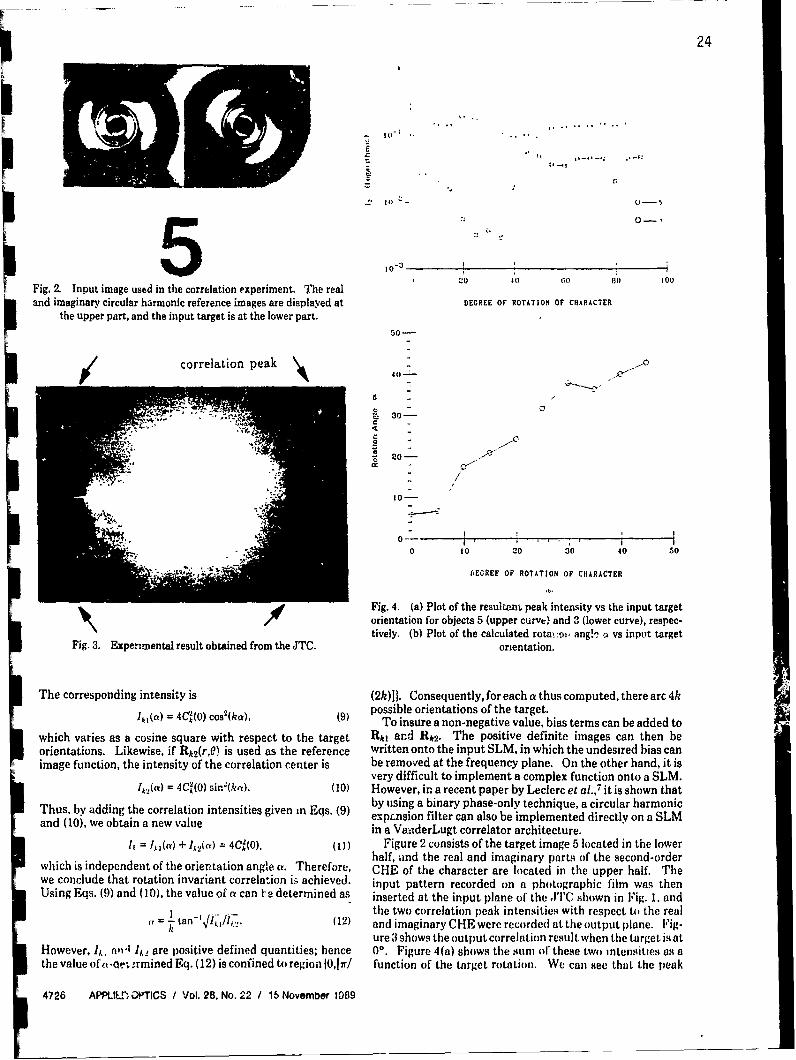
I :.I 40 60 I) IOUFig. 2. Input image used in the correlation experiment. The realand imaginary circular harmonic reference images are displayed at DEGREE OF ROTATION OF CHARACTER
the upper part, and the input target is at the lower part.
50-
correlation peak +-
>4 40 --
A -
30-
. to U 30 40 50
"" "" " ,+- " ++i~s " fEGREF OF ROTATION OF CHARACTER
Fig. 4. (a) Plot of the resultant peak intensity vs the input targetorientation for objects 5 (upper curve) and 3 (lower curve), respec-tively. (b) Plot of the calculated rotw'o: ang",: a vs input target
Fig. 3. Experimental result obtained from the JTC. orientation.
The corresponding intensity is (2k)]}. Consequently, for each a thus computed, there arc 4kl,(a) = 4C'(0) cos2(ka), possible orientations of the target.
k 4To insure a non-negative value, bias terms can be added towhich varies as a cosine square with respect to the target Rk and Rk2. The positive definite images can then beorientations. Likewise, if Rk2(r,O) is used as the reference written onto the input SLM, in which the undesired bias canimage function, the intensity of the correlation center is be removed at the frequency plane. On the other hand, it is
very difficult to implement a complex function onto a SLM.A= 4C(0) sir-ika). (10) However, in a recent paper by Leclerc et al.,7 it is shown that
Thus, by adding the correlation intensities given in Eqs. (9) by using a binary phase-only technique, a circular harmonicexpa..nsion filter can also be implemented directly on a SLM
and (10), we obtain a new value in a VanderLugt correlator architecture.
'A = AI (a) + 4,(a) = 4C'(0), (11) Figure 2 consists of the target image 5 located in the lowerhalf, and the real and imaginary parts of the second-order
which is independent of the orientation angle a. Therefore, CHE of the character are located in the upper half. Thewe conclude that rotation invariant correlation is achieved, input pattern recorded on a photographic film was thenUsing Eqs. (9) and (10). the value of' a can te determined as inserted at the input plane of the JTC shown in Fig. 1. and
Ithe two correlation peak intensities with respect to the realtan - (12) and imaginary CHE were recorded at the output plane. Fig-
ure 3 shows the output correlation result when the target is atHowever, !,, nn4 I1,2 are positive defined quantities; hence 00. Figure 4(a) shows the ui of these two intensities as athe value of at--O ,rmined Eq. (12) is confined to region lO,17r/ function of the target rotation. We can see that the peak
4726 APPLI OrTIICS / Vol. 28, No. 22 / 15 November 1089

* 25
intensity is independent of the angular rotation of the target,. functions, rotation and shift invariant object detection canTherefore. rotation invariant pattern recognition is be carried out with a JTC. The advantage of this techni, ueachieved. W',en another numerical character 3, which has is that the reference images are a positive real value, whichgreat similai.cy to the character 5, was used as the target can easily be implemented on programmable SLMs.image, the correlation response shows a high degree of fluctu-ation. This illustrates the discrimination of this filter. Fur-thermore, the orientation a of the target was also calculatedby using Eq. (12). The plot of a vs the target orientation Partial support of this research by the U.S. Army. Missilepresented in Fig. 4(b) shows that the experimental result Command, through the U.S. Army Research Office contractobtained is within an accuracy of ±50.
DAAL03-87-K-0147, is gratefully appreciated.It must be mentioned that this technique requires summa-
tion of two correlation peak intensities for each input target.This is a major drawback of this technique and introducescertain degrees of difficulties in practice. One of the twopeaks might fall below the noise level of the detected signal Referencesand would be impossible to detect. However, the comple- 1. C. S. Weaver and J. W. Goodman, "A Technique for Opticallymentary peak in this situation emerges to give a high correla- Convolving Two Functions," Appl. Upt. 5, 1248-1250 (1966.tion peak intensity based on the equation that sin2O + cos'O = 2. F. T. S. Yu and X. J. Lu, "A Real-Time Programmable Jo.int1. Therefore, one of the two peaks would be adequate to Transform Correlator," Opt. Commun. 52 (10 Nov. 1984)detect the target in this situation. 3. F. T. S. Yu, S. Jutamulia, T. W. Lin, and D. A. Gregory. "AdaptiveWhen two or more targets are present at the input scene, Real-Time Pattern Recognition Using a Liquid Crystal TV Basedmultiple correlation signals are produced. Therefore, one Joint Transform Correlator," Appl. Opt. 26, 1370-1372 (1987).also has to ensure that proper pairs of correlation peaks are to 4. Y.-N. Hsu and H. H. Arsenault, "Optical Pattern Recognitionbe added. We note that the space invariant property of a Using Circular Harmonic Expression," Appl. Opt. 21, 4016-4019JTC provides one with the position information of the target (1982).based on the location of the correlation peak. Therefore, if a 5. H. H. Arsenault, C. Ferreira, M. P. Levesque, and T. Szpolik,peak is located at position A on the output plane, its compli- "Simple Filter with Limited Rotation Invariance," Appl. Opt. 25,mentary peak must be located at a location dictated by the 3230-3234(1986).value of A and the predefined relative position of the two 6. Y.-N. Hsu, H. H. Arsenault, and G. April, "Rotation-Invariantreferences. The correct complementary peak's intensity can Digital Pattern Recognition Using Circular Harmonic Expan-then be obtained accordingly. sion," Appl. Opt. 22,4012-4015 (1982).In summary: The real value implementation of a circular 7. L. Leclerc, Y. Sheng, and H. H. Arsenault, "Rotation Invariantharmonic function in a JTC has been investigated. By using Phase-Only and Binary Phase-Only Correlation," Appl. Opt. 28,3 the real and imaginary parts of circular harmonic reference 1251-1256 (1989).
IUUIUIII
15 November 1989 / Vol. 28. No. 22 /APPLIED OPTICS 4727I

* 26
III
APPENIJiX 10.2
IEffects c~i Fringe Binari~ation
UUIIINIIIIII

* 27
II Rtprin irom Appihr Optics
II
Etffeitu Of "ig bhnariz~tfn Of mueulobeo
jOW t aasfom~ 6i*vetationFr~mis T. S, Yu. Feng Chw.V. Toshio Nagata, an- Don A.
Don Gregorj is gith U.S. Army Missile Command, Fied-stone Arsenal, Alabama 3589a; Toshio Nagata is with Ja-pan Defenfe Agency, Technical Research & DevelopmentInstitute, Fifth Rese&rch Center, 3-13-1 Nagase, Yokcicu-ka 239, Japan; and the other authors are with Pennsylva-nia State University, Elect-ical Engineering Department,University Park, Pennsylvania 16802.Received 28 November 1988.
A study of the effect of fringe binarization on the jointtransform correlator has shown that the interferencefnnges for multiple targets could produce false alarms andmisses.
One of the ir.portant features of an optical correlator isbased on the shift invariant property of the Fourier transfor-mation which allows multiple targets to be detected andtracked. In an optical joint transform correlator (JTC),1-3
both the reference object and the input targets are located inthe input plane of the coherent optical processor. The corre-sponding Joirt transform power spectrum of the input ob-jects (i.e., the reference object and input targets) consists ofvarious carrier in' erference fringes, which can be extractedby a square law device such as an image detector. By inverseFourier transforming these interference fringes, the crosscorrelations between rt ference object and input targets are
produced.In this Letter, the effects of binarization of the power
spectrum4 in a JTC are discussed. We assume that thereference object fo(xy) and the input targets f,(xy), i = 1,2... V are positioned at (a,,S), i = 0,1,... iV as shown inFig. 1. With coherent illumination, the complex light distri-bution at the Fourier plane P is given by
G(p,q) = ? F,(p,q) ezp[-j(a~p + b 7)], (1)
where
F(p,q) = ff,(xsy)J, L = 0,1,2...., (2)
2988 APPLIED OPTICS / Vol. 28. No. 15 1 1 Augus 198e
I
Cob'rt 2'Ir, "Put pmn, L. F.une plan where* represents the complex coniugate. The output ligt
-o r • q distribution, through inverse Fovarier transformation, can be.. shown to be1 CCD
- ,/i , I) . , a""
i 'I + Ro,[x - (a, - a,).y - 00 - b)q]Icomputer-
a~e~t F_-gzt ',O SL : k L " O utput pl ne C C D cam eraC be + R ,u [K + (o[ ao - a :), + (b b - )ql
p N-I
P Pz I tS--I N
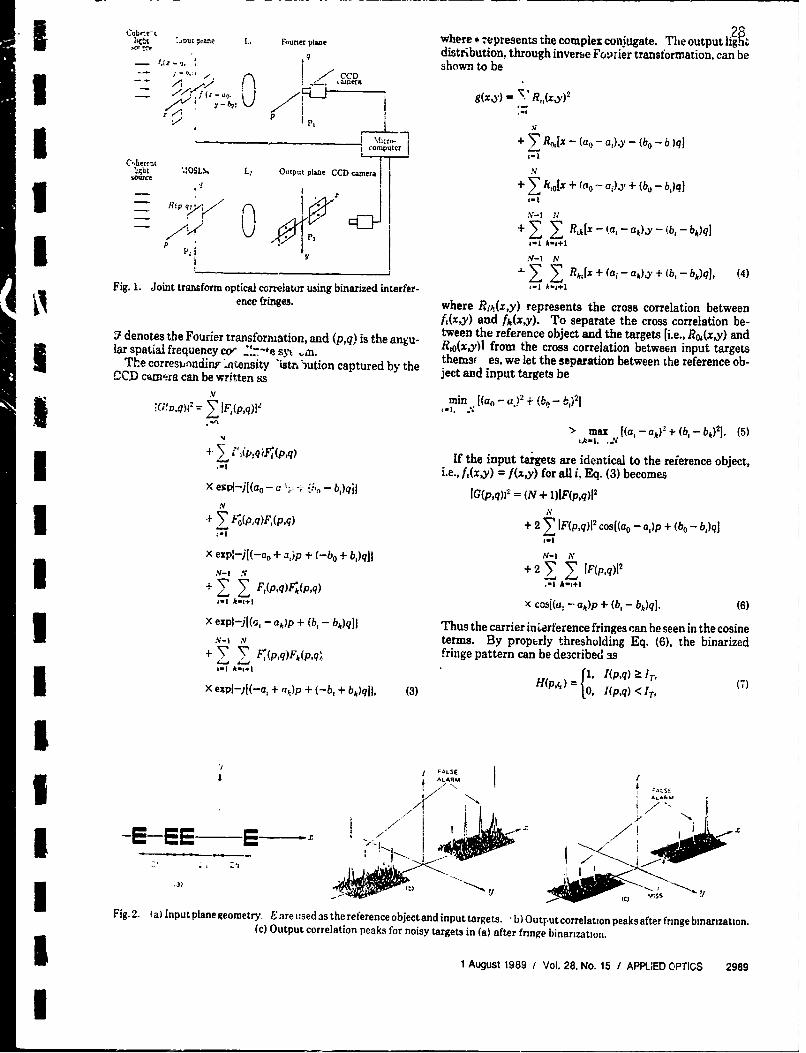
T Rk,[x + (a - ak),y + (b, - bk)ql, (4)Fig. 1. Joint transform optical correlator using binarized interfer- ,' -
ence fringes, where R; (x,y) represents the cross correlation between
f,(x,y) and fh(xy). To separate the cross correlation be-7 denotes the Fourier transformation, and (p,q) is the angu- tween the reference object and the targets [i.e., Ro(x,y) and
Ro(x,y)l from the cross correlation between input targetslar spatial frequency co, :-e syl, - themsf es we let the separation between the reference o-The corresvodin :atensity istr. ution captured by the t and input te e
WCD cametra can be written sject and input targets bem in. [(a, - a.)2 + (b0 - b,)-]
. IF,(p,q)!-
-max [(a, -ak i+ (b, -b 2]. (5)
'If the input targets are identical to the reference object,i.e., f,(x,y) = (x,y) for all i, Eq. (3) becomes
x eNpi-i[(ao -a -p b,)q]} IG(p,q)l 2 = (N + 1)IF(p,q)12
+" +(p2q)F(pq) IF(p,q)12 cos[(a 0 - a,)p + (b0 - b,)qj
x exp:-j[(-a. + a,)p + (-b o + b,)qjI N-i N
.N-1 I + 2 IF(p.q)12+ : F,(p,q)r(p,q) .m,.,
,-: - the X cci(a: - a)p + (b, - bk)qj. (6)IX expl-j[(a, - aA:)p + (b, - bkqll Thus the carrier inierferencefrnecabesninteoie
N-1 N terms. By properly thresholding Eq. (6), the binarized+7 7 ' . (p,q)Fk(p q,, fringe pattern can be described as
I~~~ ~ ,1 -+t.[, lAp,q) Z> IT,
x expl-J[(-a, + a,)p + (-bl + b*)qjI, (3) H(p, = q)<I, (7)
IIAiI
Fig.2. fa) Input plane geometry E are used as the reference objectand input targets. 'b) Out.utcorrelation peaks after fringe binarization.(c) Output correlation peaks for noisy targets in (a) after fringe binarization.
1 August 1989 / Vol. 28. No. 15 / APPUED OPTICS 2989
I

29where f(p,q) is the i itensity distribution, i.e., !G(p,q) 2, and disturbances of the same level. Thus we see that binariza-IT is the selected threshold level. tion of joint transform spectral fringes wct!ld generally intro-
Let us first consider a single input target case, then the duce flse alarms and misses for multitarget correlation.binarized pattern H(p,q) would become a rectangle wave Summarizing: we have examined the effects of the fringefunction, which contains the carrier fr--dency (i.e., interfer- binarization on the joint transform correlator via computerence fringe frequency) and its harmonics. By inverse Fouri- simulation. The simulated results show that the binarizeder transforming this function, a series of correlation spots joint tranpform interference fringes for multiple targetswill be produced. The first-order correlation spots repre- could proauce false alarms and misses. Fringe binarizationsent a match of the input targets with respect to the reference may not be usefully applied for multine target recognition.object. However. if the input is composed of multiple tar- although it can be applied succeustully to noise free singlegets, the joint transform interference fringes will be very target correlation.complicated and the binarization of these fringes could mask We acknowledge the support of the U.S. Army Researchthe carrier frequei.-y content and possibly generate unwant- We ac t u orft US mye ced frequency components. Therefore, binarization of a joint office contract DAALU3-87-0147.power spectrum for multiple targets will generally cause falsealarms and incorrect identification in the output correlationplane.
Computer simulatic -s are now given to predict the effectsof fringe binarization on the JTC. In the first example,shown in Fig. 2(a), the character E at the right-hand side is -- A -_ "used as the reference object and the other characters on the - --left-hand side are used as input targets. From this configu- 2h 3h 2h.ration, the correlation between the reference and targetsshould be located inside a viewing window given by (a)
3h<x<8h and -h<y<h,
or FA~LAPIA
-8h<x<-3h and -h<y<h. (8)
It is assumed that the character E occupies 15 X 15 pixels and ,the separation h is 17 pixels. A 512 X 512 point fast Fouriertransform was used in the calculation. Figure 2(b) shows theoutput correlation peaks within the viewing window. A false 4,a=alarm, due to the binarization process, can be seen in thissimulation. In other words, if the nonlinear operation works )well, there should be three correlation peaks in the viewingwindow. In fact, as shown in Fig. 2(b), there are four correla- Fig.3. (al Input plane geometry. A is used as the reference object.tion peaks, one of which is apparently the result cf the (b) Output correlation peaks afte- fringe binarization.binarization process. We further demonstrate that, if theinputtargets [e.g., Fig. 2(a)] are embedded in additive Gauss-ian noise (with SNR = 15 dB), a false alarm ani4 a miss areproduced. as shown in the simulation result of Fig. 2(c).Moreover, if an A, instead of the E, is used as the reference Refmrenesobject, as depicted in Fig. 3(a), a false alarm could also be 1. C. S. Weaver and J. W. Goodman. "A Technique for Opticallyproduced, as shown in Fig. 3(b), even though the reference Convolving Two Functions," Appl. Opt. 5, 1248-1249 (1966).and targets are different. In this figure, we see a strong peak 2. J. E. Rau. "Detection of Differences in Real Distributions." J.appear uninvitedly at a wrong position. which is purely due Opt. Soc. A- .56, 1490-1494 (1966).to the binarization process. Several runs of simulation, un- 3. F. T. S. Y, and J. E. Ludman. "Microcomputer-Based Program-der low level noise environment (e.g., SNR > 15 dB), have mahle Optical Correlator for Automatic Pattern Recognition andbeen tested. The positions of the false alarm and the miss Identification," Opt. Lett. 11,395-397 (1986).remain unaltered. Mention should be made that any change 4. B. Javidi and S. F. Odeh. "Multiple Object Identification byof the positions of the false alarm and the miss has not been Bipolar Joint Transform Correlation," Opt. Eng. 27, 295-300observed in various runs of simulation, with different noise (1983).
2990 APPLIED OPTICS / Vol. 28. No. 15 / 1 August 1989

* 30
III
APPENDIX 10.3
'IDetection Efficiencies
IIUIIIIIIIIIU
1 31
I Reprinted from Applied Optics
I Comparison of detection fficiencies for VanderLugt and jointtransform correlatorsIFrancis T. S. Yu, Q. W. Song, Y. S. Cheng, and Don A. GregoryI
The correlation of peak intensities of VanderLugt and joint transform correlators with a single object,multiple objects, and roisy environments are analyzed. The study shows that the Vanderl-ugt correlator cangenerally perform better for the multiple object case and also under a noisy environment.
1. Itroduction I F(o,o)I - IF(f.f)I 1 (3)
S The VanderLugt correlatorl (VLC) and the joint At the output plane, the complex light distribution cantransform correlator 2 (JTC) are the major types of be written asoptical correlators used for pattern recognition appli-cations.3-9 In tl'is paper, we investigate the detection g(xzy) =L(xy) * &,) ® &,y) + A2f(XY)
I efficiencies of these two types of correlator for multiple [IF(o,0)I + A12
objects, and within a noisy environment. + Af(x + Xffo) 0 f(x + Xffo0 y)
11. Basic A-alys + Af(x - ffoy) - f(x - ff0,y)l, (4)U In the following, we review the basic mathematics where * and ® represent the convolution and the corre-associated with the VanderLugt and Joint Transform lation operation, respectively. The third term of thecorrelators to establish notation. The complex spatial above equation represents the autocorrelation offilter as obtained with the VanderLugt technique can f(xy), in which the correlation peak intensity is givenbe written as by
Ht.f,) -IFf,fy)I2 + A2 + 2AF(,,f,)I VIF )A I/x,)ldx d>" (5)
x cosi2,fox - 0(f,.,)]. (1)[IF(,) +A'where [fV = x/(Xf),fy = y/(f)] are the spatial frequency For a given signal, the equation is a function of thecoordinates, J0 is the spatial carrier frequency of the reference beam amplitude. The optimum correlationmatched filter, A is the amplitude of the reference peak intensity occurs for unity reference-to-objectwave, X is the illuminating wavelength, f is the focal beam ratio (i.e., A = IF(0,0)I). The correspondinglength of the Fourier transform lens, and F(fx,fy) = output peak intensity can be written asIF(f.,f,) exp[io(f.,fy)] is the Fourier transform of the I I(xy)I dx dy(6object (x,y). 161 (0,0) (6)
The normalized amplitude transmittance of the spa- We shall now provide the same calculation for a jointtial filter can be written as transform correlator. Let the amplitude transmit-
H(f.J) I + A2 IIFf,)I2 + A2 tance at the input plane bet(x.y) = f(x - X, y) + (x + xz.y), (7)+ 2AIF(fI. )I cos[2rz - o(fL.f,)lL (2) where one of the input objects serves as the reference
where we have assumed image.Since the square law detector at the Fourier plane
takes the square modulus of the Fourier transform ofDonGreg, ,sw ith U.S. Army Missle Command. Redstone Arse- t(x,y), the normalized amplitude transmittance of the
nal. Alabama 35898: the other authors are with Pennsylvania State JTC filter can be written asUniversity, Electrical Engineering Department. University Park.Pennsylvania 16802. H(f,,f,) = ( +)o- - - - - 8
Received 15 November 1988. 2iF(O.0)11
10 January 1990 / Vol. 29. No. 2 / APPLIED OPTICS 225!

I 32
Assuming unity illumination of this filter, the out- For the JTC, the input transmittance can be written
put complex light distribution is given by as
g(xy) = I [2f(xy)0f[x,y) ,,=f(x + X,,.y) + " f(x - X,,.y), (14)
41 F1. 2(O.O ) 0f+ /(X + 2x, ) 0 fiX + 2Xty) where the first term represents the reference object.
After square law detection, the normalized ampli-+ fx - 2x,,,y) 0 f(x - 2xo y)], (9) tude transmittance of the JTC filter is
in which the correlation peak intensity at (2x0,0) or IF(f,,fjl2
( -2x 0,0) is n.Xy(112 = 2 ( + M)'IF(0.0)I"
161F0,0)14 i (10 + M + 2 ){ M cosl2r(x + x,)f/j
From Eqs. (6) and (10), we have=IFOO)I2 . (11) + 2 cos[2r(:., -x f (
, rn-I| mn oJ
So far we have assumed unity read-out illumination for n<M
both the VLC and the JTC. If the read-out intensity The corresponding output light distribution can befor the JTC is BI instead of unity, then Eq. (11) wotld shown to bebe equal to IF(O,0)I 2/B. Unless B is equal to IF(0,O,Iv would not equal Ii. This means for a smaller object gMJ(xy) =1_+__________ (1Q+ M)f(xy) 0 f(xy)with lower average transmittance, the ratio Iv/Ij is i' + M)2 F(0.0)12
low. Thus, the relative performance would favor theJTC for smaller objects with lower average transmit- +tance. An example can be given to demonstrate this + 'S' fix - x0 + xn,y) 0 fix - x9 + xo.)effect. Let the average amplitude transmittance of n-1
the object rand its spatial dimension be X 2. Then, the + .s fix + x®- x,).f4x+ x+ xy)
zero-oraer Fourier diffraction would be confined with- -
in the region of (Xf/X) -. Hence, the intensity at the. M M 1origin of the Fourier transform plane is i
2X 4
/(tXf)2 for + ' " fiX. + XY.) 0(x -X + Xn,Y) (16)3 unity illumination. To make Iv smaller than Ij, for X - .,-1
6 X 10⁻⁴ mm and f = 300 mm, T should be smaller n-- 3than 0.18 for an object size of 1 mm2. Thus, the correlation peak intensity at either (x0 -
I . MuW" e Detection xn,0) or {-Xo + xn,0) can be written asFor the case of multiple objects, the amplitude :f.- I If y)1 dxdy (17)
transmittance of the VanderLugt matched filter, as II given in Eq. (2), is independent of the input objects. It is apparent that the intensity of the correlationThe input amplitude transmittance is assumed to be: peak decreases very rapidly as the number of the ob-
MW jects M increases. The reason is that the wave ampli-t tmv(xy) = ' f(X- X".y), x1 < x <x 3 ... < xM, (12) tude at the origin of the Fourier transform plane is
n-, proportional to the number of input objects, whichwhere we have M nonoverlapping objects distributed includes the reference image. This is essentially limit-on the x-axis. ed by the max'rnum amplitude transmittance of theI Thus, the output complex light distribution would JTC filter, which -an not exceed unity. Furthermore,be from Eqs. (17) and (6), the correlation peak intensity
ratio between the JTC and the VLC, for the multi-gV(x-y) ' [(Jx - X-,Y) object case can be written as
IFo.o)I + A]: '- n I l~r.. j = 16 i8
• fix - x.,y) 0 f#x - x .y) lq u= (I +;_F(0.o)"
+ A-f(x - x,.y) + Af(x + Aff,. - x.y) Since the output corr..,ation intensity from the JTC is(X + N~ff,. - xY) dependent on the number of input objects, Eq. (18)
shows that the performance of the VLC would general-+Af(x - Aff. + x,,.y) f(x - A + x,,y)l, (13) ly be better than the ,ITC, unless (I + MA)- F(0.0)I < 4.
Figures 1 (a)-(d) show the cor-elation peak intensitywhere the width of each object is assumed to be X. If as a function of the number of input objects for differ-Xffi is greater than x., - x + (5/2)X the outputs do not ent values oflF( O.O)I -. Since the "V'inderLugt filter isoverlap. The corresponding correlation peak intensi- independent of this input object illumination, the VLCty at (-Xff[, + x,,,0) is then identical to that of Eq. (6). peak intensity remains cons,.ant reLardless ofthe num-
226 APPLIED OPTICS I Vol. 29. No. 2 1 iC January 1990I

5m IVI~i 33
36 1.5
1W
I4
12- IMV 0. MV
0 M 0 M1 123 45 67 89 10 1 23 45 6 78 910
(a) (b)5 W ai, _______ _aI
30.375' 0.0937'
0.25 0.0625
10.1251 0.01V
ot i M1 2 3 4 5 6 7 8 9 10 1234 5 6 7 8 91
Fig. 1. Correlation peak intensity as Lfunction of the number ofobiectsAf. IMqjadl(v. peak intesitof JTC ad VLC. respectivey (a) forIIF(O.O)12 0.03125: (b) forlF(O.O)12 = 0.125: (c) forl.F(O.0)12 = 0.5: (d) fori.0)12 = 2.0.
ber of input objects. However, the peak intensity is smaller than three. However, if IF(O,O)I > 1. thedecreases very rapidly for the JTC as the number of VLC would always perform Letter than the JTCinput objects' increases. Furthermore, the relativeperformance of the JTC and VLC depends on the IV. Detectio n ma Noisy Envronezitnumber of input objects for I F(0,0) I < 1. This can be We shall now investigate the case for input objectsdemonstrated by looking at Fig. 3(a) in which the JTC imbedded in a noisy environment. In this case, theperforms better only when the number of input objects input transmittance function can be written as310 January 1990 / Vol. 29. No. 2 / APPLIED OPTIS 227

34
M The output correlation peak and noise intensity can bet.44V(XY) = f(x - xn,.y) + n(xy), (i9) shown to be, respectively,
where n(x,y) represents additive noise. Since the am- Iplitude transmittance of a VanderLugt filter is inde- j= ( + MF(0.o)j + 1N(o~o)Ilpendent of the input object, the complex light distribu- la [2tion at the output plane can be shown to be X j if(xy) 2 dx dy (25)
g'A'xr) = (X - x.Y) * j(X - x.,Y)0 & Aj 2
1 ) [(1 + M)IF(O,0)I + IN(,o)11*fix - x~,) 1IfI:: r)d .+ A2f(x - x,.y) + Af(x + Aff o - x,.y) X n(xy)f*(zy) dx dy (26)
0 fRx + ?xff o - x.y) From these results, it is observed that the output S1+ Af(x - Xffo + x ,y) - (x - fo + x~a)] N is the same for both the JTC and the VLC. Howev- j
&er, the correlation peak intensities are quite different.+ n(x~y) * (xo,)@~y) ~ + AFor the JTC, the correlation intensity is dependent on+ An(x + Xfoy) e (x + - ,y) the presence of input noise, while for the VLC, the
peak intensity is independent. The ratio of the peak+ An(x - f4,y) * f(x - Ahf + x.)- (20) intensity between these correlations can be written as:
= 161 F(0,0)12
Thus, the output correlation peak intensity is un- (27)changed from that given in Eq. (6). The output noise M + M)F(0,0) +IN(0.o)114
intensity can be written as Figure 2(a) shows logarithmic plots of f&I4 v as arMV1= 1II n(x.y)1(xy) dxdy (21) function of M, for various noise levels 1N(0,0)121
161F(.0)[ 2 E-. 1 IF(0,0)12. For a certain noise level, In(&jIMv) de-The output signal-to-noise ratio can be expressed as creases monotonically as M increases. On the other
2 -hand, for a fixed number of input objects, the value oflf~~xy~llfl MJInrufMV) becomes smaller as the noise level in-
I ~ ~~ i f*: ,,I, " oo ..•c (22) creases. In the region above the M-axis, the correla.
,nc = y)fi.y) dx dtion peak intensity for the JTC is higher than that forthe VLC. In other words, the JTC would performFor a noisy input in JTC, the input is better in this region. On the other hand, the VLC
ab would perform better than the JTC in the region belowdx~) = I(X - x0 ) + fAX - xf.Y) + (23) the M-axis. Furthermore, the curves in Fig. 2(a) are'shifted down as IF(0,0)12 increased. This implies that
The amplitude transmittance of the JTC filter cn be due to the limited dynamic range of the square lawS wr litten as converter, the JTC correlation intensity decreases ifthe average transmittance function of the object be-
K"') 1 [ flarger. Logarithmic correlation-peak-intensityMJ , -- [U + MXF(oo)I + IN(0,0)1IF ratios as a function of noise level for various number of
input objects are plotted in Fig. 3. It is apparent thatSn M V) decreases monotonically as IN(0.0)12/
+2 F2 - 1F(O,O)12 increases. With the same noise level, then-1 value of the correlation intensity ratio becomes lower
as the number of input objects increases.+23' 7" co9[2-(x,. - X.i
+ Ft/,.,)N't,,A) exp[-i2rx 1. We have studied the detection efficiencies for the+ expfi27x4,1 jTC and the VLC, with multiobject scenes and in anoisy environment. For the single-object case. it wasfound that the relative performance, between these+ F(,f)f1 )Jq,,f ezpj-i2rxf.f two correlators, depends upon the object transmit-
tance function and the object size. In general, the+ F'fNJ,) + VLC would perform better unless the input object is- very. small with very low average transmittance.
X expfi2rxj] + J ) (24) For the multi-object case, the JTC peak intensitydecreases rapidly as the number of input objects in-creases. Since the VanderLugt filter is independent of
3 228 AP IED"opICS / Vol. 29. No. 2 1 Janu ry 1990

41v 'V
It022
-21 52 J-3'
-4' 4-
£ (a) b)
n In
3l - 3 4 C
3 0.255 6 9--11
0*2 -4 0
-66
-8
Fig.l Logarithmic intensity ratio .-I544 as a (unctiono: nmner of'objects M. tai A Ojj i ib;k tts5 for i~~iO.O1~~ = 0.: Id) ft)~or; ___
,luary !1000 'Vol 29. No. 21 A t O~M-s 229

1. 36
Iu
U=U 1=
I.
M£-pi
2UE oLE~TM 2.W W

2
Ml
I (C)
In;
0.5 It01. F(S0.0)
M I'
I M-2
(d)
Fig. 3. (c) (d) Logarithmic intensity ratio In(k4i(tv.1) as a function of IN(0,0)21F(,0)12: (c) for I F(0,0) 12 =0.5; (d) for I F(O,0) 12 2.0.
10 January 1990 / Vol. 29. No. 2 / AF )PTICS 231
38input noise, the VLC peak intensity remains constant Y. S. Cheng is on leave from Institute of Opticalregardless the number of input objects. When F(0,0) 1 Sciences, National Central University, Taiwan.< 1, the relative performance depends on the numberof input objects. The JTC may perform better if (1 + RefemncsM)21F(0,0)I < 4. However. for IF(0,0)12 > 1, the VLC 1. A. VanderLugt, "Signal Detection by ComplexSpatial Filtering,"
would always perform better than the JTC. IEEE Trans. Inf. Theory IT-10, 139-145 (1964).2. C. S. Weaver and J. W. Goodman, "Technique for Optically
Although the output signal-to-noise ratios for both Convolving Two Functions," Arp. Opt. 5, 1248-1249 (1966).correlators are the same, their correlation peak intensi- 3. F. T. S. Yu and X. J. Lu, "A Real-time Programmable Joint
ties are quite different. Since the VanderLugt filter is Transform Correlator-to," Opt. Commun. 52,10-16 (1984).not changed by input noise, it should generally per- 4. D. Casasent, "Coherent Optical Pattern Recognition: A Re-form better in a noisy environment, except for view," Opt. Eng. 24,26-32 (1985).IF(0,0)I [1 + M + IN(O,O)I/IF(O,O)11 2 < 4. 5. F. T. S. Yu and X. J. Lu, "Large-Capacity Real-Time Spatial-Spectral Scanning Optical Correlator," Appl. Opt. 25, 812-816
We finally remark that, in terms of detection effi- (1986).ciency, the VLC will generally perform better when 6. D. J. Ennis and D. A. Jared, "Optical Processing and Spacecompredto he JC. oweer, ithresect o ral- Station Automation," Opt. Eng. 25, 808-820 (1986).compared to the JTC. However, with respect to real- 7. J. L. Homer and P. D. Gianino, "Phase-Only Matched filtering,"time applications, the JTC still offers the advantages Appl. Opt. 23,812-816 (1984).in spatial filter synthesis, alignment of spatial filter, 8. D. Psaltis, E. G. Peak, and S. S. Venkatesh, "Optical Imageand overall simplicity. Correlation with a Binary Spatial Light Modulator," Opt. Eng.
23,698-704 (1984).We acknowledge the support of U.S. Army Missile 9. D.A.Gregory,"Real-TimePatternRecognitionUsingaModified
Command through the U.S. Army Research Office Liquid Crystal relevision in a Coherent Optical Correlator,"under contract DAAL03-87-0147. Appl. Opt. 25,467-469 (1986).
2IIUIIIIIII
232 APPLIED OPTICS / Vol. 29, No. 2 / 10 January 1990U

* 39
I£U
APPENDIX 10.4
£JTC Color Pattern Recognition
UUIIIUI£III£IU
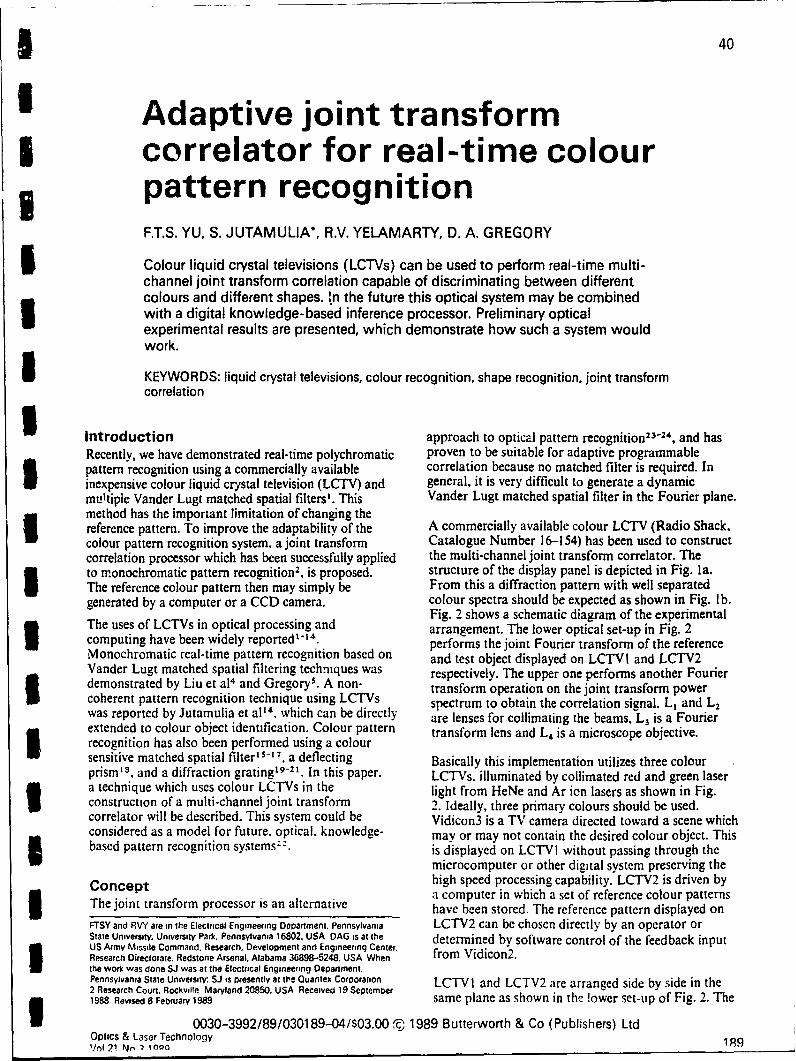
40
Adaptive joint transform3 correlator for real-time colour
pattern recognitionF.T.S. YU, S. JUTAMULIA', R.V. YELAMARTY, D. A. GREGORY
3 Colour liquid crystal televisions (LCTVs) can be used to perform real-time multi-channel joint transform correlation capable of discriminating between differentcolours and different shapes. !'n the future this optical system may be combinedwith a digital knowledge-based inference processor. Preliminary opticalexperimental results are presented, which demonstrate how such a system wouldwork.
KEYWORDS: liquid crystal televisions, colour recognition, shape recognition, joint transformcorrelation
Introduction approach to optical pattern recognition23-24, and has
Recently, we have demonstrated real-time polychromatic proven to be suitable for adaptive programmablepattern recognition using a commercially available correlation because no matched filter is required. Ininexpensive colour liquid crystal television (LCTV) and general, it is very difficult to generate a dynamicmultiple Vander Lugt matched spatial filters'. This Vander Lugt matched spatial filter in the Fourier plane.method has the important limitation of changing thereference pattern. To improve the adaptability of the A commercially available colour LCTV (Radio Shack.colour pattern recognition system. a joint transform Catalogue Number 16-154) has been used to constructcorrelation processor which has been successfully applied the multi-channel joint transform correlator. Theto monochromatic pattern recognition 2, is proposed. structure of the display panel is depicted in Fig. Ia.The reference colour pattern then may simply be From this a diffraction pattern with well separatedgenerated by a computer or a CCD camera. colour spectra should be expected as shown in Fig. lb.
Fig. 2 shows a schematic diagram of the experimentalThe uses of LCTVs in optical processing and arrangement. The lower optical set-up in Fig. 2computing have been widely reported'' 4 . performs the joint Fourier transform of the referenceMonochromatic real-time pattern recognition based on and test object displayed on LCTVI and LCTV2
Vander Lugt matched spatial filtering techniques was respectively. The upper one performs another Fourierdemonstrated by Liu et ai4 and Gregory5 . A non- transform the transformcoherent pattern recognition technique using LCTVs spectrum to obtain the correlation signal. L and Lwas reported by Jutamulia et al14 . which can be directly aspe to otating the ea s. L an r
- are lenses for collimating the beams. L3 is a Fourierextended to colour object identification. Colour pattern transform lens and L4 is a microscope objective.recognition has also been performed using a coloursensitive matched spatial filter' ", a deflecting Basically this implementation utilizes three colourprism' 8, and a diffraction grating' 9-21. In this paper. LCTVs. illuminated by collimated red and green lasera technique which uses colour LCTVs in the light from HeNe and Ar ion lasers as shown in Fig.
construction of a multi-channel joint transform 2. Ideally, three primary colours should be used.correlator will be described. This system could be Vidicon3 is a TV camera directed toward a scene whichconsidered as a model for future. optical. knowledge- may or may not contain the desired colour object. Thisbased pattern recognition systems: 2 , is displayed on LCTVI without passing through the
mispter ass ing hemicrocomputer or other digital system preserving the
Concept high speed processing capability. LCTV2 is driven byThe joint transform processor is an alternative a computer in which a set of reference colour patterns
have been stored. The reference pattern displayed onFTSY and RVY are in the Electrical Engineering Deoarment, Pennsylvania LCTV2 can be chosen directly by an operator orstate University. Unversiy Park, Pennsylvania 16802, USA OAG3 isa the determined by software control of the feedback inputUS Army Missile Command. Research. Development and Engineering Center.Research Directorate. Redstone Arsenal. Alabama 36898-5248. USA When from Vidicon2.the work was done SJ was at the Electrical Engineering Department.Pennsylvania State University: SJ is Iesently at tl'e Ouantex Corooration LCTVI and LCTV2 are arranged side by side in the2 Research Court. Rockville Maryland 20850. USA Received 19 September1988 Revised 8 February 1989 same plane as shown in the lower set-up of Fig. 2. The
0030-3992/89/030189-04/$03.00 - 1989 Butterworth & Co (Publishers) LtdOptics & Laser Technology I~ 9Vol 21 Nr, 1 10 185)

41
I t-.--I i I II Si,,r ,"ly-r L L4 Coour ino n ir
3 ~ IL.TV2
IFEEFE O LCTV)LCTV
* lILI '1 1I 1F i11
d %iMcrocomputer
X Fig. 2 Conceptual architecture of an adaptive joint transformSa correlator
3 !Red CreenalueI t
Knowledge base Optical
polychromaticV K Computer joint transform-/ 0 __o____.___ _ o_
correlatorJ
Fig. 3 Schematic diagram of a knowledge-based real-time3 polychromatic correlator
superimpose. Thus. a correlation peak which has thesame colour as the object (if three primary colours areused) can be observed. In approaching a knowledge-I (based correlation system'!, a diffraction order thatgives a spatially separated primary colour correlationpattern should be selected. A computer would analysethe independent colour signals and then determine thecolour of the object. This may require updating the
b reference pattern with patterns from the knowledgeI base for obtaining the best match. A schematic diagram
Fig. 1 (a) Structure of the colour LCTV display panel; (b) schematic of this process is depicted in Fig. 3.diagram of the polychromatic spectral distribution at the Fourier
transform plane (zero and first order maxima) Experiments
joint transform is performed by the lower lens L3. The To verify operation of this knowledge-based colourcorrelator and the usefulness of the colour LCTVs, a
pixel structur the o erLCTV produces multiple colour preliminary experiment has been performed. Aspectra in the Fourier plane as shown schematically i schematic diagram of the experimental set-up is shownFig. lb. A microscope objective lens L4 with a small microcomputer was used to generate aaperture selects and magnifies only one diffraction in Fit. 4. Asutneate aorder consisting of well separated colour spectra. The colour object and reference patterns simultaneously onintensity joint transform distribution of the selected a single LCTV. A black and white picture of thediffraction order can then be recorded bv Vidicon I generated colour patterns (simulated fighters) taken
which is directly connected to LCTV3. from a colour video monitor is given in Fig. 5a. Fig.5b shows the picture as taken directly from the LCTV
The correlation %ignal is obtained by performing a and as can be seen. the LCTV has low resolution andFourier transiorin of the intensity pattern of the colour Live a colour ghost image. The colour ghost image isjoint translorm spectra displayed on LCTV3. This is due to cross-talk between neighbouring colour pixels.done using len I-, lens I., i S anther microscope :or simplicity. only two primary colours (red andobjectve which %elctis and magnilies the colh ir green) were used. A collimated bichromatic coherentcorrelation tgnal for (lctcct.ion by Vihcoi2. If ihe /cro beam from HIoNe and Ar ion lasers is incident on the
order is sclccied. colotur correlation peaks will L,( TV. which was disassembled and immersed in a
190 Onptis & Laser TechnoloqyIfni 21 No 3 1q9
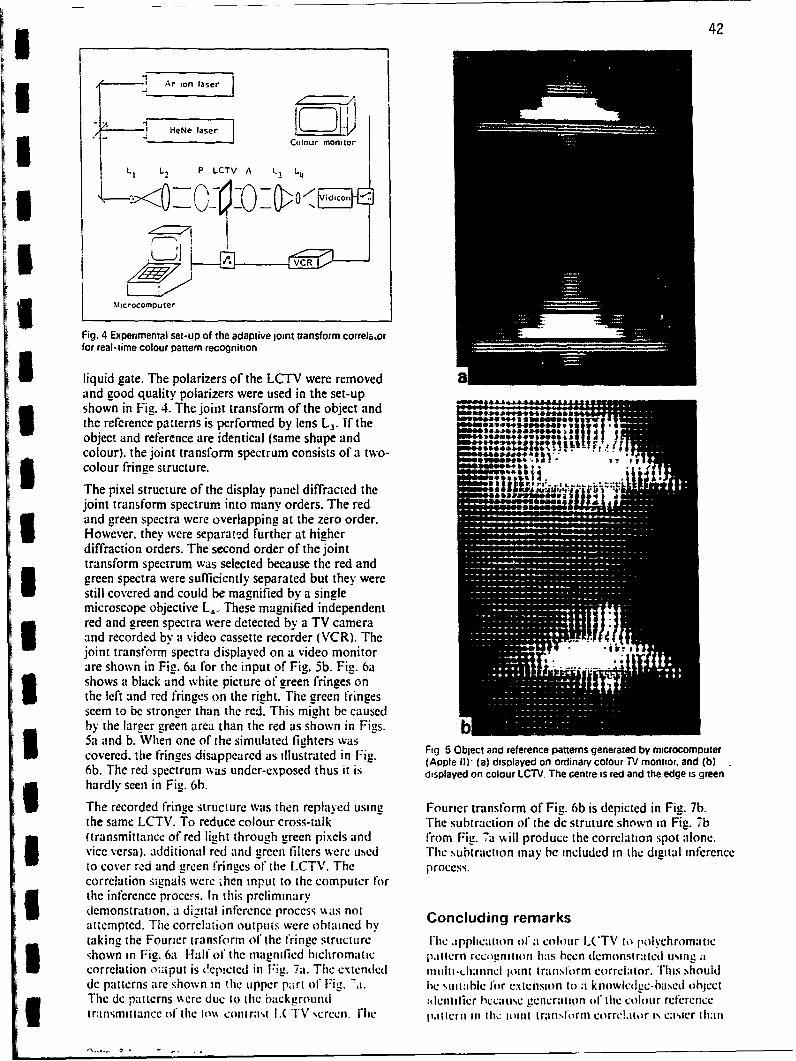
i _42
1.Ar ton laser
He " lasColour monitor
L L 2 P LCTV A L3 L 4
Microcomputer
Fig. 4 Experimental set-up of the adaptive joint transform correlaorfor real-time colour pattern recognition
liquid gate. The polarizers of the LCTV were removed aand good quality polarizers were used in the set-upshown in Fig. 4. The joint transform of the object andthe reference patterns is performed by lens L, . If theobject and reference are identical (same shape and PIP .colour), the joint transform spectrum consists of a two-colour fringe structure. e
The pixel structure of the display panel diffracted the ,, lZJ t1.joint transform spectrum into many orders. The redand green spectra were overlapping at the zero order.However. they were separated further at higherdiffraction orders. The second order of the jointtransform spectrum was selected because the red andgreen spectra were sufficiently separated but they werestill covered and could be magnified by a singlemicroscope objective L,. These magnified independentred and green spectra were detected by a TV cameraand recorded by a video cassette recorder (VCR). Thejoint transform spectra displayed on a video monitorare shown in Fie. 6a for the input of Fig. 5b. Fig. 6ashows a black and white picture of green fringes onthe left and red fringes on the right. The green fringesseem to be stronger than the red. This might be causedby the larger green area than the red as shown in Figs. bI a and b. When one of the simulated fighters wascovered, the fringes disappeared as i lustrated in Fig. Fig 5 Object and reference patterns generated by microcomputer6bveed. the rngese m wap er-ed us d in F. (Apple II)- (a) displayed on ordinary colour TV montor. and (b)6b. The red spectrum was under-exposed thus it is displayed on colour LCTV. The centre is red and the edge is greenhardly seen in Fig. 6b.
The recorded fringe structure was then replayed using Fourier transform of Fig. 6b is depicted in Fig. 7b.the same LCTV. To reduce colour cross-talk The subtraction of the dc struture shown in Fie. 7-b(transmittance of red light through green pixels and from Fig. 7 a will produce the correlation spot alone.vice versa), additional red and green filters were used The subtraction may be included in the digital inferenceto cover red and green fringes of the LCTV. The process.correlation signals were zhen input to the computer forthe inference process. In this preliminarydemonstration, a di ita! inference process %as not Concluding remarksattempted. The correlation outputs were obtained by
taking the Fourier transform of the fringe structure ['he ipplication of a colour L('TV ti polychromaticshown in Fig. 6a Half of the magnified hichromatic pattern recocnition has been demonstrated u .ine icorrelation output is decnited in Fig. 7a. The cxtended ,ll ti|-d|:|nnel joint tran.lorm correlator. This .shoulddc patterns are shown in the tipper part of Fig. e. he ,,mtahle for extension to a knowledgc-ba.ed objectThe dc patterns , erc due to the background idenilicr hccaue gencration of the co lour rcferencetransmittance of thie low contrai I(TV screen. [ic i.iiicr it in Ite Illll tranl rn correiJlhtr i' Omerile han

43
V
(i.Sfa) Joint tranfn owrseta of 54. the left and --
the a111 hgo Siti dWC stutre genaraw secwf fb) finge 7a Fourier nrnsm of Fig48(a) The sm*s gOMs at the#trUitots diapea when orie fighter in Fig 5 is covered (the ted bottoni eactate the coreraltg [bi~ ) o*ut forto a dasecum~ was undrexosi Scren CIsoA--S on "1 LCTV. snowin h otes h
subvitacton ot fbi froim Caj "wew the coreefatofl teems atomei1-4 -aft1 and th e -am str±.cttras ares green and red tespethnhr
that of the traditional Vander Ltwl. corretor. TheU yswrn is cap-able ofdiscriminatime between MHffErn 9 u_-S-Jmun Iun Wmml
liie space-bandwidth praduc, tSBPv- it Is a low-cost. 10 Mo&LFflDpitJ-L fJLX_-af&DR, )It min-e moinacr.*computer-addresabic. spatiai rrh -roduiawor cantable -- M- - jflr im --- ~ --otmId cnnsal texwmn 51uwa.
of processing polychrom~atic stionaus With further FE1 .:wm ltm~.# rr L". 154Sf OE) 74Y~mprov rnet. h ouiLIh-n o' Iphai to tiaomrqKD_ Roemn. & M-iIW&J. Kakvy. M. Oot--* Z li ff ~~ M -ai ;aerons 4Ap) 00p. 2i. IFIcoiour-sensmitve kflowiCdoe"ase valucn rccogrmton. -w_
Vu. %n T.S. Junkml S_ (nri. D.A. R meliudma
Acknowledigement 213 Y;; 17T%. JunmuwS_ Grtza. DA. p rar3e Wacknowledgeeths=-rr USI Ar-'n Research S_ un x= te, % um%0
Jutnniat-L Ln. .WVwF.T&S..RcaI-tirne uoncom-63 References irnw OtCmr-UMr.~ij IN. rCin Opt tnt. 3. (19Q75=Xi
1 Y. F.T.S.. Jmnmutw S=rn. Ttb - I -.frmt 16 Caw. k.T acnh.ihrc istnai detton iit. _- C-, Op. 18-FIs
onn.26.1i1937 _1J 17 IM Y. Mrtk Kw ra. rcctromm-uc
Z-c-1ti pattern FC a 14LiCE~. J.. atsm um.P. Lm =1 A.% rJA3Zal'cth3 C I nuroperies chcMa ti h! - 5mawa t FOR, ~Ja*----rin~.rita~
Opt Left 10. (tI1-85, nt ---- -st,lthcrsno P1715 Grgoy D.A re-cnrippr p-buFCz 1%mi' J; \ - eal-me trretr
i.#PPI opt. !51S9m. 0qTai A.M '-'m -1 hg
Otcal quit'.. 4pp frp 5 '-- - i.1TS.i J .ersCatr~knn rr~.nxi.3.~ sxn III!a. ELI - _ I !9.11 trao

Ii 44I
IIIII,
APPENDIX 10.5
Comparison Vander Lugt and Joint Transform Correlators
IIIIIIIUUIIII
_________ j

AppL. Phys. B 51. 153-164 (1990) A45to-
Applied phyt-3 Physics B W
® Springer-Verlag 1990
UComparison of Vander Lugt3 and Joint Transform CorrelatorsX. J. Lu, F. T. S. Yu, and Don A Gregory
Department of Electrical Engineering, University Park, P 16802. USAU.S. Army Missile Command, Redstone Arsenal, AL 35898-5248. USA
I Revised version received 28 November 1989/Accepted 7 December 1989
Abstract. A generalized optical correlator is used to analyze the performances of theVander Lugt and the joint transform architectures. Noise performance and the effectscaused by the differences between the input and the reference functions are analyzed. It isfound that the modulation index of the joint transform filter decreases due to the presenceof noise as well as the differences between the input and the reference functions. However.it is found that. in general, the joint transform correlator would perform better than theVander Lugt correlator and certainly has the advantage for rai-time implementation.
IPACS: 42.30. 42.80
Two commonly used techniques for optical pattern 1. A Generalized Optical Correlatorrecognition are the Vander Lugt [1] and the jointtranform [2, 3] correlators. With the Vander Lugt cor- A generalized optical correlator can be described byrelator, investigators have used a variety of techniques dividing the system performance into two parts:to synthesize multiplexing matched filters, srch as the namely, the correlation filter construction and the
frequency [4], the angular [5], the color multiplex- correlation operation. Notice that the term. -correla-ing [6], the holographic lens array [7] and the rotating tion filter.- used here is for both the matched filter(MF)grating technique [8]. However. the joint transform and the joint transform hologram (JTH). The construc-architcture combined w-ith a TV camera such as tion of these filters is basically using the same proce-
vidicon and a CCD can be operated in a real-time dure as shown in Fig. 1. where an input transparencymode with ease [9, 10]. Nevertheless. the application hfx. y - b) and a reference function &x., ,b) at theof spatial light modulators to both Vander Lugt and input plane P, are illuminattS 'y a collimated coher-
joint transform correlators provide significant im- ent light beam with wavelengh .. The intensity
provement of the system operation [8-13]. We shall, distribution of the joint Fourier sectrum at P. is given3 in this paper. analyze the basic performance of the byVander Lugt (VLC) and the joint transform (JTC) l(u.r)=iH[-+IG:+ HG*e --bH*Ge---b. (I)correlators. In the following- we first present a gen-eralized optical correlator for both architectures. The y1 Yzperformance and limitations of these correiator . are X1evaluated. Multiplicative noise introduced by theix ,.spatial light modulators has been used for the analyses.
The effects of the noise perturbation and the differencesbetween the input and the reference functions onmodulation index of the correlation filter are cal-cu. 'd. It is shown that the JTC can generally perfo-mbetter than he VLC. particularly for real-time i Limplementation. Fig. I. Construction o" a corre-at;on fiftcI
U

L i 54 X. J. Las *t 46
where 21 is the mean separation of the two functions which is the cro~s correlation function between '/ andand u and v represent the spatial frequency coordi- g. It is apparent thai the cross-correlation function Rnates. If a photographic plate is inserted in plane P.,. -.ould be diffracted around (0.2b).the amplitude transmittance of the recorded transpa- Similarly, for the third term of iS)j. it becomesrency is given by
IG=2) ! .Ge 4 r±kHGi 4 b2) Rfx,. i 3 2b)- = f I hC)g(x, - . .+ 2b)d.ZdK.
U where k is a propon::ionality constant. We note that if a which is diffracted around (0. - 2b)pinhole replaces the input object h, then (2) can be On the other hand. if the object function fix. vJ inwritten as the signal processing step is a j function, the second
3 i,. =k(A 1G2- A~ +~r iAe4 xrb. and the third te-cmns become
5 which is the well-known Vander Lugt matched filter. It Rx 3 y 2b.Is apparent that the ME can be generated by a joint =iz(x3 ).y)*g t(-X 3 - _Y3)*i(X3 , Y3 - 2b).transform architecture. and (8)U The principle of the correlation operation can beseen by placing a MF in P_ cf an optical processing Rx, 3 b
* sy stm shown in Fig. 2. T his arraagement is known as = - X3, Y3j t g(X3. .) *O(X 3-Y -~ 2b).3 a Vander Lugt correlation.
Assuingtha theinpt ojectis ~x.ii. henthe for which two cross-correlation functions of h, and a arediffracted around (0. 2b) and 10. -2b). respectively.
compex igh disrmu~onbehid te crreltio fiter Since the input object is a delta function. as shown in3is~venb Fir 2.the correlation filter is fliurrmated by a colli-
U,a(u. 0 UflfHl' +1G12) mated ight be-.-.. We se;- that no aliment is requireekFHG*- kF"Ge"' (4) for- the correlation filter. and the process is known as a
+kFHtei2 ~+FH*G4 ~2 b. 4) Joint transform correlation.U The corresponding output light field at P3 i
Ugxv= ~ 2. Noise Models3 .- kf ' 3v~)o tf- x.y 3 *1ix 3 .~IsAt3 ~.Needless to say, the correlation detection would bewseverely degraded by noise, osei a conerenrt optical
+kf(X3-V3)*.gfx r,',j*(- xt 3 -V 3 *&X3, 3 2D) correiator generally exists in the input t.ansparenc-v-in.i the spatial filter and in the syster.W shall cops!de
x0herc * denotes the convolution operation, U, r":nr here. however. the nois e ttie inout P*-2ne and in the
sents the amplitude distribution centered around thie spatial fis nr. Since spatial light modulators ISLM) are3 'fracted around I -a 2b) and (0. - 2h) respectively, W~e for real-time operation. the noise generated in thesententat in the fter construction step. we rep!ac devices should be analyzed. For s-mr'zicty. the phase
--by a delta function, i.e.. hdx. Y -b)=~ noise and amplitude noise will be 1.4a-vd separate'ly inseodtr f1)becomes -our a-nalyses. Moreover, the phasec noise zenerailv
comes from the surfacc variation o.-, SLM% and theRt 3 -b)amnlifer noise is due to the nonuifoi-n transmittance
! ~ 6) othe device. Tht s tie noise at ti C o- anotca'U - 3' :3 -. correiator may be: written as
.I(x y)=NIx. _91e
/ 1 / w n re 'N 4V U. v a n d ) a r e a - U d a nd'- -0.h3. 0II Vnoise. respectiVv
I I ~ "' i " Bv rcering to.th -- cia ze aorwr ofr:ILI- we assurre tnat tw matencto-op cvic.- i Nat IS)
53 kar used as input t-anudu' r Wl. '..-udcrvsta; -.PZ LZ ta vave iLC-Vi isem C asH 1"-~'~covre
.3 ~ ~ ;h F=--- sicr Plane i9.1'. Sine -h XIOf) is a binaryU Fig. I A gXcmeciwz o Ce~ sr transstn der"- '~ ''~'wue ft h
deieU~i la a2wiciiflt
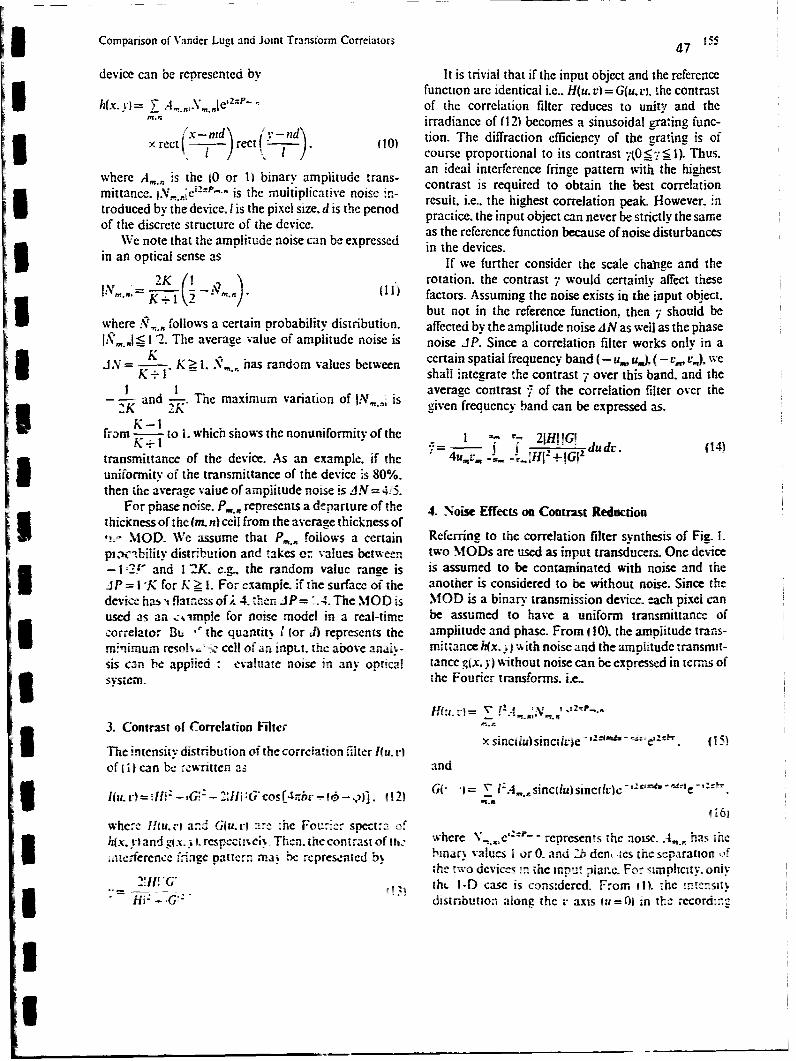
Comparison of Vander Lugt and Joint Transform Correlators 47t (55
device can be represented by It is trivial that if the input object and the referencefunction are identical i.e.. H(u. v) = G(u. aL the contrast
h(x..= A,..,,. of the correlation filter reduces to unity and theirradiance of (12) becomes a sinusoidal gra:ing func-{-d I'-d' tion. The diffraction efficiency of the raing is of
wher th ~course proportional to its contrast ;0< 1). Thus.wban ideal interference fringe pattern with the highestcontrast is required to obtain the best correlation
result, i.e.. the highest correlation peak. However, introduced by the device. I is the pixel size. d is the period practice. the input object can never be strictly the sameof the discrete structure of the device.oWte dite trctre ofplithde deicbe eas the reference function because of noise disturbances
We note that the amplitude noise can be expressed in the devices.in an optical sense as If we further consider the scale change and the
2K 'I rotation. the contrast 7 would certainly affect these*: 0 = factors. Assuming the noise exists in the input object.
wo a i a bbut not in the reference function, then i should bewhere :,,. follows a certain probability distributiun. affected by the amplitude noise dN as well as the phase!:., < 1 '2. The average value of amplitude noise is noise JP. Since a correlation filter works only in ai=K certain spatial frequency band (- u, 144 ( - c, L'4 we.N = K-. K > 1.. has random values between shall integrate the contrast i over this band. and the
I 1 average contrast j of the correlation filter over the2-- and - The maximum variation of 2NK.,i is given frequency hand can be expressed as.
K-1fram K to i. which shows the nonuniformity of the 21HI IG 2du.di.i141
transmittance of the device. As an example. if the 4urL-. 'HI'+iG d2
uniformity of the transmittance of the device is 80%.then the average value of amplitude noise is AN =_415.
For phase noise. P..., represents a departure of the . N on Contrast Reitmtionthickness of the (mn. n) cell from the average thickness of
,, MOD. We assume that P., folows a certain Referring to the correlation filter synthesis of Fi. i.
ptzcbility distribution and takes o: values between two MODs are used as input transducers. One dev-.ice- I :2 and I '2K. e.g., the random value range is is assumed to be contaminated with noise and theJP = I 'K for K > 1. For example. if the surface of the another is considered to be without noise. Since thedevice ha, - flatness of4 4. hen JP= 4. The MOD is MOD is a binary transmission device, each pixei canused as an :t-trinple for nos model in a real-time be assumed to have a uniform transmittance ofcorrelator Bu - the quarti (ior dh amplitude and phase. From (10). the amplitude trans-(o irepresents t.m;.Iimum resoiv,. - cell ofaninpL., the aioeaa) mittance M~x. -0 with noise and the ampiitude transm-t-sis can b appiied evaluate noise in any optical tance gx. y without noise can be expressed in terms of
systemthe Fourier transforms i.e.
H~fu.ii= x"iA .zP.
i 3. Contrast of Correlation Filter• Sin +| .,sincd~t Ie -.-e|
- I T h e ne n s ity ds . .b t o n ofi rs c o rri nio n filte r uit . H e
of I can be rewritten a-; and
I fAomGi-c(iu sicde I F'e ..... .l 4u. -} 1.faG-- - 2.,fh:G° Cos Parh-- _6-,1 },, .G" "= x .. . . . . ...
where If umvi and Gfu.-- are the Fourier spectra Ofch-.andc v.reecue_ n. the contrast of-: where " epresent.s the -ise. A. has zhe
interfe-rice f-inc pattern ma be represntd h- r-n-. . -aluc s 0. and c dm ,ts thc srarat'on :*h two devices -n :he inrn pa,-e. For sa--- ic' ".o "
'th. :-D case sconsdedred From -he ,- ",HE" dGtribton ao Inc .- axts U=Oi in the reord-ne
II

156 X. J. Lu et al. 48
plane can be expressed by correlation peak intensity is compared with the casewithout phase noise.
I=I sinc 2 (Iv)r($ A,.cos2,rndv 2 As an example. assuming that N,, and P. follow atruncated Gaussian density distribution.
[!YA,, cos_2..nd I ,2 '-'2 ;7 ]nV rect -a (21)
+ (XA~.N,'cos2-,(P.-andLi-- V } l-2It is assumed that a=O and that if .' and P. take
( + A,IN,f sin2,.P,,- values between - 1/2K and I12K. then we have
2 Y A,,lN,!Aos2i[P,.-2n-n')d+2bv]. 2- K>_1 (22),,.--;. .° • j2K '
(17) For simplicity, the input and reference functionsLet us first consider the amplitude noise. ie. P,, =0. are I-D arrays of dimension 2L. Since the spectral
for all n= + 1, ±+Z.... Assuming that A, = I for all distribution of a rectangular function consists ofn 2 .. equation (17) can be reduced to infinite lobes of finite bandwidth I /2L. it can be treated
as a periodic function in the spatial frequency domain.
I It can be seen that the contrast of the filter is5 I= 1sinc1r)2 [ (Y cos2rnd&7 + (3lN~lcos2r~ndv)-zreduced by the amplitude noise. while for the phasenoise. contrast is reduced and the fringes of the filter
+ (XiN~Jsin 2zndv 2 -are shifted. If the average noise AN decreases from112 to 112K. where K_-. and k.,, obeys a proba-
+2Fo s2d v'iNr c Icos2 ndr-2br1. (18) bility distribution. such as Gaussian. uniform orSexoonential, the average contrast is a function of theS If W.1[ = 1, the intensity of (1 8) is reduced to average amplitude noi -_ as shown in Fig 3. 1The curve
showing contrast reduction due to Gaussian ampli-1=2,1sinc -O(jcos2zndV) 2 1 +cos4r-bv). (19) tude noise seems to be a reasonable description of
- amplitude noise introduced by nonuniform transmit-and the contrast of the filter (without noise) for the tance of the device. When the average value AN < 0.24above equation is equal to I. Equation f18) is used to ti.e.. uniform transmittance equals 76%). the contrastcalculate the intensity distribution of the interference of the correlation filter drops 10% from unity. Figure 4fringes of a correlation filter, without amplitude noise shows the contrast as a function of the random value
2K( 0 range iP for various t,,pes of statistical phase noiseNJ = 1. and with noise, 1N..=2K( _+_ where t ""e lSoie " K ? (e.. Gaussian. uniform, and exponential distribu-
K > 1. It is assumed that R. is a random variable takenfrom a range between - 112K and I!2K. We furtherassume that _ obeys one of the probability distribu- ..
* tions such as Gaussian. uniform or exponential.If the noise introduced by the device is only phase
noise..e JN= I foralln= ± ..... and assumingthat A.=- I for all r. then 18) becomes
= sinc (ii)h[' cos2indr- 2 c. 4--7 Co M i_ -r.- i ..( , d -3I + + cos -P +a) +'n 'p ",.a.ii
2Vcos- n.- cos2-tP -nrd.:+2br) 120)
where P_ is - random variabe takcn from u ranec a A :etween -1 2K ad -2K. wh -ay a-so ony sme-,o"a" I diamaarut on.
Fi. 3 C,.¢ _,.a~ r 'i the c-,cc'-'n filter a_ a functo ofTnre typicaI noise statist-cs arc considcred G-us- he .:'C..tg: . flh'sd ,; .' ' f' I-. unflors-an. uniform. ;rod exponcnt i. In each ciLe. the a. .c..x - ! I---I-p-C no; m-aeisU

Comparison of Vander Lugt and Joint Transform Co-eiators
--- "Assuming that the scale of the input fUnztion is- changed, as can be expressed by
hfx.vi,,- [ ~~~Sx " t[5r+b)C ... _.'_=rect I77 rtIHM .......
where S is the scaie-chane factor. and H. is aweigiting factor. then the corresponding distributionat the Fourier plane is given by
, ~~4L:L- . . .F UI- S2= of: sicI=MK-o
Randomvi%. Rz-g AP I
Fig. 4. Average contrast of the correlation filter as a function of s t4 -(
the random vaiue range P. for Gaussian '--. uniforj 1 L 5 % O - .
and exporneal I---) phase norse modelsBy rterrin to tI the contrast of the correlation
i __filter tassuming that H o = Go). can be written as
2sinc(2L.u-u 0 ]sinc I 2L4 -u0 sinc. 2Lp- r ..lsincI 2.4 "L= i - L s -° (27)
U usinc: fuoAsinc2Lr- j+ -sinc i LLk! - it'.: v)
3 To obtain a simp and ci-a p-nsica piur- a I -Dcase-where u=0 and uo= 0 i considered. Thus (27)
tionsL If JP= I,-2 i.e- the surface roughness of the reaue todevices is equal to or smaller than . the contrast ofthe filter is about 0.9. fir Gaussian noise. From Fi. 2s. . ( Land 4. we have seen that a contrast of 0.9 yieids 2sc28--)s_ .!_ -_ (4N=0.24 for ampiitude noise and .P= 1.2. for phase - ."noise. This means that the surface au.:aitv oft Z2 causes 3v sinc-i.Lzr--- --sinc'.the contrast reduction as a transmittance uniforinity of76%. The average contrast J can of course be obtained by
using i141 Figur 5 shows te aer-a-ge contrast as afunon! scale factor S over the f-i-"ecf band
5. Effect Due to Diffencs Between Objectand R.ference Funcdos
To consider, he contrast reduction of the corretation_
filter caused by such differences. the reference fuictiondistribute n the Fourier Diane is given by
. :z~r5-x vi ---IUwher 2.Lx 2"L. are the dimensions of the in t C
functuors. G is the Fourt=r cfIent and is the -
pixei size the input function. However. for simpliciy.a pair of spatial fre nici ti. nsdcred, ich z-j! -- :u i uri
X. -is~r un Fby 5- C-nrs -safm-M sa -__S0c
I

(0G*_A- We see that the avera&c contrast of the fiter &- Contrast Reduction on Mdecrease as the scale factor incr-eases ft -.i-t ammt~df ecn ecncazdb
On thec other h-And. if the input fucto - s t- - I foa na ite ae cno osrlrneomi roae -_ -nu wimn% -a m-kas cesczibeci by the oiontequation: rttt& n nu unta u no
!tr.- -bi =Ablx. v -b) as shownP in Fit.1'~ccr-I The con trast of M F can be wa.tten as
* 'I. "C
(-trnOD-i obcosOiI
whereC A is tl_ conmstanzt ainpuituce o. ta e-x -rolie " ~ ~ fl& CIf 2) eee pln ave. Thus; for MOD.the orrsta
I44L~~the ME can be wri.ten as
A zk~csinc2Li!u- - 'sinzc[21fr-tr0 li
£Aa dor a 1-D meprcsenuraion- we havewe rth n o rotatinpor hee npjjfis 2R I rL; __ j5 T-he orrespondinig Fourier specurai distribution is C sne Wrrf
Wu. ~ ~ ~ ~ ~ ~ t ri4WYa< :4sn~lsn aR From --hi eauafiou w- se= that3~~~~h -coni2pco6pi~e-ntas is a Ixcumon oft seti. tr-caer
where =-usinO-rcosD- and aou-"~ n r. F .tcr zc i1 =r fL 4rn + r0 sin0- Them the aima1 ge contrast of the 1 %t'r for a thrae ela wav. * taus tbe CC=ut Or ai-fl rermsntario as pivoby UlnL.iC jd F 4C.D xtt as
- 2L a 4r- 7
S'To ootain an o- Ai mnf. oVea a Mn1 rtqutrwhere it is assumd that r.0 =0- bandt- Ac' w-, sh sm-j. -r t t.
Thr~ee avrare coantrasts Wrm ddfiren !freouencr Figure - ".ws he yas a hum fcn offrequencr. pmoU bands4 KS andA 16 etiods)a-en ooed in Fiu-z6as a overthe--rz- al F-r S is the- moi ol-tovcr Ifunction tol rotational m&n 8 We see that trr- latter
a it freaucc ban--& the faster thew a-erace contrast -
-CC
-~A- Cag-/
-m wi.- -mdff~rW I- %%=__XZ~~l'- 7._1 7_'__ a-mgof m~bod!j:mm-acls~~ aA uvmof=unapcaawlai

51Comparis',n of Vander Lugt and Joint Transform Corrlators 159
oaTIt can "~shown that the following well-known in-equalL., holds:
°"T IR(O, 0)1- > IR(x, )L2, (37)
where IR(0,0) 2 is defined as the correlation peak
intensity.SAs before, two MODs are used as reference andI_ input devices in the correlator to analyze the degra-
dation of the output peak intensity. As- -ing that the
input function f(x, y) is a scale variant .-ie reference
0 0 0 0 . - function g(x,y), we have
f, xy)= Z A.,, rect T/S rect 11(38)Fig. 8. Average contrast of a matched filter (over 8 periods) as a ,nr / )fui o taraetenyrai Rf=( A/(4Lx-mLrecGy-)5
and the corresponding FoL.ier transform is
Table 1. Optimum contrast of a matched filter F,(u, v) I I' -2nmd)nvNo. of periods 2 4 8 12 16 20 z(nSj A,.sinc( u sinec v e 2(,u+nv),
Optimum f 0,69 0.7 0.71 0.71 071 0.71 (39)Reference o-object 69 12 3 1.9 075 0.5 where S is the scale-change factor. Thus the correlationSratio function of f(x, y) and g(x, y) can be written as
periods) as a function of A, which is proportional to R. Rs(x, y) = J sinc(lu) sinc(iv)From this figure, we see that an optimum -,=0.71occurred at R = 0.05. As an example. when 4LxL= 7.2 x sine I u sine I v
Ax 4.8 mm-, then = 1.7, That means the intensity
reference-to-object beam ratio is about 3. We note that x .eover a different number of periods, the optimum 4' ,,e's1+"")e 2,¢(ux+vY)
changes very slightly with R. X e dudv. (40)The corresponding values of optimum 7 reference-
to-object beam ratio, and the number of periods is Using the convolution theorem, (40) can be expressedtabulated in T le 1 for 4L'xLy = 7.2 x 4.8 mm2 . From as
this table we see that the average contrast of the R,(x,y)=r,(x)r,(y)* A Amatched filter is around 0.7 for different numbers cf M.n M'. H "
periods covered by the MF. Comparing with the noisy I
JTC filter of Figs 3 and 4, we see that the contrast for X bx+d -m 6 y+d --n (41)the JTC filters are higher than the noiseless MF, if twesurface quality of the device is better than 2, and the where3 uniformity of the device is higher than .,0%.
r,(x)= rect((/ rect -S
7. Correlation Degradation
It is well krcwn, both for the Vander Lugt correlatr _/ xIand the J]C, that the resulting output correlationSIappears as -2 bright spot. To determine the perfor-mance of an optical correlation, it s necessary to - "x l --measure the correlation peak intensity. 1+ 2 S2
Let the correlation functions of f(x,y) and g(x,y)be given by 0,x 1
R(x,y)= 5 F(u,v)G*(u,v)e'2 (x"a")dudv. (36) (42)
I

160 X. J. Lu et al. 52
For example, a letter "A" is displayed on a MOD 1.0-device as the reference function represented byA,,R,. The correlation peak intensity R,(0, 0) of"A" -I ,,.. fl $ '1and the scale-changed "A" are calculated as a function e \of the scale change factor S. Again using a 1-D .presentation and assuming that A,,R = I for ali m and n, T(40) can be reduced to 0 ,
l() = 0 2 - U
R2 . 1 , .
. i 2n u d
m ' 0.ooo04 0X 7 e e xii,0.0 0..0 .04 0.06 0.00 0.10 0.12 0.141M Y-r,(x)* Z 6 x+d -im (43) Rotauon Angie 0=0.5 - - 550 o.5
Fig. 10. Convolution of a square with d=0.127mn and itsUsing this result, the correlation peak intensity can be rotated versioncomputed. Figure 9 shows the correlation peak inten-sity, R'(0, 0), as a function of the scale-changed "A" asthe dotted curve, while the solid curve repre.sents R(0) For simplicity, consider me correlation of the referencefor an I -D representation. function and its rotated version only on the y axis (i.e.,If the input function f(x, y) is rotated as given by u =0); then the correlation function can be expressed
.-. y (xcosO+ysinO-md asin., ' n R,(y) = r(y)* ZZA,,,,.
X rect . 1 (44) x 6[y + d(m sin0 + n cos0- n')], (46)5 where 0 denotes the angle of rotation with respect to where rc(y) represents the convolution between athe reference function. The corresponding spectral square (with side 1) with respect to its rotated versiondistribution can be written as along the y axis, i.e.,F,(u,v)= Z I2AM,,sinc[l(u cos0 + v sin0)] r,(y) rect rect rect xcosO sin0.)
xsinc[l(-usinO+vcosO)] ()
e 2ntm(ucos8+vsmnO)ei2xnlf(usno+vcos9) x rect x -+ (47)
--0 Figure 10 sketches the function r,(y) for different3 rotation angles, 0.50, 5.5', and 10.5' . From this figurewe see that for small 0, rj(y) can be approximated by0.8I
0.1<r1(y), A) (0, lyl 1.0.1 \/ 0, jyj I
Again, we use the letter "A" for computing the0.4-22Ccorrelation intensity R (0). Figure I I shows the corre-
lation peak intensity as a function of rotation angle 00.2- - (dotted curve).I"If it is assumed that A,, I. then (46) reduces to
0.0-} -,.0 1,.2 1.4 1.6 ,.A 2.0 R,(y)=rj(y)* 57 6[y+d~msinO-;ncosO-n')], (49)
3 Scale S48x48 Array-. Aon lIxS Array... which is essentially the correlation of the square arrayFig. 9. Correlation peak intensity as a function of the scale and its rotated function. The correlation peak intensitychange factor S R(O) is plotted as the solid curves in Fig. 11.
I

U Comparison of Vander Lugt and Joint Transform Correlators 167
,. 00 -. 0
- . -- a
0 004.8,
3 . •• ,. 0410
0.0 03 0.4 0.5
0.00.0 0.
0 2 4 .8 10 Average Value aN
Rotation Angle 0 Fig. 12. Correlation peak intensity as a function of average value48x48 Array_, A on 11x15 Array.-- AN for Gaussian c-), uniform (.), and exponentiai (--)
Fig. 11. Correlation peak intensity vs. rotation angle 0 amplitude noise
8. Noise and Correlation Degradation
By referring to (10), the output correlation of the noisy o..-"input object with the reference function is given by _.
C I-
R ., (x , y ) = T Z -A , n m . n', -.n , e ' 2 ;r•8. .Mr. n in"'. n'
S . I
x A x - d( A m,). [Y-dn-n')].,
(50)where A is defined in (48). 0 o.2- 0
If only amplitude noise is considered with A1 ., "..=A , , 1, the above equation is reduced to o o t'I -' ); "
y0.2 o. 0. 0.8 1.0Ra(xy)= [ - Random Value Range AP
Fig. 13. Correlation peak intensity as a function of the random
x(51) (---) value range dP for Gaussian (-), uniform (....), and exponen-I IItial (--)phase noise
I where INm.,l is given by (11).Similarly, for phase noise only, the output correla- means the maximum departure of the amplitude
tion function becomes transmittance of a MOD pixel. This corresponds to1~rP, [ 7about 24% of the unity amplitude transmittance,R A e '2Y". A _which is equal to 0.19 optical density.
.Similarly, 0) as a function of the random value1 [ )] range AP, for vanous phase noise statistics is plotted inx A 1 (52) Fig. 13. It is seen that the Gaussian phase noise is a
reasonable description. When the value range iswhere e'20
' -, represents the phase noise. Figure 12 JP = 1/2, i.e., the device has a surface quality of )/2, the
shows a set of correlation peak intensities, R(0, 0), as a correlation peak intensity drops 23% from the unityfunction of the average value AN, for Gaussian, correlation peak. Comparing Figs. 12 and 13, wc seeuniform, and exponential amplitude noise statistics, that the phase noise due to a surface quality of ;/.2 hasrespectively From this figure, we see that the variation the same effect on the correlation peak intensity as anof peak intensities for those noise statistics, drop rather amplitude noise with the average value of 0.12. Thisrapidly at about the same rate. The peaks drop to corresponds to a transmittance uniformity of 88% ofabout 77% when AN =0.12. The average value of 0.12 the MOD.
I

54
162 X. J. Lu et al.
9. Noise Performance 40
Assume that R and Rs are the output correlation .1functions with and without noise respectively. The 30
I output signal-to-noise ratio can be defined as i \I ZUS_ E{R2}
N E (R - RN) 2 } (53) 7 2 .. ,
where E{ ) represents the ensemble average. However, g ]in an optical sense, the signal-to-noise ratio can be C,--
written as iS i gIRl' dx d v
SXY "0 I' " ' = . .
0(54) 0 0 0.4 0.5
.NSJ IR-R.'dxdy' Average Value .NA r aGaussian Amphtuoe Noise
where (x,y) represent the output coordinate system. Fig. 14. Signal-to-noise ratio S/N as a function of the averageAgain for a I-D representation, R and RN, as value AlN for Gaussian armplitude noise5 referred to in (53), are given by
RN= Z e p A [ (55) 0I n~nI
and 40
R= A A (56) 30--
0Thus, we have CD 20, -
I CoR-RN= y -d(-n').R -ti A (1 -IN,lei2t) (57) --
If the amplitude noise is considered, then we have i.o0
Ry-d(n-n') ( 0.2 0 . 0.8 1.0
n,n" Random Value Range AP
Similarly for phase noise, Gaussian phase Noise
y F- d(n - n')1 Fig. 15. Signal-to-noise ratio SIN as a function or the random3R-R A value AP due to Gaussian phase noise
-X's(3.. t An Fd nf')]/ 10. Comparison of VLC and JTC
+ 1- s An2 tPl) (59) Let us now look at the modulation indices n the jointtransform filter and the matched filter. If the inputU By assuming that ,V, and P,, are Gaussianly disturbed, function is identical to the reference function under the
the output signal-to-noise ratios for amplitude and same intensity illumination, the joint transform inter-phase noise disturbances are plotted in Figs. 14 and 15, ference pattern is fully modulated. In other words. therespectively. For example, if AP< 1;4 (the surface contrast of the fringe pattern is unity throughout thequality of the device is about ..;4 or better), the signal- joint transform filter. However. to estimate the modu-to-noise ratio should be greater than 23dB. For the lation of the Vander Lugt type matched filter. thesame SNR in Fig. 14. JN ;0.07. which is equivalent to ensemble average contrast is utilized. The averagea maximum departure of 14% in the amplitude contrast of the fringes was found to be about 0.7 for antransmittance of the device, or a transmittance uni- optimum matched filter (i.e.. object-to-reference beamformity of 93%. ratio of unity) and since the average modulation indexI
I

Comparison of Vander Lugt and Joint Transform Correlators
of the joint transform hologram is higher than the Table 2. Comparison tAi Vander Lugt and joint transform
matched filter. the joint transform correlator should correiators
provide a higher autocorrelation peak intensity. Joint transform Vander LuetFor the Vander Lugt type. it is required that the
matched filter be placed back in its original recording Modulation index 7= I '0.7position. Practical alignment must be to within the Alignment No crucial. Jr=0.0l mm
order of about 0.01 mm in the Fourier plane. However. Space x bandwidth Greater smallerfor the joint transform correlation, there is no align- Multiplexing Set of reference Set of matched filters
ment requirement for the position of the filter in functions
Fourier plane. Real time operation One-step Twe-stepNoise performance The same The same
The space x bandwidth product is an important
specification for an optical processing system.although it never reaches the specific limit in practice.At first glance. thejoint transform correlator requires aspace x bandwidth product twice that of the Vander this makes a one-step Vander Lugt correlator possible.Lugt correlator. where in Fig. I a pinhole for the complicated computations must be performed to gene-construction of the matched filter can be seen. There- rate the filter.fore. the space x bandwidth product of the Vander We summarize the comparison of the Vander LugtLugt is indeed lower than that of the joint transform and the joint transform correlator in Table 2. Thus. wecorrelator. The key issue is. however, not the space see that the joint transform correlator would. inx bandwidth product. but that one can fully utilize the general, perform better. particularlN for real-timeproduct provided by the correlator, implementation.
There is also a difference between the Vander Lugtand joint transform correlators in multiplexing. ormultiple object recognition. In a Vander Lugt correla-tor, several functions are placed in the input plane and 11. Conclusiona set of metched filters placed in the Fourier plane for A generalized optical correlator has been used for thethe multiplexing operation. However, in a joint trans- Vander Lugt and the joint transform correlators.form correlator. instead of using multiple filters in theFourier plane. multiple reference functions can be put noise disturbances and the differences between the
in the input plane of the correlator for multiple object input and the reference functions are valid for both
recognition. In addition. a multichannel joint trans- architectures. To consider the effects due to noise.form correlator can be constructed by using a special various amplitude and phase models were used.multiple Fourier transform lens or an array of small ano-opt aa lh mod ls were usedlenses Magneto-optic spatial light modulators were used for
As mentioned previously, the noise in most optical ystem performance calculation.correlation systems is basically of multiplicative type. The contrast of the correlation filters for both
and is introduced either by the input object or by correlators were analyzed. We have shown that thecontrast of the correlation filter was reduced by the
spatial light modulators used in the optical system. We preseast of the Te filt wal chagedhave shown that the noise effects on the output presence of noise. The effect of scale change and
kfor both Vander Lugt and joint rotation of the input function on the contrast of thecorrelation peak ofilter was also calculated. The correlation peak inten-transform correlators are about the same. sitv under the influence of noise and differences between
We should emphasize that. for real-time operation. ethe input and reicren-e function was also studied. Wethe joint transform correlator is simpler and more have found that the decrease of the correlation peakstraightforward to operate than the Vander Lugt dependsonthetypeofnoiseandthevaluerangeofthe
transfor noise. The scale change and rotation of the input alsodegrade the correlation peak intensity. By comparing
modulators are introduced in the input and theFourier planes. The advantage of the one-step oper- the performances of the Vador Luat and joint trans-
ation is that prefabrication of the correlation filter is form correlator is easier to construct and offers
not required. However, for the Vander Lugt correlator. advantaes in real-time mplementatons.a two-step process is required in which a matched filtermust be orefabricated. Notice ttnat a computer- .cknoih, decenr We acknoicdge the upport of the " Sgenerated matched filter can be directly implemented A\rm, Missile Command through the L! S Arm Rceatrch():.fcein a spatial light modulator. ,uch as a MOD. Although under contract no . DAALO3-X-.o147

56164 X. J. Lu et al.
References 7. A. Grumet: Automatic Target Recognition System. U.S.Patent 3. 337. 492 (1972)
8. F.T.S. Yu. XJ. Lu: Appl. Opt 23, 3109 (1984)1. A. Vander Lugt: IEEE Trans. IT-J0. 139 (1964) 9. F.T.S. Yu, XJ. Lu: Opt. Commun. 52, 10 (1984)2. C.S. Weaver. J.W. Goodman: Appl. Opt. 5, 1248 (1966) 10. F.T.S. Yu, J.E. Ludman: Opt. Lett. 11. 395 (1986)3. J.E. Rau: J. Opt. Soc. Am. 56, 1490 (1966) 11. D. Casasent: Proc. IEEE 65, 143 (1977)4. A. Vander Lugt: Appl. Opt. 5, 1760 (1966) 12. A.D. Gara: Appl. Opt. 16, 149 (1977)5. J. LaMachia. D. White: Appl. Opt. 7, 91 (1968) 13. B.D. Guenther, C.R. Christensen, J. Upatnieks: IEEE J.6. N. Shi: Opt. Lett. 3, 85 (1978) QE-15, 1348 (1979)

* 57
UUU
APPENDIX 10.6
ILCTV Color Er.coder
IIIIIIIIUIIII

Ori 58I Oriinal article 1. Optics (Paris). 1988. vol. 19, n' 3. pp. 129-133
3 ELECTRICAL, ENGINEERING DEPARTMIENT. THE PENNSYLVANIA STATrE U.NIERSTY
University Park. Pennsylvani 16802
GRAY LEVEL PSEUDOCOLOR ENCODING USING A3 LIQUID CRYSTAL TELEVISION
3 F.T.S. Y'U. S. JUTAMULIA and E. TAM
MOTS CLES: KEY WORDS:
Fausses coulcurs Pseudocolor encodineICristaux Iiquides Liquid crystalTraitement d'*ia Image processine
Codage en fausses couleurs des niveauxde gris par un systime de telivision
;! eristal liquide
SUMMARY: A real-time gray level intensity pseudocolor cncod- RESUME . On prcsece~i unc methodc dc codae en faussesing method utilizing a liquid crystal television (LCTV) is pre- COL.-..- r e ieaux dc gas utilisant en temps reel ur. sys~em dcsented. The LCTV is used under two different polarizrranal~ser idIC~ision a cristat lijuidc. 1-c svsiemc a enstal liqutde CSt UtiziSecombinations to generate a positive image and a negati,.c image of a,.c dcux co.;binaisons analyscur-polaniscur pour donnecr dcan object. The images are also encoded with two different l'oble, ---!; image positive ct unc imiaga: negative. Lcs images sontprimary colors by positioning the color filters at the two optical cod&s avuc deux coulcurs de base ent plaqant dcs filtrcs sur lespaths respeensecly. The superposition of these images produces a deux trawcts optiques. La superposition dc ccs images donne ungray level pseudocolor encoded image. Discussions on the proper- codage des eras en fassc5 couleurs. Les proprices du systcma 'aties of the LCTIV is provided. Preliminary experimental results cristal Ni~adc sont %,iscutccs ct on donne quclqucs resultatsIare also demonstrated. expcri mcniaux prelimiraircs.
i. INRODUTIONLCTV to white-lighit Processing 101. which includedthe optical nseudocolor encodin- . i.e. different erar-
Most of the optical images obtained in various ins., -tructures resulted in different colors. A directscientific applications are gray level inte-nsitv imaes. method to pseudocolor-encode light intensity usingIfor example. the scanning electron microscopic im- the LCT%' was also reported recently 11I11. In thisages. muitispectral band aerial photographic images. method. a licht intensity distribution is recorded by aX-ray transparencies. endoscopic images. etc. How- video camera. in which licht itensity is transducedIever, human Perceives variations in color better than to eiecric iienal. The electronic video sianal from.those in icray levels. In other words, al color-coded the camera is' then fed to the LCTV to Produce theimage provides better visual discrimination [Il]. voltace differenice across the i-qu:d c rystal. A color
Density oseudocolor encoding. by half tone screens pattern correspondinsg to the anpplied ',olta,-, willimplementation with a coherent optical processo~r aippear due to the hnirefrinence ot the molecules of
wvas first reported by Liu and Goodman [Z'1. and liattud c-v-stal. This [.nu II. howeser. has alater -,ith --- %knite-light processo- hy T:t.i ei d, ~I disadvaintace that ihe oro zomposilioti ;% full%IBased on stim-lar principles, many optical :-ircl-tec- deten-mtned I)% the crmsta dtispla% Ntructuretures nave been reported rccntly -~~.and the orientatuon of polartzer%.
The recent appearance of a low-cost In i aor we Ieosrt I e mtoIS 100 black-and-white liquid cr~stal eke% imofl swmidr to the haif-tone screen technique -rl. e(LCTV) has attracted a -,real deal kit acrtion, to LC7TV, _cenerates t'.%o d-stinctitse oiarv cojior tin-
expl[ore i,; -setulness for real-time ontical slunl-,1 ag~e, ,,ith tontrast Tesrse . e suverroton tolUprocessine lo We dem~onstratcd the application ol the m~omeS rodutce at neudocoaior encoded

i 59
130 F. T. S. YU. S. JUTAMULIA. E. TAM J. Optics (Paris). 1988. vol. 19. n' 3
pattern. By changing the primary color filter, we 3. - LIQUID CRYSTAL TELEVISIONmay easily alter the color composition of the output.
A great number of papers have been publishedbased on the work using LCTVs. Only the properties
2. - PSEUDOCOLOR ENCODING psdooo ibeisusdhr.Fgr3sosth90twtdof the LCTV which are important to this e:xperimentWe nw dscrbe awhie-leht ntesit psedoclor will be discussed here. Figure 3 shows the 90' twisted
nematic LC molecules sandwiched between a pair ofencoding technique for monochrome images. We parallel polarizer and analyser. When there is noassume that an intensity distribution is available forpseudocolor encoding. if a LCTV can generate plied across the cell. the plane of polariz-
I positive and negative images of the object. we mayencode the two images with two different primary//
colors. Figure I shows a sketch of these normalizedirradiance as a function of gray scale./ TT
Suppose that the positive and negative image are I ! LIGHTencoded by red and ,reen filter respectively. When I L
input gray scale increase from 0 to 8. the outputcolor will eradually change from green to yellow to VOLTAGE
red. To obtain a full-color encoding, this method OFFmay be extended to three primary colors as shown in 1figure where the LCTV has to generate anadditional intermediate imaee.
rTNEGATIVE POSITIVEIMAGE IMAGE
IOLTPUTNORMALIZEDIRRADIANCE INCIDENT
LIGHT
iNPIT GRAY SCALE NO TRANSMITTED LIGHTVOLTAGE
Fic;. I - Vormait-d ,rradtances as fitn-:ons of gray sce van.- ONat~on -'r -so.priniarv'-coIor-ercodiec. "__
| : t* ft
INTEP IEDIATE - - -4-IMAGE
NEGATIVE POSITIVEIMAGE iMAGE
I I .I.0 I\
.FII L_-ZE "
PP A[i'" """ " LIGHTUI
J:.,-';- i he - :wu ed i w gat;cal LC ,trleelde indu ,i:rd"NPUT GRAY~ SCALE : n a'r ,par-el potar ::r .;ha analver 'pla,,zatoun
'U.'e l'r. tI: i a v..rze trrOWS) The; LC tintlii$dlu. ff{'~
I I \, r~;,awed :r w'u ee Is ur:io;m - f ra" . :r:- ; :1; 1 -I.atM 11M. A 1rart 41T-n (a) rnhrn ':o y,:,
on -,_-,,'..'Or ir;tI" ,- ed to (ih ) u. r ,i a tce i a P h tn ged a jogt f it - ( ,'l

J. OP tics (Paris), 1988. vol. 19 n' 3 F. T. S. Yu. S. JtUTAM%1U A. E. TMM 131 6
ation of the incident linear polarized Felht is rotated P! LGTV P3throueh 90* by the LC martal. !ience no lightpas-,es througn the analvser. When the voltae
across the cell is fully applied, the LC molecules willalien in the direction of the applied electric field-hence the polarization direction of light passed oI~through is not rotated and there is total transmissionof lielit throueh the analyser. If this parallel analysergenerates a positive image. the orthogonal analyserwould produce a neeative imaze. Chao and Liu [12j areported a pseudocolor techniqute that superimposedIred. areen and blue color-encoded imaees obtained P2 LC TV P3with parallel. 45andi 90* oriented analysers respect-ively.
The difference between the proposed techniquehere and that of Chao and Liu [121 is that we utilize 9
the hvbrid field effect of the liauid crystal ma-terial 1 131 (twisted nematic field e'ffect and birefrin-zence) while they basiczllv utilized the twisted
nemti fildeffect only. Such a difference can IN: bobserved easily from the experimental s:p.inwhich we used a common analyser and variable FIG. 4 - 7e two operanng modes of the LCTV used in thepolarizers. while Chao and Liu used variable analys- expeurnen. P1. 1 2. P-1 are poianers. The arrows show h
ers and a common polarizer. drecions of the "&=rLes.
The voltage on each pixel is determined by two _ _ _ _ _ _ _ _ _ _ _
factors : a briehtness control switch controls the biasvoltaae across all the pixels on the screen and thevideo 'nput sign.Ai controls the voltage across individ- where
ual pixels. Neglecting the detailed analysis of the le= Cos-- (90 - 00. dark . (4)physical phenomenon of birefrinence. we may
3 ~develop an empirical model as follows. When input .. i3=brh. ()3 signal is applied to a pixel, the LC molecules shows When 0~, 0, 1'
the birefringence [11l]. 'Ii polarization axis of inci-13
dent lieht is rotated by an arseie of 90* 0 - . 1.(6)where H_ is a function e :- ias voltage and whr
35 ~ a function of- the input 'hrthe two operating modes of the LCTIV 'we have 1. co- _ 90* - O. - 13)=brieht . L
used in -the experiment are as. si-own sr figure 4. in I o 9 ,) dr ~
!he first mode as showvn in fi.-fre 4(a;. ithe -rradiance
In the second mode as shown :n figure -Ji the I7Ipolarizer . C is rozzate-d by -an angle of - T, o SIGML
where 1-,r4 is the maximum anale ot n- that theLM*~ can achieve. In this exoercmnent (Radii) Shaick2Vision 3 LCTV was used', we ound r1) -
The transmitted irradiauice of tesecond M.OC'C :S9
I. Cos- I. ..ns
Suppof ;Y - 0'and 0'.
then Fi. 4 ]tc arrh::ecu'rt ~r a 1et:,'! p ud&W,Ytj'rrathcdrq_
1 L: --re cortn ier!t tr ff . si. re rc-q'or i ;rs. .P.-~ .. gi Pa-re -an ierr. PIS--IN bim.t:-: 'r
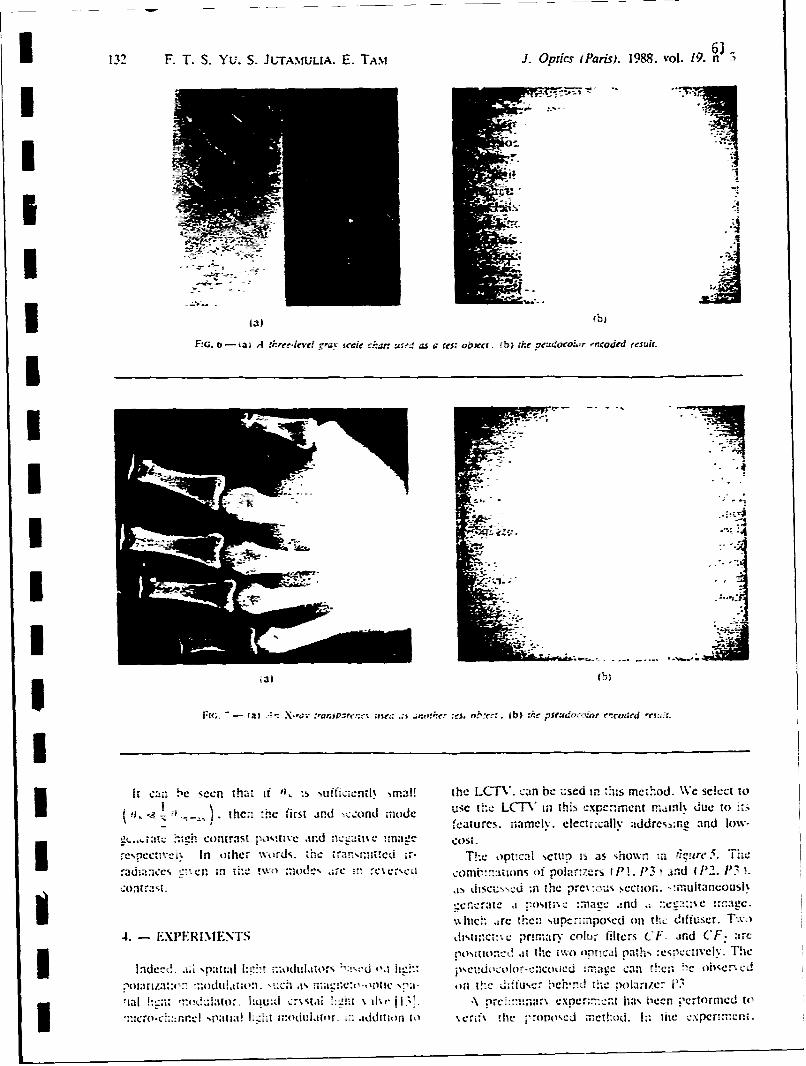
1' 132 F. T. S. Yu. S. JLT7ANWULIA. E. TAM J. Optics (Paris). 1988. vol. 19. n3
1 7 41
-A
- Si
-a
heLT .-- nb-a llsm-hd W eett
"c 'hu fisAswodi~d
UL oi s O tiea6 .mq cot -
It ca see" 1 n )tnat if 'I. th:s ;-% :e LCTV. otcan betuse is 1.1:5 m o. fWrue:, selecotheine---c n firs : a cccond.- of vo nz- 1. 1 1 man-det t
IS atu-Sw: .1 ar'U pct:za:, s ddction %- and uXu-'co trs M.-C~v .tn. .- :-_Nl*% 'nr'-'-
othe Wi-uS ti~- -'-'-;'o :* 1 ~oitU th %flOV.cr g T woI
n omut a t ew - rJ s on -vecu......e T'-c
-1:. -- nu -cto "::d Ca".s c 'n c -~ TI -oe-'' tiatial I~s ~ ul r -w X :m suis~-- LU ~ -j
ml ~ ~ ~ ~ ~ ~ ~ ~ .- e--a ez:~ xn~ao v. ct~ rr mta ena t ha%- * L- ne::;rt-crct aben rert'ormed t-t~co-c~afrei'PatIa!:iw mou lao tdtof o cu i rooa ehd u h xeJeIC1-a i i . ll% '" j~%

134 F. T. S. Yu. S. JL-r.AmuLIA. E. TAm J. Optics tParis), 1988. vol. 196n2
CF. was a red filter and CFI was a zreen filter. REFERENCESP1 and P2 were orientated at O* and - 13* withrespect to P3 accordingly. We first used a three-level
Mry scale chart as a test object. When the greenlight was blocked, a positive red imiage was observed.Similarly, a negative Preen image was observed byblocking the red light. The erav scale chart and the ~lY, 1F T_ S.). - Whi-a Light Opticai Signtal Proctssrng.
color encoded output are shown in figure 6. Three illItersicric. New York. W985.
distinctive colors were observed corresponding to i pm 21 Lc. (. K. an G ciiodc. ". Wi. Rev A p. ne .coerthe three cray levels. Another result of a X-ray (19761.'.Not.Re~Op~ 7 8
transparency is demonstrated in figure 7. However. 13I-- T~i. (A.). Yu. (F. T_ S.) and Civ% M.) - **WhiaeiitIthe intermediate color (yellow) was dim compared psuooo diensity encoder ". O.p. Lett.. 3. 190 (1"7-).with the red and green color. This might be caused 1 -:1 SAV.-AMARIA, (J.). GL;A. (M.) and BESCOS. MJ)-- OPUC21
by the low contrast of the original pattern generated psctiocoloring through contrst re-wrsal filtering". J.
on the LCTV. Opt.. 10. 151 (19,791.f - 59 CtiAo. (T. H.). ZwE:-%. (S. L) and Ylu. (17, . S.)-
Aht-ih grayoclo levelt psedocolo encoding tehnon-tailizes ~ ~ ~ ~ ~ ~ ~ ~ ~ ta modulatio ofplrztoni ptallctT . Opt. Lett. 5iaC. . -
modiesoulator n of poaiaini pta ihWhite-liejst psei~docolor cnoodift with three pflhmarmdltrhas been discussed. Though the Proposed colors '. .Opt.. 15. 41; (19's).
technique is applicable to many SLMs such a 81S Yt.. (F. T'. S..) Clitv. MX X.) and =%CUIXRE. (K. E.) -
%MOSL)M,. LCLV. MCSLM. etc.. a preliminary ex- .. Computer wFnerated linear tricolor sampling pattern and3 ~ ~periment has been demonstrated using a LCTV. The it .apKato .) O. Prs.1 7 18)191 L'.. ;K K) Crcati'e appicatom of liquid %rystalmain advantage of this method is that it is an television as a spatial lighdt modulator"'. CLEO. .9S7.economic real timne techinique with simple optical paper WJ Larchitecture. However, with the D71T1 we have [101 Ytu. (F. T. S.). JUMTAMILLIA. (S.) and HeG. MX LU -
worked with, the low contrast ratio of the device Exeimna ap tn flqulcyta eem~n
limits the dynamic range of color content. Also. (h1"61to, i rcssn pp.Ot. ~_there is a loss in details of the image due to the '111 Yu. _FI T_ S.). JULIAOM 3A. (S.). U%-. (T. WV.) and Hv_-'t.
quntztinof gray' level and the limited resolution MX L- "RcaltiMe pscudocolor encoding using a low-of the LCTV,. With further improvement in the cost LCTV ** Opi. Later rch.. 19 5(19871.quality of LCT~s. this real time pseudocolor encod- 1121 CIEAo. 1T. H.) and Ut,. il-H. K.)- ** Opttcal pseudocolor
ins! tecnique may be verv useful in medical and iaee enihancmnt with rcal-timc arce screen displayI . picatons.Opr, Eng.. 27. 393 (19S8). -.
industrialfi ati1131 G-t;%,irr. Mi). hconsee. (A. D.). BUji-. MW P.A. Mit.L.0i.). FFt~a -D. sr.) and %I rR. iG.
ACKNWLEG.1I.~TA new real-time rnn-ohcrcnt to ix-rent ltehtt imtcACKOWLDGMNTcorwrimr. ;he h -field effect kc-utd cr-sta sicht
~a~,Opt V'. 4. 217 11975.)We acKniowlede the support of U.S. Armyv Re-
search Office. contract number DAAL03.87-01-17. --Manxercp. recived .Atarrh20. MA.)
.,iunrn

* 63
III
APPEN.')IX 10.7II White-Light JTC
IUUIIUIIIIIIi
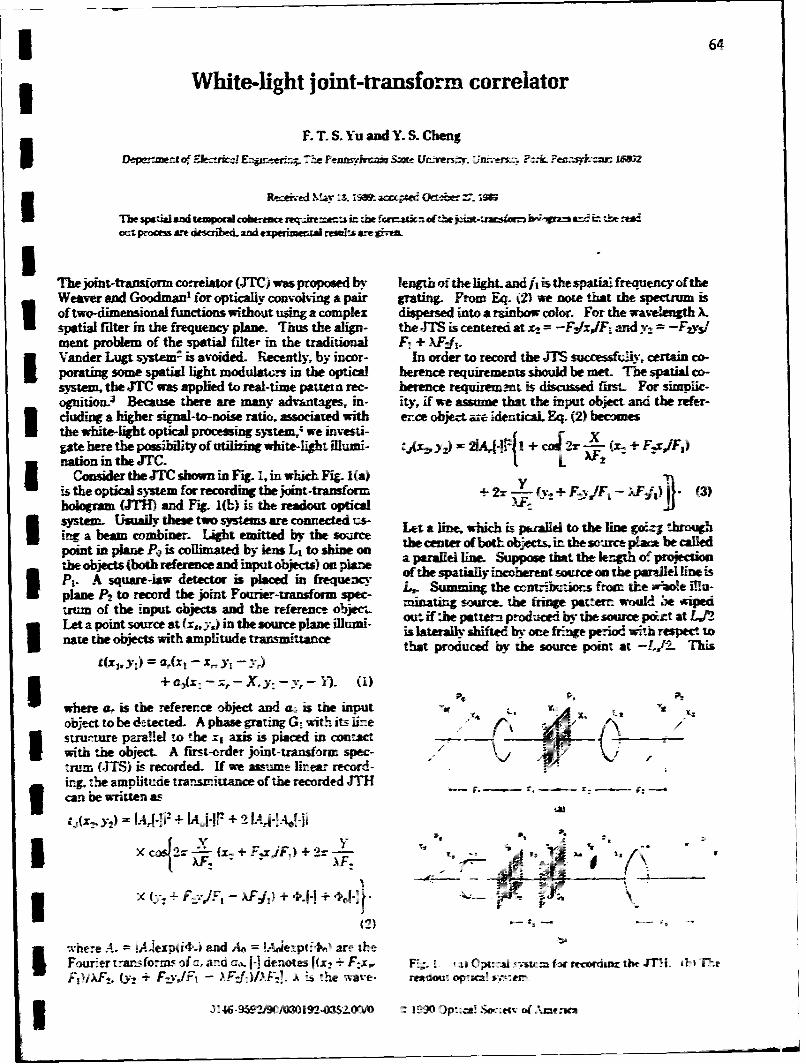
* 64
White-light joint-transform correlator
F. T. S. Yu and Y. S. Cheng5~o De=--rn $ k'ain-ez e renr-. IV =- &c Uniets) uafe. ?ct- Pe~mnn 1653
I Ree-edatr Mt M9. a=caci Octctr
CG'. WOan Am dncrb& and nxpnime=m Mkhs Oarm
The joint-transform correlator (TC was proposed by length of the light. and I is the spatial frwuency of theWeaver and Goodman' for optically convowvng a pair grating. From Eq. 2) we Dole that the spectrum asof two-dimensional functions without using a complex dispersed into a rainbow color. For the waveength .spatial filter in the frequency plam Thus the align- the -T is centered at x2 = -FjxJFI and y, = -FLysment problem of the spatial fite in the traditional F, + XF-J.I VanderLugt system? is avoided. Recently, br incv - In order to record die 4-S succe'sfu. certao o-porating some spatial light modulatrs in the optical herence requirements should be me. The spatial en-system the JTC was applied to real-time pam n rec- herence requiremmt is discussed first For simulic-ognition 4 Because there are many advantages, in- ity, if we aime that the input object and the refer-cluding a higher signal-to-noise ratio. associated with ence object areident. Eq (9) becomesthe white-light opticau processing system we invesu- r xgate here the possibility of utilizing white-light ilumi- y)l IyZr-E,.+ F.x/F.)nation in the 4TC. .
Cousiderthe JT shown in Fig. 1, in which F Haltis the optical sytem for recording the joint-transform +2z yv.+ FJvFj - wi-) Mhologram (TW) and Fig. I(b) is the readout optical . tI
S sytem- Ually these two systems are- Letaline. whichisalel tote line gc-g throughi* g a beam combiner Light emted uy the source t a ie , whitch i tthew pln becalled
poit i plan Po is collimated by en L, to SaDe on a p ent Sot tat the le of ection
the objects (both reference and input objects) on plane &arth le. Supose that t-enth prlect. ne
P,. A square-law detector is placed in frequency ofte spamlin hemt-srocs o the a alle lineis
plane P to record the joint Founer-transform spec- L S t c Wipew
trim of the input objects and the reference obout- ii oure t frne pthe sou oe atIZ* Let a point source at (xI,.y) in the source plane 0liumi- is tfel pattdrn produced by the soutce pret at L.- is l~atly shifte by o,,,n...,,,e frig pin wih resec to
nate the objects with amplitude transmittance that produced by a source point at -L-Z- Thist(x,, v. a.(xt - -. y, -Y)
+ q -- :z, - X y. - Y, (1)-- %
where a is the M erence object and a. i, th in u Nr2 k ,
objectwbe&cetected A phase grating G,Ith its line P
strut.re parlel to pthe x- axi i placed n contact ;_ zwith the object A first-order joint-transform spec-:rumf.AfS) L- recorded- fwe w-r-me lm-record-in£, the amplitude transmittance of the recorded JTH -can be written as
I - - -- --
Ix 2.' -JF -z A. , .- i .t
-ba
where A. = A4epi+ ie-i -_ ar.the'&se- ranr ~s ofC, a. a, ae-11 eonL '--Fr ca- (tOzrt virt r m-a mi7 h
v. . + J~FI -Sf )Lrj the =. weve- _CU - a
n990 cv a S-n-nCA C:

| 65Y2 trum from X - IAX to X + 1l2AX, the cosine term in Eq.A \) F, Af, (7) becomes
(X.)Fta (X X) F2 f I__$ C XFc(2 j -
I L -%--'XF iAX sine/-Z;-- X Cos 2 , (8)
where AX << X or AA. << fi is assumed. From Eq. (8),we find 'hat the number of fringes under both the
_x main lobe and the first sidelobes of the sinc fun t .on is4XlAX or 4f,/Af,,. For f, = 80 mm -1 and Al, = 10
Fig. 2. JTS for estimat;-, of AX. mm -', the number of fringes would be 32.In the readout process the cptical system shown in
corresponds to the condition (X2 + Y2)1/ 2 = XI(L 8/F). Fig. 1(b) is used. White light from a point source atSince X/(L 5/F) is the coherence length in the direction the origin of plane P0' is collimated by lens L3. Twoof the parallel line, we note that, in order to produce identical .ratings, of spatial frequency fl, are situatedthe fringe pattern with considerable contrast, the sep- on planes P3 and P4 with their line structures parallelaration between two objrts should be much smaller to the x axis. A rectangular aperture rect(xi/I than the lateral coherence length. L,)rect(y3/L,) on plane P3 limits the spatial extent of
For simplicity in discussing the temporal coherence the plane wave. Owing to the dispersion effect ofrequirement, we assume that a white-light point grating G2, the first-order wave of each wavelength Xsource, at the origin of the source plane, is illuminating would appear in the region rect(x4/Lx)rect(y 4 - XFI 1)/the objects. In this condition, Eq. (3) can be simpli- L,) on plane P4, where the diffraction effect on the rimfied t read of the rectangle is neglected. When it is incident upon
grating G3, this wave is redirected. The wave, propa-tj(x2, Y2) = 21AA-[ ]1 1 + co 25r-- x- gating in the direction parallel to the optical axi:-
" retained to shine on the JTH. Let the readout ,'.,completely overlap the JTS. At plane P, the intensity
+ 27r -Y (Y2 - XF ]) • (4) ' .rbution of the correlation spots would be
Suppose t!,at the spatial bandwidth of the object in l+(x,y) ." dX rect( rect . )the x2 direction is Afx and that in the Y2 direction isI Afy. Referring to Fig. 2, we can estimate the spectral Ibandwidth AX that contributes to 1;-ie final fringe pat- " 2fs 1tern. For the spatial spectrum of the object due to A + × A( x, Y21/2AX to be separated from that due to X - I/2AX, we X-.
I have
AXex X±f~f 1 x, d ~. exp -i2r -X---
-i where Af. << fl is - -urnd, Since the friige pattern x2 x2)dX1 d 3for each wavelength A is cer.tered at x r 0 aid y2 =Xf/F 2, the dispersion distance aAF9f1 should be -mall-er then th2 period (NF2/Y) of thd fringe pattr. il tl.e X exp -i2, -Z- .- dxody2 , (9)Y Y2 direction for the fiwni fringe pattern noc to be wiped . " "out completely. This eads to the criterion where I+ (U) derotes the intensity distribution of the
'Af 1, (6)
where Eq. (51 i, u,,ilized. For example, of an object A , T2
=3 mm -1, the uv -axis distance Y sho:,.d be smqlle-than 0.1 mm. Thus, ,o nave a fringe pattern with highcontrast, tbe centers of both the input and th, refer- fence objects should lie on a line parallel to the x, ayisIn this condition, Eq. (4) becomes - Y1
- t,stx 2, 2 = 2IA I{ 1 + cos ()-r x,)], (7) XF'o
where [-I denotes [x21XF 2 , (Y2 - XFf 1)/XP 2J. To esti-I aiate the number of fringes that are available for the _I Xzreadout process, assume that the object has a relative-ly flat spatial spectrum. in.-grating over the spec- Fig. 3. JTH illumin ted by a wave with a waveleo-th XI

194 OPTICS LETTERS / Vol. 15, No. 3 / February 1.1990 66
V K line parallel to the x, axis. The distance between thereference object and the letter Z is 4.5 mm, which is
K K Z smaller than half the lateral coherence length. Inorder to meet the requirement Af << fl, the spatial
(a) frequency of the phase grating G, is taken to be 80mm - . The focal length of lens L2 is 60 cm. Figure
(c) 4(b) shows the JTS in which the fringes under both themain lobe and the first sidelobes of the sinc functionare approximately 30 lines. In the readout process,the diameter of the white-light source is 0.2 mm, andthe focal length of the collimating lens L3 and theFourier-transform lens L4 is 30 cm. Parallel gratingsG2 and G3 are identical to grating G, and are separatedby distance F2. Shown in Fig. 4(c) is the intensitydistribution of the output at plane P. The bright dotson each side of the figure are the correlation peaks ofthe reference letter K and the input object K [to the
Fig. 4. (a) Reference and left of letter Z in Fig. 4(a)]. There is no output for the
input objects, b) the JTS, letter K that is above the letter Z because relation (6) is(c) correlation peaks at the severely violated. To identify the letter K that is
(b) output plane. above the letter Z, we have to rotate the input plane (orgrating GI) about the optical axis until the line goingthrough the center of the reference object and that ofthe input object K is parallel to the line structure of
desired correlation spot in the region where x > 0 (x < grating G1. This suggests the possibility of real-time0), XL is the longest wavelength, Xs is the shortest two-dimensional identification of the input objects.wavelength, and Eq. (7) is used. If a source of finite When spatial light modulators are placed in planes Psize is utilized instead, the output intensity distribu- and P2, a two-dimensional correlation pattern can betion would be the convolution of Eq. (9) with the produced with bright correlation spots at their corre-source distribution. Equation (9) is complicated and sponding positions if the input plane and the outputneeds further investigation. Here, we give a heuristic detector are rotated synchronously.explanation. Figure 3 shows the JTH illuminated by In summary, we have demonstrated both theoreti-a wave with wavelength X. We take L, = XF2Afx and cally and experimentally the possibility of utilizingL: = XF24A, where X is the average wavelength. Ow- white-light illumination in the JTC. When the sepa-ing to the finite size of the readout wave, the linear size ration between the reference object and the input ob-of the resolution element is XFri/(XF 2Afx) in the x C i- ject is much smaller than the lateral coherence length,rection. Similarly, it is XFs/(XF2fv) in the y direc- and the line joining both objects is pa-allel to the linetion. Since the spatial period of the fringes in the x2 structure of the grating, the JTH will I ave good fringedirection varies from (X + '/2XAf,/fi)F9/X for the top of contrast. By increasing the spati;1 frequency of thethe JTH to (X - 1/2XAA/f)F /X for the bottom of the grating, the broadening effect of the correlation spotsJTH in Fig. 3, the center of the desired correlation due to nonuni. )rmity of the fringes can be kept smallpeak would be at x = XF.3/F2, with a slight broadening in the readout process. Since each readout processXF3W If,/(F.f 1) owing to nonuniformity of the only gives the information about one line in the objectfringes. Generally, the combined broadening effect plane, in order to obtain a two-dimensional correlationdue to both nonuniformity of the fringes r the JTH map, both the input and the output planes should beand diffraction is much smaller than the distance be- continuously rotated.tween the correlation peaks. For instance, if Af& = AfWd= 10 mm-1 and F,_ = F3, the linear size of the correla- We acknowledge suIport by the U.S. Army Missiletion spot due to the combined effect is approximately Command through he U.S. krmy Research Office0.2 mm. Hence, after summing the contributions under contract DA 'L03-87.3147.from all the spectral elements, the size of the white- Y. S. Cheng ;i l eave from Institute of Opticallight correlation spot stays comparable with that due Sciences, Natioi Central Unwvrsity, Chung-Li, Tai-tc the wave with average wavelength X. wan 32054. "hin..
In the experime-:t a mercury-arc source is imaged bya condenser lens onto a pinhole of diameter 15 gm. ReferencesSince the focal length of the collimating lens is 30 cm. 1. C S. Weaver and J. W. Godman. ppl. Opt 5, 1248the lateral coherence length would be 11 mm. The (1966).letters in Fig. 4(a) are photoreduced on Kodak SO-253 2. A. 1tander Lugt, IEEE Trans. Int. Iheory IT-10, 139film and become transparent. On the left-hand side, (1964).the letter K 3erves as the reference object. while the 3. F. T. S. Yu and X j. Lu. Opt. Commun. 52, 10 (194).four letters on tne right-hand side are the input ob- .. T. S. Yu. Whae-Ltgh' ')ptta! SwDzat Processing (Wi-jects. The letters K. K, and Z are aligned to lie oa a ley, New York. 1985), p. 25.

1 67
UIU
APPENDIX 10.8
I3 High-Efficient JTC
IIIIIIIIIIIII
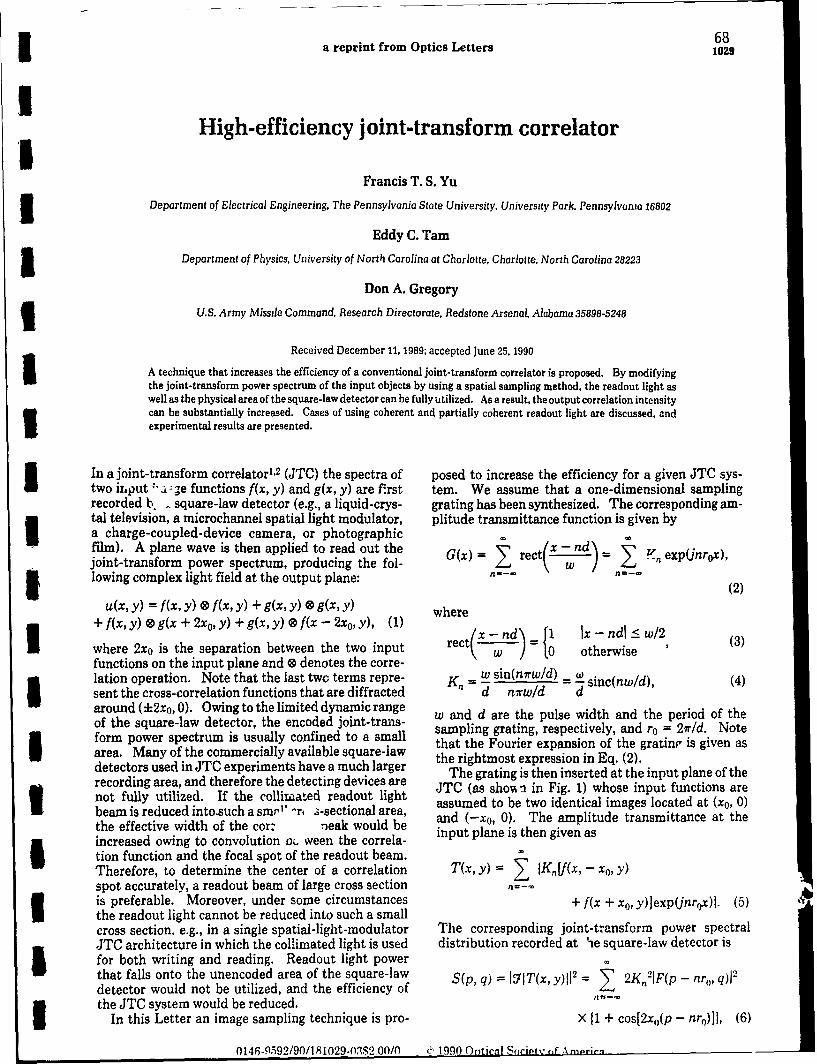
68a reprint from Optics Letters 1029
IHigh-efficiency joint-transform correlator
Francis T. S. Yu3Department of Electrical Engineering, The Pennsylvania State University, University Park. Pennsylvania 16802
Eddy C. Tam1Department of Physics, University of North Carolina at Charlotte, Charlotte, North Carolina 28223
Don A. Gregory
U.S. Army Missile Command. Research Directorate. Redstone Arsenal. Alabama 35898-5248
Received December 11, 1989; accepted June 25, 1990
A technique that increases the efficiency of a conventional joint-transform correlator is proposed. By modifyingthe joint-transform power spectrum of the input objects by using a spatial sampling method, the readout light aswell as the physical area of the square-law detector can be fully utilized. As a result, the output correlation intensitycan be substantially increased. Cases of using coherent and partially coherent readout light are discussed, andIIexperimental results are presented.
In a joint-transform correlator .2 (JTO) the spectra of posed to increase the efficiency for a given JTC sys-two irhput --a 1ge functions f(x, y) and g(x, y) are frst tem. We assume that a one-dimensional samplingrecorded b. - square-law detector (e.g., a liquid-crys- grating has been synthesized. The corresponding am-tal television, a microchannel spatial light modulator, plitude transmittance function is given bya charge-coupled-device camera, or photographicfilm). A plane wave is then applied to read out the GWx= rect Ix - 1= ) exp(jnrox),joint-transform power spectrum, producing the fol- I5 lowing complex light field at the output plane: (2)
u(x, y) = (x,y) f(x, y) + g(x, y) ® g(x, y) where+(x, y) ® g(x + 2x°, y) + g(x, y) f(x - 2x°, y) (1) r x_- n 1 Ix-nd :w/2 (3)
where 2xo is the separation between the two input r 0 otherwisefunctions on the input plane and ® denotes the corre-lation operation. Note that the last two terms repre- K n sin(nirwld) - sinc(nw/d),sent the cross-correlation functions that are diffracted d nsrw/d daround (±2xo, 0). Owing to the limited dynamic range w and d are the pulse width and the period of theof the square-law detector, the encoded joint-trans- samng d re pectidth and th perd ote
r pthat the Fourier expansion of the gratinr is given asarea. Many of the commercially available square-law thergtotxpsininE.()detectors used in JTC experiments have a much larger te rightmost expression in Eq. (2).reecorssedin r, a tereoriens h e n dcs lare The grating is then inserted at the input plane of therecording area, and therefore the detecting devices are JTC (as shoA n in Fig. 1) whose input functions arenot fully utilized. If the colliriated readout light assumed to be two identical images located at (x0 , 0)beam is reduced into.such a smrt ' ^r, a-sectional area, and (-x0, 0). The amplitude transmittance at thethe effective width of the cor: .,eak would be input plane is then given asincreased owing to convolution oL ween the correla-tion function and the focal spot of the readout beam.Therefore, to determine the center of a correlation T(x, y) = IKLf(x, - x0, y)spot accurately, a readout beam of large cross section n--is preferable. Moreover, under some circumstances + f(x + x0, y)]exp(jnr0 x)[. (5)the readout light cannot be reduced into such a smallcross section, e.g., in a single spatial-light-modulator The corresponding joint-transform power spectralJTC architecture in which the collimated light is used distribution recorded at 'ie square-law detector isfor both writing and reading. Readout light powerthat falls onto the unencoded area of the square-law S(p, q) =ST(x, y)112 = ' " 2K1,-JF(p - nr, q)12
detector would not be utilized, and the efficiency ofthe JTC system would be reduced.
In this Letter an image sampling technique is pro- X {1 + cos[2x,(p - nr)]I, (6)
0146-9.592/90/181029.01$2,00/0 e, 1990?nica, ,o,,t a ,m,-ir.

103U Uti it-b L. .I IERb \ oi. 15, No. 18 / beptemoer i5. i99U
Founer - t,nsform On the other hand. if quasi-monochromatic, partial- 69-_ Y lens 3 ly coherent light is utilized as the readout source,
o n .... x 1 whose coherence width equals the width of the joint-transform power spectrum, the object irradiance atthe output plane can be written as
(a1 I,,(x, y) = (I + 2N)[I2J(x, y) 0 f(X, y)12 + If(X, y)V f(x + 2xo,y) 2 + If(x,y) ®f(x - 2xo, y)121. (10)
f(x.x A' D The output correlation function is simply amplified bylaw converle. 1 + 2N times that of a conventional JTC. There is noI(x .,y) modulation within the correlation function, and maxi-
Fig. 1. High-efficiency joint-transform architecture, mum intensity at the center of correlation is guaran-teed. Moreover, use of partially coherent readoutlight would also suppress coherent artifact noise and
where p = (27r/fX)a and q = (27r/fX)ft are the spatial thus increases the signal-to-noise ratio. Note that thefrequency coordinates, F(p, q) is the Fourier trans- above analysis for a one-dimensional sampling gratingform of f(x, y), and Y1r.} denotes a Fourier-transforma- can be easily expanded to a two-dimensional samplingtion process. To ensure that the spectra do not over- case. The spectra array given in Eq. (4) will thenlap, it is assumed that the sampling rate satisfies the become a two-dimensional square array in which thea Nyquist requirement, i.e., d <_ 7r/Ap, where Ap is the multiple orders of the joint-transform power spectrumangular bandwidth of the input object. Thereiore, will be located at (nro, mro). Following a similarthis determines the number of orders of the spectra mathematical analysis, which leads to Eq. (10), thethat can be written onto the square-law detector. correlation spot intensity will be increased by a factorU Given this number, to obtain almost equal intensity of (1 + 2N)2 times when a two-dimensional samplingdistribution for all the spectra recorded, the width of grating is used.the sinc function sinc(pw/27r) should be large com- To verify our discussion, an experiment using a 2fpared with the dimension of the detector D, i.e., D < Fourier-transform system as shown in Fig. 1 was per-fX/2w. Note that the introduction of the modulating formed. For easy implementation, two pieces of com-term K, in Eq. (6) produces power spectra of different mercially available Ronchi rulings were used to pro-writing intensities that enhance the dynamic range of duce a two-dimenqionil sampling grid. The Fourier-the square-law detector. transform spectrum of the grating itself shows that the
For a simplified consideration, let us use only the ±1 orders are approximately half the intensity of thefirst ±N ork..ers of diffraction in which the K, attenua-tion factor can be ignored, i.e.,
N
S(p, q) - 7 21F(p - nr o, q)12
X 11 + cos[2x0(p - nro)]I. (7)
If this joint-transform power spectra array is read outI with a coherent source, the object irradiance at theoutput plane becomes
I(x, y)= 1 + 2 cos(nrx)
X [12f(x,y) (f(x,y)1 2 + If(x,y) @f(x + 2xo, y)12 (a)i + If(x, y) 0 f(x - 2Xo, y)11]. (8)
By comparing the above results with those obtained
from a conventional JTC [i.e., Eq. (1)], it can be seenL that the average energy of the correlation function inEq. (8) is increased by
g dJNLr )cos 2x dx = 1+ 2N times.
(9 )(bHowe. ;r, despite the increase in the average peak Fig. 2. Experimental results of the JTC when no sampling
Fintensity, the correlation function is modulated by the grating was used on the input plane: (a) joint-transformsquare of a sinusoidal factor, and this might not be a power spectrum, (b) correlation peak obtained by using adesirable effect in some cases. partially coherent readout light.I

September 15. 1990 / Vol. 15. No. 18 / OPTICS LETTERS 103170
predication, the peak energy should be increased by 9times. We believe that the major reason for the de-crease in experimental values is because of the weak-ened modulation in the ±1 orders of diffraction fromthe Ronchi rulings.
In conclusion, we have proposed and demonstratedan image sampling technique that improves the effi-
ciency for a given JTC system. By writing multipleorders of the joint-transform spectrum onto thesquare-law detector, the physical size of the device aswell as the readout light power are more fully utilized.Consequently, the correlation peak intensity is sub-stantially increased. Under either coherent or par-(a) tially coherent readout light, the energy of the correla-
tion function thus produced is proportional to thenumber of orders of spectra used. Such merits of thisproposed technique would be helpful under low lightintensity. Moreover, it must be mentioned that theincrease in the correlation peak intensity with thistechnique is different from simply increasing the read-out light power while reading a single order of thejoint-transform spectrum. When random noise isadded in during the JTC process, the latter approachwould increase any noise spikes present on the outputplane by the same amount as for the correlation peak.However, in our proposed technique, each spectrumorder being used would produce different noise spikesat different positions. Therefore this techniquewould also increase the discrimination ability of the
(b) JTC under noisy conditions.Fig. 3. Experimental results of the JTC when a two-dimen- Note that if a charge-coupled-device camera con-sional sampling grating was inserted: (a) the 3 X 3 power nected to a computer is used as the square-law detec-spectrum array, (b) correlation peaks. tor, then the sampling gratings need not be used in the
optical setup: A simple digital image-processing algo-rithm can be applied to replicate a single order of the
zero order. The higher orders are weak and to permit spectrum into multiple orders of the spectral array.an easy analysis were not recorded. The input pattern Since the JTC's can be regarded as generalized opticalconsists of two identical images recorded on 35-mm processors, 3 the proposed technique can improve thephotographic film. A He-Ne laser was used as the performance in other image-processing applications.coherent light source, and the power spectrum was Partial support of this research project by the U.S.recorded on film. Figures 2(a) and 3(a) show the pow-er spectrum recorded before and after the sampling Army Missile Command, through U.S. Army Researchgrating was inserted, respectively. Partially coherent Office contract DAAL03-87-K0147, is gratefully ac-light generated from a white-light source in conjunc- Knowledged. We thank the reviewers for their valu-tion with an interference filter was then used to read able comments.
out the power spectrum. Figure 2(b) shows the corre-lation result when a single spectrum order was used, Referencesand Fig. 3(a) shows the result obtained when a 3 X × 1 C. S. Weaver and J. W. Goodman, App. Opt. 5, 1248spectre array was used. It was measured that the (1966).corre!, ion peak intensity is increased by approxi- 2. F. T. S. Yu and X. J. Lu, Opt. Commun. 52, 47 (1984).mately 4.8 times when the sampling grating is inserted 3. F. T. S. Yu and J. E. Ludman, Microwave Opt. Technol.5 at the input. However, according to the mathematical Lett. 1,374 (1988).
III

* 71
II
I APPENDIX 10.9
3 Autonomous Target Tracking
iI5III3IiIIII

72
I Autonomous real-time object tracking with an adaptive jointtransform correlator
I Eddy C. Tam, MEMBER SPIE Abstract. A hybrid optical/digital system for tracking an object in a se-Francis T. S. Yu, FELLOW SPIE quence of images is described. Since a joint transform correlator does notThe Pennsylvania State Unix Brsity require a matched spatial filter in the correlation process, object trackingDepartment of Electrical Engineering can be carried out by continuously updating the reference image with theUniversity Park, Pennsylvania 16802 object image in the previous frame. This adaptive property of a joint trans-
form correlator, together with the parallelism and high processing speedDon A. Gregory, MEMBER SPIE of an optical system, ensure high correlation between objects in two se-I U.S. Army Missile Command quential frames. The relative position of the object can then be determinedResearch Directorate based on the location of the correlation peak. System performance isRedstone Arsenal, Alabama 35898-5248 evaluated and experimental demonstrations are presented.
I Richard D. Juday, MEMBER SPIE Subject terms: pattern recognition; liquid crystal television spatial light modulator;NASA target tracking; joint transform correlator; optical information processing; hybridJohnson Space Center optical correlator.Houston, Texas 77058 Optical Engineering 29(4), 314-320 (April 1990).
IIII
CONTENTS in the next picture, and therefore this is not a practical real-timeI . Introduction technique. With the recent development of various kinds of
2. Optical architecture and theory spatial light modulators (SLMs), 3 -L7 many real-time tracking3. Optical digital interface techniques have been demonstrated. Gara8 used a liquid crystal4. System performance light valve to perform real-time tracking based on a fixed MSF5. Adaptive correlation in a Vander Lugt correlator. Using a liquid crystal television6. Conclusions spatial light modulator, a dichromated gelatin multifocus holo-7. Acknowledgment lens and a MSF array, Chao and Liu 9 demonstrated a techniqueS 8. References for simultaneously tracking multiple objects. Optical tracking
using novelty filters and image subtraction have also been pro-1. INTRODUCTION posed.1'0 . in which the system detects the difference between
Optical pattern recognition has attracted much attention in var- sequential image frames and then computes the position of theious applications because of its parallel processing and high- object in motion.I speed operation capabilities, particularly in real-time applica- The joint transform correlator (JTC)' : ' 3 is an alternative ap-tions such as missile guidance, vehicle tracking, and automated proach to optical pattern recognition. It has been demonstratedlander guidance in aerospace missions.' In 1974, Vander Lugtr that a real-time programmable JTC can be implemented usingI demonstrated the use of matched spatial filters (MSFs) in per- two SLMs 14 or just a single liquid crystal television (LCTV) informing cloud motion analysis in a sequence of photographs a video feedback fashion.'. 6 In this paper, a technique for real-taken from a satellite in half-hour intervals. A new MSF was time adaptive object tracking based on a JTC is proposed and
m made for every photograph in order to correlate with the scene demonstrated. The basic idea is to correlate the object in the2721 received April 20. 1989: revised manuscrpt received Jan. 5. current frame with the object pattern in the previous frame of
Paper pulicail 20. 19W. sequential video images so as to obtain the relative locations ofaccepted for pubhtcaton Jan. Iii. 199t.
1990 Society of Photo-Optical Instrumentation Engineers. the object in the two frames. It must be pointed out that in a
I 314 /OPTICAL ENC.NEERING - April 1990 'Vol 29No 4

I AUTONOMOUS REAL-TIME OBJECT TRACKING WITH AN ADAPTIVE JOINT TRANSFORM CORRELATOR 73
Input mcoI Meg, C computerI R G~
mplate LC 'V F- HPF CLE
Fig. 1. Optical architecture for the adaptive JTC. Cl, C2 are two CCDcameras, FL is a 48 in. Fourier transform lens, and CL is a 50 mm /camera lens. The high-pass filter (HPF) is a transparent film with a .'
tiny blurred dot at th e center.
Fig. 2. FT spectrum of the Fig. 3. Pixel structure of theJTC architecture, the reference image and the input scene to be LCTV. color LCTV.correlated are placed side by side on a spatial light modulator.This unique property of a joint transform correlator enables thesystem to adapt to the input scene by continuously updating the yreference image with the previous frame to correlate with the f ramsdynamic object. The key element to this optical JTC is a high- L=contrast LCTV, and the hybrid system is fully controlled by amicrocomputer.
a-- i J x2. OPTICAL ARCHITECTURE AND THEORY JyTo improve the simplicity and compactness of the system. asingle LCTV (Seiko color LCTV model LVD202, 220 x 240 5X _ currentpixels) together with a Sony CCD camera are used in a video franefeedback architecture, shown in Fig. 1. Since this is a color
SLCTV. three neighboring RGB pixels are addressed as one pixel Fig. 4. Arrangement %f the two frames on the LCD. 2. is the heightunit when displaying a gray level image. thus decreasing the of the display unit.
resolution of the device. By observing its Fourier transformspectrum (Fig. 2). we deduced that the RGB pixels are arranged current and previous frames. and (Bx.bv) is the relative trans-in the fashion shown in Fig. 3. This is also verified by observing lation of the object from t, ( - 1 )th to the th frame. Thenthe pixel structure under a microscope. The effect of this struc- the complex light field at the frequency plane of lens FL is giventure is discussed in Sec. 4. by
* To interface this commercial product with our system, the bydiffuser and the protective glass of the LCTV were first removed.To compensate for the phase distortion, the liquid crystal display T(u. . = F _ 1u. v)exp - i2ru.x,- + ]y,_ -X+(LCD) unit was then separated from the hardware circuit boxand immersed in a liquid gate filled with mineral oil. The two { [ ( a)original polarizers attached to the display unit were left un- -F,(u.v)exp -2. u(x,+ 1 +8x)+ y,.-..y- .touched. A half-wave plate was inserted in front of the He-Ne LI laser to align the plane of polarization of the linear polarized (1)light with the LCTV's front polarizer. In this airangement, max-imum transmission and a higher contrast ratio can be obtained. The power spectrum recorded on CCD camera C1 is then sent
We now discuss the principle of the tracking algorithm. Let back to the LCTV for an inverse Fourier transformation. Thus.I us assume that two sequential scenes of a moving object ore the complex light field at the output plane becomesdisplayed on the LCTV via the computer's video frame grabber.The previous frame and the current frame are positioned in the Cx.y) = i{lTtuupper and lower half of the LCD. respectively, as depicted in Ii :Fig. 4. Let = ,
f -x - X ,- I y - y . - and R , ,(x - x . .%- v -) .
J - i. v .a whereRft )--. =JF (u.v)F*(uj1)1
be the image functions of the objects displayed on the LCD. " ....where 2)a is the height of the display unit. i and i - I are the -(u.,r - - dud%
I OPTICAL ENGINEERING /April 1990/VoI 29No 4- 315

TAM. YU. GR6GQRY. .jUOAY 74
Fig. 7. Joint transform spectrum recorded by C2. The dc light is
Fig. 5. Experimental setup of the hybrid system. bokdb h ihps itr
AT428 u3t
I IG1.21 co~pu-ebrd target
Fig. 8. Correlation result from Fig. 7. One of the two peaks is shownat the top.
I Fi. 6 Blck iagam f te opica diita inerfce.requires the location of tne object to be initialized in the first
* is the correlation function betweeenf.. andf,, and .i- (- denotes frame. This can be done using the same joint transform corre-3 the inverse Foiner transform of the function 11-. Note that the lation system but with a prestored reference image located at afirst' two terms of Eq 2) are the zero-order terms diffracted fixed position on the LCTV. In actual applications,. the object
aroun teoinofteotupl. %ietels oers mieht have distortion variations due to v arations in size, rotationaerun the rgnof c t ouptpe. hilerate at two" term. orientation. and perspective. Therefore, a hierarchy search of3 rpreentthecros-crreatin trmsdifraced t ~~X. the object might be needed. To speed up the searchi'ns process.Wih reeec toy ou ore and inesi-os. ' t ariua and distortion invariant filters such as the circular harmonic expan-
Withrefrenc toour resjousinvstigtios, te aeula an filters or the synthetic discriminant function filters can beU scale tolerance of a taret in a ITC is rouich!% about = 5 and emoloved.1017-. respectively, t3 sumn hat the motion of the object
is relatively slow compared Io the processing cycle of the cor- 3. OPTICAL DIGITAL INTERFACErelator.fi will strongly correlate withfj. and two high-intenisitv h yrdsse sui
* correlation peaks can be ObseRsed at the output plane. The new -C iscnrle agaepormloato of th hc- - ieti hnoc vwhich runs o)n an IBM AT compatible microcompvuter at 10locaron he oiec at ime is hencise by I-f cpu clock speed. Figure 6 is a block diagram of the dweital
;v-;tem hardware conticuration. Two video frame -rabber.st* IiVGI IS and AT42-S fram Datacubc Inc-). which can diitize a
Ufull framne of input video -acnat it:- a 3 84 / $ 12 image- array.In our enpernmcnt. a 50 mmn camera lens .,a,, Used to inagnills hase 1-.een ttiled in the microcomputer. The video input ;1'the Folurer spectrum toahout 5, to it0 lines mim A\ mail Circular ilhe AT-42S board is Connected to a Fairchild CCI) camera (C ) .opaqiue dot %ith a Nutrncd ed-ge. which acis as high pass lilter. whi%-ch i' aimned ait the ntect ot incte rt %isdco nutput of thewas mnered at the Flurier plane- to block the dc- h-cht from the ATJ2X board is fed tn the L_(TVi 6 ia a -tdeo, ri sicnal converter.CCI). which would -ithcrwise cas util eleto'ard ( ---.Pr'n (C2 is connctled it) (t--e P Ds hoar i an' ca1pture%Iscancrini. at the 'uriacc of the CC!) A photoeraph (if the -_s the Voin- transformn power spect-rm durt1e the first half oft ;hcperimental setup t% ~Nowfl. in F~il.,5 proC::-.,- csele. Since-. *e dto not u',c a %idco mnultiplexer, the
imust he micn:'oned that this .daptie correianion ltchniouc rLoid'pectrumn is 'etfrom the s (i hoardt thc AT hoard
I 316 O?~-TICA; ;C: E~iG~~!9 o

-AUTONOMOUS PEAL-TIME OBJECT TRACKING WITH AN ADAPTIVEP JOINT TRANSFORM CORRELATOR 75
52S3
'80 '5 IES 186 W' .88 !0.ge 2- 30 0 5
COn. Peak Locawn. x-dawecwon (pt~it zawil)xnot2.a'W f"
________________________Fig. 10. Correlation peak location as a function of the obets trans.I ~lation in the x direction. The obets overall translation displad
100- meanl . 49.23 on a 185 mm x 240 mm monitor screen was 68.5 mm. The scaleS..-4 factor was computed in terms of the distance in the monitor space
per pixel unit.0-6 0 4672
M 40
00
Z2 43 4Z 45 6 47 45 49 50S5! 52- iCoff. Peauk Locazo ymwecton ri e w44
beoei a edisplayed on he LCTV. During the second half- 2_ 3 4 5 6 2
cyscilte. o the correlationreuticauedbC2anth peak- m2- 300aon JTCrc cycles
frtepxlwith maiu nest.Apsto estv e i.1.Correlation peak location as afunction of the oec's trans-tector or a parallel array detector would definitely increase the lation in the y direction. The overall translation on the monitor sredetectiont speed. Despite thiese limitations due to the use of generalJ- wa Z. mm.purpose hardware, our system runs at approximately 1.2 s percycle. It is possible for the hybrid system to run at half the videoNetwerastdthobctlnghexietonfm0spealed seuppoy.rtigharwr isi 0 5cylsprscn.i to 50 mm in 5 nun increments. and 300 sample data of thespcaie suprig adaefr sd correlation peak locations were recorded at every step. Figure 10is eoer as an optically addressed spatial light modulator shwapltotemanfechftedtaesasaucin
is sedas hesquare law convener instead of a CCI) camera shwapltotemanfechfthdtaesasaucinand aLCTV used in video feedback fashion- then the processing of the object's translation. The result shows an excellent linearspeed could run at video frame rate, assuming that the rsponse relationship between th object space and the correlation spacetime of the second spatial light modulator is much shorter than in the x direction. From the plot, the scale factor between thea video frame cycle. However- the power consumption an sz two coordinates in the x direction -dn be evaluated in terms of
of adoule satil lght oduato arcitetur woud ~two the distance in the object space (or in the video system's space)time highuber sada lrgrtandthatof trhiecprosed sinlde ptial per pixel unit.tiigh er mouaor ar hitec tu Thti rpsdsigesail 'e same test was carried out in the v direction, and the result
ligh moulaor achiectre.is plotted in Fig. 1I. An overall linear'relationship is ohsemed.4. SYSTEM PERFORMIANCE and the y direction scale factor is also evaluated. It is interesting
To see the performance of t system. CCI) camera ClI was first t oeta h ai fteetosaefcos
focused on a stationary object. The JTC then correlated two dretosclfao 10identical scenes. The joint transform spectrum and correlation - -_
output captured by C2 arre shown in Figs. and 8. respectively. ieiosclfao 2.2We siightly modified the program so that the original imagecdisplayed is locked into the upper half of the LCD and the should be the same: as the inverse of ;he aspect ratio of the Imageupdating input frame is always displayed on t lower half. The arry. given by'program was then set to run for 300 cycles, and the distributionof the correlation peak locations is plotted in Fig. 9. The jittery 1 mornno- scrcen hech, No i'o~omntal pixelsvideo signal amplified by the low-resolution color pixel struciwre asneci ratin -ionrlr screen vidih No -.ertcal plXcif the L-CTV mighlt be one of the main sources of error that
cause fluctuation in the data. which is a measurement of the pzxc1i element's height to width
OPTICAL ENGINEERING IAprd 199-0 / Voi 29 No 4 -3 17

(8) I) (o)
Fig. 12. (a) A graphical Imaje revolves in an elliptical path at 21 s/rev. The dark dots are thehand track of the tank's positions at each of the JTC cycles. (b Tracked positions of the tankafter one revolution and (c) after four revolutions.
rect locus are observed. This reveals that detection error accu-mulates during each correlation cycle, as can also be seen easilyfrom Eq. (3). This drawback of an adaptive correlation systemmust be considered and solved by using some other method.
5. ADAPTIVE CORRELATION
A major merit of the proposed technique is the adaptive propertyof the system. We have carefully simulated two sets of image
. - ." sequences to illustrate this concept. The first set simulates a- situation in which a camera mounted on a moving vehicle, say.
a spa-.e vehicle, is imaged onto a fixed target on the ground fornavigational purposes, as shown in Fig. 13. As the space vehicleapproaches the target, the detected scenes are continuouslychanging; the target size appears larger. and its orientation andshape also change due to different perspective angles from the
Fig. 13. A camera on a space vehicle aimed at a fixed target on the vehicle in motion. Using computer-aided design graphics. a 3-Dground for navigational purposes. tree-like object was created as a target on the ground. Nine image
sequences simulating exactly the same scenes as captured by themoving space vehicle were recorded from a CAD terminal, as
ratio and is equal to 0.578 in our video system (a Panasonic shown in Fig. 14. The hybrid tracking system has little difficultyB/W monitor in its under-scan-size mode). Comparing this num- correlating the targets between frames, even if the target on theber with the x.y scale factor ratio. the two values are different first frame and the last frame look very different. Figure 15by less ,than 2%. This evaluation can serve as a check of the shows the tracked locations of the target as seen from the ve-system's overall accuracy. hicle's coordinate frame.
A close examination of Fig. II shows a periodic stair-like Another simulation illustrates a stationary camera/moving ob-data structure that is absent in Fig. 10. and we have also recorded ject situation. Figure 16 exhibits the motion sequence of a toythat the standard deviations at the "steps" are higher than usual, tank moving from lower left to upper right in the scene. AnThis can be explained as follows: When the object is translated overturned truck, which serves as stationary clutter, was alsoin the x direction, the joint transform fringes are generally aligned added to the center of the image scene. In this case. four objectsat an angle. When the object is translated in the y direction, the are displayed on the LCD during the correlation process. andfringes are aligned in the x direction. A study of the pixel struc- eight cross-correlation functions are generated on the outputture in Fig. 2 reveals that this LCTV is better able to display plane, four of which are the weak cross-correlations betweenslanted lines and vertical lines than horizontal lines. The coarse the tank and the clutter and can be ignored. Based on priorsampling in the horizontal direction thus generates higher data knowledge that the clutter is stationary, the unwanted peaks arefluctuations and periodic setbacks. always located at (0. "a), which can then be distinguished from
After these preliminary tests, a tank-shaped graphical image the peaks generated by the target in motion. Figure 17 showsdisplayed on another video monitor was used as the next test the joint transform spectrum and the correlation peaks based onobject. The tank was set to revolve in an elliptical path at a frames I and 2 of the image sequences. The tracked positionsperiod of 21 s/rev. [Fig, 12(a)l. The original program, which of the target are given in Fig. 18.updates both halves of the LCD. was set to run autonomously.Figures 12(b) and 12(c) show the locations of the tank trackedby the system, proper x and y direction scale factors are used 6. CONCLUSIONSin these plots. Excellent tracking of the object's location is ob- In this paper we have demonstrated the use of an adaptive JTCtained at the end of the first revolution. However. after four for object tracking based on the correlation between imaees inrevolutions. some deviations of the tracked points from the cor- sequential scenes. The high-speed parallel processing ability of
318 OPTICAL ENGINEERING Aprfl 1990 / Vol. 29 No 4
., ., + :;;v + +r=++ + ++ e +*+ .l~l++ +. ... ,J r .:! +,:'' l -+' ++ 2- + ' V m + .. + +v + " .-

Fig. 14. A sequence of nine images were recorded from a CAD terminal, simulating the exactscenes as captured by a camera mounted on the moving space vehicle. Only frames 1. 5. and9 are shown here.
Fig, 15 Tracked positions of the ground target as seen from thevehicle's coordinate frame
--- A&
Ftq 16 Motion sequence of ta toy tank and a %tationary truck. Six frame% were taken from dfixed camera. only frames 2, 4. and E; ire 'nii-w hiere' Note that in frame 4, the tank is partiallyoccluded by the clutter
Best Available Copy .. .. ,.* *.*. *

s ±~ _Vw V. ~ ! As &t: T=- h=2
;cru--Mt= .z I Ikr.Sng
a kn iiLL ctuss-n1F -rr ?oe 0ct ruwrt
ad~ on 6M-nree aqCf C' eserc
F, T . ureceved hs 65EI degre Ma
aord Cnd:soM a P!ffD anO~M egrepn-cr
jcCr UAW 4 . =C~tSC=s a
IWO Tewn gr -4 O
Etema :sW torote tE l wsm alr De-nparl"ferI r_ ev e ew oa~ne HtdA a eadi vu- n
&nd ersietcai ac Cw-zera qeof bDe-
drwo 1978-1974 S&tce 19ML Dr. Ifu !n beer a prkSor NI theSemcnc E-nwcmntg Deontm * ti a*rwnnsvtvn Suat LUmt-
&Sa le has ce-n a a*tsr toSever fl-&fltfL W venm
==oaczs.Heisacrve t rn-eerat W.- aie flet G!ptics VCn
figl 1 (a) Jobeumiorn spcn bmmdcitses I audi (MT.. mcmwa Cv. vMwid Wdormabo mmwv antie has OLMt-3 M~ pek apea -n the r-vApn- Waecn a=ers M, -iese ale rwas a r~pK'90"fl Far--gy Sctman MvGa fo I-- t~wuns- Adtfl-r an
l!vscM Soertces ai4 Eropieermg WWo 161e !964 Gacuwtt%-secnhe on the CaSege of Enpneni"g a Perm Swet wio vwuas= w-tva2i Pugh Prc-Osw of tlma t.?nmse ere w~ lie_a-nof AMtrwoey -"anub =zr~ P-cass a-w
an w-rj4 ' -N r~~nSgS !>. Y s3aveowotr
-- r Ao- Oremc was are i -- sAlztzi -r
wwvucs arca -- ' u - inm-_ gt SSZ rG=I .~ -rs= afa a =-
Fg PS. Tracked position -f1 r* ank it six frun& ! &'smr- A.rsem -a Al-a .eres Ern xt
V, - - l
I -- rr 0=-oeSure Opbc ----- s mo'e -
n~~~ ~ ~ ~ mnreC= fe!drp$gMmn0! u- -r uwszc_:%Mp e zpm- fmmrn- t
Tme c o Hei i-nadi &M mv-vs acz-.wr_. a ~ .ad3 :-vT' -Amm

* 79
APPENDIX 10.10
3 Image Deconvolut ion

80
Volume 74, number 1,2 OPTICS COMMUNICATIONS 1 December 1989
DEBLURRING USING JOINT TRANSFORM PROCESSOR
F.T.S. YU and Y.S. CHENG'The Pennsylvania State University, Department of Electrical Engineering University Park. PA 16RO2. USA
Received 14 March 1989; revised manuscript received 2i June 1989
By generating a blur function as the reference object, the phase of the spectrum of the blur function is automatically canceled inthe joint transform spectrum. A reference function is then utilized to c,.Tpensate the amplitude vanation ef the olur spectrum in
order to restore the original object. Experimental results are given.
1. Introduction t(f,,f)I= lA, (f, f) 12+ 1A(f, c) 12
The jo-,, transform correlator (JTC) was pro- - exp(-i4nxof.)1
posed by Weaver and Goodman [II for optically (2)
convolving a pair of 2-D functions without using a where A, is the Fourier transform of a,, , =x/).F, andcomplex spatial filter in the frequency plane. This fy=y/AF. F is the focal length of all the lenses L, andidea was further applied to real-time pattern recog- A is the wavelength of the light. Re denotes the realnition by incorporating some spatial light modula- part.tors in the optical system [2 J. Recently, deblurring In the read-out process, the amplitude transmit-using a nonlinear JTC was suggested [3 ]. In this pa- tance ofthe reference function A3(fx,f), in the planeper. we demonstrate experimentally a simple method P2, is imagect by the lens pair L3 and L, onto the JTFof deblurring using a joint transform processor [4]. through the reflection from the beam splitter BS.
Light reflected from the JTF is collected by the lensL2 and the inverse Fourier transform of 4 3(f,
2. Joint trapsform processor fy)tj(f, fy) occurs at the observation plane P. Theoutput amplitude of interest is either IFT [A, (fr, ' )
Shown in fig. lisAa joint transform processor in (f, f) A3(f., fy) I or IFT[A.,1 (f , fy) A2(f,, f,)A3(f,,f,) 1, where IFT stands for the inverse Four :r
which the configuration of the three-lens system be- transform. The former is centered at x=2xo, y=0tween the source point s, and the observation plane while the latter is centered at x= - 2xo, y=O. In gen-P is a standard optical information processing sys- eral, the joint transform processor can ac. ieve whattem. P0 is the input object plane and P, is the joint a coherent optical processor can do. However, in thistransform filter (JTF) plane. Suppose thac the am- paper, we would concentrate on a deblurringplitude transmittance of the input objecz is problem.
,x, y) =at (x-xo, y) +a,(x+xo, y). ( I ) Assume that the amplitude transmittance of theinput object takes the form
After square law detection at the plane P1, the am-plitude transmittance of the JTF (or joint transform t(x, y) =o(x-xo, y) •rect[ (x-.m)/Ihologram) can be written as +rect[(X+Xo)/l (5(y), (3)
' Y.S. Cheng is .n leave from the Institute of Optical Sciences, w',ere the first time term is the blurred object. * de-National Central University, Chungli, Taiwan 32054, R.O.C.. notes convolution operation, and 1 is the blur width.
0030-4)18/89/S03.50 0 Elsevier Science Publishers B.V (North-Holland) 19

* 81
IVolume 74. number 1.2 OPTICS COMMUNICATIONS I December 1989
U Po P, P
LciL
j~ 4i
IL 3
Ix
i Lc2
S2
Fig. 1. Joint transform processor.
T' " information in the JTF which is of interest to us can produce the JTF instantly. The operation3 is IFT[AiA A3] can then be achieved in real-time.
A.I,(ff ) A (f,) =O(f,.) sinc (If ) (4)
3 where the unimportant constants are neglected. We 3. A deblurring systemnote that the phase of the sinc function is completelycance!ed due to the presc ce of the reference object Although blurring can occur in different forms. inrect(x/l)(O). In orde- to obtai, the deblurred im- this paper, we only consider linear blur. In order te
age. all we have to do is to genera:e a reference func- reduce the dynamic range requirement. an alterna-
tion (sinc'(IJ,) I which cancels the undesired am- tive deblurring system i- which Fourier transfor-
plitude variation sinc2(If) in the object spectrum. mation takes place only in one direction is suggested
Thus. the output wave amplitude, which is centered (fig. 2). The recording system and the read-out sys-
at x=2x, v= 0. is tem can be put together as those in fig. I using a beamcombiner. However. for the ease of 3-D drawing, we
IFT[.41 (f.,.) .4*(f,]) A-'f.L, =o(x. 3) consider them separately. Let the amplitude trans-mittance of the input plane be
1(x. 1') = o(Xx' j',) * rert[ (x-..C,)/]
If programmable real-time spatial light modula- + rectl (X+x0)II. 61tors (such as LCTV are placed in the planes P0 andP. then the references object A._ and the reference Since blurring occurs only in the x-direction. wefunction ;13 can be continuously varied. On the other merely have to perform Fourier transformations inhand. a real-time square law detector (such as LCLV) that direction. In the orthogonal direction, a simple
20

* 82
IVolume 74. number 1.2 OPTICS COMMUNICATIONS I December 1989
P2 P, p 4. Experiment and discussionY', f CL2 y
/ '/ Shown in fig. 3a is the original object in which thefxi characters ABDKU serve as the object. The thin line
I CLi D
K* U
F P - 2F - t-- Fj Y b Fig. 3. (a) The original object ABDKU with a reference line.Fig. 2. (a) An optical system for recordingof thejoint transform3 spectrum. (b) A read-out optical system.
imaging would suffice. Hence, the information onthe blurred object and the reference object arebrought together only in the x-direction. After squarelaw detection at the plane PI, the JTF takes the form
I l~j(fr,,y) =sinc'(lf,,) [ Of., y)lI + 1
+O(f, y) exp( -i4rxof,)
+O(f. y) exp(i4rxcof ) , (7)
where 0( f, y) i, the object transformed in the x-direction.
The reference function (sinc-(lf,) ]' on the plane Fig. 3. (b) Blurred object and reference object.P, is then imaged onto the JTF. Finally, an opticalsystem (fig. 2b) simila" to that of fig. 2a brings thelight to the output plane. Again, inverse Fouriertransform is performed in the x-direction while sim-ple imaging .s maintained in the v-direction. Thewave amplitude at the observation plane P is
u(x. y) =o(x. y) *.o(x..V) +6(x) 6(y)
+o(x-2Xo, y) +o ( - A-2x, ). (8)
We note that the third term of the above equation isthe deblurred image. For an amplitude object, thefourth term is also a deblurred image.
Fig. 3. (c) Joint transform spectrum.
* 21U -

3 83
IVolume 74, number 1.2 OPTICS COMMUNICATIONS I December 1989
* d
I
3 Fig. 3. (f) Reference spectrum l/sinc2 (If,).
I Fig. 3. 'd) Under-exposed JTF to show the fringes in the main-lobe ofhe spectrum.
I
Fig. 3. (g) High-passed deblurred image.
Fig. 3. (e) Overly-exposed JTF t' show the fringes in the side- above a digital motorized stepper. The motion of thelobes ofthe spectrum. camera causes the recorded image to be blurred. A
further contact printing makes the blurred objectat the left hand side of the figure is blurred to be the transparent again (fig. 3b). By comparing fig. 3a withreferenc, object. BV, photo reduction, both the char- fig. 3b we note that. since the degree of blur is cho-acters ABDKU and the reference line are converted sen to be very severe, the blurred image is beyondto be transparent. The photo-reduced transparency recognition. The distance between the blurred objectis then placed in the object plane of. simple :inaging and the reference object is about 6 mm. We havesystem. Light from a mercury arc source shining on chosen the original line to have a finite width so thata piece of ground glass -:rves a the diffuse light the reference object can have comparable transmit-source. Kodak so-253 film is mounted on the camera tance as that of the blurred object. In the above re-
* 22
U "

3 84
U3 Volume 74. number 1.2 OPTICS COMMUNICATIONS I December 1989
cording processes. linearity is ensured by pre-expos- image is expected. However, due to the reason thating the film to a uniform light with total exposure is not quite clear, the edges of the images are not quitesomewhat above the toe of the H&D curve, sharp. The horizontal parts of all the characters are
In the system of JTF recording, the focal length of quite lost because of overexposure of the corre-the cylindrical lens CLI is 30 cm and that of the sponding regions which result in the lost of the in-spherical lens Ll is 20 cm. Their separation is ap- terference fringes. This problem would be avoided ifproximately the sum of their focal lengths. Hence, a continuous tone object is utilized as the originalthe image is compressed in the y,-direction by a fac- object. If the image of the original object instead oftor 2/3. Shown in fig. 3c is the joint transform spec- the high-passed object is expected, the unwanted darktrum recorded on the Kodak 649-F plate. Because region of fig. 3b should be painted totally opaque be-we have exposed the blurred object in the linear re- fore performing the read-out process.gion, the dark region of fig. 3b is not totally opaque Deblurring is mainly a combined process of phaseand the average transmitted light is squeezed into a correction and high-pass filtering. Since the phasevertical line by the !,ns Lt which overly exposes the cancellation is automatically achieved in the JTF. wezero-frequency spectrum. Some regions in the spec- merely have to perform a high-pass filtering process.trum are also overly exposed so that the interference A simpler experiment is also performed in which thefringes are quite lost. To reduce the effect of this mainlobe of the joint transform spectrum is overlyproblem. more light from the reference object is re- exposed to generate the approximate high-pass func-quired in order to faithfully record the spectrum. This tion directly on the JTF. The read-out optical systemcan be done by placing a filter in front of the char- would be a cylindrical lens together with a sphericalacters ABDKU during the blurring process. In fig. lens. Comparable result as fig. 3g is obtained.3d. the film is under-exposed to show the fringes inthe ma; rlobc of the spectrum. On the other hand. infig. 3e. the film is overly exposed to reveal the fringes 5. Conclusionin the sidelobes. The reference functionI sinc(/fr) ]- can best be generated by computer.However. in the experiment, an approximate refer- A simple deblurring method using a joint trans-ence function is produced by exposing a 649-F plate form processor is suggested. By incorporating someto the spectrum of the reference object only. The real-time devices into the optical system. the process
negative of the result is shown in fig. 3f in which the can potentially be carried out in real-time. Although
nonuniformity in the vertical direction is caused by the experiment is performed with photographic films.
that in the reference object. the result nevertheless shows some degree of de-
During the read-out process. the reference func- blurring. If a continuois tone object is used instead
tion is imaged by a lens pair L, and L3. each of focal and the procedures discissed in section 4 are taken
length 30 cm. onto the jTF (fig. 3c) on the plane Pr into account. the deblur:ed image would be much
The focal length of both the cylindrical lens CL, and better. Some other methccs. such as the one sue-
the spherical lens L4 is 30 cm. Again. they are sep- gested by Yang and Leith ( 5 1. can also be utilized to
arated by the sum of their focal lengths. Many ref- restore the original object.erence functions and joint transform filters with dif- Based on the simple method we have suggested.
ferent exposures and different chemical processing for a general blur (deiocusing, nonlinear motion.conditions are experimented. The image of the orig- etc.). we would generate the same blur as the ref-inal object which shows some degrec of deblurring is erence object. The phase of the blur spectrum is au-inalatcai cancelt in hthh joiws tranfor dere fdblrcgshown in fig. 3g. We note that the image is stretched tomaticaily canceled in the joint transform spec-
na the horizontal direction b% a factor of 9/4 with 'uim. Then. we would Zenerate a reference functionto cancel the nonuniformit% of the blur spectrum.respect to the vertical direction because of the par-
ticular lenses used. Owing to the presence of the ver- Thus. a deblured image Can be obtained.
tical lines in both the joint transform filter and thespectrum of the reference function. a high-passed
2

* 85
Volume 74, number I.2 OPTICS COMMUNICATIONS December 1989
IAcknowledgement References
We acknowledge the supnof US Army Missile [ II C.S. Weaver and J.W. Goodman. Appl. Optics 5 (1966) 1248.
SUPP~t .121 F.T.S. Yu and XiJ. Lut. Optics Comm. 52 (1984) to.Command through the U.S. Army Research Office (3] B. Javadi. H.i. Caulfield and J.L. Homer. Technical Digest.
under contract No. DAALO3-87-0147. Optical Societ of America Annual Meeting (1988) 89.[41 F.T.S. Yu and i.E. Ludman. Micro Opt. Tech. Wet. 1 (1988)
374.
(51 G.G. Yangand E. Leith. OpticsComm. 36 (WI) 101.
I-

86
RESTORATION OF BLURRED IMAGESDUE TO LINEAR MOTION USING A JOINTTRANSFORM PROCESSORI Feng Chang, Xin Xu. Shufong Wu. andl Francis T. S. YuDepartment ot Electrical EngineeringThe Pennsylvania State University
Universay Park Pennsylvania 16802Don A. GregoryU.S. Army Missile Command3 Redstone ArSenas Alabama 35898
WEY TERMIS3 Image, processing. joint transtorm processor. Fourier transtorm
ABSTRA~CTIn thisr paper we shall show that blurred photographic imatre; dzie tolinear motto,, can he restored itit a oint tanisform processor tJTPIThie aecontcontion t or tire image deblurne can ire direcmtimplemented at the input plane, qia JTP. The ipolarity of the aecoiw-
lutan !urction can ne acrompiished bt- encoding with a =-shrifted fratingsitucrure. Computer Itmuj-atialls to test the feasibiiyw the scheme itie
OnIf h mtor advantaites of a joint transform architecture
architecture of the Drocessor can also be applied to general-ized- imagte processing (311. Research in hsarea has bemotivated by re.-ent adv-ances in spatial light modulator tech-nology and the inherent real-time processing cariability.
This paper demonstrates the implementation of a joint
I transform processor dTPM architecture to restore bluned .'1-
E-IFS -43N 'rWI2

::-erent unOUt Dilane. The transmmttance distnbution can be written as 87it~at e X. f-,! 0; x- V) x",-
S;where 2a is the separation oi i,. and f,. By coherent iliumia-
.2:on. the complex H aht distribution at the Fourier Diane :s"'-Z .2 en by
3-1,0 T(p) = FJ p)xt-: 1- F.( p)exvtap) (2)
2 where p represents the angular spatial frequency coordinate.Figure 1 A one-diatensional joint transform processor
F F(p) = Ff (x-.)}. F.( p) - F! 1(x. Y))} (3)
and F denotes a I-D Fourier operator. The transmittance ofages due to linear motion. In a conventional coherent optical the joint transform hclogram produced by a square-iaw detec-processor. image debluring can be performed by synthesizing "or can be wnttenasa restoration filter, whose transfer function is the inverse of
:he blurred function [41. Notice that the inverse filter is iT(p) F.1 -F- FF. exp(-2ap). F.exp(2i generally not physically realizable due to man" concomitant (4)
difficulties. In a JTP. however, the object is made to convolve4ith a processing referecej function that is placed at the The system setup for the readout process ts the same asnout Diane. In this arrangement, some of the processmn shown in Figure 1. By placing the joint transform hologram at
constraints may be alleviated. Because the deblurring function the input plane- the cross correlation of functions f, and f::s generally a bipolar function, we have propose a satialy can be observed at (2a.O) and --2a.O) of the output plane. if
encoding techmque to produce the bipolarity of the processina one of the two functions is flione'a along the x direction. forI muncnon. in other words, two sets of rating of the same e.apie, f.(x - a. Y). m.enfl tne convoutiuon operaon insteadfrcquenc" are encoded on the input transarencv to produce a of the correlation can be erformed. It is thmiore evident
phase shifted vector. such that a bipolar nature of the -hbat TP can be used as a geeraized iaae processor.processing funcuon can be obtained in the first-order Let us assume that the biunea function isdiffraction. x3 Figure i shows a I-D joint Fourier transform correator. g(x) = It x),ret l) (5)iere cylindrical lens L, has no effect in the x decton.
I Thus. the Fourier transforms of the object and the referenm ,3 ere ox) represents the unblurret object,function in this direction are obtained at A by L_..nthi. rIn\ [Ir -L/2 5x< L/2directon. however, the input functions are imaged onto A bv =L J } 0 thesethe combination of the two lenses L and L.. Thus. ai-
* oint transform hologram can be obtained at P with a is the linear smearing function. L is the smea. z length. andsquare-law detector SLD). We assume that an obic; t-ans- denotes the convolution operation. it is a.pa.rent that. forVarenc. f.(x. and a refeenc:e f(x. y- are -iserted in the 6e=rai image oroceos m. "te outout complex l:ht field can
I C-' I
4 -
I ______------__----___-_ ___-"_____.-t___3 o oo
-C3i • _-20 -; )0O-: 0
Figure 2 T :e szr-u o hptc VmoCze.-n fucto. t-n &J - -. a -j,
IMJICROWAVE AM2OPTICAl.T_ ~tFJO.OGY L . T'ri Iv_-, 3 Jo I lj~Ary 99 25

3 88
.~I in ~: [IItiono
If
3 iu 3 nc~co ni'di 'iihIIJUG i *1.cn:O-- lun- a.; tiri funtio
beur 4~~te Grtnansigptenaple otepoesn ue(aa)bU
M X) ') - (x3.re ttxI) # -~)11 R w5t)Aburdia u oL:-mt:NotuUdwe m rmtl
th a zentim! Lr 35m iv andof negtiv fion-on ofh Bv '-D Fannr
(cost~~ -- cs( a
nx)-gx).h~) =o~~ertti-I~~x) 6 ~'S Fa A 0 bire imaaed-Iht liea nocoa : 'owhere hg- is th srrwtia luit csonse ofd t filtrf-Mrr
* malnt -ith e uatia ==teresos oM a de blnrrin th er isdt of whrtbihheeaigpn n ;ad .x r h
I ~~i whr saoooun stant antd a= t an rotralssmal resapde cinet erhatr detrm nes thea --width aj isr th(9)a rm&vcorm"Tefis-r.i.sOn.~ as usd v wnl t-3 aines~ 2- Et . ---- *-3.- d
A6,os t -M -. ;s--~---
-
To staint the :maae traxm e ghs2 ae.m tt.e cam that the imaae deblurring can be obtaned with the p-ro--mat the s"z- of the refeen-ce should be tamer tha'n noun"!- --h posed l-D 7-1?.-oecsaeae.L >!L.. Thle feasibility of' the Optical impiem-=tanon -Is studied bY
Th .-oianty the delurrn hcon A.- XICzn a computer sulation as giv m Fivise 4. Figure R1aj shows3 obtamned by encodina a set of %-shifted Roucin aracna-s W a a blurred imaee with a smeauu 1=6gt I 0:xl hshow -.n Fzar 4 nT transmittance -i the mcoCU -. =s rectanua soIkeS of ";-- deblurr-tz func-tion h~tae ~ezarttcvr can Ctwflttzf as wide- The 'a.ncdn cnitrsite rcsdm iS shown
I - a Fgure 4g!R).* Ydx. = ~-() r Li, - b~rec~ miIFinally, we wud conclude that resmoin blurre-dinae
- - ~ustng a ooe-dunensonal to tnt transformi vrocessor is feasible-h-fri~~li DI 3(- h bpla of the prcsigfunction C=n be alleviated
3f ret r 21f) hk)a M' a zra-t:'a encoazot;n scheme. -11-zs system=. :nrmcecaB .a-~be implemented %ith real-tme dcs.
2b -AAcOaAVE A'Jfl OPIC-Al TECHNOL,-OGY W E.-; /ot. 3..No I -Januarv 1990
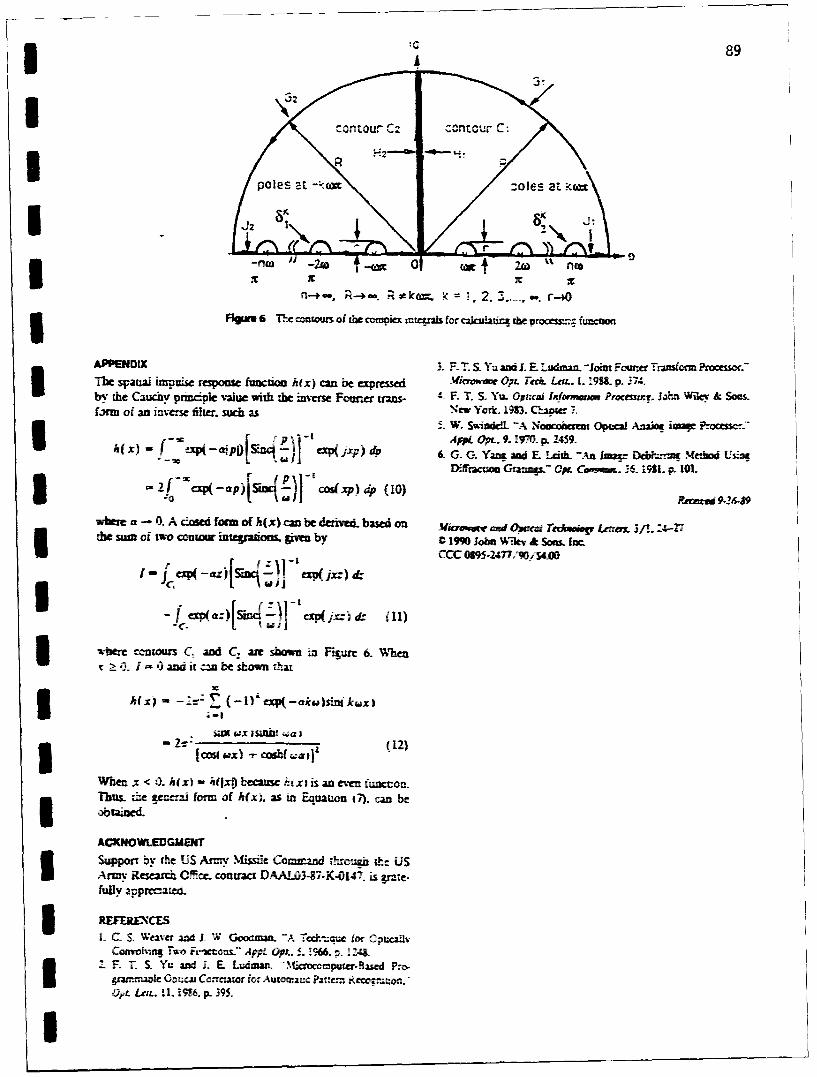
89
pes at -;koM :oies at Kcc
-2 I IW " (m 2 c
3 A~gum 6 7The conturs of the cm~ nota s for caicusaura irmw. UncUo
APPENDIX 3..F ' &Yu andj.L udma tlint Fourer Tazsiorm Processor?3The svauai inmuse response function hax) can be expressed MrwtOpt ea& La. L913. p. _*-A.byvthe Cauchy pnncii value with the invs Fur tan- 4 F. T &. &Opti Interns Procnnr. joc uc os
.W of te.sta New 'Yoti. 193"1 Cbmpa 75W. Sw'ndL -A Noaocerec: Gina A="inac .0m mcoC
AFm Op. 9. :11 . .459 D o rn-fr p j j
h(x) 'w( (' 60p iii c(j __ o1.0 G ir~ Yam 3WL E91 cAGb--n e i.-=mbo1 -ocasta~o xpido op(10)36 93.0,1
wbejic a -. A d~osed form of h(x) an bec derived, based on 0pa Tean Lem m3!/1. 4-2the sum oi two conw insegraons give by : 1990 Ioia WRev A SOnsL Inc
Imjxp(CCC G$9$:47XVO44~j
el :[Sn 4-ilxo~cm
Uwhere conwour C and C. are shown in Fuzur 6. When'and: ben shown uat
h(xa-:&E(-ii V-ak)sofkwxi-
Sm ux JVmh' &;aiar (12)3cs Wx) -rk eII
When x <'3. hfxi a ;flxf)becausl!1-x.is ann~n.~trI Thus. the aeneni bo-= of hx), as in Eouon (-I -can beobtained.
ACKNOWLEDGMSENTU Suprport by the US Armv MNnsie Coincamd th.ur~n-, USAmResearch CRim cornracr DIt i63487.K.0147. is irate-
fully appre=card.
I REFEVESLC S Weave =n I-W Goodcin- -A T fhnew tx '-'v
Contvrlmti T%-o Fr-coas .4qL Opt. 3.966. p. -24&I 1 F. T. S. Y-- a3m4 I. E LWudm . QNticrccmoteR~fased pro-yamn-.rraol Ot.-ct Cx-.=rezto-o Auwma=-"- Ptucn Rcor.nOpt Lan.. 1.13.p395.

1 90
III
APPENDIX 10.11
IReconfigurable Interconnections
IIUII*IIIIIII

I 91
IReprinted from Applied Optics
I Recontlgurable interconnectons usingphotorefractive holograms
I Shudong Wu. Qiwaig Song. Andy Mayers, Don A. Gregory and Francis T. S. Yu
u= o= aniscneml. rewnfigzm" d yspat; oduhatr. x= lu
these methods are presetw
IL I '" c e ff :de nc- of e ner gy t a ns e en e a nd th e m e h o m ayIneent ears hih speed commurucat . andhmzh not be apice at the present time-
speed computation have ar-z mterr t in op ta l In recent years, laser tholog has rapidly ad-intero ections. The advantages of optical inter- vanced with compt wavelength tunable ler diodeso r e rcei int ercetin are high beasingala_ Theirave engh rapily pro-
speed, massive parallelism, and lower mutual interfer- rides a convenient method of controlling the directionence Optical fibers. integrated waveguides, and free- of diffracted light beams. lne has proposed a tech-spaceinterconnections are all being considered. How- nique for uing a multiplexed waveguide transmissionever, interconnecon is the most attractive hologram and wavelength tunable light source to real-among the others for its potential massive parallelism. ze the reconfigurable optical interconnections. Gen-Both classical and holographic optical elementi are erally speaking, the wavelength tunable ran AX ofbeing considered as candidates for free-space intercon- laser diodes is --i0-2. However. for transmission ho-nections. Generally, classical optical elements have lograms. 10- relative wavelength variation would pro-higher efficiency of light utilization; nevertheless the duce a very small deflection of the laser beam. On theholographic optical elements have greater flexibilitv, other hand, with a surface waveguide. the usable space
Recontlurable massive interconnection is impor- is essentially one-dimensionaL These are the majortant for communication and computation aspects. resons that limit the number of interconnections us-Spatial light modulators (SLMs) were proposed for use itg transmission holograms and surface waveguides.as a reconfigurable optical crossbar based on optical Multifacet computer-generated holograms may alsomatrix-vector multiplication The main problem be used for reconfigurable optical interconnections-with the SLM method is low energy efficiency. In However. for hig fanout interconnections, the energyaddition, the SLMs suffer from low contrast low reso- efficiency of the holograms is generally lowlution. slow response. and large physical siz To in- It is well known that a photoreftactive volume holo-crease the energy efficiency, Yeh et al.3 proposed a gram can have high diffraction efficiency and hightwo-wave mixing technique to amplify the controlling angular and wavelength selectivities. We frt discusspattern. which is generaed by the SLM. However. the performance of transmission and reflection holo-high !ight itensitv (-i /cm is recuired for high grams based on coupled wave theory and law of refrac-
tion. Then reconfigurable optical inmrconnection*-w So swt h eatzn f l'crian Cc-p;: uigenzw.WdvsoQi~am= 1ZZi :iewyo ,cafitC- - er "--schemes usinr wavlength tuning and spatial divisionSS-- U-nivesiy. Syntie -New York I M4. Dr
GreLy zM US.. m-: Co .an . M , techniques are propoed. A small amount of wave-* A.bC35 aa i& -nr a-uw- ar-e . . length tuning can be used to realize a large number of
U-c.erty. D Ele -. cal E nm -. Unrse.rvtty PaMx. reconfigurable interconnectons. which can be ob-p -;,.. 169~02 .. tained by choosing the writing angle and thickness of
Fie .w2J i-SS_ the hologram. For the spa diavisin etod. theQQQ34g-r - 1 jj itW e -t, interconnection patterns canbe recorded as a series ofe iOsecai Sa4cety dA-me-X, pinhole holograms in the photorefracutve inaterial.
118 _.A-0PtOEfGSir I l 8 -- MC- 'ON-
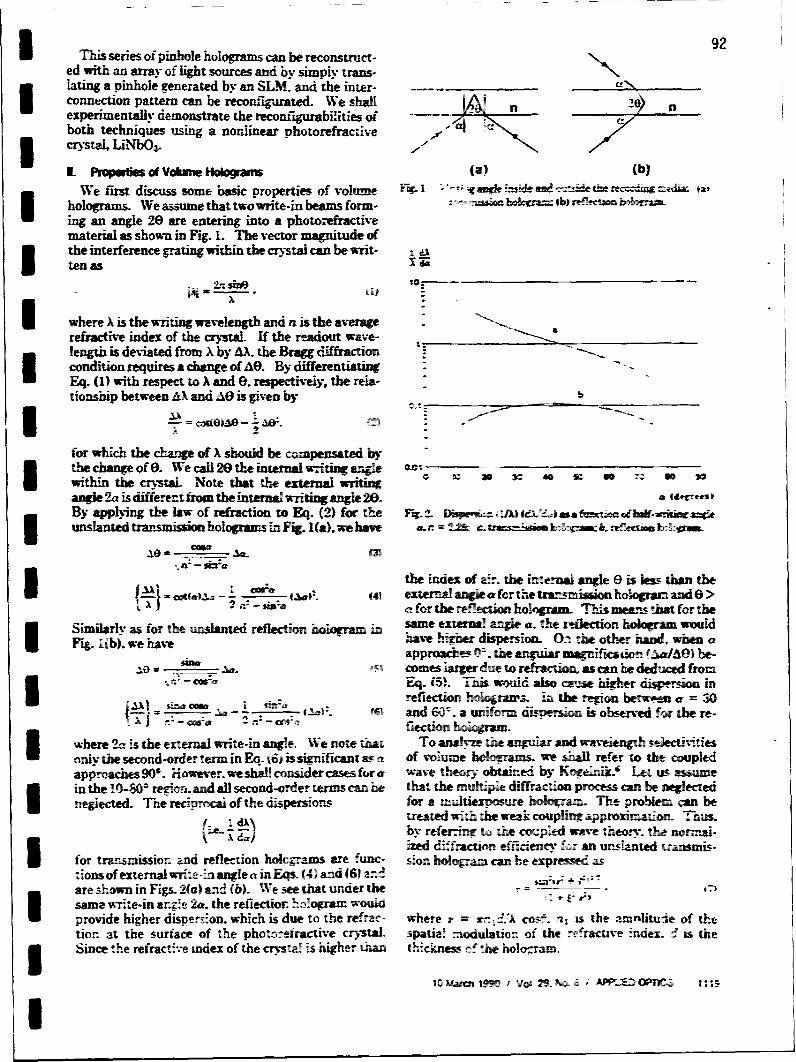
This series of pinhole holograms can be reconstruct- "K.ed with an array of light sources and by simply trans--I lating a pinhole generated by an SLM. and the inter- connection pattern can be reconfigurated. We shallexperimentally demonstrate the reconfigurabilities Of nn
both techniques using a nonlinear photorefractiveI crystal, LiUNO 3.
IL Prupedies of Voklum Hokxpaps (a) (b)
We first discuss some basic properties of volume F-! m. a= sate the r.at- z a-&-- ta,holograms. We assume that two write-in beams form- I tC6fl. -b e d --ing an angle 20 are entering into a photorefractivematerial as shown in Fig. . The vrector magnitude ofI the interference grating within the crystal can be writ-tens a
where X is the writing wavelength and n is the average -refractive index of the crystal If the readout wave- __"
length is deviated from X by AX the Bragg diffraction "condition requires a change of AO. By differentiating -
Eq. (1) with respect to A and 0. respectiv l. the rela-tionship between AX and -10 is given biy -
for which the change of A should be compensated by -I the change of 6. We call 20 the internal writing angle -:within the cry-st Note that the external writing C 20 C 4 se C M i SO IC
angle 2a is different from the internal writing angle 2e. *By applying the law of refraction to Eq. (2) for the -q. D sprn )0 w $-i'. --unslanted transmission holograms in Fg_ l(a). we have ±2- -
.1= ___ t.2
the index Wfair. the internal angle 0 is less than theIV ! ~ . _4? external al or thetrainsmissio raanrefotheeflTh~means that for the
Similarly as for t u ted reffcon hooram in same external angle. the r-action* imial as fo thhavee efetonhlgrm~ high-r dispersion. Ga the other hand. When a
Fig. (b. we have ae the angular magnification 'AA) be-
____ A comes Larger a to refra-ctoc. as can be deduced fromr.Eq- (5.. T1i would also cause hith erispersion in
reflection hologran'.- ! h region between a =3
where 9-a i the ex-tern----l w te-in a We note ,t- b To fl-ye ' ng e waveteoyhi sA'c--esonly hessecond-oaderetecmin Eq-MRis cant-as a olume holograms. we -l refer to as coupapp aces 0. n owel rwe-i hal conidecasesftr a ave - ow-uned 43 Koeik. Let andH are so i n. e and () se -e terms canbe that t-e mlupl di ,f --cesscan ,enezieced . hp ft ed p Jo for. a mulze po ue D "U oe p em- can be
[/ _... treated with th weak cou--' appro~m am -!'..'nuL.
m ed diff.a t .en- f Fitoi %r an u rts a a te t:- i--fol transminssion and reflection holm-rnams are 6 ,- Ron nolcra c--ns be exopre-m-d astion of external wrim-i angle a in Eq- 141 and (6) a:Vdare shown in Firms 2a -and (b)- INte tha'Jt under the. ,-
same write-in anei- the reflection ho0c-ram wrnLMnprovide higher dispersion. whichi i dcre to the refrac- where r = cm-odix . n; ' "he am- MUre 01 L td;on at the surface of the photfrefractve crystal spati mc4p in of .e ' -efracive ind ... di theI Since the refractive index of the cnstal is higher L'-an thickness of tde hoojra.
I

* 93
2rnd sinO Ad ba
14.I i'[2rnd snoA
X, cos(} X 121- '
I is known as the dephasing parameter, which :s depen- 1ob 1-dent on the reading angular deviation AO and thereading wavelength deviation (AX/X). 8 - b1
For the weak coupling approximation (i.e., I <<I 1), i bEq. (7) can be simplified, as given by a
= t,2 sinc2 . (8) 4 F
The angular and wavelength selectivities of the holo- 2 Fgrams can be defined by the full width of the main lobe iof the sinc function and are given by 0 50..0.g
0 10 20 30 40 so 60 7 80 90
IA, = ,(9) a (degrees)
Fig. 3. Angular selectivity of volume holograms normalized by X/d,AXi = X cose (10) n = 2.28: a, transmission hologram; b, reflection hologram.
X Jt ndsin2 O
where subscript t signifies transmission hologram. dWith reference to Eq. (3) and the law of refraction, x -x
we find that ,oo100{A} - qn- in= (11) \
sina cosa dA - s-ina ,
ff •_ (12)sin2a d I-
Similarly, for an unslanted reflection hologram, the : 10normalized diffraction efficiency can be expressed as F o
=7 ' (13) F+ 1 1 -I - j 2!1/2]
where I0.11 ;
v = jwnid/X sinO, 0 10 20 30 40 so 60 70 so 90
= 2rnd cosel Ae a (degrees)
X, Fig. 4. Wavelength selectivity of volume holograms normalized bys d, n -- 2.28: a, transmission hologram (the scale on right); b.
d n X reflection hologram (the scale on the left).
For the weak coupling case (i.e., Ivi << f), Eq. (13) canbt- reduced to the following expression: From this figure wi see that the optimal values occur
at
~=I 2 sinC2 . (14) atr _ "=(a,)op, = arcsinvn(n - v -1-), (17)
The equations for angular and wavelength selectivities r _---of an unslanted reflection hologram can be derived, (Ct) 0op = arccosn(n - v- 1),(such as respectively. For example, if n = 2.2F for LiNbO3
n - cos'a () crystal, ((t)opt = 46.50 and (a,)opt 43.5 . We noteJAM, n cosa d (15) further that in the region of a = 30-600, the hologramhas the sharpest angular selectivity both for transmis-
1 X 16) sion and reflection holograms.X ----- - sd Figure 4 shows the wavelength selectivities
where subscript r signifies the reflection hologram. -T- and -X -jFigure 3 shows the angular selectivities, (Aa)t and
(Aa , as functions of an external write-in angle a, as functions of a. From this figure we see that thewhere the vahes of Aa have been normalized by X/d. wavelength selectivity for the transmission hologram
1120 APPLIED OPTICS / Vol. 29, No. 8 / 10 March 1990

vector. In terms of momentum conservation, it is94
N,3 required that
).(Ak) = (a), = 0. (20)
Thus the z-component of Ak is directly related to thedephasing parameter s in Eq. (7) by
(a) (k).. d. (21)S(a (Equation (7) can be used to determine the diffracted
wave vector as shown in Fig. 6. For simpiiciTy, we haveassumed that all the wave vectors are in the x-z plane.
S K2Figure 5(a) shows that the reading angle of the trans-mission hologram deviates the amount AO from thewrite-in angle O. By referring to Eq. (20), the diffract-ed wave vector should deviate -AE in the first-orderapproximation. The wave vector diagram for the re-flection hologram is shown in Fig. 5(b). In this figure J
() (d) we see that the angular deviations of the reading and
Fig. 5. Diffracted wave vectors derived according to momentum writing wave vectors are identical. Figures 5(c) and
conservation (the horizontal components of the dephasing vector (d) show the effects due to reading wavelength dephas-should always be zero): (a) transmission hologram with incident ing. For the transmission hologram [i.e., Fig. 5(c)), theangular deviation; (b) reflection hologram with incident angular diffracted wave vector deviates by AO; for the first-deviation; (c) transmission hologram with reading wavelength devi- order approximation, we have
ation; (d) reflection holoram with reading wavelength deviation.
A9 = 2tan8-- (22)
This indicates that for a finite wavelength bandwidth,
Cit will cause the diffracted focal spot to smear. How-2 Aever, reflection holograms do not suffer from such focal2 spot smearing, since the wave vectors for unslanted
D B reflection holograms are always symmetrical about thex-axis.
Ill. Recoiflgurabilty with Wavelength Tuning0 The principle of the reconfigurable interconnection
0 E A using wavelength tuning can be seen as illustrated inIEFig. 6. The grating vectors OA and OB are written inthe photorefractive crystal with an angular separationAI. When the grating OA is read out with wave vector
Fig. 6. Principle of reconfigurable optical interconnects with vol. OC, the diffracted wave vector is denoted by AC (CE isume holograms. OA and OB are two grating vectors with the same the perpendicular bisector of OA). On the other hand,magnitude and an angular separation AO. CE and DF are the if grating OB is read out in the same direction, the
perpendicular bisectors of OA and OB. magnitude of the reading vector should be changed to
OD (DF is the perpendicular bisector of OB), and thediffracted wave vector deviates from AC by 2A.Thus, by changing the wavelength, we can read differ-
increases as a increases. However, transmission holo- ent. gratings in the same reading direction. S 'icegrams generally have a poorer wavelength selectivity different gratings cause different diffraction angles,than the reflection hologram. The wavelength selec- the reconfigurable optical interconnections can be re-tivity of the reflection hologram is relatively unform alized in this simple fashion. The interconnectionover a, which is .0.45X/d. pattern is previously recorded in the volume hologram,
With reference to the principle of momentum con- for which the angular and wavelength selectivitiesservation, the diffracted wave vectors can be deter- should be high enough to prevent crosstalk betweenmined. Let us assume that the holographic recording channels. We assume that the range of tunable wave-medium is infinitely extended in the x- and y-direc- lengthstions and has a finite thickness d in the z-direction. A vb ndephasing wave vector can be defined as [7]
Ak = ki - k2 - k, + k4, (19) of a laser diode is --0.01 (Ref. 5) (i.e., AX/ =-- 0.01), and
where k, and k2 are the two writing wave vectors, k3 is the required angular deviation is 2Aa = 0.2 rad, then athe reading wave vector, and k4 is the diffracted wave should be >840 for transmission holograms [from Eq.
10 March 1990 / Vol. 29, No. 8 / APPLIED OPTICS 1121
I

* 95
(2). We note that this angle requires a large size 95
recording crystal (i.e., about a/cosa, where a is the laser Ctbeam diameter). However, for reflection holograms, ais ,-45* [from Fig. 2(b)], which is in fact the optimum \4 L2angle for angular selectivity, and this angle is also moreconvenient to work with in practice.crystal should allow the bandwidth of the hologram to
be equal to or greater than the signal bandwidth. If 1
th m . d, _ _to , frequency of the laser diode is A f. i : I1 1u 1___y Xf IHI- _r
where c is the velocity of light and subscript s signifies Fig. 7. Reconfigurabh optical crossbar C, z-cut LiNbO 3 crystal;the signal. By substituting this relationship in Eq. Lh1,L2, collimating and f Y-sing lens; Pi, P2, input and output planes;
(16), we see that the thickness d of the crystal should LA. DA, laser diode ax 2y and line detector array on the planes P,
satisfy the following inequality: rnd P2.
d:5 X_ 1= d. (23)vn- - CO d "a diodes, such as (AX)stability = 0.16 nm. This is possible
l-J, for a sin.3e laser diode at the present time.
I Notice that the corresponding angular selectivity of A possible configuration of a reconfigurable optical(Aa)r can be obtained from Eq. (15). By taking (Aa)c crossbar structure is shown in Fig. 7. Multiple reflec-= 3(Aac)r as the angular separation between chan- .1s, 'don gratings are written on a piece of z-cut LiNbO3the crosstalk due to the sidelobas of the sinc function crystal. The writing light can be derived from a dyewould be less than -20 dB, where the subscript c laser or a He-Ne laser (X = 632.8 nm), and the readingsignifies the channel. The wavelength interval light can be derived from an array of laser diodes (X =
680.0 nm). The wavelength difference between write-F'Tf Cin and reading may be compensated by modifying theI write-in angle according to the dispersion relation.
can be derived from Eq. (6), and it can be used as the The writing process is performed at a fixed writinglongitudinal mode spacing of laser diodes for wave- angle, and multiple exposures are carried out by rotat-length tuning. This would require the effective opti- ing the crystal with an angular separation equal to thecal cavity length to be required channel separation. The exposure procedure
n L A (24) given by Strasser et aL7 should be adopted to make thediffraction efficiencies of different channels uniform.
T cj After writing, a fixing proc.w:ure as described by Stae-ble et al.8 should be used t ,-m the holograms in the
where n is the refractive index of the laser medium, crystal. A linear laser diode array is arranged alongSand , is the physical length of the cao2ity , the nondispersion direction at the input plane. Since
As an example using LNbO3 crystal (no = 2 28) a it is in the nondispersion direcion, there would be no680 :w., the relative signal bandwidth is = wavelength tunable range limitation for the separa-
tions between laser diodes, provided the total extent of2A XA the array is within the paraxial approximation. A 1-D
line detector array is placed at the output plane with aand the thickness of the photorefractive crystal dma = separation of the line detec:ors equal to 2 times the13.8 mm, the angular selectivity is (Aa), = 2.1 X 10- 4, channel separation, as previosly given. Different la-and the angular separation between channels is (Aa), ser diodes can use the same se. ;f ratings in the= .3 X 10- 4. For 0.1-rad angular deviation, one would crystal. In the nondispersion direction, the lighthave about 160 channels with a wavelength tuning beams are reflected according to the law of reflection.range A/ of -ut .01. The wavelength interval be- By independently controlling the wavelength of thetween chaAnnels can be shown as laser diodes, a reconfigurable electrooptical crossbar
architecture can be realized in practice.
J,= 6.7X I0 IV. Reconfigurability with Spatial Division
and the effective cavity optical length of the laser diode Another possible architecture for reconfigurable in-is nIL = 5 mi. If terconnections with volume holograms is spatial divi-3 sion instead of wavelength tuning. A page oriented
0.1 holographic setup is shown in Fig. 8. We shall applythe pinhole hologram technique ab proposed by Xu et
is used as the required relative wavelength stability, we al.9 into a photorefractive crystal. The angular selec.would have the required wavelength stability of laser tivity of the recorded volume hologram would have a
1122 APPLIED OPTICS / Vol. 29, No. / 1 10 March 1990

larger storage capacity compared with t1hin h,,vgva ,-- 9-
ic plates. The recording arrangen' it is shown in Fig.I 8(a), in which an SLM is in the focal plane of condenserAlens LI and the interconnection pattern masks areplaced at page plane P. Object beam B is focused by BL; after passing the SLM the beam is directed towardthe recording medium. We note that the SLM is used SEW
to generate a movable pinhole that allows only the pobject beam to pass in one direction. In other words, (a)
I the interconnection mask is illuminated by the objectbeam in one direction, where the pinhole of the SLM isset at a spatial location to allow the object beam to passthrough. It can be seen that a set of interconnectionmasks can be encoded in the crystal for a given refer-ence beam A by moving the SLM pinhole position andchanging the object beam B'. Similarly. another set ofinterconnection pattern masks can be encoded for an-other reference beam A' and so on. In the readout (
process, a 1-D laser diode array is placed at the front (b)focal plane Q of the collimating lens L2 as shown in Fig. Fig. 8. Geometry for reconfigurable interconnections with spatial
I 8(b). Each diode generates a reading beam that is division: (a) recording setup; (b) reading setup. L1. condensing
conjugate to a specific reference beam A. When the lens; L2, collimating lens: SLM, spatial light modulator: C. recording
SLM pinhole is set at one position, a set of interconnec- P, page plane; Q. laser diode plane.
tion patterns will be diffracted and projected onto pageI plane P. As the pinhole position is moved, the inte-connection patterns would be changed. Thus we see of the SLM is -23 X 23 mm. The main advantage ofthat the interconnections between the laser diode ar- this architecture is its rapid and random access to the
i ray and the page plane can be made reconfigurable by a pictures in contrast with the sequential access in opti-programming SLM. cal disks.
Unlike the wavelength tuning reconfigurable inter- In practice, the total number M of interconnectionconnection, the spatial division reconfiguration re- patterns which can be recorded in the volume holo-I quires low wavelength selectivity (not sensitive to the gram is basically limited by the maximum index modu-wavelength). Based on the comparisons of volume lation n of the photorefractive material. With refer-holograms discussed in Sec. II, we should use transmis- ence to Ref. 10, the number of interconnectionsion type holograms for interconnections. To have a patterns is about
I higher angular selectivity, the average write-in angle M d (25)(2a) should be --90*. If the thickness of the photore- M n Xfractive crystal (i.e., LiNbO3) is -1-2 cm, the band-
I width of the hologram would be much wider than the For example, given An - 10 - 3, if 17 - 10- 3, d = 2 cm,signal bandwidth as can be seen in Fig. 4(a). With and X = 680 nm, for an ion-doped LiNbO3 photorefrac-reference to Fig. 3(a), the angular selectivity is found tive crystal, the total number of interconnection pat-tobe(Aa)t=5X/d=3.4XlO- 4. If3(Aa)tisusedasthe terns would be M - 1.2 X 10³. Recently, photorefrac-I channel separation and assuming a 300 angular range, tive fibers have been successfully grown. The fibersthere would be -103 useful interconnection channels can be used to synthesize a large volume ,f photore-in the photorefractive crystal. Due to the degenera- fractive material,11 .12 which is not possible to grow in ation of Bragg diffraction, only a 1-D laser diode can be single crystal form. The effective thickness d of theused. If the full range of N X N SLM pinholes is used, material in Eq. (05" can be expected to increase : :-2the total number of interconnection patterns would be orders of magnitude. In addi ion, :.es ma-e. .wthM = N2 X K, where K is the number of channels (i.e., higher nl can also be expensel (.4.. jr;nir natz'riU the number of laser diodes). als).13 Therefore, the material limitation of zq. "25
In principle, this architecture can be used for mas- may be alleviated in the future. On the other hand,sive information storage. As an example if N = 32, K we would like to point out that the crosstalk from= 103, the total number M of patterns (or pictures) third-order diffraction, scattering, internal reflections,
. would be 106, which is about the capacity of a 10-h TV and noise behavior of the volume holograms shouldprogram. This architecture does not require a high be investigated before practical application of angularspace-bandwidth product of the SLM (only 32 x 32). or wavelength multiplexing in photorefractive rrateri-U The requirement of the pinhole size is about mXF/a, als.where m X m is the number of pixels, a is the size of thepictures, F is the focal length of the condenser lens Ll. V. Expeimental DemonstrationsThe size of the SLM is about mNXF/a. For example, if The experimental setup for reconfigurable intercon-S m = 512,N = 32, = 680 nm, F/a = 2, the required size nections with wavelength tuning is shown in Fig. 9.
10 March 1990 / Vol. 29. No. 8 / APPLIED OPTICS 1123I

I 97
am r m P v e l ng m h (n i9
LB M"
A
63,.-
-~2c 1 asr632k- 2
2 PBS
M ___6300 0 a 10
deflected znele ( 0.8 degreesyrig. 9. Experimental setup: C, y-cut LiNbO ; PBS, polarizing Fig. 11. Reconstru.±ion wavb!ength as a function of the deflected
I eam splitter X2, halfwave plate: M, mirror, L. focusing lens; P. agle.output plane.
II(a)
Fig. 10. Readout light spots with eight different wavelengths.
The laser beam is divided into two parts by a polarizingbeam splitter. A halfwave plate was used to rotate thepolarization of one beam so that the reflection holo-gram was formed in ordinary polarization. A piece ofy-cut LiN 3 crystal 1 mm thick was employed as the (b)recording medium. The write-in angle 2a of beams A-tndB is-50 . Since we do not have az-cut crystal, Fig. 2. Reconr igurable intercn nectionl b tste division: aint. nave the gratinI ;ector component on the c-axis, the reconstructed patterns on the p,ge plane y three different reading
writing arringe;raent shou!d be y;nmetrical. Beam directionswith the same pinhole,-osition; (b' rconstructed six focal
A is arranged to be p.rpendicular o the crystal sur- spots on the SLM plane by one readu:g beam.
face. The wavelength rsed for writing ii 632.8 n-.. Eight exp .su.:3 were roade by -otating the crystal witha 0.80 step. A tunable dye la-,ir L-, u3ed to ro.d the straight line using the dispersion relation of Eq. (2), ishologra n in the -eme dlrectiu' .,s bexm B. Th1erecori- given by2a = 148.50.structed light field is colie'ted bu'y focw. .g lens L onto The experimental setup for spatial division reconfi-output plaae P. It is, ti:-",e. aPrare't that hojo- gurable interconnections is basically the sam asgraphic gratings -aii "Pat2aduu! jLt u' e time ".,y simply shown in Fig. 8, except that one laser beam illumi-a-tuning the wavelength of 'e dv. laser. The readout tion in differen! directions is used instead of a laserspots from eight grati,:;-: encoded in the crystal using diode array. In our experiment we employed a rnov-different wavelengths are shown in P-g. 10. Pigure 11 able pinhole as the SLM pinhole. The :!oving step ofshows a linear relationship (f. r°-reconstructio,, wave- the pinhole is -I mm: the focal length of the condenserlength vs the deflection an !e. it IS clear that the lenZ is 250 mm. Figure 12(a) shows thret reconstruct-write-in angle (i.e., 2a), calcrl+t--d from the slope of the ed patterns for the same pinhole position in three
1124 APPLIED OPTICS / Vo. 2a. t1.. 10 Ma.ch 1950I _ _ _ __

1 98different reading directions. Th"e angular separation Thne support of the U.S. Army Missle ComumandIof the reading beams is -10. Figure 12(b) shows the through the U.S. Army Rtsearch Office, contractreconstructed six fs-'cal spots at the SLM plane with a DAALO3-8PtK-0147, is gratefully appreciated.single reading direction. If these s'.x focal spots areprojected onto the page plane, six interconnection pat-Iterns would overlap. To separate the overlapping pat-. eerneterns. a pinhole can be used to select one focal spot at a Rfrnetime. Thus nonoverlapping patterns can be sequen- 1- J. W. Goodman. F. Leonberger. S. Yi. Kung, and R. Athale.tiallv displayed on the pae plane. "Optical Interconnections for VLSI Systems." Proc IEEE 72,
p3 pag p.850-866(1984).2. A. A. Sawchuk and B. K. Jenkins. "Dynamic Optical I tercon-
nections; for Parallel Processors," Proc. Soc. Photo-Opt. In-strum. Eng. 625,143-149 (1986).
3. P. A. Yeh. A. E. T. Chiou. and J. Hong. "Optical InterconnectionV1. Conckision Using Photorefractive Dynamic Holograms," Appi. Opt. 27.
We have analyzed the dispersion, angular, and wave- 90-0 181selctiitis fr tansisson nd eflctin vl 4. F_ Lin. "Optical Holographic Interconnection Network-" '-r I-ar-length seetvte frtasisonadrfetinvl le and Distributed Processing," in Technica; Digest. TopicalIume holograms. The refraction on the surfaces of the Mereting on Optical Computing tOptical Society of America.crystal plays an important role in th.e performance of Washington. DC. 1989).
the holograms. Since the reflect tion holograms have 5. E. Brodley, P. K. L Yu. and A. R. Jonston. "System Issueshigher and more uniform dispersions, it is more sui.- Relating to Diode Requirements for VLSI Holographic Opticalable for the purpose of reconfigurable optical intercon- ktrencin. p.Eng. 28. 201-411 G~989).nections with a limited tunable wavelength range. It 6- H. Kogelnik. "Coupled Wave Theory for Mhck Hologram Gra-is possiblew~ satisfy the communication channel band- - tng," Beli SySt. Tech. J348.290-294(199).width if the thickness of the crystal is properly select- 7. A- C. Strasser, E. S. Maniloiff K. M. Johnson. and S. D. D.
ed. n pincple a lrgenumer f reonfgurble Goggia. "Procedure for Recording Multiple-Exposure Holo-opt Ia inconnecto wit hirg h chnne l bcnwidth grams with Equal Diffaton Efficiency in Photorefractire Me-optial nteronnctios wth igh hanel bndwdth dia&" Opt. Lett. 14.6-8 (1989).(e.g., 1010 1Iz) can be achieved by using reflection holo- 8. L Staeble. W. J. Burke. W. Phillip--. and 1.3. Amodei. "Multiple
grams. Storage and Erasure of Fixed Hologams in Fe-Doped Ll%-bO_--We have also shown that the transmission volume Appl Phys. Lett-. ,9?--186 (1975).hologram is more suitable for the spatial division 9. S. -Xu.G. Mendep, S. Hart. and J. C. Dainty. "Pinhole Hologrambcheme. Since the transmissioa volume hologram is and its Applications.- Opt. Lett. 14, 107-109(198).encoded in the form of pinhole holograms, the optical 10. L Solyman and D. J. Cooke. Volume Holography and Voi zmeinterconnection pattern from each laser diode illumi- rarigs (Academic. New York. 1981).nation can easily be reconfigured by a programmable 11. ji IC Yamamoto and A. S. Bhalla. "Growth of Sr.,!-NbOaSLM. Nevertheless, for both the wavelength tuning 1.Single Crystal Fibers.- Mater. Res. Bull. 24,761--765 (1989).
1.L Hesselink and S. tiield. "Photorefractive Holographic Re-and spatial division schemes, the maximum number of cording in Strontium Barium Niobate Fibers." Opt. Lett- 13.iner nct ions ma terial in a volume hologram is limit- rti-479 (19S8).
ed b th maxmumindex modulation of the photore- 13. S. Gray. "A New Breed of Photonic Polymers." Photon. Spectrzn
W t March 1990 'Vol. 29. No.8 e APPLIED OPTICS 1125

* 99
III
APPI~NDIX 10.12
IBinary Phase C~s-~cti6~!
IIIIIIIUI13III~

* 100* IEM P11OTONICS TE-CHNJLOGY LErrEPS. VOL. 2. NO. 2. ": RUARY 1990 143
*Closed-Loop Binary Phase Correction of an LCTVUsing a Point Diffraction Interferometer
EDDY C. TAM. ms.-r moitIBEiEE. SHUDONG WU. ARIS TANONE.
FRANCIS T. S. YU. FELLOW. IEEE. AND DON A. GREGORY
Absrct-A point diffraction inferferometer is used to extamine the ( Fphae omniformity of.a liquid crystal television (LCTV). The resultinginterference pattern ;s then binsrmed aisd written becil onto the LCTV
for phase compensation. A binary phase joint trnsforms correlation0I experimest is performsed using the bny phase corrected LCTV todemoutte the appikibility of this technique.
I~~ ~ L---*CUIN L . Polarizer
C OMMERCIALLY available liquid crystal televisions Fi.I--ilt or the potartzer to achieve bipolarphsonyMdua(LCTV have been used as an inexpensive but effectivelin3spatial light modulators (SLM) for many optical signal pro-
U cessing applications 1111-131. This device can also be operated CoVnt
as a binary phase only SLM. by orientating the second ana- Rfmc
lyzer to be perpendicular to the bisector of the two transmitted Piabole-a
plarization states of the LCrV. as illustrated in Fig. 1 (4]. 1However. the nonuniform thickness of the liquid crystal dis-p lay panel causes phase distortion which prohibits the direct l iVf
application of the LCT*s in certain optical processing Cx- fperiments that require high phase precision. Many researchers icda Scd
have~ ~~(1 imesdtedslay panel in a liquid gate filled with inl- ,n4c tn 5V bsrb
* dex matching oil. thus removing the external phase distortion.U Casasent et at. [51 ano Yu et at. 161 have also proposed the use ~ ~ O~aih ~api~ i(aur rcfrmtr
of a phase conjugation method for alleviating t is problem.I An article by Kim1 ei at. (71 suggested correcting th.phs with reduced amplitude through an absorbirng film placel atdistortion of an SUMI tbj writing the binari --d phase distortion the focal plane. The film has a small transparent pinhce act-
function back onto -he devict.. In this let. -.r. a closed-loop, ing as a point source which produces a spherical reference
*binar phase correction technique is demons. -ated which wse wavefront. The w-avefront under exaination then interferes5 a point diffraction tnterferometriL vichnique a 91 instead of i with the reference wave when being reco-M+2d by a detector
Mach-Zehnder interferomecter as mentioned in V.A closed- placed behind the absorbing film. nhe usuai fie;us shift and
loop -and on-line architecture is intr-aue oth piu tilt of the reference wavefront are made ouo-Sible by displacing
B correction function can be cenerated. the- pinhole longitudinally and laterally.rv et~i. from the3 fucal spot of the optical system. 4-owevecr. In the appiicztior.PoiN-r DiFRr~cnox, INTERFEROMETEP. dr'., -ssed here. it is desirable to place the pinho'e at the centuer
S The point diffraction interferometer was first proposed by of the focal plane since a tilt or focal shift would introduce
3 Smart and Strong [81 is a technique for measuriag the phase additional interference fringes that canaol be COMPkeLyC cITI-v-ariation across a w-avefront. the principle of whi-c-h ;s illus- p'nsated for by a binary phase correction function. Since ,he
- rated in Fig. 2. The wavefront to be examined .. brought POint %!iffraction interferometer is a consnr~on-path irnterf'trorn-to a focal spot b%, on, erging lens. and I,, then traasmitte.. 'ter tLA' fringes are sable against vibrutic.n. and 'Aide-band
lg:sou.-ces ca eused. The simplicity ofthe point diffrac-Iarnuscnpt receive -ah-'r 16. 1989. rrvisca Decermber 'i 9S9 Tum !ion int,-rk-rornezer architecture is also one of - maior merits.
wott -*-As supported tryu ... S y.-isu Comnmnd thrativ, U.S. An-,RsarhOffice und- CEc I)A0-7K04 BINARY PInASp CORRECTION
E -C Ta m. 5 NWit A~ NO, and F. T S Yu are vith i!he tDparuttcnt di:Mmac'- Enrince-rne.- Pcnns; anta Sume Uni%--ir. Let t unitq amplitude funct-on hix. Pj represent the nonunrt-PA i161 form phase aistributtion on the LCTV's display oat cl. If 'he
D. A. Gregory is ~ -wdt - U S. Ar-nfiic Command. Redstone A.1c-I nal, AL 359.!)nimokx conlmzaut of this function. Vi(x, vy. is displayedt On
N I -I l35i90o!02o0:,; ) 1.00 o 1990 IEE

10]144 IEEE PHOTONIS TKMHOLGY L-ErrERS. VOL 2. NO. 2. FEBRUARY !990
* wtcA OPC~ff FT tIU Bc
_0.6
g D
0 15 20 ___________________
Dcgr--of Phse Dis*.nion (a-b. units)
proer agl toachevebinaty phase onaly viodultdon.
*;,-,pC~r 0To itiv--stigaie the cffectiveness; of this binary phase correc-33j 0 tlon OS technique, a computer sitmulation was carried out. A set of
C;F 201levels of phase distortion were first generated- and their plane%we responses were computed by using an FET routine- The
1 0 .4 intensity and position of the focal peak at the Fourier planewere recorded as a function of the degree of phase distortion.
0 The lower curve in Fig. 3(a) shows that the peak intensitydecreases rapidly as the degree of phase distortion increases.
.Likewise. the location of the peaks also shift randomlyv as[0 5 :0 is 20 shown in Fig. 3(b). The binary phase correction scheme isDegree of Phase Disaotion; (arb. units) then employed. and the restored peak intensity is plotted in
(b) the upper curve of Fig. 3(a). It shows that the restored peakFig. 3 (a) Computer-siniulaed revilt for binary phase correcton of a pas intensity is improved up to 655KE of its original vAue even when
distorted surface. Each surface is made from a circular surface i radius =40 th inptfnioisudreeephecrupo. anlopixels) enclosed in a 216 x 256 imafre arm. A set of Gaussian distributed be seen in Fig- 3(b) that the binary phase correction schemephase angtle .-Alues (standard deviaio = zc in r' rad. unit wte first ener.
le crcuLar surface. Finally, a neigborhiood averaing filter is applied to
tin~ ~ ~ ~ ~ ~~~~~~~t ploeane~n thisrsone i h dgeeo haedsotoni eo
units t~hx ) I~. phase distortion of the sufc aial ~ tnaddipla Fi., 4 ) shw thefxpeiena s)C= ~etup ~ ) fo2)leetngtipetan would bereoe. Heethe binaryVi cret o p ertn g ha intl wh red tepresntse amplitue ofpaedhn therfen e aesdrb-t
N1256(X~xi wher 6x s thew-dduofd soel i threenl at ter fo d sp tr eak iesivcn becoddo
Conceptually, this .iequivale toadintoraioerof phe tosla the CCD caer . hu) th pefomac of he hase corr-)raeio woul the remoivte Haweedirti si the rtnd ion fucinanbeltdasaucioofheoalptfourthseuaodunttiand aodehasentonthe regiontiftth phase isl in henei BC represti the ltrsdlee of therne wiaeiatiothes second 7and) thr uar. Athoughoperf phase corcin proes usinghisouc on-the aon l.op SichetRe thepunstion cao be acs hieed phnasie fistotion ofien dily optimumx y-aceqialn. h binary phase corrcin ucio a bcba-~dI~~~~to panelio after. cor)to isn cobie obtine froe rMri. Y)o w~th ao' v
-v2 uchtha allpixl eemens o th LC mae cnst uc d sn that heientcan po ektn st colo bCT eodel d onwa
ie ntbtion s canto teahied pha e use.sTeodmenion of the display ppiu iaypaecorcinfnto an are 0 m :d6Iae fe orcini ofne oi; ~go rm-r2t

102i Me - CLOSED-LOOP StARY PHASa COaZI--E&- OF L"CTV 1')
(a)
(b)
- (d)
Fit. 6- i) A b== - Piur=-Fon -mrr !a cn obou-sc1Luncr pi"w w. a JT C hosic i .tte - . lb! Tim EClu-swe' og rm-~'e theav- powusrmr i n~- ia. 2nd the h-a2V corecoon
funo in Re Ni. to Corre-mo amut (a)n ais displayed im- U14LCT. Th -s a; On cemer aot the Wanrjon %&hik the two p or.
thx sides wr the r ~unes- fu& Curx'catwn 47UwM wh~en (bi -sdispa-cd cof Uh LCT1 "
(C)C(C)ecun (binarized joint transform power spectrum is shown in Fig.-.zw of thc -aso du --d LCTV - . . 6(a). while Fig. 6(b) shovs the Exclusive oR result t-tween
- c.r. e .-.n. the spectrum and the phase correction function. Fie. 6(c) and(d) shows the output correlation results before and after the
binary phase correction function is applied. Results are similarnm. te resolution is 238 pixols 442 pixaes. Theo those shown in Fig. 5: sharer correlation peas whos-e -
. ie -,tensities are about one-third higher than those without binarin Fig. was measured to be about 46- in this experiment set- phase correction are observed.tine. The aperture used in the point diffraction inierferometer The same phase correction principle can be applied to cor-
Thsas made by burning a pinhole p5 un on a appie transmit-oSi- rt the phase distortion of an opt-cal signai processing systemS tance film. Fig. ita} shews the optmum binary phase coffec- instead of the LCTV itself- The TV panel is used as a real-
ti on function thus generated. The focal spots recorded by C2f ts b time addressable binary phase filter solely for phase correctionbefore and after phase correctian are shown in Figs. 51b) and purposes. To illustrate this idea. -he LCTV display -as tr-lc). respectively. It can e seen that the phase compensation mersed into a home-made liauid gate. The nonuniform phase
produces a sharper plane wave response whose intensity is a- distortion of the LCTV was corrected by the index machingmost one-third higher than 'hat without phase compensation. oil. However. the undesirable cu.vature of the iuid ate's
A binary image f(x. y can also be written onto the binary optical window introduced an astigmatic aberration, whosephase corrected LCTV for image processing. In this case. interference pattern. obtained using the point diffraction inter-
I the final phase image displayed on the LCTV i- given by erometer, i shown in Fig. --a. The focal spot structures.fQX. -:hA(x. y). Since both oi these functions ar binary in recorded at the oroper focal a,an before and after binar"nature. the multiplicative operation can be rcpiac ., by an Ex- nhase correction b- the LCTV. are shown in Fie. 7b, and i.elusive OR operation which facilitates digital irt.;, ': ,ation. respectively. The proeramma.!e r.as filter * e. ne LCTV.To demonstrate that the binary phase correcte. 1 _7 v can be effectively removed and a sharp fo~ai spot wasused in binary-input image processing ,pp,,,i '-. a bnarv observed at the correct focal pmanephase only joint transform correlation 191 exp-....per-
3 formed. An LCTV (immersed in a 1ud gNc & .. .sed at
the :nut plane to display two idcni-:a nonbir. v ,;mnItude C,"cimodulated input imag ,. and a CCD camera :a p* :ed at Binary phase correction or an LCTV usin4 a point dtffrac-the Fourier plane to :cord the joint transform "v spec ton interferometer has been demonstrated. The use of a pointtrum- The power s, ,rum thus obtained was .'-er. narized diffraction intererometer offers ine.--mpiicitt ahd advantagesby usng a microcnm-M *r and displayeti on ! r -tr phase of a common-path iitericrome-er for cxamining the phase
corrected LCTV i,.. ac second Fourier transfunmation. The nonunifotmim of the I.CTV. %,hd!e the on-line and closed-

- 146 IEEE PIIOTO-MCS TECHNOLOGi LEflERIS. 'VOL 2. \O 2. FERUARY10
*CIi,7 a iw wuaN~mfra SV~ bnwq~
syIIb 1f -m Ofeo h xrxdvmmb=Wr
5phg 7 asece~m () flifyeorcco ewci
ioOP architecture is capable of generating the optimum Phase 3I F. T. S. Y%; &.ltrja and X L Hung. Eomajap--COrrteCtOI finction. Bth computer simulations and exper- of low-Cam IlOld cryswa f10 toWae-lIdw COP=2g izzwJ PCOCCSSvg- A pptt4 O E . a t;O 25 . p am 33 433 6. 195.3 imenral results demonstrate the effectivness of the binkary ;1f 1. A, Dzma. Rt. A- Rlly. K. D, feta. and It. Liu. ~pbtPhase corrction scheme. The results obtained from the bipo- of dhe I*-- :rysnal releisim for opocvai data p tsing.. Sonimnelar Phase only joint transform correlation reveal the t'ecasibiliw Optics --- ApPIr-non.r Arm SPIE. -ol- 613. pp. 245-254. 1986-m5
- 0 Cacm and S_ F Xia. ~Pzecarect" Wf I1%t*of this phase corretion technique in actual applications. Men- oy, La,_ %r 4. pp~3530 96mtioc must be made that this binary phase correction scem 61.?.SVi SW.anA' l'e.Apasmo$scc-can be used to compensate for the phase distortion of a gen- nit wO a )MMn IArMmm WioC. Opt. Cornrnvn.- -A. 761. pp-
erloptical signal processing stem. Other phae 6dua-60. 11989, .w. dSi.Jog1'asinft real-time adrsalWN;wihava ek contrast correction of a 4mnai 1;' n ciso a 1n
rato nda arerspace-bandwidth pout uha h a-4netooptic SLM's -8 01 or liquid crystal liht 52%C 1.rm w Amer- t-W. 62.p -73-7 *!172,be employed to produce even better results. . -. F_ T. S. Ts and T_ Naxa. uBaz yhs cvjm-f
taor:. Miro- opt. Ttrh.. tenar- pp .5w 91REFErRENCES O1 D. Psiffis. E G. pwk a:w S_ S V'etb-sh. -Opm- n4; uC-ma~ w-.ili a bm.arv My spa n omihe w . Op Q ~n-t. w~.H.Kll.JA Dats ani ft A- Uliv. tO- we ..aL cssmg 60$-7aW aNU. Wprocam o4 a hi-u-4crn. tetvnmnr VpilN& it UAM OW & . A ) . I eW.. -. q V A Da-sGM*.~t . P A. Ilt D.=I Coi 1. zl:x'M_
D2i A. Gc-r .Realtime oanri recognituen us-ne a mmeneP-d NC only fihters oszg die Huehea lu ry .szalij-sk {cpit g£crist'iiei -& -- a .coerm ooucal correlaor. -lApp:, Opt. wl 26 M 929-933. i9g5R5 p41-0 q6

I
APPENDIX 10.13
Ii Image Classification
Ii
I
III
II
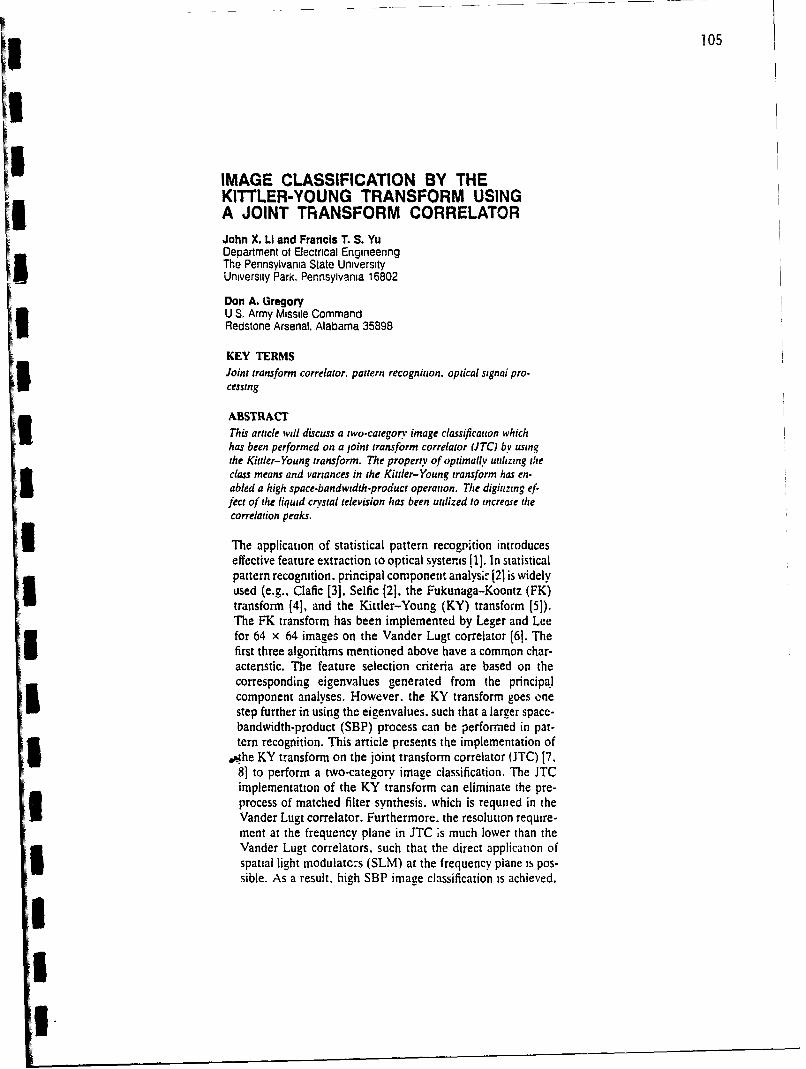
105
IMAGE CLASSIFICATION BY THEKITTLER-YOUNG TRANSFORM USINGA JOINT TRANSFORM CORRELATORJohn X. Li and Francis T. S. YuDepartment of Electrical EngineeringThe Pennsylvania State UniversityUniversity Park, Pennsylvania 16802
Don A. GregoryU S, Army Missile CommandI Redstone Arsenal, Alabama 35898
KEY TERMS
Joint transform correlator. pattern recognition, optical signal pro.cessing
ABSTRACTThis article will discuss a two-category image classification whichhas been performed on a joint transform correlator (JTC) by usingthe Kittler-Young transform. The property of oprimally utilizing theclass means and variances in the Kittler-Young transform has en-abled a high space-bandwidth-product operation. The digitizing ef-fect of the liquid crystal television has been utilized to increase the
correlation peaks.
iI The application of statistical pattern recognition introduceseffective feature extraction to optical systems [1]. In statisticalpattern recognition. principal component analysif 121 is widelyused (e.g., Clafic [3], Selfic (2], the Fukunaga-Koontz (FK)transform [4], and the Kittler-Young (KY) transform (5]).The FK transform has been implemented by Leger and Leefor 64 x 64 images on the Vander Lugt correlator [61. The
II first three algorithms mentioned above have a common char-actenstic. The feature selection criteria are based on thecorresponding eigenvalues generated from the principalcomponent analyses. However. the KY transform goes onestep further in using the eigenvalues. such that a larger space-bandwidth-product (SBP) process can be performed in pat-tern recognition. This article presents the implementation ofI .he KY transform on the joint transform correlator JTC) [7.81 to perform a two-category image classification. The JTCimplementation of the KY transform can eliminate the pre-process of matched filter synthesis, which is requited in theVander Lugt correlator. Furthermore. the resolution require-ment at the frequency plane in JTC is much lower than theVander Lugt correlators. such that the direct application ofspatial light modulatCs (SLM) at the frequency plane is pos-sible. As a result. high SBP image classification is achieved.
U!I,U
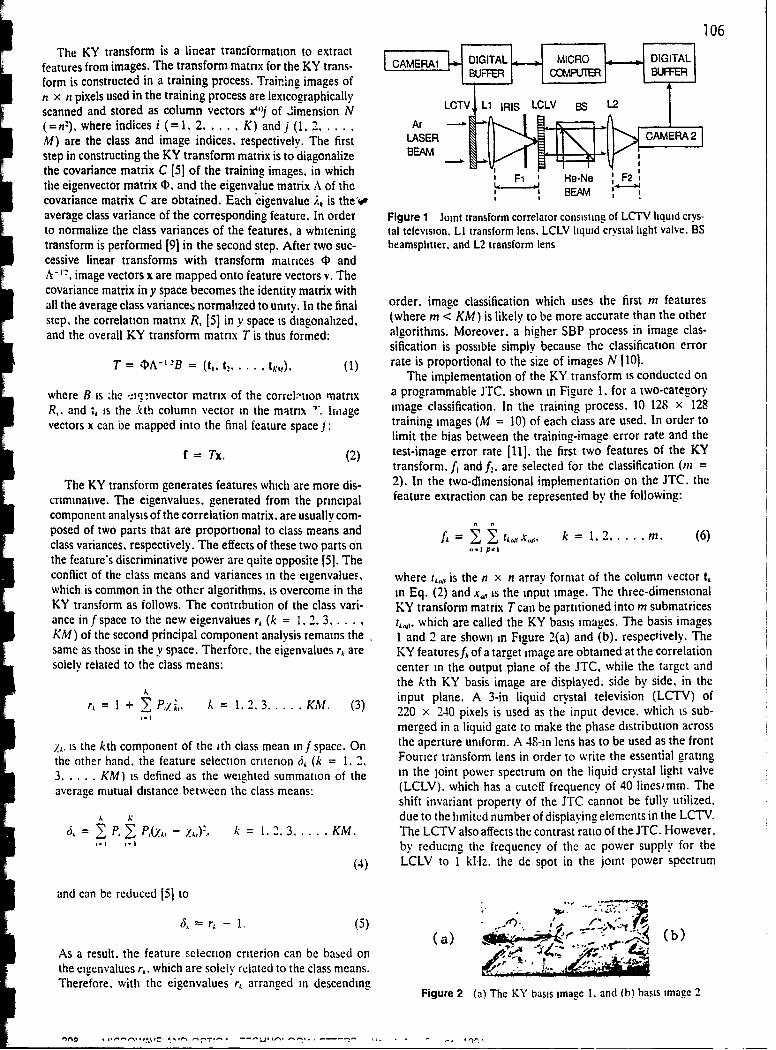
106The KY transform is a linear transformation to extract
features from images. The transform matnx for the KY trans- CAMERA1 DIGITAL MICRO DIGITAL
form is constructed in a training process. Training images of B CMT BUFER
n x n pixels used in the training process are lexicographically Lscanned and stored as column vectors x" 'j of dimension N LCTV L1 IRIS LCLV B L2
(=n2), where indices i (= 1. 2 .... K) and j (1.2 ..... ArM) are the class and image indices, respectively. The first LASER CAMER2
step in constructing the KY transform matrix is to diaeonalize BEAMthe covariance matrix C 15] of the training images. in which I F1 ' He-No ' F2the eigenvector matrix ql, and the eigenvalue matrix A of the ,-covariance matrix C are obtained. Each eigenvalue ;, is the40 'EA
average class variance of the corresponding feature. In order Figure 1 Joint transform correlator consisting of LCTV liquid crys-to normalize the class variances of the features, a whitening tal television. Ll transform lens. LCLV liquid crystal light valve. BStransform is performed [9] in the second step. After two suc- beamsplitter. and L2 transform lenscessive linear transforms with transform matrices 4) andA- "2.image vectors x are mapped onto feature vectors v. Thecovariance matrix in y space becomes the identity matrix withall the average class variances normalized to unity. In the final order, image classification which uses the first rn featuresstep. the correlation matnx R, [51 in y space is diagonalized, (where m < KM) is likely to be more accurate than the otherand the overall KY transform matrix T is thus formed: algorithms. Moreover. a higher SBP process in image clas-
sification is possible simply because the classification error
T = 4t)A- I 2B = (t,. t ....... t.), rate is proportional to the size of images N 1101.The implementation of the KY transform is conducted on
where B is t.ie :izmvector matrix of the correltion matrix a programmable JTC. shown in Figure 1. for a two-categoryR,. and :, is the ,Zth column vector in the matrix ". Image image classification. In the training process. 10 128 x 128vectors x can be mapped into the final feature space J: training images (M = 10) of each class are used. In order to
limit the bias between the training-image error rate and thef = Tx. (2) test-image error rate 111]. the first two features of the KY
transform, f, and f2, are selected for the classification (rn =The KY transform generates features which are more dis- 2). In the two-dimensional implementation on the JTC. the
criminative. The eigenvalues. generated from the principal feature extraction can be represented by the following:component analysis of the correlation matrix, are usually com-posed of two parts that are proportional to class means and n 1(class variances, respectively. The effects of these two parts on
the feature's discriminative power are quite opposite 151. Theconflict of the class means and variances in the eigenvalues, where t,, is the n x n array format of the column vector t,which is common in the other algorithms, is overcome in the in Eq. (2) and x, is the input image. The three-dimensionalKY transform as follows. The contribution of the class vari- KY transform matrix T can be partitioned into m submatricesance in f space to the new eigenvalues r, (k = 1. 2. 3. ..... t, . which are called the KY basis images. The basis imagesKM) of the second principal component analysis remains the I and 2 are shown in Figure 2(a) and (b). respectively. Thesame as those in the v space. Therfore. the eigenvalues r, are KY featuresf, of a target image are obtained at the correlationsolely related to the class means: center in the output plane of the JTC, while the target and
the kth KY basis image are displayed. side by side. in the=1.2.3. KM. (3) input plane. A 3-in liquid crystal television (LCTV) of
,. A .2... K220 x 240 pixels is used as the input device, which is sub-
merged in a liquid gate to make the phase distribution acrossz,, is the kth component of the ith class mean in f space. On the aperture uniform. A 48-in lens has to be used as the frontthe other hand, the feature selection criterion 6 (k = 1., Fourier transform lens in order to write the essential grating3 .... KM) is defined as the weighted summation of the in the joint power spectrum on the liquid crystal light valve
average mutual distance between the class means: (LCLV). which has a cutoff frequency of 40 linesimm. Theshift invariant property of the JTC cannot be fully utilized,
;. ,due to the limited number of displaying elements in the LCTV.6, = P, P,(, - Z,,)', k = 1. 2.3 ..... KM. The LCTV also affects the contrast ratio of the JTC. However,
by reducing the frequency of the ac power supply for the(4) LCLV to I kHz. the dc spot in the joint power spectrum
and can be reduced 151 to
6, r, !. ~ ~~(5) () "".,:".(a' - "- " (b)
As a result. the feature selection criterion can be based on - ,, ,;$;, -the eienvalues r,. which are solelv related to the class means. _,_.-_.-- ____- _____ _____
Therefore. with the eigenvalues r, arranged in descending Figure 2 (a) The KY basis imagc . and (b) basis image 2
Fiue2()Th Ybssiag .ad() ai mg

diminishes so that the light leakage through the space between monochromatic and partial coherent can be employed in read- 107the electrodes is blocked at the frequency plane. Therefore. out to reduce the coherent noise.a contrast ratio of 30 : 1 is achieved in the JTC. The addressing The two KY features. f, and f2, are extracted from a targetand relaxation times of the JTC are 80 and 70 ms, respectively, image in two separate joint transform correlation operations.of which the LCLV contributes a major part. A television The same process is repeated 32 times to generate the twoframe rate (30 frames/sec) operation can be achieved by re- KY features for all 32 images (20 of which are sample images.placing the CdS LCLV with the Si LCLV [121. and 12 of which are test images). The KY features of all the
Increased cross-correlations are obtained in the output images are plotted in Figure 4. A solution linear classifier isplane by taking advantage of the digitizing effect of the LCTV. obtained by using the gradient descent method [131 and isDue to the digitization of the input image by the LCTV, the also plotted in Figure 4. The results show that there is nojoint power spectrum takes a lattice form, where each dot in error in the two-category classification of the 32 128 x 128the lattice carries the same information content, The cross images. Also, the image classification by the KY transformcorrelation between a target and a KY basis image in the can be easily extended to multicategory cases.output plane is given by
REFERENCESo(x. y) = {ft(x. y) 0 b(x. y)] * 6(x - 2Ax. y)} I. Q. Tian. Y. Fainman. and Sing H. Lee. J. Opt. Soc. Am.. Vol.
5, 1988. pp. 1670-1682.x exp[-i2r(m'xis, + n'yls,)], (7) 2. S. Watanobe. Proc. 4th Prague Conf. on Information Theorv.
'I j 1965.3. S. Watanobe et at., Computers and Information Sciences. Aca-
where the symbols ® and * denote the two-dimensional cor- demic . New York. 1967. Vol. 2.4 K. Fukunaga and W L. G. Koontz. IEEE Trans. Comput.. Vol.
relation and convolution operation. respectively; i(x. y) and C -9.17.p.3-38• C-19. 1970. pp. 311-318.* b(x. y) represent the target and the KY basis image, respec- 5. Josef Kittler and Peter C. Young. Pattern Recognition. Vol. 5.
tively: s, and s, are the sampling periods of the LCTV in the 1973. pp. 335-352.x and v directions: 2Ax is the separation between the two 6. 1. R. Leger and S. H. Lee. J. Opt. Soc. Am.. Vol. 72. 1982. pp.images: ;. is the wavelength of the readout coherent light: and 556-564.f is the focal length of the lens L2. By properly adjusting the 7. F. T. S. Yu and J. E. Ludman. "Joint Fourier Transform Pro-iris in front of the LCLV. the magnitude of the extra phase cessor." Microwave Opt. Technol. Lett.. Vol. 1. 1988. p. 374.term in Eq. (7) may exceed unity such that substantially in- 8. F. T. S. Yu and X. J. Lu. "A Real-Time Programmable Jointcreased correlation peaks can be obtained. An example of Transforrm Correlator." Opt. Commun.. Vol. 52. 1984. p. 10.the correlation output is shown i Figure 3. where zero-order 9 K. Fukunaga. Introduction to Statsttcal Pattern Recognition, Ac-dithfcrlation outputdc) is showntiny Figue. whreero-ord- ademic. New York. 1972diffraction (i.e.. dc) is partially blocked. Moreover, a quasi- 10. 0. Tian. M. Barbero. Zu-han Gu. and Sing H. Lee. Opt. Eng.,
Vol. 25. 1986. pp. 834-840.11. Donald H. Foley, IEEE Trans. Inf. Theory. Vol. IT-18. 1972.
pp. 618-626.12. Keyvan Sayah. Murray S. Welkowsky. Philip G. Reif. and Nor-
I man W. Goodwin. Appl. Opt.. Vol. 28. 1989. pp. 4748-4756.13. Richard 0. Duda and Peter E. Hart, Pattern Classification and
" -I Scene Analysis. Wiley. New York. 1973.
Received 12-2190
Microwave and Optical Technology Letters. 4/5. 207-209Figure 3 Optical correlation output showing two correlation spots D 1991 John Wiley & Sons. Inc.I (marked with arrows) and the partially blocked dc spot in the middle CCC 0895-2477191/050207-03S04.00
200-
46 Sample Bird/ Test Bird180- Tet u
0j 0 Sample Fish0 o 419 Test Fish
0
10U 1 1
1 / A
T NU75 o0 G 25 50 75 2225 250 25
Figure 4 [mace cl.aNification in the Kittler-Young feature %pacc

1 108
II3 APPENDIX 10.14
I IPA Neural Network
II33I1UIIII£I
U

I 109
mReprinted from Applied Optics
3 Neural network model using interpattern association
I Taiwei Lu, Xin Xu, Sudong Wu, and Francis T. S. Yu
m This paper investigates a neural network model-interpattern association (IPA) model-in which the basiclogical operations are used to determine the interpattern association (i.e., association between the referencepatterns), and simple logical rules are applied to construct tristate interconnections in the network. Comput-er simulations for the reconstruction of similar English letters embedded in the random noise by the IPAmodel have shown improved performance compared with the Hopfield modeL A 2-D hybrid optical neuralnetwork is used to demonstrate the usefulness of the IPA model. Since there are only three gray levels used inthe interconnection weight matrix for the IPA model, the dynamic range imposed on a spatial light modulatoris rather relaxed, and the interconnections are much simpler than the Hopfield model.
II. Introduction among the reference patterns by applying a logical
Neural networks have shown effectiveness in pat- operation. Two equivalent logical rules are presented
tern recognition.'- For recognition of a given set of in Sec. H1 to construct the excitatory and inhibitory
reference patterns, there are two schemes to construct interconnections in the network. In Sec. III, the IPA
the associative memory matrix (i.e., interconnection model is compared with the Hopfield modeL Com-
weight matrix). The first is the so-called intrapattern puter simulations for the reconstruction of similar En-
association, which emphasizes the association of ele- glish letters in the random noise have shown that the
ments within each reference pattern. For example, in IPA model performs better than the Hopfield model.
the Hopfield model, the outer products of the refer- In Sec. IV, a 2-D hybrid optical neural network is used
ence patterns are added to form the interconnection to implement this new model. The experimental re-
weight matrix. This type of approach may create an sults show that the IPA model indeed performs more
unstable or ill-conditioned network if the reference effectively than the Hopfield model.
patterns are not independent of each other. The sec- 11. Interpattem Association Modelond schems is an interpattern association (IPA) forwhich the Interc.nnection weight matrix is construct- The IPA is important in the construction of the
ed by 2mphasizifg the association between reference associative memory matrix. The information ob-
patterns. Where thn reference patterns are similar to tained from tpecial areas (i.e., areas occupied by one
each other (e.g., huniatn faces, fingerprints, handwrit- pattern) is important than from common or over-
ten character;), the speriai feietures of each pattern lapped areas.
become very important in pid.terni recognition. Figure 1 shows an example of a reference set that
Therefore, it i necessary to consider the relstionships consists of three overlapping patterns A, B, and C in
between the special and common features among the the pattern space. These patterns can be divided intorc furence patterns in construLtin1 the interconnection seven suubp-ces. I, I, and III are the special areas of
weight matrix, patterns A, B, an. C, respectively. IV, V, and VrI pre
We present a neural network model based o.r, ': the common areas of A and B: B and C, C and A,
association between reference patterns. This model respectively. VII is the common area of A, B, and C.first determines the common and special features The rest can be defined as an empty space t. These
areas can be expressed by the following logic functions:
I= A A (Y v-C),II =B A (TV- C), v-= (B A C) A ;i,
TheauthorsP.-.withPennsvlvaniaStateUniversity, Department lII = C A (17 B), VI = (C A A) A 3,
of Electrical Engineering, University Park, Pennsylvania 16802. IV (A A B) A , VII (A A B A C) A ;, (1)Received 29 March 1989.0003-6935'90/020284.0502.00/0. where A, v, and - stand for the logic AND, OR, and'© 1990 Optial .Society of America. NOT operations, respectively.
2bi. APPLAUD OP'TICS / V0l. 20, r4.1 / !0 Janun rv 1990II _
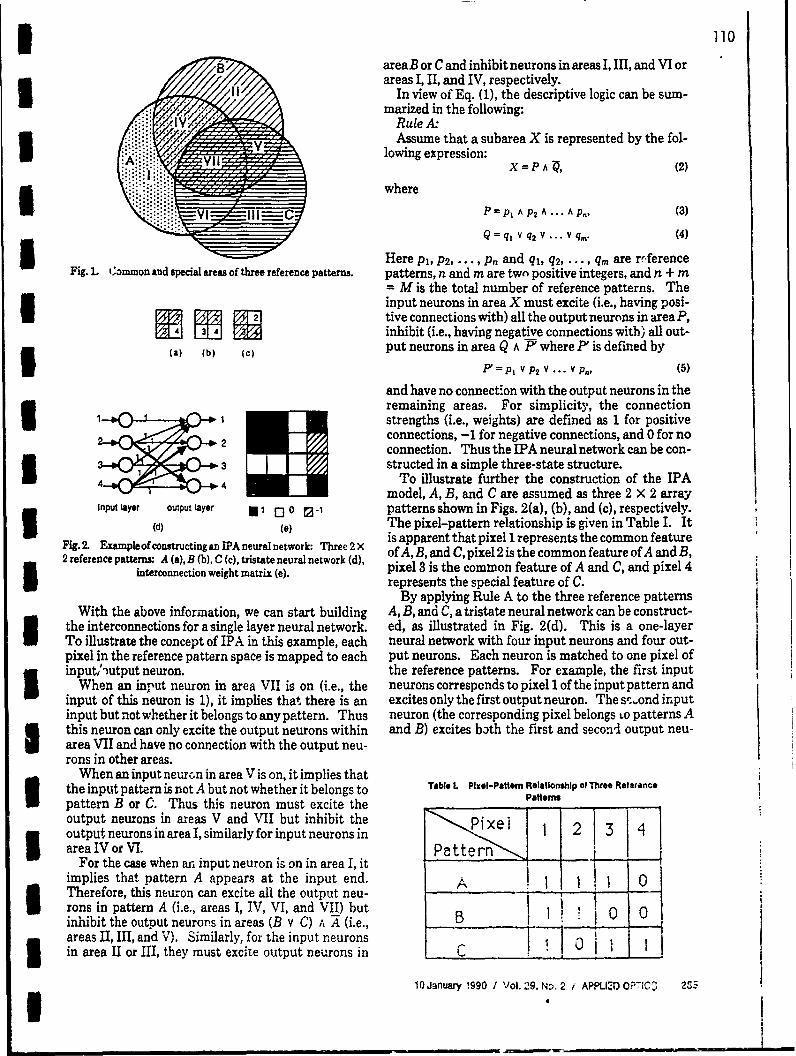
3 110
areaB or C and inhibit neurons in areas I, Il, and VI orareas I, II, and IV, respectively.
In view of Eq. (1), the descriptive logic can be sum-marized in the following:
Rule A:Assume that a subarea X is represented by the fol-
lowing expression:x = P AJ , (2)
where
Q=ql v q2 v ... v q,. (4)
Here pi, P2, ... , pn and q,, q2 -.... q,, are r-ferenceFig. 1t..3mmon and special areas of three reference patterns, patterns, n and m are twn positive integers, and n + m
= M is the total number of reference patterns. Theinput neurons in area X must excite (i.e., having posi-tive connections with) all the output neurons in area P,inhibit (i.e., having negative connections with) all out-
(a) (b) (C) put neurons in area Q A P where P' is defined by
P'= p, v P2 V... vp , (5)
and have no connection with the output neurons in theremaining areas. For simplicity, the connection
1 strengths (i.e., weights) are defined as 1 for positiveconnections, -1 for negative connections, and 0 for noconnection. Thus the ]PA neural network can be con-
3 structed in a simple three-state structure.To illustrate further the construction of the IPA
model, A, B, and C are assumed as three 2 X 2 arrayInput layer Output layer 1[] 0 -1 patterns shown in Figs. 2(a), (b), and (c), respectively.
() ()The pixel-pattern relationship is given in Table I. Itis ppren tatpixel 1 represents the common featureFig. 2. Example of constructing an IPA neural network: Three2x s , a nd C, pixel 2 is the common feature of A andB,2 reference patterns: A (a), B (b), I (c), tristate neural network (d), px A is the common feature of A and p
interconnection weight matrix (e). pixel 3 is the common feature of A and C, and pixel 4represents the special feature of C.
By applying Rule A to the three reference patternsWith the above information, we can start building A, B, and C, a tristate neural network can be construct-3 the interconnections for a single layer neural network. ed, as illustrated in Fig. 2(d). This is a one-layer
To illustrate the concept of IPA in this example, each neural network with four input neurons and four out-pixel in the reference pattern space is mapped to each put neurons. Each neuron is matched to one pixel ofinput,utput neuron. the reference patterns. For example, the first input
When an input neuron in area VII is on (i.e., the neurons corresponds to pixel 1 of the input pattern andinput of this neuron is 1), it implies that there is an excites only the first output neuron. The s'..ond inputinput but not whether it belongs to any pattern. Thus neuron (the corresponding pixel belongs to patterns Athis neuron can only excite the output neurons within and B) excites bath the first and second output neu-area VII and have no connection with the output neu-rons in other areas.
When an input neuron in area V is on, it implies thatthe input pattern is not A but not whether it belongs to Tble L PIxel-Pattern Relationship af Three Referencepattern B or C. Thus this neuron must excite the Par, -
output neurons in areas V and VII but inhibit the Pixeli output neurons in area I, similarly for input neurons in 3
area IV of Vi PFor the case when an input neuron is on in area I, it
implies that pattern A appears at the input end. A 1 1Therefore, this neuron can excite all the output neu-rons in pattern A (i.e., areas I, IV, VI, and VII) butinhibit the output neurons in areas (B v C) A 4 (i.e., _ _ _ .areas II, III, and V). Similarly, for the input neurons 1 jin area II or III, they must excite output neurons in C , . 1 1
t0 January !990 1Vol. 29, No,. 2 1 APPFLIED: OP7I:C3 285i

rons, while inhibiting the fourth output neuron, which Jf. Comparison with the Hopfleld Modelbelongs to the special area of pattern C. Tt is the differences rather than the similarities
It is interesting to analyze the structure of the IWM. among patterns that are used for pattern recognition.Sin'e the reference patterns are in 2-D form, the For example, the outline of the eyes, nose, and mouthweight matrix becomes a 4-D matrix. We can patti- are common features in all human faces. People distin-tion the 4-D IWM into a 2-D submatrix array,5 as guish different persons by the differences rather thar.illustrated in Fig. 2(e). The IWM can be divided into the detail in the faces.four blocks. Each block corresponds to one output Similar to some other neural network algorithms,
neuron. The four elements in one block represent the the Hopfield model constructs the IWM by correlatingfour neurons in the input end. For example, since all the elements within each pattern, however, ignoi-ngfour ;alem ents in the upper left block have a value of L, the relationships among the reference patterns. Theit indicates that either one of the four input neurons IWM T of the Hopfield model for three referencecan excite the first output neuron. In the upper right patterns A, B, and C can generally be expressed asblock, as another example, the first and third elementsare 0, the second element has a value of 1, and the T= AAT+ BBT + CCT- 31, (8)fourth elemenz is -1. From this example we can de- where T is the transpose of the vectors and I is the unittermine that bhe first and third input neurons have no matrix, which makes the weight matrix zero diagonal.connectior to the second output neuron, the second If input pattern A is applied ta the neural system,input neuron excites the second output neuron, and the output would bethe fourth input neuron inhibits the second outputneuron. V = TA
To simplify the algebraic operations, an equivalent . A(ATA) + B(BTA) + C(CTA) - 3A, (9)rule, Rule B, is developed as follows. It can be used toconstruct the IWM by examining the pixl-pattern where ATA represents the auto.orrelation of patternrelationships. A, while BTA and CTA are the respective cross-correla-Rule B- tion between A and B, and A and C. If the differencesLet us define D1, as a 2-D matrix that corresponds to between A, B and C are sufficiently large, the autocor-
the 2-D array in Table I, where I and i denote the row relatior. of A, B or C would be much larger than theand column numbers. Let d; be the number of pat- cross-correlation between them, i.e.,terns that are bright (i.e., in state 1) at the ith pixel. ATA >> BTA, ATA >> CrA. (10)then it can be determined by summaing the elements inthe ith column of Table I, i.e., Notice that from Eq. (9) pattern A has a larger weight-
M ing factor than patterns B and C, for which patterns Bdi D,,. (6) and C can be considered noise. By choosing the prop-
-er threshold value, pattern A will be constructed at theLet us also define kg,: output end of the neural network.
On the other hand, if A, B, and C ara very similar, Eq.M (10) no longer holds; since the weights of patterns B
and C are comparable with those of A, patterns B and Ccan no longer be considered noise. Thus the threshold
which is the sum of the product of columns i and j in value for the Hopfield model cannot be easily defined;
Table I. Ther. we can construct an IPA neural net- the Hopfield mode thus becomes unstable.work by app ing the following logical rules: Computer simulations of a 2-D neural network with
8 X 8 array neurons at the input and output ends have(1) If kij = min (di,dj), been conducted for both Hopfield and IPA models.
when di < dj, pixel i must excite pixel j, but pixel j The reference patterns considered are the twenty-sixmust not excite pixel i; capital English letters I; . ., :-- squence based on
when di = di, pixels i and] must excite eacn ocher: the similarities of the . ,, ., jr,R,F, .. and eachwhen di > d,, pixel j must excite pixel i, but pixel i letter occupies an 8 X 6 array pixel.* us not excite~ "-~o j
m t- < < mm o; Figure 3 shows the error rates as a function of refer-9. IL 0 < kii < min (di,d,), pixels i and ] have no ence patterns for Hoc .ald and IPA models with noisy
connection to each other. inputs. The input SNR for computer simulation is - 7(3) If h'j = 0, dB. We notice that the Hopfield model becomes un-
when di 0, and d, F .), pixels i and j must inhibit stable when patterns B, P, and R are stored in theeach other; IWM, whereas the IPA model is quite stable with
when d, = 0 and/or d, = 0, pixels i and j must have no twelve stored letters. Comparison is also made forconnection to each other. noiseless input. In this cordition. the IPA model can
We stress that these rules for IWMs are simple and produce correct results for all twenty-six stored lettersstraightforward, which is suitable for computer cscu- in the IWM, whereas the Hopfield model starts makinglations. In fact, the IWMs computed by Rule B are significant errors w -p the number reference patternsequivalent to those obtained by Rule A. are increased ', S.
286 APPLIED OPTICS / Vol. 29. No. 2 / It ,iuary 190I

112
4. Video Monitor Lenilet Pl Fort* .;imaging Pi~to-eectric anDetector3L Le tns Array
Hopfield IPA
1 --
Number of refer, ice patterns
Input SNR =7oB otal pixel No. = 64
Fi. 3. Comparison of the IPA ind Hopfield models.
Fig. 4. Two-dir ,.-o ;-optical neural network,
*IV. Optical ImplementationThe 2-D and 3-D parallel pi m essing capabilities of
the optical system make it an important candidate inIsolving the complex interconnuctions of a neural net-
work.S,,8An optical neural network 6 ib used for implementing (a)
the IPA model. The optical at hitecture is illustratedIin Fig. 4. In this system, a high resolution video moni-tor is used to display the IWM, which also provides thesource of incoherent light for processing. This systemdiffers from the matrix-vector processor, as proposedby Farhat et al,5 in which the positions of the inputarray and weightirg matrix mask have been ex-changed. Notice that this arrangement makes it pos-sible to use a video monitor for I,, instead of a low (b) (C)resolution, low contrast SLM. A len let array consist-ing of N X N lenses is used to establish the optical
interconnections. A moderate sized programmableI SLM ofN X N binary pixels serves as the input device.The light beam emanating from each block of the TVscreen (i.e., submatrix of IWM) is passed through aspecific lens or the lenslet airay and is imaged onto theinput SLM. The beams passing the SLM are then (e)imaged onto the output plane by an imaging lens toform an N X N array output image which representsthe product ofa4-D IWM witha 2-D input arfay. Theoutput signals can be picked up by an N X N arrayphotodetector.
To construct a closed loop noural network, the out-Iput signals from the detector array are fed back to the
input SLM via a threshold circuit. By using the corn- () (g) (h)puter to calculate and modify the IWM, the optical Fig. 5. Experiments on ar optical neurocomputer. Three similar
newral network can be made both adaptive and pro- English haters as referpnce patterns (a), poitve and negative parts !grammable. of the IWMt of he IPA model (b) and (c) and the Hopfield model (d)
In experiments, Hopfield and IPA models are cho- and (eWiputpattern, SNR = 7dB (f); results of pattern recnsruc-sen to perform pattern recognition using noisy input tion by using IPA model (g) and Hopfieid model (h).
patterns. B, P, and R are three ie-:-rs store In .. eweight matrix as shown in F ., -"a). The positive andnegative parts of the 'W.is f,: the IPA model are IPA model requires only three gray levels to repreentshown in Figs. "~ and (c,. while those for the Hop- the IWM, whereas the Hopfield model needs 2M + Ifield model are disr-dy-d irn Figs. 5(d) and fe). By gray levels. v.'here M denotes the number of storedcomaring these two IWM sets it can seen that the reference patterns.
IPA modei has two major advana.aes over the Hop- The experimental results of these two models areU field model, namely, (1) '.-e r intercornections and (2) cbtained based on an input pattern B embedded infewer gray levels. T.-- !arter is significant because the 30% random noise (SNR = 7 dB), as shown in Fig. 5(f).
10 January 1990 / Vol. 29, No. 2 1 APPLIED OPTICS 287*

113
The output patterns of th~e IPA and Hopield models Referencesare shown in Figs. 5(g) and (h), respectively. Because I- D. E. Rumeihart and J. L Mi~lelland, Eds..Parallel Distributedof the curvature of the video monitor screen, the out- Processing: Explorations in the Al icrostrueture of Cognition,
put results are somewhat -distorted. Nevertheless, the Vols. 1 and 2 (MIT Press, Cambridge. 1986).results from the IPA model have been shown to be 2. T. Kohonen. Self-Organization and Associative Memory
bettr tan hos frm th Hofied mdeL(Springer-Verlag. Berlin, 1984).bettr tan hosefro th Hopiel moel.3. K. Fukushima. "A Neural Network for Visual Pattern Recognxi-
tion," Computer 21, No. 3,6&-75 (1988).V. Cnch~ws4. G. A. Carpenter, and S. Grossbcrg, "A Massi' ny Parallel Archi-
We have proposed a new model-an IPA neural tecture for a Self-Organizing Neu-at Patte' a Recognition Ma-network. By using a simple logical rule, the common _.hine," Comput. Vision Graphics Image Pocess. 37, 54-115and special features of the reference patterns can be (1987).obtained, and the positive or negative interconnec- 5. N. H. Farhat, and D. Psaltis. "Optical Implementation of Asbk'-
tions can be assigned to each neuron. The IWM can be ciative Memory Based on Models of Neural Networks," Opticaleasily formulate", which requires merely an SLM with Signal Processing,J. L. Homer. Ed. (Academic, New York, 1987),
pp. 129-162.three gray levels to realize the IWM. Computer simu- a. T. Lu, S. WVu, X. Xu, and F. T. S. Yu, 'Two-Dimtensional Pro-lations and experiments reveal that the IPA moe s gramnmable Optical Neural Network," Appl. OpL 28, 4908-4913more effective in performing pattern recognition (11989).(among similar patterns) than the Laudels that deal 7. j. J. Hopield "Neural Network and Physical System with Emer-only with the intrapattern association. gent Collective Computational Abilities," Proc. Natl. Acad. Sci.
USA 79,2554-2558 (1982).We acknowledge the support by U.S. Army Missile 8. R. A. Athale. H. H. Ezu, and C. B. Friedlander, "Optical Imople-
Command through the U.S. Army Research Office mentation of Associative Memory with Controlled Nonlinearityunder contract DAALO3-87-K-0147. in the Correlation Domain." Opt. Lett. 11, 482-48.(1986).
288 APPLIED OPTIS Vol. 29, No. 2 I10 January 1990

114
IUI
APPENDIX 10.15
ILCTV Neural N&workI
IIIIII
IIIIII

a reprint from Optics Letters 11
Optical neural network with pocket-sized liquid-crystaltelevisions
Francis T. S. Yu, Taiwei Lu, and Xiangyang Yang3 Department of Electrical Engineering, The Pennsylvania State University. University Park. Pennsylvania 16802
Don A. Gregory3 U.S. Army Missile Comrs'ind. Redstone Arsenal. Alabama 35898
Received February 2.1990: accepted May 9. 1990
A compact optical neural network that uses high-resolution liquid-crystal televisions has been constructed. Systemdesign considerations and an experimental demonstration of the liquid-crystal television neural network arereported.
Two of the most important features of an artificial As an example, if the neurons operate in bipolarneural network must be the possibility of massive in- states, f can be described asterconnections and parallel-processing operations.1 ,2 IRecently, the use of optical techniques to perform the f(x) = 1 )tmassive interconnection in a two-dimensional optical 1 <t' (2)neural network was suggested by Farhat and Psaltis,3 where t is the thresholding value. Note that the func-for which they used the basic concept of a vector- tional operation of Eq. (1) is a nonlinear operator thatmatrix optical processor. To provide the network depends on the matrix-vector product, which can bewith self-organizing and learning capabili.ies, a high- expressed in a one-dimensional vector representation,resolution, large-dynamic-range, program .able spa- such astial light modulator is required for the interconnectionweight matrix (IWM) construction. However, cur- V(n + 1) = f[TV(n)], (3)rently available spatial light modulators have small where V is the state vector of the neurons and T is thespace-bandwidth products with limited gray levels, IWM, which is also called the associative memory ofmaking it difficult actually to build such an optical the neural network.neural network. T
We recently proposed an optical architecture using It is apparent that, for a two-dimensional N X NIvideo monitor as a programmable IWM for the im- neuron network, the iterative equation can be extend-a vieo onior s aprorammbleIWMfortheim- ed in the formplementation of optical neural networks.4 5 The reso-3 lution of the video monitor is approximately 1000 X v +1 N N 1000 pixels, and the dynamic range is approximately ulk(n + 1) = f| " Tlk,)v.:(n) (4)256 gray levels. In fact, an 8 X 8 neuron optical neuralnetwork was built recently in our laboratory. Howev-er, the physical size of a video monitor makes the where v A represents the state of the lkth neuron in ansystem large, and the curvature of the monitor screen N N space and Tt is a four-dimensional intercon-also poses some problems. To alleviate these two ma- nection weight matrix. Note that the matrix T can bejor problems, in this Letter we present a compact opti- partitioned into an array of two-dimensional subma-cal neural network using pocket-sized liquid-crystal trices T, 1.,, T1 ., TNif.. , in which each submatrix istelevisions (LCTV's). an N x Nsize.3.C Thus we see that a four-dimensional
Generally, an N-neuron network requires up to N2 associative memory matrix can be displayed as aninterconnections. As Hopfield suggested, the state of X N2 two-dimensional array representation (Fig. 1).each neuron may be expressed by the following itera- In recent developments of the LCTV, the imagingtive equation: quality has been reported to be close to that of the
commercially available high-resolution video moni-N [tors. For instance, the contrast ratio of a recent
v.(n + 1) = f V Tv,(n)' = 1, 2, -- N, (1) LCTV, with built-in thin-film transistors, can be high-1) =J11 er than 30:1, and the dynamic range is approximatelyLi1 -.z 16 gray levels, which can be continuously adjusted.-
The optical architecture that we are presenting in-where v, is the state of the ith neuron, n is for the nth cludes a Hitachi Model C5-LC1 5 in. (12.7-cm) coloriteration, T,, represents the connection strength be- LCTV that is used to display the IWM and a Seikotween the jth and the ith neurons, and f is a nonlinear Model LVD-202 2.7-in. (6.9-cm) color LCTV that isoperator of the neurons. used to display the input patterns. The resoJutions of
Al 1.Qq~f~fll ~nnlA n I onl 0,1;"-. "r A

back to the LCTV2 for a second iteration. Note thatthe data flow in the optical system is controlled pri-• . . marily by a microcomputer (PC). For instance, theIWM's and the input patterns can be written onto theLCTV1 and the LCTV2 through the PC, and the PCcan also make decisions based on the output results ofthe neural network. Thus the proposed LCTV opticalneural network is indeed a programmable and adap-tive neural network.
In the experimental setup of the compact opticalneural network, an 80-W xenon-arc lamp is used as thelight source. LCTV1 is used to display the IWM. An
Fig. 1. Partition of a four-dimensional inatrix Tl,s into an 8 X 8 lenslet array of plano-convex lenses (6-mm diam-array of two-dimensional submatrices T III, T1 2i,... TNNi,. eter, 72-mm focal length) sandwiched between two
optical flat glass plates is used to establish the opticalinterconnection between LCTV1 and LCTV2; LCTV2is used for input pattern generation. An imaging lens
LCI LCTV2 Photo. set (two identical plano-convex lenses of 100-mm di-!CcTW CTVt imaging Detector ameter and 125-mm focal length, sealed face to face in
L,gn Source Diffuser Lenslet Array Lens Array a mount, with an effective 70-mm focal length) is used
S.camera. This arrangement of plano-convex lenses has
Fig. 2. Schematic of the compact optical neural network. (a)
these LCTV's are 256 X 420 pixels and 220 X 330pixels, respectively.
A diagram of a compact LCTV optical neural net-work is shown in Fig. 2. A neural network with 8 X 8 -64 fully interconnected neurons was recently built inour laboratory, for which an 80-W xenon-arc lamp wasused as'the incoherent light source. In the presentinvestigation the Hitachi LCTV (LCTV1) is used for (b) (c)the generation of the IWM, which consists of an 8 X 8array of submatrices, with each submatrix having 8 X8 elements. This IWM is then displayed on a finediffuser immediately behind LCTV1, The SeikoLCTV (LCTV2) is used as an input device for thegeneration of the input patterns. The lenslet array, (d)which consists of 8 X 8 lonses, provides the intercon- (e)nections between the IWM and the input pattern.Each lens of the lenslet array images each of the IWMsubmatriceb onto the input LCTV2 to establish theproper interconnections. Thus we see that the inputmatrix (i.e., LCTV2) is superimposed onto and multi-plied (or interconnected) by all the IWM submatrices.This repreuents the connective part of Eq. (1), i.e., (I) (W)
N --. Fig. 3. Experimental results of the compact optical neuralZ "jfkhgjs ( n ) . network. (a) Four cartoon images, a tree, a dog, a house, and
-I J-1 an aircraft, used as reference patterns. (b) Positive and (c)negative parts of the IWM generated by using the interpat.
Iize output result from LCTV2 is then imaged onto a tern association model. (d) Input pattern embedded in 25%charge-coupled-device (CCD) array detector. The noise, and (e) its output result: a dog, obtained In onesignals collected by the CCD camera are then sent to a iteration. (f) Input pattern in 25% noise, and (g) Its outputthresholding circuit, and the final results can be fed' result.: a tree, obtained In one iteration.

August 1. 1990 / Vol. 15. No. 15 / OPTICS LETTER Is
the ability to correct lens distortion. At the end of the ;ire parts of the output results are captured by thesystem a Sony CCD camera (Model XC-77) is used as CCD camera, and the subtraction and thresho!dingan output array detector. operations are performed by the PC, for which the
The size of the optical neural network is approxi- output result is shown in Fig. 3(e). Thus a recogniz-mately 65cm X 12 cm X 12 cm. and the size of LCTV1 able dog is reconstructed with only one iteration inis approximately 12 cm. If a smaller LCTV is used for this experiment. Similarly, when a tree with 25%IWM generation (e.g., a 7-cm Epson color LCTV), noise was presented on LCTVI [Fig. 3(0], an outputthen the system size can be further reduced to approx- pattern of tree without any noise is obtained, as illus-imately 20 cm X 7 cm X 7 cm. In this case, the trated in Fig. 3(g). From this example, we can see thatdiameter of the lenses in a 16 X 20 lenslet array is the compact optical neural network is capable of per-within the submillimeter range, for which the lenslet forming pattern-recognition and image-reconstruc-
array can be synthesized by using binary optics" or tion operations.holographic techniques. In conclusion, we have shown that a compact optical
Since the LCTV1 has a resolution of 256 x 420 neural network that uses high-resolution LCTV's canpixels. a maximum number of 16 X 20 = 320 neurons be constructed. The processing speed of this neuralcan actually be built. The matrix-vector operations network can be as high as 3 X !06 interconnectionof the proposed optical neural network are performed operations per second, if a 16 X 20 leslet array is used.in parallel. The processing speed is limited by the To illustrate the performance of the LCTV opticalspeed of the LCTV's, which have an addressing speed neural network, an experimental result obtained withof 30 frames/sec. Thus the operational speed of the the interpretation association model is presented. Fi-proposed neural network with 8 X 8 neurons is approx- nally, we stress that low-cost, compact optical neuralimately 30(8 X 8) = 1.2 X 10⁵ interconnection opera- networks can indeed be built using inexpensivetions per second. However, for a 16 X 20 neural net- LCTV's.work the operational speed can be as high as 30(16 X We acknowledge the support of the U.S- Army Mis-20)2 = 3 X 10⁶ interconnection operations per second.
In experiments, we have used the Hopfield, orthogo- sile Command throgh the U.S. Army Research Officenal projection, and interpattern association4 modelsI for the generation of the ,IVIZ's. One of the interpatternassociation experimental demonstrations is shown in ReferencesFig. 3. Four cartoon images, a tree, a dog, a house, and L. McClelland, eds., Parallelan arcrftareuse asrefrene pttensandeac .D. E. Rumelhart and J.L.M leid d.,Paiean aircraft, are used as reference patterns, and each Distributed Processing: Explorations in the Micro-letter is displayed in an 8 X 8 pixel array matrix [Fig. structure of Cognition (MIT Press. Cambridge. Mass..3(a)]. We have used the interpattern association 1986) Vols. 1 and 2model (which is based on the association among the 2. J. J. Hopfield, Proc. Natl. Acad. Sci. USA 79,2554 (1982).reference patterns9) for the construction of the IWM. 3. N. H. Farhat and D. Psaltis. in Ootzcai Signal Processing.The positive and negative parts of the IWM generated J. L. Homer. ed. (Academic. Orlando. Fla.. 1987). p. 129.by the interpattern association model are shown in 4. S. Wu. T. Lu, X. Xu. and F. T. S. Yu. Microwave Opt.Figs. 3(b) and 3(c), respectively. There are, however, Technol. Lett. 2,252 (1989).ways to represent the negative values in the IWM. by 5. T. Lu. S. Wu, X. Xu. and F. T. S. Yu. Appi. Opt. 28,490-adding a bias into the IWM or by using an area-encod- (1989).ing method. However, for simplicity, the positive and 6. N. H. Farhat. D. Psaitis. A. Prata. and E. Faek. Appi. Opt.
negative parts of the IWM are sequentially displayed - 24, 1469 (1985).ngtepto the LC iWur experimentally donsis. . H. K. Liu and T. H. Chao. Appl. Opt. 28.4722( 1989).on the LCTV1 in our experimental demo8nstrations. . W. Veidkamp, in Digest of First Annual internationalAn input pattern, i.e., a dog embedded in 25% random Meeting on Neural Networks Pergamon. New York.noise, is presented on LCTV2 [Fig. 3(d)]. The input 1988).pattern is then multiplied by the submatrices of the 9. T. Lu. X. Xu. S. Wu. and F. T. S. Yu, Appl. Opt. 29. 284IWM. using the lenslet array. The positive and nega- (1990).
I

1 118
III APPENDIX 10.16
~LiII Noaconvent jonal JTC
IIIIIIIIIIIII

922 Reprinted from Optics Letters 119
Nonconventional joint-transform correlator
Francis T. S. Yu, Chenhua Zhang, and Yong ]in
Department of Electrical Engineering, The Pennsylvania State University, University Park, Pennsylvania 16802
5 Dan A. Gregory
U.S. Army Missile Command, Redstone Arsenal, Alabama 35898
Received December 27. 1988; accepted June 12. 1989A nonconventional joint-transform correlator (NJTC) is discussed. We show that the shift-invariant property of
the usual joint-transform arrangement can be preserved. The advantages of the NJTC are the efficient use of thelight source, the use of smaller transform lenses, higher cori-lation peaks, and a higher carrier fringe frequency.
5 A conventional joint-transform correlator' - 3 (JTC) of- Thus the allowable deviation from the focal lengthfers the advantages of the avoidance of normal should bematched-filter synthesis, a higher space-bandwidth 6 5 2Xf/b) 2. (6)
Ui product, a lower carrier frequency, a higher degree ofmodulation, and suitability for real-time implementa- Note that this result is known as the focal tolerance ortion. However, the conventional JTC also suffers sev- the focal depth of the optical system.4
eral major drawbacks, e.g., the inefficient use of illumi- One of the most important aspects of an opticalnation light, the requirement of a larger transform correlator must be the shift-invariant property of thelens, a more stringent spatial coherent requirement, Fourier transformation, from which the position of theand the overall small size of the joint-transform spec- object (i.e., the target) can be extracted. We nowtrum. In this Letter we describe an alternative ap- investigate the constraints in object translation underU proach that alleviates some of these limitations, the quasi-Fourier-transform regime. Consider the
The quasi-Fourier transformation of an optical sys- quasi-joint-Fourier-transform configuration of Fig. 3.tern as defined here is shown in Fig. 1. We assume A displacement of the object specLrum at the quasi-that the detection plane P2 is located a small distance 6 Fourier domain P2 is anticipated. Referring to theaway from the back focal plane of the transform lens. triangular configuration in Fig. 3, the amount of dis-With the usual Gaussian lens equation, the image of P2 placement along the vertical direction iscan be shown to be located at a distance
L = f 2/6 (1) faway from input plane P1. We now refer to the far- where d is the translation of the object.field (i.e., Fraunhofer) diffraction arrangement of Fig. To ensure good overlapping object and reference2. To achieve a Fourier diffraction pattern at plane spectra at the quasi-Fourier domain P2, the amount ofP2, it is required that AL' be sufficiently small com- displacement should be small compared with the sizepared with the illuminating wavelength X, i.e., of the main lobe of the object spectrum, i.e.,
AL' <5 X/4. (2) a <_ lf/2b. (8)In view of the similar right triangles of Fig. 2, L' can be If we simply substitute Eq. (7) into relation (8), theapproximated by amount of allowable object displaccment is
L' - (3) d 5 f2. (9)2AL' 2b3 where b is the size of the input object.
To obtain a Fourier diffraction pattern at the obser-vation screen, it is required that the inequality of rela- Monochromatic
* tion (2) hold. Thus the distance to the observation Plane Wave i" u I* screen should be -j U-. I a
L' ! b2/2,\. (4) PII
I It is apparent that, to achieve a quasi-Fourier trans-formation at P2 as depicted in Fq. (1), one should have
Fig. 1. Quasi-Fourier transformation. P' is the image ofL >9 2 L'. (5) p t. S
0146-9592/89/170922-03$2.00/0 9) 1989 Optical Society of America

Moocrmi September 1, 1989 / Vol. 14, No. 17 / OPTICS LETTERS 91P
Monochromatic where fmax is the upper spatial frequency content ofPlane Wave aL' the object and W = bfmax is the space-bandwidth
product of the object. Note that the incident angle atthe square-law detector, formed by the object and thereference beams, can be written as
b 0 c-arctan(b/am), (11)
w" 6 is the maximum focal depth of relation (6).By t.bstituting relation (6) and Eq. (10) into relation1 (11), the constraint of the incident angle is
L 0:5 arctan(2f/bW), (12)i twhere f is the focal length of the transform lens. b is the
Fig. 2. Fourier diffraction condition, size of the object, and W is the space-bandwidth prod-uct of the object. To have an idea of the magnitudes
oc finvolved, we assume that the focal length f = 500 mm,object function the object size b = 10 mm, and the space-bandwidthMonochromatic _ " b- product of the object W = 200; thus the incident angle
Plane Wave must be 0 < 270.b- We further note that the proposed nonconventional
----- 41 d T joint Fourier transformation may also be achievedat with a different arrangement, as shown in Fig. 5, in
P, P2 which we assume that the constraints of the focal
reference function Beam Splitter
Fig. 3. Quasi-joint-Fourier transformation, collmatedI ,aor LO°,Reference
Beam Splitter
Collim atedMirr 1Mror 2Laser Lightfence Object
Mirror 82 Ll f,4
0 s arctan(. Square-LawSquare-Law Deitector~Detector
Reference Fig. 5. Nonconventional quasi-joint-Fci:. r transform'.-o t beam f tion.object
beam G A
am B G G
3 Fig. 4. Nonconventional joint Fnurier transformation. Input Object Reference
To recapitulate, the separation between the object andthe reference functions should be within the con-straint of relation (9). Under this condition the obiectand reference spectra will be mostly overlapped, pro-ducing interferometric fringes (i.e.. the carrier fre-quency) such that the shift-invariant property can bepreserved.
We now describe the nonconventional joint-trans-3 form tec,'n;', ue as illustrated in Fig. 4. Let us assumethat 2a,. is Lhe size of the object spectrum, with am (b)written as
Fig.6. (a) Input object and reference function. (b) Output. = ffmA = fX W/b, (10) correlation spots.

924 OPTICS LETTERS / Vol. 14. No. 17 / September 1, 1989 121
A A Fig. 6(b). Two autocorrelation peaks, representingthe locations of the input character G, can be ob-served. Thus we see that the shift-invariant propertyof the NJTC is preserved. The incident angle for this
Input Object Reterence experiment was set at '-10.(a) To illustrate the results obtained using the quasi-
Fourier-transformation arrangement of Fig. 5, the in-f l Put object and reference function of Fig. 7(a) wereused. In this experiment three JTH's for 3 = 0, 6 = fl
m10 = 50 mm, and 6 = f/5 = 100 mm were recorded [Fig.7(b)]. Throughout the making of the set of holo-grams, the incident angle was maintaineC at 0 = 10*.
6-0 ." f/10-50mm o-f5-tO rnm Note that the scale of the joint power spectrum en-(larges as 3 increases. Again, by simple coherent illu-
(b) mination of the JTH's, their output correlation peaksFig. 7. (a) Input and reference objects. (b) Joint-trans- were obtained [Fig. 8(a)]. Photometer traces of the
m form holograms, corresponding correlation peaks are shown in Fig.8(b). From these results we see that the peak intensi-ty increases as 3 increases, while the size of the correla-tion spot decreases as 3 increases. This phenomenonis primarily due to the size of the joint-transform spec-trum, as seen in Fig. 7(b). Thus the proposed NJTChas the ability to improve the output signal-to-noiseratio and the accuracy of the signal detection.
6-0 5 110 - 50 6 -/5 - t0 mm Furthermore, with a larger incident angle 0, it is also(a) possible to increase the spatial carrier frequency 3f the
JTH. This would allow a larger separation between!3 , correlation spots away from the zeroth-order diffrac-
tion. However, higher spatial carrier fringes wouldimpose a higher resolution constraint on the square-law detector used.
:'\, A 'We have presented a NJTC technique that allevi-Y ates the inefficient use of the light source as in the, ,0-/ .__conventional JTC. We have shown that with a quasi-
Fourier arrangement the shift-invariant property of aNJTC can be maintained. The major advantages of
6 0 5 f/10 50 mm 6 f/5 = 100 mm the NJTC are the efficient use of incident light, the(b) use of smaller transform lenses, higher correlation
peaks, and a higher carrier fringe frequency.Fig. 8. (a) Output correlation spots. (b) Photometer Since a joint-transform processor5 can, in principle,traces of the output correlation peaks. process all the ..iformation that a conventional coher-
depth of relation (6) and the allowable incident angle ent optical processor can, we believeat the NJTCof relation (12) hold. These optical setups have the p0ee
advantage of producing a larger joint-transform spec-trum, for which a higher read-out correlation peak can We acknowledge the support of the U.S. Army Mis-be obtained. Furthermore, if the target displacement sile Command through the U.S. Army Research Officeis within the shift-invariant constraint of relation (9), under contract DAAL03-87-0147.the proposed nonconventional JTC (NJTC) can alsoextract the spatial location of the target. References
To illustrate the shift-invariant property of theNJTC, an input transparency with four English char- 1. C. S. Weaver and J. W. Goodman, Appl. Opt. 5, 1248acters and a reference letter [Fig. 6(a)] was used. The (1966).NJTC structure used in this experiment is shown in 2. F. T. S. Yu and X. J. Lu. Opt. Commun. 52, 10 (19'41.
Fig. 4. The joint-transform power spectrum was re- 3. D. A. Gregory, J. A. Loudin. and F. T. S. Yu, "Illumina-corded by a photographic transparency, which is tion dependence of the joint-transform correlatiim."
Appl. Opt. (to be published).called a joint-transform hologram (JTH). By simply 4. M. Born and E. Wolf. Principle of Optics, 2nd ed. (Perga-illuminating the recorded JTH with coherent light, mon. New York, 1964), p. 441.cross correlations of input characters with the refer- 5. F. T. S. Yu and J. E. Ludman. "Joint Fourier transformence letter can be viewed at the output plane shown in processor," Microwave Opt. Technol. Lett. 1,374 (i988).I
I

1 122
III
APPENDIX 10...?
KM.dti-T ~rg2t Tr&c-king
IUIII
IIIIII

-~ -.- -
Data assoviation mus~iipie target trackring using a phase-*mostly liqu~id crystal tele-visiont
Edc' C. Tarn, MEMBrh SPIE Abstract. Thiis -aper prscnttS a technique ot atsig data associatior. target5 Unive s~ty of North Carolina at uhariotta tracing in a rocttlin se ece via art aoaptiva jrxint transfatm corretator
Department of Prtysicz The massive d6Zz ;n the fi'led view can bo reduced to ; few correlationCharlune, North Corolina 282213 reaks. The average veloc-117 u! q targe during the tracking cycle is th~en
..rtined fromr thie location of the catrftlaticr pea". We have used a dataF'uncls T. S. Y*1i, FELLOW SPiF asaociation algorithm for the analysis of theSe r---rrelatiC;s signals, w-111Arts Tanorm, MEMBER SPIE which multiple targets can bre tracked. A -jhase nicstly LCTV is used inI ' Pnslvna tt Uie~iythe hvbrId; Joint transform corrulatioR av l and siMuitX t-ee's tlr ckingDepartment of Electr*,al Er ginaering of three targets is demonstrated.Univer-iiv Fiirk, Pr .nsylvanla 16802 Subject terms: optical patter roccgnition; tagat trackwFni, '~IOcrycstal televir. Ow,
04n . Groryjoint tranatt orm correlatars.
U.S. ArmV N!iosile Command Qatical Engineering 299j, 1774-! 127 1S,"tember !.9901Research DirectLorateRedstons Arsenal, Alabamas 35898-5248
I Richare'! . Juday, mvisMEn SPlENA15A Johnson Space CenterHouston, Texas 77058
I CONTENTS basis. Although parallel processing can be performed by an1. Introduction optical system, it is not feasible to build an optical system that2. Tracking algorithm performs precise decision making. The hybrid optical systemE 3. Data association that we propose uses a joint transform correlator to carry out the4. Diffraction efficiency and resolution correlation operation and a data association algorithm- for miii-5. Hybrid modulation property tiple target tracking.6. Experimental setup Target tracking with an optical correlator was first demon-
* 7. Demonstration strated by VanderLugt in 1974.1 Subsequently, real-time track-3 8. Conclusion ing using a VanderLugt correlator has been reported .2 .3 The10. Referncweens development of a joint transform correlator (JTC),4 on the other
10. cknoledgentshand, offers an alternative for target tracking.65 Simplicity. easier
1 . INTRODUCTION alignment, and the avoidance of matched filter synthesis are the* major advantages of using a JTC. It also has the capability to
One of the major advantages of optical signal processing is the adapt to new input scenes: in the proposed architecture, theU parallelism in handling high space-bandwidth signals. However, previous frame is used as a reference image to correlate withthe price paid is the complexity and stringent alignment of an th.e target in the current frame. Assuming that the processingoptical system. On the other hand, its digital counterpart offers cycle of the system is sufficiently short, then a target will lookflexibility and programmability, while sacrificing full parallel- mouch the same after a few sequential frames. and hence strong,I ism. In this paper, we describe a hybrid optical technique to correlation signals will be generated at the output plane. Thetackle a multitarget tracking problem. Let us assume that there position measurements of the correlation peaks can be interpretedare multiple targets whose dynamic states (e.- locations, ye- as the aver ,_ velocities of the targets within a tracking system.I locities, etc.) are to be evaluated in a motion se 1oeince. At every Based on these measurements, the dynamic states of the targetsframe a new scene is captured by an optical sensor. The space- can be updated c ince multiple correlation peaks are generatedbandwidth product in each frame is so high that it is extremely in a muitltitarget t~acking problem, a data association algorithmdifficult for an all electronic computer to process on a real-time can be employed :o associate each of the peaks to the correct
* paths of the targets' motion. It must be mentioned that the adap-* tive property of this system enables the tracking of targets under
Invited Paper PR-il 16recci,ced MarLh 2. I 9Q0 rcviscd mnanuscr;.ipt rc-c.vc:Apnl hnei rettosae adprpciedngtecus20. 1990. accepted for publication May l18. 14Mcac noiettosae adprpcieduigtecus,0 1990 Society of Photo-Optical Wnarumnentatmrn Eneincers. of their movement.
1l114 , OPTIC'AL ENGINEERING , September 1990 / Vol 249 No 9

D !ATA ASSOCIATION MULTIPLE TARGET TRACKING USING A PHASE-MOS fLY "_QUID CRYSTAL TELEVISION 124
In this paper we den-nstrate the use of a hybrid JTC based By translating the coordi',ate origin from the optical axis tooI the aforementioneoi technique of multiple target tracking. A (O.a). the correlation peaks .na: are generated from the sameliquid crystal television was used in our experiment, and the target in the k - I an- the k frame are then located atimplementatior of this Spatial light modulator (SLM) using phase- (Qxjkyv) in this new -.oordtnate system. If these correlationmostly modulation mode i; discussed in detail. To simplify the peaks are associate.; wi:h the proper target motions, then thesubject matter of this pape,, the problem -Af initial target acqui- locations of the targets -n the k frame are given bysition is not discussed here.
* 2. TRACKING ALGORITHM -= - - 4 ' - + bv7, n = toN. (4)
Let rfx,v). it = I to N. be the targets in an image sequence, Equation {4) sbn,' tha the new locations of the targets in theE each of which are moving independently. Two sequential scenes Equato car be da the ne locations n the resare displayed on the input plane of a JTC such that the previous k frame can be updated based on their locations in the previousfrframe nd the position measurements of the correlation peaks.
r,,p,. and lowe halves of the LCTV. respectively d The corre- It is apparent that the k and k + I frames can be sent to theimage function is given by input plan: in the next tracking cycle, so multiple targets can,pon. ing be tracked simultaneously on a near real-time basis.
I( N,'te that the position of the correlation peak in the new.- , . ,coordinate system represents the average velocity of a target
IV, /during the sainplin. 'nterval 8t, i.e..
~ v- .() 8x&i. * .(5)
:viere : the %eight of the active aperture of the L(.TV.* A- ;, -.y 4- e the kicatins of the :a:gets in the k - I frame. Therefore. with a constant sampling iterval and assuming that
and tbWt. ;) ;re the rexwe .ranslatoi cf the targets from the the sensor is not slewing or panning. the new coordinate systemk -ifranzt lo th- k frame. The correspoMin., mint transformfrepresents the plane of average velocity. For example. targetspower spectrun 1-TP5 is then inatroduced as mtrdulation at the moving with constant velocity produce stationary correlationinput plane for the .ncuid Fourier transformation. h- cgn be peaks. targets moving with constant acceleration generate cor-shown that the output coiplex light distribution is given b) re!ation peaks that are located at equally separated intervals on
* a straight line, and correlation peaks located at the origin of thet w.w coordinate plane correspond to stationary objects or back-
'~' R~"g&;X~x~~i-x~i.ground scene In our experimental demonstration, multiple tar-gets arc Zraveling at a different velocity and in different direc-
.~tons. thus the :orrelation peaks generated are located at different. _-Y'-1+k) positions at the vcit.y plane.
R ,- RI .. ,(x+. X--. -" + . v+ -,-)6- ,8' v+a) 3. DATA ASSOCIATION
In general, the motion of the targets can be represented by, ,R 2 axt x '-t-Y+v7'i-o7'-- -a). 2 dynamic models. whien are governed by well-known iws ofI Iphysics. Unpredictable changes in target motions. commonly
where called maneuvers. can also be treated as gradual changes ofmotion parameters. if th2 sampling interval is sufficiently short
R7~x-Q. y-J) = fkx.y) ®f x.y) *. 8(x--t.; "V (3) compared with the maneuver time. Therefore, it is not difficultI to associate the measurements in the velocity plane with the
is the correlation function between fk' and f', located at (a3). targets. based on the past history of the targets. Any prior know-and & and * denote the correlation and convolution operations. edge of the targets before tracking will also be helpful in this
* respectively. association process. For example, if one target is known to travelNote thai the autocorrelation functions RA'I. and RT i .k - I are much faster than the others, then its correlation peak is more
'ocated at the origin of the output plane. The correlation between likely to be loca,ed farther away from the ongin in the velocitythe same target in the k frame and the k - I frame. given as. plane than those of slower ones.RZ i. is diffracted around (84. kil + a) and (-64".- 8v-a). In this section. a parameter-based data association algorithmThe rest of the terms RZ.-n and R for m n) represent the using a Kalman filtering model is described. It is assumed thatcross-correlation functions between ta-r-et in and target n. It must the sampling interval bt is sufficiently short that tie dynamicbe stated that in this mutiple target tracking problem, we have parameters (velocity. acceleration, angular velocity. etc.) of theI assumed that the targets in any single input frame do not look targets are fairly consistent within a few sequential frames. Thus.alike, so the correlation fun~tions RZ i and R . generate much given the dynamic parameters of a target in the k frame, theweaker correlation signals !-an that generaled by the function parameters in the next franic should be rather predictable. LetI RZ'r 1. Furthermore. the size and the gray level of the targets :(k) be the measurement at the k frame and .(k I k - 1) be theare ako assumed to be relatively congruous with ea-h other, so predicted measurement in the k frame, based upon the infor-the intensities of the correlation peaks generated from .o, _. mation evaluated up to the k - I frame. Then, the Innovationn = I to N. are not significantly different. (or measurement residue), defined as
I OPTICAL ENGINEERING / September 1990 / Vol. 29 No 9 / 1115

TAM, YU TANONE. GREGORY. JUDAY 125
t (k) - (k k- ) (6) (u.v)= I F(u,v) N+X 2cos(x,,-r,)u.
can be used to eva!uate the likelihood of association betweenU :(k) and the target under consideration. In stochastic models,one would evaluate the normalized squared distance D from the where the normalization constant is set to be the magnitude atmeasured z(k) to the current track. u = 0. The correlation uutput is obtained by taking the inverseFourier transform. of I(u.v), and the intensity of the correlation
Sv'S-v ,(7) function at x,, -x is given as
where v' is the transpose of v and S is the innovation covarianceof the target. which is basically the variance of the estimated Cx, V)states. The values of 4^(k I k - 1), S. and the like can be eval- N I F(0,0) j4 jftx.y) OftxAy) * 8(x-Xa +,) (2 (10)uated by applying a standard Kalman filter to the dynamic model.The use of Kalman filt.ing in stochastic modeling 7 is a well- The 1/N4 factor seems to suggest that a JTC is of little value torknown subject on its own and will not be discussed here. How- multiple object correlation. However, it is obvious that this factorever, a brief discussion will be given in Sec. 7, followed by an comes in as the normalization constant in Eq. (9). In practicalexplanation of a simplified filtering process to illustrate the ca- considerations, the energy at the origin is much higher than thatpability of this multiple target tracking technique. in the other frequency components; it is therefore unrealistic to
A data association process can be carried out as follows: use this value as the normalization constant. In fact. in mosti cases the dynamic range of a power spectrum is so large that
Step 1: At the k - I frame, the dynamic parameters of the N no detector can record the spectrum linearly, Therefore, impos-targets are determined at track I to N. ing an upper limit on the power spectrum is unavoidable. More-
Step 2: At the k frame. N new measurements are made. given over, it can be seen that the bracketed terms in Eq. (9) are aas a~b.....N. The normalized square distances are then com- summation of sinusoidal signals of different spatial frequencies.puted: The bias level build-up in this summation significantly reduces
D1. 'V. Di= VlS 1_ - etc. the modulation of the fringes. However, due to the sensitivityD, ,,of a practical detector, part of this bias will be eliminated, hence
i and similarly for 0-. D~b...., D3. and so on. increasing the modulation of the fringes. Therefore. in mostexperiments, replacing the normalization process on the power
Step 3: The most likely association is given by choosing the spectrum with a nonlinear recording process bounded betweenE possible combination of Ds that yields the minimum sum. the lower and upper threshold is unavoidable, and the number
To initiate the tracker. all the measurements in the first few of objects in a JTC will affect the diffraction efficiency in atracking cycles are used to set up multiple potential tracks. Tracks highly nonlinear fashion. If the upper and lower threshold arethat have inconsistent dynamic parameters are dropped until only properly chosen such that the modulation of the fringes is am-a single track is assigned to each target. Recall that the mea- plified by this clipping effect, then a much better diffractionsurement in each cycle is the average velocity of . target during efficiency can be achieved even for multiple object correlation.the sampling period. Therefore. dynamic parameters can be as- The thresholding levels can be adjusted simply by changing theI signed quickly in a few cycles: only two or three cycles are output power of the illuminating source, by software program-needed to determine targets with constant velocity or constant ming, or by changing the recording property of the square lawacceleration. The tracking scheme discussed so far. however, detector. 9 In this experiment. the first two techniques mentioneddoes not determine the initial positions of the targets in the first were util:_ed to optimize the correlation output.frame nor identify the measurements to the target3 due to the Due to the nature of this adaptive tracking technique. thenature of this adaptive correlation scheme. Therefore. an initial correlation peaks generated from different targets with almostacquisition scheme is needed to perform this task before the start identical velocities will fuse together. hence reducing the res-of the adaptive tracker. This can be done by using prestored olution of the correlation spots. If W is the width of a target.reference images located at fixed positions at the image plane. ther 2W is the minimum separation for the two correlation func-Further analysis of the initial target acquisition technique is be- tions to be completely szparated. lowever. due to the nonlinearyond the scope of this paper. thresholdi'g effect imposed on the power spectrum. as discussed
* previously, the width of a correlation peak will be much .,harper4. DIFFRACTION EFFICIENCY AND RESOLUTION than 2W. Nevertheless. the minimum separation for two peaks
In multiple object correlation, the JTPS is encoded with multiple he distinguishable must be greater than or .qual to the fuli
carrier frequencies. The detection efficiency of -he s-,stm i width half maximum (FWHM) of the peak. To resohe the mea-thcarerforequinciab Thelo en esesl suremcents for two moving targets. their difference in ,elocitytherefore icvitably lower when compared with that for single mt ,,,s the conditionobject correlation.." Consider when N identical objects. each ...... t
located at x,,. n = I to N in a I -D -,pace. are the input objects (aiFWHM,)2 + (Ayi/FWHM,). > I . (IIiI to a JTC. The input function is then given as,N If the sampling interval is too short compared with the velocities
Tix.v) = Xflx-r, (8) of the targets, the correlation peaks will be crowded togethernear the origin (of the translated coordinate) and will becomeunresolvable. Therefore. this resolution criterion imposes a lim-
If the JTPS is linearly recorded and displayed on a SLM. the itation to this adaptive tracking algorithm, for which dn optimumnormaiized amplitude transmittance on the SLM becomes sampling rate should be used.
I 1116 / OPTICAL ENGINEERING Sepiember 1990 / Vol 29 No 9
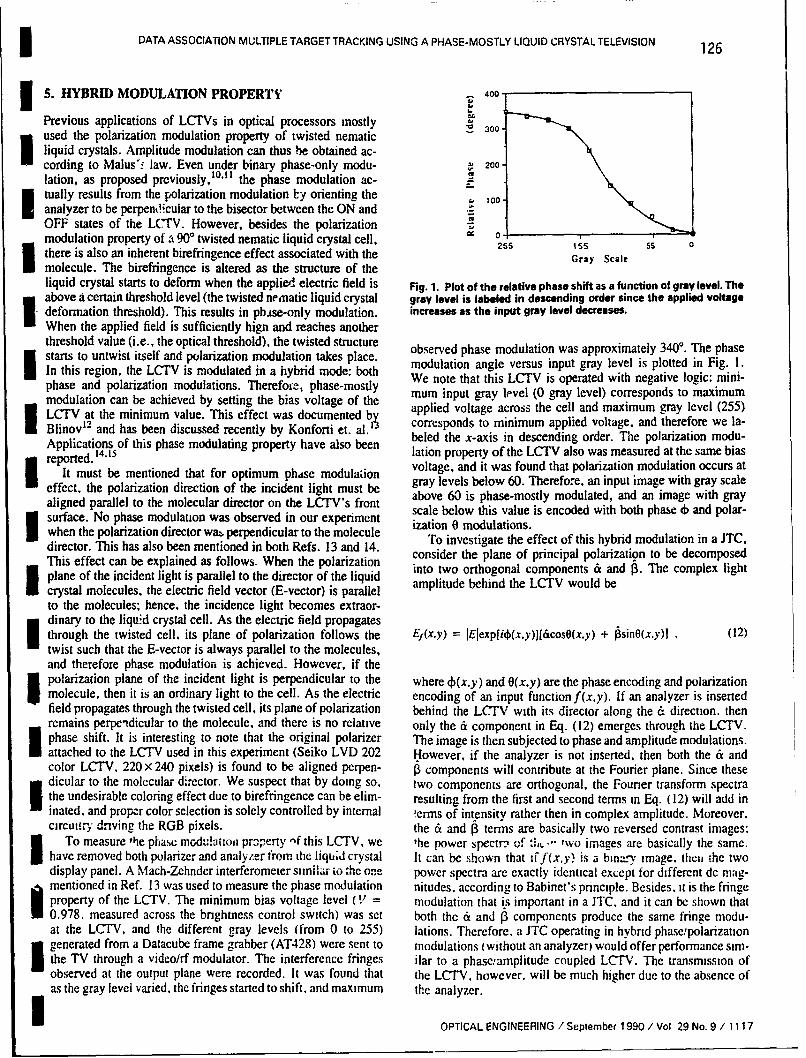
DATA ASSOCIATION MULTIPLE TARGET TRACKING USING A PHASE-MOSTLY LIQUID CRYSTAL TELEVISION 126
5. HYBRID MODULATION PROPERTZ 400
Previous applications of LCTVs in optical processors mostlyused the polarization modulation property of twisted nematic Z 300
liquid crystals. Amplitude modulation can thus be obtained ac-cording to Malus law. Even tinder binary phase-only nodu- 2oolation, as proposed previously,1° ' the phase modulation ac-tually results from the polarization modulation by orienting theanalyzer to be perpendicular to the bisector between the ON andOFF states of the L(.'V. However, besides the polarizationmodulation property of a 900 twisted nematic liquid crystal cell, "" 0 ,there is also an inherent birefringence effect associated with the Grs SCsemolecule. The birefringence is altered as the structure of theliquid crystal starts to deform when the applied electric field is Fig. 1. Plot of the relative phase shift as a function of gray level. The
* above a certain threshold level (the twisted neinatic liquid crystal gray level is labeled in descending order since the applied voltage* deformation threshold). This results in ph.ise-only modulation. increases as the input gray level decreases.
When the applied field is sufficiently hign and reaches anotherthreshold value (i.e., the optical threshold), the twisted structure observed phase modulation was approximately 340. The phase
* starts to untwist itself and polarization modulation takes place. modulation angle versus input gray level is plotted in Fig. 1.In this region, the LCTV is modulated in a hybrid mode: both We note that this LCTV is operated with negative logic: mini-phase and polarization modulations. Therefore, phase-mostly mum input gray level (0 gray level) corresponds to maximummodulation can be achieved by setting the bias voltage of the applied voltage across the cell and maximum gray level (255)LCTV at the minimum value. This effect was documented b c applied voltageand thereel we55aBlinov 2 and has been discussed recently by Konforti et. al. ° corresponds to minimum applied voltage. and therefore we la-Applictinso and phasen discusse pretl y h e al. bbeled the x-axis in descending order. The polarization modu-Applications of this phase modulating property have also been lation property of the LCTV also was measured at the same bias
It must be mentioned that for optimum phase modulaiion voltage, and it was found that polarization modulation occurs at
effect, the polarization direction of the incident light must be gray levels below 60. Therefore. an input image with gray scale
aligned parallel to the molecular director on the LCTV's front above 60 is phase-mostly modulated, and an image with grayalineuprf a le o he moeuladion a TVs observedfiu r ont scale below this value is encoded with both phase (b and polar-surface. No phase modulati on was observed in our experiment ization 0 modulations.* when the polarization director wa perpendicular to the molecule To invcstigate the effect of this hybrid modulation in a JTC,
director. This has also been mentioned in both Refs. 13 and 14. consider the e e of principal polarization to be decomposed
This effect can be explained as follows. When the polarization into two orthogonal components & and p. The complex light
plane of the incident light is parallel to the director of the liquid amplitude behind the LCTV would be
crystal molecules, the electric field vector (E-vector) is parallel
to the molecules; hence, the incidence light becomes extraor-I dinary to the liquid crystal cell. As the electric field propagatesthrough the twisted cell, its plane of polarization follows the Ef(xy) = IEexp[ih(xy)][&cosO(xy) + P3sin0(x.y)] , (12)twist such that the E-vector is always parallel to the molecules,and therefore phase modulation is achieved. However, if theI polarization plane of the incident light is perpendicular to the where 4)(x.y) and 0(x,y) are the phase encoding and polarizationmolecule, then it is an ordinary light to the cell. As the electric encoding of an input function f(xy). If an analyzer is insertedfield propagates through the twisted cell, its plane of polarization behind the LCTV with its director along the a direction. thenremains perpe'dicular to the molecule, and there is no relative only the & component in Eq. (12) emerges through the LCTV.phase shift. It is interesting to note that the original polarizer The image is then subjected to phase and amplitude modulations.attached to the LCTV used in this experiment (Seiko LVD 202 However, if the analyzer is not inserted, then both the & andcolor LCTV. 220 x 240 pixels) is found to be aligned perpen- 13 components will contribute at the Fourier plane. Since thesei dicular to the molecular director. We suspect that by doing so. two components are orthogonal, the Fourier transform spectrathe undesirable coloring effect due to birefringence can be elim- resulting from the first and second terms in Eq. (12) will add ininated, and proper color selection is solely controlled by internal 'erms of intensity rather then in complex amplitude. Moreover,circuitry dnving the RGB pixels. the & and 13 terms are basically two reversed contrast images;h To measure the phase modulatioa prc-erty -f this LCTV. we the power spectrm of :,%, o two images are basically the same.have removed both polarizer and analyzer from the liqtu;d crystal It can be shown that if f(x.y) is a btna-y image. then the twodisplay panel. A Mach-Zehnder interferometer smiilar io :he one power spectra are exactly identical except for different dc mag-
i mentioned in Ref. 13 was used to measure the phase modulation nitudes. according to Babinet's principle. Besides,t is the fringeproperty of the LCTV. The minimum bias voltage level (V = modulation that is important in a JTC. and it can be shown that0.978. measured across the brightness control switch) was set both the & and 13 components produce the same fringe modu-at the LCTV, and the different gray levels (from 0 to 255) lations. Therefore. a JTC operating in hybrid phase/polarizationi generated from a Datacube frame grabber (AT428) were sent to modulations (without an analyzer) would offer performance sim-the TV through a video/rf modulator. The interference fringes ilar to a phase/amplitude coupled LCTV. The transmission ofobserved at the output plane were recorded. It was found that the LCTV, however, will be much higher due to the absence ofas the gray level varied, the fringes started to shift, and maximum the analyzer.
U OPTICAL ENGINEERING / September 1990 / Vol 29 No. 9 / 1117
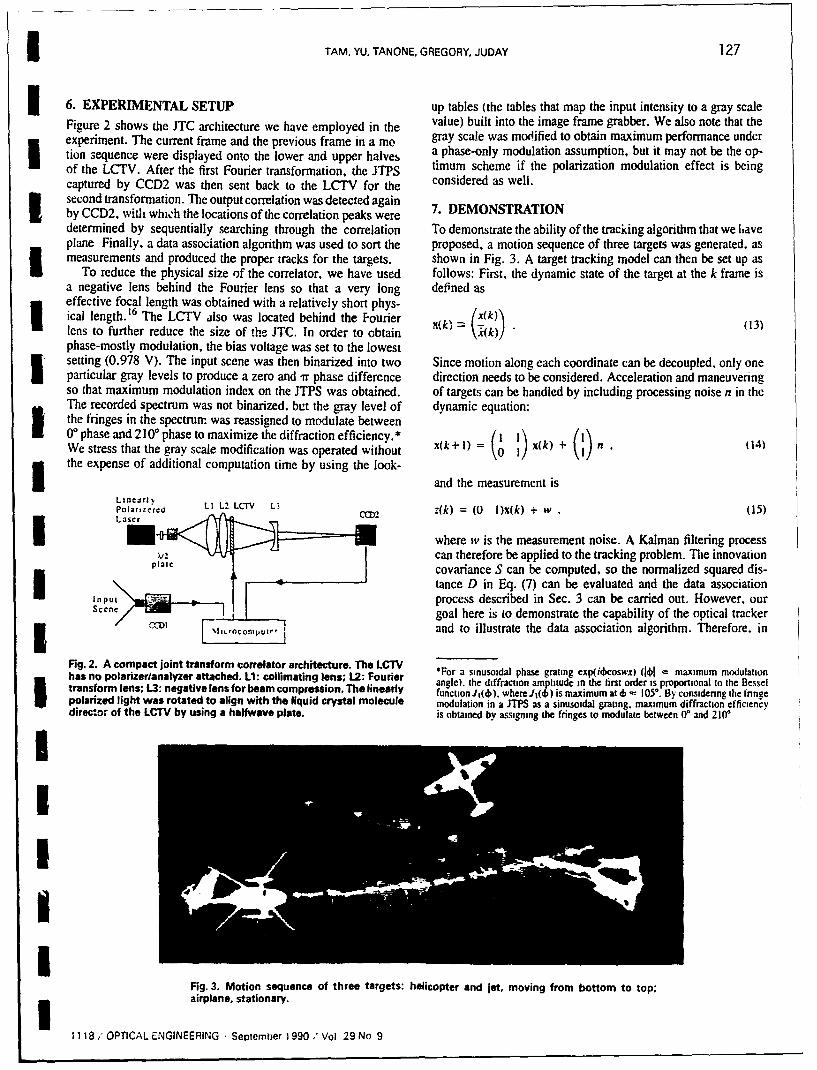
TAM, YU, TANONE. GREGORY. JUDAY 127
I 6. EXPERIMENTAL SETUP up tables (the tables that map the input intensity to a gray scaleFigure 2 shows the JTC architecture we have employed in the value) built into the image frame grabber. We also note that the
I experiment. The current frame and the previous frame in a mo- gray scale was modified to obtain maximum performance undertion sequence were displayed onto the lower and upper halves a phase-only modulation assumption, but it may not be the op-of the LCTV. After the first Fourier transformation, the JTPS timum scheme if the polarization modulation effect is beingcaptured by CCD2 was then sent back to the LCTV for the considered as well.
I second transformation. The output correlation was detected againby CCD2, with which the locations of the correlation peaks were 7. DEMONSTRATIONdetermined by sequentially searching through the correlation To demonstrate the ability of the tracking algorithm that we haveplane Finally, a data association algorithm was used to sort the proposed, a motion sequence of three targets was generated. asmeasurements and produced the proper tracks for the targets. shown in Fig. 3. A target tracking model can then be set up as
To reduce the physical size of the correlator. we have used follows: First, the dynamic state of the target at the k frame isa negative lens behind the Fourier lens so that a very long defined as
- effective focal length was obtained with a relatively short phys-ical length. 16 The LCTV also was located behind the Fourier -k) = x(k)13)lens to further reduce the size of the JTC. In order to obtain "" i(k))phase-mostly modulation, the bias voltage was set to the lowest
* setting (0.978 V). The input scene was then binarized into two Since motion along each coordinate can be decoupled, only oneparticular gray levels to produce a zero and ir phase difference direction needs to be considered. Acceleration and maneuveringso that maximum modulation index on the JTPS was obtained, of targets can be handled by including processing noise n in the
I The recorded spectrum was not binarized, but the gray level of dynamic equation:the fringes in the spectrum was reassigned to modulate between00 phase and 2100 phase to maximize the diffraction efficiency.* x I) + 1) l x~k) + il( 14)We stress that the gray scale modification was operated without x(k+ 1) l)
I the expense of additional computation time by using the look-and the measurement is
LincarI .Poiarxzcrcd LI L2 iCTV L3 z(k) = (0 I)x(k) + w (15)
W where w is the measurement noise. A Kalman filtering processX12: can therefore be applied to the tracking problem. The innovation
plae covariance S can be computed, so the normalized squared dis-tance D in Eq. (7) can be evaluated and the data association
in pui process described in Sec. 3 can be carried out. However, oursce. - goal here is to demonstrate the capability of the optical tracker31 and to illustrate the data association algorithm. Therefore. in
Fig. 2. A compact joint transform correlator architecture. The LCTV For a sinuoidal phase grating exp(icoswx (l = maximum modulationhas no polarizer/analyzer attached. L1: collimating lens; 12: Fourier angle), the diffraction amplitude in the first order is proportional to the Besseltransform lens; L3: negative lens for beam compression. The linearly function J (W.) where J(4) is maximum at (b - 105". By considenng the fnngepolarized light was rotated to align with the liquid crystal molecule modulation in a JTPS as a sinusoidal grating, maximum diffraction efficiencydirector of the LCTV by using a halfwave plate. is obtained by assigning the fringes to modulate between a' and 210*!
UIU
Fig. 3. Motion sequence of three targets: helicopter and jet, moving from bottom to top;airplane, stationary.
1118 ,OPTICAL ENGINEERING - September 1 990 ' Vol 29 No 9

3 DATA ASSOCIATION MULTIPLE TARGET TRACKING USING A PHASE-MIOSTLY LiCUID CRYSTAL TELEVISION12
Tracking Cycle 1 211
Fi 4.()M mgteunea ipae nteLT tec tpo h rcigcce
(bIh orlto eut scpue yteCDcmr ttecrepnln rcigcce-o ipiiy h au fSi loasge stevrac
Fig4. a)fheimge equnc asdiplaed o the tVat *eac t tep ube ofth tracking cycle.
*1 ~ A computer program was written that controls the joint trans-ih~ r.form process i..; %k-ell as the data association proce.,s based onI the above simplification and the discussion in Sec. 3. To initiatethe coordinate the ststem was first set to run with a stationary
Ul~~iobject a-, input. and" he position of the correlation peak thu's,enerated was assignef" as the origin of the velocit% plane co-A ordinate. The tracking program was then set to run autonomouslywith (he motion sequence in Fig. 4 as inputs. The computer
1 program was written in Microsoft C. which ran on a microcom-iii ~puter using an INTEL 58i6 processor operated at 25 MHz. andM : the processing time for - tracking c-,clc %isas approximately 0.7 s.
~j ~ i',Figures 4(a and 4(b) d, pict the images as displayed on the LCTVIand the corresponding c(_ rrelation spots generated during each
alsogivn. n Ft,. To avoid unnecessary data transfer, thecure~tfrae ws atemtel Iwcedonto the upperilower half
oft the LCTV at every trackinu cycle This modification eencrate.
Fig. 5. A 3-D plot of the correlation result obtained in one of the a correlation plane ".hose coor(;ria*,c axes are inserted at eachtracking cycles. Height of peaks are linear in intensity, cycle, and the location of the measuremrents have to be inter-
! p~rcted accordingly Table I % mrnanzcs the enipiric-il data. andorder ~ ~.. . ,, oc final resuits are sfloss n in IFic-~ '.% ii the actual loc:ations,
ore t ho'.t the basic promnerather iathfled01 tte aretsaac %!ottl-tr;.ck.ing ,cc ctl r .i dresults in this demonstration. %%.e simnpl% assume a inoisc~iree f'or complarison It ca-i he seen mnat a relatisei% %simple hybridmecasuremient %ituatiorn I t=1)), This iinmediatl'. sets the _,ain optical airchitecture is capable of track in- oultiple t~rcsratherof the filter to one The update d,,naniic states of the tarct arethen solely oic.-miried h, the new measuremnent%, and the Pre-
dcte a urem.et l is iven by 8. CO)NCL~USION
3 We have demonstrated adata asociatIon nuitarget tracking
b- It- i- l I ( i ctchnique usinge a hs rid JTC The rokL ot the coirelator is to)
OPTCA EGINER.G Sepe-V r C90 %vn. 23 ;No 9 -119

1293 TAM. YU. TANONE. GREGORY. JUDAY
3 TABLE 1. Empirical data after 11 tracking cycles.
Tricking Cycle 1 3 46 7 10 11
1.1 lntensmit 190 INK IX3 lNS12 1.0 117 57 174 INL. siIn~ (.24.-, Q.0 iHJ .32,13) 0' - 1922i n0.11 .31.131 (0,.11 (-218s) (2'. I)
pit I Assig" I III I I I I I cII III li I I I I II tl~lil 83~:5 ~' 186 ~52 i89 17S 137 1210
LLiiion (2.0) 22A ., ) 430.10) 201.7) 1-2116t 0 i !1 (.21.9)
U PithliAssig.l I f I IiIC Intensity 1:7 "s :85 .X I ",9 IN8 iN$ iX9 1:1 -N, nc None
3Pi'th As,.g 11 NoneC
Mcasurercnii thtrc5hiiid Ic'~I w.i- clit SIs1114 iii ().255 vtsy LjlI~ 1 Pcjzk tinm m
Lixiltion i( the pcaK ' ss nicsured in the swliiu, pljiiC k rdiiic
Pith sssignimci 'cre insic tleiii.I c hjscd -i theiuurmil,,iJ %qi~ure disiiiii~e titwecci tlie iniSurcracni inl the pfeviilu . (OCind that in the curirent .yLic Idetitiiniiiii,n Mhciw i dlie Vjiih% 4fd tle LiurrCssiondifl5 ljrgcis ucrc flijdC ithrough maniilft ~ ~~~~ii l -1 i eriuu t il he ':p .l em Cii '.li I ;diliiluier. 11 liil-oi~iv .~i~iiC liighter tel
Fig. 8. Final results obtained after 11 tracking cycles. The actual lotcations of the targets at eachof the tracking cycles are also given, for comparison. The initial locations of the paths were
assigned at the correct positions in this figure through manual interaction.
Ireduce the information of an input scene with large space-band- 9. ACKNOWLEDGMENTSwidth product into a few correlation signals (velocity measure- The partial support of this research by the U..Arny Missilements) so that a digital systemn is capable of tracking multiple Command. through the U. S. Army Research Office under con-tareets at real-time. Simplicity in optical architecture. relaxation trc DAAL.03-87-K-0l47. is eratefully ackaowledget. We wouldof0 aiienment reouirements. and the adaptive properiN are (he also like to express our, appreciation to the anony mous reviewersmajor advantages (if a hybrid JTC in this mode of operation. b hi snru omnsadhlfl.u~elnThe phase modulation property of a LCTV has been Investigatedand was employed in this experiment to improve the detection 10. REFERENCESe fficiency of a JTC. A motion sequence of three targets waLs i -% Vau.L."Coherent; oi'tcal PmxckQlfl. Nx11- (A.L 1 3110741used as the Input scenes to demonstrate the applicability of thits 2I) (ka Ri iei-kn i o~gnic~h sici~oritioI technique. and ,atisfactoryN results were obtained. Appi ont- MS 172 4 19791
Z PflA .GNNERiNG Se..1emib0e '990 Vol "-j 9

DATA ASSOCIATION MULTIPLE TARGET TRACKING USING A PHASE-MOSTLY LIQUID CRYSTAL TELEVISION 130
3. T. H. Chao and H. K. Liu. "Real-time optical holographic tracking of Eddy C. Tam received his BS degree in phys-multiple objects," Appl. Opt. 28. 226 (1989). ics in 1984 from the State University of New4. C. S. Weaver and J. W. Goodman, "A technique for optically convolving York College at Buffalo and his MS degree infunctions." Appl. Opt. 5. 1248 (1966). pysik in 1987 and his degree in
5. J, E. Rau. "'Detection of differences in real distnbution:' JOSA 56. 1490_ physics in 1987 and his Ph. degree in elec-(1966). trical engineering in 1990 from the Pennsyl-
6. E. C. Tam. F. T. S. Yu. D. A. Gregory, and R. Juday. "Autonomous real- vania State University. His research intereststime object tracking with an adaptive joint transform corelator," Opt Eng. include optical image processing and pattern29(4). 314-320 (1990). recognition, holography, and spatial light
7. See. for example. P. Mayback. Stochastic Models. Estimation and Con. rols. . modulators. He is currently an assistant pro-Academic. New York (1979). fessor in physics at the University of North
8. F. T. S. Yu. Q. W. Song. Y. S. Cheng. and D. A. Gregory, "Companson Carolina at Charlotte.of deection efficiencies for VanderLugt and joint transform correlators."Appl. Opt. 29. 225-232 (1990).
9. F. T. S. Yu and Q. W. Song, "Hard-clipping joint transform contlator Francis T. S. Yu: Biography and photograph appear with the paperusing a microchannel spatial light modulator." Micro. Opt. Tech. I. 323-326 "Self-organizing optical neural network for unsupervised learning"(1988). in this issue.
10. D. Psaltis. E. G. Pack. and S. S. Venkatesh. "Optical image correlationwith a binary spatial light modulator," Opt. Eng. 23(6), 698-704 !984).
I!. J. A. Davis. R. A, Lilly, K. D, Krenz, and H.-K. Liu. "Applic,"bilitv of Aris Tanone received his BS degree and doctor candidate degrees inthe liquid crystal television foroptical data processing." inNonlintrOptics physics from Gadjah Mada University in 1974 and 1976. respectively. Heand Applications. Proc. SPIE 613. 245-254 (1986). got his MS degree in applied physics engineering from Hokkaido12. L. M. Blinov. Electry.Optical and Magneto-Optical Proper:es of Liquid University in 1981. In 1982 he joined the graduate school of opto-Crystals. Chap. 4. Wiley. New York (1983).
13. N.Konforti. E. Maur. and S. T. Wu. "Phase-only modulation with twisted electrotechniquesandlaserapplicationattheUnversityoflndonesiaasanemac liquid crystal spatial light modulato":" Opt. Let=. 13, 251-253 research associate. and then he spent around three years in the(1988). microcomputer industry. In 1986 he became the Vice Dean of Academic
14. T. H. Barnes, T. Eiju. K. Matsuda. and N. Ooyam, "Phase-only mod- Affairs at the College of Engineering, Satya Wacana Christian Universityulation using a twisted nematic liquid crystal television." AppI. Opt. 28. in Indonesia. He came to the Pennsylvania State Universityto pursue his4845-4852 (1989). Ph D. degree in electrical engineering in 1989. His current research
15. D. A. Gregory, J. A- Loudin. 1. Kirsch. E. C. Tam. and F. T. S, Yu. interests include optical image processing, pattern recognition. holo-"Application of hybrid modulation properties of the liqutd crystal televi- graphy and spatial light modulators. He is a member of OSA. SPIE.sion." submitted to Appl. Opt.
16. D. L. Flannery. A. M. Biemacki. J. S. Loomis. and S. L. Cartwiight. Indonesian Physics Society, and Japan Society of Applied Physics."Real-time coherent correlator using binary magneto-optic spatial lichtmodulators at input and Founer planes." Appl. Opt. 2 466 (1986). DonA. Gregory: Biography and photograph appearwith thepaper "Self-
organizing optical neural network for unsupervised learning" in thisissue.Richrd D. Juday holds a BA in physics and a Ph.D. in electrical
engineering. Among other areas he has worked in radiation envi-ronments for manned space flight and earth resources remote sens-ing. He currently works in digital and optical image processing formachine vision. Video-rate image coordinate transformations, oneaspect of his machine vision activites, are applied to human lowvision problems. He has avid interests in whitewater boating, bad-minton, and Mexican mountain-stomping and canyon-crawling.
II
I
III
O PTICAL ENGINEERING. Seotemnbe" 1990~ V ; 2 No 9 " 21

131
III
APPENDIX 10.18
IUnsupervised Neural Net
IaIIIIUIIIIII

3132
Self-organizing optical neural network for unsupervisedlearningSTaiwei Lu. MemR sm Abstract. One of the features in neural computing must be the ability toI Francis 1. S. Yu, LLow SpE adaut to a changeable environr.ent and to recognize urknown objects-.
The Pennsylvania State University This paper deals with an adaptive optical neural network using KohonerfsElectrical and Computer Engineering self-organizing feature map atijonthm for unsupervised . -ning. A cor-
Department pact optical neural network of 64 neurons using liquid crystal televisionsUniversity Park, Pennsylvania 16802 is used for this study. To test the performance of the self-organizing neural
network, experimental demonstratin and computer simulations are pwo-Don A. Gregory vided. Effects de to unsupervised learning parameters are analyzed. We
U-S. Army Missile Command show that the optical neural network is capaWle of performing both ur-Redstone Arsenl, Alabama 35898 supervised teaming and pattern recognition operatons simultaneously.
by setting two matching scores in the learning algorithm. By using a slowerlearning rate. the construction of the remory matrix becomes more or
ganized topologically. Moreover, the iroducton of forbidden regions inthe memory space enables the neural network to learn new patte with-out erasing the old ones.
Suicr renams op6caI pattern recan:on; sorgvmg nexw arts: Wi-
2.suevie -learning, Kohoeen' ,esare nW o paw== neua nenv .ork y
a ap
i . Co~~ch~~di~n= ' viously p mrie ~ a~wr)imlo~i~lp the rwf had of the -netwo rv. Th m. im se c lleork dscaleann. ofe ndn = caetby zicns. wng os Thso=
on ef- andn thow a rqrescaiou of h kN.f4nlyinI unsITRODcTiON jability of ahe humn beain. & d To
it i nthdigirks v.caso - r ove a, few. the nea. te eror-&in bad tpoaa diproblemswmillions of times fte than humans brains. eoweer. tm mah in nre isfor ognilive tasks, such as rtntit -L% 'z --iio of the s ised len models . Thr e adauve of the i-
Ia complex envirnmet, hUe pefor of the human ban i (I:. h n . t mal-ine. ad she Kohoneus beyond the reh of ele-tronic comput- Th human brain g 'eatIre map' ate moN hve be kneo tms-
I consiss of iillwta of neurons. with each neuron icuttonalred peri. few te modpel. Among ese modres. t h Kobonen
to thousands of other neurons. Artificial n-ral ne wks ANNs) mode is lr sinpst slf-m a i igothm. cap" of per-
have adopted this unique feature of massive ierconnectios. forming statistical pattern irognin and clstficruon, and- tsimulating the arning capabiiity of a biological sAem. - can he moified for om" neural network - -
Stricdy speaking. two types of learming processes a U However. Koonen's model was on-ily destied for feauin the human brain: supervised and unsupervised leaninc If a mapping of statistical dam- to perform 1VI ad an=sr receg-heacer first organizes she information and the teaches the stu- n iv dne s m p e d ic
dents. the learning process is elviou sy sut'ervisecd For ctnple. matching cnit in tile armuig awrithm. The eaet of fastin an artificial neral network. both the in-put and desired -sut- -W sloi enmang are analyzed- The concept of foiddn freton=i'~a must be provided assrainino ezanw'es 'I oiter wifjs- the ifl the nnr -ace is zanuc- in thc Kohonen model sucANN has to be w..h e w ti n, io learn an-n to p;-- m s the that the ~n -,--x -- u- new 'n'- ob-.cts wrhxis cras,a-i.niormnation. Neverthe-less- it an unknown r~lc; is P-resetd to i~the artificial neural rx- twork during the - nssi0 . Im network Th ccxi rf AN s -etlv isin,,reti r =n-
may provide an -necous ',zit z resil. te-es (or - ire , ons ecause of lare tife-
mar. caart ai tnr caiaut wiq ~4 fl--W tidgn&n nat£mamtv ac.Cr'Wdc-netm-mm- s is3 csideijcd a Potenil cart-a ~.= ~Ji R-tS rrnrd1- r~) c ic ~ Mn~ 'dee to -~ac *-UU-11 rruxietv parallel neural neworks. 1 ate
___ ~ ~ .- ~--~ ____Mica! aej ra ne-aw r -n ea-ed onarco-fli
IIGrit- Valw~r'r'~
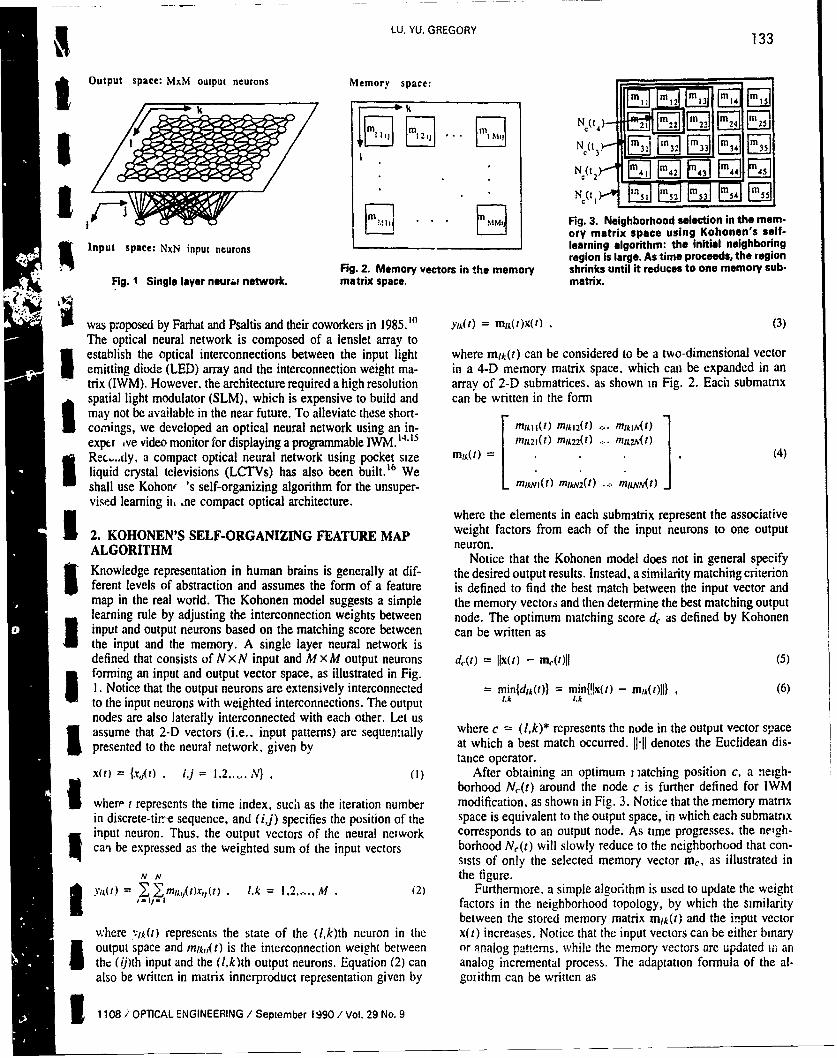
LU. YU, GREGORY 133
Output space: MxM ouiput neurons Memory space:ln m the inn
region i l;e. A1 t im prceds 14 io
21 M22 241~
N C, i 5 3 1 in53 i 54
Fig. 3. Neighborhood selection in the mem-ory matrix space using Kohonen's self-ft Input space: NxN inputn neurons learning algorithm: the initial neighboring
7 region Is large. As time proceeds, the regionFig. 2. Memory vectors in the memory shrinks until it reduces to one memory sub-
Fig. I Single layer neuria network, matrix space. matrix.
was proposed by Farhat and Psaltis and their coworkers in 1985.'0 yk(t) = mil(t)x(t) . (3)The optical neural network is composed of a lenslet array toestablish the optical interconnections between the input light where mlk(t) can be considered to be a two-dimensional vectoremitting diode (LED) array and the interconnection weight ma- in a 4-D memory matrix space. which call be expanded in antrix (IWM). However. the architecture required a high resolution array of 2-D submatrices, as shown in Fig. 2. Each submatrixspatial light modulator (SLM), which is expensive to build and can be written in the form
t may not be available in the near future. To alleviate these short-comings, we developed an optical neural network using an in- [M1l(t) ma2(t) .... mlki N()exptr ,ve video monitor for displaying a programmable "W .14.A5 rnt21(t) m1422(t) ... raNr.t)Rec-...dy. a compact optical neural network using pocket size mtA(t) (4)
liquid crystal televisions (LCTVs) has also been built. 16 Weshall use Kohon' 's self-organizing algorithm for the unsuper- mnil(t) miivM(t) .... maJi(t)vised learning ii1 .ne compact optical architecture.vwhere the elements in each submatrix represent the associative
5 2. KOHONEN'S SELF-ORGANIZING FEATURE MAP weight factors from each of the input neurons to one output
ALGORITHM neuron.Notice that the Kohonen model does not in general specify
Knowledge representation in human brains is generally at dif- the desired output results. Instead. a similarity matching criterionferent levels of abstraction and assumes the form of a feature is defined to find the best match between the input vector andmap in the real world. The Kohonen model suggests a simple the memory vectors and then determine the best matching outputlearning rule by adjusting the interconnection weights between node. The optimum matching score d, as defined by Kohoneninput and output neurons based on the matching score between can be written asthe input and the memory. A single layer neural network isdefined that consists of N x N input and M X M output neurons d,(t) = Itx(t) - m,(t)ll (5)forming an input and output vector space, as illustrated in Fig.1. Notice that the output neurons are extensively interconnected = min{dlk()} = min{Ifx(t) - mk(1)l} . (6)to the input neurons with weighted interconnections. The output Ik I.k
nodes are also laterally interconnected with each other. Let us' assume that 2-D vectors (i.e.. input patterns) are sequentially where c - (1,k)* represents the node in the output vector spacepresented to the neural network, given by at which a best match occurred. 1111 denotes the Euclidean dis-
tance operator.x(t) ={x,,t) . ij = 1.2._ N} (I) After obtaining an optimum i latching position c. a neigh-3 borhood N,(t) around the node c is further defined for IWMwher t represents the time index. such as the iteration number modification, as shown in Fig. 3. Notice that the memory matmxin discrete-tit-e sequence, and (i,j) specifies the position of the space is equivalent to the output space, in which each submatrixi input neuron. Thus, the output vectors of the neural network corresponds to an output node. As time progresses. the neigh-can be expressed as the weighted sum of the input vectors borhood No(t) will slowly reduce to the neighborhood that con-
sists of only the selected memory vector me, as illustrated inIN , the figure.
yiA(t) = ;,2mjt)xu(t) , 1.k = 1!.2... M . (2) Furthermore, a simple algorithm is used to update the weight3 '1jl factors in the neighborhood topology, by which the similaritybetween the stored memory matrix Mtk(t) and the input vector
where yk(ft) represents the state of the (/,k)th neuron in the x(t) increases. Notice that the input vectors can be either binaryI output space and mlk,,{t) is the interconnection weight between or analog patterns. while the memory vectors arc updatcd in anthe (ij)th input and the (l,k)th output neurons. Equation (2) can analog incremental process. The adaptation formula of the al-also be written in matrix innerproduct representation given by goiithm can be written as
I 1108 / OPTICAL ENGINEERING / September 1990 / Vol. 29 No. 9

SELF-ORGANIZING OPTICAL NEURAL NETWORK FOR UNSUPERVISED LEARNING 134
LCTVIIncoherent &
Light Source Diffuser Lenslet Array LCTV2magmg (D -
Lens Array
0 ~xft)F' n 111(t) y~k(t)
Fig. 4. Schematic diagram of a self-organizing optical neural net- Fig. 5. Experimental setup of a self-organizing optical neural net-work. work.
(mik(e) + a(t)[x(t) - m11(t)] . for I~kENt) Atr AtmAM o+ = (7) ytk(t+ ) = f (t) - F • Y. 1 . =,2,._M
otherwise( ()
where 0 < a(t) < I represents a gain sequence, called the where f is a nonlinear operator over the output nodes and P islearning speed. that is usually a monotonically slowly decreasing an inhibition constant between the output nodes. For simplicity,function of t. In practice, the learning speed is assumed to be we assume that the nonlinear operation f(x) is a thresholdinglinear, which can be written as function, given by
a(t) = a(O) - at. (8) f = x-a.
f(x) x ,b---x<a .(12)
where a is a learning rate. - , x<b,Mention must be made that the point density of the memory
vectors tends to approximate the probability density function of where a and b are arbitrary constants. By referring to the MAX-the input vectors, which has been proved by Kohonen. 6 NET algorithm, we see that each node will excite itself and
It should be noted that Eq. (6) can be expanded in the fol- inhibit the other nodes during each iteration. Finally, only thelowing form: maximum output node will retain, while all of the other nodes
will eventually go to zero. Since the MAXNET algorithm willNN always converge, for a < IIM, the maximum node can always
dk I E [x,7I{t) - ma,vit)]2 be found. 2
N N V N N
S Z.q",) + ZS' ,M,t) - 2 rkmt,,(t)x,{t). (9)I= I .. 3. LCTV OPTICAL NEURAL NETWORK
where the first term is a constant with regard to the output Recent developments in liquid crystal display technology haveposition (l,k). If the weight vectors are normalized so that their made the imaging quality approach that of commercially avail-autocorrelations (i.e.. the sum of the squared weights from all able video monitors. For instance, the contrast ratio of a recentinputs to each output node) are identical, then the second term LCTV, with built-in thin-film transistors (TFTs), is measured atalso becomes a constant. Under this condition, the minimum about 15:1 under white light illumination (it can be higher. thanEuclidean distance occurs whenever the third term becomes max- 30:1 if illuminated by laser light' 7); the dynamic range is aboutimum, i.e., 16 gray levels, which can be continuously adjusted; and the
transmittance of the LCTVs is in the range of 5% to 10%. Thus.{ ,j " ~ the LCTVs can be used to build inexpensive optical neural net-
de(t) = min(dt(t)} = max nlkJ5 )x,(t) (10) works.1k The schematic diagram of an LCTV optical neural network
and the experimental setup are shown in Figs. 4 and 5. A neuralwhich represents the output result of the neural network. In other network of 8 x 8 = 64 interconnected neurons was recentlywords, selecting the minimum Euclidean distance between the constiucted 16 for which an 80 W xenon qrc lamp was used asmemor vectors and the input pattern vector is equivalent to the incoherent light source. In this architecture, a Hitachi LCTVfinding the maximum output node in the output space. (LCTV I) is used for the generation of the IWM. which consists
The maximum output node can be determined by using ex- of an 8 × 8 array of submatrices. and each submatn, has 8 x 8tensive lateral inhibition among the output nodes in the oitput elements. This IWM is then displayed on a fine diffuser ini-space, which is known as the MAXNET algorithm. 2 The expres- mediately behind LCTV . A Seiko LCTV (LCTV2) is used assion of the inhibit interconnections can be written as an input device for the generation of the input patterns. The
OPTICAL ENGINEERING / September 1990 / Vol 29 No 9 , 1109

5,rU. GREGORY 135
II
I -
( (b) (c
I Fig. 6. Experimental demonstration of a self-organizing optical neural network using unsu-pervised leaming: (a) Input patterns. (b) Initial memory matrix space with random noise. (w Finalmemory matrix space. The four patterns are adapted in the memory matrix space; the tree is3 centered at (18), the dog at (7,1), the house at (7,7), and the airplane at (1,1).
lenslet array, which consists of 8 x 8 lenses, provides the inter- Then an output array can be obtained, such asi connections between the IWM and the input pattern. Each lens
of the lenslet array images each of the IWM submatrices onto N" ,the input LCTV2 to establish the proper interconnections. Thus, .k-' , /-- , 2the IWM submatrices can be superimposed to illuminate theinput vector pattern of LCTV2. This represents the matrix-vector The uniformity test array Y(to) is then divided by the outputproduct operation [i.e., the interconnective part of Eq. (10)]. array during the self-learning and recognition processes, givenThe output result from LCTV2 is then picked up by a CCD byI array detector for MAXNET operation. The final result can beobtained by a microcomputer. Notice that the data flow in the y t,(t)optical system is controlled primarily by the computer. For in- y h() = YI(to) , I.k 1.2. M . (15)stance, the IWMs and the input patterns can be written ontoLCTV I and LCTV2, and the computer can also make decisions where Y*(t) is the normalized output array in which the non-based on the output results of the neural network. Thus, the uniformity for the light illumination can be eliminated.proposed LCTV optical neural network is a programmable and Another problem with the light source is the fluctuation of
l adaptive neural network. the arc lamp, which causes detection errors. To overcome thisproblem, we took a sequence of output frames and performedaverage operations for every iteration.
4. UNSUPERVISF" LEARNING IN THE OPTICAL For experimental demonstrations, four 8 x 8 pixel binary in-NEURAL NET"* K put patterns (i.e., a tree, a dog, a house. and an airplane) were
Before apply: ,.If-organizing model in the optical neural sequentially presented at the input LCTV2 shown in Fig. 6(a).network, twL r 'qctors must be considered: one is the system Figure 6(b) shows the initial memory matrix (i.e., IWM) as aI components . al. nent errors, the other is the effect of the random pattern. The first neighboring region is chosen as NA(O)parameters of the sei. organizing system. = 5. the initial learning speed is a(0) = 0.01, and the learning
Since the IWM submatrices are precisely interconnected with rate is selected as in computer simulations, which is a = 0.000025the input pattern vector by a lenslet array, the alignment of the per iteration. The output pattern picked up by the CCD camerai interconnections is rather critical. Although the adjustment of must be normalized by referring to Eq. (15). Then the locationlenses is formidable, it is rather simple to shift the IWM sub- of the maximum output intensity can be identified by using thematrices in LCTVI. A set of test patterns can be displayed on MAXNET algorithm. The memory submatrices in the neigh-LCTVI and LCTV2. The test patterns are shifted in small steps borhood of the maximum output spot are adjusted based on theaccording to the sharpness of the output pattern detected by the adaptation rule of the Kohonon model. The amount of analogCCD camera. Thus, the interconnection alignment can be self- increase in the memory vectors can be controlled by the learningadjusted via the feedback loop. rate a. Thie updated memory matrix is then displayed on LCTV!I The uniformity and stability of the light illumination also for the next iteration. and so on. Due to the gray level limitation
pose some problems on the accuracy of the output results. To in LCTV displays, a few iterations in the learning process mayalleviate the uniformity problem, a test is performed when a result in one noticeable gray level change by the CCD detectornew input pattern vector is presented. During the test, all ele- array. Since the inputs are binary patterns at this stage, the center
£ ments in !he memory matrix are set to the same value. i.e.. memory vector in the neighborhood region eventually convergesto the binary input vector. Thus, the limited dynamic range of
mk,)= I . .k. 1.2...,.. M . iQj. = 1,2..... N . (13) LCTVs would not pose a major problem in our experiment. As
3 1110 / OPTICAL ENGINEERING / September 1990 / Vol. 29 No. 9

SELF-ORGANIZING OPTICAL NEURAL NETWORK FOR UNSUPERVISED LEARNING
a(t) a M =a (0) - ta 1 (0)aa 2(t)=az(0) - t
a2(0) 2 2
II-2"Mi 0 Time sequence
**Fig. 8. Fast and slow linear leming speeds.
Fig. 7. Feature map in memory matrix space. Three similar patternsare located on the same side in the memory matrix, B centered at(8,4), C at (6,1), and D at (8,8), while pattern A sits in the opposite It should be noted that the innerproducts of the 4-D memorydirection of the memory matrix, centered at (1,B). matrix and the 2-D input pattern are performed in parallel by
the optics, while the MAXNET algorithm, the thresholding, andthe adaptive operations are performed by a microcomputer.
shown in Fig. 6(c), after 400 iterations the memory has learned Our experiences have shown that the best results in self-the four input patterns, mapping them around four overlapping organization are obtained when the neighborhood of the memoryregions in the IWM. The centers of these patterns are located matrix space is first selected as a wide region and then allowedregi in the IWM. Tnt of esp atterns to shrink as time proceeds. The linearly decreasing learningat (1,8), (7,1), (7,7), and (1, 1), respectively. sedat silsrtdi i.8 ic Li scertaOne of the major advantages in adaptive pattern recognition speed a(t) is illustrated in Fig. 8. Since tha > at , it is clear thatis to learn the unknowns in addition to recognizing known ob- a(t) is a faster learning speed than a2(t). It is apparent that tojectsThis tk e n the achievedddin treach the stable state of the memory matrix, ai(t) would requirejects. This task can be achieved byadding three criteria to the fewer iterations than az(t). However, in real life, the intensiveKohonen learning rule, for which the matching rateR for pattern training may not always be effective. With the slower learningrecognition can be defined as
speed, the memory matrix is more organized and also appearsN N smoother. The price paid is obviously the training time required
SR Yt)l , " x t) for using the slower learning speed. As an example, the memory. . .. N Fti N (16) matrix space adapted from the faster learning speed is shown in[Xt{ oX'2t Fig. 9(a). After 400 iterations. using a(0) = 0.02 and a=
.' 0.00005, the similar patterns 1, J, and T are adapted in the lowerleft part of the memory matrix, centered at (5,1), (7,2), and
where 1-1 is the norm operator. Let us assume that two constants (8,4), respectively. The pattern X submatrices occupy the upperF, and F2 represent the matching and unmatching scores, by right part, centered at (3,8). Since pattern X is very differentwhich F < 1, F2 < 1, and FI > F2; then the criteria of the from the 1, J. and T patterns in the memory space. using thelearning rules are as follows: (a) If R -_ Fl, the input object slower learning rate, a = 0.000025, pushes the pattern X sub-matches the memory submatrix at position c. Then the neural matrices farther away to the upper right corner, centered at (1.8)network recognizes the input object. (b) If F2 _- R < Fl, the after 800 ierations, as shown in Fig. 9(b). In this figure. weinput object is identified as a pattern that belongs to the class of see that the memory space becomes more organized topologi-patterns (i.e., submatrices) around the location c. This shows cally.that the input object has some differences from the existing When the similar patterns are presented at the input of a neuralpatterns in the class. Then the memory submatrices in the neigh- network, a new pattern may occasionally override the old patternborhood of c should be modified to adapt to the new input pattern. through selecting the same optimum position in the memory(c) If R < F2, the input object is considered to be an unknown matrix space, with the old pattern gradually fading away- Thispattern. Then a new category is developed to learn the unknown phenomenon is rather similar to the learning process of humans:pattern using Eq. (7). if one moves to Southern California for a long period of time,
For illustration, Ft and F2 are selected as F, = 95% and F2 he may forget the bitterness of the cold winters in the northeast75%. A computer-simulated self-learning process is illus- region of the United States.
trated in Fig. 7. in which four standardized English letters A, An example of this phenomenon has been simulated on com-B, C. and D are sequentially presented as the input objects to puter. as shown in Fig. 10. An input pattern B is first presentedthe neural network. It can be seen that in the memory matrix, to the optical neural network. The memory matrix adapts thethe locations of the submatrices reflect the similarity among input pattern around the lower right corner. centered around (8.8), aspatterns. The grouping of the submatrix locations is known as shown in Fig. 10(a). A second pattern E is presented to theKohonen's feature map, for which the patterns of similar features neural network at a later time. Since pattern E is similar totend to stay close to each other. For example, B. C, and D are pattern B. it picks the same spot (8.8) in the memory matnxsimilar patterns; their submatrices are located on the same side space as its maximum output point. As can be seen in Fig. 10(b).of the memory matrix, centered at (8.4), (6.1), and (8.8), re- the memory submatrices of B are eventually taken over by E.spectively, while pattern A sits in the opposite direction, located here after 100 iterations. If one would like to preserve the oldat (1,8). memory while learning new knowledge. there are two ways to
OPTICAL ENGINEERING / September 1990 / Vol, 29 No 9 / 1111

5 LU. YU. GREGORY 137
X X
A Pl1 itt
I(a) )~Fig. 9. Memory matrix topology using linear learning speeds. (a) Fast learning
rate with the centers of the similar patterns I at (5,1), J at (7,2), and T at (8,4)and the center of the different pattern X at (3,8). (b) Slow learning rate with
n the pattern X pushed farther away to the upper right corner, centered at (1,8).Notice that the memory space becomes topologically more organized and also
appears smoother.
t achieve this. One way is to refresh the memory by repeatedly the self-organizing optical neural network has the ability to de-reviewing the previous input patterns, which takes a lot of corn- velop new categories in the memory matrix space to learn un-putationai time and may cause confusion. Another is to set a known objects while performing pattern recognition operations.I rule in the learning process: the new pattern would not take the The optical neural network is also capable of organizing a featureoutput nodes within certain regions of the old patterns in the map and preserving old memory while learning new knowledge.memory matrix. i.e., their center spots. This rule can be ex- These abilities can be achieved by setting new criteria of match-pressed as follows: ing scores. using a slower learning speed. and introducing the3 t N1 concept of forbidden regions in the associative memory space.
d~(t.) = max . m,tlriQt.) (17) 6. ACKNOWLEDGMENT
iLi~i~ ji3We acknowledge the support of the U.S. Army Missile Com-
mand through the U.S. Army Research Office under contractwhere Re(t,,) consists of the output nodes of dc(t,), deAt2) ... DAAL03-87-0147.dc(t 0-I) and their neighboring regions. illustrated in Fig. 10(c).The radii r of the forbidden region can be determined by ex-
I perience (in our experiments, re = 2 was selected). After this 7. REFERENCESrule is added to the Kohonen model. the neural network can I. R_ - Baron. Cerebral Computer. An Introducnion to the Computational
Structure of the Human Brain. Lawrence Eribaum Assoc. Publ.. Hillsdalc.£ easily remember 11 patterns without erasing similar patterns. as N.J. (198713 shown in Fig. 10(d). The centers of these 11 patterns in the 2. R. P. Lippmann. "lntroduce~on tocornputing with neural nets." IEEE ASSP
meoymti r t(,) t 86.Ea 68.Fa 88.Mag.. pp. 4--22 tApr. 1987).memoy mtri areB a (84), at(8.). Eat 6,8, F t (,8) 3.D E Rumeihart and J. L. McClelland. eds.. Parallel Distributed Proc-
I at (1!.8). 1 at (1.6), T at (3,8). V at (7,1), W at (6,3). X at essing: Explorations in the Microatructure of Cogniton. Vols. I & 2. MIT3I (.) nd t(.) Press. Cambridge (1986)5' 1) resl c a n beotindi teslfogniigopia 4 G A Carpenter" and S Grossberg. "'Massively parallel architecture for aAlthough reut a eotie ntesl-raiigotciseif-oreanizmng neural pattern recognon machine.' Comput. Vision Graph.
neural network by adjusting the learning parameters. the best Image Prec. 37. 54 (I987).results were achieved through experience. In addition. since the 5 K Fukushima. "'NeuraI net ,ork for visual pattern recogn~tion.' Comput.original Kooe oe a o eindfrptenrc~i .K Kohonen. Self.Organi:ation and Associative Memory. Spnnger-Verlag,
tin blt o efognztinadaatv atr e- New York (1984).tionnhanedailt byr nor oration with mortie pteffecve V Vemun, "'Afieial neural networks an ,niroduction.'" in Neural Net-
ognition can be enacdb noprto ihmr feneworks-Artificial Neural Networks. Theoretical Concepts. V Vernon. ed..L models, such as the interpattern association (IPA) model.' 8 in pp. I-IlI. IEEE Comput. Soc. Press f1988).
constructing the interconnection weight matrix during the learn- 8 i J Hopiield. "Arttshoiel neural networks. ' IEEE Circ. Devtces Mag.. pp.prces 3L-l( (Sept 1988).ing prcs.9 R Ftechi-Nielscn. "Neurocompuning. picking the human bramn.':" IEEESpectrum. pp. 36--4I (March 19881
i 5. CONCLUDING REMARKS 10. N. H. arhat. 0 Psaltis. A. Prat. and E. Pack. 'Optical implementation* of the Hopfield modlel.'" AppI. Opt. 24tlO), 1469 (1985).
SWe have demonstrated that the Kohonen self-orgtanizing feature 11 N H Farhat. "*Optoclecironic neural netrwarks and learning machines.'-IEEE Cire Devices M"(ag_. pp 32-41 rSept 1989).map algorthm can be implemented in an optical neural network 12 Y S Abu-Mostafa and D Psaltis. "'Optical neural computers." Sci Am..
toe perform adaptive pattern recognition. This model is modified pp. (895March 1987)and combined with several matching criteria we have developed. 13N H Far'hat and ID Psaltis. 'Optical implementation of ass~ciative mem-
orv hased on models or neural neiworksY in Opttwal Signal Processine.Experimental and computer-simulated results nave shown that J L. Homer. ed., pp 12ix-162. Academic Press. New York (1987)
I 1112 / OPTICAL ENGINEERING / September 1990 / Vol. 29 No. 9

SELF-ORGANIZING OPTICAL NEURAL NEiWORK FOR UNSUPERVISED LEARNING 138
,w . 14. S. Wu. T. Lu. X. Xu. and F. T. S. Yu. "Adaptive optical neural network,.:,nv a h;zS resolution video monitor.- Microwave Opt. Technol. Lett.2(7). 252 (1989).
15. T. Lu. S. Wu. X. Xu, and F. T. S. Yu. 'Two-dimensional programmableoptical neural network." AppI. Opt. 28t22). 4908 (1989)
16. F. T. S. Yu. T. Lu. X. Y. Yang,. and D. A. Gregory. "Optical neuralnetwork using pocket size liquid crystal televisions.: to be published inOpt. Lett.
Mf r ifr- U i 17. H. K. Liu and T. H. Chao. "Liquid crystal television spatial light modu-- - - - -(a) lator." AppI. Opt. 28(22). 4722 (1989)
n1 18. T. Lu. X. Xu. S. Wu. and F. T. S. Yu. "'Neural network model usingft1 . .interpattem association." App. Opt. 29(2). 284 0990.
NII)]= --- -
9Taiwei Lu received his BS degree from theUniversity of Science and Technology of Chinain 1985 and his Ph.D. degree from the Penn-
a.lylvania State University in 1990, both inelectrical engineering. He is currently a re-
- search scientist at Physical Optics Corpora-k9A tion, Torrance, *Calif. His research interestsU =- (b) - include optical neural networks, optical in-
.miterconnections, optoelectronic devices, ma-chine vision, and digitalloptical signal pro-cessing. He is a member of IEEE, OSA, SPIE,
International Neural Network Society, and Tau Beta Pi.
ancis T. S. Yu received his BSEE from MapuaInstitute of Technology, Manila, Philippines,
I__________and his MS and Ph.D. degrees in electricalengineering from the University of Michigan.From 1958 to 1965 he was a teaching fellow,
X_ .): instructor, and lecturer in the Electrical En-
ciate with the Communication Sciences Lab-oratory at the University of Michigan. From
(c) 1965 to 1980 he was on the faculty of theElectrical and Computer Engineering De-
partment at Wayne State University. He was a visiting professor inelectrical and computer engineering at the University of Michigan
during 1978-1979. Since 1980, Dr. Yu has been a professor in theElectrical Engineering Department at the Pennsylvania State Univer-i. sity. He has been a consultant to several industrial and government
laboratories. He is active in research in the fields of optical signalprocessing, holography, optics, and information theory and has pub-lished numerous technical papers in these areas. He was a recipientof the 1983 Faculty Scholar Medal for Outstanding Achievement inPhysical Sciences and Engineering and the 1984 Outstanding Re-searcher in the College of Engineering at Penn State and was namedEvan Pugh Professor of Electrical Engineering there in 1985. He isthe author of Introduction to Diffraction, Information Processing andHolography; Optics and Information Theory Optical Information Pro-
(d) cessing, White-Light Optical Processing, and Principles of OpticalEngineering Dr. Yu is a Fellow of OSA. SPIE. and IEEE.
-. .- I I5 Ijo M Don A. Gregory was born in Alabama in 1953.V 8 01 He earned BS and MS degrees in physics anda Ph.D. in physics in 1984 from the Universityof Alabama in Huntsville. Dr. Gregory is cur-
rently a research physicist at the U.S. ArmyMissile Command at Redstone Arsenal, Ala.Fig. 10. Topological memory matrix space showing leaming without His interests include optical computing, pat-
erasing the old memory: (a) Pattern B in the memory matrix space. tern recognition, and teaching. He is an ad-(b) Pattern B submatries are erased, after pattern E is learned. junct professor of physics at the University3 (c) Forbidden regions in memory matrix space. (d) Learning new pat- of Alabama in Huntsville and the University
terns without erasing old ones. The centers of the 11 patterns are of Alabama in Birmingham. He is also an ad-8 at (8,4), C at (8.6). E at (6,8), F at (8,8), I at (1.8), J at (1,6), T at (3,8), junct professor of electrical engineering at the Pennsylvania StateV at (7,1), W at (6,3), X at (1,1), and Y at (1,3). University.
3 OPTICAL ENGINEERING / September 1990 Vot 29 No 9 3

Ii 139
III
APPENDIX 10.19
IColor Holography Using LiNbO1£
II£IIIIIIIIIU

Ii 140
Volume 8 1. number 6 O'TICS COMMUNICATIONS IS March 1991i
I Color holographic storage in LiNbO 3
Francis T.S. Yu, Shudong Wu, Andy Mayers and Sumati RajanThe Pennsvlvania State Universtv. Department of Electrical Engineering. University Park, PA 16802. USA
and
Don A. GregoryThe US. ArmY Missile Command. Research Directorate. Redstone Arsenal AL 35898-5248. USA
IReceived 3 August 1990
ft Experimental demonstrations of real-time color holographic storage in LNbO using a "white ight" laser are presented. Thegeometr; of the recording setup and wavelength crosstalk are discussed.
Two of the most widely used white-light holo-grams must be the reflection hologram of Denisyuk[1] and the rainbow hologram of Benton [2,3]. Inreflection hologram, a thickness emulsion of about20 laim would have a wavelength selectivity about A;/ H3 ,.= 1/40. which is high enough to produce color hol-ogram images without significant color blur. How-ever. the physical requirements for constructing a re-flection hologram is rather stringent, which preventsits wide spread use of applications. On the other (a) (b Ihand. construction of a rainbow hologram requires
a narrow slit, for which the parallax information of Fig. .. wrting angle. ta Transmission hologram. ib) Retlec-I the hologram image would be partly lost. tion hologram.
In this communication, we shall demonstrate that length selectivities for transmission and reflectioncolor holograms can be constructed in a photore- hoogram can be shown as [5rfractive crystal using a "white-light- laser. Sincephotorefractive crystal is much thicker than conven- 5;.) (72-sinc i::a .tional photographic emulsion. it provides a higher 1,- sin-a d"wavelength selectivity such that the color blur can beminimized. Furthermore. the construction of pho- andtorefractive holograms is in real-time mode and the 6;.) shrinkage of the emulsion can be prevented. As in cos:ai" (2)contrast with the photographic film. multiplexingcolor holograms in a photorefract:ve crystal is where a -s the incident angle and )I is the refractivepossible. index of the hologram. The !;or.nalized wavelength
By applying the coupled wave theory (41 in thick selectivities as a function of- --°dent angle are plot-emulsion hologram, as illustrated tn fig. I. wave- ted in fig. 2. where we notice that the wavelength se-
£ 348 0030-4018--9SI,03-50 1 - _s er S-cence Publishers B V Nonh-Holland)
U'

j141
Volume 8 1. number 6 OPTICS COMMUNICATIONS 15 March 1991
5 d AA
- _100
I i.\
- ,b
10
-* .
0.1 -1, 10 20 30 40 50 60 70 s 90
x (degrees)
I Fig. 2. Wavelength selectivity normalized by (4./d)r= 2.23. (a) Transmission hologram (the scale on right). ib) Reflection hologramf the scale on left).
iectivity for reflection hologram is one to two orders beams to insure the color uniformity. The object-to-of magnitude higher than the transmission hologram, reference beam ratio in our experiment is about 1: 8.
For a true color hologram construction. a red. a for which a very high quality color hologram is con-green. and a blue wavelength (e.g., 630 nm. 510 aim. structed. Fig. 3 show- a color hologram image re-and 440 nm) should be used. in which the relative constructed using the "white-light" laser, notice thatwavelength spacing is about 1/5. Thus the wave- both vertical and horizontal parallaxes are pre-length selectivity of a color hologram should be served. Furthermore. by viewing the hologram im-smaller than the relative wavelength spacing of the age at different angles. it does not cause any changelight source. For instance, using 30c incident angle in the color, as in contrast with the rainbow holo-for a transmission hologram, the thickness of the graphic imaging.emulsion should be greater than 50;. which is on the We stress that. excellent color fideity can alwaysorder of a few hundred microns. This thickness can be obtained by properly controlling the exposure andeasily be obtained by using photorefractive crystal, spectral lines polarizations. Nevertheless. lif the ex-
To record a color transmission holoaram. we used posure is incorrect, color saturation dominated bya I mm thick LiNbO 3 photorefractive crystal with a the strongest spectral line would occur in the holo-writing angle of about 15'. To reduce the noise dis- gram image.
turbances caused by the defects of the crystal. a piece Multiplexing construction is a means of ,igh den-of ground glass be placed at the front of a color ob- sity holographic storage. for which the :hickness ofec& transparency. The recording light source is a photorefractive crystal makes it possible. Fig. 4 shows
Lexel Kr-Ar "white-iight" laser. which has nine spec- an optical setup for the multiplexing color hologramtl lines distribuied within the visible regioln. The construction process using a LiNbO3. A condensing
strongest spectral lines of this laser are being 488 nm. lens L, is used to focus the object beam onto the514 tim. and 647 nm wavelengths. Since the spectral crystal. The direction of the obiect beam can be ad-
lines os ate at different transversal modes. spatial justed by positioning L. by which vanous cc;ectI:iters are used in both the object and the reference transparencies can be multiplexing into the photo-
349II

1427
V'olume 8i1 number 6 OPTICS COMMUNICATIONS 15.%March !991
Fi53 eosrce clrhlgmiaeIf a l v t c y t l n t e h l g a m g e o s r c L .I i h r f r p a e t T a , i n N . i h lti o n p r o c e s s . a p inh o l i s p a e *F o h e e' r a s u e . *h n N ' o j e ,s c n b u t p e e -i
gtpee Fif3.Rounc color holorminteL~O ouor. isnearta h oo
rericrystal. n the hlograxpimae ecnsue 3 1 Ie thrfom dr.z ap rngpa re cotati nstrucpioncion procesto aciv ihoe sae di 1 for ese-aracto isi sd.thnNoecscnbmuiexdncion- o ehe olor image .hcFwudtberimare I the crho ogra e cord Snget pioesle aveatesiof epihlusda P, by ab nou e onsrtinwe ae caund beha realor b ursngak pogram the ratinllgtwheriemxmted urm r oogixms of the LoOt a omdlat o it en is leat .thoout bmv canhScrysistal. W-e othe obhat. anulipsur thecalhniue{L. b radol avr:a du.n helecotrcto
cnd achev thenial same diiracio ofl-h mnrocesbesoczecv or achcolr h~o~am mag. Frthrmo dy namhecor oogra-,mt rh eakordingpoesw a'5 th s~z o he inhoe usha ,i aote ave found t u color crossocriak. the aractii
the color crossiiks are cascaded whic. will dee--rt he rcon'st- -L.e Imaze Oual-tv. The oo
crosstalk can '0, :zicrprezed as t-c spatial be-C5 phenomena. In we- ha%-, obs-an ed !he b'freauerc~ co o h*r1 r
F ig. _5Shows a %%avvccor Jtogre- ro re ;3the bc.Ea~tn proccss. he wri-ms (Aan OFir C O~.j;:---.- cor~ :Mpric are p duc- h: -- nTih ;:. w a.j
I 350

3 143
IVolume 81, number 6 OPTICS COMMUNICATIONS 15 March 1991
I can be computed as follows.
i 23)C GWe stress that. Er small 0. the angles of beatings
would be about the same in different orders.F Fig. 6 shows the cascading beating phenomenon
generated by multi-color two-beam mixing in aLiNbO3 photorefractive crystal of I mm thick, wherethe interference angle 20 is set about 15-. The bright-est spat shown it this figure represents the normalreconstructed spot. while the other spots are gener-
ated from the beating phenomenon due to color
0 crosstalks. The color crosstalks are primarily causedby the blue light gratings read-out by green wave-Fig. 5. Wavevector diaram to represent color crosstalk, length or vice versa. For example, the angle of the
e rbeating grating, J. of the right-side spots is measuredare resulted from.. They form grating vectors AC to be 0.0103+0.001 %- which is in agreement withand BC respectively. If the read-out vector is par- thecalculatedresultof0.0102.asobtained fm eq.alleled with respect to vectors OA or OB. then the the Simlarest o 12 left-id fro e-
grating vector BD can only be read out by .,. How- (). Similarly, the spts on the left-side are gener-ever, -f the wavelength selectivity of the hoogami light.
eve. fth wveengh cl -civty f hehologram i ated by the green bearing gratings read-out by blue-tot high enough. or due to the response from the si- We have demonstrated color holographic imaging
Qlobes. then the grating vector BD can also be read- using a thick crystal LiNbO3 photorefractive crystalout 'y ,;,. In fact. the read-out vector due to cros- with a "'white-light" laser. We have experimentallystalk -. n be interpreted as the conservation of (wave shown that high quality color holoram image can bevector) .- omentum along the direction of the grat- obtained with a thick crystal without sacrificing theingvector. Thus by translating vector BD to AE. and parallax. Multiplexing color holograms in a thickdrawing EF. parallel to the bisector of angle (20). photorefractive crystal is also discussed. for whichand intersecting t: circle at F. a new wavevector OF we have proposed using a programmable spatial light
can be drawn. Wic have also seen that the wavevec- moduat e rnd adro lo s stalkmodulator for the random address. Colorcrosstalk
tots OC and OF form. a beating grating CF. which caused by the grating beating phenomena is also
can be read out by vecto: 0D of ;._. Similarly, a new studied. To minimize the color crosstaik, a highersaticto. it isFprSi ceing batihe omna i al soavevector 06 is produce*-by ., at about the same wavelength selectivity (i.e.. thick crystal) photore-direction of fF. Since vecxtors O.F and OG would in- tractive media than normally required should be
teract with OA and OB. it woula -, -erate a second- used.gary set of beatir.gs. The angle of the beating grating
I!I Fig. 6. Gratng beatiag pn:nemton.
*351
i

I144I
Volume 81. number 6 OPTICS COMMUNICATIONS 15 .March 199:
I We acknowledge the support of the U.S. Army ReferencesMissile Command through the U.S. Army ResearchOffice under contract DAAL03-87-K-0147 and the [l Y.N. Dnis,-uk Soviet Phys. Doklady 7 (1962) 543.
o2a S.A. Benton, J. Opt. Soc. Am. 59 (1969) 1545.-ppor of the white-!ight laser from the LEXEL [31 F.T.S. Yu, A. Tai and H. Chen. Opt. Eng. 19 (1980)666.LASER, Inc., Fremont. California. [4) H. Kogelnik. B.S.TJ. 48 (1969) 2902.
[51 S. Wu. Q. Song. A. Mayers. D. Gregory and FT.S. Yu. AppL.Optics 29 f1990) 1118:
IIIISII
I
I
I£ 352
U

ii145
III
APPENDIX 10.20
ICompact WI' V Neural Network
£IIISIIIIISIII

5 146
II3a reprit from Applid Optics
IIU
Co"wed opuci nar Inewek mU* -Ta LScascadind EqS cryu Wne iscWNanIXgaig Van. Tt." U1. aid Fraicis T_ S_ Yu Serc
Pfnnsnia State Uninrst. Electrical EngineeringDepartment. University Park Pennsylvania 16802.
Received 5 June 1990- z t I0 ~ ;.jSosrdbyc L C. Cha. Litton Indties
LIOpO cal Sociehi of Amftica
areiseeture offers compactne in size. cam of ai e,.higher light efficiency, better imag-e q a nd vW ocTh.e iun-plementtion of the a toassoci ative ar,. beit svc £ 113 native memories is giei. Co arct- i. ze uing 0 " -c ed LCT'.t
Much work has been done L&, b-ri about the optical imple-menuw of neural network- primarly a the palelim televisi LWI~sF InviewofthepreeeizgONN stanand massive interconnectivity of optics. The firu 2-D opti=-l n i t i heOcal neural netrrk (2-D ONN) w simulate the Hop&i. e s a numencas apertm lens. tmodelwas propoed by Farhat and Psaltisin 11986-' Aa LED order of L:.7. is needed to image the l[cadet army ontoth
ary asusd d ipu f~m cm w-k o - output, chrg-ued device 1CCD) deeco. The Jkr"%-
araywa uedasth ipu fsurecopoer wic i O-Z- tec' Ures suffer fro -n law light ef ici ency. hin aberratio - --Ically itercnnctd to a weightin mask. cal the in-: lrE-,t-sedet h mgnconnection weight ma--trix (I '}or asoitve memory m-a ,r€P i . ,~ m~n
a by. a lensiet array. To provide thenrrai networ a To aile-iate thise probems, we propose a new compactlearncncbi,. a fine resolution and high dnmc a r nectu' u ttly caser La. as DXX i FNig-
* programmable spatial light modulator (SLM are requr-n 1. -. -
for the generation of the I Xewart, t can e desce nva msr.-ec-,, pra--.Recently we proposed a differen N r operationo H4 -opiled a oi n
a hig resolu tion " de o, in nito° z tm by which ILM in we c onn e" "
panive pr in the Hopfield equiaon can be qptcafly added. , + V = j .Moe recns e tructed an ONN uninr fiquid cry- U ,
0OCoier 1990 - Vol 29.1c16, I APec__3,-I_,S 54n3
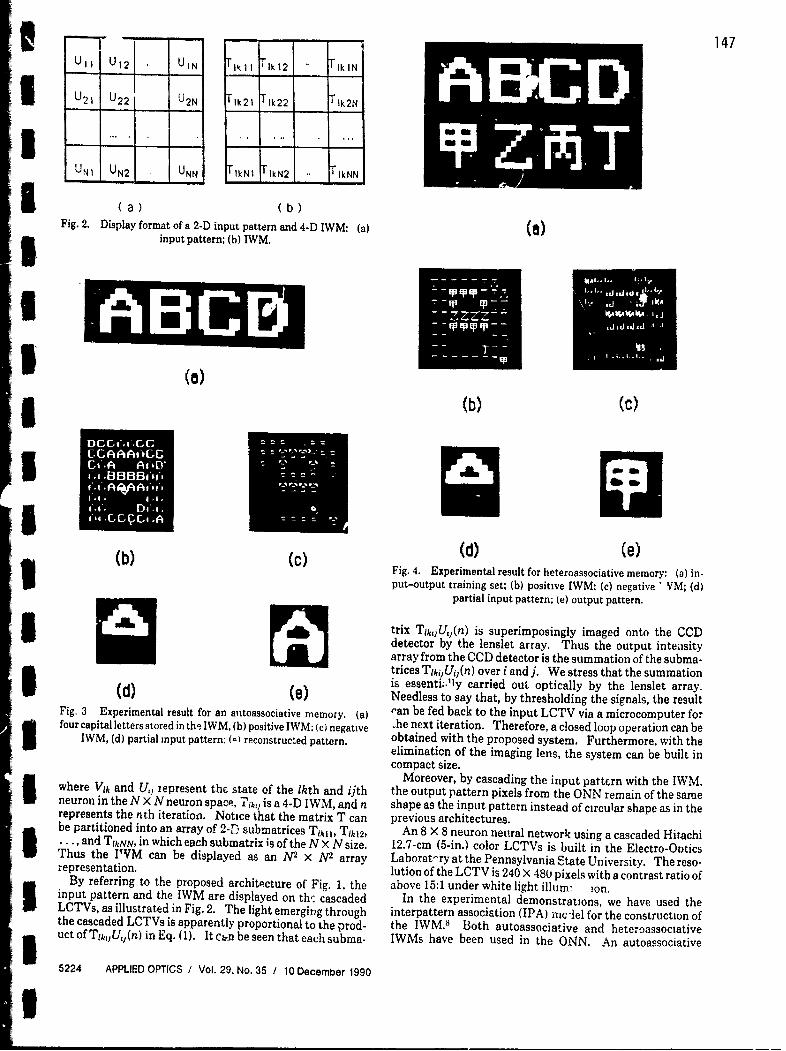
3-,- 147U,, I U 12 . UN I kiTl k12 T kIN
3 U 2 1 U 2 2 U2N TIk2j Tk22 TIk2N
UN1 UN 2 UNN TIkNi IkN2 FIkNN
i (a) (b)Fig. 2. Display format ofa 2-D input pattern and 4-D IWM: (a) (a)ft input pattern; (b) IWM.
I (a)
(d) (e-) '
(b))c(c)
I X 1If-I A
()(d)(eFig. 4. Experimental result for heteroassociative memory: (a) in-put-output training set; (b) positive IWM; (c) negative ' VM; (d)
partial input pattern; (e) output pattern.
trix T,U 1 (n) is superimposingly imaged onto the CCDdetector by the lenslet array. Thus the output intensityarray from the CCD detector is the summation of the subma-trices TjokUj,(n) over i and j. We stress that the summationis essenti..'y carried out optically by the lenslet array.(d) Needless to say that, by thresholding the signals, the resultFig. 3 Experimental result for an autoassociative memory. (a) -an be fed back to the input LCTV via a microcomputer for* four capital letters stored in the IWM, (b) positive IWM: (c) negative he next iteration. Therefore, a closed loop operation can be5 IWM, (d) partial input pattern; (A) reconstructed pattern, obtained with the proposed system. Furthermore, with theelimination of the imaging lens, the system can be built incompact size.
Moreover, by cascading the input pattern with the IWM.where Vmk and U1 represent the state of the Ikth and ijth the output pattern pixels from the ONN remain of the same* neuron in the N x N neuron space, 7i'h is a 4-D IWM, and n shape as the input pattern instead of circular shape as in therepresents the nth iteration. Notice that the matrix T can previous architectures.I be partitioned into an array of 2-D submatrices TkiIh, Tilh2, An 8 X 8 neuron neural network using a cascaded Hitachi..., and TjhNN, in which each submatrix is of the N X N size. 12.7-cm (5-in.) color LCTVs is built in the Electro-OnticsThus the IWM can be displayed as an N2 x N 2 array Laborat-ry at the Pennsylvania tate Universitv. Thereso-representation. lution of the LCTV is 240 X 480 pixels with a contrast ratio ofi By referring to the proposed architecture of Fig. 1, the above 15:1 under white light illum: ion.input pattern and the IWM are displayed on the cascaded In the experimental demonstrations, we have used theLCTVs, as illustrated in Fig. 2. The light emerging through interpattern association (IPA) mc-lel for the construction ofthe cascaded LCTVs is apparently proportional to the prod- the IWM.8 Both autoassociative and heteroassociativei uct of Tjk,,U,(n) in Eq. (1). It cinn be seen that each subma. IWMs have been used in the ONN. An autoassociative
5224 APPLIED OPTICS / Vol. 29. No. 35 / 10 December 1990
3

148
IWM for the English letters A, B, C, and D is shown in Figs. References3(b) and (c). If a partial pattern of A, as illustrated in Fig. 1. N. H. Farhat. D. Psaltis. A. Prata, and E. G. Paek, "Optical3(d), is 'rrsented at the input of the ONN, a recovery of Implementation of the Hopfield Model," Appl. Opt. 24, 1469-patt'.i. is obtained after one iteration in our experiment, 1475 (1985).aq s-.,Iw in Fig. 3(e). 2. N. H. Farhat and D. Psaltis, "Optical Implementation of Associa-
F .r the aeteroassociative memory, four English letters and tive Memory Based on Models of Neural Networks," in Opticalfcur "Li.iese characters are used as the input-output train- Signal Processing, J. L. Horner, Ed. (Academic. New York. 1987),ing set, as shown in Fig. 4(a). The heteroassociative IWM is pp. 129-162.depicted in Figi. 4(b) and (c). Again, if a partial a is present- 3. B. Macukow and H. H. Arsenault, "Optical Associative Memoryed at the input of the ONN, the corresponding Chinese Model Based on Neural Networks Having Variable Interconnec-character is obtained after one iteration, as shown in Fig. tion Weights," Appl. Opt. 26, 924-928 (1987).4(e). 4. J.-S. Jang, S.-W. Jung, S.-Y. Lee and S.-Y. Shin. "Optical Imple-
In conclusion, we built a compact ONN using tightly cas- mentation of the Hopfield Model for Two-Dimensional Associa-caded LCTVs. This optical architecture offers the advan- tive Memory," Opt. Lett. 13, 248-250, (1988).tages of compact size, easy alignment, higher light efficiency, 5. S. Wu, T. Lu, X. Xu, and F. T. S. Yu, "An Adaptive Opticalbetter image quality, and low cost. Demonstrati, is of the Neural Network Using a High Resolution Video Monitor," Mi-autoassociative memory and heteroassociative nslation crowave Opt. Technol. Lett. 2, 252-257 (1989).are provided. 6. T. Lu, S. Wu, X. Xu, and F. T. S. Yu, "Two-Dimensional Pro.
grammable Optical Neural Network," Appi. Opt. 28, 4908-4913(1989).
7. F. T. S. Yu, T. Lu, and X. Yang, "Optical Neural Network UsingPocket Size Liquid Crystal Televisions," Opt. Lett. 15, 863-865
We acknowledge the support of the U.S. Army Missile (1990).Command through the U.S. Army Research Office u:-der 8. T. Lu, X. Xu, S. Wu, and F. T. S. V-i, "Neural Network Modelcontract DAAL03-87-0147. Using Interpattern Association," Appl. Opt. 29,284-288 (1990).
10 December 1990 / Vol. 29. No. 35 / APPLI'-D OPTICS 5225

1 149
III
.~PPENDTX 10.21
IWavelength Multiplexed Matched Filters
II£IIIIIIIIIII

3 150
IVolume 81. number 6 OPTICS COMMUNICATIONS 15 March 1991
IWavelength multiplexed reflection matched spatial filters
5 using LiNbO3
Francis T.S. Yu, Shudong Wu, Andrew W. Mayers and Sumati RajanPennsYlvania State University. Department ofElectrical Engineering, 121 Electrical Engineering East.UniversitY Park. PA 16802, USA
3 Received 8 August 1990
The wavelength multiplexing properties of a reflection filter are investigated. A photorefractive LiNbO3 crystal was used toconstruct an experimental filter. The wavelength selectivity and shift invariant properties of the filter were analyzed and exper-mentally verified.
U Recently, multiplexing of filters in photorefractive tal. Referring to the coupled-mode analysis of Ko-materials has attracted much attention. By measur- gelnik [4], we will analyze the wavelengthing the maximum phase shift achieved in a deep vol- multiplexing capacity of reflection type matchedume hologram, and calculating an exposure schedule spatial filters. By integrating over the thickness of thefor recording multiple equally diffracting holograms, crystal, as was suggested by Gheen and Cheng [ 5 ],Hong et al. have estimated that over 1000 holograms we will show that thick crystal filters exhibit highcould be recorded in a 4 mm thick BaTiO 3 crystal wavelength selectivity as well as retaining a good de-[ 11. The ho!ograms can be recorded in the crystal gree of the shift invariance. Thus, by recording singleusing angular or wavelength multiplexing tech- wavelength filters, and reading-out the filters with aniques. By using a fixed image position, and chang- multi-wavelength source, parallel pattern recogni-ing the angular position of the reference beam, Mok tion can be performed.et al. have reported recording 500 high resolution, It is well known that volume holograms offer highuniformly diffracting volume holograms in a single diffraction efficiency and high angular and wave-LiNbO 3 crystal [2]. By writing holograms sequen- length selectivities. Reflection volume hologramstially, and changing the writing wavelength between have a much higher wavelength selectivity thanexposures, multiple holograms can be recorded in the transmission volume holograms, while the angularcrystal. This wavelength multiplexing technique has selectivity of the holograms remain similar. For thisthe advantage that neither the object nor the refer- reason. we chose to use reflection volume hologramsence beam needs to be changed in the writing or for the matched filter synthesis. Using the weak cou-reading processes. even though the two processes can pling approximation, where multiple diffractions arebe used in conjunction to further increase the mul- ignored. the wavelength selectivity of the reflectiontiplexing capabilities. This technique has been used hologram can be expressed as (61in holographic film in which matched filters were ( 1 )multiplexed (3]. However, the thin film emulsion - = '-cos-a D'leads to low wavelength selectivity, and the filters are
difficult to produce. In addition, the system was not where,. is the central wax elength of the writing beam.capable of quick updating of the reference patterns. D is the thickness of the crystal. n is the refractive
In this paper we will investigate wavelength mul- index of the crystal. and a is the external angle showntiplexed matched spatial filters using a LiNbO, crys- in fig. 1.
0030-4018/91I$03.50 © 1991 - Elscvier Science Publishers B.V (North-Holland) 343
I

1 151
I3 Volume 81. number 6 OPTICS COMMUNICATIONS 15 March 1991
wavevector representations in the crystal can be ex-pressed as.
I Sko(t ) (nl;,)i
20 L, 6+- 1 L
k,(A)= - 1~t+ I- X ,4.2 ;.2 ( 2n2
Fig. I. Writing angle for reflection hologram. k3 (; 2 ) = (-- 1_ L3 (2)
The shift invariant property of the spatial filter can where i and ,i are the unit vectors along and normalbe determined using layer integration over the thick- to the optical axis of the system. respectively. Theness of the crystal as proposed by Gheen and Cheng output correlation signal can be expressed by the fol-[5). Fig. 2 shows a schematic diagram for the syn- lowing integral equation:thesis of a reflection type matched spatial filter.Without loss of generality, we will use a I-D repre- -)(xusentation for the analysis, in which qt (xt) represents R (x3 ) =AIj q(xt) q2(x,)the reference image that is located at the front focal 2plane of the transform lens L. For a given point x1,a wave represented by wavevector k, (xi, ., ) is in-
cident at the photorefractive crystal. The referencebeam is a plane wave represented by wavevector where Ak represents the Bragg dephasing vector.ko (At), and is incident on the opposite side of the Ak=ko-k 1 +k,-k 3 . (4)crystal. Thus, it is apparent that a reflection typematched filter can be recorded in the crystal. Let For simplicity, assume that the size of the crystal is
q 2 (x 2 ) be the readout beam representing the input infinite in the i direction, therefore the fi component
object, which is to be detected. Thus, each point x2 of the Bragg dephasing wavevector must be zero.
would produce a readout wavevector k,(x,, A2 ) for From eq. (4), we have,which the reconstructed wavevector is k3(x 3, .), x/;.I-(x2+x 3 )/) 2 =O. (5)where x3 denotes the output coordinate plane. The
3T01 (X k,( -
IIIFig 2. Geometry tar reflection matched filter ,q x:. and x1 arc refcrence, input, and output plane, respecti,'ely kn, k1 . k:. and A, arc
reference, writing. reading. and readout wavevectors respectavcly
1 344
k

152
Volume 81. number 6 OPTICS COMMUNICATIONS 15 March 1991
It follows that cal length of the lens. It follows that the wavelengthselectivity and shift invariance property are depen-
x2= (I - AA/. )xI -x 3 , (6) dent on the thickness of the crystal. In addition, by
where AA= I-; 2. Since the relative wavelength dif- changing the effective focal length F of the system,
ference, AA/ I is small, the third order terms can be a desired shift invariance for a given thickness of the
neglected. Thus, the j4 component of the Bragg de- crystal can be obtained [ 7 ].* phasing vector can be written as Fig. 3 shows the optical setup that was used for the
I 1experiments. The beam splitter separaes the beam
Ak. [2n2 -x 3(x, -x 3) (7) into a reference beam that enters the crystal from the
I right, and an object beam that illuminates the input
By substituting eqs. (6) and (7) into eq. (3), and plane, which is transformed by lens L, ontc a 1 mm
integrating with respect to u. z. and x., the correla- thick LiNbO3 crystal. These two beams interfere in
tion signal is the crystal to form a reflection type matchei filter.After the filter has been recorded, the reference beamI! [( 'A.) is blocked. and an input object to be correlated with
) =A q - the filter is placed in the input plane. The light scat-
rD/2 ,A) 12 tered by the filter forms an output signal that is×sincLn_ 2n" -.x3(-r, -X3) dx, . (8) transformed by lens L2 onto the output CCD detec-
fIA t A tor, which is connected to a video monitor for real-
With reference to the sine factor, one can evaluate time observati o n .
the wavelength selectivity and the shift invariant In the first experimental demonstration, we tested
properties of the thick crystal filter. If the input ob- the wavelength multiplexing capabilities of a Li-
ject is centered with respect to the reference function NbO3 crystal. By using A=488 nm, D= 1 mm, and5 (i.e.. x 1=x 2), then the filter would respond to the n=2.25 in eq. (9), we found that the filter should
wavelength vanations that satisfy the inequality of not respond for wavelength shifts of AA2> 0.106 nm.eq. (9), We recorded individual matched filters using wave-
e (lengths 457.9, 465.8, 488, and 496.5 nm. ReadingI AA/)., I <A 1/nD. (9) out these filters with wavelengths different from theThis result is essentially the same as was obtained recorded wavelength produced no visible output sig-
with coupled wave theory of eq. ( 1 ) when the beams nal. Next, a multiplexed filter using the previously
are perpendicular to the surface of the crystal. cited wavelengths was recorded of the capital letters
On the other hand, if the read-out and the writing D, F, K, and J. Fig. 4a shows the output autocor-
wavelength are identical, then the filter would re-
spond to object shifting that satisfies the inequalityof eq. (10), [ gnj
3 x3(x1 -X3) AF2 < n' (10) ..S. z
where F represents the focal length of the transformlens. 7 Crysal
By substituting eq. (6) into eq. (10), and letting .u/ F/ ytc
x2=x, - Ac. we haveI A x(X1 - Ax) 1... <; 21F-'/nD. (1
ShutterThis inequality shows that the allowable shift, Ax. is3 dependent on the halfwidth of the input object(x, - Ax)n,, the thickness of the crystal, and the fo- Fig. 3. Experimental setup.
I 345
UI

3 '153
IVolume 81. numnber 6 OPTICS COMMUNICATIONS Is March 1991
IXI0
*00b
LII
Fig. 5 Shift invanance property of reflection volume filter. (a)(C) Autocorrelation of letter 0. (b) Input object consisting of two
O's and an X. (c) Output of carrelator using inpu! shown in partb.
Fig 4 Output of coffelator. (a) Autocorreiation of letter D. (b)Intensity plot of output from part a (c) Crosscorrelation with cotrrelation peak was obtained. Fig. 4c shows the out-letter C. using same wavelength.
put cross correlation of this Ifiter with an input ob-ject C using a wavelength 457.9 nim. It is apparent
relation spot of a letter D using wavelength 457.9 nm. that no detectable peak was observed. Thus. we haveThe corresponding intensity profile of the autocor- seen that the wavelength multiplexing capabilities ofrelation signal detected by the CCD camera is shown the crystal filter are in good agreement with ourIin fig. 4b. In this figure. we see that a high intensity analysis.
346
U 154
I3 Volume 8 I. number 6 OPTICS COMMUNICATIONS 15 March 1991
In the second experiment the shift invariant prop- within the beam, and we found that very little am-erry of the crystal filter was verified. By using ;.= 488 plitude variation in the correlation peak intensity wasnm. n=2.25. D= I mm. and effective focal length observed. As before. the experimental results are inF= I m. in eq. (10) is clear that [A (x,- Ax) I must good agreement with our analysis.be less than 216 mm:. The objects that were used forthis experiment have halfwidth of 1.3 mm. for which We acknowledge the support of the NASA Re-the shift invariance expression reduces to xrx< 16 search Grant NAG9-403/Basic.cm. which is much larger than the beam diameter. Areflection type filter of capital letter 0. centered atthe input plane was recorded. The corresponding Referencesoutput autocorrelation signal is shown in fig. 5a.Next. a transparency consisting of two O's and an X I I .J.H. Hong. P. Yeh. D. Psaitis and D. Brady. Optics Lett. ISas shown in fig. 5b was inserted at the input plane of (1990) 344.the optical system. The letters were translated about (21 F. Mok. M. Tackett and H.M. Stoll. in: Digest of Annual
Meeting -)f the Optical Society of Amerca (Optical SocietySmm with respect to the position of the reference of America. Washington. D.C.. 1989) p. 76.
object of the filter. The corresponding output cor- 131 S.K. Case. Appl. Optics 18 (1979) 1890.relation spots are shown in fig. 5c. where two strong [41 H. Kogelnik. Bell. Sys. Tech. J. 48 (1969) 2909.correlatton spots are observable. as well as a weak 151 G. Gheen and L. Cheng. AppI. Optics 27 (1988) 2756.
cross-correlation distribution. The input beam in this [61S. Wu. Q. Song. A Mayers. D. Gregory and F.TS. Yu. Appl.Optics 29 (1990) 1118.
experiment had a usable radius of about -eh bt 2 cm. 171 FT.S. Yu. S. Wu and Sumati Rajan. Compact joint .ransforrnand beyond this radius the beam exhibited rapid am- correiator using a thick photorefractive crystal. submitted toplitude variations. Next. the input object was shifted Optics Lett.
3I
I
III1 347
I

1
- I'3 155
UIB APPENDIX 10.22
ISpace-Time-Sharing Neural Network
IIIUIUIU3IUI3U
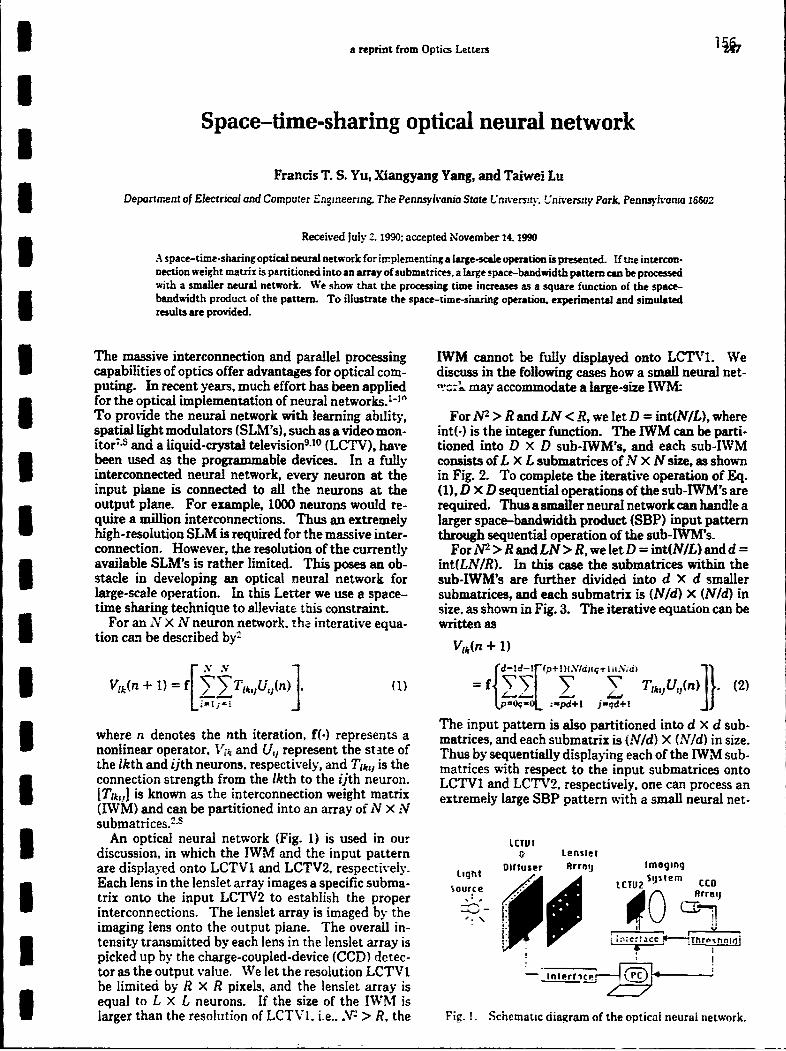
I a reprint from Optics Letters
USpace-time-sharing optical neural network
Francis T. S. Yu, Xlangyang Yang, and Taiwei Lu3 Department of Electrical and Computer Engineering. The Pennsylvania State University. Universty Park. Pennsylvania 16802
Received July 2. 1990: accepted November 14. 1990
A space-time-sharing optical neural network for implementing a large-scale operation is presented. If tne intercon-nection weight matrix is partitioned into an array of submatrices, a large space-bandwidth pattern can be processedwith a smaller neural network. We show that the processing time increases as a square function of the space-bandwidth product of the pattern. To illustrate the space-time-sharing operation. experimental and simulatedresults are provided.
The massive interconnection and parallel processing IWM cannot be fully displayed onto LCTV1. Wecapabilities of optics offer advantages for optical corn- discuss in the following cases how a small neural net-puting. In recent years, much effort has been applied -zk may accommodate a large-size IWM:for the optical implementation of neural networks-" 'To provide the neural network with learning ability, For N2 > R and LN < R, we let D = int(N/L), wherespatial light modulators (SLM's), such as a video mon- int(-) is the integer function. The IWM can be parti-itor'7- and a liquid-crystal television -so (LCTV), have tioned into D x D sub-IWM's, and each sub-IWMbeen used as the programmable devices. In a fully consists of L X L submatrices of N X N size, as showninterconnected neural network, ever- neuron at the in Fig. 2. To complete the iterative operation of Eq.input plane is connected to all the neurons at the (1),D x Dsequential operations of the sub-IWM's areoutput plane. For example, 1000 neurons would re- required. Thus a smaller neural network can handle aquire a million interconnections. Thus an extremely larger space-bandwidth product (SBP) input patternhigh-resolution SLM is required for the massive inter- through sequential operation of the sub-IWMsconnection. However, the resolution of the currently ForN2> Rand LN> R, we let D = int(N/L) and d=available SLM's is rather limited. This poses an ob- int(LN/R). In this case the submatrices within thestacle in developing an optical neural network for sub-IWM's are further divided into d X d smallerlarge-scale operation. In this Letter we use a space- submatrices, and each submatrix is (Nid) x (N/d) intime sharing technique to alleviate this constraint. size. as shown in Fig. 3. The iterative equation can be
For an N x N neuron network, the interative equa- written astion can be described by2 V(n + 1)
VA(n + 1= f( )T.,q.(,n TU K .(n (2)
U [ ~ ~ - = fj :-pd+i q-
The input pattern is also partitioned into d X d sub-where n denotes the nth iteration, f(-) represents a matrices, and each submatrix is (Nd) X (N/d) in size.nonlinear operator, 1§ and U,, represent the state of Thus by sequentially displaying each of the IWM sub-the Ikth and ijth neurons, respectively, and Tk,4 is the matrices with respect to the input submatrices ontoconnection strength from the lkth to the ijth neuron. LCTV1 and LCTV2, respectively, one can process an[Tk,,] is known as the interconnection weight matrix extremely large SBP pattern with a small neural net-(IWM) and can be partitioned into an array of N x Nsubmatrices.2-
An optical neural network (Fig. 1) is used in our LCTutdiscussion. in which the IWM and the input pattern a Lensletare displayed onto LCTV1 and LCTV2, respectively, tight Diffuser Rrrej Imgi CE
Each lens in the lenslet array images a specific subma- Source . I L /U fjt rCItrix onto the input LCTV2 to establish the proper ( rraij
interconnections. The lenslet array is imaged by the . J-imaging lens onto the output plane. The overall in- ctensity transmitted by each lens in the lenslet array is I I 'V : c , "-Th-r o .' P,
picked up by the charge-coupled-device (CCD) detec-tor as the output value. We let the resolution LCTVI -nrtc,-.be limited by R X R pixels, and the lenslet array is
i equal to L X L neurons. If the size of the IWM islarger than the resolution of LCTVI. i.e.. r2 > R. the Fig. 1. Schematic diagram of the optical neural network.
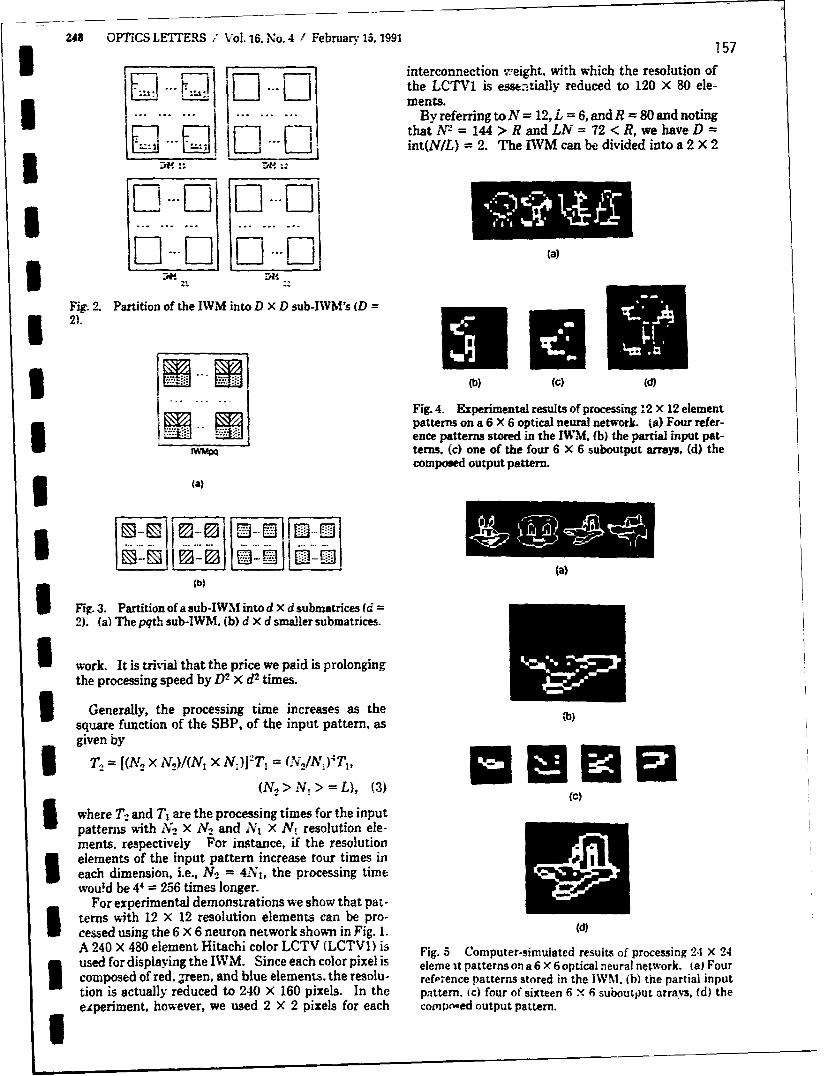
248 OPTiCS LETTERS i Vol. 16. No.4 / February 15. 1991 157interconnection weight, with which the resolution of
kinterconnectith i eigt wity redch th 120olu80oee-I- F- ments.
... ...... ... .... lBy referring to N = 12,L = 6,andR = 80 and noting_jjjjl that N-' = 144 > R and LN = 72 < R, we have D=
"'" U- EJ 01...int(N/L) = 2. The IWM can be divided into a 2 X 2
0 .--- R 0 .:.. 1 a
Fig. 2. Partition of the 1WM into D X D sub-IWM's (D32).
(b) (c) Id)
Fig. 4. Experimental results of processing 12 X 12 elementpatterns on a 6 X 6 optical neural network. (a) Four refer-
___M ________ence patterns stored in the IWM. (b) the partial input pat-rePAPQ terns. (c) one of the four 6 X 6 suboutput arrays, (d) the
composed output pattern.
3(a)
(a)i (b)
Fig. 3. Partition of a sub-IWM into d X d submatrices (d2). (a) The pqth sub-IWM. (b) d X d smaller submatrices.
I work. It is trivial that the price we paid is prolongingthe processing speed by D2 X d- times.
I Generally, the processing time increases as the %)square function of the SBP, of the input pattern, asgiven by
X fN~ jN)/(N 1 X N.)12T1 ,I)T 1
(N > N, > = L), (3) (c)
£ where 7' and T1 are the processing times for the inputpatterns with 14 X N2 and N X NI resolution ele-ments, respectively For instance, if the resolutionU elements of the input pattern increase tour times ineach dimension. i.e., N2 = 4N., the processing time Uwould be 44 = 256 times longer.
For experimental demonstrations we show that pat-terns with 12 X 12 resolution elements can be pro-cessed using the 6 X 6 neuron network shown in Fig. 1. (d)
A 240 X 480 element Hitachi color LCTV (LCTV1) is Fig. 5 Computer-simulated results of processing 24 X 24used for displaying the IWM. Since each color pixel is eleme it patterns on a 6 X 6 optical neural network. ta;Fourcomposed of red, green, and blue elements, the resolu- refp;ence patterns stored in the IWM. b) the partial inputtion is actually reduced to 240 X 160 pixels. In the pattern, (c) four of sixteen 6 X 6 suboutput arrays, (d) theexperiment, however, we used 2 X 2 pixels for each compo-ed output pattern.UI .. ....

158February 15. 1991 / Vol. 16. No. 4 / OPAICS LETTRS 249
sub-IWM array and displayed one by one onto In conclusion, we have used a space-time-sharingLCTV1. If an input pattern is displayed on LCT2. technique for large-scale net ron operation. We have
the signals collected by the CCD camera can be thresh- shown that to achieve a large SBP of the system, addi-olded and then composed to provide an output pat- tional expenditure of processing time is needed. Thetern, which has a SBP four times larger than that of amount of processing time increases as the squarethe optical neural network. function of the SBP of the input pattern. For experi-
One of the experimental results is shown in Fig. 4. mental demonstration, we have implemented the pro-The training set is shown in Fig. 4(a), and each of these cessing of 12 X 12 element patterns on a 6 X 6 neuron
patterns is limited by a 12 X 12 pixel matrix. Figure network. The processing of 24 X 24 element patterns4(b) shows a part of the second image with 12 X 5 on a 6 X 6 neuron network has been further demon-pixels blocked as the input pattern. The sub-IWM's strated by computer simulation.
are then sequentially displayed, one by one, onto We acknowledge the support of the U.S. Army Mis-LCTV1. Different parts of the output pattern are r seArmy is-
sile Command through the U.S. ArmyRearhOfcobtained, and one of the output parts is shown in Fig. sne contrhthe-U.4(c). The final output pattern recalled by the optical under contract DAAL03-87-014-.
neural network is given in Fig. 4(d).To demonstrate the larger-scale operation further, a References
24 X 24 neuron IWM is used. Since N = 24. L = 6, R = 1.N.H. Farhat. D. Psaltis, A. Prata. and & Paek, Appi.80, VNT2 = 576 > R, and LN = 96 > R, we take D int(N/L) Opt. 24,D1469 ( I985).
4 and d = int(LNVR) = 2. Thus the IWM is parti- I N. H. Farhat, and D. Psaltis. in Optical Signal Process-tioned into 4 X 4 sub-IWM's, and each sub-IWM is ing, J. L_ Homer, ed. (Academic. New York. 1987). p.divided into 2 x 2 smaller submatrices, as illustrated 129.in Fig. 3. In this case the input pattern is also divided 3. B. Macukow and H. H. Arsenault. Appl. OpL 26, 924
into 2 X 2 submatrices, and each submatrix is 12 X 12 (1987).in size. It is apparent that by sequentially displaying 4. N. Farhat. AppL Opt. -6,593 (1987).
the submatrices of IWM and the input submatrices 5. R_ A. Athale and C. W. Stirk, Opt. Eng. 28,447 (1989).
onto LCTVl and LCTV2, respectively, a 24 X 24 out- 6. D. Psaltis, D. Brady, X.-G. Gu. and K. Hsu. in Optical
ont oatternan Processing and Computing. H. H. Arsenault. ed. (Aca-put pattern can be obtained. demic, San Diego, Calif.. 1989). p. 251.
Figure 5(a) shows four 24 x 24 pixel images as the 7. S. Wu. T. Lu. X. Xu, and F. T. S. Yu. Microwave Opt.
training set. A partial pattern of the third image, Technol. Lert. 2,252 (1989).shown in Fig. 5(b), is used as the input pattern, which 8. T. Lu. S. Wu. X. Xu, and F. T. S. Yu. AppL Opt. 28,4908is divided into 2 X 2 matrices of a 12 X 12 size during (1989).the processing. Four of sixteen 6 X 6 output parts are 9. F. T. S. Yu, T. Lu, X. Yang, and D. A. Gregory, Opt. Lettshown in Fig. 5(c). In going through all the partitions 15,863 (1990).of the sub-IWM's. we compose an output pattern of 10. X. Yang, T. Lu. and F. T. S. Yu. Appl. Opt. 29, 5223
the image, as shown in Fig. 5(d). The whole process (1990).
takes D' X d2 = 64 operations of the optical neuralnetwork.
UUIUUIU

* 1591
III
APPENDIX 10.23
IBinary Phase Only JTC
IIUIIIIIIIIII

BINAYPAEOLONTRNFR OWEAO
I~ 160Y
M oftNp
ABTRANSOCCREIAOFraedra t S. Ye as Tos. bg
=ne~~ Prrspvgg Swe Lkrs
3~~~~a~ ammocd woeyprft-

* 161SLM, correlation operation of the reference and the input targets can be implemented by using liquid crystal televisions (LCTV) [6].
obtained A computer simulation for the target embedded in an additive The phase only filter can be synthesized ir a programmableGauisian noise is provided. spaual light modulator, e.g., a magnetooptic spatial lightmodulator (MOSLM) [5]. We note that the joint transforminterference fringes can be binarized by a microcomputer. TheA p.ogrammable join, transform correlator for opucal pattern basi;c objective of binarizing the fringes is to synthesize a
recognition has been discussed in recent p.pers (1, 21. In a binary phase only joint power spectrum that can be recordedjoint transform correlator, both the reference image and the at the MOSLM.input target are generated in the input plane of a coherent In Figure 1, we assumae the reference image f1(x, y) andoptical processor. A transform lens will perform the joint the input target fz(x, y) are written on the LCTV. Undertransform of the input objects. Due to coherent illumination, coherent illumination, the complex light distribution . theuniform carrier interferometric fringes are produced in the Fourier plane P, is given byjoint transform spectrum. "The interferr,4etric fringes can beextracted by a square law converter ('.&., film, CCD camera. G(p,q) FI(pq)009 + F2(pq)o.Jaq (1)etc.). Then by simple coherent readout of the joint powerG(pq)=F ,qel -F( ,qe-. ()spectral distribution, the joint correlation of the input object
function can be obtained through a second Fourier transform F( p, q) ' " l[fi(x, V)] (2)In principle, a joint transform correlator is capable of (p, q) - R'(f2(x, y)1 (3)performing any shift-invaria. , linear operations by using the
impulse response of the filter function which is displayed as areference image (3]. However, for the convolution operation, where .F denotes the Fourier transform and 2a is the center-the reference image must be the comle.x conjugate of the to-center separation of the input objects f1 (x, y) and f(x, y).inverted impulse response function. With the current stage of We stress that the purpose of the lens Lq is to magnify thetechnology, the spatial light modulator (SLM) is applicable joint transform spectrum and that the stop behind the lens Lvonly t real impulse responses due to the lack of a complex selects only a certain bandwidth.image display device. Furthermore, low dynamic range and The image captured by the CCD camera can t~e %riten asslow response of the square law conveners give rise to anotherpractical restriction. One possible realization of the joint 1(p, q) -G(p, q)12transform correlator is to employ an electrooptic device as asquare law converter (e.g., CCD carerat. The detected joint F1 (p q)1' +1 Fz(pq0
transform power spectrum is then displayed on a binary SLMI for the secc.'d transformation.In this paper, we propose a joint transform hybrid optical
correlator using a binary phase only filter f4, 51. The systemtakes advantage of the controllabiLity of tl electroovtic de- +F *(.p, q)F(p, q)e -)2' q (4)vices and the high speed optical procczsing operation. As isshown in Figure 1, the pioposed joint transform conelator where the superscript asterisk represcnts the complex conju-involves gray ev! ira.e displaying devices an3i a binawry gate and (p, q) is the spatial frequency coordinate system. Forphase spau,. 1:ght modulator both of which ran be addrcssed simoLcity, the effects of the ma icaonby a microcomiuter. The image displaying dizvices can be are neglected in the above equation. It is evident that Equa-
gn~ Fourier piane CCZO earn
- Lm,.,, + a) S t op
- _.. Micro-1 computer ,
G oheren.ore MSIM " Out;pIt P!ane CCD camera
I,
Figure 1 A phase! only)oint transform programmable optical correlator L, and L,. Fouier transform lenses. L l magnification
16 MICROWAVE AND OPTICAL TCHN.)LOGY LETTERS / Vol. 2. No. 1. January 1989

162
tion (4) is the joint power spectral disribution of F(p. q) and If the binary phase distribution of Equation (11) is readFj,(p. q). Alternatively. Equaucn (4, -a.. be written as out by coherent illumination, as shown m Figure 1. the output
complex light distribution can be shown to be1( p, q) iF( p, q)[ -F2( p, q)[ n-
-2IFtp,q) 11F(p,q)cos2aq--A . ( p.q)] g(x, v) E bo(y- 2an) b,, b., (12)
(5) 11-10
This yields a series of spots. The presence of a first order spotwhere indicates a match. On the contrary, if fl(x, y) differs from
f2 (x, y), the spot would be absent. Thus we see that a binaryAI( p, q) ( P, q) - 0( p. q) (6) phase only joint transform correlator can be used for optical
pattern recognition.and 0,.(p, q) and 42(p,q) are the phase distribution of In the following, we should provide computer simulationF(p, q) and F.(p, q), respectively. It is however interesting tests for the proposed binary joint transform correlatorto note that if the input objects are identical. i.e.. f1(x. Y = (BJTC). The 128 X 128 pixel reference and target images aref 2(x, y), then Equation (5) can be reduced to the form loaded from disk files and written onto the upper and the
lower halves of the input plane. We assume that the A/DI( p, q) = 2!F( p, q) (1 + cos[2 iq]) (7) converter for the video signal has eight bit resolution. To
avoid the conversion error, we may discard the least signifi-where the cosine term represents uniform interference fringes cant bit. The threshold level was chosen to be the lowest end
of the joint power spectral distribution. On the other hand. if of the dynamic range of the A/D convener such asthe input objects are different. AO(p, q) is not zero and it is arather complicated function. The cosine factor in Equation (5) max,.q[I( p, q) 13)no longer provides a strict uniform fringe pattern. Thus it will " :3128
eventually produce lower correlation peaks through the in-verse Fourier t,-ansformauon. Figure 2(a) shows a reference image. Figures 2(b) and (c)
The fringe pattern captured by the CCD camera can be fed represent target images. Figure 2(b) was obtained by adding
iuto a microcomputer for binanzation with a thresholding an additive Gaussian noise to the reference, with a signal-to-procedure. The binarized fringe pattern. in principle, can bewritten onto a MOSLM to obtz~n a binarized phase onlyfringe pattern (5], such that the transmittance function of theMOSLM would be
H( q e I(p q) Zt Ir 8e I(p, q) < 1Ir
here Ir is the binarizing threshold level. In reality, theinterference fringe structure has a Gaussian shaped pedestalcomponent. A stop with a ring window would pass only the (a)
uniform pedestal fringe pattern. Then the lowest end of thedynamic range of the A/D convener for the video signal maybe selected as the threshold level. Since e 1' = cos( t =±1, Equation (8) can also be written as
[ + 1 1(p, q) : Ir
H(p,q) - -1 I(p,q) < Ir (9)
If the input objects are identical, then H( p. q) reduces to aone-dimensional bipolar rectangular function with a spatialfrequency equal to
2a£ f . (10)
where f is the focal length of the transform lens and A is theilluminating wavelength. Thus H(p, q) can be expanded intoa Founer cosine series as given by
n - - X
H( p, q) E b cos[2anq] (11) (c)
Figure 2 Input images: (a) reference image of a tank: (b) target
where b, are the Fourier coefficients of H( p, q). embedded in noise iSNR = I dB); (c) target image of a truck
MICROWAVE AND OPTICAL TECHNOLOGY LETrERS / Vol, 2. No. i, January 1989 17

163. tmmaamrI .~ - in., a ."
""'-4
ii La :s r , -
wr.j-; -
( (a) (b) (c)
Figure 3 Binarized interference fringes. The DC component is eliminated by a circular stop. (a) Noiseless case of Figure 2(a); (b) noisycase of Figure 2(b); (c) different objects of Figures 2(a) and (c)
* (a)I 'Ii
III !+ .
• 'V , " - . " •-' - • "-- ' ,
\
((a)
3 1 •. .. .. t. ..• ,. ... .. .
II . ..•" • -...
4 '. 4.44,•% ,.• -.-••, -.-
• .% ... -:4.4,..
)(c)
Figure 4 Output correlation peaks: (a) noiseless case of Figure 3(a). (b) noisy case of Figure 3(b). (cj different objects of Figures 2(a)I and (c)
3noise ratio (SNR) equal to 1 dB. Figure 3 shows the computer son between Figures 4(a) and (b) shows that the correlation- simulated binarized joint transform power spectrum for noise- peaks reduce to about a half for an input SNR = 1 dB. As ts
less, noisy, and different objects. The SNR for the noisy target shown in Figure 4, no correlation peak was obtained for theUis about 1 dB. A uniform spatial frequency fringe pattern can cross correlation of different images.readily be seen in Figure 3(a). However, uniformity of the In conclusion, we have investigated a binary phase onlyfringes is somewhat deteriorated under the noisy enirinnent joint transform optical correlator for optical pattern recogni-Eas can be seen in Figure 3(b). No clear fringes can be observed dion. The major advantage of the proposed system must be thein Figure 3(c). The corresponding output correlations. simu- avoidance of s-ynthesizing a spatial matched'filter. The combi-lated by digital computer. are shown in Figure 4. A compari- nation of CCD camera and MQSLM may have an advantage
U18 MICROWAVE AND OPTICAL TECHNOLOGY LETTERS / Vol 2. No I January 1989

164
over tbe optically addressed SLM such as dexibilitv oi thresh-old level selection. We have shown that high correl ationl Deakscan be readily obtained under the noisy environment.
We acknowledize the support of U. S. Army Research office3 contract No. DAALO3-87.0147.
REFERENCES1. F T. S. Yu and X. J. Lu. "A Real-Time Programnmable Joint
Transform Correlator." opt. Commun.. Vol 52. 1984. p. 47.2. F. T. S. Yu and S. E Ludinan. Mivcrocomputer-Based Pro-
grammable Optical Correlator for Automatic Pattern Recognitionand Identification." Opt. Lem.. Vol. 11. 1986. p 395.
3. F. T. S. Yu and J. E. Ludman. "Joint Fourier Transform Processor."to be published.14. 1. L.Homnerand P D. Gianino. "Phs-nyMthdFlen
ApLOt.Vol. 23. 1984. p. 812.
U Correlation with a Binary Spatial Light %lodulator." Oat. Enge.Vol. 23. 1984. p. 698.
6. F. T. S. Yu. T. W Lin. and D. A. Gregory. -Adaptive Real-TimePattern RecosEnition Using a Liquid Crystai TY Based Joint Trans-Uform Correlator.* .ppi. Opt.. Vol. 26. 1987.. o 1370.
Received 10-25-~88
U ~ficrowave and Optical Technoio~nv Leiters. 2.1 15-191989 John Wiley & Sons. Inc.3 CCC 0895-2477 /89/S4.00