Effects of diet change on carbon and nitrogen stable-isotope ratios in blood cells and plasma of the...
13
CSIRO PUBLISHING www.publish.csiro.au/journals/ajz Australian Journal of Zoology , 2004, 52, 635–647 © CSIRO 2004 10.1071/ZO04029 0004-959X/04/060635 Effects of diet change on carbon and nitrogen stable-isotope ratios in blood cells and plasma of the long-nosed bandicoot (Perameles nasuta) Marcel Klaassen A , Michele Thums B,C and Ian D. Hume B,D A Netherlands Institute of Ecology (NIOO-KNAW), Centre for Limnology, Department of Plant–Animal Interactions, PO Box 1299, 3600 BG Maarssen, The Netherlands. B School of Biological Sciences A08, University of Sydney, NSW 2006, Australia. C Present address: School of Zoology, University of Tasmania, Hobart, Tas. 7001, Australia. D Corresponding author. Email: [email protected] Abstract Carbon (C) and nitrogen (N) stable isotopes offer a powerful tool for assessing the extent of tissue assimilation of dietary components. However, the method relies on knowledge of diet–tissue isotopic discrimination and how quickly diet shifts become apparent in various tissues. In the present study, blood plasma and blood cells, tissues that are easily obtained under field conditions, were used to validate the stable isotope method over a period of 4–5 weeks using captive long-nosed bandicoots (Perameles nasuta). Diet–tissue discrimination effects appeared to be small. For C, derived diet–tissue isotopic discriminations were 1.4‰ for blood plasma and –0.2‰ for blood cells. For N the values were 2.8‰ and 2.1‰, respectively, and were independent of the nitrogen content of the food. C and N turnover measurements in the blood plasma and cells of the bandicoots indicated that blood plasma provides dietary information integrated over a period of ~3 weeks, whereas blood cells give an impression of the assimilated diet over a period of as much as half a year. These turnover rates were low compared with the little information available for birds and eutherian mammals, and probably relate to the typically low metabolic rate of marsupials. ZO04029 Stable-isot ope rati osinbandicoot bl od M. Kl assen etal . Introduction Carbon and nitrogen stable-isotope ratios ( 13 C/ 12 C and 15 N/ 14 N) are increasingly used in studies of the diet and nutritional ecology of animals (e.g. Hobson and Clark 1992a, 1992b; Kelly 2000; Klaassen et al. 2001). All studies using C and N stable isotopes rely on the premise that these isotopes in the diets of animals are ultimately reflected in their tissues (i.e. you are what you eat: Gannes et al. 1997). However, during assimilation of dietary C and N into tissue, the preferential uptake of either the lighter or the heavier isotope of an element (isotopic discrimination) might occur. This will result in isotopic ratios in the tissues that are different from those in the diet. Moreover, different tissues might have different enrichments relative to the isotopic ratios in the diet. Studies comparing discrimination effects among and within species have identified various factors that affect the level of discrimination; these factors include body size, digestive physiology, diet quality (e.g. Tieszen and Boutton 1989), trophic level (e.g. Lee-Thorp et al. 1989) and even age (Roth and Hobson 2000). Sampling blood is a convenient means of obtaining animal tissues because it seldom invokes intolerable stress to the animal under study and can be done repeatedly, allowing the study of changes in stable-isotope ratios over time. Although many studies have estimated the C and N stable-isotope diet–tissue discrimination of whole blood, to date only four studies (on two birds and four eutherian mammals) have estimated the C and N stable-isotope diet–tissue discrimination of the two major blood components: plasma and cells (Hobson and Clark 1993; Roth and Hobson 2000; Lesage et al. 2002; Pearson et al. 2003).
Transcript of Effects of diet change on carbon and nitrogen stable-isotope ratios in blood cells and plasma of the...

CSIRO PUBLISHING
www.publish.csiro.au/journals/ajz Australian Journal of Zoology, 2004, 52, 635–647
© CSIRO 2004 10.1071/ZO04029 0004-959X/04/060635
Effects of diet change on carbon and nitrogen stable-isotope ratios in blood cells and plasma of the long-nosed bandicoot (Perameles nasuta)
Marcel KlaassenA, Michele ThumsB,C and Ian D. HumeB,D
ANetherlands Institute of Ecology (NIOO-KNAW), Centre for Limnology, Department of Plant–Animal Interactions, PO Box 1299, 3600 BG Maarssen, The Netherlands.BSchool of Biological Sciences A08, University of Sydney, NSW 2006, Australia.CPresent address: School of Zoology, University of Tasmania, Hobart, Tas. 7001, Australia.DCorresponding author. Email: [email protected]
Abstract
Carbon (C) and nitrogen (N) stable isotopes offer a powerful tool for assessing the extent of tissueassimilation of dietary components. However, the method relies on knowledge of diet–tissue isotopicdiscrimination and how quickly diet shifts become apparent in various tissues. In the present study, bloodplasma and blood cells, tissues that are easily obtained under field conditions, were used to validate thestable isotope method over a period of 4–5 weeks using captive long-nosed bandicoots (Perameles nasuta).Diet–tissue discrimination effects appeared to be small. For C, derived diet–tissue isotopic discriminationswere 1.4‰ for blood plasma and –0.2‰ for blood cells. For N the values were 2.8‰ and 2.1‰, respectively,and were independent of the nitrogen content of the food. C and N turnover measurements in the bloodplasma and cells of the bandicoots indicated that blood plasma provides dietary information integrated overa period of ~3 weeks, whereas blood cells give an impression of the assimilated diet over a period of asmuch as half a year. These turnover rates were low compared with the little information available for birdsand eutherian mammals, and probably relate to the typically low metabolic rate of marsupials.ZO04029Stable-i sot ope rati os in bandicoot bl oodM. Kl aas sen et al .
Introduction
Carbon and nitrogen stable-isotope ratios (13C/12C and 15N/14N) are increasingly used instudies of the diet and nutritional ecology of animals (e.g. Hobson and Clark 1992a, 1992b;Kelly 2000; Klaassen et al. 2001). All studies using C and N stable isotopes rely on thepremise that these isotopes in the diets of animals are ultimately reflected in their tissues(i.e. you are what you eat: Gannes et al. 1997). However, during assimilation of dietary Cand N into tissue, the preferential uptake of either the lighter or the heavier isotope of anelement (isotopic discrimination) might occur. This will result in isotopic ratios in thetissues that are different from those in the diet. Moreover, different tissues might havedifferent enrichments relative to the isotopic ratios in the diet. Studies comparingdiscrimination effects among and within species have identified various factors that affectthe level of discrimination; these factors include body size, digestive physiology, dietquality (e.g. Tieszen and Boutton 1989), trophic level (e.g. Lee-Thorp et al. 1989) and evenage (Roth and Hobson 2000). Sampling blood is a convenient means of obtaining animaltissues because it seldom invokes intolerable stress to the animal under study and can bedone repeatedly, allowing the study of changes in stable-isotope ratios over time. Althoughmany studies have estimated the C and N stable-isotope diet–tissue discrimination of wholeblood, to date only four studies (on two birds and four eutherian mammals) have estimatedthe C and N stable-isotope diet–tissue discrimination of the two major blood components:plasma and cells (Hobson and Clark 1993; Roth and Hobson 2000; Lesage et al. 2002;Pearson et al. 2003).

636 Aust. J. Zoology M. Klaassen et al.
Another possible factor of importance in the relationship between diet and tissue isotoperatios is N recycling. N recycling within the animal during periods of submaintenanceprotein intake might lead to an increase in the animal’s N stable-isotope ratio (Ambrose1993; Hobson et al. 1993; Cormie and Schwarcz 1996). That is, there is preferentialretention of 15N over 14N. Thus, not only the isotopic composition of the diet but also itsprotein content, relative to the consumer’s protein needs, might determine the isotopicsignature of the consumer’s tissues. No study to date has examined the importance ofnutritional state on isotopic discrimination in blood plasma and cells.
The use of tissues that rapidly turn over, such as blood plasma, contrasted withlonger-turnover tissues such as blood cells, allows the delineation of those individuals notin equilibrium with their current diet, thus allowing the identification of diet shifts (Hobsonand Clark 1993). However, to assess the rate at which diet shifts become noticeable in bloodplasma and blood cells, validation experiments with captive animals are required. Few suchdata exist. To date only three studies have estimated blood plasma and blood cell turnoverrates based on stable-isotope ratios, two in birds and one in a eutherian mammal (Hobsonand Clark 1993; Hilderbrand et al. 1996; Pearson et al. 2003). Although C and Nstable-isotope ratios have been used to delineate diet choice in three species of marsupials(McIlwee and Johnson 1998), isotopic discrimination has not been assessed in this groupof mammals.
Long-nosed bandicoots (Perameles nasuta) are medium-sized (0.5–2 kg) omnivorousmarsupials belonging to the family Peramelidae. Peramelids have suffered one of the greatestdeclines of all Australian marsupials and there is an urgent need for further understandingof their habitat requirements, including diet choice. Assessment of annual variation in dietcomposition of long-nosed bandicoots based on scat analysis has already been conducted(Thums et al. unpublished data), in conjunction with measurements of field metabolic rates(Thums et al. 2003), but early on we identified the need to analyse diet shifts using stableisotopes as well. Stable-isotope analysis has several advantages over scat analysis byproviding information about the bandicoot’s long-term assimilated diet and correcting forpossible bias in the scat analyses caused by differential digestibility of different food types.
By providing artificial diets with known isotopic contents, we validated thestable-isotope method for captive long-nosed bandicoots. This validation took place over aperiod of 4–5 weeks and was conducted to determine: (1) the turnover rate or the rate atwhich dietary change becomes apparent in blood plasma and blood cells; (2) the C and Nstable-isotope enrichment relative to diet for both plasma and cells; and (3) the effect ofnutritional condition (low protein intake) on N stable-isotope enrichment.
Methods
Long-nosed bandicoots were caught in baited, treadle-operated cage traps (Tomohawk, Wisconsin, USA)at Pacific Power’s Eraring Scientific Area near Newcastle, New South Wales, Australia (33°02′42″S,151°29′11″E). On 17 July 2001 we began a period of regular trapping to assess the size of the populationof long-nosed bandicoots in the area. Following this assessment period, between 24 July and 1 August 2001,we collected nine bandicoots (five females and four males) of 750–1550 g body mass. After capture, theanimals were transported to the Native Animal House at the University of Sydney. Bandicoots are solitaryanimals so the animals were housed individually. The stainless steel cages were 66 cm high with a floorsurface of 75 cm × 61 cm covered with soft rubber matting. The room was held under a 12 h light:12 h darklight regime and was air conditioned at 22°C, which is within the thermoneutral zone of bandicoots (Hulbertand Dawson 1974). Each cage was fitted with a plastic nest box, which included jute as lining material.During the experiments the animals received food and drinking water ad libitum.
Four different diets that differed markedly in protein content and N and C stable-isotope ratios(respectively δ15N and δ13C; for details of these notations see below) were used. The bulk of the diets
Stable-isotope ratios in bandicoot blood Aust. J. Zoology 637
consisted of either sweet potato (a C3 plant, low in C stable-isotope ratio) or corn (a C4 plant with a high-Cstable-isotope ratio). These components were mixed with a commercial small-carnivore diet (Wombaroo,Adelaide, Australia) in proportions that allowed us to manipulate the protein content of the food. Inaddition, agar was added to provide a firm texture to the homogenised mix. The nine animals wererandomly divided into two groups. During the first 14–22 days, depending on their time of capture, fouranimals received the high-protein corn diet and the other five received the high-protein sweet potato diet.After this, on 15 August 2001, all animals were switched to a lower-protein diet with the alternative bulkcomponent. In addition to obtaining yet another chance at estimating turnover rates of the isotopes, thelow-protein diets especially allowed us to establish the effect of low protein intake on N stable-isotopeenrichment. Unfortunately, though, at this stage one animal that had been on the high-protein corn diet wasremoved from the experiment because of an infected tail and loss of body mass. Another animal refused toeat the low-protein sweet potato diet and was switched to the low-protein corn diet on 19 August 2001. Dataon this individual collected after the diet shift were omitted from the assessment of asymptotic enrichmentand turnover rate of blood plasma and cells. Thus, the low-protein sweet potato group contained twoanimals only. In addition, we were unable to obtain a final blood sample from one of these two animals. Theanimals were kept on the low-protein diets for a further 14 days, after which all animals were released atthe point of capture. The duration of the experiment was limited for reasons of animal welfare, but waschosen in agreement with the results of similar studies that reported on blood plasma and blood-cellturnover rates (Hobson and Clark 1993; Hilderbrand et al. 1996; Pearson et al. 2003).
In order to assess the rate of change in stable-isotope ratios of blood plasma and cells in response to dietshift, all animals were bled every 4–5 days during the course of the experiment, starting on the day ofcapture and transport. Furthermore, during the period of population assessment in the field, blood sampleswere taken from all nine animals that were later taken to the laboratory, as well as from two additionalindividuals. These samples were used to compare differences in stable-isotope ratios of blood plasma andcells of free-living animals. Before blood sampling the animals were lightly anaesthetised using a 1–3%isoflurane/oxygen mixture administered at 1.5 L per minute via a Commonwealth Industrial Gases midgetanaesthetic machine. A small blood sample (0.5 mL) was taken from a lateral tail vein using a 25-gaugeneedle and a heparanised tuberculin syringe. Blood samples were centrifuged at 15000 rpm for 15 min,after which plasma and cells were separated and frozen for later analysis. After blood sampling, the animalswere weighed to the nearest gram on a balance. All animals aroused within 5 min of blood sampling.
Before δ13C and δ15N analyses were conducted, blood cell and plasma samples were freeze-dried. δ13Cand δ15N were analysed at the Centre for Limnology and the Centre for Marine and Estuarine Ecology,respectively, both of the Netherlands Institute of Ecology. The δ13C (‰, difference from 13C/12C ratio inVienna PeeDee limestone) was determined using a Carlo Erba Model 1106 elemental analyser that wascoupled online, through a Finnigan con-flo 2 interface, to a Finnigan Delta S isotope ration massspectrometer. The δ15N (‰, difference from 15N/14N ratio in atmospheric N2) was determined using aFisons elemental analyser coupled on line, via a Finnigan con-flo 2 interface, with a Finnigan Delta Sisotope ratio mass spectrometer. Nitrogen content of the four different diets was analysed by an automatedsemi-micro Kjeldahl procedure using selenium as a catalyst. Carbon content of the diets was analysed witha Euro EA 3000 element analyser. All statistics were conducted using Statistica (1999).
Results
Stable-isotope ratios of both C and N in the blood plasma and cells of long-nosedbandicoots directly after their first capture (Fig. 1) showed considerable variation in bothδ13C and δ15N. This indicates some variation in diet choice among individuals. For bothδ13C and δ15N, the blood plasma showed consistently higher values than the blood cells, thedifference remaining largely unchanged over the whole range of values obtained. The δ13Cof blood plasma was, on average, 1.6‰ (s.d. = 0.4, n = 11) higher than that of blood cells.For δ15N the difference was 0.7‰ (s.d. = 0.4, n = 11).
Values for δ13C, δ15N and the protein content of the four diets provided to the bandicootsin captivity are shown in Table 1. After transport to the laboratory nearly all animalssuffered some mass loss, after which most of the animals subsequently regained body mass.Over the whole period in which the high-protein diets were provided, body mass wasessentially stable and changed by only −3% on average (range −21 to +17%, s.d. = 11%,

638 Aust. J. Zoology M. Klaassen et al.
n = 9). There was no significant difference in the change in body mass between the two dietgroups (t7 = 0.06, P = 0.956). Over the 14 days during which low-protein diets wereprovided all animals lost mass, with the two animals on the low-protein sweet potato dietlosing more (−22% and −21%) than the six animals on the low-protein corn diet (−8%,range −2 to −17%, s.d. = 5%) (t6 = 3.08, P < 0.022). Thus, as expected, protein content ofthe diet had a strong effect on the change in body mass.
The traces of δ13C in the blood plasma of the bandicoots during the course of the fourtreatments are shown in Fig. 2. The individual patterns of change in the δ13C of the plasmaresembled the expected exponential models of the form:
δ13Cplasma = δ13Cdiet + ∆13Cdp+b . eKc.t (1)
where δ13Cplasma and δ13Cdiet are the δ13C of the plasma and the diet, respectively, ∆13Cdp isthe asymptotic C stable-isotope enrichment of the plasma relative to the diet, KC is theturnover rate of δ13C in the plasma, t is the time since diet change in days, and b is thedifference between the final, asymptotic δ13C in the plasma and the δ13C in the plasmabefore the diet switch.
The traces indicate that the 14–22 days on the initial treatments were barely enough forthe δ13C in the plasma to attain stable values on the new diet. For the animals on thehigh-protein sweet potato diet, the initial δ13C of the plasma was similar to that of the diet.Therefore, the traces of δ13C of the plasma for these animals were not useful in the
–27
–25
–23
–21
–19
–17
–27 –25 –23 –21 –19 –17
13C (‰)
3
4
5
6
7
3 4 5 6 7
15N (‰)
Blood cells
Blo
od p
lasm
a
� �
Fig. 1. Comparison between carbon and nitrogen stable-isotope ratios in the blood cells and plasma offree-living long-nosed bandicoots. The reduced major axis across the data points is shown in each panel(for δ13C, r2 = 0.964 and for δ15N, r2 = 0.743).
Table 1. Carbon stable-isotope ratios (δ13C, ‰ ± s.d.), nitrogen stable-isotope ratios (δ15N, ‰ ± s.d.), carbon content (C, % of dry mass ± s.d.) and nitrogen content (N, % of dry mass
± s.d.) of the four experimental diets DM, dry mass; HP, high-protein; LP, low-protein
Diet δ13C (‰) δ15N (‰) C (% DM) N (% DM) n
HP corn −18.6 ± 0.5 3.8 ± 0.6 45.2 ± 0.7 4.2 ± 0.2 3HP sweet potato −24.8 ± 0.3 3.3 ± 0.1 44.1 ± 0.6 3.0 ± 0.6 2LP corn −13.9 ± 0.3 1.1 ± 0.6 45.1 ± 0.2 2.2 ± 0.1 3LP sweet potato −25.8 ± 1.0 3.8 ± 0.6 43.1 ± 0.5 1.5 ± 0.6 3

Stable-isotope ratios in bandicoot blood Aust. J. Zoology 639
estimation of KC. In addition, for the animals on the high-protein corn diet, initially lowintakes are responsible for S-shaped rather than exponential traces of δ13C in plasma. Thiswill result in too low an estimate of KC. The best results were obtained on the low-proteincorn treatment, with little variation in the data, a large difference between initialenrichments of δ13C in the plasma and that of the diet, and a constant and only moderateloss in body mass over the course of the experiment.
Using Equation 1 and the data presented in Table 1 and Fig. 2, estimates for b, ∆13Cdp
and KC were obtained for each treatment using a non-linear estimation procedure. However,because of complications with the analyses, data points had to be combined for allindividuals from each of the treatments to provide sufficient power. Moreover, for theanimals on the high-protein diets, which came directly from the field, it was evident fromFigs 1 and 2 that the initial conditions varied considerably. Therefore, for each animal onthe high-protein treatments, we assumed a separate b in the non-linear estimationprocedure. The resulting estimates of ∆13Cdp and KC are shown in Table 2. There isconsiderable variation in these estimates, despite the fact that they should in principle besimilar for all treatments. However, the estimates of ∆13Cdp and KC are dependent.
0 5 10 15
corn
–26
–24
–22
–20
–18
–16
–14corn sweet potato
–26
–24
–22
–20
–18
–16
–14
0 5 10 15 20
�13C
blo
od p
lasm
a (‰
)
Days since experiment begin
sweet potato
high proteinlow protein
Fig. 2. Individual traces of C stable-isotope ratios (δ13C, ‰) in the blood plasma oflong-nosed bandicoots that were fed two different high-protein diets (corn and sweet potato)for 14–22 days (left panels). Thereafter they were switched to the low-protein version of thealternative diet for 14 days (right panels). Horizontal lines indicate δ13C of the diet.
640 Aust. J. Zoology M. Klaassen et al.
0 5 10 15
1
2
3
4
5
6
1
2
3
4
5
6
0 5 10 15 20
corn
corn sweet potato
�15N
blo
od p
lasm
a (‰
)
Days since experiment begin
sweet potato
high proteinlow protein
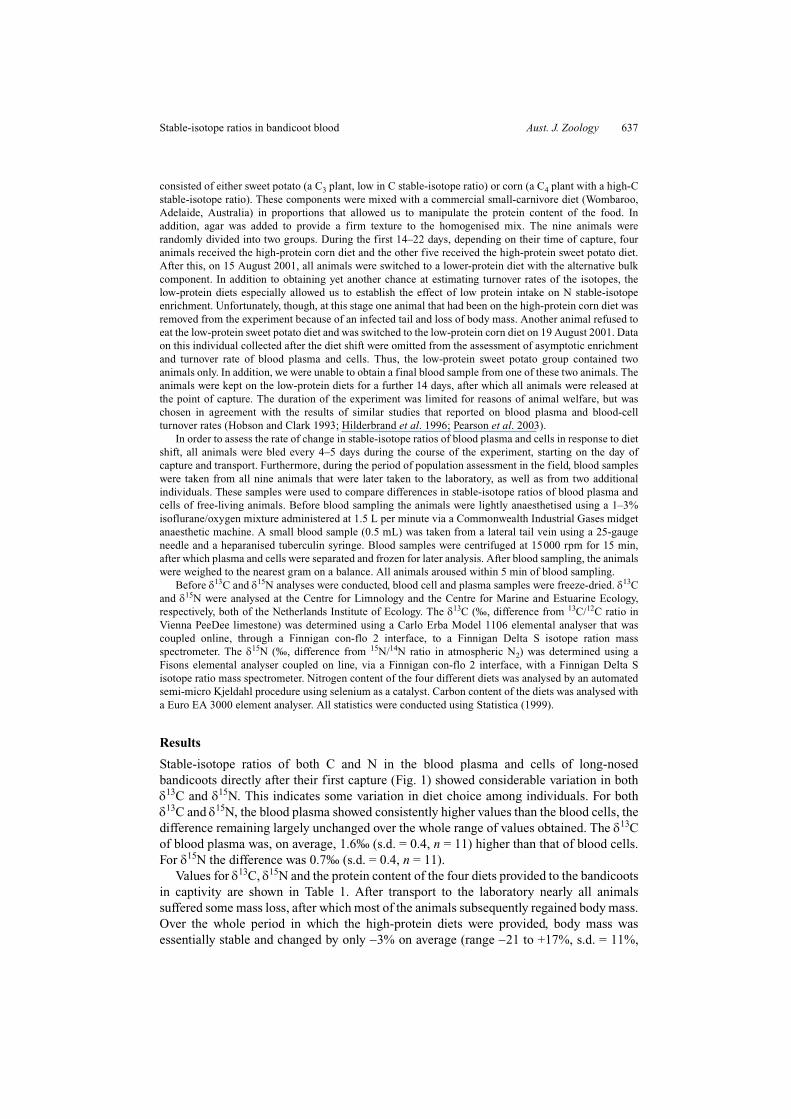
ATurnover estimates not significantly different from zero.
Table 2. Asymptotic enrichment for C stable-isotope ratios (∆13Cdp, ‰ ± s.e.) and δ13C turnover estimates (KC ± s.e.) in the blood plasma of long-nosed bandicoots kept on four different diets
consisting of a low- and high-protein version of a corn or sweet potato–based dietnI is the number of individuals on each treatment and n is the number of data points used in the estimation of the various parameters. KC(∆13Cdp = 1.4) denotes the turnover estimate when asymptotic enrichment relative to diet is set at 1.4‰, where r2(∆13Cdp = 1.4) is the new explained variance under this scenario.
In the non-linear estimation procedure for each individual bandicoot a separate initial condition was assumed for the high-protein treatments, whereas a common initial condition was assumed for the
individuals on the low-protein treatments. HP, high-protein; LP, low-protein
Diet ∆13Cdp (‰) KC r2 nI n KC(∆13Cdp = 1.4) r2(∆13Cdp = 1.4)
HP corn 3.2 ± 1.7 0.033 ± 0.010 0.961 4 20 0.048 ± 0.003 0.957HP sweet potato 1.4 ± 0.4 0.056 ± 0.028 0.813 5 25 0.054 ± 0.014 0.813LP corn −0.8 ± 1.4 0.096 ± 0.029 0.971 5 20 0.067 ± 0.003 0.968LP sweet potato 4.6 ± 0.9 0.214 ± 0.250A 0.832 2 7 0.042 ± 0.011 0.768
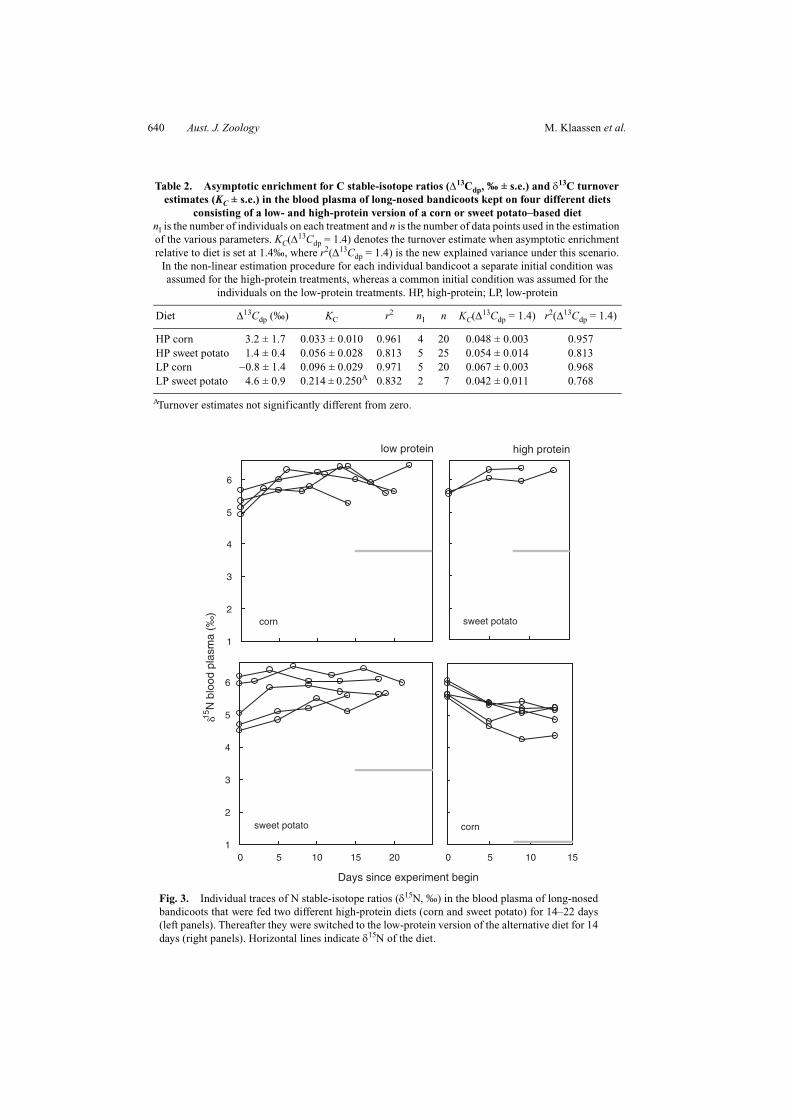
Fig. 3. Individual traces of N stable-isotope ratios (δ15N, ‰) in the blood plasma of long-nosedbandicoots that were fed two different high-protein diets (corn and sweet potato) for 14–22 days(left panels). Thereafter they were switched to the low-protein version of the alternative diet for 14days (right panels). Horizontal lines indicate δ15N of the diet.

Stable-isotope ratios in bandicoot blood Aust. J. Zoology 641
Reanalysing the data using a range of preset values for ∆13Cdp, it appeared that within asmall parameter value area with ∆13Cdp values ranging from 1.2 to 1.6‰ and KC valuesranging from 0.042 to 0.068, the ∆13Cdp and KC values converge for all four treatments.Moreover, for all treatments except the low-protein sweet potato (two bandicoots only),forcing the ∆13Cdp and KC values into this small area of parameter values resulted in a lossof explained variation of at most 0.5%. For the low-protein sweet potato treatment this losswas 6%. Using a tentative estimate of 1.4‰ for ∆13Cdp, we again calculated the KC values,which are also included in Table 2.
Because the initial δ15N levels in the plasma were similar to the δ15N in the four diets(within 2–5‰), the traces over time for δ15N levels in the plasma are relatively flat (Fig. 3).Nevertheless, the same non-linear estimation procedure that was used for δ13C traces of theblood plasma was used to estimate the asymptotic N stable-isotope enrichment of theplasma relative to the diet (∆15Ndp) and the turnover rate of δ15N in the plasma (KN) for eachtreatment. The results (Table 3) indicate a relatively small range of ∆15Ndp values, averaging2.8‰. However, only the KN value for the high-protein sweet potato treatment could beestimated with any accuracy, and that fell within the same range (0.042–0.068) found forKC.
The traces with time for δ13C and δ15N in blood cells (Figs 4, 5) show only slow changestowards the isotopic ratios in the diets on all four treatments. These data neither allow forestimation of the turnover rate of C and N in blood cells nor for estimation of the enrichmentof δ13C and δ15N in blood cells relative to dietary δ13C and δ15N. The results indicate clearlythat the turnover times of N and C in blood cells are much longer than those of plasma.
Discussion
Stable isotopes offer a potentially powerful tool for assessing the extent of tissueassimilation of dietary components over periods varying from weeks to seasons. However,it is important to know how apparent assimilation values might be influenced by isotopicdiscrimination and which tissue is likely to show diet shifts over an appropriate period(Gannes et al. 1997). In the present study on long-nosed bandicoots we attempted toestimate the extent of diet–tissue isotopic discrimination in two tissues (blood plasma andblood cells) with very different turnover rates. To accommodate the relatively low turnoverrate of blood cells we continued the experiments for 4–5 weeks, but ultimately this was
ATurnover estimates not significantly different from zero.
Table 3. Asymptotic enrichment for N stable-isotope ratios (∆15Ndp, ‰ ± s.e.) and δ15N turnover estimates (KN ± s.e.) in the blood plasma of long-nosed bandicoots
kept on four different diets consisting of a low- and high-protein version of a corn and sweet potato–based diet
nI is the number of individuals on each treatment and n is the number of data points used in the estimation of the various parameters. In the non-linear estimation procedure for each individual bandicoot a separate initial condition was assumed for the high-protein treatments, whereas a common initial condition was assumed for the individuals on the
low-protein treatments. HP, high-protein; LP, low-protein
Diet ∆15Ndp (‰) KN r2 nI n
HP corn 2.1 ± 0.1 0.476 ± 0.552A 0.496 4 20HP sweet potato 2.8 ± 0.2 0.058 ± 0.016 0.885 5 25LP corn 3.8 ± 0.2 0.347 ± 0.355A 0.501 5 20LP sweet potato 2.4 ± 0.1 0.570 ± 1.414A 0.794 2 7

642 Aust. J. Zoology M. Klaassen et al.
limited by the rate of loss of body mass of the animals on the low-protein diets. We couldnot have guaranteed the well being of the bandicoots on these diets over a much longerperiod. Consequently, we were able to obtain good direct estimates of isotopicdiscrimination between diet and blood plasma but not between diet and blood cells.
However, if we assume that the free-living bandicoots at the study site did not changetheir diet substantially over the 3 months before sampling, we can use the isotopicdiscrimination between plasma and diet to obtain the isotopic discrimination between bloodcells and diet. Faecal scat analyses support such an assumption (Scott et al. 1999; Thumset al. unpublished data). For C we derived diet–tissue isotopic discriminations of 1.4‰ forblood plasma and –0.2‰ for blood cells. For N the values are ~2.8‰ and 2.1‰respectively. Most studies on the discrimination between diet and body tissues of animalsindicate that the δ13C values of most tissues are within 5‰ of the diet (Kelly 2000). For N,3–4‰ enrichment in δ15N accompanies each trophic step (Kelly 2000). Thus far, only a fewstudies have reported on isotopic diet–tissue discrimination in blood cells and plasma. For
0 5 10 15
–26
–24
–22
–20
–18
–16
–14
–26
–24
–22
–20
–18
–16
–14
0 5 10 15 20
corn
corn sweet potato�13
C b
lood
pla
sma
(‰)
Days since experiment begin
sweet potato
high proteinlow protein
Fig. 4. Individual traces of C stable-isotope ratios (δ13C, ‰) in the blood cells oflong-nosed bandicoots that were fed two different high-protein diets (corn and sweet potato)for 14–22 days (left panels). Thereafter they were switched to the low-protein version of thealternative diet for 14 days (right panels). Horizontal lines indicate δ13C of the diet.

Stable-isotope ratios in bandicoot blood Aust. J. Zoology 643
two birds and four eutherian mammal species the δ13C discrimination between diet andblood plasma was in the range of −1.5–0.8‰ (Hobson and Clark 1993; Roth and Hobson2000; Lesage et al. 2002; Pearson et al. 2003), which was slightly lower than the value of1.4‰ that we derived for the long-nosed bandicoot. In seals with 5% lipid in their bloodplasma, Lesage et al. (2002) noted that extraction of these δ13C-depleted lipids beforeanalysis resulted in significantly higher δ13C diet–plasma discrimination values. However,there is generally much less variation in the lipid content of blood cells, and lipid extractionhad little influence on diet–red blood cell discrimination values. For the red fox (Vulpesvulpes) and the three phocid seals studied so far, δ13C-discrimination between diet and redblood cells ranges from 0.6 to 1.5‰ (Roth and Hobson 2000; Lesage et al. 2002), our valueof –0.2‰ being slightly lower. Pearson et al. (2003) for yellow-rumped warblers(Dendroica coronata) and Roth and Hobson (2000) and Lesage et al. (2002) for their fourmammal species, also studied δ15N-discrimination between diet and plasma, derivingdiscriminations ranging from 2.5 to 4.2‰ for plasma. Roth and Hobson (2000) and Lesage
0 5 10 15
b
1
2
3
4
5
6
1
2
3
4
5
6
0 5 10 15 20
corn
corn sweet potato�15
N b
lood
pla
sma
(‰)
Days since experiment begin
sweet potato
high proteinlow protein
Fig. 5. Individual traces of N stable-isotope ratios (δ15N, ‰) in the blood cells of long-nosedbandicoots that were fed two different high-protein diets (corn and sweet potato) for 14–22days (left panels). Thereafter they were switched to the low-protein version of the alternativediet for 14 days (right panels). Horizontal lines indicate δ15N of the diet.

644 Aust. J. Zoology M. Klaassen et al.
et al. (2002) also studied δ15N-discrimination between diet and blood cells; these rangedbetween 1.7 and 2.6‰. These values are close to our values of 2.8‰ and 2.1‰,respectively, and are close to the 3–4‰ generally found for δ15N diet–tissue discrimination(Kelly 2000).
Although our estimates for the δ13C and δ15N diet–tissue discrimination values comparewell with those in the literature and the ranges of these combined discrimination effects arenarrow (0.9–1.7‰), these variations in enrichments between studies still require anexplanation. One explanation is isotope routeing, whereby the isotopic composition ofsome tissues might reflect the isotopic ratios in particular nutrient components from whichthey are synthesised rather than the isotopic ratios in the bulk diet (Gannes et al. 1997). Amajor breakthrough in this respect was recently accomplished by Pearson et al. (2003), whonoted that, in yellow-rumped warblers, both the C and the N isotope-discrimination factorsincreased with the elemental concentrations of C and N in the diets provided. The diets usedin our experiment show little variation in C content (Table 1); therefore, these variationscannot be held responsible for the variations in the C diet–plasma discrimination factorsfound (Table 2). Furthermore, variations in N content of the diets seem to be uncorrelatedwith N diet–plasma discrimination factors (Table 3). Another explanation for variations indiet–tissue discrimination factors, also addressed above, is based on differences in lipidcontent between tissues. Plasma can potentially contain a large proportion of lipids, whichmay drive δ13C values downward, as seen in the seal study (Lesage et al. 2002). We did notextract lipids from our plasma samples. However, given the fact that most marsupials arelean (Hume 1999) and no lipid layer was visible in the plasma of the bandicoots, a relativeabsence of lipids could explain the relatively high δ13C-discrimination between diet andplasma for the long-nosed bandicoots in this study. However, for the blood cells, which cancontain far less fat, variations in lipid content cannot explain the relatively low δ13Cdiscrimination with diet found in our bandicoots. Yet, differences in diet are known to havean effect on δ13C diet–tissue discrimination (Kelly 2000).
Nutritional stress might result in the catabolism of body proteins, which elevates δ15Nvalues and thus δ15N diet–tissue discrimination (Hobson and Clark 1992b; Ambrose 1993;Hobson et al. 1993; Cormie and Schwarcz 1996). However, across the four diets in ourstudy, with a 3-fold difference in N content, there was no trend for an increased δ15Ndiet–plasma discrimination with a decrease in N content of the food. Moreover, theδ15N-discrimination between diet and plasma recorded in this study is lower than thatrecorded in the fox and seal studies.
Our significant estimates for δ13C and δ15N turnover rates are in the range 0.048–0.067,implying half-life times of the plasma (−ln(0.5)/K) of 10–14 days. Given the (initial) massloss in some of the treatments, we believe it is most prudent to take 9–10 days as a realistichalf-life time for long-nosed bandicoots in mass balance. Measurements of half-life timesin blood plasma using stable isotopes for yellow-rumped warblers, American crows(Corvus brachyrhynchos) and American black bears (Ursus americanus) resulted inhalf-life times of 0.4–1.7, 3 and 4 days, respectively (Hobson and Clark 1993; Hilderbrandet al. 1996; Pearson et al. 2003). Half-life time of isotopes in blood cells was studied onlyin the crows and black bears and was estimated at ~30 days in both species. The estimatedhalf-life times for blood cells are thus close to 10-fold that of plasma. Extrapolating thatfinding to long-nosed bandicoots would lead to an expected half-life time of bandicootblood cells of ~90 days. This explains the near absence of a change in blood cellstable-isotope ratios after the diet changes on the four treatments. For dietary reconstructionusing stable-isotope ratios, these findings suggest that blood plasma will provide dietary

Stable-isotope ratios in bandicoot blood Aust. J. Zoology 645
information integrated over a period of ~3 weeks. Blood cells give an impression of theassimilated diet over a period of as much as half a year.
Using an allometric equation for erythrocyte life expectancy in (mainly domesticated)mammals (Vácha 1983), we predict a much shorter half-life for long-nosed bandicooterythrocytes, in the range of 46–51 days rather than the 90 days we calculated above. Incontrast, the predicted half-life for black bear erythrocytes was three-fold that found byHilderbrand et al. (1996). An explanation for the much lower turnover rates of blood plasmaand cells found here in comparison with the findings in a bird and a eutherian mammalmight lie in the characteristically lower metabolic rate in many marsupials. Typically,marsupials have basal metabolic rates that are 26–35% lower than that expected foreutherian mammals of the same body mass (Hume 1999). It is generally accepted that25–30% of the basal metabolic rate is the energy expenditure associated with proteinturnover of tissues (e.g. Rolfe and Brown 1997). Thus, the slow metabolism of marsupialsmight indicate slow turnover rates of their tissues, including blood plasma and blood cells.
McIlwee and Johnson (1998) used δ13C and δ15N variation in the hair of Australianforegut-fermenting northern bettongs (Bettongia tropica) and rufous bettongs(Aepyprymnus rufescens) and the hindgut-fermenting northern brown bandicoot (Isoodonmacrourus) to assess changes in diet choice between a dry and a wet season, with less than4 months in between. During the dry season, the two bettongs showed an increase of up to6‰ in δ15N, which led McIlwee and Johnson to conclude that these animals relied on fungias a food source during this part of the year, whereas the bandicoots seldom ate fungi ineither season. However, hair might not be the most appropriate tissue to be sampled oversuch short periods: Tieszen et al. (1983) estimated a half life of C in the hair of eutheriangerbils (Meriones unguienlatus) of as much as 48 days. More importantly, low precipitationhas been shown to increase δ15N in herbivores by more than 10‰ in the absence of dietshifts (Cormie and Schwarcz 1996). There are as many as three alternative non-exclusiveand possibly reinforcing mechanisms that might have led to increased δ15N other than theinclusion of fungi in the bettongs’ diets during the dry season. First, reduced foodavailability and therefore moderate starvation and N recycling might increase δ15N duringthe dry season (Hobson and Clark 1992b; Ambrose 1993; Hobson et al. 1993). Second,reduced consumption of water during the dry season might result in increasinglyconcentrated urine, resulting in disproportionate excretion of 15N-depleted urea (Ambrose1991). Third, increased microbial food processing on low-quality food during the dryseason in the foregut-fermenting bettongs might also result in an increase in δ15N (Sealy etal. 1987). Our data suggest that the influence of the first explanation (the effect of low-Nintakes on δ15N through increased N recycling) is small. However, the quantitativesignificance of the two alternative explanations is unknown.
Naturally occurring stable-isotope ratios can be a powerful tool in studies on thenutritional ecology of animals under the premise that assumptions required for theassessment of the assimilated diet are validated (Gannes et al. 1997). The duration of thevarious treatments to which we subjected long-nosed bandicoots were clearly too short forprecise estimates of diet–tissue discrimination and blood plasma and blood cell turnoverrates. However, although our data should be considered tentative, they provide importantinformation allowing a more precise reconstruction of natural diets and temporal variationtherein. Thus far, little data on isotopic discrimination between diet and blood cells and dietand blood plasma have been published. Our findings appear to be largely in accordancewith limited previous findings that these discriminations are rather robust and that thedietary δ13C and δ15N can probably be discerned from blood plasma and blood cells with

646 Aust. J. Zoology M. Klaassen et al.
an error that is less than ±1‰. Furthermore, long-nosed bandicoots appear to have slowerturnover of their tissues than the non-marsupial endotherms studied to date, considerablylengthening the period over which isotope ratios in these tissues reflect diet choice.
Acknowledgments
We thank Naz Soran for conducting the Kjeldahl analyses, and for her help in preparing theanimal diets and cleaning up after us. Evelyn Chia and Brett Parker helped in capturingbandicoots and collecting the blood in the field. Dennis McNevin assisted in drying theblood samples. Virgilio Floris, Harry Korthals, Joop Nieuwenhuize and Roel Pel conductedthe stable-isotope ratio and total carbon analyses. Funding for this research was provided bygrants from the Schure-Beijerinck-Popping Foundation to MK and from the University ofSydney Sesqui Research Fund to IDH. This is Publication 3432 NIOO-KNAW of theNetherlands Institute of Ecology.
References
Ambrose, S. H. (1991). Effects of diet, climate and physiology on nitrogen isotope abundances in terrestrialfoodwebs. Journal of Archaeological Science 18, 293–317. doi:10.1016/0305-4403(91)90067-Y
Ambrose, S. H. (1993). Isotopic analysis of paleodiets: methodological and interpretive considerations. In‘Investigations of Ancient Human Tissue’. (Ed. M. K. Sanford.) pp. 59–130. (Gordon and Breach:Langhorne, PA.)
Cormie, A. P., and Schwarcz, H. P. (1996). Effects of climate on deer bone δ15N and δ13C: lack ofprecipitation effects on δ15N for animals consuming low amounts of C4 plants. Geochimica etCosmochimica Acta 60, 4161–4166. doi:10.1016/S0016-7037(96)00251-7
Gannes, L. Z., O’Brien, D. M., and Martínez del Rio, C. (1997). Stable isotopes in animal ecology:assumptions, caveats, and a call for more laboratory experiments. Ecology 78, 1271–1276.
Hilderbrand, G. V., Farley, S. D., Robbins, C. T., Hanley, T. A., Titus, K., and Servheen, C. (1996). Use ofstable isotopes to determine diets of living and extinct bears. Canadian Journal of Zoology 74,2080–2088.
Hobson, K. A., and Clark, R. G. (1992a). Assessing avian diets using stable isotopes. I. Turnover of 13C intissues. The Condor 94, 181–188.
Hobson, K. A., and Clark, R. G. (1992b). Assessing avian diets using stable isotopes. II. Factors influencingdiet–tissue fractionation. The Condor 94, 189–197.
Hobson, K. A., and Clark, R. G. (1993). Turnover of 13C in cellular and plasma fractions of blood:implications for nondestructive sampling in avian dietary studies. Auk 110, 638–641.
Hobson, K. A., Alisauskas, R. T., and Clark, R. G. (1993). Stable-nitrogen isotope enrichment in avian tissuesdue to fasting and nutritional stress: implications for isotopic analyses of diet. Condor 95, 388–394.
Hulbert, A. J., and Dawson, T. J. (1974). Thermoregulation in perameloid marsupials from differentenvironments. Compendium of Biochemical Physiology 47, 591–616. doi:10.1016/0300-9629(74)90025-5
Hume, I. D. (1999). ‘Marsupial Nutrition.’ (Cambridge University Press: Cambridge.)Kelly, J. F. (2000). Stable isotopes of carbon and nitrogen in the study of avian and mammalian trophic
ecology. Canadian Journal of Zoology 78, 1–27. doi:10.1139/CJZ-78-1-1Klaassen, M., Lindstrom, A., Meltofte, H., and Piersma, T. (2001). Arctic waders are not capital breeders.
Nature 413, 794. doi:10.1038/35101654Lee-Thorp, J. A., Sealy, J. C., and Van der Merwe, N. J. (1989). Stable carbon isotope ratio differences
between bone collagen and bone apatite, and their relationship to diet. Journal of ArchaeologicalScience 16, 585–599.
Lesage, V., Hammill, M. O., and Kovacs, K. M. (2002). Diet–tissue fractionation of stable carbon andnitrogen isotopes in phocid seals. Marine Mammal Science 18, 182–193.
McIlwee, A. P., and Johnson, C. N. (1998). The contribution of fungus to the diets of three mycophagousmarsupials in Eucalyptus forests, revealed by stable isotope analysis. Functional Ecology 12, 223–231.doi:10.1046/J.1365-2435.1998.00181.X
Pearson, S. F., Levey, D. J., Greenberg, C. H., and Martínez del Rio, C. (2003). Effects of elementalcomposition on the incorporation of dietary nitrogen and carbon isotopic signatures in an omnivoroussongbird. Oecologia 135, 516–523.

Stable-isotope ratios in bandicoot blood Aust. J. Zoology 647
http://www.publish.csiro.au/journals/ajz
Rolfe, D. F. S., and Brown, G. C. (1997). Cellular energy utilization and molecular origin of standardmetabolic rate in mammals. Physiological Reviews 77, 731–758.
Roth, J. D., and Hobson, K. A. (2000). Stable carbon and nitrogen isotopic fractionation between diet andtissue of captive red fox: implications for dietary reconstruction. Canadian Journal of Zoology 78,848–852. doi:10.1139/CJZ-78-5-848
Scott, L. K., Hume, I. D., and Dickman, C. R. (1999). Ecology and population biology of long-nosedbandicoots (Perameles nasuta) at North Head, Sydney Harbour National Park. Wildlife Research 26,805–821.
Sealy, J. C., van der Merwe, N. J., Lee-Thorp, J. A., and Latham, J. L. (1987). Nitrogen isotope ecology insouthern Africa: implications for environmental and dietary tracing. Geochimica et Cosmochimica Acta51, 2707–2717. doi:10.1016/0016–7073(87)90151–7
Statistica (1999). ‘STATISTICA for the Windows Operating System.’ (Statsoft Inc.: Tulsa, OK.)Thums, M., Hume, I. D., and Gibson, L. A. (2003). Seasonal energetics of the long-nosed bandicoot
(Perameles nasuta) in coastal New South Wales. Australian Journal of Zoology 51, 129–136.doi:10.1071/ZO02076
Tieszen, L. L., and Boutton, T. W. (1989). Stable carbon isotopes in terrestrial ecosystem research. In‘Stable Isotopes in Ecological Research’. (Eds P. W. Rundel, J. R. Ehleringer and K. A. Nagy.) pp.167–195. (Springer-Verlag: New York.)
Tieszen, L. L., Boutton, T. W., Tesdahl, K. G., and Slade, N. A. (1983). Fractionation and turnover of stablecarbon isotopes in animal tissues: implications for δ13C analysis of diet. Oecologia 57, 32–37.doi:10.1007/BF00379558
Vácha, J. (1983). Red cell life span. In ‘Red Blood Cells of Domestic Mammals’. (Eds N. S. Agar and P. G.Board.) pp. 67–132. (Elsevier: Amsterdam.)
Manuscript received 16 April 2004, accepted 18 October 2004