Analysis of the Role of Fundamental Financial Ratios ... - CORE
16
Research Journal of Finance and Accounting www.iiste.org ISSN 2222-1697 (Paper) ISSN 2222-2847 (Online) Vol.8, No.8, 2017 1 Analysis of the Role of Fundamental Financial Ratios in Predicting the Stock Returns for Commercial Banks Listed on Amman Stock Exchange Abdul Sattar Abdul Jabbar Al Kubaisi Associate Professor Accounting Department, Faculty of Finance and Business World Islamic Sciences and Education University, P.O. Box 1101, Amman 11947 Jordan Oday Hussein Afaneh Researcher Abdalla Hussain Al Assuli Researcher Accounting Department, Faculty of Finance and Business World Islamic Sciences and Education University, P.O. Box 1101, Amman 11947 Jordan Abstract The objective of this study is to determine the predictive role of the Fundamental Financial Ratios for the Stock Returns of Commercial Banks Listed on Amman Stock Exchange(2006-2015), the number of commercial banks listed on the ASE (13) Banks. The study used multiple linear regression and stepwise regression to examine the relationship between independent variables (Dividend Yield Ratio, Earning Yield Ratio, Book-to-Market Ratio), and the dependent variable (Stock Returns for Commercial Banks Listed on ASE).The results revealed that there is no role of the fundamental financial ratios to predict the Stock Returns for the Commercial Banks Listed on ASE for the complete period (2006 – 2015) .Then we divided the study years for three periods with(3-4 years) to determine predictive role for the ratios within the years of study. only during the period (2009-2011) appeared interpretive & predictive ability to predict stock returns for Commercial Banks by Earning Yield Ratio (EY), then we have examined the role of ratios in each year of the study alone which appeared the Role of the Fundamental Financial Ratios to Predict the Stock Returns for Commercial Banks in Jordan by Earning Yield Ratio (EY) in 2009, and Dividend Yield Ratio (DY) in 2010.Finally we have examined the role of these ratios to predict the Stock Returns separately for each Commercial bank, which appeared interpretive & predictive ability of the Book-to-Market Ratio (B/M) to predict stock returns for five Commercial banks out of thirteen. Keywords: Dividend Yield Ratio (DY), Earning Yield Ratio (EY), Book-to-Market Ratio (B/M), Commercial Banks, Fundamental Financial Ratios 1. Introduction Generally, the information reported in the financial statements forms the essential source on which depend managers to make their economic decisions with greater level of certainty. The financial information that is reliable, complete, neutral and free from errors assist making more rational decisions and provide physical data (valuable) which help differentiating between the different investment alternatives. The accelerated changes taking place every moment reshape our world from the economic, social, and political aspects, and the financial markets are not far from that changes that face unstable environment as a result of the global financial crisis that even after ten years still have influence with the collapse of many giant firms including banks. This situation influences the attitudes of different investors and their willingness to continue seeking their objectives of making stronger financial positions, increased or at least stable earnings. In this context, this study attempts to identify the role of the fundamental financial ratios (Dividend Yield (DY), Earning Yield (EY), and Book-to-Market (B/M)) in predicting stock returns for the commercial banks listed on Amman Stock Exchange (ASE) (2006-2015). These ratios are considered fundamental as they associate the bank financial information and market information in one ratio , thereby they are not derivative from other ratios (Meesuwan, 2015; Kheradyar et al., 2011). However, the prior studies reviewed that addressed the predictive power of the financial ratios with stock returns considered such ratios fundamental (partially or totally. A note should be made that for purpose of the present study the stock return includes earnings from holding stock (dividend yield of stock held, and the variation in stock prices over two fiscal years with stock hold period). 2. Statement of the Problem The analysis using the financial ratios is essential for evaluation of current or potential investment opportunities, because it reflects a clearer image about the financial performance of various firms including the commercial banks. The present study investigates the role of fundamental financial ratios in predicting Stock Returns for brought to you by CORE View metadata, citation and similar papers at core.ac.uk provided by International Institute for Science, Technology and Education (IISTE): E-Journals
-
Upload
khangminh22 -
Category
Documents
-
view
3 -
download
0
Transcript of Analysis of the Role of Fundamental Financial Ratios ... - CORE
Research Journal of Finance and Accounting www.iiste.org
ISSN 2222-1697 (Paper) ISSN 2222-2847 (Online)
Vol.8, No.8, 2017
1
Analysis of the Role of Fundamental Financial Ratios in
Predicting the Stock Returns for Commercial Banks Listed on
Amman Stock Exchange
Abdul Sattar Abdul Jabbar Al Kubaisi
Associate Professor
Accounting Department, Faculty of Finance and Business
World Islamic Sciences and Education University, P.O. Box 1101, Amman 11947 Jordan
Oday Hussein Afaneh
Researcher
Abdalla Hussain Al Assuli
Researcher
Accounting Department, Faculty of Finance and Business
World Islamic Sciences and Education University, P.O. Box 1101, Amman 11947 Jordan
Abstract The objective of this study is to determine the predictive role of the Fundamental Financial Ratios for the Stock
Returns of Commercial Banks Listed on Amman Stock Exchange(2006-2015), the number of commercial banks
listed on the ASE (13) Banks. The study used multiple linear regression and stepwise regression to examine the
relationship between independent variables (Dividend Yield Ratio, Earning Yield Ratio, Book-to-Market Ratio),
and the dependent variable (Stock Returns for Commercial Banks Listed on ASE).The results revealed that there
is no role of the fundamental financial ratios to predict the Stock Returns for the Commercial Banks Listed on
ASE for the complete period (2006 – 2015) .Then we divided the study years for three periods with(3-4 years)
to determine predictive role for the ratios within the years of study. only during the period (2009-2011) appeared
interpretive & predictive ability to predict stock returns for Commercial Banks by Earning Yield Ratio (EY),
then we have examined the role of ratios in each year of the study alone which appeared the Role of the
Fundamental Financial Ratios to Predict the Stock Returns for Commercial Banks in Jordan by Earning Yield
Ratio (EY) in 2009, and Dividend Yield Ratio (DY) in 2010.Finally we have examined the role of these ratios to
predict the Stock Returns separately for each Commercial bank, which appeared interpretive & predictive ability
of the Book-to-Market Ratio (B/M) to predict stock returns for five Commercial banks out of thirteen.
Keywords: Dividend Yield Ratio (DY), Earning Yield Ratio (EY), Book-to-Market Ratio (B/M), Commercial
Banks, Fundamental Financial Ratios
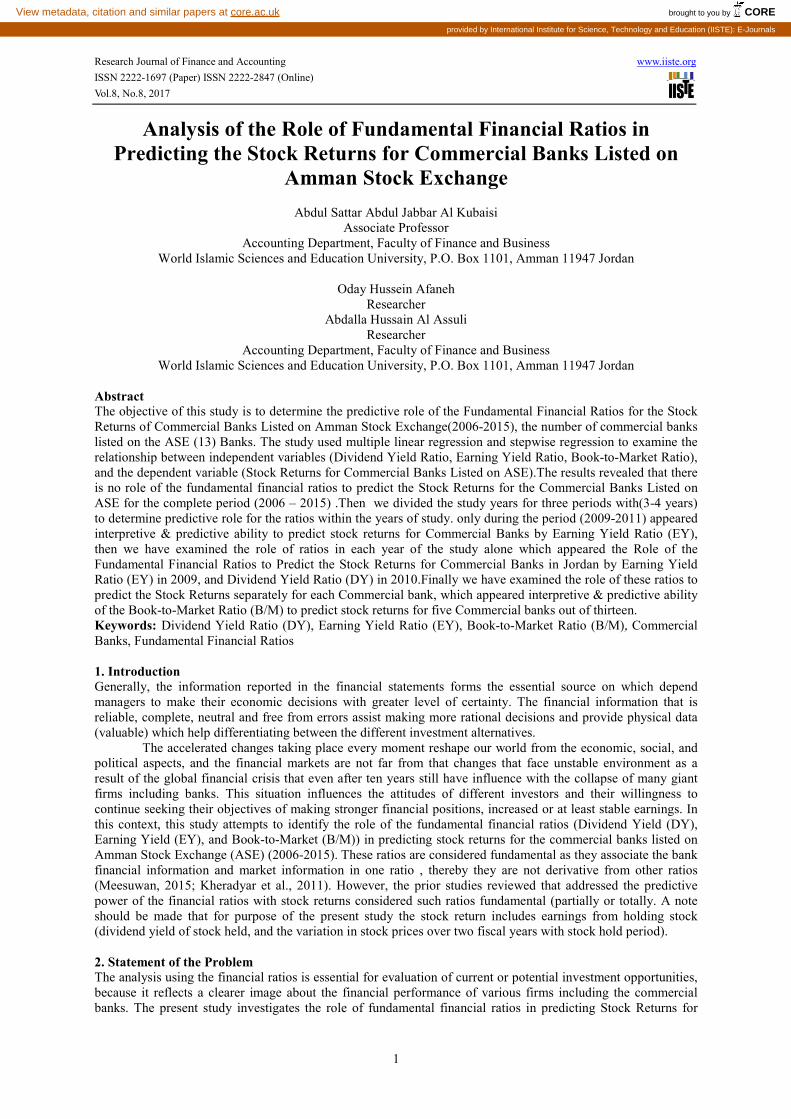
1. Introduction
Generally, the information reported in the financial statements forms the essential source on which depend
managers to make their economic decisions with greater level of certainty. The financial information that is
reliable, complete, neutral and free from errors assist making more rational decisions and provide physical data
(valuable) which help differentiating between the different investment alternatives.
The accelerated changes taking place every moment reshape our world from the economic, social, and
political aspects, and the financial markets are not far from that changes that face unstable environment as a
result of the global financial crisis that even after ten years still have influence with the collapse of many giant
firms including banks. This situation influences the attitudes of different investors and their willingness to
continue seeking their objectives of making stronger financial positions, increased or at least stable earnings. In
this context, this study attempts to identify the role of the fundamental financial ratios (Dividend Yield (DY),
Earning Yield (EY), and Book-to-Market (B/M)) in predicting stock returns for the commercial banks listed on
Amman Stock Exchange (ASE) (2006-2015). These ratios are considered fundamental as they associate the bank
financial information and market information in one ratio , thereby they are not derivative from other ratios
(Meesuwan, 2015; Kheradyar et al., 2011). However, the prior studies reviewed that addressed the predictive
power of the financial ratios with stock returns considered such ratios fundamental (partially or totally. A note
should be made that for purpose of the present study the stock return includes earnings from holding stock
(dividend yield of stock held, and the variation in stock prices over two fiscal years with stock hold period).
2. Statement of the Problem
The analysis using the financial ratios is essential for evaluation of current or potential investment opportunities,
because it reflects a clearer image about the financial performance of various firms including the commercial
banks. The present study investigates the role of fundamental financial ratios in predicting Stock Returns for
brought to you by COREView metadata, citation and similar papers at core.ac.uk
provided by International Institute for Science, Technology and Education (IISTE): E-Journals
Research Journal of Finance and Accounting www.iiste.org
ISSN 2222-1697 (Paper) ISSN 2222-2847 (Online)
Vol.8, No.8, 2017
2
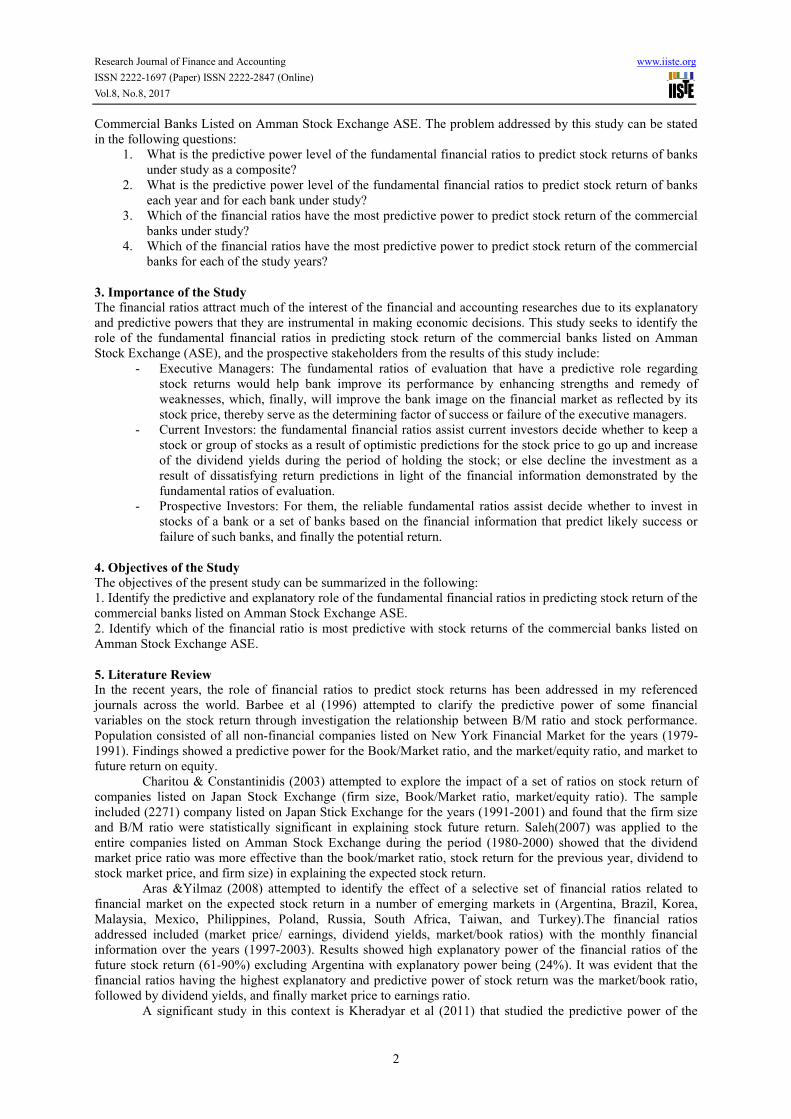
Commercial Banks Listed on Amman Stock Exchange ASE. The problem addressed by this study can be stated
in the following questions:
1. What is the predictive power level of the fundamental financial ratios to predict stock returns of banks
under study as a composite?
2. What is the predictive power level of the fundamental financial ratios to predict stock return of banks
each year and for each bank under study?
3. Which of the financial ratios have the most predictive power to predict stock return of the commercial
banks under study?
4. Which of the financial ratios have the most predictive power to predict stock return of the commercial
banks for each of the study years?
3. Importance of the Study
The financial ratios attract much of the interest of the financial and accounting researches due to its explanatory
and predictive powers that they are instrumental in making economic decisions. This study seeks to identify the
role of the fundamental financial ratios in predicting stock return of the commercial banks listed on Amman
Stock Exchange (ASE), and the prospective stakeholders from the results of this study include:
- Executive Managers: The fundamental ratios of evaluation that have a predictive role regarding
stock returns would help bank improve its performance by enhancing strengths and remedy of
weaknesses, which, finally, will improve the bank image on the financial market as reflected by its
stock price, thereby serve as the determining factor of success or failure of the executive managers.
- Current Investors: the fundamental financial ratios assist current investors decide whether to keep a
stock or group of stocks as a result of optimistic predictions for the stock price to go up and increase
of the dividend yields during the period of holding the stock; or else decline the investment as a
result of dissatisfying return predictions in light of the financial information demonstrated by the
fundamental ratios of evaluation.
- Prospective Investors: For them, the reliable fundamental ratios assist decide whether to invest in
stocks of a bank or a set of banks based on the financial information that predict likely success or
failure of such banks, and finally the potential return.
4. Objectives of the Study The objectives of the present study can be summarized in the following:
1. Identify the predictive and explanatory role of the fundamental financial ratios in predicting stock return of the
commercial banks listed on Amman Stock Exchange ASE.
2. Identify which of the financial ratio is most predictive with stock returns of the commercial banks listed on
Amman Stock Exchange ASE.
5. Literature Review
In the recent years, the role of financial ratios to predict stock returns has been addressed in my referenced
journals across the world. Barbee et al (1996) attempted to clarify the predictive power of some financial
variables on the stock return through investigation the relationship between B/M ratio and stock performance.
Population consisted of all non-financial companies listed on New York Financial Market for the years (1979-
1991). Findings showed a predictive power for the Book/Market ratio, and the market/equity ratio, and market to
future return on equity.
Charitou & Constantinidis (2003) attempted to explore the impact of a set of ratios on stock return of
companies listed on Japan Stock Exchange (firm size, Book/Market ratio, market/equity ratio). The sample
included (2271) company listed on Japan Stick Exchange for the years (1991-2001) and found that the firm size
and B/M ratio were statistically significant in explaining stock future return. Saleh(2007) was applied to the
entire companies listed on Amman Stock Exchange during the period (1980-2000) showed that the dividend
market price ratio was more effective than the book/market ratio, stock return for the previous year, dividend to
stock market price, and firm size) in explaining the expected stock return.
Aras &Yilmaz (2008) attempted to identify the effect of a selective set of financial ratios related to
financial market on the expected stock return in a number of emerging markets in (Argentina, Brazil, Korea,
Malaysia, Mexico, Philippines, Poland, Russia, South Africa, Taiwan, and Turkey).The financial ratios
addressed included (market price/ earnings, dividend yields, market/book ratios) with the monthly financial
information over the years (1997-2003). Results showed high explanatory power of the financial ratios of the
future stock return (61-90%) excluding Argentina with explanatory power being (24%). It was evident that the
financial ratios having the highest explanatory and predictive power of stock return was the market/book ratio,
followed by dividend yields, and finally market price to earnings ratio.
A significant study in this context is Kheradyar et al (2011) that studied the predictive power of the
Research Journal of Finance and Accounting www.iiste.org
ISSN 2222-1697 (Paper) ISSN 2222-2847 (Online)
Vol.8, No.8, 2017
3
fundamental valuation ratio to predict stock return for the firms listed on Malaysia Stock Exchange for the years
(2000-2009). The ratios employed included (dividend yields, earnings profit ratio, Book-to-Market ratio). The
study collected historical financial data of (960) firms. Results showed that the financial ratios measured in the
study had a predictive power to predict the stock return for the years under study. However, the most impacting
ratio was the Book-to-Market ratio, and the composite ratios were of predictive and explanatory power of stock
return.
Khan et al (2012) concluded similar results through investigating (100) non-financial firms listed on
Karachi Financial Market in Pakistan for the period (2005-2011). Results found a positive association between
the (earnings yield and the dividend yield ratios) form a hand, and stock return, from the other. A negative
association appeared between the Book-to-Market ratio with stock return, and that such ratios had perceivable
explanatory power in predicting stock return. Jiang & Lee (2012) applied the study on top (500) companies in
the United States and found that the earnings ratio to the market price is paramount in predicting stock return by
analyzing the economic cycles, whereas the Book-to-Market ratio would appear through trend analysis.
Karami &Talaeei (2013) sought to identify the strength of correlation between a set of financial ratios
(price-earnings (P/E), B/M, Dividend Yield, and capital earnings) and expected stock return for companies listed
on Tahran Financial Market for the years (1998-2007) and found a statistical significant relationship and
predictive power between the capital earnings, and Book-to-Market ratios with stock return being as predicted by
the study and for the study years.
Meesuwan (2015) was conducted on a sample of (70) firms listed on Thailand financial Market for the
years (2006-2014). The study included wide set of the fundamental financial ratios (dividend yield, earning yield
and book/market) and another set of the accounting ratios (Return on Assets, Total Asset Turnover, financial
leverage Ratio, and Net profit margin). The study found that the fundamental financial ratios in addition
to net profit margin were the ratios with highest predictive power of stock return, and the most significant was
the Book-to-market ratio. Further, the study showed that the other accounting ratios were statistically
insignificant regarding its relationship with stock return.
Fu & Yee (2016) was applied on (17) out of (50) firms in the financial sector listed on Hong Kong
Financial Market for the years (2008-2012).
The study failed to confirm a clear relationship in the financial sector between the financial ratios and
variables and the expected stock return at the financial firms listed on Hong Kong Financial Market. As a result
the study was unable to confirm which of the ratios or indices most affecting expected stock return, or which
most value for the investors and financial analysts.
To summarize, the earlier review of the prior studies shows a potential role of the fundamental financial
ratios in predicting stock earnings in the various world financial markets and economic sectors, and such role
varies from one financial market to another. In general the Book/Market ratio was the most predictive and
explanatory power of the expected stocks.
6. Methodology
6.1 Study Population & Sample
The population consisted of the commercial banks (13) listed on Amman Stock Exchange (ASE). The study
included all the related banks, but excluded the Islamic Banks (3) listed on Amman Stock Exchange (ASE) as
the financial information for the Islamic Banks are released by Amman Stock Exchange (ASE) separately from
the commercial banks considering the variation in classification of their financial statements that include, for
instance, shared investment accounts, or exclude earnings not complying with the Islamic Sharia. Table (1)
displays the names of the commercial banks studied.
Research Journal of Finance and Accounting www.iiste.org
ISSN 2222-1697 (Paper) ISSN 2222-2847 (Online)
Vol.8, No.8, 2017
4
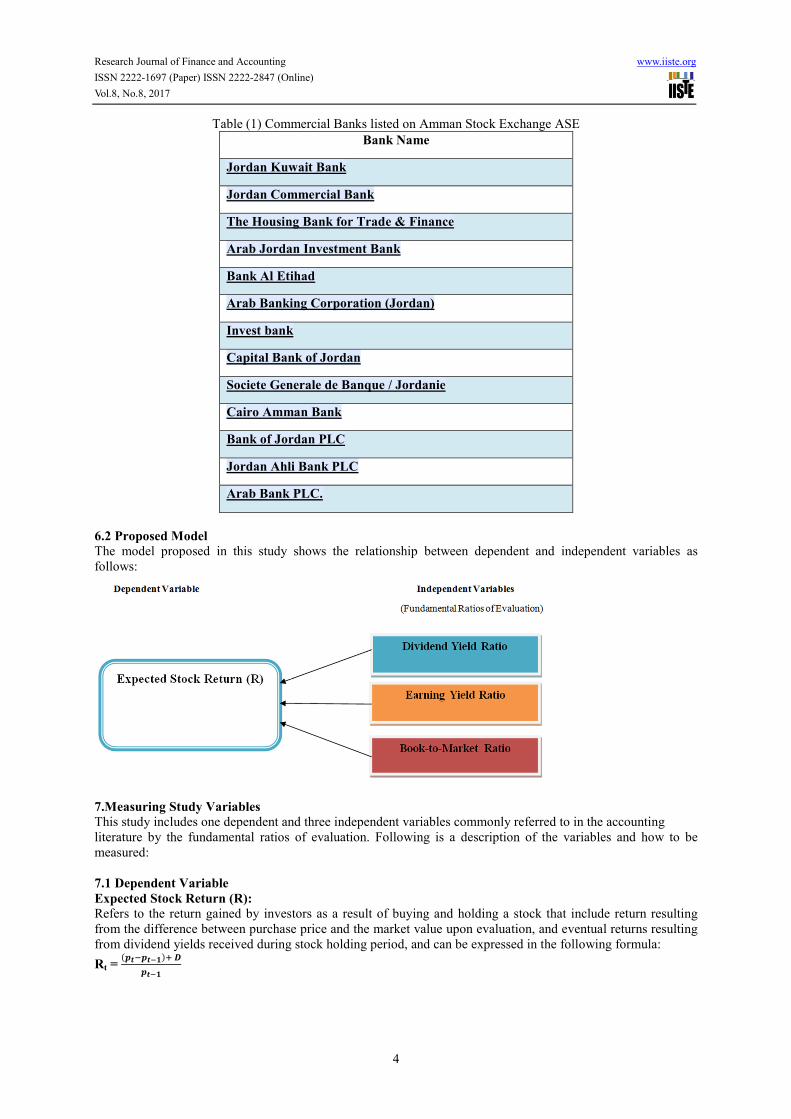
Table (1) Commercial Banks listed on Amman Stock Exchange ASE
Bank Name
Jordan Kuwait Bank
Jordan Commercial Bank
The Housing Bank for Trade & Finance
Arab Jordan Investment Bank
Bank Al Etihad
Arab Banking Corporation (Jordan)
Invest bank
Capital Bank of Jordan
Societe Generale de Banque / Jordanie
Cairo Amman Bank
Bank of Jordan PLC
Jordan Ahli Bank PLC
Arab Bank PLC.
6.2 Proposed Model
The model proposed in this study shows the relationship between dependent and independent variables as
follows:
7.Measuring Study Variables
This study includes one dependent and three independent variables commonly referred to in the accounting
literature by the fundamental ratios of evaluation. Following is a description of the variables and how to be
measured:
7.1 Dependent Variable
Expected Stock Return (R):
Refers to the return gained by investors as a result of buying and holding a stock that include return resulting
from the difference between purchase price and the market value upon evaluation, and eventual returns resulting
from dividend yields received during stock holding period, and can be expressed in the following formula:
Rt = ����������
����
Research Journal of Finance and Accounting www.iiste.org
ISSN 2222-1697 (Paper) ISSN 2222-2847 (Online)
Vol.8, No.8, 2017
5
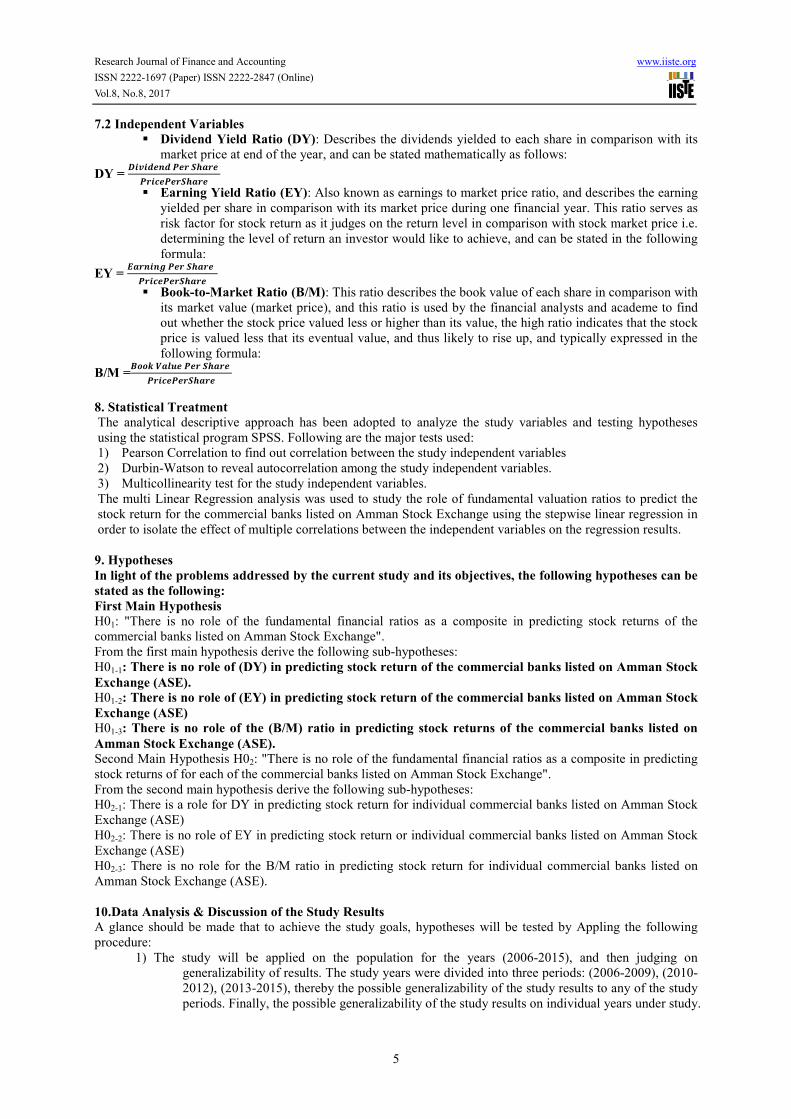
7.2 Independent Variables
� Dividend Yield Ratio (DY): Describes the dividends yielded to each share in comparison with its
market price at end of the year, and can be stated mathematically as follows:
DY = ��� �� ��������
�������������
� Earning Yield Ratio (EY): Also known as earnings to market price ratio, and describes the earning
yielded per share in comparison with its market price during one financial year. This ratio serves as
risk factor for stock return as it judges on the return level in comparison with stock market price i.e.
determining the level of return an investor would like to achieve, and can be stated in the following
formula:
EY = ���������������
�������������
� Book-to-Market Ratio (B/M): This ratio describes the book value of each share in comparison with
its market value (market price), and this ratio is used by the financial analysts and academe to find
out whether the stock price valued less or higher than its value, the high ratio indicates that the stock
price is valued less that its eventual value, and thus likely to rise up, and typically expressed in the
following formula:
B/M =�����������������
�������������
8. Statistical Treatment
The analytical descriptive approach has been adopted to analyze the study variables and testing hypotheses
using the statistical program SPSS. Following are the major tests used:
1) Pearson Correlation to find out correlation between the study independent variables
2) Durbin-Watson to reveal autocorrelation among the study independent variables.
3) Multicollinearity test for the study independent variables.
The multi Linear Regression analysis was used to study the role of fundamental valuation ratios to predict the
stock return for the commercial banks listed on Amman Stock Exchange using the stepwise linear regression in
order to isolate the effect of multiple correlations between the independent variables on the regression results.
9. Hypotheses
In light of the problems addressed by the current study and its objectives, the following hypotheses can be
stated as the following:
First Main Hypothesis
H01: "There is no role of the fundamental financial ratios as a composite in predicting stock returns of the
commercial banks listed on Amman Stock Exchange".
From the first main hypothesis derive the following sub-hypotheses:
H01-1: There is no role of (DY) in predicting stock return of the commercial banks listed on Amman Stock
Exchange (ASE).
H01-2: There is no role of (EY) in predicting stock return of the commercial banks listed on Amman Stock
Exchange (ASE)
H01-3: There is no role of the (B/M) ratio in predicting stock returns of the commercial banks listed on
Amman Stock Exchange (ASE).
Second Main Hypothesis H02: "There is no role of the fundamental financial ratios as a composite in predicting
stock returns of for each of the commercial banks listed on Amman Stock Exchange".
From the second main hypothesis derive the following sub-hypotheses:
H02-1: There is a role for DY in predicting stock return for individual commercial banks listed on Amman Stock
Exchange (ASE)
H02-2: There is no role of EY in predicting stock return or individual commercial banks listed on Amman Stock
Exchange (ASE)
H02-3: There is no role for the B/M ratio in predicting stock return for individual commercial banks listed on
Amman Stock Exchange (ASE).
10.Data Analysis & Discussion of the Study Results
A glance should be made that to achieve the study goals, hypotheses will be tested by Appling the following
procedure:
1) The study will be applied on the population for the years (2006-2015), and then judging on
generalizability of results. The study years were divided into three periods: (2006-2009), (2010-
2012), (2013-2015), thereby the possible generalizability of the study results to any of the study
periods. Finally, the possible generalizability of the study results on individual years under study.
Research Journal of Finance and Accounting www.iiste.org
ISSN 2222-1697 (Paper) ISSN 2222-2847 (Online)
Vol.8, No.8, 2017
6
2) Judging possible generalizability of results for each bank and for the entire years under study.
10.1 Testing the Relationship between the independent variables
The appropriateness of the linear regressive analysis to the study data can be established by testing the linear
correlation and autocorrelation problems.
10.2 First:Multicollinearity Tests To explore the multicollinearity between the independent variables in this study, Pearson correlation was
employed with the entire periods under study:
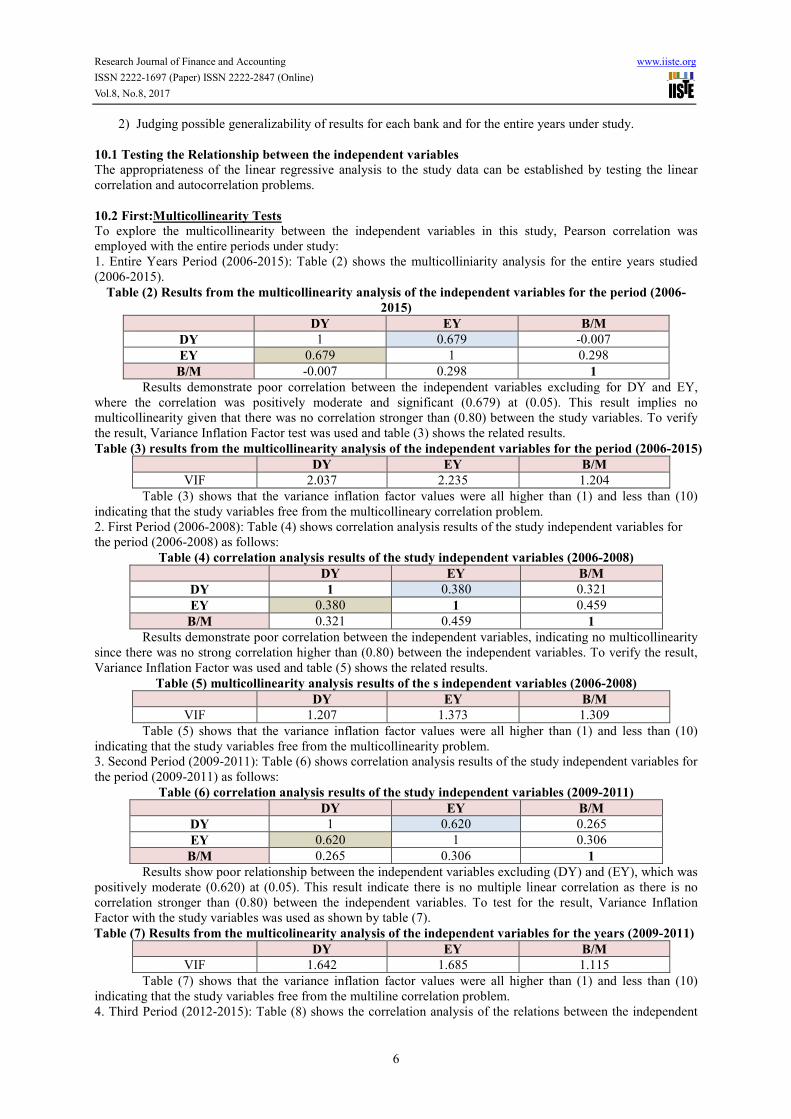
1. Entire Years Period (2006-2015): Table (2) shows the multicolliniarity analysis for the entire years studied
(2006-2015).
Table (2) Results from the multicollinearity analysis of the independent variables for the period (2006-
2015)
B/M EY DY
-0.007 0.679 1 DY
0.298 1 0.679 EY
1 0.298 -0.007 B/M
Results demonstrate poor correlation between the independent variables excluding for DY and EY,
where the correlation was positively moderate and significant (0.679) at (0.05). This result implies no
multicollinearity given that there was no correlation stronger than (0.80) between the study variables. To verify
the result, Variance Inflation Factor test was used and table (3) shows the related results.
Table (3) results from the multicollinearity analysis of the independent variables for the period (2006-2015)
B/M EY DY
1.204 2.235 2.037 VIF
Table (3) shows that the variance inflation factor values were all higher than (1) and less than (10)
indicating that the study variables free from the multicollineary correlation problem.
2. First Period (2006-2008): Table (4) shows correlation analysis results of the study independent variables for
the period (2006-2008) as follows:
Table (4) correlation analysis results of the study independent variables (2006-2008)
B/M EY DY
0.321 0.380 1 DY
0.459 1 0.380 EY
1 0.459 0.321 B/M
Results demonstrate poor correlation between the independent variables, indicating no multicollinearity
since there was no strong correlation higher than (0.80) between the independent variables. To verify the result,
Variance Inflation Factor was used and table (5) shows the related results.
Table (5) multicollinearity analysis results of the s independent variables (2006-2008)
B/M EY DY
1.309 1.373 1.207 VIF
Table (5) shows that the variance inflation factor values were all higher than (1) and less than (10)
indicating that the study variables free from the multicollinearity problem.
3. Second Period (2009-2011): Table (6) shows correlation analysis results of the study independent variables for
the period (2009-2011) as follows:
Table (6) correlation analysis results of the study independent variables (2009-2011)
B/M EY DY
0.265 0.620 1 DY
0.306 1 0.620 EY
1 0.306 0.265 B/M
Results show poor relationship between the independent variables excluding (DY) and (EY), which was
positively moderate (0.620) at (0.05). This result indicate there is no multiple linear correlation as there is no
correlation stronger than (0.80) between the independent variables. To test for the result, Variance Inflation
Factor with the study variables was used as shown by table (7).
Table (7) Results from the multicolinearity analysis of the independent variables for the years (2009-2011)
B/M EY DY
1.115 1.685 1.642 VIF
Table (7) shows that the variance inflation factor values were all higher than (1) and less than (10)
indicating that the study variables free from the multiline correlation problem.
4. Third Period (2012-2015): Table (8) shows the correlation analysis of the relations between the independent
Research Journal of Finance and Accounting www.iiste.org
ISSN 2222-1697 (Paper) ISSN 2222-2847 (Online)
Vol.8, No.8, 2017
7
variables for the period (2012-2015) as follows:
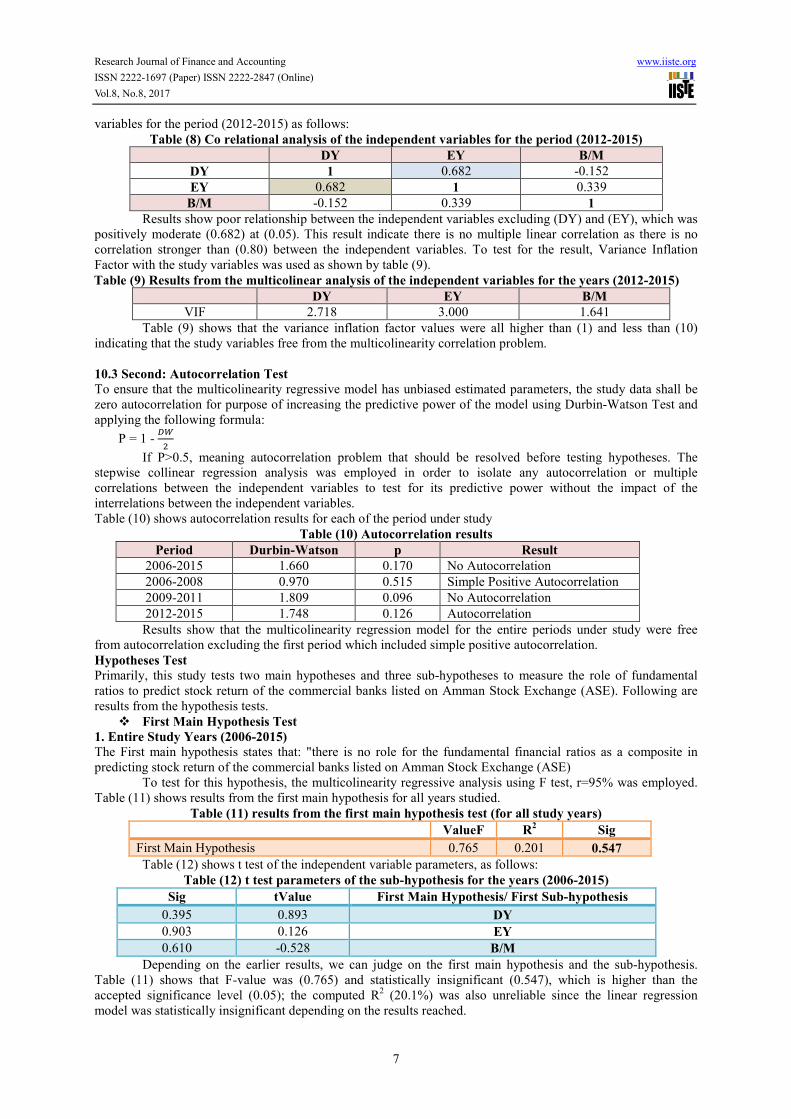
Table (8) Co relational analysis of the independent variables for the period (2012-2015)
B/M EY DY
-0.152 0.682 1 DY
0.339 1 0.682 EY
1 0.339 -0.152 B/M
Results show poor relationship between the independent variables excluding (DY) and (EY), which was
positively moderate (0.682) at (0.05). This result indicate there is no multiple linear correlation as there is no
correlation stronger than (0.80) between the independent variables. To test for the result, Variance Inflation
Factor with the study variables was used as shown by table (9).
Table (9) Results from the multicolinear analysis of the independent variables for the years (2012-2015)
B/M EY DY
1.641 3.000 2.718 VIF
Table (9) shows that the variance inflation factor values were all higher than (1) and less than (10)
indicating that the study variables free from the multicolinearity correlation problem.
10.3 Second: Autocorrelation Test
To ensure that the multicolinearity regressive model has unbiased estimated parameters, the study data shall be
zero autocorrelation for purpose of increasing the predictive power of the model using Durbin-Watson Test and
applying the following formula:
P = 1 - ��
If P>0.5, meaning autocorrelation problem that should be resolved before testing hypotheses. The
stepwise collinear regression analysis was employed in order to isolate any autocorrelation or multiple
correlations between the independent variables to test for its predictive power without the impact of the
interrelations between the independent variables.
Table (10) shows autocorrelation results for each of the period under study
Table (10) Autocorrelation results
Result p Durbin-Watson Period
No Autocorrelation 0.170 1.660 2006-2015
Simple Positive Autocorrelation 0.515 0.970 2006-2008
No Autocorrelation 0.096 1.809 2009-2011
Autocorrelation 0.126 1.748 2012-2015
Results show that the multicolinearity regression model for the entire periods under study were free
from autocorrelation excluding the first period which included simple positive autocorrelation.
Hypotheses Test
Primarily, this study tests two main hypotheses and three sub-hypotheses to measure the role of fundamental
ratios to predict stock return of the commercial banks listed on Amman Stock Exchange (ASE). Following are
results from the hypothesis tests.
� First Main Hypothesis Test
1. Entire Study Years (2006-2015)
The First main hypothesis states that: "there is no role for the fundamental financial ratios as a composite in
predicting stock return of the commercial banks listed on Amman Stock Exchange (ASE)
To test for this hypothesis, the multicolinearity regressive analysis using F test, r=95% was employed.
Table (11) shows results from the first main hypothesis for all years studied.
Table (11) results from the first main hypothesis test (for all study years)
Sig R2 ValueF
0.547 0.201 0.765 First Main Hypothesis
Table (12) shows t test of the independent variable parameters, as follows:
Table (12) t test parameters of the sub-hypothesis for the years (2006-2015)
First Main Hypothesis/ First Sub-hypothesis tValue Sig
DY 0.893 0.395
EY 0.126 0.903
B/M -0.528 0.610
Depending on the earlier results, we can judge on the first main hypothesis and the sub-hypothesis.
Table (11) shows that F-value was (0.765) and statistically insignificant (0.547), which is higher than the
accepted significance level (0.05); the computed R2 (20.1%) was also unreliable since the linear regression
model was statistically insignificant depending on the results reached.
Research Journal of Finance and Accounting www.iiste.org
ISSN 2222-1697 (Paper) ISSN 2222-2847 (Online)
Vol.8, No.8, 2017
8
The same applies to the sub-hypotheses, where t and α were statistically insignificant. To verify the
accuracy of the results, stepwise linear regression analysis was used that showed no independent variable.
The same applies to the sub-hypotheses, where t and α values were statistically insignificant. To verify
the results, stepwise linear regression analysis was used and showed no independent variable is statistically
significant or has a role in predicting stock return over the entire study periods. This result implies acceptance of
the null hypothesis for the entire study periods, stating that: "There is no role of the fundamental valuation ratios
as a composite in predicting stock return for the commercial banks listed on Amman Stock Exchange".
The same applies to the three sub-hypotheses (entire years under study), therefore:
H01-1: There is no role of the (DY) in predicting stock return of the commercial banks listed on Amman Stock
Exchange (ASE)
H01-2: There is no role of the (EY) in predicting stock return of the commercial banks listed on Amman Stock
Exchange (ASE)
H01-3: There is no role of the (B/M) in predicting stock return of the commercial banks listed on Amman Stock
Exchange (ASE)
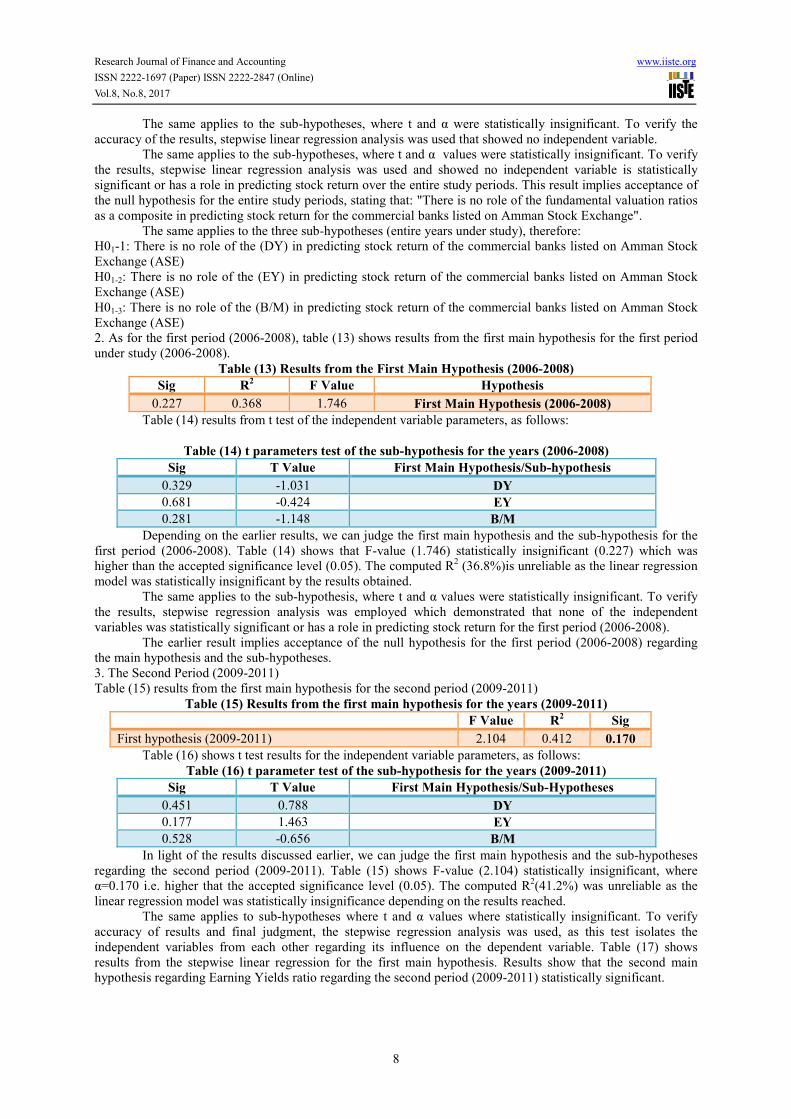
2. As for the first period (2006-2008), table (13) shows results from the first main hypothesis for the first period
under study (2006-2008).
Table (13) Results from the First Main Hypothesis (2006-2008)
Hypothesis F Value R2 Sig
First Main Hypothesis (2006-2008) 1.746 0.368 0.227
Table (14) results from t test of the independent variable parameters, as follows:
Table (14) t parameters test of the sub-hypothesis for the years (2006-2008)
First Main Hypothesis/Sub-hypothesis T Value Sig
DY -1.031 0.329
EY -0.424 0.681
B/M -1.148 0.281
Depending on the earlier results, we can judge the first main hypothesis and the sub-hypothesis for the
first period (2006-2008). Table (14) shows that F-value (1.746) statistically insignificant (0.227) which was
higher than the accepted significance level (0.05). The computed R2 (36.8%)is unreliable as the linear regression
model was statistically insignificant by the results obtained.
The same applies to the sub-hypothesis, where t and α values were statistically insignificant. To verify
the results, stepwise regression analysis was employed which demonstrated that none of the independent
variables was statistically significant or has a role in predicting stock return for the first period (2006-2008).
The earlier result implies acceptance of the null hypothesis for the first period (2006-2008) regarding
the main hypothesis and the sub-hypotheses.
3. The Second Period (2009-2011)
Table (15) results from the first main hypothesis for the second period (2009-2011)
Table (15) Results from the first main hypothesis for the years (2009-2011)
Sig R2 F Value
0.170 0.412 2.104 First hypothesis (2009-2011)
Table (16) shows t test results for the independent variable parameters, as follows:
Table (16) t parameter test of the sub-hypothesis for the years (2009-2011)
First Main Hypothesis/Sub-Hypotheses T Value Sig
DY 0.788 0.451
EY 1.463 0.177
B/M -0.656 0.528
In light of the results discussed earlier, we can judge the first main hypothesis and the sub-hypotheses
regarding the second period (2009-2011). Table (15) shows F-value (2.104) statistically insignificant, where
α=0.170 i.e. higher that the accepted significance level (0.05). The computed R2(41.2%) was unreliable as the
linear regression model was statistically insignificance depending on the results reached.
The same applies to sub-hypotheses where t and α values where statistically insignificant. To verify
accuracy of results and final judgment, the stepwise regression analysis was used, as this test isolates the
independent variables from each other regarding its influence on the dependent variable. Table (17) shows
results from the stepwise linear regression for the first main hypothesis. Results show that the second main
hypothesis regarding Earning Yields ratio regarding the second period (2009-2011) statistically significant.

Research Journal of Finance and Accounting www.iiste.org
ISSN 2222-1697 (Paper) ISSN 2222-2847 (Online)
Vol.8, No.8, 2017
9
Table (17) Results from stepwise linear regression analysis for the years (2009-2011)
b a Sig R2 F Value
2.303 -0.200 0.033 0.350 5.914 Acceptable Hypothesis (H2): EY
As a result the stock return for the commercial banks can be predicted for the second period (2009-
2011), r=0.95 and explanatory power=0.35 by the Earnings Yield ratio based on the following linear equation:
Y = -0.200 + 2.303 EY
Results from the earlier analysis indicate acceptance of the null hypothesis for the second period studied
(2009-2011) regarding the main hypothesis. The same applies to the first sub-hypothesis related to the yields
ratio, and the third sub-hypothesis related to the Book/Market ratio. The alternate second sub-hypothesis related
to Earnings Yield (EY) ratio is acceptable, and has a predictive role in explaining stock returns of the
commercial banks for this period.
4. As for the third period studied (2012-2015):
Table (18) shows results related to the first main hypothesis test for the third period studied (2012-2015).
Table (18) results from the first main hypothesis test (2012-2015)
Sig R2 F Value
0.860 0.077 0.249 First Main Hypothesis (2012-2015)
Table (19) shows t test results of the independent variable parameters, as follows:
Table (19) Parameters test for the sub-hypotheses during the period (2012-2015)
First Main Hypothesis/Sub-Hypotheses T value Sig
DY 0.826 0.430
EY -0.494 0.633
B/M 0.400 0.698
In light of the earlier results we can judge the first main hypothesis and the sub-hypothesis regarding the
third period (2012-2015). Table (14) shows that F=0.249 is insignificant at (0.860) which is higher than the
accepted significance level (α=0.05). The computed R2=7.7% is unreliable as the linear regression model was
statistically insignificant in light of the results obtained.
The same applies to the sub-hypotheses, where t value statistically insignificant. To make sure the
accuracy of results, stepwise linear regression was used. Results showed that there are no independent variables
statistically significant has a predictive role in predicting the stock return for the third period (2012-2015).
The earlier results indicate acceptance of the null hypothesis for the third period (2012-2015) studied as
to the main hypothesis and sub-hypotheses.
5. Individual years under study:
To improve the understanding of the predictive role of the fundamental valuation ratios in predicting the stock
return of the commercial banks in Jordan listed on Amman Stock Exchange the present study reviewed the
predictive power over extended periods: long-term (2006-2015) covering the whole study period, and mid-term
periods of (3-4) years. Table (20) demonstrates the predicative role in the individual years of study using the
stepwise linear regression analysis.
Table (20) results from the stepwise linear regressive analysis for individual years under study
b a Sig
R2
F Statistically Significant
Variable
Year
Insignificant Independent Variable 2006
Insignificant Independent Variable 2007
Insignificant Independent Variable 2008
3.521 -0.421 0.007 0.503 11.140 EY 2009
4.292 0.045 0.038 0.335 5.551 DY 2010
Insignificant Independent Variable 2011
Insignificant Independent Variable 2012
Insignificant Independent Variable 2013
Insignificant Independent Variable 2014
Insignificant Independent Variable 2015
The earlier results implies that the fundamental financial ratios were unable for the most study periods
to predict stock return of the commercial banks listed on Amman Stock Exchange (ASE) excluding year (2009),
where the EY ratio was able to predict the stock return of the commercial banks listed on Amman Stick
Exchange (ASE) with explanatory power of the dependent variable (50.3%), and same applies to year (2010) for
the (DY) with explanatory power (33.5%).
Research Journal of Finance and Accounting www.iiste.org
ISSN 2222-1697 (Paper) ISSN 2222-2847 (Online)
Vol.8, No.8, 2017
10
The comparison of the analysis results of the years against the analysis results for the periods specified
in the study showed agreement in results where a statistically significant relationship was found for the (EY)
ratio over the second period (2009-2011).
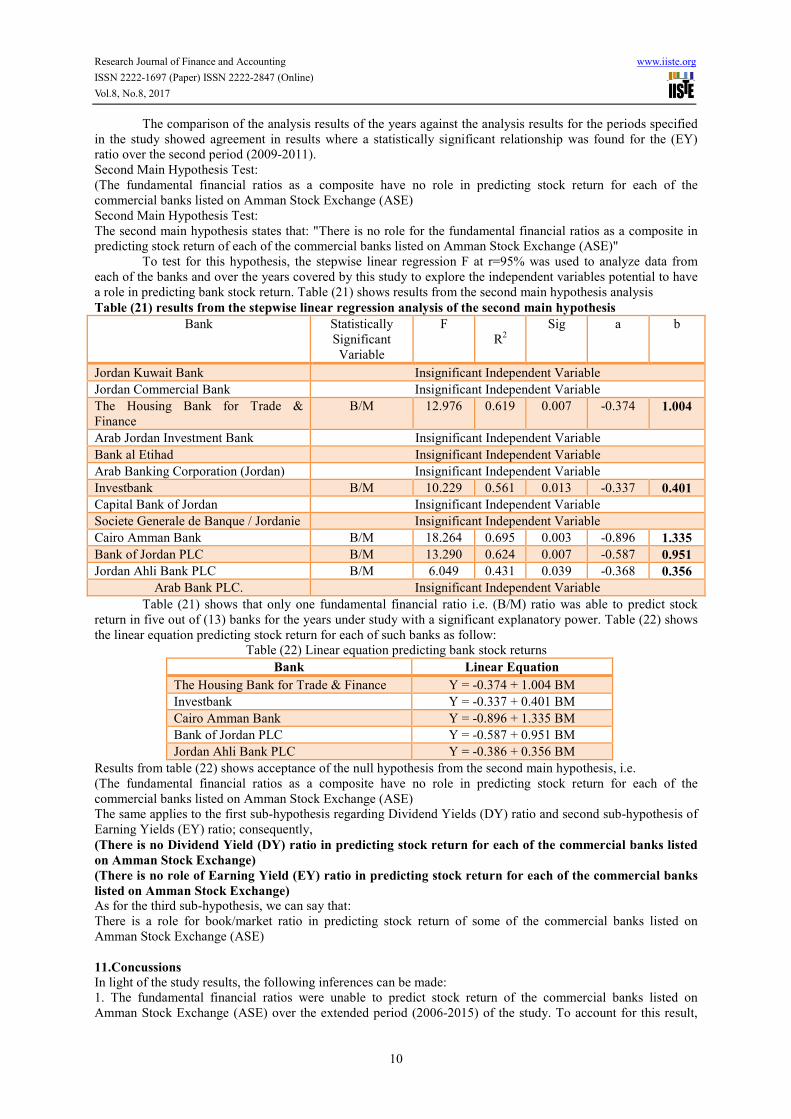
Second Main Hypothesis Test:
(The fundamental financial ratios as a composite have no role in predicting stock return for each of the
commercial banks listed on Amman Stock Exchange (ASE)
Second Main Hypothesis Test:
The second main hypothesis states that: "There is no role for the fundamental financial ratios as a composite in
predicting stock return of each of the commercial banks listed on Amman Stock Exchange (ASE)"
To test for this hypothesis, the stepwise linear regression F at r=95% was used to analyze data from
each of the banks and over the years covered by this study to explore the independent variables potential to have
a role in predicting bank stock return. Table (21) shows results from the second main hypothesis analysis
Table (21) results from the stepwise linear regression analysis of the second main hypothesis
b a Sig
R2
F Statistically
Significant
Variable
Bank
Insignificant Independent Variable Jordan Kuwait Bank
Insignificant Independent Variable Jordan Commercial Bank
1.004 -0.374 0.007 0.619 12.976 B/M The Housing Bank for Trade &
Finance
Insignificant Independent Variable Arab Jordan Investment Bank
Insignificant Independent Variable Bank al Etihad
Insignificant Independent Variable Arab Banking Corporation (Jordan)
0.401 -0.337 0.013 0.561 10.229 B/M Investbank
Insignificant Independent Variable Capital Bank of Jordan
Insignificant Independent Variable Societe Generale de Banque / Jordanie
1.335 -0.896 0.003 0.695 18.264 B/M Cairo Amman Bank
0.951 -0.587 0.007 0.624 13.290 B/M Bank of Jordan PLC
0.356 -0.368 0.039 0.431 6.049 B/M Jordan Ahli Bank PLC
Insignificant Independent Variable Arab Bank PLC.
Table (21) shows that only one fundamental financial ratio i.e. (B/M) ratio was able to predict stock
return in five out of (13) banks for the years under study with a significant explanatory power. Table (22) shows
the linear equation predicting stock return for each of such banks as follow:
Table (22) Linear equation predicting bank stock returns
Linear Equation Bank
Y = -0.374 + 1.004 BM The Housing Bank for Trade & Finance
Y = -0.337 + 0.401 BM Investbank
Y = -0.896 + 1.335 BM Cairo Amman Bank
Y = -0.587 + 0.951 BM Bank of Jordan PLC
Y = -0.386 + 0.356 BM Jordan Ahli Bank PLC
Results from table (22) shows acceptance of the null hypothesis from the second main hypothesis, i.e.
(The fundamental financial ratios as a composite have no role in predicting stock return for each of the
commercial banks listed on Amman Stock Exchange (ASE)
The same applies to the first sub-hypothesis regarding Dividend Yields (DY) ratio and second sub-hypothesis of
Earning Yields (EY) ratio; consequently,
(There is no Dividend Yield (DY) ratio in predicting stock return for each of the commercial banks listed
on Amman Stock Exchange)
(There is no role of Earning Yield (EY) ratio in predicting stock return for each of the commercial banks
listed on Amman Stock Exchange)
As for the third sub-hypothesis, we can say that:
There is a role for book/market ratio in predicting stock return of some of the commercial banks listed on
Amman Stock Exchange (ASE)
11.Concussions
In light of the study results, the following inferences can be made:
1. The fundamental financial ratios were unable to predict stock return of the commercial banks listed on
Amman Stock Exchange (ASE) over the extended period (2006-2015) of the study. To account for this result,
Research Journal of Finance and Accounting www.iiste.org
ISSN 2222-1697 (Paper) ISSN 2222-2847 (Online)
Vol.8, No.8, 2017
11
investors tend to speculate over a shorter period of time than to hold stock annual earnings. On the other hand,
poor monetary capability among investors in general would encourage them to make financial positions
depending in low risk portfolios with high liquidity, that exclude banks given that bank stock prices relatively
high in comparison with stock prices in other economic sectors in Amman Stock Exchange.
2. The fundamental financial ratios were unable to predict stock return of the commercial banks listed on
Amman Stock Exchange during mid-term period (3-4) years due to the same reasons explained earlier for the
lengthy period. The period (2009-2011) was excluded, and the reason from the authors 'opinion that period was
important for investors across the world since it was in aftermath the global economic crisis which negatively
affected the financial markets in all parts of the world, including Amman Stock Exchange due to sharp collapse
in stock prices listed on the financial markets. During this period, investors were more interested with bank
profits, as a result the significance of relationship between stock returns and Earnings Yields (EY). This result
was further verified by studying the role of such ratios separately in every year under study. The result was that
only the Earnings Yield (EY) was able to predict stock return of the banks in 2009, and only the Dividend Yields
ratio was able to predict the stock return of banks in 2010.
3- The Book/Market ratio was prominent predictor of stock returns for the individual commercial banks listed on
Amman Stick Exchange separately over the years under study. The predicative role and explanatory power of
this ratio has been confirmed for five out of thirteen banks contrary to the other ratios. This inference implies this
ratio holds reliable in making future investment decisions at the studied banks with high level of certainty.
4- In general, the was unable to confirm that the investors at the financial market depend on the financial and
market information of the commercial banks to build their economic decisions as the ratios measured by the
current study predict stock returns within specific period or years were generally inconsistent. The implication is
that the investors in this financial sector (banks) at Amman Stock Exchange are mainly speculators who expect
swift earnings relying on the fluctuation in stock prices, and the evidence comes from the results of most prior
studies reviewed that support the importance of the fundamental financial ratios employed in the present study to
predict stock return.
12.Recommendations
1. Investors in the banks listed on Amman Stock Exchange are called to be more reliant on the financial and
market information in making their future investment decisions as this would ensure for them the most level of
earnings with least risk, thereby maintain their investment and saving from lost.
2. Investors are encouraged to adopt the Book/Market ratio when they predict stock returns of the commercial
banks listed on Amman Stock Exchange, especially the banks that showed in the present study effectiveness of
this ratio in predicting their stock return and high explanatory power.
3. Further studies to show the role of other variables to predict stock return for other banks and firms are needed
by adopting other financial ratios or studying economic, financial or political variables influencing investor
tendency to invest in Amman Stock Exchange.
13.References and Resources
Abdel Qader, Moad, Al-Debi, Mamoun & Gharaibeh, Fawzi. (2008). The Relationship between Profit and Stock
Return on the Long-Term, Jordanian Journal of Business Administration, University of Jordan,
4(1): 24-44.
Abdo, Rami. (2001). The Relationship between the Book Value and Market Value and earning per share and
Stock Return, (Unpublished MA Thesis, University of Jordan), Amman, Jordan
Al Zahrani, Asma; Al Debi, Mamoun. (2016). Proposed Methods to Improve the Relation of Stock Market
Returns with the Accounting profits: Empirical Study on the Saudi Shareholding Companies,
Jordanian Journal of Business Administration, University of Jordan 12(2): 271-288.
Al-Dhaher, Mufee & Al-Fukaha, Sam. (2011). Factors Affecting Industrial Company Stock Prices Listed on
Palestine Stock Exchange: Empirical Study during the Period (2004-2008), Mu'tah for Research &
Studies (Social and Humanistic Studies Series), Mu'tah University, 26(7): 383-414.
Al-EITAN, G. N., & Al-OLEEMAT, N. H. (2015). The Causality Relationship between Financial Market
Indexes and Financial Ratios: Evidence from Amman Stock Exchange. International Journal of
Academic Research in Accounting, Finance and Management Sciences, 5 (2) : 23–31 .
Alexakis, C., & Theophano, P., & Poshakwale, S. (2010). Predictability of Stock Returns using Financial
Statement Information: Evidence on Semi-strong Efficiency of Emerging Greek Stock Market.
Applied Financial Economics, 20 (16): 1321-1326.
Al-Habashneh, Fadel; Shahatit, Mohammad; Al Bdour, Jaber & Al Amareen, Zina. (2015). Factors Affecting
Stock Market Price on Amman Stock Exchange during the Period (1984-2011), Journal of
Administrative Sciences Studies Journal, Mu'tah University, 42(2): 461-472.
Al-Shiab, M. S., & Al-Ali, A. H .(2006). Common Stock Appraisal in Relation to Their Price-Earnings Ratios
Research Journal of Finance and Accounting www.iiste.org
ISSN 2222-1697 (Paper) ISSN 2222-2847 (Online)
Vol.8, No.8, 2017
12
Using Risk Adjusted Measures: An Emerging Market Perspective. Jordan Journal of Business
Administration, 2 (1) : 115 - 133 .
Arabic Dissertations
Aras,G., & Yilmaz, M. K. (2008). Price-Earnings Ratio, Dividend Yield, & Market-to-Book Ratio to Predict
Return on Stock Market: Evidence from the Emerging Markets. Journal of Global Business and
Technology, 4 (1) : 18 - 30.
Arslan, M.,& Zaman, R. (2014). Impact of Dividend Yield and Price Earnings Ratio on StockReturns: A Study
Non-Financial listed Firms of Pakistan. Research Journal of Finance and Accounting, 5(19): 68 - 75.
Barbee, W. C., & Mukherji, S., & Raines, G. A. (1996). Do Sales–Price and Debt–Equity Explain Stock Returns
Better than Book–Market and Firm Size. Financial Analysts Journal, 52 (2): 56-60.
Bergaoui,N. (2013). Book-to-market equity and size as determinants of returns: Evidence from the Tunisian
stock exchange. Modern economy: problems, trends, prospects, June- 2013 (8): 48 – 60.
Er, S., & Vuran, B. (2012). Factors Affecting Stock Returns of Firms Quoted in ISE Market: A Dynamic Panel
Data Approach. International Journal of Business and Social Research, 2(1): 109-122.
Fama,E. F., & French, K. R. (1995). Size and Book-to-Market Factors in Earnings & Returns. The Journal of
Finance, L (1): 131 - 155.
Fu, L., & Yee, C. (2016). Relationships between Stock Returns and Corporate Financial Ratios Based on a
Statistical Analysis of Corporate Data from the Hong Kong Stock Market. Public Finance Quarterly,
1/2016: 110 -123.
Jabbari, E., & Fathi, Z. (2014). Prediction of Stock Returns using Financial Ratios Based on Historical Cost,
Compared with Adjusted Price (Accounting for Inflation) with Neural Network Approach. Indian
Journal of Fundamental and Applied Life Sciences, 4 (S4): 1064-1078.
Jiang, X., & Lee, B.S. (2012). Do Decomposed Financial Ratios Predict Stock Returns and Fundamentals
Better?, The Financial Review, 47: 531–564 .
Journals
Karami, Gholam Reza., Talaeei, Leila. , (2013), Predictability of stock returns using financial ratios in the
companies listed in Tehran Stock Exchange. International Research Journal of Applied and Basic
Sciences, 4 (12): 4261 - 4273.
Khamees, Basheer Ahmad. , (2012), Predicting the Stock Return Direction Using Artificial Neural Network: The
Case of Amman Stock Exchange. Jordan Journal of Business Administration, 8 (3): (566 - 580).
Khamis, Basheer & Al Jarrah, Edris. (2007). Dimensions Measured by the Market Ratios and Operating Cash
Flow Ratios at the Jordanian Public Industrial Shareholding Companies, Jordanian Journal of
Business Administration, University of Jordan, 3(1): 72-84.
Khan, M. B., & Gul, S., & Ur Rehman, S., & Razzaq, N., & Kamran, A. (2012) Financial Ratios and Stock
Return Predictability (Evidence from Pakistan). Research Journal of Finance and Accounting, 3
(10) : 1- 6 .
Kheradyar, S., & Ibrahim, I., & Nor, M. F. (2011). Stock Returns Predictability with Financial Ratios.
International Journal of Trade, Economics& Finance, 2 (5):391-396.
Lamont, O. (1998). Earnings and Expected Returns. Journal of Finance, 53 (5): 1563-1587.
Lewellen, J. (2004). Predicting stock returns with financial ratios. Journal of Financial Economics, 74: 209-
235.
Martani, D., Mulyono& Khairururizka, R. (2009). The effect of financial ratios, firm size, and cash flow from
operating in the interim report to the stock return. Chinese Business Review,8 (6): 44-55.
Naser, Khaled. (2015). The Effect of Published Dividends Payout and Stock Earnings on the Market Value of
Stock of the Jordanian Companies Listed on Amman Stock Exchange (Unpublished MA Thesis,
Private Applied Sciences University), Amman, Jordan.
Petcharabul, P., & Romprasert, S. (2014). Technology Industry on Financial Ratios and Stock Returns. Journal
of Business and Economics, 5 (5): 739 - 746.
Saleh, Walid. (2007). Earning-to-Price, Dividend-to-Price, Firm Growth & Stock Returns. Jordan Journal of
Business Administration, 3 (1): 85 - 106.
Shabeta, Moad. (1993). Predicting with Company Profitability and Stock Return using the Financial Statements,
(Unpublished MA Thesis, University of Jordan), Amman, Jordan.
Ul-Hasan, S. S., & Farooq, S.,& Muddassir , M . (2015) . Stock Returns Indicators: Debt to Equity, Book to
Market, Firm Size and Sales to Price. An International Peer-reviewed Journal, 16: 25 - 33.
Vedd, R., & Yassinski , N. (2015) .The Effect of Financial Ratios, Firm Size & Operating Cash Flows on Stock
Price: Evidence from the Latin America Industrial Sector. Journal of Business and Accounting, 8)1):
15 – 26.
Research Journal of Finance and Accounting www.iiste.org
ISSN 2222-1697 (Paper) ISSN 2222-2847 (Online)
Vol.8, No.8, 2017
13
International Dissertations
Charitou, A., & Constantinidis, E. (2003). Size and Book-to-Market Factors in Earnings and Stock Returns:
Empirical Evidence for Japan. Department of Business Administration, University of Cyprus,
Cyprus.
Meesuwan, N, (2015),Stock return predictability with financial ratios: A panel data analysis in the Stock
Exchange of Thailand (SET) . Senior Research for the Bachelor of Arts Degree in Economics,
Chulalongkorn University, Thailand.
Website:
Amman Stock Exchange: http://www.ase.com.jo
Securities Depository Center: http://www.sdc.com.jo
Finance Formulas Website: (http://www.financeformulas.net)
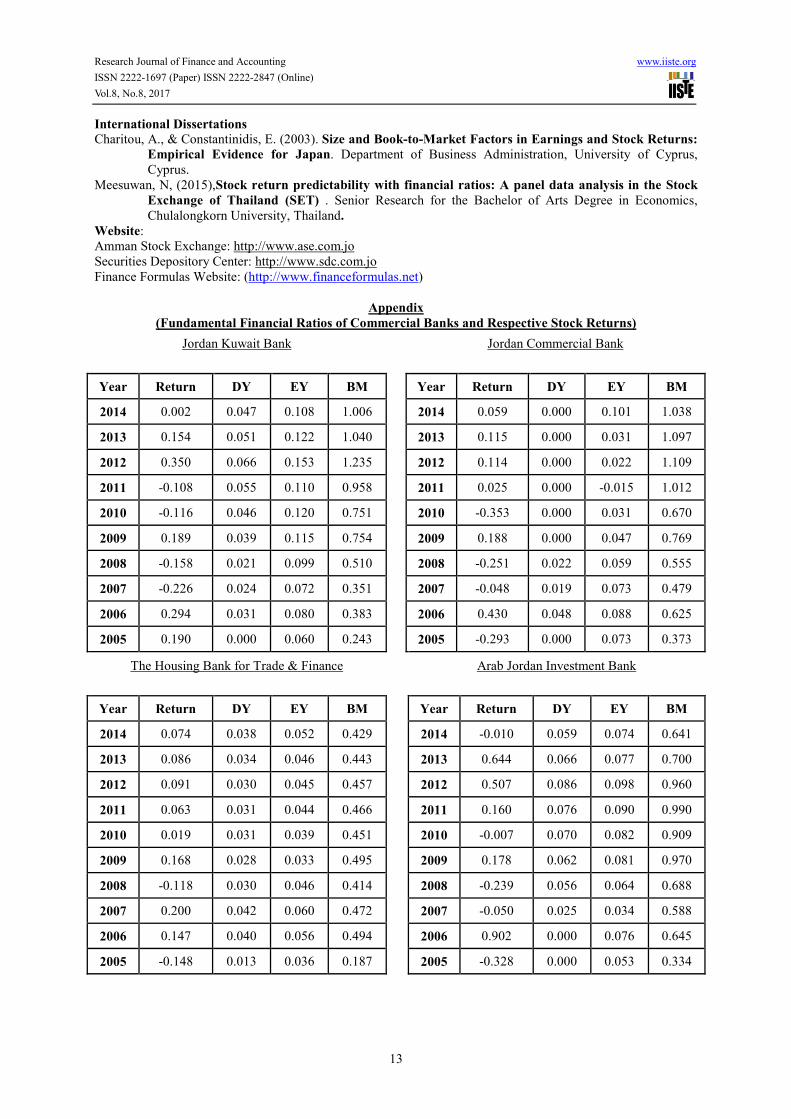
Appendix
(Fundamental Financial Ratios of Commercial Banks and Respective Stock Returns)
Jordan Kuwait Bank Jordan Commercial Bank
Year Return DY EY BM
Year Return DY EY BM
2014 0.002 0.047 0.108 1.006
2014 0.059 0.000 0.101 1.038
2013 0.154 0.051 0.122 1.040
2013 0.115 0.000 0.031 1.097
2012 0.350 0.066 0.153 1.235
2012 0.114 0.000 0.022 1.109
2011 -0.108 0.055 0.110 0.958
2011 0.025 0.000 -0.015 1.012
2010 -0.116 0.046 0.120 0.751
2010 -0.353 0.000 0.031 0.670
2009 0.189 0.039 0.115 0.754
2009 0.188 0.000 0.047 0.769
2008 -0.158 0.021 0.099 0.510
2008 -0.251 0.022 0.059 0.555
2007 -0.226 0.024 0.072 0.351
2007 -0.048 0.019 0.073 0.479
2006 0.294 0.031 0.080 0.383
2006 0.430 0.048 0.088 0.625
2005 0.190 0.000 0.060 0.243
2005 -0.293 0.000 0.073 0.373
The Housing Bank for Trade & Finance Arab Jordan Investment Bank
Year Return DY EY BM
Year Return DY EY BM
2014 0.074 0.038 0.052 0.429 2014 -0.010 0.059 0.074 0.641
2013 0.086 0.034 0.046 0.443 2013 0.644 0.066 0.077 0.700
2012 0.091 0.030 0.045 0.457 2012 0.507 0.086 0.098 0.960
2011 0.063 0.031 0.044 0.466 2011 0.160 0.076 0.090 0.990
2010 0.019 0.031 0.039 0.451 2010 -0.007 0.070 0.082 0.909
2009 0.168 0.028 0.033 0.495 2009 0.178 0.062 0.081 0.970
2008 -0.118 0.030 0.046 0.414 2008 -0.239 0.056 0.064 0.688
2007 0.200 0.042 0.060 0.472 2007 -0.050 0.025 0.034 0.588
2006 0.147 0.040 0.056 0.494 2006 0.902 0.000 0.076 0.645
2005 -0.148 0.013 0.036 0.187 2005 -0.328 0.000 0.053 0.334

Research Journal of Finance and Accounting www.iiste.org
ISSN 2222-1697 (Paper) ISSN 2222-2847 (Online)
Vol.8, No.8, 2017
14
Bank al Etihad Arab Banking Corporation (Jordan(
Year Return DY EY BM
Year Return DY EY BM
2014 0.023 0.044 0.134 1.375 2014 0.002 0.047 0.108 1.006
2013 0.139 0.036 0.124 1.389 2013 0.154 0.051 0.122 1.040
2012 0.373 0.044 0.108 1.716 2012 0.350 0.066 0.153 1.235
2011 -0.007 0.042 0.072 1.562 2011 -0.108 0.055 0.110 0.958
2010 -0.254 0.060 0.106 1.170 2010 -0.116 0.046 0.120 0.751
2009 0.183 0.056 0.091 1.274 2009 0.189 0.039 0.115 0.754
2008 -0.333 0.033 0.055 0.767 2008 -0.158 0.021 0.099 0.510
2007 -0.184 0.026 0.038 0.596 2007 -0.226 0.024 0.072 0.351
2006 0.754 0.000 0.059 0.484 2006 0.294 0.031 0.080 0.383
2005 -0.438 0.000 0.066 0.282 2005 0.190 0.000 0.060 0.243
Investbank Capital Bank of Jordan
Year Return DY EY BM
Year Return DY EY BM
2014 0.164 0.057 0.101 1.192 2014 -0.270 0.040 0.122 1.029
2013 0.075 0.058 0.099 1.156 2013 0.079 0.063 0.133 1.001
2012 0.076 0.068 0.095 1.140 2012 0.655 0.000 0.117 1.318
2011 0.103 0.070 0.084 1.150 2011 -0.169 0.000 0.005 1.000
2010 -0.020 0.000 0.087 0.861 2010 -0.117 0.000 0.021 0.891
2009 0.188 0.000 0.069 0.888 2009 0.119 0.000 0.010 0.968
2008 -0.099 0.000 0.076 0.736 2008 -0.133 0.000 0.060 0.818
2007 -0.264 0.000 0.040 0.500 2007 -0.042 0.030 0.052 0.665
2006 0.094 0.015 0.068 0.511 2006 0.143 0.000 0.082 0.673
2005 -0.293 0.019 0.133 0.333 2005 -0.335 0.000 0.063 0.387

Research Journal of Finance and Accounting www.iiste.org
ISSN 2222-1697 (Paper) ISSN 2222-2847 (Online)
Vol.8, No.8, 2017
15
Banque / JordanieSociete Generale de Cairo Amman Bank
Year Return DY EY BM
Year Return DY EY BM
2014 -0.009 0.037 0.086 1.136 2014 0.182 0.045 0.124 0.813
2013 0.247 0.000 0.079 1.262 2013 0.349 0.061 0.147 0.950
2012 0.047 0.000 0.056 1.239 2012 0.073 0.062 0.128 0.877
2011 0.789 0.000 0.069 1.267 2011 0.054 0.061 0.132 0.807
2010 0.087 0.000 0.105 1.312 2010 -0.075 0.047 0.109 0.648
2009 -0.182 0.000 0.080 0.987 2009 0.532 0.040 0.118 0.815
2008 -0.472 0.000 0.040 0.479 2008 0.122 0.020 0.101 0.751
2007 -0.105 0.000 0.020 0.242 2007 -0.143 0.031 0.087 0.604
2006 0.123 0.000 0.033 0.251 2006 0.088 0.030 0.085 0.608
2005 0.492 0.000 0.034 0.326 2005 -0.500 0.010 0.067 0.349
Bank of Jordan PLC Jordan Ahli Bank PLC
Year Return DY EY BM
Year Return DY EY BM
2014 0.057 0.075 0.115 0.817 2014 0.023 0.076 0.148 1.337
2013 0.140 0.060 0.105 0.818 2013 0.234 0.049 0.080 1.412
2012 0.152 0.065 0.102 0.775 2012 0.117 0.000 0.126 1.420
2011 0.195 0.073 0.113 0.815 2011 0.045 0.080 0.128 1.399
2010 0.153 0.056 0.107 0.724 2010 -0.075 0.052 0.108 1.153
2009 0.453 0.070 0.124 0.896 2009 0.329 0.066 0.112 1.284
2008 0.045 0.068 0.149 0.816 2008 -0.018 0.061 0.096 1.110
2007 -0.203 0.051 0.083 0.546 2007 -0.443 0.025 0.031 0.567
2006 0.194 0.026 0.099 0.541 2006 0.025 0.048 0.059 0.612
2005 -0.360 0.000 0.056 0.292 2005 -0.084 0.031 0.064 0.456
Research Journal of Finance and Accounting www.iiste.org
ISSN 2222-1697 (Paper) ISSN 2222-2847 (Online)
Vol.8, No.8, 2017
16
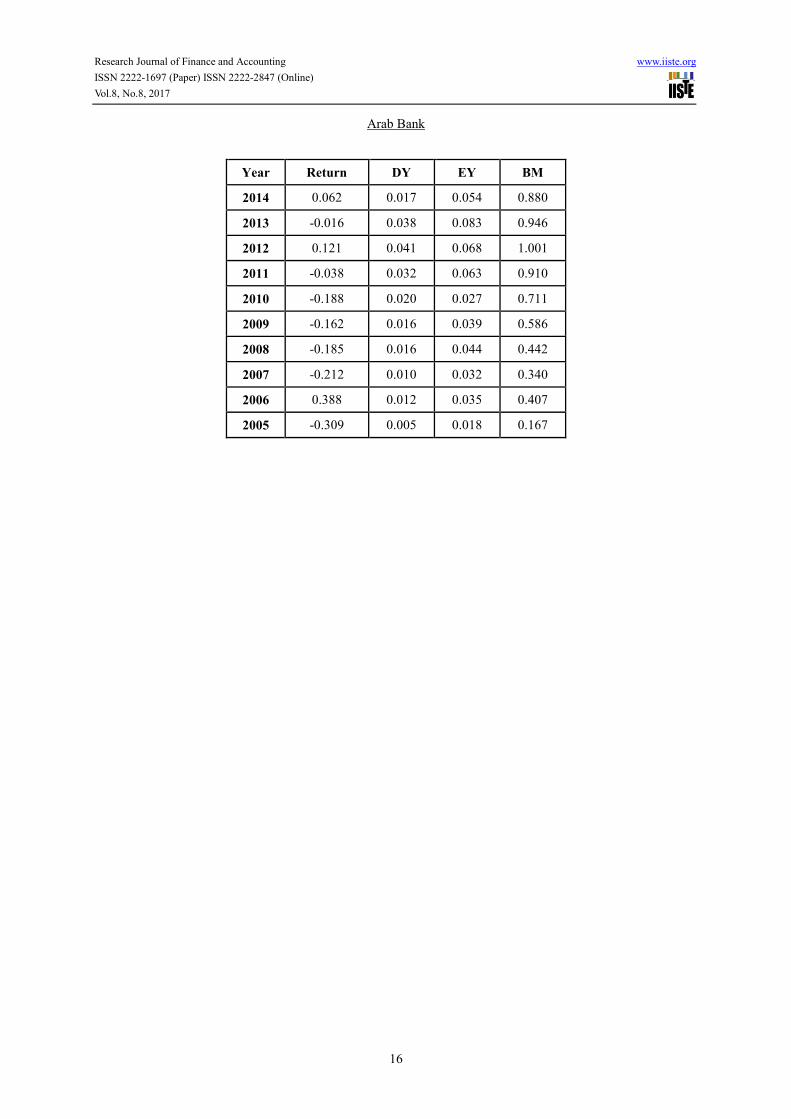
Arab Bank
Year Return DY EY BM
2014 0.062 0.017 0.054 0.880
2013 -0.016 0.038 0.083 0.946
2012 0.121 0.041 0.068 1.001
2011 -0.038 0.032 0.063 0.910
2010 -0.188 0.020 0.027 0.711
2009 -0.162 0.016 0.039 0.586
2008 -0.185 0.016 0.044 0.442
2007 -0.212 0.010 0.032 0.340
2006 0.388 0.012 0.035 0.407
2005 -0.309 0.005 0.018 0.167