
Effectiveness Improvement in Manufacturing Industry
21
Journal of Open Innovation: Technology, Market, and Complexity Article Effectiveness Improvement in Manufacturing Industry; Trilogy Study and Open Innovation Dynamics Ashwani Tayal 1 , Nirmal Singh Kalsi 2 , Munish Kumar Gupta 3,4 , Danil Yurievich Pimenov 4 , Murat Sarikaya 5 and Catalin I. Pruncu 6,7, * Citation: Tayal, A.; Kalsi, N.S.; Gupta, M.K.; Pimenov, D.Y.; Sarikaya, M.; Pruncu, C.I. Effectiveness Improvement in Manufacturing Industry; Trilogy Study and Open Innovation Dynamics. J. Open Innov. Technol. Mark. Complex. 2021, 7, 7. https://doi.org/10.3390/ joitmc7010007 Received: 11 November 2020 Accepted: 25 December 2020 Published: 30 December 2020 Publisher’s Note: MDPI stays neu- tral with regard to jurisdictional clai- ms in published maps and institutio- nal affiliations. Copyright: © 2020 by the authors. Li- censee MDPI, Basel, Switzerland. This article is an open access article distributed under the terms and con- ditions of the Creative Commons At- tribution (CC BY) license (https:// creativecommons.org/licenses/by/ 4.0/). 1 Department of Mechanical Engineering, I.K. Gujral Punjab Technical University, Jalandhar 144603, India; [email protected] 2 Department of Mechanical Engineering, Beant College of Engineering &Technology, Punjab 143521, India; [email protected] 3 Key Laboratory of High Efficiency and Clean Mechanical Manufacture, Ministry of Education, School of Mechanical Engineering, Shandong University, Jinan 250000, China; [email protected] 4 Department of Automated Mechanical Engineering, South Ural State University, Chelyabinsk 454080, Russia; [email protected] 5 Department of Mechanical Engineering, Sinop University, Sinop 57000, Turkey; [email protected] 6 Department of Mechanical Engineering, Imperial College London, London SW7 2AZ, UK 7 Design, Manufacturing & Engineering Management, University of Strathclyde, Glasgow G1 1XJ, UK * Correspondence: [email protected] or [email protected] Abstract: The purpose of this investigation is to compute overall equipment effectiveness (OEE) in the small-scale industry. The novel approach is introduced to detect bottlenecks by which OEE can be improved. This study attempts to help small-medium enterprises in analyzing performance in a better way. The automotive industry was chosen for conducting the research. The present study is comprised of three phases. In the first phase, OEE was computed and compared with world-class manufacturing. The second phase included three-level of Pareto analysis followed by making fishbone diagram to mitigate the losses. The third phase conducted improved OEE in the industry. There are seven major losses present in the industry that adversely affect the effectiveness of machine in any industry. This approach can reduce these losses and improve the quality, asset utilization (AU), OEE, total effective equipment performance (TEEP) and productivity of the machine. The study exposes that Pareto analysis uncovers all the losses and works on the principle of 80/20 rule. The major losses were thoroughly explored with the help of the fishbone diagram and solutions were implemented at the shop floor. As a result, availability, performance, quality, OEE, AU, and TEPP show improvements by 4.6%, 8.06%, 6.66%, 16.23%, 4.16%, and 14.58%, respectively. The approach offers a good opportunity for both researchers and small-medium enterprises around the world to analyze the indicators of production losses, performance, and productivity in the manufacturing industry. Keywords: manufacturing industry; pareto analysis; fishbone diagram; asset utilization; overall equipment effectiveness 1. Introduction The numerous considerations such as demand for a quality product at cost-conscious value, competition, exploration of new technology make reliability more critically during their design [1]. Recent advancements reveal an incredible improvement in the use of reliability engineering due to more intricate and advanced systems, which cater to the needs of the customer-driven market inefficient manner [2]. The reliability engineering was categorized into the specialized area. Data-driven and multi-function governance team are two characteristics which lead the world-class manufacturing system by promoting higher efficiency and satisfaction among internal and external customers. Reliability engineering faces a wide variety of challenges in today’s industrial transformation. Reliability shows J. Open Innov. Technol. Mark. Complex. 2021, 7, 7. https://doi.org/10.3390/joitmc7010007 https://www.mdpi.com/journal/joitmc
-
Upload
khangminh22 -
Category
Documents
-
view
2 -
download
0
Transcript of Effectiveness Improvement in Manufacturing Industry

Journal of Open Innovation:
Technology, Market, and Complexity
Article
Effectiveness Improvement in Manufacturing Industry;Trilogy Study and Open Innovation Dynamics
Ashwani Tayal 1 , Nirmal Singh Kalsi 2, Munish Kumar Gupta 3,4 , Danil Yurievich Pimenov 4 ,Murat Sarikaya 5 and Catalin I. Pruncu 6,7,*
�����������������
Citation: Tayal, A.; Kalsi, N.S.; Gupta,
M.K.; Pimenov, D.Y.; Sarikaya, M.;
Pruncu, C.I. Effectiveness
Improvement in Manufacturing
Industry; Trilogy Study and Open
Innovation Dynamics. J. Open Innov.
Technol. Mark. Complex. 2021, 7, 7.
https://doi.org/10.3390/
joitmc7010007
Received: 11 November 2020
Accepted: 25 December 2020
Published: 30 December 2020
Publisher’s Note: MDPI stays neu-
tral with regard to jurisdictional clai-
ms in published maps and institutio-
nal affiliations.
Copyright: © 2020 by the authors. Li-
censee MDPI, Basel, Switzerland.
This article is an open access article
distributed under the terms and con-
ditions of the Creative Commons At-
tribution (CC BY) license (https://
creativecommons.org/licenses/by/
4.0/).
1 Department of Mechanical Engineering, I.K. Gujral Punjab Technical University, Jalandhar 144603, India;[email protected]
2 Department of Mechanical Engineering, Beant College of Engineering &Technology, Punjab 143521, India;[email protected]
3 Key Laboratory of High Efficiency and Clean Mechanical Manufacture, Ministry of Education,School of Mechanical Engineering, Shandong University, Jinan 250000, China; [email protected]
4 Department of Automated Mechanical Engineering, South Ural State University, Chelyabinsk 454080, Russia;[email protected]
5 Department of Mechanical Engineering, Sinop University, Sinop 57000, Turkey; [email protected] Department of Mechanical Engineering, Imperial College London, London SW7 2AZ, UK7 Design, Manufacturing & Engineering Management, University of Strathclyde, Glasgow G1 1XJ, UK* Correspondence: [email protected] or [email protected]
Abstract: The purpose of this investigation is to compute overall equipment effectiveness (OEE)in the small-scale industry. The novel approach is introduced to detect bottlenecks by which OEEcan be improved. This study attempts to help small-medium enterprises in analyzing performancein a better way. The automotive industry was chosen for conducting the research. The presentstudy is comprised of three phases. In the first phase, OEE was computed and compared withworld-class manufacturing. The second phase included three-level of Pareto analysis followed bymaking fishbone diagram to mitigate the losses. The third phase conducted improved OEE in theindustry. There are seven major losses present in the industry that adversely affect the effectivenessof machine in any industry. This approach can reduce these losses and improve the quality, assetutilization (AU), OEE, total effective equipment performance (TEEP) and productivity of the machine.The study exposes that Pareto analysis uncovers all the losses and works on the principle of 80/20rule. The major losses were thoroughly explored with the help of the fishbone diagram and solutionswere implemented at the shop floor. As a result, availability, performance, quality, OEE, AU, andTEPP show improvements by 4.6%, 8.06%, 6.66%, 16.23%, 4.16%, and 14.58%, respectively. Theapproach offers a good opportunity for both researchers and small-medium enterprises aroundthe world to analyze the indicators of production losses, performance, and productivity in themanufacturing industry.
Keywords: manufacturing industry; pareto analysis; fishbone diagram; asset utilization; overallequipment effectiveness
1. Introduction
The numerous considerations such as demand for a quality product at cost-consciousvalue, competition, exploration of new technology make reliability more critically duringtheir design [1]. Recent advancements reveal an incredible improvement in the use ofreliability engineering due to more intricate and advanced systems, which cater to theneeds of the customer-driven market inefficient manner [2]. The reliability engineering wascategorized into the specialized area. Data-driven and multi-function governance team aretwo characteristics which lead the world-class manufacturing system by promoting higherefficiency and satisfaction among internal and external customers. Reliability engineeringfaces a wide variety of challenges in today’s industrial transformation. Reliability shows
J. Open Innov. Technol. Mark. Complex. 2021, 7, 7. https://doi.org/10.3390/joitmc7010007 https://www.mdpi.com/journal/joitmc

J. Open Innov. Technol. Mark. Complex. 2021, 7, 7 2 of 21
impressive progress for maintaining the industries, but the numerous factors such asintricacy, cost comparison, and competition make reliability more difficult in this era.Automotive trains, nuclear devices, space outposts, aviation, computers, and railways aresome of the spiral typical systems that affect our daily lives, and, therefore, they need tobe more reliable to support satisfactory operation without fail. These allocated systemsare seriously affected, directly or indirectly, by specific factors i.e., high procurement cost,complexity, safety, reliability, quality, and universal competition.
The reliability factors reveal that the fruitful execution of product design and its oper-ation phase-only results from the coordination among distinct specialists specifically froma quality, maintenance, and reliability departments, having cross-functional knowledge toretain the triumph of industrial establishment [3]. Manufacturing systems are generallyrecognized by sequential production activities involved in the conversion of raw materialinto tangible goods as initiated by planning and completed by sales and management.These systems are capitalized with a considerable amount for design and implementationof numerous types of equipment and machinery to nurture production movements atconsistent supply with marginal scrap. Manufacturing systems are labeled with distinctfeatures such as delivering essential human services, building nations’ prosperity andstrides for global reconciliation and human contentment. The integration and coordinationamong various flows (the flow of material; the flow of data; and the flow of cost) result ineffective manufacturing movements. Material flow includes conversion of raw materialinto tangible goods, information flow comprises of planning and control of productionmovements, and cost flow embraces economical production. The flow of information, mate-rial, and cost play vital role in effective manufacturing system; hence, enhancing equipmentreliability is the promising and major targeted area in the industry to maintain healthyrelationships among production and market demand [4]. Equipment failure triggers twomajor issues such as non-production hours and non-compliance of demand for products.The severity of these issues can result in shrinking profitability and even company moveout from the race of business. Maintainability can be deemed as an assistance tool to fosterthese issues; however, efficient and precise equipment directs to manufacture best qualityand quantity commodities at right time for the market. The prime objective of an effectivemaintenance plan is to achieve profitable production by reducing downtime in the plant.
The unqualified labor force, unskilled operators, inadequate machine scheduling andplanning are some of the major issues experienced by small scale industries which result inineffectiveness of the manufacturing system [5–7]. Inadequate scheduling, planning, andunskilled operators prove more stoppages, less production time, and more quality defects;hence, these minor concerns must be properly addressed to counter all the ill effects on themanufacturing system.
Numerous techniques, tools, and plans are available such as affinity diagram, treediagram, matrix diagram, arrow diagram, and process decision program categorized undermanagement techniques. Cause and effect diagram, Pareto chart, check sheet, controlchart, histogram, and scatter diagram can be shown as basic quality tools. Further, totalquality management, total productive maintenance, just in time, lean production, andKaizen can be sorted under philosophies. The success rate of any industry depends onaccumulating data analytics for effective use of 5M (man, machine, material, methods,money) and uses this data for process improvement. Generally, alternative approaches aredeliberate to mitigate the problems that occur repeatedly in the system. Existing works ofliterature are primarily fixated on the use of different techniques in numerous industries.Some of these studies are summarized as follows. Purba et al. [8] analyzed the OverallEquipment Effectiveness (OEE) with total productive maintenance method on cutting. Forthis, the researchers conducted a case study in the manufacturing industry. Their outcomesindicated that the highest OEE was 86.05% in July 2015 and the lowest OEE was 79.58% inAugust 2015. Chong et al. [9] presented the implementation of maintenance Failure Modeand Effect Analysis (FMEA) to develop OEE in a manufacturing company. The FMEA wasperformed with a five-step approach on a bottleneck process. Their outcomes showed that

J. Open Innov. Technol. Mark. Complex. 2021, 7, 7 3 of 21
by taking the necessary precautions, machine availability can be improved and so highOEE can be achieved. Kapuria et al. [10] conducted a root cause analysis and productivityimprovement in Bangladesh by using Kaizen implementation. They used Pareto analysisto identify defective items. With the implementation of the Kaizen implementation, theefficiency of the factory’s production line was increased from 45% to 60%. Nallusamy [11]studied the effectiveness and implementation of an independent maintenance system ina machine shop to improve OEE by using Total Productive Maintenance (TPM) and 5Simplementation which are described as Sort, Set in order, Shine, Standardize, and Sustain.According to the research results, OEE was increased by 5% in the horizontal machin-ing center and 7% in the vertical machining center. In another study, Nallusamy andMuthamizhmaran [12] emphasized the development OEE of the autoclave process withthe implementation of time and motion works. Low et al. [13] studied enhancing the setupprocess of injection molding machines through the developed setup improvement method.They employed overall performance effectiveness (OPE) to analyze the setup development.The results showed that OPE is a good way to observe the process. Garza-Reyes [14] pro-posed overall resource effectiveness (ORE) to further improve the OEE. Hedman et al. [15]aimed to determine critical inputs and potential pitfalls while operating automatic mea-surement of OEE. In the study, they found OEE to be 65%. In addition, almost 50% ofrecorded OEE losses could not be categorized. Azizi [16] proposed OEE as an indicatorto determine equipment efficiency and, with the work done, it has been by improved6.49%. Puvanasvaran et al. [17] employed Maynard’s Operation Sequencing Technique(MOST) in order to analyze the percentage development contributed to the OEE. A similarstudy was performed by the authors [18,19]. It is possible to extend studies conducted byWolniak et al. [20], Wan et al. [21], and Salonitis and Kolios [22], who applied numeroustools in manufacturing, process, and service industries. Techniques are extensively usedfor improving the performance and effectiveness of numerous processes highlighted in theindustry. The implementation of the combination of tools, techniques, and philosophieswere methodically analyzed, investigated, and implemented by numerous investigators tomaintain and sustain the processes by optimum use of resources during operation [12,14].Yun et al. [23] discussed the entrance of new technology in market. In their work, theydiscussed the new channels and opportunities helpful in growth of open market. Yunet al. [24] also discussed the sustainability conditions of open innovation: dynamic growthof Alibaba from SME to large enterprise. In another work of Yun et al. [25], the cultureabout the open innovation dynamics has been discussed. Munir et al. [26] studied the openinnovation tools in Sony mobile industry. Enkel et al. [27] discussed the open R&D andopen innovation phenomena in an industry.
Considering the literature information mentioned above, the present study proposeda new basis to increase the performance of an automotive manufacturing industry con-sidered as micro, small, and medium enterprises (MSME). This paper demonstrates theeffective utilization of Pareto analysis (PA), fishbone diagram (FBD), and overall equipmenteffectiveness (OEE) to mitigate the problems, which further spreads to increase the per-formance of the automotive industry. This study connects to essential information aboutcollecting and analyzing the data in the industry. The results were thoroughly instructedand implemented in the industry.
Practitioners must be educated with the use and understanding of tools used toincrease the effectiveness of any industry. The present study contributes not only to theterms of improving the effectiveness but also to create an impact on sustainability. Thispaper mitigates the losses by using optimized machining attributes on the machine. Themachining attributes contribute more to improving the availability (less machine failuredue to rated condition), performance (more material removal rate, less machining time,and better speed rating), and quality (less rejection and rework). It also helps to lessen theenergy requirements during machining, failure time, and repair time. The objective of thisresearch is to (I) surge productivity, (II) surge equipment life by increase responsiveness ofthe need for maintenance, and (III) decline cost. Outcomes of these research objectives are to

J. Open Innov. Technol. Mark. Complex. 2021, 7, 7 4 of 21
(I) conquer competitive edge, (II) surge turnover, (III) recognize equipment proprietorship,and (IV) condense overheads.
The study is divided into different sections as follows. The research methodologyadopted during this study is presented in Section 2. Section 3 presents the analyses anddiscussion with Pareto analysis, fishbone diagram, and overall equipment effectiveness.The conclusion is presented in Section 4.
2. Materials and Methods
The present study is nurtured with a combination of Pareto analysis and fishbonediagram concept in the industry. Overall equipment effectiveness measures existing andlater performance within the industry and the data was collected on the occurrence of lossesarisen, possible causes, production, scrap, and downtime for one month in the automotivecomponents manufacturing industry. The data is collected from the industry and it relatesto the unsatisfactory performance of the manufacturing premise. The numerous reasonswhich reduce the performance of manufacturing premises are inappropriate maintenance,poor selection of tool material, non-optimized machining attributes, and setup time. Thismethodology helps in mitigate all these reasons in a well-organized way to improve theperformance of the industry. The industry was visited several times for the prescribedperiod and observation was recorded for the working culture of an operator, working ofmaintenance, production, and quality personals. Figure 1 demonstrates the flowchart ofthe research methodology plan used in this study.
J. Open Innov. Technol. Mark. Complex. 2021, 7, x FOR PEER REVIEW 4 of 23
energy requirements during machining, failure time, and repair time. The objective of this research is to (I) surge productivity, (II) surge equipment life by increase responsiveness of the need for maintenance, and (III) decline cost. Outcomes of these research objectives are to (I) conquer competitive edge, (II) surge turnover, (III) recognize equipment propri-etorship, and (IV) condense overheads.
The study is divided into different sections as follows. The research methodology adopted during this study is presented in Section 2. Section 3 presents the analyses and discussion with Pareto analysis, fishbone diagram, and overall equipment effectiveness. The conclusion is presented in Section 4.
2. Materials and Methods The present study is nurtured with a combination of Pareto analysis and fishbone
diagram concept in the industry. Overall equipment effectiveness measures existing and later performance within the industry and the data was collected on the occurrence of losses arisen, possible causes, production, scrap, and downtime for one month in the au-tomotive components manufacturing industry. The data is collected from the industry and it relates to the unsatisfactory performance of the manufacturing premise. The nu-merous reasons which reduce the performance of manufacturing premises are inappro-priate maintenance, poor selection of tool material, non-optimized machining attributes, and setup time. This methodology helps in mitigate all these reasons in a well-organized way to improve the performance of the industry. The industry was visited several times for the prescribed period and observation was recorded for the working culture of an op-erator, working of maintenance, production, and quality personals. Figure 1 demonstrates the flowchart of the research methodology plan used in this study.
Figure 1. Flowchart of the research methodology plan used in this work. Figure 1. Flowchart of the research methodology plan used in this work.

J. Open Innov. Technol. Mark. Complex. 2021, 7, 7 5 of 21
The research method adopted during this investigation not only focuses on perfor-mance improvement but tries to deliver the same information among the operator workingin the industry.
The existing OEE was evaluated and compared; if it needed improvement, then Paretoanalysis and fishbone diagram analysis were carried out. All the losses were mitigatedthrough various strategies, tools, and techniques. OEE was re-evaluated and matchedwith the performance. If it was found okay, then changes are acceptable; otherwise, itwas necessary to review the techniques and tools to improve the OEE. First, a familiarityabout the method/techniques was discussed thoroughly among planning and maintenanceteams to clear any misinterpretation that arose during observation and data collection. Theobservation for concerned machine tool procedure and other activities (planned shutdowntime, unplanned downtime, scrap, breakdown) was carefully collected and investigated.The techniques like pro-active maintenance schedule, 5S approach in workstation, andautonomous maintenance approach shift the paradigm of an operator from “You to We.”This involves the use of cutting tools as recommended by either the manufacturer ormachine data handbook, regular training and monitoring of the process and personsemployed in production, and initiating industry-institute interface (3 I approach) forhealthier utilization of resources within and around the industry. The results were analyzedafter implementation and convinced the employees to follow the improved methods andtechnologies in the industry. The objective of this research is to (I) surge productivity,(II) surge equipment life by increase responsiveness of the need for maintenance, and(III) decline cost. Outcomes of these research objectives are to (I) conquer competitive edge,(II) surge turnover, (III) recognize equipment proprietorship, and (IV) condense overheads.
Overall Equipment Effectiveness
The machine availability was the only parameter for evaluating equipment perfor-mance in an earlier era [28,29]. This methodology was used for comparison at the sameoutput and same downtime. There is a high probability for speed loss due to start back upand quality forfeiture in form of scrap and rework, results from unforeseen stoppage. Allthe losses must be accountable, which can influence the capacity to mark output within thespecified limit. The improvement actions must be prioritized for effective, better integrationof all the losses. Equipment overall performance has set to be a more important indicatorfor calculating the performance of any industry and can be investigated through overallequipment effectiveness. This methodology can assimilate numerous factors availability,quality, and speed loss, so increasingly used in industrial atmospheres to evaluate theperformance by comparing the theoretical maximum output and the actual output of themachine. The man, material, and procedure also take active participation in evaluatingthe effectiveness of a manufacturing plant. The performance of equipment and alliedprocesses can be enhanced through recognizing prospects that reveal great influence onthe production floor. The sustainability and reliability achievement reflects the effortsof planning and maintenance department with the concept of performability. Overallequipment effectiveness does not only mean ensuring reliability but it should also ensuresustainability. The ecological impact must be considered at each stage of operation toachieve sustainability in any industrial activity to counter the scarcity of resources in the21st century. Clean production and knowledge can be envisioned for maximizing the yieldby deploying the approach of reducing, recycling, and reusing in industries for minimizingthe influence of production activities on ecology, which is the goal of performability.
Effective utilization of manufacturing operation can be effectively focused by thehierarchy sustained at various levels of OEE. The outcome of OEE allows the setting ofbenchmarks between different departments, machines, and operations within and aroundseveral industries. The useful and powerful individualities of OEE enables its use ineasy monitoring and improving the efficacy of production line or machines. OEE is themultiplication of three important factors, namely, availability, performance, and qualityloss. Figure 2 demonstrates the perfect model for OEE used in further study. Figure 2

J. Open Innov. Technol. Mark. Complex. 2021, 7, 7 6 of 21
also shows various losses encountered during operation in industry and must properlybe addressed to alleviate their effects on the OEE. The OEE can trace total productivemaintenance implementation in the industry along with performance measurement of thesystem. World-class manufacturing industries have more than 85% OEE and to become amember of this elite class is among the goals of every company. The OEE score describes theperformance of industry and is categorized into four levels: (i) OEE > 85% have excellentcompetitiveness; (ii) 70% < OEE < 85% considered good manufacturing facilities; (iii) 60%< OEE < 70% fall under intermediate facilities; and (iv) OEE < 60% shows bad affordability.
J. Open Innov. Technol. Mark. Complex. 2021, 7, x FOR PEER REVIEW 6 of 23
Figure 2 demonstrates the perfect model for OEE used in further study. Figure 2 also shows various losses encountered during operation in industry and must properly be ad-dressed to alleviate their effects on the OEE. The OEE can trace total productive mainte-nance implementation in the industry along with performance measurement of the sys-tem. World-class manufacturing industries have more than 85% OEE and to become a member of this elite class is among the goals of every company. The OEE score describes the performance of industry and is categorized into four levels: (i) OEE > 85% have excel-lent competitiveness; (ii) 70% < OEE < 85% considered good manufacturing facilities; (iii) 60% < OEE < 70% fall under intermediate facilities; and (iv) OEE < 60% shows bad afford-ability.
Figure 2. Overall equipment effectiveness (OEE) model.
3. Results and Discussion Every industry wants to present itself in at least a second level of OEE performance
metrics. Table 1 displays the key terms for the calculation of OEE and it has been observed that OEE and TEEP scores of 68.60 % and 61.45% need improvement in their operation and scheduling. The OEE results from the combination of individual parameters that com-prises losses at various stages. These losses must be tackled properly so that OEE can be improved. In this section, losses were tracked by Pareto analysis and fishbone diagram. OEE metrics were evaluated to counter the performance of an existing set of operations. Figure 2 reveals the seven big losses that take active contribution in degrading the numer-ical value of key metrics like OEE, AU, and TEEP (Figure 3). These seven big losses, namely, planned shutdown, setup downtime, unplanned downtime, minor stoppage, re-duced speed, rework, and start-up, need to be scrutinized systematically.
Figure 2. Overall equipment effectiveness (OEE) model.
3. Results and Discussion
Every industry wants to present itself in at least a second level of OEE performancemetrics. Table 1 displays the key terms for the calculation of OEE and it has been observedthat OEE and TEEP scores of 68.60 % and 61.45% need improvement in their operationand scheduling. The OEE results from the combination of individual parameters thatcomprises losses at various stages. These losses must be tackled properly so that OEEcan be improved. In this section, losses were tracked by Pareto analysis and fishbonediagram. OEE metrics were evaluated to counter the performance of an existing set ofoperations. Figure 2 reveals the seven big losses that take active contribution in degradingthe numerical value of key metrics like OEE, AU, and TEEP (Figure 3). These sevenbig losses, namely, planned shutdown, setup downtime, unplanned downtime, minorstoppage, reduced speed, rework, and start-up, need to be scrutinized systematically.
3.1. Pareto Analysis
The Pareto analysis helps in scrutinizing these losses operatively and it can be ex-tended to make a fishbone diagram for one of the major losses. The improvements wereimplemented internally and externally in the industry. Operational outcomes and economicprosperity are the basis of Pareto analysis, and the unevenness among these two vital pa-rameters contribute to Pareto analysis. The 80/20 rule is another name for Pareto analysis.

J. Open Innov. Technol. Mark. Complex. 2021, 7, 7 7 of 21
Table 1. Key parameters of OEE.
No. Key Terms Symbol Formula Value Unit
1. Plant Operating Time PO No. of shift × Working Hours 1× 8 hrs. = 8hrs = 480 Min
2. Planned Shutdown Time PSThis includes short breaks/meal
breaks/preventive maintenance schedule
2 Short Breaks @10 min= 201 Meal Break @ 30
min = 30 Total = 50Min
3. Planned ProductionTime PT
Plant Operating Time (PO)—PlannedShutdown Time (PS) 480 − 50 = 430 Min
4. Down Time DT
Downtime arises due to tooling failures,unplanned maintenance, generalbreakdowns, equipment failure,
setup/changeover, and material shortages
40 Min
5. Operative Time OTPlant Production Time (PT)—Down
Time Loss (DT) 430 − 40 = 390 Min
6. Ideal Cycle Time CTThe time needed to achieve the product in
a suitable time 1 Min
7. Total no. of Pieces N Total production in a single shift duringplanned production time 330 Count
8. Minor Stoppages M Misfeed, jams, sensor failure, etc. 30 Min
9. Net Operating Time NT Operative Time-Minor stoppages 390 − 30 = 360 Min
10. Efficient NetOperating Time ET Ideal Cycle Time (CT) × Total Pieces (N) 1 × 330 = 330 Min
11. Rejected Pieces NRTotal no of pieces which do not adhere
with the specification 35 Count
12. Good Unit G Total no of Pieces (N)—Rejected Pieces(NR) 330 − 35 = 295 Count
Availability
13. Availability A Operating Time (OT)⁄PlannedProduction Time (PT) 390/430 = 90.70 %
Performance
14. Performance P [Ideal Cycle Time(CT)×Total Pieces(N)]Operative Time(OT)
[1×330]390 = 84.62 %
Quality
15. Quality Q Good Units/Total Units 295/330 = 89.39 %
Overall Equipment Efficiency
16. Overall EquipmentEfficiency OEE A ×P × Q 90.70 × 84.62 × 89.39
= 68.60 %
17. Asset Utilization AU Operating Time (OT)⁄Plant OperatingTime (PO) 390/480= 81.25 %
18. Total EffectiveEquipment performance TEEP AU × P × Q 81.25 × 84.62 × 89.39
= 61.45 %
It is a column graph type diagram drawn from the collected data, and the graphdifferentiates between the vital factors and trivial ones. The priorities were fixed on theselected problem serially after data collection. The major factors were tackled, which weremore responsible for a specific problem. The problems were recognized, categorized, andgrouped based on their reoccurrence and anticipated in form of a percentage. The abscissarepresents factors arranged in descending order and vertex as percentage contribution.The graph shows its importance in the system and emphasizes the vital area rather thanthe trivial one. Figure 4 demonstrates the first level Pareto analysis of the various losses

J. Open Innov. Technol. Mark. Complex. 2021, 7, 7 8 of 21
in the system. Draw a horizontal line across the 80% and draw a vertical line through itsintersection on the abscissa. The area excluding 80% intersection attracts more to deal withthese big losses in an effective manner. The chart reveals that reject/rework and minorstoppage along with speed loss must be properly monitored and needs to be thoroughlyanalyzed. The planned downtime is considered to be one of the seven losses and needs tobe minimized so that planned production time can be increased. The planned downtimecomprises two short breaks and one meal break for the operator. This loss cannot directlytake contribution to affect speed loss and quality loss.
J. Open Innov. Technol. Mark. Complex. 2021, 7, x FOR PEER REVIEW 8 of 23
Figure 3. Performance value of key parameters.
3.1. Pareto Analysis The Pareto analysis helps in scrutinizing these losses operatively and it can be ex-
tended to make a fishbone diagram for one of the major losses. The improvements were implemented internally and externally in the industry. Operational outcomes and eco-nomic prosperity are the basis of Pareto analysis, and the unevenness among these two vital parameters contribute to Pareto analysis. The 80/20 rule is another name for Pareto analysis.
It is a column graph type diagram drawn from the collected data, and the graph dif-ferentiates between the vital factors and trivial ones. The priorities were fixed on the se-lected problem serially after data collection. The major factors were tackled, which were more responsible for a specific problem. The problems were recognized, categorized, and grouped based on their reoccurrence and anticipated in form of a percentage. The abscissa represents factors arranged in descending order and vertex as percentage contribution. The graph shows its importance in the system and emphasizes the vital area rather than the trivial one. Figure 4 demonstrates the first level Pareto analysis of the various losses in the system. Draw a horizontal line across the 80% and draw a vertical line through its intersection on the abscissa. The area excluding 80% intersection attracts more to deal with these big losses in an effective manner. The chart reveals that reject/rework and minor stoppage along with speed loss must be properly monitored and needs to be thoroughly analyzed. The planned downtime is considered to be one of the seven losses and needs to be minimized so that planned production time can be increased. The planned downtime comprises two short breaks and one meal break for the operator. This loss cannot directly take contribution to affect speed loss and quality loss.
90.7
84.6289.39
68.6
81.25
61.45
Availability Performance Quality OEE AU TEEP
0
20
40
60
80
100
% V
alue
Key metrices
Figure 3. Performance value of key parameters.J. Open Innov. Technol. Mark. Complex. 2021, 7, x FOR PEER REVIEW 9 of 23
Figure 4. First Level Pareto analysis of big losses in OEE.
This time can be effectively utilized for performing the scheduled maintenance activ-ities so that unplanned time can be inevitably cut down to some extent. The further study put more emphasis on the remaining three losses reject/rework, minor stoppage, and speed loss.
3.2. Fish Bone Diagram (FBD) Analysis The prime objective was to make a broad understanding of factors that adversely
affect the seven losses in the system. Based on the observation, these factors were charac-terized as technical subjects, people development subjects, and management subjects. These subjects were tackled properly by coordinate the technical subjects with a cross-functional team, people development subject with production area-based team, and man-agement subject with managerial officials. The data was collected and an effective man-agement tool was used to present this data efficiently. Fishbone diagram (FBD) uses an illustrative representation of causes and their effects and can be a much effective tool for a specific case [30]. The FBD shows its usefulness due to graphical appearance, which makes this tool highly effective for analyzing the production problem. If there is a cause, then the effect must be present within the system and vice versa. The diagram with suita-ble branches and sub-branches (twiglets) effectively shows their relation. Fishbone dia-gram needs to be drawn according to logic and follow the steps listed below:
1. The problem that was analyzed must be put into the right side of the fishbone dia-gram, sketch the skeleton with right side pointed arrow.
2. The effective causes of the problem, e.g., method, material, man, environment, and machine, are categorized into the main fishbone.
3. The main causes as mentioned in the second step need to be excavated thoroughly. The consequent causes are treated as middle fishbone and one cause represents one fishbone only.
50
35
30 30
24
16
0
27
46
62
78
91
100 100
Planned down time Reject/Rework Minor stoppage Speed loss Unplanned down time Setup down time Startup and yield
0
10
20
30
40
50
60 Series 1 Series 2
Factors
Seri
es 1
0
10
20
30
40
50
60
70
80
90
100
110
120 S
erie
s 2
Figure 4. First Level Pareto analysis of big losses in OEE.
This time can be effectively utilized for performing the scheduled maintenance ac-tivities so that unplanned time can be inevitably cut down to some extent. The furtherstudy put more emphasis on the remaining three losses reject/rework, minor stoppage,and speed loss.

J. Open Innov. Technol. Mark. Complex. 2021, 7, 7 9 of 21
3.2. Fish Bone Diagram (FBD) Analysis
The prime objective was to make a broad understanding of factors that adversely affectthe seven losses in the system. Based on the observation, these factors were characterizedas technical subjects, people development subjects, and management subjects. Thesesubjects were tackled properly by coordinate the technical subjects with a cross-functionalteam, people development subject with production area-based team, and managementsubject with managerial officials. The data was collected and an effective managementtool was used to present this data efficiently. Fishbone diagram (FBD) uses an illustrativerepresentation of causes and their effects and can be a much effective tool for a specificcase [30]. The FBD shows its usefulness due to graphical appearance, which makes this toolhighly effective for analyzing the production problem. If there is a cause, then the effectmust be present within the system and vice versa. The diagram with suitable branchesand sub-branches (twiglets) effectively shows their relation. Fishbone diagram needs to bedrawn according to logic and follow the steps listed below:
1. The problem that was analyzed must be put into the right side of the fishbone diagram,sketch the skeleton with right side pointed arrow.
2. The effective causes of the problem, e.g., method, material, man, environment, andmachine, are categorized into the main fishbone.
3. The main causes as mentioned in the second step need to be excavated thoroughly.The consequent causes are treated as middle fishbone and one cause represents onefishbone only.
4. The cause is further expanded until it reaches its maximum. The numerous branchescan be draw laterally on the skeleton through middle and small fishbone. Use anappropriate name and place with arrows.
5. This complete step-by-step procedure is called FBD as it looks like a spiky fishbone.
The fishbone diagram for the losses as interpreted from Pareto analysis was drawnand explained. Rework, speed loss, and minor stoppage were taken into consideration forFBD. Figures 5–7 demonstrate the various causes associated with these losses and, hence,FBD was successfully drawn by adopting the above-listed procedure. The performancewas enhanced by considering certain causes, and the source of individual problems wassystematically analyzed through the 5—why technique.
J. Open Innov. Technol. Mark. Complex. 2021, 7, x FOR PEER REVIEW 10 of 23
4. The cause is further expanded until it reaches its maximum. The numerous branches can be draw laterally on the skeleton through middle and small fishbone. Use an appropriate name and place with arrows.
5. This complete step-by-step procedure is called FBD as it looks like a spiky fishbone.
The fishbone diagram for the losses as interpreted from Pareto analysis was drawn and explained. Rework, speed loss, and minor stoppage were taken into consideration for FBD. Figures 5–7 demonstrate the various causes associated with these losses and, hence, FBD was successfully drawn by adopting the above-listed procedure. The performance was enhanced by considering certain causes, and the source of individual problems was systematically analyzed through the 5—why technique.
Figure 5. Fishbone diagram for rework/reject. Figure 5. Fishbone diagram for rework/reject.

J. Open Innov. Technol. Mark. Complex. 2021, 7, 7 10 of 21J. Open Innov. Technol. Mark. Complex. 2021, 7, x FOR PEER REVIEW 11 of 23
Figure 6. Fishbone diagram for speed loss.
Figure 7. Fishbone diagram for a minor stoppage.
Figures 5–7 reveal that the major losses result from 5M and comprise of numerous causes, which decrease the time available for the planned production time. The reappear-ance can be diminished by proper converging on the FBD. FBD analysis helps a lot in lowering the losses. Industries fail to meet the demand even running 24/7. The steady production level can be maintained by reducing these various causes, which leads to un-wanted stoppage during production. The 2nd level Pareto analysis for major causes was
Figure 6. Fishbone diagram for speed loss.
J. Open Innov. Technol. Mark. Complex. 2021, 7, x FOR PEER REVIEW 11 of 23
Figure 6. Fishbone diagram for speed loss.
Figure 7. Fishbone diagram for a minor stoppage.
Figures 5–7 reveal that the major losses result from 5M and comprise of numerous causes, which decrease the time available for the planned production time. The reappear-ance can be diminished by proper converging on the FBD. FBD analysis helps a lot in lowering the losses. Industries fail to meet the demand even running 24/7. The steady production level can be maintained by reducing these various causes, which leads to un-wanted stoppage during production. The 2nd level Pareto analysis for major causes was
Figure 7. Fishbone diagram for a minor stoppage.
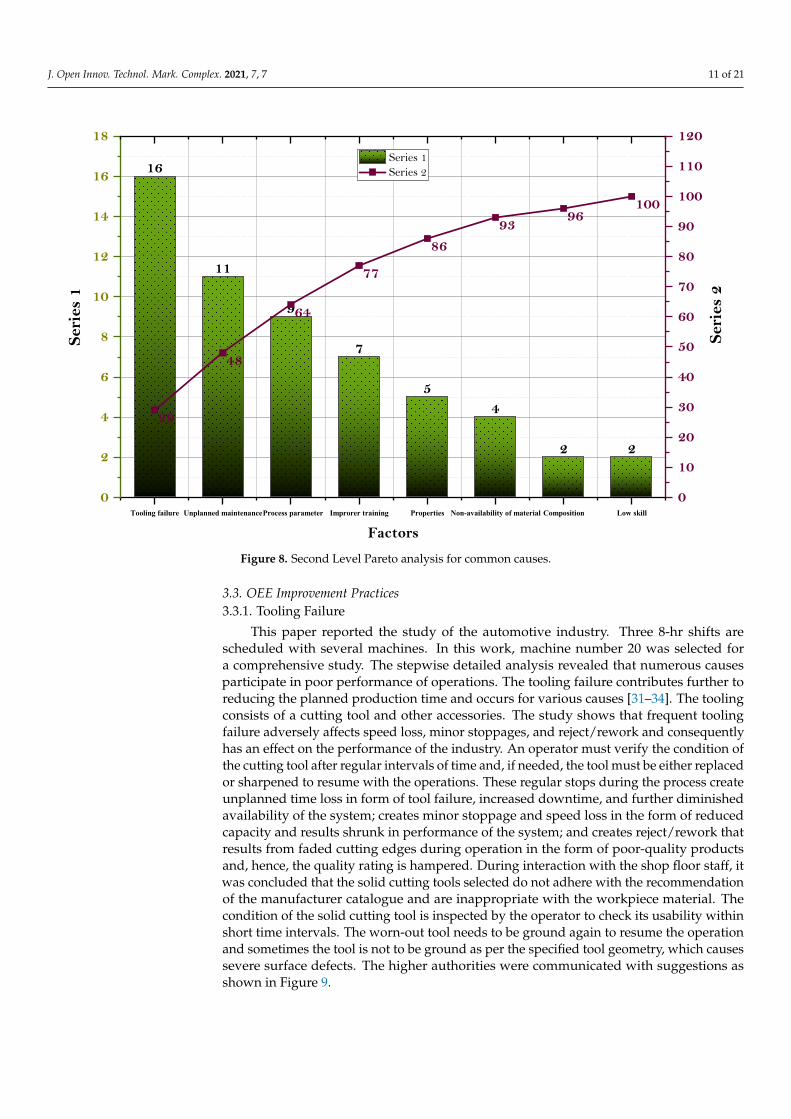
Figures 5–7 reveal that the major losses result from 5M and comprise of numerouscauses, which decrease the time available for the planned production time. The reappear-ance can be diminished by proper converging on the FBD. FBD analysis helps a lot inlowering the losses. Industries fail to meet the demand even running 24/7. The steadyproduction level can be maintained by reducing these various causes, which leads tounwanted stoppage during production. The 2nd level Pareto analysis for major causes wasframed as shown in Figure 8 and demonstrates the higher percentage of common causesfor speed loss, minor stoppages, and reject/rework.
The chart reveals that tooling failure, unplanned maintenance, process parameter,and improper training fall under 80% and need to be addressed properly to alleviate thedifferent losses. These four major issues resolve many issues that directly or indirectlyaffect the performability of an industry.
J. Open Innov. Technol. Mark. Complex. 2021, 7, 7 11 of 21
J. Open Innov. Technol. Mark. Complex. 2021, 7, x FOR PEER REVIEW 12 of 23
framed as shown in Figure 8 and demonstrates the higher percentage of common causes for speed loss, minor stoppages, and reject/rework.
Figure 8. Second Level Pareto analysis for common causes.
The chart reveals that tooling failure, unplanned maintenance, process parameter, and improper training fall under 80% and need to be addressed properly to alleviate the different losses. These four major issues resolve many issues that directly or indirectly affect the performability of an industry.
3.3. OEE Improvement Practices 3.3.1. Tooling Failure
This paper reported the study of the automotive industry. Three 8-hr shifts are sched-uled with several machines. In this work, machine number 20 was selected for a compre-hensive study. The stepwise detailed analysis revealed that numerous causes participate in poor performance of operations. The tooling failure contributes further to reducing the planned production time and occurs for various causes [31–34]. The tooling consists of a cutting tool and other accessories. The study shows that frequent tooling failure adversely affects speed loss, minor stoppages, and reject/rework and consequently has an effect on the performance of the industry. An operator must verify the condition of the cutting tool after regular intervals of time and, if needed, the tool must be either replaced or sharpened to resume with the operations. These regular stops during the process create unplanned time loss in form of tool failure, increased downtime, and further diminished availability of the system; creates minor stoppage and speed loss in the form of reduced capacity and results shrunk in performance of the system; and creates reject/rework that results from faded cutting edges during operation in the form of poor-quality products and, hence, the quality rating is hampered. During interaction with the shop floor staff, it was concluded
16
11
9
7
54
2 2
29
48
64
77
8693
96100
Tooling failure Unplanned maintenance Process parameter Improrer training Properties Non-availability of material Composition Low skill
0
2
4
6
8
10
12
14
16
18 Series 1 Series 2
Factors
Seri
es 1
0
10
20
30
40
50
60
70
80
90
100
110
120
Ser
ies
2
Figure 8. Second Level Pareto analysis for common causes.
3.3. OEE Improvement Practices3.3.1. Tooling Failure
This paper reported the study of the automotive industry. Three 8-hr shifts arescheduled with several machines. In this work, machine number 20 was selected fora comprehensive study. The stepwise detailed analysis revealed that numerous causesparticipate in poor performance of operations. The tooling failure contributes further toreducing the planned production time and occurs for various causes [31–34]. The toolingconsists of a cutting tool and other accessories. The study shows that frequent toolingfailure adversely affects speed loss, minor stoppages, and reject/rework and consequentlyhas an effect on the performance of the industry. An operator must verify the condition ofthe cutting tool after regular intervals of time and, if needed, the tool must be either replacedor sharpened to resume with the operations. These regular stops during the process createunplanned time loss in form of tool failure, increased downtime, and further diminishedavailability of the system; creates minor stoppage and speed loss in the form of reducedcapacity and results shrunk in performance of the system; and creates reject/rework thatresults from faded cutting edges during operation in the form of poor-quality productsand, hence, the quality rating is hampered. During interaction with the shop floor staff, itwas concluded that the solid cutting tools selected do not adhere with the recommendationof the manufacturer catalogue and are inappropriate with the workpiece material. Thecondition of the solid cutting tool is inspected by the operator to check its usability withinshort time intervals. The worn-out tool needs to be ground again to resume the operationand sometimes the tool is not to be ground as per the specified tool geometry, which causessevere surface defects. The higher authorities were communicated with suggestions asshown in Figure 9.

J. Open Innov. Technol. Mark. Complex. 2021, 7, 7 12 of 21
J. Open Innov. Technol. Mark. Complex. 2021, 7, x FOR PEER REVIEW 13 of 23
that the solid cutting tools selected do not adhere with the recommendation of the manu-facturer catalogue and are inappropriate with the workpiece material. The condition of the solid cutting tool is inspected by the operator to check its usability within short time intervals. The worn-out tool needs to be ground again to resume the operation and some-times the tool is not to be ground as per the specified tool geometry, which causes severe surface defects. The higher authorities were communicated with suggestions as shown in Figure 9.
Figure 9. Suggestion to mitigate tooling failure.
3.3.2. Unplanned Maintenance Unplanned maintenance causes unadorned problems in the system, increased down-
time, hampered production activities, reduced speed loss, minor stoppage, and reduced quality rate due to sudden breakdown on the machine tool. The manufacturing industries performance depends upon machine tools, and failure of these can put adverse effects on fulfilling customer demand. The failure also creates ambiguities on the shop floor and hence obstructs their efficiency and creates more monetary deficits. Manufacturing sys-tems heart includes machine tools and needs to maintain these tools efficiently for healthy breathing of the system. Therefore, planned maintenance or proactive maintenance strat-egies must be adopted to prevent such uncertainties in the system. Deficiencies during preventive maintenance result in corrective maintenance, which is to bring a piece of equipment to its original order. Unplanned maintenance also causes corrective mainte-nance and needs to stop the production activities until the equipment returns to its oper-ational state. Therefore, corrective maintenance and preventive maintenance need to be optimized for a reduction in downtime and the same has been suggested and discussed with the management team.
Corrective maintenance downtime includes three basic modules as listed and ex-plained in Table 2. The corrective maintenance efficacy increases by adopting strategies in the plant. The strategies follow in the industry were explained as follows:
1. Improve interchangeability: This concept is useful in lowering maintenance time; the inclusion of interchangeability during replacing and removing parts consumes less time and further extends planned production time.
2. Improve fault acknowledgement, position, isolation: These three main activities consume the most time in the industry. Faults can be timely acknowledged and positioned through effective maintenance procedure and well-trained personnel employed in the industry. Effective training helps to diagnose and locate the fault through mini-mal efforts within the system. Vibration monitoring, oil particle analysis, and thermal imaging are some of the approaches by which faults can be easily positioned and isolated. An effective troubleshooting procedure easily monitors and recognizes the fault. The indisputable fault isolation provides more accuracy in the time.
Figure 9. Suggestion to mitigate tooling failure.
3.3.2. Unplanned Maintenance
Unplanned maintenance causes unadorned problems in the system, increased down-time, hampered production activities, reduced speed loss, minor stoppage, and reducedquality rate due to sudden breakdown on the machine tool. The manufacturing industriesperformance depends upon machine tools, and failure of these can put adverse effects onfulfilling customer demand. The failure also creates ambiguities on the shop floor and henceobstructs their efficiency and creates more monetary deficits. Manufacturing systems heartincludes machine tools and needs to maintain these tools efficiently for healthy breathingof the system. Therefore, planned maintenance or proactive maintenance strategies mustbe adopted to prevent such uncertainties in the system. Deficiencies during preventivemaintenance result in corrective maintenance, which is to bring a piece of equipment to itsoriginal order. Unplanned maintenance also causes corrective maintenance and needs tostop the production activities until the equipment returns to its operational state. Therefore,corrective maintenance and preventive maintenance need to be optimized for a reductionin downtime and the same has been suggested and discussed with the management team.
Corrective maintenance downtime includes three basic modules as listed and ex-plained in Table 2. The corrective maintenance efficacy increases by adopting strategies inthe plant. The strategies follow in the industry were explained as follows:
1. Improve interchangeability: This concept is useful in lowering maintenance time; theinclusion of interchangeability during replacing and removing parts consumes lesstime and further extends planned production time.
2. Improve fault acknowledgement, position, isolation: These three main activities consumethe most time in the industry. Faults can be timely acknowledged and positionedthrough effective maintenance procedure and well-trained personnel employed in theindustry. Effective training helps to diagnose and locate the fault through minimalefforts within the system. Vibration monitoring, oil particle analysis, and thermalimaging are some of the approaches by which faults can be easily positioned andisolated. An effective troubleshooting procedure easily monitors and recognizes thefault. The indisputable fault isolation provides more accuracy in the time.
3. Human factors: The ergonomically designed components help to mitigate the correctivemaintenance time. The various components, pointers, and dials must be arrangedergonomically on the machine as per their size, shape, and weight criterion. Thispractice reduces efforts as well as time to convert failure state into operational statewithin minimal time.
4. Use redundancy: The redundancy in the system will reduce the load on the productionline in case of breakdown or failure in the line. The redundant components can beexchanged any time for the period of failure of the specific component for maintainingcontinuity in the system. Even though whole maintenance may not be affected, theequipment downtime decreases appreciably.

J. Open Innov. Technol. Mark. Complex. 2021, 7, 7 13 of 21
Table 2. Corrective maintenance downtime modules.
CorrectiveMaintenanceDown Time
AdministrativeandLogisticTime:Time taken for implementing decision through administrative departmentand provide the same without any hinderence.
Active Repair Time:Time taken to convert the failure state into operational state. This willdepend upon checkout, preparation, fault correction, location, adjustmentand calibration, and spare item time.
Delay Time:The actual time taken by the system from the scheduled time referred asdelay time.
Preventive maintenance reduces the risk of severity of breakdown/failure in thesystem. The effective maintenance schedule leads to less unplanned downtime. Preventivemaintenance comprises various elements as shown in Figure 10. These elements effectivelyhelp the maintenance team to reduce the above-mentioned risks and failure.
J. Open Innov. Technol. Mark. Complex. 2021, 7, x FOR PEER REVIEW 14 of 23
3. Human factors: The ergonomically designed components help to mitigate the correc-tive maintenance time. The various components, pointers, and dials must be ar-ranged ergonomically on the machine as per their size, shape, and weight criterion. This practice reduces efforts as well as time to convert failure state into operational state within minimal time.
4. Use redundancy: The redundancy in the system will reduce the load on the production line in case of breakdown or failure in the line. The redundant components can be exchanged any time for the period of failure of the specific component for maintain-ing continuity in the system. Even though whole maintenance may not be affected, the equipment downtime decreases appreciably.
Table 2. Corrective maintenance downtime modules.
Corrective Maintenance Down Time
Administrative and Logistic Time: Time taken for implementing decision through administrative department and provide the same without any hinderence. Active Repair Time: Time taken to convert the failure state into operational state. This will de-pend upon checkout, preparation, fault correction, location, adjustment and calibration, and spare item time. Delay Time: The actual time taken by the system from the scheduled time referred as delay time.
Preventive maintenance reduces the risk of severity of breakdown/failure in the sys-tem. The effective maintenance schedule leads to less unplanned downtime. Preventive maintenance comprises various elements as shown in Figure 10. These elements effec-tively help the maintenance team to reduce the above-mentioned risks and failure.
Figure 10. Elements of preventive maintenance.
Availability of necessary support such as testing instrument, tools, a past database of equipment, skilled labor, manufacturer index, management cooperation, and manuals leads to an effective preventive maintenance program. First, the area must be chosen for initiation of maintenance effort. The maintenance requirements prioritized, based upon
Prev
entiv
e Mai
nten
ance
•Inspection: Periodically inspecting and comparing actual physical, mechanical, andother conditions with standards.•Callibration: Correcting any inconsistency found while comparing with standards•Testing: Regular testing to maintain the equipment as per standards.•Adjustment: Continually making corrections as notified by the inspection team toachieve optimal effectiveness.•Servicing: Regularly cleaning, lubricating, and adjusting the equipment to preventreoccurrence of failures.•Installation: Replacing the items regularly as per their limited life cycle and weardegradation pattern.•Alignment: Align the replaced/repair items as per specified standards.
Figure 10. Elements of preventive maintenance.
Availability of necessary support such as testing instrument, tools, a past databaseof equipment, skilled labor, manufacturer index, management cooperation, and manualsleads to an effective preventive maintenance program. First, the area must be chosen forinitiation of maintenance effort. The maintenance requirements prioritized, based uponpriorities of maintenance activities, were developed through daily and periodic inspections.Maintenance events occurrence were recorded and reviewed properly to make an effectivedaily and periodical maintenance plan. The final plan for both the types was approvedand executed at the shop floor level for desired results. The effective stepwise procedurehelps to minimize the planned downtime for maintenance purposes.
3.3.3. Process Parameters
The status of the process was measured concerning certain indicators and values.These values are known as process variable or process parameters. The parameters mustbe under uninterrupted control for effective use of equipment. The measured parameteralways results in improved performance without affecting the system. The overall sys-tem performance can be acquired efficiently when process parameters are used to countmachine reliability. As the process parameter changes, it will disturb the production rate,performance, and probability of failure of a given system. The inclusion of parameter per-

J. Open Innov. Technol. Mark. Complex. 2021, 7, 7 14 of 21
mits improved estimation of an overall performance rate. These parameters are influencedby workpiece formation and material. Therefore, proper selection of these parametersresults in increased planned production time, reduced time, reductions in six big losses, andincreased economy. Generally, three parameters i.e., cutting speed, depth of cut, and feedare considered for evaluation. Optimized machining attributes result in less tooling failureand consequential losses are reduced. If losses are reduced, then it leads to an increase inthe effectiveness of the industry [35–39]. The cutting speed, expressed in meters per minute(m/min) or feet per minute (ft/min), is the path traveled by a point on the cutter. Literaturereveals that using extremely slow cutting speed is unviable for production and extremelyhigh cutting speed is unworkable for economical production [40]. The most viable cuttingspeed must be chosen for a workpiece tool interface without affecting performance andeconomy [41,42]. While selecting optimal cutting speed, feed (as per cutting tool strengthand surface finish requirement) and depth of cut (machine tool, cutting tool and system re-quirement), all outcomes should be considered. Production efficiency comprises machiningtime, tool changing time, setup time, and costs associated with them. The proper selectionof parameters results in optimal production rate (Pr) and production cost (Cp), as can beseen from Equations (1)–(4).
Tp = Ti + Mt + TchNt
Nb, Tp = Ti + Mt + Tch
Nb × Mt
Nb × T(1)
Tedge = TchMt
T. . . ; Mt = πdl/1000Vc f (2)
Tp = Ti + Mt + Tedge (3)
Cp = (K1 × Mt) + (K1 × Ti) +(
K1 × Tedge
)+ (K2 × Mt/T) (4)
Tp = Ti + Mt + TchNb × Mt
Nb × T(5)
The machining economics helps to choose the process parameters to minimize theproduction unit time (Tp), which comprises of load/unload time (Ti), actual machining time(Mt), and the average time spent in changing insert tip (Tedge). Nb is the total componentsproduce a batch, Nt is the total number of tools used. K1, K2 are man-machine hour rate($/min) and the cost of consumable per cutting edge ($). The appropriate tool material(high-grade material), tool geometry (positive, neutral, and negative), tool inserts (PhysicalVapor Deposition and Chemical Vapor Deposition), and optimal process parameter stronglyinfluence the availability rate, performance rate, and quality rate. Equations (1)–(4) revealthat production time is dependent upon machining time, and further machining timeshows the relation between cutting speed and feed. Equation (5) displays the tool lifeequation, where C, n, n1, and n2 are the constant depending upon the tool material. Also,C depends on the tool-workpiece material interface and helps to trace out the availabilityrate of the machine. Less tool life means more tool changing and less machine available,and vice versa. Repeated tool changing increases minor stoppages and reduces the speed,and so affects the performance rate of the industry. Abrupt breakage in the tool seriouslydamages the workpiece surface and sometimes the machine tool is also affected by theseabrupt impacts, which leads to reject/rework, and hence affects the quality rate. The toolwear is highly influenced by cutting speed, feed, and depth of cut, and results in poordimensional accuracy, process stability, and surface finish, causing reject/rework as shownin Figure 11. The same results were reported by Murat et al. in their scientific works [43].

J. Open Innov. Technol. Mark. Complex. 2021, 7, 7 15 of 21
J. Open Innov. Technol. Mark. Complex. 2021, 7, x FOR PEER REVIEW 16 of 23
(4) reveal that production time is dependent upon machining time, and further machining time shows the relation between cutting speed and feed. Equation (5) displays the tool life equation, where C, n, n1, and n2 are the constant depending upon the tool material. Also, C depends on the tool-workpiece material interface and helps to trace out the availability rate of the machine. Less tool life means more tool changing and less machine available, and vice versa. Repeated tool changing increases minor stoppages and reduces the speed, and so affects the performance rate of the industry. Abrupt breakage in the tool seriously damages the workpiece surface and sometimes the machine tool is also affected by these abrupt impacts, which leads to reject/rework, and hence affects the quality rate. The tool wear is highly influenced by cutting speed, feed, and depth of cut, and results in poor dimensional accuracy, process stability, and surface finish, causing reject/rework as shown in Figure 11. The same results were reported by Murat et al. in their scientific works [43].
Figure 11. Effect of tool wear on the machined surface.
3.3.4. Improper Training Training greatly affects the overall performance of the industry. Third level Pareto
analysis reveals that improper training was considered one of the main causes as per the 80/20 rule and, hence, needs to be tackled to improve the performance in the industry. If the workforce is properly trained, then most of the problems routinely disappear from the machine area. A skilled workforce understands the effects of following non-standardized procedure during the machining operation. The motive of addressing tooling failure, un-planned maintenance, and process parameter is to mitigate the big losses that can result from the unskilled worker. Unskilled workforce needs to undergo training to fortify their skills as well as utilize their improved skills in improving the overall effectiveness of the industry. The effect of these minor changes is observed during the operation. Labor is reinforced with the training of 5S terminology and autonomous maintenance in the in-dustry to keep industry progressive in nature.
3.3.5. 5’S Methodology Every organization deals with poor effectiveness due to waste in the form of either
defect, waiting time, superfluous motion, surplus inventory, extra processing, pointless conveyance, and unutilized talents. This technique helps to increase performance by
Figure 11. Effect of tool wear on the machined surface.
3.3.4. Improper Training
Training greatly affects the overall performance of the industry. Third level Paretoanalysis reveals that improper training was considered one of the main causes as per the80/20 rule and, hence, needs to be tackled to improve the performance in the industry. Ifthe workforce is properly trained, then most of the problems routinely disappear from themachine area. A skilled workforce understands the effects of following non-standardizedprocedure during the machining operation. The motive of addressing tooling failure,unplanned maintenance, and process parameter is to mitigate the big losses that can resultfrom the unskilled worker. Unskilled workforce needs to undergo training to fortify theirskills as well as utilize their improved skills in improving the overall effectiveness ofthe industry. The effect of these minor changes is observed during the operation. Laboris reinforced with the training of 5S terminology and autonomous maintenance in theindustry to keep industry progressive in nature.
3.3.5. 5’S Methodology
Every organization deals with poor effectiveness due to waste in the form of eitherdefect, waiting time, superfluous motion, surplus inventory, extra processing, pointlessconveyance, and unutilized talents. This technique helps to increase performance bymaintaining the workplace clean, reliable, well managed, and uncluttered. This techniquenot only recognizes five words but helps the organization to reduce wastage and losses.The industry faces too much-unplanned downtime due to cluttered organization. The 5’Smethodology is the right technique to conquer cluttered organization. The shop floor scancum diagnostic sheet was prepared and successfully communicated with managementteam for improvement in the industry, as demonstrated in Table 3. The sheet rated fivelevels from L1 to L5. If more than four problems occur, then L1 is written in the sheet;three problems mean L2; two problems mean L3; 1 problem means L4; and zero problemmeans L5.

J. Open Innov. Technol. Mark. Complex. 2021, 7, 7 16 of 21
Table 3. Shop floor scan cum diagnostic sheet.
Classification Descriptions Rating Remarks
L1 L2 L3 L4 L5
A
SEIRIORGANIZE
(SORT)
J. Open Innov. Technol. Mark. Complex. 2021, 7, x FOR PEER REVIEW 18 of 23
Table 3. Shop floor scan cum diagnostic sheet.
Classification Descriptions Rating Remarks
L1 L2 L3 L4 L5
A
SEIRI ORGANIZE
(SORT)
1. Distinguish between wanted and unwanted items
2. Unwanted equipment, tool, other items on the shop floor.
3. Purpose of the items, frequency of use 4. Unwanted items in the staircase, corners. 5. Unwanted items on walls and information board. 6. Unwanted inventory supplies or materials.
B
SEITON UNIFORMIT
Y (SET IN ORDER)
7. A place of everything and everything in its place. 8. Items are not in order 9. Workstations, items location not demarcated 10. Correct items not grouped
11. Quantity limits are not appropriate
C
SEISO CLEANLINES
S (SHINE)
12. Cleaning and looking ways are not organized 13. Workplace area, floor, stairs are contaminated
14. Machine tools, equipment’s and other items are not clean.
15. Sanitary items are not easily assessable. 16. Signage and board are either dirty or broken. 17. Relevant issues
D
SEIKETSU STANDARDI
ZE (NORMALIZ
E)
18. Implementation of the first 3S 19. Standards are not properly documented 20. Job, cleaning, and another checklist not framed 21. Part recognition is poor
22. Items located in specified limit
E
SHITSUK DISCIPLINE (SUSTAIN)
23. Adhere with rules 24. Workers not undergone 5S training 25. The frequency for not performing 5S in last week 26. How many jobs not updated as per standard
27. The frequency for last week that belongings not properly maintained
3.3.6. Autonomous Maintenance This maintenance is the first pillar of total productive maintenance strategy. As in-
dustry mostly suffers from either planned downtime or unplanned downtime, each time needs to be reduced through applying effective strategies and methodologies in the in-dustry. This methodology helps the industry to lessen downtime due to common causes. In this strategy, the operator endlessly monitors their machines and performs minor tasks, adjustment, and set up on the machine by own effort without assigning to, specifically, maintenance personnel. This saves a lot of wastages in form of either waiting, transporta-tion, motion, or non-availability of the specialized worker. Technical knowledge about machine and workplace imparts to workers a feeling of ownership for the whole work-place so that they can standardize routine inspection schedule. The effective autonomous maintenance works on two principal elements: (1) the proper operation helps in less de-preciation of machine, and (2) keeping equipment in “like new” situation through effec-tive repair and management. The autonomous procedure is demonstrated in Figure 12.
1. Distinguish between wanted and unwanted items
2. Unwanted equipment, tool, other items on the shop floor.
3. Purpose of the items, frequency of use
4. Unwanted items in the staircase, corners.
5. Unwanted items on walls and information board.
6. Unwanted inventory supplies or materials.
B
SEITONUNIFORMITY
(SET IN ORDER)
J. Open Innov. Technol. Mark. Complex. 2021, 7, x FOR PEER REVIEW 18 of 23
Table 3. Shop floor scan cum diagnostic sheet.
Classification Descriptions Rating Remarks
L1 L2 L3 L4 L5
A
SEIRI ORGANIZE
(SORT)
1. Distinguish between wanted and unwanted items
2. Unwanted equipment, tool, other items on the shop floor.
3. Purpose of the items, frequency of use 4. Unwanted items in the staircase, corners. 5. Unwanted items on walls and information board. 6. Unwanted inventory supplies or materials.
B
SEITON UNIFORMIT
Y (SET IN ORDER)
7. A place of everything and everything in its place. 8. Items are not in order 9. Workstations, items location not demarcated 10. Correct items not grouped
11. Quantity limits are not appropriate
C
SEISO CLEANLINES
S (SHINE)
12. Cleaning and looking ways are not organized 13. Workplace area, floor, stairs are contaminated
14. Machine tools, equipment’s and other items are not clean.
15. Sanitary items are not easily assessable. 16. Signage and board are either dirty or broken. 17. Relevant issues
D
SEIKETSU STANDARDI
ZE (NORMALIZ
E)
18. Implementation of the first 3S 19. Standards are not properly documented 20. Job, cleaning, and another checklist not framed 21. Part recognition is poor
22. Items located in specified limit
E
SHITSUK DISCIPLINE (SUSTAIN)
23. Adhere with rules 24. Workers not undergone 5S training 25. The frequency for not performing 5S in last week 26. How many jobs not updated as per standard
27. The frequency for last week that belongings not properly maintained
3.3.6. Autonomous Maintenance This maintenance is the first pillar of total productive maintenance strategy. As in-
dustry mostly suffers from either planned downtime or unplanned downtime, each time needs to be reduced through applying effective strategies and methodologies in the in-dustry. This methodology helps the industry to lessen downtime due to common causes. In this strategy, the operator endlessly monitors their machines and performs minor tasks, adjustment, and set up on the machine by own effort without assigning to, specifically, maintenance personnel. This saves a lot of wastages in form of either waiting, transporta-tion, motion, or non-availability of the specialized worker. Technical knowledge about machine and workplace imparts to workers a feeling of ownership for the whole work-place so that they can standardize routine inspection schedule. The effective autonomous maintenance works on two principal elements: (1) the proper operation helps in less de-preciation of machine, and (2) keeping equipment in “like new” situation through effec-tive repair and management. The autonomous procedure is demonstrated in Figure 12.
7. A place of everything and everything in its place.
8. Items are not in order
9. Workstations, items location not demarcated
10. Correct items not grouped
11. Quantity limits are not appropriate
C
SEISOCLEANLINESS
(SHINE)
J. Open Innov. Technol. Mark. Complex. 2021, 7, x FOR PEER REVIEW 18 of 23
Table 3. Shop floor scan cum diagnostic sheet.
Classification Descriptions Rating Remarks
L1 L2 L3 L4 L5
A
SEIRI ORGANIZE
(SORT)
1. Distinguish between wanted and unwanted items
2. Unwanted equipment, tool, other items on the shop floor.
3. Purpose of the items, frequency of use 4. Unwanted items in the staircase, corners. 5. Unwanted items on walls and information board. 6. Unwanted inventory supplies or materials.
B
SEITON UNIFORMIT
Y (SET IN ORDER)
7. A place of everything and everything in its place. 8. Items are not in order 9. Workstations, items location not demarcated 10. Correct items not grouped
11. Quantity limits are not appropriate
C
SEISO CLEANLINES
S (SHINE)
12. Cleaning and looking ways are not organized 13. Workplace area, floor, stairs are contaminated
14. Machine tools, equipment’s and other items are not clean.
15. Sanitary items are not easily assessable. 16. Signage and board are either dirty or broken. 17. Relevant issues
D
SEIKETSU STANDARDI
ZE (NORMALIZ
E)
18. Implementation of the first 3S 19. Standards are not properly documented 20. Job, cleaning, and another checklist not framed 21. Part recognition is poor
22. Items located in specified limit
E
SHITSUK DISCIPLINE (SUSTAIN)
23. Adhere with rules 24. Workers not undergone 5S training 25. The frequency for not performing 5S in last week 26. How many jobs not updated as per standard
27. The frequency for last week that belongings not properly maintained
3.3.6. Autonomous Maintenance This maintenance is the first pillar of total productive maintenance strategy. As in-
dustry mostly suffers from either planned downtime or unplanned downtime, each time needs to be reduced through applying effective strategies and methodologies in the in-dustry. This methodology helps the industry to lessen downtime due to common causes. In this strategy, the operator endlessly monitors their machines and performs minor tasks, adjustment, and set up on the machine by own effort without assigning to, specifically, maintenance personnel. This saves a lot of wastages in form of either waiting, transporta-tion, motion, or non-availability of the specialized worker. Technical knowledge about machine and workplace imparts to workers a feeling of ownership for the whole work-place so that they can standardize routine inspection schedule. The effective autonomous maintenance works on two principal elements: (1) the proper operation helps in less de-preciation of machine, and (2) keeping equipment in “like new” situation through effec-tive repair and management. The autonomous procedure is demonstrated in Figure 12.
12. Cleaning and looking ways are not organized
13. Workplace area, floor, stairs are contaminated
14. Machine tools, equipment’s and other items are not clean.
15. Sanitary items are not easily assessable.
16. Signage and board are either dirty or broken.
17. Relevant issues
D
SEIKETSUSTANDARDIZE(NORMALIZE)
J. Open Innov. Technol. Mark. Complex. 2021, 7, x FOR PEER REVIEW 18 of 23
Table 3. Shop floor scan cum diagnostic sheet.
Classification Descriptions Rating Remarks
L1 L2 L3 L4 L5
A
SEIRI ORGANIZE
(SORT)
1. Distinguish between wanted and unwanted items
2. Unwanted equipment, tool, other items on the shop floor.
3. Purpose of the items, frequency of use 4. Unwanted items in the staircase, corners. 5. Unwanted items on walls and information board. 6. Unwanted inventory supplies or materials.
B
SEITON UNIFORMIT
Y (SET IN ORDER)
7. A place of everything and everything in its place. 8. Items are not in order 9. Workstations, items location not demarcated 10. Correct items not grouped
11. Quantity limits are not appropriate
C
SEISO CLEANLINES
S (SHINE)
12. Cleaning and looking ways are not organized 13. Workplace area, floor, stairs are contaminated
14. Machine tools, equipment’s and other items are not clean.
15. Sanitary items are not easily assessable. 16. Signage and board are either dirty or broken. 17. Relevant issues
D
SEIKETSU STANDARDI
ZE (NORMALIZ
E)
18. Implementation of the first 3S 19. Standards are not properly documented 20. Job, cleaning, and another checklist not framed 21. Part recognition is poor
22. Items located in specified limit
E
SHITSUK DISCIPLINE (SUSTAIN)
23. Adhere with rules 24. Workers not undergone 5S training 25. The frequency for not performing 5S in last week 26. How many jobs not updated as per standard
27. The frequency for last week that belongings not properly maintained
3.3.6. Autonomous Maintenance This maintenance is the first pillar of total productive maintenance strategy. As in-
dustry mostly suffers from either planned downtime or unplanned downtime, each time needs to be reduced through applying effective strategies and methodologies in the in-dustry. This methodology helps the industry to lessen downtime due to common causes. In this strategy, the operator endlessly monitors their machines and performs minor tasks, adjustment, and set up on the machine by own effort without assigning to, specifically, maintenance personnel. This saves a lot of wastages in form of either waiting, transporta-tion, motion, or non-availability of the specialized worker. Technical knowledge about machine and workplace imparts to workers a feeling of ownership for the whole work-place so that they can standardize routine inspection schedule. The effective autonomous maintenance works on two principal elements: (1) the proper operation helps in less de-preciation of machine, and (2) keeping equipment in “like new” situation through effec-tive repair and management. The autonomous procedure is demonstrated in Figure 12.
18. Implementation of the first 3S
19. Standards are not properly documented
20. Job, cleaning, and another checklist not framed
21. Part recognition is poor
22. Items located in specified limit
E
SHITSUKDISCIPLINE(SUSTAIN)
J. Open Innov. Technol. Mark. Complex. 2021, 7, x FOR PEER REVIEW 18 of 23
Table 3. Shop floor scan cum diagnostic sheet.
Classification Descriptions Rating Remarks
L1 L2 L3 L4 L5
A
SEIRI ORGANIZE
(SORT)
1. Distinguish between wanted and unwanted items
2. Unwanted equipment, tool, other items on the shop floor.
3. Purpose of the items, frequency of use 4. Unwanted items in the staircase, corners. 5. Unwanted items on walls and information board. 6. Unwanted inventory supplies or materials.
B
SEITON UNIFORMIT
Y (SET IN ORDER)
7. A place of everything and everything in its place. 8. Items are not in order 9. Workstations, items location not demarcated 10. Correct items not grouped
11. Quantity limits are not appropriate
C
SEISO CLEANLINES
S (SHINE)
12. Cleaning and looking ways are not organized 13. Workplace area, floor, stairs are contaminated
14. Machine tools, equipment’s and other items are not clean.
15. Sanitary items are not easily assessable. 16. Signage and board are either dirty or broken. 17. Relevant issues
D
SEIKETSU STANDARDI
ZE (NORMALIZ
E)
18. Implementation of the first 3S 19. Standards are not properly documented 20. Job, cleaning, and another checklist not framed 21. Part recognition is poor
22. Items located in specified limit
E
SHITSUK DISCIPLINE (SUSTAIN)
23. Adhere with rules 24. Workers not undergone 5S training 25. The frequency for not performing 5S in last week 26. How many jobs not updated as per standard
27. The frequency for last week that belongings not properly maintained
3.3.6. Autonomous Maintenance This maintenance is the first pillar of total productive maintenance strategy. As in-
dustry mostly suffers from either planned downtime or unplanned downtime, each time needs to be reduced through applying effective strategies and methodologies in the in-dustry. This methodology helps the industry to lessen downtime due to common causes. In this strategy, the operator endlessly monitors their machines and performs minor tasks, adjustment, and set up on the machine by own effort without assigning to, specifically, maintenance personnel. This saves a lot of wastages in form of either waiting, transporta-tion, motion, or non-availability of the specialized worker. Technical knowledge about machine and workplace imparts to workers a feeling of ownership for the whole work-place so that they can standardize routine inspection schedule. The effective autonomous maintenance works on two principal elements: (1) the proper operation helps in less de-preciation of machine, and (2) keeping equipment in “like new” situation through effec-tive repair and management. The autonomous procedure is demonstrated in Figure 12.
23. Adhere with rules
24. Workers not undergone 5S training
25. The frequency for not performing 5S in last week
26. How many jobs not updated as per standard
27. The frequency for last week that belongings notproperly maintained
3.3.6. Autonomous Maintenance
This maintenance is the first pillar of total productive maintenance strategy. Asindustry mostly suffers from either planned downtime or unplanned downtime, eachtime needs to be reduced through applying effective strategies and methodologies inthe industry. This methodology helps the industry to lessen downtime due to commoncauses. In this strategy, the operator endlessly monitors their machines and performsminor tasks, adjustment, and set up on the machine by own effort without assigningto, specifically, maintenance personnel. This saves a lot of wastages in form of eitherwaiting, transportation, motion, or non-availability of the specialized worker. Technicalknowledge about machine and workplace imparts to workers a feeling of ownership for thewhole workplace so that they can standardize routine inspection schedule. The effectiveautonomous maintenance works on two principal elements: (1) the proper operationhelps in less depreciation of machine, and (2) keeping equipment in “like new” situation

J. Open Innov. Technol. Mark. Complex. 2021, 7, 7 17 of 21
through effective repair and management. The autonomous procedure is demonstrated inFigure 12.
J. Open Innov. Technol. Mark. Complex. 2021, 7, x FOR PEER REVIEW 19 of 23
Figure 12. Autonomous maintenance procedure.
3.4. Improved OEE Figure 3 reveals that the overall equipment effectiveness of the machine was 68.6%.
There were a lot of scopes to increase this OEE for the improvement of the industry. Efforts were made through the implementation of an effective strategy in the industry. Six big losses adversely affect the effectiveness of industry, and these losses were thoroughly at-tempted with the help of 1st, 2nd, and 3rd Pareto analysis and FBD. The major causes like tooling failure, unplanned maintenance, process parameter, and improper training were thoroughly analyzed and effectively communicated with the production and manage-ment teams. The improved data were apprehended and improved OEE was calculated as listed in Table 4.
Table 4. Improved key metrics.
No. Key Terms Symbol Past Value Present Value Unit 1. Plant Operating Time PO 1 × 8 hrs. = 8 hrs = 480 1 × 8 hrs. = 8 hrs = 480 min
2. Planned Shutdown Time PS 2 Short Breaks @10 min = 20 1 Meal Break @ 30 min = 30
Total = 50
2 Short Breaks @10 min = 20 1 Meal Break @ 30 min = 30
Total = 50 min
3. Planned Production Time PT 480 − 50 = 430 480 − 50 = 430 min 4. Down Time DT 40 20 min 5. Operative Time OT 430 − 40 = 390 430 − 20 = 410 min 6. Ideal Cycle Time CT 1 1 min 7. Total no. of Pieces N 330 380 count 8. Minor Stoppages M 30 15 min 9. Net Operating Time NT 390 − 30 = 360 410 – 15 = 395 min 10. Efficient Net Operating Time ET 1 × 330 = 330 1 × 380 = 380 min 11. Rejected Pieces NR 35 15 count 12. Good Unit G 330 − 35 = 295 380 − 15 = 365 count 13. Availability A 390/430 = 90.70 410/430 = 95.30 % 14. Performance P [ × ] = 84.62 [ × ] = 92.68 % 15. Quality Q 295/330 = 89.39 365/380 = 96.05 % 16. Overall Equipment Efficiency OEE 90.70 × 84.62 × 89.39 = 68.60 95.30 × 92.68 × 96.05 = 84.83 % 17. Asset Utilization AU 390/480 = 81.25 410/480= 85.41 %
Figure 12. Autonomous maintenance procedure.
3.4. Improved OEE
Figure 3 reveals that the overall equipment effectiveness of the machine was 68.6%.There were a lot of scopes to increase this OEE for the improvement of the industry. Effortswere made through the implementation of an effective strategy in the industry. Six biglosses adversely affect the effectiveness of industry, and these losses were thoroughlyattempted with the help of 1st, 2nd, and 3rd Pareto analysis and FBD. The major causes liketooling failure, unplanned maintenance, process parameter, and improper training werethoroughly analyzed and effectively communicated with the production and managementteams. The improved data were apprehended and improved OEE was calculated as listedin Table 4.
Table 4. Improved key metrics.
No. Key Terms Symbol Past Value Present Value Unit
1. Plant Operating Time PO 1 × 8 hrs. = 8 hrs = 480 1 × 8 hrs. = 8 hrs = 480 min
2. Planned Shutdown Time PS
2 Short Breaks @10 min = 201 Meal Break @ 30 min = 30
Total = 50
2 Short Breaks @10 min = 201 Meal Break @ 30 min = 30
Total = 50min
3. Planned Production Time PT 480 − 50 = 430 480 − 50 = 430 min
4. Down Time DT 40 20 min
5. Operative Time OT 430 − 40 = 390 430 − 20 = 410 min
6. Ideal Cycle Time CT 1 1 min
7. Total no. of Pieces N 330 380 count
8. Minor Stoppages M 30 15 min
9. Net Operating Time NT 390 − 30 = 360 410 – 15 = 395 min
10. Efficient Net Operating Time ET 1 × 330 = 330 1 × 380 = 380 min
11. Rejected Pieces NR 35 15 count
12. Good Unit G 330 − 35 = 295 380 − 15 = 365 count
13. Availability A 390/430 = 90.70 410/430 = 95.30 %
14. Performance P [1 × 330]390 = 84.62 [1 × 380]
410 = 92.68 %
15. Quality Q 295/330 = 89.39 365/380 = 96.05 %
16. Overall Equipment Efficiency OEE 90.70 × 84.62 × 89.39 = 68.60 95.30 × 92.68 × 96.05 = 84.83 %
17. Asset Utilization AU 390/480 = 81.25 410/480= 85.41 %

J. Open Innov. Technol. Mark. Complex. 2021, 7, 7 18 of 21
4. Conclusions
The healthy strategies in the industry help to sustain effectiveness for qualitativeand quantitative production, which leads to higher customer satisfaction. To ensure this,researchers proposed a novel approach in this study for increasing the effectiveness inthe industry. There are seven major losses present in the industry which adversely affectsthe effectiveness of machine in any industry. This approach can reduce these losses andimprove the quality, asset utilization (AU), OEE, total effective equipment performance(TEEP), and productivity of the machine. The study exposes that Pareto analysis uncoversall the losses and works on the principle of 80/20 rule. The major losses were thoroughlyexplored with the help of the fishbone diagram and solutions were implemented on theshop floor.
In the current paper, the OEE approach jointly with Pareto analysis and fishbonediagram accords superior control over the production efficiency. Planned downtime,reject/rework, minor stoppage, and speed loss considered main causes through Paretoanalysis as presented in Figure 4. The losses reject/rework, minor stoppage, speed loss,unplanned downtime, and setup downtime decreased as demonstrated by Figure 13.Performance key metrics were remarkably improved (refer to Figure 14). In other word,key metrics i.e., availability, performance, quality, OEE, asset utilization, and total effectiveequipment performance showed improvements by 4.6%, 8.06%, 6.66%, 16.23%, 4.16%, and14.58%, respectively, after successful execution of trilogy approach in the industry. Thestatistical tool, condition monitoring, and other management tools can be used to mitigatethe losses. In summary, the approach offers a good opportunity for both researchers andsmall-medium enterprises around the world to analyze the indicators of production losses,performance, and productivity in the manufacturing industry. Research efforts proposed inthe future include further development of existing assessment methods, conducting hybridanalysis by collaborating with different methods, and investigating more determiningfactors affecting key metrics in the manufacturing industry.
J. Open Innov. Technol. Mark. Complex. 2021, 7, x FOR PEER REVIEW 20 of 23
4. Conclusions The healthy strategies in the industry help to sustain effectiveness for qualitative and
quantitative production, which leads to higher customer satisfaction. To ensure this, re-searchers proposed a novel approach in this study for increasing the effectiveness in the industry. There are seven major losses present in the industry which adversely affects the effectiveness of machine in any industry. This approach can reduce these losses and im-prove the quality, asset utilization (AU), OEE, total effective equipment performance (TEEP), and productivity of the machine. The study exposes that Pareto analysis uncovers all the losses and works on the principle of 80/20 rule. The major losses were thoroughly explored with the help of the fishbone diagram and solutions were implemented on the shop floor.
In the current paper, the OEE approach jointly with Pareto analysis and fishbone di-agram accords superior control over the production efficiency. Planned downtime, re-ject/rework, minor stoppage, and speed loss considered main causes through Pareto anal-ysis as presented in Figure 4. The losses reject/rework, minor stoppage, speed loss, un-planned downtime, and setup downtime decreased as demonstrated by Figure 13. Perfor-mance key metrics were remarkably improved (refer to Figure 14). In other word, key metrics i.e., availability, performance, quality, OEE, asset utilization, and total effective equipment performance showed improvements by 4.6%, 8.06%, 6.66%, 16.23%, 4.16%, and 14.58%, respectively, after successful execution of trilogy approach in the industry. The statistical tool, condition monitoring, and other management tools can be used to mitigate the losses. In summary, the approach offers a good opportunity for both researchers and small-medium enterprises around the world to analyze the indicators of production losses, performance, and productivity in the manufacturing industry. Research efforts proposed in the future include further development of existing assessment methods, con-ducting hybrid analysis by collaborating with different methods, and investigating more determining factors affecting key metrics in the manufacturing industry.
Figure 13. Comparison of seven big losses.
Planned down time Reject/rework Minor stoppage Speed loss Unplanned down time Setup down time Startup and yield0
10
20
30
40
50
Min
ute
Key terms
Before After
Figure 13. Comparison of seven big losses.

J. Open Innov. Technol. Mark. Complex. 2021, 7, 7 19 of 21J. Open Innov. Technol. Mark. Complex. 2021, 7, x FOR PEER REVIEW 21 of 23
Figure 14. Comparison of key metrics.
Author Contributions: Conceptualization, A.T., K.N.S., and M.K.G.; methodology, A.T. and M.K.G.; software, M.K.G. and M.S.; validation, M.K.G., D.Y.P., and K.N.S.; formal analysis, A.T. and M.K.G.; investigation, A.T.; resources, M.K.G. and D.Y.P.; data curation, A.T. and K.N.S.; writ-ing—original draft preparation, A.T.; writing—review and editing, A.T. and C.I.P.; visualization, M.S. and M.K.G.; supervision, K.N.S.; project administration, K.N.S. All authors have read and agreed to the published version of the manuscript.
Funding: This research received no external funding.
Data Availability Statement: The data presented in this study are openly available online.
Conflicts of Interest: The authors declare no conflict of interest.
References 1. Franco, M.; Haase, H. Interfirm Partnerships and Organizational Innovation: Study of SMEs in the Automotive Sector. J. Open
Innov. Technol. Mark. Complex. 2020, 6, doi:10.3390/joitmc6040193. 2. Rocco, C.M.; Hernandez-Perdomo, E.; Mun, J. Introduction to Formal Concept Analysis and Its Applications in Reliability En-
gineering. Reliab. Eng. Syst. Saf. 2020, 107002, doi:10.1016/j.ress.2020.107002. 3. Freiheit, T.; Hu, S.J. Impact of Machining Parameters on Machine Reliability and System Productivity. J. Manuf. Sci. Eng. 2002,
124, 296–304. 4. Supattananon, N.; Akararungruangkul, R. Modified Differential Evolution Algorithm for a Transportation Software Applica-
tion. J. Open Innov. Technol. Mark. Complex. 2019, 5, doi:10.3390/joitmc5040084. 5. Sooraj, S.; Vijayakumar, N.; Gaitonde, V.N.; Kotturshettar, B.B. Productivity Improvement of a Manufacturing Industry by Pro-
cess Improvement through Bottleneck and Root Cause Analysis. In AIP Conference Proceedings; AIP Publishing LLC: Melville, NY, USA, 2019; Volume 2200, p. 20053.
6. Basu, P.; Nath, A. Productivity Improvement by Root Cause Analysis in Manufacturing Industry. Int. J. Sci. Res. Dev. 2016, 4, 36–42.
7. Jirasirilerd, G.; Pitakaso, R.; Sethanan, K.; Kaewman, S.; Sirirak, W.; Kosacka-Olejnik, M. Simple Assembly Line Balancing Prob-lem Type 2 by Variable Neighborhood Strategy Adaptive Search: A Case Study Garment Industry. J. Open Innov. Technol. Mark. Complex. 2020, 6, doi:10.3390/joitmc6010021.
8. Purba, H.H.; Wijayanto, E.; Aristiara, N. Analysis of Overall Equipment Effectiveness (OEE) with Total Productive Maintenance Method on Jig Cutting: A Case Study in Manufacturing Industry. J. Sci. Eng. Res. 2018, 5, 397–406.
9. Chong, K.E.; Ng, K.C.; Goh, G.G.G. Improving Overall Equipment Effectiveness (OEE) through Integration of Maintenance Failure Mode and Effect Analysis (Maintenance-FMEA) in a Semiconductor Manufacturer: A Case Study. IEEE Int. Conf. Ind. Eng. Eng. Manag. 2016, 1427–1431, doi:10.1109/IEEM.2015.7385883.
Availability Performance Quality OEE AU TEEP0
10
20
30
40
50
60
70
80
90
100
% v
alue
Key metrics
Before After
Figure 14. Comparison of key metrics.
Author Contributions: Conceptualization, A.T., N.S.K., and M.K.G.; methodology, A.T. and M.K.G.;software, M.K.G. and M.S.; validation, M.K.G., D.Y.P., and N.S.K.; formal analysis, A.T. and M.K.G.;investigation, A.T.; resources, M.K.G. and D.Y.P.; data curation, A.T. and N.S.K.; writing—originaldraft preparation, A.T.; writing—review and editing, A.T. and C.I.P.; visualization, M.S. and M.K.G.;supervision, N.S.K.; project administration, N.S.K. All authors have read and agreed to the publishedversion of the manuscript.
Funding: This research received no external funding.
Data Availability Statement: The data presented in this study are openly available online.
Conflicts of Interest: The authors declare no conflict of interest.
References1. Franco, M.; Haase, H. Interfirm Partnerships and Organizational Innovation: Study of SMEs in the Automotive Sector. J. Open
Innov. Technol. Mark. Complex. 2020, 6, 193. [CrossRef]2. Rocco, C.M.; Hernandez-Perdomo, E.; Mun, J. Introduction to Formal Concept Analysis and Its Applications in Reliability
Engineering. Reliab. Eng. Syst. Saf. 2020, 107002. [CrossRef]3. Freiheit, T.; Hu, S.J. Impact of Machining Parameters on Machine Reliability and System Productivity. J. Manuf. Sci. Eng. 2002,
124, 296–304. [CrossRef]4. Supattananon, N.; Akararungruangkul, R. Modified Differential Evolution Algorithm for a Transportation Software Application.
J. Open Innov. Technol. Mark. Complex. 2019, 5, 84. [CrossRef]5. Sooraj, S.; Vijayakumar, N.; Gaitonde, V.N.; Kotturshettar, B.B. Productivity Improvement of a Manufacturing Industry by Process
Improvement through Bottleneck and Root Cause Analysis. In AIP Conference Proceedings; AIP Publishing LLC: Melville, NY,USA, 2019; Volume 2200, p. 20053.
6. Basu, P.; Nath, A. Productivity Improvement by Root Cause Analysis in Manufacturing Industry. Int. J. Sci. Res. Dev. 2016, 4,36–42.
7. Jirasirilerd, G.; Pitakaso, R.; Sethanan, K.; Kaewman, S.; Sirirak, W.; Kosacka-Olejnik, M. Simple Assembly Line BalancingProblem Type 2 by Variable Neighborhood Strategy Adaptive Search: A Case Study Garment Industry. J. Open Innov. Technol.Mark. Complex. 2020, 6, 21. [CrossRef]
8. Purba, H.H.; Wijayanto, E.; Aristiara, N. Analysis of Overall Equipment Effectiveness (OEE) with Total Productive MaintenanceMethod on Jig Cutting: A Case Study in Manufacturing Industry. J. Sci. Eng. Res. 2018, 5, 397–406.
9. Chong, K.E.; Ng, K.C.; Goh, G.G.G. Improving Overall Equipment Effectiveness (OEE) through Integration of MaintenanceFailure Mode and Effect Analysis (Maintenance-FMEA) in a Semiconductor Manufacturer: A Case Study. IEEE Int. Conf. Ind.Eng. Eng. Manag. 2016, 1427–1431. [CrossRef]

J. Open Innov. Technol. Mark. Complex. 2021, 7, 7 20 of 21
10. Kapuria, T.K.; Rahman, M.; Haldar, S. Root Cause Analysis and Productivity Improvement of An Apparel Industry in BangladeshThrough Kaizen Implementation. J. Appl. Res. Ind. Eng. 2017, 4, 227–239. [CrossRef]
11. Nallusamy, S. Enhancement of Productivity and Efficiency of CNC Machines in a Small Scale Industry Using Total ProductiveMaintenance. Int. J. Eng. Res. Africa 2016, 25, 119–126. [CrossRef]
12. Nallusamy, S.; Muthamizhmaran, S. Enhancement of Productivity and Overall Equipment Efficiency Using Time and MotionStudy Technique—A Review. Adv. Eng. Forum 2015, 14, 59–66. [CrossRef]
13. Low, S.-N.; Chong, S.-H.; Sim, H.-Y.; Razalli, S.; Kamaruddin, S. Measurement of Overall Performance Effectiveness in SetupImprovement. J. Ind. Eng. 2014, 2014, 264980. [CrossRef]
14. Garza-Reyes, J.A. From Measuring Overall Equipment Effectiveness (OEE) to Overall Resource Effectiveness (ORE). J. Qual.Maint. Eng. 2015, 21, 506–527. [CrossRef]
15. Hedman, R.; Subramaniyan, M.; Almström, P. Analysis of Critical Factors for Automatic Measurement of OEE. Procedia CIRP2016, 57, 128–133. [CrossRef]
16. Azizi, A. Evaluation Improvement of Production Productivity Performance Using Statistical Process Control, Overall EquipmentEfficiency, and Autonomous Maintenance. Procedia Manuf. 2015, 2, 186–190. [CrossRef]
17. Puvanasvaran, A.P.; Mei, C.Z.; Alagendran, V.A. Overall Equipment Efficiency Improvement Using Time Study in an AerospaceIndustry. Procedia Eng. 2013, 68, 271–277. [CrossRef]
18. Puvanasvaran, A.P.; Yoong, S.S.; Tay, C.C. Effect of Hidden Wastes in Overall Equipment Effectiveness Calculation. ARPN J. Eng.Appl. Sci. 2017, 12, 6443–6448.
19. Wolniak, R. Downtime in the Automotive Industry Production Process—Cause Analysis. Qual. Innov. Prosper. 2019, 23, 101–118.[CrossRef]
20. Wan, S.; Li, D.; Gao, J.; Roy, R.; He, F. A Collaborative Machine Tool Maintenance Planning System Based on Content ManagementTechnologies. Int. J. Adv. Manuf. Technol. 2018, 94, 1639–1653. [CrossRef]
21. Salonitis, K.; Kolios, A. Reliability Assessment of Cutting Tool Life Based on Surrogate Approximation Methods. Int. J. Adv.Manuf. Technol. 2014, 71, 1197–1208. [CrossRef]
22. Yun, J.J.; Kim, D.; Yan, M.-R. Open Innovation Engineering—Preliminary Study on New Entrance of Technology to Market.Electronics 2020, 9, 791. [CrossRef]
23. Yun, J.J.; Zhao, X.; Park, K.; Shi, L. Sustainability Condition of Open Innovation: Dynamic Growth of Alibaba from SME to LargeEnterprise. Sustainability 2020, 12, 4379. [CrossRef]
24. Yun, J.J.; Zhao, X.; Jung, K.; Yigitcanlar, T. The Culture for Open Innovation Dynamics. Sustainability 2020, 12, 5076. [CrossRef]25. Munir, H.; Linåker, J.; Wnuk, K.; Runeson, P.; Regnell, B. Open Innovation Using Open Source Tools: A Case Study at Sony
Mobile. Empir. Softw. Eng. 2018, 23, 186–223. [CrossRef]26. Enkel, E.; Gassmann, O.; Chesbrough, H. Open R&D and Open Innovation: Exploring the Phenomenon. R D Manag. 2009, 39,
311–316. [CrossRef]27. Sonmez, V.; Testik, M.C.; Testik, O.M. Overall Equipment Effectiveness When Production Speeds and Stoppage Durations Are
Uncertain. Int. J. Adv. Manuf. Technol. 2018, 95, 121–130. [CrossRef]28. Chikwendu, O.C.; Chima, A.S.; Edith, M.C. The Optimization of Overall Equipment Effectiveness Factors in a Pharmaceutical
Company. Heliyon 2020, 6, e03796. [CrossRef] [PubMed]29. Yazdani, A.-A.; Tavakkoli-Moghaddam, R. Integration of the Fish Bone Diagram, Brainstorming, and AHP Method for Problem
Solving and Decision Making—a Case Study. Int. J. Adv. Manuf. Technol. 2012, 63, 651–657. [CrossRef]30. Gupta, M.K.; Sood, P.K.; Singh, G.; Sharma, V.S. Sustainable Machining of Aerospace Material—Ti (Grade-2) Alloy: Modeling and
Optimization. J. Clean. Prod. 2017, 147, 614–627. [CrossRef]31. Gupta, M.K.; Sood, P. Machining Comparison of Aerospace Materials Considering Minimum Quantity Cutting Fluid: A Clean
and Green Approach. Proc. Inst. Mech. Eng. Part C J. Mech. Eng. Sci. 2017, 231, 1445–1464. [CrossRef]32. Singh, G.; Pruncu, C.I.; Gupta, M.K.; Mia, M.; Khan, A.M.; Jamil, M.; Pimenov, D.Y.; Sen, B.; Sharma, V.S. Investigations of
Machining Characteristics in the Upgraded MQL-Assisted Turning of Pure Titanium Alloys Using Evolutionary Algorithms.Materials 2019, 12, 999. [CrossRef] [PubMed]
33. Gupta, M.K.; Song, Q.; Liu, Z.; Pruncu, C.I.; Mia, M.; Singh, G.; Lozano, J.A.; Carou, D.; Khan, A.M.; Jamil, M.; et al. MachiningCharacteristics Based Life Cycle Assessment in Eco-Benign Turning of Pure Titanium Alloy. J. Clean. Prod. 2020, 251, 119598.[CrossRef]
34. Gupta, M.K.; Mia, M.; Pruncu, C.I.; Kapłonek, W.; Nadolny, K.; Patra, K.; Mikolajczyk, T.; Pimenov, D.Y.; Sarikaya, M.; Sharma,V.S. Parametric Optimization and Process Capability Analysis for Machining of Nickel-Based Superalloy. Int. J. Adv. Manuf.Technol. 2019, 102, 3995–4009. [CrossRef]
35. Sarıkaya, M.; Yılmaz, V.; Dilipak, H. Modeling and Multi-Response Optimization of Milling Characteristics Based on Taguchi andGray Relational Analysis. Proc. Inst. Mech. Eng. Part B J. Eng. Manuf. 2016, 230, 1049–1065. [CrossRef]
36. Gupta, M.K.; Mia, M.; Jamil, M.; Singh, R.; Singla, A.K.; Song, Q.; Liu, Z.; Khan, A.M.; Rahman, M.A.; Sarikaya, M. MachinabilityInvestigations of Hardened Steel with Biodegradable Oil-Based MQL Spray System. Int. J. Adv. Manuf. Technol. 2020, 108, 735–748.[CrossRef]
37. Gupta, M.K.; Mia, M.; Singh, G.R.; Pimenov, D.Y.; Sarikaya, M.; Sharma, V.S. Hybrid Cooling-Lubrication Strategies to ImproveSurface Topography and Tool Wear in Sustainable Turning of Al 7075-T6 Alloy. Int. J. Adv. Manuf. Technol. 2019. [CrossRef]

J. Open Innov. Technol. Mark. Complex. 2021, 7, 7 21 of 21
38. Grzesik, W. Chapter Fourteen-Machining Economics and Optimization. In Advanced Machining Processes of Metallic Materials,2nd ed.; Elsevier: Amsterdam, The Netherlands, 2017; pp. 265–283.
39. Khan, A.M.; Jamil, M.; Mia, M.; He, N.; Zhao, W.; Gong, L. Sustainability-Based Performance Evaluation of Hybrid NanofluidAssisted Machining: Sustainability Assessment of Hybrid Nanofluid Assisted Machining. J. Clean. Prod. 2020, 257, 120541.[CrossRef]
40. Khan, A.M.; Gupta, M.K.; Hegab, H.; Jamil, M.; Mia, M.; He, N.; Song, Q.; Liu, Z.; Pruncu, C.I. Energy-Based Cost IntegratedModelling and Sustainability Assessment of Al-GnP Hybrid Nanofluid Assisted Turning of AISI52100 Steel. J. Clean. Prod. 2020,257, 120502. [CrossRef]
41. Yıldırım, Ç.V.; Kıvak, T.; Sarıkaya, M.; Erzincanlı, F. Determination of MQL Parameters Contributing to Sustainable Machining inthe Milling of Nickel-Base Superalloy Waspaloy. Arab. J. Sci. Eng. 2017, 42, 4667–4681. [CrossRef]
42. Sarikaya, M.; Güllü, A. Taguchi Design and Response Surface Methodology Based Analysis of Machining Parameters in CNCTurning under MQL. J. Clean. Prod. 2014, 65, 604–616. [CrossRef]
43. Sarıkaya, M.; Güllü, A. Multi-Response Optimization of Minimum Quantity Lubrication Parameters Using Taguchi-Based GreyRelational Analysis in Turning of Difficult-to-Cut Alloy Haynes 25. J. Clean. Prod. 2015, 91, 347–357. [CrossRef]