Cost-effectiveness and affordability of community mobilisation through women’s groups and quality...
15
RESEARCH Open Access Cost-effectiveness and affordability of community mobilisation through women’ s groups and quality improvement in health facilities (MaiKhanda trial) in Malawi Tim Colbourn 1* , Anni-Maria Pulkki-Brännström 1,5 , Bejoy Nambiar 1 , Sungwook Kim 1 , Austin Bondo 2 , Lumbani Banda 2 , Charles Makwenda 2 , Neha Batura 1 , Hassan Haghparast-Bidgoli 1 , Rachael Hunter 3 , Anthony Costello 1 , Gianluca Baio 4 and Jolene Skordis-Worrall 1 Abstract Background: Understanding the cost-effectiveness and affordability of interventions to reduce maternal and newborn deaths is critical to persuading policymakers and donors to implement at scale. The effectiveness of community mobilisation through women’s groups and health facility quality improvement, both aiming to reduce maternal and neonatal mortality, was assessed by a cluster randomised controlled trial conducted in rural Malawi in 2008–2010. In this paper, we calculate intervention cost-effectiveness and model the affordability of the interventions at scale. Methods: Bayesian methods are used to estimate the incremental cost-effectiveness of the community and facility interventions on their own (CI, FI), and together (FICI), compared to current practice in rural Malawi. Effects are estimated with Monte Carlo simulation using the combined full probability distributions of intervention effects on stillbirths, neonatal deaths and maternal deaths. Cost data was collected prospectively from a provider perspective using an ingredients approach and disaggregated at the intervention (not cluster or individual) level. Expected Incremental Benefit, Cost-effectiveness Acceptability Curves and Expected Value of Information (EVI) were calculated using a threshold of $780 per disability-adjusted life-year (DALY) averted, the per capita gross domestic product of Malawi in 2013 international $. Results: The incremental cost-effectiveness of CI, FI, and combined FICI was $79, $281, and $146 per DALY averted respectively, compared to current practice. FI is dominated by CI and FICI. Taking into account uncertainty, both CI and combined FICI are highly likely to be cost effective (probability 98% and 93%, EVI $210,423 and $598,177 respectively). Combined FICI is incrementally cost effective compared to either intervention individually (probability 60%, ICER $292, EIB $9,334,580 compared to CI). Future scenarios also found FICI to be the optimal decision. Scaling-up to the whole of Malawi, CI is of greatest value for money, potentially averting 13.0% of remaining annual DALYs from stillbirths, neonatal and maternal deaths for the equivalent of 6.8% of current annual expenditure on maternal and neonatal health in Malawi. Conclusions: Community mobilisation through women’ s groups is a highly cost-effective and affordable strategy to reduce maternal and neonatal mortality in Malawi. Combining community mobilisation with health facility quality improvement is more effective, more costly, but also highly cost-effective and potentially affordable in this context. Keywords: Cost-effectiveness, Affordability, Community mobilisation, Women’ s groups, Quality improvement, MaiKhanda, Scale-up, Future scenarios, Malawi * Correspondence: [email protected] 1 UCL Institute for Global Health, 30 Guilford Street, London WC1N 1EH, UK Full list of author information is available at the end of the article © 2015 Colbourn et al.; licensee BioMed Central. This is an Open Access article distributed under the terms of the Creative Commons Attribution License (http://creativecommons.org/licenses/by/4.0), which permits unrestricted use, distribution, and reproduction in any medium, provided the original work is properly credited. The Creative Commons Public Domain Dedication waiver (http://creativecommons.org/publicdomain/zero/1.0/) applies to the data made available in this article, unless otherwise stated. Colbourn et al. Cost Effectiveness and Resource Allocation (2015) 13:1 DOI 10.1186/s12962-014-0028-2
-
Upload
independent -
Category
Documents
-
view
1 -
download
0
Transcript of Cost-effectiveness and affordability of community mobilisation through women’s groups and quality...
Colbourn et al. Cost Effectiveness and Resource Allocation (2015) 13:1 DOI 10.1186/s12962-014-0028-2
RESEARCH Open Access
Cost-effectiveness and affordability of communitymobilisation through women’s groups and qualityimprovement in health facilities (MaiKhanda trial)in MalawiTim Colbourn1*, Anni-Maria Pulkki-Brännström1,5, Bejoy Nambiar1, Sungwook Kim1, Austin Bondo2,Lumbani Banda2, Charles Makwenda2, Neha Batura1, Hassan Haghparast-Bidgoli1, Rachael Hunter3,Anthony Costello1, Gianluca Baio4 and Jolene Skordis-Worrall1
Abstract
Background: Understanding the cost-effectiveness and affordability of interventions to reduce maternal andnewborn deaths is critical to persuading policymakers and donors to implement at scale. The effectiveness ofcommunity mobilisation through women’s groups and health facility quality improvement, both aiming toreduce maternal and neonatal mortality, was assessed by a cluster randomised controlled trial conductedin rural Malawi in 2008–2010. In this paper, we calculate intervention cost-effectiveness and model theaffordability of the interventions at scale.
Methods: Bayesian methods are used to estimate the incremental cost-effectiveness of the community andfacility interventions on their own (CI, FI), and together (FICI), compared to current practice in rural Malawi.Effects are estimated with Monte Carlo simulation using the combined full probability distributions of interventioneffects on stillbirths, neonatal deaths and maternal deaths. Cost data was collected prospectively from a providerperspective using an ingredients approach and disaggregated at the intervention (not cluster or individual) level.Expected Incremental Benefit, Cost-effectiveness Acceptability Curves and Expected Value of Information (EVI) werecalculated using a threshold of $780 per disability-adjusted life-year (DALY) averted, the per capita gross domesticproduct of Malawi in 2013 international $.
Results: The incremental cost-effectiveness of CI, FI, and combined FICI was $79, $281, and $146 per DALY avertedrespectively, compared to current practice. FI is dominated by CI and FICI. Taking into account uncertainty, both CI andcombined FICI are highly likely to be cost effective (probability 98% and 93%, EVI $210,423 and $598,177 respectively).Combined FICI is incrementally cost effective compared to either intervention individually (probability 60%, ICER $292,EIB $9,334,580 compared to CI). Future scenarios also found FICI to be the optimal decision. Scaling-up to the whole ofMalawi, CI is of greatest value for money, potentially averting 13.0% of remaining annual DALYs from stillbirths, neonataland maternal deaths for the equivalent of 6.8% of current annual expenditure on maternal and neonatal health inMalawi.
Conclusions: Community mobilisation through women’s groups is a highly cost-effective and affordable strategy toreduce maternal and neonatal mortality in Malawi. Combining community mobilisation with health facility qualityimprovement is more effective, more costly, but also highly cost-effective and potentially affordable in this context.
Keywords: Cost-effectiveness, Affordability, Community mobilisation, Women’s groups, Quality improvement, MaiKhanda,Scale-up, Future scenarios, Malawi
* Correspondence: [email protected] Institute for Global Health, 30 Guilford Street, London WC1N 1EH, UKFull list of author information is available at the end of the article
© 2015 Colbourn et al.; licensee BioMed CentrCommons Attribution License (http://creativecreproduction in any medium, provided the orDedication waiver (http://creativecommons.orunless otherwise stated.
al. This is an Open Access article distributed under the terms of the Creativeommons.org/licenses/by/4.0), which permits unrestricted use, distribution, andiginal work is properly credited. The Creative Commons Public Domaing/publicdomain/zero/1.0/) applies to the data made available in this article,
Colbourn et al. Cost Effectiveness and Resource Allocation (2015) 13:1 Page 2 of 15
BackgroundMaternal [1], perinatal and neonatal mortality in Malawiremain high [2]. Community and health facility-basedinterventions are needed to reduce these deaths [3] inMalawi and other high-burden countries in order toachieve millennium development goals four and five [4].The MaiKhanda cluster randomised controlled trial(cRCT) in Malawi showed that combining communitymobilisation through women’s groups (CI) and healthfacility-based quality improvement (FI) reduced neonatalmortality by 22% (95% CI: −40%, +1%; p = 0.057) [5].The community intervention on its own reduced peri-natal mortality by 16% (95% CI: −28%, −3%; p = 0.020);no significant effects of FI on its own were observed onneonatal, perinatal or maternal mortality or of CI andFICI combined on maternal mortality [5]. Given re-source constraints in Malawi and other low-income set-tings where these interventions might be appropriate,policymakers need to know their cost-effectiveness andaffordability relative to available alternative interven-tions. In this article we determine the cost-effectivenessand affordability of the community and facility-basedinterventions, both on their own (CI, FI), and incombination (FICI), as implemented by MaiKhanda inthree central region districts of Malawi between 2007and 2010.We used a similar approach to costing as in other,
similar trials with women’s groups as one of the inter-ventions [6-9]. In evaluating the benefits, we focus onthe primary outcomes of the interventions [10], extend-ing the analysis reported in the trial paper [5] by takinginto account all of the cRCT-measured effects on still-births, neonatal deaths and maternal deaths, irrespectiveof statistical significance. We determine the probabilitythat each intervention is cost-effective at a range ofWillingness-to-pay (WTP) threshold values ($ per DALYaverted), including the per capita gross domestic product(GDP) of Malawi, and calculate the Expected Value ofPerfect Information [11] to determine whether reducinguncertainty in the cRCT effect parameters is worthwhile.We complement our cost-effectiveness analysis withanalyses of affordability [12] in relation to the number ofpotential beneficiaries in Malawi and available govern-ment and donor budgets for the interventions.
MethodsIn any cost-effectiveness analysis it is important to considerthe alternatives being compared, perspective, time-horizonand discounting, component parts of the measures of thecosts and effects of the intervention, and how all of thesecould vary [10]. Each of these is detailed below, along withdetails of how uncertainty surrounding measures wasassessed. This section finishes with details of the mathem-atical and statistical analyses undertaken and outcome
measures reported. Our reporting conforms to theCHEERS statement [13].
Study settingMalawi is a low-income, predominantly rural country inthe rift valley of south-eastern Africa. It had an esti-mated population of 16.4 million people in 2013 [14].Gross Domestic Product (GDP) per capita was estimatedat $779.8 in purchasing-power-parity adjusted inter-national dollars for 2013 [14]. Female literacy was esti-mated at 67.6% in 2010 [2] and female life expectancy atbirth at 54.8 in 2012 [14]. The MaiKhanda trial waslocated in three central region districts of Malawi:Lilongwe, Kasungu and Salima, and involved the ran-domisation of health facility catchment populations(clusters) to either, both or none of the interventions, ina two-by-two factorial design [5,15].
Alternatives comparedEach intervention is described in detail elsewhere [5,15].Briefly, the community mobilisation intervention (CI)involves participatory women’s groups mobilising com-munities around maternal and neonatal health, usingvolunteer facilitators supported by programme staff. Thegroups follow an ‘action cycle’ , adapted from previousstudies [16-19], to identify and prioritise maternal andneonatal health problems, decide upon locally appropri-ate solutions, advocate for, implement and evaluatethe solutions. 729 groups were set up, facilitated by 81volunteers (who received bicycles, monthly bicyclemaintenance allowances and supervision from 9 salariedMaiKhanda staff ). Each group met monthly for anaverage of 16 times and strategies adopted includedbicycle ambulances, vegetable gardens, health education,village savings and loans, and bednets.The health facility quality improvement intervention
(FI) involves ‘breakthrough series collaboratives’ [20]. Aquality improvement team was set up in each healthcentre in order to share quality improvement ideaswithin and across facilities and implement them withintheir facilities in action periods. The intervention in-cluded training staff in quality improvement techniques,implementing change packages [21] focused on obstetricand newborn care, conducting death reviews [22], lead-ership training and specific additional protocol-based insitu clinical trainings. No new staff were recruited andno additional financial resources were provided to thefacilities as part of the intervention evaluated in the trial.The interventions were implemented in addition to
current Government of Malawi Ministry of Health(MoH) practice in maternal and neonatal health. The in-cremental cost-effectiveness of the CI, FI and FICI inter-ventions, were therefore calculated relative to ‘current
Colbourn et al. Cost Effectiveness and Resource Allocation (2015) 13:1 Page 3 of 15
practice’ , which was assumed to be equal in interventionand control areas.
PerspectiveCost effectiveness is calculated from the provider per-spective. In any future scale-up of the interventionthroughout Malawi, this will likely be the MoH. Giventhat the MoH relies significantly on donor funding, wehave taken account of potential future trajectories fordonor funding in our assessment of the affordability ofthe interventions.
CostsWomen’s groups are a community intervention forwhich resource use can only be meaningfully identifiedat the community level. Therefore economic costingguidelines, which have been developed for individual-level variation in resource use, need to be adapted [6]. Inour case, both interventions were implemented for eachintervention arm as a whole, not cluster-by-cluster,meaning that it was not possible to identify cluster-levelvariation in resource use.The main source of economic cost data were the financial
accounts of MaiKhanda, the Malawian non-governmentalorganisation (NGO) implementing the interventions. Costswere also incurred by overseas implementing partners: theUS-based Institute for Healthcare Improvement (IHI) andthe UK-based Women and Children First (WCF). Keyinformant interviews and project documents were used toassist in the conversion of accounting costs to economiccosts. We were unable to cost health worker’s time, there-fore our costing of the FI is not a full economic-costing.For reasons stated in the discussion we believe it still re-flects the replicable costs of implementation. Researchcosts, which were collected via a separate accounting sys-tem and therefore easily separable, are excluded for thepurposes of this analysis. Project accounts were used toidentify staff, material and capital costs directly associatedwith setting up and implementing the CI and FI interven-tions. We also identified joint (programme) costs, whichcould not be directly allocated to either intervention or tothe other trial activities (stakeholder engagement, monitor-ing and evaluation, process evaluation, and research). Aproportion of joint costs each year was allocated to the CIand FI interventions using joint cost allocation rules, whichwere arrived at through discussion with key informants [6].Capital costs were annualized over the expected lifespan as-suming constant linear depreciation.Costs were converted to 2013 values using the Malawi
consumer price index and to international dollars usingthe implied 2013 purchasing-power parity conversionfactor for GDP (1 INT$ = 105.8 Malawi Kwacha) [14].Costs incurred in Pounds Sterling (GBP; £) and United
States Dollars (USD, $) were also converted into 2013international dollars.Not all external staff costs were available from ac-
counting systems. Key informants were interviewed toestimate the costs of external experts using either theirannual salary when applicable, or using the daily rate(averaged over the study period) of each named expertinvolved with the trial, the number of stays, and dur-ation of each visit. External costs estimated in this wayamounted to 607 days and are reported separately dueto the different degree of accuracy compared to staffcosts for which programme accounts data was available.As intervention costs could not be disaggregated by
trial cluster or arm, the cost of the combined FICI armhad to be estimated from the costs of the FI and CI in-terventions, both implemented across two arms. We as-sumed conservatively no economies of scope, in thesense that the cost of FI in the FI only arm was equal tothe cost of FI in the combined FICI arm; and similarlyfor CI. In practice, when FICI costs are doubled to per-tain to the same size population as FI and CI (Table 1),this is equivalent to assuming that the cost of the com-bined intervention is the sum of the two. In the trialanalysis this is likely to be an accurate reflection of real-ity, because the CI and FI teams worked across trialarms. Our implementation design did not allow us toinvestigate possible cost savings that may arise fromcomplementarity when implementing both interventionsoutside a trial setting.
EffectsThe benefits of the interventions were assessed over theduration of the trial period: 1st October 2008 to 31stDecember 2010. The effects of the CI, FI and FICI inter-ventions on maternal, neonatal and perinatal mortalityhave been previously reported as odds ratios (OR) [5].The trial did not collect data on individual-level covari-ates except mortality. In this paper we use cluster-leveltotals of births, stillbirths, neonatal deaths and maternaldeaths, along with cluster-level covariates (district andurban/rural cluster stratification and intervention desig-nation of the clusters (CI, FI, FICI, control) to determineoverall effects on stillbirths and neonatal deaths com-bined (baby mortality), and maternal deaths (mothermortality) [5]. These were modelled in separate logisticregression equations and combined to give an overallmeasure of effect.Due to the two-by-two factorial nature of the trial
[5], we first modelled the effects of two-arm CI vs.two-arm ‘no CI’ and two-arm FI vs. two-arm ‘no FI’ ,and then modelled the effects of one-arm FICI vs.one-arm control. The results of each model weresaved in order to compare CI, FI and FICI in one cost-effectiveness analysis.
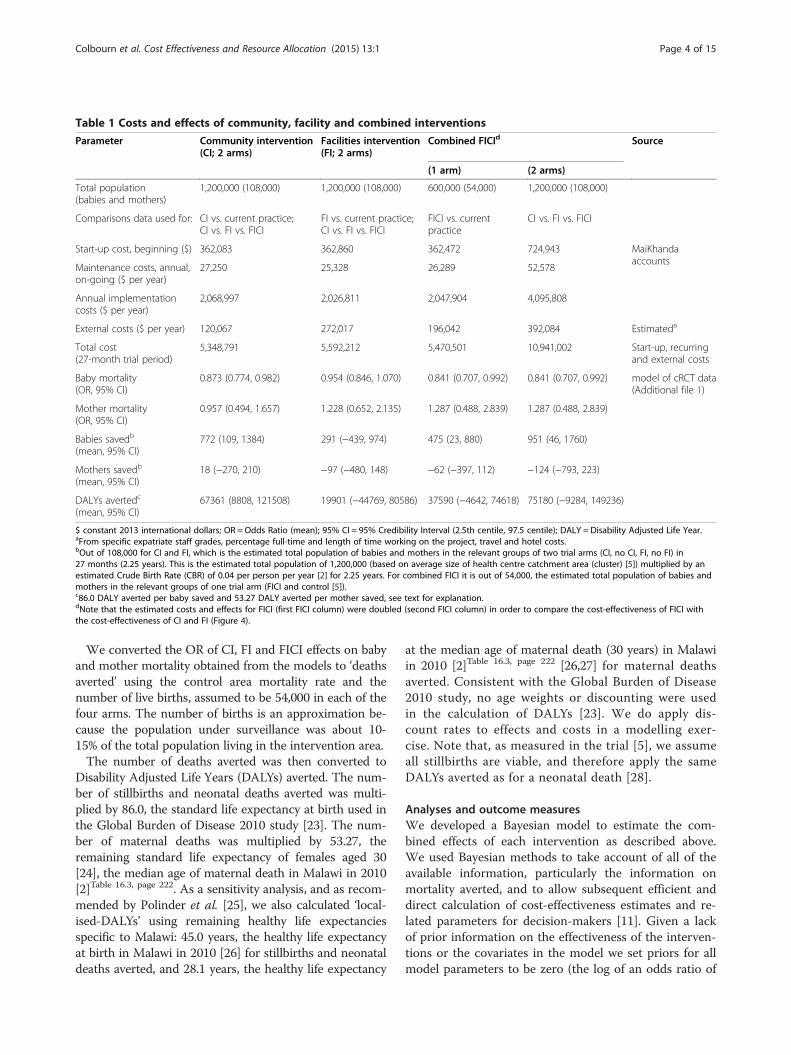
Table 1 Costs and effects of community, facility and combined interventions
Parameter Community intervention(CI; 2 arms)
Facilities intervention(FI; 2 arms)
Combined FICId Source
(1 arm) (2 arms)
Total population(babies and mothers)
1,200,000 (108,000) 1,200,000 (108,000) 600,000 (54,000) 1,200,000 (108,000)
Comparisons data used for: CI vs. current practice;CI vs. FI vs. FICI
FI vs. current practice;CI vs. FI vs. FICI
FICI vs. currentpractice
CI vs. FI vs. FICI
Start-up cost, beginning ($) 362,083 362,860 362,472 724,943 MaiKhandaaccounts
Maintenance costs, annual,on-going ($ per year)
27,250 25,328 26,289 52,578
Annual implementationcosts ($ per year)
2,068,997 2,026,811 2,047,904 4,095,808
External costs ($ per year) 120,067 272,017 196,042 392,084 Estimateda
Total cost(27-month trial period)
5,348,791 5,592,212 5,470,501 10,941,002 Start-up, recurringand external costs
Baby mortality(OR, 95% CI)
0.873 (0.774, 0.982) 0.954 (0.846, 1.070) 0.841 (0.707, 0.992) 0.841 (0.707, 0.992) model of cRCT data(Additional file 1)
Mother mortality(OR, 95% CI)
0.957 (0.494, 1.657) 1.228 (0.652, 2.135) 1.287 (0.488, 2.839) 1.287 (0.488, 2.839)
Babies savedb
(mean, 95% CI)772 (109, 1384) 291 (−439, 974) 475 (23, 880) 951 (46, 1760)
Mothers savedb
(mean, 95% CI)18 (−270, 210) −97 (−480, 148) −62 (−397, 112) −124 (−793, 223)
DALYs avertedc
(mean, 95% CI)67361 (8808, 121508) 19901 (−44769, 80586) 37590 (−4642, 74618) 75180 (−9284, 149236)
$ constant 2013 international dollars; OR = Odds Ratio (mean); 95% CI = 95% Credibility Interval (2.5th centile, 97.5 centile); DALY = Disability Adjusted Life Year.aFrom specific expatriate staff grades, percentage full-time and length of time working on the project, travel and hotel costs.bOut of 108,000 for CI and FI, which is the estimated total population of babies and mothers in the relevant groups of two trial arms (CI, no CI, FI, no FI) in27 months (2.25 years). This is the estimated total population of 1,200,000 (based on average size of health centre catchment area (cluster) [5]) multiplied by anestimated Crude Birth Rate (CBR) of 0.04 per person per year [2] for 2.25 years. For combined FICI it is out of 54,000, the estimated total population of babies andmothers in the relevant groups of one trial arm (FICI and control [5]).c86.0 DALY averted per baby saved and 53.27 DALY averted per mother saved, see text for explanation.dNote that the estimated costs and effects for FICI (first FICI column) were doubled (second FICI column) in order to compare the cost-effectiveness of FICI withthe cost-effectiveness of CI and FI (Figure 4).
Colbourn et al. Cost Effectiveness and Resource Allocation (2015) 13:1 Page 4 of 15
We converted the OR of CI, FI and FICI effects on babyand mother mortality obtained from the models to ‘deathsaverted’ using the control area mortality rate and thenumber of live births, assumed to be 54,000 in each of thefour arms. The number of births is an approximation be-cause the population under surveillance was about 10-15% of the total population living in the intervention area.The number of deaths averted was then converted to
Disability Adjusted Life Years (DALYs) averted. The num-ber of stillbirths and neonatal deaths averted was multi-plied by 86.0, the standard life expectancy at birth used inthe Global Burden of Disease 2010 study [23]. The num-ber of maternal deaths was multiplied by 53.27, theremaining standard life expectancy of females aged 30[24], the median age of maternal death in Malawi in 2010[2]Table 16.3, page 222. As a sensitivity analysis, and as recom-mended by Polinder et al. [25], we also calculated ‘local-ised-DALYs’ using remaining healthy life expectanciesspecific to Malawi: 45.0 years, the healthy life expectancyat birth in Malawi in 2010 [26] for stillbirths and neonataldeaths averted, and 28.1 years, the healthy life expectancy
at the median age of maternal death (30 years) in Malawiin 2010 [2]Table 16.3, page 222 [26,27] for maternal deathsaverted. Consistent with the Global Burden of Disease2010 study, no age weights or discounting were usedin the calculation of DALYs [23]. We do apply dis-count rates to effects and costs in a modelling exer-cise. Note that, as measured in the trial [5], we assumeall stillbirths are viable, and therefore apply the sameDALYs averted as for a neonatal death [28].
Analyses and outcome measuresWe developed a Bayesian model to estimate the com-bined effects of each intervention as described above.We used Bayesian methods to take account of all of theavailable information, particularly the information onmortality averted, and to allow subsequent efficient anddirect calculation of cost-effectiveness estimates and re-lated parameters for decision-makers [11]. Given a lackof prior information on the effectiveness of the interven-tions or the covariates in the model we set priors for allmodel parameters to be zero (the log of an odds ratio of
Colbourn et al. Cost Effectiveness and Resource Allocation (2015) 13:1 Page 5 of 15
1, which denotes the null hypothesis of no effect), withlarge uncertainty (variance of 10000 on the log scale).Equivalent parameters for the baby and mother mortal-ity equations were modelled as multivariate normal dis-tributions to improve the efficiency of estimation [11].We modelled the effects with JAGS [29] in R [30]. For
each model, 100,000 simulations were saved from twochains of 510,000 simulations, with a burn-in of 10,000that were discarded and thinning of only every 10thsimulation being saved to reduce autocorrelation [11].The R package BCEA (Bayesian Cost Effectiveness Ana-lysis) [31] was used with the estimate of total interven-tion costs to produce the following four key aspects ofthe results [11]. Additional file 1 contains the statisticalmodels, R code including all details related to priors andinitial values, and cluster-level data, used and should en-able replication of our results.
1. Incremental cost-effectiveness ratios (ICERs) weredetermined for CI, FI and FICI interventions, usingthe following formula:
ICERð$ per DALYÞ ¼ C1−C0E1−E0
¼ C1E1
ð1Þ
where C1 is the cost of the intervention in 2013 inter-national dollars ($), E1 the effect of the intervention inDALY averted, and C0 and E0 respectively the costs andeffects of the base case ‘current practice’ , both zerobecause the ‘current practice’ costs and effects in the inter-vention and control areas are assumed to be equal and totherefore cancel each other out. For each comparison, the100,000 simulations of E1 against the fixed C1 were plottedon the cost-effectiveness plane and the ICER calculated.E1 in equation (1) represents the mean effects of the inter-vention from all 100,000 simulations. In a final three-waycomparison of CI, FI and FICI, ICER of FICI (C1, E1) andFI (C1, E1) were each calculated relative to CI (C0, E0).
2. Expected Incremental Benefit (EIB) is the monetaryvalue of the net benefit of the intervention and wasdetermined by multiplying the number of DALYsaverted by the cost-effectiveness threshold (k) – themaximum cost per DALY averted that the providermight be willing to pay – and subtracting the differ-ence in costs:
EIB $Þ ¼ k E1−E0ð Þ− C1−C0ð Þ ¼ kE1−C1ð ð2Þ
3. Cost-effectiveness Acceptability Curves (CEAC)were calculated to show the probability that eachintervention is cost-effective in comparison to
current practice or each other, given the data(following our use of the Bayesian framework) andspecified alternative k. Following others [11,12,32]chapters 4 and 5, probabilities of cost-effectiveness werecalculated by determining the proportion of thesimulations in which the reference intervention wasmore cost-effective than the comparator at a given$-per-DALY threshold, repeating at a range ofthreshold $-per-DALY values relevant to currentand potential government health spending inMalawi, and plotting the results.
4. Expected Value of Information (EVI) was calculatedto quantify the monetary ($) value of reducinguncertainty in the model parameters throughadditional research. It is calculated by comparing theEIB of the current decision with the probable EIBgiven additional information on the modelparameters. EVI can be compared with the EIB(both at specified values of k) to determine ifspending additional money on research to reduceparameter uncertainty might be worthwhile.
Trial-based cost-effectivenessFirstly, we report ICER, EIB, CEAC and EVI using thetrial data. We assume the costs to be point estimates forthe whole intervention prospectively collected duringstart-up and implementation (56 months) and the effectsas distributions, estimated from the cRCT during the27-month intervention period, as detailed above, and nodiscounting of costs or effects.
Scale-up modelling exercise: Time-horizon anddiscountingSecondly, we assess affordability and undertake a model-ling exercise of cost-effectiveness and affordability basedon future scenarios with differing available budgets, dis-count rates, and time-horizons. Costs were collectedover a period of 4.6 years from May 2006 to December2010. Activities in the two years before the start of thetrial period in October 2008, included hiring and train-ing research and implementation staff, developing andpiloting the interventions, and introducing the interven-tions into village communities through the traditionalleadership hierarchy. All costs incurred in 2006 wereclassified as start-up costs. When scaling up the inter-vention many of the activities conducted during thisperiod, such as intervention design, would not be repli-cated. As such, only those start-up activities relevant tothe intervention implementation, such as the purchaseof vehicles and equipment and the hiring and training ofstaff to run the intervention, are included in the scale-upmodel. In 2007 50% of costs were classified as start-upbecause intervention implementation and the trial base-line period began in July 2007. Between July 2007 and

Colbourn et al. Cost Effectiveness and Resource Allocation (2015) 13:1 Page 6 of 15
December 2010 recruitment and training costs were clas-sified as maintenance costs, with all other intervention-associated costs classified as implementation costs. Theeconomic costs for all start up, maintenance and imple-mentation activities required to replicate the interventionat scale, have been included in this model.As recommended by the WHO, we go on to model
cost-effectiveness over a 10-year time horizon [33].Start-up costs from 2006 and 2007 are included in yearone costs of the model. Maintenance costs for activitiessuch as the regular recruitment and (re)training thatwould be required throughout an intervention, wereannualised and included for each of years one to ten.Implementation costs for the 2007–2010 implementa-tion period were annualised by dividing their total by thelength of the trial period – the period when the effectswere measured (2.25 years), and included for each ofyears one to ten. The trial period length was used toalign costs with effects. Effects were also annualised byassuming the same effect per year as estimated over the2.25 years of the trial period. Annualisation of costs andeffects enables us to model cost-effectiveness over timehorizons different to the observed trial period. We thenapplied the 3% annual discount rate recommended bythe WHO [33], to the total costs for years two to ten. Insensitivity analysis, the time horizon was varied from 5to 20 years, to reflect short-term and longer-termdecision-making time frames, and to explicitly modelthe effect of intervention duration on the spread of setupand capital expenditure (among other fixed costs). Thediscount rate on costs was varied between 0% and 10%to reflect a plausible range of scenarios. Future effects(health benefits) were discounted at 2% and varied from0% to 3% in different sensitivity analyses. It is likely thatthe discount rate for health benefits would be lower thanthe discount rate for costs [34,35], especially if the ($ perDALY) cost-effectiveness threshold increases in future,in-line with expected per-capita GDP growth [36]. Con-sistent with best practise and the Gates Reference Case[37], we also include the 3% discount rate for effects toshow results of scenarios with equal discount rates.
AffordabilityGiven the fixed costs of the interventions (no uncer-tainty in the costs due to no individual- or cluster-levelcosts being available) the affordability of the interven-tions in a hypothetical scale-up to the whole of Malawiwas estimated deterministically. This was done using thefollowing estimates of the available budget for maternaland neonatal health (MNH) in Malawi. In 2010, annualper capita expenditure on health in Malawi was $228.7in constant 2013 international dollars, and the totalpopulation was 15,013,694 [14]. The percentage of totalhealth expenditure spent on maternal and neonatal
health was estimated to be 11.95% in 2010 [38]. Multi-plying these figures yields an estimate of $410,354,347for the total expenditure on MNH in Malawi in 2010.This estimate frames the available budget for affordabil-ity calculations.To estimate the cost of scaling-up each intervention to
the whole of Malawi we multiplied the annualised costby a ratio of the total population of mothers and babies(estimated from the total population and the crude birthrate) to the population of mothers and babies covered inthe trial, for that intervention. We then present afford-ability as a percentage of total annual MNH expenditure.2010 was used for these analyses due to data availability,especially for estimation of DALYs averted from currentpractice interventions. We used the latter to comparepercentage expenditure with expected percentages ofremaining DALYs averted by the interventions inscale-up scenarios across Malawi (Additional file 2,and discussion).
ResultsTable 1 summarises the costs and effects for each of thethree interventions. The community intervention cost atotal of $5,348,791 of which $362,083 were start-upcosts, $2,068,997 annual implementation costs, $27,250annual maintenance costs and $120,067 were annual ex-ternal (overseas) staff costs. The facility intervention hadsimilar start-up costs, higher external costs, but slightlylower annual implementation costs, resulting in slightlyhigher total costs for the trial period, of $5,592,212.The mean newborn deaths (DALYs) averted by the
community, facility and combined interventions wererespectively estimated as 772 (66,409), 291 (25,048) and951 (81,772). The mean effect of CI on maternal mortal-ity was 18 deaths averted, while the mean effect of FIand combined FICI was negative (97 and 124 extramaternal deaths respectively), though the 95% credibleintervals were very wide. The combined effect was67,361, 19,901 and 75,180 DALYs averted, with only the2.5th centile of the posterior distribution of the effect ofthe community intervention being above zero, denotinga significant effect with 95% credibility. Additional file 1contains full results for all model parameters and modeldiagnostic statistics.Figure 1 plots the ICER, EIB, CEAC and EVI results of
the community intervention compared to current prac-tice. Figure 1a shows the results of each of the 100,000saved Monte Carlo simulations on the cost-effectivenessplane (note the constant costs but uncertain effects) andshows the ICER of the community intervention in com-parison to current practice to be $79 per DALY averted.Figure 1b shows a linear increase in EIB as WTPincreases above the break-even point of the ICER. At aWTP of $780 per DALY (approximately the WHO-
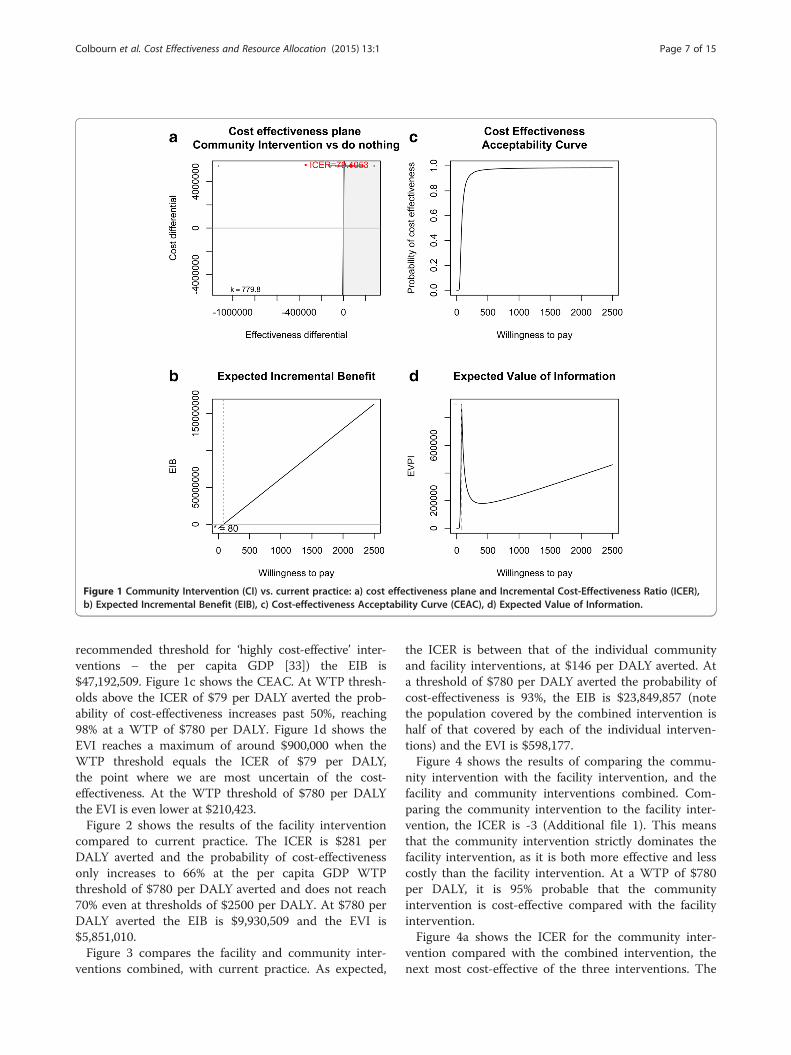
Figure 1 Community Intervention (CI) vs. current practice: a) cost effectiveness plane and Incremental Cost-Effectiveness Ratio (ICER),b) Expected Incremental Benefit (EIB), c) Cost-effectiveness Acceptability Curve (CEAC), d) Expected Value of Information.
Colbourn et al. Cost Effectiveness and Resource Allocation (2015) 13:1 Page 7 of 15
recommended threshold for ‘highly cost-effective’ inter-ventions – the per capita GDP [33]) the EIB is$47,192,509. Figure 1c shows the CEAC. At WTP thresh-olds above the ICER of $79 per DALY averted the prob-ability of cost-effectiveness increases past 50%, reaching98% at a WTP of $780 per DALY. Figure 1d shows theEVI reaches a maximum of around $900,000 when theWTP threshold equals the ICER of $79 per DALY,the point where we are most uncertain of the cost-effectiveness. At the WTP threshold of $780 per DALYthe EVI is even lower at $210,423.Figure 2 shows the results of the facility intervention
compared to current practice. The ICER is $281 perDALY averted and the probability of cost-effectivenessonly increases to 66% at the per capita GDP WTPthreshold of $780 per DALY averted and does not reach70% even at thresholds of $2500 per DALY. At $780 perDALY averted the EIB is $9,930,509 and the EVI is$5,851,010.Figure 3 compares the facility and community inter-
ventions combined, with current practice. As expected,
the ICER is between that of the individual communityand facility interventions, at $146 per DALY averted. Ata threshold of $780 per DALY averted the probability ofcost-effectiveness is 93%, the EIB is $23,849,857 (notethe population covered by the combined intervention ishalf of that covered by each of the individual interven-tions) and the EVI is $598,177.Figure 4 shows the results of comparing the commu-
nity intervention with the facility intervention, and thefacility and community interventions combined. Com-paring the community intervention to the facility inter-vention, the ICER is -3 (Additional file 1). This meansthat the community intervention strictly dominates thefacility intervention, as it is both more effective and lesscostly than the facility intervention. At a WTP of $780per DALY, it is 95% probable that the communityintervention is cost-effective compared with the facilityintervention.Figure 4a shows the ICER for the community inter-
vention compared with the combined intervention, thenext most cost-effective of the three interventions. The
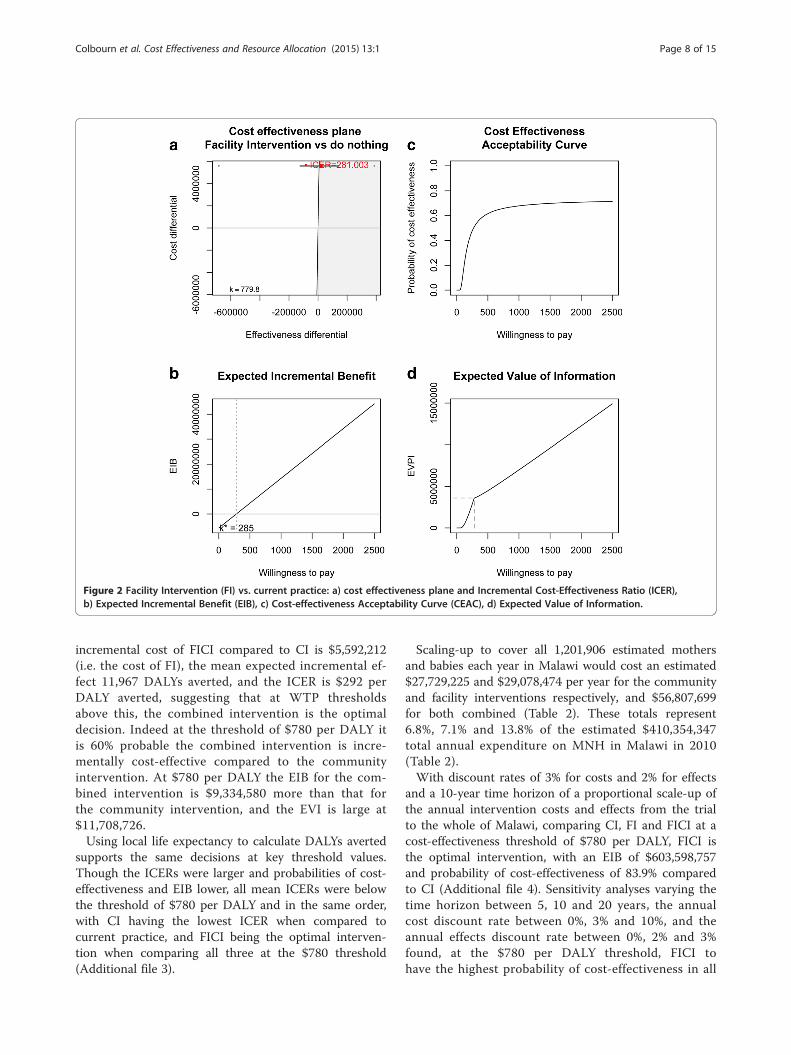
Figure 2 Facility Intervention (FI) vs. current practice: a) cost effectiveness plane and Incremental Cost-Effectiveness Ratio (ICER),b) Expected Incremental Benefit (EIB), c) Cost-effectiveness Acceptability Curve (CEAC), d) Expected Value of Information.
Colbourn et al. Cost Effectiveness and Resource Allocation (2015) 13:1 Page 8 of 15
incremental cost of FICI compared to CI is $5,592,212(i.e. the cost of FI), the mean expected incremental ef-fect 11,967 DALYs averted, and the ICER is $292 perDALY averted, suggesting that at WTP thresholdsabove this, the combined intervention is the optimaldecision. Indeed at the threshold of $780 per DALY itis 60% probable the combined intervention is incre-mentally cost-effective compared to the communityintervention. At $780 per DALY the EIB for the com-bined intervention is $9,334,580 more than that forthe community intervention, and the EVI is large at$11,708,726.Using local life expectancy to calculate DALYs averted
supports the same decisions at key threshold values.Though the ICERs were larger and probabilities of cost-effectiveness and EIB lower, all mean ICERs were belowthe threshold of $780 per DALY and in the same order,with CI having the lowest ICER when compared tocurrent practice, and FICI being the optimal interven-tion when comparing all three at the $780 threshold(Additional file 3).
Scaling-up to cover all 1,201,906 estimated mothersand babies each year in Malawi would cost an estimated$27,729,225 and $29,078,474 per year for the communityand facility interventions respectively, and $56,807,699for both combined (Table 2). These totals represent6.8%, 7.1% and 13.8% of the estimated $410,354,347total annual expenditure on MNH in Malawi in 2010(Table 2).With discount rates of 3% for costs and 2% for effects
and a 10-year time horizon of a proportional scale-up ofthe annual intervention costs and effects from the trialto the whole of Malawi, comparing CI, FI and FICI at acost-effectiveness threshold of $780 per DALY, FICI isthe optimal intervention, with an EIB of $603,598,757and probability of cost-effectiveness of 83.9% comparedto CI (Additional file 4). Sensitivity analyses varying thetime horizon between 5, 10 and 20 years, the annualcost discount rate between 0%, 3% and 10%, and theannual effects discount rate between 0%, 2% and 3%found, at the $780 per DALY threshold, FICI tohave the highest probability of cost-effectiveness in all
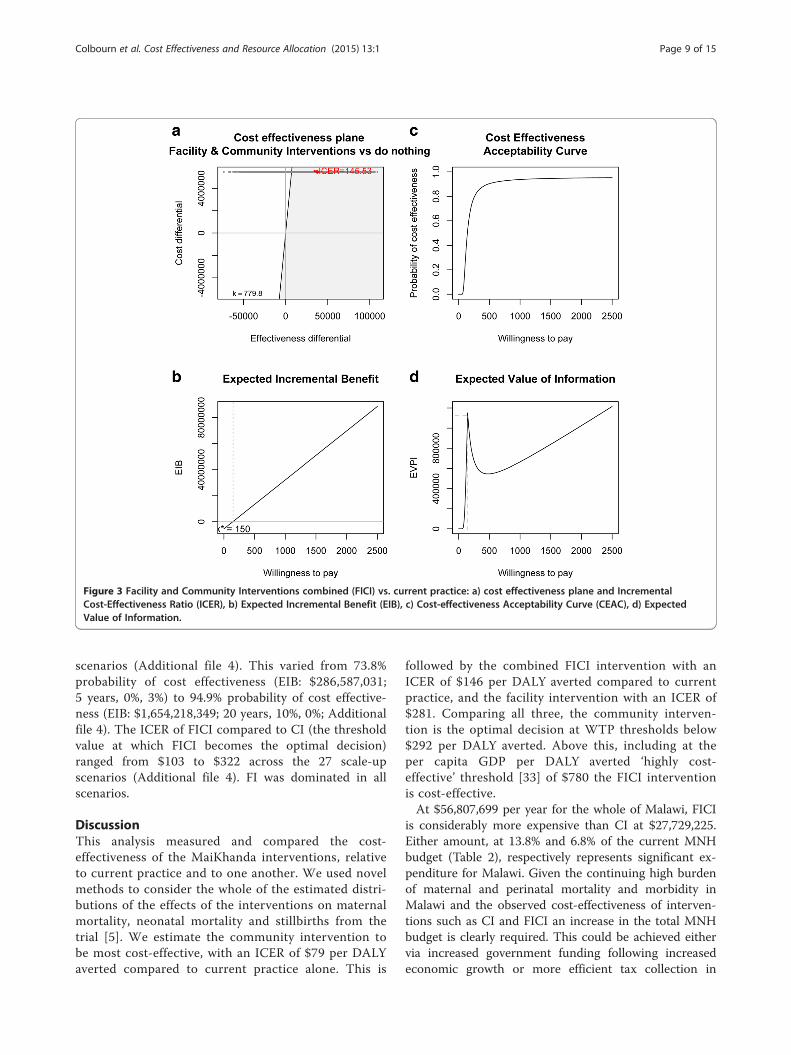
Figure 3 Facility and Community Interventions combined (FICI) vs. current practice: a) cost effectiveness plane and IncrementalCost-Effectiveness Ratio (ICER), b) Expected Incremental Benefit (EIB), c) Cost-effectiveness Acceptability Curve (CEAC), d) ExpectedValue of Information.
Colbourn et al. Cost Effectiveness and Resource Allocation (2015) 13:1 Page 9 of 15
scenarios (Additional file 4). This varied from 73.8%probability of cost effectiveness (EIB: $286,587,031;5 years, 0%, 3%) to 94.9% probability of cost effective-ness (EIB: $1,654,218,349; 20 years, 10%, 0%; Additionalfile 4). The ICER of FICI compared to CI (the thresholdvalue at which FICI becomes the optimal decision)ranged from $103 to $322 across the 27 scale-upscenarios (Additional file 4). FI was dominated in allscenarios.
DiscussionThis analysis measured and compared the cost-effectiveness of the MaiKhanda interventions, relativeto current practice and to one another. We used novelmethods to consider the whole of the estimated distri-butions of the effects of the interventions on maternalmortality, neonatal mortality and stillbirths from thetrial [5]. We estimate the community intervention tobe most cost-effective, with an ICER of $79 per DALYaverted compared to current practice alone. This is
followed by the combined FICI intervention with anICER of $146 per DALY averted compared to currentpractice, and the facility intervention with an ICER of$281. Comparing all three, the community interven-tion is the optimal decision at WTP thresholds below$292 per DALY averted. Above this, including at theper capita GDP per DALY averted ‘highly cost-effective’ threshold [33] of $780 the FICI interventionis cost-effective.At $56,807,699 per year for the whole of Malawi, FICI
is considerably more expensive than CI at $27,729,225.Either amount, at 13.8% and 6.8% of the current MNHbudget (Table 2), respectively represents significant ex-penditure for Malawi. Given the continuing high burdenof maternal and perinatal mortality and morbidity inMalawi and the observed cost-effectiveness of interven-tions such as CI and FICI an increase in the total MNHbudget is clearly required. This could be achieved eithervia increased government funding following increasedeconomic growth or more efficient tax collection in
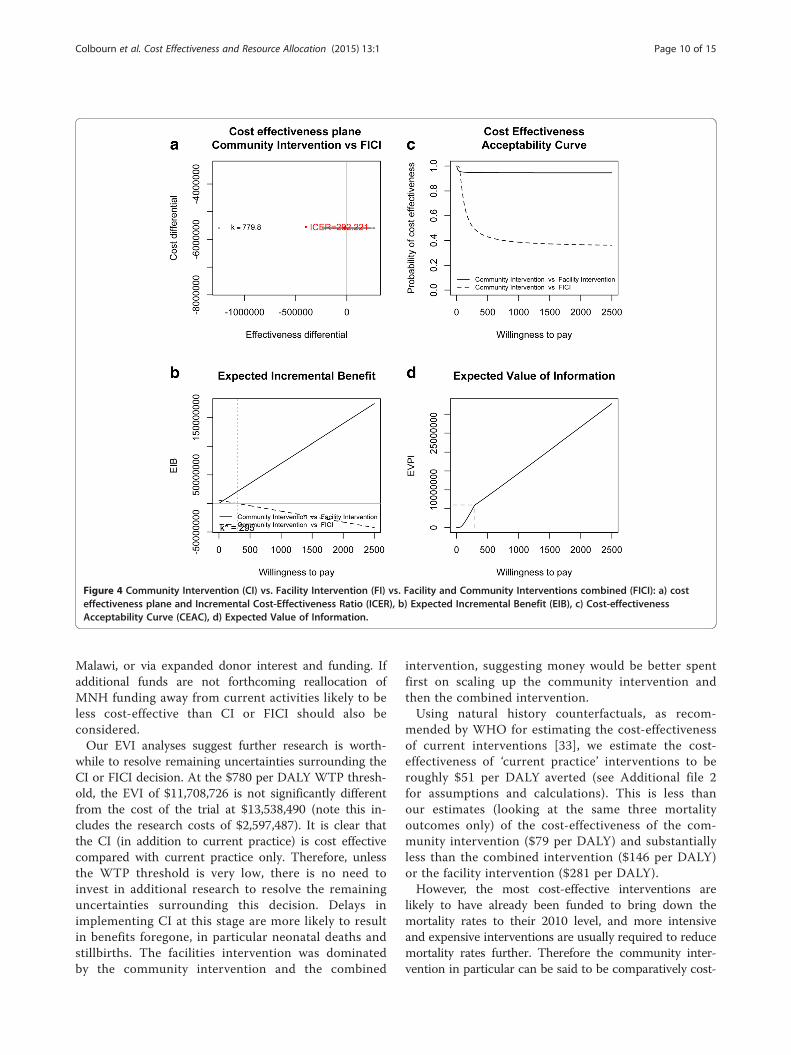
Figure 4 Community Intervention (CI) vs. Facility Intervention (FI) vs. Facility and Community Interventions combined (FICI): a) costeffectiveness plane and Incremental Cost-Effectiveness Ratio (ICER), b) Expected Incremental Benefit (EIB), c) Cost-effectivenessAcceptability Curve (CEAC), d) Expected Value of Information.
Colbourn et al. Cost Effectiveness and Resource Allocation (2015) 13:1 Page 10 of 15
Malawi, or via expanded donor interest and funding. Ifadditional funds are not forthcoming reallocation ofMNH funding away from current activities likely to beless cost-effective than CI or FICI should also beconsidered.Our EVI analyses suggest further research is worth-
while to resolve remaining uncertainties surrounding theCI or FICI decision. At the $780 per DALY WTP thresh-old, the EVI of $11,708,726 is not significantly differentfrom the cost of the trial at $13,538,490 (note this in-cludes the research costs of $2,597,487). It is clear thatthe CI (in addition to current practice) is cost effectivecompared with current practice only. Therefore, unlessthe WTP threshold is very low, there is no need toinvest in additional research to resolve the remaininguncertainties surrounding this decision. Delays inimplementing CI at this stage are more likely to resultin benefits foregone, in particular neonatal deaths andstillbirths. The facilities intervention was dominatedby the community intervention and the combined
intervention, suggesting money would be better spentfirst on scaling up the community intervention andthen the combined intervention.Using natural history counterfactuals, as recom-
mended by WHO for estimating the cost-effectivenessof current interventions [33], we estimate the cost-effectiveness of ‘current practice’ interventions to beroughly $51 per DALY averted (see Additional file 2for assumptions and calculations). This is less thanour estimates (looking at the same three mortalityoutcomes only) of the cost-effectiveness of the com-munity intervention ($79 per DALY) and substantiallyless than the combined intervention ($146 per DALY)or the facility intervention ($281 per DALY).However, the most cost-effective interventions are
likely to have already been funded to bring down themortality rates to their 2010 level, and more intensiveand expensive interventions are usually required to reducemortality rates further. Therefore the community inter-vention in particular can be said to be comparatively cost-
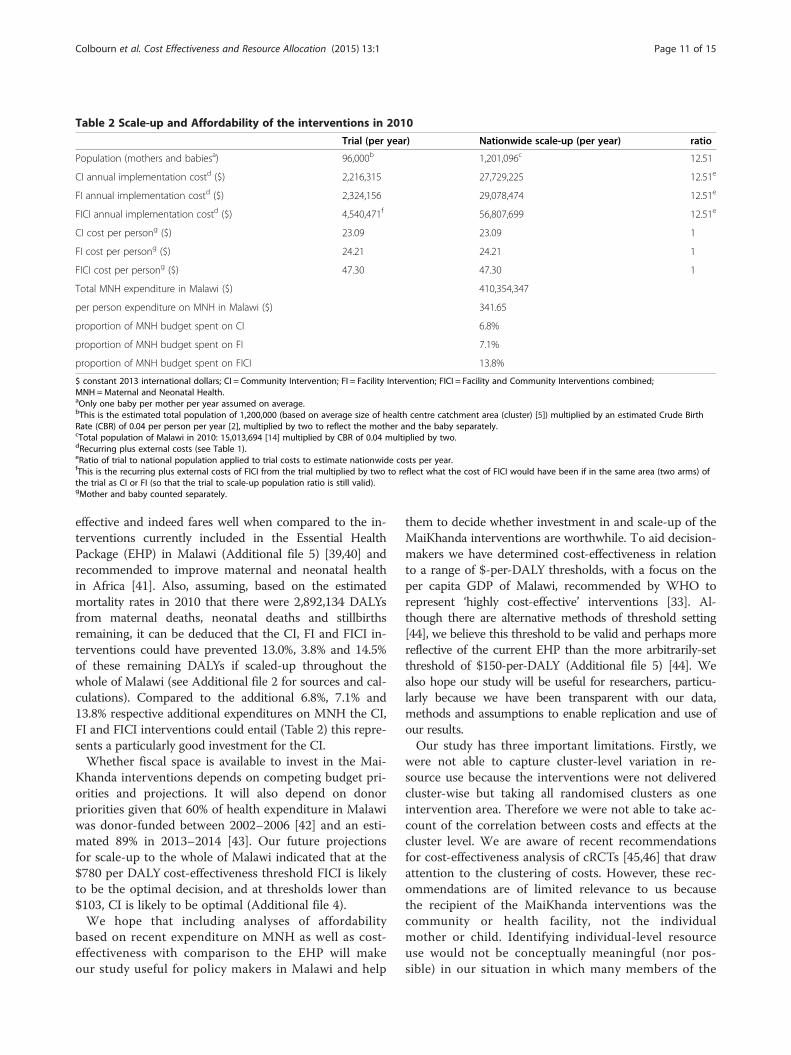
Table 2 Scale-up and Affordability of the interventions in 2010
Trial (per year) Nationwide scale-up (per year) ratio
Population (mothers and babiesa) 96,000b 1,201,096c 12.51
CI annual implementation costd ($) 2,216,315 27,729,225 12.51e
FI annual implementation costd ($) 2,324,156 29,078,474 12.51e
FICI annual implementation costd ($) 4,540,471f 56,807,699 12.51e
CI cost per persong ($) 23.09 23.09 1
FI cost per persong ($) 24.21 24.21 1
FICI cost per persong ($) 47.30 47.30 1
Total MNH expenditure in Malawi ($) 410,354,347
per person expenditure on MNH in Malawi ($) 341.65
proportion of MNH budget spent on CI 6.8%
proportion of MNH budget spent on FI 7.1%
proportion of MNH budget spent on FICI 13.8%
$ constant 2013 international dollars; CI = Community Intervention; FI = Facility Intervention; FICI = Facility and Community Interventions combined;MNH =Maternal and Neonatal Health.aOnly one baby per mother per year assumed on average.bThis is the estimated total population of 1,200,000 (based on average size of health centre catchment area (cluster) [5]) multiplied by an estimated Crude BirthRate (CBR) of 0.04 per person per year [2], multiplied by two to reflect the mother and the baby separately.cTotal population of Malawi in 2010: 15,013,694 [14] multiplied by CBR of 0.04 multiplied by two.dRecurring plus external costs (see Table 1).eRatio of trial to national population applied to trial costs to estimate nationwide costs per year.fThis is the recurring plus external costs of FICI from the trial multiplied by two to reflect what the cost of FICI would have been if in the same area (two arms) ofthe trial as CI or FI (so that the trial to scale-up population ratio is still valid).gMother and baby counted separately.
Colbourn et al. Cost Effectiveness and Resource Allocation (2015) 13:1 Page 11 of 15
effective and indeed fares well when compared to the in-terventions currently included in the Essential HealthPackage (EHP) in Malawi (Additional file 5) [39,40] andrecommended to improve maternal and neonatal healthin Africa [41]. Also, assuming, based on the estimatedmortality rates in 2010 that there were 2,892,134 DALYsfrom maternal deaths, neonatal deaths and stillbirthsremaining, it can be deduced that the CI, FI and FICI in-terventions could have prevented 13.0%, 3.8% and 14.5%of these remaining DALYs if scaled-up throughout thewhole of Malawi (see Additional file 2 for sources and cal-culations). Compared to the additional 6.8%, 7.1% and13.8% respective additional expenditures on MNH the CI,FI and FICI interventions could entail (Table 2) this repre-sents a particularly good investment for the CI.Whether fiscal space is available to invest in the Mai-
Khanda interventions depends on competing budget pri-orities and projections. It will also depend on donorpriorities given that 60% of health expenditure in Malawiwas donor-funded between 2002–2006 [42] and an esti-mated 89% in 2013–2014 [43]. Our future projectionsfor scale-up to the whole of Malawi indicated that at the$780 per DALY cost-effectiveness threshold FICI is likelyto be the optimal decision, and at thresholds lower than$103, CI is likely to be optimal (Additional file 4).We hope that including analyses of affordability
based on recent expenditure on MNH as well as cost-effectiveness with comparison to the EHP will makeour study useful for policy makers in Malawi and help
them to decide whether investment in and scale-up of theMaiKhanda interventions are worthwhile. To aid decision-makers we have determined cost-effectiveness in relationto a range of $-per-DALY thresholds, with a focus on theper capita GDP of Malawi, recommended by WHO torepresent ‘highly cost-effective’ interventions [33]. Al-though there are alternative methods of threshold setting[44], we believe this threshold to be valid and perhaps morereflective of the current EHP than the more arbitrarily-setthreshold of $150-per-DALY (Additional file 5) [44]. Wealso hope our study will be useful for researchers, particu-larly because we have been transparent with our data,methods and assumptions to enable replication and use ofour results.Our study has three important limitations. Firstly, we
were not able to capture cluster-level variation in re-source use because the interventions were not deliveredcluster-wise but taking all randomised clusters as oneintervention area. Therefore we were not able to take ac-count of the correlation between costs and effects at thecluster level. We are aware of recent recommendationsfor cost-effectiveness analysis of cRCTs [45,46] that drawattention to the clustering of costs. However, these rec-ommendations are of limited relevance to us becausethe recipient of the MaiKhanda interventions was thecommunity or health facility, not the individualmother or child. Identifying individual-level resourceuse would not be conceptually meaningful (nor pos-sible) in our situation in which many members of the
Colbourn et al. Cost Effectiveness and Resource Allocation (2015) 13:1 Page 12 of 15
study population never participated in a women’sgroup nor had contact with a health facility.Secondly, our cost analysis adopted a limited interven-
tion provider perspective. We did not include relatedhealth sector costs, such as the costs of increased care-seeking that may result from a combined ‘pull’ of thesupply side intervention (FI) and ‘push’ of the demandside intervention (CI). However, the trial found no sig-nificant differences in utilisation of health services forchildbirth across arms [5] supplementary figure; data on ante-natal or postnatal care was not collected. Providingcover for staff attending the Quality Improvement (QI)workshops was not considered. Given chronic staffshortages in Malawi [47] it is very unlikely that absentstaff would be covered. Importantly, the effect on mor-tality of staff brought in to cover absent staff would alsoremain unknown. Neither did we include potential costsavings that may arise in particular in the FI interventionas a result of a reduction in staff attrition. It is possiblethat the time health workers spent on the quality im-provement activities of FI whilst at work in their healthfacilities could be spent on other, more effective, activ-ities. This is an area for further research and we are notaware of any existing economic evaluations of similarinterventions with time use data that explored this ques-tion. Donations and volunteer inputs were also not in-cluded. However, these were minimal, such as limiteddrug and equipment donations to a few facilities. Thecommunity intervention relied on volunteer women’sgroup facilitators as an integral part of the interventionand defining characteristic of the MaiKhanda trial. Givencosts were prospectively collected, the only major sourceof uncertainty in our cost estimates was the allocation ofjoint costs to each intervention. Based on the agreementof the donor and the partner organisations implement-ing each intervention, we chose an equal allocation ofjoint costs for FI and CI based on the equal – propor-tional to implementing staff number – allocation of of-fice space and equal use of administrative staff and jointprogramme resources. Joint costs were 46% of CI and53% of FI costs, therefore introducing, say, +/− 5 per-centage points uncertainty in the allocation rule wouldresult in the total cost estimates for each interventionvarying by +/−2.3% and +/−2.7% respectively. Assumingsymmetrical uncertainty and that each interventionwould have an equal (proportional to need) joint costallocation as per the implementing programme part-ner’s agreement, the ICERs for each intervention –which as a ratio of the expected value of two uncertainparameters have no uncertainty themselves - wouldremain unchanged.Thirdly, our analysis is likely to present an underesti-
mate of the full effects of the interventions. In particular,estimating the effects on maternal and neonatal
morbidity was beyond the scope of this study. More-over, the community intervention could empowerwomen and other members of the community, andimprove a variety of areas of quality of life includingthose related to physical and psychological health,social relationships and the environment [48]. The fa-cility intervention could improve staff morale, motiv-ation and empowerment and reduce staff attrition.Both interventions could also improve links betweencommunities and health facilities. Measurement of allof these potential benefits were also beyond the scopeof the current study due to its resource constraints,although small sample sub-studies on many of thesemeasures were undertaken [15,48].We also made a number of assumptions within our
analyses. The international travel and salary costs of theexternal technical experts that contributed to the com-munity and facility interventions have been included asrecurring costs throughout the modelled time horizons.From the perspective of the MoH these costs may bedetermined less necessary if local experts could be usedinstead at lower cost. However, as per the trial, localexperts may not be available, and even if available theymight steer the interventions in a different direction,which could result in different effects as well as lowercosts. We have also assumed that the costs and effectsof each of the interventions increase proportionallywith any scale-up of the interventions. Further researchis needed on how the costs (and effects) of theinterventions may change at scale. For the costs,economies-of-scale are possible via a number ofmechanisms including decreases in unit prices whenincreased quantities of equipment and materials arepurchased, and cost-sharing resulting from the MoHor other NGOs sharing activities in any scale-up.However, given that the interventions are mainly reli-ant on human resources (55% and 49% of the commu-nity and facility intervention costs, respectively), sucheconomies-of-scale may not be significant. How theprocess of scaling-up affects staff deployment shouldnevertheless be investigated. Variations in prices byregion of the country may also be important whenestimating scale-up costs. Health effects may not beindependent of scale, especially if the populationcoverage and density of the interventions is not keptat the same level as the cRCT in the scale-up [9].Complex interventions such as the MaiKhanda com-munity and facility interventions are also unlikely tobe replicated in exactly the same way. Although pro-cesses and function should be standardised to someextent, exact content will depend on local context[15,49], meaning costs and effects of any scale-up arelikely to be different to the trial-based estimates wehave used.
Colbourn et al. Cost Effectiveness and Resource Allocation (2015) 13:1 Page 13 of 15
As with any cost-effectiveness results our resultsshould be considered along with other health systemgoals such as equity and acceptability to stakeholders[50]. Information on equity of distribution and accept-ability of the interventions to different stakeholders re-mains unavailable, although an on-going study [51] isinvestigating the equity of the distribution of the effectsof the women’s group intervention [52] in Malawi.Future research to refine our assumptions and addresssome of the limitations of our study would be worth-while. A cost-effectiveness analysis of all women’s grouptrials and potential scale-up as reported in Prost et al.[9] is in progress.
ConclusionsCommunity mobilisation through women’s groups is, ac-cording to these analyses, both cost-effective and afford-able, compares well with current interventions in Malawiand could avert a large proportion of DALYs caused bystillbirths, neonatal and maternal deaths considering theproportion of the budget it would require. When com-bined with facility quality improvement it is highly cost-effective and affordable, and at a per capita GDP thresholdthe combined intervention warrants scale-up throughoutMalawi. Additional research could reduce the remaininguncertainty surrounding this decision and assist decision-makers in similar settings that could also benefit fromthese interventions.
Additional files
Additional file 1: Models, cluster-level mortality data, R source codeand output.
Additional file 2: Calculation of MNH DALYs averted in Malawi in 2010with ‘current practice’ interventions, cost-effectiveness of ‘currentpractice’ interventions, and proportion of total remaining DALYs theMaiKhanda interventions could avert. [1,2,14,23,24,38,53-56].
Additional file 3: Comparison of results with standard and local lifeexpectancies. The number of deaths averted (the effects of theinterventions) were converted to Disability Adjusted Life Years (DALYs)averted. As the base-case, ‘standard’ life expectancy was used to calculateDALYs. The number of stillbirths and neonatal deaths averted wasmultiplied by 86.0, the standard life expectancy at birth used in theGlobal Burden of Disease 2010 study [23]. The number of maternal deathswas multiplied by 53.27, the remaining standard life expectancy offemales aged 30 [24], the median age of maternal death in Malawi in2010 [2]Table 16.3, page 222. As a sensitivity analysis, and as recommendedby Polinder et al [25], we also calculated ‘DALYs’ using ‘local’ lifeexpectancy: remaining healthy life expectancies specific to Malawi:45.0 years, the healthy life expectancy at birth in Malawi in 2010 [26] forstillbirths and neonatal deaths averted, and 28.1 years, the healthy lifeexpectancy at the median age of maternal death (30 years) in Malawi in2010 [2]Table 16.3, page 222 [26,27] for maternal deaths averted. The resultsof both analyses are shown side-by-side in the table to aid comparison.
Additional file 4: Future Scale-up scenarios. Scale-up to the wholepopulation of Malawi, using the trial population to total population ratioexplained in Table 2 of the paper. Annual maintenance, implementationand external costs were used from Table 1 of the paper, and werediscounted using the costs discount rate for the scenario and added to
the scaled-up beginning start-up costs. Effects were annualised bydividing the estimates from the 27-month trial by 2.25, and discountedaccording to the effects discount rate of the scenario. Note that allmodels were run with only 20000 saved Monte Carlo simulations from 2chains of 21000 simulations with a burn-in of 1000 and thinning of 2(as compared to the 100,000 saved simulations from the main analysis), butadequate convergence of these models was achieved (Additional file 1).
Additional file 5: How the cost Effectiveness of the MaiKhandainterventions compares to the Essential Health Package currentlyused in Malawi.
Competing interestsThe authors declare that they have no competing interests.
Authors’ contributionsTC, BN, AC and JSW conceived the study. TC carried out the analyses withsupport from GB, all authors contributed to their interpretation, AB, LB andCM adding their perspectives from Malawi and involvement with theimplementation of the interventions. APB designed the costing tool withsupport from JSW and supervised SK in entering the cost data, which TCsourced. APB wrote the costing sections and provided oversight of thecosting analysis, which was conducted by TC. TC wrote the first draft of thepaper including all web appendices, and collated inputs to all subsequentdrafts. All authors reviewed and revised several iterations of the paper,contributed intellectual content and have seen and approved the finalversion of the paper.
AcknowledgementsWe acknowledge everyone involved in the MaiKhanda trial (see ackowlegementsof trial paper [5]), and, for providing the accounts data for the costing, theMaiKhanda accounts staff: Peter Salilika, Felix Kamange and the late FrancisDzinkambani who sadly passed away in 2010.The MaiKhanda trial was funded by The Health Foundation as were TC andBN during the early stages of this work until February 2011. The funders hadno role in the identification, design, conduct, or reporting of the analysis.Development of the costing tool was funded by a Wellcome Trust StrategicAward (number 085417MA/Z/08/Z).
Author details1UCL Institute for Global Health, 30 Guilford Street, London WC1N 1EH, UK.2Parent and Child Health Initiative (PACHI), Amina House, Western Wing –Second Floor, Capital City, P.O. Box 31686, Lilongwe 3, Malawi. 3ResearchDepartment of Primary Care & Population Health, UCL Priment Clinical TrialsUnit, Royal Free Campus, London NW3 2PF, UK. 4Department of StatisticalScience, University College London, 1-19 Torrington Place, London WC1E6BT, UK. 5Epidemiology and Global Health, Umeå University, 901 87 Umeå,Sweden.
Received: 22 August 2014 Accepted: 18 December 2014
References1. Colbourn T, Lewycka S, Nambiar B, Anwar I, Phoya A, Mhango C. Maternal
Mortality in Malawi, 1977–2012. BMJ Open. 2013;3:e004150.2. National Statistical Office (NSO), ICF Macro. Malawi Demographic and Health
Survey 2010. Zomba, Malawi, and Calverton, Maryland, USA: NSO and ICFMacro; 2011.
3. The Partnership for Maternal Newborn & Child Health. A Global Review ofthe Key Interventions Related to Reproductive, Maternal, Newborn andChild Health (RMNCH). Geneva, Switzerland: PMNCH; 2011.
4. WHO, UNICEF. Countdown to 2015, Maternal, Newborn and Child Survival:Building a Brighter Future for Women and Children, The 2012 Report. 2012.
5. Colbourn T, Nambiar B, Bondo A, Makwenda C, Tsetekani E, Makonda-RidleyA, et al. Effects of quality improvement in health facilities and communitymobilisation through women’s groups on maternal, neonatal and perinatalmortality in three districts of Malawi: MaiKhanda, a cluster randomisedcontrolled effectiveness trial. Int Health. 2013;5:180–95.
6. Batura N, Pulkki-Brannstrom A-M, Agrawal P, Bagra A, Haghparast-Bidgoli H,Bozzani F, et al. Collecting and analysing cost data for complex publichealth trials: reflections on practice. Global Health Action. 2014;7:23257.
Colbourn et al. Cost Effectiveness and Resource Allocation (2015) 13:1 Page 14 of 15
7. Lewycka S, Mwansambo C, Rosato M, Kazembe P, Phiri T, Mganga A, et al.Effect of women’s groups and volunteer peer counsellors on rates ofmortality, morbidity and health behaviours in mothers and children in ruralMalawi (MaiMwana): a factorial, cluster-randomised controlled trial. Lancet.2013;381:1721–35.
8. Fottrell E, Azad K, Kuddus A, Younes L, Shaha S, Nahar T, et al. The effect ofincreased coverage of participatory women’s groups on neonatal mortalityin Bangladesh: A cluster randomized trial. JAMA Pediatr. 2013;167:816–25.
9. Prost A, Colbourn T, Seward N, Azad K, Coomarasamy A, Copas A, et al.Women’s groups practising participatory learning and action to improvematernal and newborn health in resource-limited settings: systematic reviewand meta-analysis. Lancet. 2013;381:1736–46.
10. Drummond MF, Sculpher M, O’Brien B, Torrance GW. Methods for theEconomic Evaluation of Health Care Programmes. Oxford: Oxford UniversityPress; 2005.
11. Baio G. Bayesian Methods in Health Economics. Boca Raton, FL, USA:Chapman and Hall/CRC Biostatistics series; 2012.
12. Sendi PP, Briggs AH. Affordability and cost-effectiveness: decision-makingon the cost-effectiveness plane. Health Econ. 2001;10:675–80.
13. Husereau D, Drummond M, Petrou S, Carswell C, Moher D, Greenberg D,et al. Consolidated Health Economic Evaluation Reporting Standards(CHEERS) statement. Cost Effect Resource Allocation. 2013;11:6.
14. World Bank: World DataBank. World Development Indicators, Malawi(available at: http://databank.worldbank.org/data/views/reports/chart.aspx(accessed 22/07/2014).
15. Colbourn T, Nambiar B, Costello A: MaiKhanda - Final evaluation report.The impact of quality improvement at health facilities and communitymobilisation by women’s groups on birth outcomes: an effectivenessstudy in three districts of Malawi. Available at http://www.health.org.uk/publications/maikhanda/ (accessed 29/10/2013). pp. 1–364. London:The Health Foundation; 2013:1–364.
16. O’Rourke K, Howard-Grabman L, Seoane G. Impact of communityorganization of women on perinatal outcomes in rural Bolivia. Rev PanamSalud Publica. 1998;3:9–14.
17. Manandhar DS, Osrin D, Shrestha BP, Mesko N, Morrison J, TumbahangpheKM, et al. Effect of a participatory intervention with women’s groups onbirth outcomes in Nepal: cluster-randomised controlled trial. Lancet.2004;364:970–9.
18. Lewycka S, Mwansambo C, Kazembe P, Phiri T, Mganga A, Rosato M, et al. Acluster randomised controlled trial of the community effectiveness of twointerventions in rural Malawi to improve health care and to reducematernal, newborn and infant mortality. Trials. 2010;11:88.
19. Rosato M, Mwansambo C, Lewycka S, Kazembe P, Phiri T, Malamba F, et al.MaiMwana women’s groups: a community mobilisation intervention toimprove mother and child health and reduce mortality in rural Malawi.Malawi Med J. 2010;22:112–9.
20. Franco LM, Marquez L. Effectiveness of collaborative improvement: evidencefrom 27 applications in 12 less-developed and middle-income countries.BMJ Qual Saf Healthcare. 2011;20:658–65.
21. Langley GJ, Moen R, Nolan KM, Nolan TW, Norman CL, Provost LP. TheImprovement Guide: A Practical Approach to Enhancing OrganizationalPerformance. 2nd ed. San Francisco, CA, USA: Jossey Bass; 2009.
22. Kongnyuy EJ, Mlava G, van den Broek N. Facility-based maternal death reviewin three districts in the central region of Malawi an analysis of causes andcharacteristics of maternal deaths. Womens Health Issues. 2009;19:14–20.
23. Murray CJL, Ezzati M, Flaxman AD, Lim S, Lozano R, Michaud C, et al. GBD2010: design, definitions, and metrics. Lancet. 2012;380:2063–6.
24. World Health Organisation: Burden of Disease Reference Standard Life Table(bodreferencestandardlifetable.xls). Available at http://www.who.int/healthinfo/bodreferencestandardlifetable.xls (accessed 22/07/2014). Geneva:World Health Organisation; 2013.
25. Polinder S, Haagsma JA, Stein C, Havelaar AH. Systematic review of generalburden of disease studies using disability-adjusted life years. Popul HealthMetrics. 2012;10:21.
26. Salomon JA, Wang H, Freeman MK, Vos T, Flaxman AD, Lopez AD, et al.Healthy life expectancy for 187 countries, 1990–2010: a systematic analysisfor the Global Burden Disease Study 2010. Lancet. 2012;380:2144–62.
27. Global Burden of Disease 2010 Healthy Years Lost vs Life Expectancy DataVisualisation http://www.healthmetricsandevaluation.org/gbd/visualizations/gbd-2010-healthy-years-lost-vs-life-expectancy- data visualisation no longeravailable, but was (accessed 18/03/2014)
28. Simon J, Petrou S, Gray A. The valuation of prenatal life in economicevaluations of perinatal interventions. Health Econ. 2009;18:487–94.
29. Plummer M: JAGS: Just Another Gibbs Sampler. http://mcmc-jags.sourceforge.net/ (accessed 18/03/2014). 2010.
30. The R Foundation for Statistical Computing. R version 3.0.2 (2013-09-25) –“Frisbee Sailing”. Copyright (C) 2013 The R Foundation for StatisticalComputing. Platform: x86_64-apple-darwin10.8.0 (64-bit). 2013.
31. Baio G: BCEA: A package to run Bayesian Cost-Effectiveness Analysis in R.https://sites.google.com/a/statistica.it/gianluca/bcea (accessed 17/03/2014).2012.
32. Briggs AH, Claxton K, Sculpher M. Decision Modelling for Health EconomicEvaluation. Oxford: Oxford University Press; 2007.
33. World Health Organisation. Making Choices in Health: WHO Guide toCost-Effectiveness Analysis. Geneva: World Health Organisation; 2003.
34. Postma MJ, Parouty M, Westra TA. Accumulating evidence for the case ofdifferential discounting. Expert Rev Clin Pharmacol. 2013;6:1–3.
35. Nord E. Discounting future health benefits: the poverty of consistencyarguments. Health Econ. 2011;20:16–26.
36. Claxton K, Paulden M, Gravelle H, Brouwer W, Culyer AJ. Discounting anddecision making in the economic evaluation of health-care technologies.Health Econ. 2011;20:2–15.
37. Claxton KP, Revill P, Sculpher M, Wilkinson T, Cairns J, Briggs A. The GatesReference Case for Economic Evaluation. Seattle, WA, USA: The Bill andMelinda Gates Foundation; 2014.
38. Mwase T. Reproductive Health (RH) Financing and Expenditure Lanscape inMalawi using 2009–2012 National Health Accounts. PowerpointPresentation to 11th MamaYe Reproductive Health Seminar, KamuzuCollege of Nursing, Lilongwe, Malawi, 30th May 2014. Lilongwe, Malawi:Abt Associates Inc.; SSDI systms project; USAID; 2014.
39. Government of Malawi Ministry of Health. Health Sector Strategic Plan2011–2016. Moving towards equity and quality. Lilongwe: Ministry ofHealth; 2011.
40. Bowie C, Mwase T. Assessing the use of an essential health package in asector wide approach in Malawi. Health Res Policy Syst. 2011;9:4.
41. Adam T, Lim SS, Mehta S, Bhutta ZA, Fogstad H, Mathai M, et al. Achievingthe millennium development goals for health. Cost effectiveness analysis ofstrategies for maternal and neonatal health in developing countries. BMJ.2005;331:1107–12.
42. Zere E, Walker O, Kirigia J, Zawaira F, Magombo F, Kataika E. Healthfinancing in Malawi: Evidence from National Health Accounts. BMC IntHealth Hum Rights. 2010;10:27.
43. Ministry of Health [Malawi], Ministry of Finance [Malawi]. Key findings fromRound 2 of Resource Mapping. Presentation to Health Financing Summiton 2nd July 2013. Lilongwe, Malawi: Government of the Republic ofMalawi; 2013.
44. Shillcutt SD, Walker DG, Goodman CA, Mills AJ. Cost effectiveness inlow- and middle-income countries. a review of the debates surroundingdecision rules. Pharmacoeconomics. 2009;27:903–17.
45. Gomes M, Grieve R, Nixon R, Edmunds WJ. Statistical methods forcost-effectiveness analyses that use data from cluster randomized trials:a systematic review and checklist for critical appraisal. Med Decis Mak.2012;32:209–20.
46. Gomes M, Ng ES-W, Grieve R, Nixon R, Carpenter J, Thompson SG.Developing appropriate methods for cost-effectiveness analysis of clusterrandomized trials. Med Decis Mak. 2012;32:350–61.
47. Mueller DH, Lungu D, Acharya A, Palmer N, 6. Constraints to implementingthe Essential Health Package in Malawi. PLoS ONE. 2011;6:6:e20741.
48. Colbourn T. Investigating the benefits of women’s groups in Malawi:adapted quality of life measurement, best-worst scaling choice-experimentsand contingent valuation [Ph.D. thesis]. London, UK: UCL, Centre forInternational Health and Development; 2012.
49. Hawe P, Shiell A, Riley T. Complex interventions: how “out of control” can arandomised controlled trial be? BMJ. 2004;328:1561–3.
50. Hutubessy R, Chisholm D, Tan-Torres Edejaer T, Who C. Generalizedcost-effectiveness analysis for national-level priority-setting in the healthsector. Cost Effect Resource Allocation. 2003;1:8.
51. EquiNaM: EquiNaM: building evidence to support equitable improvement innewborn and maternal health (ESRC-DFID funded project: http://equinam.global-health-inequalities.info/ accessed 12th April 2014). 2011–2014.
52. Houweling TAJ, Tripathy P, Nair N, Rath S, Rath S, Gope R, et al. The equityimpact of participatory women’s groups to reduce neonatal mortality in
Colbourn et al. Cost Effectiveness and Resource Allocation (2015) 13:1 Page 15 of 15
India: secondary analysis of a cluster-randomised trial. Int J Epidemiol.2013;42:520–32.
53. Van Lerberghe W, De Brouwere V. Of blind alleys and things that haveworked: history’s lessons on reducing maternal mortality. In: De Brouwere V,Van Lerberghe W, editors. Safe motherhood strategies: a review of theevidence. Antwerp: ITG Press; 2001. Studies in Health Services Organisationand Policy, 17:7–33.
54. Oestergaard MZ, Inoue M, Yoshida S, Mahanani WR, Gore FM, Cousens S,et al. Neonatal Mortality Levels for 193 Countries in 2009 with Trends since1990: A Systematic Analysis of Progress, Projections, and Priorities. PLoSMed. 2011;8:e1001080.
55. Zimba E, Kinney M, Kachale F, Waltensperger KZ, Blencowe H, Colbourn T,et al. Newborn survival in Malawi: a decade of change and futureimplications. Health Policy Plan. 2012;27:iii88–103.
56. Cousens S, Blencowe H, Stanton C, Chou D, Ahmed S, Steinhardt L, et al.National, regional, and worldwide estimates of stillbirth rates in 2009 withtrends since 1995: a systematic analysis. Lancet. 2011;377:1319–30.
Submit your next manuscript to BioMed Centraland take full advantage of:
• Convenient online submission
• Thorough peer review
• No space constraints or color figure charges
• Immediate publication on acceptance
• Inclusion in PubMed, CAS, Scopus and Google Scholar
• Research which is freely available for redistribution
Submit your manuscript at www.biomedcentral.com/submit