
process flow improvement proposal of a batch manufacturing ...
15
Review of General Management Volume 21, Issue 1, Year 2015 63 PROCESS FLOW IMPROVEMENT PROPOSAL OF A BATCH MANUFACTURING SYSTEM USING ARENA SIMULATION MODELING Chowdury M. L. RAHMAN 1 Shafayet Ullah SABUJ 2 Abstract: Simulation is frequently the technique of choice in problem solving. Nowadays computer simulation is being employed in many manufacturing organizations to design, develop, implement, and analyze manufacturing system’s problem of interest. Using a valid simulation model gives several benefit and advantages in developing a better system and in predicting the system behavior under varying set of circumstances in order to improve the system performance. This paper is concerned with implementing a computer simulation model to a batch manufacturing system for process flow improvement. The model is an ARENA simulation model of a UPS manufacturing line in a selected UPS manufacturing industry. The simulation model has been developed using process oriented simulation software where Arena Input Analyzer has been used for input data analysis by selecting standard stochastic distributions and Microsoft Excel software package has been used for statistical analysis. This research work is based on balancing a UPS production flow line where output is not in the satisfactory level compared to input due to improper layout design and improper load distribution to workers. In this research of balancing the UPS manufacturing line through simulation modeling, it has been determined that the transformer making section, among seven other sections of manufacturing the UPS, was the main system bottleneck while other sections were running concomitantly without any considerable delay. It has also been found through analysis of the process flow line that the product flow layout which has been followed in making the transformer of UPS was not in accordance with the standard design of production layout. Simulation model has been used to identify these bottlenecks and to evaluate some of the possible alternatives to solve the problems identified. Facilities re-layout, changing the level of resources and adding extra workers have been suggested as alternative methods to improve the current system performance. Keywords: Simulation Modeling, ARENA, Layout design, Line Balancing, System Bottleneck. JEL Classification: L63 1 AssistantProfessor, Industrial andProduction Engineering Department, ShahJalal University of Scienceand Technology, Sylhet, Bangladesh, e-mail: [email protected] 2 Graduates, Industrial andProduction Engineering Dept., ShahJalal University of Scienceand Technology, Sylhet, Bangladesh
-
Upload
khangminh22 -
Category
Documents
-
view
3 -
download
0
Transcript of process flow improvement proposal of a batch manufacturing ...

Review of General Management Volume 21, Issue 1, Year 2015 63
PROCESS FLOW IMPROVEMENT PROPOSAL OF A BATCH MANUFACTURING SYSTEM USING ARENA
SIMULATION MODELING
Chowdury M. L. RAHMAN1 Shafayet Ullah SABUJ2
Abstract: Simulation is frequently the technique of choice in problem solving. Nowadays computer simulation is being employed in many manufacturing organizations to design, develop, implement, and analyze manufacturing system’s problem of interest. Using a valid simulation model gives several benefit and advantages in developing a better system and in predicting the system behavior under varying set of circumstances in order to improve the system performance. This paper is concerned with implementing a computer simulation model to a batch manufacturing system for process flow improvement. The model is an ARENA simulation model of a UPS manufacturing line in a selected UPS manufacturing industry. The simulation model has been developed using process oriented simulation software where Arena Input Analyzer has been used for input data analysis by selecting standard stochastic distributions and Microsoft Excel software package has been used for statistical analysis. This research work is based on balancing a UPS production flow line where output is not in the satisfactory level compared to input due to improper layout design and improper load distribution to workers. In this research of balancing the UPS manufacturing line through simulation modeling, it has been determined that the transformer making section, among seven other sections of manufacturing the UPS, was the main system bottleneck while other sections were running concomitantly without any considerable delay. It has also been found through analysis of the process flow line that the product flow layout which has been followed in making the transformer of UPS was not in accordance with the standard design of production layout. Simulation model has been used to identify these bottlenecks and to evaluate some of the possible alternatives to solve the problems identified. Facilities re-layout, changing the level of resources and adding extra workers have been suggested as alternative methods to improve the current system performance. Keywords: Simulation Modeling, ARENA, Layout design, Line Balancing,
System Bottleneck. JEL Classification: L63
1 AssistantProfessor, Industrial andProduction Engineering Department, ShahJalal University
of Scienceand Technology, Sylhet, Bangladesh, e-mail: [email protected] 2 Graduates, Industrial andProduction Engineering Dept., ShahJalal University of
Scienceand Technology, Sylhet, Bangladesh
64
Introduction
Manufacturing industries such as textile, furniture, re-rolling mill, paper mill, electronics parts manufacturing such as- UPS, IPS, television, battery and refrigerator production companies etc. play a major role towards building up a nation’s economy of least developed countries in today’s competitive market. As a result many engineering techniques, analytical methods, and software tools have been developed to help designing a productive manufacturing system. In such context, simulation is a key engineering tool that is widely used for the analysis and improvement of a manufacturing system.
Simulation is frequently the technique of choice in problem solving. Simulation is also being used to study systems in the design phase before such systems are built so that the problem may be identified and resolved well before implementation (Banks et al., 2000). Nowadays computer simulation is being employed in many manufacturing organizations to design, develop, implement, and analyze manufacturing system’s problem of interest. Manufacturing industry has made extensive use of simulation as a means of modeling the system and trying to model the impact of variability on system behavior and to explore various ways to cope up with the changes and uncertainty. Using a valid simulation model gives several benefit and advantages in developing a better system and in predicting the system behavior under varying set of circumstances in order to improve the system performance.
Load shedding is a nationwide problem of subcontinent countries like Bangladesh affecting the social and economic lives, industrial and service sectors and so on. There are so many products and machines depending solely on the electrical energy, where a little interruption in the electricity supply might cause a major problem. UPS (Uninterrupted Power Supply) machine is such type of electrical product that maintains uninterrupted electricity supply. There seems to be a lack of research on using queuing theory and simulation of the process flow in the UPS manufacturing system considering independent system. In this concern, this research work has been conducted with the aim of implementing a computer simulation model to a batch manufacturing system for process flow improvement. The model developed is an ARENA simulation model of a UPS manufacturing line of a leading UPS manufacturing industry of Bangladesh.

Review of General Management Volume 21, Issue 1, Year 2015 65
2. Research Objectives
The objectives of the research work are as follows: To collect and analyze data needed for building an accurate model
of a UPS manufacturing line; To develop a computer simulation model of a batch manufacturing
system using ARENA; To analyze the behavior of the existing manufacturing system
under varying set of circumstances; To identify the typical problems and their underlying causes by
using the developed model; To suggest some possible solution alternatives for few specific
problems and develop a proposed model to enhance the current system performance.
3. Research Methodology
There are several softwares to create simulation models on computer, such as: Automod (2011), Arena (2011), AweSim (2011), Extend (2011) etc. Among these, ARENA (Academic version 10) simulation tool has been used to develop the computer simulation model as it is available and flexible to use, and a powerful tool one.
3.1. Arena Overview
The ARENA modeling system from Systems Modeling Corporation is a flexible and powerful tool that allows analysts to create animated simulation models (Kelton et al., 2007). It accurately represents virtually any system with the help of animation and simulation. Arena automatically calculates the 95% confidence interval unless the user specifies otherwise. ARENA Input Analyzer can be used to obtain appropriate probability distributions for being used in the models.
ARENA Output Analyzer lets the user carry out statistical analysis on the results obtained. Finally, the Process Analyzer helps examine the selected outcomes of several different alternatives dependent on selected controls of the system. The most attractive is the animation that accompanies the model.

Volume 21, Issue 1, Year 2015 Review of General Management 66
3.2. Research Steps
The action plan of research methodology followed to complete the research work is shown in Figure no. 1.
Figure no. 1. Steps of the research study Moreover, the process flow line of the selected UPS manufacturing
system has been analyzed using the queuing theory and Arena simulation tool. The studied manufacturing system consists of seven individual sections. The flow chart of manufacturing a UPS with the existing system is shown in Figure no. 2.

Review of General Management Volume 21, Issue 1, Year 2015 67
Figure no. 2. Flow Chart of Existing UPS Manufacturing System
4. Model Development
The main part of this research work was to develop a computer simulation model to study and assess the performance of the UPS manufacturing system of interest. The specific goals of this model are to minimize the flow time, to improve the layout design and to maximize the production rate as well. The most important performance measures of interest illustrating the system's performance include the production output and the parts average queuing time.
4.1. Data Collection and Analysis Procedure
In order to generate the UPS manufacturing model, required data have been collected on various parameters, namely parts arrival, availability of resources, part processing times, size of batch etc.

Volume 21, Issue 1, Year 2015 Review of General Management 68
4.1.1. Data Collection Part arrival rates, part processing rates, number and availability of
resources etc. are essential parameters to calculate system performance measures such as average waiting time, resource utilization, and average time in system. For each part, the arrival time of parts, part’s processing start time, and processing end time from each work station using time study method have been recorded for seven working days each of seven work hours.
4.1.2. Data Analysis All collected data have been evaluated by the Arena Input Analyzer
software in order to determine distribution function. For example, evaluation of a processing time distribution has been found using the Arena input analyzer as shown in Table no. 1.
Table no. 1
Summary of Input analyzer
Distribution Summary Distribution type : Beta Expression: 35 + 49 * BETA (1.07, 2.04) Square error: 0.045131 Data summary No. of data points = 29 Min Data Value = 35 Max Data Value = 84 Sample Mean = 51.8 Sample Std Dev = 11.5 Histogram summary Histogram Range =35-84 Number of Intervals = 6
Chi Square Test No. of intervals= 4 Deg. of freedom= 1 Test Statistic =3.18 Corresponding p-value =0.0792 K-S Test Test Statistic = 0.115 Corresponding p-value > 0.15
The distribution functions for all production processes involved in each work station have been found and are given in Table no. 2.

Review of General Management Volume 21, Issue 1, Year 2015 69
Table no. 2 Distribution function and Expression
Resource name Distribution
type Expression
Paint Beta 35 + 49 * Beta(1.07, 2.04) Wiring Beta 18 + 9 * Beta(0.998, 2.44) Coiling Gamma 14 + 8 * Beta(1.09, 0.986) Tapping Weibull 3.61 + Weib(2.17, 1.96) Core Fitting Beta 50 + 16 * Beta(1.65, 1.3) Battery and transformer attaching Gamma 18 + Gamma(0.738, 2.72) CCB Lognormal 1.88 + LOGN(0.24, 0.145) PCB Lognormal 14 + LOGN (2.01, 1.39) Cover Attaching Gamma 1 + Gamma(0.126, 3.2)
4.2. Model of the Existing System
After completing the data analysis, a simulation model has been built using ARENA software. The model developed is shown in Figure no. 3.
BASE PART
W AS HI NG
Bat c h 1
PAI NTSep ar at e 1St at ion 5 Rout e 3
St at ion 6
Dis p os e 1
Ba t c h 2 HEATTI NG St at ion 7Rout e 4
St at ion 8
PRI NT
M at ch 1Bat c h 3
ATTACHI NGand BATTERY
TRANSFO RM ER
W I RI NG
St at ion 9 Rout e 5
St at ion 10
Se pa r at e 2
CO VER PART
Bat c h 5
Decide 2T r u e
F a ls e
Bat c h 6M at ch 4
CO VER LAG ANO
Se pa r at e 3
Bat c h 7
CCB BO ARD BO ARD CREATI NG
M at ch 5Bat c h 8
PCB ATTACHI NG
BO BI N CO I L TAPI NG
C O I L . W I P = = 0 & & c o r e f it t in g 1 . W I P > 4T A P I N G . W I P = = 0
E ls e
Decide 7
c or e f it t in g 1
CO RE FI TTI NG . 2
CO RE FI TTI NG 3
Hold 2
GROUND FLOOR
FIRST FLOOR
SECOND FLOOR
Sheet Metal Section Painting Section
Transformer Section PCB Making Section
Washing Section
Print SectionAssembly Section
0
0
0
0
0
0 0
0 0 0
0
0
09:00:00
0
0
0
0
0
0
0
0
0
0 0
wireing out
0
TAPPING OUT
0
0 0 0
0
0
0
12 August, 2012
Figure no. 3. Simulation Model of the existing system

Volume 21, Issue 1, Year 2015 Review of General Management 70
4.3. Output Result and Analysis
After analyzing all the data in required format and specifying the appropriate replication number of 4 and each replication length of 1260 minutes, these values have been utilized as model input and the setup has been performed. Then the simulation has been run and the output results generated have been summarized in the table no. 3.
Table no. 3
Output results of existing model Name of the process Avg. Waiting time (hour) Avg. No. of queue
Coil 2.9250 6.6161
Core Fitting.2 1.3195 0.4674
Core Fitting 1 2.5451 2.6267
Core Fitting 3 0.6213 0.3749
Taping 0.4107 0.8267
Cover Attaching 0.00771881 0.01190880
PCB Attaching 0.00067608 0.00104850
Paint 0.1095 0.5007
Heating 0.00 0.00
Server 3.5654 1.7261
Server1 4.3727 2.0779
Server 2 2.8817 1.1018
Server 3 3.6901 1.6186
Server 4 1.9035 0.8602
Server 5 4.3463 2.1427
Server 6 1.6191 0.6268
Transformer Attaching 0.04150633 0.06618943
Wiring 2.3104 5.2656
4.3.1. Problem Identification and Solution From the overall output results as found from the developed model, 3
sections of the existing UPS manufacturing line have been identified to go for improvements and these are –
i. Transformer section: long queue time, requires extra server with appropriate positioning of server.
ii. Washing plant: layout problem, over traveling and excess time consumption

Review of General Management Volume 21, Issue 1, Year 2015 71
iii. Overall floor layout: over traveling and excess transferring time consumption.
4.3.1.1 Problem Observed in Transformer Section and Possible Solution Transformer section of the plant has been identified as the main
bottleneck of this UPS manufacturing line, while other sections of manufacturing the UPS were running concomitantly without any considerable delay. The work flow in this section (transformer assembly) is shown in Figure no. 4. Here in the assembly line, coiling and tapping resource persons have been arranged in such a way that they work in parallel to the core fitting when they remain free (represented by dash lines in the figure no. 4).
Figure no.4. Transformer assembly line
This current transformer assembly line has not been producing the
desired output. To improve the performance of the existing assembly line, four possible solution alternatives have been identified and then one among them has been selected as best alternative based on less waiting time and maximum output.
Alternative 1: In alternative 1, coiling will be done by one worker, coiling main.
Coiling main is fixed here for coiling, whereas in existing situation coiling worker also helps in core fitting.

Volume 21, Issue 1, Year 2015 Review of General Management 72
In tapping section, worker is not only doing the tapping, but also helps in core fitting, when free (represented by dash line).
Another change is in the core fitting part where a resource person is added (CORE-FITING 2), who will be working in parallel to resource person ‘Core fitting’. So, there will be two resource persons working for core fitting of the assembly line at a time.
Alternative 2: In alternative 2, coiling will be done by two resource persons, ‘coiling
main’ and ‘coiling’. Meanwhile, the resource person ‘coiling’ works temporarily for core fitting according to necessity.
Tapping worker works like as before, when gets time helps core fitting operation. Core fitting is doing here with only one permanent resource ‘core fitting’. Other two are helping this resource’ they are not permanent at all.
Both of these alternatives are simulated under two conditions based on input quantity. These are –
1A and 1B: Remaining the same input quantity as existing. 2A and 2B: Changing the input quantity to determine maximum
output. A comparative scenario of output results among four solution
alternatives of transformer section is shown in Figure no. 5.
Figure no. 5. Comparison graph among solution alternatives of Transformer
section

Review of General Management Volume 21, Issue 1, Year 2015 73
4.3.1.2 Problem Observed in Washing Section and Possible Solution Layout of the existing washing bath of UPS manufacturing line is shown in Figure no. 6.
Figure no. 6. Present layout of washing section
Due to the improper position of the baths, over travelling of parts has
been occurred which in turn leads to excess consumption of time. As this over travelling is one of the significant wastes of the seven wastes of manufacturing, this ultimately leads to the lower productivity. To rectify the problem as well as to improve the performance of this section, a re-layout of washing section has been proposed. The proposed layout of the washing section is shown in Figure no. 7.
Figure no. 7. Proposed layout of washing section
Volume 21, Issue 1, Year 2015 Review of General Management 74
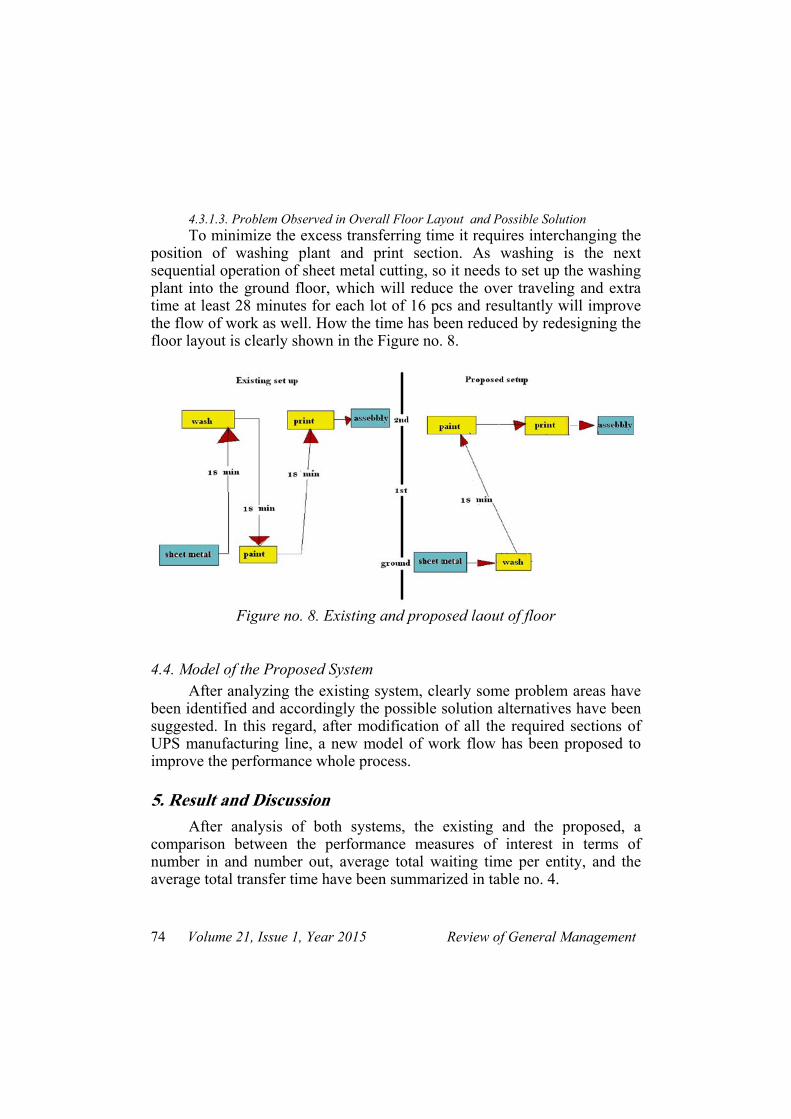
4.3.1.3. Problem Observed in Overall Floor Layout and Possible Solution To minimize the excess transferring time it requires interchanging the
position of washing plant and print section. As washing is the next sequential operation of sheet metal cutting, so it needs to set up the washing plant into the ground floor, which will reduce the over traveling and extra time at least 28 minutes for each lot of 16 pcs and resultantly will improve the flow of work as well. How the time has been reduced by redesigning the floor layout is clearly shown in the Figure no. 8.
Figure no. 8. Existing and proposed laout of floor
4.4. Model of the Proposed System After analyzing the existing system, clearly some problem areas have
been identified and accordingly the possible solution alternatives have been suggested. In this regard, after modification of all the required sections of UPS manufacturing line, a new model of work flow has been proposed to improve the performance whole process.
5. Result and Discussion
After analysis of both systems, the existing and the proposed, a comparison between the performance measures of interest in terms of number in and number out, average total waiting time per entity, and the average total transfer time have been summarized in table no. 4.
Review of General Management Volume 21, Issue 1, Year 2015 75
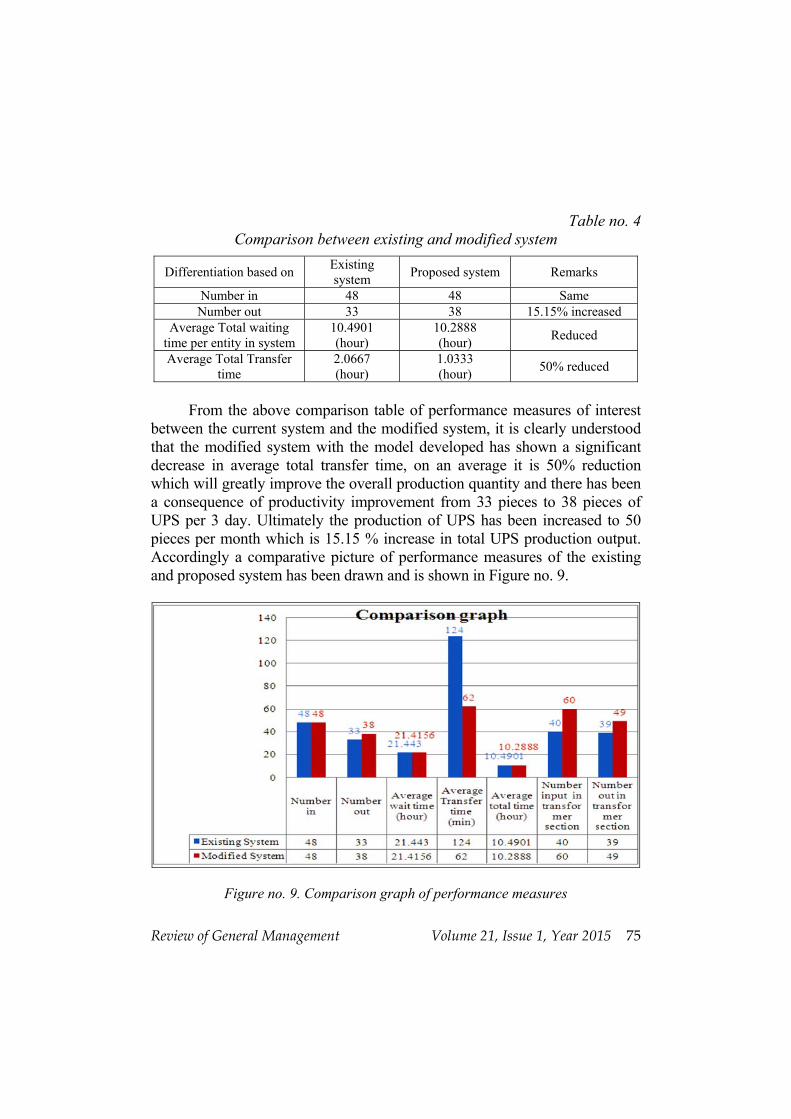
Table no. 4 Comparison between existing and modified system
Differentiation based on Existing system
Proposed system Remarks
Number in 48 48 Same Number out 33 38 15.15% increased
Average Total waiting time per entity in system
10.4901 (hour)
10.2888 (hour)
Reduced
Average Total Transfer time
2.0667 (hour)
1.0333 (hour)
50% reduced
From the above comparison table of performance measures of interest
between the current system and the modified system, it is clearly understood that the modified system with the model developed has shown a significant decrease in average total transfer time, on an average it is 50% reduction which will greatly improve the overall production quantity and there has been a consequence of productivity improvement from 33 pieces to 38 pieces of UPS per 3 day. Ultimately the production of UPS has been increased to 50 pieces per month which is 15.15 % increase in total UPS production output. Accordingly a comparative picture of performance measures of the existing and proposed system has been drawn and is shown in Figure no. 9.
Figure no. 9. Comparison graph of performance measures

Volume 21, Issue 1, Year 2015 Review of General Management 76
6. Conclusion
This research work has been conducted with the aim of implementing a computer simulation model for process flow improvement to a batch manufacturing system of UPS production. The model developed was an ARENA simulation model of a UPS manufacturing line in a selected UPS manufacturing industry. The research work was based on balancing a UPS production flow line where output is not in the satisfactory level compared to input due to improper layout design and improper load distribution to workers.
Through this research of balancing the UPS manufacturing line by simulation modeling and also from the analysis of results of the modified system model, it can be concluded that the product flow layout which has been followed in manufacturing the transformer of UPS was not in accordance with the standard design of production layout. The computer simulation model developed has been used to identify these bottlenecks and to evaluate some of the possible solution alternatives to solve the problems identified. The output results obtained from the experimental run of the modified simulation model has shown that the parts average waiting time in the system has been reduced and consequently the number of UPS production output has been increased to a significant figure. Facilities re-layout design, changing the level of resources and adding extra workers have been suggested to the concerned management of the UPS manufacturing system as alternative methods to improve the current system’s performance.
References Banks, J., Carson, J. S., Nelson, B. L., Nicol, D. M. et al., (2000). Discrete-
Event System Simulation, 3rd Edition. Prentice Hall, Inc. Fowler, J. W. & Rose, O., (2004).Grand Challenges in Modeling and
Simulation of Complex Manufacturing Systems. Simulation: Transactions of The Society for Modeling and Simulation International. 80(9), 469-476.
Sebastien G., Olivier M., Alexandre S., Esko J. et al., (2004).Production Optimization on PCB Assembly Lines Using Discrete-Event Simulation. Control Engineering Laboratory, Dept. of Process and Environmental Engineering, University of Oulu, Finland.
Review of General Management Volume 21, Issue 1, Year 2015 77
Kelton, W. D., Sadowski, R. P., Sturrock, D. T. et al., (2007). Simulation with Arena, 4th Edition.The McGraw Hill, Inc.
http://www.autosim.com/ (Accessed April, 2011). http://www.arenasimulation.com/ (Accessed April, 2011). http://www.pritsker.com/ (Accessed April, 2011). http://www.imaginethatinc.com/ (Accessed April, 2011).