Easy Does It - OhioLINK ETD Center
160
Easy Does It: How the Organization of Print Advertisements Influences Product Evaluations A dissertation presented to the faculty of the College of Arts and Sciences of Ohio University In partial fulfillment of the requirements for the degree Doctor of Philosophy Jennifer K. Elek March 2010 © 2010 Jennifer K. Elek. All Rights Reserved.
-
Upload
khangminh22 -
Category
Documents
-
view
1 -
download
0
Transcript of Easy Does It - OhioLINK ETD Center

Easy Does It:
How the Organization of Print Advertisements Influences Product Evaluations
A dissertation presented to
the faculty of
the College of Arts and Sciences of Ohio University
In partial fulfillment
of the requirements for the degree
Doctor of Philosophy
Jennifer K. Elek
March 2010
© 2010 Jennifer K. Elek. All Rights Reserved.

2
This dissertation titled
Easy Does It:
How the Organization of Print Advertisements Influences Product Evaluations
by
JENNIFER K. ELEK
has been approved for
the Department of Psychology
and the College of Arts and Sciences by
Emily Balcetis
Assistant Professor of Psychology
Benjamin M. Ogles
Dean, College of Arts and Sciences

3
ABSTRACT
ELEK, JENNIFER K., Ph.D., March 2010, Experimental Psychology
Easy Does It: How the Organization of Print Advertisements Influences Product
Evaluations (160 pp.)
Director of Dissertation: Emily Balcetis
How can advertisers improve consumer attitudes toward a given brand?
Improving the ease with which consumers can process and make sense of an
advertisement that features the product appears to be one possible strategy. Eight studies
explored whether the location of a familiar or novel product in the context of a print
advertisement influences consumer appraisals of the brand. Across five experiments in
which participants viewed print advertisements, participants presented with ads that
featured familiar brands tended to respond more favorably to those in which the brand
appeared in the center, rather than along the margins, of the image. Conversely,
participants presented with advertisements of novel brands reported more favorable
appraisals when the ad featured the brand along the margins of the image than at the
center. This response pattern appears to emerge via a processing fluency mechanism:
When the consumer’s metacognitive understanding of fluency as a positive evaluative
cue changed, the response pattern reversed. These findings indicate that simple aesthetic
decisions about the construction of print advertisements could elicit more favorable
consumer responses to the featured brand.

4 Approved: _____________________________________________________________
Emily Balcetis
Assistant Professor of Psychology

5
ACKNOWLEDGMENTS
I am grateful for the time and effort my advisor, Dr. Emily Balcetis, devoted to
the success of this project. Her guidance and timely feedback throughout all stages of
research contributed greatly to the completion of this work. Furthermore, I would like to
thank the other members of my dissertation committee for their constructive feedback
and contributions: Drs. Keith Markman, Mark Alicke, and Jane Sojka. Several
undergraduate research assistants also helped make this project possible: Teresa Mueller,
Mason Rabbitt, Laura Baskin, and Brittany Barta. I am grateful for each of their efforts.
On a personal note, I would like to thank my father, Robert Elek, for his
unwavering support throughout this long journey.

6
TABLE OF CONTENTS
Page Abstract ............................................................................................................................... 3
Acknowledgments............................................................................................................... 5
List of Tables .................................................................................................................... 12
List of Figures ................................................................................................................... 14
Chapter 1: Introduction ..................................................................................................... 15
Processing Fluency, Attitudes, and Behavior ............................................................... 17
Perceptual Processing ........................................................................................... 19
Cognitive Processing ............................................................................................ 20
Product Location in the Advertisement ........................................................................ 23
Brand Familiarity .......................................................................................................... 27
Current Research ........................................................................................................... 32
Chapter 2: Experiments 1 – 6............................................................................................ 37
Overview of Study 1: Intuitions About Product Location ............................................ 37
Study 1: Method ............................................................................................................ 38
Participants ............................................................................................................ 38
Design and Procedure ........................................................................................... 38
Study 1: Results ............................................................................................................ 39
Manipulation Check .............................................................................................. 39
Transformations .................................................................................................... 39
Effectiveness Ratings ............................................................................................ 40

7
Study 1: Discussion ...................................................................................................... 40
Overview of Studies 2A and 2B: Evaluations of Brands After Viewing Print
Advertisements ............................................................................................................. 41
Study 2A ....................................................................................................................... 41
Study 2A: Method ......................................................................................................... 42
Participants ............................................................................................................ 42
Stimulus Materials ................................................................................................ 42
Design and Procedure ........................................................................................... 42
Study 2A: Results ......................................................................................................... 44
Preliminary Analyses and Exclusions ................................................................... 44
Transformations .................................................................................................... 45
Reported Attitudes ................................................................................................ 45
Study 2B ....................................................................................................................... 46
Study 2B: Method ......................................................................................................... 47
Participants ............................................................................................................ 47
Stimulus Materials ................................................................................................ 47
Design and Procedures .......................................................................................... 48
Study 2B: Results .......................................................................................................... 48
Transformations .................................................................................................... 48
Reported Attitudes ................................................................................................ 48
Studies 2A and 2B: Discussion ..................................................................................... 49

8
Overview of Studies 3A and 3B: Visual Attention in Viewing Advertisement Stimuli
...................................................................................................................................... 49
Study 3A ....................................................................................................................... 50
Study 3A: Method ......................................................................................................... 51
Participants ............................................................................................................ 51
Design and Procedure ........................................................................................... 51
Study 3A: Results ......................................................................................................... 52
Manipulation Check: Accuracy ............................................................................ 52
Reported Attitudes ................................................................................................ 53
Study 3B ....................................................................................................................... 53
Study 3B: Method ......................................................................................................... 54
Participants ............................................................................................................ 54
Design and Procedure ........................................................................................... 54
Study 3B: Results .......................................................................................................... 55
Manipulation Check: Accuracy ............................................................................ 55
Reported Attitudes ................................................................................................ 55
Studies 3A and 3B: Discussion ..................................................................................... 56
Overview of Study 4: Assessing the Processing Experience and Controlling for
Stimulus-Based Confounds ........................................................................................... 57
Study 4: Method ............................................................................................................ 59
Participants ............................................................................................................ 59
Stimulus Materials Pretest .................................................................................... 60

9
Design and Procedure ........................................................................................... 61
Study 4: Results ............................................................................................................ 63
Data Reduction...................................................................................................... 63
Consumer Appraisals ............................................................................................ 64
Processing Fluency ............................................................................................... 65
Assessing Need for Cognition as a Moderator of Consumer Appraisals .............. 67
Consumer Appraisals of Individual Product Types .............................................. 68
Study 4: Discussion ...................................................................................................... 70
Overview of Study 5: Does Processing Fluency Inform Consumer Evaluations? ....... 72
Study 5: Method ............................................................................................................ 75
Participants ............................................................................................................ 75
Stimulus Materials ................................................................................................ 75
Design and Procedure ........................................................................................... 76
Study 5: Results ............................................................................................................ 77
Manipulation Checks ............................................................................................ 77
Data Reduction...................................................................................................... 77
Consumer Appraisals ............................................................................................ 78
Study 5: Discussion ...................................................................................................... 80
Overview of Study 6: Manipulating Brand Familiarity ................................................ 82
Study 6: Method ............................................................................................................ 83
Participants ............................................................................................................ 83
Stimulus Materials ................................................................................................ 83

10
Design and Procedure ........................................................................................... 84
Study 6: Results ............................................................................................................ 85
Manipulation Check: Familiarity .......................................................................... 85
Data Reduction...................................................................................................... 86
Consumer Appraisals and Processing Fluency ..................................................... 87
Study 6: Discussion ...................................................................................................... 90
Chapter 3: General Discussion.......................................................................................... 93
Print Advertisements and Consumer Appraisals .................................................. 93
Does Processing Fluency Inform Consumer Appraisals of Advertising? ............ 94
Individual Differences in Consumer Judgment .................................................... 96
Alternative Explanations ............................................................................................... 97
No Effect or a Priming Effect? ............................................................................. 97
Visual Attention .................................................................................................. 100
Conclusions: Implications and Limitations ................................................................ 102
Limitations .......................................................................................................... 103
References ....................................................................................................................... 108
Appendix A: Consumer Survey Items for Study 1 ......................................................... 122
Appendix B: Advertisement Attitudes Questionnaire Items for Studies 2A and 2B ...... 123
Appendix C: Advertisement Attitudes Questionnaire Items for Study 3A and 3B ........ 124
Appendix D: Advertisement Attitudes Questionnaire Items for Study 4 ....................... 125
Appendix E: Word Sets for the Goal-priming Manipulation of Study 5 ........................ 127
Appendix F: Advertisement Attitudes Questionnaire Items for Study 5 ........................ 128

11 Appendix G: Consumer Reviews Used in Study 6 ......................................................... 129
Appendix H: Part I Survey Items in Study 6 .................................................................. 130

12
LIST OF TABLES
Page Table 1: Mean Attitude Toward the Ad, Attitude Toward the Brand, and Purchase Intent,
as a Function of Brand Familiarity (Study 4) ...............................................................131
Table 2: Mean Attitude Toward the Ad, Attitude Toward the Brand, and Purchase Intent,
as a Function of Background Context (Study 4) ...........................................................132
Table 3: Processing Fluency as a Function of Background Context and Product Location
(Study 4)........................................................................................................................133
Table 4: Purchase Intent as a Function of Background Context and Need for Cognition
Score (Study 4) .............................................................................................................134
Table 5: Attitude Toward the Ad, Attitude Toward the Brand, and Purchase Intent as a
Function of Free Recall by Trial for Familiar Brands (Study 4) ..................................135
Table 6: Attitude Toward the Ad as a Function of Background Relatedness for Each
Familiar Brand (Study 4) ..............................................................................................136
Table 7: Attitude Toward the Brand, Purchase Price, and Processing Fluency as a
Function of Brand Familiarity (Study 5) ......................................................................137
Table 8: Mean Purchase Price for the Familiar and Novel Brands as a Function of Goal
Condition and Product Location (Study 5) ...................................................................138
Table 9: Standardized Purchase Price, Processing Fluency, Attitude Toward the Brand,
Attitude Toward the Ad, and Purchase Intent as a Function of Brand Familiarity (Study
6) ...................................................................................................................................139

13 Table 10: Processing Fluency as a Function of Brand Familiarity and Product Location
(Study 6)........................................................................................................................140
Table 11: Correlations between Processing Fluency and Attitude Toward the Ad, Attitude
Toward the Brand, and Purchase Intent for Each Ad Type (Study 6) ..........................141
Table 12: Purchase Price and Purchase Intent as a Function of Brand Familiarity and
Need for Cognition (Study 6) .......................................................................................142

14
LIST OF FIGURES
Page Figure 1: Center- and margin-placed product advertisements for five familiar brands used
in Study 2A ...................................................................................................................143
Figure 2: Center- and margin-placed product advertisements for five novel brands used in
Study 2B........................................................................................................................145
Figure 3: Center- and margin-placed product advertisements for four familiar brands
containing related and unrelated background contexts, as used in Study 4 ..................148
Figure 4: Center- and margin-placed product advertisements for four novel brands
containing related and unrelated background contexts, as used in Study 4 ..................152
Figure 5: Center- and margin-placed product advertisements for the familiar and novel
brands of chocolate bars used in Study 5 ......................................................................156
Figure 6: Center- and margin-placed product advertisements for eight brands used in
Study 6 ..........................................................................................................................157

15
CHAPTER 1: INTRODUCTION
The typical American sees approximately 1500 advertisements over the course of
a single day (Lane, 2007). These advertisements interrupt TV and web-cast
programming, add volume to magazines and newspapers, await daily commuters on the
subway and line highways, pop up during internet browsing, and even seek out
consumers individually through the U.S. Postal Service and electronic mail. Of these ads,
consumers view most incidentally and process them with little conscious cognitive effort
(see Fang, Singh, & Ahluwalia, 2007; Janiszewski, 1988, 1990, 1993). Considering that
American companies spent over $149 billion on advertising in 2007 alone (TNS Media
Intelligence, 2008), understanding precisely how these passively observed advertisements
might impact consumer attitudes toward featured brands could provide valuable
knowledge to advertisers and the companies they represent.
Advertisers acknowledged that the modern consumer rarely processes
advertisements deliberatively and with the intent to evaluate the brand. As a result,
advertisers adopted visual strategies to appeal to this low-involvement or passive style of
processing (Phillips & McQuarrie, 2002). In consideration of consumers’ attentional
limitations, modern advertisers now rely on increasingly visual marketing techniques
(e.g., McQuarrie, 2008). That is, in contrast to traditional advertisement strategies that
incorporated paragraphs of persuasive text to convince the analytical reader to purchase
the featured product, modern advertising layouts evolved over the past 100 years to
largely eliminate text in favor of full-page, evocative pictures and only brief taglines
(McQuarrie, 2008; McQuarrie & Phillips, 2008). If “a picture is worth a thousand

16 words,” modern picture-dominant advertising represents a much more efficient method of
influence than traditional strategies that relied on verbal content.
Whereas visual marketing more efficiently conveys the advertisement message,
the content of the advertisement influences how easily consumers process that message.
Specifically, consumers understand and remember advertisements that contain
interrelationships between the visual objects in the ad image and the type of product,
brand name, and copy text (i.e., tagline) more easily than ads that do not relate these
components to one another (Schmitt, Tavassoli, & Millard, 1993; Edell & Staelin, 1983;
Labroo & Kim, 2009; Labroo & Lee, 2004). That is, infusing an advertisement with
multiple related visual and semantic elements facilitates consumer recall of the featured
product, and this, in turn, increases the likelihood that the consumer will consider the
brand for purchase (e.g., Coates, Butler, & Berry, 2006).
In the present research, I examined whether the consumer response to print
advertisements depends on how easily the consumer is able to categorize and identify the
brand featured within the ad. For example, how rapidly consumers conclude that the
featured brand in a given advertisement is Frosted Flakes, which they know to be a brand
of children’s sugary breakfast cereal that may be consumed to satiate hunger, may
influence how positively they then rate the brand, or how likely they see themselves
actually purchasing the brand. I seek to demonstrate that consumers’ evaluations of
products become more favorable after viewing visual ads that are relatively easy, rather
than difficult, to process.

17
To examine this question, I explored whether two particular aspects of
advertisement content inform consumer appraisals through a processing fluency
mechanism. Specifically, I examined whether the advertiser’s decision about where to
physically place the featured product in an advertisement image influences how easily
consumers process that ad, and if that influence depends on whether the featured product
is a familiar or novel brand. If consumers spend a mere two seconds attending to the
average advertisement (du Plessis, 2005), and if they, at most, process what the
advertisement is for (Sutherland & Sylvester, 2000), what consumers first see in an
advertisement could help determine how quickly and easily they come to understand that
ad. Given evidence that perceivers tend to direct their visual attention towards the center
of static images when freely viewing them, exhibiting a center bias (Mannan, Ruddock,
& Wooding, 1996, 1997; Tatler, 2007; Foulsham & Underwood, 2008), I argue that
placing a familiar or novel brand of product in the center of the advertisement image or
along the visual periphery of that image could influence how quickly and easily
consumers come to understand the purpose of the advertisement as a whole. How easily
consumers process this information, in turn, should inform subsequent consumer
judgments.
Processing Fluency, Attitudes, and Behavior
Absent any specific processing goals, advertisements that consumers experience
as easy to process or understand should contribute to more favorable evaluations of the
featured product. In general, the easier it is for people to make sense of a given stimulus,
the more they report liking that stimulus. Much recent research demonstrates how the

18 ease with which a target object can be detected, identified, or otherwise perceptually or
cognitively processed, referred to as processing fluency, increases hedonic evaluations of
that target (see Winkielman, Schwarz, Fazendeiro, & Reber, 2003, for a review). For
example, when informational text appears in ornate or blurry font styles, consumers
experience greater difficulty reading the text and, as a result, evaluate the product as less
desirable or tempting than those who read the same description in a clearer font style
(Labroo & Kim, 2009). People also rate food additives with more complex and difficult-
to-pronounce names more negatively than those with less complex names (Song &
Schwarz, 2009). Consumers prompted by imagery appeals in advertisements evaluate
featured travel destinations more favorably only when the imagery is easy to generate,
such as when ads provide more vivid descriptions of the featured destination (Petrova &
Cialdini, 2005). These and a growing repertoire of other experiments indicate that
consumers tend to use their metacognitive experience of processing fluency as an
informative cue regarding their own attitudes when making judgments, evaluating targets
like featured products more favorably when the information conveyed is easier to
process.
How easily consumers process and make sense of an advertisement is a function
of several factors, both internal and external to the perceiver. Any feature of
advertisement images, brand logos, and product packaging that makes it subjectively
easier to detect, identify, and understand the product should facilitate more favorable
evaluations of that brand of product. Similarly, certain higher-order thought processes
can also facilitate a perceiver’s understanding of a given target. For example, product

19 location and brand familiarity could influence which knowledge structures first become
activated in memory and, as a result, determine how quickly consumers come to
understand or make sense of the ad.
Perceptual Processing
When consumers encounter an advertisement image, they first must process the
physical characteristics of the ad. This sensory input includes the luminance, shape, size,
texture, and proximity of the target, as well as cues regarding the orientation at or
physical perspective from which the perceiver views the stimulus (Willingham, 2001).
Viewers receive this perceptual information and use it to help them categorize, identify,
or label the visual target.
Several aspects of the advertisement itself can make the ad easier to process and
therefore elicit more positive evaluations of the featured target, including visual clarity,
figure-ground contrast, and simplicity. For example, the clarity of a visual target can
determine how rapidly observers detect a given stimulus (Whittlesea, Jacoby, & Girard,
1990). Similarly, the relative simplicity of symmetrical stimuli, compared to
asymmetrical stimuli, appears to make such targets easier for viewers to make sense of
and therefore generally more likeable (see Reber, Schwarz, & Winkielman, 2004). That
is, the resulting increase in ease of processing then facilitates positive attitudes. For
instance, people judge visual targets with high figure-ground contrast as “prettier” than
those with low figure-ground contrast, liking pictures of mundane objects like circles
more the easier it is to detect them (Reber, Winkielman, & Schwarz, 1998). Applied to
advertising, print ads should elicit the most positive consumer response if information

20 most diagnostic of the brand (i.e., information that is most helpful in understanding the
purpose of the brand and ad) is also the easiest to process or detect.
The downstream consequences of these differences in how easily the perceiver
can process an advertisement may impact consumer purchase decisions and other
behaviors as well. For example, consumers experiencing processing difficulty, or
disfluency, when reading about several competing purchase alternatives may instead elect
to defer their choice or select a less-than-ideal compromise option (Novemsky, Dhar,
Schwarz, & Simonson, 2007). Similarly, after reading instructions written in atypical,
ornate fonts that require more cognitive effort to process, people reported less willingness
to personally execute the described activities compared to those who read the same
instructions written in a clearer font style (Song & Schwarz, 2008). The metacognitive
experience of ease appears to influence donation behaviors as well. Participants reading
about a charity described in easy-to-read font subsequently donated more money to the
charity than participants presented with the same information written in a difficult-to-read
font (Labroo & Kim, 2009). The more easily consumers process and understand the
advertisement, the more favorably they respond to the target, and the more likely the
consumer then becomes to follow through with donating to the cause, trying the activity,
or purchasing the featured brand.
Cognitive Processing
Certainly, the physical, perceptual features of an advertisement do not solely
determine the consumer’s processing experience, or how easily consumers come to
understand the ad. Higher-order thought processes come into play as well, often guiding

21 the detection of and attention to visual features in a manner that can inform and even
expedite perceptual processing.
One important internal factor that can influence the processing experience of
advertisements is the context in which the target brand appears (e.g., Labroo & Lee,
2006; Labroo & Kim, 2009; Schlosser, 2003; Labroo et al., 2008). In general, people can
more rapidly identify and name objects when they appear in the context of a coherent,
diagnostic, conceptually related background than when they appear in an incoherent,
conceptually unrelated background (Boyce, Pollatsek, & Rayner, 1989; Boyce &
Pollatsek, 1992). This is because the act of viewing contextual information automatically
activates associated representations in memory (Higgins, Rholes, & Jones, 1977), which
can then spread to related constructs to make them more accessible (e.g., Collins &
Loftus, 1975; Neely, 1977; Biederman, Mezzanotte, & Rabinowitz, 1982). Thus,
information gathered from the background context of an advertisement can cue a schema
in memory for that type of scene. This activated schema is associated in memory with
information about the types of objects typically appearing in such a scene, facilitating
their recognition. That is, with relevant knowledge structures already activated in
memory, identifying featured products in an advertisement becomes easier.
When the increased accessibility of associated information facilitates the
identification of related objects in the environment, this ease of processing can also then
automatically elicit positive affect (see Reber et al., 2004). Products will receive more
favorable evaluations if viewed following visual depictions of highly related constructs or
predictive contexts compared to less related constructs or contexts (Lee & Labroo, 2004).

22 That is, one can identify a brand of bottled beer more quickly, and will evaluate it more
favorably, than a brand of multivitamins when viewed in the context of a bar scene,
because beer is consistent with the perceiver’s expectations, as generated by the activated
bar scene schema.
By presenting background scenes related to the product and activating
conceptually related information in the mind of the consumer, advertisers may not only
facilitate the identification of and positive attitudes toward the product that appears in a
given ad, but may also increase the likelihood that consumers will consider purchasing
the product. By providing viewers with a familiar link with which to associate the
featured product in memory, advertisers can improve consumer recall for the brand. And
by increasing brand memorability, an advertisement increases the likelihood that
consumers will consider the product as an option when making actual purchases – a
primary goal for advertisers (e.g., Shapiro, MacInnis, & Heckler, 1997; Coates, Butler, &
Berry, 2006). For example, consumers better remember print advertisements that contain
conceptual or lexical relationships amongst the brand name, copy text, and image used in
the ad than those without such relationships (Schmitt, Tavassoli, & Millard, 1993).
Similarly, when unknown brands of products appear in a conceptually related context (for
example, an unfamiliar brand of briefcase carried by a businessman on his way to work),
consumers evaluate those products more favorably and report a greater likelihood of
actually purchasing the featured product than if it had appeared by itself on a plain white
background (Shapiro, 1999).

23
Thus, when consumers encounter advertisements that contain perceptual or
conceptual links to a given product, this product becomes more accessible, evaluated
more positively across a range of evaluative dimensions, and is more likely to be chosen
at the point of purchase as a result, regardless of any conscious awareness of this process
(Berger & Fitzsimons, 2008). The color of pens consumers use (orange, green)
unknowingly influences their later consumer choice preferences between Sunkist orange
soda or lemon-lime Gatorade. Simply viewing pictures of dogs improves subsequent
consumer evaluations of Puma sneakers, but not other brands of sneakers. Even reading
the word “frog” before viewing a brand of wine with a frog on the label can increase
preference for this wine over other brands (Labroo, Dhar, & Schwarz, 2008). Consumers
more easily and more rapidly make sense of a target brand if knowledge structures
relevant to identifying the brand or features of the brand have been activated than if they
have not. What the consumer first sees in a given advertisement, then, may not only
determine how rapidly he or she identifies the featured brand, but should also inform
subsequent brand attitudes, purchase intentions, and behaviors.
Product Location in the Advertisement
How easily consumers come to understand an advertisement, and their subsequent
attitudes about the featured brand, may depend in part on how the advertisement is
organized. Some research already indicates that the spatial organization of an
advertisement can inform how viewers evaluate the featured brand. Specifically,
incidentally viewed advertisements that place the ad image to the left, with the brand
name, persuasive text, or product description written on the right, elicit more positive

24 evaluations of the product and brand name than those that utilize the opposite spatial
relationship (Janiszewski, 1990, 1993). But within the advertisement image, what might
influence how consumers process brand information?
The spatial organization of a given advertisement image likely influences
consumer evaluations of the featured brand because what consumers initially attend to in
an ad can inform how and how quickly they identify its contents. What is first attended to
in a simple visual scene, for example, can guide how one thinks about the objects
contained within it. People tend to describe scenes using sentence structures that mimic
the order of their eye movements (Nappa, January, Gleitman, & Trueswell, 2004;
Gleitman, January, Nappa, & Trueswell, 2007). Additionally, where perceivers focus
their visual attention when viewing ambiguous targets like reversible figures, for
example, may bias interpretations of those images (Toppino, 2003). Focusing eye gaze to
critical features of these reversible figures (Georgiades & Harris, 1997) and manipulating
the gaze sequence when looking at the image (Pomplun, Ritter, & Velichkovsky, 1996)
can induce the perception of one interpretation over another. Finally, people become
much more likely to successfully complete problem-solving tasks if their visual attention
is directed towards the piece of the puzzle instrumental to its solution (Grant & Spivey,
2003). That is, by simply manipulating visual attention toward the key part, these
incidental ocular movements influenced the perceiver’s subsequent cognitive processing
of the puzzle to produce the insight necessary for its solution. Thus, not only do thought
processes influence how one directs visual attention, as may be expected (see Richardson
& Spivey, 2004), but the reciprocal relationship can and does emerge: Visual attention

25 and the perceptual sequence can inform cognitive processing, influencing consumer ease
in the identification of, for example, the contents of print advertisements.
Since the information that consumers perceive in a given advertisement can
influence the speed with which they may identify the featured product, it is important to
know where people look when viewing print advertisements. Generally, humans exhibit a
center bias when viewing images of scenes; that is, people more often tend to focus their
visual attention on the center of static images (Mannan et al., 1996, 1997; Tatler, 2007;
Foulsham & Underwood, 2008), including television and computer screens (Tosi,
Meccaci, & Pasquali, 1997; Brasel & Gips, 2008b), than other, more visually peripheral
locations. As a result, the proximity of brand logos in relation to the center of the image
appears to matter, for example, to television viewers scanning through commercial breaks
(Brasel & Gips, 2008a, 2008b). This location within the image – in the center rather than
along the margins of a commercial advertisement –elicited more positive evaluations of
the featured brand (Brasel & Gips, 2008a). That is, viewers tended to focus more on the
center of the image, and therefore demonstrated improved memory for and more
favorable attitudes toward brand logos appearing in that region compared to those that
appeared along the borders or margins of the screen.
Given that consumers exhibit a centrality bias with scenes and images, what
appears at the center of a print advertisement could be of particular importance in
determining the consumer’s processing experience. Whereas commercial advertising
studies often portray an informative context conceptually or perceptually linked to the
brand in the center of the screen before, after, and/or during the presentation of the brand

26 logo (Brasel & Gips, 2008a, 2008b), static print advertisements contain more limited
information, presenting only one still image to the consumer. In these cases, scene or
background context information present in the initial eye fixations on an image facilitates
the speed with which the perceiver can categorize and identify the target objects observed
within those scenes (Boyce & Pollatsek, 1992), although this depends on how relevant or
related the background context is to the target object (Davenport, 2007). Moreover, even
though consumers may grasp the gist of an advertisement scene within the first 40
milliseconds of exposure to inform object categorization and identification (Joubert,
Rousselet, Fize, & Fabre-Thorpe, 2007), this rapid global processing occurs based on
perceptual information gleaned primarily from the center of the fixated area as opposed
to information in the visual periphery, where visual acuity is poor (Rayner, 2009). The
center of a given visual fixation corresponds to the fovea of the eye, where visual acuity
is greatest; the perceiver then moves his or her eyes to fixate this foveal area on
perceptual regions of interest (e.g., toward the featured product, located elsewhere in the
advertisement image) for further processing (Mannan et al., 1996). However, if the
featured product is present in the first visual fixation, perceivers may process this visually
salient object at the expense of background context or scene information, which becomes
more difficult and requires additional processing time particularly if the contextual
information is conceptually inconsistent with the featured product (see Joubert et al.,
2007). Therefore, absent any expectations that lead the consumer’s initial visual attention
elsewhere (Tosi et al., 1997), what the advertiser chooses to display at the center of a
27 print advertisement may help determine the consumer’s processing experience with the
ad.
Brand Familiarity
In addition to the organization of the ad, familiarity with a brand should also
facilitate the processing and identification of sensory input during subsequent exposures.
A perceiver becomes familiar with a given product through prior exposures, which create
a memory trace for the configuration of physical features associated with the brand. This
memory trace facilitates the visual processing, and liking, of the product in subsequent
encounters (Fang et al, 2007; Shapiro, 1999). Viewers most efficiently process a given
stimulus when the physical features of that stimulus in both encounters match (Roediger
& Blaxton, 1987). However, even prior exposure to similar, but not identical, visual
information can improve processing speed for subsequently viewed images. For example,
visual primes can help viewers discern subsequently viewed images, increasing the speed
with which they identify the target. In one study, participants viewed an image of lines
that matched or did not match the visual contours of a subsequently viewed, slightly
degraded stimulus picture. Participants identified the contents of these matched pictures
more quickly, and liked their contents better, than pictures viewed following mismatched
pictures (Reber et al, 1998). Thus, how frequently consumers encounter a given brand
may increase the speed with which consumers identify a given configuration of physical
features as belonging to the brand.
Prior experience links perceptual and conceptual information in memory to a
given brand, and so upon viewing the product or brand logo, these concepts and

28 knowledge structures become activated in memory. Viewing a well-known, familiar
brand activates this rich network of associations formed across a history of experiences
and repeated encounters with that brand. However, this knowledge and experience is
absent when viewing a novel brand. Instead, for unfamiliar, novel products, additional
contextual information would make it easier for consumers to categorize and make sense
of the product. Viewing a conceptually relevant background scene in an advertisement
activates a representation of that context, or schema, in memory. This schema creates
expectations that then facilitate the recognition of related objects, like the featured
product.
Viewing perceptually or conceptually related background contexts first, then, will
result in faster categorization and identification of novel brands. For example, an
advertisement image that focuses on a smiling model pouring the clear contents of a
bottle into her mouth allows consumers to quickly categorize the otherwise novel product
in her hand as bottled water. However, if consumers first view the novel product and then
refer to the visual periphery for contextual information before arriving at a conclusion
about the nature of the product, processing time should take longer and evaluations
should be less positive than those following the reverse fixation sequence.
The best cue for activating representations of a familiar brand in memory,
however, should be the brand itself. For popular, well-known products, focusing visual
attention on the product itself should result in rapid identification. As a result, ads for
well-known brands that focus on the actual product should prompt the most efficient
understanding of the ad, because consumers can easily identify the features of the

29 familiar product (e.g., the red and blue logo indicates Pepsi), which readily cue
associations of product meaning (e.g., Pepsi is a caffeinated soda that one often drinks
during daily lunch breaks). Other contextual information (e.g., a teenage girl drinking a
bottled beverage) should not activate this identification or facilitate this understanding
more quickly and easily than the product itself.
Certainly, how favorably consumers respond to an advertisement depends in part
on how subjectively familiar or novel the featured brand is. Frequent exposures to a
brand, of course, make that brand feel familiar (Shapiro, 1999; Fang et al., 2007).
Frequent exposures to, and therefore familiarity with, a non-negative target then
automatically results in greater liking, a phenomenon called the mere exposure effect
(Zajonc, 1968). In this classic study, repeated exposure to novel and otherwise entirely
meaningless Chinese ideographs led to more favorable evaluations of those stimuli.
People also demonstrated a significant preference for one’s own mirror image over the
true orientation of one’s likeness, but preferred the true orientation of others’ likenesses
(Mita, Dermer, & Knight, 1977). That is, people preferred viewing depictions of the self
and others that matched the orientation they were most accustomed to viewing. Frequent
exposure to one’s inverted likeness cultivates a preference for viewing these familiar
images. Although beyond the scope of the present investigation, it is worth noting that
consumers appear to respond more favorably to products (i.e., earrings) presented on this
preferred image of the self, compared to the true orientation of the self, as a result of the
association (Cho & Schwarz, 2006). Familiarity based on repetitive exposures improves
evaluations of a variety of inanimate objects, and a meta-analysis of 208 experiments

30 conducted over a span of 20 years found mere exposure to be a robust and reliable effect
(Bornstein, 1989). This effect emerges even without conscious awareness of exposure to
the stimulus (Kunst-Wilson & Zajonc, 1980; Monahan, Murphy, & Zajonc, 2000),
without recognition of the stimulus as familiar (Moreland & Zajonc, 1977), and even
when exposure is incidental – that is, in absence of any intentional effort to process
stimulus information (Janiszewski, 1988, 1990, 1993).
Importantly, the consumer’s processing experience – how subjectively easy or
difficult it is to process and understand an advertisement – appears to directly underlie the
effects of familiarity on liking. When greater familiarity with an object increases the
speed with which the object is identified, and this ease is experienced as positive affect
(Fang et al., 2007; Winkielman et al., 2003). Then, when people come to associate
processing fluency with familiarity, the reciprocal relationship may also be observed.
That is, viewers may attribute an experience of processing fluency or positive affect to
familiarity with that target. Viewers who experience ease in processing an apparently
complex stimulus may perceive this fluency as resulting from prior exposure to or
familiarity with the target, even if the target is in fact novel (Shapiro, 1999; Klinger &
Greenwald, 1994).
Well-known, familiar products, then, should generally elicit more positive
evaluations than novel, unfamiliar products. In general, familiar brands do elicit greater
liking than unknown, novel brands. For example, after initial exposures, participants
exhibit a preference for familiar brands over novel ones (Janiszewski & Meyvis, 2001).
Consumers also demonstrate prolonged interest during repeated exposures to the same

31 advertisement over time if that advertisement features a brand already familiar to the
viewer, rather than one that is completely novel. That is, although satiation and boredom
can eventually set in following a high frequency of exposures to the same advertisement
(Janiszewski & Meyvis, 2001; Groves & Thompson, 1970; Bornstein, 1989), such
wearout effects of inattention and disinterest are delayed when the featured brand is
already well known to the perceiver (Campbell & Keller, 2003).
Few studies directly examine how advertisements may be differentially effective
for familiar, versus novel, brands. Of these studies, most focus primarily on how
incidental emotions or the environmental context in which the ad appears affect consumer
memory and evaluations of featured products (e.g., Holden & Vanhuele, 1999; Coates,
Butler, & Berry, 2006; Yi, 1990, 1993; Janssens & De Pelsmacker, 2005). None,
however, appear to investigate how brand familiarity may interact with the organization
of the ad (i.e., product location) to impact consumer evaluations. While brand familiarity
appears to influence consumer evaluations, how evaluations may change as a function of
product location remains unknown.
I posit that brand familiarity interacts with the relative placement of the product in
the ad to determine how rapidly consumers make sense of the ad and, ultimately, how
consumers then respond to the featured brand. That is, in viewing print advertisements,
how easily consumers process and make sense of an ad depends on both the consumer’s
familiarity with the featured brand and the location of the product in the advertisement
image. The first feature of an ad that a consumer initially sees can activate associated
constructs in memory. Whether understanding is facilitated or hindered is a function of

32 consumer familiarity with the featured product. For ads that feature a familiar brand,
consumers will more easily make sense of ads that display the product as the most central
visual object (also henceforth referred to as center-placed product advertisements),
compared to ads that relegate the brand to the outskirts or margins of the image (also
henceforth referred to as margin-placed product advertisements). For ads that contain a
novel brand, however, consumers will more efficiently understand ads that feature a
relevant context (margin-placed product ads) than ads that focus visual attention on the
unfamiliar product itself (center-placed product ads). Efficiency in understanding and
making sense of an ad should subsequently influence how favorably consumers evaluate
the featured brand, with more efficient ads eliciting more favorable appraisals in low-
involvement, passive processing contexts.
Current Research
In the current research, I aimed to establish whether or not product location
interacts with brand familiarity to inform consumer evaluations of the featured brand
through a processing fluency mechanism. Given that advertising requires repeated
exposures in order to be effective (du Plessis, 2005), and that increased exposures
consistently improve attitudes only toward initially neutral or positive stimuli (e.g.,
Bornstein, 1989), consumers’ passive or low-involvement processing of advertisements is
likely only effective when advertisers feature affectively neutral or positive stimuli. The
current research, therefore, considers ads for unfamiliar, completely novel brands and
popular, well-known brands towards which consumers have affectively neutral or
positive attitudes.

33
I first explored whether students with relevant academic and work experience in
the field of advertising and marketing possess any beliefs regarding an interaction effect
between product location and brand familiarity on consumer responses to advertisements,
compared to the beliefs of the lay consumer. Then, in the seven studies that follow, lay
consumers viewing real or mock-up center-placed and margin-placed product
advertisements featuring a familiar or novel brand assessed the ad and brand using a
provided questionnaire form. If brand familiarity and product location interact to
determine the consumer’s processing experience and, subsequently, inform their
responses to the advertisement, consumers should offer more favorable appraisals of
familiar brands following center-placed product ads, but more favorable appraisals of
novel brands following margin-placed product ads. If these two factors indeed influence
consumers’ processing experience and responses following advertisement exposure, the
present research may be useful to advertising professionals in devising effective visual
marketing strategies to promote their products.
Secondly, I tested whether these effects emerged as a result of a processing
fluency mechanism. Product location and brand familiarity may interactively inform the
consumer’s subsequent appraisals of the brand because these factors contribute to the
ease with which the consumer is able to process the advertisement. In Studies 4 and 6,
consumers answered questions designed to assess the subjective ease or difficulty of their
processing experience with each advertisement. If easily understood advertisements elicit
more positive consumer appraisals, Studies 4 and 6 should demonstrate a similar pattern
of results for both processing fluency and attitudinal measures.

34
In addition to the two studies that incorporated self-report measures of processing
fluency, I also explored whether processing fluency underlies the proposed interaction
effects using a second approach. Given that certain circumstances can cause perceivers to
view processing difficulty, rather than fluency, as a positive cue when evaluating a
product (Brinol, Petty, & Tormala, 2006; Alter & Oppenheimer, 2009), Study 5
examined whether such a variable known to moderate these effects of processing fluency
also moderates consumer responses to the different ad types for familiar and novel
brands. This moderator is the consumer’s active goal state when viewing the
advertisement. When perceivers adopt and pursue a goal, they tend to evaluate objects
relevant to that goal more favorably if their subjective processing experience requires
greater mental effort (a phenomenon called the instrumentality heuristic); in the absence
of a goal, feelings of ease facilitate positive evaluations (Labroo & Kim, 2009). For
example, the more difficulty the consumer experiences in processing an advertisement for
chocolates, the more instrumental the consumer then presumably perceives those
chocolates to be in attaining his or her goal if they are pursuing a goal to experience
pleasure. Thus, these perceivers view processing disfluency as a positive cue about the
value of the target, therefore responding more favorably to the chocolate after viewing
the more difficult-to-process advertisement. However, another consumer, for whom this
goal is not accessible, will evaluate those same chocolates less favorably as a result of the
experienced processing difficulty. If processing fluency indeed underlies the effects of
product location and brand familiarity on brand appraisals, the same goal manipulations
that moderate the effects of processing fluency on consumer appraisals in other contexts

35 should similarly influence appraisals of familiar and novel brands that appear in center-
placed and margin-placed product advertisements. Study 5 explores this possibility. Thus,
when consumers perceive processing disfluency as a positive evaluative cue, novel
brands should receive more favorable appraisals following center-placed, and not margin-
placed, product advertisements. Correspondingly, center-placed product ads should no
longer elicit more favorable evaluations of familiar brands. If active goal states moderate
the interaction effect of product location and brand familiarity on consumer appraisals,
and the perceptual sequence interacts with prior knowledge sets to inform how easily
observers come to make sense of even a single visual scene, the effects of processing
fluency in every day life may be even more ubiquitous than previously suspected.
Finally, I attempted to examine whether processing fluency informs the brand
evaluations of different types of individuals in different ways (Studies 4 and 6). How
individual differences affect the consumer response has long been a topic of interest in
the field of advertising (see Haugtvedt, Petty, & Cacioppo, 1992). One well-established
individual difference variable seems of particular relevance to the processing fluency
phenomenon: an individual’s need for cognition, or the extent to which they engage in
and enjoy cognitively effortful tasks (Cacioppo & Petty, 1982). If cognitive effort appeals
to the consumer, he or she may not perceive processing disfluency to be as negative of an
evaluative cue – nor may he or she experience processing fluency as positively as a
consumer with a low need for cognition. Moreover, consumers low in need for cognition
tend to rely more on cognitive shortcuts or heuristics and tend to be more persuaded by
peripheral (message-unrelated) cues inherent to the ad or message, such as spokesperson

36 attractiveness (Cacioppo, Petty, Feinstein, & Jarvis, 1996; Smith & Petty, 1996;
Haugtvedt, Petty, Cacioppo, & Steidley, 1988). Those low in need for cognition may be
similarly influenced by the subjective ease with which an advertisement is processed. As
a result, consumers low in need for cognition should be more likely to exhibit the
predicted product location and brand familiarity interaction in their appraisals of brands
featured in print advertisements than those high in need for cognition.

37
CHAPTER 2: EXPERIMENTS 1 – 6
Overview of Study 1: Intuitions About Product Location
Study 1 examines specific intuitions about what constitutes a successful print
advertisement. Regardless of which advertising strategies actually influence consumer
evaluations of brands, does the layperson, with no marketing or advertising expertise,
believe that the spatial location of the product within a given print advertisement
influences subsequent consumer appraisals of that featured brand? Alternatively, do those
with relevant marketing experience believe that manipulations of the location of the
product within a given ad can increase the ad’s effectiveness?
Study 1 asked every-day consumers and marketing students to indicate how much
they believed that center-placed product advertisements and margin-placed product
advertisements might be successful in persuading consumer attitudes in favor of the
featured product brand. If lay consumers or marketing students differentiate between
center- and margin-placed product advertisement layouts and identify one type of product
location as generally more effective than the other, participants in Study 1 should
demonstrate such a preference across advertisement strategies. If lay consumers or
marketing students endorse the specific belief that center-placed product advertisements
are more effective than margin-placed product advertisements for familiar products, but
the reverse for novel products, these beliefs would be consistent with the current
hypothesis. That is, these results would match predictions that product location interacts
with brand familiarity to affect the ease with which consumers understand the

38 advertisement image, subsequently influencing judgments and appraisals that pertain to
the featured product and advertisement as a whole.
Study 1: Method
Participants
In exchange for partial course credit, 126 public university undergraduate students
with no specific marketing expertise or enrolled in an upper-level marketing course
completed a brief consumer survey.
Design and Procedure
Participants imagined either a well-known brand (Corona) or an unknown,
fictitious brand (Barton’s) of bottled beer. They then read four short descriptions of
possible print advertisement layouts (see Appendix A). Two of these advertisement
strategies employed center-placed product descriptions and two advertisement strategies
employed margin-placed product descriptions. For example, one center-placed product
description stated, “The ad should focus on the (product) itself, with nothing else
competing for your attention.” Alternatively, one margin-placed product description
stated, “The ad should focus on a popular celebrity or successful athlete, with the
(product) off to the side in the spokesperson’s hand.”
Each participant rated these two versions of center-placed and two versions of
margin-placed product advertisement descriptions on how effective they believed each
would be in promoting the specified product. The survey defined an effective ad as one
that piqued interest and enticed the general public to purchase the product. Participants
used a 1 (not at all effective) to 7 (extremely effective) Likert-type scale to evaluate each
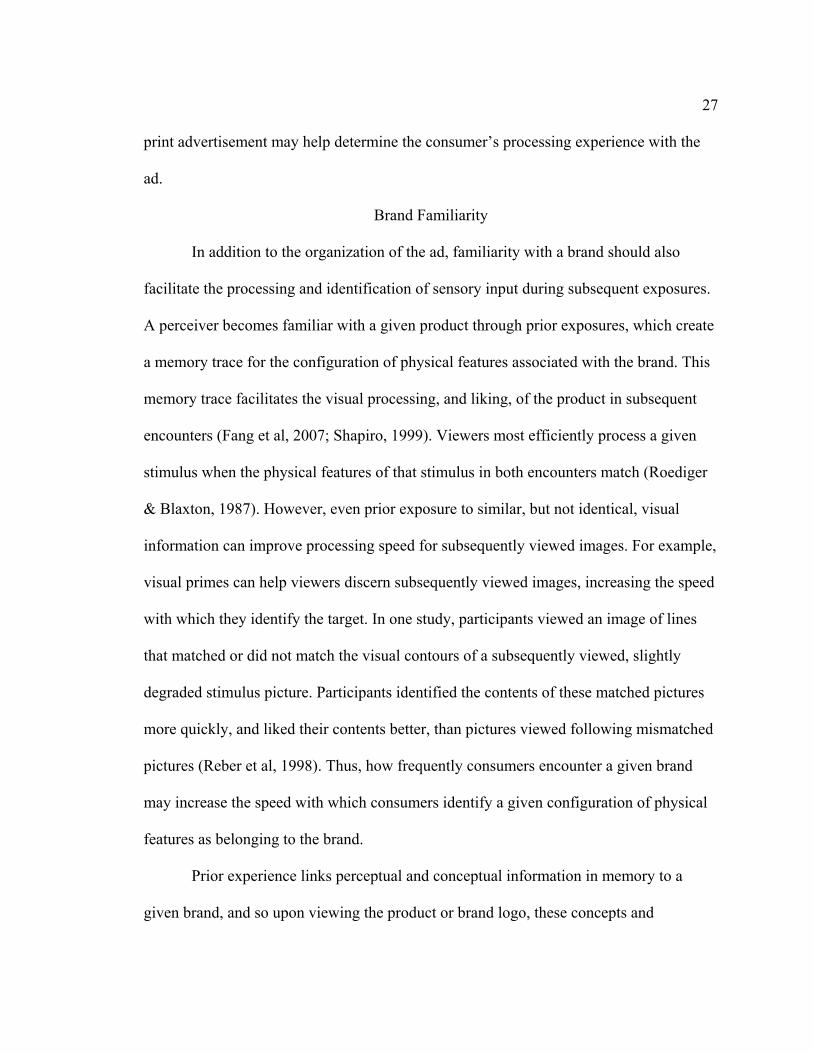
39 description. This produced a 2 (respondent: marketing student vs. lay consumer) x 2
(brand: familiar vs. novel) x 2 (product location: center vs. margin) mixed experimental
design, with respondent and brand type as the between-subjects variables and product
location as the within-subjects variable.
As measures of relevant expertise, participants also indicated how many
marketing courses they had completed and how many years of relevant work experience
they possessed.
Study 1: Results
Manipulation Check
One-sample t-tests examined whether or not the sample of marketing students
possessed a statistically greater amount of relevant educational and work experience than
students considered to be lay consumers. The reported number of courses taken and years
of work experience were both significantly greater for marketing student respondents
(MMcourse = 2.4, SDMcourse = 1.5; MMexp = 1.0, SDMexp = 1.6) than for lay consumer
respondents (MLcourse = 0.3, SDLcourse = 0.6; MLexp = 0.2, SDLexp = 0.6), with t(62) = 10.02,
p < .001, and t(62) = 3.90, p < .001, respectively.
Transformations
Participant evaluations of both center-placed and both margin-placed
advertisement descriptions were averaged to create one center-placed advertisement
effectiveness score and one margin-placed advertisement effectiveness score for analysis.

40 Effectiveness Ratings
I conducted a 2 (respondent) x 2 (brand) x 2 (product location) repeated measures
ANOVA on advertisement effectiveness scores. This analysis revealed a significant
three-way interaction, F (1, 122) = 5.92, p = .016. Simple effects tests revealed that lay
consumers perceived no difference in the effectiveness of center-placed or margin-placed
advertisements for the familiar or novel brand of product, F (1, 122) = 0.96 and F (1,
122) = 1.17, respectively. Marketing students, on the other hand, evaluated margin-placed
advertisements (Mm = 4.6, SDm = 0.8) as a more effective strategy than center-placed
advertisements (Mc = 3.7, SDc = 1.3) for the novel brand, F (1, 122) = 12.88, p < .001.
However, no statistically significant difference emerged in marketing students’
evaluations of these two advertisement layout strategies for the familiar brand, F (1, 122)
= 2.20.
Study 1: Discussion
Study 1 revealed that lay consumers, with no specific marketing expertise or
insight, believe that advertising efforts are equally effective regardless of the visual
strategy used. Lay consumers also do not appear to discriminate based on the familiarity
of the brand. That is, lay consumers do not appear to believe that brand familiarity and
product location interact to inform consumer attitudes.
In contrast to lay consumers, marketing students appear to be somewhat sensitive
to the interaction between product location and brand familiarity. That is, students with
relevant marketing education and work experience rated the margin-placed product
layout as a more effective advertising strategy than the center-placed product layout for

41 the unfamiliar brand, but not for the familiar brand. This pattern of beliefs about the
effectiveness of center- and margin-placed product advertisements, emerging only from
participants with relevant marketing experience, lends credence to the possibility that
product location and brand familiarity may indeed interact to produce more favorable
downstream consumer evaluations in the real world.
Overview of Studies 2A and 2B: Evaluations of Brands After Viewing Print
Advertisements
Study 1 suggests that greater marketing experience may lead individuals to
recognize that brand familiarity and product location interact to influence subsequent
evaluations of a given brand. Studies 2A and 2B explore whether product location
actually influences consumers’ evaluations of familiar and novel brands featured in print
advertisements, respectively. If these studies produce the predicted effect of ad type on
consumer appraisals, they would support the general hypothesis that these different ad
types, as defined by brand familiarity and product location, determine the consumer’s
processing experience, which can inform the consumer’s response to the advertisement.
Study 2A
To examine whether the location of familiar products in real-world print
advertisements might influence consumers’ subsequent evaluations of these well-known
brands, Study 2A presented participants with a series of contemporary product
advertisements selected from actual real-world marketing campaigns. In this study,
participants viewed real product advertisements containing familiar brands of products
that appeared either in the center or along the visual periphery of the advertisement

42 images. If product location influences consumers’ evaluations by facilitating the
identification and understanding of the featured brand, center-placed product
advertisements should evoke more favorable evaluations from consumers than margin-
placed product ads.
Study 2A: Method
Participants
In exchange for partial course credit, 103 undergraduate students participated in
the study and were randomly assigned to conditions.
Stimulus Materials
Visual stimuli for this study included published advertisements for familiar
products, selected from contemporary magazines and from internet web pages. Two ads
promoting each of the following corporate marketing campaigns were selected: Dasani
brand water, Heineken brand beer, Bacardi brand rum, Chanel brand perfume, and Evian
brand water. For each familiar product, one ad utilized a center-placed product layout and
the other utilized a margin-placed product layout (Figure 1).
Three short paragraphs of celebrity news, headlining on popular internet news
pages, were included as filler items in this study. These paragraphs referenced paparazzi
regulars such as Britney Spears, Lindsey Lohan, and Christian Bale.
Design and Procedure
Participants completed a computerized experiment, presumably as part of a study
on consumer magazine reading habits. In this computerized experiment, participants
alternated between viewing and evaluating the content of product advertisements and

43 reading short, filler celebrity news paragraphs. The news paragraphs were included to
bolster the cover story and reduce the likelihood that participants would develop
expectations that would divert and guide visual attention away from the center of the
screen in anticipation of upcoming images. Participants viewed the advertisement images
for 1000 milliseconds each, a duration that replicates the exposure time used in visual
search paradigms (see Fenske and Raymond, 2006). After reading a paragraph of
celebrity news, participants manually advanced the presentation.
Participants viewed one advertisement for each of the 5 different brands of
familiar products and 3 filler news paragraphs as a within-participants manipulation. The
featured products appeared in the center or along the margin of each ad, with participants
viewing only one ad for each familiar product. As a result, one group of participants saw
a stimulus set that contained 3 center-placed and 2 margin-placed product ads, and the
second group viewed the counterbalanced version containing 3 margin-placed and 2
center-placed product ads. This created a 2 (product location: center vs. margin) x 2
(stimulus set) mixed experimental design, with product location as the within-subjects
variable and stimulus set as the between-subjects variable.
After viewing each advertisement image, participants completed a questionnaire
that measured their explicit attitudes regarding both the advertisement image they viewed
and the familiar product featured in that ad (see Appendix B). Participants rated how
much they liked the ad using a 1 to 11 Likert-type scale. They also rated how desirable
the familiar product was. Product desirability was an aggregate measure that averaged
across participants’ responses to three questions assessing: how participants felt about the

44 product (1 = extremely dislike and 11 = really like), how interested participants were in
using the product (1 = not at all and 11 = extremely interested), and how likely they
would be to actually buy the product (1 = not at all and 11 = extremely likely).
Participants also estimated the amount of time they would be willing to wait in line to
purchase the product (in minutes and seconds), and the price at which they would be
willing to sell the product once owned (in dollars and cents). Participants were then
debriefed and dismissed.
Study 2A: Results
Preliminary Analyses and Exclusions
Certain products (i.e., perfume) and advertisement images (i.e., celebrity or sex
appeal) may elicit strong, gender-specific reactions (Meyers-Levy, 1994; Purinton &
Rosen, 2005). To examine whether gender differences influenced the subjective appeal of
the brands of familiar products and advertisement images used in this study, a 2 (product
location: center vs. margin) x 2 (participant gender: male vs. female) ANOVA was
conducted for each brand.
Study 2A observed no stimulus-specific interaction effects in four of the five
familiar product ad pairs on product desirability or image attractiveness variables, with
all F’s < 1.70. A participant gender by product location interaction effect emerged with
ads featuring the classic perfume Chanel No. 5, F (6, 96) = 3.50, p = .004. Specifically,
females (Mf = 7.7, SDf = 1.6) found Chanel No. 5 to be substantially more desirable than
males (Mm = 4.5, SDm = 1.3) after viewing a margin-placed product advertisement that
also depicted Nicole Kidman. This gender difference was less pronounced (Mf = 6.6, SDf

45 = 2.0 and Mm = 4.9, SDm = 1.9) when viewing the center-placed product ad that did not
contain this well-known celebrity spokeswoman, F (1, 102) = 4.60, p = .035. That is, the
quality of content in center-placed compared to margin-placed product ads for Chanel
No. 5 clearly produced significant differences in a substantial subset of the participant
sample. Because these content differences may have overwhelmed potential effects
produced by the main variable of interest (i.e., product location), the Chanel No. 5 ad
pairs were excluded from further analyses.
Transformations
The amount of time participants said they would wait to buy the familiar product and the
price they would sell it at was square-root transformed and then standardized. For each
participant, how much they liked the image, product desirability variables, and
standardized wait time and sell prices were averaged across all center-placed product ad
trials and across all margin-placed product ad trials.
Reported Attitudes
Four items (how much participants liked the image, how participants felt about the
product, how interested they were in the product, and how likely they would be to
actually buy the product) showed high internal consistency for both center-placed (α =
.890) and margin-placed product ads (α = .823). As a result, these questionnaire items
were averaged to create the aggregate consumer attitude variable. Participants rated
center-placed products (Mc = 7.1, SDc = 1.7) more favorably than margin-placed products
(Mp = 6.5, SDp = 1.4), t(102) = 3.32, p < .001. Center- and margin-placed product ads
elicited no statistically significant differences in how long participants would be willing

46 to wait to purchase the item or how much they would be willing to sell the familiar
product for, with all ts < 1.18.
Study 2B
In parallel to Study 2A, Study 2B explores whether product location actually
influences consumer evaluations of novel brands featured in print advertisements. To
examine whether product location in novel print advertisements for unknown (indeed,
fictitious) brands might influence consumers’ subsequent evaluations of these unfamiliar
brands, Study 2B presented participants with completely novel ad images featuring
unfamiliar, fictitious products, constructed by a graphic designer. If product location
influences consumers’ evaluations by facilitating the identification and understanding of
the featured brand, margin-placed product advertisements of novel brands should evoke
more favorable attitudes from consumers than center-placed product ads, contrary to the
pattern of findings for the familiar brands in Study 2A.
Additionally, Study 2B addresses some possible confounds evident in Study 2A.
Specifically, the center- and margin-placed product ads used in Study 2A differ in ways
other than just the location of the product. A center-placed product ad and a margin-
placed product ad for any given product varied on many important visual dimensions,
including the position and size of the product in the ads. Therefore, Study 2B explored
product location using images that were rigorously matched on these visual dimensions to
eliminate the possibility that any structural differences between two ad images could be
responsible for eliciting different brand judgments. In addition to featuring novel brands
of products, these stimuli controlled for other visual elements between the center- and

47 margin-placed product advertisements of each brand, such as color scheme, the presence
of human actors and the race and gender of those actors, and the size and orientation of
the product in the ad. Given that use of conceptually relevant copy text can facilitate
consumer understanding of a given advertisement (Schmitt, Tavassoli, & Millard, 1993;
Edell & Staelin, 1983; Labroo & Lee, 2004), both versions of each advertisement also
incorporated the same tagline.
Study 2B: Method
Participants
In exchange for partial course credit, thirty-eight undergraduate students
participated in the study and were randomly assigned to conditions.
Stimulus Materials
A professional graphic designer created five novel brands of products for this
study (Figure 2). These ads featured Doggy ‘Do dog shampoo, Vino wine, Toothbrush,
Inc. toothbrushes, Koku coffee, and Suds dish soap, and embedded each in one center-
and one margin-placed product advertisement. These novel advertisements matched the
center- and margin-placed product ad images for a given novel brand on product size and
the orientation of the product in the image (i.e., the angle of rotation at which the product
is displayed, if any). Furthermore, these two ad images contained similar color schemes
and similar degrees of motion within the ad (i.e., the image as a “freeze frame” of active
movement, or the image as a static display of nonmoving objects). Finally, the presence
of actors, and the gender and race of those actors, were identical between center- and
margin-placed product advertisements for each brand.

48 Design and Procedures
Study 2B employed a within-subjects design identical to Study 2A, replacing the
real advertisements with five advertisements featuring novel brands of products.
Participants viewed one of two possible stimulus sets constructed in the same manner as
Study 2A. Participants indicated how much they liked the advertisement image, the
desirability of the product, how long they would wait to purchase the product, and the
price at which they would be willing to sell the product once owned using the same
questions as Study 2A.
Study 2B: Results
Transformations
Identical to Study 2A, the amount of time participants said they would wait to buy
the product and the price they would sell it at was square-root transformed and then
standardized. For each participant, how much they liked the image, product desirability
variables, and standardized wait time and sell prices were averaged across all center-
placed product ad trials and across all margin-placed product ad trials.
Reported Attitudes
The four consumer attitude measures again showed high internal consistency for
both center-placed product ads (α = .88) and margin-placed product ads (α = .88) and
were averaged across participants. Participants rated products located in margin-placed
product ads (Mp = 6.5, SDp = 1.3) more favorably than products located in center-placed
product ads (Mc = 5.9, SDc = 1.4), t(25) = -2.66, p = .013.

49
No statistically significant differences were observed between stimulus sets, or
between center- and margin-placed product ads on how long participants would be
willing to wait to purchase the item or how much they would be willing to sell the
product for, with all ts > -0.5.
Studies 2A and 2B: Discussion
Studies 2A and 2B support the hypothesis that processing fluency affects
consumer judgments by providing preliminary evidence that a product’s location within
an ad can influence consumer attitudes toward the product. In Study 2A, center-placed
product ads elicited more positive evaluations of familiar products and of the ad itself
than margin-placed product ads. In Study 2B, margin-placed product ads elicited more
positive evaluations of familiar products and of the ad itself than center-placed product
ads. Together, these studies support the hypothesis that consumers’ ease of understanding
is at least partially a function of familiarity with the brand and the spatial location of the
product in a given ad. This suggests that simply altering a given product’s spatial location
within an advertisement image could improve consumer attitudes toward the featured
brand. Students with relevant academic and work experience in the field of marketing
appear to possess a greater understanding of this, but to the lay consumer, this evidence is
counterintuitive (see Study 1).
Overview of Studies 3A and 3B: Visual Attention in Viewing Advertisement Stimuli
One particular confound prevents a straightforward interpretation of the findings
in Studies 2A and 2B. These studies assumed that participants attended to the center of
the screen as each advertisement image appeared, focusing on the product when it was
50 placed in the center of the ad image or on the context when the product was placed in the
periphery of the ad image. Prior research suggests that viewers’ attention automatically
gravitates toward the center of an image on a screen (e.g., Brasel & Gips, 2008a, 2008b;
Tosi et al., 1997). Without measures in place to verify that participants attended to the
center of each ad in Studies 2A and 2B, however, whether or not participants actually did
so remains questionable. Given that novelty attracts attention (e.g., Mitchell, Livosky, &
Mather, 1998; Chong, Riis, McGinnis, Williams, Holcomb, & Daffner, 2008; Karacan &
Hayhoe, 2008), the possibility remains that, for example, consumers’ focus of visual
attention in print advertisements could differ as a function of whether the featured brand
is novel or familiar, irrespective of product location. Studies 3A and 3B address this
alternative possibility by engaging participants in a secondary addition task to ensure that
they attended to the center of the screen as each image appeared before them. These
studies replicated Studies 2A and 2B, but employed a guided attention paradigm that
drew participants’ attention to the center of the screen as each advertisement image
appeared.
Study 3A
Study 3A employed a guided attention paradigm that drew participants’ attention
to the center of the screen as each of the real-world advertisements from Study 2A
appeared by presenting them with a simple arithmetic task. If participants in Study 2A
visually attended to the center of each advertisement image as expected based on prior
research, participants in Study 3A should accurately perform the arithmetic task.
Furthermore, participants in Study 3A should evaluate familiar products and their

51 advertisement images more favorably after viewing center-placed product advertisements
than margin-placed product advertisements, replicating results from Study 2A.
Study 3A: Method
Participants
In exchange for partial course credit, 77 undergraduate students participated in the
experiment and were randomly assigned to conditions.
Design and Procedure
The present study utilized a 2 (product location: center vs. margin) x 2 (stimulus
set) mixed experimental design, with product location as a within-subjects and the
specific set of advertisements viewed as a between-subjects variable. In this experiment,
participants viewed and evaluated a series of four print advertisements for four well-
known products used in Study 2A. Also similar to Study 2A, half of these ads placed the
product at the center of the ad and the remaining half placed the product along the
margins of the ad. That is, each participant viewed two center-placed and two margin-
placed product ads featuring one of four real, familiar products, presented in the form of
two possible stimulus sets that were counterbalanced between participants.
In addition, participants completed a basic arithmetic task as they viewed each
advertisement image. This secondary task required them to add three numbers that
appeared sequentially at the center of the screen while the advertisement image appeared,
forcing participants to attend to the center of each ad image for the duration of the
presentation. A new single-digit number appeared every 2 seconds, with the overall ad
exposure time lasting 6 seconds. Immediately following each trial of this two-part task,

52 participants recorded the summed value of the numbers they viewed and identified the
last number that appeared on the screen. These values served as a manipulation check to
verify whether or not participants indeed attended to the center of the screen while
viewing each image.
Participants then completed an explicit attitudes questionnaire on each
advertisement image they just viewed. Participants assessed product desirability by rating
questionnaire items identical to those used in Studies 2A and 2B. To further probe the
extent to which product location differences may influence consumer judgments about
familiar and novel brands and the ads in which they are featured, the questionnaire also
asked participants to rate how much they trust each brand based on the image they
viewed (brand trust) and how eye-catching, attractive, exciting, and appealing the image
was (additional ratings of image attractiveness; see Appendix C) on 11-point Likert-type
scales in which 1 = not at all and 11 = extremely.
Study 3A: Results
Manipulation Check: Accuracy
If attending to the center of each image, participants should be able to accurately
report the sum of values from each 3-number addition trial, as well as the final number
presented in each trial. Indeed, participants reported the correct sum value in 91% of all
trials and reported the correct final number in 98% of all trials in the experiment. This
confirms that participants generally focused their attention on the center of the screen,
where each of these numbers appeared during the course of the experiment.

53 Reported Attitudes
Three product desirability items (how participants felt about the product, how
interested they were in the product, and how likely they would be to actually buy the
product) and the brand trust item all showed high internal consistency for both center-
placed product (α = .89) and margin-placed product (α = .89) ads. Additionally, all five
image attractiveness items (how much they liked the image and how captivating,
appealing, exciting, and attractive they felt the image was) also showed high internal
consistency for both center-placed product (α = .92) and margin-placed product (α = .96)
ads. Therefore, these items were averaged to create the aggregate product desirability and
image attractiveness variables.
Two 2 (location: center-placed vs. margin-placed) x 2 (stimulus set) repeated
measures ANOVAs on product desirability and image attractiveness revealed that center-
placed product advertisements generally elicited more favorable evaluations of the
familiar brand (Mc = 4.4, SDc = 1.1) than margin-placed product advertisements (Mp =
4.0, SDp = 1.2), F (1, 75) = 9.66, p = .003. Participants also generally rated advertisement
images that employed the center-placed product layout more favorably (Mc = 5.0, SDc =
0.9) than those employing the margin-placed product layout (Mp = 4.4, SDp = 1.1), F (1,
75) = 11.01, p < .001. No interaction effect or main effect of stimulus set emerged, F’s
(1, 75) < 3.38.
Study 3B
Study 3B determined whether participants viewing novel ads in Study 2B
exhibited the same bias towards attending to the center of the image as participants

54 viewing real ads did in Studies 2A and 3A. To accomplish this, the present study
replicated the design used in Study 3A for the novel ads featuring unfamiliar, fictitious
products used in Study 2B. Participants in Study 3B should evaluate novel products and
their advertisement images more favorably after viewing margin-placed product
advertisements than center-placed product advertisements. However, if novel brands
attract visual attention, either the pattern of evaluations should change when participants
view novel ads using the guided visual attention paradigm, or participants should be
inaccurate in the arithmetic task for trials that feature margin-placed product
advertisements.
Study 3B: Method
Participants
In exchange for partial course credit, 78 undergraduate students participated in the
experiment and were randomly assigned to conditions.
Design and Procedure
The present study utilized a 2 (product location: center vs. margin) x 2 (stimulus
set) mixed design, with product location as a within-subjects and stimulus set as a
between-subjects variable. This study used a procedure identical to Study 3A, except in
one respect. In this experiment, participants viewed and evaluated a series of four print
advertisements on four of the unknown products used in Study 2B. Half of these ads
employed the center-placed product layout and the remaining half employed the center-
placed product layout. That is, each participant viewed two center-placed and two

55 margin-placed product ads featuring one of four fictitious products, presented in the form
of two possible stimulus sets that were counterbalanced between participants.
Study 3B: Results
Manipulation Check: Accuracy
If attending to the center of each image, participants should be able to accurately
report the sum of values from each 3-number addition trial, as well as the final number
presented in each trial. Indeed, participants reported the correct sum value in 85% of all
trials and reported the correct final number in 98% of all trials in the experiment. This
again confirms that participants generally focused their attention on the center of the
screen, where each of these numbers appeared during the course of the experiment.
Reported Attitudes
The three product desirability items (how participants felt about the product, how
interested they were in the product, and how likely they would be to actually buy the
product) and the brand trust item all showed high internal consistency for both center-
placed product (α = .93) and margin-placed product (α = .91) ads. Additionally, all five
image attractiveness items (how much they liked the image and how captivating,
appealing, exciting, and attractive they felt the image was) also showed high internal
consistency for both center-placed product (α = .94) and margin-placed product (α = .95)
ads. Therefore, these items were averaged to create the aggregate product desirability and
image attractiveness variables.
A 2 (product location: center vs. margin) x 2 (stimulus set) repeated measures
ANOVA revealed that margin-placed product advertisements generally elicited more

56 favorable evaluations of novel brands (Mc = 4.7, SDc = 1.6) than center-placed product
advertisements (Mp = 5.3, SDp = 1.8), F (1, 76) = 6.63, p = .012. Participants also
generally rated advertisement images that employed the center-placed product layout
more favorably (Mc = 5.7, SDc = 1.8) than those employing the margin-placed product
layout (Mp = 6.5, SDp = 1.8), F (1, 76) = 12.804, p = .001. No interaction effect or main
effect of stimulus set emerged, F’s (1, 75) < 1.01.
Studies 3A and 3B: Discussion
Studies 3A and 3B confirmed that participants’ visual attention gravitated toward
the center of each ad appearing on the screen in Studies 2A and 2B by replicating prior
findings using a guided attention paradigm. As in Study 2A, Study 3A demonstrated that
participants rated familiar brands as more desirable, and the advertisement images as
more attractive, after viewing center-placed product ads than margin-placed product ads.
Similarly, participants in Study 3B rated novel brands as more desirable, and the
advertisement images as more attractive, after viewing margin-placed product ads than
center-placed product ads. Together, these findings rule out the alternative explanation
that novel products, wherever they are placed in an ad, automatically attract more visual
attention than familiar products. Furthermore, these results are consistent the hypothesis
that brand familiarity and product location interact to affect ease or speed of processing,
which in turn should inform subsequent consumer evaluations of the brand and ad.

57 Overview of Study 4: Assessing the Processing Experience and Controlling for Stimulus-
Based Confounds
With Study 4, I hoped to accomplish 5 goals. First, Study 4 used new sets of
rigorously controlled advertisement stimuli, created to address the alternative explanation
that prior findings were driven not by product location and brand familiarity, but by other
possible variations between the center- and margin-placed product advertisements. Recall
that Studies 2A and 3A utilized real-world examples of center- and margin-placed
product advertisements of popular American brands, collected from images available on
the internet. By using real-world advertisements, these studies offered ecological validity;
however, as a result, these studies could not control for other variations in product size,
product orientation, color scheme, and other important differences in content and style.
Participants evaluating familiar brands could have rated center-placed product ads more
favorably not because of differences in product location, but because of other aesthetic
differences. Study 4 addresses this alternative by presenting participants with more
tightly controlled center- and margin-placed advertisements that systematically
manipulated the brand and the spatial location of the product in the context of otherwise
identical print advertisements. If the product location and brand familiarity interaction
observed in prior experimental studies replicate, participants in Study 4 should respond
more favorably to familiar brands after viewing center-placed product advertisements and
novel brands after viewing margin-placed product advertisements.
Another concern with prior studies may be the assumption that participants would
be familiar with the popular American brands selected for use in Studies 2A and 3A. In

58 prior studies, the effect of product location appears to be smaller with familiar brands
than with novel brands. However, this may occur because participants, in fact, did not
overwhelmingly recognize the “familiar,” popular brands I selected for use in these
experiments. To explore the possibility that differences in degree of familiarity with the
“familiar” brands influenced the effect of product location on consumer appraisals of
those brands, participants in Study 4 completed a brand awareness recall test to assess
whether participants were or were not highly familiar with the “familiar” brands used in
this experiment.
Third, Study 4 investigated whether conceptual coherence between the content of
the background image and the featured product matters. By manipulating the conceptual
relevance of background image to the product that appears in each ad, this study should
show that this visual context helps or hinders consumers’ ease in processing an ad,
affecting subsequent evaluations of the product. Consumers should evaluate coherent ads
with related contexts more favorably, and process them more easily, than ads in which
the background image or visual context is not conceptually related to the featured
product.
Study 4 also begins to directly explore processing fluency as the mechanism
through which brand familiarity and product placement inform subsequent evaluations. In
this study, participants completed additional self-report measures designed to assess the
consumer’s processing experience, derived from the processing fluency literature
(Schwarz, 2004; Labroo & Lee, 2004; Whittlesea et al. 1990; see Appendix D). If Study
4 replicates the findings of Studies 2A – 3B with new advertisement stimuli and if

59 processing fluency mediates this effect of ad type on consumer appraisals, then
participants should evaluate center-placed product advertisements featuring familiar
products as easier to understand than corresponding margin-placed product
advertisements. Similarly, participants should evaluate margin-placed product
advertisements featuring novel products as easier to understand than corresponding
center-placed product advertisements.
Finally, certain individual differences may alter the manner in which a consumer
responds to an advertisement image. Because individuals low in need for cognition tend
to rely more on cognitive shortcuts and other cues peripheral to message content when
forming attitudes and making judgments compared to those high in need for cognition
(e.g., Haugtvedt et al., 1988; Cacioppo et al., 1996; Smith & Petty, 1996), Study 4
explored the possibility that need for cognition may moderate the predicted effect of
brand familiarity and product location on consumer judgments as well. In the present
paradigm, individuals low in need for cognition may be more likely use processing
fluency as a cue about their own attitudes. Individuals with a high need for cognition, on
the other hand, may respond less favorably toward easy-to-process advertisements or
more favorably toward more disfluent, or difficult to process, advertisements than those
with a low need for cognition.
Study 4: Method
Participants
In exchange for partial course credit, 235 undergraduate students participated in
this experiment.

60 Stimulus Materials Pretest
Four different product types appeared in the advertisements created for this study.
One novel and one familiar brand were selected to represent each of the four different
product types. The familiar brands used in this task included the following: Palmolive
liquid dish soap, Corona beer, Starbucks coffee, and Fiji bottled water (Figure 3). The
novel product brands used in this task included the following: Suds liquid dish soap,
Tiger beer, Koku coffee, and Vida bottled water (Figure 4). In a pretest, participants (N =
34) evaluated the novel and familiar brand of each of the four product types as equally
attractive, with all t’s < .95.
Each of the eight brands listed above appeared in four different versions of an
advertisement. That is, each brand appeared at the center or along the margins of an ad
containing a conceptually related background image and copy text. Each brand also
appeared at the center or along the margins of an ad containing a conceptually unrelated
theme. When viewing the background images by themselves, participants (N = 28) rated
the related and unrelated background contexts that would be used behind each product as
equally attractive, with all t’s < .59. When viewing the background image and product
together as an advertisement, participants (N = 18) also identified each related context as
significantly more related to the featured product than the unrelated context selected for
use, with all t’s > 5.24, p’s < .001. These respondents evaluated the professional quality
of familiar-product and novel-product versions of the same advertisement as statistically
equal, with all t’s < 1.64.

61 Design and Procedure
To begin the study, each participant completed a brand awareness recall test, one
of the most commonly employed methods in marketing research to assess consumer
knowledge and awareness of a given brand (Bettman, 1979). A recall test assesses
whether or not an individual can freely remember and list the brand name (e.g.,
Aquafina) when prompted only with the name of the product category (e.g., bottled
water; Blythe, 2008). This is superior to other recognition measures that provide
consumers with the brand name and ask directly whether or not they recognize or are
otherwise familiar with the name, as these methods often falsely elicit positive claims of
recognition and familiarity. As part of the test, Study 4 participants were asked to recall
and list as many brand names as they could for each of four different types of products:
bottled water, beer, dish soap, and coffee.
After the recall test, participants individually engaged in a computer task in which
they viewed and evaluated a series of four print advertisements on four familiar or four
novel brands of products. The presentation of each ad followed the appearance of a
fixation cross at the center of a blank screen. Each ad displayed on the screen for 2000
milliseconds, which reflects the average time consumers spend looking at a given
advertisement (du Plessis, 2005). For both real and novel product sets, half of these ads
employed a center-placed product layout and the remaining half employed a margin-
placed product layout. That is, each participant viewed two center-placed product and
two margin-placed product ads. In addition, half of these presented the product within a
conceptually related context, and the remaining half presented the product within a

62 conceptually unrelated context. For example, a related context for a brand of coffee might
contain a background of breakfast foods and a steamy mug, accompanied by the words,
“Good morning!” An unrelated context for the same brand might contain an image of an
SUV atop a mound of crumbling rock and the phrase, “Get straight to the point.” This
produced a 2 (brand: familiar vs. novel) x 2 (product location: center vs. margin) x 2
(background context: related vs. unrelated to the product) mixed experimental design for
analysis, with brand type as the between-subjects variable and background context and
product location as the within-subjects variables.
After viewing each ad, participants then completed a questionnaire designed to
measure consumer attitudes, purchase intent, and processing fluency (see Appendix D for
a comprehensive list of items). To assess consumer attitudes and purchase intent, this
questionnaire adapted items from Studies 2A-B and 3A-B and included measures
commonly used in consumer psychology and advertising research, such as attitude
toward the ad (Campbell & Keller, 2003; Phelps & Thorson, 1991), attitude toward the
brand (Campbell & Keller, 2003; Phelps & Thorson, 1991), and purchase intent
(MacKenzie, Lutz, & Belch, 1986). To assess how easily consumers understood each ad,
participants completed several measures adapted from or created based on processing
fluency research (Labroo & Kim, 2009; Labroo & Lee, 2004; Schwarz, 2004; Whittlesea
et al., 1990). Specifically, participants indicated how easy to understand they find each
advertisement to be (Labroo & Lee, 2004), how much effort it took to process each ad
(Labroo & Lee, 2004), and how clear the picture display was on 11-point Likert-type
scales (Whittlesea et al., 1990), for which 1 = not at all easy, effortful, or clear and 11 =

63 extremely easy, effortful, or clear. Participants also estimated how long they believed the
advertisement appeared on the screen (in milliseconds). The questionnaire also measured
how familiar each advertisement felt to participants on an 11-point Likert-type scale,
where 1 = not at all and 11 = extremely, as a possible alternative measure of processing
fluency (Schwarz, 2004). In addition, the questionnaire measured brand familiarity as a
manipulation check by asking participants to indicate how familiar they were with the
brand on an 11-point Likert-type scale, where 1 = not at all familiar and 11 = extremely
familiar, to ensure that participants experienced familiar brands as familiar and novel
brands as unfamiliar.
After the computer task, participants completed the Need for Cognition Scale
(Cacioppo, Petty, & Kao, 1984) to assess their individual tendency to engage in and
satisfaction gained from the process of thinking.
Study 4: Results
Data Reduction
The four attitude towards the ad items (good – bad, appealing – unappealing,
pleasant – unpleasant, and high-quality – low-quality) all showed high internal
consistency, with Cohen’s α > .942 for each ad type. Additionally, the four attitude
towards the brand items (good – bad, appealing – unappealing, pleasant – unpleasant,
and high-quality – low-quality) also showed high internal consistency (α’s > .930), as did
the three purchase intent items (probable-improbable, likely-unlikely, possible-
impossible; α’s > .887). Therefore, these items were averaged to create the aggregate

64 attitude towards the ad, attitude towards the brand, and purchase intent variables for
analysis.
The four processing fluency measures (how clear the image was, how much effort
it took to process the advertisement [reverse coded], how easy the advertisement was to
understand, and how familiar the advertisement felt) were also combined to create an
aggregate processing fluency variable for analysis. However, it is worth noting that these
four items showed only moderate internal consistency (αFam_C = .642, αFam_M = .710,
αNov_C = .665, and αNov_M = .676).
Consumer Appraisals
I conducted a 2 (brand: familiar vs. novel) x 2 (product location: center vs.
margin) x 2 (background: related vs. unrelated) repeated measures ANOVAs on the three
consumer appraisal variables (attitude toward the brand, attitude toward the ad, and
purchase intent), with background and product location as within-subjects variables and
brand type as the between-subjects variable. A main effect of brand familiarity emerged
for each measure, revealing that familiar brands evoked more favorable attitudes toward
the ad, F (1, 233) = 22.72, p < .001, more favorable attitudes toward the brand, F (1, 233)
= 154.79, p < .001, and a greater reported purchase intent, F (1, 233) = 93.63, p < .001,
than novel brands (Table 1). As expected, this analysis did not detect a main effect of
product location on any of the three consumer appraisal measures, F’s (1, 233) < 1.31.
However, a significant main effect of background relatedness emerged for each of the
three aggregate consumer appraisal variables. Specifically, conceptually related
backgrounds elicited more favorable attitudes toward the ad, F (1, 233) = 78.04, p < .001,

65 and brand, F (1, 233) = 13.37, p < .001. Participants also reported an increased likelihood
of actually purchasing the product after viewing ads that contained conceptually related
background images compared to those that contained conceptually unrelated background
images, F (1, 233) = 17.13, p < .001 (Table 2). This finding provides conclusive evidence
that conceptually related background images in these advertisements contribute to
consumers’ appraisals of the brand and ad over conceptually unrelated background
images.
The repeated measures ANOVAs on attitude toward the brand, attitude toward
the ad, and purchase intent failed to produce the predicted two-way interaction between
brand familiarity and product location to replicate the findings from Studies 2A – 3B,
with all Fs < 1.13. No other interaction effects achieved conventional levels of
significance, F’s (1, 233) < 2.88.
Processing Fluency
To determine whether ad type influenced how easily consumers were able to
process the contents of the ad, I conducted the same 3-way repeated measures ANOVA
on the aggregate processing fluency measure. As expected, a main effect of brand
familiarity on processing fluency emerged, F (1, 233) = 37.47, p < .001. Participants
reported that advertisements featuring familiar brands were easier to process (MF = 7.7,
SDF = 1.4) than advertisements featuring novel brands (MN = 6.6, SDN = 1.2). A main
effect of product location on processing fluency also emerged, F (1, 233) = 26.70, p <
.001. Participants reported processing center-placed product advertisements more easily
(MC = 7.5, SDC = 1.7) than margin-placed product advertisements (MM = 6.8, SDM =

66 1.8). In addition, a main effect of background relatedness on processing fluency emerged,
F (1, 233) = 70.13, p < .001. That is, in line with predictions, advertisements with
conceptually related backgrounds were easier for consumers to process (Mrel = 7.6, SDrel
= 1.7) than those with conceptually unrelated backgrounds (Mun = 6.7, SDun = 1.7).
However, a 2-way interaction effect of product location and background relatedness on
processing fluency emerged, F (1, 233) = 5.23, p = .023. Simple effects t-tests revealed
that participants processed center-placed product ads more easily than margin-placed
product ads when the background image was conceptually unrelated to the product, t
(233) = 5.49, p < .001. This was also true for ads containing conceptually related
backgrounds, t (233) = 2.48, p = .014, although the difference between means was less
extreme with these ads than with those containing conceptually unrelated background
images (see Table 3). One may infer from this result that because participants directed
their visual attention toward the center of the ad, their identification of center-placed
products was less affected by scene incoherence, requiring less effort to process, than
margin-placed products that consumers focused on later in the viewing experience. No
other interaction effects achieved conventional levels of statistical significance, F’s (1,
233) < 1.64.
I also assessed whether a relationship existed between processing fluency and
consumer appraisals by computing the correlations between processing fluency and each
dependent variable for both brand familiarity conditions and for both types of
backgrounds. As expected, for both familiar and novel brands, processing fluency was
highly correlated with the consumer’s attitude toward the ad, r (119) = .473, p < .001 and

67 r (116) = .385, p < .001, attitude toward the brand, r (119) = .307, p = .001 and r (116) =
.337, p < .001, and purchase intent, r (119) = .202, p = .03 and r (119) = .223, p = .016,
respectively. Similarly, for ads containing conceptually related background contexts and
for those containing conceptually unrelated background contexts, processing fluency
again correlated with the consumer’s attitude toward the ad, r (234) = .524, p < .001 and r
(233) = .483, p < .001, attitude toward the brand, r (234) = .529, p < .001 and r (233) =
.388, p < .001, and purchase intent, r (234) = .413, p < .001 and r (233) = .299, p < .001,
respectively. Because this study failed to replicate the interaction effect of brand
familiarity and product location on consumer appraisals, a mediation analysis was not
warranted.
Assessing Need for Cognition as a Moderator of Consumer Appraisals
The items on the Need for Cognition Scale (Cacioppo et al., 1984) were highly
intercorrelated, α = .884. Scores ranged from 30 to 84, with a median score of 59.
Following the procedure used by Petty, Brinol, and Tormala (2002), I conducted a
median split on these scores, categorizing any participant with a score of 59 or greater as
earning a high need for cognition score and any participant with a score under 59 as
earning a low need for cognition score.
I conducted a 2 (brand: familiar vs. novel) x 2 (product location: center vs.
margin) x 2 (background: related vs. unrelated) x 2 (need for cognition: high vs. low)
repeated measures ANOVA, in which product location and background were within-
subjects variables and brand type and need for cognition score were between-subjects
variables. In this analysis, there was a single two-way interaction between background

68 and need for cognition score on purchase intent, F (1, 230) = 4.43, p = .036. Specifically,
consumers low in need for cognition reported significantly higher purchase prices when
the advertisement contained a background context conceptually related to the featured
product than when it contained an incoherent background, t (230) = 4.34, p < .001. On
the other hand, ad coherence did not appear to significantly inform the purchase prices of
those high in need for cognition, t (230) = 1.52 (see Table 4). The inclusion of the need
for cognition variable produced no other statistically significant effects, F’s (1, 230) <
2.63.
Consumer Appraisals of Individual Product Types
I also explored whether participants assigned to view familiar brands actually
recognized them. In self-reports of brand familiarity, 32 of the 119 participants in the
“familiar brands” condition (27%) indicated that they were not at all familiar, or only
somewhat familiar, with the Fiji brand of bottled water. More surprisingly, 50 (42%)
respondents in this condition indicated a lack of familiarity with the Palmolive brand of
dish soap. For Starbucks coffee and Corona beer, this was less of a concern, with only 11
(9%) and 14 (12%) participants indicating a lack of familiarity with the brand,
respectively.
Of particular interest was whether or not participants in the familiar condition
successfully recalled and listed the supposedly familiar brand name (e.g., Fiji) in
response to a product category label (e.g., bottled water). If a particular brand name is
closely linked in one’s memory to its more general product category, participants should
be more likely to recall and list this brand name when prompted by the product category

69 name than those for whom the brand is not as familiar or closely associated with the
product category. So for those participants in the “familiar brand” condition, I wished to
determine whether those who were familiar enough with the featured brand that they
were able to freely recall and the brand name reported more favorable responses to those
familiar brands when later viewed in the context of a center-placed, compared to a
margin-placed, product advertisement. In the recall test, 91, 48, 165, and 114 of the 235
participants freely recalled the target brand name out of all bottled waters, beers, dish
soaps, and coffees, respectively. As expected, no participant cited the name of any of the
novel brands used in the experiment during the recall test. For this reason, the following
analyses examined data only from participants in the familiar brand condition.
For each familiar brand, I conducted a 2 (recall: free vs. failed) x 2 (product
location: center vs. margin) x 2 (background: related vs. unrelated) between-subjects
ANOVA. This produced only two statistically significant effects. First, a main effect of
free recall on attitude toward the ad, attitude toward the brand, and purchase intent
emerged for all familiar brands, F’s (1, 111) > 5.03, p < .027 (Table 5). The only
exception was for Fiji bottled water on attitude toward the ad, F (1, 111) = 1.02. Thus, as
expected, greater brand familiarity (as indicated by a brand-awareness free-recall test) led
to more positive consumer appraisals. Second, a main effect of background relatedness
on attitude toward the ad emerged for three of the four familiar brands, F’s (1, 111) >
6.32, p < .013 (Table 6). Specifically, participants rated the Fiji bottled water, Palmolive
dish soap, and Starbucks coffee advertisements more favorably if the ad also contained a
conceptually related background than if it contained a conceptually unrelated

70 background, as expected. No other main or interaction effects achieved statistical
significance in more than one trial for those in the familiar brand condition.
In sum, with the inclusion of brand awareness as an individual difference variable,
analyses of each individual product type failed to demonstrate the predicted brand
familiarity and product location interaction effect on consumer appraisals.
Study 4: Discussion
Consistent with research on the mere exposure effect and other work on the
influence of prior exposure on one’s processing experience with and subsequent
evaluations of a target (e.g., Fang et al., 2007; Winkielman et al., 2003; Bornstein, 1989;
Zajonc, 1968; Janizsewski, 1988, 1990, 1993), Study 4 confirmed that the consumer’s
familiarity with a given brand matters. Ads featuring familiar brands elicited more
favorable appraisals of the ad and brand from consumers, and were easier for consumers
to process, than otherwise identical advertisements featuring novel brands of the same
product type. Moreover, when considering individual differences in brand awareness,
participants able to freely recall a brand tended to evaluate it more favorably than
participants who were unable to list the brand.
Consistent with prior research on the advantages of scene coherence (e.g., Boyce
et al., 1989; Boyce & Pollatsek, 1992; Biederman et al., 1982; Lee & Labroo, 2004;
Shapiro, 1999), Study 4 also demonstrated that the conceptual relatedness of background
images to the products featured in advertisements informs the consumer’s processing
experience and ultimate response. Consumers processed advertisements more easily,
evaluated the ad and brand more positively, and reported a greater likelihood of actually

71 purchasing the product when those advertisements contained backgrounds that were
conceptually related to the featured product than when they contained conceptually
unrelated backgrounds.
Study 4 also presented participants with more rigorously controlled print
advertisements for familiar and novel brands. However, Study 4 did not produce the
predicted two-way interaction between product location and brand familiarity on the
consumer appraisal or processing fluency measures, failing to replicate findings from
Studies 2A – 3B. These findings could suggest that ad type does not inform the
consumer’s processing experience or subsequent evaluations. Alternatively, the brand
awareness recall test may have inadvertently served as a conceptual prime for these
product types, facilitating brand identification speed above and beyond what might have
been observed as a result of manipulations of brand familiarity and product location
within the ad. If the recall test operated as a conceptual prime, this task may have
activated the types of schemas in memory that otherwise would have been activated by
the advertisement background contexts, facilitating consumer processing of all ads seen
in the context of this experiment.
Finally, individual differences in need for cognition does not appear to moderate
the predicted effect of product location and brand familiarity on consumer appraisals.
However, need for cognition did appear to moderate the effect of background relatedness
on purchase intent. That is, incoherent background contexts elicited less favorable
evaluations from individuals low in need for cognition than coherent backgrounds, but
for those high in need for cognition, the advertiser’s choice of background image made

72 no apparent difference. Given that advertisements containing incoherent backgrounds
were more difficult to process, this finding indicates that individuals high in need for
cognition, who enjoy engaging in effortful thought processes, may have interpreted this
processing difficulty in a positive light (see Schwarz, 2004 and Brinol, Petty, & Tormala,
2006 for further discussion of the importance of naïve theories in determining the effects
of processing fluency on attitudes and social judgments). However, those low in need for
cognition, who often rely more on extrinsic cues and heuristics and less on effortful
thought when making decisions (Haugtvedt et al., 1988; Smith & Petty, 1996; Cacioppo
et al., 1996), likely interpreted processing difficulty as a negative cue. This suggests that
need for cognition may be a useful individual difference variable to consider as a
potential moderator when examining the effects of processing fluency or disfluency on
consumer appraisals.
In sum, Study 4 confirmed both that familiar brands elicit more favorable
consumer appraisals than novel brands and that advertisements containing related
background contexts evoke more favorable appraisals than advertisements with unrelated
background contexts. Despite this, the brand familiarity and product location interaction
effect noted in Studies 2A – 3B failed to replicate, suggesting either that these prior
findings could have been driven solely by extraneous stimulus differences or that a
priming confound introduced in Study 4 contaminated the present findings.
Overview of Study 5: Does Processing Fluency Inform Consumer Evaluations?
If consumers evaluate brands more favorably as a result of their processing
experience, there should be instances when a fluent processing experience produces

73 different patterns of results. For situations in which processing fluency serves as a
negative evaluative cue, as is the case when consumers assess the instrumentality of a
product in satisfying their current needs, processing fluency should have the opposite
effect on consumer appraisals. In the original demonstration of the instrumentality
heuristic, the consumer’s current goal state affected his or her interpretation of processing
fluency as an informative cue when evaluating products relevant to these desires (Labroo
& Kim, 2009). Participants evaluated easy-to-process ads more favorably that difficult-
to-process ads in absence of an active goal state, but when consumers possessed an active
goal state relevant to the product featured in the advertisement they viewed, difficult-to-
process ads elicited more favorable evaluations than easy-to-process ads. The authors
argued that this reversal resulted from a change in the definition of processing fluency
(Labroo & Kim, 2009). Specifically, when consumers process targets passively or with
low involvement, they tend to evaluate those targets more favorably and are willing to
pay more to obtain those targets when their processing experience is a fluent one.
However, when consumers possess a relevant goal state, this default interpretation of
fluency changes to one in which difficulty, and not ease, is construed as a positive cue.
Presumably, this is because consumers associate difficulty with a more useful or
instrumental means of achieving one’s goals (consider the old adage that nothing easy is
worthwhile).
To determine whether or not processing fluency drives the effects of ad type on
consumer appraisals as observed in Studies 2A – 3B, Study 5 manipulated the active goal
states of participants prior to viewing advertisements by adopting the experimental

74 procedures used to demonstrate the instrumentality heuristic. Thus, in the current study, if
the presence or absence of a relevant goal state moderates the effects of ad type on the
consumer response, then such findings would support the hypothesis that differences in
brand familiarity and product location inform consumer appraisals through a processing
fluency mechanism.
If processing fluency underlies the effects of ad type on consumer appraisals as
proposed, goal states should affect consumer appraisals following these different ad types
in predictable ways. In the absence of an active goal state, consumers should evaluate
center-placed product and margin-placed product advertisements in a manner identical to
Studies 2A, 2B, 3A, and 3B. That is, participants should evaluate the easy-to-process ad
more favorably than the more difficult-to-process ad, favoring the familiar brand more
after viewing a center-placed product ad than after viewing a margin-placed product ad
but favoring the novel brand more after viewing a margin-placed product ad than a
center-placed product ad. However, inducing a goal state relevant to the product that
consumers then evaluate should cause those consumers to adopt the instrumentality
heuristic, with those primed with the goal to feel good (“aim for pleasure”) exhibiting a
pattern of responses opposite to that observed when the goal is absent. That is, for
consumers who enjoy chocolate, those with an active goal state to feel good should
evaluate a chocolate bar more favorably after viewing a difficult-to-process ad than an
easy-to-process ad. These consumers should then evaluate the familiar brand more
favorably after viewing a margin-placed product ad than a center-placed product ad, but

75 should evaluate a novel brand more favorably after viewing a center-placed product ad
than a margin-placed product ad.
If processing fluency does not underlie the effects of ad type on consumer
appraisals, however, introducing a relevant active goal state should affect consumer
appraisals of all ad types in the same manner. Active goal states facilitate the pursuit of
these goals at a nonconscious, automatic level and result in more favorable appraisals of
goal-relevant targets (Ferguson & Bargh, 2004). If processing fluency does not underlie
the effects of ad type on consumer judgments, the introduction of a relevant active goal
state should result in more favorable consumer evaluations equally across all ad types.
Study 5: Method
Participants
In exchange for partial course credit, 220 undergraduate students participated in a
study consisting of several ostensibly unrelated surveys.
Stimulus Materials
For this study, I selected one familiar American brand of chocolate (Ghirardelli)
and one novel brand of chocolate available only in Australia (Koko Black). Participants
in a pretest evaluated the novel and familiar brands of chocolate as equally attractive on a
7-point Likert-type scale, t(32) = 1.66. When asked whether or not they recognized the
brand, a greater proportion of respondents reported that they recognized the familiar
brand (88%) compared to the unfamiliar, novel brand (6%), χ2 (1, N = 34) = 23.07, p <
.001.

76 Design and Procedure
Following a procedure similar to that used by Labroo and Kim (2009, experiment
1), this experiment utilized a 2 (goal: feel-good vs. no goal) x 2 (brand: familiar vs.
novel) x 2 (product location: center vs. margin) between-subjects design, with
participants randomly assigned to one of 8 possible conditions.
Identical to the Labroo and Kim (2009) procedure, participants first completed a
word scramble task designed as a goal priming manipulation (see Appendix E).
Specifically, participants viewed six different sets of five words each and formed a
grammatically correct sentence out of the words provided in each set. Depending on the
priming condition, the sentences pertained either to a feel-good goal (e.g., “aim for most
pleasure”) or were unrelated to a goal (e.g., “the ball is blue”). For the subsequent,
ostensibly unrelated survey, participants briefly viewed and then evaluated an
advertisement for a brand of chocolate following the procedure outlined in Study 4.
Participants saw one of four possible advertisements that contained either a familiar or
novel brand placed either in the center or along the margins of an otherwise identical
advertisement (see Figure 5). To evaluate the ad, participants completed a questionnaire
similar to that used in Study 4, but which also contained measures used by Labroo & Kim
(2009). These items included how much participants wanted the brand of chocolate, how
tempting it was, how much they liked chocolate in general, how much attention they paid
during the task, how good the task made them feel, and measures of how limited and
special the brand of chocolate seemed on a 7-point Likert-type scale in which 1
represented the least and 7 represented the most on each dimension (see Appendix F).

77 Participants also reported how frequently they eat chocolate on an 11-point Likert-type
scale, in which 1 = never and 11 = very frequently.
Study 5: Results
Manipulation Checks
As expected, participants in the 8 conditions did not differ on how much they like
chocolate in general, how frequently they eat chocolate, how much they paid attention
during the task, or how the task itself made them feel, F’s (1, 211) < 1.10. Moreover,
participants rated the familiar brand no differently than the novel brand with respect to
how limited or special they perceived the brand of chocolate to be, F’s (1, 217) < 1.51.
As expected, compared to participants viewing the novel brand of chocolate (Koko
Black), those viewing the familiar brand of chocolate (Ghirardelli) reported that brand as
being more familiar, F(1, 217) = 259.12, p < .001, and recognizable, F(1, 217) = 244.78,
p < .001.
Thirty-five participants (15.9% of all respondents), however, indicated that they
found chocolate to be undesirable. Because participants must perceive chocolate as
desirable for it to be instrumental in fulfilling a feel-good goal, these 35 participants were
excluded from further analyses.
Data Reduction
The four attitude toward the brand items from Study 4 again showed high internal
consistency (α = .93) and were thus combined to create one aggregate dependent
variable. Following the procedure outlined in Study 4, I also created the aggregate
attitude toward the ad (α = .91) and purchase intent (α = .90) variables. Three

78 participants exceeded three standard deviations from the mean response on one of the two
remaining dependent variables: their estimate of how long they believed the
advertisement appeared on the screen or how much they would pay for the product. As a
result, these three participants were excluded from further analysis.
The four processing fluency measures (how clear the image was, how much effort
it took to process the advertisement [reverse coded], how easy the advertisement was to
understand, and how familiar the advertisement felt) were also combined to create an
aggregate processing fluency variable for analysis. However, these four items again
showed only moderate internal consistency (α = .548).
Consumer Appraisals
I conducted a 2 (goal: feel-good vs. no goal) x 2 (brand: familiar vs. novel) x 2
(product location: center vs. margin) between-subjects ANOVA on purchase price and on
attitude toward the ad, attitude toward the brand, purchase intent, and processing fluency.
These analyses produced a main effect of brand familiarity on each of the following
dependent variables: purchase price, F (1, 171) = 5.64, p = .019, attitude toward the
brand, F (1, 171) = 11.70, p = .001, and processing fluency, F (1, 171) = 26.10, p < .001.
Specifically, the familiar brand elicited a higher purchase price and more favorable
attitudes than the novel brand. Moreover, consumers found the familiar brand
advertisement to be easier to process than the advertisement featuring the novel brand
(Table 7). No other main effects achieved conventional levels of statistical significance
for any other dependent variable, F’s (1, 171) < 3.20.

79
Additional analyses revealed a two-way interaction between product location and
goal condition on purchase intent, F(1, 171) = 4.67, p = .032. This effect appears to be
driven primarily by a difference in the feel-good condition. Specifically, participants in
the feel-good goal condition reported a higher intent to purchase the product after
viewing the margin-placed product advertisement (MM = 7.4, SDM = 2.6) compared to
those who viewed the center-placed product advertisement (MC = 6.3, SDC = 2.4).
Most importantly, this analysis revealed the predicted three-way interaction on
purchase price, F (1, 171) = 5.143, p = .025 (see Table 8 for all means and standard
deviations). To more clearly determine the nature of this effect, I conducted separate 2
(brand familiarity) x 2 (product location) ANOVAs on purchase price for both goal
conditions. For participants in the no-goal condition, the 2-way interaction effect between
brand familiarity and product location noted in Studies 2A – 3B replicated as expected, F
(1, 82) = 7.80, p = .007. Those who viewed the familiar brand of chocolate reported that
they would be willing to pay a marginally greater amount to purchase the product if they
viewed the center-placed product advertisement than the margin-placed product
advertisement, t(82) = 1.94, p = .055. Participants who viewed the novel brand of
chocolate reported a higher purchase price after viewing the margin-placed product
advertisement than the center-placed product advertisement, t(82) = -2.01, p = .048.
However, for participants in the feel-good goal condition, this 2-way interaction effect
was eliminated, F (1, 89) = 0.61. Although the differences between means do not achieve
conventional levels of statistical significance, it is worth noting that these participants
demonstrated a modest trend toward reversing the brand familiarity-product location

80 interaction effect, as predicted. That is, participants in the feel-good goal condition
appeared to respond somewhat more favorably to familiar brands after viewing margin-
placed compared to center-placed product ads, but to novel brands after viewing center-
placed compared to margin-placed product ads (refer to Table 8).
The omnibus 3-way ANOVA tests produced no other significant interaction
effects for any other dependent variable, F’s (1, 171) < 3.11.
Study 5: Discussion
Recent evidence indicates that the influence of processing fluency on judgments
depends on whether or not the perceived target pertains to an active goal state, with
consumers evaluating difficult-to-process goal-relevant stimuli more favorably than
comparable easy-to-process goal-relevant stimuli (the instrumentality heuristic; Labroo &
Kim, 2009). That is, the default metacognitive interpretation of processing fluency as a
peripheral cue in judgment appears to be a distinctly positive one, but active goal states
can trigger a perceiver’s use of the instrumentality heuristic, conferring a negative
interpretation on more fluent processing experiences.
To determine whether processing fluency underlies the observed differences
between center-placed and margin-placed product advertisements for familiar and novel
brands (as evidenced in Studies 2A, 2B, 3A, and 3B), Study 5 replicated the conditions
for the instrumentality heuristic phenomenon to examine consumer judgments in this
context. If the introduction of a relevant goal state reversed the traditional effects of ad
type on judgments, this study would provide evidence that processing fluency underlies
the observed effects of ad type on consumer appraisals. Indeed, in the absence of a

81 specific goal state, participants evaluated center-placed and margin-placed product
advertisements in a manner similar to the pattern observed in Studies 2A – 3B.
Participants reported that they would pay more money to purchase chocolate after
viewing an easy-to-process ad compared to a more difficult-to-process ad. However,
participants with an active “feel-good” goal were unaffected by these variables and
reported purchase prices that trended in the opposite directions from that observed with
participants in the no-goal condition and in Studies 2A – 3B. That is, participants with a
relevant active goal state reported that they would pay approximately 50 cents less for
brands featured in easy-to-process ad types (the center-placed familiar brand ad and
margin-placed novel brand ad), but approximately 50 cents more for brands featured in
difficult-to-process ad types (the margin-placed familiar brand ad and center-placed novel
brand ad) compared to participants who did not possess a relevant goal state. Thus, the
presence of a relevant goal state did not simply inflate consumer judgments of all ads, as
might be expected if processing fluency did not underlie the effects of ad type on
consumer appraisals. Instead, the presence or absence of a goal state influenced how
consumers differentially evaluated center- and margin-placed product advertisements of
familiar and novel brands, in a manner predicted by research on processing fluency and
the instrumentality heuristic. By replicating the effects of the instrumentality heuristic on
consumer judgments in the present context, Study 5 offers evidence that processing
fluency underlies the observed differences between center- and margin-placed product
advertisements.

82
Overview of Study 6: Manipulating Brand Familiarity
Studies 1 – 3B indicate that center-placed product advertisements should elicit
more favorable evaluations for any brand familiar to the consumer than margin-placed
product advertisements. Alternatively, in absence of prior efforts to increase consumers’
familiarity with an unknown product, margin-placed product advertisements should elicit
more positive consumer attitudes than center-placed product advertisements. To more
conclusively assess the relationship between brand familiarity, product location, and
subsequent product attitudes, Study 6 directly manipulated viewers’ familiarity with each
of eight real-world products. This experiment removes much of the variance introduced
by well-established brand image information and eliminates the alternative possibility
present in prior studies that aspects of the well-established image associated with popular,
real-world brands or the image associated with users of these brands, and not
advertisement processing fluency per se, affects consumer judgments.
The findings from the previous experimental studies should replicate under
conditions that involve a direct manipulation of brand familiarity. That is, participants
exposed to information about otherwise novel brands before viewing advertisements that
feature these products should respond more favorably after viewing a center-placed
product advertisement than a margin-placed product advertisement. However,
participants who do not receive any prior exposure to or information about these same
brands should respond more favorably after viewing a margin-placed product
advertisement than a center-placed product advertisement. Furthermore, if ease of
understanding improves evaluations of products featured in print advertisements,

83 participants should evaluate center-placed product advertisements featuring these newly
familiar brands as easier to understand than corresponding margin-placed product
advertisements. Similarly, participants without prior exposure to these otherwise novel
brands should evaluate margin-placed product advertisements as easier to understand
than corresponding center-placed product advertisements.
Study 6: Method
Participants
In exchange for partial course credit, 164 undergraduate students participated in a
study on consumer attitudes toward products featured in a range of multimedia marketing
communications.
Stimulus Materials
For this study, I selected eight novel brands of real-world products from
international advertising campaigns using the same pretesting procedures employed in
Study 4. I obtained electronic images of and commercials for these brands via Google’s
image search tool and Youtube, respectively. In a pretest (N = 26), participants rated the
attractiveness of all brands of products and all background images on a 7-point Likert-
type scale, with 1 = not at all and 7 = very. Mean ratings for each brand and each
background image were neutral to positive, earning a rating of at least a 3 or better. No
more than 15.4% of responding participants (4 of the 26 surveyed) indicated that they
recognized any individual brand. Participants also viewed each advertisement and rated
each background image as related to the product, offering a mean rating of at least 3 or
better on a 7-point Likert-type scale, with 1 = not at all and 1 = very. These product and

84 context images created mock-up center-placed product and margin-placed product
advertisements similar to those used in Study 4. Participants reported no statistically
significant difference in the professional quality of center-placed compared to margin-
placed product advertisements for each of the eight brands, with all t(24)’s < 2.064.
Design and Procedure
In this study, all participants were randomly assigned to one of four possible
conditions. These four conditions determined which brands of products each participant
became familiarized with and which brands remained novel, and also determined whether
these participants viewed a center-placed or margin-placed product advertisement for
each brand. Each participant viewed 2 product advertisements for each of 4 types of ads:
center-placed and margin-placed familiar brand ads, and center-placed and margin-placed
novel brand ads. Participant responses would be aggregated across both trials for each of
the four ad types, creating a 2 (brand familiarity: familiar vs. novel) x 2 (product location:
center vs. margin) within-subjects experimental design for analysis.
Upon entering the lab, participants first completed a brand familiarity
manipulation task in which they learned about four foreign products that would
presumably enter the American market in the coming year. Half of these participants
learned about the following brands of products: Hovis bread, the Citroen C4 automobile,
Belu bottled water, and Samboy potato chips. The remaining half of these participants
learned about the following alternative brands of products: Kingsmill bread, the Tata
Indica V2 automobile, Aqua Monta bottled water, and Smith’s potato chips. Participants
learned about each set of products by first reading positive consumer reviews (see

85 Appendix G) and then watching television commercials featuring each of the four brands.
They then evaluated each product by writing a brief response that answered open-ended
questions about (a) what they found appealing about the product and (b) what they liked
about the commercial advertisement (see Appendix H). As a brand familiarity
manipulation check, participants also indicated whether or not they possessed knowledge
about the brand of product prior to the experimental session and identified how familiar
they now felt with the brand using a 7-point Likert-type scale, for which 1 = not at all
familiar and 7 = extremely familiar.
In the second part of the experiment, all participants then viewed and evaluated a
series of eight mock-up print advertisements using a procedure identical to that of Study
4. Each of the eight target products appeared either in the center or along the margins of
an otherwise identical image to create two versions of each advertisement (see Figure 6).
Two possible sets of stimuli, featuring four center-placed product and four margin-placed
product ads each, presented participants with only one version of each of the eight target
product advertisements. Participants evaluated each ad by responding to questionnaire
items identical to those used in Study 4, and completed the Need for Cognition Scale
(Cacioppo et al., 1984) to conclude the experiment.
Study 6: Results
Manipulation Check: Familiarity
To determine the effectiveness of the brand familiarity manipulation task, I
conducted a 2 (time: before and after) x 2 (stimulus set) repeated measures ANOVA on
participants’ self-reported ratings of familiarity, collapsed across all four brands. A

86 significant main effect of time emerged, F (1, 480) = 1301.97, p < .001. That is,
participants reported a general lack of familiarity with the featured brands prior to the
brand familiarity manipulation task (Mpre = 1.2, SEpre = .024) but reported being
significantly more familiar with the brands after completing the task (Mpost = 4.6, SEpost =
.098). Participants randomly assigned to learn about Aqua Monta bottled water, the Tata
Indica V2 automobile, Smith’s potato chips, and Kingsmill bread responded no
differently than participants randomly assigned to learn about Belu bottled water, the
Citroen C4 automobile, Samboy potato chips, and Hovis bread, F (1, 480) = 2.70. These
findings confirm that participants generally felt more familiar with these featured brands
after undergoing the brand familiarity manipulation task at the beginning of the
experiment.
Data Reduction
As in Studies 4 and 5, the four attitude towards the ad items (good – bad,
appealing – unappealing, pleasant – unpleasant, and high-quality – low-quality) all
showed high internal consistency, with Cohen’s α of at least .920 or greater for each ad
type. Additionally, the four attitude towards the brand items (good – bad, appealing –
unappealing, pleasant – unpleasant, and high-quality – low-quality) also showed high
internal consistency, with α’s > .799, as did the three purchase intent items (probable-
improbable, likely-unlikely, possible-impossible; α’s > .889). Therefore, these items were
averaged to create the aggregate attitude towards the ad, attitude towards the brand, and
purchase intent variables for analysis.

87
The four processing fluency measures using a Likert-type scale (how clear the
image was, how much effort it took to process the advertisement [reverse coded], how
easy the advertisement was to understand, and how familiar the advertisement felt) were
again aggregated to form a processing fluency index variable. However, these four items
again showed only moderate internal consistency (all α’s between .527 and .715) and
should be regarded with caution.
Finally, for each participant, the attitude toward the ad, attitude toward the brand,
purchase intent, standardized price participants would pay for the product, and processing
fluency variables were averaged across all center-placed product ad trials and across all
margin-placed product ad trials for the familiar and novel brands. This created aggregate
values on each dimension for each participant in response to center-placed familiar brand
ads, margin-placed familiar brand ads, center-placed novel ads, and margin-placed novel
ads.
Consumer Appraisals and Processing Fluency
The Need for Cognition Scale (Cacioppo et al., 1984) questionnaire items were
highly intercorrelated, α = .831. Scores ranged from 24 to 99, with a median score of 56.
Following the procedure used by Petty et al. (2002) and in Study 4, I conducted a median
split on these scores, categorizing any participant with a score of 56 or greater as earning
a high need for cognition score and any participant with a score under 56 as earning a low
need for cognition score.
I conducted a 2 (brand: familiar vs. novel) x 2 (product location: center vs.
margin) x 2 (need for cognition: high vs. low) repeated measures ANOVA in which

88 brand familiarity and product location were within-subjects variables and need for
cognition score was the between-subjects variable on each of the following dependent
variables: attitude toward the ad, attitude toward the brand, purchase intent, purchase
price, and processing fluency. Consistent with Studies 4 and 5, this analysis produced a
main effect of brand familiarity on all five of the dependent variables. Specifically, ads
featuring familiar brands were easier to process, F (1, 158) = 38.50, p < .001, elicited
more favorable attitudes toward the brand, F (1, 155) = 81.28, p < .001, more favorable
attitudes toward the ad, F (1, 157) = 31.50, p < .001, a greater intent to purchase the
featured product, F (1, 157) = 65.35, p < .001, and a greater purchase price, F (1, 148) =
9.30, p = .003, than ads featuring novel brands (see Table 9). In addition, a main effect of
need for cognition emerged for purchase price, F (1, 148) = 5.93, p < .016. Specifically,
those low in need for cognition indicated that they would generally pay more to purchase
the featured product (MZlow = .101, SEZlow = .064) than those high in need for cognition
(MZhigh = -.109, SEZhigh = .058). No other significant main effects emerged for any other
dependent variable, all F’s < 2.16.
This analysis also detected a significant interaction effect between brand
familiarity and product location on processing fluency, F (1, 158) = 4.97, p = .027.
Simple effects tests revealed that center-placed product ads were easier for consumers to
process than margin-placed product ads for familiar brands, t (158) = 1.96, p = .05. No
difference emerged between center- and margin-placed product ads featuring novel
brands, t (158) = 0.66 (Table 10). The predicted interaction between brand familiarity and
product location on consumer appraisals, however, failed to emerge, F’s < 1.99.

89 Regardless, to assess whether a relationship existed between processing fluency and each
measure of consumer appraisals, I computed their correlations for each of the four ad
types. As expected, processing fluency was highly correlated with the consumer’s
attitude toward the ad, attitude toward the brand, and purchase intent for each ad type
(see Table 11). However, because ad type failed to elicit significant differences in the
consumer appraisal dependent variables in this study, a mediation analysis was not
warranted.
Additionally, a significant interaction effect of brand familiarity and need for
cognition on purchase intent emerged from the repeated measures ANOVAs, F (1, 157) =
4.38, p = .038. Simple effects tests revealed no significant difference in purchase intent
towards familiar brands between those high and those low in need for cognition, t (157) =
0.61. However, participants low in need for cognition reported a significantly greater
intent to purchase novel brands than participants high in need for cognition, t (157) =
2.06, p = .04 (Table 12). There was also a significant interaction between brand
familiarity and need for cognition on purchase price, F (1, 148) = 4.95, p = .025. Simple
effects tests revealed no significant difference in purchase price for familiar brands
between those high and those low in need for cognition, t (148) = 1.41. However,
participants low in need for cognition reported a significantly greater purchase price for
novel brands than participants high in need for cognition, t (148) = 2.99, p = .003 (Table
12). No other effects achieved conventional levels of statistical significance, F’s < 3.36.

90
Study 6: Discussion
Study 6 replicated the Study 4 findings that the consumer’s familiarity with a
given brand influences the perceiver’s processing experience and informs his or her
appraisals of the ad and brand. Ads featuring familiar brands elicited more favorable
evaluations from consumers, and were easier for consumers to process, than otherwise
identical advertisements featuring novel brands of the same product type.
While Study 6 produced the predicted two-way interaction between product
location and brand familiarity on processing fluency, this did not emerge for consumer
appraisals. As a result, this experiment failed to replicate findings from Studies 2A – 3B.
These results could indicate that ad type, as defined by brand familiarity and product
location, does not inform consumer judgments, unlike the results from Studies 2A – 3B
and Study 5. However, several plausible alternative explanations for these null findings
could explain why the predicted effect of ad type on consumer appraisals failed to
emerge.
One alternative explanation for the absence of the predicted effect of ad type on
consumer appraisals could be that the brand familiarity manipulation task, like the brand
awareness task in Study 4, primed these four product types and facilitated the
categorization and identification of any brand belonging to these product categories (i.e.,
all brands in the experiment), superceding any effect of ad type. However, participants
did report that center-placed familiar brands were easier to process than margin-place
familiar brands in this study, making this possibility less likely for Study 6 than Study 4.
Instead, consumers could have attributed this subtle difference in fluency not to their

91 attitudes and judgments, but to the brand familiarity manipulation task. By adopting a
different naïve theory about the meaning of their fluent or disfluent processing
experience, consumers could have eliminated the traditional effects of processing fluency
on their attitudes and judgments (cf. Schwarz, 2004; Brinol, Petty, & Tormala, 2006;
Wegener & Petty, 1995). Alternatively, by asking consumers to consider certain product
types, the initial brand familiarization task in Study 6 and the brand awareness recall task
of Study 4 could have induced a relevant active goal state in these participants, reversing
or nullifying the effect of processing fluency on consumer appraisals in a manner similar
to that observed in Study 5. Finally, in asking consumers to assess their own reactions to
brands and ads of the same product category along several dimensions, the very nature of
the task in both Studies 4 and 6 may have lent itself to a more analytical, deliberative
processing approach that relied less on heuristics, default responses, and peripheral cues
in general (Alter, Oppenheimer, Epley, & Eyre, 2007). Consumers who adopted a
resource-intensive analytical reasoning style could have corrected for the effects of
processing fluency on judgments.
Finally, individual differences in need for cognition does not appear to moderate
the predicted effect of product location and brand familiarity on consumer appraisals.
However, need for cognition does appear to inform purchase intent and decisions about
purchase price. Those low in need for cognition report that they would pay a higher price
to purchase products than those high in need for cognition. This discrepancy becomes
more marked when the brand under consideration is a novel one: consumers low in need
for cognition pay more, and report a greater intent to purchase, novel brands than those

92 high in need for cognition. Interestingly, although some research indicates that need for
cognition may moderate purchase intent across a range of advertising appeals (e.g.,
Zhang & Buda, 1999; Kim & Kramer, 2006; Putrevu, 2008), to this author’s knowledge,
no prior evidence exists to indicate that need for cognition directly informs purchase
intent or that need for cognition moderates responses to differentially familiar or novel
brands.
In sum, Study 6 confirmed both that familiar brands elicit more favorable
consumer appraisals than novel brands and that center-placed familiar brand ads, and
margin-placed novel brand ads, are easier for consumers to process than their
organizational alternatives. Despite this, the interaction effect of brand familiarity and
product location on consumer appraisals of the featured brand noted in Studies 2A – 3B
failed to replicate, suggesting either that these prior findings could have been driven
solely by extraneous stimulus differences or that a new confound wiped out these more
subtle effects.

93
CHAPTER 3: GENERAL DISCUSSION
An advertising campaign can help jumpstart the popularity of a brand, or usher in
its quick demise. Most consumers today, for example, may recognize Nesquik as a brand
of flavored milk product, but may not know that a competing brand called Raging Cow
ever existed – and for good reason (Ireland, 2004). More common than a brand’s
spectacular crash and burn, however, are the subtle, incremental changes in a brand’s
performance as a result of advertising (Sutherland & Sylvester, 2000). As illustrated in
the present research, some of these subtle, incremental differences in the consumer
response may occur when advertising appeals to consumers through psychological
mechanisms that are subtler still.
Print Advertisements and Consumer Appraisals
The current research shows that what may appear to be minor modifications in the
layout of a print advertisement can gently, but perceptibly, affect consumer judgments.
Specifically, the choice of where to place the image of the product in the spatial design of
a print advertisement, in combination with the consumer’s familiarity with the featured
brand, can inform subsequent appraisals of that brand. To the lay consumer, such a
decision appears not to matter to the success of the advertisement (Study 1), but to
university students enrolled in marketing courses, the belief that the organization of the
ad matters in producing more favorable consumer responses does emerge. These
marketing students believed that margin-placed product advertisements would elicit more
favorable outcomes for a novel brand than center-placed product advertisements. Across
the five of the seven studies that followed to explore actual consumer responses to these

94 different types of ads (Studies 2A – 3B, Studies 5), advertisements that featured novel
brands did tend to elicit more favorable responses from consumers when the product
appeared along the margins of the image than when it appeared in the center. However,
advertisements featuring familiar brands tended to elicit more favorable responses from
consumers when the product was positioned in the center, compared to the margins or
visual periphery, of the image. This occurred with real-world advertisements (Studies 2A
and 3A), ads created by a graphic designer with no knowledge of the experimental
hypothesis (Studies 2B and 3B), and with ads specially developed by the experimenter to
account for possible confounds inherent to real-world advertisements between ad types
(Study 5). This effect emerged with a range of consumer appraisals, including attitudes
(toward the ad and brand), purchase intent, and even purchase price – the amount
consumers reported that they would pay to purchase the product. Thus, the apparently
simple aesthetic decision about where to position the product in an advertisement image
prompted a general effect on subsequent consumer judgments – one that emerged using
several methods of measurement for a variety of product types, and one that appeared in
response to a diverse collection of ads created by several different individual designers.
Does Processing Fluency Inform Consumer Appraisals of Advertising?
The present research provides some evidence that brand familiarity and product
location interact to inform the consumer response through a processing fluency
mechanism. Processing fluency generally informs any judgment that pertains to the target
stimulus, such as the truthfulness of a statement (Reber & Schwarz, 1999), the beauty of
an object (Reber, Schwarz, & Winkielman, 2004), or the accuracy of a trivia response

95 (Alter et al., 2007), in a manner dependent on the metacognitive heuristic applied (Brinol
et al., 2006). In predicting consumer appraisals, the important question to consider is
whether the perceiver views processing fluency as a positive cue or a negative cue about
the target in the provided context. Typically, and particularly in low-elaboration contexts
in which the consumer either cannot or chooses not to think critically about the message
(Petty & Cacioppo, 1986), perceivers view the experience of ease when processing or
identifying a target as a positive indicator of the value of that target on whatever
dimension receives consideration (Alter & Oppenheimer, 2009). If processing fluency
accounts for the present findings, the more easily consumers identify products featured in
the advertisements, the more positively they then should evaluate the target brand.
Unfortunately, Studies 4 and 6 failed to show the predicted interaction effect of
brand familiarity and product location on consumer appraisals. Study 6 did demonstrate,
however, that center-placed familiar brand ads and margin-placed novel brand ads were
indeed easier to process than their matched counterparts (i.e., margin-placed familiar
brand ads and center-placed novel brand ads). Moreover, processing fluency self-report
measures were highly positively correlated with the attitudinal measures in Studies 4 and
6: When consumers indicated that the advertisement was easier to process, they also
offered more favorable appraisals of the featured target following advertisement
exposure.
Finally, Study 5 offered an alternative examination of processing fluency that did
not rely on consumer self-report measures. Under certain circumstances, such as when
the perceiver possesses an active goal relevant to the product being evaluated, consumers

96 may interpret the experience of fluency as a negative evaluative cue. That is, simply by
inducing a relevant goal state in the perceiver, the effects of processing fluency can
reverse: Consumer evaluations of an easy-to-process advertisement should decrease,
whereas evaluations of a difficult-to-process advertisement should increase (Labroo &
Kim, 2009). If processing fluency underlies the effects of product location and brand
familiarity, a manipulation of active consumer goals should similarly influence their
evaluations of the featured brands. As expected, those participants in Study 5 with no
active goal reported a pattern of responses that replicated the pattern of responses
observed in Studies 2A – 3B. For those with a relevant active goal state, however, this
effect was eliminated, with trends in directions opposite to that observed with the no-goal
participants. This, in combination with the positively correlated self-report measures from
Study 6 indicating that increases in processing fluency generally elicit more favorable
appraisals of the given target, supports the notion that processing fluency underlies the
observed attitudinal effects in response to center- and margin-placed product
advertisements for familiar and novel brands.
Individual Differences in Consumer Judgment
Studies 4 and 6 offer some indications that need for cognition may moderate the
effects of the types of advertisements investigated in the present research on purchase
intent and purchase price. Consumers low in need for cognition appear to rely somewhat
more on peripheral mechanisms and heuristics, like those used to interpret the meaning of
processing fluency, when making their appraisals than consumers high in need for
cognition. Specifically, in Study 4, center-placed familiar brand advertisements

97 persuaded consumers low in need for cognition to report a greater intent to purchase the
brand than consumers high in need for cognition. Differences in background coherence
also affected consumers low in need for cognition more than those high in need for
cognition, with advertisements that feature a coherent background eliciting a greater
intent to purchase the brand from low need for cognition consumers than high need for
cognition consumers. In Study 6, need for cognition directly influenced consumer
appraisals of purchase price. Low and high need for cognition differentially informed
appraisals of purchase price and purchase intent with novel brands. Future research may
more directly investigate the moderating role of need for cognition in determining the
effects of processing fluency on consumer attitudes and judgments.
Alternative Explanations
No Effect or a Priming Effect?
Studies 4 and 6 both failed to produce the predicted interaction effect between
product location and brand familiarity on consumer judgments. This may indicate that
this combination of factors does not influence consumer judgments when controlling for
other possible confounds like product size, orientation, color scheme, background image,
and so forth. However, given evidence of such an effect in five other studies (Studies 2A
– 3B and 5), including an experiment that used equally matched print advertisement
stimuli (Study 5), it is possible that Studies 4 and 6 failed to replicate the predicted
effects because they both incorporated a new confound in their designs. Specifically, both
the brand awareness test used in Study 4 and the brand familiarity manipulation used in
Study 6 increased the accessibility of the featured product categories and corresponding

98 brand names, which may have altered how consumers thought about or how quickly they
processed the brands they later viewed in the context of print advertisements.
One possibility is that the initial tasks in Studies 4 and 6 primed certain concepts
that then increased consumers’ processing speed of the advertisements they later viewed.
For example, Study 4’s initial brand recall task could have facilitated participants’
recognition or rapid identification of brands in the subsequently viewed product
advertisements by asking them to recall popular brands that belong to the overarching
product categories. The brand familiarity manipulation task in Study 6 similarly may
have activated consumers’ mental representations of these product categories by
presenting them with and asking them to think about information regarding a new
competing brand. By asking consumers to consider certain products in advance, these
studies increased accessibility of these products, facilitating speed of recall during ad
viewing (Collins & Loftus, 1975; Neely, 1977). In initiating this process before
consumers viewed the actual advertisements, these tasks could have eliminated the more
subtle effect of product location on the consumer’s processing experience. However,
participants in Study 6 still reported a more fluent processing experience when viewing
center-placed than margin-placed familiar brand ads, as predicted. This indicates that
product location still mattered in determining the consumer’s processing experience in
this study, and that the processing speed alternative may fall short of a satisfactory
explanation.
Alternatively, the initial tasks in Studies 4 and 6 could have altered consumers’
naïve theories about the meaning of fluency, made the source of fluency obvious, or

99 primed a higher-elaboration analytical reasoning style that corrected for the influence of
fluency on judgments. For example, like Study 5’s deliberate goal priming task, Study 4’s
brand awareness recall task and Study 6’s familiarity manipulation may have activated
relevant goal states in these participants. Because the naïve theories associated with
processing fluency change under different goal states, a priming task could have altered
the consumer’s metcognitive interpretation of processing fluency, eliminating any brand
familiarity and product location interaction effects on consumer appraisals, as observed in
Study 5. On the other hand, participants in Studies 4 and 6 could have easily attributed
any experienced processing fluency not to their own attitudes, but to the initial task in
which they directly considered the same types of products. If the true source of
processing fluency is known, the perceiver will not misattribute fluency to other causes,
such as the likeability or value of the stimulus (Whittlesea & Williams, 1998, 2001a,
2001b). Furthermore, the initial task in Studies 4 and 6 could have prompted participants
to adopt an analytical, deliberative reasoning style (see Alter et al., 2007). As a result,
participants could have thought harder about the quality of the ad argument and/or
attempted to correct for the influence of peripheral cues in their reported judgments.
To rule out these possibilities, future research could reexamine Studies 4 and 6
with only slight procedural modifications to determine whether the original results
presented in this paper replicate, or whether one can attribute the current findings to one
of the possible alternative explanations posited above. For example, one could eliminate
the brand awareness task in Study 4, and introduce a neutral filler task between the brand
familiarity manipulation and the presentation of advertisements in Study 6, to address

100 these concerns. If such a modified experiment produced the predicted interaction effect of
brand familiarity and product location on consumer appraisals, an analysis of self-
reported processing fluency as a mediator of this effect, as well as a reassessment of need
for cognition as a moderator, may be warranted.
Visual Attention
In the present research, I proposed that a primacy effect in visual attention, in
which initially attended visual information guides subsequent perceptual processing,
could produce differences in processing fluency between ad types that in turn informs
consumer appraisals. What consumers first attend to in a given scene or image does affect
the consumer’s processing experience (Boyce & Pollatsek, 1992; Nappa et al., 2004;
Gleitman et al., 2007; Toppino, 2003, Pomplun et al., 1996). Under low-elaboration
conditions, this processing fluency, as generated using a range of diverse methods, then
tends to promote more favorable judgments of the perceived target along a vast array of
dimensions, including liking, value, confidence, truth, intelligence, fame, intelligence,
and stereotypicality (see Alter & Oppenheimer, 2009 for a review).
A critic may suggest a plausible alternative explanation: The benefit of visual
attention could lie not in the information obtained from the initial visual fixation on an
advertisement image, but in the proportion of time the perceiver fixates on that location
during ad exposure. Instead of the diagnosticity of information obtained in the initial eye
gaze influencing the consumer’s processing experience, the total amount of time the
perceiver allocates to viewing a perceptual target like the featured product could evoke
more favorable evaluations. The distribution of visual attention when viewing a scene

101 does affect subsequent judgments, with perceivers attributing, for example, greater
causality to the more visually salient interactant in a conversation (Taylor & Fiske, 1975).
Thus, products placed at the center, compared to those placed along the margins, of an
advertisement image could be more visually salient to consumers, capturing a greater
proportion of their visual attention during ad exposure as would be expected given
evidence of a center bias in visual attention (Mannan et al., 1996, 1997; Tatler, 2007;
Foulsham & Underwood, 2008).
This alternative, however, does not explain why consumers might evaluate novel
brands more favorably when placed along the margins of the advertisement. If the
salience of central visual information is the key, once would expect more favorable
evaluations of a product that appears in the center of the advertisement than along the
margins, regardless of whether that product was a familiar or novel one. Even if one
ignores evidence of the center bias in visual attention, if one instead assumes that
consumers direct their visual attention to the product featured in the ad, wherever it is
located (i.e., that products are visually salient regardless of placement), this too cannot
explain the differences in consumer judgments observed between center and margin-
placed product ads. If products attracted attention regardless of their spatial location
within the ad, consumers should, for example, evaluate novel brands no differently when
they appear in the center of an ad compared to when they appear along the visual
periphery. Finally, if no single perceptual feature uniformly captures consumers’ visual
attention across the advertisements used in the present research, and visual salience
instead depends on a confluence of well-known perceptual factors, such as figure-ground

102 contrast, size, and luminance, the product location and brand familiarity interaction effect
should not consistently emerge in consumer judgments across the variety of
advertisements used in Studies 2/3A, 2/3B, and 5. Finally, even if visual salience biased
subsequent self-reported estimates of a range of judgments, including processing fluency
measures, and the experience of processing fluency is not the mechanism through which
different ad types inform consumer appraisals of the brand, this account could not explain
why a manipulation of perceiver goal states (Study 5) would moderate the effect of brand
familiarity and product location on consumer appraisals (cf. Labroo & Kim, 2009). Thus,
the visual salience account fails to address several key aspects of the present findings,
offering a poor alternative explanation for the effects of product location on consumer
judgments.
Conclusions: Implications and Limitations
Altogether, the current research demonstrates that brand familiarity and product
location may interact to affect the ease with which a viewer processes and comes to
understand product advertisements in certain cases, and this, in turn, informs the
consumer response. Viewers make sense of advertisements featuring novel brands of
products more easily and evaluate them more favorably when a conceptually relevant
context is featured at the center of the image, helping consumers identify the product that
appears along the visual periphery. Advertisements featuring familiar brands of products,
however, may elicit more fluent consumer processing and, in turn, more favorable brand
outcomes by placing the product at the center of the image. The present studies illustrate
how processing fluency may emerge as a result of how an advertisement is organized,

103 and how it may operate in every day life to influence judgments based on peripheral
mechanisms rather than high-elaboration processes. Important to merchandisers,
marketers and advertisers, these findings demonstrate that simple differences in the
position of familiar or novel brands in print advertisements may influence consumer
attitudes about the brand, the audience’s intent to purchase the item later, and what
shoppers believe to be a reasonable purchase price for that product. These findings could
inform a range of strategic advertising decisions, including what layout to use in
designing an advertisement for a particular brand of product, which print advertisement
in a given advertising campaign receives full-page treatment, or possibly even whether
center-screen pop-ups or margin-placed banner and sidebar options offer more effective
means of web-based advertising for a given brand. In combination with other recent
research efforts (Torres, Sierra, & Heiser, 2007; Brasel & Gips, 2008a, 2008b;
Janiszewski, 1990), the present research may provoke further exploration of alternative
methods by which the organizational structure of print, web, and commercial advertising
can be modified or manipulated to produce an easier-to-understand or more fluently
processed layout.
Limitations
The present investigation, of course, provides only a small snapshot of one
manner in which advertising may subtly influence consumer judgments. Ease of
understanding an advertisement could be established in ways other than the product
location by brand familiarity interaction investigated in this paper. Aside from other well-
documented manipulations of processing fluency such as font legibility and figure-

104 ground contrast (see Alter & Oppenheimer, 2009 for a review), many leading brands
cemented their presence in popular culture by developing highly recognizable advertising
campaigns. By claiming a unique signature advertising strategy, consumers develop
strong associations between the advertising approach and the featured brand. For
example, the distinctive Absolut vodka ad campaign almost exclusively features the
product. These ads always place a creative visual depiction of the product prominently at
the center of the image, accompanied by an only slightly modified tagline. Frequent
magazine readers may easily recognize these advertisements based on a quick glance at
the format alone. Similarly, margin-placed product advertisements may become equally
effective for familiar products if they feature a highly associated target. For example,
Coca-Cola developed a strong association between its product and old-fashioned
representations of Santa Claus and polar bears. For consumers familiar with this
advertising campaign, simply viewing such a depiction of Santa Claus in the grocery
store – even in absence of the Coca-Cola product or logo – could activate the
representation of Coca-Cola in memory and increase the likelihood that the consumer
might retrieve the product for purchase.
Additionally, easy-to-understand advertisements may require more frequent
replacement than more complex creative efforts. While easy-to-understand
advertisements may initially boost consumer appraisals of the brand, they may also elicit
boredom and wear out more rapidly compared to more complex or ambiguous ads (Tellis,
2004). For this reason, advertisers should be prepared to issue a diverse array of these
types of ads to minimize consumers’ frequency of exposure to any one specific

105 advertisement from the campaign. Some advertisers do issue a variety of advertisement
images that incorporate an overarching theme associated with the brand. For example, the
successful Absolut vodka campaign continually refreshes its array of easy-to-understand
ads, using small variations in the slogan (e.g., “Absolut Perfection,” “Absolut Citron,”
and “Absolut Attraction”) and bottle context (a halo inserted over the vodka bottle, the
vodka bottle imitating an orange lava lamp, and a martini glass bending towards the
vodka bottle, respectively) to prevent wear-out.
Finally, the utility and value of product location in advertisements in informing
consumer evaluations may change under different circumstances. Under conditions of
low elaboration, such as when the decision about which brand to purchase from an array
of choices matters little to the consumer or when the consumer does not possess the
attentional resources to fully process the advertisement, content-free peripheral cues that
do not provide any additional information about the product itself, such as the celebrity
status of the product’s spokesperson or, in this case, a design factor that makes the
advertisement easier for the consumer to process, may indeed inform consumer
judgments (Petty & Cacioppo, 1986). However, the consumer’s metacognitive
interpretation of what processing fluency means to a given judgment may change
depending on other contextual factors. For example, as indicated by consumer use of the
instrumentality heuristic in Study 5, occasionally the difficulty, rather than ease, in
processing may elicit more favorable consumer evaluations (see also Labroo & Kim,
2009). Alternatively, when the evaluative question is utilitarian instead of hedonic in
nature, increased complexity can actually lead to the perception of greater quality (Galak

106 & Nelson, 2009). Recent evidence also suggests that when consumers seek “special
occasion” goods, difficulty in processing information about those unfamiliar luxury
products increases the desirability of those items compared to situations in which product
information is easier to process (Pocheptsova & Dhar, 2009). In addition, with increasing
awareness of the true source of processing fluency, consumers are less likely to attribute
a fluent experience to the favorability of the stimulus (Bornstein & D’Agostino, 1992,
1994). However, when consumers adopt a more deliberative, thoughtful, high-
elaboration, analytic processing style, such as when the differences between each brand
alternative varies widely or with important, costly decisions like automobile or home
purchases, content-free peripheral cues hold less persuasive power (e.g., Petty &
Cacioppo, 1979; Johnson & Eagly, 1989). In these cases, the subtle effects of processing
fluency on consumer appraisals observed in low-elaboration situations lessen
(Kruglanski, Freund, & Bar-Tal, 1996) and may disappear entirely.
In addition to the consumer’s interpretation of processing fluency, the context in
which the advertisement appears could influence how easily consumers process its
contents. That is, the context in which advertisers choose to place their advertisements
could determine whether or not viewers experience the ad itself as easy or difficult to
process (Shen, Jiang, & Adaval, in press). Thus, by placing a simple, straightforward
advertisement next to an obtuse movie review or beside a comparatively more difficult-
to-process advertisement for a competing brand, advertisers could maximize the
effectiveness of their advertisement on the consumer response.

107
In sum, advertisers should carefully consider the confluence of several factors,
beyond mere product location choice and consumer familiarity with the featured brand,
when crafting their advertisements. First, advertisers should determine the nature of the
competition within the category of products to which their brand belongs. Are consumers
likely to analyze their purchase decisions for this type of product, assessing the
performance of each of their purchase options on a range of important attributes?
Advertisers should consider their projected audience as well: Do common goals drive the
members of this audience (e.g., a college population) or do the audience members share
similar limitations of their attentional capacity (e.g., distracted rush-hour commuters)?
Finally, the environmental context in which the ad appears may determine the success or
failure of the advertisement. Will consumers view this ad after reading a mentally taxing
article, or viewing a complicated ad for a competing brand? Advertisers should carefully
consider the convergence of each of these factors when making decisions about the types
of strategies discussed in this paper.

108
REFERENCES
Alter, A. L., & Oppenheimer, D. M. (2009). Uniting the tribes of fluency to form a
metacognitive nation. Personality and Social Psychology Review, 13, 219-235.
Alter, A. L., & Oppenheimer, D. M., Epley, N., & Eyre, R. N. (2007). Overcoming
intuition: Metacognitive difficulty activates analytic reasoning. Journal of
Experimental Psychology: General, 136, 569-576.
Balas, B., Cox, D., & Conwell, E. (2007). The effect of real-world personal familiarity on
the speed of face information processing. PloS ONE, 2, e1223. Retrieved
November 6, 2009, from
http://www.plosone.org/article/info:doi%2F10.1371%2Fjournal.pone.0001223
Baron, R., & Kenny, D. (1986). The moderator-mediator variable distinction in social
psychological research: Conceptual, strategic, and statistical considerations.
Journal of Personality and Social Psychology, 51, 1173-1182.
Berger, J. & Fitzsimons, G. (2008). Dogs on the street, Pumas on your feet: How cues in
the environment influence product evaluation and choice. Journal of Marketing
Research, 45, 1-14.
Bettman, J. R. (1979). An information processing theory of consumer choice. Reading,
MA: Addison-Wesley.
Biederman, I., Mezzanotte, R. J., & Rabinowitz, J. C. (1982). Scene perception:
Detecting and judging objects undergoing relational violations. Cognitive
Psychology, 14, 143-177.
Blythe, J. (2008). Consumer behaviour. London: Thompson Learning.

109 Bogart, L., & Lehman, C. (1973). What makes a brand name familiar? Journal of
Marketing Research, 10, 17-22.
Bornstein, R. F. (1989). Exposure and affect: Overview and meta-analysis of research,
1968-1987. Psychological Bulletin, 106, 265-289.
Bornstein, R. F., & D’Agostino, P. R. (1992). Stimulus recognition and the mere
exposure effect. Journal of Personality and Social Psychology, 63, 545-552.
Bornstein, R. F., & D’Agostino, P. R. (1994). The attribution and discounting of
perceptual fluency: Preliminary tests of a perceptual fluency/attributional model
of the mere exposure effect. Social Cognition, 12, 103-128.
Boyce, S. J., & Pollatsek, A. (1992). Identification of objects in scenes: The role of scene
background in object naming. Journal of Experimental Psychology: Learning,
Memory, & Cognition, 18, 531-543.
Boyce, S. J., Pollatsek, A., & Rayner, K. (1989). Effects of background information on
object identification. Journal of Experimental Psychology: Human Perception &
Performance, 15, 556-566.
Brasel, S. A., & Gips, J. (2008a). Breaking through fast-forwarding: Brand information
and visual attention. Journal of Marketing, 72, 31-48.
Brasel, S. A., & Gips, J. (2008b). Points of view: Where do we look when we watch TV?
Perception, 37, 1880-1894.
Brinol, P., Petty, R. E., & Tormala, Z. L. (2006). The malleable meaning of subjective
ease. Psychological Science, 17, 200-206.

110 Cacioppo, J. T., & Petty, R. E. (1982). The need for cognition. Journal of Personality and
Social Psychology, 42, 116–131.
Cacioppo, J. T., Petty, R. E., & Kao, C. F. (1984). The efficient assessment of need for
cognition. Journal of Personality Assessment, 48, 306-307.
Cacioppo, J. T., Petty, R. E., Feinstein, J. A., & Jarvis, W. B. G. (1996). Dispositional
differences in cognitive motivation: The life and times of individuals varying in
need for cognition. Psychological Bulletin, 119, 197-253.
Campbell, M. C., & Keller, K. L. (2003). Brand familiarity and advertising repetition
effects. Journal of Consumer Research, 30, 292-304.
Cho, H., & Schwarz, N. (2006). When good pictures make for good products: Consumer
misattribution effects in virtual product presentation. Advances in Consumer
Research, 33, 637-638.
Chong, H., Riis, J. L., McGinnis, S. M., Williams, D. M., Holcomb, P. J., & Daffner, K.
R. (2008). To ignore or explore: Top-down modulation of novelty processing.
Journal of Cognitive Neuroscience, 20, 120-134.
Coates, S. L., Butler, L. T., & Berry, D. C. (2006). Implicit memory and consumer
choice: The mediating role of brand familiarity. Applied Cognitive Psychology,
20, 1101-1116.
Collins, A. M., & Loftus, E. F. (1975). A spreading activation theory of semantic
processing. Psychological Review, 82, 407-428.
Davenport, J. L. (2007). Consistency effects between objects in scenes. Memory &
Cognition, 35, 393-401.

111 Dodd, M. D., Van der Stigehel, S., & Hollingworth, A. (2009). Novelty is not always the
best policy: Inhibition of return and facilitation of return as a function of visual
task. Psychological Science, 20, 333-339.
du Plessis, Eric (2005). The Advertised Mind: Ground-breaking insights into how our
brains respond to advertising. Sterling, VA: Kogan Page.
Fang, X., Singh, S., & Ahluwalia, R. (2007). An examination of different explanations
for the mere exposure effect. Journal of Consumer Research, 34, 97-103.
Fenske, M., & Raymond, J. E. (2006). Affective influences of selective attention. Current
Directions in Psychological Science, 15, 312-316.
Ferguson, M. J., & Bargh, J. A. (2004). Liking is for doing: The effects of goal pursuit on
automatic evaluation. Journal of Personality and Social Psychology, 87, 557-572.
Ferrari, V., Didierjean, A., & Marmeche, E. (2008). Effect of expertise acquisition on
strategic perception: The example of chess. The Quarterly Journal of
Experimental Psychology, 6, 1265-1280.
Foulsham, T., & Underwood, G. (2008). What can saliency models predict about eye
movements? Spatial and sequential aspects of fixations during encoding and
recognition. Journal of Vision, 8, 1 – 17.
Galak, J., & Nelson, L. D. (2009). Complexity is good: When disfluent communication
signals author erudition. Paper presented at the annual meeting of the Society for
Consumer Psychology, San Diego, CA.
Georgiades, M. S., & Harris, J. P. (1997). Biasing effects in ambiguous figures: Removal
or fixation of critical features can affect perception. Visual Cognition, 4, 383-408.

112 Gleitman, L. R., January, D., Nappa, R., & Trueswell, J. C. (2007). On the give and take
between event apprehension and utterance formulation. Journal of Memory and
Language, 57, 544-569.
Grant, E., & Spivey, M. (2003). Eye movements and problem solving: Guiding attention
guides thought. Psychological Science, 14, 462-466.
Haugtvedt, C. P., Petty, R. E., & Cacioppo, J. T. (1992). Need for cognition and
advertising: Understanding the role of personality variables in consumer behavior.
Journal of Consumer Psychology, 1, 239-260.
Haugtvedt, C. P., Petty, R. E., Cacioppo, J. T., & Steidley, T. (1988). Personality and ad
effectiveness: Exploring the utility of need for cognition. Advances in Consumer
Research, 15, 209-212.
Higgins, T. E., Rholes, W. S., & Jones, C. R. (1977). Category accessibility and
impression formation. Journal of Social Psychology, 13, 151-154.
Holden, S., & Vanhuele, M. (1999). Know the name, forget the exposure: Brand
familiarity versus memory of exposure context. Psychology & Marketing, 16,
479-496.
Ireland, T. (2004). The Raging Cow boycott. Retrieved October 29, 2009 from
http://www.bloggerheads.com/raging_cow/
Janiszewski, C. (1988). Preconscious processing effects: The independence of attitude
formation and conscious thought. Journal of Consumer Research, 15, 199-209.
Janiszewski, C. (1990). The influence of print advertisement organization on affect
toward a brand name. Journal of Consumer Research, 17, 263-278.

113 Janiszewski, C. (1993). Preattentive mere exposure effects. Journal of Consumer
Research, 20, 376-392.
Janizsewski, C. & Meyvis T. (2001). Effects of brand logo complexity, repetition, and
spacing on processing fluency and judgment. Journal of Consumer Research, 28,
18-31.
Janssens, W. & De Pelsmacker, P. (2005). Advertising for new and existing brands: The
impact of media context and type of advertisement. Journal of Marketing
Communications, 11, 113-128.
Johnson, B. T., & Eagly, A. H. (1989). Effects of involvement on persuasion: A meta-
analysis. Psychological Bulletin, 106, 290-314.
Joubert, O., Rousselet, G. A., Fize, D., & Fabre-Thorpe, M. (2007). Processing scene
context: Fast categorization and object interference. Vision Research, 47, 3286-
3297.
Karacan, H., & Hayhoe, M. M. (2008). Is attention drawn to changes in familiar scenes?
Visual Cognition, 16, 356-374.
Kim, H. M., & Kramer, T. (2006). The effect of novel discount presentation on
consumers’ deal evaluations. Marketing Letters, 17, 331-321.
Klinger, M. R., & Greenwald, A. G. (1994). Preferences need no inferences?: The
cognitive basis of unconscious mere exposure effects. In P. M. Niedenthal & S.
Kitayama (Eds.), The heart’s eye (pp. 67-85). San Diego: Academic Press.
Kruglanski, A. W., Freund, T. & Bar-Tal, D. (1996). Motivational effects in the mere-
exposure paradigm. European Journal of Social Psychology, 26, 479-499.

114 Kunst-Wilson, W. R., & Zajonc, R. B. (1980). Affective discrimination of stimuli that
cannot be recognized. Science, 207, 557-558.
Labroo, A., Dhar, R., & Schwarz, N. (2004). Of frog wines and frowning watches:
Semantic priming, perceptual fluency, and brand evaluation. Journal of Consumer
Research, 34, 819-831.
Labroo, A., & Kim, S. (2009). The “instrumentality” heuristic: Why metacognitive
difficulty is desirable during goal pursuit. Psychological Science, 20, 127-134
Labroo, A., & Lee, A. Y. (2006). Between two brands: A goal fluency account of brand
evaluation. Journal of Marketing Research, 43, 374-385.
Lane, B. (2007, May 18). Marketing advertising and branding: A critical analysis of
commercial advertising strategies. Suite101.com. Retrieved January 19, 2008,
from http://advertising-influence.suite101.com/article.cfm/advertising_tactics
Lee, A. Y., & Labroo, A. (2004). The effect of conceptual and perceptual fluency on
affective judgment. Journal of Marketing Research, 41, 151-165.
MacKenzie, S. B., Lutz, R. J., & Belch G. E. (1986). The role of attitude toward the ad as
a mediator of advertising effectiveness: A test of competing explanations. Journal
of Marketing Research, 23, 130-143.
Mannan, S. K., Ruddock, K. H., & Wooding, D. S. (1996). The relationship between
locations of spatial features and those of fixations made during visual examination
of briefly presented images. Spatial Vision, 10, 165-188.

115 Mannan, S. K., Ruddock, K. H., & Wooding, D. S. (1997). Fixation sequences made
during visual examination of briefly presented 2D images. Spatial Vision, 11,
157-178.
McQuarrie, E. F. (2008). Differentiating the pictorial element in advertising. In M. Wedel
& R. Pieters (Eds.), Visual marketing: From attention to action (pp. 91-112), New
York: Lawrence Erlbaum.
McQuarrie, E. F., & Phillips, B. J. (2008). It’s not your father’s magazine ad: Magnitude
and direction of recent changes in advertising style. Journal of Advertising, 37,
95-106.
McWhinnie, H. J. (1968). A review of research on aesthetic measure. Acta Psychologica,
Amsterdam, 28, 363-375.
Meyers-Levy, J. (1994). Gender differences in cortical organization: Social and
biochemical antecedents and advertising consequences. In E. Clark, T. Brock, &
D. Stewart (Eds.), Attention, attitude, and affect in response to advertising, 107-
122. Hilldale, NJ: Lawrence Erlbaum.
Mita, T. H., Dermer, M., & Knight, J. (1977). Reversed facial images and the mere-
exposure hypothesis. Journal of Personality and Social Psychology, 35, 597-601.
Mitchell, K. J., Livosky, M., & Mather, M. (1998). The weapon focus effect revisited:
The role of novelty. Legal and Criminological Psychology, 3, 287-303.
Monahan, J. L., Murphy, S. T., & Zajonc, R. B. (2000). Subliminal mere exposure:
Specific, general, and diffuse effects. Psychological Science, 11, 462-466.

116 Moreland, R. L., & Zajonc, R. B. (1977). Is stimulus recognition a necessary condition
for the occurrence of exposure effects? Journal of Personality and Social
Psychology, 35, 191-199.
Nappa, R. L., January, D., Gleitman, L. R., & Trueswell, J. (2004). Paying attention to
attention: Perceptual priming effects on word order. Proceedings of the 26th
Annual Conference of the Cognitive Science Society, Chicago, IL.
Neely, J. H. (1977). Semantic priming and retrieval from lexical memory: Roles of
inhibitionless spreading activation and limited capacity attention. Journal of
Experimental Psychology: General, 106, 226-254.
Novemsky, N., Dhar, R., Schwarz, N., & Simonson, I. (2007). Preference fluency in
consumer choice. Journal of Marketing Research, 44, 347-356.
Petty, R. E., Brinol, P., & Tormala, Z. L. (2002). Thought confidence as a determinant of
persuasion: The self-validation hypothesis. Journal of Personality and Social
Psychology, 82, 722-741.
Petty, R. E., & Cacioppo, J. T. (1979). Issue involvement can increase or decrease
persuasion by enhancing message-relevant cognitive responses. Journal of
Personality and Social Psychology, 37, 1915-1926.
Petty, R. E., & Cacioppo, J. T. (1986). The elaboration likelihood model of persuasion. In
L. Berkowitz (Ed.), Advances in Experimental Social Psychology, Vol. 19 (pp.
123-205). New York: Academic Press.
Petrova, P. K., & Cialdini, R. B. (2005). Fluency of consumption imagery and the
backfire effects of imagery appeals. Journal of Consumer Research, 32, 442-452.

117 Phelps, J., & Thorson, E. (1991). Brand familiarity and product involvement effects on
the attitude toward an ad – brand attitude relationship. In R. Holman & M.
Solomon (Eds.), Advances in consumer research, Vol. 18, 202-209. Provo, UT:
Association for Consumer Research.
Phillips, B. J., & McQuarrie, E. F. (2002). The development, change, and transformation
of rhetorical style in magazine advertisements. Journal of Advertising, 31, 1-13.
Pocheptsova, A., & Dhar, R. (2009). The mere luxury effect. Paper presented at the
annual meeting of the Society for Consumer Psychology, San Diego, CA.
Pomplun, M., Ritter, H., & Velichkovsky, B. (1996). Disambiguating complex visual
information: Towards communication of personal views of a scene. Perception,
25, 941-948.
Purinton, E., & Rosen, D. (2005). Gendered information processing: Implications for web
site design. In C. Haugtvedt, K. Machleit, & R. Yalch (Eds.), Online consumer
psychology: Understanding and influencing consumer behavior in the virtual
world, 303-324. Mahwah, NJ: Lawrence Erlbaum.
Putrevu, S. (2008). Consumer responses toward sexual and nonsexual appeals: The
influence of involvement, need for cognition (NFC), and gender. Journal of
Advertising, 37, 57-69.
Rayner, K. (2009). Eye movements and attention in reading, scene perception, and visual
search. The Quarterly Journal of Experimental Psychology, 62, 1457-1506.
Reber, R., & Schwarz, N. (1999). Effects of perceptual fluency on judgments of truth.
Consciousness and Cognition, 8, 338-342.

118 Reber, R., Schwarz, N., & Winkielman, P. (2004). Processing fluency and aesthetic
pleasure: Is beauty in the perceiver’s processing experience? Personality and
Social Psychology Review, 8, 364-382.
Reber, R., Winkielman, P., & Schwarz, N. (1998). Effects of perceptual fluency on
affective judgments. Psychological Science, 9. 45-48.
Roediger, H. L., & Blaxton, T. A. (1987). Effects of varying modality, surface features,
and retention interval on priming in word-fragment completion. Memory &
Cognition, 15, 379-388.
Schlosser, A. E. (2003). Computers as situational cues: Implications for consumers’
product cognitions and attitudes. Journal of Consumer Psychology, 13, 103-112.
Schmitt, B. H., Tavassoli, N., T., & Millard, R. T. (1993). Memory for print ads:
Understanding relations among brand name, copy, and picture. Journal of
Consumer Psychology, 2, 55-81.
Schwarz, N. (2004). Metacognitive experiences in consumer judgment and decision
making. Journal of Consumer Psychology, 14, 332-348.
Shapiro, S. (1999). When an ad’s influence is beyond our conscious control: Perceptual
and conceptual fluency effects caused by incidental ad exposure. Journal of
Consumer Research, 26, 16-36.
Shapiro, S., MacInnis, D. J., & Heckler, S. (1997). The effects of incidental ad exposure
on the formation of consideration sets. Journal of Consumer Research, 24, 94-
104.

119 Shen, H., Jiang, Y., & Adaval, R. (in press). Contrast and assimilation effects of
processing fluency. Journal of Consumer Research.
Smith, J. D., & Melara, R. J. (1990). Aesthetic preference and syntactic prototypicality in
music: ‘Tis the gift to be simple. Cognition, 34, 279-298.
Smith, S. M., & Petty, R. E. (1996). Message framing and persuasion: A message
processing analysis. Personality and Social Psychology Bulletin, 22, 257-268.
Song, H., & Schwarz, N. (2008). If it’s hard to read, it’s hard to do: Processing fluency
affects effort prediction and motivation. Psychological Science, 19, 986-988.
Song, H., & Schwarz, N. (2009). If it’s difficult to pronounce, it must be risky: Fluency,
familiarity, and risk perception. Psychological Science, 20, 135-138.
Tatler, B. W. (2007). The central fixation bias in scene viewing: Selecting an optimal
viewing position independently of motor biases and image feature distributions.
Journal of Vision, 7, 1-17.
Taylor, S. E., & Fiske, S. T. (1975). Point of view and perceptions of causality. Journal
of Personality and Social Psychology, 32, 439 – 445.
Tellis, G. J. (2004). Effective advertising: Understanding when, how, and why
advertising works. Thousand Oaks, CA: Sage Publications.
TNS Media Intelligence (2008, March 25). TNS Media Intelligence reports U. S.
advertising expenditures grew 0.2 percent in 2007. Retrieved April 14, 2009, from
http://www.tns-mi.com/news/03252008.htm
Toppino, T. (2003). Reversible-figure perception: Mechanisms of intentional control.
Perception & Psychophysics, 65, 1285-1295.

120 Tosi, V., Mecacci, V., & Pasquali, E. (1997). Scanning eye movements made when
viewing film: Preliminary observations. International Journal of Neuroscience,
92, 47-52.
Wegener, D. T., & Petty, R. E. (1995). Flexible correction processes in social judgment:
The role of naïve theories in corrections for perceived bias. Journal of Personality
and Social Psychology, 68, 38-51.
Whittlesea, B., Jacoby, L. L., & Girard, K. A. (1990). Illusions of immediate memory:
Evidence of an attributional basis for feelings of familiarity and perceptual
quality. Journal of Memory & Language, 29, 716-732.
Whittlesea, B. W., & Williams, L. D. (1998). Why do strangers feel familiar, but friends
don’t? A discrepancy-attribution account of feelings of familiarity. Acta
Psychologica, 98, 141-165.
Whittlesea, B. W., & Williams, L. D. (2001a). The discrepancy-attribution hypothesis: I.
The heuristic basis of feelings of familiarity. Journal of Experimental
Psychology: Learning, Memory, and Cognition, 27, 3-13.
Whittlesea, B. W., & Williams, L. D. (2001b). The discrepancy-attribution hypothesis: II.
Expectation, uncertainty, surprise, and feelings of familiarity. Journal of
Experimental Psychology: Learning, Memory, and Cognition, 27, 14-33.
Willingham, D. B. (2001). Cognition: The thinking animal. Upper Saddle River, NJ:
Prentice Hall.
Winkielman, P., Schwarz, N., Fazendiero, T., & Reber, R. (2003). The hedonic marking
of processing fluency: Implications for evaluative judgment. In J. Musch & K. C.

121
Klauer (Eds.), The psychology of evaluation: Affective processes in cognition and
emotion, 189-217. Mahwah, NJ: Lawrence Erlbaum.
Yi, Y. (1990). Cognitive and affective priming effects of the context for print
advertisements. Journal of Advertising, 19, 40-48.
Yi, Y. (1993). Contextual priming effects in print advertisements: The moderating role of
prior knowledge. Journal of Advertising, 22, 1-10.
Zajonc, R. B. (1968). Attitudinal effects of mere exposure. Journal of Personality and
Social Psychology: Monograph Supplement, 9, 1-27.
Zhang, Y., & Buda, R. (1999). Moderating effects of need for cognition on responses to
positively versus negatively framed advertising messages. Journal of Advertising,
28, 1-15.

122
APPENDIX A: CONSUMER SURVEY ITEMS FOR STUDY 1
How effective do you think the following strategies would be in promoting (brand)? (A) The ad should depict a “cool” model who holds the product up to the lens so that
most of what you see is (product). (B) The ad should focus on a popular celebrity or successful athlete, with the
(product) off to the side in the spokesperson’s hand. (C) The ad should center in on the (product) itself, with nothing competing for your
attention. (D) The ad should focus on a fun scene or activity, with the (product) featured in the
corner of the page.

123
APPENDIX B: ADVERTISEMENT ATTITUDES QUESTIONNAIRE ITEMS FOR
STUDIES 2A AND 2B
1. How much did you like the advertisement image overall? 2. How do you feel about this product? 3. How interested are you in using this product? 4. How likely would you be to actually buy this product for yourself over other,
competing brands? 5. How long would you wait in line at the store in order to purchase this item? 6. If you personally owned this item and other people wanted to buy it from you,
how much (in U.S. dollars) would you be willing to sell it to them for?

124
APPENDIX C: ADVERTISEMENT ATTITUDES QUESTIONNAIRE ITEMS FOR
STUDY 3A AND 3B
Product desirability items: 1. How much do you like this product? 2. How interested are you in using this product? 3. How likely would you be to actually buy this product for yourself over other,
competing brands? 4. Based on this advertisement, how much do you trust this brand? Image attractiveness items: 5. How much did you like the advertisement image overall? 6. How captivating or eye-catching was the advertisement image? 7. How attractive was the advertisement image? 8. How exciting was the advertisement image? 9. How appealing was the advertisement image?

125
APPENDIX D: ADVERTISEMENT ATTITUDES QUESTIONNAIRE ITEMS FOR
STUDY 4
Familiarity and recognition manipulation check items 1. How well do you recognize this brand (i.e., did you know about this brand before
today)? 2. How familiar would you say you were with this specific brand before today? 3. How frequently would you say you use this type of product (including any other
brands)? Attitude toward the brand items Campbell & Keller (2003):
The brand is… 1. Good? 2. Appealing? 3. Pleasant? 4. High-quality?
Phelps & Thorson (1991): 1. How much do you like this brand of product? 2. How valuable is this brand of product? Attitude toward the ad items Campbell & Keller (2003):
The ad is… 1. Good? 2. Appealing? 3. Pleasant? 4. High-quality?
Phelps & Thorson (1991): 5. How much did you like the advertisement image? 6. How irritating was the advertisement image? 7. How attention-grabbing was the advertisement image? Purchase intent items MacKenzie, Lutz, & Belch (1986):
“I would buy this brand.” This statement is… 1. Probable? 2. Likely? 3. Possible?

126
Attitudinal items adapted from Studies 2A, 2B, 3A, and 3B 1. How attractive is this brand of product? 2. How much do you trust this brand of product? 3. How likely would you be to actually buy this brand of product for yourself over
other, competing brands? 4. How interesting was the advertisement image?
Fluency items Labroo & Lee (2004): 1. How much effort did it take for you to process this advertisement? 2. How easy to understand was this advertisement?
Based on Schwarz (2004) review: 3. Estimate how long, in milliseconds (ms), you think the advertisement appeared on
the screen. 4. How familiar did this advertisement feel?
Based on Whittlesea et al. (1990) findings: 5. How clear was the picture you viewed as it displayed on the monitor?

127
APPENDIX E: WORD SETS FOR THE GOAL-PRIMING MANIPULATION OF
STUDY 5
Feel-good goal condition: 1. pleasure for most aim happy 2. to want magnet smile I 3. is running content vital being 4. a moment always the enjoy 5. life a seek beauty pleasant 6. car virtue a cheerfulness is
No-goal condition:
1. blue the running is ball 2. a driver I’m slow desk 3. is higher green the grass 4. magnet wanted he go to 5. papers he the rain filed 6. door the running open is

128
APPENDIX F: ADVERTISEMENT ATTITUDES QUESTIONNAIRE ITEMS FOR
STUDY 5
Labroo and Kim (2009), Experiment 1: 1. How much would you pay for a full-size bar of (brand of chocolate)? 2. How much do you want (brand of chocolate)? (not at all – very much) 3. What do you think of (brand of chocolate)?
a. Very desirable – not at all desirable b. Very tempting – not at all tempting
4. How much do you agree – disagree with the following statements? a. In general, I like chocolate b. (Brand of chocolate) seems limited c. (Brand of chocolate) seems special
5. While doing the task, you… a. Paid a lot – a little attention b. Felt good – bad
Study 4 measures: Familiarity and recognition manipulation checks Attitude toward the brand items Attitude toward the ad items Purchase intent items Fluency items

129
APPENDIX G: CONSUMER REVIEWS USED IN STUDY 6
Bread:
Consumer Search.com – Bread review: Popular with lovers of Italian bread, (BRAND NAME) bread is low in fat, high in fiber, and is cholesterol- and transfat-free. In a blind taste test, consumer rated the flavor highly amongst competing brands, nudging past Wonder Bread, a popular American brand. Suggested retail price is $1.29 per loaf.
Automobile:
CR Review – Small Sedans: “The (BRAND NAME) is a comfortable, roomy small car that provides good fuel economy, a quiet and nicely finished interior, and plenty of features for the money. Comes with standard electronic stability control, which is absent on many other small cars. Fun to drive!” Suggested retail price: $19,900 – 26,900.
Bottled Water:
Independent Opinion review – Best bottled water: “Based on public opinion, (BRAND NAME) is rated higher than several popular brands in the U.S., such as Dasani, Aquafina, and Evian. (BRAND NAME) is bottled from a natural source and scientific testing reveals that it contains fewer contaminants than brands that process and repackage tap water.” Suggested retail price for a 24-pack of 500mL bottles is $4.99.
Potato Chips: Taquitos.net snack review: In a review of 1136 varieties of potato chips, (BRAND NAME) scored among the best. Currently the best brand available in Australia, these chips have a light flavor that is not overpowering but not so mild that you feel cheated. Gentle aroma and not as oily as the competition. Available in several unique and impressive flavors. Suggested retail price for a 1 lb. bag is $3.19.

130
APPENDIX H: PART I SURVEY ITEMS IN STUDY 6
1. Describe one positive thing you learned about this product. 2. Describe one thing you really liked about the commercial for this product. 3. How familiar were you with this brand BEFORE TODAY? (not at all familiar –
very familiar) 4. How familiar ARE YOU NOW with this brand? (not at all familiar – very
familiar)

131 Table 1
Mean Attitude Toward the Ad, Attitude Toward the Brand, and Purchase Intent, as a
Function of Brand Familiarity (Study 4)
Familiar Novel
M SD M SD
Attitude Toward the Ad 6.3 1.4 5.5 1.1
Attitude Toward the Brand 7.7 1.6 5.4 1.2
Purchase Intent 7.4 1.9 5.0 1.8

132 Table 2
Mean Attitude Toward the Ad, Attitude Toward the Brand, and Purchase Intent, as a
Function of Background Context (Study 4)
Related Unrelated
M SD M SD
Attitude Toward the Ad 6.4 1.5 5.4 1.7
Attitude Toward the Brand 6.8 2.0 6.4 2.1
Purchase Intent 6.5 2.4 5.8 2.6

133 Table 3
Processing Fluency as a Function of Background Context and Product Location (Study
4)
Related Unrelated
M SE M SE
Center 7.8 .123 7.1 .133
Margin 7.4 .146 6.2 .130

134 Table 4
Purchase Intent as a Function of Background Context and Need for Cognition Score
(Study 4)
Related Unrelated
M SE M SE
Low Need for Cognition 6.6 .209 5.6 .213
High Need for Cognition 6.3 .198 6.0 .201

135 Table 5
Attitude Toward the Ad, Attitude Toward the Brand, and Purchase Intent as a Function of
Free Recall by Trial for Familiar Brands (Study 4)
Attitude Toward
the Ad
Attitude Toward
the Brand
Purchase Intent
M SD M SD M SD
Fiji Free recall - - 8.6 1.8 7.7 2.8
No recall - - 7.3 2.2 6.2 2.7
Palmolive Free recall 6.6 2.6 8.7 1.9 9.7 1.7
No recall 5.5 1.8 6.4 1.8 6.6 2.6
Starbucks Free recall 7.1 2.0 9.0 2.0 8.6 2.9
No recall 6.0 1.9 7.6 2.7 6.9 3.6
Corona Free recall 7.7 1.8 8.4 2.2 8.1 2.8
No recall 6.7 2.1 7.2 2.4 6.8 3.2

136 Table 6
Attitude Toward the Ad as a Function of Background Relatedness for Each Familiar
Brand (Study 4)
Attitude Toward the Ad
M SD
Fiji Related 6.6 1.6
Unrelated 4.5 2.1
Palmolive Related 6.0 2.0
Unrelated 5.4 2.0
Starbucks Related 7.4 1.7
Unrelated 5.9 2.0
Corona Related - -
Unrelated - -

137 Table 7
Attitude Toward the Brand, Purchase Price, and Processing Fluency as a Function of
Brand Familiarity (Study 5)
Familiar Brand Novel Brand
M SD M SD
Attitude Toward the Brand 8.7 1.7 7.8 1.8
Purchase Price $2.54 1.67 $2.01 1.20
Processing Fluency 8.1 1.5 7.0 1.4

138 Table 8
Mean Purchase Price for the Familiar and Novel Brands as a Function of Goal
Condition and Product Location (Study 5)
Feel-Good Goal No Goal
Center Margin Center Margin
M SD M SD M SD M SD
Familiar Brand Name
Price $2.45 1.37 $2.73 2.45 $2.85 1.47 $2.16 1.23
Novel Brand Name
Price $2.20 1.43 $1.93 1.24 $1.61 0.76 $2.37 1.22

139 Table 9
Standardized Purchase Price, Processing Fluency, Attitude Toward the Brand, Attitude
Toward the Ad, and Purchase Intent as a Function of Brand Familiarity (Study 6)
Familiar Brand Novel Brand
M SE M SE
Purchase Price (Z) .053 .045 -.061 .049
Processing Fluency 8.2 .116 7.5 .131
Attitude Toward the Brand 7.7 .116 6.8 .114
Attitude Toward the Ad 7.4 .121 6.8 .129
Purchase Intent 6.9 .137 6.0 .148

140 Table 10
Processing Fluency as a Function of Brand Familiarity and Product Location (Study 6)
Center Margin
M SE M SE
Familiar 8.3 .131 8.0 .135
Novel 7.4 .150 7.5 .137

141 Table 11
Correlations between Processing Fluency and Attitude Toward the Ad, Attitude Toward
the Brand, and Purchase Intent for Each Ad Type (Study 6)
Familiar Novel
Center Margin Center Margin
Attitude Toward the Ad .357 c .337 c .294 c .402 c
Attitude Toward the Brand .303 c .292 c .257 c .298 c
Purchase Intent .272 c .226 b .168 a .285 c
a p < .05.
b p < .01.
c p ≤ .001.

142 Table 12
Purchase Price and Purchase Intent as a Function of Brand Familiarity and Need for
Cognition (Study 6)
High Need for Cognition Low Need for Cognition
Familiar Novel Familiar Novel
M SE M SE M SE M SE
Purchase Price (Z) .116 .067 .086 .072 -.011 .061 -.208 .066
Purchase Intent 7.0 .203 6.3 .219 6.8 .184 5.7 .199

143
Brand 1: Center-Placed Product Ad Brand 1: Margin-Placed Product Ad
Brand 2: Center-Placed Product Ad Brand 2: Margin-Placed Product Ad
Brand 3: Center-Placed Product Ad Brand 3: Margin-Placed Product Ad

144 Brand 4: Center-Placed Product Ad Brand 4: Margin-Placed Product Ad
Brand 5: Center-Placed Product Ad Brand 5: Margin-Placed Product Ad
Figure 1. Center- and margin-placed product advertisements for five familiar brands used
in Study 2A.

145 Brand 1: Center-Placed Product Ad Brand 1: Margin-Placed Product Ad
Brand 2: Center-Placed Product Ad Brand 2: Margin-Placed Product Ad

146 Brand 3: Center-Placed Product Ad Brand 3: Margin-Placed Product Ad
Brand 4: Center-Placed Product Ad Brand 4: Margin-Placed Product Ad

147 Brand 5: Center-Placed Product Ad Brand 5: Margin-Placed Product Ad
Figure 2. Center- and margin-placed product advertisements for five novel brands used in
Study 2B.

148
Brand 1: Center-placed product in a related-context ad
Brand 1: Margin-placed product in a related-context ad
Brand 1: Center-placed product in an unrelated-context ad
Brand 1: Margin-placed product in an unrelated-context ad

149
Brand 2: Center-placed product in a related-context ad
Brand 2: Margin-placed product in a related-context ad
Brand 2: Center-placed product in an unrelated-context ad
Brand 2: Margin-placed product in an unrelated-context ad

150
Brand 3: Center-placed product in a related-context ad
Brand 3: Margin-placed product in a related-context ad
Brand 3: Center-placed product in an unrelated-context ad
Brand 3: Margin-placed product in an unrelated-context ad

151
Brand 4: Center-placed product in a related-context ad
Brand 4: Margin-placed product in a related-context ad
Brand 4: Center-placed product in an unrelated-context ad
Brand 4: Margin-placed product in an unrelated-context ad
Figure 3. Center- and margin-placed product advertisements for four familiar brands
containing related and unrelated background contexts, as used in Study 4.

152
Brand 1: Center-placed product in a related-context ad
Brand 1: Margin-placed product in a related-context ad
Brand 1: Center-placed product in an unrelated-context ad
Brand 1: Margin-placed product in an unrelated-context ad

153
Brand 2: Center-placed product in a related-context ad
Brand 2: Margin-placed product in a related-context ad
Brand 2: Center-placed product in an unrelated-context ad
Brand 2: Margin-placed product in an unrelated-context ad

154
Brand 3: Center-placed product in a related-context ad
Brand 3: Margin-placed product in a related-context ad
Brand 3: Center-placed product in an unrelated-context ad
Brand 3: Margin-placed product in an unrelated-context ad

155
Brand 4: Center-placed product in a related-context ad
Brand 4: Margin-placed product in a related-context ad
Brand 4: Center-placed product in an unrelated-context ad
Brand 4: Margin-placed product in an unrelated-context ad
Figure 4. Center- and margin-placed product advertisements for four novel brands
containing related and unrelated background contexts, as used in Study 4.

156
Center-placed familiar product ad
Margin-placed familiar product ad
Center-placed novel product ad
Margin-placed novel product ad
Figure 5. Center- and margin-placed product advertisements for the familiar and novel
brands of chocolate bars used in Study 5.

157
Brand 1: Center-placed product ad
Brand 1: Margin-placed product ad
Brand 2: Center-placed product ad
Brand 2: Margin-placed product ad

158
Brand 3: Center-placed product ad
Brand 3: Margin-placed product ad
Brand 4: Center-placed product ad
Brand 4: Margin-placed product ad

159
Brand 5: Center-placed product ad
Brand 5: Margin-placed product ad
Brand 6: Center-placed product ad
Brand 6: Margin-placed product ad

160
Brand 7: Center-placed product ad
Brand 7: Margin-placed product ad
Brand 8: Center-placed product ad
Brand 8: Margin-placed product ad
Figure 6. Center- and margin-placed product advertisements for eight brands used in
Study 6.