
Literature Review - OhioLINK ETD Center
106
Permeability and Porosity Reduction of Fused Deposition Modeling Parts via Internal Epoxy Injection Methods THESIS Presented in Partial Fulfillment of the Requirements for the Degree Master of Science in the Graduate School of The Ohio State University By Miriam R. Simon Cater, B.S, M.F.A Graduate Program in Mechanical Engineering The Ohio State University 2014 Master’s Examination Committee: Dr. Blaine Lilly, Advisor Dr. Rebecca Dupaix Dr. Jose Castro
-
Upload
khangminh22 -
Category
Documents
-
view
7 -
download
0
Transcript of Literature Review - OhioLINK ETD Center

Permeability and Porosity Reduction of Fused Deposition Modeling Parts via Internal
Epoxy Injection Methods
THESIS
Presented in Partial Fulfillment of the Requirements for the Degree Master of Science in
the Graduate School of The Ohio State University
By
Miriam R. Simon Cater, B.S, M.F.A
Graduate Program in Mechanical Engineering
The Ohio State University
2014
Master’s Examination Committee:
Dr. Blaine Lilly, Advisor
Dr. Rebecca Dupaix
Dr. Jose Castro

Copyright by
Miriam R. Simon Cater
2014

ii
Abstract
Fused deposition modeling, or FDM, is a rapidly developing technology currently
used in prototyping and some manufacturing areas. Available since the 1980s and
commercialized by Stratasys in the 1990s, FDM has quickly become a standard in the
area of rapid-prototyping or as it is most commonly known, 3D printing. FDM is known
as an additive process in which a shape is created by extruding material into layers which
are controlled by a computer to form the final shape. Some FDM machines allow the user
to control various aspects of the layering process such as layer thickness, air gap between
extrusions, process speed, contour angle, and extrusion width. These directly impact the
final shape’s mass, density, strength, durability and permeability. This study looks into
the various aspects of ensuring FDM permeability for its use in pressure applications
utilizing different printable materials. Not only will this study recommend ideal machine
settings in order to reduce porosity and design the optimal internal structure for the part,
but will also suggest post-processing techniques based on injecting epoxy into the parts
that will reduce porosity and decrease permeability. The two FDM machines that are used
for testing samples are the Fortus 400mc and the Stratasys Dimension 1200es. The
ultimate goal of this study is to understand how to create permeable plastic solutions in
order to improve the use of FDM prototyping and manufacturing for high pressure
applications, without compromising the part’s original exterior dimensions and surface
finishes.

iii
Dedication
This document is dedicated to my family, for all their support throughout my education.
iv
Acknowledgements
I would like to thank my thesis committee members, Dr. Lilly, Dr. Castro, and Dr.
Dupaix for all their support and advice.
I would like to thank Dr. Lilly, my adviser, for his incredible support over the last 5 years
and whose encouragement and advice throughout those years has led me to where I am
today. Thank you!
I would like to thank Kevin Wolf and Ryan Kay for their assistance with the research
project and for always bringing humor to our weekly meetings. I would like to thank the
following individuals for their support throughout the research project: Walter Greene,
Chad Bivens, Joe West, Matt Mulyana, Ziwei Zhao.
I would like to thank Dr. John Merrill for his and the EEIC’s support over the last 3
years.
I would like to thank my dad, mom, and brother, Danny, for their incredible
encouragement and support over so many years of Graduate School.
Finally, I would like to thank my husband, Marko, for his continued love and support,
and the encouragement to always take something to the next level.
v
Vita
May 2003 ……………………………….. American Cooperative School, La Paz, Bolivia
May 2007 ……………………………….. B.S. Computer Graphics Technology, Purdue
University
2007 – 2009 …………………................. Product Engineer – American Furukawa, Inc. at
Honda Research and Development, Americas,
Inc., Raymond, OH
August 2011 ……………….…………... M.F.A. Design Development, The Ohio State
University
2009 – Present ………………………….. Graduate Teaching Associate, Department of
Design, College of Engineering, The Ohio
State University
Publications
Cater, M., Kay, R., 2013. Fused-Deposition Modeling Parameters and Their Effects on
Mechanical Properties. Presented at Recruiting Engineers Day. Columbus, OH (October
2013)
vi
Gustafson, Robert J., and Simon, Miriam R., Assessing Engineering Global
Competencies. Proc. of 120th ASEE Annual Conference and Exposition, Atlanta,
Georgia. 2013
Simon, Miriam R., Gregory D. Bixler, Bradley Doudican, and Roger Dzwonczyk.
"Engineering Service-Learning – Importance of Appropriate Collaboration with
International Partners." International Journal for Service Learning in Engineering 7.1
(2012): 28-39.
Simon, Miriam R. "Design and Engineering of Small-scale Wind Generators for
Developing Countries." Edward F. Hayes Graduate Research Forum. Columbus, OH. 24
Feb. 2012.
Bixler, G., Dzwonczyk, R., Simon, M., 2011. Developing appropriate technology for
Honduras in a service learning program. Presented at the National Outreach Scholarship
Program. East Lansing, MI, USA (October 2011)
Fields of Study
Major Field: Mechanical Engineering

vii
Table of Contents
Abstract ............................................................................................................................... ii
Dedication .......................................................................................................................... iii
Acknowledgements ............................................................................................................ iv
Vita ...................................................................................................................................... v
List of Figures .................................................................................................................... ix
List of Tables .................................................................................................................... xii
Chapter 1: Introduction ....................................................................................................... 1
Thesis Structure ............................................................................................................. 2
Chapter 2: Background and Literature Review .................................................................. 5
Additive Manufacturing and Fused Deposition Modeling ............................................ 5
Materials Used in this Study ........................................................................................ 11
FDM Machines ............................................................................................................ 14
Sealing Methods........................................................................................................... 16
Previous FDM Permeability and Porosity Studies....................................................... 17
Chapter 3: Methodology ................................................................................................... 21
Initial Testing Apparatus.............................................................................................. 23
Eliminating Noise ........................................................................................................ 27
Epoxy Samples............................................................................................................. 27
Chapter 4: Results ............................................................................................................. 28

viii
Initial Disk Porosity Testing ........................................................................................ 28
Epoxy-Filled Samples .................................................................................................. 36
Final Recommendations and Guidelines ..................................................................... 65
Chapter 5: Conclusion....................................................................................................... 71
Research Outcomes ...................................................................................................... 72
Future Recommendations ............................................................................................ 73
References ......................................................................................................................... 78
Appendix A – CAD Drawings .......................................................................................... 80
Appendix B – Test Data .................................................................................................... 92

ix
List of Figures
Figure 1 - Programmable Printer Parameters ...................................................................... 7
Figure 2 - Possible Raster Orientation – Vertical / Horizontal; Angular; Concentric ........ 7
Figure 3 - Interrupted Raster vs. Continuous Raster Tool path Setting .............................. 7
Figure 4 - Raster Types ..................................................................................................... 10
Figure 5 - Fortus 400mc Material Properties (STRATASYS) ......................................... 15
Figure 6 - Sample of Disks Tested .................................................................................... 22
Figure 7 - Peaucellieur-Lipkin Proportions (Image from Wikipedia) .............................. 24
Figure 8 – The constant pressure testing apparatus .......................................................... 24
Figure 9 - Cross-section of the Cylinder-Tester ............................................................... 26
Figure 10 - Fortus 400mc Custom Circular and Default Samples in ABS-M30i ............. 30
Figure 11 - Batch 1 Pressure Testing Results (4.35 psi) ................................................... 31
Figure 12 - Close-up of Fortus 400mc Ultem Custom Circular Sample .......................... 32
Figure 13 - Weight differences after BJB Epoxy Addition .............................................. 34
Figure 14 - Low Rate of Displacement Samples Tested under High Pressure ................. 35
Figure 15 - Fortus Default BJB Samples Tested under High Pressure ............................. 35
Figure 16 - Samples Tested under Low Pressure .............................................................. 36
Figure 17 - Dimension 1200es Print Profile Cross-Sections ............................................ 37
Figure 18 - Low-Density CAD Model Showing Internal Sparse Structure ...................... 37
Figure 19 - Epoxy-filled Samples: Casting Epoxy vs. ABS Epoxy ................................. 38

x
Figure 20 - Epoxy-Filled Sample Results ......................................................................... 39
Figure 21 - Sample drilled on the side to expose internal structure.................................. 39
Figure 22 - Sample setup on the work table ..................................................................... 40
Figure 23 - Complete view of sample setup ..................................................................... 40
Figure 24 - Initial Epoxy Injection Sample ....................................................................... 42
Figure 25 - Part being filled with a syringe full of epoxy ................................................. 43
Figure 26 - Part filled with epoxy during curing stage ..................................................... 43
Figure 27 - Internal air bubbles in the epoxy-filled samples ............................................ 44
Figure 28 - Epoxy permeating through the outer walls .................................................... 45
Figure 29 - Complex shape without and with 45 degree side sections ............................. 46
Figure 30 - Section view of the intended internal structure .............................................. 46
Figure 31 - Section view of part with two hollow compartments..................................... 47
Figure 32 - Injection Molding Simulation ........................................................................ 48
Figure 33 - Simulated Weld Lines .................................................................................... 49
Figure 34 - Simulation vs. Experimental Epoxy Flow ..................................................... 50
Figure 35 - Cavities formed during the printing process .................................................. 51
Figure 36 - Fully printed test part ..................................................................................... 52
Figure 37 - Sawtooth Raster on Layers X, X+1, X+2 ...................................................... 53
Figure 38 - Final epoxy-filled sample ............................................................................... 54
Figure 39 - Post-processed part ready for pressure testing ............................................... 55
Figure 40 - Bell Jar Pressure Testing Apparatus .............................................................. 55
Figure 41 - Treated part being tested on the Bell Jar Pressure Apparatus ........................ 56
Figure 42 - Flat sample used for epoxy testing ................................................................. 57
xi
Figure 43 - Theoretical vs. Experimental raster patterns in the flat samples .................... 58
Figure 44 - 0.130 Inch Flat Sample Fill-Test .................................................................... 59
Figure 45 - Epoxy-filled PC-ABS Tensile Samples ......................................................... 60
Figure 46 - Sample Tensile Test on Instron ...................................................................... 61
Figure 47 - PC-ABS Stress-Strain Curve Comparison ..................................................... 63
Figure 48 - Epoxy-Filled Samples after Tensile Tests...................................................... 63
Figure 49 - Internal Structure of Epoxy-Filled Tensile Sample ....................................... 64
Figure 50 - Drawing of the Nozzle ................................................................................... 68
Figure 51 - Porosity on the Top Layer of a Test Disk ...................................................... 76
Figure 52 - Disk Printed on the Side with Raster Directions Highlighted in Yellow ....... 77
xii
List of Tables
Table 1 - ABS Permeability Properties ............................................................................. 12
Table 2 - Polycarbonate Permeability Properties.............................................................. 13
Table 3 - Stratasys Table of Sealant Properties ................................................................ 16
Table 4 - Batch 1 Printed Part Characteristics .................................................................. 30
Table 5 - Batch 2 Printed Part Characteristics .................................................................. 33
Table 6 - Flat Sample Thickness Tests ............................................................................. 58
Table 7 - Tensile Test Results for Epoxy-Filled Parts ...................................................... 62
1
Chapter 1: Introduction
Fused deposition modeling (FDM) is a technology based on layering strands of
semi-molten thermoplastics on top of each other in order to create a 3-dimensional shape.
The model is created on a computer and then exported as an STL (stereolithography) file
for processing. The computer sections the STL file into layers, which are then used by the
FDM machine to create the desired shape. However, because of the inherent layering
process that FDM uses to create parts, there are air-gaps left in between the layers which
allow for air and/or liquids to permeate through the parts.
Since FDM allows users to conveniently create complex shapes and “print” them
easily, it is a technology that has been rapidly growing over the last few years. FDM
machines are becoming more affordable due to companies like MakerBot who target their
machines to hobbyists. However, other applications for FDM that have proven to be quite
successful are in the field of tissue engineering, in which porous structures are desired.
As Liu-Tsang explains in her paper, “CAD-based techniques have been adapted to
fabricate three-dimensional polymer for tissue engineering applications (Liu–Tsang
2004). Although a positive property for tissue engineering, one of the pitfalls of FDM is
that “while FDM allows exceptional control in the xy plane, this method is however
limited in the z-direction in that the height of the pores is by the size of the polymer
filament extruded through the nozzle (Liu-Tsang, 2004).” Liu-Tsang points out one of the
inherent properties of FDM that makes parts non-permeable, which is the porosity
2
created by the printing process itself. Another limitation of FDM is the print size which
not only applies to not being able to print parts larger than the machine’s pre-determined
print envelope, but prints smaller than a certain size are not possible. The size limitations
for small parts are based on the material extrusion width as well as the malleability of the
material based on the oven’s temperature and material properties. Complex or small
features require support material and if the part is too small, support material may not be
able to be layered and the small parts would collapse creating deformed features. Another
concern is that when the extruding head lifts away from the part surface, it leaves a
globule of material that extends the print’s outline and creates a ridge on the part. In
complex small features, this can potentially decrease the part’s accuracy. Stratasys’
printing guidelines recommend that parts not be printed smaller than 1 in. x 1 in. x 1 in.
or larger than 16 in. x 14 in. x 16 in. (Stratasys, 2). Although FDM does indeed have
several limitations, there are ways in which parts can be post-processed in order to
become fully functional parts.
Thesis Structure
The first part of the study consisted of an initial analysis of samples from both the
Fortus 400mc and the Dimension 1200es machines. It was determined that if a part was
printed as “solid” as possible using custom machine settings, the parts were nevertheless
quite permeable to air, when compared to an aluminum control sample. Parts coated with
BJB epoxy performed better than the non-treated samples, for the most part, but were still
able to diffuse air. Parts were then printed with a semi-hollow internal structure and were
filled with various types of epoxy to seal them from the inside instead of externally as
3
with BJB epoxy and other currently accepted external sealants. Once parts were tested, it
was determined that this method was successful in making parts non-permeable and non-
porous when compared to the aluminum control sample. The latter part of the study
consisted of creating more complex shapes to assure that the method of injecting epoxy
into the parts as a sealing agent was successful. This process was then compared to
commercially available software for simulating mold filling in injection molding to
determine if users could plan an injection scheme for their models using the simulation,
and successfully fill them after fabrication. This new method of post–processing
components fabricated by FDM definitely has potential, but further work remains to be
done. The final test compared the mechanical properties of composite plastic-epoxy parts
to plain plastic parts.
Although various methods currently exist for sealing parts, each of these methods
has serious drawbacks. Some of the methods currently used include acetone dips, vapor
smoothing, and exterior epoxy coating. With all these methods, the main drawback is that
the exterior surface is physically altered. This may be desirable in some cases but not all,
as parts could potentially be dimensionally altered to the point at which they would be
out of their tolerance range. Acetone and vapor smoothing make the parts smaller, while
the BJB epoxy coating and paint add to the overall dimensions. Another drawback in
using acetone are the serious health hazards associated with the material. With BJB
epoxy, the surface finish is typically not constant throughout the entire part and air
bubbles are seen on the outer surface of parts prepared using this method.
The present study analyzes the different types of epoxy used for part sealing, as
well as various methods for filling and testing the parts once they have cured. Finally, the

4
study recommends ideal settings and guidelines for being able to make parts non-
permeable and non-porous, without relying on an external post-print process.
5
Chapter 2: Background and Literature Review
Additive Manufacturing and Fused Deposition Modeling
Additive manufacturing is generally classified into three main categories: liquid,
solid, and powder–based technologies. Fused deposition modeling (FDM) is considered
to belong to the solid category. FDM is a technology which was developed by S. Scott
Crump, co-founder of Stratasys, in the 1980s (Crump, 1992). The basic concept of all
additive manufacturing methods is that a three-dimensional CAD (computer aided
design) model in an ‘.stl’ format is ‘sliced’ into layers. An ‘.stl’ file is created by
converting a three-dimensional CAD object into a ‘shell’ using a series of triangles
created by an algorithm based on either an ASCII or Binary code (Burkardt, 2001).
Software used by the FDM machines reads the STL shell data and ‘slices’ the model into
layers. These layers are then ‘printed’ or extruded one by one on top of each other thus
creating the complete shape of the model. The Stratasys website defines FDM as a
“process [which] creates parts by extruding molten thermoplastic in fine layers to build
the part layer by layer.” Chua explains that the air in the printing chamber is maintained
at a slightly lower temperature than the solidification temperature of the material used to
print the part, so that it solidifies almost instantly following extrusion (Chua, 2003).
In terms of order of operations, once the CAD model has been converted from an
IGES or native format into a stereolithography (.stl) file, it is loaded into the FDM

6
machine’s software. Before the desired part can be made, the FDM software first needs to
create another model of support material which will hold the part on the printer tray and
support features which protrude from the main body of the part. This support material is
separated from the final part once the process is finished by mechanically separating the
two materials or dissolving the support material in a chemical bath. When creating
complex geometries, this support geometry is highly necessary to avoid any deformities
in the final product, especially when the model itself uses thermoplastics that have a
relatively high melting point.
As rapid prototyping technology has advanced, the resolution of individual layers that
can be printed has improved, thus creating smoother and higher quality products. As
Chua (2003) explains, the primary physical constraints in using FDM are “material
column strength, material flexural modulus, material viscosity, positioning accuracy, road
widths, depositions speed, volumetric flow rate, tip diameter, envelope temperature and
part geometry.” Similarly, Montero, et al. (2001) explain that when printing a model, one
must consider the following parameters, some of which are shown in Figure 1.
Bead (row) width: The width of the individual track of model material laid down
by the extruding tip. FDM machines typically have a range of bead width, which
are a function of the speed at which the model material is laid down, as well as the
diameter of the actual extrusion nozzle.
Slice Height: Similar to bead width, but in a vertical rather than horizontal
direction.
Model Build Temperature: The extrusion temperature of the material.

7
Air Gap: The amount of air left in between successive beads or slices. In certain
machines, one can set the air gap to be negative, which means that the layers are
printed “on top” of each other in attempts to remove air pockets from the model.
Raster Orientation: Direction of the bead relative to the loading of the part (see
Figure 2).
Figure 1 - Programmable Printer Parameters
Figure 2 - Possible Raster Orientation – Vertical / Horizontal; Angular; Concentric
Figure 3 - Interrupted Raster vs. Continuous Raster Tool path Setting

8
Figure 3 represents an interrupted raster vs. a continuous raster. Depending on the
settings of the FDM machine, one can set the print setting to a continuous raster to
minimize print time as well as reduce the air gap. However, this can potentially reduce
the accuracy of the model, based on the speed that the FDM machine extrudes the molten
material. One must analyze the part being printed and decide on the most appropriate tool
path for the application.
On certain machines, such as the Fortus 400mc, one can set different parameters
in terms of contour style and contour width to be able to reduce the air gap and porosity
in a given part. Most FDM machines will also allow the user to define parameters that
will determine how the inside interior structure of the part will be. For example, if one is
not concerned with porosity, but is concerned with the weight of the part, speed of
production, and cost, one can reduce the amount of material built into the interior sections
of the part as “filler.” Alternatively, one can choose to make the part as dense as possible
in order to reduce porosity (Stratasys, 2011). The Dimension 1200es FDM machine has
three different built-in parameters for part density. These include low-density (sparse),
high-density, and solid; the cross-sections of these can be seen in Figure 4. The Fortus
400mc can be programmed to create custom part interiors, or default tool paths can be
used. Figure 4 shows various types of layers that can be printed, as well as which of the
FDM machines used in this study these correspond to. Standard practice calls for the
solid layer to be used for creating the outer surface of the entire part, while the other layer
types are used for interior supporting structures.
The Dimension 1200es (using CatalystEX software) allows the user to pick a
default solid layer for the exterior and a solid, sparse, or sparse double dense structure for

9
the interior, without giving the user the option of defining which layers they would like to
build using the solid or sparse structures. The Fortus 400mc, which uses the more
advanced Insight software, allows the user to customize individual layer types as well as
allowing users to have multiple layer types in one printed part. Note that Figure 4 also
shows the porosity that is inherent in this process, even when one chooses the ‘solid’
layer setting. Porosity typically occurs when features have tight radii as well as features
having transitions from straight to curved sections.

10
Figure 4 - Raster Types

11
Materials Used in this Study
The recent growth of the three-dimensional printing industry has led to companies
being able to create parts in many different types of materials, including many different
types of thermoplastics. Depending on parameters such as cost, strength, print time,
overall finish, and application, users have recently gained the ability to choose a wider
range of materials based on its properties. The Additive Manufacturing Lab at Ohio State
is currently (2014) capable of fabricating parts using the materials discussed here.
Acrylonitrile-Butadiene-Styrene Terpolymer (ABS)
ABS is a very widely used engineering plastic. The terpolymer is typically composed of
“…more than 50% styrene and varying amounts of acrylonitrile and butadiene. The three
components are combined by a variety of methods involving polymerization, graft
copolymerization, and physical blending (Massey, 2003).” Manufacturing processes that
employ ABS include extrusion and injection molding. Various grades of ABS have been
tested for water and gas permeability, with results showing that ABS is a permeable
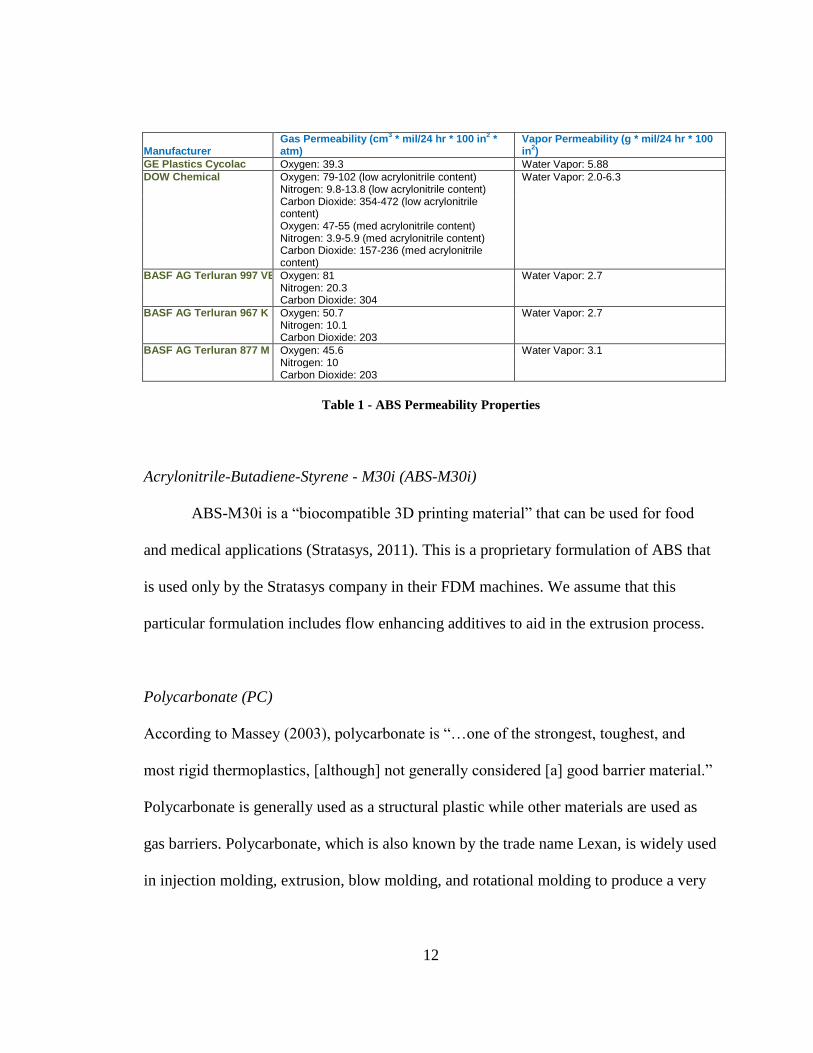
plastic. Permeability tests conducted on various grades of ABS have shown the
following, according to Massey (2003).
12
Manufacturer Gas Permeability (cm
3 * mil/24 hr * 100 in
2 *
atm) Vapor Permeability (g * mil/24 hr * 100 in
2)
GE Plastics Cycolac Oxygen: 39.3 Water Vapor: 5.88
DOW Chemical Oxygen: 79-102 (low acrylonitrile content) Water Vapor: 2.0-6.3 Nitrogen: 9.8-13.8 (low acrylonitrile content)
Carbon Dioxide: 354-472 (low acrylonitrile content)
Oxygen: 47-55 (med acrylonitrile content) Nitrogen: 3.9-5.9 (med acrylonitrile content)
Carbon Dioxide: 157-236 (med acrylonitrile content)
BASF AG Terluran 997 VE Oxygen: 81 Water Vapor: 2.7 Nitrogen: 20.3 Carbon Dioxide: 304
BASF AG Terluran 967 K Oxygen: 50.7 Water Vapor: 2.7 Nitrogen: 10.1 Carbon Dioxide: 203
BASF AG Terluran 877 M Oxygen: 45.6 Water Vapor: 3.1 Nitrogen: 10 Carbon Dioxide: 203
Table 1 - ABS Permeability Properties
Acrylonitrile-Butadiene-Styrene - M30i (ABS-M30i)
ABS-M30i is a “biocompatible 3D printing material” that can be used for food
and medical applications (Stratasys, 2011). This is a proprietary formulation of ABS that
is used only by the Stratasys company in their FDM machines. We assume that this
particular formulation includes flow enhancing additives to aid in the extrusion process.
Polycarbonate (PC)
According to Massey (2003), polycarbonate is “…one of the strongest, toughest, and
most rigid thermoplastics, [although] not generally considered [a] good barrier material.”
Polycarbonate is generally used as a structural plastic while other materials are used as
gas barriers. Polycarbonate, which is also known by the trade name Lexan, is widely used
in injection molding, extrusion, blow molding, and rotational molding to produce a very
13
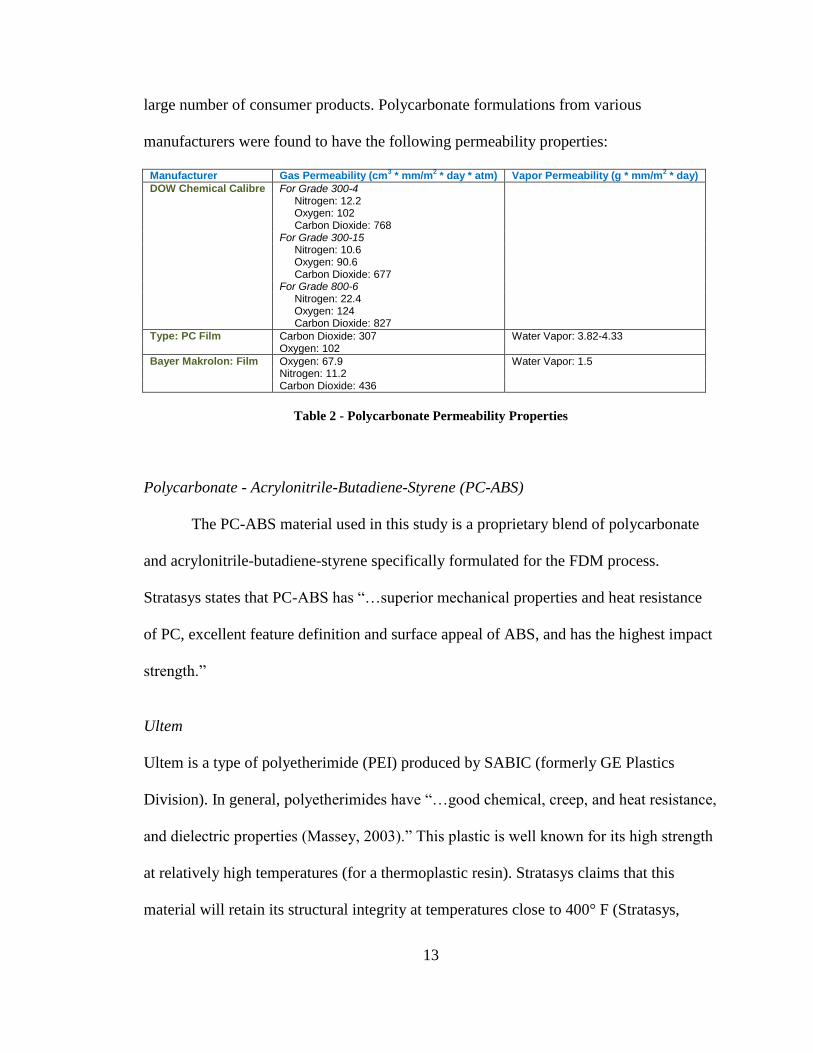
large number of consumer products. Polycarbonate formulations from various
manufacturers were found to have the following permeability properties:
Manufacturer Gas Permeability (cm3 * mm/m
2 * day * atm) Vapor Permeability (g * mm/m
2 * day)
DOW Chemical Calibre For Grade 300-4 Nitrogen: 12.2 Oxygen: 102 Carbon Dioxide: 768 For Grade 300-15 Nitrogen: 10.6 Oxygen: 90.6 Carbon Dioxide: 677 For Grade 800-6 Nitrogen: 22.4 Oxygen: 124 Carbon Dioxide: 827
Type: PC Film Carbon Dioxide: 307 Water Vapor: 3.82-4.33 Oxygen: 102
Bayer Makrolon: Film Oxygen: 67.9 Water Vapor: 1.5 Nitrogen: 11.2 Carbon Dioxide: 436
Table 2 - Polycarbonate Permeability Properties
Polycarbonate - Acrylonitrile-Butadiene-Styrene (PC-ABS)
The PC-ABS material used in this study is a proprietary blend of polycarbonate
and acrylonitrile-butadiene-styrene specifically formulated for the FDM process.
Stratasys states that PC-ABS has “…superior mechanical properties and heat resistance
of PC, excellent feature definition and surface appeal of ABS, and has the highest impact
strength.”
Ultem
Ultem is a type of polyetherimide (PEI) produced by SABIC (formerly GE Plastics
Division). In general, polyetherimides have “…good chemical, creep, and heat resistance,
and dielectric properties (Massey, 2003).” This plastic is well known for its high strength
at relatively high temperatures (for a thermoplastic resin). Stratasys claims that this
material will retain its structural integrity at temperatures close to 400° F (Stratasys,
14
2011). Parts made using PEI are typically manufactured by extrusion, thermoforming,
compression, injection, and blow molding processes.
FDM Machines
The two FDM machines used for this study are the Fortus 400mc and the
Dimension 1200es, both manufactured by Stratasys, Ltd. of Eden Prairie, Minnesota. The
Dimension 1200es is an older, smaller machine which uses a single model material,
ABSplus. The Dimension 1200es printing software, CatalystEX, allows the user to
import the stereolithography file, place it on the printer’s build surface, choose the type of
internal structure desired, and commence the printing process. CatalystEX allows users to
print multiple files at once as long as they don’t exceed the machine’s print envelope. The
Fortus 400mc is a newer and larger machine, capable of printing with four different
materials. This machine uses the Insight software, which is much more flexible for
fabricating custom components. Insight allows users to create custom tool paths and
change part densities to allow for more part customization. This section provides detailed
information on both machines so one can compare and contrast, using information
provided by Statasys, 2011.
FORTUS 400mc Specifications
The FORTUS 400mc has the following print specifications.
Build envelope: 16 x 14 x 16 inches
Accuracy: +/- 0.005 inch or +/- 0.0015 inch per printed inch

15
Operating environment: Max room temperature: 85°F
Software: Insight ™ and Control Center ™
Figure 5 - Fortus 400mc Material Properties (STRATASYS)
DIMENSION 1200es Specifications
The DIMENSION 1200es has the following specifications.
Build envelope: 10 x 10 x 12 inches
Accuracy: 0.010 inches
Materials: ABSplus
Layer thickness: 0.010 and 0.013 inches
Software: CatalystEX
16
Sealing Methods
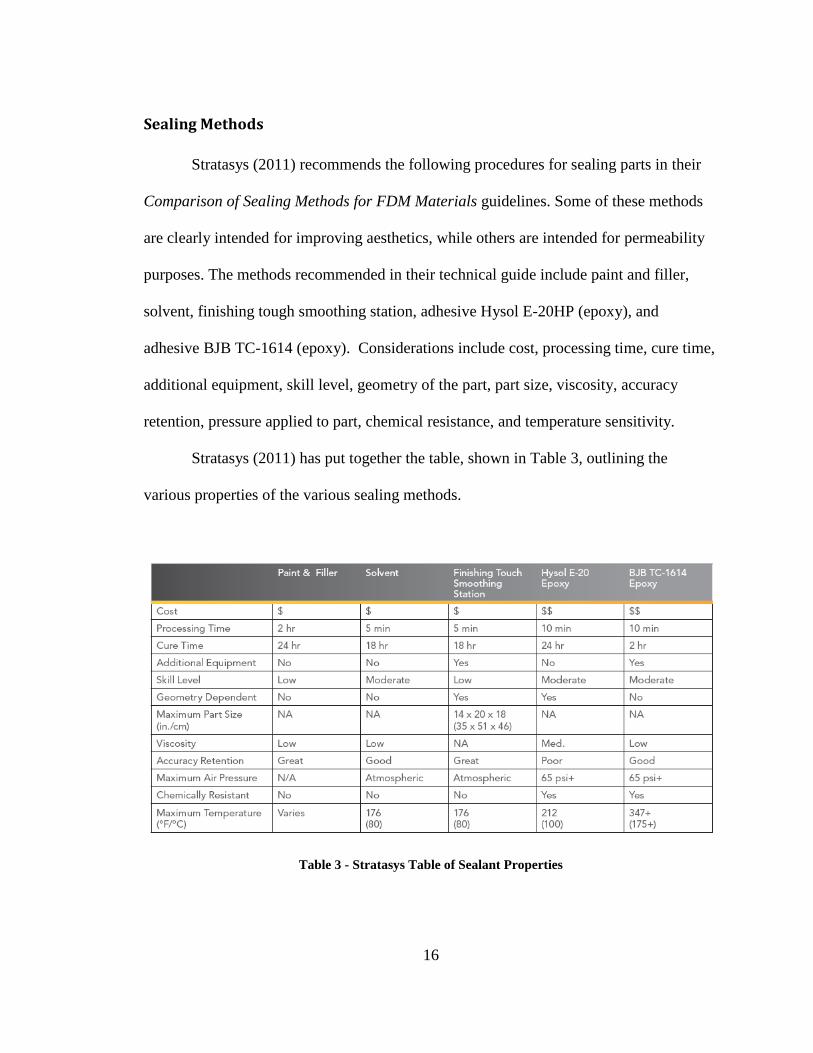
Stratasys (2011) recommends the following procedures for sealing parts in their
Comparison of Sealing Methods for FDM Materials guidelines. Some of these methods
are clearly intended for improving aesthetics, while others are intended for permeability
purposes. The methods recommended in their technical guide include paint and filler,
solvent, finishing tough smoothing station, adhesive Hysol E-20HP (epoxy), and
adhesive BJB TC-1614 (epoxy). Considerations include cost, processing time, cure time,
additional equipment, skill level, geometry of the part, part size, viscosity, accuracy
retention, pressure applied to part, chemical resistance, and temperature sensitivity.
Stratasys (2011) has put together the table, shown in Table 3, outlining the
various properties of the various sealing methods.
Table 3 - Stratasys Table of Sealant Properties

17
A popular method for sealing FDM parts is with the use of acetone, as
McCullough (2013) stated in his research for the use of FDM in biomedical applications.
His research involved “…a method to fabricate water-tight microfluidic devices using a
method of chemical dissolution via acetone is shown to render a porous FDM ABS
device impervious to water flow between layers, while preserving the structural fidelity
of printed microstructures down to 250 μm (McCullough, 948).” There are several
drawbacks to the use of acetone, one being that “undiluted acetone very quickly dissolves
ABS and can erode the features of the printed devices (McCullough, 949).” Another
drawback of using acetone is that it can cause damage to the user’s body, including
kidney and liver damage as well as fertility issues (New Jersey D.O.H., 2011).
Previous FDM Permeability and Porosity Studies
This section summarizes previously conducted studies that have looked into the
areas of FDM permeability and porosity. Currently, most of the studies in this area deal
with medical applications of FDM, some of which regard porosity as a positive aspect of
FDM. Other studies look into methods of reducing permeability and porosity. The two
studies described in this section dealt with the currently accepted methods of sealing
FDM parts with varying levels of success.
Mireles, et al. (2013)
Jorge Mireles et al. at the University of Texas El Paso, working closely with
Stratasys has conducted an analysis of various different types of sealants that could be
applied to the exterior of FDM parts. The sealants used are the following:
18
DEFT Clear Brushing Lacquer
IPS Weld-On 3 Cement
Minwax Sanding Sealer
Minwax Oil Base Polyurethane
Thompson’s Multi-Surface Waterproofer
BJB TC-1614 A/B, Hysol E-30CL
Stycast W19 + Catalyst 9
West Marine Penetrating Epoxy + West System 105 Resin + 209 Hardener
Epoxy.
The sealant methods employed in this study included vacuum infiltration and
brushing. The most successful of their sealants was BJB TC-1614 epoxy which was able
to withstand pressures of 276 kPa (40 psi) and 138 kPa (20 psi) for 5 minutes using the
brushing and vacuum infiltration processes respectively. However, one of the main
drawbacks stated in this study is the potential for dimensional changes which are hard to
control using either of their sealing methods. Their results yielded many sealant
accumulations around tight corners of their test parts. Their pressures were also added
gradually as opposed to instant, which could yield different results during pressure
application.
The testing apparatus they used included a custom-made shape that was modeled
to include complex features and abrupt shape changes to more accurately measure the
success of their sealants. This ABS-M30i part was mounted onto a plate with O-ring seals
in between the part and the plate in order to ensure a tight seal. The plate had a hole
drilled at the bottom of it where a pressure line would deliver air into the part. The part
19
was then submerged in water. In order to visually check for leaks, the researchers
observed air bubbles forming on the part, which would show an indication of an air leak.
It was noted that the majority of air bubbles formed at the locations where there were
abrupt changes in the shape.
Overall results for this study concluded that the best external sealant is BJB
Epoxy TC-1614 applied as two coats using a brushing method. This was the only method
able to withstand a pressure of 207-276 kPa. Other sealants that were applied with 2
brushed coats and able to withstand pressures between 138-207 kPa include Minwax
Sanding Sealer, Minwax Oil Based Polyurethane, PRO Finisher Water-Base
Polyurethane, Stycast W19 + Catalyst 9, and West System’s 105 Resin + 209 Hardener
Epoxy. The only vacuum infiltration process that was able to withstand 138-207 kPa of
pressure was the BJB Epoxy TC-1614, with all other processes yielding lower pressure
results or no pressure retention.
McCullough (2013)
Eric McCullough et al. conducted a study to seal FDM parts using acetone. Their
study focused on biocompatible applications, and focused on specific properties such as
roughness, charge, modulus, and hydrophilicity. Their solution to treating the FDM part
surfaces was to soak parts in acetone (Smith-Aldrich and deionized water 18.2 MΩcm)
for various amounts of time. Their samples were then placed in high-humidity
environments and colored dye was injected into printed channels to visually check for
fluid seepage.
20
Their samples were printed on a Dimension 1200es machine using ABSplus.
Samples were composed of thin rectangles that had a series of channels on the top
surface. Prior to the acetone bath, researchers were able to physically observe and
measure individual strands of ABSplus that made up the part. After the acetone bath, the
strands of ABSplus were smoother and fused together, making it difficult to measure
strands individually. Researchers also observed that un-treated samples were permeable
to liquids, and post-processed samples were able to retain liquids. The liquids were
placed in the channels that were on the top surface of the part and parts were observed for
permeability.
Although their treatment was successful for sealing samples, it was noted that
there were surface changes that occurred from the acetone chemically interacting with the
ABS. One other drawback from their study was that with surface modifications their
CAD models would have to be updated and removal of material using acetone had to be
accounted for so the specifications for desired contact angle between specimens would
remain. Another drawback stated by the researchers was that some applications relied on
surface roughness for flow in microfluidic devices, and roughness was one characteristic
that changed due to the addition of acetone. The one interesting observation pointed out
by the researchers was that the amount of time the acetone was left of the part was not
proportional to the amount of roughness measured, concluding that surface roughness
was due to the concentration of acetone in the solution, rather than the amount of time the
samples were left in the acetone bath. Overall, their results were successful in showing
that acetone can indeed be used as an FDM part sealer, with certain characteristics to be
kept in mind if one is interested in maintaining the part’s original dimensional quality.
21
Chapter 3: Methodology
The testing that was completed for this thesis evolved over the course of the project.
Because so little was known about the porosity of parts produced by the fused deposition
modeling process, and because prior work in this area is so limited, the testing protocols
employed here were revised according to the results obtained in prior tests.
The overall sequence of events reported on here was as follows:
The first test was to print disks using the Dimension 1200es machine and analyze
the internal structure in order to understand the inherent porosity due to print
structure in FDM applications.
Concluding that the Dimension 1200es “solid” disks still had a large amount of
porosity, the next step was to print disks using the Fortus 400mc machine and try
to reduce the porosity by printing parts with customized raster patterns.
Multiple disk samples were then tested against a ‘control’ disk machined from an
aluminum blank, using a simple piston-cylinder system in order to gauge air
permeability rates. These disks were printed on the Dimension 1200es and the
Fortus 400mc, using various print parameters as well as various materials. Figure
6 shows a sample of the disks tested: from left to right, aluminum, Fortus 400mc
Ultem Custom, Fortus 400mc ABS-M30i Custom, Fortus 400mc ABS-M30i
default, and Dimension 1200es ABS-plus. Samples were tested under a Low

22
Pressure (LP) condition of 4.35 psi or a High Pressure (HP) condition of 38.16 psi
based on an initial assessment of pressure that the parts could hold over a long
enough time to be able to accurately measure a displacement.
Figure 6 - Sample of Disks Tested
The next step was to coat some of the FDM samples in BJB Epoxy and test these
relative to the non-coated parts and the aluminum disk.
Subsequently, the disks were printed using a sparse internal structure and filled
with epoxy (poured onto open-section samples). These parts were tested in the
piston-cylinder system and compared to the previous parts (non-coated and
coated) as well as the aluminum control disk.
The next step was to determine a way to fill the samples with minimum external
modifications as well as filling them using a closed-section sample.
Following the successful test of the closed-section epoxy-filled samples, it was
determined that more complex shapes were to be printed and filled using an
injection method.
Following the successful filling of these parts, they were tested under pressure to
compare the rate at which pressure dropped once the part was pressurized.
23
The next test was to determine the minimum thickness a part could have that
would permit filling using the epoxy-injection method. These samples were
fabricated in both the Dimension 1200es and Fortus 400mc machines.
The last test was to print and fill with epoxy five tensile samples (creating a
composite) and compare their mechanical behavior to non-treated tensile samples.
Initial Testing Apparatus
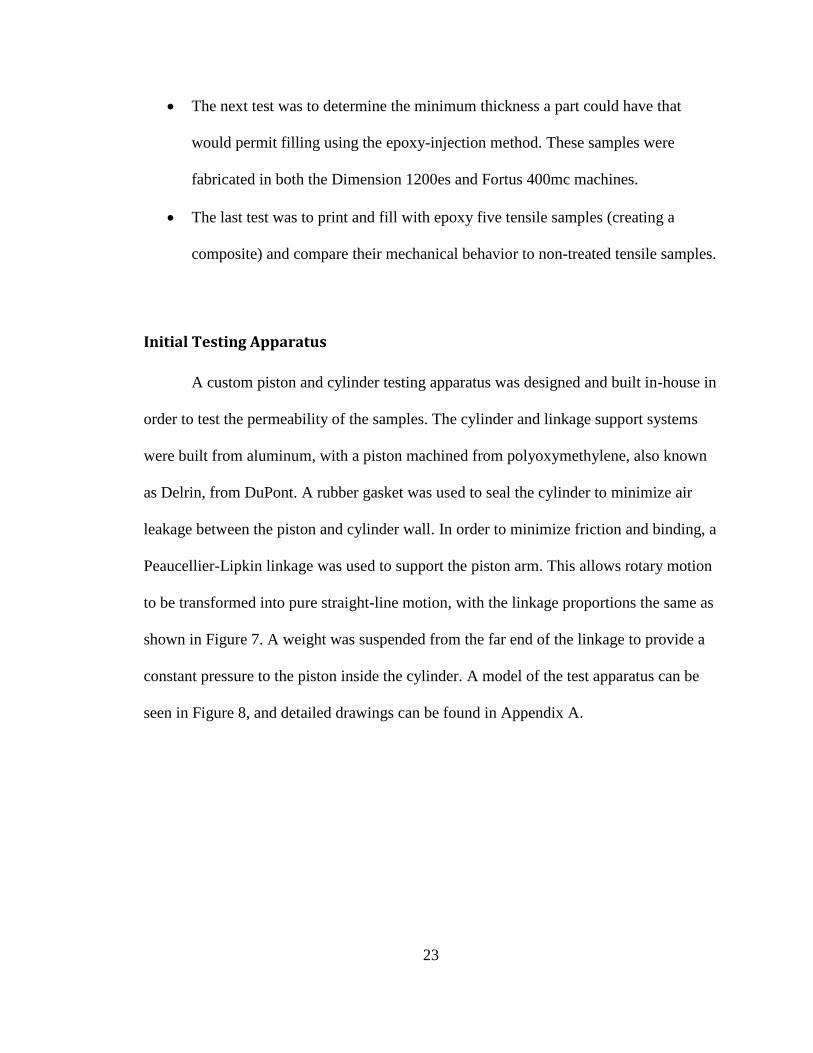
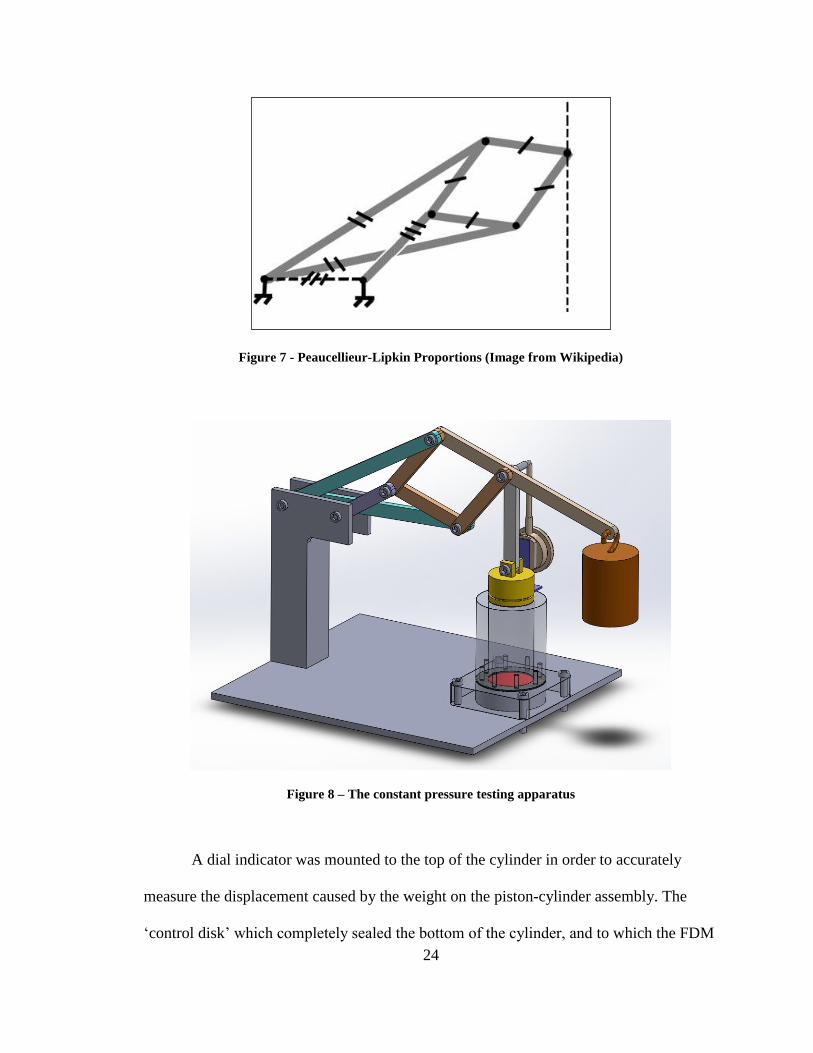
A custom piston and cylinder testing apparatus was designed and built in-house in
order to test the permeability of the samples. The cylinder and linkage support systems
were built from aluminum, with a piston machined from polyoxymethylene, also known
as Delrin, from DuPont. A rubber gasket was used to seal the cylinder to minimize air
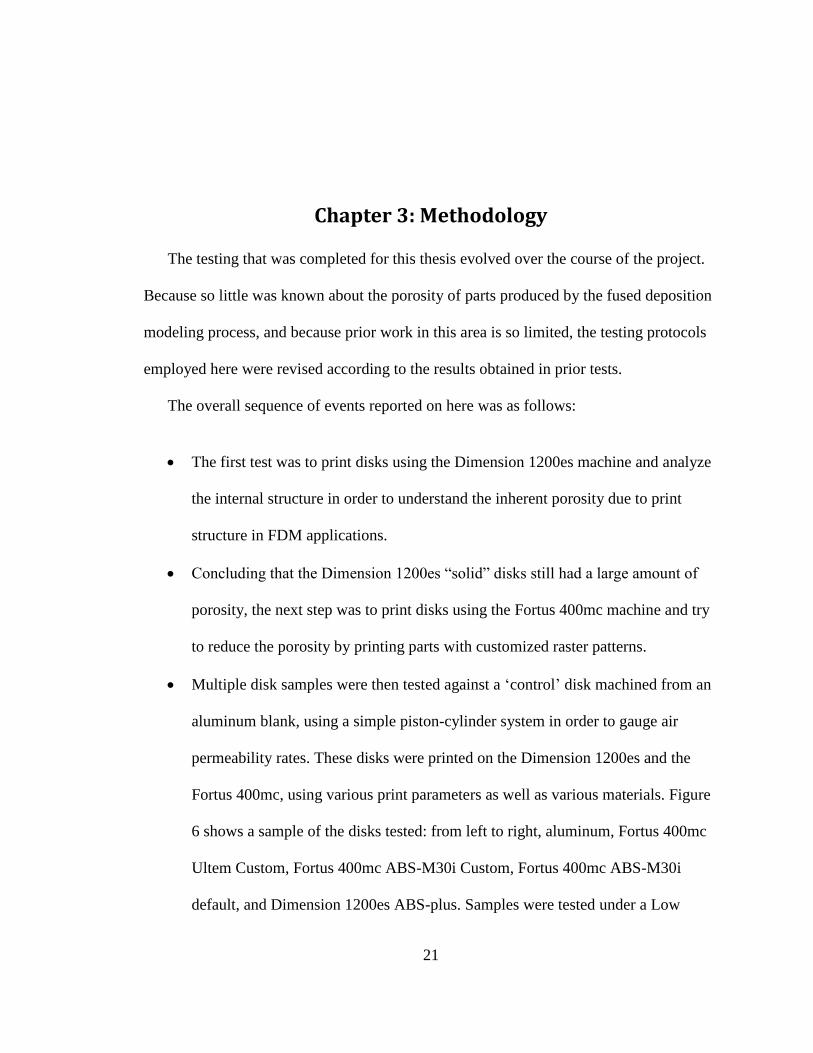
leakage between the piston and cylinder wall. In order to minimize friction and binding, a
Peaucellier-Lipkin linkage was used to support the piston arm. This allows rotary motion
to be transformed into pure straight-line motion, with the linkage proportions the same as
shown in Figure 7. A weight was suspended from the far end of the linkage to provide a
constant pressure to the piston inside the cylinder. A model of the test apparatus can be
seen in Figure 8, and detailed drawings can be found in Appendix A.
24
Figure 7 - Peaucellieur-Lipkin Proportions (Image from Wikipedia)
Figure 8 – The constant pressure testing apparatus
A dial indicator was mounted to the top of the cylinder in order to accurately
measure the displacement caused by the weight on the piston-cylinder assembly. The
‘control disk’ which completely sealed the bottom of the cylinder, and to which the FDM
25
printed disks were compared, was machined from aluminum, as previously noted. The
disk was mounted at the bottom of the cylinder (shown in red in Figure 8) and fixed in
place with eight socket–head screws. The FDM disks were originally 1.8 inches in
diameter and 0.5 inches in thickness. These were later changed to 1.8 inches in diameter
and 0.125 inches in thickness. The change in thickness was made to reduce the material
quantity, as it was noted that the change in thickness did not affect the degree of
permeability. Three different types of ABS disks were tested using different print
parameters, from each of the FDM machines. Disks made from Ultem were also printed
and compared to the other samples. Rubber gaskets were placed on the top and bottom
surfaces of the disks, as shown in Figure 9, in order to ensure minimum air leakage due to
the part geometry. The bottom of each disk was open to the atmosphere.
26
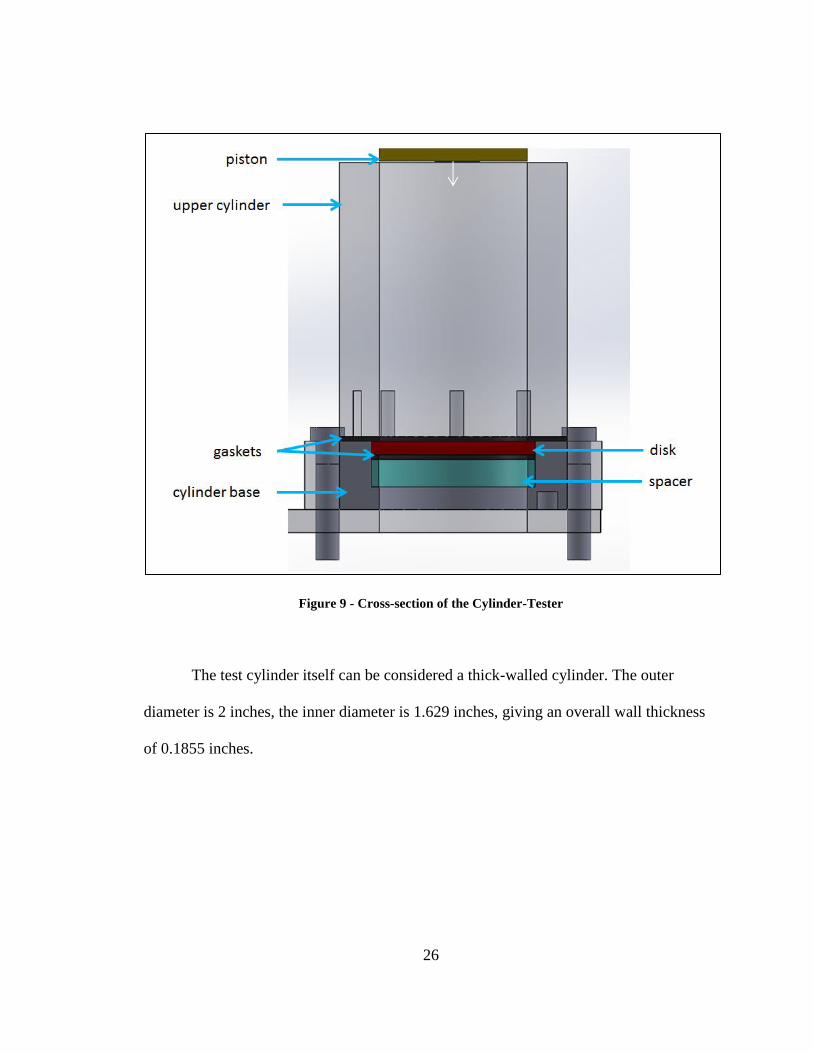
Figure 9 - Cross-section of the Cylinder-Tester
The test cylinder itself can be considered a thick-walled cylinder. The outer
diameter is 2 inches, the inner diameter is 1.629 inches, giving an overall wall thickness
of 0.1855 inches.

27
Eliminating Noise
As Phadke notes, there are various noise factors in the deposition process. The
“nonuniform thickness and the surface defects of the [material] layer are caused by
variations in the parameters involved in the chemical reactions associated with the
deposition process (Phadke, 1989).” Sample dimensions were measured with precision
calipers to assure that all specimens were similar to each other, thus eliminating the
possibility of “print-noise” as a factor in pressure differences amongst data points.
Similarly, samples were picked at random and examined under a microscope to analyze
uniformity and print accuracy.
Epoxy Samples
After comparison of the initial piston-cylinder testing apparatus, samples were
filled with epoxy as an internal sealing method. These disk samples were then compared
to the aluminum samples to assure the reduction of permeability and porosity. Once it
was concluded that the epoxy injection method was successful at sealing the samples, it
was determined that an integral nozzle, built into each specimen, would be used to fill the
parts with epoxy using a syringe or a vacuum pump. These parts were tested for pressure
purposes using a vacuum pump. Epoxy-filled tensile samples were also created to
compare plain plastic samples to epoxy-plastic composites.

28
Chapter 4: Results
Initial Disk Porosity Testing
A summary of the printed samples can be seen in Table 4. The original data can be
found in Appendix B: Test Data. These values were used to calculate the average
percentage of air, or porosity in the samples using the following steps used for one of the
sample calculations.
Disk Volume Calculations:
For the 0.5 inch height disk with a diameter of 1.80 inches:
For the 0.150 inch height disk with a diameter of 1.80 inches:
Conversion from inches to centimeters:
For the 0.5 inch height disk with a diameter of 1.80 inches:
For the 0.150 inch height disk with a diameter of 1.80 inches:
29
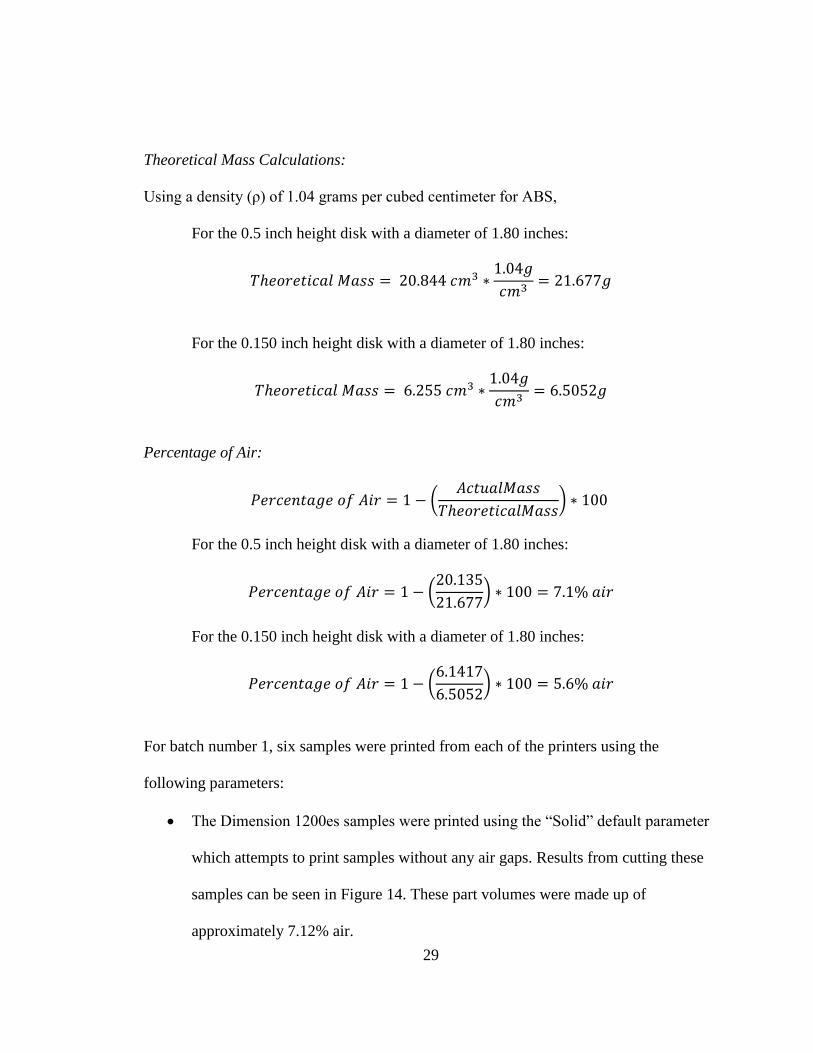
Theoretical Mass Calculations:
Using a density (ρ) of 1.04 grams per cubed centimeter for ABS,
For the 0.5 inch height disk with a diameter of 1.80 inches:
For the 0.150 inch height disk with a diameter of 1.80 inches:
Percentage of Air:
(
)
For the 0.5 inch height disk with a diameter of 1.80 inches:
(
)
For the 0.150 inch height disk with a diameter of 1.80 inches:
(
)
For batch number 1, six samples were printed from each of the printers using the
following parameters:
The Dimension 1200es samples were printed using the “Solid” default parameter
which attempts to print samples without any air gaps. Results from cutting these
samples can be seen in Figure 14. These part volumes were made up of
approximately 7.12% air.
30
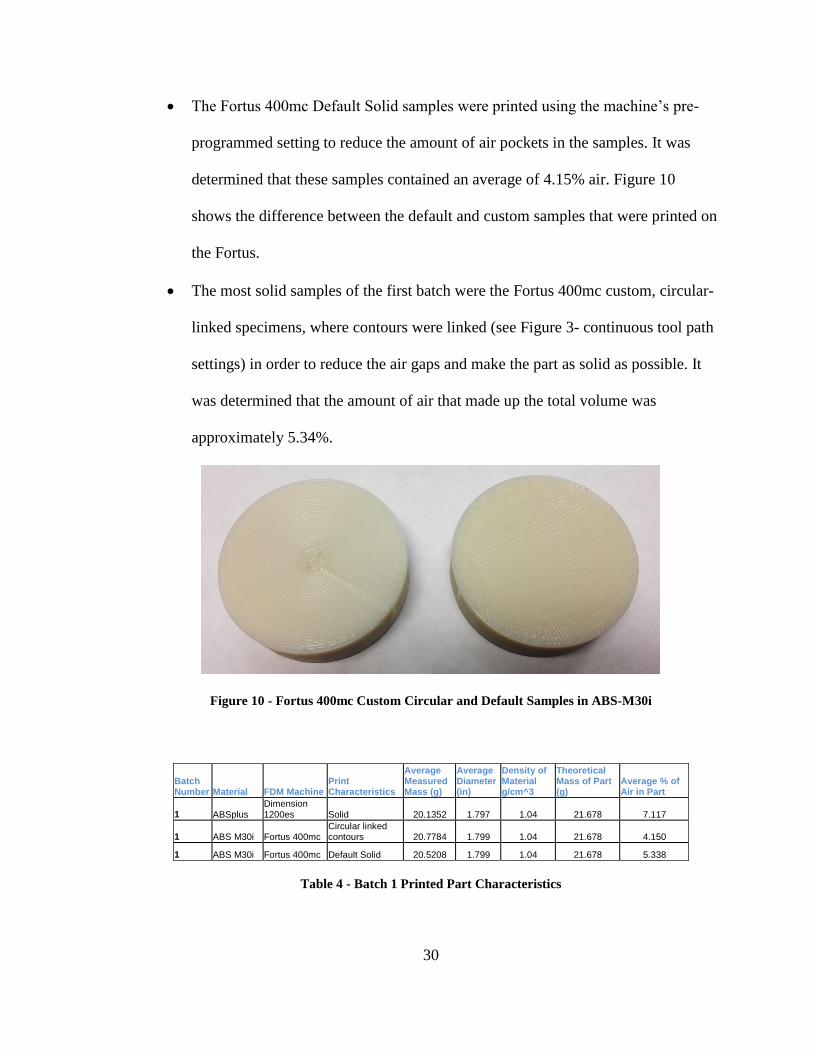
The Fortus 400mc Default Solid samples were printed using the machine’s pre-
programmed setting to reduce the amount of air pockets in the samples. It was
determined that these samples contained an average of 4.15% air. Figure 10
shows the difference between the default and custom samples that were printed on
the Fortus.
The most solid samples of the first batch were the Fortus 400mc custom, circular-
linked specimens, where contours were linked (see Figure 3- continuous tool path
settings) in order to reduce the air gaps and make the part as solid as possible. It
was determined that the amount of air that made up the total volume was
approximately 5.34%.
Figure 10 - Fortus 400mc Custom Circular and Default Samples in ABS-M30i
Batch Number Material FDM Machine
Print Characteristics
Average Measured Mass (g)
Average Diameter (in)
Density of Material g/cm^3
Theoretical Mass of Part (g)
Average % of Air in Part
1 ABSplus Dimension 1200es Solid 20.1352 1.797 1.04 21.678 7.117
1 ABS M30i Fortus 400mc Circular linked contours 20.7784 1.799 1.04 21.678 4.150
1 ABS M30i Fortus 400mc Default Solid 20.5208 1.799 1.04 21.678 5.338
Table 4 - Batch 1 Printed Part Characteristics
31
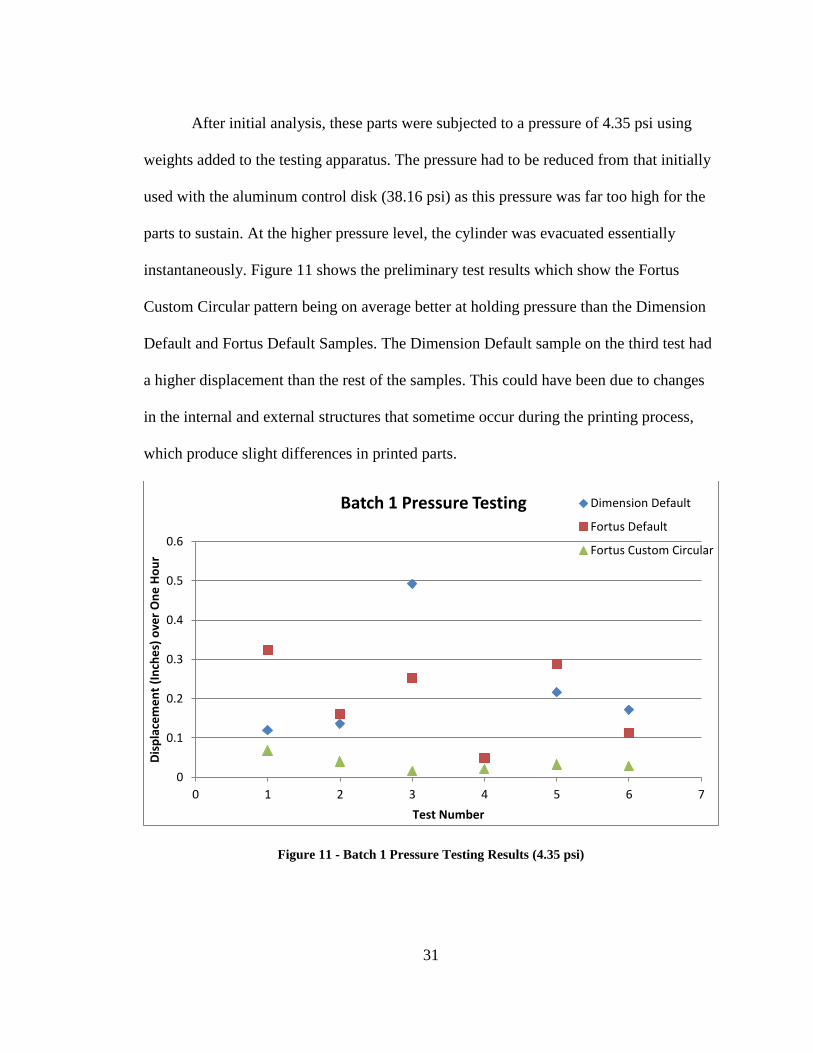
After initial analysis, these parts were subjected to a pressure of 4.35 psi using
weights added to the testing apparatus. The pressure had to be reduced from that initially
used with the aluminum control disk (38.16 psi) as this pressure was far too high for the
parts to sustain. At the higher pressure level, the cylinder was evacuated essentially
instantaneously. Figure 11 shows the preliminary test results which show the Fortus
Custom Circular pattern being on average better at holding pressure than the Dimension
Default and Fortus Default Samples. The Dimension Default sample on the third test had
a higher displacement than the rest of the samples. This could have been due to changes
in the internal and external structures that sometime occur during the printing process,
which produce slight differences in printed parts.
Figure 11 - Batch 1 Pressure Testing Results (4.35 psi)
0
0.1
0.2
0.3
0.4
0.5
0.6
0 1 2 3 4 5 6 7
Dis
pla
cem
en
t (I
nch
es)
ove
r O
ne
Ho
ur
Test Number
Batch 1 Pressure Testing Dimension Default
Fortus Default
Fortus Custom Circular
32
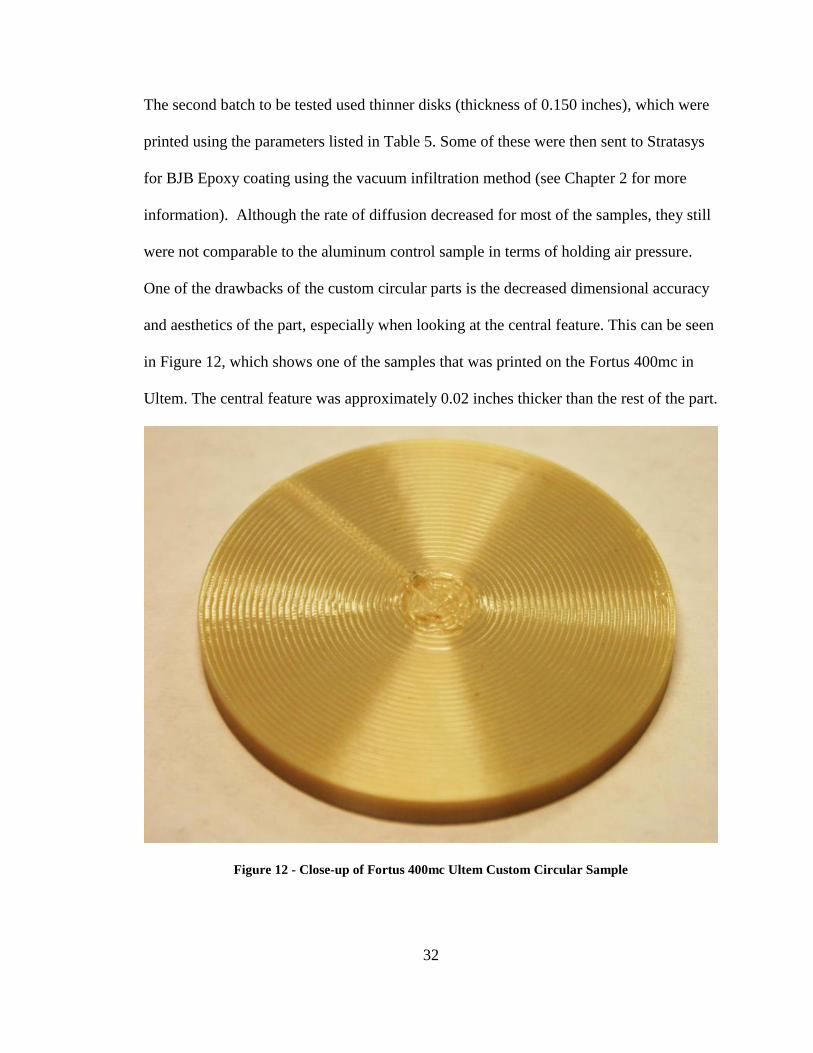
The second batch to be tested used thinner disks (thickness of 0.150 inches), which were
printed using the parameters listed in Table 5. Some of these were then sent to Stratasys
for BJB Epoxy coating using the vacuum infiltration method (see Chapter 2 for more
information). Although the rate of diffusion decreased for most of the samples, they still
were not comparable to the aluminum control sample in terms of holding air pressure.
One of the drawbacks of the custom circular parts is the decreased dimensional accuracy
and aesthetics of the part, especially when looking at the central feature. This can be seen
in Figure 12, which shows one of the samples that was printed on the Fortus 400mc in
Ultem. The central feature was approximately 0.02 inches thicker than the rest of the part.
Figure 12 - Close-up of Fortus 400mc Ultem Custom Circular Sample
33
Batch Number Material FDM Machine
Print Characteristics
Average Measured Mass (g)
Average Diameter (in)
Density of Material g/cm^3
Theoretical Mass of Part (g)
Average % of Air in Part
2 ABSplus Dimension 1200es Solid 6.1417 1.798 1.04 6.5052 5.588
2 ABS M30i Fortus 400mc Circular linked contours 6.2443 1.799 1.04 6.5052 4.011
2 ABS M30i Fortus 400mc Default Solid 6.2101 1.797 1.04 6.5052 4.536
2 Ultem Fortus 400mc Circular linked contours 7.6633 1.798 1.34 8.3817 8.571
Table 5 - Batch 2 Printed Part Characteristics
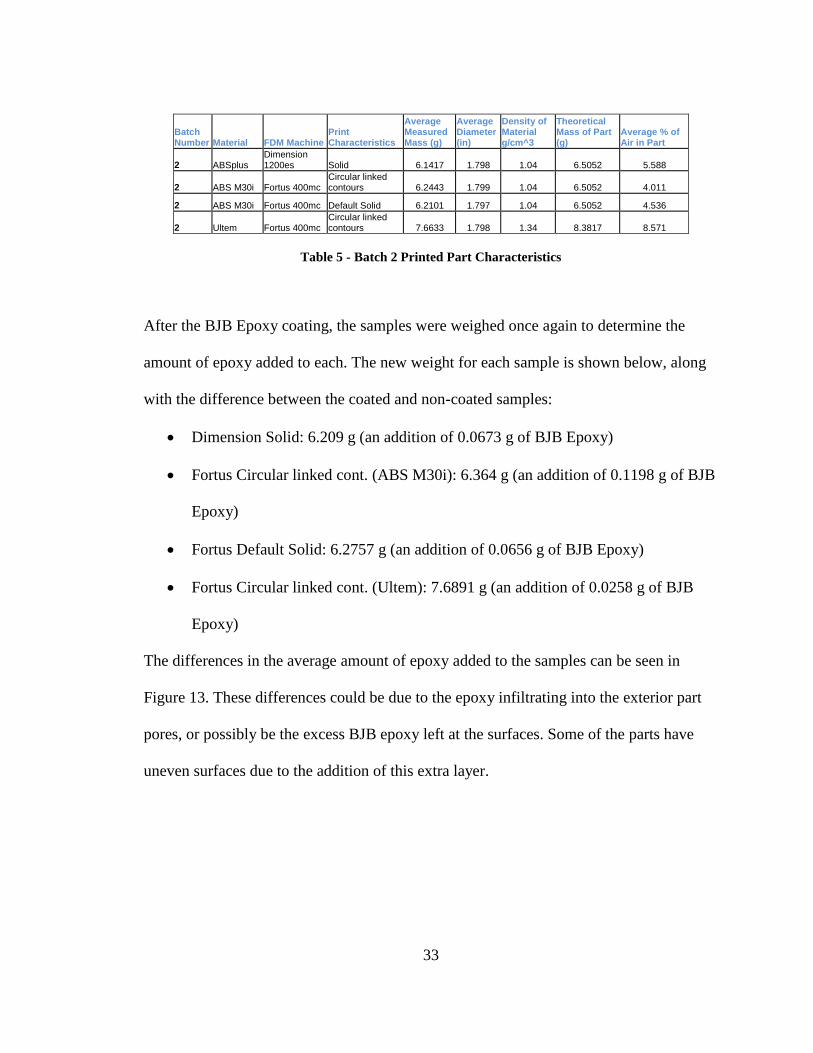
After the BJB Epoxy coating, the samples were weighed once again to determine the
amount of epoxy added to each. The new weight for each sample is shown below, along
with the difference between the coated and non-coated samples:
Dimension Solid: 6.209 g (an addition of 0.0673 g of BJB Epoxy)
Fortus Circular linked cont. (ABS M30i): 6.364 g (an addition of 0.1198 g of BJB
Epoxy)
Fortus Default Solid: 6.2757 g (an addition of 0.0656 g of BJB Epoxy)
Fortus Circular linked cont. (Ultem): 7.6891 g (an addition of 0.0258 g of BJB
Epoxy)
The differences in the average amount of epoxy added to the samples can be seen in
Figure 13. These differences could be due to the epoxy infiltrating into the exterior part
pores, or possibly be the excess BJB epoxy left at the surfaces. Some of the parts have
uneven surfaces due to the addition of this extra layer.
34
Figure 13 - Weight differences after BJB Epoxy Addition
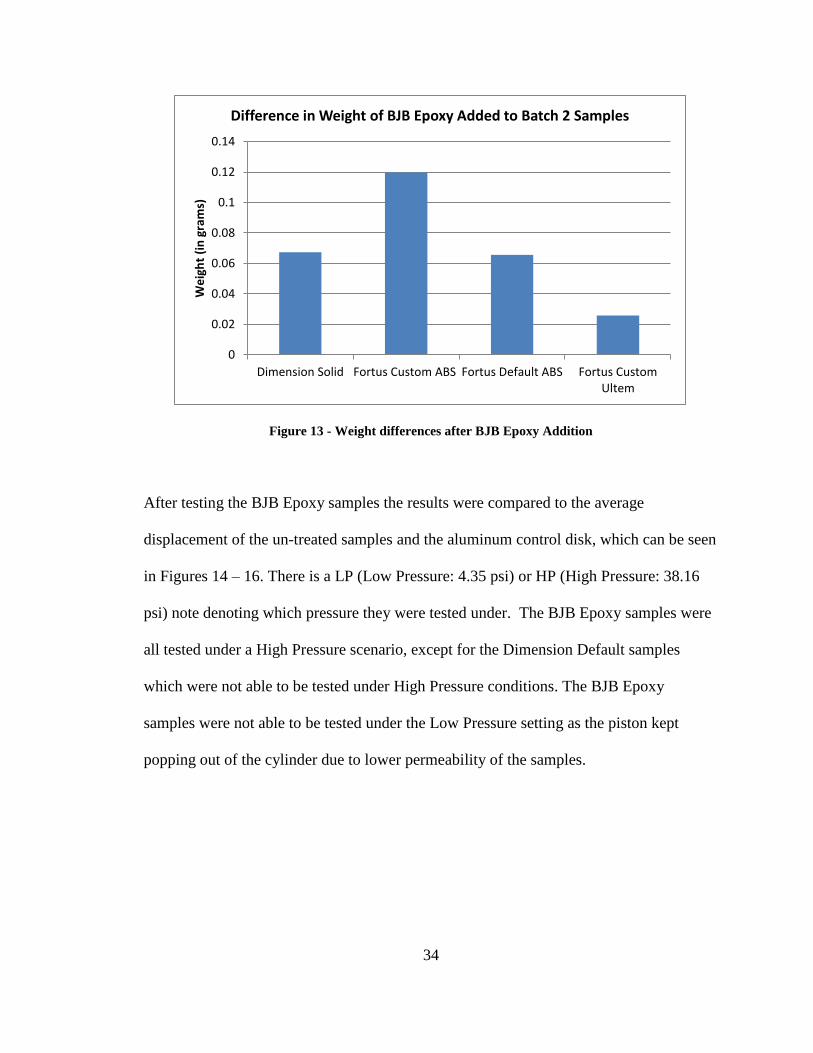
After testing the BJB Epoxy samples the results were compared to the average
displacement of the un-treated samples and the aluminum control disk, which can be seen
in Figures 14 – 16. There is a LP (Low Pressure: 4.35 psi) or HP (High Pressure: 38.16
psi) note denoting which pressure they were tested under. The BJB Epoxy samples were
all tested under a High Pressure scenario, except for the Dimension Default samples
which were not able to be tested under High Pressure conditions. The BJB Epoxy
samples were not able to be tested under the Low Pressure setting as the piston kept
popping out of the cylinder due to lower permeability of the samples.
0
0.02
0.04
0.06
0.08
0.1
0.12
0.14
Dimension Solid Fortus Custom ABS Fortus Default ABS Fortus CustomUltem
We
igh
t (i
n g
ram
s)
Difference in Weight of BJB Epoxy Added to Batch 2 Samples

35
Figure 14 - Low Rate of Displacement Samples Tested under High Pressure
Figure 15 - Fortus Default BJB Samples Tested under High Pressure
0
0.002
0.004
0.006
0.008
0.01
0.012
0.014
Aluminum Fortus Custom Ultem BJB Fortus Custom ABS BJB
Rat
e o
f P
isto
n D
isp
lace
men
t (i
nch
es/h
ou
r)
Samples Tested under High Pressure (HP)
0
0.5
1
1.5
2
2.5
3
Aluminum Fortus Default ABS BJB
Rat
e o
f P
isto
n D
isp
lace
men
t (i
nch
es/h
ou
r)
Fortus Default BJB Tested under High Pressure (HP)
36
Figure 16 - Samples Tested under Low Pressure
Epoxy-Filled Samples
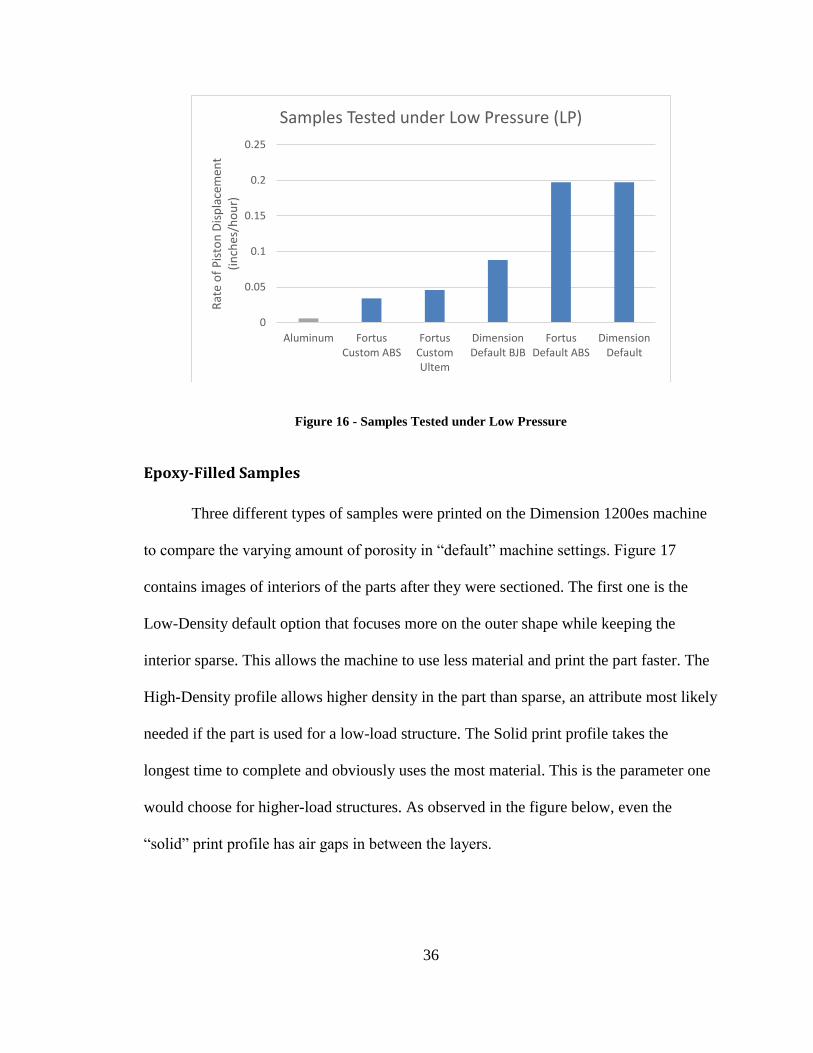
Three different types of samples were printed on the Dimension 1200es machine
to compare the varying amount of porosity in “default” machine settings. Figure 17
contains images of interiors of the parts after they were sectioned. The first one is the
Low-Density default option that focuses more on the outer shape while keeping the
interior sparse. This allows the machine to use less material and print the part faster. The
High-Density profile allows higher density in the part than sparse, an attribute most likely
needed if the part is used for a low-load structure. The Solid print profile takes the
longest time to complete and obviously uses the most material. This is the parameter one
would choose for higher-load structures. As observed in the figure below, even the
“solid” print profile has air gaps in between the layers.
0
0.05
0.1
0.15
0.2
0.25
Aluminum FortusCustom ABS
FortusCustomUltem
DimensionDefault BJB
FortusDefault ABS
DimensionDefault
Rat
e o
f P
isto
n D
isp
lace
men
t (i
nch
es/h
ou
r)
Samples Tested under Low Pressure (LP)

37
Figure 17 - Dimension 1200es Print Profile Cross-Sections
A Low-Density (sparse) profile was used for the epoxy filled samples. For this
test, parts were printed on the Dimension 1200es and the print process was stopped
before the part could completely finish, leaving the internal structure of the part
completely exposed at the top. This provided the opportunity to fill the gaps seen in
Figure 18 with epoxy for sealing purposes.
Figure 18 - Low-Density CAD Model Showing Internal Sparse Structure
Two different epoxies were used for this test. One was a two-part casting epoxy
used for arts and crafts (Easy Cast); this specific material has a viscosity of
approximately 600 cP. Information on this epoxy can be found on the TAP Plastics
website (EX-74, 2014). This epoxy easily flowed through the structure in order to fill in
38
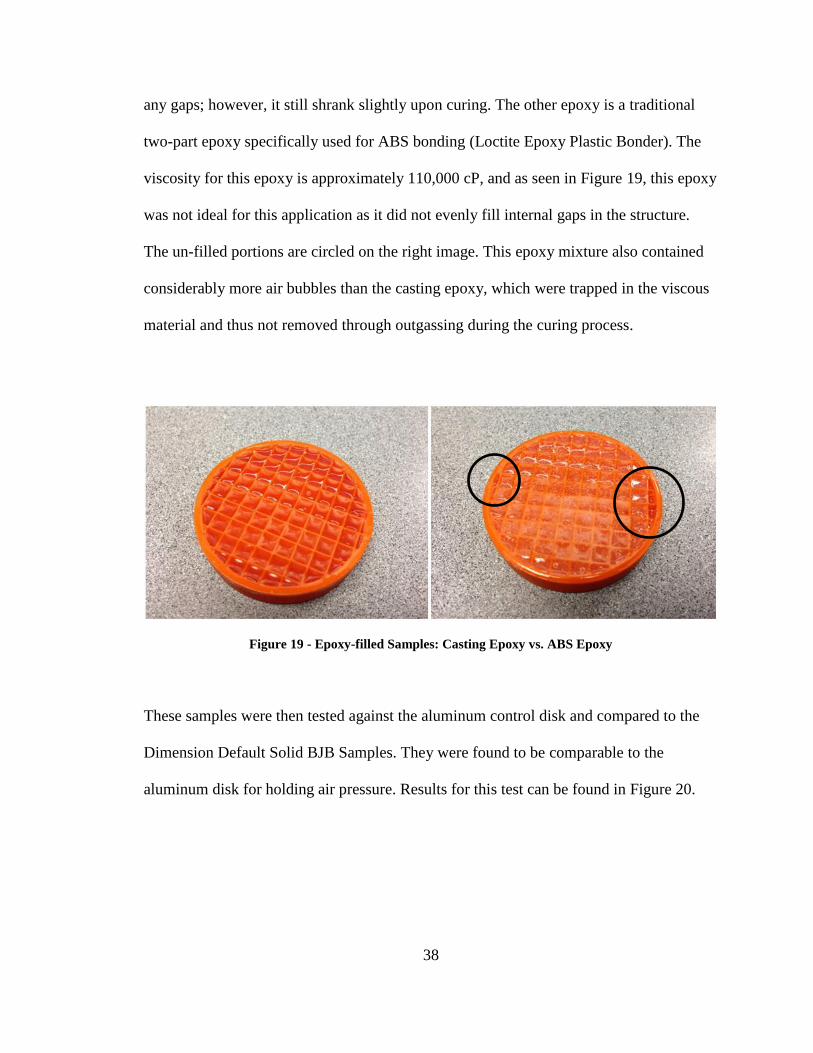
any gaps; however, it still shrank slightly upon curing. The other epoxy is a traditional
two-part epoxy specifically used for ABS bonding (Loctite Epoxy Plastic Bonder). The
viscosity for this epoxy is approximately 110,000 cP, and as seen in Figure 19, this epoxy
was not ideal for this application as it did not evenly fill internal gaps in the structure.
The un-filled portions are circled on the right image. This epoxy mixture also contained
considerably more air bubbles than the casting epoxy, which were trapped in the viscous
material and thus not removed through outgassing during the curing process.
Figure 19 - Epoxy-filled Samples: Casting Epoxy vs. ABS Epoxy
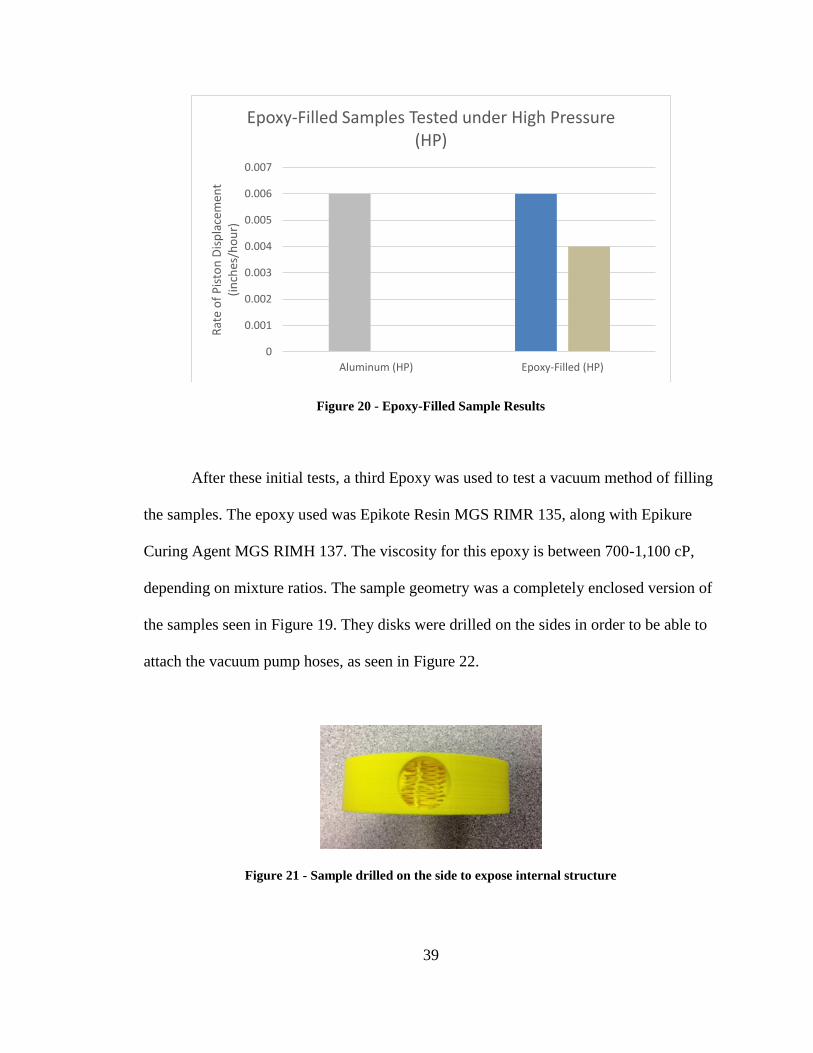
These samples were then tested against the aluminum control disk and compared to the
Dimension Default Solid BJB Samples. They were found to be comparable to the
aluminum disk for holding air pressure. Results for this test can be found in Figure 20.
39
Figure 20 - Epoxy-Filled Sample Results
After these initial tests, a third Epoxy was used to test a vacuum method of filling
the samples. The epoxy used was Epikote Resin MGS RIMR 135, along with Epikure
Curing Agent MGS RIMH 137. The viscosity for this epoxy is between 700-1,100 cP,
depending on mixture ratios. The sample geometry was a completely enclosed version of
the samples seen in Figure 19. They disks were drilled on the sides in order to be able to
attach the vacuum pump hoses, as seen in Figure 22.
Figure 21 - Sample drilled on the side to expose internal structure
0
0.001
0.002
0.003
0.004
0.005
0.006
0.007
Aluminum (HP) Epoxy-Filled (HP)
Rat
e o
f P
isto
n D
isp
lace
men
t (i
nch
es/h
ou
r)
Epoxy-Filled Samples Tested under High Pressure (HP)
40
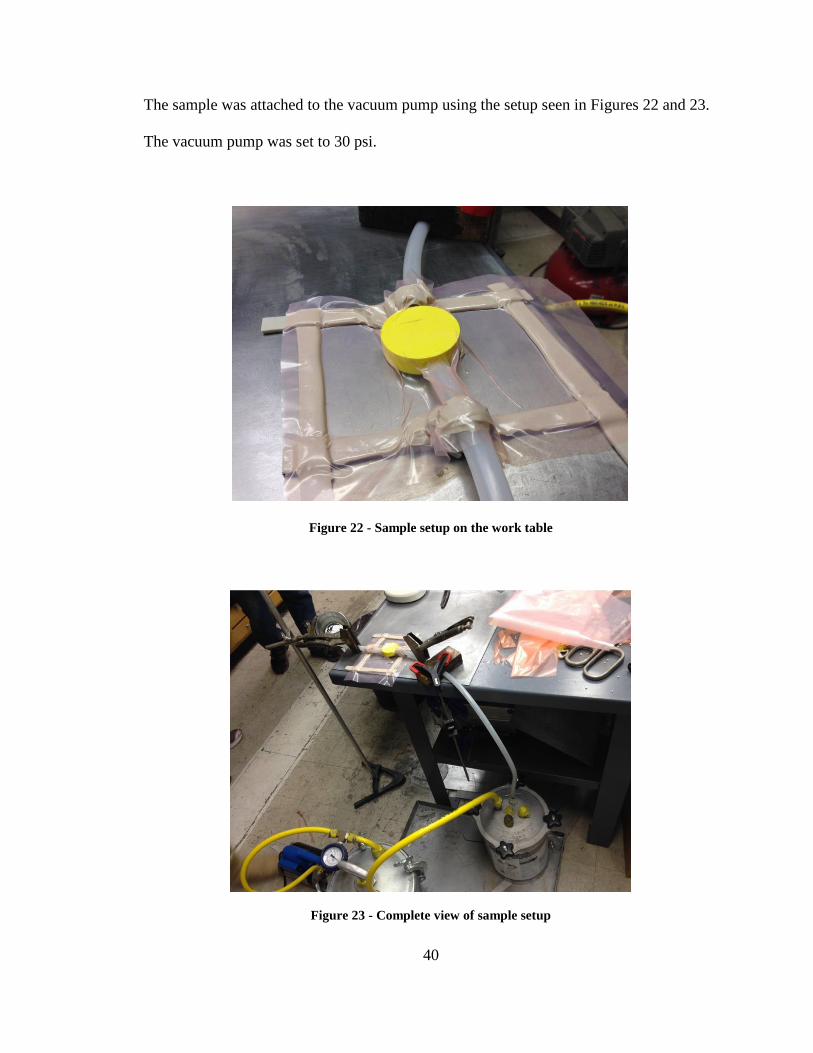
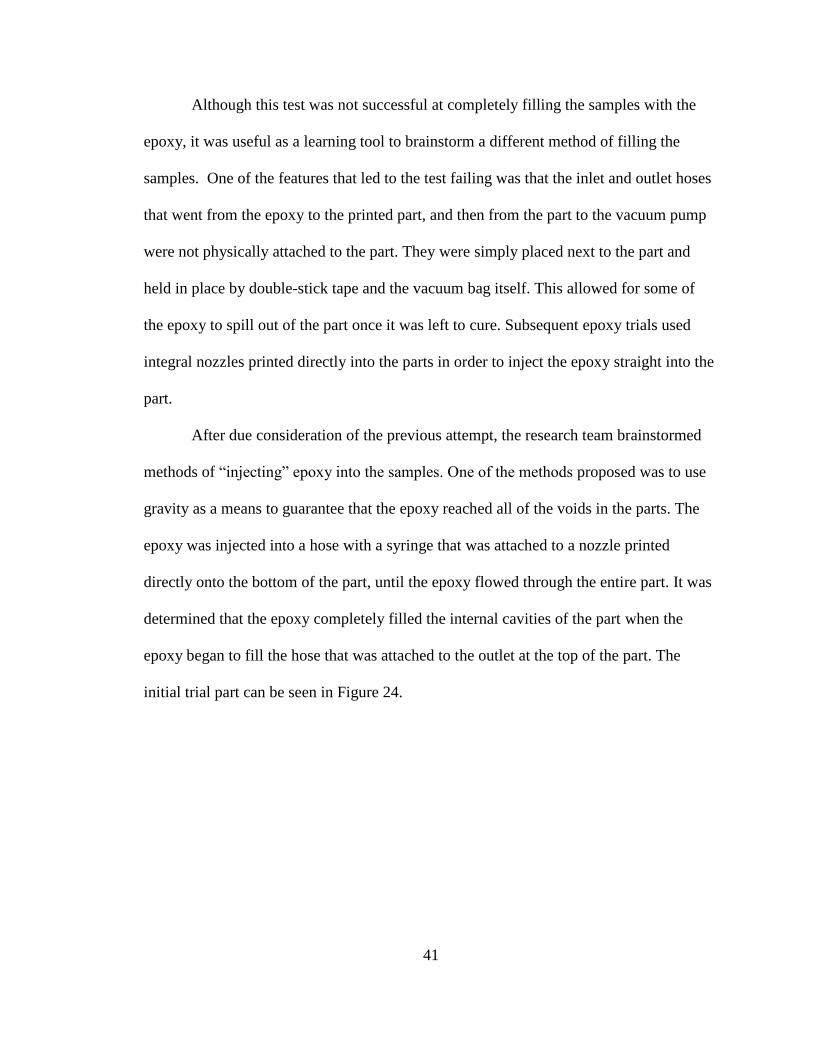
The sample was attached to the vacuum pump using the setup seen in Figures 22 and 23.
The vacuum pump was set to 30 psi.
Figure 22 - Sample setup on the work table
Figure 23 - Complete view of sample setup
41
Although this test was not successful at completely filling the samples with the
epoxy, it was useful as a learning tool to brainstorm a different method of filling the
samples. One of the features that led to the test failing was that the inlet and outlet hoses
that went from the epoxy to the printed part, and then from the part to the vacuum pump
were not physically attached to the part. They were simply placed next to the part and
held in place by double-stick tape and the vacuum bag itself. This allowed for some of
the epoxy to spill out of the part once it was left to cure. Subsequent epoxy trials used
integral nozzles printed directly into the parts in order to inject the epoxy straight into the
part.
After due consideration of the previous attempt, the research team brainstormed
methods of “injecting” epoxy into the samples. One of the methods proposed was to use
gravity as a means to guarantee that the epoxy reached all of the voids in the parts. The
epoxy was injected into a hose with a syringe that was attached to a nozzle printed
directly onto the bottom of the part, until the epoxy flowed through the entire part. It was
determined that the epoxy completely filled the internal cavities of the part when the
epoxy began to fill the hose that was attached to the outlet at the top of the part. The
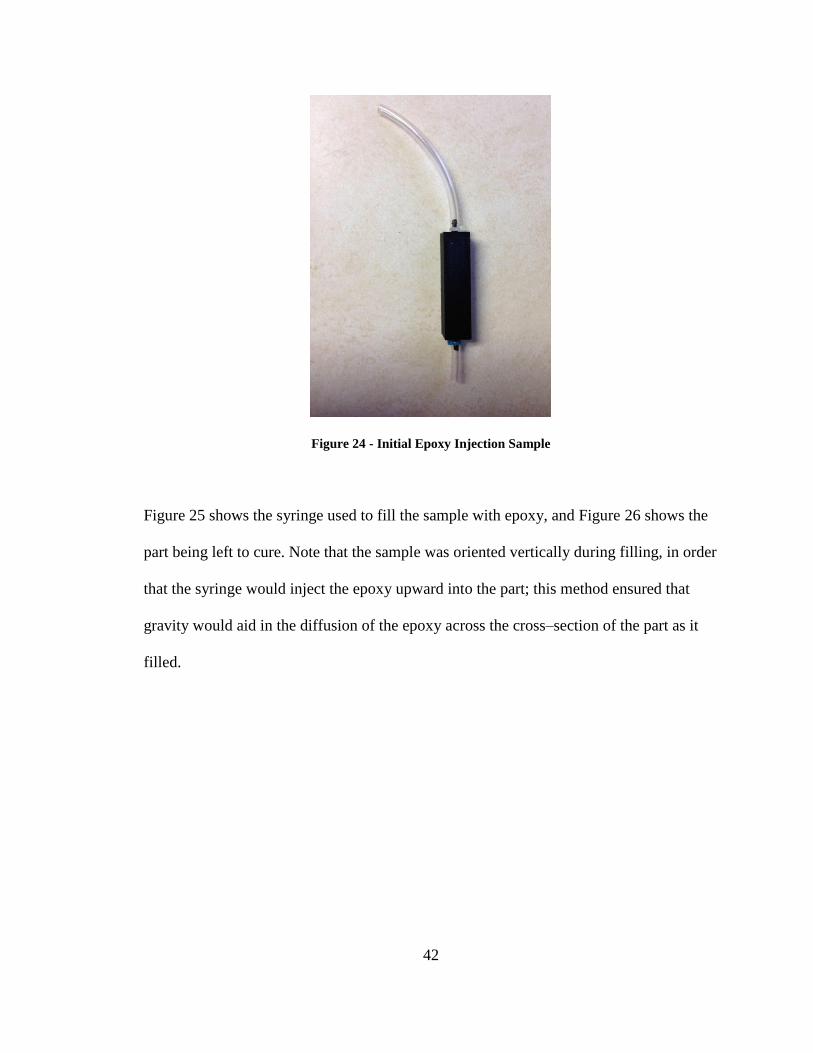
initial trial part can be seen in Figure 24.
42
Figure 24 - Initial Epoxy Injection Sample
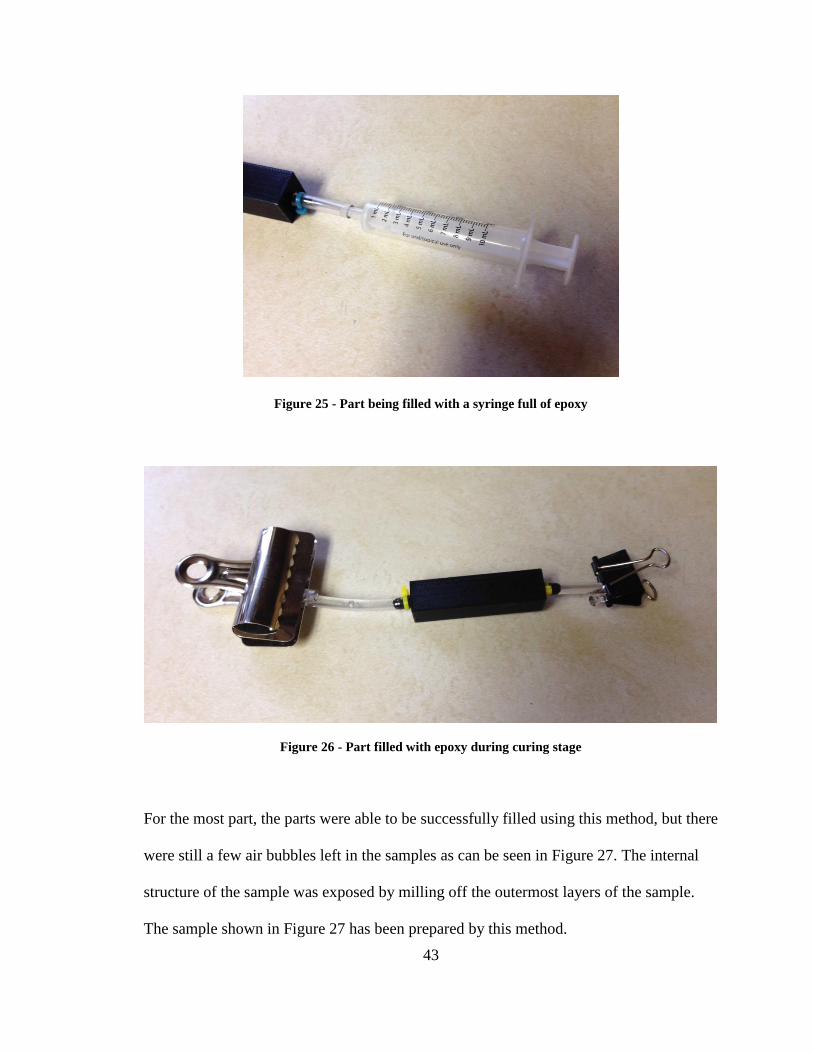
Figure 25 shows the syringe used to fill the sample with epoxy, and Figure 26 shows the
part being left to cure. Note that the sample was oriented vertically during filling, in order
that the syringe would inject the epoxy upward into the part; this method ensured that
gravity would aid in the diffusion of the epoxy across the cross–section of the part as it
filled.
43
Figure 25 - Part being filled with a syringe full of epoxy
Figure 26 - Part filled with epoxy during curing stage
For the most part, the parts were able to be successfully filled using this method, but there
were still a few air bubbles left in the samples as can be seen in Figure 27. The internal
structure of the sample was exposed by milling off the outermost layers of the sample.
The sample shown in Figure 27 has been prepared by this method.

44
Figure 27 - Internal air bubbles in the epoxy-filled samples
These results indicated that the process of injecting epoxy into the samples was
successful, but needed some refinement in order to reduce the number of air bubbles left
by the initial filling process with the syringe. The inherent porosity of FDM was revealed
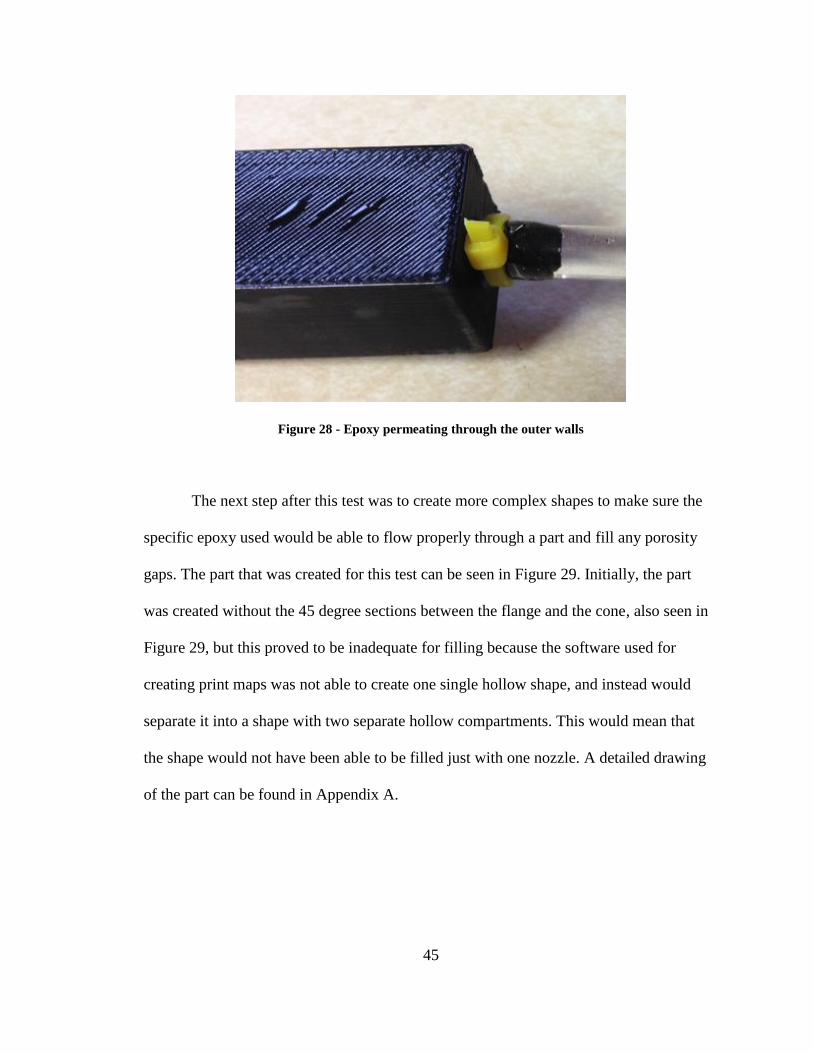
when epoxy started leaking out one of the outer surfaces, as can be seen in Figure 28.
Even though the outer walls of the part were approximately 1/8 of an inch thick (or in this
case, 4 solid layers thick), there were still enough gaps between the layers to allow the
epoxy to permeate through.
45
Figure 28 - Epoxy permeating through the outer walls
The next step after this test was to create more complex shapes to make sure the
specific epoxy used would be able to flow properly through a part and fill any porosity
gaps. The part that was created for this test can be seen in Figure 29. Initially, the part
was created without the 45 degree sections between the flange and the cone, also seen in
Figure 29, but this proved to be inadequate for filling because the software used for
creating print maps was not able to create one single hollow shape, and instead would
separate it into a shape with two separate hollow compartments. This would mean that
the shape would not have been able to be filled just with one nozzle. A detailed drawing
of the part can be found in Appendix A.

46
Figure 29 - Complex shape without and with 45 degree side sections
Figure 30 contains the section view of the CAD model showing the intended
semi-hollow space inside of the part, which when printed, would have an internal
structure similar to the Low-Density print profile in Figure 18. This would allow for the
use of only one of the bottom nozzles to be used for filling purposes.
Figure 30 - Section view of the intended internal structure
47
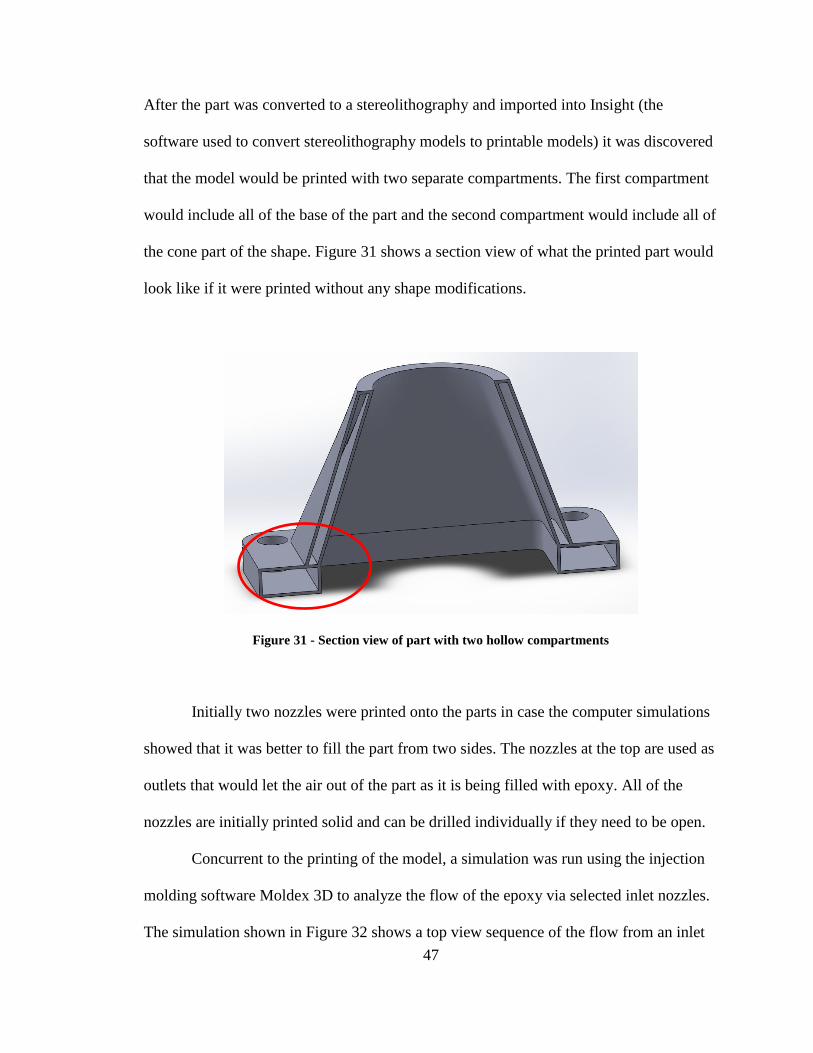
After the part was converted to a stereolithography and imported into Insight (the
software used to convert stereolithography models to printable models) it was discovered
that the model would be printed with two separate compartments. The first compartment
would include all of the base of the part and the second compartment would include all of
the cone part of the shape. Figure 31 shows a section view of what the printed part would
look like if it were printed without any shape modifications.
Figure 31 - Section view of part with two hollow compartments
Initially two nozzles were printed onto the parts in case the computer simulations
showed that it was better to fill the part from two sides. The nozzles at the top are used as
outlets that would let the air out of the part as it is being filled with epoxy. All of the
nozzles are initially printed solid and can be drilled individually if they need to be open.
Concurrent to the printing of the model, a simulation was run using the injection
molding software Moldex 3D to analyze the flow of the epoxy via selected inlet nozzles.
The simulation shown in Figure 32 shows a top view sequence of the flow from an inlet
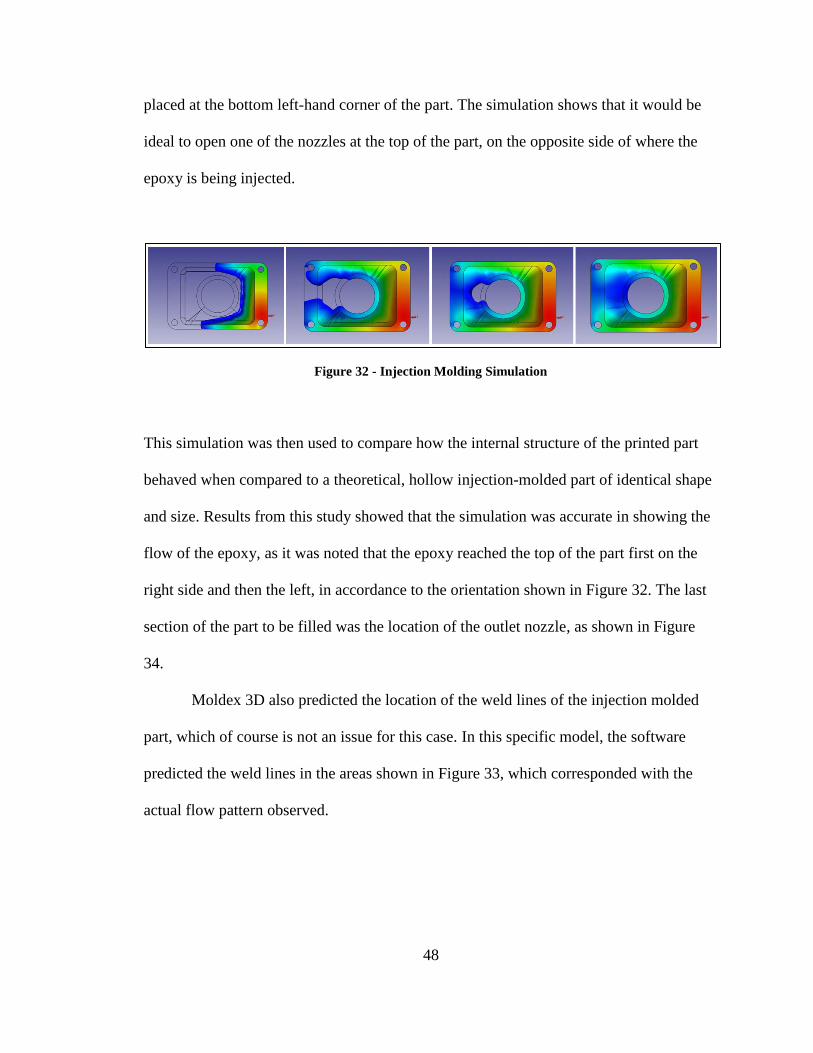
48
placed at the bottom left-hand corner of the part. The simulation shows that it would be
ideal to open one of the nozzles at the top of the part, on the opposite side of where the
epoxy is being injected.
Figure 32 - Injection Molding Simulation
This simulation was then used to compare how the internal structure of the printed part
behaved when compared to a theoretical, hollow injection-molded part of identical shape
and size. Results from this study showed that the simulation was accurate in showing the
flow of the epoxy, as it was noted that the epoxy reached the top of the part first on the
right side and then the left, in accordance to the orientation shown in Figure 32. The last
section of the part to be filled was the location of the outlet nozzle, as shown in Figure
34.
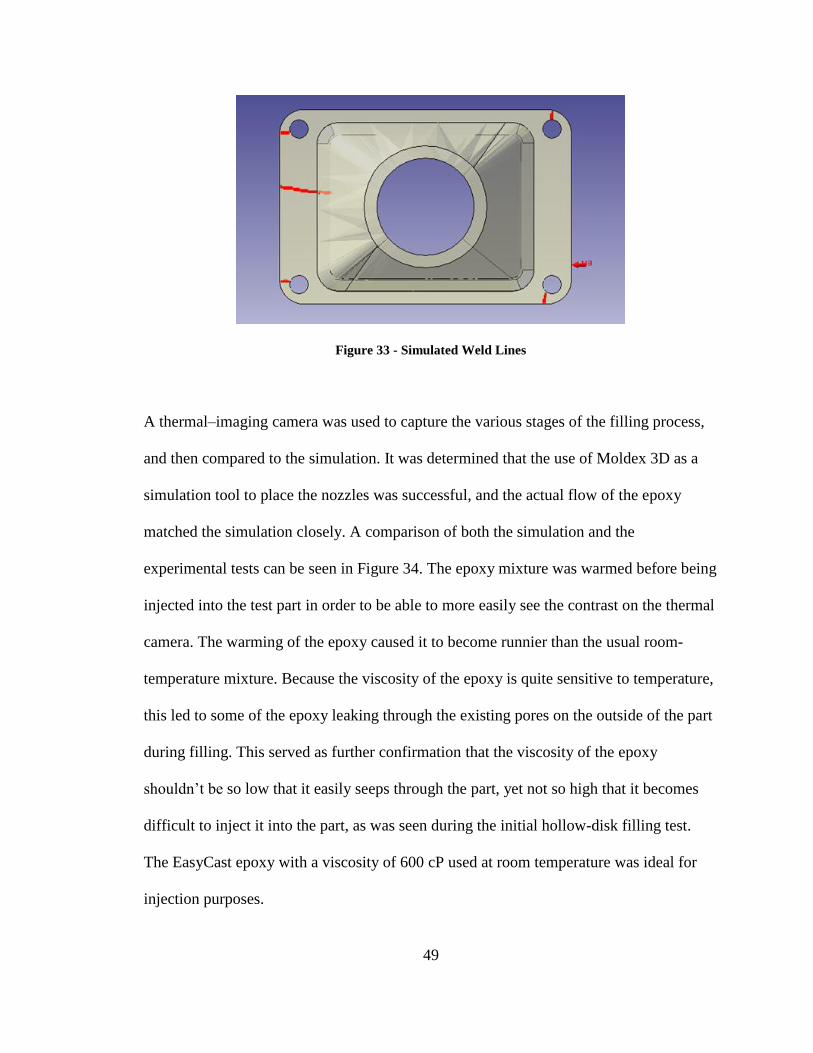
Moldex 3D also predicted the location of the weld lines of the injection molded
part, which of course is not an issue for this case. In this specific model, the software
predicted the weld lines in the areas shown in Figure 33, which corresponded with the
actual flow pattern observed.
49
Figure 33 - Simulated Weld Lines
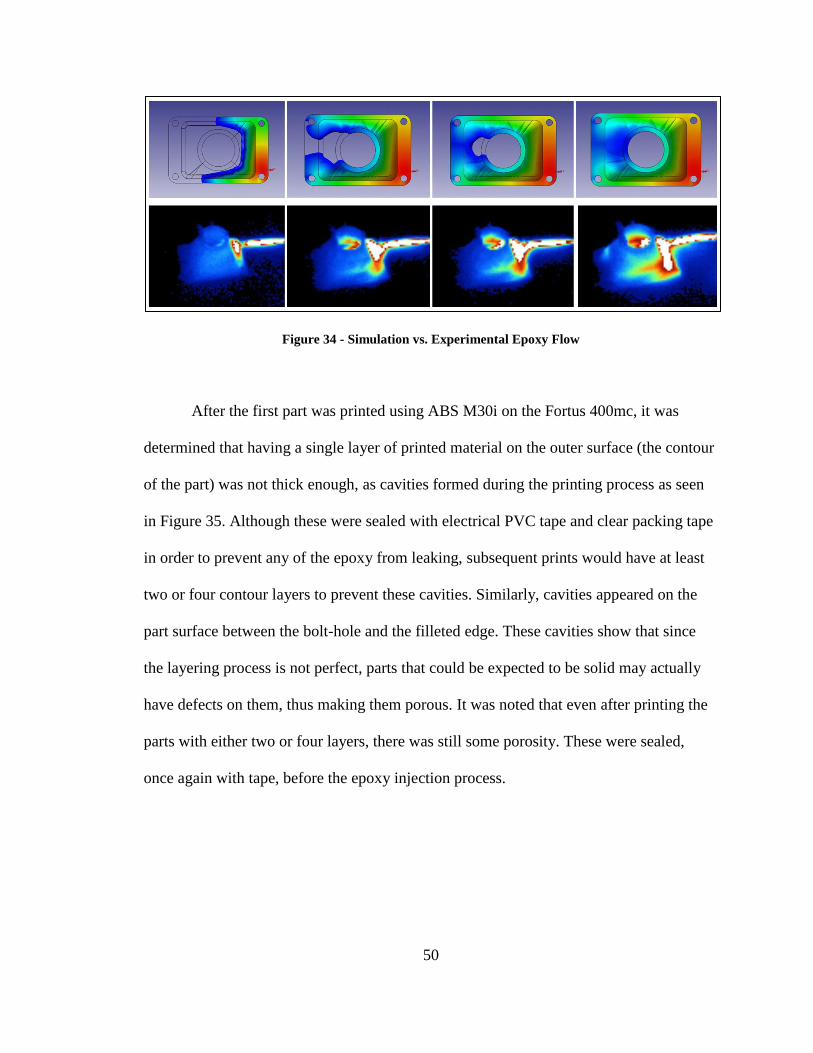
A thermal–imaging camera was used to capture the various stages of the filling process,
and then compared to the simulation. It was determined that the use of Moldex 3D as a
simulation tool to place the nozzles was successful, and the actual flow of the epoxy
matched the simulation closely. A comparison of both the simulation and the
experimental tests can be seen in Figure 34. The epoxy mixture was warmed before being
injected into the test part in order to be able to more easily see the contrast on the thermal
camera. The warming of the epoxy caused it to become runnier than the usual room-
temperature mixture. Because the viscosity of the epoxy is quite sensitive to temperature,
this led to some of the epoxy leaking through the existing pores on the outside of the part
during filling. This served as further confirmation that the viscosity of the epoxy
shouldn’t be so low that it easily seeps through the part, yet not so high that it becomes
difficult to inject it into the part, as was seen during the initial hollow-disk filling test.
The EasyCast epoxy with a viscosity of 600 cP used at room temperature was ideal for
injection purposes.
50
Figure 34 - Simulation vs. Experimental Epoxy Flow
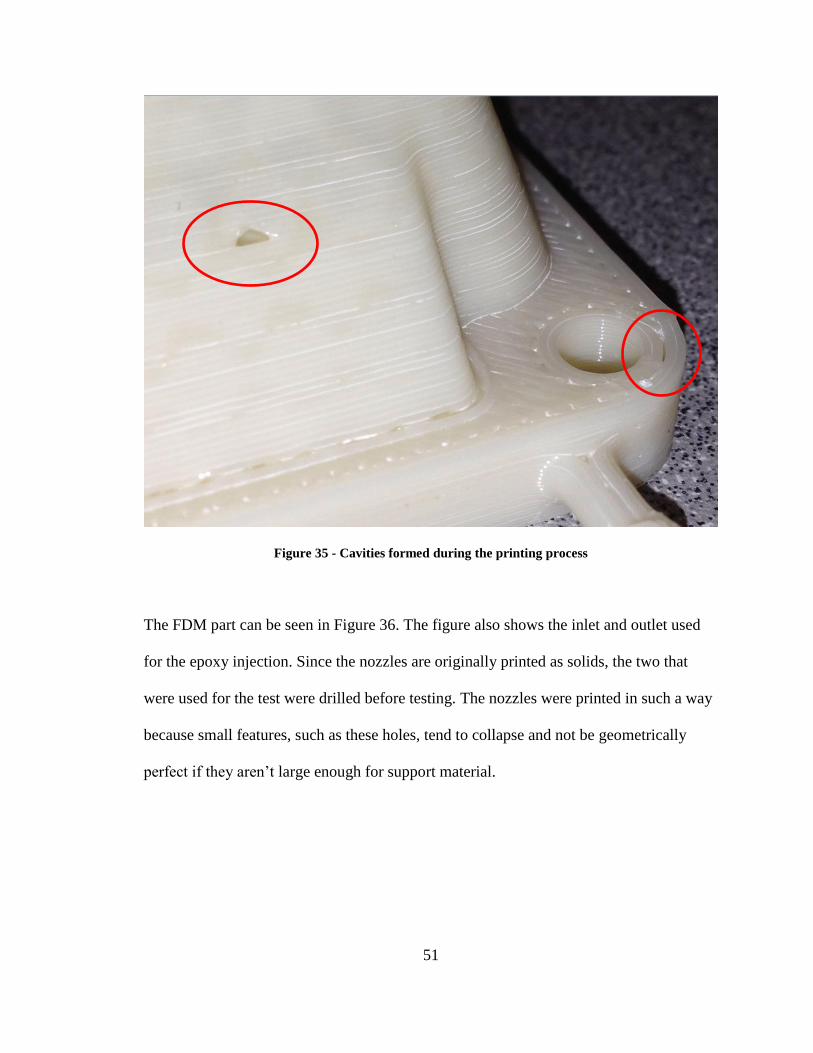
After the first part was printed using ABS M30i on the Fortus 400mc, it was
determined that having a single layer of printed material on the outer surface (the contour
of the part) was not thick enough, as cavities formed during the printing process as seen
in Figure 35. Although these were sealed with electrical PVC tape and clear packing tape
in order to prevent any of the epoxy from leaking, subsequent prints would have at least
two or four contour layers to prevent these cavities. Similarly, cavities appeared on the
part surface between the bolt-hole and the filleted edge. These cavities show that since
the layering process is not perfect, parts that could be expected to be solid may actually
have defects on them, thus making them porous. It was noted that even after printing the
parts with either two or four layers, there was still some porosity. These were sealed,
once again with tape, before the epoxy injection process.
51
Figure 35 - Cavities formed during the printing process
The FDM part can be seen in Figure 36. The figure also shows the inlet and outlet used
for the epoxy injection. Since the nozzles are originally printed as solids, the two that
were used for the test were drilled before testing. The nozzles were printed in such a way
because small features, such as these holes, tend to collapse and not be geometrically
perfect if they aren’t large enough for support material.
52
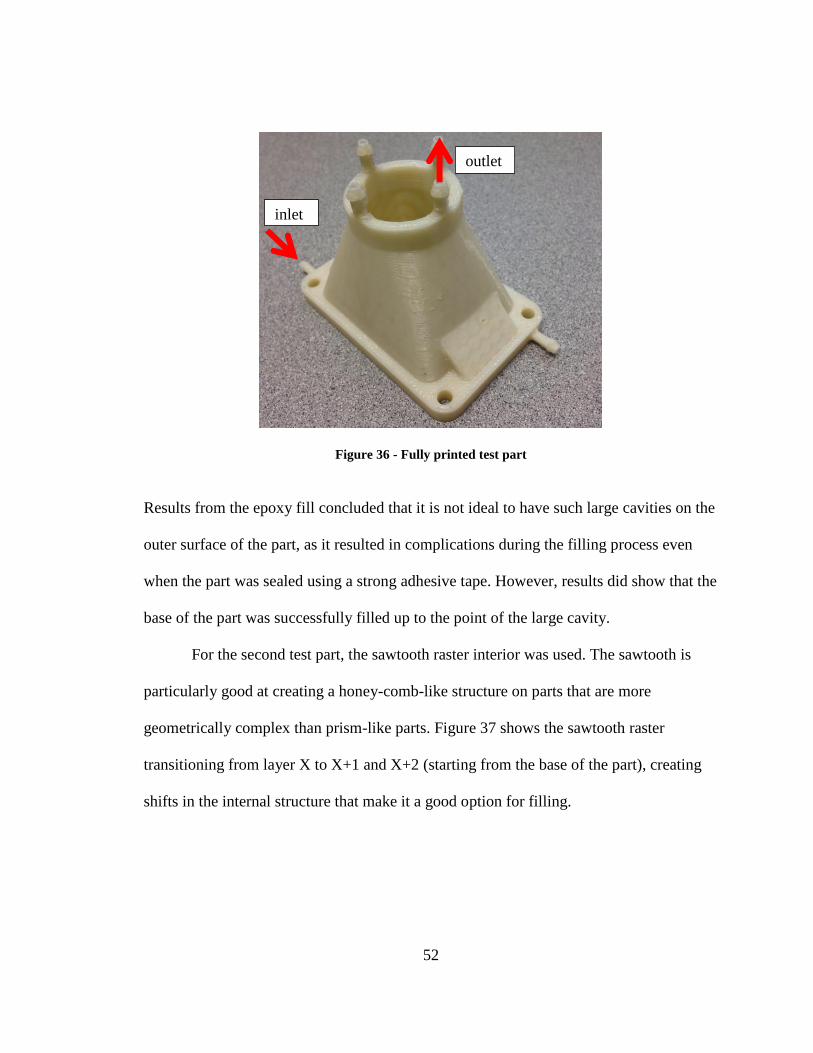
Figure 36 - Fully printed test part
Results from the epoxy fill concluded that it is not ideal to have such large cavities on the
outer surface of the part, as it resulted in complications during the filling process even
when the part was sealed using a strong adhesive tape. However, results did show that the
base of the part was successfully filled up to the point of the large cavity.
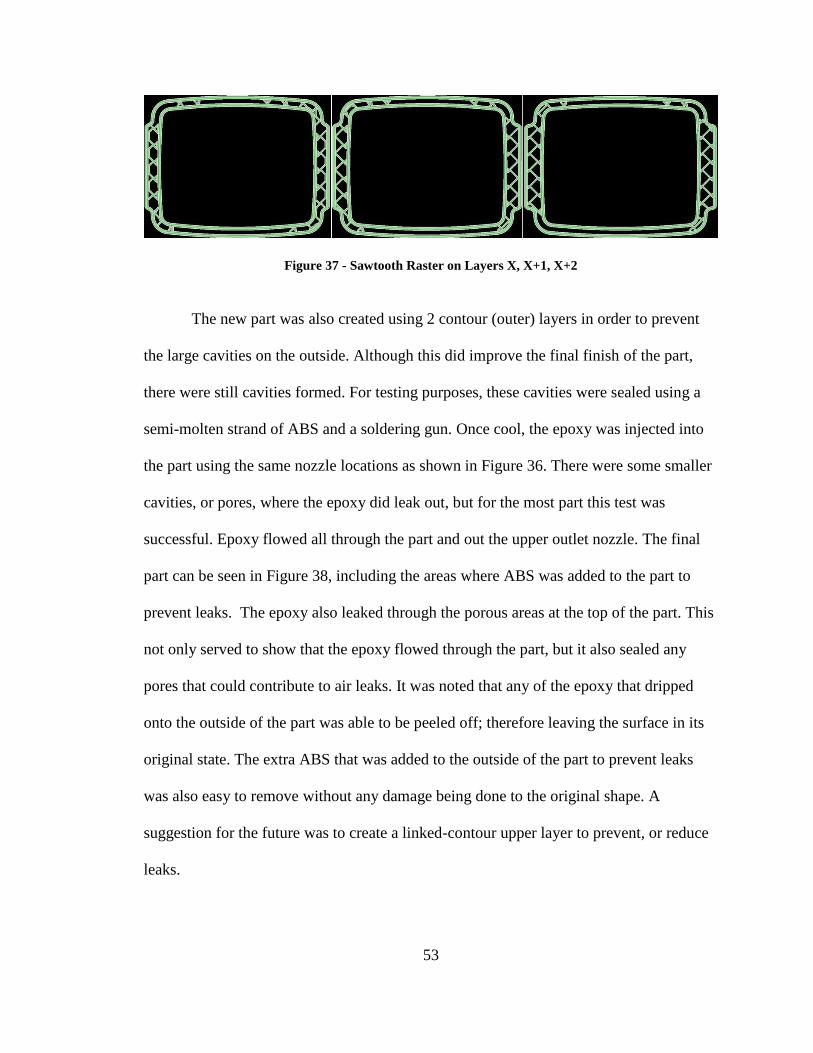
For the second test part, the sawtooth raster interior was used. The sawtooth is
particularly good at creating a honey-comb-like structure on parts that are more
geometrically complex than prism-like parts. Figure 37 shows the sawtooth raster
transitioning from layer X to X+1 and X+2 (starting from the base of the part), creating
shifts in the internal structure that make it a good option for filling.
inlet
outlet
53
Figure 37 - Sawtooth Raster on Layers X, X+1, X+2
The new part was also created using 2 contour (outer) layers in order to prevent
the large cavities on the outside. Although this did improve the final finish of the part,
there were still cavities formed. For testing purposes, these cavities were sealed using a
semi-molten strand of ABS and a soldering gun. Once cool, the epoxy was injected into
the part using the same nozzle locations as shown in Figure 36. There were some smaller
cavities, or pores, where the epoxy did leak out, but for the most part this test was
successful. Epoxy flowed all through the part and out the upper outlet nozzle. The final
part can be seen in Figure 38, including the areas where ABS was added to the part to
prevent leaks. The epoxy also leaked through the porous areas at the top of the part. This
not only served to show that the epoxy flowed through the part, but it also sealed any
pores that could contribute to air leaks. It was noted that any of the epoxy that dripped
onto the outside of the part was able to be peeled off; therefore leaving the surface in its
original state. The extra ABS that was added to the outside of the part to prevent leaks
was also easy to remove without any damage being done to the original shape. A
suggestion for the future was to create a linked-contour upper layer to prevent, or reduce
leaks.

54
Figure 38 - Final epoxy-filled sample
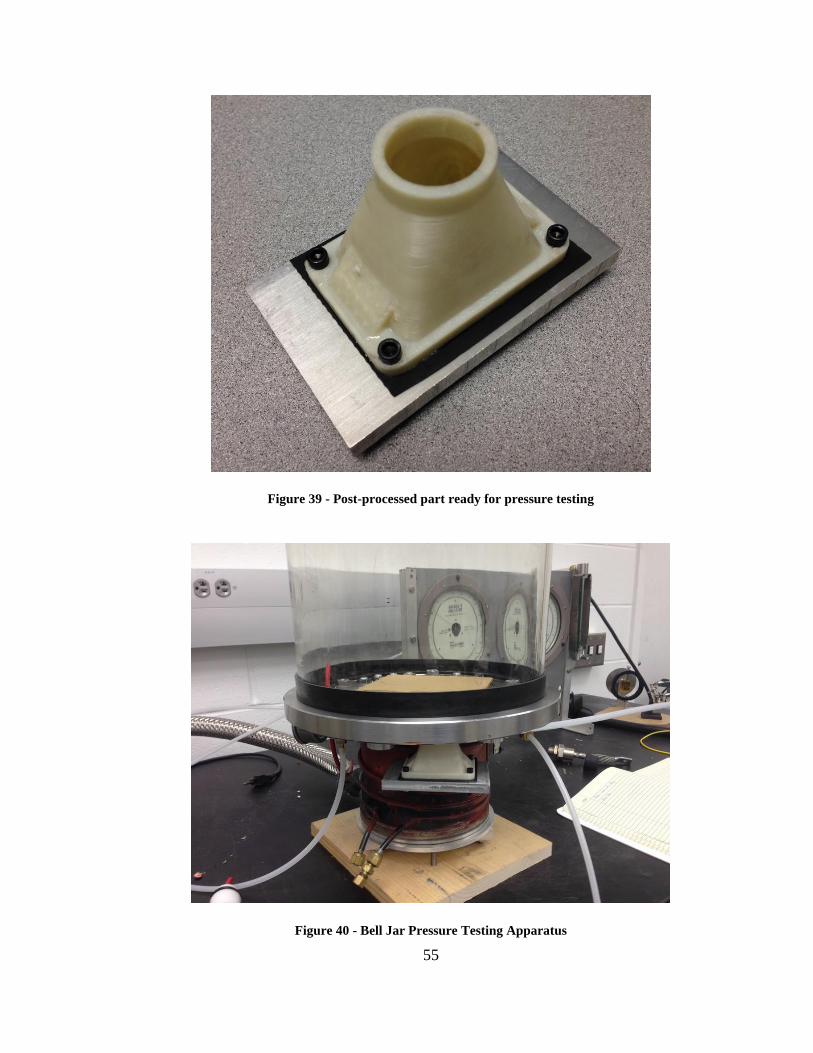
This part was used for pressure testing to see what the rate of pressure loss was after the
parts were subjected to pressure. The parts were sealed at the bottom by adhering a gasket
to the part and mounting the part onto an aluminum plate. The final part, once the
nozzles were cut-off and sanded, can be seen in Figure 39. Two parts were used for
pressure testing; the part seen in Figure 39, which was the one injected with epoxy, and
an un-treated part for comparison. The parts were mounted onto a bell jar pressure
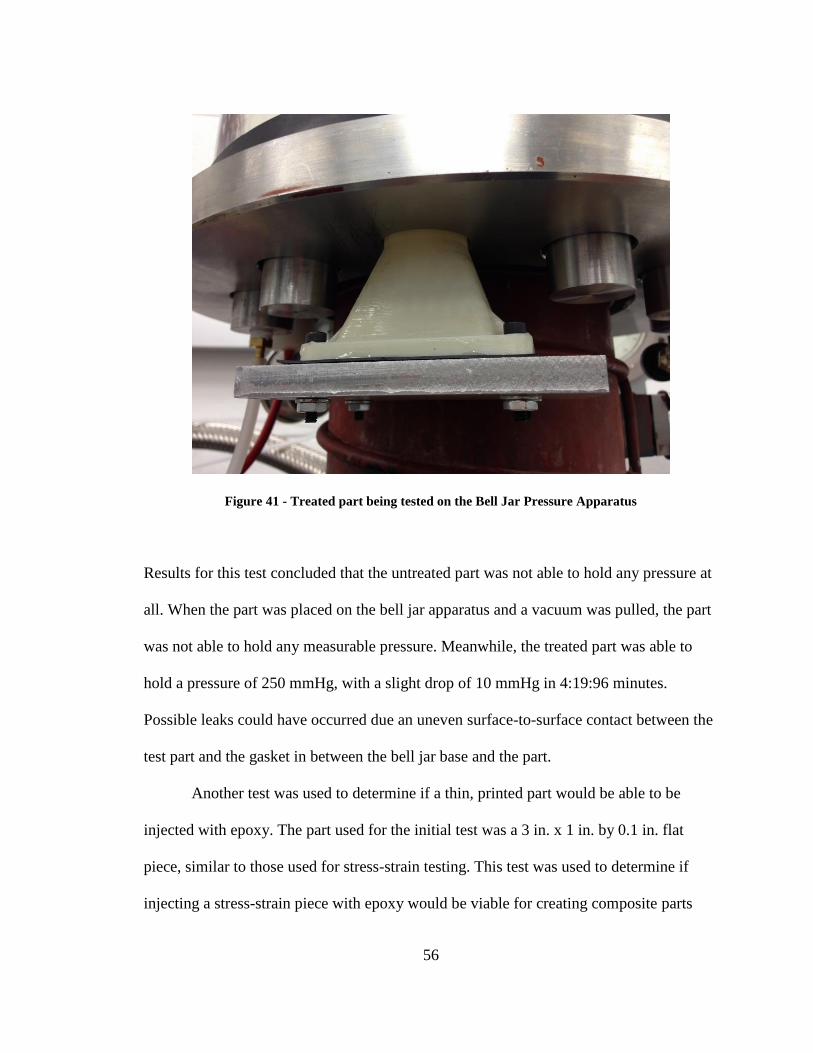
apparatus, as seen in Figures 40 and 41.
55
Figure 39 - Post-processed part ready for pressure testing
Figure 40 - Bell Jar Pressure Testing Apparatus
56
Figure 41 - Treated part being tested on the Bell Jar Pressure Apparatus
Results for this test concluded that the untreated part was not able to hold any pressure at
all. When the part was placed on the bell jar apparatus and a vacuum was pulled, the part
was not able to hold any measurable pressure. Meanwhile, the treated part was able to
hold a pressure of 250 mmHg, with a slight drop of 10 mmHg in 4:19:96 minutes.
Possible leaks could have occurred due an uneven surface-to-surface contact between the
test part and the gasket in between the bell jar base and the part.
Another test was used to determine if a thin, printed part would be able to be
injected with epoxy. The part used for the initial test was a 3 in. x 1 in. by 0.1 in. flat
piece, similar to those used for stress-strain testing. This test was used to determine if
injecting a stress-strain piece with epoxy would be viable for creating composite parts
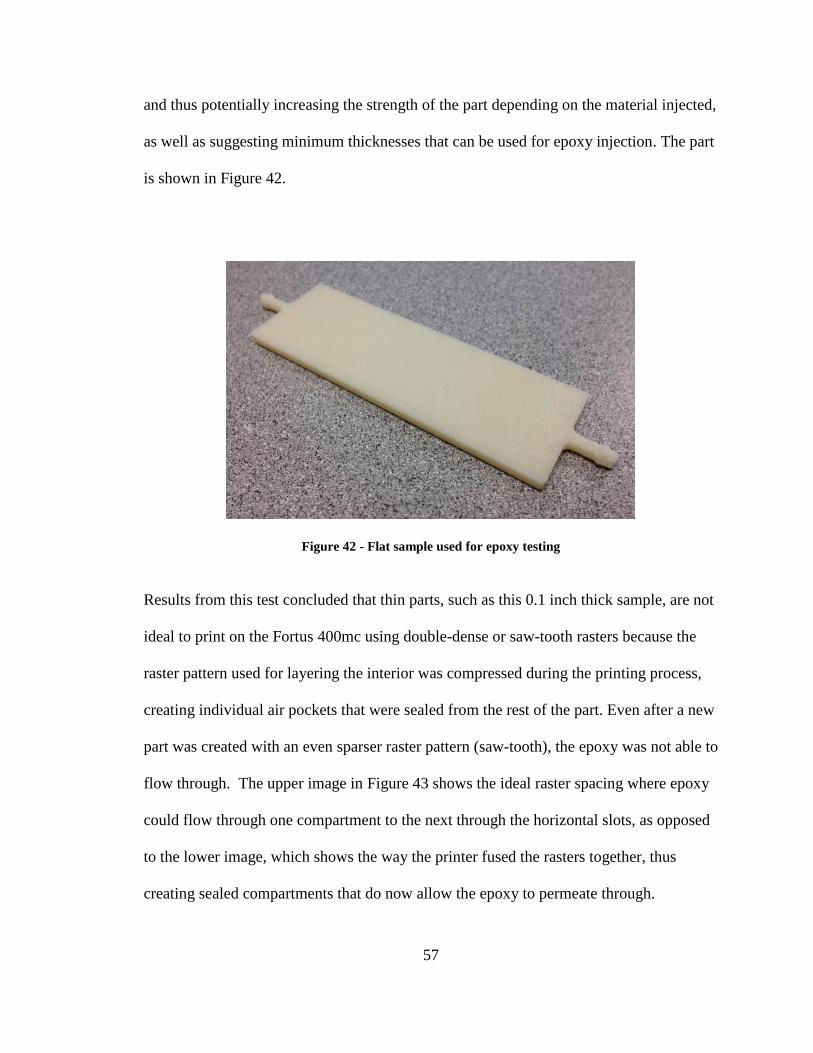
57
and thus potentially increasing the strength of the part depending on the material injected,
as well as suggesting minimum thicknesses that can be used for epoxy injection. The part
is shown in Figure 42.
Figure 42 - Flat sample used for epoxy testing
Results from this test concluded that thin parts, such as this 0.1 inch thick sample, are not
ideal to print on the Fortus 400mc using double-dense or saw-tooth rasters because the
raster pattern used for layering the interior was compressed during the printing process,
creating individual air pockets that were sealed from the rest of the part. Even after a new
part was created with an even sparser raster pattern (saw-tooth), the epoxy was not able to
flow through. The upper image in Figure 43 shows the ideal raster spacing where epoxy
could flow through one compartment to the next through the horizontal slots, as opposed
to the lower image, which shows the way the printer fused the rasters together, thus
creating sealed compartments that do now allow the epoxy to permeate through.
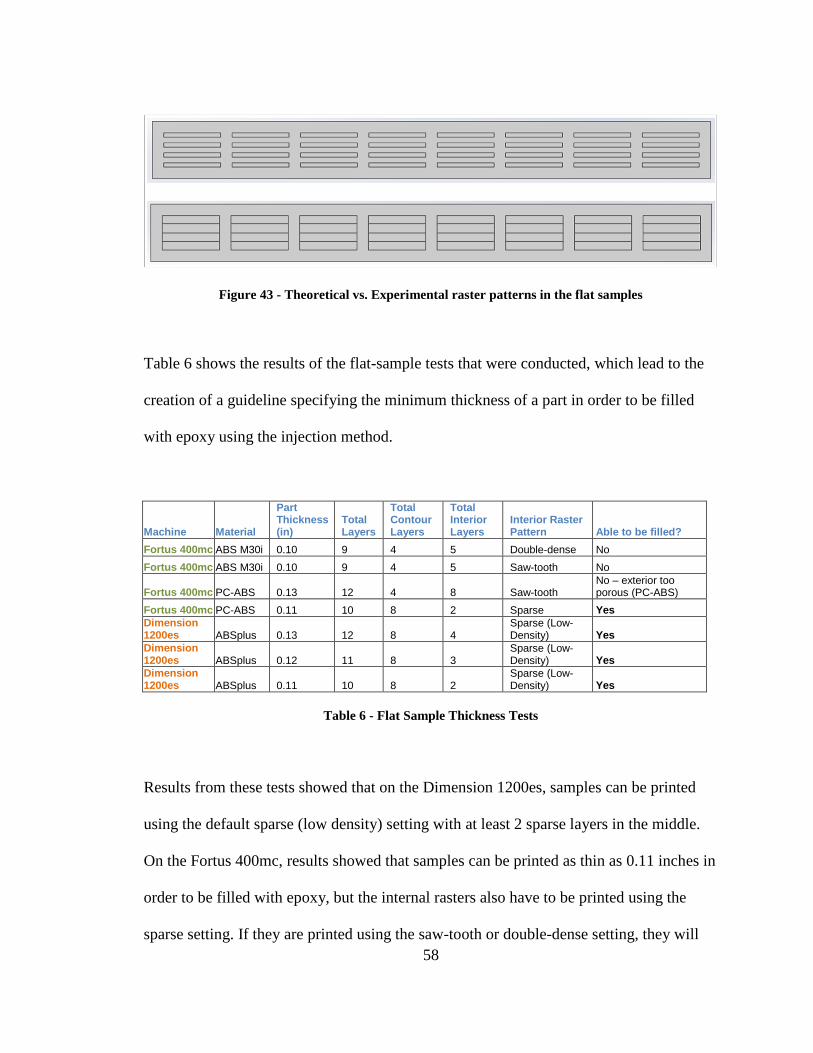
58
Figure 43 - Theoretical vs. Experimental raster patterns in the flat samples
Table 6 shows the results of the flat-sample tests that were conducted, which lead to the
creation of a guideline specifying the minimum thickness of a part in order to be filled
with epoxy using the injection method.
Machine Material
Part Thickness (in)
Total Layers
Total Contour Layers
Total Interior Layers
Interior Raster Pattern Able to be filled?
Fortus 400mc ABS M30i 0.10 9 4 5 Double-dense No
Fortus 400mc ABS M30i 0.10 9 4 5 Saw-tooth No
Fortus 400mc PC-ABS 0.13 12 4 8 Saw-tooth No – exterior too porous (PC-ABS)
Fortus 400mc PC-ABS 0.11 10 8 2 Sparse Yes
Dimension 1200es ABSplus 0.13 12 8 4
Sparse (Low-Density) Yes
Dimension 1200es ABSplus 0.12 11 8 3
Sparse (Low-Density) Yes
Dimension 1200es ABSplus 0.11 10 8 2
Sparse (Low-Density) Yes
Table 6 - Flat Sample Thickness Tests
Results from these tests showed that on the Dimension 1200es, samples can be printed
using the default sparse (low density) setting with at least 2 sparse layers in the middle.
On the Fortus 400mc, results showed that samples can be printed as thin as 0.11 inches in
order to be filled with epoxy, but the internal rasters also have to be printed using the
sparse setting. If they are printed using the saw-tooth or double-dense setting, they will
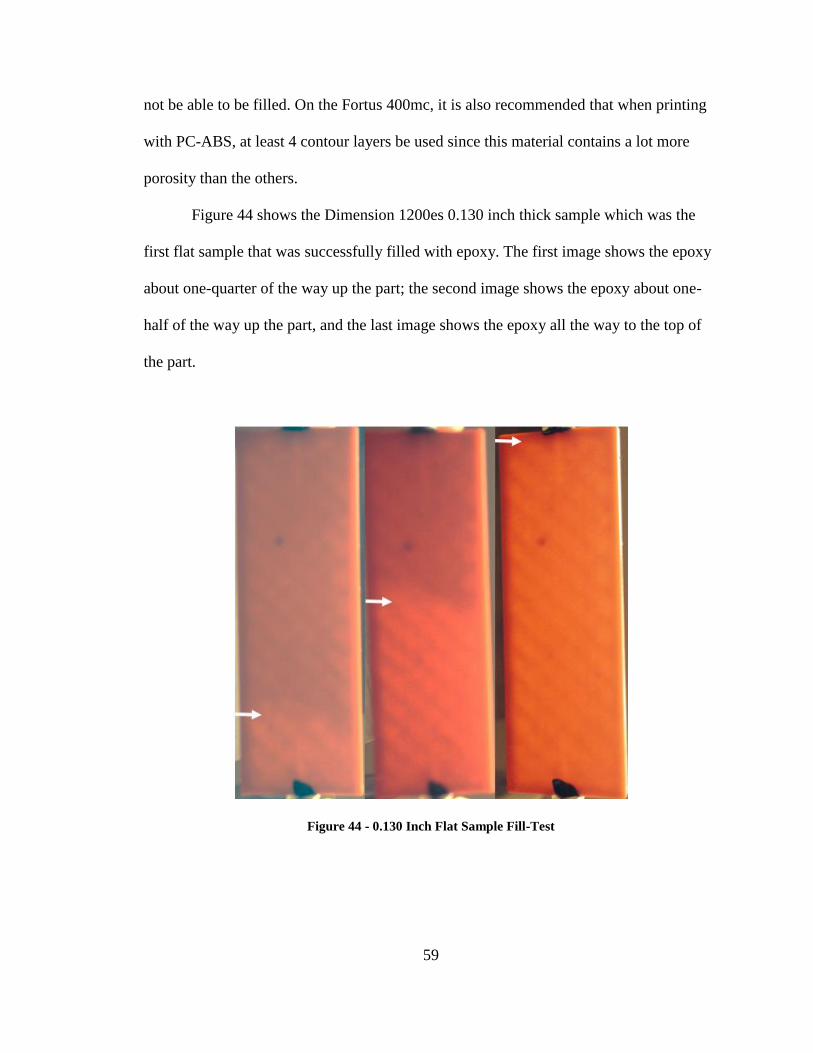
59
not be able to be filled. On the Fortus 400mc, it is also recommended that when printing
with PC-ABS, at least 4 contour layers be used since this material contains a lot more
porosity than the others.
Figure 44 shows the Dimension 1200es 0.130 inch thick sample which was the
first flat sample that was successfully filled with epoxy. The first image shows the epoxy
about one-quarter of the way up the part; the second image shows the epoxy about one-
half of the way up the part, and the last image shows the epoxy all the way to the top of
the part.
Figure 44 - 0.130 Inch Flat Sample Fill-Test

60
Results from these successful fill tests were used for the last test, which was to epoxy-fill
sparse tensile test specimens and compare the results to non-epoxy, solid tensile samples.
The samples were printed using the following properties:
Material: PC-ABS, printed on the Fortus 400mc
Dimensions: 1 inch wide; 0.25 inch thick and 10 inches long.
Structure: 4 default (45 degree) contour layers each at the bottom and top of the
part and a sparse interior.
Total material used: 1.553 cubic inches.
A total of five samples were printed, although only four were able to be filled with epoxy.
This was due to the high amount of porosity in the PC-ABS samples, which allowed a
large amount of epoxy to leak through the sample on the first fill attempt. The fill process
was later modified for the remaining samples, which were tighter with a larger amount of
packing tape used to seal the exteriors of the parts to prevent excessive leakage. The final
4 samples can be seen in Figure 45.
Figure 45 - Epoxy-filled PC-ABS Tensile Samples
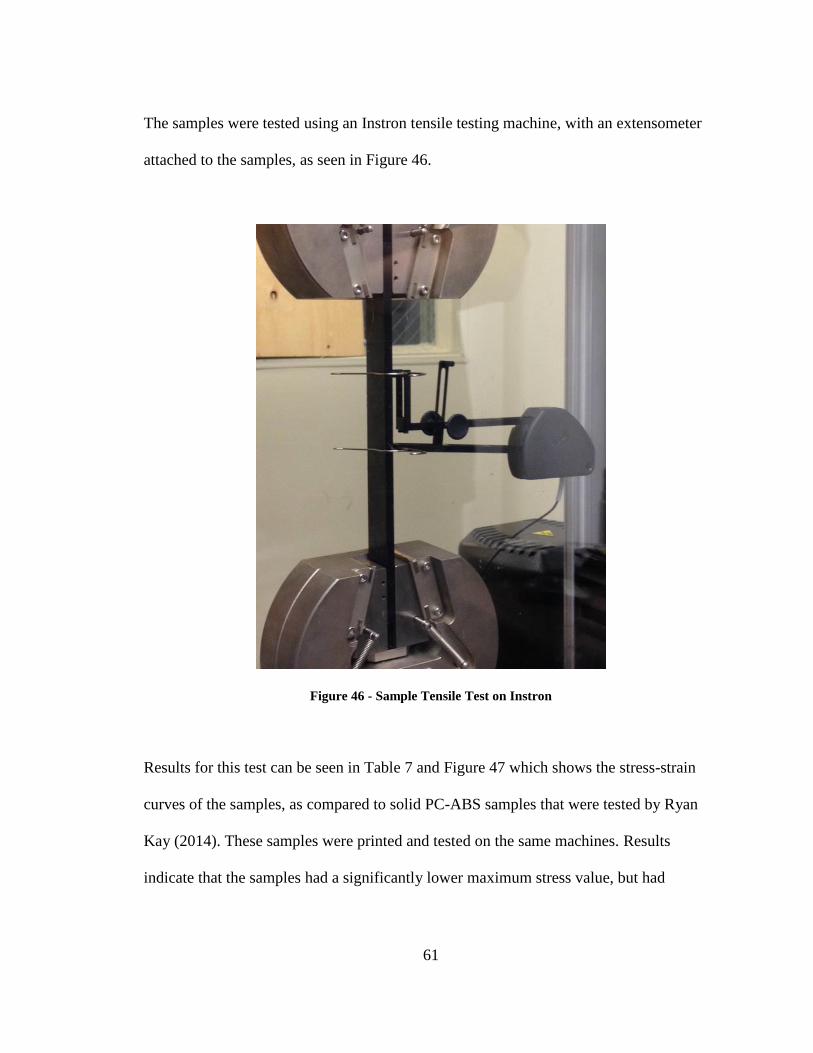
61
The samples were tested using an Instron tensile testing machine, with an extensometer
attached to the samples, as seen in Figure 46.
Figure 46 - Sample Tensile Test on Instron
Results for this test can be seen in Table 7 and Figure 47 which shows the stress-strain
curves of the samples, as compared to solid PC-ABS samples that were tested by Ryan
Kay (2014). These samples were printed and tested on the same machines. Results
indicate that the samples had a significantly lower maximum stress value, but had
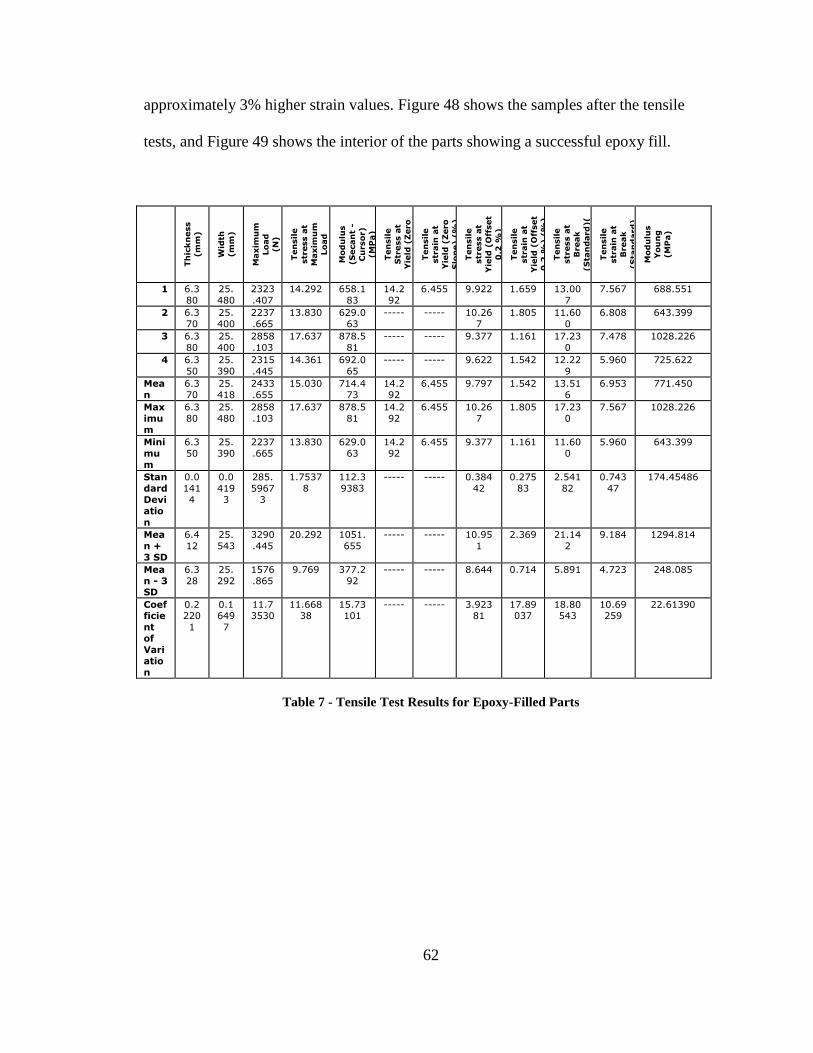
62
approximately 3% higher strain values. Figure 48 shows the samples after the tensile
tests, and Figure 49 shows the interior of the parts showing a successful epoxy fill.
Th
ickn
ess
(m
m)
Wid
th
(m
m)
Maxim
um
Load
(N
)
Ten
sile
str
ess a
t
Maxim
um
Load
(M
Pa)
Mod
ulu
s
(S
ecan
t -
Cu
rsor)
(M
Pa)
Ten
sile
Str
ess a
t
Yie
ld (
Zero
Slo
pe) (
MP
a)
Ten
sile
str
ain
at
Yie
ld (
Zero
Slo
pe) (
%)
Ten
sile
str
ess a
t
Yie
ld (
Off
set
0.2
%)
(M
Pa)
Ten
sile
str
ain
at
Yie
ld (
Off
set
0.2
%) (
%)
Ten
sile
str
ess a
t
Break
(S
tan
dard
)(
MP
a)
Ten
sile
str
ain
at
Break
(S
tan
dard
)
(%
)
Mod
ulu
s
You
ng
(M
Pa)
1 6.3
80
25.
480
2323
.407
14.292 658.1
83
14.2
92
6.455 9.922 1.659 13.00
7
7.567 688.551
2 6.3
70
25.
400
2237
.665
13.830 629.0
63
----- ----- 10.26
7
1.805 11.60
0
6.808 643.399
3 6.3
80
25.
400
2858
.103
17.637 878.5
81
----- ----- 9.377 1.161 17.23
0
7.478 1028.226
4 6.3
50
25.
390
2315
.445
14.361 692.0
65
----- ----- 9.622 1.542 12.22
9
5.960 725.622
Mea
n
6.3
70
25.
418
2433
.655
15.030 714.4
73
14.2
92
6.455 9.797 1.542 13.51
6
6.953 771.450
Max
imu
m
6.3
80
25.
480
2858
.103
17.637 878.5
81
14.2
92
6.455 10.26
7
1.805 17.23
0
7.567 1028.226
Mini
mu
m
6.3
50
25.
390
2237
.665
13.830 629.0
63
14.2
92
6.455 9.377 1.161 11.60
0
5.960 643.399
Stan
dard
Devi
atio
n
0.0
141
4
0.0
419
3
285.
5967
3
1.7537
8
112.3
9383
----- ----- 0.384
42
0.275
83
2.541
82
0.743
47
174.45486
Mea
n +
3 SD
6.4
12
25.
543
3290
.445
20.292 1051.
655
----- ----- 10.95
1
2.369 21.14
2
9.184 1294.814
Mea
n - 3 SD
6.3
28
25.
292
1576
.865
9.769 377.2
92
----- ----- 8.644 0.714 5.891 4.723 248.085
Coefficie
nt
of
Vari
atio
n
0.2220
1
0.1649
7
11.73530
11.66838
15.73101
----- ----- 3.92381
17.89037
18.80543
10.69259
22.61390
Table 7 - Tensile Test Results for Epoxy-Filled Parts

63
Figure 47 - PC-ABS Stress-Strain Curve Comparison
Figure 48 - Epoxy-Filled Samples after Tensile Tests
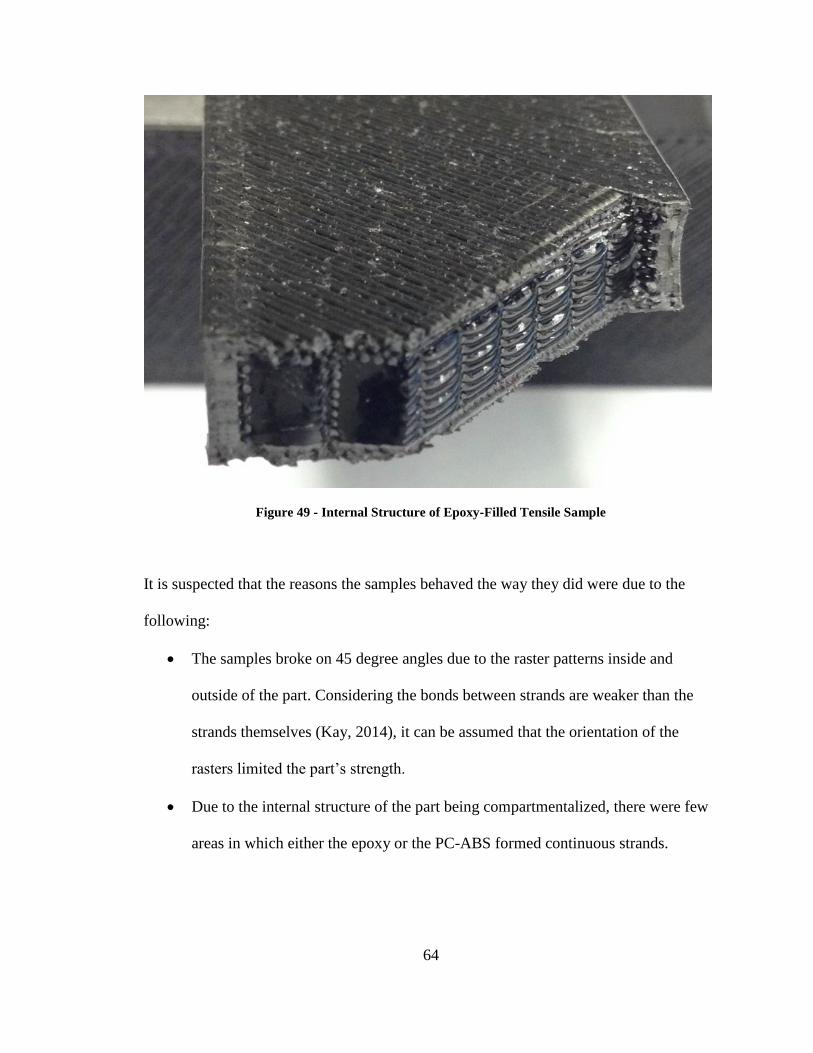
64
Figure 49 - Internal Structure of Epoxy-Filled Tensile Sample
It is suspected that the reasons the samples behaved the way they did were due to the
following:
The samples broke on 45 degree angles due to the raster patterns inside and
outside of the part. Considering the bonds between strands are weaker than the
strands themselves (Kay, 2014), it can be assumed that the orientation of the
rasters limited the part’s strength.
Due to the internal structure of the part being compartmentalized, there were few
areas in which either the epoxy or the PC-ABS formed continuous strands.
65
From these results, it can be determined that parts created using 45 degree internal
and external raster patterns and filled with EasyCast casting epoxy were not stronger
than solid parts, but were more flexible.
Final Recommendations and Guidelines
This section is intended as a set of recommendations and guidelines that one
should use when trying to seal FDM parts internally using the epoxy injection method.
Although refinements will no doubt continue to be made to the process in the future,
these guidelines will yield a successfully sealed FDM part.
Dimension 1200es
The Dimension 1200es machine only prints in ABS, and has three pre-determined
print parameters for part density (low-density, high-density, and solid). Tests showed that
the minimum part thickness one can print on the Dimension 1200es while still being able
to fill the part using the injection method was 0.11 inches thick, using the pre-determined
low-density setting. This setting created four solid layers at the top and bottom of the
part, and 2 sparse layers in between.
Due to the lack of flexibility of the printer’s parameters, the Dimension 1200es is
better for creating parts that are not too complex if they are to be filled using the epoxy
injection method. This is due to the lack of ability to create custom layers, thus not
allowing users to manipulate the internal structures needed for the epoxy to flow through.
The overall quality of the parts created on the Dimension 1200es were fairly
good. The surfaces were smooth and consistent, but the edges of the parts where the

66
surfaces met the part contours were still relatively porous. These pores allowed for some
of the epoxy to leak through the part during the injection process; however, the epoxy
was able to be removed easily after curing.
Fortus 400mc
The Fortus 400mc machine is highly customizable and is able to build parts using
multiple materials. For the epoxy injection method, materials used were ABS-M30i, PC-
ABS, and PC. All of these were printed at a resolution of 0.010 inches, but can be printed
with a resolution of 0.005 inches if necessary.
The minimum thickness for creating a part on the Fortus 400mc to fill with epoxy
is 0.11 inches as well, but with a sparse-only interior as opposed to using either the saw-
tooth raster or double-dense raster.
Of the three materials used for epoxy-injection, the ABS-M30i was found to be
the least porous. ABS seemed to adhere better to adjacent layers, as opposed to PC, or
PC-ABS, where gaps between strands were clearly visible. More contour (outer) layers
are needed for PC and PC-ABS to prevent excessive leaks than for the ABS parts.
As for the layer types used for the Fortus parts, the following were found to be the
best combinations for filling specific types of parts:
A flat, simple, thin part (0.11 inches thick) was printed with default solid layers
for the outsides (at least 3 layers, especially when using PC or PC-ABS) and a
sparse internal raster.
A thicker part, e.g., 0.25 inches or more, was able to be easily filled with epoxy
with minor external leaks when there were 4 contour-outside layers and an
67
interior structure such as sparse-double-dense or saw-tooth. The PC-ABS parts
still had more exterior leaks than the ABS even when 4 outer layers were created.
It is recommended that more than 4 contour layers be used when using PC and
PC-ABS if the part geometry allows.
A more complex part may require the use of custom tool path settings. For
example, the part should have a base of at least 4 solid layers; an internal structure
made up of a saw-tooth or sparse structure, and an upper layer created of solid,
linked contours. Circular features should be created with concentric circles as
opposed to a hatching-like pattern that doesn’t follow the shape’s contour. This
will reduce the number of pores created on the boundaries between the surfaces
and the contours.
Nozzle Design
The nozzle used for filling the parts was designed from a standard part made to fit
tubing with an inner diameter of 3/8 of an inch. The nozzle was small enough that it
wouldn’t drastically change the exterior surface of the part when removed for
finishing purposes, but large enough that it would allow epoxy to easily flow through
it. The nozzle itself was printed as solid and was later drilled. This was to prevent any
collapse of the structure during fabrication, as well as improve the overall appearance.
Figure 50 shows a detailed drawing of the nozzle. The drill bit used for drilling the
interior had an 11/64 inch diameter. A fillet of radius 0.05 inches was used to add
strength to the edge between the nozzle and the part.
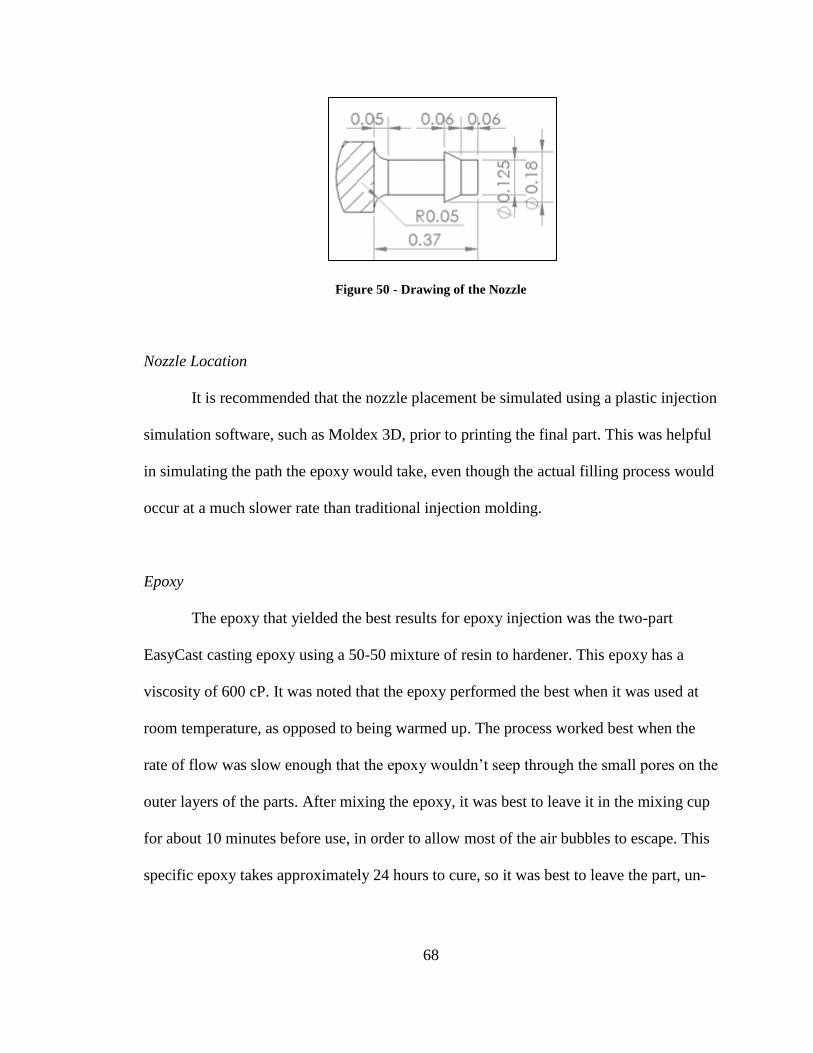
68
Figure 50 - Drawing of the Nozzle
Nozzle Location
It is recommended that the nozzle placement be simulated using a plastic injection
simulation software, such as Moldex 3D, prior to printing the final part. This was helpful
in simulating the path the epoxy would take, even though the actual filling process would
occur at a much slower rate than traditional injection molding.
Epoxy
The epoxy that yielded the best results for epoxy injection was the two-part
EasyCast casting epoxy using a 50-50 mixture of resin to hardener. This epoxy has a
viscosity of 600 cP. It was noted that the epoxy performed the best when it was used at
room temperature, as opposed to being warmed up. The process worked best when the
rate of flow was slow enough that the epoxy wouldn’t seep through the small pores on the
outer layers of the parts. After mixing the epoxy, it was best to leave it in the mixing cup
for about 10 minutes before use, in order to allow most of the air bubbles to escape. This
specific epoxy takes approximately 24 hours to cure, so it was best to leave the part, un-
69
touched and on a cardboard surface for about a day before handling. The amount of
epoxy needed for the part can be calculated using the CAD drawings of the part.
Part Preparation
Before the part can be injected with epoxy, it had to be prepared. This included
making sure the part was completely dry before the process. Water and/or the chemical
solution used to dissolve the support material always seeps into the part’s pores so one
must make sure that the part is dry before completing the next steps. This can be done
using an oven at low heat.
The next part is to drill the holes through the nozzles using an 11/64 inch drill bit.
It is a good idea to blow air through the part to make sure any plastic pieces are out of the
part. The next step is to use electrical tape to wrap the nozzles a few times, just to
guarantee a good seal between the nozzles and the tubing. After that, one can place the
tubing on top of the nozzles and secure them using small zip ties. If any small pores are
present on the outer layers of the parts, one can use either electrical tape or clear packing
tape to seal them. If larger holes are present, one can use a soldering gun to melt strands
of the material used to print the part onto the part itself, always being careful to not
damage the part. These pieces of molten material can be easily peeled-off once the epoxy
has been cured. Now one can start filling the part with epoxy using a syringe. If the
syringe is too small for the tubing used, electrical tape can be wrapped at the end of the
syringe to create a good seal with the tubing. It is important that the correct amount of
epoxy to fill the whole part be in the syringe in order to avoid injecting bubbles into the
parts. Once the part is fully filled, one can clamp the ends of the inlet and outlet tubing to

70
prevent any of the epoxy from leaking back out of the part. The part can then be left to
cure for at least 24 hours.
Once the part has cured, one can remove the tubing and cut off the nozzles using a
small saw. The part can then be sanded down to the exterior surface to create a smooth
finish. There will only be a small circle of diameter 11/64 inches of epoxy left on the
outer surface of the part, which is where the epoxy inlets and outlets were located.
71
Chapter 5: Conclusion
Additive manufacturing, especially the area of fused deposition modeling, has
progressed substantially in the past few decades. Not only are FDM machines now
available at a low cost for hobbyists, but food and aerospace industries, among others, are
finding creative ways to use this technology to advance their sectors. However, due to the
nature of the FDM process there are limitations as to what can be printed successfully.
This specific study looked at the inherent porosity of FDM parts, a characteristic that is
inherent to this process. Due to this porosity, industries that attempt to use FDM parts for
purposes of holding high pressure or vacuum, or to create permeable parts, have no
choice but to substantially modify their parts using a chemical agent which causes
external part modifications, or abandon the use of this technology altogether. Currently,
the only available methods of sealing parts involve modifications to the exterior of the
part through the addition of adhesives, sealants or paint, or by chemically altering the
surface using substances such as acetone. These methods all physically change look of
the part, and in most cases, also change the dimensions of the part. This study looked at a
method of internally sealing FDM parts using a method of epoxy injection that would
leave the exterior of the parts virtually un-changed and able to hold pressure.
72
Research Outcomes
Initial Test Samples
From the initial samples that were printed, it was determined that no matter how
“solid” one makes the part, it will still be porous. Materials printed with a custom raster
pattern were able to hold pressure better than parts created by default settings, but not as
well as the aluminum ‘control’ disk. Samples coated with BJB Epoxy were able to hold
more pressure than the un-coated samples, but not as well as the aluminum control disk.
The only samples that were able to perform as well as the aluminum control disk were the
epoxy-filled samples. This led to the second part of the study, which focused on creating
a process that could be used to successfully fill parts in order to reduce porosity and
permeability.
Epoxy Samples
From the three different types of epoxy used, the one that had the best viscosity
for filling the samples was the 2-part EasyCast casting epoxy. With a viscosity of 600 cP,
it was able to fill the parts easily, without being so fluid that the epoxy seeped through the
surface pores. It was also determined that it was best to use the epoxy at room
temperature as opposed to elevated temperatures. Printed part recommendations for
filling with epoxy are listed in the Final Recommendations section of the Results chapter.
73
Simulation
It was determined that the use of the injection molding software, Moldex 3D, was
beneficial for the placement of the inlet and outlet nozzles. Similarly, the path of the
epoxy was accurately mapped in the simulation and physically verified through the use of
a thermal imaging camera.
Tensile Samples
Tests showed that if one is interested in creating samples that have a higher strain
(in the case of PC-ABS) than just regular, solid samples, one can fill them with epoxy in
order to achieve about 3% higher strain. Samples had an overall lower maximum stress
point before breaking. This was most likely due to the internal and external raster
patterns and the compartmentalization of the part, but needs further tests to verify this
theory.
Future Recommendations
The epoxy injection method has the potential to change the way FDM technology
is viewed in industry. Not only does it provide a new and unique method of sealing parts
that has not been attempted before, but shows potential for making the technology more
usable in manufacturing settings. Due to the infancy of the process, much more can be
done to improve efficiency and the method itself. Below are some future
recommendations that could take this process to new levels.
74
Ideal Pressure Settings for Epoxy Fill
For the test samples creating in this study, the epoxy was filled using a store-
bought syringe. Epoxy was injected into the parts by simply pressing on the plunger at a
slow rate, keeping in mind that a higher rate could potentially cause errors. These errors
include not filling the entire part with epoxy, as well as having a rate too high that a
significant amount of epoxy is pushed through the surface’s pores. A future study could
look into ideal rate settings based on the internal structures of the parts, the overall
shapes, and the viscosity of the epoxy.
Temporarily Sealing the Parts for Epoxy-Fill Preparation
One of the drawbacks of printing with materials such as PC-ABS, is that the
material doesn’t adhere to itself as well as ABS. This creates quite a bit of external
surface porosity and makes filling parts with epoxy somewhat messy. Although electrical
and packing tape were used to temporarily seal the parts so epoxy doesn’t seep through, it
was not the ideal method for complex shapes. One future recommendation for this issue
is to investigate different methods of sealing these parts externally before the epoxy-
injection process. One method could be to use the vacuum bag method that was used to
initially fill the samples with epoxy. Custom bags could be made to seal the parts
externally, which could be removed once the epoxy has cured.
An example of this was during the tensile part filling process, with parts that were
long and slender, and made from PC-ABS. These were particularly difficult to inject with
epoxy due to the high levels of external porosity. Although wrapping the samples in
packing tape helped to seal some of the pores and prevent excessive epoxy leakage, it
would be a good idea to find a method that is less messy.
75
Filling Extra-large Samples with Epoxy
One of the drawbacks of using the syringe method of filling the parts is that one is
limited by the size of the syringe. It is not recommended that the syringe be removed
from the tubing in the middle of the filling process because this can lead to the injection
of bubbles into the part. Therefore, the recommendation is to look into methods of filling
large parts, possibly using a low-pressure vacuum pump that will slowly fill the parts
with epoxy. The one used for the initial epoxy filling trial was set to 30 psi, had a large
diameter tube attached to it, and the epoxy had a low viscosity. These settings were not
ideal for this particular scenario, as it was seen that the part was not fully filled with
epoxy. Another recommendation would be to possibly add multiple nozzles on the part
(using the help of the injection molding simulation software Moldex 3D) to aid in the
filling of large parts.
Filling Parts with Different Materials
From the literature review it was determined that multiple industries would
benefit from the addition of different materials into parts created by the FDM process.
One of these includes the addition of antibiotics and other medicines to FDM parts to aid
in custom implant and tissue creation. Other materials that could be mixed into the epoxy
include magnetic fragments, metal fragments, and other small parts that could be mixed
into the epoxy and injected into parts for various applications. This could allow users to
create magnetic components with a magnetic core, instead of the addition of an external
magnet.
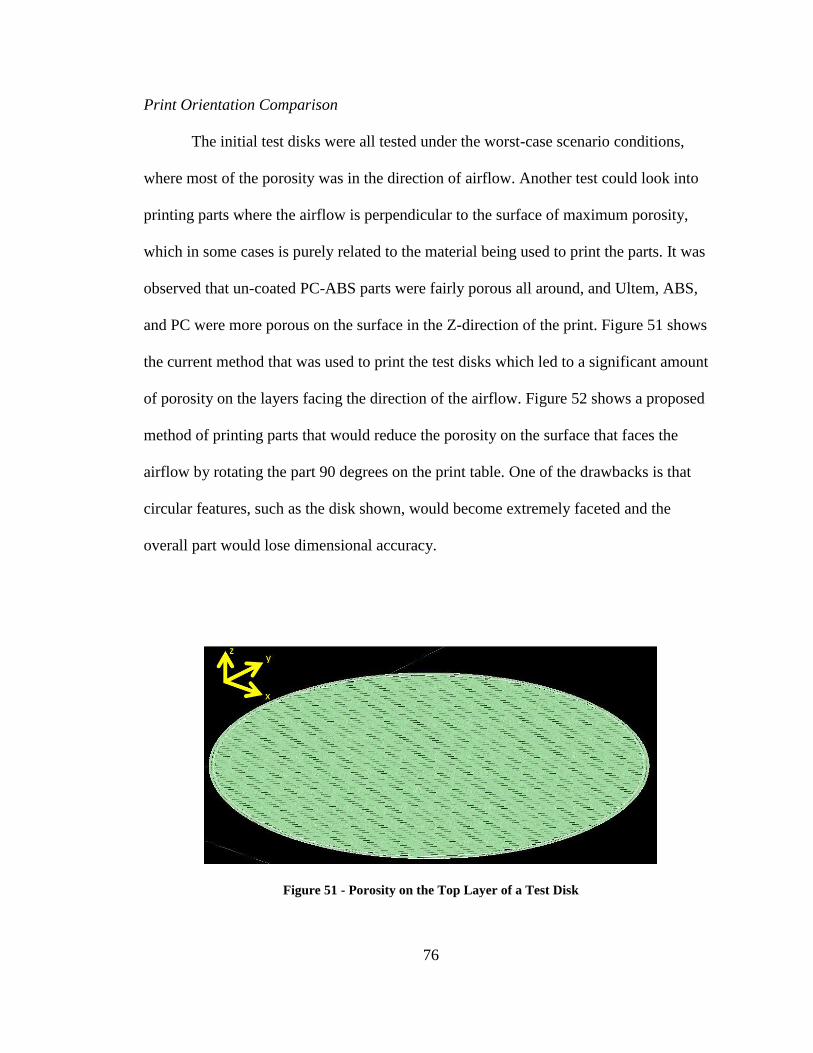
76
Print Orientation Comparison
The initial test disks were all tested under the worst-case scenario conditions,
where most of the porosity was in the direction of airflow. Another test could look into
printing parts where the airflow is perpendicular to the surface of maximum porosity,
which in some cases is purely related to the material being used to print the parts. It was
observed that un-coated PC-ABS parts were fairly porous all around, and Ultem, ABS,
and PC were more porous on the surface in the Z-direction of the print. Figure 51 shows
the current method that was used to print the test disks which led to a significant amount
of porosity on the layers facing the direction of the airflow. Figure 52 shows a proposed
method of printing parts that would reduce the porosity on the surface that faces the
airflow by rotating the part 90 degrees on the print table. One of the drawbacks is that
circular features, such as the disk shown, would become extremely faceted and the
overall part would lose dimensional accuracy.
Figure 51 - Porosity on the Top Layer of a Test Disk

77
Figure 52 - Disk Printed on the Side with Raster Directions Highlighted in Yellow
Internal Structure Simulation
Another future study could look into modeling the internal structure of the parts in CAD
in order to more accurately simulate the epoxy flow. This could aid in nozzle placement
for more complex parts seeing as epoxy dispersion is a factor due to the internal structure.
78
References
"About Stratasys Ltd." 3D Printers, 3D Models, Fused Deposition Modeling. N.p., n.d.
Web. 15 Mar. 2013.
ASTM Standard D1434-82, 2009, “Standard Test Method for Determining Gas
Permeability Characteristics of Plastic Film and Sheeting,” DOI 10.1520/D1434-
82R09E01
ASTM Standard D3985-05, 2010, “Standard Test Method for Oxygen Gas Transmission
Rate Through Plastic Film and Sheeting Using a Coulometric Sensor,” DOI
10.1520/D3985-05R10E01
Burkardt. STL Files. Iowa State University, 26 July 2001. Web. 22 Mar. 2014
Chua, Chee Kai., Kah Fai. Leong, and Chu Sing. Lim. Rapid Prototyping: Principles and
Applications. Singapore: World Scientific, 2003. Print.
Crump, S. Scott. Apparatus and Method for Creating Three-dimensional Objects.
Stratasys, Inc., assignee. Patent US5121329 A. 09 June 1992.
Dimension Printing, Stratysis Inc. P430 ABSplus Material Properties. Eden Prairie, MN:
Dimension Printing, Stratysis, n.d. Print.
"EX-74 : TAP Plastics." EX-74 : TAP Plastics. N.p., n.d. Web. 06 Feb. 2014.
<http://www.tapplastics.com/product/fiberglass/epoxy_resins/ultra_glo_ex_74/391>.
"Finishing Applications - Bond, Seal and Beautify 3D Printed Parts." Finishing.
Stratasys, n.d. Web. 07 Aug. 2013.
Kay, R. (2014). [Citations from master’s thesis]. Unpublished raw data
Liutsang, V. "Three-dimensional Tissue Fabrication." Advanced Drug Delivery Reviews
56.11 (2004): 1635-647.
"Loctite Adhesives." Loctite Epoxy Plastic Bonder from. Henkel Group, n.d. Web. 06
Feb. 2014. <http://www.loctiteproducts.com/p/epxy_plstc_s/overview/Loctite-Epoxy-
Plastic-Bonder.htm>.
79
Massey, Liesl K. Permeability Properties of Plastics and Elastomers: A Guide to
Packaging and Barrier Materials. Norwich, NY, USA: Plastics Design Library/William
Andrew Pub., 2003.
McCullough, Eric J., and Vamsi K. Yadavalli. "Surface Modification of Fused
Deposition Modeling ABS to Enable Rapid Prototyping of Biomedical Microdevices."
Journal of Materials Processing Technology 947-954 213.2013 (2013): 947-54.
Mireles, Jorge, Arturo Adame, David Espalin, Francisco Medina, Rob Winker, Terry
Hoppe, Bob Zinniel, and Ryan Wicker. Analysis of Sealing Methods for FDM-fabricated
Parts. El Paso, TX: n.p., July 2013. Pdf.
Montero, M., Roundy, S., Odell, D., Ahn, S. and Wright, P. (2001), “Material
characterization of fused deposition modeling (FDM) ABS by designed experiments”,
Proceedings of Rapid Prototyping & Manufacturing Conference, Cincinnati, OH, USA,
May 15-17
"Peaucellier-lipkin-linkage." Wikipedia. N.p., 03 July 2005. Web. 14 Jan. 2014.
<http://commons.wikimedia.org/wiki/File:Peaucellier-lipkin-linkage.jpg>.
Phadke, Madhav Shridhar. Quality Engineering Using Robust Design. Englewood Cliffs,
NJ: Prentice Hall, 1989.
Stratasys. DIMENSION 1200es. N.p.: Stratasys, 2012. Print.
Stratasys. FDM for End-Use Parts: Tips and Techniques for Optimization. Eden Prairie,
MN: Stratasys, 2011. Print.
Stratasys. FORTUS 400mc. N.p.: Stratasys, 2011. Print.
Stratasys. TECHNICAL APPLICATION GUIDE: FDM for End-Use Parts: Tips and
Techniques for Optimization. Eden Prairie, MN: Stratasys, 2011. Print.
United States. New Jersey Department of Health. Hazardous Substance Fact Sheet -
Acetone. 2011.
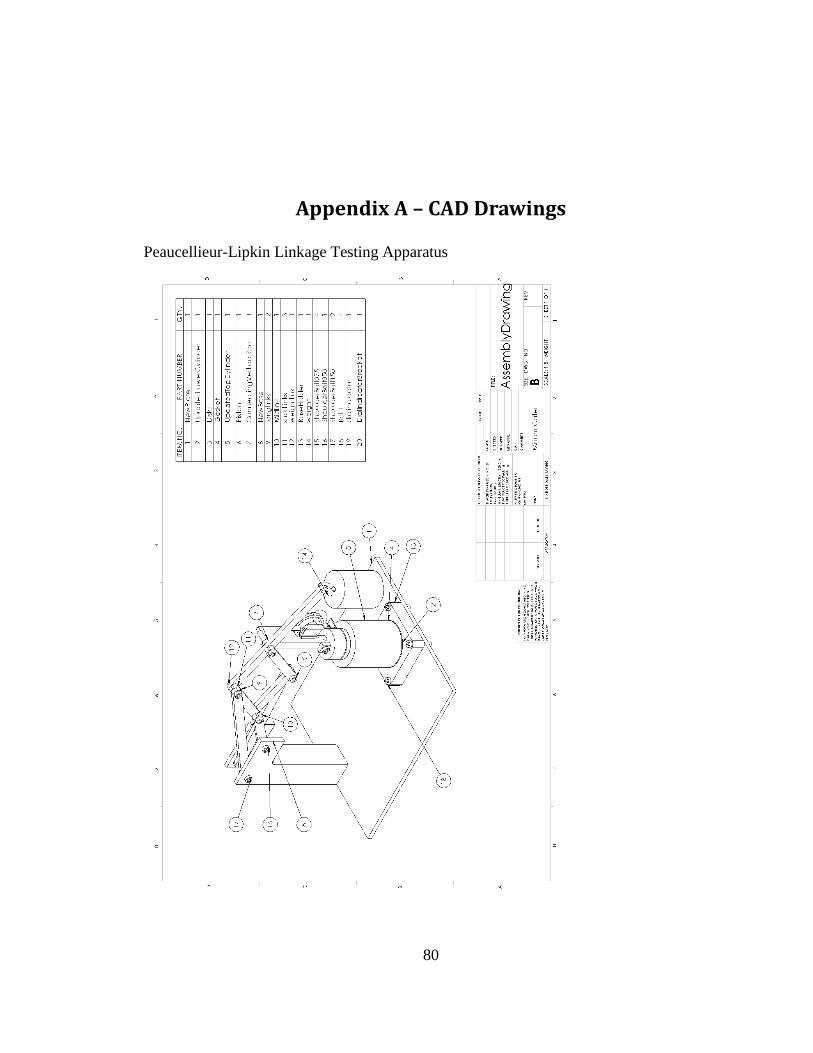
80
Appendix A – CAD Drawings
Peaucellieur-Lipkin Linkage Testing Apparatus
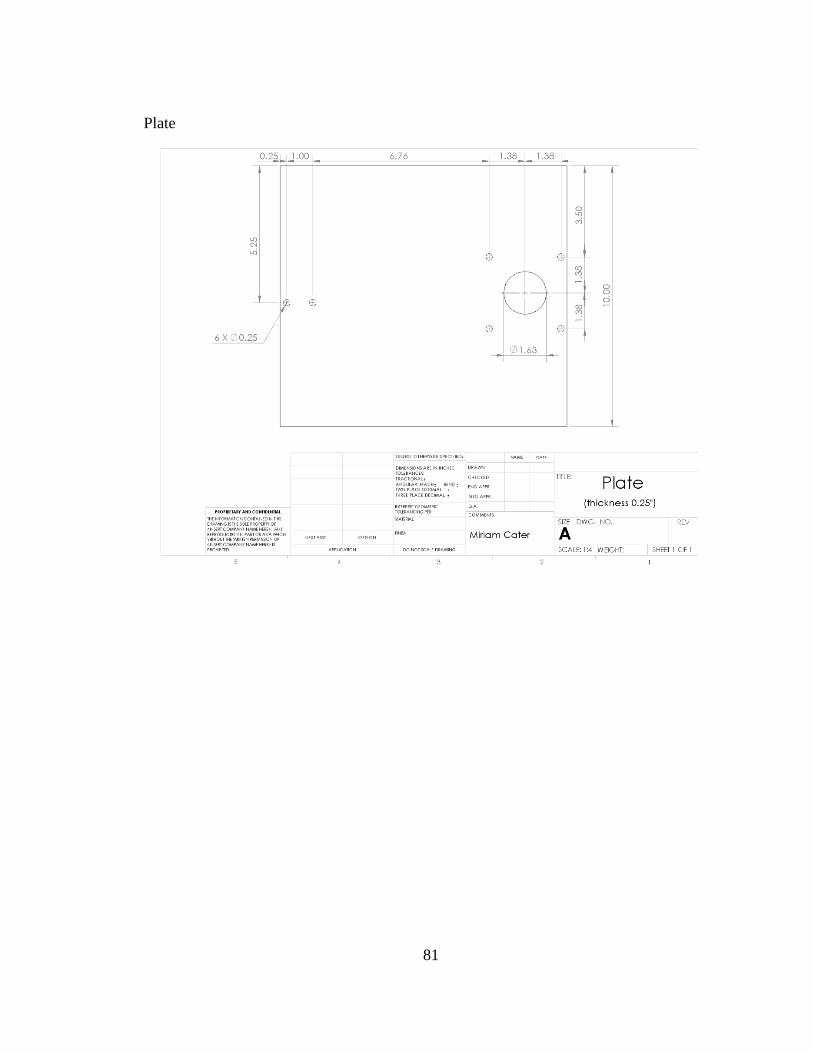
81
Plate

82
Updated Lower Cylinder
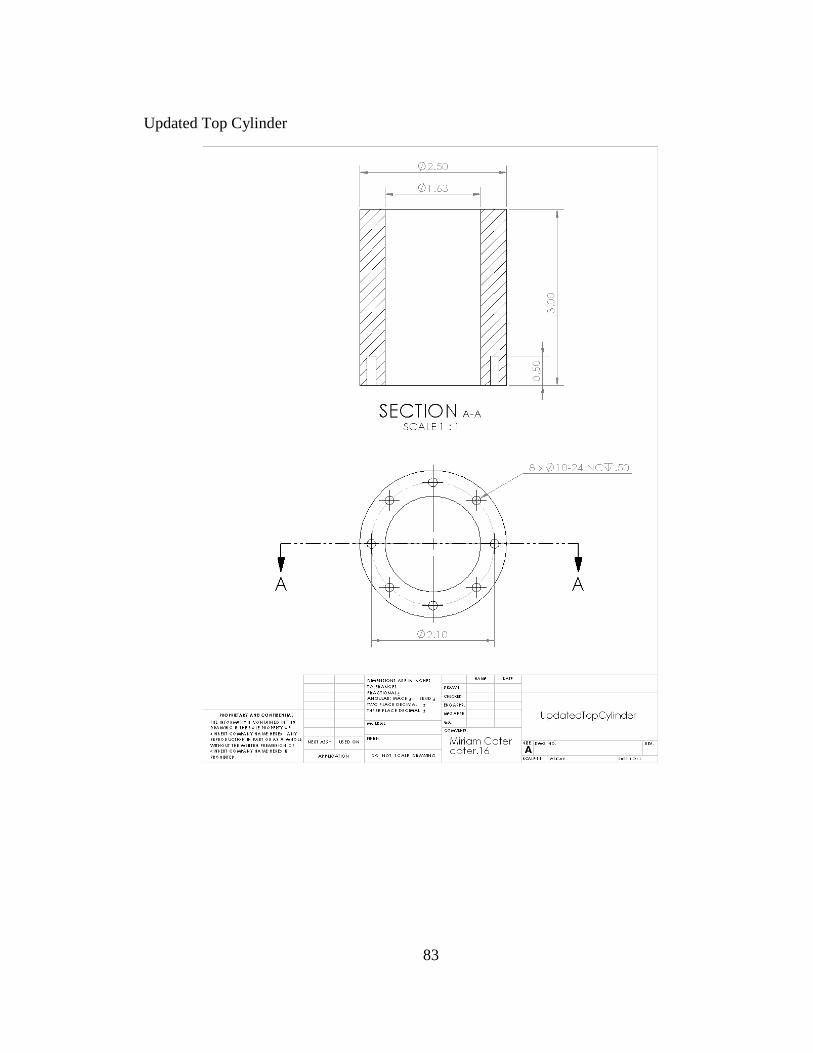
83
Updated Top Cylinder
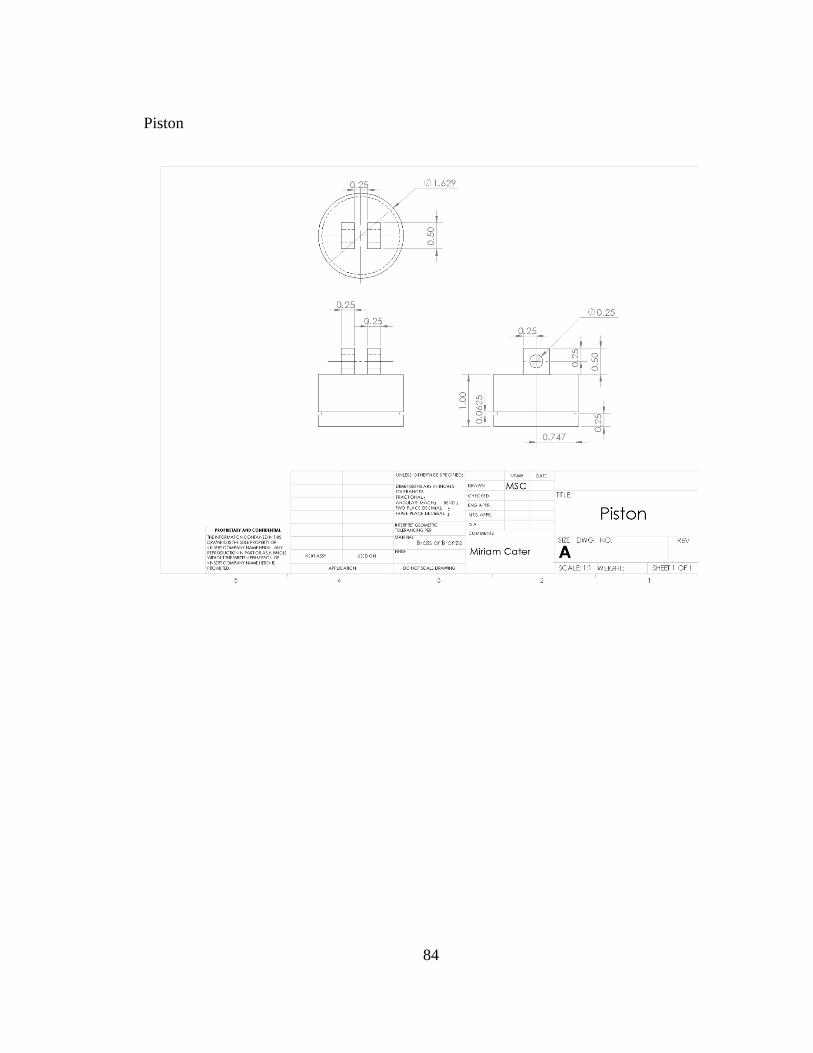
84
Piston
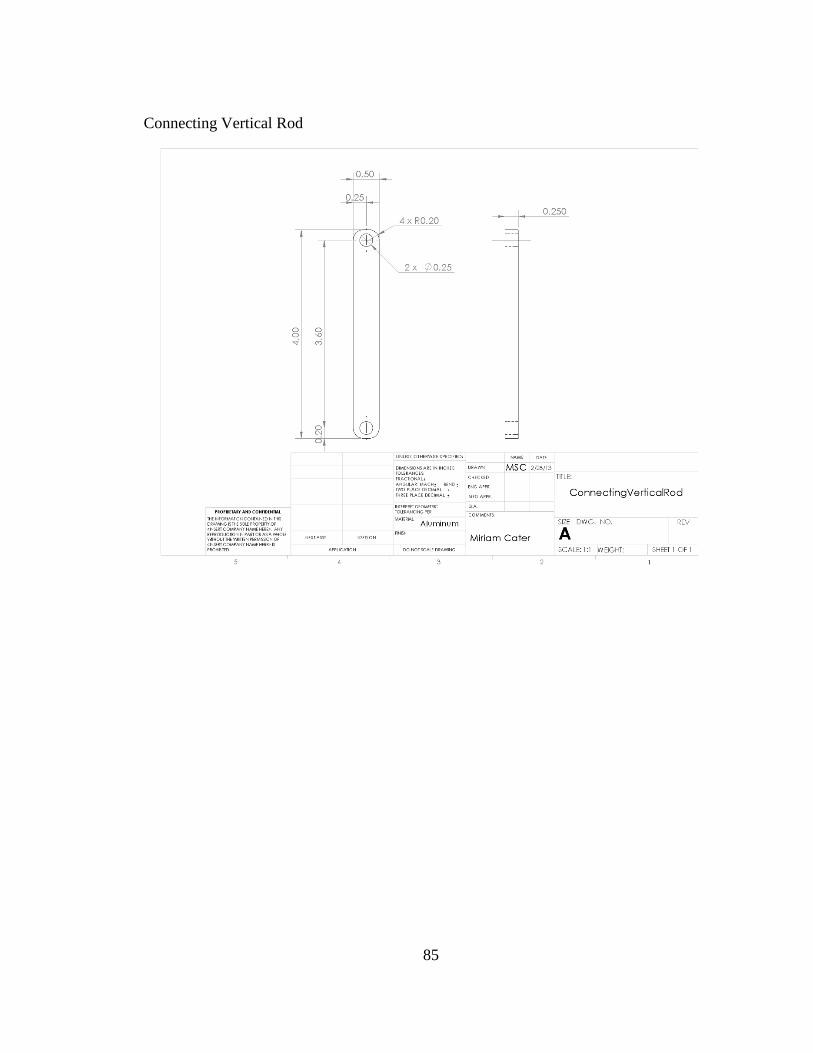
85
Connecting Vertical Rod
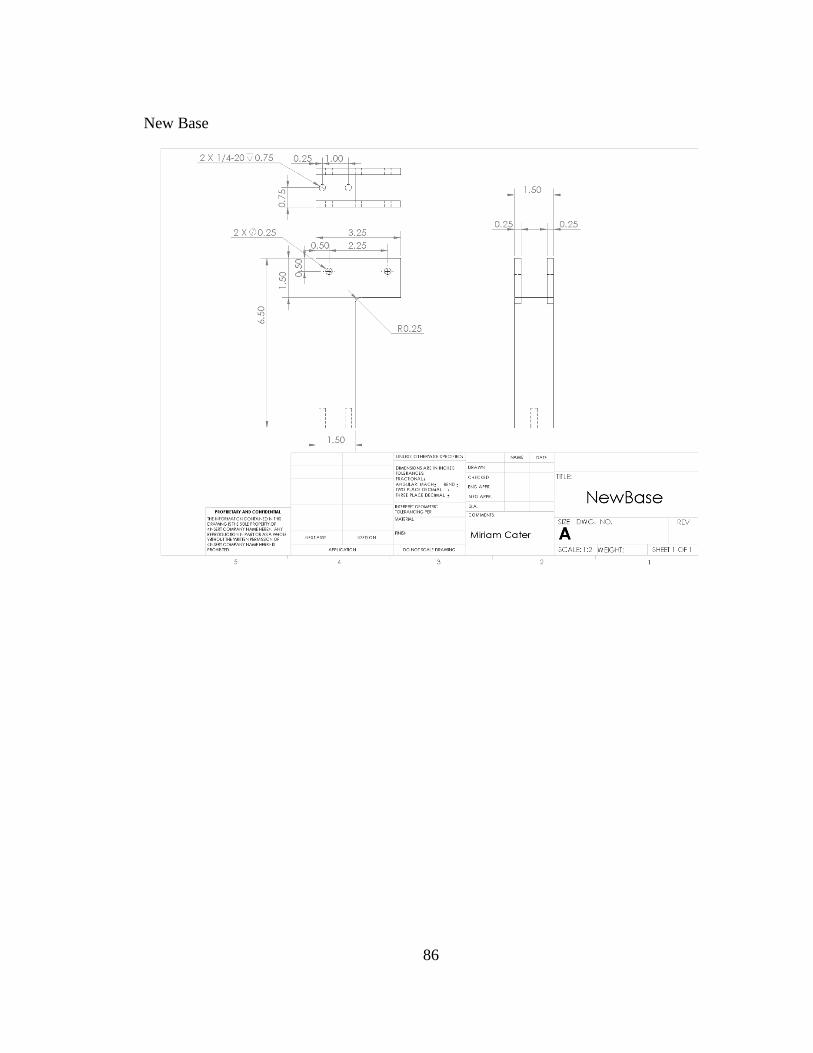
86
New Base
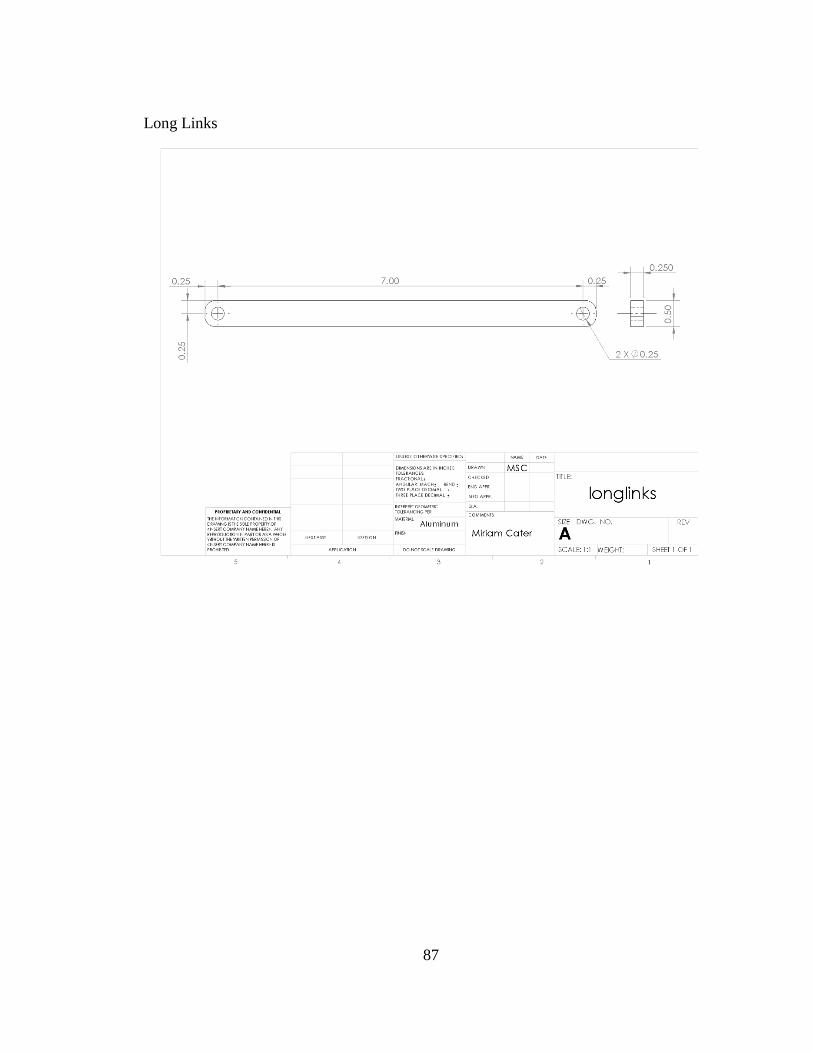
87
Long Links
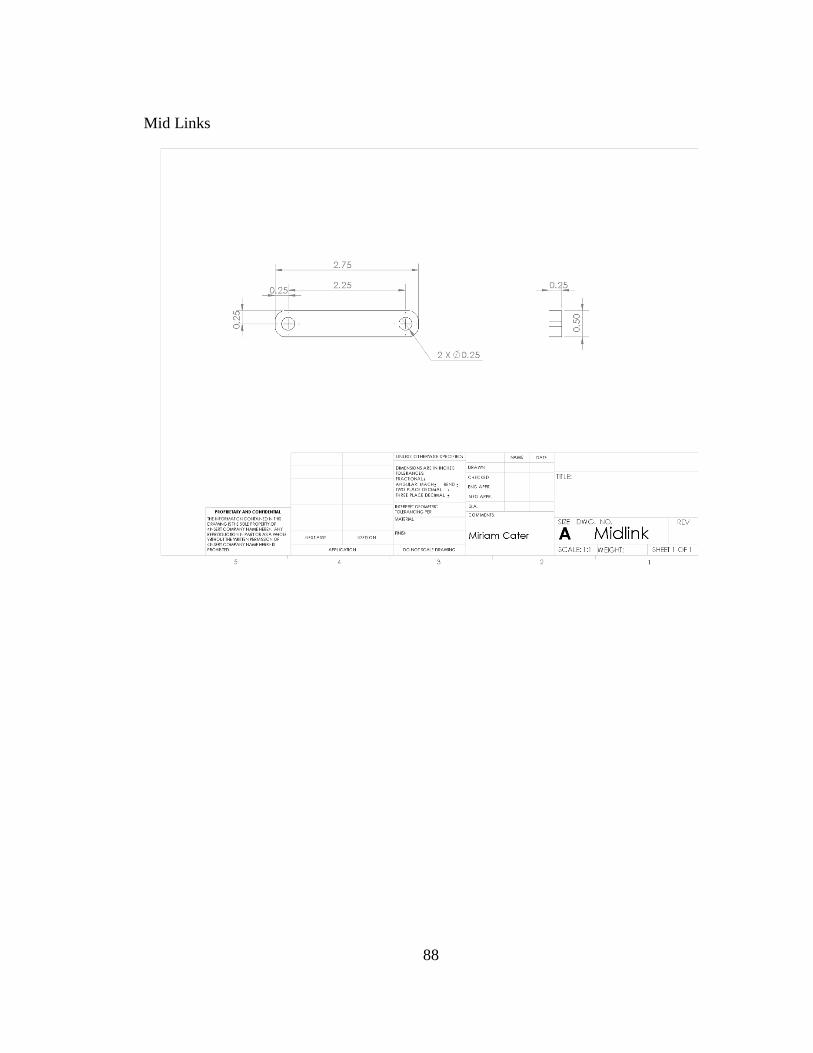
88
Mid Links
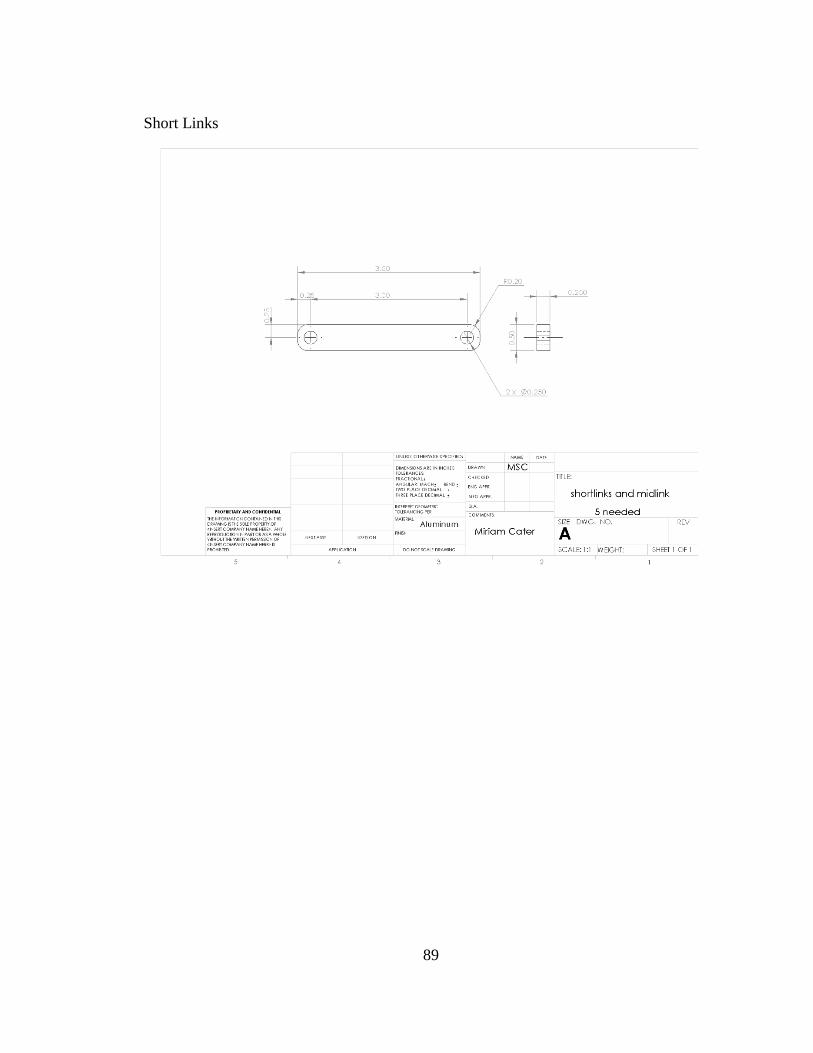
89
Short Links
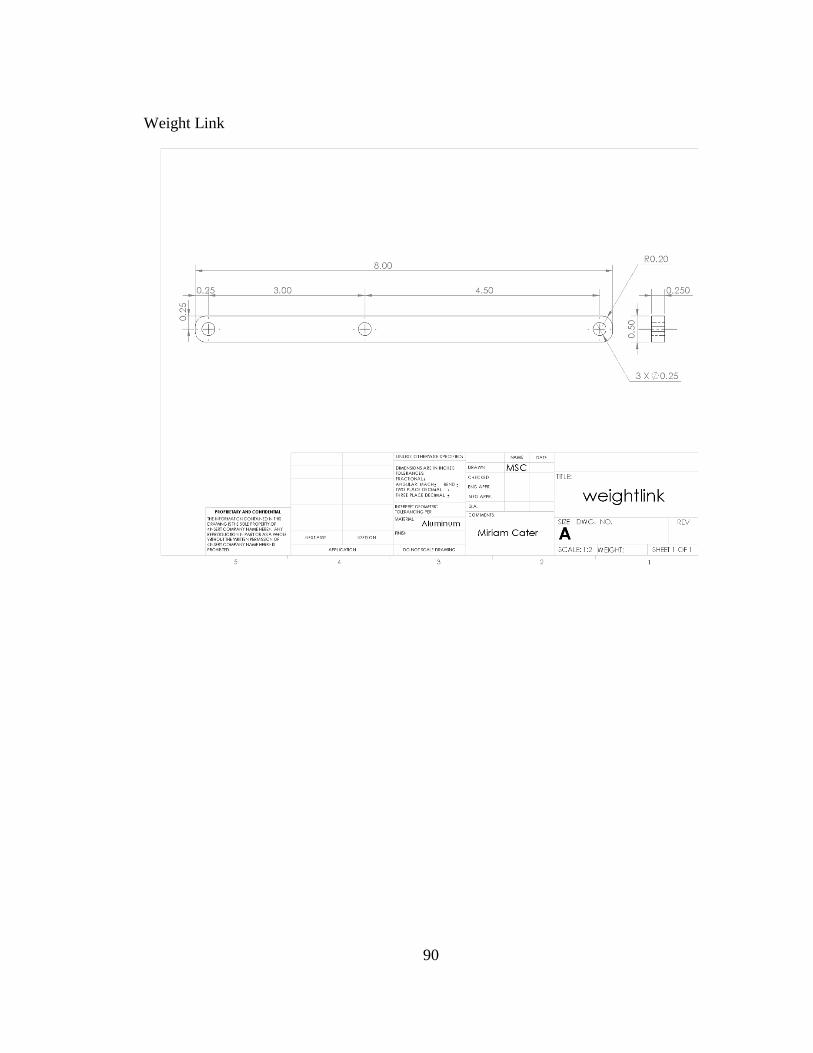
90
Weight Link
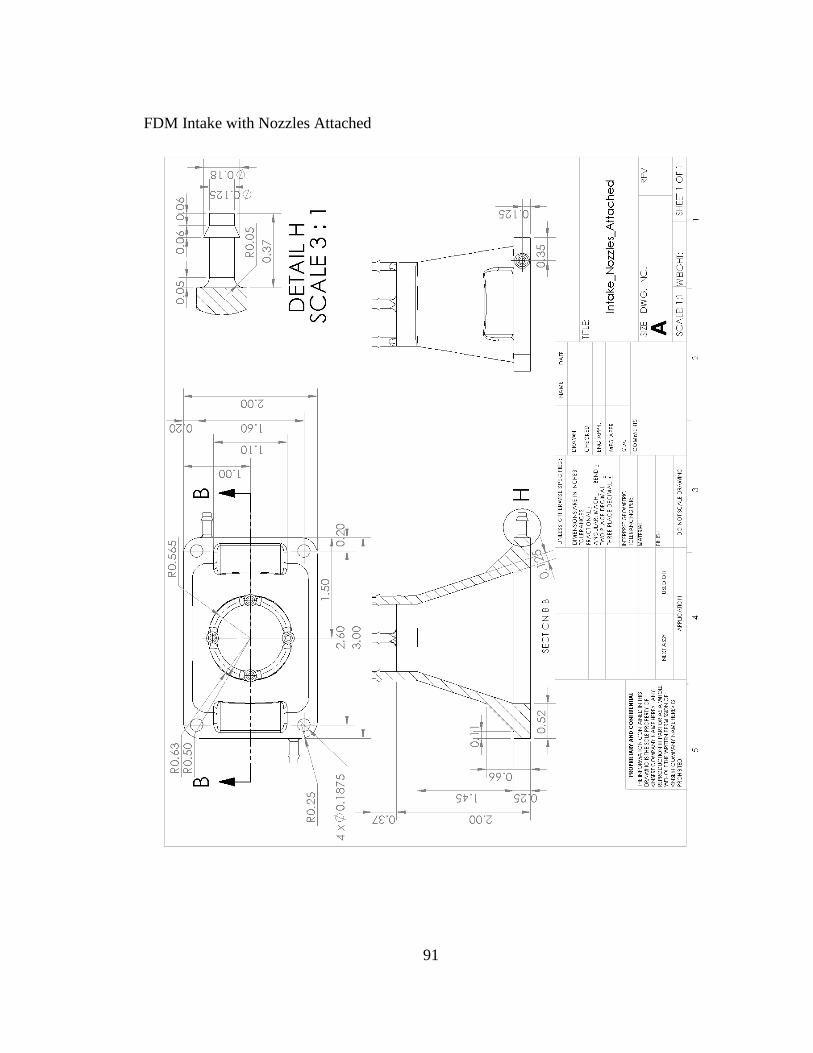
91
FDM Intake with Nozzles Attached
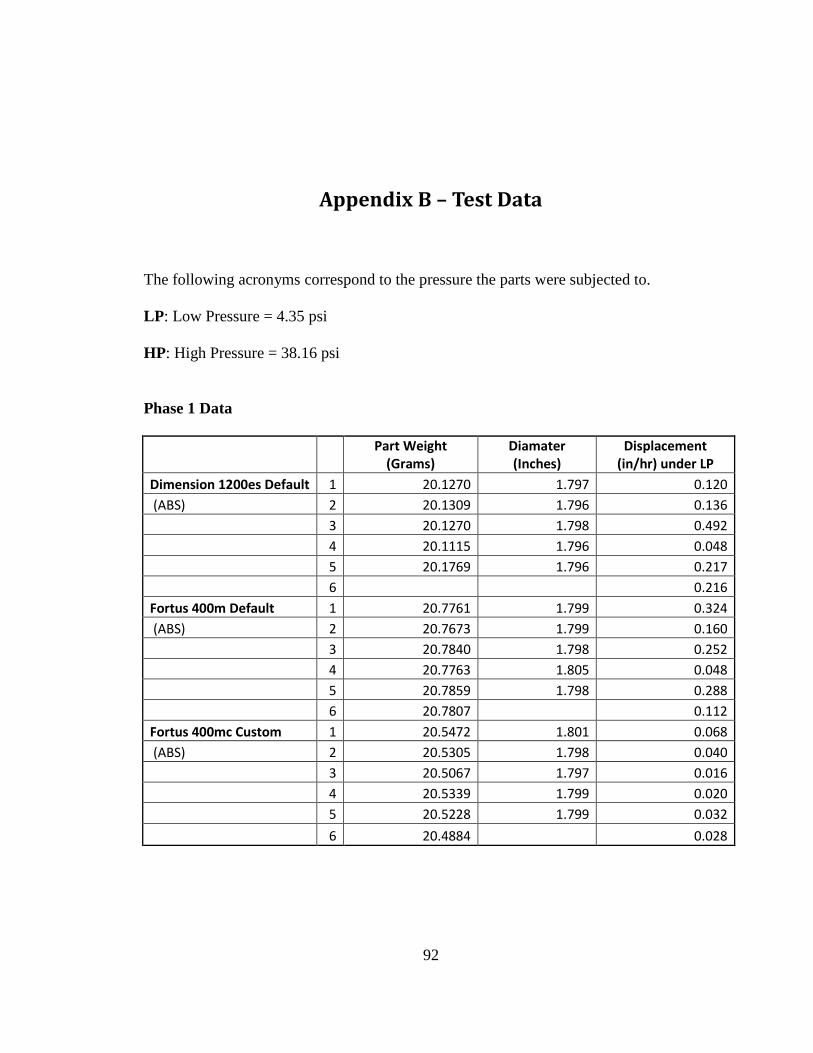
92
Appendix B – Test Data
The following acronyms correspond to the pressure the parts were subjected to.
LP: Low Pressure = 4.35 psi
HP: High Pressure = 38.16 psi
Phase 1 Data
Part Weight
(Grams) Diamater (Inches)
Displacement (in/hr) under LP
Dimension 1200es Default 1 20.1270 1.797 0.120
(ABS) 2 20.1309 1.796 0.136
3 20.1270 1.798 0.492
4 20.1115 1.796 0.048
5 20.1769 1.796 0.217
6
0.216
Fortus 400m Default 1 20.7761 1.799 0.324
(ABS) 2 20.7673 1.799 0.160
3 20.7840 1.798 0.252
4 20.7763 1.805 0.048
5 20.7859 1.798 0.288
6 20.7807 0.112
Fortus 400mc Custom 1 20.5472 1.801 0.068
(ABS) 2 20.5305 1.798 0.040
3 20.5067 1.797 0.016
4 20.5339 1.799 0.020
5 20.5228 1.799 0.032
6 20.4884 0.028
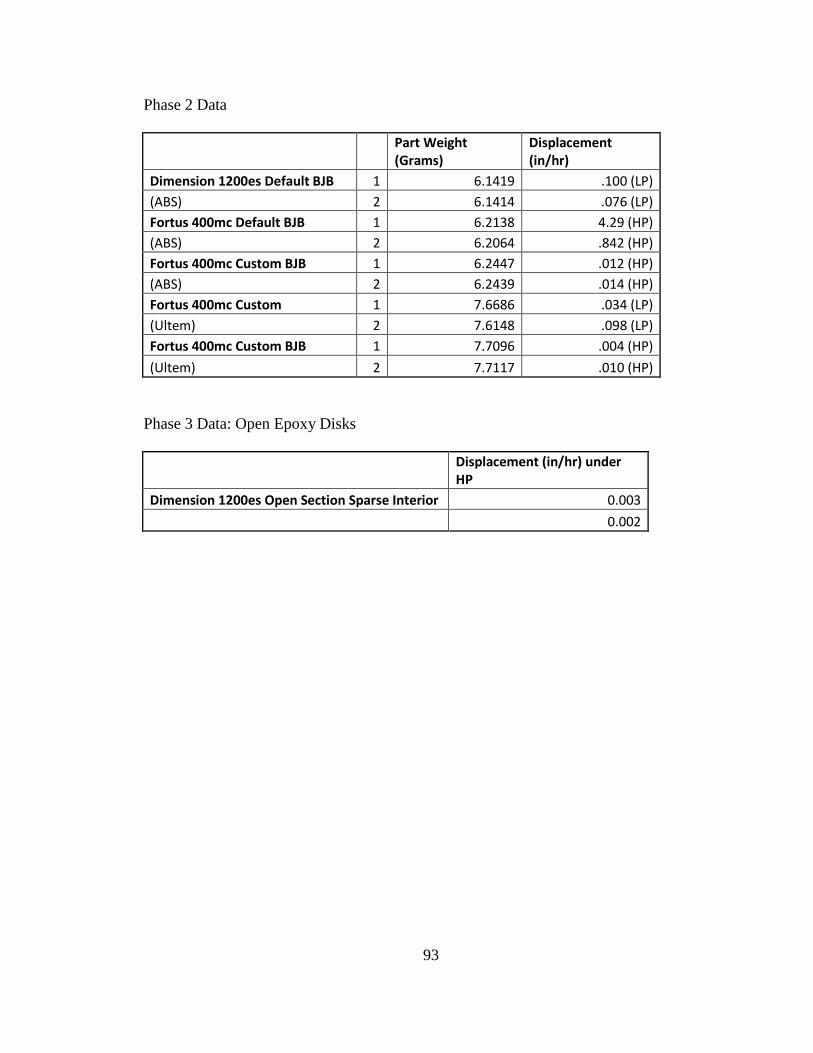
93
Phase 2 Data
Part Weight (Grams)
Displacement (in/hr)
Dimension 1200es Default BJB 1 6.1419 .100 (LP)
(ABS) 2 6.1414 .076 (LP)
Fortus 400mc Default BJB 1 6.2138 4.29 (HP)
(ABS) 2 6.2064 .842 (HP)
Fortus 400mc Custom BJB 1 6.2447 .012 (HP)
(ABS) 2 6.2439 .014 (HP)
Fortus 400mc Custom 1 7.6686 .034 (LP)
(Ultem) 2 7.6148 .098 (LP)
Fortus 400mc Custom BJB 1 7.7096 .004 (HP)
(Ultem) 2 7.7117 .010 (HP)
Phase 3 Data: Open Epoxy Disks
Displacement (in/hr) under HP
Dimension 1200es Open Section Sparse Interior 0.003
0.002