university of cincinnati - OhioLINK ETD
177
UNIVERSITY OF CINCINNATI Date: _December 16, 2004_ I, Moo-Jin Suh____ ________________________________________ , hereby submit this work as part of the requirements for the degree of: Doctor of Philosophy (Ph.D.) in: Department of Chemistry It is entitled: Matrix-Assisted Laser Desorption/Ionization Time-of-Flight Mass Spectrometry of Bacterial Ribosomal Proteins and Ribosomes This work and its defense approved by: Chair: _Prof. Patrick A. Limbach______ _Prof. Joseph A. Caruso_ ____ _Prof. Richard A. Day ____ _____________________________ _____________________________
-
Upload
khangminh22 -
Category
Documents
-
view
4 -
download
0
Transcript of university of cincinnati - OhioLINK ETD
UNIVERSITY OF CINCINNATI Date: _December 16, 2004_
I, Moo-Jin Suh____ ________________________________________, hereby submit this work as part of the requirements for the degree of:
Doctor of Philosophy (Ph.D.)
in:
Department of Chemistry
It is entitled: Matrix-Assisted Laser Desorption/Ionization Time-of-Flight Mass Spectrometry of Bacterial Ribosomal Proteins and Ribosomes
This work and its defense approved by:
Chair: _Prof. Patrick A. Limbach______ _Prof. Joseph A. Caruso_ ____ _Prof. Richard A. Day ____ _____________________________ _____________________________
MATRIX-ASSISTED LASER DESORPTION/IONIZATION TIME-OF-FLIGHT MASS SPECTROMETRY OF
BACTERIAL RIBOSOMAL PROTEINS AND RIBOSOMES
A dissertation submitted to the
Division of Research and Advanced Studies of the University of Cincinnati
In partial fulfillment of the requirements for the degree of
Doctor of Philosophy (Ph.D.)
In the Department of Chemistry of the College of Arts and Sciences
December 2004
By
Moo-Jin Suh
B.S., Korea University, South Korea 1995 M.S., Korea University, South Korea 1997
Committee Chair: Prof. Patrick A. Limbach
This dissertation is dedicated to our baby, Eun-Bi Suh, who had a life for 5 months in
Mother.
마음속 깊은 곳에는 언제나 이제는, 다시금 시작.. 언제나처럼 살기야 살겠지만, 느끼기에 괴롭고, 그립기에 보고싶고, 생각나기에 나오는 한줄기의 눈물 속에서 아! 그래도 감사함을 느끼는 나이기에 그래도 희망이라는 빛을 잡고 싶은 어쩔 수 없는 한 인간이기에 오늘도 난 누군가를 그리며 내일은 누군가와의 삶을 꿈꾸는 한 여자이고, 한 남자의 아내이기에 마음속 깊은 곳에는 언제나 너와 함께지만 그리움이라는 그리고 아쉬움이라는 이름으로 너를 보낸다. 엄마,아빠 많이 미안해 그리고 꼭 만나자. 은비야! 사랑해 엄마가 너를 지키지 못해서 미안해 혼자 살아서 미안하다. 영원히..
- From Jamie J. Suh -
ii

Anyone who receives instruction in the word must share all good things with his
instructor.
Let us not become weary in doing good, for at the proper time we will reap a harvest if we
do not give up.
Galatians 6:6,9
iii
ABSTRACT
The ribosome is a ribonucleoprotein (RNP) complex that provides an ideal model
for developing new analytical approaches for charactering RNPs. Here, I propose to
develop suitable approaches for the systematic study of ribosomal proteins and ribosomes
by mass spectrometry. As an initial trial, I have investigated the applicability of several
common protein isolation procedures for their compatibility with downstream
matrix-assisted laser desorption/ionization mass spectrometry (MALDI-MS) and
numerated the Escherichia coli ribosomal proteins and their post-translational
modifications with good sensitivity and high speed. This approach in combination with a
ribosomal protein search algorithm was applied to Thermus thermophilus ribosomes. A
major effort involved the use of limited proteolysis in combination with MALDI-MS to
determine the stability of ribosomal proteins and to interrogate the interaction between
ribosomal proteins and rRNA by monitoring the time-dependent production of
proteolytic peptides and any remaining intact proteins. While exposed and unstructured
proteins yield significant peptide ions via proteolytic digestion, proteins that are protected
by rRNA in the inner part of the ribosome are not affected under the limited proteolysis
conditions employed. Finally I expanded the use of limited proteolysis to the much larger
and more complex 70S ribosomes from Thermus thermophilus to understand the role of
ribosomal proteins in inter-subunit bridges. Extension regions of ribosomal proteins in
inter-subunit bridges interact with rRNA and are important in maintaining the
architecture of the complete 70S ribosome. It is envisioned that a combination of mass
spectrometry and limited proteolysis can be used to further refine our understanding of iv

the ribosome in various functional states, in particular, and also serve as a general method
for characterizing other RNPs.
v

Copyright notice
vi
ACKNOWLEDGMENTS
Before all, I would like to thank God for the strength and endurance to have made it
this far. Thank God for giving me the talents and for answering my prayers.
I would like to express my gratitude to my advisor, Professor Patrick A. Limbach,
for the opportunity to work in his lab and for invaluable assistance, patience and support
over the years. You are truly one of the friendliest mentors I’ve ever known. I would also
like to thank my committee, Drs. Michael J. Baldwin, Joseph A. Caruso and Richard A.
Day for their advice and help in reviewing this work. I would like to thank Drs, Steven T.
Gregory and Albert E. Dahlberg (Brown University) for a kind gift of Thermus
thermophilus and for their discussion. Thanks to Department of Chemistry at Louisiana
State University, for the opportunity to matriculate in LSU, to Department of Chemistry
at University of Cincinnati and National Institutes of Health for the funding.
vii
To the Limbach group (Anita, April, Beniam, Chad, Daisy, Justin, Dr. Larry Sallans,
Dr. Lianji Jin, Mahmud, Rama, Dr. Stephen Macha and Zhaojing) for their help at
different stage of this work and their discussion. I write all of your names here because I
want to keep my memory alive and you are a part of my memory. To LSU members,
special thanks for always keeping me a part of the “home team” and reminding me a part
of family. To Soheil, thank you for sharing me what you know and for spending time in
laboratory late at night. To Wendy, thank you for a lot of help and for sharing
information. To Dr. Anne Mclachlan, thank you for the kindness and sweet heart.

I would like to thank to my master advisor, Dr. Young Sook Yoo, for boosting up
my ego and for encouraging me. I would like to thank to everybody who knows me even
though I do not mention their names here.
To my parents, I thank you for being who you are, but mostly for making me who I
am today. To mother, thank you for the phone calls, the encouragement and the concern.
To father, thank you for the continuous support in my education and for making warm
family. To mother-in-the-law, thank you for the support and concern. To my brother
Moo-Seok, thank you for loving me for myself and for taking care of parents. As you are
proud of me, I am proud of you. To my sister-in-the-law Susie, thank you for taking care
of Jamie instead of me and for the concern. Finally to my wife Jamie, my hopes, my
strength, thank you for your standing, patience and endless love.
viii
TABLE OF CONTENTS
Dedication........................................................................................................................... ii Epilogue............................................................................................................................. iii Abstract...............................................................................................................................iv Acknowledgments ............................................................................................................ vii List of Tables ......................................................................................................................xi List of Figures.................................................................................................................. xiii List of Schemes.............................................................................................................. xviii List of Abbreviations ........................................................................................................xix Chapter 1. Introduction and Background.............................................................................1 1.1 Mass Spectrometer.............................................................................................1 1.2 MALDI Overview .............................................................................................2
1.3 Limited Proteolysis............................................................................................8 1.4 Ribosome .........................................................................................................11
Chapter 2. Literature Overview .........................................................................................21 2.1 Analysis of Ribosomal Proteins by Mass Spectrometry..................................21 2.2 Purpose of the Work Presented........................................................................31 Chapter 3. Escherichia coli Culturing and Ribosome Preparation....................................34 3.1 Introduction......................................................................................................34 3.2 Experimental....................................................................................................34
3.3 Results and Discussion ....................................................................................39 Chapter 4. Investigation of Methods Suitable for Matrix-Assisted Laser Desorption/Ionization Mass Spectrometric Analysis of Proteins from Ribonucleoprotein Complexes .........................................................................................................................46 4.1 Introduction......................................................................................................46 4.2 Experimental....................................................................................................47 4.3 Results and Discussion ....................................................................................50 4.4 Conclusion .......................................................................................................68
ix
Chapter 5. Extending Protein Identifications to Unsequenced Bacterial Strains Using Matrix-Assisted Laser Desorption/Ionization (MALDI) Mass Spectrometry...................70 5.1 Introduction......................................................................................................70 5.2 Experimental....................................................................................................71 5.3 Results and Discussion ....................................................................................73 5.4 Conclusion .......................................................................................................92 Chapter 6. Determination of Protease Accessible Ribosomal Proteins of the 30S Ribosomal Subunits from Escherichia coli by Limited Proteolysis and Matrix-Assisted Laser Desorption/Ionization Mass Spectrometry ..............................................................94 6.1 Introduction......................................................................................................94 6.2 Experimental....................................................................................................95 6.3 Results..............................................................................................................98 6.4 Discussion......................................................................................................107 6.5 Conclusion .....................................................................................................115 Chapter 7. Limited Proteolysis Behavior of Ribosomal Proteins Involved in Inter-Subunit Bridges of Thermus thermophilus 70S Ribosomes .........................................................116 7.1 Introduction....................................................................................................116 7.2 Experimental..................................................................................................118 7.3 Results............................................................................................................121 7.4 Discussion......................................................................................................127 7.5 Conclusions....................................................................................................137 Chapter 8. Conclusions and Future Perspectives.............................................................138 8.1 Conclusions....................................................................................................138 8.2 Future Perspectives........................................................................................140 Bibliography ....................................................................................................................146 Vita ..................................................................................................................................156
x
LIST OF TABLES
1.1 Protease specificity of the common proteases used for limited proteolysis. The
location of cleavage is denoted by a slash (/) before or after the amino acid responsible for specificity. X stands for an arbitrary amino acid. ... ...............................10
1.2 Properties of ribosomal proteins from Escherichia coli (MRE 600 or K12). .................14 1.3 Post-translational modifications observed in ribosomal proteins. ...................................16 4.1 Masses and relative abundances of E. coli ribosomal proteins obtained by different
sample preparation procedures. ........................................................................................63 4.2 MALDI-TOF MS analysis of in-gel LysC digested putative S1 protein band (Figure
4.10-(B)). .........................................................................................................................67 5.1 Properties of Thermus thermophilus HB27 ribosomal proteins. ......................................75 5.2 The 13 ribosomal proteins from T. thermophilus HB8 assigned based upon direct
correspondence between predicted molecular weight based upon HB27 sequence and experimentally measured value. ......................................................................................78
5.3 The 22 ribosomal proteins from T. thermophilus HB8 assigned based upon direct
correspondence between predicted molecular weight based upon HB27 sequence with loss of N-terminal methionine and experimentally measured value. ......................79
5.4 Ribosomal proteins from T. thermophilus HB8 that cannot be assigned based upon
direct correspondence between predicted molecular weight based upon HB27 sequence (with or without loss of N-terminal methionine) and experimentally measured values. Putative protein assignments are listed along with possible post-translational modifications (see text for details). .....................................................81
5.5 Assignment of large subunit ribosomal proteins from T. thermophilus IB21 based
upon MALDI-TOF MS data obtained in Figure 5.6 and HB27 gene sequences. ** denote protein assignments for the IB21 strain which are identical to experimental m/z values and assignments for the HB8 strain. ...............................................................88
5.6 Assignment of small subunit ribosomal proteins from T. thermophilus IB21 based
upon MALDI-TOF MS data obtained in Figure 5.6 and HB27 gene sequences. ** denote protein assignments for the IB21 strain which are identical to experimental m/z values and assignments for the HB8 strain. A total of 56 distinct m/z values were identified from the MALDI-MS data. . ............................................................................89
xi
6.1 MALDI-TOF MS analysis of proteolytic fragments generated by trypsin (Figure 6.1). The identification of proteolytic fragments can occur even when m/z values are detected for intact proteins, as seen here for ribosomal protein S7. Protein fragments identified by asterisks, *, were still detectable after a 500 min incubation period with trypsin. a The average singly protonated masses of the tryptic products are shown as calculated using SequenceEditor ver. 1.0, provided by Bruker Daltonics and ProteinProspector. ..........................................................................................................102
6.2 Properties of ribosomal proteins from 30S subunits. * were intact proteins remaining
after the 500 min incubation period with both proteases................................................114 8.1 Summary of the ribosomal proteins modified as well as the number of
2-imino-thiolane adducts. ...............................................................................................143
xii
LIST OF FIGURES
1.1 Block diagram of components of a mass spectrometer. ..................................................1 1.2 Schematic diagram of matrix-assisted laser desorption and ionization. .........................5 1.3 Schematic diagram of linear mode MALDI Time-of-Flight mass analyzer....................7 1.4 Schematic diagram of reflectron mode MALDI Time-of-Flight mass analyzer. ............8 1.5 Cartoon of the prokaryotic ribosome and its subunits based on the results of X-ray
crystallographic studies. ................................................................................................11 1.6 Process of protein synthesis in ribosome. .....................................................................18 2.1 Mass spectrometry-based approaches for characterizing ribosomal proteins and
ribosomes. 1D RPLC-ESI-FTICR corresponds to One-Dimensional Reversed- Phase Liquid Chromatography Electrospray Ionization Fourier Transform-Ion Cyclotron Resonance. CE and 2D SCX-RPLC stand for Capillary Electrophoresis and Two-Dimensional Strong Cation Exchange Reversed-Phase Liquid Chromatography, respectively. .....................................................................................22
3.1 The growth curve of E. coli MRE 600 in LB medium. ................................................41 3.2 Sucrose gradient profile of crude ribosomes. ...............................................................42 3.3 Sucrose gradient profile of tight-couple 70S ribosomes. ..............................................44 3.4 Sucrose gradient profile of dissociated 50S and 30S ribosomal subunits. ...................45 4.1 Effect of TFA precipitation on the MALDI mass spectral analysis of 70S ribosomal
proteins. (A) No TFA, (B) 1% TFA, (C) 2.5% TFA, (D) 5% TFA, (E) 10% TFA added to 70S ribosome sample with supernatant analyzed by MALDI-MS. The information obtained from the addition of 2.5% TFA is used as a comparison against other sample preparation methods investigated. ..............................................52
4.2 MALDI sample crystals containing ribosomal proteins precipitated using stated
amounts of TFA. Matrix used is sinapinic acid. ..........................................................53 4.3 Effect of TFA precipitation on the MALDI mass spectral analysis of standard
proteins. Matrix used is sinapinic acid. .......................................................................54
xiii
4.4 The MALDI mass spectrum of pellets produced after TFA treatment of 70S ribosomes. Pellets are resuspended in deionized water and then the resuspended sample was mixed with matrix solution. .......................................................................56
4.5 MALDI mass spectral data obtained after 70S ribosomes were precipitated with acetic acid. The supernatant was lyophilized and resuspended in (A) deionized water and (B) 2.5% TFA prior to MALDI-MS analysis. Acetic acid precipitation is comparable to TFA precipitation, although the subsequent addition of TFA before MALDI-MS analysis leads to the loss of ion signal for higher molecular weight proteins. .........................................................................................................................57
4.6 MALDI mass spectral data obtained after 70S ribosomes were precipitated with (A)
acetone and (B) ethanol. Precipitates were resuspended in deionized water to denature ribosome and then treated with 2.5% TFA to precipitate ribosomal proteins prior to MALDI-MS analysis. Initial acetone precipitation leads to higher yield of ribosomal proteins. ..........................................................................................59
4.7 MALDI mass spectra obtained after phenol extraction of standard proteins. (A)
aqueous phase, (B) organic phase. Matrix used is sinapinic acid. ...............................61 4.8 MALDI mass spectra obtained after phenol extraction of 70S ribosomes. (A)
aqueous phase, (B) organic phase. The lower molecular weight proteins L36, S22, L34, L33 and L32 are found in the aqueous phase. The proteins analyzed in the organic phase yielded higher ion abundance than those found during TFA precipitation alone. .......................................................................................................62
4.9 12.5% SDS-PAGE gel of ribosomes treated by the approaches described in text.
Lanes 1, 2, 7 and 12: intact ribosomes; Lane 3: pellet obtained after ethanol precipitation; Lane 4: pellet obtained after acetone precipitation; Lanes 5 and 6: supernatant obtained after acetic acid precipitation; Lane 8: supernatant obtained after ethanol precipitation; Lane 9: supernatant obtained after acetone precipitation; Lane 10: pellet obtained after acetic acid precipitation; Lane 11: supernatant obtained after 2.5% TFA precipitation. Lanes 1-7 and 12: 1.0 µL sample loaded; Lanes 8-11: 5.0 µL sample loaded. See text for discussion. .......................................65
4.10 (A) 10% SDS-PAGE gel of protein markers and intact ribosomes (B) MALDI mass
spectrum of peptide products obtained after LysC digestion of band circled in Fig. 4.10-(A). The insets show the resolution of ~11000 FWHM at m/z 1214.76 and 7000 FWHM at 2595.35. All assigned masses marked by asterisks correspond to LysC digested peptides within 25 ppm of database values. The peaks marked by + are from modification by carbamidomethylation. ........................................................66
5.1 Flowchart for identifying the tentatively detected ribosomal proteins with a
systematic search algorithm. .........................................................................................74 5.2 MALDI-TOF mass spectra of ribosome or ribosomal subunits from T. thermophilus
HB8 (A) 70S, (B) 50S and (C) 30S in positive ion mode. Peaks belong to Category 1 (blue), 2 (black) and 3 (red) are labeled. ...................................................................76
xiv
5.3 SDS-PAGE analysis of subunits obtained after sucrose gradient. ...............................77 5.4 MALDI-TOF mass spectra of 70S ribosome from (A) T. thermophilus wild strain
HB8 and (B) prmA::htk null mutant TLK90. The portions of the spectra containing proteins in the mass range of 14,000 to 18,000 Da are shown. ....................................83
5.5 Alignment of the amino acid sequences of ribosomal protein L35 of T. thermophilus
HB8, HB27, and the plausible amino acid sequence of ribosomal protein L35 determined by mass spectrometric observation. Gene sequence of HB8 L35 is from accession number P80341. ............................................................................................85
5.6 MALDI-TOF mass spectrum of intact 70S ribosome from T. thermophilus IB21 in
positive ion mode. The inset provides an expanded view showing resolved peaks. (A) 70S, (B) 50S and (C) 30S, respectively. Peaks belong to Category 1 (blue), 2 (black) and 3 (red) are labeled. .....................................................................................87
5.7 Expansion of the mass spectra in the m/z range from 11500 to 13500 for comparison
of inherited characteristics in: (A) theoretical peaks of HB27 strain, and (B) the observed peaks of HB8 strain and (C) IB21 strain. “M” stands for “methionine.”......90
6.1 MALDI mass spectral data after incubation of 30S subunits with trypsin under
limited proteolysis conditions for the time periods denoted. The intact ribosomal proteins detected after each incubation period are summarized in Figure 6.2. Table 6.1 summarizes the identification of new m/z values that arise during the limited proteolysis experiments. ...............................................................................................99
6.2 Intact ribosomal proteins from the 30S ribosomal subunits observed with
MALDI-TOF MS after incubation with protease for denoted time periods. ..............100 6.3 The 12.5% SDS-PAGE results arising from the limited proteolysis of 30S
ribosomal subunits using Trypsin. Lanes 1, 2: protein markers; Lanes 3-10: 30S small ribosomal subunits incubated with trypsin for 0 min, 10 min, 30 min, 60 min, 125 min, 250 min, 500 min and 1000 min respectively. A new band marked with an arrow is truncated S3. .................................................................................................104
6.4 MALDI mass spectral data after incubation of 30S subunits with Proteinase K
under limited proteolysis conditions for the time periods denoted. The intact ribosomal proteins detected after each incubation period are summarized in Figure 6.2. ..............................................................................................................................105
6.5 The 12.5% SDS-PAGE results arising from the limited proteolysis of 30S subunits
using Proteinase K. Lanes 1-8: intact ribosomes incubated with Proteinase K for 0 min, 10min, 30 min, 60 min, 125 min, 250 min, 500 min and 500 min (without Proteinase K) respectively. .........................................................................................106
xv
6.6 The ribosomal proteins detected intact after the different incubation period with trypsin. (A) 10 min, (B) 60 min and (C) 500 min. (1) Interface and (2) backside view of E. coli 30S subunit. The primary binding or backbone proteins are colored in red. X-ray crystallographic data for S22 and S21 proteins were not available. ....110
6.7 The ribosomal proteins detected intact after the different incubation period with
Proteinase K. (A) 10 min, (B) 60 min and (C) 500 min. (1) Interface and (2) backside view of E. coli 30S subunit. The primary binding or backbone proteins are colored in red. X-ray crystallographic data for S22 and S21 proteins were not available. . ....................................................................................................................112
6.8 The assembly diagram for the E. coli 30S subunit as deduced from in vitro
reconstitution studies. The ribosomal proteins detected intact after the 500 min incubation period with both proteases, trypsin and Proteinase K are circled in red. ..113
7.1 Inter-subunit bridges in T. thermophilus ribosomes. Interface views of the 50S and
30S subunits with bridges. rRNA-rRNA contacts are shown in magenta: protein-rRNA and protein-protein contacts are shown in yellow. Interaction sites in inter-subunit bridges are numbered B1a, B1b, etc, as shown in Figure 7.1. . .............118
7.2 Sucrose gradient profiles of tight-couple 70S ribosomes from T. thermophilus. (A)
0 min (B) 500 min incubation without protease. A total of 73 pmol of tight-couple 70S ribosomal solution (3 A260 units) was applied on the top of the 0-45% sucrose gradient. .......................................................................................................................122
7.3 Sucrose gradient profiles from the limited proteolysis of T. thermophilus 70S
ribosomes using trypsin. (A) 30 min, (B) 120 min and (C) 500 min incubation........123 7.4 MALDI mass spectra of fractions (A) 8, (B) 12 and (C) 19 obtained through sucrose
gradient analysis after the limited proteolysis of the T. thermophilus 70S ribosomes using trypsin for 30 min...............................................................................................125
7.5 MALDI mass spectra of fractions (A) 9 and (B) 12 obtained through sucrose
gradient analysis after the limited proteolysis of the T. thermophilus 70S ribosomes using trypsin for 500 min.............................................................................................126
7.6 Ribosomal proteins in inter-subunit bridges of 30S subunit from T. thermophilus
(A) S11; (B) S19 and S13 ribosomal proteins. ...........................................................131 7.7 Ribosomal proteins in inter-subunit bridges of 50S subunit from T. thermophilus
(A) 50S subunit; (B) L5, (C) L2 and (D) L14 ribosomal proteins. 23S rRNA is colored in gray and 16S rRNA in light blue. ..............................................................133
xvi
7.8 Diagrammatic presentation of interaction between the 50S and 30S subunit. The protease-resistant ribosomal proteins, L2, L5 and L14 are colored in gray. The protease accessible ribosomal proteins, L19, S11, S13 and S19 are colored in green. 23S rRNA and 16S rRNA from each subunit are colored in yellow, and 5S rRNA from 50S subunit is colored in light blue. The interacting regions of L2, L5 and L14 on the 30S subunit are marked with red stars. ............................................................134
7.9 Views of the structure of the 70S ribosome with the ribosomal proteins in
inter-subunit bridges. (A) to (D) are successive 90˚ rotation about the vertical axis. The different molecular components are colored for identification: yellow, 16S rRNA; pink, 23S rRNA; orange, 5S rRNA; intact proteins from limited proteolysis with trypsin; gray; digested proteins from limited proteolysis with trypsin, green. ...136
8.1 (A) Intact ribosomal proteins. (B) Modified ribosomal proteins after reaction with
2-iminothiolane. ..........................................................................................................142
xvii
LIST OF SCHEMES
2.1 Proposed scheme for the study of RNP complexes. ......................................................33 8.1 Proposed scheme for the cross-linking study of RNP complexes. ..............................144
xviii
LIST OF ABBREATIONS
CE capillary electrophoresis
CHCA α-cyano-4-hydroxycinnamic acid
Da daltons, 1 Da =1 amu (atomic mass unit)
DEPC diethylpyrocarbonate
DNA deoxyribonucleic acid
E. coli Escherichia coli
EM electron microscopy
ESI electrospray ionization
FWHM full width at half maximum
FT-ICR Fourier transform-ion cyclotron resonance
GTP guanosine triphosphate
HEPES 4-(2-hydroxylethyl)-1-piperazine-ethane sulfonic acid
IR infrared
LB luria broth
m/z mass-to-charge ratio
MALDI matrix-assisted laser desorption/ionization
mRNA messenger ribonucleic acid
MS mass spectrometry
MWCO molecular weight cut-off
NATs N-terminal acetyltransferases
xix
PAGE polyacrylamide gel electrophoresis
PTM post-translational modification
R. palustris Rhodopseudomnas palustris
RNP ribonucleoprotein
rRNA ribosomal ribonucleic acid
S. cerevisiae Saccharomyces cerevisiae
SA sinapinic acid
SDS sodium-dodecyl sulfate
T. thermophilus Thermus thermophilus
TFA trifluoroacetic acid
TOF time-of-flight
Tris tris(hydroxymethyl)aminomethane
tRNA transfer ribonucleic acid
UV ultraviolet
xx
Chapter 1. Introduction and Background
1.1 Mass Spectrometer
A mass spectrometer is an analytical instrument that separates ions on the basis of
their mass-to-charge ratio (m/z) from which their molecular weight can be determined.
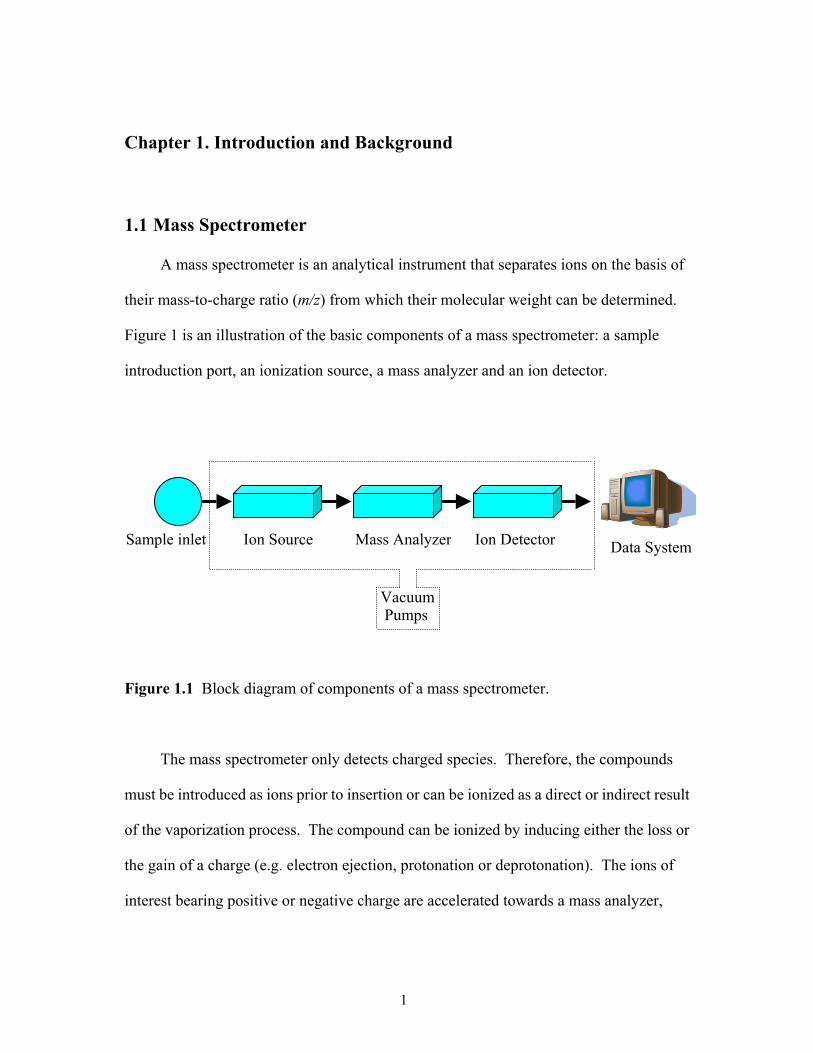
Figure 1 is an illustration of the basic components of a mass spectrometer: a sample
introduction port, an ionization source, a mass analyzer and an ion detector.
Data SystemIon DetectorMass AnalyzerIon SourceSample inlet
Vacuum Pumps
Figure 1.1 Block diagram of components of a mass spectrometer.
The mass spectrometer only detects charged species. Therefore, the compounds
must be introduced as ions prior to insertion or can be ionized as a direct or indirect result
of the vaporization process. The compound can be ionized by inducing either the loss or
the gain of a charge (e.g. electron ejection, protonation or deprotonation). The ions of
interest bearing positive or negative charge are accelerated towards a mass analyzer,
1
which separates the ions according to their m/z. Passing through the mass analyzer, the
ions strike a dynode surface, which is a component of the detector, and are converted into
electrons. A mass spectrum showing signal abundance as a function of mass-to-charge
ratio values is plotted with each peak representing an m/z value inherent to a specific ion.
In the field of protein chemistry, mass spectrometry (MS) has gained widespread
use in a number of applications such as determination of molecular weight (3),
identification of post-translational modification (4), amino acid sequencing (5,6), and
structural analysis (7). The advantages that MS provides are sensitivity, rapid analysis,
accuracy, and the ability to analyze complex mixtures, particularly with low sample
quantities. In the study of biological samples, the two most common ionization
techniques are matrix-assisted laser desorption/ionization (MALDI) (8,9) and
electrospray ionization (ESI) (10). The following section includes a detailed discussion
of the MALDI mass spectrometer.
1.2 Matrix-Assisted Laser Desorption/Ionization Overview
In 1987, two research groups in Germany and Japan independently reported the first
use of MALDI. Hillenkamp and Karas (8,11) described the use of a solid matrix
compound, whereas the method of Tanaka and coworkers (9,12) employed glycerol and
ultra-fine metal powder as a matrix. MALDI-MS has become a very powerful tool for the
analytical characterization of a wide variety of samples.
MALDI uses a compound referred to as a matrix to absorb the energy of the laser.
Briefly, samples mixed with matrix in liquid form are allowed to dry onto the MALDI
target forming a crystalline spot. The energy from the laser is dissipated throughout the
2
crystalline spot, giving the necessary energy required for desorption. Transfer of energy
from the matrix allows for desorption of the sample. Typically, ultraviolet (UV) lasers
(11) are used with the nitrogen laser (λ= 337 nm) being the most common due to
economic cost, however infrared radiation (IR) lasers such as CO2 or Er:YAG (13) have
also been used in MALDI.
Most of the more than 6000 reports listed in the current contents database utilizing
the MALDI technique employ modified versions of the method of Hillenkamp and Karas,
mainly due to its better sensitivity; however liquid matrices are still being investigated for
specific applications and this approach has seen a recent resurgence (14,15).
1.2.1 Sample Preparation
The MALDI experiment is dominated by sample preparation issues. The first and
most critical step for the success of MALDI experiments is sample preparation. There are
several different sample preparation techniques, which have been developed depending
on the nature of the sample to be analyzed. The commonly established techniques
include the dried-droplet method (11), vacuum drying method (16), two layer method
(17), and, most recently, the solid-solid compressing method (18), which is used for hard
to dissolve samples. The dried-droplet method is the most common method because of its
simplicity. However, a major disadvantage of using this method is the creation of
heterogeneous matrix crystals (hot spots), which result in poor spectral reproducibility.
Application of the dried-droplet method involves mixing the analyte with the matrix
solution containing a large molar excess (typically in a ratio of 1:103-105) of a
UV-absorbing organic compound (a matrix) and a solvent chosen by the nature of the
3
matrix and analyte used. Practically, the analyte and matrix solutions are prepared
separately and then mixed together to obtain the required ratio. After mixing, a few
microliters of the matrix/analyte mixture are deposited on the MALDI target, which is
typically a stainless steel or gold substrate of a particular shape and size depending on the
commercial instrument being used. The sample on the target is left to dry, then
introduced into the MALDI instrument vacuum chamber. Typically, the working
pressure in the MALDI mass spectrometer varies between 10-7 to 10-10 torr depending on
the analyzer with the higher vacuum allowing for better resolution.
1.2.2 Desorption/Ionization Process
While the exact mechanism of MALDI is still under debate, the generally accepted
MALDI process can be categorized into two models, the charge reneutralization and
thermodynamic models. First, in the charge reneutralization model (19), after the
desorption and charge separation steps, final ions detected in the mass spectrum are under
kinetic control and influenced primarily by excess electrons present in the plume. This
plume is characterized by a high density of neutral matrix molecules and a variety of ionic,
radical, and electronically excited species. For the latter model, Zenobi (20) suggested
that ion-molecule reactions are under thermodynamic control and lead to the formation of
final ions detected in the mass spectrum. These two models are similar in principle in that
the absorption of energy from a laser is required to desorb the sample from the MALDI
target, but the final step to generate ions detected in the mass spectrum is different. In
general, the MALDI process is thought to occur in several sequential, yet interrelated
steps. A matrix compound absorbs laser energy resulting in the desorption of clusters
4
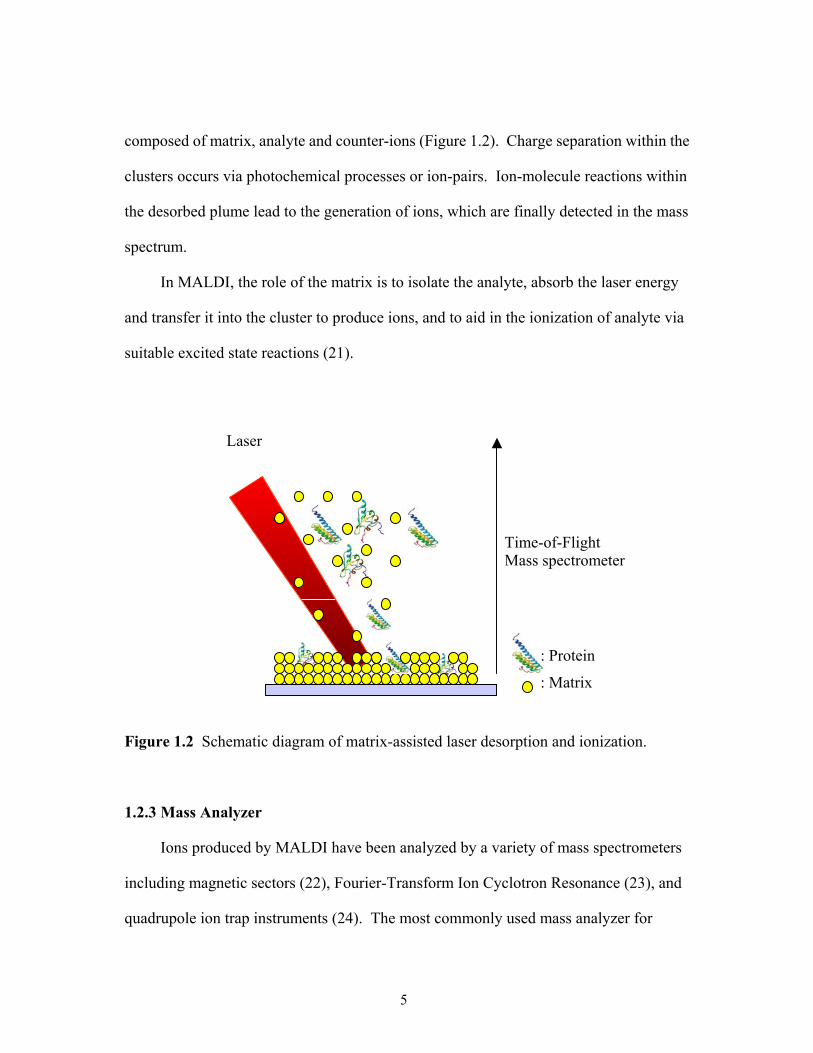
composed of matrix, analyte and counter-ions (Figure 1.2). Charge separation within the
clusters occurs via photochemical processes or ion-pairs. Ion-molecule reactions within
the desorbed plume lead to the generation of ions, which are finally detected in the mass
spectrum.
In MALDI, the role of the matrix is to isolate the analyte, absorb the laser energy
and transfer it into the cluster to produce ions, and to aid in the ionization of analyte via
suitable excited state reactions (21).
: Protein
: Matrix
Laser
Time-of-Flight Mass spectrometer
Figure 1.2 Schematic diagram of matrix-assisted laser desorption and ionization.
1.2.3 Mass Analyzer
Ions produced by MALDI have been analyzed by a variety of mass spectrometers
including magnetic sectors (22), Fourier-Transform Ion Cyclotron Resonance (23), and
quadrupole ion trap instruments (24). The most commonly used mass analyzer for
5
MALDI ions, however, is the time-of-flight (TOF) because of its unlimited mass range,
high ion transmission, and compatibility with pulsed lasers. As a consequence,
MALDI-TOF MS makes possible high throughput analysis because of the high duty
cycle of the TOF analyzer and pulsed nature of the ionization technique. Recently, new
combinations of TOF/TOF (25) and tandem quadrupole/TOF instrument (26) show
promise for future work.
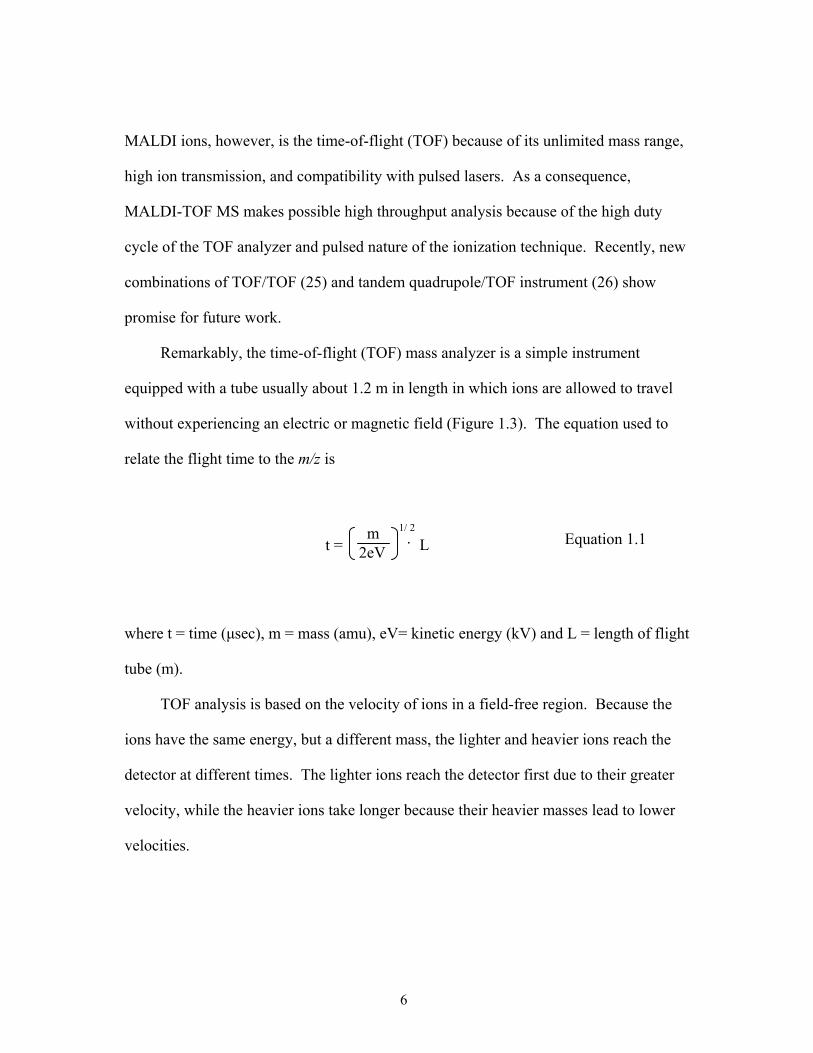
Remarkably, the time-of-flight (TOF) mass analyzer is a simple instrument
equipped with a tube usually about 1.2 m in length in which ions are allowed to travel
without experiencing an electric or magnetic field (Figure 1.3). The equation used to
relate the flight time to the m/z is
t = .1/ 2m
2eVEquation 1.1 L
where t = time (µsec), m = mass (amu), eV= kinetic energy (kV) and L = length of flight
tube (m).
TOF analysis is based on the velocity of ions in a field-free region. Because the
ions have the same energy, but a different mass, the lighter and heavier ions reach the
detector at different times. The lighter ions reach the detector first due to their greater
velocity, while the heavier ions take longer because their heavier masses lead to lower
velocities.
6
The TOF analyzer allows for high transmission of ions since no slits are used, but
the resolving power of TOF is low. To improve the resolving power of TOF, various
ways to enhance the basic TOF design have been investigated.
Microchannel Plate Detector
Mass of IonsExtraction
Lens
time or m/z
High Voltage
Flight Tube
Field Free Region
>>
Figure 1.3 Schematic of linear mode MALDI Time-of-Flight mass analyzer.
Time-lag focusing, commonly referred to as delayed-extraction (DE), can be
coupled to TOF as a means of reducing the initial velocity spread of ions while they are
still in the accelerating region of the mass spectrometer (27). Delayed extraction is an
effective and simple technique for mass resolution enhancement in MALDI-TOF MS.
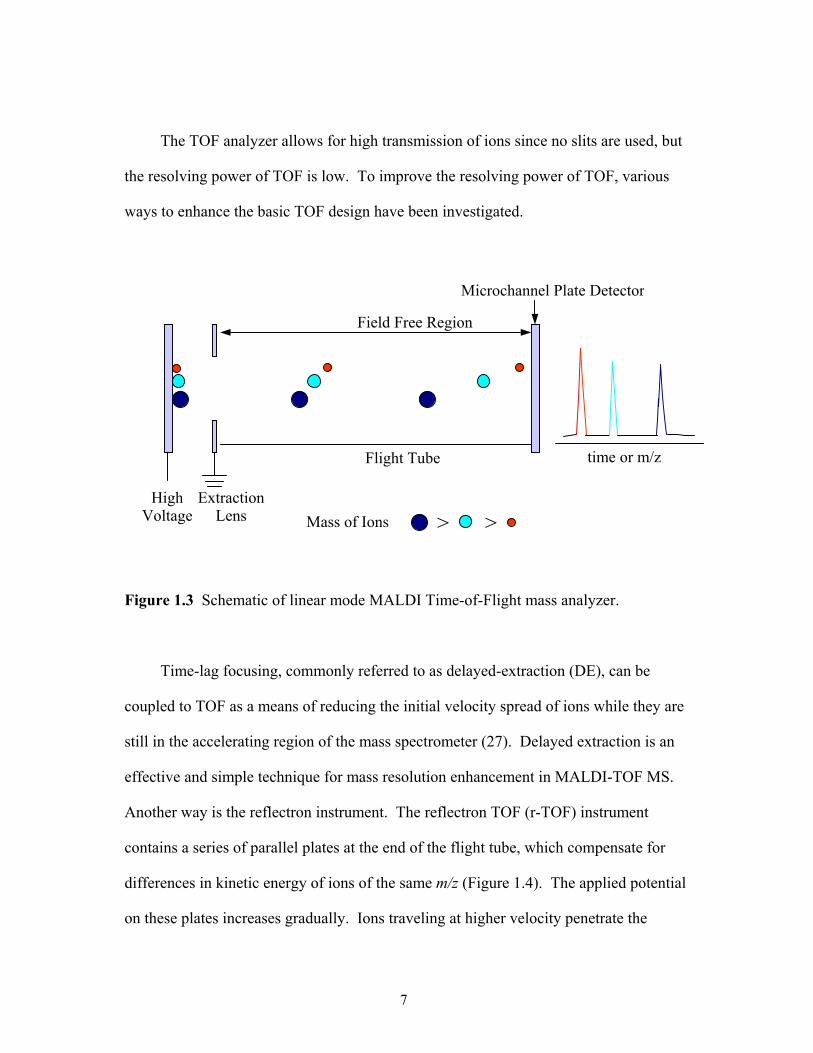
Another way is the reflectron instrument. The reflectron TOF (r-TOF) instrument
contains a series of parallel plates at the end of the flight tube, which compensate for
differences in kinetic energy of ions of the same m/z (Figure 1.4). The applied potential
on these plates increases gradually. Ions traveling at higher velocity penetrate the
7
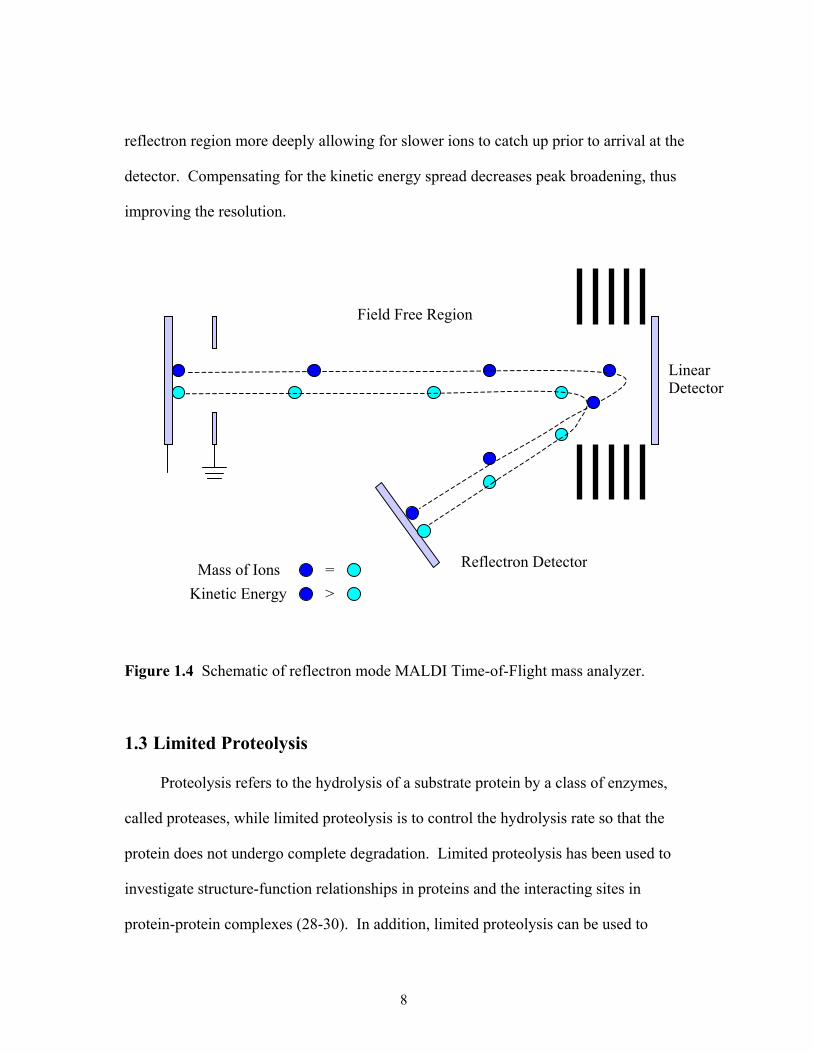
reflectron region more deeply allowing for slower ions to catch up prior to arrival at the
detector. Compensating for the kinetic energy spread decreases peak broadening, thus
improving the resolution.
>Kinetic Energy =Mass of Ions Reflectron Detector
Field Free Region
Linear Detector
Figure 1.4 Schematic of reflectron mode MALDI Time-of-Flight mass analyzer.
1.3 Limited Proteolysis
Proteolysis refers to the hydrolysis of a substrate protein by a class of enzymes,
called proteases, while limited proteolysis is to control the hydrolysis rate so that the
protein does not undergo complete degradation. Limited proteolysis has been used to
investigate structure-function relationships in proteins and the interacting sites in
protein-protein complexes (28-30). In addition, limited proteolysis can be used to
8
provide details of the exposed sites of protein-nucleic acid complexes, which are useful
for modeling three-dimensional structures.
Reaction conditions for limited proteolysis are typically chosen to ensure that
complete degradation of the substrate protein does not take place and that the substrate
protein maintains its native structure. In order to limit digestion, a number of
experimental parameters are typically considered including protein-nucleic acid or
protein-protein interactions, location of proteins within the complex, enzyme:substrate
ratio, time of incubation, pH, temperature, and enzyme specificity.
The enzyme:substrate ratio, which is restricted to somewhere between 1:50 and
1:1000 (w/w), is often used to control the rate of proteolysis so that intermediates may be
observed accumulating over time. For topology studies, it is important to maintain the
structure of the protein of interest. No significant loss of function or activity should be
observed and the protein should possess the same structural properties. Generally,
optimal experimental conditions for limited proteolysis require preliminary
experimentation.
Proteases can be classed into two categories: enzymes with high specificity such as
trypsin, V8 and endoprotease Arg-C, and enzymes with low specificity such as subtilisin
and Proteinase K. Usually amino acids with hydrophilic side chains are found in greater
abundance on the surface of proteins and proteases that cleave at these hydrophilic sites
are preferred for the structural analysis (or domain analysis) of a protein. Trypsin and V8,
which cleave basic (arginine and lysine) and acidic sites (glutamic acid and aspartic acid),
respectively, are good choices. Subtilisin and Proteinase K will readily cleave after
almost any amino acid and are useful for determining contact area(s) or protecting site(s)
9
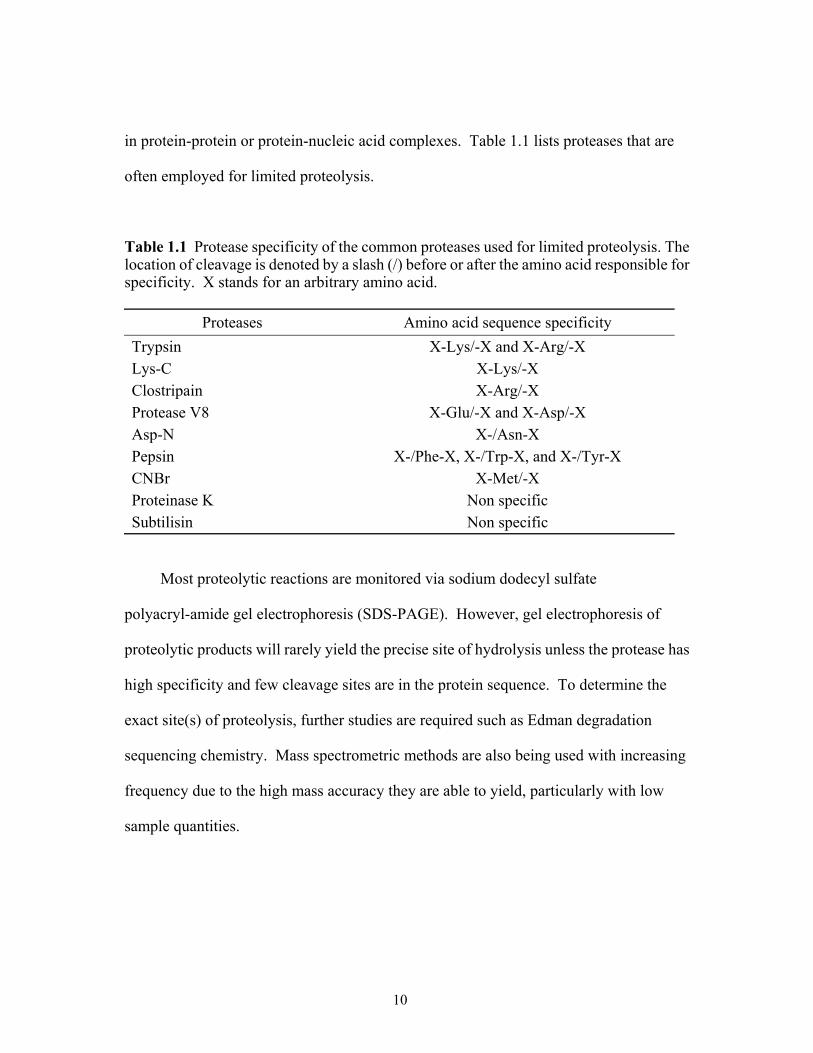
in protein-protein or protein-nucleic acid complexes. Table 1.1 lists proteases that are
often employed for limited proteolysis.
Table 1.1 Protease specificity of the common proteases used for limited proteolysis. The location of cleavage is denoted by a slash (/) before or after the amino acid responsible for specificity. X stands for an arbitrary amino acid.
Proteases Amino acid sequence specificity Trypsin X-Lys/-X and X-Arg/-X Lys-C X-Lys/-X Clostripain X-Arg/-X Protease V8 X-Glu/-X and X-Asp/-X Asp-N X-/Asn-X Pepsin X-/Phe-X, X-/Trp-X, and X-/Tyr-X CNBr X-Met/-X Proteinase K Non specific Subtilisin Non specific
Most proteolytic reactions are monitored via sodium dodecyl sulfate
polyacryl-amide gel electrophoresis (SDS-PAGE). However, gel electrophoresis of
proteolytic products will rarely yield the precise site of hydrolysis unless the protease has
high specificity and few cleavage sites are in the protein sequence. To determine the
exact site(s) of proteolysis, further studies are required such as Edman degradation
sequencing chemistry. Mass spectrometric methods are also being used with increasing
frequency due to the high mass accuracy they are able to yield, particularly with low
sample quantities.
10
1.4 Ribosome
The ribosome, coined by Roberts in 1958 to describe a class of ribonucleoprotein
particles, has been studied as a topic in biology and chemistry fields for more than 40
years (31). From the biological point of view, the ribosome, universally found in all
organisms, is a cellular organelle that performs the activity of peptide bond formation and
elongation according to the genetic code sequence. From the chemical point of view, the
ribosome is one of the largest macromolecular complexes composed of a mixture of
many different proteins and ribonucleic acids (RNAs) in the cell. In Escherichia coli,
ribosomes constitute 25% of the dried cell mass and a single cell contains about 15,000 or
more ribosomes (32). They have a diameter of about 18 nm and a sedimentation
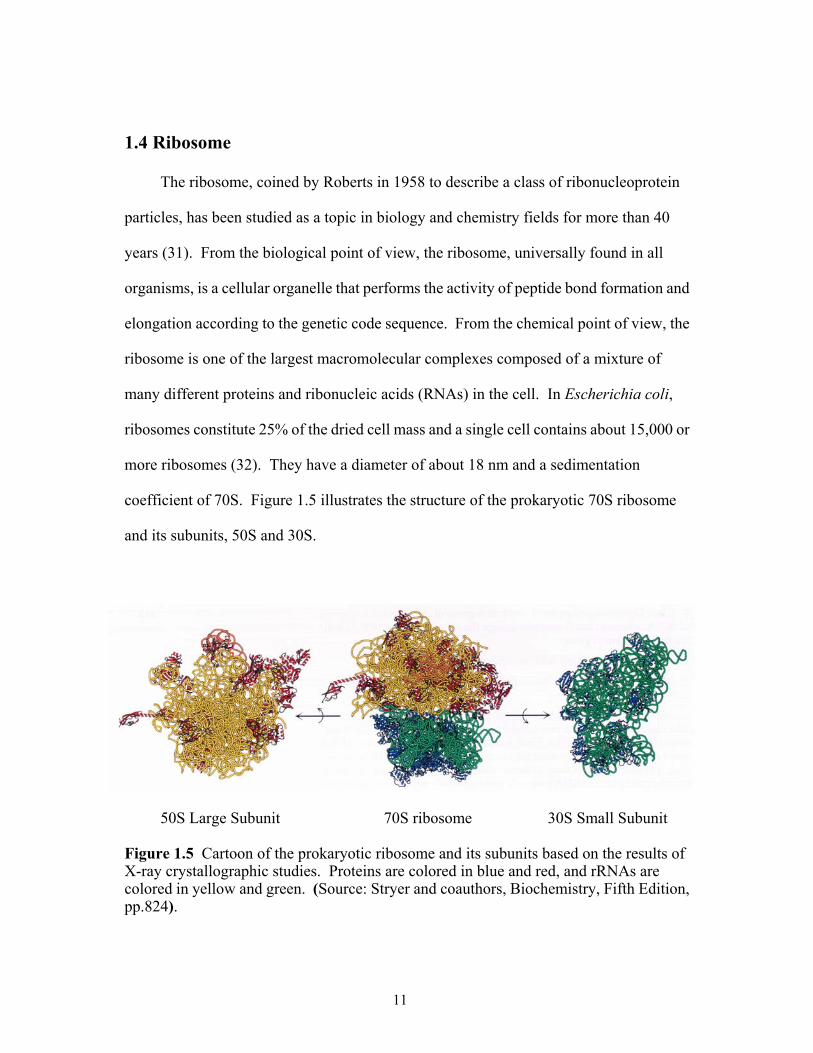
coefficient of 70S. Figure 1.5 illustrates the structure of the prokaryotic 70S ribosome
and its subunits, 50S and 30S.
50S Large Subunit 70S ribosome 30S Small Subunit Figure 1.5 Cartoon of the prokaryotic ribosome and its subunits based on the results of X-ray crystallographic studies. Proteins are colored in blue and red, and rRNAs are colored in yellow and green. (Source: Stryer and coauthors, Biochemistry, Fifth Edition, pp.824).
11
1.4.1 Components of the Ribosome - Ribosomal Proteins
Prokaryotic ribosomes, which sediment at 70S, have a molecular mass of
approximately 2.5 ×10⁶ Da and consist of two subunits, the 50S and the 30S. Each
subunit has unique number of proteins and rRNA(s). Eukaryotic ribosomes, which
sediment at 80S, are substantially larger and more complex than their prokaryotic
counterparts due to increases in the size of the rRNA, the presence of an additional rRNA,
and the addition of 20-30 extra ribosomal proteins, but show similarities in ribosomal
function and structural form. Two subunits, the 60S and 40S, together contain at least 78
unique proteins and 4 rRNAs in the eukaryotic ribosome, which is typically larger than
3.2 ×10⁶ Da.
In Escherichia coli, the 30S subunit contains a single 16S rRNA molecule (1542
nucleotides corresponding to a predicted mass of 498,389 Da) and 22 different proteins
(total mass 348,292 Da). The 50S subunit has two rRNA molecules, a 23S (2900
nucleotides corresponding to a mass of 938,936 Da) and a 5S (120 nucleotides
corresponding to a mass of 38,731 Da) along with 34 proteins (total mass 473,703 Da)
(33,34). The ratio of the molecular weight of RNA to that of protein in all ribosomes is
approximately 65:35. The small subunit binds messenger RNA (mRNA) and mediates
the interactions between mRNA and transfer RNAs (tRNAs). The larger subunit
catalyzes peptide-bond formation. During the initiation phase of protein synthesis, the
two subunits behave independently, assembling into complete ribosomes only when
elongation is about to begin.
Starting with ribosomal proteins L7/L12, which are easily washed off from
ribosomes, the sequencing of ribosomal proteins has been individually carried out after
12
isolation by separation techniques. As a result, the sequences were available for 52 out of
55 ribosomal proteins from Escherichia coli by 1984 (35). Currently, many ribosomal
proteins have been sequenced and identified from other species (36,37). In Escherichia
coli, ribosomal proteins cover a molecular weight range of 4 to 62 kDa (Table 1.2). The
ribosomal proteins are designated with an arbitrary numbering system according to their
estimated size on two-dimensional polyacrylamide gel electrophoresis (2D-PAGE)
wherein ribosomal proteins from the large subunit are denoted by an L and ribosomal
proteins from the small subunit are denoted by an S.
The small subunit proteins (S1-S22) are present in 1 copy each except S6, which is
present in 2 copies. The protein composition of the large subunit (L1-L36) is more
complex. Despite the nomenclature, there are 34 different proteins, not 36.
The spot originally identified as protein L8 is an aggregation artifact. The proteins
L7 and L12 are identical except that one of the serines on the N-terminus of L7 is
acetylated. The large subunit also contains one copy of each protein except for L7/L12,
which is present as a dimer of dimers (four copies). In addition, S20 is the same protein
as L26 (32,33). Many of the ribosomal proteins are small, hydrophobic and basic with
most having a pI in the range of 8.5 and 10 (38). Most of the ribosomal proteins have a
higher frequency of arginine (Arg) and lysine (Lys) in their sequence and are rich in basic
amino acids to neutralize the negative charges on the phosphates of the rRNA and
generate the ribonucleoprotein (RNP) particle through close packing with rRNAs.
13
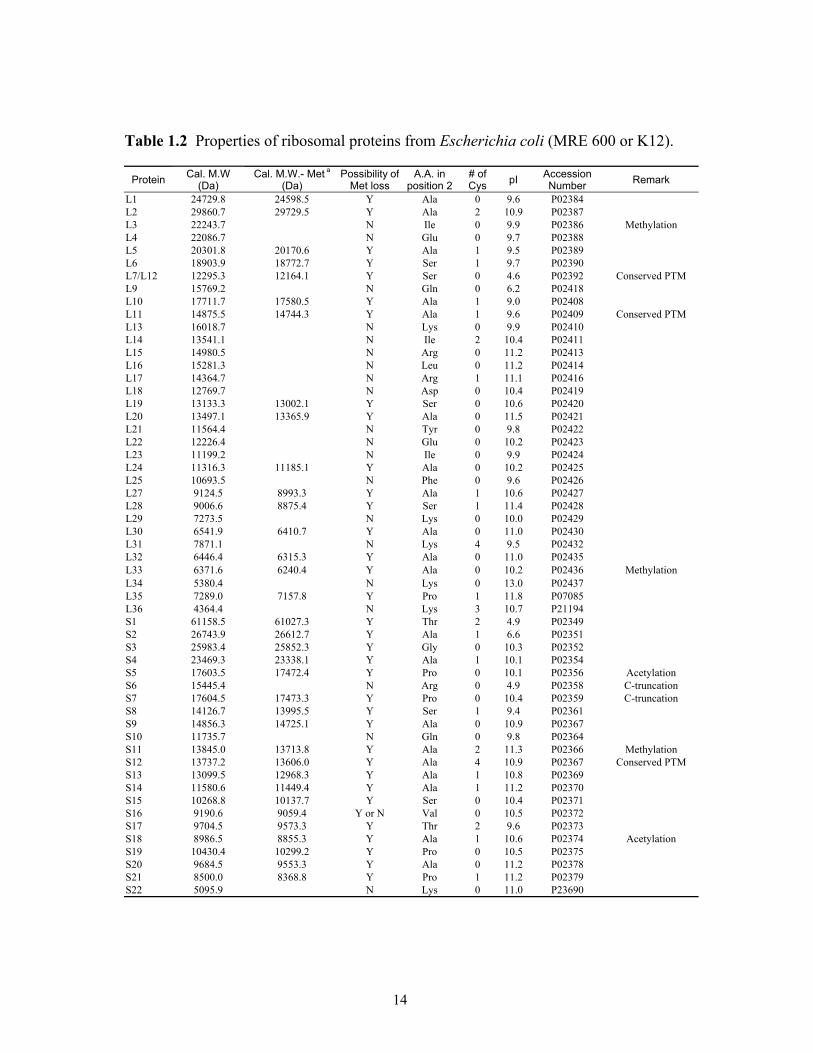
Table 1.2 Properties of ribosomal proteins from Escherichia coli (MRE 600 or K12).
Protein Cal. M.W (Da)
Cal. M.W.- Met a (Da)
Possibility of Met loss
A.A. in position 2
# of Cys pI Accession
Number Remark
L1 24729.8 24598.5 Y Ala 0 9.6 P02384 L2 29860.7 29729.5 Y Ala 2 10.9 P02387 L3 22243.7 N Ile 0 9.9 P02386 Methylation L4 22086.7 N Glu 0 9.7 P02388 L5 20301.8 20170.6 Y Ala 1 9.5 P02389 L6 18903.9 18772.7 Y Ser 1 9.7 P02390 L7/L12 12295.3 12164.1 Y Ser 0 4.6 P02392 Conserved PTM L9 15769.2 N Gln 0 6.2 P02418 L10 17711.7 17580.5 Y Ala 1 9.0 P02408 L11 14875.5 14744.3 Y Ala 1 9.6 P02409 Conserved PTM L13 16018.7 N Lys 0 9.9 P02410 L14 13541.1 N Ile 2 10.4 P02411 L15 14980.5 N Arg 0 11.2 P02413 L16 15281.3 N Leu 0 11.2 P02414 L17 14364.7 N Arg 1 11.1 P02416 L18 12769.7 N Asp 0 10.4 P02419 L19 13133.3 13002.1 Y Ser 0 10.6 P02420 L20 13497.1 13365.9 Y Ala 0 11.5 P02421 L21 11564.4 N Tyr 0 9.8 P02422 L22 12226.4 N Glu 0 10.2 P02423 L23 11199.2 N Ile 0 9.9 P02424 L24 11316.3 11185.1 Y Ala 0 10.2 P02425 L25 10693.5 N Phe 0 9.6 P02426 L27 9124.5 8993.3 Y Ala 1 10.6 P02427 L28 9006.6 8875.4 Y Ser 1 11.4 P02428 L29 7273.5 N Lys 0 10.0 P02429 L30 6541.9 6410.7 Y Ala 0 11.0 P02430 L31 7871.1 N Lys 4 9.5 P02432 L32 6446.4 6315.3 Y Ala 0 11.0 P02435 L33 6371.6 6240.4 Y Ala 0 10.2 P02436 Methylation L34 5380.4 N Lys 0 13.0 P02437 L35 7289.0 7157.8 Y Pro 1 11.8 P07085 L36 4364.4 N Lys 3 10.7 P21194 S1 61158.5 61027.3 Y Thr 2 4.9 P02349 S2 26743.9 26612.7 Y Ala 1 6.6 P02351 S3 25983.4 25852.3 Y Gly 0 10.3 P02352 S4 23469.3 23338.1 Y Ala 1 10.1 P02354 S5 17603.5 17472.4 Y Pro 0 10.1 P02356 Acetylation S6 15445.4 N Arg 0 4.9 P02358 C-truncation S7 17604.5 17473.3 Y Pro 0 10.4 P02359 C-truncation S8 14126.7 13995.5 Y Ser 1 9.4 P02361 S9 14856.3 14725.1 Y Ala 0 10.9 P02367 S10 11735.7 N Gln 0 9.8 P02364 S11 13845.0 13713.8 Y Ala 2 11.3 P02366 Methylation S12 13737.2 13606.0 Y Ala 4 10.9 P02367 Conserved PTM S13 13099.5 12968.3 Y Ala 1 10.8 P02369 S14 11580.6 11449.4 Y Ala 1 11.2 P02370 S15 10268.8 10137.7 Y Ser 0 10.4 P02371 S16 9190.6 9059.4 Y or N Val 0 10.5 P02372 S17 9704.5 9573.3 Y Thr 2 9.6 P02373 S18 8986.5 8855.3 Y Ala 1 10.6 P02374 Acetylation S19 10430.4 10299.2 Y Pro 0 10.5 P02375 S20 9684.5 9553.3 Y Ala 0 11.2 P02378 S21 8500.0 8368.8 Y Pro 1 11.2 P02379 S22 5095.9 N Lys 0 11.0 P23690
14
1.4.2 Post-Translational Modification in Ribosomal Proteins
Post-translational modifications (PTMs) to proteins are covalent processing events,
which involve the addition or removal of chemical groups on particular amino acids in
the polypeptide chain. The identification of PTMs can be critical in understanding the
functions of proteins involved in biological pathways. However, it is difficult to observe
PTMs because the presence of the modification in a protein cannot be predicted from the
gene sequence. A mass difference between the observed and the calculated mass from
the gene sequence suggests the presence of a PTM so mass spectrometric techniques,
which are able to provide accurate molecular weights for proteins and peptides, are
regarded as an indispensable tool and can be used to characterize the modification.
PTMs of ribosomal proteins are common and necessary for the translational
machinery, although the role of PTMs in the ribosome is not fully understood. Hence,
knowledge of the nature of such modifications will facilitate the understanding of
ribosome function. Until now, the observed PTMs of ribosomal proteins detected using
mass spectrometry include the loss of N-terminal methionine, which occurs on the vast
majority of the expressed proteins. Other PTMs are methylation, acetylation,
β-methylthiolation, C-terminal truncation, and extended C-termini with phosphorylation
only observed in eukaryotic ribosomes. For example, the bacterial ribosomal protein L11,
which comprises a major part of the factor-binding region of the 50S subunit (39), is
trimethylated at three amino acid positions (40). Although it is not a common
modification, β-methylthiolation is also observed on ribosomal protein S12, which plays
an important role in maintenance of translational accuracy (41), and is evolutionarily
15
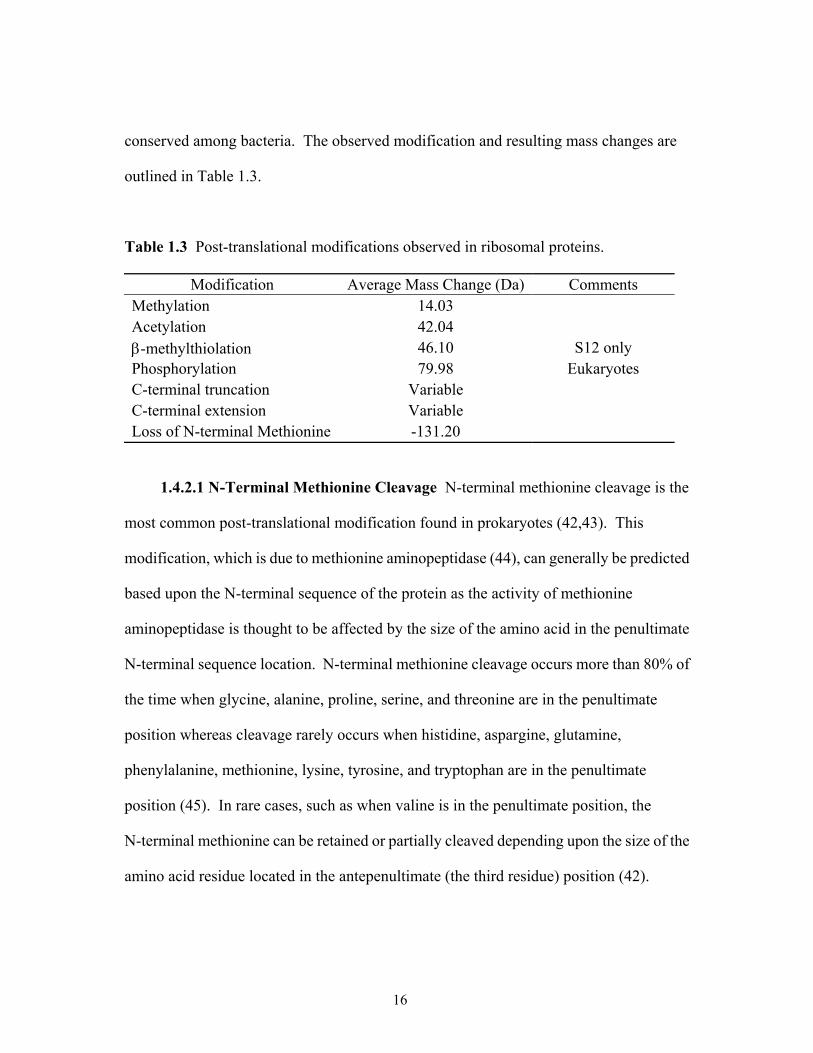
conserved among bacteria. The observed modification and resulting mass changes are
outlined in Table 1.3.
Table 1.3 Post-translational modifications observed in ribosomal proteins.
Modification Average Mass Change (Da) Comments Methylation 14.03 Acetylation 42.04 β-methylthiolation 46.10 S12 only Phosphorylation 79.98 Eukaryotes C-terminal truncation Variable C-terminal extension Variable Loss of N-terminal Methionine -131.20
1.4.2.1 N-Terminal Methionine Cleavage N-terminal methionine cleavage is the
most common post-translational modification found in prokaryotes (42,43). This
modification, which is due to methionine aminopeptidase (44), can generally be predicted
based upon the N-terminal sequence of the protein as the activity of methionine
aminopeptidase is thought to be affected by the size of the amino acid in the penultimate
N-terminal sequence location. N-terminal methionine cleavage occurs more than 80% of
the time when glycine, alanine, proline, serine, and threonine are in the penultimate
position whereas cleavage rarely occurs when histidine, aspargine, glutamine,
phenylalanine, methionine, lysine, tyrosine, and tryptophan are in the penultimate
position (45). In rare cases, such as when valine is in the penultimate position, the
N-terminal methionine can be retained or partially cleaved depending upon the size of the
amino acid residue located in the antepenultimate (the third residue) position (42).
16
1.4.2.2 Acetylation The next most widespread modification of ribosomal proteins
is N-terminal acetylation. N-terminal acetylation occurs on more than one-half of
eukaryotic proteins, but seldom on prokaryotic proteins (46,47). In most cases the
initiator methionine is hydrolyzed and an acetyl group from Acetyl-Coenzyme A
(Acetyl-CoA) is added to the new N-terminal amino acid by different N-terminal
acetyltransferases (NATs) acting sequentially (47,48). Because N-terminal acetylation
of proteins occurs with different NATs having different specificities, it cannot be easily
predicted like the N-terminal methionine cleavage.
1.4.2.3 Methylation An enzyme, methyltransferase, activates the transfer of a
methyl group from S-adenosylmethionine to the target protein (49,50). Methylation has
been previously observed on lysine and/or arginine residues in a number of ribosomal
proteins if the protein is modified at the N-terminus (51,52).
1.4.2.4 Phosphorylation Phosphorylation is one of the most common protein
modifications that occur in eukaryotes. The enzymes that phosphorylate proteins are
called kinases and those that remove phosphates are termed phosphatases. The vast
majority of phosphorylation occurs as a mechanism to regulate the biological activity of a
protein. The determination of phosphorylated sites on ribosomal protein is crucial to the
elucidation of ribosomal function. Typically, phosphorylation of a protein occurs on a
serine, threonine, or tyrosine residue (53). To date, phosphorylation of ribosomal
proteins has been reported in yeast and mammals but not in prokaryotes (54,55).
17
1.4.3 Function of the Ribosome
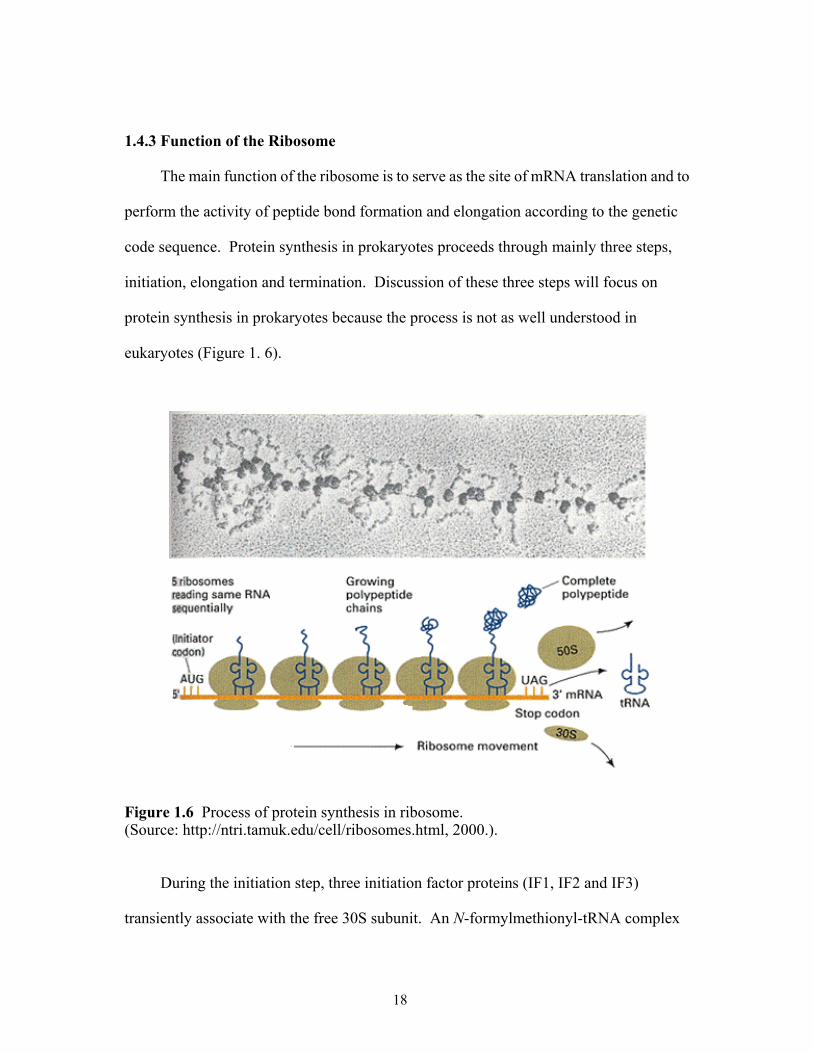
The main function of the ribosome is to serve as the site of mRNA translation and to
perform the activity of peptide bond formation and elongation according to the genetic
code sequence. Protein synthesis in prokaryotes proceeds through mainly three steps,
initiation, elongation and termination. Discussion of these three steps will focus on
protein synthesis in prokaryotes because the process is not as well understood in
eukaryotes (Figure 1. 6).
Figure 1.6 Process of protein synthesis in ribosome. (Source: http://ntri.tamuk.edu/cell/ribosomes.html, 2000.).
During the initiation step, three initiation factor proteins (IF1, IF2 and IF3)
transiently associate with the free 30S subunit. An N-formylmethionyl-tRNA complex
18
attaches to the P-site of the small subunit. The small subunit, 30S, binds to the 5'-end of
an mRNA bearing the code of the polypeptide to be translated and slides along the mRNA
until the N-formylmethionyl-tRNA anticodon recognizes an AUG codon and then stops.
After the process, which requires guanosine triphosphate (GTP) hydrolysis, initiation
factors are released, and the remaining complex binds to the 50S subunit. An
aminoacyl-tRNA then enters the A-site of the 70S ribosome and chain elongation
initiates.
The elongation step is a repetitive process in which the polypeptide chains are
lengthened by covalent attachment of successive amino acids. The next aminoacyl-tRNA
is brought to the vacant A-site of the ribosome by elongation factor EF-TU. The
carboxyl-end of the nascent peptide attached to the tRNA in the P-site is detached and
reattached by a peptide bond to the amino-end of the amino acid attached to the tRNA in
the A-site. The protein is now one amino acid longer, but it is bound as peptidyl-tRNA in
the A-site. Peptide bond formation occurs at the peptidyl transferase center on the 50S
subunit. The activity is believed to be mediated by the 23S rRNA because removal of
many proteins from the 50S subunit does not abolish the peptidyl transferase activity of
the remaining rRNA. The peptidyl-tRNA is then translocated from the A site to the P site
and the empty tRNA moves to the E site and dissociates from the ribosome. This
translocation step requires elongation factor EF-G and GTP hydrolysis. During
translocation, the ribosome shifts three bases along the mRNA and moves a new codon
into the A-site to make room for the next incoming aminoacylated tRNA. The elongation
cycle is repeated until all the amino acids that are specified by that mRNA have been
added.
19
Termination occurs when 1 of 3 possible termination codons in the mRNA enters
the A-site on the ribosome. The polypeptide chain is then released from the ribosome,
aided by proteins called release factors. The ribosome detached from the mRNA
dissociates into 30S and 50S subunits that are free to begin another round of translation
(32).
Protein synthesis in bacteria occurs very rapidly. It begins as the mRNA is still
being transcribed from the DNA and a single mRNA molecule can serve as template for
many ribosomes translating simultaneously. The overall error rate of protein synthesis is
1 per 104 amino acids incorporated.
20
Chapter 2. Literature Overview
2.1 Analysis of Ribosomal Proteins by Mass Spectrometry
The ribosome is a challenging target for mass spectrometric techniques because it is
composed of two different types of biomolecules, RNAs and proteins, which have
different physical and chemical properties (52,56-59). Ribosome studies have mainly
concentrated on: (a) isolation and characterization of the numerous ribosomal
components; (b) elucidation of ribosome structure or topology; and (c) investigation of
ribosome function.
Mass spectrometric techniques, an indispensable tool for peptide and protein
primary structure analysis, can be used for the identification and characterization of
ribosomal proteins through single- and/or multi-step analysis. Using different mass
spectrometric techniques it is possible to obtain information about the exact molecular
weight of ribosomal proteins, the presence and sequence location of PTMs, and even the
spatial arrangement and interactions of ribosomal proteins in ribosomes. In this chapter, I
will discuss recent progress in the development and application of mass
spectrometry-based approaches for the analysis of ribosomal proteins and for the
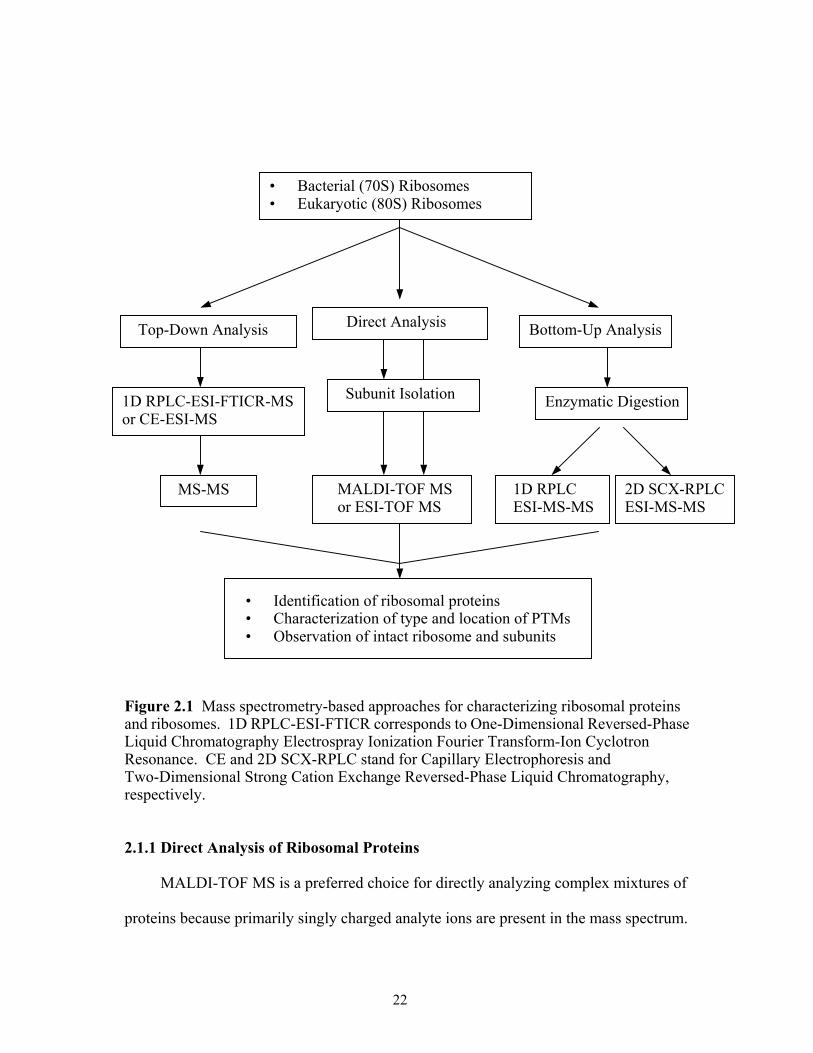
characterization of ribosomes. The most applicable mass spectrometry-based approaches
are outlined in Figure 2.1.
21
• Identification of ribosomal proteins• Characterization of type and location of PTMs• Observation of intact ribosome and subunits
MS-MS
1D RPLC-ESI-FTICR-MS or CE-ESI-MS
Top-Down Analysis
Subunit Isolation
MALDI-TOF MSor ESI-TOF MS
Direct Analysis
2D SCX-RPLCESI-MS-MS
1D RPLC ESI-MS-MS
Enzymatic Digestion
Bottom-Up Analysis
• Bacterial (70S) Ribosomes• Eukaryotic (80S) Ribosomes
Figure 2.1 Mass spectrometry-based approaches for characterizing ribosomal proteins and ribosomes. 1D RPLC-ESI-FTICR corresponds to One-Dimensional Reversed-Phase Liquid Chromatography Electrospray Ionization Fourier Transform-Ion Cyclotron Resonance. CE and 2D SCX-RPLC stand for Capillary Electrophoresis and Two-Dimensional Strong Cation Exchange Reversed-Phase Liquid Chromatography, respectively.
2.1.1 Direct Analysis of Ribosomal Proteins
MALDI-TOF MS is a preferred choice for directly analyzing complex mixtures of
proteins because primarily singly charged analyte ions are present in the mass spectrum.
22
MALDI-TOF MS was used by Arnold and Reilly to observe the ribosomal proteins
from Escherichia coli (52). They observed a total of 55 out of 56 ribosomal proteins.
With MALDI-TOF MS and ESI-MS, Wilcox and coworkers characterized the mutations
present in ribosomal proteins relating to antibiotic resistance (60). Pineda and coworkers
used MALDI-TOF MS for identification of microorganisms based on biomarker masses
derived from ribosomal proteins (61). There prior results demonstrate that MALDI-TOF
MS can be used for the rapid identification of ribosomal proteins and can be used to
detect changes in individual proteins from RNP complexes.
However, most MALDI-TOF MS studies do not observe all ribosomal proteins in a
single analysis due to several reasons: rRNAs, loss of ribosomal proteins during sample
preparation, and from suppression effects common to MALDI. The key step for
successful analysis of ribosomal proteins by MALDI-TOF MS is how well the protein
mixture was prepared to minimize sample losses.
Most of the ribosomal proteins have a higher frequency of arginine and lysine in
their sequence and are rich in basic amino acids to compensate for the poly anionic
charges from rRNA. For analysis of ribosomal proteins, rRNA should be removed
because the different physico-chemical properties of ribosomal proteins and rRNAs can
lead to complications during MS analysis. As a result, special care prior to mass
spectrometric analysis is required for the isolation and preparation of ribosomal proteins
tightly bound through electrostatic interaction with rRNA (62). For removal of rRNAs,
trifluoroacetic acid (TFA) was added to solutions of ribosomes to precipitate rRNAs and
to enhance the signal of proteins in MALDI (52). However, some acidic and larger
23
molecular weight proteins were co-precipitated with rRNAs during TFA treatment
although they were seen in the SDS-PAGE gel.
ESI-MS can also be used for the observation of ribosomal proteins. ESI, a gentler
ionization technique compared to MALDI, can give a different picture of ribosomes.
Benjamin and coworkers (63) introduced intact Escherichia coli ribosomes into the ion
source of an ESI mass spectrometer and assigned individual ribosomal proteins and
non-covalent complexes of up to five component proteins. Interestingly, L7/L10/L12
complexes, which have strong interactions between the component proteins, were
observed as the intact complexes as well as the dissociated individual proteins. In
addition, ribosomal protein S1 from 30S subunits was detected (63). This protein was not
detected in prior MALDI mass spectral analyses (52,58,60). Because complex mixtures
of proteins are difficult to deconvolute in ESI-MS due to multiply charged ions being
generated for every component, most strategies developed for the characterization of a
mixture of ribosomal proteins using ESI include separation prior to mass spectrometric
analysis.
2.1.2 Bottom-Up and Top-Down Analysis of Ribosomal Proteins
Although direct analysis of ribosomal proteins with MALDI-TOF MS provides
information on molecular weight and any changes between wild and mutant types, it
cannot provide the identity of unpredicted proteins or protein sequences. Therefore,
alternative approaches, based on separation methods coupled to mass spectrometry, have
been applied with the aim of enabling a more comprehensive analysis of ribosomal
proteins (56-59,64).
24
The bottom-up approach starts with the enzymatic digestion (usually trypsin) of a
mixture of ribosomal proteins. The digested ion products are identified using tandem
mass spectrometry (MS/MS) to induce fragmentation of individual tryptic peptides after
liquid chromatography separation. Database searching of these “sequence tags” is used
to identify the proteins of interest. Link and coworkers (56) developed a rapid and
sensitive approach for comprehensively identifying proteins in a whole cell lysate by
using multi-dimensional liquid chromatography and tandem mass spectrometry. To
evaluate the approach, 80S ribosomes from Saccharomyces cerevisiae were analyzed.
Overall, 75 out of 78 predicted ribosomal proteins were detected plus one new ribosomal
protein (YMR116p) that had not previously been identified. This approach has also been
applied to characterize the chloroplast ribosomal subunits and the complete 70S ribosome
(64,65). This approach is considered suitable for high throughput analysis and yields
more proteins than the direct and top-down approaches.
McLafferty and coworkers (66) developed the top-down approach using
electrospray ionization Fourier transform ion cyclotron resonance mass spectrometry
(ESI-FTICR MS). This approach, like the direct approach, provides molecular weight
information on the protein of interest. Identification of PTMs is possible by gas-phase
dissociation of the protein of interest.
Applying the top-down approach to ribosomal proteins requires placing a
separation technique prior to the mass spectrometry step because high separation
efficiency is important for obtaining sequence information by gas-phase fragmentation.
Lee and coworkers (57) demonstrated the use of ESI-FTICR MS coupled to capillary
reverse-phase liquid chromatography for the mass spectrometric analysis of 60S
25
ribosomal proteins from Saccharomyces cerevisiae. That study identified 42 of the 43
core large subunit ribosomal proteins and 58 of 64 possible large subunit ribosomal
protein isoforms in a single analysis. Moini and Huang (58) demonstrated the used of
capillary electrophoresis (CE) ESI-MS for the analysis of E. coli ribosomal proteins.
Using two different background electrolytes, 44 and 39 ribosomal proteins, respectively,
were detected in each run with 55 out of the 56 proteins identified overall. Ribosomal
protein S1 was not detected because it was precipitated out with rRNA upon the addition
of acid as occurred previously (52). An advantage of CE-ESI-MS is the low sample
volume required for analysis.
Each approach described above can provide some information on the identity,
sequence, molecular weight, and PTMs of ribosomal proteins. Usually, the bottom-up
approach identifies more ribosomal proteins than the direct and the top-down approaches
while the molecular weight of ribosomal proteins can only be obtained from the top-down
or direct approach. A weakness of the top-down approach includes non-uniform
detection of proteins due to their widely varying physical and chemical characteristics,
which affect both their chromatographic separation and introduction into the mass
spectrometer via electrospray. The most significant limitations of the bottom-up
approach are the difficulty in observing peptides having extreme pI values, in identifying
isoforms of modified proteins, and the lack of automated tools for identification of PTMs.
To compensate for the disadvantages of each approach, a comprehensive mass
spectrometric approach that integrates intact protein molecular mass measurement and
proteolytic fragment identification was used by Hurst and coworkers to characterize the
70S ribosomal proteins from Rhodopseudomnas palustris (59). 42 intact proteins were
26
identified by the top-down approach and 53 out of the 54 orthologs to E. coli ribosomal
proteins were identified from the bottom-up analysis. In addition, from the combined
mass spectrometry data, Hurst and coworkers were able to validate the gene annotations
for three ribosomal proteins predicted to possess extended C-termini (59).
2.1.3 Post-Translational Modification in Ribosomal Proteins
2.1.3.1 N-Terminal Methionine Cleavage N-terminal methionine cleavage
results in a 131 Da mass decrease. This modification occurs in 35 out of 55 E. coli
ribosomal proteins (52). Hurst and coworkers (59) identified N-terminal methionine
cleavage in 32 R. palustris ribosomal proteins by using the integrated top-down and
bottom-up approaches.
2.1.3.2 Acetylation N-terminal acetylation of yeast ribosomal proteins was
determined with MALDI-TOF MS by comparing a normal strain with the mutants of
ard1-∆, nat3-∆, and mak3-∆, each lacking a catalytic subunit of three different
N-terminal acetyltransferases (NATs) (67). The results showed 30 ribosomal proteins
N-terminally acetylated out of the 68 identified ribosomal proteins from yeast, and this
data was used to expand the hypothesis explaining the mechanism of acetylation by
NATs.
2.1.3.3 Methylation Because methylation results in a 14 Da mass increase, it is
easily detected with mass spectrometry. However, low resolving power mass
spectrometers cannot distinguish between these two modifications (trimethylation and
27
actylation) because trimethylation and acetylation result in the same nominal mass
increase (42 Da). To distinguish multiple methylation (three methyl groups) from
acetylation, high-resolution mass spectrometry was used to characterize ribosomal
protein L7/L12 from R. palustris (59). Hurst and coworkers suggested this protein was
trimethylated rather than acetylated because the measured molecular weight of L7/L12
was closer to the calculated value for trimethylation (1.5 ppm error) than acetylation (4.2
ppm). The bacterial ribosomal protein L11, which comprises a major part of the
factor-binding region of the 50S subunit (39), is trimethylated at three amino acid
positions.
2.1.3.4 β-Methylthiolation Although it is not a common modification,
β-methylthiolation has been observed at aspartic acid position 88 of E. coli ribosomal
protein S12. β-methylthiolation plays an important role in maintenance of translational
accuracy and is evolutionarily conserved among bacteria. β-methylthiolation adds 46 Da
to the original sequence mass. The position of modification of E. coli ribosomal protein
S12 was localized using MALDI-TOF MS post-source decay (PSD) with or without
microscale chemical derivatization (68). In addition, S12 from R. palustris was identified
and localized by top down and bottom up approaches using FT-ICR mass spectrometry
(59). The modification of S12 from R. palustris was found in the same position and
amino acid.
28
2.1.3.5 Phosphorylation Eukaryotic ribosomal protein S6 has five serine residues
at the C-terminus, which are the target for phosphorylation by various protein kinases
(69). The extent of phosphorylation of these serine residues depends on various cell
stimulators, such as hormones and growth factors (37). The eukaryotic counterpart of the
bacterial stalk complex that evolved from two L7/L12 dimers is a tetramer of acidic “P
proteins.” In ribosomes from S. cerevisiae there are five stalk proteins, P0, P1α, P1β, P2α,
and P2β that may be phosphorylated (70). Phosphorylation is believed to be a
requirement for their association with the ribosomal particle (71).
2.1.4 Observation of Intact Ribosomes and Ribosomal Subunits
The non-covalent interaction study of biomolecule complexes using MS requires
mild ionization conditions in which complexes are not dissociated in the gas phase. ESI,
a gentler ionization technique compared to MALDI, is used to observe complexes with
little or no fragmentation. In ESI-MS, complexes generally produce multiply charged
ions, which bring them into the range of mass-to-charge ratio of typical mass
spectrometers so that there are no upper mass limits to biomolecules that can be analyzed.
Few reports of non-covalent biomolecule complexes analyzed using ESI-MS are found in
the literature.
In 1998, Benjamin and coworkers (63) introduced intact E. coli ribosomes into the
electrospray ion source of a mass spectrometer and observed dissociated ribosomal
proteins and non-covalently associated proteins, which were composed of the mobile
stalk region from ribosomes. The pattern of dissociation correlated strongly with a
feature of ribosomal protein-protein and protein-rRNA interaction. That study
29
demonstrated an ESI approach to probe ribosomal protein-protein interactions within
ribosomes. Later, intact ribosomes were analyzed using ESI-q-TOF MS (34). By
lowering the Mg2+ concentration in solution, intact E. coli 70S ribosomes were found to
dissociate into the 30S and 50S subunits. A further investigation into the factors that
affect the propensity for release of proteins from the ribosome revealed that the
magnitude of the surface area of interaction between protein and rRNA was the major
determinant in preventing dissociation in the gas phase. In addition, in the presence of
elongation factor G, major conformational changes in ribosomes were observed through
destabilizing ribosomal protein-rRNA interactions(72). Most ESI approaches to
ribosomes have been reported by the Robinson group (73,74).
2.1.5 Limited Proteolysis in Ribosomes
Limited proteolysis has been used to investigate structure-function relationships in
proteins and has been used to identify the interacting sites in protein-protein complexes.
In addition, limited proteolysis can be used to provide details of the exposed sites of
protein-nucleic acid complexes, which are useful for modeling three-dimensional
structures. While limited proteolysis yields useful information regarding the topology of
biomolecules, it has not been widely applied to studies of RNP complexes in general, or
the ribosome in particular, due to the complexity of data interpretation as previous
investigations of a ribosomal subunit by this approach relied upon two dimensional (2D)
gel electrophoresis for the separation/detection scheme. 2D gel electrophoresis and
Edman sequencing have been the method of choice for the analysis of digested peptides
from ribosomal subunits (75). However, data interpretation was difficult and sometimes
30
impossible using 2D gel electrophoresis due to the complexity of the sample and low
resolution. Another obvious disadvantage of an electrophoretic-based approach is the
need to perform additional identifications of bands.
2.2 Purpose of the Work Presented
As mentioned above, the ribosome is a good model for developing new analytical
approaches for characterizing ribonucleoprotein (RNP) complexes. MALDI-TOF MS
developed in the late 1980s has been tremendously successful for the analysis of
biological molecules such as nucleic acids and proteins.
My dissertation is divided into two specific aims, which include the development of
an MS-method for analyzing the protein components of RNP complexes via a single
analytical experiment and the use of limited proteolysis in combination with MALDI-MS
for characterizing protein:rRNA interactions within RNP complexes.
First, efforts were directed at optimizing sample preparation protocols so that high
quality MALDI mass spectral data could be obtained on a mixture containing all (or
nearly all) of the ribosomal proteins as seen in Chapter 4. This developed method was
extended and evaluated with T. thermophilus in Chapter 5. This MALDI approach was
combined with limited proteolysis to obtain structural information relating to protease
accessible ribosomal proteins of ribosomal subunits and ribosomes in Chapters 6 and 7.
The initial development of this method was tested with the E. coli 30S ribosomal subunit
as the model system in Chapter 6. Then this developed method was applied to T.
thermophilus 70S to investigate the role of ribosomal proteins involved in inter-subunit
bridges necessary for the integrity of 70S ribosomes. The methods developed here will
31
be applicable to a wide range of ribosomes from other organisms for which there are no
crystal structures available.
My belief is that this project will lead to a rapid and accurate approach for
identification of protein components from RNP complexes and will permit more detailed
studies on the functional importance of the spatial location of ribosomal proteins and the
interaction between ribosomal proteins and nucleic acids within RNP complexes.
32
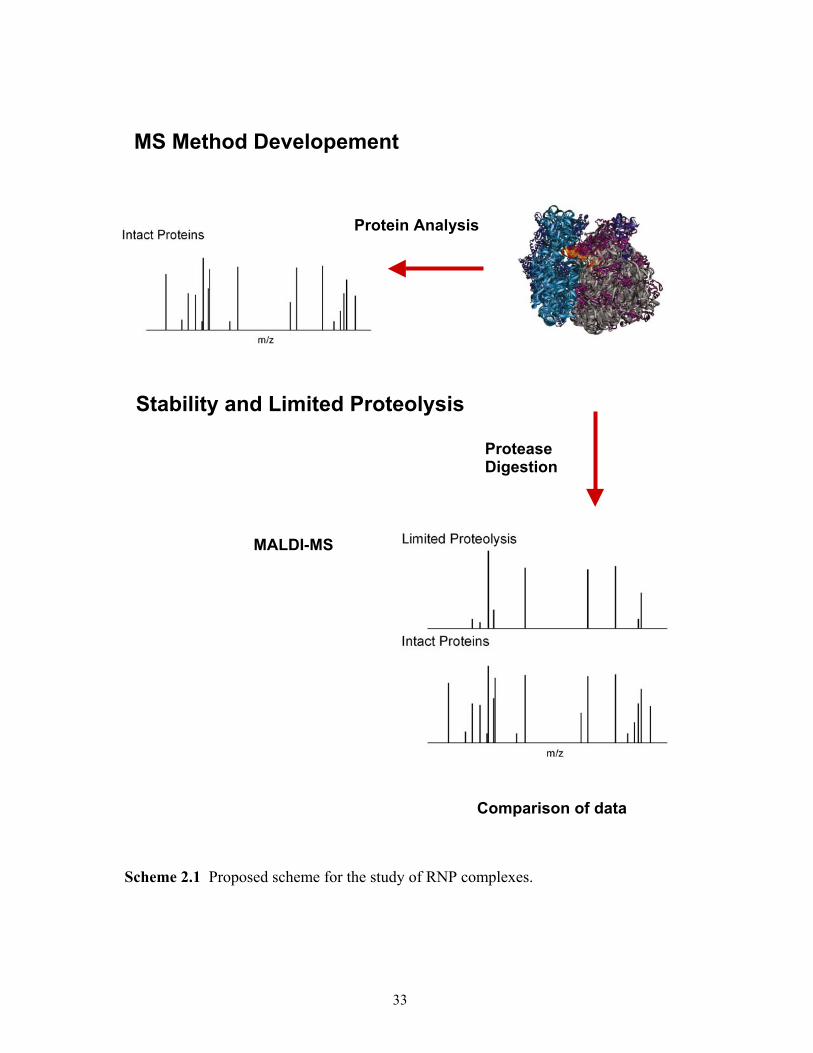
Stability and Limited
MALDI-MS
MS Method Developement
Scheme 2.1 Proposed scheme for
Protein Analysis
Protease Digestion
Proteolysis
Comparison of data
the study of RNP complexes.
33
Chapter 3. Escherichia coli Culturing and Ribosome Preparation
3.1 Introduction
Escherichia coli is a bacterium that is a common inhabitant of the human intestine.
It also lives in the intestine of many other animals. E. coli is one of the most thoroughly
studied living things. The complete sequence of the genome of a harmless laboratory
strain of E. coli (K-12) was reported in September 1997 (76). The genome consists of a
single molecule of deoxyribonucleic acid (DNA) containing 4,639,221 base pairs. This
genome encodes 4288 proteins and 89 RNAs. Many of the genes were already known
and the function of many others can be deduced from their similarity to known genes.
However, the function of 38% of the genes remains to be discovered.
One E. coli cell contains at least 15,000 ribosomes constituting 25% of the total wet
mass of these bacterial cells. The magnesium ion-dependent reversible association of E.
coli 30S and 50S ribosomal subunits to the 70S ribosome has been known for a long time
(77). This chapter will discuss those techniques appropriate for the preparation of
ribosomes (crude and tight-coupled forms) and its subunits.
3.2 Experimental
3.2.1 Materials
Bacto-trypton (cat. # 211705, pancreatic digest of casein) and bacto-yeast extract
(cat. # 212750, extract of autolysed yeast cells) were purchased from Difco, (Sparks, MD,
USA). Sodium chloride, sodium hydroxide, ammonium chloride, sodium acetate, Tris
34
(tris(hydroxymethyl)aminomethane)-HCl, magnesium chloride and polyallomer tube
(cat. # 326823) were purchased from Fisher Scientific (Hampton, NH, USA).
β-mercaptoethanol and magnesium acetate were obtained from Sigma (St.Louis, MO,
USA). DNase (cat. # M6101) was from Promega (Madison, WI, USA). Sucrose (RNase
free and DNase free grade) was purchased from Acros Organics (Fairlawn, NJ, USA).
All solutions were made from nanopure water that was purified and autoclaved in house.
Incubation of E. coli (MRE 600) was done in an Innova 4000 incubator (New Brunswick
Scientific (Edison, NJ, USA)). An American Instrument Co. French Press was used to
lyse cells. A Sorvall RC5C centrifuge (Newtown, CT, USA) and Beckman
ultracentrifuge XL-80 (Fullerton, CA, USA) were used to isolate ribosomes and separate
ribosomal subunit. All concentration measurements were made on a Shimadzu Biospec
1601 (Columbia, MD, USA) UV/Vis spectrometer at 600 and 260 nm.
3.2.2 General Precautions
Ribonucleases, enzymes which hydrolyze nucleic acids, are ubiquitous so certain
precautions and steps need to be taken for the successful isolation of ribosomal
components. To minimize contamination from ribonucleases, all glassware and plastic
ware must be sterilized by autoclaving at 150 ˚C. All water and most buffers should be
autoclaved, and, if necessary, may be treated with 0.1% (v/v) diethylpyrocarbonate
(DEPC) for 1 hour, prior to being autoclaved. Autoclaving removes all traces of DEPC.
In addition disposable gloves should be worn.
35
β-mercaptoethanol absorbs strongly at 260 nm so that the concentration of a
ribosome solution should be measured with a buffer excluding β-mercaptoethanol. Later,
β-mercaptoethanol should be added fresh if necessary.
3.2.3 Methods
3.2.3.1 Escherichia coli Culture The normal Luria broth (LB) media for E. coli
(MRE 600) is first prepared by autoclaving 1 L of deionized water containing 10 g
tryptone, 5 g yeast extract and 10 g sodium chloride. The 1 L of prepared media is split
into 900 mL of fresh media and 100 mL of start media. The mouth of all glassware
containing media must be flamed to prevent contamination.
E. coli (MRE 600) cell cultures are initiated by adding a small aliquot of the stock
culture (10 µL) to a flask containing 100 mL of LB start media (pH 7.5). The culture is
allowed to incubate at 37 ̊ C with a shaking rate of 250 rpm. After 16 hours, the culture is
transferred into 900 mL of fresh LB media and cultured under the same conditions for an
additional 3 to 4 hours. After the transfer, an aliquot is removed every hour and the
absorbance at 600 nm is determined. After reaching mid-log phase, the cultures are
slowly cooled to 10 ̊ C for 3 hours (or 4 ˚C for 30 min) to produce run-off ribosomes. The
cells are harvested by centrifugation at 10,000×g for 15 minutes in a GSA rotor with the
Sorvall RC5C centrifuge at 4 ˚C and washed by adding 1 mL of buffer A (20 mM
Tris-HCl at pH 7.5, 10.5 mM magnesium acetate, 100 mM NH4Cl, 0.5 mM EDTA, 3 mM
β-mercaptoethanol (added fresh)) to each tube.
36
3.2.3.2 Preparation of Crude Ribosomes The washed cells are resuspended in
buffer A (ratios of cell wet weight to buffer volume range from 1:1 to 1:4 g/mL). The
resuspended sample is added to the French Press chamber and brought to the desired
pressure (12,000 pound per square inch). A second or third pass through the French Press
is useful for greater cell lysis. 15 mL of buffer A and 2.5 µL of DNase / 1 g of cell are
added and incubated for 30 minutes at 4 ˚C. The mixture is transferred to a centrifuge
tube and centrifuged at 10,000×g for 15 minutes in a GAS rotor with the Sorvall RC5C
centrifuge at 4 ˚C to remove cell debris. The supernatant is retained and centrifuged at
30,000×g for 45 minutes in an SS 34 rotor with the Sorvall RC5C centrifuge at 4 ˚C to
remove more cell debris. Three-fourths of the clear supernatant from the top was retained
for the sucrose cushion. After adding 4 mL of 1.1 M sucrose to each tube (12 mL volume
of tube), 4 mL of supernatant are layered over sucrose and centrifuged at 39,000 rpm for
15 hours in a Ti 50 rotor with a Beckman ultracentrifuge at 4 ˚C. The pellets precipitated
after centrifugation are suspended in a low salt buffer and dialyzed against the same
buffer using 6-8 kDa molecular weight cut-off (MWCO) membrane tube to remove the
excess sucrose and any small particles, if necessary. The aliquots of ribosomes in
suspension can be stored at -80 ˚C for further analysis.
3.2.3.3 Preparation of Tight-Couple Ribosomes E. coli tight-couple 70S
ribosomes were obtained following the procedure described by Rheinberger and
coworkers (78). The tight-couple 70S ribosomes were isolated through a 10-30% sucrose
gradient in ribosomal buffer containing 10 mM Tris-HCl at pH 7.6, 5.25 mM magnesium
acetate, 60 mM NH4Cl, and 0.25 mM EDTA. Sucrose gradients in a polyallomer tube
37
were formed by layering different concentrations of sucrose solution followed by
diffusion. 12 mL of 30%, 12 mL of 20%, and 12 mL of 10% sucrose solution in
ribosomal buffer were layered into a Beckman polyallomer tube and diffusion was
allowed to proceed overnight in the cold. 200 A260 units of crude ribosomes were layered
on the top of the gradient and the gradient was centrifuged at 19,000 rpm for 15 hours in
an SW28 rotor with a Beckman ultracentrifuge at 4 ˚C. The gradients were collected
immediately by punching a small hole in the bottom of the tube (polyallomer tube) with a
16-gauge needle. Fractions of 1.1-1.2 mL were collected manually, and the absorbance at
260 nm was measured to determine the location of 70S ribosomes. After pooling
appropriately fractions, an equal volume of buffer (10 mM Tris-HCl at pH 7.6, 10 mM
magnesium acetate, 60 mM NH4Cl, and 3 mM β-mercaptoethanol (added fresh)) was
added followed by additional centrifugation at 39,000 rpm for 15 hours in a Ti 50 rotor
with a Beckman ultracentrifuge at 4 ˚C.
3.2.3.4 Isolation of Ribosomal Subunits The 30S and 50S ribosomal subunits
were isolated through a 0-45% sucrose gradient in dissociation buffer containing 10 mM
Tris-HCl at pH 7.6, 1 mM magnesium acetate, and 60 mM NH4Cl. Sucrose gradients in
polyallomer tube were generated by the frozen and then thaw method with dissociation
buffer containing 22.5% sucrose. Crude 70S ribosomes were diluted in the dissociation
buffer and left overnight at 4 ºC. Approximately 200 A260 units of the diluted crude 70S
ribosome were layered on the top of the gradient (36 mL sucrose solution) and
centrifuged at 19,000 rpm for 17 hours in an SW28 rotor with a Beckman ultracentrifuge
at 4 ˚C. After centrifugation, fractions were collected immediately by punching a small
38
hole in the bottom of the tube (polyallomer tube) with a 16-gauge needle and allowing the
solution to flow into 1.5 mL centrifuge tubes. Fractions of 1.1-1.2 mL were collected
manually. A 1 µL aliquot from each collected fraction was diluted with 999 µL of sterile
water and the absorbance at 260 nm was measured to determine the location of the 50S
and 30S subunits. The 50S and 30S ribosomal subunit fractions were pooled and
centrifuged again at 48,000 rpm for 18 hours in a Ti 50 rotor with a Beckman
ultracentrifuge at 4 ˚C. Once finished, pellets were collected immediately and dissolved
in 20 mM Tris-HCl at pH 7.6, 10.5 mM magnesium acetate, and 30 mM NH4Cl, 3 mM
β-mercaptoethanol (added fresh), and aliquots were stored at -80 ºC. The ribosome
concentration was determined by UV absorbance (1 A260 unit = 69 pmoles for 30S and 34
pmoles for 50S subunit (79)).
3.3 Results and Discussion
3.3.1 Escherichia coli Culture
In an appropriate media and given suitable physical conditions a bacterial cell will
grow at a characteristic rate as long as growth is not influenced by the concentration of
nutrients becoming limiting or by a build-up of toxic metabolic by-products. Bacteria
display a characteristic four-phase pattern (Lag, Log, Stationary and Death Phase) of
growth in liquid culture. Transfers of bacteria from one medium to another, where there
exist chemical differences between the two media, typically result in a lag in cell division.
The initial Lag phase is a period of slow growth during which the bacteria are adapting to
the conditions in the fresh medium. There is no significant increase in cells with time.
The following phase is called a Log phase during which the living bacteria population
39
increases exponentionally. The Stationary phase occurs when the nutrients become
limiting, and the rate of multiplication equals the rate of death. With the exhaustion of
nutrients and build-up of waste and secondary metabolic products, the growth rate has
slowed to the point where the growth rate equals the death rate. The Death phase occurs
when cells die faster than they are replaced. The living bacteria population decreases
with time, due to a lack of nutrients and a build-up of toxic metabolic by-products.
A typical growth curve for E. coli MRE600 is shown in Figure 3.1. After
transferring a starter into a new medium, the absorbance at 600 nm was measured to
monitor the growth of E. coli. As seen in this figure, growth starts to slow at
approximately 4 hours, which corresponds to a total time of 20 hours (16 hours in starter
media plus 4 hours in fresh media).
Based upon the growth curve of the bacteria, cells were harvested at mid-log growth
phase (approximately 19 hours) after incubation at 4 ˚C for 30 min in order to produce
run-off ribosomes. Approximately 10 grams of E. coli cells were harvested from 4 L of
medium.
40
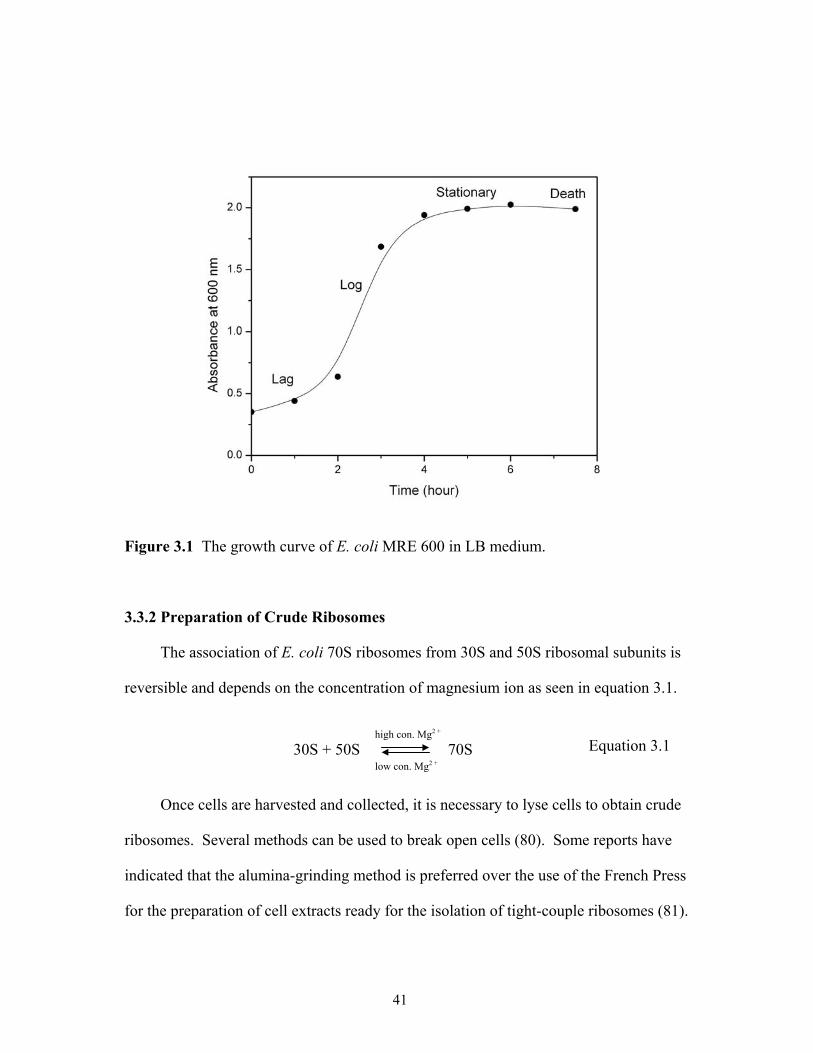
Figure 3.1 The growth curve of E. coli MRE 600 in LB medium.
3.3.2 Preparation of Crude Ribosomes
The association of E. coli 70S ribosomes from 30S and 50S ribosomal subunits is
reversible and depends on the concentration of magnesium ion as seen in equation 3.1.
30S + 50S 70S low con. Mg2 +
high con. Mg2 +
Equation 3.1
Once cells are harvested and collected, it is necessary to lyse cells to obtain crude
ribosomes. Several methods can be used to break open cells (80). Some reports have
indicated that the alumina-grinding method is preferred over the use of the French Press
for the preparation of cell extracts ready for the isolation of tight-couple ribosomes (81).
41
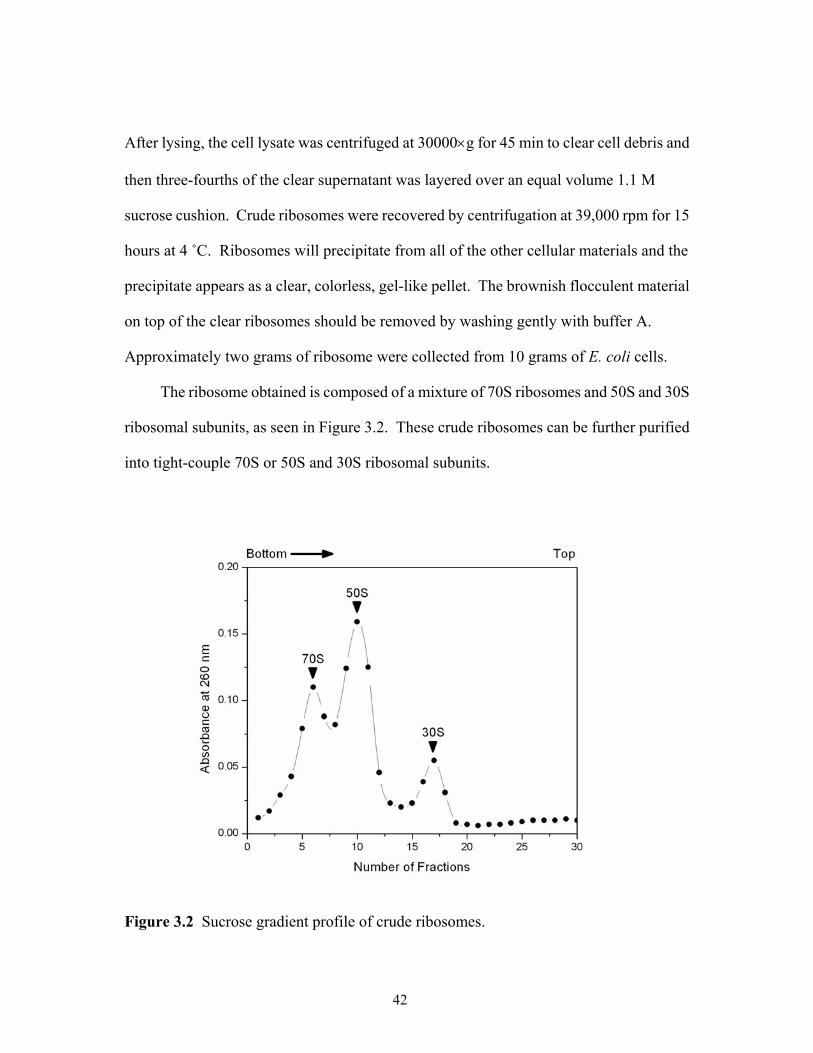
After lysing, the cell lysate was centrifuged at 30000×g for 45 min to clear cell debris and
then three-fourths of the clear supernatant was layered over an equal volume 1.1 M
sucrose cushion. Crude ribosomes were recovered by centrifugation at 39,000 rpm for 15
hours at 4 ˚C. Ribosomes will precipitate from all of the other cellular materials and the
precipitate appears as a clear, colorless, gel-like pellet. The brownish flocculent material
on top of the clear ribosomes should be removed by washing gently with buffer A.
Approximately two grams of ribosome were collected from 10 grams of E. coli cells.
The ribosome obtained is composed of a mixture of 70S ribosomes and 50S and 30S
ribosomal subunits, as seen in Figure 3.2. These crude ribosomes can be further purified
into tight-couple 70S or 50S and 30S ribosomal subunits.
Figure 3.2 Sucrose gradient profile of crude ribosomes.
42
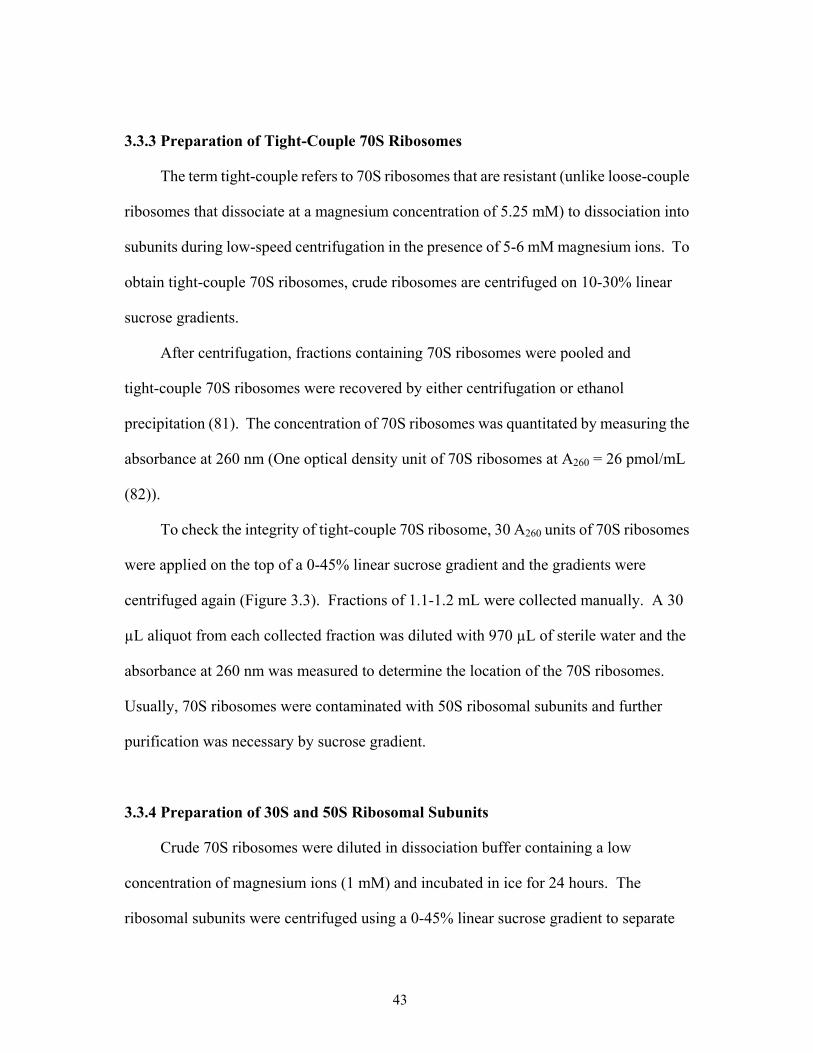
3.3.3 Preparation of Tight-Couple 70S Ribosomes
The term tight-couple refers to 70S ribosomes that are resistant (unlike loose-couple
ribosomes that dissociate at a magnesium concentration of 5.25 mM) to dissociation into
subunits during low-speed centrifugation in the presence of 5-6 mM magnesium ions. To
obtain tight-couple 70S ribosomes, crude ribosomes are centrifuged on 10-30% linear
sucrose gradients.
After centrifugation, fractions containing 70S ribosomes were pooled and
tight-couple 70S ribosomes were recovered by either centrifugation or ethanol
precipitation (81). The concentration of 70S ribosomes was quantitated by measuring the
absorbance at 260 nm (One optical density unit of 70S ribosomes at A260 = 26 pmol/mL
(82)).
To check the integrity of tight-couple 70S ribosome, 30 A260 units of 70S ribosomes
were applied on the top of a 0-45% linear sucrose gradient and the gradients were
centrifuged again (Figure 3.3). Fractions of 1.1-1.2 mL were collected manually. A 30
µL aliquot from each collected fraction was diluted with 970 µL of sterile water and the
absorbance at 260 nm was measured to determine the location of the 70S ribosomes.
Usually, 70S ribosomes were contaminated with 50S ribosomal subunits and further
purification was necessary by sucrose gradient.
3.3.4 Preparation of 30S and 50S Ribosomal Subunits
Crude 70S ribosomes were diluted in dissociation buffer containing a low
concentration of magnesium ions (1 mM) and incubated in ice for 24 hours. The
ribosomal subunits were centrifuged using a 0-45% linear sucrose gradient to separate
43
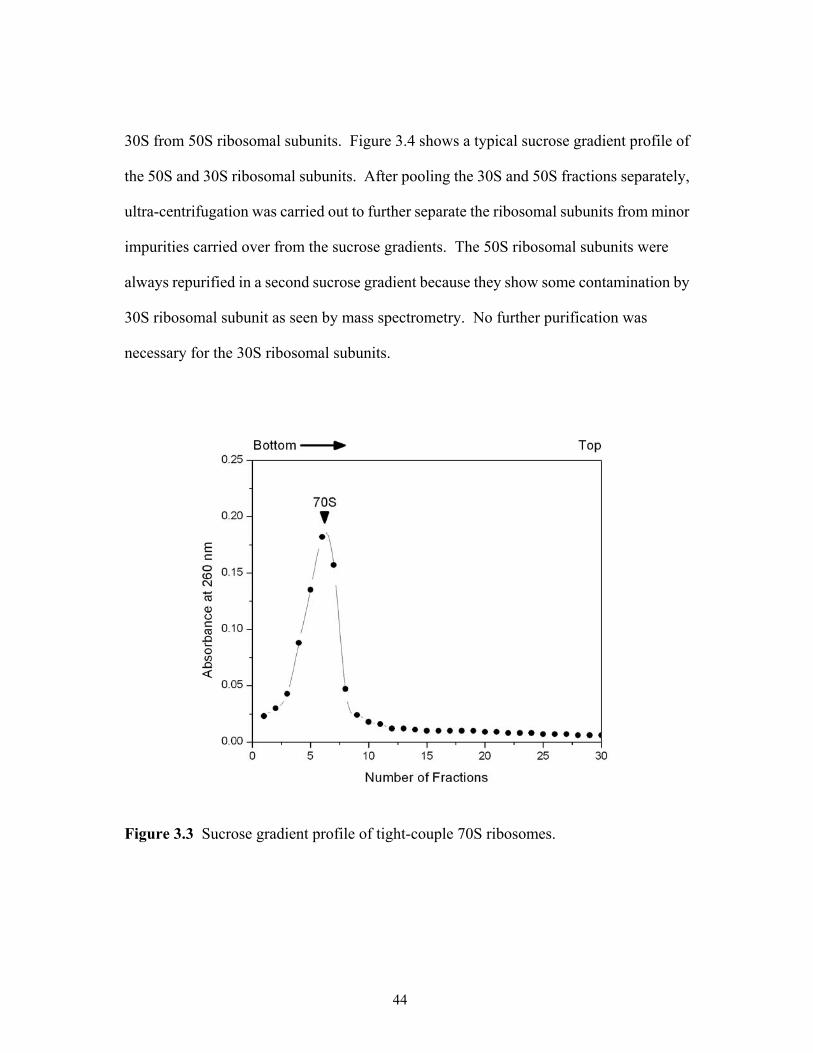
30S from 50S ribosomal subunits. Figure 3.4 shows a typical sucrose gradient profile of
the 50S and 30S ribosomal subunits. After pooling the 30S and 50S fractions separately,
ultra-centrifugation was carried out to further separate the ribosomal subunits from minor
impurities carried over from the sucrose gradients. The 50S ribosomal subunits were
always repurified in a second sucrose gradient because they show some contamination by
30S ribosomal subunit as seen by mass spectrometry. No further purification was
necessary for the 30S ribosomal subunits.
Figure 3.3 Sucrose gradient profile of tight-couple 70S ribosomes.
44
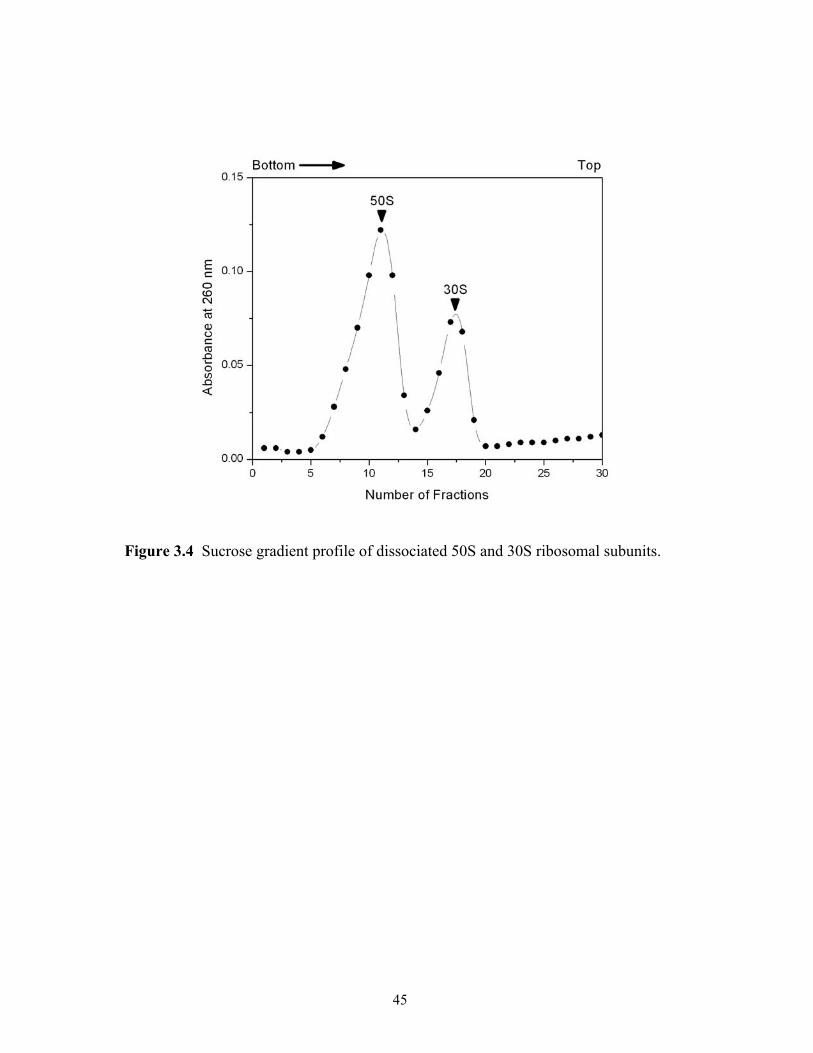
Figure 3.4 Sucrose gradient profile of dissociated 50S and 30S ribosomal subunits.
45
Chapter 4. Investigation of Methods Suitable for The Matrix-Assisted Laser Desorption/Ionization Mass Spectrometric Analysis of Proteins from Ribonucleoprotein Complexes
4.1 Introduction
A key to the effective use of mass spectrometry, including MALDI-MS, for the
characterization of proteins from complexes such as RNPs is the sufficient purification of
the protein mixture. A variety of approaches for obtaining and concentrating
biomolecules from complexes including ribosomes exist (81). Phenol extraction is
commonly used for isolating proteins or nucleic acids from complex particles (83,84).
Organic solvents such as acetone (85) and ethanol (86) have been used for concentrating
proteins and ribosomal subunits from dilute solution and are popular for the purification
of nucleic acids (87). Additionally, ribosomal proteins have been precipitated by acetic
acid (88) with subsequent analysis by two-dimensional gel electrophoresis (33).
To determine which sample preparation approach is most effective for use in
MALDI-MS based analyses of RNP complexes, I have investigated the applicability of
several common protein isolation procedures. Using E. coli 70S ribosomes as the model
complex system, a combination of electrophoretic and mass spectrometric analyses were
done to characterize sample yields and MALDI compatibility. I show that an initial
sample denaturing step improves subsequent protein recovery by precipitation. All of the
methods investigated were found to be compatible with downstream MALDI-MS and
provide the opportunity for the analysis of protein complexes in a single mass
spectrometric experiment.
46
4.2 Experimental
4.2.1 Materials
Tryptone and yeast extract were obtained from Difco Labs (Detroit, MI, USA).
Trifluoroacetic acid (cat. # T-6508, (TFA)), buffer reagents and peptide calibration kit
were obtained from Sigma (St. Louis, MO, USA). Trizol reagent (cat. # 15596-026), a
monophasic solution of phenol and guanidine isothiocyanate, was from Invitrogen
(Carlsbad, CA, USA). Endoproteinase LysC (cat. # 45175), sinapinic acid (SA) and
α-cyano-4-hydroxycinnamic acid (CHCA) were obtained from Fluka (Milwaukee, WI,
USA). Acids and organic solvents were HPLC grade or better. DNase (cat. # M6101)
was purchased from Promega (Madison, MI, USA). Molecular weight cut-off membrane
tubing (cat. # 132 110, 3.5 kDa) was obtained from Spectrum (Laguna Hills, CA, USA).
4.2.2 Methods
4.2.2.1 Preparation of 70S Ribosomes Ribosomes were cultured in house as
described in Chapter 3. Ribosome suspensions were diluted 2 to 10-fold prior to
MALDI-MS analysis. The final protein concentrations were determined by using a
modified Bradford protein assay with bovine serum albumin (BSA) as a standard.
4.2.2.2 Acid Extraction TFA extraction of ribosomal proteins was done as
described by Reilly (52). About 1 µL of TFA of different concentrations was added to 9
µL of buffered 70S ribosomes. The resulting supernatant was mixed with a MALDI
matrix for MALDI-MS analysis. Acetic acid extraction of ribosomal proteins was done
according to Hardy (33). A solution of 67% acetic acid and 0.1 M MgCl2 was added to
47
the 70S ribosome suspension and then stirred in an ice bath for 1 hour. After removal of
the rRNA precipitate, the supernatant was lyophilized and reconstituted in deionized
water prior to further analysis.
4.2.2.3 Acetone and Ethanol Precipitation Acetone and ethanol extraction were
performed with minor modifications to the methods described by Hames (89) and Hamel
(90), respectively. One volume of ice-cold organic solvent was added to ribosomes
prepared at a concentration of 20 absorbance units (λ=260 nm: A260)/mL in buffer (10
mM Tris-HCl, 5.25 mM magnesium acetate, 60 mM NH4Cl, 0.25 mM EDTA, 3 mM
β-mercaptoethanol). After incubation for 2 hours at -80 ˚C, the precipitated ribosomes
were collected by centrifugation and resuspended in deionized water. Before
MALDI-MS analysis, a 2.5% TFA solution was added to the resuspended ribosomal
solution. The resulting supernatant was combined with matrix and analyzed by
MALDI-MS.
4.2.2.4 Phenol Extraction A complete description of phenol extraction is given
elsewhere (83). Briefly, in order to extract ribosomal proteins from ribosomes, 100 µL of
Trizol reagent was added to 30 µL of buffered 70S ribosomes followed by the addition of
20 µL of chloroform. After phase separation, proteins in the organic layer were obtained
by precipitating with 2-propanol, dried under vacuum and resuspended in deionized
water. To recover low molecular weight proteins remaining in the aqueous layer,
precipitation by 2-propanol was done.
48
4.2.2.5 SDS-PAGE and In-Gel Digestion SDS-PAGE was carried out using 10%
or 12.5% polyacrylamide gels of 1-mm thickness run at 300 V for 6 to 10 hours. The
SDS-PAGE gels were visualized by staining with Coomassie Brilliant Blue R250. To
confirm the identity of ribosomal protein S1, the gel band visualized at 66 kDa was
excised, cut into pieces and transferred into a siliconized micro-centrifuge tube. The gel
pieces were destained and washed with a solution of 30% methanol and 10% acetic acid.
The pieces were in-gel reduced by 10 mM dithiothreitol and alkylated by 55 mM
iodoacetamide (91). After washing, the gel pieces were dehydrated by acetonitrile and
dried by a SpeedVac. The dried gel pieces were re-swollen in a buffer solution (5 mM
Tris-HCl, pH 8.0) containing LysC followed by overnight digestion at 37 ˚C. The
digested products were vortexed for 5 min and extracted twice by sonication for 5 min in
50 µL of extraction solution (50% acetonitrile, 5% formic acid). The supernatants
containing the extracted peptides were pooled together prior to MALDI-TOF MS
analysis.
4.2.2.6 MALDI Analysis All MALDI-MS experiments were done on a Bruker
Reflex IV reflectron MALDI-TOF mass spectrometer (Bruker Daltonics, Billerica, MA,
USA) equipped with a 337-nm nitrogen laser. Protein mass spectra were obtained in the
positive ion mode with delayed extraction by accumulating 200 laser shots. All samples
were analyzed under identical parameters. These parameters were determined by
optimizing the instrument for both ion abundance and resolution using a set of standard
proteins and sinapinic acid.
49
For all protein analyses, saturated SA in 33% aqueous acetonitrile/0.1% TFA was
used as the matrix. Samples were prepared by mixing 1 µL of sample solution (~0.5–2 µg
total protein) with 9 µL of matrix. For peptide experiments, 100 mM CHCA in 50%
aqueous acetonitrile/0.1% TFA was used as the matrix. Calibration of protein mass
spectra was done using a mixture of insulin, ubiquitin, cytochrome c, myoglobin, and
BSA and then recalibrated internally with well-resolved ribosomal proteins. Calibration
of peptide mass spectra was done using the Sigma peptide calibration kit composed of
angiotensin II, ACTH (fragment 18-39) and insulin chain B.
4.3 Results and Discussion
The analysis of complex mixtures of proteins, such as ribosomal proteins, requires
optimization of a variety of experimental parameters such as type of matrix, solvent and
sample preparation conditions (92,93). For the analysis of ribosomal proteins, various
matrices including 2,5-dihydroxybenzoic acid, CHCA and sinapinic acid were
investigated. Sinapinic acid was found to be to the most effective matrix for analyzing
the wide range of molecular masses present in this sample and was used for all
subsequent investigations. Once the matrix was chosen, the primary focus of the
remaining optimization studies involved examination of various sample preparation
conditions.
Ribosomal proteins are unique in that they originally exist in combination with
rRNAs. Thus, ribonucleoprotein complexes, such as the ribosome, present unique
challenges in the optimization of protein isolation/sample preparation steps. As
ribosomal proteins are intimately associated with rRNAs within the ribosome, the
50
primary goal of this work was to examine various approaches for isolating ribosomal
proteins that would allow for their analysis by MALDI-MS in a single experiment. There
are two experimental concerns associated with such isolations. First, because some
ribosomal proteins are known to be tightly associated within the interior of the ribosome
(94-99), an effective protein isolation approach should result in the release and recovery
of all ribosomal proteins present. Second, to limit the potential suppression of protein
signals by nucleic acids, an effective protein isolation approach should completely
separate rRNAs from ribosomal proteins. Thus, three approaches previously used for the
isolation of ribosomal proteins were investigated to determine their effectiveness at
recovering all ribosomal proteins in the absence of any rRNA as well as their downstream
compatibility with MALDI-MS. Ribosomal proteins are denoted using standard
nomenclature wherein ribosomal proteins from the large subunit are identified by an L
and ribosomal proteins from the small subunit are identified by an S.
4.3.1 Acid Extraction
Arnold and Reilly previously showed that the addition of trifluoroacetic acid (TFA)
is effective at precipitating rRNA from intact ribosomes and is compatible with
downstream MALDI-MS analysis (52). Therefore, TFA was chosen as a reference to
which other protein isolation protocols could be compared. Here, several TFA solutions
of increasing concentration were used to establish an optimum TFA concentration and
generate a suitable reference mass spectrum.
51
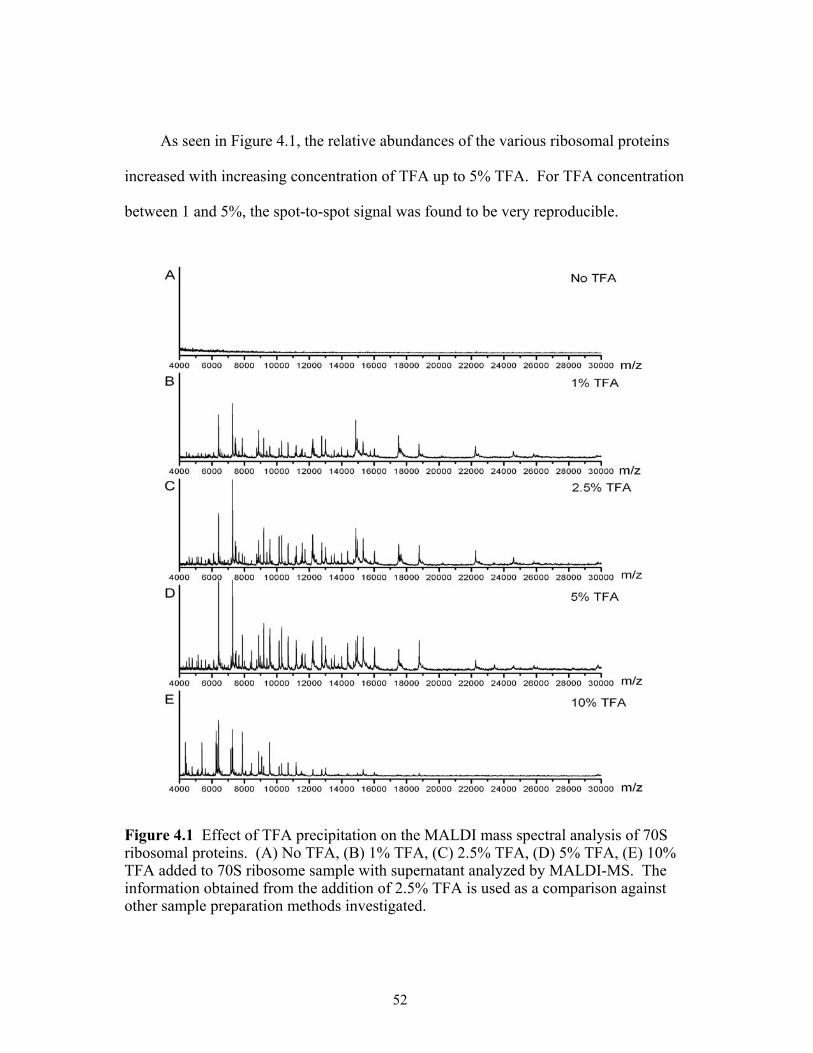
As seen in Figure 4.1, the relative abundances of the various ribosomal proteins
increased with increasing concentration of TFA up to 5% TFA. For TFA concentration
between 1 and 5%, the spot-to-spot signal was found to be very reproducible.
Figure 4.1 Effect of TFA precipitation on the MALDI mass spectral analysis of 70S ribosomal proteins. (A) No TFA, (B) 1% TFA, (C) 2.5% TFA, (D) 5% TFA, (E) 10% TFA added to 70S ribosome sample with supernatant analyzed by MALDI-MS. The information obtained from the addition of 2.5% TFA is used as a comparison against other sample preparation methods investigated.
52
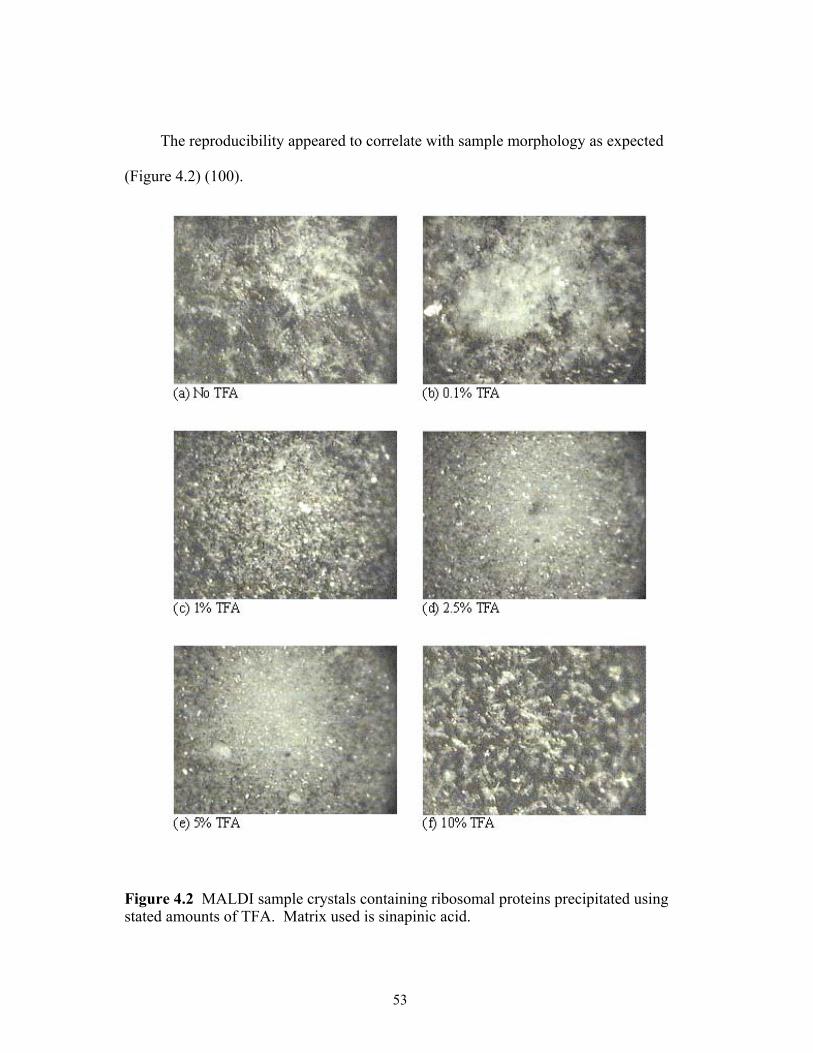
The reproducibility appeared to correlate with sample morphology as expected
(Figure 4.2) (100).
Figure 4.2 MALDI sample crystals containing ribosomal proteins precipitated using stated amounts of TFA. Matrix used is sinapinic acid.
53
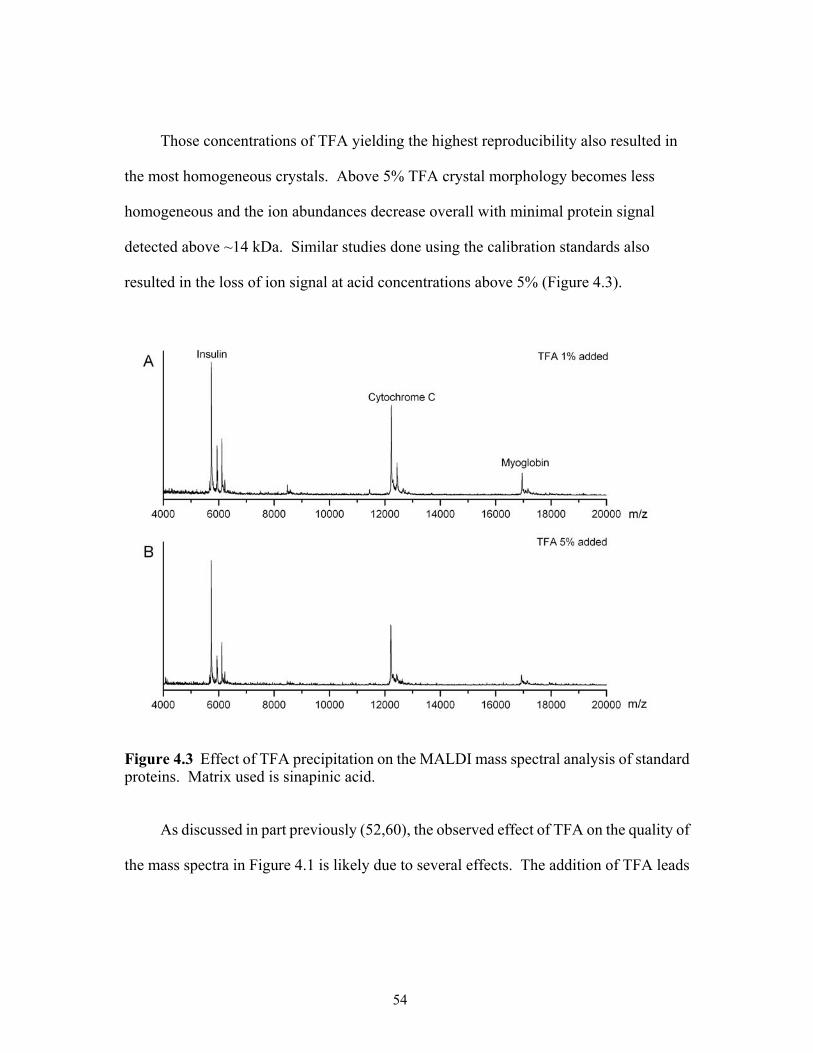
Those concentrations of TFA yielding the highest reproducibility also resulted in
the most homogeneous crystals. Above 5% TFA crystal morphology becomes less
homogeneous and the ion abundances decrease overall with minimal protein signal
detected above ~14 kDa. Similar studies done using the calibration standards also
resulted in the loss of ion signal at acid concentrations above 5% (Figure 4.3).
Figure 4.3 Effect of TFA precipitation on the MALDI mass spectral analysis of standard proteins. Matrix used is sinapinic acid.
As discussed in part previously (52,60), the observed effect of TFA on the quality of
the mass spectra in Figure 4.1 is likely due to several effects. The addition of TFA leads
54
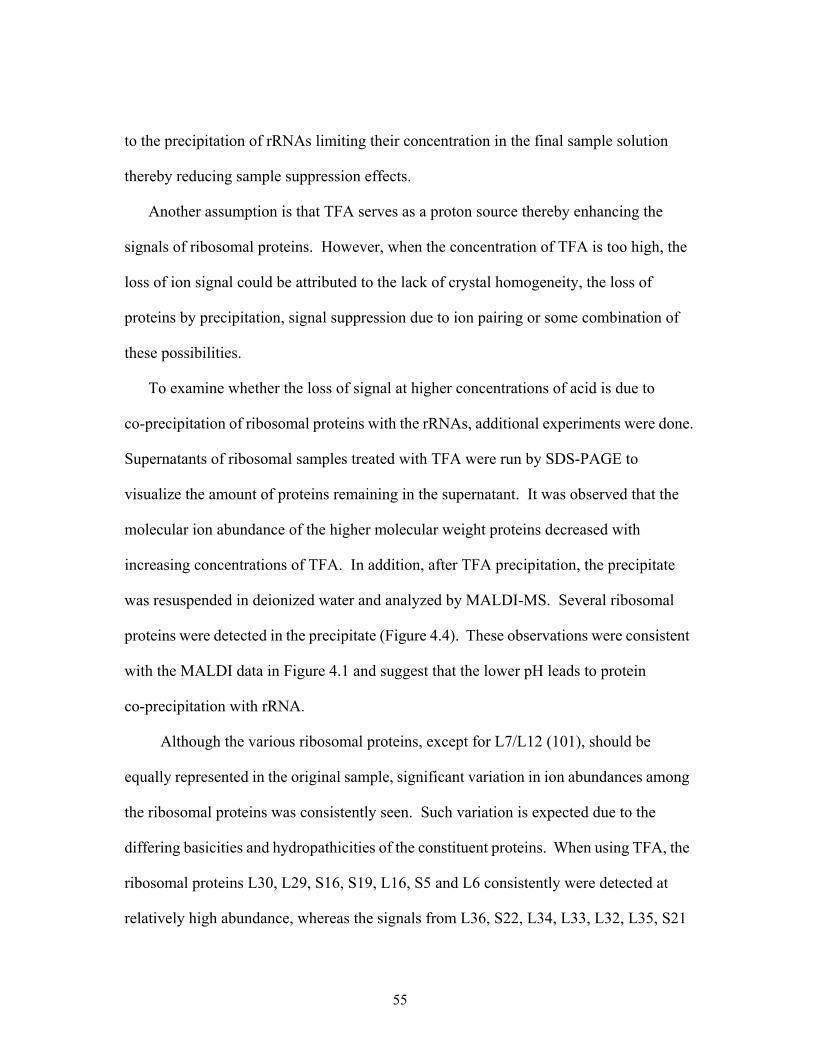
to the precipitation of rRNAs limiting their concentration in the final sample solution
thereby reducing sample suppression effects.
Another assumption is that TFA serves as a proton source thereby enhancing the
signals of ribosomal proteins. However, when the concentration of TFA is too high, the
loss of ion signal could be attributed to the lack of crystal homogeneity, the loss of
proteins by precipitation, signal suppression due to ion pairing or some combination of
these possibilities.
To examine whether the loss of signal at higher concentrations of acid is due to
co-precipitation of ribosomal proteins with the rRNAs, additional experiments were done.
Supernatants of ribosomal samples treated with TFA were run by SDS-PAGE to
visualize the amount of proteins remaining in the supernatant. It was observed that the
molecular ion abundance of the higher molecular weight proteins decreased with
increasing concentrations of TFA. In addition, after TFA precipitation, the precipitate
was resuspended in deionized water and analyzed by MALDI-MS. Several ribosomal
proteins were detected in the precipitate (Figure 4.4). These observations were consistent
with the MALDI data in Figure 4.1 and suggest that the lower pH leads to protein
co-precipitation with rRNA.
Although the various ribosomal proteins, except for L7/L12 (101), should be
equally represented in the original sample, significant variation in ion abundances among
the ribosomal proteins was consistently seen. Such variation is expected due to the
differing basicities and hydropathicities of the constituent proteins. When using TFA, the
ribosomal proteins L30, L29, S16, S19, L16, S5 and L6 consistently were detected at
relatively high abundance, whereas the signals from L36, S22, L34, L33, L32, L35, S21
55
and L27 depend on the amount of TFA present. Arnold and Reilly found that L36, S22,
L34, L33 and L32 could be observed when CHCA was used as a matrix, presumably
because these low molecular weight proteins are better suited for this matrix (52).
Figure 4.4 The MALDI mass spectrum of pellets produced after TFA treatment of 70S ribosomes. Pellets are resuspended in deionized water and then the resuspended sample was mixed with matrix solution.
From the MALDI-MS and SDS-PAGE results, it was determined that the optimum
TFA concentration was 2.5% based on the number and abundance of the proteins
detected. For all subsequent comparisons, the MALDI-MS data obtained from this
concentration was chosen as the reference mass spectrum (Figure 4.1-(C)).
In the TFA approach first demonstrated by Reilly (52), the supernatant is analyzed
directly without any additional steps. By way of comparison to that approach,
precipitation of rRNAs by acetic acid was done as described by Agafonov (102). In this
56
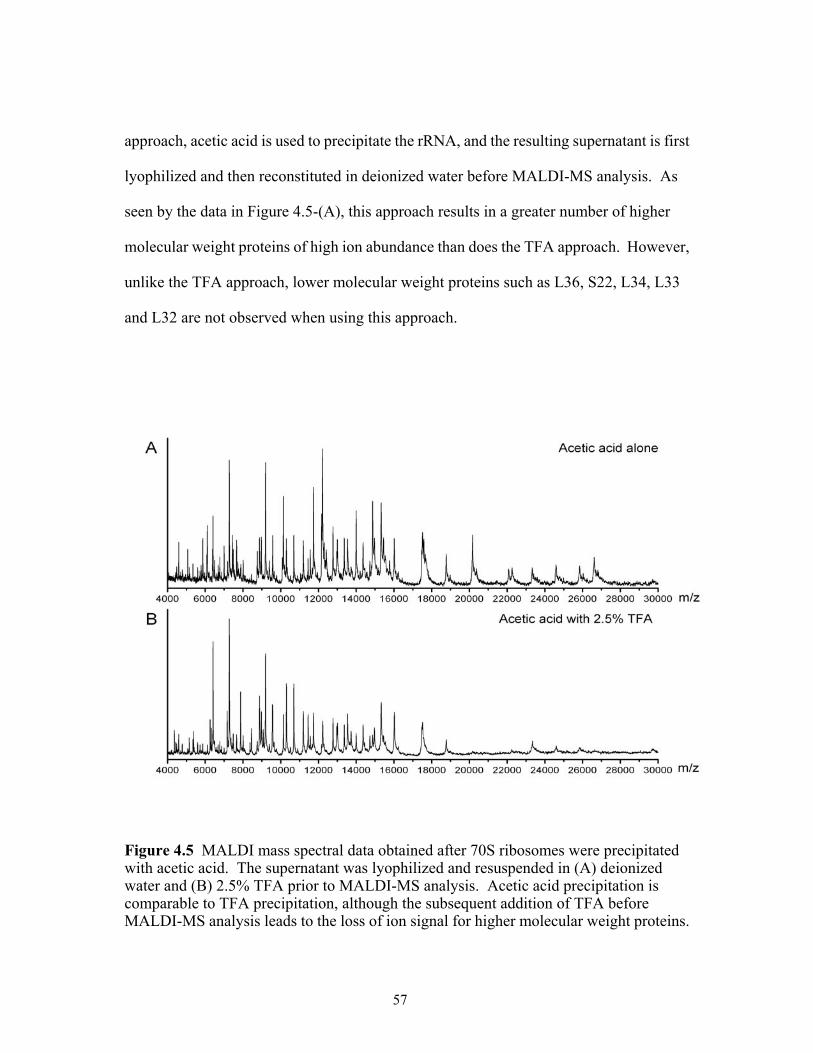
approach, acetic acid is used to precipitate the rRNA, and the resulting supernatant is first
lyophilized and then reconstituted in deionized water before MALDI-MS analysis. As
seen by the data in Figure 4.5-(A), this approach results in a greater number of higher
molecular weight proteins of high ion abundance than does the TFA approach. However,
unlike the TFA approach, lower molecular weight proteins such as L36, S22, L34, L33
and L32 are not observed when using this approach.
Figure 4.5 MALDI mass spectral data obtained after 70S ribosomes were precipitated with acetic acid. The supernatant was lyophilized and resuspended in (A) deionized water and (B) 2.5% TFA prior to MALDI-MS analysis. Acetic acid precipitation is comparable to TFA precipitation, although the subsequent addition of TFA before MALDI-MS analysis leads to the loss of ion signal for higher molecular weight proteins.
57
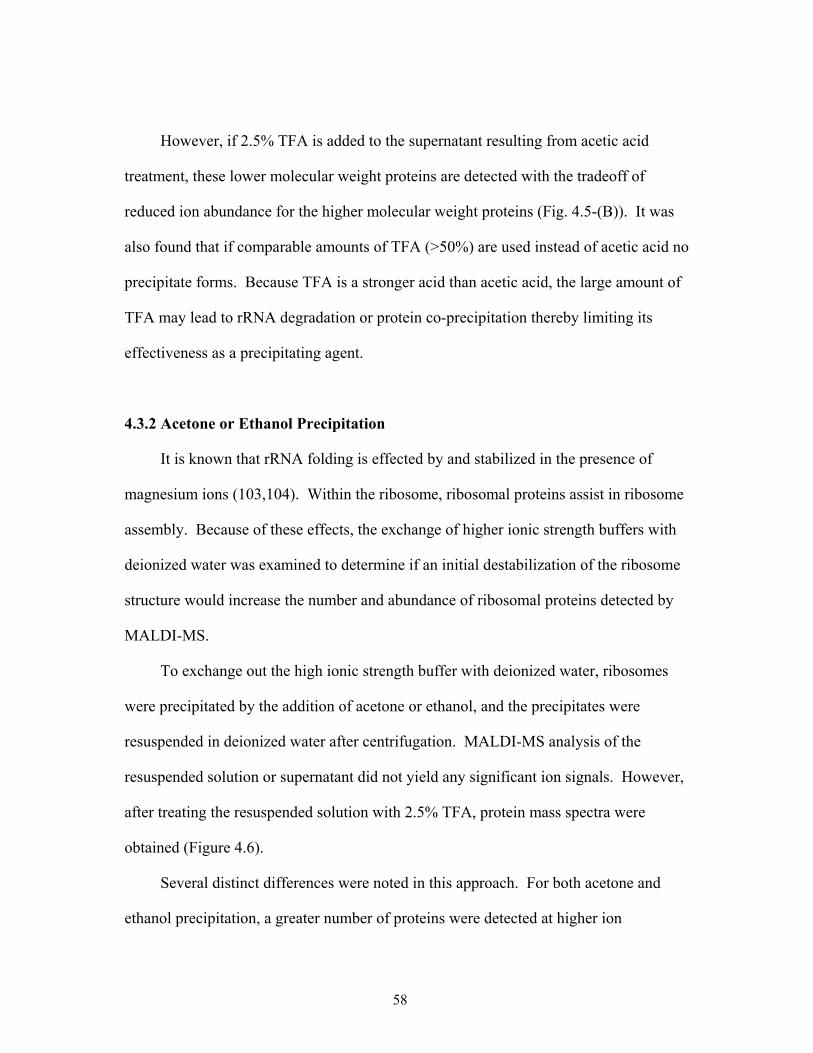
However, if 2.5% TFA is added to the supernatant resulting from acetic acid
treatment, these lower molecular weight proteins are detected with the tradeoff of
reduced ion abundance for the higher molecular weight proteins (Fig. 4.5-(B)). It was
also found that if comparable amounts of TFA (>50%) are used instead of acetic acid no
precipitate forms. Because TFA is a stronger acid than acetic acid, the large amount of
TFA may lead to rRNA degradation or protein co-precipitation thereby limiting its
effectiveness as a precipitating agent.
4.3.2 Acetone or Ethanol Precipitation
It is known that rRNA folding is effected by and stabilized in the presence of
magnesium ions (103,104). Within the ribosome, ribosomal proteins assist in ribosome
assembly. Because of these effects, the exchange of higher ionic strength buffers with
deionized water was examined to determine if an initial destabilization of the ribosome
structure would increase the number and abundance of ribosomal proteins detected by
MALDI-MS.
To exchange out the high ionic strength buffer with deionized water, ribosomes
were precipitated by the addition of acetone or ethanol, and the precipitates were
resuspended in deionized water after centrifugation. MALDI-MS analysis of the
resuspended solution or supernatant did not yield any significant ion signals. However,
after treating the resuspended solution with 2.5% TFA, protein mass spectra were
obtained (Figure 4.6).
Several distinct differences were noted in this approach. For both acetone and
ethanol precipitation, a greater number of proteins were detected at higher ion
58
abundances than found by the addition of TFA alone. Both precipitations resulted in the
increase in ion signal from lower molecular weight proteins such as L36, S22, L34, L33
and L32 with ethanol yielding higher ion signals from these proteins than acetone.
Figure 4.6 MALDI mass spectral data obtained after 70S ribosomes were precipitated with (A) acetone and (B) ethanol. Precipitates were resuspended in deionized water to denature ribosome and then treated with 2.5% TFA to precipitate ribosomal proteins prior to MALDI-MS analysis. Initial acetone precipitation leads to higher yield of ribosomal proteins.
Interestingly, acetone precipitation resulted in the detection of L7/L12 while ethanol
precipitation did not. These two proteins are only weakly associated with the ribosome
complex, and they are typically lost during many sample preparation treatments (105).
59
The likely explanation for this result is the reduced solubility of these two proteins in
acetone as compared to ethanol. Thus, they likely do not precipitate during ethanol
treatment and would therefore be lost in this sample preparation approach.
4.3.3 Phenol Extraction
As an alternative to either of the precipitation-based approaches previously discussed,
organic extraction of ribosomal proteins was examined. Phenol extraction is a method
commonly used for isolating nucleic acids from cell lysates (83). The extraction
efficiency of phenol was first verified using the protein calibration standards. After
phenol extraction, the aqueous layer, which should not contain proteins, was analyzed by
MALDI-MS and no protein signals were observed (Figure 4.7-(A)). The organic layer
resulting from phenol extraction was treated with 2-propanol to precipitate any proteins.
The precipitate was re-dissolved in deionized water and then analyzed by MALDI-MS.
Each of the proteins from the calibration standards was detected, suggesting the viability
of this approach (Figure 4.7-(B)).
This same protocol was then performed on intact 70S ribosomes. As seen in Figure
4.8, ribosomal proteins were observed after phenol extraction. Although all of the
expected ribosomal proteins were not detected, the quality of the mass spectral results
was improved as compared to that obtained when using 2.5% TFA. In particular,
improved ion abundance for the higher molecular weight proteins was observed (Figure
4.8-(B)). Analysis of the aqueous layer resulting from phenol extraction yielded the
lower molecular weight proteins L36, S22, L34, L33 and L32 (Figure 4.8-(A)).
60
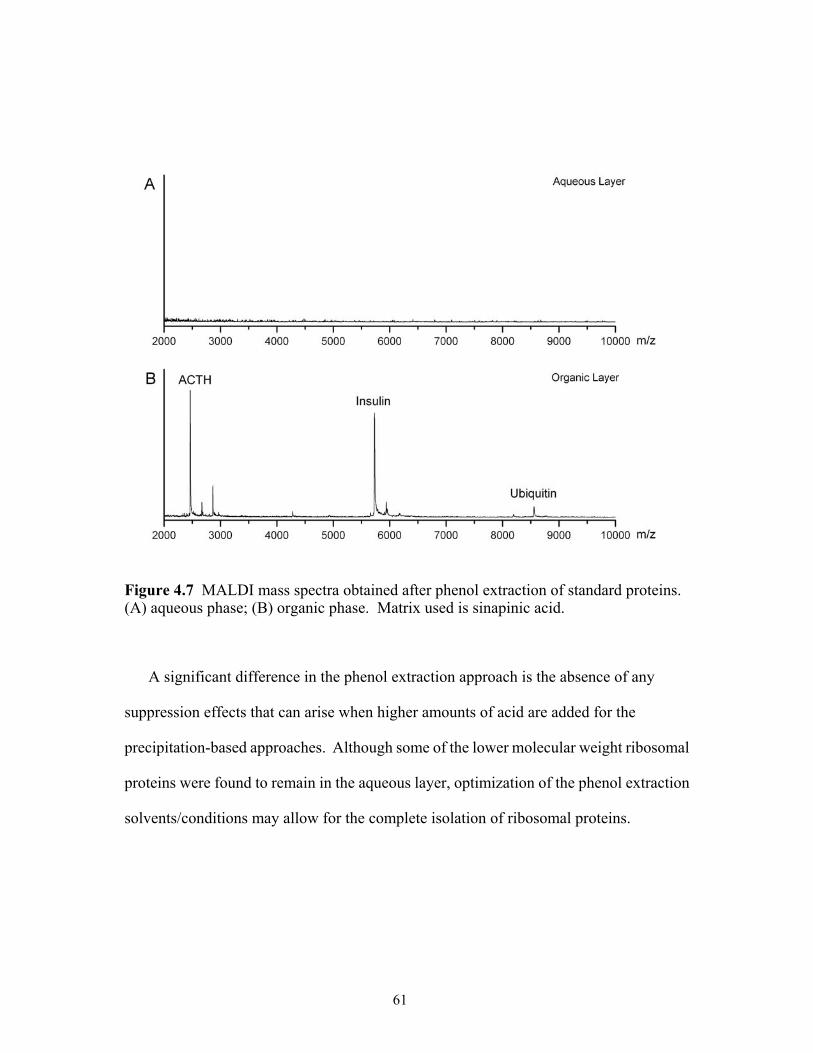
Figure 4.7 MALDI mass spectra obtained after phenol extraction of standard proteins. (A) aqueous phase; (B) organic phase. Matrix used is sinapinic acid.
A significant difference in the phenol extraction approach is the absence of any
suppression effects that can arise when higher amounts of acid are added for the
precipitation-based approaches. Although some of the lower molecular weight ribosomal
proteins were found to remain in the aqueous layer, optimization of the phenol extraction
solvents/conditions may allow for the complete isolation of ribosomal proteins.
61
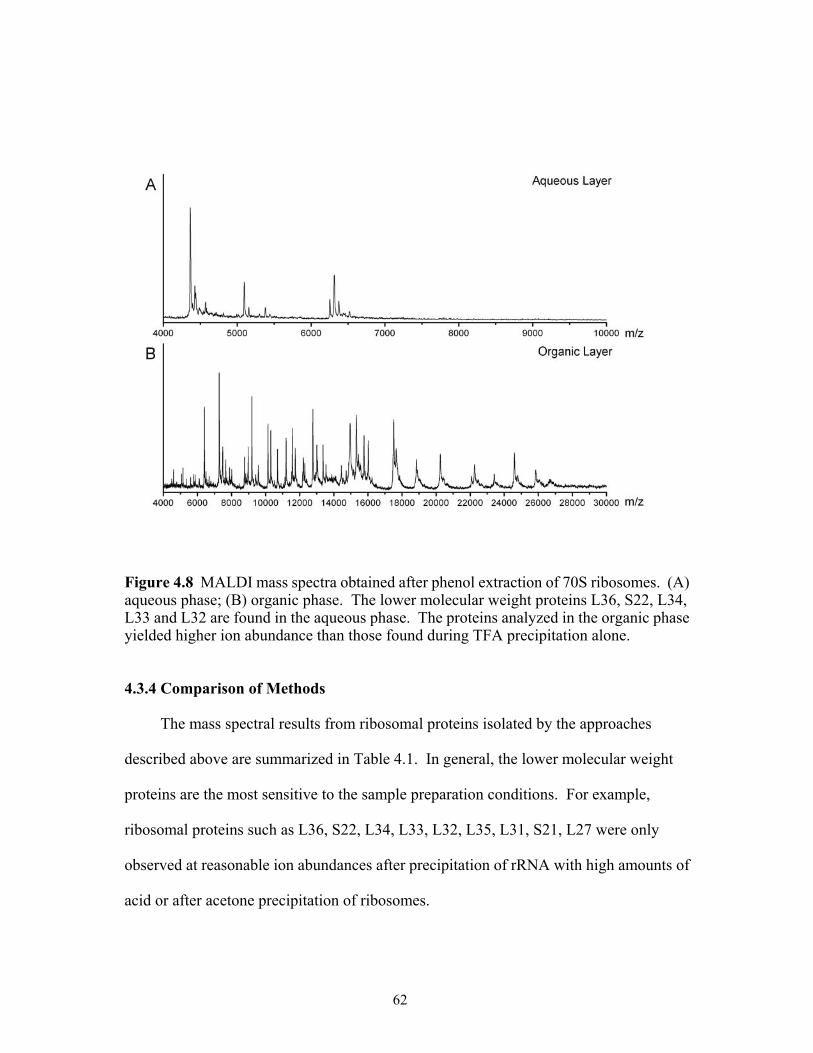
Figure 4.8 MALDI mass spectra obtained after phenol extraction of 70S ribosomes. (A) aqueous phase; (B) organic phase. The lower molecular weight proteins L36, S22, L34, L33 and L32 are found in the aqueous phase. The proteins analyzed in the organic phase yielded higher ion abundance than those found during TFA precipitation alone.
4.3.4 Comparison of Methods
The mass spectral results from ribosomal proteins isolated by the approaches
described above are summarized in Table 4.1. In general, the lower molecular weight
proteins are the most sensitive to the sample preparation conditions. For example,
ribosomal proteins such as L36, S22, L34, L33, L32, L35, L31, S21, L27 were only
observed at reasonable ion abundances after precipitation of rRNA with high amounts of
acid or after acetone precipitation of ribosomes.
62
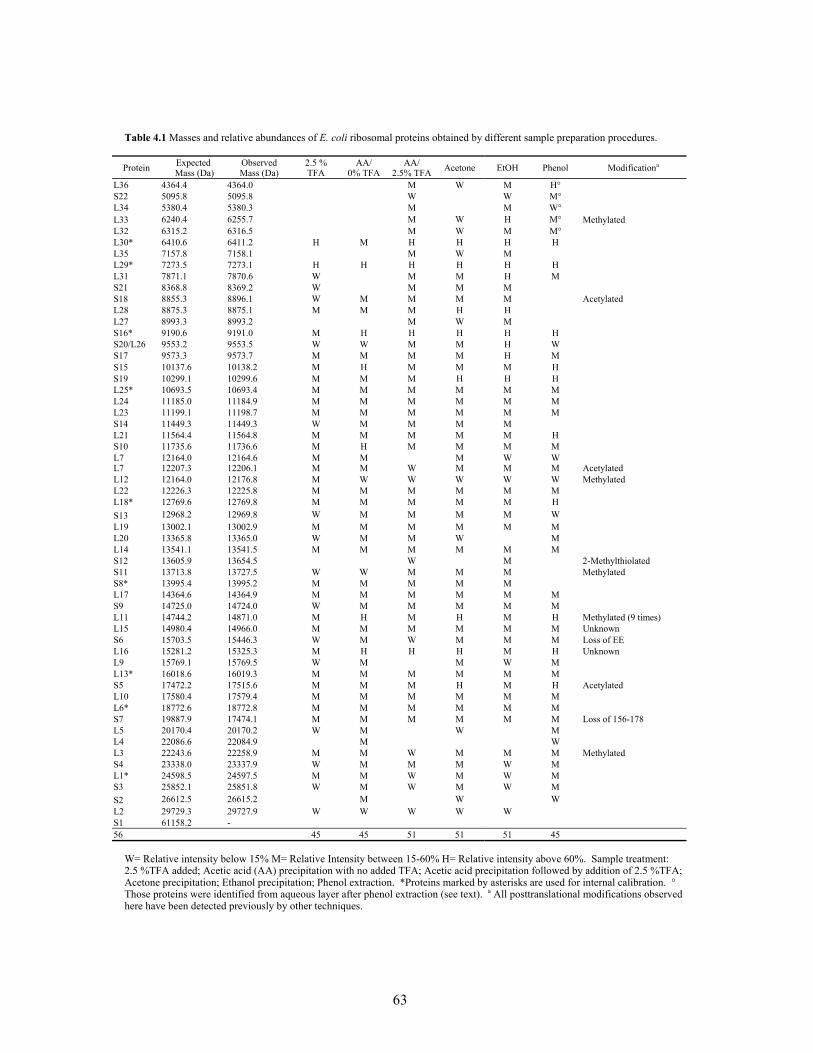
Table 4.1 Masses and relative abundances of E. coli ribosomal proteins obtained by different sample preparation procedures.
Protein Expected Mass (Da)
Observed Mass (Da)
2.5 % TFA
AA/ 0% TFA
AA/ 2.5% TFA Acetone EtOH Phenol Modificationa
L36 4364.4 4364.0 M W M H° S22 5095.8 5095.8 W W M° L34 5380.4 5380.3 M M W° L33 6240.4 6255.7 M W H M° Methylated L32 6315.2 6316.5 M W M M° L30* 6410.6 6411.2 H M H H H H L35 7157.8 7158.1 M W M L29* 7273.5 7273.1 H H H H H H L31 7871.1 7870.6 W M M H M S21 8368.8 8369.2 W M M M S18 8855.3 8896.1 W M M M M Acetylated L28 8875.3 8875.1 M M M H H L27 8993.3 8993.2 M W M S16* 9190.6 9191.0 M H H H H H S20/L26 9553.2 9553.5 W W M M H W S17 9573.3 9573.7 M M M M H M S15 10137.6 10138.2 M H M M M H S19 10299.1 10299.6 M M M H H H L25* 10693.5 10693.4 M M M M M M L24 11185.0 11184.9 M M M M M M L23 11199.1 11198.7 M M M M M M S14 11449.3 11449.3 W M M M M L21 11564.4 11564.8 M M M M M H S10 11735.6 11736.6 M H M M M M L7 L7
12164.0 12207.3
12164.6 12206.1
M M
M M
W
M M
W M
W M Acetylated
L12 12164.0 12176.8 M W W W W W Methylated L22 12226.3 12225.8 M M M M M M L18* 12769.6 12769.8 M M M M M H S13 12968.2 12969.8 W M M M M W L19 13002.1 13002.9 M M M M M M L20 13365.8 13365.0 W M M W M L14 13541.1 13541.5 M M M M M M S12 13605.9 13654.5 W M 2-Methylthiolated S11 13713.8 13727.5 W W M M M Methylated S8* 13995.4 13995.2 M M M M M L17 14364.6 14364.9 M M M M M M S9 14725.0 14724.0 W M M M M M L11 14744.2 14871.0 M H M H M H Methylated (9 times) L15 14980.4 14966.0 M M M M M M Unknown S6 15703.5 15446.3 W M W M M M Loss of EE L16 15281.2 15325.3 M H H H M H Unknown L9 15769.1 15769.5 W M M W M L13* 16018.6 16019.3 M M M M M M S5 17472.2 17515.6 M M M H M H Acetylated L10 17580.4 17579.4 M M M M M M L6* 18772.6 18772.8 M M M M M M S7 19887.9 17474.1 M M M M M M Loss of 156-178 L5 20170.4 20170.2 W M W M L4 22086.6 22084.9 M W L3 22243.6 22258.9 M M W M M M Methylated S4 23338.0 23337.9 W M M M W M L1* 24598.5 24597.5 M M W M W M S3 25852.1 25851.8 W M W M W M S2 26612.5 26615.2 M W W L2 29729.3 29727.9 W W W W W S1 61158.2 - 56 45 45 51 51 51 45
W= Relative intensity below 15% M= Relative Intensity between 15-60% H= Relative intensity above 60%. Sample treatment: 2.5 %TFA added; Acetic acid (AA) precipitation with no added TFA; Acetic acid precipitation followed by addition of 2.5 %TFA; Acetone precipitation; Ethanol precipitation; Phenol extraction. *Proteins marked by asterisks are used for internal calibration. ° Those proteins were identified from aqueous layer after phenol extraction (see text). a All posttranslational modifications observed here have been detected previously by other techniques.
63
SDS-PAGE analysis of either precipitates or supernatants from various treatments
was done to determine if the absence of abundant ion signals from these lower molecular
weight proteins is due to the loss of these proteins during isolation or ion suppression
effects as seen in Figure 4.9.
As seen in Figure 4.9, faint bands arising from lower molecular weight proteins are
present in the ethanol and acetone supernatant. However, both the ethanol and acetone
precipitates still contain bands representative of these lower molecular weight proteins
suggesting that while some sample loss is found, the lack of lower molecular weight
protein signals in the MALDI data arises through ion suppression. Surprisingly, while
acetic acid precipitation of rRNA appears to lead to losses in ribosomal proteins present
in the remaining supernatant, no proteins are observed in the precipitated pellet (Fig. 4.9
lane 10).
Moreover, the combination of acetic acid and TFA yielded the highest quality mass
spectral coverage of ribosomal proteins at lower mass. Acetic acid alone yielded high
quality MALDI-MS data for higher molecular weight proteins, again suggesting that the
addition of TFA can lead to suppression effects for the higher molecular weight
components of the sample.
In general, with the exception of ribosomal protein S1 as noted below, the
approaches investigated here provide a ready means of isolating proteins from RNP
complexes in a manner compatible with MALDI-MS analysis. Except for the variations
noted for the lower molecular weight proteins, no other general trends relating to the
absence of proteins in the final mass spectra were noted.
64
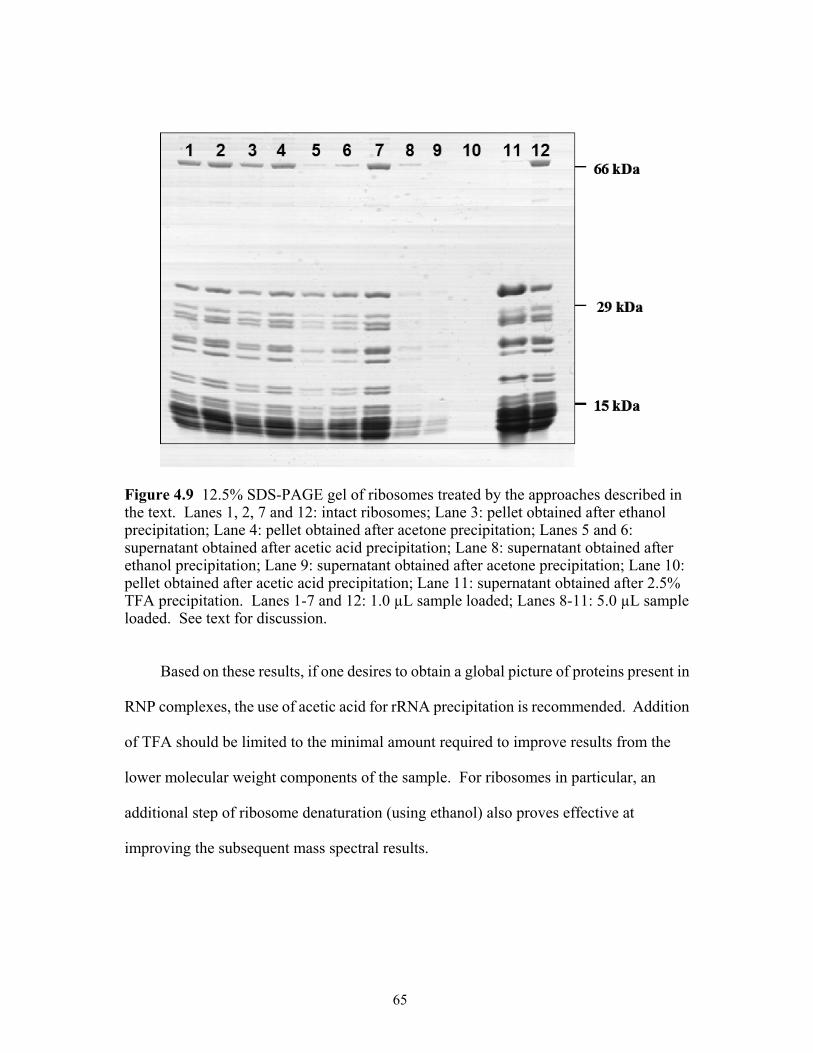
Figure 4.9 12.5% SDS-PAGE gel of ribosomes treated by the approaches described in the text. Lanes 1, 2, 7 and 12: intact ribosomes; Lane 3: pellet obtained after ethanol precipitation; Lane 4: pellet obtained after acetone precipitation; Lanes 5 and 6: supernatant obtained after acetic acid precipitation; Lane 8: supernatant obtained after ethanol precipitation; Lane 9: supernatant obtained after acetone precipitation; Lane 10: pellet obtained after acetic acid precipitation; Lane 11: supernatant obtained after 2.5% TFA precipitation. Lanes 1-7 and 12: 1.0 µL sample loaded; Lanes 8-11: 5.0 µL sample loaded. See text for discussion.
Based on these results, if one desires to obtain a global picture of proteins present in
RNP complexes, the use of acetic acid for rRNA precipitation is recommended. Addition
of TFA should be limited to the minimal amount required to improve results from the
lower molecular weight components of the sample. For ribosomes in particular, an
additional step of ribosome denaturation (using ethanol) also proves effective at
improving the subsequent mass spectral results.
65
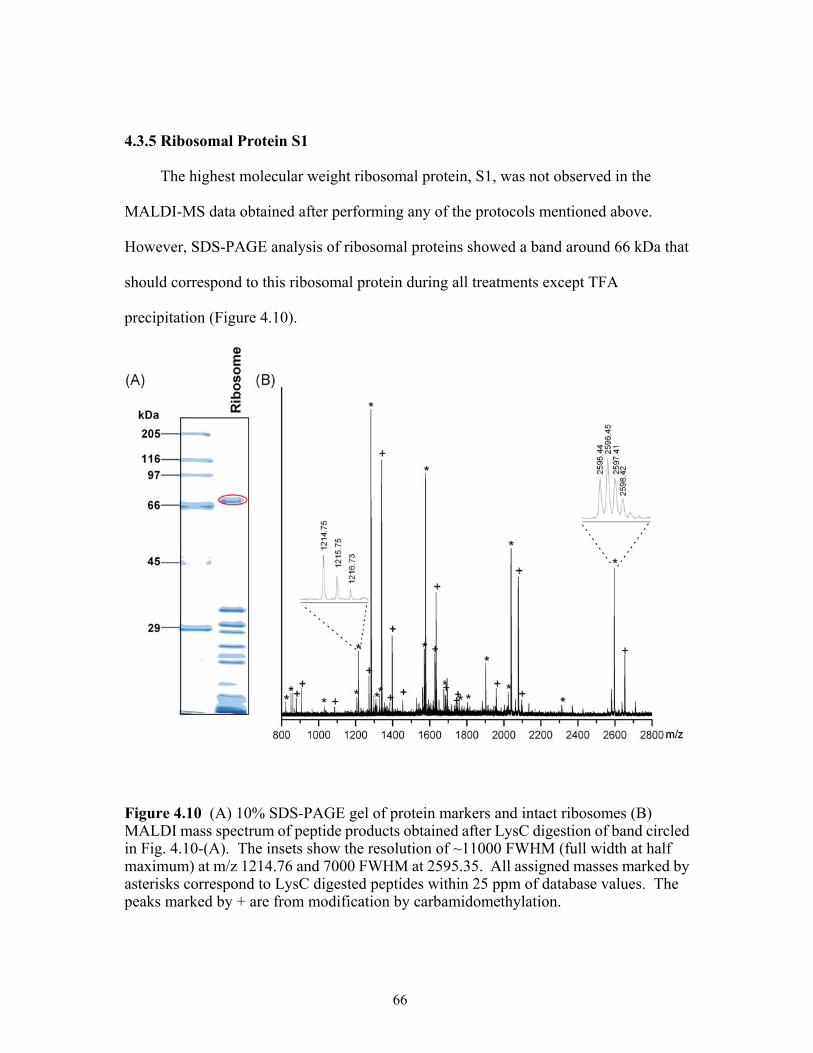
4.3.5 Ribosomal Protein S1
The highest molecular weight ribosomal protein, S1, was not observed in the
MALDI-MS data obtained after performing any of the protocols mentioned above.
However, SDS-PAGE analysis of ribosomal proteins showed a band around 66 kDa that
should correspond to this ribosomal protein during all treatments except TFA
precipitation (Figure 4.10).
Figure 4.10 (A) 10% SDS-PAGE gel of protein markers and intact ribosomes (B) MALDI mass spectrum of peptide products obtained after LysC digestion of band circled in Fig. 4.10-(A). The insets show the resolution of ~11000 FWHM (full width at half maximum) at m/z 1214.76 and 7000 FWHM at 2595.35. All assigned masses marked by asterisks correspond to LysC digested peptides within 25 ppm of database values. The peaks marked by + are from modification by carbamidomethylation.
66
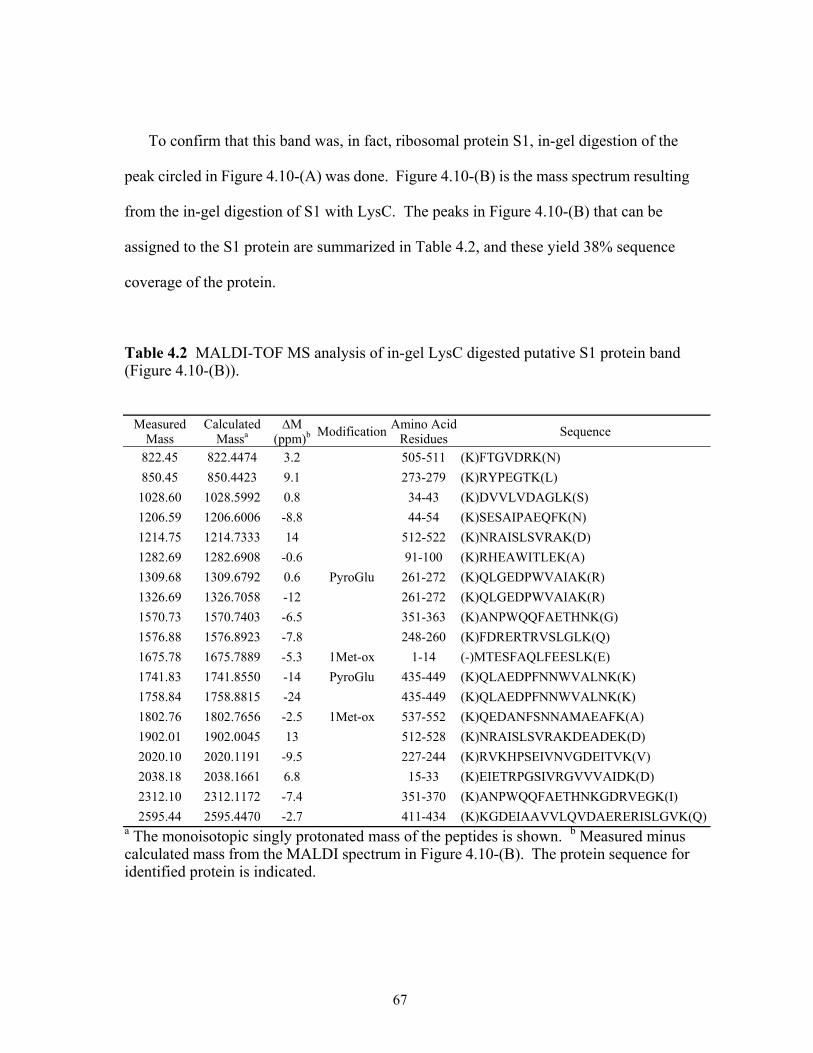
To confirm that this band was, in fact, ribosomal protein S1, in-gel digestion of the
peak circled in Figure 4.10-(A) was done. Figure 4.10-(B) is the mass spectrum resulting
from the in-gel digestion of S1 with LysC. The peaks in Figure 4.10-(B) that can be
assigned to the S1 protein are summarized in Table 4.2, and these yield 38% sequence
coverage of the protein.
Table 4.2 MALDI-TOF MS analysis of in-gel LysC digested putative S1 protein band (Figure 4.10-(B)).
Measured Mass
Calculated Massa
∆M (ppm)b Modification Amino Acid
Residues Sequence
822.45 822.4474 3.2 505-511 (K)FTGVDRK(N) 850.45 850.4423 9.1 273-279 (K)RYPEGTK(L)
1028.60 1028.5992 0.8 34-43 (K)DVVLVDAGLK(S) 1206.59 1206.6006 -8.8 44-54 (K)SESAIPAEQFK(N) 1214.75 1214.7333 14 512-522 (K)NRAISLSVRAK(D) 1282.69 1282.6908 -0.6 91-100 (K)RHEAWITLEK(A) 1309.68 1309.6792 0.6 PyroGlu 261-272 (K)QLGEDPWVAIAK(R) 1326.69 1326.7058 -12 261-272 (K)QLGEDPWVAIAK(R) 1570.73 1570.7403 -6.5 351-363 (K)ANPWQQFAETHNK(G) 1576.88 1576.8923 -7.8 248-260 (K)FDRERTRVSLGLK(Q) 1675.78 1675.7889 -5.3 1Met-ox 1-14 (-)MTESFAQLFEESLK(E) 1741.83 1741.8550 -14 PyroGlu 435-449 (K)QLAEDPFNNWVALNK(K) 1758.84 1758.8815 -24 435-449 (K)QLAEDPFNNWVALNK(K) 1802.76 1802.7656 -2.5 1Met-ox 537-552 (K)QEDANFSNNAMAEAFK(A) 1902.01 1902.0045 13 512-528 (K)NRAISLSVRAKDEADEK(D) 2020.10 2020.1191 -9.5 227-244 (K)RVKHPSEIVNVGDEITVK(V) 2038.18 2038.1661 6.8 15-33 (K)EIETRPGSIVRGVVVAIDK(D) 2312.10 2312.1172 -7.4 351-370 (K)ANPWQQFAETHNKGDRVEGK(I) 2595.44 2595.4470 -2.7 411-434 (K)KGDEIAAVVLQVDAERERISLGVK(Q)
a The monoisotopic singly protonated mass of the peptides is shown. b Measured minus calculated mass from the MALDI spectrum in Figure 4.10-(B). The protein sequence for identified protein is indicated.
67
Thus, based upon the SDS-PAGE analyses of various sample preparations as seen
in Figure 4.9, S1 is present in the original sample mixture even though it is not detected
during MALDI-MS. It appears that whenever TFA is added, S1 is lost to precipitation.
For those analyses done in the absence of TFA, S1 could be suppressed by the other
sample components or requires MALDI sample conditions more conducive to high
molecular weight protein analysis.
4.4 Conclusions
In this chapter, I have investigated the applicability of several ribosomal protein
isolation approaches with downstream MALDI-MS analysis. Because ribosomal
proteins associate with rRNAs in this ribonucleoprotein complex, methods allowing for
the isolation of all ribosomal proteins in the absence of any rRNA were sought. All of the
methods investigated were generally successful at isolating ribosomal proteins and
allowing for their subsequent analysis and identification by MALDI-MS. The approach
yielding the most reproducible and significant ion abundances from the majority of
ribosomal proteins was the use of acetic acid for rRNA precipitation. Alternatively,
buffer exchange by acetone or ethanol precipitation of ribosomes followed by acid
precipitation of ribosomal proteins also provides high protein coverage. Phenol
extraction appears attractive potentially due to the lack of suppression effects, although
optimization of the solvent conditions would be necessary to effectively isolate the lower
molecular weight proteins currently retained in the aqueous phase.
Most of the approaches investigated here were also found to be at least as effective as
the TFA approach previously described (52,60). Of particular note, these methods allow
68
for the simultaneous analysis of nearly all of the E. coli 70S ribosomal proteins in a single
MALDI-MS experiment. While separate mass spectral conditions for low and high
molecular weight proteins reduce suppression effects, the strategies discussed here
should improve our ability to rapidly screen proteins present in a RNP complex such as
the ribosome. In addition, these methods should also be useful for isolation and
MALDI-based analysis of proteins from other RNP complexes. In chapter 5, ribosomal
proteins from Thermus thermophilus ribosomes will be analyzed with the developed
method.
69
Chapter 5. Extending Protein Identification to Unsequenced Bacterial Strains Using Matrix-Assisted Laser Desorption/ Ionization Mass Spectrometry
5.1 Introduction
In Chapter 4, an effective approach for analyzing ribosomal proteins from E. coli by
MALDI-TOF MS has been developed. For identification and characterization of proteins
using mass spectrometry, the sequences, either DNA-derived or amino acid-determined,
of ribosomal proteins are necessary for matching the calculated masses with the peaks
observed in mass spectrometry. Typically, ribosomal proteins from organisms with
publicly available sequences can be a target for identification and characterization. This
chapter describes a straightforward procedure for assigning ribosomal proteins based
upon MALDI-MS data and a ribosomal protein search algorithm using DNA-derived
protein sequences.
Thermus thermophilus HB8, a Gram-negative extremely thermophilic eubacterium
with an optimal growth temperature of 75 ˚C, was isolated in 1971 from a thermal spring
in Japan, and the genome of this strain is partially sequenced. The T. thermophilus HB27
strain genome is completely sequenced (106), and interesting genes of this strain have
been investigated for potential biotechnological application. However, a direct sequence
comparison of the ribosomal proteins from different T. thermophilus strains is
challenging because the genome is not available for any of the other strains.
In this study, assignments of 50 out of 54 ribosomal proteins (93%) from T.
thermophilus HB8 detected by MALDI-MS could be made using the gene sequence of T.
thermophilus HB27 ribosomal proteins. This approach is also applied to the 70S
70
ribosome from T. thermophilus IB21, a halotolerant strain of T. thermophilus isolated
from an icelandic submarine thermal vent (107), to see what similarities or differences
arise in the ribosomal proteins of different strains. In case of IB21, 49 out of 54
ribosomal proteins (91%) could be identified. The PTMs present in ribosomal proteins,
L11 (multiple methylation) and S12 (β-methylthiolation), are conserved in two strains
from T. thermophilus like corresponding proteins from other bacterial ribosomes.
This developed procedure allows currently available protein database information
specific for a particular strain of an organism to be extended to strains for which no
database information exists. This is possible because, due to the conserved nature of the
ribosome, ribosomal proteins do not differ as much between strains as they do between
organisms. As a direct approach, MALDI-TOF MS coupled to this ribosomal protein
search algorithm can allow one to readily identify ribosomal proteins and to compare
differences among ribosomal proteins in different strains and/or organisms for
phylogenetic studies.
5.2 Experimental
5.2.1 Materials
Trifluoroacetic acid (TFA), buffer reagents and protein calibration kit were obtained
from Sigma (St. Louis, MO, USA). Sinapinic acid (SA) was obtained from Fluka
(Milwaukee, WI, USA). Sucrose (RNAse and DNAse free grade) was purchased from
Acros Organics (Fairlawn, NJ, USA). Acids and organic solvents were HPLC grade or
better.
71
5.2.2 Methods
5.2.2.1 Ribosome Preparation T. thermophilus HB8 (wild-type and mutant) and
IB21 ribosomes were a kind gift of Drs. S.T. Gregory and A.E. Dahlberg (Brown
University, Providence, RI, USA). Conditions for culturing T. thermophilus HB8
(ATCC27642) and IB21 (ATTC43615) and isolating ribosomes have been described
elsewhere (108). Aliquots of intact 70S ribosomes at a concentration of 22 mg/mL in a
buffer containing 10 mM HEPES-KOH at pH 7.6, 10 mM MgCl2, 50 mM NH4Cl, and 5
mM β-mercaptoethanol were stored at -80 ̊ C. Intact 70S ribosome solutions were diluted
prior to MALDI-MS analysis.
The 30S and 50S ribosomal subunits were isolated through a 0-45% sucrose
gradient as described in Chapter 3. The pellets were resuspended in 10 mM Tris-HCl at
pH 7.6, 10 mM MgCl2, 50 mM NH4Cl, 0.25 mM EDTA, 4 mM β-mercaptoethanol, and
aliquots were further analyzed.
5.2.2.2 SDS-PAGE Analysis 12.5% SDS-PAGE analysis was carried out as
described in Chapter 4.
5.2.2.3 MALDI MS Analysis All MALDI-TOF MS experiments were done on a
Bruker Reflex IV reflectron MALDI-TOF mass spectrometer (Bruker Daltonics,
Billerica, MA, USA) equipped with a nitrogen laser as previously described (109).
For all protein analyses, saturated SA in 33% aqueous acetonitrile/0.1% TFA was
used as the matrix. 1 µL of sample, which was prepared by mixing 1 µL of acidified
ribosomal solution (around 2 pmol ribosome) with 9 µL of matrix, was loaded onto a
MALDI target and allowed to air dry. Calibration of protein mass spectra was done using
72
E. coli MRE 600 ribosomal proteins as external calibrants and then recalibrated internally
with well-resolved ribosomal proteins from T. thermophilus.
5.2.2.4 Data Analysis The amino acid sequence of T. thermophilus HB27 was
taken from GenBank (http://www.ncbi.nlm.nih.gov/genomes) with accession number
AE017221 (chromosome). The theoretical molecular weights of ribosomal proteins from
T. thermophilus HB27 were calculated using the SequenceEditor software provided by
the MALDI manufacturer.
5.3 Results and Discussion
5.3.1 General Approach
The approach developed to readily confirm assigned protein identities and to
distinguish possible sequence variations is provided in the flowchart of Figure 5.1.
Starting with proteins assigned from annotated sequenced DNA, mass spectral data
arising from the analysis of intact proteins is sequentially evaluated to classify proteins.
Proteins can be classified into four categories: (1) Proteins yielding identical molecular
weights to DNA-derived sequences; (2) Proteins yielding molecular weights
corresponding to N-terminal methionine loss; (3) Proteins yielding molecular weights
consistent with conserved post-translational modifications; and (4) Proteins that cannot
be assigned directly which may reflect differences at the primary sequence or
post-translational level. To demonstrate the applicability of this approach, ribosomal
proteins from T. thermophilus were evaluated. Theoretical molecular weights of
ribosomal proteins from T. thermophilus HB 27 were first calculated based on
73
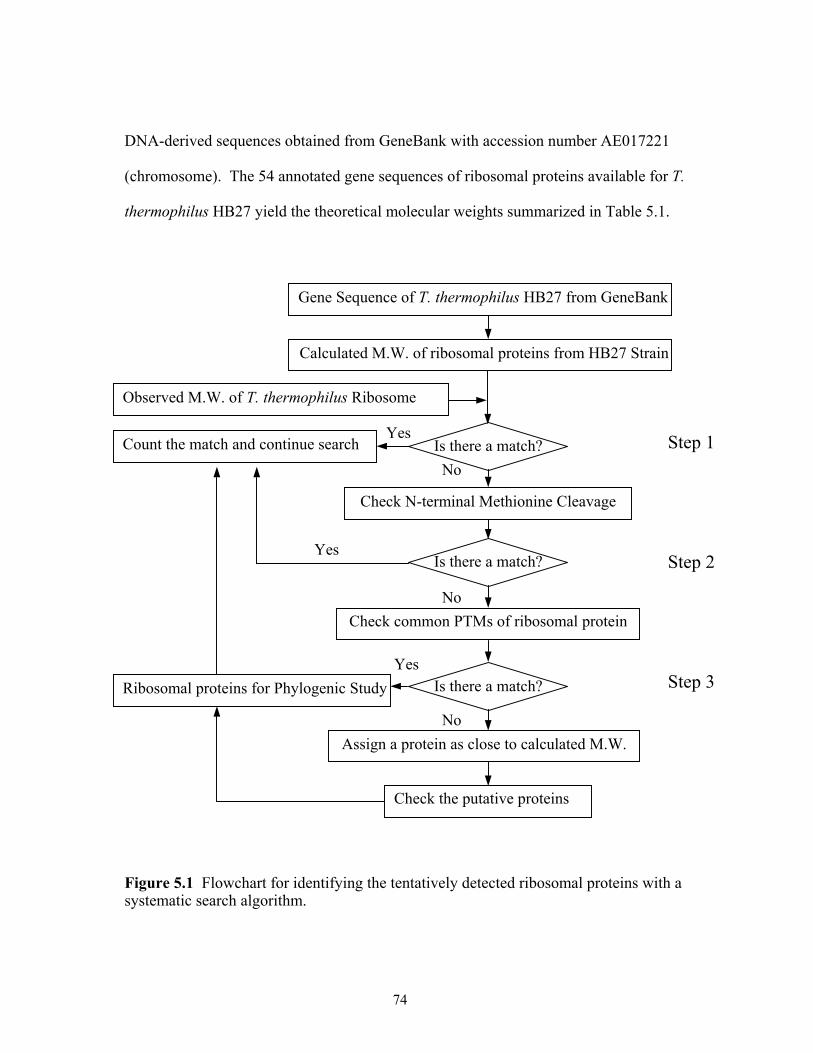
DNA-derived sequences obtained from GeneBank with accession number AE017221
(chromosome). The 54 annotated gene sequences of ribosomal proteins available for T.
thermophilus HB27 yield the theoretical molecular weights summarized in Table 5.1.
Observed M.W. of T. thermophilus Ribosome
Gene Sequence of T. thermophilus HB27 from GeneBank
Is there a match?
Is there a match?Ribosomal proteins for Phylogenic Study
Is there a match?
Step 3
Step 2
Step 1
Check the putative proteins
NoAssign a protein as close to calculated M.W.
Yes
Check common PTMs of ribosomal protein
Yes
No
Count the match and continue search
Check N-terminal Methionine Cleavage
No
Yes
Calculated M.W. of ribosomal proteins from HB27 Strain
Figure 5.1 Flowchart for identifying the tentatively detected ribosomal proteins with a systematic search algorithm.
74
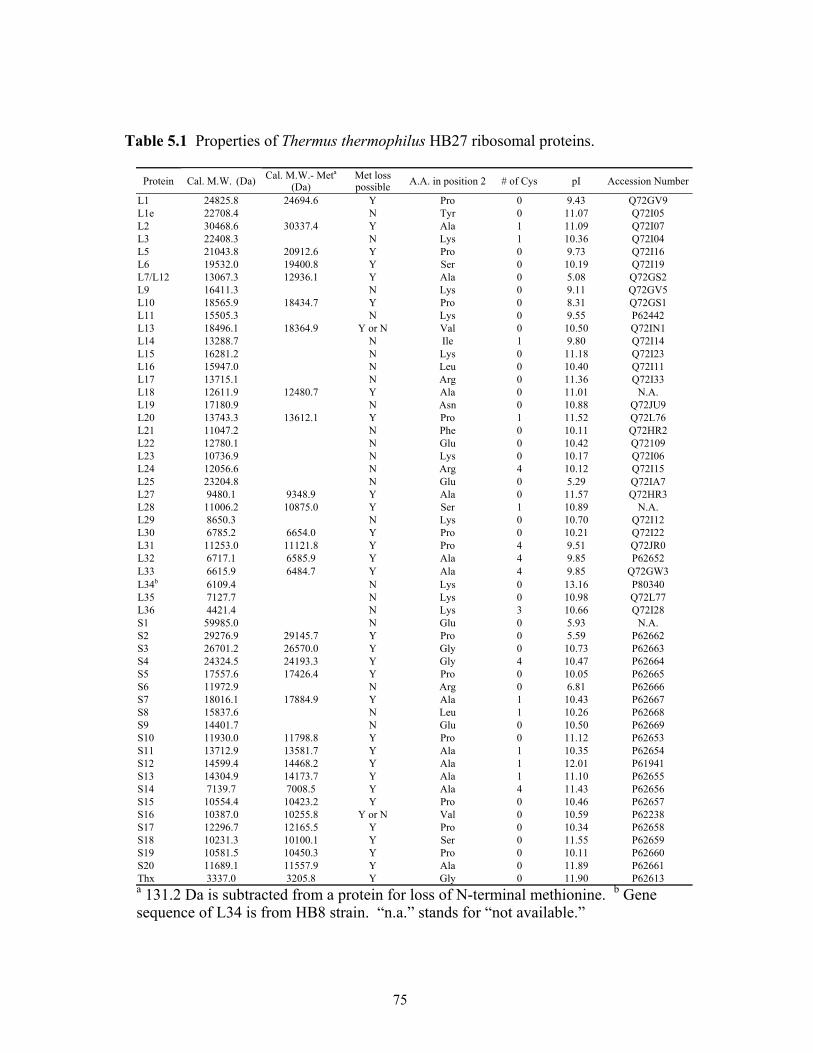
Table 5.1 Properties of Thermus thermophilus HB27 ribosomal proteins.
Protein Cal. M.W. (Da) Cal. M.W.- Meta
(Da) Met loss possible A.A. in position 2 # of Cys pI Accession Number
L1 24825.8 24694.6 Y Pro 0 9.43 Q72GV9 L1e 22708.4 N Tyr 0 11.07 Q72I05 L2 30468.6 30337.4 Y Ala 1 11.09 Q72I07 L3 22408.3 N Lys 1 10.36 Q72I04 L5 21043.8 20912.6 Y Pro 0 9.73 Q72I16 L6 19532.0 19400.8 Y Ser 0 10.19 Q72I19 L7/L12 13067.3 12936.1 Y Ala 0 5.08 Q72GS2 L9 16411.3 N Lys 0 9.11 Q72GV5 L10 18565.9 18434.7 Y Pro 0 8.31 Q72GS1 L11 15505.3 N Lys 0 9.55 P62442 L13 18496.1 18364.9 Y or N Val 0 10.50 Q72IN1 L14 13288.7 N Ile 1 9.80 Q72I14 L15 16281.2 N Lys 0 11.18 Q72I23 L16 15947.0 N Leu 0 10.40 Q72I11 L17 13715.1 N Arg 0 11.36 Q72I33 L18 12611.9 12480.7 Y Ala 0 11.01 N.A. L19 17180.9 N Asn 0 10.88 Q72JU9 L20 13743.3 13612.1 Y Pro 1 11.52 Q72L76 L21 11047.2 N Phe 0 10.11 Q72HR2 L22 12780.1 N Glu 0 10.42 Q72109 L23 10736.9 N Lys 10.17 Q72I06 L24 12056.6 N Arg 4 10.12 Q72I15 L25 23204.8 N Glu 0 5.29 Q72IA7 L27 9480.1 9348.9 Y Ala 0 11.57 Q72HR3 L28 11006.2 10875.0 Y Ser 1 10.89 N.A. L29 8650.3 N Lys 0 10.70 Q72I12 L30 6785.2 6654.0 Y Pro 0 10.21 Q72I22 L31 11253.0 11121.8 Y Pro 4 9.51 Q72JR0 L32 6717.1 6585.9 Y Ala 4 9.85 P62652 L33 6615.9 6484.7 Y Ala 4 9.85 Q72GW3 L34b 6109.4 N Lys 0 13.16 P80340 L35 7127.7 N Lys 0 10.98 Q72L77 L36 4421.4 N Lys 3 10.66 Q72I28 S1 59985.0 N Glu 0 5.93 N.A. S2 29276.9 29145.7 Y Pro 0 5.59 P62662 S3 26701.2 26570.0 Y Gly 0 10.73 P62663 S4 24324.5 24193.3 Y Gly 4 10.47 P62664 S5 17557.6 17426.4 Y Pro 0 10.05 P62665 S6 11972.9 N Arg 0 6.81 P62666 S7 18016.1 17884.9 Y Ala 1 10.43 P62667 S8 15837.6 N Leu 1 10.26 P62668 S9 14401.7 N Glu 0 10.50 P62669 S10 11930.0 11798.8 Y Pro 0 11.12 P62653 S11 13712.9 13581.7 Y Ala 1 10.35 P62654 S12 14599.4 14468.2 Y Ala 1 12.01 P61941 S13 14304.9 14173.7 Y Ala 1 11.10 P62655 S14 7139.7 7008.5 Y Ala 4 11.43 P62656 S15 10554.4 10423.2 Y Pro 0 10.46 P62657 S16 10387.0 10255.8 Y or N Val 0 10.59 P62238 S17 12296.7 12165.5 Y Pro 0 10.34 P62658 S18 10231.3 10100.1 Y Ser 0 11.55 P62659 S19 10581.5 10450.3 Y Pro 0 10.11 P62660 S20 11689.1 11557.9 Y Ala 0 11.89 P62661 Thx 3337.0 3205.8 Y Gly 0 11.90 P62613
0
a 131.2 Da is subtracted from a protein for loss of N-terminal methionine. b Gene sequence of L34 is from HB8 strain. “n.a.” stands for “not available.”
75
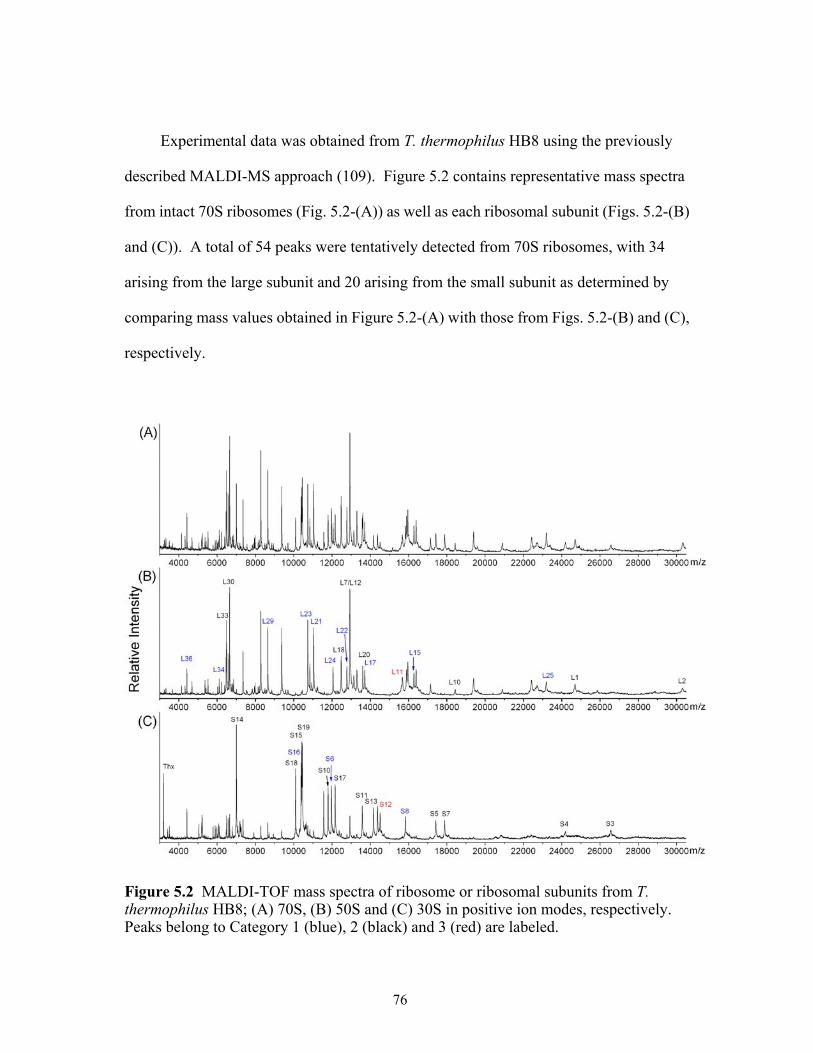
Experimental data was obtained from T. thermophilus HB8 using the previously
described MALDI-MS approach (109). Figure 5.2 contains representative mass spectra
from intact 70S ribosomes (Fig. 5.2-(A)) as well as each ribosomal subunit (Figs. 5.2-(B)
and (C)). A total of 54 peaks were tentatively detected from 70S ribosomes, with 34
arising from the large subunit and 20 arising from the small subunit as determined by
comparing mass values obtained in Figure 5.2-(A) with those from Figs. 5.2-(B) and (C),
respectively.
Figure 5.2 MALDI-TOF mass spectra of ribosome or ribosomal subunits from T. thermophilus HB8; (A) 70S, (B) 50S and (C) 30S in positive ion modes, respectively. Peaks belong to Category 1 (blue), 2 (black) and 3 (red) are labeled.
76
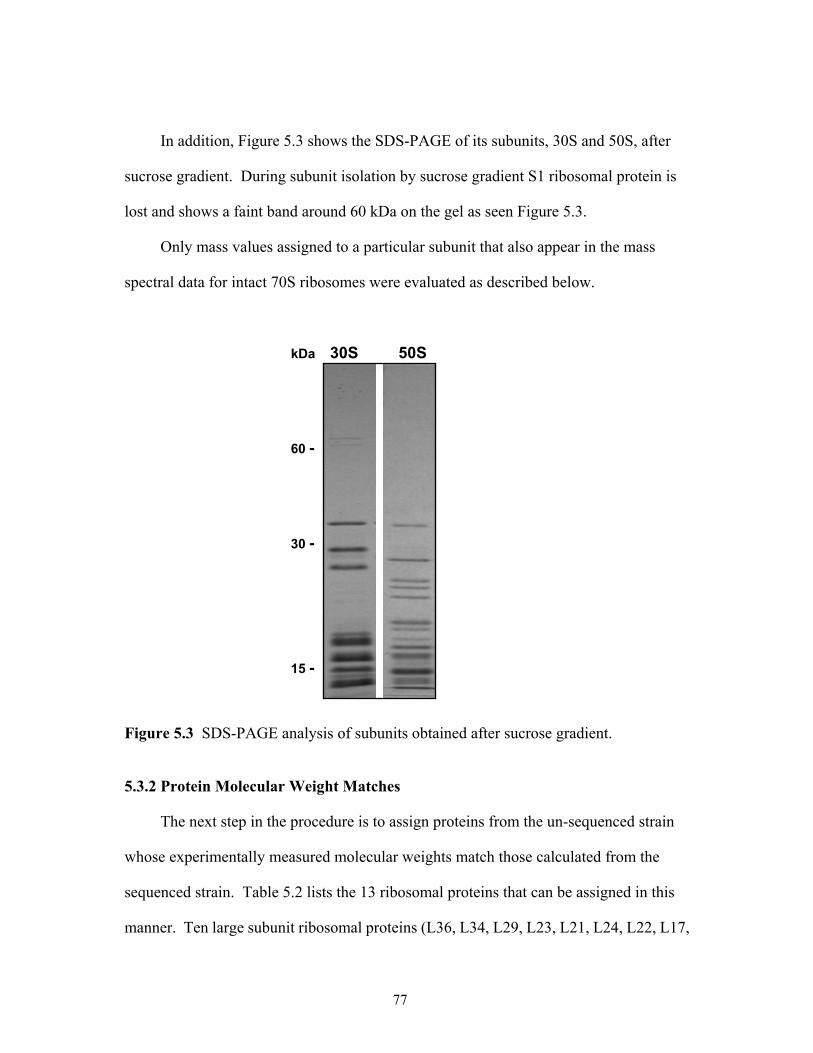
In addition, Figure 5.3 shows the SDS-PAGE of its subunits, 30S and 50S, after
sucrose gradient. During subunit isolation by sucrose gradient S1 ribosomal protein is
lost and shows a faint band around 60 kDa on the gel as seen Figure 5.3.
Only mass values assigned to a particular subunit that also appear in the mass
spectral data for intact 70S ribosomes were evaluated as described below.
kDa 30S 50S
60 -
30 -
15 -
Figure 5.3 SDS-PAGE analysis of subunits obtained after sucrose gradient.
5.3.2 Protein Molecular Weight Matches
The next step in the procedure is to assign proteins from the un-sequenced strain
whose experimentally measured molecular weights match those calculated from the
sequenced strain. Table 5.2 lists the 13 ribosomal proteins that can be assigned in this
manner. Ten large subunit ribosomal proteins (L36, L34, L29, L23, L21, L24, L22, L17,
77
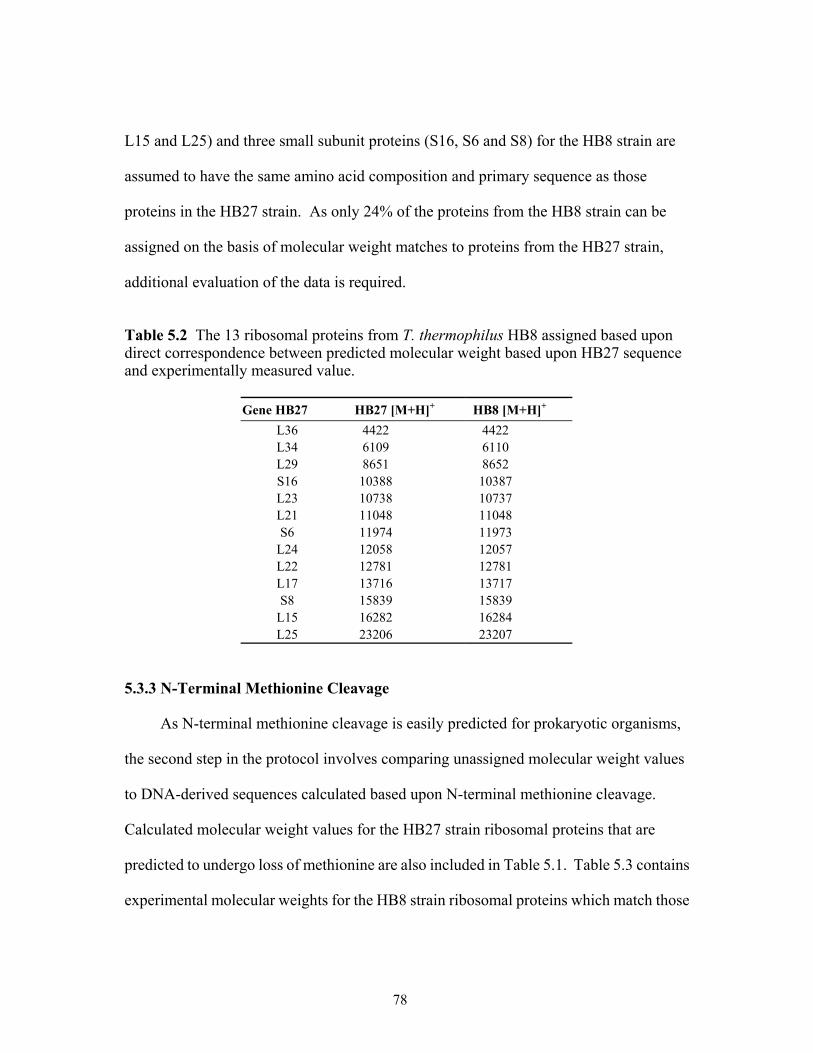
L15 and L25) and three small subunit proteins (S16, S6 and S8) for the HB8 strain are
assumed to have the same amino acid composition and primary sequence as those
proteins in the HB27 strain. As only 24% of the proteins from the HB8 strain can be
assigned on the basis of molecular weight matches to proteins from the HB27 strain,
additional evaluation of the data is required.
Table 5.2 The 13 ribosomal proteins from T. thermophilus HB8 assigned based upon direct correspondence between predicted molecular weight based upon HB27 sequence and experimentally measured value.
Gene HB27 HB27 [M+H]+ HB8 [M+H]+ L36 4422 4422 L34 6109 6110 L29 8651 8652 S16 10388 10387 L23 10738 10737 L21 11048 11048 S6 11974 11973
L24 12058 12057 L22 12781 12781 L17 13716 13717 S8 15839 15839
L15 16282 16284 L25 23206 23207
5.3.3 N-Terminal Methionine Cleavage
As N-terminal methionine cleavage is easily predicted for prokaryotic organisms,
the second step in the protocol involves comparing unassigned molecular weight values
to DNA-derived sequences calculated based upon N-terminal methionine cleavage.
Calculated molecular weight values for the HB27 strain ribosomal proteins that are
predicted to undergo loss of methionine are also included in Table 5.1. Table 5.3 contains
experimental molecular weights for the HB8 strain ribosomal proteins which match those
78
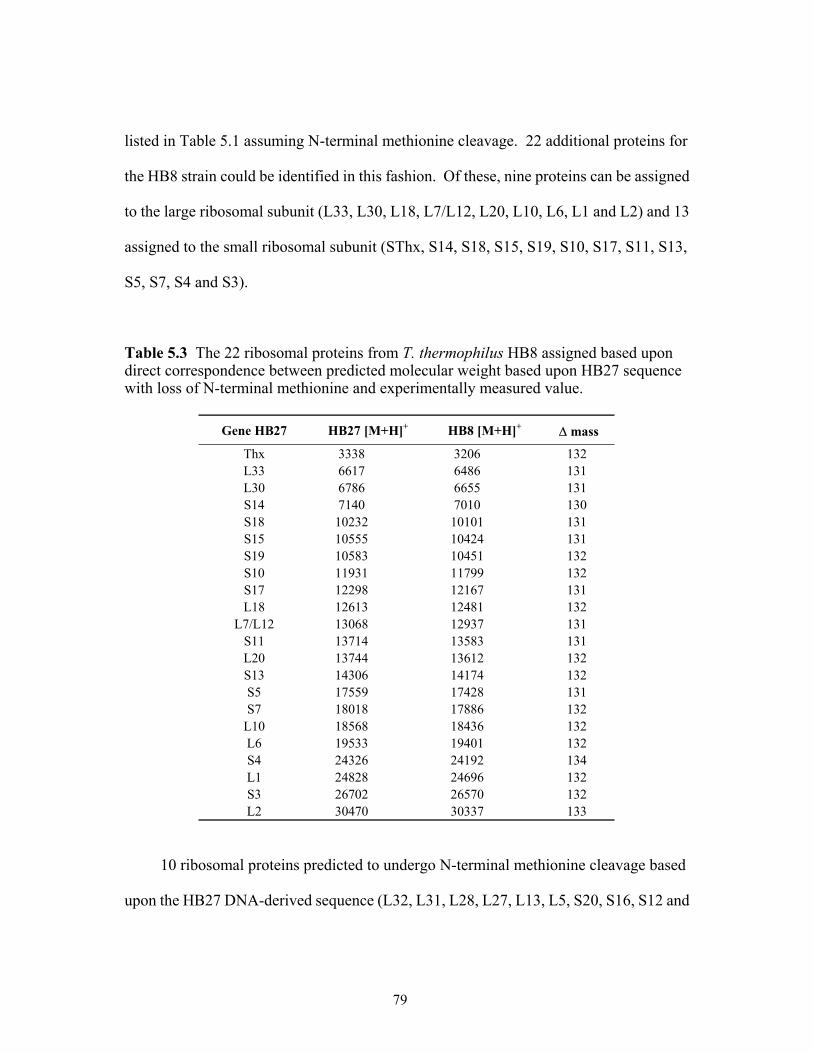
listed in Table 5.1 assuming N-terminal methionine cleavage. 22 additional proteins for
the HB8 strain could be identified in this fashion. Of these, nine proteins can be assigned
to the large ribosomal subunit (L33, L30, L18, L7/L12, L20, L10, L6, L1 and L2) and 13
assigned to the small ribosomal subunit (SThx, S14, S18, S15, S19, S10, S17, S11, S13,
S5, S7, S4 and S3).
Table 5.3 The 22 ribosomal proteins from T. thermophilus HB8 assigned based upon direct correspondence between predicted molecular weight based upon HB27 sequence with loss of N-terminal methionine and experimentally measured value.
Gene HB27 HB27 [M+H]+ HB8 [M+H]+ ∆ mass
Thx 3338 3206 132 L33 6617 6486 131 L30 6786 6655 131 S14 7140 7010 130 S18 10232 10101 131 S15 10555 10424 131 S19 10583 10451 132 S10 11931 11799 132 S17 12298 12167 131 L18 12613 12481 132
L7/L12 13068 12937 131 S11 13714 13583 131 L20 13744 13612 132 S13 14306 14174 132 S5 17559 17428 131 S7 18018 17886 132
L10 18568 18436 132 L6 19533 19401 132 S4 24326 24192 134 L1 24828 24696 132 S3 26702 26570 132 L2 30470 30337 133
10 ribosomal proteins predicted to undergo N-terminal methionine cleavage based
upon the HB27 DNA-derived sequence (L32, L31, L28, L27, L13, L5, S20, S16, S12 and
79
S2) were not observed as truncated proteins from the HB8 strain. Of these, ribosomal
protein S16 was already assigned as a Category 1 protein whose molecular weight
matches that predicted from the HB27 DNA-derived sequence. As S16 from the HB27
sequence has Valinine in the penultimate position and Lysine in the antepenultimate
position, N-terminal methionine cleavage would not be probable. After the second step
of this procedure a total of 35 ribosomal proteins (65%) from the HB8 strain can be
assigned based upon information from the HB27 strain.
5.3.4 Common or Conserved Post-Translational Modifications
While the procedure outlined above identifies approximately 60% of the HB8
counterparts to HB27 ribosomal proteins, 19 ribosomal proteins arising from the
annotation of the HB27 genome remain unassigned in the HB8 experimental data and are
listed in Table 5.4. Thus, the next step undertaken was to consider commonly observed
post-translational modifications, especially those known or suspected to be highly
conserved within this family of proteins. Among ribosomal proteins, post-translational
modification of L11, S12 and L7/L12 are well-documented (39,59,68,108,110). The
commonly observed post-translation modifications of ribosomal proteins in prokaryotic
organisms are methylation, acetylation, and β-methylthiolation.
Ribosomal protein L11 belongs to the class of conserved proteins from prokaryotic
and eukaryotic organisms (111). In E. coli, ribosomal protein L11 is trimethylated at
three amino acid positions by a single enzyme, L11 methyltransferase (39). Methylation
of ribosomal protein L11 from T. thermophilus HB8 was reported previously by HPLC
separation and sequencing although the extent of methylation of L11 was unknown (110).
80
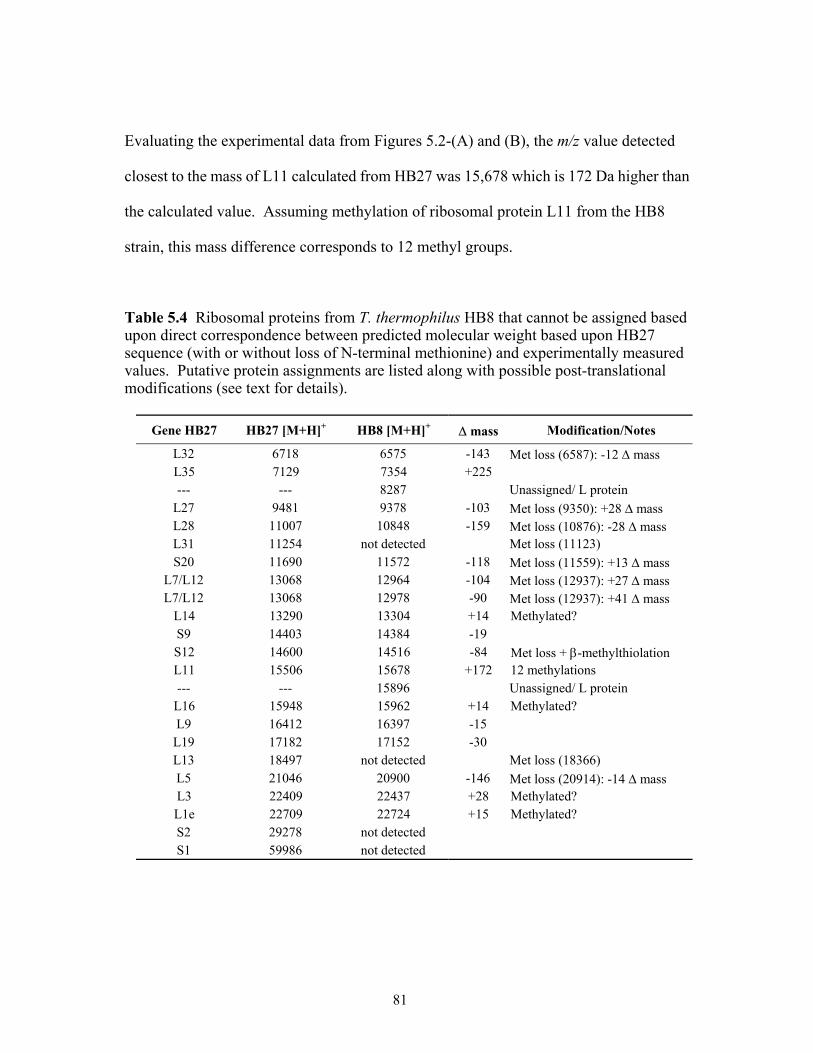
Evaluating the experimental data from Figures 5.2-(A) and (B), the m/z value detected
closest to the mass of L11 calculated from HB27 was 15,678 which is 172 Da higher than
the calculated value. Assuming methylation of ribosomal protein L11 from the HB8
strain, this mass difference corresponds to 12 methyl groups.
Table 5.4 Ribosomal proteins from T. thermophilus HB8 that cannot be assigned based upon direct correspondence between predicted molecular weight based upon HB27 sequence (with or without loss of N-terminal methionine) and experimentally measured values. Putative protein assignments are listed along with possible post-translational modifications (see text for details).
Gene HB27 HB27 [M+H]+ HB8 [M+H]+ ∆ mass Modification/Notes
L32 6718 6575 -143 Met loss (6587): -12 ∆ mass L35 7129 7354 +225 --- --- 8287 Unassigned/ L protein
L27 9481 9378 -103 Met loss (9350): +28 ∆ mass L28 11007 10848 -159 Met loss (10876): -28 ∆ mass L31 11254 not detected Met loss (11123) S20 11690 11572 -118 Met loss (11559): +13 ∆ mass
L7/L12 13068 12964 -104 Met loss (12937): +27 ∆ mass L7/L12 13068 12978 -90 Met loss (12937): +41 ∆ mass
L14 13290 13304 +14 Methylated? S9 14403 14384 -19 S12 14600 14516 -84 Met loss + β-methylthiolation L11 15506 15678 +172 12 methylations --- --- 15896 Unassigned/ L protein
L16 15948 15962 +14 Methylated? L9 16412 16397 -15
L19 17182 17152 -30 L13 18497 not detected Met loss (18366) L5 21046 20900 -146 Met loss (20914): -14 ∆ mass L3 22409 22437 +28 Methylated? L1e 22709 22724 +15 Methylated? S2 29278 not detected S1 59986 not detected
81
To ascertain the multiple methylation(s) of T. thermophilus L11 by the L11
methyltransferase, the mutated HB8 strain lacking the pramA gene encoding the L11
methyltransferase was constructed and then the 70S ribosomes from the mutated HB8
strain were analyzed (108) as seen in Figure 5.4. All other peaks except for L11 from the
mutated HB8 are observed without any mass variation. However, L11 from the mutated
HB8 strain was observed at 15505, which is the expected mass from the DNA-derived
sequence (108). Thus, these studies confirm L11 is methylated twelve times, and these
multiple methylations of T. thermophilus L11 are similar to that of L11 from E. coli
which contains 9 times methylations (112). In addition, ribosomal protein L11 from R.
palustris was identified as having multiple methylations although it was ambiguous
whether the modification was 12 times methyl groups or nine methyl groups and an
acetyl group (59).
Ribosomal protein S12, which plays a role in the maintenance of translational
accuracy, is also a phylogenetically conserved ribosomal protein (41). S12 from E. coli
was identified as being post-translationally modified with a 3-methylthioaspartic acid at
D88 by use of MALDI-TOF MS in combination with post-source decay sequencing (68).
S12 from R. palustris was also identified and the 3-methylthioaspartic acid at D88
localized with “top-down” and “bottom-up” approaches coupled to FT-ICR MS (59).
From the experimental data generated in this study, no ion corresponding to the
unmodified ribosomal protein S12 at m/z 14,600 was detected. However, an ion at m/z
14,515 was found, and this ion would correspond to S12 with N-terminal methionine
cleavage and a 3-methylthioaspartic acid. Although this modification must be validated
by additional experiments, based upon the information derived from this study plus prior
82
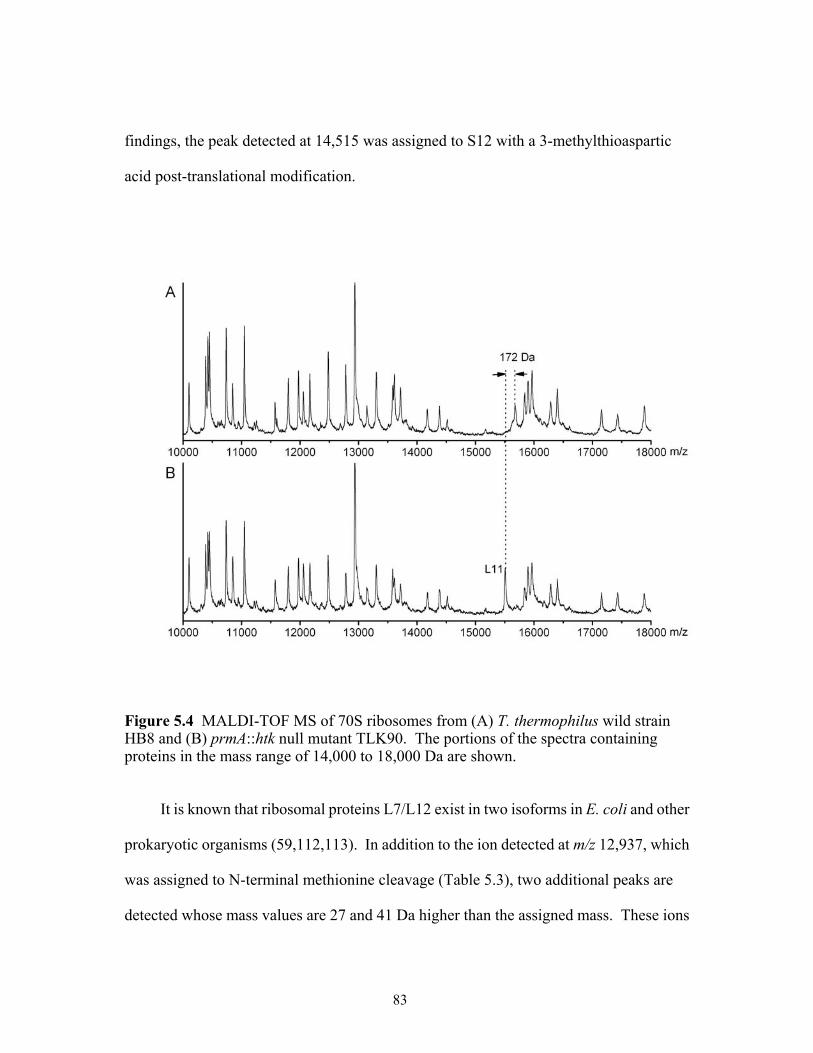
findings, the peak detected at 14,515 was assigned to S12 with a 3-methylthioaspartic
acid post-translational modification.
Figure 5.4 MALDI-TOF MS of 70S ribosomes from (A) T. thermophilus wild strain HB8 and (B) prmA::htk null mutant TLK90. The portions of the spectra containing proteins in the mass range of 14,000 to 18,000 Da are shown.
It is known that ribosomal proteins L7/L12 exist in two isoforms in E. coli and other
prokaryotic organisms (59,112,113). In addition to the ion detected at m/z 12,937, which
was assigned to N-terminal methionine cleavage (Table 5.3), two additional peaks are
detected whose mass values are 27 and 41 Da higher than the assigned mass. These ions
83
likely correspond to dimethylated and trimethylated or acetylated modifications to
L7/L12, respectively. Although insufficient mass accuracy is available to distinguish
trimethylation (42.09 Da) from acetylation (42.04 Da), these results are consistent with
the existence of two isoforms of this protein and these additional peaks are assigned as
modified L7/L12.
5.3.5 Unmatched Peaks
After completion of steps 1 through 3 of this procedure, 37 of the 54 ribosomal
proteins from T. thermophilus HB8 can be assigned, and two additional m/z values can be
assigned as post-translationally modified isoforms of L7/L12. Tentative assignments of
the remaining ribosomal proteins were made as follows. First, any proteins expected to
undergo N-terminal methionine cleavage were matched to the nearest m/z values. As a
result, ribosomal proteins L32, L28, L27, L5, S20 and S9 were tentatively identified and
the resulting mass differences between the HB27 derived molecular weights and the
experimentally measured molecular weights are listed in Table 5.4. The mass differences
range from +28 Da to -28 Da and could be due to either post-translational modifications
or differences between the HB27 and HB8 sequences.
The remaining m/z values were then tentatively assigned based upon molecular
weight comparisons to HB27 ribosomal proteins. In this fashion, ribosomal proteins L35,
L19, L16, L14, L9, L3 and L1e were identified and the resulting mass differences
between the HB27 derived molecular weights and the experimentally measured
molecular weights are listed in Table 5.4. With the exception of L35 (∆ mass = 225 Da),
all other experimentally measured molecular weights differed from that calculated from
84
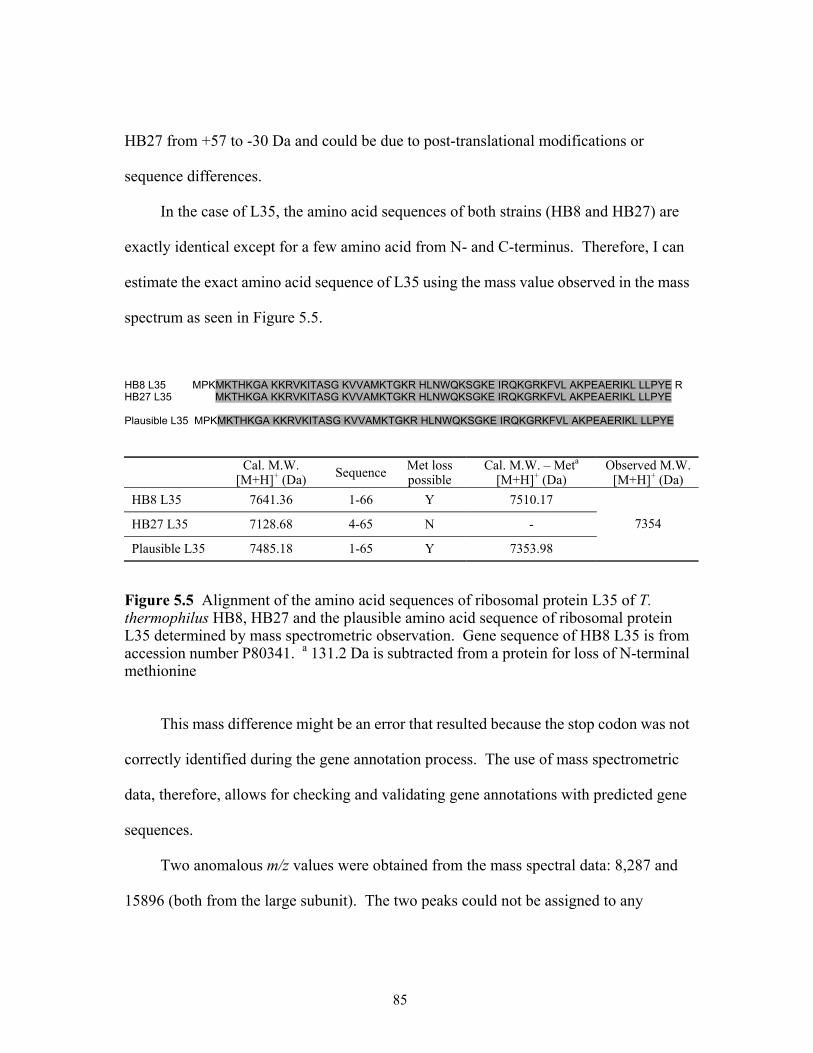
HB27 from +57 to -30 Da and could be due to post-translational modifications or
sequence differences.
In the case of L35, the amino acid sequences of both strains (HB8 and HB27) are
exactly identical except for a few amino acid from N- and C-terminus. Therefore, I can
estimate the exact amino acid sequence of L35 using the mass value observed in the mass
spectrum as seen in Figure 5.5.
HB8 L35 MPKMKTHKGA KKRVKITASG KVVAMKTGKR HLNWQKSGKE IRQKGRKFVL AKPEAERIKL LLPYE R HB27 L35 MKTHKGA KKRVKITASG KVVAMKTGKR HLNWQKSGKE IRQKGRKFVL AKPEAERIKL LLPYE Plausible L35 MPKMKTHKGA KKRVKITASG KVVAMKTGKR HLNWQKSGKE IRQKGRKFVL AKPEAERIKL LLPYE
Cal. M.W. [M+H]+ (Da) Sequence Met loss
possible Cal. M.W. – Meta
[M+H]+ (Da) Observed M.W.
[M+H]+ (Da) HB8 L35 7641.36 1-66 Y 7510.17
HB27 L35 7128.68 4-65 N -
Plausible L35 7485.18 1-65 Y 7353.98
7354
Figure 5.5 Alignment of the amino acid sequences of ribosomal protein L35 of T. thermophilus HB8, HB27 and the plausible amino acid sequence of ribosomal protein L35 determined by mass spectrometric observation. Gene sequence of HB8 L35 is from accession number P80341. a 131.2 Da is subtracted from a protein for loss of N-terminal methionine
This mass difference might be an error that resulted because the stop codon was not
correctly identified during the gene annotation process. The use of mass spectrometric
data, therefore, allows for checking and validating gene annotations with predicted gene
sequences.
Two anomalous m/z values were obtained from the mass spectral data: 8,287 and
15896 (both from the large subunit). The two peaks could not be assigned to any
85
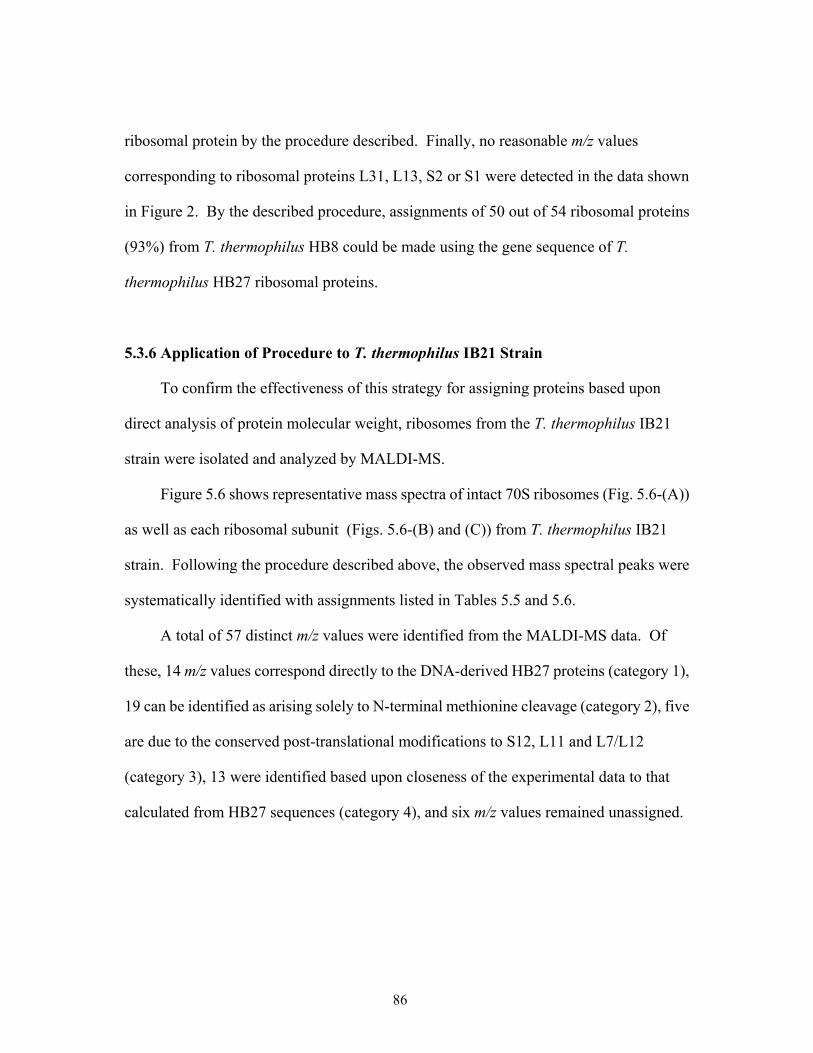
ribosomal protein by the procedure described. Finally, no reasonable m/z values
corresponding to ribosomal proteins L31, L13, S2 or S1 were detected in the data shown
in Figure 2. By the described procedure, assignments of 50 out of 54 ribosomal proteins
(93%) from T. thermophilus HB8 could be made using the gene sequence of T.
thermophilus HB27 ribosomal proteins.
5.3.6 Application of Procedure to T. thermophilus IB21 Strain
To confirm the effectiveness of this strategy for assigning proteins based upon
direct analysis of protein molecular weight, ribosomes from the T. thermophilus IB21
strain were isolated and analyzed by MALDI-MS.
Figure 5.6 shows representative mass spectra of intact 70S ribosomes (Fig. 5.6-(A))
as well as each ribosomal subunit (Figs. 5.6-(B) and (C)) from T. thermophilus IB21
strain. Following the procedure described above, the observed mass spectral peaks were
systematically identified with assignments listed in Tables 5.5 and 5.6.
A total of 57 distinct m/z values were identified from the MALDI-MS data. Of
these, 14 m/z values correspond directly to the DNA-derived HB27 proteins (category 1),
19 can be identified as arising solely to N-terminal methionine cleavage (category 2), five
are due to the conserved post-translational modifications to S12, L11 and L7/L12
(category 3), 13 were identified based upon closeness of the experimental data to that
calculated from HB27 sequences (category 4), and six m/z values remained unassigned.
86
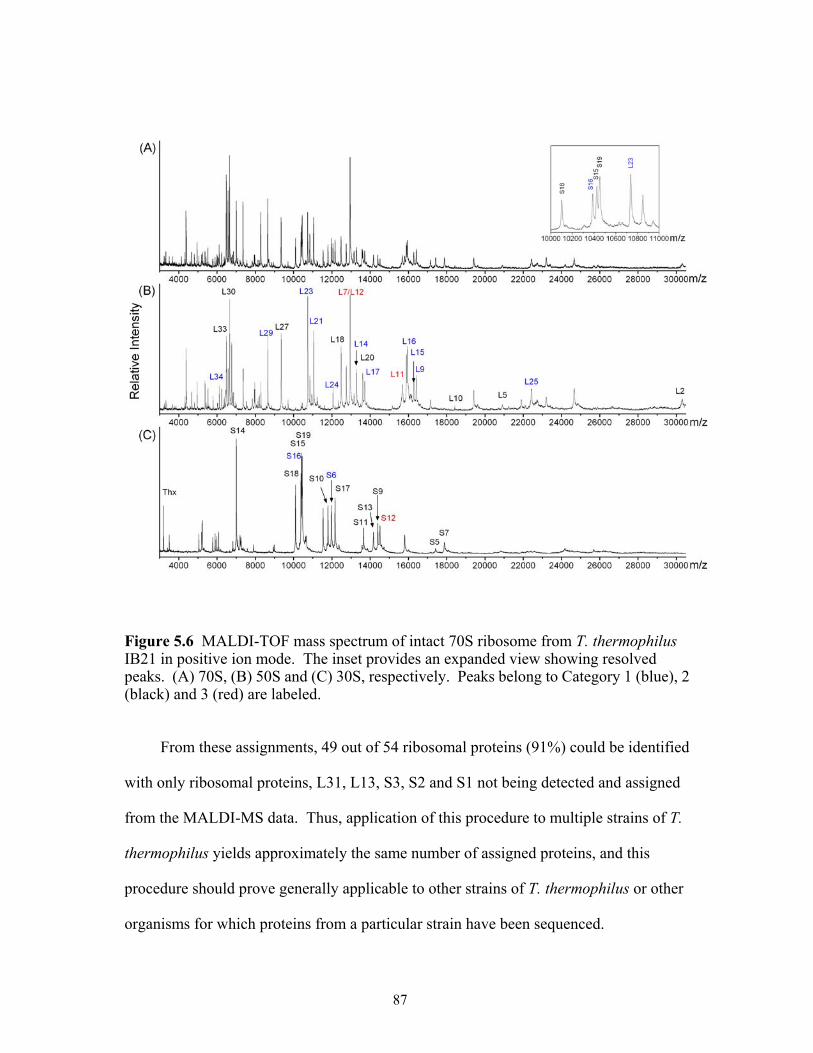
Figure 5.6 MALDI-TOF mass spectrum of intact 70S ribosome from T. thermophilus IB21 in positive ion mode. The inset provides an expanded view showing resolved peaks. (A) 70S, (B) 50S and (C) 30S, respectively. Peaks belong to Category 1 (blue), 2 (black) and 3 (red) are labeled.
From these assignments, 49 out of 54 ribosomal proteins (91%) could be identified
with only ribosomal proteins, L31, L13, S3, S2 and S1 not being detected and assigned
from the MALDI-MS data. Thus, application of this procedure to multiple strains of T.
thermophilus yields approximately the same number of assigned proteins, and this
procedure should prove generally applicable to other strains of T. thermophilus or other
organisms for which proteins from a particular strain have been sequenced.
87
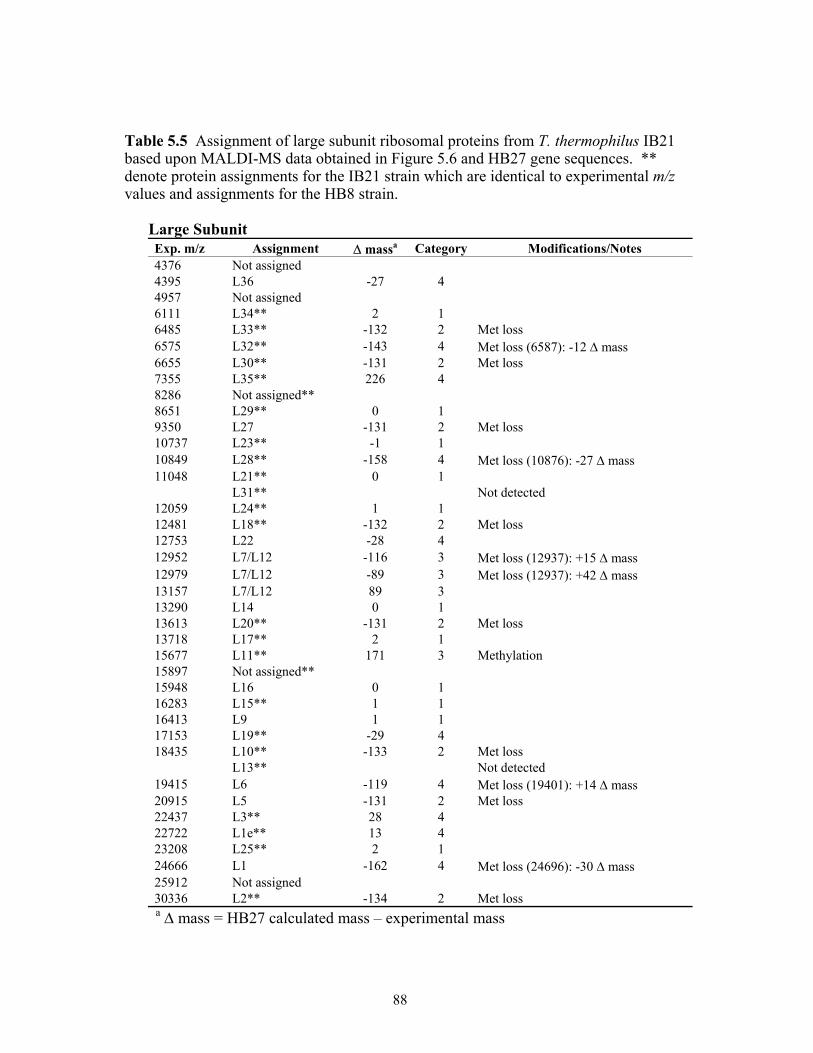
Table 5.5 Assignment of large subunit ribosomal proteins from T. thermophilus IB21 based upon MALDI-MS data obtained in Figure 5.6 and HB27 gene sequences. ** denote protein assignments for the IB21 strain which are identical to experimental m/z values and assignments for the HB8 strain.
Large Subunit Exp. m/z Assignment ∆ massa Category Modifications/Notes 4376 Not assigned 4395 L36 -27 4 4957 Not assigned 6111 L34** 2 1 6485 L33** -132 2 Met loss 6575 L32** -143 4 Met loss (6587): -12 ∆ mass 6655 L30** -131 2 Met loss 7355 L35** 226 4 8286 Not assigned** 8651 L29** 0 1 9350 L27 -131 2 Met loss 10737 L23** -1 1 10849 L28** -158 4 Met loss (10876): -27 ∆ mass 11048 L21** 0 1 L31** Not detected 12059 L24** 1 1 12481 L18** -132 2 Met loss 12753 L22 -28 4 12952 L7/L12 -116 3 Met loss (12937): +15 ∆ mass 12979 L7/L12 -89 3 Met loss (12937): +42 ∆ mass 13157 L7/L12 89 3 13290 L14 0 1 13613 L20** -131 2 Met loss 13718 L17** 2 1 15677 L11** 171 3 Methylation 15897 Not assigned** 15948 L16 0 1 16283 L15** 1 1 16413 L9 1 1 17153 L19** -29 4 18435 L10** -133 2 Met loss L13** Not detected 19415 L6 -119 4 Met loss (19401): +14 ∆ mass 20915 L5 -131 2 Met loss 22437 L3** 28 4 22722 L1e** 13 4 23208 L25** 2 1 24666 L1 -162 4 Met loss (24696): -30 ∆ mass 25912 Not assigned 30336 L2** -134 2 Met loss a ∆ mass = HB27 calculated mass – experimental mass
88
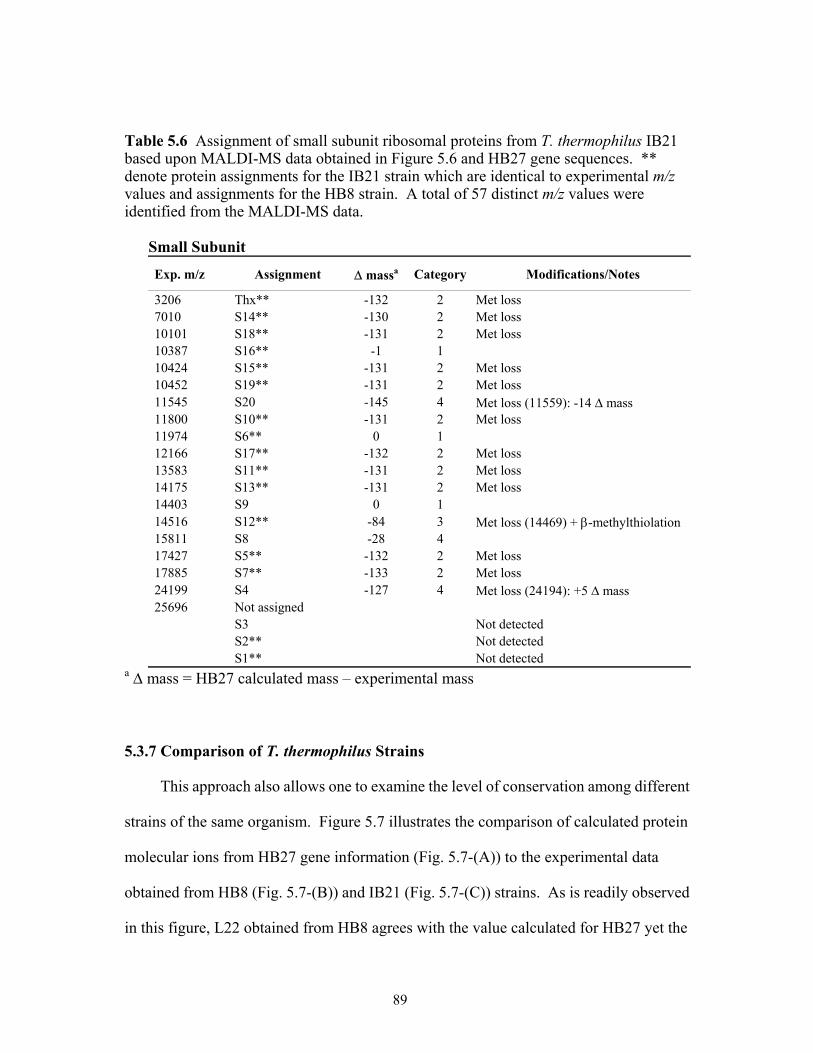
Table 5.6 Assignment of small subunit ribosomal proteins from T. thermophilus IB21 based upon MALDI-MS data obtained in Figure 5.6 and HB27 gene sequences. ** denote protein assignments for the IB21 strain which are identical to experimental m/z values and assignments for the HB8 strain. A total of 57 distinct m/z values were identified from the MALDI-MS data.
Small Subunit
Exp. m/z Assignment ∆ massa Category Modifications/Notes
3206 Thx** -132 2 Met loss 7010 S14** -130 2 Met loss 10101 S18** -131 2 Met loss 10387 S16** -1 1 10424 S15** -131 2 Met loss 10452 S19** -131 2 Met loss 11545 S20 -145 4 Met loss (11559): -14 ∆ mass 11800 S10** -131 2 Met loss 11974 S6** 0 1 12166 S17** -132 2 Met loss 13583 S11** -131 2 Met loss 14175 S13** -131 2 Met loss 14403 S9 0 1 14516 S12** -84 3 Met loss (14469) + β-methylthiolation 15811 S8 -28 4 17427 S5** -132 2 Met loss 17885 S7** -133 2 Met loss 24199 S4 -127 4 Met loss (24194): +5 ∆ mass 25696 Not assigned S3 Not detected S2** Not detected S1** Not detected
a ∆ mass = HB27 calculated mass – experimental mass
5.3.7 Comparison of T. thermophilus Strains
This approach also allows one to examine the level of conservation among different
strains of the same organism. Figure 5.7 illustrates the comparison of calculated protein
molecular ions from HB27 gene information (Fig. 5.7-(A)) to the experimental data
obtained from HB8 (Fig. 5.7-(B)) and IB21 (Fig. 5.7-(C)) strains. As is readily observed
in this figure, L22 obtained from HB8 agrees with the value calculated for HB27 yet the
89
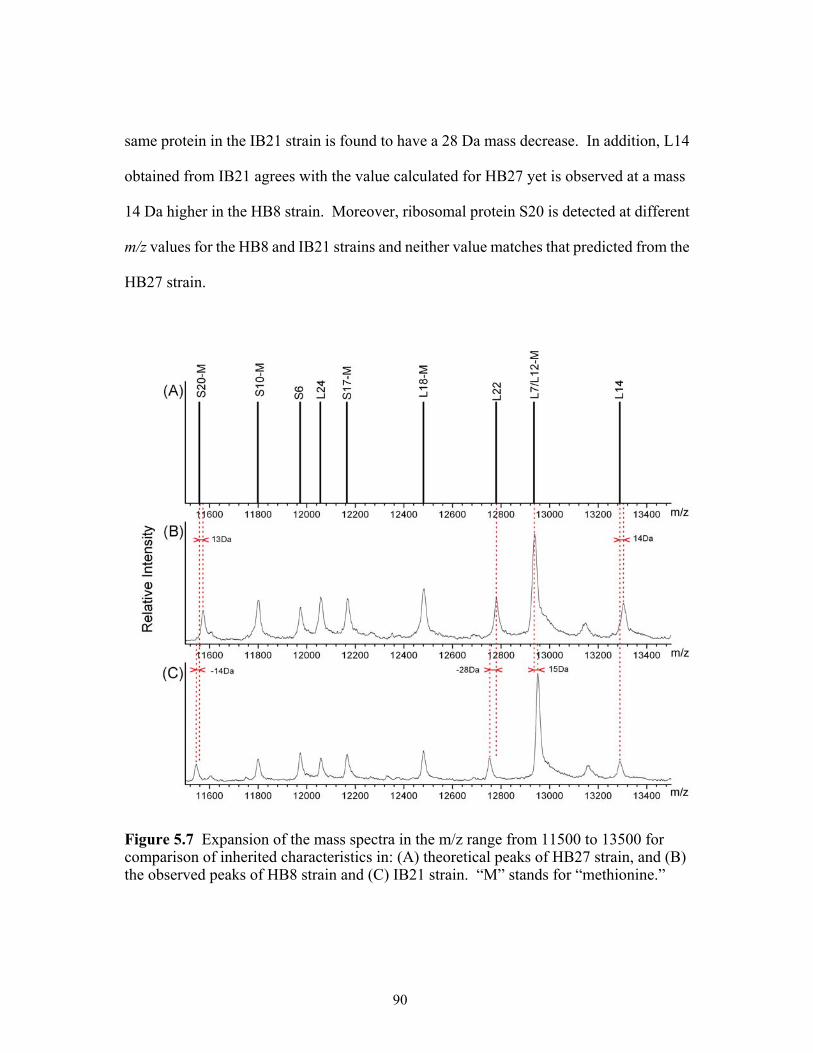
same protein in the IB21 strain is found to have a 28 Da mass decrease. In addition, L14
obtained from IB21 agrees with the value calculated for HB27 yet is observed at a mass
14 Da higher in the HB8 strain. Moreover, ribosomal protein S20 is detected at different
m/z values for the HB8 and IB21 strains and neither value matches that predicted from the
HB27 strain.
Figure 5.7 Expansion of the mass spectra in the m/z range from 11500 to 13500 for comparison of inherited characteristics in: (A) theoretical peaks of HB27 strain, and (B) the observed peaks of HB8 strain and (C) IB21 strain. “M” stands for “methionine.”
90
As noted in Tables 5.5 and 5.6, 35 ribosomal proteins were found to yield identical
molecular weights from the HB8 and IB21 strains. Fourteen ribosomal proteins (L36,
L27, L22, L16, L14, L7/L12, L9, L6, L5, L1, S20, S9, S8 and S4) were found to yield
different molecular weights between the HB8 and IB21 strains. Ribosomal proteins L36,
L22, L6, L7/L12, L1 and S8 were found to have identical molecular weights for the HB8
and HB27 strains yet were detected at different m/z values in the IB21 strain. Conversely,
ribosomal proteins L27, L16, L14, L9, L5 and S9 were found to have the same molecular
weights for the HB27 and IB21 strains yet were detected at different m/z values in the
HB8 strain. S20 was the only ribosomal protein found to yield a different molecular
weight for all three strains. Thus, S20 would be an example of a protein that could serve
as a biomarker to distinguish among these strains of T. thermophilus.
Several ribosomal proteins (L31, L13, S2 and S1) were not detected in either strain.
It has previously been reported that detection of all ribosomal proteins by MALDI-MS is
difficult due to a combination of ion suppression and sample losses during the preparation
step. However, during similar analyses of E. coli ribosomal proteins, only S1 was unable
to be detected by MALDI-MS (109). Thus, further investigations are necessary to
characterize the four proteins not detected in this work. Moreover, the unassigned ions at
m/z 8286 and 15896 were detected during the analysis of both strains. Whether these ions
correspond to a ribosomal protein that was not correctly annotated from the HB27
genome or correspond to a contaminating protein is unknown at the present time.
91
5.4 Conclusions
A straightforward procedure for assigning prokaryotic proteins based upon
MALDI-MS data and DNA-derived protein sequences has been presented. This
procedure allows currently available protein database information specific for a particular
strain of an organism to be extended to strains for which no database information exists.
As illustrated with T. thermophilus, more than 90% of the analyzed proteins can be
assigned by this procedure. And while around 60% of the ribosomal proteins for the HB8
and IB21 strains were found to yield molecular weights consistent with the published
protein sequences for the HB27 strain, 20% of the investigated proteins yielded
molecular weights which differed among the three strains.
Although the MALDI-MS approach provides a rapid and sensitive route for
extending protein assignments, the approach as described cannot determine the exact
chemical constituents that lead to mass differences between measured and database
values. For these discrepancies, either a negative or a positive mass shift is observed.
Negative mass shifts are most likely due to differences in the primary amino acid
sequence of the proteins, which may be caused by a polymorphism leading to the
substitution of a single amino acid in the corresponding protein sequence. Positive mass
shifts are either due to differences in the primary amino acid sequence of the proteins or
due to differential post-translational modifications. While the data generated by
MALDI-MS cannot distinguish between these two possibilities nor provide information
on the specific site of amino acid substitution or post-translational modification, these
data do allow one to focus further efforts on only those proteins suspected of differing
amongst the various strains. Further, this approach can allow one to readily identify
92

proteins that could serve as potential biomarkers for establishing strain identity from
unknown samples.
93
Chapter 6. Determination of Protease Accessible Ribosomal Proteins of the 30S Ribosomal Subunits from Escherichia coli by Limited Proteolysis and Matrix-Assisted Laser Desorption/Ionization Mass Spectrometry
6.1 Introduction
A fundamental prerequisite for understanding the biochemical interactions
occurring within the ribosome during protein synthesis is a detailed knowledge of the
structure of the ribosome. A number of experimental approaches including crosslinking,
immunoelectron microscopy (IEM), cryo-electron microscopy (cryo-EM), neutron
scattering, nuclear magnetic resonance (NMR) and X-ray crystallography have been used
to characterize ribosome structure and topology (2,114-125). Some of the most
successful approaches for characterizing intact ribosomes include IEM, cryo-EM,
neutron scattering and X-ray crystallography. Within the past five years, high-resolution
crystal structures of ribosomal subunits or intact ribosomes have been obtained that
provide detailed structural information at the atomic level (2,123-127). To better
understand the structure and function of the ribosome new methods sensitive to the
different functional states of the dynamic ribosome are necessary.
Limited proteolysis is a method that can be used for determining how exposed
surfaces of the ribosome are affected by conformational rearrangements and movements
of ribosomal components during the steps associated with protein translation.
Mass spectrometry has been used as the readout step in a limited proteolysis
approach for characterizing macromolecular structure (128-133). In those previous
reports, single proteins with nucleic acids or ligands (128,130) or virus complexes (132)
94
were investigated by limited proteolysis with mass spectrometry. Most prior limited
proteolysis studies have been carried out to observe the conformational changes of a
protein with and without bound nucleic acid or ligands, and for probing the structural and
dynamic differences between the holo and apo form of a protein (129). Based on the
interaction between a protein and a nucleic acid or ligand, the stable domain of a protein
or the likely sites of binding within the protein could be directly determined by mass
spectrometry without requiring sample isolation after limited proteolysis.
Here I expand the use of limited proteolysis with MALDI-TOF MS to a much larger
and more complex macromolecular assembly containing ribosomal proteins and rRNAs.
The initial method development was tested with 30S ribosomal subunits from E. coli. In
the present study the protease accessible ribosomal proteins have been identified by a
combination of limited proteolysis and MALDI-TOF MS. The nine ribosomal proteins
extensively associated with 16S rRNA were identified and unambiguously assigned
based upon their accurately measured molecular weights. In addition, some proteins
were determined to be stable in a truncated form suggesting that these truncated proteins
are still associated with rRNA.
6.2 Experimental
6.2.1 Materials
Buffer reagents, Proteinase K and the MALDI protein/peptide calibration kit were
obtained from Sigma (St. Louis, MO, USA). Trypsin (sequencing grade) and DNase
were purchased from Promega (Madison, MI, USA). Sinapinic acid (SA) and
α-cyano-4-hydroxycinnamic acid (CHCA) were obtained from Fluka (Milwaukee, WI,
95
USA). Sucrose (RNAse free and DNAse free grade) was purchased from Acros Organics
(Fairlawn, NJ, USA). Acids and organic solvents were HPLC grade or better.
6.2.2 Methods
6.2.2.1 Preparation of 70S Ribosome and its Subunits E. coli (MRE 600) 70S
ribosomes were obtained in-house as described in Chapter 3. Ribosomal subunits were
isolated through 0-45% sucrose gradient as described in Chapter 3. The pellets were
resuspended in buffer (10 mM Tris-HCl at pH 7.6, 10.5 mM MgCl2, and 50 mM NH4Cl),
and aliquots were further analyzed.
6.2.2.2 Limited Proteolysis of 30S Subunits Limited proteolysis using trypsin or
Proteinase K was carried out in a buffer of 10 mM Tris-HCl (pH 7.6), 10.5 mM
magnesium acetate, 50 mM NH4Cl and 3 mM β-mercaptoethanol at 37 ˚C. The enzyme
to substrate ratio was adjusted to 1:500 (w/w) to achieve time-resolved cleavage with
around 200 µg of 30S subunit present initially. The concentration of the 30S subunit was
determined by UV absorbance (1 A260 unit = 69 pmole for 30S (82)). The total volume of
reaction mixture was 80 µL. Aliquots were withdrawn from the reaction mixture at
specified time intervals for electrophoretic and mass spectrometric analysis. For
electrophoretic analysis, 5 µL of reaction mixture was removed, combined with the
electrophoresis loading buffer and then immediately heated in a boiling water bath for 10
min to halt proteolysis. For protein analysis with MALDI-MS, 4.5 µL of reaction
mixture was removed and combined with 0.5 µL of 25% trifluoroacetic acid (TFA) to
stop the reaction. For peptide analysis with MALDI-MS, 1 µL of reaction mixture was
96
removed and combined with 5 µL of matrix solution. As controls, ribosomal proteins
isolated from the 30S subunit by acetic acid treatment were incubated with trypsin, and
the 30S subunit was incubated without added protease. All control reactions were
prepared for analysis by either electrophoresis or MALDI-MS as described above.
6.2.2.3 SDS-PAGE and In-Gel Digestion 12.5% SDS-PAGE analysis was carried
out as described in Chapter 4. As necessary to confirm proteolytic fragment identities,
in-gel digestion followed by MALDI peptide mass fingerprinting was also done as
described in Chapter 4.
6.2.2.4 MALDI Analysis All MALDI-MS experiments were done on a Bruker
Reflex IV reflectron MALDI-TOF mass spectrometer (Bruker Daltonics, Billerica, MA,
USA) equipped with a nitrogen laser as described in Chapter 4. MALDI samples were
prepared by combining 1 µL of TFA-treated ribosomal solution with 9 µL of the SA
matrix. For peptide analysis, 100 mM CHCA in 50% aqueous acetonitrile/0.1% TFA
was used as the matrix. Calibration of peptide mass spectra was done using the Sigma
peptide calibration kit composed of angiotensin II, ACTH (fragment 18-39) and insulin
chain B. Calibration of protein mass spectra was done using a mixture of insulin,
ubiquitin, cytochrome c, myoglobin and BSA and then recalibrated internally with
well-resolved ribosomal proteins.
6.2.2.5 Data Analysis Proteolytic digestion products were identified using the
SequenceEditor software provided by the MALDI manufacturer and Protein Prospector
(3). The coordinates for the 9-10 Å resolution structure of the E. coli ribosomes reported
97
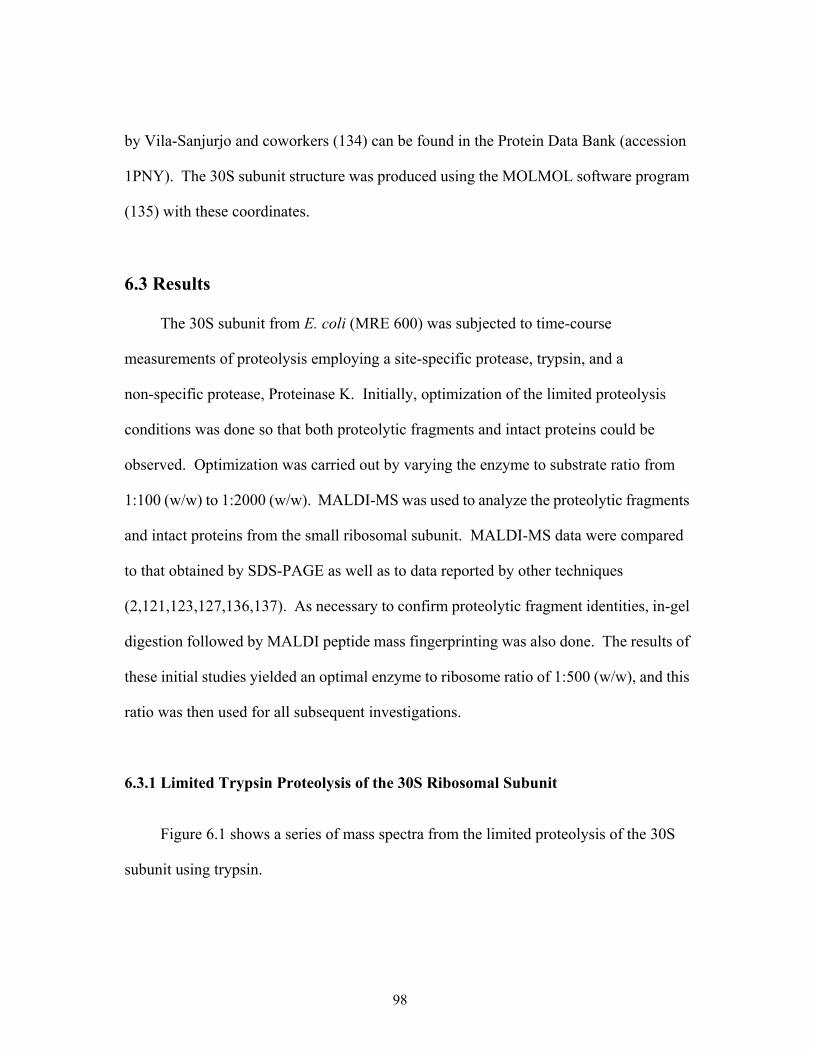
by Vila-Sanjurjo and coworkers (134) can be found in the Protein Data Bank (accession
1PNY). The 30S subunit structure was produced using the MOLMOL software program
(135) with these coordinates.
6.3 Results
The 30S subunit from E. coli (MRE 600) was subjected to time-course
measurements of proteolysis employing a site-specific protease, trypsin, and a
non-specific protease, Proteinase K. Initially, optimization of the limited proteolysis
conditions was done so that both proteolytic fragments and intact proteins could be
observed. Optimization was carried out by varying the enzyme to substrate ratio from
1:100 (w/w) to 1:2000 (w/w). MALDI-MS was used to analyze the proteolytic fragments
and intact proteins from the small ribosomal subunit. MALDI-MS data were compared
to that obtained by SDS-PAGE as well as to data reported by other techniques
(2,121,123,127,136,137). As necessary to confirm proteolytic fragment identities, in-gel
digestion followed by MALDI peptide mass fingerprinting was also done. The results of
these initial studies yielded an optimal enzyme to ribosome ratio of 1:500 (w/w), and this
ratio was then used for all subsequent investigations.
6.3.1 Limited Trypsin Proteolysis of the 30S Ribosomal Subunit
Figure 6.1 shows a series of mass spectra from the limited proteolysis of the 30S
subunit using trypsin.
98
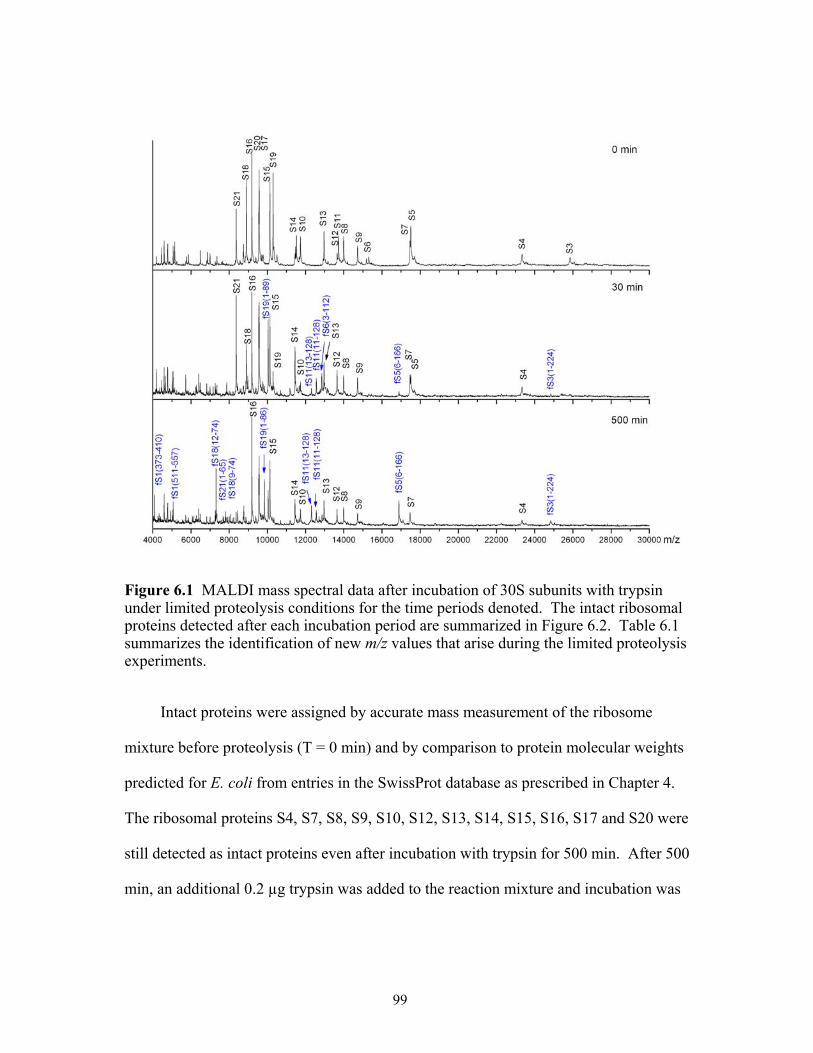
Figure 6.1 MALDI mass spectral data after incubation of 30S subunits with trypsin under limited proteolysis conditions for the time periods denoted. The intact ribosomal proteins detected after each incubation period are summarized in Figure 6.2. Table 6.1 summarizes the identification of new m/z values that arise during the limited proteolysis experiments.
Intact proteins were assigned by accurate mass measurement of the ribosome
mixture before proteolysis (T = 0 min) and by comparison to protein molecular weights
predicted for E. coli from entries in the SwissProt database as prescribed in Chapter 4.
The ribosomal proteins S4, S7, S8, S9, S10, S12, S13, S14, S15, S16, S17 and S20 were
still detected as intact proteins even after incubation with trypsin for 500 min. After 500
min, an additional 0.2 µg trypsin was added to the reaction mixture and incubation was
99
continued for 60 min. Even under these conditions, no difference in the mass spectral
results was seen as compared to the data obtained at 500 min.
The mass spectral data limited to those proteins remaining intact after limited
proteolysis with trypsin are summarized in Figure 6.2.
Figure 6.2 Intact ribosomal proteins from 30S ribosomal subunits observed with MALDI-TOF MS after incubation with protease for denoted time periods.
The ribosomal proteins S3, S5, S6, S11, S19 and S22 were digested within 60 min
under the conditions employed here as determined by the disappearance of mass spectral
peaks corresponding to the mass of the intact protein. Given the relative instability of
these ribosomal proteins to limited proteolysis using trypsin, such proteins must be
100
well-exposed on the ribosome surface or, at a minimum, have regions containing
lysine(s) or arginine(s) that are sufficiently exposed for proteolysis. In addition to the
loss of mass spectral peaks from these ribosomal proteins, new ion signals at various m/z
values were detected during these analyses. The mass spectral data of these new
proteolytic fragments are summarized in Table 6.1. The new m/z values that arise during
limited proteolysis were identified, where possible, by combining knowledge of the
specificity of trypsin with the mass values and original masses of the intact ribosomal
proteins.
As seen in Table 6.1, the proteolytic fragments generally arise from cleavage of N-
and/or C-terminal domains of the various ribosomal proteins. Similar cleavages have
been found during limited proteolysis studies of isolated ribosomal proteins whose
tertiary structure was maintained after extraction from ribosomes (138).
To verify that the results obtained in these experiments reflected the interaction
between ribosomal proteins and rRNA, ribosomal proteins were analyzed after
incubating at 37 ˚C for 500 min without trypsin. No difference in the mass spectral data
obtained under these conditions as compared to the T = 0 min data in Figure 6.1 was
found. In addition, ribosomal proteins that were isolated from the small ribosomal
subunit by acetic acid treatment were also incubated with trypsin for 500 min.
MALDI-MS analysis of this reaction mixture yielded no intact proteins. Under
these conditions, ribosomal proteins are separated from rRNA and the organizational
structure of the small ribosomal subunit is destroyed. Thus, these analyses demonstrate
that the limited proteolysis studies carried out here can be used to probe the interaction
between ribosomal proteins and rRNAs within the 30S subunit.
101
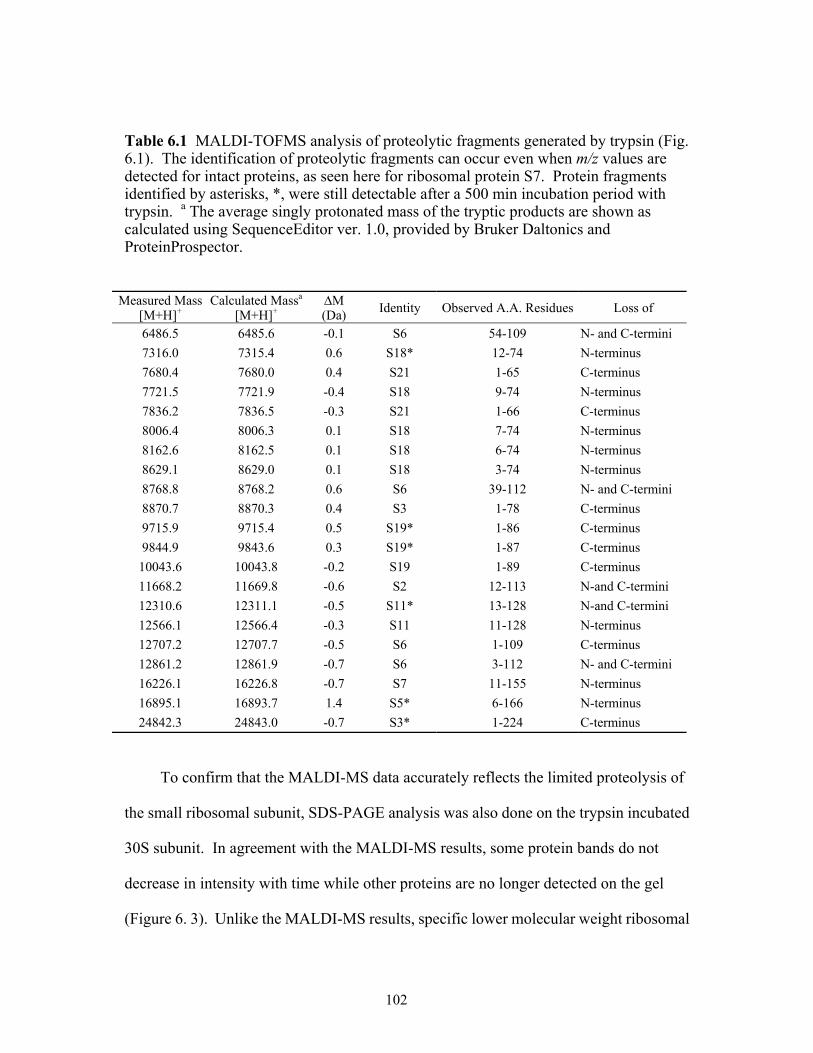
Table 6.1 MALDI-TOFMS analysis of proteolytic fragments generated by trypsin (Fig. 6.1). The identification of proteolytic fragments can occur even when m/z values are detected for intact proteins, as seen here for ribosomal protein S7. Protein fragments identified by asterisks, *, were still detectable after a 500 min incubation period with trypsin. a The average singly protonated mass of the tryptic products are shown as calculated using SequenceEditor ver. 1.0, provided by Bruker Daltonics and ProteinProspector.
Measured Mass [M+H]+
Calculated Massa
[M+H]+ ∆M (Da) Identity Observed A.A. Residues Loss of
6486.5 6485.6 -0.1 S6 54-109 N- and C-termini 7316.0 7315.4 0.6 S18* 12-74 N-terminus 7680.4 7680.0 0.4 S21 1-65 C-terminus 7721.5 7721.9 -0.4 S18 9-74 N-terminus 7836.2 7836.5 -0.3 S21 1-66 C-terminus 8006.4 8006.3 0.1 S18 7-74 N-terminus 8162.6 8162.5 0.1 S18 6-74 N-terminus 8629.1 8629.0 0.1 S18 3-74 N-terminus 8768.8 8768.2 0.6 S6 39-112 N- and C-termini 8870.7 8870.3 0.4 S3 1-78 C-terminus 9715.9 9715.4 0.5 S19* 1-86 C-terminus 9844.9 9843.6 0.3 S19* 1-87 C-terminus
10043.6 10043.8 -0.2 S19 1-89 C-terminus 11668.2 11669.8 -0.6 S2 12-113 N-and C-termini 12310.6 12311.1 -0.5 S11* 13-128 N-and C-termini 12566.1 12566.4 -0.3 S11 11-128 N-terminus 12707.2 12707.7 -0.5 S6 1-109 C-terminus 12861.2 12861.9 -0.7 S6 3-112 N- and C-termini 16226.1 16226.8 -0.7 S7 11-155 N-terminus 16895.1 16893.7 1.4 S5* 6-166 N-terminus 24842.3 24843.0 -0.7 S3* 1-224 C-terminus
To confirm that the MALDI-MS data accurately reflects the limited proteolysis of
the small ribosomal subunit, SDS-PAGE analysis was also done on the trypsin incubated
30S subunit. In agreement with the MALDI-MS results, some protein bands do not
decrease in intensity with time while other proteins are no longer detected on the gel
(Figure 6. 3). Unlike the MALDI-MS results, specific lower molecular weight ribosomal
102
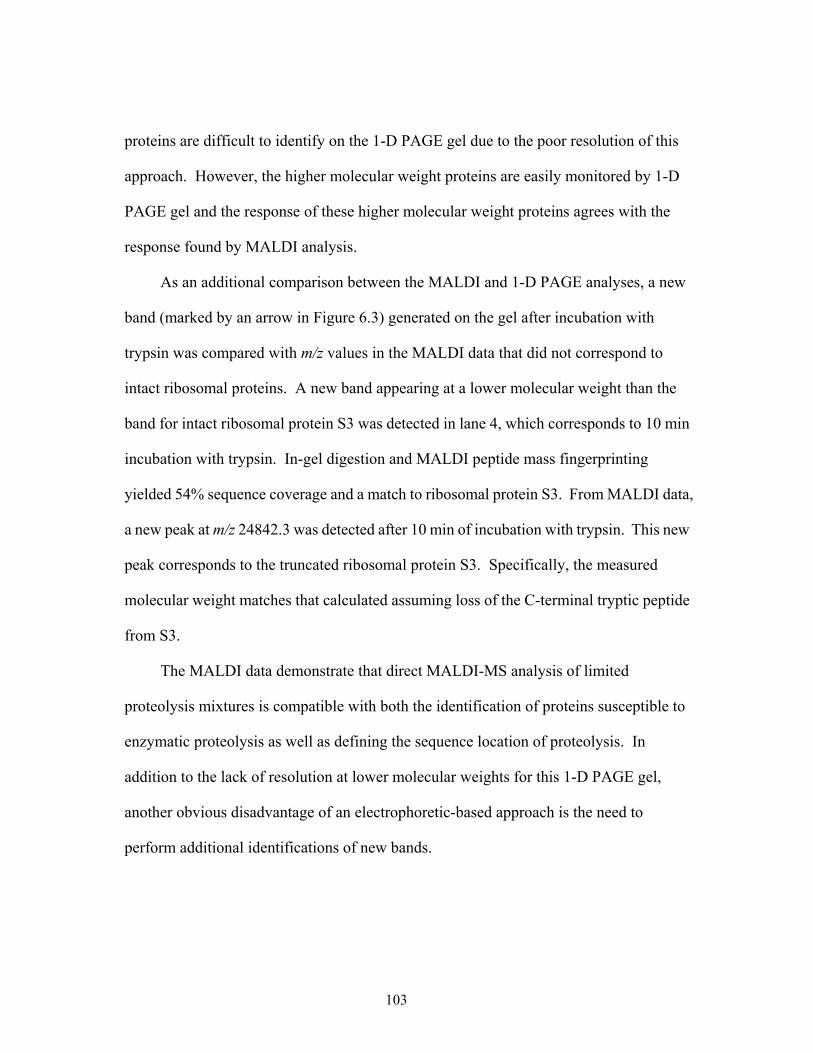
proteins are difficult to identify on the 1-D PAGE gel due to the poor resolution of this
approach. However, the higher molecular weight proteins are easily monitored by 1-D
PAGE gel and the response of these higher molecular weight proteins agrees with the
response found by MALDI analysis.
As an additional comparison between the MALDI and 1-D PAGE analyses, a new
band (marked by an arrow in Figure 6.3) generated on the gel after incubation with
trypsin was compared with m/z values in the MALDI data that did not correspond to
intact ribosomal proteins. A new band appearing at a lower molecular weight than the
band for intact ribosomal protein S3 was detected in lane 4, which corresponds to 10 min
incubation with trypsin. In-gel digestion and MALDI peptide mass fingerprinting
yielded 54% sequence coverage and a match to ribosomal protein S3. From MALDI data,
a new peak at m/z 24842.3 was detected after 10 min of incubation with trypsin. This new
peak corresponds to the truncated ribosomal protein S3. Specifically, the measured
molecular weight matches that calculated assuming loss of the C-terminal tryptic peptide
from S3.
The MALDI data demonstrate that direct MALDI-MS analysis of limited
proteolysis mixtures is compatible with both the identification of proteins susceptible to
enzymatic proteolysis as well as defining the sequence location of proteolysis. In
addition to the lack of resolution at lower molecular weights for this 1-D PAGE gel,
another obvious disadvantage of an electrophoretic-based approach is the need to
perform additional identifications of new bands.
103
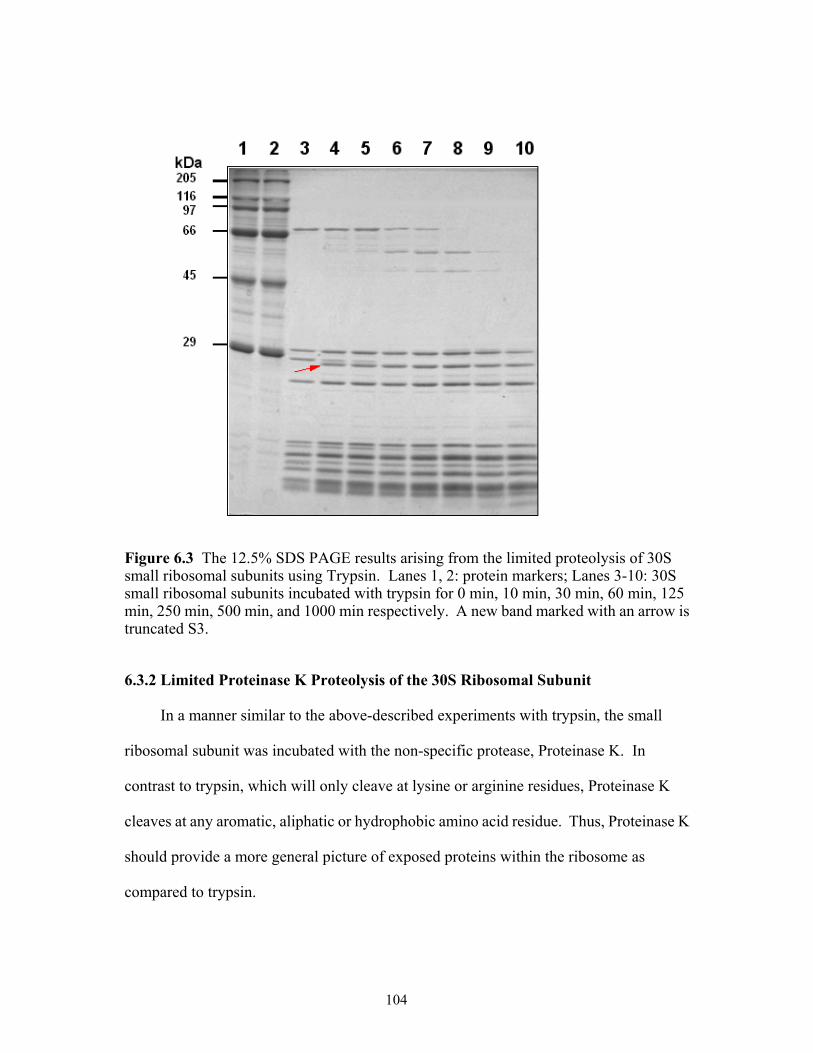
Figure 6.3 The 12.5% SDS PAGE results arising from the limited proteolysis of 30S small ribosomal subunits using Trypsin. Lanes 1, 2: protein markers; Lanes 3-10: 30S small ribosomal subunits incubated with trypsin for 0 min, 10 min, 30 min, 60 min, 125 min, 250 min, 500 min, and 1000 min respectively. A new band marked with an arrow is truncated S3.
6.3.2 Limited Proteinase K Proteolysis of the 30S Ribosomal Subunit
In a manner similar to the above-described experiments with trypsin, the small
ribosomal subunit was incubated with the non-specific protease, Proteinase K. In
contrast to trypsin, which will only cleave at lysine or arginine residues, Proteinase K
cleaves at any aromatic, aliphatic or hydrophobic amino acid residue. Thus, Proteinase K
should provide a more general picture of exposed proteins within the ribosome as
compared to trypsin.
104
Figure 6.4 shows a series of mass spectra from the limited proteolysis of the 30S
subunit using Proteinase K for 500 min.
Figure 6.4 MALDI mass spectral data after incubation of 30S small subunits with Proteinase K under limited proteolysis conditions for the time periods denoted. The intact ribosomal proteins detected after each incubation period are summarized in Figure 6.2.
The mass spectral data limited to those proteins remaining intact after limited
proteolysis with Proteinase K are summarized in Figure 6.2. In comparison to the data
obtained via limited proteolysis with trypsin, the ribosomal proteins S4, S8, S9, S12, S13,
S15, S16, S17 and S20 were detected intact after incubation with either Proteinase K or
105
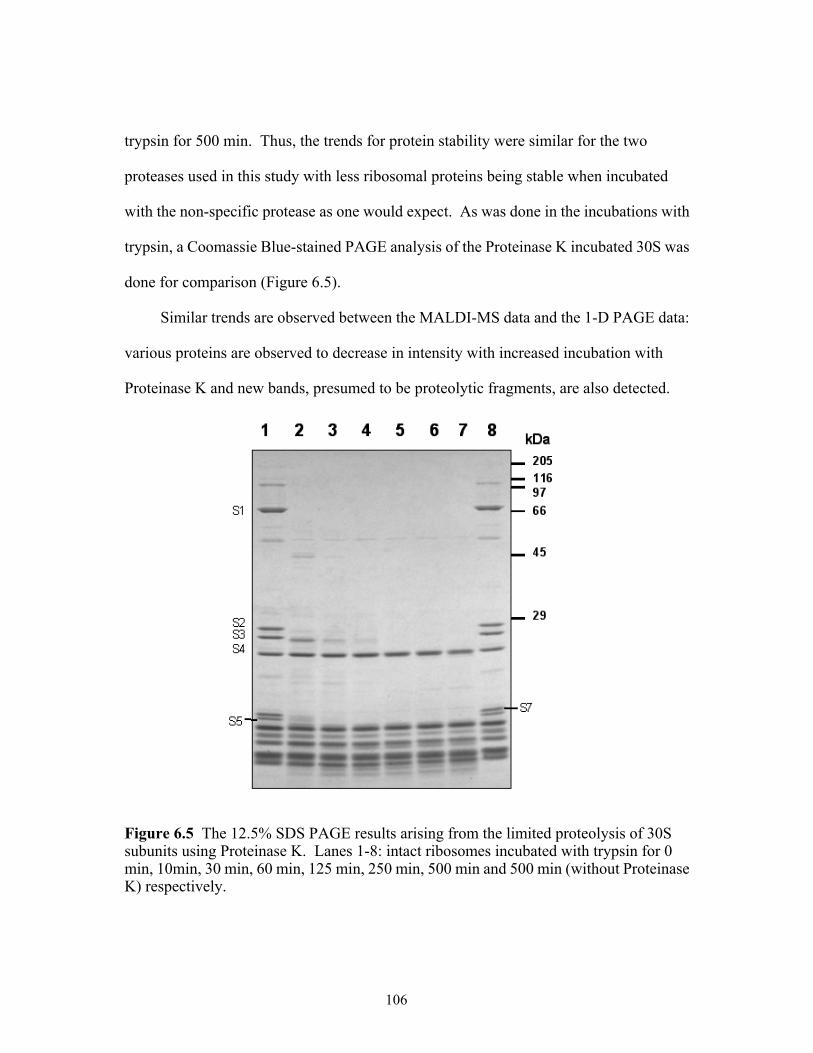
trypsin for 500 min. Thus, the trends for protein stability were similar for the two
proteases used in this study with less ribosomal proteins being stable when incubated
with the non-specific protease as one would expect. As was done in the incubations with
trypsin, a Coomassie Blue-stained PAGE analysis of the Proteinase K incubated 30S was
done for comparison (Figure 6.5).
Similar trends are observed between the MALDI-MS data and the 1-D PAGE data:
various proteins are observed to decrease in intensity with increased incubation with
Proteinase K and new bands, presumed to be proteolytic fragments, are also detected.
Figure 6.5 The 12.5% SDS PAGE results arising from the limited proteolysis of 30S subunits using Proteinase K. Lanes 1-8: intact ribosomes incubated with trypsin for 0 min, 10min, 30 min, 60 min, 125 min, 250 min, 500 min and 500 min (without Proteinase K) respectively.
106
The use of a non-specific protease hinders determination of precise sites of
proteolysis. A few digested products, which are cleaved from N- or C-termini, can be
assigned based on proteolytic fragments generated by trypsin. For example, ribosomal
protein S5 was cleaved at the similar locations in both proteases, (in trypsin, residues
6-166, in Proteinase K, residues 7-166) and a stable peptide remained. Most significant,
though, is the correlation between MALDI and PAGE results as well as the correlation
between ribosomal protein stability and limited proteolysis with the two enzymes. By
comparison of the limited proteolysis results obtained between trypsin and Proteinase K,
the ribosomal proteins most strongly interacting with rRNA and ribosomal proteins
whose surface exposed regions are resistant to trypsin but not general proteolysis can be
identified.
6.4 Discussion
6.4.1 Combining Limited Proteolysis with MALDI-MS
Several factors including ribosomal protein-rRNA or protein-protein interactions,
location of proteins within the 30S subunits, protease:ribosome ratio, time of incubation,
pH, temperature, and protease specificity will influence the data obtained from limited
proteolysis experiments. The ribosomal proteins isolated from 30S subunits were rapidly
and completely digested by trypsin. However, when limited proteolysis was done on the
30S subunit, information relating to the interaction between ribosomal proteins and
rRNAs was obtained. Our results demonstrate that the limited proteolysis experiments
that were done in this study accurately reflect interactions between ribosomal proteins
and rRNA and are sensitive to the specific factors mentioned above.
107
The use of the less specific protease, Proteinase K, resulted in 3 more digested
proteins as compared to trypsin. Such results are to be expected given the lack of
specificity for Proteinase K. However, because interactions between ribosomal proteins
and rRNA are usually through salt-bridges between positively charged residues on the
proteins and phosphate oxygen atoms on the rRNA (62), basic residues such as arginine
and lysine that interact with rRNA through salt-bridges will be less susceptible to
proteolysis. Thus, protease specificity may not account for all of the differences between
trypsin and Proteinase K found in this study, although an examination of the data
obtained in this study did not discern any relationship between the frequency of
arginine/lysine residues within a protein and the rate of proteolysis with trypsin. Taken
together, I conclude that these limited proteolysis experiments provide insight into
specific intermolecular interactions within the 30S subunit.
There are several advantages to using MALDI-MS as the detection step for limited
proteolysis of the 30S subunit. Because molecular weight is an intrinsic property, a
detection method that reports molecular weights can be used to directly identify those
proteins resistant to proteolysis. In addition, when a protease of high specificity, such as
trypsin, is used, the identification of proteolytic fragments is also possible, especially
when the hydrolyzed peptide is from the N- or C-terminus of the protein. In that case, a
simple comparison of measured molecular weight values to those predicted based upon
loss of an N- or C-terminus tryptic peptide is all that is needed to assign the identity of the
proteolytic fragment and site of proteolysis. When internal peptide domains are cleaved,
data analysis and interpretation becomes more difficult primarily due to the greater
number of theoretical cleavage masses that must be calculated. A limitation of the
108
approach described here is that some ribosomal proteins, S1 and S2, are not detected in
the control experiments because those acidic proteins are easily lost during TFA
treatments. As noted in Chapter 4, some proteins may be difficult to detect when all
ribosomal proteins are analyzed due to MALDI suppression effects.
6.4.2 Comparison of MALDI-MS Data Obtained from Different Proteases
The ribosomal proteins S4, S8, S9, S12, S13, S15, S16, S17 and S20 were not
completely digested by either trypsin or Proteinase K even at the longest periods of
incubation (500 min) examined in these studies. Thus, the trends in protein stability are
very similar for the two proteases investigated in this study. Those proteins stable to
proteolysis in both cases are likely important in maintaining ribosome organization and
should be the core proteins that have significant interactions with rRNA.
The ribosomal proteins from the 30S subunit found to be resistant to limited
proteolysis using trypsin have been placed on the E. coli 30S subunit crystal structure in
Figure 6.6. As expected from the protease specificity, when trypsin is used for limited
proteolysis, fewer proteins were found to be digested from the 30S subunit than when
Proteinase K was used. In particular, the ribosomal proteins S7, S10 and S14 were
resistant to extensive limited proteolysis with trypsin yet digested when Proteinase K was
used. Even the addition of higher amounts of trypsin after 500 min and further incubation
does not lead to proteolysis of those proteins.
109
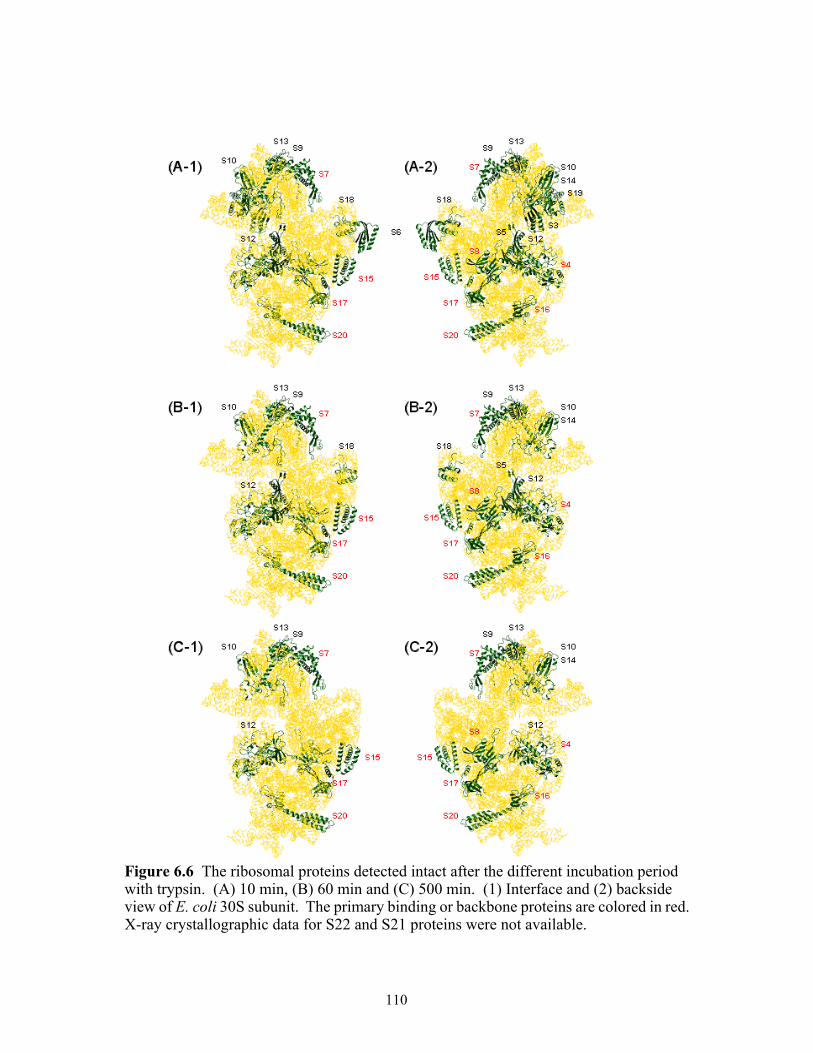
Figure 6.6 The ribosomal proteins detected intact after the different incubation period with trypsin. (A) 10 min, (B) 60 min and (C) 500 min. (1) Interface and (2) backside view of E. coli 30S subunit. The primary binding or backbone proteins are colored in red. X-ray crystallographic data for S22 and S21 proteins were not available.
110
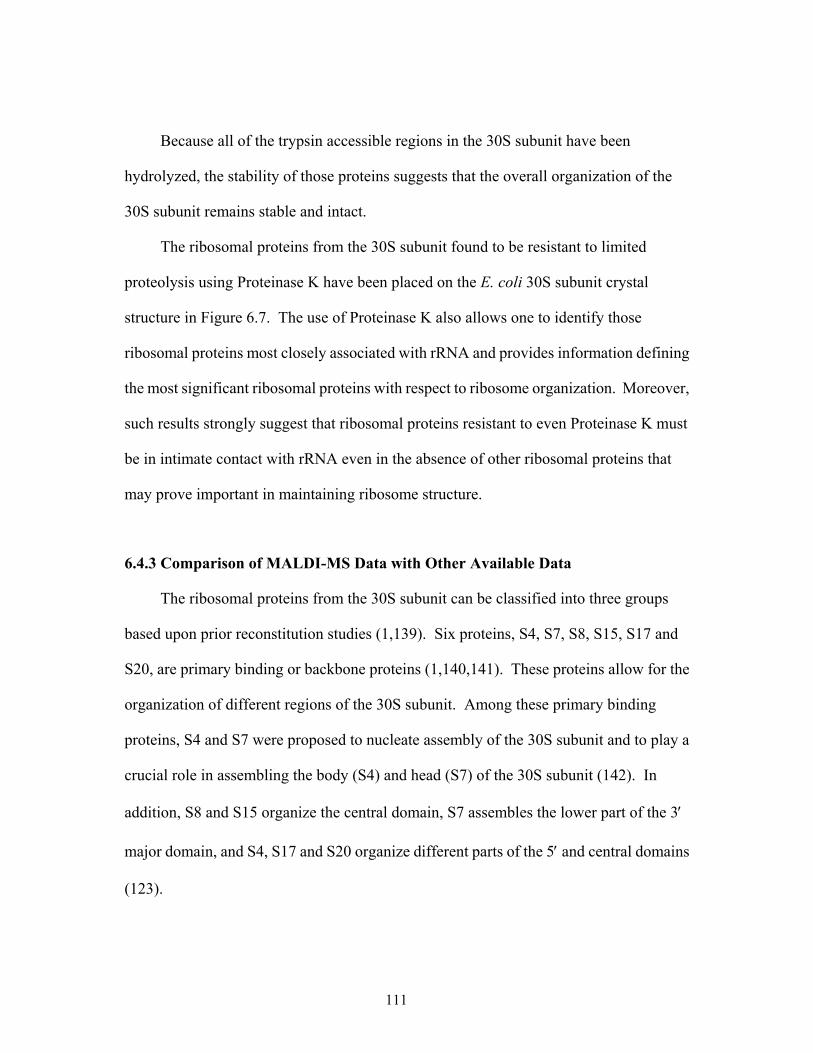
Because all of the trypsin accessible regions in the 30S subunit have been
hydrolyzed, the stability of those proteins suggests that the overall organization of the
30S subunit remains stable and intact.
The ribosomal proteins from the 30S subunit found to be resistant to limited
proteolysis using Proteinase K have been placed on the E. coli 30S subunit crystal
structure in Figure 6.7. The use of Proteinase K also allows one to identify those
ribosomal proteins most closely associated with rRNA and provides information defining
the most significant ribosomal proteins with respect to ribosome organization. Moreover,
such results strongly suggest that ribosomal proteins resistant to even Proteinase K must
be in intimate contact with rRNA even in the absence of other ribosomal proteins that
may prove important in maintaining ribosome structure.
6.4.3 Comparison of MALDI-MS Data with Other Available Data
The ribosomal proteins from the 30S subunit can be classified into three groups
based upon prior reconstitution studies (1,139). Six proteins, S4, S7, S8, S15, S17 and
S20, are primary binding or backbone proteins (1,140,141). These proteins allow for the
organization of different regions of the 30S subunit. Among these primary binding
proteins, S4 and S7 were proposed to nucleate assembly of the 30S subunit and to play a
crucial role in assembling the body (S4) and head (S7) of the 30S subunit (142). In
addition, S8 and S15 organize the central domain, S7 assembles the lower part of the 3′
major domain, and S4, S17 and S20 organize different parts of the 5′ and central domains
(123).
111
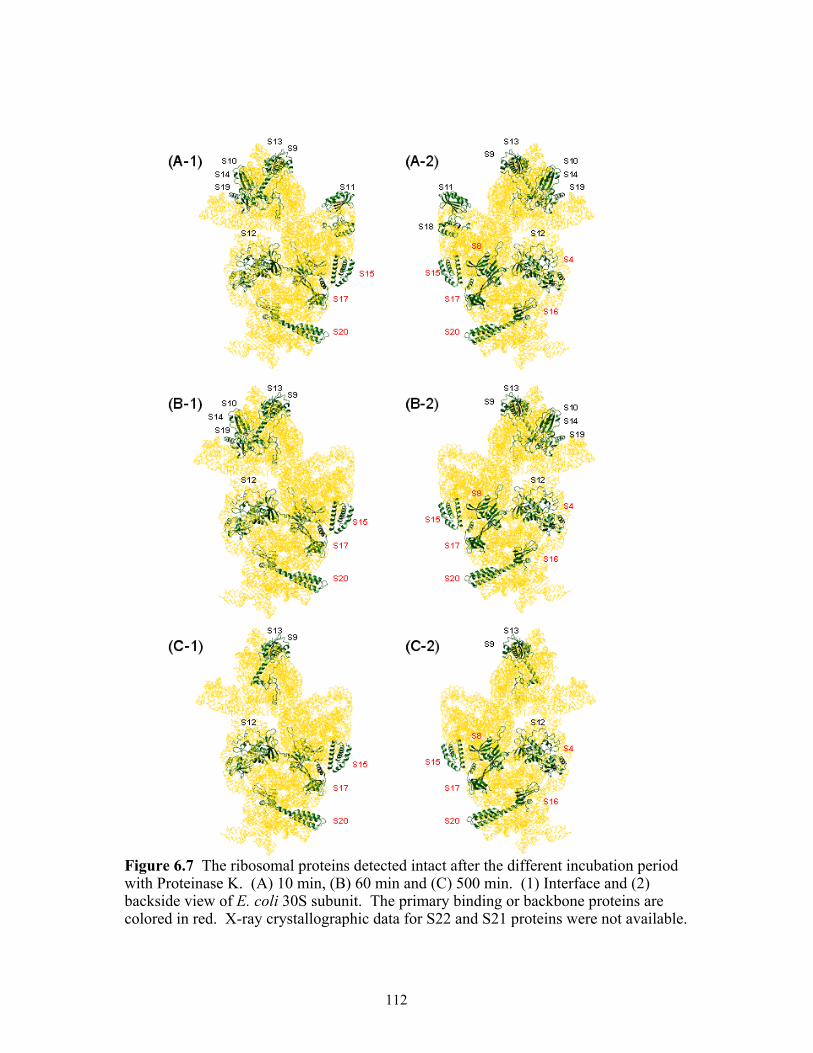
Figure 6.7 The ribosomal proteins detected intact after the different incubation period with Proteinase K. (A) 10 min, (B) 60 min and (C) 500 min. (1) Interface and (2) backside view of E. coli 30S subunit. The primary binding or backbone proteins are colored in red. X-ray crystallographic data for S22 and S21 proteins were not available.
112
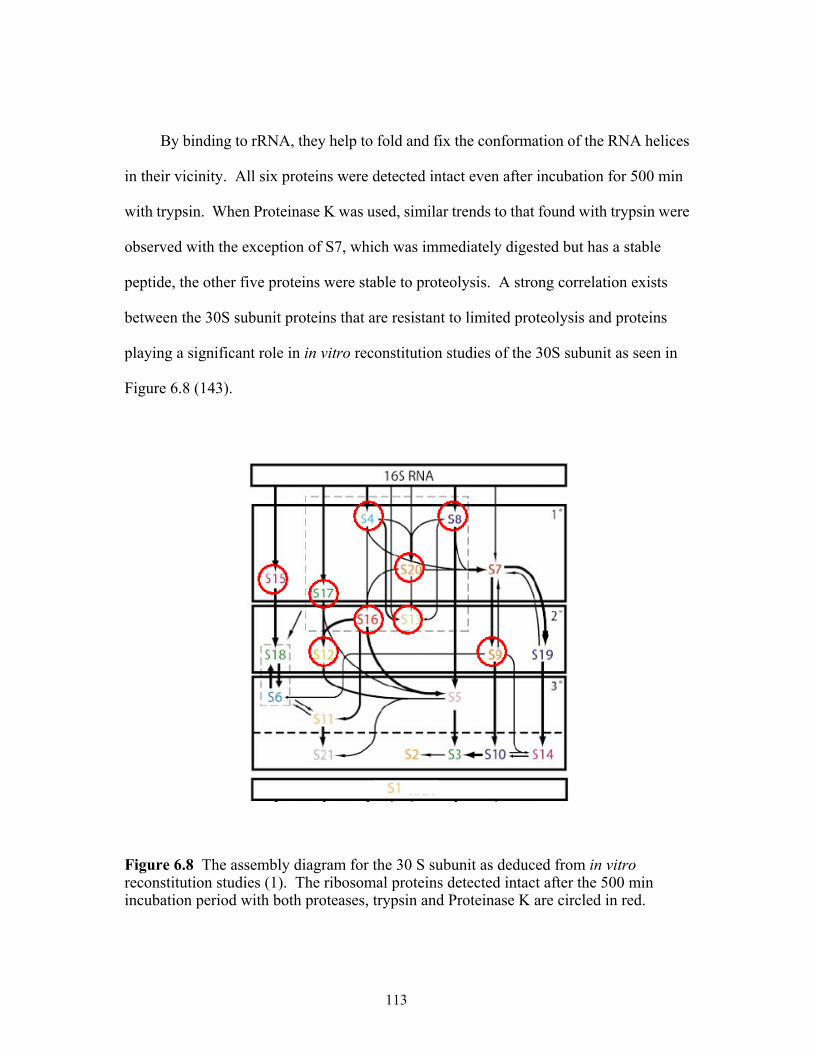
By binding to rRNA, they help to fold and fix the conformation of the RNA helices
in their vicinity. All six proteins were detected intact even after incubation for 500 min
with trypsin. When Proteinase K was used, similar trends to that found with trypsin were
observed with the exception of S7, which was immediately digested but has a stable
peptide, the other five proteins were stable to proteolysis. A strong correlation exists
between the 30S subunit proteins that are resistant to limited proteolysis and proteins
playing a significant role in in vitro reconstitution studies of the 30S subunit as seen in
Figure 6.8 (143).
Figure 6.8 The assembly diagram for the 30 S subunit as deduced from in vitro reconstitution studies (1). The ribosomal proteins detected intact after the 500 min incubation period with both proteases, trypsin and Proteinase K are circled in red.
113
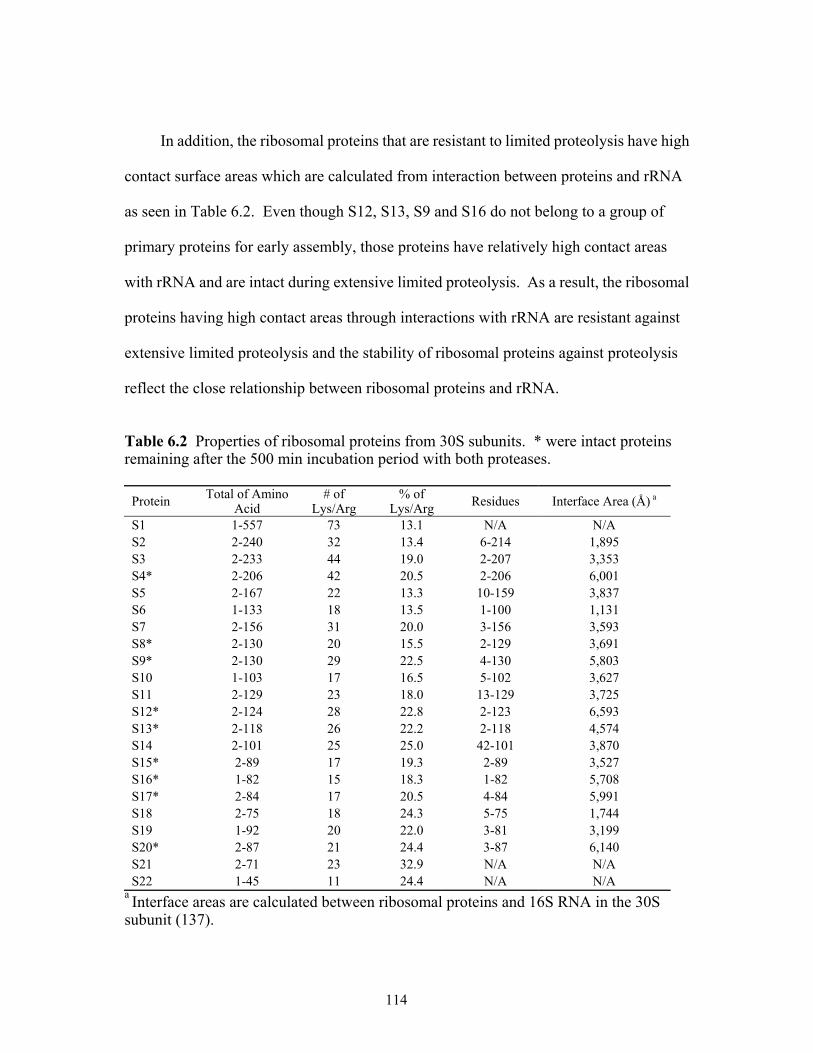
In addition, the ribosomal proteins that are resistant to limited proteolysis have high
contact surface areas which are calculated from interaction between proteins and rRNA
as seen in Table 6.2. Even though S12, S13, S9 and S16 do not belong to a group of
primary proteins for early assembly, those proteins have relatively high contact areas
with rRNA and are intact during extensive limited proteolysis. As a result, the ribosomal
proteins having high contact areas through interactions with rRNA are resistant against
extensive limited proteolysis and the stability of ribosomal proteins against proteolysis
reflect the close relationship between ribosomal proteins and rRNA.
Table 6.2 Properties of ribosomal proteins from 30S subunits. * were intact proteins remaining after the 500 min incubation period with both proteases.
Protein Total of Amino Acid
# of Lys/Arg
% of Lys/Arg Residues Interface Area (Å) a
S1 1-557 73 13.1 N/A N/A S2 2-240 32 13.4 6-214 1,895 S3 2-233 44 19.0 2-207 3,353 S4* 2-206 42 20.5 2-206 6,001 S5 2-167 22 13.3 10-159 3,837 S6 1-133 18 13.5 1-100 1,131 S7 2-156 31 20.0 3-156 3,593 S8* 2-130 20 15.5 2-129 3,691 S9* 2-130 29 22.5 4-130 5,803 S10 1-103 17 16.5 5-102 3,627 S11 2-129 23 18.0 13-129 3,725 S12* 2-124 28 22.8 2-123 6,593 S13* 2-118 26 22.2 2-118 4,574 S14 2-101 25 25.0 42-101 3,870 S15* 2-89 17 19.3 2-89 3,527 S16* 1-82 15 18.3 1-82 5,708 S17* 2-84 17 20.5 4-84 5,991 S18 2-75 18 24.3 5-75 1,744 S19 1-92 20 22.0 3-81 3,199 S20* 2-87 21 24.4 3-87 6,140 S21 2-71 23 32.9 N/A N/A S22 1-45 11 24.4 N/A N/A
a Interface areas are calculated between ribosomal proteins and 16S RNA in the 30S subunit (137).
114
6.5 Conclusion
Limited proteolysis has been utilized in the past to study various protein or protein
complexes and RNP complexes. However, analysis of the resulting proteolytic
fragments has been limited to liquid chromatography and/or gel electrophoresis followed
by microsequencing by Edman degradation. These analysis methods place severe
constraints on the length of fragments analyzed, generally cannot detect sub-picomole
amounts of protein, and require highly-pure samples which results in a significant
investment in time and expense. Mass spectrometry offers a sensitive, rapid and
reasonable alternative for the analysis of peptides and intact proteins in an RNP complex.
This study is the first to use limited proteolysis coupled to mass spectrometry for the
analysis of ribosomal subunits.
The use of MALDI-MS for the direct determination of ribosomal proteins resistant
to limited proteolysis has been demonstrated. This approach can be used at the level of
intact ribosomes and can provide information on sites of proteolysis when proteases of
high specificity are used. A comparison of the results found for trypsin and Proteinase K
allows us to define those ribosomal proteins most protected from limited proteolysis by
intermolecular interactions. In addition, MALDI data show correlation with other
available data. The speed and sensitivity of MALDI-MS, combined with the
measurement of molecular mass, an intrinsic property of proteins, will allow this
approach to be extended to ribosomes from other organisms.
115
Chapter 7. Limited Proteolysis Behavior of Ribosomal Proteins Involved in Inter-Subunit Bridges of Thermus thermophilus 70S Ribosomes
7.1 Introduction
The aim of this chapter is to investigate the limited proteolysis behavior of
ribosomal proteins in inter-subunits bridges, which are necessary for maintaining the
complete architecture of 70S ribosomes. The initial development of this method was
tested with Escherichia coli 30S subunits in Chapter 6. Here, I expand the use of limited
proteolysis to the much larger and more complex 70S ribosomes from Thermus
thermophilus.
Recently, several structures of ribosomal subunits and ribosomes from different
organisms have been obtained by X-ray crystallography that provides detailed structural
information at the atomic level. With the aid of the atomic structures of the T.
thermophilus 30S and H. marismortui 50S subunits, a model for the RNA and protein
backbone of T. thermophilus 70S ribosomes was subsequently constructed based on a
5.5Å X-ray map (2,123-127). The majority of biochemical data have been obtained using
ribosomes from E. coli although a high-resolution structure of the E. coli ribosome is not
yet available. The emphasis on the physical data obtained from X-ray crystallography
has been paid to rRNA, while the emphasis on the biochemical data has focused on
ribosomal proteins. To better understand the structure and function of the ribosome,
biochemical and physical investigations of both rRNAs and ribosomal proteins are
necessary.
116
The inter-subunit bridges are important for maintaining the overall architecture of
the 70S ribosome (144-146) and can also be expected to play a role in the dynamics of
translation. It is known that rearrangements of ribosomal components are required for
subunit association (144). Several inter-subunit bridges were first visualized in
low-resolution cryo-EM maps of E. coli ribosomes (146) and described in high-resolution
maps of T. thermophilus ribosomes (2). Many bridges in E. coli are virtually identical to
the bridges found in T. thermophilus, in terms of their locations and the RNA helices and
proteins involved (115). Furthermore, the same observation was made in a comparison of
the inter-subunit bridges between bacterial and yeast ribosomes (114). The high
similarity suggests that the inter-subunit bridge regions highly conserved across species
are essential for the function and dynamic mechanism of the ribosome.
Specifically, ribosomal proteins L2, L5, L14, S13 and S19 seem to be participating
in bridging connections through protein-rRNA and protein-protein interactions (2). The
protein-protein interactions are found between proteins L5 and S13. In addition, L19 is
located on the inter-subunit surface, forming potential bridges with the 30S subunit (115).
Figure 7.1 shows the 50S and 30S bridge contacts viewed from the interface (2).
Mass spectrometry was used as the readout step in a limited proteolysis approach
for characterizing macromolecular structure as presented in Chapter 6. In the previous
chapter, ribosomal proteins, which are resistant to proteases, are identified using mass
spectrometry by measuring their intrinsic property, molecular weight.
In this chapter I have focused on the protease-resistant and accessible ribosomal
proteins in inter-subunit bridges via limited proteolysis of tight-coupled 70S ribosomes.
In the present study ribosomal proteins L2, L5, L14 are found to be protease-resistant,
117
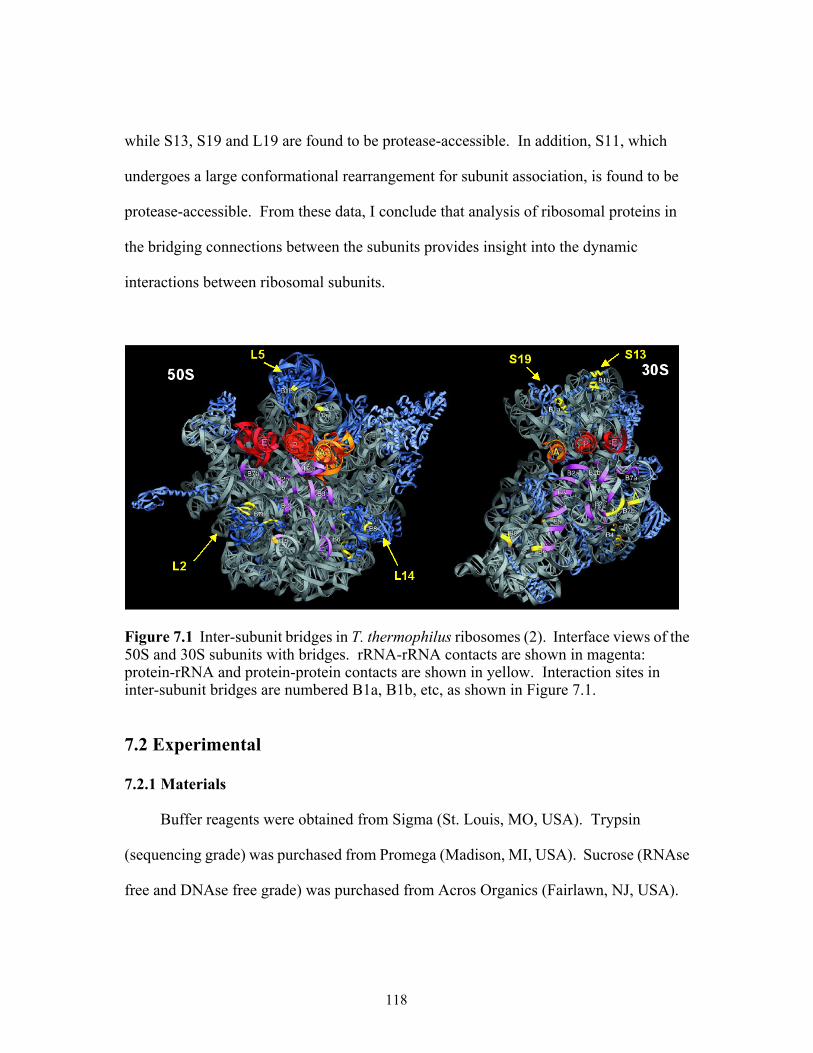
while S13, S19 and L19 are found to be protease-accessible. In addition, S11, which
undergoes a large conformational rearrangement for subunit association, is found to be
protease-accessible. From these data, I conclude that analysis of ribosomal proteins in
the bridging connections between the subunits provides insight into the dynamic
interactions between ribosomal subunits.
Figure 7.1 Inter-subunit bridges in T. thermophilus ribosomes (2). Interface views of the 50S and 30S subunits with bridges. rRNA-rRNA contacts are shown in magenta: protein-rRNA and protein-protein contacts are shown in yellow. Interaction sites in inter-subunit bridges are numbered B1a, B1b, etc, as shown in Figure 7.1.
7.2 Experimental
7.2.1 Materials
Buffer reagents were obtained from Sigma (St. Louis, MO, USA). Trypsin
(sequencing grade) was purchased from Promega (Madison, MI, USA). Sucrose (RNAse
free and DNAse free grade) was purchased from Acros Organics (Fairlawn, NJ, USA).
118
Sinapinic acid (SA) was obtained from Fluka (Milwaukee, WI, USA). Acids and organic
solvents were HPLC grade or better.
7.2.2 Methods
7.2.2.1 Preparation of Tight-Couple 70S Ribosome T. thermophilus HB8 was a
kind gift of Drs. S.T. Gregory and A.E. Dahlberg (Brown University, Providence, RI,
USA). The conditions for growing T. thermophilus HB8 strains (ATCC 27634) are
described elsewhere (108). Aliquots at a concentration of 22 mg/mL of the tight-couple
70S ribosomes in a buffer containing 10 mM Tris-HCl (pH 7.6), 10.5 mM magnesium
acetate, 60 mM NH4Cl, and 3 mM β-mercaptoethanol were stored at -80 ˚C.
7.2.2.2 Limited Proteolysis of 70S Ribosomes Limited proteolysis using trypsin
was carried out in the same buffer of 10 mM Tris-HCl (pH 7.6), 10.5 mM magnesium
acetate, 60 mM NH4Cl, and 3 mM β-mercaptoethanol at 37 ˚C. The enzyme to ribosome
ratio was adjusted to 1:500 (w/w) to achieve time-resolved cleavage with around 200 µg
of ribosome present initially. The total reaction mixture volume was 80 µL.
7.2.2.3 Sucrose Gradient To check the integrity of tight-couple 70S ribosomes,
sucrose gradient analysis was carried out. 3 A260 units were applied on the top of the
sucrose solution containing a 0-45% sucrose gradient as described in Chapter 3.
Fractions of 1.1-1.2 mL were collected manually and the absorbance at 260 nm was
measured to determine the location of the 70S ribosomes. As a control, the tight-couple
70S ribosomes (3 A260 units) were incubated for 500 min without added protease. The
control reactions were prepared for analysis by either sucrose gradient or MALDI-MS.
119
For sucrose gradient analysis of limited proteolysis products, 5 × 80 µL of reaction
mixture were applied on the top of the sucrose solution containing a 0-45% sucrose
gradient as described above. Fractions of 1.1-1.2 mL were collected manually and the
absorbance at 260 nm was measured to determine the location of the 70S ribosomes and
the 50S and 30S subunits.
1 mL volume of cold ethanol was added into 0.3 mL volume of each fraction
containing the 70S ribosomes and the 50S and 30S subunits. After overnight incubation
at -20 ̊ C the ribosomes and the subunits were precipitated by centrifugation at 13000 rpm
for 10 min at 4 ̊ C. The pellets were resuspended in buffer (10 mM Tris-HCl at pH 7.6, 10
mM MgCl2, 60 mM NH4Cl, 3 mM β-mercaptoethanol), and aliquots were further
analyzed by MALDI-TOF MS for comparison of ribosomal protein profiles.
For MALDI analysis of the limited proteolysis products, 4.5 µL of resuspended
solution was removed and combined with 0.5 µL of 25% trifluoroacetic acid (TFA) to
precipitate rRNA (109).
7.2.2.4 MALDI Analysis All MALDI-MS experiments were done on a Bruker
Reflex IV reflectron MALDI-TOF mass spectrometer (Bruker Daltonics, Billerica, MA,
USA) equipped with a nitrogen laser as described in Chapter 4. MALDI samples were
prepared by combining 1 µL of TFA-treated ribosomal solution with 9 µL of the SA
matrix. Protein mass spectra were obtained in the positive ion mode with delayed
extraction. Mass spectra were obtained by averaging 300 laser shots.
7.2.2.5 Data Analysis Proteolytic digestion products were identified using the
SequenceEditor software provided by the MALDI manufacturer and Protein Prospector
120
(3). The coordinates for the 3 Å resolution structure of the T. thermophilus 30S subunit
reported by Wimberly and coworkers (127) and the high resolution structure of the
Deinococcus radiodurans 50S subunit (125) can be found in the Protein Data Bank
(accession 1FJF and 1NKW). The ribosome structure was produced using the MOLMOL
software program (135) with these coordinates.
7.3 Results
The tight-couple 70S ribosomes from T. thermophilus (strain HB8) were subjected
to time-course measurements of proteolysis employing a site-specific protease, trypsin.
Trypsin, which will only cleave at lysine or arginine residues, can disturb salt-bridges
between positively charged residues on the protein and phosphate groups on the rRNA.
Initially, optimization of the limited proteolysis conditions was done so that both
proteolytic fragments and intact proteins could be observed. MALDI-MS was used to
analyze the proteolytic fragments and intact proteins from ribosomes.
To guarantee the integrity of the tight-couple 70S ribosome during incubation, the
reaction was carried out under the same conditions without protease and then a sucrose
gradient was run. The sucrose gradient profile of the tight-couple 70S ribosomes
incubated for 500 min without protease was not changed when it was compared with that
of the tight-couple 70S ribosomes (T = 0 min) (Figure 7.2). Therefore, I conclude that
incubation does not affect the integrity of the tight-couple 70S ribosomes. In addition,
the results of the initial studies yielded an optimal enzyme to ribosome ratio of 1:500
(w/w), and this ratio was then used for all subsequent investigations.
121
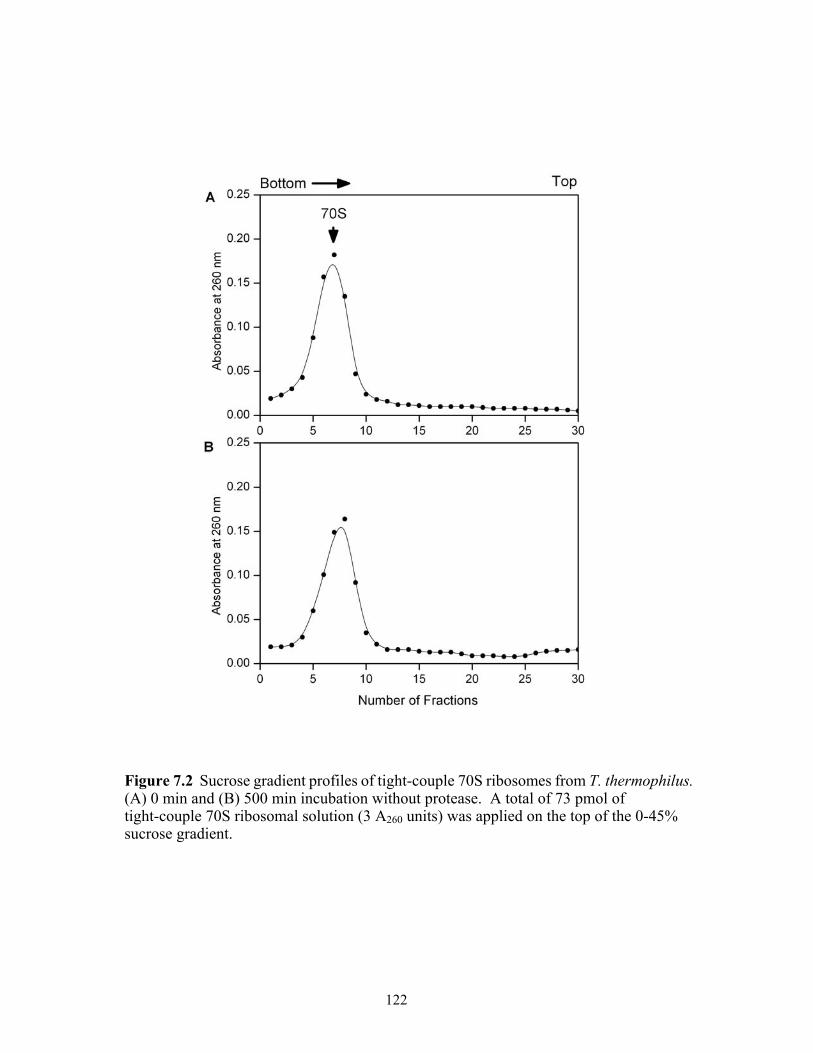
Figure 7.2 Sucrose gradient profiles of tight-couple 70S ribosomes from T. thermophilus. (A) 0 min and (B) 500 min incubation without protease. A total of 73 pmol of tight-couple 70S ribosomal solution (3 A260 units) was applied on the top of the 0-45% sucrose gradient.
122
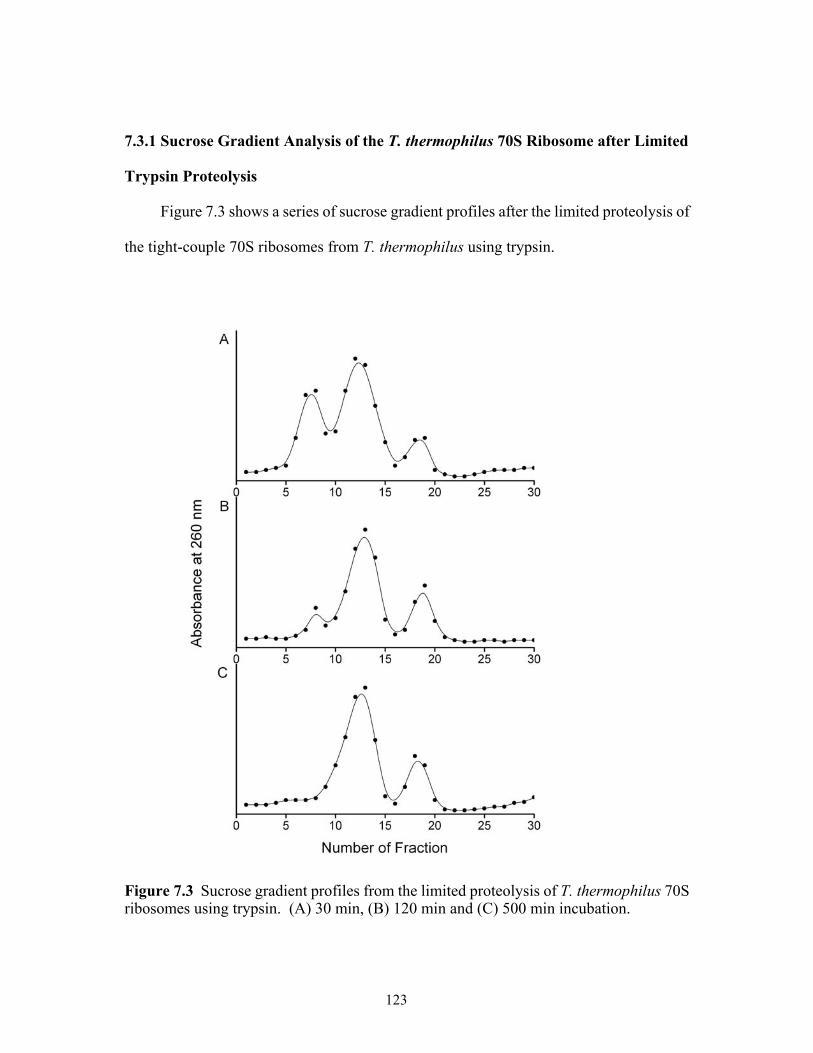
7.3.1 Sucrose Gradient Analysis of the T. thermophilus 70S Ribosome after Limited
Trypsin Proteolysis
Figure 7.3 shows a series of sucrose gradient profiles after the limited proteolysis of
the tight-couple 70S ribosomes from T. thermophilus using trypsin.
Figure 7.3 Sucrose gradient profiles from the limited proteolysis of T. thermophilus 70S ribosomes using trypsin. (A) 30 min, (B) 120 min and (C) 500 min incubation.
123
The tight-couple 70S ribosomes from T. thermophilus (15 A260 units) started to
dissociate into its 50S and 30S subunits during the limited trypsin proteolysis. After 500
min incubation, the tight-couple 70S ribosomes were completely dissociated so that no
tight-couple 70S ribosomes were observed.
My hypothesis is that dissociation of tight-couple 70S ribosomes into each subunit
occurs when ribosomal proteins in the inter-subunit bridges are digested. If correct, I
expect that ribosomal protein profiles in a fraction corresponding to 70S ribosomes will
be different from those fractions containing 50S and 30S subunits. To investigate this
hypothesis ribosomal protein analyses were carried out by MALDI-TOF MS.
7.3.2 MALDI-MS Analysis of Each Fraction of Sucrose Gradient after Limited
Trypsin Proteolysis of the T. thermophilus 70S Ribosome
After sucrose gradient analysis of ribosomes incubated with trypsin for 30 min
(Figure 7.3-(A)), fractions 8, 12 and 19 were treated with cold ethanol to precipitate
ribosomes and subunits, which were analyzed using MALDI-MS as seen in Figure 7.4.
Intact proteins were assigned by accurate mass measurement of the 70S ribosome before
proteolysis (T = 0 min) and by comparison to protein molecular weights predicted for T.
thermophilus from entries in the SwissProt database as in Chapter 5. In addition to the
loss of mass spectral peaks from these ribosomal proteins, new ion signals at various m/z
values were detected during these analyses.
Differences in ribosomal proteins were determined by comparing the mass
spectrum (7.4-A) of fraction 8 with those of fraction 12 (7.4-(B)) and fraction 19
(7.4-(C)). Fraction 8 contained most of the ribosomal proteins from both subunits and
124
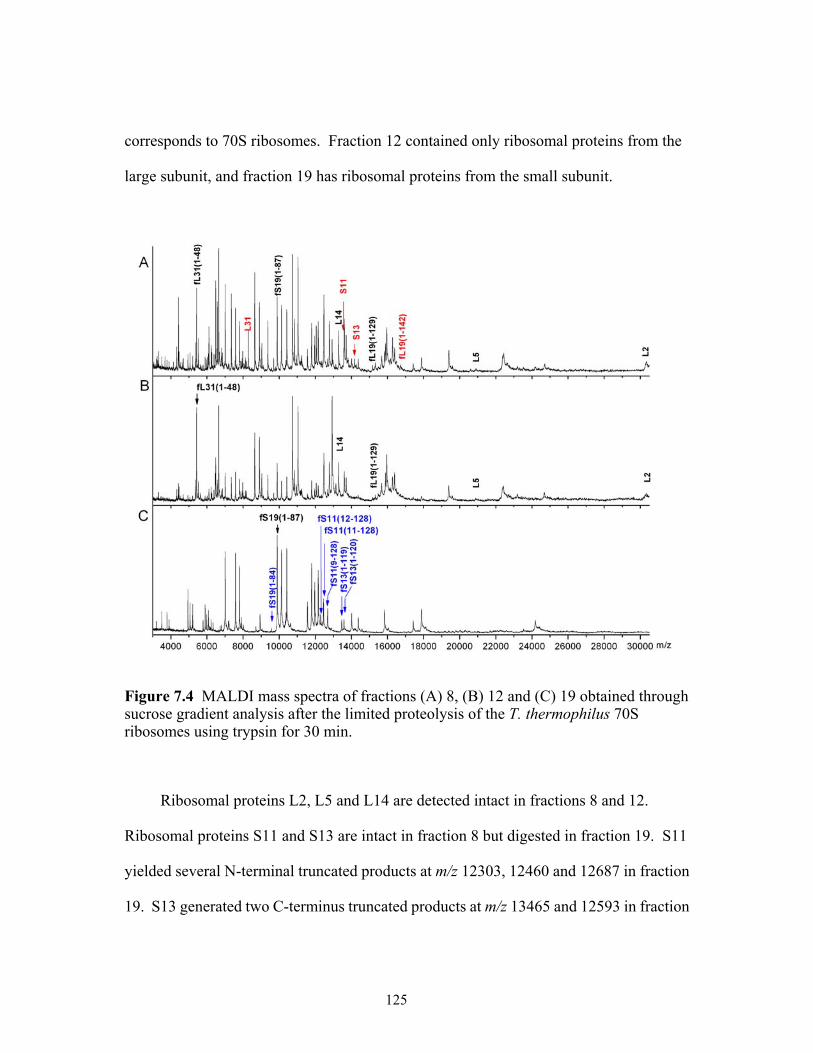
corresponds to 70S ribosomes. Fraction 12 contained only ribosomal proteins from the
large subunit, and fraction 19 has ribosomal proteins from the small subunit.
Figure 7.4 MALDI mass spectra of fractions (A) 8, (B) 12 and (C) 19 obtained through sucrose gradient analysis after the limited proteolysis of the T. thermophilus 70S ribosomes using trypsin for 30 min.
Ribosomal proteins L2, L5 and L14 are detected intact in fractions 8 and 12.
Ribosomal proteins S11 and S13 are intact in fraction 8 but digested in fraction 19. S11
yielded several N-terminal truncated products at m/z 12303, 12460 and 12687 in fraction
19. S13 generated two C-terminus truncated products at m/z 13465 and 12593 in fraction
125
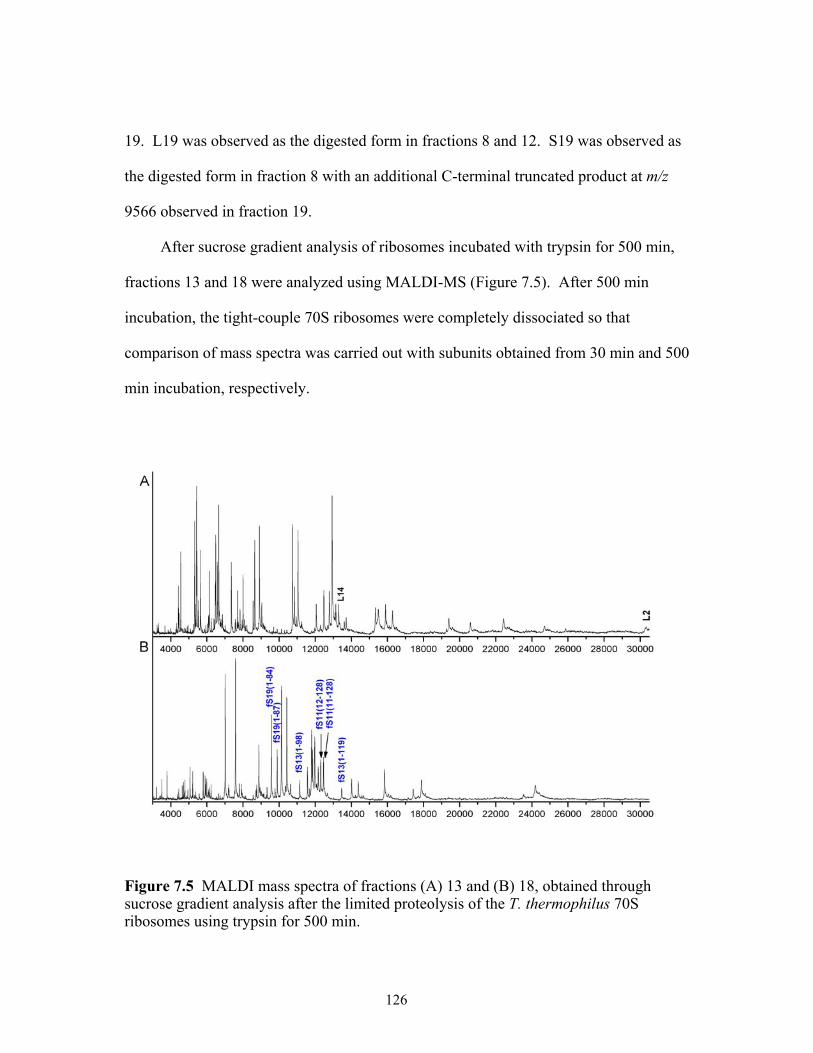
19. L19 was observed as the digested form in fractions 8 and 12. S19 was observed as
the digested form in fraction 8 with an additional C-terminal truncated product at m/z
9566 observed in fraction 19.
After sucrose gradient analysis of ribosomes incubated with trypsin for 500 min,
fractions 13 and 18 were analyzed using MALDI-MS (Figure 7.5). After 500 min
incubation, the tight-couple 70S ribosomes were completely dissociated so that
comparison of mass spectra was carried out with subunits obtained from 30 min and 500
min incubation, respectively.
Figure 7.5 MALDI mass spectra of fractions (A) 13 and (B) 18, obtained through sucrose gradient analysis after the limited proteolysis of the T. thermophilus 70S ribosomes using trypsin for 500 min.
126
Ribosomal proteins L2 and L14 were detected intact in fraction 13, but L5 was not
observed due to suppression effect or low abundance peak. Ribosomal proteins S11, S13
and S19 were observed like Figure 7.4-(C) although some peaks at m/z 3465 (fS13
(1-120)) and 12687 (fS11 (9-128)) in Figure 7.4-(C) disappeared. One new peak at m/z
11423 generated from 500 min incubation was from a further C-terminus truncated
product of S13. Further digestion of some proteins may be occurring after dissociation of
subunits. Overall, the digested patterns of ribosomal proteins in inter-subunits bridges
did not very significantly as seen from a comparison between 30 min and 500 min
incubation.
7.4 DISCUSSION
Limited proteolysis coupled to MALDI MS can scrutinize the exposed or protease
accessible regions of ribosomal proteins. Trypsin generates digestion products generated
from the loss of solvent exposed regions of an intact protein. Most cleaved regions are
from the N- and C-terminus consistent with the extension regions of ribosomal proteins
as seen in Chapter 6.
The data obtained from limited proteolysis of tight-couple 70S ribosomes are
compared with the other available data from X-ray crystallography and real space
refinement (2,115,123,147) even though limited proteolysis is carried out under solution
conditions and with a different form of the 70S ribosome (tight-couple form). Therefore,
the data from limited proteolysis may more accurately reflect the dynamic status of
ribosomes.
127
7.4.1 The Role of Ribosomal Proteins
The functional core of the ribosome including the decoding center and the
peptidyl-transferase center were observed to be rich in rRNA in the crystal structure
(126,127). Therefore, ribosomal proteins can be regarded as ancillary, mainly important
for assembly of the complete 70S structure and for maintaining its stability (126,148). In
addition, the apparent primary function of most of the ribosomal proteins is to stabilize
the interdomain interactions of rRNA that shape the particle as a whole.
The role of ribosomal proteins found in the 50S subunit from the archaeon
Haloarcula marismortui was investigated (147). In addition, ribosomal proteins in the
30S subunit from T. thermophilus were scrutinized by X-ray crystallography (123).
From the work of Steitz and coworkers (147), the single striking feature of the ribosomal
proteins are the many long stretches of idiosyncratically folded polypeptides. These
extensions from ribosomal proteins form three-dimensional structures in the ribosome,
which depend on interactions with rRNA. These extensions are disordered and not seen
by X-ray crystallography. The extensions have a distinctive amino acid composition,
which are glycine, arginine and lysine, and their content of acidic residues is relatively
low. Therefore, the basic nature of the extensions enables them to neutralize the
negatively charged rRNA backbone in the core of the folding of 23S RNA or 16S RNA.
In addition, the flexible extensions of the ribosomal proteins, which are located on the
inter-subunit surface, can form inter-subunit bridges with their counterpart subunit. As a
result, ribosomal proteins, in particular extension regions, can alter the assembly of
regions of the 70S from a considerable distance during subunit association and can
influence the overall conformation of this RNP complex.
128
7.4.2 Ribosomal Proteins in Inter-Subunit Bridges
The inter-subunit bridges are important for maintaining the overall architecture of
the 70S ribosomes (144-146), and can also be expected to play a role in the dynamics of
translation. Furthermore, rearrangement of ribosomal components by ribosomal proteins
is found during subunit association. Relatively large-scale movement of the 30S subunit
was observed using Real-space refinement (115). The regions showing largest
movement are the head domain of the 16S rRNA, particularly helices 39, 41 and 42, and
the spur (helix 6). The mobility of the head has been predicted both from the 16S
secondary structure (2) and from neutron scattering (149). Based on all available data,
these local rearrangements are mostly related to the movement of proteins. The
ribosomal proteins having the long extensions and loops, which are unusually rich in the
basic side chains, arginine and lysine, are involved in interactions with rRNA and
movement.
In the following sections, I analyzed the ribosomal proteins present in inter-subunit
bridges, and compared MALDI-MS data with other available data provided by X-ray
crystallography and computer modeling.
Protein S11
S11 is located on the upper part of the platform, where it interacts with protein S18
and loops of 16S RNA (123). The N-terminus (1-10) of S11 is disordered and not seen by
X-ray crystallography. While S11 is not known as a protein involved in inter-subunit
bridges, it is among the few proteins that surround the regions of inter-subunit contacts
129
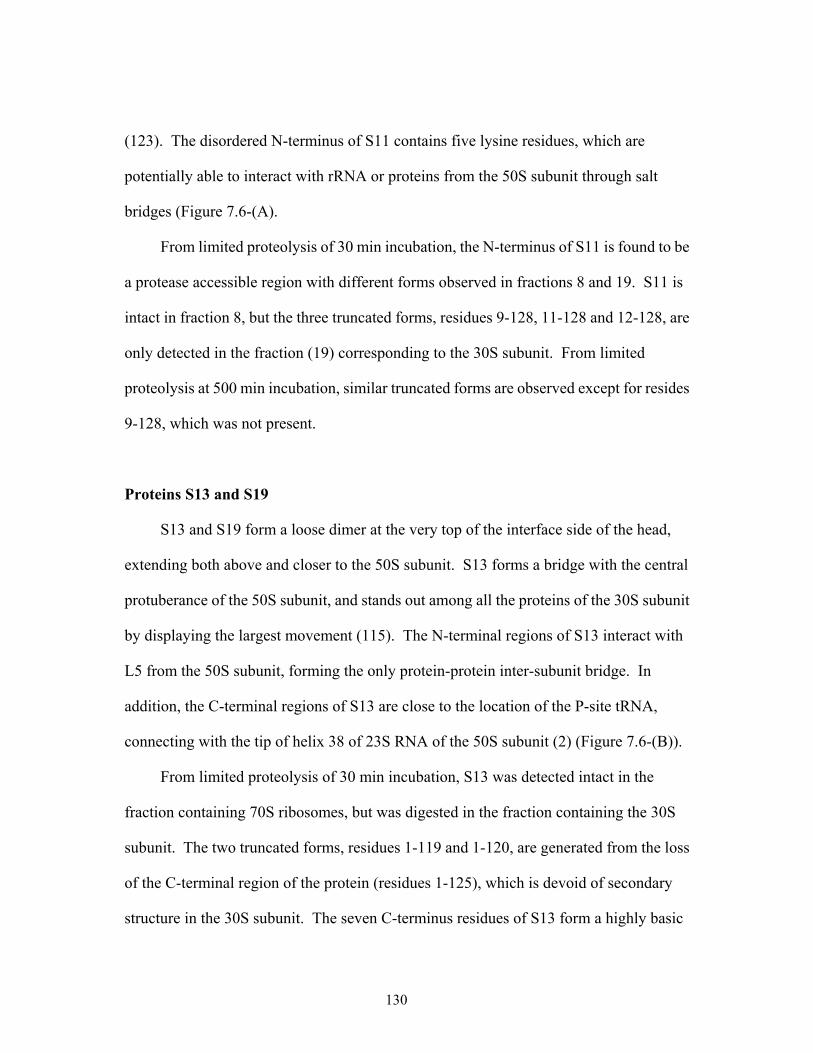
(123). The disordered N-terminus of S11 contains five lysine residues, which are
potentially able to interact with rRNA or proteins from the 50S subunit through salt
bridges (Figure 7.6-(A).
From limited proteolysis of 30 min incubation, the N-terminus of S11 is found to be
a protease accessible region with different forms observed in fractions 8 and 19. S11 is
intact in fraction 8, but the three truncated forms, residues 9-128, 11-128 and 12-128, are
only detected in the fraction (19) corresponding to the 30S subunit. From limited
proteolysis at 500 min incubation, similar truncated forms are observed except for resides
9-128, which was not present.
Proteins S13 and S19
S13 and S19 form a loose dimer at the very top of the interface side of the head,
extending both above and closer to the 50S subunit. S13 forms a bridge with the central
protuberance of the 50S subunit, and stands out among all the proteins of the 30S subunit
by displaying the largest movement (115). The N-terminal regions of S13 interact with
L5 from the 50S subunit, forming the only protein-protein inter-subunit bridge. In
addition, the C-terminal regions of S13 are close to the location of the P-site tRNA,
connecting with the tip of helix 38 of 23S RNA of the 50S subunit (2) (Figure 7.6-(B)).
From limited proteolysis of 30 min incubation, S13 was detected intact in the
fraction containing 70S ribosomes, but was digested in the fraction containing the 30S
subunit. The two truncated forms, residues 1-119 and 1-120, are generated from the loss
of the C-terminal region of the protein (residues 1-125), which is devoid of secondary
structure in the 30S subunit. The seven C-terminus residues of S13 form a highly basic
130
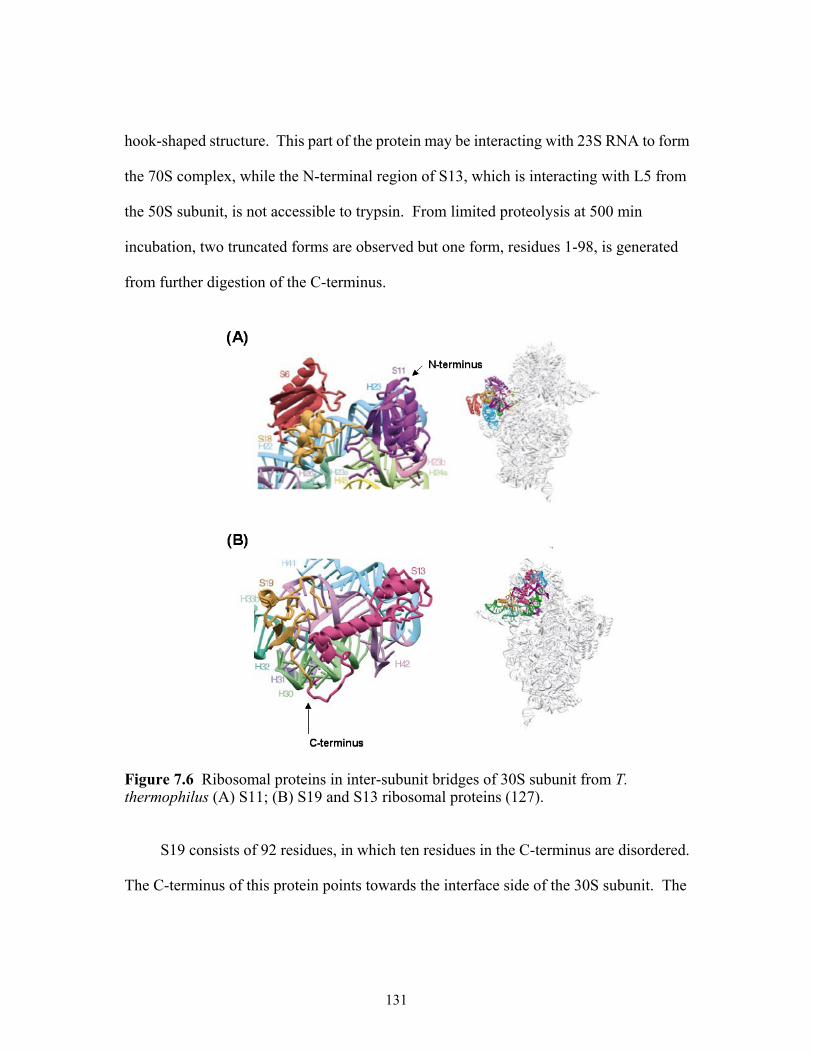
hook-shaped structure. This part of the protein may be interacting with 23S RNA to form
the 70S complex, while the N-terminal region of S13, which is interacting with L5 from
the 50S subunit, is not accessible to trypsin. From limited proteolysis at 500 min
incubation, two truncated forms are observed but one form, residues 1-98, is generated
from further digestion of the C-terminus.
Figure 7.6 Ribosomal proteins in inter-subunit bridges of 30S subunit from T. thermophilus (A) S11; (B) S19 and S13 ribosomal proteins (127).
S19 consists of 92 residues, in which ten residues in the C-terminus are disordered.
The C-terminus of this protein points towards the interface side of the 30S subunit. The
131
ten residues in the C-terminus contain the five lysine residues, which are very flexible and
may become ordered through interaction with rRNA in the 70S complex (123).
From limited proteolysis at 30 min incubation, the two truncated forms, residues
1-84 and 1-87, of S19 are generated from the loss of C-terminal regions. Of them,
residues 1-84 are detected as a low abundance in fraction 19 only. From limited
proteolysis at 500 min incubation, the two truncated forms, residues 1-84 and 1-87, of
S19 are also observed with high abundance. Therefore, the C-terminus may be
participating in interaction with 23S rRNA from the 50S subunit.
Proteins L2, L5 and L14
The bridge interactions from the 50S subunit are made by proteins L2, L5, L14 and
L19 which are involved in inter-subunit bridges B1b, B5, B7b and B8 (Figure 7.7-(A)).
L2 is located near the base of the L1 stalk and makes two distinct contacts with 16S
rRNA (B7b) at helices 23 and 24. L2 is also very close to S6 and may make transient
contacts with it during translation. In the MALDI mass spectra, L2 was detected as its
intact form (Figure 7.7-(C)).
L5 is located on the central protuberance of the 50S subunit, where it interacts
directly with loops of 5S rRNA and S13. Relatively less exposed L5 is protected by 5S
rRNA (Figure 7.7-(B)). In the MALDI mass spectra, L5 was detected as its intact form
with a low abundance peak.
It is known that L14, which interacts with L19 by forming an intermolecular β-sheet,
contacts the major groove side of the 345 loop of helix 14 of 16S rRNA to form bridge B8
as seen in Figure 7.7-(D) (115). L14 contributes little to the stabilization of RNA
132
structure and is buried in 23S rRNA. In the MALDI mass spectra, L5 was detected as its
intact form without any change.
Figure 7.7 Ribosomal proteins in inter-subunit bridges of 50S subunit from T. thermophilus (A) 50S subunit (126); (B) L5, (C) L2 and (D) L14 ribosomal proteins (2). 23S rRNA is colored in gray, 16S rRNA is colored in light blue. Protein L19
L19 interacts with L14 which surrounds the regions of inter-subunit contacts
(Figure 7.7-(D)). Intact L19 was not observed at m/z 17181 Da, but was measured at m/z
17153 Da. Intact L19 was not detected in either fractions 8 or 12 after limited proteolysis.
The truncated form cannot be detected due to lack of modification information.
133
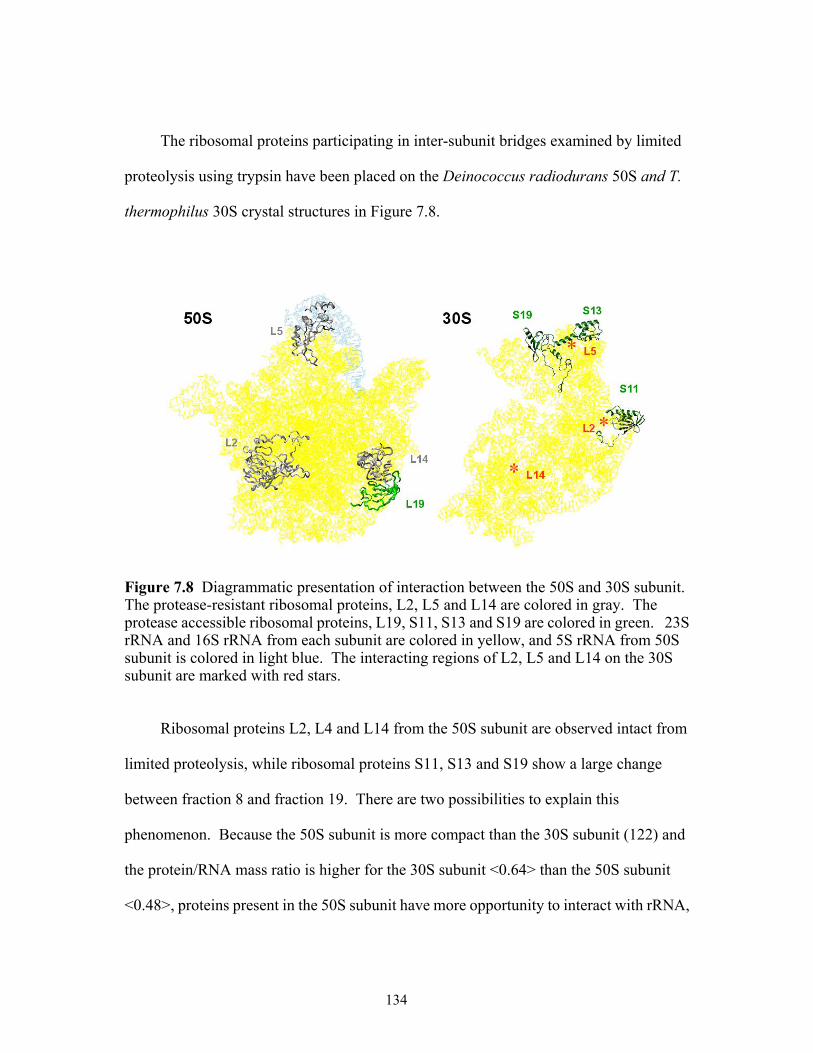
The ribosomal proteins participating in inter-subunit bridges examined by limited
proteolysis using trypsin have been placed on the Deinococcus radiodurans 50S and T.
thermophilus 30S crystal structures in Figure 7.8.
Figure 7.8 Diagrammatic presentation of interaction between the 50S and 30S subunit. The protease-resistant ribosomal proteins, L2, L5 and L14 are colored in gray. The protease accessible ribosomal proteins, L19, S11, S13 and S19 are colored in green. 23S rRNA and 16S rRNA from each subunit are colored in yellow, and 5S rRNA from 50S subunit is colored in light blue. The interacting regions of L2, L5 and L14 on the 30S subunit are marked with red stars.
Ribosomal proteins L2, L4 and L14 from the 50S subunit are observed intact from
limited proteolysis, while ribosomal proteins S11, S13 and S19 show a large change
between fraction 8 and fraction 19. There are two possibilities to explain this
phenomenon. Because the 50S subunit is more compact than the 30S subunit (122) and
the protein/RNA mass ratio is higher for the 30S subunit <0.64> than the 50S subunit
<0.48>, proteins present in the 50S subunit have more opportunity to interact with rRNA,
134
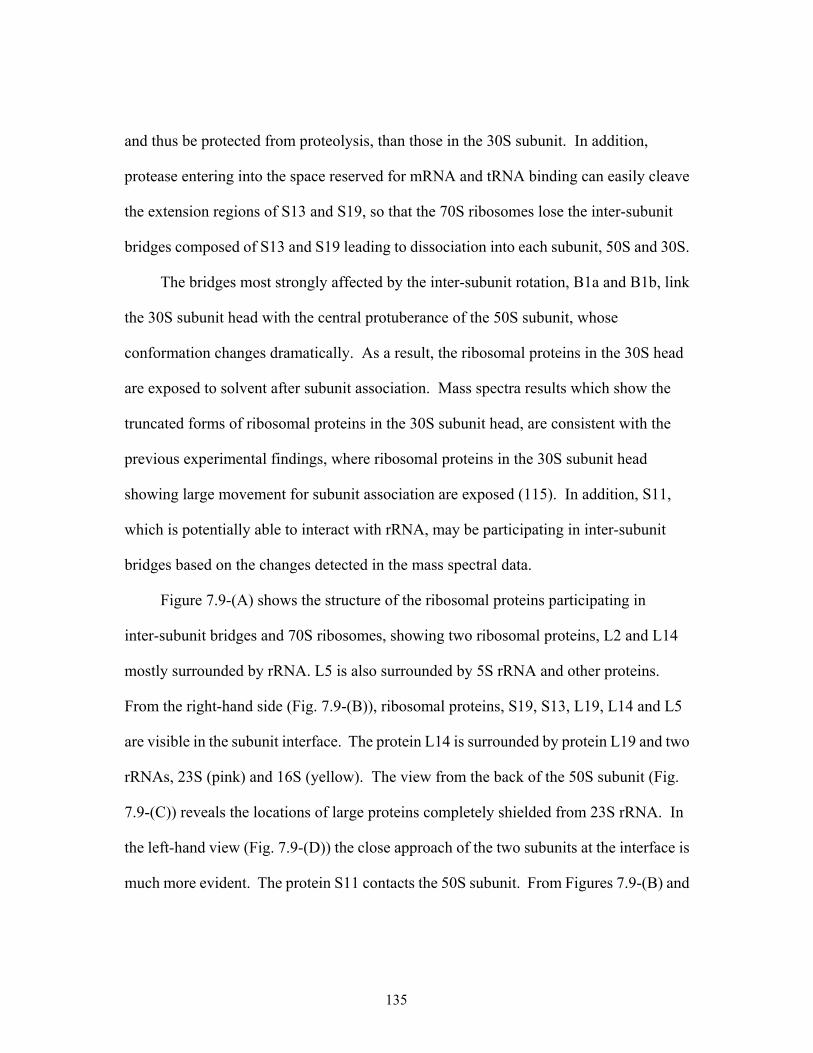
and thus be protected from proteolysis, than those in the 30S subunit. In addition,
protease entering into the space reserved for mRNA and tRNA binding can easily cleave
the extension regions of S13 and S19, so that the 70S ribosomes lose the inter-subunit
bridges composed of S13 and S19 leading to dissociation into each subunit, 50S and 30S.
The bridges most strongly affected by the inter-subunit rotation, B1a and B1b, link
the 30S subunit head with the central protuberance of the 50S subunit, whose
conformation changes dramatically. As a result, the ribosomal proteins in the 30S head
are exposed to solvent after subunit association. Mass spectra results which show the
truncated forms of ribosomal proteins in the 30S subunit head, are consistent with the
previous experimental findings, where ribosomal proteins in the 30S subunit head
showing large movement for subunit association are exposed (115). In addition, S11,
which is potentially able to interact with rRNA, may be participating in inter-subunit
bridges based on the changes detected in the mass spectral data.
Figure 7.9-(A) shows the structure of the ribosomal proteins participating in
inter-subunit bridges and 70S ribosomes, showing two ribosomal proteins, L2 and L14
mostly surrounded by rRNA. L5 is also surrounded by 5S rRNA and other proteins.
From the right-hand side (Fig. 7.9-(B)), ribosomal proteins, S19, S13, L19, L14 and L5
are visible in the subunit interface. The protein L14 is surrounded by protein L19 and two
rRNAs, 23S (pink) and 16S (yellow). The view from the back of the 50S subunit (Fig.
7.9-(C)) reveals the locations of large proteins completely shielded from 23S rRNA. In
the left-hand view (Fig. 7.9-(D)) the close approach of the two subunits at the interface is
much more evident. The protein S11 contacts the 50S subunit. From Figures 7.9-(B) and
135
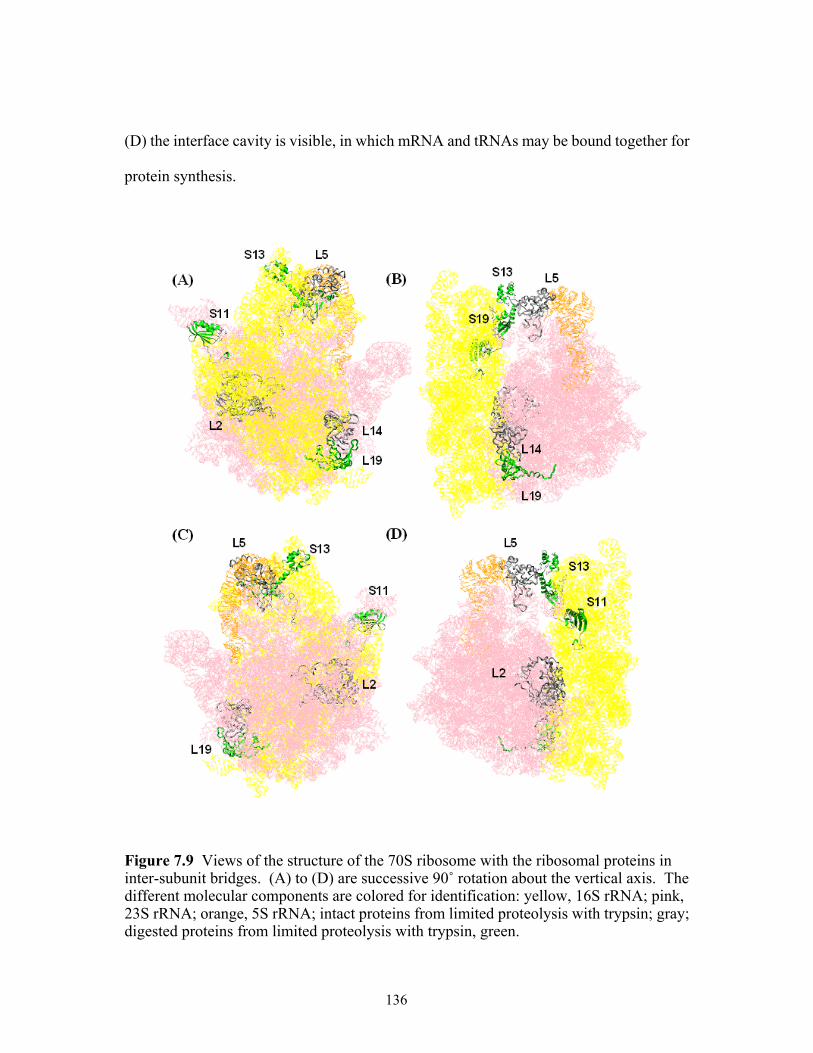
(D) the interface cavity is visible, in which mRNA and tRNAs may be bound together for
protein synthesis.
136
Figure 7.9 Views of the structure of the 70S ribosome with the ribosomal proteins in inter-subunit bridges. (A) to (D) are successive 90˚ rotation about the vertical axis. The different molecular components are colored for identification: yellow, 16S rRNA; pink, 23S rRNA; orange, 5S rRNA; intact proteins from limited proteolysis with trypsin; gray; digested proteins from limited proteolysis with trypsin, green.
7.5 Conclusion
This study is the first to examine changes to ribosomal proteins in inter-subunit
bridges of tight-couple 70S ribosomes from T. thermophilus by limited proteolysis
coupled to mass spectrometry.
In the present study ribosomal proteins L2, L5 and L14 are protease-resistant, while
S11, S13, S19 and L19 are protease-accessible. The digested regions of these proteins
except for L19, which has unknown sequence, are the flexible extensions regions.
Therefore, the extension regions from S11, S13 and S19 are concluded to be important
for maintaining the integrity of the complete 70S ribosome from T. thermophilus.
With the power of mass spectrometry as a detection technique, limited proteolysis
offers the potential of determining how ribosomal proteins are affected by
conformational rearrangements and movements of 70S ribosomes in various functional
states. I conclude that these limited proteolysis experiments provide insight into specific
intermolecular interactions in inter-subunit bridges within the complete 70S ribosome.
137
Chapter 8. Conclusions and Future Perspectives
8.1 Conclusions
The overall goal of this work was the development and application of MALDI-MS
for the systematic study of ribosomal proteins and ribosomes. As mentioned in Chapter 2,
the ribosome is a good model for developing new analytical approaches for
characterizing RNP complexes. One of our long-term goals is to design, develop and
evaluate suitable mass spectrometric techniques for studying the structural interactions
between proteins and nucleic acids in RNP complexes. Advantages of MALDI-TOF MS
for such analyses include short analysis time and the ability to detect all ribosomal
proteins in a single experiment.
My dissertation research is divided into two specific aims: the development of a
mass spectrometric method for analyzing the protein components of RNP complexes via
a single analytical experiment, and the use of limited proteolysis in combination with
MALDI-MS for characterizing protein:rRNA interactions within RNP complexes.
First, I investigated the applicability of several ribosomal protein isolation methods
with downstream MALDI-MS analysis so that high quality MALDI mass spectral data
could be obtained on a mixture containing all (or nearly all) of the ribosomal proteins
(Chapter 4). While successful, alternative methods for acidic proteins, which are easily
precipitated by acetic acid or TFA treatment are needed. In addition, optimization of the
solvent conditions for phenol extraction, which appears attractive due to the lack of
suppression effects, will be necessary to effectively isolate lower molecular weight
proteins. The optimized sample preparation method was applied to different stains of T.
138
thermophilus. The T. thermophilus ribosomal proteins were identified using a ribosomal
protein search algorithm I developed (Chapter 5). However, some peaks remain
unassigned, and the characterization of these peaks and other assigned proteins suspected
to contain post-translational modifications will provide pertinent information on the
phylogenetic characteristics of ribosomal proteins from T. thermophilus.
A major effort was to combine MALDI-MS with limited proteolysis to obtain
structural information relating to protease accessible ribosomal proteins within 30S
ribosomal subunits (Chapter 6). I used mass spectrometry as the readout step to identify
the proteolytic digestion products and intact proteins. The ribosomal proteins having
high contact areas through interactions with rRNA were resistant to extensive limited
proteolysis and the stability of ribosomal proteins to digestion reflected the close
relationship between ribosomal proteins and rRNA. The methods developed here will be
applicable to a wide range of ribosomes from other organisms for which there are no
crystal structures available.
I then expanded the use of limited proteolysis to the much larger and more complex
70S ribosomes from T. thermophilus to understand the role of ribosomal proteins in
inter-subunit bridges (Chapter 7). The ribosomal proteins L2, L5 and L14 that surround
the regions of inter-subunit contact are intact during limited proteolysis. However, the
ribosomal proteins S13 and S19 that are in a position to interact with the 50S subunit were
easily digested. In addition, the N-terminus of S11 that is disordered and not seen by
X-ray crystallography may be facing the regions of inter-subunit contact and be
potentially able to form bridges for maintaining the overall architecture of the 70S
ribosome. These results are consistent with data obtained from real-space refinement.
139
The MALDI approach in combination with limited proteolysis will offer the potential of
determining how ribosomal proteins are affected by conformational rearrangements and
movements of 70S ribosomes in various functional states.
My belief is that this project will lead to a valuable approach for the structural
elucidation of RNP complexes. This research will provide a rapid and accurate method
for the structural analysis of RNP complexes and will permit more detailed studies on the
functional importance of the spatial location of ribosomal proteins and the interaction
between ribosomal protein and nucleic acids within RNP complexes.
8.2 Future Perspectives
The results from the studies described in this dissertation yield a general
progression for future experiments in the ongoing characterization of interactions
between nucleic acids and proteins in RNP complexes. Future studies will focus on
further defining and localizing interacting sites between nucleic acids and proteins after
capturing the binding partners through covalent chemical cross-linking experiments.
Also, there are plans for probing protein and nucleic acid interactions that are important
in maintaining the functional organization of the ribosome after combining limited
proteolysis with cross-linking experiments. A number of future experiments should be
completed to investigate the identities of the interacting partners and to localize
interacting sites at the amino acid level. The following section lists possible experiments
for these studies.
140
8.2.1 MALDI-TOF MS Protein Mapping After Cross-linking
I will focus on the use of MALDI-TOF MS to identify and localize ribosomal
protein:rRNA interactions. My primary interests in cross-linking are to determine the
extent of protein modification through covalent chemical cross-linking experiments.
Chemical cross-linking irreversibly captures binding partners so that even transient
interactions can be detected. Cross-linking studies provide information about specific
interactions between components of the rRNA and ribosomal protein using conventional
analytical or biochemical approaches. Due to the time-and sample-consuming analyses
necessary when using such methods, the vast majority of studies have been done on
individual ribosomal proteins, rRNA or subunits.
One of the more basic questions of interest in ribosome structure is to determine the
interacting sites between ribosomal proteins and rRNA. Often, it is important to know
only the identities of the interacting partners.
Here I propose to use MALDI protein mapping to rapidly access which ribosomal
proteins are interacting with rRNA. This method takes advantage of the conserved nature
of the ribosome, and is built upon my results that demonstrate our ability to detect nearly
all of the ribosomal proteins in a single MALDI-MS analysis. First, intact ribosomes
were reacted with 2-iminothiolane·HCl without UV radiation. Figure 8.1 is the result
obtained after treatment with 2-iminothiolane.
MALDI TOF-MS analysis of the reaction mixture allows for the rapid
determination of protein modification based on the 101 Da mass increases due to the
2-iminothiolane modifications. Due to steric considerations, those ribosomal proteins
modified by 2-iminothiolane must be accessible to the solvent when present in assembled
141
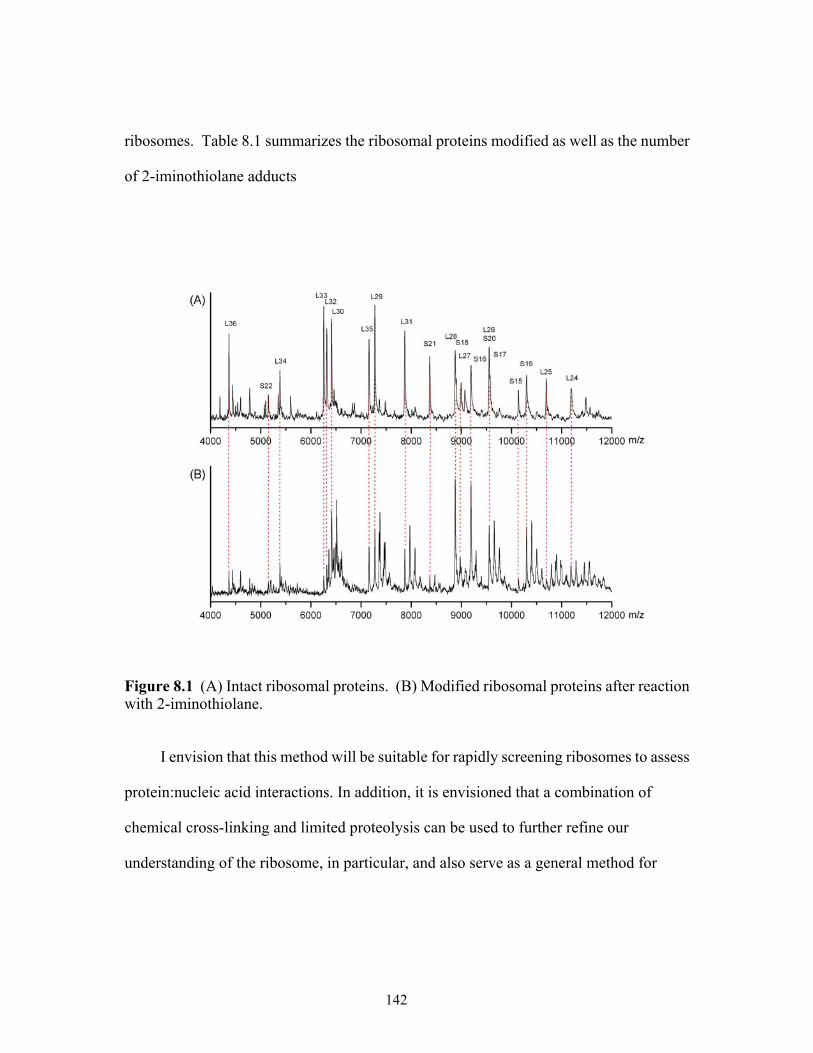
ribosomes. Table 8.1 summarizes the ribosomal proteins modified as well as the number
of 2-iminothiolane adducts
Figure 8.1 (A) Intact ribosomal proteins. (B) Modified ribosomal proteins after reaction with 2-iminothiolane.
I envision that this method will be suitable for rapidly screening ribosomes to assess
protein:nucleic acid interactions. In addition, it is envisioned that a combination of
chemical cross-linking and limited proteolysis can be used to further refine our
understanding of the ribosome, in particular, and also serve as a general method for
142
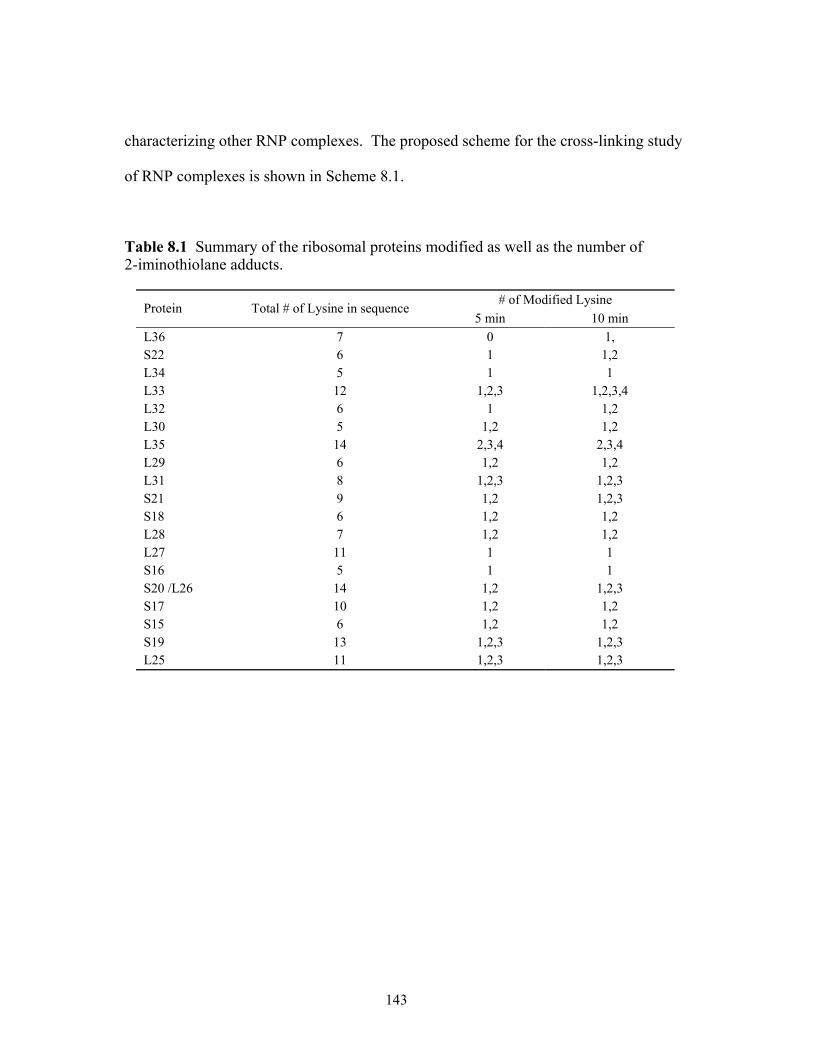
characterizing other RNP complexes. The proposed scheme for the cross-linking study
of RNP complexes is shown in Scheme 8.1.
Table 8.1 Summary of the ribosomal proteins modified as well as the number of 2-iminothiolane adducts.
# of Modified Lysine Protein Total # of Lysine in sequence
5 min 10 min L36 7 0 1, S22 6 1 1,2 L34 5 1 1 L33 12 1,2,3 1,2,3,4 L32 6 1 1,2 L30 5 1,2 1,2 L35 14 2,3,4 2,3,4 L29 6 1,2 1,2 L31 8 1,2,3 1,2,3 S21 9 1,2 1,2,3 S18 6 1,2 1,2 L28 7 1,2 1,2 L27 11 1 1 S16 5 1 1 S20 /L26 14 1,2 1,2,3 S17 10 1,2 1,2 S15 6 1,2 1,2 S19 13 1,2,3 1,2,3 L25 11 1,2,3 1,2,3
143
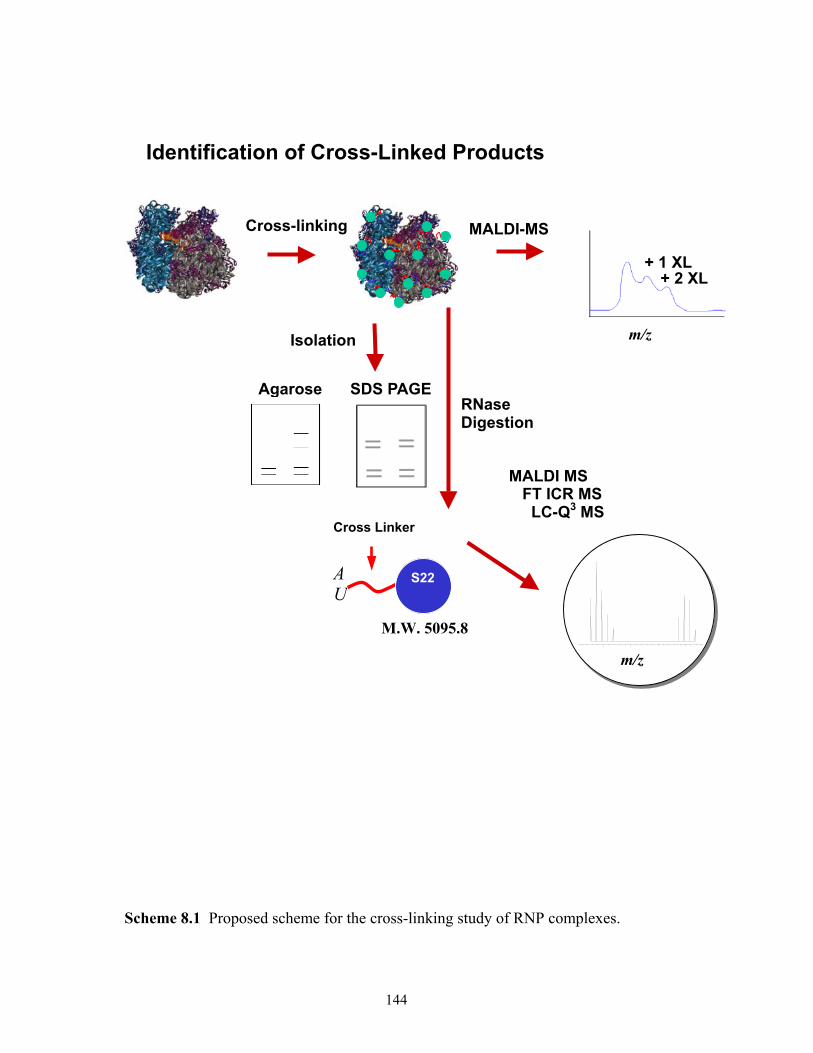
Identification of Cross-Linked Products
Cross-linking MALDI-MS
m/z
m/z
M.W. 5095.8
S22A U
Cross Linker
MALDI MS FT ICR MS LC-Q3 MS
RNaseDigestion
SDS PAGEAgarose
Isolation
+ 2 XL+ 1 XL
Scheme 8.1 Proposed scheme for the cross-linking study of RNP complexes.
144
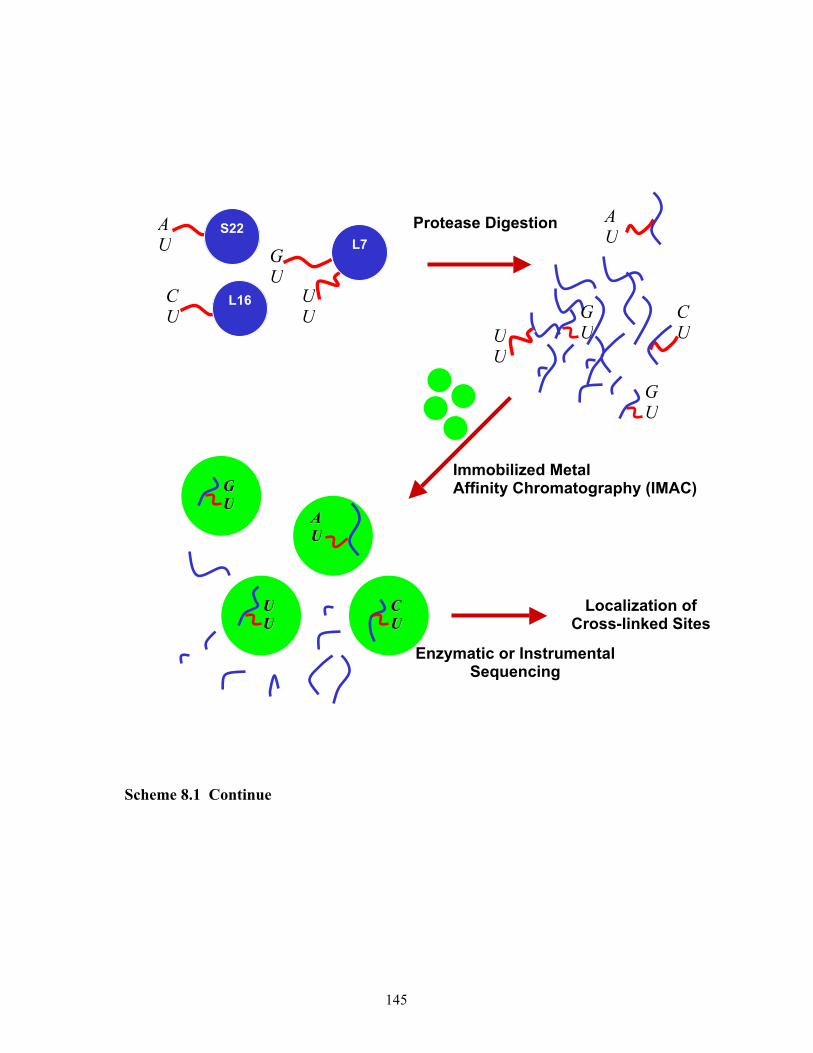
Protease Digestion A U
S22
G U
L7
C U
L16 U U
UU
A U
CU
GU
GU
Enzymatic or Instrumental Sequencing
Immobilized Metal Affinity Chromatography (IMAC)
CCUU UU UU
GG UU
AA UU
Localization of
Cross-linked Sites
Scheme 8.1 Continue
145
Bibliography
1. Held, W. A., Ballou, B., Mizushima, S., and Nomura, M. (1974) J. Biol. Chem.
249, 3103-3111
2. Yusupov, M. M., Yusupova, G. Z., Baucom, A., Lieberman, K., Earnest, T. N.,
Cate, J. H. D., and Noller, H. F. (2001) Science 292, 883-896
3. Clauser, K. R., Baker, P., and Burlingame, A. L. (1999) Anal. Chem. 71,
2871-2882
4. Mann, M., and Jensen, O. N. (2003) Nat. Biotechnol. 21, 255-261
5. Henzel, W. J., Watanabe, C., and Stults, J. T. (2003) J. Am. Soc. Mass Spectrom.
14, 931-942
6. Aebersold, R., and Goodlett, D. R. (2001) Chem. Rev. 101, 269-295
7. Villanueva, J., Villegas, V., Querol, E., Aviles, F. X., and Serrano, L. (2002) J.
Mass Spectrom. 37, 974-984
8. Karas, M., Bachmann, D., Bahr, U., and Hillenkamp, F. (1987) Int. J. Mass
Spectrom. Ion Processes 78, 53-68
9. Tanaka, K., Waki, H., Ido, Y., Akita, S., Yoshida, Y., and Yoshida, T. (1988)
Rapid Commun. Mass Spectrum. 2, 151-153
10. Fenn, J. B., Mann, M., Meng, C. K., Wong, S. F., and Whitehouse, C. M. (1989)
Science 246, 64-71
11. Karas, M., and Hillenkamp, F. (1988) Anal.Chem. 60, 2299-2301
12. Tanaka, K., Ido, Y., and Akita, S. (1987) In Proceedings of the Second
Japan-China Joint Symposium on Mass Spectrometry (Matsuda, H., Liang, X.-T.,
and Eds., eds), pp. 185-188, Bando Press, Osaka, Japan
13. Overberg, A., Karas, M., Bahr, U., Kaufman, R., and Hillenkamp, F. (1990)
Rapid Commun. Mass Spectrum. 4, 293-296
14. Berkenkamp, S., Kirpekar, F., and Hillenkamp, F. (1998) Science 281, 260-262
15. Menzel, C., Berkenkamp, S., and Hillenkamp, F. (1999) Rapid Commun. Mass
Spectrum. 13, 26-32
146
16. Weinberger, S. R., Boernsen, K. O., Finchy, J. W., Robertson, V., and Musselman,
B. D. (1993) In proceedings of the 41st ASMS conference on mass spectrometry
and allied topics, pp. 775, San Francisco, CA
17. Dai, Y. Q., Whittal, R. M., and Li, L. (1996) Anal. Chem. 68, 2494-2500
18. Skelton, R., Dubois, F., and Zenobi, R. (2000) Anal. Chem. 72, 1707-1710
19. Glu¨ckmann, M., Pfenninger, A., Kru¨ger, R., Thierolf, M., Karas, M., Horneffer,
V., Hillenkamp, F., and Strupat, K. (2001) Int. J. Mass Spectrom. 210/211,
121-132
20. Zenobi, R., and Knochenmuss, R. (1998) Mass Spectrom. Rev. 17, 337-366
21. Limbach, P. A. (1998) Spectroscopy 13, 17-27
22. Strobel, F. H., Solouki, T., White, M. A., and Russell, D. H. (1991) J. Am. Soc.
Mass Spectrom. 2, 91-94
23. Hettich, R. L. (1991) J. Am. Soc. Mass Spectrom. 2, 22-28
24. Qin, J., Steenvoorden, R. J. J. M., and Chait, B. T. (1996) Anal. Chem. 68,
1784-1791
25. Medzihradszky, K. F., Campbell, J. M., Baldwin, M. A., Falick, A. M., Juhasz, P.,
Vestal, M. L., and Burlingame, A. L. (2000) Anal. Chem. 72, 552-558
26. Loboda, A. V., Krutchinsky, A. N., Bromirski, M., Ens, W., and Standing, K. G.
(2000) Rapid Commun. Mass Spectrum. 14, 1047-1057
27. Brown, R. S., and Lennon, J. J. (1995) Anal. Chem. 67, 1998-2003
28. Peng, B.-H., Lee, J. C., and Campbell, G. A. (2003) J. Biol. Chem. 278,
49644-49651
29. Meyer, E. L., Strutz, N., Gahring, L. C., and Rogers, S. W. (2003) J. Biol. Chem.
278, 23786-23796
30. Hijarrubia, M. J., Aparicio, J. F., and Martin, J. F. (2003) J. Biol. Chem. 278,
8250-8256
31. Roberts, R. B. (1958) Microsomal particles and protein systhesis, Pergamon,
New York
32. Nierhaus, K. H. (1982) Curr. Topics Microbiol. Immunol. 97, 81-155
147
33. Hardy, S. J. S., Kurland, C. G., Voynow, P., and Mora, G. (1969) Biochemistry 8,
2897-2905
34. Rostom, A. A., Fucini, P., Benjamin, D. R., Juenemann, R., Nierhaus, K. H., Hartl,
F. U., Dobson, C. M., and Robinson, C. V. (2000) Proc. Natl. Acad. Sci. U.S.A. 97,
5185-5190
35. Wittmann-Liebold, B. (1984) Adv. Prot. Chem. 36, 56-78
36. Wittmann-Liebold, B., Kopke, A. K. E., Arndt, E., Kromer, W., and Hatakeyama,
T. (eds) (1990) Sequence comparison and evolution of ribosomal proteins and
their genes. In the Ribosome: Structure, Function, and Genetics. Edited by Hill,
W. E., Dahlberg, A., Garrett, R. A., Moore, P. B., and Schlessinger, D., Am. Soc.
Microbiol, Washington DC
37. Wool, I. G., Chan, Y.-L., and Gluck, A. (1995) Biochem. Cell Biol. 73, 933-947
38. Giri, L., Hill, W. E., and Whittmann, H. G. (1984) Adv. Prot. Chem. 36, 1-9
39. Dognin, M. J., and Wittmann-Liebold, B. (1980) Eur. J. Biochem. 112, 131-151
40. Wimberly, B. T., Guymon, R., McCutcheon, J. P., White, S. W., and
Ramakrishnan, V. (1999) Cell 97, 423-426
41. Kurland, C. G., Jorgensen, F., Richter, A., Ehrenberg, M., Bilgin, N., and Rojas,
A. M. (1990) Through the accuracy window. The ribosome:structure, function,
and evolution. (Hill, W. E., Uhlberg, A., Garrett, R. A., Moore, P. B.,
Schlessinger, D., and Warner, J. R. e., Eds.), American Society for Microbiology,
Washington, D.C.
42. Polevoda, B., and Sherman, F. (2000) J. Biol. Chem. 275, 36479-36482
43. Demirev, P. A., Lin, J. S., Pineda, F. J., and Fenselau, C. (2001) Anal. Chem. 73,
4566-4573
44. Gonzales, T., and Robert-Baudouy, J. (1996) FEMS Microbiol. Rev. 18, 319-344
45. Hirel, P. H., and Schmitter, M. J. (1989) Proc. Natl. Acad. Sci. U.S.A. 86,
8247-8251
46. Kendall, R. L., Yamada, R., and Bradshaw, R. A. (1990) Methods Enzymol. 185,
398-407
148
47. Polevoda, B., Norbeck, J., Takakura, H., Blomberg, A., and Sherman, F. (1999)
EMBO J. 18, 6155-6168
48. Moerschell, R., Hosokawa, Y., Tsunasawa, S., and Sherman, F. (1990) J. Biol.
Chem. 265, 19638-19643
49. Fontecave, M., Atta, M., and Mulliez, E. (2004) Trends in Biochemical Sciences
29, 243-249
50. Gary, J. D., Lin, W.-J., Yang, M. C., Herschman, H. R., and Clarke, S. (1996) J.
Biol. Chem. 271, 12585-12594
51. Arnold, R. J., and Reilly, James P. (2002) Methods Mol. Biol. 194, 205-210
52. Arnold, R. J., and Reilly, J. P. (1999) Anal. Biochem. 269, 105-112
53. Yan, J. X., Packer, N. H., Gooley, A. A., and Williams, K. L. (1998) J.
Chromatogr. A 808, 23-41
54. Jefferies, H. B. J., Fumagalli, S., Dennis, P. B., Reinhard, C., Pearson, R. B., and
Thomas, G. (1997) EMBO J. 16, 3693-3704
55. Mazumder, B., Sampath, P., Seshadri, V., Maitra, R. K., DiCorleto, P. E., and Fox,
P. L. (2003) Cell 115, 187-198
56. Link, A. J., Eng, J., Schieltz, D. M., Carmack, E., Mize, G. J., Morris, D. R.,
Garvik, B. M., and Yates, J. R., III. (1999) Nat. Biotechnol. 17, 676-682
57. Lee, S.-W., Berger, S. J., Martinovi, S., Paa-Toli, L., Anderson, G. A., Shen, Y.,
Zhao, R., and Smith, R. D. (2002) Proc. Natl. Acad. Sci. U.S.A. 99, 5942-5947
58. Moini, M., and Huang, H. (2004) Electrophoresis 25, 1981-1987
59. Strader, M. B., Verberkmoes, N. C., Tabb, D. L., Connelly, H. M., Barton, J. W.,
Bruce, B. D., Pelletier, D. A., Davison, B. H., Hettich, R. L., Larimer, F. W., and
Hurst, G. B. (2004) J. Proteome Res. 3, 965-978
60. Wilcox, S. K., Cavey, G. S., and Pearson, J. D. (2001) Antimicrob. Agents
Chemother. 45, 3046-3055
61. Pineda, F. J., Antoine, M. D., Demirev, P. A., Feldman, A. B., Jackman, J.,
Longenecker, M., and Lin, J. S. (2003) Anal. Chem. 75, 3817-3822
62. Allers, J., and Shamoo, Y. (2001) J. Mol. Biol. 311, 75-86
149
63. Benjamin, D. R., Robinson, C. V., Hendrick, J. P., Hartl, F. U., and Dobson, C. M.
(1998) Proc. Natl. Acad. Sci. U.S.A. 95, 7391-7395
64. Yamaguchi, K., Beligni, M. V., Prieto, S., Haynes, P. A., McDonald, W. H.,
Yates, J. R., III, and Mayfield, S. P. (2003) J. Biol. Chem. 278, 33774-33785
65. Yamaguchi, K., Prieto, S., Beligni, M. V., Haynes, P. A., McDonald, W. H.,
Yates, J. R., III, and Mayfield, S. P. (2002) Plant Cell 14, 2957-2974
66. Kelleher, N. L., Lin, H. Y., Valaskovic, G. A., Aaserud, D. J., Fridriksson, E. K.,
and McLafferty, F. W. (1999) J. Am. Chem. Soc. 121, 806-882
67. Arnold, R. J., Polevoda, B., Reilly, J. P., and Sherman, F. (1999) J. Biol. Chem.
274, 37035-37040
68. Kowalak, J. A., and Walsh, K. A. (1996) Protein Sci. 5, 1625-1632
69. Kisilevsky, R., Treloar, M. A., and Weiler, L. (1984) J. Biol. Chem. 259,
1351-1356
70. Hanson, C. L., Videler, H., Santos, C., Ballesta, J. P. G., and Robinson, C. V.
(2004) J. Biol. Chem. 279, 42750-42757
71. Ballesta, J. P. G., Rodriguez-Gabriel, M. A., Bou, G., Briones, E., Zambrano, R.,
and Remacha, M. (1999) FEMS Microbiology Reviews 23, 537-550
72. Hanson, C. L., Fucini, P., Ilag, L. L., Nierhaus, K. H., and Robinson, C. V. (2003)
J. Biol. Chem. 278, 1259-1267
73. Hernandez, H., and Robinson, C. V. (2001) J. Biol. Chem. 276, 46685-46688
74. Hanson, C. L., and Robinson, C. V. (2004) J. Biol. Chem. 279, 24907-24910
75. Kruft, V., and Wittmann-Liebold, B. (1991) Biochemistry 30, 11781-11787
76. Blattner, F. R., Plunkett, G., III, Bloch, C. A., Perna, N. T., Burland, V., Riley, M.,
Collado-Vides, J., Glasner, J. D., Rode, C. K., Mayhew, G. F., Gregor, J., Davis,
N. W., Kirkpatrick, H. A., Goeden, M. A., Rose, D. J., Mau, B., and Shao, Y.
(1997) Science 277, 1453-1462
77. Zitomer, R. S., and Flaks, J. G. (1972) J. Mol. Biol 71, 263-279
78. Rheinberger, H.-J., Geigenmuller, U., Wedde, M., and Nierhaus, K. H. (1988)
Methods Enzymol. 164, 658-670
79. Stern, S., Moazed, D., and Noller, H. F. (1988) Methods Enzymol. 164, 481-489
150
80. Bollag, D. M., Rozycki, M. D., and Edelstein, S. J. (1996) Protein Methods,
Second Edition, Wiley-Liss Inc, New York
81. Spedding, G. (1990) Oxford University Press, pp.1-27
82. Stanley, W. M., and Bock, R. M. (1965) Biochemistry 4, 1302-1311
83. Chomczynski, P., and Sacchi, N. (1987) Anal. Biochem. 162, 156-159
84. Zhu, N., and Wang, Z. (1997) Anal. Biochem. 246, 155-158
85. Barritault, D., Expert-Bezancon, A., Guerin, M.-F., and Hayes, D. (1976) Eur. J.
Biochem. 63, 131-135
86. Cohlberg, J. A. (1980) Anal. Biochem. 106, 195-198
87. Shapiro, D. J. (1981) Anal. Biochem. 110, 229-231
88. Hindennach, I., Stoffler, G., and Wittmann, H. G. (1971) Eur. J. Biochem. 23,
7-11
89. Hames, B. D. (1981) in In Gel Electrophoresis of Proteins. A Practical Approach,
pp. 290, RL Press Limited,, London
90. Hamel, E., Koka, M., and Nakamoto, T. (1972) J. Biol. Chem. 217, 805-814
91. Rowley, A., Choudhary, J. S., Marzioch, M., Ward, M. A., Weir, M., Solari, R. C.
E., and Black, W. P. (2000) Methods 20, 383-397
92. Cohen, S. L., and Chait, B.T. (1996) Anal. Chem. 68, 31-37
93. Williams, T. L., Andrzejewski, D., Lay, J. O. J., and Musser, S. M. (2003) J. Am.
Soc. Mass Spectrom. 14, 342-351
94. Blyn, L. B. (2000) Nucleic Acids Research 28, 1778-1784
95. Stelzl, U., Spahn, C. M. T., and Nierhaus, K. H. (2000) Proc. Natl. Acad. Sci.
U.S.A. 97, 4597-4602
96. Okada, S., Okada, T., Aimi, T., Morinaga, T., and Itoh, T. (2000) FEBS Lett. 485,
153-156
97. Sengupta, J., Agrawal, R. K., and Frank, J. (2001) Proc. Natl. Acad. Sci. U.S.A. 98,
11991-11996
98. Gerstner, R. B., Pak, Y., and Draper, D. E. (2001) Biochemistry 40, 7165-7173
99. Iwasaki, K., Kikukawa, S., Kawamura, S., Kouzuma, Y., Tanaka, I., and Kimura,
M. (2002) Biosci. Biotechnol. and Biochem. 66, 103-110
151
100. Amado, F. M. L., Domingues, P., Santana-Marques, M. G., Ferrer-Correia, A. J.,
and Tomer, K. B. (1997) Rapid Commun. Mass Spectrum. 11, 1347-1352
101. Wahl, M. C. (2002) Current Protein & Peptide Science 3, 93-106
102. Agafonov, D. E., Kolb, V. A., and Spirin, A. S. (1997) Proc. Natl. Acad. Sci.
U.S.A. 94, 12892-12897
103. Shiman, R., and Draper, D. E. (2000) J. Mol. Biol. 302, 79-91
104. Misra, V. K., and Draper, D. E. (1998) Biopolymers 48, 113-135
105. Donner, D., Villems, R., Liljas, A., and Kurland, C. G. (1978) Proc. Natl. Acad.
Sci. U.S.A. 75, 3192-3195
106. Henne, A., Brüggemann, H., Raasch, C., Wiezer, A., Hartsch, T., Liesegang, H.,
Johann, A., Lienard, T., Gohl, O., Martinez-Arias, R., Jacobi, C., Starkuviene, V.,
Schlenczeck, S., Dencker, S., Huber, R., Klenk, H.-P., Kramer, W., Merkl, R.,
Gottschalk, G., and Fritz, H.-J. (2004) Nat. Biotechnol. 22, 547 - 553
107. Kristjansson, J. K., Hreggvidsson, G. O., and Alfredsson, G. A. (1986) Appl.
Environ. Microbiol. 52, 1313-1316
108. Cameron, D. M., Gregory, S. T., Thompson, J., Suh, M.-J., Limbach, P. A., and
Dahlberg, A. E. (2004) J. Bacteriol. 186, 5819-5825
109. Suh, M.-J., and Limbach, P. A. (2004) Eur. J. Mass Spectrum. 10, 89-99
110. Triantafillidou, D., Simitsopoulou, M., Franceschi, F., and Choli-Papadopoulou,
T. (1999) J. Protein Chem. 18, 215-223
111. Tompson, J., Musters, W., Cundliffe, E., and Dahlberg, A. E. (1993) EMBO J. 12,
1499-1504
112. Wittmann, H. G., Littlechild, J. A., and Wittmann-Liebold, B. (1980) In
Ribosomes (Chambliss, G., et al.,, Ed.), Univ.Park Press, Baltimore, MD
113. Terhorst, C., Wittmann-Liebold, B., and Moller, W. (1972) Eur. J. Biochem. 25,
13-19
114. Spahn, C. M. T., Beckmann, R., Eswar, N., Penczek, P. A., Sali, A., Blobel, G.,
and Frank, J. (2001) Cell 107, 373-386
152
115. Gao, H., Sengupta, J., Valle, M., Korostelev, A., Eswar, N., Stagg, S. M., Van
Roey, P., Agrawal, R. K., Harvey, S. C., Sali, A., Chapman, M. S., and Frank, J.
(2003) Cell 113, 789-801
116. Urlaub, H., Kruft, V., Bischof, O., Muller, E., and Wittmann-Liebold, B. (1995)
EMBO J. 14, 4578-4588
117. Thiede, B., Urlaub, H., Neubauer, H., Grelle, G., and Wittmann-Liebold, B.
(1998) Biochem. J. 334, 39-42
118. Lambert, J. M., Boileau, G., Cover, J. A., and Traut, R. R. (1983) Biochemistry 22,
3913-3920
119. Pohl, T., and Wittmann-Liebold, B. (1988) J. Biol. Chem. 263, 4293-4301
120. Celander, D. W., and Abelson, J. N. (2000) RNA-ligand interactions, Part A.
Methods Enzymol., 318, Acedemic Press, San Diego
121. Walleczek, J., Schuler, D., Stoffler-Meilicke, M., Brimacombe, R., and Stoffler,
G. (1988) EMBO J. 7, 3571-3576
122. Wilson, D. N., and Nierhaus, K. H. (2003) Angew. Chem. Int. Ed. 42, 3464-3486
123. Brodersen, D. E., Clemons, W. M., Carter, A. P., Wimberly, B. T., and
Ramakrishnan, V. (2002) J. Mol. Biol. 316, 725-768
124. Schluenzen, F., Tocilj, A., Zarivach, R., Harms, J., Gluehmann, M., Janell, D.,
Bashan, A., Bartels, H., Agmon, I., Franceschi, F., and Yonath, A. (2000) Cell
102, 615-623
125. Harms, J., Schluenzen, F., Zarivach, R., Bashan, A., Gat, S., Agmon, I., Bartels,
H., Franceschi, F., and Yonath, A. (2001) Cell 107, 679-688
126. Ban, N., Nissen, P., Hansen, J., Moore, P. B., and Steitz, T. A. (2000) Science 289,
905
127. Wimberly, B. T., Broderson, D. E., Clemons, W. M., Morgan-Warrent, R. J.,
Carter, A. P., Vonrhein, C., Hartsch, T., and Ramakrishnan, V. (2000) Nature 407,
327
128. Cohen, S. L., Ferre-D'amare, A. R., Burley, S. K., and Chait, B. T. (1995) Protein
Sci. 4, 1088-1099
153
129. Fontana, A., Zambonin, M., de Laureto, P. P., Filippis, V. D., Clementi, A., and
Scaramella, E. (1997) J. Mol. Biol. 266, 223-230
130. Yang, F., Cheng, Y., Peng, J., Zhou, J., and Jing, G. (2001) Eur. J. Biochem. 268,
4227-4232
131. Leite, J. F., Amoscato, A. A., and Cascio, M. (2000) J. Biol. Chem. 275,
13683-13689
132. Bothner, B., Dong, X. F., Bibbs, L., Johnson, J. E., and Siuzdak, G. (1998) J. Biol.
Chem. 273, 673-676
133. Gervasoni, P., Staudenmann, W., James, P., and Plueckthun, A. (1998)
Biochemistry 37, 11660-11669
134. Vila-Sanjurjo, A., Ridgeway, W. K., Seymaner, V., Zhang, W., Santoso, S., Yu,
K., and Cate, J. H. D. (2003) Proc. Natl. Acad. Sci. U.S.A. 100, 8682-8687
135. Koradi, R., Billeter, M., and Wüthrich, K. (1996) J. Mol. Graphics 14, 51-55
136. Nierhaus, K. H. (1990) in Ribosomes and Protein Synthesis: A Practical
Approach Oxford University Press, pp.161-189
137. Tung, C.-S., Joseph, S., and Sanbonmatsu, K. Y. (2002) Nat. Struct. Biol. 9,
750-755
138. Littlechild, J., Malcolm, A., Paterakis, K., Ackermann, I., and Dijk, J. (1987)
Biochim. Biophys. Acta 913, 245-255
139. Mizushima, S., and Nomura, M. (1970) Nature 226, 1214-1218
140. Laughrea, M., and Moore, P. B. (1978) J. Mol. Biol. 122, 109-112
141. Hochkeppel, H.-K., Spicer, E., and Craven, G. R. (1976) J. Mol. Biol. 101,
155-170
142. Nowothy, V., and Nierhaus, K. H. (1988) Biochemistry 27, 7051-7055
143. Held, W. A., Mizushima, S., and Nomura, M. (1973) J. Biol. Chem. 248,
5720-5730
144. Frank, J., and Agrawal, R. K. (2000) Nature 406, 318-322
145. Cate, J. H., Yusupov, M. M., Yusupova, G. Z., Earnest, T. N., and Noller, H. F.
(1999) Science 285, 2095-2104
154
146. Gabashvili, I. S., Agrawal, R. K., Spahn, C. M. T., Grassucci, R. A., Svergun, D.
I., Frank, J., and Penczek, P. (2000) Cell 100, 537-549
147. Klein, D. J., Moore, P. B., and Steitz, T. A. (2004) J. Mol. Biol 340, 141-177
148. Moore, P. B., and Steitz, T. A. (2002) Nature 418, 229-235
149. Serdyuk, I., Baranov, V., Tsalkova, T., Gulyamova, D., Pavlov, M., Spirin, A.,
and May, R. (1992) Biochimie 74, 299-306
155
156
Vita
Moo-Jin Suh was born July 24, 1973, in Busan, South Korea. He completed his high
school education at the Jayang School in 1991 and earned his Bachelor of Science degree
in chemistry at the Korea University in February 1995. He continued his study at the
same advanced school and earned his Master of Science degree in chemistry at the Korea
University in February 1997. Mr. Suh attended graduate school at the Louisiana State
University in Baton Rouge, Louisiana, in August 2000, where he pursued his doctoral
degree under the leadership of Dr. Patrick A. Limbach. After one year, he transferred to
the University of Cincinnati, Ohio and continued his doctoral degree with Dr. Patrick A.
Limbach. He got married with Jamie Jeeyung Bang in January 10, 2004. He will receive
the degree of Doctor of Philosophy in December 2004. He will continue to his research
as a post-doctoral fellow at Weill Medical College of Cornell University, New York in
January 2005.