VEGETATED ROOF SYSTEMS - OhioLINK ETD
227
VEGETATED ROOF SYSTEMS: DESIGN, PRODUCTIVITY, RETENTION, HABITAT, AND SUSTAINABILITY IN GREEN ROOF AND ECOROOF TECHNOLOGY DISSERTATION Presented in Partial Fulfillment of the Requirements for the Degree Doctor of Philosophy in the Graduate School of The Ohio State University By Reid R. Coffman, M.L.A. * * * * * The Ohio State University 2007 Dissertation Committee Approved by Professor: Claudio Pasian, Adviser Professor: Jane Amidon Professor: Jay Martin _____________________________ Professor: Tom Waite Adviser Horticulture and Crop Science Graduate Program
-
Upload
khangminh22 -
Category
Documents
-
view
2 -
download
0
Transcript of VEGETATED ROOF SYSTEMS - OhioLINK ETD
VEGETATED ROOF SYSTEMS: DESIGN, PRODUCTIVITY, RETENTION, HABITAT, AND SUSTAINABILITY IN
GREEN ROOF AND ECOROOF TECHNOLOGY
DISSERTATION
Presented in Partial Fulfillment of the Requirements for
the Degree Doctor of Philosophy in the Graduate School of The Ohio State University
By
Reid R. Coffman, M.L.A.
* * * * *
The Ohio State University 2007
Dissertation Committee Approved by Professor: Claudio Pasian, Adviser Professor: Jane Amidon Professor: Jay Martin _____________________________ Professor: Tom Waite Adviser Horticulture and Crop Science Graduate Program
-
ii-
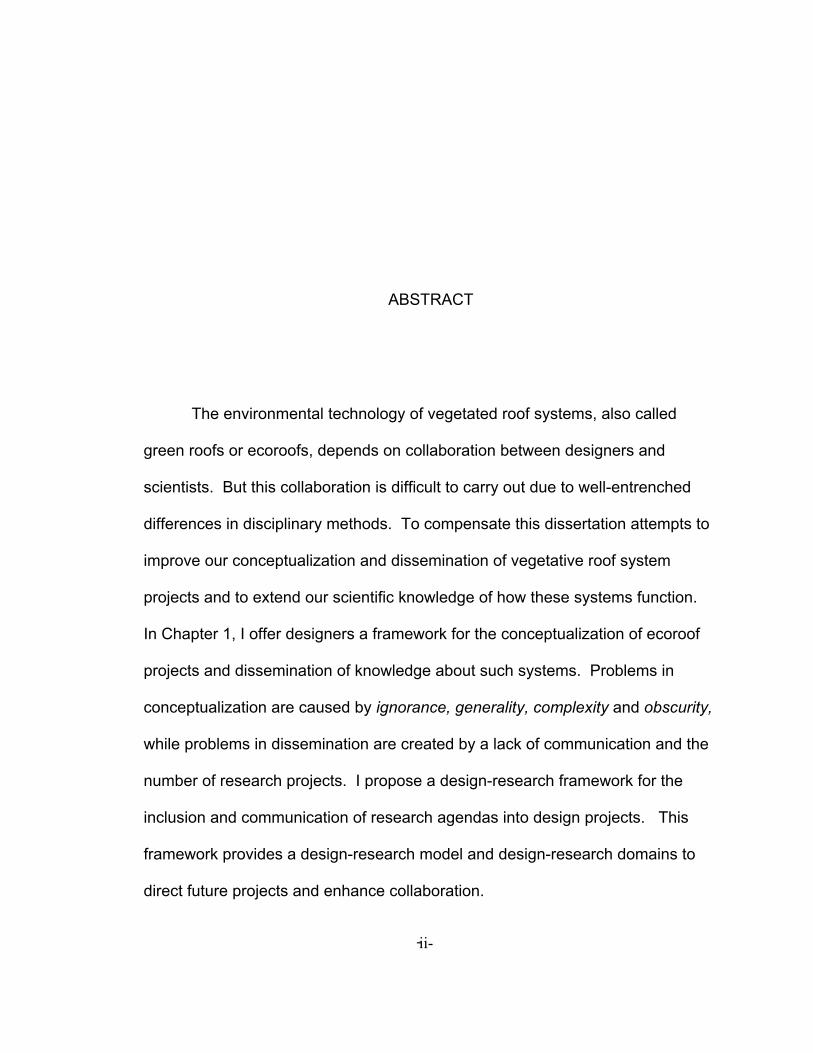
ABSTRACT
The environmental technology of vegetated roof systems, also called
green roofs or ecoroofs, depends on collaboration between designers and
scientists. But this collaboration is difficult to carry out due to well-entrenched
differences in disciplinary methods. To compensate this dissertation attempts to
improve our conceptualization and dissemination of vegetative roof system
projects and to extend our scientific knowledge of how these systems function.
In Chapter 1, I offer designers a framework for the conceptualization of ecoroof
projects and dissemination of knowledge about such systems. Problems in
conceptualization are caused by ignorance, generality, complexity and obscurity,
while problems in dissemination are created by a lack of communication and the
number of research projects. I propose a design-research framework for the
inclusion and communication of research agendas into design projects. This
framework provides a design-research model and design-research domains to
direct future projects and enhance collaboration.
-
iii-
Innovation in ecoroof technology persists, but often occurs with assumed
benefits possessing unknown consequences. Therefore, in Chapter 2, I describe
the first scientific study, which was designed to evaluate experimentally the effect
of substrate depth on net primary productivity, water retention, and water quality.
My data revealed that deep substrate roofs retained 18% more rainwater while
producing 2.5 times more biomass than shallow substrate roofs. Roofs using
water recycling or run-on water produced up to 26% more biomass than those
receiving only direct precipitation and did so without any significant reduction in
retention. All roofs showed low productivity compared to grassland and forest
ecosystems. Water quality was lowest in deep roofs, yet remained higher than
receiving streams. This chapter demonstrates that ecoroof innovation should
continue as a part of the technology’s development.
The use of ecoroofs for the conservation of urban biodiversity is
advocated by enthusiasts, yet the affects are largely unknown. In Chapter 3, I
quantify animal diversity for several taxa on two vegetated roof systems and
promote a methodological approach for such studies. I used a rapid assessment
method to quantify the diversity of insects, spiders and birds on these ecoroofs
based on relative abundance data. The Rènyi family of diversity indices was
used to compare diversity between the two ecoroofs. My data revealed relatively
low similarity between the species assemblages, but a relatively strong similarity
in community structure. Overall, the intensive ecoroof supported slightly higher
diversity.
-
iv-
Finally, the overriding support for implementing ecoroof technology
centers on the idea of improving urban sustainability, which goes unmeasured.
Therefore, in Chapter 4, I use emergy analysis to quantify and compare the
sustainability of three vegetated roof systems: an agricultural roof garden, a
shallow-substrate ecoroof, and a deep-substrate ecoroof. The shallow-substrate
ecoroof was the most sustainable (least unsustainable) of the three, followed by
the deep-substrate ecoroof and the agricultural roof garden. All three systems
were less sustainable than various agricultural practices, while being more
sustainable than conventional landscapes, urban gardens and cities. These
results confirm that vegetated roof systems can improve the sustainability of a
city, but are reliant on many non-renewable resources for their construction and
upkeep.
-
v-
DEDICATION
This work is dedicated
to my parents, Sally and Larry Coffman,
and my wife, Kelly Coffman,
for their faithful support.
-
vi-
ACKNOWLEDGMENTS
I wish to thank my main advisor, Dr. Claudio Pasian, for the intellectual
support, and the creation of a well-balanced environment of learning and growth,
and his patience in undertaking such an interdisciplinary effort that was underway
prior to his involvement.
I wish to thank my sustainability chapter advisor, Dr. Jay Martin, for his
educational support and encouragement from the very early stages of this
endeavor, through beginning discussions in classroom teaching to the academic
guidance of this project’s development.
I wish to thank design chapter advisor, Professor Jane Amidon, for her
fresh perspective provided during mid-project stage, and the contribution of a
design perspective and methods connecting the various involved disciplinary
investigations to landscape architecture.
I wish to thank my habitat chapter advisor, Dr. Tom Waite, who provided
the much needed foundational research guidance in this project and who made
himself available in times of need during my transition period between main
-
vii-
advisors. His help interpreting the concepts and applications of ecology were
irreplaceable and deeply appreciated.
I am grateful to the following for their assistance: Dr Norman Johnson
(Insect identification) and Dr Richard Bradley (Arachnid identification) and
Graham Davis, researcher of The Ohio State University for their guidance and
assistance. The Wexner Center for the Performing Arts and the Ford Motor
Company for their cooperation in providing information and access and
particularly Don Russell for his involvement. The Department of Horticulture and
Crop Science at OSU, the National Wildlife Federation (NWF) and the Ohio
Agricultural Research and Development Center (OARDC) for their financial
support. The several anonymous peer reviews provided by members from the
research committee of the Greening Roofs for Healthy Cities organization.
Lastly, I wish to thank Martin F. Quigley, PhD for his initial encouragement
and support of this project.
-
viii-
VITA
April 25, 1970 ……………………………..Born, Battlecreek, MI 1993 ………………………………………..B.S. Education, University of Missouri 1998 ………………………………………..M.L.A. Architecture, University of
Colorado 2001 ………………………………………..Adjunct Faculty, College of Architecture The Ohio State University 2002-2004………………………………….Graduate Assistant, College of Food, Agricultural and Environmental Sciences The Ohio State University 2004 ……….……………………………….Campus Ecology Fellowship National Wildlife Federation The Ohio State University 2004-present……………………………….Assistant Professor, College of Architecture, University of Oklahoma
PUBLICATIONS Coffman, R. 2007 “Understanding Assignments: Improving the Edge Condition of
a Mitigation Wetland ” Council of Educators of Landscape Architecture Conference, State College, PA
-
ix-
Coffman, R. 2007 “Ecoroofs as Habitat? Assessing Biodiversity Across Green Roof Class.” Greening Rooftops for Sustainable Communities, Minneapolis, MN
Coffman, R. and Davis, G., 2005 “Insect and Avian Fauna Presence on Ford’s
River Rouge Plant.” Greening Rooftops for Sustainable Communities, Washington D.C
Coffman, R. and Martin, Jay 2004 “The Sustainability of an Agricultural Roof
Garden” Greening Rooftops for Sustainable Communities, Portland, OR
FIELDS OF STUDY Major Field
Horticulture and Crop Science Specialization
Urban Ecology Plant and Systems Ecology
-
x-
TABLE OF CONTENTS
ABSTRACT ...........................................................................................................ii DEDICATION ....................................................................................................... v ACKNOWLEDGMENTS .......................................................................................vi VITA ...................................................................................................................viii TABLE OF CONTENTS ....................................................................................... x LIST OF FIGURES ............................................................................................. xiii LIST OF TABLES .............................................................................................. xvii
CHAPTER 1 AMBIGUOUSLY GREEN? IMPROVING COMMUNICATION IN ECOROOF TECHNOLOGY THROUGH A DESIGN-RESEARCH FRAMEWORK ................................................................................................ 1
1.1 ABSTRACT .................................................................................................... 1 1.2 INTRODUCTION .............................................................................................. 3
1.2.1 Overview .............................................................................................. 3 1.2.2 Vegetated Roof System Terms and Types........................................... 5 1.2.3 Vegetated Roof System History ........................................................... 7
1.3 BROAD SHIFT TO ENVIRONMENTAL SERVICES .................................................. 9 1.3.1 Sustainability and Environmental Services........................................... 9 1.3.2 Environmental Services of Vegetated Roof System ........................... 11
1.4 SPECIFIC PROBLEMS .................................................................................... 14 1.4.1 Current problems in dissemination ..................................................... 14 1.4.2 Current problems in conceptualization ............................................... 17
1.5 PROPOSED METHODOLOGY.......................................................................... 26
-
xi-
1.5.1 The design model precedent .............................................................. 26 1.6 DESIGN-RESEARCH DOMAINS....................................................................... 28
1.6.1 Productivity Domain............................................................................ 29 1.6.2 Biodiversity Domain............................................................................ 32 1.6.3 Energy ................................................................................................ 35 1.6.4 Nutrient Cycling Domain..................................................................... 37 1.6.5 Hydrologic Cycle Domain ................................................................... 39 1.6.6 Social Understanding and Stewardship.............................................. 43
1.7 SAMPLE APPLICATIONS ................................................................................ 45 1.7.1 Rosetti Building .................................................................................. 46 1.7.2 Ford Assembly Plant Ecoroof ............................................................. 48 1.7.3 Latter Day Saints Conference Center................................................. 49
1.8 DISCUSSION................................................................................................ 52 1.9 CITATIONS .................................................................................................. 54
CHAPTER 2 PRIMARY PRODUCTIVITY, WATER RETENTION AND LEACHATE QUALITY IN TWO ALTERNATIVE ECOROOF DESIGNS........ 61
2.1 ABSTRACT .................................................................................................. 61 2.2 INTRODUCTION ............................................................................................ 62
2.2.1 Ecoroofs ............................................................................................. 62 2.3 MATERIAL AND METHODS.............................................................................. 69
2.3.1 Constructed Plots ............................................................................... 69 2.3.2 Experimental Design .......................................................................... 73 2.3.3 Data collection.................................................................................... 73 2.3.4 Data analysis...................................................................................... 74
2.4 RESULTS .................................................................................................... 74 2.4.1 Biomass.............................................................................................. 74 2.4.2 Retention ............................................................................................ 78 2.4.3 Water Quality...................................................................................... 82 2.4.4 Interactions......................................................................................... 87
2.5 DISCUSSION................................................................................................ 92 2.6 CONCLUSIONS............................................................................................. 96 2.7 CITATIONS .................................................................................................. 98
CHAPTER 3 ECOROOFS AND BIODIVERSITY: ASSESSING ANIMAL DIVERSITY ON TWO TYPES OF VEGETATED ROOFS........................... 103
3.1 ABSTRACT ................................................................................................ 103 3.2 INTRODUCTION .......................................................................................... 104 3.3 VEGETATED ROOF SYSTEMS AND ANIMAL DIVERSITY ASSESSMENT............... 107
-
xii-
3.4 METHODS ................................................................................................. 112 3.5 RESULTS .................................................................................................. 116 3.6 DISCUSSION.............................................................................................. 121
3.6.1 Combining Rapid Assessment and the Rènyi method for quantifying diversity ..................................................................................................... 122 3.6.2 Ecoroof Biodiversity and Conservation............................................. 123
3.7 CONCLUSIONS........................................................................................... 126 3.8 CITATIONS ................................................................................................ 128
CHAPTER 4 EMERGY EVALUTION OF THE PRODUCTIVITY AND SUSTAINABILITY OF THREE VEGETATED ROOF SYSTEMS ................ 132
4.1 ABSTRACT ................................................................................................ 132 4.2 INTRODUCTION .......................................................................................... 133 4.3 METHODS ................................................................................................. 138
4.3.1 Systems Descriptions ....................................................................... 138 4.3.2 Emergy Flows and Definitions .......................................................... 139 4.3.3 Emergy Analysis............................................................................... 142
4.4 SUB-ANALYSIS OF EXPANDED CLAY ............................................................. 150 4.4.1 The emergy analysis of expanded clay ............................................ 150
4.5 RESULTS .................................................................................................. 153 4.5.1 Renewable ....................................................................................... 153 4.5.2 Purchased Resources ...................................................................... 154 4.5.4 Yields and Specific Emergy.............................................................. 155 4.5.5 Emergy Indices................................................................................. 156
4.6 DISCUSSION.............................................................................................. 158 4.6.1 Limitations ........................................................................................ 158 4.6.2 Vegetated Roof Systems Sustainability and Productivity ................. 160 4.6.3 Comparison to other landscape systems.......................................... 162 4.6.3 The City and Vegetated Roof Systems............................................. 167 4.6.4 The Perception of the Vegetated Roof Technology.......................... 168 4.6.5 Improved Sustainability .................................................................... 169
4.7 CONCLUSIONS........................................................................................... 172 4.8 CITATIONS ................................................................................................ 174
REFERENCES................................................................................................. 179 APPENDIX A VEGETATED ROOF SYSTEM DESCRIPTIONS...................... 193 APPENDIX B STATESTICAL ANALYSIS ....................................................... 197 APPENDIX C EMERGY CALCULATIONS..................................................... 200 APPENDIX D COPYRIGHT PERMISSION ..................................................... 209
-
xiii-
LIST OF FIGURES
Figure Page 1.1 Two vegetated roof system classes: The Ford Motor Assembly Plant,
Dearborn, MI USA (left) is an extensive system (<15.24cm of soil) consisting of a shallow rock-based substrate containing exotic succulents that regulate energy and stormwater, while the Fairmont Waterfront, Vancouver, BC Canada (right) is an intensive system consisting of raised beds of thick, rich topsoil (with planters >1m deep) producing local produce and herbs……………………………………….......7
1.2 The contributing effects persisting in ecoroof projects, shown above in
ovals with arrows indicating cumulative influence………………………... 19 1.3 An example of the effect of ignorance at Ford Assembly Plant ecoroof
Dearborn MI. Irrigation is used past the plant establishment period in order to maintain a visual appearance likely impacting its main goal of stormwater retention…………………………………………………………..21
1.4 The complex intellectual design-research model allows research and
design collaboration through semi-alternating phases. The model begins with current knowledge that can be applied to the site and defined through discrete elements that can be constructed, assessed and disseminated. The knowledge returns to inform future projects………………………………………………………………………....27
1.5 A diagram of ecoroof design-research domains with example criteria
are shown in circles and two-way arrows indicate potential influence…..29 1.6 An illustrative image-diagram for the Rosetti Building ecoroof in Zurich,
Switzerland prioritizing biodiversity, productivity, energy, and hydrologic cycling (shown in circles) in the project agenda. The background image
-
xiv-
shows the site while text explains the proposal, means of installation and assessment criteria………………………..………………………....…..47
1.7 An illustrative image-diagram for the Ford Assembly Plant Ecoroof,
Dearborn, MI USA prioritizing energy, hydrologic cycling and stewardship (shown in circles) in the project agenda The background image shows the site while text explains the proposal, means of installation and assessment criteria. ………………………………….…..49
1.8 An illustrative image-diagram for the Church of Latter Day Saints
Conference Center ecoroof, Salt Lake City, UT USA prioritizing stewardship, biodiversity and energy (shown in circles) in the project agenda. The images show the site while text explains the proposal, means of installation and assessment criteria. …………………………..51
2.1 General view of the plots located in the Waterman Farm at the OSU
campus, Columbus, OH……………………………………………………....71 2.2 Plot Layout. Class: e (extensive) or i (intensive). Alternative: a (apron),
d (direct), r (recycle) and c (control). Aprons are shown as attached squares with a X drawn on them………………………………………….…72
2.3 Mean productivity measured as whole plant biomass by class (±SE)
(P-value < 0.001, 95% CI). Bars with same letter are not significantly different.………………………………………………………………………...75
2.4 Mean productivity measured as whole plant biomass by alternative
(± SE.) (All P-values are < 0.05, 95% CI). Bars with same letter are not significantly different.……………………………………………………..76
2.5 Mean productivity measured as whole plant biomass by alternative
and class (± SE.) (All P-values are < 0.05, 95% CI). Bars with same letter are not significantly different …………………………………………..77
2.6 Mean productivity measured as whole plant biomass per species
(± SE.) (P < 0.001, 95% CI). Bars with same letter are not significantly different.………………………………………………………….78
2.7 Mean water retention by class (± SE). (P < 0.001, 95% CI) Bars with
same letter are not significantly different……………………………….…..79 2.8 Mean water retention by alternative irrespective of class (± SE). (All P
values are < .05, 95% C.I.) Bars with same letter are not significantly different………………………………………………………………………....80
-
xv-
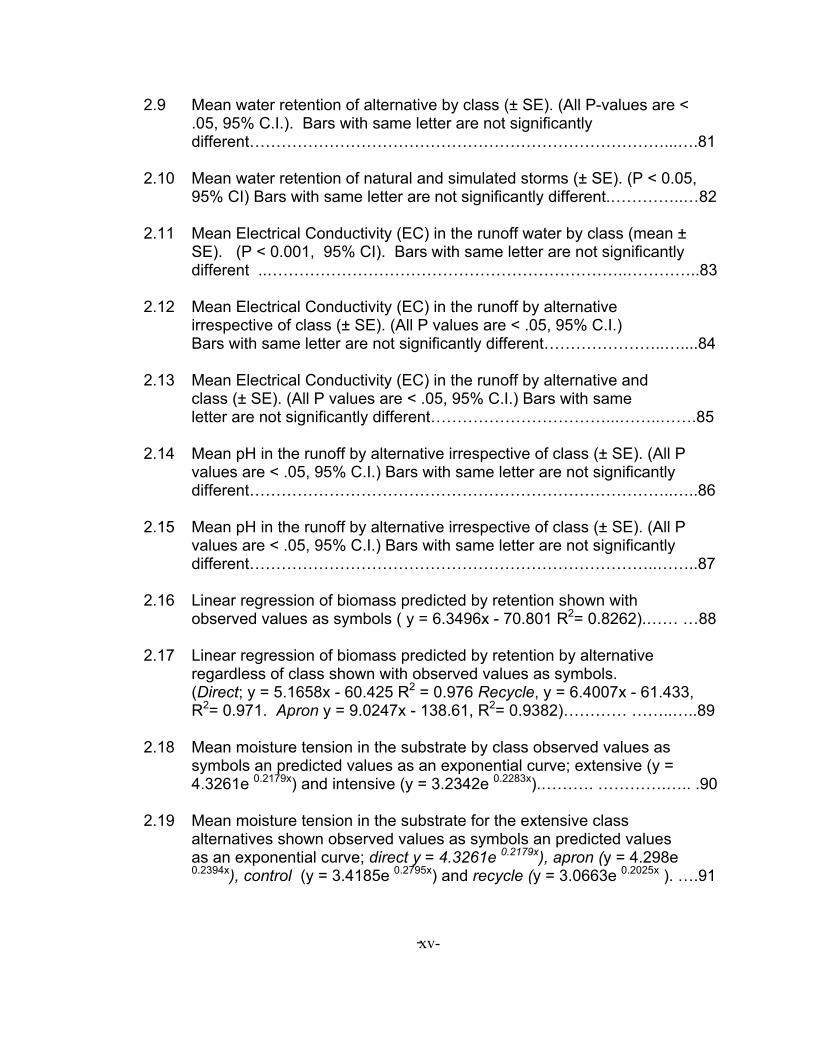
2.9 Mean water retention of alternative by class (± SE). (All P-values are < .05, 95% C.I.). Bars with same letter are not significantly different……………………………………………………………………...….81
2.10 Mean water retention of natural and simulated storms (± SE). (P < 0.05,
95% CI) Bars with same letter are not significantly different.…………..…82 2.11 Mean Electrical Conductivity (EC) in the runoff water by class (mean ±
SE). (P < 0.001, 95% CI). Bars with same letter are not significantly different ..…………………………………………………………..…………..83
2.12 Mean Electrical Conductivity (EC) in the runoff by alternative
irrespective of class (± SE). (All P values are < .05, 95% C.I.) Bars with same letter are not significantly different…………………..…....84
2.13 Mean Electrical Conductivity (EC) in the runoff by alternative and
class (± SE). (All P values are < .05, 95% C.I.) Bars with same letter are not significantly different……………………………...……..…….85
2.14 Mean pH in the runoff by alternative irrespective of class (± SE). (All P
values are < .05, 95% C.I.) Bars with same letter are not significantly different……………………………………………………………………..…..86
2.15 Mean pH in the runoff by alternative irrespective of class (± SE). (All P
values are < .05, 95% C.I.) Bars with same letter are not significantly different…………………………………………………………………..……..87
2.16 Linear regression of biomass predicted by retention shown with
observed values as symbols ( y = 6.3496x - 70.801 R2= 0.8262).…… …88 2.17 Linear regression of biomass predicted by retention by alternative
regardless of class shown with observed values as symbols. (Direct; y = 5.1658x - 60.425 R2 = 0.976 Recycle, y = 6.4007x - 61.433, R2= 0.971. Apron y = 9.0247x - 138.61, R2= 0.9382)………… ……..…..89
2.18 Mean moisture tension in the substrate by class observed values as
symbols an predicted values as an exponential curve; extensive (y = 4.3261e 0.2179x) and intensive (y = 3.2342e 0.2283x).………. ………….….. .90
2.19 Mean moisture tension in the substrate for the extensive class
alternatives shown observed values as symbols an predicted values as an exponential curve; direct y = 4.3261e 0.2179x), apron (y = 4.298e 0.2394x), control (y = 3.4185e 0.2795x) and recycle (y = 3.0663e 0.2025x ). ….91
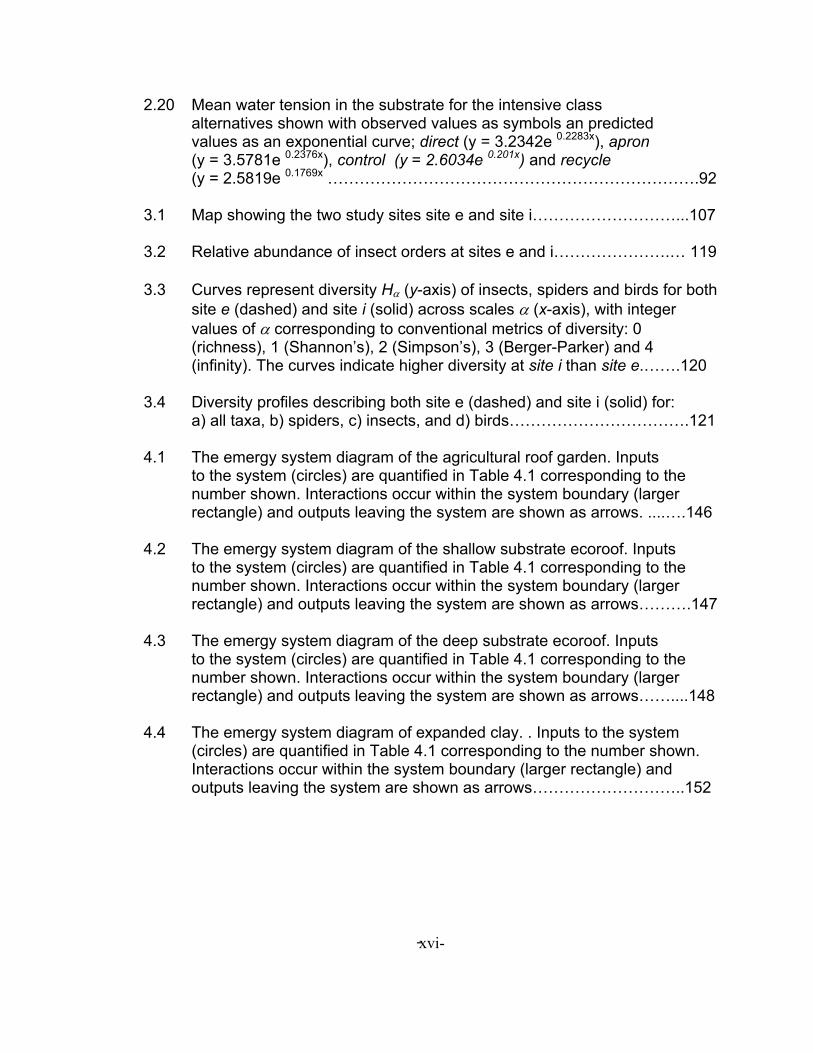
-
xvi-
2.20 Mean water tension in the substrate for the intensive class alternatives shown with observed values as symbols an predicted values as an exponential curve; direct (y = 3.2342e 0.2283x), apron (y = 3.5781e 0.2376x), control (y = 2.6034e 0.201x) and recycle (y = 2.5819e 0.1769x …………………………………………………………….92
3.1 Map showing the two study sites site e and site i………………………...107 3.2 Relative abundance of insect orders at sites e and i………………….… 119 3.3 Curves represent diversity Hα (y-axis) of insects, spiders and birds for both
site e (dashed) and site i (solid) across scales α (x-axis), with integer values of α corresponding to conventional metrics of diversity: 0 (richness), 1 (Shannon’s), 2 (Simpson’s), 3 (Berger-Parker) and 4 (infinity). The curves indicate higher diversity at site i than site e.…….120
3.4 Diversity profiles describing both site e (dashed) and site i (solid) for:
a) all taxa, b) spiders, c) insects, and d) birds…………………………….121 4.1 The emergy system diagram of the agricultural roof garden. Inputs
to the system (circles) are quantified in Table 4.1 corresponding to the number shown. Interactions occur within the system boundary (larger rectangle) and outputs leaving the system are shown as arrows. ....….146
4.2 The emergy system diagram of the shallow substrate ecoroof. Inputs
to the system (circles) are quantified in Table 4.1 corresponding to the number shown. Interactions occur within the system boundary (larger rectangle) and outputs leaving the system are shown as arrows……….147
4.3 The emergy system diagram of the deep substrate ecoroof. Inputs
to the system (circles) are quantified in Table 4.1 corresponding to the number shown. Interactions occur within the system boundary (larger rectangle) and outputs leaving the system are shown as arrows……....148
4.4 The emergy system diagram of expanded clay. . Inputs to the system
(circles) are quantified in Table 4.1 corresponding to the number shown. Interactions occur within the system boundary (larger rectangle) and outputs leaving the system are shown as arrows………………………..152
-
xvii-
LIST OF TABLES
Table Page 1.1 Green roof research occurring in public institutions………………….…….13 3.1 The two study sites compared by categorical.…………………….......….113 3.2 Collected Taxa from the two study sites …………………………..…117-118 4.1 The emergy table of the vegetated roof systems quantifies inputs and
outputs from raw units, which are multiplied by the emergy per unit (transformity) to get a total emergy value for each input. Output is the sum of the all emergy values……….……………………………………….149
4.2 Substrate composition table of the three vegetated roofs systems by
volume and percentage per cubic meter. …………………………………150 4.3 Emergy table of expanded clay quantifies inputs and outputs from raw
units, which are multiplied by the emergy per unit (transformity) to get a total emergy value for each input. Output is the sum of the all emergy values. ………………………………………………………………………..153
4.4 Emergy indices table describing the three vegetated roofs systems and
branched flow of the agricultural roof garden. ………………………...157 4.5 Comparative landscapes table describes the values of the three
vegetated roof systems and ten previously evaluated landscapes. ……166 B.1 ANOVA (General Linear Model) for whole plant biomass (per plant per plot) versus class, alternative, plant………………………………………..196
-
xviii-
B.2: ANOVA (Friedman’s) for biomass (per plot) amongst class………….....197 B.3: ANOVA (Friedman’s) for biomass (per plot) amongst alternative……....197 B.4: ANOVA (General Linear Model) for Retention……………………………197 B.5: ANOVA (General Linear Model) for Electrical Conductivity……………..198 B.6: ANOVA (General Linear Model) for pH……………………………………198
1
CHAPTER 1
AMBIGUOUSLY GREEN? IMPROVING COMMUNICATION IN ECOROOF
TECHNOLOGY THROUGH A DESIGN-RESEARCH FRAMEWORK
1.1 Abstract
This study offers to design disciplines a framework for conceptualizing,
developing design methods and establishing assessment criteria for vegetative
roof systems. The study’s framework is intended to function as a designer’s
‘toolkit’ to assist in their communication with researchers, while offering
opportunities to direct design projects toward research applicability and
dissemination. Excluded from this study is an equivalent ‘toolkit’ assisting
researches in understanding the design process. The original intent of this study
was to combine design and scientific research methodologies into a singular
(interdisciplinary) process in order to assist developing solutions in ecoroof
technology. The integration of design and scientific research proved difficult as
2
established methodologies governing the practice and dissemination of
disciplinary work remained distinct. Poor communication between design
professionals and applied researchers persists as an impediment in the
development of the technology.
Therefore, this study proposes a first step towards rectify the current
professional gap by connecting design and research through the use of both a
design model and design-research domains. Beginning with a discussion of the
available literature, the problems associated with research dissemination and
project conceptualization are described. The design profession factors
contributing to the problem include: ignorance, generality, complexity and
obscurity. To improve project conceptualization a design-research model is
offered to establish greater clarity in project goals through the use of design-
research domains. Six design-research domains are proposed to identify the
multidisciplinary initiatives of ecoroofs: productivity, biodiversity, energy balance,
nutrient cycling, hydrological cycling, and stewardship. The domains are based
on published and developing research agendas within ecoroof technology and
are intended to strengthen project development while providing research
legitimacy. The design-research domains are applied to sample applications of
past projects. The domains are shown as image-based illustrative diagrams
inclusive of disciplinary perspective while displaying the hierarchy of project
goals. Finally, further opportunities for disciplinary collaboration in ecoroofs and
design are discussed.
3
1.2 Introduction
1.2.1 Overview
Although ecoroof technology has recently experienced a rapid rise in
popularity as a green building practice, it remains plagued by problems of clarity
and miscommunication that are hampering its development, implementation and
effectiveness (Bruce 2005; Calkins 2005). These problems are caused by
general issues, such as a shared understanding of sustainability by involved
members, and specific issues, such as misinterpreting disciplinary knowledge.
However, one “weak link” that has been expressed by Bruce (2005) is the poor
relationship between design and research professions. Designers, lack effective
relationships with researchers, and therefore contribute to technological
problems through their leadership in project conceptualization and subsequently
reduce the effectiveness of knowledge dissemination. Therefore, this study
provides designers with a ‘toolkit’ to address these problems through improved
association with, and recognition of research contributions.
Many issues contribute to these problems. One is the current shift from a
general concept of sustainability to the concept of ecosystem services, which are
the environmental benefits society receives from the natural processes of
ecosystems (Costanza et al. 1997; Daily 1997; de Groot et al. 2002). This broad
epistemological shift is influencing the way team members approach a project. In
addition to such broad changes, many disciplines are trained categorically and
have knowledge and methods considered exclusive. This creates a series of
4
problems in the sharing of knowledge (dissemination) and in the development of
the project (conceptualization).
Most recently, calls for greater communication between the disciplines
involved in design and research have been made (Grant and Jones 2005;
Oberlander and Whitelaw 2005; Dunnett 2006). One framework for managing the
complexity of these projects has been proposed by Grant and Jones (2005).
However, the framework does not consider several existing research areas,
overlooks design innovation as a part of research objectives, and, most
importantly, does not offer a method to actively connect designers with
researchers.
This study shows that design and research exist simultaneously but are
not currently coordinated. Design continues to be committed to aesthetic-only
design proposals that compromise and contradict understood performance,
which is a risk of professional marginalization. In my opinion, research, on the
other hand, is developing in relative isolation, at times repeating itself, but overall
developing the knowledge of the technology. In the worst case scenario, the
fields come together as knowledge is applied as design regulation which often
results in professional contention. The attempt of this study is to inform
designers on how they can improve their association with researchers by better
understanding current research agendas and how to include research input into a
design project.
Therefore, this chapter proposes a framework to rectify the current
situation by connecting design and research through the use of a design model
5
and design-research domains. The chapter begins with description of the
selected literature reviews used in this study, an explanation of ecoroof types and
terminology; a discussion of the broad shift to environmental services, and
discusses the specific problems with the technology. From that point, the new
methodology is proposed by explaining the design model precedent and design-
research domains. To further understand how the domains function, they are
applied to three projects as sample applications. Lastly, a discussion of the
design-research methodology is provided.
1.2.2 Vegetated Roof System Terms and Types
A vegetated roof system is simply vegetation growing on a building
rooftop. This is a generalized term that has been used informally to discuss all
types roof greening. The more specific terms used to describe vegetated roof
systems are ecoroof, living roof, brown roof, roof garden and green roof, which
are more distinctive terms, yet are often used interchangeably. Ecoroof and
living roof have been associated with systems that complete an apparent season
cycle, such as dormancy due to heat or cold. Therefore, they are understood to
be an expression of an ecological or a living condition. These two terms have
been used in the Western United States. Brown roofs are, on the other hand,
associated with the urban reclamation process in which disturbed on-site soils
are used as growing medium for vegetation. This term has been used in the
United Kingdom. In addition, roof garden, the oldest and most common term, is
associated with a contrived aesthetic space for human inhabitation.
6
The term green roof has two connotations: one is more specific, signifies a
thin green layer of substrate and vegetation, not intended for human inhabitation;
the other is a broad meaning that includes all forms of roof greening. Commonly,
the use of the term green roof implies that the entire roof is covered with a layer
of impervious membrane, which is topped with soil and vegetation in order to
optimize the site-specific and community environmental benefits (Peck and Kuhn
2001; Scholz-Barth 2001). Occasionally, the term green roof will be conjoined
with other roof descriptors such as ‘agricultural green roof’ or ‘green roof garden’.
At this time, no universal taxonomy, or agreement on the terminology,
exists for this technology. Miller (2004) points out that these terms are all
prescriptive, and none are currently based on descriptive performance factors.
This is likely to be the reason that all terms are used interchangeably, often
overlapping, and frequently conjoined. Throughout this chapter, the term
vegetated roof system or ecoroof will be used when referring to a broad inclusive
group, and green roof when speaking about the more discrete systems known as
the extensive classes.
The two accepted classes of vegetated roof systems are based largely on
structure and to a lesser degree on function. The first class is an extensive
system consisting of less than 10 cm of substrate and allowing for only a few
plant species. The other class is an intensive system consisting of more than 30
cm (12”) of soil medium and allowing numerous plants species (Peck et al. 1999;
Dunnett and Kingsbury 2004). Examples of these two classes are shown in Fig
1.1.
7
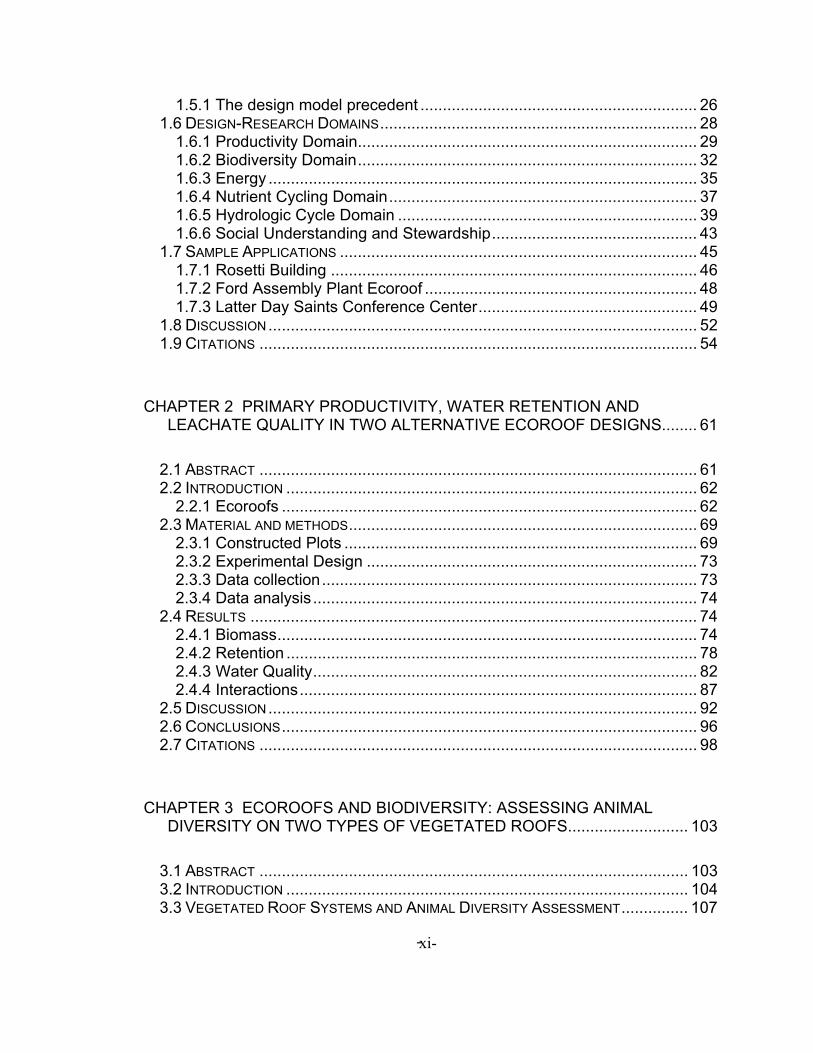
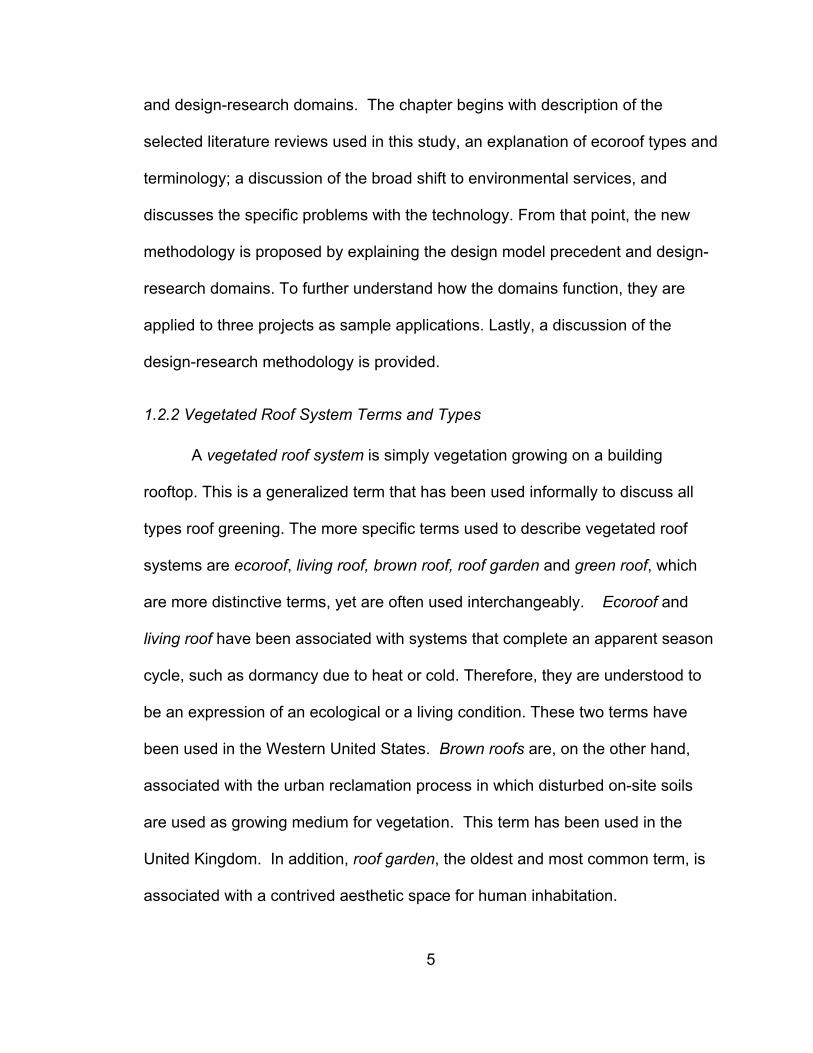
Figure 1.1. Two vegetated roof system classes: The Ford Motor Assembly
Plant, Dearborn, MI USA (left) is an extensive system (<15.24cm of soil)
consisting of a shallow rock-based substrate containing exotic succulents that
regulate energy and stormwater, while the Fairmont Waterfront, Vancouver, BC
Canada (right) is an intensive system consisting of raised beds of thick, rich
topsoil (with planters >1m deep) producing local produce and herbs.
1.2.3 Vegetated Roof System History
The concept of roof greening has two histories: one of opulence and the
other of economy. As explained by Osmundson (2001), the luxury of roof
greening for wealth and power dates back to before 2000 BC. Works such as the
Hanging Gardens of Babylon, The Ziggurat of Nanna and the 19th-century
Kremlin all possess environments of abundant vegetation created for a ruling
8
class as demonstrations of their affluence. These were technological marvels of
their time period, requiring immense labor for construction and maintenance, and
in the process consuming amounts of vast resources. On the other hand, the
thrifty use of locally available materials, such as sod, by needy individuals, to
protect and insulate their dwellings, has been a part of many cultures for equally
as long. Northern European cultures have conserved examples of these works
as a part of national heritage sites. These examples are made of local soils and
plants and placed on small dwellings to be used almost solely to cool the
structure during intense heat or warm the structure during intense cold. In
America, an example of this is European settlers using sod roofs in dwellings on
the Great Plains.
Although credit for the contemporary concept of roof greening can be
attributed to the Austrian artist Friedensreich Hundertwasser, the first recorded
English-language use of the contemporary term “green roof” may have been
Kohler’s (1990) book section on urban ecology. Shortly after, the subject was
published as a book topic by Johnston and Newton (1993), while the first
academic journal publication in English was cited using the term “green roof” do
not appear until 1998 in the analysis for heating and cooling benefits by
Eumorfopoulou (1998) and Palomo Del Barrio (1998). In 2003, for the first time
the English-language listings of academic records using the term “green roofs”
climbed out of the single digits. Many of the English-language written popular
articles cite German studies. The German citations occur in academic journals,
trade journals, conference proceedings and self published institutional reports.
9
The term “ecoroof” is a more recent, synonymous term employed by western
North American professionals whose landscapes are not perennially green in
color (Lipton 2003). It is used in this dissertation because it implies local or
regional context and an ecosystem approach.
Although growing vegetation on a rooftop is an ancient practice, the
current technology is a very recent development in North America. There
remains a large body of untranslated work regarding ecoroof technology from
Europe, specifically Germany which has been best illustrated by Mentens et al.
(2003). Some of this work has made its way to North America through trade and
manufacturer information. In the last five years, over a dozen North American
universities have begun research on vegetated roof systems.
1.3 Broad Shift to Environmental Services
1.3.1 Sustainability and Environmental Services
As sustainability remains a governing principle for community
development, the focus on discrete criteria for determining sustainability is
beginning to supplant the general measures of sustainability. The shift in focus
to performance criteria for constructed landscapes such as ecoroofs is related to
the shift in understanding the ecosystem benefits provided by landscapes.
The most widely used definition for sustainability was offered by the UN
World Commission for the Environment and Development (WCED). In its report,
entitled Our Common Future, the WCED conflates sustainability with economics
under the concept of sustainable development. “‘Sustainable development’ is
10
development that meets the needs of the present without compromising the
ability of future generations to meet their own needs” (WCED 1987). This
generality was criticized and expanded upon further defining “sustainable
development” through “sustainable growth,” “sustainable use,” and “sustainable
economy” (Munro and Holdgate 1991). All of these failed to make sustainability
measurable.
In design, the concept of sustainability has been addressed by many
(McHarg 1992; Lyle 1994; Van der Ryn and Cowan 1996; Thompson and Sorvig
2000; Birkeland 2002). Measuring sustainability has proved difficult but has been
performed through emergy analysis (Odum 1994; Ulgiati et al. 1994; Brown and
Ulgiati 1997) and the ecological footprint method (Rees and Wackernagel 1996).
Recently, the sustainability of ecoroofs has been measured by emergy (Coffman
and Martin 2004). Coffman and Martin (2004) demonstrated that an agricultural
roof garden can be as sustainable as on-grade gardens and more sustainable
than a conventional residential lawn. However, as useful as a technique like
emergy analysis may be at determining sustainability, it has yet to be accepted
by design professionals and the lay public due to its complex theory. There
continues to be a demand for more distinct performance criteria that define
sustainability.
Several focus groups have been working to define the criteria of a
sustainable landscape: USGBC is developing LEED for Neighborhood
Development (USGBC 2007), and the American Society of Landscape
Architects (ASLA) and the Ladybird Johnson Wildflower Center are developing
11
‘Site Metrics’ to quantify sustainable landscapes as a part of their organizations’
sustainability initiatives (ASLA 2007).
Each group has begun defining criteria that can be used to determine
levels of sustainability. Many of these criteria are related to the concept of
ecosystem benefits, which are the environmental services society receives from
the natural processes of ecosystems (Costanza et al. 1997; Daily 1997; de Groot
et al. 2002). Costanza et al (1997) describe seventeen services and functions
that benefit society, such as: climate regulation, water regulation, nutrient cycling,
and pollination. These services have been shown to be provided in urban
settings by constructed landscapes (Bolund and Hunhammar 1999). These
services are measured using discrete variables that have been developed to
evaluate the performance of a given ecosystem function. For example, the
service of habitat can be assessed as biodiversity and can be measured
discretely by the number of species, or the genetic variation within the examined
species. Equally, regulation can be assessed as water balance and can be
measured discretely by stormwater retention or evapotransporation. Thus, many
sustainable initiatives are now looking at ways to explain and measure
performance through more discrete criteria.
1.3.2 Environmental Services of Vegetated Roof System
The roof systems provide services such as temperature amelioration,
stormwater runoff retention, habitat establishment, and food creation (Peck et al.
1999; Onmura et al. 2001; Scholz-Barth 2001; Brenneisen 2003; Rowe et al.
2003; Wong et al. 2003; Dunnett and Kingsbury 2004; Alcazar and Bass 2005;
12
Hunt and Smith 2005). However, only recently experimental research has been
performed by public institutions. Early experimental research was performed
under proprietary agreements with private sponsors, making dissemination
difficult.
Early research on vegetated roofs focused on developing growing media
to provide services. The growing media used in these systems is called
substrate. Substrates have been designed to optimize water capacity, provide
structure, and limit bulk weight, by being a mix of lightweight mineral and organic
(75% mineral/25% organic material (Hydrotech 2000)) that meet a German
industrial standard. The mineral material is strong, light weight and absorbs water
for slow release; examples include diatomaceous earth, expanded clay or baked
shale. The organic material is hummus or compost, which provides nutrients.
The substrate depth strongly influences the growth and development of the plant
community.
However, public and public-private projects examining more issues are
becoming common (Table 1.1). One example of private sponsorship that initiated
subsequent public research in North America is the Ford Motor Company’s
project. The research was initiated to determine the feasibility of a vegetated roof
system on a new facility in Dearborn, Michigan (USA). Ford partnered with a
roofing manufacturer and a local research institution (Michigan State University).
Initial studies determined an extensive vegetated roof system could be used to
achieve the project’s goals of storm water retention and energy efficiency. An
extensive system of 10 cm depth planted entirely with sedum spp. was installed
13
on a building area of 0.2 Ha. The project evaluated several issues, such as plant
survival in a thin substrate as well as water retention. The research project has
been extended by the local university to determine the survivability of native
perennials and grasses in thin substrates (<15.24cm).
An example of a public project that spurred further research is the Chicago
City Hall, Chicago, Illinois (USA). It is an example of a public retrofit on 3,065m2
of existing rooftop. The project’s main purpose was to initiate studies in the area
temperature amelioration and plant establishment. The subsequent research
questions generated from this project created enough interest to establish two
local centers: the Chicago Center for Green Roof Technology and the Illinois
Environmental Protection Agency Green Roof Research Station. Each center is
studying temperature amelioration, stormwater retention, vegetation and runoff
quality. The establishment of public research appears to growing as more local a
regional communities desire an improved understanding of the environmental
benefits of vegetated roof systems.
14
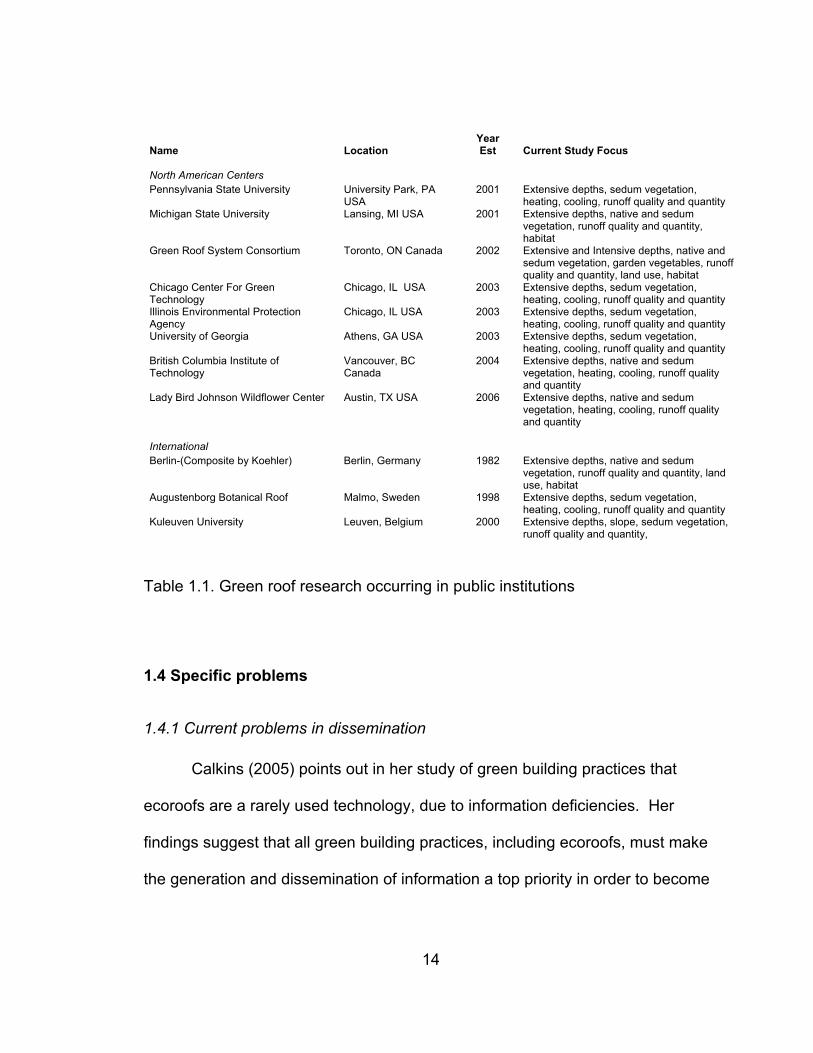
Name Location Year Est Current Study Focus
North American Centers Pennsylvania State University University Park, PA
USA 2001 Extensive depths, sedum vegetation,
heating, cooling, runoff quality and quantity Michigan State University Lansing, MI USA 2001 Extensive depths, native and sedum
vegetation, runoff quality and quantity, habitat
Green Roof System Consortium Toronto, ON Canada 2002 Extensive and Intensive depths, native and sedum vegetation, garden vegetables, runoff quality and quantity, land use, habitat
Chicago Center For Green Technology
Chicago, IL USA 2003 Extensive depths, sedum vegetation, heating, cooling, runoff quality and quantity
Illinois Environmental Protection Agency
Chicago, IL USA 2003 Extensive depths, sedum vegetation, heating, cooling, runoff quality and quantity
University of Georgia Athens, GA USA 2003 Extensive depths, sedum vegetation, heating, cooling, runoff quality and quantity
British Columbia Institute of Technology
Vancouver, BC Canada
2004 Extensive depths, native and sedum vegetation, heating, cooling, runoff quality and quantity
Lady Bird Johnson Wildflower Center Austin, TX USA 2006 Extensive depths, native and sedum vegetation, heating, cooling, runoff quality and quantity
International Berlin-(Composite by Koehler) Berlin, Germany 1982 Extensive depths, native and sedum
vegetation, runoff quality and quantity, land use, habitat
Augustenborg Botanical Roof Malmo, Sweden 1998 Extensive depths, sedum vegetation, heating, cooling, runoff quality and quantity
Kuleuven University Leuven, Belgium 2000 Extensive depths, slope, sedum vegetation, runoff quality and quantity,
Table 1.1. Green roof research occurring in public institutions
1.4 Specific problems
1.4.1 Current problems in dissemination
Calkins (2005) points out in her study of green building practices that
ecoroofs are a rarely used technology, due to information deficiencies. Her
findings suggest that all green building practices, including ecoroofs, must make
the generation and dissemination of information a top priority in order to become
15
accepted in practice. She states that pursuing detailed, unbiased research on
performance and costs is the key to advancement of all green building practices.
Often created by multidisciplinary teams, ecoroofs can become either
examples of collaboration or underperforming liabilities, due to their critical
technical requirements. Osmundson, in his book Roof Gardens (1999), explains
the very delicate balance between roof garden success and failure. He explains
that, although this is an ancient practice, there is a dearth of current professional
knowledge. Many designers have echoed this concern for a greater clarity, or
understanding, in ecoroof projects (Grant and Jones 2005; Oberlander and
Whitelaw 2005; Dunnett 2006).
Bruce (2005) explains that ecoroof technology cannot persist given the
current paucity of knowledge. This paucity is not only preventing the design
profession from delivering the promised performances of these systems, but it is
also affecting innovation. He states that only limited quantifiable information is
available about the performance and benefits of green roof technology and
argues that continued development must come from both innovation, in the form
of ideas, and technology, in the form of performance. In order to remedy the
problems of information and dissemination, he advocates that “all [ecoroof]
projects serve as a research platform,” which would act “to expand the industry’s
understanding and advocacy of green technologies”. Therefore, collaboration of
design and research through ‘live’ projects is the way to improve knowledge.
This collaboration requires an improved communication in the ecoroof project.
16
Diverse disciplines with specific knowledge and objectives are often
involved in ecoroof design. The engineer is concerned with structural loads and
waterproofing. Additionally, he or she may be interested in stormwater runoff,
storage, or recycling. Environmental scientists are often interested in the issues
of local climate cooling or pollution removal. Both of these professions could be
concerned with the reduced energy uses of the building. Wildlife biologists are
concerned with biodiversity and habitat. Horticulturalists and plant scientists are
concerned with plant survival and maintenance practices. Landscape architects
are concerned with appearance, use, meaning, and general function. Each
disciplinary role influences the responsibilities and outcomes of the other
disciplines, making success largely a result of interdisciplinary coordination.
In addition to a lack of information, language considered specific to the
various disciplines can also impede interdisciplinary projects.
Miscommunications, and the importance of proper communication, are spoken of
by ecoroof professionals (Osmundson 1999; Bruce 2005; Dunnett 2006).
Definitions, concepts, and their associated methods are not equally understood
by all parties, creating miscommunications. In ecoroofs, the language
contributing to miscommunications first begins with the ambiguity in terms used
for ecoroof systems. These miscommunications are passed forward through
design and construction projects, where they can compromise the legitimacy of
post construction research.

17
1.4.2 Current problems in conceptualization
It is difficult to determine the precise causes for the problems occurring in
the conceptualization of ecoroof design, due to the field’s relatively young age
and limited publications. In this section, the contributing effects are described
that individually or collectively create problems between ecoroof design and
research.
For the purposes of this study, a problem can be defined as any specific
matter of difficulty that occurs in a project between design and research
professionals. These problems vary based on the design goals and the type of
the intended research. The problems discussed here may involve various
disciplines, but are specific to the conceptualization of the projects and have
been taken from actual projects. However, the causes of the problems are
commonly found in many projects. It is this study’s intent to illustrate common
contributors, or ‘contributing effects’, to problems in ecoroof design and research,
which, if recognized, would benefit the advancement of the technology and bring
design and research closer together on this subject.
Problems commonly arise between design and research when a design
team strives for synthesis and creates project proposals that are unreasonable
and unsupported, and the outcomes are immeasurable. Often a designer aims
to construct several possible meanings and interpretations within the built work.
This also happens to be the definition of ambiguity. However, ambiguity, in
research is considered a near fatality. It is equivocal and lacks definiteness,
which is contradictory to the overall goal of research.
18
When a design proposal expresses contrary positions, it devalues the
research agendas by interrupting the logic with misleading propositions, making it
difficult to prove any results from the design. This often occurs in parts of a
design process that employ inductive reasoning, where ideas are generated from
group interaction. However, the problem is created when the proposal never
passes through a rigorous phase of critique, evaluation, and selection to clear its
contradictory properties. Because contrary positions are so problematic to
research, the design and research of ecoroofs should be scrutinized for problems
possessing contradictions. In this chapter, several ecoroof projects are examined
in terms of contributing effects that lead to contradictions.
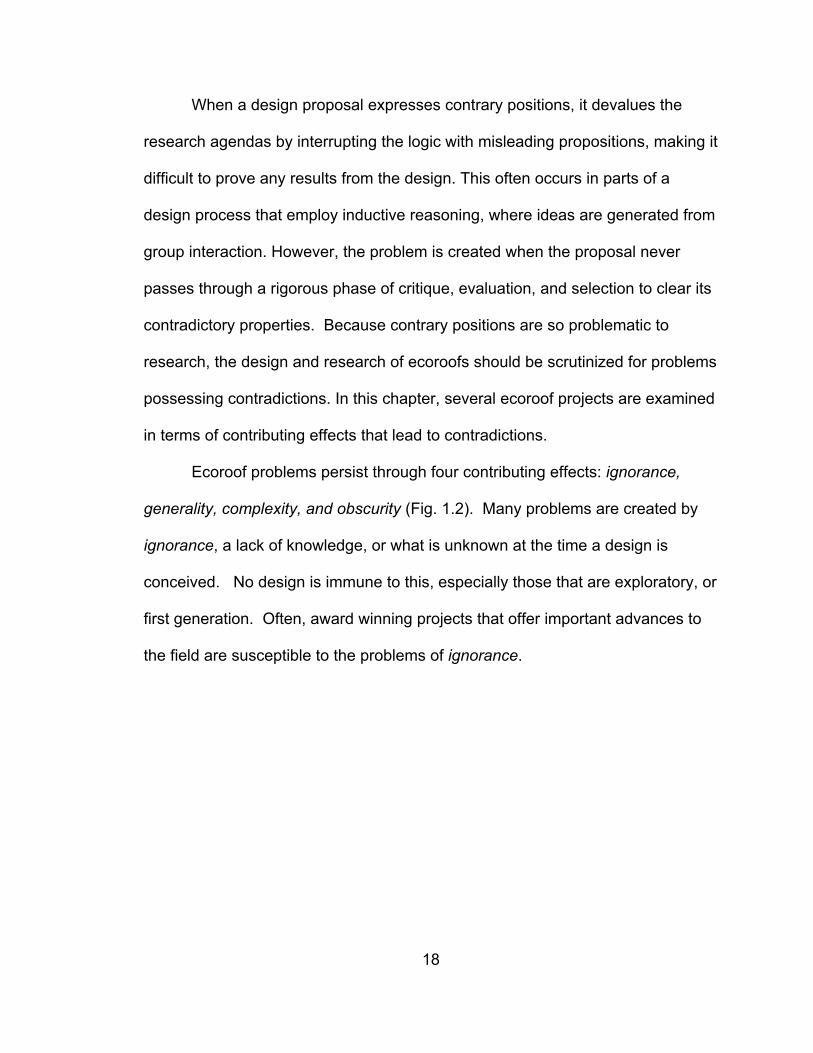
Ecoroof problems persist through four contributing effects: ignorance,
generality, complexity, and obscurity (Fig. 1.2). Many problems are created by
ignorance, a lack of knowledge, or what is unknown at the time a design is
conceived. No design is immune to this, especially those that are exploratory, or
first generation. Often, award winning projects that offer important advances to
the field are susceptible to the problems of ignorance.
19
Figure 1.2. The contributing effects persisting in ecoroof projects, shown above
in ovals with arrows indicating cumulative influence.
This issue of ignorance may arise in a project’s original proposal. One
example has been shown in the Gap Corporation building ecoroof (William
McDonough + Partners, Hargreaves & Associates with Rana Creek Consulting).
It was proposed, that employing an indigenous plant palette to the ecoroof would
continue to provide an unaltered form of wildlife habitat conservation. This was
understood as “from a bird’s perspective, nothing has changed” (Burke 2003).
However, the project focused on the technology of growing native plants on
rooftops and the bird research was never performed; therefore the assertion can
20
never be proven, leaving the project open for continual scrutiny. The disregard of
preliminary research demonstrates the effect of ignorance in the
conceptualization of a project.
The failure to communicate the design goals throughout the project is
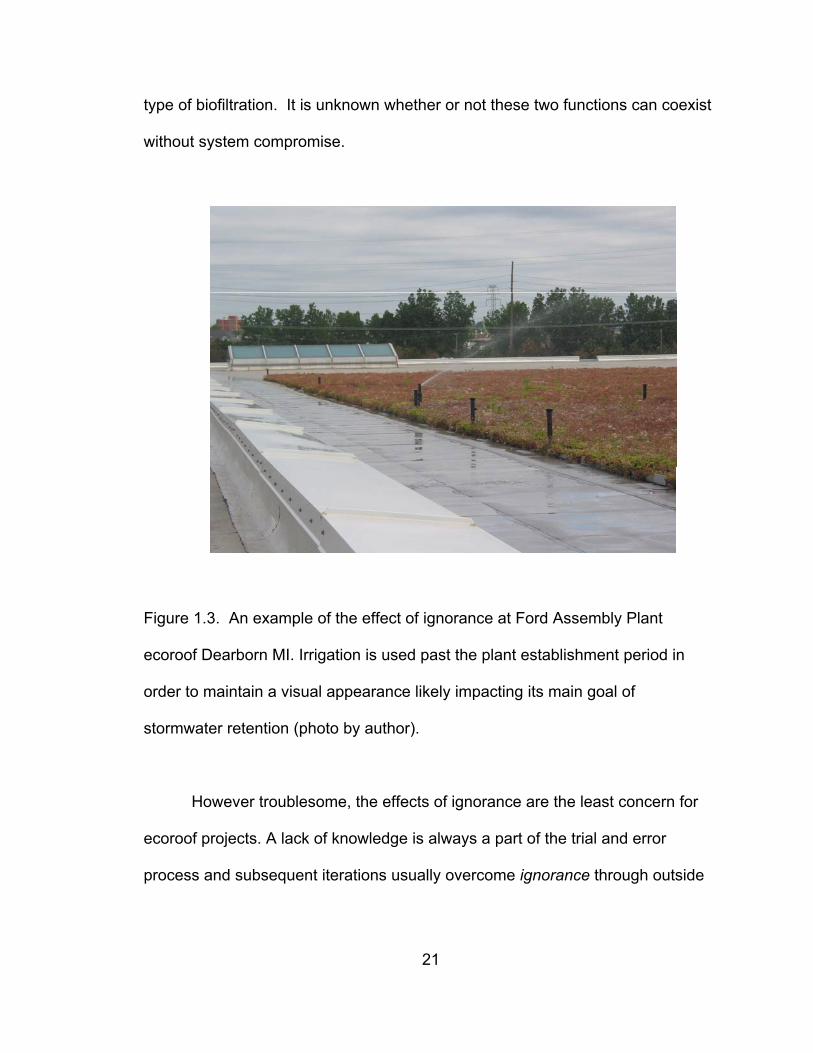
evidence of another form of ignorance. For example the Ford Assembly Plant
(McDonough and Braungart, Xero flo) in Dearborn, Michigan, was constructed
with the primary intent to reduce stormwater runoff. However, Ford built an
overlook tower where visitors can view the green roof. To meet visitors
expectations of a green “colored” roof, the ecoroof continues to be irrigated past
establishment. This arguably affects the functioning of the environmental benefit
of retention because it was not designed for continued irrigation (Fig 1.3).
Another form of ignorance is when organizational support lacks
knowledge. For example, Leadership in Energy and Environmental Design
(LEED) (a US-based organization renowned for its evaluation system for
sustainable design and construction practices) is currently recognizing ecoroof
designs that possess inherent potential contradictions. In the Mountain Co-Op
project in Winnipeg, Ontario Canada (Design Solutions), a LEED-accredited
building, the ecoroof received a full credit point for ‘habitat’ in the Sustainable
Site section for protecting open space, where it is expected to protect and restore
prairie habitat (Kula 2005). However, it also received points in the Water
Efficiency section for “innovative waste water technology” by incorporating solid
and liquid waste water recycling in the ecoroof, thereby using the ecoroof as a
21
type of biofiltration. It is unknown whether or not these two functions can coexist
without system compromise.
Figure 1.3. An example of the effect of ignorance at Ford Assembly Plant
ecoroof Dearborn MI. Irrigation is used past the plant establishment period in
order to maintain a visual appearance likely impacting its main goal of
stormwater retention (photo by author).
However troublesome, the effects of ignorance are the least concern for
ecoroof projects. A lack of knowledge is always a part of the trial and error
process and subsequent iterations usually overcome ignorance through outside
22
criticism. More worrisome is the level of problems created by the effects of
generality.
A problem created by generality is one in which a project establishes and
retains loose, nonspecific goals that have broad appeal in the design phase, but
which can belabor construction and weaken research objectives. It is assumed
that, during the design process, the design goals will reach greater specificity.
But when imprecise goals such as ‘sustainability’ are proposed early and the
project fails to develop specific objectives, even if considered successful in terms
of budget and waterproofing, the vague agenda can create confusion in design
development and construction and make research objectives difficult to establish.
An example of a project threatened by generality is ”Meadow in the sky”
for the Sechelt Justice Building (Sharp and Diamond) Sechelt, Canada which
replicates an indigenous dry coastal meadow ecosystem in place of the
grassland meadow the building was destroying. The stated design intent was to
fulfill the mission of the firm, which was to “work to restore natural landscapes as
well as establishing new plant communities suited for specific climates” (Sharp
2003). The claim of restoring natural landscapes or creating new plant
communities is so grossly non-specific and contradictory that no form of research
could actually evaluate it. The sub-claim of creating a meadow in the sky pertains
to either the overall characteristics or the unlimited potential of the system, and
both would be extremely difficult to prove. For the designers, researchers, the
client, and the general public, it is difficult to determine whether or not anything is
valuable from such a loose proposal. A project suffering from generality often is
23
received with indifference by both professionals and researchers and could be
overlooked for any beneficial contribution that it possesses.
At the other end of the spectrum from generality is complexity, where
many agendas create a complicated project. The problem of complexity occurs
when numerous agendas are added to a project without consideration of their
effect on the main goals, creating a project predicated upon compromise. It is
understood that overlap occurs in most projects, but that overlap must be clearly
understood and compatible in order to communicate through construction and
possess an environment conducive to research. Any intricate components
should be well developed and expressed.
For example, the Multnomah County building ecoroof (Macdonald
Environmental Planning) experienced a design process in which the original
design concept, created by a visual artist, was replaced because of public
scrutiny, leading to a problem of complexity. The main design goal was to create
an aesthetic public improvement for building occupants and visitors. As the
project lost support, it was coupled to other benefits, such as long term cost
savings, stormwater retention, energy reduction and technical viability. The later
benefits became ultimate priorities, defining by the post construction monitoring,
while aesthetics and social involvement became antidotal and go unmeasured by
researchers. In the end, the ecoroof was constructed with a planting palette
meeting aesthetic demands requiring seasonal irrigation and unexpected
maintenance in the form of weeding, thus compromising sustainable water and
maintenance goals. Limited access occurs on a recessed patio separated by
24
fencing and retaining walls making direct involvement with the plants impossible
and viewing very difficult thus compromising the aesthetic public improvement
goal.
Many projects begin under non-specific general sustainability ideals, but
become problematic through excessively random complexity applied with
generality. In their approach, they obscure the main goals of the design.
Obscurity creates the greatest problem in ecoroof design, because of its impact
on the many parties involved.
Obscurity occurs in a project when so many agendas are added to a
project that the main goals and the foundation knowledge are confounded by
claims that oscillate between very general and complex. The quantity of
contradictions is likely to be higher in projects impacted by obscurity due to a lack
of distinction and the occurrence of periodic confusion. Projects of obscurity can
be identified by these contradictions that propose almost everything, while failing
both to explain how they will deliver and to prove what is being proposed.
For example, the plan called “Long Island (Green) City,” (Balmori
Associates) proposed to create an elevated Central Park in Queens, New York
(Wayland-Smith 2005). Their claims are so exhaustive and unclear that the
design proposal contains several contradictions. The claims are illogical,
confusing, and concealed. Overall, they claim to provide sustainability outcomes
while ignoring universally accepted ecological processes and demonstrated
results from ecoroof research. Lastly, they claim to be providing a pre-accepted
aesthetic of nature that is based on a grid layout.
25
Balmori Associates envisions a “self-sufficient and self-sustaining” system
that brings “nature’s principles of reuse, storage and adaptability” into the city for
the contemplation of our coexistence with nature, through “checker board,” or
“Mondrian-inspired” geometric grids that displace the current “ecological
experiments” of ecoroofs (Wayland-Smith 2005). This proposal contradicts itself
numerous times by misrepresenting how it will function; its most obvious
contradiction is the antithetic proposal of establishing a permanent visual field, or
scene, while operating within ecological theory and promising a self-sufficient
system. There are two major contradictions in this proposal. First, the proposed
aesthetic contradicts ecological understanding. The Sedum spp. palette is
governed by physical laws of energy and will function to reorganize the “checker
board” design creating a patchwork aesthetic, which has been shown by Kohler
(2003). Even the thinnest substrates created for Sedum spp. can recruit
colonizing grasses and herbaceous species (Koehler 2003; Dunnett 2005). In
order to maintain the grid and its associated aesthetic, the system would require
weeding and fertilization, as demonstrated by Emilsson (2004) and Rowe et al
(2006) even in the extremely thin substrates. Secondly, Wayland-Smith (2005)
goes on only when these aesthetically driven systems replace the current
“ecological experiments” of ecoroofs will there be a “wide spread adoption of the
technology” . This very large contradiction is the claim that the technology is
functional understood and no more experimentation (or innovation) is needed,
which defies the opinions of most designers and researchers (Miller 2004; Bruce
26
2005; Calkins 2005; Grant and Jones 2005; Oberlander and Whitelaw 2005;
Dunnett 2006).
1.5 Proposed Methodology
1.5.1 The design model precedent
The issue of collaboration of research and design is contested by many
designers, with regards to when research is to be included in the process, the
types of expected results, and even semantics (Chenoweth 1992; LaGro 1999).
However, models of how designers can incorporate research into a design
problem do exist (Milburn and Brown 2003). And examples of ecoroof projects
employing a design-science method have been recorded (MacDonagh et al.
2006).
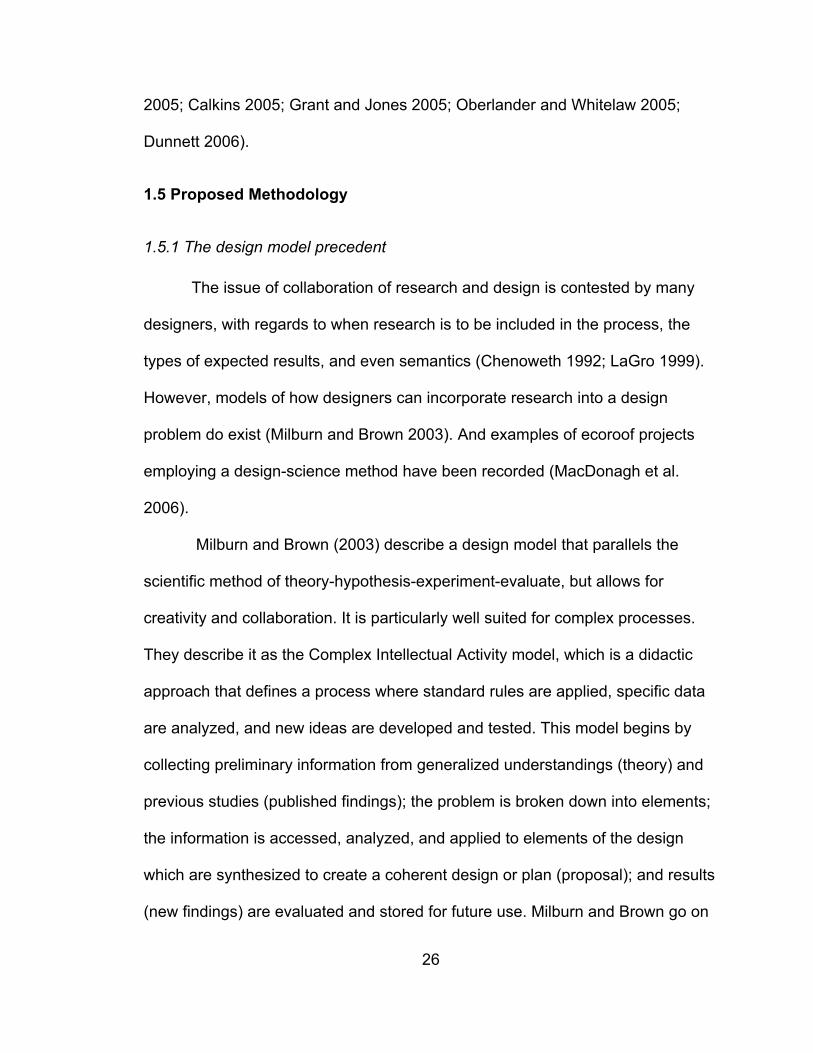
Milburn and Brown (2003) describe a design model that parallels the
scientific method of theory-hypothesis-experiment-evaluate, but allows for
creativity and collaboration. It is particularly well suited for complex processes.
They describe it as the Complex Intellectual Activity model, which is a didactic
approach that defines a process where standard rules are applied, specific data
are analyzed, and new ideas are developed and tested. This model begins by
collecting preliminary information from generalized understandings (theory) and
previous studies (published findings); the problem is broken down into elements;
the information is accessed, analyzed, and applied to elements of the design
which are synthesized to create a coherent design or plan (proposal); and results
(new findings) are evaluated and stored for future use. Milburn and Brown go on
27
to explain, through what they call an analytical approach, that research is
continual and informs the design; that the process is pragmatic; that the concept
is interpreted on the site and the site remains significant where the overall focus
in on the process. This allows creative problem solving and experimentation to
be governed by a process that delivers measurable results. The complex
intellectual activity model proposed by Milburn and Brown was slightly modified
for its application by adding a stage of assessment (Fig. 1.4). Also, descriptions
of activities were clarified to include both the research scientist, as well as, the
designer.
Figure 1.4. The complex intellectual design-research model allows research and
design collaboration through semi-alternating phases. The model begins with
current knowledge that can be applied to the site and defined through discrete
elements that can be constructed, assessed and disseminated. The knowledge
returns to inform future projects.
28
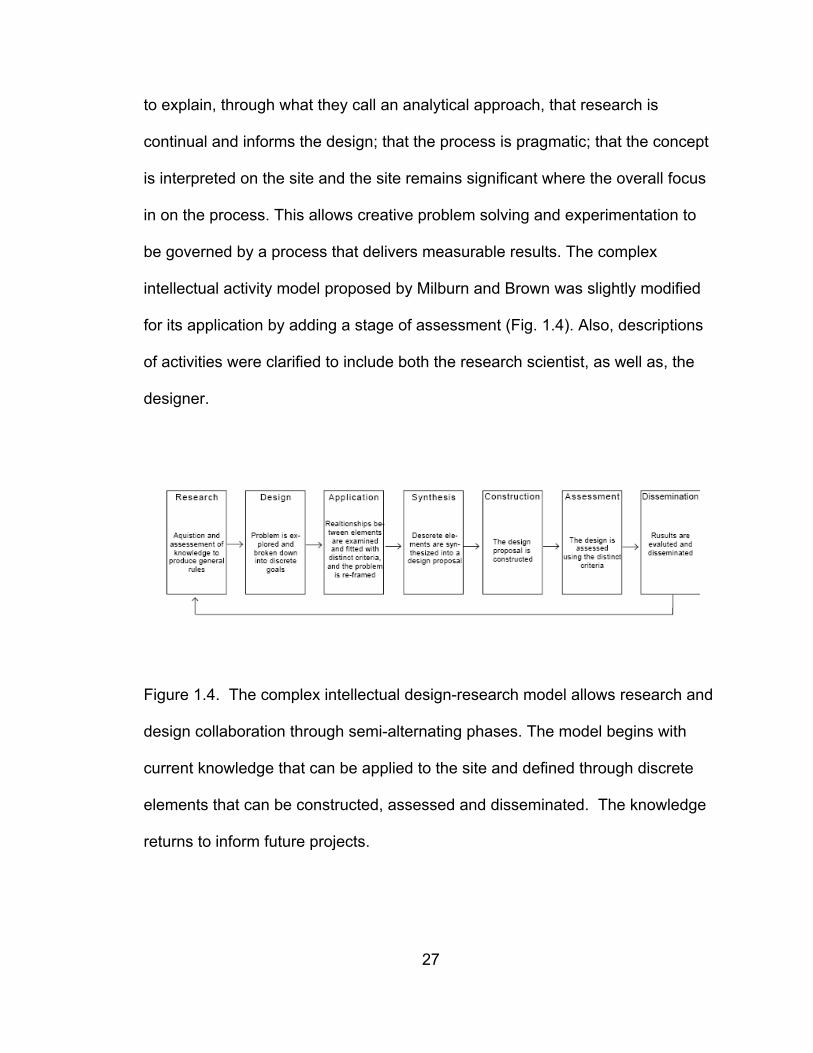
1.6 Design-Research Domains
The design-research domains established from scientific areas in order to
assist designers in advancing design concepts targeting environmental service
goals. The domains are ‘tools’ used by designers to enhance the communication
in the conceptualization of projects which subsequently allows for the improved
potential of dissemination. The domains focus communication and link the
design process with post-construction evaluation opportunities through
measurable criteria. The presence of criteria can then engage research
assessment, evaluation and dissemination.
These domains are not mutually exclusive per se, but are categorized to
direct the project towards various measurable criteria (Fig. 1.5). They are based
on structure-function relationships in which each domain can influence the
others. For example, productivity might influence biodiversity. The general idea
is that first a domain is identified as the main project goal and then the
performance criterion can be identified. Subsequent domains can then be
selected. The domains are as follows: productivity, biodiversity, energy balance,
nutrient cycling, hydrological cycling, and stewardship.
Each listed domain, is presented based on published information for that
domain. In this way, each domain provides a short literature review of previous
findings.
29
Figure 1.5. A diagram of ecoroof design-research domains with example criteria
are shown in circles and two-way arrows indicate potential influence.
1.6.1 Productivity Domain
This domain includes the growth of plants (possibly animals) and overall
production of biomass as a baseline measure of ecoroof function. Projects
concerned with producing vegetative cover, or developing biomass as a form of
mitigation, are concerned with overall function which is indicated by the level of
30
productivity. Productivity is the rate of production of biomass of an ecosystem
and provides a general view of how an ecosystem performs (Stiling 2002).
Primary productivity, the growth of plant biomass, is the basic measure and is
usually recorded in g.m-2.yr, Productivity underlies various goals of sustainability,
wherein the level of productivity correlates to levels of ecosystem function. For
example, high productivity is commonly associated with higher nutrient uptake,
water uptake, and solar interception (Lieth 1978). For design projects striving for
higher ecosystem benefits higher productivity would be the priority design intent.
Although productivity has not been identified as a sustainability goal in ecoroofs,
it is discussed here because it is a composite measure that can be associated
with many ecosystem services.
In recent ecoroof studies, productivity has been concerned mostly with the
individual plant and to a small degree the ecosystem. In ecoroofs studies, whole
plant level studies on establishment, survival, and growth are most common, as
roof designers attempt to create a plant palette that will survive the conditions of
the roof. It has been found that ecoroof plant growth is influenced by 1) the water
capacity of the system, 2) the method of plant implementation, 3) the building
architecture, and 4) the maintenance of the vegetation stand (Koehler 2003).
Koehler (2003) has compiled information and drawn conclusions from
eight separate study sites that have recorded data over an eighteen-year period
of collection. He states that total plant biomass (dry weight) from these studies
ranged between 4.2 g.m-2.yr and 47.2 g.m-2.yr. The leaf area index is 0.64 on the
31
highest area of coverage. And the shoot to root ratio is approximately 0.9. This
information was supported by his earlier studies (Koehler 1990).
In both studies by Koehler (1990 & 2003), dominant species are listed and
given as a percent of cover. He states that Allium schoenoprasum had more than
75% coverage in the first site; the second site, a younger site, was covered with
60% Sedum spp. The younger site possessed a greater number of plant species
(88) compared with the older site, but it was noted that this site originally used
irrigation in establishment methods. None of the other species’ percentage of
cover were given. Although no quantities or percentage of cover were listed,
Koehler states that the total number of plants in the older site has declined with
age. Also, absent from the recorded data was the listing of substrate depths and
maintenance regimes.
In general, green roof ecosystems are oligotrophic, or low nutrient,
because they rely solely on precipitation for nutrient input. Low soil water content
is stated to be a factor limiting green roof plant growth. Pearce (2003) records
observations that support this, while Koehler’s (2003) study concludes that green
roof plants will develop slower than plants on typical grasslands due to
physiologic constraints of the ecosystem.
The substrate parallels the properties of an A-C soil horizon structure,
where a plant exists in a small amount of soil over immediate bedrock preventing
its connection with any base-flow water source. This makes the plant entirely
dependent on precipitation as a water source. Koehler (2003) cites that plants in
32
central Europe must be able to adapt to up to four weeks without water during
their summer growing periods.
Species lists for North American projects are becoming more available.
However, they do not always distinguish the type of roof properties that would
provide the appropriate habitat. Native plant development is the subject of
experiments in various locations (see Biodiversity domain). The most commonly
used plants are Sedum spp., due to their tolerance of extreme environmental
conditions.
The growing of vegetable garden plants has been documented in texts
(Tinkel 1977) (Kortright 2001; Levenston 2002). Practical planting and growing
methods are covered by Tinkle (1977). Rough data on the quantities of food
produced has been recorded, but they are not supported by detailed explanation
of methods (Ehrenfeld 2000; Martin 2001).
As the priority for providing ecosystem benefits persists in ecoroofs,
productivity is likely to emerge as a more important determinant influencing
design intent. It may also become a strong delimiter for the classes or types of
ecoroof systems.
1.6.2 Biodiversity Domain
This domain includes the variation in plant and animal life found on an
ecoroof. Projects involving habitat goals, biological diversity, or species
mitigation are concerned with biodiversity. Overall habitat functions to conserve
important biological and genetic attributes, and evolutionary processes can be
measured through diversity. Biodiversity can be defined as any one of the
33
following: the variety of species (species diversity), genetic variability among
individuals (genetic diversity), and variety of ecosystems (ecosystem diversity)
(Miller 1998). This offers potential for flexibility in the design of an ecoroof for
habitat. For example, if biodiversity is a goal of the project, then a criterion could
be plant species richness (the number of plant species).
Biodiversity in green roofs thus far has addressed species and ecosystem
level issues and is considered to have enormous opportunities for more research
(Lundholm 2005). Moreover, creating habitat for species conservation has been
the primary reason behind recent initiatives within this area, in an effort to
improve regionally-based species diversity (Gedge 2003; Brenneisen 2005).
General habitat for maximum species biodiversity is now advocated and
technically instructed at the annual Greening Rooftops for Sustainable
Communities conference.
The work to date has dealt largely with secondary biodiversity (fauna) and
its connection with primary biodiversity (plants) at the species level. Secondary
biodiversity has been examined by Brenneisen (2001, 2003) and Kadas (2002). It
has been shown that invertebrate species diversity (Shannon Index) and roof
design factors such as substrate depth, structure, and vegetation diversity are
strongly associated (Kadas 2002). Bird, beetle and spider diversity (species
richness) correlated with roofs possessing topographic (mounds), substrate, and
floristic diversity (Brenneisen 2003). Invertebrate community composition has
been listed for central North America (Coffman and Davis 2005) and assessed
for rare species in England and Switzerland (Jones 2002; Brenneisen 2003).
34
Green roof fauna communities have been compared to terrestrial
brownfields with differing results. Brenneisen (2003) found community similarity
across selected taxa (birds, beetles and spiders), while Kadas (2002) recording
single taxa (spiders) did not.
Rare species of fauna and flora have been documented in green roofs.
Invertebrate species have been the most commonly assessed fauna.
Brenneisen (2003) found four spider species, and twenty four beetle species
listed in the Red Data book. In England, Kadas (2002) recorded two rare spider
species, and Jones (2002) recorded rare bug species and several nationally
scarce beetles and spiders.
One species of bird, the Black Redstart (Phoenicurus ochruros) was found
in high abundance in vegetated roofs in Switzerland. This bird is an endangered
species in the United Kingdom. As a result of a community action plan creating
15,000 m2 of green roof in London, the Black Redstart has been observed using
the new roofs (Gedge 2003).
Rare species of plants have been recorded on the Moos water treatment
plant in Zurich, Switzerland. The roof was constructed in 1914 using a traditional
method of placing the existing soil on the building rooftop, and it continues to
exist today without replacement or disturbance. The topsoil was taken from the
local environment, which at the time was a seasonal wet prairie. Consequently,
the green roof possesses numerous extirpated plants, including several rare
species and nine species of orchid (Orchis spp.) It is home to the only population
of Orchis moro left in the region (6000 individuals).
35
A few studies draw attention to the ecosystem level diversity by
recognizing the importance of the substrate (Brenneisen 2004; Dunnett and
Kingsbury 2004). The ecosystem most commonly associated with ecoroofs is the
rock outcrop ecosystem, which is a thin topsoil layer over parent material
possessing an A-C horizon. This is where native plant palettes have been
generated (MacDonagh et al. 2006) and plant community research studies are
based (Lundholm 2005).
Survivorship for native plant experiments are being performed by Michigan
State University and case study observations are found on locally generated
public projects. Although it is the intention in many of these projects that native
plants are used, they must use plants that can adapt to drier, more extreme
conditions. Survivorship can be confounded when non-adaptive native or
horticultural species are selected and supplemental irrigation becomes a post-
hoc management practice.
1.6.3 Energy
The energy domain includes all forms of energy used or altered by an
ecoroof. Projects involving resource use and temperature analysis, such as the
urban heat island effect, are concerned with energy. Ecoroof influence on the
urban heat island effect has been studied at local as well as regional scales, and
is currently a part of the Smart Growth and Urban Heat Island initiative by the US
Environmental Protection Agency.
Vegetated roofs have been modeled to reduce roof surface and ambient
air temperatures (Palomo Del Barrio 1998). In experimental studies, roof
36
maximum surface temperatures have been reported to be reduced on green
roofs by approximately 30o C (Onmura et al. 2001; Liu and Baskaran 2003; Tan
et al. 2003; Wong et al. 2003). Membrane temperatures between conventional
exposed roofs and green roofs differ by 40o C (Liu and Baskaran 2003). More
convincingly, heat flux was reduced by 50% in Onmura’s study, and Liu and
Baskaran (2003) saw diurnal fluctuations of 45 o C for a conventional roof while
recording only 6 o C in a vegetated roof. Tan et al (2003) reported similar
findings.
The average daily energy demand for space conditioning due to the heat
flow through a conventional roof was 6.0-7.5 kWh·day-1 (20,500-25,600 BTU·day-
1). However, the growing medium and the plants of the green roof modified the
heat flow and reduced the average daily energy demand to less than 1.5
kWh·day-1 (5,100 BTU·day-1)–a reduction of over 75% (April-Sept) (Liu and
Baskaran 2003). Multi-story buildings in warm summer climates have been
shown to reduce up to 6% of summer energy costs (Alcazar and Bass 2005).
Martens and Bass (2006) calculated energy savings in a 250m x 250m green-
roof design with 50,000 W internal loading. The seasonal energy savings was
found to be 73%, 29%, and 18%, for a 1, 2, and 3-story design, respectively,
using the Bowen ratio and ESP-r model.
Energy modeling has been used to accurately simulate green roof
temperature cycles by Gaffin et al. (2006). They found a range for the Bowen
ratio β of 0.12 –0.35, indicating the latent heat losses (evapotranspiration) were a
factor of 3-8 times larger than sensible heat (air convection). The variations in β
37
were evidently due to variations in soil moisture content. On a regional scale,
modeling of the urban heat island effect with irrigated green roofs has been
estimated to reduce the urban heat island by 1oC (Bass et al. 2003).
1.6.4 Nutrient Cycling Domain
The nutrient cycling domain includes the recycling of chemical elements
that are used to support life, which in excess can contribute to waste. Projects
concerned with water quality, carbon sequestration and soil fertility are
concerned with nutrient cycling. Because nutrients are the chemical elements
that are used to support life they are commonly tied to energy issues because
they help facilitate energy flow. Some of the most common are hydrogen, carbon,
oxygen, nitrogen, and phosphorus. Water and light (energy) are also essential
nutrients, but here they have their own domains for clarity. The quantities of
these common elements are often studied to understand how a system is
functioning. For example, nitrogen levels can be assessed in plants and the soil
to determine how nitrogen is moving through the ecosystem. Balanced nitrogen
levels in a system means the nutrient is being used efficiently for plant growth,
but excess amounts found in the soil can create change in the plant community.
New species that require more nitrogen to survive will begin to establish. Or, the
excess nitrogen could be carried out of the system by water leading to an
accumulation in another ecosystem. This creates pollution.
Nutrients are studied by assessing their quantities in water, soils and
organisms (plants and animals). The most common study is soil nutrient
assessment used to determine nutrient availability (usually called fertility), such
38
as the amount of phosphorus to grow fruit crops. More complex studies look at
the cycles through food web patterns and organism effects on nutrients. These
can address local cycles, such as the local uptake of phosphorus by plant, or
global cycles, such as carbon cycle influence on the biosphere.
Nutrient cycling has not been largely investigated in ecoroofs, but is
emerging in the USA in order to address National Pollutant Discharge Elimination
System Phase II (NPDES) (www.epa.gov) requirements to reduce stormwater
impacts on receiving water bodies. The published results for ecoroof effect on the
nutrient levels in stormwater discharge have been shown to be contradictory.
The nutrient inputs come from three sources: the initial substrate,
maintenance practices and atmospheric deposition. The methods for measuring
nutrients in the hydrologic cycle have been through direct discharge points from
the ecoroofs as well as in receiving bodies of water (Koehler 2003).
Ecoroofs have been shown to reduce lead 94.7%, cadmium 87.6% and
nitrate 80.2% to receiving waters (Koehler et al. 2002). Beattie et al. (2002) has
preliminary shown reductions in first flush and composite events from
precipitation values in nitrate (50%), and total suspended solids. Turbidity
showed an increase while electrical conductivity results were inconclusive.
However, some fluctuations appear to be a result of maintenance and use on the
green roof (Hutchinson et al. 2003; Lipton and Strecker 2003).
It has been demonstrated that fertilization allows for exportation of
nutrients, even when applied at the rate of the international guidelines for green
roofs (FLL) (Emilsson 2004). In preliminary findings, Emilsson (2004) found that
39
by applying the FLL guidelines of 5g(N)·m²·yr-1) produce a 16% rise in nitrogen
export. Recordings of specific levels of nutrient application and use of time-
released products reduce nutrient export (Rowe et al. 2006). However, a study
by Hunt and Smith (2005) indicated that newly constructed green roofs leach
nitrogen (Total Kjeldahl Nitrogen, NO3+NO2, NH3) and phosphorus (Total
Phosphorus and Organic Phosphorus) from their substrate when compared to
rainfall and a control roof. Subsequent studies showed that this could be due to
the amount and type of compost used in the substrate (Hunt et al. 2006).
1.6.5 Hydrologic Cycle Domain
The hydrologic cycle domain includes the use of water by an ecoroof and
its subsequent impact on nearby environments. Projects involved with
stormwater retention, irrigation and grey water recycling are concerned with
hydrologic cycling. The hydrologic properties are one of the more studied areas
of vegetated roof system technology. Most studies have focused on water
quantity through the system as retention and runoff. This is one reason green
roofs have achieved recent popularity. As stormwater runoff has been linked to
flooding and combined sewer overflow events, ecoroofs have been assessed for
reducing roof runoff.
The hydrological cycle is important in urbanization for the reason of
flooding. However, it is equally important for its influence on living things. The
amount of available water influences vegetation and animal life.
Generally, vegetated roof systems retain between 20-80% of annual
rainfall in temperate climates (Mentens et al. 2003) and can reduce peak flows
40
(Hutchinson et al. 2003; Rowe et al. 2003). Studies in Berlin have recorded
runoff reduction of 75% of total precipitation (Peck et al. 1999). Koehler (2002)
also references a Berlin study that estimates total (annual) runoff reduction to be
60-79% over a three year period. However, the substrate depth was not
mentioned. Hutchinson et al. (2003) has recorded local data for Portland, OR
stating 4-5 in (12 cm) thick can absorb 69% of the rain falling on to it. This is
assumed to be annual data for that region. Additionally, a fourteen inch deep
intensive green roof is said to reduce annual runoff by 85-95% (Miller 2002).
Minke (1982) has been quoted by Peck (1999) stating that a simple grass
covered roof with 20-40 cm (8-16”) deep substrate can hold 10-15cm (4-6”) of
water. Peck (1999) interprets Liesecke’s (1989) work to conclude that retention
rates vary with seasonality, stating that summer rates are 70-100%, while winter
rates are 40-50%.
Storm events contribute another set of data that appears to show green
roofs, especially extensive green roofs, are effective at retaining short duration
storm events such as cloud bursts. A winter ten year storm event records only a
43% retention, but summer storm event retentions were recorded to be 100% for
the same 8 cm (3.5 inch) deep green roof (Miller 2002).
Beattie et al. (2002) at the Penn State Center for Green Roof Research, in
a web-published EPA study, recorded runoff reductions of small duration storm of
approximate 50%. Rowe et al (2003) has recorded reductions of 74% for a 4 cm
deep, 2% sloped roof, and 69% for a 4 cm, 6.5% sloped roof over a 6 week
study. However, these occurred at very low levels of precipitation. In a low-
41
volume storm event (10cm), a green roof reduces runoff 80%, while in a large
storm event (30cm), the same green roof reduces runoff to no more than 20%
(Green Roof Consortium 2003). Similar results were recorded by Rowe (2003).
Miller (2002) has calculated that greater depth of substrate can improve
retention capacity. He calculates that a typical 35 cm (14”) deep green roof can
retain up to 95% of annual rainfall (Miller 2002), and can be used in combination
with other water management techniques to obtain a zero discharge goal for the
site.
Graham and Kim (2003) use modeling to analyze the effect of green roofs
in combination with other point source control strategies, such as bioretention.
This incorporates land use variations into an overall analysis. Projections from a
multi-family lot with 70% lot coverage show runoff reductions by 80% in dry year
to 40% in a wet year. However, this model shows that annual runoff reductions
correlate with soil depth, but do not change under intense storm events (Graham
and Kim 2003).
Carter and Rasmusen (2005) calculated a runoff (hydrologic) curve
number (CN) of 88 for an extensive green roof from experimental studies using
the Soil Conservation Service model. From their study they found that ecoroofs
were shown to be most effective on small storm events at the roof scale. For
example, they found in a watershed in which ecoroofs maintain 15% of the total
land area and 30% of the total impervious area, the ecoroofs create a 15%
reduction in stormwater volume from the 1.2” storm event, 7% reduction for the 1
year, 24-hour event, 4% reduction for the 25 year, 24-hour event, and 3% for the
42
100 year 24-hour event. The also found ecoroofs alone were not effective
enough to protect for urban discharges into receiving streams in suburbanizing
watersheds, thus recommending they be included only as a part of watershed
scale management.
Another way of understanding the hydrological properties of vegetated
roof systems is to determine the maximum water capacity (MWC) which is a
benchmark number for the amount of water that can be stored in the ecoroof
system (Miller 2002). By subtracting the quantity of water absorbed by the
system during a rainfall event that will not be released later as runoff, which is
known as field capacity, from the MWC, the effectiveness of suppressing peak
flows can be determined. When this involves the design, it is measured as the
initial abstraction, which is the quantity of rainfall that must occur before
appreciable runoff will commence. By designing vegetated roof systems that
have a higher initial abstraction, a greater reduction in runoff is created. Miller
(2003) states that water management is determined by substrate, drainage layer
and irrigation. The substrate should efficiently absorb and retain water, be readily
drained, and offer a high void ratio (air volume) (Miller 2003).
Results from a study by Menten’s (2003) show green roof performance is
determined by four basic factors: roof properties (slope, substrate depth, etc)
and yearly, seasonally, and storm event properties. He gives the example for
annual reduction in Brussels: standard roof obtains 19% reduction, standard with
5 cm of gravel obtains 23% reduction, green roof with 5cm of substrate obtains
50% reduction, green roof with 10 cm of substrate obtains 55% reduction, and
43
green roof with 15 cm of substrate obtains 60% reduction (Mentens et al. 2003).
It is generally understood that green roofs reduce stormwater, but its
performance varies. Menten’s four factors may explain the inconsistency of
findings in the literature.
Solutions for addressing design intents with water quantity and quality
may mean coupling ecoroofs with other integrated management practices. As
previously stated, Carter and Rasmussen (2005) showed that ecoroofs would not
be enough to reduce flows to receiving streams in an urbanizing watershed and
suggest bioretention in the form of rain gardens as an integrated practice that
may achieve on-site retention.
Lastly, hydrology has begun to be measured using the evapotranspiration
of ecoroofs by Schmidt (2006). In preliminary studies, he showed ecoroofs
evapotranspired over 60% of their water budget. Using lysimeters, he is
investigating the potential and real evapotranspiration rates for building cooling
effect. Compton and Whitlow (2006) have linked evapotranspiration to
stormwater retention.
1.6.6 Social Understanding and Stewardship
The social understanding and stewardship domain includes the
contribution and impact of ecoroofs directly on the lives of people. Projects
involving education mission or scenic improvements are concerned with social
understanding and stewardship. This domain is largely implied through
experiential and aesthetic functions, and supported mostly by observation rather
than empirical research. It is often essential to have some type of direct human
44
benefit when designing an ecoroof: therefore, work in this domain addresses
those design intents made for direct involvement, or engagement, of people with
ecoroofs.
The experiential functions of ecoroofs, as roof gardens, has been
presented by Tinkle (1977), Osmundson (1998), and Dunnett and Kingsbury
(2005) under the same general arguments as parks, or on-grade gardens. They
function as leisure and recreation spaces in public settings, often substituting for
a park when on-grade space is not available (Dunnett and Kingsbury 2004),
while in private they offer opportunities for respite and isolation where visitors
experience “pleased astonishment that such a nice, quiet place can exist in a
busy city” (Osmundson 1999). If created informally by a resident or group, they
provide opportunities for individual exploration, creativity and ownership (Tinkel
1977).
Consideration within this domain, especially when designing an intensive
ecoroof, opens the project to a wide range of design intents common to park and
residential landscape designs. This can make outcome criteria difficult to
determine as design programs can be developed to include anything from
passive to active recreational activities, and can be changed rapidly in the design
process.
Aesthetic improvement as one of the functions of ecoroof design is
generally accepted as a given; therefore, there is a dearth of empirical
information in this area and only a few published opinions. It is assumed that
people prefer a view of a green roof to that of a conventional roof based on the
45
history of park and garden construction which is implied by Peck et al (1999).
From this general assumption, critiques are forming to address context,
biodiversity, and visual quality, where aesthetics can be used to convey cultural
and historical references (Oberlander and Whitelaw 2005; Wayland-Smith 2005;
Dunnett 2006). A method for quantifying the scenic improvements of roof
greening has been explored by Lee and Koshimiz (Lee and Koshimiz 2006).
Educational missions in this domain are very common. Many first-time
public projects in a city are considered to be demonstration projects. However,
organizations fail to determine any performance criteria of the demonstration and
convert that information to published results. It is likely that they are highly
effective, but failure in the educational mission’s to specify evaluative criteria
relegates the project to support only through personal testimonials or critiques.
1.7 Sample Applications
Three projects were selected to be fitted with design-research domains to
demonstrate the use of the methodology to improve clarity and communication in
the technology. These projects are not known to have been designed or
constructed using design-research domains, but possess the coordination
needed between design and research objectives. For these projects, the fitted
domains were selected based on each project’s goals and operation. The
selection of more than one domain creates a network which highlights the
projects’ priorities, and influences of one domain upon another. To illustrate the
use of design-domains each project is represented in an image-diagram (Figure
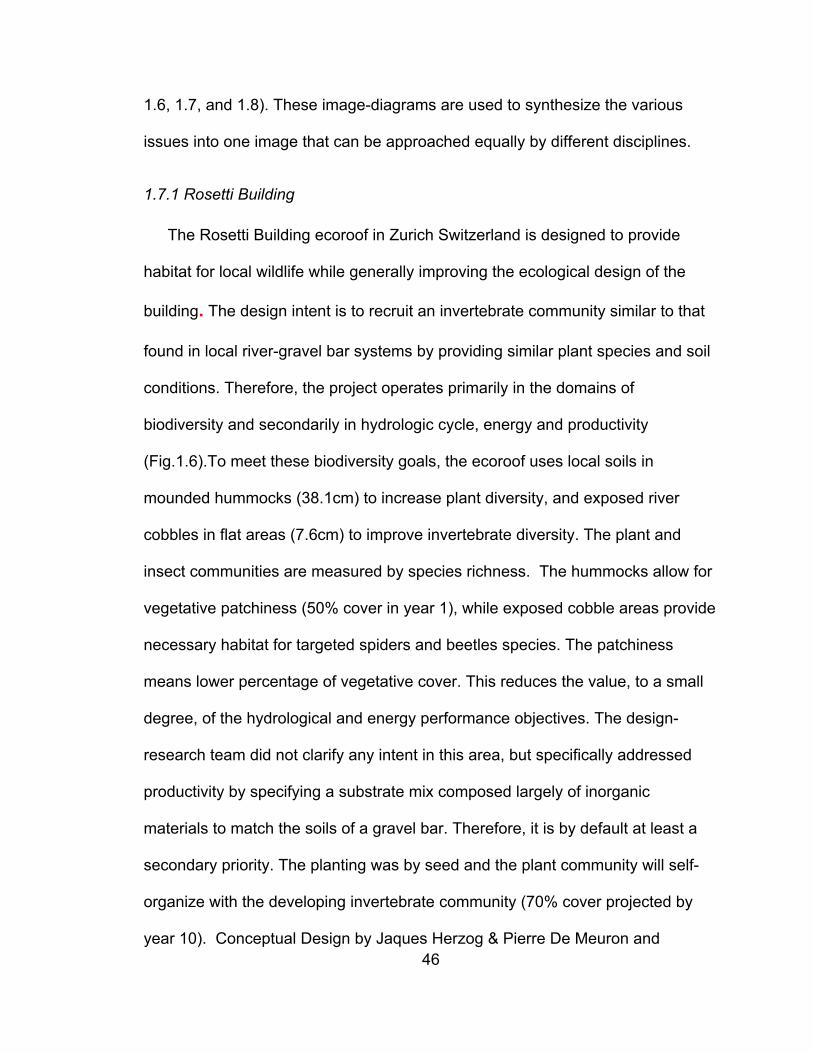
46
1.6, 1.7, and 1.8). These image-diagrams are used to synthesize the various
issues into one image that can be approached equally by different disciplines.
1.7.1 Rosetti Building
The Rosetti Building ecoroof in Zurich Switzerland is designed to provide
habitat for local wildlife while generally improving the ecological design of the
building. The design intent is to recruit an invertebrate community similar to that
found in local river-gravel bar systems by providing similar plant species and soil
conditions. Therefore, the project operates primarily in the domains of
biodiversity and secondarily in hydrologic cycle, energy and productivity
(Fig.1.6).To meet these biodiversity goals, the ecoroof uses local soils in
mounded hummocks (38.1cm) to increase plant diversity, and exposed river
cobbles in flat areas (7.6cm) to improve invertebrate diversity. The plant and
insect communities are measured by species richness. The hummocks allow for
vegetative patchiness (50% cover in year 1), while exposed cobble areas provide
necessary habitat for targeted spiders and beetles species. The patchiness
means lower percentage of vegetative cover. This reduces the value, to a small
degree, of the hydrological and energy performance objectives. The design-
research team did not clarify any intent in this area, but specifically addressed
productivity by specifying a substrate mix composed largely of inorganic
materials to match the soils of a gravel bar. Therefore, it is by default at least a
secondary priority. The planting was by seed and the plant community will self-
organize with the developing invertebrate community (70% cover projected by
year 10). Conceptual Design by Jaques Herzog & Pierre De Meuron and
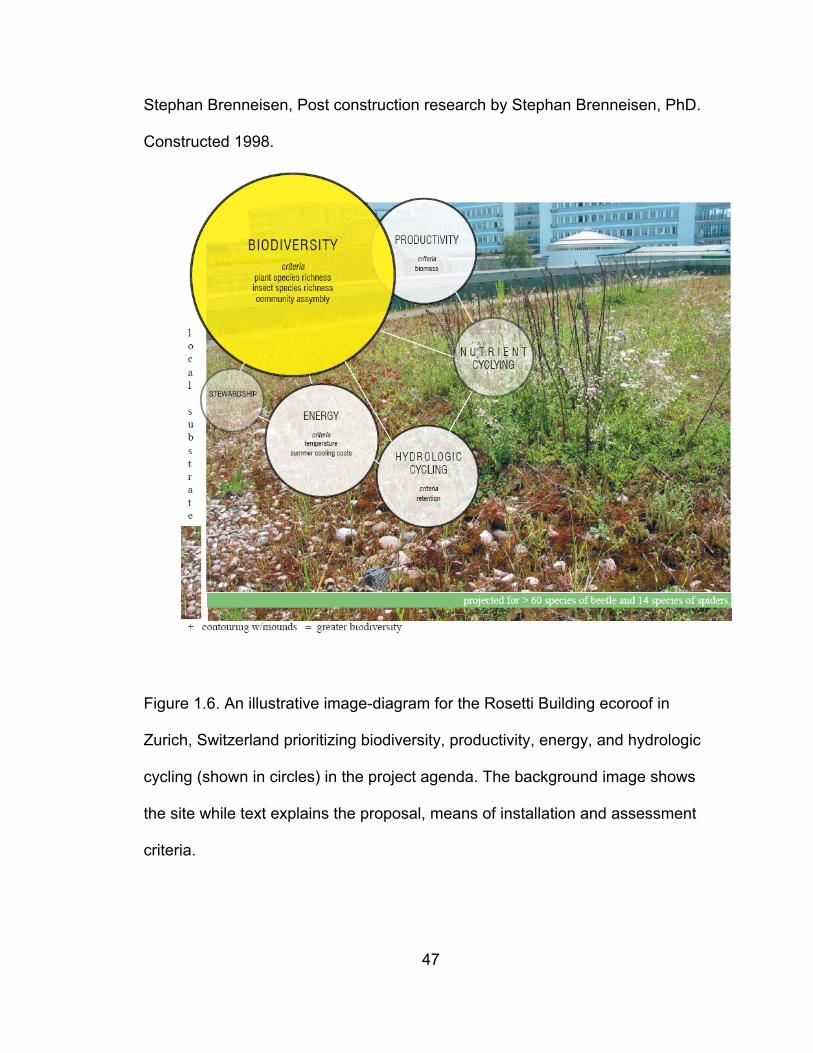
47
Stephan Brenneisen, Post construction research by Stephan Brenneisen, PhD.
Constructed 1998.
Figure 1.6. An illustrative image-diagram for the Rosetti Building ecoroof in
Zurich, Switzerland prioritizing biodiversity, productivity, energy, and hydrologic
cycling (shown in circles) in the project agenda. The background image shows
the site while text explains the proposal, means of installation and assessment
criteria.
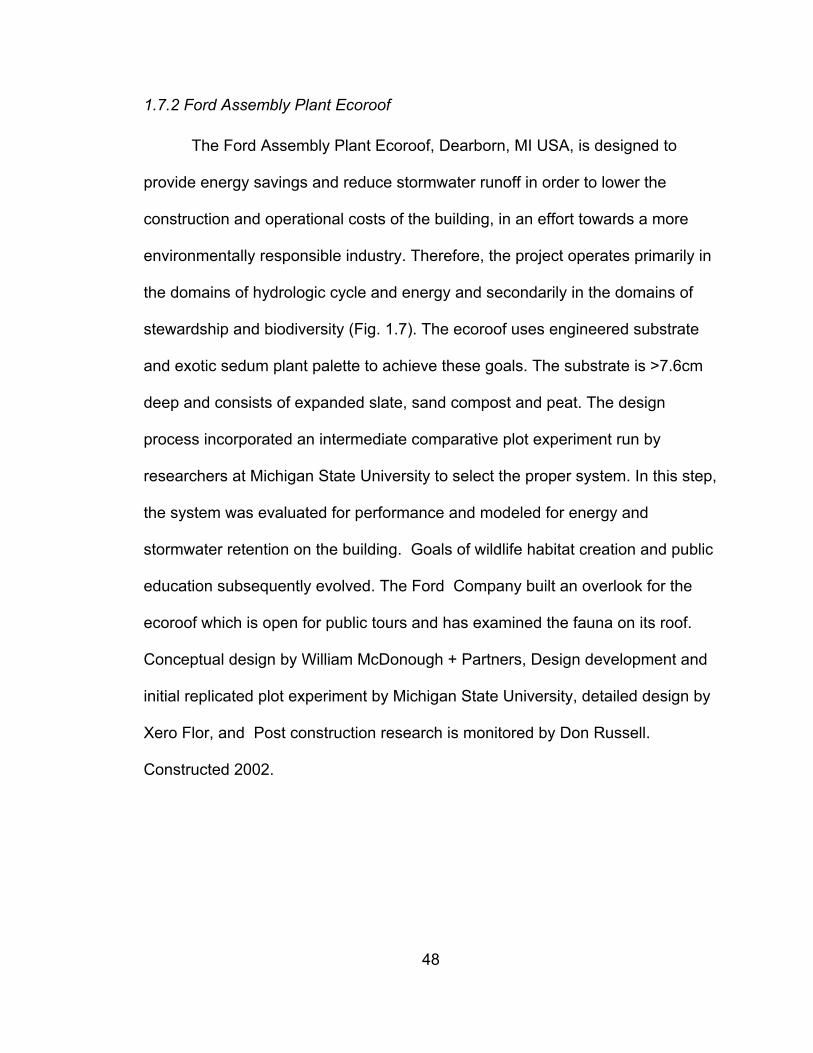
48
1.7.2 Ford Assembly Plant Ecoroof
The Ford Assembly Plant Ecoroof, Dearborn, MI USA, is designed to
provide energy savings and reduce stormwater runoff in order to lower the
construction and operational costs of the building, in an effort towards a more
environmentally responsible industry. Therefore, the project operates primarily in
the domains of hydrologic cycle and energy and secondarily in the domains of
stewardship and biodiversity (Fig. 1.7). The ecoroof uses engineered substrate
and exotic sedum plant palette to achieve these goals. The substrate is >7.6cm
deep and consists of expanded slate, sand compost and peat. The design
process incorporated an intermediate comparative plot experiment run by
researchers at Michigan State University to select the proper system. In this step,
the system was evaluated for performance and modeled for energy and
stormwater retention on the building. Goals of wildlife habitat creation and public
education subsequently evolved. The Ford Company built an overlook for the
ecoroof which is open for public tours and has examined the fauna on its roof.
Conceptual design by William McDonough + Partners, Design development and
initial replicated plot experiment by Michigan State University, detailed design by
Xero Flor, and Post construction research is monitored by Don Russell.
Constructed 2002.
49
Figure 1.7. An illustrative image-diagram for the Ford Assembly Plant Ecoroof,
Dearborn, MI USA prioritizing energy, hydrologic cycling and stewardship
(shown in circles) in the project agenda The background image shows the site
while text explains the proposal, means of installation and assessment criteria.
1.7.3 Latter Day Saints Conference Center
Church of Latter Day Saints Conference Center ecoroof, Salt Lake City, UT,
USA, was designed to recall the story of the church leaders’ religious journey
taken in the unique environmental settings through the replication of several local
ecosystems (Fig. 1.7 ). The intent was to communicate the interactions between
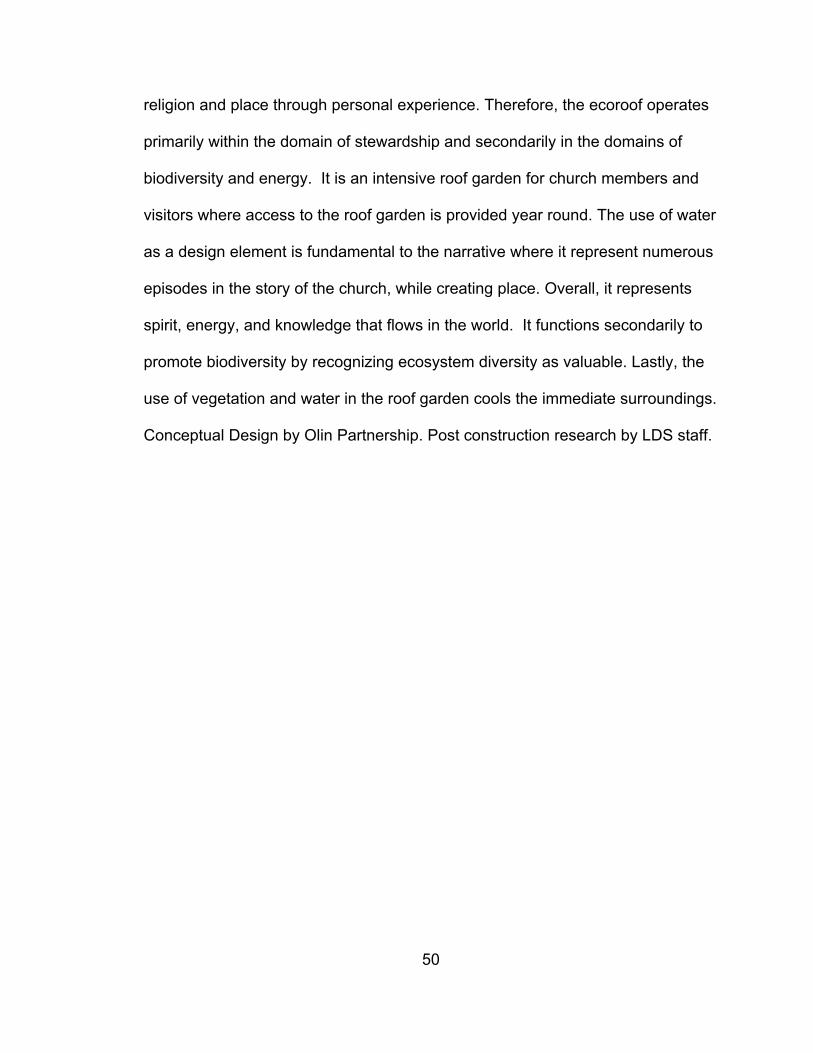
50
religion and place through personal experience. Therefore, the ecoroof operates
primarily within the domain of stewardship and secondarily in the domains of
biodiversity and energy. It is an intensive roof garden for church members and
visitors where access to the roof garden is provided year round. The use of water
as a design element is fundamental to the narrative where it represent numerous
episodes in the story of the church, while creating place. Overall, it represents
spirit, energy, and knowledge that flows in the world. It functions secondarily to
promote biodiversity by recognizing ecosystem diversity as valuable. Lastly, the
use of vegetation and water in the roof garden cools the immediate surroundings.
Conceptual Design by Olin Partnership. Post construction research by LDS staff.
51
Figure 1.8. An illustrative image-diagram for the Church of Latter Day Saints
Conference Center ecoroof, Salt Lake City, UT USA prioritizing stewardship,
biodiversity and energy (shown in circles) in the project agenda. The images
show the site while text explains the proposal, means of installation and
assessment criteria.
52
1.8 Discussion
The problem of communication and the contributing effects raise a
cautionary flag for designers, such as landscape architects, who intend to lead
ecoroof projects with aesthetics-only design proposals, as championed by Kiers
(2004) and Wayland Smith (2005). This strategy may result in a compromise in
performance. Instead, aesthetics or experiential goals should be strongly
balanced with science, as shown by MacDonagh et al (2006). New aesthetics in
vegetated roofs systems may be explored with ecoroof experimentation, but it
should not compromise or contradict understood performance. A reliance solely
on visual information is likely to marginalize the designer’s leadership role.
The design-research domains may contribute to the design decision
framework proposed by Grant and Jones (2005) . However, at least three issues
must be considered when using their framework. One is that the biological
factors must be included as criteria (both plants and animals), because research
findings have shown that plants affect ecoroof performance. Second, design
cannot entirely rely on pure research experimentation, but must work hand-and-
hand to develop innovative technology through applied research and post
construction evaluations. Lastly, it is a precedent based framework relying on
current knowledge through case study review and not on scientific findings. This
isolates new design from research endeavors and diminishes the legitimacy of
research findings.
The fields of design and scientific research are unlikely to move towards
adopting a common methodology, yet the coupling of disciplinary methods
53
seems plausible. Landscape architectural firms have merged with researchers in
order to approach environmental problems from both disciplines (Arvidson 2004).
Arvidson (2004) explains the ‘merging’ leads to a longer ‘design-science’ process
because it tends to be additive from both disciplines. If this, in fact, becomes the
common form of disciplinary interaction, then researchers must improve their
understanding of the design process. Subsequent studies should be performed
to investigate issues and explain to researchers the factors in the design process
that may affect research. With this improved understanding by research it is likely
both disciplines can better communicate to assist individual projects, as well as,
the technology.
The advancement towards determining sustainability by the criteria of an
ecosystems services model is likely to assist ecoroof projects. Designers and
researchers may find common ground for discussion, and from their interaction
may emerge a clarification of the ambiguous term “green.”
54
1.9 Citations
Alcazar, S. S. and B. Bass (2005). Energy performance of green roofs in a multi storey residential building in Madrid. In conference proceedings of Greening Rooftops for Sustainable Communities Washington D.C. , Green Roofs for Healthy Cities.
Arvidson, A. R. (2004). " Deeper shade of green: three firms strive to fuse design
with ecology." Landscape Architecture 94(3): p.46,48,50,52-56. ASLA. (2007). "Site Metric Summit." Bass, B., E. S. Krayenhoff, A. Martilli, R. B. Stull and H. Auld (2003). The impact
of Green Roofs on Toronto's Urban Heat Island. Greening Rooftops for Sutainable Communities, Chicago. Green Roofs for Healthy Cities.
Birkeland, J. (2002). Design for sustainability: A sourcebook of integrated, eco-
logical solutions. London ; Sterling, VA, Earthscan Publications. Bolund, P. and S. Hunhammar (1999). "Ecosystem services in urban areas."
Ecological Economics 29(2): 293 - 301. Brenneisen, S. (2003). Biodiversity of European Greenroofs. In conference
proceedings of Greening Rooftops for Sustainable Communities Chicago, IL, Green Roofs for Healthy Cities.
Brenneisen, S. (2004). From Biodiversity to Agricultural Productivity. In
conference proceedings of Greening Rooftops for Sustainable Communities Portland, OR, Green Roofs for Healthy Cities.
Brenneisen, S. (2005). Green roofs recapturing urban spaces for wildlife- A
Challenge for Urban Planning and Environmental Education. In conference proceedings of Greening Rooftops for Sustainable Communities Washington D.C., Green Roofs for Healthy Cities.
Brown, M. T. and S. Ulgiati (1997). "Emergy-based indices and ratios to evaluate
sustainability: monitoring economies and technology toward environmentally sound innovation." Ecological Engineering 9(1-2): 51-69.
55
Bruce, J. (2005). The weakest link: Constructing green roofs in the real world. In conference proceedings of Greening Rooftops for Sustainable Communities Washington D.C., Green Roofs for Healthy Cities.
Burke, K. (2003). Green roofs and regenerative design strategies-The Gap's 901 Cherry project. In conference proceedings of Greening Rooftops for Sustainable Communities, Chicago, IL. Green Roofs for Healthy Cities.
Calkins, M. (2005). "Strategy use and challenges of ecological design in
landscape architecture." Landscape and Urban planning 73(1): 29-48. Chenoweth, R. (1992). "Research: hype and reality." Landscape Architecture
82(3): 47-48. Coffman, R. and G. Davis (2005). Insect and Avian Fauna Presence on the Ford
River Rouge Green Roof. In the conference proceedings of Greening Rooftops for Sustainable Conference, Washington DC, Green Roofs for Healthy Cities.
Coffman, R. and J. F. Martin (2004). The Sustainability of An Agricultural Roof
Garden. In the conference proceedings of Greening Rooftops for Sustainable Communities, Portland, OR, Green Roofs for Healthy Cities.
Compton, J. S. and T. H. Whitlow (2006). A zero discharge green roof system
and species selection to optimize evapotranspiration and water retention. In conference proceedings of Greening Rooftops for Sustainable Communities Boston, MA. Green Roofs for Healthy Cities.
Consortium, G. S. (2003). "Recent Results." Retrieved 9-2-03, 2003, from
http://www.greenroofsystems.org. Costanza, R., R. d'Arge, R. de Groot, S, S. Farber, M. Grasso, B. Hannon, K.
Limburg, S. Naeem, R. O'Neill, J. Paruelo, R. Raskin and P. Sutton (1997). "The value of the world's ecosystem services and natural capital." Nature 387(6630): 253-260.
Daily, G. C., Ed. (1997). Nature's Services: Societal Dependence on Natural
Ecosystems. Washington D.C., Island Press. de Groot, R. S., M. A. Wilson and R. M. J. Boumans (2002). "A typology for the
classification, description and valuation of ecosystem functions, goods and services." Ecological Economics 41: 393 - 408.
Dunnett, N. (2005). Vegetation composition and structure significantly influence
green roof performance. In conference proceedings of Greening Rooftops for Sustainable Communities Washington DC.
56
Dunnett, N. (2006). Green roofs for biodiversity: Reconciling aesthetics with ecology. In conference proceedings of Greening Rooftops for Sustainable Communities Boston, MA.
Dunnett, N. and N. Kingsbury (2004). Planting Green Roofs and Living Walls. Portland, OR, Timber Press.
Dunnett, N. and N. Kingsbury (2004). Planting Green Roofs and Living Walls.
Portland, OR, Timber Press. Ehrenfeld, J. (2000). "Evaluating Wetlands within an urban context." Urban
Ecosystems 4(1): 69-85. Emilsson, T. (2004). Impact of fertilisation on vegetation development and water
quality. In conference proceedings of Greening Rooftops for Sustainable Communities Portland, OR, Green Roofs for Healthy Cities.
Eumorfopoulou, E. A., Dimitris (1998). "The Contribution of a planted roof tothe
thermal protection of buildings in Greece." Energy and Building 27: 29-36. Gaffin, S., C. Rosenzweig, L. Parshall, D. Hillel, J. Eichenbaum-Pikser, A.
Greenbaum, R. Blake, D. Beattie and R. Berghage (2006). Quantifying evaporative cooling from green roofs and comparison to other land surfaces. In conference proceedings of Greening Rooftops for Sustainable Communities Boston, MA, Green Roofs for Healthy Cities.
Gedge, D. (2003). '...From rubble to Redstarts...' In conference proceedings
Greening Rooftops for Sustainable Communities Chicago, Peck Associates. Green Roofs for Healthy Cities.
Graham, P. and M. Kim (2003). Evaluating the Stormwater Management Benefits
of Green Roofs Through Water Balance Modeling. Greening Rooftops for Sustainable Communites, Chicago, IL, Green Roofs for Healthy Cities.
Grant, E. J. and J. R. Jones (2005). A frame work for decision-making in vegetated roofing system design. In conference proceedings of Greening Rooftops for Sustainable Communities Washington DC, Green Roofs for Healthy Cities.
Hunt, W., A. M. Hathaway, J. T. Smith and J. Calabria (2006). Choosing the right
green roof media for water quality. In conference proceedings of Greening Rooftops for Sustainable Communities Boston, MA, Green Roofs for Healthy Cities.
Hunt, W. and J. Smith (2005). Hydrologic and water quality performance from
green roofs in North Carolina. In conference proceedings of Greening Rooftops for Sustainable Communities, Washington D.C., Greening Rooftops for Healthy Cities.
57
Hutchinson, D., P. Abrams, R. Retzlaff and T. Lipton (2003). Stormwater
Monitoring Two Ecoroofs in Portland, Oregon, USA. Greening Rooftops for Sustainable Communities, Chicago, IL, Greening Rooftops for Healthy Cities.
Hydrotech (2000). The Roof Garden Planning Guide, Company Literature. Johnston, J. and J. Newton (1993). Building green : a guide to using plants on
roofs, walls and pavements. London, Ecology Unit. Jones, R. A. (2002). Tecticolous Invertebrates. A preliminary investigation of the
invertebrate fauna on green roofs in urban London. London, English Nature: 36.
Kadas, G. (2002). Study of invertebrates on green roofs - How roof design can
maximise biodiversity in an urban environment. Dept. of Geography. London, University College. MSc Conservation: 76.
Koehler, M. (1990). The living conditions of plants on the roofs of buildings.
Urban Ecology: Plants and the plant communities in urban environments. H. F. H. Lieth. Stroudsburg, PN, Dowden, Hutchinson & Ross.
Koehler, M. (2003). Plant Survival Research and Biodiversity: Lessons From
Europe. In conference proceedings of Greening Rooftops for Sustainable Communities, Chicago, IL, Green Roofs for Healthy Cities.
Koehler, M., M. Schmidt, F. W. Grimme, M. Laar, V. L. d. A. Paiva and S.
Tavares (2002). "Green roof in the hot-humid tropics- far beyond aesthetics." Environmental Management and Health 13(4): 382-391.
Kortright, R. (2001). Evaluating the potential of green roof agriculture: A review of
the literature. Unpublished Paper, Trent University: 61. Kula, R. (2005). Green Roofs and the LEED green building rating system. In
conference proceedings of Greening Rooftops for Sustainable Communities, Washington DC, Greening Rooftops for Healthy Cities.
LaGro, J. A. (1999). "Research capacity: matter of semantics?" Landscape
Journal 18(2): p.179-186. Lee, H. and H. Koshimiz (2006). Research on the scenic meaning of rooftop
greening with semantic differential measure and join-count analysis. . In conference proceedings of Greening Rooftops for Sustainable Communities Boston, MA. Green Roofs for Healthy Cities.
58
Levenston, M. (2002). "City Farmer." Retrieved 12/27/02, 1994-2002, from http://www.cityfarmer.org/subrooftops.html#roofs.
Lieth, H. F., Ed. (1978). Patterns of Primary Production in the Biosphere.
Benchmark Papers in Ecology. Stroudsburg, PN, Dowden, Hutchinson & Ross.
Lipton, T. and E. Strecker (2003). EcoRoofs (Greenroofs)- A more Sustainble
Infrastructure. National Conference for Stormwater Managers, Portland, OR.
Liu, K. and B. Baskaran (2003). Thermal performance of green roofs through
field evaluation. In conference proceedings of Greening Rooftops for Sustainable Communities Chicago. Chicago, IL Green Roofs for Healthy Cities.
Lundholm, J. (2005). A habitat template approach to green building surfaces. In
conference proceedings of Greening Rooftops for Sustainable Communities, Washington DC, Green Roofs for Healthy Cities.
Lyle, J. (1994). Regenerative Design for Sustainable Development. New York,
John Wiley &Sons. MacDonagh, L. P., N. M. Hallyn and S. Rolph (2006). Midwestern USA plant
communities + Design = Bedrock Bluff Prairie Communites. In conference proceedings of Greening Rooftops for Sustainable Communities Boston, MA, Green Roofs for Healthy Cities.
Martens, R. and B. Bass (2006). Roof-envelope ratio impact on green roof
energy performance. In conference proceedings of Greening Rooftops for Sustainable Communities Boston, MA, Green Roofs for Healthy Cities.
Martin, B. (2001). "A Wading Pool Garden." Retrieved 1/1, 2003, from
http://www.suite101.com/article.cfm/cottage_gardening/66126. McHarg, I. (1992). Design With Nature. New York, John Wiley. Mentens, J., D. Raes and M. Hermy (2003). Effect of orientation on the water
balance of greenroofs. In conference proceedings of Greening Rooftops for Sustainable Communities Chicago.
Milburn, L.-A. and R. D. Brown (2003). "The relationship between research and
design in landscape architecture." Landscape and Urban planning 64(1-2): 47-66.
59
Miller, C. (2002). Use of Vegatated Roof Covers in Runoff Management. Phildelphia, PA, Roofscapes: 6.
Miller, C. (2003). Moisture Management In Green Roofs. Greening Rooftops for
Sustainable Communities, Chicago, IL, Green Roofs for Healthy Cities. Miller, C. (2004). Formulation of Effective Performance Specifications for Green
Roofs. In conference proceedings of Greening Rooftops for Sustainable Communitie, Portland, OR, Green Roofs for Healthy Cities.
Miller, G. T. (1998). Living in the Environment. New York, Wadsworth. Munro, D. A. and M. W. Holdgate, Eds. (1991). Caring for the earth : a strategy
for sustainable living. Gland, Switzerland, IUCN, UNEP, WWF. Oberlander, C. H. and E. Whitelaw (2005). Aesthetic design and green roofs. In
conference proceedings of Greening Rooftops for Sustainable Communities Washington DC, Greening Rooftops for Healthy Cities.
Odum, H. T. (1994). The Emergy of Natural Capital. Investing in Natural Capital.
J. M. Jansen, C. Folke and R. Costanza. Covelo, CA, Island Press: pg200-212.
Onmura, S., M. Matsumoto and S. Hokoi (2001). "Study on evaporative cooling
effect of roof lawn gardens." Energy and Buildings 33: 653-666. Osmundson, T. (1999). Roof gardens : history, design, and construction. New
York, W.W. Norton. Palomo Del Barrio, E. (1998). "Analysis of the green roofs cooling potential in
buildings." Energy and Buildings 27(2): 179-193. Peck, S., C. Callaghan, B. Bass and M. Kuhn (1999). Greenbacks from Green
Roofs: Forging a New Industry in Canada. Ottawa, ON, Canada Mortgage and Housing Corporation: 54.
Peck, S. and M. Kuhn. (2001). "Design Guidelines for Green Roofs." Retrieved
9-24-02, 2002, from http://peck.ca/grhcc/. Rees, W. and M. Wackernagel (1996). "Urban ecological footprints: why cities
cannot be sustainable--and why they are a key to sustainability." Environmental Impact Assessment Review 16(4-6): 223-248.
Rowe, D. B., M. A. Monterusso and C. L. Rugh (2006). "Assessment of Heat-
expanded Slate and Fertility Requirements in Green Roof Substrates." HortTech 16(3): 321-332.
60
Rowe, D. B., C. Rugh, N. VanWoert, M. Monterusso and D. Russell (2003).
Green roof slope, substrate depth and vegetation influence on runoff. In conference proceedings of Greening Rooftops for Sustainable Communities Chicago, IL, Greening Rooftops for Healthy Cities.
Scholz-Barth, K. (2001). "Green roofs: stormwater management from the top
down." Environmental Design & Construction. Sharp, R. F. (2003). A coastal meadow in the sky. In conference proceedings of
Greening Rooftops for Sustainable Communities, Chicago, IL. Stiling, P. (2002). Ecology: Theory and Applications. Upper Saddle River, New
Jersey, Prentice Hall. Tan, Y. P., N. H. Wong, Y. Chen, L. C. Ong and A. Sia (2003). Thermal Benefits
of Rooftop Gardens in Singapore. Greening rooftops for Sustainable Cities, Chicago, IL, Green Roofs for Healthy Cities.
Thompson, W. J. and K. Sorvig (2000). Sustainable Landscape Construction: A
guide to green building outdoors. Washington D.C., Island press. Tinkel, K. C. (1977). Rooftop gardening. Radnor, Pa., Chilton Book Co. Ulgiati, S., H. T. Odum and S. Bastianoni (1994). "Emergy use, environmental
loading and sustainability: An emergy analysis of Italy." Ecological Modeling 73: 215-268.
USGBC. (2007). "LEED for New Development." from
www.usgbc.org/DisplayPage.aspx?CMSPageID=148. Van der Ryn, S. and S. Cowan (1996). Ecological design. Washington, D.C.,
Island Press. Wayland-Smith, S. (2005). Drawing green in New York City: Aesthetic design +
sustainable development. In conference proceedings of Greening Rooftops for Sustainable Communities Washington D.C., Green Roofs for Healthy Cities.
WCED (1987). Our Common Future. New York, Oxford Press. Wong, N. H., S. F. Tay, R. Wong, C. L. Ong and A. Sia (2003). "Investigation of
thermal benefits of rooftop garden in the tropical environment." Building and Environment 38(2): 261-270.
61
CHAPTER 2
PRIMARY PRODUCTIVITY, WATER RETENTION AND LEACHATE QUALITY
IN TWO ALTERNATIVE ECOROOF DESIGNS
2.1 Abstract
This study is intended to provide environmental scientists and planting
designers with an understanding of the environmental performance of vegetated
roof systems. It describes the results of an experiment evaluating the net primary
productivity, water retention and water quality of two ecoroof designs when
compared with conventional ecoroof designs. The investigations accessed the
effects of class, alternative and plant on biomass production; class, alternative
and storm event on water retention; and class, alternative, and storm event on
water EC. In this study, it was found that an intensive roof can retain 18% more
precipitation and produce 2.5 times more biomass than an extensive roof.
Design alternatives that employed recycle and run-on techniques produced 26%
more biomass than a conventional ecoroof receiving direct precipitation without
significant reductions in retention. It was demonstrated in this study that the
62
runoff from extensive roofs was of higher water quality (lower electrical
conductivity, EC) than from intensive ones.
2.2 Introduction
2.2.1 Ecoroofs
In general, ecoroofs are considered to be oligotrophic ecosystems wherein
ecoroof productivity studies are overlooked when compared to other research
initiatives dealing with plant establishment, temperature and water regulation,
energy balance and wildlife (Peck and Bass 2000; Jones 2002; Dunnett et al.
2005). The few results describing ecoroof productivity are supplemental to
findings in plant establishment or survival studies (Koehler 1990; Koehler 2003).
Yet, research results explaining ecoroof performance, and their associated
environmental benefits, are influenced by growth attributes such as leaf area,
vegetated cover and community composition (Rowe et al. 2003; Wong et al.
2003; Dunnett et al. 2005). This association between environmental benefits and
growth attributes implies that having a better knowledge of ecoroof productivity
would be essential to understanding their performance. This study investigates
the productivity of ecoroofs.
Productivity is a basic attribute of ecosystems (Lieth 1978). It has been
shown that all ecosystems provide essential environmental services to society
through their functions: 1) regulation, 2) habitat 3) production and 4) information
which, in turn, are determined by ecosystem structure and process (Costanza et
63
al. 1997; Daily 1997; de Groot et al. 2002). De Groot et al (2002) explain that
each of these four functions is the result of complex natural processes which
have been conveniently grouped. Regulation functions maintain life supporting
systems such as clean air, water and soils, which operate through mechanisms
such as bio-geochemical cycles. Habitat functions provide refuge and allow
plants and animal reproduction to and create the services of genetic diversity and
evolutionary processing. Production functions include photosynthesis and
nutrient uptake by autotrophs to create a variety of carbohydrate structures which
can be used by secondary producers to create greater living biomass.
Information functions provide essential ‘reference’ function to human health in the
cognitive, spiritual, recreational and aesthetic experience realms.
Productivity is influenced by temperature, nutrient and water availability
(Lieth 1973). Subsequently, water has been shown to be involved in plant
ecophysiological processes related to growth such as stomatal conductance,
photosynthesis and carbon and nitrogen partitioning (Eamus 2003). Although
some tropical areas of high precipitation experience lower levels of productivity
due to rapid nutrient loss, in temperate regions productivity is associated with
increased water availability (Clawson et al. 2001; Schuur and Matson 2001).
The study of productivity, which became popular in the middle of the 20th
Century remains effective today a as primary attribute characterizing and
understanding both natural and constructed ecosystems (Kozlovsky 1968;
Kucharik et al. 2001; O’Connell et al. 2003; Takyu et al. 2003). The productivity
theory postulates that productivity influences species richness as a measure of
64
diversity. It is also said to influence biotic community function, ecosystem
stability and global health (Naeem et al. 1996; Tilman et al. 1996; Schoen 1997).
The rise of popularity of ecoroofs is due to their potential in reducing
stormwater runoff, ameliorating urban temperatures, creating wildlife habitat and
improving the experience and appearance of the city (Peck and Bass 2000;
Dunnett and Kingsbury 2004). These systems provide benefits from their
ecosystem functions. For example, the systems function to regulate hydrologic
and atmospheric cycles, which has been shown to prevent stormwater runoff in
retention studies (Scholz-Barth 2001; Koehler et al. 2002; Miller 2002; Lipton and
Strecker 2003; Rowe et al. 2003; Dunnett et al. 2005; Hunt and Smith 2005).
Intercept solar radiation by the vegetation which cools the air through
evapotranspiration (Onmura et al. 2001; Liu and Baskaran 2003; Wong et al.
2003). Create habitat for both flora and fauna in which extirpated terrestrial plant
populations and rare invertebrates have been conserved in ecoroofs, while
newer roofs areas are being used for refuge by common insects and birds (Jones
2002; Kadas 2002; Gedge 2003; Brenneisen 2004; Coffman and Davis 2005).
The systems function to provide information through spiritual and aesthetic
experiences for urbanites who are isolated from natural environments
(Osmundson 1999). Production in ecoroofs, on the other hand, has not been
largely studied.
The reasons to investigate productivity in ecoroofs are: 1) it is a basic
attribute of an ecosystem as shown by Lieth (1978) 2) productivity is linked to
other ecosystem functions, such as biodiversity and community stability, and may
65
contribute to ecological theory (Naeem et al. 1996), 3) productivity appears to
affect the environmental benefits provided by ecoroofs (Brenneisen 2003; Wong
et al. 2003) and 4) advocates in the public realm are currently proposing
productivity as a way to maximize environmental benefits in ecoroofs
(Mankiewicz and McDonnell 2006). Therefore, in this study I investigate net
primary production of the two major types of ecoroof in two alternative designs to
provide comparison and understanding of these constructed ecosystems.
2.2.2 Productivity in ecoroofs
Ecoroofs are categorized by their substrate depth and their plant
community. There are two classes of ecoroofs, extensive and intensive;
Extensive are those possessing less than 15 cm of substrate depth and
composed largely of plants of the Crassulaceae family. On the other hand,
intensive roofs have more than 30cm of substrate depth and are composed of a
“greater variety” of plants including those with woody stems. Ecoroof substrate
depth correlates positively with water retention and plant diversity, where woody
stemmed shrubs, may only exist in the deeper substrates (Peck and Bass 2000;
Scholz-Barth 2001; Miller 2002; Dunnett and Kingsbury 2004). However, I did
not find in my literature search any studies recording the quantitative values for
productivity across class.
Productivity in ecoroofs has been included in regulatory, habitat and
information studies and it appears to influence results in stormwater retention,
thermal and biodiversity performance (Rowe et al. 2003; Wong et al. 2003;
Brenneisen 2004). One of the most obvious determinants of ecoroof productivity
66
is water availability. In ecoroofs stormwater studies Rowe et al. (2003) showed
that vegetative cover significantly impacts retention. In their study of water
retention performances across several substrate depths and mixes, they
demonstrated that greater retention was observed on roofs that possessed
vegetative cover. They also demonstrated that greater substrate depth retained
more precipitation, and a planted and deeper substrate retained the most water.
However, their experiments were limited to a maximum of depth of 10 cm. As a
consequence, they assessed only the extensive class.
Additionally, studies on the microclimatic temperature regulation of
ecoroofs have demonstrated that increased leaf area enhanced ambient air
temperature reductions in field studies, using thermodynamic models (Wong et
al. 2003; Clark 2005; Currie and Bass 2005 ). Wong et al (2003) examined
ambient air temperatures in a vertical section of an ecoroof demonstrating that
from a thermal protection perspective it is desirable to have plants with a high
leaf area index. Their results indicated that this may require an intensive class
ecoroof. Clark (2005) demonstrated that removal of atmospheric NOx (Nitrogen
Oxide) was dependent on leaf area as well. His study found that larger leaf area
in the C3 plant Nicotiana tabacum, contributed to an improved performance in
annual NOx removal over the CAM plant Kalanbloss feldiana. However, Clark
failed to explore the depth of substrate required to growth these two plants in
ecoroofs. N. tabacum, may require an intensive ecoroof depth level of substrate
for plant growth. Currie and Bass (2005) in an urban scale modeling study
proposed grasses to be used on ecoroofs to decrease urban air pollution. The
67
use of grasses would also necessitate constructing an intensive ecoroof as it has
been shown that grasses have poor establishment in extensive roofs. (Rowe et
al. 2005). These studies illustrate that productivity appears to be associated with
substrate depth and that distinction amongst substrate depths has not been
considered in experimentation and modeling.
At this time, only three studies list productivity (growth) rates as part of
larger research objectives involving ecoroofs and plants (Koehler 1990; Koehler
2003; Rowe et al. pending). Koehler (2003) states ecoroof plant development is
influenced by 1) the water holding capacity of the system 2) the planting method
3) the building architecture and 4) the maintenance of the vegetation stand. He
compiled information and drew conclusions from eight separate study sites that
have recorded data over eighteen years. He states that the phytomass (whole
plant dry weight) presented in these studies ranged between 4.2 g·m-2 and 47.2
g·m-2. Unfortunately, he presents only one value for the leaf area index (0.64)
and the shoot to root ratio (0.9) without explaining how they are related.
Although plant survivability is influenced by various environmental
variables, water remains an important factor contributing to ecoroof plant growth
(Mentens et al. 2003). It has been determined that substrate water retention is a
function of its volume, and that such retained water is used by plants (Miller
2002). These two works illustrate the relationships of productivity to substrate
depth.
Advocates in the public realm are proposing new ways to maximize the
environmental benefits of ecoroofs by varying substrate depth and capturing or
68
recycling water and nutrients (Brenneisen 2003; Kula 2005). Brenneisen (2003)
found that diversity of insects and birds, positively correlated with plant diversity,
which was created by hummock areas in extensive roofs. In a five year study
evaluating 24 ecoroofs, it was shown that primary and secondary biodiversity
was greater on roofs with topographic diversity. Hummocks, of substrate ranging
from 15 cm to 30 cm existed on many extensive roofs, making them “semi-
intensive”. Resulting from this study has been the establishment of municipal
codes in Basel and Zurich requiring ecoroofs designed to increase biodiversity
through the use of hummocks (Brenneisen 2005).
The use of grey water recycling or collecting water stormwater from
nearby roofs is likely to impact the productivity within an ecoroof. Several
alternative ecoroof designs using recycled water are being constructed to
maximize stormwater retention and maximize evapotranspiration. Under the
concept of zero-discharge, a system aims to capture, rainwater in cistern storage
for later recycle or collecting roofs which drain to ecoroofs in order to further
reduce, or eliminate runoff by maximizing evapotranspiration rates (Shirley-Smith
2003; Kula 2005; Compton and Whitlow 2006; Mankiewicz and McDonnell 2006).
Mankiewicz and McDonnell (2006) propose using a building’s grey water, which
is domestic waste water from washing dishes and other low contaminant
sources, to irrigate a plant palette consisting of species possessing high levels of
stomata conductance in order to increase evapotranspiration rates in the entire
ecoroof. Compton and Whitlow (2006) explored both obligate wetland species
and facultative upland pioneering colonizers in ecoroof in order to optimize
69
evapotranspiration rates. Their preliminary results show zero discharge. These
zero-discharge designs are considered more valuable to sustainable design
organizations such as the United States Green Building’s Council’s Leadership in
Energy and Environmental Design (LEED) (Kula 2005) because they prevent all
stormwater discharge.
The intent of my study was to compare productivity and stormwater runoff
for two soil depths and two design alternatives to improve the understanding of
ecoroof productivity and retention. My objectives were first, to determine if
productivity could be increased through alternative designs, such as recycle or
run-on, as well as record the influence of substrate depth on biomass
development. Second, I expected to determine if water retention would be
greater in the alternative ecoroofs when compared to a conventional ecoroof
receiving only direct precipitation, as well as, confirm that deeper substrates
improve retention. Lastly, I expected to ascertain any differences in electrical
conductivity (EC) in the leachate from the ecoroofs.
2.3 Material and methods
2.3.1 Constructed Plots
Twenty four experimental vegetated roof system plots were built
approximately one meter above the ground on a crushed stone nursery pad at
The Ohio State University agricultural farm, Columbus, OH USA (40o N latitude)
in the spring of 2004 (Fig. 2.1 and 2.2). All 24 plots were 1m2. In order to
create two classes, depth in 12 plots was 10 cm (extensive) and in the other 12,
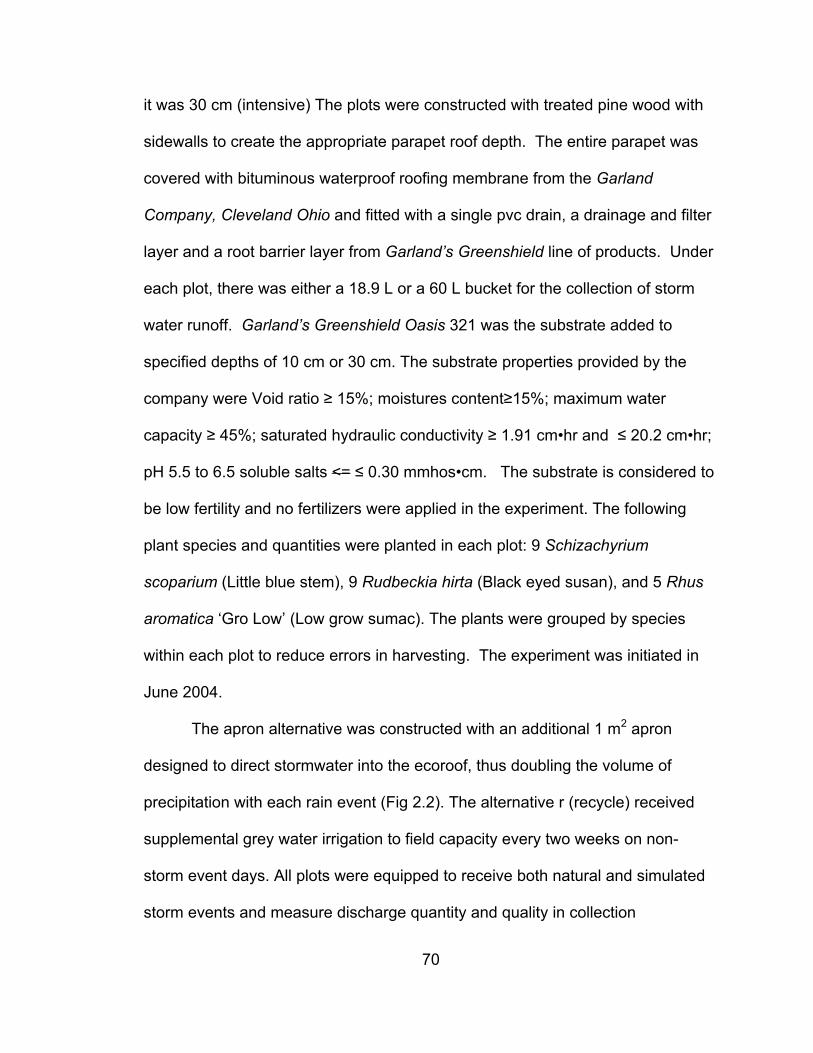
70
it was 30 cm (intensive) The plots were constructed with treated pine wood with
sidewalls to create the appropriate parapet roof depth. The entire parapet was
covered with bituminous waterproof roofing membrane from the Garland
Company, Cleveland Ohio and fitted with a single pvc drain, a drainage and filter
layer and a root barrier layer from Garland’s Greenshield line of products. Under
each plot, there was either a 18.9 L or a 60 L bucket for the collection of storm
water runoff. Garland’s Greenshield Oasis 321 was the substrate added to
specified depths of 10 cm or 30 cm. The substrate properties provided by the
company were Void ratio ≥ 15%; moistures content≥15%; maximum water
capacity ≥ 45%; saturated hydraulic conductivity ≥ 1.91 cm•hr and ≤ 20.2 cm•hr;
pH 5.5 to 6.5 soluble salts <= ≤ 0.30 mmhos•cm. The substrate is considered to
be low fertility and no fertilizers were applied in the experiment. The following
plant species and quantities were planted in each plot: 9 Schizachyrium
scoparium (Little blue stem), 9 Rudbeckia hirta (Black eyed susan), and 5 Rhus
aromatica ‘Gro Low’ (Low grow sumac). The plants were grouped by species
within each plot to reduce errors in harvesting. The experiment was initiated in
June 2004.
The apron alternative was constructed with an additional 1 m2 apron
designed to direct stormwater into the ecoroof, thus doubling the volume of
precipitation with each rain event (Fig 2.2). The alternative r (recycle) received
supplemental grey water irrigation to field capacity every two weeks on non-
storm event days. All plots were equipped to receive both natural and simulated
storm events and measure discharge quantity and quality in collection
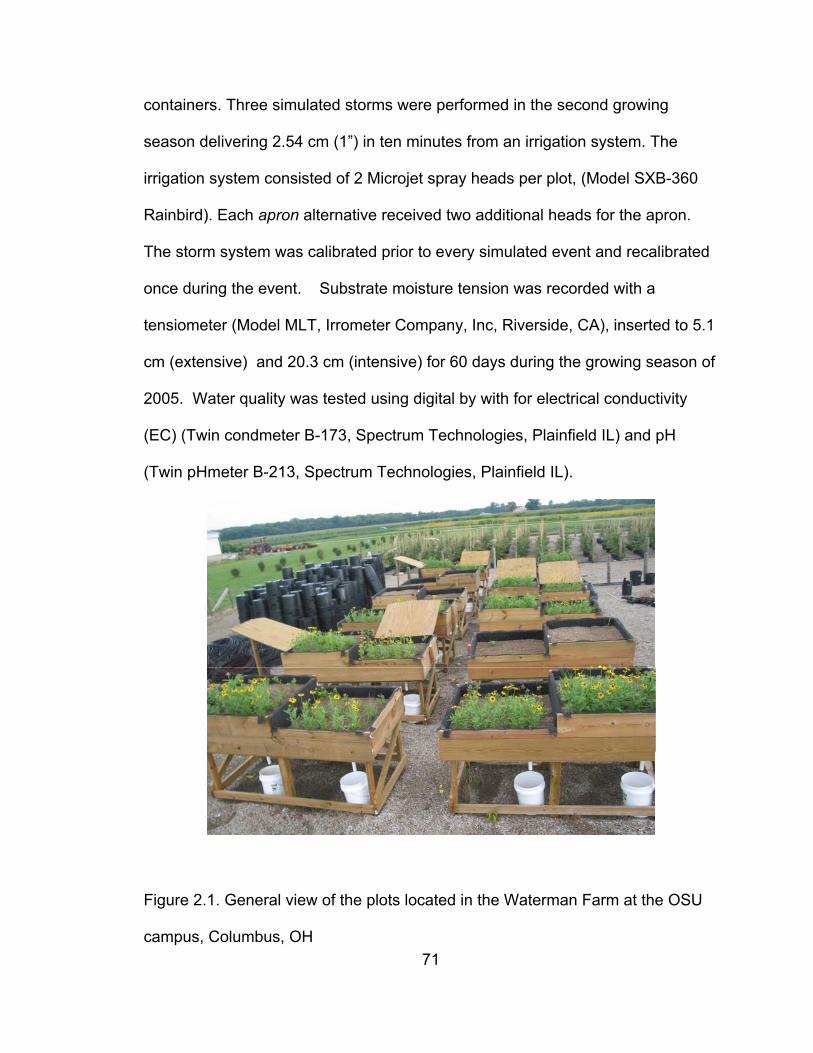
71
containers. Three simulated storms were performed in the second growing
season delivering 2.54 cm (1”) in ten minutes from an irrigation system. The
irrigation system consisted of 2 Microjet spray heads per plot, (Model SXB-360
Rainbird). Each apron alternative received two additional heads for the apron.
The storm system was calibrated prior to every simulated event and recalibrated
once during the event. Substrate moisture tension was recorded with a
tensiometer (Model MLT, Irrometer Company, Inc, Riverside, CA), inserted to 5.1
cm (extensive) and 20.3 cm (intensive) for 60 days during the growing season of
2005. Water quality was tested using digital by with for electrical conductivity
(EC) (Twin condmeter B-173, Spectrum Technologies, Plainfield IL) and pH
(Twin pHmeter B-213, Spectrum Technologies, Plainfield IL).
Figure 2.1. General view of the plots located in the Waterman Farm at the OSU
campus, Columbus, OH
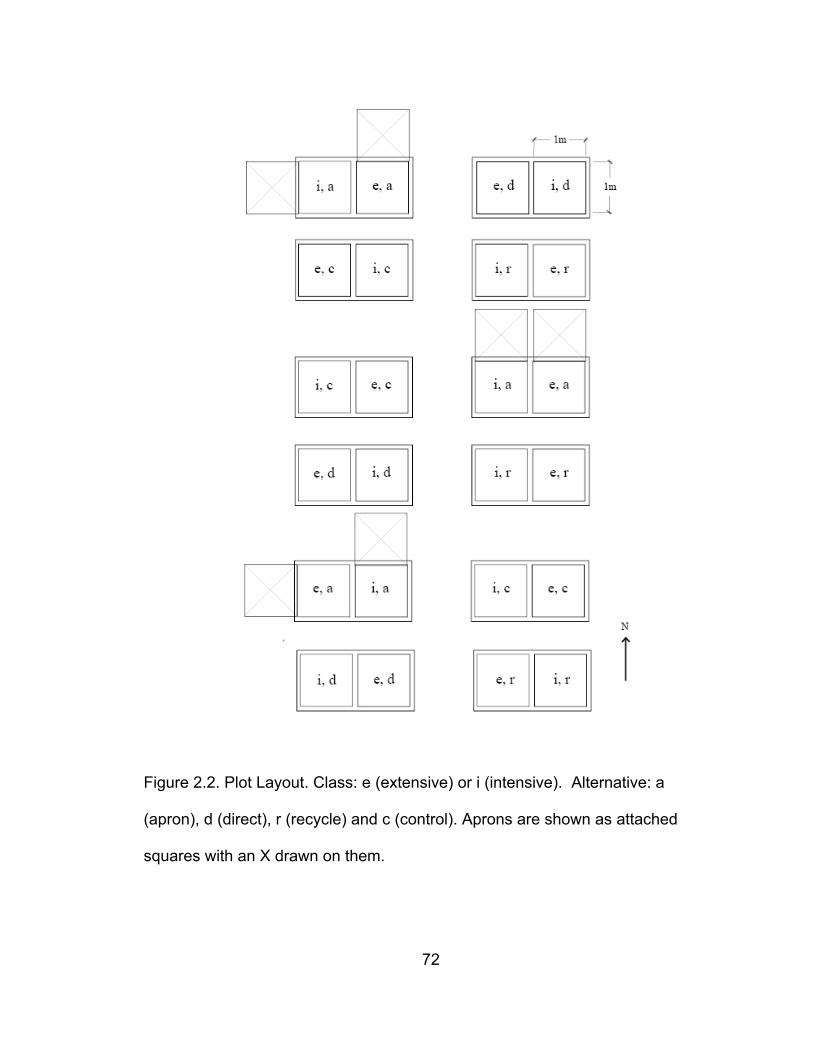
72
Figure 2.2. Plot Layout. Class: e (extensive) or i (intensive). Alternative: a
(apron), d (direct), r (recycle) and c (control). Aprons are shown as attached
squares with an X drawn on them.
73
2.3.2 Experimental Design
The experiment was designed for paired analysis, first by class and then
by alternative. The two classes, extensive and intensive, and all treatments were
randomly assigned (Fig. 3.2). The treatments were:
1. control, (unplanted roof)
2. direct precipitation, (conventional design)
3. apron, (run-on)
4. recycle, (leachate recycled)
2.3.3 Data collection
Data were collected over two growing seasons from June 2004 to Sept
2005. Storm water data were collected from nine natural storm events and three
simulated storm events.
Biomass was measured after whole plant harvesting. First initial biomass
measurements were taken at planting and total crop harvesting was done after
the second season. The samples were harvested (including roots), root washed,
and dried at 55oC in a drying oven for 72 hours and then weighed.
A total of three natural rain events were recorded in 2004 and nine rain
events including all natural and simulated events were recorded in summer 2005.
Rainfall within a 24hr period constituted a natural event. Rainfall was recorded
on site and water volume entering each plot was measured. Runoff was collected
directly under the plot in individual containers where volume was determined by
dipstick and calculations. Percent of retention for each plot was determined.
Water quality was also tested with calibrated digital instruments form each
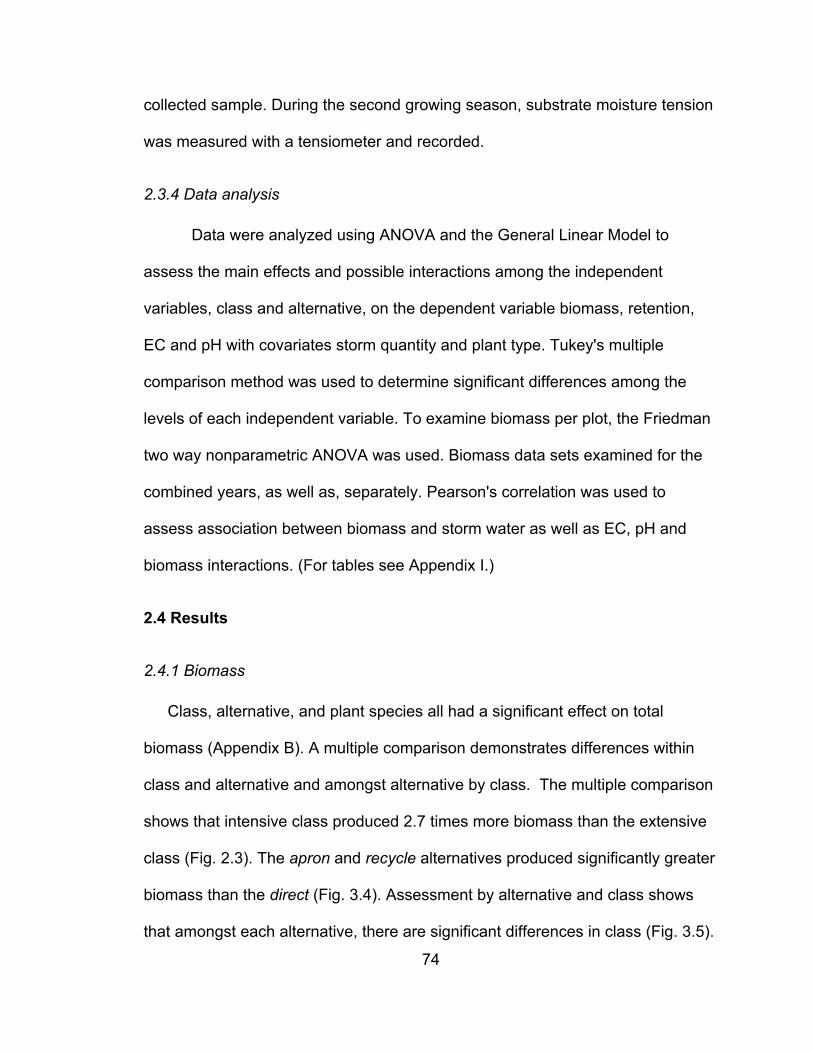
74
collected sample. During the second growing season, substrate moisture tension
was measured with a tensiometer and recorded.
2.3.4 Data analysis
Data were analyzed using ANOVA and the General Linear Model to
assess the main effects and possible interactions among the independent
variables, class and alternative, on the dependent variable biomass, retention,
EC and pH with covariates storm quantity and plant type. Tukey's multiple
comparison method was used to determine significant differences among the
levels of each independent variable. To examine biomass per plot, the Friedman
two way nonparametric ANOVA was used. Biomass data sets examined for the
combined years, as well as, separately. Pearson's correlation was used to
assess association between biomass and storm water as well as EC, pH and
biomass interactions. (For tables see Appendix I.)
2.4 Results
2.4.1 Biomass
Class, alternative, and plant species all had a significant effect on total
biomass (Appendix B). A multiple comparison demonstrates differences within
class and alternative and amongst alternative by class. The multiple comparison
shows that intensive class produced 2.7 times more biomass than the extensive
class (Fig. 2.3). The apron and recycle alternatives produced significantly greater
biomass than the direct (Fig. 3.4). Assessment by alternative and class shows
that amongst each alternative, there are significant differences in class (Fig. 3.5).
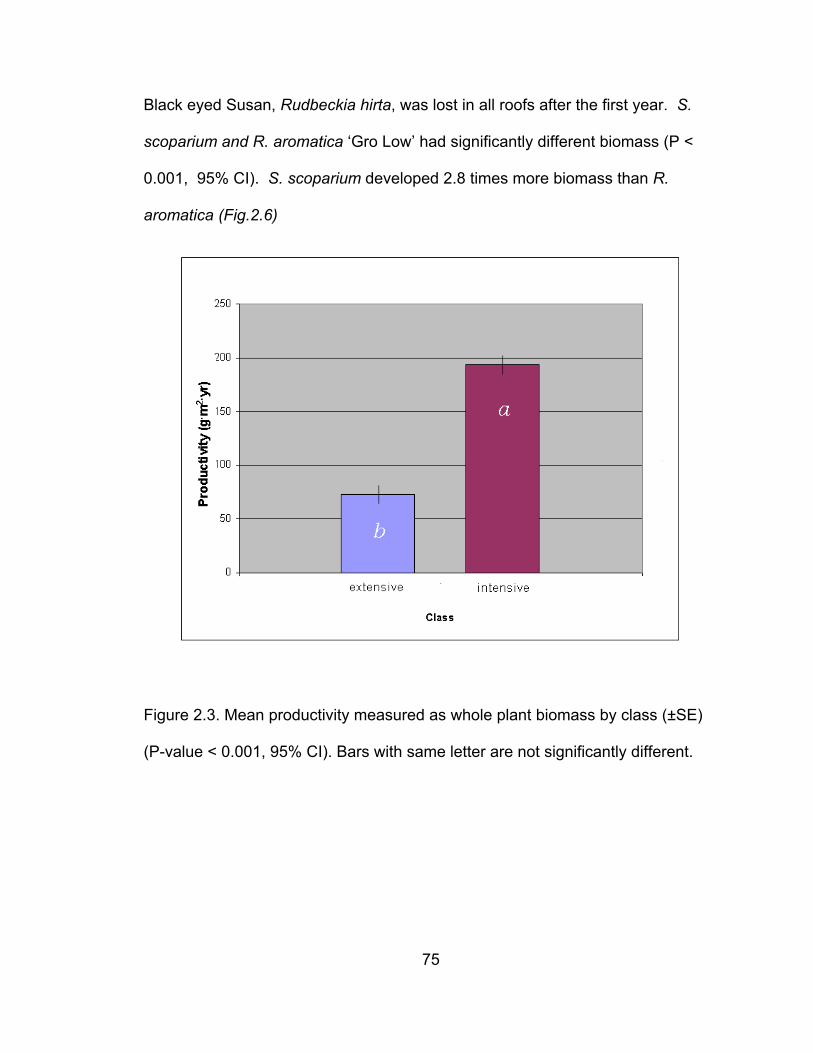
75
Black eyed Susan, Rudbeckia hirta, was lost in all roofs after the first year. S.
scoparium and R. aromatica ‘Gro Low’ had significantly different biomass (P <
0.001, 95% CI). S. scoparium developed 2.8 times more biomass than R.
aromatica (Fig.2.6)
Figure 2.3. Mean productivity measured as whole plant biomass by class (±SE)
(P-value < 0.001, 95% CI). Bars with same letter are not significantly different.
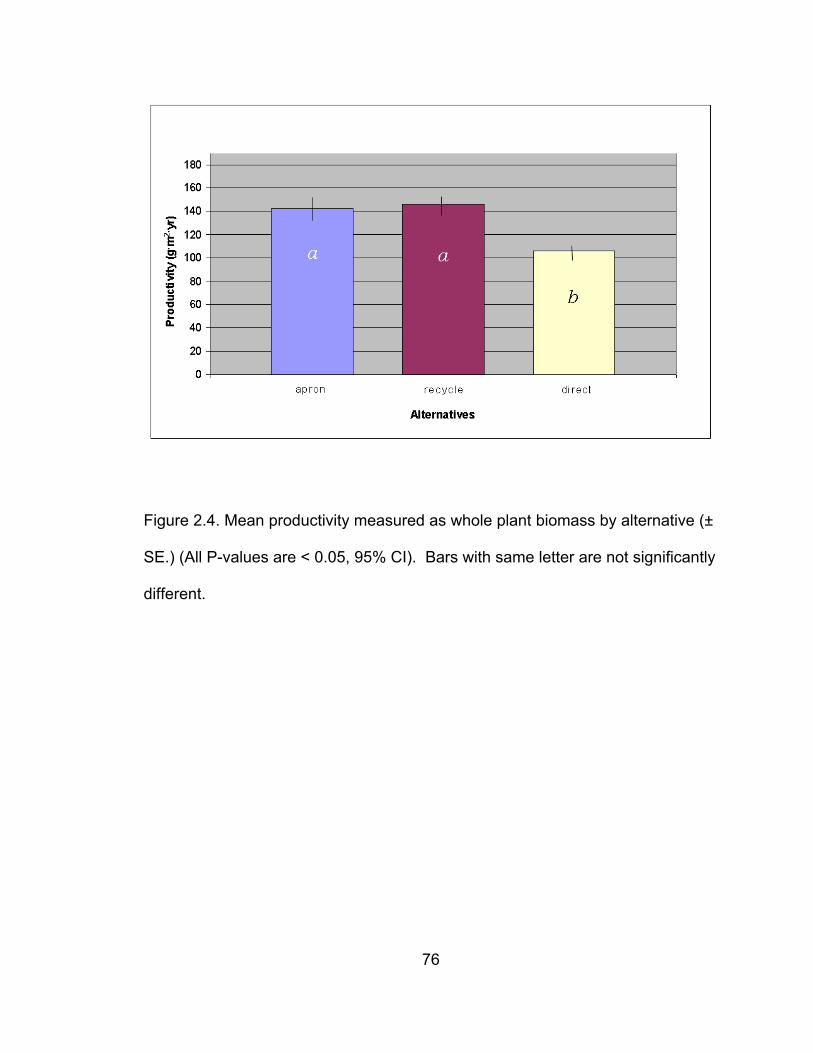
76
Figure 2.4. Mean productivity measured as whole plant biomass by alternative (±
SE.) (All P-values are < 0.05, 95% CI). Bars with same letter are not significantly
different.
77
Figure 2.5. Mean productivity measured as whole plant biomass by alternative
and class (± SE.) (All P-values are < 0.05, 95% CI). Bars with same letter are not
significantly different.
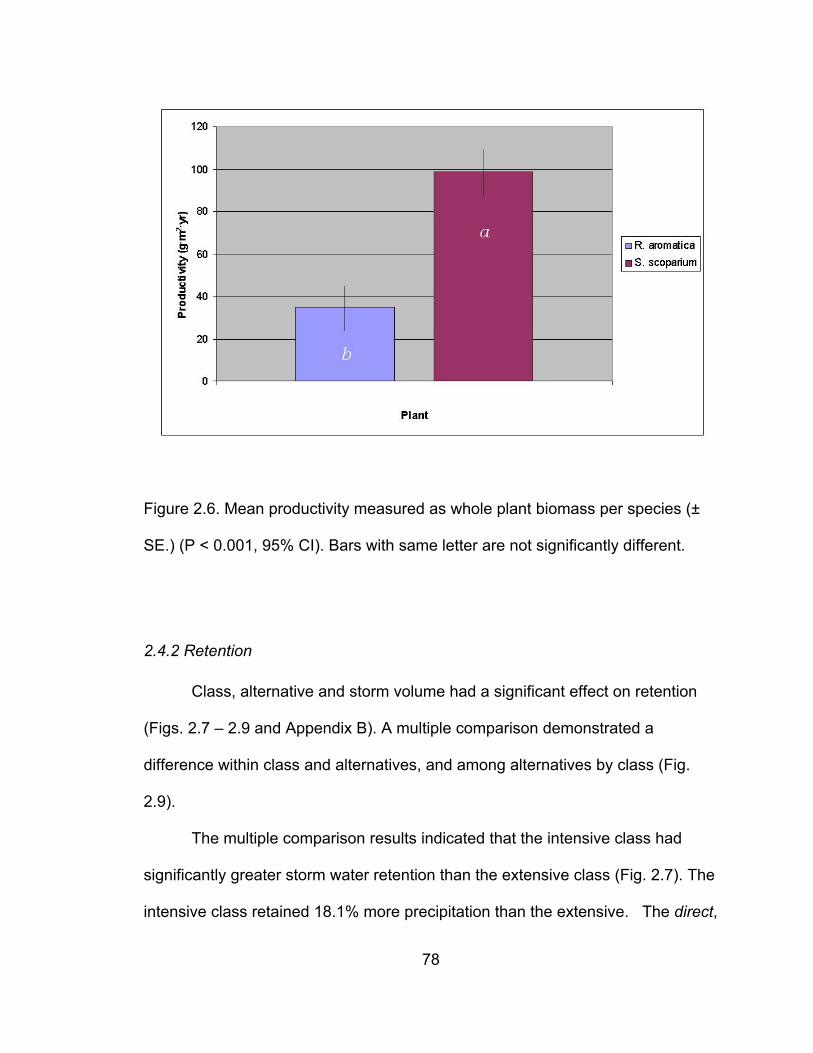
78
Figure 2.6. Mean productivity measured as whole plant biomass per species (±
SE.) (P < 0.001, 95% CI). Bars with same letter are not significantly different.
2.4.2 Retention
Class, alternative and storm volume had a significant effect on retention
(Figs. 2.7 – 2.9 and Appendix B). A multiple comparison demonstrated a
difference within class and alternatives, and among alternatives by class (Fig.
2.9).
The multiple comparison results indicated that the intensive class had
significantly greater storm water retention than the extensive class (Fig. 2.7). The
intensive class retained 18.1% more precipitation than the extensive. The direct,
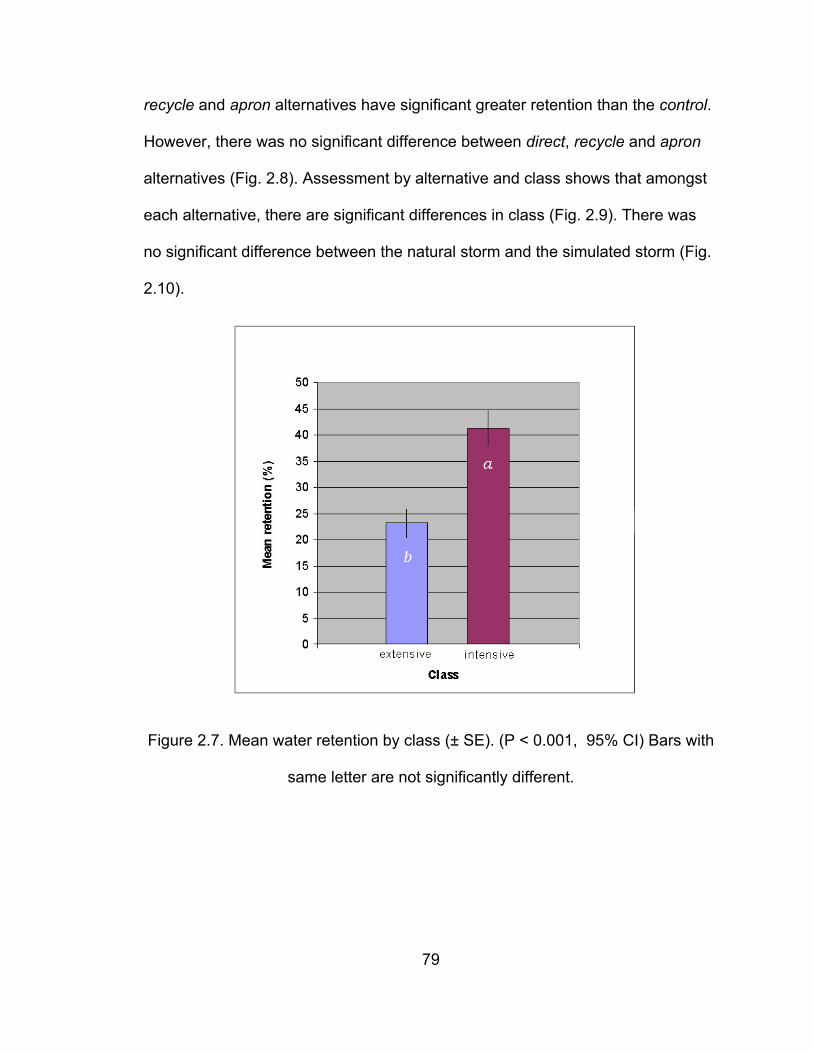
79
recycle and apron alternatives have significant greater retention than the control.
However, there was no significant difference between direct, recycle and apron
alternatives (Fig. 2.8). Assessment by alternative and class shows that amongst
each alternative, there are significant differences in class (Fig. 2.9). There was
no significant difference between the natural storm and the simulated storm (Fig.
2.10).
Figure 2.7. Mean water retention by class (± SE). (P < 0.001, 95% CI) Bars with
same letter are not significantly different.
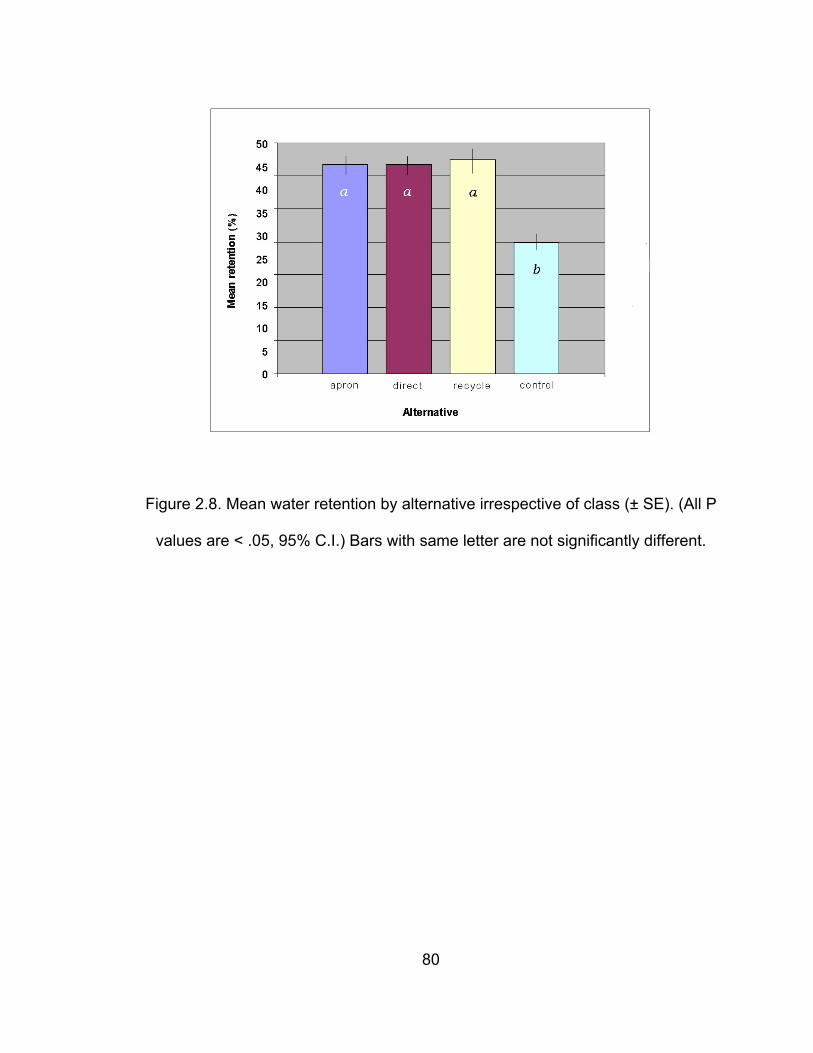
80
Figure 2.8. Mean water retention by alternative irrespective of class (± SE). (All P
values are < .05, 95% C.I.) Bars with same letter are not significantly different.
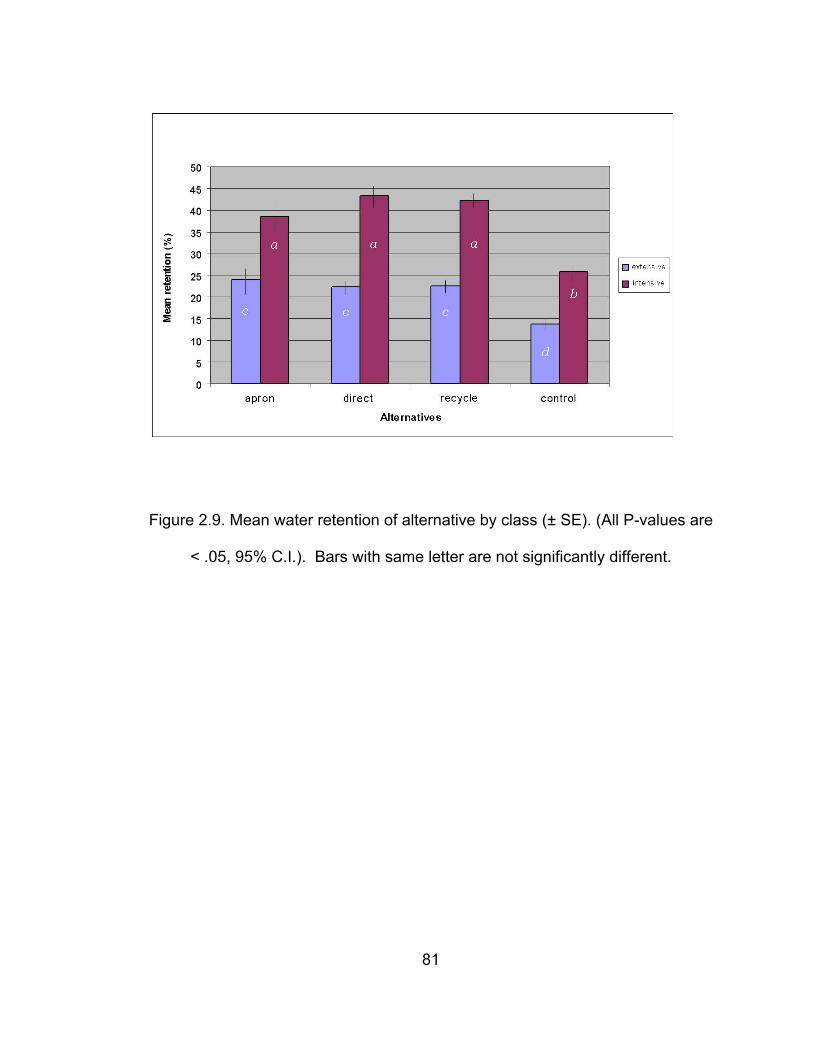
81
Figure 2.9. Mean water retention of alternative by class (± SE). (All P-values are
< .05, 95% C.I.). Bars with same letter are not significantly different.
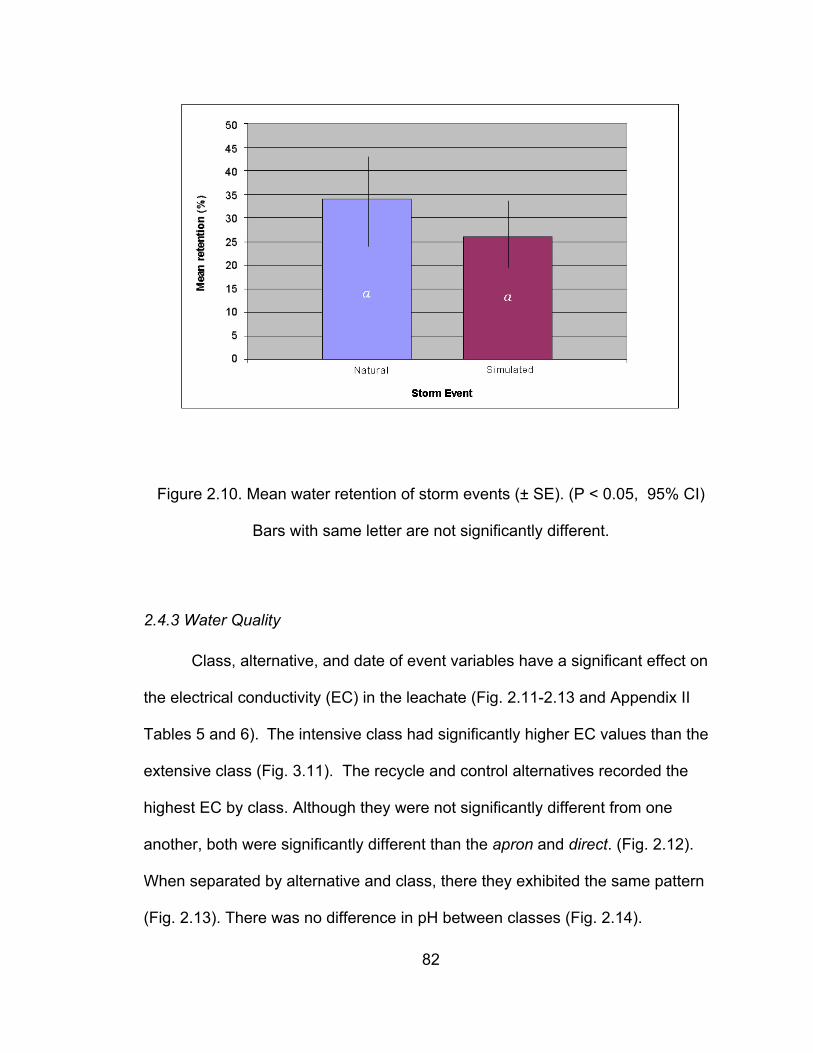
82
Figure 2.10. Mean water retention of storm events (± SE). (P < 0.05, 95% CI)
Bars with same letter are not significantly different.
2.4.3 Water Quality
Class, alternative, and date of event variables have a significant effect on
the electrical conductivity (EC) in the leachate (Fig. 2.11-2.13 and Appendix II
Tables 5 and 6). The intensive class had significantly higher EC values than the
extensive class (Fig. 3.11). The recycle and control alternatives recorded the
highest EC by class. Although they were not significantly different from one
another, both were significantly different than the apron and direct. (Fig. 2.12).
When separated by alternative and class, there they exhibited the same pattern
(Fig. 2.13). There was no difference in pH between classes (Fig. 2.14).
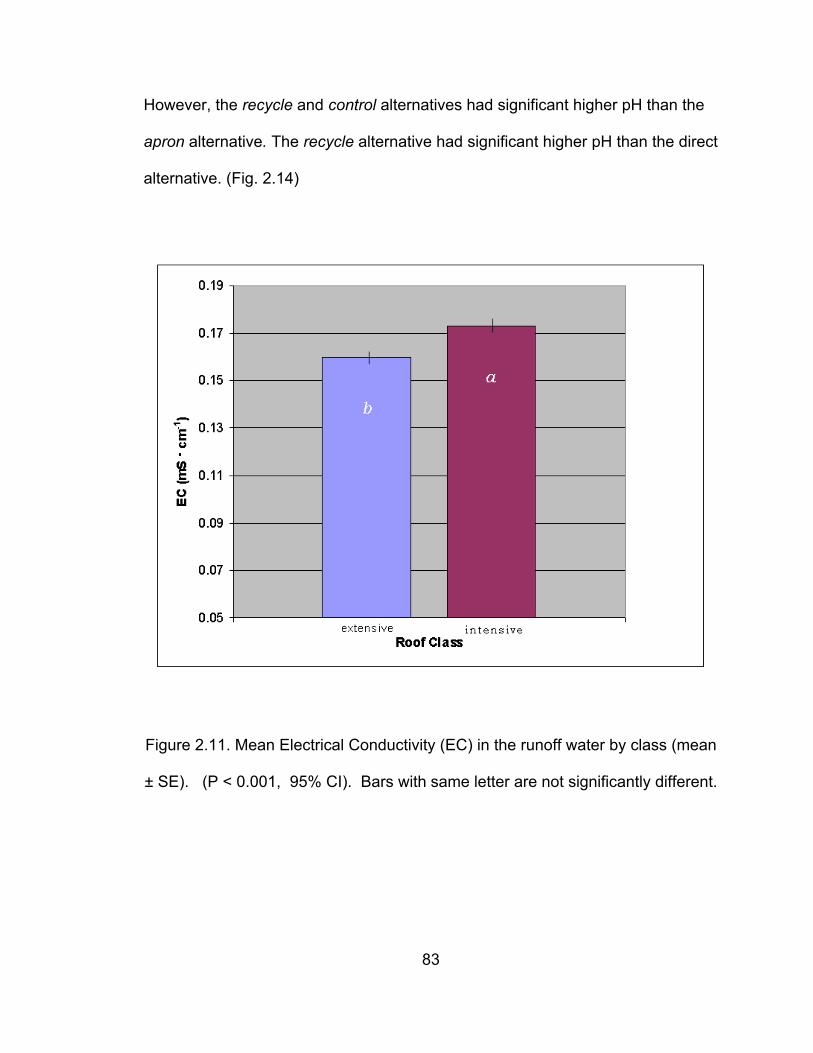
83
However, the recycle and control alternatives had significant higher pH than the
apron alternative. The recycle alternative had significant higher pH than the direct
alternative. (Fig. 2.14)
Figure 2.11. Mean Electrical Conductivity (EC) in the runoff water by class (mean
± SE). (P < 0.001, 95% CI). Bars with same letter are not significantly different.
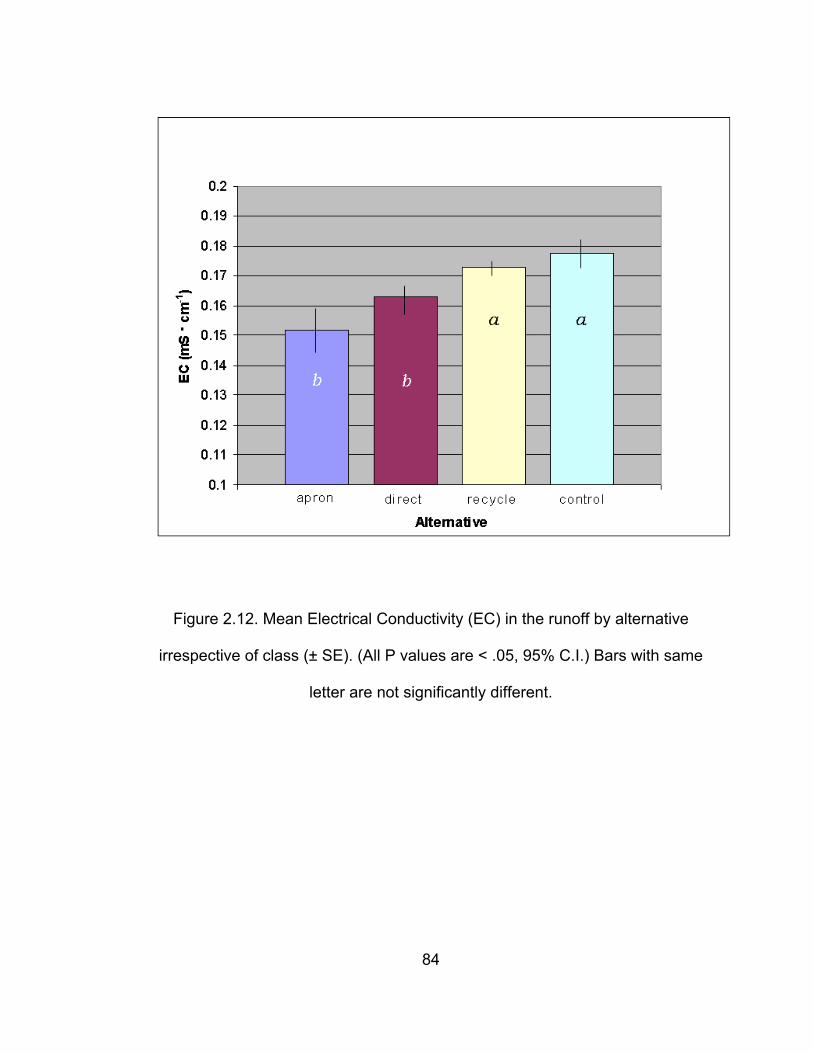
84
Figure 2.12. Mean Electrical Conductivity (EC) in the runoff by alternative
irrespective of class (± SE). (All P values are < .05, 95% C.I.) Bars with same
letter are not significantly different.
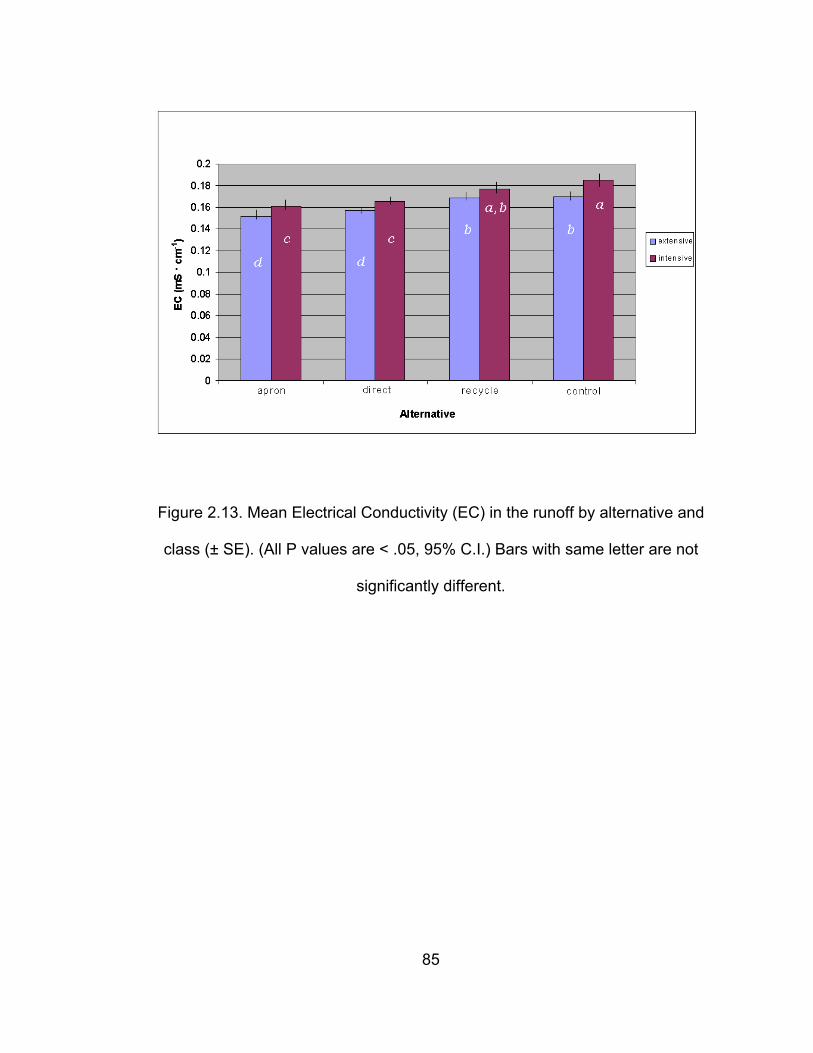
85
Figure 2.13. Mean Electrical Conductivity (EC) in the runoff by alternative and
class (± SE). (All P values are < .05, 95% C.I.) Bars with same letter are not
significantly different.
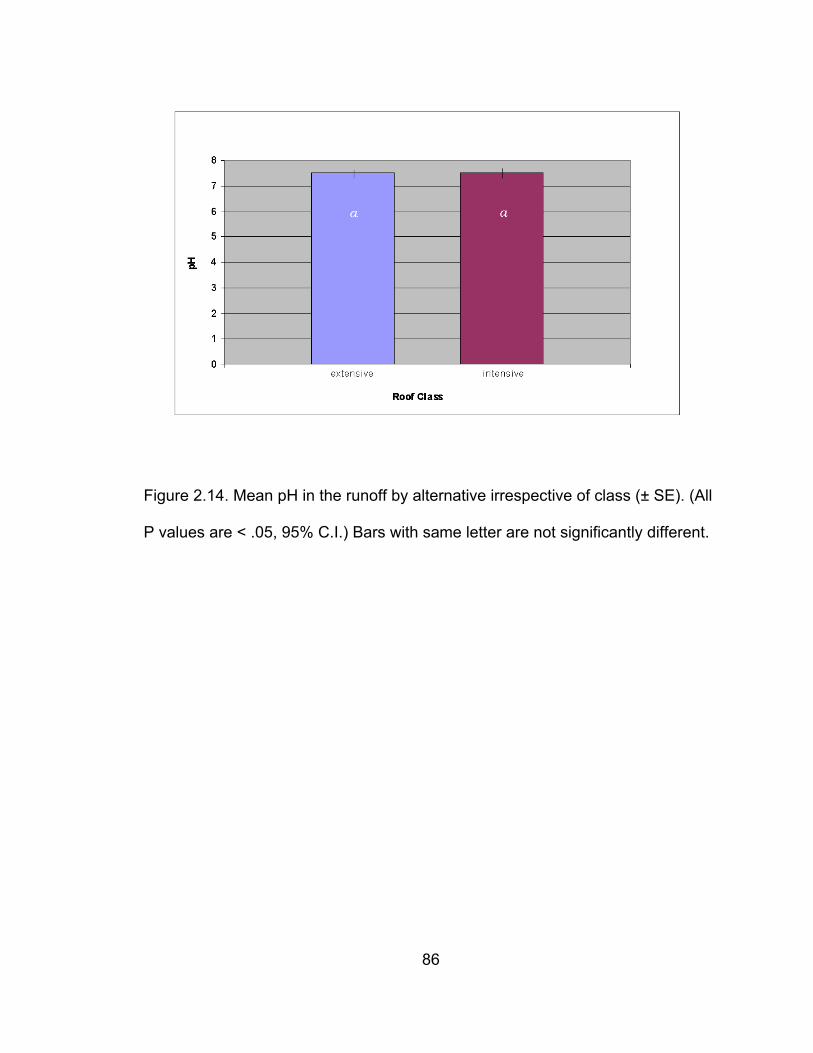
86
Figure 2.14. Mean pH in the runoff by alternative irrespective of class (± SE). (All
P values are < .05, 95% C.I.) Bars with same letter are not significantly different.
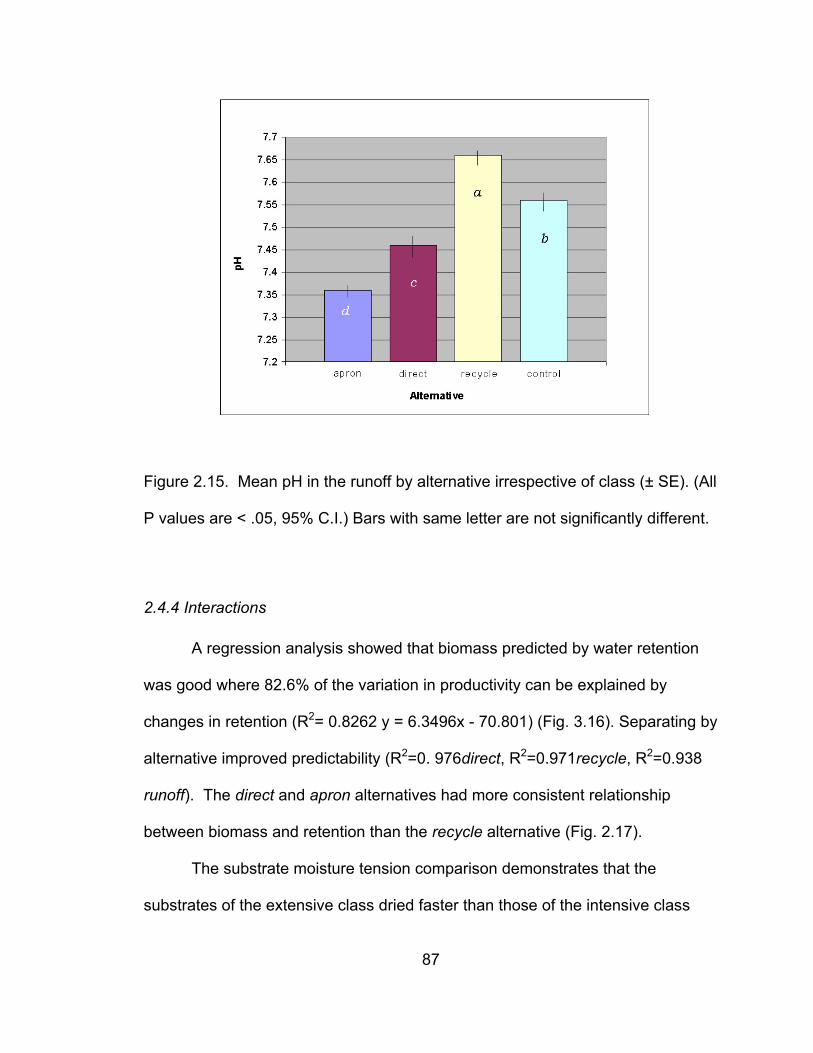
87
Figure 2.15. Mean pH in the runoff by alternative irrespective of class (± SE). (All
P values are < .05, 95% C.I.) Bars with same letter are not significantly different.
2.4.4 Interactions
A regression analysis showed that biomass predicted by water retention
was good where 82.6% of the variation in productivity can be explained by
changes in retention (R2= 0.8262 y = 6.3496x - 70.801) (Fig. 3.16). Separating by
alternative improved predictability (R2=0. 976direct, R2=0.971recycle, R2=0.938
runoff). The direct and apron alternatives had more consistent relationship
between biomass and retention than the recycle alternative (Fig. 2.17).
The substrate moisture tension comparison demonstrates that the
substrates of the extensive class dried faster than those of the intensive class
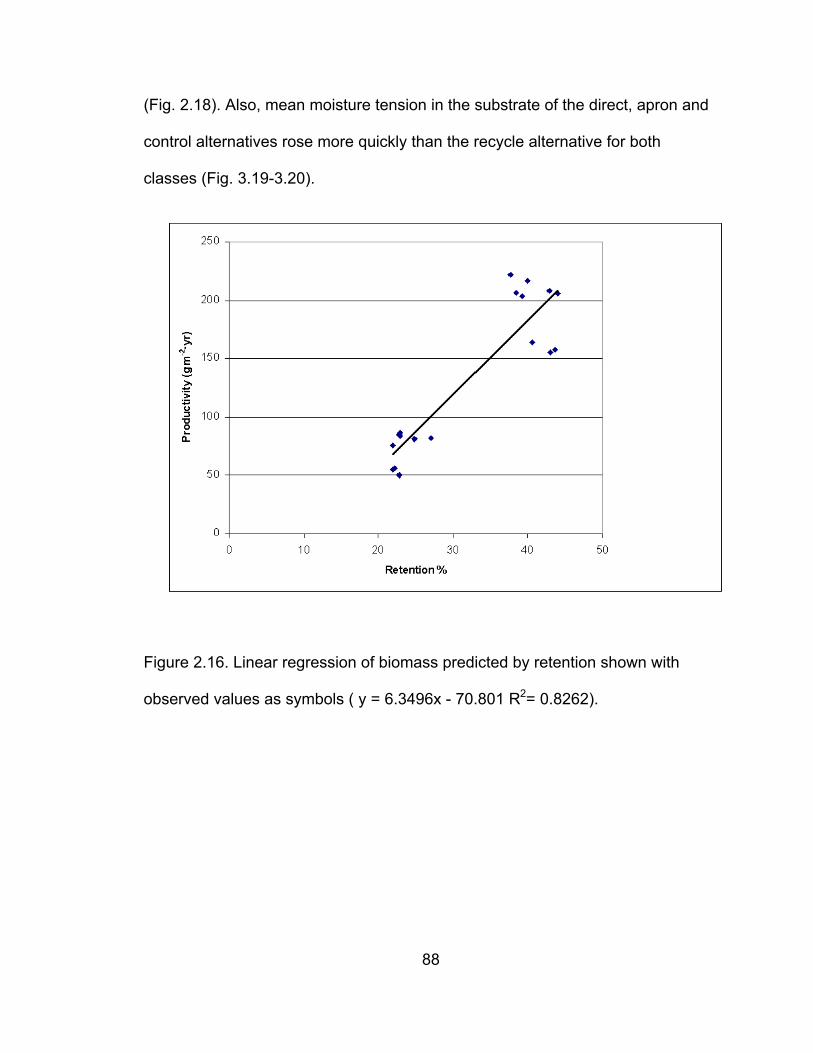
88
(Fig. 2.18). Also, mean moisture tension in the substrate of the direct, apron and
control alternatives rose more quickly than the recycle alternative for both
classes (Fig. 3.19-3.20).
Figure 2.16. Linear regression of biomass predicted by retention shown with
observed values as symbols ( y = 6.3496x - 70.801 R2= 0.8262).
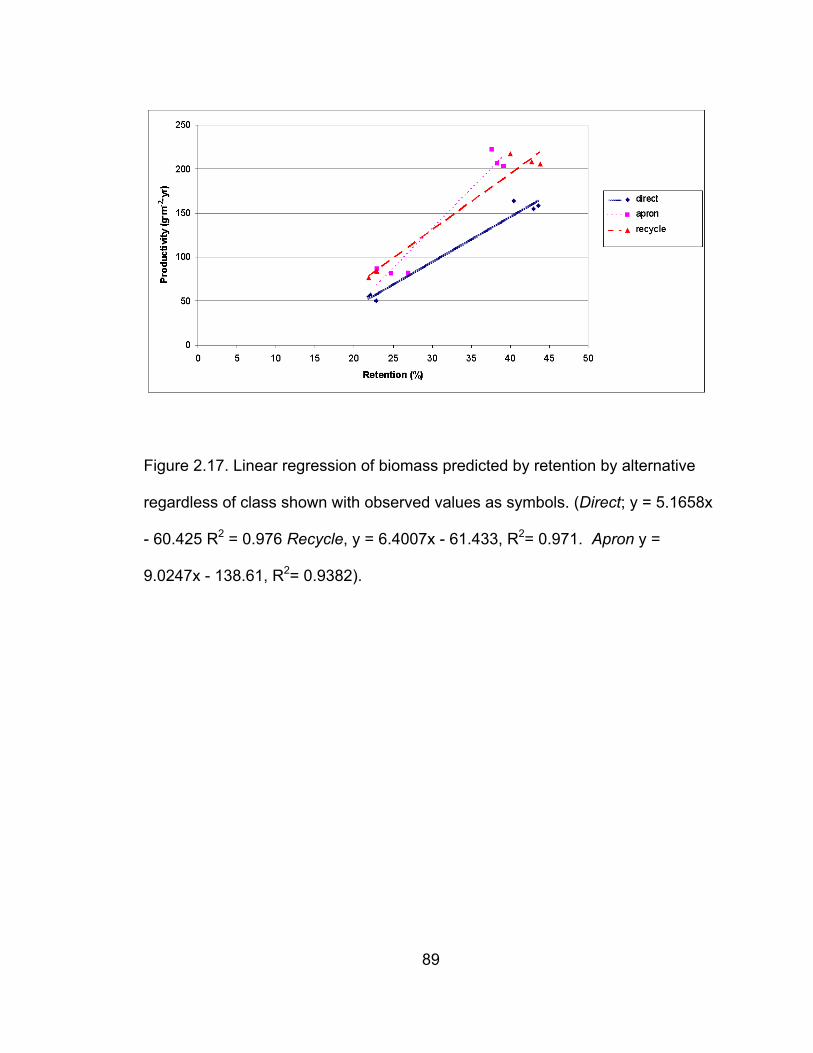
89
Figure 2.17. Linear regression of biomass predicted by retention by alternative
regardless of class shown with observed values as symbols. (Direct; y = 5.1658x
- 60.425 R2 = 0.976 Recycle, y = 6.4007x - 61.433, R2= 0.971. Apron y =
9.0247x - 138.61, R2= 0.9382).
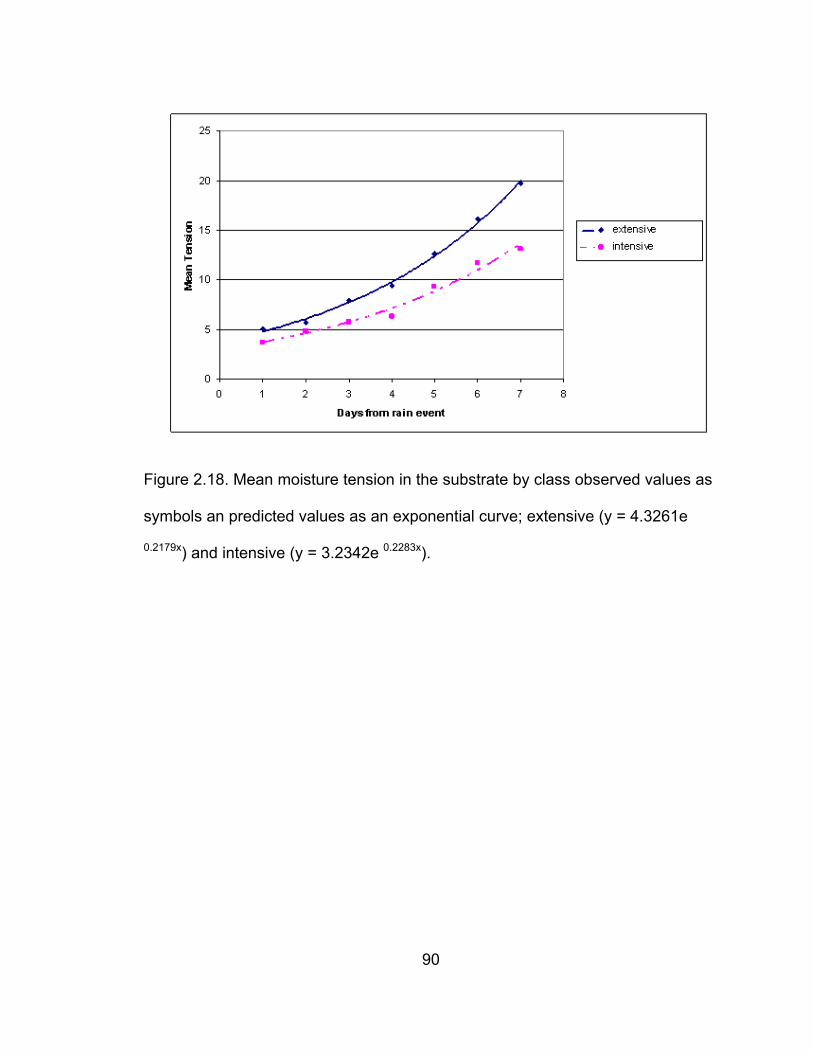
90
Figure 2.18. Mean moisture tension in the substrate by class observed values as
symbols an predicted values as an exponential curve; extensive (y = 4.3261e
0.2179x) and intensive (y = 3.2342e 0.2283x).
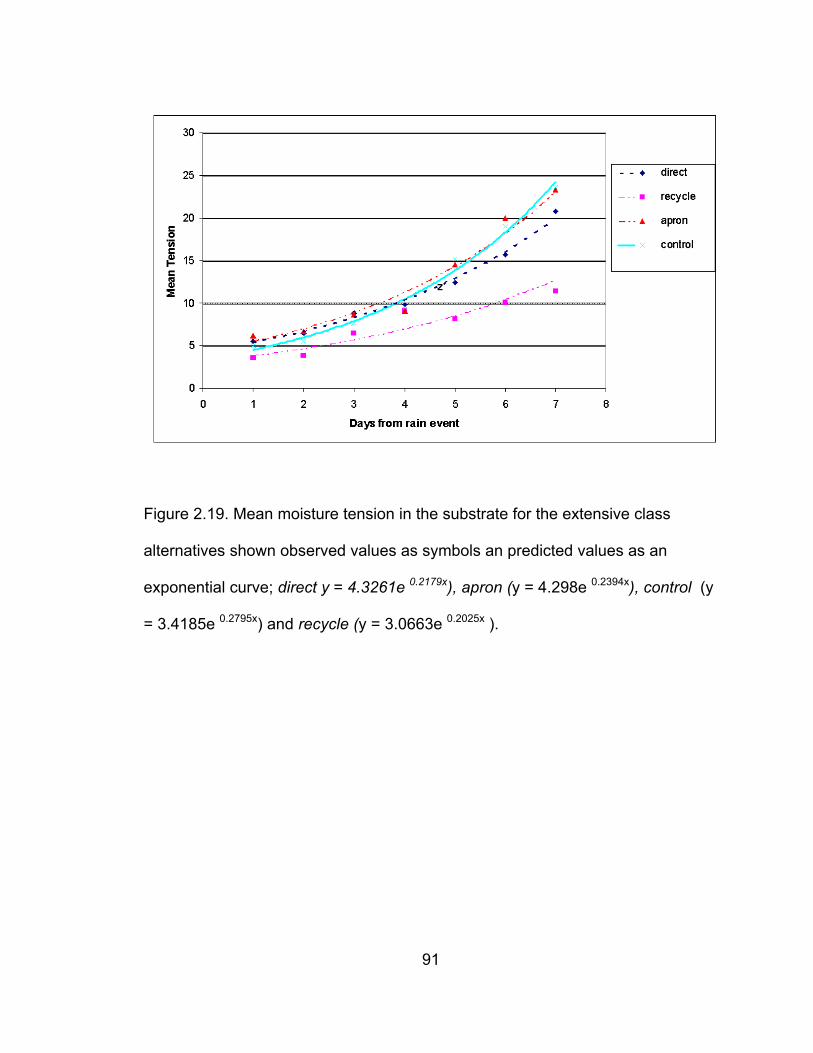
91
Figure 2.19. Mean moisture tension in the substrate for the extensive class
alternatives shown observed values as symbols an predicted values as an
exponential curve; direct y = 4.3261e 0.2179x), apron (y = 4.298e 0.2394x), control (y
= 3.4185e 0.2795x) and recycle (y = 3.0663e 0.2025x ).
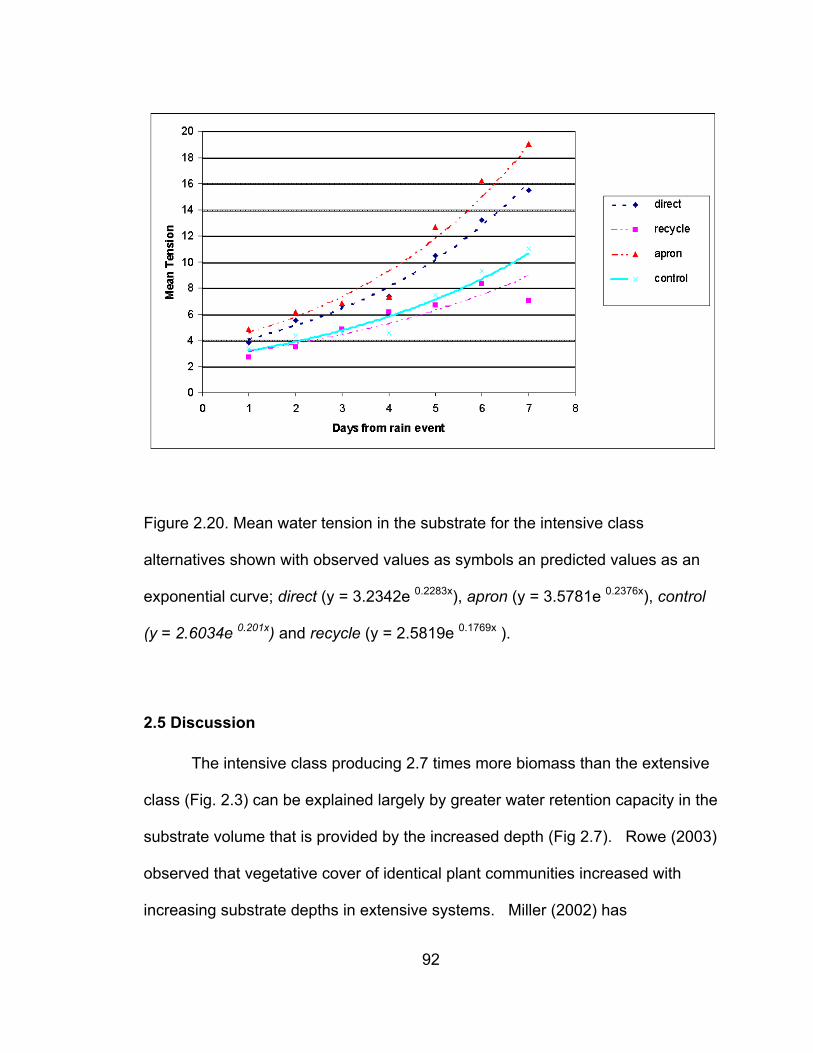
92
Figure 2.20. Mean water tension in the substrate for the intensive class
alternatives shown with observed values as symbols an predicted values as an
exponential curve; direct (y = 3.2342e 0.2283x), apron (y = 3.5781e 0.2376x), control
(y = 2.6034e 0.201x) and recycle (y = 2.5819e 0.1769x ).
2.5 Discussion
The intensive class producing 2.7 times more biomass than the extensive
class (Fig. 2.3) can be explained largely by greater water retention capacity in the
substrate volume that is provided by the increased depth (Fig 2.7). Rowe (2003)
observed that vegetative cover of identical plant communities increased with
increasing substrate depths in extensive systems. Miller (2002) has
93
demonstrated that substrate depth positively correlates to water holding capacity.
Figure 2.7 and 2.18 demonstrate that the intensive class retains more water
(18% more of the precipitation) and dries more slowly than the extensive making
more water available to plants over a longer period of time.
Plant selection impacted ecoroof productivity. S.Scoparium produced
more biomass than R. aromatica. By using non-typical extensive ecoroof plants,
this study showed higher levels of productivity; 72.8 g·m-2 compared with 48.4
g·m-2 from the Koehler (1999) study. The previous study used succulent plant
selections, rather than grass or woody vegetation which possibly reduced
productivity. Rudbeckia hirta was used as a native perennial and was guaranteed
by the grower as such, however, it behaved as an annual, perhaps due to
environmental stresses such as lack of water or low temperatures. Subsequently,
a study by Monterrusso et al (2005) presents the result of low over wintering
mortality and survivability in R. hirta. The cause for loss can be attributed to a
limited root growth environment insufficient in water, nutrients and thermal
protection.
Using different alternatives demonstrated that water distribution impacted
productivity. The greater biomass of the apron and recycle alternatives may be
attributed to greater volumes of water entering the system during the growing
season. In the recycle alternative water was added every two weeks to field
capacity. The apron received twice the regular precipitation during storm events
that often went beyond holding capacity. One first time finding was that the
recycle substrate dried more slowly than all other roofs, while the apron substrate
94
dried more quickly than all others. This can partially be explained by the
distribution of water. By distributing leachate water during non-storm event days
to the recycle alternative the substrate remained moist for longer periods. During
those periods more water was availability to the plants. The influence of
availability of water on plant growth is addressed by Koehler (1990). The quicker
drying substrate in the recycle is difficult to explain and requires further
investigation.
The reason the extensive class had less water retention than the intensive
one is largely due to a greater water holding capacity of the deeper substrate.
Mentens et al. (2003) explains that roof properties including substrate depth are
a primary factor influencing water holding capacity. However, it likely could be by
higher plant growth, but also it is influenced by the volume of precipitation. These
results support previous findings by Rowe et al (2003) where volume of
precipitation and roof depth are considered to be the factors influencing retention.
However, it could also be due the evapotranspiration of the grasses in the
intensive systems. Evapotranspiration rates have been shown to be higher in
planted extensive ecoroofs than unplanted (Beattie et al. 2002). Because
biomass in the intensive treatment was 2.5 times that of the extensive one it can
be speculated that more water was being used by the plants. Compton and
Waller (2006) recorded higher evapotranspiration rates in fast growing C3
grasses supporting the idea that roofs with high growth rates use more water.
It is generally understood that plants will utilize the nutrients in the ecoroof
substrate and those arriving from atmospheric deposition, thus preventing
95
nutrient export (Peck et al. 1999). However, Hunt et al. (2006) showed that
leaching is also a function of substrate composition. Differences in leachate
quality indicators in this study such as EC and pH, can be partially explained by
considering water distribution and the presence of plants. The recycle alternative
recorded higher levels of EC than both the direct and the apron. It also recorded
the highest (neutral) pH. These occurrences could be caused by the
redistribution of leachate as irrigation water in the recycle alternative. In this
scenario leachates do not exit but instead accumulate in the system. The control,
which was unplanted, shows the effect of plants on EC. Plant presence may
decrease EC levels in leachate. Roots contribute to the organic matter of a soil.
The organic matter has high cation exchange capacity and retains some of the
cations that may otherwise be leached. This could be enhanced by the use of
light weight expanded aggregate which possess nutrient and bacteria absorption
capacities (Eikebrokk 2001 ).
When compared to EC in previous studies of nearby receiving streams,
leachate from all vegetated roofs system showed lower EC. In a study by Spieles
and Mitsch (2000) stream EC ranges were recorded between 0.348 - 0.701
mS•cm-2 compared to the range of 0.152-0.168 mS•cm-2 recorded in the
ecoroofs.
One question asked by developers and conservationists is whether
ecoroofs can be built to recreate local habitat that is being destroyed by the
proposed building. Although it is possible to create some form of habitat for
local species using ecoroof systems, the re-creation of the local habitat on a
96
rooftop appears unrealistic. The mean productivity of ecoroof systems in this
study when compared to other studies of terrestrial ecosystems was much lower.
The extensive ecoroofs (72 g·m-2·yr ) are lower than a desert scrubland (90 g·m-
2·yr ) and intensive ecoroofs (193 g·m-2·yr ) are slightly higher than an alpine
tundra (140 g·m-2·yr). They are both lower in mean productivity than that of
natural grasslands (600 g·m-2·yr ) and a woodland shrublands (700 g·m-2·yr ), but
certainly higher than extreme deserts (3 g·m-2·yr ) (Whittaker and Likens 1975).
Even the most productive systems, the alternative designs (210 g·m-2·yr), were
much lower than the local forest biome (700 g·m-2·yr) in which the experiment
occurred. This confirms the oligotrophic label placed upon the systems by
Koelher (2003). It also reinforces the position that ecoroofs are “new”
ecosystems incapable of recovering local terrestrial ecosystem loss when
constructed with in a temperate biome (Scholz-Barth 2001).
These findings show that the alternative designs apron and recycle do not
significantly compromise stormwater retention. This is important information to
ecoroofs built with recycling and collection systems. However, important to
retention is the distribution of the water relative to the water holding capacity and
frequency of storms.
2.6 Conclusions
The study shows that ecoroof productivity can be predicted largely by
water retention. Productivity increased through alternative designs capturing
more water, such as recycle or run-on. The increasing of substrate depth
improved biomass development. Also, water retention was greater in the
97
alternative ecoroofs when compared to a conventional ecoroof receiving only
direct precipitation. Equally, retention improved in deeper substrates. Lastly,
there were differences in electrical conductivity (EC) in the leachate from the
ecoroofs.
It was shown that an intensive green roof produces greater amounts of
biomass and retains more precipitation, while having higher levels of dissolved
salts in discharge waters than extensive roofs. The retaining of additional storm
water in the roof system during the growing season is related to greater plant
biomass, however, not necessarily related to dissolved salts and pH. Designing
of green roofs to use recycled storm water or catch additional storm water on
aprons creates greater levels of plant growth and may not significantly reduce
storm water retention performance in those same roofs. Additionally, recycling
ecoroof runoff as grey water irrigation can elevate the dissolved salts and the pH
of the discharge.
98
2.7 Citations
Beattie, D. J., R. D. Berghage, A. Jarrett, H. B. Manbeck, J. Srebric and J. De
Nardo. (2002). "EPA Heat Island Presentation." Retrieved 12/29/02, 2002, from http://hortweb.cas.psu.edu/research/greenroofcenter/news.html.
Brenneisen, S. (2003). Biodiversity of European greenroofs. In conference
proceedings of Greening Rooftops for Sustainable Communities Chicago, IL. Green Roofs for Healthy Cities
Brenneisen, S. (2004). From Biodiversity to Agricultural Productivity. In
conference proceedings of Greening Rooftops for Sustainable Communities Portland, OR. Green Roofs for Healthy Cities
Brenneisen, S. (2005). Green roofs recapturing urban spaces for wildlife- A
challenge for urban planning and environmental education. In conference proceedings of Greening Rooftops for Sustainable Communities Washington D.C. Green Roofs for Healthy Cities
Clark, C. (2005). Optimization of green roofs for air pollution mitigation. . In
conference proceedings of Greening Rooftops for Sustainable Communities Washington D.C.
Clawson, R. G., B. G. Lockaby and B. Rummer (2001). "Changes in production
and nutrient cycling across a wetness gradient within a floodplain forest." Ecosystems 4.
Coffman, R. and G. Davis (2005). Insect and Avian Fauna Presence on the Ford
River Rouge Green Roof. In the conference proceedings of Greening Rooftops for Sustainable Conference, Washington DC, Green Roofs for Healthy Cities.
Compton, J. S. and T. H. Whitlow (2006). A zero discharge green roof system
and species selection to optimize evapotranspiration and water retention. In conference proceedings of Greening Rooftops for Sustainable Communities Boston, MA.
Costanza, R., R. d'Arge, R. de Groot, S, S. Farber, M. Grasso, B. Hannon, K.
Limburg, S. Naeem, R. O'Neill, J. Paruelo, R. Raskin and P. Sutton (1997). "The value of the world's ecosystem services and natural capital." Nature 387: 253-260.
99
Currie, B. A. and B. Bass (2005 ). Estimates of air pollution mitigation with green plants and green roofs using the UFORE model In conference proceedings of Greening Rooftops for Sustainable Communities Washington D.C.
Daily, G. C., Ed. (1997). Nature's Services: Societal Dependence on Natural
Ecosystems. Washington D.C., Island Press. 394pgs. de Groot, R. S., M. A. Wilson and R. M. J. Boumans (2002). "A typology for the
classification, description and valuation of ecosystem functions, goods and services." Ecological Economics 41: 393 - 408.
Dunnett, N. and N. Kingsbury (2004). Planting Green Roofs and Living Walls.
Portland, OR, Timber Press. Dunnett, N., A. Nagase, R. Booth and P. Grime (2005). Vegetation composition
and structure significantly influence green roof performance. In conference proceedings of Greening Rooftops for Sustainable Communities, Washington, D.C.
Eamus, D. (2003). "How does ecosystem water balance affect net primary
productivity of woody ecosystems?" Functional Plant Biology 30: 187-205. Gedge, D. (2003). '...From rubble to Redstarts...' In conference proceedings
Greening Rooftops for Sustainable Communities Chicago, Green Roofs for Healthy Cities
Hunt, W. and J. Smith (2005). Hydrologic and water quality performance from
green roofs in North Carolina. In conference proceedings of Greening Rooftops for Sustainable Communities, Washington D.C. Green Roofs for Healthy Cities
Jones, R. A. (2002). Tecticolous Invertebrates. A preliminary investigation of the
invertebrate fauna on green roofs in urban London. London, English Nature: 36.
Kadas, G. (2002). Study of invertebrates on green roofs - How roof design can
maximise biodiversity in an urban environment. Dept. of Geography. London, University College. MSc Conservation: 76.
Koehler, M. (1990). The living conditions of plants on the roofs of buildings.
Urban Ecology: Plants and the plant communities in urban environments. H. F. H. Lieth. Stroudsburg, PN, Dowden, Hutchinson & Ross.
100
Koehler, M. (2003). Plant Survival Research and Biodiversity: Lessons From Europe. In conference proceedings of Greening Rooftops for Sustainable Communities, Chicago, IL. Green Roofs for Healthy Cities
Koehler, M., M. Schmidt, F. W. Grimme, M. Laar, V. L. d. A. Paiva and S.
Tavares (2002). "Green roof in the hot-humid tropics- far beyond aesthetics." Environmental Management and Health 13(4): 382-391.
Kozlovsky, D. (1968). "A critical evaluation of the trophic level concept:
Ecological efficiencies." Ecology 49: 48-60. Kucharik, C. J., K. R. Brye, J. M. Norman, J. A. Foley, S. T. Gower and L. G.
Bundy (2001). "Measurements and Modeling of Carbon and Nitrogen Cycling in Agroecosystems of Southern Wisconsin: Potential for SOC Sequestration during the Next 50 Years." Ecosystems 4: 237-258.
Kula, R. (2005). Green roofs and the LEED green building rating system. In
conference proceedings of Greening Rooftops for Sustainable Communities, Washington D.C.
Lieth, H. (1973). "Primary production: terrestrial ecosystems." Human Ecology 1:
303-332. Lieth, H. F., Ed. (1978). Patterns of Primary Production in the Biosphere.
Benchmark Papers in Ecology. Stroudsburg, PN, Dowden, Hutchinson & Ross.
Lipton, T. and E. Strecker (2003). EcoRoofs (Greenroofs)- A more Sustainable
Infrastructure. National Conference for Stormwater Managers, Portland, OR. Green Roofs for Healthy Cities
Liu, K. and B. Baskaran (2003). Thermal performance of green roofs through
field evaluation. In conference proceedings of Greening Rooftops for Sustainable Communities Chicago. IL. Green Roofs for Healthy Cities
Mankiewicz, P. S. and T. McDonnell (2006). Sustainable green roof design:
Optimizing water budgets through wastes-into-resources technologies in the Bronx. In conference proceedings of Greening Rooftops for Sustainable Communities Boston, MA. Green Roofs for Healthy Cities
Mentens, J., D. Raes and M. Hermy (2003). Effect of orientation on the water
balance of greenroofs. In conference proceedings of Greening Rooftops for Sustainable Communities Chicago. IL. Green Roofs for Healthy Cities
Miller, C. (2002). "Benefits of Green roofs." Retrieved 12/12/02, from
http://www.roofscapes.com/benefits.html.
101
Naeem, S., K. Hakansson, J. H. Lawton, M. J. Crawley and L. J. Thompson
(1996). "Biodiversity and plant productivity in a model assemblage of plant species." Oikos 76: 259-64.
O’Connell, K. E. B., S. T. Gower and J. M. Norman (2003). "Net Ecosystem
Production of Two Contrasting Boreal Black Spruce Forest Communities." Ecosystems 6: 248-260.
Onmura, S., M. Matsumoto and S. Hokoi (2001). "Study on evaporative cooling
effect of roof lawn gardens." Energy and Buildings 33: 653-666. Osmundson, T. (1999). Roof gardens : history, design, and construction. New
York, W.W. Norton. Peck, S. and B. Bass (2000). Green Roof Infrastructure Workshop: Establishing
Common Protocals for Building and Aggregate Level Green Roof Benefits Research. Toronto, University of Toronto: 43.
Peck, S., C. Callaghan, B. Bass and M. Kuhn (1999). Greenbacks from Green
Roofs: Forging a New Industry in Canada. Ottawa, ON, Canada Mortgage and Housing Corporation: 54.
Rowe, D. B., M. Monterusso and C. Rugh (2005). Evaluation of Sedum species
and Michigan native taxa for green roof applications. In conference proceedings Greening Rooftops for Sustainable Communities Washington D.C.
Rowe, D. B., M. A. Monterusso and C. L. Rugh (2006). "Assessment of Heat-
expanded Slate and Fertility Requirements in Green Roof Substrates." HortTech 16(3): 321-332.
Rowe, D. B., M. A. Monterusso and C. L. Rugh (pending). "Assessment of Green
Roof Substrate Composition and Fertility Requirements." HortTechnology. Rowe, D. B., C. Rugh, N. VanWoert, M. Monterusso and D. Russell (2003).
Green roof slope, substrate depth and vegetation influence on runoff. In conference proceedings of Greening Rooftops for Sustainable Communities Chicago. IL. Green Roofs for Healthy Cities
Schoen, D. (1997). "Primary production: The link to global health." Bioscience
47(8): 477-483. Scholz-Barth, K. (2001). "Green roofs: stormwater management from the top
down." Environmental Design & Construction.
102
Schuur, E. A. G. and P. A. Matson (2001). "Net primary productivity and nutrient cycling across a mesic to wet precipitation gradient in Hawaiian montane forest." Oecologia 128: 431-442.
Shirley-Smith, C. (2003). The Sustainability Value of the Green Roof as a Water
Recycling System [GROW] in Urban Locations. In conference proceedings of Greening Rooftops for Sustainable Communities, Chicago IL. Green Roofs for Healthy Cities
Takyu, M., S.-I. Aiba and K. Kitayama (2003). "Changes in biomass, productivity
and decomposition along topographical gradients under different geological conditions in tropical lower montane forests on Mount Kinabalu, Borneo." Oecologia 134: 397-404.
Tilman, D., D. Wedin and J. Knops (1996). "Productivity and sustainability
influenced by biodiversity in grassland ecosystems." Nature 379: 718-20. Whittaker, R. H. and G. E. Likens (1975). The biosphere and man. . Primary
Production of the Biosphere. N. Y. Lieth and Whittaker (eds.). Springer-Verlag. 4. 435pgs
Wong, N. H., S. F. Tay, R. Wong, C. L. Ong and A. Sia (2003). "Investigation of
thermal benefits of rooftop garden in the tropical environment." Building and Environment 38(2): 261-270.
103
CHAPTER 3
ECOROOFS AND BIODIVERSITY: ASSESSING ANIMAL DIVERSITY ON TWO
TYPES OF VEGETATED ROOFS
3.1 Abstract
This study provides a description of animal diversity on two dissimilar,
vegetated roofs, and it promotes a general methodological approach for such
studies. I used a rapid assessment method to quantify the diversity of insects,
spiders and birds on these ecoroofs. I describe diversity using presence-
absence and relative abundance data. Birds were assessed at the species level,
and insects and spiders were assessed at higher taxonomic levels. The Rènyi
family of diversity indices, which encompass conventional metrics, was used to
compare animal diversity between the two ecoroofs. My data revealed relatively
low similarity between the ecoroofs, with some key differences. Overall, the
intensive ecoroof supported slightly higher diversity. Spider diversity was most
104
similar between the ecoroofs, followed by insect diversity, while the species
assemblages of birds were entirely distinct. I promote the methodological
approach used here, speculate on why diversity differed between the ecoroofs,
and discuss conservation implications of these constructed habitats.
3.2 Introduction
In keeping with the goal of increasing local biological diversity, one urban
development practice, known as roof greening, provides habitat for wild species
within cities (Peck et al. 1999; Dunnett and Kingsbury 2004). This practice is not
a form of restoration ecology, but rather a form of reconciliation ecology, where
new habitat is created for nonhuman species (Rosenzweig 2003). While all
vegetated roofs inevitably provide some form of habitat, presumably the
properties of the roof, the type of vegetation used, and the overall design will
combine to impact animal diversity (Jones 2002; Brenneisen 2003; Brenneisen
2006). Studies aimed at evaluating these potentially complex impacts are in their
infancy. Here, I attempt to redress two weaknesses of prior studies. First,
although ecoroofs vary in character and size, so far biodiversity assessments
have been limited to a single major type of ecoroof within each study. Thus,
whether the observed patterns of diversity are generalizable to other kinds of
ecoroofs remains doubtful. Second, although ecoroofs are supposedly designed
to enhance biodiversity across taxa, most assessments to date have examined
just a single taxon (e.g. insects). Therefore, a method is needed for efficient
assessment of diversity across taxa and across roof types and sizes. Ideally,
105
any such method would provide reliable descriptions of ecoroof biodiversity,
which could be compared to make inferences about which types of ecoroof
provide the best habitat, while recognizing that even the best such constructed
habitat could be sink rather than habitat for some taxa and so could have
detrimental impacts.
A vegetated roof, or ecoroof, is simply vegetation growing on a building’s
rooftop. Superficially, these roofs provide a suite of environmental benefits:
stormwater retention (Scholz-Barth 2001; Miller 2003; Rowe et al. 2003), energy-
use reduction (Onmura et al. 2001; Wong et al. 2003; Gaffin et al. 2006), food
production (Tinkel 1977), and habitat creation (Jones 2002; Brenneisen 2005).
Attempts to maximize these various benefits have resulted in variation among
vegetated roof systems. Two accepted types of vegetated roof systems are
based largely on structure rather than function. The first is an extensive system
consisting of <10 cm of substrate and allowing for only a few plants species,
which is designed to reduce energy demands and stormwater runoff. The other
is an intensive system consisting of soil medium >30 cm and allowing for
numerous plant species, which is often designed for aesthetics. (Peck et al.
1999; Dunnett and Kingsbury 2004). Ecoroofs could be categorized based on
various other features, but I use this simple distinction between extensive and
intensive systems throughout.
Studies quantifying biodiversity on vegetated roofs have so far relied on a
single diversity index (e.g., species richness, Shannon, Simpson). Such studies
depend on high investments of labor and often yield inaccurate point estimates
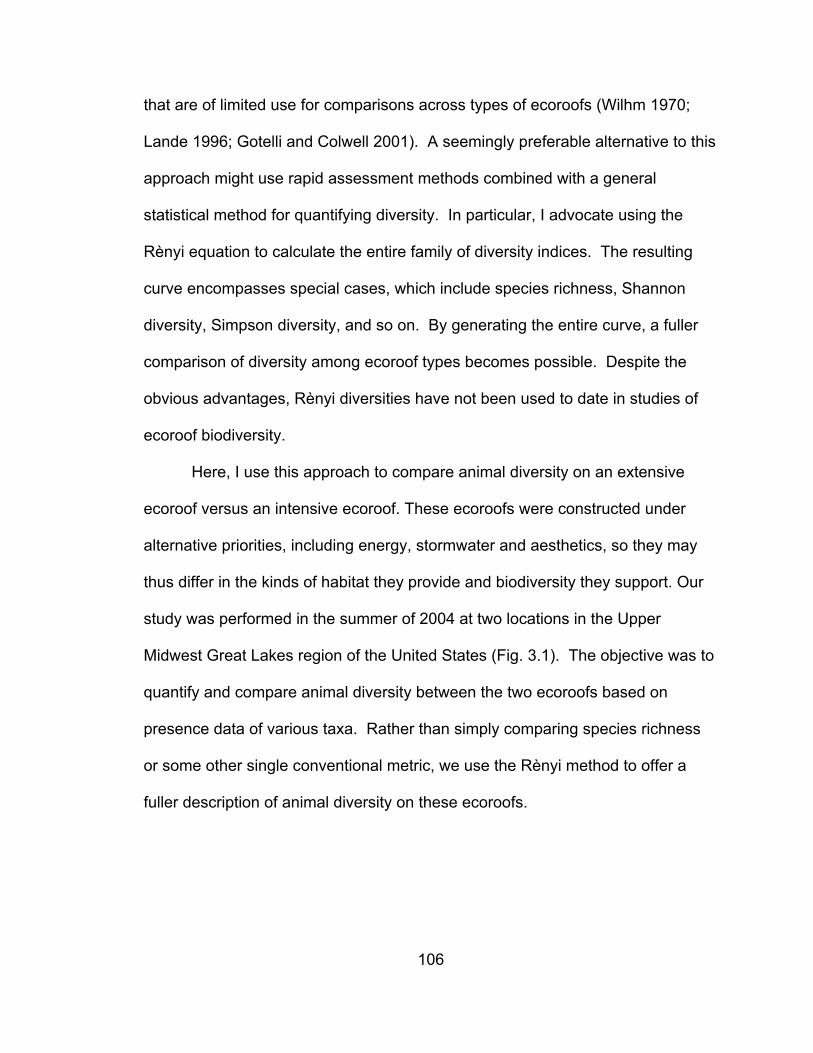
106
that are of limited use for comparisons across types of ecoroofs (Wilhm 1970;
Lande 1996; Gotelli and Colwell 2001). A seemingly preferable alternative to this
approach might use rapid assessment methods combined with a general
statistical method for quantifying diversity. In particular, I advocate using the
Rènyi equation to calculate the entire family of diversity indices. The resulting
curve encompasses special cases, which include species richness, Shannon
diversity, Simpson diversity, and so on. By generating the entire curve, a fuller
comparison of diversity among ecoroof types becomes possible. Despite the
obvious advantages, Rènyi diversities have not been used to date in studies of
ecoroof biodiversity.
Here, I use this approach to compare animal diversity on an extensive
ecoroof versus an intensive ecoroof. These ecoroofs were constructed under
alternative priorities, including energy, stormwater and aesthetics, so they may
thus differ in the kinds of habitat they provide and biodiversity they support. Our
study was performed in the summer of 2004 at two locations in the Upper
Midwest Great Lakes region of the United States (Fig. 3.1). The objective was to
quantify and compare animal diversity between the two ecoroofs based on
presence data of various taxa. Rather than simply comparing species richness
or some other single conventional metric, we use the Rènyi method to offer a
fuller description of animal diversity on these ecoroofs.
107
Figure 3.1. Map showing the two study sites, e and i.
3.3 Vegetated Roof Systems and Animal Diversity Assessment
These built systems (of constructed materials) have the potential to create
new habitat for wild species, while also providing additional ecosystem services.
Creating habitat so that it may blend with, or even depend upon, human-
dominated ecosystems is a form of reconciliation ecology. Rosenzweig (2003)
advocated ecoroofs in core urban areas as a way to provide new habitat for
species. Almost simultaneously, workers began to document the value of
vegetated roofs as habitat.
Studies on insects and spiders have been carried out in England and
Switzerland, mostly on extensive roofs, including some with hummocks or
mounds of substrate. Some surveys have focused on beetles and spiders
108
(Kadas 2002; Brenneisen 2003), while one study described the community of
large invertebrates (Jones 2002). Some surveys have simply quantified species
richness (Jones 2002), while others have quantified Shannon diversity (Kadas
2002; Brenneisen 2003). All studies have documented the presence of rare
insects (www.iucn.org), regardless of ecoroof structure. The spider and beetle
studies showed significant differences in diversity across ecoroofs, while the
large-invertebrate study did not. The spider and beetle diversity differences were
found to be associated with abiotic factors of the ecoroof structure.
Ecoroof systems with a variety of substrate depths and vegetation types
tend to have higher spider, beetle and bird diversity (Brenneisen 2003).
Brenneisen (2003) showed that “contouring” vegetated roof systems with
hummocks apparently led to increased diversity. Prompted by these findings,
design criteria have emerged. These criteria stipulate the use of local soils,
native plants, and a variety of substrate properties and microtopographies.
Constructing systems using these criteria has been shown to increase species
richness during the establishment period (Brenneisen 2006).
Although vegetated roofs as habitat operate under the “Field of Dreams”
premise, where “if you build it, then they (wild species) will come,” a wide range
of priorities exist within this practice. At the highest level of priority, a very small
number of systems are designed to maximize biodiversity. At the lowest, most
common level of priority, potential impacts on biodiversity are only casually
considered. Any resultant habitat is seen as a perk to wildlife and society. In
response to this neglectful approach, incentives and regulations for designing
109
ecoroofs with biodiversity goals have arisen in both Switzerland and England
(Gedge 2003; Brenneisen 2005). In Switzerland, new vegetated roof systems
must pass a review of their biodiversity design (Brenneisen 2005). Many roofing
systems use local cobble-based soils as substrate, local vegetation, and
connections to terrestrial habitat to enhance colonization. Likewise, in London, a
metropolis-wide biodiversity initiative advocates the use of vegetated roofs to
enhance biodiversity. Studies in both Switzerland and London have shown the
diversity of spiders and birds on ecoroofs to be comparable with that in
“brownfields” (i.e., gaps in the urban setting that await redevelopment)
(Brenneisen 2003; Gedge and Kadas 2004; Kadas 2006). Therefore all
terrestrial habitats, even urban remnants, could serve as sources for immigrating
ecoroof species.
These findings notwithstanding, studies on the value of ecoroofs as
habitat are barely underway. The current paucity of information on the topic may
be due to several factors. I contend that one contributing factor has been the
reliance on species-level assessment, which demands intensive sampling and
expert identification by trained systematists (Brenneisen 2003; Kadas (2006).
These exhaustive assessments may often be impractical for studies aimed as
evaluating ecoroof habitat. An obvious alternative is to use rapid assessment
methods. These methods could greatly facilitate research, allowing us to assess
the ecological value of vast numbers of roofs designed with the intent of
maximizing biodiversity.
110
Because most ecoroofs are designed to enhance biodiversity in
unspecified ways, rather than to provide habitat for target species, rapid
assessment methods could conceivably provide adequate descriptions of
biodiversity. These methods are meant to be efficient. They aim to identify
organisms (usually invertebrates) at higher-than-species taxonomic levels and
thereby avoid wasting time, labor, and money in species-level assessment (Pik et
al. 1999). Rapid assessment is sufficient when identifying organisms to the level
of morphotaxonomic resolution satisfies the research objectives (Ellis 1985;
Ferraro and Cole 1990). These methods have been used in terrestrial (non-
ecoroof) studies of insects (Oliver and Beattie 1996; Pik et al. 1999; Kerr et al.
2000), spiders (Kapoor 2006), and birds (Poulsen and Krabbe 1998).
Despite the efficiency advantage of rapid assessment, this approach has
not been used in any prior study of ecoroof biodiversity. This study therefore fills
a gap in knowledge by quantifying animal diversity on two dissimilar vegetated
roof systems by assessing insects and spiders at higher taxon levels and birds at
the species level.
Studies so far have relied on single diversity indices, such as species
richness or Shannon’s Index, which used alone can often be inaccurate (Wilhm
1970; Peet 1974; Gotelli and Colwell 2001). One alternative to the dependence
on single indices is the Rènyi family of diversity indices (Hill 1973; Walker et al.
2003; Kindt et al. 2006). The Rènyi extends the Shannon Index by calculating the
frequency of each component species and a scale a parameter as:
111
Equation 3.1:
The values (Hα) are calculated from the frequencies of each component species
(proportional abundance pi = abundance of species i divided by the total
abundance summed across all species) and a scale parameter (α) ranging from
zero to infinity (Legendre and Legendre 1998 ; Kindt et al. 2006). The following
integer values of α, 0, 1, 2, and 3, correspond to species richness, and the
Shannon, Simpson, and Berger-Parker diversity indices, respectively (Kindt et al.
2006). By measuring across these scales, a profile is created to rank
communities from low to high diversity. Once constructed, the profile describes
community structure across scales of diversity (i.e. from species richness [α = 0]
toward evenness [α = ∝]) and allows for ranking and comparing communities by
their profiles. If the profiles cross one another, then they are considered
incomparable and cannot be ranked, but if the one profile is entirely above the
other, then they can be compared and ranked.
In addition, the profiles can be used to describe the influence of rare and
common species. The shape of the profile depends on interrelationships
between richness and evenness for a community (Walker et al. 2003). A profile
that decreases rapidly with increasing scale (α) indicates the presence of rare
species. A profile that decreases slowly indicates more common species and
reflects greater evenness across species in their abundance within the
community.
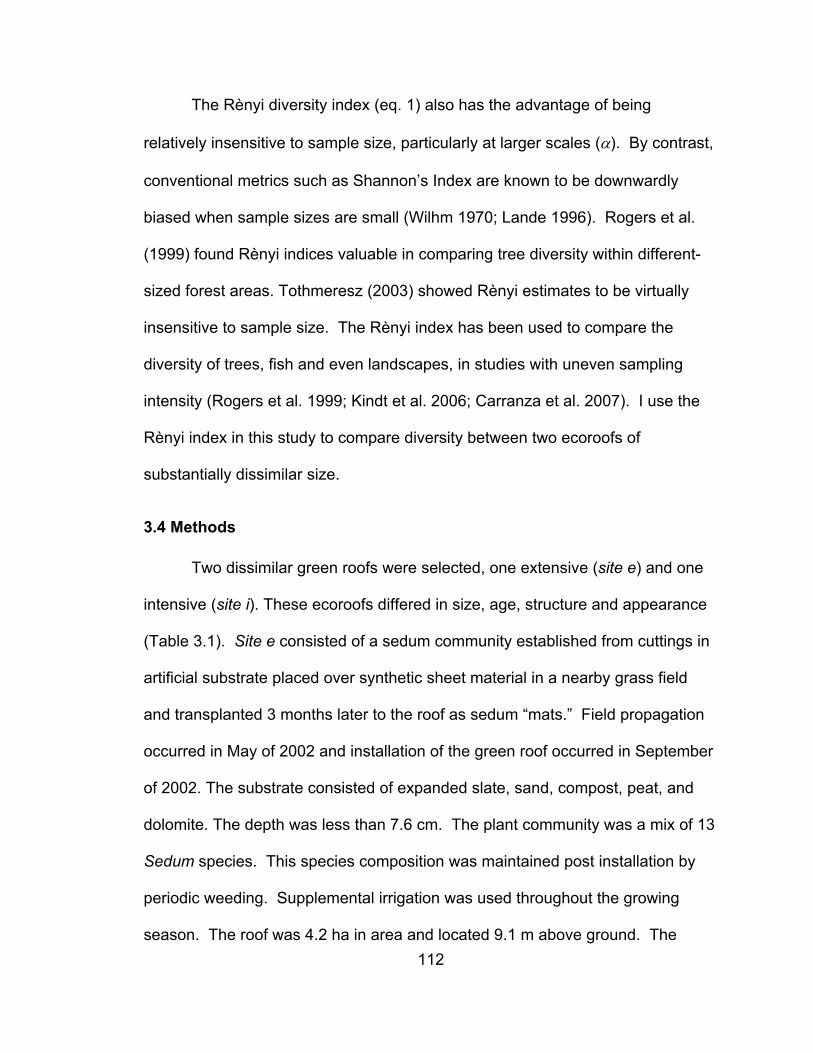
112
The Rènyi diversity index (eq. 1) also has the advantage of being
relatively insensitive to sample size, particularly at larger scales (α). By contrast,
conventional metrics such as Shannon’s Index are known to be downwardly
biased when sample sizes are small (Wilhm 1970; Lande 1996). Rogers et al.
(1999) found Rènyi indices valuable in comparing tree diversity within different-
sized forest areas. Tothmeresz (2003) showed Rènyi estimates to be virtually
insensitive to sample size. The Rènyi index has been used to compare the
diversity of trees, fish and even landscapes, in studies with uneven sampling
intensity (Rogers et al. 1999; Kindt et al. 2006; Carranza et al. 2007). I use the
Rènyi index in this study to compare diversity between two ecoroofs of
substantially dissimilar size.
3.4 Methods
Two dissimilar green roofs were selected, one extensive (site e) and one
intensive (site i). These ecoroofs differed in size, age, structure and appearance
(Table 3.1). Site e consisted of a sedum community established from cuttings in
artificial substrate placed over synthetic sheet material in a nearby grass field
and transplanted 3 months later to the roof as sedum “mats.” Field propagation
occurred in May of 2002 and installation of the green roof occurred in September
of 2002. The substrate consisted of expanded slate, sand, compost, peat, and
dolomite. The depth was less than 7.6 cm. The plant community was a mix of 13
Sedum species. This species composition was maintained post installation by
periodic weeding. Supplemental irrigation was used throughout the growing
season. The roof was 4.2 ha in area and located 9.1 m above ground. The
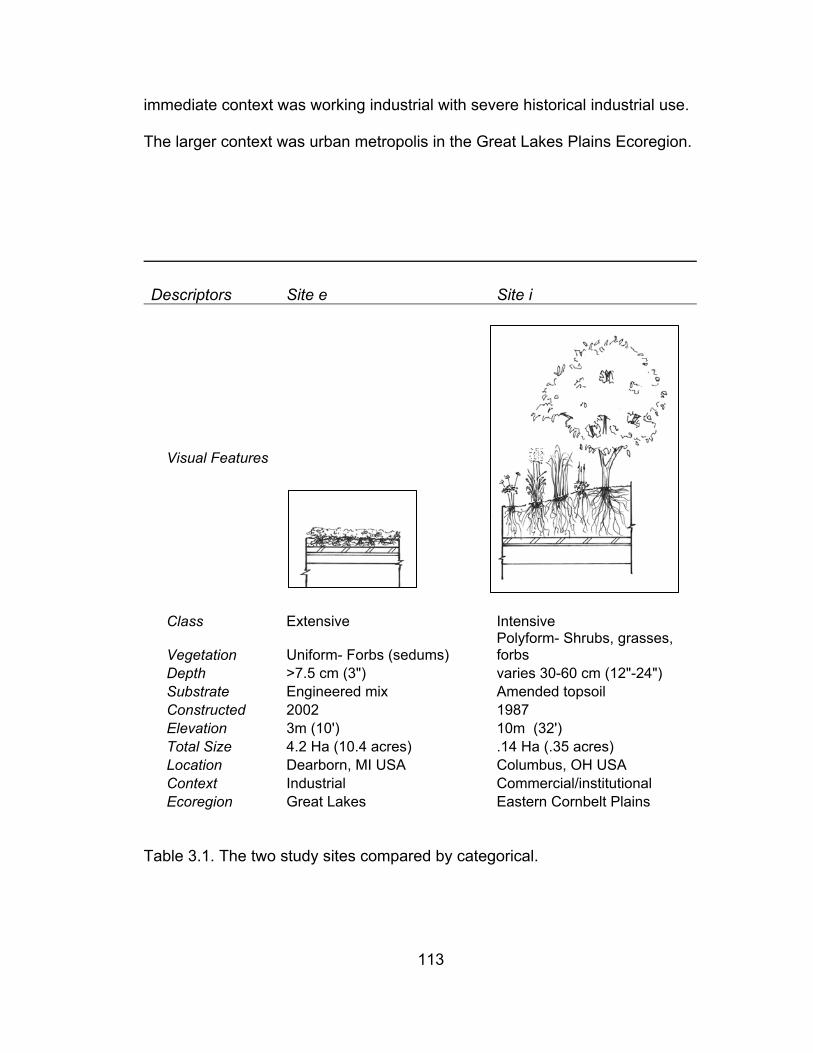
113
immediate context was working industrial with severe historical industrial use.
The larger context was urban metropolis in the Great Lakes Plains Ecoregion.
Descriptors Site e Site i
Visual Features
Class Extensive Intensive
Vegetation Uniform- Forbs (sedums) Polyform- Shrubs, grasses, forbs
Depth >7.5 cm (3") varies 30-60 cm (12"-24") Substrate Engineered mix Amended topsoil Constructed 2002 1987 Elevation 3m (10') 10m (32') Total Size 4.2 Ha (10.4 acres) .14 Ha (.35 acres) Location Dearborn, MI USA Columbus, OH USA Context Industrial Commercial/institutional Ecoregion Great Lakes Eastern Cornbelt Plains
Table 3.1. The two study sites compared by categorical.
114
Site i consisted of installed container-grown nursery plants including
Miscanthus spp., Calamagrotis spp., Koeleria spp. (junegrass) and Amelancheir
spp. (serviceberry), and immigrant (naturally colonizing) species. Installation
occurred in 1987. The substrate was amended planting soil. The depth ranged
from 30-60 cm. The original system was designed for supplemental irrigation,
but this failed soon after installation. The plant community was a mix of original
populations and urban pioneering species including Daucus spp. (Queen Anne’s
lace), Chrysanthemum spp. (daisy), and Morus spp. (mulberry). The plant
community was maintained by annual herbicide application for dicot plants and
by hand weeding of any other visually dissimilar plants. The roof was 0.14 ha
and located approximately 2.5 m aboveground. The immediate context was
long-term commercial and institutional land uses. The larger context was urban
metropolis in Eastern Corn Belt Plains Ecoregion.
Motivated by pragmatism, the collection and identification of animal taxa
employed rapid assessment methods. We collected organisms and data from
both sites in a single season using sweep net and observation methods. Four
collecting and observational sessions were conducted on each site during July
through August of 2004. Site e was reduced to an overall collection area of 0.8
ha. Sweep-netting was done along transects in both systems covering the
proportional area of 24.5 m/m2 . The total sample area of site i was 18% of that
on site e. I used a long-handled net with a 40-cm diameter hoop (BioQuip
7328NA). Samples were placed in killing jars, separated, identified and
cataloged. We performed bird observations in 1.5-h sessions prior to
115
invertebrate collection. All sightings and behaviors such as foraging were
recorded. Insects were identified as morphospecies within families or
superfamilies, and arachnids within genera. All insect and spider voucher
specimens and sub-samples were reviewed by taxonomic specialists to minimize
splitting and lumping as recommended by Oliver and Beattie (1996b).
Morphospecies are groups of organisms identified as belonging to higher-level
taxa based on their morphological traits (Oliver and Beattie 1996b; Kerr et al.
2000). Birds were identified to species when possible. Taxonomic groups were
combined for analysis and relative abundance was calculated.
Diversity was quantified in two ways. I first used the Rènyi calculation to
compare the two sites (Hill 1973). A diversity profile for each site was
constructed from the Rènyi equation to determine: 1) whether one site clearly
outranked the other in overall diversity and 2) whether the shapes of the Rènyi
curves suggested any clear distinction in community structure. I then calculated
the common diversity indices to provide the more familiar evaluation of
biodiversity. I used the following conventional indices: species richness,
Shannon’s index, Simpson’s index, and eveness. Finally, I also calculated
similarity using Sorenson’s coefficient, and percent similarity. These calculations
used the Ecological Calculator by Oakleaf Systems
(www.oakleafsystems.net/EcoCalc1.html).
116
3.5 Results
Insects, spiders and birds were represented within both communities
(Table 3.2). I recorded 59 morphospecies of insects (in 1853 samples), followed
by 9 morphospecies or higher-level groups of spiders and allies in 34 samples,
and 8 species (in 104 samples) of birds. When separated by site and taxonomic
group, highest individual abundances were: Site e- Cicadelliadae (leaf hoppers),
Tetraganthidae (long-jawed orbweavers) and Contopus cooperi (olive-sided
flycatcher), and Site i- Aphidadae (aphids), both Tetraganthidae and Oxyopidae
(lynx spider) and Passer domesticus (house sparrow).
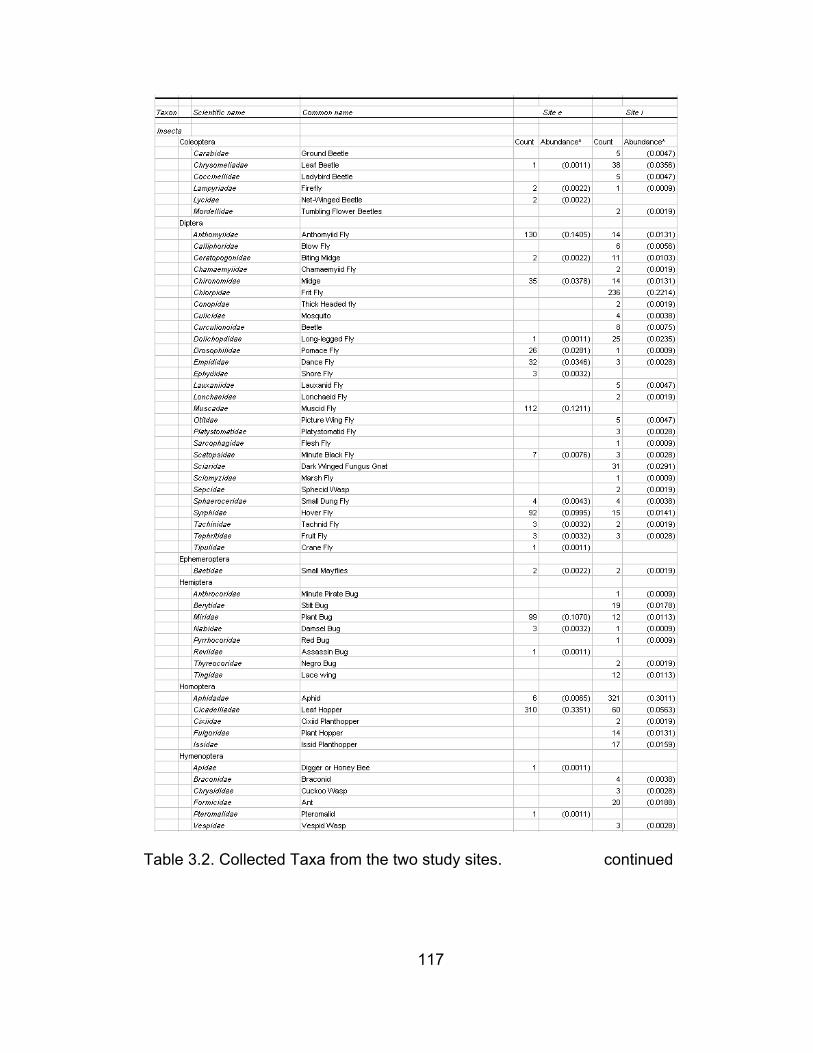
117
Table 3.2. Collected Taxa from the two study sites. continued
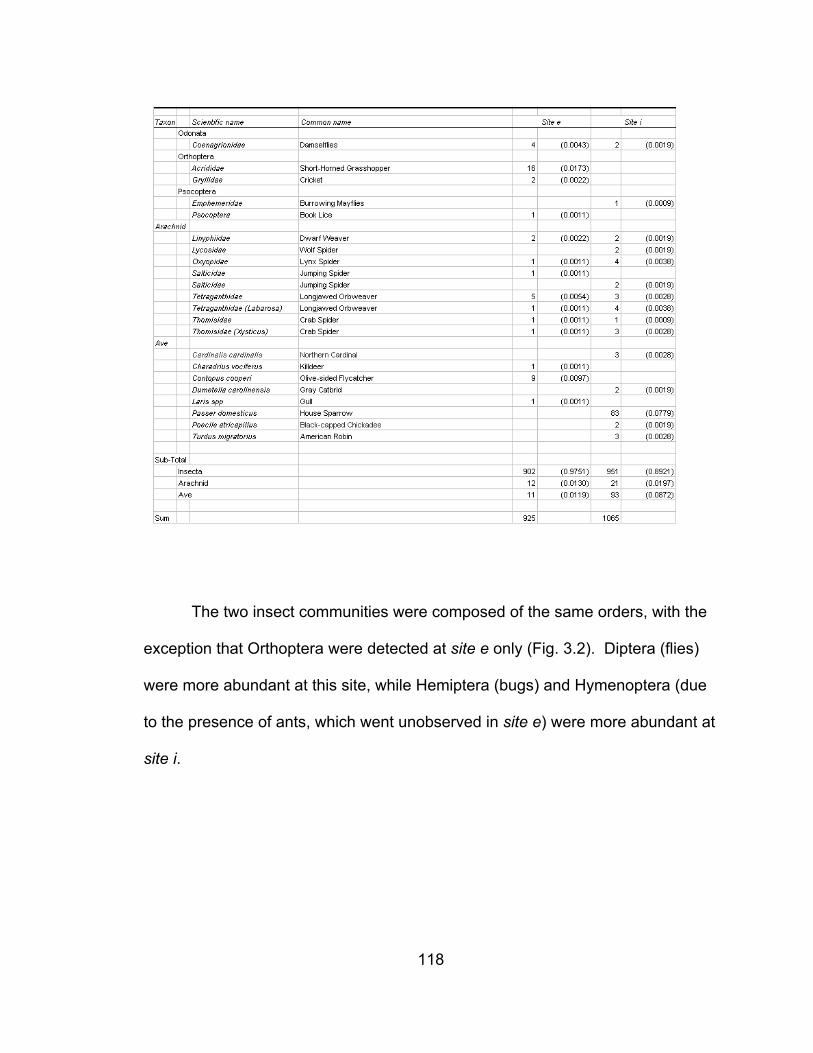
118
The two insect communities were composed of the same orders, with the
exception that Orthoptera were detected at site e only (Fig. 3.2). Diptera (flies)
were more abundant at this site, while Hemiptera (bugs) and Hymenoptera (due
to the presence of ants, which went unobserved in site e) were more abundant at
site i.
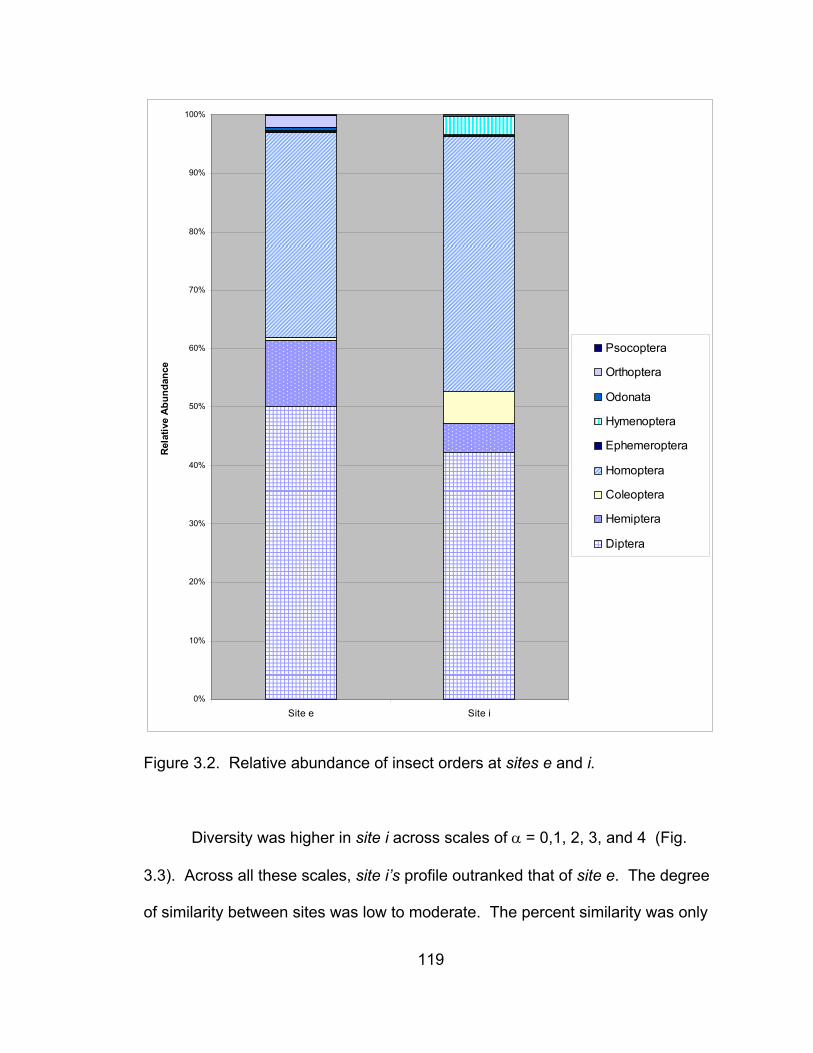
119
0%
10%
20%
30%
40%
50%
60%
70%
80%
90%
100%
Site e Site i
Rel
ativ
e A
bund
ance
Psocoptera
Orthoptera
Odonata
Hymenoptera
Ephemeroptera
Homoptera
Coleoptera
Hemiptera
Diptera
Figure 3.2. Relative abundance of insect orders at sites e and i.
Diversity was higher in site i across scales of α = 0,1, 2, 3, and 4 (Fig.
3.3). Across all these scales, site i’s profile outranked that of site e. The degree
of similarity between sites was low to moderate. The percent similarity was only
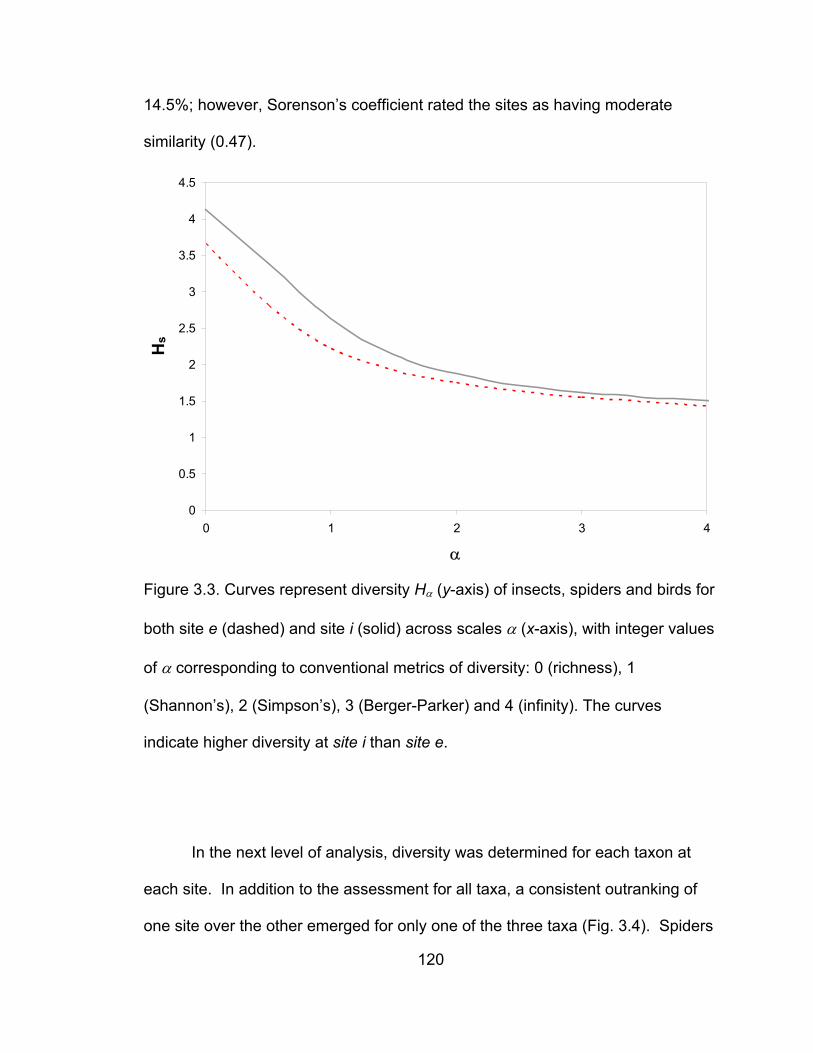
120
14.5%; however, Sorenson’s coefficient rated the sites as having moderate
similarity (0.47).
0
0.5
1
1.5
2
2.5
3
3.5
4
4.5
0 1 2 3 4
α
Hs
Figure 3.3. Curves represent diversity Hα (y-axis) of insects, spiders and birds for
both site e (dashed) and site i (solid) across scales α (x-axis), with integer values
of α corresponding to conventional metrics of diversity: 0 (richness), 1
(Shannon’s), 2 (Simpson’s), 3 (Berger-Parker) and 4 (infinity). The curves
indicate higher diversity at site i than site e.
In the next level of analysis, diversity was determined for each taxon at
each site. In addition to the assessment for all taxa, a consistent outranking of
one site over the other emerged for only one of the three taxa (Fig. 3.4). Spiders
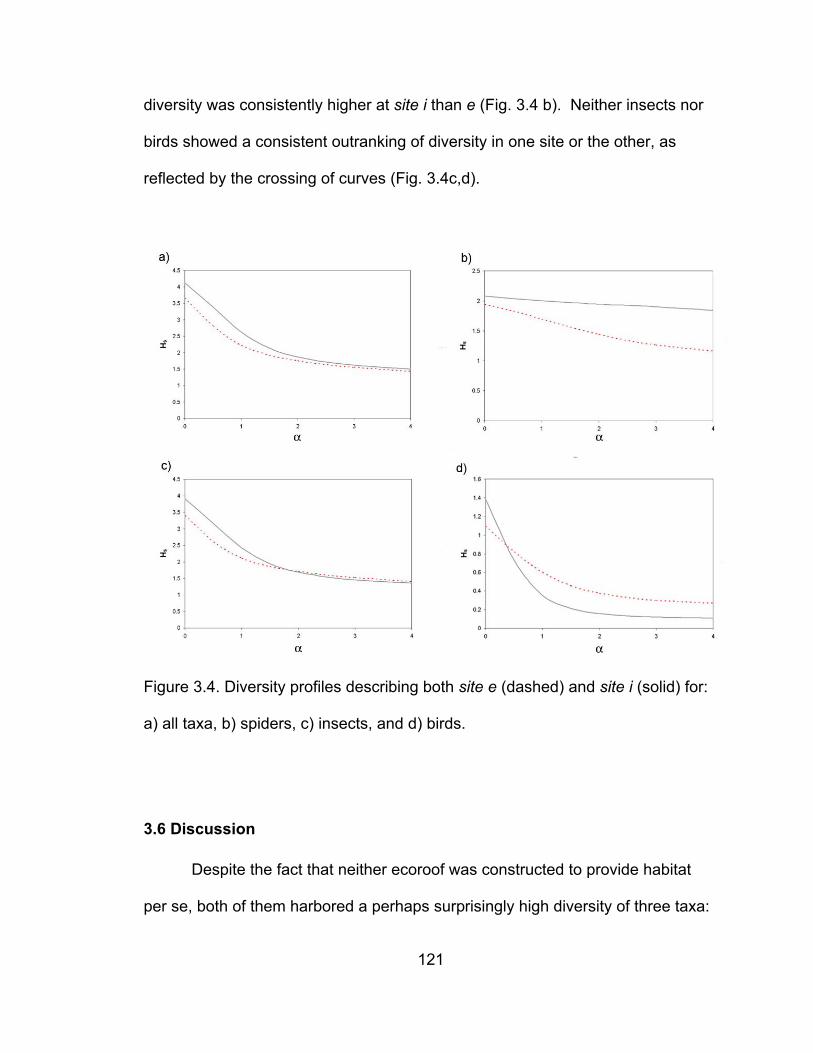
121
diversity was consistently higher at site i than e (Fig. 3.4 b). Neither insects nor
birds showed a consistent outranking of diversity in one site or the other, as
reflected by the crossing of curves (Fig. 3.4c,d).
Figure 3.4. Diversity profiles describing both site e (dashed) and site i (solid) for:
a) all taxa, b) spiders, c) insects, and d) birds.
3.6 Discussion
Despite the fact that neither ecoroof was constructed to provide habitat
per se, both of them harbored a perhaps surprisingly high diversity of three taxa:
122
insects, spiders and birds. The combination of rapid assessment method and the
Rènyi family of diversity indices allowed for apparently meaningful quantitative
descriptions of the diversity of the two ecoroofs. Because wild species inhabited
these ecoroofs, I raise the question as to whether low-quality ecoroof habitat
could create attractive sink habitat, or ecological traps, and consequently
undermine the efforts to conserve wild species.
3.6.1 Combining Rapid Assessment and the Rènyi method for quantifying
diversity
The use of morphospecies allowed for inclusion of invertebrate taxa in the
study. I was able to identify samples as belonging to higher taxonomic levels
using morphological traits. One exception to this was the use of a sub-samples
procedure in the insect analysis, where expert solicitation revealed lumping of
species within the order Diptera. In addition, spider sub-samples contained some
splitting that was corrected by a systematist (as recommended by Oliver and
Beattie 1999a). These methods improved accuracy and allowed for the inclusion
of insects and spiders.
The use of the Rènyi family of diversity indices provided a convenient way
to compare the diversity between the two ecoroofs. The intensive ecoroof has
higher diversity across scales than the extensive ecoroof (Fig. 3.3). However, in
the absence of inferential statistical analysis, interpretation of the curves remains
tentative. Based on Hill (1973) and Walker et al. (2003), I suggest that site i has
more rare species and common species than site e. This pattern is shown when
both lines displays a rapid decline from the scale of α = 0, where rare species are
123
more common in site i, to higher scales indicating more common species.
Alternatively, a crossing of the curves would demonstrate that each ecoroof
possessed its own unique pattern. The fact that the curves do not cross
indicates similarity in community structure on the two ecoroofs.
3.6.2 Ecoroof Biodiversity and Conservation
The plant communities on green roofs appear to influence animal
diversity. The prostrate sedum covering in site e creates an environment with
few visual obstructions that is favorable to the olive-sided flycatcher, and the
killdeer, a common gravel roof nester. The olive-sided flycatcher foraged by
perching on protruding skylights 3 m above the ecoroof and making sallies to
capture insects. On the other hand, the high seed-producing ornamental grasses
and densely foliaged berry-producing shrubs in site i are favorable for the urban
species (i.e., house sparrow, northern cardinal, American robin, and gray
catbird). The house sparrow took refuge in the serviceberry shrubs. The higher-
level biodiversity in site i may be explained by the plants of the roof, but other
influences might have contributed to the greater diversity. Jones (2002)
observed that uniform vegetation in extensive ecoroofs can limit diversity. The
use of local soils and substrates of varying depth creates greater variety of plant
architecture, which in turn provides habitat for a greater variety of fauna
(Brenneisen 2003). However, the greater maturity (time since creation) and
closer positioning of site i to the ground may also account for its higher diversity.
These factors of maturity and elevation could influence the use by wild species,
including birds. Many of the urban species such as the sparrow, robin and
124
cardinal were observed only on site i. In this case, the roof may act less like an
isolated patch and more like an extension of, or linkage to, the urban context
where multiple species interact. The large presence of adaptable urban birds in
site i could be one indicator of a low quality habitat.
The presence of wild species in both sites is likely to have been influenced
by plant installation methods and maintenance practices. Site e was constructed
by first growing sedum “mats” in a nearby agricultural field. The plants were
started from seeds and cuttings and grown in shallow substrate over plastic
during the growing season. Immigration of plant-feeding insects during that
season probably occurred. In the fall, the mats were cut into 1m2 sections,
relocated to the roof and installed, creating a form of unintended inoculation. This
method of installation could account for the large fly population, if maggots were
relocated in the plant roots during installation. On the other hand, site i was
installed with greenhouse-grown nursery container plants. Both communities are
likely influenced by management practices. Site e included heavy seasonal
irrigation and weekly hand-weeding of all non-sedum vegetation during the
growing season. Site i included annual (summer) spot spraying and cut back
(winter) of all herbaceous plantings.
Currently, attempts to conserve animal biodiversity on ecoroofs are being
advocated without any serious consideration as to whether they may do more
harm than good. Putting an ecoroof in place may often amount to setting an
ecological trap. An ecological trap is a habitat that is “low in quality for
reproduction and survival [that] cannot sustain a population yet…is preferred
125
over available, high quality habitats (Donovan and Thompson 2001). In this
scenario, animals make errors in habitat assessment as result of environmental
cues and these errors lead to negative population growth. Donovan and
Thompson (2001), in a simulation study of possible impacts of ecological traps
on migratory birds, found that population growth was most sensitive to adult and
juvenile survival through their habitat selection. When given the choice of high-
quality habitats, populations remained stable, but when low-quality habitat
exceeded 30% of the available area, the population shrank. Because cities
rarely possess high-quality habitat, species may select the lower-quality habitat
in ecoroofs. Their choice can result in reiterative preference for the deceptive
habitat, while attracting other settlers to that same habitat (Swartwout et al.
unpublished results). In a study reflecting this behavior, Baumann (2006)
observed that ecoroofs attracted ground-nesting birds but they suffered low
fecundity in successive years. At this time, we simply do not know whether the
ecoroofs we studied were attractive sinks. Due to the difference in ecoroof
design, habitat quality is likely to vary with each ecoroof increasing the risk of
creating an ecological trap.
It is conceivable that ecoroofs may create suitable, if not ideal, habitat for
wild species. For instance, migratory birds use a variety of stopover habitats in
urban landscapes (Mehlman et al. 2005). These habitats vary in quality and yet
may all provide a valuable ecosystem service. Three types of essential stopover
sites are:1) “fire escape,” 2) “convenience store,“ and 3) ”full service hotel.” The
fire escape and convenience store offer minimal resources and yet may be the
126
highest planning priority because they are small remnants near or within large
ecological barriers (like cities) and are often unmanaged. The observations of
the olive-sided flycatcher in site e confirm stopover use on ecoroofs. Thus,
ecoroofs may fill the role of a fire escape or convenient store stopover for some
birds, by providing emergency stopover habitats and furnishing nominal but
necessary resources. As more ecoroofs are created in the city, it is important to
design and construct them in ways that do not set ecological traps but rather
provide suitable habitat.
3.7 Conclusions
First, both types of vegetated roofs provided habitat, regardless of intent. I
found that even in systems constructed without clear conservation objectives
contained wild species of insects, spiders and birds. This conclusion supports
the popular notion of a “field of dreams” approach to building ecoroofs as habitat.
Second, the two systems have distinct species compositions in which over 85%
of species were found to be present in one system and not the other. Third, the
Rènyi family of diversity indices indicated a remarkable degree of similarity in
community structure between the two sites. Diversity was only slightly higher on
the intensive than extensive system, while evenness was similar on the two
roofs. Finally, Tangley (1986) states that ecological investigations in the urban
setting are as valid as those in more pristine environments, but the systems of
study may possess unique ecological processes. Vegetated roof systems may
possess many of these unique processes and so represent an emerging
opportunity for ecological studies. An increase in observation and
127
experimentation is needed as vegetated roof systems continue to be advocated
as a new form of urban habitat.
128
3.8 Citations
Baumann, N. (2006). "Ground-Nesting Birds on Green Roofs in Switzerland: Preliminary Observations." Urban Habitats 4(1): pgs 37-50.
Brenneisen, S. (2003). Biodiversity of European Greenroofs. In conference
proceedings of Greening Rooftops for Sustainable Communities Chicago, IL, Green Roofs for Healthy Cities.
Brenneisen, S. (2005). Green roofs recapturing urban spaces for wildlife- A
Challenge for Urban Planning and Environmental Education. In conference proceedings of Greening Rooftops for Sustainable Communities Washington D.C., Green Roofs for Healthy Cities..
Brenneisen, S. (2006). "Space for Urban Wildlife: Designing Green Roofs as
Habitats in Switzerland." Urban Habitats 4(1): pg 27-36. Carranza, M. L., A. Acosta and C. Ricotta (2007). "Analyzing landscape diversity
in time: The use of Renyi’s generalized entropy function." Ecological Indicators 7(3): 505-510.
Donovan, T. and F. I. Thompson (2001). "Modeling the Ecological Trap
Hypothesis: A Habitat and Demographic Analysis for Migrant Songbirds." Ecological Applications 1(3): 871-882.
Dunnett, N. and N. Kingsbury (2004). Planting Green Roofs and Living Walls.
Portland, OR, Timber Press. Ellis, D. (1985). "Taxonomic sufficiency in pollution assessment." Marine
Pollution Bulletin 16: p459. Ferraro, S. P. and F. A. Cole (1990). "Taxonomic level and sample size sufficient
for assessing pollution impacts on the Southern California Bight macrobenthos " Marine Ecology Progress Series 67: 251-262.
Gaffin, S., C. Rosenzweig, L. Parshall, D. Hillel, J. Eichenbaum-Pikser, A.
Greenbaum, R. Blake, D. Beattie and R. Berghage (2006). Quantifying evaporative cooling from green roofs and comparison to other land surfaces. In conference proceedings of Greening Rooftops for Sustainable Communities Boston, MA, Green Roofs for Healthy Cities..
Gedge, D. (2003). '...From rubble to Redstarts...' In conference proceedings
Greening Rooftops for Sustainable Communities Chicago, Peck Associates.
129
Gedge, D. and G. Kadas (2004). Bugs, bees and spiders: Green roof design for rare invertebrates. In conference proceedings of Greening Rooftops for Sustainable Communities, Portland, OR. Green Roofs for Healthy Cities.
Gotelli, N. J. and R. K. Colwell (2001). "Quantifying biodiversity: procedures and
pitfalls in the measurement and comparison of species richness." Ecology Letters 4(2): 379-391.
Hill, M. O. (1973). "Diversity and evenness: A unifying notation and its
consequences." Ecology 54(2): 427-432. Jones, R. A. (2002). Tecticolous Invertebrates. A preliminary investigation of the
invertebrate fauna on green roofs in urban London. London, English Nature: 36.
Kadas, G. (2002). Study of invertebrates on green roofs - How roof design can
maximise biodiversity in an urban environment. Dept. of Geography. London, University College. MSc Conservation: 76.
Kadas, G. (2006). "Rare Invertebrates Colonizing Green Roofs in London."
Urban Habitats 4(1): pg66-86. Kapoor, V. (2006). "An assessment of spider sampling methods in tropical
rainforest fragments of the Anamalai Hills, Western Ghats, India." Zoos' Print Journal 21(12): 2483-2488.
Kerr, J. T., A. Sugar and L. Packer (2000). "Indicator taxa, rapid biodiversity
assessment, and nestedness in an endangered ecosystem." Conservation Biology 14(6): 1726-1734.
Kindt, R., P. Van Damme and A. J. Simons (2006). "Tree diversity in western
Kenya: using profiles to characterise richness and evenness" Biodiversity and Conservation (2006) 15: 15(4): pgs 1253-1270.
Lande, R. (1996). "Statistics and Partitioning of Species Diversity, and Similarity
among Multiple Communities." Oikos 76(1): pg 5-13. Legendre, P. and L. Legendre (1998 ). Numerical Ecology. Amsterdam Elsevier
Science BV. Mehlman, D. W., S. Mabey, D. Ewert, C. Ducan, B. Able, D. Cimprich, R. D.
Sutter and M. Woodrey (2005). "Conserving stopover sites for forest-dwelling migratory landbirds " The Auk 122(4): 1281-1290.
Miller, C. (2003). Moisture Management In Green Roofs. Greening Rooftops for
Sustainable Communities, Chicago, IL, Green Roofs for Healthy Cities.
130
Oliver, I. and A. J. Beattie (1996). "Invertebrate morphospecies as surrogates for species: A case study." Conservation Biology 10(1): 99-109.
Oliver, I. and A. J. Beattie (1996b). "Designing a cost-effective invertebrate
survey: A test of methods for rapid assessment of biodiversity " Ecological Applications 6(2): 594-607.
Onmura, S., M. Matsumoto and S. Hokoi (2001). "Study on evaporative cooling
effect of roof lawn gardens." Energy and Buildings 33: 653-666. Peck, S., C. Callaghan, B. Bass and M. Kuhn (1999). Greenbacks from Green
Roofs: Forging a New Industry in Canada. Ottawa, ON, Canada Mortgage and Housing Corporation: 54.
Peet, R. (1974). "The measurement of species diversity." Annual Review of
Ecological Systems 5: pgs285-307. Pik, A. J., I. Oliver and A. J. Beattie (1999). "Taxonomic sufficiency in ecological
studies of terrestrial invertebrates." Australian Journal of Ecology 24(3): 555-562.
Poulsen, B. O. and N. Krabbe (1998). "Avifaunal diversity of five high-altitude
cloud forests on the Andean western slope of Ecuador: testing a rapid assessment method." Journal of Biogeography 25(1): 83-93.
Rogers, S. I., D. Maxwell, A. D. Rijnsdorpb, U. Damm and W. Vanhee (1999).
"Fishing effects in northeast Atlantic shelf seas: patterns in fishing effort, diversity and community structure. IV. Can comparisons of species diversity be used to assess human impacts ondemersal fish faunas?" Fisheries Research 40(3): pgs 135-152.
Rosenzweig, M. L. (2003). Win-Win Ecology: How the Earth's Species Can
Survive in the Midst of Human Enterprise. New York, Oxford University Press.
Rowe, D. B., C. Rugh, N. VanWoert, M. Monterusso and D. Russell (2003).
Green roof slope, substrate depth and vegetation influence on runoff. In conference proceedings of Greening Rooftops for Sustainable Communities Chicago, IL, Green Roofs for Healthy Cities.
Scholz-Barth, K. (2001). "Green roofs: stormwater management from the top
down." Environmental Design & Construction. Swartwout, P., A. D’Orazio, T. A. Waite and H. Kokko (unpublished results). "The
bandwagon effect: conspecific attraction and vulnerability to ecological traps ".
131
Tangley, L. (1986). "The Urban Ecologist." BioScience 36(2): 68-71. Tinkel, K. C. (1977). Rooftop gardening. Radnor, Pa., Chilton Book Co. Tothmeresz, B. (2003). "Comparison of different methods for diversity ordering."
Journal of Vegetation Science 6(2): 283-290. Walker, D., G. Wiseman, A. Vasudevan, R. Baydack and J. M. Campbell (2003).
Developing a 'richness-free' statistic for measuring ecosystem diversity in landscape management decision support. In the proceedings of the 5th International Science and Management of Protected Areas (SAMPA) Conference, University of Victoria, British Columbia.
Wilhm, J. L. (1970). "Effect of sample size on Shannon's formula." The
Southwest Naturalist 14(4): 441-445. Wong, N. H., S. F. Tay, R. Wong, C. L. Ong and A. Sia (2003). "Investigation of
thermal benefits of rooftop garden in the tropical environment." Building and Environment 38(2): 261-270.
132
CHAPTER 4
EMERGY EVALUTION OF THE PRODUCTIVITY AND SUSTAINABILITY OF
THREE VEGETATED ROOF SYSTEMS
4.1 Abstract
This study used emergy analysis to quantify and compare the
sustainability of three different vegetated roof systems. The study assessed and
compared an agricultural roof garden, a shallow substrate ecoroof, and a deep
substrate ecoroof for flows of energy required for the production of biomass.
Emergy analysis was used to quantify and compare the environmental impacts
and respective benefits of the systems through the fraction renewable, emergy
yield ratio (EYR), environmental loading ratio (ELR) and emergy sustainability
index (ESI). The roof systems were compared to agricultural systems,
constructed landscapes, and a city in order to determine how each system
performed as a sustainable development technology relative to other landscapes.
The shallow substrate ecoroof (ESI = .072) was the most sustainable of the
three, followed by the deep substrate ecoroof (ESI = .03), and lastly the
133
agricultural roof garden (ESI = .022). The levels of sustainability were associated
with low percentage usage of renewable resources (extensive 6%, intensive 3%,
agriculture 2%). All three systems were more sustainable than conventional
landscapes, urban gardens and a city while being less sustainable than various
agricultural practices. This study identifies vegetated roof systems with the
greatest non-renewable inputs and makes recommendations to improve the
sustainability of the technology.
4.2 Introduction
Environmental change and diminishing local resources have made
scientists and designers increasingly concerned about urban development.
One goal of sustainable urban development is to build cities that rely on
renewable rather than non-renewable energies and local rather than global
resources. With a goal of increasing the sustainability of buildings and cities,
vegetated roofs systems, or green roofs, are being installed on rooftops in urban
settings (Peck et al. 1999; Dunnett and Kingsbury 2004). However, much of the
materials used in building vegetated roof systems are not locally available, and
require nonrenewable energy inputs to manufacture and transport. Building roofs
with large proportions of non-renewable energies, may compromise the
sustainability of green roofs. To make certain vegetated roof systems are aiding
cities they must be evaluated to determine if the environmental benefits balance
with the resource use and environmental degradation created by their
construction and maintenance. Therefore, this study evaluates the quantities of
134
energy and resources used by ecoroofs to improve the understanding of how
these systems impact a city’s sustainable development.
Cities “succeed” due in part to the use of global, or distant, resources that
make cities productive centers. These resources assist in making cities attractive
for living by providing desirable conditions for people. The allocation and
distribution of distant resources demand extensive transportation infrastructure,
which dictates the size and population densities of cities (Mills 1967; Henderson
1974). Another reason cities thrive is because of available energy. Non-
renewable forms of energy, such as coal and gas, are made available to most
cities. Cities converting to renewable forms of energy, such as wind, continue to
require resources. As these energies converge in the city the functions of trade,
government, education and knowledge are created. Once developed these
functions are exported, often times back to the distant resource locations.
Cities experience heightened resource demands as a part of their
increased urbanization. Odum (1971) explained that cities were ‘parasitic’ with
regards to water, air and food. The larger they become, the greater the
proportional cost to the environment. Population increases, combined with
decreasing quality of local resources, create the problems of resource depletion
and environmental degradation, which can result in resource scarcity (Homer-
Dixon 1999). It is projected these problems will increase as 60% of the world’s
population are expected to live in urban areas by 2030 (NRCS 1997).These
problems are caused in part by the conversion of productive agricultural land and
native ecosystems to urban areas, which results in a dependence on global
135
markets to provide resources. Cities with a dependence on distant resources
risk long term instability contributing to resource scarcity (Rees and Wackernagel
1996; Holden and Linnerud 2007).
A solution to resource scarcity is the concept of sustainable urban
development. Sustainable development principles imply that in developing land,
resources are balanced with use in space and time to maintain potential to
deliver goods and services to future generations (WCED 1987). Cities can use
renewable energy sources (such as solar and wind) to a small degree, and
employ construction and manufacturing processes that do not compromise the
quality of the natural systems of water and air. Huang and Hsu (2003) explain as
cities use renewable resources and employ self-regulating resource flows they
can better ensure the continued viability of the environments on which they
depend. One construction technology that may contribute to sustainable
development is the practice of roof greening.
Roof greening is the process of growing plants on a building’s rooftop. The
result is called a vegetated roof system. The concept of roof greening uses a
layer of growing medium (soil) and vegetation on rooftops to intercept light and
water to grow plants (Peck et al. 1999). This technology reduces associated
wastes, such as stormwater exports and secondary wastes of carbon (CO2)
created by cooling building structures, while producing oxygen (O2), habitats, and
plant biomass. The environmental benefits of urban plant biomass in vegetated
roof systems have been studied as stormwater retention (Scholz-Barth 2001;
Miller 2003; Rowe et al. 2003), energy reduction (Onmura et al. 2001; Wong et
136
al. 2003; Gaffin et al. 2006), habitat creation (Jones 2002; Brenneisen 2005), and
food production (Tinkel 1977). Maximizing these different environmental benefits
has resulted in variation of types among green roof systems.
Two distinct variations of vegetated roofs are ecoroofs and agricultural
roof gardens. Ecoroofs are constructed to retain stormwater, intercept sunlight
and provide habitat. These roofs have variable soil depths and cover the entire
roof surface. The vegetation is usually allowed to self-organize. Maintenance
practices include hand weeding several times a year to eliminate membrane
damaging plants. On the other hand, agricultural roof gardens (roofs designed
specifically for production of food) are intended to reduce the demands for an
imported food supply, making the city more self-reliant by reducing food imports
through local production (Orabon 1990; Allen 1999; Levenston 2002). These
systems involve planting in pots or raised beds containing deep substrates
(soils). They are often built on apartment-building rooftops. Traditional vegetable
garden maintenance practices are employed: improving the soil with organic
matter prior to planting, fertilizing, watering, weeding, and harvesting (Tinkel
1977). The variation between these systems can make assessment and
comparison difficult.
Emergy analysis, which evaluates different systems components on a
common basis, is a promising tool to evaluate resource use and production in
vegetated roof systems. It is a method of environmental accounting where
renewable natural processes and products can be compared on a common basis
with economic processes and products. Emergy analysis has been defined as
137
the measure of both the work of nature and of humans in generating products
and services (Odum 1996). This type of analysis puts “the contributions of the
economy on the same basis as the work of the environment” (Odum and Odum
2000). This tool is used as an alternative for determining the net value of
environmental projects to human society. It has been used to evaluate
ecosystems such as wetlands (Howington et al. 1997; Ton et al. 1998),
agricultural farms and farm practices (An 1998; Bastianoni et al. 2001; Rydberg
and Jansén 2002), waste water treatment facilities (Nelson et al. 2001), urban
landscapes in metropolitan areas (Huang et al. 1995; Huang 1998; Huang et al.
2001), and entire regions, such as the state of Maine (Campbell 1998). Brown
and Ulgiati (1997) demonstrated emergy is effective at assessing the
performance of “eco-technologies,” technologies involving natural resources or
ecosystem services. It has been used as a comparative method to measure the
sustainability of some seemingly disparate systems, such as economies, and
some products, such as crude oil and corn, through a series of indices (see
section 5.3.2) (Ulgiati and Brown 1998). More recently, researchers have used
these indices to measure and compare the sustainability of constructed urban
landscapes and agriculture (Beck et al. 2001; Martin et al. 2006)
The goal of this study was to assess three vegetated roof systems with
regard to their resource use, productivity, environmental impact, and overall
sustainability, and compare them to one another and to other constructed
landscapes. The first system was an agricultural roof garden based on a system
in Chicago, Illinois, producing vegetables used to feed the local community. The
138
second system was a shallow substrate ecoroof system, based on an ecoroof
simulator system in Columbus, Ohio constructed to retain stormwater and
intercept sunlight. The third was a deep substrate ecoroof based on an ecoroof
simulator system in Columbus, Ohio constructed to retain higher amounts of
stormwater and intercept sunlight. Finally, these systems were compared to
other constructed (non-roof) agricultural or urban landscapes that have been
previously assessed using emergy.
4.3 Methods
4.3.1 Systems Descriptions
The agricultural roof garden was a series of raised beds created on the
top level of a parking garage in an urban neighborhood in Chicago, which
operated for one year (1997). Records on inputs and yields were published for
the Chicago study by Martin (2001). The system consisted of annual plantings
and required seasonal watering, fertilizing, weeding, and harvesting. Plants were
lettuce (Lactuca sativa), spinach (Spinacia oleracea), squash (Cucurbita spp.),
tomato (Lycopersicon esculentum), peppers (Capsicum spp.), onion (Allium
spp.), and cucumber (Cucumis sativis)
The two replicate ecoroofs were constructed one meter above the ground
on a crushed stone nursery pad at the Ohio State University agricultural farm,
Columbus, Ohio, USA, in the spring of 2004. These systems simulated ecoroofs
and contained nine shallow plots 10 cm deep and nine deep plots 30 cm deep.
All the plots were sized at 1m2. They were planted once with Little blue stem
139
(Schizachyrium scoparium) and Low grow sumac (Rhus aromatica ‘Gro Low’).
Maintenance practices involved weeding once a year for woody plants with
membrane-penetrating roots.
Quantities of all inputs were recorded for one year for the agricultural roof
garden and a measure of vegetable biomass was taken at harvest. For both
ecoroofs all input quantities were recorded over two years to determine annual
biomass. Ecoroof plants were harvested in the second year for each system.
Data from both of these systems was extrapolated to represent a 98m2 area to
equal that of the agricultural roofs. The renewable inputs used the regional
values of Chicago for sun, wind, and rainfall distribution. In addition, membrane
inputs were equated. Membrane inputs for agricultural systems were made to
conform to the national standards of roof greening systems by including drainage
and root protection membranes. The assessment is based on thirty-year
duration due to the life expectancy of the water-proofing membrane.
4.3.2 Emergy Flows and Definitions
Emergy analysis is based on the flow of the following resource inputs
(Figure 5.1-5.4); Renewable resources (R), such as sun wind and rain; Non-
Renewable resources (N), which are the local energy stores within the system,
such as topsoil in a farm system; and Purchased resources (F), which are the
inputs containing human investment, such as equipment, construction materials,
and services, including labor. Inputs interact in the system and produce a yield. A
Yield (Y) is equal to the sum of all inputs (Y = R+N+F). The detailed flow is
illustrated in the emergy diagrams of the vegetated roof systems (Fig 4.1-4.3).
140
The inputs on the left of the system (sun, wind, and rain) are the renewable
resources. Those on the top are the purchased resources; some examples
include plants, membranes, topsoil, fertilizers, irrigation and labor. The absence
of non-renewable inputs (N) in each of the vegetated roof systems was found.
Therefore, the soils are shown as storage that was imported as a purchased
input. Tables 4.1 and 4.3 denote the specific flows that comprise the resources.
The flows of resources are converted to emergy through transformities which
have been calculated for a wide variety of resources and renewable energies.
They can be found in past publications, articles and dissertations (Odum 1996;
Burnakarn 1998; Odum et al. 2000; Bastianoni 2001; Brown and Bardi 2001;
Brandt-Williams 2002; Huang and Hsu 2003; Ganeshan 2005). An additional
analysis was performed to determine the emergy of expanded clay material used
in the extensive and intensive ecoroofs (See section 4.4).
The emergy analysis tables (Tables 4.1 and 4.3) were directly constructed
from the diagrams (Fig. 4.1-4.4), using inflows and outflows crossing the system
boundary as row headings. Within each table, the annual amount of input or
output of each flow is quantified in raw units (joules, grams, dollars). The next
column is the transformity value, which was multiplied by the raw units resulting
in the third column, annual solar emergy of each flow (Appendix III).
Definitions for terms regarding emergy (Ulgiati and Brown 1998)
• Emergy: The available energy of one kind that is used in the
transformation directly and indirectly to make a product or service. Emergy
141
is measured in emjoules. Sunlight, fuel, electricity and human service and
all other resource flows can be put on a common basis by expressing
them in solar emjoules (sej)
• Solar emjoules: The units of solar energy previously used to generate a
product or service. One solar emjoule (sej) equals one joule (J) of sunlight.
• Transformity: The ratio obtained by dividing the total emergy that was
used in a process by the energy yielded as output. This is used to convert
different types of energies to emergy. It is expressed as solar emjoules
per joule (sej/J).
• Specific emergy: The emergy per unit of mass output. This is usually
expressed as solar emergy per gram (sej/g-1).
Emergy indices compare flows from the economy to flows of the
environment. Through these measurements, net yields can be compared to
environmental loads. Measuring sustainability through emergy analysis indicates
if a process provides a suitable yield contribution to the user with a low
environmental pressure. This can be used to measure the resource use,
environmental impact and sustainability of the construction, and operation, of an
agricultural roof garden and determine if these systems provide a suitable
contribution to the urban environment. The one modification being that non-
renewable inputs (N) were omitted from the calculations because they were not
present in the examined systems. The indices and their descriptions used here
have been provided by Ulgiati and Brown (1998).
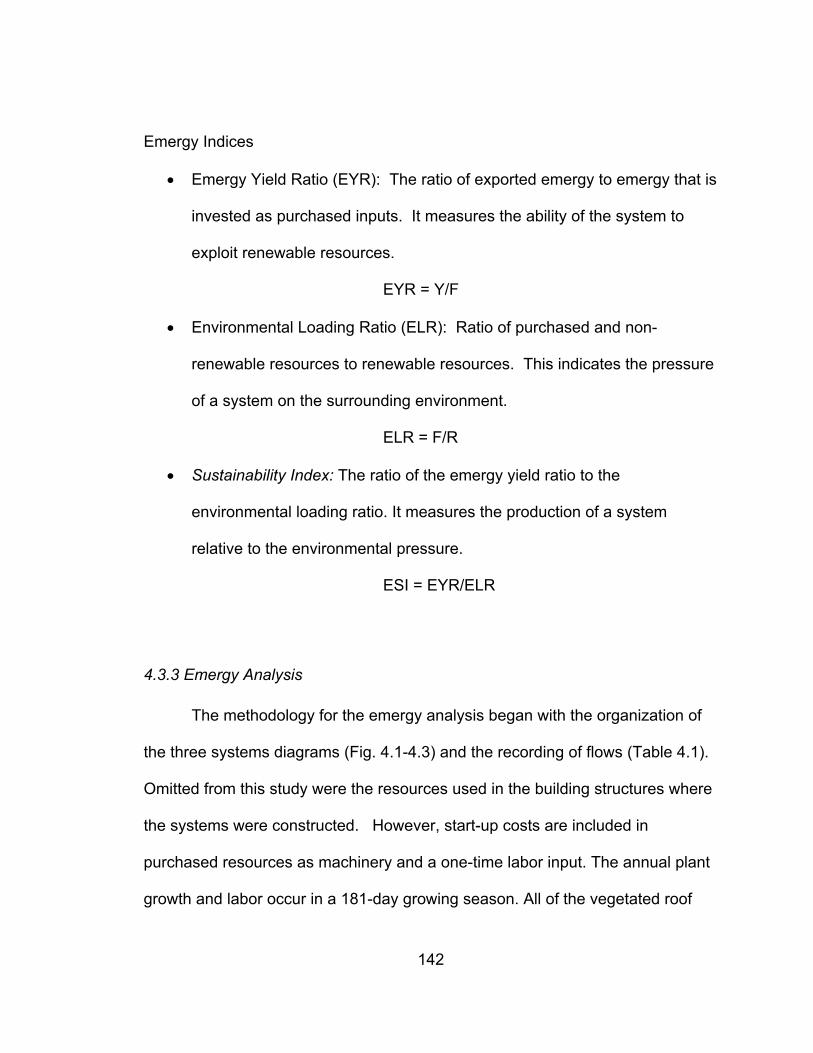
142
Emergy Indices
• Emergy Yield Ratio (EYR): The ratio of exported emergy to emergy that is
invested as purchased inputs. It measures the ability of the system to
exploit renewable resources.
EYR = Y/F
• Environmental Loading Ratio (ELR): Ratio of purchased and non-
renewable resources to renewable resources. This indicates the pressure
of a system on the surrounding environment.
ELR = F/R
• Sustainability Index: The ratio of the emergy yield ratio to the
environmental loading ratio. It measures the production of a system
relative to the environmental pressure.
ESI = EYR/ELR
4.3.3 Emergy Analysis
The methodology for the emergy analysis began with the organization of
the three systems diagrams (Fig. 4.1-4.3) and the recording of flows (Table 4.1).
Omitted from this study were the resources used in the building structures where
the systems were constructed. However, start-up costs are included in
purchased resources as machinery and a one-time labor input. The annual plant
growth and labor occur in a 181-day growing season. All of the vegetated roof
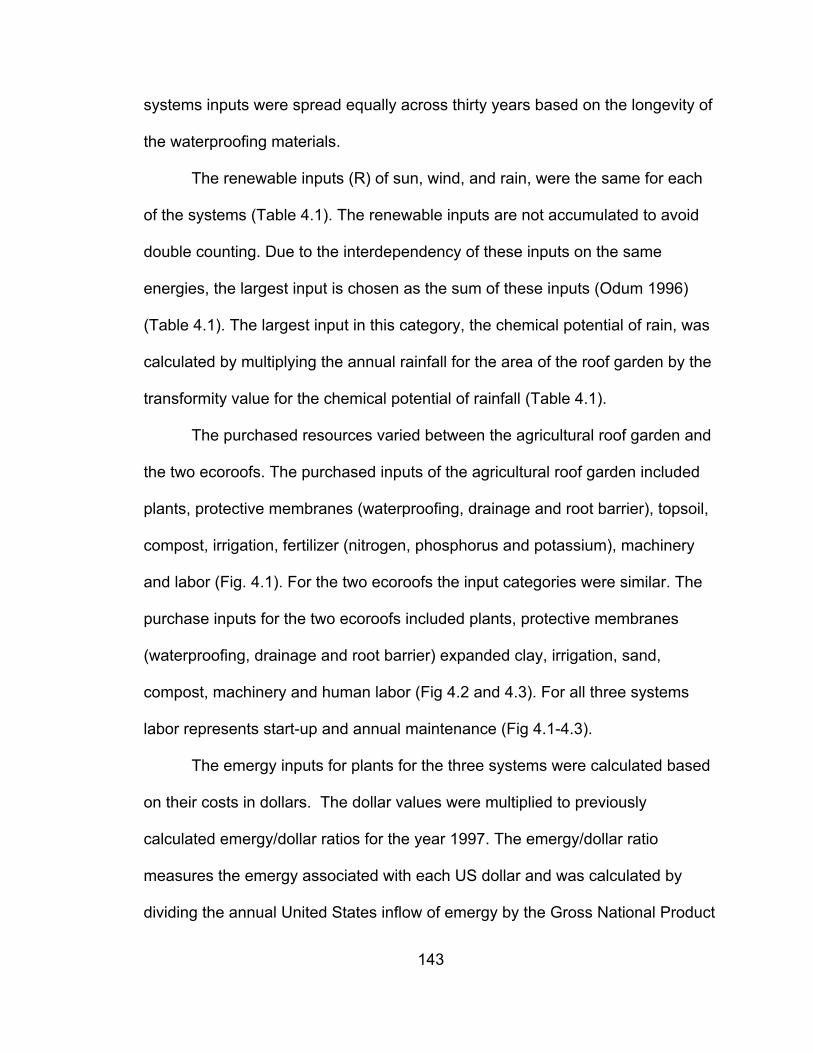
143
systems inputs were spread equally across thirty years based on the longevity of
the waterproofing materials.
The renewable inputs (R) of sun, wind, and rain, were the same for each
of the systems (Table 4.1). The renewable inputs are not accumulated to avoid
double counting. Due to the interdependency of these inputs on the same
energies, the largest input is chosen as the sum of these inputs (Odum 1996)
(Table 4.1). The largest input in this category, the chemical potential of rain, was
calculated by multiplying the annual rainfall for the area of the roof garden by the
transformity value for the chemical potential of rainfall (Table 4.1).
The purchased resources varied between the agricultural roof garden and
the two ecoroofs. The purchased inputs of the agricultural roof garden included
plants, protective membranes (waterproofing, drainage and root barrier), topsoil,
compost, irrigation, fertilizer (nitrogen, phosphorus and potassium), machinery
and labor (Fig. 4.1). For the two ecoroofs the input categories were similar. The
purchase inputs for the two ecoroofs included plants, protective membranes
(waterproofing, drainage and root barrier) expanded clay, irrigation, sand,
compost, machinery and human labor (Fig 4.2 and 4.3). For all three systems
labor represents start-up and annual maintenance (Fig 4.1-4.3).
The emergy inputs for plants for the three systems were calculated based
on their costs in dollars. The dollar values were multiplied to previously
calculated emergy/dollar ratios for the year 1997. The emergy/dollar ratio
measures the emergy associated with each US dollar and was calculated by
dividing the annual United States inflow of emergy by the Gross National Product
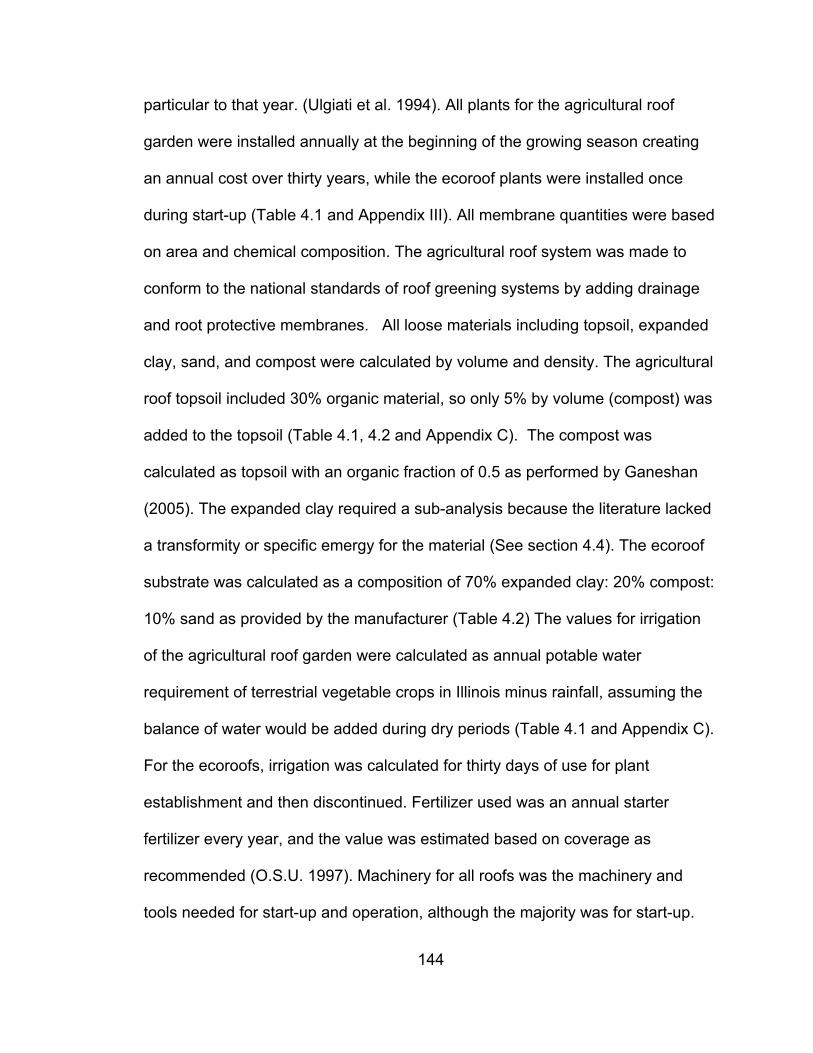
144
particular to that year. (Ulgiati et al. 1994). All plants for the agricultural roof
garden were installed annually at the beginning of the growing season creating
an annual cost over thirty years, while the ecoroof plants were installed once
during start-up (Table 4.1 and Appendix III). All membrane quantities were based
on area and chemical composition. The agricultural roof system was made to
conform to the national standards of roof greening systems by adding drainage
and root protective membranes. All loose materials including topsoil, expanded
clay, sand, and compost were calculated by volume and density. The agricultural
roof topsoil included 30% organic material, so only 5% by volume (compost) was
added to the topsoil (Table 4.1, 4.2 and Appendix C). The compost was
calculated as topsoil with an organic fraction of 0.5 as performed by Ganeshan
(2005). The expanded clay required a sub-analysis because the literature lacked
a transformity or specific emergy for the material (See section 4.4). The ecoroof
substrate was calculated as a composition of 70% expanded clay: 20% compost:
10% sand as provided by the manufacturer (Table 4.2) The values for irrigation
of the agricultural roof garden were calculated as annual potable water
requirement of terrestrial vegetable crops in Illinois minus rainfall, assuming the
balance of water would be added during dry periods (Table 4.1 and Appendix C).
For the ecoroofs, irrigation was calculated for thirty days of use for plant
establishment and then discontinued. Fertilizer used was an annual starter
fertilizer every year, and the value was estimated based on coverage as
recommended (O.S.U. 1997). Machinery for all roofs was the machinery and
tools needed for start-up and operation, although the majority was for start-up.
145
Machinery is not used in maintenance operations, and tools are rarely used
because they are potential hazards to the protective membranes.
For the agricultural roof garden, labor was calculated as 3.5 hour per day
over the growing season. This allowed for all labor activities, including planting,
weeding, fertilizing, watering, and harvesting (3.5 hr/day *178days=622hrs/yr)
(Ebenezer 2003). Labor for the ecoroof systems was based on the routine
maintenance practice of three days per year (8 hrs/day *3=24hrs/yr) (Dunnett
and Kingsbury 2004) (Table 5.1 and Appendix III). Additionally, a one-time
figure was added to labor for start up costs, including planning, design, and
installation for each system. It assumed 80 hours for 15 weeks (1200hrs) at a
technician rate (4.30E+12 sej/hr), (Oretga 2000) . The extensive roof figure was
reduced by 20% to account for lower quantity of installed growing material.
The system output was vegetable yield (edible biomass) and whole plant
(dry weight) biomass for the agricultural roof garden, and whole plant (dry weight)
biomass for the ecoroofs. Recording different weights to represent food and
ecological services allows for disciplinary comparison. The total annual harvest
of fresh material from the agricultural roof for 1997 was recorded to be 446.1 kg
(Ebenezer 2003). The ratio of edible biomass to whole plant was 4:1 creating
557.6 kg total whole plant biomass (Stockert et al. 2000). The fresh weight was
multiplied by the dry weight ratio of 0.08 from Thornley et al. (1981) and Jung et
al. (2004). The biomass for the ecoroofs was harvested from the ecoroof
simulator as whole plant biomass dried at 55oC for 72 hours and weighed. The
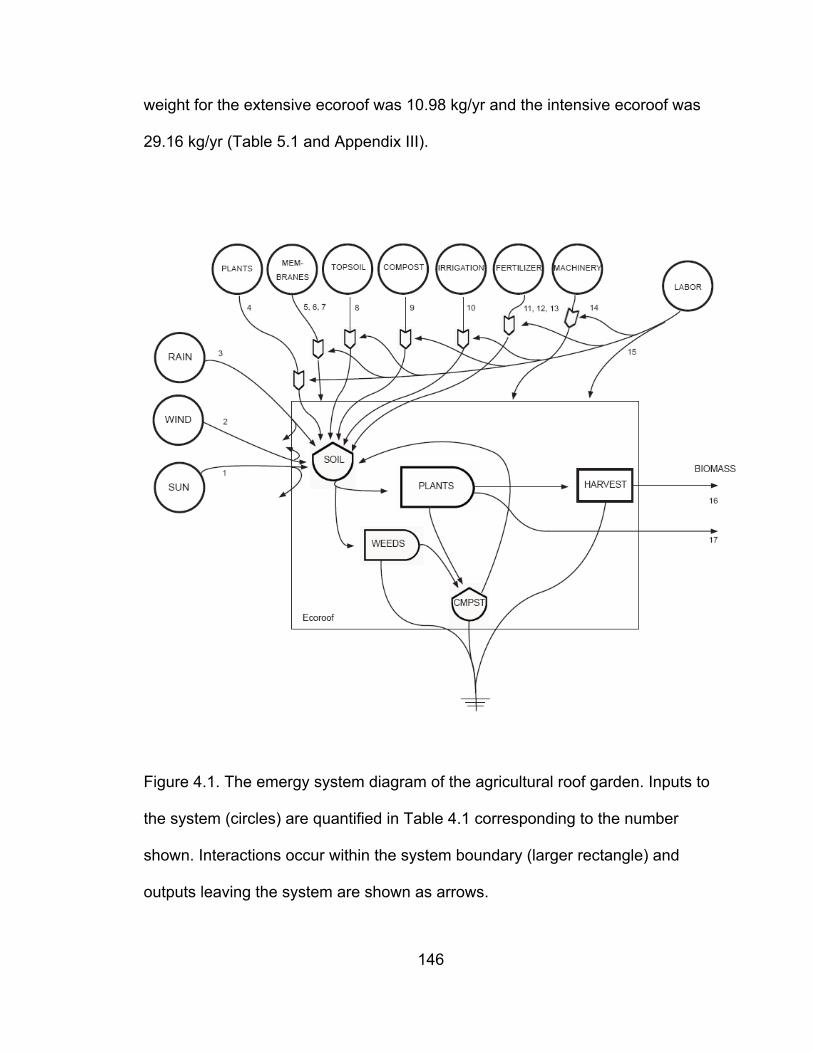
146
weight for the extensive ecoroof was 10.98 kg/yr and the intensive ecoroof was
29.16 kg/yr (Table 5.1 and Appendix III).
Figure 4.1. The emergy system diagram of the agricultural roof garden. Inputs to
the system (circles) are quantified in Table 4.1 corresponding to the number
shown. Interactions occur within the system boundary (larger rectangle) and
outputs leaving the system are shown as arrows.
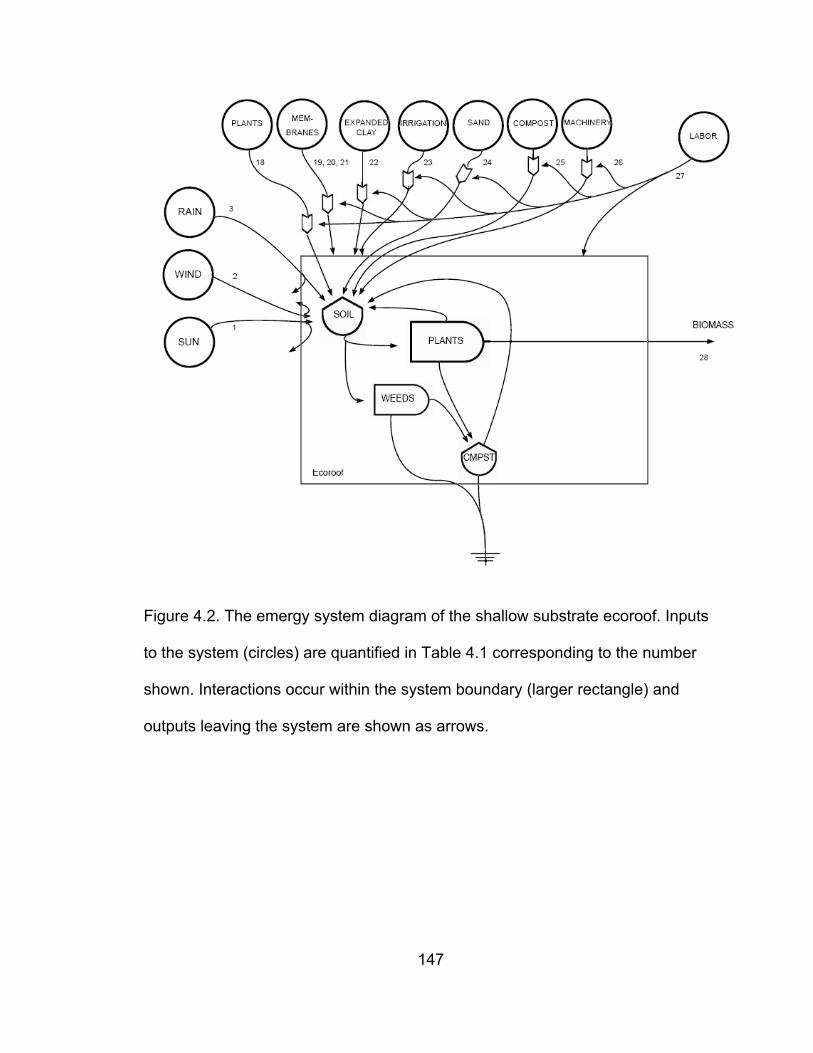
147
Figure 4.2. The emergy system diagram of the shallow substrate ecoroof. Inputs
to the system (circles) are quantified in Table 4.1 corresponding to the number
shown. Interactions occur within the system boundary (larger rectangle) and
outputs leaving the system are shown as arrows.
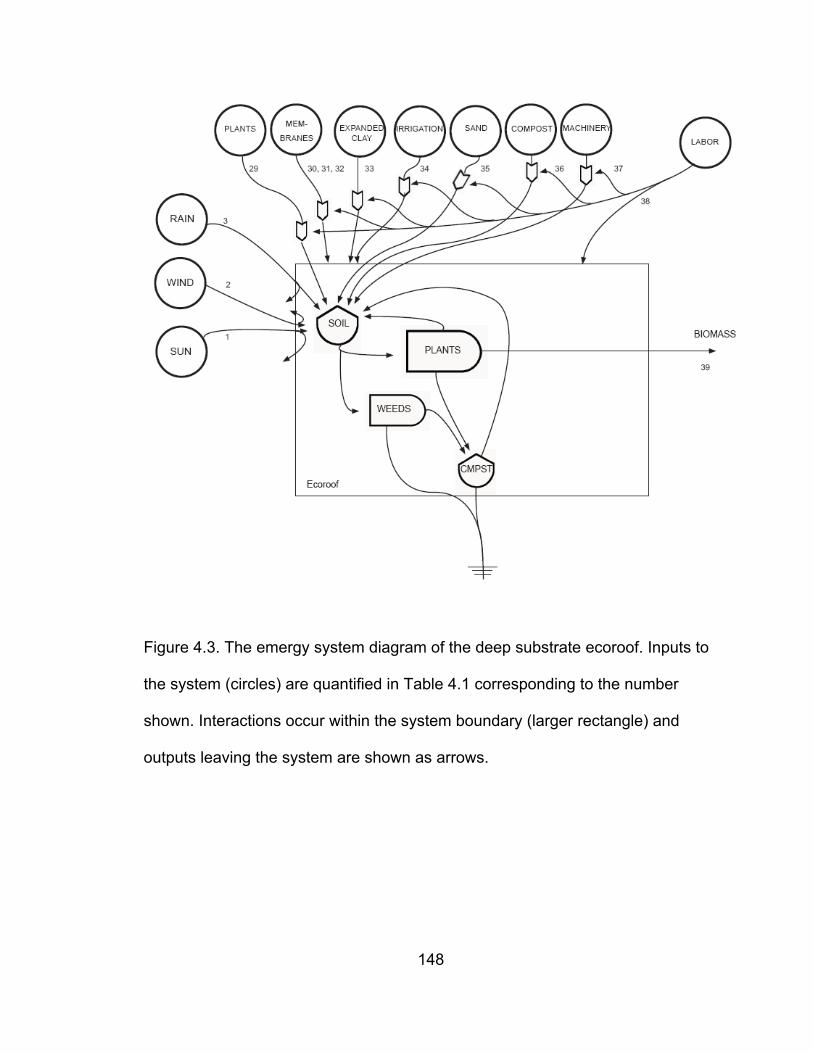
148
Figure 4.3. The emergy system diagram of the deep substrate ecoroof. Inputs to
the system (circles) are quantified in Table 4.1 corresponding to the number
shown. Interactions occur within the system boundary (larger rectangle) and
outputs leaving the system are shown as arrows.
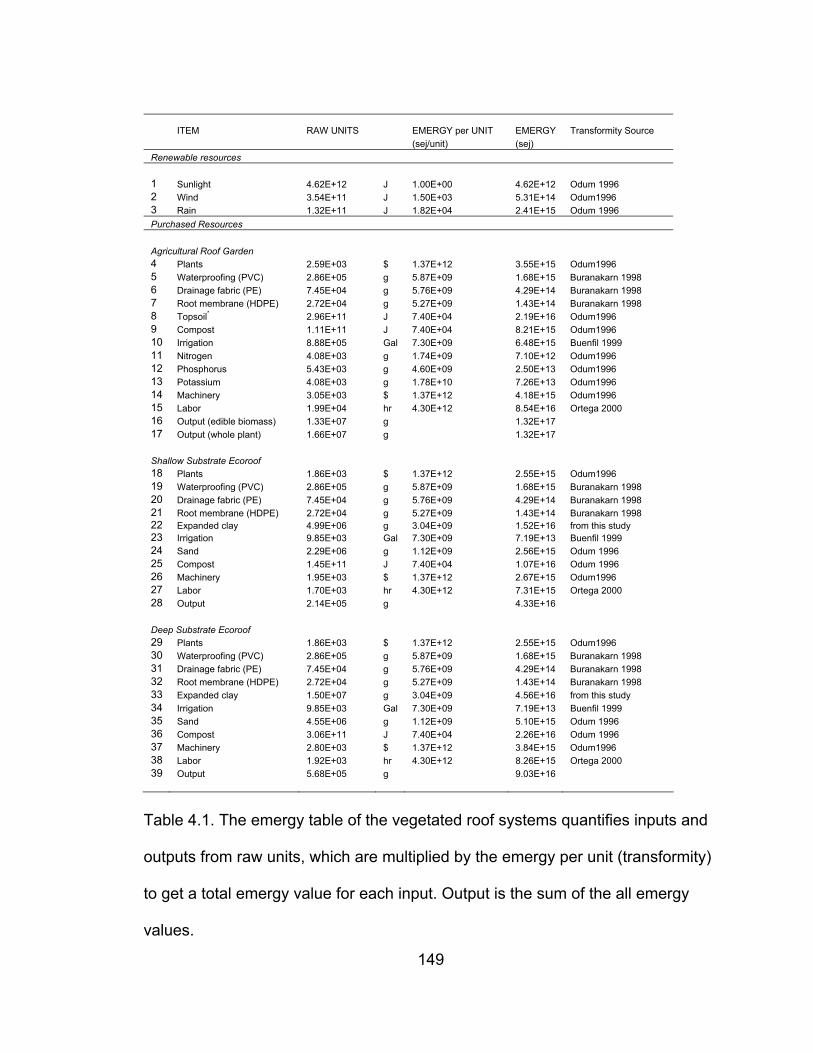
149
ITEM RAW UNITS EMERGY per UNIT
EMERGY Transformity Source
(sej/unit) (sej) Renewable resources 1 Sunlight 4.62E+12 J 1.00E+00 4.62E+12 Odum 1996 2 Wind 3.54E+11 J 1.50E+03 5.31E+14 Odum1996 3 Rain 1.32E+11 J 1.82E+04 2.41E+15 Odum 1996 Purchased Resources Agricultural Roof Garden 4 Plants 2.59E+03 $ 1.37E+12 3.55E+15 Odum1996 5 Waterproofing (PVC) 2.86E+05 g 5.87E+09 1.68E+15 Buranakarn 1998 6 Drainage fabric (PE) 7.45E+04 g 5.76E+09 4.29E+14 Buranakarn 1998 7 Root membrane (HDPE) 2.72E+04 g 5.27E+09 1.43E+14 Buranakarn 1998 8 Topsoil* 2.96E+11 J 7.40E+04 2.19E+16 Odum1996 9 Compost 1.11E+11 J 7.40E+04 8.21E+15 Odum1996 10 Irrigation 8.88E+05 Gal 7.30E+09 6.48E+15 Buenfil 1999 11 Nitrogen 4.08E+03 g 1.74E+09 7.10E+12 Odum1996 12 Phosphorus 5.43E+03 g 4.60E+09 2.50E+13 Odum1996 13 Potassium 4.08E+03 g 1.78E+10 7.26E+13 Odum1996 14 Machinery 3.05E+03 $ 1.37E+12 4.18E+15 Odum1996 15 Labor 1.99E+04 hr 4.30E+12 8.54E+16 Ortega 2000 16 Output (edible biomass) 1.33E+07 g 1.32E+17 17 Output (whole plant) 1.66E+07 g 1.32E+17 Shallow Substrate Ecoroof 18 Plants 1.86E+03 $ 1.37E+12 2.55E+15 Odum1996 19 Waterproofing (PVC) 2.86E+05 g 5.87E+09 1.68E+15 Buranakarn 1998 20 Drainage fabric (PE) 7.45E+04 g 5.76E+09 4.29E+14 Buranakarn 1998 21 Root membrane (HDPE) 2.72E+04 g 5.27E+09 1.43E+14 Buranakarn 1998 22 Expanded clay 4.99E+06 g 3.04E+09 1.52E+16 from this study 23 Irrigation 9.85E+03 Gal 7.30E+09 7.19E+13 Buenfil 1999 24 Sand 2.29E+06 g 1.12E+09 2.56E+15 Odum 1996 25 Compost 1.45E+11 J 7.40E+04 1.07E+16 Odum 1996 26 Machinery 1.95E+03 $ 1.37E+12 2.67E+15 Odum1996 27 Labor 1.70E+03 hr 4.30E+12 7.31E+15 Ortega 2000 28 Output 2.14E+05 g 4.33E+16 Deep Substrate Ecoroof 29 Plants 1.86E+03 $ 1.37E+12 2.55E+15 Odum1996 30 Waterproofing (PVC) 2.86E+05 g 5.87E+09 1.68E+15 Buranakarn 1998 31 Drainage fabric (PE) 7.45E+04 g 5.76E+09 4.29E+14 Buranakarn 1998 32 Root membrane (HDPE) 2.72E+04 g 5.27E+09 1.43E+14 Buranakarn 1998 33 Expanded clay 1.50E+07 g 3.04E+09 4.56E+16 from this study 34 Irrigation 9.85E+03 Gal 7.30E+09 7.19E+13 Buenfil 1999 35 Sand 4.55E+06 g 1.12E+09 5.10E+15 Odum 1996 36 Compost 3.06E+11 J 7.40E+04 2.26E+16 Odum 1996 37 Machinery 2.80E+03 $ 1.37E+12 3.84E+15 Odum1996 38 Labor 1.92E+03 hr 4.30E+12 8.26E+15 Ortega 2000 39 Output 5.68E+05 g 9.03E+16
Table 4.1. The emergy table of the vegetated roof systems quantifies inputs and
outputs from raw units, which are multiplied by the emergy per unit (transformity)
to get a total emergy value for each input. Output is the sum of the all emergy
values.
150
ITEM UNIT AGRICULTURAL ROOF GARDEN (%) EXTENSIVE
ECOROOF (%) INTENSIVE ECOROOF (%)
Topsoil m3 29.71 (0.95) - -
Compost m3 1.51 (0.05) 1.98 (0.2) 4.16 (0.2)
Expanded clay m3 - 6.94 (0.75) 20.8 (0.75)
Sand m3 - 0.99 (0.1) 1.98 (0.1)
Table 4.2. Substrate composition table of the three vegetated roofs systems by
volume and percentage per cubic meter.
4.4 Sub-analysis of expanded clay
4.4.1 The emergy analysis of expanded clay
The material transformity of expanded clay in the shallow and deep
ecoroof systems was not found and therefore required a sub-analysis. Expanded
clay is lightweight aggregate produced by the thermal expansion of clay bodies
through a rotary kiln (EPA 1993). The analysis of this process is based on the
emergy analysis of similar construction materials performed by Burnakarn
(1998). The information was provided by contributors to the Expanded Shale,
Clay and Slate Institute and is based on the operations of a sponsor facility
(ESCSI 2004). The process as described by the individual facility was compared
to current publications (Aineto et al. 2004; Pioro and Pioro 2004).
An emergy diagram was constructed to assess the flows of resources in
the process (Fig. 4.4). The process includes only purchased inputs and services
151
(F) of clay, natural gas, coal, machinery, fuels and labor (Table 5.3). The
expanded clay did not possess any renewable inputs (R) (Fig. 5.4). All inputs
were based on annual quantities used by the facility. Natural gas and coal were
used to operate the facility and the kiln. The machinery component included the
kilns, trucks and sorting equipment. Fuels were used for transportation. The labor
was based on hours of work by the numbers of employees used to operate the
facility.
The output of the process was 2.70E+10 g, while the Yield was 7.88E+19
sej (Table 4.4). The specific emergy for expanded clay was determined by
dividing the Yield (Y) by the amount of materials produced as explained by Odum
(1996). The specific emergy for expanded clay was 3.04E+09 sej/g. This value is
higher than concrete block at 3.54E+08 sej/g, brick at 2.22E+09 sej/g (Burnakarn
1998), and steel at 2.16E+09 sej/g (Odum 1996), but lower than fertilizer at
3.8E+09 sej/g (Odum 1996), and aluminum at 1.74E+10 sej/g (Lagerberg and
Brown 1999).
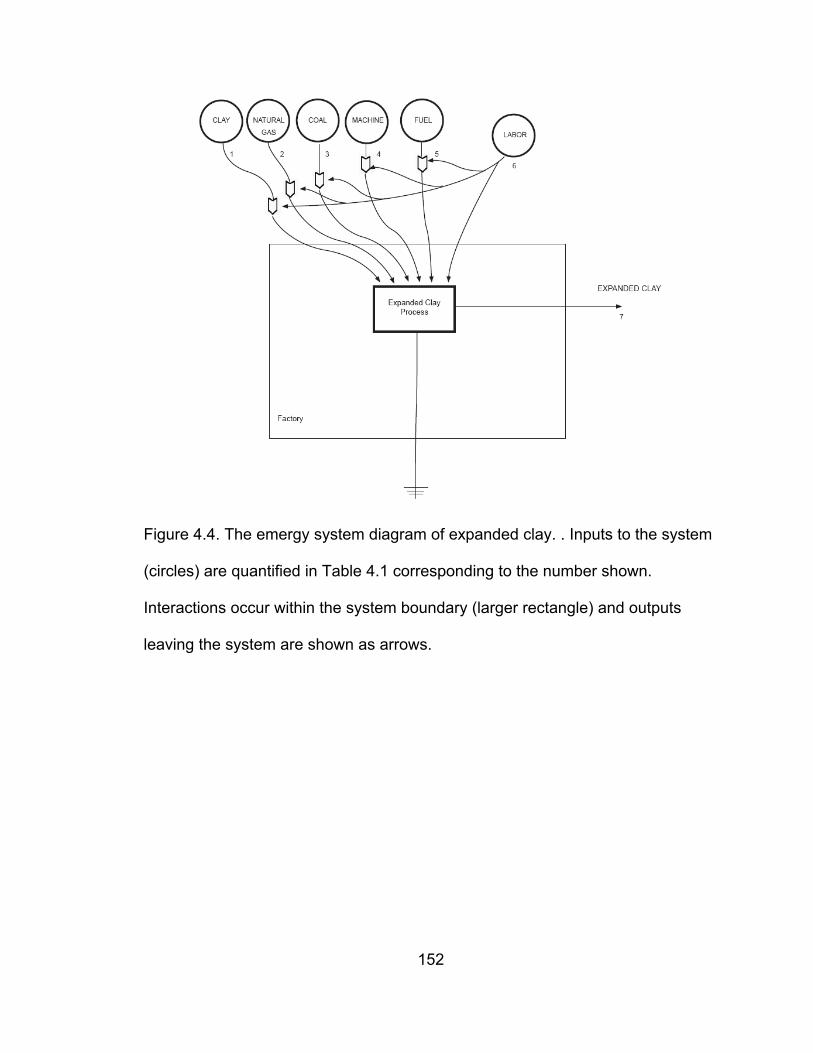
152
Figure 4.4. The emergy system diagram of expanded clay. . Inputs to the system
(circles) are quantified in Table 4.1 corresponding to the number shown.
Interactions occur within the system boundary (larger rectangle) and outputs
leaving the system are shown as arrows.
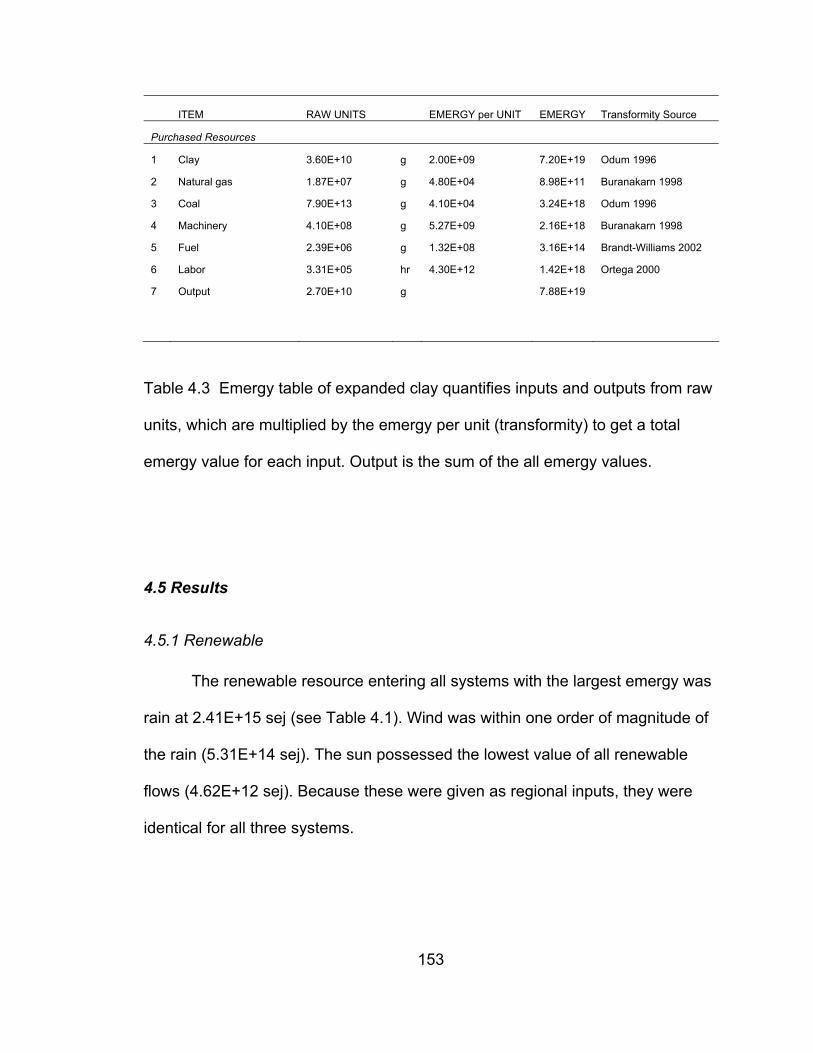
153
ITEM RAW UNITS EMERGY per UNIT EMERGY Transformity Source
Purchased Resources
1 Clay 3.60E+10 g 2.00E+09 7.20E+19 Odum 1996
2 Natural gas 1.87E+07 g 4.80E+04 8.98E+11 Buranakarn 1998
3 Coal 7.90E+13 g 4.10E+04 3.24E+18 Odum 1996
4 Machinery 4.10E+08 g 5.27E+09 2.16E+18 Buranakarn 1998
5 Fuel 2.39E+06 g 1.32E+08 3.16E+14 Brandt-Williams 2002
6 Labor 3.31E+05 hr 4.30E+12 1.42E+18 Ortega 2000
7 Output 2.70E+10 g 7.88E+19
Table 4.3 Emergy table of expanded clay quantifies inputs and outputs from raw
units, which are multiplied by the emergy per unit (transformity) to get a total
emergy value for each input. Output is the sum of the all emergy values.
4.5 Results
4.5.1 Renewable
The renewable resource entering all systems with the largest emergy was
rain at 2.41E+15 sej (see Table 4.1). Wind was within one order of magnitude of
the rain (5.31E+14 sej). The sun possessed the lowest value of all renewable
flows (4.62E+12 sej). Because these were given as regional inputs, they were
identical for all three systems.
154
4.5.2 Purchased Resources
The emergy inputs in all three systems were the highest in the area of
purchased resources when compared to renewable inputs. Across all systems,
the imported resources of labor, growing medium (topsoil or expanded clay),
plants, and compost were the larger inputs in this category. Labor in the
agricultural roof garden recorded the highest of all inputs in any system at
8.54E+16 sej (Table 5.1). The large amount of emergy was due both to the
amount of labor imported (1.99E+04 hr) and the transformity of this resource
(4.30E+12 sej). This input accounted for 65% of all the purchased inputs in the
agricultural roof garden. Topsoil was the second greatest input to the agricultural
system at 16% (2.19E+16 sej). The third was the compost, which accounted for
6% (8.21E+15sej). Irrigation and machinery accounted for 5% each, and sand
and plants for 3% each. Collectively, the protective membranes accounted for
1.6%. Lastly, fertilizers accounted for 1% or less of the total.
In the shallow substrate ecoroof, the expanded clay, which constituted
part of the growing material, was the largest input (1.52E+16 sej) due to its
quantity (4.99E+06 g) and the specific emergy (3.04E+09 sej/g, Table 5.1) of the
resource. This accounted for 35% of all purchased inputs. Compost, which was
mixed with the expanded clay, was the second major input for the extensive roof
at 25% (1.07E+16 sej). The third was human labor at 17% (7.31E+15 sej).
Machinery, sand, and plants each accounted for 6% of the purchased resources.
Collectively, the protective membranes accounted for 5%. Lastly, irrigation
155
accounted for less than 1% because it was used only for one season during plant
establishment.
In the deep substrate ecoroof, the inputs from the growing materials of
expanded clay and compost accounted for the majority of the purchased
resources. Expanded clay accounted for 50% of all the purchased inputs
(4.56E+16 sej, Table 4.1). This was due to its quantity (1.50E+07 g). Compost
accounted for the second greatest input at 26% (2.24E+16 sej). Following those
two larger inputs were labor at 9%, sand at 5%, and machinery at 4%.
Collectively, the protective membranes accounted for 2%. Lastly, irrigation
accounted for less than 1%.
Due to the large emergy inputs from labor, topsoil and compost, the
purchased emergy was greatest for the agricultural roof garden (1.32E+17 sej,
Table 4.1). The deep substrate ecoroof had the second greatest input of
purchased resources, 9.03E+16 sej, or 73% of that of the agricultural roof garden
(Table 4.1). The shallow substrate ecoroof had the lowest input of purchased
resources, at 32% of the agricultural roof garden resources (4.33E+16 sej, Table
4.1).
4.5.4 Yields and Specific Emergy
The system yield was calculated by totaling the renewable, non-
renewable, and purchased inputs. In the agricultural roof garden, the system
yield was 1.34E+17 sej (Table 4.4) and the biomass output, the amount of
vegetables produced, was 1.33E+07g, which resulted in the specific emergy of
1.01E+10 sej/g (Table 4.3). The yield of the branched outflow of the whole plant
156
in the agricultural roof remained 1.34E+17 sej and the biomass output, the
amount of plant biomass produced, was 1.66E+07g, which resulted in the
specific emergy of 9.92E+10 sej/g. The system yield for the shallow substrate
ecoroof was 4.57E+16 sej (Table 4.1) and the biomass output was 2.14E+05 g.
This resulted in a specific emergy of 2.14E+11 sej/g for the shallow ecoroof. The
system yield for the deep substrate ecoroof was 1.04E+17 sej/g and the biomass
output was 5.68E+05 g, which resulted in a specific emergy of 1.84E+11 sej/g
(Table 4.4).
4.5.5 Emergy Indices
Each of the three systems used very low amounts of renewable resources
when compared to purchased resources. The fraction of renewable inputs for
each system were 0.02 (agricultural roof garden), 0.06 (shallow substrate
ecoroof), and 0.03 (deep substrate ecoroof) (Table 4.4). This indicates that no
system used more than 6% of renewable resources in order to operate. The
shallow ecoroof used the most at 6%, while the agricultural roof was the lowest
and used only 2%. The emergy yield ratio was greatest in the shallow ecoroof
(1.06), while the agricultural roof garden and deep ecoroof both recorded the
score of 1.02 (Table 4.3). The environmental loading ratio was the highest in the
agricultural roof garden (45) and lowest for the shallow ecoroof (15) (Table 4.4).
The emergy sustainability index was the highest for the shallow ecoroof (7.17E-
02), followed by the deep ecoroof (2.96E-02), with the lowest being the
agricultural roof garden (2.27E-02) (Table 4.4).
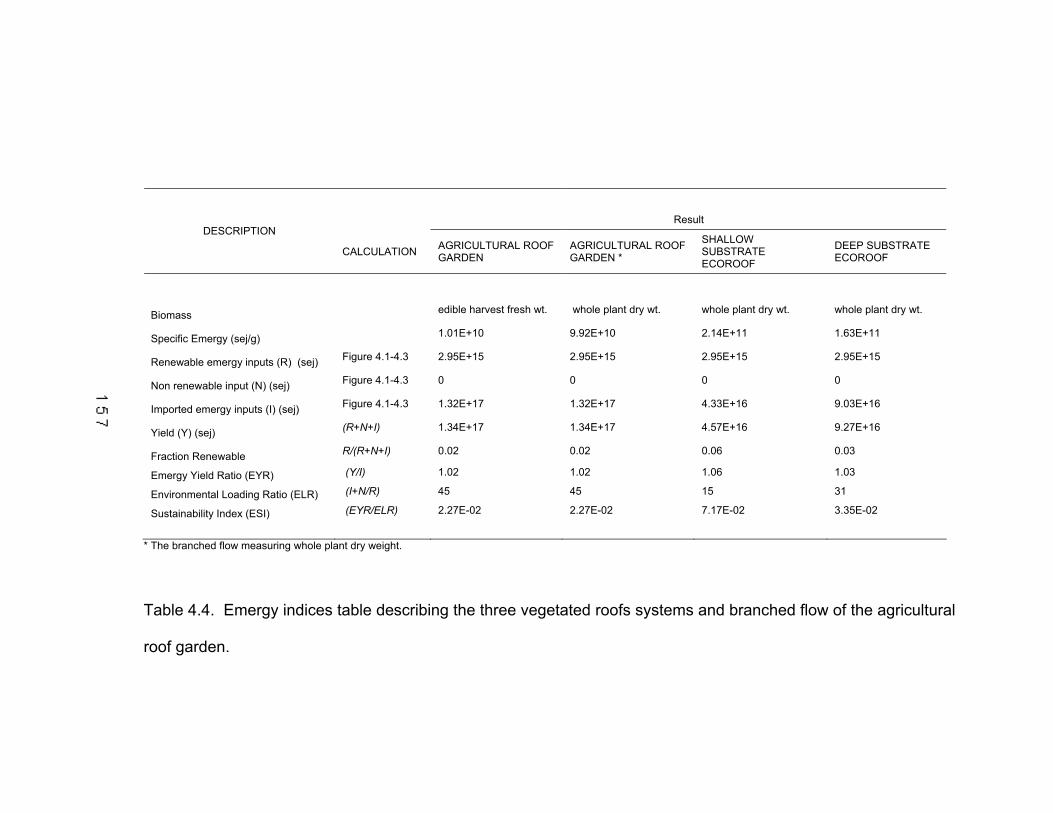
Result DESCRIPTION
CALCULATION AGRICULTURAL ROOF GARDEN
AGRICULTURAL ROOF GARDEN *
SHALLOW SUBSTRATE ECOROOF
DEEP SUBSTRATE ECOROOF
Biomass edible harvest fresh wt. whole plant dry wt. whole plant dry wt. whole plant dry wt.
Specific Emergy (sej/g) 1.01E+10 9.92E+10 2.14E+11 1.63E+11
Renewable emergy inputs (R) (sej) Figure 4.1-4.3 2.95E+15 2.95E+15 2.95E+15 2.95E+15
Non renewable input (N) (sej) Figure 4.1-4.3 0 0 0 0
Imported emergy inputs (I) (sej) Figure 4.1-4.3 1.32E+17 1.32E+17 4.33E+16 9.03E+16
Yield (Y) (sej) (R+N+I) 1.34E+17 1.34E+17 4.57E+16 9.27E+16
Fraction Renewable R/(R+N+I) 0.02 0.02 0.06 0.03
Emergy Yield Ratio (EYR) (Y/I) 1.02 1.02 1.06 1.03
Environmental Loading Ratio (ELR) (I+N/R) 45 45 15 31
Sustainability Index (ESI) (EYR/ELR) 2.27E-02 2.27E-02 7.17E-02 3.35E-02
* The branched flow measuring whole plant dry weight.
Table 4.4. Emergy indices table describing the three vegetated roofs systems and branched flow of the agricultural
roof garden.
158
4.6 Discussion
4.6.1 Limitations
Vegetated roof systems have various outputs, however, only biomass was
assessed. The reasons to assess biomass (productivity) in ecoroofs are: 1)
productivity is linked to other ecosystem functions, such as biodiversity and
community stability (Naeem et al. 1996), 2) productivity appears to affect the
environmental benefits of energy, habitat, and stormwater runoff provided by
ecoroofs (Wong et al. 2003; Brenneisen 2004; Rowe et al. pending), and 4)
advocates in the public realm are currently proposing productivity as a way to
maximize environmental benefits in ecoroofs (Mankiewicz and McDonnell 2006).
Although many studies provide information on other environmental benefits few
report findings with measurable outputs. For example, storm water retention has
been recorded, but there are very few reporting evapotranspiration, which would
be the measurable output of the hydrological cycle (Lipton and Strecker 2003;
Rowe et al. 2003; Hunt and Smith 2005). Another example is wildlife studies are
beginning to record species presence and diversity (Brenneisen 2003), but
studies investigating dispersal could not be found. By recording whole plant
biomass, I am trying to indirectly account for these benefits; however, this is an
underestimation of the total benefits from the system. The limitation of not
accounting for these individual outputs is lower overall output and a higher
specific emergy for each system. For example, the output for evapotranspiration
159
and dispersal when summed with the output of biomass could increase the
system’s total output. When included, these outputs would lower the specific
emergy, or transformity, of each vegetated roof system. Equally, systems
characteristics such as greater water storage in the deep substrate ecoroof may
allow for increased evapotranspiration compared with the shallow substrate
ecoroof, thus improving the system’s total output of one roof over another.
The location of the system’s boundary may impact the measure of
performance and sustainability. The boundary was placed at the roof level.
Expanding this boundary may affect performance. Beck et al (2001) noted
limitations that plot level studies may have an effect on the values of constructed
landscapes. When the system boundary included the residential house,
resources such as labor could be reallocated with effects on sustainability. The
labor, or a portion of it, would no longer be considered a purchased input but
instead renewable. In vegetated roof systems for instance, individuals living and
working in the building with an agricultural roof garden and providing the required
labor for the garden could reduce the need for purchased labor inputs. This
would reduce the environmental loading ratio and improve the emergy
sustainability index based on the proportion of food resources used in supporting
the individuals. However, widening the boundary may have the reverse impacts
on performance. Carter and Rasmussen (2005) found that scale changes
impacted ecoroof performance in stormwater. Performances of vegetated roof
160
systems were considered less effective in sparsely developed watershed when
compared to their studies using just the ecoroof as a boundary.
4.6.2 Vegetated Roof Systems Sustainability and Productivity
Although definitions of sustainability differ, Brown and Ulgiati (1997)
explain that sustainability is a function of yield, renewability and load on the
environment. Therefore, a system that produces a negative net yield by
definition, cannot be sustained without continual flows of purchased emergy.
Equally, if a system relies on non-renewable resources and places an extreme
load on the environment, it threatens any long term operation. Assuming this
interpretation, each of the examined vegetated roof systems operate with a low
level of sustainability because of their dependence on purchased inputs for yields
and high loads on the environment. The variation of in each vegetated roof
system input quantities contributed to a range of sustainability of the systems.
Of the three systems, the shallow ecoroof possessed a greater level of
sustainability because it used a greater percentage of renewable inputs
compared to those of purchased inputs (Table 4.4). The higher emergy
sustainability index value of the shallow ecoroof (7.17E-02 Table 4.4), was
because the system used twice the percentage of renewable inputs (6%) than
the deep ecoroof (3%) and two-thirds more than the agricultural roof garden
(2%). This is reflected in the environmental loading ratios which have direct
inverse relationships to the fraction renewable (Ulgiati and Brown 1998). The
161
shallow ecoroof had a lower environmental loading ratio (15) than the agricultural
roof garden (45) and the deep ecoroof (35). Another way of understanding this
relationship is the degree of sustainability that was shown to be a reciprocal to
the level of purchased inputs. The shallow ecoroof had the highest sustainability
and the lowest amounts of purchase inputs, while the agricultural roof garden
recorded the lowest sustainability and the highest amounts of purchased inputs.
The growing media and labor were the inputs most influencing the level of
sustainability.
Contributing to the higher sustainability of the shallow ecoroof was the
lower input use of growing medium (2.85E+16 sej) than both the agricultural
(3.01E+16 sej) and intensive (8.50E+16 sej). Additionally, the shallow ecoroof
system operated with the lowest input of labor at 7.31E+15 sej compared to the
deep (8.26E+15 sej) and the agricultural (8.54E+16 sej). The high level of labor
input for the agricultural roof garden was due to manual labor of annual planting,
hand watering, and seasonal harvesting. In the intensive ecoroof, labor was
higher because of greater initial start-up inputs.
Due to the purchased inputs vegetated roof systems do not operate like
natural systems. Ulgiati and Brown (1998) state that natural systems commonly
have ELR = 0 when operating on 100% renewable inputs. Tilley and Swank
(2003) showed that managed natural systems, such as forest reserves used for
timber, recreation, and conservation, received up to 49% of their emergy from the
162
natural resources of precipitation, wind, and sunlight. Therefore, vegetated roof
systems cannot be considered ‘natural’ with renewable inputs below 6%.
Of the three systems the agricultural roof was the most efficient at
producing biomass for food and environmental services. The specific emergy of
the agricultural roof (edible biomass) was 1.10E+10 sej/j. This demonstrates the
benefits of investing in higher quality energies such as labor, fertilizers and
irrigation. These energies improve production efficiencies in the roof. However,
these efficiencies were not as good as those observed by Martin et al (2006) in
the conventional corn and blackberry farms. When adjusted to a comparable unit,
corn (4.29E+08 sej/g/ha) had a lower specific emergy than blackberries
(4.83E+08 sej/g/ha), while both were lower than the agricultural roof. Therefore,
the agricultural roof was not as productive as conventional farming. On the other
hand if the investment in higher quality inputs in the agricultural roof does not
compromise environmental services, then the system can produce greater
regulatory services than the other roofs as well. The roof generates more whole
plant biomass at a lower transformity (9.92E+10 sej/g) (Table 4.5). This means
the agricultural roof could cool the building structure or reduce runoff with more
efficiency than ecoroofs due to its productivity.
4.6.3 Comparison to other landscape systems
In order to better understand the vegetated roof systems, they were
compared to other constructed landscapes previously assessed using emergy
163
(Table 4.5). When compared to landscapes that either produce food or are
constructed as part of urban settings, vegetated roof systems recorded middle
range values of ratios and indices. Compared with traditional and conventional
agriculture, all three vegetated roof systems recorded lower emergy yield ratios
and higher environmental loading ratios resulting in lower emergy sustainability
index values. On the other hand, compared to a city, constructed urban gardens
and a conventional landscape the three systems showed higher emergy yield
ratios and lower environmental loads, which resulted in higher emergy
sustainability index values (Table 4.5). The three vegetated roof systems
possess ESI of 0.07 (shallow ecoroof), 0.03 (deep ecoroof), and 0.04
(agricultural roof garden). All roof systems had lower sustainability than
indigenous farming in Chiapas, Mexico (ESI of 115), a local farm in Italy (1.75), a
blackberry farm in the USA (0.65), a local vineyard in Italy (0.44) and a
conventional corn farm in the USA (0.06). All agricultural systems had higher
emergy yield ratios and lower environmental loading ratios than the roof systems.
Therefore, the vegetated roof systems had lower sustainability due to the lower
yields and higher pressures on the environment. However, all vegetated roof
systems have higher sustainability than a conventional landscape (8.61E-06), an
organic garden (0.002), an edible landscape (0.002), a forest garden (0.001) and
the city of Taipei, China (0.001). All of the urban landscapes possessed lower
emergy yield ratios and higher environmental loading ratios. Therefore,
164
vegetated roof systems had greater levels of sustainability due to higher yields
and lower pressures on the environment.
The entire group of constructed urban systems, including vegetated roof
systems, possessed low levels of sustainability as shown by their low emergy
sustainability index scores. This should be of concern to not only the designers of
vegetated roof systems, but also to all professions involved with practices of
creating urban landscapes and urban ecological systems. Beck et al (2001)
noted these results were due to the cumulative emergy investment for almost all
items that were brought into the system for establishment. The establishment of
vegetated roof systems is similar to these landscapes; however, less purchased
resources are added and they operate more efficiently. Beck et al (2001)
continued to show that the conventional landscape possessing a lawn is one of
the most unsustainable constructed urban systems. Comparatively, conventional
landscapes would further reduce the already low levels of the sustainability of a
city such as Taipei. The vegetated roof systems recorded much higher levels of
sustainability (0.07, 0.03, and 0.02) when compared to the conventional
landscape (8.61E-06) and gardens (0.002-0.001). This means that vegetated
roof systems would be a more sustainable choice in the city to provide food or
environmental services than a conventional landscape and urban gardens.
The vegetated roofs systems seem to operate similarly to constructed
urban landscapes such as gardens. Beck et al (2001) noted that the low emergy
yield ratios and the emergy sustainability were due to high levels of purchased
165
resources from the economy. This was reflected in their high environmental
loading ratio. The addition of materials and labor to prevent unwanted plants
(weeds) from damaging either the aesthetic quality or productivity of the gardens
created higher environmental loads for the gardens. One difference is that
vegetated roof systems operate more efficiently by importing less purchased
resources and being freer from demands of weed competition and aesthetics.
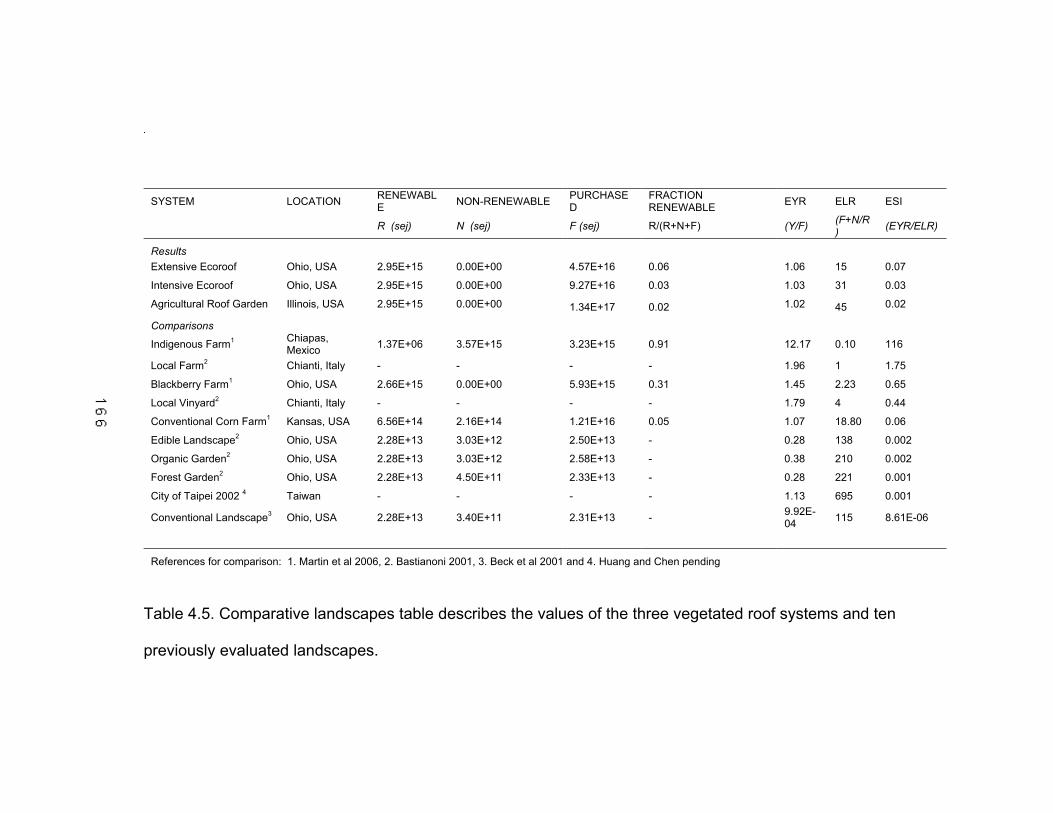
SYSTEM LOCATION RENEWABLE NON-RENEWABLE PURCHASE
D FRACTION RENEWABLE EYR ELR ESI
R (sej) N (sej) F (sej) R/(R+N+F) (Y/F) (F+N/R) (EYR/ELR)
Results
Extensive Ecoroof Ohio, USA 2.95E+15 0.00E+00 4.57E+16 0.06 1.06 15 0.07
Intensive Ecoroof Ohio, USA 2.95E+15 0.00E+00 9.27E+16 0.03 1.03 31 0.03
Agricultural Roof Garden Illinois, USA 2.95E+15 0.00E+00 1.34E+17 0.02 1.02 45 0.02
Comparisons
Indigenous Farm1 Chiapas, Mexico 1.37E+06 3.57E+15 3.23E+15 0.91 12.17 0.10 116
Local Farm2 Chianti, Italy - - - - 1.96 1 1.75
Blackberry Farm1 Ohio, USA 2.66E+15 0.00E+00 5.93E+15 0.31 1.45 2.23 0.65
Local Vinyard2 Chianti, Italy - - - - 1.79 4 0.44
Conventional Corn Farm1 Kansas, USA 6.56E+14 2.16E+14 1.21E+16 0.05 1.07 18.80 0.06
Edible Landscape2 Ohio, USA 2.28E+13 3.03E+12 2.50E+13 - 0.28 138 0.002
Organic Garden2 Ohio, USA 2.28E+13 3.03E+12 2.58E+13 - 0.38 210 0.002
Forest Garden2 Ohio, USA 2.28E+13 4.50E+11 2.33E+13 - 0.28 221 0.001
City of Taipei 2002 4 Taiwan - - - - 1.13 695 0.001
Conventional Landscape3 Ohio, USA 2.28E+13 3.40E+11 2.31E+13 - 9.92E-04 115 8.61E-06
References for comparison: 1. Martin et al 2006, 2. Bastianoni 2001, 3. Beck et al 2001 and 4. Huang and Chen pending
Table 4.5. Comparative landscapes table describes the values of the three vegetated roof systems and ten
previously evaluated landscapes.
167
4.6.3 The City and Vegetated Roof Systems
All three vegetated roofs systems (0.07-0.02) were found to be more
sustainable than the city of Taipei (0.001). Each vegetated roof system
possessed higher emergy yield ratios and lower environmental loading ratios
(Table 4.5). Cities like Taipei import energy and resources such as petroleum,
coal, steel and lumber as well as services, such as information and banking,
creating a high environmental loading ratio (695). Taipei also uses
hydroelectricity, a renewable input, as well as local non-renewables, such as coal
and topsoil. This improves the higher emergy yield ratio compared to vegetated
roofs. However, the greater use of renewable and local non-renewable resources
is not enough to offset the large amounts of purchased resources. Although, the
vegetated roofs systems use very little renewable resources they have much
lower environmental loads compared to the city. The combination of these makes
for a system that operates with improved sustainability. This means adding any
of the vegetated roof systems to the city of Taipei would improve its
sustainability.
Vegetated roof systems can improve urban sustainability, but only if they
depend on renewable inputs, do not increase purchased inputs and are built in a
highly urban setting that has a low ESI. Huang and Chen (2005) explain that as
cities urbanize they lose self-sufficiency as they convert from natural areas to
urban infrastructure. As imported energies converge in the city there is a decline
168
of natural areas and a loss of biomass and biomass storage. As a result nearby
agricultural and natural resources must be used to support the city center.
Because vegetated roof systems produce biomass, they can perform particular
environmental services that regional resources would otherwise have to provide.
The roof systems can in part manage stormwater and temperature regulation and
create habitat and food locally. However, the assumption is made that biomass
in the city operates from renewable inputs. Lastly, Huang and Shih (1992)
explain as communities urbanize there is a decrease in their emergy
sustainability index. This would mean that vegetated roof systems would have
greater impact in the improvement of a city’s sustainability, if the setting is largely
urban, or urbanizing. On the other hand, vegetated roof systems would have the
opposite effect in a city that is less urban or possesses a higher ESI. In this case,
a vegetated roof would have the opposite effect lowering the sustainability of the
city. This makes the contributions of any vegetated roof system dependent on
the level of sustainability of the city.
4.6.4 The Perception of the Vegetated Roof Technology
The vegetated roof systems assessed in this study performed contrary to
current perception. Most vegetated roof systems are expected to operate with a
high level of sustainability. Instead, the vegetated roof systems operated only
with more sustainability than other constructed landscapes. Vegetated roof
systems did not use enough renewable energies to be considered highly
169
sustainable. A more apt description of the current technology is that they are a
less unsustainable choice for the city than conventional landscape and
constructed gardens. This is due to start-up installation as well as maintenance.
Beck et al (2001) show that labor and materials used to tend the garden were
large inputs that would continue in order to create and maintain the landscape
aesthetics and harvest the produce. They state that the sustainability of a
conventional landscape and gardens appears not to be strongly related to time,
but rather the investment of purchased inputs. Because ecoroofs import less
materials and services than conventional landscapes they are more sustainable.
One important advantage of vegetated roof systems, especially ecoroofs,
is they are constructed systems possessing no universal aesthetic, which could
offer a high potential for a naturalized aesthetic (Dunnett 2006). Allowing roof
system vegetation to self-organize post construction could effectively reduce
labor inputs. Although natural aesthetics on vegetated roof systems have been
said to be ‘out-of-place’ in the urban environment (Wayland-Smith 2005), the
reduction of associated labor may be necessary to improve the high
environmental loads of the systems.
4.6.5 Improved Sustainability
To improve system sustainability the construction of new systems should
consider finding ways to improve yield, use proportionately more renewable
resources, and alleviate the high inputs of purchased resources that have been
170
associated with these systems. This would allow vegetated roofs to improve the
sustainability in more settings. The use of growing media (topsoil, expanded clay
and compost) is one area to consider because it was the largest input for both
ecoroofs (>65%) and the second largest input for the agricultural roof (>20%).
Most contemporary vegetated roof systems use imported soil-less media made
from expanded lightweight aggregate (Schundler 2002). If the systems used
topsoil instead, which was stockpiled during construction for later use on the roof
top, a system could potentially reduce purchased inputs. A sensitivity analysis,
which halved the soil inputs affected the intensive ecoroof the most by increasing
the percent renewable by 66%, decreasing the ELR by 49% and subsequently
increasing the ESI by 94%. The others showed the same pattern to a lesser
degree. Additionally, structural support may be required to support a on-site
topsoil, which is heavier than expanded clay. This could be justified if the
structural improvements are minor, because the specific emergy of expanded
clay (3.04E+09 sej/g) is higher than concrete at 1.44E+09 sej/g (Burnakarn 1998)
and steel at 2.16E+09 sej/g (Odum 1996). Because substrate is so often studied
in this technology, this area shows promise for reducing the purchased inputs of
vegetated roof systems. Actions to reduce the environmental loading ratio in the
systems by using on-site topsoil would allow for a reduction in the ratio.
Reallocating this resource as local and re-calculating for wind erosion of the
materials would add non-renewable inputs, but potentially be a net reduction in
the environmental loading ratio. Gedge (2003) has shown that on-site topsoil can
171
be used in constructing an extensive ecoroof. Additionally, local topsoil has been
shown to improve biodiversity (Brenneisen 2003). Post- construction practices
recommend wind erosion protection in the form of coir sheets spread over the
substrate surface (Peck and Kuhn 2001), yet more publications recording the
rates of erosion would be needed for calculations.
Another recommendation for the agricultural roof garden to reduce
irrigation inputs is to recycle the stormwater. Recycling stormwater in vegetated
roof system is being increasingly experimented and proposed (Compton and
Whitlow 2006; Shirley-Smith 2006). The input of planting of seeds, instead of
starter plants, may also reduce the inputs of labor in all systems. Lastly, if the
compost were generated on site as a part of the construction process, inputs
may be further reduced. By reducing all of the purchased inputs, the
environmental loading ratio would decrease and improve the emergy
sustainability index.
To aide a city’s level of sustainability vegetated roof systems must be
considered at the scale of the building or city. Huang and Chen (2005) conclude
that waste generation and treatment must be considered in the urban setting
through circular resource flows. Vegetated roof systems are particularly suited for
inter-urban circular flows. The recycle of both stormwater as well as moderate
amounts of building composted wastes could be utilized in vegetated roof
systems. Kula (2005) has shown that even small area vegetated roof systems
can treat building wastes. Also, the reduction of energy use from air conditioning
172
due to vegetated roof systems has been shown (Onmura et al. 2001; Alcazar and
Bass 2005). From the scale of the city, like Taipei, which uses renewable
sources, labor can become a renewable input. In the first stages of the
technology, skilled labor and knowledge are imported as purchased resources.
Overtime the knowledge can be stored locally and reused in a skilled workforce.
When this transition happens the systems use less purchased resources.
4.7 Conclusions
Emergy analysis allowed for the assessment of sustainability of three
vegetated roof systems and the comparison of those systems to other
landscapes. Overall, vegetated roof systems use relatively low percentages of
renewable inputs when compared to purchased inputs. In their current form they
use very little local resources. The dependence on purchased inputs creates low
levels of sustainability in each of the vegetated roof systems. To improve system
sustainability vegetated roofs should be constructed with on-site topsoil, built with
recycled irrigation and composting systems, and consider the current level of
sustainability of the city.
The shallow substrate ecoroof was more sustainable than the deep
substrate ecoroof. Both ecoroofs were more sustainable than the agricultural
ecoroof. This was due to larger amounts of purchased inputs of substrate
(topsoil) and labor in the deep substrate ecoroof and agricultural roof garden.
173
In comparison to other constructed urban landscapes, vegetated roof
systems were shown to be more sustainable than a conventional landscape,
urban gardens and a city, but far from the level of sustainability of local and
indigenous agricultural practices. The similarity of all the constructed landscapes,
the city and vegetated roofs lies in the reliance on purchased energy flows. This
means that improving the sustainability of a city with vegetated roof systems is
dependant upon the urbanizing condition of the city, the percent of renewable
inputs used in vegetated roof systems, and other factors affecting the
construction and maintenance of the systems such as aesthetic demands.
174
4.8 Citations Allen, P. (1999). "Reweaving the food security safety net: Mediating entitlement
and entrepreneurship." Agriculture and Human Values 16: 117–129. An, S. B. H., Zou,C (1998). "Studies of emergy flow in a compound agro-
ecosystem in the Taihu Lake area, Jiangsu Province, China." Ecological Engineering 11: 303–313.
Bastianoni, S., N. Marchettini, M. Panzieri and E. Tiezzi (2001). "Sustainability
assessment of a farm in the Chianti area (Italy)." Journal of Cleaner Production 9(4): 365-373.
Beattie, D. J., R. D. Berghage, A. Jarrett, H. B. Manbeck, J. Srebric and J. De
Nardo. (2001). "Green Roof Summary." Retrieved 12/ 29/02, from http://hortweb.cas.psu.edu/research/greenroofcenter/history.html.
Beck, T., M. Quigley and J. F. Martin (2001). "Emergy evaluation of food
production in urban residential landscapes." Urban Ecosystems 5(3): 187-207.
Burnakarn, V. (1998). Evaluation of Recycling and Reuse of Building Materials
Using the Emergy Analysis Method. Architecture, University of Florida. Doctorate of Philosophy: 281pgs.
Campbell, D. E. (1998). "Emergy Analysis of Human Carrying Capacity and
Regional Sustainability: an Example Using the State of Maine." Environmental Monitoring and Assessment 51(1/2): 531-569.
Carter, T. L. and T. C. Rassmussen (2005). Use of green roofs for ultra-urban
stream restoration in the Georgia Piedmont (USA). conference proceedings of Greening Rooftops for Sustainable Communities, Washington D.C. Green Roofs for Healthy Cities.
Costanza, R., R. d'Arge, R. de Groot, S, S. Farber, M. Grasso, B. Hannon, K.
Limburg, S. Naeem, R. O'Neill, J. Paruelo, R. Raskin and P. Sutton (1997). "The value of the world's ecosystem services and natural capital." Nature 387(6630): 253-260.
Daily, G. C., Ed. (1997). Nature's Services: Societal Dependence on Natural
Ecosystems. Washington D.C., Island Press. 391 pgs.
175
de Groot, R. S., M. A. Wilson and R. M. J. Boumans (2002). "A typology for the classification, description and valuation of ecosystem functions, goods and services." Ecological Economics 41: 393 - 408.
Dunnett, N. and N. Kingsbury (2004). Planting Green Roofs and Living Walls.
Portland, OR, Timber Press. 254 pgs. Ebenezer, J. (2003). "History of The Wading Pool Gardens." Retrieved 1/1,
2003, from http://www.arts4all.com/elca/page1.html. EPA (1993). Lightweight Aggregate Manufacturing Section 11.20. Emission
Factor Documentation for AP- 42, United States Environmental Protection Agency Air Quality Division.
Howington, T. M., M. T. Brown and M. Wiggington (1997). "Effect of hydrologic
subsidy on self-organization of a constructed wetland in Central Florida." Ecological Engineering 9(3-4): 137-156.
Huang, S.-L. (1998). "Urban ecosystems, energetic hierarchies, and ecological
economics of Taipei metropolis." Journal of Environmental Management 52(1): 39 - 51.
Hunag, S.L. and W.B.Chen, personal communication, Socioeconomic
metabolism of Taipei, 6/27/2007. Huang, S.-L., H.-Y. Lai and C.-L. Lee (2001). "Energy hierarchy and urban
landscape system." Landscape and Urban Planning 53(1-4): 145-161. Huang, S. L., S. C. Wu and W. B. Chen (1995). "Ecosystem, environmental
quality and ecotechnology in Taipei metropolitan region." Ecological Engineering 4: 233-248.
Johnston, J. and J. Newton (1993). Building green : a guide to using plants on
roofs, walls and pavements. London, Ecology Unit. Levenston, M. (2002). "City Farmer." Retrieved 12/27/02, 1994-2002, from
http://www.cityfarmer.org/subrooftops.html#roofs. Martin, B. (2001). "A Wading Pool Garden." Retrieved 1/1, 2003, from
http://www.suite101.com/article.cfm/cottage_gardening/66126.
176
Martin, J. F. (2002). "Emergy valuation of diversions of river water to marshes in the Mississippi River Delta." Ecological Engineering 18( 3): 265 - 286.
Martin, J. F., S. A. W. Diemont, E. Powell, M. Stanton and S. Levy-Tacher
(2006). "Emergy evaluation of the performance and sustainability of three agricultural systems with different scales and management." Agriculture Ecosystems & Environment 115(1-4): 128-140.
Nelson, M., H. T. Odum, M. T. Brown and A. Alling (2001). "Living off the Land:
Resource Efficiency of Wetland Wastewater Treatment." Advanced Space Research 27(9): 1547-1556.
NRCS. (1997, 2000). "NRCS Urbanizing Data." Retrieved 12-1, 2002, from
http://www.nrcs.usda.gov/technical/land/urban.html. O.S.U., e. (1997). Ohio Vegetable Production Guide. Columbus OH, The Ohio
State University: 48. Odum, E. P. (1971). Fundamentals of Ecology. Philadelphia, W.B. Saunders
Company. Odum, H. (1988). "Self organization, transformity, and information." Science 242:
1132-1139. Odum, H. T. (1994). The Emergy of Natural Capital. Investing in Natural Capital.
J. M. Jansen, C. Folke and R. Costanza. Covelo, CA, Island Press: 200-212.
Odum, H. T. (1996). Environmental accounting : EMERGY and environmental
decision making. New York, Wiley. Odum, H. T. and E. P. Odum (2000). "The Energetic Basis for Valuation of
Ecosystem Services." Ecosystems 3: 21-23. Orabon, J. (1990). "Up on a Roof: Could Cities Ever Feed Themselves? Yes
Says the Developer of a Revolutionary Rooftop Greenhouse." New Age Journal: 38.
Osmundson, T. (1999). Roof gardens : history, design, and construction. New
York, W.W. Norton. 318pgs.
177
Peck, S., C. Callaghan, B. Bass and M. Kuhn (1999). Greenbacks from Green Roofs: Forging a New Industry in Canada. Ottawa, ON, Canada Mortgage and Housing Corporation: 54.
Rees, W. and M. Wackernagel (1996). "Urban ecological footprints: why cities
cannot be sustainable--and why they are a key to sustainability." Environmental Impact Assessment Review 16(4-6): 223-248.
Rydberg, T. and J. Jansén (2002). "Comparison of horse and tractor traction
using emergy analysis." Ecological Engineering 19(1): 13 - 28. Scholz-Barth, K. (2001). "Green roofs: stormwater management from the top
down." Environmental Design & Construction. Schundler, B. (2002). "Green Roof Technology." Retrieved 12/29/02, 2002, from
http://www.schundler.com/greenroofs.htm. Stevens, D. (1997). Roof Gardens, Balcones and Terraces. New York, Rizzoli. Tinkel, K. C. (1977). Rooftop gardening. Radnor, Pa., Chilton Book Co. Ton, S., H. T. Odum and J. J. Delfino (1998). "Ecological - economic evaluation
of wetland management alternatives." Ecological Engineering 11: 291–302.
Ulgiati, S. and M. T. Brown (1998). "Monitoring patterns of sustainability in
natural and man-made ecosystems." Ecological Modeling 108(1-3): 23-36. Ulgiati, S., H. T. Odum and S. Bastianoni (1994). "Emergy Use, environmental
loading and sustainability: An Emergy Analysis of Italy." Ecological Modeling 71: 215-268.

178
179
REFERENCES
Alcazar, S. S. and B. Bass (2005). Energy performance of green roofs in a multi
storey residential building in Madrid. In conference proceedings of Greening Rooftops for Sustainable Communities Washington D.C. , Greening Rooftops for Healthy Cities.
Allen, P. (1999). "Reweaving the food security safety net: Mediating entitlement
and entrepreneurship." Agriculture and Human Values 16: 117–129. An, S. B. H., Zou,C (1998). "Studies of emergy flow in a compound agro-
ecosystem in the Taihu Lake area, Jiangsu Province, China." Ecological Engineering 11: 303–313.
ASLA. (2007). "Site Metric Summit." Bass, B., E. S. Krayenhoff, A. Martilli, R. B. Stull and H. Auld (2003). The impact
of Green Roofs on Toronto's Urban Heat Island. Greening Rooftops for Sutainable Communities, Chicago.
Bastianoni, S., N. Marchettini, M. Panzieri and E. Tiezzi (2001). "Sustainability
assessment of a farm in the Chianti area (Italy)." Journal of Cleaner Production 9(4): 365-373.
Beattie, D. J., R. D. Berghage, A. Jarrett, H. B. Manbeck, J. Srebric and J. De
Nardo. (2001). "Green Roof Summary." Retrieved 12/ 29/02, from http://hortweb.cas.psu.edu/research/greenroofcenter/history.html.
Beattie, D. J., R. D. Berghage, A. Jarrett, H. B. Manbeck, J. Srebric and J. De
Nardo. (2002). "EPA Heat Island Presentation." Retrieved 12/29/02, 2002, from http://hortweb.cas.psu.edu/research/greenroofcenter/news.html.
180
Beck, T., M. Quigley and J. F. Martin (2001). "Emergy evalution of food production in urban residential landscapes." Urban Ecosystems 5(3): 187-207.
Birkeland, J. (2002). Design for sustainability : a sourcebook of integrated, eco-
logical solutions. London ; Sterling, VA, Earthscan Publications. Boivin, M.-A., M.-P. Lamy, A. Gosselin and B. Dansereau (2001). "Effect of
Artificial Substrate Depth on Freezing injury of Six Herbaceous Perennials Grown in a Green Roof System." HortTechnology 11(3): 409-412.
Bolund, P. and S. Hunhammar (1999). "Ecosystem services in urban areas."
Ecological Economics 29(2): 293 - 301. Brenneisen, S. (2003). Biodiversity of European Greenroofs. In conference
proceedings of Greening Rooftops for Sustainable Communities Chicago, IL. Green Roofs for Healthy Cities.
Brenneisen, S. (2004). From biodiversity to agricultural productivity. In
conference proceedings of Greening Rooftops for Sustainable Communities Portland, OR. Green Roofs for Healthy Cities.
Brenneisen, S. (2005). Green roofs recapturing urban spaces for wildlife- A
Challenge for Urban Planning and Environmental Education. In conference proceedings of Greening Rooftops for Sustainable Communities Washington D.C. Green Roofs for Healthy Cities.
Brown, M. T. and S. Ulgiati (1997). "Emergy-based indices and ratios to evaluate
sustainability: monitoring economies and technology toward environmentally sound innovation." Ecological Engineering 9(1-2): 51-69.
Bruce, J. (2005). The weakest link: Constructing green roofs in the real world. In
conference proceedings of Greening Rooftops for Sustainable Communities Washington D.C., Greening Rooftops for Healthy Cities.
Burke, K. (2003). Green roofs and regenerative design strategies-The Gap's 901
Cherry project. In conference proceedings of Greening Rooftops for Sustainable Communities, Chicago, IL.
Burnakarn, V. (1998). Evaluation of Recycling and Reuse of Building Materials
Using the Emergy Analysis Method. Architecture, University of Florida. Doctorate of Philosophy: 281.
181
Calkins, M. (2005). "Strategy use and challenges of ecological design in landscape architecture." Landscape and Urban planning 73(1): 29-48.
Campbell, D. E. (1998). "Emergy Analysis of Human Carrying Capacity and
Regional Sustainability: an Example Using the State of Maine." Environmental Monitoring and Assessment 51(1/2): 531-569.
Carter, T. L. and T. C. Rassmussen (2005). Use of green roofs for ultra-urban
stream restoration in the Georgia Piedmont (USA). conference proceedings of Greening Rooftops for Sustainable Communities Washington DC, Green Roofs for Healthy Cities.
Chenoweth, R. (1992). "Research: hype and reality." Landscape Architecture
82(3): 47-48. Clark, C. (2005). Optimization of green roofs for air pollution mitigation. . In
conference proceedings of Greening Rooftops for Sustainable Communities Washington D.C.
Clawson, R. G., B. G. Lockaby and B. Rummer (2001). "Changes in production
and nutrient cycling across a wetness gradient within a floodplain forest." Ecosystems 4.
Coffman, R. and G. Davis (2005). Insect and Avian Fauna Presence on the Ford
River Rouge Green Roof. In the conference proceedings of Greening Rooftops for Sustainable Conference, Washington DC, Greenroofs for Healthy Cities.
Coffman, R. and J. F. Martin (2004). The Sustainability of An Agricultural Roof
Garden. In the conference proceedings of Greening Rooftops for Sustainable Communities, Portland, OR, Greenroofs for Healthy Cities.
Compton, J. S. and T. H. Whitlow (2006). A zero discharge green roof system
and species selection to optimize evapotranspiration and water retention. In conference proceedings of Greening Rooftops for Sustainable Communities Boston, MA.
Consortium, G. S. (2003). "Recent Results." Retrieved 9-2-03, 2003, from
http://www.greenroofsystems.org. Costanza, R., R. d'Arge, R. de Groot, S, S. Farber, M. Grasso, B. Hannon, K.
Limburg, S. Naeem, R. O'Neill, J. Paruelo, R. Raskin and P. Sutton
182
(1997). "The value of the world's ecosystem serivces and natural capital." Nature 387(6630): 253-260.
Costanza, R., R. d'Arge, R. de Groot, S, S. Farber, M. Grasso, B. Hannon, K.
Limburg, S. Naeem, R. O'Neill, J. Paruelo, R. Raskin and P. Sutton (1997). "The value of the world's ecosystem serivces and natural capital." Nature 387: 253-260.
Currie, B. A. and B. Bass (2005). Estimates of air pollution mitigation with green
plants and green roofs using the UFORE model. In conference proceedings of Greening Rooftops for Sustainable Communities Washington D.C. Green Roofs for Healthy Cities.
Daily, G. C., Ed. (1997). Nature's Services: Societal Dependence on Natural
Ecosystems. Washington D.C. Island Press. de Groot, R. S., M. A. Wilson and R. M. J. Boumans (2002). "A typology for the
classification, description and valuation of ecosystem functions, goods and services." Ecological Economics 41: 393 - 408.
Donovan, T. and F. I. Thompson (2001). "Modeling the Ecological Trap
Hypothesis:A Habitat and Demographic Analysis for Migrant Songbirds." Ecological Applications 1(3): 871-882.
Dunnett, N. (2005). Vegetation composition and structure significantly influence
green roof performance. In conference proceedings of Greening Rooftops for Sustainable Communities Washington DC.
Dunnett, N. (2006). Green roofs for biodiversity: Reconciling aesthetics with
ecology. In conference proceedings of Greening Rooftops for Sustainable Communities Boston, MA.
Dunnett, N. and N. Kingsbury (2004). Planting Green Roofs and Living Walls.
Portland, OR, Timber Press. Dunnett, N., A. Nagase, R. Booth and P. Grime (2005). Vegetation composition
and structure significantly influence green roof performance. In conference proceedings of Greening Rooftops for Sustainable Communities, Washington, D.C.
Eamus, D. (2003). "How does ecosystem water balance affect net primary
productivity of woody ecosystems?" Functional Plant Biology 30: 187-205.
183
Ebenezer, J. (2003). "History of The Wading Pool Gardens." Retrieved 1/1, 2003, from http://www.arts4all.com/elca/page1.html.
Ehrenfeld, J. (2000). "Evaluating Wetlands within an urban context." Urban
Ecosystems 4(1): 69-85. Emilsson, T. (2003). The Influence of Substrate: Establishment Method and
Species Mix on Plant Cover. In conference proceedings of Greening Rooftops for Sustainable Communities Chicago, IL, Greening Rooftops for Healthy Cities.
Emilsson, T. (2004). Impact of fertilisation on vegetation development and water
quality. In conference proceedings of Greening Rooftops for Sustainable Communities
EPA (1993). Lighweight Aggregate Manufacturing Section 11.20. Emission
Factor Documentation fo AP- 42, United States Environmental Protection Agency Air Quality Division.
Eumorfopoulou, E. A., Dimitris (1998). "The Contribution of a planted roof to the
thermal protection of buildings in Greece." Energy and Building 27: 29-36. Forman, R. T. T. and M. Godron (1986). Landcape Ecology. New York, John
Wiley. Gaffin, S., C. Rosenzweig, L. Parshall, D. Hillel, J. Eichenbaum-Pikser, A.
Greenbaum, R. Blake, D. Beattie and R. Berghage (2006). Quantifying evaporative cooling from green roofs and comparison to other land surfaces. In conference proceedings of Greening Rooftops for Sustainable Communities Greening Rooftops for Healthy Cities.
Gedge, D. (2003). '...From rubble to Redstarts...' In conference proceedings
Greening Rooftops for Sustainable Communities Chicago, Peck Associates.
Gedge, D. and G. Kadas (2004). Bugs, bees and spiders: Green roof design for
rare invertebrates. In conference proceedings of Greening Rooftops for Sustainable Communities, Portland, OR.
Graham, P. and M. Kim (2003). Evaluating the Stormwater Management Benefits
of Green Roofs Through Water Balance Modeling. Greening Rooftops for Sustainable Communities, Chicago, Peck Associates.
184
Grant, E. J. and J. R. Jones (2005). A frame work for decision-making in vegetated roofing system design. In conference proceedings of Greening Rooftops for Sustainable Communities Washington DC.
Hill, M. O. (1973). "Diversity and evenness: A unifying notation and its
consequences." Ecology 54(2): 427-432. Howington, T. M., M. T. Brown and M. Wiggington (1997). "Effect of hydrologic
subsidy on self-organization of a constructed wetland in Central Florida." Ecological Engineering 9(3-4): 137-156.
Huang, S.-L. (1998). "Urban ecosystems, energetic hierarchies, and ecological
economics of Taipei metropolis." Journal of Environmental Management 52(1): 39 - 51.
Hunag, S.L. and W.B.Chen, personal communication, Socioeconomic
metabolism of Taipei, 6/27/2007. Huang, S. L., H. Y. Hsiao-Yin Lai and C. L. Lee (2001). "Energy hierarchy and
urban landscape system." Landscape and Urban Planning 53: 145-161. Huang, S. L., S. C. Wu and W. B. Chen (1995). "Ecosystem, environmental
quality and ecotechnology in Taipei metropolitan region." Ecological Engineering 4: 233-248.
Hunt, W., A. M. Hathaway, J. T. Smith and J. Calabria (2006). Choosing the right
green roof media for water quality. In conference proceedings of Greening Rooftops for Sustainable Communities Minneapolis, MN, Greening Rooftops for Healthy Cities.
Hunt, W. and J. Smith (2005). Hydrologic and water quality performance from
green roofs in North Carolina. In conference proceedings of Greening Rooftops for Sustainable Communities, Washington D.C.
Hutchinson, D., P. Abrams, R. Retzlaff and T. Lipton (2003). Stormwater
Monitoring Two Ecoroofs in Portland, Oregon, USA. Greening Rooftops for Sustainable Communities, Chicago, www.greenroofs.ca.
Hydrotech (2000). The Roof Garden Planning Guide, Company Literature. Johnston, J. and J. Newton (1993). Building green : a guide to using plants on
roofs, walls and pavements. London, Ecology Unit.
185
Jones, R. A. (2002). Tecticolous Invertebrates. A preliminary investigation of the invertebrate fauna on green roofs in urban London. London, English Nature: 36.
Kadas, G. (2002). Study of invertebrates on green roofs - How roof design can
maximise biodiversity in an urban environment. Dept. of Geography. London, University College. MSc Conservation: 76.
Koehler, M. (1990). The living conditions of plants on the roofs of buildings.
Urban Ecology: Plants and the plant communities in urban environments. H. F. H. Lieth. Stroudsburg, PN, Dowden, Hutchinson & Ross.
Koehler, M. (2003). Plant Survival Research and Biodiversity: Lessons From
Europe. In conference proceedings of Greening Rooftops for Sustainable Communities, Chicago, IL.
Koehler, M., M. Schmidt, F. W. Grimme, M. Laar, V. L. d. A. Paiva and S.
Tavares (2002). "Green roof in the hot-humid tropics- far beyond aesthetics." Environmental Management and Health 13(4): 382-391.
Kortright, R. (2001). Evaluating the potential of green roof agriculture: A review of
the literature. Unpublished Paper, Trent University: 61. Kozlovsky, D. (1968). "A critical evaluation of the trophic level concept:
Ecological efficiencies." Ecology 49: 48-60. Kristan, W. B. I. (2003). "The role of habitat selection behavior in populations
dynamics soucre-sink systems and ecological traps." Oikos 103(3): 457-468.
Kucharik, C. J., K. R. Brye, J. M. Norman, J. A. Foley, S. T. Gower and L. G.
Bundy (2001). "Measurements and Modeling of Carbon and Nitrogen Cycling in Agroecosystems of Southern Wisconsin: Potential for SOC Sequestration during the Next 50 Years." Ecosystems 4: 237-258.
Kula, R. (2005). Green Roofs and the LEED green building rating system. In
conference proceedings of Greening Rooftops for Sustainable Communities, Washington DC.
LaGro, J. A. (1999). "Research capacity: matter of semantics?" Landscape
Journal 18(2): p.179-186.
186
Lee, H. and H. Koshimiz (2006). Research on the scenic meaning of rooftop greening with semantic differential measure and join-count analysis. . In conference proceedings of Greening Rooftops for Sustainable Communities Boston, MA. Green Roofs for Healthy Cities.
Levenston, M. (2002). "City Farmer." Retrieved 12/27/02, 1994-2002, from
http://www.cityfarmer.org/subrooftops.html#roofs. Lieth, H. (1973). "Primary production: terrestrial ecosystems." Human Ecology 1:
303-332. Lieth, H. F., Ed. (1978). Patterns of Primary Production in the Biosphere.
Benchmark Papers in Ecology. Stroudsburg, PN, Dowden, Hutchinson & Ross.
Lipton, T. and E. Strecker (2003). EcoRoofs (Greenroofs)- A more Sustainable
Infrastructure. National Conference for Stormwater Managers, Portland, OR.
Liu, K. and B. Baskaran (2003). Thermal performance of green roofs through
field evaluation. In conference proceedings of Greening Rooftops for Sustainable Communities Chicago.
Lundholm, J. (2005). A habitat template approach to green building surfaces. In
conference proceedings of Greening Rooftops for Sustainable Communities, Washington DC.
Lyle, J. (1994). Regenerative Design for Sustainable Development. New York,
John Wiley &Sons. MacDonagh, L. P., N. M. Hallyn and S. Rolph (2006). Midwestern USA plant
communities + Design = Bedrock Bluff Prairie Communities. In conference proceedings of Greening Rooftops for Sustainable Communities Minneapolis MN, Greening Rooftops for Healthy Cities.
Mankiewicz, P. (1996). Urban rooftop agriculture. Eco-pioneers :practical
visionaries solving today's environmental problems. S. Lerner. Cambridge, Mass., MIT Press.
Mankiewicz, P. S. and T. McDonnell (2006). Sustainable green roof design:
Optimizing water budgets through wastes-into-resources technologies in the Bronx. In conference proceedings of Greening Rooftops for Sustainable Communities
187
Martens, R. and B. Bass (2006). Roof-envelope ratio impact on green roof
energy performance. In conference proceedings of Greening Rooftops for Sustainable Communities Chicago, IL Green Roofs for Healthy Cities.
Martin, B. (2001). "A Wading Pool Garden." Retrieved 1/1, 2003, from
http://www.suite101.com/article.cfm/cottage_gardening/66126. Martin, J. F. (2002). "Emergy valuation of diversions of river water to marshes in
the Mississippi River Delta." Ecological Engineering 18( 3): 265 - 286. Martin, J. F., S. A. W. Diemont, E. Powell, M. Stanton and S. Levy-Tacher
(2006). "Emergy evaluation of the performance and sustianability of three agricultural systems with different scales and management." Agriculture Ecosystems & Environment 115(1-4): 128-140.
McHarg, I. (1992). Design With Nature. New York, John Wiley. Mehlman, D. W., S. Mabey, D. Ewert, C. Ducan, B. Able, D. Cimprich, R. D.
Sutter and M. Woodrey (2005). "Conserving stopover sites for forest-dwelling migratory landbirds " The Auk 122(4): 1281-1290.
Mentens, J., D. Raes and M. Hermy (2003). Effect of orientation on the water
balance of greenroofs. In conference proceedings of Greening Rooftops for Sustainable Communities Chicago IL Green Roofs for Healthy Cities.
Milburn, L.-A. and R. D. Brown (2003). "The relationship between research and
design in landscape architecture." Landscape and Urban planning 64(1-2): 47-66.
Miller, C. (2002). "Benefits of Green roofs." Retrieved 12/12/02, from
http://www.roofscapes.com/benefits.html. Miller, C. (2002). Use of Vegetated Roof Covers in Runoff Management.
Phildelphia, PA, Roofscapes: 6. Miller, C. (2003). Moisture Management In Green Roofs. Greening Rooftops for
Sustainable Communities, Chicago, IL. Miller, C. (2004). Formulation of Effective Performance Specifications for Green
Roofs. In conference proceedings of Greening Rooftops for Sustainable Communities, Portland, OR.
188
Miller, G. T. (1998). Living in the Environment. New York, Wadsworth. Munro, D. A. and M. W. Holdgate, Eds. (1991). Caring for the earth : a strategy
for sustainable living. Gland, Switzerland, IUCN, UNEP, WWF. Naeem, S., K. Hakansson, J. H. Lawton, M. J. Crawley and L. J. Thompson
(1996). "Biodiversity and plant productivity in a model assemblage of plant species." Oikos 76: 259-64.
Nelson, M., H. T. Odum, M. T. Brown and A. Alling (2001). "Living off the Land:
Resource Efficiency of Wetland Wastewater Treatment." Advanced Space Research 27(9): 1547-1556.
Niering, W. A. (1997). "Human Dominated Ecosystems and the Role of
Restoration Ecology." Restoration Ecology 5(4): pp. 273-274. NRCS. (1997, 2000). "NRCS Urbanizing Data." Retrieved 12-1, 2002, from
http://www.nrcs.usda.gov/technical/land/urban.html. O.S.U., e. (1997). Ohio Vegetable Production Guide. Columbus OH, The Ohio
State University: 48. O’Connell, K. E. B., S. T. Gower and J. M. Norman (2003). "Net Ecosystem
Production of Two Contrasting Boreal Black Spruce Forest Communities." Ecosystems 6: 248-260.
Oberlander, C. H. and E. Whitelaw (2005). Aesthetic design and green roofs. In
conference proceedings of Greening Rooftops for Sustainable Communities Washington DC. Green Roofs for Healthy Cities.
Odum, E. P. (1971). Fundamentals of Ecology. Philadelphia, W.B. Saunders
Company. Odum, H. (1988). "Self organization, transformity, and information." Science 242:
1132-1139. Odum, H. T. (1994). The Emergy of Natural Capital. Investing in Natural Capital.
J. M. Jansen, C. Folke and R. Costanza. Covelo, CA, Island Press: pg200-212.
Odum, H. T. (1996). Environmental accounting : EMERGY and environmental
decision making. New York, Wiley.
189
Odum, H. T. and E. P. Odum (2000). "The Energetic Basis for Valuation of Ecosystem Services." Ecosystems 3: 21-23.
Onmura, S., M. Matsumoto and S. Hokoi (2001). "Study on evaporative cooling
effect of roof lawn gardens." Energy and Buildings 33: 653-666. Orabon, J. (1990). "Up on a Roof: Could Cities Ever Feed Themselves? Yes
Says the Developer of a Revolutionary Rooftop Greenhouse." New Age Journal: 38.
Osmundson, T. (1999). Roof gardens : history, design, and construction. New
York, W.W. Norton. Palomo Del Barrio, E. (1998). "Analysis of the green roofs cooling potential in
buildings." Energy and Buildings 27(2): 179-193. Pearce, K. (2003). Toronto City Hall- Early Research Findings. Greening
Rooftops for Sustainable Communities, Chicago, IL. Peck, S. and B. Bass (2000). Green Roof Infrastructure Workshop: Establishing
Common Protocols for Building and Aggregate Level Green Roof Benefits Research. Toronto, University of Toronto: 43.
Peck, S., C. Callaghan, B. Bass and M. Kuhn (1999). Greenbacks from Green
Roofs: Forging a New Industry in Canada. Ottawa, ON, Canada Mortgage and Housing Corporation: 54.
Peck, S. and M. Kuhn. (2001). "Design Guidelines for Green Roofs." Retrieved
9-24-02, 2002, from http://peck.ca/grhcc/. Rees, W. and M. Wackernagel (1996). "Urban ecological footprints: why cities
cannot be sustainable--and why they are a key to sustainability." Environmental Impact Assessment Review 16(4-6): 223-248.
Rowe, D. B., M. Monterusso and C. Rugh (2005). Evaluation of Sedum species
and Michigan native taxa for green roof applications. In conference proceedings Greening Rooftops for Sustainable Communities Washington D.C. Green Roofs for Healthy Cities.
Rowe, D. B., M. A. Monterusso and C. L. Rugh (2006). "Assessment of Heat-
expanded Slate and Fertility Requirements in Green Roof Substrates." HortTech 16(3): 321-332.
190
Rowe, D. B., C. Rugh, N. VanWoert, M. Monterusso and D. Russell (2003). Green roof slope, substrate depth and vegetation influence on runoff. In conference proceedings of Greening Rooftops for Sustainable Communities Chicago.
Rydberg, T. and J. Jansén (2002). "Comparison of horse and tractor traction
using emergy analysis." Ecological Engineering 19(1): 13 - 28. Schoen, D. (1997). "Primary production: The link to global health." Bioscience
47(8): 477-483. Scholz-Barth, K. (2001). "Green roofs: stormwater management from the top
down." Environmental Design & Construction. Schundler, B. (2002). "Green Roof Technology." Retrieved 12/29/02, 2002, from
http://www.schundler.com/greenroofs.htm. Schuur, E. A. G. and P. A. Matson (2001). "Net primary productivity and nutrient
cycling across a mesic to wet precipitation gradient in Hawaiian montane forest." Oecologia 128: 431-442.
Sharp, R. F. (2003). A coastal meadow in the sky. In conference proceedings of
Greening Rooftops for Sustainable Communities, Chicago, IL. Green Roofs for Healthy Cities.
Shirley-Smith, C. (2003). The Sustainability Value of the Green Roof as a Water
Recycling System [GROW] in Urban Locations. In conference proceedings of Greening Rooftops for Sustainable Communities, Chicago IL. Green Roofs for Healthy Cities.
Stevens, D. (1997). Roof Gardens, Balcones and Terraces. New York, Rizzoli. Stifler, R. (1997). Greenery on the Roof: Futuristic, Ecological Building Method.
Hundertwasser Architecture: For a more Human architecture in harmony with nature. A. Taschen. New York, Taschen.
Stiling, P. (2002). Ecology: Theory and Applications. Upper Saddle River, New
Jersey, Prentice Hall. Takyu, M., S.-I. Aiba and K. Kitayama (2003). "Changes in biomass, productivity
and decomposition along topographical gradients under different geological conditions in tropical lower montane forests on Mount Kinabalu, Borneo." Oecologia 134: 397-404.
191
Tan, Y. P., N. H. Wong, Y. Chen, L. C. Ong and A. Sia (2003). Tehrmal Benefits
of Rooftop Gardens in Singapore. Greening rooftops for Sustainble Cities, Chicago.
Tangley, L. (1986). "The Urban Ecologist." BioScience 36(2): 68-71. Thompson, W. J. and K. Sorvig (2000). Sustainable Landscape Construction: A
guide to green building outdoors. Washington D.C., Island press. Tilman, D. (1987). "Secondary succession and the pattern of plant dominance
along experimental nitrogen gradients." Ecological Monographs 57(3): pg189-214.
Tilman, D., D. Wedin and J. Knops (1996). "Productivity and sustainability
influenced by biodiversity in grassland ecosystems." Nature 379: 718-20. Tinkel, K. C. (1977). Rooftop gardening. Radnor, Pa., Chilton Book Co. Ton, S., H. T. Odum and J. J. Delfino (1998). "Ecological - economic evaluation
of wetland management alternatives." Ecological Engineering 11: 291–302.
Ulgiati, S. and M. T. Brown (1998). "Monitoring patterns of sustainability in
natural and man-made ecosystems." Ecological Modeling 108(1-3): 23-36. Ulgiati, S., H. T. Odum and S. Bastianoni (1994). "Emergy use, environmental
loading and sustainability: An emergy analysis of Italy." Ecological Modeling 73: 215-268.
USGBC. (2007). "LEED for New Development." from
www.usgbc.org/DisplayPage.aspx?CMSPageID=148. Van der Ryn, S. and S. Cowan (1996). Ecological design. Washington, D.C.,
Island Press. Waller, E. (1997). "Singapore's Environment and Food Production."
Environmental Monitoring and Assessment 44(1/3): 1-9. Wayland-Smith, S. (2005). Drawing green in New York City: Aesthetic design +
sustainable development. In conference proceedings of Greening Rooftops for Sustainable Communities Washington D.C., Greening Rooftops for Healthy Cities.
192
WCED (1987). Our Common Future. New York, Oxford Press. Whittaker, R. H. and G. E. Likens (1975). The biosphere and man. . Primary
Production of the Biosphere. N. Y. Lieth and Whittaker (eds.). Springer-Verlag.
Wieditz, I. (2003). Urban Biodiversity- An oxymoron? Green Roof Infrastructure
Monitor. Toronto. 5: 9-10. Wong, N. H., S. F. Tay, R. Wong, C. L. Ong and A. Sia (2003). "Investigation of
thermal benefits of rooftop garden in the tropical environment." Building and Environment 38(2): 261-270.
193
APPENDIX A
VEGETATED ROOF SYSTEM DESCRIPTIONS
Ford Motor Plant
Location: Deaborn Mi, USA Owner: Ford Motor Company Building Architect; William McDonough + Partners Ecoroof Designer: McDonough and Braungart, Xero flo Ecoroof Contractor: na Year of construction: 2003 Area of ecoroof: 41,806 m2 Substrate type: lightweight aggregates, sand and organic material Substrate Depth: 7.0 cm Weight: 11lbs/ft2 Plant installation: sedum mats Ecoroof Researchers: Don Russell, Reid Coffman, Topics of Research: energy, hydrology, plant coverage, biodiversity
GAP
Location: San Bruno, CA, USA Owner: Gap, Inc. Building Architect: William McDonough + Partners Ecoroof Designer: Hargreaves & Associates w/Paul Kephart, Rana Creek Ecoroof Contractor: Swinerton Year of construction: 1997 Area of ecoroof: 6410 m2 Substrate type: engineered growing medium Substrate Depth: 15.2 cm
194
Weight: na Plant installation: plugs/pots . Ecoroof Researcher: Stephan Brenneisen Topics of Research: biodiversity- plant and invertebrate species richness, energy, productivity
Latter Day Saints Conference Center
Location: Salt Lake Center, UT USA Owner: Church of Latter Day Saints Architect: Simmer Gunsel Frasca Partnership, Ecoroof Designer: Olin Partnership, Landscape Architect Ecoroof Contractor: KPFF Year of construction: 2000 Area of ecoroof: 32,326 m2 Substrate type: expanded aggregate and organic material Substrate Depth: 5.08 -121.1 cm Weight: na Plant installation: various, seed (prairie) to containers (trees) Ecoroof Researcher: na Topics of Research: stewardship- use counts and personal testimony, plant survival
Long Island (Green) City Location: Long Island City, Queens, New York USA Owner: varies Building Architect: varies Ecoroof Designer: Balamori Associates Ecoroof Contractor: varies Year of construction: 2005+ Area of ecoroof: 2.6 Km2 Substrate type: na Substrate Depth: 7.6-15.2 cm Weight: na Plant installation: Sedums Ecoroof Researcher: Earth Pledge Topics of Research: hydrology and energy
Mountain Equipment Co-op Location: Winnipeg, Ontario Canada Owner: Winnipeg Mountain Equipment Co-op Building Architect: na Ecoroof Designer: Design Solutions Ecoroof Contractor: na
195
Year of construction: 2003 Area of ecoroof: na Substrate type: lightweight aggregates, sand and organic material Substrate Depth: 20.1 cm Weight: na Plant installation: plugs/pots Ecoroof Researchers: Richard Kula Topics of Research: hydrology, plant biodiversity
Multnomah County Building
Location: Portland, OR USA Owner: County of Multnomah Building Architect: na Ecoroof Designer: Macdonald Environmental Planning Ecoroof Contractor: na Year of construction: 2002 Area of ecoroof: 1114 m2 Substrate type: lightweight aggregates, sand and organic material Substrate Depth: 15.2 cm Weight: 30lbs/ft2 Plant installation: seed, fescue and wildflowers, sedum, and ornamental grass Ecoroof Researchers: Portland State University, Macdonald Engineering Topics of Research: hydrology- runoff and water budgets
Sechelt Justice Building
Location: Sechelt, British Columbia Canada Owner: City of Sechelt Building Architect: (retro-fit) project architects Carleton Hart Ecoroof Designer: Sharp and Diamond Landscape Architecture Ecoroof Contractor: na Year of construction: 2002 Area of ecoroof: na Substrate type: lightweight aggregates, sand and organic material Substrate Depth: 7.62 cm Weight: 30lbs/ft2 Plant installation: plugs/pots Ecoroof Researchers: na Topics of Research: na
196
Rossetti Location: Basel, Switzerland Owner: City of Basel Building Architect: Jaques Herzog & Peirre De Meuron Ecoroof Designer: Stephan Brenneisen Ecoroof Contractor: Biber Dach Year of construction: 1998 Area of ecoroof: 1500 m2 Substrate type: local topsoil of sandy loamy gravel. Substrate Depth: 7-30cm Weight: na Plant installation: seed- Basel forbs and herbs. Ecoroof Researcher: Stephan Brenneisen Topics of Research: biodiversity- plant and invertebrate species richness, energy, productivity
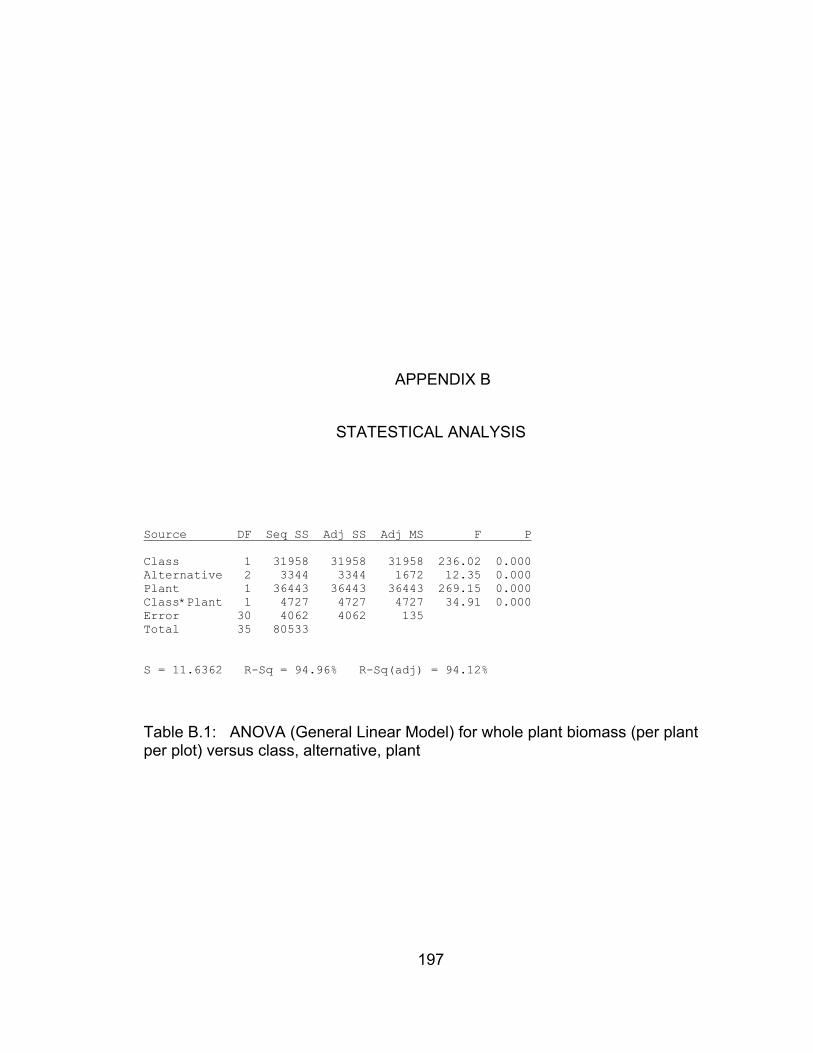
197
APPENDIX B
STATESTICAL ANALYSIS
Source DF Seq SS Adj SS Adj MS F P Class 1 31958 31958 31958 236.02 0.000 Alternative 2 3344 3344 1672 12.35 0.000 Plant 1 36443 36443 36443 269.15 0.000 Class*Plant 1 4727 4727 4727 34.91 0.000 Error 30 4062 4062 135 Total 35 80533 S = 11.6362 R-Sq = 94.96% R-Sq(adj) = 94.12%
Table B.1: ANOVA (General Linear Model) for whole plant biomass (per plant per plot) versus class, alternative, plant
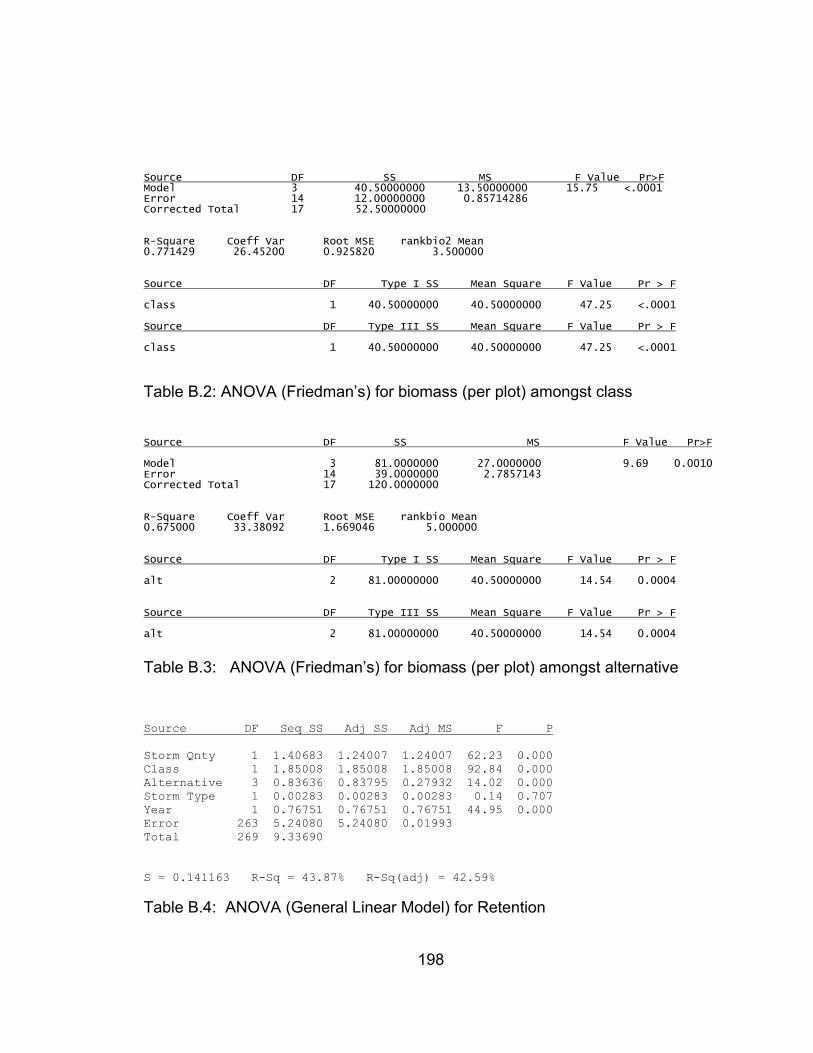
198
Source DF SS MS F Value Pr>F Model 3 40.50000000 13.50000000 15.75 <.0001 Error 14 12.00000000 0.85714286 Corrected Total 17 52.50000000 R-Square Coeff Var Root MSE rankbio2 Mean 0.771429 26.45200 0.925820 3.500000 Source DF Type I SS Mean Square F Value Pr > F class 1 40.50000000 40.50000000 47.25 <.0001 Source DF Type III SS Mean Square F Value Pr > F class 1 40.50000000 40.50000000 47.25 <.0001
Table B.2: ANOVA (Friedman’s) for biomass (per plot) amongst class Source DF SS MS F Value Pr>F Model 3 81.0000000 27.0000000 9.69 0.0010 Error 14 39.0000000 2.7857143 Corrected Total 17 120.0000000 R-Square Coeff Var Root MSE rankbio Mean 0.675000 33.38092 1.669046 5.000000 Source DF Type I SS Mean Square F Value Pr > F alt 2 81.00000000 40.50000000 14.54 0.0004 Source DF Type III SS Mean Square F Value Pr > F alt 2 81.00000000 40.50000000 14.54 0.0004
Table B.3: ANOVA (Friedman’s) for biomass (per plot) amongst alternative Source DF Seq SS Adj SS Adj MS F P Storm Qnty 1 1.40683 1.24007 1.24007 62.23 0.000 Class 1 1.85008 1.85008 1.85008 92.84 0.000 Alternative 3 0.83636 0.83795 0.27932 14.02 0.000 Storm Type 1 0.00283 0.00283 0.00283 0.14 0.707 Year 1 0.76751 0.76751 0.76751 44.95 0.000 Error 263 5.24080 5.24080 0.01993 Total 269 9.33690 S = 0.141163 R-Sq = 43.87% R-Sq(adj) = 42.59%
Table B.4: ANOVA (General Linear Model) for Retention
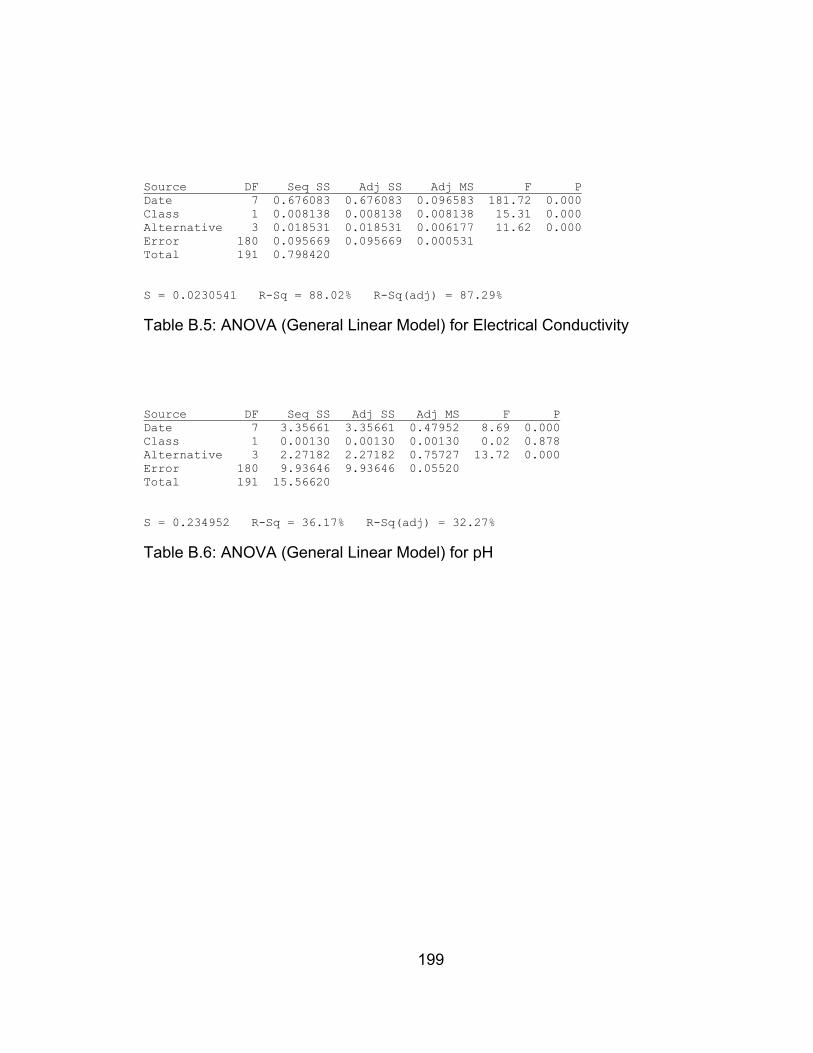
199
Source DF Seq SS Adj SS Adj MS F P Date 7 0.676083 0.676083 0.096583 181.72 0.000 Class 1 0.008138 0.008138 0.008138 15.31 0.000 Alternative 3 0.018531 0.018531 0.006177 11.62 0.000 Error 180 0.095669 0.095669 0.000531 Total 191 0.798420 S = 0.0230541 R-Sq = 88.02% R-Sq(adj) = 87.29%
Table B.5: ANOVA (General Linear Model) for Electrical Conductivity Source DF Seq SS Adj SS Adj MS F P Date 7 3.35661 3.35661 0.47952 8.69 0.000 Class 1 0.00130 0.00130 0.00130 0.02 0.878 Alternative 3 2.27182 2.27182 0.75727 13.72 0.000 Error 180 9.93646 9.93646 0.05520 Total 191 15.56620 S = 0.234952 R-Sq = 36.17% R-Sq(adj) = 32.27%
Table B.6: ANOVA (General Linear Model) for pH
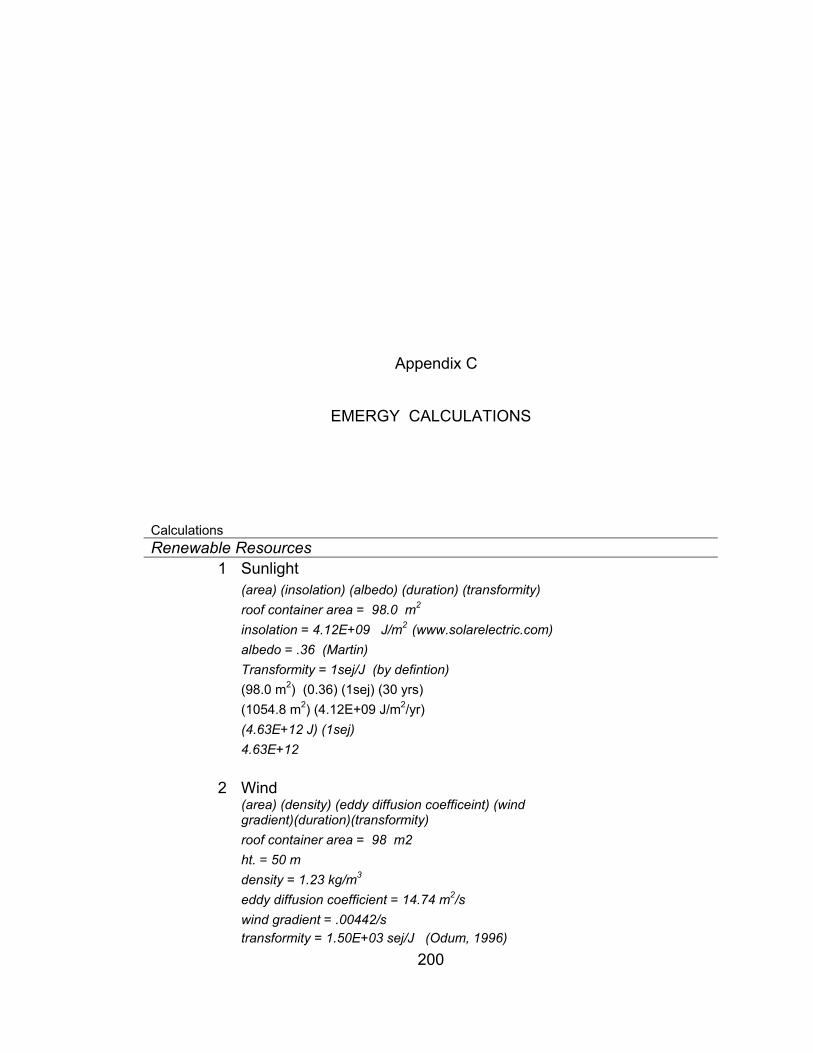
200
Appendix C
EMERGY CALCULATIONS
Calculations Renewable Resources
1 Sunlight (area) (insolation) (albedo) (duration) (transformity) roof container area = 98.0 m2 insolation = 4.12E+09 J/m2 (www.solarelectric.com) albedo = .36 (Martin) Transformity = 1sej/J (by defintion) (98.0 m2) (0.36) (1sej) (30 yrs) (1054.8 m2) (4.12E+09 J/m2/yr) (4.63E+12 J) (1sej) 4.63E+12
2 Wind
(area) (density) (eddy diffusion coefficeint) (wind gradient)(duration)(transformity)
roof container area = 98 m2 ht. = 50 m density = 1.23 kg/m3 eddy diffusion coefficient = 14.74 m2/s wind gradient = .00442/s transformity = 1.50E+03 sej/J (Odum, 1996)
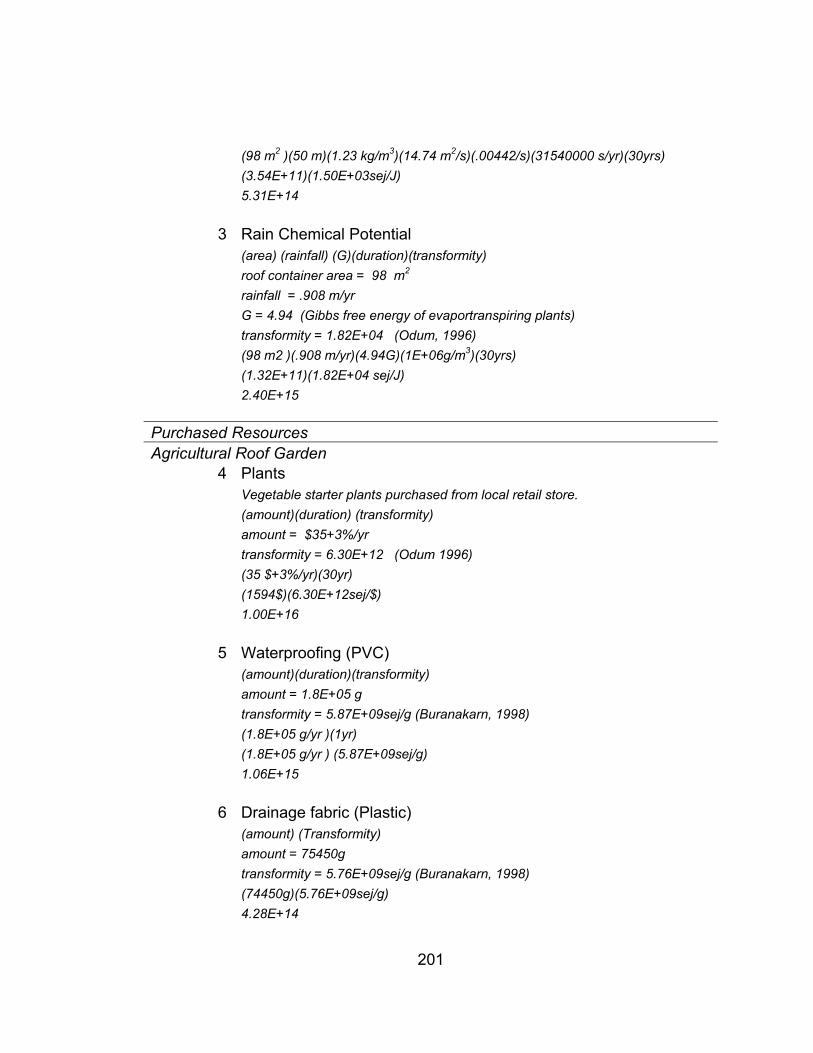
201
(98 m2 )(50 m)(1.23 kg/m3)(14.74 m2/s)(.00442/s)(31540000 s/yr)(30yrs) (3.54E+11)(1.50E+03sej/J) 5.31E+14
3 Rain Chemical Potential (area) (rainfall) (G)(duration)(transformity) roof container area = 98 m2 rainfall = .908 m/yr G = 4.94 (Gibbs free energy of evaportranspiring plants) transformity = 1.82E+04 (Odum, 1996) (98 m2 )(.908 m/yr)(4.94G)(1E+06g/m3)(30yrs) (1.32E+11)(1.82E+04 sej/J) 2.40E+15
Purchased Resources Agricultural Roof Garden
4 Plants Vegetable starter plants purchased from local retail store. (amount)(duration) (transformity) amount = $35+3%/yr transformity = 6.30E+12 (Odum 1996) (35 $+3%/yr)(30yr) (1594$)(6.30E+12sej/$) 1.00E+16
5 Waterproofing (PVC) (amount)(duration)(transformity) amount = 1.8E+05 g transformity = 5.87E+09sej/g (Buranakarn, 1998) (1.8E+05 g/yr )(1yr) (1.8E+05 g/yr ) (5.87E+09sej/g) 1.06E+15
6 Drainage fabric (Plastic) (amount) (Transformity) amount = 75450g transformity = 5.76E+09sej/g (Buranakarn, 1998) (74450g)(5.76E+09sej/g) 4.28E+14
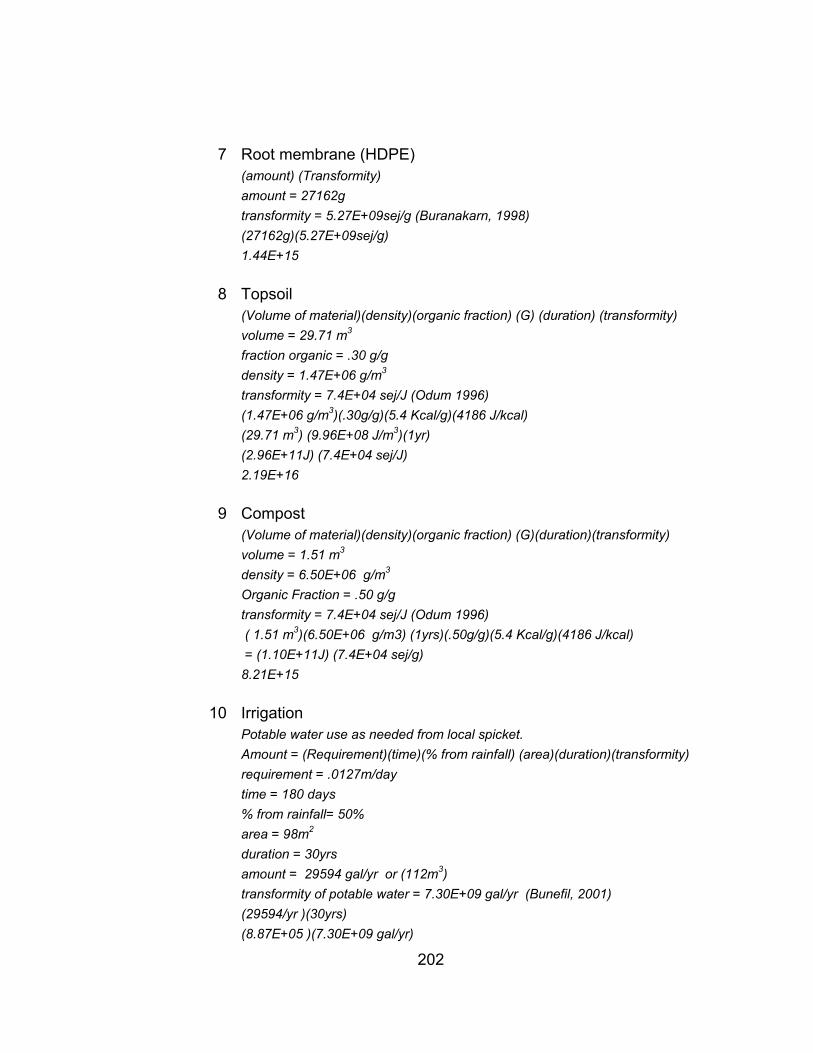
202
7 Root membrane (HDPE) (amount) (Transformity) amount = 27162g transformity = 5.27E+09sej/g (Buranakarn, 1998) (27162g)(5.27E+09sej/g) 1.44E+15
8 Topsoil (Volume of material)(density)(organic fraction) (G) (duration) (transformity) volume = 29.71 m3 fraction organic = .30 g/g density = 1.47E+06 g/m3 transformity = 7.4E+04 sej/J (Odum 1996) (1.47E+06 g/m3)(.30g/g)(5.4 Kcal/g)(4186 J/kcal) (29.71 m3) (9.96E+08 J/m3)(1yr) (2.96E+11J) (7.4E+04 sej/J) 2.19E+16
9 Compost (Volume of material)(density)(organic fraction) (G)(duration)(transformity) volume = 1.51 m3 density = 6.50E+06 g/m3 Organic Fraction = .50 g/g transformity = 7.4E+04 sej/J (Odum 1996) ( 1.51 m3)(6.50E+06 g/m3) (1yrs)(.50g/g)(5.4 Kcal/g)(4186 J/kcal) = (1.10E+11J) (7.4E+04 sej/g) 8.21E+15
10 Irrigation Potable water use as needed from local spicket. Amount = (Requirement)(time)(% from rainfall) (area)(duration)(transformity) requirement = .0127m/day time = 180 days % from rainfall= 50% area = 98m2 duration = 30yrs amount = 29594 gal/yr or (112m3) transformity of potable water = 7.30E+09 gal/yr (Bunefil, 2001) (29594/yr )(30yrs) (8.87E+05 )(7.30E+09 gal/yr)
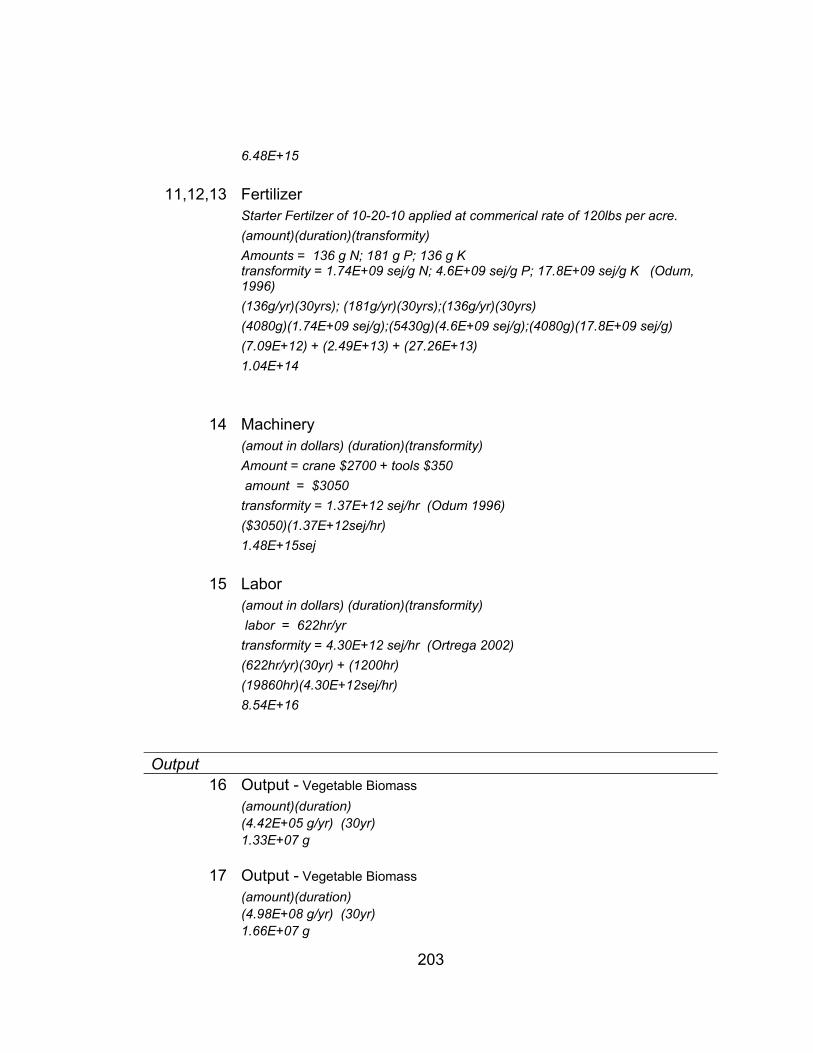
203
6.48E+15
11,12,13 Fertilizer Starter Fertilzer of 10-20-10 applied at commerical rate of 120lbs per acre. (amount)(duration)(transformity) Amounts = 136 g N; 181 g P; 136 g K
transformity = 1.74E+09 sej/g N; 4.6E+09 sej/g P; 17.8E+09 sej/g K (Odum, 1996)
(136g/yr)(30yrs); (181g/yr)(30yrs);(136g/yr)(30yrs) (4080g)(1.74E+09 sej/g);(5430g)(4.6E+09 sej/g);(4080g)(17.8E+09 sej/g) (7.09E+12) + (2.49E+13) + (27.26E+13) 1.04E+14
14 Machinery (amout in dollars) (duration)(transformity) Amount = crane $2700 + tools $350 amount = $3050 transformity = 1.37E+12 sej/hr (Odum 1996) ($3050)(1.37E+12sej/hr) 1.48E+15sej
15 Labor (amout in dollars) (duration)(transformity) labor = 622hr/yr transformity = 4.30E+12 sej/hr (Ortrega 2002) (622hr/yr)(30yr) + (1200hr) (19860hr)(4.30E+12sej/hr) 8.54E+16
Output 16 Output - Vegetable Biomass
(amount)(duration) (4.42E+05 g/yr) (30yr) 1.33E+07 g
17 Output - Vegetable Biomass (amount)(duration)
(4.98E+08 g/yr) (30yr) 1.66E+07 g
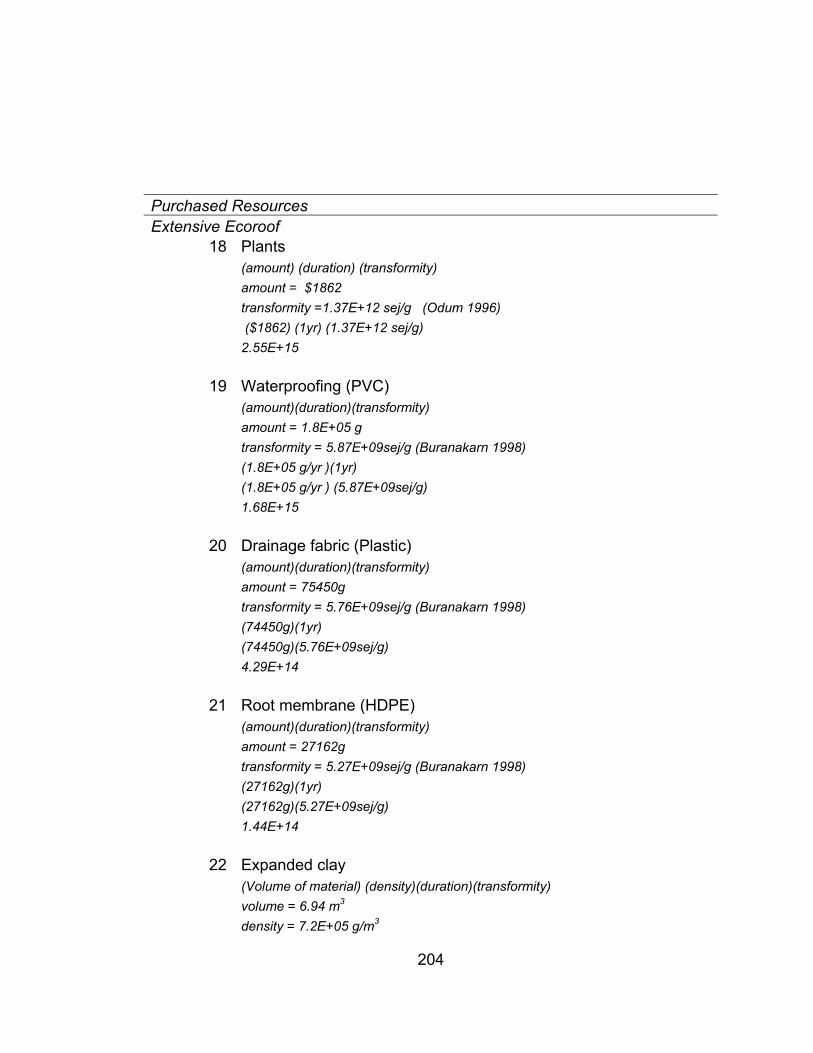
204
Purchased Resources Extensive Ecoroof
18 Plants (amount) (duration) (transformity) amount = $1862 transformity =1.37E+12 sej/g (Odum 1996) ($1862) (1yr) (1.37E+12 sej/g) 2.55E+15
19 Waterproofing (PVC) (amount)(duration)(transformity) amount = 1.8E+05 g transformity = 5.87E+09sej/g (Buranakarn 1998) (1.8E+05 g/yr )(1yr) (1.8E+05 g/yr ) (5.87E+09sej/g) 1.68E+15
20 Drainage fabric (Plastic) (amount)(duration)(transformity) amount = 75450g transformity = 5.76E+09sej/g (Buranakarn 1998) (74450g)(1yr) (74450g)(5.76E+09sej/g) 4.29E+14
21 Root membrane (HDPE) (amount)(duration)(transformity) amount = 27162g transformity = 5.27E+09sej/g (Buranakarn 1998) (27162g)(1yr) (27162g)(5.27E+09sej/g) 1.44E+14
22 Expanded clay (Volume of material) (density)(duration)(transformity) volume = 6.94 m3 density = 7.2E+05 g/m3
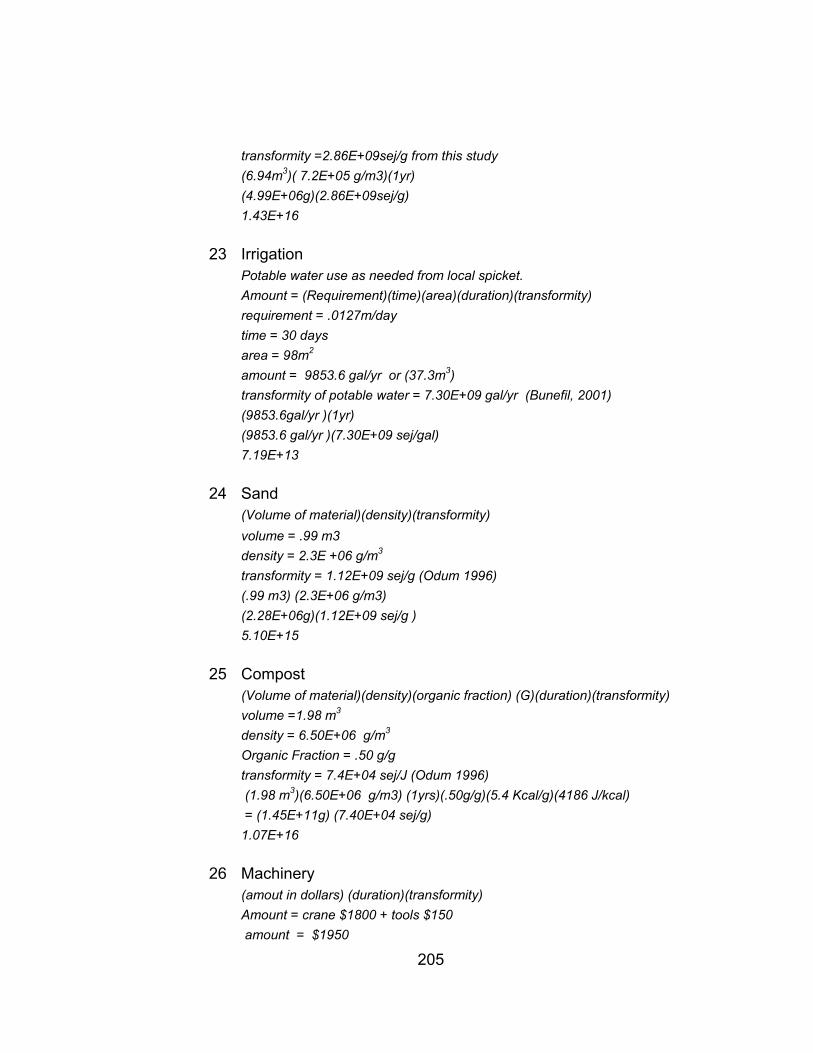
205
transformity =2.86E+09sej/g from this study (6.94m3)( 7.2E+05 g/m3)(1yr) (4.99E+06g)(2.86E+09sej/g) 1.43E+16
23 Irrigation Potable water use as needed from local spicket. Amount = (Requirement)(time)(area)(duration)(transformity) requirement = .0127m/day time = 30 days area = 98m2 amount = 9853.6 gal/yr or (37.3m3) transformity of potable water = 7.30E+09 gal/yr (Bunefil, 2001) (9853.6gal/yr )(1yr) (9853.6 gal/yr )(7.30E+09 sej/gal) 7.19E+13
24 Sand (Volume of material)(density)(transformity) volume = .99 m3 density = 2.3E +06 g/m3 transformity = 1.12E+09 sej/g (Odum 1996) (.99 m3) (2.3E+06 g/m3) (2.28E+06g)(1.12E+09 sej/g ) 5.10E+15
25 Compost (Volume of material)(density)(organic fraction) (G)(duration)(transformity) volume =1.98 m3 density = 6.50E+06 g/m3 Organic Fraction = .50 g/g transformity = 7.4E+04 sej/J (Odum 1996) (1.98 m3)(6.50E+06 g/m3) (1yrs)(.50g/g)(5.4 Kcal/g)(4186 J/kcal) = (1.45E+11g) (7.40E+04 sej/g) 1.07E+16
26 Machinery (amout in dollars) (duration)(transformity) Amount = crane $1800 + tools $150 amount = $1950
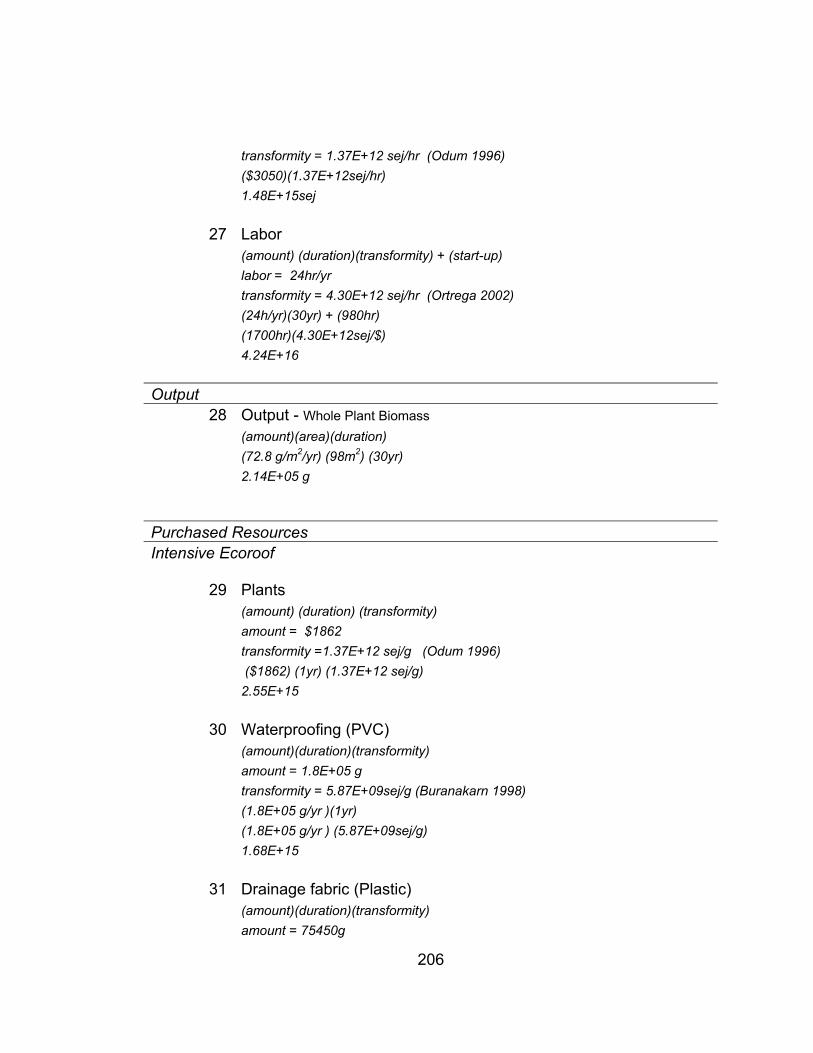
206
transformity = 1.37E+12 sej/hr (Odum 1996) ($3050)(1.37E+12sej/hr) 1.48E+15sej
27 Labor (amount) (duration)(transformity) + (start-up) labor = 24hr/yr transformity = 4.30E+12 sej/hr (Ortrega 2002) (24h/yr)(30yr) + (980hr) (1700hr)(4.30E+12sej/$) 4.24E+16
Output 28 Output - Whole Plant Biomass
(amount)(area)(duration) (72.8 g/m2/yr) (98m2) (30yr) 2.14E+05 g
Purchased Resources Intensive Ecoroof
29 Plants (amount) (duration) (transformity) amount = $1862 transformity =1.37E+12 sej/g (Odum 1996) ($1862) (1yr) (1.37E+12 sej/g) 2.55E+15
30 Waterproofing (PVC) (amount)(duration)(transformity) amount = 1.8E+05 g transformity = 5.87E+09sej/g (Buranakarn 1998) (1.8E+05 g/yr )(1yr) (1.8E+05 g/yr ) (5.87E+09sej/g) 1.68E+15
31 Drainage fabric (Plastic) (amount)(duration)(transformity) amount = 75450g
207
transformity = 5.76E+09sej/g (Buranakarn 1998) (74450g)(1yr) (74450g)(5.76E+09sej/g) 4.29E+14
32 Root membrane (HDPE) (amount)(duration)(transformity) amount = 27162g transformity = 5.27E+09sej/g (Buranakarn 1998) (27162g)(1yr) (27162g)(5.27E+09sej/g) 1.44E+14
33 Expanded clay (Volume of material)(density)(duration)(transformity) volume = 20.8 m3 density = 7.2E + 5 g/m3 transformity =2.86E+09sej/g from this study (20.8m3)(7.2E+05 g/m3)(1yr) (1.50E+07g) (2.86E+09sej/g) 4.28E+16
34 Irrigation Potable water use as needed from local spicket. Amount = (Requirement)(time)(area)(duration)(transformity) requirement = .0127m/day time = 30 days area = 98m2 amount = 9853.6 gal/yr or (37.3m3) transformity of potable water = 7.30E+09 gal/yr (Bunefil, 2001) (9853.6gal/yr )(1yr) (9853.6 gal/yr )(7.30E+09 sej/gal) 7.19E+13
35 Sand (Volume of material)(density)(transformity) volume = 1.98 m3 density = 2.3E +06 g/m3 transformity = 1.12E+09 sej/g (Odum, 1996) ( 1.98 m3)(2.3E+06 g/m3)
208
(4.55E+06g) (1.12E+09 sej/g ) 5.10E+15
36 Compost (Volume of material)(density)(organic fraction) (G)(duration)(transformity) volume =5.94 m3 density = 6.50E+06 g/m3 Organic Fraction = .50 g/g transformity = 7.4E+04 sej/J (Odum 1996) (5.94 m3)(6.50E+06 g/m3) (1yrs)(.50g/g)(5.4 Kcal/g)(4186 J/kcal) = (4.63E+11g) (7.40E+04 sej/g) 3.43E+16
37 Machinery (amout in dollars) (duration)(transformity) amount = crane $2700 + tools $150 amount = $2850 transformity = 1.37E+12 sej/hr (Ortrega 2002) ($2850)(1.37E+12sej/hr) 1.48E+15sej
38 Labor (amount) (duration)(transformity) + (start-up) labor = 24hr/yr transformity = 4.30E+12 sej/hr (Ortrega 2002) (24h/yr)(30yr) + (1200hr) (1920hr)(4.30E+12sej/$) 4.43E+16
Output 39 Output - Whole Plant Biomass
(amount)(area)(duration) (193.3 g/m2/yr) (98m2) (30yr) 5.68E+05 g
209
APPENDIX D
PERMISSION TO USE COPYRIGHTED MATERIAL
March 14, 2007 Reid R. Coffman Doctoral Candidate The Ohio State University Re: Copyright request Mr. Coffman, Green Roofs for Healthy Cities authorizes, Reid R. Coffman, permission to use the following GRHC copyrighted materials for the purpose of dissertation submittal at The Ohio State University, and the subsequent microfilming by ProQuest/UMI. Coffman, R. (2007). Comparing wildlife habitat and biodiversity across green roof type. In the
conference proceedings of Greening Rooftops for Sustainable Conference, Minneapolis MN, Green Roofs for Healthy Cities.
Coffman, R. and G. Davis (2005). Insect and Avian Fauna Presence on the Ford River Rouge
Green Roof. In the conference proceedings of Greening Rooftops for Sustainable Conference, Washington DC, Green Roofs for Healthy Cities.
Coffman, R. and J. F. Martin (2004). The Sustainability of An Agricultural Roof Garden. In the
conference proceedings of Greening Rooftops for Sustainable Communities, Portland, OR, Green Roofs for Healthy Cities.
Regards, Jennifer Sprout Director, Conferences and Events Green Roofs for Healthy Cities Telephone: 416-971-4494 E-Mail: [email protected]