
A Dissertation - OhioLINK ETD Center
341
A Dissertation entitled Linking Antecedents and Consequences of Value Density in the Healthcare Delivery Supply Chain by David D. Dobrzykowski Submitted to the Graduate Faculty as partial fulfillment of the requirements for the Doctor of Philosophy Degree in Manufacturing and Technology Management __________________________________________ Dr. T.S. Ragu-Nathan, Major Advisor __________________________________________ Dr. Mark A. Vonderembse, Major Advisor __________________________________________ Dr. Michael Bisesi, Committee Member __________________________________________ Dr. Stephen Callaway, Committee Member __________________________________________ Dr. Joseph Shapiro, Committee Member __________________________________________ Dr. Monideepa Tarafdar, Committee Member _______________________________________ Dr. Patricia R. Komuniecki, Dean College of Graduate Studies The University of Toledo December 2010
-
Upload
khangminh22 -
Category
Documents
-
view
0 -
download
0
Transcript of A Dissertation - OhioLINK ETD Center

A Dissertation
entitled
Linking Antecedents and Consequences of Value Density
in the Healthcare Delivery Supply Chain
by
David D. Dobrzykowski
Submitted to the Graduate Faculty as partial fulfillment of the requirements
for the Doctor of Philosophy Degree in Manufacturing and Technology Management
__________________________________________
Dr. T.S. Ragu-Nathan, Major Advisor
__________________________________________
Dr. Mark A. Vonderembse, Major Advisor
__________________________________________
Dr. Michael Bisesi, Committee Member
__________________________________________
Dr. Stephen Callaway, Committee Member
__________________________________________
Dr. Joseph Shapiro, Committee Member
__________________________________________
Dr. Monideepa Tarafdar, Committee Member
_______________________________________
Dr. Patricia R. Komuniecki, Dean
College of Graduate Studies
The University of Toledo
December 2010

Copyright 2010, David D. Dobrzykowski
This document is copyrighted material. Under copyright law, no parts of this
document may be reproduced without the expressed permission of the author.
iii
An abstract of
Linking Antecedents and Consequences of Value Density
in the Healthcare Delivery Supply Chain
by
David D. Dobrzykowski
Submitted to the Graduate Faculty as partial fulfillment of the requirements
for the Doctor of Philosophy Degree in Manufacturing and Technology Management
The University of Toledo
December 2010
Unprecedented scientific and technological advancements now enable people to
live longer, and with this increase in the aging population comes increased demand for
healthcare services (IOM, 2001). These shifts have contributed to disturbing trends
related to cost, quality, and even competition among healthcare providers. The Centers
for Medicare and Medicaid Services is estimated to spend more than $2.5 trillion for
healthcare services in 2009, or about $8,160 per U.S. resident compared to $75 billion, or
$356 per resident in 1970 (Kaiser, 2009). Healthcare spending is estimated to represent
17.6% of gross domestic product (GDP) in 2009, compared with only 7.2% in 1970
(Kaiser, 2009). Concomitant to these cost increases has been a decrease in consumer
confidence regarding access to quality care (Cogan et al., 2004). Such quality concerns
have been substantiated by reports that each year nearly 2 million people acquire
infections during hospital stays resulting in death for almost 99,000 patients (Klevens et
al., 2007). Consequently, interest in improving cost, quality, and other outcomes has
increased in recent years, highlighting the need for better operational coordination during
iv
healthcare delivery (Gittell et al., 2000; Fredendall et al., 2009). As such, practitioners
and scholars are directing their attention toward the benefits that can be realized by
efficient and effective supply chain management in healthcare (Schneller and Smeltzer,
2006). However, while a fair amount of supply chain management research exists in the
manufacturing context, generalizing these findings in healthcare has proven thorny
(Smeltzer and Ramanathan, 2002). As such, researchers have identified the need for new
studies exploring supply chain management in the uniquely decentralized context of
healthcare delivery (Shah et al., 2008).
This research study conceptualizes the healthcare delivery supply chain focusing
on the information and resource flows between admitting/attending physicians (e.g.,
surgeons) who make referrals to hospitals and deliver care to inpatients, and the internal
clinical staff members (e.g., nurses and other allied health professionals) who coordinate
and provide care to inpatients (Lambert and Cooper, 2000; Ford and Scanlon, 2007;
Schneller and Smeltzer, 2006). Sinha and Kohnke (2009) refer to such a
conceptualization from a macro level as the downstream, decentralized (Shah et al.,
2008) portion of the healthcare supply chain.
Service-dominant logic (SDL), and its central theme of value co-creation, are
employed to hypothesize that a partner relationship with admitting/attending physicians
will serve as a coordination mechanism affecting a hospital‘s strategy for integrating
information and resources during patient care, and also a hospital‘s culture or
entrepreneurial orientation. An integrative information and resource strategy (Sabherwal
and Chan, 2001; and Vonderembse et al., 2006) and entrepreneurial culture
(Jambulingam et al., 2005) will affect the work practices/interactions among
v
admitting/attending physicians and a hospital‘s clinical staff. These work practices are
conceptualized herein as integrative supply chain practices. Value is co-created in this
supply chain by the personalized interactions among patients, physicians, hospital
employees, and other supply chain actors (Prahalad and Ramaswamy, 2004a; Prahalad
and Krishnan, 2008). Thus, the focus of the hospital may be well served to shift from the
product/service itself to the supply chain or value creation system which comprises these
actors. Outcomes are enhanced when these actors work in a value dense environment
comprised of the information, knowledge, and other resources needed during patient care
(Normann and Ramirez, 1993). Value density, and consequently the performance of the
healthcare delivery supply chain, are enhanced by integrative supply chain practices such
as physician partnerships, patient relationships, information sharing, information quality,
lean principles, and Information Systems (IS) enabled processes (Li et al., 2005; Shah et
al., 2008; Rai et al., 2006). Finally, a value dense environment and the supply chain
performance of the care delivery team are hypothesized to affect a hospital‘s healthcare
delivery capability with regard to safety, effectiveness, patient-centeredness, timeliness,
and efficiency (IOM, 2001).
In order to test these hypothesized relationships, instruments were developed or
revalidated for seven major constructs and thirty-five subconstructs using pre-test,
structured interviews, and Q-sort pilot testing procedures. Next, the proposed model was
tested using Structural Equation Modeling (SEM) to analyze data collected from a large-
scale survey of 190 acute care hospitals in the United States. The empirical results
support eight out of nine hypothesized relationships with the exception of the link
between a value dense environment and a hospital‘s healthcare delivery capability. A
vi
value dense environment is shown to influence healthcare delivery capability; however,
this relationship is mediated by the supply chain performance of the care delivery team.
Specifically, this study provides evidence of critical linkages between partner relationship
and integrative information and resource strategy, partner relationship and entrepreneurial
culture, integrative information and resource strategy and integrative supply chain
practices, entrepreneurial culture and integrative supply chain practices, integrative
supply chain practices and value dense environment, integrative supply chain practices
and supply chain performance, value dense environment and supply chain performance,
and finally supply chain performance and healthcare delivery capability.

vii
To my loving wife, Sarah, and parents, Patricia and Daniel. Your support and
encouragement throughout this process has enabled any contribution which will be
realized as a result of this work. I look forward to enjoying the fruits of this labor with
you. Thank you.

viii
ACKNOWLEDGEMENTS
This experience has truly been a labor of love with the greater sacrifices being
made by my family, friends, and mentors. It is because of these individuals and countless
others, that I consider myself blessed to submit this work. You all have my deepest
gratitude. Given the one page requirement, I am only able to provide a list of individuals
to whom I am indebted.
In no particular order, my most sincere thanks go to Dr. T.S. Ragu-Nathan, Dr.
Mark Vonderembse, Dr. Michael Bisesi, Dr. Stephen Callaway, Dr. Joseph Shapiro, Dr.
Monideepa Tarafdar, Dr. Jeen Lim, Dr. Jerzy Kamburowski, Dr. Paul Hong, Dr. William
Doll, Dr. Thuong Le, Dr. Sonny Ariss, Dr. Anand Kunnathur, Dr. Brian Fink, Dr. Sheryl
Milz, Dr. James Pope, Dr. Thomas Sharkey, Dr. Sachin Modi, Dr. Subba Rao, Dr. Hassan
Hassab-Elnaby, Dean Thomas Gutteridge, Dr. E. Vance Wilson, Oanh Tran, Dr. Erika
Marsillac, Dr. Susita Asree, Dr. Sufian Qrunfleh, Abdullah Aldakhil, KiHyun Park, Ma
Ga Yang, Vafa Saboorideilami, Alison Avendt, Dr. Kathy Carlson, Cynthia Cremeans,
Steve Durham, Pat Fizer-Vogel, Carolyn Guzman Fitzenreiter, Dr. Brian Hinch, Dr.
Joseph Tomashefski, the 190 respondents from the Case Management Society of
America, University HealthSystems Consortium, and the American Hospital Association,
and the ‗student callers‘ and staff at UT‘s Urban Affairs Center.
I am especially grateful to my beloved wife, Sarah. Finally, thank you to my
loving and always supportive parents, Patricia and Daniel. It is your lifelong love and
support that have enabled this and all of my accomplishments and dreams. Thank you
all.
ix
TABLE OF CONTENTS
Abstract .............................................................................................................................. iii
Dedication ........................................................................................................................ vii
Acknowledgements .......................................................................................................... viii
Table of Contents ............................................................................................................... ix
List of Tables .................................................................................................................. xiv
List of Figures ................................................................................................................ xvii
1 Introduction .................................................................................................................1
1.1 Problem Statement .............................................................................................5
1.1.1 Supply Chain Management, Value Co-Creation, and Healthcare
Delivery..................................................................................................6
1.2 The Antecedents and Consequences of Value Co-Creation ............................10
1.3 Research Objectives and Contributions ...........................................................13
2 Theoretical Framework and Hypotheses ..................................................................16
2.1 The Downstream Healthcare Supply Chain .....................................................17
2.2 Research in Supply Chain Management ..........................................................23
2.3 The Context of The Study ................................................................................25
2.3.1 The Co-Production Phenomenon .........................................................27
2.3.2 Actor Role Ambiguity, Variable Demand, and Physician Centrality ..31
x
2.3.2.1 The Decentralized Healthcare Delivery Supply Chain ..........34
2.3.3 Information Asymmetries ....................................................................35
2.4 Theoretical Grounding .....................................................................................37
2.5 Theoretical Model ............................................................................................43
2.6 Partner Relationship .........................................................................................50
2.7 Integrative Information and Resource Strategy ...............................................54
2.7.1 Partner Relationship and Integrative Information and Resource
Strategy ..................................................................................................64
2.8 Entrepreneurial Culture ....................................................................................66
2.8.1 Partner Relationship and Entrepreneurial Culture ...............................70
2.9 Integrative Supply Chain Practices ..................................................................71
2.9.1 Integrative Information and Resource Strategy and Integrative
Supply Chain Practices ........................................................................79
2.9.2 Entrepreneurial Culture and Integrative Supply Chain Practices ........80
2.10 Value Dense Environment ...............................................................................82
2.10.1 Integrative Supply Chain Practices and Value Dense Environment ....86
2.11 Supply Chain Performance ..............................................................................87
2.11.1 Integrative Supply Chain Practices and Supply Chain Performance ...89
2.11.2 Value Dense Environment and Supply Chain Performance ................91
2.12 Healthcare Deliver Capability ..........................................................................91
2.12.1 Value Dense Environment and Healthcare Delivery Capability .........98
2.12.2 Supply Chain Performance and Healthcare Delivery Capability ......100
3 Instrument Development – Item Generation and Pilot Testing ..............................102
xi
3.1 Item Generation .............................................................................................102
3.2 Pre-Testing .....................................................................................................104
3.3 Q-Sort Pilot Testing .......................................................................................105
3.3.1 Assessment of Q-Sort Results ............................................................108
3.3.2 Results of Q-Sort Pilot Testing ..........................................................110
4 Large-Scale Survey – Instrument Validation ..........................................................114
4.1 Research Methodology ..................................................................................114
4.1.1 Data Collection – Methods and Procedures .......................................114
4.1.1.1 The American Hospital Association Sample ......................118
4.1.1.2 The Case Management Society of America Sample...........120
4.1.1.3 The University Healthsystem Consortium Sample .............122
4.1.2 Testing A Priori Sample Aggregation ...............................................124
4.1.3 Sample Characteristics .......................................................................127
4.1.4 Non-Response Bias Testing ...............................................................135
4.2 Instrument Validation ....................................................................................137
4.2.1 Structural Equation Modeling (SEM) ................................................137
4.2.2 Selection of the Measurement Model Approach (Reflective and
Formative Models) .............................................................................138
4.2.3 Assessment Methodology for Reflective Measurement Models .......147
4.2.4 Measurement Model Analysis and Results ........................................151
4.2.4.1 Partner Relationship ............................................................151
4.2.4.2 Integrative Information and Resource Strategy ..................154
4.2.4.3 Entrepreneurial Culture .......................................................158
xii
4.2.4.4 Integrative Supply Chain Practices .....................................163
4.2.4.5 Value Dense Environment ..................................................173
4.2.4.6 Supply Chain Performance .................................................176
4.2.4.7 Healthcare Delivery Capability...........................................180
4.2.5 Ave Test of Discriminant Validity .....................................................184
4.2.6 Instrument Validation Summary ........................................................186
5 Structural Model Analysis and Results ...................................................................188
5.1 Proposed Model .............................................................................................188
5.2 Rationale for PLS ...........................................................................................191
5.3 Methods for Assessing Formative Structural Models ....................................193
5.4 Path Model Results ........................................................................................195
5.4.1 Data Analysis Procedures ..................................................................196
5.4.2 Measurement ‗Outer‘ Model Results .................................................196
5.4.3 Structural ‗Inner‘ Model Results .......................................................199
5.4.4 Post Hoc Testing For Common Method Bias ....................................202
5.5 Discussion of Hypotheses ..............................................................................205
5.5.1 Summary of Results ...........................................................................220
6 Contributions, Implications, Limitations, and Future Research .............................221
6.1 Contributions..................................................................................................221
6.2 Implications for Scholars ...............................................................................226
6.3 Implications for Practitioners .........................................................................230
6.4 Limitations .....................................................................................................235
6.5 Future Research Opportunities ......................................................................237
xiii
References ........................................................................................................................240
Appendix A: Items Entering Round 1 of Q-Sort .............................................................273
Appendix B: Survey Refinement & Validation Instructions ...........................................281
Appendix C: Q-Sort Results ............................................................................................282
Appendix D: Online Survey Instrument .........................................................................287
Appendix E: CMSA Online Newsletter Survey ..............................................................312
Appendix F: UHC Listserv Announcement .....................................................................317
Appendix G: Glossary of Key Terms and Variables .......................................................318
xiv
LIST OF TABLES
2.2.1 Conceptualizations of supply chain practices ...................................................25
2.3.1 Summary of the key characteristics of the healthcare delivery supply chain ...27
2.4.1 Foundational premises of service-dominant logic .............................................40
2.5.1 Construct definitions .........................................................................................47
2.6.1 List of Subconstructs for Partner Relationship .................................................52
2.7.1 List of Subconstructs for Integrative Information and Resource Strategy ........58
2.7.2 IS Strategy profiles of Defenders, Prospectors, and Analyzers ........................63
2.8.1 List of Subconstructs for Entrepreneurial Culture ............................................70
2.9.1 List of Subconstructs for Integrative Supply Chain Practices ...........................73
2.10.1 List of Subconstructs for Value Dense Environment ........................................86
2.11.1 List of Subconstructs for Supply Chain Performance .......................................89
2.12.1 List of Subconstructs for Healthcare Delivery Capability ................................94
3.3.1 Numbers of items entering Q-sort ...................................................................107
3.3.1.1 Interpreting various values of K (Kappa) ........................................................110
3.3.2.5 Inter-judge raw agreement scores: Third Q-sort round ...................................112
3.3.2.6 Items placement rations: Third Q-sort round ..................................................112
3.3.2.7 Summary of the three round Q-sort pilot test ..................................................113
4.1.1.1 Other hospital study response rates from Journal of Operations
Management ....................................................................................................121
4.1.1.3.1 Data collection summary .................................................................................124
xv
4.1.2.1 Analysis of variance of demographic variables ..............................................126
4.1.2.2 Chi-square analysis of the three samples ........................................................127
4.3.1.1 Sample characteristics: type, location, size, and employment ........................132
4.3.1.2 Sample characteristics: activity, teaching status, and acuity ...........................133
4.3.1.3 Sample characteristics: coordination mechanisms ..........................................134
4.3.1.4 Sample characteristics: job titles of individual respondents ...........................134
4.1.4.1 T-tests of respondents and non-respondents for bed size ................................136
4.1.4.2 Chi-square analysis for non-response bias ......................................................137
4.2.2.1 Key differing traits of reflective and formative measurement ........................139
4.2.2.2 Decision rules for determining reflective or formative measurement .............142
4.2.2.3 Conceptual definition and measurement items for leagile strategy ................145
4.2.3.1 Summary of statistical cut-off values for measurement models .....................150
4.2.4.1.1 Partner Relationship measurement model .......................................................152
4.2.4.1.2 Partner Relationship – discriminant validity assessment ................................153
4.2.4.2.1 Integrative Information and Resource Strategy measurement model .............155
4.2.4.2.2 Integrative Information and Resource Strategy – discriminant validity
assessment .......................................................................................................156
4.2.4.3.1 Entrepreneurial Culture measurement model ..................................................160
4.2.4.3.2 Entrepreneurial Culture – discriminant validity assessment ...........................161
4.2.4.4.1 Integrative Supply Chain Practices measurement model ................................164
4.2.4.4.2 Integrative Supply Chain Practices – discriminant validity assessment .........167
4.2.4.4.3 Integrative Supply Chain Practices – discriminant validity assessment .........167
4.2.4.4.4 Integrative Supply Chain Practices – discriminant validity assessment .........167
4.2.4.5.1 Value Dense Environment measurement model .............................................174
4.2.4.5.2 Value Dense Environment – discriminant validity assessment .......................175
4.2.4.6.1 Supply Chain Performance measurement model ...........................................178
xvi
4.2.4.6.2 Supply Chain Performance – discriminant validity assessment ......................179
4.2.4.7.1 Healthcare Delivery Capability measurement model ......................................181
4.2.4.7.2 Healthcare Delivery Capability – discriminant validity assessment ...............182
4.2.5.1 Correlations and discriminant validity testing of first order constructs ..........185
4.2.6.1 Summary of measurement models ..................................................................187
5.3.1 Assessment indexes for formative structural models ......................................194
5.4.2.1 Measurement ‗outer‘ model results .................................................................198
5.4.3.1 Summary of structural model results ...............................................................200
5.4.4.1 Conceptual definition and measurement items for ASDR ..............................203
5.4.4.2 Summary of path model results controlled for common method bias ...........205
xvii
LIST OF FIGURES
2.1.1 Macro-level view of supply chain for the healthcare sector .........................18
2.1.3 The healthcare delivery supply chain ...........................................................21
2.1.4 The health care system and research framework under study ......................23
2.3.1.1 Modified form of Schmenner‘s (1986) service matrix .................................29
2.3.1.2 Distinctions between products and services, and examples ..........................29
2.4.2 Linear value chain representation in a healthcare context ............................39
2.4.3 Service(s) exchanged for services .................................................................42
2.5.1 Theoretical model .........................................................................................46
3.3.1.1 The Kappa (K) calculation ..........................................................................109
4.2.2.1 Hypothetical reflective and formative measurement models ......................139
4.2.2.2 Two distinct formative conceptualizations of organizational performance 141
4.2.4.1.1 Correlated model for Partner Relationship .................................................154
4.2.4.2.1 Correlated model for IS for Comprehensiveness Strategy .........................157
4.2.4.1.2 Correlated model for IS for Comprehensiveness and Leagile Strategy ......158
4.2.4.3.1 Correlated model for Entrepreneurial Culture ...........................................162
4.2.4.4.1 Correlated model for Comprehensive EMR Use ........................................170
4.2.4.4.2 Correlated model for Comprehensive EMR Use and IT for Asset
Management ................................................................................................171
4.2.4.4.3 Correlated model for Integrative Supply Chain Practices ..........................172
4.2.4.5.1 Correlated model for Value Dense Environment ........................................176
4.2.4.6.1 Correlated model for Supply Chain Performance .......................................180
4.2.4.7.1 Correlated model for Healthcare Delivery Capability ................................183
5.1.1 Theoretical model (repeated) ......................................................................190

xviii
5.4.3.1 Structural model results ..............................................................................201
1
CHAPTER 1: INTRODUCTION
The past 50 years have brought advancements in medical science and related
technologies at unprecedented rates (IOM, 2001). These advancements, in part, have
brought about an increased demand for medical care services in terms of volume as well
as variety. Scientific and technological advancements now enable to people live longer
and with this increase in the aging population comes increased demand for healthcare
services (IOM, 2001). As a result, healthcare delivery has grown in complexity placing
significant demands on providers to know more (knowledge), do more (work), manage
more (activity), share more (information), and interact with more people (coordinate)
than ever before (IOM, 2001).
These shifts have contributed to disturbing trends related to cost, quality, and even
competition among healthcare providers. The Centers for Medicare and Medicaid
Services (CMS) is estimated to spend more than $2.5 trillion for healthcare services in
2009, or about $8,160 per U.S. resident compared to $75 billion, or $356 per resident in
1970 (Kaiser, 2009). When compared to other nations, the U.S. spends considerably more
on healthcare as a percentage of GDP. In 2006, healthcare expenditures account for
15.3% of GDP in the U.S., compared with Canada (10.0%), France (11.0%), Germany
(10.6%), Japan (8.1%), and the United Kingdom (8.4%) (Kaiser, 2009). By 2009,
healthcare spending was estimated to represent 17.6% of gross domestic product (GDP),
compared with only 7.2% in 1970 (Kaiser, 2009). Not only is healthcare delivery
expensive, but some studies show that around the globe ―on an average, there seems to be
a decline in the performance efficiencies of hospitals‖ (Ramanathan, 2005: p. 52). Not
surprisingly, researchers now believe that ―it is almost requisite that any discussion about
2
the future of health care begin with a reference to the unsustainable growth rate of U.S.
medical spending,‖ (Hwang and Christensen, 2008: p. 1329).
Concomitant to these cost increases has been a decline in consumer confidence in
the quality of healthcare delivery. Cogan et al. (2004) report that 67% of people
responding to a survey expressed concern about access to the best medical treatment.
Extant evidence supports such concerns over quality. For example, in analyzing data
from the Center for Disease Control (CDC) Klevens et al. (2007) estimate that 1.7 million
patients are treated for nosocomial infections, (which are infections acquired while in the
hospital for an otherwise unrelated procedure), resulting in 99,000 deaths each year.
Today, ―the United States has the most expensive health care system in the world. In
spite of that, health care is of inconsistent quality and leads to poorer health outcomes
relative to other, similar nations,‖ (IOM, 2009: p. 6).
Cost and quality concerns have, at least in part, led some patients/consumers to
seek care abroad in international markets, opening up global competition. In some cases,
procedures performed abroad can be provided for substantially less than the same
procedure performed in developed countries such as the U.S. (Marek, 2009). As such
Sinha and Kohnke (2009: p. 198) observe that ―the costs of care and the waiting times for
receiving care in developed countries have increased to a level that, notwithstanding the
obvious risks, it is not uncommon for patients to travel to select health care delivery
facilities in developing countries that have now established a reputation for providing
high-quality, low-cost, and timely care, leading to the emergence of the phenomenon
referred to as medical tourism (Economist, 2008; Einhorn and Arnst, 2008; Lagace,
2007).‖
3
These trends are not unique to the healthcare industry. ―Global competition,
technological change and demanding customers are creating a more knowledge-intensive,
turbulent, complex and uncertain environment,‖ (Doll and Vonderembse, 1991; Huber,
1984; Jaikumar, 1986; Miles and Snow, 2007; Skinner, 1985; Vonderembse et al., 2006;
Zhang et al., 2002: p. 561). This environment creates pressure on firms as they now face
customers who demand more variety, better quality, lower cost, and more responsiveness
(Vonderembse et al., 2006). In response, many firms, including healthcare providers, are
pursuing a more integrative approach, referred to as supply chain management (SCM)
from the field of operations management (OM), for managing activities along their entire
value chain (Bechtel and Jayaram, 1997; Chan, et al., 2005; Childerhouse et al., 2002;
McKone-Sweet et al., 2005; Tan, 2001; Vonderembse, 2002; Vonderembse et al., 2006).
SCM involves the use of information technologies (IT) (Vonderembse et al.,
2006) and other practices which improve the management and coordination of
relationships with suppliers and customers (Li et al., 2009). SCM has been suggested to
improve cost, quality, flexibility, and responsiveness (Chen and Paulraj, 2004). Given
these changes in the environment and the benefits of SCM, many scholars suggest that
competition no longer occurs just among firms (or hospitals), but instead has shifted to
the supply chain level (Agarwal et al., 2006; Christopher, 1992; Lambert and Cooper,
2000; Towill and Christopher, 2002; Vonderembse, et al., 2006; Miles and Snow, 2007).
According to Lambert and Cooper (2000: p. 65) ―in this emerging competitive
environment, the ultimate success of the single business will depend on management‘s
ability to integrate the company‘s intricate network of business relationships,‖
(Bowersox, 1997; Christopher, 1998; Drucker, 1998).
4
This trend toward integration has created a more networked environment which
has implications for the fundamental logic of value creation (Normann and Ramirez,
1993). ―In the traditional conception of value creation, consumers were outside the firm,‖
(Prahalad and Ramaswamy, 2004a: p. 6). This view sees the customer as exogenous to
value creation activities and actually conceptualizes the customer as a destroyer or
consumer of value (Vargo and Akaka, 2009). However today, armed with new tools such
as IT enabled integration and dissatisfied with their available options, consumers desire
to interact with firms to co-create value, (Prahalad and Ramaswamy, 2004b). As such,
Zhang and Chen (2008: p. 242) observe that ―companies are shifting their focus from
increasing internal efficiency to leverage external resources, especially customer
competence, in order to gain new competitive advantages, (Lovelock and Young, 1979;
Prahalad and Ramaswamy, 2004b, Zhang and Chen, 2006; Prahalad and Krishnan,
2008).‖ ―Their focus of strategic analysis is not the company or even the industry but the
value-creation system itself, within which different economic actors – supplier, business
partners, allies, customers – work together to co-produce value,‖ (Normann and Ramirez,
1993: pp. 65-66). This has led to a network conceptualization of relationships which
converge to create value in a web of resource integration (Vargo and Akaka, 2009).
Vargo and Lusch (2008) refer to these resource integration networks as service
ecosystems or loosely coupled systems of larger service systems which exist in healthcare
delivery supply chains (Prahalad and Ramaswamy, 2004a; Shah et al., 2008; Sinha and
Kohnke, 2009).
5
1.1 Problem Statement
A review of the literature related to value co-creation reveals an emerging body of
work that is largely of the conceptual variety (Zhang and Chen, 2008). Vargo et al.
(2008) and Vargo and Akaka (2009) advance the theory of value co-creation by
providing a rich discussion of service dominant logic (SDL), the fundamental
underpinning of the phenomenon (Vargo and Lusch, 2004a; 2008). SDL posits that value
is realized in the use of resources, as opposed to the goods dominant logic (GDL) view
that value is realized in the exchange (or transaction) of resources (Vargo and Akaka,
2009). A primary distinction between GDL and SDL rests in the perspective of each view
related to the role of goods and services. Specifically, GDL is grounded in the traditional
paradigm of economic exchange, suggesting that goods (tangible products) hold primacy
over services or add-ons (intangible products such as after sale service) (Vargo and
Lusch, 2004; 2008). On the other hand, ―SDL is based on the idea that service, the
application of competences for the benefit of another, is the fundamental basis of value
creation through exchange. That is, services are exchanged for other services (i.e., by
service systems) and goods when involved, are service provision vehicles,‖ (Vargo and
Akaka, 2009: p. 32). As such, value is always co-created at the intersection of, and
interaction among, two or more value creation systems (with customers and others)
(Vargo and Akaka, 2009).
This view is gaining currency (Schmenner et al., 2009) as the requisite
interactions can be facilitated by IT and as such IT enabled value co-creation has been the
focus of some researchers (see Prahalad and Krishnan, 2008). Others have explored value
co-creation investigating the nature and enablers of firm interactions with customers (see
6
Prahalad and Ramaswamy, 2004a; 2004b). Normann and Ramirez (1993) provide a
broader perspective extending their view beyond the customer – firm interaction, instead
conceptualizing a constellation of economic actors (such as suppliers, customers, key
partners, and focal firm employees) who interact to co-create value.
Ford and Scanlon (2007) conceptualize the health system supply chain, in essence
describing a networked constellation. The healthcare supply chain is comprised of
primary care physicians, specialists, hospitals, pharmacies, and health plans, all of whom
interface with the patient to create value (Ford and Scanlon, 2007). This supply chain
conceptualization (Ford and Scanlon, 2007), as well as the work of other scholars in the
area of healthcare supply chain (Sinha and Kohnke, 2009) describe a value co-creation
system (Normann and Ramirez, 1993) or a service ecosystem (Vargo and Akaka, 2009).
These concepts have been extensively described in the value co-creation literature related
to co-creation interactions with customers/patients (Prahalad and Ramaswamy, 2004a;
2004b; Prahalad and Krishnan, 2008) and more broadly with suppliers/healthcare
providers, allies, business partners, and customers/patients (Normann and Ramirez,
1993). However, while much has been done to advance the conceptual understanding of
value co-creation, research ―is still in an early stage. The literature largely overlooked
construct development,‖ and empirical testing (Zhang and Chen, 2008: p. 242).
1.1.1 Supply Chain Management, Value Co-creation, and Healthcare Delivery
A few observations emerge from the literature. First, supply chain management
concepts may help scholars to unlock the empirical understanding of value co-creation.
While empirical testing has been sparse, Zhang and Chen (2008) offer a notable
7
exception by examining value co-creation through the supply chain lens of mass
customization. The authors tested and supported relationships between key value co-
creation activities, ―customerization‖1 capability, and service capability (see Zhang and
Chen, 2008). The use of supply chain concepts stands to reason given that ―supply chain
is a governing strategy that creates value for customers, and it is defined as a system,
which integrates suppliers, manufacturers, distributors, and customers in terms of
material, financial, and information flows,‖ (Liao, 2008: p.2).
However, there is ―an absence of an integrated framework, incorporating all the
activities [including organizational architectural factors such as strategy and culture] both
upstream and downstream sides of the supply chain,‖ in the extant literature (Li et al.,
2006: p. 108). Strategy and culture are important concerns of firms because both have
great influence on value creation and become more elusive and less understandable as
firms ―interact and align with the diverse network of suppliers and customers as their
supply chain partners,‖ (Roh et al., 2008: p. 362). Some scholars refer to the extant
ambiguity related to supply chain practices (such as integration) which link supply chain
strategies and performance as a black box (Handfield and Lawson, 2007). ―Questions
remain about how supply chains function and how deeply supply chain concepts are
ingrained,‖ (Vonderembse et al., 2006: p. 224). This is particularly true in the healthcare
context where scholars posit that healthcare is ―the home of some of the best and worst
practices in supply chain management,‖ (Byrnes, 2004).
1 Zhang and Chen (2008: p. 243) defined customerization capability as ―the unique capabilities generated
during value co-creation processes by involving customers during customerization.‖ These capabilities
include: (1) providing the customer exactly what he/she wants, (2) increased collaboration, (3) less
bureaucracy, and (4) precise targeting of customers.
8
Second, while these supply chain management concepts have gained momentum
in the healthcare field (for example, see Chan et al., 2005; and Varkey et al., 2007), very
little scholarly attention from Operations Management (OM) researchers has been paid to
these issues in a broader service context, let alone in healthcare (Machuca et al., 2007).
Research opportunities abound because ―as hospitals face an increasingly complex list of
challenges (e.g. aging population, cost pressures, and increasing concerns for patient
safety) there is much to be gained by applying the rich knowledge base from the field of
Operations Management (OM) to many of these problems,‖ (Ramanathan, 2005;
McDermott and Stock, 2007: p. 1021). However, the blind application of supply
chain/OM concepts from manufacturing in the healthcare context should be done
cautiously, as generalizations are not easily made (Smeltzer and Ramanathan, 2002). Key
differences emerge when comparing the manufacturing and healthcare contexts
(Schneller and Smeltzer, 2006; Shah et al., 2008; Smeltzer and Ramanathan, 2002).
Understanding these differences is valuable given that supply chain management
practices can be contextually specific (Liao, 2008).
While OM scholars have largely overlooked the healthcare supply chain, the
relevant studies focus on back office processes which closely mirror the characteristics of
manufacturing processes (Condel et al., 2004; Persoon et al., 2006; Rabb et al., 2006;
Raab et al., 2006). This has left a limited stream of research into front office processes,
such as patient care delivery, which deal with customer presence, and subsequent process
variability (Frei et al., 1999). The process variability in the healthcare delivery supply
chain can contribute to adverse performance such as buffering costs (de Treville and
Antonakis, 2006; Hopp and Spearman, 2004). The dearth of studies into front office
9
processes consists primarily of conceptual papers (Lapinski et al., 2006; Spear, 2004;
Spear, 2005) with a few notable exceptions (Shannon, et al., 2006; and Tucker, 2007)
which provide empirical studies of process improvement in patient care processes (Shah
et al., 2008). In summary, ―the U.S. health care industry is unique, and future research
defining [effective] work characteristics‖ is needed to advance the scholarly
understanding of supply chain concepts in this context (Shah et al., 2008: p. 783).
The purpose of this study is to advance the current scholarly understanding of the
antecedents and consequences of value co-creation in healthcare delivery, a front office
process. A supply chain management perspective is employed to inform the overarching
research question: does supply chain management influence value co-creation in a
hospital environment where healthcare is delivered? This broad curiosity is informed by
addressing four more granular research questions.
1) What are the antecedent partner relationship, integrative information and resource
strategy, and entrepreneurial culture characteristics that enable value co-creation
through integrative supply chain practices?
2) What are the integrative supply chain practices that influence value density and
supply chain performance?
3) What are the dimensions of supply chain performance and value density
(environment) that lead to the development of a healthcare delivery capability?
4) What are the relationships between these antecedents and consequences of value
density in healthcare delivery?
10
This general theme of this scholarly curiosity is shared by other prominent
researchers in the field, providing evidence of novelty. For example, Schneller and
Smeltzer (2006: p. 4) in their book entitled, Strategic Management of the Health Care
Supply Chain, suggest the following research questions.
1. “What are the characteristics of the more progressive hospital and
hospital systems in managing the supply chains?
- How do business strategy, organizational structure, personnel
capabilities, and environmental and competitive forces of the
organizations with more progressive supply chain practices differ from
organizations with less progressive supply chain practices?
- What is the role of leadership by clinicians and nonclinicians in
organizations characterized by progressive supply chains?
2. What conditions predisposed these organizations to have leading-edge
supply chain structures and practices?
3. What are the enablers and barriers to progressive supply chain
management practices in hospitals and hospital systems?
- What guidelines will lead to progressive supply chain practices?
4. What progressive supply chain practices can hospital and systems
managers best use from leading practices in manufacturing and retail
supply chains?”
1.2 The Antecedents and Consequences of Value Co-creation
The focus of the current study is to explore value co-creation and specifically
value density (Normann and Ramirez, 1993; Vargo and Akaka, 2009), positing that
integrative information and resource strategy (Sabherwal and Chan, 2001; Vonderembse
et al., 2006) and entrepreneurial culture (Jambulingam et al., 2005) can be empirically
measured as antecedents of integrative supply chain management practices and value
dense environment. Given the notion of Lambert and Cooper (2000) that supply chain
11
management has two primary emphases; the management of information, and material or
resources, supply chain management strategy is conceptualized in two dimensions: 1)
information management strategy using Information Systems (IS) (Sabherwal and Chan,
2001; Apigian et al., 2006), and 2) resource management strategy (Vonderembse et al.,
2006). Both integrative information and resource strategy and entrepreneurial culture are
important antecedents to value co-creation given that these organizational architectures
guide supply chain management processes, practices, and behaviors (Roh et al., 2008;
Schein, 1992).
However, the healthcare delivery supply chain is unique as compared to the
traditional product-focused supply chain in that there is no financial exchange as the
patient moves from one provider to another for services (Shah et al., 2008). This has lead
to scholarly curiosity regarding the actor motivations or the interaction mechanisms in
healthcare delivery that drive providers to work together in supply chain management
practices (Shah et al., 2008). This curiosity regarding the coordination mechanisms, or
drivers of closeness, in the supply chain exists within and even outside of the healthcare
context and has not been adequately explored or empirically tested (Goffin et al., 2006;
Liao, 2008; McCutcheon and Stuart, 2000). Therefore, this study extends the work of
Shah et al. (2008), and proposes that partnership relationship, comprised of three sub-
dimensions including: 1) trust, 2) commitment, and 3) shared vision (Li, 2002; Liao,
2008), motivates the development of a hospital‘s healthcare delivery (supply chain)
strategy and also drives its Entrepreneurial Culture.
Firms seek fit or alignment by configuring practices that are consistent with their
strategies (Doty et al., 1993). This vertical alignment involves the creation of consistency
12
among the strategies, objectives, action plans, and decisions throughout different levels of
the firm (Kathuria et al., 2007). This is manifested through ―management philosophies,
patterns of organizational routines and behavioral norms,‖ (Roh et al., 2008: p. 365).
Therefore, this study identifies integrative supply chain practices for healthcare delivery
consistent with the firm‘s strategies and culture. These supply chain management
practices include: 1) physician partnership, 2) patient relationship, 3) information sharing,
4) information quality, 5) lean principles, and 6) Information Systems (IS) enabled
processes (adapted from Li et al., 2005; Rai et al., 2006; Schneller and Smeltzer, 2006;
Shah et al., 2008).
Integrative supply chain practices are in essence the development, unbundling,
and rebundling of resources in order to configure them for use by other value co-creators
(Normann, 2001; Vargo and Akaka, 2009). This phenomenon is referred to as density
creation and it ―is a measure of the best combination of resources mobilized for a
particular situation,‖ (Vargo and Akaka, 2009: p. 39). It is this value dense environment,
characterized by large amounts of information, knowledge, and resources (Normann and
Ramirez, 1993) that enables the performance of the healthcare delivery supply chain.
This study measures the performance of the healthcare delivery supply chain along five
dimensions adapted from Li (2002) which include: 1) supply chain flexibility, 2) supply
chain integration, 3) patient responsiveness, 4) physician performance, and 5) partnership
quality. The performance of the healthcare delivery supply chain and value density of the
environment drive healthcare delivery capability measured using five of the Institute of
Medicine‘s (2001) aims for healthcare delivery: 1) safety (IOM, 2000; 2001; Tucker,
2007), 2) effectiveness or mortality (Shah et al., 2008), 3) patient-centeredness or patient
13
satisfaction (Marley et al., 2004), 4) timeliness or average length of stay (McDermott and
Stock, 2007; Shah et al., 2008) and 5) efficiency or cost (Li and Benton, 2006; Shah et
al., 2008).
1.3 Research Objectives and Contributions
While the present study develops an integrated model of the healthcare delivery
supply chain, grounded in SDL theory, it would be valuable to test this model through
large-scale empirical data collection thus producing a theoretical foundation as well as
empirical evidence. This research develops one of the first integrated models linking
supply chain strategy, practices, performance, and capability, a contribution which is
absent in the literature (Li et al., 2006). The present study also provides a very early
attempt to measure key phenomena related to the nascent theory of SDL, using SCM
construct measures extending the conceptual work of Normann and Ramirez (1993),
Prahalad and Ramaswamy (2004a) (2004b), Prahalad and Krishnan (2008), Vargo et al.
(2008), Vargo and Akaka (2009) among others. Finally, this supply chain study is
conceptualized in the healthcare delivery context. While interest from supply chain, OM,
and IT scholars is growing in this area (for examples, see Shah et al., 2008; Sinha and
Kohnke, 2009; Fredendall et al., 2009; Ilie et al., 2009), the field is largely
underrepresented in the literature (Machuca et al., 2007).
Therefore, the objectives of this study are to empirically investigate: 1) the direct
effects of partner relationship on a hospital‘s integrative information and resource (supply
chain) strategy, 2) the direct effects partner relationship on entrepreneurial culture, 3) the
direct effects of integrative information and resource (supply chain) strategy on
14
integrative supply chain practices, 4) the direct relationship of entrepreneurial culture on
integrative supply chain practices, 5) the direct effects of integrative supply chain
practices on the creation of a value dense environment, 6) the direct effects of integrative
supply chain practices on supply chain performance, 7) the direct effects of a value dense
environment on supply chain performance, 8) the direct effects of a value dense
environment on healthcare delivery capability, and 9) the direct effects of supply chain
performance on healthcare delivery capability. In a nomological sense, these objectives
will develop the antecedents and consequences of value density in the healthcare delivery
supply chain as well as test their linkages. In doing so, these objectives will inform the
research questions discussed in section 1.1.1.
This study provides value for the academic as well as practitioner communities.
By using SDL theory, this study develops a theoretical model of the partner relationship
characteristics, strategies, cultural elements, practices, performance, value density, and
capabilities of the healthcare delivery supply chain. This research project represents one
of the first empirical studies to develop and measure these phenomenological variables in
the healthcare delivery supply chain. It is also one of the first large scale empirical studies
into the antecedent strategies and practices of value co-creation. This study also identifies
capability/competitive advantage as a consequence of value density in the healthcare
delivery supply chain. Finally, another significant scholarly contribution of this study is
the development of valid and reliable measurement instruments for 1) Integrative
Information and Resource Strategy, 2) Integrative Supply Chain Practices, 3) Value
Dense Environment, and 4) Healthcare Delivery Capability. The study also revalidates 1)
Partner Relationship, 2) Entrepreneurial Culture, and 3) Supply Chain Performance.
15
For practitioners, this study provides insights into the architecture of effective
healthcare delivery supply chains. Specific direction is provided in the form of
operational definitions for Partner Relationship, Integrative Information and Resource
Strategy, Entrepreneurial Culture, Integrative Supply Chain Practices, Value Dense
Environment, Supply Chain Performance, and Healthcare Delivery Capability. Empirical
testing provides evidence of key relationships between strategies, practices, performance,
and capability as well as organizational architectural elements such as culture and also
coordination mechanisms such as partner relationship.
This study proceeds as follows. Chapter 2 of this study develops a theoretical
framework for healthcare delivery supply chains grounded in SDL theory. As such,
Chapter 2 provides construct definitions and hypothesis development. This is followed by
Chapter 3 which describes the first three stages of instrument (scale) development, while
Chapter 4 discusses the large-scale survey which was employed to collect data for
validity and reliability testing of the measures studied herein. Chapter 5 describes the
analysis of the structural model for hypothesis testing and Chapter 6 outlines the
contributions of this study as well as the implications, limitations, and opportunities for
future research.
16
CHAPTER 2: THEORETICAL FRAMEWORK AND HYPOTHESES
Reasonable consensus regarding the overarching definition of supply chain
management has existed for sometime from practitioners to academics as well as in
differing contexts. Consider the Council of Logistics (CLM, 2000) definition of supply
chain management as ―the systemic, strategic coordination of the traditional business
functions and tactics across business functions within a particular organization and across
businesses within the supply chain for the purposes of improving the long-term
performance of the individual organizations and the supply chain as a whole.‖ In a
manufacturing context, scholars have acknowledged that ―SCM has been defined to
explicitly recognize the strategic nature of coordination between trading partners and to
explain the dual purpose of SCM: to improve the performance of an individual
organization, and to improve the performance of the whole supply chain,‖ (Li et al.,
2006: p. 107). Similarly in differing contexts such as healthcare, scholars have opined
that supply chain management ―can be interpreted to include the flow of products and
associated services to meet the needs of the hospital and those who serve patients,‖
Schneller and Smeltzer (2006: p. 5). Schneller and Smeltzer (2006: p. 30) provide
additional detail, defining the health care supply chain as ―the information, supplies, and
finances involved with the acquisition and movement of goods and services from the
supplier to the end user in order to enhance clinical outcomes while controlling costs.‖
Collectively, supply chain management deals with the coordination and flow of
information and resources in the endeavor to create value and enhance performance for
all of participating economic actors (see Fiala, 2005).
17
Supply chain management can thus be said to be about the strategies and practices
employed by a firm to manage information and resources (including processes) in such a
way that leads to valuable, rare, inimitable, and non-substitutable resource bundles useful
in the creation of value and ultimately sustained performance or competitive advantage
(Wernerfelt, 1984; Barney, 1991; Grant, 1991). The delivery of healthcare can be viewed
as a bundle of resources, referred to as care bundles comprised of goods, services, and
experiences (Sinha and Kohnke, 2009). The resources which comprise each care bundle
are contributed and used by actors such as suppliers, customers, hospital employees,
strategic partners and others in the healthcare supply chain who work together to create
value (Norman and Ramirez, 1993). In healthcare as in other industries such as
manufacturing, ―a provider delivers ‗higher value‘ if it delivers the same quality of
services as another provider but at a lower cost or if it delivers higher-quality services at
the same cost,‖ (Miller, 2008: p. 3).
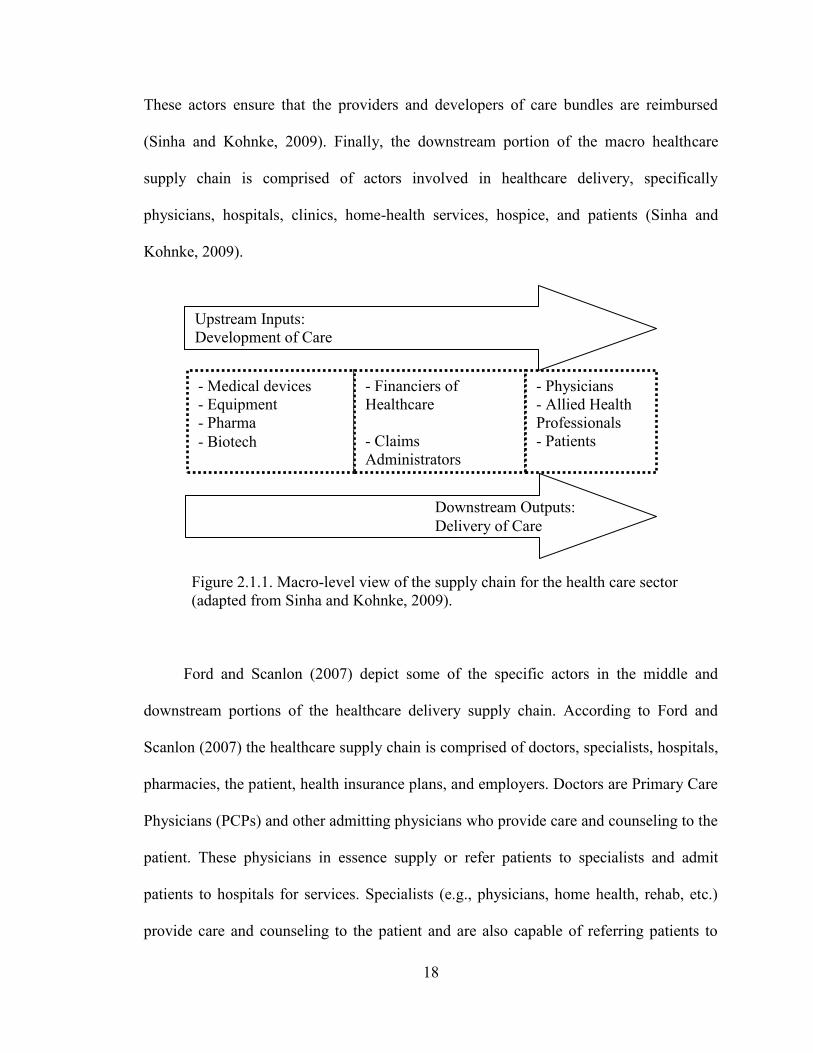
2.1 The Downstream Healthcare Supply Chain
According to Sinha and Kohnke (2009), the macro healthcare supply chain can be
viewed in three delineated sections described as upstream, middle, and downstream. This
is depicted in Figure 2.1.1. The upstream portion of the healthcare supply chain is
comprised of actors involved in the development of important elements of the care
bundle such as medical device manufacturers, biotech firms, and pharmaceutical
manufacturers (Sinha and Kohnke, 2009). The middle of the macro healthcare supply
chain deals with the financing and claims administration associated with care delivery
and is occupied by banks, insurance companies, and third party administrators (TPAs).
18
These actors ensure that the providers and developers of care bundles are reimbursed
(Sinha and Kohnke, 2009). Finally, the downstream portion of the macro healthcare
supply chain is comprised of actors involved in healthcare delivery, specifically
physicians, hospitals, clinics, home-health services, hospice, and patients (Sinha and
Kohnke, 2009).
Figure 2.1.1. Macro-level view of the supply chain for the health care sector
(adapted from Sinha and Kohnke, 2009).
Ford and Scanlon (2007) depict some of the specific actors in the middle and
downstream portions of the healthcare delivery supply chain. According to Ford and
Scanlon (2007) the healthcare supply chain is comprised of doctors, specialists, hospitals,
pharmacies, the patient, health insurance plans, and employers. Doctors are Primary Care
Physicians (PCPs) and other admitting physicians who provide care and counseling to the
patient. These physicians in essence supply or refer patients to specialists and admit
patients to hospitals for services. Specialists (e.g., physicians, home health, rehab, etc.)
provide care and counseling to the patient and are also capable of referring patients to
- Medical devices
- Equipment
- Pharma
- Biotech
- Financiers of
Healthcare
- Claims
Administrators
- Physicians
- Allied Health
Professionals
- Patients
Upstream Inputs:
Development of Care
Downstream Outputs:
Delivery of Care
19
other specialists and admitting patients to hospitals for services. The hospital – and its
allied health professional staff including nurses, physical therapists, and other personnel
in the hospital – coordinate and provide care and counseling to the patient typically
related to a specific medical procedure. Pharmaceutical companies and dispensers (such
as pharmacies) provide medications and counseling services to the patient. The health
insurance firm or health plan provides access to care through covered benefits and other
services such as health coaching and chronic disease management to the patient. Finally,
the employer in Ford and Scanlon‘s (2007) supply chain depiction is primarily
responsible for selection of the health plan and the ultimate financier of healthcare
services.
While it is commonly accepted that the current performance of the healthcare
system is unsustainable (Hwang and Christensen, 2009), there is less consensus regarding
where to focus improvement efforts. Consider that ―Medicare Part D spending [covering
pharmaceutical drugs] is estimated to be about $51 billion in 2009,‖ (Dicken, 2009: p. 3)
and is expected to rise. Additionally, health insurance premiums increased by 131% from
1999 to 2009 (National Coalition on Health, 2009). These facts lead some to focus
improvement efforts on the upstream or middle portions of the macro healthcare supply
chain. When considering the downstream healthcare supply chain, some go so far as to
argue against reducing costs associated with the actual delivery of healthcare owing to
concerns over a quality trade off. However, ―research has shown that more services and
higher spending do not result in better outcomes; indeed, they often produce just the
opposite result,‖ (Miller, 2008: p. 1). This reveals the downstream portion of the
healthcare supply chain as an attractive context for improvement as ―the most pressing
20
task of health care [delivery] is to make care effective and affordable,‖ (Coye et al., 2009:
p. 126).
The majority of the burden in this regard falls on the shoulders of healthcare
providers such as hospitals and physicians given that more than one-half (1/2) of health
spending in the U.S. is for hospital, physician, and other clinical services, (Kaiser, 2009).
As Ford and Scanlon (2007) discuss, the delivery of care is often very complex and
uncoordinated, requiring steps and patient ―handoffs‖ that delay or slow down care,
increasing cost and decreasing safety and/or quality (IOM, 2001). These cumbersome
processes waste valuable resources and lead to loss or asymmetry of information (IOM,
2001; Ford and Scanlon, 2007).
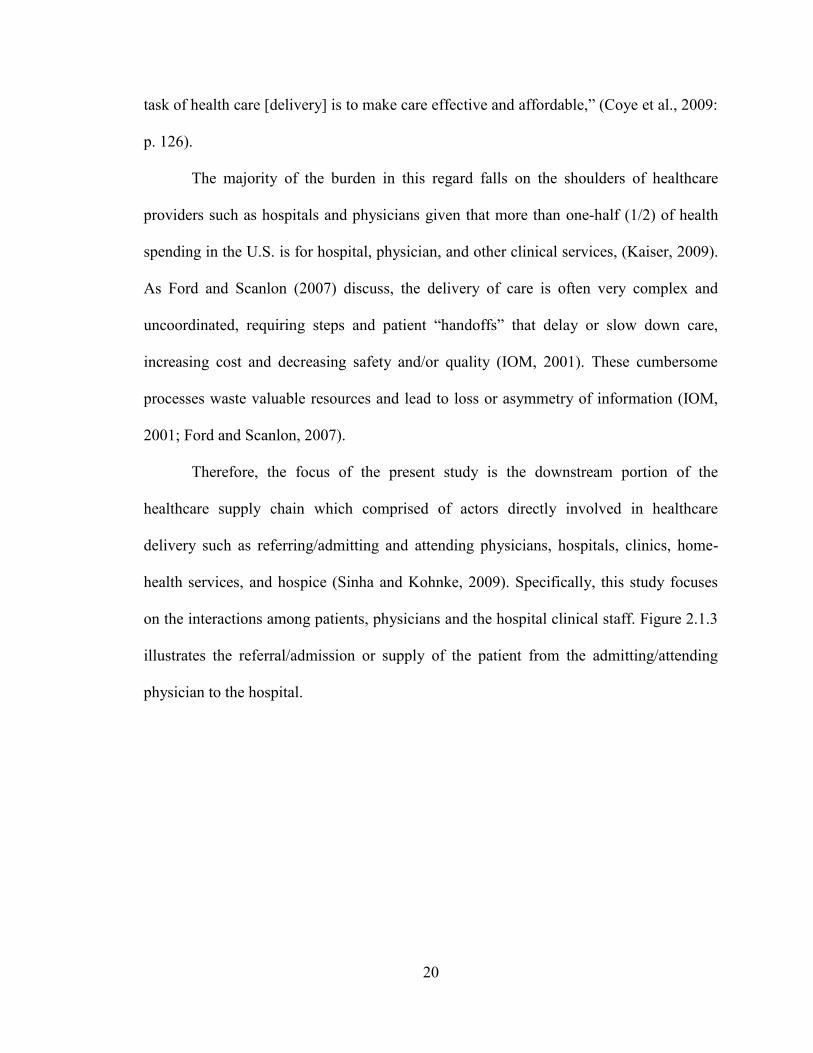
Therefore, the focus of the present study is the downstream portion of the
healthcare supply chain which comprised of actors directly involved in healthcare
delivery such as referring/admitting and attending physicians, hospitals, clinics, home-
health services, and hospice (Sinha and Kohnke, 2009). Specifically, this study focuses
on the interactions among patients, physicians and the hospital clinical staff. Figure 2.1.3
illustrates the referral/admission or supply of the patient from the admitting/attending
physician to the hospital.
21
Note: Solid arrow indicates patient referral from physician to
hospital. Double-headed arrows indicate the service exchange among
the admitting/attending physician, the patient and hospital clinicians.
Admitting/Attending
Physician
(e.g., surgeons)
Hospital
(e.g., Nurses and
other clinicians)
Patient
(as a hospital
inpatient)
Patient
Referral
Point
Service
Exchange
Service
Exchange
Service
Exchange
Figure 2.1.3. The healthcare delivery supply chain (developed based on Ford and
Scanlon, 2007; and Sinha and Kohnke, 2009).
As an inpatient, service exchange occurs among the patient, the
admitting/attending physician, and other clinicians coordinated by the hospital. Services
are also exchanged between the physician and the hospital (e.g. the physician orders and
receives diagnostics, or nurses provide the physician with information about the patient‘s
condition which is useful in treatment). This conceptualizes the downstream supply chain
actors as follows. Admitting/attending physicians supply patients (material) and services
to the hospital and provide services to patients during inpatient hospitalizations. Thus,
22
this study conceptualizes admitting/attending physicians primarily as ‗suppliers‘ in a
traditional supply chain sense. As will be discussed later, the physician‘s role in the
downstream healthcare delivery supply chain is complex and multifaceted. As such, this
conceptualization is admittedly a dramatic simplification of the physician‘s supply chain
role. However, it is the most appropriate conceptualization in this context and is useful
given the focus of this study. The hospital is conceptualized as the ‗focal firm‘ in a
traditional supply chain sense, given that care is delivered in the hospital and involves
significant work by individuals employed by or affiliated with the hospital (Butler et al.,
1996). Finally, the patient is conceptualized as the ultimate customer – the beneficiary of
care (Schneller and Smeltzer, 2006).
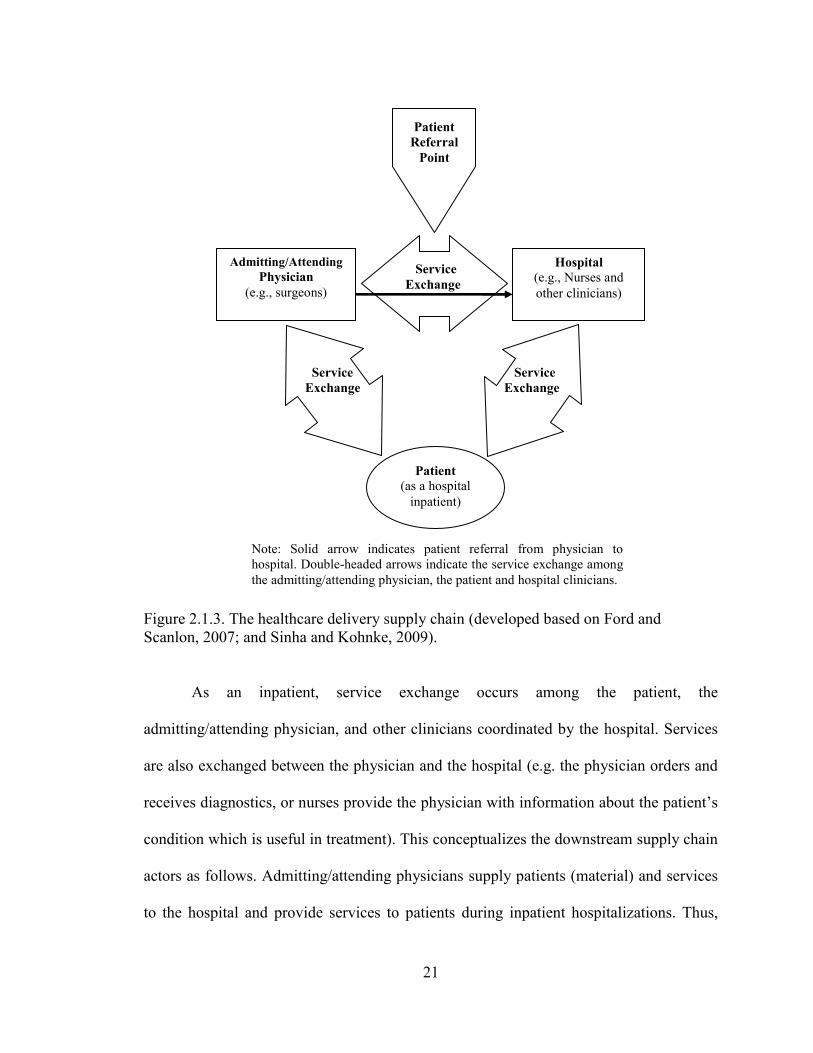
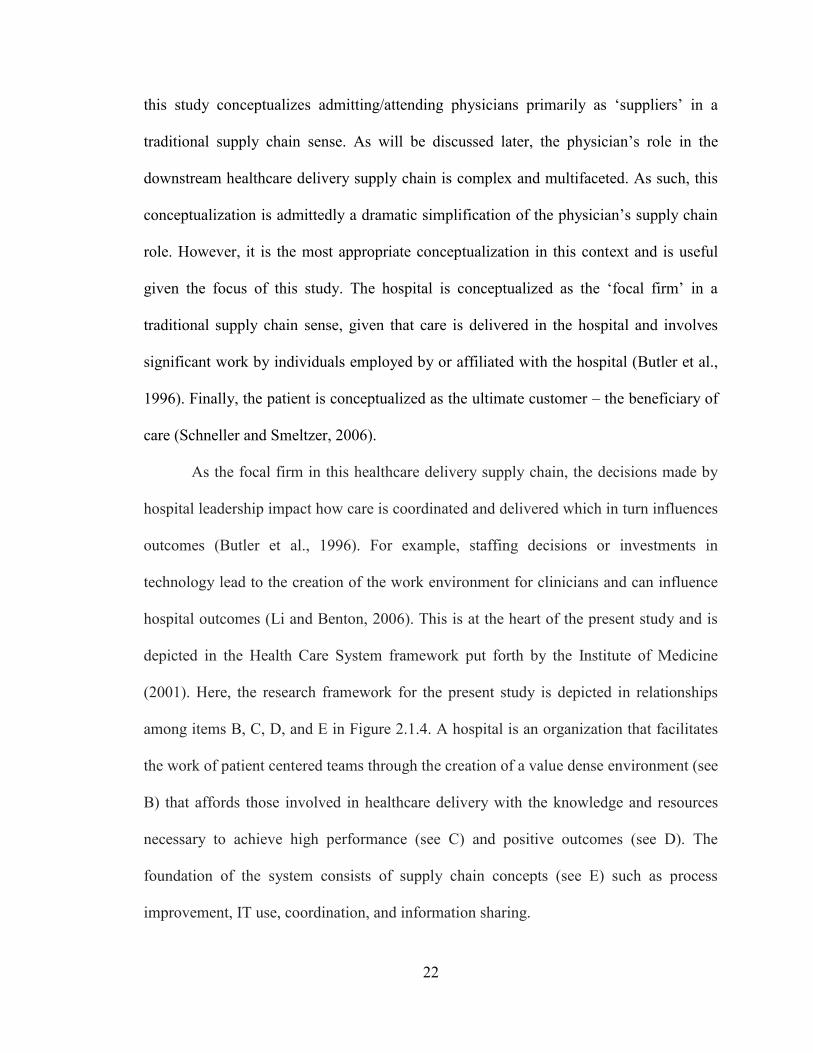
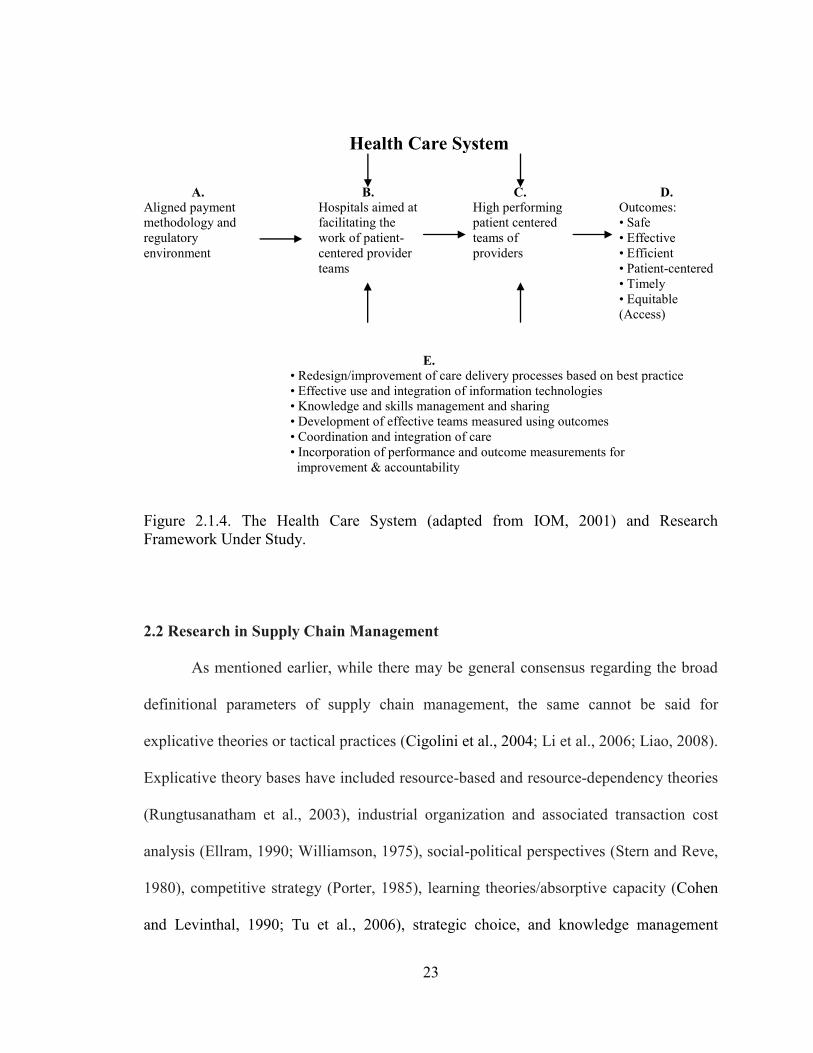
As the focal firm in this healthcare delivery supply chain, the decisions made by
hospital leadership impact how care is coordinated and delivered which in turn influences
outcomes (Butler et al., 1996). For example, staffing decisions or investments in
technology lead to the creation of the work environment for clinicians and can influence
hospital outcomes (Li and Benton, 2006). This is at the heart of the present study and is
depicted in the Health Care System framework put forth by the Institute of Medicine
(2001). Here, the research framework for the present study is depicted in relationships
among items B, C, D, and E in Figure 2.1.4. A hospital is an organization that facilitates
the work of patient centered teams through the creation of a value dense environment (see
B) that affords those involved in healthcare delivery with the knowledge and resources
necessary to achieve high performance (see C) and positive outcomes (see D). The
foundation of the system consists of supply chain concepts (see E) such as process
improvement, IT use, coordination, and information sharing.
23
Health Care System
A.
Aligned payment
methodology and
regulatory
environment
B.
Hospitals aimed at
facilitating the
work of patient-
centered provider
teams
C.
High performing
patient centered
teams of
providers
D.
Outcomes:
• Safe
• Effective
• Efficient
• Patient-centered
• Timely
• Equitable
(Access)
E.
• Redesign/improvement of care delivery processes based on best practice
• Effective use and integration of information technologies
• Knowledge and skills management and sharing
• Development of effective teams measured using outcomes
• Coordination and integration of care
• Incorporation of performance and outcome measurements for
improvement & accountability
Figure 2.1.4. The Health Care System (adapted from IOM, 2001) and Research
Framework Under Study.
2.2 Research in Supply Chain Management
As mentioned earlier, while there may be general consensus regarding the broad
definitional parameters of supply chain management, the same cannot be said for
explicative theories or tactical practices (Cigolini et al., 2004; Li et al., 2006; Liao, 2008).
Explicative theory bases have included resource-based and resource-dependency theories
(Rungtusanatham et al., 2003), industrial organization and associated transaction cost
analysis (Ellram, 1990; Williamson, 1975), social-political perspectives (Stern and Reve,
1980), competitive strategy (Porter, 1985), learning theories/absorptive capacity (Cohen
and Levinthal, 1990; Tu et al., 2006), strategic choice, and knowledge management
24
(Miles and Snow, 2007), relational coordination (Gittell, 2000; 2001; 2002a; 2002b;
Weinberg et al., 2007; Gittell et al., 2000; Shah et al., 2008) and the theory of swift and
even flow (Schmenner and Swink, 1998; Fredendeall et al., 2009). Still, others have
recently identified the need for new theories, such as SDL, which are capable of better
explaining SCM phenomena (Schmenner et al., 2009).
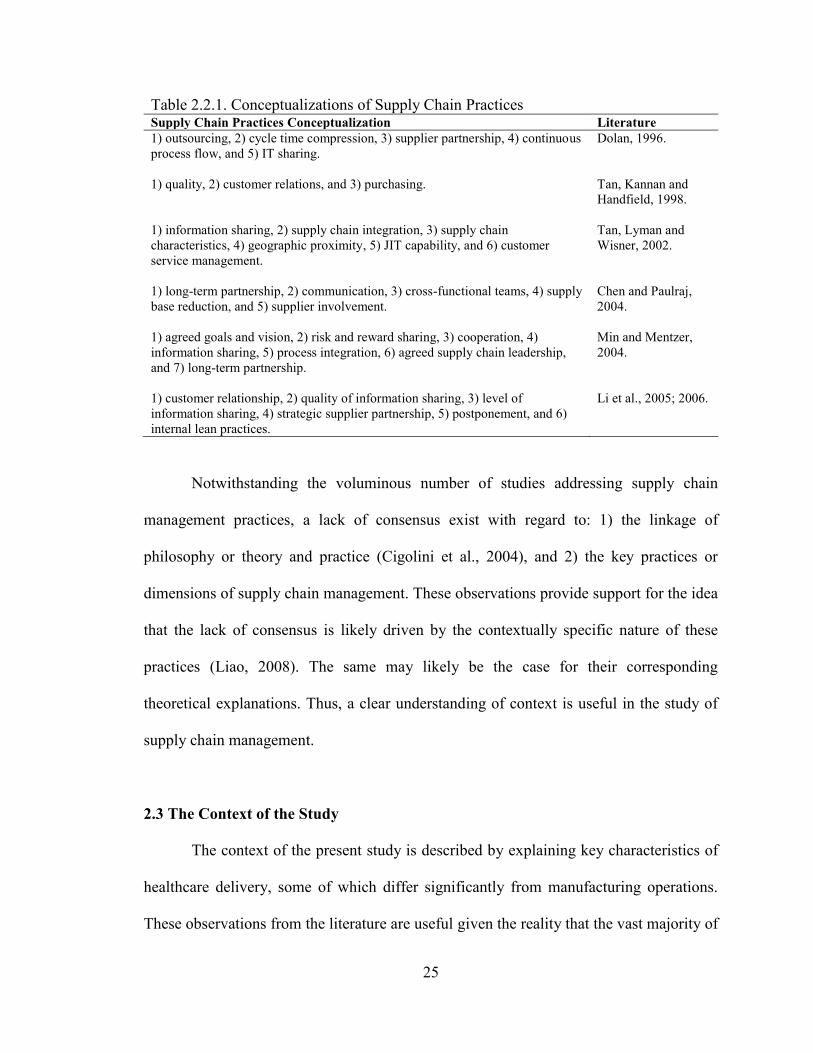
Similarly, numerous conceptualizations of SCM practices have been proposed (Li
et al., 2006). The various conceptualizations include practices such as outsourcing, cycle
time compression, supplier partnership, continuous process flow, IT sharing, quality,
customer relations, purchasing, information sharing, supply chain integration, supply
chain characteristics, geographic proximity, JIT capability, communication, cross-
functional teams, supply base reduction, supplier involvement, agreed goals and vision,
risk and reward sharing, cooperation, agreed supply chain leadership, quality of
information sharing, and postponement (Dolan, 1996; Chen and Paulraj, 2004; Li et al.,
2005; 2006; Min and Mentzer, 2004; Tan et al., 1998; Tan et al., 2002). See Table 2.2.1.
Alvarado and Kotzab (2001) also suggest that IT use such as EDI for inter-organizational
data exchange is a supply chain management practice.
25
Table 2.2.1. Conceptualizations of Supply Chain Practices Supply Chain Practices Conceptualization Literature
1) outsourcing, 2) cycle time compression, 3) supplier partnership, 4) continuous
process flow, and 5) IT sharing.
Dolan, 1996.
1) quality, 2) customer relations, and 3) purchasing. Tan, Kannan and
Handfield, 1998.
1) information sharing, 2) supply chain integration, 3) supply chain
characteristics, 4) geographic proximity, 5) JIT capability, and 6) customer
service management.
Tan, Lyman and
Wisner, 2002.
1) long-term partnership, 2) communication, 3) cross-functional teams, 4) supply
base reduction, and 5) supplier involvement.
Chen and Paulraj,
2004.
1) agreed goals and vision, 2) risk and reward sharing, 3) cooperation, 4)
information sharing, 5) process integration, 6) agreed supply chain leadership,
and 7) long-term partnership.
Min and Mentzer,
2004.
1) customer relationship, 2) quality of information sharing, 3) level of
information sharing, 4) strategic supplier partnership, 5) postponement, and 6)
internal lean practices.
Li et al., 2005; 2006.
Notwithstanding the voluminous number of studies addressing supply chain
management practices, a lack of consensus exist with regard to: 1) the linkage of
philosophy or theory and practice (Cigolini et al., 2004), and 2) the key practices or
dimensions of supply chain management. These observations provide support for the idea
that the lack of consensus is likely driven by the contextually specific nature of these
practices (Liao, 2008). The same may likely be the case for their corresponding
theoretical explanations. Thus, a clear understanding of context is useful in the study of
supply chain management.
2.3 The Context of the Study
The context of the present study is described by explaining key characteristics of
healthcare delivery, some of which differ significantly from manufacturing operations.
These observations from the literature are useful given the reality that the vast majority of
26
the extant supply chain/OM scholarly knowledge base has been studied and developed in
the manufacturing context (Machuca et al., 2007). ―Probably more is known about supply
chains in manufacturing than in any other industry type,‖ (Smeltzer and Ramanathan,
2002: p. 2561). Given the decades of research into issues such as quality management,
operations strategy, and efficiency, most often in the manufacturing sector, there is an
obvious need to transfer some of these important learnings into the healthcare operations
context (McDermott and Stock, 2007). However, if scholars are to effectively transfer
knowledge, or generalize from the extant base, it is important to do so with the
understanding that ―health care supply chains are organized quite differently from
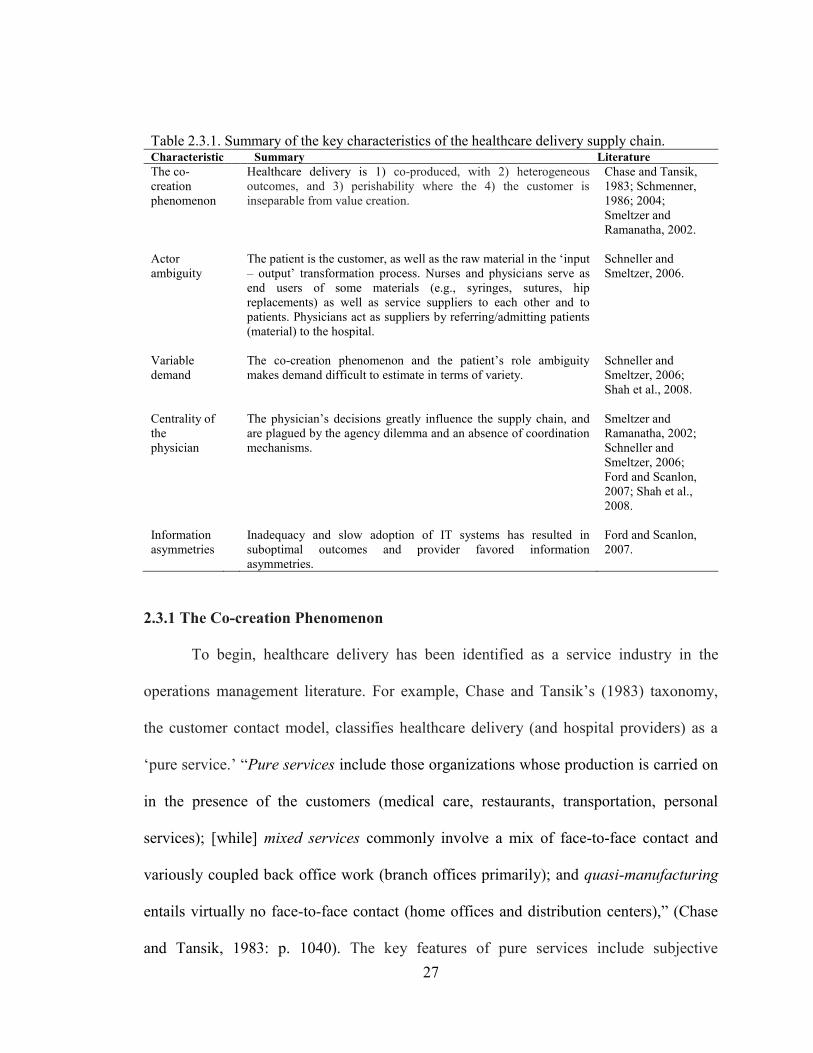
product-based scenarios,‖ (Shah et al., 2008: p. 765). With this understanding, some key
characteristics of healthcare delivery are summarized in Table 2.3.1 and will now be
discussed.
27
Table 2.3.1. Summary of the key characteristics of the healthcare delivery supply chain. Characteristic Summary Literature
The co-
creation
phenomenon
Healthcare delivery is 1) co-produced, with 2) heterogeneous
outcomes, and 3) perishability where the 4) the customer is
inseparable from value creation.
Chase and Tansik,
1983; Schmenner,
1986; 2004;
Smeltzer and
Ramanatha, 2002.
Actor
ambiguity
The patient is the customer, as well as the raw material in the ‗input
– output‘ transformation process. Nurses and physicians serve as
end users of some materials (e.g., syringes, sutures, hip
replacements) as well as service suppliers to each other and to
patients. Physicians act as suppliers by referring/admitting patients
(material) to the hospital.
Schneller and
Smeltzer, 2006.
Variable
demand
The co-creation phenomenon and the patient‘s role ambiguity
makes demand difficult to estimate in terms of variety.
Schneller and
Smeltzer, 2006;
Shah et al., 2008.
Centrality of
the
physician
The physician‘s decisions greatly influence the supply chain, and
are plagued by the agency dilemma and an absence of coordination
mechanisms.
Smeltzer and
Ramanatha, 2002;
Schneller and
Smeltzer, 2006;
Ford and Scanlon,
2007; Shah et al.,
2008.
Information
asymmetries
Inadequacy and slow adoption of IT systems has resulted in
suboptimal outcomes and provider favored information
asymmetries.
Ford and Scanlon,
2007.
2.3.1 The Co-creation Phenomenon
To begin, healthcare delivery has been identified as a service industry in the
operations management literature. For example, Chase and Tansik‘s (1983) taxonomy,
the customer contact model, classifies healthcare delivery (and hospital providers) as a
‗pure service.‘ ―Pure services include those organizations whose production is carried on
in the presence of the customers (medical care, restaurants, transportation, personal
services); [while] mixed services commonly involve a mix of face-to-face contact and
variously coupled back office work (branch offices primarily); and quasi-manufacturing
entails virtually no face-to-face contact (home offices and distribution centers),‖ (Chase
and Tansik, 1983: p. 1040). The key features of pure services include subjective
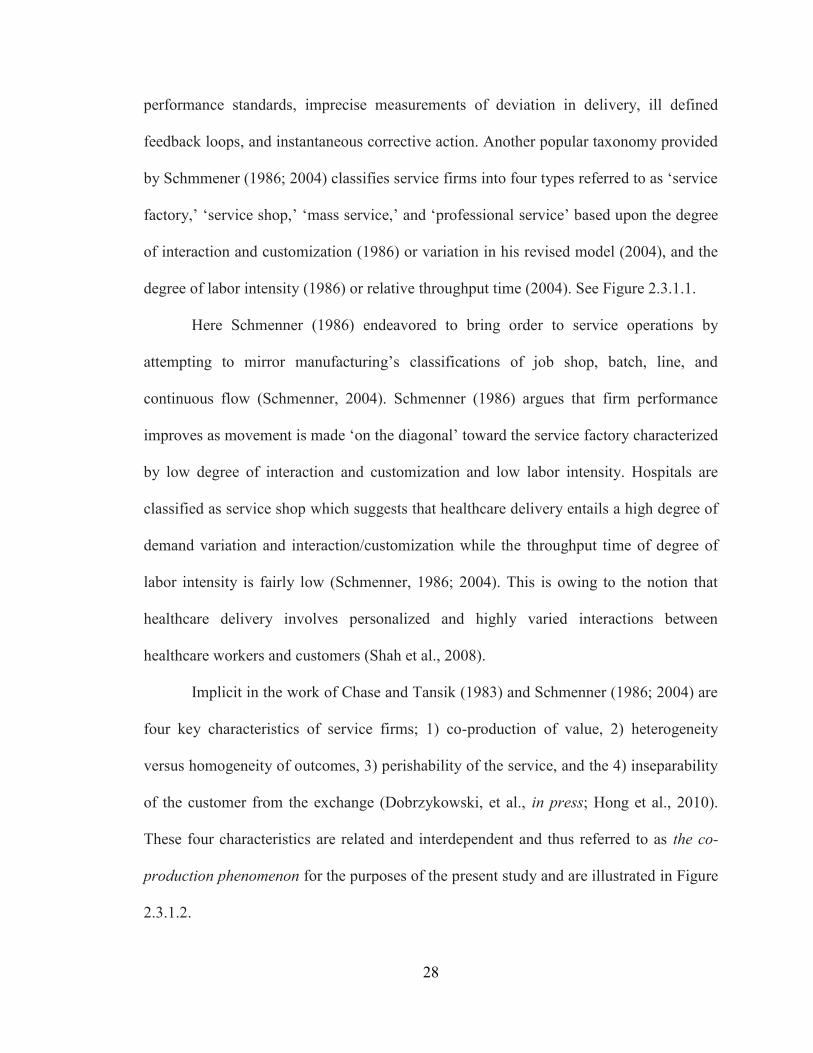
28
performance standards, imprecise measurements of deviation in delivery, ill defined
feedback loops, and instantaneous corrective action. Another popular taxonomy provided
by Schmmener (1986; 2004) classifies service firms into four types referred to as ‗service
factory,‘ ‗service shop,‘ ‗mass service,‘ and ‗professional service‘ based upon the degree
of interaction and customization (1986) or variation in his revised model (2004), and the
degree of labor intensity (1986) or relative throughput time (2004). See Figure 2.3.1.1.
Here Schmenner (1986) endeavored to bring order to service operations by
attempting to mirror manufacturing‘s classifications of job shop, batch, line, and
continuous flow (Schmenner, 2004). Schmenner (1986) argues that firm performance
improves as movement is made ‗on the diagonal‘ toward the service factory characterized
by low degree of interaction and customization and low labor intensity. Hospitals are
classified as service shop which suggests that healthcare delivery entails a high degree of
demand variation and interaction/customization while the throughput time of degree of
labor intensity is fairly low (Schmenner, 1986; 2004). This is owing to the notion that
healthcare delivery involves personalized and highly varied interactions between
healthcare workers and customers (Shah et al., 2008).
Implicit in the work of Chase and Tansik (1983) and Schmenner (1986; 2004) are
four key characteristics of service firms; 1) co-production of value, 2) heterogeneity
versus homogeneity of outcomes, 3) perishability of the service, and the 4) inseparability
of the customer from the exchange (Dobrzykowski, et al., in press; Hong et al., 2010).
These four characteristics are related and interdependent and thus referred to as the co-
production phenomenon for the purposes of the present study and are illustrated in Figure
2.3.1.2.
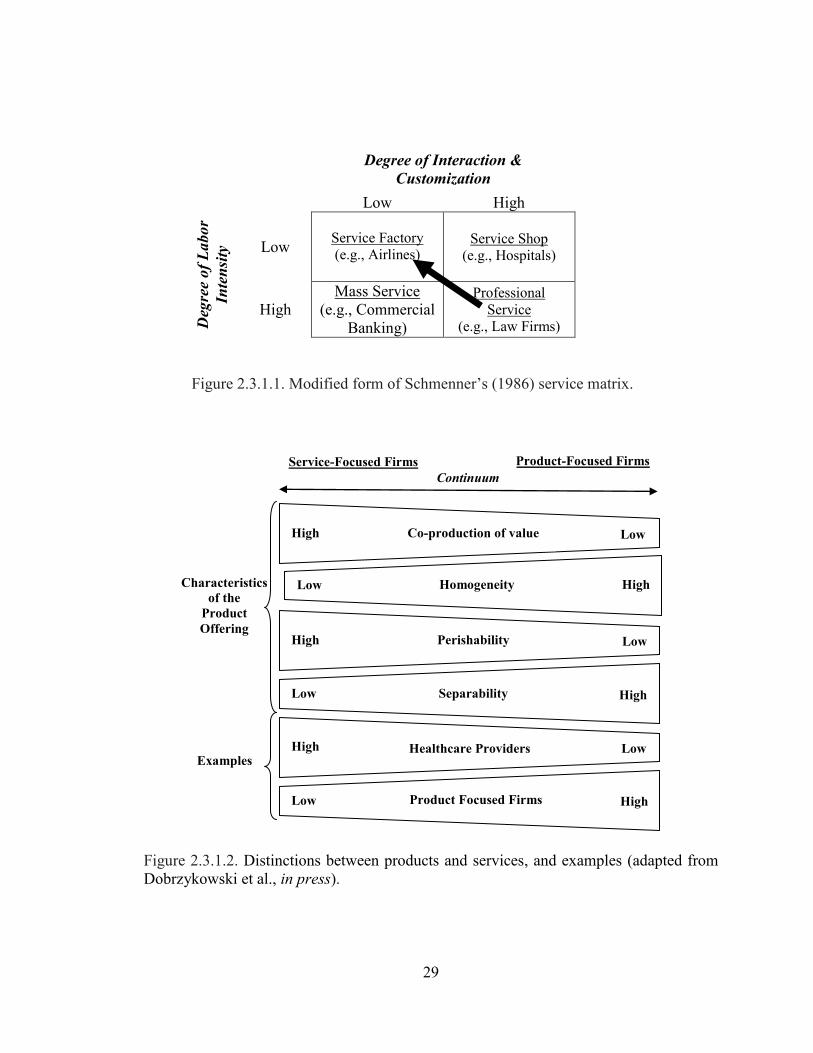
29
Degree of Interaction &
Customization
Low High D
egre
e o
f L
abor
Inte
nsi
ty Low
Service Factory
(e.g., Airlines)
Service Shop
(e.g., Hospitals)
High
Mass Service
(e.g., Commercial
Banking)
Professional
Service
(e.g., Law Firms)
Figure 2.3.1.1. Modified form of Schmenner‘s (1986) service matrix.
Figure 2.3.1.2. Distinctions between products and services, and examples (adapted from
Dobrzykowski et al., in press).
Low High Homogeneity
Service-Focused Firms Product-Focused Firms
Continuum
Characteristics
of the
Product
Offering High Low Perishability
Examples
Low High Separability
High Low Healthcare Providers
Low High Product Focused Firms
High Co-production of value Low
30
Customer involvement in the production process is reasonably straightforward
(Bitner, et al., 1997; Foster et al., 2000). Customer involvement is essential in service
firms while less perceptible in product-focused manufacturing firms (Foster et al., 2000).
Involvement can vary from minimal interaction to high interaction (product co-creation)
(Chase and Tansik, 1983; Dobrzykowski et al., forthcoming). As their level of
involvement rises, customers increase in criticality in co-creating the service experience.
Under such circumstances, customers can take on production roles (as co-producers of
value) and have impact on the quality, productivity, and value of the outputs (Bitner et
al., 1997). The ability of service firms to interact with customers results in the creation of
idiosyncratically unique or heterogeneous outputs for customers, or what Schmenner
(1986) refers to as customization. This is different from product focused manufacturers
who seek homogeneity or standardization of products as illustrated in Figure 2.3.1.2
(Foster et al., 2000). The concept has its roots in the idea that ―products can be
commoditized but co-creation experiences cannot,‖ (Prahalad and Ramaswamy, 2004a: p.
9). Foster et al. (2000) suggest that heterogeneity can be viewed in two aspects: (1)
heterogeneous service providers and service processes and (2) heterogeneous creation of
value outputs within a given firm. Hong et al. (2010) point out two additional
distinctions; perishability and inseparability (Rathmell, 1966; Kaplan and Haenlin, 2006).
―Services produced by healthcare provider institutions unlike many material
products have to be produced and consumed at the same time,‖ (Smeltzer and
Ramanathan, 2002). Because services cannot be inventoried per se, they are considered to
be consumed at the moment of production (perishability) (Sundbo, 2002). Therefore, the
customer is engaged as a co-producer, participating in the production/creation and
31
delivery process, becoming inseparable from key activities involved in value creation
(Kelley et al., 1990). This co-producer role leads customers to evaluate service not solely
on the outcome, but also the process of service delivery (Chen et al., 1994). This is
particularly the case in healthcare delivery as ―patients may not be certain of the quality
level of their surgery [for example], but they know they were treated well or poorly by
the doctors and staff,‖ (Marley et al., 2004: p. 354).
2.3.2 Actor Role Ambiguity, Variable Demand, and Physicians‟ Centrality
This co-production phenomenon is complicated in the healthcare context by actor
role ambiguity. Not only does the hospital have contact with the customer, but the
customer is not clearly defined (Smeltzer and Ramanathan, 2002) with many key actors
playing multiple roles in value creation. ―The patient, of course, is the ultimate client or
beneficiary of an effective [healthcare] supply chain,‖ (Schneller and Smeltzer, 2006: p.
6). However, patients have a duality of roles in the healthcare delivery supply chain given
that they also serve as the material input, coming in different shapes and sizes (Schneller
and Smeltzer, 2006). Disease in any one individual is frequently characterized by its
‗emergence,‘ or change, rather than its steady state,‖ (Schneller and Smeltzer, 2006: p. 7).
This results in highly varied demand and very personalized interactions among clinicians
and customers (Shah et al., 2008).
Nurses, physicians, and other allied health professionals are the end users of many
materials (e.g. syringes, sutures, hip replacement devices, etc.), thus as actors in the
healthcare delivery supply chain of the hospital, they may be viewed as internal
customers (Schneller and Smeltzer, 2006). On the other hand, owing to the
32
conceptualization of the patient as a material input in the traditional production ‗input –
output‘ transformation process (Schneller and Smeltzer, 2006), physicians also serve as
supplier to the hospital by admitting patients for procedures. This leads to the centrality
of the physician in the healthcare delivery supply chain.
Physicians play a central or dominant role in diagnosing a patient‘s illness and
determining the course of treatment (or treatment plan) within some acceptable
parameters (Schneller and Smeltzer, 2006). These assessments and consequent decisions
regarding the patient‘s needs (e.g., how much stress a patient will apply to a hip implant)
produce large variation in the materials used in care delivery, even for patients with
comparable demand characteristics (Schneller and Smeltzer, 2006). This can lead to large
inventories and create inefficiencies borne largely by the hospital. Ultimately, physician
decisions influence the patient‘s length of stay (LOS), a key outcomes metric (Gnanlet
and Gilland, 2009), along with other consumption drivers of hospital materials and
resources (Schneller and Smeltzer, 2006). ―Probably no other organization in the United
States has such important members who are not employees but perform their work within
the organization,‖ (Smeltzer and Ramanathan, 2002: p. 2562). The centrality of the
physician in the healthcare delivery supply chain presents two unique challenges related
to: 1) an agency dilemma (Ford and Scanlon, 2007) and 2) a lack of coordination
mechanisms (Shah et al., 2008).
With regard to the agency dilemma, consider the physician‘s relationships with 1)
the patient receiving treatment services, 2) the hospital where services are provided, and
3) the health insurance plan contracted with and remunerating both the physician and the
hospital. The physician maintains a significant responsibility in ensuring both service
33
delivery quality as well as contract fulfillment. ―In meeting these responsibilities, an
agency conflict can arise between reducing costs, as a representative of the health plan
[and hospital], and ensuring quality as an agent for the patient,‖ (Ford and Scanlon, 2007:
p, 194). From the physician‘s perspective, providing more service, often in the form of
diagnostic tests, state-of-the art clinical procedures, and/or pharmaceutical medications is
a means of ensuring that the patient‘s expectations for quality are satisfied. In the fee-for-
service environment, more testing may also increase payments to the physician while
possibly mitigating the risk of medical malpractice claims and costs (Ford and Scanlon,
2007). However, many of these actions can drive up costs in the supply chain.
Another agency problem facing physicians relates to upstream supplier
relationships. Physicians often have entrenched relationships with suppliers which result
in product preferences (Schneller and Smeltzer, 2006). These relationships are sometimes
rooted in physician training where supplier preferences are developed. Another source of
supplier preference is supplier-supported product development, in which many physicians
participate, given the healthcare sector‘s emphasis on research and development. These
dependencies can span R&D, typically extending to continuing education and product
training. As a result, ―clinicians are often loyal to certain products and resistant to
changing products or processes,‖ (Schneller and Smeltzer, 2006: p. 7). This can
contribute to poor supply chain performance, exacerbated by the absence of coordination
mechanisms.
34
2.3.2.1 The Decentralized Healthcare Delivery Supply Chain
The supply chain literature suggests that the allocation of decision making rights
across supply chain actors and work design improvement should be directed by financial
and/or contractual arrangements (Ganeshan et al., 1998; Li and Wang, 2007; Sahin and
Robinson, 2002: Tsay, 1999). Absent these coordination mechanisms, there is little
incentive for independent economic enterprises to coordinate their respective activities or
assume risk (Gan et al., 2005). In supply chains linked by contractual agreements or
common ownership, the supply chain is perceived as one entity with distributed work
aimed at optimizing the performance of the value creation system. ―However, in a
decentralized supply chain, members act independently to optimize their individual
performance,‖ (Shah et al., 2008: p. 760).
The healthcare delivery supply chain is an example of a decentralized supply
chain largely characterized by a lack of coordination mechanisms (financial or
contractual) amongst physicians, hospitals, and patients. It should be stated that a few
trifling coordination mechanisms do exist among these actors, such as the credentialing
agreement between the hospital and the physician granting the physician ‗privileges‘ to
practice at said hospital, but such agreements are rarely revoked in the absence of
egregious clinical wrongdoing. This conceptualization also assumes a scenario whereby
the physician is not an employee of the hospital. With regard to the patient-physician or
patient-hospital relationship, the relatively de minimis financial deductible is typically the
only coordination mechanism in place.
35
Shah et al., (2008) describe the implications of decentralization in a case study of
a downstream healthcare supply chain consisting of independent hospital providers in a
patient referral relationship.
“A review of the supply chain literature indicates that coordination
mechanisms in product-based supply chains revolve around financial tools
because upstream suppliers are dependent on downstream manufacturers
to be remunerated for the products they supply (the work they do). Such
financial dependence allows the downstream manufacturer to have
considerable influence on upstream suppliers and their operations. In a
coordinated supply chain, decision-making rights regarding how work is
done are allocated by the focal firm. [Supply chain management practices
such as process] improvement in such a supply chain is accomplished
either by fiat (e.g., all subunits of an organization must implement six
sigma) or by setting institutional norms (e.g., ISO 9000 certification is
required to be a Ford supplier). When the supply chain members are not
linked through contractual or financial mechanisms, undertaking [supply
chain management practices such as] process improvement is challenging
because, in the absence of an apparent focal firm, the proper allocation of
decision-making rights among supply chain members is not clear,”
(Shah et al., 2008: p. 761).
2.3.3. Information Asymmetries
Finally, healthcare delivery is complex and the IT systems capable of capturing
and transforming data into information are not widespread and fully integrated (Ford and
Scanlon, 2007). ―There are problems getting information about healthcare procedures and
products,‖ (Smeltzer and Ramanathan, 2002: p. 2562). Information asymmetries or
incomplete information flows among patients, physicians, hospitals, insurers, and payers
arise in the supply chain giving some members a distinct advantage in negotiations and
resulting in suboptimal outcomes (Ford and Scanlon, 2007). While IT has been a
fundamental enabler of supply chain improvements in manufacturing, the adoption of IT
in healthcare has been sparse (Smeltzer and Ramanathan, 2002).
36
While services – specifically healthcare delivery – have distinguishing contextual
characteristics, scholars are considering the service and manufacturing classifications as a
continuum in which firms may be more product-focused or more service-focused and
vice versa (Hill et al., 2002; Mont, 2002; Gunasekaran, 2005; Hong et al., 2010;
Dobrzykowski et al., in press). For example, Ayres (1998) observes that services have
risen in activity within manufacturing. Others note that 65-75% of the employees
working in traditional manufacturing industries now perform service functions (Mont,
2002). This trend toward service provision is reflected in the work of (Hill et al., 2002)
and Gunasekaran (2005) who suggest that manufacturing has become more of a service.
Manufacturing firms nowadays in many cases offer service ‗solutions‘ as value added
benefits for customers of tangible products (Hill et al., 2002: p. 195). These observations
imply that traditional boundaries between services and manufacturing are blurring (Mont,
2002) and thus the view of a manufacturing/service continuum is gaining wide
acceptance. This is evident in the healthcare delivery context as the output or care bundle
is clearly comprised of a bundle of goods, services, and experiences (Sinha and Kohnke,
2009). See Figure 2.1.1 earlier. This may provide insight into the significant history of
migration of manufacturing-based tools and techniques into the healthcare setting,
(McDermott and Stock, 2007).
The care bundle conceptualization considered along with the characteristics of the
healthcare delivery supply chain described in Table 2.3.1 earlier – the co-creation
phenomenon, actor ambiguity, variable demand, the centrality of the physician, and
information asymmetries – present unique challenges, but may help to explain why
scholars have selected this context as a favored exemplar of value co-creation (for
37
examples, see Normann and Ramirez, 1993; Prahalad and Ramaswamy, 2004a). A
detailed discussion of value co-creation theory is now provided.
2.4 Theoretical Grounding
An understanding of contemporary value creation theory and methods is essential
given that this is an important fundamental aim of supply chain management (Fiala,
2005). SDL provides an explanation for value creation with roots extending back to
Adam Smith‘s (1776) work distinguishing between two broad views of value – ‗value-in-
use‘ and ‗value-in-exchange.‘ (Vargo et al., 2008; Vargo and Akaka, 2009).
―Historically, value-in-use has been recognized as the real meaning of value, until Smith
refocused on value-in-exchange for convenience, given his national wealth standard [unit
of analysis], rather than a personal (or national) wellbeing standard,‖ (Vargo and Akaka,
2009: p. 38). While Smith acknowledged that value-in-use represents ‗real value‘ as
determined and realized by the individual (customer), he focused on value-in-exchange
(or nominal value) owing to its more straight forward measurement and simplicity as
compared to value-in-use (real value) (Vargo et al., 2008). The work of Smith (1776)
together with Say‘s (1821) notion of utility – utility embedded in products represented by
price – drove the adoption of a goods-centered paradigm or goods dominant logic (GDL).
GDL then emerged in the scholarly business disciplines that followed (Vargo and
Morgan, 2005) such as Operations, IT, and Marketing (Vargo and Akaka, 2009).
The GDL perspective is consistent with established thinking on value creation.
Consider, Porter‘s (1985) value chain concept which has long been accepted as a useful
explanation of a value creation in the firm and consequent competitive advantage owing
38
to its identification of cost drivers and sources of differentiation. The value chain model
describes the primary and secondary activities of a firm necessary to create margin or
nominal value-in-exchange, and in doing so provides a framework for those activities
which may be performed internally or outsourced to ―pursue exactly what is required:
inbound materials, raw materials inventories (both considered inbound logistics by
Porter), manufacturing (called operations by Porter), finished goods inventories, and
distribution within a single organization (considered outbound logistics by Porter),‖
(Gehmlich, 2008: p. 31). Value chain thinking has been applied in and outside of
manufacturing, specifically discussed in healthcare (Gehmlich, 2008).
Primary activities include patient admission (representing inbound logistics),
diagnosis, treatment, and care delivery (representing operations), patient discharge
(representing outbound logistics), hospital marketing (representing marketing and sales),
and health check ups (representing after sale service). The supporting activities are shown
as hospital infrastructure (representing firm infrastructure), hospital staff (representing
human resource management), research and development (representing technological
development), and medical supplies (representing procurement) (Gehmlich, 2008).
According to Porter (1985), a firm manages these activities in a unique way to create
value-in-exchange referred to as margin in the space between it and the patient, placing
the customer on the outside of the value creation process (Prahalad and Ramaswamy,
2004a).
Under the GDL view, the supply chain can be viewed as a linear collection of
value chains, as opposed to a network (Ford and Scanlon, 2007) or constellation of value
co-creating actors (Normann and Ramirez, 1993). According to this perspective, every
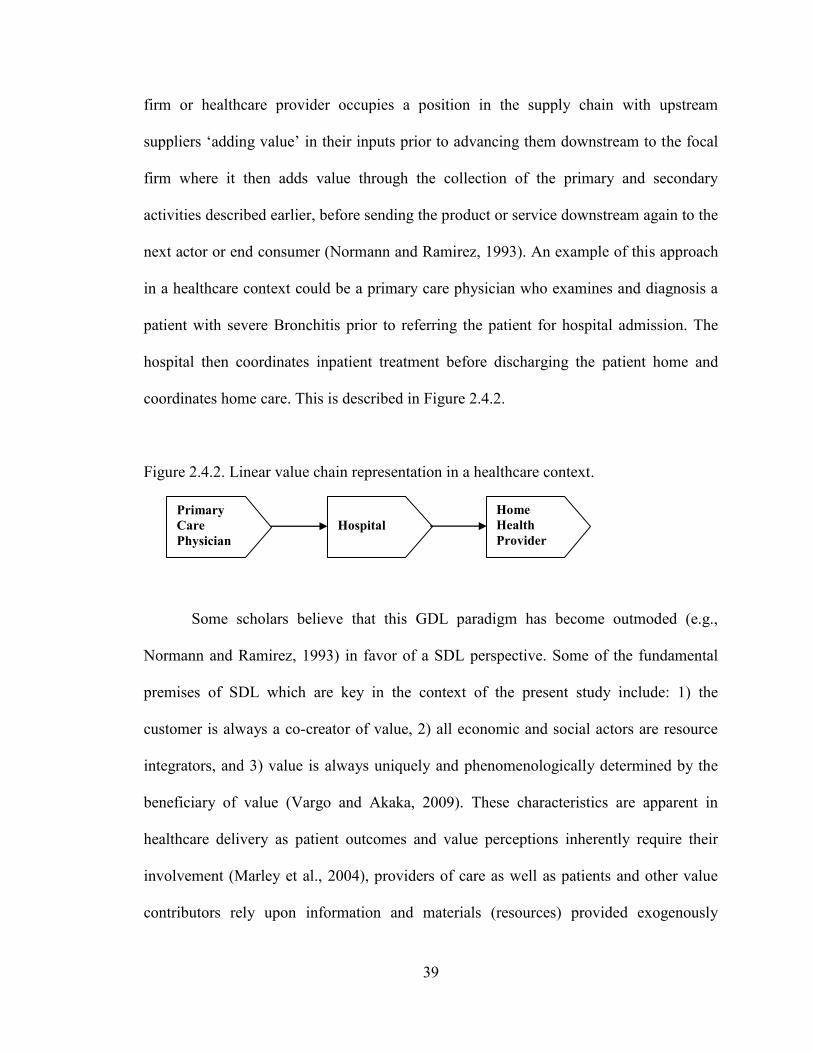
39
firm or healthcare provider occupies a position in the supply chain with upstream
suppliers ‗adding value‘ in their inputs prior to advancing them downstream to the focal
firm where it then adds value through the collection of the primary and secondary
activities described earlier, before sending the product or service downstream again to the
next actor or end consumer (Normann and Ramirez, 1993). An example of this approach
in a healthcare context could be a primary care physician who examines and diagnosis a
patient with severe Bronchitis prior to referring the patient for hospital admission. The
hospital then coordinates inpatient treatment before discharging the patient home and
coordinates home care. This is described in Figure 2.4.2.
Figure 2.4.2. Linear value chain representation in a healthcare context.
Some scholars believe that this GDL paradigm has become outmoded (e.g.,
Normann and Ramirez, 1993) in favor of a SDL perspective. Some of the fundamental
premises of SDL which are key in the context of the present study include: 1) the
customer is always a co-creator of value, 2) all economic and social actors are resource
integrators, and 3) value is always uniquely and phenomenologically determined by the
beneficiary of value (Vargo and Akaka, 2009). These characteristics are apparent in
healthcare delivery as patient outcomes and value perceptions inherently require their
involvement (Marley et al., 2004), providers of care as well as patients and other value
contributors rely upon information and materials (resources) provided exogenously
Primary
Care
Physician
Hospital
Home
Health
Provider
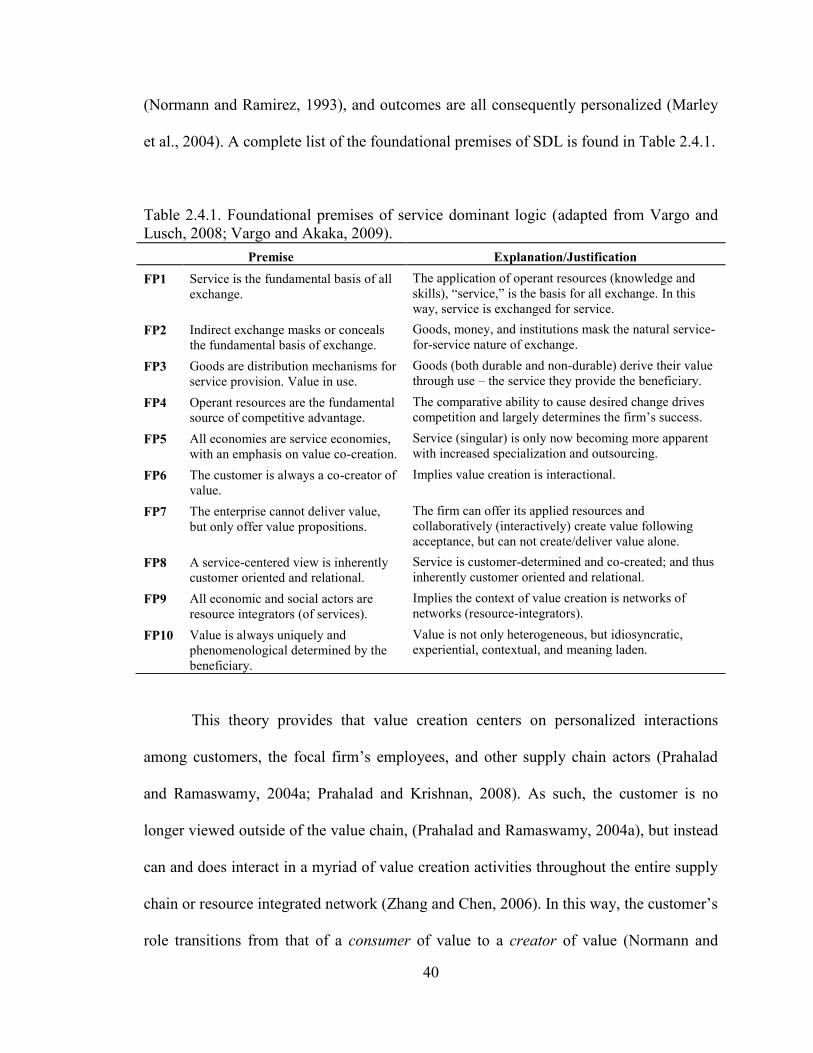
40
(Normann and Ramirez, 1993), and outcomes are all consequently personalized (Marley
et al., 2004). A complete list of the foundational premises of SDL is found in Table 2.4.1.
Table 2.4.1. Foundational premises of service dominant logic (adapted from Vargo and
Lusch, 2008; Vargo and Akaka, 2009).
Premise Explanation/Justification
FP1 Service is the fundamental basis of all
exchange.
The application of operant resources (knowledge and
skills), ―service,‖ is the basis for all exchange. In this
way, service is exchanged for service.
FP2 Indirect exchange masks or conceals
the fundamental basis of exchange.
Goods, money, and institutions mask the natural service-
for-service nature of exchange.
FP3 Goods are distribution mechanisms for
service provision. Value in use.
Goods (both durable and non-durable) derive their value
through use – the service they provide the beneficiary.
FP4 Operant resources are the fundamental
source of competitive advantage.
The comparative ability to cause desired change drives
competition and largely determines the firm‘s success.
FP5 All economies are service economies,
with an emphasis on value co-creation.
Service (singular) is only now becoming more apparent
with increased specialization and outsourcing.
FP6 The customer is always a co-creator of
value.
Implies value creation is interactional.
FP7 The enterprise cannot deliver value,
but only offer value propositions.
The firm can offer its applied resources and
collaboratively (interactively) create value following
acceptance, but can not create/deliver value alone.
FP8 A service-centered view is inherently
customer oriented and relational.
Service is customer-determined and co-created; and thus
inherently customer oriented and relational.
FP9 All economic and social actors are
resource integrators (of services).
Implies the context of value creation is networks of
networks (resource-integrators).
FP10 Value is always uniquely and
phenomenological determined by the
beneficiary.
Value is not only heterogeneous, but idiosyncratic,
experiential, contextual, and meaning laden.
This theory provides that value creation centers on personalized interactions
among customers, the focal firm‘s employees, and other supply chain actors (Prahalad
and Ramaswamy, 2004a; Prahalad and Krishnan, 2008). As such, the customer is no
longer viewed outside of the value chain, (Prahalad and Ramaswamy, 2004a), but instead
can and does interact in a myriad of value creation activities throughout the entire supply
chain or resource integrated network (Zhang and Chen, 2006). In this way, the customer‘s
role transitions from that of a consumer of value to a creator of value (Normann and
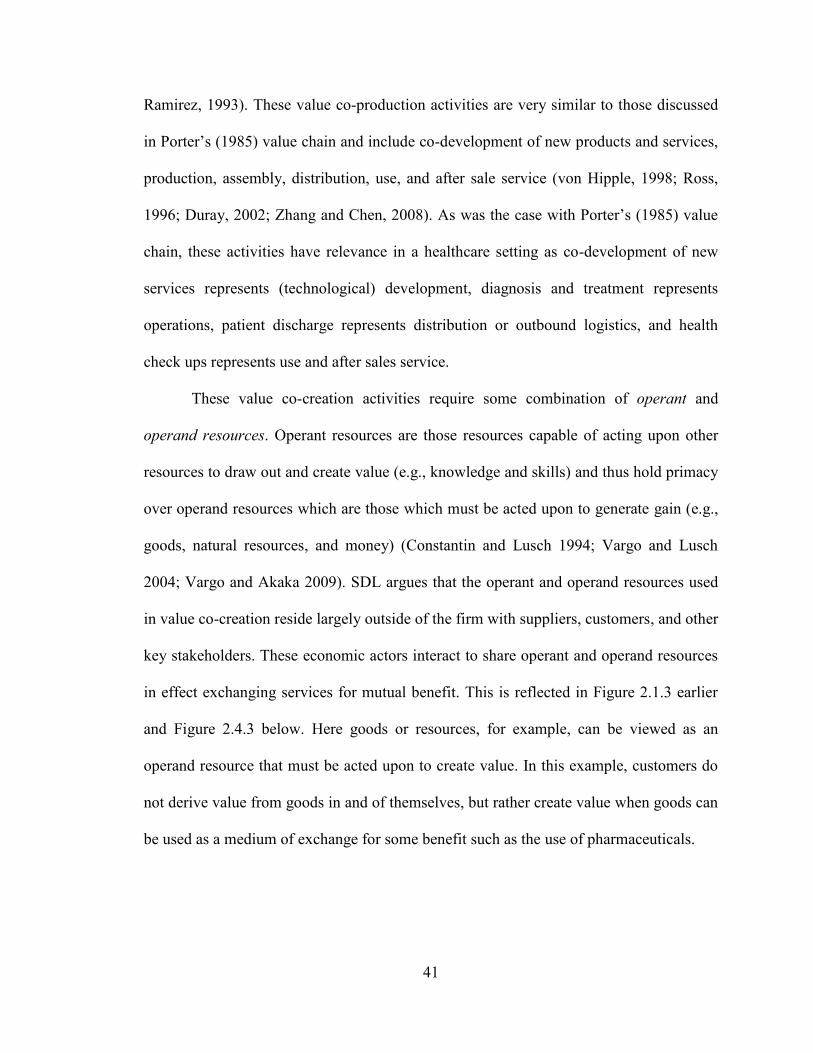
41
Ramirez, 1993). These value co-production activities are very similar to those discussed
in Porter‘s (1985) value chain and include co-development of new products and services,
production, assembly, distribution, use, and after sale service (von Hipple, 1998; Ross,
1996; Duray, 2002; Zhang and Chen, 2008). As was the case with Porter‘s (1985) value
chain, these activities have relevance in a healthcare setting as co-development of new
services represents (technological) development, diagnosis and treatment represents
operations, patient discharge represents distribution or outbound logistics, and health
check ups represents use and after sales service.
These value co-creation activities require some combination of operant and
operand resources. Operant resources are those resources capable of acting upon other
resources to draw out and create value (e.g., knowledge and skills) and thus hold primacy
over operand resources which are those which must be acted upon to generate gain (e.g.,
goods, natural resources, and money) (Constantin and Lusch 1994; Vargo and Lusch
2004; Vargo and Akaka 2009). SDL argues that the operant and operand resources used
in value co-creation reside largely outside of the firm with suppliers, customers, and other
key stakeholders. These economic actors interact to share operant and operand resources
in effect exchanging services for mutual benefit. This is reflected in Figure 2.1.3 earlier
and Figure 2.4.3 below. Here goods or resources, for example, can be viewed as an
operand resource that must be acted upon to create value. In this example, customers do
not derive value from goods in and of themselves, but rather create value when goods can
be used as a medium of exchange for some benefit such as the use of pharmaceuticals.
42
Figure 2.4.3. Service(s) exchanged for services (adapted from Vargo et al., in press).
This movement toward value co-creation has caused firms to realize that they do
not simply add value in a discrete process stage, but instead they partner with
customers/patients, suppliers, and other business partners to repeatedly reinvent value
(Normann and Ramirez, 1993). As such, the focus of these firms has shifted from the
product/service itself to the value creation system or ecosystem which comprises these
actors (Vargo and Akaka, 2009). The continual quest to improve the fit between the
composition and competencies of the value creation system and the customer has
emerged as a primary goal centering attention on the ―reconfiguration of roles and
relationships among this constellation of actors in order to mobilize the creation of value
in new forms and by new players,‖ (Normann and Ramirez, 1993: 66).
Given the discussion above regarding the healthcare delivery context and value
co-creation, a research model is developed which employs supply chain management
constructs and coordination mechanisms to measure antecedents and consequences of
value density, grounded in the theory of service-dominant logic (SDL). Construct
definitions and hypothesized relationships follow in Sections 2.5 through Section 2.12.
Actor B –
Proposing
and Sharing
Services
The SDL ―Market‖
- Money as a medium
- Goods as distribution
mechanisms
- Firms are resource
integrators
- Networks link value co-
creation systems
Actor A –
Proposing
and Sharing
Services
43
2.5 Theoretical Model
Partnering Relationship, Organizational Architecture, Supply Chain Management,
Value Density and Capability
As discussed in Chapter 1, attention today in healthcare operations is focused on
managing costs, improving quality, and the over all efficiency and effectiveness of
delivering care (McDermott and Stock, 2007). At the same time, contemporary ideas
regarding value creation methods based on knowledge sharing are being introduced
(Normann and Ramirez, 1993; Schmenner et al., 2009). This is shifting attention from the
traditional internal focus to ―the design of multi-firm network organizations whose
capabilities are focused on knowledge sharing and application,‖ (Miles and Snow, 2007:
p. 459). For example, Bamford and Griffin (2008: p. 228) in case study research
exploring operational teamwork in eight U.K. hospitals found evidence that it is not ―so
much a multi-disciplinary team, but rather a multi-disciplinary network which spanned
the patient pathway (the patients journey through the ‗process‘).‖ As such, it is
recognized that an efficient and user-friendly supply chain can produce positive financial
outcomes for providers and improve service to patients (McKone-Sweet et al., 2005).
However, the unique characteristics of healthcare delivery cause the supply chain to be
decentralized requiring coordination mechanisms to effectively implement a supply chain
management strategy.
Relational coordination theory provides some insight into potential coordination
mechanisms for the decentralized healthcare delivery supply chain suggesting that work
is coordinated through communication networks and relationships that exist among
44
workers (Shah et al., 2008). The strength of the actor networks is associated with superior
performance (Gittell, 2000, 2001, 2002a). Relational coordination is comprised of three
basic coordination mechanisms; shared knowledge, shared goals, and mutual respect for
work (Gittell, 2002a). Shared knowledge provides feedback, informing the worker of
how their tasks and the tasks of other contributing actors impact the overall work process.
Shared goals serve to motivate and inspire workers to act with greater regard for the
overall work process. Finally, mutual respect for others‘ work provides positive
reinforcement to behave in line with the goals of the overall work process (Shah et al.,
2008). Viewed in aggregate these three mechanisms reinforce timeliness, frequency, and
problem solving in communication, therefore enhancing coordination. According to Shah
et al. (2008: p. 780), ―the theory of relational coordination helps explain the improved
performance in the [decentralized healthcare] supply chain even in the absence of
financial incentives.‖ However, many studies suggest that healthcare providers fail to
coordinate their work to the detriment of outcomes (e.g., Cannon et al., 2002; Jacobs et
al., 2006).
While relational coordination provides an explanation for the facilitation of
supply chain management practices (specifically lean process improvement) in Shah‘s et
al., (2008) single case study, their findings may lack generalizability to explain
breakdowns in coordination. This is particularly true in the context of the present study,
given not only the healthcare delivery supply chain‘s decentralized nature, but also the
centrality of the physician and the subsequent agency dilemma. One alternative
explanation may rest in the shared vision of supply chain members, as well as the trust
and commitment they possess. According to Miles and Snow (2007: p. 461),
45
―collaborative networks will appear in various knowledge-intensive industries [such as
healthcare], and they will require ongoing investments in intangible assets, such as the
ability to collaborate and build inter-organizational trust, in order to grow and succeed.‖
Other scholars studying supply chain management practices in healthcare operations have
suggested that a lack of accountability or commitment may negatively impact practices
(Hayer, 2002; Bamford and Griffin, 2008). As such, there is an opportunity to build upon
Shah‘s et al. (2008) conceptualization of relational coordination, extending the concept to
include not only sharing of knowledge, goals, and respect for work – in other words a
shared vision – but also trust and commitment. Li (2002) and Liao (2008) conceptualized
and tested a construct called Partner Relationship which consists of these three
dimensions; trust, commitment, and shared vision, finding evidence of its role as an
antecedent of supply chain management. This is reflected in the theoretical model, Figure
2.5.1. Construct definitions are provided in Table 2.5.1.
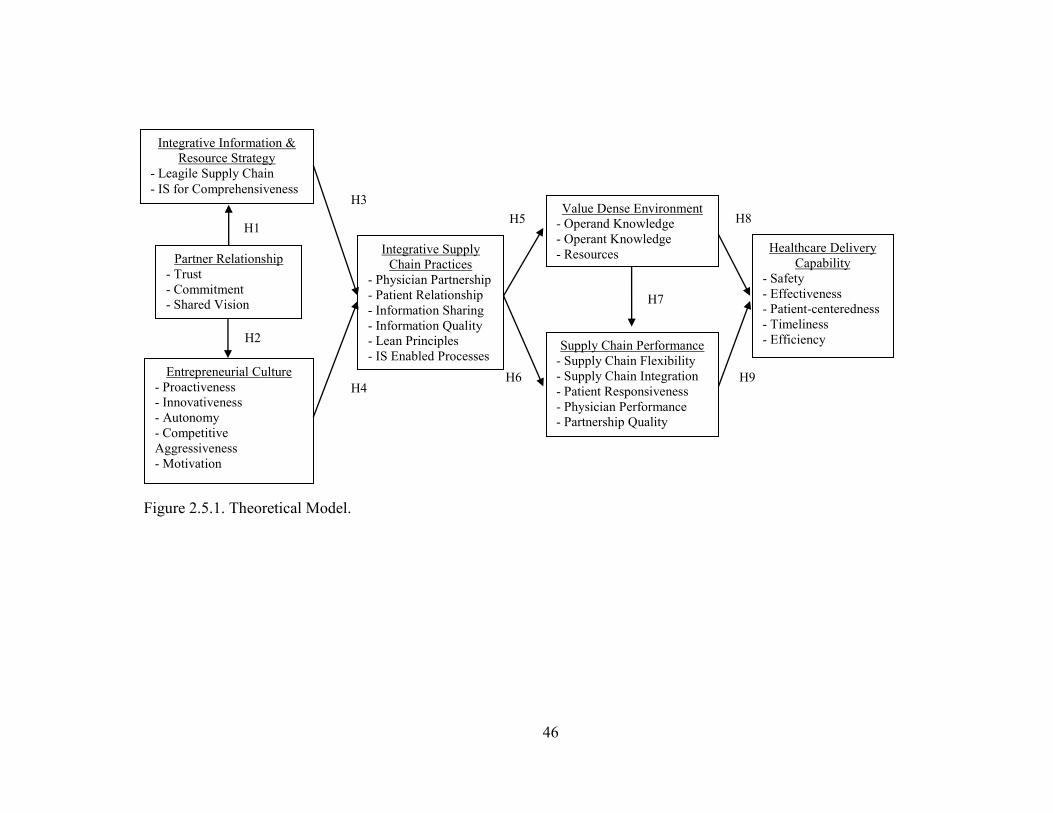
46
Figure 2.5.1. Theoretical Model.
H8
H9
H1
H2
H3
H4 H6
H7
Integrative Information &
Resource Strategy
- Leagile Supply Chain
- IS for Comprehensiveness
Entrepreneurial Culture
- Proactiveness
- Innovativeness
- Autonomy
- Competitive
Aggressiveness
- Motivation
Integrative Supply
Chain Practices
- Physician Partnership
- Patient Relationship
- Information Sharing
- Information Quality
- Lean Principles
- IS Enabled Processes
Partner Relationship
- Trust
- Commitment
- Shared Vision
Supply Chain Performance
- Supply Chain Flexibility
- Supply Chain Integration
- Patient Responsiveness
- Physician Performance
- Partnership Quality
Value Dense Environment
- Operand Knowledge
- Operant Knowledge
- Resources Healthcare Delivery
Capability
- Safety
- Effectiveness
- Patient-centeredness
- Timeliness
- Efficiency
H5
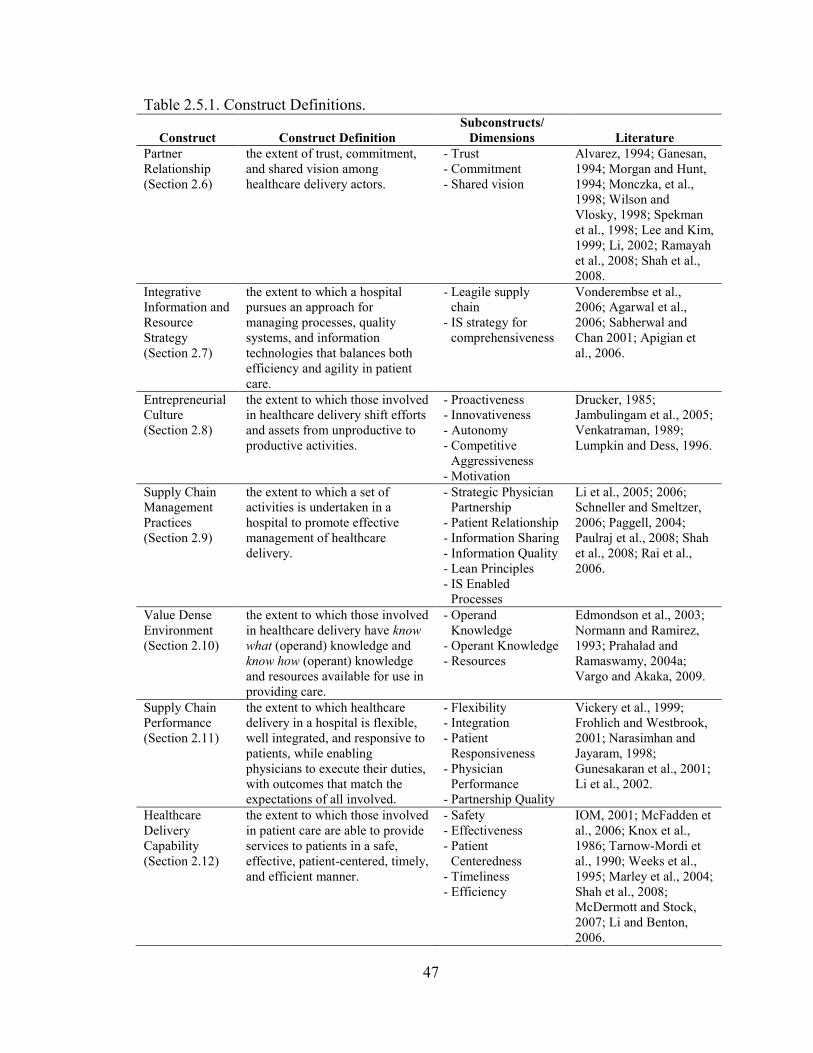
47
Table 2.5.1. Construct Definitions.
Construct Construct Definition
Subconstructs/
Dimensions Literature
Partner
Relationship
(Section 2.6)
the extent of trust, commitment,
and shared vision among
healthcare delivery actors.
- Trust
- Commitment
- Shared vision
Alvarez, 1994; Ganesan,
1994; Morgan and Hunt,
1994; Monczka, et al.,
1998; Wilson and
Vlosky, 1998; Spekman
et al., 1998; Lee and Kim,
1999; Li, 2002; Ramayah
et al., 2008; Shah et al.,
2008.
Integrative
Information and
Resource
Strategy
(Section 2.7)
the extent to which a hospital
pursues an approach for
managing processes, quality
systems, and information
technologies that balances both
efficiency and agility in patient
care.
- Leagile supply
chain
- IS strategy for
comprehensiveness
Vonderembse et al.,
2006; Agarwal et al.,
2006; Sabherwal and
Chan 2001; Apigian et
al., 2006.
Entrepreneurial
Culture
(Section 2.8)
the extent to which those involved
in healthcare delivery shift efforts
and assets from unproductive to
productive activities.
- Proactiveness
- Innovativeness
- Autonomy
- Competitive
Aggressiveness
- Motivation
Drucker, 1985;
Jambulingam et al., 2005;
Venkatraman, 1989;
Lumpkin and Dess, 1996.
Supply Chain
Management
Practices
(Section 2.9)
the extent to which a set of
activities is undertaken in a
hospital to promote effective
management of healthcare
delivery.
- Strategic Physician
Partnership
- Patient Relationship
- Information Sharing
- Information Quality
- Lean Principles
- IS Enabled
Processes
Li et al., 2005; 2006;
Schneller and Smeltzer,
2006; Paggell, 2004;
Paulraj et al., 2008; Shah
et al., 2008; Rai et al.,
2006.
Value Dense
Environment
(Section 2.10)
the extent to which those involved
in healthcare delivery have know
what (operand) knowledge and
know how (operant) knowledge
and resources available for use in
providing care.
- Operand
Knowledge
- Operant Knowledge
- Resources
Edmondson et al., 2003;
Normann and Ramirez,
1993; Prahalad and
Ramaswamy, 2004a;
Vargo and Akaka, 2009.
Supply Chain
Performance
(Section 2.11)
the extent to which healthcare
delivery in a hospital is flexible,
well integrated, and responsive to
patients, while enabling
physicians to execute their duties,
with outcomes that match the
expectations of all involved.
- Flexibility
- Integration
- Patient
Responsiveness
- Physician
Performance
- Partnership Quality
Vickery et al., 1999;
Frohlich and Westbrook,
2001; Narasimhan and
Jayaram, 1998;
Gunesakaran et al., 2001;
Li et al., 2002.
Healthcare
Delivery
Capability
(Section 2.12)
the extent to which those involved
in patient care are able to provide
services to patients in a safe,
effective, patient-centered, timely,
and efficient manner.
- Safety
- Effectiveness
- Patient
Centeredness
- Timeliness
- Efficiency
IOM, 2001; McFadden et
al., 2006; Knox et al.,
1986; Tarnow-Mordi et
al., 1990; Weeks et al.,
1995; Marley et al., 2004;
Shah et al., 2008;
McDermott and Stock,
2007; Li and Benton,
2006.
48
Hospitals develop strategies and make decisions in managing the supply chain
regarding how to best ―organize the resources under their control to achieve their goals,‖
(McDermott and Stock, 2007: p. 1022). The present study conceptualizes Integrative
Information and Resource Strategy, which is comprised of two subconstructs: 1) Leagile
Supply Chain Strategy (Vonderembse et al., 2006; Agarwal et al., 2006), and 2) IS for
Comprehensiveness Strategy (Apigian et al., 2006; Sabherwal and Chan, 2001). This is
owing to the notion that supply chain management deals with resource and information
management between value co-creation actors (Lambert and Copper, 2000). The focus of
this strategy rests on how the firm plans to collaborate with others to create value and is
motivated by the nature of the firm‘s external relationships, making relationship
attributes, such as trust, key (Miles and Snow, 2007). The theoretical model therefore
postulates that Partner Relationship will influence the hospital‘s Integrative Information
and Resource Strategy.
Networked approaches to value creation center not only on trust, but also the
creation of an organizational culture which promotes equitable treatment and
collaboration with actors external to the firm (Miles and Snow, 2007). Entrepreneurial
orientations are particularly beneficial as firms strive to maximize the value of their
collaborations, developing a culture of ―collaborative entrepreneurship,‖ (Miles and
Snow, 2007: p. 461). Given this, trust, commitment, and shared vision motivate the
hospital to develop an Entrepreneurial Culture in its dealings with value creation actors.
This is reflected in Figure 2.5.1.
49
Supply chain management involves the management of information and resources
toward the aim of its primary objective – value creation (Lambert and Cooper, 2000;
Schneller and Smeltzer, 2006). Cabrera et al. (2001: p. 251) opine that ―whether or not
the organization is able to achieve its strategic objective will depend on whether it can
deploy the right kinds of processes and behaviors, which are in turn determined by the
organization‘s architecture.‖ Strategy and culture are two high impact architectural
elements at the firm‘s disposal (Roh et al., 2008). Together, the appropriate culture and
strategy can guide the firm to execute valuable supply chain practices such as effective
information flow (Leisen et al., 2002; Gallivan and Srite, 2005). ―These decisions lead to
hands-on, action oriented activities that dictate how a planned strategy is turned into an
effectively implemented one,‖ (McDermott and Stock, 2007: p. 1022). Therefore as
shown in Figure 2.5.1, the present study posits relationships linking the Integrative
Information and Resource Strategy of the hospital to its Integrative Supply Chain
Practices, and a hospital‘s Entrepreneurial Culture to its Integrative Supply Chain
Practices.
Integrative Supply Chain Practices bring benefits to the firm in terms of
performance and the environment within which value creations actors work. For
example, long term supplier (physician) relationships can improve supplier (physician)
performance and increase customer (patient) responsiveness (Power et al., 2001; Li et al.,
2006). Integrative Supply Chain Practices such as information quality and information
sharing also serve to create an environment where value creation actors have access to the
operand and operant resources necessary for value co-creation (Edmondson et al., 2003;
Vargo and Akaka, 2009). Such an environment, referred to herein as a Value Dense
50
Environment, can be measured by its value density (Normann and Ramirez, 1993). The
present study thus postulates relationships between Integrative Supply Chain Practices
and the Value Dense Environment within which value co-creation actors work, as well as
between Integrative Supply Chain Practices and the Supply Chain Performance of the
healthcare delivery supply chain (Li et al., 2006). Herein, Supply Chain Performance is
adapted from Li (2002) and comprised of flexibility, integration, patient responsiveness,
physician performance, and partnership quality.
A Value Dense Environment provides the resources necessary for value co-
creation actors such as physicians and other clinicians to achieve better supply chain
performance. This is because value density can be thought of as a measure of the ―best
combination of resources mobilized for a particular situation,‖ (Normann, 2001: p. 27). In
a Value Dense Environment, actors share, trade, and utilize operand and operant inputs
such as information and resources to improve supply chain performance and also develop
healthcare delivery capability related to important outcomes metrics such as safety,
effectiveness, patient centeredness, timeliness of care delivery and efficiency (IOM,
2001). Supply Chain Performance has also been shown to positively impact capability (Li
et al., 2006) and as such the present study postulates a positive relationship between
Supply Chain Performance and the development of Healthcare Delivery Capability. See
Figure 2.5.1.
2.6 Partner Relationship
Ramayah et al. (2008: p. 38) state that ―a high level of trust, commitment, and a
shared common vision among supply chain partners is indeed essential for inter-
51
organizational collaboration (Spekman et al., 1998).‖ Formal collaborative relationships,
such as those between physicians and hospitals in providing care to patients, must be
rooted in mutual trust, shared vision and objectives, and require frameworks and
structures that encourage and facilitate such behavior (Bowersox et al., 2000). These can
be considered coordination mechanisms and they are of particular benefit in managing
decentralized supply chains (Shah et al., 2008) such as that understudy herein.
Scholars suggest that supply chain management is actually built upon the
foundation of trust and commitment (Lee and Billington, 1992). In the absence of this
foundation, any effort to manage the flow of resources and information in the supply
chain is problematic (Handfield and Nichols, 1999). Trust and commitment are necessary
to build and foster long-term, collaborative relationships among economic actors
(Spekman et al., 1998; Tan et al., 1998; Li 2002). Given the current more networked
approach to value creation, these organizational attributes are of particular importance
(Miles and Snow, 2007).
Li (2002) conceptualized a construct for Partner Relationship consisting of three
dimensions; trust, commitment, and shared vision. The present study adapts Li‘s (2002)
conceptualization of Partner Relationship for the context of a decentralized healthcare
delivery supply chain. Partner Relationship is thus defined as the extent of trust,
commitment, and shared vision among healthcare delivery actors. A list of subconstructs
and their respective definitions and literature support are provided in Table 2.6.1.
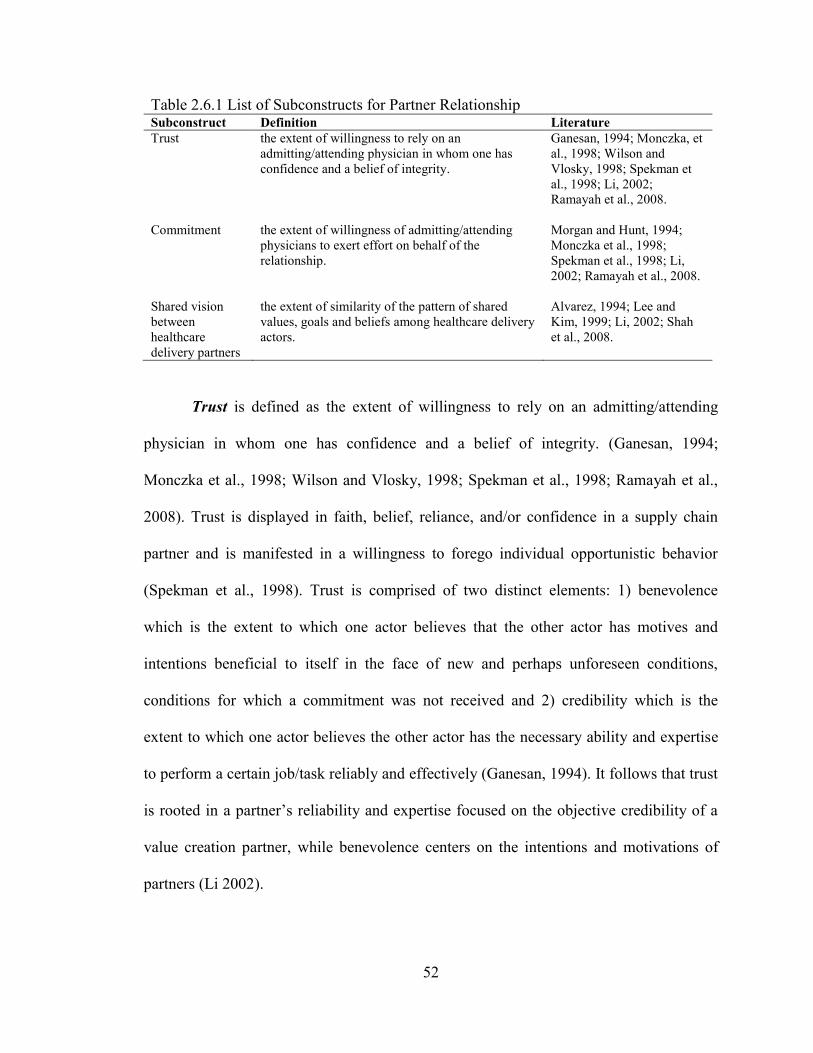
52
Table 2.6.1 List of Subconstructs for Partner Relationship Subconstruct Definition Literature
Trust the extent of willingness to rely on an
admitting/attending physician in whom one has
confidence and a belief of integrity.
Ganesan, 1994; Monczka, et
al., 1998; Wilson and
Vlosky, 1998; Spekman et
al., 1998; Li, 2002;
Ramayah et al., 2008.
Commitment the extent of willingness of admitting/attending
physicians to exert effort on behalf of the
relationship.
Morgan and Hunt, 1994;
Monczka et al., 1998;
Spekman et al., 1998; Li,
2002; Ramayah et al., 2008.
Shared vision
between
healthcare
delivery partners
the extent of similarity of the pattern of shared
values, goals and beliefs among healthcare delivery
actors.
Alvarez, 1994; Lee and
Kim, 1999; Li, 2002; Shah
et al., 2008.
Trust is defined as the extent of willingness to rely on an admitting/attending
physician in whom one has confidence and a belief of integrity. (Ganesan, 1994;
Monczka et al., 1998; Wilson and Vlosky, 1998; Spekman et al., 1998; Ramayah et al.,
2008). Trust is displayed in faith, belief, reliance, and/or confidence in a supply chain
partner and is manifested in a willingness to forego individual opportunistic behavior
(Spekman et al., 1998). Trust is comprised of two distinct elements: 1) benevolence
which is the extent to which one actor believes that the other actor has motives and
intentions beneficial to itself in the face of new and perhaps unforeseen conditions,
conditions for which a commitment was not received and 2) credibility which is the
extent to which one actor believes the other actor has the necessary ability and expertise
to perform a certain job/task reliably and effectively (Ganesan, 1994). It follows that trust
is rooted in a partner‘s reliability and expertise focused on the objective credibility of a
value creation partner, while benevolence centers on the intentions and motivations of
partners (Li 2002).
53
Commitment is defined as the extent of willingness of admitting/attending
physicians to exert effort on behalf of the relationship (Morgan and Hunt, 1994; Monczka
et al., 1998; Spekman et al., 1998; Ramayah et al., 2008). Ramayah et al. (2008: p. 40)
state that ―similar to trust, commitment is one of the most important ingredients for
successful partnership alliances (Mohr and Spekman, 1994; Monczka et al., 1998; Lee
and Kim, 1999).‖ Commitment is a lasting desire to maintain a valued relationship (Li
2002) and serves as a key facilitator of social exchange (Morgan and Hunt, 1994). It
refers to the willingness of value creation actors to commit their resources such as
money, time, and facilities to their relationships (Ramayah et al., 2008). In doing so,
partners display commitment recognizing that it 1) is important factor for the success of
long-term relationship benefits, 2) displays an intention for deeper involvement in the
partnership through investments that may bring some risk to the actor, and 3)
demonstrates the importance of the relationship to other partners (Mentzer et al., 2000). It
follows that many scholars agree (see Monczka et al., 1998; Li 2002) ―that commitment
induces partners to allocate resources to maintain and to continue to enhance the
effectiveness of the supply chain,‖ (Ramayah et al., 2008: p. 40).
Shared Vision is defined as the extent of similarity of the pattern of shared
values, goals and beliefs among healthcare delivery actors (Alvarez, 1994; Lee and Kim,
1999; Shah et al., 2008). Shared vision is thus the extent to which partners in healthcare
delivery share common beliefs about the goals, behaviors, and policies which are
appropriate and inappropriate, important and unimportant, and/or right or wrong (Ballou
et al., 2000). Shah et al. (2008) implicitly describe shared vision as a critical coordination
mechanism in decentralized supply chains such as the focus of this study. Shah et al.
54
(2008) ground their work in relational coordination theory suggesting three basic
mechanism for coordination; shared knowledge, shared goals, and mutual respect for
work (Gittell, 2002a). Shared knowledge informs actors how their work and the work of
other partners contribute to the overall value creation effort, while mutual respect for one
another‘s work reinforces the necessity to behave in a fashion consistent with the shared
goals of the group (Shah et al., 2008). In their case study of hospital providers, Shah et al.
(2008: p. 781) finds that ―a broader understanding of the entire process, guided by shared
goals and knowledge, also helps to create an environment in which employees feel
psychologically safe and empowered to suggest possible process improvements, while
reducing waste associated with a culture of finger pointing (Edmondson et al., 2003).‖
2.7 Integrative Information and Resource Strategy
The implementation of an appropriate supply chain management strategy can
produce improvements in cost, quality, flexibility, responsiveness and delivery
(dependability) (Chen and Paulraj, 2004). The notion that these pressures are extant in
healthcare delivery points to the potential gains that could be realized by improved
operations management strategy in healthcare (McDermott and Stock, 2007).
The body of research exploring healthcare operations is nascent (McDermott and
Stock, 2007) and thus far has focused primarily on capacity and demand management
(Jack and Powers, 2004). For example, Smith-Daniels et al. (1988) establish a research
agenda suggesting that demand and capacity management in healthcare centers on
decision making related to the allocation of: 1) facilities, 2) equipment, and 3) workforce.
More recently, research as explore standard performance measures, (Li and Benton,
55
1995), the influence of strategic operations management on hospital performance (Li et
al., 2002), and the influence of operational decisions on clinical performance in Health
Maintenance Organizations (HMOs) (Heinke, 1995). While these researchers have
explored various aspects of capacity and demand management (see Kim, Horowitz et al.,
2000; Jack and Powers, 2004; Powers and Jack, 2008; Jack and Powers, 2009), none have
adopted a downstream supply chain view of healthcare delivery as described by Sinha
and Kohnke (2009). ―Operations strategy has flourished as a field, yet there is still much
to be learned regarding how this knowledge base can effectively be applied within the
healthcare setting,‖ (McDermott and Stock, 2007: p. 1022).
There are two fundamental aspects of strategy as relates to healthcare delivery.
Stock and McDermott (2007: p. 1023) state that ―through structural (e.g. facilities,
location, technology) and infrastructural (e.g. workforce management, incentives,
hospital processes, quality systems) investments (Skinner, 1969; Hayes and Wheelwright,
1984; and see Tucker and Edmondson, 2003) hospitals configure their operations to
achieve their strategic goals (Heineke, 1995; Butler, Leong and Everett, 1996; Goldstein
et al., 2002; Li et al., 2002).‖ The present study focuses attention on technology as one of
a hospital‘s structural elements given that facilities and location largely fall outside of the
scope of the research questions under study. With regard to technology, research suggests
that investments in information technology (both software and hardware) as well as other
types of equipment appear to be positively associated with multiple hospital performance
metrics including quality (Kumar and Motwani, 1999; Li and Collier, 2000; Li and
Benton, 2003; 2006), efficiency (Watcharasriroj and Tang, 2004), costs (Kumar and
Motwani, 1999; Li and Benton, 2006), and financial performance (Li and Collier, 2000).
56
With regard to the infrastructural elements of a hospital‘s operations strategy, researchers
have explored aspects such as hospital processes (Tucker and Edmondson, 2003;
Edmondson, 2003; Goldstein and Ward, 2004), quality systems (Li et al., 2002),
workforce management (Li et al., 2002), and demand management (a hospital analogue
to planning and control systems) (Li et al., 2002; McDermott and Stock, 2007). The focus
of the present study rests on the hospital processes and quality systems infrastructural
elements that comprise Integrative Supply Chain Practices.
―Strategy is the art of creating value,‖ (Normann and Ramirez, 1993: p. 65). The
strategies of the firm indicate the deliberate choices managers make from a diverse set of
activities (or structural and infrastructural elements) to deliver a mix of value that is
unique (Porter, 1996). In doing so, strategy is about combining specific activities (Porter,
1996). In developing strategies, or in essence selecting the key structural and
infrastructural elements employed by a hospital to create value, researchers have
suggested three primary foci (Butler et al., 1996). These foci have generally organized the
firm around achieving: 1) low cost, 2) unique performance or value for customers, or 3)
some combination thereof. A few well known business strategy typologies have guided
much of the work in the area of strategy development. These seminal works consist of
Porter‘s (1980) cost leadership, differentiation, and focus strategic types, and Miles and
Snow‘s (1978) defenders, prospectors, and analyzers strategic types (Apigian et al.,
2006). Since the developed of these strategic foci, similar themes have emerged, either
explicitly or implicitly, in other contexts such as information systems strategy (see
Sabherwal and Chan, 2001; and Apigian et al., 2006), supply chain management strategy
57
(see Vonderembse et al., 2006), manufacturing strategy (see Miller and Roth, 1994;
Frohlich and Dixon, 2001), and even healthcare operations (Butler et al., 1996).
With this understanding, it follows that a primary pursuit of the firm is to achieve
fit between its context or environment and its strategy (Porter, 1996). Miles and Snow
(1984) suggest that such alignment is instrumental for the firm‘s survival, excellence, and
sustainable excellence. However, it is important to note that while these concepts are
applicable in the healthcare context, the strategic types may be less clearly defined, or at
least less discrete in nature. For example, Shortell et al. (1990) analyze hospitals,
categorizing them in the Miles and Snow (1978) typology of prospectors, defenders, and
analyzers. Shortell et al. (1990) provide rare empirical evidence that this strategy
typology is applicable in the healthcare context. However, their findings show that
although the dichotomous conceptualizations of prospectors and defenders are apparent,
―both require skill at cost-containment and service differentiation,‖ and must be
addressed from the clinical as well as business perspectives of the hospital (Butler et al.,
1996; p. 140). This implies that in developing healthcare delivery supply chains, hospitals
face a duality of objectives centering on cost as well as flexibility. Clearly, the challenge
facing healthcare managers is to devise and implement resource management strategies
that ensure that they consistently provide high quality services despite demand
fluctuations (Jack and Powers, 2009) and at the same time respond to cost and quality
pressures (McDermott and Stock, 2007). In other words, healthcare delivery supply
chains should be lean and also agile in managing the structural and infrastructural
elements of the supply chain.
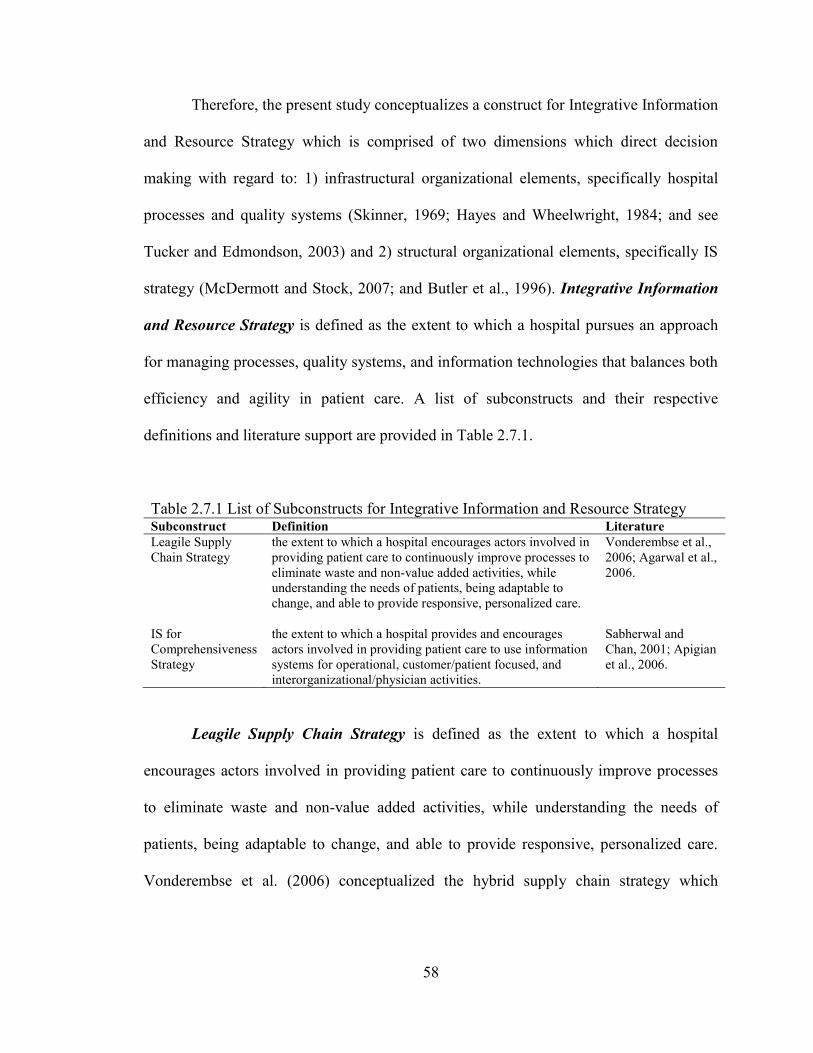
58
Therefore, the present study conceptualizes a construct for Integrative Information
and Resource Strategy which is comprised of two dimensions which direct decision
making with regard to: 1) infrastructural organizational elements, specifically hospital
processes and quality systems (Skinner, 1969; Hayes and Wheelwright, 1984; and see
Tucker and Edmondson, 2003) and 2) structural organizational elements, specifically IS
strategy (McDermott and Stock, 2007; and Butler et al., 1996). Integrative Information
and Resource Strategy is defined as the extent to which a hospital pursues an approach
for managing processes, quality systems, and information technologies that balances both
efficiency and agility in patient care. A list of subconstructs and their respective
definitions and literature support are provided in Table 2.7.1.
Table 2.7.1 List of Subconstructs for Integrative Information and Resource Strategy Subconstruct Definition Literature
Leagile Supply
Chain Strategy
the extent to which a hospital encourages actors involved in
providing patient care to continuously improve processes to
eliminate waste and non-value added activities, while
understanding the needs of patients, being adaptable to
change, and able to provide responsive, personalized care.
Vonderembse et al.,
2006; Agarwal et al.,
2006.
IS for
Comprehensiveness
Strategy
the extent to which a hospital provides and encourages
actors involved in providing patient care to use information
systems for operational, customer/patient focused, and
interorganizational/physician activities.
Sabherwal and
Chan, 2001; Apigian
et al., 2006.
Leagile Supply Chain Strategy is defined as the extent to which a hospital
encourages actors involved in providing patient care to continuously improve processes
to eliminate waste and non-value added activities, while understanding the needs of
patients, being adaptable to change, and able to provide responsive, personalized care.
Vonderembse et al. (2006) conceptualized the hybrid supply chain strategy which
59
contains elements from both the lean and agile (leagile) supply chain strategies in
recognition that certain environments call for both cost containment as well as flexibility.
The lean enterprise concept began gaining popularity over two decades ago
(Womack et al., 1990; Womack and Jones, 1996). Lean aims to eliminate of waste or
non-value added activities through continuous improvement efforts (Towill and
Christopher, 2002; Agarwal et al., 2006; Vondrembse et al., 2006; Mohammed and
Banwet, 2008). Employee empowerment and team work is a central theme of the lean
supply chain (Vonderembse et al., 2006). Using lean, firms work on confirmed orders
(Vonderembse et al., 2006) and it is best suited for environments where demand is
relatively predictable and stable and where variety requirements are low (Towill and
Christopher, 2002). As such, lean supply chains focus on upstream IT integration with
operations and suppliers (Vonderembse et al., 2006). The result is that lean supply chain
stress high quality but standard and low cost products.
On the other hand, agility is defined as the firm‘s ability to respond rapidly to
changes in demand, both in term of volume and variety (Christopher, 2000). The agile
strategy emerged as market and customer demand characteristics began to change rapidly
(Hayes and Wheelwright, 2005). Firms responded by pursuing volume and variety
flexibility to be more responsive (Booth, 1996; Vondrembse et al., 2006). The agile
supply chain strategy emphasizes connectivity with customers (the market) by integrating
IT (Agarwal et al., 2006; Vondrembse et al., 2006). Information sharing throughout the
supply chain is key to success. This enables the agile organization to be context-specific,
dynamic, flexible and growth-oriented across the supply chain (Vondrembse et al., 2006).
60
This is achieved through deployment new technologies, new competencies, and even
develop new markets.
Many scholars have observed that these two approaches can complement one
another, and suggest the Leagile supply chain strategy in many contexts (Towill and
Christopher, 2002; Lee, 2004; Agarwal et al., 2006; Vondrembse et al., 2006). ―The best
supply chains aren‘t just fast and cost-effective. They are also agile and adaptable, and
they ensure that all their companies‘ interests stay aligned,‖ (Lee, 2004: p. 102). The
Leagile supply chain strategy employs concepts from both the lean and agile strategies to
achieve agility at the product line level, while following lean principles as the component
level (Vonderembse et al., 2006).
Product level demand variability addresses variation in customer orders for a
given product, while demand variability at the component level addresses variation in the
component requirements for each ordered product. For example, product variability for a
restaurant is uncertainty centering on which dish(es) a customer who enters the store will
order. It is difficult for the restaurateur to predict whether the customer will order
breakfast, lunch, dinner, deserts, etc. Component level variability is uncertainty that
exists regarding the customer‘s requirements for each product ordered such as choice of
bread, meat, cheese, and condiments for a lunch sandwich. If the restaurateur receives an
advance lunch order from the customer, the restaurateur will be ready with all of the
necessary components to make the sandwich, but he/she would not have prepared the
products and components necessary for breakfast and dinner. This allows the restaurant
to eliminate multiple forms of waste and improve customer responsiveness. This is a
61
simplistic example of a manufacturing concept referred to as ‗assemble to order‘ which is
at the heart of the Leagile supply chain strategy (Vonderembse et al., 2006).
In the ‗assemble to order‘ environment, product demand is reasonably predictable,
while component demand may be variable. This is much like the environment in the
downstream healthcare delivery supply chain. One notable exception is care delivered in
the emergency department (Shah et al., 2008). However, in the context of care delivered
during most inpatient hospital stays (e.g., following surgery), the order is received prior
to admission, or minimally the nursing staff on the floor is notified in advance that the
patient will be transported to a room under their purview, enabling the clinical and allied
health professionals identify the product-line needs of the patient (e.g. breakfast, lunch,
or dinner) such as cardiac services, etc. and begin to assemble the appropriate
components in the form of ancillary equipment and services.
Lean methods are emphasized in the Leagile supply chain strategy through the use
of continuous process improvement to eliminate waste which improves costs and
flexibility (Vonderembse et al., 2006). A key aspect of lean that is employed under the
Leagile approach is employee empowerment. Here the focus rests in empowering
employees to perform work in their functional teams or departments (Vonderembse et al.,
2006).
Finally, the Leagile Supply Chain Strategy emphasizes integration across the
healthcare delivery supply chain. This includes integration with suppliers (physicians in
the case of the present study) as well as with customers, again in an attempt to understand
and deliver on their requirements (Vonderembse et al., 2006). The Leagile supply chain is
a suitable Integrative Information and Resource Strategy given that the primary hospital
62
strategy typically emphasizes quality of care, flexibility, and timeliness, owing to the
customized nature of delivering care in an environment pressured for cost reductions
(Jack and Powers, 2004).
IS for Comprehensiveness Strategy is defined as the extent to which a hospital
provides and encourages actors involved in providing patient care to use information
systems for operational, customer/patient focused, and interorganizational/physician
activities. Sabherwal and Chan (2001) use Miles and Snow‘s (1978) strategy typology to
develop IS strategies. In doing so, the authors link four types of IS systems deployed by
firms to support the overall value creation strategy to the Miles and Snow (1978) strategy
typology (e.g., Camillus and Lederer, 1985; Karimi, Gupta and Somers, 1996; Gilbert,
1995). These four types of IS systems include: (1) operational support systems which are
used to control and monitor day-to-day operations, (2) market information systems which
are used to observe customer demand changes and quickly respond to their requirements,
(3) interorganizational support systems which are used to connect customers and
suppliers, known in the context of the current study as value co-creation actors, and (4)
strategic support systems which are used in the long range planning process of a hospital
to identify and forecast major market opportunities (Shortell and Zajac, 1990). Sabherwal
and Chan (2001) described the use of these four systems across the Miles and Snow
(1978) typology as shown in Table 2.7.2.
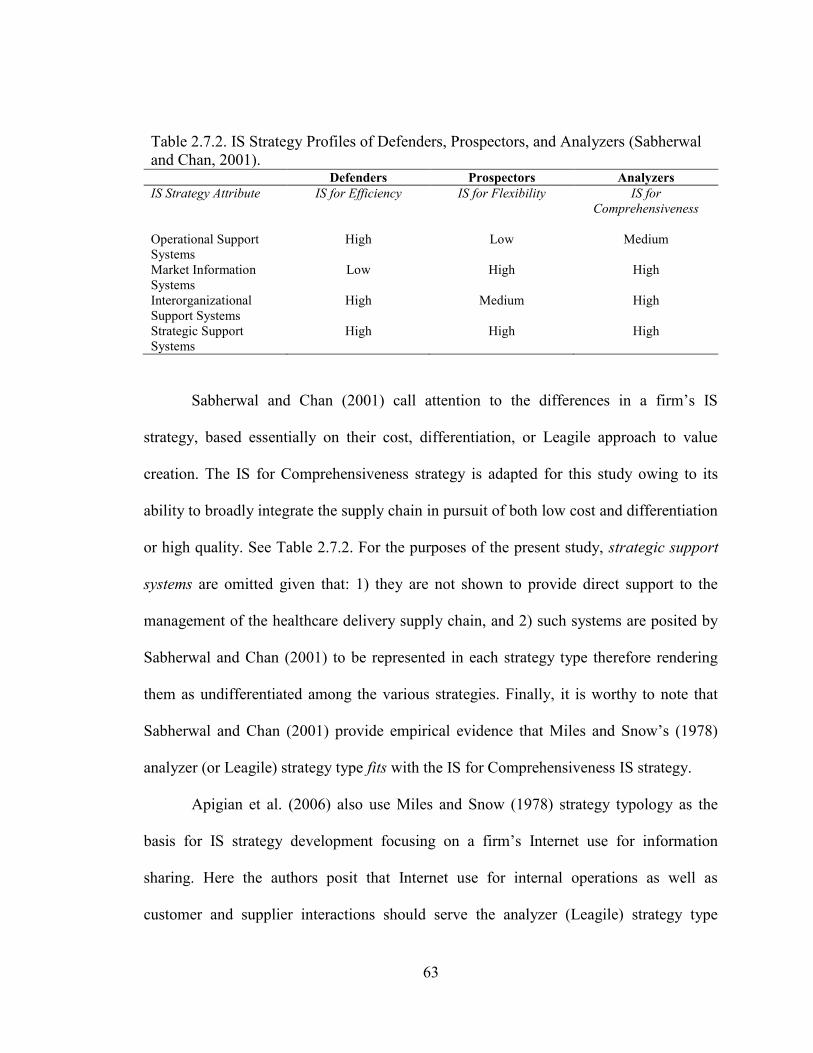
63
Table 2.7.2. IS Strategy Profiles of Defenders, Prospectors, and Analyzers (Sabherwal
and Chan, 2001). Defenders Prospectors Analyzers
IS Strategy Attribute IS for Efficiency IS for Flexibility IS for
Comprehensiveness
Operational Support
Systems
High
Low
Medium
Market Information
Systems
Low High High
Interorganizational
Support Systems
High Medium High
Strategic Support
Systems
High High High
Sabherwal and Chan (2001) call attention to the differences in a firm‘s IS
strategy, based essentially on their cost, differentiation, or Leagile approach to value
creation. The IS for Comprehensiveness strategy is adapted for this study owing to its
ability to broadly integrate the supply chain in pursuit of both low cost and differentiation
or high quality. See Table 2.7.2. For the purposes of the present study, strategic support
systems are omitted given that: 1) they are not shown to provide direct support to the
management of the healthcare delivery supply chain, and 2) such systems are posited by
Sabherwal and Chan (2001) to be represented in each strategy type therefore rendering
them as undifferentiated among the various strategies. Finally, it is worthy to note that
Sabherwal and Chan (2001) provide empirical evidence that Miles and Snow‘s (1978)
analyzer (or Leagile) strategy type fits with the IS for Comprehensiveness IS strategy.
Apigian et al. (2006) also use Miles and Snow (1978) strategy typology as the
basis for IS strategy development focusing on a firm‘s Internet use for information
sharing. Here the authors posit that Internet use for internal operations as well as
customer and supplier interactions should serve the analyzer (Leagile) strategy type
64
(Apigian et al., 2006). The empirical results of Apigian et al. (2006) however, do not lend
support for the use of IS for customer and supplier interactions, but they do reveal the
critical role that IS plays in coordinating internal operations. In summary, the Sabherwal
and Chan (2001) study essentially supports the notion that Leagile strategies are well
served to deploy an IS strategy focused on market/customer support and
interorganizational support systems, as well as operational support systems but to a
slightly lesser extent. The Apigian et al. (2006) study posits that Leagile approaches to
value creation employ balanced Internet strategies connecting customers, suppliers and
internal operations, while providing empirical support only for internal operations. Taken
together the findings of Apigian et al. (2006) emphasize the primacy of IS systems use
for internal operations, which when considered with Sabherwal and Chan‘s (2001)
findings suggests a balance approach between operational, market/customer focused, and
interorganizational systems.
2.7.1 Partner Relationship and Integrative Information and Resource Strategy
As firms develop trust and collaborative skills necessary to form networks, the
design of strategies, structures and processes becomes important to grow in capability
and scope (Miles and Snow, 2007). This leads the hospital to develop a Integrative
Information and Resource Strategy in order to gain access to more knowledge and
increase their value co-creating capability. This is particularly the case when considering
the decentralized nature of the healthcare delivery supply chain.
―A decentralized supply chain can be coordinated by fostering close relationships
among supply chain partners,‖ (Shah et al. 2008: p. 781). Trust is a foundational element
65
that ensures successful supply chain performance (Kwon and Suh, 2004; Hong and Jin,
2007). ―Lack of trust between supply chain partners reduces willingness to share tactical
and strategic information,‖ (Ramayah et al., 2008: p. 39). Further, an absence of trust
impairs the ability of a value creation network (or system) to make critical exchanges of a
social, political and economic nature (Bowersox et al., 2000; Cross and Kelley, 2004).
This leads to adverse outcomes such as increased transaction costs (hand-offs) and
inefficient and ineffective performance (Kwon and Suh, 2004). Finally Smith and Smith
(2005) in a case study of the Australian auto textile and healthcare industries, illustrated
that the development of trusting, cooperative relationships between supply chain actors
positively influenced organizational performance (Ramayah et al., 2008). Improving
organizational performance is a fundamental driver of a hospital‘s strategy (McDermott
and Stock, 2007).
Finally, the partner relationship construct was directly adopted and tested by Liao
(2008) from Li (2002). Both studies provide evidence that partner relationship is an
antecedent to supply chain management. Li (2002) tested and provided evidence that
partner relationship positively impacts supply chain management practices as well as
supply chain performance. Liao (2008) modeled and tested relationships of partner
relationship as an antecedent to supplier alignment and supplier empowerment. Both
relationships were statistically significant. The present study postulates that strategy
guides the firm‘s practices and behavior. In the context of supply chain management,
particularly in a decentralized supply chain, partner relationship should be an important
antecedent to the strategy a hospital pursues with its supply chain partners.
66
Therefore, the present study postulates:
H1: Partner Relationship is positively associated with Integrative
Information and Resource Strategy.
2.8 Entrepreneurial Culture
Organizational culture (or orientation) is the fundamental tacit set of assumptions
about the world and organization that a group of people share, and that determines their
thoughts, perceptions, feelings, and their outward-facing behaviors (Schein, 1996; Roh et
al., 2008). When considering supply chain management, cultures or orientations can be
unique to a firm (Min and Mentzer, 2004) and should be contextually specific to the
firm‘s situation (Roh et al., 2008). Cultures are evident in the various behavior patterns of
firms and show differences in terms of focus, the management of employees, criteria for
success, criteria for effectiveness, and organizational glue (Cameron and Quinn, 1999).
Roh et al. (2008: p. 365) point out that ―it should be noted, however, that these patterns of
culture are not mutually exclusive (Al-Khalifa and Aspinwall, 2001). [In other words,] no
organization may show only one cultural pattern.‖ Rather cultural types provide general
classifications to assist in understanding a firm‘s orientation.
Entrepreneurship is a relevant cultural orientation in the supply chain
management context (see Jambulingam et al., 2005). An entrepreneurial focus is a
strategic orientation that involves the way in which the firm commits and controls
resources, including how it forms networks (relationships) (Kuratko and Hornsby, 2009).
Entrepreneurial hospitals can be thought of as those which encourage patient care actors
to shift efforts and assets from unproductive to productive activities (Drucker, 1985).
Jambulingam et al. (2005) provide useful and relevant insights into the cultural
67
orientations of another service shop type of business (from Schmenner, 1986), that of
retail pharmacies. Jambulingam et al. (2005) explore the entrepreneurial orientation or
culture of these service firms suggesting that such an orientation is comprised of ―a firm‘s
ability and willingness to: (1) innovate (innovativeness), (2) take action in anticipation of
changes (proactiveness), (3) encourage independent activity by employees (autonomy),
(4) respond to maneuvers of rivals (competitive aggressiveness), (5) take chances (risk
taking), and (6) motivate employees to work hard and face challenges (motivation)
(Lumpkin and Dess, 1996).‖ The authors suggest that firms vary in the degree to which
they demonstrate each of these entrepreneurial intangibles.
Innovativeness is conceptualized as a firm‘s tendency to engage in and support
new ideas, experimentation, novelty, and creativity that may result in new services
(Lumpkin and Dess, 1996). Proactiveness refers to a firm‘s processes targeted at
anticipating and acting on unknown future needs (Venkatraman, 1989). Autonomy
addresses the degree to which all employees of a firm enjoy freedom to bring forth new
vision or ideas and follow it through to completion. Competitive aggressiveness refers to
the firm‘s propensity to directly and intensely challenge competitors to improve their
current market position or enter a new market altogether. (Lumpkin and Dess, 1996).
Competitive aggressiveness captures the reactive tendencies of the firm – the opposite of
proactiveness. Risk taking speaks to the firm‘s proclivity or appetite for risky projects. It
reflects managerial preferences for bold action to achieve firm objectives (Gasse, 1982).
Finally, motivation refers to a firm‘s ability to enhance employees‘ morality and attitudes
about work. Favorable attitudes about and morale of hard work contributes to their
motivation to produce high level job performance (Jambulingam et al., 2005).
68
Analysis of survey data collected from the pharmacies reveals six clusters of
entrepreneurial cultures (Jambulingam et al., 2005). These include: 1) competitive
aggressors, 2) ambitious, 3) true entrepreneurs, 4) low-risk entrepreneurs, 5) proactive
innovators, and 6) anything but entrepreneurs. The authors then analyzed the data in
search of the performance of each cluster against four outcome measures consisting of
effectiveness, customer orientation, growth, and innovative services provided. Two
clusters outperform the other four – true entrepreneurs and low-risk entrepreneurs. The
true entrepreneurs cluster is comprised of firms which emphasize risk-taking,
innovativeness and proactiveness to a greater extent than any other cluster. Their
emphasis on competitive aggressiveness and autonomy is significantly higher,
statistically speaking, than four of the five clusters, however, not significantly lower than
low-risk entrepreneurs. The true entrepreneurs cluster places a simultaneously high
emphasis on each of the six entrepreneurial dimensions (Jambulingam et al., 2005). Low-
risk entrepreneurs are very similar to true entrepreneurs with one important exception.
Low-risk entrepreneurs display a significantly lower emphasis on risk taking. Like true
entrepreneurs, the low-risk entrepreneur cluster is significantly higher than any of the
other groups on innovativeness, proactiveness, and autonomy. With regard to competitive
aggressiveness and motivation, it is significantly higher than three of the four groups,
however not significantly lower than the true entrepreneurs cluster. The low-risk
entrepreneurs place significantly lower emphasis on risk-taking (about one-half or one-
third) compared to any of the other entrepreneurial dimensions (Jambulingam et al.,
2005). Given the characteristics of each of these clusters, their associated outcomes are
not surprising. True entrepreneurs outperformed all other clusters for growth and
69
innovative services, while the low-risk entrepreneurs outperformed all other clusters for
effectiveness and customer orientation.
The present study conceptualizes a construct for Entrepreneurial Culture which is
comprised of the five dimensions from the low-risk entrepreneurship culture type from
Jambulingam et al. (2005). This conceptualization is supported by 1) logical reasoning
and literature indicating that patient care is well served to avoiding risk (Tucker, 2004),
as well as 2) the findings of Jambulingam et al. (2005) that a low-risk entrepreneurial
culture is associated with better outcomes for effectiveness and customer orientation,
both of which are key measures for success in healthcare delivery (IOM, 2001).
Entrepreneurial Culture is thus defined as the extent to which those involved in
healthcare delivery shift efforts and assets from unproductive to productive activities
(Drucker, 1985). A list of subconstructs (the dimensions of an Entrepreneurial Culture)
and their respective definitions and literature support are provided in Table 2.8.1.
Proactiveness is defined as the extent to which healthcare delivery processes are
targeted at anticipating and acting on unknown future market (patient) needs
(Venkatraman, 1989; Jambulingam et al., 2005).
Innovativeness is defined as the extent to which those involved healthcare
delivery engage in and support new ideas, experimentation, novelty, and creativity, some
of which that may result in new services (Lumpkin and Dess, 1996).
Autonomy is defined as the extent to which all those involved in healthcare
delivery have freedom to bring forth new vision or ideas and follow it through to
completion (Jambulingam et al., 2005).
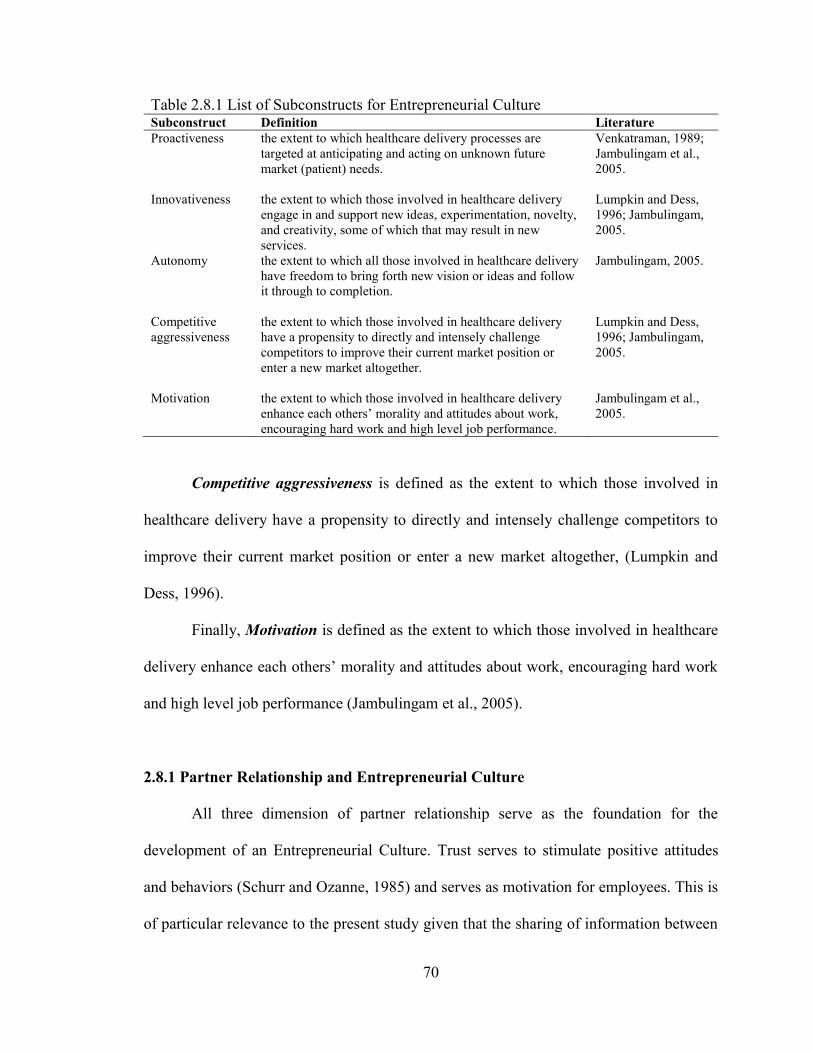
70
Table 2.8.1 List of Subconstructs for Entrepreneurial Culture Subconstruct Definition Literature
Proactiveness the extent to which healthcare delivery processes are
targeted at anticipating and acting on unknown future
market (patient) needs.
Venkatraman, 1989;
Jambulingam et al.,
2005.
Innovativeness the extent to which those involved in healthcare delivery
engage in and support new ideas, experimentation, novelty,
and creativity, some of which that may result in new
services.
Lumpkin and Dess,
1996; Jambulingam,
2005.
Autonomy the extent to which all those involved in healthcare delivery
have freedom to bring forth new vision or ideas and follow
it through to completion.
Jambulingam, 2005.
Competitive
aggressiveness
the extent to which those involved in healthcare delivery
have a propensity to directly and intensely challenge
competitors to improve their current market position or
enter a new market altogether.
Lumpkin and Dess,
1996; Jambulingam,
2005.
Motivation the extent to which those involved in healthcare delivery
enhance each others‘ morality and attitudes about work,
encouraging hard work and high level job performance.
Jambulingam et al.,
2005.
Competitive aggressiveness is defined as the extent to which those involved in
healthcare delivery have a propensity to directly and intensely challenge competitors to
improve their current market position or enter a new market altogether, (Lumpkin and
Dess, 1996).
Finally, Motivation is defined as the extent to which those involved in healthcare
delivery enhance each others‘ morality and attitudes about work, encouraging hard work
and high level job performance (Jambulingam et al., 2005).
2.8.1 Partner Relationship and Entrepreneurial Culture
All three dimension of partner relationship serve as the foundation for the
development of an Entrepreneurial Culture. Trust serves to stimulate positive attitudes
and behaviors (Schurr and Ozanne, 1985) and serves as motivation for employees. This is
of particular relevance to the present study given that the sharing of information between
71
supply chain actors places a premium on trust because of the consequential competitive
risks (Young et al., 1999). Further, Chen et al. (2007) suggest that trust in supply chain
partners is key for effective collaboration (Ramayah et al., 2008). As such, if a hospital is
to develop a culture centered on partner collaboration, it must first have trust in its
partners.
Further, trust and a shared vision with supply chain partners drives the culture of
the firm toward a collaborative ‗world view‘ (Spekman et al., 1998; Lee and Kim, 1999;
Li 2002). These relationship dimensions, along with commitment to value creation
partners, is necessary for the development of a culture of collaboration. Partner
Relationship is particularly important considering SDL, given that the hospital‘s clinical
staff is most likely to ―share what [they] have with committed partners [which is key,]
because relationships shape the trajectory of the opportunity,‖ (Read et al., 2009: p. 3).
Therefore, the present study postulates:
H2: Partner Relationship is positively associated with Entrepreneurial
Culture.
2.9 Integrative Supply Chain Practices
Min and Mentzer (2004: p. 63) state that ―supply chain management extends the
concept of functional integration (i.e., the integration of traditional business functions,
departments, and processes) beyond a firm to all the firms in the supply chain (Cooper
and Ellram, 1993; Cooper et al., 1997: Ellram and Cooper, 1990; Greene. 1991) and,
thus, individual members of a supply chain help each other improve the competitiveness
of the supply chain, which should improve competitiveness for all supply chain members
72
(Bowersox and Closs, 1996; Cavinato, 1992; Cooper and Ellram, 1993; Lee and
Billington. 1992).‖ As discussed in Chapter 2, while general consensus exists regarding
the concept of supply chain management, much less is known about the specific practices
required to maximize the potential benefits (Li et al., 2006). This is particularly the case
when considering value co-creation in the healthcare context. The present study therefore
conceptualizes a construct for supply chain management practices based on the work of
Li (2002) and Li et al. (2005; 2006), which is comprised of six integrative dimensions
which include: 1) strategic physician partnership, 2) patient relationship, 3) information
sharing, 4) information quality, 5) lean principles, and 6) IS enabled processes.
Integrative Supply Chain Practices is defined as the extent to which a set of activities is
undertaken in a hospital to promote effective management of healthcare delivery (adapted
from Li et al., 2005; 2006). A list of subconstructs and their respective definitions and
literature support are provided in Table 2.9.1.
Strategic Physician Partnership is defined as the extent to which the hospital has
long-term relationships with its key physicians intended to leverage the strategic and
operational capabilities of both parties to help them achieve significant ongoing benefits.
A strategic partnership involves long-term, direct relations that promote collaboration
such as mutual planning or problem solving (Gunasekaran et al., 2001). Such
relationships enable a firm to work closely with a smaller number of partners who are
amenable to sharing responsibility for the success of the firm‘s offerings (Li et al., 2005).
Partners involved in product/service design for example can provide valuable insights
into cost effective design choices and technologies (Monczka et al., 1993). Strategically
aligned partners are also able to work very closely, therefore eliminating wasteful effort
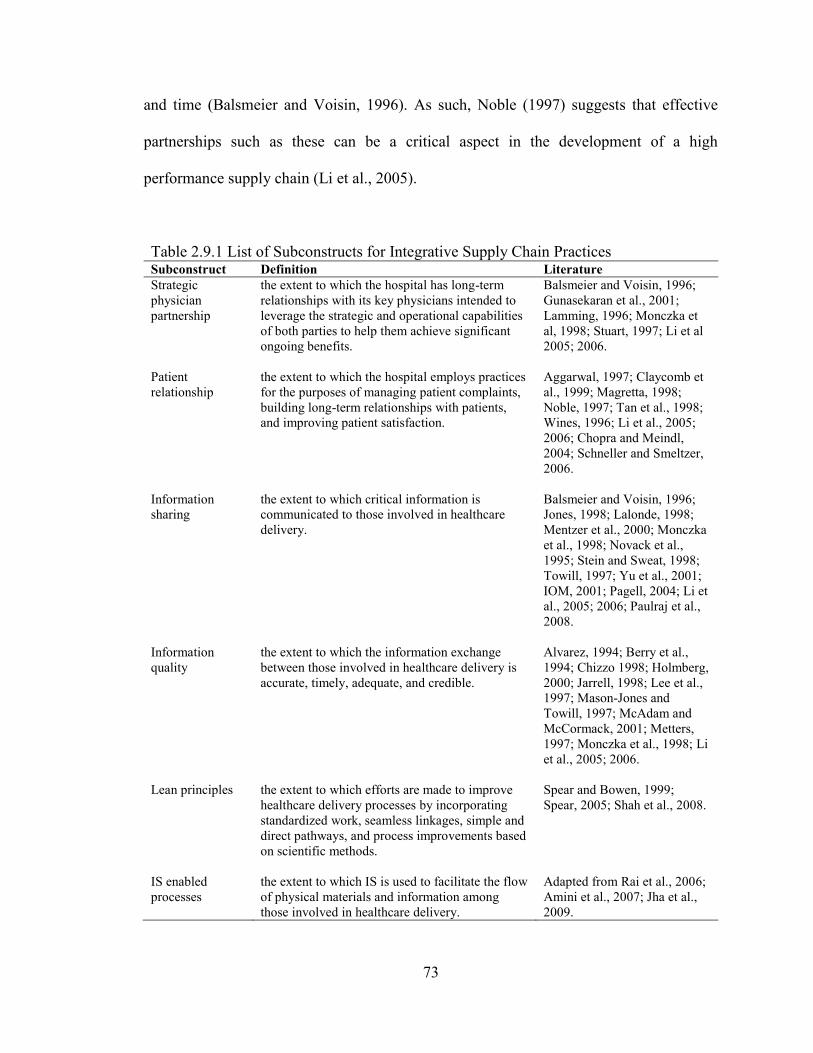
73
and time (Balsmeier and Voisin, 1996). As such, Noble (1997) suggests that effective
partnerships such as these can be a critical aspect in the development of a high
performance supply chain (Li et al., 2005).
Table 2.9.1 List of Subconstructs for Integrative Supply Chain Practices Subconstruct Definition Literature
Strategic
physician
partnership
the extent to which the hospital has long-term
relationships with its key physicians intended to
leverage the strategic and operational capabilities
of both parties to help them achieve significant
ongoing benefits.
Balsmeier and Voisin, 1996;
Gunasekaran et al., 2001;
Lamming, 1996; Monczka et
al, 1998; Stuart, 1997; Li et al
2005; 2006.
Patient
relationship
the extent to which the hospital employs practices
for the purposes of managing patient complaints,
building long-term relationships with patients,
and improving patient satisfaction.
Aggarwal, 1997; Claycomb et
al., 1999; Magretta, 1998;
Noble, 1997; Tan et al., 1998;
Wines, 1996; Li et al., 2005;
2006; Chopra and Meindl,
2004; Schneller and Smeltzer,
2006.
Information
sharing
the extent to which critical information is
communicated to those involved in healthcare
delivery.
Balsmeier and Voisin, 1996;
Jones, 1998; Lalonde, 1998;
Mentzer et al., 2000; Monczka
et al., 1998; Novack et al.,
1995; Stein and Sweat, 1998;
Towill, 1997; Yu et al., 2001;
IOM, 2001; Pagell, 2004; Li et
al., 2005; 2006; Paulraj et al.,
2008.
Information
quality
the extent to which the information exchange
between those involved in healthcare delivery is
accurate, timely, adequate, and credible.
Alvarez, 1994; Berry et al.,
1994; Chizzo 1998; Holmberg,
2000; Jarrell, 1998; Lee et al.,
1997; Mason-Jones and
Towill, 1997; McAdam and
McCormack, 2001; Metters,
1997; Monczka et al., 1998; Li
et al., 2005; 2006.
Lean principles the extent to which efforts are made to improve
healthcare delivery processes by incorporating
standardized work, seamless linkages, simple and
direct pathways, and process improvements based
on scientific methods.
Spear and Bowen, 1999;
Spear, 2005; Shah et al., 2008.
IS enabled
processes
the extent to which IS is used to facilitate the flow
of physical materials and information among
those involved in healthcare delivery.
Adapted from Rai et al., 2006;
Amini et al., 2007; Jha et al.,
2009.
74
Patient Relationship is defined as the extent to which the hospital employs
practices for the purposes of managing patient complaints, building long-term
relationships with patients, and improving patient satisfaction (adapted from Aggarwal,
1997; Claycomb et al., 1999; Tan et al., 1998). Many scholars consider customer (or in
the case of this study patient) relationship management to be a critical aspect of supply
chain management (see Noble, 1997; and Tan et al., 1998). In healthcare delivery,
customer relationship management (CRM) is considered to be one of the three primary
supply chain management processes, next to internal supply management (ISM), and
supplier relationship management (SRM) (Chopra and Meindl, 2004; Schneller and
Smeltzer, 2006). Close relationships with customers/patients enables a firm to
differentiate its service offerings from the competition and extend the value provided to
its customers (Magretta, 1998; Li et al., 2005).
Information Sharing is defined as the extent to which critical information is
communicated to those involved in healthcare delivery. Information among healthcare
delivery supply chain partners is critical to achieve positive outcomes, yet many
healthcare organizations, physicians, and hospitals operate as separate ―silos,‖ making
diagnosis and treatment decisions with asymmetric information about the patient‘s
medical history, condition, medications provided by other clinicians, or services provided
in other settings (IOM, 2001). Many scholars have postulated that the key element in
developing a seamless supply chain rests in making up-to-date and undistorted
information about customer needs available to all value creation actors in the supply
chain (Balsmeier and Voisin, 1996). Similarly, Lalonde (1998) suggests that information
sharing is one of the five building blocks that represent a concrete supply chain
75
relationship (Li et al., 2005). Supply chain partners who regularly share information are
successful in working together as one entity (Stein and Sweat, 1998), a critically
important concept in the decentralized healthcare supply chain. In working together,
supply chain actors can better understand the needs of the customer and respond more
quickly (Li et al., 2006). The negative effects of poor information sharing or information
asymmetries are apparent in the supply chain literature, causing the bullwhip effect (Yu
et al., 2001). On the other hand, effective information sharing has been shown to reduce
costs and improve quality (Stein and Sweat, 1998). For these reasons, many scholars
observe that by capturing available data and sharing it with supply chain partners can
serve as a source of capability/competitive advantage (Jones, 1998; Novack et al., 1995).
Lean Principles is defined as the extent to which efforts are made to improve
healthcare delivery processes by incorporating standardized work, seamless linkages,
simple and direct pathways, and process improvements based on scientific methods. Lean
has been studied in a healthcare context, specifically in a similarly conceptualized
healthcare deliver supply chain in a case study by Shah et al (2008). Shah et al (2008: pp.
763-764) conceptualized Lean based on Spears and Bowen (1999) and Spear (2005)
highlighting the following principles.
―Principle 1—Standardized work: defines how people perform their work
and ensures that all work is highly specified to its content, sequence,
timing, and outcome. Processes must be designed such that deviations
from
this specification are readily apparent. Standardized work reduces or
eliminates decision making related to how work should be performed.
Principle 2—Seamless linkages: establishes that people performing the
work must be connected to one another with direct and unambiguous
links. There is complete certainty about exactly who has performed what
work at each process handoff. Seamless linkages reduce or eliminate the
76
need for information transfer and the errors (defects and delays) such
transfers introduce.
Principle 3—Simple and direct pathways: designates that the process must
be designed so that production flows are simple and direct and do not
change from one production run to another. Such predictable flows ensure
that the exact appropriate resources are devoted to production. Simple and
direct pathways reduce or eliminate decision making related to where
work should be directed as it flows through the process.
Principle 4—Process improvements based on scientific methods: outlines
the scientific method of hypothesis testing that employees must use to
improve the process and discourages them from learning from personal
experience alone. Such methods reduce or eliminate decision making
based on intuition while promoting decision making based on
scientifically derived evidence.‖
Contrary to much of the scholarly research into supply chain practices such as
lean (see Schmenner and Swink, 1998; Hopp and Spearman, 2004), Shah et al (2008: p.
778) show that lean can be implemented in highly variable, unpredictable environments
which are not ―stable or [where] unstable demand can be buffered using production
smoothing techniques.‖
IS Enabled Processes is defined as the extent to which IS is used to facilitate the
flow of physical materials and information among those involved in healthcare delivery.
While some scholars omit IS in their conceptualizations of supply chain practice (for
example see Li et al., 2005), it plays an unmistakably important role in managing supply
chain activities. Given this, Donlan (1996), includes IT sharing in a conceptualization of
supply chain management practices which include: 1) outsourcing, 2) cycle time
compression, 3) supplier partnership, 4) continuous process flow and 5) IT sharing.
Likewise, Alvarado and Kotzab (2001) suggest that IT use such as EDI for inter-
organizational data exchange is a supply chain management practice (Li et al., 2006).
77
These conceptualizations of supply chain practices considered along with the statement
by Ilie et al. (2009: p. 216) that ―observers of the health care sector have recognized that
IT has the potential to reduce health care costs (Thompson and Brailer, 2004) while also
improving the overall quality of care by providing consistency of clinical data and data
sharing along the health care supply chain (IOM, 2001; Menachemi et al., 2007),‖ has
motivated the inclusion of IS enabled processes as a dimension of supply chain
management practices in the current study.
According to Rai et al. (2006) three types of supply chain process integration
capabilities manage the: 1) physical flows of materials, 2) the information flows, and 3)
the financial flows. Given that the focus of this study is the decentralized healthcare
delivery supply chain, financial flows between supply chain actors play only a minimal or
no role and are therefore excluded from the conceptualization of IS enabled processes.
This leaves IS enabled processes related to the physical flows and information flows
during healthcare delivery. Radio Frequency Identification (RFID) is the focus of this
study in investigating physical flows, while electronic medical records (EMR) represent
the focus of this study‘s investigation into information flows.
RFID is an emerging technology employed in hospitals for asset management
(tracking) purposes, thus affording visibility into the status of assets in the supply chain
(Amini et al., 2007). The technology consists of small integrated-circuit ‗tags‘ that are
able to retain data, and be passively tracked for location by virtue of a wireless
―integrator‖ network that reads the tags. RFID has recently been employed in hospitals to
track a variety of physical inventory and materials such as products, equipment and even
humans (Amini et al., 2007). ―Today, improvements in technology-assisted patient care
78
are critical,‖ (Amini et al., 2007: p. 596). RFID based systems can help [improve care
delivery] in a number of ways, from providing real-time tracking information about
patients, medications and medical equipment, to reporting process-related statictics,‖
(Amini et al., 2007: p. 596). For the purposes of this study, RFID is considered an
operational IS tool (Sabherwal and Chan, 2001).
Based on the extant literature, this study defines a dimension of IS Enabled
Processes referred to as IT Use for Asset Management which is defined as the extent to
which RFID is used to monitor and locate resource materials needed during patient care
(Amini et al., 2007; Tzeng et al., 2008).
EMR is an IS (application) tool which enables the healthcare delivery supply
chain to operate efficiently and effectively (Ilie et al., 2009). According to the Institute of
Medicine, an EMR is ―an electronic patient record that resides in a system specifically
designed to support users through availability of complete and accurate data, practitioner
reminders and alerts, clinical decision-support, links to bodies of medical knowledge and
other aids‖ (IOM, 1991: pp. 2–3, 11). EMR‘s typically maintain a computerized
physician order entry (CPOE) module enabling physicians to ―directly enter orders for
medications, diagnostic tests and ancillary services,‖ (Poon et al., 2004: p. 184). An EMR
integrates the healthcare delivery supply chain providing health record interoperability
for physicians, pharmacies, insurance providers, pharmaceutical manufacturers and other
economic actors in the supply chain (Ilie et al., 2009).
This integration is achieved through four required functionalities for
comprehensive EMR use (Jha et al., 2009). These include: 1) electronic clinical
documentation (e.g., patient demographics, medication lists, etc.), 2) results viewing
79
(e.g., lab reports, consultant reports, etc.), 3) computerized provider order entry (e.g., lab
tests, consultation requests, etc.), and 4) decision support (e.g., clinical guidelines, drug
allergy alerts, etc.). In their large scale survey of 3,049 U.S. hospitals, Jha et al. (2009)
revealed that hospital usage of EMR systems varies significantly with only 16% using
CPOE applications while 80% reported use of laboratory of radiology reporting systems.
This is consistent with other research suggesting the EMR adoption varied dramatically
(see AHA, 2005, Ash et al., 2004; Cutler et al., 2005).
Based on the work of Jha et al. (2009), this study defines a dimension of IS
Enabled Processes that addresses the management of patient care information. This
dimension is Comprehensive EMR Use and it is defined as the extent to which EMR is
utilized in the hospital for clinical documentation, results viewing, computerized
physician order entry (CPOE), and decision support.
2.9.1 Integrative Information and Resource Strategy and Integrative Supply Chain
Practices
Prahalad and Krishnan (2008: p. 51) state that business processes link business
strategy to operations and ―define the logical relationships among activities within the
firm and its relationships with network collaborators and its relationships with
consumers.‖ In doing so, the practices of a firm should be consistent with an overarching
strategy (Doty et al., 1993).
A hospital‘s Integrative Information and Resource Strategy, as described herein,
strives for efficiency, flexibility and effectiveness. The pursuit of efficiency leads a
hospital to employ lean principles to eliminate waste and non-value added activities.
80
Lean principles also enhance flexibility (Vonderembse et al., 2006), which relies upon
the sharing of high accurate, timely, adequate and credible information. Such information
sharing can be facilitated by a comprehensive IS system (Sabherwal and Chan, 2001;
Apigian et al., 2006) among physicians and other clinical staff members.
Effectiveness is ensured when a hospital employs practices for managing patient
complaints and improving satisfaction. Effectiveness, in a lasting sense, also results from
the establishment of long-term relationships with physicians which emphasize mutual
benefit (Edmondson et al., 2003).
Therefore, the present study postulates:
H3: Integrative Information and Resource Strategy is positively
associated with Integrative Supply Chain Practices.
2.9.2 Entrepreneurial Culture and Integrative Supply Chain Practices
―A change in corporate culture is required for the implementation of supply chain
management practice,‖ (Tan et al., 1998; Li, 2002: p. 39). This is owing to the notion that
behaviors and practices are the product of 1) identifying with, sharing, and/or
internalizing an organizations values (e.g., the culture) or 2) the cognitive assessment of
the instrumental worth of an ongoing relationship with a partner (Li, 2002). Hayer (2002)
found support for this idea in a study for the Commission for Health Improvement,
finding that a culture of non-accountability negatively impacts practices (Bamford and
Griffin, 2008).
Certainly, a hospital‘s culture can influence the work of actors in the healthcare
delivery supply chain. Shah et al. (2008) suggest that an interorganizational culture of
respect for others‘ work among healthcare providers can influence coordination and
81
positively impact the performance of the healthcare delivery supply chain. On the other
hand, as with Hayer (2002), a culture of finger pointing has been associated with
inefficiency and increased waste in healthcare delivery (Edmondson et al., 2003).
An Entrepreneurial Culture promotes ‗working together‘ with other individuals
involved in healthcare delivery, and in doing so clinicians can effectuate or influence the
nature of their work practices (Sarasvathy, 2001). As such, a culture can promote the
development of long-term, mutually beneficial relationships with physicians as well as
the sharing of timely, accurate, adequate, and credible information. Further, quality, a
supply chain management practice, is at the heart of an entrepreneurial culture focused on
shifting efforts and assets from unproductive to productive activities (Drucker, 1985). For
example, in order for a quality process to function effectively, it must have a complete
focus on the customer. If a company postpones initiatives awaiting customer complaints
before initiating improvements, it has most likely waited too long, (Kuratko and Hornsby,
2009). Additionally, Hwang and Christensen (2008) suggest the frequent need for
increased involvement (proactiveness) of the non-physician clinical staff in healthcare
delivery in an effort to reduce cost. Considering SDL, an Entrepreneurial Culture can
inspire the clinical staff to work closely with other willful agents (e.g., physicians with
high Partner Relationship) to co-create the future (value) (Read et al., 2009).
Therefore, the present study postulates:
H4: Entrepreneurial Culture is positively associated with Integrative
Supply Chain Practices
82
2.10 Value Dense Environment
It has been discussed earlier, that in this more networked environment firms are
turning their focus from the product or service they provide to the value creation system
itself (Normann and Ramirez, 1993). More specifically, firms are focusing on the
environment that they develop for their economic actors to co-create value (Normann and
Ramirez, 1993). This environment can be measured by its value density or in other
words, ―the amount of information, knowledge and other resources that an economic
actor has on hand at any moment in time to leverage his or her own value creation,‖
(Normann and Ramirez, 1993: p. 69). Such a value dense environment is not only created
directly by the focal firm, but it is also the result of knowledge and resources brought
forth by other value co-creating actors. This knowledge and resources emerge in two
varieties; operand and operant. As discussed earlier in section 2.4, operand resources are
those which must be acted on to be beneficial such as goods, natural resources, and
money (Constantin and Lusch, 1994; Vargo and Lusch, 2004a). Operant resources are
those which act upon other resources (of the operand variety) to create benefit (Vargo and
Akaka, 2009). ―That is operant resources, such as knowledge and skills, are the
underlying source of value,‖ (Vargo and Akaka, 2009: p. 36).
Prahalad and Ramaswamy (2004a) describe the necessary building blocks –
dialog, access, risk-benefits, and transparency (DART) – as the foundation for
interactions between economic actors participating in the value co-creation system.
Dialog refers to the deep engagement, ability, interaction, and of significant importance,
the willingness of both sides to engage in conversation. Access describes the idea that the
effectiveness of the value creation system depends on the focal firm availing value co-
83
creating actors to as much information as he/she needs from the firm as well as the other
actors in the system. This is consistent with the importance of information transparency,
the third building block. Finally, the risk-benefits dimension of DART refers to the
capability of the customer to fairly and thoroughly assess the advantages and
disadvantages of the expected outcomes of his/her decisions in the value creation system.
Prahalad and Ramaswamy (2004a) illustrate the concept in healthcare, by suggesting that
these decisions may be related to seeking treatment or taking medications. In an effective
value creation system, ―instead of just depending on the doctor – the expert – the patient
has the tools and the support structure to help make that decision – not in some generic
risk category but for ‗me‘ – with a medical condition, a lifestyle, or social obligations,‖
(Prahalad and Ramaswamy, 2004a: p. 9).
It follows then that the objective of all actors in the supply chain (or value co-
creation system) is to provide input into the value creation processes of other actors and
therefore to obtain reciprocal input (Vargo and Akaka, 2009). This is accomplished
through service provision, and the application of resources that contribute to the density
of other actors (Vargo and Akaka, 2009). Density creation then results from the
‗unbundling,‘ ‗rebundling,‘ and ‗liquefied‘ resources in an effort to reconfigure them for
use by other value co-creation actors (Normann and Ramirez, 1993; Normann, 2001) and
leads to the best combination of resources on hand for any given situation (Vargo and
Akaka, 2009). Given this discussion, some scholars postulate that ―density creation is the
new operations,‖ (Vargo and Akaka, 2009: p. 39).
The knowledge management literature may provide some useful insights into this
concept. In investigating the nature of knowledge scholars distinguish between the degree
84
to which knowledge is codified or tacit (Nelson and Winter, 1982; Polyani, 1966).
Codified knowledge is more easily transmittable in formal, symbolic language, while
tacit knowledge is acquired through experience and difficult to articulate (Polyani, 1966).
Nonaka (1994) suggests that tacit knowledge is often context specific and centers in
action.
According to Edmondson et al. (2003), tacit and codified knowledge are not
discrete dichotomies, but rather serve as end points on a continuum. Some tacit
knowledge may exist owing to an absence of an agreed upon form of communication
among an epistemic cohort, but may not be permanently or inherently tacit. For example,
the codified/tactic status of medical knowledge deployed in healthcare delivery may be
temporal in nature, considering that much of the current codified knowledge was
previously tacit (e.g., Vosburg and Newbower, 2000).
Teece (1977) describes a central implication of these conceptual distinctions
regarding knowledge in discussing the ease of transfer across organizations, groups, and
individuals. When knowledge is codified, it can be more easily transferred in documents
– a transfer that is complete when this ‗know what‟ is acquired in the receipt of such
materials (Edmondson et al., 2003). In the case of codified „know how‟ transfer is still
reasonably straightforward using these mechanisms, although practice or discussion may
be necessary to capably execute the new task (Edmondson et al., 2003). On the other
hand, tacit knowledge often requires proximity and interpersonal interaction for its
transmission (Davenport and Prusak, 1998; Hansen, 1999; Sole and Edmondson, 2002;
Szulanski, 1996). Hansen (1999) investigated the transfer of tacit and codified knowledge
and found that personal contact and close relationships were important for tacit
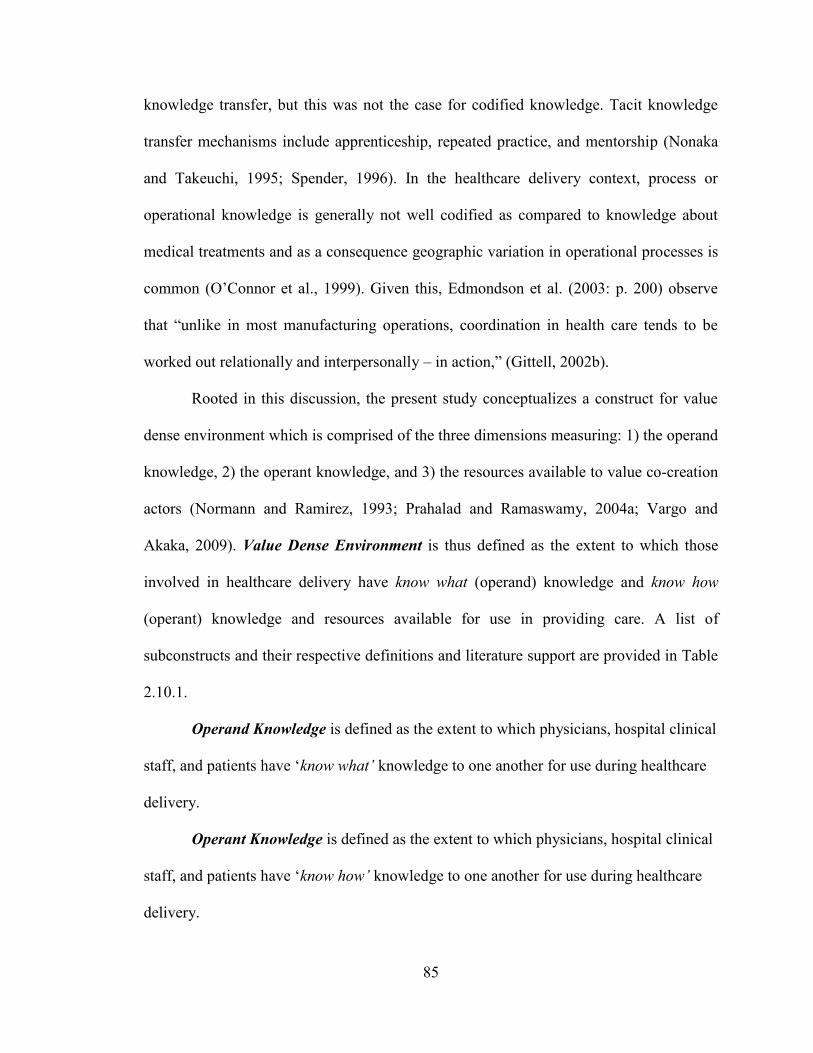
85
knowledge transfer, but this was not the case for codified knowledge. Tacit knowledge
transfer mechanisms include apprenticeship, repeated practice, and mentorship (Nonaka
and Takeuchi, 1995; Spender, 1996). In the healthcare delivery context, process or
operational knowledge is generally not well codified as compared to knowledge about
medical treatments and as a consequence geographic variation in operational processes is
common (O‘Connor et al., 1999). Given this, Edmondson et al. (2003: p. 200) observe
that ―unlike in most manufacturing operations, coordination in health care tends to be
worked out relationally and interpersonally – in action,‖ (Gittell, 2002b).
Rooted in this discussion, the present study conceptualizes a construct for value
dense environment which is comprised of the three dimensions measuring: 1) the operand
knowledge, 2) the operant knowledge, and 3) the resources available to value co-creation
actors (Normann and Ramirez, 1993; Prahalad and Ramaswamy, 2004a; Vargo and
Akaka, 2009). Value Dense Environment is thus defined as the extent to which those
involved in healthcare delivery have know what (operand) knowledge and know how
(operant) knowledge and resources available for use in providing care. A list of
subconstructs and their respective definitions and literature support are provided in Table
2.10.1.
Operand Knowledge is defined as the extent to which physicians, hospital clinical
staff, and patients have ‗know what‟ knowledge to one another for use during healthcare
delivery.
Operant Knowledge is defined as the extent to which physicians, hospital clinical
staff, and patients have ‗know how‟ knowledge to one another for use during healthcare
delivery.
86
Resources is defined as the extent to which physicians, hospital clinical staff, and
patients have the materials necessary during healthcare deliver.
Table 2.10.1 List of Subconstructs for Value Dense Environment Subconstruct Definition Literature
Operand
knowledge
the extent to which physicians, hospital clinical staff, and
patients have ‗know what‟ knowledge for use during
healthcare delivery.
Garud, 1997;
Lundvall and
Johnson, 1994;
Edmondson et al.,
2003; Vargo and
Akaka, 2009.
Operant
knowledge
the extent to which physicians, hospital clinical staff, and
patients have „know how‟ knowledge for use during
healthcare delivery.
Garud, 1997;
Lundvall and
Johnson, 1994;
Edmondson et al.,
2003; Vargo and
Akaka, 2009.
Resources the extent to which physicians, hospital clinical staff, and
patients have the resources necessary during healthcare
deliver.
Normann and
Ramirez, 1993;
Vargo and Akaka,
2009.
2.10.1 Integrative Supply Chain Practices and Value Dense Environment
Long-term, mutually beneficial physician partnerships and the sharing of timely,
accurate, adequate and credible information are key for the creation of a value dense
environment (Normann and Ramirez, 1993). These activities signal that a dialogue is
open among those involved in delivering care (Prahalad and Ramaswamy, 2004a). This
results in a transparent environment where those who need information, knowledge and
resources to create value have appropriate access and can make well informed decisions
as a result (Prahalad and Ramaswamy, 2004a).
This type of information sharing involves all value co-creation actors bringing
forth information about what kind of care to deliver (e.g., treatment plans) to patients and
how (e.g., demonstration) to deliver it (Edmondson et al., 2003). This information sharing
can be facilitated by EMR (Ilie et al., 2009). Lean principles contribute to this
87
environment by streamlining process flows and the resources needed by value co-creation
actors (Shah et al., 2008). Additionally, IS enabled processes such as RFID can assist in
locating resources, thereby ensuring that the necessary resources (e.g., equipment) are
available for care delivery when they are needed. Support for this notion is provided by
Hwang and Christensen (2008) in their suggestion that the pairing of technology enablers
and new approaches to business, such as a more networked approach, is what leads to
greater affordability and accessibility in healthcare. Finally, practices employed to
manage and improve patient satisfaction can inform the healthcare delivery environment.
Therefore, the present study postulates:
H5: Integrative Supply Chain Practices is positively associated with a
Value Dense Environment.
2.11 Supply Chain Performance
Performance measurement is a key concept in managing any endeavor. According
to Beamon (1998) a set of performance measures are valuable to the firm as they can be
used to assess a system‘s efficiency and/or effectiveness or to benchmark competing
systems. A significant challenge in measuring supply chain management performance is
the extant disconnect between strategy and measurement (Holmberg, 2000). It follows
that just as strategy is contextually specific to the firm (Roh et al., 2008), so should be the
firm‘s performance measurements. Finally, Holmberg (2000) also suggests that measures
should account for activities which span the entire supply chain. Considering these
insights, the current study adapts the supply chain management performance measures of
Li (2002) which are comprised of five dimensions: 1) supply chain flexibility, 2) supply
88
chain integration, 3) patient responsiveness, 4) physician performance, and 5) partnership
quality.
Supply Chain Performance is thus defined as the extent to which healthcare
delivery in a hospital is flexible, well integrated, and responsive to patients, while
enabling physicians to execute their duties, with outcomes that match the expectations of
all those involved. The first three dimensions reflect the Integrative Information and
Resource Strategy conceptualized in section 2.7 earlier (requiring both agility and
leaness) and also takes into consideration the characteristics of the healthcare delivery
environment, namely the centrality of the physician in the fourth dimension as well also
addressing value co-creation, the theoretical grounding of the study in the fifth
dimension. A list of subconstructs and their respective definitions and literature support
are provided in Table 2.11.1.
Supply Chain Flexibility is defined as the extent to which those involved in
healthcare delivery are able to effectively adapt or respond to changes that directly
impacts the hospital‘s patient.
Supply Chain Integration is defined as the extent to which all of the activities, of
all of those involved in healthcare delivery are coordinated together.
Patient Responsiveness is defined as the extent to which a hospital can provide
prompt attention to a patient‘s needs.
Physician Performance is defined as the extent to which admitting/attending
physicians provide dependable, timely, and appropriate services to patients.
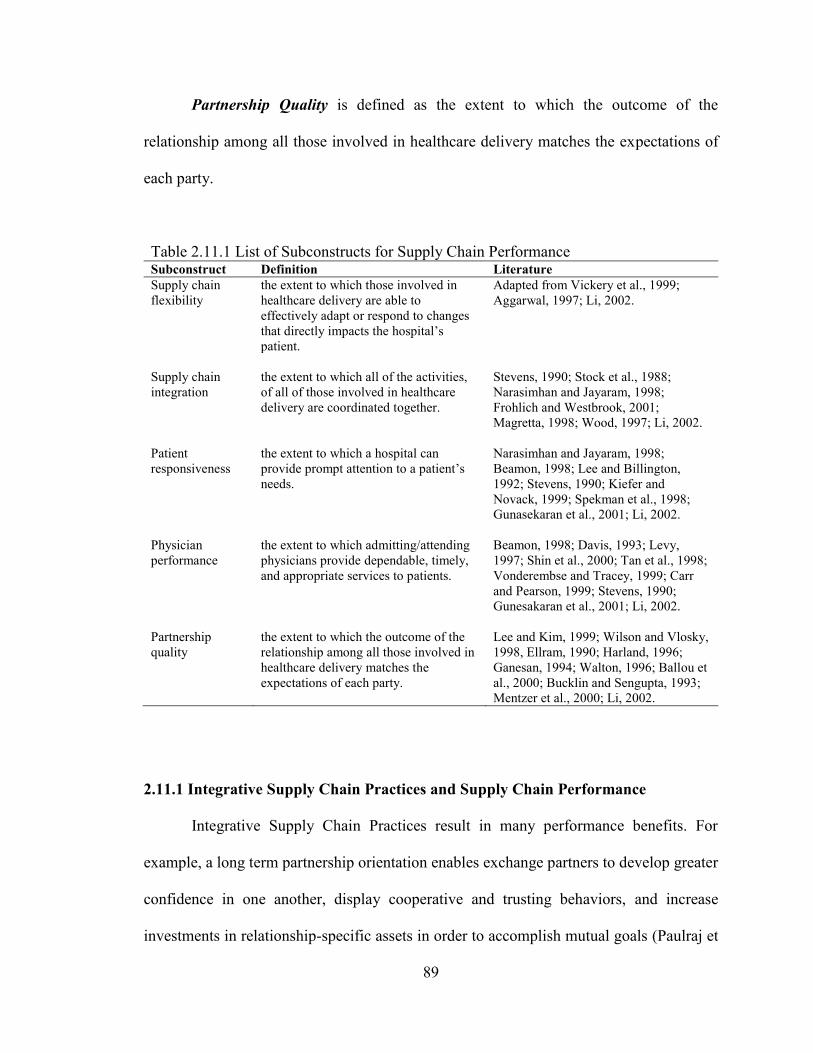
89
Partnership Quality is defined as the extent to which the outcome of the
relationship among all those involved in healthcare delivery matches the expectations of
each party.
Table 2.11.1 List of Subconstructs for Supply Chain Performance Subconstruct Definition Literature
Supply chain
flexibility
the extent to which those involved in
healthcare delivery are able to
effectively adapt or respond to changes
that directly impacts the hospital‘s
patient.
Adapted from Vickery et al., 1999;
Aggarwal, 1997; Li, 2002.
Supply chain
integration
the extent to which all of the activities,
of all of those involved in healthcare
delivery are coordinated together.
Stevens, 1990; Stock et al., 1988;
Narasimhan and Jayaram, 1998;
Frohlich and Westbrook, 2001;
Magretta, 1998; Wood, 1997; Li, 2002.
Patient
responsiveness
the extent to which a hospital can
provide prompt attention to a patient‘s
needs.
Narasimhan and Jayaram, 1998;
Beamon, 1998; Lee and Billington,
1992; Stevens, 1990; Kiefer and
Novack, 1999; Spekman et al., 1998;
Gunasekaran et al., 2001; Li, 2002.
Physician
performance
the extent to which admitting/attending
physicians provide dependable, timely,
and appropriate services to patients.
Beamon, 1998; Davis, 1993; Levy,
1997; Shin et al., 2000; Tan et al., 1998;
Vonderembse and Tracey, 1999; Carr
and Pearson, 1999; Stevens, 1990;
Gunesakaran et al., 2001; Li, 2002.
Partnership
quality
the extent to which the outcome of the
relationship among all those involved in
healthcare delivery matches the
expectations of each party.
Lee and Kim, 1999; Wilson and Vlosky,
1998, Ellram, 1990; Harland, 1996;
Ganesan, 1994; Walton, 1996; Ballou et
al., 2000; Bucklin and Sengupta, 1993;
Mentzer et al., 2000; Li, 2002.
2.11.1 Integrative Supply Chain Practices and Supply Chain Performance
Integrative Supply Chain Practices result in many performance benefits. For
example, a long term partnership orientation enables exchange partners to develop greater
confidence in one another, display cooperative and trusting behaviors, and increase
investments in relationship-specific assets in order to accomplish mutual goals (Paulraj et
90
al., 2008: p. 57). Operations Management as well as healthcare scholars have found that
the performance of a new procedure or technology improves with increased experience
(Ramsay, et al., 2000). This provides support to the experience curve or learning curve
experience notion that firms ‗learn by doing,‘ or that ‗practice makes perfect‘ (Pisano,
1996). This supports the notion that physician partnership can positive influence
performance.
In their study of 15 hospitals implementing new technology, Edmondson et al.
(2003: p. 198) state that ―to realize performance improvement, existing routines may
need to be revised or discarded to make room for new routines, (Edmondson et al.,
2001).‖ This suggests that the development of new and/or improved healthcare delivery
performance may require the implementation of lean principles.
Li et al. (2009) suggest that inter-organizational information sharing quality has
a positive impact on the supply chain integrated performance. These practices, considered
collectively, can improve the flexibility, integration, patient responsiveness, physician
performance, and over all partnership quality of the healthcare delivery supply chain. As
such, it is expected that integrative supply chain practices will results in better supply
chain performance (Narasimhan and Jayaram, 1998).
Therefore, the present study postulates:
H6: Integrative Supply Chain Practices is positively associated with
Supply Chain Performance.
91
2.11.2 Value Dense Environment and Supply Chain Performance
An environment characterized by the right combination of operand and operant
knowledge and resources is key for the creation of personalized care delivery (Vargo and
Akaka, 2009). This is a manifestation of flexibility. In such an environment, healthcare
delivery supply chain actors have the tools necessary to provide prompt response to the
needs of patients. This improves physician performance by enabling the physician to
provide timely and appropriate services to the patient. Such an environment also engages
the patient in their healthcare by providing he/she with the tools necessary to participate
in decisions about their care (Prahalad and Ramaswamy, 2004a). For these reasons, all
those involved in healthcare delivery – patients, physicians, and the clinical staff of the
hospital – are able to achieve their goals and expectations from their value co-creation
interactions (Normann and Ramirez, 1993).
Therefore, the present study postulates:
H7: Value Dense Environment is positively associated with Supply
Chain Performance.
2.12 Healthcare Delivery Capability
A competitive advantage or capability is the extent to which a firm (such as a
hospital) is able to create a defensible position over the competition (Porter, 1985;
McGinnis and Vallopra, 1999; Li et al., 2006). These capabilities are potential
differentiators between the firm and the competition and are the outcomes of critical
management decisions, but they are not under the direct control of management (Tracey
et al., 1999). The capabilities that form a firm‘s competitive advantage are the result of its
strategic business objectives and thus the firm strategies (Giffy et al., 1990). The
92
empirical literature in supply chain is reasonably consistent regarding the key capabilities
that represent competitive advantage: price/cost, quality, delivery, and flexibility (White,
1996; Skinner, 1985; Roth and Miller, 1990; Tracey et al., 1999). Subsequent research
provides support for time based competition as an important competitive capability
(Stalk, 1988; Vesey, 1991; Handfield and Pannesi, 1995; Kessler and Chakrabarti, 1996;
Zhang, 2001). Koufteros et al. (1997) developed a framework for competitive capabilities
focusing on time based practices (Li et al., 2006).
In the study of healthcare operations, ―attention typically comes in the form of
focus on costs of services, quality (often measured through mortality rates) and length of
stay,‖ (McDermott and Stock, 2007: p. 1020). Similarly, Butler et al. (1996) suggest that
a hospital‘s operational capabilities should consist of foci on cost, quality, service
delivery, and flexibility. In a more specific sense, the Institute of Medicine 2001 report,
Crossing the Quality Chasm (IOM, 2001) identifies six aims to improve the quality on
healthcare outcomes. Five of these aims are appropriate outcomes goals for the healthcare
delivery supply chain conceptualized in this study. The report posits that healthcare
delivery should be safe, effective, patient-centered, timely, efficient, and equitable (IOM,
2009). The report continues to define each aim.
Safe: avoiding injuries to patients from the care that is intended to help
them.
Effective: providing services based on scientific knowledge to all who
could benefit, and refraining from providing services to those not likely to
benefit.
Patient-centered: providing care that is respectful of and responsive to
individual patient preferences, needs, and values, and ensuring that patient
values guide all clinical decisions.
93
Timely: reducing waits and sometimes harmful delays for both those who
receive and those who give care
Efficient: avoiding waste, including waste of equipment, supplies, ideas,
and energy.
Equitable: providing care that does not vary in quality because of personal
characteristics such as gender, ethnicity, geographic location, and
socioeconomic status.
The first five of these aims are the result of activities which occur in the
healthcare delivery supply chain. Safety can be conceptualized and measured using the
surrogate of medial errors. Effectiveness is analogous to quality and can be measured by
mortality. Patient-centeredness can be measured by patient satisfaction. Timeliness can
be conceptualized by process time. Efficiency is appropriately measured by cost. Length
of stay (LOS) is also include as an important outcome capability of the healthcare
delivery supply chain owing to the notion that it is an important aggregate measure of
effectiveness and efficiency (McDermott and Stock, 2007). This leaves only one of the
IOM (2001) aims unaccounted for; healthcare should be equitable. While this is a worthy
pursuit it falls outside of the scope of the present study given that advancements in this
area reside at the policy level.
Therefore, the present study conceptualizes a construct for healthcare delivery
capability which is comprised of five dimensions measuring: 1) safety, 2) effectiveness,
3) patient centeredness, 4) timeliness, and 5) efficiency (IOM, 2001). Healthcare
delivery capability is thus defined as the extent to which those involved in patient care
are able to provide services to patients in a safe, effective, patient-centered, timely, and
efficient manner. A list of subconstructs and their respective definitions and literature
support are provided in Table 2.12.1.
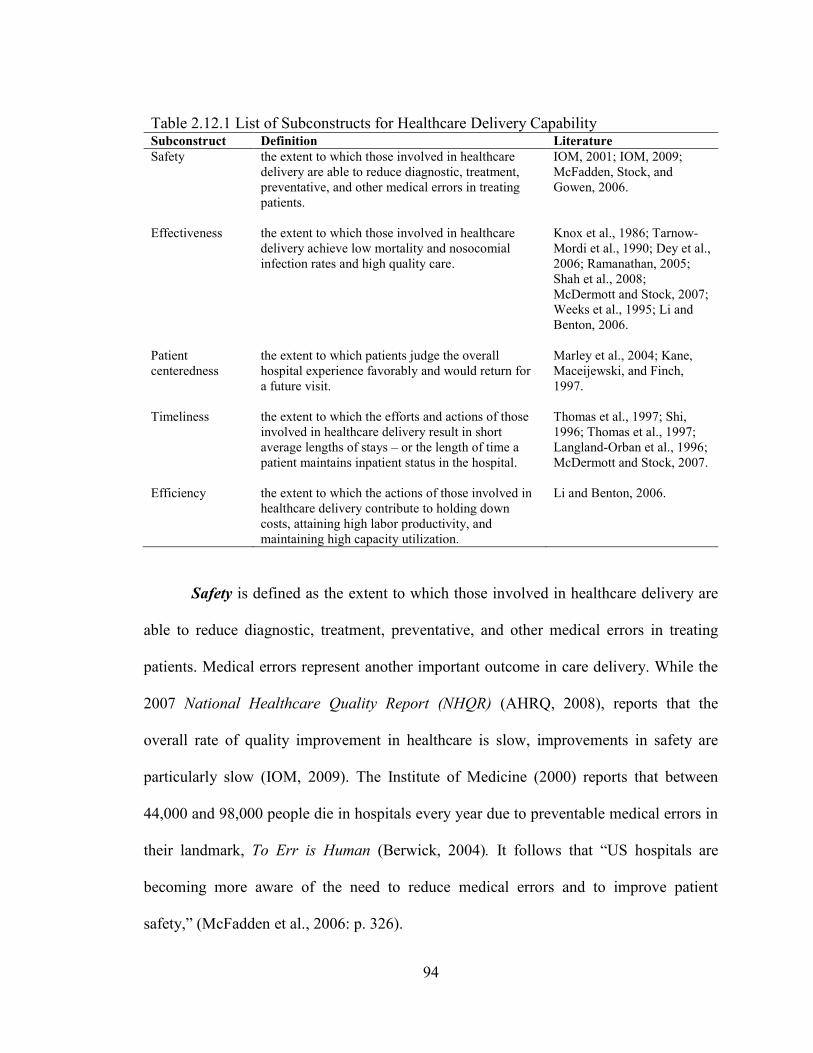
94
Table 2.12.1 List of Subconstructs for Healthcare Delivery Capability Subconstruct Definition Literature
Safety the extent to which those involved in healthcare
delivery are able to reduce diagnostic, treatment,
preventative, and other medical errors in treating
patients.
IOM, 2001; IOM, 2009;
McFadden, Stock, and
Gowen, 2006.
Effectiveness the extent to which those involved in healthcare
delivery achieve low mortality and nosocomial
infection rates and high quality care.
Knox et al., 1986; Tarnow-
Mordi et al., 1990; Dey et al.,
2006; Ramanathan, 2005;
Shah et al., 2008;
McDermott and Stock, 2007;
Weeks et al., 1995; Li and
Benton, 2006.
Patient
centeredness
the extent to which patients judge the overall
hospital experience favorably and would return for
a future visit.
Marley et al., 2004; Kane,
Maceijewski, and Finch,
1997.
Timeliness the extent to which the efforts and actions of those
involved in healthcare delivery result in short
average lengths of stays – or the length of time a
patient maintains inpatient status in the hospital.
Thomas et al., 1997; Shi,
1996; Thomas et al., 1997;
Langland-Orban et al., 1996;
McDermott and Stock, 2007.
Efficiency the extent to which the actions of those involved in
healthcare delivery contribute to holding down
costs, attaining high labor productivity, and
maintaining high capacity utilization.
Li and Benton, 2006.
Safety is defined as the extent to which those involved in healthcare delivery are
able to reduce diagnostic, treatment, preventative, and other medical errors in treating
patients. Medical errors represent another important outcome in care delivery. While the
2007 National Healthcare Quality Report (NHQR) (AHRQ, 2008), reports that the
overall rate of quality improvement in healthcare is slow, improvements in safety are
particularly slow (IOM, 2009). The Institute of Medicine (2000) reports that between
44,000 and 98,000 people die in hospitals every year due to preventable medical errors in
their landmark, To Err is Human (Berwick, 2004). It follows that ―US hospitals are
becoming more aware of the need to reduce medical errors and to improve patient
safety,‖ (McFadden et al., 2006: p. 326).
95
Medical errors are defined by the Institute of Medicine (2000) as the failure of a
planned action to be completed as intended or the use of a wrong plan to achieve an aim.
Errors are not only costly in terms of human life, but they also drive up the financial cost
of healthcare delivery in hospitals by between $17 billion and $29 billion per year in
USA, as well as drive down satisfaction for patients and healthcare professionals (IOM,
2000). Medical errors have been categorized in four groups (IOM, 2000).
Diagnostic
- Error or delay in diagnosis
- Failure to employ indicated tests
- Use of outmoded tests or therapy
- Failure to act on results of monitoring or testing
Treatment
- Error in the performance of an operation, procedure, or test
- Error in administering the treatment
- Error in the dose or method of using a drug
- Avoidable delay in treatment or in responding to an abnormal test
- Inappropriate (not indicated) care
Preventive
- Failure to provide prophylactic treatment
- Inadequate monitoring or follow-up of treatment
Other
- Failure of communication
- Equipment failure
- Other system failure
Such errors are not believed to result from individual recklessness or the decisions
and actions of a particular group of ―bad apples‖ (IOM, 2000). Instead, the Institute of
Medicine (2000) suggests that errors are caused by faulty systems and processes which
lead healthcare professionals to make mistakes or fail to prevent them.
Effectiveness is defined as the extent to which those involved in healthcare delivery
achieve low mortality and nosocomial infection rates and high quality care. Mortality
96
rates are an important measure of hospital performance (Knox et al., 1986; Tarnow-
Mordi et al., 1990; Ramanathan, 2005; Shah et al., 2008). As such, researchers have
placed a strong emphasis on mortality rates, or even better – risk adjusted mortality rates
– as a measure of hospital quality (Butler et al., 1996; see Dey et al., 2006; McDermott
and Stock, 2007).
However, Sherck and Shatney (1996) point out that morbidity (a measure of disease)
is an important measure of quality which may be tied to the delivery of care (Dey et al.,
2006). As such infection rates (particularly nosocomial or hospital acquired infections)
are meaningful measures of quality in healthcare (Weeks et al., 1995).
While quality can be measured using archival data, this study proposes a
psychometric measure for quality adopted from Li and Benton (2006) in their study of
nurse management and technology investment decisions in community hospitals. Li and
Benton (2006) employed four perceptual measurement items which included: 1) clinical
quality, 2) customer satisfaction, 3) responding to patient request, and 4) responding to
patient complaints.
Patient-centeredness is defined as the extent to which patients judge the overall
hospital experience favorably and would return for a future visit (Marley et al., 2004).
This satisfaction measurement should consider the technical, interpersonal, social, and
moral dimensions of care (Kane et al., 1997). In an Institute of Medicine (IOM) study
investigating highly effective clinical services, the IOM (2008) suggests that the
imperatives in healthcare delivery include constraining costs, improving quality, and
engaging patients as consumers of healthcare. With regard to patient engagement, many
politicians and policy makers believe that empowering patients as consumers is key to
97
achieving positive outcomes across many metrics, however, this requires that consumers
have access to information (i.e., about treatment effectiveness, risk, benefits, and
alternative treatments) which is sparse in many environments (IOM, 2008).
Timeliness is defined as the extent to which the efforts and actions of those involved
in healthcare delivery result in short average lengths of stays – or the length of time a
patient maintains inpatient status in the hospital (Thomas et al., 1997). The present study
is consistent with Shah et al. (2008: p. 767) in their study of a downstream healthcare
delivery supply chain in that ―while cycle time has been alternately defined as takt-time
(i.e., the desired time between units of production output, synchronized to customer
demand) and total throughput time (Schroeder, 2008, p. 128), we use the total throughput
time here because customer demand is uncertain in the population, making takt-time
difficult to compute and less applicable in this context.‖
A great deal of effort has been dedicated toward understanding and improving the
availability of resources for the provision of prompt healthcare delivery services. ―This
[LOS] is a synonymous to the critical feature of ‗speed; in the manufacturing strategy
literature,‖ (Butler et al., 1996: p. 147). LOS refers to the average length of time a patient
maintains inpatient status in the hospital (Thomas et al., 1997). As such, lower values for
LOS reflect better operational performance (Shi, 1996; Thomas et al., 1997; Langland-
Orban et al., 1996). LOS is a popular performance measure because it is thought to
encompass many traditional operations performance dimensions (Skinner, 1969; Hayes
and Wheelwright, 1984; McDermott and Stock, 2007). Scholarly research as revealed
that LOS is related to efficiency, cost, speed in service delivery, and quality (Ashby et al.,
2000; Glick et al., 2003; Thomas et al., 1997; Burns et al., 1994). Thus, it has been
98
adopted by many hospitals as a key performance metric and can be seen as a meaningful
overall performance measure (McDermott and Stock, 2007).
Efficiency is defined as the extent to which the actions of those involved in healthcare
delivery contribute to holding down costs, attaining high labor productivity, and
maintaining high capacity utilization. LOS and staffing costs are key measures of
efficiency which drive hospital administrators to seek optimal coordination of available
internal and external resources (Gnanlet and Gilland, 2009). Constraining costs is a key
outcome measure in care delivery owing to the notion that a significant portion of
healthcare costs are directly related to care delivery (IOM, 2008). In their study of nurse
management and technology investment decisions in community hospitals, Li and Benton
(2006) measured cost using perceptual measures which included three items: 1) holding
down in patient costs, 2) attaining high labor productivity, and 3) maintaining high
capacity utilization. These items are adopted by the present study.
2.12.1 Value Dense Environment and Healthcare Delivery Capability
According to Normann and Ramirez (1993: p. 69), ―companies [hospitals] create
value when they make not only their offerings more intelligent but their customers
[patients] and suppliers [physicians] more intelligent as well.‖ The creation and continual
recreation of a value dense environment enables a hospital to create capability or
competitive advantage (Normann and Ramirez, 1993). Consider mortality, a key
performance metric for hospitals. Hospital administrators strive to effectively juggle
internal resources and external resources, including the clinical staff, to create an
99
environment ―to reduce adverse outcomes such as high mortality rates,‖ (Gnanlet and
Gilland, 2009: p. 296).
Likewise with regard to safety, Das et al. (2008: p. 532) suggests that ―perhaps
high expertise workers have accumulated the knowledge needed to take precautionary
on-the-job measures‖ to improve safety. This supports a relationship between a value
dense environment and the development of healthcare delivery capability in that expertise
is both developed and shared through operant tacit knowledge exchange (Edmondson et
al., 2003). Such a capability is also developed in an environment with the right
combination of knowledge and resources. Integrative supply chain practices facilitate this
environment and are said to be key to achieving healthcare delivery capability in
―ensuring a constant supply of drugs and materials, establishing good inter- and intra-
departmental communication,‖ (Dey et al., 2006: p. 854). This constant supply of
resources contributes to a value dense environment and can enhance a hospital‘s
healthcare delivery capability.
A value dense environment enables providers to create patient centeredness and
enhance effectiveness while having access to the right resources and knowledge
necessary for patient care. This results in timely and efficient healthcare delivery.
Therefore, the present study postulates:
H8: Value Dense Environment is positively associated with Healthcare
Delivery Capability.
100
2.12.2 Supply Chain Performance and Healthcare Delivery Capability
Various studies have provided evidence that a well managed supply chain will
directly and positively influence organizational performance (Shin et al. 2000; Prasad and
Tata, 2000). More specifically, supply chain performance has been linked to a firm‘s
competitive advantage and capabilities by a number of Operations Management
researchers (Li, 2002). Consider Vonderembse and Tracey (1999) who found that
supplier performance is associated with firm capabilities related to cost, quality, and
delivery. Frohlich and Westbrook (2001) provide another relevant example in their
findings that supplier and customer integration is related to cost, time (speed), and
dependability among other firm capabilities.
In healthcare, a more integrated approach is anticipated to pay big dividends.
When considering the integration resulting from EMR, ―the U.S. Department of Health
and Human Services (Thompson and Brailer, 2004) estimates that EMR technology could
save the U.S. economy $140 billion a year (10% of current health care costs) while also
reducing the estimated 98,000 annual deaths attributed to medication errors,‖ (Ilie et al.,
2009: p. 214). Others believe that the better integration achieved through EMR use may
lead to more timely information, fewer medical errors, better patient care, and cost
reduction (Menachemi et al., 2007).
Shah et al (2008: p. 778) in a case study of a decentralized healthcare deliver
supply chain in the ER, suggest that characteristics of lean such as the use of
―standardized and highly specific protocol[s] and involving, empowering, and training all
[supply chain] process members‖ can influence healthcare delivery supply chain quality
101
outcomes such as process cycle times and patient mortality. These outcomes represent
healthcare delivery capability in terms of timeliness and effectiveness.
―Competitive advantage capability can be gained through partnership by
providing better service to customers with improved delivery systems and lead times,‖
(Ramayah et al., 2008: p. 38). In short, effective supply chain performance can benefit
safety, effectiveness, patient-centeredness, timeliness and the efficiency of healthcare
delivery.
Therefore, the present study postulates:
H9: Supply Chain Performance is positively associated with Healthcare
Delivery Capability.
102
CHAPTER 3: INSTRUMENT DEVELOPMENT
– ITEM GENERATION AND PILOT TEST
An essential tenet of scientific method is the provision of clearly defined
variables, methods, and procedures (Pedhazur and Schmelkin, 1991). It is with this in
mind that Chapters 3, 4, and 5 describe the research methods employed herein, including
instrument development, sample frame, data collection, and data analysis.
This research study employs survey method, and consequently requires the use of
psychometric measurement instruments to test the hypotheses posited herein. As such, it
is necessary to ensure the validity and reliability of these instruments. Therefore, an aim
of this study is to develop (or revalidate) valid and reliable instruments for the following
constructs: partner relationship (PR) integrative information and resource strategy (IIRS),
entrepreneurial culture (EC), integrative supply chain management practices (ISCM),
value dense environment (VDE), supply chain performance (SCP), and healthcare
delivery capability (HCDC). This is referred to as the instrument development process
and consists of four overarching stages in the case of this study (see Jin, 2008). The four
stages are: 1) item generation2, 2) pre-testing, 3) Q-sort pilot study testing, and 4) large-
scale data analysis and instrument validation. This chapter describes stages 1 through 3,
while stage 4, the large-scale data analysis, is described in chapter 4.
3.1 Item generation
The first step in developing valid scientific measures centers on specifying the
domain of the construct, which begins with a review of the literature (Churchill, 1979). It
is through a comprehensive literature review and academic and practitioner field
2 Item generation is a process which involves the development of a set of questions, whereby each question
corresponds to an item that measures a particular phenomenological dimension of the variable under study.
103
interviews (testing) that items can be generated which provide valid and reliable
measurement properties. Therefore, the comprehensive literature review provided in
Chapter 2 has been employed to develop clear construct definitions. As cited, these
definitions provide an understanding of the domain of each construct and have been built
upon the work of pervious authors. See Table 2.5.1 for the construct definitions and the
subsequent tables in sections 2.6 through 2.12 for subconstruct definitions.
This study closely adapts operational measures (items) for four constructs
developed in other studies: PR (from Li, 2002; Liao, 2008), EC (from Jambulingam et al.,
2005), ISCM (from Li et al., 2005; 2006), and SCP (Li, 2002) with minor modification.
A notable exception is ISCM, which owing to the context of the study, will require two
subconstructs not included in the Li et al., (2005; 2006) studies; lean principles and IS
enabled processes. Shah et al. (2008) and Rai et al. (2006), respectfully, serve as the
literature base for measurement development for these subconstructs.
This study develops new measurement scales for three constructs: IIRS (based on
the work of Vonderembse et al., 2006; Agarwal et al., 2006; Apigian et al., 2006;
Sabherwal and Chan, 2001), VDE (based on the work of Edmondson et al., 2003;
Normann and Ramirez, 1993; Prahalad and Ramaswamy, 2004a; Vargo and Akaka,
2009), and HCDC (based on IOM, 2001; McFadden et al., 2006; Knox et al., 1986;
Tarnow-Mordi et al., 1990; Weeks et al., 1995; Marley et al., 2004; Shah et al., 2008;
McDermott and Stock, 2007; Li and Benton, 2006).
Item generation follows the development of construct definitions. Understanding
that ―the literature should indicate how the variable has been defined previously and how
many dimensions or components it has,‖ (Churchill, 1979; p. 67), the extant studies
104
discussed in Chapter 2 serve as the foundation for item generation. Specifically, the
studies cited in the tables in sections 2.6 through 2.12 provide the literature base for
subconstruct item generation.
3.2 Pre-testing
In an attempt to further develop and refine the scales, interviews with two
academicians and two practitioners possessing sufficient domain knowledge were
conducted as part of an experience survey (Churchill, 1979). The participating academics
are considered experts in their fields of supply chain management and IT and are well
published in these areas. The participating practitioners each possess approximately 20
years of hospital-based and healthcare experience, primarily in the quality management
area.
The theoretical model was be presented during the interviews, following the
rigorous instrument development approach of Swink and Song (2007), in an Operations
Management study focused on supply chain integration practices. The subjects were then
solicited for their opinions regarding the construct definitions and the researcher
requested them to describe any relevant experiences. The subject‘s perceptions of the
relevance and completeness of the candidate scale items was also solicited. Each
respondent‘s feedback was analyzed for consistency with the researcher‘s expectation for
the meaning of each construct. As a result of this feedback, additional items were
generated and included through the instrument development and purification process
resulting from experience surveying (Churchill, 1979).
105
These interviews assisted in the improvement of the phraseology of the items as
well as to support the choice of scale values and response format. This exercise also
enhanced the content validity of the instrument. Upon final review of the survey items,
‗practitioner one‘ commented that ―I thought the survey was very easy to follow and to
understand.‖ Additionally, ‗practitioner two‘ opined, ―I like the scale (easy to use) the
questions are worded in a way that anyone with hospital knowledge should be able to
answer them and, specifically, any administrator or manager should be able to answer the
questions for their own organization. Two thumbs up.‖
3.3 Q-sort pilot testing
The steps described during the item generation and pre-testing phases produced a
set of questions intended to measure each construct. These questions were subjected to
additional testing using the Q-sort methodology (Moore and Benbasat, 1991). A
summary of the number of items entering the Q-sort is provided in table 3.3.1. The list of
original Q-sort items can be found in Appendix A.
Six healthcare professionals with significant hospital-based experience were
selected and participated as judges in the Q-sort process (Churchill, 1979). The study-
related domain knowledge of the judges was confirmed by the researcher and is
evidenced in their job titles which include: President of Physician Services and Clinical
Integration, Ambulatory Medical Information Officer, Service Line Vice President,
Clinical Director and Department Chair, Regional Manager of Physician Relations, and
Manager of Care Coordination/Black Belt. Three of the Q-sort judges were Physicians
(Medical Doctors – MDs) and all of the judges possessed prior clinical academic training.
106
Structured interviews were conducted in three rounds containing two judges each.
The structured interviews began with the researcher providing the research model and a
standard set of instructions to the judges. These instructions can be found in Appendix B.
Envelopes labeled with construct definitions were then provided to the judges along with
randomized index cards, each labeled with a specific candidate scale item. Each judge
was then asked to organize the cards in construct categories, creating a grouping of cards
for each construct. A category of ―not applicable‖ was also provided to the participating
judge. The researcher was available to answer procedurally oriented questions, therefore
the judges understanding was confirmed throughout the process to ensure outcome
accuracy.
Upon the completion of each Q-sort exercise, inconsistencies between the judge‘s
item placement and the researcher‘s expectations were identified and discussed. Judges
were asked to provide their reasoning for these placements as well as for feedback
capable of clarifying ambiguous items. A thorough analysis was the conducted following
each round to evaluate and decide the disposition of ambiguous items. Consequently,
items were revised, deleted, combined and disentangled when double-barreled in nature.
This process will ensure construct validity, and identify any items or combinations of
items which may be considered ambiguous or to possess ‗different shades of meaning‘ by
the respondent (Churchill, 1979).
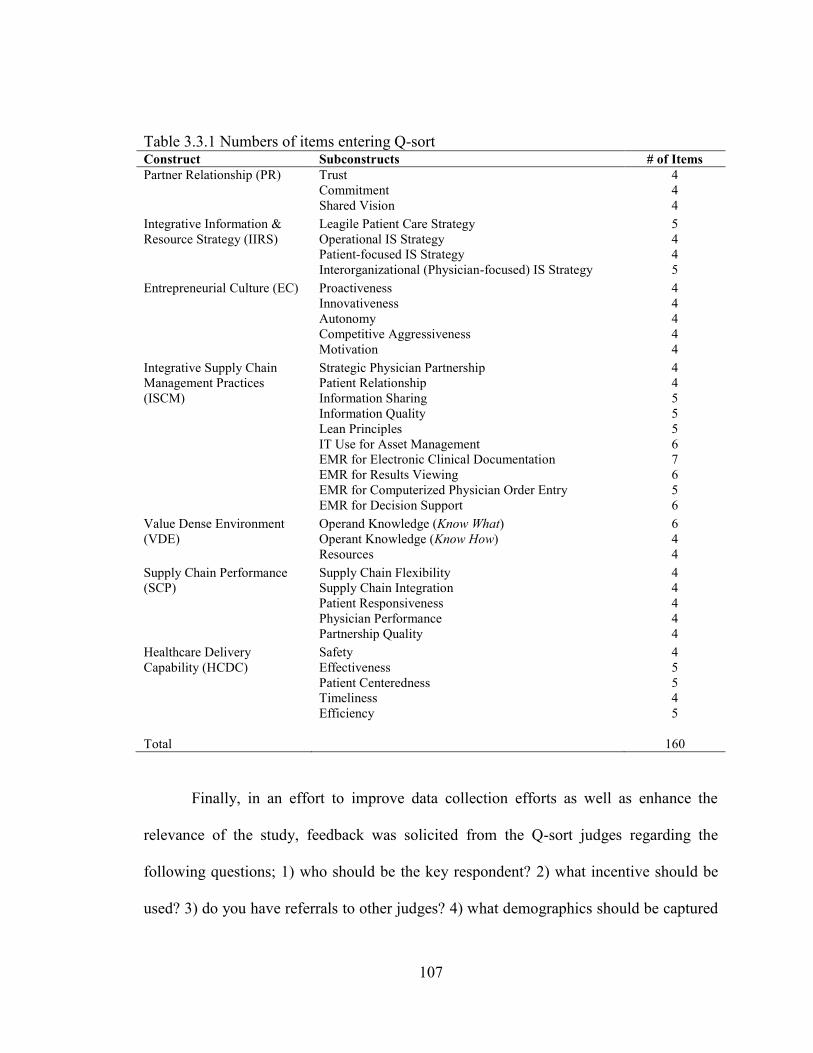
107
Table 3.3.1 Numbers of items entering Q-sort Construct Subconstructs # of Items
Partner Relationship (PR) Trust
Commitment
Shared Vision
4
4
4
Integrative Information &
Resource Strategy (IIRS)
Leagile Patient Care Strategy
Operational IS Strategy
Patient-focused IS Strategy
Interorganizational (Physician-focused) IS Strategy
5
4
4
5
Entrepreneurial Culture (EC) Proactiveness
Innovativeness
Autonomy
Competitive Aggressiveness
Motivation
4
4
4
4
4
Integrative Supply Chain
Management Practices
(ISCM)
Strategic Physician Partnership
Patient Relationship
Information Sharing
Information Quality
Lean Principles
IT Use for Asset Management
EMR for Electronic Clinical Documentation
EMR for Results Viewing
EMR for Computerized Physician Order Entry
EMR for Decision Support
4
4
5
5
5
6
7
6
5
6
Value Dense Environment
(VDE)
Operand Knowledge (Know What)
Operant Knowledge (Know How)
Resources
6
4
4
Supply Chain Performance
(SCP)
Supply Chain Flexibility
Supply Chain Integration
Patient Responsiveness
Physician Performance
Partnership Quality
4
4
4
4
4
Healthcare Delivery
Capability (HCDC)
Safety
Effectiveness
Patient Centeredness
Timeliness
Efficiency
4
5
5
4
5
Total 160
Finally, in an effort to improve data collection efforts as well as enhance the
relevance of the study, feedback was solicited from the Q-sort judges regarding the
following questions; 1) who should be the key respondent? 2) what incentive should be
used? 3) do you have referrals to other judges? 4) what demographics should be captured

108
in the survey? and 5) does physician employment status matter (as a coordination
mechanism)?
3.3.1 Assessment of Q-sort results
Convergent and discriminant validity is assessed using three methods of inter-
rater reliability; inter-judge raw agreement, placement ratio, and Cohen‘s Kappa (Moore
and Benbasat, 1991). The inter-rater raw agreement score is calculated by summing the
total number of items agreed upon by both judges placed into one category. This number
is then divided by the total number of items, which is 160 in the present study. The
placement ratio is a measure of the agreement of category classifications between the
judges and theories. Therefore, it is calculated by assessing the total numbers of items
that are correctly placed into the intended category by one judge as well as the second
judge and dividing that number by twice the total number of items, which is 320 in the
present study. The higher the percentage of correct placements, the higher the degree of
construct validity (in terms of convergence and divergence) and potential for reliability
can be expected. The minimum target percentage for correct placements is generally
80%.
Cohen‘s Kappa (Cohen, 1960) is the third and most robust indicator of inter-rater
agreement. Unlike the raw agreement and placement ratio tests, Cohen‘s Kappa informs
two key questions. ―First, how much better is the agreement between the observers‟
readings [placements] than would be expected by chance alone?‖ (Gordis, 2009: p. 104).
This is addressed by calculating the percentage agreement observed minus the percentage

109
% agreement observed – % agreement expected by chance alone
Κ =
100% – % agreement expected by chance alone
agreement expected by chance alone, and forms the numerator in the Kappa formula. See
figure 3.3.1.1.
Figure 3.3.1.1 The Kappa (Κ) calculation (Gordis, 2009)
Second, ―what is the most that the two observers could have improved their
agreement over the agreement that would have been expected by chance alone?”
(Gordis, 2009: p. 104). This second question is addressed in the denominator of the
Kappa formula; 100% (which represents full agreement) minus the percentage agreement
expected by chance alone. See figure 3.3.1.1.3 ―Thus, Kappa quantifies the extent to
which the observed agreement that the observers [judges] achieved exceeds that which
would be expected by chance alone, and expresses it as a proportion of the maximum
improvement that could occur beyond the agreement expected by chance alone,‖ (Gordis,
2009: 104). This is likely why Cohen‘s Kappa has been so widely accepted as a measure
of inter-rater agreement, having been cited more than 2,000 times in literature (Hsu and
Field, 1989).
Landis and Koch (1977) provide guidance regarding the interpretation of Cohen‘s
Kappa. The authors contend that Kappa values as low as 0.20 represent ‗fair agreement,‘
however values above 0.60 are far more desirable, with Kappa values greater than ―0.75
representing excellent agreement beyond chance‖ (Gordis, 2009: 105). See table 3.3.1.1.
3 Jin (2008) provides additional mathematical detail regarding the Kappa calculation.
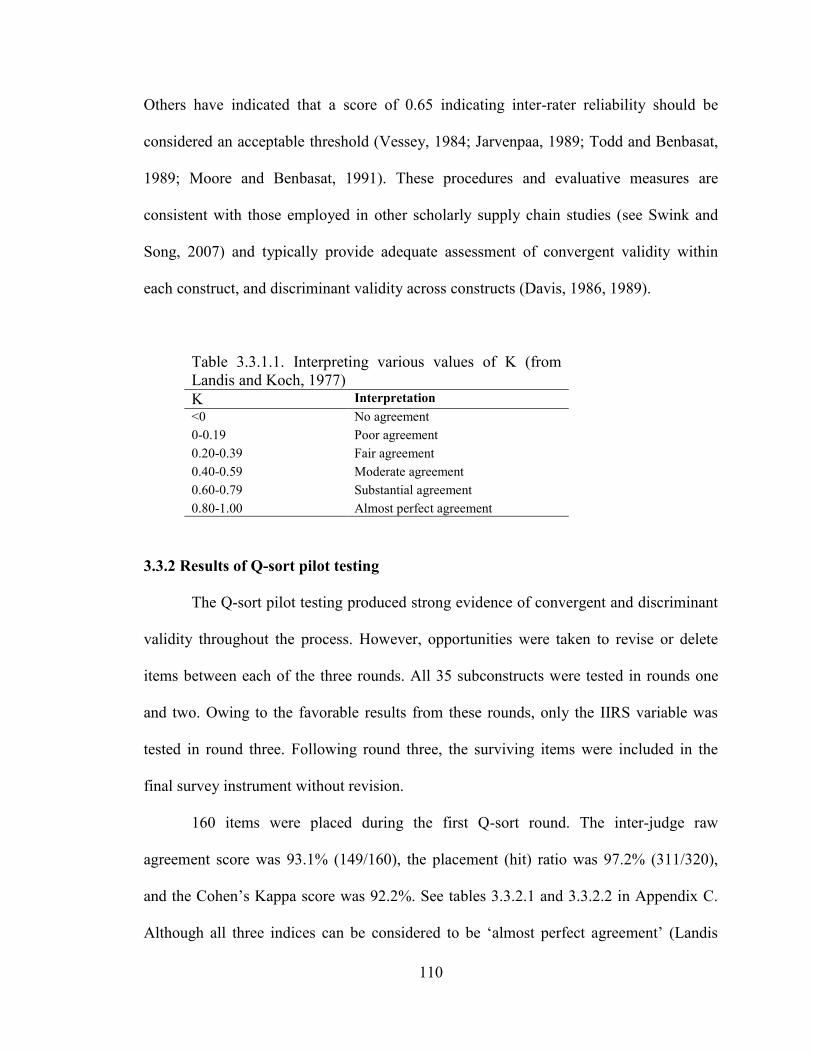
110
Others have indicated that a score of 0.65 indicating inter-rater reliability should be
considered an acceptable threshold (Vessey, 1984; Jarvenpaa, 1989; Todd and Benbasat,
1989; Moore and Benbasat, 1991). These procedures and evaluative measures are
consistent with those employed in other scholarly supply chain studies (see Swink and
Song, 2007) and typically provide adequate assessment of convergent validity within
each construct, and discriminant validity across constructs (Davis, 1986, 1989).
Table 3.3.1.1. Interpreting various values of Κ (from
Landis and Koch, 1977)
Κ Interpretation
<0 No agreement
0-0.19 Poor agreement
0.20-0.39 Fair agreement
0.40-0.59 Moderate agreement
0.60-0.79 Substantial agreement
0.80-1.00 Almost perfect agreement
3.3.2 Results of Q-sort pilot testing
The Q-sort pilot testing produced strong evidence of convergent and discriminant
validity throughout the process. However, opportunities were taken to revise or delete
items between each of the three rounds. All 35 subconstructs were tested in rounds one
and two. Owing to the favorable results from these rounds, only the IIRS variable was
tested in round three. Following round three, the surviving items were included in the
final survey instrument without revision.
160 items were placed during the first Q-sort round. The inter-judge raw
agreement score was 93.1% (149/160), the placement (hit) ratio was 97.2% (311/320),
and the Cohen‘s Kappa score was 92.2%. See tables 3.3.2.1 and 3.3.2.2 in Appendix C.
Although all three indices can be considered to be ‗almost perfect agreement‘ (Landis
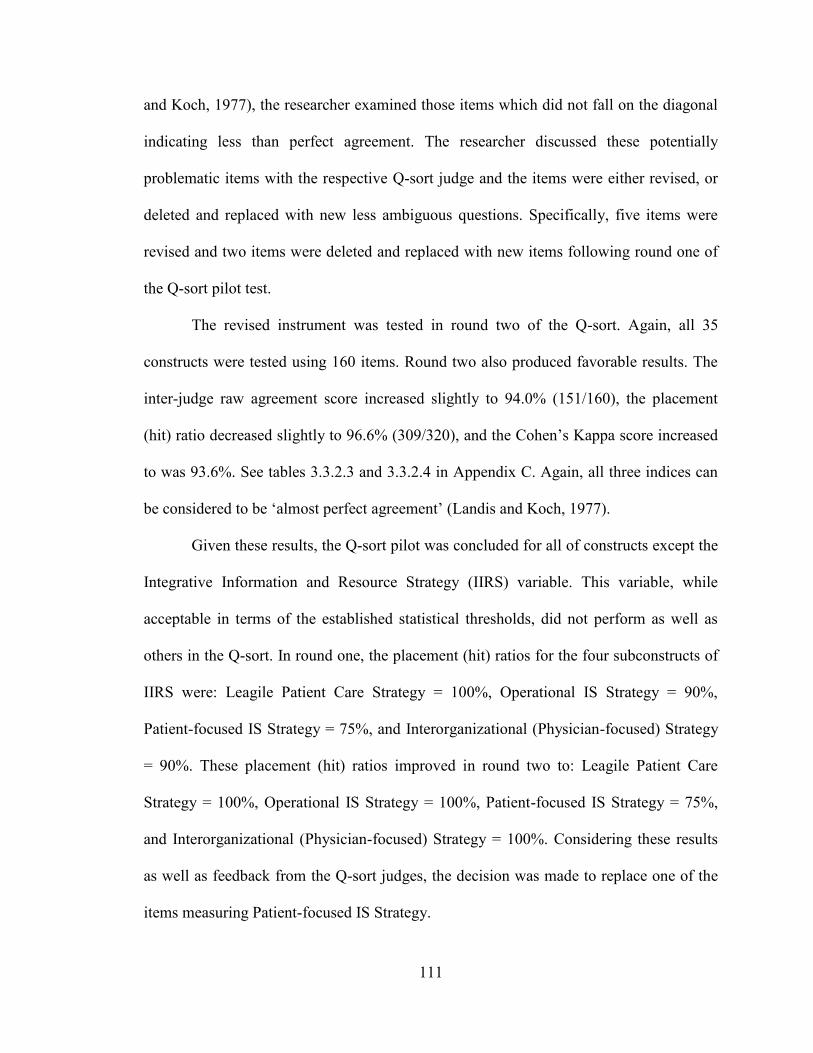
111
and Koch, 1977), the researcher examined those items which did not fall on the diagonal
indicating less than perfect agreement. The researcher discussed these potentially
problematic items with the respective Q-sort judge and the items were either revised, or
deleted and replaced with new less ambiguous questions. Specifically, five items were
revised and two items were deleted and replaced with new items following round one of
the Q-sort pilot test.
The revised instrument was tested in round two of the Q-sort. Again, all 35
constructs were tested using 160 items. Round two also produced favorable results. The
inter-judge raw agreement score increased slightly to 94.0% (151/160), the placement
(hit) ratio decreased slightly to 96.6% (309/320), and the Cohen‘s Kappa score increased
to was 93.6%. See tables 3.3.2.3 and 3.3.2.4 in Appendix C. Again, all three indices can
be considered to be ‗almost perfect agreement‘ (Landis and Koch, 1977).
Given these results, the Q-sort pilot was concluded for all of constructs except the
Integrative Information and Resource Strategy (IIRS) variable. This variable, while
acceptable in terms of the established statistical thresholds, did not perform as well as
others in the Q-sort. In round one, the placement (hit) ratios for the four subconstructs of
IIRS were: Leagile Patient Care Strategy = 100%, Operational IS Strategy = 90%,
Patient-focused IS Strategy = 75%, and Interorganizational (Physician-focused) Strategy
= 90%. These placement (hit) ratios improved in round two to: Leagile Patient Care
Strategy = 100%, Operational IS Strategy = 100%, Patient-focused IS Strategy = 75%,
and Interorganizational (Physician-focused) Strategy = 100%. Considering these results
as well as feedback from the Q-sort judges, the decision was made to replace one of the
items measuring Patient-focused IS Strategy.
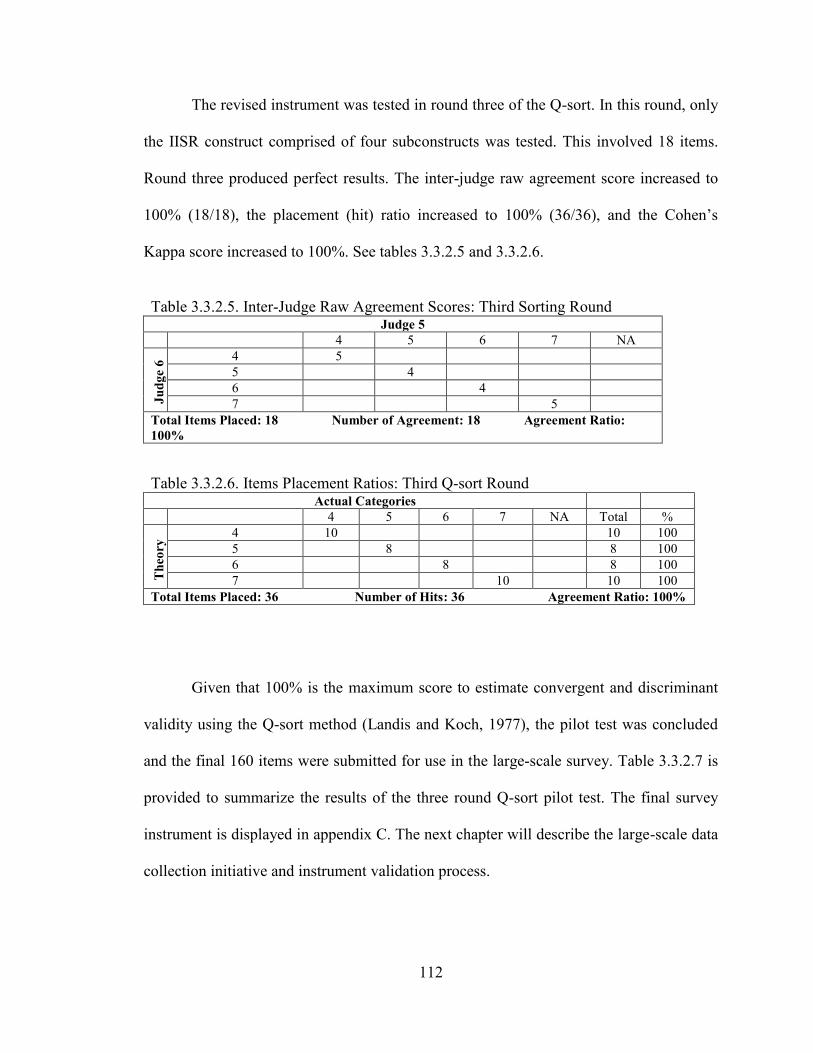
112
The revised instrument was tested in round three of the Q-sort. In this round, only
the IISR construct comprised of four subconstructs was tested. This involved 18 items.
Round three produced perfect results. The inter-judge raw agreement score increased to
100% (18/18), the placement (hit) ratio increased to 100% (36/36), and the Cohen‘s
Kappa score increased to 100%. See tables 3.3.2.5 and 3.3.2.6.
Table 3.3.2.5. Inter-Judge Raw Agreement Scores: Third Sorting Round Judge 5
4 5 6 7 NA
Ju
dg
e 6
4 5
5 4
6 4
7 5
Total Items Placed: 18 Number of Agreement: 18 Agreement Ratio:
100%
Table 3.3.2.6. Items Placement Ratios: Third Q-sort Round Actual Categories
4 5 6 7 NA Total %
Th
eory
4 10 10 100
5 8 8 100 6 8 8 100 7 10 10 100
Total Items Placed: 36 Number of Hits: 36 Agreement Ratio: 100%
Given that 100% is the maximum score to estimate convergent and discriminant
validity using the Q-sort method (Landis and Koch, 1977), the pilot test was concluded
and the final 160 items were submitted for use in the large-scale survey. Table 3.3.2.7 is
provided to summarize the results of the three round Q-sort pilot test. The final survey
instrument is displayed in appendix C. The next chapter will describe the large-scale data
collection initiative and instrument validation process.

113
Table 3.3.2.7. Summary of the three round Q-sort pilot test Agreement Indicators Round 1 Round 2 Round 3*
Raw agreement 93.1% 94.0% 100%
Placement (hit) ratio 97.3% 96.6% 100%
Cohen‘s Kappa 92.2% 93.6% 100%
* Round three tested only the IIRS construct (18 items total).
114
CHAPTER 4: LARGE-SCALE SURVEY – INSTRUMENT VALIDATION
Data were collected via a large-scale survey following item generation, pre-
testing, and the Q-sort pilot test. The purpose of the large-scale survey was to collect data
useful for the validation of the instruments developed, as described in chapter 3, as well
as to test the relationships hypothesized herein. Chapter 4 describes the research
methodology employed in the large-scale survey (section 4.1) and discusses the validity
and reliability testing of the measurement models of the variables under study (section
4.2).
4.1 Research Methodology
This section discusses the data collection method and procedures, the sample
frames used for data collection, and the characteristics of the survey respondents. This
will be followed by a discussion of the statistical testing performed to assess the validity
and reliability of the instruments.
4.1.1 Data collection – methods and procedures
A sample survey approach, using an online survey, was employed for data
collection. Survey is an attractive method of data collection as it has the potential to
afford the researcher a large amount of information that can be analyzed to test
relationships between two or more variables (Miller, 1991). It allows for ―both
quantitative and qualitative data [to be] analyzed with appropriate parametric and
nonparametric statistics,‖ (Miller, 1991: p. 22). Survey is also attractive owing to its
ability to generate a great deal of information from a large sample of the subjects under
115
study (Kerlinger, 1986). This presents the opportunity to validate a researcher‘s
psychometric measurement scales and also increase the generalizability of findings
beyond that of some case study or structured interview methods (Jin, 2008;
Dobrzykowski et al., 2010). However, survey method is not absent all weaknesses.
A challenge faced by the researcher when using survey method is low response
rate. Response rate can be critical to the generalizability of a research study‘s findings
(Malhotra and Grover, 1998). This is a serious and timely concern for researchers as
response rates in academic studies have been observed to have declined steadily in recent
decades (Baruch, 1999). These challenges have been exacerbated in the context of online
internet based surveys owing to personal reluctance to use the internet, limited web
access, and protected email addresses (Klassen and Jacobs, 2001).
Recognizing these challenges, actions were taken, following suggestions from
Erdos (1970) and Blankenship and Breen (1992), to enhance the response to this survey.
In terms of design, ―the questionnaire should have a simple, appealing appearance,‖
(Erdos, 1970: p. 128). Blankenship and Breen (1992) share this recommendation. The
survey instrument for this study was designed to be easy to read with a white background
and clear black letters that are highly visible. See appendix C. Next, Erdos (1970)
advocates for the use of incentives to drive survey participation. This opinion also
emerged from the Q-sort pilot testing phase. Thus, following the suggestions of the
expert practitioner judges, a $1,000 incentive was employed. The incentive came by
virtue of a random raffle drawing for survey respondents and earmarked $500 for the
winning individual respondent and $500 for a charity of the winning respondent‘s choice.
It was anticipated that the selected charity would be the Foundation of the respondent‘s
116
hospital. Finally, advanced personalized notice is thought to increase response rate
(Blankenship and Breen, 1992; see also Erdos, 1970). Therefore, when possible,
telephone calls were placed to potential respondents to pre-qualify them and enable the
personalization of an e-mail containing the respondent‘s name, as well as the reasons for
and importance of the study. The email message also contained a link to the online
questionnaire. The pre-qualification step (when possible) also mitigated another threat to
survey research – ―that the questionnaire may be answered by someone other than the
addressee,‖ (Erdos, 1970: p. 125).
This leads to another critical issue, that is, the identification and selection of an
appropriate respondent (Kerlinger, 1986). Given, the focus of this study on the
downstream healthcare delivery supply chain, described in detail in section 2.1, the unit
of analysis is acute care hospitals in the USA. To reiterate from section 2.1, this is a
worthy area of study owing to the fact that greater than 50% of healthcare spending in the
U.S. is directed toward hospital, physician, and other clinical services, (Kaiser, 2009).
Therefore, acute care facilities in the USA have been selected as the focus of the study.
Next, the researcher turned to the extant literature as an initial step in ensuring
that a respondent was selected who possessed adequate domain knowledge of the
phenomenon under study. Executives in the area of Quality have served as key
respondents in complimentary Operations Management research studies (see Meyer and
Collier, 2001; Goldstein and Naor, 2005; Gowen III et al., 2006; McFadden et al., 2009).
Additionally, nursing professionals have been another key respondent for Operational
investigations (see Tucker, 2004; McFadden et al., 2009). Next, knowledgeable
practitioners were solicited for input regarding the appropriate respondent during the Q-
117
sort pilot testing phase of instrument development. Two additional respondent types
gained consideration as a result of these solicitations; Patient Care Services Executives
and Case Management Executives. These areas are primarily involved in coordinating
patient care, a primary focus of this study. Documents obtained from large tertiary care
hospitals and health systems confirm that such individuals ―lead the day-to-day
operational activities of the Case Management staff… [and] … collaborate with medical
staff and patient care departments to achieve quality, cost effective care.‖ In a consistent
fashion, the Case Management Society of America defines Case Management as ―a
collaborative process of assessment, planning, facilitation and advocacy for options and
services to meet an individual's health needs through communication and available
resources to promote quality cost-effective outcomes,‖ (CMSA, 2010a). Thus, the final
sample frame included target respondents holding the titles of Vice President (VP) of
Patient Care Services, Chief Nursing Officer (CNO) or VP of Nursing, Director of
Nursing, VP of Case Management, Director of Case Management, VP of Quality
Initiatives, Director of Quality Initiatives or an equivalent substitute. Internet research
also confirmed that individuals at this level of the organization possess sufficient domain
knowledge to serve as a survey respondent.
Notwithstanding the rigor employed in the procedure just described, ―a sample
survey deals with only a fraction of the total population (universe),‖ (Miller, 1991: p. 22).
Therefore, research can benefit when ―more than one data collection method is used
within a single study‖ as this can enhance the generalizability and richness of findings
(Erdos, 1970: p. 163). Thus, this study collected data from three sample frames; The
118
American Hospital Association (AHA), the Case Management Society of America
(CMSA), and the University HealthSystem Consortium (UHC).
4.1.1.1 The American Hospital Association (AHA) sample
The AHA was founded in 1898 and today functions as the national organization
for all types of hospitals in the USA. ―Close to 5,000 hospitals, health care systems,
networks, other providers of care and 37,000 individual members come together to form
the AHA,‖ (AHA, 2010a). Their members include long-term care providers, acute care
hospitals, clinics, Veterans Administration hospitals, For-Profit and Not-For-Profit
hospitals, and various other healthcare providers. Owing to the widely held respect for
the organization and the comprehensive composition of their membership, the AHA has
served as the sample frame, or a portion thereof, for other scholarly studies in the
Operations literature (see Meyer and Collier, 2001; Li et al., 2002; Li and Benton, 2006).
The initial step in developing this sample frame began with the procurement of a
random list of hospitals from the AHA. This list contained general information such as
hospital name, location, and telephone number for a random list of acute care hospitals
located throughout the USA. Neither specific hospital employees, nor their contact
information were identified on this list. Next, following the data collection approach of
McFadden et al. (2009), multiple telephonic attempts were made to contact as many
hospitals as feasible under reasonable resource parameters. The purpose of these contact
attempts was to speak with the targeted respondents described earlier, explain the study,
and invite their participation. In some cases, attempts to contact multiple target
respondents within a hospital were made. During each telephone call, the solicitor was
119
able to explain to the target respondents that the focus of the study was linking
improvements in patient care outcomes with the integration of nursing and physician
work practices. ―By calling the personnel directly, we were able to explain the purpose of
the study, ensure that the surveys [web links] were emailed to the appropriate individuals
and that email addresses were accurate and current,‖ (McFadden et al., 2009: p. 396).
Flynn et al. (1990) suggest that is approach can be effective in increasing response rates
in Operations Management research. As such, other researchers have incorporated
telephonic contacts into their data collection procedures in the manufacturing context (see
Frohlich, 2002; Qi et al., 2009).
Outcomes from these efforts fell into four categories: 1) the target respondent was
unavailable and a message was left, 2) the target respondent was unavailable but an email
address for that person was obtained from an assistant, 3) the target respondent was
reached and agreed to participate in the study, or 4) the target respondent was reached
and declined participation in the study. In sum, 1,475 outbound telephone calls were
placed to 959 hospitals. From these hospitals, 260 executives agreed to participate in the
survey and provided their email address. An additional 180 email addresses were
obtained without participation commitments, while 81 executives from 75 hospitals
declined participation. This left 440 email invitations to be sent by the solicitation team
immediately following the telephone contact. From these, 134 survey responses were
received with no redundancy (i.e., two executives from the same hospital submitting
survey responses). This provides for a response rate of 30.5% (134/440). After screening,
one of the surveys was deleted from the database due to excessive missing values. This
calculation method is consistent with Qi et al. (2009). This response rate compares
120
favorably to other Operations study‘s in the hospital context. See table 4.1.1.1. This is
particularly evident when applying the method of McFadden et al. (2009), who used only
target respondents who agreed to participate in the study. This calculation procedure
produces a response rate of 51.5% (134/260) for the present study. In the end, the data
collected from the AHA sample represents 70.0% (133/190) of the data available for
analysis in the study.
4.1.1.2 The Case Management Society of America (CMSA) sample
A sample frame was sought from CMSA owing to the input of the Q-sort judges,
specifically their observations and secondary documentation regarding the important role
of case management personnel in coordinating patient care. The CMSA was founded in
1990 and now serves over 11,000 members and 70 chapters with networking
opportunities (CMSA, 2010b). CMSA membership is comprised of case managers from a
variety of healthcare organizations including acute care hospitals, long term care facilities
(nursing homes), insurance companies, health and wellness firms, and home healthcare
providers among others. These members look to the CMSA for leadership with regard to
educational forums, establishing standards, and legislative advocacy to advance the
profession (CMSA, 2010b). Essentially, the CMSA‘s organizational mission involves the
improvement of healthcare delivery. Given that this pursuit is shared by the present
study, the CMSA agreed to endorse this study.
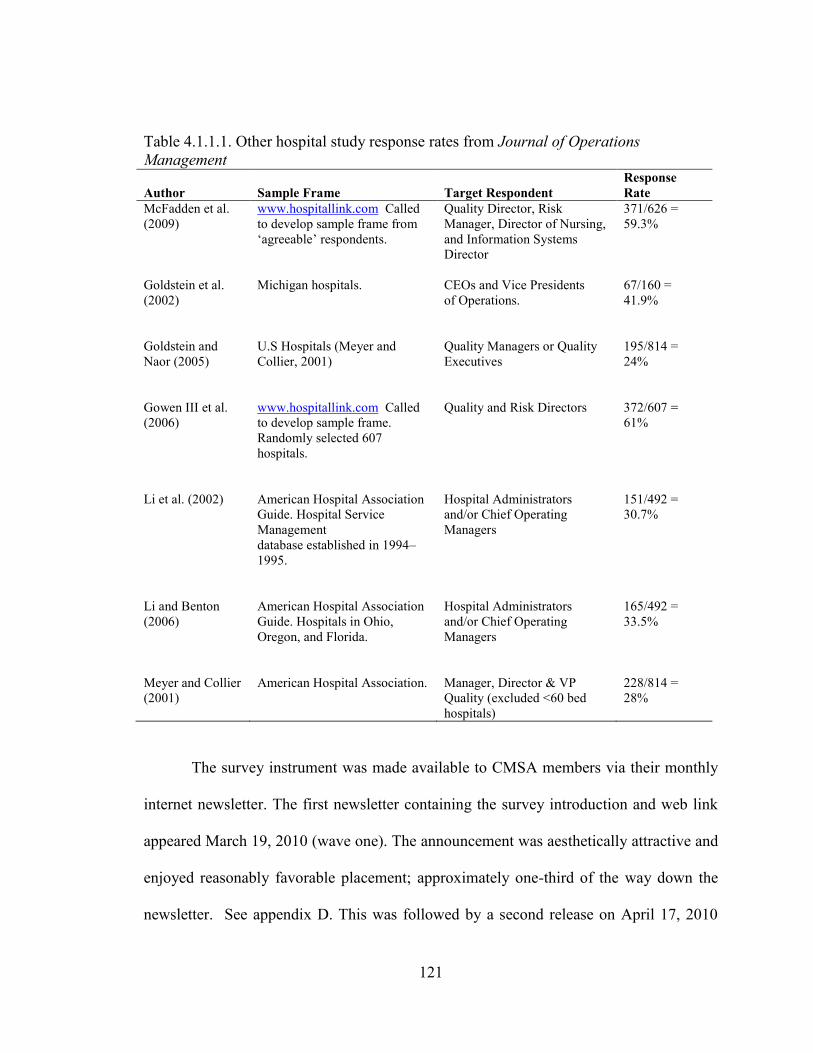
121
Table 4.1.1.1. Other hospital study response rates from Journal of Operations
Management
Author Sample Frame Target Respondent
Response
Rate
McFadden et al.
(2009)
www.hospitallink.com Called
to develop sample frame from
‗agreeable‘ respondents.
Quality Director, Risk
Manager, Director of Nursing,
and Information Systems
Director
371/626 =
59.3%
Goldstein et al.
(2002)
Michigan hospitals. CEOs and Vice Presidents
of Operations.
67/160 =
41.9%
Goldstein and
Naor (2005)
U.S Hospitals (Meyer and
Collier, 2001)
Quality Managers or Quality
Executives
195/814 =
24%
Gowen III et al.
(2006)
www.hospitallink.com Called
to develop sample frame.
Randomly selected 607
hospitals.
Quality and Risk Directors 372/607 =
61%
Li et al. (2002) American Hospital Association
Guide. Hospital Service
Management
database established in 1994–
1995.
Hospital Administrators
and/or Chief Operating
Managers
151/492 =
30.7%
Li and Benton
(2006)
American Hospital Association
Guide. Hospitals in Ohio,
Oregon, and Florida.
Hospital Administrators
and/or Chief Operating
Managers
165/492 =
33.5%
Meyer and Collier
(2001)
American Hospital Association. Manager, Director & VP
Quality (excluded <60 bed
hospitals)
228/814 =
28%
The survey instrument was made available to CMSA members via their monthly
internet newsletter. The first newsletter containing the survey introduction and web link
appeared March 19, 2010 (wave one). The announcement was aesthetically attractive and
enjoyed reasonably favorable placement; approximately one-third of the way down the
newsletter. See appendix D. This was followed by a second release on April 17, 2010
122
with a similar position (wave two). Wave one produced 15 responses and wave two
generated an additional 16 responses for a total of 31 completed surveys. All responses
were free of substantial missing values and were from unique hospitals with no
redundancy. Unfortunately, the response rate is impossible to calculate, as the CMSA
database cannot be filtered to determine the number of members who are employed in
managerial or executive level positions in acute care hospitals. In the end, the data
collected from the CMSA sample represents 16.3% (31/190) of the data available for
analysis in the study.
4.1.1.3 The University HealthSystem Consortium (UHC) sample
UHC is an alliance of approximately 100 academic medical centers and 200
affiliate hospitals located throughout the U.S. This represents greater than 90% of the
non-profit academic medical centers in the country. UHC was established in 1984 and its
purpose is to assist its members to measure and improve clinical, operational, and
financial performance.
Operations researchers have taken interest in investigating Academic Medical
Centers owing to the notion that these institutions tend to be early adopters of new
technologies and procedures and consequently produce high quality outcomes.
McDermott and Stock (2007) provide one example as they found that teaching hospitals
were associated with better ALOS performance than non-teaching hospitals. This finding
might be driven by the notion that staff and faculty at teaching hospitals, as researchers
and educators, are more familiar and comfortable with adopting newer practices and
techniques to improve operations (McDermott and Stock, 2007). In turn, this propensity
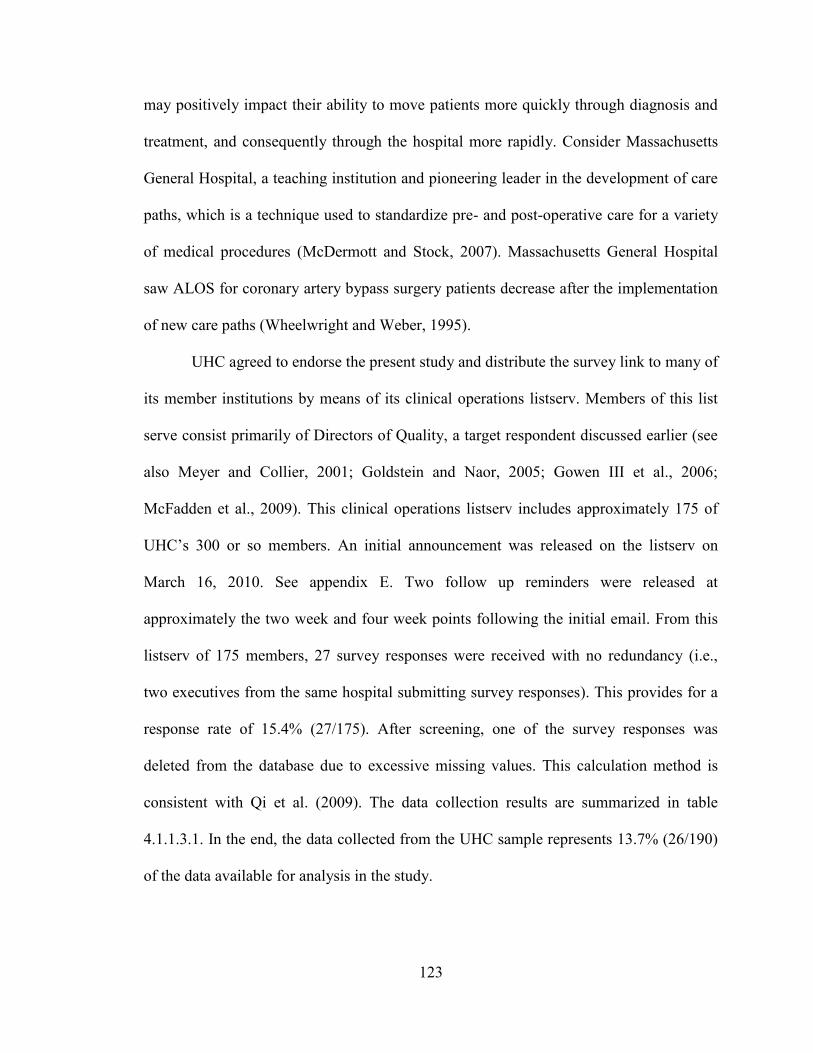
123
may positively impact their ability to move patients more quickly through diagnosis and
treatment, and consequently through the hospital more rapidly. Consider Massachusetts
General Hospital, a teaching institution and pioneering leader in the development of care
paths, which is a technique used to standardize pre- and post-operative care for a variety
of medical procedures (McDermott and Stock, 2007). Massachusetts General Hospital
saw ALOS for coronary artery bypass surgery patients decrease after the implementation
of new care paths (Wheelwright and Weber, 1995).
UHC agreed to endorse the present study and distribute the survey link to many of
its member institutions by means of its clinical operations listserv. Members of this list
serve consist primarily of Directors of Quality, a target respondent discussed earlier (see
also Meyer and Collier, 2001; Goldstein and Naor, 2005; Gowen III et al., 2006;
McFadden et al., 2009). This clinical operations listserv includes approximately 175 of
UHC‘s 300 or so members. An initial announcement was released on the listserv on
March 16, 2010. See appendix E. Two follow up reminders were released at
approximately the two week and four week points following the initial email. From this
listserv of 175 members, 27 survey responses were received with no redundancy (i.e.,
two executives from the same hospital submitting survey responses). This provides for a
response rate of 15.4% (27/175). After screening, one of the survey responses was
deleted from the database due to excessive missing values. This calculation method is
consistent with Qi et al. (2009). The data collection results are summarized in table
4.1.1.3.1. In the end, the data collected from the UHC sample represents 13.7% (26/190)
of the data available for analysis in the study.
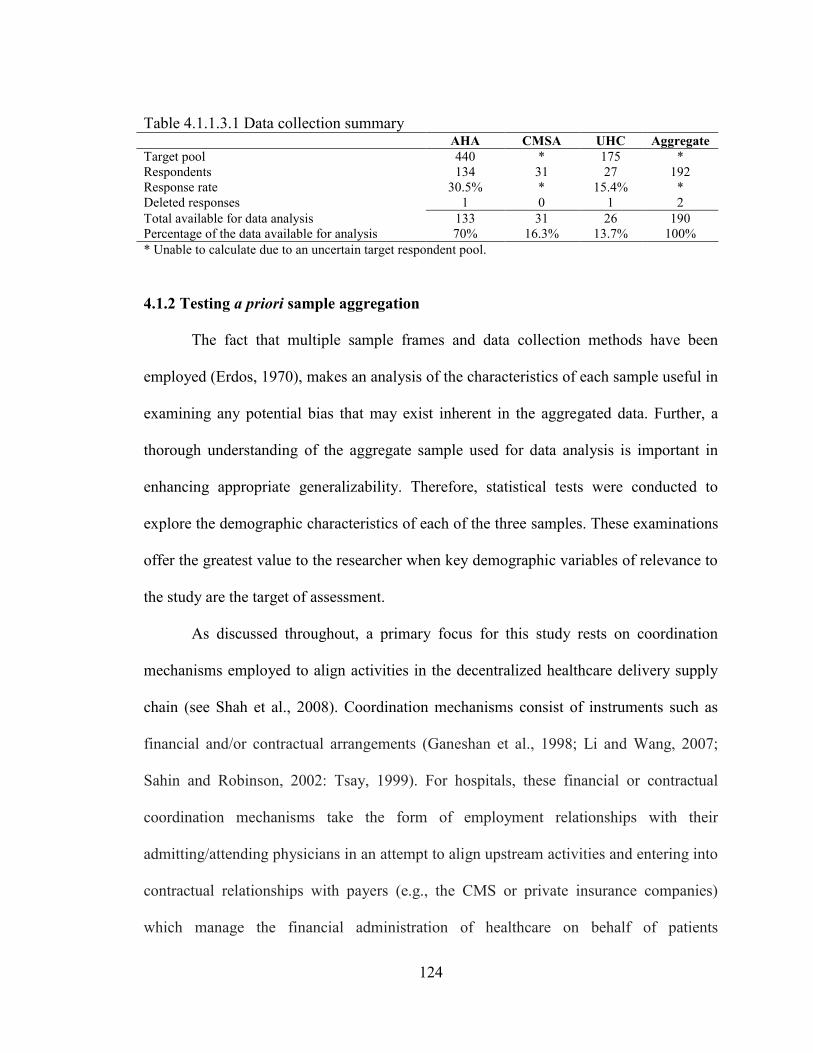
124
Table 4.1.1.3.1 Data collection summary AHA CMSA UHC Aggregate
Target pool 440 * 175 *
Respondents 134 31 27 192
Response rate 30.5% * 15.4% *
Deleted responses 1 0 1 2
Total available for data analysis 133 31 26 190
Percentage of the data available for analysis 70% 16.3% 13.7% 100%
* Unable to calculate due to an uncertain target respondent pool.
4.1.2 Testing a priori sample aggregation
The fact that multiple sample frames and data collection methods have been
employed (Erdos, 1970), makes an analysis of the characteristics of each sample useful in
examining any potential bias that may exist inherent in the aggregated data. Further, a
thorough understanding of the aggregate sample used for data analysis is important in
enhancing appropriate generalizability. Therefore, statistical tests were conducted to
explore the demographic characteristics of each of the three samples. These examinations
offer the greatest value to the researcher when key demographic variables of relevance to
the study are the target of assessment.
As discussed throughout, a primary focus for this study rests on coordination
mechanisms employed to align activities in the decentralized healthcare delivery supply
chain (see Shah et al., 2008). Coordination mechanisms consist of instruments such as
financial and/or contractual arrangements (Ganeshan et al., 1998; Li and Wang, 2007;
Sahin and Robinson, 2002: Tsay, 1999). For hospitals, these financial or contractual
coordination mechanisms take the form of employment relationships with their
admitting/attending physicians in an attempt to align upstream activities and entering into
contractual relationships with payers (e.g., the CMS or private insurance companies)
which manage the financial administration of healthcare on behalf of patients
125
downstream. These payers have unique guidelines or standards for the care their
members receive and as such influence the delivery of healthcare within a hospital. This
makes the assessment of a hospital‘s payer mix relevant to understanding the procedural
activities associated with a particular patient. Another coordination (mechanism) trend
for hospitals in recent years has been to merge together, creating an affiliated health
system. This ‗system affiliation‘ approach has been posited to increase integration of the
healthcare delivery supply chain and serve to coordinate healthcare delivery, thereby
improving outcomes (Evans, 2008). These three coordination mechanisms – physician
employment, insurance payer mix, and system affiliation – were also identified as key
issues during the Q-sort pilot test.
These three demographic variables have therefore been selected to examine
upstream coordination mechanisms (the ‗percentage of employed physicians‘), focal firm
coordination mechanisms (affiliation with a health system), and downstream coordination
mechanisms (patient ‗payer mix‘). These demographic variables have been examined for
statistical differences among the three samples using two statistical tests; Analysis of
Variance (ANOVA) and the chi-square test.
ANOVA is a ―statistical technique used to determine whether samples from two
or more groups come from populations with equal means (i.e., Do the group means differ
significantly?)‖ Hair et al., (2006: p. 384). This test enables the researcher to identify
statistical differences within as well as between groups. ANOVA is often used in the
Operations Management literature to investigate differences among respondent groups
(see Qi et al., 2009; Naor et al., 2010). ANOVA is useful for interval (continuous) data
and is therefore an appropriate choice to analyze the ‗percentage of employed physicians‘
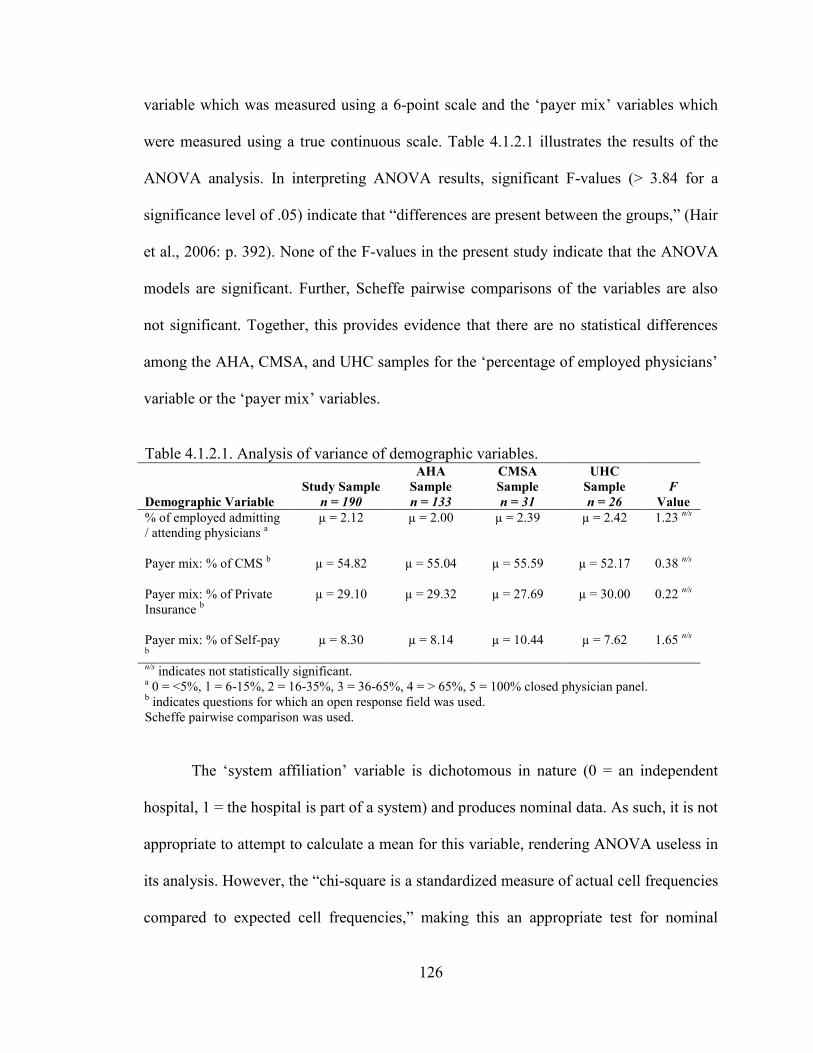
126
variable which was measured using a 6-point scale and the ‗payer mix‘ variables which
were measured using a true continuous scale. Table 4.1.2.1 illustrates the results of the
ANOVA analysis. In interpreting ANOVA results, significant F-values (> 3.84 for a
significance level of .05) indicate that ―differences are present between the groups,‖ (Hair
et al., 2006: p. 392). None of the F-values in the present study indicate that the ANOVA
models are significant. Further, Scheffe pairwise comparisons of the variables are also
not significant. Together, this provides evidence that there are no statistical differences
among the AHA, CMSA, and UHC samples for the ‗percentage of employed physicians‘
variable or the ‗payer mix‘ variables.
Table 4.1.2.1. Analysis of variance of demographic variables.
Demographic Variable
Study Sample
n = 190
AHA
Sample
n = 133
CMSA
Sample
n = 31
UHC
Sample
n = 26
F
Value
% of employed admitting
/ attending physicians a
µ = 2.12 µ = 2.00 µ = 2.39 µ = 2.42 1.23 n/s
Payer mix: % of CMS b µ = 54.82 µ = 55.04 µ = 55.59 µ = 52.17 0.38
n/s
Payer mix: % of Private
Insurance b
µ = 29.10 µ = 29.32 µ = 27.69 µ = 30.00 0.22 n/s
Payer mix: % of Self-pay b
µ = 8.30 µ = 8.14 µ = 10.44 µ = 7.62 1.65 n/s
n/s indicates not statistically significant.
a 0 = <5%, 1 = 6-15%, 2 = 16-35%, 3 = 36-65%, 4 = > 65%, 5 = 100% closed physician panel.
b indicates questions for which an open response field was used.
Scheffe pairwise comparison was used.
The ‗system affiliation‘ variable is dichotomous in nature (0 = an independent
hospital, 1 = the hospital is part of a system) and produces nominal data. As such, it is not
appropriate to attempt to calculate a mean for this variable, rendering ANOVA useless in
its analysis. However, the ―chi-square is a standardized measure of actual cell frequencies
compared to expected cell frequencies,‖ making this an appropriate test for nominal
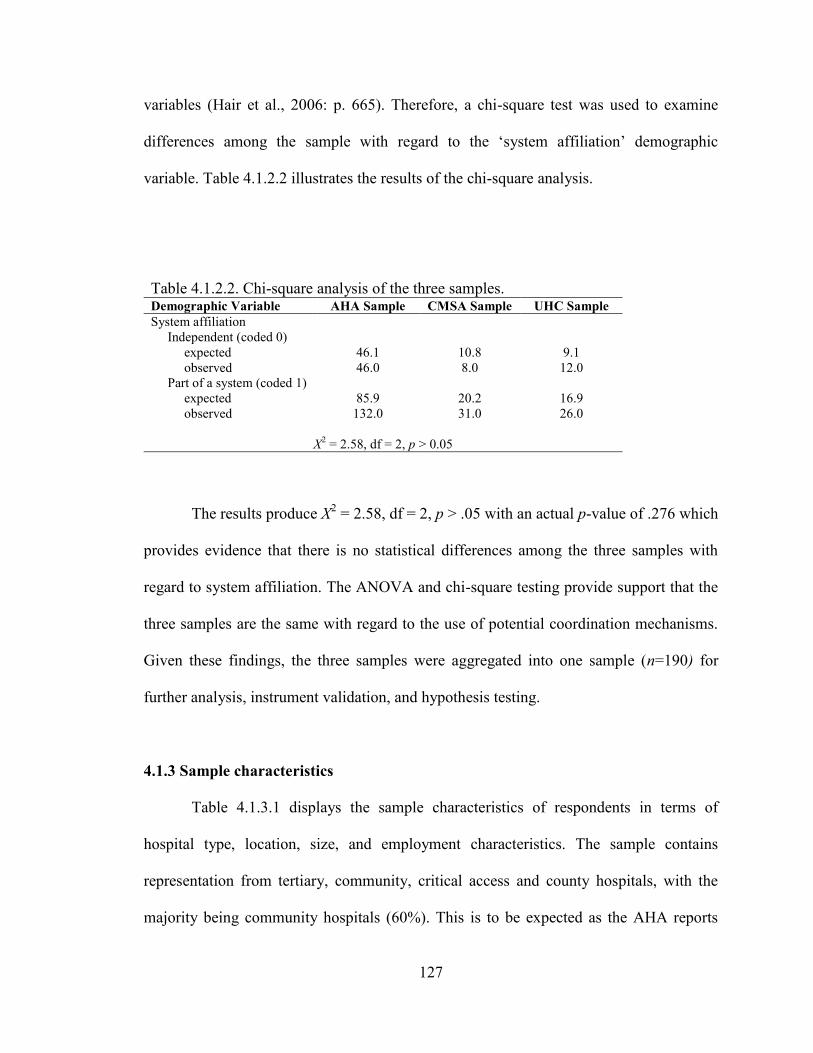
127
variables (Hair et al., 2006: p. 665). Therefore, a chi-square test was used to examine
differences among the sample with regard to the ‗system affiliation‘ demographic
variable. Table 4.1.2.2 illustrates the results of the chi-square analysis.
Table 4.1.2.2. Chi-square analysis of the three samples. Demographic Variable AHA Sample CMSA Sample UHC Sample
System affiliation
Independent (coded 0)
expected
observed
46.1
46.0
10.8
8.0
9.1
12.0
Part of a system (coded 1)
expected
observed
85.9
132.0
20.2
31.0
16.9
26.0
X2 = 2.58, df = 2, p > 0.05
The results produce X2 = 2.58, df = 2, p > .05 with an actual p-value of .276 which
provides evidence that there is no statistical differences among the three samples with
regard to system affiliation. The ANOVA and chi-square testing provide support that the
three samples are the same with regard to the use of potential coordination mechanisms.
Given these findings, the three samples were aggregated into one sample (n=190) for
further analysis, instrument validation, and hypothesis testing.
4.1.3 Sample characteristics
Table 4.1.3.1 displays the sample characteristics of respondents in terms of
hospital type, location, size, and employment characteristics. The sample contains
representation from tertiary, community, critical access and county hospitals, with the
majority being community hospitals (60%). This is to be expected as the AHA reports
128
that 86% of hospitals in the USA fall into this category (5,010/5,815) (AHA, 2010b).
―Community hospitals are defined as all nonfederal, short-term general, and other special
hospitals,‖ (AHA, 2010b). The majority of respondents are located in urban settings
(62%). This is also to be expected as according to the 2007 AHA annual survey, 62.4%
of hospitals in the USA are located in of urban settings. The representation of For-profit
hospitals in this study (15%) is also in line with the AHA which estimates that these
facilities make up about 20% (982/5,010) of the hospitals in the USA (AHA, 2010b).
Hospital size was measured by the number of beds (Meyer and Collier, 2001; Jha et al.,
2009) and number of employees. Approximately 30% of respondents in this study
represent hospitals with between 0-99 beds, while 43% are from hospitals with 100-399
beds, and the remaining 25% represent large hospitals with more than 400 beds. This is
consistent with the data collection attempt of 4,814 hospitals by Jha et al., (2009) which
was comprised of 43% 100-399 beds hospitals. The distribution of hospital employment
is fairly balanced once considering hospitals with more than 250 employees. Finally,
organization of labor was measured by union status of each hospital‘s clinical employees.
In this sample, 78% of hospitals have not unionized clinical employees.
Table 4.1.3.2 displays the sample characteristics of respondents in terms of
activity, teaching status, and acuity. Activity was measured using the annual number of
adjusted discharges as an expert judge in the Q-sort pilot opined that this has become a
more popular measure of hospital activity than admissions statistics. This sample
provides a balanced representation of hospitals with no adjusted discharges category
representing less than 12% or more than 20% of the sample. Activity was also measured
by annual revenue. Here the revenue categories were adopted from the Internal Revenue
129
Service‘s Exempt Organizations Hospital Compliance Project Final Report. The sample
is reasonably balance among the various annual revenue categories with 43% of
respondents generating less than US$100M and 41% generating more than US$100M. It
should be noted that 17% of hospitals did not respond to this question, most likely owing
to the clinical focus of the respondent‘s position. The sample is fairly balanced in terms
of teaching status with 27% of respondents representing major teaching hospitals, 31%
representing minor teaching hospitals, and the balance of 42% responding from
nonteaching hospitals. While balanced among the categories, this sample may not be
representative of the USA hospital population. Jha et al. (2009) in a much larger study
attempting to collect data from 4,814 hospitals found that only 4%-7% of hospitals can be
classified as major teaching hospitals, while 16% are minor teaching hospitals, and 77%-
80% are nonteaching hospitals. This is discussed further in the Limitations section in
Chapter Six. Finally, when attempting to measure hospital care delivery outcomes as is
the case in the present study, it is important to measure the level of acuity (severity of
illness) of a hospital‘s patients. This belief is common in the medical literature and was
shared by some of the Q-sort judges. As such, the acuity of a hospital‘s patients was
measured using Case Mix Index (CMI). According to the Center for Medicare and
Medicaid Services (CMS), CMI ―represents the average diagnosis-related group (DRG)
relative weight for that hospital. It is calculated by summing the DRG weights for all
Medicare discharges and dividing by the number of discharges,‖ (CMS, 2010). In this
sample, CMI was reasonably balanced among the respondents.
Table 4.1.3.3 displays the sample characteristics of respondents in terms of
coordination mechanisms consisting of system affiliation, physician employment, and
130
payer mix. These were discussed in detail in section 4.1.2 earlier. This sample contains
65% representation from hospitals which are part of a system, while 35% are
independent. This is slightly higher, yet consistent with the AHA statistics which suggest
that approximately 57% (2,868/5,010) of community hospitals are part of a system
(AHA, 2010b). The percentage of employed admitting/attending physicians is reasonably
balanced across the sample with the possible exception of 100% closed systems which
represent 7% of the sample. This is likely to be indicative of the population however, as
closed systems (e.g., Kaiser Permanente) remain relatively unique (Shapiro, 2003).
Finally, the means were provided for four general payers thought to be common to most
hospitals: 1) CMS, 2) private insurance companies, 3) self-pay patients, and 4)
uncompensated care.
Table 4.1.3.3 displays the sample characteristics of the individual respondents in
terms of his or her job title. To reiterate, the four targeted respondents were VP or
Director of Case Management, Chief Nursing Officer (or VP or Director), VP or Director
of Patient Care Services, and VP or Director of Quality Initiatives. These positions
comprise the top five places in terms of frequency of respondent type. Together these
targeted positions account for 55% of the respondents. There is also a relatively large
group of respondents (26%) that marked ‗other‘ for job title on the survey. An open field
was provided for respondents to clarify this selection. The following titles were among
those provided in the open field; Chief Quality Officer, Corporate Compliance Officer,
Patient Safety Officer, Information Officer, Administrative Officer, VP of Clinical and
Business Integration, VP of Professional Services, Associate VP of Nursing, Associate
VP of Quality Improvement, Director of Medical Staff Affairs, Director of
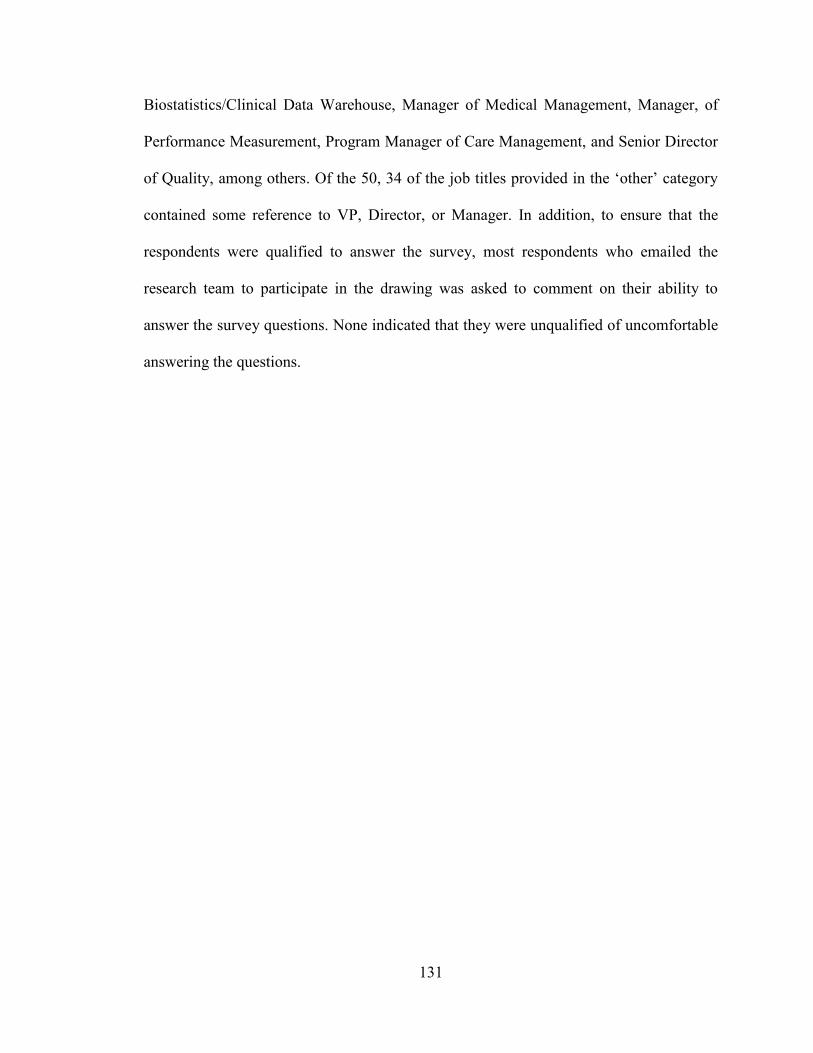
131
Biostatistics/Clinical Data Warehouse, Manager of Medical Management, Manager, of
Performance Measurement, Program Manager of Care Management, and Senior Director
of Quality, among others. Of the 50, 34 of the job titles provided in the ‗other‘ category
contained some reference to VP, Director, or Manager. In addition, to ensure that the
respondents were qualified to answer the survey, most respondents who emailed the
research team to participate in the drawing was asked to comment on their ability to
answer the survey questions. None indicated that they were unqualified of uncomfortable
answering the questions.
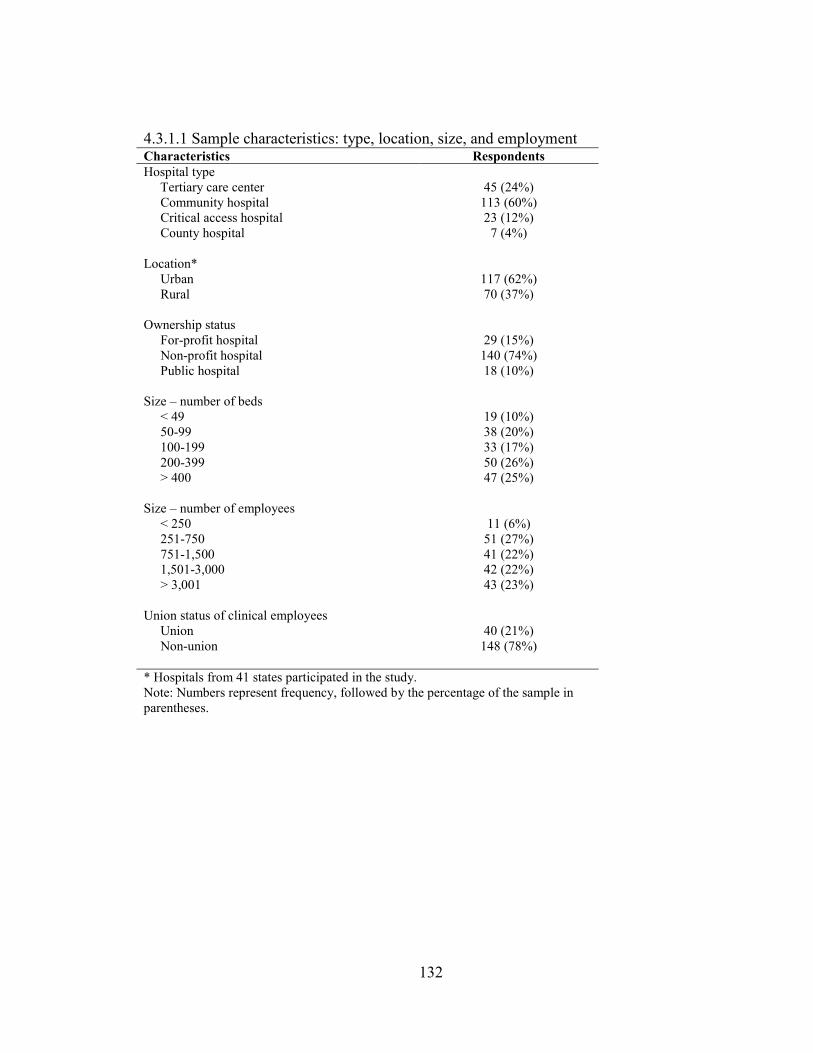
132
4.3.1.1 Sample characteristics: type, location, size, and employment Characteristics Respondents
Hospital type
Tertiary care center 45 (24%)
Community hospital 113 (60%)
Critical access hospital 23 (12%)
County hospital 7 (4%)
Location*
Urban 117 (62%)
Rural 70 (37%)
Ownership status
For-profit hospital 29 (15%)
Non-profit hospital 140 (74%)
Public hospital 18 (10%)
Size – number of beds
< 49 19 (10%)
50-99 38 (20%)
100-199 33 (17%)
200-399 50 (26%)
> 400 47 (25%)
Size – number of employees
< 250 11 (6%)
251-750 51 (27%)
751-1,500 41 (22%)
1,501-3,000 42 (22%)
> 3,001 43 (23%)
Union status of clinical employees
Union 40 (21%)
Non-union 148 (78%)
* Hospitals from 41 states participated in the study.
Note: Numbers represent frequency, followed by the percentage of the sample in
parentheses.
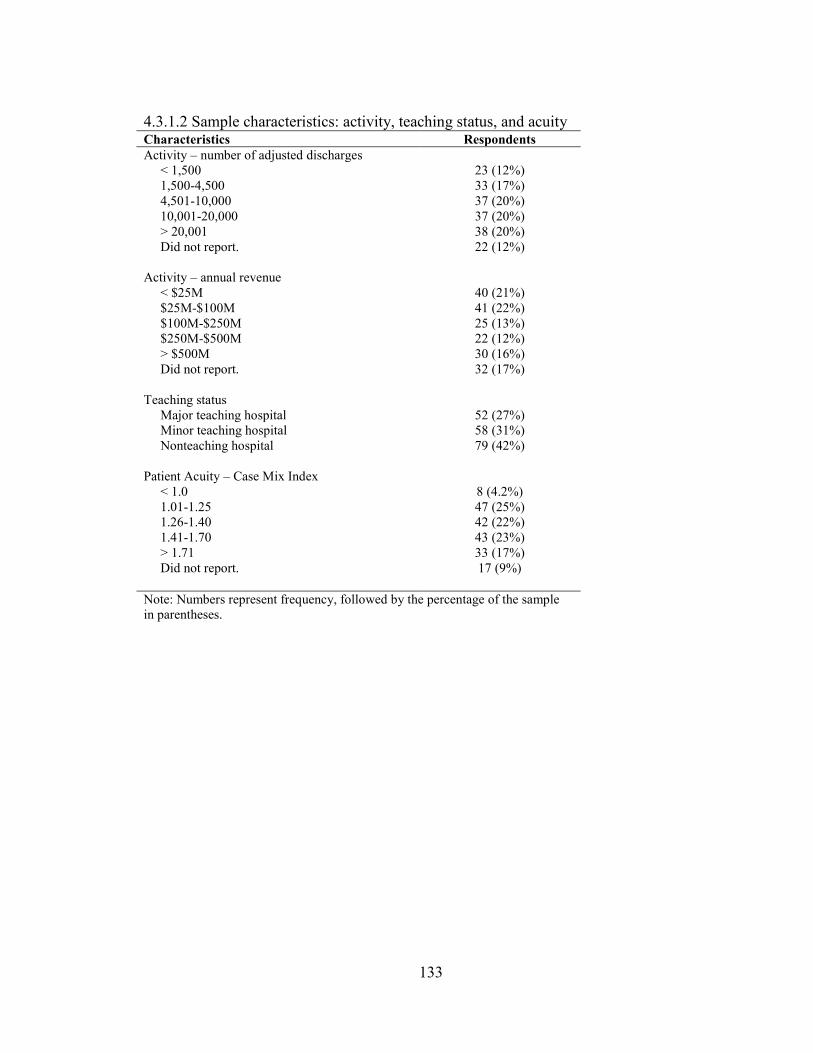
133
4.3.1.2 Sample characteristics: activity, teaching status, and acuity
Characteristics Respondents
Activity – number of adjusted discharges
< 1,500 23 (12%)
1,500-4,500 33 (17%)
4,501-10,000 37 (20%)
10,001-20,000 37 (20%)
> 20,001 38 (20%)
Did not report. 22 (12%)
Activity – annual revenue
< $25M 40 (21%)
$25M-$100M 41 (22%)
$100M-$250M 25 (13%)
$250M-$500M 22 (12%)
> $500M 30 (16%)
Did not report. 32 (17%)
Teaching status
Major teaching hospital 52 (27%)
Minor teaching hospital 58 (31%)
Nonteaching hospital 79 (42%)
Patient Acuity – Case Mix Index
< 1.0 8 (4.2%)
1.01-1.25 47 (25%)
1.26-1.40 42 (22%)
1.41-1.70 43 (23%)
> 1.71 33 (17%)
Did not report. 17 (9%)
Note: Numbers represent frequency, followed by the percentage of the sample
in parentheses.
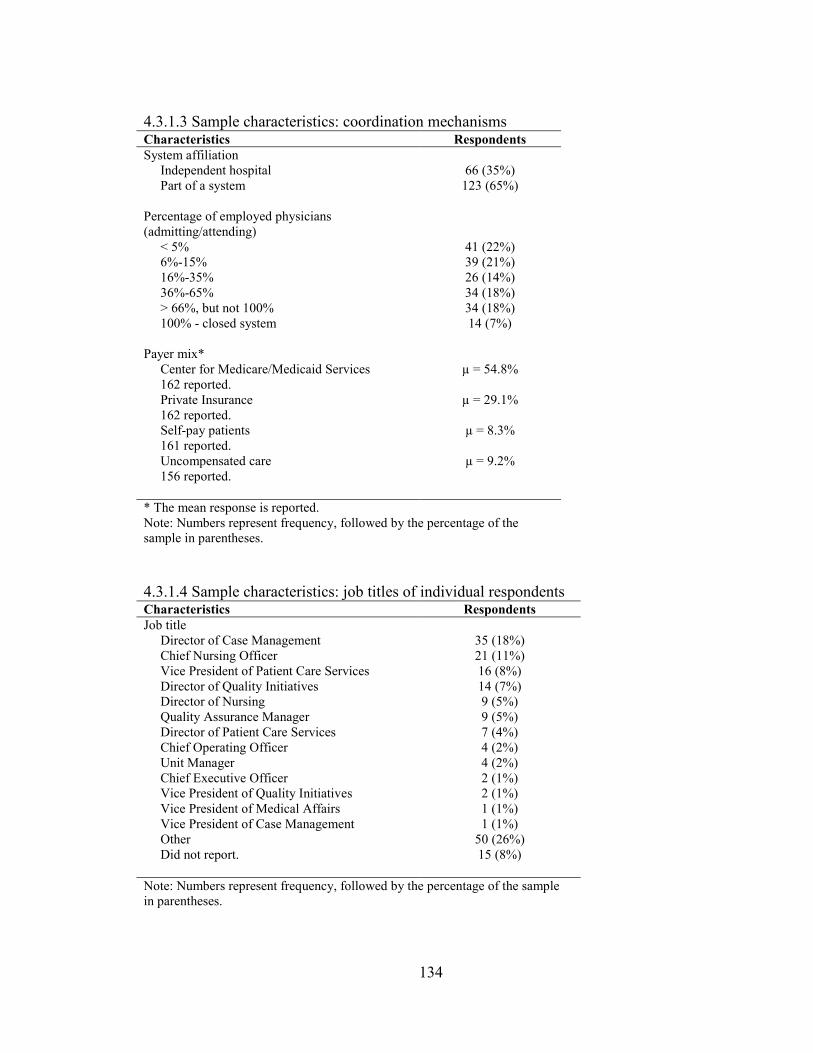
134
4.3.1.3 Sample characteristics: coordination mechanisms Characteristics Respondents
System affiliation
Independent hospital 66 (35%)
Part of a system 123 (65%)
Percentage of employed physicians
(admitting/attending)
< 5% 41 (22%)
6%-15% 39 (21%)
16%-35% 26 (14%)
36%-65% 34 (18%)
> 66%, but not 100% 34 (18%)
100% - closed system 14 (7%)
Payer mix*
Center for Medicare/Medicaid Services
162 reported.
µ = 54.8%
Private Insurance
162 reported.
µ = 29.1%
Self-pay patients
161 reported.
µ = 8.3%
Uncompensated care
156 reported.
µ = 9.2%
* The mean response is reported.
Note: Numbers represent frequency, followed by the percentage of the
sample in parentheses.
4.3.1.4 Sample characteristics: job titles of individual respondents
Characteristics Respondents
Job title
Director of Case Management 35 (18%)
Chief Nursing Officer 21 (11%)
Vice President of Patient Care Services 16 (8%)
Director of Quality Initiatives 14 (7%)
Director of Nursing 9 (5%)
Quality Assurance Manager 9 (5%)
Director of Patient Care Services 7 (4%)
Chief Operating Officer 4 (2%)
Unit Manager 4 (2%)
Chief Executive Officer 2 (1%)
Vice President of Quality Initiatives 2 (1%)
Vice President of Medical Affairs 1 (1%)
Vice President of Case Management 1 (1%)
Other 50 (26%)
Did not report. 15 (8%)
Note: Numbers represent frequency, followed by the percentage of the sample
in parentheses.
135
4.1.4 Non-response bias testing
Non-response bias is a significant challenge in survey research. Individuals who
reply to a survey are typically those most interested in or have strong feelings about the
topic. ―If persons who respond differ substantially from those who do not, the results do
not directly allow one to say how the entire sample would have responded – [thus, non-
response bias testing is] certainly an important step before the sample is generalized to
the population,‖ (Armstrong and Overton, 1977: p. 396).
However, ―Podsakoff et al. (2003) argue that biases are also reduced through the
use of high quality scales, and by temporal, proximal, psychological, or methodological
separation of measurements,‖ (Swink and Song, 2007: p. 210). With this in mind, the
rigorous instrument development process described herein was intended to contribute to
bias reduction. Still others argue that with strong response rates, such as that enjoyed by
this study (particularly for those who agreed to participate in the survey), reasonably
assure generalizability exists thereby reducing the need for non-response bias testing4
(Flynn et al. 1990; McFadden et al., 2009). These opinions notwithstanding, this study
tests key characteristics captured in the sample data from the respondents to the same
characteristics of those who chose not to respond (non-respondents). Therefore,
recognizing that the use of known values can be very useful in non-response bias testing
(Armstrong and Overton, 1977) this study captured key data elements from non-
respondent hospitals for testing juxtaposed to respondent hospitals.
4 Flynn et al. (1990) suggest that response rates of 50-60% ensure generalizability. McFadden et al. (2009)
make this claim based on their collection of 59.3% of responses from hospital executives who previously
agreed to participate in their survey. Applying this calculation methodology to the present study produces a
51.5% response rate.
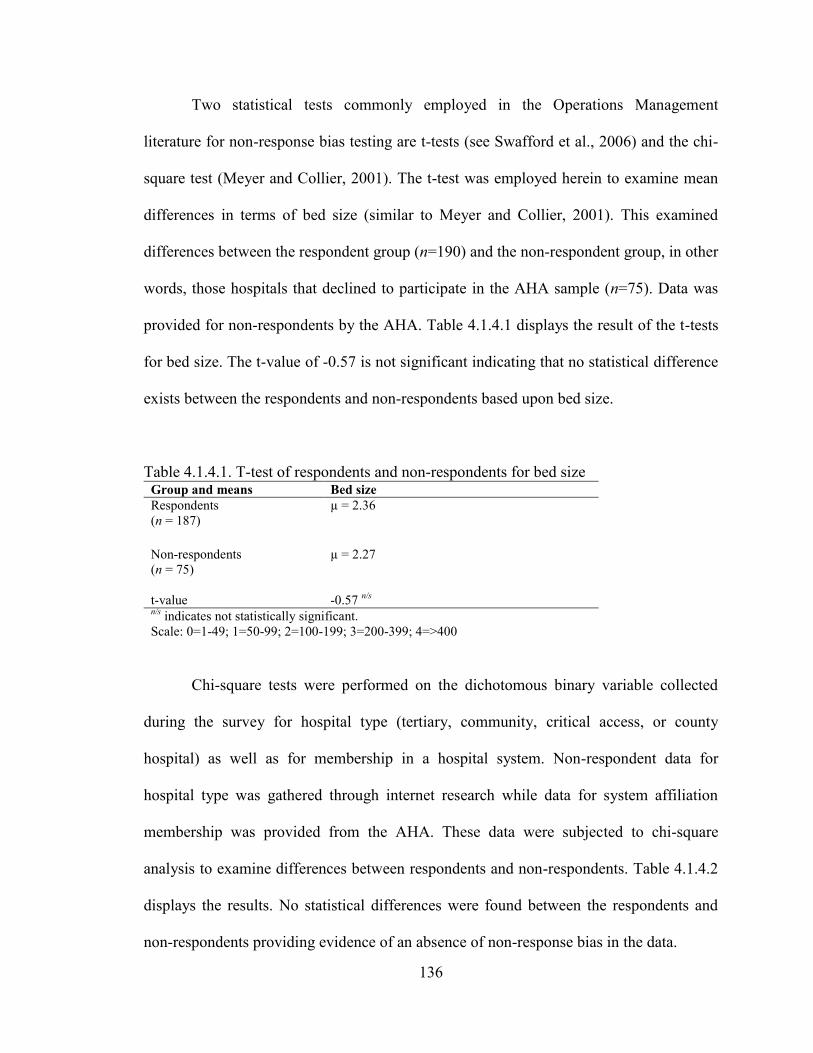
136
Two statistical tests commonly employed in the Operations Management
literature for non-response bias testing are t-tests (see Swafford et al., 2006) and the chi-
square test (Meyer and Collier, 2001). The t-test was employed herein to examine mean
differences in terms of bed size (similar to Meyer and Collier, 2001). This examined
differences between the respondent group (n=190) and the non-respondent group, in other
words, those hospitals that declined to participate in the AHA sample (n=75). Data was
provided for non-respondents by the AHA. Table 4.1.4.1 displays the result of the t-tests
for bed size. The t-value of -0.57 is not significant indicating that no statistical difference
exists between the respondents and non-respondents based upon bed size.
Table 4.1.4.1. T-test of respondents and non-respondents for bed size Group and means Bed size Respondents
(n = 187) µ = 2.36
Non-respondents
(n = 75)
µ = 2.27
t-value -0.57 n/s
n/s
indicates not statistically significant.
Scale: 0=1-49; 1=50-99; 2=100-199; 3=200-399; 4=>400
Chi-square tests were performed on the dichotomous binary variable collected
during the survey for hospital type (tertiary, community, critical access, or county
hospital) as well as for membership in a hospital system. Non-respondent data for
hospital type was gathered through internet research while data for system affiliation
membership was provided from the AHA. These data were subjected to chi-square
analysis to examine differences between respondents and non-respondents. Table 4.1.4.2
displays the results. No statistical differences were found between the respondents and
non-respondents providing evidence of an absence of non-response bias in the data.
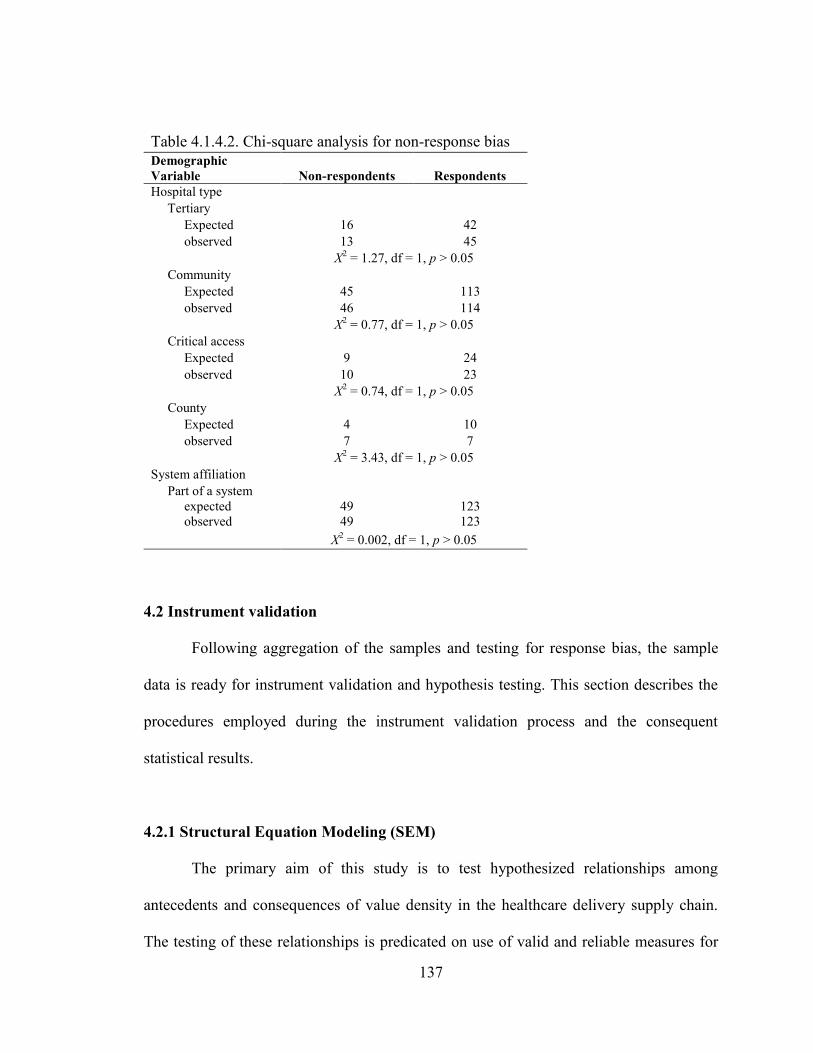
137
Table 4.1.4.2. Chi-square analysis for non-response bias
Demographic
Variable Non-respondents Respondents
Hospital type
Tertiary
Expected 16 42
observed 13 45
X2 = 1.27, df = 1, p > 0.05
Community
Expected 45 113
observed 46 114
X2 = 0.77, df = 1, p > 0.05
Critical access
Expected 9 24
observed 10 23
X2 = 0.74, df = 1, p > 0.05
County
Expected 4 10
observed 7 7
X2 = 3.43, df = 1, p > 0.05
System affiliation
Part of a system
expected
observed
49
49
123
123
X2 = 0.002, df = 1, p > 0.05
4.2 Instrument validation
Following aggregation of the samples and testing for response bias, the sample
data is ready for instrument validation and hypothesis testing. This section describes the
procedures employed during the instrument validation process and the consequent
statistical results.
4.2.1 Structural Equation Modeling (SEM)
The primary aim of this study is to test hypothesized relationships among
antecedents and consequences of value density in the healthcare delivery supply chain.
The testing of these relationships is predicated on use of valid and reliable measures for
138
these constructs. Toward this end, the researcher maintains two goals at this point; 1) the
validation of the measurement instruments, and 2) the testing of the hypothesized
relationships. Anderson and Gerbing (1998) refer to this as the two step process. First, the
researcher examines the measurement properties of the variables under study, what is
referred to as the measurement model. This is followed by the assessment of the
relationships among variables, referred to as the structural model.
Structural Equation Modeling (SEM) has proven to be a very useful statistical
method for assessing measurement as well as structural models. SEM allows the
―distinction between the measurement model, which relates the constructs to their
measures, and the structural model which relates the constructs to each other,‖ (Jarvis et
al. 2003: p. 199). The foundation of SEM lies in two multivariate techniques: factor
analysis and multiple regression (Hair et al., 2006). Specifically, ―it examines the
structure of interrelationships expressed in a series of equations, similar to a series of
multiple regression equations,‖ (Hair et al., 2006: p. 711). Owing to these traits, SEM
was selected as the analysis technique for the assessment of the measurement and
structural models under study.
4.2.2 Selection of the measurement model approach (reflective and formative
models)
The constructs conceptualized in this study are unobservable or not directly
measurable. In other words, these constructs are latent factors which are represented by
multiple measures (Hair et al., 2006). These variables are measured using items (or
survey questions) which are intended to capture a specific dimension of the variable
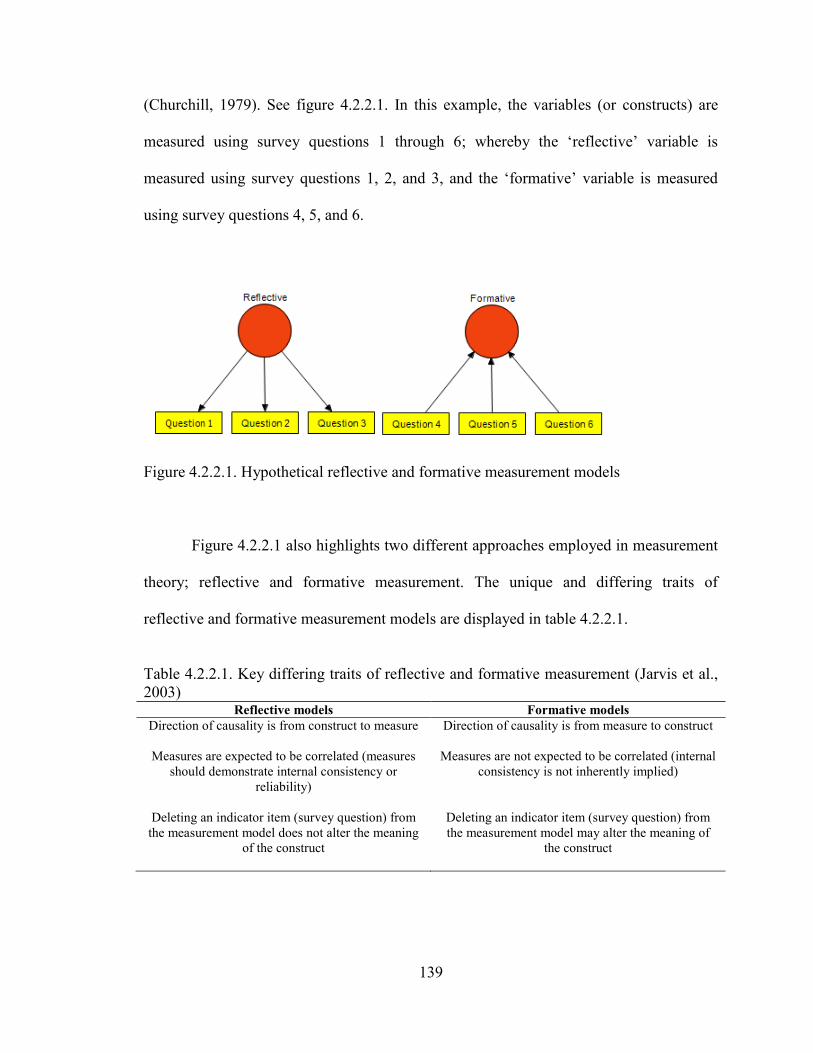
139
(Churchill, 1979). See figure 4.2.2.1. In this example, the variables (or constructs) are
measured using survey questions 1 through 6; whereby the ‗reflective‘ variable is
measured using survey questions 1, 2, and 3, and the ‗formative‘ variable is measured
using survey questions 4, 5, and 6.
Figure 4.2.2.1. Hypothetical reflective and formative measurement models
Figure 4.2.2.1 also highlights two different approaches employed in measurement
theory; reflective and formative measurement. The unique and differing traits of
reflective and formative measurement models are displayed in table 4.2.2.1.
Table 4.2.2.1. Key differing traits of reflective and formative measurement (Jarvis et al.,
2003) Reflective models Formative models
Direction of causality is from construct to measure Direction of causality is from measure to construct
Measures are expected to be correlated (measures
should demonstrate internal consistency or
reliability)
Measures are not expected to be correlated (internal
consistency is not inherently implied)
Deleting an indicator item (survey question) from
the measurement model does not alter the meaning
of the construct
Deleting an indicator item (survey question) from
the measurement model may alter the meaning of
the construct
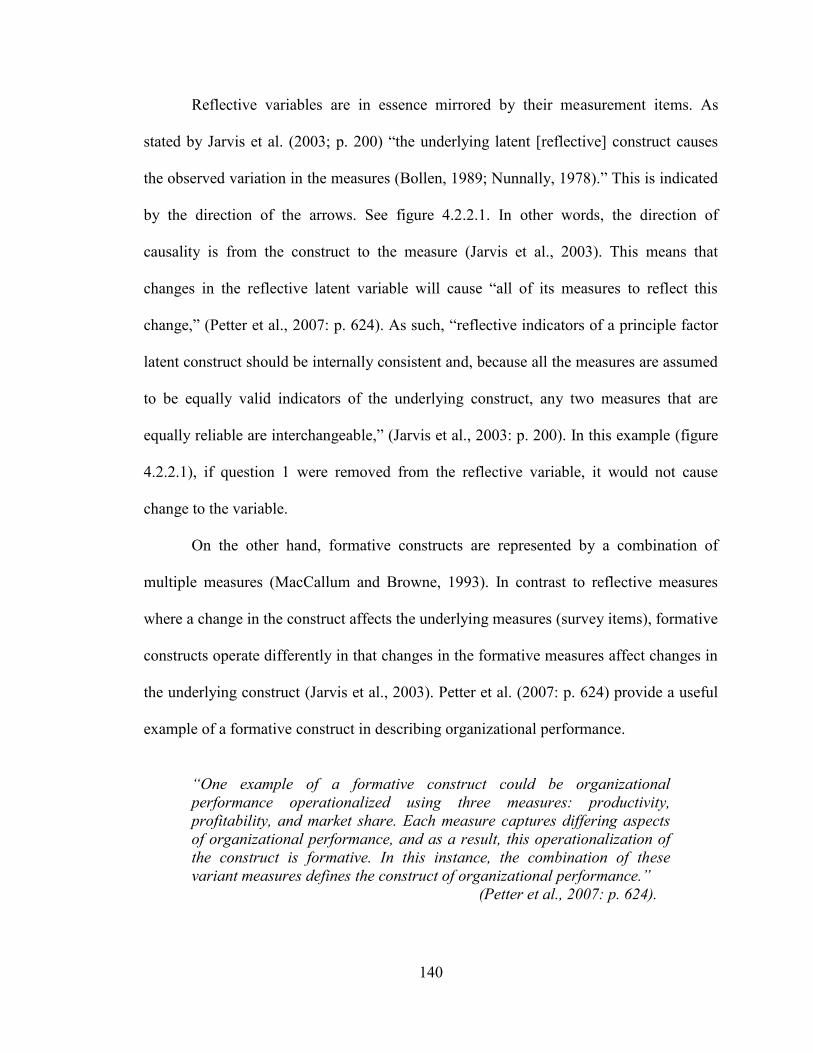
140
Reflective variables are in essence mirrored by their measurement items. As
stated by Jarvis et al. (2003; p. 200) ―the underlying latent [reflective] construct causes
the observed variation in the measures (Bollen, 1989; Nunnally, 1978).‖ This is indicated
by the direction of the arrows. See figure 4.2.2.1. In other words, the direction of
causality is from the construct to the measure (Jarvis et al., 2003). This means that
changes in the reflective latent variable will cause ―all of its measures to reflect this
change,‖ (Petter et al., 2007: p. 624). As such, ―reflective indicators of a principle factor
latent construct should be internally consistent and, because all the measures are assumed
to be equally valid indicators of the underlying construct, any two measures that are
equally reliable are interchangeable,‖ (Jarvis et al., 2003: p. 200). In this example (figure
4.2.2.1), if question 1 were removed from the reflective variable, it would not cause
change to the variable.
On the other hand, formative constructs are represented by a combination of
multiple measures (MacCallum and Browne, 1993). In contrast to reflective measures
where a change in the construct affects the underlying measures (survey items), formative
constructs operate differently in that changes in the formative measures affect changes in
the underlying construct (Jarvis et al., 2003). Petter et al. (2007: p. 624) provide a useful
example of a formative construct in describing organizational performance.
“One example of a formative construct could be organizational
performance operationalized using three measures: productivity,
profitability, and market share. Each measure captures differing aspects
of organizational performance, and as a result, this operationalization of
the construct is formative. In this instance, the combination of these
variant measures defines the construct of organizational performance.”
(Petter et al., 2007: p. 624).
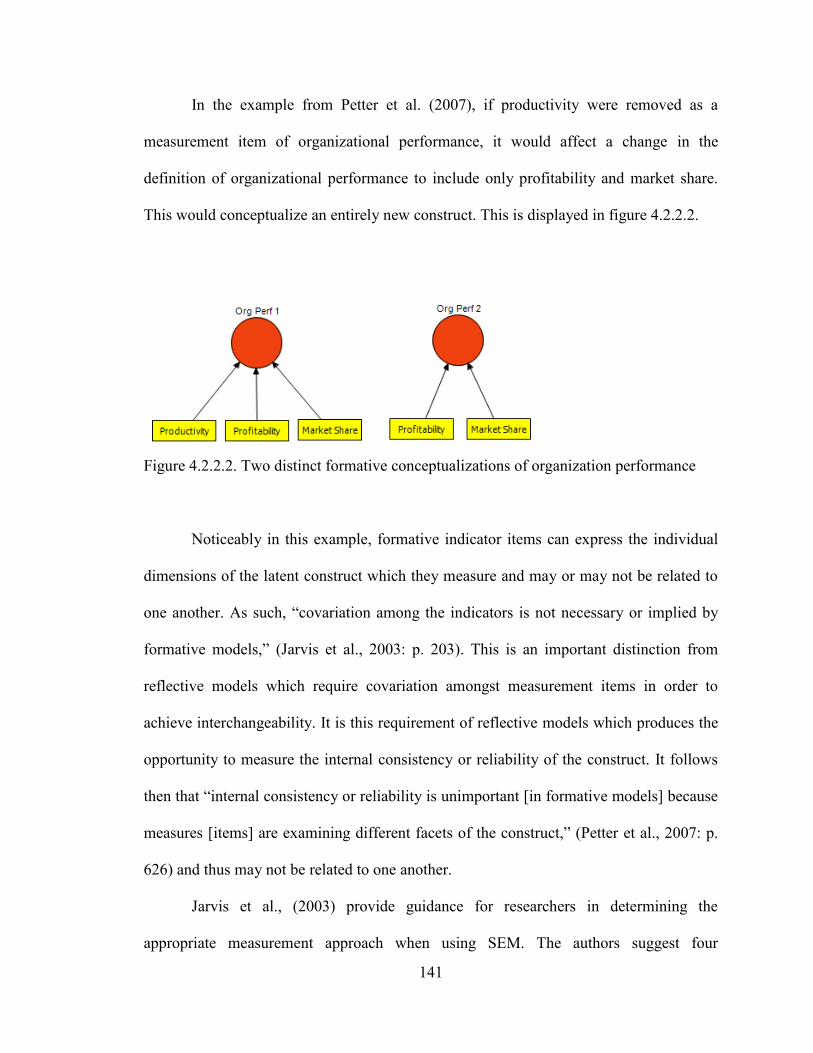
141
In the example from Petter et al. (2007), if productivity were removed as a
measurement item of organizational performance, it would affect a change in the
definition of organizational performance to include only profitability and market share.
This would conceptualize an entirely new construct. This is displayed in figure 4.2.2.2.
Figure 4.2.2.2. Two distinct formative conceptualizations of organization performance
Noticeably in this example, formative indicator items can express the individual
dimensions of the latent construct which they measure and may or may not be related to
one another. As such, ―covariation among the indicators is not necessary or implied by
formative models,‖ (Jarvis et al., 2003: p. 203). This is an important distinction from
reflective models which require covariation amongst measurement items in order to
achieve interchangeability. It is this requirement of reflective models which produces the
opportunity to measure the internal consistency or reliability of the construct. It follows
then that ―internal consistency or reliability is unimportant [in formative models] because
measures [items] are examining different facets of the construct,‖ (Petter et al., 2007: p.
626) and thus may not be related to one another.
Jarvis et al., (2003) provide guidance for researchers in determining the
appropriate measurement approach when using SEM. The authors suggest four
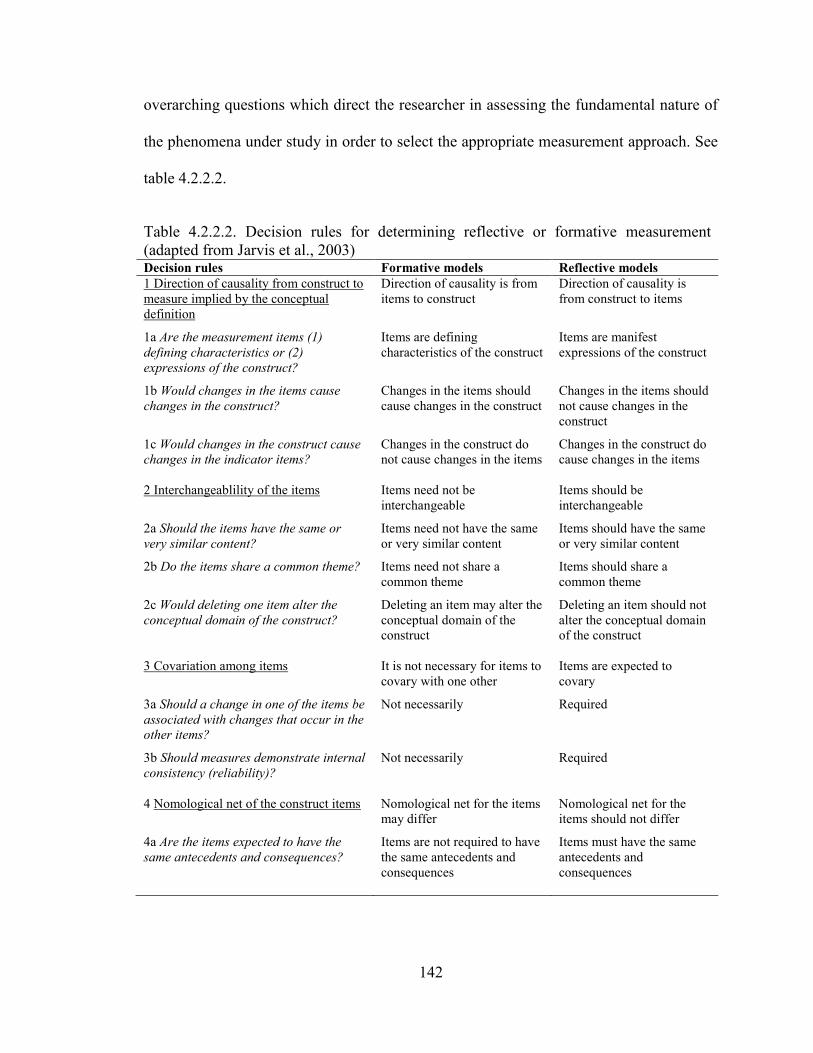
142
overarching questions which direct the researcher in assessing the fundamental nature of
the phenomena under study in order to select the appropriate measurement approach. See
table 4.2.2.2.
Table 4.2.2.2. Decision rules for determining reflective or formative measurement
(adapted from Jarvis et al., 2003) Decision rules Formative models Reflective models
1 Direction of causality from construct to
measure implied by the conceptual
definition
Direction of causality is from
items to construct
Direction of causality is
from construct to items
1a Are the measurement items (1)
defining characteristics or (2)
expressions of the construct?
Items are defining
characteristics of the construct
Items are manifest
expressions of the construct
1b Would changes in the items cause
changes in the construct?
Changes in the items should
cause changes in the construct
Changes in the items should
not cause changes in the
construct
1c Would changes in the construct cause
changes in the indicator items?
Changes in the construct do
not cause changes in the items
Changes in the construct do
cause changes in the items
2 Interchangeablility of the items Items need not be
interchangeable
Items should be
interchangeable
2a Should the items have the same or
very similar content?
Items need not have the same
or very similar content
Items should have the same
or very similar content
2b Do the items share a common theme? Items need not share a
common theme
Items should share a
common theme
2c Would deleting one item alter the
conceptual domain of the construct?
Deleting an item may alter the
conceptual domain of the
construct
Deleting an item should not
alter the conceptual domain
of the construct
3 Covariation among items It is not necessary for items to
covary with one other
Items are expected to
covary
3a Should a change in one of the items be
associated with changes that occur in the
other items?
Not necessarily Required
3b Should measures demonstrate internal
consistency (reliability)?
Not necessarily Required
4 Nomological net of the construct items Nomological net for the items
may differ
Nomological net for the
items should not differ
4a Are the items expected to have the
same antecedents and consequences?
Items are not required to have
the same antecedents and
consequences
Items must have the same
antecedents and
consequences
143
The first set of questions is related to the direction of causality between the items
and the construct for which they are intended to measure. ―For formative measurement
models, the direction of causality flows from the measures to the construct, and it flows
from the construct to the measures for reflective measurement models,‖ (Jarvis et al.,
2007: p. 203). This is illustrated in figure 4.2.2.1. The next set of questions deals with the
interchangeability of the items of a construct. ―The indicators need not be
interchangeable for formative measurement models but should be for reflective
measurement models,‖ (Jarvis et al., 2007: p. 203). The third set of questions address the
covariation among indicator items. ―Covariation among indicators is not necessary or
implied by formative models, but covariation among the indicators is a necessary
condition for reflective models,‖ (Jarvis et al., 2003: p. 203). The final set of questions
leads the researcher to investigate the nomological net of the construct items. A
nomological net is a group of variables which are posited to share relationships ―based on
theory or prior research,‖ (Hair et al., 2006: p. 138). These consist of antecedents and
consequences of the variable under study. This final set of questions seeks to understand
whether or not the variables (or measurement items) share the same set of antecedents
and consequences. ―For the reflective indicator model, since all of the indicators reflect
the same underlying construct and are assumed to be interchangeable, they should all
have the same antecedents and consequences. However, for the formative indicator
model, because the measures do not necessarily capture the same aspects of the
construct‘s domain and are therefore not necessarily interchangeable, there is no reason
to expect them to have the same antecedents and consequences,‖ (Jarvis et al., 2003: p.
203).
144
In applying the four question filter of Jarvis et al. (2003) to the conceptualized
constructs and hypothesized relationships posited in this study, a distinction emerges with
regard to the appropriate measurement approach. The higher order constructs are
conceptualized as formative models, while the first order measurement models are
conceptualized as reflective constructs.
Consider the integrative information and resource strategy higher order construct
for example. Its first order models (leagile supply chain strategy, patient-focused IS
strategy, Physician-focused IS strategy, and operational IS strategy) are all distinct
dimensions of an integrative information and resource strategy and the omission of any
one dimension would alter the construct‘s definition, changing its meaning in this study
(criterion 1: formative). This is similar to the earlier example of the Petter et al. (2007)
organizational performance variable. When productivity was removed it fundamentally
alter the meaning or definition of the variable. Likewise, the dimensions of the integrative
information and resource strategy construct are clearly not interchangeable. For example,
the content of the patient-focused IS strategy does not overlap significantly with the
operational IS strategy variable. Therefore, the deletion of either the patient-focused IS
strategy variable or the operational IS strategy variable would alter the conceptual
domain of the construct (criterion 2: formative). Next, the first order constructs of
integrative information and resource strategy may or may not covary. These represent
different types of strategies guiding efforts in different functional areas of the firm and as
such, they may or may not be related. The literature guides the development of this
construct based on the notion that supply chain deals with the management of
information and resources (Lambert and Cooper, 2000) but these are not necessarily
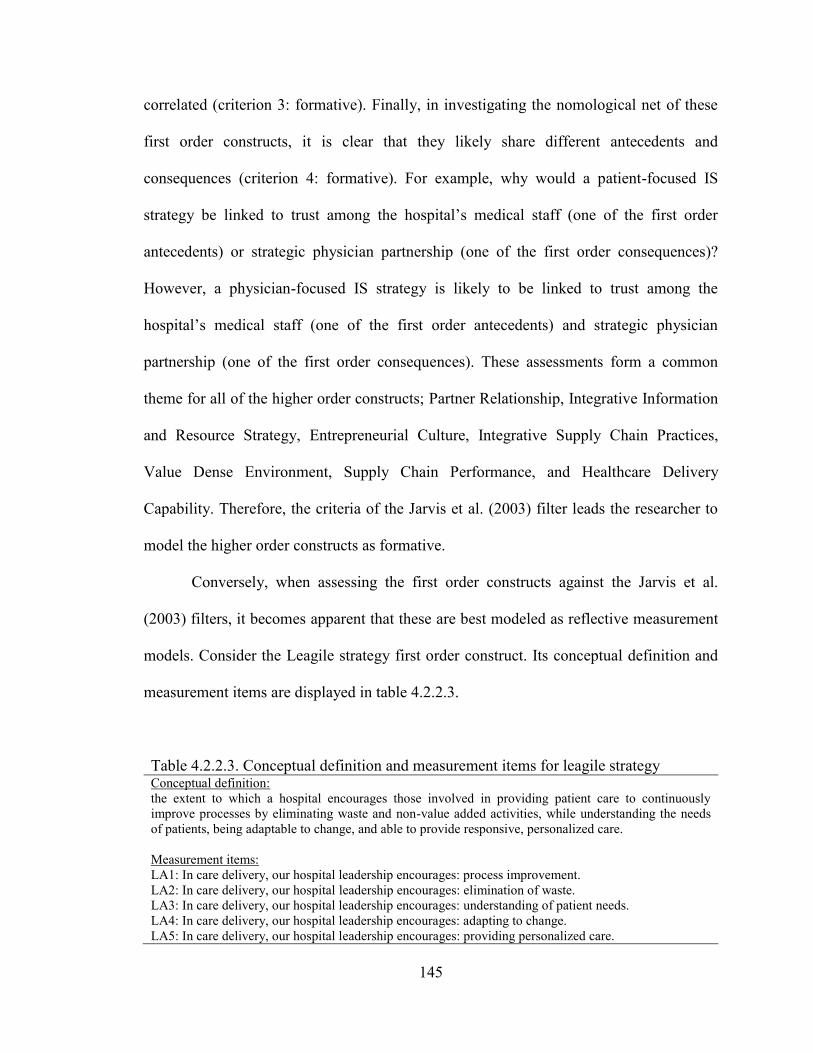
145
correlated (criterion 3: formative). Finally, in investigating the nomological net of these
first order constructs, it is clear that they likely share different antecedents and
consequences (criterion 4: formative). For example, why would a patient-focused IS
strategy be linked to trust among the hospital‘s medical staff (one of the first order
antecedents) or strategic physician partnership (one of the first order consequences)?
However, a physician-focused IS strategy is likely to be linked to trust among the
hospital‘s medical staff (one of the first order antecedents) and strategic physician
partnership (one of the first order consequences). These assessments form a common
theme for all of the higher order constructs; Partner Relationship, Integrative Information
and Resource Strategy, Entrepreneurial Culture, Integrative Supply Chain Practices,
Value Dense Environment, Supply Chain Performance, and Healthcare Delivery
Capability. Therefore, the criteria of the Jarvis et al. (2003) filter leads the researcher to
model the higher order constructs as formative.
Conversely, when assessing the first order constructs against the Jarvis et al.
(2003) filters, it becomes apparent that these are best modeled as reflective measurement
models. Consider the Leagile strategy first order construct. Its conceptual definition and
measurement items are displayed in table 4.2.2.3.
Table 4.2.2.3. Conceptual definition and measurement items for leagile strategy Conceptual definition:
the extent to which a hospital encourages those involved in providing patient care to continuously
improve processes by eliminating waste and non-value added activities, while understanding the needs
of patients, being adaptable to change, and able to provide responsive, personalized care.
Measurement items:
LA1: In care delivery, our hospital leadership encourages: process improvement.
LA2: In care delivery, our hospital leadership encourages: elimination of waste.
LA3: In care delivery, our hospital leadership encourages: understanding of patient needs.
LA4: In care delivery, our hospital leadership encourages: adapting to change.
LA5: In care delivery, our hospital leadership encourages: providing personalized care.
146
In considering criterion 1 from the Jarvis et al. (2003), it can be argued that the
indicators items for Leagile strategy are affected by the latent construct. For example, if
hospital leadership encourages Leagile activities it will be reflected in the proposed
measurement items. However, if one of the items is deleted from the set it will not
fundamentally alter the definition of leaglie. Consider the deletion of „LA2: In care
delivery, our hospital leadership encourages: elimination of waste.‟ While the
elimination of waste is clearly a core concept within the Lean literature, if this item were
omitted, it would not fundamentally alter the leagile construct because „LA1: In care
delivery, our hospital leadership encourages: process improvement‟ does overlap and
capture much of the essence of LA2. This is also true of „LA3: In care delivery, our
hospital leadership encourages: understanding of patient needs.‟ If it were eliminated,
much of its trait would be captured by „LA5: In care delivery, our hospital leadership
encourages: providing personalized care‘ (criterion 1: reflective). Likewise, it is
reasonable to argue that to a large extent, these items could be interchangeable,
measuring equal amounts of the Leagile strategy (criterion 2: reflective). Owing to the
notion that these measurement items overlap in meaning, and ultimately to some extent in
measurement, it would be expected that they would share some statistical covariance
(criterion 3: reflective).5 Finally, with regard to their nomological net, it is reasonable to
expect that these items will share many of the same antecedents and consequences. For
example, one would expect that all of the measurement items could be linked to the use
of Lean principles as a consequence of the Leagile strategy (criteria 4: reflective. These
assessments form a common theme for all of the first order constructs. Therefore, the
5 Evidence will be provided later in this chapter in support of the correlation among these items.
147
criteria of the Jarvis et al. (2003) filter leads the researcher to model the first order
constructs as reflective. This results in what Jarvis et al. (2003) refer to as a ‗type II‘
model with reflective first order constructs serving as latent measures for formative
second order constructs.
4.2.3 Assessment methodology for reflective measurement models
The researcher‘s ability to produce meaningful scientific findings rests on the use
of valid and reliable measurement instruments. Validity is a measure of the instruments
ability to measure the ‗true‘ concept intended by the designer. Reliability on the other
hand, is a measure ―of the degree to which a set of indicators of a latent construct is
internally consistent based on how highly interrelated the indicators are. In other words, it
represents the extent to which they all measure the same thing,‖ (Hair et al., 2006: p.
712). Reliable instruments produce measurement results which are consistent over time
and populations. As such, a construct cannot be valid if it fails to be reliability, while that
same construct can be reliable in the absence of validity (Gordis, 2009).
Bagozzi (1980) and Bagozzi and Phillips (1982) suggest that the key validity and
reliability indicators for reflective measurement models consist of content validity,
convergent validity, discriminant validity, and reliability. While content validity is
assessed through comprehensive literature review (Nunnally, 1978), SEM provides
rigorous statistical tests to examine construct convergent validity, discriminant validity,
and reliability (Bagozzi, 1980; Fornell and Larcker, 1981; Gerbing and Anderson, 1988;
Jarvis et al., 2003). Thus, Confirmatory Factor Analysis (CFA) incorporating Statistical
Package for the Social Sciences (SPSS) 15.0 and Analysis of Moment Structures
148
(AMOS) 5.0 was employed to evaluate the properties of the measures addressing the
latent first order constructs in this study. This technique has been suggested as an
appropriate technique for theoretical model testing (Hair, et al., 2006) and is an
acceptable approach for assessing the convergent and discriminant validity of the
constructs under study.
Content validity assesses the representativeness of each measurement item in
relation to its theoretically posited construct. A construct is said to possess content
validity when the items of the construct sufficiently cover the domain of that construct
(Kerlinger, 1978; Churchill, 1979). Content validity is examined through a
comprehensive literature review (Nunnally, 1978), an evaluation of the measurement
items by expert judges such as other academic researchers or practitioners, and/or
through Q-sort testing (Moore and Banbasat, 1991). This study employed all three
procedures to ensure the content validity of the constructs under study. This is detailed in
chapters 2 and 3.
Convergent validity assesses the extent to which the measurement items in one
construct come together to form a single common dimension. As stated, confirmatory
methods using AMOS are employed by this study to assess the validity of the first order
measurement models. Model fit statistics assess how well the sample data fit the
hypothesized model. ―Measurement model validity depends on the ‗goodness of fit‘ for
the measurement model‖ (Hair et al., 2006: p. 745). The goodness of fit (GFI), adjusted
goodness of fit (AGFI), and root mean square residual (RMR) indices are provided for
each first order measurement model (Hair et al., 2006; Liao, 2008). Generally, GFI values
> 0.85 (preferably > 0.90) and AGFI > 0.80 are considered acceptable measures for

149
model fit (Hadjistavropoulos et. al., 1999; Hair et. al., 1998). RMR is an error fit
indicator and as such lower values represent adequacy in the model. RMR values < 0.05
indicate good fit while values < 0.08 represent reasonably acceptable errors of
approximation (Browne and Cudeck, 1993). RMR values < 0.10 indicate mediocre fit,
and those > 0.10 indicate poor fit (MacCallum et. al., 1996). This study also employs the
comparative fit index (CFI) and the normed fit index (NFI), given that these are widely
accepted as incremental model fit indices which consider values > 0.90 to be associated
with acceptable model fit (Hair et al., 2006).
In CFA, the average variance extracted (AVE) among a set of construct items
may also be used as an indicator of convergence and as such AVE is also provided for
each first order measurement model (Fornell and Larcker, 1981; Hair et al., 2006). Hair et
al. (2006) suggest that value of 0.5 or higher (>0.5) is an adequate measure of
convergence and as such will represent the target threshold for convergent validity in this
study.
Discriminant validity examines the extent to which the measurement items form a
unique dimension of a construct which is independent of all other dimensions (Bagozzi
and Phillips, 1982). Discriminant validity is assessed in CFA by pairing constructs and
comparing AVE to the square of the correlation estimates between the two constructs.
Fornell and Larcker (1981) suggest that this is an appropriate approach, by which if the
AVE estimate is greater than the squared correlation estimate, discriminant validity exists
(Hair et al., 2006). The single-factor/two-factor (pairwise) X2 test is also used to provide
evidence of discriminant validity (Segars, 1997). This consists of three steps. First, two
dimensions in one construct are modeled to form a correlated model and the X2
value of
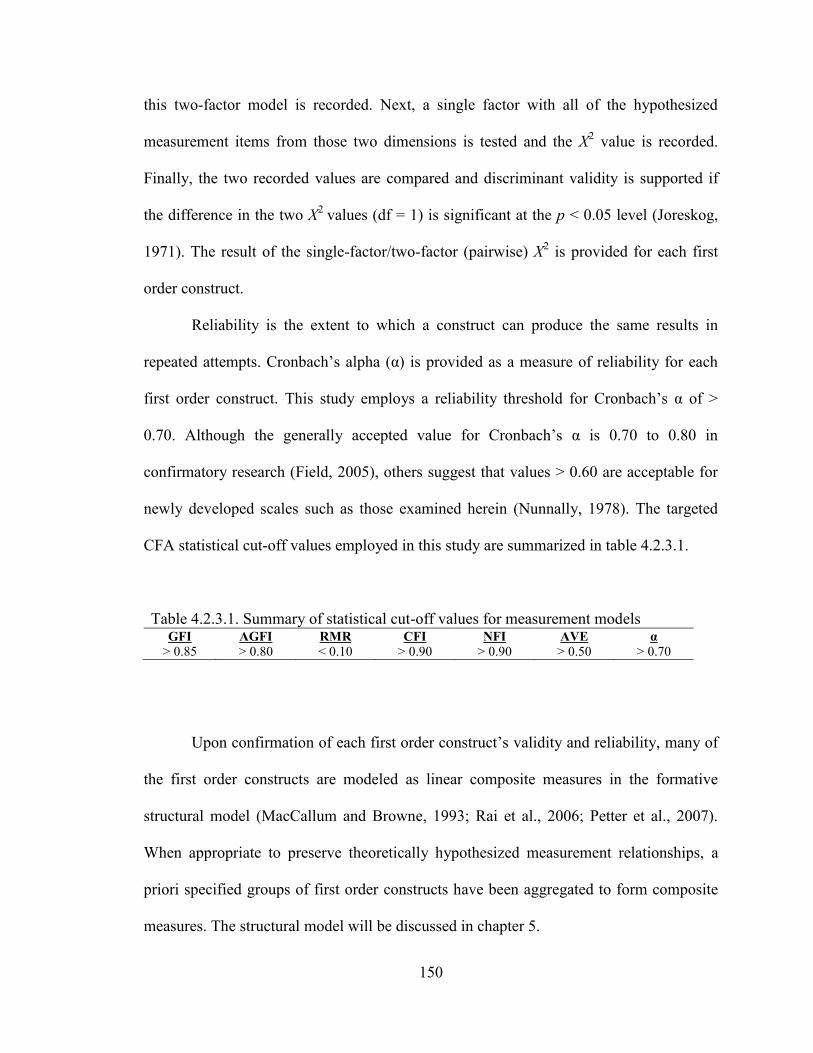
150
this two-factor model is recorded. Next, a single factor with all of the hypothesized
measurement items from those two dimensions is tested and the X2 value is recorded.
Finally, the two recorded values are compared and discriminant validity is supported if
the difference in the two X2
values (df = 1) is significant at the p < 0.05 level (Joreskog,
1971). The result of the single-factor/two-factor (pairwise) X2 is provided for each first
order construct.
Reliability is the extent to which a construct can produce the same results in
repeated attempts. Cronbach‘s alpha (α) is provided as a measure of reliability for each
first order construct. This study employs a reliability threshold for Cronbach‘s α of >
0.70. Although the generally accepted value for Cronbach‘s α is 0.70 to 0.80 in
confirmatory research (Field, 2005), others suggest that values > 0.60 are acceptable for
newly developed scales such as those examined herein (Nunnally, 1978). The targeted
CFA statistical cut-off values employed in this study are summarized in table 4.2.3.1.
Table 4.2.3.1. Summary of statistical cut-off values for measurement models GFI AGFI RMR CFI NFI AVE α
> 0.85 > 0.80 < 0.10 > 0.90 > 0.90 > 0.50 > 0.70
Upon confirmation of each first order construct‘s validity and reliability, many of
the first order constructs are modeled as linear composite measures in the formative
structural model (MacCallum and Browne, 1993; Rai et al., 2006; Petter et al., 2007).
When appropriate to preserve theoretically hypothesized measurement relationships, a
priori specified groups of first order constructs have been aggregated to form composite
measures. The structural model will be discussed in chapter 5.
151
4.2.4 Measurement model analysis and results
The measurement model validation results for the each of the seven constructs
will be provided in subsections 4.2.4.1 through 4.2.4.7.
4.2.4.1 Partner Relationship
Convergent validity and reliability: The twelve items for Partner Relationship
and their corresponding codes are listed in table 4.2.4.1.1. The lambdas for these items
are provided immediately following each surviving item. AVE and Cronbach‘s α values
(for reliability testing) for the final measurement model are displayed following the
construct name. The items have been sequentially deleted in the CFA using AMOS in an
effort to improve convergent validity while preserving the content validity of the
construct.
TRT3 has been deleted to improve model fit. Upon review and discussion with
practitioners it has been determined that respect for the confidentiality of patient
information among physicians is simply expected in the course of normal operations and
is not a measure of trust. The initial model fit for the commitment dimension
demonstrated adequate model fit and was not modified. SV3 has been deleted from the
shared vision construct. Upon review it was determined that SV3 was not a good fit with
the other SV items as ‗collaboration‘ infers action whereas the other items are more
closely related to vision. The initial model fit indexes and final model fit indexes are
provided in the table. All of the model fit values as well as the AVE values indicate
adequate convergent validity for each dimension of the construct. Additionally, the
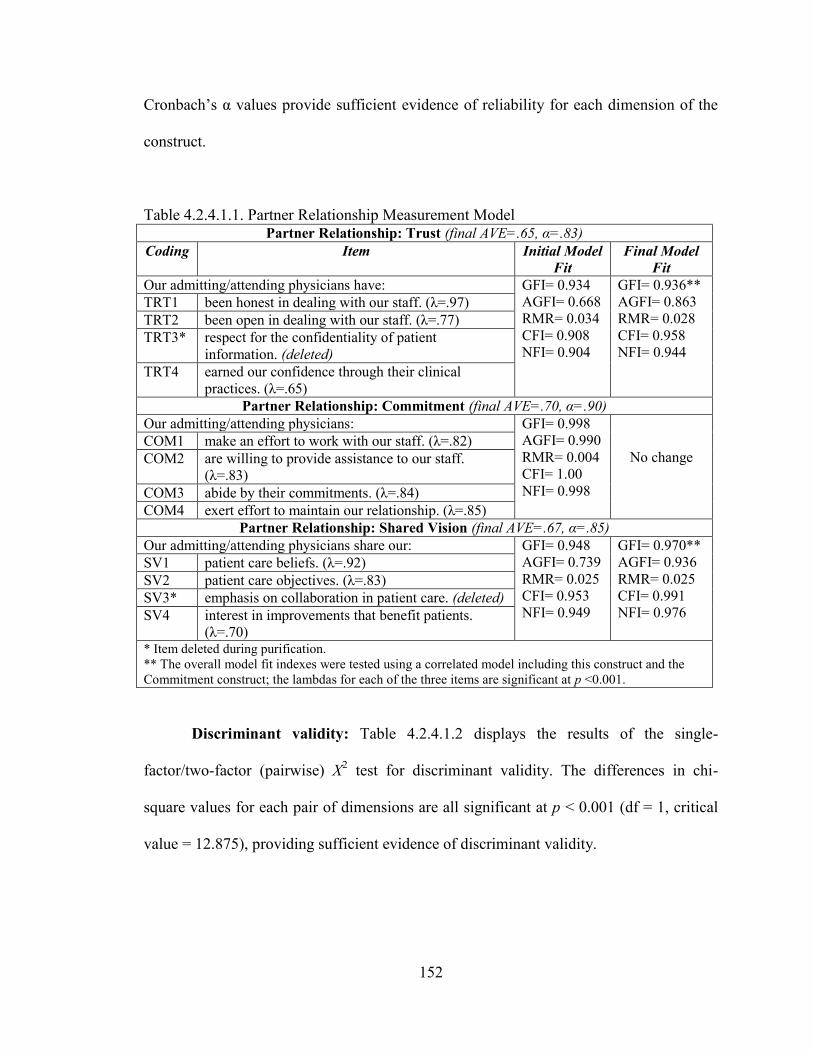
152
Cronbach‘s α values provide sufficient evidence of reliability for each dimension of the
construct.
Table 4.2.4.1.1. Partner Relationship Measurement Model Partner Relationship: Trust (final AVE=.65, α=.83)
Coding Item Initial Model
Fit
Final Model
Fit
Our admitting/attending physicians have: GFI= 0.934
AGFI= 0.668
RMR= 0.034
CFI= 0.908
NFI= 0.904
GFI= 0.936**
AGFI= 0.863
RMR= 0.028
CFI= 0.958
NFI= 0.944
TRT1 been honest in dealing with our staff. (λ=.97)
TRT2 been open in dealing with our staff. (λ=.77)
TRT3* respect for the confidentiality of patient
information. (deleted)
TRT4 earned our confidence through their clinical
practices. (λ=.65)
Partner Relationship: Commitment (final AVE=.70, α=.90)
Our admitting/attending physicians: GFI= 0.998
AGFI= 0.990
RMR= 0.004
CFI= 1.00
NFI= 0.998
No change COM1 make an effort to work with our staff. (λ=.82)
COM2 are willing to provide assistance to our staff.
(λ=.83)
COM3 abide by their commitments. (λ=.84)
COM4 exert effort to maintain our relationship. (λ=.85)
Partner Relationship: Shared Vision (final AVE=.67, α=.85)
Our admitting/attending physicians share our: GFI= 0.948
AGFI= 0.739
RMR= 0.025
CFI= 0.953
NFI= 0.949
GFI= 0.970**
AGFI= 0.936
RMR= 0.025
CFI= 0.991
NFI= 0.976
SV1 patient care beliefs. (λ=.92)
SV2 patient care objectives. (λ=.83)
SV3* emphasis on collaboration in patient care. (deleted)
SV4 interest in improvements that benefit patients.
(λ=.70) * Item deleted during purification.
** The overall model fit indexes were tested using a correlated model including this construct and the
Commitment construct; the lambdas for each of the three items are significant at p <0.001.
Discriminant validity: Table 4.2.4.1.2 displays the results of the single-
factor/two-factor (pairwise) X2 test for discriminant validity. The differences in chi-
square values for each pair of dimensions are all significant at p < 0.001 (df = 1, critical
value = 12.875), providing sufficient evidence of discriminant validity.
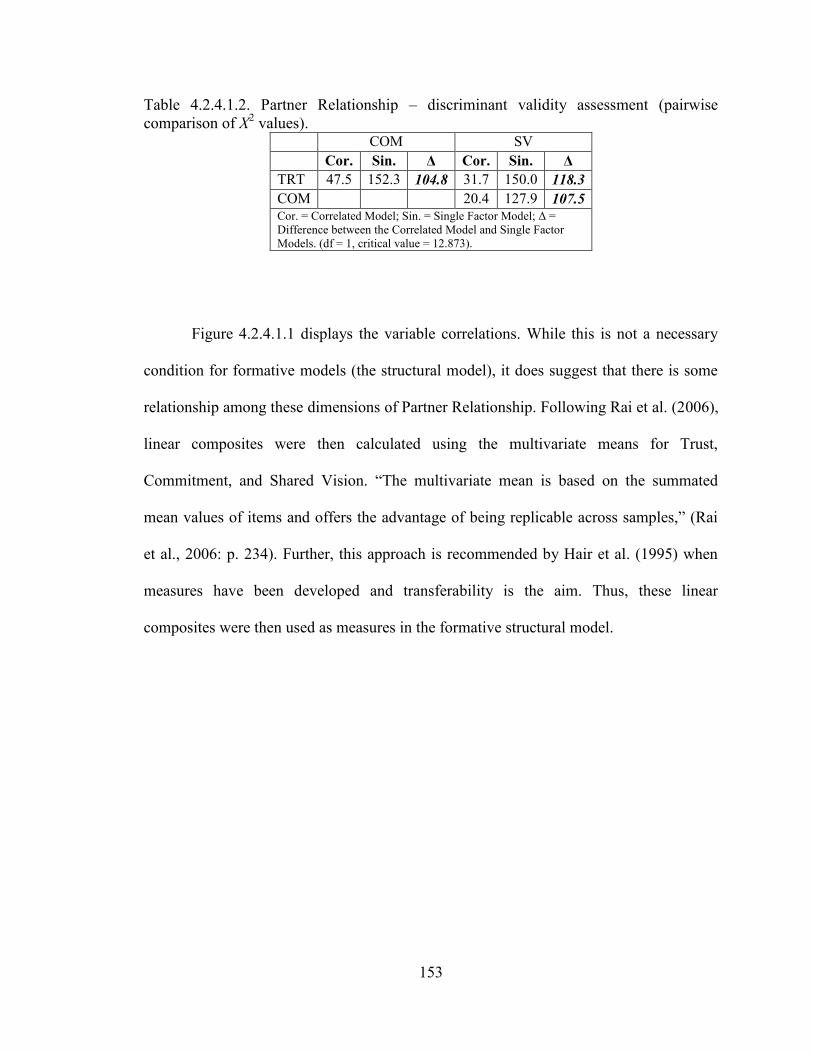
153
Table 4.2.4.1.2. Partner Relationship – discriminant validity assessment (pairwise
comparison of X2 values).
COM SV
Cor. Sin. Δ Cor. Sin. Δ
TRT 47.5 152.3 104.8 31.7 150.0 118.3
COM 20.4 127.9 107.5 Cor. = Correlated Model; Sin. = Single Factor Model; Δ =
Difference between the Correlated Model and Single Factor
Models. (df = 1, critical value = 12.873).
Figure 4.2.4.1.1 displays the variable correlations. While this is not a necessary
condition for formative models (the structural model), it does suggest that there is some
relationship among these dimensions of Partner Relationship. Following Rai et al. (2006),
linear composites were then calculated using the multivariate means for Trust,
Commitment, and Shared Vision. ―The multivariate mean is based on the summated
mean values of items and offers the advantage of being replicable across samples,‖ (Rai
et al., 2006: p. 234). Further, this approach is recommended by Hair et al. (1995) when
measures have been developed and transferability is the aim. Thus, these linear
composites were then used as measures in the formative structural model.
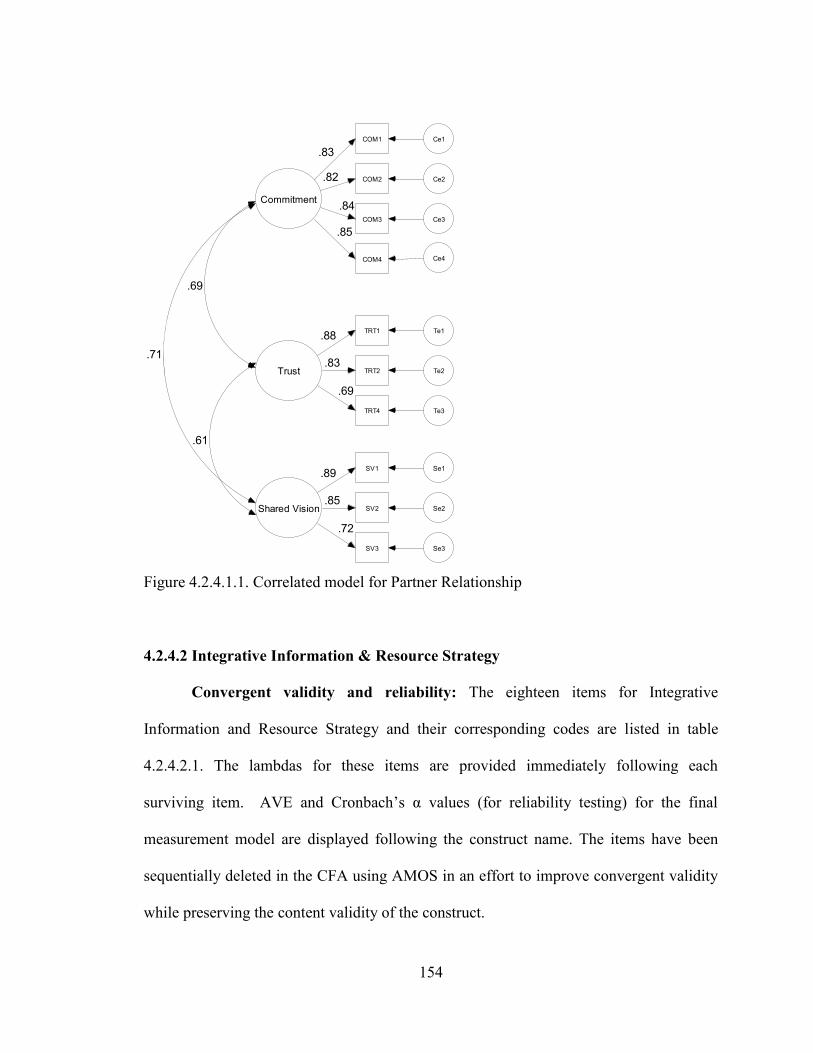
154
Trust
TRT1 Te1.88
TRT2 Te2.83
TRT4 Te3
.69
Shared Vision
SV1 Se1
SV2 Se2
SV3 Se3
.89
.85
.72
Commitment
COM1 Ce1
COM2 Ce2
COM3 Ce3
.83
.82
.84
COM4 Ce4
.85
.61
.71
.69
Figure 4.2.4.1.1. Correlated model for Partner Relationship
4.2.4.2 Integrative Information & Resource Strategy
Convergent validity and reliability: The eighteen items for Integrative
Information and Resource Strategy and their corresponding codes are listed in table
4.2.4.2.1. The lambdas for these items are provided immediately following each
surviving item. AVE and Cronbach‘s α values (for reliability testing) for the final
measurement model are displayed following the construct name. The items have been
sequentially deleted in the CFA using AMOS in an effort to improve convergent validity
while preserving the content validity of the construct.
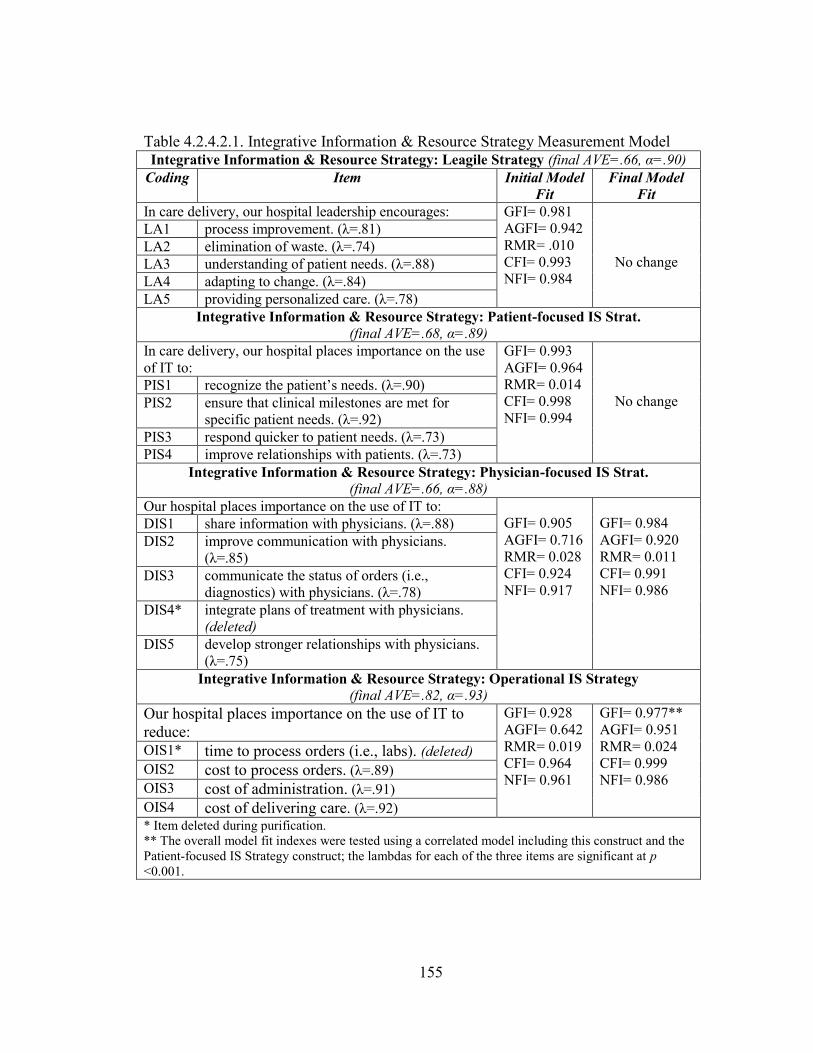
155
Table 4.2.4.2.1. Integrative Information & Resource Strategy Measurement Model Integrative Information & Resource Strategy: Leagile Strategy (final AVE=.66, α=.90)
Coding Item Initial Model
Fit
Final Model
Fit
In care delivery, our hospital leadership encourages: GFI= 0.981
AGFI= 0.942
RMR= .010
CFI= 0.993
NFI= 0.984
No change
LA1 process improvement. (λ=.81)
LA2 elimination of waste. (λ=.74)
LA3 understanding of patient needs. (λ=.88)
LA4 adapting to change. (λ=.84)
LA5 providing personalized care. (λ=.78)
Integrative Information & Resource Strategy: Patient-focused IS Strat. (final AVE=.68, α=.89)
In care delivery, our hospital places importance on the use
of IT to:
GFI= 0.993
AGFI= 0.964
RMR= 0.014
CFI= 0.998
NFI= 0.994
No change PIS1 recognize the patient‘s needs. (λ=.90)
PIS2 ensure that clinical milestones are met for
specific patient needs. (λ=.92)
PIS3 respond quicker to patient needs. (λ=.73)
PIS4 improve relationships with patients. (λ=.73)
Integrative Information & Resource Strategy: Physician-focused IS Strat.
(final AVE=.66, α=.88)
Our hospital places importance on the use of IT to:
GFI= 0.905
AGFI= 0.716
RMR= 0.028
CFI= 0.924
NFI= 0.917
GFI= 0.984
AGFI= 0.920
RMR= 0.011
CFI= 0.991
NFI= 0.986
DIS1 share information with physicians. (λ=.88)
DIS2 improve communication with physicians.
(λ=.85)
DIS3 communicate the status of orders (i.e.,
diagnostics) with physicians. (λ=.78)
DIS4* integrate plans of treatment with physicians.
(deleted)
DIS5 develop stronger relationships with physicians.
(λ=.75)
Integrative Information & Resource Strategy: Operational IS Strategy
(final AVE=.82, α=.93)
Our hospital places importance on the use of IT to
reduce:
GFI= 0.928
AGFI= 0.642
RMR= 0.019
CFI= 0.964
NFI= 0.961
GFI= 0.977**
AGFI= 0.951
RMR= 0.024
CFI= 0.999
NFI= 0.986
OIS1* time to process orders (i.e., labs). (deleted)
OIS2 cost to process orders. (λ=.89)
OIS3 cost of administration. (λ=.91)
OIS4 cost of delivering care. (λ=.92)
* Item deleted during purification.
** The overall model fit indexes were tested using a correlated model including this construct and the
Patient-focused IS Strategy construct; the lambdas for each of the three items are significant at p
<0.001.
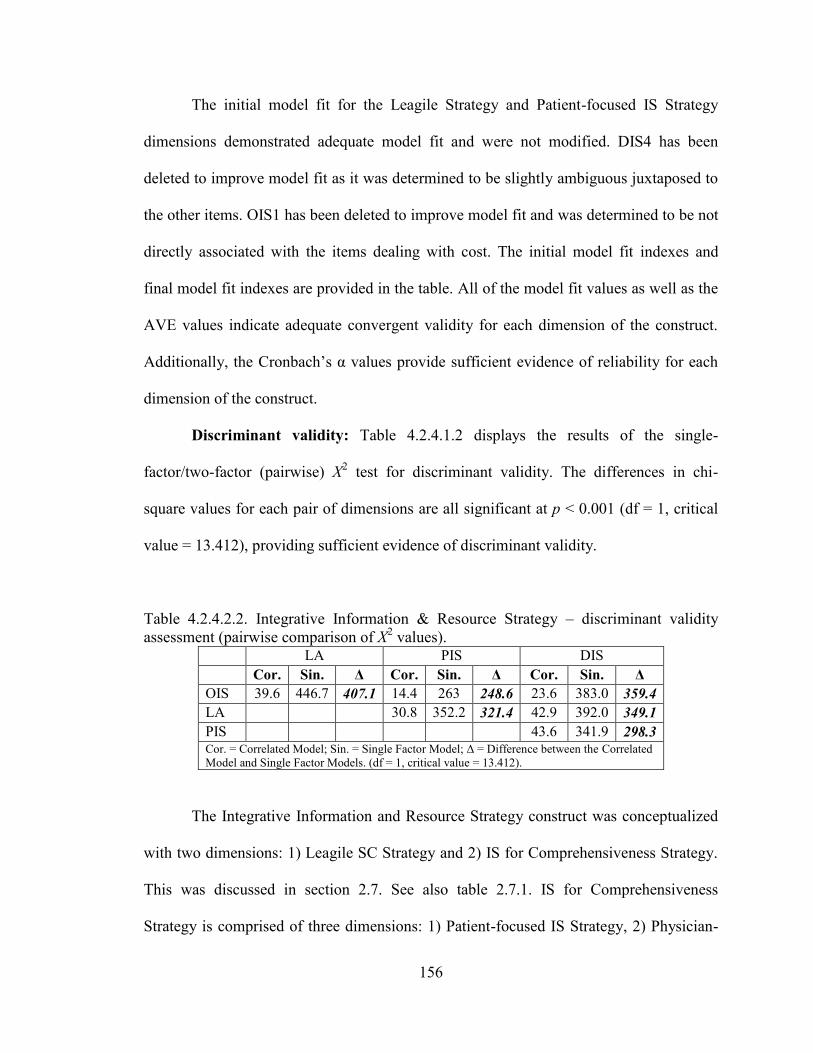
156
The initial model fit for the Leagile Strategy and Patient-focused IS Strategy
dimensions demonstrated adequate model fit and were not modified. DIS4 has been
deleted to improve model fit as it was determined to be slightly ambiguous juxtaposed to
the other items. OIS1 has been deleted to improve model fit and was determined to be not
directly associated with the items dealing with cost. The initial model fit indexes and
final model fit indexes are provided in the table. All of the model fit values as well as the
AVE values indicate adequate convergent validity for each dimension of the construct.
Additionally, the Cronbach‘s α values provide sufficient evidence of reliability for each
dimension of the construct.
Discriminant validity: Table 4.2.4.1.2 displays the results of the single-
factor/two-factor (pairwise) X2 test for discriminant validity. The differences in chi-
square values for each pair of dimensions are all significant at p < 0.001 (df = 1, critical
value = 13.412), providing sufficient evidence of discriminant validity.
Table 4.2.4.2.2. Integrative Information & Resource Strategy – discriminant validity
assessment (pairwise comparison of X2 values).
LA PIS DIS
Cor. Sin. Δ Cor. Sin. Δ Cor. Sin. Δ
OIS 39.6 446.7 407.1 14.4 263 248.6 23.6 383.0 359.4
LA 30.8 352.2 321.4 42.9 392.0 349.1
PIS 43.6 341.9 298.3 Cor. = Correlated Model; Sin. = Single Factor Model; Δ = Difference between the Correlated
Model and Single Factor Models. (df = 1, critical value = 13.412).
The Integrative Information and Resource Strategy construct was conceptualized
with two dimensions: 1) Leagile SC Strategy and 2) IS for Comprehensiveness Strategy.
This was discussed in section 2.7. See also table 2.7.1. IS for Comprehensiveness
Strategy is comprised of three dimensions: 1) Patient-focused IS Strategy, 2) Physician-
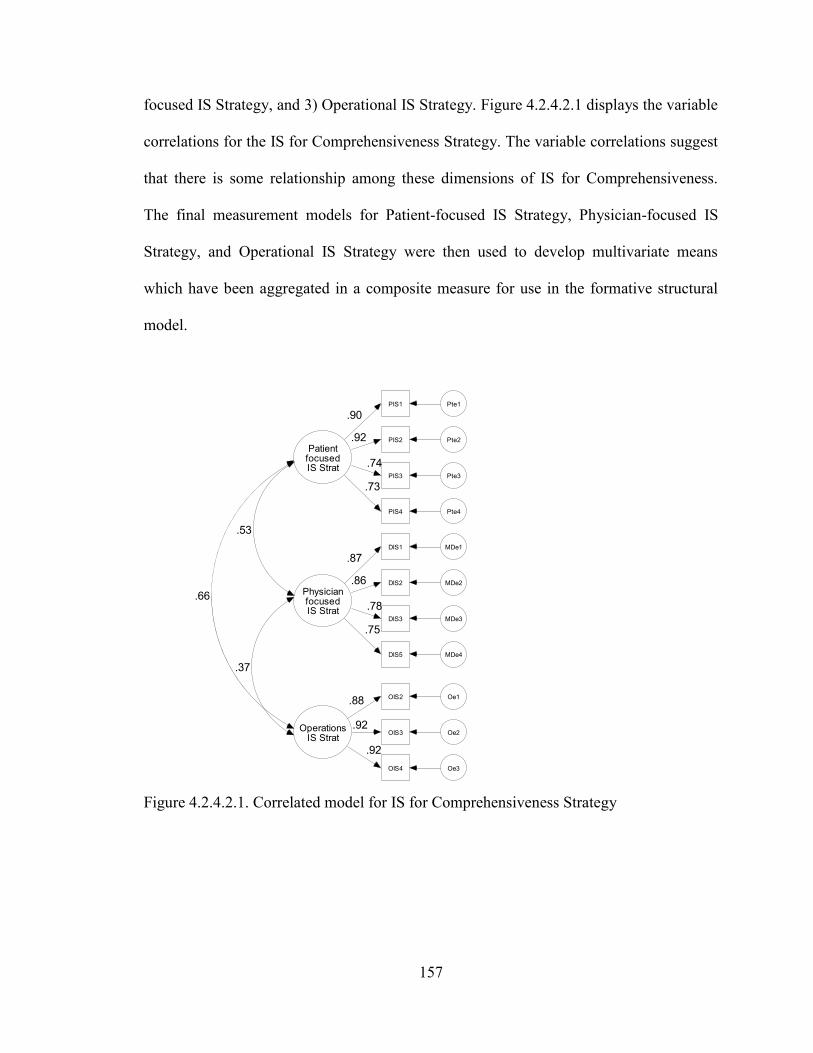
157
PatientfocusedIS Strat
PIS1 Pte1
.90
PIS2 Pte2.92
PIS3 Pte3
.74
PIS4 Pte4
.73
PhysicianfocusedIS Strat
DIS1 MDe1
DIS2 MDe2
DIS3 MDe3
DIS5 MDe4
.87
.86
.78
.75
OperationsIS Strat
OIS2 Oe1.88
OIS3 Oe2.92
OIS4 Oe3
.92
.66
.37
.53
focused IS Strategy, and 3) Operational IS Strategy. Figure 4.2.4.2.1 displays the variable
correlations for the IS for Comprehensiveness Strategy. The variable correlations suggest
that there is some relationship among these dimensions of IS for Comprehensiveness.
The final measurement models for Patient-focused IS Strategy, Physician-focused IS
Strategy, and Operational IS Strategy were then used to develop multivariate means
which have been aggregated in a composite measure for use in the formative structural
model.
Figure 4.2.4.2.1. Correlated model for IS for Comprehensiveness Strategy
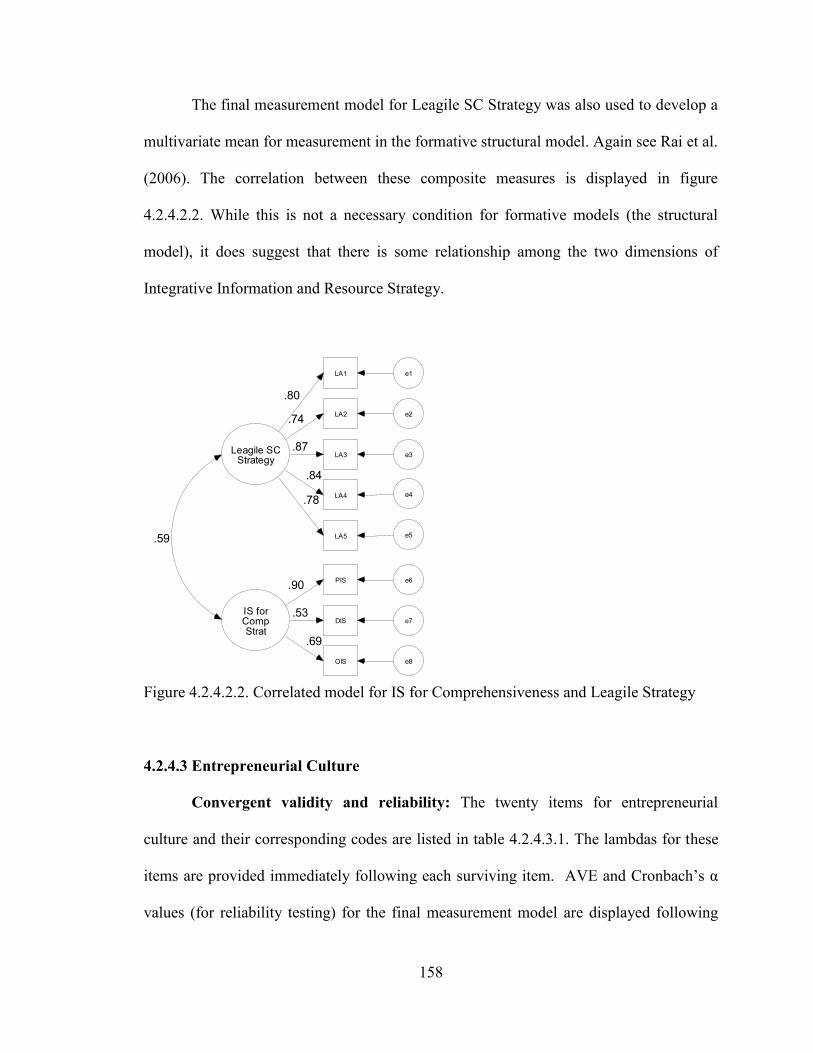
158
IS forCompStrat
PIS e6
DIS e7
OIS e8
.90
.53
.69
Leagile SCStrategy
LA1 e1
LA2 e2
LA3 e3
.80
.74
.87
LA4 e4
.84
LA5 e5
.78
.59
The final measurement model for Leagile SC Strategy was also used to develop a
multivariate mean for measurement in the formative structural model. Again see Rai et al.
(2006). The correlation between these composite measures is displayed in figure
4.2.4.2.2. While this is not a necessary condition for formative models (the structural
model), it does suggest that there is some relationship among the two dimensions of
Integrative Information and Resource Strategy.
Figure 4.2.4.2.2. Correlated model for IS for Comprehensiveness and Leagile Strategy
4.2.4.3 Entrepreneurial Culture
Convergent validity and reliability: The twenty items for entrepreneurial
culture and their corresponding codes are listed in table 4.2.4.3.1. The lambdas for these
items are provided immediately following each surviving item. AVE and Cronbach‘s α
values (for reliability testing) for the final measurement model are displayed following
159
the construct name. The items have been sequentially deleted in the CFA using AMOS in
an effort to improve convergent validity while preserving the content validity of the
construct.
The initial model fit for the Proactiveness, Autonomy, Motivation, and
Innovativeness dimensions demonstrated adequate model fit and were not modified.
ECC3 has been deleted to improve model fit as it was determined that it likely overlaps
with ECC1. The initial model fit indexes and final model fit indexes are provided in the
table. All of the model fit values as well as the AVE values indicate adequate convergent
validity for each dimension of the construct. Additionally, the Cronbach‘s α values
provide sufficient evidence of reliability for each dimension of the construct.
Discriminant validity: Table 4.2.4.3.2 displays the results of the single-
factor/two-factor (pairwise) X2 test for discriminant validity. The differences in chi-
square values for each pair of dimensions are all significant at p < 0.001 (df = 1, critical
value = 13.831), providing sufficient evidence of discriminant validity.
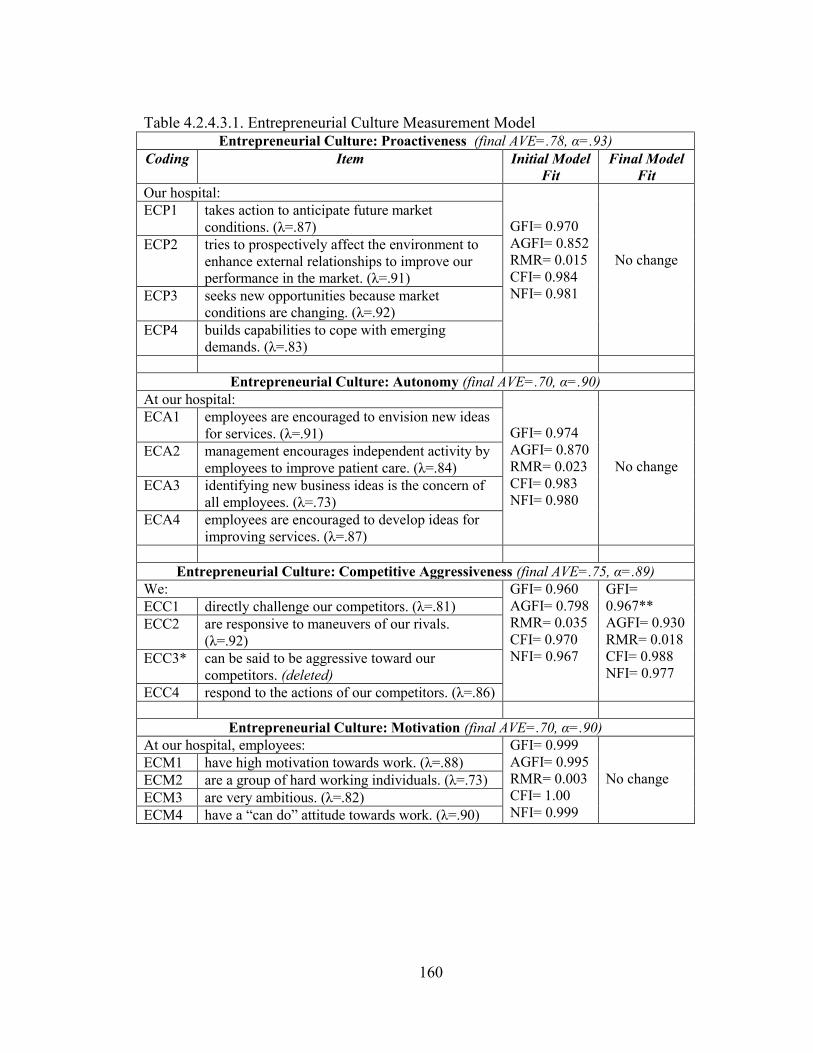
160
Table 4.2.4.3.1. Entrepreneurial Culture Measurement Model Entrepreneurial Culture: Proactiveness (final AVE=.78, α=.93)
Coding Item Initial Model
Fit
Final Model
Fit
Our hospital:
GFI= 0.970
AGFI= 0.852
RMR= 0.015
CFI= 0.984
NFI= 0.981
No change
ECP1 takes action to anticipate future market
conditions. (λ=.87)
ECP2 tries to prospectively affect the environment to
enhance external relationships to improve our
performance in the market. (λ=.91)
ECP3 seeks new opportunities because market
conditions are changing. (λ=.92)
ECP4 builds capabilities to cope with emerging
demands. (λ=.83)
Entrepreneurial Culture: Autonomy (final AVE=.70, α=.90)
At our hospital:
GFI= 0.974
AGFI= 0.870
RMR= 0.023
CFI= 0.983
NFI= 0.980
No change
ECA1 employees are encouraged to envision new ideas
for services. (λ=.91)
ECA2 management encourages independent activity by
employees to improve patient care. (λ=.84)
ECA3 identifying new business ideas is the concern of
all employees. (λ=.73)
ECA4 employees are encouraged to develop ideas for
improving services. (λ=.87)
Entrepreneurial Culture: Competitive Aggressiveness (final AVE=.75, α=.89)
We: GFI= 0.960
AGFI= 0.798
RMR= 0.035
CFI= 0.970
NFI= 0.967
GFI=
0.967**
AGFI= 0.930
RMR= 0.018
CFI= 0.988
NFI= 0.977
ECC1 directly challenge our competitors. (λ=.81)
ECC2 are responsive to maneuvers of our rivals.
(λ=.92)
ECC3* can be said to be aggressive toward our
competitors. (deleted)
ECC4 respond to the actions of our competitors. (λ=.86)
Entrepreneurial Culture: Motivation (final AVE=.70, α=.90)
At our hospital, employees: GFI= 0.999
AGFI= 0.995
RMR= 0.003
CFI= 1.00
NFI= 0.999
No change ECM1 have high motivation towards work. (λ=.88)
ECM2 are a group of hard working individuals. (λ=.73)
ECM3 are very ambitious. (λ=.82)
ECM4 have a ―can do‖ attitude towards work. (λ=.90)
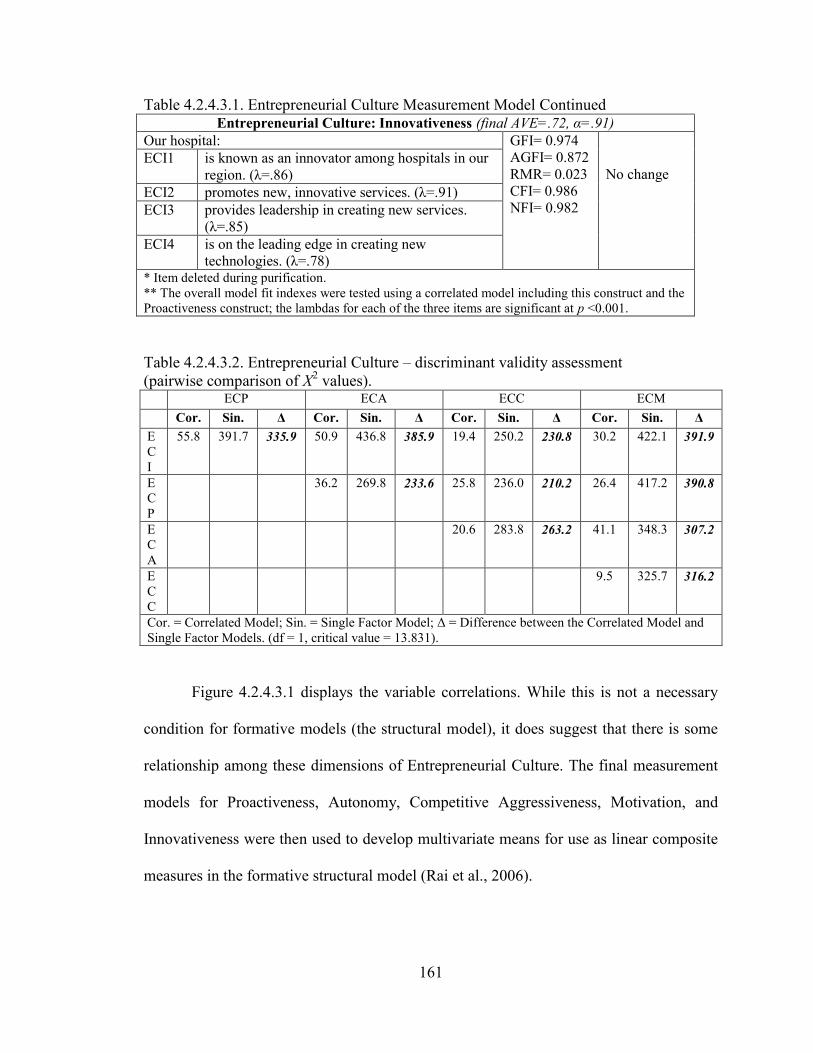
161
Table 4.2.4.3.1. Entrepreneurial Culture Measurement Model Continued
Entrepreneurial Culture: Innovativeness (final AVE=.72, α=.91)
Our hospital: GFI= 0.974
AGFI= 0.872
RMR= 0.023
CFI= 0.986
NFI= 0.982
No change ECI1 is known as an innovator among hospitals in our
region. (λ=.86)
ECI2 promotes new, innovative services. (λ=.91)
ECI3 provides leadership in creating new services.
(λ=.85)
ECI4 is on the leading edge in creating new
technologies. (λ=.78) * Item deleted during purification.
** The overall model fit indexes were tested using a correlated model including this construct and the
Proactiveness construct; the lambdas for each of the three items are significant at p <0.001.
Table 4.2.4.3.2. Entrepreneurial Culture – discriminant validity assessment
(pairwise comparison of X2 values).
ECP ECA ECC ECM
Cor. Sin. Δ Cor. Sin. Δ Cor. Sin. Δ Cor. Sin. Δ
E
C
I
55.8 391.7 335.9 50.9 436.8 385.9 19.4 250.2 230.8 30.2 422.1 391.9
E
C
P
36.2 269.8 233.6 25.8 236.0 210.2 26.4 417.2 390.8
E
C
A
20.6 283.8 263.2 41.1 348.3 307.2
E
C
C
9.5 325.7 316.2
Cor. = Correlated Model; Sin. = Single Factor Model; Δ = Difference between the Correlated Model and
Single Factor Models. (df = 1, critical value = 13.831).
Figure 4.2.4.3.1 displays the variable correlations. While this is not a necessary
condition for formative models (the structural model), it does suggest that there is some
relationship among these dimensions of Entrepreneurial Culture. The final measurement
models for Proactiveness, Autonomy, Competitive Aggressiveness, Motivation, and
Innovativeness were then used to develop multivariate means for use as linear composite
measures in the formative structural model (Rai et al., 2006).
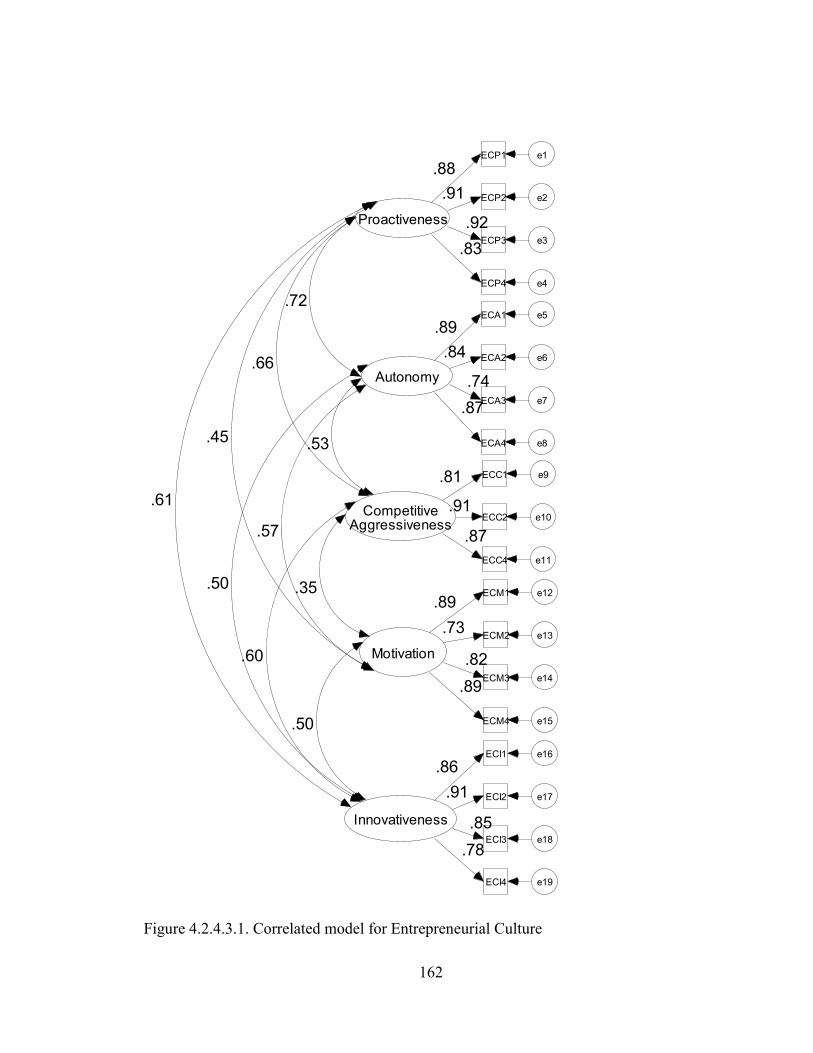
162
Proactiveness
ECP1 e1
.88
ECP2 e2.91
ECP3 e3
.92
ECP4 e4
.83
Autonomy
ECA1 e5
ECA2 e6
ECA3 e7
ECA4 e8
.89
.84
.74
.87
CompetitiveAggressiveness
ECC1 e9.81
ECC2 e10.91
ECC4 e11
.87
Motivation
ECM1 e12
ECM2 e13
ECM3 e14
ECM4 e15
.89
.73
.82
.89
Innovativeness
ECI1 e16
ECI2 e17
ECI3 e18
ECI4 e19
.86
.91
.85
.78
.61
.50
.60
.50
.45
.57
.35
.66
.53
.72
Figure 4.2.4.3.1. Correlated model for Entrepreneurial Culture
163
4.2.4.4 Integrative Supply Chain Practices
Convergent validity and reliability: The fifty-three items for Integrative SC
Practices and their corresponding codes are listed in table 4.2.4.4.1 (which is a 2 page
table). The lambdas for these items are provided immediately following each surviving
item. AVE and Cronbach‘s α values (for reliability testing) for the final measurement
model are displayed following the construct name. The items have been sequentially
deleted in the CFA using AMOS in an effort to improve convergent validity while
preserving the content validity of the construct.
The initial model fit for the Lean Principles, Patient Relationship, Strategic
Physician Partnership, and Information Sharing dimensions demonstrated adequate
model fit and were not modified. RF1 and RF6 have been deleted to improve model fit as
a review of the wording of these items reveals that they do not appear to be as closely
related to actual patient care as the other items. ECD1, ECD5, ECD6, and ECD7 have
been deleted to improve model fit as these appear to capture phenomena which are less
directly related to patient care in the inpatient setting than is true for the remaining items.
For example, information about patient demographics, discharge summaries, and
advanced directives are less likely to influence patient care during an inpatient stay than
would information about problem (complaint) lists, nursing assessments, or physicians
notes. ERV5 has been deleted to improve model fit most likely because it overlaps with
the other items. While ERV6 demonstrates a low lambda value (.43), the item has been
retained owing to its theoretical measurement significance. CPOE4 and CPOE5 have
been deleted to improve model fit because these items (consultants reports and nursing
orders) would not typically be ‗ordered,‘ but instead would reside in the electronic chart.
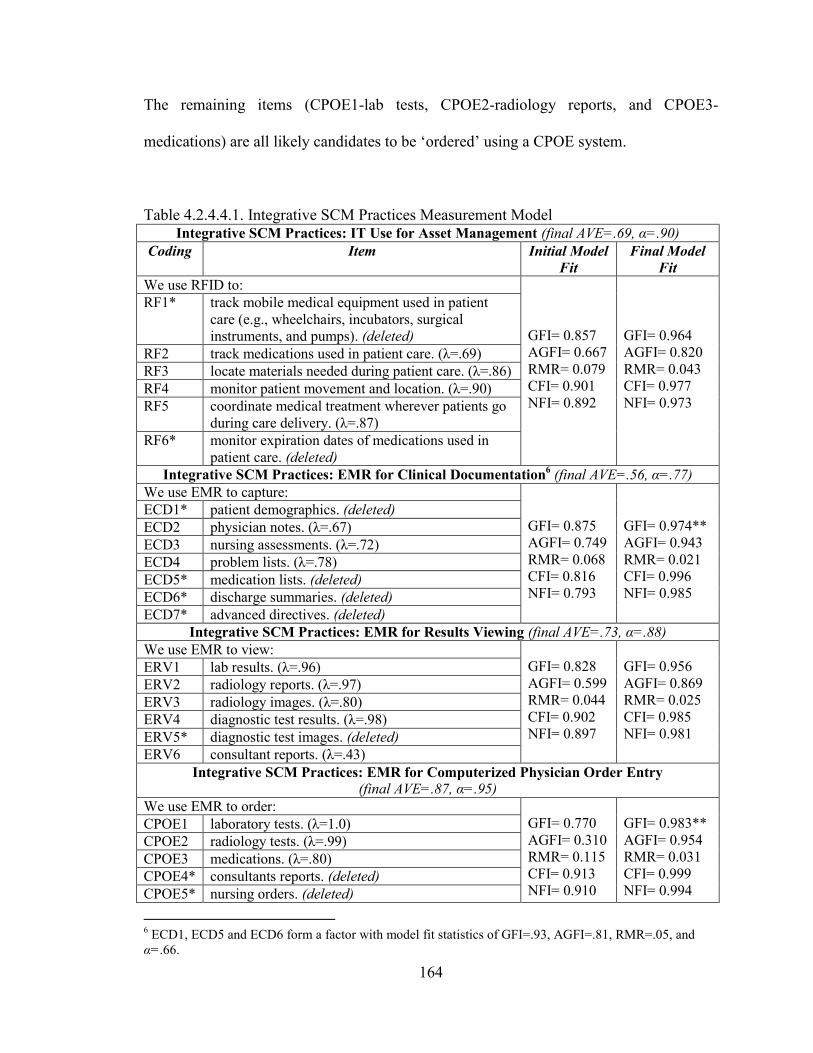
164
The remaining items (CPOE1-lab tests, CPOE2-radiology reports, and CPOE3-
medications) are all likely candidates to be ‗ordered‘ using a CPOE system.
Table 4.2.4.4.1. Integrative SCM Practices Measurement Model Integrative SCM Practices: IT Use for Asset Management (final AVE=.69, α=.90)
Coding Item Initial Model
Fit
Final Model
Fit
We use RFID to:
GFI= 0.857
AGFI= 0.667
RMR= 0.079
CFI= 0.901
NFI= 0.892
GFI= 0.964
AGFI= 0.820
RMR= 0.043
CFI= 0.977
NFI= 0.973
RF1* track mobile medical equipment used in patient
care (e.g., wheelchairs, incubators, surgical
instruments, and pumps). (deleted)
RF2 track medications used in patient care. (λ=.69)
RF3 locate materials needed during patient care. (λ=.86)
RF4 monitor patient movement and location. (λ=.90)
RF5 coordinate medical treatment wherever patients go
during care delivery. (λ=.87)
RF6* monitor expiration dates of medications used in
patient care. (deleted)
Integrative SCM Practices: EMR for Clinical Documentation6 (final AVE=.56, α=.77)
We use EMR to capture:
GFI= 0.875
AGFI= 0.749
RMR= 0.068
CFI= 0.816
NFI= 0.793
GFI= 0.974**
AGFI= 0.943
RMR= 0.021
CFI= 0.996
NFI= 0.985
ECD1* patient demographics. (deleted)
ECD2 physician notes. (λ=.67)
ECD3 nursing assessments. (λ=.72)
ECD4 problem lists. (λ=.78)
ECD5* medication lists. (deleted)
ECD6* discharge summaries. (deleted)
ECD7* advanced directives. (deleted)
Integrative SCM Practices: EMR for Results Viewing (final AVE=.73, α=.88)
We use EMR to view:
GFI= 0.828
AGFI= 0.599
RMR= 0.044
CFI= 0.902
NFI= 0.897
GFI= 0.956
AGFI= 0.869
RMR= 0.025
CFI= 0.985
NFI= 0.981
ERV1 lab results. (λ=.96)
ERV2 radiology reports. (λ=.97)
ERV3 radiology images. (λ=.80)
ERV4 diagnostic test results. (λ=.98)
ERV5* diagnostic test images. (deleted)
ERV6 consultant reports. (λ=.43)
Integrative SCM Practices: EMR for Computerized Physician Order Entry
(final AVE=.87, α=.95)
We use EMR to order:
GFI= 0.770
AGFI= 0.310
RMR= 0.115
CFI= 0.913
NFI= 0.910
GFI= 0.983**
AGFI= 0.954
RMR= 0.031
CFI= 0.999
NFI= 0.994
CPOE1 laboratory tests. (λ=1.0)
CPOE2 radiology tests. (λ=.99)
CPOE3 medications. (λ=.80)
CPOE4* consultants reports. (deleted)
CPOE5* nursing orders. (deleted)
6 ECD1, ECD5 and ECD6 form a factor with model fit statistics of GFI=.93, AGFI=.81, RMR=.05, and
α=.66.
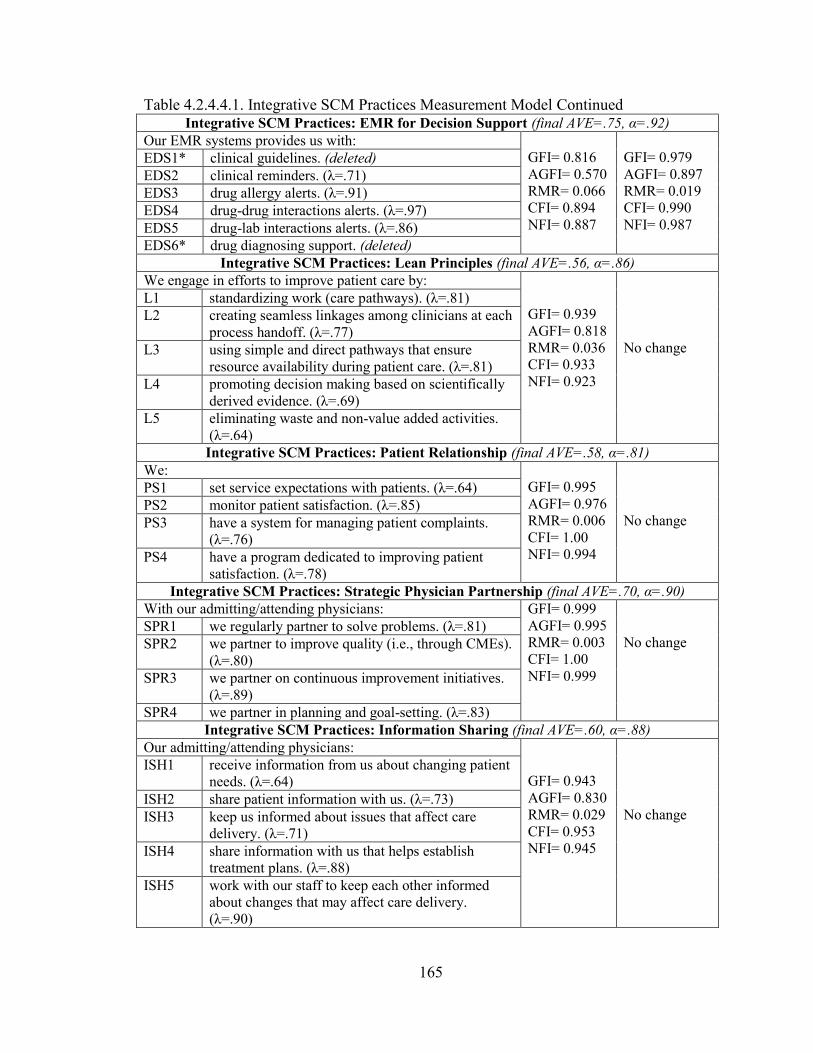
165
Table 4.2.4.4.1. Integrative SCM Practices Measurement Model Continued Integrative SCM Practices: EMR for Decision Support (final AVE=.75, α=.92)
Our EMR systems provides us with:
GFI= 0.816
AGFI= 0.570
RMR= 0.066
CFI= 0.894
NFI= 0.887
GFI= 0.979
AGFI= 0.897
RMR= 0.019
CFI= 0.990
NFI= 0.987
EDS1* clinical guidelines. (deleted)
EDS2 clinical reminders. (λ=.71)
EDS3 drug allergy alerts. (λ=.91)
EDS4 drug-drug interactions alerts. (λ=.97)
EDS5 drug-lab interactions alerts. (λ=.86)
EDS6* drug diagnosing support. (deleted)
Integrative SCM Practices: Lean Principles (final AVE=.56, α=.86)
We engage in efforts to improve patient care by:
GFI= 0.939
AGFI= 0.818
RMR= 0.036
CFI= 0.933
NFI= 0.923
No change
L1 standardizing work (care pathways). (λ=.81)
L2 creating seamless linkages among clinicians at each
process handoff. (λ=.77)
L3 using simple and direct pathways that ensure
resource availability during patient care. (λ=.81)
L4 promoting decision making based on scientifically
derived evidence. (λ=.69)
L5 eliminating waste and non-value added activities.
(λ=.64)
Integrative SCM Practices: Patient Relationship (final AVE=.58, α=.81)
We:
GFI= 0.995
AGFI= 0.976
RMR= 0.006
CFI= 1.00
NFI= 0.994
No change
PS1 set service expectations with patients. (λ=.64)
PS2 monitor patient satisfaction. (λ=.85)
PS3 have a system for managing patient complaints.
(λ=.76)
PS4 have a program dedicated to improving patient
satisfaction. (λ=.78)
Integrative SCM Practices: Strategic Physician Partnership (final AVE=.70, α=.90)
With our admitting/attending physicians: GFI= 0.999
AGFI= 0.995
RMR= 0.003
CFI= 1.00
NFI= 0.999
No change SPR1 we regularly partner to solve problems. (λ=.81)
SPR2 we partner to improve quality (i.e., through CMEs).
(λ=.80)
SPR3 we partner on continuous improvement initiatives.
(λ=.89)
SPR4 we partner in planning and goal-setting. (λ=.83)
Integrative SCM Practices: Information Sharing (final AVE=.60, α=.88)
Our admitting/attending physicians:
GFI= 0.943
AGFI= 0.830
RMR= 0.029
CFI= 0.953
NFI= 0.945
No change
ISH1 receive information from us about changing patient
needs. (λ=.64)
ISH2 share patient information with us. (λ=.73)
ISH3 keep us informed about issues that affect care
delivery. (λ=.71)
ISH4 share information with us that helps establish
treatment plans. (λ=.88)
ISH5 work with our staff to keep each other informed
about changes that may affect care delivery.
(λ=.90)
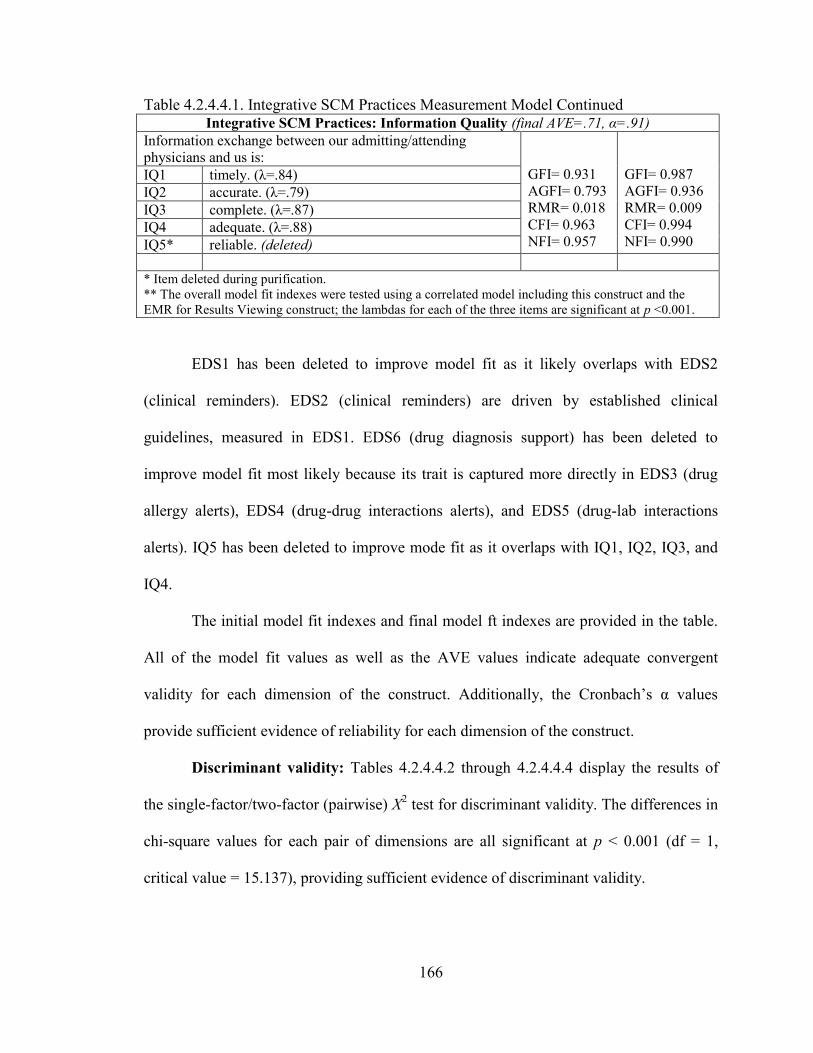
166
Table 4.2.4.4.1. Integrative SCM Practices Measurement Model Continued
Integrative SCM Practices: Information Quality (final AVE=.71, α=.91)
Information exchange between our admitting/attending
physicians and us is:
GFI= 0.931
AGFI= 0.793
RMR= 0.018
CFI= 0.963
NFI= 0.957
GFI= 0.987
AGFI= 0.936
RMR= 0.009
CFI= 0.994
NFI= 0.990
IQ1 timely. (λ=.84)
IQ2 accurate. (λ=.79)
IQ3 complete. (λ=.87)
IQ4 adequate. (λ=.88)
IQ5* reliable. (deleted)
* Item deleted during purification.
** The overall model fit indexes were tested using a correlated model including this construct and the
EMR for Results Viewing construct; the lambdas for each of the three items are significant at p <0.001.
EDS1 has been deleted to improve model fit as it likely overlaps with EDS2
(clinical reminders). EDS2 (clinical reminders) are driven by established clinical
guidelines, measured in EDS1. EDS6 (drug diagnosis support) has been deleted to
improve model fit most likely because its trait is captured more directly in EDS3 (drug
allergy alerts), EDS4 (drug-drug interactions alerts), and EDS5 (drug-lab interactions
alerts). IQ5 has been deleted to improve mode fit as it overlaps with IQ1, IQ2, IQ3, and
IQ4.
The initial model fit indexes and final model ft indexes are provided in the table.
All of the model fit values as well as the AVE values indicate adequate convergent
validity for each dimension of the construct. Additionally, the Cronbach‘s α values
provide sufficient evidence of reliability for each dimension of the construct.
Discriminant validity: Tables 4.2.4.4.2 through 4.2.4.4.4 display the results of
the single-factor/two-factor (pairwise) X2 test for discriminant validity. The differences in
chi-square values for each pair of dimensions are all significant at p < 0.001 (df = 1,
critical value = 15.137), providing sufficient evidence of discriminant validity.
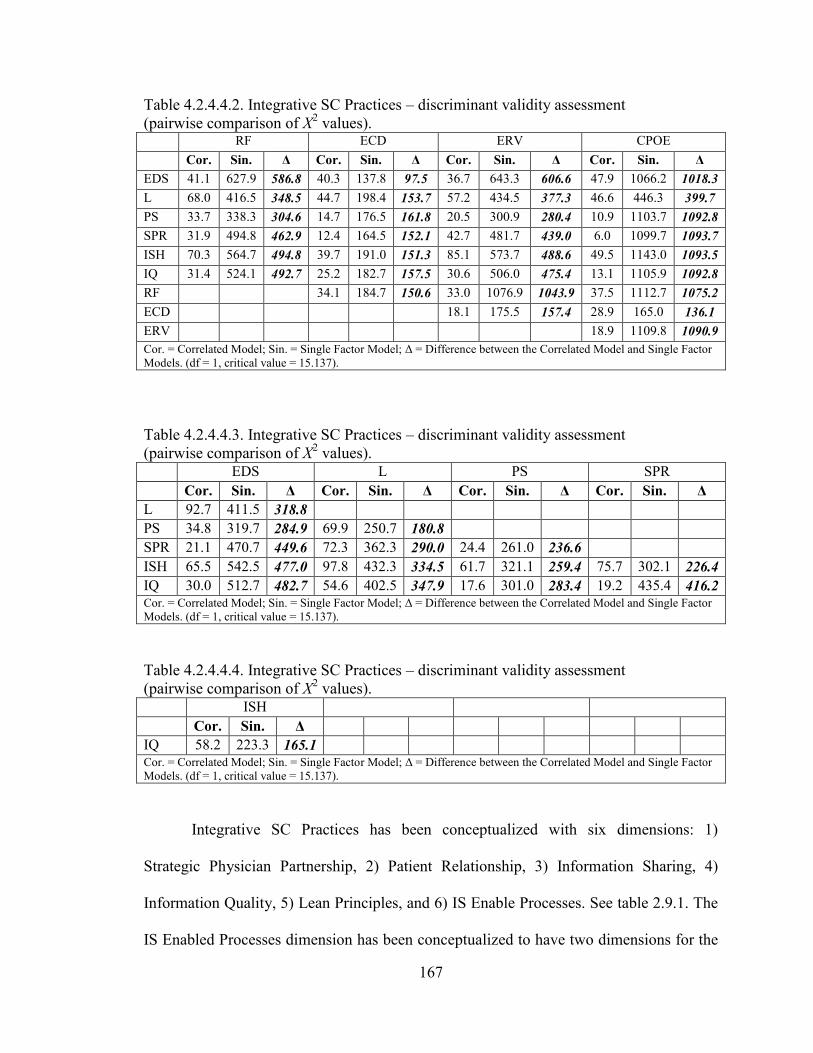
167
Table 4.2.4.4.2. Integrative SC Practices – discriminant validity assessment
(pairwise comparison of X2 values).
RF ECD ERV CPOE
Cor. Sin. Δ Cor. Sin. Δ Cor. Sin. Δ Cor. Sin. Δ
EDS 41.1 627.9 586.8 40.3 137.8 97.5 36.7 643.3 606.6 47.9 1066.2 1018.3
L 68.0 416.5 348.5 44.7 198.4 153.7 57.2 434.5 377.3 46.6 446.3 399.7
PS 33.7 338.3 304.6 14.7 176.5 161.8 20.5 300.9 280.4 10.9 1103.7 1092.8
SPR 31.9 494.8 462.9 12.4 164.5 152.1 42.7 481.7 439.0 6.0 1099.7 1093.7
ISH 70.3 564.7 494.8 39.7 191.0 151.3 85.1 573.7 488.6 49.5 1143.0 1093.5
IQ 31.4 524.1 492.7 25.2 182.7 157.5 30.6 506.0 475.4 13.1 1105.9 1092.8
RF 34.1 184.7 150.6 33.0 1076.9 1043.9 37.5 1112.7 1075.2
ECD 18.1 175.5 157.4 28.9 165.0 136.1
ERV 18.9 1109.8 1090.9
Cor. = Correlated Model; Sin. = Single Factor Model; Δ = Difference between the Correlated Model and Single Factor
Models. (df = 1, critical value = 15.137).
Table 4.2.4.4.3. Integrative SC Practices – discriminant validity assessment
(pairwise comparison of X2 values).
EDS L PS SPR
Cor. Sin. Δ Cor. Sin. Δ Cor. Sin. Δ Cor. Sin. Δ
L 92.7 411.5 318.8
PS 34.8 319.7 284.9 69.9 250.7 180.8
SPR 21.1 470.7 449.6 72.3 362.3 290.0 24.4 261.0 236.6
ISH 65.5 542.5 477.0 97.8 432.3 334.5 61.7 321.1 259.4 75.7 302.1 226.4
IQ 30.0 512.7 482.7 54.6 402.5 347.9 17.6 301.0 283.4 19.2 435.4 416.2 Cor. = Correlated Model; Sin. = Single Factor Model; Δ = Difference between the Correlated Model and Single Factor
Models. (df = 1, critical value = 15.137).
Table 4.2.4.4.4. Integrative SC Practices – discriminant validity assessment
(pairwise comparison of X2 values).
ISH
Cor. Sin. Δ
IQ 58.2 223.3 165.1 Cor. = Correlated Model; Sin. = Single Factor Model; Δ = Difference between the Correlated Model and Single Factor
Models. (df = 1, critical value = 15.137).
Integrative SC Practices has been conceptualized with six dimensions: 1)
Strategic Physician Partnership, 2) Patient Relationship, 3) Information Sharing, 4)
Information Quality, 5) Lean Principles, and 6) IS Enable Processes. See table 2.9.1. The
IS Enabled Processes dimension has been conceptualized to have two dimensions for the
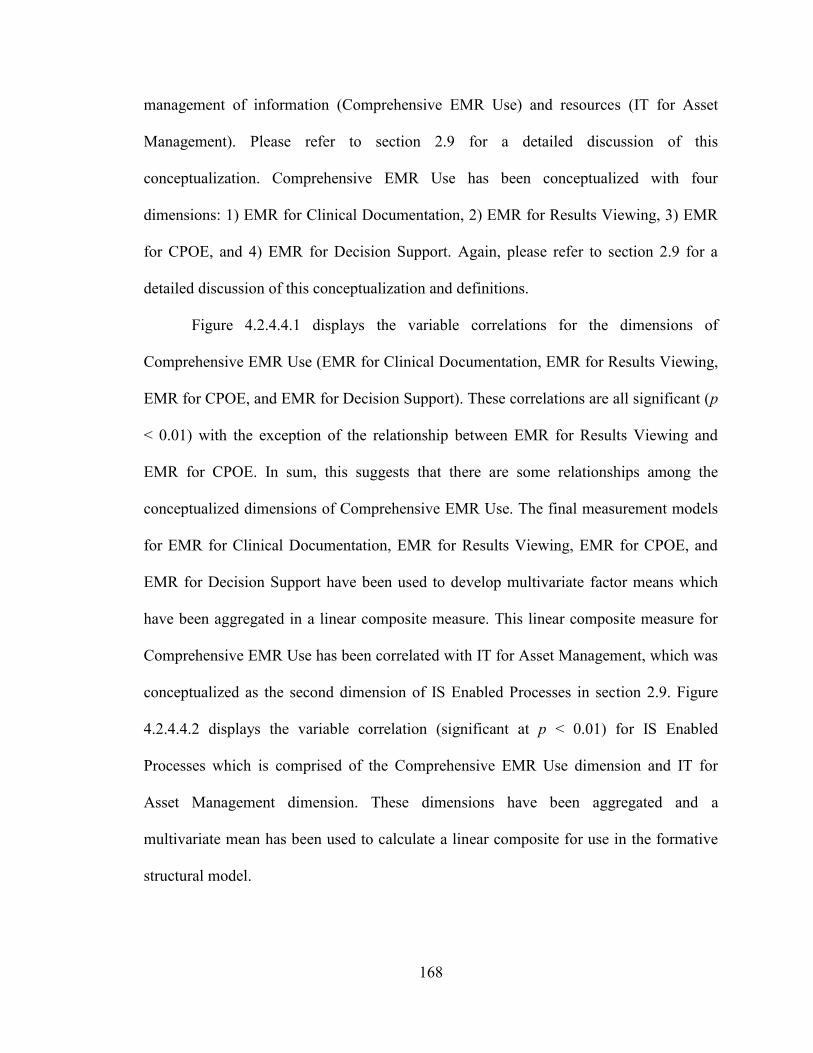
168
management of information (Comprehensive EMR Use) and resources (IT for Asset
Management). Please refer to section 2.9 for a detailed discussion of this
conceptualization. Comprehensive EMR Use has been conceptualized with four
dimensions: 1) EMR for Clinical Documentation, 2) EMR for Results Viewing, 3) EMR
for CPOE, and 4) EMR for Decision Support. Again, please refer to section 2.9 for a
detailed discussion of this conceptualization and definitions.
Figure 4.2.4.4.1 displays the variable correlations for the dimensions of
Comprehensive EMR Use (EMR for Clinical Documentation, EMR for Results Viewing,
EMR for CPOE, and EMR for Decision Support). These correlations are all significant (p
< 0.01) with the exception of the relationship between EMR for Results Viewing and
EMR for CPOE. In sum, this suggests that there are some relationships among the
conceptualized dimensions of Comprehensive EMR Use. The final measurement models
for EMR for Clinical Documentation, EMR for Results Viewing, EMR for CPOE, and
EMR for Decision Support have been used to develop multivariate factor means which
have been aggregated in a linear composite measure. This linear composite measure for
Comprehensive EMR Use has been correlated with IT for Asset Management, which was
conceptualized as the second dimension of IS Enabled Processes in section 2.9. Figure
4.2.4.4.2 displays the variable correlation (significant at p < 0.01) for IS Enabled
Processes which is comprised of the Comprehensive EMR Use dimension and IT for
Asset Management dimension. These dimensions have been aggregated and a
multivariate mean has been used to calculate a linear composite for use in the formative
structural model.
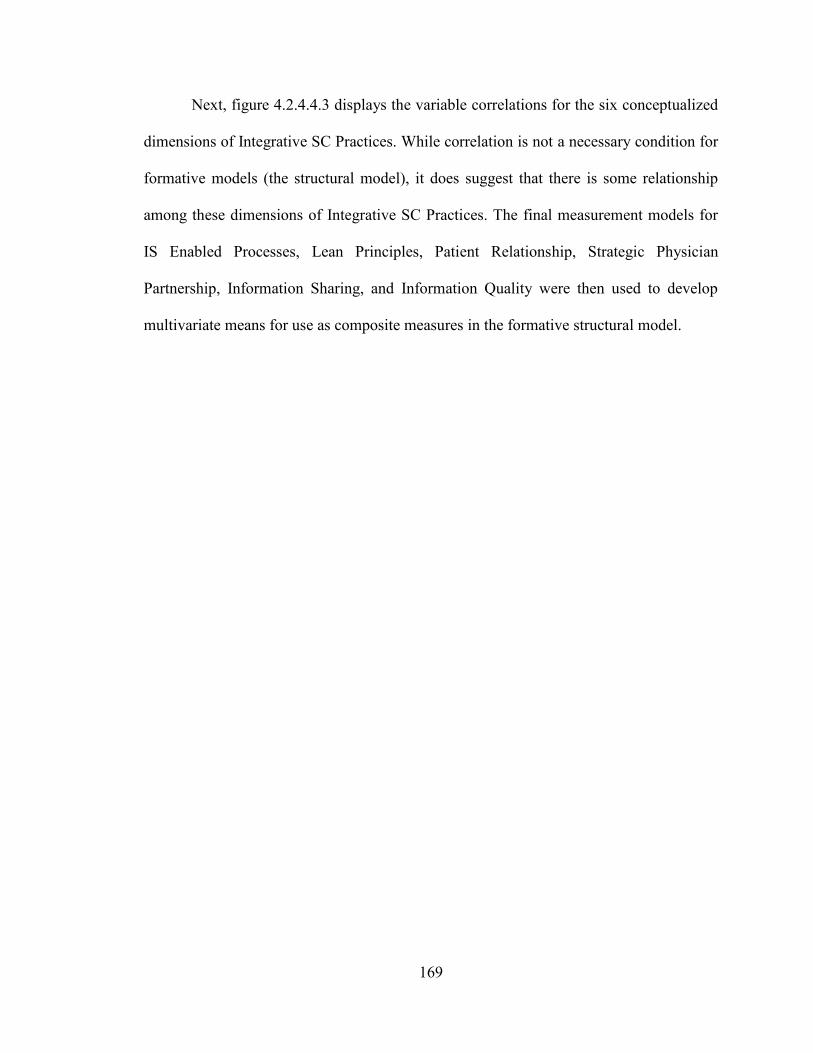
169
Next, figure 4.2.4.4.3 displays the variable correlations for the six conceptualized
dimensions of Integrative SC Practices. While correlation is not a necessary condition for
formative models (the structural model), it does suggest that there is some relationship
among these dimensions of Integrative SC Practices. The final measurement models for
IS Enabled Processes, Lean Principles, Patient Relationship, Strategic Physician
Partnership, Information Sharing, and Information Quality were then used to develop
multivariate means for use as composite measures in the formative structural model.
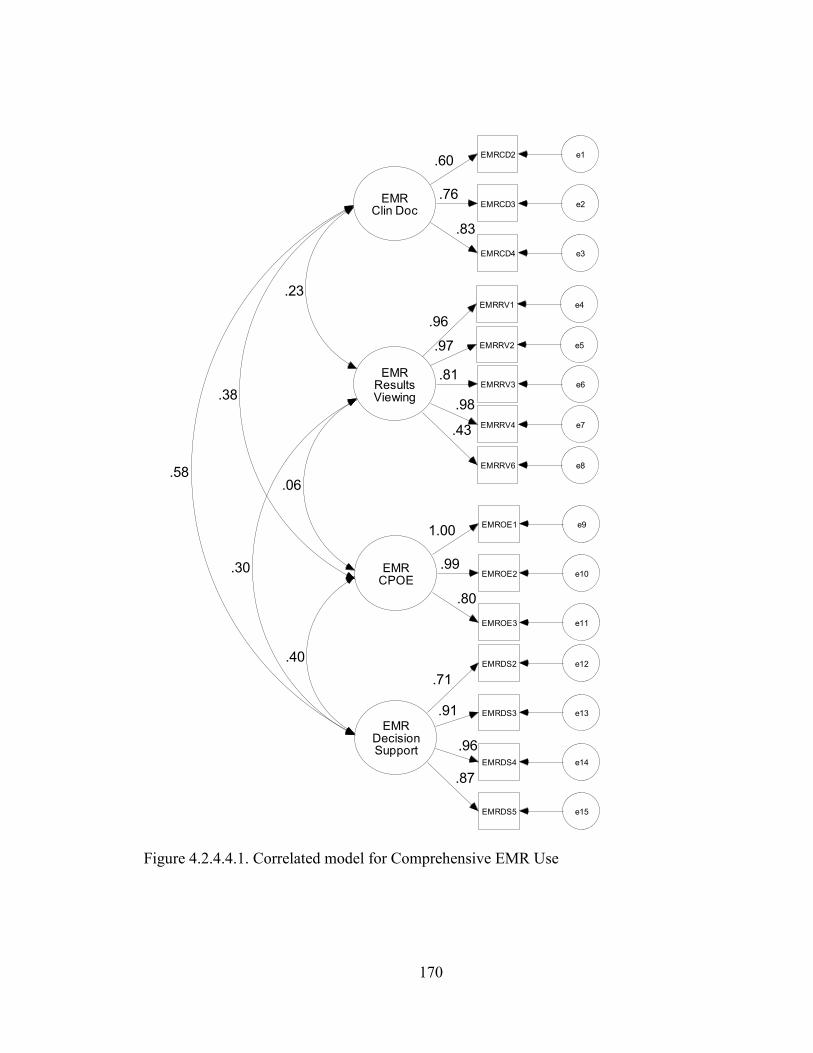
170
EMRResultsViewing
EMRRV1 e4
.96
EMRRV2 e5.97
EMRRV3 e6.81
EMRClin Doc
EMRRV4 e7
.98
EMRCD2 e1.60
EMRCD3 e2.76
EMRCD4 e3
.83
EMRDecisionSupport
EMRDS2 e12
EMRDS3 e13
EMRDS4 e14
EMRDS5 e15
.71
.91
.96
.87
EMRCPOE
EMROE1 e9
EMROE2 e10
EMROE3 e11
1.00
.99
.80
.58
.40
.30
.38
.23
.06
EMRRV6 e8
.43
Figure 4.2.4.4.1. Correlated model for Comprehensive EMR Use
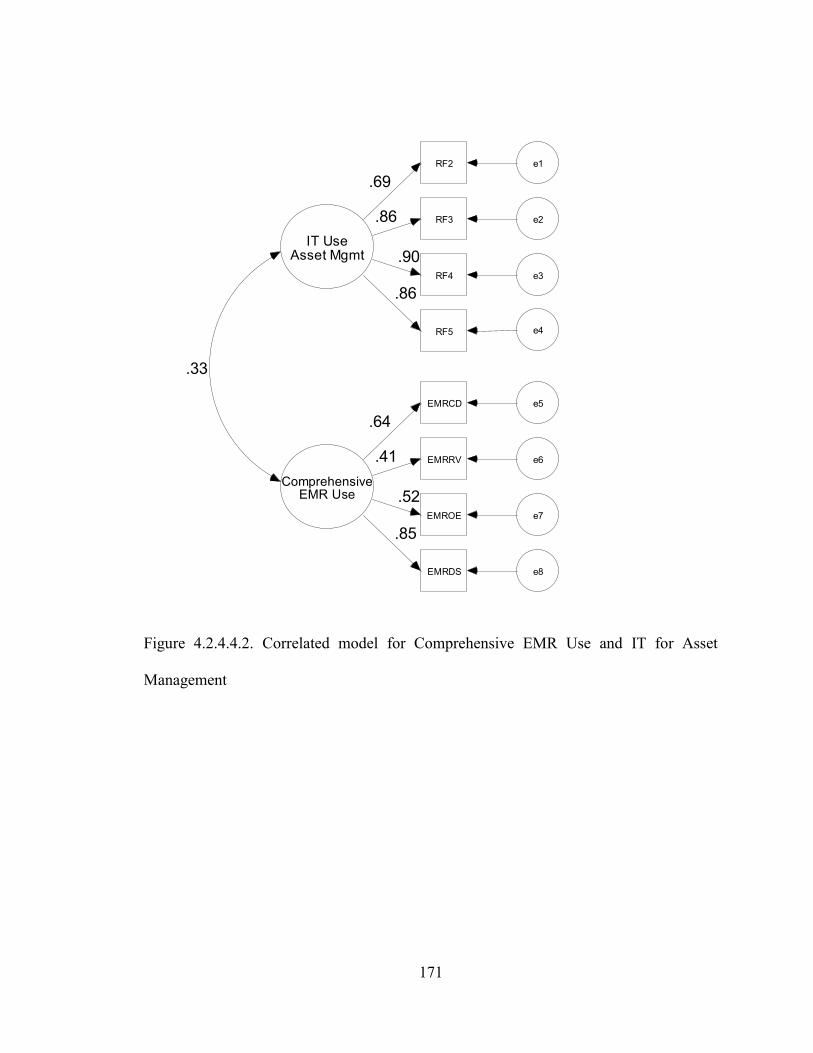
171
ComprehensiveEMR Use
EMRCD e5
.64
EMRRV e6.41
EMROE e7
.52
IT UseAsset Mgmt
RF2 e1
RF3 e2
RF4 e3
.69
.86
.90
RF5 e4
.86
EMRDS e8
.85
.33
Figure 4.2.4.4.2. Correlated model for Comprehensive EMR Use and IT for Asset
Management
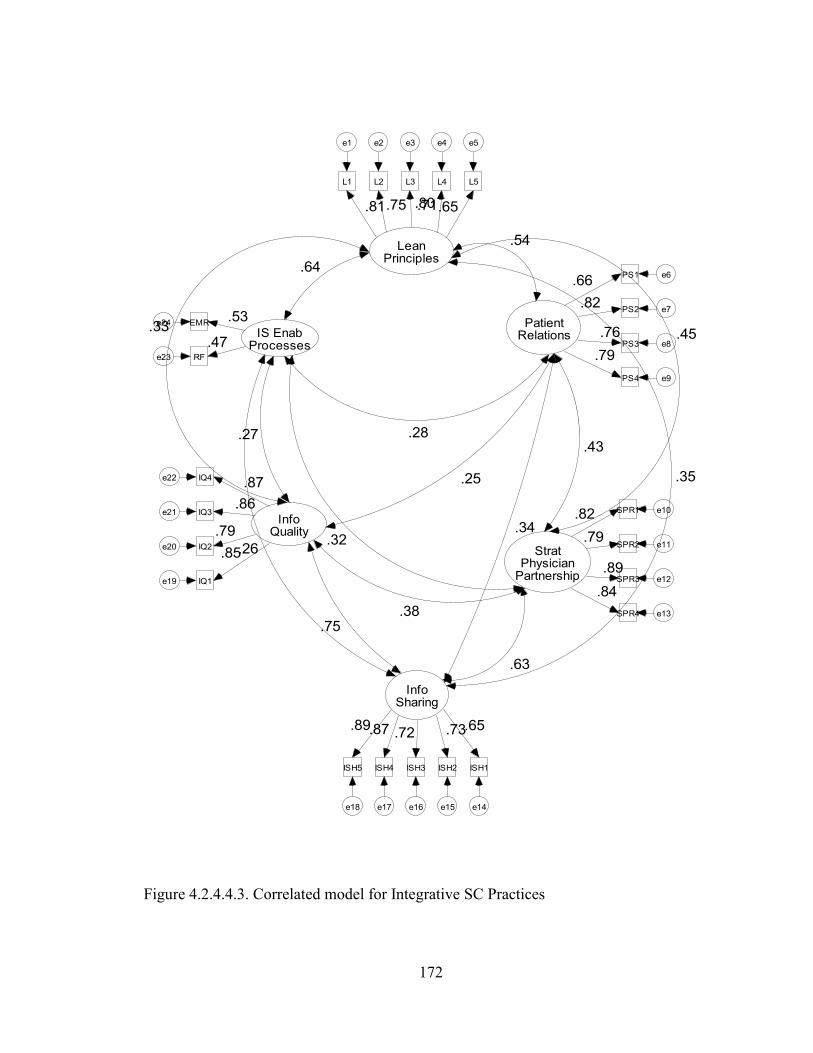
172
LeanPrinciples
L1
e1
.81
L2
e2
.75
L3
e3
.80
L4
e4
.71
L5
e5
.65
PatientRelations
PS1 e6.66
PS2 e7.82
PS3 e8.76
PS4 e9
.79
StratPhysician
Partnership
SPR1 e10
SPR2 e11
SPR3 e12
SPR4 e13
.82
.79
.89
.84
InfoSharing
ISH1
e14
ISH2
e15
ISH3
e16
ISH4
e17
ISH5
e18
.65.73.72.87.89
InfoQuality
IQ1e19
IQ2e20
IQ3e21
IQ4e22
.85
.79
.86
.87
IS EnabProcesses
RFe23
EMRe24
.47
.53
.54
.45
.35
.33
.64
.43
.34
.25
.28
.63
.38
.32
.75
.26
.27
Figure 4.2.4.4.3. Correlated model for Integrative SC Practices
173
4.2.4.5 Value Dense Environment
Convergent validity and reliability: The fourteen items for the Value Dense
Environment construct and their corresponding codes are listed in table 4.2.4.5.1. The
lambdas for these items are provided immediately following each surviving item. AVE
and Cronbach‘s α values (for reliability testing) for the final measurement model are
displayed following the construct name. The items have been sequentially deleted in the
CFA using AMOS in an effort to improve convergent validity while preserving the
content validity of the construct.
VDW1 (physicians orders), VDW2 (consultants reports), and VDW6 (treatment
protocols) have been deleted to improve model fit as it was determined that these were
likely viewed by respondents as operand knowledge generated by actors outside of the
hospital (focal firm). Given that the respondent was answering the questionnaire from the
perspective of the hospital, this distinction may have caused the respondent to believe
that ‗their staff‘ would not find utility in items such as consultant reports and treatment
protocol as those are used primarily by physicians in treating patients. VDH4
(competence) has been deleted to improve model fit as it overlaps with the remaining
three items. VDR4 (facilities) has been deleted to improve model fit as it was not likely
viewed as a resource directly related to patient care as would likely be the case with the
remaining items. The initial model fit indexes and final model fit indexes are provided in
the table. All of the model fit values as well as the AVE values indicate adequate
convergent validity for each dimension of the construct. Additionally, the Cronbach‘s α
values provide sufficient evidence of reliability for each dimension of the construct.
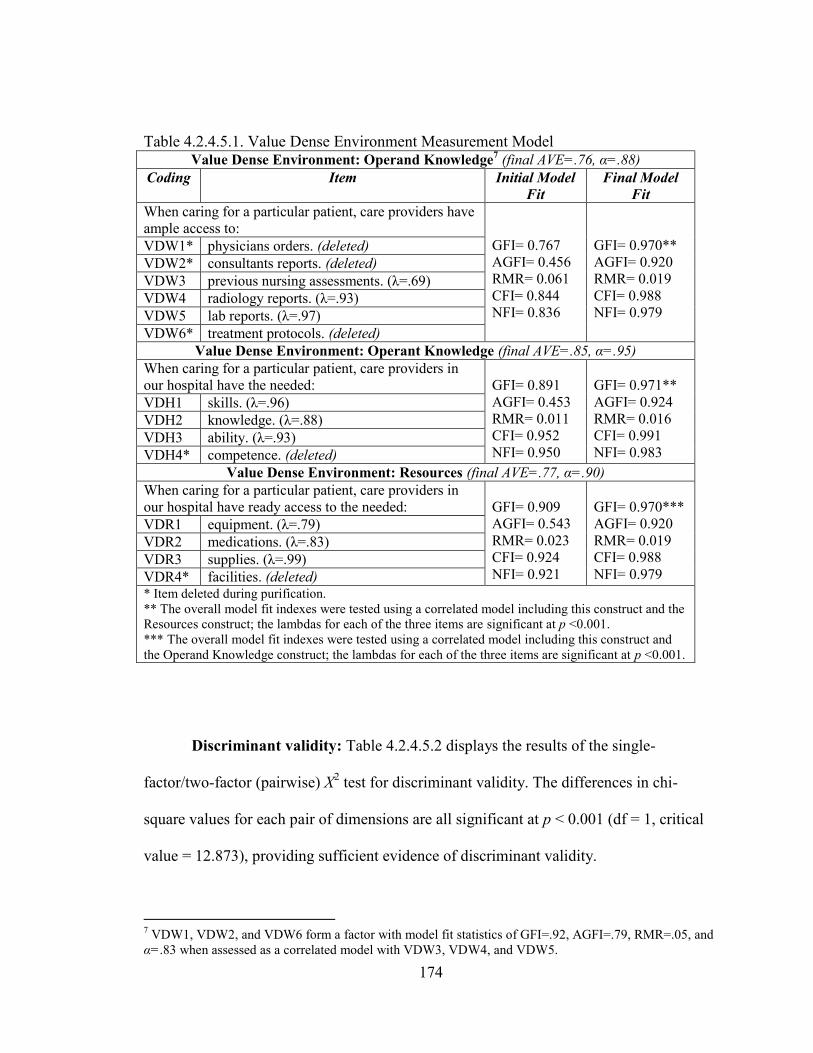
174
Table 4.2.4.5.1. Value Dense Environment Measurement Model Value Dense Environment: Operand Knowledge
7 (final AVE=.76, α=.88)
Coding Item Initial Model
Fit
Final Model
Fit
When caring for a particular patient, care providers have
ample access to:
GFI= 0.767
AGFI= 0.456
RMR= 0.061
CFI= 0.844
NFI= 0.836
GFI= 0.970**
AGFI= 0.920
RMR= 0.019
CFI= 0.988
NFI= 0.979
VDW1* physicians orders. (deleted)
VDW2* consultants reports. (deleted)
VDW3 previous nursing assessments. (λ=.69)
VDW4 radiology reports. (λ=.93)
VDW5 lab reports. (λ=.97)
VDW6* treatment protocols. (deleted)
Value Dense Environment: Operant Knowledge (final AVE=.85, α=.95)
When caring for a particular patient, care providers in
our hospital have the needed:
GFI= 0.891
AGFI= 0.453
RMR= 0.011
CFI= 0.952
NFI= 0.950
GFI= 0.971**
AGFI= 0.924
RMR= 0.016
CFI= 0.991
NFI= 0.983
VDH1 skills. (λ=.96)
VDH2 knowledge. (λ=.88)
VDH3 ability. (λ=.93)
VDH4* competence. (deleted)
Value Dense Environment: Resources (final AVE=.77, α=.90)
When caring for a particular patient, care providers in
our hospital have ready access to the needed:
GFI= 0.909
AGFI= 0.543
RMR= 0.023
CFI= 0.924
NFI= 0.921
GFI= 0.970***
AGFI= 0.920
RMR= 0.019
CFI= 0.988
NFI= 0.979
VDR1 equipment. (λ=.79)
VDR2 medications. (λ=.83)
VDR3 supplies. (λ=.99)
VDR4* facilities. (deleted) * Item deleted during purification.
** The overall model fit indexes were tested using a correlated model including this construct and the
Resources construct; the lambdas for each of the three items are significant at p <0.001.
*** The overall model fit indexes were tested using a correlated model including this construct and
the Operand Knowledge construct; the lambdas for each of the three items are significant at p <0.001.
Discriminant validity: Table 4.2.4.5.2 displays the results of the single-
factor/two-factor (pairwise) X2 test for discriminant validity. The differences in chi-
square values for each pair of dimensions are all significant at p < 0.001 (df = 1, critical
value = 12.873), providing sufficient evidence of discriminant validity.
7 VDW1, VDW2, and VDW6 form a factor with model fit statistics of GFI=.92, AGFI=.79, RMR=.05, and
α=.83 when assessed as a correlated model with VDW3, VDW4, and VDW5.
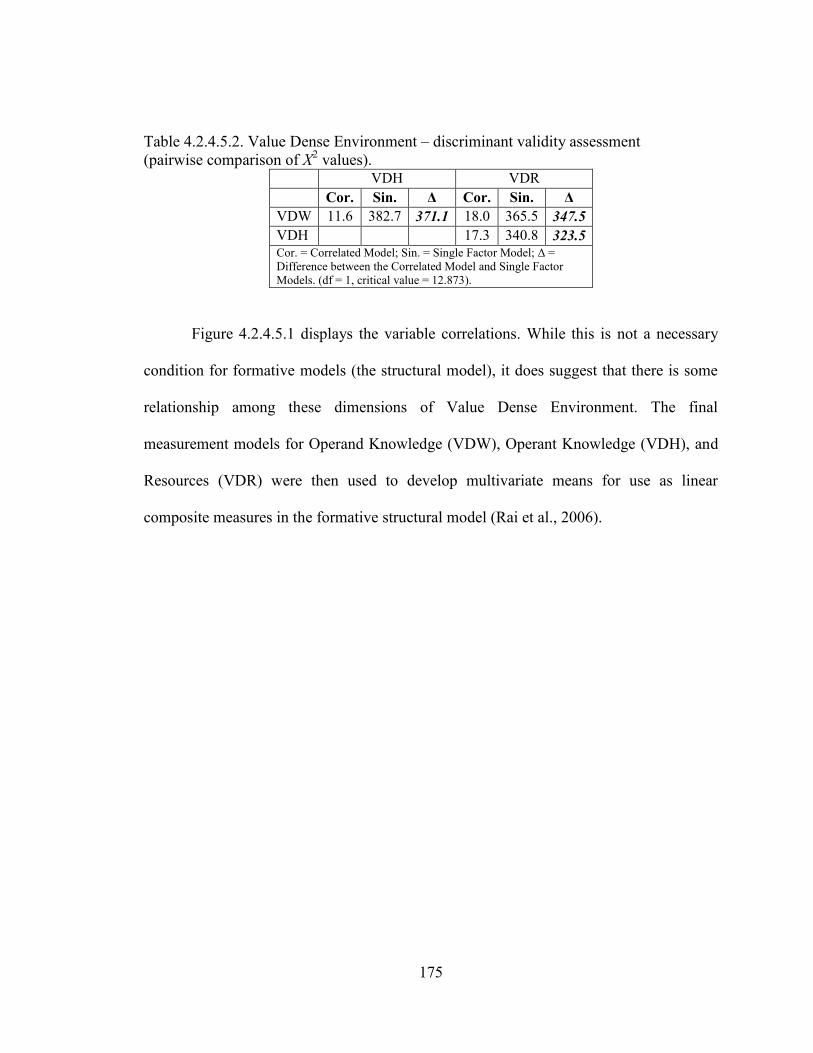
175
Table 4.2.4.5.2. Value Dense Environment – discriminant validity assessment
(pairwise comparison of X2 values).
VDH VDR
Cor. Sin. Δ Cor. Sin. Δ
VDW 11.6 382.7 371.1 18.0 365.5 347.5
VDH 17.3 340.8 323.5 Cor. = Correlated Model; Sin. = Single Factor Model; Δ =
Difference between the Correlated Model and Single Factor
Models. (df = 1, critical value = 12.873).
Figure 4.2.4.5.1 displays the variable correlations. While this is not a necessary
condition for formative models (the structural model), it does suggest that there is some
relationship among these dimensions of Value Dense Environment. The final
measurement models for Operand Knowledge (VDW), Operant Knowledge (VDH), and
Resources (VDR) were then used to develop multivariate means for use as linear
composite measures in the formative structural model (Rai et al., 2006).
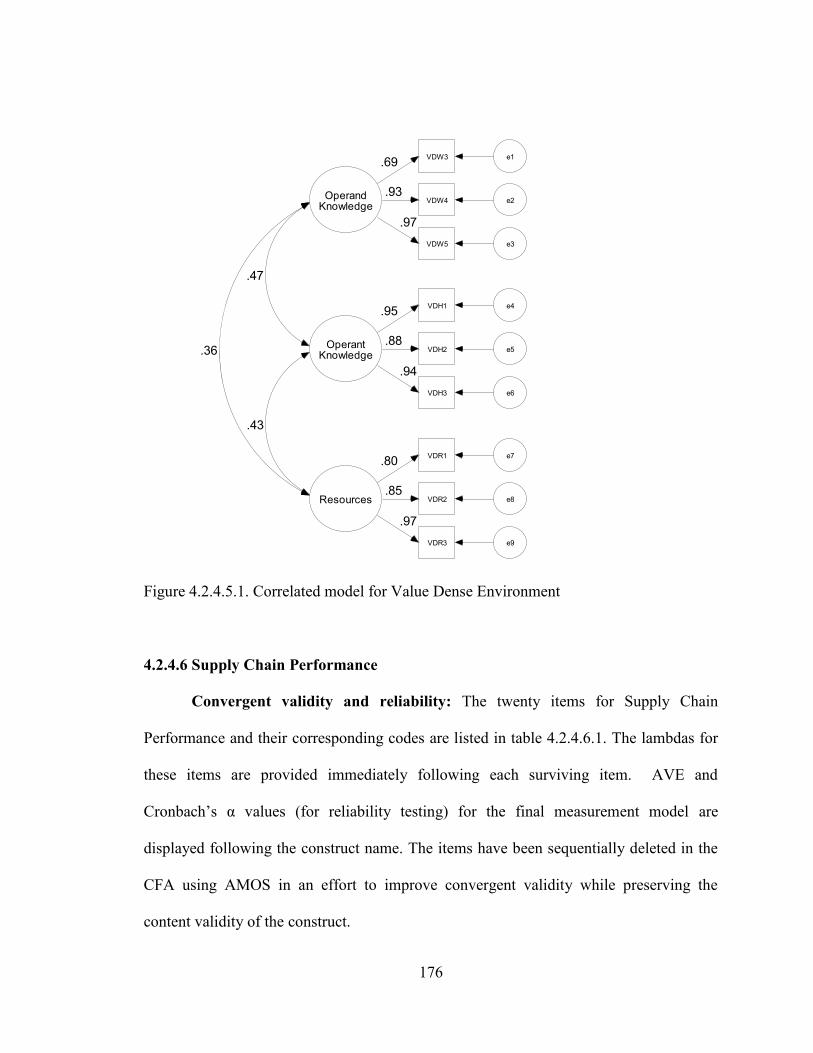
176
OperantKnowledge
VDH1 e4.95
VDH2 e5.88
VDH3 e6
.94
Resources
VDR1 e7
VDR2 e8
VDR3 e9
.80
.85
.97
OperandKnowledge
VDW3 e1.69
VDW4 e2.93
VDW5 e3
.97
.43
.47
.36
Figure 4.2.4.5.1. Correlated model for Value Dense Environment
4.2.4.6 Supply Chain Performance
Convergent validity and reliability: The twenty items for Supply Chain
Performance and their corresponding codes are listed in table 4.2.4.6.1. The lambdas for
these items are provided immediately following each surviving item. AVE and
Cronbach‘s α values (for reliability testing) for the final measurement model are
displayed following the construct name. The items have been sequentially deleted in the
CFA using AMOS in an effort to improve convergent validity while preserving the
content validity of the construct.
177
The initial model fit for the Patient Responsiveness, Physician Performance, and
Partnership Quality dimensions demonstrated adequate model fit and were not modified.
F1 has been deleted to improve model fit as it was determined that it likely overlaps with
the other items. I4 has been deleted to improve model fit as it may have been viewed as
ambiguous by the respondents when compared to the other items. The initial model fit
indexes and final model fit indexes are provided in the table. All of the model fit values
as well as the AVE values indicate adequate convergent validity for each dimension of
the construct. Additionally, the Cronbach‘s α values provide sufficient evidence of
reliability for each dimension of the construct.
Discriminant validity: Table 4.2.4.6.2 displays the results of the single-
factor/two-factor (pairwise) X2 test for discriminant validity. The differences in chi-
square values for each pair of dimensions are all significant at p < 0.001 (df = 1, critical
value = 13.412), providing sufficient evidence of discriminant validity.
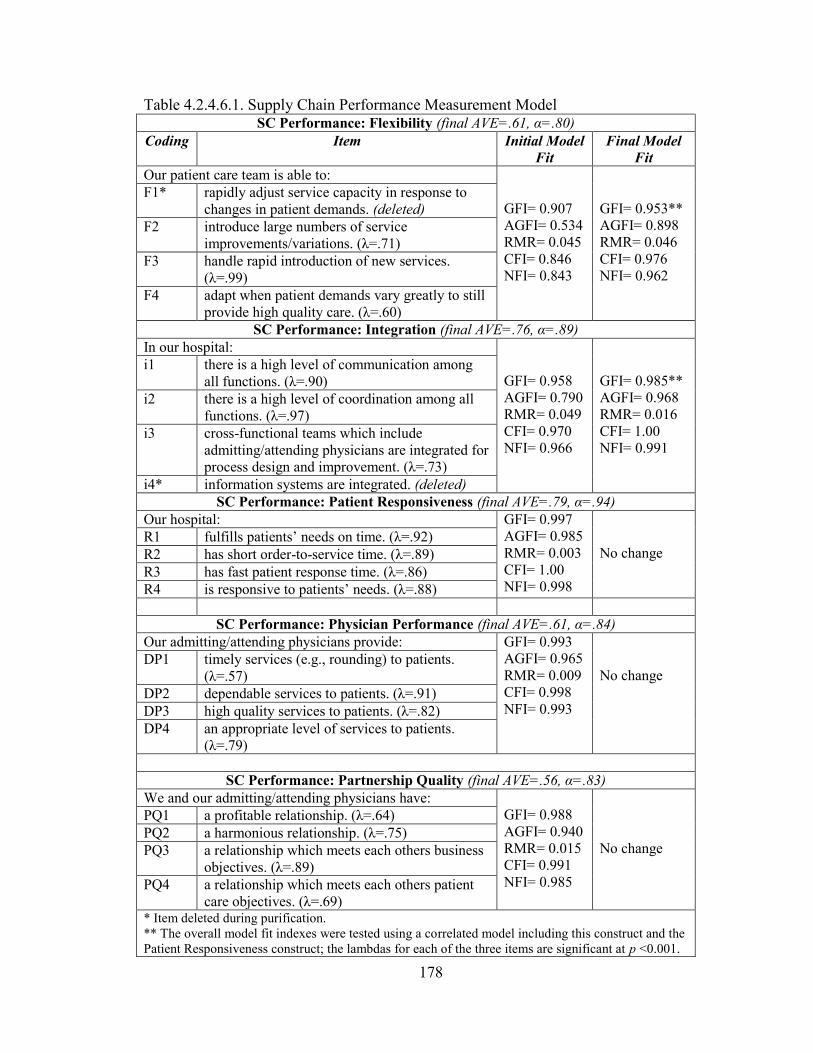
178
Table 4.2.4.6.1. Supply Chain Performance Measurement Model SC Performance: Flexibility (final AVE=.61, α=.80)
Coding Item Initial Model
Fit
Final Model
Fit
Our patient care team is able to:
GFI= 0.907
AGFI= 0.534
RMR= 0.045
CFI= 0.846
NFI= 0.843
GFI= 0.953**
AGFI= 0.898
RMR= 0.046
CFI= 0.976
NFI= 0.962
F1* rapidly adjust service capacity in response to
changes in patient demands. (deleted)
F2 introduce large numbers of service
improvements/variations. (λ=.71)
F3 handle rapid introduction of new services.
(λ=.99)
F4 adapt when patient demands vary greatly to still
provide high quality care. (λ=.60)
SC Performance: Integration (final AVE=.76, α=.89)
In our hospital:
GFI= 0.958
AGFI= 0.790
RMR= 0.049
CFI= 0.970
NFI= 0.966
GFI= 0.985**
AGFI= 0.968
RMR= 0.016
CFI= 1.00
NFI= 0.991
i1 there is a high level of communication among
all functions. (λ=.90)
i2 there is a high level of coordination among all
functions. (λ=.97)
i3 cross-functional teams which include
admitting/attending physicians are integrated for
process design and improvement. (λ=.73)
i4* information systems are integrated. (deleted)
SC Performance: Patient Responsiveness (final AVE=.79, α=.94)
Our hospital: GFI= 0.997
AGFI= 0.985
RMR= 0.003
CFI= 1.00
NFI= 0.998
No change R1 fulfills patients‘ needs on time. (λ=.92)
R2 has short order-to-service time. (λ=.89)
R3 has fast patient response time. (λ=.86)
R4 is responsive to patients‘ needs. (λ=.88)
SC Performance: Physician Performance (final AVE=.61, α=.84)
Our admitting/attending physicians provide: GFI= 0.993
AGFI= 0.965
RMR= 0.009
CFI= 0.998
NFI= 0.993
No change DP1 timely services (e.g., rounding) to patients.
(λ=.57)
DP2 dependable services to patients. (λ=.91)
DP3 high quality services to patients. (λ=.82)
DP4 an appropriate level of services to patients.
(λ=.79)
SC Performance: Partnership Quality (final AVE=.56, α=.83)
We and our admitting/attending physicians have:
GFI= 0.988
AGFI= 0.940
RMR= 0.015
CFI= 0.991
NFI= 0.985
No change
PQ1 a profitable relationship. (λ=.64)
PQ2 a harmonious relationship. (λ=.75)
PQ3 a relationship which meets each others business
objectives. (λ=.89)
PQ4 a relationship which meets each others patient
care objectives. (λ=.69) * Item deleted during purification.
** The overall model fit indexes were tested using a correlated model including this construct and the
Patient Responsiveness construct; the lambdas for each of the three items are significant at p <0.001.
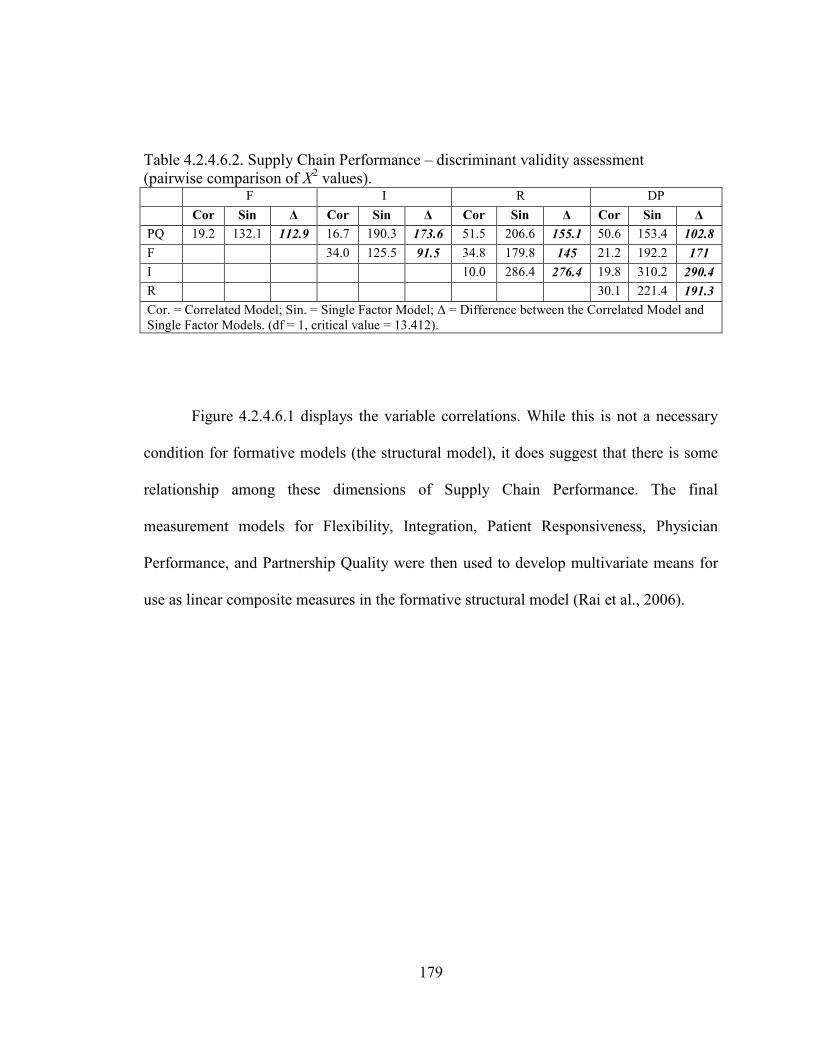
179
Table 4.2.4.6.2. Supply Chain Performance – discriminant validity assessment
(pairwise comparison of X2 values).
F I R DP
Cor Sin Δ Cor Sin Δ Cor Sin Δ Cor Sin Δ
PQ 19.2 132.1 112.9 16.7 190.3 173.6 51.5 206.6 155.1 50.6 153.4 102.8
F 34.0 125.5 91.5 34.8 179.8 145 21.2 192.2 171
I 10.0 286.4 276.4 19.8 310.2 290.4
R 30.1 221.4 191.3
Cor. = Correlated Model; Sin. = Single Factor Model; Δ = Difference between the Correlated Model and
Single Factor Models. (df = 1, critical value = 13.412).
Figure 4.2.4.6.1 displays the variable correlations. While this is not a necessary
condition for formative models (the structural model), it does suggest that there is some
relationship among these dimensions of Supply Chain Performance. The final
measurement models for Flexibility, Integration, Patient Responsiveness, Physician
Performance, and Partnership Quality were then used to develop multivariate means for
use as linear composite measures in the formative structural model (Rai et al., 2006).
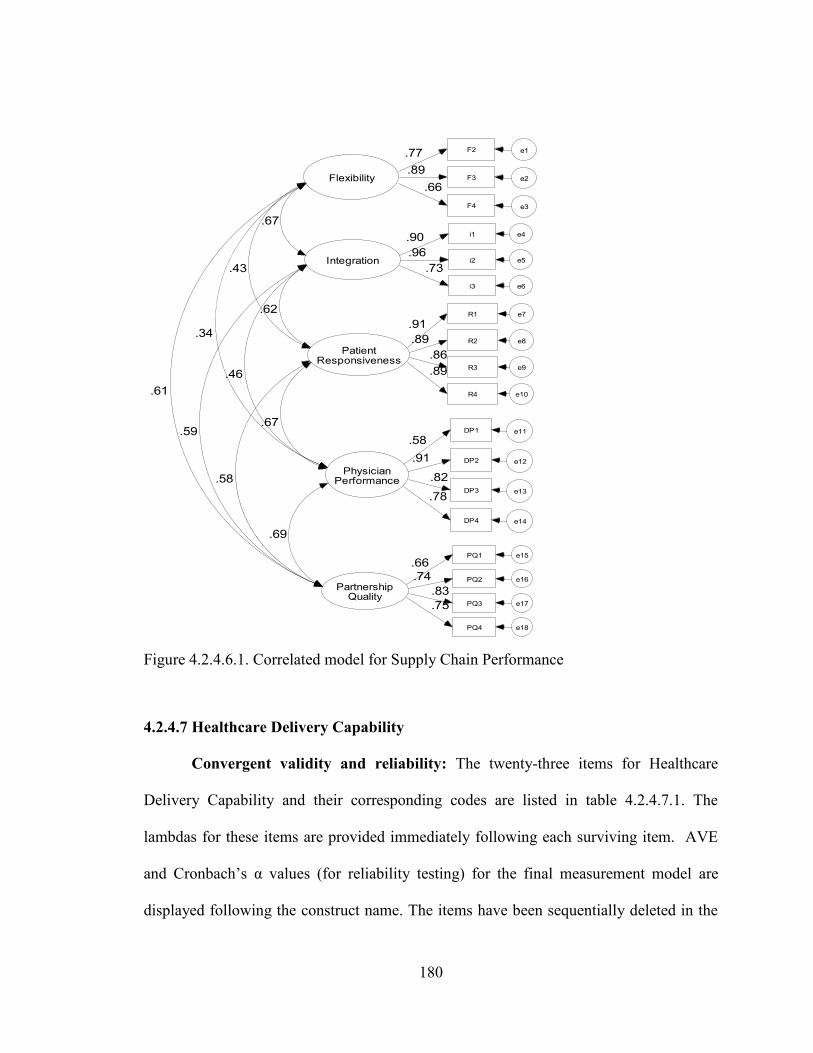
180
Flexibility
Integration
PatientResponsiveness
PhysicianPerformance
PartnershipQuality
.61
.59
.58
.69
.34
.46
.67
.43
.62
.67
R1 e7
.91
R2 e8.89
R3 e9
.86
R4 e10
.89
DP1 e11
.58
DP2 e12.91
DP3 e13
.82
DP4 e14
.78
PQ1 e15
.66
PQ2 e16.74
PQ3 e17
.83
PQ4 e18
.75
F2 e1.77
F3 e2.89
F4 e3
.66
i1 e4.90
i2 e5.96
i3 e6
.73
Figure 4.2.4.6.1. Correlated model for Supply Chain Performance
4.2.4.7 Healthcare Delivery Capability
Convergent validity and reliability: The twenty-three items for Healthcare
Delivery Capability and their corresponding codes are listed in table 4.2.4.7.1. The
lambdas for these items are provided immediately following each surviving item. AVE
and Cronbach‘s α values (for reliability testing) for the final measurement model are
displayed following the construct name. The items have been sequentially deleted in the
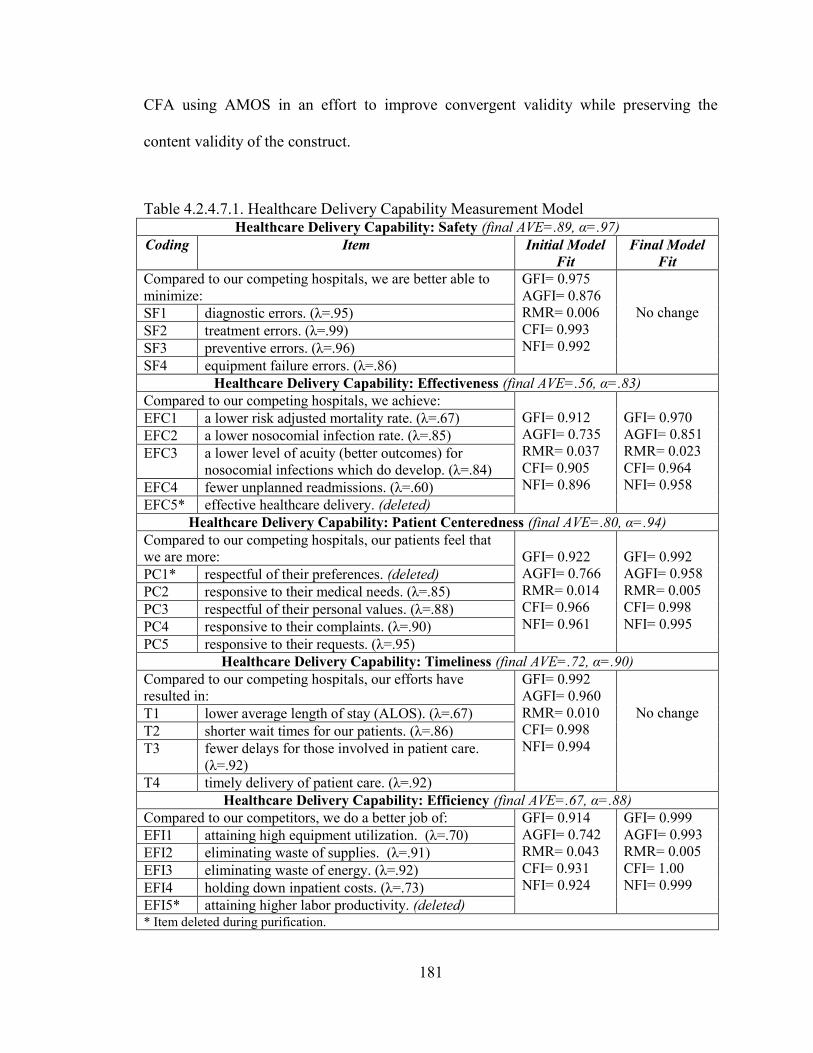
181
CFA using AMOS in an effort to improve convergent validity while preserving the
content validity of the construct.
Table 4.2.4.7.1. Healthcare Delivery Capability Measurement Model Healthcare Delivery Capability: Safety (final AVE=.89, α=.97)
Coding Item Initial Model
Fit
Final Model
Fit
Compared to our competing hospitals, we are better able to
minimize:
GFI= 0.975
AGFI= 0.876
RMR= 0.006
CFI= 0.993
NFI= 0.992
No change SF1 diagnostic errors. (λ=.95)
SF2 treatment errors. (λ=.99)
SF3 preventive errors. (λ=.96)
SF4 equipment failure errors. (λ=.86)
Healthcare Delivery Capability: Effectiveness (final AVE=.56, α=.83)
Compared to our competing hospitals, we achieve:
GFI= 0.912
AGFI= 0.735
RMR= 0.037
CFI= 0.905
NFI= 0.896
GFI= 0.970
AGFI= 0.851
RMR= 0.023
CFI= 0.964
NFI= 0.958
EFC1 a lower risk adjusted mortality rate. (λ=.67)
EFC2 a lower nosocomial infection rate. (λ=.85)
EFC3 a lower level of acuity (better outcomes) for
nosocomial infections which do develop. (λ=.84)
EFC4 fewer unplanned readmissions. (λ=.60)
EFC5* effective healthcare delivery. (deleted)
Healthcare Delivery Capability: Patient Centeredness (final AVE=.80, α=.94)
Compared to our competing hospitals, our patients feel that
we are more:
GFI= 0.922
AGFI= 0.766
RMR= 0.014
CFI= 0.966
NFI= 0.961
GFI= 0.992
AGFI= 0.958
RMR= 0.005
CFI= 0.998
NFI= 0.995
PC1* respectful of their preferences. (deleted)
PC2 responsive to their medical needs. (λ=.85)
PC3 respectful of their personal values. (λ=.88)
PC4 responsive to their complaints. (λ=.90)
PC5 responsive to their requests. (λ=.95)
Healthcare Delivery Capability: Timeliness (final AVE=.72, α=.90)
Compared to our competing hospitals, our efforts have
resulted in:
GFI= 0.992
AGFI= 0.960
RMR= 0.010
CFI= 0.998
NFI= 0.994
No change T1 lower average length of stay (ALOS). (λ=.67)
T2 shorter wait times for our patients. (λ=.86)
T3 fewer delays for those involved in patient care.
(λ=.92)
T4 timely delivery of patient care. (λ=.92)
Healthcare Delivery Capability: Efficiency (final AVE=.67, α=.88)
Compared to our competitors, we do a better job of: GFI= 0.914
AGFI= 0.742
RMR= 0.043
CFI= 0.931
NFI= 0.924
GFI= 0.999
AGFI= 0.993
RMR= 0.005
CFI= 1.00
NFI= 0.999
EFI1 attaining high equipment utilization. (λ=.70)
EFI2 eliminating waste of supplies. (λ=.91)
EFI3 eliminating waste of energy. (λ=.92)
EFI4 holding down inpatient costs. (λ=.73)
EFI5* attaining higher labor productivity. (deleted) * Item deleted during purification.
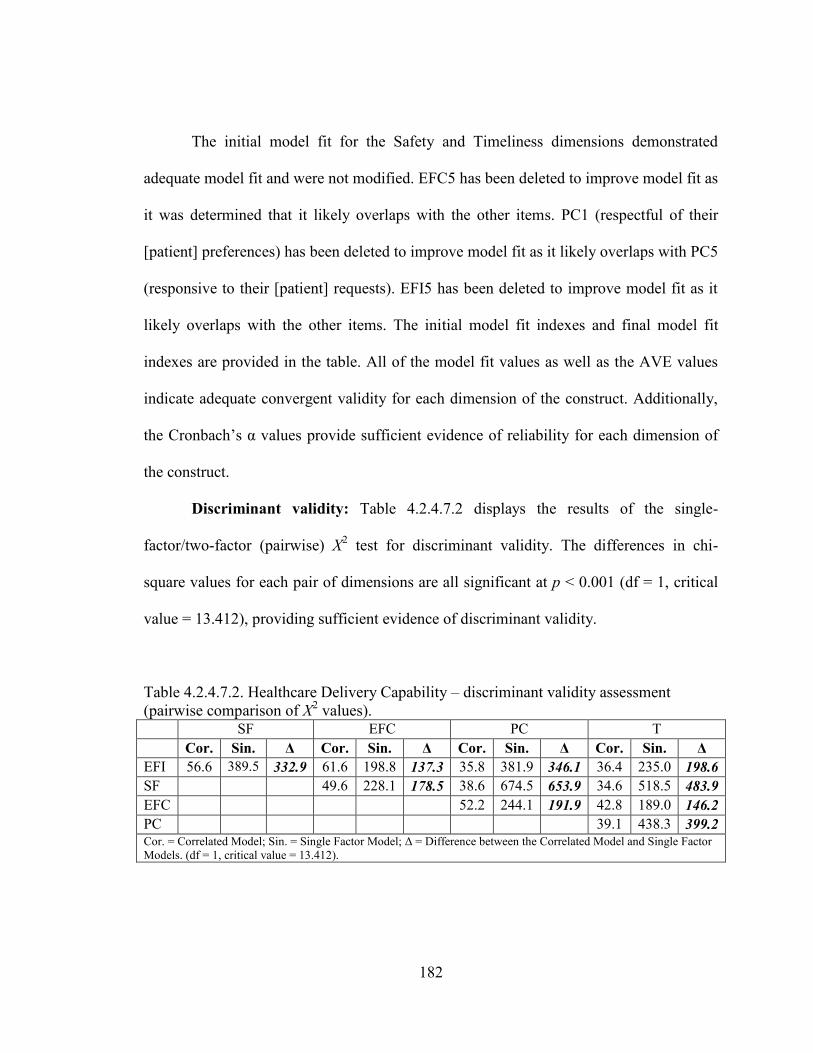
182
The initial model fit for the Safety and Timeliness dimensions demonstrated
adequate model fit and were not modified. EFC5 has been deleted to improve model fit as
it was determined that it likely overlaps with the other items. PC1 (respectful of their
[patient] preferences) has been deleted to improve model fit as it likely overlaps with PC5
(responsive to their [patient] requests). EFI5 has been deleted to improve model fit as it
likely overlaps with the other items. The initial model fit indexes and final model fit
indexes are provided in the table. All of the model fit values as well as the AVE values
indicate adequate convergent validity for each dimension of the construct. Additionally,
the Cronbach‘s α values provide sufficient evidence of reliability for each dimension of
the construct.
Discriminant validity: Table 4.2.4.7.2 displays the results of the single-
factor/two-factor (pairwise) X2 test for discriminant validity. The differences in chi-
square values for each pair of dimensions are all significant at p < 0.001 (df = 1, critical
value = 13.412), providing sufficient evidence of discriminant validity.
Table 4.2.4.7.2. Healthcare Delivery Capability – discriminant validity assessment
(pairwise comparison of X2 values).
SF EFC PC T
Cor. Sin. Δ Cor. Sin. Δ Cor. Sin. Δ Cor. Sin. Δ
EFI 56.6 389.5 332.9 61.6 198.8 137.3 35.8 381.9 346.1 36.4 235.0 198.6
SF 49.6 228.1 178.5 38.6 674.5 653.9 34.6 518.5 483.9
EFC 52.2 244.1 191.9 42.8 189.0 146.2
PC 39.1 438.3 399.2 Cor. = Correlated Model; Sin. = Single Factor Model; Δ = Difference between the Correlated Model and Single Factor
Models. (df = 1, critical value = 13.412).
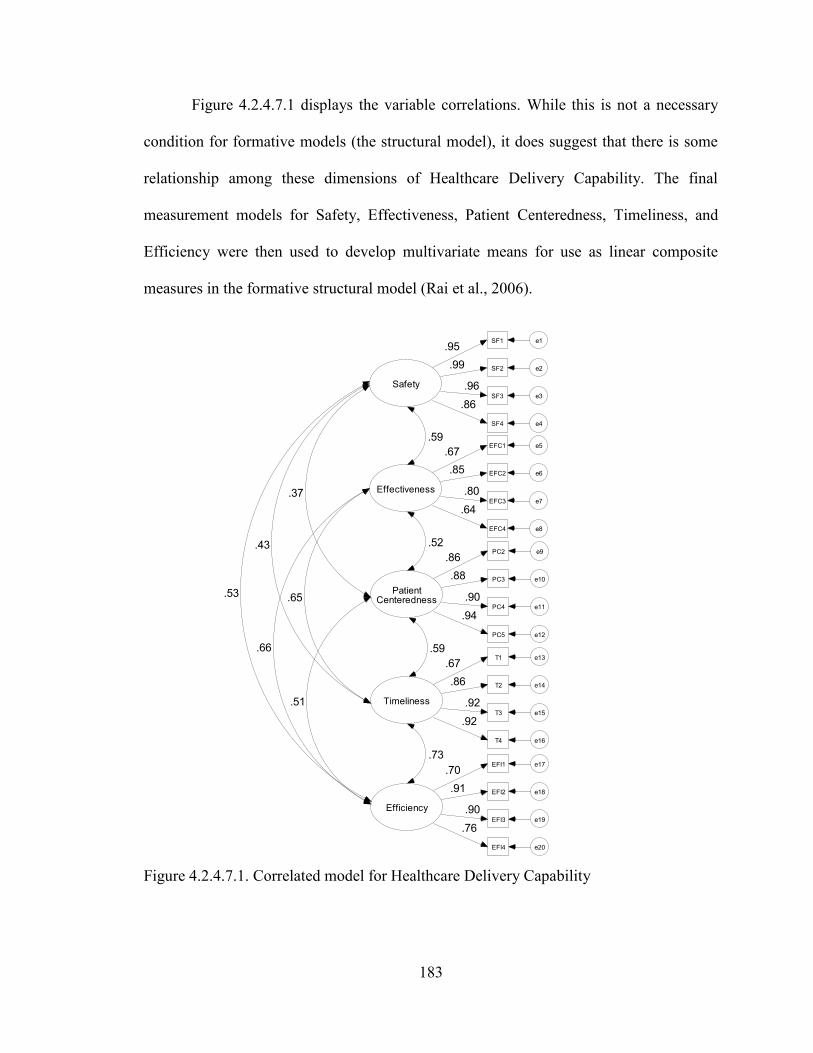
183
Safety
SF1 e1.95
SF2 e2.99
SF3 e3
.96
SF4 e4
.86
Effectiveness
EFC1 e5
EFC2 e6
EFC3 e7
EFC4 e8
.67
.85
.80
.64
PatientCenteredness
PC2 e9
PC3 e10
PC4 e11
PC5 e12
.86
.88
.90
.94
Timeliness
T1 e13
T2 e14
T3 e15
T4 e16
.67
.86
.92
.92
Efficiency
EFI1 e17
EFI2 e18
EFI3 e19
EFI4 e20
.70
.91
.90
.76
.73
.59
.52
.59
.51
.66
.53 .65
.43
.37
Figure 4.2.4.7.1 displays the variable correlations. While this is not a necessary
condition for formative models (the structural model), it does suggest that there is some
relationship among these dimensions of Healthcare Delivery Capability. The final
measurement models for Safety, Effectiveness, Patient Centeredness, Timeliness, and
Efficiency were then used to develop multivariate means for use as linear composite
measures in the formative structural model (Rai et al., 2006).
Figure 4.2.4.7.1. Correlated model for Healthcare Delivery Capability
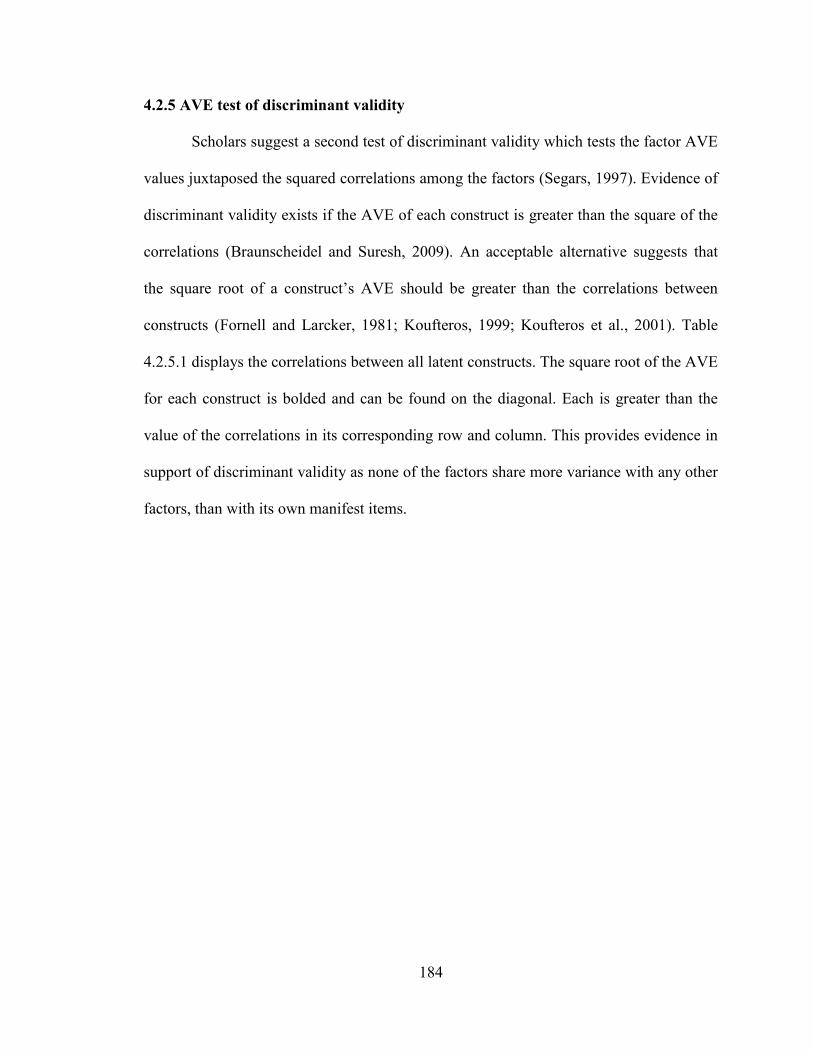
184
4.2.5 AVE test of discriminant validity
Scholars suggest a second test of discriminant validity which tests the factor AVE
values juxtaposed the squared correlations among the factors (Segars, 1997). Evidence of
discriminant validity exists if the AVE of each construct is greater than the square of the
correlations (Braunscheidel and Suresh, 2009). An acceptable alternative suggests that
the square root of a construct‘s AVE should be greater than the correlations between
constructs (Fornell and Larcker, 1981; Koufteros, 1999; Koufteros et al., 2001). Table
4.2.5.1 displays the correlations between all latent constructs. The square root of the AVE
for each construct is bolded and can be found on the diagonal. Each is greater than the
value of the correlations in its corresponding row and column. This provides evidence in
support of discriminant validity as none of the factors share more variance with any other
factors, than with its own manifest items.
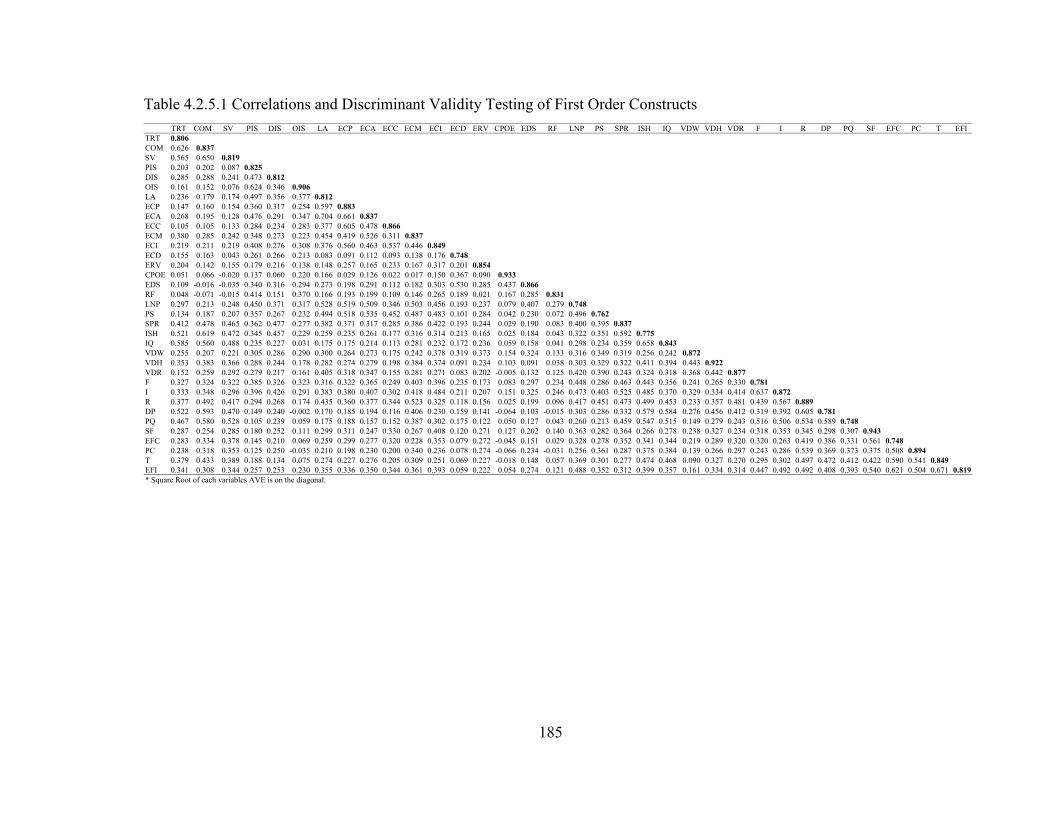
185
TRT COM SV PIS DIS OIS LA ECP ECA ECC ECM ECI ECD ERV CPOE EDS RF LNP PS SPR ISH IQ VDW VDH VDR F I R DP PQ SF EFC PC T EFI
TRT 0.806
COM 0.626 0.837
SV 0.565 0.650 0.819
PIS 0.203 0.202 0.087 0.825
DIS 0.285 0.288 0.241 0.473 0.812
OIS 0.161 0.152 0.076 0.624 0.346 0.906
LA 0.236 0.179 0.174 0.497 0.356 0.377 0.812
ECP 0.147 0.160 0.154 0.360 0.317 0.254 0.597 0.883
ECA 0.268 0.195 0.128 0.476 0.291 0.347 0.704 0.661 0.837
ECC 0.105 0.105 0.133 0.284 0.234 0.283 0.377 0.605 0.478 0.866
ECM 0.380 0.285 0.242 0.348 0.273 0.223 0.454 0.419 0.526 0.311 0.837
ECI 0.219 0.211 0.219 0.408 0.276 0.308 0.376 0.560 0.463 0.537 0.446 0.849
ECD 0.155 0.163 0.043 0.261 0.266 0.213 0.083 0.091 0.112 0.093 0.138 0.176 0.748
ERV 0.204 0.142 0.155 0.179 0.216 0.138 0.148 0.257 0.165 0.233 0.167 0.317 0.201 0.854
CPOE 0.051 0.066 -0.020 0.137 0.060 0.220 0.166 0.029 0.126 0.022 0.017 0.150 0.367 0.090 0.933
EDS 0.109 -0.016 -0.035 0.340 0.316 0.294 0.273 0.198 0.291 0.112 0.182 0.303 0.530 0.285 0.437 0.866
RF 0.048 -0.071 -0.015 0.414 0.151 0.370 0.166 0.193 0.199 0.109 0.146 0.265 0.189 0.021 0.167 0.285 0.831
LNP 0.297 0.213 0.248 0.450 0.371 0.317 0.528 0.519 0.509 0.346 0.503 0.456 0.193 0.237 0.079 0.407 0.279 0.748
PS 0.134 0.187 0.207 0.357 0.267 0.232 0.494 0.518 0.535 0.452 0.487 0.483 0.101 0.284 0.042 0.230 0.072 0.496 0.762
SPR 0.412 0.478 0.465 0.362 0.477 0.277 0.382 0.371 0.317 0.285 0.386 0.422 0.193 0.244 0.029 0.190 0.083 0.400 0.395 0.837
ISH 0.521 0.619 0.472 0.345 0.457 0.229 0.259 0.235 0.261 0.177 0.316 0.314 0.213 0.165 0.025 0.184 0.043 0.322 0.351 0.592 0.775
IQ 0.585 0.560 0.488 0.235 0.227 0.031 0.175 0.175 0.214 0.113 0.281 0.232 0.172 0.236 0.059 0.158 0.041 0.298 0.234 0.359 0.658 0.843
VDW 0.255 0.207 0.221 0.305 0.286 0.290 0.300 0.264 0.273 0.175 0.242 0.378 0.319 0.373 0.154 0.324 0.133 0.316 0.349 0.319 0.256 0.242 0.872
VDH 0.353 0.383 0.366 0.288 0.244 0.178 0.282 0.274 0.279 0.198 0.384 0.374 0.091 0.234 0.103 0.091 0.038 0.303 0.329 0.322 0.411 0.394 0.443 0.922
VDR 0.152 0.259 0.292 0.279 0.217 0.161 0.405 0.318 0.347 0.155 0.281 0.271 0.083 0.202 -0.005 0.132 0.125 0.420 0.390 0.243 0.324 0.318 0.368 0.442 0.877
F 0.327 0.324 0.322 0.385 0.326 0.323 0.316 0.322 0.365 0.249 0.403 0.396 0.235 0.173 0.083 0.297 0.234 0.448 0.286 0.463 0.443 0.356 0.241 0.265 0.330 0.781
I 0.333 0.348 0.296 0.396 0.426 0.291 0.383 0.380 0.407 0.302 0.418 0.484 0.211 0.207 0.151 0.325 0.246 0.473 0.403 0.525 0.485 0.370 0.329 0.334 0.414 0.637 0.872
R 0.377 0.492 0.417 0.294 0.268 0.174 0.435 0.360 0.377 0.344 0.523 0.325 0.118 0.156 0.025 0.199 0.096 0.417 0.451 0.473 0.499 0.453 0.233 0.357 0.481 0.439 0.567 0.889
DP 0.522 0.593 0.470 0.149 0.240 -0.002 0.170 0.185 0.194 0.116 0.406 0.230 0.159 0.141 -0.064 0.103 -0.015 0.303 0.286 0.332 0.579 0.584 0.276 0.456 0.412 0.319 0.392 0.605 0.781
PQ 0.467 0.580 0.528 0.105 0.239 0.059 0.175 0.188 0.157 0.152 0.387 0.302 0.175 0.122 0.050 0.127 0.043 0.260 0.213 0.459 0.547 0.515 0.149 0.279 0.243 0.516 0.506 0.534 0.589 0.748
SF 0.287 0.254 0.285 0.180 0.252 0.111 0.299 0.311 0.247 0.330 0.267 0.408 0.120 0.271 0.127 0.202 0.140 0.363 0.282 0.364 0.266 0.278 0.238 0.327 0.234 0.318 0.353 0.345 0.298 0.307 0.943
EFC 0.283 0.334 0.378 0.145 0.210 0.069 0.259 0.299 0.277 0.320 0.228 0.353 0.079 0.272 -0.045 0.151 0.029 0.328 0.278 0.352 0.341 0.344 0.219 0.289 0.320 0.320 0.263 0.419 0.386 0.331 0.561 0.748
PC 0.238 0.318 0.353 0.125 0.250 -0.035 0.210 0.198 0.230 0.200 0.340 0.236 0.078 0.274 -0.066 0.234 -0.031 0.256 0.361 0.287 0.375 0.384 0.139 0.266 0.297 0.243 0.286 0.539 0.369 0.373 0.375 0.508 0.894
T 0.379 0.433 0.389 0.188 0.134 0.075 0.274 0.227 0.276 0.205 0.309 0.251 0.069 0.227 -0.018 0.148 0.057 0.369 0.301 0.277 0.474 0.468 0.090 0.327 0.270 0.295 0.302 0.497 0.472 0.412 0.422 0.590 0.541 0.849
EFI 0.341 0.308 0.344 0.257 0.253 0.230 0.355 0.336 0.350 0.344 0.361 0.393 0.059 0.222 0.054 0.274 0.121 0.488 0.352 0.312 0.399 0.357 0.161 0.334 0.314 0.447 0.492 0.492 0.408 0.393 0.540 0.621 0.504 0.671 0.819
* Square Root of each variables AVE is on the diagonal.
Table 4.2.5.1 Correlations and Discriminant Validity Testing of First Order Constructs
186
4.2.6 Instrument validation summary
In summary, the seven constructs in this study demonstrate adequate reliability
and validity with respect to content validity, convergent validity, and discriminant
validity. These results are summarized in table 4.2.6.1. These measures are now ready for
modeling in the formative structural model for hypothesis testing. As described, the
modeling process involved developing linear composites which were calculated using the
multivariate means for the first order constructs (Rai et al., 2006). ―The multivariate
mean is based on the summated mean values of items and offers the advantage of being
replicable across samples,‖ (Rai et al., 2006: p. 234). Further, this approach is
recommended by Hair et al. (1995) when measures have been developed and
transferability is the aim. Thus, these linear composites were then used as measures in the
formative structural model. The details of this process have been provided in the
discussion of the validation of each construct in subsections 4.2.4.1 through 4.2.4.7. The
results of the structural model (hypothesis) testing are discussed in chapter 5.
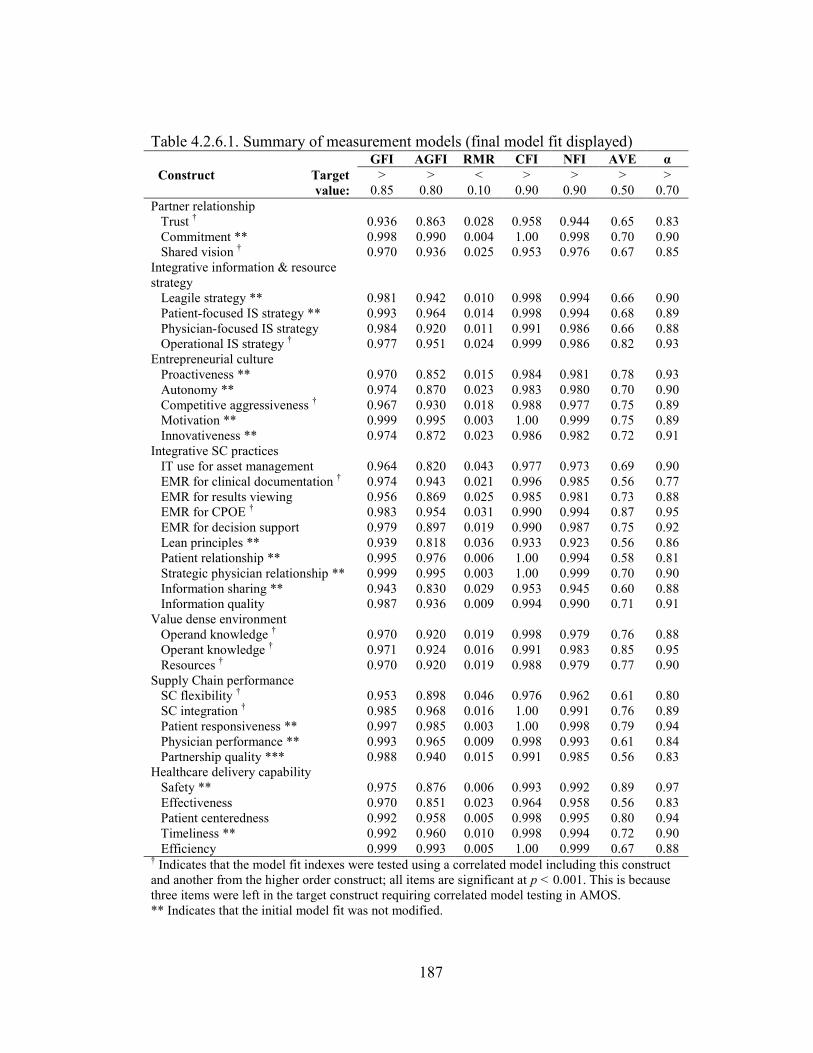
187
Table 4.2.6.1. Summary of measurement models (final model fit displayed) GFI AGFI RMR CFI NFI AVE α
Construct Target
value:
>
0.85
>
0.80
<
0.10
>
0.90
>
0.90
>
0.50
>
0.70
Partner relationship
Trust † 0.936 0.863 0.028 0.958 0.944 0.65 0.83
Commitment ** 0.998 0.990 0.004 1.00 0.998 0.70 0.90
Shared vision † 0.970 0.936 0.025 0.953 0.976 0.67 0.85
Integrative information & resource
strategy
Leagile strategy ** 0.981 0.942 0.010 0.998 0.994 0.66 0.90
Patient-focused IS strategy ** 0.993 0.964 0.014 0.998 0.994 0.68 0.89
Physician-focused IS strategy 0.984 0.920 0.011 0.991 0.986 0.66 0.88
Operational IS strategy † 0.977 0.951 0.024 0.999 0.986 0.82 0.93
Entrepreneurial culture
Proactiveness ** 0.970 0.852 0.015 0.984 0.981 0.78 0.93
Autonomy ** 0.974 0.870 0.023 0.983 0.980 0.70 0.90
Competitive aggressiveness † 0.967 0.930 0.018 0.988 0.977 0.75 0.89
Motivation ** 0.999 0.995 0.003 1.00 0.999 0.75 0.89
Innovativeness ** 0.974 0.872 0.023 0.986 0.982 0.72 0.91
Integrative SC practices
IT use for asset management 0.964 0.820 0.043 0.977 0.973 0.69 0.90
EMR for clinical documentation † 0.974 0.943 0.021 0.996 0.985 0.56 0.77
EMR for results viewing 0.956 0.869 0.025 0.985 0.981 0.73 0.88
EMR for CPOE † 0.983 0.954 0.031 0.990 0.994 0.87 0.95
EMR for decision support 0.979 0.897 0.019 0.990 0.987 0.75 0.92
Lean principles ** 0.939 0.818 0.036 0.933 0.923 0.56 0.86
Patient relationship ** 0.995 0.976 0.006 1.00 0.994 0.58 0.81
Strategic physician relationship ** 0.999 0.995 0.003 1.00 0.999 0.70 0.90
Information sharing ** 0.943 0.830 0.029 0.953 0.945 0.60 0.88
Information quality 0.987 0.936 0.009 0.994 0.990 0.71 0.91
Value dense environment
Operand knowledge † 0.970 0.920 0.019 0.998 0.979 0.76 0.88
Operant knowledge † 0.971 0.924 0.016 0.991 0.983 0.85 0.95
Resources † 0.970 0.920 0.019 0.988 0.979 0.77 0.90
Supply Chain performance
SC flexibility † 0.953 0.898 0.046 0.976 0.962 0.61 0.80
SC integration † 0.985 0.968 0.016 1.00 0.991 0.76 0.89
Patient responsiveness ** 0.997 0.985 0.003 1.00 0.998 0.79 0.94
Physician performance ** 0.993 0.965 0.009 0.998 0.993 0.61 0.84
Partnership quality *** 0.988 0.940 0.015 0.991 0.985 0.56 0.83
Healthcare delivery capability
Safety ** 0.975 0.876 0.006 0.993 0.992 0.89 0.97
Effectiveness 0.970 0.851 0.023 0.964 0.958 0.56 0.83
Patient centeredness 0.992 0.958 0.005 0.998 0.995 0.80 0.94
Timeliness ** 0.992 0.960 0.010 0.998 0.994 0.72 0.90
Efficiency 0.999 0.993 0.005 1.00 0.999 0.67 0.88 † Indicates that the model fit indexes were tested using a correlated model including this construct
and another from the higher order construct; all items are significant at p < 0.001. This is because
three items were left in the target construct requiring correlated model testing in AMOS.
** Indicates that the initial model fit was not modified.
188
CHAPTER 5: STRUCTURAL MODEL ANALYSIS AND RESULTS
This chapter describes the procedures used in testing the formative structural
model, the aim of which is hypothesis testing. Thus, the focus of this chapter is on the
evaluation of the predictions theorized in chapter two. As was the case with the
measurement model in chapter four, SEM was employed for statistical analysis. SEM is
considered a more rigorous approach for assessing predictive validity than other
statistical methods such as correlation (Joreskog, 1970). This analysis was performed
using the statistical application SMART Partial Least Squares (PLS) version 2.0 M3
(Ringle et al., 2005).
The proposed model is reviewed in section 5.1. This is followed by a discussion
of the rationale for using PLS in section 5.2, and the methodology for assessing formative
structural models in section 5.3. Next, the measurement and structural model results are
presented in section 5.4 and discussed in section 5.5 where a summary is also provided.
5.1 Proposed model
For the convenience of those reading this study, Figure 5.1.1 repeats the
theoretical model in figure 2.5.1. The model features seven constructs. The model begins
with the exogenous variable, Partner Relationship (PR), and is followed by six
endogenous variables conceptualized as Integrative Information and Resource Strategy
(IIRS), Entrepreneurial Culture (EC), Integrative Supply Chain Practices (ISCP), Value
Dense Environment (VDE), Supply Chain Performance (SCP), and Healthcare Delivery
Capability (HCDC).

189
The model contains nine hypotheses which were theorized in chapter two.
Hypothesis 1 is the relationship of PR → IIRS; Hypothesis 2 is the relationship of PR →
EC; Hypothesis 3 is the relationship IIRS → ISCP; Hypothesis 4 is the relationship of EC
→ ISCP; Hypothesis 5 is the relationship of ISCP → VDE; Hypothesis 6 is the
relationship of ISCP → SCP; Hypothesis 7 is the relationship of VDE → SCP;
Hypothesis 8 is the relationship of VDE → HCDC; and Hypothesis 9 is the relationship
of SCP → HCDC.
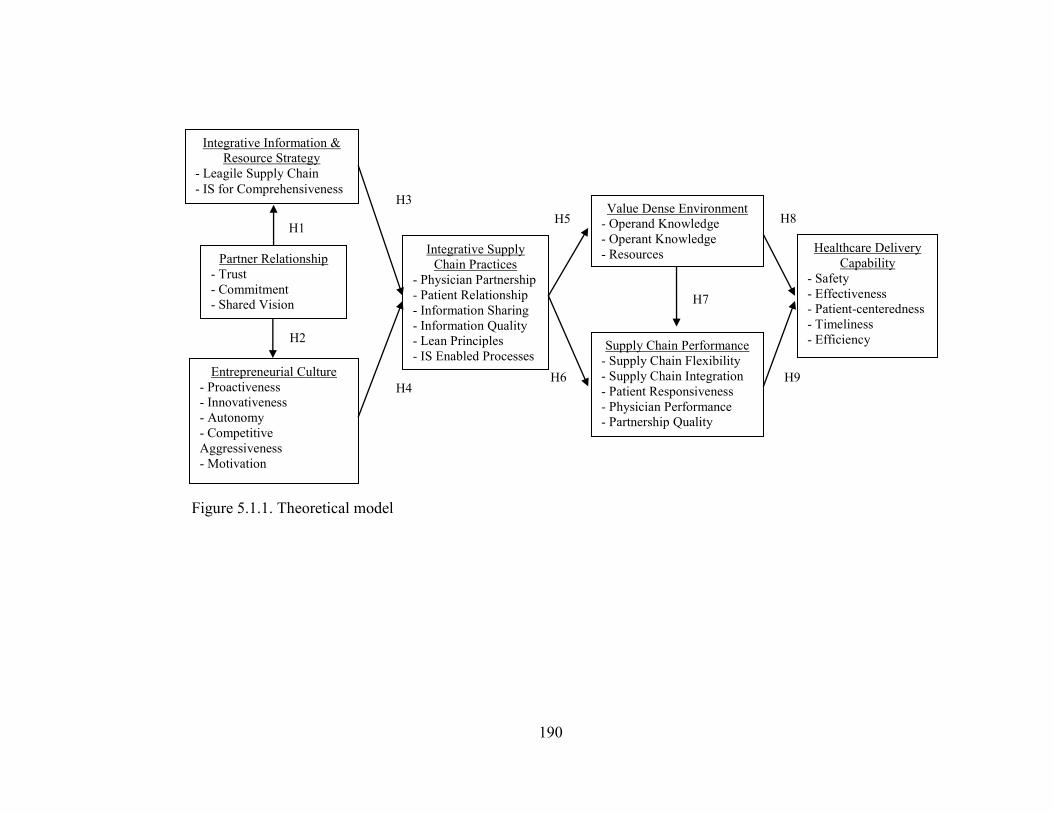
190
Figure 5.1.1. Theoretical model
H8
H9
H1
H2
H3
H4 H6
H7
Integrative Information &
Resource Strategy
- Leagile Supply Chain
- IS for Comprehensiveness
Entrepreneurial Culture
- Proactiveness
- Innovativeness
- Autonomy
- Competitive
Aggressiveness
- Motivation
Integrative Supply
Chain Practices
- Physician Partnership
- Patient Relationship
- Information Sharing
- Information Quality
- Lean Principles
- IS Enabled Processes
Partner Relationship
- Trust
- Commitment
- Shared Vision
Supply Chain Performance
- Supply Chain Flexibility
- Supply Chain Integration
- Patient Responsiveness
- Physician Performance
- Partnership Quality
Value Dense Environment
- Operand Knowledge
- Operant Knowledge
- Resources Healthcare Delivery
Capability
- Safety
- Effectiveness
- Patient-centeredness
- Timeliness
- Efficiency
H5
191
5.2 Rationale for PLS
PLS differs from co-variance based SEM (CBSEM) techniques (e.g., AMOS and
LISREL) in that it is a components-based approach to structural modeling (Chin et al.,
2003; Henseler et al., 2009). In PLS, the structural and measurement models are
comprised of multiple relational collections. First is the measurement model, referred to
as the outer model (measurement items are on the outside of the model), which specifies
relationships between unobserved latent variables and their related observed variables.
Second is the structural model, referred to as the inner model (these are the relationships
modeled on the inside of the model), which specifies relationships among latent variables
(see Henseler et al., 2009). Hsu et al. (2006) provide a detailed description of these
relational sets.
PLS has long been employed in Operations Management research (see
Sambamurthy & Chin, 1994; and Lee, 1997) and its general popularity is growing
(Henseler et al., 2009). Recent examples of similar studies include Braunscheidel and
Suresh (2009) who used PLS to examine the influence of internal and external integration
on supply chain agility, and Rosenzweig (2009) who explored relationships among e-
collaboration, operational performance, and business performance. The increased
popularity of PLS may be owing to its advantages over co-variance based SEM
approaches in studies: (1) exploring new theoretical bases, (2) analyzing smaller sample
sizes, (3) testing complex models, (4) possessing a predictive orientation, and 5) testing
formative models (Fornell, 1982; Hsu et al., 2006; Henseler et al., 2009).
The present study is characterized by these traits. With regard to theoretical
grounding, value co-creation is a nascent line of thinking from the service-dominant logic
192
(SDL) movement which is just gaining momentum with OM scholars (see Schmenner et
al., 2009). In a rare empirical study of value co-creation, Zhang and Chen (2008: p. 242)
observe that ―research on co-creation… …is still in an early stage.‖ Next with regard to
sample size, PLS is suggested to be a more appropriate tool for modest samples sizes
(e.g., around 200) as co-variance based SEM solutions can ―require several hundred or
even thousands of observations,‖ (Boomsma and Hoogland, 2001; Henseler et al., 2009:
p. 291). This may in part explain the motivation of Braunscheidel and Suresh (2009),
who employed PLS in an analysis of data collected from 218 supply chain professionals.
This sample size is comparable to that of the present study (n = 190).
PLS is also an appropriate SEM approach for complex models and those testing
higher -order constructs (Venaik et al., 2005). The present study examines a complex
structural model featuring seven latent constructs, all of which are of the higher order
variety. The measurement model examines the linear compositions of 132 manifest items
(140 manifest items when testing for common method bias post hoc) which is nearly
double that employed in Braunscheidel and Suresh‘s (2009) model containing
approximately 70 measurement items. Additionally, PLS was selected owing to the
notion that ―the methodology assists researchers who focus on the explanation of
endogenous constructs,‖ (Henseler et al., 2009: p. 282). Such a focus is shared by the
present author herein who seeks to inform the relationships among six endogenous
constructs precipitated by the posited coordination mechanism, Partner Relationship.
Finally, ―PLS can handle both reflective and formative measurement models,‖ (Henseler
et al., 2009: p. 283). This is a paramount advantage for PLS as it is the only statistical
package that possesses the capability to test formative models. Thus, following direction
193
from Fornell (1982), PLS was employed given that ―…the component-based SEM
technique [PLS] is primarily for predictive analysis in situations of high complexity but
low theoretical information (Hsu et al., 2006: p. 359).‖
5.3 Methods for assessing formative structural models
As introduced in section 5.2, ―…publications addressing CBSEM (e.g., Rigdon,
1998) often refer to structural models and measurement models or (observed) indicator
variables; whereas those focusing on PLS path modeling (e.g., Lohmöller, 1989) use the
terms inner model and outer model or manifest variables for similar elements of the
causal model,‖ (Henseler et al., 2009: p. 284). Therefore, like CBSEM, the evaluation of
both the measurement and structural aspects of PLS path models is possible. However, a
key difference between component-based and CBSEM techniques is that ―PLS does not
use fit indices,‖ (Braunscheidel and Suresh, 2009: p. 128). That said, PLS does provide
an array of tests for formative models capable of revealing interesting and useful insights
for scholars and practitioners alike.
Measurement ‗outer‘ model assessments can be made by examining the
relationships among the indicators and their respective latent constructs in terms of the t-
values of their loadings for statistical significance. While the focus of formative modeling
rests on the theorizing of the relationship between an indicator and its respective
formative construct, statistical significance can provide additional evidence of the
relationship in support of the theorized measurement model.
The assessment of formative structural models is conducted by evaluating: 1) the
estimates of the path coefficients, 2) the R2 of the endogenous variables, and 3) the effect
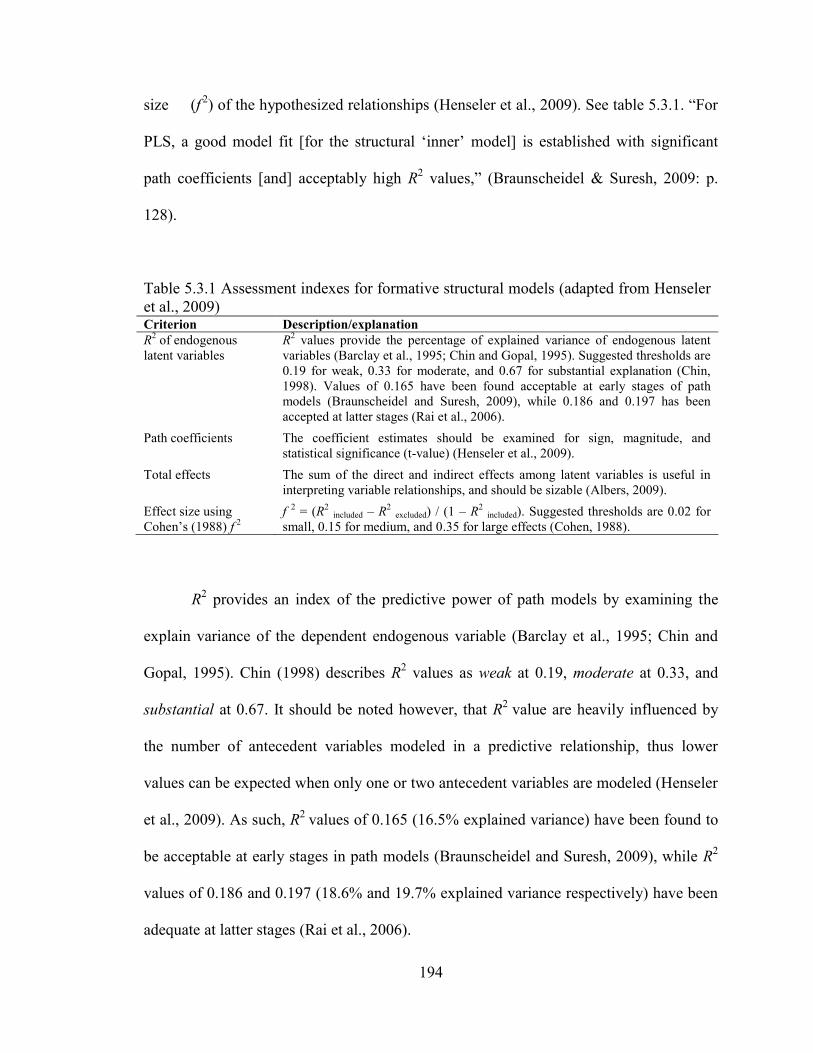
194
size (f
2) of the hypothesized relationships (Henseler et al., 2009). See table 5.3.1. ―For
PLS, a good model fit [for the structural ‗inner‘ model] is established with significant
path coefficients [and] acceptably high R2 values,‖ (Braunscheidel & Suresh, 2009: p.
128).
Table 5.3.1 Assessment indexes for formative structural models (adapted from Henseler
et al., 2009) Criterion Description/explanation
R2 of endogenous
latent variables
R2 values provide the percentage of explained variance of endogenous latent
variables (Barclay et al., 1995; Chin and Gopal, 1995). Suggested thresholds are
0.19 for weak, 0.33 for moderate, and 0.67 for substantial explanation (Chin,
1998). Values of 0.165 have been found acceptable at early stages of path
models (Braunscheidel and Suresh, 2009), while 0.186 and 0.197 has been
accepted at latter stages (Rai et al., 2006).
Path coefficients The coefficient estimates should be examined for sign, magnitude, and
statistical significance (t-value) (Henseler et al., 2009).
Total effects The sum of the direct and indirect effects among latent variables is useful in
interpreting variable relationships, and should be sizable (Albers, 2009).
Effect size using
Cohen‘s (1988) f
2
f
2 = (R
2 included – R
2 excluded) / (1 – R
2 included). Suggested thresholds are 0.02 for
small, 0.15 for medium, and 0.35 for large effects (Cohen, 1988).
R2 provides an index of the predictive power of path models by examining the
explain variance of the dependent endogenous variable (Barclay et al., 1995; Chin and
Gopal, 1995). Chin (1998) describes R2 values as weak at 0.19, moderate at 0.33, and
substantial at 0.67. It should be noted however, that R2
value are heavily influenced by
the number of antecedent variables modeled in a predictive relationship, thus lower
values can be expected when only one or two antecedent variables are modeled (Henseler
et al., 2009). As such, R2
values of 0.165 (16.5% explained variance) have been found to
be acceptable at early stages in path models (Braunscheidel and Suresh, 2009), while R2
values of 0.186 and 0.197 (18.6% and 19.7% explained variance respectively) have been
adequate at latter stages (Rai et al., 2006).
195
Next, ―the estimated values for the path relationships in the structural model
should be evaluated in terms of sign, magnitude, and significance,‖ (Henseler et al., 2009:
p. 303). In addition to the path coefficients however, it is useful to explore the total
effects of the variables in a path model (Albers, 2009). ―This new paradigm copes with a
frequent observation in PLS [as well as CBSEM] that [in] path modeling the standardized
inner path model coefficients decline with an increased number of indirect relationships,
especially when mediating latent variables have a suppressor effect on the direct path,‖
(Henseler et al., 2009: p. 304). Therefore, the total effects can be useful in validating the
relationships among variables which are modeled to be mediated by one or more
variables, and consequently are at different stages in a path model.
Finally, the effect in the path model can be assessed to examine the effect size (f
2), using Cohen‘s (1988) f
2. ―The effect size is calculated as the increase in the R
2 relative
to the proportion of variance of the endogenous latent variable that remains unexplained,‖
(Henseler et al., 2009: 304). Cohen (1988) prescribes values of 0.02 for small, 0.15 for
medium, and 0.35 for large effect sizes.
5.4 Path model results
This section describes the testing procedures and the consequent results of model
test using the criteria described in section 5.3. Results are provided for the measurement
and structural relationships under study in subsections 5.4.2 and 5.4.3 respectively.
Additionally, the results of post hoc testing to assess the potential effects of common
method bias (CMB) (Podsakoff et al., 2003) is provided in subsection 5.4.4.
196
5.4.1 Data analysis procedures
As discussed in chapter four, the structural model was specified using the
formative approach (Jarvis et al., 2003). Seven latent constructs were measured using
linear composite measures (multivariate factor means) which is a common approach for
complex models such as the model hypothesized for testing herein (Jin, 2008; Byrne,
2001). The seven latent formative constructs were linked by nine hypotheses in a
structural equation model which was tested using PLS.
The bootstrapping procedure was employed to develop estimates of the statistical
significance of the theorized model parameters. ―Bootstrap analysis was done with 500
subsamples and path coefficients were reestimated using each of these samples,‖ (Rai et
al., 2006: p. 235). The case count was set to 190 to match the sample size of the study.
The author then employed ―bootstrap samples of 250 and 1000 to assess that stability of
the parameter estimates,‖ (Rosenzweig et al., 2009: p. 468). This produced consistent
results across the 250, 500, and 1000 bootstrap samples providing evidence of model
stability. ―The vector of parameter estimates was used to compute parameter means,
standard errors, significance of path coefficients, [and] indicator loadings,‖ (Rai et al.,
2006: p. 235). This describes the recommended method for estimating the statistical
significance of indicator loadings and path coefficients (Löhmoeller, 1984).
5.4.2 Measurement „outer‟ model results
The results from measurement (‗outer‘) model testing are displayed in table
5.4.2.1. An analysis of the statistical significance of the indicator or ‗outer‘ loadings
suggests that all of the indicators are statistically significant on their respective latent
197
construct at p < 0.001. This provides further evidence in support of the theorized
measurement conceptualizations described in chapter two and the instrument validation
procedures discussed in chapter four.
Next, each construct dimension was assessed for multicollinearity, as high
multicollinearity ―could mean that the indicator‘s information is redundant,‖ (Henseler et
al., 2009: p. 302). Essentially, this means that two or more dimensions of the construct
substantially overlap in domain measurement. One test for multicollinearity consists of an
examination of the correlations among the variables. Variable correlations have been
displayed earlier in table 4.2.5.1. While some of the variables are highly correlated (e.g.,
the Autonomy and Proactiveness dimensions of the Entrepreneurial Culture construct at a
coefficient of 0.66), all are well below the 0.90 cutoff as a measure of collinearity
suggested by Hair et al. (2006).
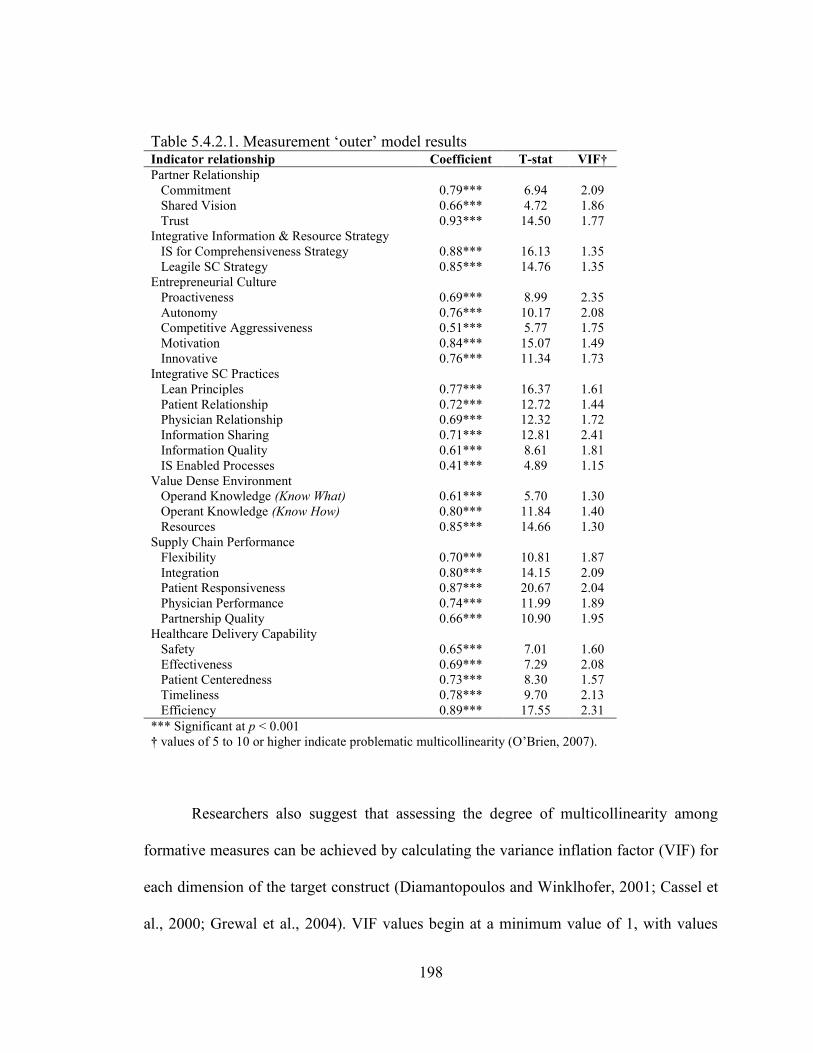
198
Table 5.4.2.1. Measurement ‗outer‘ model results Indicator relationship Coefficient T-stat VIF†
Partner Relationship
Commitment 0.79*** 6.94 2.09
Shared Vision 0.66*** 4.72 1.86
Trust 0.93*** 14.50 1.77
Integrative Information & Resource Strategy
IS for Comprehensiveness Strategy 0.88*** 16.13 1.35
Leagile SC Strategy 0.85*** 14.76 1.35
Entrepreneurial Culture
Proactiveness 0.69*** 8.99 2.35
Autonomy 0.76*** 10.17 2.08
Competitive Aggressiveness 0.51*** 5.77 1.75
Motivation 0.84*** 15.07 1.49
Innovative 0.76*** 11.34 1.73
Integrative SC Practices
Lean Principles 0.77*** 16.37 1.61
Patient Relationship 0.72*** 12.72 1.44
Physician Relationship 0.69*** 12.32 1.72
Information Sharing 0.71*** 12.81 2.41
Information Quality 0.61*** 8.61 1.81
IS Enabled Processes 0.41*** 4.89 1.15
Value Dense Environment
Operand Knowledge (Know What) 0.61*** 5.70 1.30
Operant Knowledge (Know How) 0.80*** 11.84 1.40
Resources 0.85*** 14.66 1.30
Supply Chain Performance
Flexibility 0.70*** 10.81 1.87
Integration 0.80*** 14.15 2.09
Patient Responsiveness 0.87*** 20.67 2.04
Physician Performance 0.74*** 11.99 1.89
Partnership Quality 0.66*** 10.90 1.95
Healthcare Delivery Capability
Safety 0.65*** 7.01 1.60
Effectiveness 0.69*** 7.29 2.08
Patient Centeredness 0.73*** 8.30 1.57
Timeliness 0.78*** 9.70 2.13
Efficiency 0.89*** 17.55 2.31
*** Significant at p < 0.001
† values of 5 to 10 or higher indicate problematic multicollinearity (O‘Brien, 2007).
Researchers also suggest that assessing the degree of multicollinearity among
formative measures can be achieved by calculating the variance inflation factor (VIF) for
each dimension of the target construct (Diamantopoulos and Winklhofer, 2001; Cassel et
al., 2000; Grewal et al., 2004). VIF values begin at a minimum value of 1, with values
199
higher than 5 or 10 indicating problematic levels of multicollinearity (see O‘Brien, 2007;
or Henseler et al., 2009). The VIF values for all construct dimensions are displayed in
table 5.4.2.1. All of the values fall well within the guidelines for acceptability at < 5 to
10.
5.4.3 Structural „inner‟ model results
The structural model results from testing are displayed in figure 5.4.3.1 and a
summary of the results is provided in table 5.4.3.1. The values displayed in figure 5.4.3.1
include the path coefficients and corresponding t-values. To reiterate, good model fit is
established with acceptably high R2 values and significant path coefficients
(Braunscheidel and Suresh, 2009). Overall, the model demonstrates good fit when
considering these criteria. Five of the seven latent constructs demonstrate an R2 values
above .33 which Chin (1998) suggests indicates moderate explanatory power. The two
latent constructs which do not display sufficient R2 values are located at the initial stages
of the model and are therefore it is not surprisingly that these offer low explanatory
power (Henseler et al., 2009).
Eight of the nine hypothesized path coefficients provide strong statistical evidence
of positive relationships among the variables under study. Hypotheses 1, 2, 3, 4, 5, 6, 7,
and 9 are all supported by statistically significant path coefficients, significant f 2
values,
and significant total effect coefficients on the dependent variable HCDC. The significant
path coefficients support the hypothesized linkages among the variables. The significant f
2 values indicate that the effect sizes are meaningful and the significant total effect
coefficients signal that the constructs in the model are appropriate for the phenomena
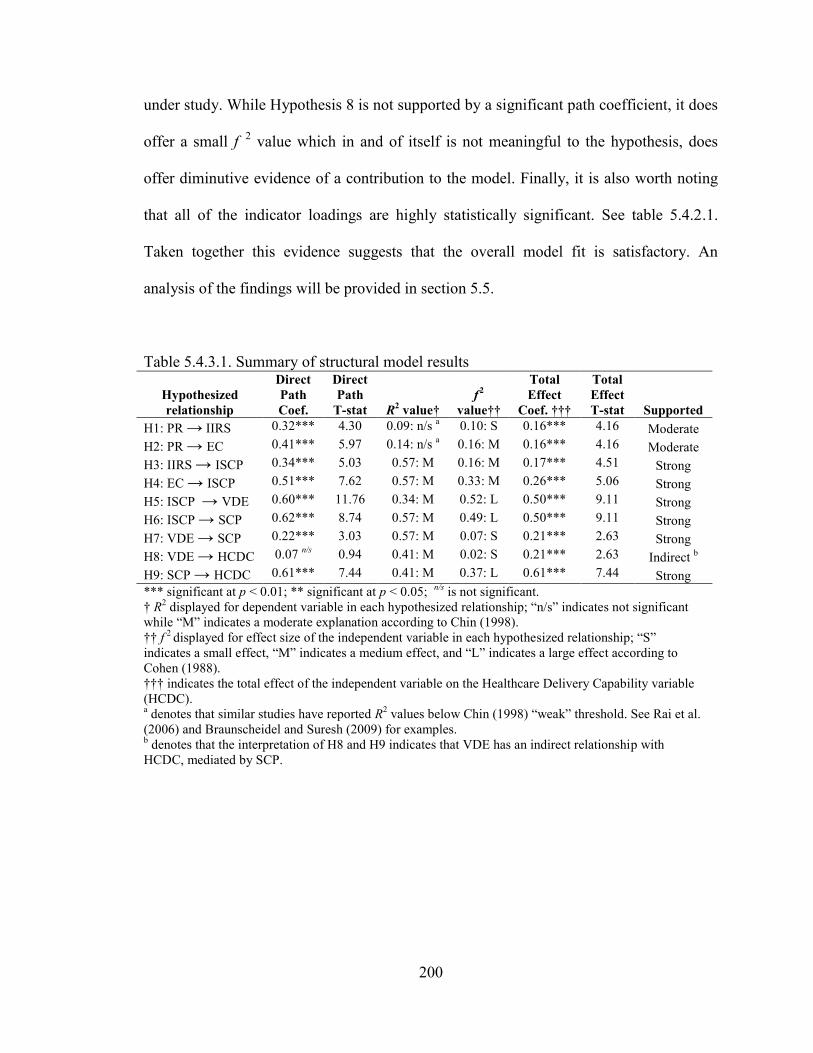
200
under study. While Hypothesis 8 is not supported by a significant path coefficient, it does
offer a small f
2 value which in and of itself is not meaningful to the hypothesis, does
offer diminutive evidence of a contribution to the model. Finally, it is also worth noting
that all of the indicator loadings are highly statistically significant. See table 5.4.2.1.
Taken together this evidence suggests that the overall model fit is satisfactory. An
analysis of the findings will be provided in section 5.5.
Table 5.4.3.1. Summary of structural model results
Hypothesized
relationship
Direct
Path
Coef.
Direct
Path
T-stat R2 value†
f
2
value††
Total
Effect
Coef. †††
Total
Effect
T-stat Supported
H1: PR → IIRS 0.32*** 4.30 0.09: n/s a 0.10: S 0.16*** 4.16 Moderate
H2: PR → EC 0.41*** 5.97 0.14: n/s a 0.16: M 0.16*** 4.16 Moderate
H3: IIRS → ISCP 0.34*** 5.03 0.57: M 0.16: M 0.17*** 4.51 Strong
H4: EC → ISCP 0.51*** 7.62 0.57: M 0.33: M 0.26*** 5.06 Strong
H5: ISCP → VDE 0.60*** 11.76 0.34: M 0.52: L 0.50*** 9.11 Strong
H6: ISCP → SCP 0.62*** 8.74 0.57: M 0.49: L 0.50*** 9.11 Strong
H7: VDE → SCP 0.22*** 3.03 0.57: M 0.07: S 0.21*** 2.63 Strong
H8: VDE → HCDC 0.07 n/s
0.94 0.41: M 0.02: S 0.21*** 2.63 Indirect b
H9: SCP → HCDC 0.61*** 7.44 0.41: M 0.37: L 0.61*** 7.44 Strong
*** significant at p < 0.01; ** significant at p < 0.05; n/s
is not significant.
† R2 displayed for dependent variable in each hypothesized relationship; ―n/s‖ indicates not significant
while ―M‖ indicates a moderate explanation according to Chin (1998).
†† f
2 displayed for effect size of the independent variable in each hypothesized relationship; ―S‖
indicates a small effect, ―M‖ indicates a medium effect, and ―L‖ indicates a large effect according to
Cohen (1988).
††† indicates the total effect of the independent variable on the Healthcare Delivery Capability variable
(HCDC).
a denotes that similar studies have reported R
2 values below Chin (1998) ―weak‖ threshold. See Rai et al.
(2006) and Braunscheidel and Suresh (2009) for examples. b denotes that the interpretation of H8 and H9 indicates that VDE has an indirect relationship with
HCDC, mediated by SCP.
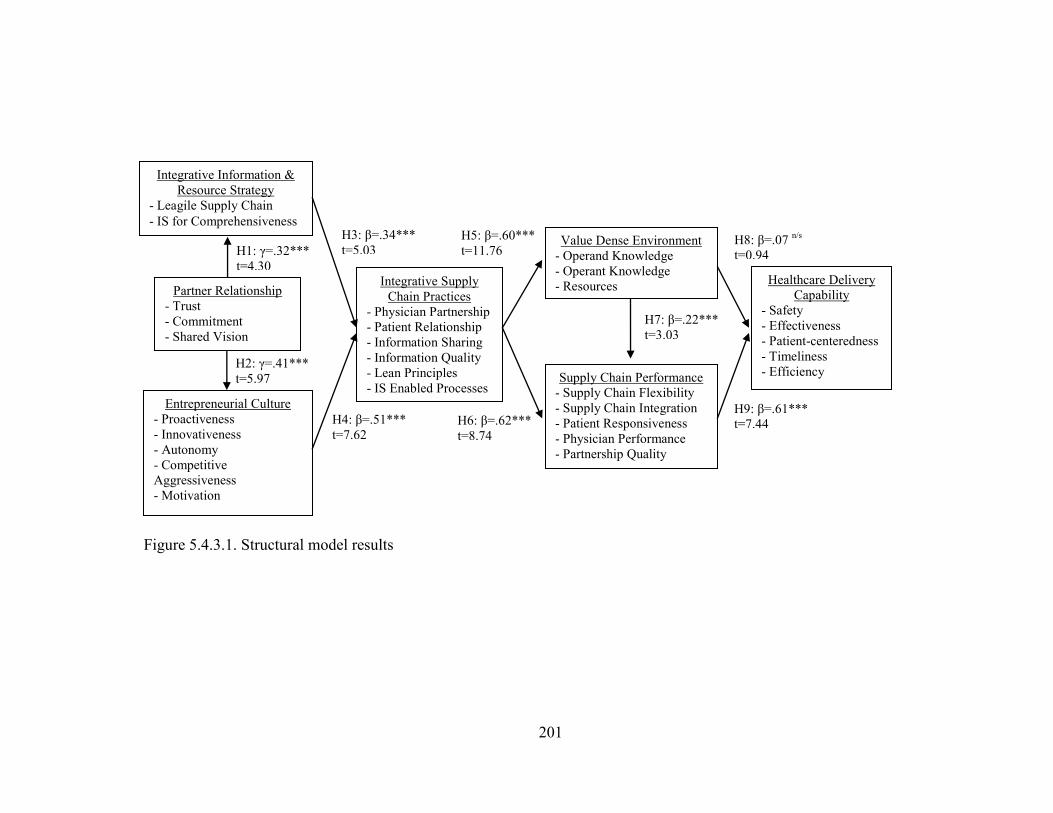
201
Figure 5.4.3.1. Structural model results
H7: β=.22***
t=3.03
H8: β=.07 n/s
t=0.94
H9: β=.61***
t=7.44 H6: β=.62***
t=8.74
H5: β=.60***
t=11.76
H4: β=.51***
t=7.62
H3: β=.34***
t=5.03
H2: γ=.41***
t=5.97
Partner Relationship
- Trust
- Commitment
- Shared Vision
H1: γ=.32***
t=4.30
Integrative Information &
Resource Strategy
- Leagile Supply Chain
- IS for Comprehensiveness
Entrepreneurial Culture
- Proactiveness
- Innovativeness
- Autonomy
- Competitive
Aggressiveness
- Motivation
Integrative Supply
Chain Practices
- Physician Partnership
- Patient Relationship
- Information Sharing
- Information Quality
- Lean Principles
- IS Enabled Processes
Supply Chain Performance
- Supply Chain Flexibility
- Supply Chain Integration
- Patient Responsiveness
- Physician Performance
- Partnership Quality
Value Dense Environment
- Operand Knowledge
- Operant Knowledge
- Resources Healthcare Delivery
Capability
- Safety
- Effectiveness
- Patient-centeredness
- Timeliness
- Efficiency
202
5.4.4 Post hoc testing for Common Method Bias
Notwithstanding the many advantages of survey research discussed in chapter
three, the data collection method is susceptible to common method bias (CMB) when
seeking responses from only one respondent per firm (in studies when the unit of analysis
is at the firm level). This same fate befalls the present study. CMB is essentially the
tendency of the survey respondent to ―edit their responses to be more socially desirable,
lenient, acquiescent, and consistent with how they think the researcher wants them to
respond,‖ (Podsakoff et al., 2003: p. 888).
Proactive attempts were undertaken to minimize CMB in this study. Following
the guidance of Podsakoff et al. (2003), respondents were provided the opportunity to
respond to the survey anonymously. Additionally, the questions measuring the predictor
and criterion variables were segmented into different sections of the survey instrument.
Similar ‗procedural remedies‘ have been employed by other Operations Management
researchers (see Rosenzweig, 2009). In addition to these steps, items associated with a
previously validated scale were added to the survey instrument to allow the researcher to
‗control‘ for social desirability bias (SDB). Podsakoff et al. (2003) advocate for statistical
analysis techniques which enable the researcher to control for such biases.
The scale was developed and validated by Manning et al. (2009) and has been
designed to capture what the authors‘ refer to as Agent‘s Socially Desirable Responding
(ASDR). This is defined as ―organizational informants‘ tendencies to present the firm
favorably with respect to norms and standards,‖ (Manning et al. 2009: p. 33). The
instrument is an 8-item refinement of the longstanding work of Paulhus (1984) who
developed the Balanced Inventory of Desirable Responding (BIDR) as well as the
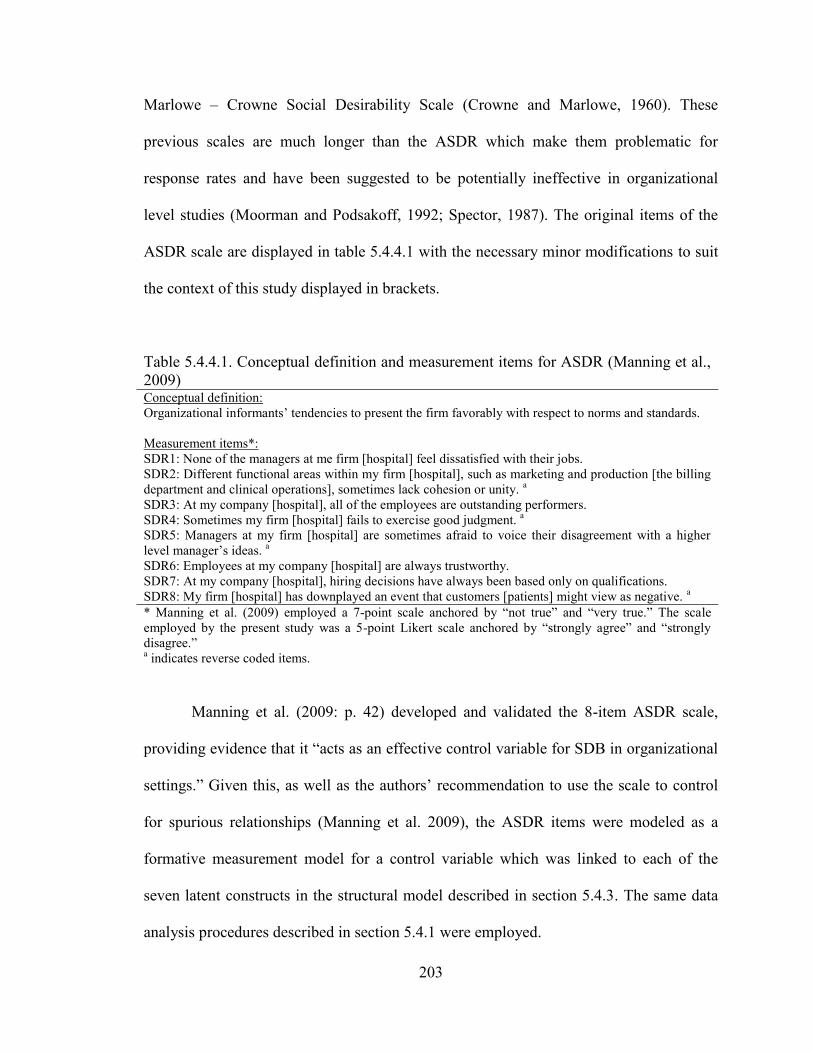
203
Marlowe – Crowne Social Desirability Scale (Crowne and Marlowe, 1960). These
previous scales are much longer than the ASDR which make them problematic for
response rates and have been suggested to be potentially ineffective in organizational
level studies (Moorman and Podsakoff, 1992; Spector, 1987). The original items of the
ASDR scale are displayed in table 5.4.4.1 with the necessary minor modifications to suit
the context of this study displayed in brackets.
Table 5.4.4.1. Conceptual definition and measurement items for ASDR (Manning et al.,
2009) Conceptual definition:
Organizational informants‘ tendencies to present the firm favorably with respect to norms and standards.
Measurement items*:
SDR1: None of the managers at me firm [hospital] feel dissatisfied with their jobs.
SDR2: Different functional areas within my firm [hospital], such as marketing and production [the billing
department and clinical operations], sometimes lack cohesion or unity. a
SDR3: At my company [hospital], all of the employees are outstanding performers.
SDR4: Sometimes my firm [hospital] fails to exercise good judgment. a
SDR5: Managers at my firm [hospital] are sometimes afraid to voice their disagreement with a higher
level manager‘s ideas. a
SDR6: Employees at my company [hospital] are always trustworthy.
SDR7: At my company [hospital], hiring decisions have always been based only on qualifications.
SDR8: My firm [hospital] has downplayed an event that customers [patients] might view as negative. a
* Manning et al. (2009) employed a 7-point scale anchored by ―not true‖ and ―very true.‖ The scale
employed by the present study was a 5-point Likert scale anchored by ―strongly agree‖ and ―strongly
disagree.‖ a indicates reverse coded items.
Manning et al. (2009: p. 42) developed and validated the 8-item ASDR scale,
providing evidence that it ―acts as an effective control variable for SDB in organizational
settings.‖ Given this, as well as the authors‘ recommendation to use the scale to control
for spurious relationships (Manning et al. 2009), the ASDR items were modeled as a
formative measurement model for a control variable which was linked to each of the
seven latent constructs in the structural model described in section 5.4.3. The same data
analysis procedures described in section 5.4.1 were employed.
204
The results are displayed in table 5.4.4.2. With regard to measurement, as was the
case with Rosenzweig‘s (2009) attempt to test for CMB, ―all path loadings of the
hypothesized indicators with their respective constructs remain statistically significant [at
p < 0.001].‖ In testing the structural model, Hypotheses 3, 4, 5, 6, 7, and 9 remain
statistically significant at the p < 0.01 level and consequently remain supported.
Hypothesis 2 is statistically significant and consequently remains supported, but at the p
< 0.05 level. Hypothesis 1 is statistically significant at the p < 0.1 level. While this is
often not considered to be a strong finding in top journals, the t-value is 1.92 which is
approaching the threshold for significance at the p < 0.05 level (t-value = 1.96) which is
commonly accepted as statistical support. Hypothesis 8 was not significant in the original
model and the same is true in the control model. These results, by in large, suggest that
the relationships hypothesized herein remain supported when controlled for CMB.
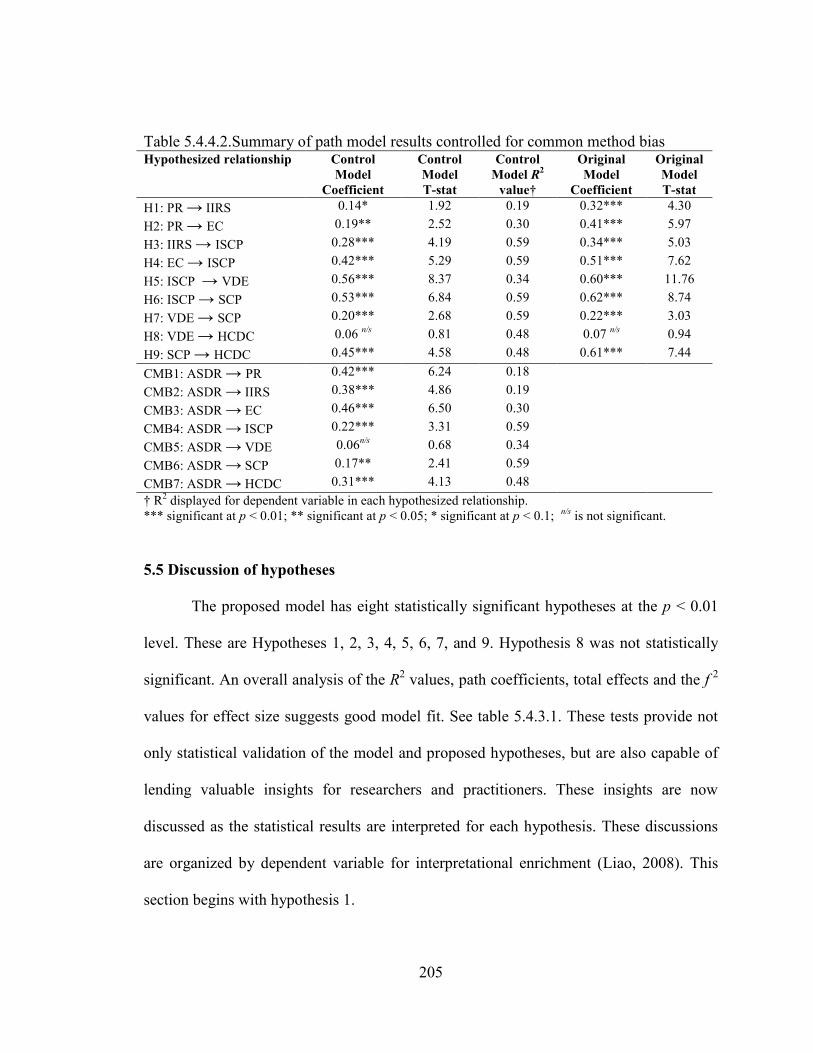
205
Table 5.4.4.2.Summary of path model results controlled for common method bias Hypothesized relationship Control
Model
Coefficient
Control
Model
T-stat
Control
Model R2
value†
Original
Model
Coefficient
Original
Model
T-stat
H1: PR → IIRS 0.14* 1.92 0.19 0.32*** 4.30
H2: PR → EC 0.19** 2.52 0.30 0.41*** 5.97
H3: IIRS → ISCP 0.28*** 4.19 0.59 0.34*** 5.03
H4: EC → ISCP 0.42*** 5.29 0.59 0.51*** 7.62
H5: ISCP → VDE 0.56*** 8.37 0.34 0.60*** 11.76
H6: ISCP → SCP 0.53*** 6.84 0.59 0.62*** 8.74
H7: VDE → SCP 0.20*** 2.68 0.59 0.22*** 3.03
H8: VDE → HCDC 0.06 n/s
0.81 0.48 0.07 n/s
0.94
H9: SCP → HCDC 0.45*** 4.58 0.48 0.61*** 7.44
CMB1: ASDR → PR 0.42*** 6.24 0.18
CMB2: ASDR → IIRS 0.38*** 4.86 0.19
CMB3: ASDR → EC 0.46*** 6.50 0.30
CMB4: ASDR → ISCP 0.22*** 3.31 0.59
CMB5: ASDR → VDE 0.06n/s
0.68 0.34
CMB6: ASDR → SCP 0.17** 2.41 0.59
CMB7: ASDR → HCDC 0.31*** 4.13 0.48
† R2 displayed for dependent variable in each hypothesized relationship.
*** significant at p < 0.01; ** significant at p < 0.05; * significant at p < 0.1; n/s
is not significant.
5.5 Discussion of hypotheses
The proposed model has eight statistically significant hypotheses at the p < 0.01
level. These are Hypotheses 1, 2, 3, 4, 5, 6, 7, and 9. Hypothesis 8 was not statistically
significant. An overall analysis of the R2 values, path coefficients, total effects and the f
2
values for effect size suggests good model fit. See table 5.4.3.1. These tests provide not
only statistical validation of the model and proposed hypotheses, but are also capable of
lending valuable insights for researchers and practitioners. These insights are now
discussed as the statistical results are interpreted for each hypothesis. These discussions
are organized by dependent variable for interpretational enrichment (Liao, 2008). This
section begins with hypothesis 1.
206
Hypothesis 1: Partner relationship is positively associated with a
hospital‟s integrative information and resource strategy.
The statistical analysis displayed in table 5.4.3.1 provides moderate support for
Hypothesis 1 as three of the four model assessment indexes (path coefficient, R2, f
2, and
the total effect) indicate that PR plays a meaningful role in directly affecting IIRS, and
also in indirectly affecting the dependent variable HCDC. The path coefficient between
PR and IIRS is found to be highly significant and positive (γ=0.32, t=4.30). This
indicates that PR has a direct positive impact on IIRS. The significant factor loadings
provide evidence that PR is made up of Trust, Commitment and Shared Vision. This
signifies that when PR is high, the relationship between the hospital‘s admitting/attending
physicians can principally be described as honest and open in their dealings with the
hospital‘s clinical staff, having earned the hospital‘s confidence through their clinical
practices. Hypothesis 1 finds that this influences the likelihood that the hospital will
adopt an IIRS.
The significant factor loadings on IIRS signify that when a hospital adopts this
strategy, leadership will emphasize a Leagile SC Strategy as well as an IS for
Comprehensiveness Strategy. See table 5.4.2.1. This implies for example, when PR is
high, leadership will emphasize process improvement, elimination of waste,
understanding of patient needs, adapting to change, and providing personalized care.
With regard to IT, leadership is likely to emphasize: 1) a Patient-focus for IT such as the
use of IT to recognize the patient‘s needs, ensure that clinical milestones are met, respond
quicker to patient‘s needs; 2) a Physician-focus for IT such as the use of IT to share
information with physicians, improve communication with physicians, communicate the
207
status of orders and develop stronger relationships with physicians; and 3) an Operational
IT focus such as the use of IT to reduce the cost of processing orders, administration, and
delivering care.
However, PR is found to explain only 9% (R2 value) of the variance in IIRS.
Further, the effect size for PR on IIRS is considered small (0.10), but still meaningful
(Cohen, 1988). Therefore, PR is a antecedent of IIRS, but is one of only a number of
phenomena which may drive a hospital to implement a highly ‗integrative‘ strategy. One
potential phenomenon worthy of consideration as another antecedent of IIRS is
environmental context (Porter, 1996). Another may be product (or in this case service)
characteristics (Vonderembse at al., 2006). When considering SDL, some would argue
that advancements in IT motivate the desire for integration and could be modeled as an
antecedent (Prahalad and Ramaswamy, 2004a; Day, 2006; Callaway and Dobrzykowski,
2009). That said, the inclusion of PR in the model is valuable as evidenced not only by
the positive linkage to IIRS, but also by its total effect on HCDC (coefficient = 0.16, p <
0.01).
Next is a discussion of the implications related to Hypothesis 2.
Hypothesis 2: Partner relationship is positively associated with a
hospital‟s entrepreneurial culture.
The statistical analysis displayed in table 5.4.3.1 provides moderate support for
Hypothesis 2 as three of the four model assessment indexes (path coefficient, R2, f
2, and
the total effect) indicate that PR plays a meaningful role in directly affecting EC, and also
in indirectly affecting the dependent variable HCDC. The path coefficient between PR
208
and IIRS is found to be highly significant and positive (γ=0.41, t=5.97). This indicates
that EC has a direct positive impact on IIRS. As discussed with Hypothesis 1, the
significant factor loadings provide evidence that PR is made up of Trust, Commitment
and Shared Vision. See table 5.4.2.1. This signifies that when PR is high, the relationship
between the hospital‘s admitting/attending physicians can principally be described as
honest and open in their dealings with the hospital‘s clinical staff, having earned the
hospital‘s confidence through their clinical practices. Hypothesis 2 finds that this
influences the likelihood that the hospital will develop an EC.
The significant factor loadings on EC provide evidence signifying that when a
hospital fosters this culture, it will be characterized by Proactiveness, Innovativeness,
Autonomy, Competitive Aggressiveness, and Motivation. See table 5.4.2.1. This suggests
for example, that hospitals with admitting/attending physicians who are honest and open
in their dealings with the hospital‘s clinical staff, and who have earned the hospital‘s
confidence through their clinical practices are likely to be known as an innovator among
hospitals in their region, promote new and innovative services, provide leadership in
creating new services, exist on the leading edge in creating new technologies. These
hospitals are also likely to have clinical employees who are highly motivated toward
work, hard working, very ambitious, and have a ―can do‖ attitude.
However, PR is found to explain only 14% (R2 value) of the variance in EC. That
said, the effect size for PR on EC is considered medium (0.16) and meaningful (Cohen,
1988). Therefore, PR is an antecedent of EC, but it is one of only a number of phenomena
which may drive a hospital to foster this type of culture. The borderline R2 value (see
comparable findings in the Operations Management and IT literature from Rai et al.,
209
2006; Braunscheidel and Suresh, 2009) does encourage the researcher to consider other
antecedents of EC. One potential antecedent may be munificence as Jambulingam et al.
(2005) suggest that pharmacies displaying the five dimensions of EC conceptualized
herein are more likely to perceive growth opportunities than other firms. These
pharmacies also view their environment as highly competitive (Jambulingam et al.,
2005), making competitive intensity a potential antecedent for hospitals with an EC. In
their study of a ‗safety culture‘ in hospitals, McFadden et al. (2009) found that
transformational leadership is a positive antecedent. Certainly, transformational
leadership could lead to an EC as described herein. That said, the inclusion of PR in the
model is valuable as evidenced not only by the positive linkage to EC, but also by its total
effect on HCDC (coefficient = 0.16, p < 0.01).
Next is a discussion of the implications related to Hypothesis 3 and 4.
Hypothesis 3: Integrative information and resource strategy is positively
associated with a hospital‟s integrative supply chain practices.
Hypothesis 4: Entrepreneurial culture is positively associated with a
hospital‟s integrative supply chain practices.
The statistical analysis displayed in table 5.4.3.1 provides strong support for
Hypothesis 3 as all four model assessment indexes (path coefficient, R2, f
2, and the total
effect) indicate that IIRS plays a meaningful role in directly affecting ISCP, and also in
indirectly affecting the dependent variable HCDC. The path coefficient between IIRS and
ISCP is found to be highly significant and positive (β=0.34, t=5.03). This indicates that
IIRS has a direct positive impact on ISCP. As discussed in the analysis of Hypothesis 1,
the significant factor loadings on IIRS provide support that when a hospital adopts this
210
strategy, leadership will emphasize a Leagile SC Strategy as well as an IS for
Comprehensiveness Strategy. See table 5.4.2.1. This suggests for example, that when
IIRS is high, leadership will emphasize process improvement, elimination of waste,
understanding of patient needs, adapting to change, and providing personalized care.
With regard to IT, leadership is likely to emphasize: 1) a Patient-focus for IT such as the
use of IT to recognize the patient‘s needs, ensure that clinical milestones are met, respond
quicker to patient‘s needs; 2) a Physician-focus for IT such as the use of IT to share
information with physicians, improve communication with physicians, communicate the
status of orders and develop stronger relationships with physicians; and 3) an Operational
IT focus such as the use of IT to reduce the cost of processing orders, administration, and
delivering care. Hypothesis 3 finds that this influences the likelihood that the hospital
employees will engage in ISCP.
The statistical analysis displayed in table 5.4.3.1 also provides strong support for
Hypothesis 4 as all four model assessment indexes (path coefficient, R2, f
2, and the total
effect) indicate that EC plays a meaningful role in directly affecting ISCP, and also in
indirectly affecting the dependent variable HCDC. The path coefficient between EC and
ISCP is found to be highly significant and positive (β=0.51, t=7.62). This indicates that
EC also has a direct positive impact on ISCP. As discussed in the analysis of Hypothesis
2, the significant factor loadings on EC provide evidence signifying that when a hospital
fosters this culture, it will be characterized by Proactiveness, Innovativeness, Autonomy,
Competitive Aggressiveness, and Motivation. See table 5.4.2.1. This suggests for
example, that hospitals with admitting/attending physicians who are honest and open in
their dealings with the hospital‘s clinical staff, and who have earned the hospital‘s
211
confidence through their clinical practices are likely to be known as an innovator among
hospitals in their region, promote new and innovative services, provide leadership in
creating new services, and exist on the leading edge in creating new technologies. These
hospitals are also likely to have clinical employees who are highly motivated toward
work, hard working, very ambitious, and have a ―can do‖ attitude. Hypothesis 4 finds that
this also influences the likelihood that the hospital employees will engage in ISCP.
The significant factor loadings on ISCP provide evidence signifying that when
hospital employees engage in these practices, their actions will be characterized by
Physician Partnership, Patient Relationship, Information Sharing, Information Quality,
Lean Principles, and IS Enabled Processes. See table 5.4.2.1. This suggests for example,
that when IIRS and EC are high, hospital employees are likely to act to improve patient
care by standardizing work (care pathways), use simple and direct pathways that ensure
resource availability during patient care, monitor patient satisfaction, have a program
dedicated to improving patient satisfaction, partner on continuous improvement
initiatives with admitting/attending physicians, regularly partner with admitting/attending
physicians to solve problems, work with admitting/attending physicians to keep each
other informed about changes that may affect care delivery, share information with
admitting/attending physicians that helps establish treatment plans, exchange information
with admitting/attending physicians that is adequate, complete, timely, and accurate, use
RFID to monitor patient movement and location, use RFID to coordinate medical
treatment wherever patients go during care delivery, use EMR for clinical documentation
to capture problem lists and nursing assessments, use EMR to view diagnostic test
results, radiology reports, and laboratory results, use EMR for CPOE to order laboratory
212
and radiology tests, and use EMR for decision support to access drug interaction alerts
and clinical reminders.
IIRS and EC are found to explain 57% (R2 value) of the variance in ISCP which is
considered to be a moderate explanation and thus meaningful Chin (1998). The effect
size for both IIRS on ISCP (0.16) and EC on ISCP (0.33) are considered medium and
thus meaningful (Cohen, 1988). It is worth noting however that the effect size of EC on
ISCP is substantially greater than that of IIRS on ISCP and is approaching the Cohen
(1988) threshold of 0.35 which would be considered a large effect. This is also reflected
in a comparison of the beta coefficients of the two independent variables in these
relationships (β=0.34 for IIRS and β=0.51 for EC). While EC has a greater influence on
ISCP, taken together these findings provide evidence that both IIRS and EC are key
antecedents of ISCP. The inclusion of IIRS and EC in the model is valuable as evidenced
not only by their positive linkages to ISCP, but also by their total effects on HCDC
(coefficient = 0.17, p < 0.01 and coefficient = 0.26, p < 0.01 respectively).
Next is a discussion of the implications related to Hypothesis 5.
Hypothesis 5: Integrative supply chain practices are positively associated
with a value dense environment.
The statistical analysis displayed in table 5.4.3.1 provides strong support for
Hypothesis 5 as all four model assessment indexes (path coefficient, R2, f
2, and the total
effect) indicate that ISCP plays a meaningful role in directly affecting VDE, and also in
indirectly affecting the dependent variable HCDC. The path coefficient between ISCP
and VDE is found to be highly significant and positive (β=0.60, t=11.76). This indicates
213
that ISCP has a direct positive impact on VDE. As discussed in the analysis of
Hypotheses 3 and 4, the significant factor loadings on ISCP provide support signifying
that when hospital employees engage in these practices, their actions will be
characterized by Physician Partnership, Patient Relationship, Information Sharing,
Information Quality, Lean Principles, and IS Enabled Processes. See table 5.4.2.1. This
suggests for example, that when ISCP is high, hospital employees are likely to act to
improve patient care by standardizing work (care pathways), use simple and direct
pathways that ensure resource availability during patient care, monitor patient
satisfaction, have a program dedicated to improving patient satisfaction, partner on
continuous improvement initiatives with admitting/attending physicians, regularly partner
with admitting/attending physicians to solve problems, work with admitting/attending
physicians to keep each other informed about changes that may affect care delivery, share
information with admitting/attending physicians that helps establish treatment plans,
exchange information with admitting/attending physicians that is adequate, complete,
timely, and accurate, use RFID to monitor patient movement and location, use RFID to
coordinate medical treatment wherever patients go during care delivery, use EMR for
clinical documentation to capture problem lists and nursing assessments, use EMR to
view diagnostic test results, radiology reports, and laboratory results, use EMR for CPOE
to order laboratory and radiology tests, and use EMR for decision support to access drug
interaction alerts and clinical reminders. Hypothesis 5 finds that this influences the
likelihood that the hospital employees will function in a VDE.
The significant factor loadings on VDE provide evidence signifying that when a
hospital creates this type of environment, it will be characterized by Operand Knowledge
214
(know what), Operant Knowledge (know how), and Resources. See table 5.4.2.1. This
suggests for example, that hospitals with high ISCP are likely to have a work
environment characterized by care providers who have the skills, ability, and knowledge
along with ready access to the supplies, medications, and equipment needed when caring
for a particular patient.
ISCP is found to explain 34% (R2 value) of the variance in VDE which is
considered to be a moderate explanation and thus meaningful Chin (1998). The effect
size for ISCP on VDE (0.52) is considered large and thus also meaningful (Cohen, 1988).
These findings provide evidence that ISCP is a key antecedent of VDE. The inclusion of
ISCP in the model is valuable as evidenced not only by its positive linkage to VDE, but
also by its total effect on HCDC (coefficient = 0.50, p < 0.01).
Next is a discussion of the implications related to Hypotheses 6 and 7.
Hypothesis 6: Integrative supply chain practices are positively associated
with a hospital‟s supply chain performance.
Hypothesis 7: Value dense environment is positively associated with a
hospital‟s supply chain performance.
The statistical analysis displayed in table 5.4.3.1 provides strong support for
Hypothesis 6 as all four model assessment indexes (path coefficient, R2, f
2, and the total
effect) indicate that ISCP plays a meaningful role in directly affecting SCP, and also in
indirectly affecting the dependent variable HCDC. The path coefficient between ISCP
and SCP is found to be highly significant and positive (β=0.62, t=8.74). This indicates
that ISCP has a direct positive impact on SCP. As discussed in the analysis of Hypotheses
215
3, 4, and 5, the significant factor loadings on ISCP provide support signifying that when
hospital employees engage in these practices, their actions will be characterized by
Physician Partnership, Patient Relationship, Information Sharing, Information Quality,
Lean Principles, and IS Enabled Processes. See table 5.4.2.1. This suggests for example,
that when ISCP is high, hospital employees are likely to act to improve patient care by
standardizing work (care pathways), use simple and direct pathways that ensure resource
availability during patient care, monitor patient satisfaction, have a program dedicated to
improving patient satisfaction, partner on continuous improvement initiatives with
admitting/attending physicians, regularly partner with admitting/attending physicians to
solve problems, work with admitting/attending physicians to keep each other informed
about changes that may affect care delivery, share information with admitting/attending
physicians that helps establish treatment plans, exchange information with
admitting/attending physicians that is adequate, complete, timely, and accurate, use RFID
to monitor patient movement and location, use RFID to coordinate medical treatment
wherever patients go during care delivery, use EMR for clinical documentation to capture
problem lists and nursing assessments, use EMR to view diagnostic test results, radiology
reports, and laboratory results, use EMR for CPOE to order laboratory and radiology
tests, and use EMR for decision support to access drug interaction alerts and clinical
reminders. Hypothesis 6 finds that this influences the likelihood that the hospital will
achieve high SCP.
The statistical analysis displayed in table 5.4.3.1 also provides strong support for
Hypothesis 7 as all four model assessment indexes (path coefficient, R2, f
2, and the total
effect) indicate that VDE plays a meaningful role in directly affecting SCP, and also in
216
indirectly affecting the dependent variable HCDC. The path coefficient between VDE
and SCP is found to be significant and positive (β=0.22, t=3.03). This indicates that VDE
has a direct positive impact on SCP. As discussed in the analysis of Hypotheses 5, the
significant factor loadings on VDE provide support that when a hospital creates this type
of environment, it will be characterized by Operand Knowledge (know what), Operant
Knowledge (know how), and Resources. See table 5.4.2.1. This suggests for example,
that hospitals with high VDE are likely to have a work environment characterized by care
providers who have the skills, ability, and knowledge along with ready access to the
supplies, medications, and equipment needed when caring for a particular patient.
Hypothesis 7 finds that this also influences the likelihood that the hospital will achieve
high SCP.
The significant factor loadings on SCP provide evidence signifying that when
hospital achieves high SCP, it will be characterized by high levels Flexibility, Integration,
Patient Responsiveness, Physician Performance, and Partnership Quality. See table
5.4.2.1. This suggests for example, that hospitals with high SCP are likely to be
characterized as having patient care teams that are able to handle the rapid introduction of
new services, introduce large numbers of service improvements/variations, adapt when
patient demands vary greatly to still provide high quality care, achieve high levels of
coordination and communication among all functions, fulfill patients‘ needs on time and
be responsive to patients‘ needs, and have admitting/attending physicians who provide
dependable, high quality services to patients.
ISCP and VDE are found to explain 57% (R2 value) of the variance in SCP which
is considered to be a moderate explanation and thus meaningful Chin (1998). The effect
217
size for ISCP on SCP (0.49) is considered large, while the effect size of VDE on SCP
(0.07) is considered small but still meaningful (Cohen, 1988). Clearly, the effect size of
ISCP on SCP is substantially greater than that of VDE on SCP. This is also reflected in a
comparison of the beta coefficients of the two independent variables in these
relationships (β=0.62 for ISCP and β=0.22 for VDE). While ISCP has a greater influence
on SCP, taken together these findings provide evidence that both ISCP and VDE are key
antecedents of SCP. The inclusion of ISCP and VDE in the model is valuable as
evidenced not only by their positive linkages to SCP, but also by their total effects on
HCDC (coefficient = 0.50, p < 0.01 and coefficient = 0.21, p < 0.01 respectively).
Next is a discussion of the implications related to Hypothesis 8 and 9.
Hypothesis 8: Value dense environment is positively associated with
healthcare delivery capability.
Hypothesis 9: Supply chain performance is positively associated with
healthcare delivery capability.
The statistical analysis displayed in table 5.4.3.1 provides negligible support for
Hypothesis 8 when interpreting the four model assessment indexes (path coefficient, R2, f
2, and the total effect). The results indicate that VDE does not play a direct role in
affecting HCDC. The path coefficient between VDE and HCDC is not found to be
significant (β=0.07, t=0.94). Likewise, the effect size (0.02) is considered to be small.
However, as discussed in the analysis of Hypothesis 7, the total effects coefficient for
VDE on HCDC is significant and positive (coefficient = 0.21, p < 0.01), thereby
218
indicating that a positive association does exist, albeit not a direct relationship. This will
be further explained as Hypothesis 9 is analyzed.
The statistical analysis displayed in table 5.4.3.1 also provides strong support for
Hypothesis 9 as all four model assessment indexes (path coefficient, R2, f
2, and the total
effect) indicating that SCP plays a meaningful role in directly affecting the dependent
variable HCDC. The path coefficient between SCP and HCDC is found to be significant
and positive (β=0.61, t=7.44). This indicates that SCP has a direct positive impact on
HCDC. As discussed in the analysis of Hypotheses 6 and 7, the significant factor
loadings on SCP provide support that when hospital achieves high SCP, it will be
characterized by high levels Flexibility, Integration, Patient Responsiveness, Physician
Performance, and Partnership Quality. See table 5.4.2.1. This suggests for example, that
hospitals with high SCP are likely to be characterized as having patient care teams that
are able to handle the rapid introduction of new services, introduce large numbers of
service improvements/variations, adapt when patient demands vary greatly to still
provide high quality care, achieve high levels of coordination and communication among
all functions, fulfill patients‘ needs on time and be responsive to patients‘ needs, and have
admitting/attending physicians who provide dependable, high quality services to patients.
This is found to mediate the relationship between VDE and HCDC. It is worth reiterating
the measurement model results at this point, which support that when a hospital creates a
VDE, it is characterized by Operand Knowledge (know what), Operant Knowledge
(know how), and Resources. This suggests for example, that hospitals with high VDE are
likely to have a work environment characterized by care providers who have the skills,
ability, and knowledge along with ready access to the supplies, medications, and
219
equipment needed when caring for a particular patient. While this environment does not
in and of itself directly influence a hospital‘s HCDC, it is impactful through the
achievement of SCP. Thus, Hypothesis 9 finds that SCP directly influences the likelihood
that the hospital will achieve HCDC, while Hypothesis 8 finds that VDE influences the
likelihood that the hospital will achieve HCDC, but indirectly and through SCP.
The significant factor loadings on HCDC provide evidence signifying that when
hospital achieves HCDC, its patient care outcomes will be characterized by high levels of
Safety, Effectiveness, Patient Centeredness, Timeliness, and Efficiency. See table 5.4.2.1.
This suggests for example, that the hospitals patients will feel that the hospital is more
responsive to patients‘ requests, complaints, personal values, and medical needs while the
hospital also does a better job of eliminating waste of energy and supplies, holds down
inpatient costs, and attains high equipment utilization than competing hospitals.
VDE and SCP are found to explain 41% (R2 value) of the variance in HCDC
which is considered to be a moderate explanation and thus meaningful Chin (1998). The
effect size for VDE on HCDC (0.02) is considered small, while the effect size of SCP on
HCDC (0.37) is considered to be large and thus more meaningful (Cohen, 1988). Clearly,
the effect size of ISCP on SCP is substantially greater than that of VDE on SCP. This is
provides evidence of its mediation role as discussed earlier. This mediation relationship is
also reflected in a comparison of the beta coefficients of the two independent variables in
these relationships (β=0.07n/s
for VDE and β=0.61 for SCP). While SCP has the only
significant direct influence on SCP (when comparing these two variables), taken together
these findings provide evidence that both VDE and SCP are key antecedents of SCP. The
220
inclusion of VDE and SCP in the model is valuable as evidenced by their total effects on
HCDC (coefficient = 0.21, p < 0.01 and coefficient = 0.61, p < 0.01 respectively).
5.5.1 Summary of results
Overall, these results indicate that high levels of partner relationship will lead to
high levels of integrative information and resources strategy and an entrepreneurial
culture. In turn, high levels of integrative information and resource strategy and
entrepreneurial culture will lead to high levels of integrative supply chain practices. High
levels of integrative supply chain practices will lead to high levels of a value dense
environment and supply chain performance. While high levels of value dense
environment will lead to supply chain performance, it does not lead to high levels of
healthcare delivery capability, but instead is mediated by the relationship between supply
chain performance and healthcare delivery capability.
The next and final chapter will summarize the key contributions of this study,
highlight important implications for practitioners and scholars, present some of the
study‘s limitations, and outline future opportunities to continue this line of research.
221
CHAPTER 6: CONTRIBUTIONS, IMPLICATIONS, LIMITATIONS, AND
FUTURE RESEARCH
This chapter discusses the key contributions of this study in section 6.1. It then
goes on to highlight important implications for scholars in section 6.2, and implications
for practitioners in section 6.3. Section 6.4 presents some of the study‘s limitations.
Finally, section 6.5 concludes the study with a discussion of future opportunities to
continue this line of research.
6.1 Contributions
This study developed an integrated model of the healthcare delivery supply chain
grounded in SDL. It also collected and analyzed large-scale empirical data from 190 US
hospitals, producing a theoretical foundation as well as empirical evidence. In doing so,
this research develops one of the first integrated models linking supply chain strategy,
practices, performance, and capability, a contribution which is absent in the literature (Li
et al., 2006). This is useful as a comprehensive integrative framework with well defined
contextual links is absent in the literature. This supply chain study is conceptualized in
the downstream healthcare delivery context. While interest in this research area from
supply chain, OM, and IT scholars is growing (see Shah et al., 2008; Sinha and Kohnke,
2009; Fredendall et al., 2009; Ilie et al., 2009), the field is largely underrepresented in the
literature (Machuca et al., 2007). Finally, this study provides a very early attempt to
measure key phenomena related to the nascent theory of SDL using SCM construct
measures. Until now, the vast majority of the work in SDL has been conceptual and
scholars have suggested empirical studies into this theoretical base (see Zhang and Chen,
222
2008). Toward this end, this study extends the conceptual work of Normann and Ramirez
(1993), Prahalad and Ramaswamy (2004a) (2004b), Prahalad and Krishnan (2008),
Vargo et al. (2008), Vargo and Akaka (2009) among others.
This study specifically set out to adopt a supply chain management perspective to
inform the overarching research question: does supply chain management influence value
co-creation in a hospital environment where healthcare is delivered? In doing so, four
more granular research questions have been addressed. First, what are the antecedent
partner relationship, integrative information and resource strategy, and entrepreneurial
culture characteristics that enable value co-creation through integrative supply chain
practices? Second, what are the integrative supply chain practices that influence value
density and supply chain performance? Third, what are the dimensions of supply chain
performance and value density (environment) that lead to the development of healthcare
delivery capability? And finally, what are the relationships among these antecedents and
consequences of value density in healthcare delivery? This study makes a number of
contributions in exploring these research questions.
The overarching contribution of this study is the theorization and testing of a
comprehensive integrated framework for supply chain practices in a specific and well
defined context. This integrative framework was supported in eight of nine hypotheses,
providing interpretations which inform all four of the research questions. To begin,
through extensive literature review and empirical testing this study provides support for
Partner Relationship, Integrative Information and Resource Strategy, and Entrepreneurial
Culture as antecedents of Integrative Supply Chain Practices and a Value Dense
Environment. Next, this study theorizes and empirically supports six dimensions of
223
Integrative Supply Chain Management Practices which bring together key dimensions
described in the IT and supply chain literature. In addition, the key dimensions of Supply
Chain Performance, Value Dense Environment, and Healthcare Delivery Capability have
been theorized and empirically supported. Finally, relationships among these variables
have been theorized using SDL and empirically supported. A more detailed discussion of
this study‘s contributions follows.
The first contribution of this study is the theorization and confirmative testing of
Partner Relationship as a coordination mechanism in the decentralized healthcare
delivery supply chain. This extends the work of Shah et al. (2008) and others. This study
shows how Partner Relationship can align the interests of admitting/attending physicians
with the hospital in the downstream healthcare delivery supply chain. In this way, Partner
Relationship serves as a key antecedent in the development of a hospital‘s integration
strategy as well as influences the hospital‘s culture. This is an important and useful
finding in a supply chain context absent of financial and/or contractual coordination
mechanisms.
The second contribution is the identification of six supply chain management
practices which are contextually grounded. Scholars have posited many different
configurations of supply chain management practices (see Dolan, 1996; Tan et al., 1998;
Tan et al., 2002; Chen and Paulraj, 2004; Min and Mentzer, 2004; Li et al., 2005; 2006).
This is discussed in detail in section 2.2 and displayed in table 2.2.1. A potential driver of
these difference configurations is that perhaps not enough attention has been paid by
supply chain researchers to the context of study. In other words, contextual elements are
likely to have an influence on the nature and composition of supply chain practices (Liao,
224
2008). This study has made a considerable effort to define the unique context of
healthcare delivery in section 2.3. This has been highlighted as an important aim in the
literature and is perhaps a contribution to the Operations Management literature in and of
itself (see Shah et al., 2008). In doing so, this study conceptualized and then provided
empirical evidence in support of six Integrative Supply Chain Practice dimensions
drawing on the IT and Supply Chain literature (Physician Partnership, Patient
Relationship, Information Sharing, Information Quality, Lean Principles, and IS Enabled
Processes). These Integrative Supply Chain Practices were then linked to the Supply
Chain Performance of the care delivery team as well as the creation of a Value Dense
Environment. These variables have been shown herein to influence a hospital‘s
Healthcare Delivery Capability.
The third contribution of this study rests at the intersection of Supply Chain
Management and SDL. As discussed, studies into SDL have largely been conceptual
while attempts at empirical measurement have been sparse. Zhang and Chen (2008)
provide the notable exception in connecting Mass Customization and SDL. In doing so,
the authors highlight the potential to explain value co-creation and SDL through the use
of supply chain concepts and measurement scales. Likewise, other researchers have
pointed out the opportunity for research at the intersection of Supply Chain/OM and SDL
(Schmenner et al.,2009). This study addresses this gap in the literature by conceptualizing
and empirically supporting the linkages among Integrative Supply Chain Practices, Value
Dense Environment, and Supply Chain Performance. Additionally, these relationships
have been nested in a larger nomological net which provides a rich explanation of the
antecedents and consequences of value density. As such, the findings from this study
225
with regard to supply chain concepts and value density make a substantial contribution to
the nascent foundation which is currently being established for the study of SDL.
The fourth contribution of this study is the development of 35 first order
measurement scales. All of the scales were tested through Q-sort pilot testing and large-
scale empirical data analysis. While many of these scales are obviously and appropriately
rooted in previous literature, the development process was necessary to ensure the
appropriateness of these scales in the healthcare context. As such, researchers have a new
set of instruments to study SCM in healthcare delivery that have been shown to be valid
and reliable.
The fifth set of contributions is of the methodological variety. Following the
recommendation of Erdos (1970), this study collected data from three separate sample
frames while employing three different procedures for data collection. The samples were
tested for inherent biases and evidence was found to support their aggregation. While the
value of this particular feature of this study should not be overstated, the use of multiple
methods is generally thought to enhance scientific rigor and interpretational richness. The
next methodological contribution is the analysis of the reflective measurement models in
AMOS, and formative structural model in PLS. This approach was supported by theory
and facilitated rich interpretations. In following the recommendations of Henseler et al.
(2009) among others, this analysis method enabled statistical and theoretical rigor while
revealing rich, granular interpretation of the data beyond that of simple beta path
coefficients and t-statistics for significance levels. The final methodological contribution
is the post hoc testing for common method bias. Common method bias has emerged as a
troublesome challenge which threatens the internal validity of survey research. As such,
226
the successful use of ASDR (Manning et al., 2009) as a control variable in post hoc
testing suggests that common method bias can be dealt with effectively, consequently
strengthening the validity of survey findings.
6.2 Implications for scholars
This study produced findings with several scholarly implications. SDL, a nascent
theoretical lens to the Operations Management field was conceptualized and tested herein
(Schmenner et al., 2009). Further SDL, has been applied to a specific context in
Operations Management which is ripe for additional research, that of healthcare delivery
(Machuca et al., 2007). This study intersects and informs two important gaps in this
regard. First, Operations Management scholars have pointed out the cry for new theories
with relevant explicative power for use in the supply chain field (Schmenner et al., 2009),
with particular interest in healthcare delivery (Shah et al., 2008). Second, SDL
researchers have highlighted the need for the development and empirical testing of
measurement instruments capable of advancing the current understanding of value co-
creation and SDL (Zhang and Chen, 2008). Several, more detailed, contributions have
been made in this overarching context.
First, this study revalidates a measure for Partner Relationship (see Li, 2002;
Liao, 2008), with minor modifications, in a decentralized context (that of healthcare) and
empirically tests it as a posited coordination mechanism in the supply chain. Evidence is
presented to suggest that this measure is valid and reliable, and is now available for future
use by other scholars. Additionally, these findings provide evidence that Partner
Relationship can serve as an antecedent coordination mechanism in decentralized supply
227
chains as an antecedent to both Integrative Information and Resource Strategy and
Entrepreneurial Culture. This adds to the potential antecedent coordination mechanisms
for decentralized supply chains discussed by Fugate et al. (2006). In a more granular
sense, this is highly generalizable to healthcare delivery, but may also be generalizable to
other decentralized supply chains in a context dependent fashion. Further, these findings
support the link between the relational aspects of economic actor interactions and the
entrepreneurial effectuation that can enhance SDL‘s value co-creation (Callaway and
Dobrzykowski, 2009). Specifically, if Trust (shown to be a key dimension of Partner
Relationship), can be linked to staff Motivation and Innovativeness (key dimensions of
the culture construct), then this may be a first step in unlocking some of the contextually
supportive antecedents of SDL.
Second, this is the first study to attempt to conceptualize, develop, measure, and
model antecedent and consequential relationships related to the Integrative Information
and Resource Strategy of a firm. This is a valuable contribution as its measurement and
positive path model relationships provide evidence to advance the notion of Lambert and
Cooper (2000) that the management of information (through the use of IT) and resources
are related. Additionally, the development of a valid and reliable measure for Leagile SC
Strategy provides an empirical measure for the hybrid SC strategy concept put forth for
Vonderembse et al. (2006). The development and testing of these measures in the
decentralized healthcare delivery supply chain context also offers and new tool for
healthcare researchers interested in exploring information and resource management
strategies.
228
Third, this study makes minor modifications to and revalidates the measurement
instrument of Jambulingam et al. (2005) for Entrepreneurial Culture. It also places this
construct in a nested path model which provides evidence of its key role as an antecedent
of Integrative SC Practices. Taken together with the nested model results from the
Integrative Information and Resource Strategy variable, this study sheds light on the
relationship among strategy, culture, and organizational practices, thereby advancing the
work of Roh et al. (2008).
Fourth, borrowing from Li et al. (2005; 2006), Rai et al. (2006), Amini et al.
(2007), Tzeng et al. (2008), Jha et al. (2009) and building upon concepts from Shah et al.
(2008), this study develops a valid and reliable measure for Integrative SC Practices. As
described in section 6.1, the development of this construct with a well defined context has
the potential to inform the ambiguity over „what constitutes SCM practices?‟ This is also
the first attempt to empirically measure this group of six Integrative SC Practice
dimensions in healthcare. Thus, the development of the construct provides other
researchers with a valuable measurement scale for future research.
Fifth, from the perspective of SDL, these measures extend the work of Prahalad
and Ramaswamy (2004a) who suggest the influence of IT on value co-creation by
measuring IS Enabled Processes as a dimension of Integrative SC Practices and linking
this construct to Supply Chain Performance and Value Dense Environment. Further, the
evidence for Integrative Information and Resources Strategy and Entrepreneurial Culture
as antecedents to Integrative SC Practices, and Value Dense Environment and Supply
Chain Performance as consequences of Integrative SC Practices delivers multiple
contributions. It provides a valuable nested model for the application of Integrative SC
229
Practices in the healthcare context. Moreover, it serves to link key antecedents and
consequences of Value Density from SDL, thereby linking SCM to SDL.
Sixth, this is the first study to attempt the measurement of Value Dense
Environment. This measure has been developed and empirical evidence is provided in
support of its validity and reliability. Next, the exploration of the linkages among
Integrative SC Practices, Value Dense Environment, Supply Chain Performance, and
Healthcare Delivery Capability, advances the understanding of SDL phenomena.
Specifically, these findings suggest that Integrative Supply Chain Practices can be linked
to the creation of a Value Dense Environment which in turn contributes to the Supply
Chain Performance of the firm. This linkage between Supply Chain and SDL is valuable
to researchers, but perhaps of even greater interest is the absence of support found for a
direct relationship between Value Dense Environment and Healthcare Delivery
Capability. As discussed, these results indicate that this relationship is mediated by
Supply Chain Performance which further informs the nature of the link between SDL and
Supply Chain Management. Therefore, this study extends the SDL work of Zhang and
Chen (2008) who linked Key Co-creation Activities, ‗Customerization‘ Capability, and
Service Capability, by developing and testing a nested model which can be linked to the
development of a Value Dense Environment. In doing so, this advances SDL theory and
empirical measurement. This also operationalizes the Value Dense Environment concept
posited by Normann and Ramirez (1993).
Seventh, this study adapts and revalidates the Supply Chain Performance
construct from Li (2002), porting it into the decentralized healthcare delivery context. As
230
discussed, in terms of SDL the construct provides very useful findings in a nested model
mediating Value Dense Environment and Healthcare Delivery Capability.
Eighth, this is the first study to attempt the measurement of Healthcare Delivery
Capability. This measure was developed and empirical evidence has been provided in
support of its validity and reliability. This extends the key aims for healthcare set out by
the IOM (2001) by operationalizing this important overall outcomes measure. Next, the
exploration of the linkages among Supply Chain Performance and Healthcare Delivery
Capability lend support to the notion that SCM concepts and measures have applicability
in healthcare delivery.
6.3 Implications for practitioners
This study provides many valuable insights capable of assisting practitioners to
improve hospital operations, improve the use of IT in healthcare, improve physician
relations, and develop a healthcare delivery capability which results in better Safety,
Effectiveness, Patient Centeredness, Timeliness, and Efficiency in healthcare delivery.
For practitioners outside of healthcare, these findings may be applicable in the context of
decentralized relationships intended to enable, result in, or improve the integrated
creation of value.
First, these findings show that Partner Relationship can serve as a coordination
mechanism in the decentralized healthcare delivery supply chain by motivating the
development of an Integrative Information and Resource Strategy. This infers that the
development of Trust, Commitment, and Shared Vision in the hospital‘s medical staff are
key to implementing IS for Comprehensiveness Strategy and/or Leagile SC Strategy.
231
This lends insight for practitioners as field interviews conducted by the researcher have
revealed that hospitals often struggle to engage their medical staff in integrative strategies
such as those intended to implement Lean process improvement or EMR systems. These
findings suggest, for example, that hospitals with admitting/attending physicians who are
honest and open in their dealings with the hospital‘s clinical staff, and who have earned
the hospital‘s confidence through their clinical practices are better positioned to
implement an integrative strategy with regard to Leagile SC and Comprehensive IS use.
Second, Entrepreneurial Culture is found to be precipitated by Partner
Relationship. This infers that the establishment of Trust, Commitment, and Shared Vision
with the hospital‘s medical staff may make the hospital‘s clinical staff (employees)
behave in ways which are Proactive, Innovative, Autonomous, Competitively
Aggressive, and Motivated. This could be a key finding for practitioners. A concomitant
field interview conducted by the researcher with one survey respondent (a Chief Nursing
Officer) revealed that among her greatest concerns is understanding the antecedents of
job satisfaction among her nursing staff. This is a critical issue currently plaguing
hospital executives and it is expected to worsen as pressure is realized from the projected
shortage of nursing professionals (and physicians). The findings herein address this
problem by suggesting that Trust, Commitment, and Shared Vision in the hospital‘s
admitting/attending physicians may serve to motivate the nursing staff. Specifically, the
measurement items suggest that hospitals with admitting/attending physicians who are
honest and open in their dealings with the hospital‘s clinical staff, and who have earned
the hospital‘s confidence through their clinical practices may also have clinical
232
employees who are highly motivated toward work, hard working, very ambitious, and
have a ―can do‖ attitude.
Furthermore, a field interview conducted with a recently retired hospital system
CEO (with purview over a tertiary care hospital and several community hospitals)
revealed that ‗developing new avenues for revenue generation‘ was one of the greatest
sources of pressure from the Board of Trustees. According to Jambulingam et al. (2005)
an innovative orientation can be linked to innovation outcomes. Therefore, it is logical
that hospital executives encourage Innovativeness in the organizational culture. The close
working relationship of admitting/attending physicians and nurses, along with the
influence that these physicians have over the performance of the hospital (Smeltzer and
Ramanathan, 2002), and the pressure for new sources of revenue faced by hospital
executives makes the potential link between Partner Relationship and Innovativeness a
valuable finding for practitioners. Specifically, the items suggest that hospitals with
admitting/attending physicians who are honest and open in their dealings with the
hospital‘s clinical staff, and who have earned the hospital‘s confidence through their
clinical practices may be known as an innovator among hospitals in their region, promote
new and innovative services, provide leadership in creating new services, exist on the
leading edge in creating new technologies.
Third, Integrative Supply Chain Practices are shown herein to result from an
Integrative Information and Resource Strategy as well as an Entrepreneurial Culture. For
practitioners, this means that these organizational elements can deliver highly integrated
care delivery practices consisting of better Physician Partnerships, Patient Relationships,
Information Sharing, Information Quality, use of Lean Principles, and IS Enabled
233
Processes. One specific, plausible example may be that when hospital leadership
encourages process improvement, elimination of waste, understanding patient needs,
adapting to change and providing personalized care that they can anticipate that the staff
will engage in efforts to standardize work through the use of care pathways, create
seamless linkages among clinicians at each process handoff, use simple and direct
pathways that ensure resource availability during patient care, promote decision making
based on scientifically derived evidence, and eliminate waste and non-value added
activities.
Fourth, managers desire to place their employees in an ‗environment for success.‘
This study sheds light on the essential elements of such an environment by highlighting
the importance that Operand Knowledge (know what), Operant Knowledge (know how)
and Resources have in forming a Value Dense Environment. Such an environment is
shown to come as the result of human behavioral practices such as Information Sharing,
Lean, Physician Partnership, and Information Quality as well as technology enabled
practices such as Comprehensive EMR Use and RFID use. This finding emphasizes the
importance of both the human behavioral practices most likely for the transfer and
accumulation of tacit knowledge and technology enabled practices most likely for the
management of codified knowledge and physical resources.
Fifth, Integrative SC Practices are shown to influence Supply Chain Performance.
This links these human behavioral practices and technology enabled practices described
in the preceding paragraph with the hospital‘s desire for Flexibility, Integration, Patient
Responsiveness, Physician Performance, and Partnership Quality in healthcare delivery.
These performance outcomes are also supported by a Value Dense Environment. Given
234
the relatively recent surge in the use of supply chain concepts (e.g., Lean) in healthcare,
these findings provide support for their use, and also provide some clarity regarding the
expected outcomes from such programs. A recent field interview with a VP of Quality
Initiatives highlighted the focus of hospital leadership on measuring the performance of
the process improvement group in terms of financial ROI. The VP shared with the
researcher that while ROI is certainly critical to the organization, there „had to be other
benefits to these programs as well.‟ This study illuminates some of these potential
performance outcomes in the Supply Chain Performance construct. Another field
interview with a Physician-Hospital Organization (PHO) Executive Director generated
the comment, „how do I improve the performance of my physicians?‟ This study provides
insight into this question, suggesting that the path to improved Physician Performance is
linked to fostering better Physician Partnerships, Information Sharing and Information
Quality and the other dimensions of Integrative SC Practices as well as a Value Dense
Environment.
Sixth, this study shows that a hospital can develop a Healthcare Delivery
Capability which is made up of care delivery outcomes which are Safe, Effective,
Patient-Centered, Timely, and Efficient. These results show that the path to these desired
outcomes for managers comes not through a focus on providing resources and training
(the creation of an Value Dense Environment) for employees, but through fostering better
performance from the healthcare delivery team in terms of Flexibility, Integration, Patient
Responsiveness, Physician Performance, and Partnership Quality.
235
6.4 Limitations
While this study has made several theoretical and practical contributions to
healthcare delivery (clinical integration) from a supply chain and IT perspective, it also
offers notable limitations as described below.
First, while three sampling frames were employed, and two of the calculable
response rates are considered high by today‘s survey response rate standards (over 15%
and 30%), the data were all collected from hospitals within the USA. Given the dramatic
healthcare policy differences among world nations it would be useful to engage in
comparative research studies. For example, the Canadian or British systems could be
considered less decentralized than that of the USA healthcare system, which may enable
a comparative study providing useful insights into best practices for coordination
mechanisms.
Second, as mentioned in the preceding paragraph, data were collected from three
sampling frames, only two of which made it possible to calculate survey response rate.
While the AHA and UHC response rates were strong, the inability to calculate the
response rate for the CMSA sample (n=31) is a limitation of the study.
Third, data were collected from one respondent from each hospital. This approach
has been questioned as a single respondent may not have the ability to provide accurate
information regarding complex organizational phenomena (Venkatraman and Grant,
1986). Further, this precludes the researcher from performing any inter-rater reliability
tests of the survey data. While, the post hoc test for common method bias provides
evidence of an absence of method bias in the data, it would be useful to collect data from
multiple respondents in each hospital (see McFadden et al., 2009).
236
Fourth, the use of cross-sectional data in this study provides only a ‗snapshot‘ of
the current operations of the hospital respondents. This inherent flaw in the method
typically makes longitudinal studies attractive alternatives. This condition is exacerbated
in the current healthcare environment given the federal pressure for operational changes
in the healthcare system such as the implementation and meaningful use of the EMR.
Fifth, survey method offers the advantage of collecting large amounts of data
from large populations. This data can then be used to identify relationships of interest as
has been the case for this study. However, ―survey information ordinarily does not
penetrate very deeply below the surface,‖ (Kerlinger, 1986). In other words, while survey
data may be useful in identifying relationships among variables, it may not always
provide insight into ‗why‘ these relationships exist. Although the theoretical grounding
provided by SDL is useful in this regard, follow up ethnographic studies would likely be
worthwhile to explore the phenomena under study in a real-life context (Yin, 1981;
Dobrzykowski et al., 2010).
Sixth, the study sample contains a large portion of ‗teaching‘ hospitals (58% of
the sample). While this is an advantage in terms of studying cutting edge best practices
(McDermott and Stock, 2007), it does bear consideration as a potential limitation when
considering the generalizability of the findings. Given this, a post hoc ANOVA test was
performed to analyze mean differences among ‗major teaching‘, ‗minor teaching‘ and
‗non-teaching‘ hospitals. The results reveal that no statistical differences exist among
these groups for the higher order constructs under study (the structural path model
variables). The structural path model analysis was also repeated, employing teaching
status as a control variable for each endogenous construct in the model. The results reveal
237
that teaching status is not significant as a control variable on any of the higher order
endogenous constructs in the structural path model, nor did any of the previously
supported hypothesized relationships change significantly. Finally, an ANOVA analysis
was performed on each of the 35 first order constructs. This test revealed only one
statistically significant mean difference (at p < 0.01) among the groups. The results show
that ‗major teaching‘ hospitals have a higher mean (µ=4.19) for ‗Innovativeness‘ as a
dimension of ‗Entrepreneurial Culture‘ than is the case for ‗non-teaching‘ hospitals
(µ=3.57). In this same dimension, the mean difference between ‗major teaching‘
(µ=4.19) and ‗minor teaching‘ hospitals (µ=3.78) is only marginally significant at p <
0.1. The mean difference between ‗minor teaching‘ and ‗non-teaching‘ hospitals on this
dimension is not significant. These results suggest that while the goals and missions of
teaching and non-teaching hospitals may differ (Li et al., 2002), the operational strategies
and practices with regard to the phenomena under study here are not significantly
different8. This thereby enhances the generalizability of the study findings presented
herein.
6.5 Future research opportunities
The limitations mentioned in the preceding section (6.4), the statistical results
presented herein, and structured interviews conducted part and parcel to the Q-sort
process, reveal some interesting and meaningful opportunities for future research.
First, with regard to the limitations of the study, there is a clear need to repeat this
study in an attempt to create longitudinal comparisons. As mentioned in section 6.4,
8 Other OM studies have hypothesized differences between teaching and non-teaching hospitals and found
no statistically significant differences (see Goldstein and Naor, 2005; Tucker et al., 2007; McFadden et al.,
2009).
238
hospitals today are facing tremendous pressure to improve operations and implement IT
effectively. Unfortunately, little research, particularly of the empirical variety, has been
conducted into the best practices for these and other similar hospital initiatives. While the
present study sheds some light on best practices in this area, the rapidly evolving
adoption environment warrants investigatory repetition. In a related note, it may be
worthwhile to expand the sample frame to include more non-teaching hospitals as well.
The collection of additional data would also be useful in validating the instruments
developed herein.
Second, with regard to the statistical results of this study, two obvious
opportunities readily appear. Attention is drawn to Hypothesis 8 which was not supported
in the model. While this was able to be explained by the mediating effect of Supply
Chain Performance, there may be other variables which were not considered in this study
that may affect the relationship between having a Value Dense Environment and
achieving a Healthcare Delivery Capability. Additionally, attention is also drawn to the
exogenous variable in the model, Partner Relationship. While this study theorized and
statistically supported Partner Relationship as a coordination mechanism in the
decentralized supply chain conceptualized herein, many questions are left unanswered
about this variable. For example, what are the antecedents of Partner Relationship? This
study provides value in emphasizing the importance of this variable, but does little to
explain how a hospital can achieve Partner Relationship. One final comment on the
statistical results is worth mentioning. The structural model conceptualized in this study
was very large and complex, measuring 35 constructs with over 130 items. As such, a
239
great deal of opportunity exists in decomposing the model and exploring relationships at
the subconstruct (or dimensional) level.
Third, the structured interviews and discussions with some of the survey
respondents revealed many valuable insights into relevant research opportunities with
regard to the decentralized nature of the healthcare delivery supply chain. Integration of
the decentralized healthcare delivery supply chain is a current trend in healthcare. One of
the more popular approaches in this regard involves the employment of
admitting/attending physicians. These employment relationships involve the hospital (or
health system) as the employer, and the physician as the employee. This is a practice
which gained great momentum in the early 1990s before waning later in the decade.
However, the structured interviews revealed that this trend has again gained momentum,
with little if any empirical evidence of its effectiveness in practice. As such, an important
opportunity exists to conduct research into this phenomenon thereby informing relevant
curiosity among scholars and practitioners alike.
240
References
Aggarwal, S. (1997). Flexibility management: the ultimate strategy. Industrial
Management, 39(1), 26–31.
Agarwal, A., Shankar, R., and Tiwari, M.K. (2006). Modeling the metrics of lean, agile,
and leagile supply chain: An ANP-based approach. European Journal of
Operational Research, 173, 211-225.
AHRQ. (2008). 2007 National Healthcare Quality Report. Rockville, MD: Agency for
Healthcare Research and Quality.
Albers, S. (2009). PLS and success factor studies in marketing. In: V. Esposito Vinzi, W.
W. Chin, J. Henseler, and H.Wang (Eds), Handbook of partial least squares:
Concepts, methods, and applications. Berlin: Springer (in print).
Al-Khalifa, K. and Aspinwall, E. (2001). Using the competing values framework to
investigate the culture of Qatar industries. Total Quality Management, 12(4), 417-
28.
Alvarado U. and Kotzab H. (2001). Supply chain management: the integration of
logistics in marketing. Industrial Marketing Management,30(2):183–98.
Alvarez, D. (1994). Solving the puzzle of industry‘s rubic cube-effective supply chain
management. Logistics Focus, 2(4), 2-4.
American Hospital Association (AHA). (2010a). About the American Hospital
Association. Retrieved June 18, 2010, from
http://www.aha.org/aha/about/index.html
American Hospital Association (AHA). (2010b). Fast Facts on US Hospitals. Retrieved
on June 20, 2010, from http://www.aha.org/aha/resource-center/Statistics-and-
Studies/fast-facts.html
American Hospital Association (AHA). (2005). Forward momentum: hospital use of
information technology. American Hospital Association: Chicago, IL.
Amini, M., Otondo, R., Janz, B. and Pitts, M. (2007). Simulation modeling and analysis:
a collateral application and exposition of RFID technology. Production and
Operations Management, 16(5), 586-598.
Anderson, J.C. and Gerbing, D.W. (1988). Structural equation modeling in practice: a
review and recommended two-step approach. Psychological Bulletin, 103(3),
411–423.
241
Apigian, C.H., Ragu-Nathan, B.S. and Ragu-Nathan, T.S. (2006). Strategic profiles and
Internet Performance: An empirical investigation into the development of a
strategic Internet system. Information and Management, 43, 455-468.
Armstrong, J.S. and Overton, T.S. (1977). Estimating non-response bias in mail surveys.
Journal of Marketing Research, 24, 396-402.
Ash, J.S., Gorman, P.N., Seshadri, V., et al. (2004). Computerized Physician Order Entry
5. in U.S. Hospitals: Results of a 2002 Survey. Journal of the American Medical
Informatics Association, 11(2): 95–99.
Ashby, J., Guterman, S. and Greene, T. (2000). An analysis of hospital productivity and
product change, Health Affairs, 19(5), 197-205.
Ayres, R.U. (1998). Technological progress: A proposed measure. Technology Forecast
Social Change, 59, 213-233.
Bagozzi, R.P. (1980). A causal model in marketing. New York: Wiley.
Bagozzi, R.P., and Phillips, L.W. (1982). Representing and testing organizational
theories: a holistic construct. Administrative Science Quarterly, 27, 459-489.
Ballou, D.S., Gillbert, S.M. and Mukherjee, A. (2000). New managerial challenge from
supply chain opportunities. Industrial Marketing Management, 29, 7-18.
Balsmeier, P.W. and Voisin, W. (1996). Supply chain management: a time-based
strategy. Industrial Management, 38(5), 24–27.
Bamford, D. and Griffin, M. (2008). A case study into operational team-working within a
UK hospital. International Journal of Operations and Production Management,
28(3), 215-237.
Barclay, D.W., Higgins, C., and Thompson, R. (1995). The partial least squares approach
to causal modeling: Personal computer adoption and use as illustration.
Technology Studies, 2(2), 285–309.
Barney, J. (1991). ―The resource-based model of the firm: origins, implications, and
prospects‖, Journal of Management, 17 (1), 97–117.
Baruch, Y. (1999). Response rate in academic studies. Human Relations, 52(4), 421-438
Beamon, B.M. (1998). Supply chain design and analysis: models and methods.
International Journal of Production Economics, 55(3), 281-294.
Bechtel, C., Jayaram, J. (1997). Supply chain management: A strategic perspective.
International Journal of Logistics Management, 8(1), 15–34.
242
Berwick, D. M. (2004). Crossing the quality chasm: Health care for the 21st century.
Presentation at the IOM Quality Chasm Summit, Washington, DC.
Berry, D., Towill, D.R. and Wadsley, N. (1994). Supply chain management in the
electronics products industry. International Journal of Physical Distribution and
Logistics Management, 24(10), 20–32.
Bitner, M.J., Faranda, W.T., Hubbert, A.R., and Zeithaml, V.A. (1997). Customer
contributions and roles in service delivery, International Journal of Service
Industry Management, 8(3), 193-205.
Blankenship and Breen (1992). State of the Art Marketing Research, Ch. 7, Choosing the
Method of Collecting Data, 121-165.
Bollen, K. (1989). Structural equations with latent variables. Wiley: New York, NY.
Boomsma, A. and Hoogland, J.J. (2001). The robustness of LISREL modeling revisited. In:
R. Cudeck, S. duToit, and D. Sorbom (Eds), Structural equation modeling: Present and
future (139–168). Chicago, IL: Scientific Software International.
Booth, R. (1996). Agile manufacturing. Engineering Management Journal, April, 105-
111.
Bowersox, D. J. (1997). Integrated Supply Chain Management: A Strategic Imperative, in
Annual Conference Proceedings, Council of Logistics Management, Chicago,
Illinois, 181–189.
Bowersox, D.J. and Closs, D.J. (1996). Logistical Management: The Integrated Supply
Chain Process. McGraw-Hill Series in Marketing. New York: The McGraw-Hill
Companies.
Bowersox, D. J., Closs, D. J., & Stank, T. P. (2000). Ten mega-trends that will
revolutionize supply chain logistics. Journal of Business Logistics, 21, 1–16.
Braunscheidel, M. and Suresh, N. (2009). The organizational antecedents of a firm‘s supply
chain agility for risk mitigation and response. Journal of Operations Management, 27,
119-140.
Browne, M.W. and Cudeck, R. (1993). Alternative ways of assessing model fit. In K.A.
Bollen & J.S. Long (Eds.), Testing structural equation models (pp. 445-455).
Newbury Park, CA: Sage.
Bucklin, L.P. and Sengupta, S. (1993). Organizing successful co-marketing alliances.
Journal of Marketing, 57 (April), 32-46.
243
Burns, L.R., Chilingerian, J.A. and Wholey, D.R. (1994). The effect of physician practice
organization on efficient utilization of hospital resources. Health Services
Research, 29(5), 583-603.
Butler, T.W., Leong, G.K. and Everett, L.N. (1996), The operations management role in
hospital strategic planning. Journal of Operations Management, 14(2), 137-56.
Byrne, B.M. (2001). Structural equation modeling with AMOS. Mahwah, New Jersey:
Lawrence Erlbaum Associates, Inc.
Byrnes, Jonathan L.S. (2004). Fixing the Healthcare Supply Chain. Harvard Business
School: Working Knowledge. Retrieved February 26, 2009.
http://hbswk.hbs.edu/archive/4036.html.
Cabrera, A., Cabrera, E.F. and Barajas, S. (2001). The key role of organizational culture
in a multi-system view of technology-driven change. International Journal of
Information Management, 21(3), 245-61.
Calantone, R., Droge, C., Vickery, S. (2002). Investigating the manufacturing–market
interface in new product development: Does context affect the strength of
relationships? Journal of Operations Management, 20(3), 273–287.
Callaway, S. and Dobrzykowski, D. (2009). Service-Oriented Entrepreneurship: Service-
Dominant Logic in green design and healthcare. Service Science, 1(4), 225-240.
Cameron, K. and Quinn, R. (1999). Diagnosing and Changing Organizational Culture.
Addison-Wesley, Reading, MA.
Camillus, J.C. and Lederer, A.L. (1985). Corporate strategy and the design of
computerized information systems, Sloan Management Review, 26(3), 35-42.
Cannon, C. P., Bahit, M. C., Haugland, J. M., Henry, T. D., Schweiger, M. J.,
McKendall, G. R., et al. (2002). Under-utilization of evidence-based medications
in acute ST elevation myocardial infarction. Critical Pathways in Cardiology,
1(1), 44–52.
Carr, A.S. and Person, J.N. (1999). Strategically managed buyers-seller relationships and
performance outcomes. Journal of Operations Management, 17(5), 497-519.
Cassel, C.M., Hackl, P., and Westlund, A.H. (2000). On measurement of intangible
assets: A study of robustness of partial least squares. Total Quality Management,
11(7), 897–907.
Cavinato, Joseph L. (1992). A Total Cost/Value Model for Supply Chain
Competitiveness," Journal of Business Logistics, (13)2, 285-301.
244
Center for Medicare and Medicaid Services (CMS). (2010). Acute inpatient – files to
download. Retrieved on June 20, 2010 at
http://www.cms.hhs.gov/AcuteInpatientPPS/FFD/itemdetail.asp?filterType=none
&filterByDID=0&sortByDID=1&sortOrder=ascending&itemID=CMS1198557&
intNumPerPage=10
Chan, P., Wen-Ta, C., Wan-Ming, C., Min-Fang, L. Benette, C. (2005). Applying Six
Sigma methodology to maximise magnetic resonance imaging capacity in a
hospital. International Journal of Healthcare Technology & Management, 6(3).
Chase, R.B. and Tansik, D.A. (1983). The customer contact model for organization
design. Management Science, 29(9), 1037-50.
Chen, M.-C., Yang, T., and Li, H.-C. (2007). Evaluating the supply chain performance of
IT-based inter-enterprise collaboration. Information and Management, 44, 524–
534.
Chen, I. and Paulraj, A. (2004). Towards a theory of supply chain management: the
constructs and measurement. Journal of Operations Management, 22, 119-150.
Childerhouse, P., Aitken, J., Towill, D.R. (2002). Analysis and design of focused demand
chains. Journal of Operations Management, 20, 675–689.
Chin, W.W. (1998). Issues and opinion on structural equation modeling. MIS Quarterly,
22(1), 7-16.
Chin, W.W. and Gopal. A. (1995). Adoption Intention in GSS: Relative Importance of
Beliefs. The Data Base for Advances in Information Systems, 26(2&3), 42-63.
Chin, W.W., Marcolin, B.L. and Newsted, P.R. (2003). A partial least squares latent variable
modeling approach for measuring interaction effects: results from a Monte Carlo
simulation study and voice mail emotion/adoption study. Information Systems Research,
14(2), 189–217.
Chizzo, S.A. (1998). Supply chain strategies: solutions for the customer-driven
enterprise. In: Software Magazine. Supply Chain Management Directions
Supplement, (January), 4–9.
Chopra, S. and Meindl, P. (2004). Supply Chain Management: Strategy, Planning, and
Operations. Upper Saddle River, N.J.: Prentice Hall.
Christopher, M. (1992). Logistics and Supply Chain Management. Pitmans, London.
Christopher, M. G. (1998). Relationships and Alliances: Embracing the era of network
competition, in Strategic Supply Chain Management, J. Gattorna, ed., Gower
Press, Hampshire, England, 272–284.
245
Christopher, M. (2000). The agile supply chain: Competing in volatile markets. Industrial
Marketing Management, 29(1), 37-44.
Churchill Jr., G.A. (1979). A paradigm for developing better measures of marketing
constructs. Journal of Marketing Research, 16(February), 64–73.
Cigolini, R., Cozzi, M. and Perona, M. (2004). A new framework for supply chain
management Conceptual model and empirical test. International Journal of
Operations and Production Management, 24(1), 7-41.
Claycomb, C., Droge, C. and Germain, R. (1999). The effect of just-in-time with
customers on organizational design and performance. International Journal of
Logistics Management, 10(1), 37–58.
CMSA, Case Management Society of America. (2010a). What is a Case Manager?
Retrieved on June 1, 20101 from
http://www.cmsa.org/CMSA/WhoWeAre/tabid/222/default.aspx
CMSA, Case Management Society of America. (2010b). Who we are. Retrieved on June
1, 20101 from http://www.cmsa.org/CMSA/WhoWeAre/tabid/222/default.aspx
Cogan, J., Hubbard, R. and Kessler, D. (2004). Healthy, wealthy, and wise. Wall Street
Journal, A. 20.
Cohen, J.A. (1960). A coefficient of agreement for nominal scales. Educational and
Psychological Measurement, 20, 37–46.
Cohen, J. (1988). Statistical power analysis for the behavioral sciences (2nd ed.).
Hillsdale, NJ: Lawrence Erlbaum Associates.
Cohen, W. and Levinthal, D. (1990) Absorptive capacity: A new perspective on learning
and innovation. Administrative Sciences Quarterly, 35, 128-152.
Condel, J. L., Sharbaugh, D. T. and Raab, S. S. (2004). Error-free pathology: Applying
lean production methods to anatomic pathology. Clinics in Laboratory Medicine,
24(4), 865–899.
Constantin, J. A. and Lusch, R. F. (1994). Understanding Resource Management.
Oxford, OH: The Planning Forum.
Cooper, M.C. and Ellram, L.M. (1993). Characteristics of Supply Chain Management and
the Implication for Purchasing and Logistics Strategy. The International Journal
of Logistics Management, 4(2), 13-24.
246
Cooper, M.C, Ellram, L.M., Gardner, J.T. and Hanks, A.M. (1997). Meshing Multiple
Alliances Journal of Business Logistics,18(1), 67-89.
Council of Logistics Management (CLM). (2000). What it‟s all about. Oak Brook: CLM.
Coye, M., Haselkorn, A., and DeMello, S. (2009). Remote Patient Management:
Technology-Enabled Innovation And Evolving Business Models For Chronic
Disease Care, Health Affairs, 28(1), 126-135.
Cross, A., and Kelley, L. L. (2004). Trust, commitment and team working: The paradox
of virtual organizations. Global Network, 4, 375–390.
Crowne, D.P. and Marlowe, D. (1960). A new scale for social desirability independent of
psychopathology. Journal of Consulting Psychology, 24, 349–354.
Culter, D.M., Feldman, N.E. and Horwitz J.R. (2005). U.S. Adoption of Computerized
Physician Order Entry Systems.‖ Health Affairs (Millwood), 24(6):1654–1663.
Das, A., Pagell, M., Behm, M. and Veltri, A. (2008). Toward a theory of the linkages
between safety and quality. Journal of Operations Management, 26, 521-535.
Davis, F.D. (1986). A technology acceptance model for empirically testing new end user
information systems: theory and results, Unpublished Doctoral Dissertation,
Massachusetts Institute of Technology.
Davis, F.D. (1989). Perceived usefulness, perceived ease of use, and user acceptance.
MIS Quarterly, 13(3), 319–330.
Davis, T. (1993). Effective supply chain management. Sloan Management Review, 34(4),
35-46.
Davenport, T.H. and Prusak, L. (1998). Working knowledge: how organizations manage
what they know. Boston: Harvard Business School Press.
Day, G. (2006). Achieving advantage with a service-dominant logic. In R. Lusch & S.
Vargo (Eds.), The Service-Dominant Logic of Marketing (139-149). Armonk,
New York: M.E.Sharpe.
de Treville, S., and Antonakis, J. (2006). Could lean production job design be
intrinsically motivating? Contextual, configurational, and levels-of-analysis issue.
Journal of Operations Management, 24(2), 99–123.
Dey, P.K., Hariharan, S. and Clegg, B.T. (2006). Measuring the operational performance
of intensive care units using the analytic hierarchy process approach.
International Journal of Operations and Production Management, 26(8), 849-
865.
247
Diamantopoulos, A., and Winklhofer, H. (2001). Index construction with formative
indicators: An alternative to scale development. Journal of Marketing Research,
38(2), 269–277.
Dicken, J. (2009). PRESCRIPTION DRUGS: Overview of Approaches to Control
Prescription Drug Spending in Federal. United States Government Accountability
Office, (June), 1-16.
Dobrzykowski, D.D., Tran, O.T. and Hong, P.C. (in press 2011). Insights into integration
for supply chain redesign in service and product-focused firms, International
Journal of Services and Operations Management, 3(11).
Dobrzykowski, D., Tran, O. and Tarafdar, M. (2010). Value Co-Creation and Resource
Based Perspectives for Strategic Sourcing. Strategic Outsourcing: An
International Journal, 3(2), 106-127.
Doll,W. and Vonderembse,M. (1991). The evolution of manufacturing systems: towards
the post-industrial enterprise. Omega, 19, 401-411.
Donlon J. (1996). Maximizing value in the supply chain. Chief Executive,117, 54–63.
Doty, H.D., Glick, W.H., and Huber, G.P. (1993). Fit, equifinality, and organizational
effectiveness: A test of two configurational theories. Academy of Management
Review, 36(6), 1196-1250.
Drucker, P.F. (1985). Innovation and Entrepreneurship. Harper & Row: New York, NY.
Drucker, P. F. (1998). ―Management‘s New Paradigms.‖ Forbes Magazine, October 5,
52–177.
Duray, R. (2002). Mass customization origins: Mass or custom manufacturing?
International Journal of Operations and Production Management, 22(3), 314–
328.
Economist. (2008). Operating profit. Economist, 388(8593), 74–76.
Edmondson, A.C. (2003). Speaking up in the operating room: how team leaders promote
learning in interdisciplinary action teams. Journal of Management Studies, 40(6),
1419-52.
Edmondson, A.C., Bohmer, R.M. and Pisano, G.P. (2001), Disrupted routines:
teamlearning and new technology implementation in hospitals. Administrative
Sciences Quarterly, 46(4) 685-716.
248
Edmondson, A. C., Winslow, A. B., Bohmer, R. M. J., & Pisano, G. P. (2003). Learning
how and learning what: Effects of tacit and codified knowledge on performance
improvement following technology adoption. Decision Sciences, 34(2), 197–223.
Ellram L.M. (1990). The supplier selection decision in strategic partnerships. Journal of
Purchasing and Materials and Management, (Fall), 8–14.
Ellram, L.M. and Cooper, M.C. (1990). Supply Chain Management, Partnerships, and the
Shipper-Third Party Relationship. The International Journal of Logistics
Management, 1(2), 1-10.
Einhorn, B., & Arnst, C. (2008, March 24). Outsourcing the patients. Business-Week,
4076, 36.
Erdos, P.L. (1970). Professional Mail Surveys. McGraw-Hill, New York, NY.
Evans, M. (2008). (2010). Integrating efficiency. Modern Healthcare, February 4, 2008,
26-29.
Fiala, P. (2005). Information Sharing in Supply Chains. Omega, 33(5), 419-423.
Field, A. (2005). Discovering Statistics Using SPSS. SAGE Publications, Thousand
Oaks, CA.
Fisher, M.L. (1997). What is the right supply chain for your product? Harvard Business
Review, (March–April), 105–116.
Flynn, B.B., Sakakibara, S., Schroeder, R.G., Bates, K.A., Flynn, E.J., (1990). Empirical
research methods in operations management. Journal of Operations Management,
9(2), 250–284.
Ford, E. and Scanlon, D. (2007). Promise and problems with supply chain management
approaches to healthcare purchasing. Healthcare Management Review, 32(3),
192-202.
Fornell, C. (1982). A second generation of multivariate analysis: An overview. In: C. Fornell
(Ed.), A second generation of multivariate analysis (1, 1–21). New York, NY: Praeger.
Fornell, C. and Larcker, D. (1981) Evaluating Structural Equations Models with
Unobservable Variables and Measurement Error. Journal of Marketing Research,
18, 39-50.
Foster, S.T. Jr, Sampson, S.E. and Dunn, S.C. (2000). The impact of customer contact on
environmental initiatives for service firms. International Journal of Operations &
Production Management, 20(2), 87-203.
249
Frohlich, M. T. (2002). Techniques for improving response rates in OM survey research.
Journal of Operations Management, 20(1), 53–62.
Frohlich, M.T. and Westbrook, R. (2001). Arcs of Integration: an International Study of
Supply Chain Strategies. Journal of Operations Management, 19(2), 185–200.
Frohlich, M. and Dixon, R. (2001). A taxonomy of manufacturing strategies revisited.
Journal of Operations Management, 19, 541-558.
Frei, F. X., Kalakota, R., Leone, A. J., & Marx, L. M. (1999). Process variation as a
determinant of bank performance: Evidence from the retail banking study.
Management Science, 45(9), 1210–1220.
Fredendall, L., Craig, J., Fowler, P., and Damali, U. (2009). Barriers to swift, even flow
in the internal supply chain of perioperative surgical service department: a case
study. Decision Sciences, 40(2), 327-350.
Fugate, B., Sahin, F. and Mentzer, J.T. (2006). Supply chain management coordination
mechanisms. Journal of Business Logistics, 27(2), 129-161.
Gallivan, M. and Srite, M. (2005). Information technology and culture: identifying
fragmentary and holistic perspectives of culture. Information and Organization,
15(4), 295-338.
Gan, X., Sethi, S. P., & Yan, H. (2005). Channel coordination with a risk-neutral supplier
and a downside-risk-averse retailer. Production and Operations Management,
14(1), 80–89.
Ganesan, S. (1994). Determinants of long-term orientation in buyer-seller relationships.
Journal of Marketing, 58, 1-19.
Ganeshan, R., Jack, E., Magazine, M. J., & Stephens, P. (1998). A taxonomic review of
supply chain management research. In S. Tayur, R. Ganeshan, & M. Magazine
(Eds.), Quantitative models for supply chain management (pp. 839–879).
(International Series in Operations Research and Management Science, vol. 17).
Norwell, MA: Kluwer Academic Publishers.
Garud, R. (1997). On the distinction between know how, know what, and know why. In
J.P. Walsh and A.S. Huff (Eds.), Advances in strategic management 1997:
organizational learning and strategic management. 14, London: JAI, 81-101.
Gasse, Y. (1982). Elaborations on the psychology of the entrepreneur. Encyclopedia of
Entrepreneurship, 209–223.
Gehmlich, V. (2008). ‗Opportunities of supply chain management in healthcare‘, In
Hübner, U. and Elmhorst, M. (eds.), eBusiness in healthcare; from eprocurement
to supply chain management, Springer-Verlag London Limited.
250
Giffy, C., Roth, A. and Seal, G. (1990). Surveys shows priorities are quality, workers,
and mature technologies, CIM Review, 7(1), 5-16.
Gilbert, A.H. (1995). An analysis of the relationships among information systems design,
strategy, and organizational performance using structural equation modeling.
Doctoral Dissertation, College of Administration and Business, Louisiana Tech
University.
Gittell, J. H. (2000). Paradox of coordination and control. California Management
Review, 42(3), 1–17.
Gittell, J. H., Fairfield, K. M., Bierbaum, B., Head,W., Jackson, R., Kelly, M., et al.
(2000). Impact of relational coordination on quality of care, postoperative pain
and functioning, and length of stay: A nine hospital study of surgical patients.
Medical Care, 38(8), 807–819.
Gittell, J. H. (2001). Supervisory span, relational coordination, and flight departure
performance: A reassessment of post-bureaucracy theory. Organization Science,
12(4), 467–482.
Gittell, J. H. (2002a). Relationships between service providers and their impact on
customers. Journal of Service Research, 4(4), 299–311.
Gittell, J.H. (2002b). Coordinating mechanisms in care provider groups: relational
coordination as a mediator and input uncertainty as a moderator of performance
effects. Management Science, 48(11), 1408-1426.
Glick, H.A., Orzol, S.M., Tooley, J.F. and Mauskopf, J.O. (2003). Design and analysis of
unit cost estimation studies: how many hospital diagnoses? How many countries?
Health Economics, 12(7), 517-27.
Gnanlet, A. and Gilland, W. (2009). Sequential and simultaneous decision making for
optimizing health care resource flexibilities. Decision Sciences, 40(2), 295-326.
Goffin, K., Lemke, F., Szwejczewski, M. (2006). An Exploratory Study of 'Close'
Supplier-manufacturer Relationships. Journal of Operations Management, 24(2),
189-209.
Goldstein, S.M., Ward, P.T., Leong, G.K. and Butler, T.W. (2002). The effect of
location, strategy, and operations technology on hospital performance. Journal of
Operations Management, 20(1), 63-75.
Goldstein, S.M. and Ward, P.T. (2004). Performance effects of physicians‘ involvement
in hospital strategic decisions. Journal of Service Research, 6(4), 361-72.
251
Goldstein, S.M. and Naor, M. (2005). Linking publicness to operations management
practices: a study of quality management practices in hospitals. Journal of
Operations Management, 23, 209-228.
Gordis, L. (2009). Epidemiology, Fourth Edition. Philadelphia: Saunders Elsevier.
Gowen III, C.R., McFadden, K.L., Hoobler, J.M. and Tallon, W.J. (2006). Exploring the
efficacy of healthcare quality practices, employee commitment, and employee
control. Journal of Operations Management, 24, 765-778.
Grant, R. (1991). The Resource-Based Theory of Competitive Advantage: Implications
for Strategy Formulation. California Management Review, 33(3), 114-135.
Greene, A.H. (1991). Supply Chain of Customer Satisfaction. Production and Inventory
Management Review and APICS News, 11(4), 24-25.
Grewal, R., Cote, J.A., and Baumgartner, H. (2004). Multicollinearity and measurement
error in structural equation models: Implications for theory testing. Marketing
Science, 23(4), 519–529.
Gunasekaran, A. (2005). Editorial: New service and manufacturing environments:
Challenges for operations management researchers and practitioners.
International Journal Services and Operations Management, 1(1), 1-6.
Gunasekaran, A., Patel, C., and Tirtiroglu, E. (2001). Performance measures and metrics
in a supply chain environment. International Journal of Operations and
Production Management, 21(1–2), 71–87.
Hadjistavropoulos, H.D., Frombach, I.K., and Asmundson, G.J.G. (1999). Exploratory
and confirmatory factor analytic investigations of the Illness Attitudes Scale in a
nonclinical sample. Behaviour Research and Therapy, 37, 671-684.
Handfield, R.B., and Nichols, E.L. (1999). Introduction to supply chain management,
Prentice Hall: Upper Saddler River, NJ.
Handfield R.B. and Pannesi R.T. (1995). Antecedents of lead-time competitiveness in
make-to-order manufacturing firms. International Journal of Production
Research, 33(2), 511–537.
Handfield, R. and Lawson, B. (2007). Integrating suppliers into new product
development. Research Technology Management. September – October 2007.
Hansen, M.T. (1999). The search-transfer problem: the role of weak ties in sharing
knowledge across organizational subunits. Administrative Sciences Quarterly,
44(1), 82-111.
252
Hair, J., Black, W., Babin, B., Anderson, R., and Tatham, R. (2006). Multivariate Data
Analysis, Sixth edition. Pearson Prentice Hall: Upper Saddle River, NJ.
Hair, J.F., Anderson, R.E., Tatham, R.L., and Black, W.C. (1998). Multivariate Data
Analysis, Fifth edition. Macmillan Publishing Company: New York, NY.
Hair, J., Black, W., Babin, B., Anderson, R., and Tatham, R. (1995). Multivariate Data
Analysis, Fourth edition. Prentice Hall: Englewood Cliffs, NJ.
Harland, C.M. (1996). Supply chain management: relationships, chains and networks.
British Journal of Management, 7(special issues), s63-s80.
Hayer, H. (2002). CHI – its work and emerging themes. Workshop presentation at the HR
in the NHS Conference. Birmingham, July.
Hayes, R.H. and Wheelwright, S.C. (1984). Restoring our Competitive Edge: Competing
through Manufacturing, Wiley, New York, NY.
Hayes, Robert, Pisano, Gary, Upton, David and Wheelwright. (2005). Operations,
Strategy, and Technology: Pursuing the Competitive Edge. Wiley, New York,
NY.
Heineke, J. (1995). Strategic operations management decisions and professional
performance in U.S. HMOs. Journal of Operations Management, 13, 255–277.
Henseler, J., Ringle, C. and Sinkovics, R. (2009). The use of partial least squares path
modeling in international marketing. New Challenges to International Marketing, 20,
277-319.
Hill, A., Collier, D., Froehle, C., Goodale, J., Metters, R. and Verma, R. (2002). Research
opportunities in service process design. Journal of Operations Management, 20,
189-202.
Holmberg, S. (2000). A systems perspective on supply chain measurements.
International Journal of Physical Distribution and Logistics Management, 30(10),
847–868.
Hong, P. and Jin, Y. (2007). Coordinating global inter-firm product development.
Journal of Enterprise Information Management, 20(5), 544-561
Hong, P., Dobrzykowski, D. and Vonderembse, M. (2010). Integration of supply chain IT
and lean practices for mass customization: benchmarking of product and service
focused manufacturers. Benchmarking: An International Journal, 17(4), 561-592.
Hopp,W. J., and Spearman, M. L. (2004). To pull or not to pull: What is the question?
Manufacturing and Service Operations Management, 6(3), 133–148.
253
Hsu, S.H., Chen, W.H. & Hsieh, M.J. (2006). Robustness testing of PLS, LISREL, EQS,
and ANN-based SEM for measuring customer satisfaction. Total Quality Management,
17(3), 355-371.
Hsu, L. and Field, R. (2003). Interrater Agreement Measures: Comments on Kappan,
Cohen‘s Kappa, Scott‘s Pie, and Aickin‘s Alpha. Understanding Statistics, 2(3),
205-219.
Huber, G. P. (1984). The nature and design of post-industrial organizations. Management
Science, 30, 928-951.
Hwang, J. and Christensen, C. (2008). Disruptive Innovation In Health Care Delivery: A
Framework For Business-Model Innovation. Health Affairs, 27(5), 1329-1335.
Ilie, V., Van Slyke, C., Parikh, M., and Courtney, J. (2009). Paper versus electronic
medical records: the effects of access on physicians. Decision Sciences, 40(2)
213-242.
Institute of Medicine (IOM). (1991). The computer-based patient record: An essential
technology for healthcare. Washington, DC: National Academy Press. Waikoloa,
HI, 142–152.
Institute of Medicine (IOM). (2000). To err is human: Building a safer health system.
Washington,DC: National Academy Press.
Institute of Medicine (IOM). (2001). Crossing the quality chasm: A new health system for
the 21st century. Washington, DC: National Academy Press.
Institute of Medicine (IOM). (2008). Knowing What Works in Health Care: A Roadmap
for the Nation (Executive Summary). Washington, D.C.: National Academies
Press.
Institute of Medicine (IOM). (2009). Toward Health Equity and Patient-Centeredness:
Integrating Health Literacy, Disparities Reduction, and Quality Improvement:
Workshop Summary. Washington, D.C.: National Academies Press.
Jack, E. and Powers, T. (2004). Volume flexibility strategies in health services: a research
framework. Production and Operations Management, 13(3), 230-244.
Jack, E. and Powers, T. (2009). A review and synthesis of demand management, capacity
management and performance in health-care services. International Journal of
Management Reviews, 11(2), 149-174.
Jacobs, A. K.,Antman, E. M., Ellrodt, G., Faxon, D. P.,Gregory, T.,Mensah, G. A., et al.
(2006). Recommendation to develop strategies to increase the number of ST-
254
elevation myocardial infarction patients with timely access to primary
percutaneous coronary intervention. Circulation, 113(17), 2152–2163.
Jaikumar, R. (1986). Postindustrial manufacturing. Harvard Business Review, November-
December, 69-76.
Jambulingam, T. Kathuria, R. and Doucette, W. (2005). Entrepreneurial orientation as
a basis for classification within a service industry: the case of retail pharmacy
industry. Journal of Operations Management, 23, 23-42.
Jarrell, J.L. (1998). Supply chain economics. World Trade, 11(11), 58–61.
Jarvenpaa, S. (1989). The effect of task demands and graphical format on information
processing strategies. Management Science, 35(3), 285–303.
Jarvis, C.B., Mackenzie, S.B., and Podsakoff, P.M. (2003). A critical review of construct
indicators and measurement model specification in marketing and consumer
research. Journal of Consumer Research, 30, 199-218.
Jha, A.K., DesRoches, C.M., Campbell, E.G., Donelan, K., Rao, S.R., Ferrid, T.G.,
Shields, A. and Rosenmaum, S. (2009). Chapter 1: Beyond the doctor‘s office:
adoption of electronic health records in U.S. hospitals. In C.M. DesRoches and
A.K. Jha (Eds.), Health Information Technology in the United States: On the
Cusp of Change (8-20). Robert Wood Johnson Foundation: Princeton, NJ.
Jin, Y. (2008). The influences of power and resources on flexibilities in a supply chain
context. Dissertation, the University of Toledo.
Jones, C. (1998). Moving beyond ERP: making the missing link. Logistics Focus, 6(7),
2–7.
Joreskog, K.G. (1970). A General Method for Analysis of Covariance Structures.
Software Inc., Chicago, IL.
Kaiser Family Foundation. (2009). Trends in health care costs and spending. (March).
Retrieved from http://www.kff.org/insurance/upload/7692_02.pdf
Kane, R. L., Maceijewski, M., and Finch, M. (1997). The relationship of patient
satisfaction with care and clinical outcomes. Medical Care, 35(7), 714–730.
Kaplan, A. and Haenlein, M. (2006). Toward a Parsimonious Definition of Traditional
and Electronic Mass Customization. Journal of Product Innovation Management,
23, 168-182.
255
Karimi, J., Gupta, Y.P., and Somers, T.M. (1996). Impact of competitive strategy and
information technology maturity on firms‘ response to globalization. Journal of
Management Information Systems, 12(4) 55-88.
Kathuria, R., Joshi, M.P, and Porth, S.J. (2007). Organizational alignment and,
performance: Past, present and future. Management Decision, 45(3), 503-517.
Kenny, D.A., and McCoach, D.B. (2003). Effect of the Number of Variables on
Measures of Fit in Structural Equations Modeling. Structural Equations
Modeling, 10(3), 333-51.
Kelley, S., Donnelly, J. and Skinner, S. (1990). Customer Participation in Service
Production and Delivery. Journal of Retailing, 66(3), 315–335.
Kerlinger, (1986). Foundations of Behavioral Research. McGraw Hill: New York, NY.
Kerlinger, (1978). Foundations of Behavioral Research. McGraw Hill: New York, NY.
Kessler, E. and Chakrabarti, A. (1996). Innovation speed: a conceptual mode of context,
antecedents, and outcomes. The Academy of Management Review, 21(4),1143–
1191.
Kiefer, A.W. and Novack, R.A. (1999). An empirical analysis of warehouse measurement
systems in the context of supply chain implementation. Transportation Journal,
38(3), 18-27.
Kim, S., Horowitz, I., Young, K. and Buckley, T. (2000). Flexible bed allocation and
performance in the intensive care unit. Journal of Operations Management, 18,
427-443.
Klassen, R. D., and Jacobs, J. (2001). Experimental comparison of web, electronic and
mail survey technologies in operations management. Journal of Operations
Management, 19, 713-728.
Klevens, M., Edwards, J., Richards, C., Horan, T., Gaynes, R., Pollock, D., Cardo, D.
(2007). Public Health Report, 122, 160-6.
Knox, E.G., Lancashire, R. and Armstrong, E.H. (1986). Perinatal mortality standards:
construction and use of a health care performance indicator. Journal of
Epidemiology and Community Health, 40(3), 193-204.
Koufteros, X., Vonderembse, M.A. & Doll, W. (2001). Concurrent engineering and its
consequences. Journal of Operations Management, 19, 97–115.
256
Koufteros, X. (1999). Testing a model of pull production: a paradigm for manufacturing
research using structural equation modeling. Journal of Operations Management, 17,
467–488.
Koufteros X.A., Vonderembse, M.A., and Doll W.J. (1997). Competitive capabilities:
measurement and relationships. Proceedings Decision Science Institute, 1067–
1068.
Kumar, A. and Motwani, J.G. (1999). Management of health care technology literature
(1979-1997): a multidimensional introspection. IEEE Transactions on
Engineering Management, 46(3), 247-64.
Kuratko, D.F. and Hornsby, J.S. (2009). New venture management: the entrepreneur‟s
roadmap. Pearson Prentice Hall; Upper Saddle River, New Jersey.
Kwon, I.G. and Suh, T. (2004). Factors affecting the level of trust and commitment in
supply chain relationships. Journal of Supply Chain Management: A Global
Review of Purchasing & Supply, 40(2), 4-14.
Lambert, D. and Cooper, M. (2000). Issues in supply chain management. Industrial
Marketing Management, 29 65-83.
Lamming, R.C. (1996). Squaring lean supply with supply chain management.
International Journal of Operations and Production Management, 16(2), 183–
196.
Landis, J.R. and Koch, G.G. (1977). The measurement of observe agreement for
categorical data. Biometrics, 33, 159.
Langland-Orban, B., Gapenski, L.C. and Vogel, W.B. (1996). Differences in
characteristics of hospitals with sustained high and sustained low profitability.
Hospital & Health Services Administration, 41(3), 385-99.
Lapinski, A. R., Horman, M. J., & Riley, D. R. (2006). Lena processes for sustainable
project delivery. Journal of Construction Engineering and Management, 132(10),
1083–1091.
Lagace, M. (2007). The rise of medical tourism. Harvard Business School Working
Knowledge, December 17.
Lalonde, B.J. (1998). Building a supply chain relationship. Supply Chain Management
Review, 2(2), 7–8.
Law, K.S., Wong, C.S., and Mobley, W.H. (1998). Toward a taxonomy of
multidimensional constructs. Academy of Management Review. 23(4), 741-755.
257
Lee, D. (1997). The impact of poor performance on risk-taking attitudes: A longitudinal
study with a PLS causal modeling approach. Decision Sciences, 28(1), 59-80.
Lee, H. L., and Billington, C. (1992). Managing supply chain inventory: Pitfalls and
opportunities. MIT Sloan Management Review, 33, 65–73.
Lee, H.L., Padmanabhan, V. and Whang, S. (1997). Information distortion in a supply
chain: the bullwhip effect. Management Science, 43(4), 546–558.
Lee, Hau. (2004). The triple A supply chain. Harvard Business Review, October, 102-
112.
Lee, J. N. and Kim, Y. G. (1999). Effect of partnership quality on IS outsourcing:
Conceptual framework and empirical validation. Journal of Management
Information System, 15, 29–61.
Leisen, B., Lilly, B. and Winsor, R.D. (2002). The effects of organizational culture and
market orientation on the effectiveness of strategic marketing alliances. Journal of
Services Marketing, 16(3), 201-22.
Levy, D.L. (1997). Lean production in an international supply chain. Sloan Management
Review, 38(2), 94-102.
Li G., Yang, H., Sun, L., and Sohal, A. (2009). The impact of IT implementation on
supply chain integration and performance. International Journal of Production
Economics, 120, 125-138.
Li, L., Chao, C., Chen, J., and Chin, L. (2009). The impacts of supply chain management
systems on information sharing and integrated-performance. Human Systems
Management, 28( 3), 101-121.
Li, S. (2002). An Integrated Model for Supply Chain Management, Performance and
Competitive Advantage. Dissertation, the University of Toledo.
Li, S., Rao, S., Ragu-Nathan, T. and Ragu-Nathan, B. (2005). Development and
validation f a measurement instrument for studying supply chain management
practices. Journal of Operations Management, 23, 618-641.
Li, S., Ragu-Nathan, B., Ragu-Nathan, T.S., Rao, S.S. (2006). The Impact of Supply
Chain Management Practices on Competitive Advantage and Organizational
Performance. Omega, 34, 107–24.
Li, L. X. and Benton, W. C. (1995). Performance measurement criteria in health care
organizations: Review and future research directions. European Journal of
Operations Research, 93, 449–468.
258
Li, L. X., Benton, W.C. and Leong, G. K. (2002). The impact of strategic operations
management decisions on community hospital performance. Journal of
Operations Management, 20, 389–408.
Li, L. and Benton, W.C. (2003). Hospital capacity management decisions: emphasis on
cost control and quality enhancement. European Journal of Operational
Research, 146(3), 596-614.
Li, L. and Benton, W.C. (2006). Hospital technology and nurse staffing management
decisions. Journal of Operations Management, 24, 676-691.
Li, L.X. and Collier, D.A. (2000). The role of technology and quality on hospital
financial performance: an exploratory analysis. International Journal of Service
Industry Management, 11(3), 202-24.
Li, X., and Wang, Q. (2007). Coordination mechanisms of supply chain systems.
European Journal of Operational Research, 179(1), 1–16.
Liao, K. (2008). Achieving Build-to-order Supply Chain Capability through Practices
Driven by Supplier Alignment and Supplier Empowerment. Dissertation, the
University of Toledo.
Lohmöller, J.B. (1989). Latent variable path modeling with partial leasts quares.
Heidelberg: Physica.
Löhmoeller, J. B. (1984). LVPS 1.6 Program Manual: Latent Variable Path Analysis
with Partial Least Squares Estimation, Universitaet zu Koehn, Zentralarehiv fuer
Empidsche Sozialforschung.
Lovelock, C.H., Young, R.F. (1979). Look to consumers to increase productivity.
Harvard Business Review, 57(3), 168–178.
Lumpkin, G.T. and Dess, G.G. (1996). Clarifying the entrepreneurial orientation
construct and linking it to performance. Academy of Management Review, 21(1),
135–172.
Lundvall, B.A. and Johnson, B. (1994). The learning economy. Journal of Industry
Studies, 1(2), 23-42.
MacCallum, R.C., Browne, M.W., and Sugawara, H.M. (1996). Power analysis and
determination of sample size for covariance structure modeling. Psychological
Methods, 1, 130-149.
MacCallum, R.C. and Browne, M.W. (1993). The use of casual indicators in covariance
structure models: some practical issues. Psychological Bulletin, 114(3), 533-541.
259
Machuca, J., Gonzalez-Zamora, M. and Aguilar-Escobar, V. (2007). Service Operations
Management. Journal of Operations Management, 25, 585-603.
Magretta, J. (1998). The power of virtual integration: an interview with Dell computers‘
Michael Dell. Harvard Business Review, 76(2), 72–84.
Malhotra, M.K., and Grover, V. (1998). An assessment of survey research in POM: from
constructs to theory. Journal of Operations Management, 16, 407-425
Manning, K.C., Bearden, W.O., and Tian, K. (2009). Development and validation of the
Agent‘s Socially Desireable Responding (ASDR) scale. Marketing Letters, 20,
31-44.
Marek, A. (2009). All inclusive surgery. Smart Money, July, 18(7), 64-67.
Marley, K., Collier, D., and Goldstein, S. (2004). The role of clinical and process quality
in achieving patient satisfaction in hospital. Decision Sciences, 35(3), 349-369.
Mason-Jones, R. and Towill, D.R. (1997). Information enrichment: designing the supply
chain for competitive advantage. Supply Chain Management, 2(4), 137–148.
McAdam, R. and McCormack, D. (2001). Integrating business processes for global
alignment and supply chain management. Business Process Management Journal,
7(2), 113–130.
McCutcheon, D. and Stuart, F.I. (2000). Issues in the Choice of Supplier Alliance
Partners. Journal of Operations Management, 18(3), 279-301.
McDermott, C. and Stock, G. (2007). Hospital operations and length of stay performance.
International Journal of Operations and Production Management, 27(9), 1020-
1042.
McFadden, K.L., Henagan, S.C. and Gowen, C.R., III. (2009). The patient safety chain:
Transformational leadership‘s effect on patient safety culture, initiatives, and
outcomes. Journal of Operations Management, 27, 390-404.
McGinnis, M.A. and Vallopra, R.M. (1999). Purchasing and supplier involvement in
process improvement: a source of competitive advantage. Journal of Supply
Chain Management, 35(4), 42–50.
McKone-Sweet, K. E.; Hamilton, P. ,Willis, S. B. (2005). The Ailing Healthcare Supply
Chain: A Prescription for Change. Journal of Supply Chain Management: A
Global Review of Purchasing & Supply, 41 (1) 4-17.
Menachemi, N., Saunders, C., Chukmaitov, Matthews, M. C. and Brooks, R. G. (2007).
Hospital adoption of information technologies and improved patient safety: A
260
study of 98 hospitals in Florida. Journal of Healthcare Management, 52(6), 398–
409.
Mentzer, J. M., Min, S. H. and Zacharia, Z. G. (2000). The nature of interim partnering in
supply chain management. Journal of Retailing, 76, 549–568.
Metters, R. (1997). Quantifying the bullwhip effect in supply chains. Journal of
Operations Management, 15(2), 89–100.
Meyer, S.M. and Collier, D.A. (2001). An empirical test of the causal relationships in the
Baldrige Health Care Pilot Criteria. Journal of Operations Management, 19, 403-
425.
Miles, R. and Snow, C.C. (1978). Organizational Strategy, Structure, and Process.
McGraw-Hill, New York, NY.
Miles, R.E. and Snow, C.C. (1984). Fit, failure, and the hall of fame. California
Management Review, 26(3), 10-28.
Miles, R. and Snow, C. (2007). Organization theory and supply chain management: An
evolving research perspective. Journal of Operations Management, 25, 459-463.
Miller, D.C. (1991). Handbook of Research Design and Social Measurement, 5th
edition.
Sage Publications: Newbury Park, CA. 704 pages.
Miller, H. (2008). From volume to value: Transforming health care payment and delivery
systems to improve quality and reduce costs. Network for Regional Healthcare
Improvement, 1-51.
Miller, J.G. and Roth, A. (1994). A taxonomy of manufacturing strategies. Management
Science, 40(3), 285–304.
Min. S and Mentzer, J. (2004). Developing and measuring supply chain concepts.
Journal of Business Logistics, 25(1), 63–99.
Mohr, J. and Spekman, R. (1994). Characteristics of partnership success: Partnership
attributes, communication behavior, and conflict resolution techniques. Strategic
Management Journal, 15, 135–152.
Mohammed, I. and Banwet, R. (2008). Creating flex-lean-agile value chain by
outsourcing: an ISM-based interventional roadmap. Business Process
Management Journal, 14(3), 338-389.
Monczka, R. M., Peterson, K. J., Handfield, R. B., and Ragatz, G. L. (1998). Success
factors in strategic supplier alliances: The buying company perspective. Decision
Science, 29, 553–577.

261
Mont, O.K. (2002). Clarifying the concept of product-service system. Journal of Cleaner
Production, 10, 237-245.
Moore, G.C. and Benbasat, I. (1991). Development of an instrument to measure the
perceptions of adopting an information technology innovation. Information
Systems Research, 2(3), 192-222.Morgan, R. M., & Hunt, S. D. (1994). The
commitment-trust theory of relationship marketing. Journal of Marketing, 58, 20–
38.
Morgan, R. M., & Hunt, S. D. (1994). The commitment-trust theory of relationship
marketing. Journal of Marketing, 58, 20–38.
National Coalition on Health Care. (2009). Health care facts: costs. Retrieved from
http://www.nchc.org/documents/Fact%20Sheets/Fact%20Sheet%20-
%20Cost%20Sep-09.pdf
Narasimhan, R. and Jayaram, J. (1998). Causal linkage in supply chain management: an
exploratory study of North American manufacturing firms. Decision Sciences,
29(3), 579-605.
Nelson, R.R. and Winter, S.G. (1982). An evolutionary theory of economic change.
Cambridge, MA: Belknap Press of Harvard University.
Noble, D. (1997). Purchasing and supplier management as a future competitive edge.
Logistics Focus, 5(5), 23–27.
Nonaka, I. (1994). A dynamic theory of organizational knowledge creation. Organization
Science, 5(1), 14-37.
Nonaka, I. and Takeuchi, H. (1995). The knowledge-creating company: how Japanese
companies create the dynamics of innovation. New York: Oxford University
Press.
Normann, R. (2001). Reframing Business: When the Map Changes the Landscape. New
York, NY: John Wiley & Sons.
Normann, R. and Ramirez, R. (1993). From value chain to value constellation: Designing
interactive strategy. Harvard Business Review, July/August, 65-77.
Novack, R.A., Langley Jr., C.J. and Rinehart, L.M. (1995). Creating Logistics Value:
Themes for the Future. Council of Logistics Management, Oak Brook, IL.
Nunnally, J.C. (1978). Psychometric theory. McGraw Hill: New York, NY.
262
O'Brien, Robert M. (2007). "A Caution Regarding Rules of Thumb for Variance Inflation
Factors," Quality and Quantity, 41(5), 673-690.
O‘Connor, G.T., Quinton, H.B., Traven, N.D., Ramunno, L.D., Dodds, T.A., Marciniak,
T.A, and Wennberg, J.E. (1999). Geographic variation in the treatment of acute
myocardial infarction: the cooperative cardiovascular project. Journal of the
American Medical Association, 281(7), 627-633.
O‘Neill, P. (2007). A health care bargain. New York Times, October 16.
Paulhus, D.L. (1984). Two-component models of socially desirable responding. Journal
of Personality and Social Psychology, 46, 598–609.
Paulraj, A., Lado, A., Injazz, C. (2008). Inter-organizational communication as a
relational competency: Antecedents and performance outcomes in collaborative
buyer–supplier relationships. Journal of Operations Management, 26, 45-64.
Pagell, M. (2004). Understanding the factors that enable and inhibit the integration of
operations, purchasing and logistics. Journal of Operations Management, 22,
459-487.
Pedhazur, E. and Schmelkin, L. (1991). Chapter 8, ―Definitions and Variables‖ in
Measurement Design and Analysis: An Integrated Approach, Lawrence Erlbaum
Associates, London.
Persoon, T. J., Zaleski, S., & Frerichs, J. (2006). Improving preanalytic processes using
the principles of lean production (Toyota Production System). American Journal
of Clinical Pathology, 125(1), 16–25.
Petter, S., Straub, D., and Rai, A. (2007). Specifying formative constructs in Information
Systems research. MIS Quarterly, 31(4), 623-656.
Pisano, G.P. (1996). Learning-before-doing in the development of new process
technology. Research Policy, 25(7), 1097-1119.
Podsakoff, P.M., MacKenzi, S.B., Lee, J.Y. and Podsakoff, N.P. (2003). Common
method biases in behavioral research: a critical review of the literature and
recommended remedies. Journal of Applied Psychology, 88(5), 879–903.
Polanyi, M. (1966). The tacit dimension. Garden City, NY: Doubleday.
Poon, E. G., Bloomenthal, D., Jaggi, T., Honour, M. M., Bates, D.W., & Kaushal, R.
(2004). Overcoming barriers to adopting and implementing computerized
physician order entry systems in U.S. hospitals. Health Affairs, 23(4), 184– 190.
Porter, M.E. (1980). Competitive Strategy. The Free Press, New York, NY.
263
Porter, M. (1985). Competitive Advantage: Creating and Sustaining Superior
Performance. New York: The Free Press.
Porter, M. (1996). What is strategy? Harvard Business Review, November-December,
61-78.
Power, D.J. Sohal, A. and Rahman, S.U. (2001). Critical success factors in agile
supplychain management: an empirical study. International Journal of Physical
Distribution and Logistics Management, 31(4), 247–65.
Powers, T. and Jack, E. (2008). Using volume flexible strategies to improve customer
satisfaction and performance in health care services. Journal of Services
Marketing, 22(3), 188-197.
Prahalad, C. and Krishnan, M. (2008). The New Age of Innovation: Driving Co-created
Value through Global Networks. McGraw-Hill, New York.
Prahalad, C. and Ramaswamy, V. (2004a). Co-creation experiences: the next practice in
value creation, Journal of Interactive Marketing, 18(3), 5-14.
Prahalad C. and Ramaswamy, V. (2004b). The future of competition: co-creating unique
value with customers. Boston: Harvard Business School Press.
Qi, Y., Boyer, K. and Zhao, X. (2009). Supply chain strategy, product characteristics, and
performance impact: Evidence from Chinese manufacturers. Decision Sciences,
40(4), 667-695.
Raab, S. S., Grzybicki, D. M., Sudilovsky, D., Balassanian, R., Janosky, J. E., and Vrbin,
C. M. (2006). Effectiveness of Toyota process redesign in reducing thyroid gland
fine-needle aspiration error. American Journal of Clinical Pathology, 126(4),
585–592.
Raab, S. S., Andrew-JaJa, C., Condel, J. L., & Dabbs, D. J. (2006). Improving
Papanicolaou test quality and reducing medical errors by using Toyota production
system methods. American Journal of Obstetrics and Gynecology, 194(1), 57–64.
Rai, A., Patnayakuni, R. and Seth, N. (2006). Firm performance impacts of digitally enabled
supply chain integration capabilities. MIS Quarterly, 30(2), 225-246.
Ramanathan, R. (2005). Operations assessment of hospitals in the Sultanate of Oman.
International Journal of Operations and Production Management, 25(1), 39-54.
Ramayah, T., Sang, T.Y., Omar, R. and Dahlan, N. (2008). Impact of information
technology (IT) tools, partner relationship and supply chain performance. Asian
Academy of Management Journal, 13(2), 33-55.
264
Ramsay, C.R., Grant, A.M., Wallace, S.A., Garthwaite, P.H., Monk, A.F. and Russell,
I.T. (2000). Assessmnet of the learning curve in health technologies: a systematic
review. International Journal of Technology Assessment in Health Care, 16(4),
1095-1108.
Rathmell, J. (1966). What Is Meant by Services? Journal of Marketing. 30 (4).
Read, S., Dew, N., Sarasvathy, S.D., Song, M., and Wiltbank, R. (2009). Marketing
under uncertainty: the logic of an effectual approach. Journal of Marketing,
73(May), 1-18.
Reiner, G., Trcka, M. (2004). Customized supply chain design: Problems and alternatives
for a production company in the food industry. A simulation based approach, 89,
217–229.
Rigdon, E.E. (1998). Structural equation modeling. In: G.A.Marcoulides (Ed.), Modern
methods for business research, 251–294. Mahwah, NJ: Lawrence Erlbaum
Associates.
Ringle, C.M./Wende, S./Will, S.: SmartPLS 2.0 (M3) Beta, Hamburg 2005,
http://www.smartpls.de.
Roh, J., Hong, P., and Park, Y. (2008). Organizational culture and supply chain strategy:
a framework for effective information flows. Journal of Enterprising Information,
21(4), 361-376.
Rosenzweig, E.D. (2009). A contingent view of e-collaboration and performance in
manufacturing. Journal of Operations Management, 27, 462-478.
Ross, A. (1996). Selling uniqueness — Mass customization: The new religion for
manufacturers? Management Engineer, 75(6), 260–263.
Roth A. and Miller J. (1990). Manufacturing strategy, manufacturing strength,
managerial success, and economic outcomes. In: Ettlie J, Burstein M, Fiegehaum
A., editors. Manufacturing strategy. Norwell, MA: Kluwer Academic Publishers,
97–108.
Rungtusanatham M, Salvador F, Forza C, Choi TY. (2003). Supply chain linkage and
operational performance, a resource-based view perspective. International
Journal of Operations and Production Management,23(9), 1084–99.
Sabherwal, R. and Chan, Y. (2001). Alignment between business and IS strategies: a
study of prospectors, analyzers, and defenders. Information Systems Research,
12(1), 11-33.
265
Sahin, F. and Robinson, P. E. (2002). Flow coordination and information sharing in
supply chains: Review, implications, and directions for future research. Decision
Science, 33(4), 505–535.
Sambamurthy, V. & Chin, W.W. (1994). The effects of group attitudes toward alternative
GDSS designs on the decision-making performance of computer-supported groups.
Decision Sciences, 25(2), 215-241.
Sarasvathy, S.D. (2001). Causation and effectuation: toward a theoretical shift from
economic inevitability to entrepreneurial contingency. Academy of Management
Review. 26(2), 243-263.
Say, J. (1821). A Treatise on the Political Economy. Boston: Wells and Lilly.
Schein, E. (1992). Organizational Culture and Leadership, 2nd ed., Jossey-Bass, San
Francisco, CA.
Schein, E.H. (1996). Three cultures of management: the key to organizational learning,
Sloan Management Review, 38(1), 9-20.
Schmenner, R.W. (1986). ―How can service businesses survive and prosper? Sloan
Management Review, 27(3), 21-32.
Schmmener, R.W. (2004). Service Businesses and Productivity. Decision Sciences, 35(3),
333-347.
Schmenner, R. W. and Swink, M. L. (1998). On theory in operations management.
Journal of Operations Management, 17(1), 97–113.
Schmenner, R.W., Van Wassenhove, L., Ketokivi, M., Heyl, J., and Lusch, R.F. (2009). Too
much theory, not enough understanding. Journal of Operations Management, 27, 339-
343.
Schneller, E. S., and Smeltzer, L. R. (2006). Strategic management of the health care
supply chain. San Francisco, CA: Jossey-Bass.
Schurr, P.H. and Ozanne, J.L. (1985). Influences on exchange processes: buyers‘
preconceptions of a seller‘s trustworthiness and bargaining toughness. Journal of
consumer research, 11(4), 939-953.
Segars, A. (1997). Assessing the unidimensionality of measurement: a paradigm and
illustration within the context of information systems research. Omega
International Journal of Management Science, 25(1), 107-121.
266
Shah, R., Goldstein, S., Unger, B., and Henry, T. (2008). Explaining anomolous high
performance in a health care supply chain. Decision Sciences Journal, 39(4), 759-
789.
Shannon, R. P., Frndak, D., Grunden, N., Lloyd, J. C., Herbert, C., Patel, B., et al. (2006).
Using real-time problem solving to eliminate central line infections. Joint
Commission Journal on Quality and Patient Safety, 32(9), 479–487.
Shapiro, J. (2003). Lessons for the NHS from Kaiser Permanente. British Medical
Journal,327, 1241-1242.
Sherck, J.P. and Shatney, C.H. (1996). ICU scoring systems do not allow prediction of
patient outcomes or comparison of ICU performance. Critical Care Clinic, 12,
515-23.
Shi, L. (1996). Patient and hospital characteristics associated with average length of stay.
Health Care Management Review, 21(2), 46-61.
Shin, H., Collier, D.A. and Wilson, D.D. (2000). Supply management orientation and
supplier/buyer performance. Journal of Operations Management, 18(3), 317-333.
Shortell, S. and Zajac, E. (1990). Perceptual and archival measures of Miles and Snow‘s
strategic types: a comprehensive assessment of reliability and validity. Academy
of Management Journal, 33(4), 817-832.
Shortell, S.M., Morrison, E.M. and Friedman, B. (1990). Strategic choices for American
hospitals, Jossey-Bass, San Francisco, CA.
Singhal, J., Singhal, K., 2002. Supply chains and compatibility among components in
product design. Journal of Operations Management, 20(3), 289–302.
Sinha, K. and Kohnke, E. (2009). Health care supply chain design: toward linking the
development and delivery of care globally. Decision Sciences, 40(2), 197-212.
Skinner, W. (1969). Manufacturing – missing link in corporate strategy, Harvard
Business Review, 47(3), 136-45.
Skinner, W. (1985). The taming of lions: how manufacturing leadership evolved, 1780-
1984. In K. B. Clark, R. Hayes and C. Lorenz (eds), The Uneasy Alliance:
Managing the Productivity- Technology Dilemma (Boston, MA: Harvard
Business School Press), 63-114.
Smeltzer, L. and Ramanathan, V. (2002). Supply chain processes that lead to a
competitive advantage for a manufacturer compared to a health care provider.
Decision Sciences Institue 2002 Annual Meeting Proceedings.
267
Smith-Daniels, V., S. Schweikhart, D. Smith-Daniels. (1988). Capacity management in
health care services: Review and future research directions. Decision Sciences,
19(4), 889–919.
Smith, K. L., and Smith, D. (2005). Performance measurement in supply chains.
Australian Accounting Review, 15, 39–51.
Sole, D. and Edmondson, A. (2002). Situated knowledge and learning in dispersed teams.
British Journal of Management, 13 (special issue), s17-s34.
Spear, S., & Bowen, H. K. (1999). Decoding the DNA of the Toyota production system.
Harvard Business Review, 77(5), 97–106.
Spear, S. J. (2004). Learning to lead at Toyota. Harvard Business Review, 82(5), 78–86.
Spear, S. J. (2005). Fixing health care from the inside, today. Harvard Business Review,
83(9), 78–91.
Spekman, R. E., Kamauff, J. W., and Myhr, N. (1998). An empirical investigation into
supply chain management: A perspective on partnerships. International Journal
of Physical Distribution & Logistics Management, 28, 630–650.
Spender, J.C. (1996). Competitive advantage for tactic knowledge? Unpacking the
concept and its strategic implications. In B. Moingeon and A. Edmondson (Eds.),
Organizational learning and competitive advantage. London: Sage, 56-73.
Stalk G. (1988). Time—the next source of competitive advantage. Harvard Business
Review, 66(4), 41–51.
Stein, T. and Sweat, J. (1998). Killer supply chains. Informationweek, 708(9), 36–46.
Stern L. and Reve T. (1980). Distribution channels as political economies: a framework
for competitive analysis. Journal of Marketing, 44, 52–64.
Stevens, G.C. (1990). Successful supply-chain management. Management Decision,
28(8), 25-30.
Stock, G.N., Greis, N.P. and Kasarda, J.D. (1998). Logistics, strategy and structure.
International Journal of Production and Operations Management, 18(1), 37-52.
Stuart, F.I. (1997). Supply-chain strategy: organizational influence through supplier
alliances. British Academy of Management, 8(3), 223–236.
Sundbo, J. (2002). The Service Economy: Standardisation or Customisation? Service
Industries Journal, 22(4), 93–116.
268
Swink, M. and Song, M. (2007). Effects of marketing-manufacturing integration on new
product development time and competitive advantage. Journal of Operations
Management, 25, 203-217.
Szulanski, G. (1996). Exploring internal stickiness: impediments to the transfer of best
practice within the firm. Strategic Management Journal, 17, 27-43.
Tan, K., Kannan V. and Handfield R. (1998). Supply chain management: supplier
performance and firm performance. International Journal of Purchasing and
Materials Management, 34(3), 2–9.
Tan, K.C. (2001). A framework of supply chain management literature. European
Journal of Purchasing & Supply Management, 7, 39–48.
Tan, K., Lyman, S. and Wisner, J. (2002). Supply chain management: a strategic
perspective. International Journal of Operations and Production Management,
22(6), 614–31.
Tan, K.C., Kannan, V.R. and Handfield, R.B. (1998). Supply chain management: supplier
performance and firm performance. International Journal of Purchasing and
Materials Management, 34(3), 2–9.
Tarnow-Mordi, W., Ogston, S., Wilkinson, A.R., Reid, E., Gregory, J., Saeed, M. and
Wilkie, R. (1990). Predicting death from initial disease severity in very low birth-
weight infants: a method for comparing the performance of neonatal units. British
Medical Journal, 300(23), 1611-14.
Teece, D.J. (1977). Technology transfer by multinational firms: the resource cost of
transferring technological know-how. Economic Journal, 87(346), 242-261.
Thompson, T. G., and Brailer, D. J. (2004). The decade of health information technology:
Delivering consumer-centric and information-rich health care: Framework for
strategic action. Washington, DC: Department of Health and Human Services,
National Coordinator for Health Information Technology. Retrieved October 14,
2007, from http://www.hhs.gov/onchit/ framework/hitframework.pdf
Thomas, J.W., Guire, K.E. and Horvat, G. (1997). Is patient length of stay related to
quality of care?, Hospital & Health Services Administration, 42(4), 489-507.
Todd, P.A. and Benbasat, I. (1989). An Experimental Investigation of the Impact of
Computer Based Decision Aids on the Process of Preferential Choice. Working
Paper, School of Business, Queen's University, Kingston, Ontario.
Towill, D.R. (1997). The seamless chain- the predator‘s strategic advantage.
International Journal of Technology Management, 13(1), 37–56.
269
Towill, D. and Christopher M. (2002). The supply chain strategy conundrum: To be lean
or agile or to be lean and agile. International Journal of Logistics, 5(3), 299-309.
Tracey M., Vonderembse M.A. and Lim J.S. (1999). Manufacturing technology and
strategy formulation: keys to enhancing competitiveness and improving
performance. Journal of Operations Management, 7(4), 411–28.
Tsay, A. A. (1999). The quantity-flexibility contract and supplier-customer incentives.
Management Science, 45(10), 1339–1358.
Tu, Q., Vonderembse, M., Ragu-Nathan, T. and Sharkey, T. (2006). Absorptive capacity:
Enhancing the assimilation of time-based manufacturing practices. Journal of
Operations Management, 24, 692-710.
Tucker, A. L. (2007). An empirical study of system improvement by frontline employees
in hospital units. Manufacturing and Service Operations Management, 9(4), 492–
505.
Tucker, A.L., Nembhard, I.M. and Edmondson, A.C. (2007). Implementing new
practices: an empirical study of organizational learning in hospital intensive care
units. Management Science, 53(6), 894-907.
Tucker, A. (2004). The impact of operational failures on hospital nurses and their
patients. Journal of Operations Management, 22, 151-169.
Tucker, A.L. and Edmondson, A.C. (2003). Why hospitals don‘t learn from failures:
organizational and psychological dynamics that inhibit system change. California
Management Review, 45(2), 55-72.
Varkey, P., Reller, K. and Resar, R. (2007). Basics of quality improvement in health care.
Mayo Clinic Proceedings, 82(6), 735-739.
Vargo, S. and Akaka, M. (2009). Service-dominant logic as a foundation for service
science: Clarifications. Service Science Journal, 1(1) 32-41.
Vargo, S. and Lusch, F. (2008). Service-dominant logic: Continuing the evolution.
Journal of the Academy of Marketing Science, 36(1) 1-10.
Vargo, S. and Lusch, F. (2006). Service-Dominant Logic: What It Is, What It Is Not,
What It Might Be. The Service-Dominant Logic of Marketing: Dialog, Debate,
and Directions, Robert F. Lusch and Stephen L. Vargo, Eds. Armonk, New York:
M.E. Sharpe, 43-56.
Vargo, S. and Lusch, F. (2004a). Evolving to a New Dominant Logic for Marketing.
Journal of Marketing, 68(1), 1-17.
270
Vargo, S. and Lusch, F. (2004b). The Four Service Marketing Myths: Remnants of a
Goods-Based, Manufacturing Model. Journal of Service Research, 6(4), 324-35.
Vargo, S. and Morgan, F. (2005). Services in Society and Academic Thought: A
Historical Analysis. Journal of Macromarketing, 25(1), 42-53.
Vargo, S., Maglio, P., and Akaka, A. (2008). On value and value co-creation: A service
systems and service logic perspective. European Management Journal, 26, 145-
152.
Vargo, S., Lusch, R. F., Akaka, M. A., and He, Y. (2009). The Service-Dominant Logic:
A Review and Assessment, Review of Marketing Research (in press).
Venaik, S., Midgley, D.F., and Devinney, T.M. (2005). Dual paths to performance: The
impact of global pressures on MNC subsidiary conduct and performance. Journal of
International Business Studies, 36(6), 655–675.
Venkatraman, N. and Grant, J. H. (1986). Construct measurement in organizational strategy
research: a critique and proposal. Academy of Management Review, 11(1), 71-87
Venkatraman, N. (1989). Strategic orientation of business enterprises: the construct,
dimensionality, and measurement. Management Science, 35(8), 942–962.
Vesey, J.T. (1991). The new competitors: they think in terms of speed to- market.
Academy of Management Executive, 5(2), 23–33.
Vessey, I. (1984). An Investigation of the Psychological Processes Underlying the
Debugging of Computer Programs. Unpublished PhD Dissertation, Department of
Commerce, University of Queensland.
Vickery, S., Calantone, R. and Droge, C. (1999). Supply chain flexibility: an empirical
study. The Journal of Supply Chain Management, 35(3), 16-24.
von Hippel, E., (1988). The Sources of Innovation. Oxford University Press, New York.
Vonderembse, M.A. (2002). Building Supplier Relationships that Enhance
Manufacturing Performance. London: Spiro Press.
Vonderembse, M.A. and Tracey, M. (1999). The impact of supplier selection criteria and
supplier involvement on manufacturing performance. Journal of Supply Chain
Management, 35(3), 33-39.
Vondrembse, M.A., Uppal, M., Huang, S.H., and Dismukes, J.P. (2006). Designing
supply chains: Towards theory development. International Journal of Production
Economics, 100, 223-238.
271
Vosburgh, K.G. and Newbower, R.S. (2000). Moore‘s law, disruptive technologies, and
the clinician. In J.D. Westwood, H.M. Hoffman, G.T. Mogel, R.A. Robb and D.
Stredney (Eds.), Medicine meets virtual reality. Amsterdam: IOS Press, 8-13.
Walton, L.W. (1996). Partnership satisfaction: using the underlying dimensions of supply
chain partnership to measure current and expected levels of satisfaction. Journal
of Business Logistics, 17(2), 57-75.
Watcharasriroj, B. and Tang, J. (2004). The effects of size and information technology on
hospital efficiency. Journal of High Technology Management Research, 15(1), 1-
16.
Weinberg, D. B., Gittell, J. H., Lusenhop, R. W., Kautz, C. M., & Wright, J. (2007).
Beyond our walls: Impact of patient and provider coordination across the
continuum on outcomes for surgical patients. Health Service Research,42(1), Part
I: 7–24.
Wernerfelt, B. (1984). A resource based view of the firm. Strategic Management Journal,
5, 171-180.
Wheelwright, S.C. and Weber, J.A. (1995). Massachusetts General Hospital: CABG
Surgery (A), Harvard Business School Publishing, Boston, MA, Product Number
9-696-015.
Williamson O. (1975). Markets and hierarchies: analysis and antitrust implications. New
York: The Free Press.
Wilson, D.T. and Vlosky, R.P. (1998). Inter-organizational information system
technology and buyer-seller relationships. Journal of Business and Industrial
Marketing, 13(3), 215-234.
Wines, L. (1996). High order strategy for manufacturing. The Journal of Business
Strategy, 17(4), 32–33.
White, G. (1996). A meta-analysis model of manufacturing capabilities. Journal of
Operations Management, 14(4), 315-331.
Womack, J., Jones, D., and Roos, D. (1990). The Machine that Changed the World.
Macmillan, NY.
Womack, J and Jones, D. (1996). Lean Thinking. Simon and Schuster, NY.
Wood, A. (1997). Extending the supply chain: strengthening links with IT. Chemical
Week, 159(25), 25-26.
272
Yin, R. (1981). The case study crisis: some answers, Administrative Sciences Quarterly,
26, 58-65.
Young, D., Carr, H.H. and Rainer, R.K. Jr. (1999). Strategic implication of electronic
linkages. Information Systems Management, Winter, 32-39.
Yu, Z.X., Yan, H. and Cheng, T.C.E. (2001). Benefits of information sharing with supply
chain partnerships. Industrial Management and Data Systems, 101(3), 114–119.
Zhang, Q.Y. (2001).Technology infusion enabled value chain flexibility: a learning and
capability-based perspective. Doctoral dissertation, University of Toledo, Toledo,
OH.
Zhang, Q., Vonderembse, M., and Lim, J. (2002). Value chain Flexibility: a dichotomy of
competence and capability. International Journal of Production Research, 40(3),
561-583.
Zhang, X. and Chen, R. (2008). Examining the mechanism of the value co-creation with
customers. International Journal of Production Economics, 116, 242-250.
Zhang, X., Chen, R.Q. (2006). Customer participative chain: Linking customers and firm
to co-create competitive advantages. Management Review, 18(1), 51–56 (in
Chinese with English abstract).
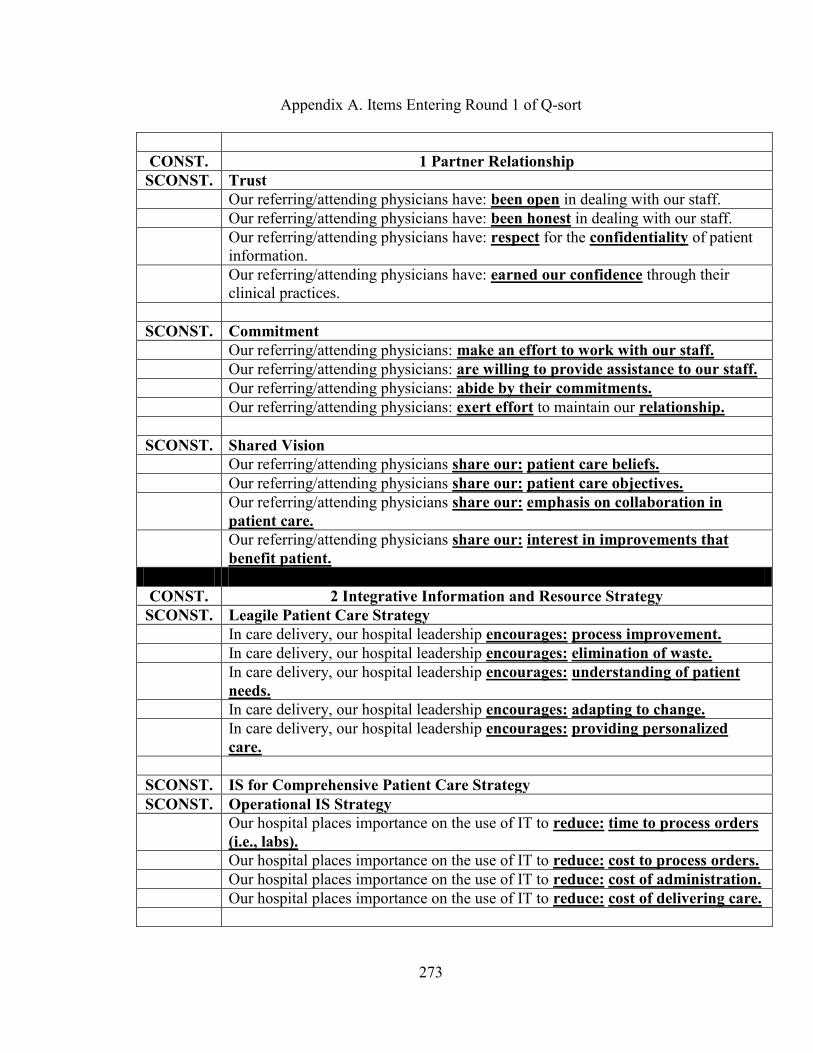
273
Appendix A. Items Entering Round 1 of Q-sort
CONST. 1 Partner Relationship
SCONST. Trust
Our referring/attending physicians have: been open in dealing with our staff.
Our referring/attending physicians have: been honest in dealing with our staff.
Our referring/attending physicians have: respect for the confidentiality of patient
information.
Our referring/attending physicians have: earned our confidence through their
clinical practices.
SCONST. Commitment
Our referring/attending physicians: make an effort to work with our staff.
Our referring/attending physicians: are willing to provide assistance to our staff.
Our referring/attending physicians: abide by their commitments.
Our referring/attending physicians: exert effort to maintain our relationship.
SCONST. Shared Vision
Our referring/attending physicians share our: patient care beliefs.
Our referring/attending physicians share our: patient care objectives.
Our referring/attending physicians share our: emphasis on collaboration in
patient care.
Our referring/attending physicians share our: interest in improvements that
benefit patient.
CONST. 2 Integrative Information and Resource Strategy
SCONST. Leagile Patient Care Strategy
In care delivery, our hospital leadership encourages: process improvement.
In care delivery, our hospital leadership encourages: elimination of waste.
In care delivery, our hospital leadership encourages: understanding of patient
needs.
In care delivery, our hospital leadership encourages: adapting to change.
In care delivery, our hospital leadership encourages: providing personalized
care.
SCONST. IS for Comprehensive Patient Care Strategy
SCONST. Operational IS Strategy
Our hospital places importance on the use of IT to reduce: time to process orders
(i.e., labs).
Our hospital places importance on the use of IT to reduce: cost to process orders.
Our hospital places importance on the use of IT to reduce: cost of administration.
Our hospital places importance on the use of IT to reduce: cost of delivering care.
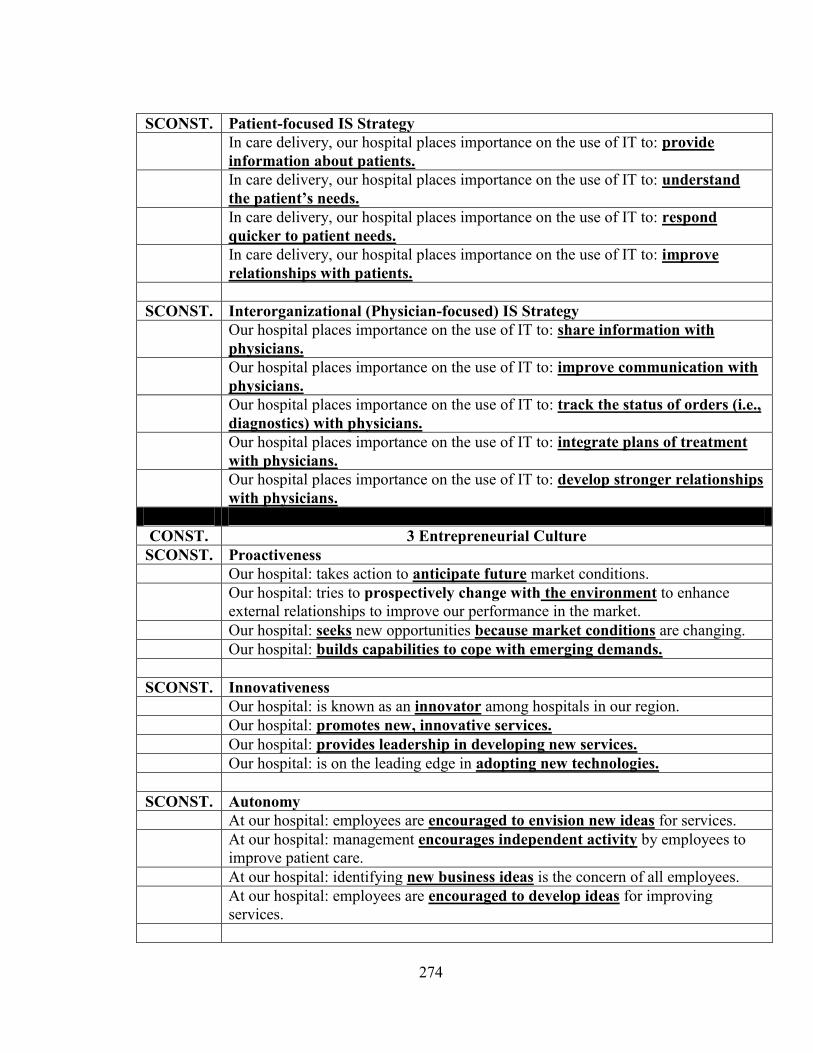
274
SCONST. Patient-focused IS Strategy
In care delivery, our hospital places importance on the use of IT to: provide
information about patients.
In care delivery, our hospital places importance on the use of IT to: understand
the patient‟s needs.
In care delivery, our hospital places importance on the use of IT to: respond
quicker to patient needs.
In care delivery, our hospital places importance on the use of IT to: improve
relationships with patients.
SCONST. Interorganizational (Physician-focused) IS Strategy
Our hospital places importance on the use of IT to: share information with
physicians.
Our hospital places importance on the use of IT to: improve communication with
physicians.
Our hospital places importance on the use of IT to: track the status of orders (i.e.,
diagnostics) with physicians.
Our hospital places importance on the use of IT to: integrate plans of treatment
with physicians.
Our hospital places importance on the use of IT to: develop stronger relationships
with physicians.
CONST. 3 Entrepreneurial Culture
SCONST. Proactiveness
Our hospital: takes action to anticipate future market conditions.
Our hospital: tries to prospectively change with the environment to enhance
external relationships to improve our performance in the market.
Our hospital: seeks new opportunities because market conditions are changing.
Our hospital: builds capabilities to cope with emerging demands.
SCONST. Innovativeness
Our hospital: is known as an innovator among hospitals in our region.
Our hospital: promotes new, innovative services.
Our hospital: provides leadership in developing new services.
Our hospital: is on the leading edge in adopting new technologies.
SCONST. Autonomy
At our hospital: employees are encouraged to envision new ideas for services.
At our hospital: management encourages independent activity by employees to
improve patient care.
At our hospital: identifying new business ideas is the concern of all employees.
At our hospital: employees are encouraged to develop ideas for improving
services.
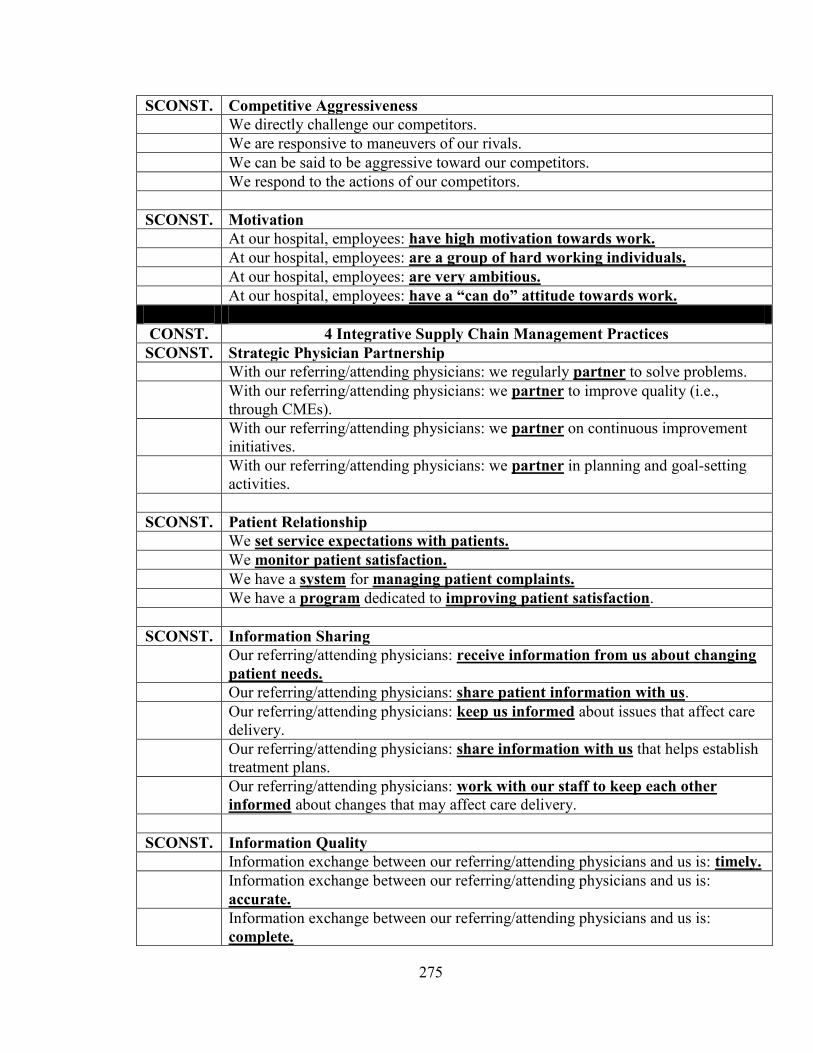
275
SCONST. Competitive Aggressiveness
We directly challenge our competitors.
We are responsive to maneuvers of our rivals.
We can be said to be aggressive toward our competitors.
We respond to the actions of our competitors.
SCONST. Motivation
At our hospital, employees: have high motivation towards work.
At our hospital, employees: are a group of hard working individuals.
At our hospital, employees: are very ambitious.
At our hospital, employees: have a “can do” attitude towards work.
CONST. 4 Integrative Supply Chain Management Practices
SCONST. Strategic Physician Partnership
With our referring/attending physicians: we regularly partner to solve problems.
With our referring/attending physicians: we partner to improve quality (i.e.,
through CMEs).
With our referring/attending physicians: we partner on continuous improvement
initiatives.
With our referring/attending physicians: we partner in planning and goal-setting
activities.
SCONST. Patient Relationship
We set service expectations with patients.
We monitor patient satisfaction.
We have a system for managing patient complaints.
We have a program dedicated to improving patient satisfaction.
SCONST. Information Sharing
Our referring/attending physicians: receive information from us about changing
patient needs.
Our referring/attending physicians: share patient information with us.
Our referring/attending physicians: keep us informed about issues that affect care
delivery.
Our referring/attending physicians: share information with us that helps establish
treatment plans.
Our referring/attending physicians: work with our staff to keep each other
informed about changes that may affect care delivery.
SCONST. Information Quality
Information exchange between our referring/attending physicians and us is: timely.
Information exchange between our referring/attending physicians and us is:
accurate.
Information exchange between our referring/attending physicians and us is:
complete.
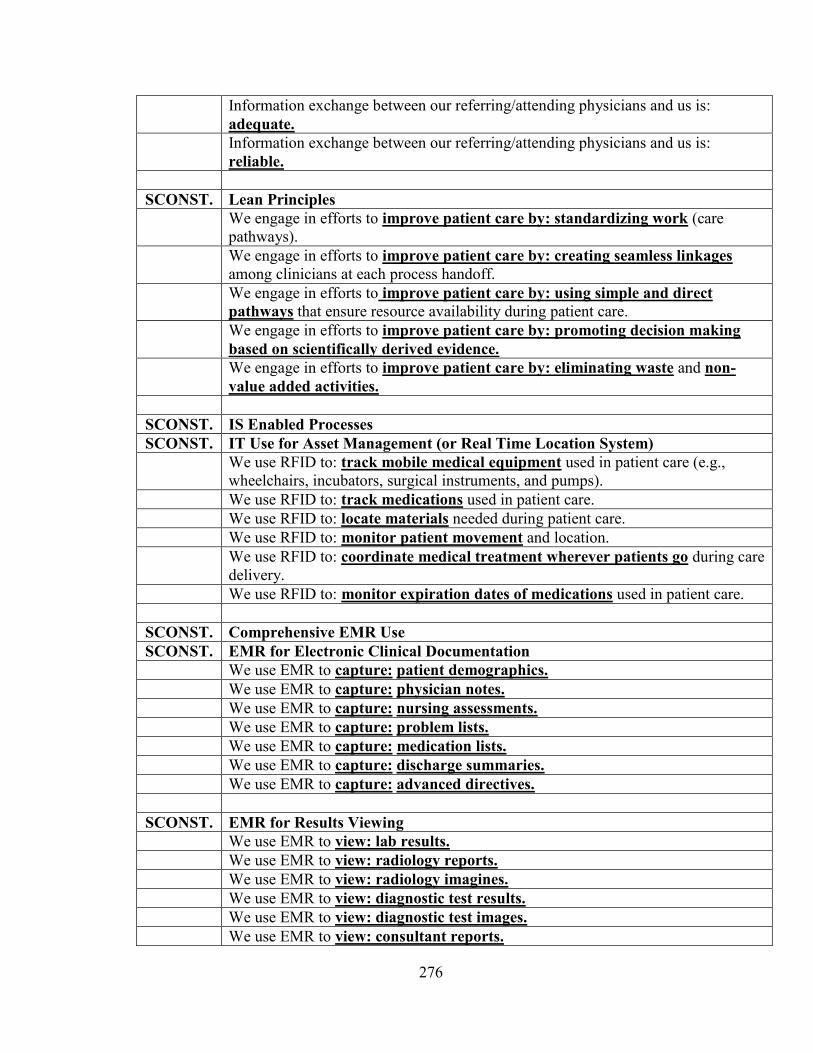
276
Information exchange between our referring/attending physicians and us is:
adequate.
Information exchange between our referring/attending physicians and us is:
reliable.
SCONST. Lean Principles
We engage in efforts to improve patient care by: standardizing work (care
pathways).
We engage in efforts to improve patient care by: creating seamless linkages
among clinicians at each process handoff.
We engage in efforts to improve patient care by: using simple and direct
pathways that ensure resource availability during patient care.
We engage in efforts to improve patient care by: promoting decision making
based on scientifically derived evidence.
We engage in efforts to improve patient care by: eliminating waste and non-
value added activities.
SCONST. IS Enabled Processes
SCONST. IT Use for Asset Management (or Real Time Location System)
We use RFID to: track mobile medical equipment used in patient care (e.g.,
wheelchairs, incubators, surgical instruments, and pumps).
We use RFID to: track medications used in patient care.
We use RFID to: locate materials needed during patient care.
We use RFID to: monitor patient movement and location.
We use RFID to: coordinate medical treatment wherever patients go during care
delivery.
We use RFID to: monitor expiration dates of medications used in patient care.
SCONST. Comprehensive EMR Use
SCONST. EMR for Electronic Clinical Documentation
We use EMR to capture: patient demographics.
We use EMR to capture: physician notes.
We use EMR to capture: nursing assessments.
We use EMR to capture: problem lists.
We use EMR to capture: medication lists.
We use EMR to capture: discharge summaries.
We use EMR to capture: advanced directives.
SCONST. EMR for Results Viewing
We use EMR to view: lab results.
We use EMR to view: radiology reports.
We use EMR to view: radiology imagines.
We use EMR to view: diagnostic test results.
We use EMR to view: diagnostic test images.
We use EMR to view: consultant reports.
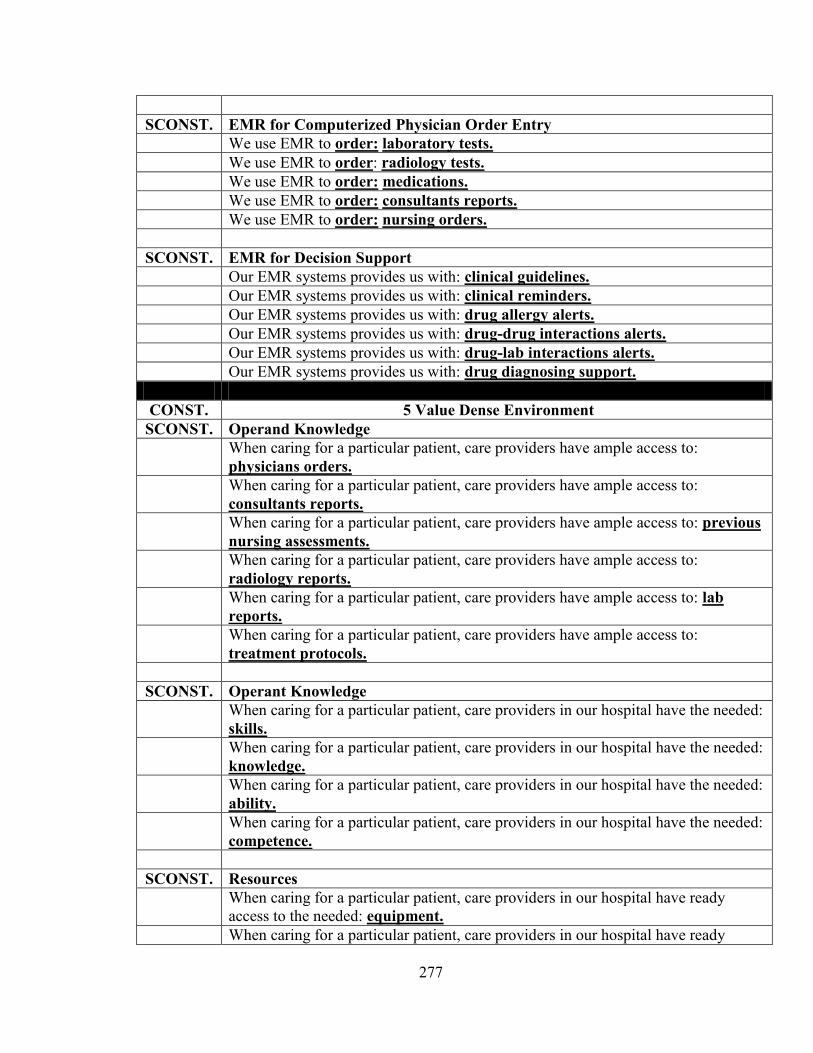
277
SCONST. EMR for Computerized Physician Order Entry
We use EMR to order: laboratory tests.
We use EMR to order: radiology tests.
We use EMR to order: medications.
We use EMR to order: consultants reports.
We use EMR to order: nursing orders.
SCONST. EMR for Decision Support
Our EMR systems provides us with: clinical guidelines.
Our EMR systems provides us with: clinical reminders.
Our EMR systems provides us with: drug allergy alerts.
Our EMR systems provides us with: drug-drug interactions alerts.
Our EMR systems provides us with: drug-lab interactions alerts.
Our EMR systems provides us with: drug diagnosing support.
CONST. 5 Value Dense Environment
SCONST. Operand Knowledge
When caring for a particular patient, care providers have ample access to:
physicians orders.
When caring for a particular patient, care providers have ample access to:
consultants reports.
When caring for a particular patient, care providers have ample access to: previous
nursing assessments.
When caring for a particular patient, care providers have ample access to:
radiology reports.
When caring for a particular patient, care providers have ample access to: lab
reports.
When caring for a particular patient, care providers have ample access to:
treatment protocols.
SCONST. Operant Knowledge
When caring for a particular patient, care providers in our hospital have the needed:
skills.
When caring for a particular patient, care providers in our hospital have the needed:
knowledge.
When caring for a particular patient, care providers in our hospital have the needed:
ability.
When caring for a particular patient, care providers in our hospital have the needed:
competence.
SCONST. Resources
When caring for a particular patient, care providers in our hospital have ready
access to the needed: equipment.
When caring for a particular patient, care providers in our hospital have ready
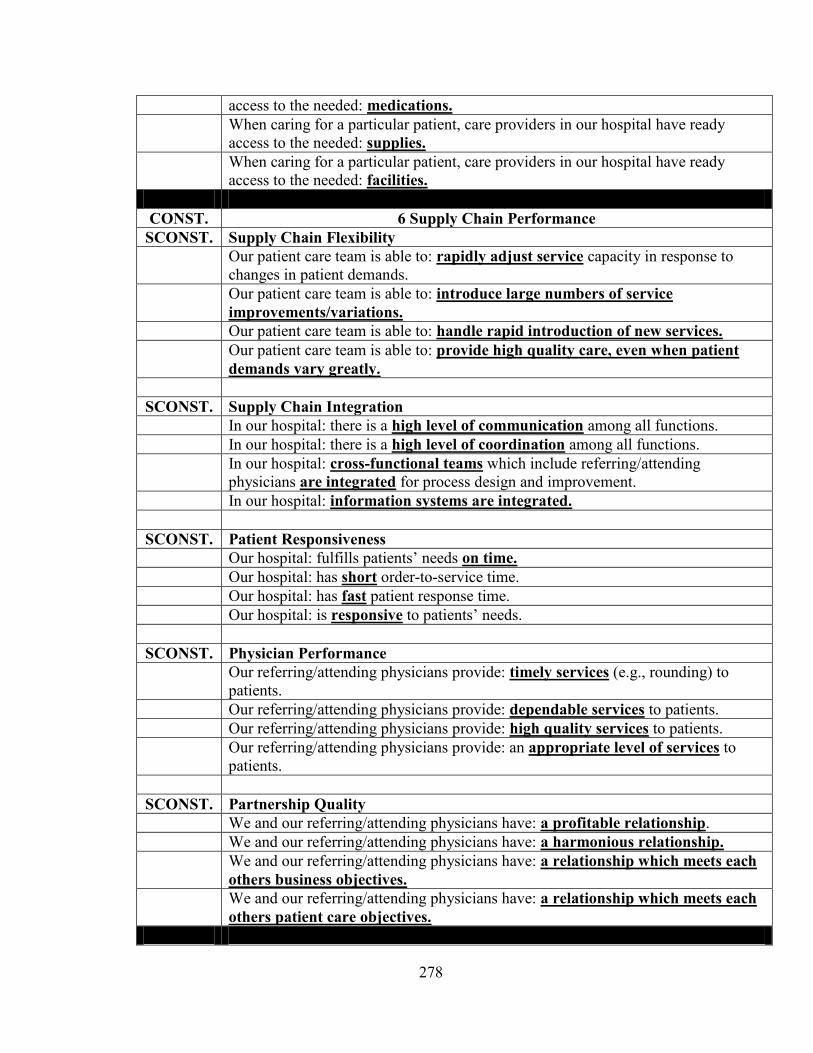
278
access to the needed: medications.
When caring for a particular patient, care providers in our hospital have ready
access to the needed: supplies.
When caring for a particular patient, care providers in our hospital have ready
access to the needed: facilities.
CONST. 6 Supply Chain Performance
SCONST. Supply Chain Flexibility
Our patient care team is able to: rapidly adjust service capacity in response to
changes in patient demands.
Our patient care team is able to: introduce large numbers of service
improvements/variations.
Our patient care team is able to: handle rapid introduction of new services.
Our patient care team is able to: provide high quality care, even when patient
demands vary greatly.
SCONST. Supply Chain Integration
In our hospital: there is a high level of communication among all functions.
In our hospital: there is a high level of coordination among all functions.
In our hospital: cross-functional teams which include referring/attending
physicians are integrated for process design and improvement.
In our hospital: information systems are integrated.
SCONST. Patient Responsiveness
Our hospital: fulfills patients‘ needs on time.
Our hospital: has short order-to-service time.
Our hospital: has fast patient response time.
Our hospital: is responsive to patients‘ needs.
SCONST. Physician Performance
Our referring/attending physicians provide: timely services (e.g., rounding) to
patients.
Our referring/attending physicians provide: dependable services to patients.
Our referring/attending physicians provide: high quality services to patients.
Our referring/attending physicians provide: an appropriate level of services to
patients.
SCONST. Partnership Quality
We and our referring/attending physicians have: a profitable relationship.
We and our referring/attending physicians have: a harmonious relationship.
We and our referring/attending physicians have: a relationship which meets each
others business objectives.
We and our referring/attending physicians have: a relationship which meets each
others patient care objectives.
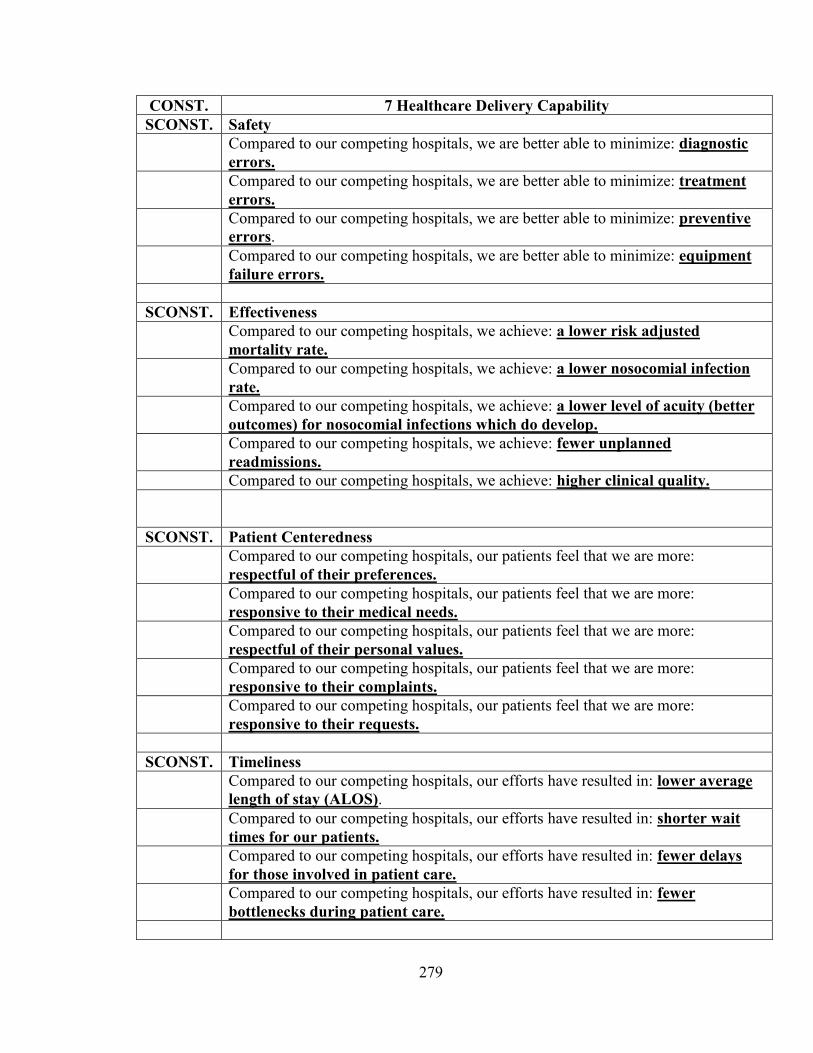
279
CONST. 7 Healthcare Delivery Capability
SCONST. Safety
Compared to our competing hospitals, we are better able to minimize: diagnostic
errors.
Compared to our competing hospitals, we are better able to minimize: treatment
errors.
Compared to our competing hospitals, we are better able to minimize: preventive
errors.
Compared to our competing hospitals, we are better able to minimize: equipment
failure errors.
SCONST. Effectiveness
Compared to our competing hospitals, we achieve: a lower risk adjusted
mortality rate.
Compared to our competing hospitals, we achieve: a lower nosocomial infection
rate.
Compared to our competing hospitals, we achieve: a lower level of acuity (better
outcomes) for nosocomial infections which do develop.
Compared to our competing hospitals, we achieve: fewer unplanned
readmissions.
Compared to our competing hospitals, we achieve: higher clinical quality.
SCONST. Patient Centeredness
Compared to our competing hospitals, our patients feel that we are more:
respectful of their preferences.
Compared to our competing hospitals, our patients feel that we are more:
responsive to their medical needs.
Compared to our competing hospitals, our patients feel that we are more:
respectful of their personal values.
Compared to our competing hospitals, our patients feel that we are more:
responsive to their complaints.
Compared to our competing hospitals, our patients feel that we are more:
responsive to their requests.
SCONST. Timeliness
Compared to our competing hospitals, our efforts have resulted in: lower average
length of stay (ALOS).
Compared to our competing hospitals, our efforts have resulted in: shorter wait
times for our patients.
Compared to our competing hospitals, our efforts have resulted in: fewer delays
for those involved in patient care.
Compared to our competing hospitals, our efforts have resulted in: fewer
bottlenecks during patient care.
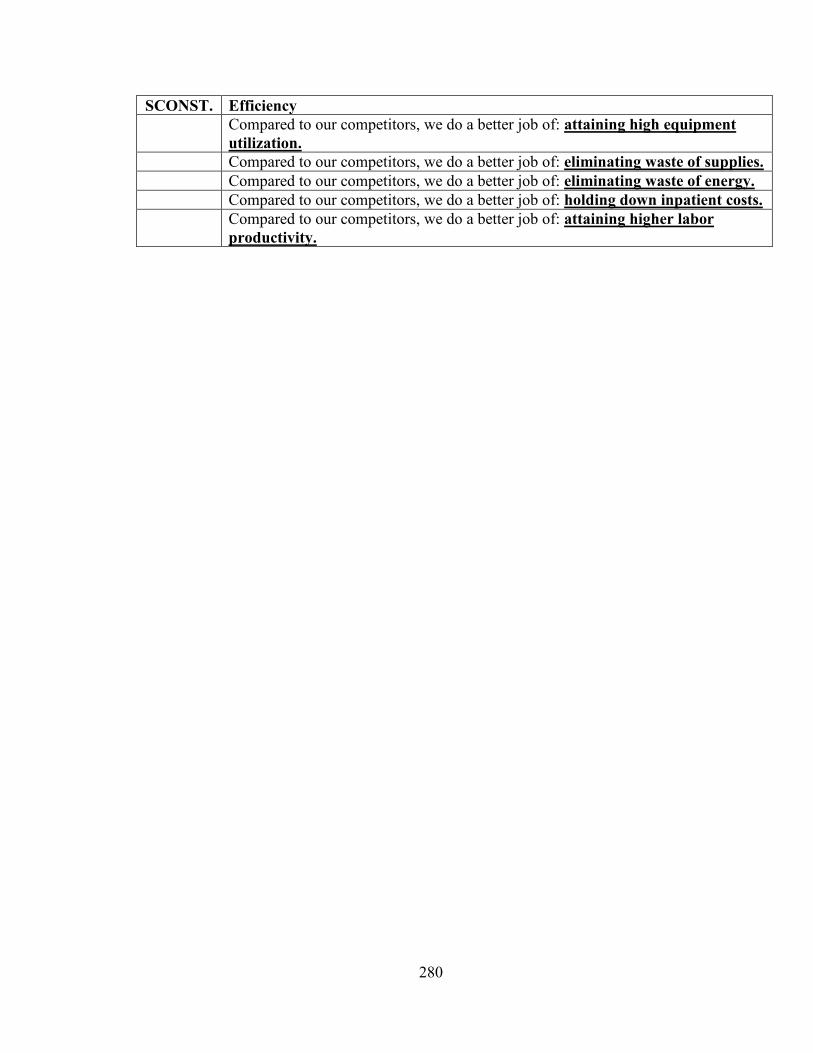
280
SCONST. Efficiency
Compared to our competitors, we do a better job of: attaining high equipment
utilization.
Compared to our competitors, we do a better job of: eliminating waste of supplies.
Compared to our competitors, we do a better job of: eliminating waste of energy.
Compared to our competitors, we do a better job of: holding down inpatient costs.
Compared to our competitors, we do a better job of: attaining higher labor
productivity.
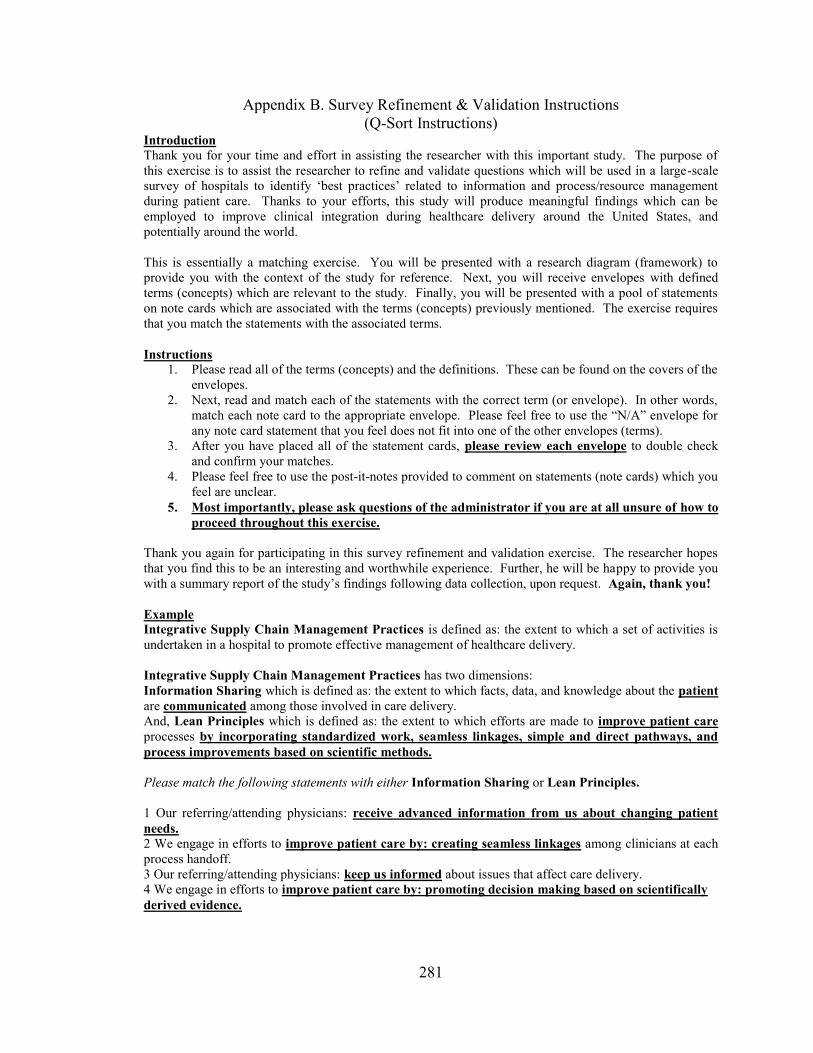
281
Appendix B. Survey Refinement & Validation Instructions
(Q-Sort Instructions) Introduction
Thank you for your time and effort in assisting the researcher with this important study. The purpose of
this exercise is to assist the researcher to refine and validate questions which will be used in a large-scale
survey of hospitals to identify ‗best practices‘ related to information and process/resource management
during patient care. Thanks to your efforts, this study will produce meaningful findings which can be
employed to improve clinical integration during healthcare delivery around the United States, and
potentially around the world.
This is essentially a matching exercise. You will be presented with a research diagram (framework) to
provide you with the context of the study for reference. Next, you will receive envelopes with defined
terms (concepts) which are relevant to the study. Finally, you will be presented with a pool of statements
on note cards which are associated with the terms (concepts) previously mentioned. The exercise requires
that you match the statements with the associated terms.
Instructions
1. Please read all of the terms (concepts) and the definitions. These can be found on the covers of the
envelopes.
2. Next, read and match each of the statements with the correct term (or envelope). In other words,
match each note card to the appropriate envelope. Please feel free to use the ―N/A‖ envelope for
any note card statement that you feel does not fit into one of the other envelopes (terms).
3. After you have placed all of the statement cards, please review each envelope to double check
and confirm your matches.
4. Please feel free to use the post-it-notes provided to comment on statements (note cards) which you
feel are unclear.
5. Most importantly, please ask questions of the administrator if you are at all unsure of how to
proceed throughout this exercise.
Thank you again for participating in this survey refinement and validation exercise. The researcher hopes
that you find this to be an interesting and worthwhile experience. Further, he will be happy to provide you
with a summary report of the study‘s findings following data collection, upon request. Again, thank you!
Example
Integrative Supply Chain Management Practices is defined as: the extent to which a set of activities is
undertaken in a hospital to promote effective management of healthcare delivery.
Integrative Supply Chain Management Practices has two dimensions:
Information Sharing which is defined as: the extent to which facts, data, and knowledge about the patient
are communicated among those involved in care delivery.
And, Lean Principles which is defined as: the extent to which efforts are made to improve patient care
processes by incorporating standardized work, seamless linkages, simple and direct pathways, and
process improvements based on scientific methods.
Please match the following statements with either Information Sharing or Lean Principles.
1 Our referring/attending physicians: receive advanced information from us about changing patient
needs. 2 We engage in efforts to improve patient care by: creating seamless linkages among clinicians at each
process handoff.
3 Our referring/attending physicians: keep us informed about issues that affect care delivery.
4 We engage in efforts to improve patient care by: promoting decision making based on scientifically
derived evidence.
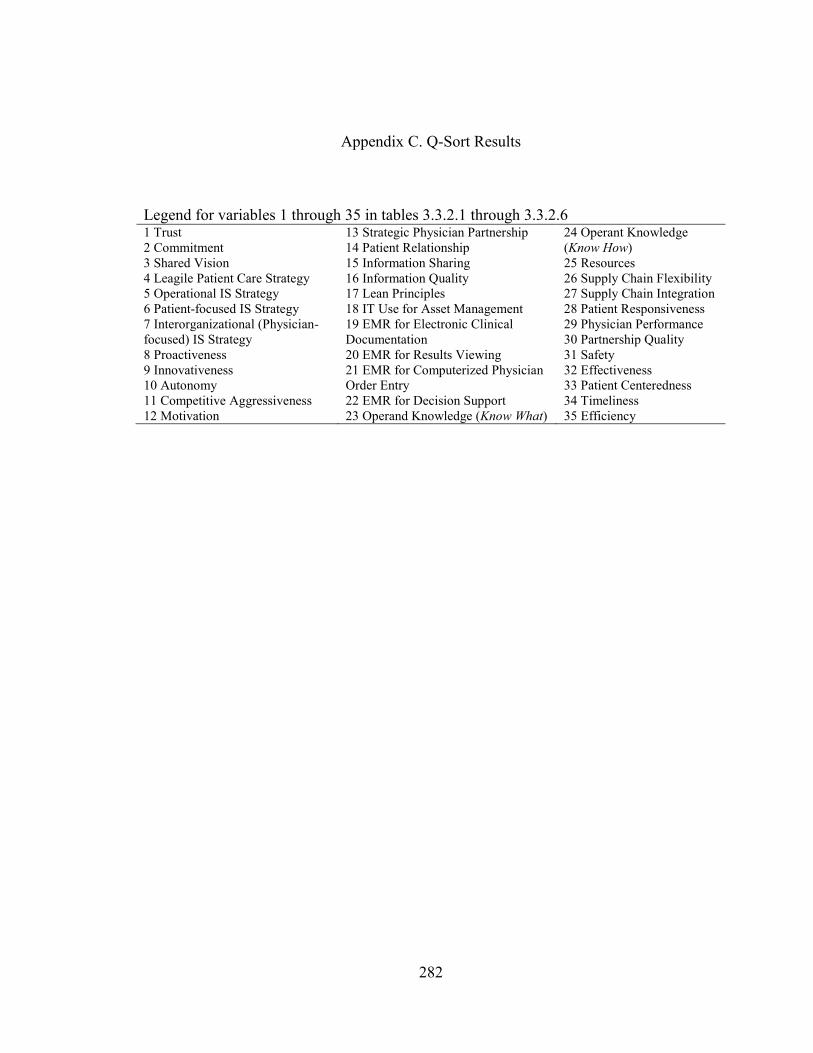
282
Appendix C. Q-Sort Results
Legend for variables 1 through 35 in tables 3.3.2.1 through 3.3.2.6 1 Trust
2 Commitment
3 Shared Vision
4 Leagile Patient Care Strategy
5 Operational IS Strategy
6 Patient-focused IS Strategy
7 Interorganizational (Physician-
focused) IS Strategy
8 Proactiveness
9 Innovativeness
10 Autonomy
11 Competitive Aggressiveness
12 Motivation
13 Strategic Physician Partnership
14 Patient Relationship
15 Information Sharing
16 Information Quality
17 Lean Principles
18 IT Use for Asset Management
19 EMR for Electronic Clinical
Documentation
20 EMR for Results Viewing
21 EMR for Computerized Physician
Order Entry
22 EMR for Decision Support
23 Operand Knowledge (Know What)
24 Operant Knowledge
(Know How)
25 Resources
26 Supply Chain Flexibility
27 Supply Chain Integration
28 Patient Responsiveness
29 Physician Performance
30 Partnership Quality
31 Safety
32 Effectiveness
33 Patient Centeredness
34 Timeliness
35 Efficiency
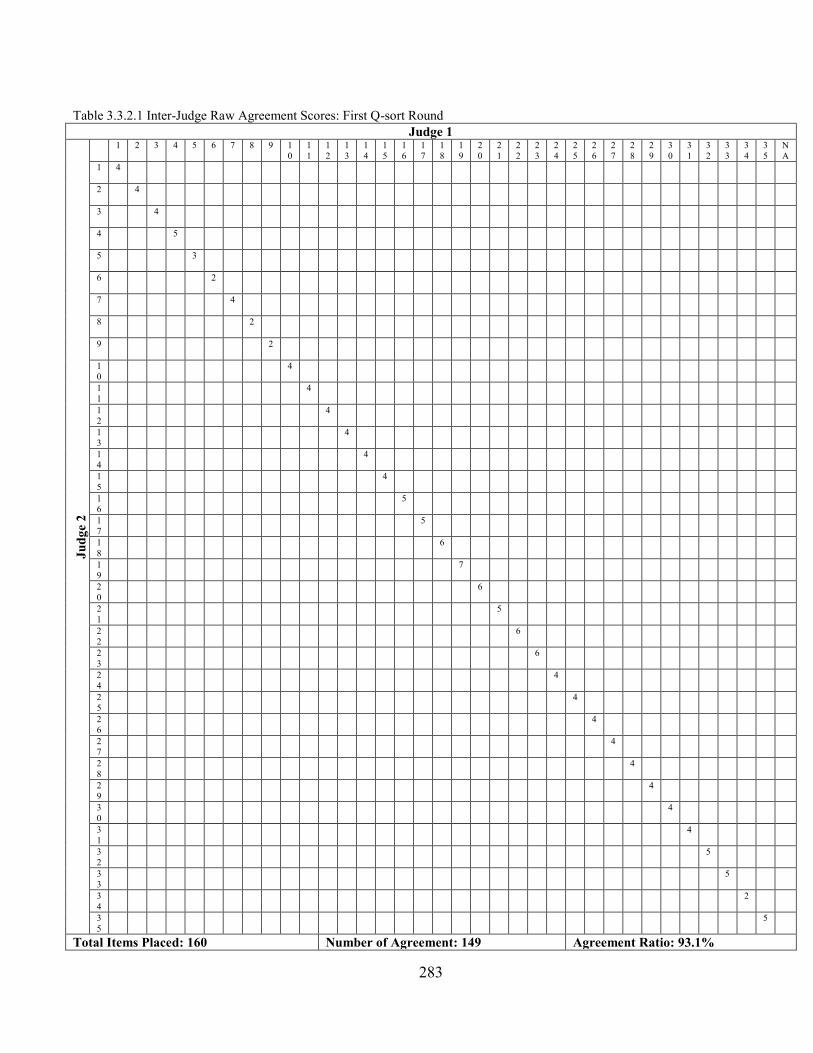
283
Table 3.3.2.1 Inter-Judge Raw Agreement Scores: First Q-sort Round
Judge 1
Ju
dg
e 2
1 2 3 4 5 6 7 8 9 1
0
1
1
1
2
1
3
1
4
1
5
1
6
1
7
1
8
1
9
2
0
2
1
2
2
2
3
2
4
2
5
2
6
2
7
2
8
2
9
3
0
3
1
3
2
3
3
3
4
3
5
N
A
1
4
2
4
3
4
4
5
5
3
6
2
7
4
8
2
9
2
1
0
4
1
1
4
1
2
4
1
3
4
1
4
4
1
5
4
1
6
5
1
7
5
1
8
6
1
9
7
2
0
6
2
1
5
2
2
6
2
3
6
2
4
4
2
5
4
2
6
4
2
7
4
2
8
4
2
9
4
3
0
4
3
1
4
3
2
5
3
3
5
3
4
2
3
5
5
Total Items Placed: 160 Number of Agreement: 149 Agreement Ratio: 93.1%
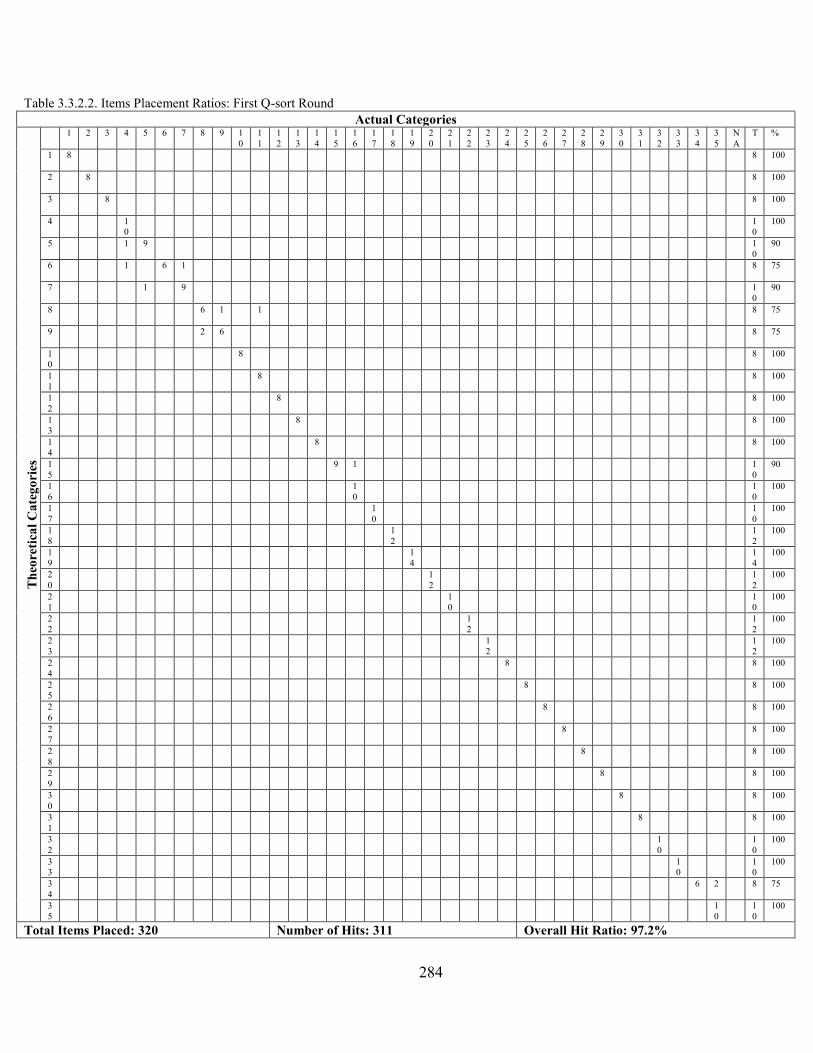
284
Table 3.3.2.2. Items Placement Ratios: First Q-sort Round
Actual Categories
Th
eore
tica
l C
ate
go
ries
1 2 3 4 5 6 7 8 9 1
0
1
1
1
2
1
3
1
4
1
5
1
6
1
7
1
8
1
9
2
0
2
1
2
2
2
3
2
4
2
5
2
6
2
7
2
8
2
9
3
0
3
1
3
2
3
3
3
4
3
5
N
A
T %
1
8 8 100
2
8 8 100
3
8 8 100
4
1
0
1
0
100
5
1 9 1
0
90
6
1 6 1 8 75
7
1 9 1
0
90
8
6 1 1 8 75
9
2 6 8 75
1
0
8 8 100
1
1
8 8 100
1
2
8 8 100
1
3
8 8 100
1
4
8 8 100
1
5
9 1 1
0
90
1
6
1
0
1
0
100
1
7
1
0
1
0
100
1
8
1
2
1
2
100
1
9
1
4
1
4
100
2
0
1
2
1
2
100
2
1
1
0
1
0
100
2
2
1
2
1
2
100
2
3
1
2
1
2
100
2
4
8 8 100
2
5
8 8 100
2
6
8 8 100
2
7
8 8 100
2
8
8 8 100
2
9
8 8 100
3
0
8 8 100
3
1
8 8 100
3
2
1
0
1
0
100
3
3
1
0
1
0
100
3
4
6 2 8 75
3
5
1
0
1
0
100
Total Items Placed: 320 Number of Hits: 311 Overall Hit Ratio: 97.2%
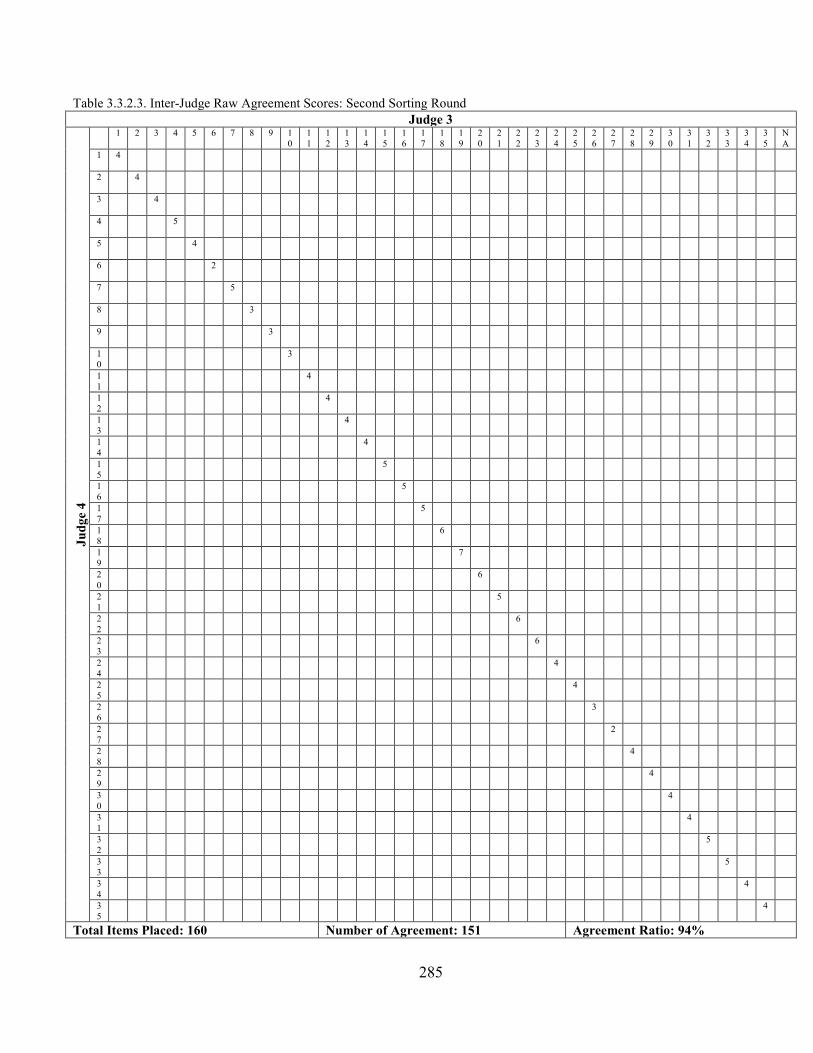
285
Table 3.3.2.3. Inter-Judge Raw Agreement Scores: Second Sorting Round
Judge 3
Ju
dg
e 4
1 2 3 4 5 6 7 8 9 1
0
1
1
1
2
1
3
1
4
1
5
1
6
1
7
1
8
1
9
2
0
2
1
2
2
2
3
2
4
2
5
2
6
2
7
2
8
2
9
3
0
3
1
3
2
3
3
3
4
3
5
N
A
1
4
2
4
3
4
4
5
5
4
6
2
7
5
8
3
9
3
1
0
3
1
1
4
1
2
4
1
3
4
1
4
4
1
5
5
1
6
5
1
7
5
1
8
6
1
9
7
2
0
6
2
1
5
2
2
6
2
3
6
2
4
4
2
5
4
2
6
3
2
7
2
2
8
4
2
9
4
3
0
4
3
1
4
3
2
5
3
3
5
3
4
4
3
5
4
Total Items Placed: 160 Number of Agreement: 151 Agreement Ratio: 94%
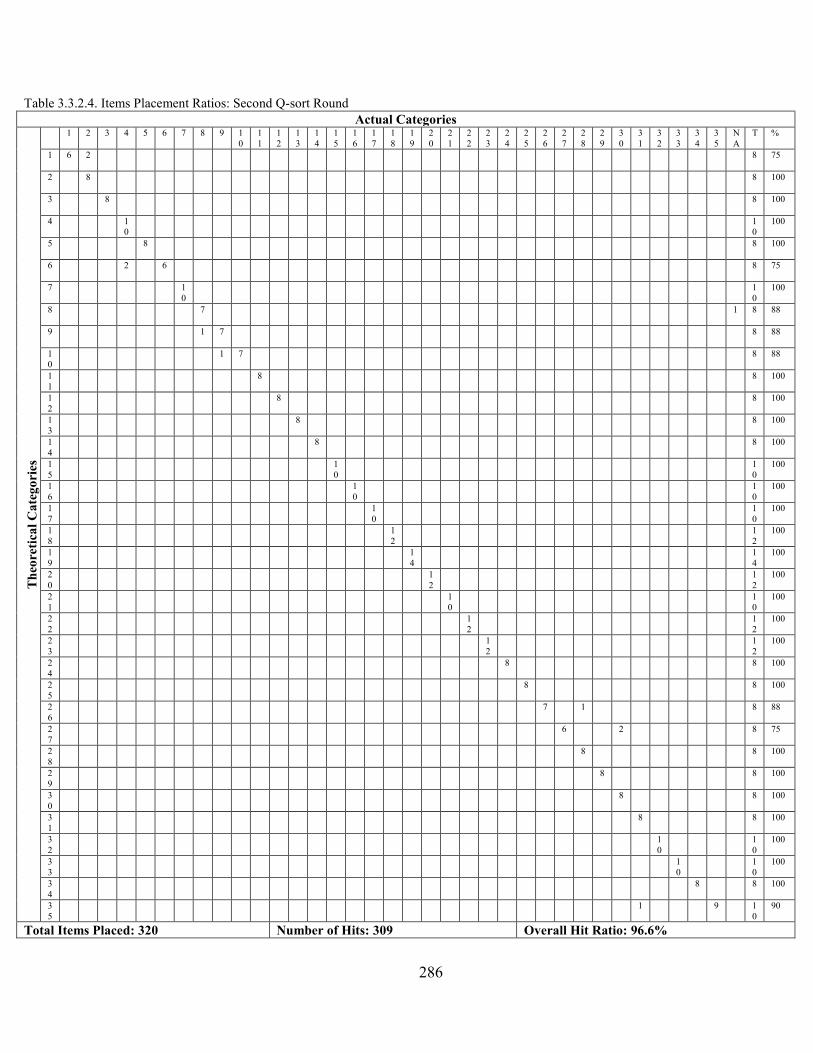
286
Table 3.3.2.4. Items Placement Ratios: Second Q-sort Round
Actual Categories
Th
eore
tica
l C
ate
go
ries
1 2 3 4 5 6 7 8 9 1
0
1
1
1
2
1
3
1
4
1
5
1
6
1
7
1
8
1
9
2
0
2
1
2
2
2
3
2
4
2
5
2
6
2
7
2
8
2
9
3
0
3
1
3
2
3
3
3
4
3
5
N
A
T %
1
6 2 8 75
2
8 8 100
3
8 8 100
4
1
0
1
0
100
5
8 8 100
6
2 6 8 75
7
1
0
1
0
100
8
7 1 8 88
9
1 7 8 88
1
0
1 7 8 88
1
1
8 8 100
1
2
8 8 100
1
3
8 8 100
1
4
8 8 100
1
5
1
0
1
0
100
1
6
1
0
1
0
100
1
7
1
0
1
0
100
1
8
1
2
1
2
100
1
9
1
4
1
4
100
2
0
1
2
1
2
100
2
1
1
0
1
0
100
2
2
1
2
1
2
100
2
3
1
2
1
2
100
2
4
8 8 100
2
5
8 8 100
2
6
7 1 8 88
2
7
6 2 8 75
2
8
8 8 100
2
9
8 8 100
3
0
8 8 100
3
1
8 8 100
3
2
1
0
1
0
100
3
3
1
0
1
0
100
3
4
8 8 100
3
5
1 9 1
0
90
Total Items Placed: 320 Number of Hits: 309 Overall Hit Ratio: 96.6%
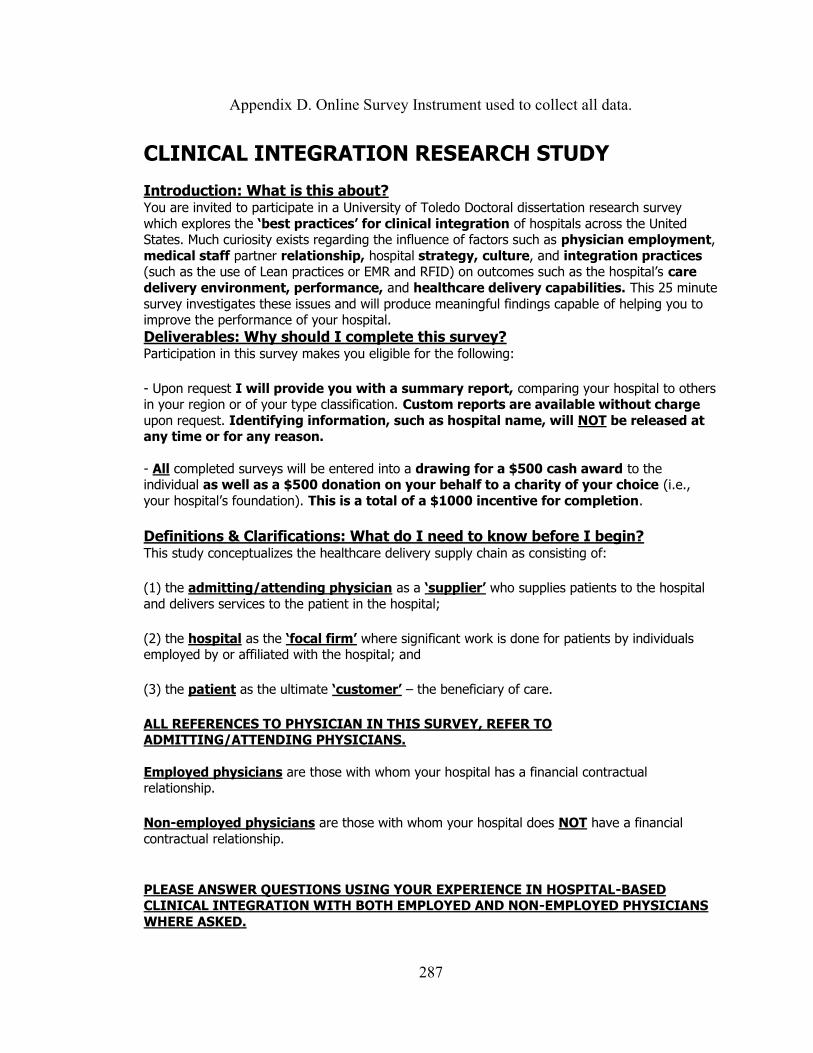
287
Appendix D. Online Survey Instrument used to collect all data. CLINICAL INTEGRATION RESEARCH STUDY
Introduction: What is this about?
You are invited to participate in a University of Toledo Doctoral dissertation research survey
which explores the ‘best practices’ for clinical integration of hospitals across the United States. Much curiosity exists regarding the influence of factors such as physician employment,
medical staff partner relationship, hospital strategy, culture, and integration practices (such as the use of Lean practices or EMR and RFID) on outcomes such as the hospital’s care
delivery environment, performance, and healthcare delivery capabilities. This 25 minute
survey investigates these issues and will produce meaningful findings capable of helping you to improve the performance of your hospital.
Deliverables: Why should I complete this survey?
Participation in this survey makes you eligible for the following:
- Upon request I will provide you with a summary report, comparing your hospital to others in your region or of your type classification. Custom reports are available without charge
upon request. Identifying information, such as hospital name, will NOT be released at any time or for any reason.
- All completed surveys will be entered into a drawing for a $500 cash award to the individual as well as a $500 donation on your behalf to a charity of your choice (i.e.,
your hospital’s foundation). This is a total of a $1000 incentive for completion.
Definitions & Clarifications: What do I need to know before I begin? This study conceptualizes the healthcare delivery supply chain as consisting of:
(1) the admitting/attending physician as a ‘supplier’ who supplies patients to the hospital
and delivers services to the patient in the hospital;
(2) the hospital as the ‘focal firm’ where significant work is done for patients by individuals employed by or affiliated with the hospital; and
(3) the patient as the ultimate ‘customer’ – the beneficiary of care.
ALL REFERENCES TO PHYSICIAN IN THIS SURVEY, REFER TO ADMITTING/ATTENDING PHYSICIANS.
Employed physicians are those with whom your hospital has a financial contractual relationship.
Non-employed physicians are those with whom your hospital does NOT have a financial
contractual relationship.
PLEASE ANSWER QUESTIONS USING YOUR EXPERIENCE IN HOSPITAL-BASED CLINICAL INTEGRATION WITH BOTH EMPLOYED AND NON-EMPLOYED PHYSICIANS
WHERE ASKED.
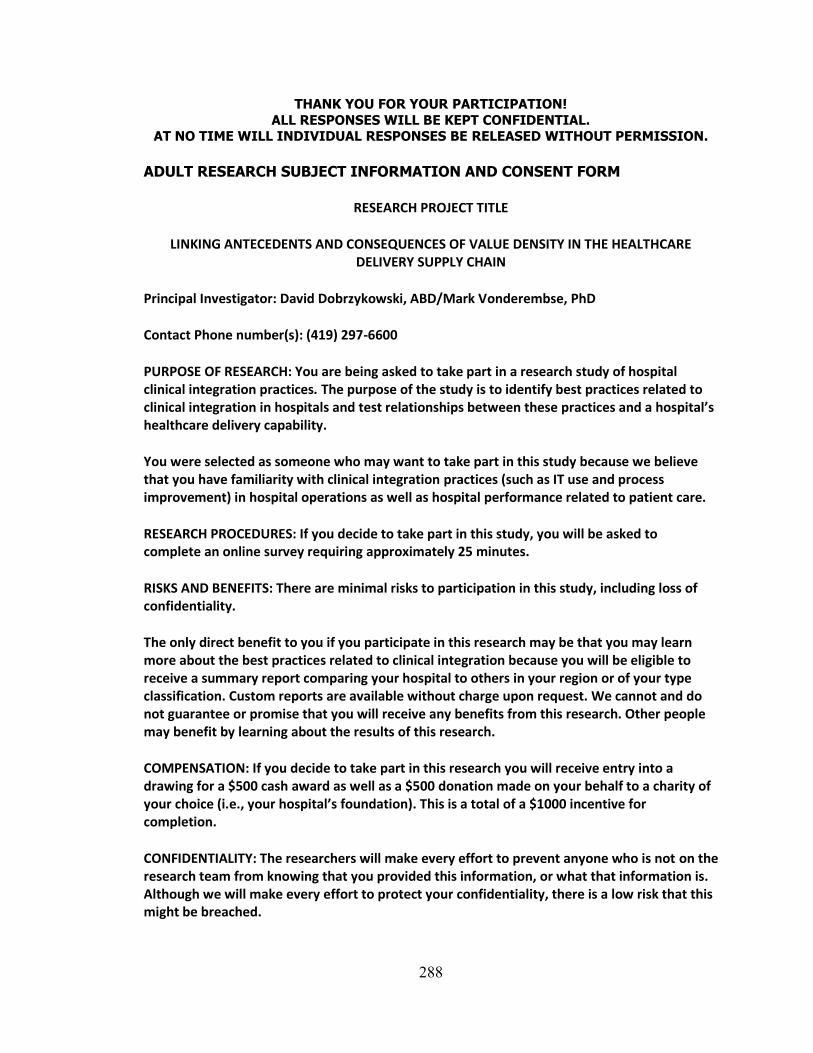
288
THANK YOU FOR YOUR PARTICIPATION!
ALL RESPONSES WILL BE KEPT CONFIDENTIAL. AT NO TIME WILL INDIVIDUAL RESPONSES BE RELEASED WITHOUT PERMISSION.
ADULT RESEARCH SUBJECT INFORMATION AND CONSENT FORM
RESEARCH PROJECT TITLE
LINKING ANTECEDENTS AND CONSEQUENCES OF VALUE DENSITY IN THE HEALTHCARE DELIVERY SUPPLY CHAIN
Principal Investigator: David Dobrzykowski, ABD/Mark Vonderembse, PhD
Contact Phone number(s): (419) 297-6600
PURPOSE OF RESEARCH: You are being asked to take part in a research study of hospital clinical integration practices. The purpose of the study is to identify best practices related to clinical integration in hospitals and test relationships between these practices and a hospital’s healthcare delivery capability.
You were selected as someone who may want to take part in this study because we believe that you have familiarity with clinical integration practices (such as IT use and process improvement) in hospital operations as well as hospital performance related to patient care.
RESEARCH PROCEDURES: If you decide to take part in this study, you will be asked to complete an online survey requiring approximately 25 minutes.
RISKS AND BENEFITS: There are minimal risks to participation in this study, including loss of confidentiality.
The only direct benefit to you if you participate in this research may be that you may learn more about the best practices related to clinical integration because you will be eligible to receive a summary report comparing your hospital to others in your region or of your type classification. Custom reports are available without charge upon request. We cannot and do not guarantee or promise that you will receive any benefits from this research. Other people may benefit by learning about the results of this research.
COMPENSATION: If you decide to take part in this research you will receive entry into a drawing for a $500 cash award as well as a $500 donation made on your behalf to a charity of your choice (i.e., your hospital’s foundation). This is a total of a $1000 incentive for completion.
CONFIDENTIALITY: The researchers will make every effort to prevent anyone who is not on the research team from knowing that you provided this information, or what that information is. Although we will make every effort to protect your confidentiality, there is a low risk that this might be breached.

289
VOLUNTARY PARTICIPATION: Taking part in this study is voluntary. You may refuse to participate or discontinue participation at any time without penalty or a loss of benefits to which you are otherwise entitled. If you decide not to participate or to discontinue participation, your decision will not affect your future relations with the University of Toledo.
QUESTIONS: If you have questions regarding the research at any time before, during or after the study, you may contact David Dobrzykowski at (419) 297-6600.
If you have questions beyond those answered by the research team or about your rights as a research subject please feel free to contact the Chairperson of the University of Toledo Biomedical Institutional Review Board at 419-383-6796.
CONSENT: IF YOU COMPLETE THE SURVEY, YOU ARE CONSENTING TO PARTICIPATION.
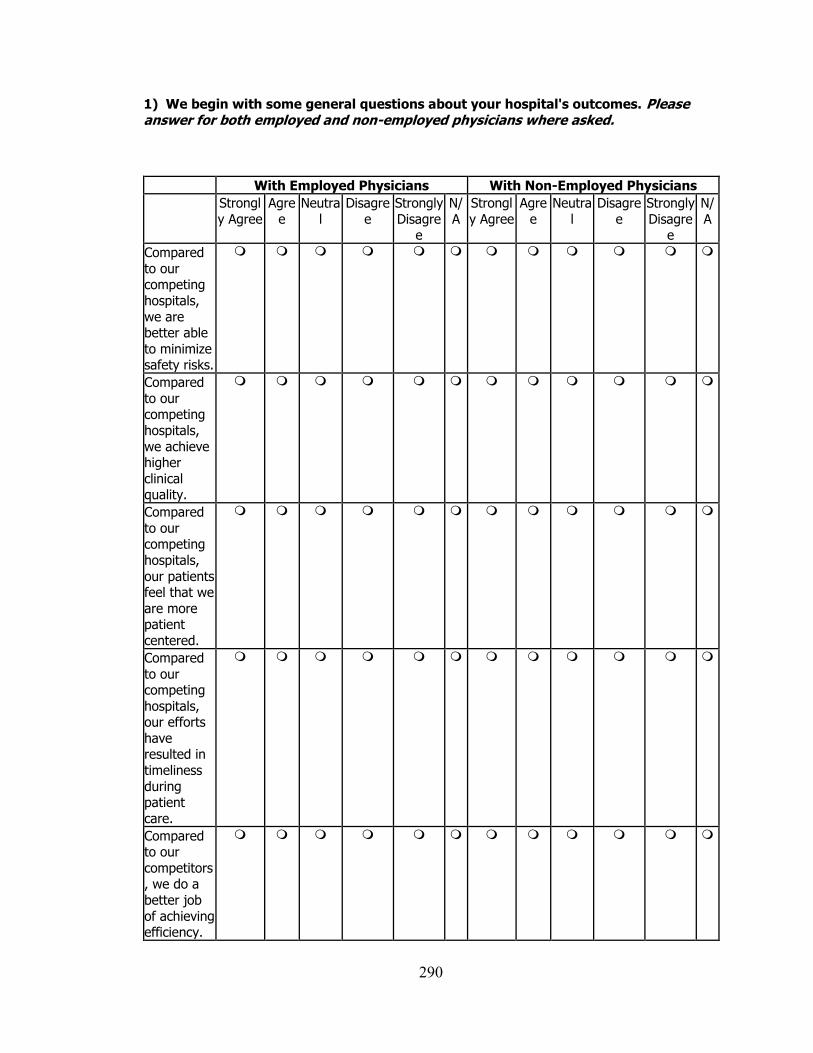
290
1) We begin with some general questions about your hospital's outcomes. Please answer for both employed and non-employed physicians where asked.
With Employed Physicians With Non-Employed Physicians
Strongl
y Agree
Agre
e
Neutra
l
Disagre
e
Strongly
Disagree
N/
A
Strongl
y Agree
Agre
e
Neutra
l
Disagre
e
Strongly
Disagree
N/
A
Compared
to our competing
hospitals,
we are better able
to minimize safety risks.
Compared
to our competing
hospitals,
we achieve higher
clinical quality.
Compared
to our competing
hospitals,
our patients feel that we
are more patient
centered.
Compared
to our competing
hospitals, our efforts
have resulted in
timeliness
during patient
care.
Compared to our
competitors, we do a
better job
of achieving efficiency.
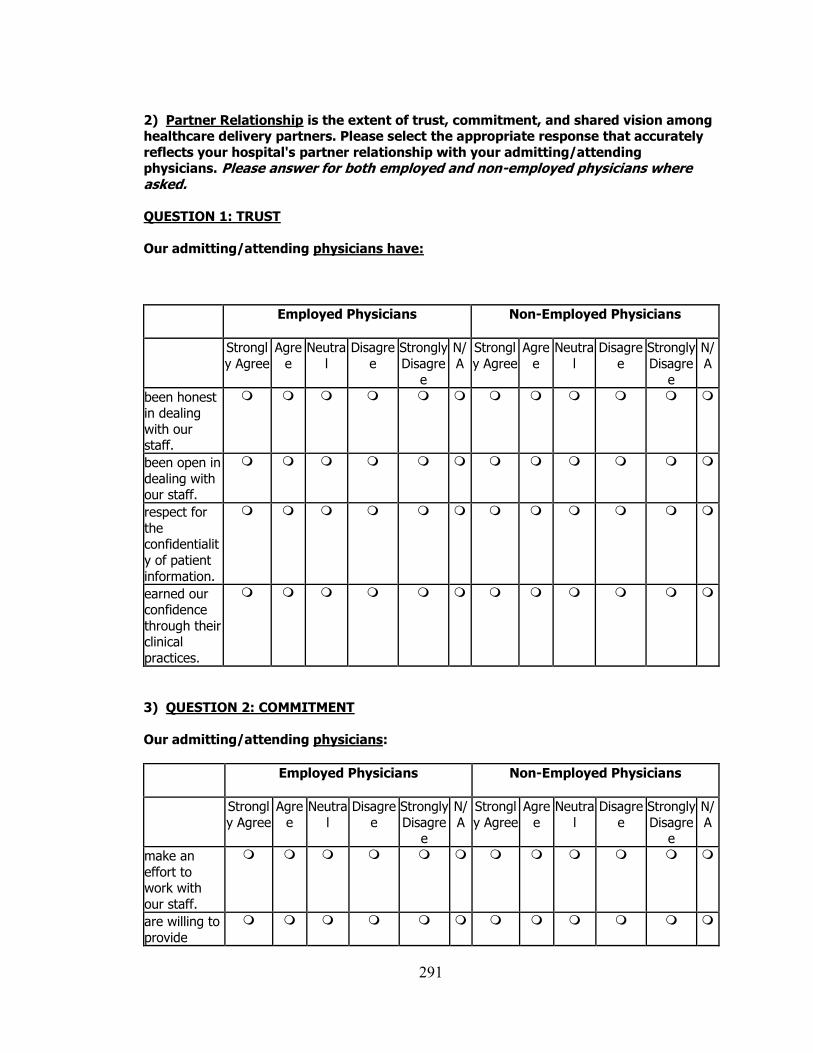
291
2) Partner Relationship is the extent of trust, commitment, and shared vision among healthcare delivery partners. Please select the appropriate response that accurately
reflects your hospital's partner relationship with your admitting/attending physicians. Please answer for both employed and non-employed physicians where asked. QUESTION 1: TRUST
Our admitting/attending physicians have:
Employed Physicians
Non-Employed Physicians
Strongl
y Agree
Agre
e
Neutra
l
Disagre
e
Strongly
Disagre
e
N/
A
Strongl
y Agree
Agre
e
Neutra
l
Disagre
e
Strongly
Disagre
e
N/
A
been honest in dealing
with our staff.
been open in
dealing with our staff.
respect for
the confidentialit
y of patient
information.
earned our confidence
through their clinical
practices.
3) QUESTION 2: COMMITMENT
Our admitting/attending physicians:
Employed Physicians
Non-Employed Physicians
Strongl
y Agree
Agre
e
Neutra
l
Disagre
e
Strongly
Disagree
N/
A
Strongl
y Agree
Agre
e
Neutra
l
Disagre
e
Strongly
Disagree
N/
A
make an
effort to work with
our staff.
are willing to
provide
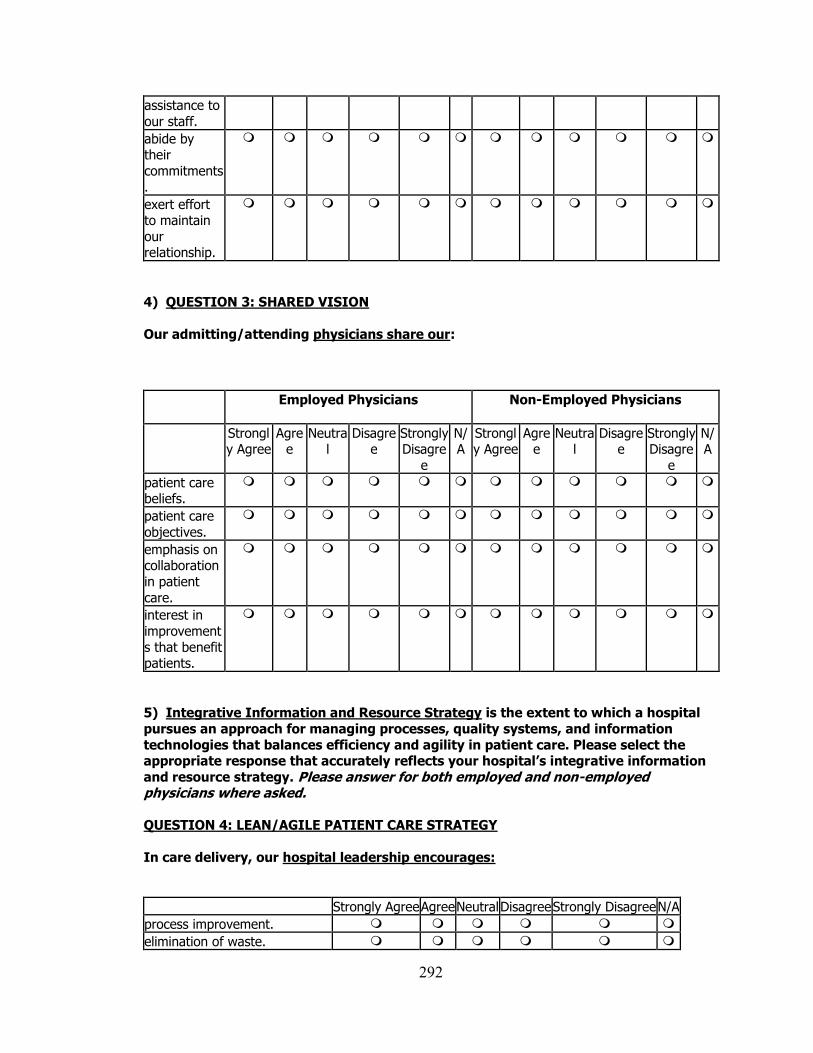
292
assistance to
our staff.
abide by their
commitments
.
exert effort to maintain
our relationship.
4) QUESTION 3: SHARED VISION
Our admitting/attending physicians share our:
Employed Physicians
Non-Employed Physicians
Strongly Agree
Agree
Neutral
Disagree
Strongly Disagre
e
N/A
Strongly Agree
Agree
Neutral
Disagree
Strongly Disagre
e
N/A
patient care beliefs.
patient care
objectives.
emphasis on collaboration
in patient
care.
interest in
improvement
s that benefit patients.
5) Integrative Information and Resource Strategy is the extent to which a hospital
pursues an approach for managing processes, quality systems, and information
technologies that balances efficiency and agility in patient care. Please select the appropriate response that accurately reflects your hospital’s integrative information
and resource strategy. Please answer for both employed and non-employed physicians where asked. QUESTION 4: LEAN/AGILE PATIENT CARE STRATEGY
In care delivery, our hospital leadership encourages:
Strongly Agree Agree Neutral Disagree Strongly Disagree N/A
process improvement.
elimination of waste.
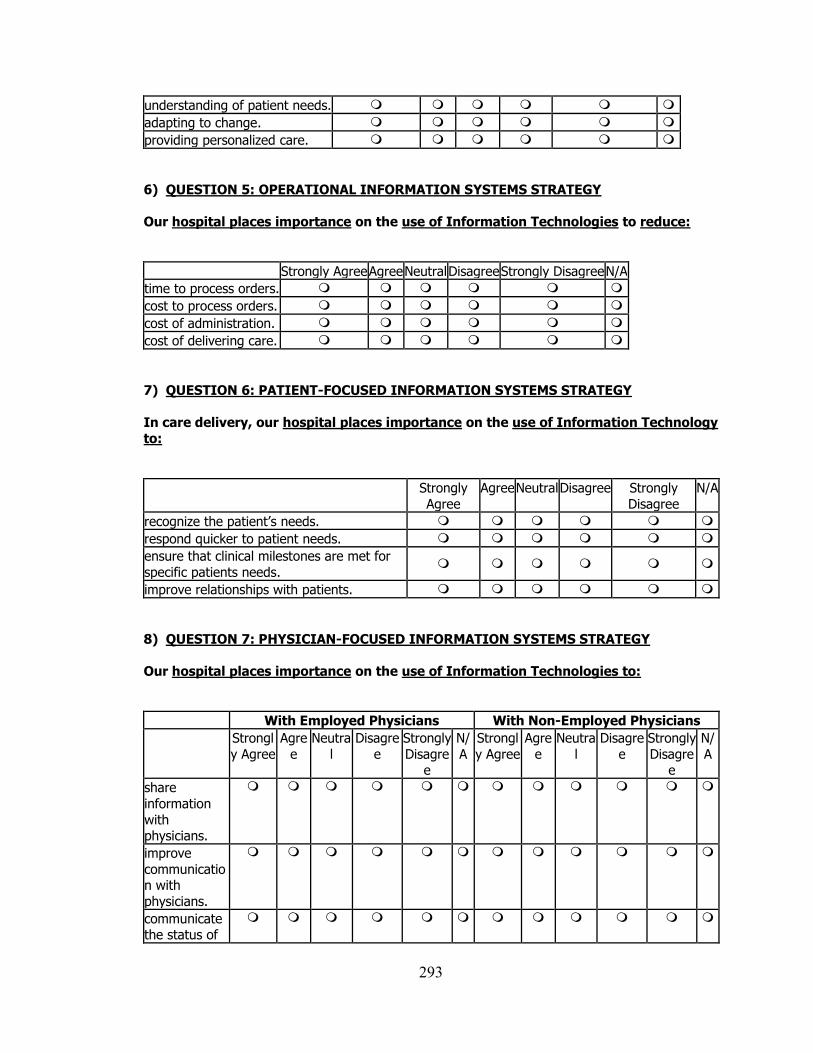
293
understanding of patient needs.
adapting to change.
providing personalized care.
6) QUESTION 5: OPERATIONAL INFORMATION SYSTEMS STRATEGY
Our hospital places importance on the use of Information Technologies to reduce:
Strongly Agree Agree Neutral Disagree Strongly Disagree N/A
time to process orders.
cost to process orders.
cost of administration.
cost of delivering care.
7) QUESTION 6: PATIENT-FOCUSED INFORMATION SYSTEMS STRATEGY
In care delivery, our hospital places importance on the use of Information Technology
to:
Strongly
Agree
Agree Neutral Disagree Strongly
Disagree
N/A
recognize the patient’s needs.
respond quicker to patient needs.
ensure that clinical milestones are met for
specific patients needs.
improve relationships with patients.
8) QUESTION 7: PHYSICIAN-FOCUSED INFORMATION SYSTEMS STRATEGY
Our hospital places importance on the use of Information Technologies to:
With Employed Physicians With Non-Employed Physicians
Strongl
y Agree
Agre
e
Neutra
l
Disagre
e
Strongly
Disagree
N/
A
Strongl
y Agree
Agre
e
Neutra
l
Disagre
e
Strongly
Disagree
N/
A
share
information
with physicians.
improve
communication with
physicians.
communicate the status of
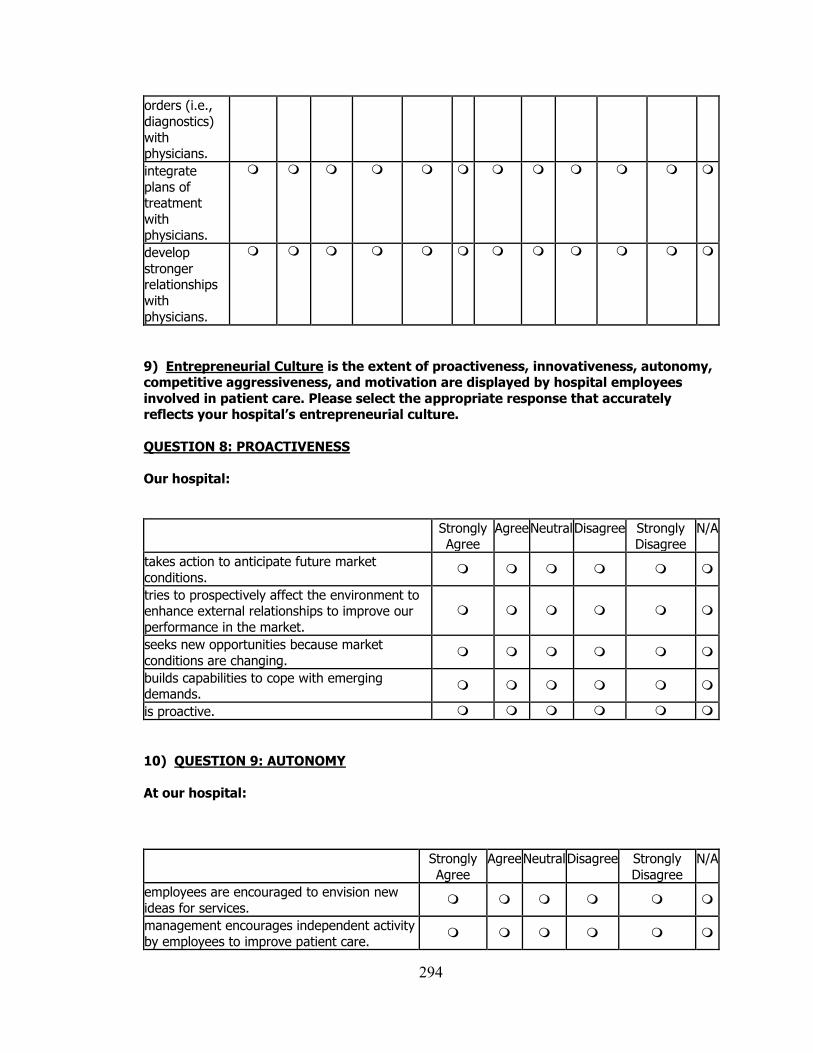
294
orders (i.e.,
diagnostics)
with physicians.
integrate
plans of treatment
with physicians.
develop
stronger relationships
with
physicians.
9) Entrepreneurial Culture is the extent of proactiveness, innovativeness, autonomy, competitive aggressiveness, and motivation are displayed by hospital employees
involved in patient care. Please select the appropriate response that accurately reflects your hospital’s entrepreneurial culture.
QUESTION 8: PROACTIVENESS
Our hospital:
Strongly Agree
Agree Neutral Disagree Strongly Disagree
N/A
takes action to anticipate future market
conditions.
tries to prospectively affect the environment to enhance external relationships to improve our
performance in the market.
seeks new opportunities because market
conditions are changing.
builds capabilities to cope with emerging demands.
is proactive.
10) QUESTION 9: AUTONOMY
At our hospital:
Strongly
Agree
Agree Neutral Disagree Strongly
Disagree
N/A
employees are encouraged to envision new
ideas for services.
management encourages independent activity
by employees to improve patient care.
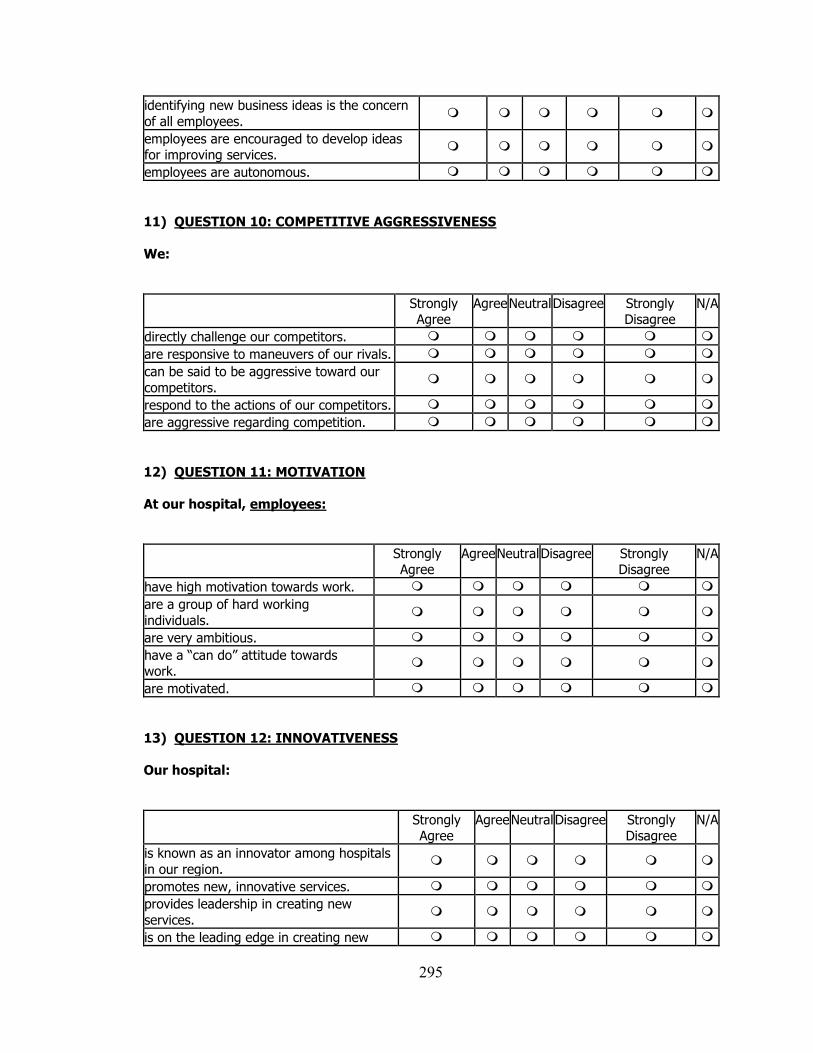
295
identifying new business ideas is the concern
of all employees.
employees are encouraged to develop ideas for improving services.
employees are autonomous.
11) QUESTION 10: COMPETITIVE AGGRESSIVENESS
We:
Strongly Agree
Agree Neutral Disagree Strongly Disagree
N/A
directly challenge our competitors.
are responsive to maneuvers of our rivals.
can be said to be aggressive toward our
competitors.
respond to the actions of our competitors.
are aggressive regarding competition.
12) QUESTION 11: MOTIVATION
At our hospital, employees:
Strongly Agree
Agree Neutral Disagree Strongly Disagree
N/A
have high motivation towards work.
are a group of hard working
individuals.
are very ambitious.
have a “can do” attitude towards work.
are motivated.
13) QUESTION 12: INNOVATIVENESS
Our hospital:
Strongly Agree
Agree Neutral Disagree Strongly Disagree
N/A
is known as an innovator among hospitals
in our region.
promotes new, innovative services.
provides leadership in creating new
services.
is on the leading edge in creating new
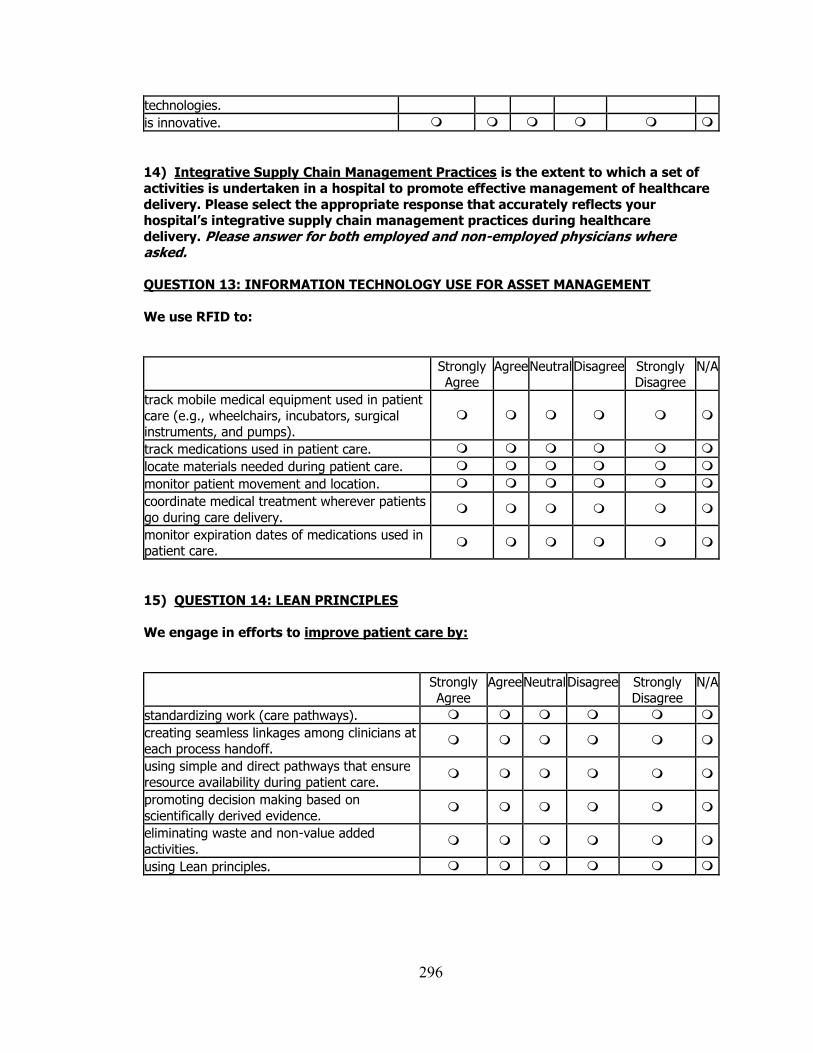
296
technologies.
is innovative.
14) Integrative Supply Chain Management Practices is the extent to which a set of
activities is undertaken in a hospital to promote effective management of healthcare
delivery. Please select the appropriate response that accurately reflects your hospital’s integrative supply chain management practices during healthcare
delivery. Please answer for both employed and non-employed physicians where asked. QUESTION 13: INFORMATION TECHNOLOGY USE FOR ASSET MANAGEMENT
We use RFID to:
Strongly Agree
Agree Neutral Disagree Strongly Disagree
N/A
track mobile medical equipment used in patient
care (e.g., wheelchairs, incubators, surgical instruments, and pumps).
track medications used in patient care.
locate materials needed during patient care.
monitor patient movement and location.
coordinate medical treatment wherever patients
go during care delivery.
monitor expiration dates of medications used in patient care.
15) QUESTION 14: LEAN PRINCIPLES
We engage in efforts to improve patient care by:
Strongly Agree
Agree Neutral Disagree Strongly Disagree
N/A
standardizing work (care pathways).
creating seamless linkages among clinicians at
each process handoff.
using simple and direct pathways that ensure
resource availability during patient care.
promoting decision making based on
scientifically derived evidence.
eliminating waste and non-value added
activities.
using Lean principles.
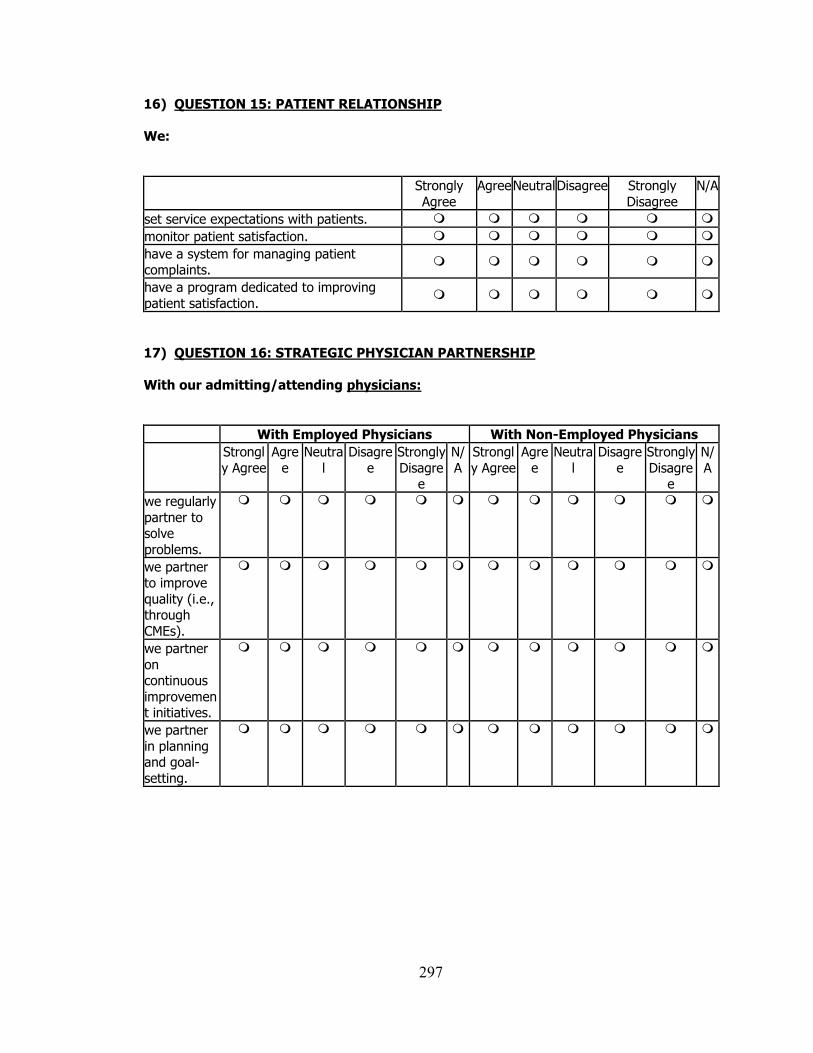
297
16) QUESTION 15: PATIENT RELATIONSHIP
We:
Strongly
Agree
Agree Neutral Disagree Strongly
Disagree
N/A
set service expectations with patients.
monitor patient satisfaction.
have a system for managing patient complaints.
have a program dedicated to improving
patient satisfaction.
17) QUESTION 16: STRATEGIC PHYSICIAN PARTNERSHIP
With our admitting/attending physicians:
With Employed Physicians With Non-Employed Physicians
Strongl
y Agree
Agre
e
Neutra
l
Disagre
e
Strongly
Disagree
N/
A
Strongl
y Agree
Agre
e
Neutra
l
Disagre
e
Strongly
Disagree
N/
A
we regularly
partner to solve
problems.
we partner to improve
quality (i.e., through
CMEs).
we partner
on continuous
improvement initiatives.
we partner
in planning and goal-
setting.
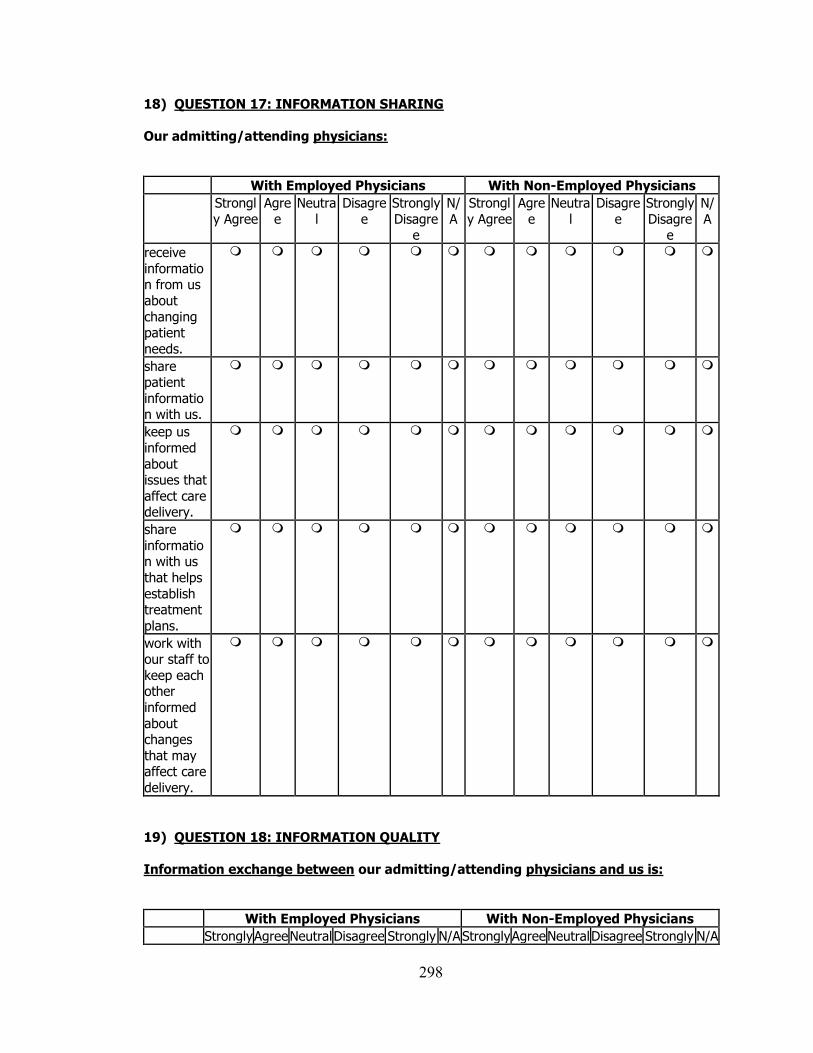
298
18) QUESTION 17: INFORMATION SHARING
Our admitting/attending physicians:
With Employed Physicians With Non-Employed Physicians
Strongl
y Agree
Agre
e
Neutra
l
Disagre
e
Strongly
Disagree
N/
A
Strongl
y Agree
Agre
e
Neutra
l
Disagre
e
Strongly
Disagree
N/
A
receive
information from us
about
changing patient
needs.
share patient
information with us.
keep us
informed
about issues that
affect care delivery.
share
information with us
that helps
establish treatment
plans.
work with our staff to
keep each other
informed
about changes
that may affect care
delivery.
19) QUESTION 18: INFORMATION QUALITY
Information exchange between our admitting/attending physicians and us is:
With Employed Physicians With Non-Employed Physicians
Strongly Agree Neutral Disagree Strongly N/A Strongly Agree Neutral Disagree Strongly N/A
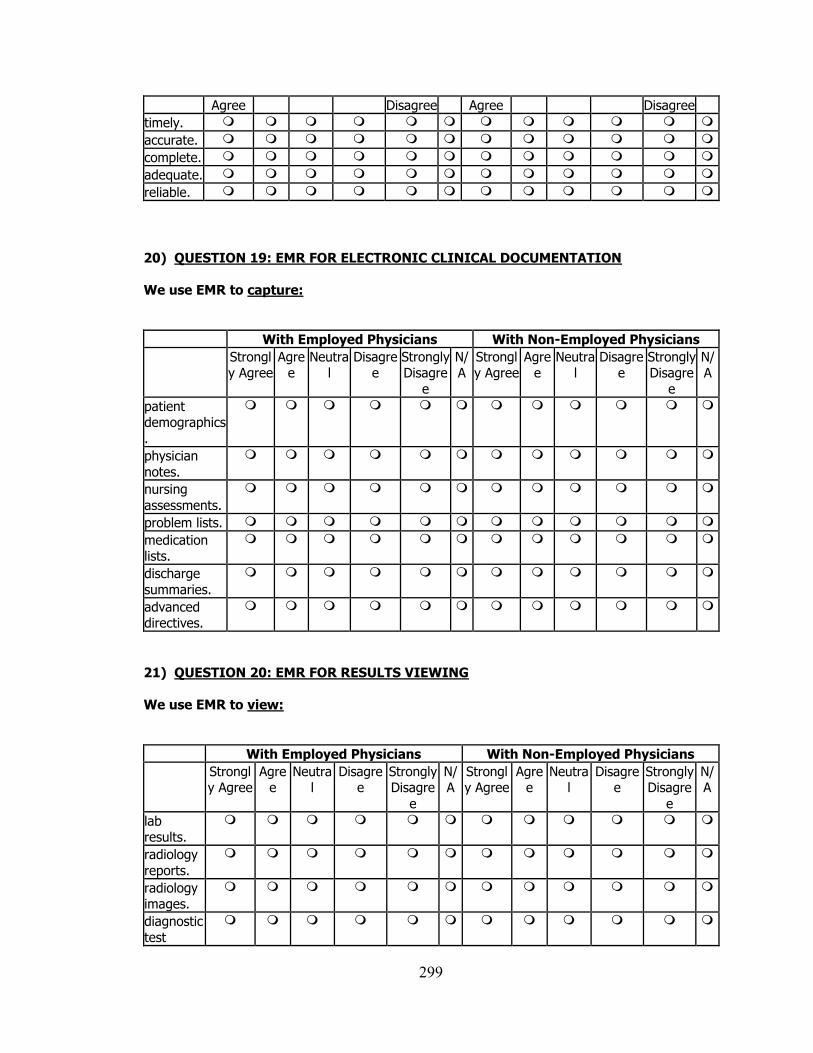
299
Agree Disagree Agree Disagree
timely.
accurate.
complete.
adequate.
reliable.
20) QUESTION 19: EMR FOR ELECTRONIC CLINICAL DOCUMENTATION
We use EMR to capture:
With Employed Physicians With Non-Employed Physicians
Strongly Agree
Agree
Neutral
Disagree
Strongly Disagre
e
N/A
Strongly Agree
Agree
Neutral
Disagree
Strongly Disagre
e
N/A
patient demographics
.
physician
notes.
nursing
assessments.
problem lists.
medication lists.
discharge
summaries.
advanced directives.
21) QUESTION 20: EMR FOR RESULTS VIEWING
We use EMR to view:
With Employed Physicians With Non-Employed Physicians
Strongly Agree
Agree
Neutral
Disagree
Strongly Disagre
e
N/A
Strongly Agree
Agree
Neutral
Disagree
Strongly Disagre
e
N/A
lab results.
radiology
reports.
radiology images.
diagnostic
test
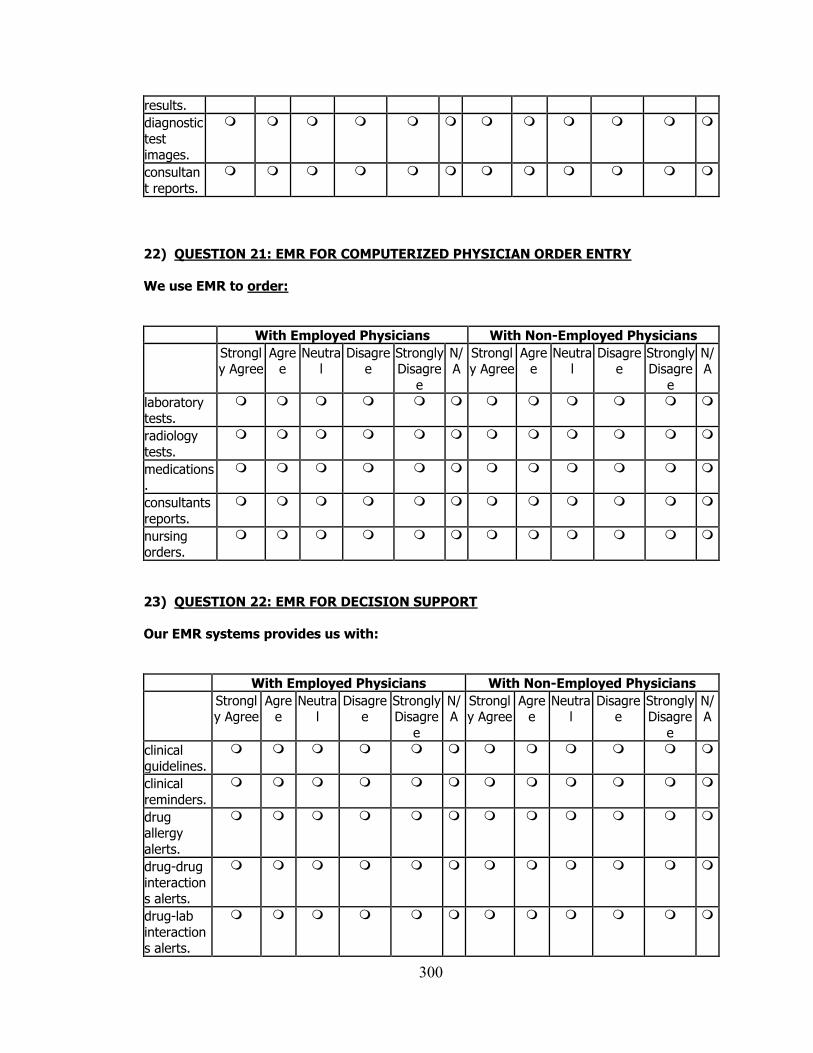
300
results.
diagnostic
test images.
consultan
t reports.
22) QUESTION 21: EMR FOR COMPUTERIZED PHYSICIAN ORDER ENTRY
We use EMR to order:
With Employed Physicians With Non-Employed Physicians
Strongly Agree
Agree
Neutral
Disagree
Strongly Disagre
e
N/A
Strongly Agree
Agree
Neutral
Disagree
Strongly Disagre
e
N/A
laboratory tests.
radiology
tests.
medications.
consultants
reports.
nursing orders.
23) QUESTION 22: EMR FOR DECISION SUPPORT
Our EMR systems provides us with:
With Employed Physicians With Non-Employed Physicians
Strongly Agree
Agree
Neutral
Disagree
Strongly Disagre
e
N/A
Strongly Agree
Agree
Neutral
Disagree
Strongly Disagre
e
N/A
clinical guidelines.
clinical
reminders.
drug allergy
alerts.
drug-drug
interactions alerts.
drug-lab
interactions alerts.
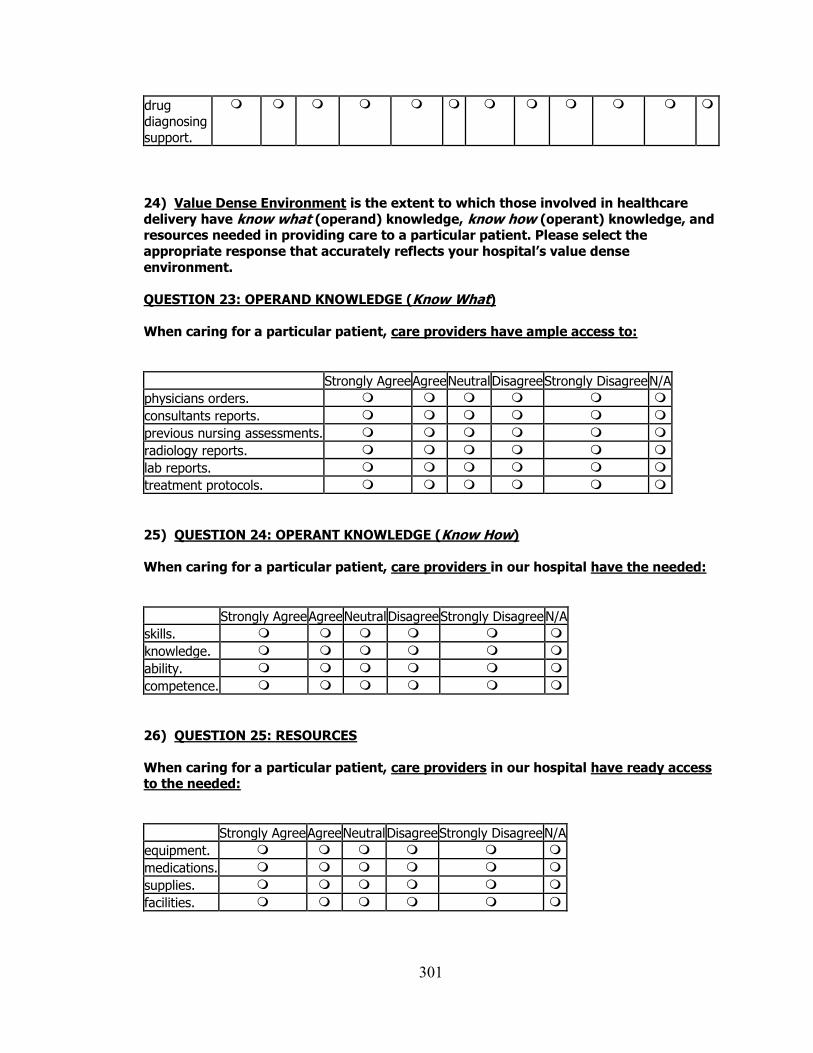
301
drug
diagnosing
support.
24) Value Dense Environment is the extent to which those involved in healthcare
delivery have know what (operand) knowledge, know how (operant) knowledge, and resources needed in providing care to a particular patient. Please select the
appropriate response that accurately reflects your hospital’s value dense
environment.
QUESTION 23: OPERAND KNOWLEDGE (Know What)
When caring for a particular patient, care providers have ample access to:
Strongly Agree Agree Neutral Disagree Strongly Disagree N/A
physicians orders.
consultants reports.
previous nursing assessments.
radiology reports.
lab reports.
treatment protocols.
25) QUESTION 24: OPERANT KNOWLEDGE (Know How)
When caring for a particular patient, care providers in our hospital have the needed:
Strongly Agree Agree Neutral Disagree Strongly Disagree N/A
skills.
knowledge.
ability.
competence.
26) QUESTION 25: RESOURCES
When caring for a particular patient, care providers in our hospital have ready access to the needed:
Strongly Agree Agree Neutral Disagree Strongly Disagree N/A
equipment.
medications.
supplies.
facilities.
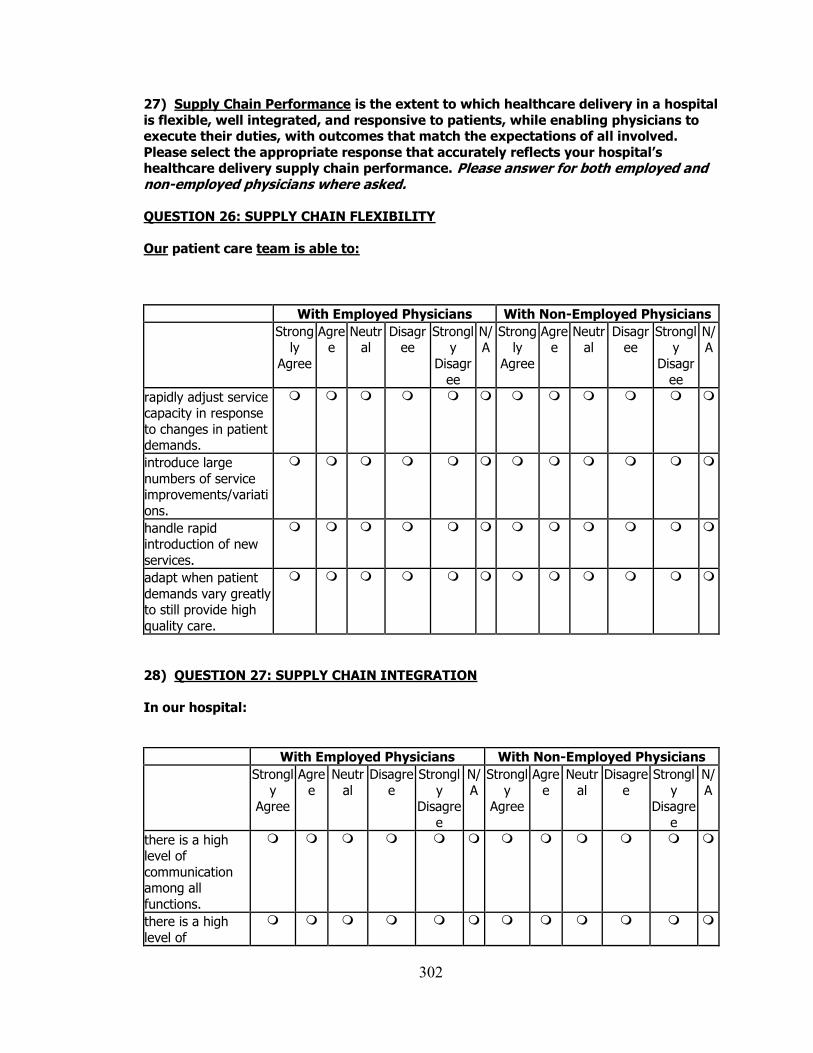
302
27) Supply Chain Performance is the extent to which healthcare delivery in a hospital
is flexible, well integrated, and responsive to patients, while enabling physicians to execute their duties, with outcomes that match the expectations of all involved.
Please select the appropriate response that accurately reflects your hospital’s healthcare delivery supply chain performance. Please answer for both employed and non-employed physicians where asked. QUESTION 26: SUPPLY CHAIN FLEXIBILITY
Our patient care team is able to:
With Employed Physicians With Non-Employed Physicians
Strongly
Agree
Agree
Neutral
Disagree
Strongly
Disagr
ee
N/A
Strongly
Agree
Agree
Neutral
Disagree
Strongly
Disagr
ee
N/A
rapidly adjust service capacity in response
to changes in patient demands.
introduce large
numbers of service improvements/variati
ons.
handle rapid introduction of new
services.
adapt when patient
demands vary greatly to still provide high
quality care.
28) QUESTION 27: SUPPLY CHAIN INTEGRATION
In our hospital:
With Employed Physicians With Non-Employed Physicians
Strongl
y Agree
Agre
e
Neutr
al
Disagre
e
Strongl
y Disagre
e
N/
A
Strongl
y Agree
Agre
e
Neutr
al
Disagre
e
Strongl
y Disagre
e
N/
A
there is a high level of
communication among all
functions.
there is a high
level of
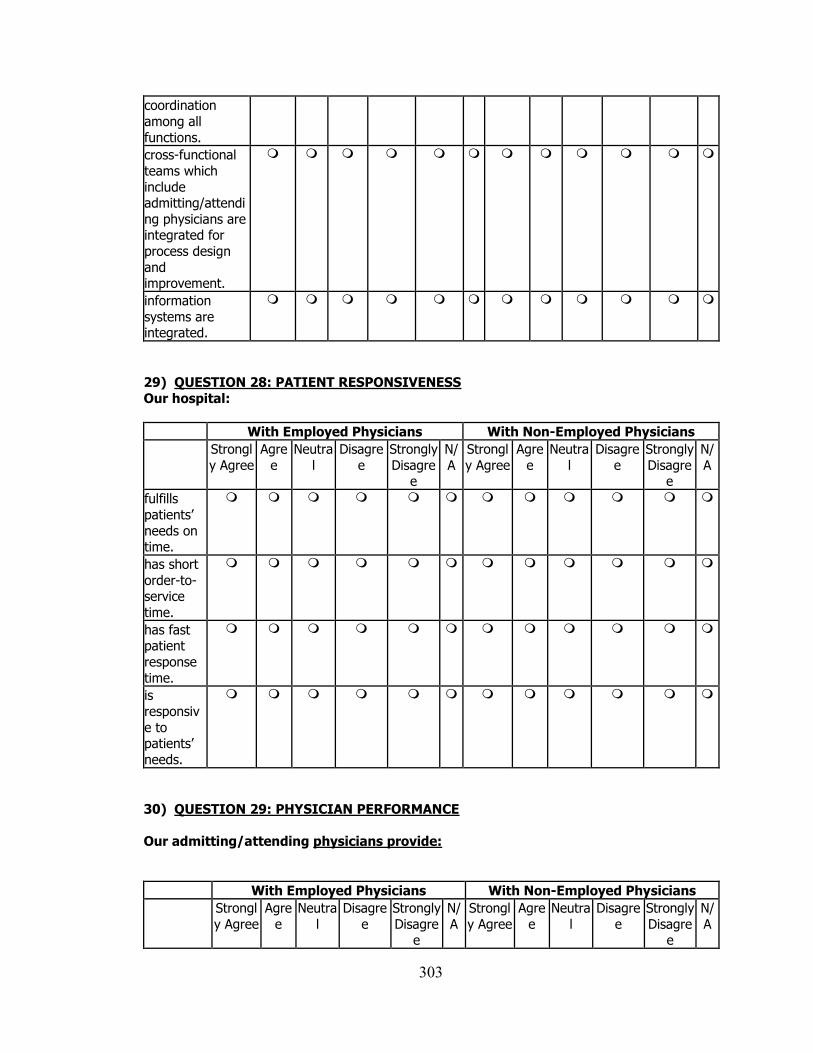
303
coordination
among all
functions.
cross-functional
teams which
include admitting/attendi
ng physicians are integrated for
process design
and improvement.
information
systems are integrated.
29) QUESTION 28: PATIENT RESPONSIVENESS
Our hospital:
With Employed Physicians With Non-Employed Physicians
Strongl
y Agree
Agre
e
Neutra
l
Disagre
e
Strongly
Disagree
N/
A
Strongl
y Agree
Agre
e
Neutra
l
Disagre
e
Strongly
Disagree
N/
A
fulfills
patients’
needs on time.
has short
order-to-service
time.
has fast patient
response
time.
is
responsiv
e to patients’
needs.
30) QUESTION 29: PHYSICIAN PERFORMANCE
Our admitting/attending physicians provide:
With Employed Physicians With Non-Employed Physicians
Strongl
y Agree
Agre
e
Neutra
l
Disagre
e
Strongly
Disagree
N/
A
Strongl
y Agree
Agre
e
Neutra
l
Disagre
e
Strongly
Disagree
N/
A
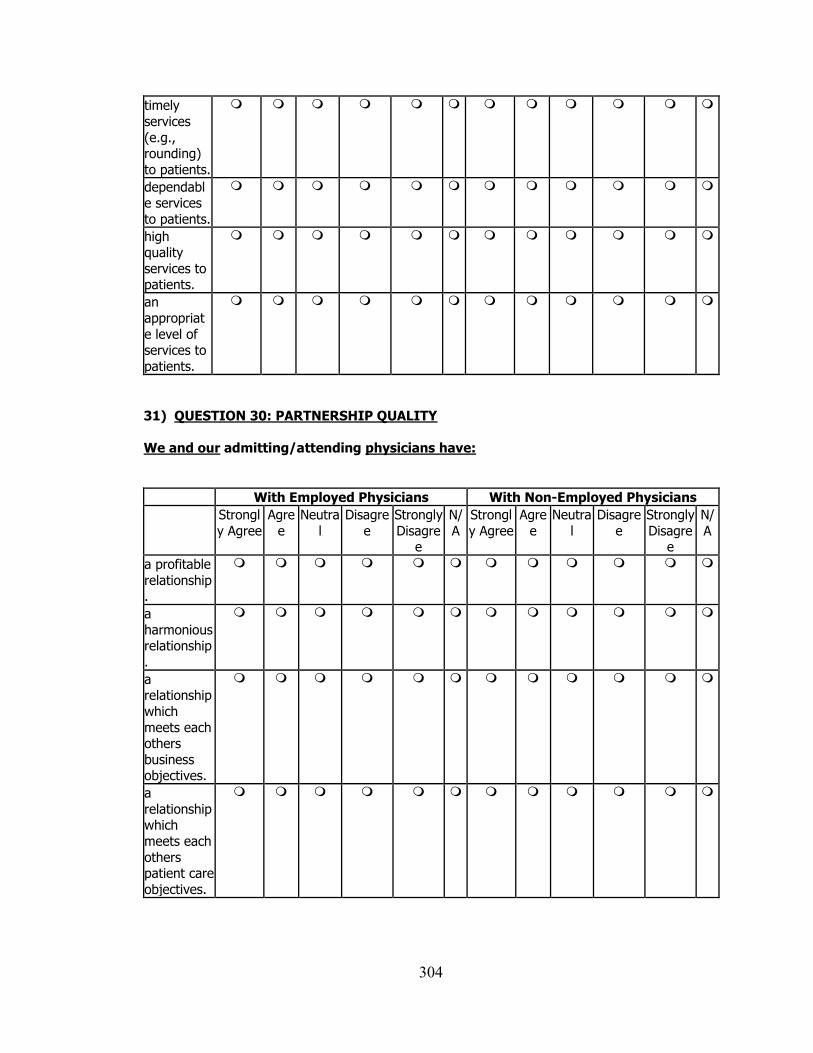
304
timely
services
(e.g., rounding)
to patients.
dependable services
to patients.
high quality
services to patients.
an
appropriat
e level of services to
patients.
31) QUESTION 30: PARTNERSHIP QUALITY
We and our admitting/attending physicians have:
With Employed Physicians With Non-Employed Physicians
Strongl
y Agree
Agre
e
Neutra
l
Disagre
e
Strongly
Disagree
N/
A
Strongl
y Agree
Agre
e
Neutra
l
Disagre
e
Strongly
Disagree
N/
A
a profitable
relationship.
a
harmonious relationship
.
a relationship
which
meets each others
business objectives.
a
relationship which
meets each
others patient care
objectives.
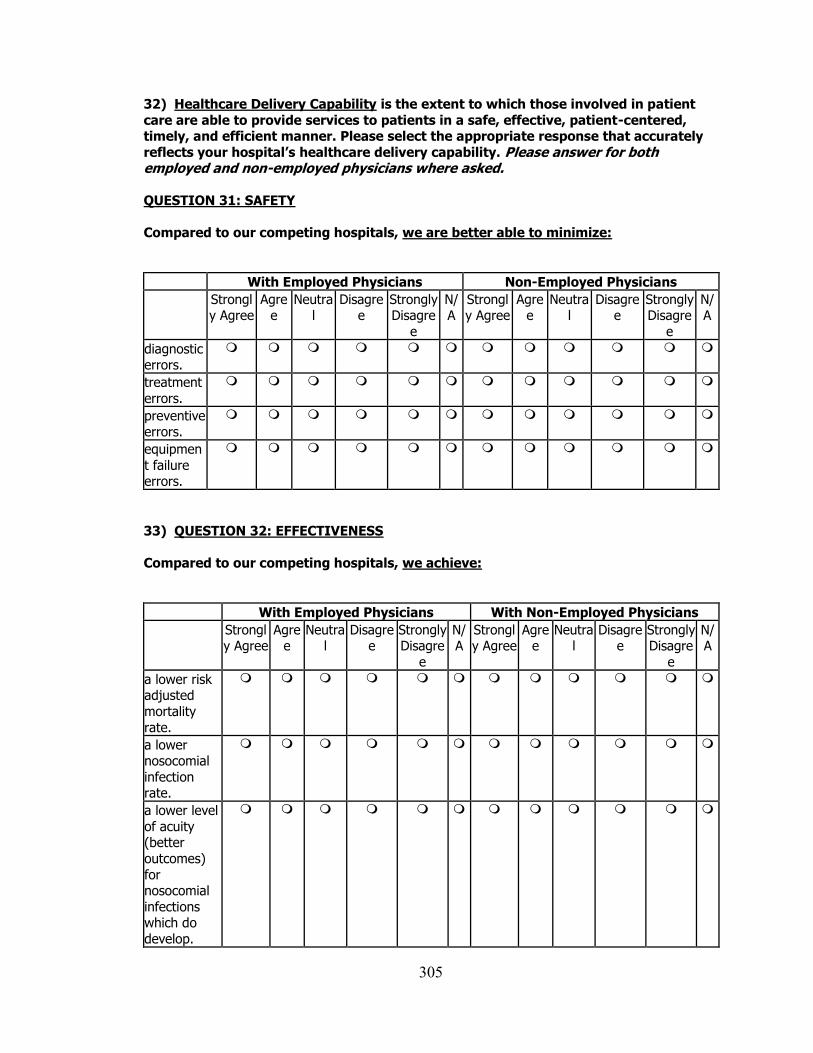
305
32) Healthcare Delivery Capability is the extent to which those involved in patient
care are able to provide services to patients in a safe, effective, patient-centered, timely, and efficient manner. Please select the appropriate response that accurately
reflects your hospital’s healthcare delivery capability. Please answer for both employed and non-employed physicians where asked.
QUESTION 31: SAFETY
Compared to our competing hospitals, we are better able to minimize:
With Employed Physicians Non-Employed Physicians
Strongly Agree
Agree
Neutral
Disagree
Strongly Disagre
e
N/A
Strongly Agree
Agree
Neutral
Disagree
Strongly Disagre
e
N/A
diagnostic errors.
treatment
errors.
preventive errors.
equipmen
t failure errors.
33) QUESTION 32: EFFECTIVENESS
Compared to our competing hospitals, we achieve:
With Employed Physicians With Non-Employed Physicians
Strongly Agree
Agree
Neutral
Disagree
Strongly Disagre
e
N/A
Strongly Agree
Agree
Neutral
Disagree
Strongly Disagre
e
N/A
a lower risk adjusted
mortality
rate.
a lower nosocomial
infection rate.
a lower level
of acuity (better
outcomes)
for nosocomial
infections which do
develop.
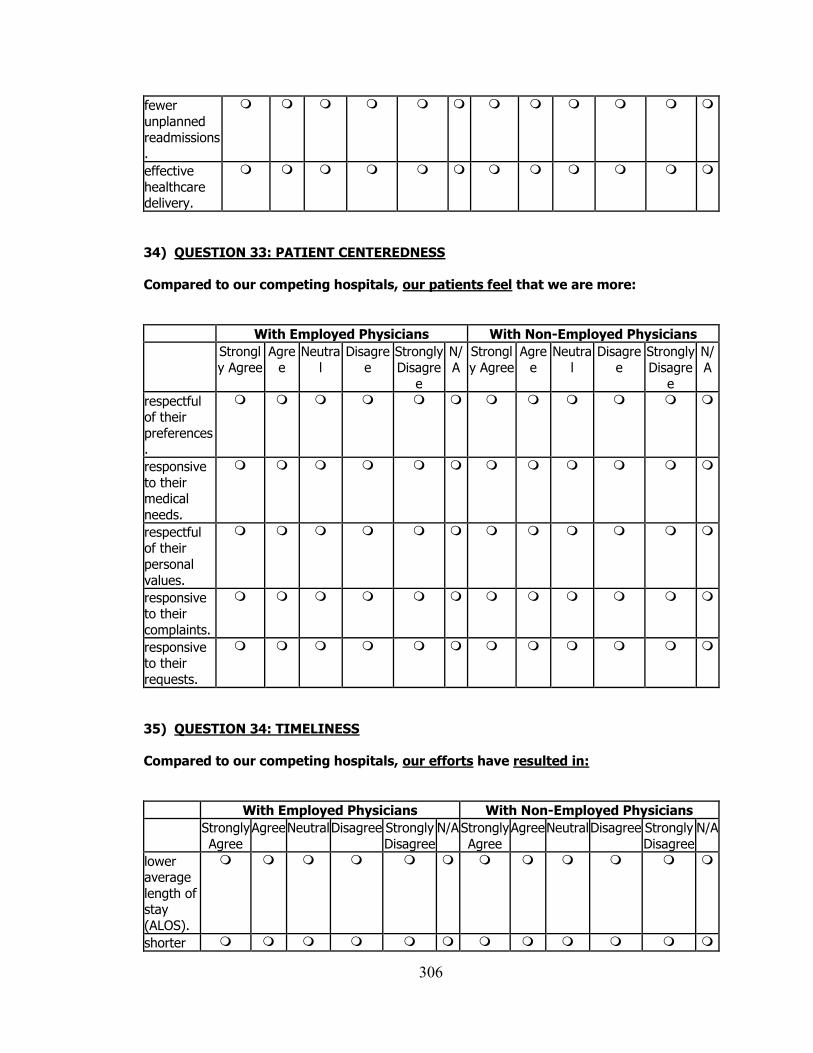
306
fewer
unplanned
readmissions.
effective
healthcare delivery.
34) QUESTION 33: PATIENT CENTEREDNESS
Compared to our competing hospitals, our patients feel that we are more:
With Employed Physicians With Non-Employed Physicians
Strongl
y Agree
Agre
e
Neutra
l
Disagre
e
Strongly
Disagre
e
N/
A
Strongl
y Agree
Agre
e
Neutra
l
Disagre
e
Strongly
Disagre
e
N/
A
respectful of their
preferences.
responsive
to their medical
needs.
respectful of their
personal
values.
responsive to their
complaints.
responsive to their
requests.
35) QUESTION 34: TIMELINESS
Compared to our competing hospitals, our efforts have resulted in:
With Employed Physicians With Non-Employed Physicians
Strongly
Agree
Agree Neutral Disagree Strongly
Disagree
N/A Strongly
Agree
Agree Neutral Disagree Strongly
Disagree
N/A
lower average
length of stay
(ALOS).
shorter
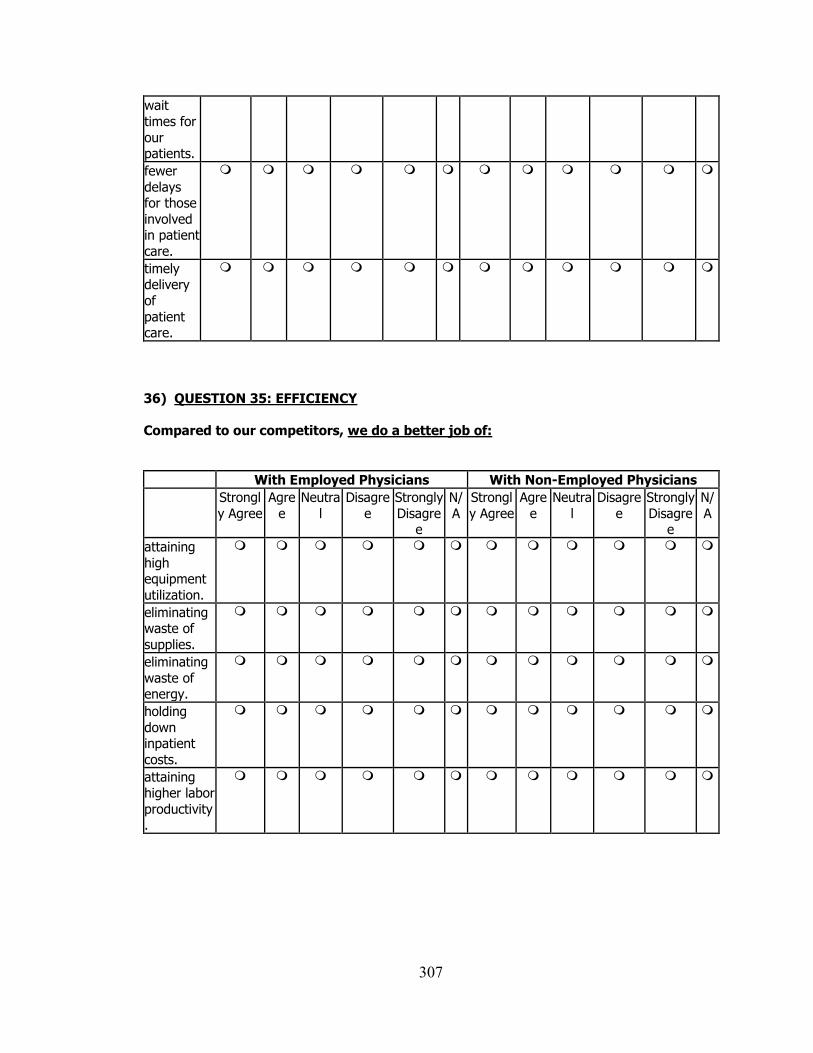
307
wait
times for
our patients.
fewer
delays for those
involved in patient
care.
timely delivery
of
patient care.
36) QUESTION 35: EFFICIENCY
Compared to our competitors, we do a better job of:
With Employed Physicians With Non-Employed Physicians
Strongl
y Agree
Agre
e
Neutra
l
Disagre
e
Strongly
Disagree
N/
A
Strongl
y Agree
Agre
e
Neutra
l
Disagre
e
Strongly
Disagree
N/
A
attaining
high equipment
utilization.
eliminating waste of
supplies.
eliminating
waste of energy.
holding
down inpatient
costs.
attaining higher labor
productivity.
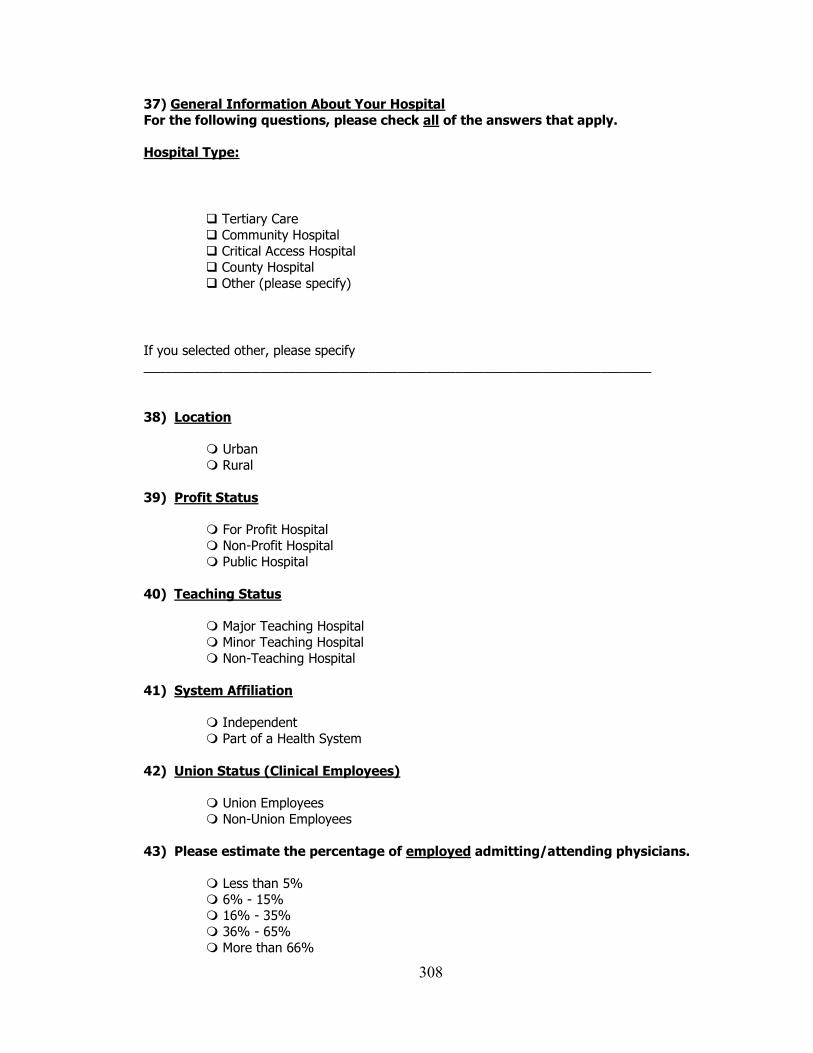
308
37) General Information About Your Hospital
For the following questions, please check all of the answers that apply.
Hospital Type:
Tertiary Care
Community Hospital
Critical Access Hospital
County Hospital
Other (please specify)
If you selected other, please specify ______________________________________________________________________
38) Location
Urban
Rural
39) Profit Status For Profit Hospital
Non-Profit Hospital
Public Hospital
40) Teaching Status
Major Teaching Hospital
Minor Teaching Hospital
Non-Teaching Hospital
41) System Affiliation
Independent
Part of a Health System
42) Union Status (Clinical Employees) Union Employees
Non-Union Employees
43) Please estimate the percentage of employed admitting/attending physicians.
Less than 5%
6% - 15% 16% - 35%
36% - 65%
More than 66%
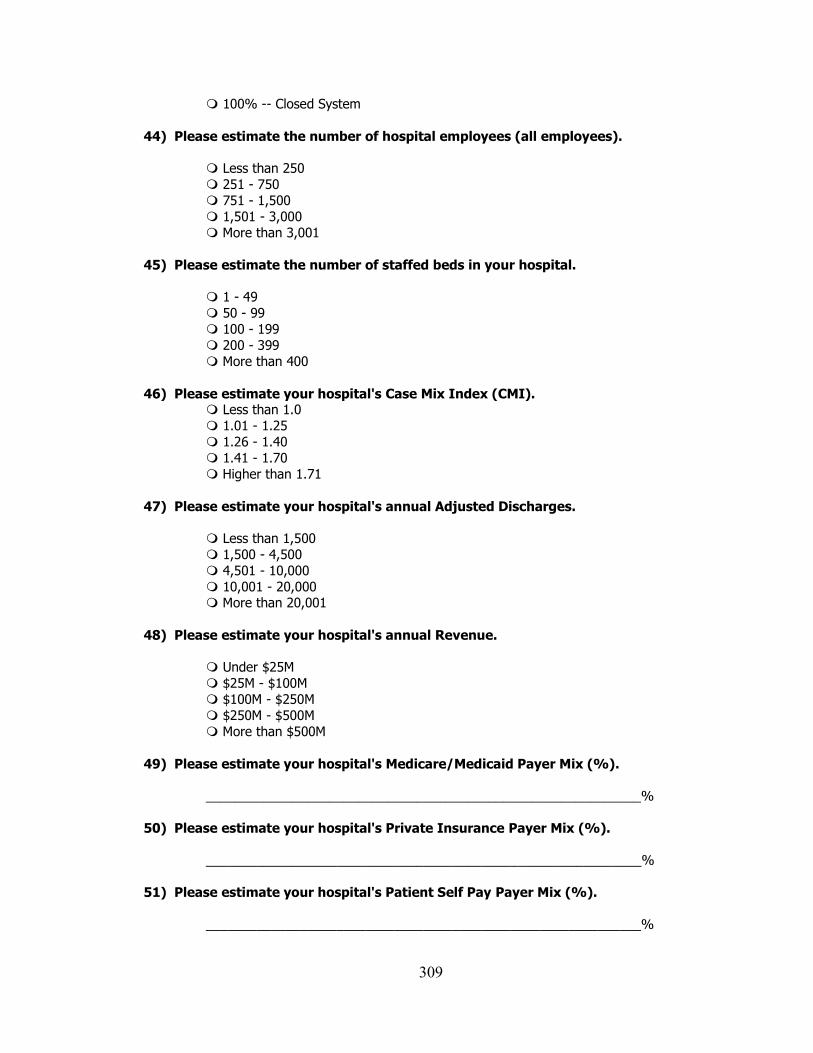
309
100% -- Closed System
44) Please estimate the number of hospital employees (all employees). Less than 250
251 - 750
751 - 1,500
1,501 - 3,000
More than 3,001
45) Please estimate the number of staffed beds in your hospital.
1 - 49
50 - 99
100 - 199
200 - 399
More than 400
46) Please estimate your hospital's Case Mix Index (CMI). Less than 1.0
1.01 - 1.25
1.26 - 1.40
1.41 - 1.70
Higher than 1.71
47) Please estimate your hospital's annual Adjusted Discharges. Less than 1,500
1,500 - 4,500
4,501 - 10,000
10,001 - 20,000 More than 20,001
48) Please estimate your hospital's annual Revenue.
Under $25M
$25M - $100M
$100M - $250M
$250M - $500M
More than $500M
49) Please estimate your hospital's Medicare/Medicaid Payer Mix (%).
____________________________________________________________%
50) Please estimate your hospital's Private Insurance Payer Mix (%).
____________________________________________________________%
51) Please estimate your hospital's Patient Self Pay Payer Mix (%).
____________________________________________________________%
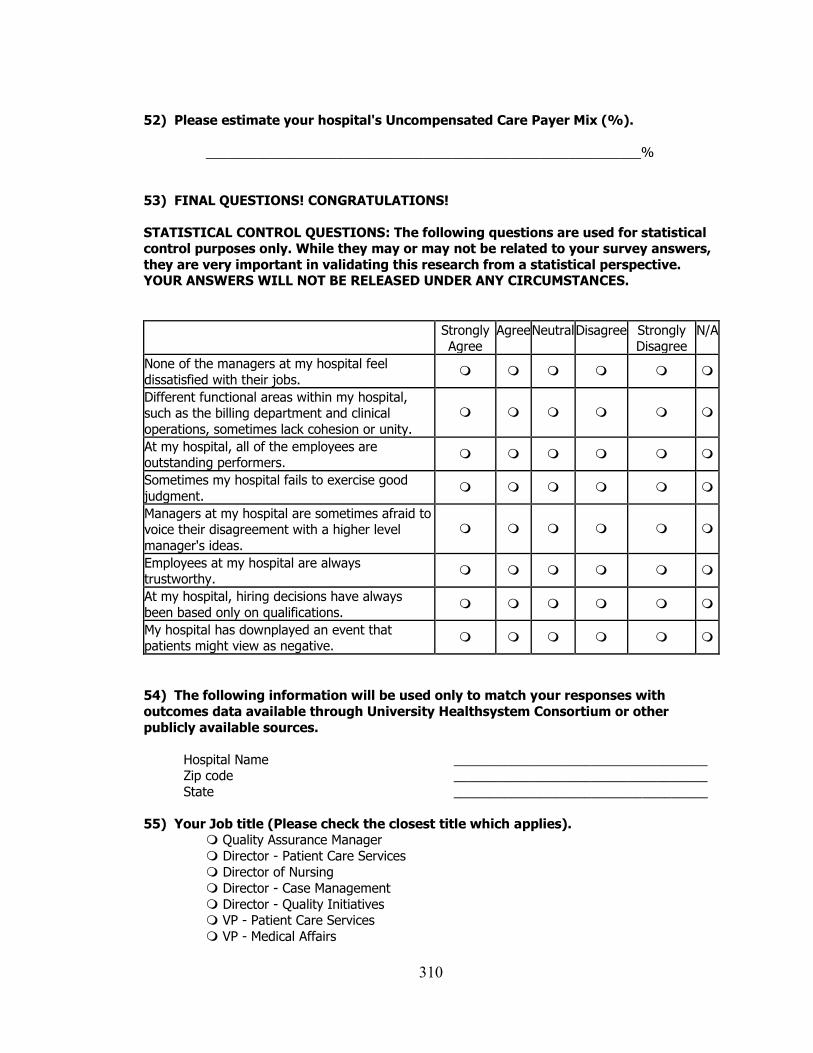
310
52) Please estimate your hospital's Uncompensated Care Payer Mix (%).
____________________________________________________________%
53) FINAL QUESTIONS! CONGRATULATIONS!
STATISTICAL CONTROL QUESTIONS: The following questions are used for statistical control purposes only. While they may or may not be related to your survey answers,
they are very important in validating this research from a statistical perspective. YOUR ANSWERS WILL NOT BE RELEASED UNDER ANY CIRCUMSTANCES.
Strongly Agree
Agree Neutral Disagree Strongly Disagree
N/A
None of the managers at my hospital feel
dissatisfied with their jobs.
Different functional areas within my hospital, such as the billing department and clinical
operations, sometimes lack cohesion or unity.
At my hospital, all of the employees are outstanding performers.
Sometimes my hospital fails to exercise good
judgment.
Managers at my hospital are sometimes afraid to voice their disagreement with a higher level
manager's ideas.
Employees at my hospital are always trustworthy.
At my hospital, hiring decisions have always
been based only on qualifications.
My hospital has downplayed an event that patients might view as negative.
54) The following information will be used only to match your responses with
outcomes data available through University Healthsystem Consortium or other
publicly available sources.
Hospital Name ___________________________________ Zip code ___________________________________
State ___________________________________
55) Your Job title (Please check the closest title which applies). Quality Assurance Manager
Director - Patient Care Services
Director of Nursing
Director - Case Management
Director - Quality Initiatives VP - Patient Care Services
VP - Medical Affairs

311
VP - Case Management
VP - Quality Initiatives
Chief Executive Officer
Chief Operating Officer
Chief Medical Officer
Chief Nursing Officer
Unit Manager
Other (please specify) If you selected other, please specify
______________________________________________________________________
If you would like to be entered into the $1000 raffle, or if you want a summary report the survey findings, please send email to
THANK YOU FOR PARTICIPATING!
David Dobrzykowski
Doctoral Candidate
University of Toledo
College of Business Administration Toledo, Ohio 43606
(419) 297-6600

312
Appendix E. CMSA Online Newsletter Survey Announcement
Released March 19, 2010

313

314

315

316

317
Appendix F. UHC Listserv Announcement
Released March 16, 2010
Clinical Integration Study Meurer, Steve [[email protected]] Sent: Tuesday, March 16, 2010 9:56 PM To: [email protected] Cc: Dobrzykowski, David Daniel
Group, I want to provide you with an opportunity to be part of a study looking at clinical integration. Please feel free to forward the survey on to the person who you believe would be best to complete the survey. Although the survey will take some time to complete, I guarantee the results will be of particular interest. Please click the link below or depending on your computer/network system cut and paste the link into your web browser to participate in this opportunity. In doing so, you will be helping a doctoral student and you will become eligible to receive a free ‘best practices’ report. Best of all you will be eligible to participate in a $1000 drawing. Thank you! CLICK: http://vovici.com/wsb.dll/s/15b20g43adf XXXXXX YYYYYY PhD, MBA, MHS
Vice President, Clinical Data & Informatics
University HealthSystem Consortium
318
Appendix G. Glossary of Key Terms and Variables
Term Definition
Autonomy (ECA) The extent to which all those involved in healthcare delivery
have freedom to bring forth new vision or ideas and follow it
through to completion. This is a hypothesized dimension of
Entrepreneurial Culture for the purposes of this study.
Commitment (COM) The extent of willingness of admitting/attending physicians
to exert effort on behalf of the relationship. This is a
hypothesized dimension of Partner Relationship for the
purposes of this study.
Competitive
Aggressiveness (ECC)
The extent to which those involved in healthcare delivery
have a propensity to directly and intensely challenge
competitors to improve their current market position or enter
a new market altogether. This is a hypothesized dimension of
Entrepreneurial Culture for the purposes of this study.
Comprehensive
Electronic Medical
Records (EMR) Use
The extent to which EMR is utilized in the hospital for
clinical documentation, results viewing, computerized
physician order entry (CPOE), and decision support. This is
a hypothesized dimension of IS Enabled Processes for the
purposes of this study.
Effectiveness (EFC) The extent to which those involved in healthcare delivery
achieve low mortality and nosocomial infection rates and
high quality care. This is a hypothesized dimension of
Healthcare Delivery Capability for the purposes of this
study.
Efficiency (EFI) The extent to which the actions of those involved in
healthcare delivery contribute to holding down costs,
attaining high labor productivity, and maintaining high
capacity utilization. This is a hypothesized dimension of
Healthcare Delivery Capability for the purposes of this
study.
Entrepreneurial Culture
(EC)
The extent to which those involved in healthcare delivery
shift efforts and assets from unproductive to productive
activities. It involves five dimensions of organizational
culture: proactiveness, innovation, autonomy, competitive
aggressiveness, and motivation.
Flexibility (F) See Supply Chain Flexibility. This is a hypothesized
dimension of Supply Chain Performance for the purposes of
this study.
319
Healthcare Delivery
Capability (HCDC)
The extent to which those involved in patient care are able to
provide services to patients in a safe, effective, patient-
centered, timely, and efficient manner.
Integration (I) See Supply Chain Integration. This is a hypothesized
dimension of Supply Chain Performance for the purposes of
this study.
Integrative Information
and Resource Strategy
(IIRS)
The extent to which a hospital pursues an approach for
managing processes, quality systems, and information
technologies that balances both efficiency and agility in
patient care.
Integrative Supply
Chain Practices (ISCP)
The extent to which a set of activities is undertaken in a
hospital to promote effective management of healthcare
delivery.
Information Sharing
(ISH)
The extent to which critical information is communicated to
those involved in healthcare delivery. This is a hypothesized
dimension of Integrative Supply Chain Practices for the
purposes of this study.
Information Systems
(IS)
The use of technology, often computers, in managing,
processing, and communicating information.
Information Technology
(IT)
See Information Systems (IS).
Innovativeness (ECI) The extent to which those involved healthcare delivery
engage in and support new ideas, experimentation, novelty,
and creativity, some of which that may result in new
services. This is a hypothesized dimension of Entrepreneurial
Culture for the purposes of this study.
IS Enabled Processes The extent to which IS is used to facilitate the flow of
physical materials and information among those involved in
healthcare delivery. This is a hypothesized dimension of
Integrative Supply Chain Practices for the purposes of this
study.
IS for
Comprehensiveness
Strategy
The extent to which a hospital provides and encourages
actors involved in providing patient care to use information
systems for operational, customer/patient focused, and
320
interorganizational / physician activities. This is a
hypothesized dimension of Integrative Information and
Resource Strategy for the purposes of this study.
IT Use for Asset
Management
The extent to which Radio Frequency Identification
technology (RFID) is used to monitor and locate resource
materials needed during patient care. This is a hypothesized
dimension of IS Enabled Processes for the purposes of this
study.
Leagile Supply Chain
Strategy
The extent to which a hospital encourages actors involved in
providing patient care to continuously improve processes to
eliminate waste and non-value added activities, while
understanding the needs of patients, being adaptable to
change, and able to provide responsive, personalized care.
This is a hypothesized dimension of Integrative Information
and Resource Strategy for the purposes of this study.
Lean Principles (LNP) The extent to which efforts are made to improve healthcare
delivery processes by incorporating standardized work,
seamless linkages, simple and direct pathways, and process
improvements based on scientific methods. This is a
hypothesized dimension ofIntegrative Supply Chain
Practices for the purposes of this study.
Motivation (ECM) The extent to which those involved in healthcare delivery
enhance each others‘ morality and attitudes about work,
encouraging hard work and high level job performance. This
is a hypothesized dimension of Entrepreneurial Culture for
the purposes of this study.
Operand Knowledge
(VDW)
The extent to which physicians, hospital clinical staff, and
patients have ‗know what‟ knowledge to one another for use
during healthcare delivery. This is a hypothesized dimension
of Value Dense Environment for the purposes of this study.
Operant Knowledge
(VDH)
The extent to which physicians, hospital clinical staff, and
patients have „know how‟ knowledge to one another for use
during healthcare delivery. This is a hypothesized dimension
of Value Dense Environment for the purposes of this study.
Operations Management A field of study concerned with the transformation of inputs
321
(OM) into desired finished goods or services, thus producing and
delivering goods and/or services of value to customers of the
organization.
Partner Relationship
(PR)
The extent of trust, commitment, and shared vision among
healthcare delivery actors.
Partnership Quality (PQ) The extent to which the outcome of the relationship among
all those involved in healthcare delivery matches the
expectations of each party. This is a hypothesized dimension
of Supply Chain Performance for the purposes of this study.
Patient Centeredness
(PC)
The extent to which patients judge the overall hospital
experience favorably and would return for a future visit. This
is a hypothesized dimension of Healthcare Delivery
Capability for the purposes of this study.
Patient Relationship
(PS)
The extent to which the hospital employs practices for the
purposes of managing patient complaints, building long-term
relationships with patients, and improving patient
satisfaction. This is a hypothesized dimension of Integrative
Supply Chain Practices for the purposes of this study.
Patient Responsiveness
(R)
The extent to which a hospital can provide prompt attention
to a patient‘s needs. This is a hypothesized dimension of
Supply Chain Performance for the purposes of this study.
Physician Performance
(DP)
The extent to which admitting/attending physicians provide
dependable, timely, and appropriate services to patients. This
is a hypothesized dimension of Supply Chain Performance
for the purposes of this study.
Proactiveness (ECP) The extent to which healthcare delivery processes are
targeted at anticipating and acting on unknown future market
(patient) needs. This is a hypothesized dimension of
Entrepreneurial Culture for the purposes of this study.
Resources (VDR) The extent to which physicians, hospital clinical staff, and
patients have the materials necessary during healthcare
deliver. This is a hypothesized dimension of Value Dense
Environment for the purposes of this study.
Responsiveness (R) See Patient Responsiveness.
Safety (SF) The extent to which those involved in healthcare delivery are
able to reduce diagnostic, treatment, preventative, and other
322
medical errors in treating patients. This is a hypothesized
dimension of Healthcare Delivery Capability for the
purposes of this study.
Shared Vision (SV) The extent of similarity of the pattern of shared values, goals
and beliefs among healthcare delivery actors. This is a
hypothesized dimension of Partner Relationship for the
purposes of this study.
Strategic Physician
Partnership (SPR)
The extent to which the hospital has long-term relationships
with its key physicians intended to leverage the strategic and
operational capabilities of both parties to help them achieve
significant ongoing benefits. This is a hypothesized
dimension of Integrative Supply Chain Practices for the
purposes of this study.
Supply Chain Flexibility
(F)
The extent to which those involved in healthcare delivery are
able to effectively adapt or respond to changes that directly
impacts the hospital‘s patient. This is a hypothesized
dimension of Supply Chain Performance for the purposes of
this study.
Supply Chain
Integration (I)
The extent to which all of the activities, of all of those
involved in healthcare delivery are coordinated together.
This is a hypothesized dimension of Supply Chain
Performance for the purposes of this study.
Supply Chain
Management (SCM)
The systemic, strategic coordination of business functions
and tactics across business functions within a particular
organization and among trading partners for the purposes of
improving the long-term performance of the individual
organizations and the network as a whole.
Supply Chain
Performance (SCP)
The extent to which healthcare delivery in a hospital is
flexible, well integrated, and responsive to patients, while
enabling physicians to execute their duties, with outcomes
that match the expectations of all those involved. (SCP)
Timeliness (T) The extent to which the efforts and actions of those involved
in healthcare delivery result in short average lengths of stays
– or the length of time a patient maintains inpatient status in
the hospital. This is a hypothesized dimension of Supply
Chain Performance for the purposes of this study.
323
Trust (TRT) The extent of willingness to rely on an admitting/attending
physician in whom one has confidence and a belief of
integrity. This is a hypothesized dimension of Partner
Relationship for the purposes of this study.
Value Chain The view that an organization (or multiple organizations)
exist as a series of processes, each of which adds worth to a
product or service.
Value Dense
Environment (also
Value Density) (VDE)
The extent to which those involved in healthcare delivery
have know what (operand) knowledge and know how
(operant) knowledge and resources available for use in
providing care.