Adaptive Mechanisms of Niche Remodeling in Streptococcus ...
Upload
khangminh22Category
view
1download
0
Early cardiac remodeling in women with breast cancer, receiving sequential therapy with anthracycline and trastuzumab
– Cardiac MRI study
by
Mustafa A Abdul Selam Altaha
A thesis submitted in conformity with the requirements for the degree of Master of Science
Institute of Medical Science University of Toronto
© Copyright by Mustafa Abdul Selam (2019)

ii
Cardiac Remodeling during Cancer Therapy in Women with Breast
Cancer
Mustafa A Abdul Selam Altaha
Master of Science
Institute of Medical Science University of Toronto
2019
Abstract
Background: Cardiotoxicity is an adverse prognostic marker in women with early-stage breast
cancer. Understanding cardiac changes using cardiac-MRI will provide the opportunity to
establish predictive models for early detection of cardiotoxicity.
Methods: Eighty-three patients had cardiac MRI pre-anthracycline, within three weeks post-
anthracycline, and at five months (~three months into trastuzumab therapy) on a 1.5T scanner;
along with thirty volunteers scanned at matched time points.
Results: Temporal and inter-observer test-retest variability, repeatability, and reproducibly of
left and right ventricular volumetric parameters in healthy volunteers were statistically small.
Ten patients (12.1%) developed LV-cardiotoxicity, 1 (10%) at 2 months and 9 (90%) at 5
months. LV-cardiotoxicity was associated with a significant increase in LVESV in 91% of the
patients.
Conclusions: Ventricular remodeling occurs during cancer therapy. The primary mechanism of
cardiotoxicity is likely a reduction in contractility. Change in LVESV at 2 months is an early
predictor of cardiotoxicity by 5 months.
iii
Acknowledgments
To my lord, the most gracious and merciful.
To my primary supervisors, Dr. Paaladinesh Thavendiranathan and Dr. Kim Connelly. Thank
you for being there for me at all times and for all your excellent teaching and support. I have
been most fortunate to have such great mentors and teachers as my supervisors. I remember
when my leg was broken in my second year, how you supported me unconditionally during that
difficult time.
To my Mom and Dad, Dr. Amira Ibrahim Al-Bayati and Dr. Abdul-Halim Abdul-Selam Altaha.
I can’t thank you enough for your unconditional love and support. Your inspiration has been my
biggest motivation to continue walking the path of success despite the many challenges,
especially that I have been living far from you. I have been through many tough times, but you
constantly checking on me has kept me determined to achieve my goals.
To my beautiful wife Maryam Altaha and my two angels Taha and Teba. The long hours away
from you do not go in vain. I love you and I want you to know that none of my success would
have been possible without your presence in my life.
To my dearest brother Ahmed Altaha - the wise young man, I won’t forget your frequent
support, including and not limited to proof-reading my English writings early during my MSc.
To my tender loving sister Dr. Zainab Abdul Selam, I still remember when you helped me
prepare for my grade 12 exams by reading to me some of my text books when I was sick and
couldn’t open my eyes for many days.

iv
To my PAC member and my previous supervisor, Dr. Narinder Paul. Thank you for believing in
me and for all your support and advice. I remember when I started my very first research project
under your supervision. With your excellent mentorship, I got into MSc and later into my dream
residency training in Diagnostic Radiology. Also, to my PAC member, Dr. Eitan Amir. Thank
you for being kind and flexible to meeting with me and for your advice.
To my best friend and big brother, Dr. Hatem Mehrez. Thank you for your noble altruistic
character, as you always made time for me even when you have been busy. Your mentorship of
me in the many aspects of life was one of my primary tools for success.
To all my colleagues and friends who contributed to this work or to my knowledge, including Dr.
Mark Nolan and Roula Raptis. And to all doctors and scientists who taught me something within
or outside the University of Toronto, including: Dr. Bernd Wintershperger, Prof. Jack Goodman,
Dr. Andrew Yan, and Dr. Rachel Wald.

v
Table of Contents Acknowledgments ........................................................................................................................ iii
Table of Contents ...........................................................................................................................v
List of Tables ................................................................................................................................ ix
List of Figures ............................................................................................................................... xi
Chapter 1 ........................................................................................................................................1
INTRODUCTION .....................................................................................................................1
1.1 Background and Rationale ...............................................................................................1
1.2 Hypothesis ...........................................................................................................................3
1.3 Objectives ............................................................................................................................3
Chapter 2 ........................................................................................................................................5
REVIEW OF LITRATURE .....................................................................................................5
2.1 Cancer and Cardiovascular Disease .................................................................................5
2.2 Cancer Survival ..................................................................................................................6
2.3 Cardiovascular disease in patients with cancer ..............................................................6
2.3.1 Shared Risk Factors of Cancer and CVD ..............................................................7
2.3.2 Shared Biology for Cancer and Cardiovascular Disease ......................................8
2.3.3 Cancer therapy as a cause for CVD .......................................................................9
2.4 Breast Cancer ...................................................................................................................10
2.4.1 Breast Cancer types and taxonomy ......................................................................11
2.4.2 Human Epidermal Receptor-2 Positive (HER2+) Breast Cancer .......................12
2.5 Breast Cancer Therapy ...................................................................................................13
2.5.1 HER2+ Breast Cancer Therapy ...........................................................................14
2.5.2 Anthracyclines .......................................................................................................14
2.5.3 Trastuzumab ..........................................................................................................18
2.6 Cardiotoxicity ...................................................................................................................20
vi
2.6.1 Definition of Cardiotoxicity ..................................................................................20
2.6.2 Cardiotoxicity due to Radiotherapy ......................................................................21
2.6.3 Cardiotoxicity due to Endocrine Agents ..............................................................21
2.6.4 Outcomes of Cardiotoxicity ..................................................................................22
2.6.5 Why not treat everyone at risk for cardiotoxicity prophylactically? ...................23
2.6.6 Current methods to identify cardiotoxicity ...........................................................23
2.6.7 Current knowledge gap in identifying cardiotoxicity ..........................................28
2.7 Cardiac Remodeling ........................................................................................................29
2.7.1 Definition of Cardiac Remodeling .......................................................................29
2.7.2 Cardiac Remodeling due to loading conditions ...................................................31
2.7.3 Cardiac Remodeling due to cardiotoxic cancer therapy ......................................34
Chapter 3 ......................................................................................................................................38
MATERIALS AND METHODS ...........................................................................................38
3.1 Patient population ............................................................................................................38
3.1.1 Patients’ Inclusion criteria ...................................................................................38
3.1.2 Patients’ Exclusion criteria ..................................................................................39
3.1.3 Healthy Volunteers’ Inclusion and Exclusion Criteria ......................................39
3.2 Data collection ..................................................................................................................39
3.3 Cancer therapy .................................................................................................................40
3.4 Timing of imaging in relation to cancer therapy ..........................................................40
3.5 Primary outcome – (and definition of LV-cardiotoxicity) ...........................................41
3.6 Secondary outcome – (and LVEF sensitivity analysis) .................................................42
3.7 Definition of RV-cardiotoxicity ......................................................................................42
3.8 Definition of significant change in volumes ...................................................................42
3.9 Bio-specimen collection and bio-banking ......................................................................43
3.10 Cardiac MRI acquisition .................................................................................................43
vii
3.11 Cardiac MRI post-processing .........................................................................................44
3.11.1 Image setup ...........................................................................................................44
3.11.2 Volume, function, mass quantification ................................................................49
3.11.3 Confirmation of results .........................................................................................57
3.12 Intra-observer and inter-observer, test-retest and temporal variability quantification – Healthy Volunteers ..............................................................................57
3.13 Statistical analysis ............................................................................................................58
3.13.1 Volunteers .............................................................................................................58
3.13.2 Patients ..................................................................................................................59
Chapter 4 ......................................................................................................................................61
RESULTS – 1 (Validation, Healthy Volunteers) ..................................................................61
4.1 Healthy Volunteers ..........................................................................................................61
4.2 Ventricular Volumes, Mass, and Function ....................................................................62
4.2.1 Normal Values – Left Ventricle ............................................................................62
4.2.2 Normal Values – Right Ventricle .........................................................................63
4.2.3 Temporal Variability (table 4.3) ...........................................................................64
4.2.4 Intra-Observer Variability (table 4.4) ...................................................................68
4.2.5 Inter-Observer Variability (table 4.5) ...................................................................69
4.2.6 Inter-Observer Test-Retest Variability (table 4.6) ................................................70
4.3 High-Sensitivity Troponin-I and BNP ...........................................................................71
4.3.1 Normal Values (table 4.7) .....................................................................................71
4.3.2 Temporal Variability (table 4.8) ...........................................................................72
Chapter 5 ......................................................................................................................................74
RESULTS – 2 (Patients with Breast Cancer) .......................................................................74
5.1 Patient Population ............................................................................................................74
5.2 Overall Changes in Left Ventricular Volumes, Mass, and Function ..........................76
5.3 Overall Changes in Right Ventricular Volumes and Function ...................................78

viii
5.4 Overall Changes in High Sensitivity Troponin-I (Hs-TnI) and BNP ..........................79
5.5 Comparison of Patients with and without Cardiac-Toxicity LV Cardiotoxicity – Primary Definition ............................................................................................................80
5.5.2 LV-Cardiotoxicity – Sensitivity Definition ...........................................................86
5.5.3 RV Cardiotoxicity ..................................................................................................86
5.6 Association Between Changes in LV Volumes and Cardiotoxicity .............................88
5.7 Intra-observer Variability in Patients ............................................................................92
Chapter 6 ......................................................................................................................................94
DISCUSSION ..........................................................................................................................94
6.1 Healthy volunteers’ variability .......................................................................................94
6.1.1 Normal values .......................................................................................................94
6.1.2 Temporal Variability .............................................................................................94
6.1.3 Observer Variability ..............................................................................................95
6.2 LV – Cardiotoxicity .........................................................................................................96
6.3 Right ventricular – Cardiotoxicity .................................................................................96
6.4 Relationship Between Ventricular Volumes and Cardiotoxicity .................................97
6.5 LV ejection fraction, contractility, and global longitudinal strain ..............................98
6.6 Comparison to Prior Work .............................................................................................98
6.7 Novelty ..............................................................................................................................99
6.8 Strengths and Limitations .............................................................................................100
6.9 Future Directions ...........................................................................................................101
6.10 Conclusion ......................................................................................................................102
References ...................................................................................................................................103
Copyright Acknowledgements ..................................................................................................119
Appendix .....................................................................................................................................120

ix
List of Tables
Table 2.1. Summary of potential mechanisms of cardiovascular damage induced by common anticancer treatments .......................................................................................... 10
Table 2.2. Main histological types, frequency, and outcome of invasive breast carcinoma . 12 Table 2.3. Main types of cancer therapy-related cardiac dysfunction .................................. 15 Table 2.4. Cardiotoxicity imaging modalities’ characteristics ............................................. 28 Table 3.1. Cardiac MRI Acquisition parameters .................................................................. 44 Table 4.1. Clinical Characteristics and Demographic Data for Healthy Volunteers ............ 61 Table 4.2. Normal Values for Left and Right Ventricular Volumetric Parameters in healthy
volunteers ............................................................................................................. 63 Table 4.3. Temporal Variability of Left and Right Ventricular Volumetric Parameters for
all Time Points in Healthy Volunteers, Represented as Standard Error of Measurement (SEM) 95% CI, and as Coefficient of Variation (COV) 95% CI .. 65
Table 4.4a. Two-Reader Intra-Observer Variability of Left Ventricular Volumetric Parameters for all Time Points in Healthy Volunteers, Represented as Standard Error of Measurement (SEM) 95% CI, and as Coefficient of Variation (COV) 95% CI ................................................................................................................. 68
Table 4.4b. Single-Reader Intra-Observer Variability of Right Ventricular Volumetric Parameters for all Time Points in Healthy Volunteers, Represented as Standard Error of Measurement (SEM) 95% CI, and as Coefficient of Variation (COV) 95% CI ................................................................................................................. 69
Table 4.5. Inter-Observer Variability of Left Ventricular Volumetric Parameters for all Time Points in Healthy Volunteers, Represented as Standard Error of Measurement (SEM) 95% CI, and as Coefficient of Variation (COV) 95% CI .. 70
Table 4.6. Inter-Observer Test-Retest (6-month) Variability of Left Ventricular Volumetric Parameters for all Time Points in Healthy Volunteers, Represented as Standard Error of Measurement (SEM) 95% CI, and as Coefficient of Variation (COV) 95% CI ................................................................................................................. 71
Table 4.7. Normal Values for high-sensitivity troponin-I (hs-TnI) and BNP in Healthy Volunteers ............................................................................................................ 72
Table 4.8. Temporal Variability for high-sensitivity troponin-I (hs-TnI) and BNP in Healthy Volunteers ............................................................................................................ 73
Table 5.1. Clinical and demographic data for the included patient’s pre-cancer treatment . 75 Table 5.2. Sequential change in patients’ LV cardiac MRI parameters ............................... 77 Table 5.3. Sequential change in patients’ RV cardiac MRI parameters ............................... 79 Table 5.4. Sequential changes in patients’ biomarkers ......................................................... 80 Table 5.5. Baseline characteristics of subset of patients who did subsequently developed
cardiotoxicity and who did not develop cardiotoxicity by 5 months ................... 81 Table 5.6. CMR Volumetric determinants of left ventricular ejection fraction decline
categorized by different cardiotoxicity definitions and the time of occurrence .. 83 Table 5.7. Summary of changes in left, right ventricular ejection fraction, high-sensitivity
troponin-I, and BNP between pre-anthracycline, within 3 weeks post anthracycline, and 3 months during trastuzumab therapy ................................... 85
Table 5.8. Univariable logistic regression analysis of association between baseline variables and development of cardiotoxicity by 5 months (~3 months into trastuzumab) . 89
Table 5.9. Univariable logistic regression analysis of association between changes at 3 months (post anthracycline) and development of cardiotoxicity by 6 months (~3 months into trastuzumab) ..................................................................................... 91

x
Table 5.10. Univariable logistic regression analysis of association between changes in ventricular volume and function measurements and development of cardiotoxicity ............................................................................................................................... 92

xi
List of Figures
Figure 2.1. Statistics of Breast Cancer in Canada (2012) ........................................................ 5 Figure 2.2. Shared risk factors of cancer and cardiovascular disease ...................................... 8 Figure 2.3. Risk factors of cardiotoxicity ............................................................................... 17 Figure 3.1. Timing of cardiac MRI imaging in relation to cancer therapy ............................ 41 Figure 3.2. CMR post-processing - window layout ............................................................... 45 Figure 3.3. CMR post-processing – complete tracing of a single case ............................. 47-48 Figure 3.4. CMR post-processing – LV-epicardial contours, chemical shift tracings ........... 49 Figure 3.5. CMR post-processing – LV basal slice quantification in end-diastole ................ 51 Figure 3.6. CMR post-processing – LVOT in end-diastole ................................................... 51 Figure 3.7. CMR post-processing – LV basal slice quantification in end-systole ................. 52 Figure 3.8. CMR post-processing – LV basal slice quantification in end-systole ................. 53 Figure 3.9. CMR post-processing – LV basal slice quantification in end-systole ................. 53 Figure 3.10. CMR post-processing – LVOT in end-systole .................................................... 54 Figure 3.11. CMR post-processing – RV in end-diastole ........................................................ 54 Figure 3.12. CMR post-processing – RVOT in end-diastole ................................................... 55 Figure 3.13. CMR post-processing – RV in end-systole .......................................................... 56 Figure 3.14. CMR post-processing – RVOT in end-systole .................................................... 56 Figure 3.15. CMR post-processing – RVOT in end-systole .................................................... 57 Figure 4.1. Mean +/- standard deviation of Normal values in health volunteers for LV
ejection fraction, LV end-diastolic volume, LV end-systolic volume, LV stroke volume, and LV mass over three time points (baseline, 3 months, and 6 months) ............................................................................................................................... 66
Figure 4.2. Temporal variability by coefficient of variation (CoV) in health volunteers comparing side by side left and right ventricular ejection fraction, end-diastolic volume, end-systolic volume, and stroke volume over the 6-month follow-up period ................................................................................................................... 67
Figure 5.1. Changes in hemodynamic variables and LV mass over time with p-values calculated using linear mixed models. A) weight, B) heart rate, C) arterial elastance, D) systolic blood pressure, E) diastolic blood pressure and e) LV mass ............................................................................................................................... 76
Figure 5.2. Changes in LV and RV volumes and ejection fraction and LVmass. (A) Changes over time in LV end-diastolic and end-systolic volumes, LVEF, and LV-mass in 83 patients. (B) Changes over time in RV end-diastolic and end-systolic volumes and RVEF in 83 patients ...................................................................................... 78
Figure 5.3. Side by side comparison of changes in LV and RV volumes and ejection fraction. (A) Changes over time in LV and RV ejection fraction in 83 patients. (B) Changes over time in LV and RV end-diastolic and end-systolic volumes in 83 patients ................................................................................................................. 78
Figure 5.4. Causes for reduction in LVEF. (A) cardiotoxicity was defined as per CREC recommendations. (B) Any >5% reduction in LVEF at 3 or 5 months compared to baseline ................................................................................................................ 82
Figure 5.5. Changes over time in high sensitivity Troponin-I and BNP in 83 patients ......... 86 Figure 5.6a. Comparison between mean changes in LVEF and RVEF in patients with LV
dysfunction at pre-anthracycline, within 3 weeks post anthracycline, and 3 months during trastuzumab therapy .................................................................................. 87

xii
Figure 5.6b. Comparison between mean changes in LVEF and RVEF in patients with no LV dysfunction at pre-anthracycline, within 3 weeks post anthracycline, and 3 months during trastuzumab therapy .................................................................................. 88
Figure 5.7. Intra-observer variability in 20 patients using Bland Altman Plots. (a) LVEF, (b) LVEDV, (c) LVESV, and (d) LVmass ................................................................ 93

1
Chapter 1
INTRODUCTION
1.1 Background and Rationale
Every year, about 26,300 new cases of breast cancer are identified in Canadian women(1). Up to
one fourth of these new cases have an aggressive subtype due to over-expression of the human
epidermal growth factor receptor 2 gene (HER2+) (1,2). For this aggressive subtype,
chemotherapy with anthracyclines is routinely supplemented with trastuzumab - a revolutionary,
monoclonal antibody that can reduce breast cancer recurrence by 50% and mortality by 30% (3-
5). Unfortunately, however, this combined therapy is also associated with a 10-30% risk of
cardiac-toxicity, defined as left ventricular dysfunction or heart failure (HF) (6,7). Cardiac-
toxicity is a serious, life threatening complication; once HF ensues, about 60% of patients die
within 2 years (8); furthermore, HF associated with cancer therapy was linked to 3.5-fold increase in
mortality risk compared to idiopathic dilated cardiomyopathy(8,9). It is therefore important to be able
use this combined cancer therapy to treat this common and aggressive form of breast cancer, yet
without allowing for cardiac-toxicity to compromise patients’ overall outcome.
The point at which cardiac-toxicity with this combined cancer therapy occurs is still not known.
Many HER2+ breast cancer survivors don’t experience any cardiac-toxicity while others develop
heart failure (1 to 5%) and/or cardiac dysfunction (10 to 20%) during or even many years after
treatment completion(6,7,10). There are many known risk factors for the development of
cardiac-toxicity in these patients; however, cardiac-toxicity still occurs even in the absence of
these risk factors. It is therefore important to use more sensitive methods to identify patients at
high risk for cardiac-toxicity, so that ultimately heart failure and cardiac mortality can be
prevented.
Traditionally, when cardiac-toxicity was first identified as a serious side effect of anthracycline
therapy in the 70s, patients were frequently tested with myocardial biopsy during chemotherapy
to identify those that develop myocardial pathological changes suggestive of cardiac-toxicity, so
chemotherapy can be stopped to avoid heart failure. Soon this method was deemed ineffective

due to inconsistent results, sampling challenges, and aggressiveness of the procedure reducing
the enthusiasm for it routine use. Since then cardiac-toxicity identification has been based on
non-invasive methods to identify myocardial functional changes suggestive of myocardial injury.
For this purpose, MUGA scans became the standard of practice with more recent move towards
2D/3D echocardiography due to the risk of exposure to radiation and limited information of
myocardial structure obtained from MUGA scans. One of the popular definitions of cardiac-
toxicity is proposed by the Cardiac Review and Evaluation Committee (CREC) as: “(1)
cardiomyopathy characterized by a decrease in cardiac LVEF that was either global or more
severe in the septum; (2) symptoms of congestive heart failure (CHF); (3) associated signs of
CHF, including but not limited to S3 gallop, tachycardia, or both; and (4) decline in LVEF of at
least 5% to less than 55% with accompanying signs or symptoms of CHF, or a decline in LVEF
of at least 10% to below 55% without accompanying signs or symptoms” (11). Since most of
current objective definitions of cardiac-toxicity require a significant drop in LVEF of at least
10% in the absence of signs and symptoms of heart failure, the inherent variability in
echocardiography based LVEF measurements has raised concerns about its value in identifying
early myocardial dysfunction. In fact, several studies have demonstrated that once there is a
significant reduction in LVEF identified by echocardiography or MUGA, many patients will not
have complete recovery despite current heart failure medications.
In the recent years there has also been a growing interest in using serum biomarkers (12); (13),
and novel echocardiographic and other advanced cardiac imaging techniques to detect early
cardiotoxicity (14). Most commonly studied serum biomarkers include high sensitivity troponin-
I (hs-TnI) and Brain Natriuretic Peptide (BNP). Although not consistent amongst studies, hs-TnI
has been shown to increase immediately post anthracycline administration and predicted future
development of cardiac-toxicity (15-17). Increase in BNP levels appear to occur after more
severe cardiac injury and have not been shown to be a good predictor of future cardiotoxicity.
Measurement of myocardial deformation using novel echocardiographic strain techniques has
been shown to better predict future reductions in ventricular function than conventional LVEF
measurements. Echo-measured global longitudinal strain (GLS) is currently suggested as a useful
tool to follow cancer patients during cancer therapy to identify early myocardial injury.
However, echo-measured GLS has limited positive predictive value (50%) for subsequent fall in
LVEF.

Cardiac MRI (CMR), is a safe non-invasive imaging technique that has the potential to identify
subtle myocardial morphological and functional changes (18). This is due to the superior
accuracy and reproducibility of CMR techniques to measure left ventricular volumes and
function. Our group hypothesizes that in patients receiving cancer therapy early ventricular
remodeling is more likely to happen before a change in myocardial function (i.e cardiotoxicity)
can occur. This ventricular remodeling is best assessed using CMR over other cardiac imaging
techniques. However, normal physiological changes over time in healthy volunteers and those
receiving cancer therapies as measured by CMR are still unknown. This knowledge would be
necessary to then define physiological versus pathological remodelling. A large study in
homogenous patient group and with similar cancer therapy regimens, who are imaged frequently
at constant intervals using CMR and biomarkers are ideal to study the process of ventricular
remodeling. Understanding cardiac remodeling longitudinally can provide the opportunity to
establish predictive models for early detection of cardiac-toxicity.
1.2 Hypothesis
1. Cardiac MRI measured ventricular function and volumes will have excellent temporal
and observer variability and will be lower than that described for 2D and 3D
echocardiography in the literature.
2. Significant increase in left ventricular end-systolic volume (i.e. a surrogate measure of
reduced myocardial contractility) measured using cardiac MRI will precede the reduction
in LVEF in women with HER2+ breast cancer who develop cardiotoxicity
1.3 Objectives
1. To define the temporal, inter-observer, intra-observer, and inter-observer test-retest
variability for left ventricular function, mass, and volumes measurements in healthy
volunteers.
2. To define the temporal and intra-observer variability for right ventricular function and
volumes measurements in healthy volunteers.

3. To describe the cardiac remodeling of LV/RV during anthracycline and trastuzumab
therapy in women with HER2+ breast cancer
4. To determine if an increase in LV-ESV can predict the development of cardiotoxicity
during treatment
5. To determine the association between ventricular remodeling and blood markers
(Troponin I, BNP)

5
Chapter 2
REVIEW OF LITRATURE
2.1 Cancer and Cardiovascular Disease Cancer and cardiovascular disease (CVD) are the two most common causes of death globally. In
Canada, cancer and CVD account for 30.2% and 19.7% of all deaths, respectively (Figure 2.1)
(19). It is estimated that half of Canadians will develop cancer in their lifetime and that 50% of
these patients will die from it (19).
Figure 2.1. Statistics of Breast Cancer in Canada (2012) Data source: Canadian Vital Statistics Death database at Statistics Canada
6
The second most common cancer in Canada is breast cancer with a 5-year net survival estimated
at 89%. Cancer survivors have multiple causes for premature mortality including infections,
heart disease, stroke, hypertension, lung disease, increased risk of other cancers, osteoporosis,
and depression (20).
It is estimated that 2.4 million Canadian adults live with heart disease of whom 12 die every
hour. Ischemic heart disease is the leading cause of premature mortality. A diagnosis of heart
failure in adults (40 years or older) portends 6 times higher rate of death compared to non-heart
failure patients. Heart failure, not only is a prevalent disease with significant morbidity and poor
prognosis, but also has the highest hospital readmission rate (21). Majority of patients with heart
failure get admitted at least once in their life time and about 22% of heart failure patients get
readmitted again within the first month. These hospitalizations contribute to a large health care
burden and cost. In the US, it has been estimated that heart failure hospitalizations per patient
costs 83, 980USD over each patient’s lifetime (22). In cancer patients, it is crucial, therefore, to
prevent iatrogenic heart failure from developing during or after cancer therapy.
2.2 Cancer Survival
Cancer survival has steadily improved for the majority of cancer types over the last 30 – 40 years
in Canada and in most developed countries across both adult and pediatric populations (17-21).
This improvement can be attributed to many factors, but is mainly due to better cancer detection
and treatment (23-25). The improvement in imaging techniques including CT scans and MRIs
has made early detection feasible for many cancers. Chemotherapy and targeted therapy have
significantly improved survival of most cancers. Therefore, with the advancement and
availability of cancer therapies, millions of treated patients are now cancer survivors(19).
2.3 Cardiovascular disease in patients with cancer
Unfortunately with improved cancer survival, cardiovascular (CV) complications have become
an important cause of morbidity and mortality in survivors (26). This is attributable to various

7
different reasons including shared risk factors and biology and the direct impact of cancer
therapy on the cardiovascular system.
2.3.1 Shared Risk Factors of Cancer and CVD
We are increasingly learning that cancer and CVD are highly interconnected (27). Risk factors of
CVD including cigarette smoking, obesity, unhealthy diet, and physical inactivity are also
associated with increased incidence of cancer and worse outcomes (28) (Figure 2.2). Although
cigarette smoking has been decreasing; according to Canadian statistics, as much as 17% of
Canadians aged ³12 years smoked either daily or occasionally in 2016. Smokers have 2 to 3
times higher risk of death mostly related to development of cancer and CVD, with recent data
showing a direct link between smoking and breast and prostate cancers, as an example (29).
Incidence of obesity over the last decade in Canada, has been relatively stable in children and
adolescents compared to adults. However, 1 in 7 Canadian children and adolescents and 1 in 4
Canadian adults are obese (30). Obesity increases cancer incidence by at least 8%. Metabolic
syndrome and its risk factors that are associated with obesity such as hyperglycemia,
dyslipidemia, and elevated body mass index, all increase the incidence and mortality from cancer
and CVD (31,32). It is intriguing to realize that obesity may increase CVD-related mortality
indirectly through increased myocardial susceptibility to injury from cancer therapy; and that
obesity may increase cancer-related mortality indirectly through decreased cardiovascular
reserve due to pre-existing CVD (28). This double insult phenomena of obesity on patients with
cancer and CVD may also be true for other shared risk factors of cancer and CVD, including
smoking, poor diet, and sedentary lifestyle.
8
2.3.2 Shared Biology for Cancer and Cardiovascular Disease
CVD risk is further heightened in cancer patients because of shared biology of the two diseases.
Inflammation is a common factor in the etiology and progression of both cancer and CVD
(33,34). Not only chronic inflammation can promote tumor formation, but also tumor formation
can blunt the systemic inflammation response mediated by the host-immune system (33). High
concentrations of cytokines and chemokines released by cancer inflammatory component attract
leukocytes including: neutrophils, macrophages, lymphocytes, dendritic cells, eosinophils, and
mast cells. These leukocytes then differentiate and can potentiate neoplastic process by
producing wide range of mediators including chemokines, extracellular proteases, pro-
angiogenic factors (such as vascular endothelial growth factor), and cytotoxic mediators (such as
reactive oxygen species) (33,35). Likewise, Inflammatory mediators are long recognized as
being central in the initiation and development of atherosclerosis leading to myocardial
infraction (MI) as well as in complicating MI with fibrosis. Atherosclerosis formation starts
Figure 2.2. Shared risk factors of cancer and cardiovascular disease

9
when inflammation causes changes in the endothelium leading to monocytes migration to the
intima, followed by monocyte transformation to macrophages to engulf lipids to become foam
cells and to initiate fatty streaks, and finally complex atherosclerotic plaques ensues as
inflammation persists (34). Traditional CVD risk factors including obesity, diabetes,
hypertension, and cigarette smoking are associated with inflammation, which also promotes
carcinogenesis and tumor growth (36-41). Oxidative stress due to endogenous metabolic
reactions or exogenous sources (e.g. smoking) is associated with cancer and CVD (41-43). An
increasing number of hormones (e.g. leptin), cytokines, and growth factors are linked to both
cancer and CVD (44,45). Consequently, patients who develop cancer are inherently at higher risk
for CVD or may already have subclinical CVD.
2.3.3 Cancer therapy as a cause for CVD
In addition to shared risk factors and shared biology between cancer and CVD there is also a
growing interest in the direct cardiovascular impact of cancer therapy (26). Cancer therapy can
cause injury to the different structures of the heart and/or the peripheral vascular system
depending mainly on the type of drug used (46). CV injuries differ in incidence, severity, and
impact on clinical outcome mainly based on patient’s characteristics (e.g. age, sex,
comorbidities, risk factors, receptors status, genetic predisposition, etc.). Congestive heart failure
with anthracycline therapy, for instance, has an incidence of ~1-5% but is associated with poor
prognosis with mortality rates of 60% within 2 years (8). Examples of other common
complications include coronary artery disease/acute coronary syndrome, LV systolic and/or
diastolic dysfunction, acute myocarditis, pericarditis, arrhythmia, bradycardia, cardiogenic
shock, hypotension, valvular heart disease, thromboembolism, angioedema, and myocardial
fibrosis (47). CV complications can occur not only with the first line chemotherapeutic agents
such as: anthracyclines (e.g. doxorubicin), alkylating agents (e.g. cyclophosphamide), and
humanized monoclonal antibody (e.g. trastuzumab), but also with other currently used
chemotherapeutic agents such as: antimetabolites (e.g. 5-fluorouracil), hormonal therapies (e.g.
tamoxifen), anti-microtubule agents (e.g. paclitaxel), VSP inhibitors (e.g. bevacizumab), and
proteasome inhibitors (e.g. proteasomib) (27,48). CV complications can also be caused by other
forms of cancer treatment such as involved field radiation (26,27) and stem cell transplant. Table
2.1 shows some common chemotherapeutic drugs and their common CV complications.

10
Cardiovascular complications of cancer therapy have therefore become an important focus of
research, with special interest in CHF due to its associated poor prognosis. And this focus is
specifically relevant in Breast Cancer due to the fact it is the most common cancer amongst
women and it has good survivorship.
2.4 Breast Cancer
Breast cancer is the most common cancer diagnosed among women in Canada, accounting for
nearly 1 in 4 cancers (26%). It is also the second leading cause of cancer death among Canadian
(+) = likely; (−) = unlikely; (?) = unknown; (< >) = probable. ROS = reactive oxygen species; CHF = congestive heart failure; LVD = left ventricular dysfunction; HDL = high-density lipoprotein; LDL = low-density lipoprotein; GI = gastrointestinal tract; SERMs = selective estrogen receptor modulators
Table 2.1. Summary of potential mechanisms of cardiovascular damage induced by common anticancer treatments
11
women after lung cancer, accounting for 13% of all cancer-related deaths. One in 9 women in
Canada is expected to develop breast cancer in her lifetime(1).
Breast Cancer mortality has improved by 44% since 1986 due to advancement in screening and
treatment. The 5-year relative survival ratio has improved from 82% in 1992 to 87% in 2018. It
is expected that breast cancer will continue to be a leading contributor to cancer burden moving
forward. This is because, breast cancer incidence and mortality are many fold higher as women
age, with the majority of breast cancer deaths (52%) occurring in women over 70 years of age(1).
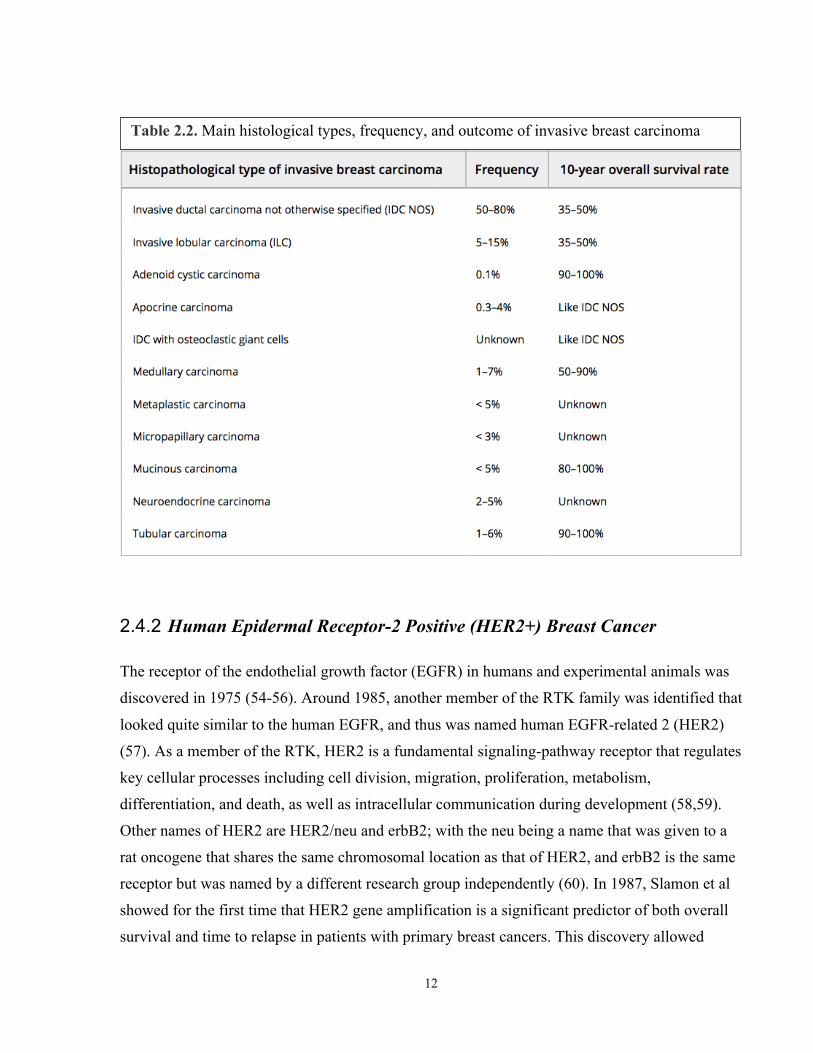
2.4.1 Breast Cancer types and taxonomy
Breast cancer is a complex and heterogenous disease, which can be categorized based on
histologic type, receptor status, clinical stage, and molecular taxonomy. The major breast cancer
types are: invasive, non-invasive, inflammatory, and Paget’s disease of the nipple(1). Based on
the histological type, invasive breast carcinoma (IBC) is divided into 18 types; the majority of
IBC (50-80%) fails to identify clear morphological features and thus grouped into IBC-not
otherwise specified. The remaining 17 IBC types exhibit specified features and termed
histological-special types (Table 2.2) (49) (50-52). Non-invasive breast cancer - AKA carcinoma
in situ - includes mainly either ductal carcinoma in situ (DCIS) or lobular carcinoma in situ, with
DCIS being the most common of the non-invasive types. Breast cancer is further characterized
by its receptor status. There are three main receptors clinically relevant to breast cancer:
estrogen, progesterone, and HER2, each of which can be either status positive or negative. Breast
cancer receptor status is an important factor in determining appropriate therapy. Breast cancer is
divided into four stages (I-IV) depending on extent of the disease, with I-III considered early
stage and IV as advanced or metastatic. Breast cancer can also be classified based on the
molecular genotype. Molecular taxonomy is a new approach that has the potential to become the
gold standard for breast cancer classification as it categorizes breast cancers based on
transcriptomic features and patient outcome (53). Based on this method, three main types of
breast cancer were identified: HER2+, luminal, and basal-like. As more molecular genotypes get
identified, this model could be used to individualize therapy for breast cancer patients based on
gene expression patterns (51).
12
2.4.2 Human Epidermal Receptor-2 Positive (HER2+) Breast Cancer
The receptor of the endothelial growth factor (EGFR) in humans and experimental animals was
discovered in 1975 (54-56). Around 1985, another member of the RTK family was identified that
looked quite similar to the human EGFR, and thus was named human EGFR-related 2 (HER2)
(57). As a member of the RTK, HER2 is a fundamental signaling-pathway receptor that regulates
key cellular processes including cell division, migration, proliferation, metabolism,
differentiation, and death, as well as intracellular communication during development (58,59).
Other names of HER2 are HER2/neu and erbB2; with the neu being a name that was given to a
rat oncogene that shares the same chromosomal location as that of HER2, and erbB2 is the same
receptor but was named by a different research group independently (60). In 1987, Slamon et al
showed for the first time that HER2 gene amplification is a significant predictor of both overall
survival and time to relapse in patients with primary breast cancers. This discovery allowed
Table 2.2. Main histological types, frequency, and outcome of invasive breast carcinoma
13
genomic researchers to develop a specific cancer therapy targeted against the HER2 receptor –
the antibody trastuzumab.
Now, we know that about 20 to 25% of all primary breast cancers are HER2 positive (2). HER2
positive breast cancers amplify the HER2 gene leading to overexpression of HER2 receptors (up
to 100 times the ordinary) making this subtype clinically more aggressive than the HER2
negative breast cancer (59). Recent studies have demonstrated that overexpression of HER2
receptor portends poor outcomes because this subtype is more likely to be associated with poorly
differentiated high-grade tumors, increased rates of cell proliferation, high risk of lymph node
involvement, resistance to certain types of chemotherapy, and greater rate of recurrence.
2.5 Breast Cancer Therapy
With improved screening, the majority of patients with newly diagnosed breast cancer today
have curable early stage disease. The treatment of breast cancer depends on the stage of disease
and tumor characteristics (61). Along with surgery, nearly all early stage patients receive either
adjuvant or neoadjuvant systemic therapy to eradicate micro-metastases and a subgroup receives
radiotherapy (61,62). The decision for systemic therapy is based on tumor characteristics,
estrogen (ER) and progesterone (PR) receptor status, and amplification of the HER2 gene (61).
Systemic therapy options for breast cancer are chemotherapy and endocrine therapy.
Chemotherapy includes anthracycline or taxane-based treatment, and in HER2+ disease, the
addition of trastuzumab. Adjuvant chemotherapy improves survival and reduces the recurrence
of cancer by approximately 20-38% in early-stage breast cancer (63,64). The addition of ER
blockade provides a 26% reduction in mortality and up to a 47% reduction in local recurrence at
10-year follow-up in ER+ disease (64,65). The use of radiotherapy reduces the absolute risk of
cancer recurrence by 15.4-21.2% and mortality by 3.3-8.5%. Finally, the use of trastuzumab with
chemotherapy is associated with an approximate 30% reduction in mortality and a 50% reduction
in the recurrence of cancer in HER2+ patients (3-5,66,67). Therefore, with the available therapy
for early stage disease, millions of treated patients are now cancer survivors.

14
2.5.1 HER2+ Breast Cancer Therapy
Many randomized controlled trials have shown that HER2 positive cancer is particularly
sensitive to anti-HER2 agents, including trastuzumab, as well as to anthracycline-based
chemotherapy (68-78).
2.5.2 Anthracyclines
Anthracyclines are an old class of chemotherapy, with daunomycin/daunorubicin being the first
approved for clinical use more than 50 years ago. Anthracyclines have always been the corner
stone of chemotherapy in many cancers and remain widely used in both early stage and
metastatic breast cancers. Unfortunately, anthracyclines can cause injury to myocardial cells. As
early as 1967, the first anthracycline used clinically (daunomycin/daunorubicin) was recognized
to have serious cardiotoxicity including heart failure (79). Similarly in 1984, Adriamycin, which
is a very potent anthracycline, was noticed to cause significant cardiotoxicity (80). Many studies
have confirmed anthracyclines side effects on the heart and its mechanism of cardiotoxicity.
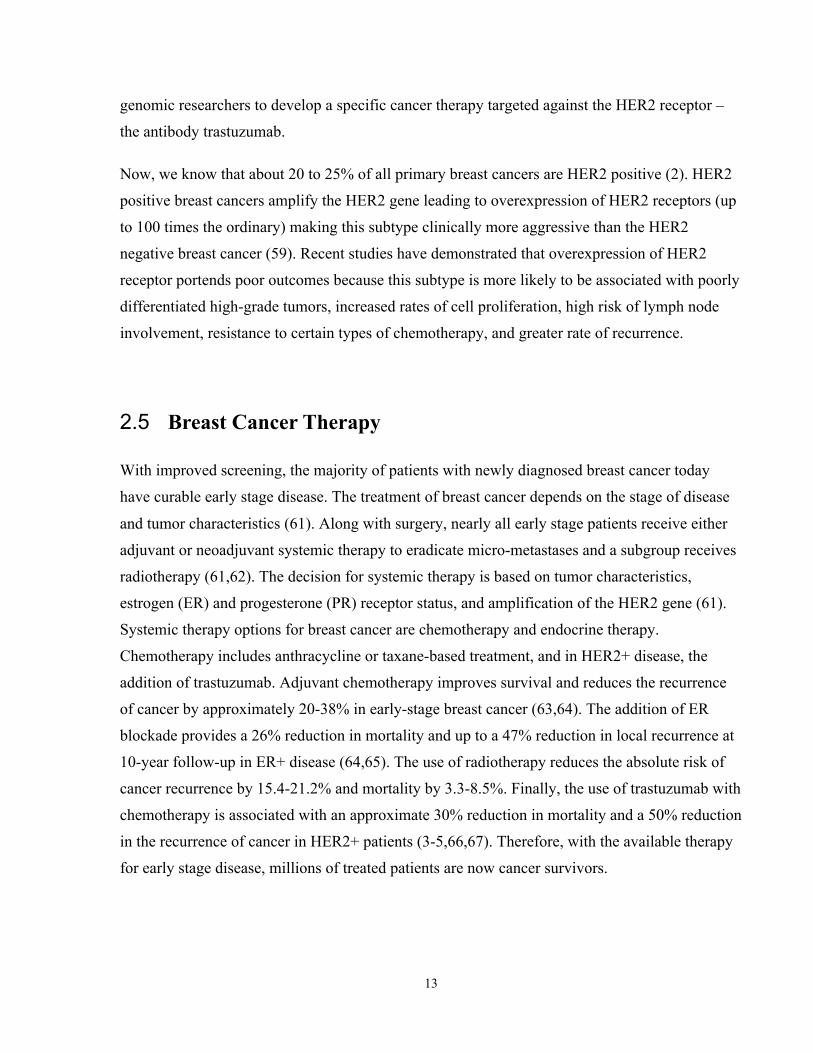
Anthracyclines cause type-1 myocardial injury (Table 2.3) (81).
2.5.2.1 Mechanism of cardiotoxicity with Anthracycline
Proposed mechanisms of anthracycline cardiotoxicity include interference with cardiac
topoisomerase Iβ and ROS mediated injury leading to cardiomyocyte apoptosis initially and
necrosis with higher doses, as well as fibrosis of the extracellular space (82) (83).
15
Typical anthracyclines that are in use today for HER2+ early breast cancer is doxorubicin and
epirubicin. Myocardial injury form anthracyclines is dose dependent (84). Heart failure during
Anthracycline therapy is reported in up to 18% of patients at cumulative doses of 700mg/m2 of
doxorubicin (85); however, even with lower cumulative doses and less toxic anthracyclines,
cardiotoxicity is still reported in 3.3-18% of patients (83). Current suggested threshold of
cumulative anthracycline doses to minimize the risk of cardiac dysfunction has been reduced to
240–360 mg/m2 doxorubicin and 450–600 mg/m2 epirubicin. At low cumulative dose of
anthracycline, mild cardiac damage can be masked by cardiac compensatory mechanisms
keeping LVEF in the normal range during this compensated stage (86). At moderate-high
cumulative dose of anthracycline, the heart’s compensatory reserve can get exhausted, leading to
Type 1
e.g. Doxorubicin
Type 2
e.g. Trastuzumab
Cellular death Cellular dysfunction
Damage starts with first administration
Biopsy changes No typical biopsy changes
Cumulative dose related Not cumulative dose related
Permanent damage (myocyte death) Predominantly reversible (myocyte dysfunction)
Risk factors
Prior/concurrent radiotherapy Prior/concurrent anthracycline
Combination chemotherapy Paclitaxel
Age Age
Previous cardiac disease Previous cardiac disease
Hypertension Obesity (BMI > 25)
Table 2.3. Main types of cancer therapy-related cardiac dysfunction
16
development of overt cardiac-toxicity. Risk factors that increase cardiac-toxicity include: pre-
existing co-morbidities, CVD or their risk factors, old age, genetics (87), previous exposure to
chemotherapy or radiation, and concurrent exposure to chemotherapeutic drugs, especially to
trastuzumab (Figure 2.3) (88). Even if the heart’s function remains compensated during
anthracycline therapy, the irreversible anthracycline-induced cardiac damage lingers in the heart
forever as the cardiomyocytes do not have the capacity to regenerate (89). The heart function
may then worsen overtime due to physiological and/or pathological reasons such as new onset
hypertension or diabetes. This possibly explains the occurrence of late cardiac dysfunction after
anthracycline exposure (90).

17
Increased risk of cardiac toxicity
Concurrent Medication: - Endocrine therapy e.g. tamoxifen - Erythropoietin
Prior or concurrent radiotherapy
Patient-dependent risk factors: - Age - Prior heart disease - Dyslipidemia - Diabetes - Tobacco, Alcohol
Prior chemotherapy
Figure 2.3. Risk factors of cardiotoxicity

18
2.5.3 Trastuzumab
Trastuzumab, a monoclonal antibody against HER2 receptor, was initially approved as a first-
line treatment for metastatic HER2-positive breast cancer, in 1998 (5,72). In 2005, results from
five important randomized controlled trials (RCTs) showed a significant survival advantage with
use of adjuvant trastuzumab, in addition to the conventional therapy, in patients with early stage
HER2+ breast cancers leading to the approval of trastuzumab as a first line therapy in this patient
population (72,76). Based on short- and long-term results from these five RCTs and other RCTs
subsequently: 12 months of treatment with trastuzumab became the standard of care for early
stage HER2+ breast cancer (76). Some of the clinically important conclusions from these RTCs
are the following:
1- The addition of trastuzumab to chemotherapy improved disease-free survival and overall
survival significantly in comparison to chemotherapy alone (70-72).
2- Trastuzumab administered sequentially to chemotherapy that included anthracycline
showed numerically better disease-free survival and overall survival than when
administered with chemotherapy that didn’t include anthracycline (69).
3- Trastuzumab initiated sequentially to anthracycline treatment showed less cardiotoxicity
and better outcome than given concurrently (91,92).
4- Trastuzumab given for 52 weeks (12 month) with paclitaxel (subsequent to completion of
anthracycline) had superior disease-free survival and overall survival when compared to
no-trastuzumab administration; furthermore, trastuzumab administered concurrently with
paclitaxel for 52 weeks showed numerically better (not statistically significant) disease-
free survival and overall survival in comparison to trastuzumab administered sequentially
(75,76).
5- Two years of trastuzumab offers no additional benefits to patients compared to 12 months
of trastuzumab (73); of note, outcome of 6 months of trastuzumab treatment was recently
tested versus 12 months and showed a non-inferior results, yet was still considered not
significant enough to alter the current standard of 12 months treatment course of
trastuzumab (74).

19
2.5.3.1 Mechanism of action of trastuzumab
Trastuzumab is a monoclonal antibody that binds to domain IV of HER2 receptor on the surface
of breast cancer cells as well as cardiomyocytes interrupting HER2 signaling (59). Disrupting
HER2 signaling of the overexpressed HER2 receptors interferes with tumor progression leading
to reduced aggressiveness and improved outcome in HER2+ breast cancer patients making
trastuzumab an essential treatment in this patient population.
2.5.3.2 Mechanism of cardiotoxicity with trastuzumab
Unfortunately, HER2 signaling is indispensable for normal cardiac function. Furthermore, HER2
signaling has been shown to have a cardioprotective effects in both human and animal hearts
(92). Trastuzumab binding to HER2 receptors can halt important cellular mechanisms that are
normally cardio-protective, including during stress. Some cardio-protective mechanisms of
normal HER2 signaling include promotion of: “antiapoptotic pathways (93-95), hypertrophic and
even mitotic growth (87,88,90), cell elongation with improved cell-cell adhesion (96),
angiogenesis (97), and reduced sensitivity to adrenergic stimulation (98)” (99). These important
cardio-protective mechanisms of HER2 signaling are referred to as survival pathways.
Interrupting these survival pathways in the heart can cause cardiac dysfunction. Cardiac-
dysfunction can occur even when trastuzumab is used as monotherapy with incidence rate
reported at 2-7% (11). Trastuzumab’s mechanism of myocardial dysfunction is likely through
impairing contractility and not through death of myocytes and permanent myocardial damage as
in the case of anthracyclines. Trastuzumab causes type-II cardiotoxicity, as opposed to the
classic type-I cardiotoxicity caused by the prototype anthracyclines (100), (Table 2.3). The main
feature of trastuzumab’s type-II cardiotoxicity is its high likelihood for recovery to baseline or to
near baseline cardiac status within 2-4 months of trastuzumab discontinuation reflecting its half-
life of 20-25 days. Heart function can return to normal post discontinuation of trastuzumab
allowing for future re-administration of trastuzumab when required. Other proposed mechanisms
of trastuzumab-induced myocardial dysfunction, however, include mitochondrial dysfunction
with ATP depletion and immune-mediated destruction of cardiomyocytes (101).

20
2.6 Cardiotoxicity
With improved breast cancer survival, the cardiac-toxicity due to cancer therapy has become an
important cause of morbidity and mortality in survivors (6,83,102,103). The main drugs
implicated with cardiotoxicity in patients with HER2+ breast cancer are anthracyclines and
trastuzumab (83). The five-year cumulative incidence of major cardiac events due to cancer
therapy in HER2+ breast cancer is 4.13%, whereas it is 1.68% in the general population with no
cancer (104). Although disease-free survival and overall survival is significantly better when
anthracyclines are used and sequentially followed by trastuzumab, the incidence of cardiotoxicity
is higher with this sequential regimen than with either drug alone or anthracycline- and
trastuzumab-free regimens. Incidence of major cardiac events during sequential therapy with
anthracycline and trastuzumab in clinical trials ranges from 3.9% in NSABP-B31 trial (105), to
2.0% in BCIRG 006 trial (106), and to 1.7% in a meta-analysis of clinical trials (107).
Specifically in the NSABP-31 trial of sequential anthracyclines and trastuzumab therapy, the
incidence of HF and subclinical LV dysfunction was 3.6% and 14.0% respectively (108). Even
the development of subclinical LV dysfunction is not benign, as data from the Framingham study
suggests a 4.8 fold higher risk of subsequent symptomatic HF and 1.6 fold higher risk of
mortality (10). Outside of the clinical trial setting, cardiomyopathy and HF among anthracycline
and trastuzumab-treated patients have ranged between 15.5-41.9% over long-term follow-up
(6,7). The higher toxicity with the combined therapy can result from a “two-hit” hypothesis
which proposes that the myocardial injury and activation of cardiomyocyte death pathways by
anthracyclines is not naturally opposed by the survival pathways mediated by the HER2 receptor
activation (109). Inhibition of the survival pathways that can be mediated by trastuzumab, can
aggravate cardiomyocyte death, LV dysfunction, and subsequent HF (110).
2.6.1 Definition of Cardiotoxicity
There are several definitions for cardiotoxicity. They typically vary based on the modality used,
inclusion of symptoms, and lower cut-off of normal depending on the experience of the different
cardiology and oncology organizations (111). The National Cancer Institute, for example,

21
defines cardiotoxicity as “toxicity that affects the heart”; although this definition is quite simple,
it includes direct and indirect effects of the cancer therapy on the heart (46,112). The Cardiac
Review and Evaluation Committee (CREC), as mentioned earlier is more comprehensive as it
defines cardiotoxicity as “(1) cardiomyopathy characterized by a decrease in cardiac LVEF that
was either global or more severe in the septum; (2) symptoms of congestive heart failure (CHF);
(3) associated signs of CHF, including but not limited to S3 gallop, tachycardia, or both; and (4)
decline in LVEF of at least 5% to less than 55% with accompanying signs or symptoms of CHF,
or a decline in LVEF of at least 10% to below 55% without accompanying signs or symptoms”
(11). Although, this definition is clinically used, it is not sensitive to the subclinical injury that
can happen with cancer therapy (46). In our study, we used the fourth criterion of the CREC
definition since this definition was also used in the Cardiac Dysfunction in the Trastuzumab
Clinical Trials Experience (11).
2.6.2 Cardiotoxicity due to Radiotherapy
Radiotherapy can also be associated with cardiotoxicity due to micro or macro-vascular coronary
disease or acute myocarditis; but, the incidence is not well established (113,114). Most
clinically-important cardiotoxicity due to radiotherapy is in patients with early breast cancer and
Hodgkin’s lymphoma, as these patients are typically young and survive longer to experience the
late effects of cardiotoxicity, including fatal cardiovascular events in up to 2.2% and 7% of the
patients respectively (115).
2.6.3 Cardiotoxicity due to Endocrine Agents
Tamoxifen and/or aromatase inhibitors (AIs) are established agents for the treatment of post-
menopausal hormone receptor-positive early breast cancer. Third generation AIs, however, have
an advantage over tamoxifen for treatment of estrogen-receptor positive breast cancer by
significantly reducing recurrence and mortality and improving overall survival. AIs,
nevertheless, increase the risk of cardiovascular disease including ischemic heart disease in
comparison to tamoxifen as the latter has a cardioprotective effect; the absolute risk of

22
developing cardiac-toxicity has been shown to be 4.2% with aromatase inhibitors and 3.4% with
tamoxifen (116-118).
2.6.4 Outcomes of Cardiotoxicity
The development of symptomatic HF with anthracyclines is associated with poor prognosis (8),
therefore, attention has been directed towards recognition of patients during stage B HF. Stages
of heart failure defined by ACCF/AHA are: stage A, at high risk of HF but without structural
heart disease or symptoms; stage B, structural heart disease but without signs or symptoms of
HF, stage C, structural heart disease with prior or current symptoms of HF; stage D, refractory
HF requiring specialized interventions(119). Based on HF guidelines, patients in stage B HF
generally benefit from treatment with beta-blockers and ACE inhibitors (120). Currently, in
HER2+ breast cancer patients receiving cancer therapy, stage B HF is identified by repeated
LVEF measurements pre-therapy, prior to initiation of trastuzumab, and every 3 months
thereafter. First, modification to cancer therapy or addition of cardiac medication is dependent on
a reduction in LVEF. This approach has limitations since measurement variability for LVEF
using 2D or 3D echocardiography (echo) in breast cancer patients is ~6-10% (14). Even with
multi-gated acquisition scans (MUGA), LVEF measures are affected by physiological changes
(86). However, cardiac MRI-measured LVEF can provide more accurate diagnosis of
cardiotoxicity given its lower measurement variability. Secondly, once LVEF falls, it frequently
necessitates interruptions to cancer treatment possibly affecting cancer outcomes. Thirdly,
although traditionally, stage B HF is defined by an asymptomatic drop in LVEF, for
chemotherapy-induced cardiomyopathy, even this definition appears to be too late. In studies of
anthracycline- (121) or trastuzumab- (121-123) treated breast cancer patients, once LV
dysfunction occurred, 40-58% of the patients had no subsequent recovery. These patients then
had more adverse cardiovascular events in follow-up. Therefore, for chemotherapy-induced
cardiotoxicity it is important to move beyond the traditional definition of stage B HF and identify
other surrogate markers that indicate ventricular injury before LVEF falls, including LV end-
systolic volume (ESV), LV end-diastolic volume (EDV), myocardial strain, and tissue
characterization techniques. These early changes may trigger the initiation of therapies to prevent
subsequent drop in LVEF and HF.

23
2.6.5 Why not treat everyone at risk for cardiotoxicity prophylactically?
One approach to preventing cardiotoxicity is to treat everyone receiving cancer therapy
prophylactically with cardio-protective therapy including angiotensin converting enzyme
inhibitors (ACEi) and beta-blockers (BB) (124). Although this approach is attractive, the
literature on the benefit of this approach is controversial. (125,126). Two recent randomized
controlled trials (PRADA and MANTICORE) have tested the effect of using cardioprotective
medications during treatment of early breast cancer therapy (127,128). In PRADA trial,
candesartan, but not metoprolol mitigated the decline in LVEF (125). In the MANTICORE trial,
where the effects of perindopril and bisoprolol were studied for the prevention of trastuzumab-
mediated cardiotoxicity; neither was able to prevent ventricular remodeling, despite having
attenuated trastuzumab-mediated declines in LVEF (126). Another limitation of the “treat-all
approach” include the that patients receiving chemotherapy commonly experience vomiting,
dehydration, pre-syncope, renal impairment, and fatigue; therefore, the non-selective addition of
medications such as beta-blockers and ACE inhibitors may be poorly tolerated as recently
demonstrated (124). Also, since in clinical practice ~75% of the patients will not experience
cardiotoxicity, the need for close monitoring with the cardiac drugs in all patients will make this
approach costly. At present, an approach focused on identification of patients at the highest risk
for developing cardiac dysfunction and initiating targeted therapy appears more appealing.
2.6.6 Current methods to identify cardiotoxicity
2.6.6.1 Biopsy
Endomyocardial biopsy was first successfully performed in 1956 (129) and it underwent many
refinements to become more safe over the years (130). Endomyocardial biopsy has some
advantages for cardiotoxicity identification over the conventional non-invasive methods: (1) it
can identify early changes of cardiotoxicity at the cellular level before the functional and clinical
changes occur; (2) it can differentiate, to a certain degree between cardiac pathological changes

24
specific to cancer therapy versus other types of heart disease; and (3) it can determine the grade
of overall pathology, and whether further cancer therapy can be safely given (131). The
challenges with biopsy, however, include: (1) patient safety, (2) limited accessibility and (3) its
limitation to subendocardial myocardium. Perhaps the main limitation of biopsy in the context of
cardiotoxicity is secondary to its false positive and false negative results where pathology in
cardiotoxicity is typically diffuse, and biopsy is usually limited to a number of small-sized tissue
specimens usually accessed from the right ventricle only. Biopsy thus can frequently miss
significant lesions, or sometimes lands on a pathological lesion that is otherwise not clinically
representative of the entire heart. As a consequence correlation between histologic and functional
changes has been deemed imperfect (132). Endomyocardial biopsy therefore has limited
usefulness for serial assessments in the context of early detection of cardiotoxicity during cancer
therapy.
2.6.6.2 MUGA
Multi-gated radionuclide angiography (MUGA) is a conventional, non-invasive technique that
uses 99m Technetium (Tc)-erythrocyte labeling to visualize the cardiac blood pool by gama-
camera (133). MUGA provides a precise and reproducible measurement of LV volumes and
function independent of geometric assumptions, yet still slightly less accurate than CMR (134).
For many decades, MUGA was the standard technique used clinically to measure left ventricular
volumes and function including adult patients treated with cardiotoxic agents (135). However,
due to its limitations, MUGA is now reserved as a third modality in cardio-oncology after echo
and CMR (136). These limitations include: exposure to ionizing radiation, susceptibility to soft
tissue attenuation artifacts affecting image quality, and susceptibility to patients’ physiological
changes resulting in inaccurate LVEF measurement affecting its usefulness in the serial
assessment of cardiotoxicity (83,130). Recent studies using more contemporary equipment have
demonstrated better agreement between MUGA measured LVEF and cardiac MRI specifically in
patients receiving cancer therapy, but radiation continues to be a big limiting factor (137).

25
2.6.6.3 Blood biomarkers to predict cardiotoxicity Amongst blood biomarkers, the one that is best associated with early cardiac injury is cardiac
troponin. Cardinale et al demonstrated that patients who had troponin increase early post high-
dose anthracycline, developed cardiac dysfunction many years later (138). They also showed that
post trastuzumab-based therapy, an early rise in troponin was an independent predictor of future
development of cardiac dysfunction (12). However, data for troponin levels to predict LV
dysfunction or HF are conflicting (15-17). The type of troponin assay to use, the optimal time to
measure during treatment, and the threshold to define abnormality are unknown. The largest
studies that have illustrated the utility of troponin as a marker of early injury performed blood
sampling at 5 time points around each chemotherapy dose (15-17,138). Clinical application of
such a strategy is challenging. The two most recent studies of breast cancer patients receiving
adjuvant trastuzumab therapy have shown that even high sensitivity troponin I (hs-TnI) only had
a positive predictive value between 44-50% (139) (140) for subsequent cardiotoxicity.
Other novel biomarkers that have been recently shown to have potential value in predicting
cardiotoxicity are myeloperoxidase (MPO) and growth differentiation factor (GDF)-15 (13).
MPO is believed to be a marker of oxidative stress, which may represent the central mechanism
of anthracycline cardiotoxicity (141,142), as well as ErbB2 inhibition, by trastuzumab (143).
Similarly GDF-15 is a member of the TGF-cytokine family with increased expression with
oxidative stress and inflammation (144,145). There is currently limited literature on the use of
these latter biomarkers and the timing of measurements or the thresholds to detect early cardiac
injury have not been defined.
2.6.6.4 Echocardiography
Two-dimensional echocardiography (2D echo) is currently the most widely used method to
assess cardiac function in cancer population. It remains a preferred method for LVEF assessment
over MUGA since the latter exposes cancer patients to radiation. 2D echo determines cardiac
function by measuring LVEF indirectly by utilizing geometric assumptions. 2D echo
reproducibility is however limited by geometric assumptions and by being operator dependent.
3D echo is a newer, less operator dependent technique when compared to 2D echo as it uses
semi-automated algorithms to assess LVEF, which rely less on geometric assumptions but is

26
dependent upon good acoustic windows. As a result of the above limitations,2D and 3D echo
inter-observer variability has been shown to be high (when compared to MUGA or CMR),
limiting their utility in sequential screening and early detection of cardiotoxicity.
Thavendiranathan et al showed that 2D and 3D echo inter observer variability to be 11% and 8%,
respectively (14). 2D echo represents a significant advance in those with poor acoustic windows
enabling superior assessment of regional function, but also suffers from high inter-observer
variability because of limited visualization of the base of the heart and also suffers from operator
dependence. Regardless of these limitations, the ability of echocardiography to assess both LV
and RV systolic and diastolic function, volumes, pericardial disease and valvular dysfunction in
a portable, cost effective manner has maintained echocardiography place as the preferred
modality used to assess cardiotoxicity.
2.6.6.5 Peak systolic global longitudinal strain (GLS) to predict cardiotoxicity Echo measured GLS is deemed sensitive method for screening and for measuring subclinical LV
dysfunction (17,146,147). An early reduction in GLS during breast cancer therapy appears to
predict subsequent LV systolic dysfunction (139,140). However, obtaining diagnostic quality
images with echo is often difficult due to post-operative chest-wall pain and acoustic window
limitations, especially in patients with breast cancer. Even in healthy volunteers, strain
measurements may not be obtained in 1 in 5 subjects (148). Secondly, the relative change in
myocardial strain values that have been shown to predict subsequent cardiotoxicity for the
population is between 10-15% (139,140,149,150). However, the reported 95% confidence
interval for the inter-observer variability for GLS even in healthy volunteers has been between -
11.4% and +11.8%, while the test-re-test variability was -9.6% to +9.7% (148). Therefore, using
such a threshold in an individual patient can be challenging especially in patients with significant
hemodynamic variations due to chemotherapy. As a consequence, early GLS changes have only
shown modest sensitivity and specificity and poor positive predictive value (50%) for subsequent
cardiotoxicity (139,140,151).
Therefore, given the limitation of existing methods to predict cardiotoxicity, a large study that
examines all these potential predictors along with novel markers of cardiotoxicity is needed to
identify the most robust predictor of subsequent cardiotoxicity. This will allow investigation of

27
patient-specific cardio-protective strategies to prevent cardiotoxicity and its associated
morbidity/mortality and allow uninterrupted completion of cancer therapy.
2.6.6.6 Cardiac MRI to predict cardiotoxicity
Cardiac MRI, a non-invasive non-radiation based imaging technique is currently the most precise
and accurate technique to identify a drop in LVEF (152). Furthermore, CMR’s precision allows
for accurate quantification of two important determinants of LVEF, namely end-diastolic (EDV)
and end-systolic volumes (ESV). Physiologically, LV-EDV and/or LV-ESV must change before
a drop in LVEF can occur. Changes in LV-ESV and/or LV-EDV can represent changes at the
morphological level, whereas a decrease in LVEF reflects a change at the functional level. The
changes at the morphological and functional cardiac levels are collectively known as cardiac
remodeling. Studying cardiac remodeling longitudinally may provide novel knowledge as to
whether a change in LV-EDV and/or LV-ESV beyond a certain threshold can predict a
subsequent drop in LVEF.
Cardiac MRI also have the advantage of providing information beyond quantification of LV and
RV EF, volumes, and mass. Cardiac MRI can assess myocardial tissue characterization,
myocardial deformation as well as atrial and vesicular flow assessments, making cardiac MRI
the obvious go to technique for accurate and comprehensive assessment of heart function. Table
2.4 compares the main imaging modalities used for assessment in cardiotoxicity.

28
2.6.7 Current knowledge gap in identifying cardiotoxicity
Early detection of cardiac-injury to prevent cardiac-toxicity is a research priority. Currently there
are no risk prediction models for early detection of cardiac-toxicity. Although there has been a
lot of enthusiasm about new techniques such as 2D and 3D echo, echo-measured GLS, and hs-
TnI, they all have intrinsic limitations. For example, the measurement variability for LVEF using
2D or 3D echo in breast cancer patients is >6-10% (14); also the positive predictive value of
echo-measured GLS as well as hs-TnI for detecting subsequent cardiac-toxicity is only around

29
50% (139,140,151). CMR has not been studied formally for early detection yet. CMR has a
better precision and accuracy to detect small changes in LVEF (<5%); CMR can also detect
changes in myocardial volumes (morphological changes) that precede the small changes in
LVEF (functional changes). Furthermore, there is a limited knowledge of the association of these
cardiac morphological and functional changes in cardiac-toxicity. Understanding these
associations can potentially help in early prediction of future cardiac-toxicity. Understanding
these associations requires examining these changes longitudinally in a large, homogenous
cohort of patients. In addition, it is also important to understand normal physiological variability
in healthy individuals over time in order to define thresholds above which a change can be
considered to be pathological. Therefore, understanding remodeling in both healthy people and
breast cancer patients will allow us to define the volumetric and functional changes associated
with development of cardiac-toxicity. Our work will help establish this new knowledge.
2.7 Cardiac Remodeling
2.7.1 Definition of Cardiac Remodeling
The term “cardiac remodeling” was first referred to by Pfeffer et al in 1985 to describe the
ventricular dilatation post-MI in a rat model (153). The term has since been used to describe
various ventricular changes occurring in response to chronic stresses on the heart that are
typically mechanical in nature (154). However, remodeling can essentially occur in response to
any stressors, even due to cardiotoxic drugs such as anthracyclines and trastuzumab (155).
Ventricular changes of remodeling can be simply classified as changes that occur at three main
levels: molecular level, morphological level, and the functional level. Naturally, remodeling at
the molecular level precedes that of the morphological level, and the latter precedes that of the
functional level (Diagram below).
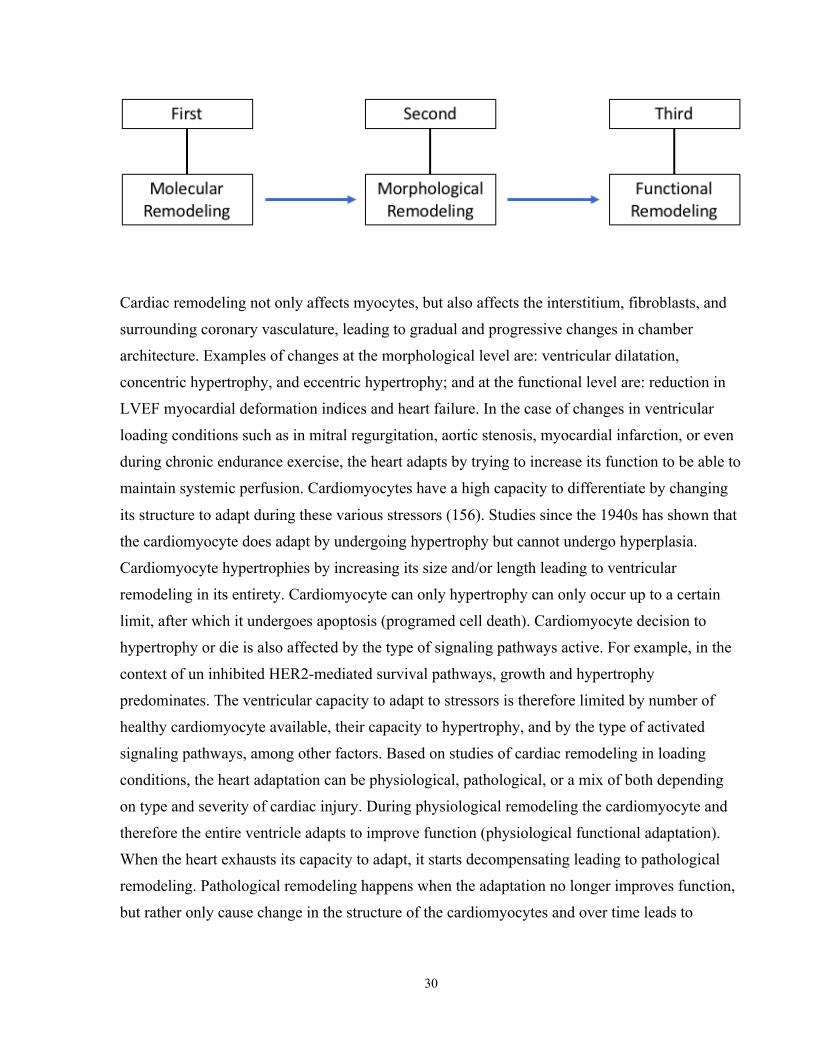
30
Cardiac remodeling not only affects myocytes, but also affects the interstitium, fibroblasts, and
surrounding coronary vasculature, leading to gradual and progressive changes in chamber
architecture. Examples of changes at the morphological level are: ventricular dilatation,
concentric hypertrophy, and eccentric hypertrophy; and at the functional level are: reduction in
LVEF myocardial deformation indices and heart failure. In the case of changes in ventricular
loading conditions such as in mitral regurgitation, aortic stenosis, myocardial infarction, or even
during chronic endurance exercise, the heart adapts by trying to increase its function to be able to
maintain systemic perfusion. Cardiomyocytes have a high capacity to differentiate by changing
its structure to adapt during these various stressors (156). Studies since the 1940s has shown that
the cardiomyocyte does adapt by undergoing hypertrophy but cannot undergo hyperplasia.
Cardiomyocyte hypertrophies by increasing its size and/or length leading to ventricular
remodeling in its entirety. Cardiomyocyte can only hypertrophy can only occur up to a certain
limit, after which it undergoes apoptosis (programed cell death). Cardiomyocyte decision to
hypertrophy or die is also affected by the type of signaling pathways active. For example, in the
context of un inhibited HER2-mediated survival pathways, growth and hypertrophy
predominates. The ventricular capacity to adapt to stressors is therefore limited by number of
healthy cardiomyocyte available, their capacity to hypertrophy, and by the type of activated
signaling pathways, among other factors. Based on studies of cardiac remodeling in loading
conditions, the heart adaptation can be physiological, pathological, or a mix of both depending
on type and severity of cardiac injury. During physiological remodeling the cardiomyocyte and
therefore the entire ventricle adapts to improve function (physiological functional adaptation).
When the heart exhausts its capacity to adapt, it starts decompensating leading to pathological
remodeling. Pathological remodeling happens when the adaptation no longer improves function,
but rather only cause change in the structure of the cardiomyocytes and over time leads to
31
structural change of the entire ventricle (pathological structural adaptation). Pathological
structural adaptation eventually leads to ventricular dysfunction and heart failure (157).
Cardiac physiological and pathological remodeling in response to alterations in loading
conditions has been studied extensively with the intention to develop treatments to prevent or
reverse heart failure by preventing or reversing pathological remodeling. Cardiac physiological
and pathological remodeling during cardiotoxic medications, has not been adequately
investigated, especially with the use of contemporary imaging techniques.
2.7.2 Cardiac Remodeling due to loading conditions
Three main loading conditions have been described: pressure overload, volume overload, and a
mix of pressure and volume overload. In each one of these loading conditions, myriad of cardiac
compensatory mechanisms are triggered to maintain adequate cardiac output to ensure sufficient
systemic perfusion. These compensatory mechanisms initially increase cardiac function by
inducing changes at the cardiomyocyte level (cardiac functional unit) to increase contractility
and changes at the surrounding coronary vasculature to enhance fueling of the heart (adaptive
remodeling). Cardiac compensatory mechanisms can also stimulate proliferation of fibroblasts
leading to fibrosis and thickening (maladaptive remodeling) leading eventually to myocardial
dysfunction (158). The adaptive remodeling occurs by means of physiologic hypertrophy (159).
2.7.2.1 Physiological and Pathological Remodeling
Physiological remodeling is best exemplified in athletes. Hearts of athletes who do regular heavy
physical work increase in weight from 300gm to 500gm (LV from 100gm to 300gm) by
increasing length and thickness of cardiomyocytes and by slight increase in the width of the
capillary network making their hearts hypertrophy and more able to produce higher cardiac
output (157). The hypertrophy in athletes is mostly physiological as the loading stressor is
gradual in nature and voluntary.
Pathological remolding can happen when the loading stressor is sudden and significant (aortic
stenosis, mitral regurgitation), or when there is direct injury to the myocardium (MI,

32
anthracyclines). As the systemic perfusion demands exceeds the limits of heart’s-functional
adaptation, the myocardium undergoes structural adaptation leading to decompensated heart -
signified by failure and dilatation (157).
The extent of physiological/pathological cardiac remodeling is influenced by the severity of the
loading stressor and by the cross-sectional area of normal cardiac tissue capable for adaptation.
2.7.2.1.1 Physiological Remodeling – at the molecular level
Biomechanical stress due to increased LV stretch during diastole and/or due to increased LV
load during systole induces both local and systemic neurohormonal stimuli. Both stimuli are
sensed by specialized myocardial receptors leading to activation of intracellular signaling
pathways activating nuclear responses and gene expression. This lead to changes in
cardiomyocyte phenotype and new cellular and extracellular growth (160). Multiple molecular
signaling pathways have been identified, some leads to physiological remodeling, and others lead
to pathological remodeling, but each one is associated with distinctive biochemical and
molecular signatures (161) (158). Unfortunately, patients frequently have a mix of physiological
and pathological remodeling taking place on different parts of the heart at the same time.
2.7.2.1.2 Physiological Remodeling – at the morphological level
In the case of a relatively mild loading stressor, cardiac remodeling at the cardiomyocyte and
heart’s morphological levels has been divided into three main types: (1) in case of pressure
overload such as due to mild aortic stenosis: myocytes thicken leading to concentric LV
hypertrophy to normalize wall stress; (2) in case of volume overload such as due to mitral
regurgitation: myocytes elongate leading to eccentric LV hypertrophy to accommodate the
increased volume; (3) in the case of mild to moderate post-myocardial infarction: the LV can be
subjected to both concentric and eccentric remodeling (154). In all of these scenarios, the
myocardium hypertrophies typically to increase its energy-producing mass and its contractile
structure so it can meet the body’s demand by maintaining adequate perfusion. In any of these
33
three types of loading stressors, if functional hypertrophy predominates then cardiac remodeling
can be considered physiologic (162).
2.7.2.1.3 Pathological Remodeling – at the morphological level
In the case of moderate or severe hemodynamic load, a cardiomyocyte can either survive the
loading stress and augment heart’s function through further hypertrophy, or undergo apoptosis
(programed cell death) (154). One of the known characteristics of cardiomyocyte’s pathological
hypertrophy, is that there is gene alteration in the type of the cardiac myosin heavy-chain due to
decreased ATPase activity. This alteration causes re-induction of the fetal isoform of myosin
heavy-chain rather than the adult’s isoform. The problem with the fetal isoform is its slower rate
of contractility (163). Since this alteration reduces contractility it potentially contributes to the
development of ventricular dysfunction as a consequence of pathologic remodeling (164).
Pathological remodeling also at the extracellular level is characterized by proliferation of cardiac
fibroblast and enhanced collagen synthesis leading to progressive interstitial and perivascular
fibrosis and eventually myocardial stiffening. This myocardial stiffening, although not know
why it happens, plays an important role in the development of myocardial dysfunction (165).
2.7.2.1.4 Pathological Remodeling – at the molecular level
Increased oxidative stress has been shown, both in animal and human studies, to play an
important role in the development of pathological hypertrophy and heart failure (166) (165).
Oxidative stress happens when production of reactive oxygen species (ROS) occurs in excess of
cell’s natural antioxidant capacity (158) (165). ROS are a natural by-product of mitochondrial
energy generation that exist in all aerobic cells including cardiomyocyte. Also, in
cardiomyocytes, ROS can be produced by xanthine oxidase, NADH/NADPH oxidase, and
endothelial nitric oxide synthase (167,168). ROS are a group of highly toxic oxygen containing
reactive free radicals that have important roles in cell signaling and homeostasis (169). Under
normal conditions, body’s natural anti-oxidants degrade ROS to nontoxic molecules. Excessive
production of ROS during pathological conditions cause cell dysfunction, apoptosis, DNA
damage, protein and lipid peroxidation, cardiac fibroblast proliferation, and activation of matrix

34
metalloproteinases leading to cellular and extracellular myocardial pathological remodeling and
heart failure (168) (170-173).
2.7.3 Cardiac Remodeling due to cardiotoxic cancer therapy
Many chemotherapeutic agents, including anthracyclines and trastuzumab are known to cause
cardiotoxicity, but their mechanism for cardiac remodeling is not fully understood. The
morphological remodeling is a reflection of the molecular remodeling. As these molecular
changes increase in magnitude and reach a certain threshold, changes at the morphological level
become evident. By the same token, structural changes need to reach a threshold point before
changes in cardiac function becomes apparent, and eventually signs and symptoms of heart
dysfunction manifest, if this cycle is not interrupted.
2.7.3.1 Molecular remodeling due to cancer therapy
There is limited data regarding molecular remodeling during breast cancer treatment. As
described earlier, anthracyclines induce ROS production leading to direct myocardial cell
damage, whereas trastuzumab seems to inhibit important cellular functions leading to inhibition
of survival pathways. In light of our understanding of physiological and pathological cardiac
remodeling due to loading conditions, anthracyclines can be considered to essentially cause
pathological remodeling by directly injuring myocytes through the generation of ROS leading to
irreversible cellular (apoptosis and necrosis) and extracellular damage (fibrosis, and thickening).
Biopsy and necropsy studies have confirmed these cellular and extracellular injuries post
anthracyclines treatment. Small studies using cardiac MRI tissue characterization techniques
such as T1 and T2 mapping and ECV has demonstrated edema, inflammation, and fibrosis post
anthracycline use. The heart adapts to the insult of anthracycline injury by augmenting
physiological remolding of the uninjured cardiomyocytes to preserve heart structure and
function. Therefore, during anthracycline treatment the heart undergoes both direct pathologic
remolding and indirect physiological remolding (Diagram below).

35
Molecular Remodeling due to trastuzumab therapy is variable depending on the level of
concomitant stress exerted on the myocardium during the presence of trastuzumab in the
circulation. If the trastuzumab-inhibited heart gets exposed to high loading stressor requiring
compensation and hypertrophy, then this hypertrophy becomes maladaptive (due to inhibited
cardiac survival pathways) leading to pathological remodeling. Examples of high stresses include
anthracycline-induced ROS cell damage, hypertension, MI, or any other loading conditions.
Even in patients with unrecognized subclinical heart dysfunction trastuzumab therapy might tip
these patients over into developing heart failure. This is especially important in older patients
with little reserve as trastuzumab inhibits heart capacity to adapt and hypertrophy (Diagram
below).
Without these stressors trastuzumab is generally believed to have no cardiotoxic effects or only cause subclinical transient reversible ventricular dysfunction (Diagram below).

36
2.7.3.2 Morphological remodeling due to cancer therapy
The current understanding of the morphological remodeling during treatment with anthracyclines
and/or trastuzumab is conflicting since only a few studies with small sample size have studied
remodeling using the non-invasive gold standard cardiac MRI. Other limitations of existing data
include: studying remodeling in a mix of tumors, with mixed treatment regimens, and variable
imaging techniques. Over the recent years, controversy exist regarding the mechanism of
pathological morphological remodeling that leads to drop in LV ejection fraction and
development of cardiac dysfunction. Some groups believe that LV diastolic remodeling
(measured by increase in LVEDV) is the primary insult leading to LV dysfunction (126,174); Haykowsky et al. reported that LV EDV and ESV at rest and peak (dobutamine stress) were significantly
increased after the 4-month intervention period (174); Bergamini et al, further showed that baseline
LVEDV is an independent predictor of LV dysfunction (175). Other groups including ours,
believe that reduction in LV contractility is the first insult leading to LV dysfunction. More
recently, Hundley’s group showed that isolated reduction in preload (measured by reduction in
LVEDV) can lead to LV dysfunction in about 20% of patients during chemotherapy (176,177).
Uncertainties exist regarding the remolding of LVmass during or post cancer therapy. Lipshultz
and Neilan showed that myocardial mass reduces significantly many years post cancer therapy in
pediatric an adults cancer patients, respectively (178,179). Haykowsky et al showed that
myocardial mass increases significantly during trastuzumab therapy in HER2 positive breast
cancer (174). Yet, Avelar et al did not demonstrate significant change of myocardial mass during
cancer therapy, but did show that LVmass/LVEDV decreased significantly during breast cancer
therapy with anthracycline or trastuzumab for early stage breast cancer (180).

37
The aforementioned controversies and uncertainties clearly demonstrates the need for a carefully
performed longitudinal study to delineate the process of ventricular remodeling using cardiac
MRI-derived volumes, function, and mass in a uniform population of cancer during standardized
treatment. Such longitudinal cardiac MRI study will also provide an understanding of cardiac
remodeling which can then be used to study methods to prevent progression to ventricular
dysfunction and heart failure.

38
Chapter 3
MATERIALS AND METHODS
3.1 Patient population
Eighty-seven consecutive women with early stage HER2+ breast cancer who were scheduled to
receive cancer therapy were recruited prospectively from outpatient clinics between January
2014 and April 2017 from Princess Margaret Cancer Centre/University Health Network (UHN),
St. Michael’s Hospital, and the Odette Cancer Centre/Sunnybrook Health Sciences Center.
Thirty-two healthy volunteers were also recruited between July 2014 and November 2016
through advertisements at the Toronto General Hospital. The study was approved by the research
ethics board at the respective sites and all patients and volunteers signed informed consent.
Funding of this study was made possible by the Canadian Institutes of Health Research (CIHR).
3.1.1 Patients’ Inclusion criteria
(1) Women ≥18 years with stage I-III, HER2+ breast cancer scheduled to undergo treatment
with one of: (a) 5-fluorouracil, epirubicin, cyclophosphamide, followed by docetaxel and
trastuzumab, (b) adriamycin, cyclophosphamide, followed by docetaxel and trastuzumab,
(c) adriamycin-cyclophosphamide with weekly paclitaxel and trastuzumab, or (d) dose-
dense adriamycin and cyclophosphamide followed by dose-dense paclitaxel and
trastuzumab; (2) able to tolerate five ~60 minute CMR examinations over 15 months; (3)
able to give informed consent; and (4) able to travel to the University Health Network
(UHN) hospitals for cardiac imaging.

39
3.1.2 Patients’ Exclusion criteria
(1) Life expectancy <12 months; (2) participating in a clinical trial of a new cancer drug; (3)
having received previous anthracycline or radiotherapy to the thoracic region; (4) history of
myocardial infarction or HF; (5) current unstable angina, persistent atrial fibrillation or other
irregular rhythm, or a history of more than mild regurgitant or stenotic valvular heart disease; (6)
severely reduced renal function (GFR ≤ 30ml/min); (7) general contraindications to MRI (e.g.
pacemaker, breast expanders); (8) echo image quality inadequate for strain analysis (unable to
adequately visualize 2 contiguous segments in 2 out of the 3 long axis views).
3.1.3 Healthy Volunteers’ Inclusion and Exclusion Criteria
Inclusion criteria for healthy volunteers were: (1) men and women ≥18 years of age willing to
undergo three CMR scans with contrast over a 6 months period, (2) no prior cardiovascular
disease history, (3) no history of hypertension, diabetes, or hyperlipidemia, (4) not on any
cardiac medications, and (5) no other known systemic diseases. We excluded volunteers with
general contraindications to CMR (e.g. ferromagnetic implants, renal dysfunction).
3.2 Data collection
A research coordinator at each site screened patients at the breast cancer clinic using standard
screening forms. Patients meeting enrollment criteria were approached by the primary oncologist
for participation. The research coordinator obtained written informed consent from all patients
and healthy volunteers. Unique identification numbers were assigned to all consented patients
and healthy volunteers and were linked to their demographic and clinical data in a separate
secure database.

40
3.3 Cancer therapy
All included patients received either adjuvant (i.e. after surgery) or neoadjuvant (i.e. prior
surgery) cancer therapy that consisted of two months of concurrent administration of
anthracycline, and cyclophosphamide +/- 5-flurouracil, followed subsequently by 52 weeks of
concurrent taxane and trastuzumab administration every 3 weeks (71,72). Taxanes were only
administered with trastuzumab during the first 3-4 cycles. The total duration of cancer therapy
was approximately 15 months.
3.4 Timing of imaging in relation to cancer therapy
Cardiac MRI imaging was scheduled, during the 15 months of cancer therapy administration, at
5-time points (Figure 3.A): (1) at baseline (i.e. prior to any cancer therapy), (2) at ~2-3 months
(immediately post completion of anthracyclines but prior to first dose of trastuzumab), (3) at ~5-
6 months (3 months into trastuzumab therapy), (4) at ~9 months (6 months into trastuzumab
therapy), and (5) at ~15months (completion of cancer therapy). During base line visit, cardiac
MRI scan, Echocardiography, and blood samples were performed, as well as the following
clinical data were extracted from hospital electronic patient records or direct patient history using
standardized forms: age, coronary risk factors (hypertension, diabetes, hypercholesterolemia,
smoking, family history of coronary artery disease, and obesity), current medications and doses,
date of cancer diagnosis, tumor characteristics (size, grade, ER, PR status, laterality), vital signs,
height, and weight. All data were entered prospectively into a Medidata RAVE online database
system.
Patients’ first follow up visit (time point 2) was scheduled within 2-3 week of completion of
chemotherapy administration (~2-3 months from baseline). Subsequent Patients’ follow up visits
were scheduled at 3-months, 6-months, and 12-months through trastuzumab therapy (~5-6
months, 9 months, and 15 months from baseline). Cardiac MRI, Echocardiography, and blood
samples were performed as well as patients’ clinical data were extracted for all patients at all
these four follow-up time points. Further, a research coordinator recorded medication use and
cumulative chemotherapy doses for patients during these follow up visits. In patients receiving

41
radiotherapy, total cardiac radiation dose volume histogram data were collected. A standardized
questionnaire was used to collect cardiac symptoms and any cardiac related hospitalizations.
Healthy volunteers’ baseline and follow up visits were scheduled to correspond to the first 3-time
points only (at baseline and at ~2-3 months and ~5-6 months from baseline). Similarly, all
volunteers had cardiac MRI, echocardiography, and blood samples performed as well as clinical
data recorded at all 3-time points. All data were entered prospectively into a Medidata RAVE
database system.
3.5 Primary outcome – (and definition of LV-cardiotoxicity)
For the current study only, cardiac MRI imaging performed at the first 3 time points were
included in the analysis. These time points were chosen to gain an understanding of the early
remodeling during cancer therapy in our patient cohort. The primary outcome for the current
study was the development of cardiotoxicity at any of the first 2 follow up visits. Our primary
definition for cardiotoxicity was based on the CREC criteria as follows: (1) using cardiac MRI, a
≥5% reduction in LVEF from baseline and to <55% with signs or symptoms of HF, OR (2) using
cardiac MRI, a ≥10% reduction in LVEF from baseline to <55% without accompanying signs or
symptoms of HF (11). Presence or absence of heart failure symptoms was determined at time of
each CMR examination by clinical review by a cardiologist with > 5-year experience in cardio-
Figure 3.1. Timing of cardiac MRI imaging in relation to cancer therapy

42
oncology using a synthesis of clinical history, physical examination and results of cardiac
investigations.
3.6 Secondary outcome – (and LVEF sensitivity analysis)
Our study secondary outcome was based on a pre-defined sensitivity analyses including a mild
reduction in LVEF of >5% at any of the follow-up time-points compared to baseline, using
cardiac MRI. We used this cut-off based on published recent data showing that: (1) in breast
cancer patients treated with anthracyclines and/or trastuzumab the mean drop in LVEF using
cardiac MRI was 5.0-5.2% (181,182); (2) cardiac MRI’s excellent observer and test-re-test
reproducibility makes detection of a 5% change over time reliable (177,183,184); (3). This
precision is also confirmed with our own data (results section) where intra-observer, inter-
observer, and temporal variabilities for LVEF and ventricular volumes using cardiac MRI are
well below 5% for our cohort of healthy volunteers.
3.7 Definition of RV-cardiotoxicity
RV cardiotoxicity was defined as a >10% drop in RVEF to <51% based on recently published
normal values by Kawel-Boehm et al (185).
3.8 Definition of significant change in volumes
Significant changes in cardiac MRI measured LV volumes were defined to be consistent with
published literature as LVEDV reduction >10 mL and LVESV increase >5 mL (177). These
thresholds are also higher than the inter-study variability for these measurements reported in the
literature (186). Arterial elastance (EaI) was calculated as end-systolic pressure (0.9 x brachial
systolic blood pressure)/LV stroke volume indexed to BSA (176)

43
3.9 Bio-specimen collection and bio-banking
Blood sample was collected by venipuncture from every volunteer at every time point within 1
hour of the CMR study. hs-TnI, and BNP measurements were obtained using the central hospital
laboratory. High sensitivity Troponin-I and BNP assays were performed on the ARCHITECT
i2000 immunoassay analyzer (Abbott Diagnostics, Abbott Park, IL, USA) using
the manufacturer's reagents. The limit of detection for the troponin assay is 2 pg/mL with
routine CV of 5.6% at 46 pg/mL and 4.3% at 1400 pg/mL. The limit of detection for the BNP
assay is 10 pg/mL with routine CV of 8.8% at 67 pg/mL and 8.2% at 300 pg/mL.
3.10 Cardiac MRI acquisition
Cardiac MRI studies were performed on a 1.5T scanner (Siemens) using a multi-element
receiver-coil array. The study consisted of: (1) long axis (3, 2, 4 chamber) and a stack of short
axis (SAX) cine steady state-free precession (SSFP) slices for LV function assessment.
Acquisition parameters for the CMR techniques are summarized in Table 3.1. Cardiac MRI
studies were performed pre-therapy, at ~2-3 months (post-anthracycline completion but pre
trastuzumab initiation), at ~5-6 months (3 months into trastuzumab), at ~9 months (6 months into
trastuzumab), and at completion of trastuzumab (~15 months from baseline - Figure A).
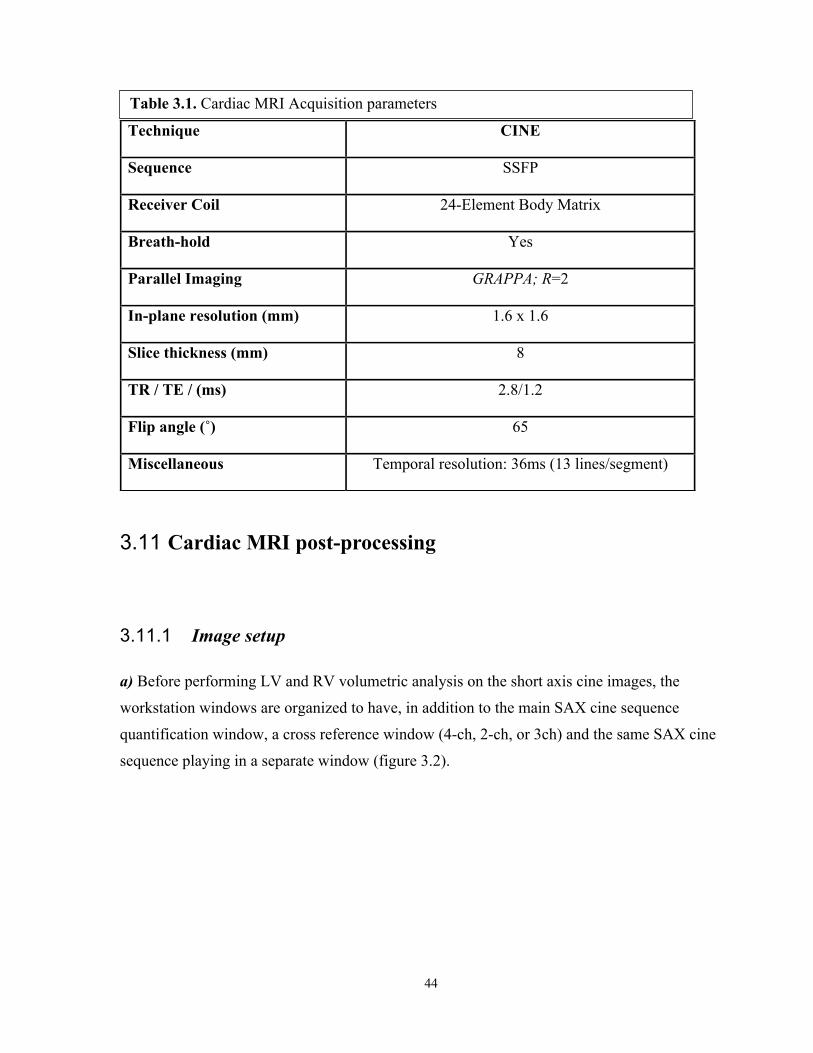
44
3.11 Cardiac MRI post-processing
3.11.1 Image setup
a) Before performing LV and RV volumetric analysis on the short axis cine images, the
workstation windows are organized to have, in addition to the main SAX cine sequence
quantification window, a cross reference window (4-ch, 2-ch, or 3ch) and the same SAX cine
sequence playing in a separate window (figure 3.2).
Technique CINE
Sequence SSFP
Receiver Coil 24-Element Body Matrix
Breath-hold Yes
Parallel Imaging GRAPPA; R=2
In-plane resolution (mm) 1.6 x 1.6
Slice thickness (mm) 8
TR / TE / (ms) 2.8/1.2
Flip angle (˚) 65
Miscellaneous Temporal resolution: 36ms (13 lines/segment)
Table 3.1. Cardiac MRI Acquisition parameters

45
b) Windows’ size and contrast are optimized, quality of image planning is checked, and a 4
chamber cines sequence is checked in movie mode to note the presence/absence of any valvular
regurgitation (Figure 3.2).
c) A single LV end-diastolic phase is defined by identifying visually the phase with the largest
LV blood volume. Also, a single LV end-systolic phase is defined by identifying visually the
phase with the smallest LV blood volume.
d) Similarly, a single RV end-diastolic phase is defined by identifying visually the phase with the
largest RV blood volume and a single RV end-systolic phase defined as the phase with the
smallest RV blood volume.
Figure 3.2. CMR post-processing - window layout: A. SAX cine primary quantification window showing tracing at end-diastolic phase: LV
endo-cardial contour (red), LV epi-cardial contour (green), RV endo-caridial contour (yellow), and cross-reference line (white);
B. A movie window playing the same SAX cine sequence at the same slice level. The current phase is at end-systole showing similarly, yet only, LV endo-cardial contour (red) and RV endo-cardial contour (yellow);
C. A 4-chamber cross-reference window showing all cross-referencing lines spanning both LV and RV from base to apex. Current slice position is at mid-ventricle (yellow line) and at end-diastole (synchronized with the primary quantification window).
A B
C

46
e) LV and RV end-diastole are usually on the same phase; however, LV and RV end-systole may
not necessarily be on the same phase.
f) First basal end-systolic slice position is usually lower than that of the first basal end-diastolic
slice position for both LV and RV due to the systolic motion of the annular ring toward the apex
(basal descent).
g) In the case of difficult LV end-systolic phase determination, phase that precedes closure of the
aortic valve is selected.
h) LV and RV parameters recorded were: end-diastolic volume, end-systolic volume, ejection
fraction, stroke volume, mass (latter only for LV), and body-surface area-indexed values of all
except ejection fraction.
i) Endocardial borders are contoured at end-diastole and end-systole for both LV and RV;
epicardial borders are only contoured at end-diastole for LV only (Figure 3.3).

47
A
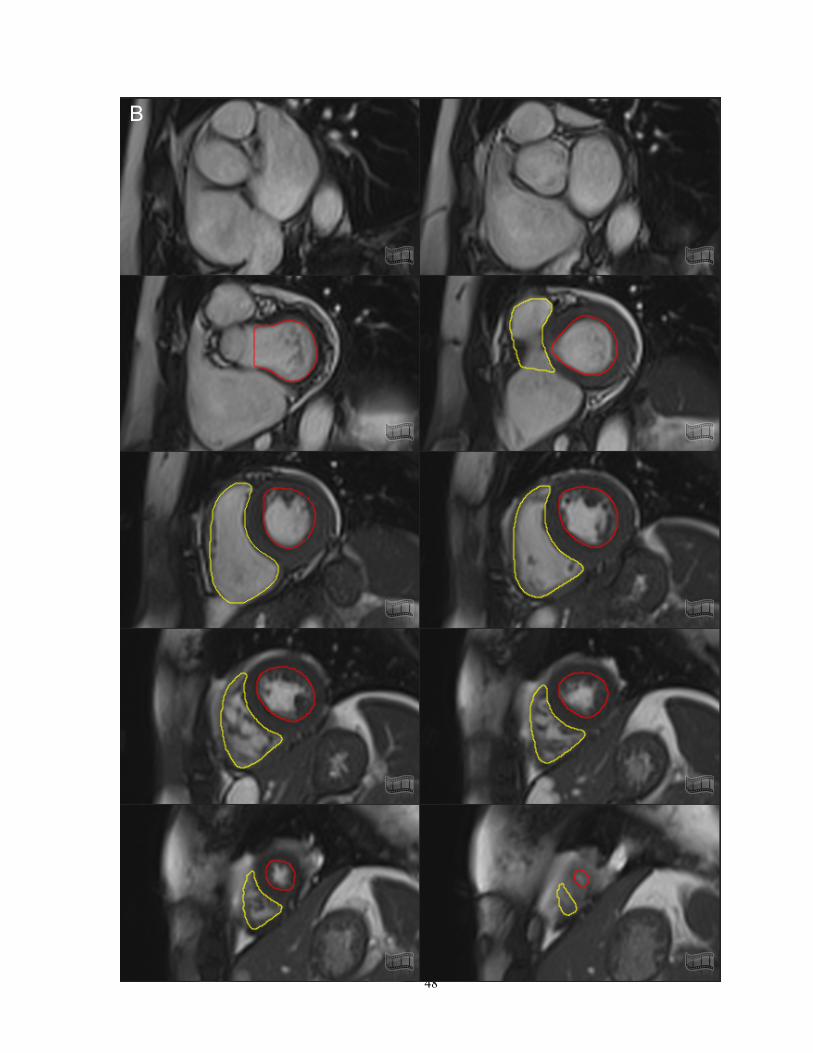
48
B

49
3.11.2 Volume, function, mass quantification
3.11.2.1 General
a) Smooth endocardial borders are drawn right where the compact and trabecular myocardium
meet, making sure no white areas (blood) are seen outside the traced line (Figure 3.3).
b) Smooth epicardial borders are drawn so no white areas (fat) are seen inside the traced line. In
case of chemical shift (thick black) artifact line, epicardial contours should be drawn right on the
middle of the chemical shift artifact line (Figure 3.4).
c) LV Papillary muscles are included in the LV blood pool volume (excluded from LV mass);
similarly, RV trabecular tissue and papillary muscles are included in the RV blood pool volume
(Figure 3.3).
Figure 3.3. CMR post-processing – complete tracing of a single case A. All slices at end-diastolic phase B. All slices at end-systolic phase
Figure 3.4. CMR post-processing – LV-epicardial contours, chemical shift tracings
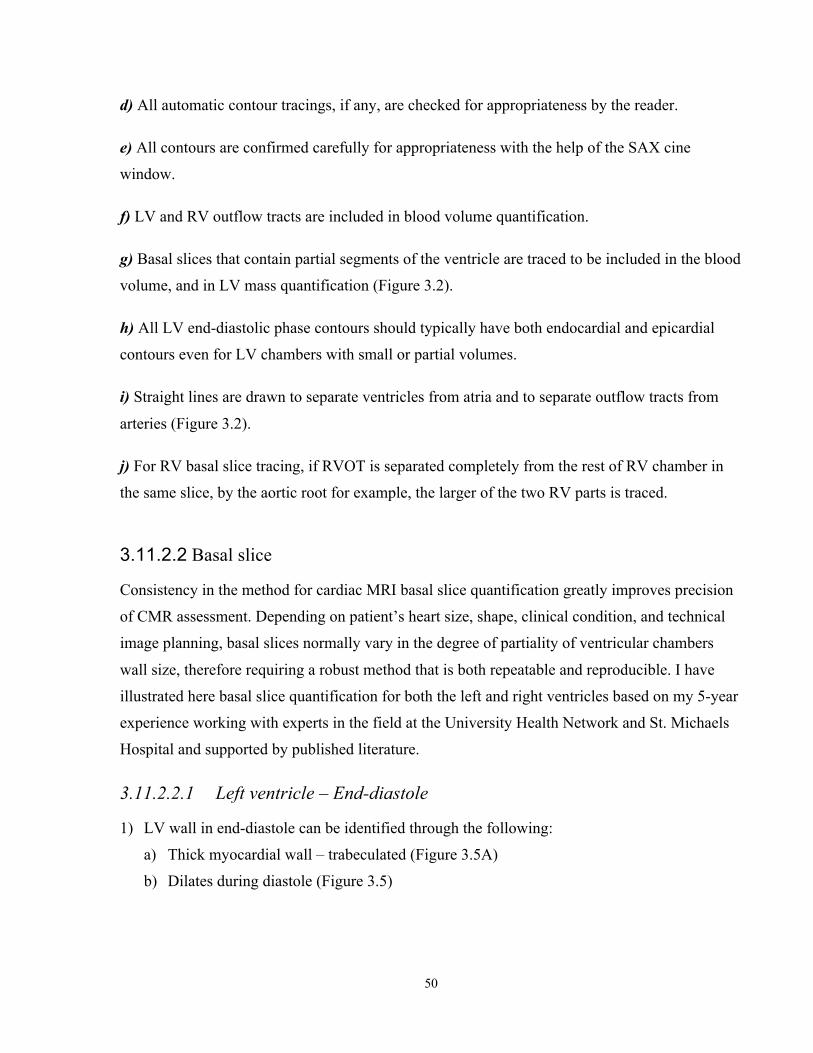
50
d) All automatic contour tracings, if any, are checked for appropriateness by the reader.
e) All contours are confirmed carefully for appropriateness with the help of the SAX cine
window.
f) LV and RV outflow tracts are included in blood volume quantification.
g) Basal slices that contain partial segments of the ventricle are traced to be included in the blood
volume, and in LV mass quantification (Figure 3.2).
h) All LV end-diastolic phase contours should typically have both endocardial and epicardial
contours even for LV chambers with small or partial volumes.
i) Straight lines are drawn to separate ventricles from atria and to separate outflow tracts from
arteries (Figure 3.2).
j) For RV basal slice tracing, if RVOT is separated completely from the rest of RV chamber in
the same slice, by the aortic root for example, the larger of the two RV parts is traced.
3.11.2.2 Basal slice
Consistency in the method for cardiac MRI basal slice quantification greatly improves precision
of CMR assessment. Depending on patient’s heart size, shape, clinical condition, and technical
image planning, basal slices normally vary in the degree of partiality of ventricular chambers
wall size, therefore requiring a robust method that is both repeatable and reproducible. I have
illustrated here basal slice quantification for both the left and right ventricles based on my 5-year
experience working with experts in the field at the University Health Network and St. Michaels
Hospital and supported by published literature.
3.11.2.2.1 Left ventricle – End-diastole
1) LV wall in end-diastole can be identified through the following:
a) Thick myocardial wall – trabeculated (Figure 3.5A)
b) Dilates during diastole (Figure 3.5)

51
2) LV outflow tract wall in end-diastole can be identified through the following:
a) Relatively thin straight wall up to, but not including any bulge that represent aortic cusps
(Figure 3.6A)
b) Does not constrict during diastole
A B
Figure 3.5. CMR post-processing – LV basal slice quantification in end-diastole: A. SAX image - Thick trabeculated myocardial wall, dilates during diastole (Red arrow);
Thin non-trabeculated atrial wall, constricts during diastole (yellow arrow); Mitral valve leaflets (black arrows).
B. 2-chamber image is ideal to cross-reference mitral ring. Black arrow head shows that the mitral valve insertion is below the yellow cross-referencing line (left atrium), explaining why it was excluded from LV wall quantification in A.
Figure 3.6. CMR post-processing – LVOT in end-diastole: A. Straight thin walled LVOT (red arrow); Aorta (yellow arrow). B. 3-chamber image is ideal to cross-reference the LVOT.
A B

52
3.11.2.2.2 Left ventricle – End-systole
3) LV wall in end-systole can be identified through the following:
a) Thick myocardial wall – trabeculated (Figure 3.7A)
b) constricts during systole (Figure 3.7)
c) Sometimes a thin annular ring can be confused for atrial tissue. But it can be clearly
visualized by the corresponding cross-referencing long axis images as being part of the
LV chamber (below the plain of mitral valve) (Figure 3.8 and 3.9).
Figure 3.7. CMR post-processing – LV basal slice quantification in end-systole: A. SAX image - Thick trabeculated myocardial wall constricts during systole (Blue
arrow); Thin non-trabeculated atrial wall, dilates during systole (yellow arrow); Mitral valve closed (black arrows).
B. 2-chamber image is ideal to cross-reference mitral ring attachments – Arrows correspond to A; Black arrow head shows that the mitral valve insertion is below the yellow cross-referencing line (left atrium), explaining why it was excluded from LV wall quantification in A.
A B
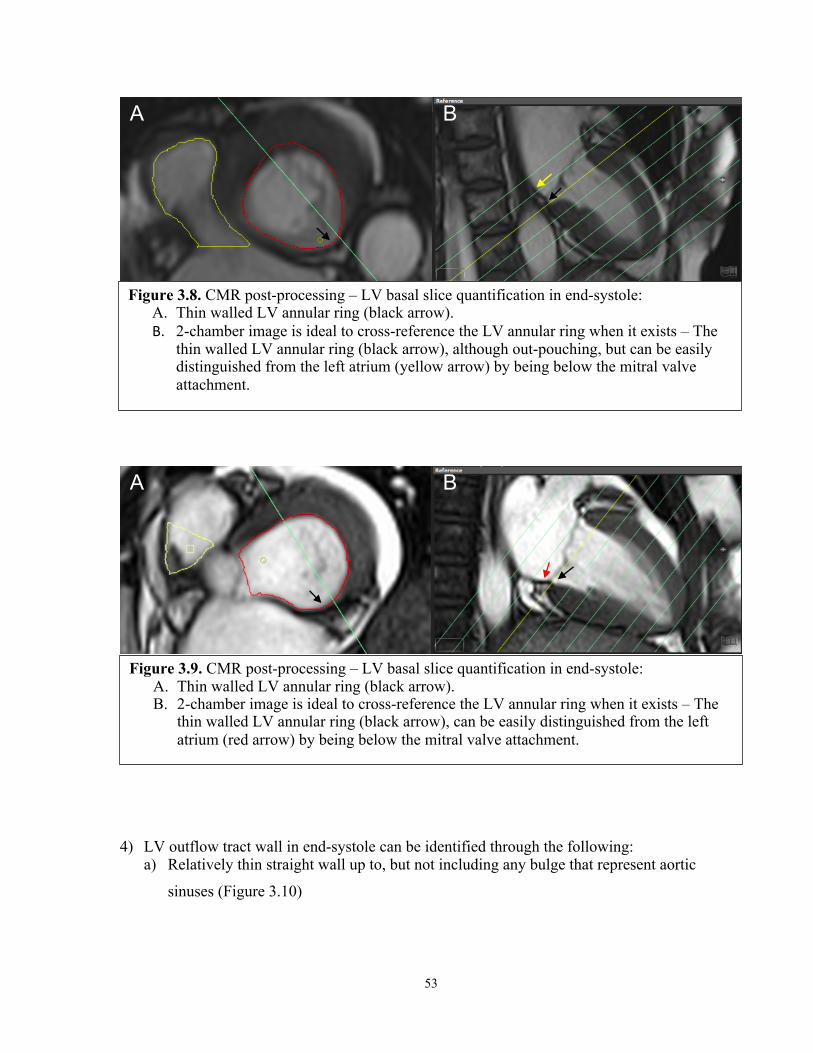
53
4) LV outflow tract wall in end-systole can be identified through the following: a) Relatively thin straight wall up to, but not including any bulge that represent aortic
sinuses (Figure 3.10)
Figure 3.8. CMR post-processing – LV basal slice quantification in end-systole: A. Thin walled LV annular ring (black arrow). B. 2-chamber image is ideal to cross-reference the LV annular ring when it exists – The
thin walled LV annular ring (black arrow), although out-pouching, but can be easily distinguished from the left atrium (yellow arrow) by being below the mitral valve attachment.
Figure 3.9. CMR post-processing – LV basal slice quantification in end-systole: A. Thin walled LV annular ring (black arrow). B. 2-chamber image is ideal to cross-reference the LV annular ring when it exists – The
thin walled LV annular ring (black arrow), can be easily distinguished from the left atrium (red arrow) by being below the mitral valve attachment.
A B
A B

54
b) Does not dilate during systole
3.11.2.2.3 Right ventricle – End-diastole
5) RV wall can be identified through the following:
a) Thin to mildly thick and trabeculated wall (Figure 3.1 and 3.10)
b) Dilates during diastole (Figure 3.11)
Figure 3.10. CMR post-processing – LVOT in end-systole: A. Straight thin walled LVOT (black arrows); Aortic cusp (yellow arrow). B. 3-chamber image is ideal to cross-reference the LVOT.
A B
Figure 3.11. CMR post-processing – RV in end-diastole: A. SAX image: trabeculated myocardial wall (black arrows), dilates during diastole
(yellow arrow); Thin non-trabeculated right atrial wall that constricts during diastole (red arrow).
B. 4-chamber image is ideal to cross-reference RV wall and tricuspid valve.
A B

55
6) RV outflow tract wall in end-diastole can be identified through the following:
a) Long and thin wall up to, but not including any bulge that represent pulmonary valve
cusps (Figure 3.12)
b) Expands during diastole
3.11.2.2.4 Right ventricle – End-systole
7) RV wall in end-systole can be identified through the following:
a) Relatively thick trabecular wall (Figure 3.13)
b) constricts during systole (Figure 3.13)
Figure 3.12. CMR post-processing – RVOT in end-diastole: A. Straight thin walled LVOT (black arrows); Neck of the pulmonary valve (yellow
arrows).
A

56
8) RV outflow tract wall in end-systole can be identified through the following:
a) Long and thin wall (constricts during systole) up to but not including any bulge that
represent pulmonary artery sinuses (Figure 3.14 and 3.15)
A B
Figure 3.13. CMR post-processing – RV in end-systole: A. Trabeculated myocardial wall (blue arrows), constricts during systole (yellow arrow);
Thin non-trabeculated right atrial wall that dilates during systole (red arrow); cross reference line identifies attachment point of tricuspid valve on the interventricular septum (black arrow head).
B. 4-chamber image is ideal to cross-reference RV wall and tricuspid valve.
Figure 3.14. CMR post-processing – RVOT in end-systole: A. Straight and thin walled LVOT (black arrows); Neck of the pulmonary valve (yellow
arrows).
A
57
3.11.3 Confirmation of results
“If no intracardiac shunts or valvular regurgitation is present, the RV and LV stroke volumes
should be nearly equal (small differences are seen as a result of bronchial artery supply). Since
the LV stroke volume is more reliably determined than the RV stroke volume, the LV data can
be used to validate RV data” (187).
3.12 Intra-observer and inter-observer, test-retest and temporal variability quantification – Healthy Volunteers
For the healthy volunteers, temporal variability for LV and RV parameters (baseline, 3-month,
and 6-month; 90 CMR studies), were analyzed by the same reader (MA). For intra- and inter-
observer variability the primary reader (MA) repeated 45 CMR studies (15 random patients x 3
time points) 4 weeks later blinded to prior measurements and in a random fashion to eliminate
any memory of the first measurements. A second reader (MN) independently performed the
analysis on the same 45 scans and repeated it 4 weeks later blinded to prior measurements and in
Figure 3.15. CMR post-processing – RVOT in end-systole: A. RVOT constricts during systole (yellow arrow); Left atrium dilates during systole (red
arrow); cross reference line identifies the approximate attachment point of tricuspid valve on the interventricular septum (black arrow head).
B. 4-chamber image.
A B

58
a random fashion. The inter-observer variability is the average of 2 readers, while the inter-
observer variability accounted for both within reader and between reader variability (14,188).
We also calculated the 6-month inter-observer test-retest variability by randomly using baseline
first measurement by reader one compared to 6-month first measurement by reader two (15
volunteers x 1 time-point x 2 readers x 2 measurements each reader = 60 scans). This represents
variability in measurements when measurements are performed by two different readers at two
separate time points as is the case in routine clinical practice.
For the patients, Intra- and inter-observer variability was assessed in 20 randomly chosen single
time point CMR data sets. Intra-observer variability was assessed by a single observer repeating
the analysis (about 3 months apart) blinded to previous results and clinical data. Inter-observer
variability was assessed by two observers blinded to clinical and each other data.
3.13 Statistical analysis
Data are summarized as mean (SD) or median (IQR) as appropriate. All data were first assessed
for normality based on skewness, kurtosis, and the Kolmogorov-Smirnov test. No
transformations were necessary.
3.13.1 Volunteers
To assess if there was significant temporal variability in LVEF, LVEDV and LVESV we
performed linear mixed model analysis with the variable of interest as the dependent, volunteers
as random effect, and time (in days) as a covariate. We used compound symmetry as our model
for covariance structure since our healthy volunteers were expected to have constant variances
over time and constant correlation between measurement times. Repeated measured analysis of
variance was used to calculate the mean square error using the parameter of interest (LVEF,
LVEDV, LVESV, LVSV, LVmass, RVEF, RVEDV, RVESV, RVSV, hs-TnI, or BNP) as the
dependent variable, subjects as fixed factors, and time as the observer. The square root of the
error term provided the standard error of the measurement (SEM) for each parameter over the 3

59
time points and was the primary measure of temporal variability. The 95% confidence interval
(CI) for the SEM was calculated as:
(𝑛 − 1)𝑆'
𝑋𝑢' < 𝜎' <(𝑛 − 1)𝑆'
𝑋𝑙'
Where XU2 is the upper-tail of the chi-square distribution for df=n-1 with area α/2 to its right
and XL2 is the lower-tail value with α/2 to its left. The minimal temporal change in the measured
parameters above which measurements over time in the same patient could be considered to be
truly different was taken as twice the SEM for each technique. In addition, the coefficient of
variation (COV) and 95% CI (as described above) was also calculated as a second measure of
temporal variability for each method in order to allow inter-method comparisons. The absence of
overlap in 95% CI for various SEM and COV measurements were used as a measure of
significant differences in measurements.
Intra- and inter-observer variability were determined using the 2-way ANOVA approach as
described by Eliasziw et al (188) with observers used as random factors. This technique was
recently described specifically for use with cardiac imaging studies (189). In this analysis the
inter-observer variability consists of the variability between the measurements of the two readers
as well as each reader’s intrinsic variability. The inter-observer test-retest variability was also
calculated using the 2-way ANOVA and consists of variability within observers, between
observers, and over time. For all 3 measures, the 95% CI was calculated as a measure of the
smallest difference between 2 measurements above which the measurements can be considered
to be truly different (189). The method used to calculate the 95% CI has been previously
described (189). All statistical analysis was performed with SPSS (version 24.0.0.0, SPSS,
Chicago, Illinois).
3.13.2 Patients
Comparison of means was performed using paired or unpaired t-test as appropriate. Longitudinal
data analysis was performed using linear mixed models to determine changes in vitals and
imaging parameters over study period. The frequency of LVEDV declines or LVESV increases
were calculated based on above criteria in those with cardiotoxicity. Association between

60
cardiotoxicity and various parameters at baseline or their early change were assessed using
univariable logistic regression models. To assess whether early changes predict cardiotoxicity,
the changes in the following parameters were considered: LV and RV volumes and EF, serum
biomarkers, BSA, EaI, and NYHA. Multivariable adjustments could not be performed due to the
small number of cardiotoxicity events. Intra-observer variability were calculated using co-
efficient of variation and Bland-Altman analysis. A two-sided p-value <0.05 was considered
significant. Statistical analysis was performed using SPSS version 24 (IBM Corp., Armonk, NY)
and R statistical software (Vienna, Austria).

61
Chapter 4
RESULTS – 1 (Validation, Healthy Volunteers)
4.1 Healthy Volunteers
Amongst the 32-healthy volunteers recruited, 2 dropped out after their first CMR study. Thirty
healthy volunteers, 60% female, mean age ± SD = 50.0 ± 13.5 years (range 23.3–80.4)
completed all three time points and were included in the analysis (30 volunteers x 3 time points =
90 studies). Volunteers’ vitals at all 3 time points are summarized in Table 4.1. The systolic
blood pressure was higher on the first exam compared to the subsequent studies. There was no
difference in diastolic blood pressure, or heart rate over the study period.
Table 4.1. Clinical Characteristics and Demographic Data for Healthy Volunteers Variable All Time-Points Baseline 3-Months 6-Months p-Value*
Age 50.0 ± 13.5
Females 18 (60%)
Heart Rate (beat/min) 64.6 ± 8.8 65.6 ± 8.6 63 ± 8.9 65.1 ± 9 0.249
Systolic BP (mmHg) 129.2 ± 16.6 134.7 ± 19.6 126.6 ± 14.8 126.3 ± 14.1 0.011
Diastolic BP (mmHg) 77.4 ± 11 77.9 ± 12.4 76.8 ± 9.8 77.4 ± 10.9 0.986
Body Mass Index (kg/m2) 25.2 ± 4.5 24.9 ± 4.9 25.5 ± 4.6 25.2 ± 4.2 0.742
eGFR (ml/min/1.73 m2) 73.1 ± 12 73.3 ± 12.6 73.4 ± 12.1 72.6 ± 11.8 0.796
Hematocrit (%) 40.8 ± 3.2 40.1 ± 3 40.9 ± 3.2 40.7 ± 3.4 0.818
Troponin-I (ng/ml) 2.2 ± 0.9 2.1 ± 0.6 2.3 ± 1 2.3 ± 1.1 0.203
BNP (pg/ml) 23.0 ± 21.3 22.5 ± 22 22.1 ± 15.7 24.3 ± 25.6 0.620
LVEF (%) 59.5 ± 4.4 59.9 ± 3.8 59.0 ± 4.7 59.5 ± 4.5 0.372
Values provided are mean ± SD, * Linear mixed model - correlation compound symmetry

62
4.2 Ventricular Volumes, Mass, and Function
4.2.1 Normal Values – Left Ventricle
All left ventricular (LV) data were analyzable in all 3 time points from all 30 volunteers.
Considering all 90 studies, the mean ± SD value (range) for LV-EF was 59.5 ± 4.4%, (50.0-
68.6%); for LV-EDV was 153.4 ± 36.3ml, (103.5-279.7ml); for LV-ESV was 62.8 ± 18.8ml,
(35.0-128.3ml); LV-stroke volume (SV) was 90.7 ± 19.5ml, (64.3-151.9ml); and LV-mass was
74.4 ± 18.9g, (39.6-126.9g). LV parameters at baseline and follow-up time points are
summarized in Table 2; there were no significant differences over the 3 time points in LV-EF,
EDV, ESV, SV, or Mass values (p-value >0.05 for all) (Table 4.2).
Mean LVEF was normal at baseline (59.9 ± 4.0%); however, 3 healthy volunteers had LVEF
between 50-55%, and no-one had an LVEF below 50% at baseline. Similarly, mean LVEF was
normal at the follow-up time points (58.9 ± 4.7% at 3-month and 59.7 ± 4.4% at 6-month). No
healthy volunteer had an LVEF below 50% at the follow-up time points.

63
Table 4.2. Normal Values for Left and Right Ventricular Volumetric Parameters in healthy volunteers
Variable All Time
points
SD Range Baseline SD 3-
Months
SD 6-
Months
SD *P-
Value
Left Ventricular Parameters:
EF (%) 59.5 4.4 50.0-68.6 59.9 4.0 58.9 4.7 59.7 4.4 0.350
EDV (ml) 153.4 36.3 103.5-279.7 153.3 36.0 153.0 38.4 154.0 35.5 0.889
ESV (ml) 62.8 18.8 35.0-128.3 61.9 17.2 63.6 20.6 62.8 19.0 0.445
SV (ml) 90.7 19.5 64.3-151.9 91.4 20.7 89.4 19.7 91.2 18.8 0.443
Mass (gm) 74.4 18.9 39.6-126.9 74.1 18.5 76.1 20.2 73.1 18.3 0.059
Right Ventricular Parameters:
EF (%) 54.7 4.9 44.8-66.1 55.2 5.0 54.2 5.1 54.8 4.7 0.230
EDV (ml) 167.1 38.8 111.2-285.5 166.6 40.5 167.2 39.3 167.5 37.9 0.931
ESV (ml) 76.2 21.7 41.3-133.3 75.2 22.3 77.1 21.9 76.4 21.5 0.373
SV (ml) 90.8 19.9 62.5-153.2 91.4 21.3 90.1 20.1 91.1 18.8 0.731
* Linear mixed model - correlation compound symmetry
4.2.2 Normal Values – Right Ventricle
All right ventricular (RV) data were analyzable in all 3 time points from all 30 volunteers.
Considering all 90 studies, the mean ± SD value (range) for RV-EF was 54.7 ± 4.9%, (44.8-
66.1%); for RV-EDV was 167.1 ± 38.8ml, (111.2-285.5ml); for RV-ESV was 76.2 ± 21.7ml,
(41.3-133.3ml); and for RV-SV was 90.8 ± 19.9ml, (62.5-153.2ml). RV parameters at baseline
and follow-up time points are summarized in Table 2; there were no significant differences over
the 3 time points in RV-EF, EDV, ESV, or SV values (p-value >0.05 for all) (Table 4.2).
Mean RVEF was normal at baseline (55.2 ± 5.0%); however, 3 healthy volunteers had RVEF
between 45-50%, and only one had an RVEF below that range at 44.8% at baseline. Similarly,
mean RVEF was normal at the follow-up time points (54.2 ± 5.1% at 3-month and 54.8 ± 4.7%
at 6-month). No healthy volunteer had an RVEF below 45% at the follow-up time points.

64
4.2.3 Temporal Variability (table 4.3)
The temporal variability as measured by SEM (95%CI), was small for all LV and RV volumetric
parameters, (table 4.3, figure 4.1). Based on our data the temporal variability for EF for both
ventricles was approximately 2.5% with upper 95%CI below 3.0%, while the temporal
variability for LV-EDV and LV-ESV, as measured by SEM (upper 95%CI), was 8.3ml (9.7ml)
and 5.2ml (6.1ml), respectively.
The temporal variability as measured by COV (95%CI), were within a close range of each other
for all LV and RV corresponding volumetric parameters, (table 4.3, figure 4.2). The temporal
variability as measured by COV (95%CI), comparing LV volumetric parameters, was smallest
for LV-EF at 3.8% (3.1–4.6%), followed by LV-EDV at 4.3% (3.0%–5.7%), and then LV-ESV
at 7.1% (5.6– 8.6%). Similarly, the temporal variability measured by COV (95%CI) comparing
RV volumetric parameters, was smallest for RV-EF at 3.9% (3.4–4.5%), followed by RV-EDV
at 4.9% (3.8%–6.0%), and then RV-ESV at 6.2% (4.8– 7.6%).

65
Table 4.3. Temporal Variability of Left and Right Ventricular Volumetric Parameters for all Time Points in Healthy Volunteers, Represented as Standard Error of Measurement (SEM) 95% CI, and as Coefficient of Variation (COV) 95% CI.
Variable Temporal
Variability by SEM
Lower
95%CI
Upper
95%CI
Temporal
Variability by COV
Lower
95%CI
Upper
95%CI
Left Ventricular Parameters:
EF 2.55% 2.23 2.99 3.82% 3.05 4.59
EDV 8.26 ml 7.20 9.68 4.33% 2.99 5.67
ESV 5.22 ml 4.55 6.12 7.08% 5.55 8.61
SV 6.83 ml 5.96 8.00 6.26% 4.81 7.72
Mass 4.86 gm 4.24 5.69 5.48% 4.26 6.7
Right Ventricular Parameters:
EF 2.28% 1.99 2.67 3.93% 3.36 4.5
EDV 8.96 ml 7.82 10.50 4.88% 3.81 5.95
ESV 5.32 ml 4.64 6.24 6.19% 4.83 7.55
SV 6.81 ml 5.94 7.98 6.33% 4.85 7.8

66
Figure 4.1. Mean +/- standard deviation of Normal values in health volunteers for LV ejection fraction, LV end-diastolic volume, LV end-systolic volume, LV stroke volume, and LV mass over three time points (baseline, 3 months, and 6 months).
Para
met
er

67
Figure 4.2. Temporal variability demonstrated as coefficient of variation (CoV) in healthy volunteers comparing side by side left and right ventricular ejection fraction, end-diastolic volume, end-systolic volume, and stroke volume over the 6-month follow-up period.
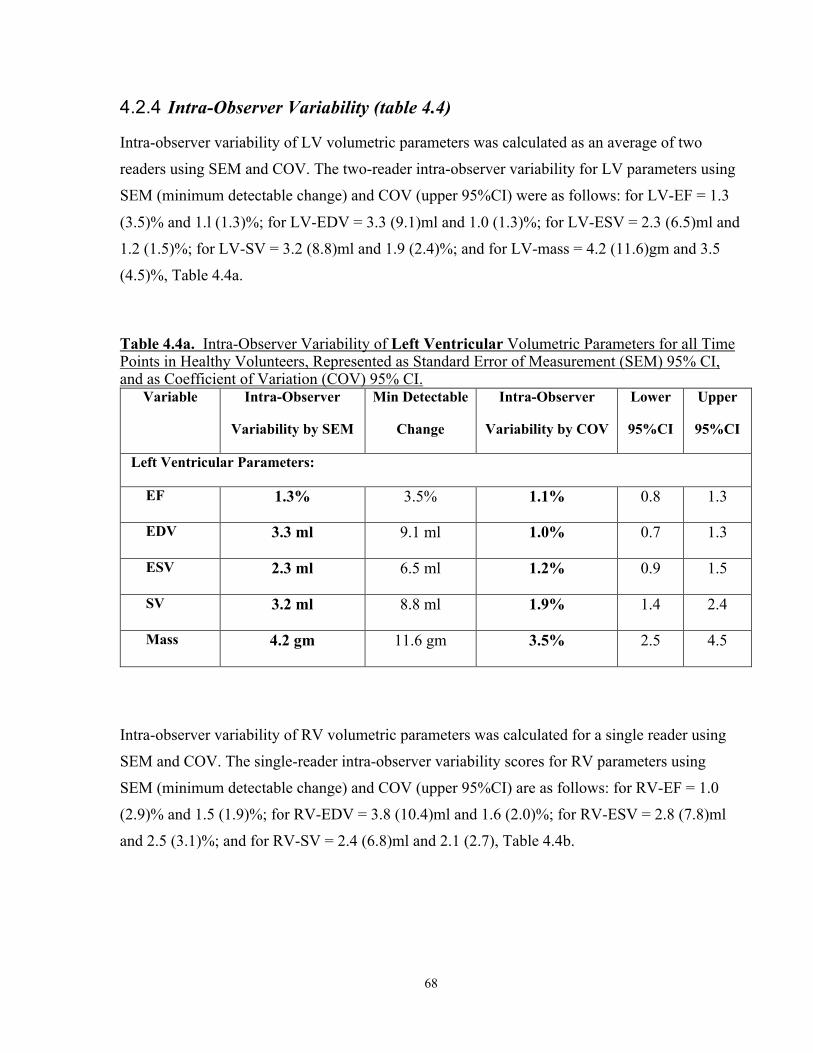
68
4.2.4 Intra-Observer Variability (table 4.4)
Intra-observer variability of LV volumetric parameters was calculated as an average of two
readers using SEM and COV. The two-reader intra-observer variability for LV parameters using
SEM (minimum detectable change) and COV (upper 95%CI) were as follows: for LV-EF = 1.3
(3.5)% and 1.l (1.3)%; for LV-EDV = 3.3 (9.1)ml and 1.0 (1.3)%; for LV-ESV = 2.3 (6.5)ml and
1.2 (1.5)%; for LV-SV = 3.2 (8.8)ml and 1.9 (2.4)%; and for LV-mass = 4.2 (11.6)gm and 3.5
(4.5)%, Table 4.4a.
Table 4.4a. Intra-Observer Variability of Left Ventricular Volumetric Parameters for all Time Points in Healthy Volunteers, Represented as Standard Error of Measurement (SEM) 95% CI, and as Coefficient of Variation (COV) 95% CI.
Variable Intra-Observer
Variability by SEM
Min Detectable
Change
Intra-Observer
Variability by COV
Lower
95%CI
Upper
95%CI
Left Ventricular Parameters:
EF 1.3% 3.5% 1.1% 0.8 1.3
EDV 3.3 ml 9.1 ml 1.0% 0.7 1.3
ESV 2.3 ml 6.5 ml 1.2% 0.9 1.5
SV 3.2 ml 8.8 ml 1.9% 1.4 2.4
Mass 4.2 gm 11.6 gm 3.5% 2.5 4.5
Intra-observer variability of RV volumetric parameters was calculated for a single reader using
SEM and COV. The single-reader intra-observer variability scores for RV parameters using
SEM (minimum detectable change) and COV (upper 95%CI) are as follows: for RV-EF = 1.0
(2.9)% and 1.5 (1.9)%; for RV-EDV = 3.8 (10.4)ml and 1.6 (2.0)%; for RV-ESV = 2.8 (7.8)ml
and 2.5 (3.1)%; and for RV-SV = 2.4 (6.8)ml and 2.1 (2.7), Table 4.4b.

69
Table 4.4b. Single-Reader Intra-Observer Variability of Right Ventricular Volumetric Parameters for all Time Points in Healthy Volunteers, Represented as Standard Error of Measurement (SEM) 95% CI, and as Coefficient of Variation (COV) 95% CI.
Variable Intra-Observer
Variability by SEM
Min Detectable
Change
Intra-Observer
Variability by COV
Lower
95%CI
Upper
95%CI
Right Ventricular Parameters:
EF 1.0% 2.9% 1.5% 1.2 1.9
EDV 3.8 ml 10.4 ml 1.6% 1.1 2.0
ESV 2.8 ml 7.8 ml 2.5% 1.9 3.1
SV 2.4 ml 6.8 ml 2.1% 1.6 2.7
4.2.5 Inter-Observer Variability (table 4.5)
Inter-observer variability of LV volumetric parameters was calculated between the two readers
using SEM and COV. The LV inter-observer variability using SEM (minimum detectable
change) and COV (upper 95%CI) were as follows: for LV-EF = 1.7 (4.8)% and 2.5 (2.8)%; for
LV-EDV = 5.9 (16.5)ml and 2.6 (3.2)%; for LV-ESV = 3.5 (9.7)ml and 4.1 (4.5)%; for LV-SV =
5.0 (13.8)ml and 3.8 (4.7)%; and for LV-mass = 5.6 (15.4)g and 5.7 (6.5)%, Table 4.5.

70
Table 4.5. Inter-Observer Variability of Left Ventricular Volumetric Parameters for all Time Points in Healthy Volunteers, Represented as Standard Error of Measurement (SEM) 95% CI, and as Coefficient of Variation (COV) 95% CI.
Variable Inter-Observer
Variability by SEM
Min Detectable
Change
Inter-Observer
Variability by COV
Lower
95%CI
Upper
95%CI
Left Ventricular Parameters:
EF 1.7% 4.8% 2.5% 2.1 2.8
EDV 5.9 ml 16.5 ml 2.6% 2.0 3.2
ESV 3.5 ml 9.7 ml 4.1% 3.6 4.5
SV 5.0 ml 13.8 ml 3.8% 2.9 4.7
Mass 5.6 g 15.4 g 5.7% 4.9 6.5
4.2.6 Inter-Observer Test-Retest Variability (table 4.6)
The inter-observer test-retest variability of LV volumetric parameters was calculated between the
two readers (variability within readers, between readers, and over time) using SEM and COV.
The LV inter-observer test-retest variability using SEM (minimum detectable change) and COV
(upper 95%CI) were as follows: for LV-EF = 2.1 (5.7)% and 2.6 (3.6)%; for LV-EDV = 12.6
(34.9)ml and 4.7 (8.0)%; for LV-ESV = 7.4 (20.5)ml and 6.9 (10.3)%; for LV-SV = 7.4 (20.6)ml
and 4.8 (8.2)%; and for LV-mass = 5.7 (15.7)g and 6.0 (7.3)%, Table 4.6.

71
Table 4.6. Inter-Observer Test-Retest (6-month) Variability of Left Ventricular Volumetric Parameters for all Time Points in Healthy Volunteers, Represented as Standard Error of Measurement (SEM) 95% CI, and as Coefficient of Variation (COV) 95% CI.
Variable Inter-Observer
Variability by SEM
Min Detectable
Change
Inter-Observer
Variability by COV
Lower
95%CI
Upper
95%CI
Left Ventricular Parameters:
EF 2.1% 5.7% 2.6% 1.6 3.6
EDV 12.6 ml 34.9 ml 4.7% 1.4 8.0
ESV 7.4 ml 20.5 ml 6.9% 3.5 10.3
SV 7.4 ml 20.6 ml 4.8% 1.5 8.2
Mass 5.7 g 15.7 g 6.0% 4.7 7.3
4.3 High-Sensitivity Troponin-I and BNP
4.3.1 Normal Values (table 4.7)
Hs-TnI blood values were available in all 3 time points from all 30 volunteers; BNP blood values
were available in all except one time point. Considering all 90 studies, the median and IQR
(range) for hs-TnI was 2.0 and 0.0 (2.0-8.0) ng/ml; for BNP was 15.3 and 16.1 (10.0-127.7)
pg/ml. Hs-TnI and BNP values at baseline and follow-up time points are summarized in Table
4.8; there were no significant differences over the 3 time points in hs-TnI or BNP (p-value >0.05
for all) (Table 4.7).
Mean hs-TnI was normal at baseline (2.1 ± 0.6ng/ml), as well as at the follow-up time points (2.3
± 0.9 at 3-month and 2.3 ± 1.1% at 6-month). No healthy volunteer had hs-TnI above 27 at
baseline or at the follow-up time points.
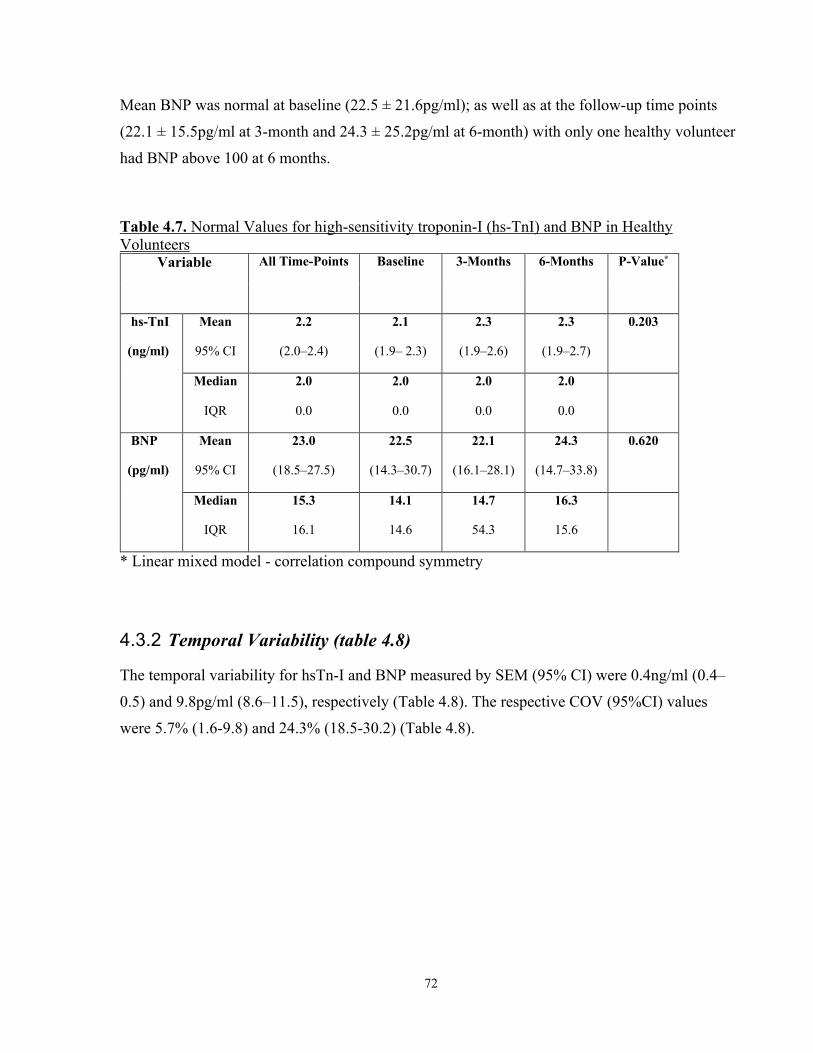
72
Mean BNP was normal at baseline (22.5 ± 21.6pg/ml); as well as at the follow-up time points
(22.1 ± 15.5pg/ml at 3-month and 24.3 ± 25.2pg/ml at 6-month) with only one healthy volunteer
had BNP above 100 at 6 months.
Table 4.7. Normal Values for high-sensitivity troponin-I (hs-TnI) and BNP in Healthy Volunteers
Variable All Time-Points Baseline 3-Months 6-Months P-Value*
hs-TnI
(ng/ml)
Mean
95% CI
2.2
(2.0–2.4)
2.1
(1.9– 2.3)
2.3
(1.9–2.6)
2.3
(1.9–2.7)
0.203
Median
IQR
2.0
0.0
2.0
0.0
2.0
0.0
2.0
0.0
BNP
(pg/ml)
Mean
95% CI
23.0
(18.5–27.5)
22.5
(14.3–30.7)
22.1
(16.1–28.1)
24.3
(14.7–33.8)
0.620
Median
IQR
15.3
16.1
14.1
14.6
14.7
54.3
16.3
15.6
* Linear mixed model - correlation compound symmetry
4.3.2 Temporal Variability (table 4.8)
The temporal variability for hsTn-I and BNP measured by SEM (95% CI) were 0.4ng/ml (0.4–
0.5) and 9.8pg/ml (8.6–11.5), respectively (Table 4.8). The respective COV (95%CI) values
were 5.7% (1.6-9.8) and 24.3% (18.5-30.2) (Table 4.8).
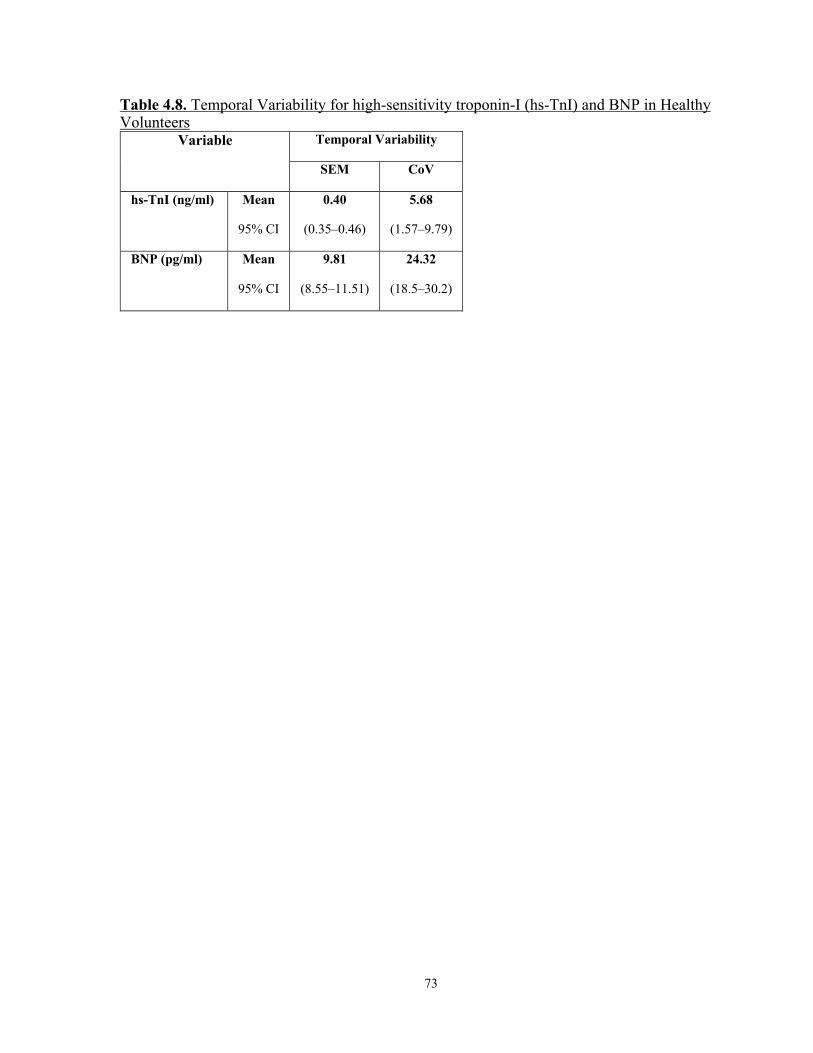
73
Table 4.8. Temporal Variability for high-sensitivity troponin-I (hs-TnI) and BNP in Healthy Volunteers
Variable Temporal Variability
SEM CoV
hs-TnI (ng/ml) Mean
95% CI
0.40
(0.35–0.46)
5.68
(1.57–9.79)
BNP (pg/ml) Mean
95% CI
9.81
(8.55–11.51)
24.32
(18.5–30.2)

74
Chapter 5
RESULTS – 2 (Patients with Breast Cancer)
5.1 Patient Population
Out of the 87-breast cancer patients recruited, 4 dropped out after their first or second CMR
studies. Eighty-three women mean age ± SD = 51.0 ± 9.5 years (range 27–70 years) completed
the first three time points and were included in the analysis. Patient clinical characteristics are
summarized in Table 5.1. At least one cardiovascular risk factor was present in 34 patients
(41.0%). Over the six-month follow-up period there was no statistically significant change in
systolic blood pressure, or arterial elastance. There was, however, a small but statistically
significant increase in mean weight and HR over the follow-up period (p < 0.001) (Figure 5.1).
There was no change in the mean weight between baseline and 3 months (66.7 ± 13.5kg to 66.7
± 13.6kg, p = 0.99), but the weight increased significantly at 6 months (68.1 ± 13.9kg, p =
0.006). All HER2+ patients received either adjuvant or neoadjuvant cancer therapy that consisted
of two months of concurrent anthracycline, and cyclophosphamide +/- 5-flurouracil, followed
subsequently by 52 weeks of trastuzumab administration every 3 weeks (71,72). All patients also
received taxanes along with trastuzumab every 3 weeks during the first 3-4 cycles. Taxanes have
the potential to increase fluid retention and therefore can affect measurement of cardiac function
artifactually.
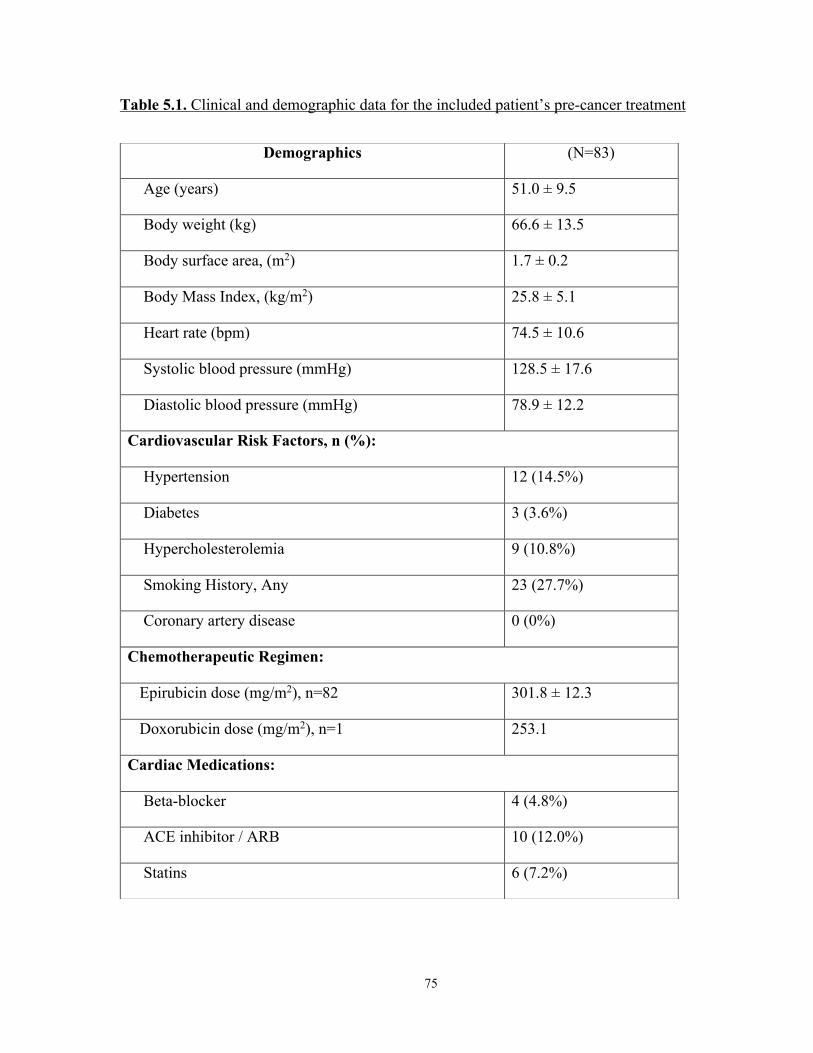
75
Table 5.1. Clinical and demographic data for the included patient’s pre-cancer treatment
Demographics (N=83)
Age (years) 51.0 ± 9.5
Body weight (kg) 66.6 ± 13.5
Body surface area, (m2) 1.7 ± 0.2
Body Mass Index, (kg/m2) 25.8 ± 5.1
Heart rate (bpm) 74.5 ± 10.6
Systolic blood pressure (mmHg) 128.5 ± 17.6
Diastolic blood pressure (mmHg) 78.9 ± 12.2
Cardiovascular Risk Factors, n (%):
Hypertension 12 (14.5%)
Diabetes 3 (3.6%)
Hypercholesterolemia 9 (10.8%)
Smoking History, Any 23 (27.7%)
Coronary artery disease 0 (0%)
Chemotherapeutic Regimen:
Epirubicin dose (mg/m2), n=82 301.8 ± 12.3
Doxorubicin dose (mg/m2), n=1 253.1
Cardiac Medications:
Beta-blocker 4 (4.8%)
ACE inhibitor / ARB 10 (12.0%)
Statins 6 (7.2%)

76
Figure 5.1. Changes in hemodynamic variables and LV mass over time with p-values calculated using linear mixed models. A) weight, B) heart rate, C) arterial elastance, D) systolic blood pressure, E) diastolic blood pressure and e) LV mass.
5.2 Overall Changes in Left Ventricular Volumes, Mass, and
Function
LV CMR parameters at baseline and follow-up are summarized in Table 5.2. Mean (± SD)
LVEF was normal with 60.1% ± 4.4% at baseline, however, 12 patients had LVEF between 50 –
55% and one patient had an LVEF of 47% at baseline. These patients with a mild reduction in
LVEF still received treatment since cardiac screening prior to cancer therapy was based on 2D
echocardiography (which did not identify the low normal/mild LV dysfunction) as per standard
of care. Over the three-month period, there was an overall significant increase only in LVESV
(including after being normalized to BSA) and an overall significant reduction in LVEF (p<0.01
for all). Over the six-month period, there was an overall significant increase in LVEDV, LVESV,
and LV-mass (including after being normalized to BSA), and a significant reduction in LVEF

77
(p<0.05 for LV-mass and p<0.001 for the rest). Changes are summarized in Table 5.2 and
Figures 5.2A and 5.3.
Table 5.2. Sequential change in patients’ LV cardiac MRI parameters
Data presented as frequency mean ± standard deviation, *Within 1 month of completion of anthracycline, &Within 2-3 months of initiation of trastuzumab
Characteristic Pre-Cancer therapy ~2 Months* P-value
(0-2)
~5 Months& P-value
(0-5) Mean SD Mean SD Mean SD
Cardiac MRI Left Ventricular Parameters:
LVEF (%) 60.1 4.4 58.8 4.3 0.004 55.6 4.1 <0.001
LVEDV (ml) 130.1 23.0 131.6 25.2 0.334 141.9 23.0 <0.001
LVEDV indexed (ml/m2) 76.5 10.3 77.8 12.4 0.199 83.1 11.6 <0.001
LVESV (ml) 52.2 12.0 54.4 12.5 0.006 63.4 13.8 <0.001
LVESV indexed (ml/m2) 30.7 6.0 32.1 6.6 0.003 37.0 7.4 <0.001
LVSV (ml) 77.9 13.5 77.3 15.2 0.474 78.6 11.7 0.572
LVSV indexed (ml/m2) 45.8 6.1 45.6 7.5 0.584 46.0 6.0 0.772
LV mass, (gm) 61.0 12.4 61.5 12.8 0.501 62.8 12.2 0.007
LV mass indexed, (gm/m2) 35.8 5.5 36.1 5.6 0.387 36.6 5.5 0.022

78
Figure 5.2. Changes in LV and RV volumes and ejection fraction and LVmass. (A) Changes over time in LV end-diastolic and end-systolic volumes, LVEF, and LV-mass in 83 patients. (B) Changes over time in RV end-diastolic and end-systolic volumes and RVEF in 83 patients.
Figure 5.3. Side by side comparison of changes in LV and RV volumes and ejection fraction. (A) Changes over time in LV and RV ejection fraction in 83 patients. (B) Changes over time in LV and RV end-diastolic and end-systolic volumes in 83 patients.
5.3 Overall Changes in Right Ventricular Volumes and Function
RV CMR parameters at baseline and follow-up are summarized in Table 5.3. All patients had
normal RVEF at baseline with Mean (± SD) RVEF = 57.6 ± 4.5%. Over the three-month period,
there was no significant change overall in any of the RV volumes nor in RVEF (p>0.05 for all).
Over the six-month period, however, there was an overall significant increase in both RVEDV

79
and RVESV (including after being normalized to BSA), and a significant reduction in RVEF
(p<0.001 for all). Changes are summarized in Table 5.3 and Figures 5.2B and 5.3.
Table 5.3. Sequential change in patients’ RV cardiac MRI parameters
Data presented as frequency mean ± standard deviation, *Within 1 month of completion of anthracycline, &Within 2-3 months of initiation of trastuzumab
5.4 Overall Changes in High Sensitivity Troponin-I (Hs-TnI) and
BNP
Hs-TnI and BNP values at baseline and follow-up are summarized in Table 5.4. All patients had
normal Hs-TnI and BNP at baseline with mean (± SD) Hs-TnI and BNP were 2.4 (± 1.5) ng/ml
and 21.9 (± 14.5) pg/ml, respectively. No patient had an above normal hs-TnI (>27ng/ml) or
BNP (>100pg/ml) values during the follow-up time points. At the three-month time point, there
was an overall significant increase only in hs-TnI (p<0.001). At the six-month time point, hsTnI
values decreased compared to 3 months, yet the values still remained elevated compared to
Characteristic Pre-Cancer therapy ~2 Months* P-value
(0-2)
~5 Months& P-value
(0-5) Mean SD Mean SD Mean SD
Cardiac MRI Right Ventricular Parameters:
RVEF (%) 57.6 4.5 57.2 4.4 0.320 54.5 3.9 <0.001
RVEDV (ml) 136.4 25.6 135.8 26.2 0.637 144.9 24.4 <0.001
RVEDV indexed ml/m2) 80.2 11.8 80.3 13.1 0.853 84.8 12.4 <0.001
RVESV (ml) 58.2 14.1 58.3 13.3 0.997 66.0 14.4 <0.001
RVESV indexed (ml/m2) 34.2 7.1 34.5 7.2 0.754 38.6 7.5 <0.001
RVSV (ml) 78.2 13.8 77.5 15.3 0.463 78.6 12.1 0.773
RVSV indexed (ml/m2) 46.0 6.3 45.8 7.7 0.582 46.0 6.2 0.965
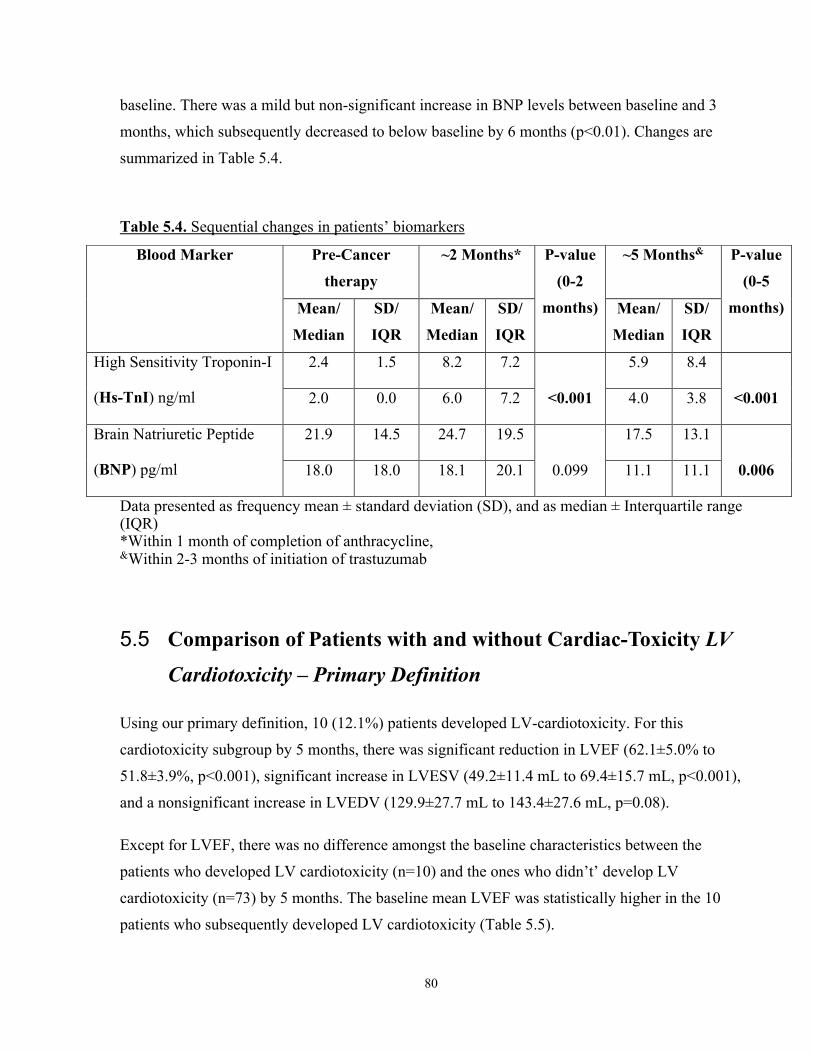
80
baseline. There was a mild but non-significant increase in BNP levels between baseline and 3
months, which subsequently decreased to below baseline by 6 months (p<0.01). Changes are
summarized in Table 5.4.
Table 5.4. Sequential changes in patients’ biomarkers
Data presented as frequency mean ± standard deviation (SD), and as median ± Interquartile range (IQR) *Within 1 month of completion of anthracycline, &Within 2-3 months of initiation of trastuzumab
5.5 Comparison of Patients with and without Cardiac-Toxicity LV
Cardiotoxicity – Primary Definition
Using our primary definition, 10 (12.1%) patients developed LV-cardiotoxicity. For this
cardiotoxicity subgroup by 5 months, there was significant reduction in LVEF (62.1±5.0% to
51.8±3.9%, p<0.001), significant increase in LVESV (49.2±11.4 mL to 69.4±15.7 mL, p<0.001),
and a nonsignificant increase in LVEDV (129.9±27.7 mL to 143.4±27.6 mL, p=0.08).
Except for LVEF, there was no difference amongst the baseline characteristics between the
patients who developed LV cardiotoxicity (n=10) and the ones who didn’t’ develop LV
cardiotoxicity (n=73) by 5 months. The baseline mean LVEF was statistically higher in the 10
patients who subsequently developed LV cardiotoxicity (Table 5.5).
Blood Marker Pre-Cancer
therapy
~2 Months* P-value
(0-2
months)
~5 Months& P-value
(0-5
months) Mean/
Median
SD/
IQR
Mean/
Median
SD/
IQR
Mean/
Median
SD/
IQR
High Sensitivity Troponin-I
(Hs-TnI) ng/ml
2.4 1.5 8.2 7.2
<0.001
5.9 8.4
<0.001 2.0 0.0 6.0 7.2 4.0 3.8
Brain Natriuretic Peptide
(BNP) pg/ml
21.9 14.5 24.7 19.5
0.099
17.5 13.1
0.006 18.0 18.0 18.1 20.1 11.1 11.1

81
Table 5.5. Baseline characteristics of two subsets of patients: who did subsequently developed cardiotoxicity and who did not develop cardiotoxicity by 5 months.
Baseline Characteristics
No cardiotoxicity (n=73) Cardiotoxicity (n=10) P-value
*† Mean SD Mean SD
Age 50.1 8.9 57.8 11.2 0.060
Weight (kg) 66.4 13.5 68.1 14.1 0.723
BSA (kg/m2) 1.7 0.2 1.7 0.2 0.790
HR (b/min) 70 10.2 72.5 10 0.470
DBP (mmHg) 79.6 13.9 75.1 13.3 0.337
SBP (mmHg) 130.1 20.3 133 19.7 0.674
Troponin I (ng/ml) 2.4 1.5 2.4 1.3 0.923
BNP (pg/ml 20.4 12.6 32.5 22.6 0.129
LVEF (%) 59.7 4.3 62.7 3.7 0.034
LVEDVi (ml) 76.4 9.9 77.3 13 0.830
LVESVi (ml) 31 6 28.8 5.4 0.269
LVSVi (ml) 45.4 5.7 48.7 8.7 0.274
LVmass i (gm) 36.1 5.6 34 4.8 0.239
RVEF (%) 57.3 4.4 59.6 4.6 0.159
RVEDVi (ml) 79.9 11.5 82.2 14.3 0.635
RVESVi (ml) 34.3 7.1 33.3 7.1 0.663
RVSVi (ml) 45.6 5.9 49 8.6 0.260
Total Epirubicin (mg)‡ 512.8 54 511 61.1 0.932
Epirubicin Dose i (mg/m2)‡ 302.3 11.6 298.1 16.7 0.455
*Independent T-test, †Equal variances not assumed, ‡Not at baseline

82
LV- cardiotoxicity was identified in only 1 patient by two months (who continued to have
cardiotoxicity by 5 months) and the remaining 9 patients developed cardiotoxicity by five
months. Among cardiotoxicity patients, eight patients had LVEF declines to between 50% and
55%, while 2 patients had a decline to <50%. Also, from the cardiotoxicity group, seven patients
had reduction in LVEF of >10% while three had symptomatic declines in LVEF between 8.1%
and 9.7% with HF symptoms progressing from NYHA class 0-I to II. Of the 12 patients with
baseline LVEF <55% by CMR, only one developed LV- cardiotoxicity, as diagnosed by a
symptomatic 9.4% absolute decline in LVEF from baseline value of 54.3%.
Of the 10 patients with LV-cardiotoxicity, 8 (80.0%) had isolated increase in LVESV, and 2
(20.0%) had combined significant increase in LVESV and decrease in LVEDV; none developed
LV-cardiotoxicity due to isolated reduction in LVEDV (Table 5.6, Figure 5.4a).
Figure 5.4. Causes for reduction in LVEF. (A) cardiotoxicity was defined as per CREC recommendations. (B) Any >5% reduction in LVEF at 3 or 5 months compared to baseline.
a b

83
Table 5.6. CMR Volumetric determinants of left ventricular ejection fraction decline categorized by different cardiotoxicity definitions and the time of occurrence. LV-Cardiotoxicity*† ~2 Months
n
~5 Months
n
Entire Follow Up
n (%)
Isolated ESV increase 1 7 8 (9.6%)
Isolated EDV decrease 0 0 0
Combined ESV increase and EDV decrease 0 2 2 (2.4%)
No significant Change in ESV or EDV 0 0 0
Total 1 9 10 (12.1%)
LVEF decline >5% (sensitivity definition)† ~2 Months
n
~5 Months
n
Entire Follow Up
n (%)
Isolated ESV increase 9 21 30 (79.0%)
Isolated EDV decrease 3 2 5 (13.2%)
Combined ESV increase and EDV decrease 0 1 1 (2.6%)
No significant Change in ESV or EDV 2 0 2 (5.3%)
Total 14 24 38 (42.2%)
RV-Cardiotoxicity‡# ~2 Months
n
~5 Months
n
Entire Follow Up
n (%)
Isolated ESV increase 1 0 1 (1.2%)
Isolated EDV decrease 0 0 0
Combined ESV increase and EDV decrease 0 1 1 (1.2%)
No significant Change in ESV or EDV 0 0 0
Total 1 1 2 (2.4%)
EDV, end-diastolic volume; ESV, end-systolic volume

84
*LV-Cardiotoxicity is defined by >5% Symptomatic drop in LVEF to <55%, or asymptomatic >10% drop in LVEF to <55% ‡ RV-Cardiotoxicity is defined by a >10% drop in RVEF to <51% †Significant LVEDV decrease is >10ml, Significant LVESV increase is >5ml # Significant RVEDV decrease is >10ml, Significant RVESV increase is >5ml
5.5.1.1 LVEF Changes in patients’ with and without LV-cardiotoxicity
In patients who developed cardiotoxicity, the mean LVEF declined significantly at two and five
months. In patients not meeting our binary cardiotoxicity criteria, there was still a statistically
significant reduction in LVEF by five months (table 5.7).
5.5.1.2 RVEF Changes in patients’ with and without LV-cardiotoxicity
In both patients with or without LV-cardiotoxicity, mean RVEF declined significantly only at 5
months (table 5.7). Mean (± SD) LVEF and RVEF at baseline, ~2-month, and ~5-month for all
patients and those with and without cardiotoxicity are summarized in table 5.7.
5.5.1.3 Biomarker changes in patients with and without LV-cardiotoxicity
In both patients with and without cardiotoxicity, mean hs-TnI increased significantly at 2
months. However, in both groups there was reduction in LVEF at 5 months although the values
remain significantly higher than baseline only in the cohort that did not develop LV
cardiotoxicity (table 5.7). This possibly reflects the sample size differences between the two
groups.
In patients with cardiotoxicity, mean BNP did not change significantly at the follow up time
points. However, in patients without cardiotoxicity, the 5-month’s mean BNP was significantly
lower than that of the baseline. (table 5.7).

85
Table 5.7. Summary of changes in left and right ventricular ejection fraction, high-sensitivity troponin-I, and BNP between pre-anthracycline, within 3 weeks post anthracycline, and 3 months during trastuzumab therapy
Data presented as frequency mean ± standard deviation, *Within 3 weeks of completion of anthracycline, †Within 3 months of initiation of trastuzumab ‡Paired t-test.
Characteristics Pre-Cancer
therapy
~2 Months* P-value‡
(0-2)
~5 Months† P-value‡
(0-5)
Left Ventricular Ejection fraction, (%)
All patients (n=83) 60.1 ± 4.4 58.8 ± 4.3 .003 55.6 ± 4.1 <.001
In pts with LV dysfunction 62.7 ± 3.7 57.7 ± 4.1 .001 51.3 ± 3.5 <.001
In pts with No LV dysfunction 59.7 ± 4.3 58.9 ± 4.3 .076 56.2 ± 3.9 <.001
Right Ventricular Ejection fraction, (%)
All patients (n=83) 57.6 ± 4.5 57.2 ± 4.4 .299 54.5 ± 4.0 <.001
In pts with LV dysfunction 59.6 ± 4.6 58.7 ± 5.1 .339 53.5 ± 3.4 .002
In pts with No LV dysfunction 57.3 ± 4.5 57.0 ± 4.3 .429 54.6 ± 4.0 <.001
High-Sensitivity Troponin-I (ng/ml)
All patients (n=83) 2.4 ± 1.5 8.2 ± 7.2 <.001 5.9 ± 8.4 <.001
In pts with LV dysfunction 2.5 ± 1.6 8.0 ± 7.2 .005 6.0 ± 8.9 .077
In pts with No LV dysfunction 2.4 ± 1.3 11.0 ± 8.5 <.001 6.1 ± 7.0 .001
Brain Natriuretic Peptide (pg/ml)
All patients (n=83) 21.9 ± 14.5 24.7 ± 19.5 .099 17.5 ± 13.1 .006
In pts with LV dysfunction 32.5 ± 22.6 43.3 ± 30.0 .207 29.6 ± 23.6 .666
In pts with No LV dysfunction 20.4 ± 12.8 22.5 ± 16.5 .263 16.0 ± 12.2 .004

86
Figure 5.5. Changes over time in high sensitivity Troponin-I and BNP in 83 patients.
5.5.2 LV-Cardiotoxicity – Sensitivity Definition
Using the sensitivity definition for LV-cardiotoxicity, a >5% reduction in LVEF occurred in 38
(45.8%) patients (Table 5.6). Amongst these patients 30 (79.0%) had an isolated increase in
LVESV, five (13.2%) had isolated decrease in LVEDV, one had both, and two had neither
(Table 5.6, Figure 5.4B).
5.5.3 RV Cardiotoxicity
Using our definition for RV-cardiotoxicity, two patients (2.4%) developed RV-cardiotoxicity,
one by 2 months and the second by 5 months. Of these two patients with RV-cardiotoxicity, none
developed RV-cardiotoxicity due to isolated reduction in RVEDV, one patient had isolated
significant increase in RVESV, and one had combined significant increase in RVESV and
decrease in RVEDV, of whom one patient also had LV-cardiotoxicity (Table 5.6).
Unlike in patients with LV dysfunction, where mean LVEF significantly dropped at both 2 and 5
months; significant reduction in mean RVEF only occurred at 5 months (Figure 5.6a, Table 5.7).
14
17
20
23
26
29
0
2
4
6
8
10
1 2 3
BNP
(pg/
ml)
Trop
onin
-I (n
g/m
l)
Time Point
Troponin-I BNP

87
Figure 5.6a. Comparison between mean changes in LVEF and RVEF in patients with LV dysfunction at pre-anthracycline, within 3 weeks post anthracycline, and 3 months during trastuzumab therapy
Changes in RVEF mirrored that of LVEF in the patients who did not develop LV cardiotoxicity
figure 5.6b.
Baseline ~2 Months ~5 MonthsRV EF 59.6 58.7 53.5LV EF 62.7 57.7 51.3
45
50
55
60
65
LV a
nd R
V EF
(%)
Axis Title
LV Toxicity (n=10)
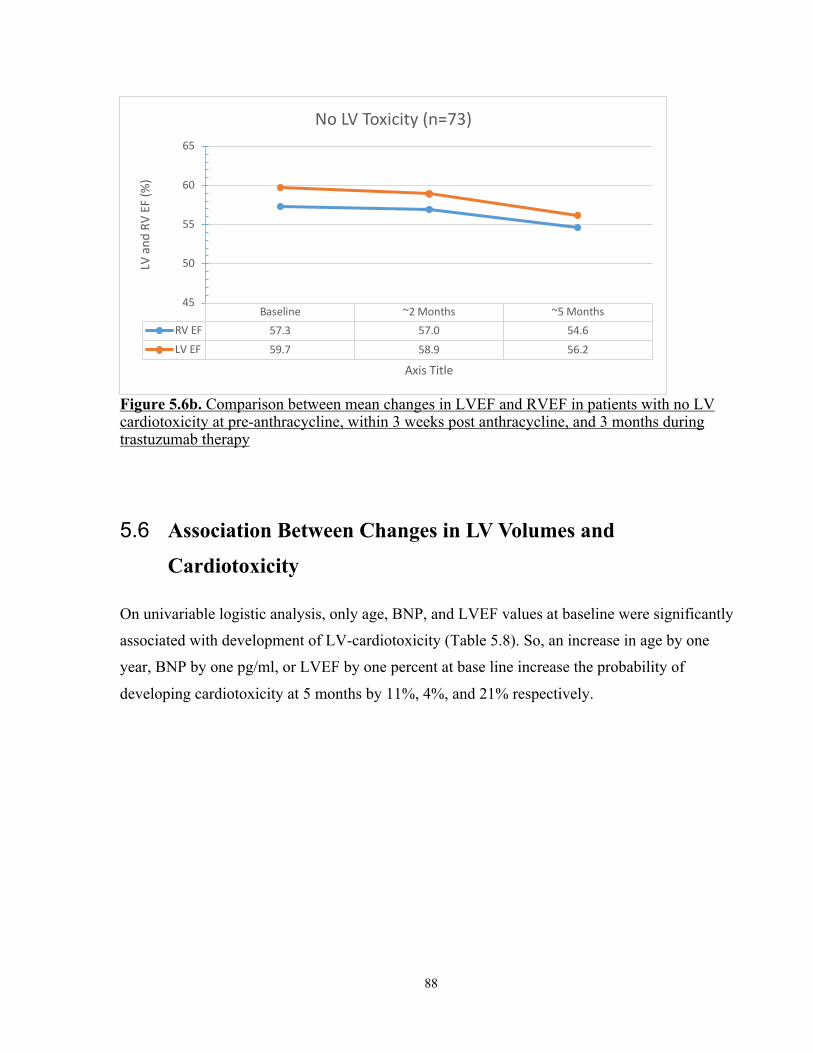
88
Figure 5.6b. Comparison between mean changes in LVEF and RVEF in patients with no LV cardiotoxicity at pre-anthracycline, within 3 weeks post anthracycline, and 3 months during trastuzumab therapy
5.6 Association Between Changes in LV Volumes and
Cardiotoxicity
On univariable logistic analysis, only age, BNP, and LVEF values at baseline were significantly
associated with development of LV-cardiotoxicity (Table 5.8). So, an increase in age by one
year, BNP by one pg/ml, or LVEF by one percent at base line increase the probability of
developing cardiotoxicity at 5 months by 11%, 4%, and 21% respectively.
Baseline ~2 Months ~5 MonthsRV EF 57.3 57.0 54.6LV EF 59.7 58.9 56.2
45
50
55
60
65LV
and
RV
EF (%
)
Axis Title
No LV Toxicity (n=73)

89
Table 5.8. Univariable logistic regression analysis of association between baseline variables and development of cardiotoxicity by 5 months (~3 months into trastuzumab). Baseline variables*† OR LV-cardiotoxicity p-value‡
95%CI
Age 1.11 1.02 1.20 0.020
Weight (kg) 1.01 0.96 1.06 0.705
BSA (kg/m2) 1.68 0.04 77.15 0.791
HR (b/min) 1.02 0.96 1.09 0.460
DBP (mmHg) 0.98 0.93 1.03 0.333
SBP (mmHg) 1.01 0.98 1.04 0.670
Troponin I (ng/ml) 0.98 0.61 1.56 0.932
BNP (pg/ml) 1.04 1.01 1.09 0.027
LVEF (%) 1.21 1.00 1.45 0.045
LVEDVi (ml/m2) 1.01 0.95 1.08 0.785
LVESVi (ml/m2) 0.94 0.84 1.06 0.286
LVSVi (ml/m2) 1.09 0.98 1.23 0.120
LVmass I (g/m2) 0.93 0.81 1.06 0.268
RVEF (%) 1.11 0.97 1.28 0.132
RVEDVi (ml/m2) 1.02 0.96 1.08 0.562
RVESVi (ml/m2) 0.98 0.89 1.08 0.651
RVSVi (ml/m2) 1.09 0.98 1.22 0.120
EaI (mmHg/ml/m2) 0.85 0.27 2.70 0.778
*Variables at baseline, †i = indexed for BSA, ‡Univariable logistic regression
90
On univariable logistic regression analysis for changes at 2 months, only an increase in LVESV-
normalized (OR 1.43, 95%CI 1.14–1.80, p=0.002), and an increase in LVEF (OR 0.75, 95%CI
0.62–0.91, p=0.004) were significantly associated with development of LV-cardiotoxicity by 5
months (Table 5.9). So, an increase in LVESV-normalized by one ml, or a drop in LVEF by one
percent by 2 months increases the probability of developing cardiotoxicity at 5 months by 43%
and 33%, respectively. Changes at two months in LVEDV, LVmass, RV volumes, RVEF, h-TnI,
and BNP were not significantly associated with development of LV-cardiotoxicity by 5 months
(Table 5.9). Furthermore, epirubicin cumulative dose by 2 months normalized to BSA was not
associated with cardiotoxicity by 5 months (OR 0.98, 95%CI 0.94–01.02, p=0.319).

91
Table 5.9. Univariable logistic regression analysis of association between changes at 2 months (post anthracycline) and development of cardiotoxicity by 5 months (~3 months into trastuzumab). Change in variables at 2 months
*†
OR LV-cardiotoxicity p-value
‡ 95%CI
BSA (kg/m2) 0.00 0.00 4.38 0.066
LVEF (%) 0.75 0.62 0.91 0.004
LVEDVi (ml) 1.04 0.96 1.14 0.35
LVESVi (ml) 1.43 1.14 1.80 0.002
LVSVi (ml) 0.91 0.80 1.04 0.173
LVmass-i (gm) 1.08 0.90 1.31 0.411
RVEF (%) 0.96 0.80 1.14 0.64
RVEDVi (ml) 0.99 0.93 1.04 0.593
RVESVi (ml) 1.00 0.89 1.14 0.948
RVSVi (ml) 0.96 0.88 1.05 0.379
Trop (ng/ml) 1.05 0.97 1.13 0.213
BNP (pg/ml) 1.03 0.99 1.07 0.142
Eal (mmHg/ml) 1.40 0.36 5.53 0.627
NYHA 2.48 0.65 9.45 0.184
*Change between baseline and post completion of anthracycline (0 and 3 months). †i = indexed for BSA ‡Binary univariable logistic regression
For univariable analysis using the LVEF sensitivity definition, similarly, change in LVESV by
two months was significantly associated with a decrease in LVEF of >5% by 5 months, but
change in LVEDV was not associated with a decrease in LVEF of >5% (Table 5.10).

92
Table 5.10. Univariable logistic regression analysis of association between changes in ventricular volume and function measurements and development of cardiotoxicity Changes in Left Ventricular Parameters LVEF decrement >5%
OR 95%CI p-value
∆EDV (mL) 1.00 0.97 – 1.02 0.75
∆ESV (mL) 1.06 1.01 – 1.14 0.04
EDV – End-Diastolic volume; ESV- End-Systolic Volume; LVEF – Left Ventricular Ejection fraction
5.7 Intra-observer Variability in Patients
Intra-observer variability of the primary reader was tested in 20 randomly selected patients with
a 4-week interval between the two reads. Bland-Altman plots show small intra-observer
variability in LV parameter (LVEF, LVEDV, LVESV, and LV mass), figure 5.10.

93
Figure 5.7. Intra-observer variability in 20 patients using Bland Altman Plots. (a) LVEF (%), (b) LVEDV (ml), (c) LVESV (ml), and (d) LVmass (g).

94
Chapter 6
DISCUSSION
6.1 Healthy volunteers’ variability
6.1.1 Normal values
Our randomly selected sample of volunteers included a balanced mix of males and females (60%
females) and a wide age range (23 – 80 years). Volunteer’s clinical characteristics were normal
at baseline and remained stable over the 6-month follow up period. Similarly, mean values for all
LV and RV volumetric parameters and for blood markers were all within normal range at
baseline and remained so over the follow up time points.
6.1.2 Temporal Variability
In order to identify cardiac toxicity using a threshold change in left ventricular ejection fraction
during cancer therapy, a robust imaging method with excellent accuracy and precision for LVEF
measurements is needed. Traditionally oncologists have used echocardiography or MUGA scans
for this purpose. Although readily available clinically, both techniques have intrinsic limitations
as previously discussed. Although these methods will perhaps remain the method of choice to
monitor for cardiotoxicity, CMR is likely the ideal method to understand ventricular remodeling
and early changes to myocardial function. Our work in healthy volunteers was performed to
establish the expected temporal, inter-observer, and intra-observer variability for ventricular
volume and ejection fraction measurements when repeated at intervals similar to that performed
in patients undergoing cancer therapy. This allowed us to establish threshold values above which
a change could be considered to have occurred beyond physiological, imaging, and analysis
related variability.

95
The majority of analysis for temporal variability use measures of co-variance or correlation to
quantify stability. Although these methods are well established, for practical purposes it would
be important to know the variability measured in the same units as the primary measure.
Therefore, we used a recently described method to quantify temporal and observer variability for
cardiac imaging studies (189). Using this method, we demonstrate that the temporal variability of
LVEF and RVEF measurements over a 6-month period is < 3.0% (absolute); and using CoV
method, temporal variability for LVEF was 3.8% and for RVEF was 3.9%. In addition, the
temporal variability for left ventricular volumes using SEM was <9ml for LV-EDV and <5.5ml
for LV-ESV; and using CoV, for LVEDV was 4.3% and for LVESV was 7.1%. Similarly, for
right ventricular volumes the temporal variability using SEM was <9ml for RV-EDV and <5.5ml
for RV-ESV; and using CoV, for RVEDV was 4.9% and for RVESV was 6.25. This low
absolute temporal variability in LVED and LESV is important as it confirms that the changes in
left ventricular end-diastolic volumes of 10ml and end-systolic volumes of 5 ml used to define
significant changes in our cardiotoxicity population are likely to represent changes beyond
expected variability. Furthermore, the temporal variability for available biomarkers over 6-month
period using SEM method was 0.4ng/ml for hs-TnI and 9.8pg/ml for BNP; and using CoV
method, temporal variability for hs-TnI was 5.7% and for BNP was 24.3%. longitudinal
variability in routinely used biomarkers (BNP and hs-TnI) were twice higher for hs-TnI and 6-
times higher for BNP than that seen with LVEF and RVEF, demonstrating the robustness of
LVEF and RVEF for following myocardium temporal changes in the various disease.
6.1.3 Observer Variability
The data in the healthy volunteers also demonstrates the excellent inter- and intra-observer
variability for the left and right ventricular volumes and ejection fraction again confirming the
strength of cardiac MRI as a robust technique for quantification of cardiac volumes and function.
These variabilities are significantly smaller than what has been reported, using the same
statistical methodology, using 2D and 3D echocardiography recently (150). The larger inter-
observer test re-test variability than the temporal variability (measured by a single reader)
suggests that in order to identify small changes in ventricular volumes and function it is more
ideal for the same user to analyze all data over time for the same patient. The use of COV data
presented allows us to compare between various measures. For temporal and observer variability

96
we demonstrated that measurements of end-systolic volume are more variable than end-diastolic
volume. This emphasizes the importance of careful attention to end-systolic endocardial contours
during cardiac MRI analysis.
6.2 LV – Cardiotoxicity
In our cohort of consecutively-recruited HER2-positive breast cancer patients receiving uniform
cancer treatment, LV-cardiotoxicity by five months was seen in 12.1% of the patients. The
reduction in LVEF was associated with a significant increase in LVESV in 100% of the patients.
None of the patients had an isolated reduction in LVEDV, as would be expected with reduced
preload. These findings suggest that the primary mechanism of reduction in LVEF from cancer
therapy is due to a reduction in myocardial contractility, rather than an isolated reduction in
preload. In contrast, when a lower threshold was used to define cardiotoxicity (change in LVEF
>5%), a minority of patients attained these changes solely due to a reduction in preload (13.2%);
however, these small changes would not trigger interventions for cardiotoxicity. Age, BNP, as
well as LVEF at baseline were predictors of LV-cardiotoxicity by 5 months.
6.3 Right ventricular – Cardiotoxicity
Right ventricular -cardiotoxicity by five months was seen in 2.4% of the patients. The reduction
in RVEF was associated with a significant increase in RVESV in both patients (100%),
suggesting that the primary mechanism of reduction from cancer therapy in RVEF is also due to
a reduction in myocardial contractility. One of these two patients, however, also had significant
reduction in RVEDV, which could be attributed to concomitant reduction in preload.
Nevertheless, reduction in preload was not an isolated phenomenon in RV dysfunction.
Unlike in patients with LV dysfunction, where mean LVEF significantly dropped at both 2 and 5
months, significant RVEF reduction only occurred at 5 months. RV dysfunction is less common
than LV dysfunction during the first 5 months of sequential anthracycline and trastuzumab
therapy in HER2+ breast cancer. Changes in LVEF and RVEF appear to mirror each other when

97
examined as a continuous variable. This suggests that toxicity from anthracyclines and
trastuzumab is not limited to the left ventricle as commonly described. However, a significant
drop in RVEF as defined in this study occurs later than that of the left ventricle and seems to
occur mostly during trastuzumab therapy. This may reflect the fact that our definition of RV
dysfunction was too conservative or that significant injury first occurs to the LV prior to the RV.
This needs to be studied further in larger studies with longer term follow-up. Our work however
does suggest that when patients are followed sequentially during cancer therapy it is important to
concomitantly assess changes to the LV and the RV.
6.4 Relationship Between Ventricular Volumes and Cardiotoxicity
Using a well-established criterion for cardiotoxicity, 10 out of 10 (100%) patients in our study
developed cardiotoxicity associated with an increase in LVESV. None had an isolated reduction
in LVEDV. Our findings were further confirmed by the univariable logistic regression analysis,
where a change in LVESV by 2 months but not LVEDV as a continuous parameter showed
significant association with development of cardiotoxicity. Our work therefore suggests that
currently used definitions for cardiotoxicity based on LVEF appear to identify patients who have
a reduction in contractility. Small reductions in LVEF (>5% and <10%) can occur in a subset
(13.2%) of patients due to isolated reduction in preload, however larger LVEF reductions
(>10%) appear invariably associated with reduced contractility. Our work also suggests that an
increase in LVESV may be an early measure of myocardial injury and identify patients who are
at risk of subsequent cardiotoxicity. Given the small number of cardiotoxicity events in our
cohort, multivariable analysis was not feasible. However, as the current study continues to finish
recruitment and complete follow-up, we believe that there will be many more cardiotoxicity
events to perform a multivariable adjustment.
High sensitivity troponin-I and BNP did not show an association with LV-cardiotoxicity using
univariate logistic regression models, questioning again the utility of these markers in predicting
cardiotoxicity.

98
6.5 LV ejection fraction, contractility, and global longitudinal
strain
Using echocardiography, multiple studies have demonstrated that changes in deformation (strain)
precedes changes in ejection fraction in cancer patients during cancer therapy. Myocardial strain
imaging is likely the best surrogate imaging marker of contractility available. Amongst strain
methods GLS is the measure with the smallest variability and appears to have the best sensitivity
in predicting subsequent cardiotoxicity (defined by threshold change in LVEF) by
echocardiography (149). This observation is most likely because 2D LVEF measurements are
not sensitive enough to detect small changes in LVEF, due to its intrinsic measurement
variability as discussed previously (14). Recently, using cardiac MRI, Ong et al have shown that
changes in GLS and LVEF measured by cardiac MRI mirror each other during cancer therapy
(190). This finding has also been shown previously by other groups using MRI strain (182).
Therefore, similar to our findings with LVEF, these recently described association between
reduction in LVEF and GLS in patients receiving cancer therapy also supports the notion of a
reduction in myocardial contractility as the primary mechanism of reduction in LVEF.
6.6 Comparison to Prior Work
Recent studies from Greg Hundley’s group has raised concern that reduction in LVEF may occur
secondary to reduction in preload in the context of cancer therapy (176,177). This was based on
the demonstration that a fall in LVEF measured by CMR was driven by a reduction in LVEDV
with preserved LVESV in 16-19% of patients. Furthermore, a reduction in CMR measured
circumferential and global longitudinal strain were associated with a reduction in LVEDV. These
data raised the possibility that a subset of patients diagnosed with cardiotoxicity have normal
myocardial contractility and hence should not be subject to the usual management of cancer
therapy adjustment and/or addition of cardiac medications. These findings have important
clinical consequences, as one would need a robust method to accurately measure concomitant
changes in LVEF and LVEDV during cancer therapy. Most commonly available clinically, 2D
and 3D echocardiography techniques have test-re-test variability for LVEDV measurement

99
between 21-38ml making it challenging to reproducibly identify a 10ml reduction in LVEDV.
The use of CMR in routine clinical practice would be challenging due to availability and cost.
Our finding that cardiotoxicity was primarily due to a reduction in LVESV (i.e. contractility)
differed from recent work described above. This may be due to the following main reasons: 1)
There were differences in the types of cancers included (100% breast cancer in our study versus
<50% in prior studies) which are associated with different treatment regimens; 2) Our study
included ~2 and ~5-month follow-up while the prior study included only ~3-month follow-up; 3)
the definition of cardiotoxicity in the prior studies (>10% decrement in LVEF or any absolute
LVEF value <50% between baseline to 3-month) differs from our definition. The definition of
LVEF reduction to <50% used by Hundley’s group may include patients with a small change in
LVEF (e.g. from 54% to 49%); our data also shows that such small changes in LVEF can in fact
occur due to isolated reduction in pre-load. However, based on current guidelines such small
changes in LVEF would not constitute cardiotoxicity or require changes to cancer treatment.
6.7 Novelty
The EMBRACE-MRI study is the largest and first contemporary multicenter study using
comprehensive quantitative CMR volumetric quantification of both Left and Right ventricles and
biomarkers in patients and healthy volunteers for early detection of cancer-therapy-related
cardiotoxicity (18). This advances the field from reliance on echo-based LV function methods to
more sensitive methods capable of identifying pre-clinical changes of cardiotoxicity (i.e.,
LVESV and LVEDV) directly. Our study also provides an appreciation of the temporal
variability of CMR volumetric parameters and blood markers in healthy people reflecting true
physiologic changes that physicians need to account for in every patient during follow up to
determine disease progression. Our study identifies for the first time that changes in LVESV are
an early predictor (by 2 months) of future development (by 5 month) of LV-cardiotoxicity.

100
6.8 Strengths and Limitations
The strengths of our study include uniform patient population with uniform treatment,
consecutive recruitment, prospective follow-up, use of contemporary definitions of
cardiotoxicity, use of contemporary CVD-related biomarkers, and validating changes in patients
with matched healthy volunteers. Limitations include a relatively small number of outcomes.
However, our sample size and event rate are consistent with contemporary studies in cardio-
oncology. Furthermore, each patient had repeated cardiac imaging at three separate time points
with the acquisition of CMR within 2 hours of blood collection. We used CMR for volumetric
measurements as it the modality that was most accurate and reproducible for volumetric analysis.
Furthermore, we showed for the first time that reproducibility for RV parameters are quite
similar to that of the LV and provided a detailed illustration of CMR postprocessing protocol
used in our lab. Our protocol demonstrated in this thesis might be limited by using 2 dimensional
images for illustration, however we emphasise the importance of utilizing the dynamic window
when contouring difficult slices. We used hs-TnI and BNP as the biomarkers of interest as they
are the most widely used and correlated with cardiovascular disease. We, therefore, believe our
findings are clinically relevant. However, since our cohort was limited to a specific group of
HER2+ breast cancer patients, the results may not be extrapolated to non-breast cancer
populations treated with other regimens. We made the assumption that a reduction in LVEDV
represents reduced preload, however other causes (e.g. diastolic dysfunction secondary to
cardiotoxicity) have not been excluded. Unfortunately, a reference standard for assessment of
preload does not exist. Similarly, we assumed that an increase in LVESV reflects reduction in
contractility. However, there are no non-invasive ways to measure contractility in a reliable
manner. Furthermore, caution is warranted when discussing myocardial contractility as end-
systolic elastance or end-systolic wall stress were not measured. A small subset of our patients
had LVEF<55% at baseline, which may have impacted cardiotoxicity incidence. However, only
one of these patients developed LV-cardiotoxicity. Inclusion of these patients was based on the
fact that baseline screening was performed by echocardiography as per clinical practice.

101
6.9 Future Directions
This EMBRACE-MRI study will be continued beyond the first three patient visits (5-month
follow-up) to include total of 5 time points to examine the process of cardiac remodeling
throughout the 15 months of cancer therapy. Sample size will also increase to a projected 136
patients (each with 5 time points) to increase power of analysis further. Examining CMR-
volumetric changes longitudinally over the entire cancer therapy duration will serve two primary
purposes: First, to test if there is an association between cardiotoxicity through the entire
treatment period and early changes in LV volumes (ESV, EDV) or mass. If found, this
association could be used to test various strategies to prevent LV remodeling, dysfunction, or HF
in patients who develop these changes early on, such as 1) addition of dexrazoxane, beta-
blockers, ACE inhibitors, 2) instituting a formal exercise program, 3) more aggressive treatment
of existing cardiac risk factors, 4) increasing the frequency of cardiac imaging / follow-up, and
5) extending the time lag between anthracyclines and trastuzumab. Second, to examine other
novel parameters including quantitative CMR tissue characterization (T1, T2 and ECV maps)
and CMR strain for early detection of chemotherapy-related cardiotoxicity. If our EMBRACE-
MRI study’s primary purpose is achieved then, CMR can be used to identify high-risk patients
who can then continue on with their current imaging surveillance as per clinical practice (6
studies), while those at low risk may be able to have less frequent follow-up. Since ~75% of the
patients do not experience cardiotoxicity, by reducing the number of repeated MUGAs or echos
in this low-risk group, there may be overall cost savings. The complete EMBRACE-MRI study
is going to be the first to include clinical assessment, echo, CMR, biomarkers in a single study to
determine ability to predict cardiotoxicity. Therefore, this study will describe which one of these
biomarkers alone or in combination would be the best to predict cardiotoxicity. Since
cardiotoxicity is determined prospectively using a gold standard technique (CMR), the
associations will be more robust. This would have tremendous clinical impact by allowing
optimal risk stratification of patients.

102
6.10 Conclusion
In a uniform cohort of women with HER2+ breast cancer receiving anthracyclines followed by
trastuzumab this work demonstrates that left and right ventricular remodeling occurs during
treatment. Left ventricular cardiotoxicity is more common than right ventricular cardiotoxicity
and appears to occur earlier during treatment. The primary mechanism for cardiotoxicity is an
increase in left ventricular end-systolic volume as opposed to a reduction in left ventricular end-
diastolic volume. Although requires confirmation, our findings suggest that the primary
mechanism of cardiotoxicity is likely a reduction in contractility and not a reduction in pre-load.
Although there has been a growing interest in using serum biomarkers to identify early
myocardial injury, these were not found to be valuable in our patient population.

103
References 1. Breast Cancer Statistics 2017. cancer.ca. http://www.cancer.ca/en/cancer-information/cancer-
type/breast/statistics/?region=on
2. Anderson WF, Jatoi I, Devesa SS. Distinct breast cancer incidence and prognostic patterns in the NCI's SEER program: suggesting a possible link between etiology and outcome. Breast Cancer Res Treat. Kluwer Academic Publishers; 2005 Mar;90(2):127–37.
3. Baselga J, Carbonell X, Castañeda-Soto N-J, Clemens M, Green M, Harvey V, et al. Phase II study of efficacy, safety, and pharmacokinetics of trastuzumab monotherapy administered on a 3-weekly schedule. J Clin Oncol. 2005 Apr 1;23(10):2162–71.
4. Baselga J, Perez EA, Pienkowski T, Bell R. Adjuvant trastuzumab: a milestone in the treatment of HER-2-positive early breast cancer. Oncologist. AlphaMed Press; 2006;11 Suppl 1(suppl_1):4–12.
5. Slamon DJ, Leyland-Jones B, Shak S, Fuchs H, Paton V, Bajamonde A, et al. Use of chemotherapy plus a monoclonal antibody against HER2 for metastatic breast cancer that overexpresses HER2. N Engl J Med. Massachusetts Medical Society; 2001 Mar 15;344(11):783–92.
6. Chen J, Long JB, Hurria A, Owusu C, Steingart RM, Gross CP. Incidence of heart failure or cardiomyopathy after adjuvant trastuzumab therapy for breast cancer. Journal of the American College of Cardiology. 2012 Dec 18;60(24):2504–12.
7. Du XL, Xia R, Burau K, Liu C-C. Cardiac risk associated with the receipt of anthracycline and trastuzumab in a large nationwide cohort of older women with breast cancer, 1998–2005. Med Oncol. 5 ed. Springer US; 2010 Oct 22;28(S1):80–90.
8. Felker GM, Thompson RE, Hare JM, Hruban RH, Clemetson DE, Howard DL, et al. Underlying causes and long-term survival in patients with initially unexplained cardiomyopathy. N Engl J Med. 2000 Apr 13;342(15):1077–84.
9. Armenian SH, Xu L, Ky B, Sun C, Farol LT, Pal SK, et al. Cardiovascular Disease Among Survivors of Adult-Onset Cancer: A Community-Based Retrospective Cohort Study. Journal of Clinical Oncology. 2016 Apr;34(10):1122–30.
10. Wang TJ, Evans JC, Benjamin EJ, Levy D, LeRoy EC, Vasan RS. Natural history of asymptomatic left ventricular systolic dysfunction in the community. Circulation. American Heart Association, Inc; 2003 Aug 26;108(8):977–82.
11. Seidman A, Hudis C, Pierri MK, Shak S, Paton V, Ashby M, et al. Cardiac dysfunction in the trastuzumab clinical trials experience. J Clin Oncol. 2002 Mar 1;20(5):1215–21.
104
12. Cardinale D, Colombo A, Torrisi R, Sandri MT, Civelli M, Salvatici M, et al. Trastuzumab-induced cardiotoxicity: clinical and prognostic implications of troponin I evaluation. J Clin Oncol. American Society of Clinical Oncology; 2010 Sep 1;28(25):3910–6.
13. Ky B, Putt M, Sawaya H, French B, Januzzi JL, Sebag IA, et al. Early increases in multiple biomarkers predict subsequent cardiotoxicity in patients with breast cancer treated with doxorubicin, taxanes, and trastuzumab. Journal of the American College of Cardiology. 2014 Mar 4;63(8):809–16.
14. Thavendiranathan P, Grant AD, Negishi T, Plana JC, Popović ZB, Marwick TH. Reproducibility of echocardiographic techniques for sequential assessment of left ventricular ejection fraction and volumes: application to patients undergoing cancer chemotherapy. Journal of the American College of Cardiology. 2013 Jan 8;61(1):77–84.
15. Cardinale D, Sandri MT, Martinoni A, Borghini E, Civelli M, Lamantia G, et al. Myocardial injury revealed by plasma troponin I in breast cancer treated with high-dose chemotherapy. Ann Oncol. 2002 May;13(5):710–5.
16. Dodos F, Halbsguth T, Erdmann E, Hoppe UC. Usefulness of myocardial performance index and biochemical markers for early detection of anthracycline-induced cardiotoxicity in adults. Clin res cardiol. D. Steinkopff-Verlag; 2008 May;97(5):318–26.
17. Fallah-Rad N, Walker JR, Wassef A, Lytwyn M, Bohonis S, Fang T, et al. The utility of cardiac biomarkers, tissue velocity and strain imaging, and cardiac magnetic resonance imaging in predicting early left ventricular dysfunction in patients with human epidermal growth factor receptor II-positive breast cancer treated with adjuvant trastuzumab therapy. Journal of the American College of Cardiology. United States; 2011;57(22):2263–70.
18. Thavendiranathan P, Wintersperger BJ, Flamm SD, Marwick TH. Cardiac MRI in the assessment of cardiac injury and toxicity from cancer chemotherapy: a systematic review. Circulation: Cardiovascular Imaging. American Heart Association, Inc; 2013 Nov;6(6):1080–91.
19. Canadian Cancer Statistics 2017.
20. Long-Term Side Effects of Cancer Treatment. Long-Term Side Effects of Cancer Treatment.
21. Kilgore M, Patel HK, Kielhorn A, Maya JF, Sharma P. Economic burden of hospitalizations of Medicare beneficiaries with heart failure. Risk Manag Healthc Policy. Dove Press; 2017;10:63–70.
22. Dunlay SM, Shah ND, Shi Q, Morlan B, VanHouten H, Long KH, et al. Lifetime costs of medical care after heart failure diagnosis. Circ Cardiovasc Qual Outcomes. American Heart Association, Inc; 2011 Jan 1;4(1):68–75.
23. De Angelis R, Sant M, Coleman MP, Francisci S, Baili P, Pierannunzio D, et al. Cancer survival in Europe 1999-2007 by country and age: results of EUROCARE--5-a population-based study. Lancet Oncol. 2014 Jan;15(1):23–34.

105
24. Linabery AM, Ross JA. Childhood and adolescent cancer survival in the US by race and ethnicity for the diagnostic period 1975-1999. Cancer. Wiley-Blackwell; 2008 Nov 1;113(9):2575–96.
25. Reaman GH. Pediatric cancer research from past successes through collaboration to future transdisciplinary research. J Pediatr Oncol Nurs. SAGE Publications; 2004 May;21(3):123–7.
26. Narayan V, Ky B. Common Cardiovascular Complications of Cancer Therapy: Epidemiology, Risk Prediction, and Prevention. Annu Rev Med. Annual Reviews; 2018 Jan 29;69(1):97–111.
27. Chang H-M, Moudgil R, Scarabelli T, Okwuosa TM, Yeh ETH. Cardiovascular Complications of Cancer Therapy: Best Practices in Diagnosis, Prevention, and Management: Part 1. Journal of the American College of Cardiology. 2017 Nov 14;70(20):2536–51.
28. Johnson CB, Davis MK, Law A, Sulpher J. Shared Risk Factors for Cardiovascular Disease and Cancer: Implications for Preventive Health and Clinical Care in Oncology Patients. Can J Cardiol. 2016 Jul;32(7):900–7.
29. Carter BD, Freedman ND, Jacobs EJ. Smoking and mortality--beyond established causes. N Engl J Med. 2015 May 28;372(22):2170–0.
30. Bancej C, Jayabalasingham B, Wall RW, Rao DP, Do MT, de Groh M, et al. Evidence Brief--Trends and projections of obesity among Canadians. Health Promot Chronic Dis Prev Can. 2015 Sep;35(7):109–12.
31. Stocks T, Bjørge T, Ulmer H, Manjer J, Häggström C, Nagel G, et al. Metabolic risk score and cancer risk: pooled analysis of seven cohorts. Int J Epidemiol. 2015 Aug;44(4):1353–63.
32. Kanters SD, Banga J-D, Stolk RP, Algra A. Incidence and determinants of mortality and cardiovascular events in diabetes mellitus: a meta-analysis. Vascular Medicine. Sage Publications; 1999 May 1;4(2):67–75.
33. Coussens LM, Werb Z. Inflammation and cancer. Nature 2002 420:6917. Nature Publishing Group; 2002 Dec 19;420(6917):860–7.
34. Libby P. Inflammation and cardiovascular disease mechanisms. Am J Clin Nutr. 2006 Feb;83(2):456S–460S.
35. Wahl LM, Kleinman HK. Tumor-associated macrophages as targets for cancer therapy. J Natl Cancer Inst. 1998 Nov 4;90(21):1583–4.
36. Berg AH, Scherer PE. Adipose tissue, inflammation, and cardiovascular disease. Circ Res. American Heart Association, Inc; 2005 May 13;96(9):939–49.
37. Esposito K, Nappo F, Marfella R, Giugliano G, Giugliano F, Ciotola M, et al. Inflammatory cytokine concentrations are acutely increased by hyperglycemia in humans: role of oxidative stress. Circulation. American Heart Association, Inc; 2002 Oct 15;106(16):2067–72.
106
38. Frayn K, Bernard S, Spalding K, Arner P. Adipocyte triglyceride turnover is independently associated with atherogenic dyslipidemia. J Am Heart Assoc. American Heart Association, Inc; 2012 Dec;1(6):e003467–7.
39. Rodríguez-Iturbe B, Pons H, Quiroz Y, Johnson RJ. The immunological basis of hypertension. Am J Hypertens. 2014 Nov;27(11):1327–37.
40. Lin S-Y, Hsieh M-S, Chen L-S, Chiu Y-H, Yen AM-F, Chen TH-H. Diabetes mellitus associated with the occurrence and prognosis of non-Hodgkin's lymphoma. Eur J Cancer Prev. 2007 Oct;16(5):471–8.
41. Morton LM, Hartge P, Holford TR, Holly EA, Chiu BCH, Vineis P, et al. Cigarette smoking and risk of non-Hodgkin lymphoma: a pooled analysis from the International Lymphoma Epidemiology Consortium (interlymph). Cancer Epidemiology Biomarkers & Prevention. American Association for Cancer Research; 2005 Apr;14(4):925–33.
42. Barrera G. Oxidative stress and lipid peroxidation products in cancer progression and therapy. ISRN Oncol. Hindawi; 2012;2012(10):137289–21.
43. Thanan R, Techasen A, Hou B, Jamnongkan W, Armartmuntree N, Yongvanit P, et al. Development and characterization of a hydrogen peroxide-resistant cholangiocyte cell line: A novel model of oxidative stress-related cholangiocarcinoma genesis. Biochem Biophys Res Commun. 2015 Aug 14;464(1):182–8.
44. Hou N, Luo J-D. Leptin and cardiovascular diseases. Clin Exp Pharmacol Physiol. Wiley/Blackwell (10.1111); 2011 Dec;38(12):905–13.
45. Stefanou N, Papanikolaou V, Furukawa Y, Nakamura Y, Tsezou A. Leptin as a critical regulator of hepatocellular carcinoma development through modulation of human telomerase reverse transcriptase. BMC Cancer. 6 ed. BioMed Central; 2010 Aug 19;10(1):442.
46. Albini A, Pennesi G, Donatelli F, Cammarota R, De Flora S, Noonan DM. Cardiotoxicity of anticancer drugs: the need for cardio-oncology and cardio-oncological prevention. J Natl Cancer Inst. 2010 Jan 6;102(1):14–25.
47. Moslehi JJ. Cardiovascular Toxic Effects of Targeted Cancer Therapies. Longo DL, editor. N Engl J Med. 2016 Oct 13;375(15):1457–67.
48. Drímal J, Zúrová-Nedelcevová J, Knezl V, Sotníková R, Navarová J. Cardiovascular toxicity of the first line cancer chemotherapeutic agents: doxorubicin, cyclophosphamide, streptozotocin and bevacizumab. Neuro Endocrinol Lett. 2006 Dec;27 Suppl 2:176–9.
49. Hanby AM, walker C. Tavassoli FA, Devilee P: Pathology and Genetics: Tumours of the Breast and Female Genital Organs. WHO Classification of Tumours series - volume IV. Lyon, France: IARC Press. Breast Cancer Research. BioMed Central; 2004 Mar 31;6(3):349.

107
50. Weigelt B, Horlings HM, Kreike B, Hayes MM, Hauptmann M, Wessels LFA, et al. Refinement of breast cancer classification by molecular characterization of histological special types. J Pathol. Wiley-Blackwell; 2008 Oct;216(2):141–50.
51. Weigelt B, Reis-Filho JS. Histological and molecular types of breast cancer: is there a unifying taxonomy? Nat Rev Clin Oncol. Nature Publishing Group; 2009 Dec;6(12):718–30.
52. Li CI, Uribe DJ, Daling JR. Clinical characteristics of different histologic types of breast cancer. Br J Cancer. Nature Publishing Group; 2005 Oct 31;93(9):1046–52.
53. Weigelt B, Geyer FC, Reis-Filho JS. Histological types of breast cancer: How special are they? Børresen-Dale A-L, Sørlie T, Kristensen VN, editors. Molecular Oncology. Wiley-Blackwell; 2010 Apr 18;4(3):192–208.
54. Carpenter G, Lembach KJ, Morrison MM, Cohen S. Characterization of the binding of 125-I-labeled epidermal growth factor to human fibroblasts. J Biol Chem. 1975 Jun 10;250(11):4297–304.
55. Gschwind A, Fischer OM, Ullrich A. The discovery of receptor tyrosine kinases: targets for cancer therapy. Nat Rev Cancer. Nature Publishing Group; 2004 May;4(5):361–70.
56. Carpenter G, King L, Cohen S. Epidermal growth factor stimulates phosphorylation in membrane preparations in vitro. Nature 2002 420:6917. 1978 Nov 23;276(5686):409–10.
57. Coussens L, Yang-Feng TL, Liao YC, Chen E, Gray A, McGrath J, et al. Tyrosine kinase receptor with extensive homology to EGF receptor shares chromosomal location with neu oncogene. Science. 1985 Dec 6;230(4730):1132–9.
58. Yarden Y, Sliwkowski MX. Untangling the ErbB signalling network. Nat Rev Mol Cell Biol. Nature Publishing Group; 2001 Feb;2(2):127–37.
59. Burstein HJ. The distinctive nature of HER2-positive breast cancers. N Engl J Med. 2005 Oct 20;353(16):1652–4.
60. King CR, Kraus MH, Aaronson SA. Amplification of a novel v-erbB-related gene in a human mammary carcinoma. Science. 1985 Sep 6;229(4717):974–6.
61. Benson JR, Jatoi I, Keisch M, Esteva FJ, Makris A, Jordan VC. Early breast cancer. Lancet. 2009 Apr 25;373(9673):1463–79.
62. Early Breast Cancer Trialists' Collaborative Group (EBCTCG), Darby S, McGale P, Correa C, Taylor C, Arriagada R, et al. Effect of radiotherapy after breast-conserving surgery on 10-year recurrence and 15-year breast cancer death: meta-analysis of individual patient data for 10,801 women in 17 randomised trials. Lancet. 2011 Nov 12;378(9804):1707–16.
63. Early Breast Cancer Trialists' Collaborative Group (EBCTCG), Clarke M, Coates AS, Darby SC, Davies C, Gelber RD, et al. Adjuvant chemotherapy in oestrogen-receptor-poor breast cancer: patient-level meta-analysis of randomised trials. Lancet. 2008 Jan 5;371(9606):29–40.

108
64. Early Breast Cancer Trialists' Collaborative Group (EBCTCG). Effects of chemotherapy and hormonal therapy for early breast cancer on recurrence and 15-year survival: an overview of the randomised trials. Lancet. 2005 May;365(9472):1687–717.
65. Tamoxifen for early breast cancer: an overview of the randomised trials. Early Breast Cancer Trialists' Collaborative Group. Lancet. 1998 May 16;351(9114):1451–67.
66. Marty M, Cognetti F, Maraninchi D, Snyder R, Mauriac L, Tubiana-Hulin M, et al. Randomized phase II trial of the efficacy and safety of trastuzumab combined with docetaxel in patients with human epidermal growth factor receptor 2-positive metastatic breast cancer administered as first-line treatment: the M77001 study group. J Clin Oncol. American Society of Clinical Oncology; 2005 Jul 1;23(19):4265–74.
67. Vogel CL, Cobleigh MA, Tripathy D, Gutheil JC, Harris LN, Fehrenbacher L, et al. Efficacy and safety of trastuzumab as a single agent in first-line treatment of HER2-overexpressing metastatic breast cancer. J Clin Oncol. American Society of Clinical Oncology; 2002 Feb 1;20(3):719–26.
68. Pritchard KI, Shepherd LE, O'Malley FP, Andrulis IL, Tu D, Bramwell VH, et al. HER2 and responsiveness of breast cancer to adjuvant chemotherapy. N Engl J Med. 2006 May 18;354(20):2103–11.
69. Slamon DJ, Eiermann W, Robert NJ, Giermek J, Martin M, Jasiowka M, et al. Abstract S5-04: Ten year follow-up of BCIRG-006 comparing doxorubicin plus cyclophosphamide followed by docetaxel (AC→T) with doxorubicin plus cyclophosphamide followed by docetaxel and trastuzumab (AC→TH) with docetaxel, carboplatin and trastuzumab (TCH) in HER2+ early breast cancer. Cancer Research. American Association for Cancer Research; 2016 Feb 18;76(4 Supplement):S5–04–S5–04.
70. Jackisch C, Piccart MJ, Gelber RD, Procter M, Goldhirsch A, DeAzambuja E, et al. Abstract PD5-01: HERA trial: 10 years follow up of trastuzumab after adjuvant chemotherapy in HER2 positive early breast cancer – Final analysis. Cancer Research. American Association for Cancer Research; 2016 Feb 18;76(4 Supplement):PD5–01–PD5–01.
71. Perez EA, Romond EH, Suman VJ, Jeong J-H, Sledge G, Geyer CE, et al. Trastuzumab plus adjuvant chemotherapy for human epidermal growth factor receptor 2-positive breast cancer: planned joint analysis of overall survival from NSABP B-31 and NCCTG N9831. J Clin Oncol. American Society of Clinical Oncology; 2014 Nov 20;32(33):3744–52.
72. Romond EH, Perez EA, Bryant J, Suman VJ, Geyer CE, Davidson NE, et al. Trastuzumab plus adjuvant chemotherapy for operable HER2-positive breast cancer. N Engl J Med. 2005 Oct 20;353(16):1673–84.
73. Goldhirsch A, Gelber RD, Piccart-Gebhart MJ, de Azambuja E, Procter M, Suter TM, et al. 2 years versus 1 year of adjuvant trastuzumab for HER2-positive breast cancer (HERA): an open-label, randomised controlled trial. Lancet. 2013 Sep 21;382(9897):1021–8.
109
74. Pivot X, Romieu G, Debled M, Pierga J-Y, Kerbrat P, Bachelot T, et al. 6 months versus 12 months of adjuvant trastuzumab for patients with HER2-positive early breast cancer (PHARE): a randomised phase 3 trial. Lancet Oncol. 2013 Jul;14(8):741–8.
75. Perez EA, Suman VJ, Davidson NE, Gralow JR, Kaufman PA, Visscher DW, et al. Sequential versus concurrent trastuzumab in adjuvant chemotherapy for breast cancer. J Clin Oncol. 2011 Dec 1;29(34):4491–7.
76. Loibl S, Gianni L. HER2-positive breast cancer. Lancet. 2017 Jun 17;389(10087):2415–29.
77. Moliterni A, Ménard S, Valagussa P, Biganzoli E, Boracchi P, Balsari A, et al. HER2 overexpression and doxorubicin in adjuvant chemotherapy for resectable breast cancer. J Clin Oncol. American Society of Clinical Oncology; 2003 Feb 1;21(3):458–62.
78. Paik S, Bryant J, Tan-Chiu E, Yothers G, Park C, Wickerham DL, et al. HER2 and choice of adjuvant chemotherapy for invasive breast cancer: National Surgical Adjuvant Breast and Bowel Project Protocol B-15. J Natl Cancer Inst. 2000 Dec 20;92(24):1991–8.
79. Tan C, Tasaka H, Yu KP, Murphy ML, Karnofsky DA. Daunomycin, an antitumor antibiotic, in the treatment of neoplastic disease. Clinical evaluation with special reference to childhood leukemia. Cancer. 1967 Mar;20(3):333–53.
80. Kantrowitz NE, Bristow MR. Cardiotoxicity of antitumor agents. Progress in Cardiovascular Diseases. 1984 Nov;27(3):195–200.
81. Shakir D. Chemotherapy Induced Cardiomyopathy: Pathogenesis, Monitoring and Management. Journal of Clinical Medicine Research. 2009;0(1):8–12.
82. Gewirtz D. A critical evaluation of the mechanisms of action proposed for the antitumor effects of the anthracycline antibiotics adriamycin and daunorubicin. Biochemical Pharmacology. 1999 Apr;57(7):727–41.
83. Yeh ETH, Bickford CL. Cardiovascular complications of cancer therapy: incidence, pathogenesis, diagnosis, and management. Journal of the American College of Cardiology. 2009 Jun 16;53(24):2231–47.
84. Swain SM, Whaley FS, Ewer MS. Congestive heart failure in patients treated with doxorubicin: a retrospective analysis of three trials. Cancer. Wiley-Blackwell; 2003 Jun 1;97(11):2869–79.
85. Hoff Von DD, Layard MW, Basa P, Davis HL, Hoff Von AL, Rozencweig M, et al. Risk factors for doxorubicin-induced congestive heart failure. Ann Intern Med. 1979 Nov;91(5):710–7.
86. Ewer MS, Lenihan DJ. Left ventricular ejection fraction and cardiotoxicity: is our ear really to the ground? J Clin Oncol. 2008 Mar 10;26(8):1201–3.
87. Wojnowski L, Kulle B, Schirmer M, Schlüter G, Schmidt A, Rosenberger A, et al. NAD(P)H oxidase and multidrug resistance protein genetic polymorphisms are associated with doxorubicin-induced cardiotoxicity. Circulation. American Heart Association, Inc; 2005 Dec 13;112(24):3754–62.

110
88. O'Hare M, Sharma A, Murphy K, Mookadam F, Lee H. Cardio-oncology Part I: chemotherapy and cardiovascular toxicity. Expert Rev Cardiovasc Ther. 2015 May;13(5):511–8.
89. Bergmann O, Bhardwaj RD, Bernard S, Zdunek S, Barnabé-Heider F, Walsh S, et al. Evidence for cardiomyocyte renewal in humans. Science. American Association for the Advancement of Science; 2009 Apr 3;324(5923):98–102.
90. Mann DL, Bristow MR. Mechanisms and models in heart failure: the biomechanical model and beyond. Circulation. American Heart Association, Inc; 2005 May 31;111(21):2837–49.
91. Suter TM, Procter M, van Veldhuisen DJ, Muscholl M, Bergh J, Carlomagno C, et al. Trastuzumab-associated cardiac adverse effects in the herceptin adjuvant trial. J Clin Oncol. American Society of Clinical Oncology; 2007 Sep 1;25(25):3859–65.
92. Eschenhagen T, Force T, Ewer MS, de Keulenaer GW, Suter TM, Anker SD, et al. Cardiovascular side effects of cancer therapies: a position statement from the Heart Failure Association of the European Society of Cardiology. Eur J Heart Fail. Wiley-Blackwell; 2011 Jan;13(1):1–10.
93. Zhao YY, Sawyer DR, Baliga RR, Opel DJ, Han X, Marchionni MA, et al. Neuregulins promote survival and growth of cardiac myocytes. Persistence of ErbB2 and ErbB4 expression in neonatal and adult ventricular myocytes. J Biol Chem. 1998 Apr 24;273(17):10261–9.
94. Lemmens K, Segers VFM, Demolder M, de Keulenaer GW. Role of neuregulin-1/ErbB2 signaling in endothelium-cardiomyocyte cross-talk. J Biol Chem. American Society for Biochemistry and Molecular Biology; 2006 Jul 14;281(28):19469–77.
95. Fukazawa R, Miller TA, Kuramochi Y, Frantz S, Kim YD, Marchionni MA, et al. Neuregulin-1 protects ventricular myocytes from anthracycline-induced apoptosis via erbB4-dependent activation of PI3-kinase/Akt. J Mol Cell Cardiol. 2003 Dec;35(12):1473–9.
96. Kuramochi Y, Guo X, Sawyer DB. Neuregulin activates erbB2-dependent src/FAK signaling and cytoskeletal remodeling in isolated adult rat cardiac myocytes. J Mol Cell Cardiol. 2006 Aug;41(2):228–35.
97. Russell KS, Stern DF, Polverini PJ, Bender JR. Neuregulin activation of ErbB receptors in vascular endothelium leads to angiogenesis. Am J Physiol. 1999 Dec;277(6 Pt 2):H2205–11.
98. Lemmens K, Fransen P, Sys SU, Brutsaert DL, de Keulenaer GW. Neuregulin-1 induces a negative inotropic effect in cardiac muscle: role of nitric oxide synthase. Circulation. American Heart Association, Inc; 2004 Jan 27;109(3):324–6.
99. de Keulenaer GW, Doggen K, Lemmens K. The vulnerability of the heart as a pluricellular paracrine organ: lessons from unexpected triggers of heart failure in targeted ErbB2 anticancer therapy. Circ Res. American Heart Association, Inc; 2010 Jan 8;106(1):35–46.
100. Ewer MS, Lippman SM. Type II chemotherapy-related cardiac dysfunction: time to recognize a new entity. J Clin Oncol. 2005 May 1;23(13):2900–2.
111
101. Force T, Krause DS, Van Etten RA. Molecular mechanisms of cardiotoxicity of tyrosine kinase inhibition. Nat Rev Cancer. Nature Publishing Group; 2007 May;7(5):332–44.
102. Telli ML, Hunt SA, Carlson RW, Guardino AE. Trastuzumab-related cardiotoxicity: calling into question the concept of reversibility. J Clin Oncol. American Society of Clinical Oncology; 2007 Aug 10;25(23):3525–33.
103. Moja L, Tagliabue L, Balduzzi S, Parmelli E, Pistotti V, Guarneri V, et al. Trastuzumab containing regimens for early breast cancer. Cochrane Breast Cancer Group, editor. Cochrane Database Syst Rev. John Wiley & Sons, Ltd; 2012 Apr 18;353(4):CD006243.
104. Thavendiranathan P, Abdel-Qadir H, Fischer HD, Camacho X, Amir E, Austin PC, et al. Breast Cancer Therapy-Related Cardiac Dysfunction in Adult Women Treated in Routine Clinical Practice: A Population-Based Cohort Study. J Clin Oncol. American Society of Clinical Oncology; 2016 Jul 1;34(19):2239–46.
105. Romond EH, Jeong J-H, Rastogi P, Swain SM, Geyer CE, Ewer MS, et al. Seven-year follow-up assessment of cardiac function in NSABP B-31, a randomized trial comparing doxorubicin and cyclophosphamide followed by paclitaxel (ACP) with ACP plus trastuzumab as adjuvant therapy for patients with node-positive, human epidermal growth factor receptor 2-positive breast cancer. J Clin Oncol. 2012 Nov 1;30(31):3792–9.
106. Slamon D, Eiermann W, Robert N, Pienkowski T, Martin M, Press M, et al. Adjuvant trastuzumab in HER2-positive breast cancer. N Engl J Med. Massachusetts Medical Society; 2011 Oct 6;365(14):1273–83.
107. Chen T, Xu T, Li Y, Liang C, Chen J, Lu Y, et al. Risk of cardiac dysfunction with trastuzumab in breast cancer patients: a meta-analysis. Cancer Treat Rev. 2011 Jun;37(4):312–20.
108. Tan-Chiu E, Yothers G, Romond E, Geyer CE, Ewer M, Keefe D, et al. Assessment of cardiac dysfunction in a randomized trial comparing doxorubicin and cyclophosphamide followed by paclitaxel, with or without trastuzumab as adjuvant therapy in node-positive, human epidermal growth factor receptor 2-overexpressing breast cancer: NSABP B-31. Journal of Clinical Oncology. 2005 Nov 1;23(31):7811–9.
109. Crone SA, Zhao Y-Y, Fan L, Gu Y, Minamisawa S, Liu Y, et al. ErbB2 is essential in the prevention of dilated cardiomyopathy. Nat Med. Nature Publishing Group; 2002 May;8(5):459–65.
110. Chien KR. Herceptin and the Heart — A Molecular Modifier of Cardiac Failure. N Engl J Med. 2006 Feb 23;354(8):789–90.
111. Khouri MG, Douglas PS, Mackey JR, Martin M, Scott JM, Scherrer-Crosbie M, et al. Cancer therapy-induced cardiac toxicity in early breast cancer: addressing the unresolved issues. Circulation. American Heart Association, Inc; 2012 Dec 4;126(23):2749–63.
112. Brana I, Tabernero J. Cardiotoxicity. Ann Oncol. 2010 Oct;21 Suppl 7(Supplement 7):vii173–9.

112
113. Marks LB, Yu X, Prosnitz RG, Zhou S-M, Hardenbergh PH, Blazing M, et al. The incidence and functional consequences of RT-associated cardiac perfusion defects. Int J Radiat Oncol Biol Phys. 2005 Sep 1;63(1):214–23.
114. Patt DA, Goodwin JS, Kuo Y-F, Freeman JL, Zhang DD, Buchholz TA, et al. Cardiac Morbidity of Adjuvant Radiotherapy for Breast Cancer. Journal of Clinical Oncology. 2005 Oct 20;23(30):7475–82.
115. Bovelli D, Plataniotis G, Roila F, ESMO Guidelines Working Group. Cardiotoxicity of chemotherapeutic agents and radiotherapy-related heart disease: ESMO Clinical Practice Guidelines. Vol. 21 Suppl 5, Annals of oncology : official journal of the European Society for Medical Oncology. 2010. pp. v277–82.
116. Amir E, Seruga B, Niraula S, Carlsson L, Ocaña A. Toxicity of adjuvant endocrine therapy in postmenopausal breast cancer patients: a systematic review and meta-analysis. J Natl Cancer Inst. 2011 Sep 7;103(17):1299–309.
117. Curigliano G, Mayer EL, Burstein HJ, Winer EP, Goldhirsch A. Cardiac toxicity from systemic cancer therapy: a comprehensive review. Progress in Cardiovascular Diseases. 2010 Sep;53(2):94–104.
118. Khosrow-Khavar F, Filion KB, Al-Qurashi S, Torabi N, Bouganim N, Suissa S, et al. Cardiotoxicity of aromatase inhibitors and tamoxifen in postmenopausal women with breast cancer: a systematic review and meta-analysis of randomized controlled trials. Ann Oncol. 2017 Mar 1;28(3):487–96.
119. Hunt SA, Abraham WT, Chin MH, Feldman AM, Francis GS, Ganiats TG, et al. 2009 Focused update incorporated into the ACC/AHA 2005 Guidelines for the Diagnosis and Management of Heart Failure in Adults A Report of the American College of Cardiology Foundation/American Heart Association Task Force on Practice Guidelines Developed in Collaboration With the International Society for Heart and Lung Transplantation. Vol. 53, Journal of the American College of Cardiology. 2009. pp. e1–e90.
120. Yancy CW, Jessup M, Bozkurt B, Butler J, Casey DE, Drazner MH, et al. 2013 ACCF/AHA guideline for the management of heart failure: a report of the American College of Cardiology Foundation/American Heart Association Task Force on Practice Guidelines. Vol. 62, Journal of the American College of Cardiology. 2013. pp. e147–239.
121. Cardinale D, Colombo A, Lamantia G, Colombo N, Civelli M, De Giacomi G, et al. Anthracycline-induced cardiomyopathy: clinical relevance and response to pharmacologic therapy. Journal of the American College of Cardiology. 2010 Jan 19;55(3):213–20.
122. Wadhwa D, Fallah-Rad N, Grenier D, Krahn M, Fang T, Ahmadie R, et al. Trastuzumab mediated cardiotoxicity in the setting of adjuvant chemotherapy for breast cancer: a retrospective study. Breast Cancer Res Treat. Netherlands; 2009;117(2):357–64.

113
123. Fallah-Rad N, Lytwyn M, Fang T, Kirkpatrick I, Jassal DS. Delayed contrast enhancement cardiac magnetic resonance imaging in trastuzumab induced cardiomyopathy. J Cardiovasc Magn Reson. England; 2008;10:5.
124. Bosch X, Rovira M, Sitges M, Domènech A, Ortiz-Pérez JT, de Caralt TM, et al. Enalapril and carvedilol for preventing chemotherapy-induced left ventricular systolic dysfunction in patients with malignant hemopathies: the OVERCOME trial (preventiOn of left Ventricular dysfunction with Enalapril and caRvedilol in patients submitted to intensive ChemOtherapy for the treatment of Malignant hEmopathies). Journal of the American College of Cardiology. 2013 Jun 11;61(23):2355–62.
125. Gulati G, Heck SL, Ree AH, Hoffmann P, Schulz-Menger J, Fagerland MW, et al. Prevention of cardiac dysfunction during adjuvant breast cancer therapy (PRADA): a 2 × 2 factorial, randomized, placebo-controlled, double-blind clinical trial of candesartan and metoprolol. Eur Heart J. 2016 Jun 1;37(21):1671–80.
126. Pituskin E, Mackey JR, Koshman S, Jassal D, Pitz M, Haykowsky MJ, et al. Multidisciplinary Approach to Novel Therapies in Cardio-Oncology Research (MANTICORE 101-Breast): A Randomized Trial for the Prevention of Trastuzumab-Associated Cardiotoxicity. J Clin Oncol. 2017 Mar 10;35(8):870–7.
127. L HS, G G, H RA, J S-M, B G, H R, et al. Rationale and design of the prevention of cardiac dysfunction during an adjuvant breast cancer therapy (PRADA) trial. Cardiology. Switzerland: S. Karger AG (Allschwilerstrasse 10, P.O. Box, Basel CH-4009, Switzerland); 2012;123(4):240–7.
128. Pituskin E, Haykowsky M, Mackey JR, Thompson RB, Ezekowitz J, Koshman S, et al. Rationale and design of the Multidisciplinary Approach to Novel Therapies in Cardiology Oncology Research Trial (MANTICORE 101--Breast): a randomized, placebo-controlled trial to determine if conventional heart failure pharmacotherapy can prevent trastuzumab-mediated left ventricular remodeling among patients with HER2+ early breast cancer using cardiac MRI. BMC Cancer. BioMed Central; 2011 Jul 27;11(1):318.
129. KENT G, SUTTON DC, SUTTON GC. Needle biopsy of the human ventricular myocardium. Q Bull Northwest Univ Med Sch. Northwestern University Feinberg School of Medicine; 1956;30(3):213–4.
130. Fowles RE, Mason JW. Role of cardiac biopsy in the diagnosis and management of cardiac disease. Progress in Cardiovascular Diseases. 1984 Nov;27(3):153–72.
131. Druck MN, Gulenchyn KY, Evans WK, Gotlieb A, Srigley JR, Bar-Shlomo BZ, et al. Radionuclide angiography and endomyocardial biopsy in the assessment of doxorubicin cardiotoxicity. Cancer. 1984 Apr 15;53(8):1667–74.
132. Isner JM, Ferrans VJ, Cohen SR, Witkind BG, Virmani R, Gottdiener JS, et al. Clinical and morphologic cardiac findings after anthracycline chemotherapy. Analysis of 64 patients studied at necropsy. Am J Cardiol. 1983 Apr;51(7):1167–74.

114
133. Hesse B, Lindhardt TB, Acampa W, Anagnostopoulos C, Ballinger J, Bax JJ, et al. EANM/ESC guidelines for radionuclide imaging of cardiac function. 3rd ed. Vol. 35, European journal of nuclear medicine and molecular imaging. 2008. pp. 851–85.
134. Walker J, Bhullar N, Fallah-Rad N, Lytwyn M, Golian M, Fang T, et al. Role of three-dimensional echocardiography in breast cancer: comparison with two-dimensional echocardiography, multiple-gated acquisition scans, and cardiac magnetic resonance imaging. J Clin Oncol. 2010 Jul 20;28(21):3429–36.
135. de Geus-Oei L-F, Mavinkurve-Groothuis AMC, Bellersen L, Gotthardt M, Oyen WJG, Kapusta L, et al. Scintigraphic techniques for early detection of cancer treatment-induced cardiotoxicity. J Nucl Med. Society of Nuclear Medicine; 2011 Apr;52(4):560–71.
136. Pepe A, Pizzino F, Gargiulo P, Perrone-Filardi P, Cadeddu C, Mele D, et al. Cardiovascular imaging in the diagnosis and monitoring of cardiotoxicity: cardiovascular magnetic resonance and nuclear cardiology. J Cardiovasc Med (Hagerstown). United States; 2016;17 Suppl 1 Special issue on Cardiotoxicity from Antiblastic Drugs and Cardioprotection:e45–e54.
137. Huang H, Nijjar PS, Misialek JR, Blaes A, Derrico NP, Kazmirczak F, et al. Accuracy of left ventricular ejection fraction by contemporary multiple gated acquisition scanning in patients with cancer: comparison with cardiovascular magnetic resonance. J Cardiovasc Magn Reson. BioMed Central; 2017 Mar 24;19(1):34.
138. Cardinale D, Sandri MT, Martinoni A, Tricca A, Civelli M, Lamantia G, et al. Left ventricular dysfunction predicted by early troponin I release after high-dose chemotherapy. Journal of the American College of Cardiology. 2000 Aug;36(2):517–22.
139. Sawaya H, Sebag IA, Plana JC, Januzzi JL, Ky B, Cohen V, et al. Early detection and prediction of cardiotoxicity in chemotherapy-treated patients. Am J Cardiol. 2011 May 1;107(9):1375–80.
140. Sawaya H, Sebag IA, Plana JC, Januzzi JL, Ky B, Tan TC, et al. Assessment of echocardiography and biomarkers for the extended prediction of cardiotoxicity in patients treated with anthracyclines, taxanes, and trastuzumab. Circulation: Cardiovascular Imaging. American Heart Association, Inc; 2012 Sep 1;5(5):596–603.
141. Timolati F, Ott D, Pentassuglia L, Giraud M-N, Perriard J-C, Suter TM, et al. Neuregulin-1 beta attenuates doxorubicin-induced alterations of excitation-contraction coupling and reduces oxidative stress in adult rat cardiomyocytes. J Mol Cell Cardiol. 2006 Nov;41(5):845–54.
142. Kang YJ, Chen Y, Epstein PN. Suppression of doxorubicin cardiotoxicity by overexpression of catalase in the heart of transgenic mice. J Biol Chem. 1996 May 24;271(21):12610–6.
143. Dirican A, Levent F, Alacacioglu A, Kucukzeybek Y, Varol U, Kocabas U, et al. Acute cardiotoxic effects of adjuvant trastuzumab treatment and its relation to oxidative stress. Angiology. SAGE PublicationsSage CA: Los Angeles, CA; 2014 Nov;65(10):944–9.
144. Xu X, Li Z, Gao W. Growth differentiation factor 15 in cardiovascular diseases: from bench to bedside. Biomarkers. 2011 Sep;16(6):466–75.
115
145. Kempf T, Wollert KC. Growth-differentiation factor-15 in heart failure. Heart Fail Clin. 2009 Oct;5(4):537–47.
146. Dedobbeleer C, Rai M, Donal E, Pandolfo M, Unger P. Normal left ventricular ejection fraction and mass but subclinical myocardial dysfunction in patients with Friedreich's ataxia. Eur Heart J Cardiovasc Imaging. 2012 Apr;13(4):346–52.
147. Phelan D, Collier P, Thavendiranathan P, Popović ZB, Hanna M, Plana JC, et al. Relative apical sparing of longitudinal strain using two-dimensional speckle-tracking echocardiography is both sensitive and specific for the diagnosis of cardiac amyloidosis. Heart. BMJ Publishing Group Ltd and British Cardiovascular Society; 2012 Oct;98(19):1442–8.
148. Marwick TH, Leano RL, Brown J, Sun J-P, Hoffmann R, Lysyansky P, et al. Myocardial strain measurement with 2-dimensional speckle-tracking echocardiography: definition of normal range. JACC Cardiovasc Imaging. 2009 Jan;2(1):80–4.
149. Plana JC, Galderisi M, Barac A, Ewer MS, Ky B, Scherrer-Crosbie M, et al. Expert consensus for multimodality imaging evaluation of adult patients during and after cancer therapy: a report from the American Society of Echocardiography and the European Association of Cardiovascular Imaging. J Am Soc Echocardiogr. 2014 Sep;27(9):911–39.
150. Thavendiranathan P, Poulin F, Lim K-D, Plana JC, Woo A, Marwick TH. Use of myocardial strain imaging by echocardiography for the early detection of cardiotoxicity in patients during and after cancer chemotherapy: a systematic review. Journal of the American College of Cardiology. 2014 Jul 1;63(25 Pt A):2751–68.
151. Hare JL, Brown JK, Leano R, Jenkins C, Woodward N, Marwick TH. Use of myocardial deformation imaging to detect preclinical myocardial dysfunction before conventional measures in patients undergoing breast cancer treatment with trastuzumab. American Heart Journal. 2009 Aug;158(2):294–301.
152. Bellenger NG, Burgess MI, Ray SG, Lahiri A, Coats AJ, Cleland JG, et al. Comparison of left ventricular ejection fraction and volumes in heart failure by echocardiography, radionuclide ventriculography and cardiovascular magnetic resonance; are they interchangeable? Eur Heart J. 2000 Aug;21(16):1387–96.
153. Pfeffer JM, Pfeffer MA, Braunwald E. Influence of chronic captopril therapy on the infarcted left ventricle of the rat. Circ Res. 1985 Jul 1;57(1):84–95.
154. Opie LH, Commerford PJ, Gersh BJ, Pfeffer MA. Controversies in ventricular remodelling. Lancet. 2006 Jan 28;367(9507):356–67.
155. Octavia Y, Tocchetti CG, Gabrielson KL, Janssens S, Crijns HJ, Moens AL. Doxorubicin-induced cardiomyopathy: from molecular mechanisms to therapeutic strategies. J Mol Cell Cardiol. 2012 Jun;52(6):1213–25.
156. Goldstein S. Cardiac Remodeling: Mechanism and Treatment. Circulation. American Heart Association, Inc; 2006 May 23;113(20):e774–4.
116
157. Linzbach AJ. Heart failure from the point of view of quantitative anatomy∗. Am J Cardiol. 1960 Mar;5(3):370–82.
158. Bernardo BC, Weeks KL, Pretorius L, McMullen JR. Molecular distinction between physiological and pathological cardiac hypertrophy: Experimental findings and therapeutic strategies. Pharmacology & Therapeutics. Pergamon; 2010 Oct 1;128(1):191–227.
159. Linzbach AJ. Mikrometrische und histologische Analyse hypertropher menschlicher Herzen. Virchows Archiv f�r Pathologische Anatomie und Physiologie und f�r Klinische Medizin. Springer-Verlag; 1947;314(5-6):534–94.
160. Xu J, Carretero OA, Liao T-D, Peng H, Shesely EG, Xu J, et al. Local angiotensin II aggravates cardiac remodeling in hypertension. Am J Physiol Heart Circ Physiol. American Physiological Society Bethesda, MD; 2010 Nov;299(5):H1328–38.
161. Iemitsu M, Miyauchi T, Maeda S, Sakai S, Kobayashi T, Fujii N, et al. Physiological and pathological cardiac hypertrophy induce different molecular phenotypes in the rat. Am J Physiol Regul Integr Comp Physiol. American Physiological SocietyBethesda, MD; 2001 Dec;281(6):R2029–36.
162. MEERSON FZ. Compensatory hyperfunction of the heart and cardiac insufficiency. Circ Res. American Heart Association, Inc; 1962 Mar;10(3):250–8.
163. Morkin E. Control of cardiac myosin heavy chain gene expression. Microsc Res Tech. Wiley-Blackwell; 2000 Sep 15;50(6):522–31.
164. Weber KT, Brilla CG. Pathological hypertrophy and cardiac interstitium. Fibrosis and renin-angiotensin-aldosterone system. Circulation. 1991 Jun;83(6):1849–65.
165. Greenberg BH. Cardiac remodeling : mechanisms and treatment. New York: Taylor & Francis; 2006.
166. McMurray J, Chopra M, Abdullah I, Smith WE, Dargie HJ. Evidence of oxidative stress in chronic heart failure in humans. Eur Heart J. 1993 Nov;14(11):1493–8.
167. Murdoch CE, Zhang M, Cave AC, Shah AM. NADPH oxidase-dependent redox signalling in cardiac hypertrophy, remodelling and failure. Cardiovasc Res. 2006 Jul 15;71(2):208–15.
168. Cai H, Harrison DG. Endothelial dysfunction in cardiovascular diseases: the role of oxidant stress. Circ Res. 2000 Nov 10;87(10):840–4.
169. Devasagayam TPA, Tilak JC, Boloor KK, Sane KS, Ghaskadbi SS, Lele RD. Free radicals and antioxidants in human health: current status and future prospects. J Assoc Physicians India. 2004 Oct;52:794–804.
170. Sabri A, Hughie HH, Lucchesi PA. Regulation of hypertrophic and apoptotic signaling pathways by reactive oxygen species in cardiac myocytes. Antioxid Redox Signal. 2003 Dec;5(6):731–40.

117
171. Cesselli D, Jakoniuk I, Barlucchi L, Beltrami AP, Hintze TH, Nadal-Ginard B, et al. Oxidative stress-mediated cardiac cell death is a major determinant of ventricular dysfunction and failure in dog dilated cardiomyopathy. Circ Res. 2001 Aug 3;89(3):279–86.
172. Rajagopalan S, Meng XP, Ramasamy S, Harrison DG, Galis ZS. Reactive oxygen species produced by macrophage-derived foam cells regulate the activity of vascular matrix metalloproteinases in vitro. Implications for atherosclerotic plaque stability. J Clin Invest. American Society for Clinical Investigation; 1996 Dec 1;98(11):2572–9.
173. Kinugawa S, Tsutsui H, Hayashidani S, Ide T, Suematsu N, Satoh S, et al. Treatment with dimethylthiourea prevents left ventricular remodeling and failure after experimental myocardial infarction in mice: role of oxidative stress. Circ Res. 2000 Sep 1;87(5):392–8.
174. Haykowsky MJ, Mackey JR, Thompson RB, Jones LW, Paterson DI. Adjuvant trastuzumab induces ventricular remodeling despite aerobic exercise training. Clin Cancer Res. 2009 Aug 1;15(15):4963–7.
175. Bergamini C, Torelli F, Ghiselli L, Rossi A, Trevisani L, Vinco G, et al. Left ventricular end-diastolic volume as early indicator of trastuzumab-related cardiotoxicity in HER2+ breast cancer patients: results from a single-center retrospective study. Minerva Cardioangiol. 2017 Jun;65(3):278–87.
176. Meléndez GC, Sukpraphrute B, D'Agostino RB, Jordan JH, Klepin HD, Ellis L, et al. Frequency of Left Ventricular End-Diastolic Volume-Mediated Declines in Ejection Fraction in Patients Receiving Potentially Cardiotoxic Cancer Treatment. Am J Cardiol. Elsevier; 2017 May 15;119(10):1637–42.
177. Jordan JH, Sukpraphrute B, Meléndez GC, Jolly M-P, D'Agostino RB, Hundley WG. Early Myocardial Strain Changes During Potentially Cardiotoxic Chemotherapy May Occur as a Result of Reductions in Left Ventricular End-Diastolic Volume: The Need to Interpret Left Ventricular Strain With Volumes. Circulation. American Heart Association, Inc; 2017 Jun 20;135(25):2575–7.
178. E LS, J AM, D CS, S CL, H HE, T HD, et al. Long-term cardiovascular toxicity in children, adolescents, and young adults who receive cancer therapy: Pathophysiology, course, monitoring, management, prevention, and research directions: A scientific statement from the American Heart Association. Circulation. United States: Lippincott Williams and Wilkins (530 Walnut Street,P O Box 327, Philadelphia PA 19106-3621, United States); 2013;128(17):1927–55.
179. Neilan TG, Coelho-Filho OR, Pena-Herrera D, Shah RV, Jerosch-Herold M, Francis SA, et al. Left ventricular mass in patients with a cardiomyopathy after treatment with anthracyclines. Am J Cardiol. 2012 Dec 1;110(11):1679–86.
180. E A, A TQ, D I, R M, C Y, E K, et al. Effect of Adjuvant Chemotherapy on Left Ventricular Remodeling in Women with Newly Diagnosed Primary Breast Cancer. J Thorac Imaging. United States: Lippincott Williams and Wilkins (E-mail: [email protected]); 2017;32(6):365–9.

118
181. S G, P LD, A C, L J, D K, K C, et al. Left and right ventricular effects of anthracycline and trastuzumab chemotherapy: A prospective study using novel cardiac imaging and biochemical markers. Int J Cardiol. Ireland: Elsevier Ireland Ltd (P.O. Box 85, Limerick, Ireland); 2013;168(6):5465–7.
182. Drafts BC, Twomley KM, D'Agostino R, Lawrence J, Avis N, Ellis LR, et al. Low to moderate dose anthracycline-based chemotherapy is associated with early noninvasive imaging evidence of subclinical cardiovascular disease. JACC Cardiovasc Imaging. 2013 Aug;6(8):877–85.
183. Danilouchkine MG, Westenberg JJM, de Roos A, Reiber JHC, Lelieveldt BPF. Operator induced variability in cardiovascular MR: left ventricular measurements and their reproducibility. J Cardiovasc Magn Reson. 2005;7(2):447–57.
184. Moon JCC, Lorenz CH, Francis JM, Smith GC, Pennell DJ. Breath-hold FLASH and FISP cardiovascular MR imaging: left ventricular volume differences and reproducibility. Radiology. 2002 Jun;223(3):789–97.
185. Kawel-Boehm N, Maceira A, Valsangiacomo-Buechel ER, Vogel-Claussen J, Turkbey EB, Williams R, et al. Normal values for cardiovascular magnetic resonance in adults and children. J Cardiovasc Magn Reson. 3rd ed. BioMed Central; 2015 Apr 18;17(1):3.
186. Grothues F, Smith GC, Moon JCC, Bellenger NG, Collins P, Klein HU, et al. Comparison of interstudy reproducibility of cardiovascular magnetic resonance with two-dimensional echocardiography in normal subjects and in patients with heart failure or left ventricular hypertrophy. Am J Cardiol. 2002 Jul 1;90(1):29–34.
187. Schulz-Menger J, Bluemke DA, Bremerich J, Flamm SD, Fogel MA, Friedrich MG, et al. Standardized image interpretation and post processing in cardiovascular magnetic resonance: Society for Cardiovascular Magnetic Resonance (SCMR) Board of Trustees Task Force on Standardized Post Processing. J Cardiovasc Magn Reson. 2013;15(1):35.
188. Eliasziw M, Young SL, Woodbury MG, Fryday-Field K. Statistical methodology for the concurrent assessment of interrater and intrarater reliability: using goniometric measurements as an example. Phys Ther. 1994 Aug;74(8):777–88.
189. Popović ZB, Thomas JD. Assessing observer variability: a user's guide. Cardiovasc Diagn Ther. 2017 Jun;7(3):317–24.
190. Ong G, Brezden-Masley C, Dhir V, Deva DP, Chan KKW, Chow C-M, et al. Myocardial strain imaging by cardiac magnetic resonance for detection of subclinical myocardial dysfunction in breast cancer patients receiving trastuzumab and chemotherapy. Int J Cardiol. 2018 Jun 15;261:228–33.

119
Copyright Acknowledgements Figure 2.1.
Canadian Cancer Statistics Advisory Committee. Canadian Cancer Statistics 2017. Toronto, ON:
Canadian Cancer Society; 2017. Available at: cancer.ca/Canadian-Cancer-Statistics-2017-EN (accessed
Sep 2018)
Table 2.1.
Modified from open access: no copyright required. Publication: Journal of the National Cancer Institute.
Title: Cardiotoxicity of Anticancer Drugs: The Need for Cardio-Oncology and Cardio-Oncological
Prevention (2010)
Table 2.2.
Order Number: 4437171252881. Publication: Journal of Pathology. Title: Refinement of breast cancer
classification by molecular characterization of histological special types (2008)
Figure 2.2
Order Number: 4437661505753. Publication: Canadian Journal of Cardiology. Title: Shared Risk
Factors for Cardiovascular Disease and Cancer: Implications for Preventive Health and Clinical Care in
Oncology Patients
Figure 2.3
Modified from the original – no copyright required. Publication: Expert Review of Cardiovascular
Therapy. Title: Cardio-oncology Part I: chemotherapy and cardiovascular toxicity

120
Appendix List of peer-reviewed abstracts from this work:
1- 2018, Oct. Mustafa A. Altaha. Left and Right Ventricular Remodeling in Patients with Early Stage Breast Cancer Receiving Sequential Anthracycline and Trastuzumab Therapy - A Cardiac MRI Study. Presented e-poster at the Canadian Cardiovascular Congress (CCC) in Toronto, ON
Left and Right Ventricular Remodeling in Patients with Early Stage Breast Cancer Receiving Sequential Anthracycline and Trastuzumab Therapy - A Cardiac MRI Study
Mustafa A Altaha, MBBS; Mark Nolan, MD; Kim Connelly, MD, PhD; Eitan Amir, MD, PhD; Christine
Brezden-Masley MD, PhD; Bernd J Wintersperger, MD; Paaladinesh Thavendiranathan, MD, MSc, SM, on Behalf of the EMBRACE-MRI Investigators
Introduction: Cardiac dysfunction induced by anthracycline and trastuzumab sequential therapy is an adverse prognostic marker in women with early-stage breast cancer. There is currently limited description of the patterns of ventricular remodeling during treatment in these patients. Also, much of the focus in cardiotoxicity has been on left ventricular dysfunction. Understanding changes to cardiac function beyond the left ventricle will provide a broader appreciation of cardiac impact of cancer therapy and can have implications for screening of cardiotoxicity. Methods/Results: Eighty-three consecutive women (age: 51 ± 9.5 years) with early stage HER2+ breast cancer, receiving sequential anthracycline and trastuzumab therapy, were prospectively recruited. The mean dose of epirubicin used was 301.8 mg/m2 ± 12.3. All patients had cardiac MRI (CMR) pre-anthracycline, within three weeks post-anthracycline (but before trastuzumab, ~2 months), and at five months (~three months into trastuzumab therapy) on a 1.5T Siemens Avanto Fit magnet. Short axis SSFP cines with 8mm slice thickness (2mm gap) were acquired for ventricular function analysis. Left and right ventricular (LV/RV) volumes and ejection fraction (EF), and LV mass were measured by an observer blinded to patient identification and imaging time point. LV cardiotoxicity was defined as a >10% drop in LVEF to <55%, while RV cardiotoxicity was defined as a >10% drop in RVEF to <51%. A paired t-test was used for comparison. Ten patients (12%) developed LV dysfunction, 1 (10%) at 2 months and 9 (90%) at 5 months. Two patients (2.4%) developed RV dysfunction, both of which occurred at 6 months. One patient had concomitant LV and RV dysfunction. In patients with LV dysfunction, mean LVEF significantly dropped at both 2 and 5 months; whereas significant RVEF reduction only occurred at 6 months figure-1, table-1. Changes in RVEF mirrored that of LVEF in the patients who did not develop LV cardiotoxicity figure-2, table-1. Mean (± SD) LVEF and RVEF at baseline, ~2-month, and ~5-month for all patients, patients with LV dysfunction, and patients without LV dysfunction are summarized in table-1.

121
Conclusions: RV dysfunction is less common than LV dysfunction during the first 6 months of sequential anthracycline and trastuzumab therapy in HER2+ breast cancer. Changes in LVEF and RVEF appear to mirror each other when examined as a continuous variable. However, a significant drop in RVEF appear to occur later than that of the left ventricle and seems to occur only during trastuzumab therapy. Figure-1: Comparison between mean changes in LVEF and RVEF in patients with LV dysfunction at pre-anthracycline, within 3 weeks post anthracycline, and 3 months during trastuzumab therapy
Baseline ~2 Months ~5 MonthsRV EF 59.64 58.71 53.53LV EF 62.73 57.70 51.32
45
50
55
60
65
LV a
nd R
V EF
(%)
Axis Title
LV Toxicity (n=10)

122
Figure-2: Comparison between mean changes in LVEF and RVEF in patients with no LV dysfunction at pre-anthracycline, within 3 weeks post anthracycline, and 3 months during trastuzumab therapy
Table-1: Summary of changes in left and right ventricular ejection fraction between pre-anthracycline, within 3 weeks post anthracycline, and 3 months during trastuzumab therapy
Data presented as frequency mean ± standard deviation, *Within 1 month of completion of anthracycline, †Within 3 months of initiation of trastuzumab ‡paired t-test.
Baseline ~2 Months ~5 MonthsRV EF 57.31 56.96 54.60LV EF 59.69 58.94 56.21
45
50
55
60
65
LV a
nd R
V EF
(%)
Axis Title
No LV Toxicity (n=73)
Characteristics Pre-Cancer therapy
~2 Months* P-value (0-3)
~5 Months† P-value (0-6)
Left Ventricular Ejection fraction, (%) All patients (n=83) 60.06 ± 4.4 58.79 ± 4.3 .003 55.62 ± 4.1 <.001 In pts with LV dysfunction (n=10) 62.73 ± 3.7 57.70 ± 4.1 .001 51.32 3.5 <.001 In pts with No LV dysfunction (n=73) 59.69 ± 4.3 58.94 ± 4.3 .076 56.21 ± 3.9 <.001 Right Ventricular Ejection fraction, (%) All patients (n=83) 57.59 ± 4.5 57.17 ± 4.4 .299 54.47 ± 4.0 <.001 In pts with LV dysfunction (n=10) 59.64 ± 4.6 58.71 ± 5.1 .339 53.53 ± 3.4 .002 In pts with No LV dysfunction (n=73) 57.31 ± 4.5 56.96 ± 4.3 .429 54.60 ± 4.0 <.001

123
2- 2018, Mar. Mustafa A. Altaha. Ventricular Remodeling in Early Stage Breast Cancer Patients Receiving Sequential Anthracycline and Trastuzumab Therapy – A Cardiac MRI Study. Abstract is submitted to the American College of Cardiology (ACC) 67th Annual Scientific Sessions in Orlando, FL, USA
Ventricular Remodeling in Early Stage Breast Cancer Patients Receiving Sequential Anthracycline and Trastuzumab Therapy – A Cardiac MRI Study Mustafa A. Altaha, MBBS; Eitan Amir, MD, PhD; Christine Brezden-Masley MD, PhD; Kim Connelly, MD, PhD; Maria Michalowska, BSc; Bernd J Wintersperger, MD; Paaladinesh Thavendiranathan, MD, MSc, SM on behalf of the EMBRACE-MRI Investigators Background Recent work raised concern that intravascular volume depletion (i.e. reduced pre-load) may be responsible for the observed fall in left ventricular (LV) ejection fraction (EF) in some patients receiving cancer therapy. We examined potential mechanisms for fall in LVEF in women with breast cancer receiving chemotherapy. Methods Sixty-eight consecutive women (50.9 ± 9.4 years) with early stage HER2+ breast cancer, receiving cancer therapy, were recruited prospectively. All had cardiac MRI pre-treatment, post-anthracycline, and at 5 months (3 months after trastuzumab initiation). LV volumes and EF were measured blinded to all patient’s data. Cardiotoxicity was defined as a fall in LVEF by ≥10% or a drop to <50%. A change in LV end diastolic volume (LVEDV) >10ml or LV end-systolic volume (LVESV) >5ml was considered significant. A sensitivity analysis was performed for any drop in LVEF by ≥5%. Results Nine patients (13.3%) developed cardiotoxicity. The LVEF fall was primarily due to a rise in LVESV (Fig 1a) and not to isolated drop in LVEDV. Using the more sensitive definition, 26 patients had LVEF fall of ≥5% (but <10%). This fall occurred due to isolated drop in LVEDV in 3 of 26 patients, but was mainly due to a rise in LVESV (n=22, p<0.001) (Fig 1b). Conclusion The dominant mechanism of cardiotoxicity in breast cancer therapy relates to a rise in LVESV most likely reflecting altered myocardial contractility. Volume depletion may play a minor role in small falls in LVEF not meeting cardiotoxicity criteria.

124
Figure-1
N=0
EDV >10ml
ESV
N=2
EDV >10ml
ESV >5ml
N=6
EDV
ESV >5ml
N=1
EDV
ESV
Suggested
intravascular volume depletion
0%
Suggested intravascular
volume depletion +
LV systolic dysfunction
22.2%
LV systolic dysfunction
66.7%
Minor changes in either LVEDV or
LVEDS
11.1%
(a)-From 68 participants receiving sequential anthracycline and trastuzumab, 9 experienced an LVEF decline of ≥10% or a drop in LVEF to an absolute value of <50% (baseline to 6 months)

125
N=3
EDV >10ml
ESV
N=0
EDV >10ml
ESV >5ml
N=22
EDV
ESV >5ml
N=1
EDV
ESV
Suggested
intravascular volume depletion
11.5 %
Suggested intravascular
volume depletion +
LV systolic dysfunction
0%
LV systolic dysfunction
84.6%
Minor changes in either LVEDV or
LVEDS
3.9%
(b)-From 68 participants receiving sequential anthracycline and trastuzumab, 26 experienced a drop in LVEF by >5%, but <10% (baseline to 6 months)

126
3- 2017, Feb. Mustafa A. Altaha. Ventricular Remodeling and Right Ventricular Involvement in Patients with Early Stage Breast Cancer Receiving Anthracycline Chemotherapy. Abstract was accepted for walking poster (oral) presentation at the 20th annual Society of Cardiovascular Magnetic Resonance (SCMR) scientific sessions in Washington, DC, USA
Ventricular Remodeling and Right Ventricular Involvement in Patients with Early Stage Breast Cancer Receiving Anthracycline Chemotherapy
Mustafa A Altaha, MBBS; Kim Connelly, MD, PhD; Eitan Amir, MD, PhD; Christine Brezden-
Masley MD, PhD; Bernd J Wintersperger, MD; Paaladinesh Thavendiranathan, MD, MSc, SM, on Behalf of the EMBRACE-MRI Investigators
Introduction: Chemotherapy induced cardiac dysfunction is an adverse prognostic marker in women with early stage breast cancer. Patterns of ventricular remodeling and frequency of bi-ventricular involvement during cancer therapy in these patients have not been described. Understanding ventricular remodeling will provide novel knowledge as to the mechanism by which patients eventually develop heart failure (HF). This can help design targeted methods to prevent HF. Describing changes to cardiac function beyond the left ventricle will provide a broader appreciation of cardiac impact of cancer therapy and can have implications for screening of cardiotoxicity. Methods: Thirty-eight consecutive women (age: 49.6 ± 9.1 years) with early stage HER2+ breast cancer, receiving cancer therapy (anthracyclines followed by trastuzumab) were prospectively recruited. All patients had cardiac MR studies performed pre and post-anthracycline treatment on a 1.5T Siemens Avanto Fit magnet. Short axis SSFP cines with 8mm slice thickness (2mm gap) were acquired for ventricular function analysis. Left and right ventricular (LV/RV) volumes and ejection fraction (EF), and LV mass were measured by an observer blinded to patient identification and imaging time point. A significant change in EF was prospectively defined as a >5% drop after anthracycline therapy based on known reproducibility of cardiac MR measured EF. A paired t-test was used for comparison. Results: All patients received epirubicin (515.2 mg/m2 +/- 49.9). Ventricular function and volumetric parameters pre and post epirubicin are summarized in the Table below. Eight (21.0%) patients had a fall in LVEF by >5%, and the primary cause was an increase in end-systolic volume (ESV) as opposed to a change in end-diastolic volume (EDV); Similarly, ten (26.3%) patients had a fall in RVEF by >5% primarily due to an increase in ESV. LVEF and RVEF reduction by >5% occurred concomitantly in four (10.5%) patients. Hypertension was more common in the 14 patients who had a significant drop in LVEF and/or RVEF compared to those who did not (36% versus 17%). Conclusions: In this study anthracycline exposure resulted in concomitant reduction in LV and RVEF by >5.0% in 10.5% of patients with breast cancer. The main mechanism of reduction in ventricular function was an increase in ESV, which is likely due to a reduction in contractility, as opposed to
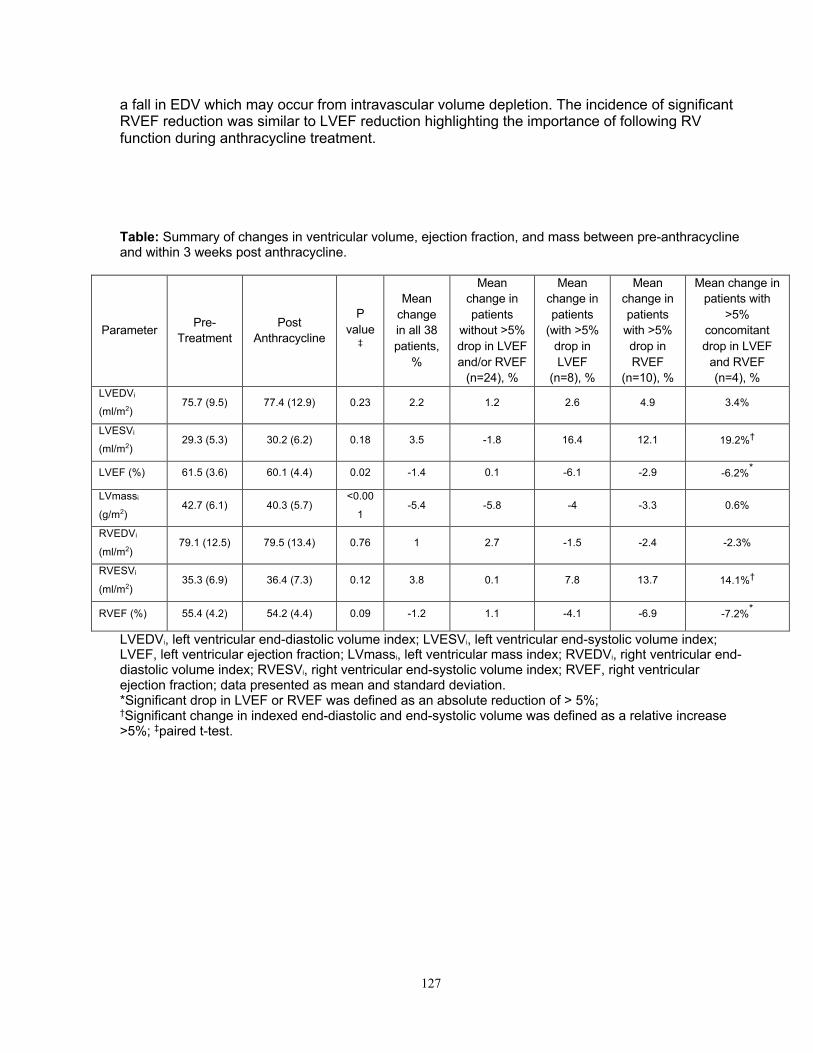
127
a fall in EDV which may occur from intravascular volume depletion. The incidence of significant RVEF reduction was similar to LVEF reduction highlighting the importance of following RV function during anthracycline treatment. Table: Summary of changes in ventricular volume, ejection fraction, and mass between pre-anthracycline and within 3 weeks post anthracycline.
Parameter Pre-Treatment
Post Anthracycline
P value
‡
Mean change in all 38 patients,
%
Mean change in patients
without >5% drop in LVEF and/or RVEF
(n=24), %
Mean change in patients
(with >5% drop in LVEF
(n=8), %
Mean change in patients
with >5% drop in RVEF
(n=10), %
Mean change in patients with
>5% concomitant drop in LVEF
and RVEF (n=4), %
LVEDVi
(ml/m2) 75.7 (9.5) 77.4 (12.9) 0.23 2.2 1.2 2.6 4.9 3.4%
LVESVi
(ml/m2) 29.3 (5.3) 30.2 (6.2) 0.18 3.5 -1.8 16.4 12.1 19.2%†
LVEF (%) 61.5 (3.6) 60.1 (4.4) 0.02 -1.4 0.1 -6.1 -2.9 -6.2%*
LVmassi
(g/m2) 42.7 (6.1) 40.3 (5.7)
<0.00
1 -5.4 -5.8 -4 -3.3 0.6%
RVEDVi
(ml/m2) 79.1 (12.5) 79.5 (13.4) 0.76 1 2.7 -1.5 -2.4 -2.3%
RVESVi
(ml/m2) 35.3 (6.9) 36.4 (7.3) 0.12 3.8 0.1 7.8 13.7 14.1%†
RVEF (%) 55.4 (4.2) 54.2 (4.4) 0.09 -1.2 1.1 -4.1 -6.9 -7.2%*
LVEDVi, left ventricular end-diastolic volume index; LVESVi, left ventricular end-systolic volume index; LVEF, left ventricular ejection fraction; LVmassi, left ventricular mass index; RVEDVi, right ventricular end-diastolic volume index; RVESVi, right ventricular end-systolic volume index; RVEF, right ventricular ejection fraction; data presented as mean and standard deviation. *Significant drop in LVEF or RVEF was defined as an absolute reduction of > 5%; †Significant change in indexed end-diastolic and end-systolic volume was defined as a relative increase >5%; ‡paired t-test.
Copyright © 2022 FDOKUMEN