Adaptive Mechanisms of Niche Remodeling in Streptococcus ...
169
Washington University in St. Louis Washington University Open Scholarship Arts & Sciences Electronic eses and Dissertations Arts & Sciences Summer 8-15-2015 Adaptive Mechanisms of Niche Remodeling in Streptococcus pyogenes Elyse Paluscio Washington University in St. Louis Follow this and additional works at: hps://openscholarship.wustl.edu/art_sci_etds is Dissertation is brought to you for free and open access by the Arts & Sciences at Washington University Open Scholarship. It has been accepted for inclusion in Arts & Sciences Electronic eses and Dissertations by an authorized administrator of Washington University Open Scholarship. For more information, please contact [email protected]. Recommended Citation Paluscio, Elyse, "Adaptive Mechanisms of Niche Remodeling in Streptococcus pyogenes" (2015). Arts & Sciences Electronic eses and Dissertations. 674. hps://openscholarship.wustl.edu/art_sci_etds/674
-
Upload
khangminh22 -
Category
Documents
-
view
7 -
download
0
Transcript of Adaptive Mechanisms of Niche Remodeling in Streptococcus ...

Washington University in St. LouisWashington University Open Scholarship
Arts & Sciences Electronic Theses and Dissertations Arts & Sciences
Summer 8-15-2015
Adaptive Mechanisms of Niche Remodeling inStreptococcus pyogenesElyse PaluscioWashington University in St. Louis
Follow this and additional works at: https://openscholarship.wustl.edu/art_sci_etds
This Dissertation is brought to you for free and open access by the Arts & Sciences at Washington University Open Scholarship. It has been acceptedfor inclusion in Arts & Sciences Electronic Theses and Dissertations by an authorized administrator of Washington University Open Scholarship. Formore information, please contact [email protected].
Recommended CitationPaluscio, Elyse, "Adaptive Mechanisms of Niche Remodeling in Streptococcus pyogenes" (2015). Arts & Sciences Electronic Theses andDissertations. 674.https://openscholarship.wustl.edu/art_sci_etds/674

WASHINGTON UNIVERSITY IN ST. LOUIS Division of Biology and Biomedical Sciences
Molecular Microbiology and Microbial Pathogenesis
Dissertation Examination Committee: Michael Caparon, Chair
David Hunstad Jeff Henderson Amanda Lewis
Christina Stallings Joseph Vogel
Adaptive Mechanisms to Niche Remodeling in Streptococcus pyogenes
by
Elyse Paluscio
A dissertation presented to the Graduate School of Arts & Sciences
of Washington University in partial fulfillment of the
requirements for the degree of Doctor of Philosophy
August 2015
St. Louis, Missouri

© 2015, Elyse Paluscio

ii
Table of Contents
List of Figures ............................................................................................................................... iv
List of Tables ................................................................................................................................ vi
Acknowledgments ....................................................................................................................... vii
Abstract ......................................................................................................................................... ix
CHAPTER I: INTRODUCTION……………………………………………………………….1 Overview of Streptococcus pyogenes and streptococcal disease………………………………….2 Streptococcus pyogenes Pathogenesis…………………………………………………………….4 Metabolism of Streptococcus pyogenes………………………………………………………….13 Transcriptional regulation in Streptococcus pyogenes…………………………………………..16 References………………………………………………………………………………………..27 CHAPTER II: Streptococcus pyogenes Malate Degradation Pathway Links pH Regulation and Virulence…………………………………………………………………………………...47 Summary…………………………………………………………………………………………48 Introduction………………………………………………………………………………………49 Results……………………………………………………………………………………………54 Discussion………………………………………………………………………………………..65 Materials and Methods…………………………………………………………………………...76 References………………………………………………………………………………………..80 CHAPTER III: RocA Required for Growth-Phase Expression of Virulence Factors of SPN and SLO in Streptococcus pyogenes……………………………………..............……………..89 Summary…………………………………………………………………………………………90 Introduction………………………………………………………………………………………91 Results……………………………………………………………………………………………94 Discussion………………………………………………………………………………………103 Materials and Methods………………………………………………………………………….107 References………………………………………………………………………………………111 CHAPTER IV: Alterations of CcpA Activation has Significant Effects on the Outcome of a Streptococcus pyogenes Infection……………………………………………………………..120

iii
Summary………………………………………………………………………………………..121 Introduction……………………………………………………………………………………..122 Results…………………………………………………………………………………………..125 Discussion………………………………………………………………………………………133 Materials and Methods………………………………………………………………………….136 References………………………………………………………………………………………139 CHAPTER V: Conclusions and Future Directions…………………………………………146 Conclusions……………………………………………………………………………………..147 Future Directions……………………………………………………………………………….149 References………………………………………………………………………………………154

iv
List of Figures Chapter I: Introduction Figure 1: Pathogenesis of S. pyogenes………………………………………………………...…..3 Figure 2: Virulence factors produced by S. pyogenes……………………………………………..5 Figure 3: β-NAD+ cleavage………………………………………………………………………10 Figure 4: The spn operon………………………………………………………………………...11 Figure 5: Cytolysin-mediated translocation……………………………………………………...12 Figure 6: Fermentation pathways in S. pyogenes………………………………………………...15 Figure 7: S. pyogenes virulence factors are expressed in a temporal and spatial pattern………..17 Figure 8: Bacterial two-component system……………………………………………………...18 Figure 9: The CovRS regulon……………………………………………………………………19 Figure 10: Model for Dissemination of CovRS mutants………………………………………...20 Chapter II: Streptococcus pyogenes Malate Degradation Pathway Links pH Regulation and Virulence Figure 1: The malic enzyme (ME) pathway in S. pyogenes……………………………………..51 Figure 2: ME mutants are deficient in malate catabolism……………………………………….55 Figure 3: MaeK regulates malate-dependent expression of maePE……………………………..57 Figure 4: Carbon catabolite repression of ME genes is CcpA independent……………………..58 Figure 5: Carbon catabolite repression of ME genes controlled by P~His-HPr…………………60 Figure 6: pH regulation of ME is malate-independent, but requires MaeK…………..…………62 Figure 7: Loss of MaeE causes hypervirulence in vivo………………………………………….64 Chapter III: RocA Required for Growth-Phase Expression of Virulence Factors of SPN and SLO in Streptococcus pyogenes Figure 1: Growth phase expression of spn and slo…………………………………………..…..94 Figure 2: Expression of spn and slo is regulated by pH…………………………………………95 Figure 3: Deletion of RocA uncouples spn and slo from pH regulation………………………...97 Figure 4: RocA is a transcriptional repressor of spn and slo………………………………….....99 Figure 5: RocA is not a functional histidine kinase…………………………………………….101 Figure 6: RocA repression of SPN requires CovRS…………………………………………....102 Chapter IV: Alterations of CcpA Activation has Significant Effects on the Outcome of a Streptococcus pyogenes Infection Figure 1: CcpA and carbon catabolite repression……………………………………………....125 Figure 2: Design of constitutively active CcpA………………………………………………...126 Figure 3: Growth of CcpA mutants in vitro…………………………………………………….127 Figure 4: CcpAT307Y is constitutively active in the absence of glucose signal……….……...…..128

v
Figure 5: CcpA mutants have reduced virulence in soft tissue infections……………………...130 Figure 6: CcpA mutants have differential phenotypes in mucosal colonization model………..131 Chapter V: Conclusion Figure 1: Mechanism of action for pseudokinases………..…………………………………....151
vi
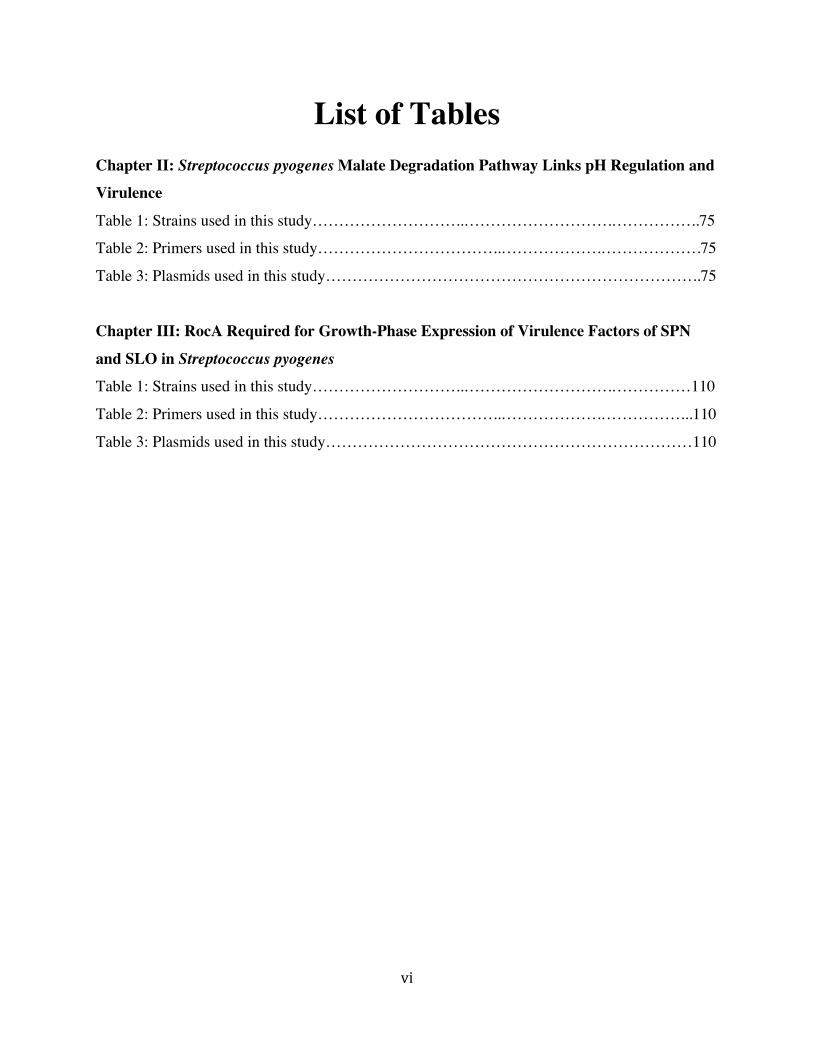
List of Tables Chapter II: Streptococcus pyogenes Malate Degradation Pathway Links pH Regulation and Virulence
Table 1: Strains used in this study………………………..……………………….……………..75
Table 2: Primers used in this study……………………………..……………….……………….75
Table 3: Plasmids used in this study……………………………………………………………..75
Chapter III: RocA Required for Growth-Phase Expression of Virulence Factors of SPN
and SLO in Streptococcus pyogenes
Table 1: Strains used in this study………………………..……………………….……………110
Table 2: Primers used in this study……………………………..……………….……………...110
Table 3: Plasmids used in this study……………………………………………………………110

vii
Acknowledgments
First and foremost, I would like to that my advisor, Dr. Michael Caparon. He has been an
exceptional mentor over the (many) years I have been at Washington University. His patience,
guidance, and ability to provide constructive criticism throughout my time in his lab are qualities
that I most appreciate about him. He has taught me how to think critically about experimental
design, as well as greatly improved my written communication skills through many rounds of
manuscript editing.
I would also like to thank my thesis committee (Drs. David Hunstad, Amanda Lewis,
Christina Stallings, Jeffrey Henderson, and Joseph Vogel) for their guidance and helpful
suggestions over the years.
I would next like to thank the members of the Caparon lab, both past and present. I know
dealing with me on a daily basis can be a challenge, but I appreciate all of you and the help that
everyone has provided over the years. Previous members include: Dr. Colin Kietzman (who
helped teach me how to clone things), Dr. N’Goundo Magassa (who taught me how to do the
enzymatic SPN assay), Dr. Dave Riddle, Dr. Ada Lin, Dr. Mike Watson, Dr. Zac Cusumano (my
mentor when I was a lowly 1st year rotation student), Dr. Suki Chandrasekaran (for answering all
of my SPN questions), and Dr. Luis Vega. Current members include: Dr. Gary Port (who politely
tolerates my daily science questions and is always ready to help brainstorm new ideas), Cara
Mozola (whose blunt honesty I thoroughly appreciate) and Wei Xu (who just joined our lab and
seems very nice).
I also need to thank the small committee of people that helped keep me sane throughout
this ordeal known as “grad school”. First, there is my family (Father, Sherri, Marco, Taz,
Tinkerbell) for their encouragement and support over the years. Second, I’d like to thank my

viii
fellow graduate students for their friendship and support. In particular I would like to thank Dr.
Travis Chapa (who I could always depend on for free food, good conversation, and pep talks)
and Camille Linton (for all of our talks over bubble tea or thai food).
Finally, I would like to thank the most important people in my life, my beloved cats,
Peter and Stubby Feldman. Thank you for your unwavering support over the years. I couldn’t
have done it without you.
ix
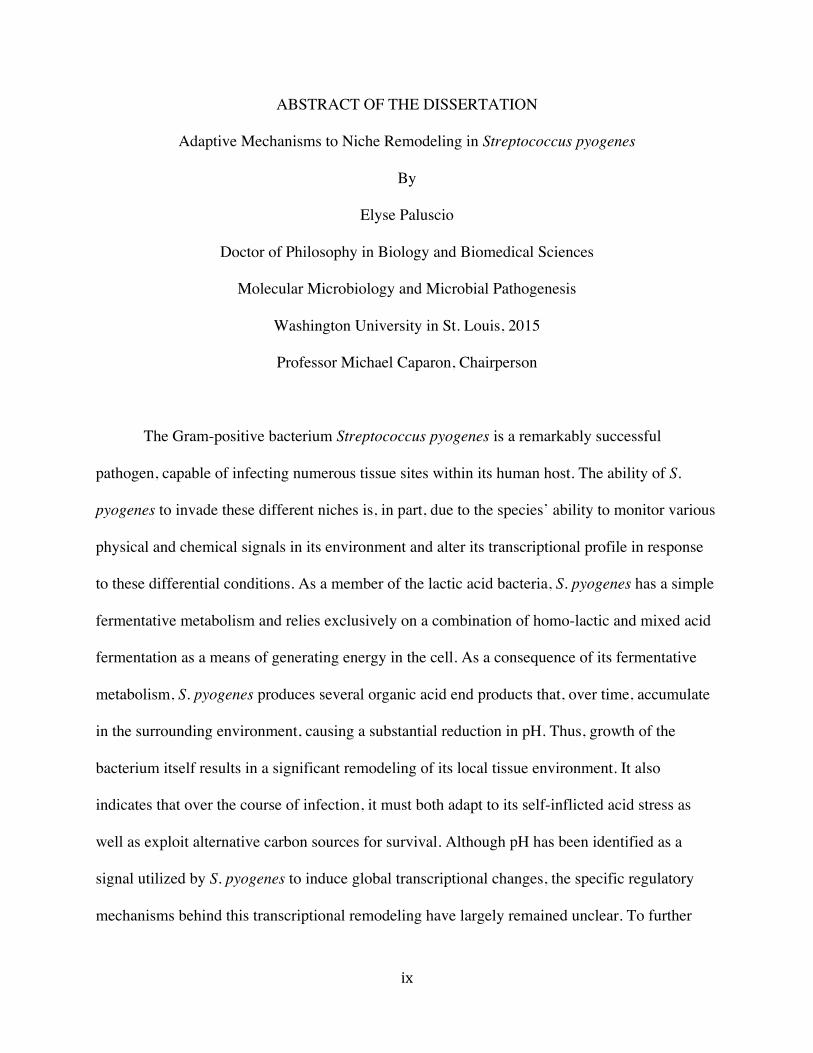
ABSTRACT OF THE DISSERTATION
Adaptive Mechanisms to Niche Remodeling in Streptococcus pyogenes
By
Elyse Paluscio
Doctor of Philosophy in Biology and Biomedical Sciences
Molecular Microbiology and Microbial Pathogenesis
Washington University in St. Louis, 2015
Professor Michael Caparon, Chairperson
The Gram-positive bacterium Streptococcus pyogenes is a remarkably successful
pathogen, capable of infecting numerous tissue sites within its human host. The ability of S.
pyogenes to invade these different niches is, in part, due to the species’ ability to monitor various
physical and chemical signals in its environment and alter its transcriptional profile in response
to these differential conditions. As a member of the lactic acid bacteria, S. pyogenes has a simple
fermentative metabolism and relies exclusively on a combination of homo-lactic and mixed acid
fermentation as a means of generating energy in the cell. As a consequence of its fermentative
metabolism, S. pyogenes produces several organic acid end products that, over time, accumulate
in the surrounding environment, causing a substantial reduction in pH. Thus, growth of the
bacterium itself results in a significant remodeling of its local tissue environment. It also
indicates that over the course of infection, it must both adapt to its self-inflicted acid stress as
well as exploit alternative carbon sources for survival. Although pH has been identified as a
signal utilized by S. pyogenes to induce global transcriptional changes, the specific regulatory
mechanisms behind this transcriptional remodeling have largely remained unclear. To further

x
characterize the process of S. pyogenes’ pH adaptive response we have identified several novel
pH-sensitive transcriptional regulators and analyzed their contribution to gene expression and S.
pyogenes pathogenesis.
The malic enzyme pathway, which allows the cell to utilize malate as a carbon source for
growth, consists of four genes in two adjacent operons, with the regulatory TCS MaeKR being
required for the expression of the genes encoding a malate permease (maeP) and malic enzyme
(maeE). Results show that expression of the maePE operon is influenced independently by
external malate concentrations and pH in a MaeK-dependent mechanism. The ME genes are
additionally regulated by a unique CcpA-independent form of catabolite repression which
involves the PTS proteins PtsI and HPr. Furthermore, in vivo experiments demonstrate that loss
of any individual ME gene has a significant effect on the outcome of a soft tissue infection.
The secreted toxins SPN and SLO have been shown to contribute to S. pyogenes
cytotoxicity and virulence in multiple models of pathogenesis, however little information is
known about the specific regulatory mechanism that control expression of these toxins. Our work
has determined that the growth-phase pattern of expression of the spn/slo operon is regulated by
environmental pH. Additionally, this regulation requires both the CovRS two-component system
as well as an additional protein, RocA. Additional data suggests that RocA does not function as a
traditional histidine kinase, despite high structural and sequence homology to known histidine
kinases such as CovS. However, all three regulatory proteins are required for the pH-mediated
regulation of this virulence operon.

1
Chapter I
Introduction

2
Overview of Streptococcus pyogenes and streptococcal diseases
Streptococcus pyogenes (GAS) is a Gram-positive, chain forming bacterium that is able
to invade numerous different tissue sites within the host. S. pyogenes, a strict human pathogen, is
responsible for numerous superficial and systemic diseases and is believed to cause a wider
range of human diseases than any other bacterial pathogen (3-7).
S. pyogenes primarily causes superficial, self-limiting infections of the skin (impetigo)
and throat (pharyngitis) (3, 7, 8). These diseases are typically limited to the initial site of
infection and do not invade deeper tissues. S. pyogenes is the most common causative agent of
pharyngitis, with approximately 600 million cases annually (11). The symptoms of pharyngitis
include a sore throat and sudden onset fever. The sore throat is due to inflammation of the tonsils
and pharynx, often with patchy exudates and enlarged lymph nodes (11). Pharyngitis is typically
spread directly from person-to-person contact through nasal secretion or saliva droplets from
infected individuals. Incidence of pharyngitis is highest in crowded places, such as schools,
where approximately 15% of school children will contract the disease in developed countries
(12). Impetigo is caused by a S. pyogenes infection of the skin, leading to the formation of large
pustules that, once ruptured, will form thick, honey-colored scabs (11). This disease is spread by
direct skin contact and is most often seen in children living in tropical or subtropical climates and
in areas with poor hygiene (11). Despite the increasing numbers of antibiotic resistant pathogens,
S. pyogenes remains sensitive to penicillin, and this is generally the first line of treatment for
these superficial infections (13).

3
Less frequent than the superficial infections of the skin and throat, S. pyogenes can also
breach the epithelial barriers to cause a number of invasive diseases. These types of infections
have a high morbidity and mortality rate, where approximately 8-23% of invasive infections lead
to death within 7 days (14-16). The most common systemic diseases caused by S. pyogenes are
cellulitis and bacteremia (11). Although less common, S. pyogenes can also cause necrotizing
fasciitis and streptococcal toxic shock syndrome (STSS) (17). In the case of necrotizing fasciitis,
antibiotic treatment with penicillin has little effect on the spread of the disease, suggesting that
the release of bacterial toxins, not growth of the bacteria itself, is the main contributor of this
disease (18). The main treatment for necrotizing fasciitis is surgical debridement of infected
tissue, however mortality rates for this type disseminating disease is quite low (less than 20%)
(11, 14-16).
Figure 1. Pathogenesis of S. pyogenes. Diagram of host tissue sites and the resulting diseases caused. Adapted from (9).
4
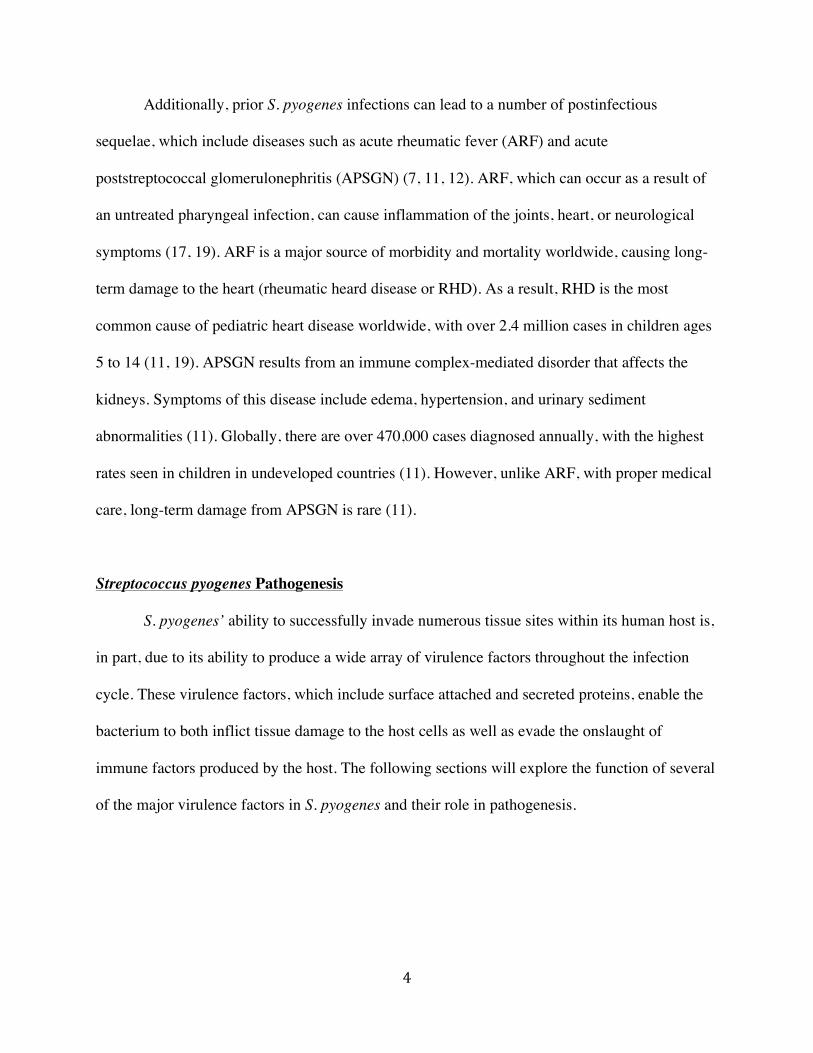
Additionally, prior S. pyogenes infections can lead to a number of postinfectious
sequelae, which include diseases such as acute rheumatic fever (ARF) and acute
poststreptococcal glomerulonephritis (APSGN) (7, 11, 12). ARF, which can occur as a result of
an untreated pharyngeal infection, can cause inflammation of the joints, heart, or neurological
symptoms (17, 19). ARF is a major source of morbidity and mortality worldwide, causing long-
term damage to the heart (rheumatic heard disease or RHD). As a result, RHD is the most
common cause of pediatric heart disease worldwide, with over 2.4 million cases in children ages
5 to 14 (11, 19). APSGN results from an immune complex-mediated disorder that affects the
kidneys. Symptoms of this disease include edema, hypertension, and urinary sediment
abnormalities (11). Globally, there are over 470,000 cases diagnosed annually, with the highest
rates seen in children in undeveloped countries (11). However, unlike ARF, with proper medical
care, long-term damage from APSGN is rare (11).
Streptococcus pyogenes Pathogenesis
S. pyogenes’ ability to successfully invade numerous tissue sites within its human host is,
in part, due to its ability to produce a wide array of virulence factors throughout the infection
cycle. These virulence factors, which include surface attached and secreted proteins, enable the
bacterium to both inflict tissue damage to the host cells as well as evade the onslaught of
immune factors produced by the host. The following sections will explore the function of several
of the major virulence factors in S. pyogenes and their role in pathogenesis.
5
Surface-associated virulence factors
Lipoteichoic acid (LTA)
The first step required for S. pyogenes to successfully invade host tissue is to adhere to
human cells. Adherence is thought to be a two-step process, beginning with LTA. Bound to the
surface of the bacterial cell, LTA is an amphiphilic polymer of glycerol phosphate containing
glucose and D-alanine substitutes (10, 11, 20). It’s thought that these polymers are involved in
weak hydrophobic interactions with various host cell components. This initial interaction
between the bacterial and host cell can then allow long-distance attachments and higher-affinity
binding events (21).
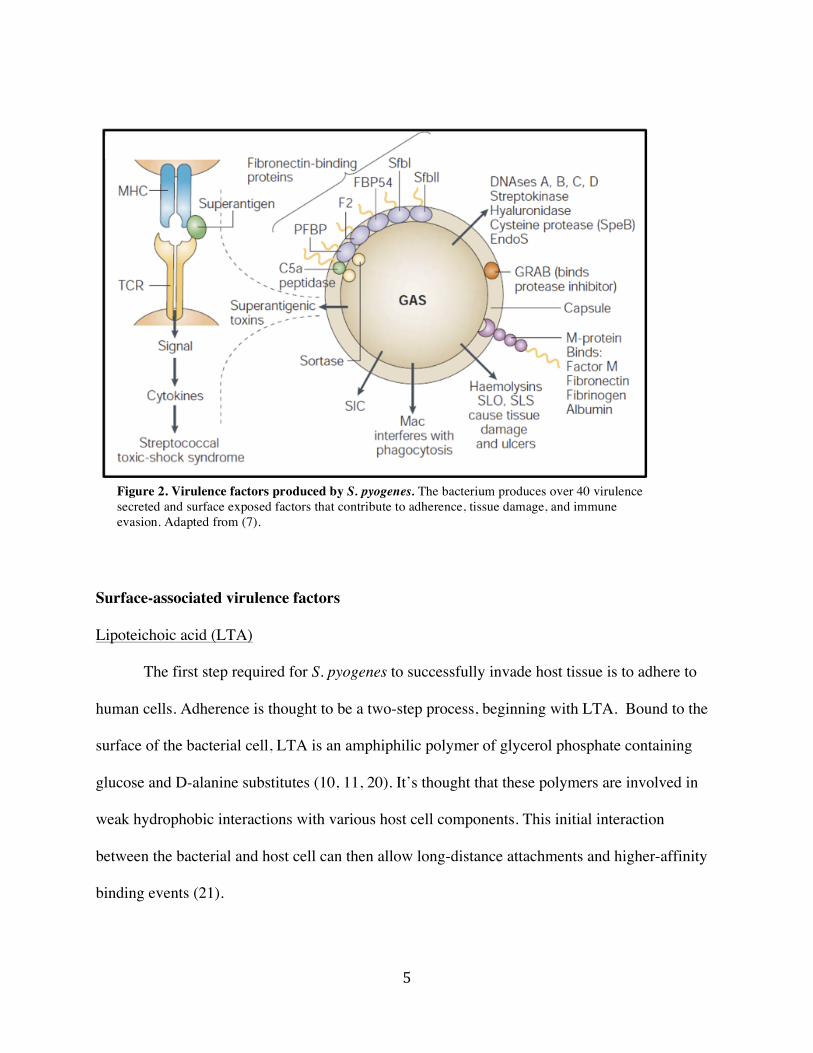
Figure 2. Virulence factors produced by S. pyogenes. The bacterium produces over 40 virulence secreted and surface exposed factors that contribute to adherence, tissue damage, and immune evasion. Adapted from (7).

6
M protein
The surface-attached M protein is one of the most well characterized virulence factors
produced by S pyogenes. It is a fibrillar protein made up of α-helical coiled-coil dimers and is
attached to the cell wall through the function of sortase and an LPXTG motif (21-24). S.
pyogenes strains are classified by emm types, which are identified by the hypervariable region of
the N-terminal sequence of the protein (21). Following the hypervariable region is a set of four
repeat regions (A-D), where the A repeats are hypervariable and the B regions are semivariable
(21, 22). Different hypervariable A regions from different M proteins have been shown to bind
to C4b-binding protein (C4BP), plasminogen, IgA and IgG, and factor H (25). The B regions are
necessary for binding to fibrinogen and IgG (22). The highly conserved C region can also bind
factor H, as well as human serum albumin (HSA) and the host cell ligand CD46 (26, 27).
Due to its ability to interact with a number of human proteins, M protein contributes to S.
pyogenes pathogenesis in multiple ways. Through binding to components of the extracellular
matrix (ECM) such as fibronectin, it aids in adherence to epithelial cells and keratinocytes (28-
33). In addition, it prevents phagocytosis by binding complement-inhibitory proteins C4BP,
factor H, and factor H-like protein 1 (34-36). In vivo studies have shown that M protein is
required for full virulence in subcutaneous mouse models of invasive disease (37).
Hyaluronic capsule
Encoded by the hasABC operon, S. pyogenes expresses a hyaluronic capsule, composed
of polymers of glucuronic β-1, 3-N-acetylglucosamine (11). This capsule is structurally identical
to the hyaluronic acid expressed on host cells and connective tissue, providing protection to the
bacteria through molecular mimicry (17). Additionally, the thick capsule blocks immunological
7
access to surface epitopes, inhibits host complement proteins and antimicrobial peptides, and
prevents phagocytosis (38-41). In vivo studies have shown that S. pyogenes requires capsule for
full virulence in both mouse and nonhuman primate models of invasive disease (42-46).
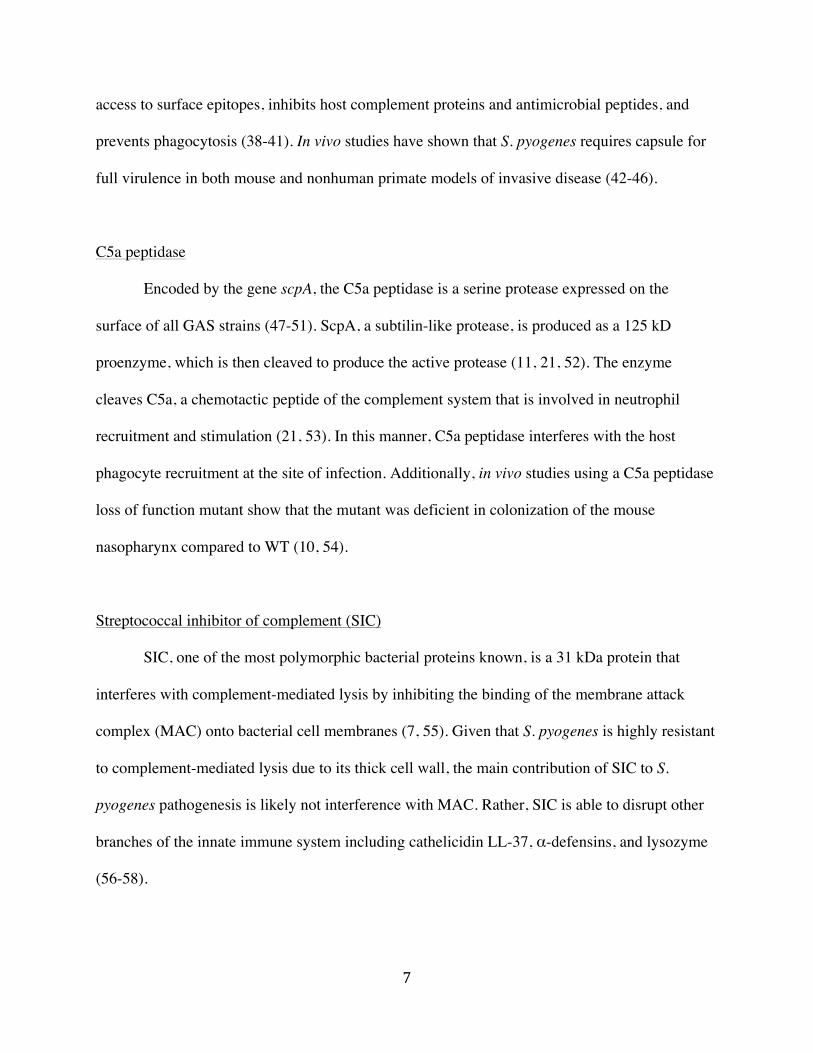
C5a peptidase
Encoded by the gene scpA, the C5a peptidase is a serine protease expressed on the
surface of all GAS strains (47-51). ScpA, a subtilin-like protease, is produced as a 125 kD
proenzyme, which is then cleaved to produce the active protease (11, 21, 52). The enzyme
cleaves C5a, a chemotactic peptide of the complement system that is involved in neutrophil
recruitment and stimulation (21, 53). In this manner, C5a peptidase interferes with the host
phagocyte recruitment at the site of infection. Additionally, in vivo studies using a C5a peptidase
loss of function mutant show that the mutant was deficient in colonization of the mouse
nasopharynx compared to WT (10, 54).
Streptococcal inhibitor of complement (SIC)
SIC, one of the most polymorphic bacterial proteins known, is a 31 kDa protein that
interferes with complement-mediated lysis by inhibiting the binding of the membrane attack
complex (MAC) onto bacterial cell membranes (7, 55). Given that S. pyogenes is highly resistant
to complement-mediated lysis due to its thick cell wall, the main contribution of SIC to S.
pyogenes pathogenesis is likely not interference with MAC. Rather, SIC is able to disrupt other
branches of the innate immune system including cathelicidin LL-37, α-defensins, and lysozyme
(56-58).

8
Secreted virulence factors
SpeB
The cysteine protease SpeB is secreted as a 40kD zymogen, which is then
autocatalytically cleaved into a 28kD active form. SpeB is one of the most abundantly produced
virulence factors and its expression is regulated by numerous growth phase and nutritional cues,
including carbohydrate availability, NaCl concentrations, and pH (59, 60). SpeB has broad-
spectrum protease activity and has been shown to degrade a number of host proteins. Host targets
of its protease activity include IgG, chemokines, complement protein C3b, and ECM
components including fibrinogen (61-64). In addition, SpeB activity is responsible for cleaving
several bacterial proteins, including other virulence factors such as SPN, SLO, M protein, and
streptokinase, among others (61, 65, 66). For these reasons, the complex role of SpeB in
promoting disease is unclear and varies by strain and by animal model.
Streptokinase (Ska)
Ska is a secreted enzyme that converts plasminogen (which is coated on the surface of the
bacterial cell through the actions of several plasminogen binding M proteins (PAM)) to plasmin,
the active form of the protein (67-71). Once active, plasmin functions as a broad-spectrum serine
protease and is able to degrade blood clots, ECM components, and activate metalloproteases
(72). As S. pyogenes is strictly a human pathogen, Ska is highly specific for human plasminogen.
In vivo studies using humanized mice (transgenic for human plasminogen) have shown that Ska
and acquisition of active plasmin is necessary for dissemination of the bacteria (73).

9
Superantigens
Different strains of S. pyogenes produce a variety of phage-encoded superantigens
proteins called the streptococcal pyogenic exotoxins (Spe). This family of proteins includes
SpeA, SpeC, SpeG, SpeH, SpeJ, SpeK, SpeL, streptococcal superantigen A (SSA), and the
streptococcal mitogenic exotoxin Z (SmeZ) (7). Production of these superantigens is associated
with severe bacterial diseases such as STSS and necrotizing fasciitis (7, 74). Superantigens bind
to the β-chain of CD4+ T cells and MHC class II molecules on B cells, monocytes, and dendritic
cells (7, 75, 76), thereby resulting in an overstimulation of the host inflammatory response and
production of large amounts of TNFα, IL-1β, IL-2, and IFNγ (7, 77). The release of these
cytokines results in a drop in blood pressure and multi-organ failure, the classic hallmarks of
STSS (7, 11).
Streptolysin S (SLS)
SLS is a β-hemolysin produced by the majority of S. pyogenes strains during stationary
phase growth (78, 79) and is responsible for the beta-hemolysis seen on blood-agar plates, a
classic marker for clinical identification. SLS is encoded in a highly conserved nine-gene operon
comprised of genes sagA-I (78, 79). SLS contributes to S. pyogenes pathogenesis by lysing a
large number of host cells, including lymphocytes and erythrocytes, among others (80). In vitro
data suggests that SLS contributes to pathogenesis through cytotoxicity, stimulation of host
inflammatory cells, and inhibition of phagocytosis (81). In vivo, SLS is required for full
virulence in a murine model of necrotizing soft tissue infection, as infection with an SLS-
deficient mutant resulted in decreases in bacterial burden, neutrophilic inflammation, and tissue
necrosis (79).

10
SPN, SLO, and Cytolysin mediated translocation
The streptococcal NAD+ glycohydrolase (SPN) is a 52kDa secreted protein that, when
delivered into the host cell cytosol, cleaves β-NAD+ into nicotinamide and ADP-ribose (1, 82,
83). There are two important features that make SPN’s enzymatic activity unique from other
classes of NAD+ cleaving enzymes. First, SPN has been shown to be a strict NAD+
glycohydrolase and is unable to further catalyze the products from the initial reaction (1).
Second, SPN is capable of cleaving β-NAD+ at an incredibly high rate, thus causing rapid
depletion of β-NAD+ stores within the host cell (1, 82).
Recent studies analyzing the various alleles of spn have shown that this gene is evolving
under positive selection, leading to a separation of two distinct subtypes, NADase positive which
retains the glycohydrolase activity, and an NADase negative form (82, 84). Little is known as to
the specific role of the NADase negative subtype in pathogenesis, but there is a correlation
between SPN subtypes and tissue tropism. S. pyogenes primarily causes superficial infection of
the skin or throat. Epidemiological evidence has shown that there are subpopulations of S.
pyogenes that specialize in infections at only one of these two tissue sites (skin-specialists and
Figure 3. β-NAD+ cleavage. β-NAD+ is cleaved to form nicotinamide and ADP-ribose. Adapted from (1)

11
throat-specialists) (85). In addition, there is a third subpopulation that can infect both tissue types
(generalists) (85). An analysis of series of 113 clinical isolates demonstrated that skin or throat
specialists were more likely to encode the NADase negative spn allele while generalist strains
encoded the NADase positive spn allele (84). Recent work from the Caparon lab has also shown
that both NADase active and inactive forms of SPN are cytotoxic to host cells, indicating that
SPN’s contribution to S. pyogenes pathogenesis involves a secondary mechanism beyond β-
NAD+ depletion (82).
The spn gene is the first gene in a 3-gene operon, which also includes the genes for
immunity factor of SPN (IFS) and Streptolysin O (SLO). IFS is a small, cytosolic
protein that binds to the active site of SPN, blocking its enzymatic activity while in the
bacterial cell (86). The third gene in this operon, slo, produces a cholesterol-dependent cytolysin
SLO. This protein, when secreted, contributes to pathogenesis in several ways. First, SLO
functions as a cholesterol dependent cytolysin. This class of proteins binds to cholesterol rich
areas of host membranes, oligomerizes, and inserts itself into cell membranes to form pores (87).
In this way, SLO contributes to cytotoxicity of host cells.
Secondly, a specific interaction between SPN and SLO allows for the translocation of
SPN directly into host cell cytosols (83, 88-91). This process, termed cytolysin-mediated
Figure 4. The spn operon. Organization of the spn operon in S. pyogenes.

12
translocation (CMT), involves a complex series of interactions between SPN and SLO and a
great deal of work in the Caparon lab has been performed to elucidate the mechanism behind this
delivery system. From this work, several important details have been discovered about this
process.
First, CMT is highly specific for these two proteins. Replacement of SLO with the closely
related cytolysin PFO does not allow SPN translocation (90). Second, SPN appears to be the
only substrate involved in CMT (83, 89). Additionally, it has been shown that SLO pore
formation is not necessary for SPN translocation to occur (90). Finally, recent work from our lab
has established that SPN translocation can occur through a cholesterol-insensitive mode of
Figure 5. Cytolysin mediated translocation. SPN, IFS, and SLO are expressed during the exponential phase of growth. In the bacterial cytosol, IFS binds to the SPN active site, blocking its NADase activity. SPN and SLO are secreted through the sec machinery into the extracellular milieu. After the bacteria adhere to the host cell, SLO monomers oligomerize and form pores in the host cell membrane. The interaction between SPN and SLO at the membrane enables SPN to be translocated into the host cell cytosol. Image courtesy of S. Chandrasekaran.

13
membrane binding that requires both SPN and SLO for membrane binding (91). It has also been
shown that both proteins play a role in cytotoxicity, as loss of either protein has reduced
virulence in cultured epithelial cells and in vivo in a mouse model of soft tissue infection (83,
88). Taken together, these studies demonstrate that both SPN and SLO play an important role in
the pathogenesis of S. pyogenes.
Metabolism of Streptococcus pyogenes
S. pyogenes is a member of the group Lactobacillacea or lactic acid bacteria (LAB). This
group is characterized as lacking an electron transport chain (ETC) and TCA cycle. Instead,
these bacteria rely solely on a mix of homolactic and mixed acid fermentation as a means of
generating energy in the cell (92). S pyogenes is able to utilize a number of different carbon
sources for growth, which can be obtained through several different pathways.
Carbohydrate Utilization
The majority of carbohydrates that S. pyogenes can utilize are transported into the cell
through the actions of the phosphotransferase (PTS) pathway. Like most bacteria, the preferred
carbohydrate for S. pyogenes is glucose, which can be brought into the cell and phosphorylated
via the PTS system, where it then shuttles to the Embden-Meyerhof-Parnas pathway (92, 93).
The breakdown of one glucose molecule through this pathway leads to the formation of two
molecules of ATP, NADH and pyruvate (92). Further metabolism of pyruvate via homolactic
and mixed acid fermentation allows for the re-oxidation of the NADH formed during glycolysis
(92). In the absence of glucose, S. pyogenes is able to utilize alternative carbohydrates such as

14
galactose. Similar to glucose, galactose utilization begins with uptake and phosphorylation
through the PTS pathway. However, unlike glucose, the phosphorylated galactose molecule is
broken down through the tagatose pathway, leading to formation of two three-carbon sugars,
glyceraldehyde-3-phosphate (G3P) and dihydroxyacetone phosphate (DHAP) (94). From there,
these 3-carbon sugars are able to reenter the Embden-Meyerhof pathway for conversion to
pyruvate.
Homolactic and Mixed Acid Fermentation
Lacking a complete TCA cycle and ETC, S. pyogenes relies exclusively on a simple
fermentative metabolism as a means of regenerating NAD+ necessary for additional rounds of
glycolysis. The simplest and most well-known pathway for this is homolactic fermentation, the
conversion of pyruvate to lactate via the enzyme lactate dehydrogenase (LDH) (95). In this
pathway, each molecule of pyruvate is converted to lactate and one molecule of NADH is
oxidized (92, 95). The enzymatic activity of LDH is influenced by the intracellular levels of
fructose 1,6-bisphosphate, meaning that homolactic fermentation is generally only utilized when
high levels of glucose are present (92, 95, 96).
As an alternative to homolactic fermentation, S. pyogenes can also undergo mixed acid
fermentation, a pathway that begins with the conversion of pyruvate into acetyl-CoA. In
S. pyogenes this conversion is performed by the oxygen-sensitive enzyme pyruvate formate lyase
(PFL), which converts pyruvate into acetyl-CoA and formate (92, 96). PFL, in addition to being
sensitive to oxygen, is also inhibited by low intracellular levels of G3P and DHAP (92).

15
Therefore, homolactic fermentation is the predominant pathway utilized by S. pyogenes in high
glucose environments. The pool of acetyl-CoA must be broken down further to regenerate
NAD+. This is achieved via the enzymes acetaldehyde dehydrogenase (ADH) and ethanol
dehydrogenase (EDH), where ethanol is the end product of the pathway (92, 96). Alternatively,
acetyl-CoA can be converted into acetate through the enzymes phosph otransacetylase (PTA)
and acetate kinase (AckA). Although the PTA/AckA pathway does not allow for the oxidation of
NADH, it does produce one molecule of ATP (92, 96). In this way, mixed acid fermentation
enables the cell to balance its redox neutrality, as well as benefit from an additional source of
ATP.
Figure 6. Fermentation pathways in S. pyogenes. Pyruvate, which is formed by the upper glycolytic pathway, is catabolized via homolactic or mixed acid fermentation.

16
Metabolism of Alternative Carbon Sources
Within the group of LAB, several pathways are present for the catabolism of various
amino acids. In S. pyogenes the arginine deiminase (ADI) pathway has been shown to benefit the
bacterium in several different capacities. This pathway enables the conversion of arginine to
ornithine, ammonia, carbon dioxide, and one molecule of ATP (97, 98). Studies have shown that
arginine can be utilized by the bacterium for growth, and that the production of ammonia acts as
a buffering agent to counter the acid stress, which is a consequence of mixed acid fermentation
(98, 99). Additionally, recent work from the Caparon lab has shown that the ADI pathway
contributes to pathogenesis in a murine model of inflammatory infection of cutaneous tissue
(99). It was shown that infection with S. pyogenes stimulates iNOS expression in cultured
macrophages and that this innate immune response could be modulated by the availability of
arginine. Therefore, the depletion of arginine via ArcA (the first enzyme involved in the ADI
pathway) prevents production of NO�, allowing for enhanced virulence of S. pyogenes.
Transcriptional regulation in Streptococcus pyogenes
The ability of S. pyogenes to colonize and persist within its human host is dependent
upon its capacity to acquire nutrients from the surrounding environment while evading host
immune factors. The infection cycle of this pathogen begins with the initial colonization of the
skin or throat, penetration into subcutaneous tissues, and, in the case of invasive disease,
dissemination through the blood to secondary sites of infection (100). To survive and persist
within each location the bacterium needs to adjust to numerous changes in the environment such
as glucose levels, protein concentrations, pH, osmolarity, and temperature (100-102).
17
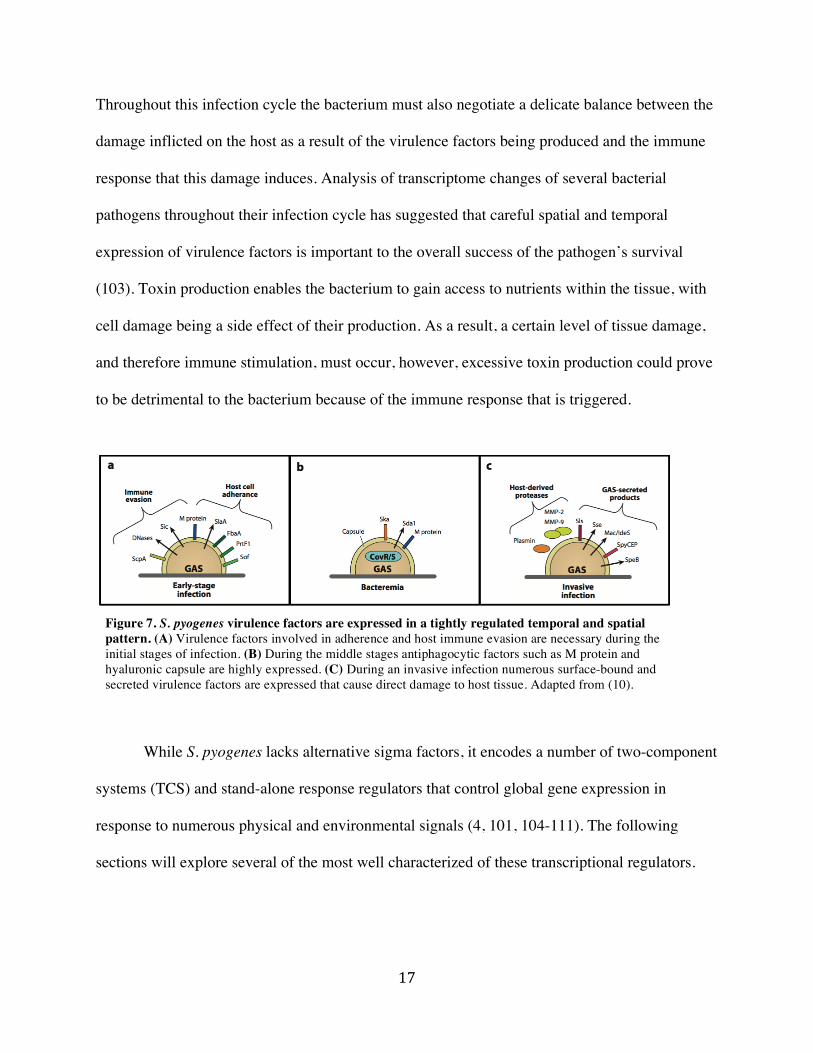
Throughout this infection cycle the bacterium must also negotiate a delicate balance between the
damage inflicted on the host as a result of the virulence factors being produced and the immune
response that this damage induces. Analysis of transcriptome changes of several bacterial
pathogens throughout their infection cycle has suggested that careful spatial and temporal
expression of virulence factors is important to the overall success of the pathogen’s survival
(103). Toxin production enables the bacterium to gain access to nutrients within the tissue, with
cell damage being a side effect of their production. As a result, a certain level of tissue damage,
and therefore immune stimulation, must occur, however, excessive toxin production could prove
to be detrimental to the bacterium because of the immune response that is triggered.
While S. pyogenes lacks alternative sigma factors, it encodes a number of two-component
systems (TCS) and stand-alone response regulators that control global gene expression in
response to numerous physical and environmental signals (4, 101, 104-111). The following
sections will explore several of the most well characterized of these transcriptional regulators.
Figure 7. S. pyogenes virulence factors are expressed in a tightly regulated temporal and spatial pattern. (A) Virulence factors involved in adherence and host immune evasion are necessary during the initial stages of infection. (B) During the middle stages antiphagocytic factors such as M protein and hyaluronic capsule are highly expressed. (C) During an invasive infection numerous surface-bound and secreted virulence factors are expressed that cause direct damage to host tissue. Adapted from (10).
18
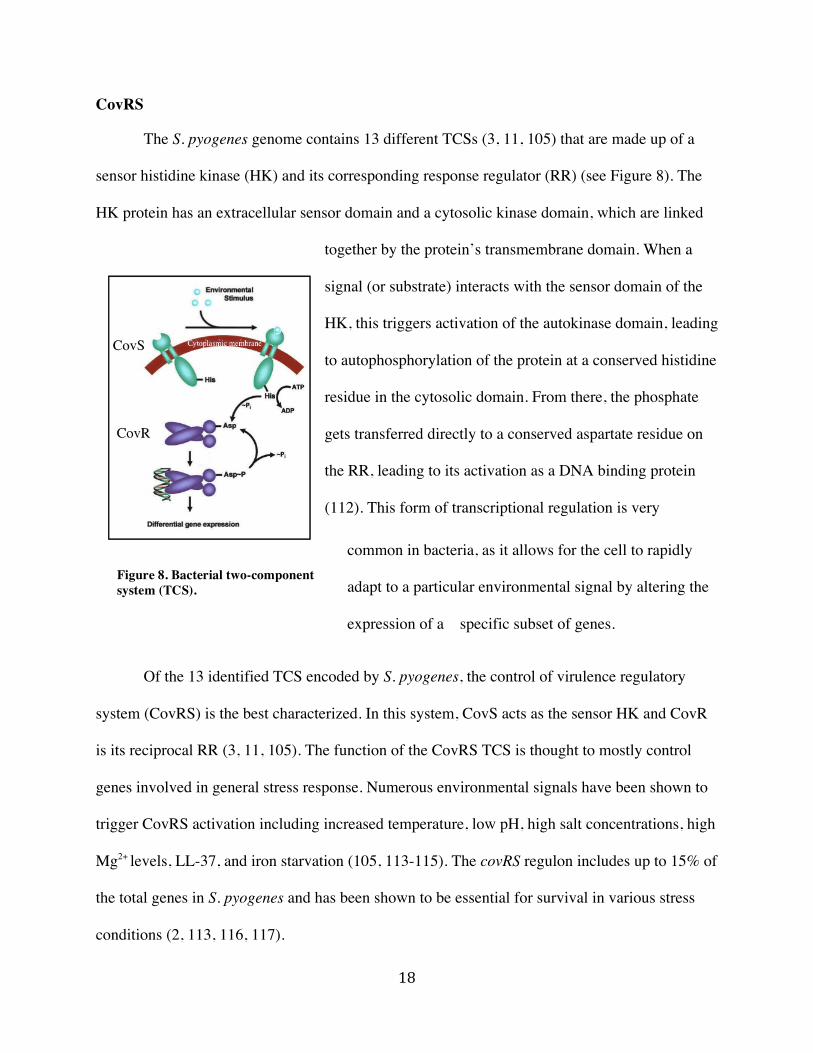
CovRS
The S. pyogenes genome contains 13 different TCSs (3, 11, 105) that are made up of a
sensor histidine kinase (HK) and its corresponding response regulator (RR) (see Figure 8). The
HK protein has an extracellular sensor domain and a cytosolic kinase domain, which are linked
together by the protein’s transmembrane domain. When a
signal (or substrate) interacts with the sensor domain of the
HK, this triggers activation of the autokinase domain, leading
to autophosphorylation of the protein at a conserved histidine
residue in the cytosolic domain. From there, the phosphate
gets transferred directly to a conserved aspartate residue on
the RR, leading to its activation as a DNA binding protein
(112). This form of transcriptional regulation is very
common in bacteria, as it allows for the cell to rapidly
adapt to a particular environmental signal by altering the
expression of a specific subset of genes.
Of the 13 identified TCS encoded by S. pyogenes, the control of virulence regulatory
system (CovRS) is the best characterized. In this system, CovS acts as the sensor HK and CovR
is its reciprocal RR (3, 11, 105). The function of the CovRS TCS is thought to mostly control
genes involved in general stress response. Numerous environmental signals have been shown to
trigger CovRS activation including increased temperature, low pH, high salt concentrations, high
Mg2+ levels, LL-37, and iron starvation (105, 113-115). The covRS regulon includes up to 15% of
the total genes in S. pyogenes and has been shown to be essential for survival in various stress
conditions (2, 113, 116, 117).
Figure 8. Bacterial two-component system (TCS).

19
CovR acts largely as a repressor of gene expression and is thought to bind and repress
genes in both a phosphorylated and a nonphosphorylated state (118). It has been hypothesized
that CovR acts on one subset of its regulon when phosphorylated and another subset of genes
when in a nonphosphorylated state (118). The CovRS regulon includes a significant number of
known virulence factors such as SpeB, Ska, SPN, SLO, Ig-degrading enzymes, and DNases,
among others (116, 119). An important thing to note is that while CovRS acts as a repressor for
most virulence factors, it is an activator for SpeB expression (11, 116).
Strains incurring mutations leading to inactivation of either CovR or CovS are associated
with hypervirulence in mice and invasive disease (11, 116, 120). This is likely due to the
overexpression of numerous virulence factors that aid in tissue destruction and immune evasion
(116, 121). In particular, covRS mutants are highly resistant to phagocytosis and neutrophil
killing due to high productions of hyaluronic capsule, SIC, SpeA, Ska, and C5a peptidase (116).
Figure 9. CovRS regulon. CovRS responds to multiple environmental signals and modulates expression of several virulence factors involved in growth and adaptation. Adapted from (2)

20
Mga
In addition to its 13 TCS, S. pyogenes encodes several stand-alone response regulators.
One of the most well characterized of the stand-alone response regulators in S. pyogenes, Mga is
a global transcriptional regulator and is responsible for positive regulation of target genes during
exponential growth (11, 101, 109). Although the mga gene is present in all serotypes, there are
two allelic variants of the gene. These variants have been linked to tissue tropism, where the
mga-1 allele is found mostly in throat-specialists and mga-2 is associated with skin- specialists or
“generalists” (85, 109).
Figure 10. Model for dissemination of CovRS mutants. Spontaneous mutations in the covRS operon during invasion of subepithelial tissue can lead to enhanced resistance to neutrophil killing. These resistant mutants can then go on to invade deeper tissue, leading to systemic infection. Adapted from (3).

21
Numerous growth phase and environmental signals are associated with Mga regulation
including CO2, temperature, and iron levels (122-124). Recent work has demonstrated that
phosphorylation and inactivation of Mga can occur through interactions with proteins of the
phosphotransferase system (PTS) (125, 126). This information provides a direct link between
sugar metabolism and Mga activity.
Mga is associated with controlling expression of genes involved in colonization of host
tissue and immune evasion. Genes directly activated by Mga (i.e. Mga directly binds to the
promoters of these targets) are referred to as the “core” Mga regulon. Target genes within this
group include adhesins (such as M protein, M-like proteins, fibronectin- and collagen-binding
proteins), immune modulators (C5a peptidase, SIC, and Ig-binding proteins), and the mga gene
itself (101, 106, 126). Beyond this core set, there are numerous other target genes whose
expression is indirectly affected by Mga. These indirect targets can include virulence factors
such as the hasABC capsule synthesis locus and speB, as well as genes involved in metabolism
such as several PTS genes (106, 127). Additionally, there is a large amount of variation within
the Mga regulon, indicating a significant amount of strain-specific regulation (109, 127). Since
Mga is involved in the activation of several of the major S. pyogenes virulence factors, its role in
virulence has been studied in detail. It has been shown that loss of mga results in defects in
adherence to host cells, as well as an attenuation of virulence in murine models of invasive
disease (128-131).
RopB
Another well-characterized stand-alone response regulator in S. pyogenes is RopB, first

22
identified as a positive regulator of the secreted virulence factor SpeB (132). Regulation by
RopB is linked to growth phase, controlling gene expression during stationary phase of growth
(101, 133, 134). Analyses of the role of RopB in transcriptional regulation has shown that
deletion of this regulator has a pleiotropic effect, altering the expression of genes involved in
virulence, metabolism, and stress response among others (135-138). This varied response is
likely, in part, an indirect effect, as RopB itself is a regulator of a number of uncharacterized
transcriptional regulators (133, 139). Further complicating the role of RopB regulation in S.
pyogenes is the fact that there is a great deal of strain specificity in the RopB regulon, with speB
being one of the few genes that is consistently controlled by this regulator in multiple strains
(133, 136).
Currently, the mechanism of activation for RopB is also unclear. RopB is classified as a
member of the Rgg family of transcriptional regulators. In Gram-positive bacteria, this family is
associated with quorum sensing via interactions with oligopeptide pheromones (133). However,
no evidence has been reported to indicate that RopB is involved in a quorum sensing mechanism
(133). Finally, the contribution of RopB to S. pyogenes pathogenesis is also unclear at this time.
Despite both direct and indirect regulation of numerous virulence factors, there have been
conflicting reports on the effects of RopB inactivation on virulence (135, 138, 140). These
results are, at least partially, the result of the strain-specific nature of the RopB regulon (133).
CcpA
In Gram-positive bacteria, carbon catabolite repression (CCR) is largely under the control
of the transcriptional repressor CcpA. CCR ensures that the bacterial cell maximize its fitness

23
through the hierarchical utilization of carbon sources (141-143). In the presence of a preferred
carbon source such as glucose, the molecule will be rapidly taken into the cell and degraded
through the glycolytic pathway, leading to high intracellular concentrations of fructose-
bisphosphate (FBP). The fluctuation of this metabolic intermediate affects the enzymatic activity
of the protein HprK.
HprK, a protein found exclusively in Gram-positive bacteria, is a dual kinase/phosphatase
whose role is to control the phosphorylation of the PTS protein HPr (142-144). In Gram-
positives, HPr can be phosphorylated on either of two conserved residues. HprK controls
phosphorylation of HPr on a specific serine residue, Ser46 in S. pyogenes (143, 145). At high
FBP concentrations, HprK functions as a kinase, phosphorylating HPr at Ser46. This P~Ser-HPr
acts as a cofactor for CcpA, binding to the CcpA dimer and inducing a structural change that is
required for CcpA to bind target promoter DNA (146). When in its active conformation, CcpA
will bind to catabolic-responsive elements (cre) sites, acting largely as a repressor of gene
expression (144, 146).
CcpA has been shown to control up to 20% of the total genome of S. pyogenes. Global
transcriptional analysis of the CcpA regulon has shown that, in addition to controlling alternative
catabolic operons, it controls expression of a number of virulence factors including speB, sagA,
and cfa (147, 148). Additionally, although a significant portion of the CcpA regulon includes
glucose-regulated genes, there is a subset of genes that appear to be regulated by CcpA
independently of glucose concentrations (148). This information suggests that there is a second,
currently unknown, catabolite-sensing pathway involved in CcpA regulation.

24
LacD.1
LacD.1 was identified initially through a genetic screen as a negative regulator of the
cysteine protease SpeB. It was determined that this protein repressed SpeB expression in
response to neutral pH, high salt concentrations, and carbohydrate availability (60, 149). LacD.1
is annotated as a tagatose bisphosphate aldolase, an enzyme involved in the catabolism of lactose
and galactose (150). In S. pyogenes there are two Lac loci, Lac1 (which includes LacD.1) and
Lac2 (149, 151). The lac1 locus contains several truncated genes, making it unable to utilize
lactose and galactose, but has evolved into a regulatory locus via LacD.1 (151). Conversely, the
Lac2 locus has maintained full-length genes and is able to utilize lactose and galactose, but does
not have any reported regulatory activity (151).
The specific mechanism that LacD.1 uses to regulate genes remains unclear, but it has
been shown that this protein does not require its enzymatic activity for this regulation (149). It
does, however, require the ability to bind to the glycolytic intermediates G3P and DHAP (149).
This information has led to the hypothesis that LacD.1 functions to regulate genes in response to
carbohydrate availability. Further indication of this includes the fact that a significant number of
genes in S. pyogenes that are regulated by glucose levels are also part of the LacD.1 regulon
(148). These include virulence genes like SpeB, as well as genes involved in various metabolic
processes (148).
CodY
The global transcriptional regulator CodY is involved in controlling gene expression in
response to amino acid starvation (102, 152, 153). CodY, which has been shown to control 17%

25
of the total genome through direct and indirect regulation, is activated by high levels of GTP and
branched chain amino acids (BCAA) (102, 111). In the presence of high concentrations of these
substrates, CodY is able to bind to DNA target promoters with high affinity, leading to
repression of target genes. Conversely, when these substrates are present in low levels, as would
be expected during starvation conditions, CodY is inactivated, leading to enhanced transcription
of the CodY regulon. Genes identified as being regulated by CodY include transcriptional
regulators such as covRS, mga, and codY itself (152). Additionally, numerous virulence factors
are repressed by CodY including DNases, M protein, capsule synthesis, cytolysins SLO and
SLS, and several proteases, among others (152, 153). This has led to the hypothesis that the main
function of CodY is to alleviate starvation by allowing the bacterial cell to produce proteins that
can aid in dissemination and macromolecular breakdown, thus providing the bacteria access to
additional sources of nutrients during an infection (111, 153)
26
Aim and Scope of Thesis
The aim of this thesis was to provide insights into the convergence of metabolism and
virulence in the pathogenic bacterium Streptococcus pyogenes. In particular, we sought to
identify regulatory mechanisms utilized by Streptococcus pyogenes in response to remodeling of
its local tissue environment during an infection. As a lactic acid bacterium, S. pyogenes utilizes a
mix of homolactic and mixed acid fermentation to produce energy in the cell. As a result, several
organic end products are produced and secreted, thus affecting the pH of the surrounding
environment. In order for the bacteria to survive over time, it must adapt to late stage conditions
of low pH and glucose depletion. Although it has been established that both carbohydrate
availability and environmental pH are triggers for global transcriptome remodeling in this
bacterium, the specific regulatory pathways controlling these transcriptional responses are
largely unknown.
To that end, the work presented here will characterize several novel mechanisms by
which S. pyogenes is able to adapt to its self-induced acid stress and carbohydrate depletion. The
research in this thesis will describe two separate regulatory systems, one controlling an
alternative catabolic pathway and one controlling an important pair of cytotoxic proteins, both of
which are controlled by environmental pH. Taken together, this work provides greater insight
into adaptive mechanisms utilized by S. pyogenes during late stages of growth.

27
REFERENCES
1. Ghosh J, Anderson PJ, Chandrasekaran S, Caparon MG. 2010. Characterization of
Streptococcus pyogenes beta-NAD+ glycohydrolase: re-evaluation of enzymatic
properties associated with pathogenesis. The Journal of biological chemistry 285:5683-
5694.
2. Graham MR, Smoot LM, Migliaccio CA, Virtaneva K, Sturdevant DE, Porcella SF,
Federle MJ, Adams GJ, Scott JR, Musser JM. 2002. Virulence control in group A
Streptococcus by a two-component gene regulatory system: global expression profiling
and in vivo infection modeling. Proceedings of the National Academy of Sciences of the
United States of America 99:13855-13860.
3. Cole JN, Barnett TC, Nizet V, Walker MJ. 2011. Molecular insight into invasive
group A streptococcal disease. Nat Rev Microbiol 9:724-736.
4. Fiedler T, Sugareva V, Patenge N, Kreikemeyer B. 2010. Insights into Streptococcus
pyogenes pathogenesis from transcriptome studies. Future microbiology 5:1675-1694.
5. Johansson L, Norrby-Teglund A. 2013. Immunopathogenesis of streptococcal deep
tissue infections. Current topics in microbiology and immunology 368:173-188.
6. Krzysciak W, Pluskwa KK, Jurczak A, Koscielniak D. 2013. The pathogenicity of the
Streptococcus genus. European journal of clinical microbiology & infectious diseases :
official publication of the European Society of Clinical Microbiology 32:1361-1376.
7. Mitchell TJ. 2003. The pathogenesis of streptococcal infections: from tooth decay to
meningitis. Nat Rev Microbiol 1:219-230.
8. Tan LK, Eccersley LR, Sriskandan S. 2014. Current views of haemolytic streptococcal
pathogenesis. Current opinion in infectious diseases 27:155-164.

28
9. Patterson MJ. 1996. Streptococcus. In Baron S (ed.), Medical Microbiology, 4th ed,
Galveston (TX).
10. Olsen RJ, Musser JM. 2010. Molecular pathogenesis of necrotizing fasciitis. Annual
review of pathology 5:1-31.
11. Walker MJ, Barnett TC, McArthur JD, Cole JN, Gillen CM, Henningham A,
Sriprakash KS, Sanderson-Smith ML, Nizet V. 2014. Disease manifestations and
pathogenic mechanisms of group a Streptococcus. Clinical microbiology reviews 27:264-
301.
12. Carapetis JR, Steer AC, Mulholland EK, Weber M. 2005. The global burden of group
A streptococcal diseases. The Lancet. Infectious diseases 5:685-694.
13. Bisno AL, Gerber MA, Gwaltney JM, Jr., Kaplan EL, Schwartz RH, Infectious
Diseases Society of A. 2002. Practice guidelines for the diagnosis and management of
group A streptococcal pharyngitis. Infectious Diseases Society of America. Clinical
infectious diseases : an official publication of the Infectious Diseases Society of America
35:113-125.
14. Lamagni TL, Darenberg J, Luca-Harari B, Siljander T, Efstratiou A, Henriques-
Normark B, Vuopio-Varkila J, Bouvet A, Creti R, Ekelund K, Koliou M, Reinert
RR, Stathi A, Strakova L, Ungureanu V, Schalen C, Strep ESG, Jasir A. 2008.
Epidemiology of severe Streptococcus pyogenes disease in Europe. Journal of clinical
microbiology 46:2359-2367.
15. O'Grady KA, Kelpie L, Andrews RM, Curtis N, Nolan TM, Selvaraj G, Passmore
JW, Oppedisano F, Carnie JA, Carapetis JR. 2007. The epidemiology of invasive

29
group A streptococcal disease in Victoria, Australia. The Medical journal of Australia
186:565-569.
16. O'Loughlin RE, Roberson A, Cieslak PR, Lynfield R, Gershman K, Craig A,
Albanese BA, Farley MM, Barrett NL, Spina NL, Beall B, Harrison LH, Reingold
A, Van Beneden C, Active Bacterial Core Surveillance T. 2007. The epidemiology of
invasive group A streptococcal infection and potential vaccine implications: United
States, 2000-2004. Clinical infectious diseases : an official publication of the Infectious
Diseases Society of America 45:853-862.
17. Cunningham MW. 2000. Pathogenesis of group A streptococcal infections. Clinical
microbiology reviews 13:470-511.
18. Stevens DL, Gibbons AE, Bergstrom R, Winn V. 1988. The Eagle effect revisited:
efficacy of clindamycin, erythromycin, and penicillin in the treatment of streptococcal
myositis. The Journal of infectious diseases 158:23-28.
19. Cunningham MW. 2012. Streptococcus and rheumatic fever. Current opinion in
rheumatology 24:408-416.
20. Musser JM, Shelburne SA, 3rd. 2009. A decade of molecular pathogenomic analysis of
group A Streptococcus. The Journal of clinical investigation 119:2455-2463.
21. Nobbs AH, Lamont RJ, Jenkinson HF. 2009. Streptococcus adherence and
colonization. Microbiol Mol Biol Rev 73:407-450, Table of Contents.
22. Smeesters PR, McMillan DJ, Sriprakash KS. 2010. The streptococcal M protein: a
highly versatile molecule. Trends Microbiol 18:275-282.
23. Nilson BH, Frick IM, Akesson P, Forsen S, Bjorck L, Akerstrom B, Wikstrom M.
1995. Structure and stability of protein H and the M1 protein from Streptococcus

30
pyogenes. Implications for other surface proteins of gram-positive bacteria. Biochemistry
34:13688-13698.
24. Fischetti VA, Pancholi V, Schneewind O. 1990. Conservation of a hexapeptide
sequence in the anchor region of surface proteins from gram-positive cocci. Mol
Microbiol 4:1603-1605.
25. McArthur JD, Walker MJ. 2006. Domains of group A streptococcal M protein that
confer resistance to phagocytosis, opsonization and protection: implications for vaccine
development. Mol Microbiol 59:1-4.
26. Giannakis E, Jokiranta TS, Ormsby RJ, Duthy TG, Male DA, Christiansen D,
Fischetti VA, Bagley C, Loveland BE, Gordon DL. 2002. Identification of the
streptococcal M protein binding site on membrane cofactor protein (CD46). Journal of
immunology 168:4585-4592.
27. Okada N, Liszewski MK, Atkinson JP, Caparon M. 1995. Membrane cofactor protein
(CD46) is a keratinocyte receptor for the M protein of the group A streptococcus. Proc
Natl Acad Sci U S A 92:2489-2493.
28. Courtney HS, von Hunolstein C, Dale JB, Bronze MS, Beachey EH, Hasty DL. 1992.
Lipoteichoic acid and M protein: dual adhesins of group A streptococci. Microbial
pathogenesis 12:199-208.
29. Cue D, Dombek PE, Lam H, Cleary PP. 1998. Streptococcus pyogenes serotype M1
encodes multiple pathways for entry into human epithelial cells. Infect Immun 66:4593-
4601.
30. Ellen RP, Gibbons RJ. 1972. M protein-associated adherence of Streptococcus
pyogenes to epithelial surfaces: prerequisite for virulence. Infect Immun 5:826-830.

31
31. Siemens N, Patenge N, Otto J, Fiedler T, Kreikemeyer B. 2011. Streptococcus
pyogenes M49 plasminogen/plasmin binding facilitates keratinocyte invasion via
integrin-integrin-linked kinase (ILK) pathways and protects from macrophage killing.
The Journal of biological chemistry 286:21612-21622.
32. Wang JR, Stinson MW. 1994. M protein mediates streptococcal adhesion to HEp-2
cells. Infect Immun 62:442-448.
33. Rezcallah MS, Hodges K, Gill DB, Atkinson JP, Wang B, Cleary PP. 2005.
Engagement of CD46 and alpha5beta1 integrin by group A streptococci is required for
efficient invasion of epithelial cells. Cellular microbiology 7:645-653.
34. Berggard K, Johnsson E, Morfeldt E, Persson J, Stalhammar-Carlemalm M,
Lindahl G. 2001. Binding of human C4BP to the hypervariable region of M protein: a
molecular mechanism of phagocytosis resistance in Streptococcus pyogenes. Mol
Microbiol 42:539-551.
35. Horstmann RD, Sievertsen HJ, Knobloch J, Fischetti VA. 1988. Antiphagocytic
activity of streptococcal M protein: selective binding of complement control protein
factor H. Proc Natl Acad Sci U S A 85:1657-1661.
36. Johnsson E, Berggard K, Kotarsky H, Hellwage J, Zipfel PF, Sjobring U, Lindahl
G. 1998. Role of the hypervariable region in streptococcal M proteins: binding of a
human complement inhibitor. Journal of immunology 161:4894-4901.
37. Ashbaugh CD, Warren HB, Carey VJ, Wessels MR. 1998. Molecular analysis of the
role of the group A streptococcal cysteine protease, hyaluronic acid capsule, and M
protein in a murine model of human invasive soft-tissue infection. The Journal of clinical
investigation 102:550-560.

32
38. Dinkla K, Sastalla I, Godehardt AW, Janze N, Chhatwal GS, Rohde M, Medina E.
2007. Upregulation of capsule enables Streptococcus pyogenes to evade immune
recognition by antigen-specific antibodies directed to the G-related alpha2-
macroglobulin-binding protein GRAB located on the bacterial surface. Microbes and
infection / Institut Pasteur 9:922-931.
39. Dale JB, Washburn RG, Marques MB, Wessels MR. 1996. Hyaluronate capsule and
surface M protein in resistance to opsonization of group A streptococci. Infect Immun
64:1495-1501.
40. Foley MJ, Wood WB, Jr. 1959. Studies on the pathogenicity of group A streptococci. II.
The antiphagocytic effects of the M protein and the capsular gel. The Journal of
experimental medicine 110:617-628.
41. Cole JN, Pence MA, von Kockritz-Blickwede M, Hollands A, Gallo RL, Walker MJ,
Nizet V. 2010. M protein and hyaluronic acid capsule are essential for in vivo selection
of covRS mutations characteristic of invasive serotype M1T1 group A Streptococcus.
mBio 1.
42. Moses AE, Wessels MR, Zalcman K, Alberti S, Natanson-Yaron S, Menes T, Hanski
E. 1997. Relative contributions of hyaluronic acid capsule and M protein to virulence in a
mucoid strain of the group A Streptococcus. Infect Immun 65:64-71.
43. Wessels MR, Bronze MS. 1994. Critical role of the group A streptococcal capsule in
pharyngeal colonization and infection in mice. Proc Natl Acad Sci U S A 91:12238-
12242.

33
44. Wessels MR, Goldberg JB, Moses AE, DiCesare TJ. 1994. Effects on virulence of
mutations in a locus essential for hyaluronic acid capsule expression in group A
streptococci. Infect Immun 62:433-441.
45. Wessels MR, Moses AE, Goldberg JB, DiCesare TJ. 1991. Hyaluronic acid capsule is
a virulence factor for mucoid group A streptococci. Proc Natl Acad Sci U S A 88:8317-
8321.
46. Ashbaugh CD, Moser TJ, Shearer MH, White GL, Kennedy RC, Wessels MR. 2000.
Bacterial determinants of persistent throat colonization and the associated immune
response in a primate model of human group A streptococcal pharyngeal infection.
Cellular microbiology 2:283-292.
47. Chen CC, Cleary PP. 1990. Complete nucleotide sequence of the streptococcal C5a
peptidase gene of Streptococcus pyogenes. The Journal of biological chemistry
265:3161-3167.
48. Shet A, Kaplan EL, Johnson DR, Cleary PP. 2003. Immune response to group A
streptococcal C5a peptidase in children: implications for vaccine development. The
Journal of infectious diseases 188:809-817.
49. O'Connor SP, Cleary PP. 1986. Localization of the streptococcal C5a peptidase to the
surface of group A streptococci. Infect Immun 53:432-434.
50. Cleary PP, Prahbu U, Dale JB, Wexler DE, Handley J. 1992. Streptococcal C5a
peptidase is a highly specific endopeptidase. Infect Immun 60:5219-5223.
51. DeMaster E, Schnitzler N, Cheng Q, Cleary P. 2002. M(+) group a streptococci are
phagocytized and killed in whole blood by C5a-activated polymorphonuclear leukocytes.
Infect Immun 70:350-359.

34
52. Wexler DE, Chenoweth DE, Cleary PP. 1985. Mechanism of action of the group A
streptococcal C5a inactivator. Proc Natl Acad Sci U S A 82:8144-8148.
53. Brown CK, Gu ZY, Matsuka YV, Purushothaman SS, Winter LA, Cleary PP,
Olmsted SB, Ohlendorf DH, Earhart CA. 2005. Structure of the streptococcal cell wall
C5a peptidase. Proc Natl Acad Sci U S A 102:18391-18396.
54. Park HS, Cleary PP. 2005. Active and passive intranasal immunizations with
streptococcal surface protein C5a peptidase prevent infection of murine nasal mucosa-
associated lymphoid tissue, a functional homologue of human tonsils. Infect Immun
73:7878-7886.
55. Fernie-King BA, Seilly DJ, Willers C, Wurzner R, Davies A, Lachmann PJ. 2001.
Streptococcal inhibitor of complement (SIC) inhibits the membrane attack complex by
preventing uptake of C567 onto cell membranes. Immunology 103:390-398.
56. Fernie-King BA, Seilly DJ, Davies A, Lachmann PJ. 2002. Streptococcal inhibitor of
complement inhibits two additional components of the mucosal innate immune system:
secretory leukocyte proteinase inhibitor and lysozyme. Infect Immun 70:4908-4916.
57. Fernie-King BA, Seilly DJ, Lachmann PJ. 2004. The interaction of streptococcal
inhibitor of complement (SIC) and its proteolytic fragments with the human beta
defensins. Immunology 111:444-452.
58. Frick IM, Akesson P, Rasmussen M, Schmidtchen A, Bjorck L. 2003. SIC, a secreted
protein of Streptococcus pyogenes that inactivates antibacterial peptides. The Journal of
biological chemistry 278:16561-16566.

35
59. Chaussee MS, Phillips ER, Ferretti JJ. 1997. Temporal production of streptococcal
erythrogenic toxin B (streptococcal cysteine proteinase) in response to nutrient depletion.
Infect Immun 65:1956-1959.
60. Loughman JA, Caparon M. 2006. Regulation of SpeB in Streptococcus pyogenes by
pH and NaCl: a model for in vivo gene expression. Journal of bacteriology 188:399-408.
61. Kapur V, Topouzis S, Majesky MW, Li LL, Hamrick MR, Hamill RJ, Patti JM,
Musser JM. 1993. A conserved Streptococcus pyogenes extracellular cysteine protease
cleaves human fibronectin and degrades vitronectin. Microbial pathogenesis 15:327-346.
62. Nelson DC, Garbe J, Collin M. 2011. Cysteine proteinase SpeB from Streptococcus
pyogenes - a potent modifier of immunologically important host and bacterial proteins.
Biological chemistry 392:1077-1088.
63. Eriksson A, Norgren M. 2003. Cleavage of antigen-bound immunoglobulin G by SpeB
contributes to streptococcal persistence in opsonizing blood. Infect Immun 71:211-217.
64. Nyberg P, Rasmussen M, Bjorck L. 2004. alpha2-Macroglobulin-proteinase complexes
protect Streptococcus pyogenes from killing by the antimicrobial peptide LL-37. The
Journal of biological chemistry 279:52820-52823.
65. Aziz RK, Pabst MJ, Jeng A, Kansal R, Low DE, Nizet V, Kotb M. 2004. Invasive
M1T1 group A Streptococcus undergoes a phase-shift in vivo to prevent proteolytic
degradation of multiple virulence factors by SpeB. Mol Microbiol 51:123-134.
66. Kapur V, Majesky MW, Li LL, Black RA, Musser JM. 1993. Cleavage of interleukin
1 beta (IL-1 beta) precursor to produce active IL-1 beta by a conserved extracellular
cysteine protease from Streptococcus pyogenes. Proc Natl Acad Sci U S A 90:7676-
7680.

36
67. Boyle MD, Lottenberg R. 1997. Plasminogen activation by invasive human pathogens.
Thrombosis and haemostasis 77:1-10.
68. Coleman JL, Benach JL. 1999. Use of the plasminogen activation system by
microorganisms. The Journal of laboratory and clinical medicine 134:567-576.
69. Berge A, Sjobring U. 1993. PAM, a novel plasminogen-binding protein from
Streptococcus pyogenes. The Journal of biological chemistry 268:25417-25424.
70. Sanderson-Smith M, Batzloff M, Sriprakash KS, Dowton M, Ranson M, Walker
MJ. 2006. Divergence in the plasminogen-binding group a streptococcal M protein
family: functional conservation of binding site and potential role for immune selection of
variants. The Journal of biological chemistry 281:3217-3226.
71. Sanderson-Smith ML, Dowton M, Ranson M, Walker MJ. 2007. The plasminogen-
binding group A streptococcal M protein-related protein Prp binds plasminogen via
arginine and histidine residues. J Bacteriol 189:1435-1440.
72. Werb Z. 1997. ECM and cell surface proteolysis: regulating cellular ecology. Cell
91:439-442.
73. Sun H, Ringdahl U, Homeister JW, Fay WP, Engleberg NC, Yang AY, Rozek LS,
Wang X, Sjobring U, Ginsburg D. 2004. Plasminogen is a critical host pathogenicity
factor for group A streptococcal infection. Science 305:1283-1286.
74. Norrby-Teglund A, Thulin P, Gan BS, Kotb M, McGeer A, Andersson J, Low DE.
2001. Evidence for superantigen involvement in severe group a streptococcal tissue
infections. The Journal of infectious diseases 184:853-860.
37
75. Norrby-Teglund A, Johansson L. 2013. Beyond the traditional immune response:
bacterial interaction with phagocytic cells. International journal of antimicrobial agents
42 Suppl:S13-16.
76. Marrack P, Kappler J. 1990. The staphylococcal enterotoxins and their relatives.
Science 248:705-711.
77. Norrby-Teglund A, Chatellier S, Low DE, McGeer A, Green K, Kotb M. 2000. Host
variation in cytokine responses to superantigens determine the severity of invasive group
A streptococcal infection. European journal of immunology 30:3247-3255.
78. Nizet V, Beall B, Bast DJ, Datta V, Kilburn L, Low DE, De Azavedo JC. 2000.
Genetic locus for streptolysin S production by group A streptococcus. Infect Immun
68:4245-4254.
79. Betschel SD, Borgia SM, Barg NL, Low DE, De Azavedo JC. 1998. Reduced
virulence of group A streptococcal Tn916 mutants that do not produce streptolysin S.
Infect Immun 66:1671-1679.
80. Ofek I, Bergner-Rabinowitz S, Ginsburg I. 1970. Oxygen-stable hemolysins of group
A streptococci. VII. The relation of the leukotoxic factor to streptolysin S. The Journal of
infectious diseases 122:517-522.
81. Ginsburg I. 1999. Is streptolysin S of group A streptococci a virulence factor? APMIS :
acta pathologica, microbiologica, et immunologica Scandinavica 107:1051-1059.
82. Chandrasekaran S, Ghosh J, Port GC, Koh EI, Caparon MG. 2013. Analysis of
polymorphic residues reveals distinct enzymatic and cytotoxic activities of the
Streptococcus pyogenes NAD+ glycohydrolase. The Journal of biological chemistry
288:20064-20075.

38
83. Madden JC, Ruiz N, Caparon M. 2001. Cytolysin-mediated translocation (CMT): a
functional equivalent of type III secretion in gram-positive bacteria. Cell 104:143-152.
84. Riddle DJ, Bessen DE, Caparon MG. 2010. Variation in Streptococcus pyogenes
NAD+ glycohydrolase is associated with tissue tropism. J Bacteriol 192:3735-3746.
85. Bessen DE, Lizano S. 2010. Tissue tropisms in group A streptococcal infections. Future
microbiology 5:623-638.
86. Meehl MA, Pinkner JS, Anderson PJ, Hultgren SJ, Caparon MG. 2005. A novel
endogenous inhibitor of the secreted streptococcal NAD-glycohydrolase. PLoS pathogens
1:e35.
87. Hotze EM, Tweten RK. 2012. Membrane assembly of the cholesterol-dependent
cytolysin pore complex. Biochim Biophys Acta 1818:1028-1038.
88. Bricker AL, Cywes C, Ashbaugh CD, Wessels MR. 2002. NAD+-glycohydrolase acts
as an intracellular toxin to enhance the extracellular survival of group A streptococci.
Mol Microbiol 44:257-269.
89. Ghosh J, Caparon MG. 2006. Specificity of Streptococcus pyogenes NAD(+)
glycohydrolase in cytolysin-mediated translocation. Mol Microbiol 62:1203-1214.
90. Magassa N, Chandrasekaran S, Caparon MG. 2010. Streptococcus pyogenes
cytolysin-mediated translocation does not require pore formation by streptolysin O.
EMBO reports 11:400-405.
91. Mozola CC, Magassa N, Caparon MG. 2014. A novel cholesterol-insensitive mode of
membrane binding promotes cytolysin-mediated translocation by Streptolysin O. Mol
Microbiol 94:675-687.

39
92. Neijssel OM, Snoep JL, Teixeira de Mattos MJ. 1997. Regulation of energy source
metabolism in streptococci. Soc Appl Bacteriol Symp Ser 26:12S-19S.
93. Martinussen J, Solem C, Holm AK, Jensen PR. 2012. Engineering strategies aimed at
control of acidification rate of lactic acid bacteria. Curr Opin Biotechnol 24:124-129.
94. Rosey EL, Oskouian B, Stewart GC. 1991. Lactose metabolism by Staphylococcus
aureus: characterization of lacABCD, the structural genes of the tagatose 6-phosphate
pathway. J Bacteriol 173:5992-5998.
95. Cocaign-Bousquet M, Garrigues C, Loubiere P, Lindley ND. 1996. Physiology of
pyruvate metabolism in Lactococcus lactis. Antonie van Leeuwenhoek 70:253-267.
96. Yesilkaya H, Spissu F, Carvalho SM, Terra VS, Homer KA, Benisty R, Porat N,
Neves AR, Andrew PW. 2009. Pyruvate formate lyase is required for pneumococcal
fermentative metabolism and virulence. Infect Immun 77:5418-5427.
97. Abdelal AT. 1979. Arginine catabolism by microorganisms. Annual review of
microbiology 33:139-168.
98. Cotter PD, Hill C. 2003. Surviving the acid test: responses of gram-positive bacteria to
low pH. Microbiol Mol Biol Rev 67:429-453, table of contents.
99. Cusumano ZT, Watson ME, Jr., Caparon MG. 2013. Streptococcus pyogenes
Arginine and Citrulline Catabolism Promotes Infection and Modulates Innate Immunity.
Infect Immun.
100. Tart AH, Walker MJ, Musser JM. 2007. New understanding of the group A
Streptococcus pathogenesis cycle. Trends Microbiol 15:318-325.
40
101. Kreikemeyer B, McIver KS, Podbielski A. 2003. Virulence factor regulation and
regulatory networks in Streptococcus pyogenes and their impact on pathogen-host
interactions. Trends Microbiol 11:224-232.
102. Malke H, Steiner K, McShan WM, Ferretti JJ. 2006. Linking the nutritional status of
Streptococcus pyogenes to alteration of transcriptional gene expression: the action of
CodY and RelA. International journal of medical microbiology : IJMM 296:259-275.
103. La MV, Raoult D, Renesto P. 2008. Regulation of whole bacterial pathogen
transcription within infected hosts. FEMS Microbiol Rev 32:440-460.
104. Chaussee MS, Somerville GA, Reitzer L, Musser JM. 2003. Rgg coordinates virulence
factor synthesis and metabolism in Streptococcus pyogenes. J Bacteriol 185:6016-6024.
105. Churchward G. 2007. The two faces of Janus: virulence gene regulation by CovR/S in
group A streptococci. Molecular microbiology 64:34-41.
106. Hondorp ER, McIver KS. 2007. The Mga virulence regulon: infection where the grass
is greener. Mol Microbiol 66:1056-1065.
107. Hynes W. 2004. Virulence factors of the group A streptococci and genes that regulate
their expression. Frontiers in bioscience : a journal and virtual library 9:3399-3433.
108. McIver KS. 2009. Stand-alone response regulators controlling global virulence networks
in streptococcus pyogenes. Contributions to microbiology 16:103-119.
109. Patenge N, Fiedler T, Kreikemeyer B. 2013. Common regulators of virulence in
streptococci. Current topics in microbiology and immunology 368:111-153.
110. Shelburne SA, Olsen RJ, Suber B, Sahasrabhojane P, Sumby P, Brennan RG,
Musser JM. 2010. A combination of independent transcriptional regulators shapes
bacterial virulence gene expression during infection. PLoS pathogens 6:e1000817.

41
111. Sonenshein AL. 2005. CodY, a global regulator of stationary phase and virulence in
Gram-positive bacteria. Curr Opin Microbiol 8:203-207.
112. Hoch JA. 2000. Two-component and phosphorelay signal transduction. Curr Opin
Microbiol 3:165-170.
113. Dalton TL, Scott JR. 2004. CovS inactivates CovR and is required for growth under
conditions of general stress in Streptococcus pyogenes. J Bacteriol 186:3928-3937.
114. Gryllos I, Levin JC, Wessels MR. 2003. The CsrR/CsrS two-component system of
group A Streptococcus responds to environmental Mg2+. Proc Natl Acad Sci U S A
100:4227-4232.
115. Froehlich BJ, Bates C, Scott JR. 2009. Streptococcus pyogenes CovRS mediates
growth in iron starvation and in the presence of the human cationic antimicrobial peptide
LL-37. J Bacteriol 191:673-677.
116. Sumby P, Whitney AR, Graviss EA, DeLeo FR, Musser JM. 2006. Genome-wide
analysis of group a streptococci reveals a mutation that modulates global phenotype and
disease specificity. PLoS pathogens 2:e5.
117. Dalton TL, Hobb RI, Scott JR. 2006. Analysis of the role of CovR and CovS in the
dissemination of Streptococcus pyogenes in invasive skin disease. Microbial
pathogenesis 40:221-227.
118. Trevino J, Perez N, Ramirez-Pena E, Liu Z, Shelburne SA, 3rd, Musser JM, Sumby
P. 2009. CovS simultaneously activates and inhibits the CovR-mediated repression of
distinct subsets of group A Streptococcus virulence factor-encoding genes. Infection and
immunity 77:3141-3149.

42
119. Levin JC, Wessels MR. 1998. Identification of csrR/csrS, a genetic locus that regulates
hyaluronic acid capsule synthesis in group A Streptococcus. Mol Microbiol 30:209-219.
120. Walker MJ, Hollands A, Sanderson-Smith ML, Cole JN, Kirk JK, Henningham A,
McArthur JD, Dinkla K, Aziz RK, Kansal RG, Simpson AJ, Buchanan JT,
Chhatwal GS, Kotb M, Nizet V. 2007. DNase Sda1 provides selection pressure for a
switch to invasive group A streptococcal infection. Nature medicine 13:981-985.
121. Maamary PG, Sanderson-Smith ML, Aziz RK, Hollands A, Cole JN, McKay FC,
McArthur JD, Kirk JK, Cork AJ, Keefe RJ, Kansal RG, Sun H, Taylor WL,
Chhatwal GS, Ginsburg D, Nizet V, Kotb M, Walker MJ. 2010. Parameters
governing invasive disease propensity of non-M1 serotype group A streptococci. Journal
of innate immunity 2:596-606.
122. Caparon MG, Geist RT, Perez-Casal J, Scott JR. 1992. Environmental regulation of
virulence in group A streptococci: transcription of the gene encoding M protein is
stimulated by carbon dioxide. J Bacteriol 174:5693-5701.
123. Podbielski A, Peterson JA, Cleary P. 1992. Surface protein-CAT reporter fusions
demonstrate differential gene expression in the vir regulon of Streptococcus pyogenes.
Mol Microbiol 6:2253-2265.
124. McIver KS, Heath AS, Scott JR. 1995. Regulation of virulence by environmental
signals in group A streptococci: influence of osmolarity, temperature, gas exchange, and
iron limitation on emm transcription. Infect Immun 63:4540-4542.
125. Hondorp ER, Hou SC, Hause LL, Gera K, Lee CE, McIver KS. 2013. PTS
phosphorylation of Mga modulates regulon expression and virulence in the group A
streptococcus. Mol Microbiol 88:1176-1193.
43
126. Hondorp ER, Hou SC, Hempstead AD, Hause LL, Beckett DM, McIver KS. 2012.
Characterization of the Group A Streptococcus Mga virulence regulator reveals a role for
the C-terminal region in oligomerization and transcriptional activation. Mol Microbiol
83:953-967.
127. Ribardo DA, McIver KS. 2006. Defining the Mga regulon: Comparative transcriptome
analysis reveals both direct and indirect regulation by Mga in the group A streptococcus.
Mol Microbiol 62:491-508.
128. Perez-Casal JF, Dillon HF, Husmann LK, Graham B, Scott JR. 1993. Virulence of
two Streptococcus pyogenes strains (types M1 and M3) associated with toxic-shock-like
syndrome depends on an intact mry-like gene. Infect Immun 61:5426-5430.
129. Kihlberg BM, Cooney J, Caparon MG, Olsen A, Bjorck L. 1995. Biological
properties of a Streptococcus pyogenes mutant generated by Tn916 insertion in mga.
Microbial pathogenesis 19:299-315.
130. Luo F, Lizano S, Banik S, Zhang H, Bessen DE. 2008. Role of Mga in group A
streptococcal infection at the skin epithelium. Microbial pathogenesis 45:217-224.
131. Fiedler T, Kreikemeyer B, Sugareva V, Redanz S, Arlt R, Standar K, Podbielski A.
2010. Impact of the Streptococcus pyogenes Mga regulator on human matrix protein
binding and interaction with eukaryotic cells. International journal of medical
microbiology : IJMM 300:248-258.
132. Lyon WR, Gibson CM, Caparon MG. 1998. A role for trigger factor and an rgg-like
regulator in the transcription, secretion and processing of the cysteine proteinase of
Streptococcus pyogenes. The EMBO journal 17:6263-6275.

44
133. Jimenez JC, Federle MJ. 2014. Quorum sensing in group A Streptococcus. Frontiers in
cellular and infection microbiology 4:127.
134. Neely MN, Lyon WR, Runft DL, Caparon M. 2003. Role of RopB in growth phase
expression of the SpeB cysteine protease of Streptococcus pyogenes. J Bacteriol
185:5166-5174.
135. Carroll RK, Musser JM. 2011. From transcription to activation: how group A
streptococcus, the flesh-eating pathogen, regulates SpeB cysteine protease production.
Mol Microbiol 81:588-601.
136. Dmitriev AV, McDowell EJ, Chaussee MS. 2008. Inter- and intraserotypic variation in
the Streptococcus pyogenes Rgg regulon. FEMS Microbiol Lett 284:43-51.
137. Dmitriev AV, McDowell EJ, Kappeler KV, Chaussee MA, Rieck LD, Chaussee MS.
2006. The Rgg regulator of Streptococcus pyogenes influences utilization of nonglucose
carbohydrates, prophage induction, and expression of the NAD-glycohydrolase virulence
operon. Journal of bacteriology 188:7230-7241.
138. Hollands A, Aziz RK, Kansal R, Kotb M, Nizet V, Walker MJ. 2008. A naturally
occurring mutation in ropB suppresses SpeB expression and reduces M1T1 group A
streptococcal systemic virulence. PloS one 3:e4102.
139. Anbalagan S, McShan WM, Dunman PM, Chaussee MS. 2011. Identification of Rgg
binding sites in the Streptococcus pyogenes chromosome. J Bacteriol 193:4933-4942.
140. Ikebe T, Ato M, Matsumura T, Hasegawa H, Sata T, Kobayashi K, Watanabe H.
2010. Highly frequent mutations in negative regulators of multiple virulence genes in
group A streptococcal toxic shock syndrome isolates. PLoS pathogens 6:e1000832.

45
141. Bruckner R, Titgemeyer F. 2002. Carbon catabolite repression in bacteria: choice of the
carbon source and autoregulatory limitation of sugar utilization. FEMS Microbiol Lett
209:141-148.
142. Deutscher J. 2008. The mechanisms of carbon catabolite repression in bacteria. Curr
Opin Microbiol 11:87-93.
143. Deutscher J, Francke C, Postma PW. 2006. How phosphotransferase system-related
protein phosphorylation regulates carbohydrate metabolism in bacteria. Microbiol Mol
Biol Rev 70:939-1031.
144. Gorke B, Stulke J. 2008. Carbon catabolite repression in bacteria: many ways to make
the most out of nutrients. Nat Rev Microbiol 6:613-624.
145. Deutscher J, Herro R, Bourand A, Mijakovic I, Poncet S. 2005. P-Ser-HPr--a link
between carbon metabolism and the virulence of some pathogenic bacteria. Biochim
Biophys Acta 1754:118-125.
146. Schumacher MA, Allen GS, Diel M, Seidel G, Hillen W, Brennan RG. 2004.
Structural basis for allosteric control of the transcription regulator CcpA by the
phosphoprotein HPr-Ser46-P. Cell 118:731-741.
147. Kietzman CC, Caparon MG. 2009. CcpA and LacD.1 affect temporal regulation of
Streptococcus pyogenes virulence genes. Infect Immun 78:241-252.
148. Kietzman CC, Caparon MG. 2010. Distinct time-resolved roles for two catabolite-
sensing pathways during Streptococcus pyogenes infection. Infect Immun 79:812-821.
149. Loughman JA, Caparon MG. 2006. A novel adaptation of aldolase regulates virulence
in Streptococcus pyogenes. The EMBO journal 25:5414-5422.

46
150. Lukomski S, Burns EH, Jr., Wyde PR, Podbielski A, Rurangirwa J, Moore-Poveda
DK, Musser JM. 1998. Genetic inactivation of an extracellular cysteine protease (SpeB)
expressed by Streptococcus pyogenes decreases resistance to phagocytosis and
dissemination to organs. Infect Immun 66:771-776.
151. Loughman JA, Caparon MG. 2007. Comparative functional analysis of the lac operons
in Streptococcus pyogenes. Molecular microbiology 64:269-280.
152. Malke H, Ferretti JJ. 2007. CodY-affected transcriptional gene expression of
Streptococcus pyogenes during growth in human blood. Journal of medical microbiology
56:707-714.
153. McDowell EJ, Callegari EA, Malke H, Chaussee MS. 2012. CodY-mediated
regulation of Streptococcus pyogenes exoproteins. BMC microbiology 12:114.

47
Chapter II
Streptococcus pyogenes Malate Degradation Pathway
Links pH Regulation and Virulence
Elyse Paluscio and Michael G. Caparon
Infect Immun. 2015 Mar:83(3):1162-71. First published on January 15, 2015,
doi: 10.1128/IAI.02814-14.

48
SUMMARY
The ability of Streptococcus pyogenes to infect different niches within its human host
most likely relies on its ability to utilize alternative carbon sources. In examining this question,
we discovered that all sequenced S. pyogenes strains possess the genes for the malic enzyme
(ME) pathway, which allows malate to be used as a supplemental carbon source for growth. ME
is comprised of four genes in two adjacent operons, with the regulatory two-component MaeKR
required for expression of genes encoding a malate permease (maeP) and malic enzyme (maeE).
Analysis of transcription indicated that expression of maeP and maeE are induced by both malate
and low pH, and induction in response to both cues is dependent on the MaeK sensor-kinase.
Furthermore, both maePE and maeKR are repressed by glucose, which occurs via a CcpA-
independent mechanism. Additionally, malate utilization requires the PTS transporter EI enzyme
(PtsI), as a PtsI- mutant fails to express the ME genes and is unable to utilize malate. Virulence
of selected ME mutants was assessed in a murine model of soft tissue infection. MaeP-, MaeK-,
and MaeR- mutants were attenuated for virulence, whereas a MaeE- mutant showed enhanced
virulence as compared to wild type. Taken together, these data show that ME contributes to S.
pyogenes’ carbon source repertory, that malate utilization is a highly regulated process, and that
a single regulator controls ME expression in response to diverse signals. Furthermore, malate
uptake and utilization contribute to the adaptive pH response and ME can influence the outcome
of infection.

49
INTRODUCTION
Although it has a relatively small genome (approx. 1.8 Mbp), the pathogenic Gram-positive
bacterium Streptococcus pyogenes has a remarkable ability to adapt to a variety of human
tissues. This trait allows it to cause numerous diseases ranging from superficial and self-limiting
infections in soft tissues like the skin (impetigo) and pharynx (pharyngitis) to more problematic
infections at a number of diverse anatomical sites (1). Understanding the complex regulatory
interactions that allow it to adapt to these diverse environments provides a unique opportunity to
gain insight into how a pathogen can efficiently employ a relatively limited genetic repertory to
maximize its ability to cause disease.
An important question is how S. pyogenes uses its limited metabolic potential to grow
efficiently in diverse tissues. Considerable evidence has accrued to suggest that the patterns by
which S. pyogenes exploits available growth substrates are intimately associated with both
temporal and compartment-specific patterns of virulence gene expression (2-4). As a lactic acid
bacterium, S. pyogenes relies exclusively on fermentation via the homo-lactic and mixed acid
pathways to generate energy (5-7). However, the specific carbon sources it preferentially utilizes
in different tissues, the temporal patterns with which these are consumed, and how these patterns
impact regulation of virulence gene expression are not well understood.
One approach to gain insight into conditions encountered during infection has involved
comparison of the S. pyogenes transcriptome between organisms recovered from various models
of infection to organisms cultured under different in vitro conditions. In general, these studies
have revealed that at the latter time points of infection, patterns of gene expression most closely
resemble those observed in vitro in environments of low pH (pH 6.0-6.5) and low concentrations
of glucose (8-10). These two conditions are likely related, as the fermentation of glucose by
50
lactic acid bacteria results in the highest rates of production of acidic end products including
lactate, acetate and formate (6, 7). This suggests that S. pyogenes’ choice of carbon source results
in a significant remodeling of its local tissue environment. It also indicates that over the course
of infection, it must both adapt to its self-inflicted acid stress as well as exploit alternative carbon
sources. In this regard, transcriptome profiling revealed that one of the most highly differentially
activated gene clusters under conditions of acid stress, glucose starvation, and in murine soft
tissue encodes a putative operon of two genes predicted to function in the catabolism of malate
(10), annotated as the malic permease (maeP) and the malic enzyme (maeE) (Fig. 1A).
The di-carboxylic organic acid malate is found in abundance in tissue and in the
environment, so it is not surprising that numerous malate degradation pathways have been
identified among both prokaryotic and eukaryotic organisms (11-17). In lactic acid bacteria, two
distinct pathways have been identified that make very different contributions to physiology. The
most common of these is malolactic fermentation (MLF), which allows for the conversion of
malate into lactate through the function of the malolactic enzyme (MLE). Typically, MLF does
not contribute to growth yields, but does play an important role in maintenance of ATP pools
during starvation and in protection from acid killing (18-21). Since malate is a stronger acid than
lactate, its decarboxylation by MLF results in alkalization of the cytoplasm and the resulting pH
gradient drives the malate/lactate antiporter coupled to ATP synthesis (7, 18-21).

51
ATP
maeR maeK maeP maeE
MaeE
MaeP
NAD + H ++
NADH + CO2
MaeP-malate permeaseMaeE-malic enzymeMaeK-sensor kinaseMaeR-response regulator
Malate
MaeRMaeRP
161
151cre
159cre401 80 120
3 2 1
3 2 1
3 2 1
Sp HSC5
Ef JH2-2
Lc BL23
04170 04175 04180 04185
Malate
A.
B.
Malate
Pyruvate
MaeK
ADP
Figure 1. The malic enzyme (ME) pathway in S. pyogenes. (A) The arrangement of the open reading frames that comprise the ME locus of S. pyogenes are shown by large arrows. Gene names are shown below and the genomic loci listed within the open reading frames are based on the genome of S. pyogenes HSC5 (23). Known (black font) and predicted (grey font) regulatory elements of the intergenic region of S. pyogenes and Enterococcus faecalis JH2-2 (Ef JH2-2, (58)) and Lactobacillus casei BL23 (Lc BL23, (15)) are shown below. Arrows indicate sites in DNA bound by MaeR, while sites bound by CcpA are boxes labeled “cre” (catabolite regulatory element). Numbers below indicate intergenic distances in numbers of base-pairs. (B) Schematic of the ME pathway. The subcellular localization, function and reactions catalyzed by the various components of the ME pathway that are listed in the Figure are shown.

52
Less commonly found is an alternative degradation pathway that converts malate to pyruvate
and carbon dioxide (18) that is known as the malic enzyme (ME) pathway (Fig. 1B). A unique
feature of ME is that, unlike MLF, it enables cells to utilize malate as a carbon source for growth
(16, 18). However, while the MLF system has been extensively studied, the regulation and
physiological significance of the ME pathway is not as well understood. Studies in several lactic
acid species, including Enterococcus faecalis, Streptococcus bovis, and Lactobacillus casei (13,
15, 17, 22), have indicated that ME requires 4 genes organized into two adjacent operons (Fig.
1A). These include the maePE operon that encodes the transmembrane permease (maeP) and
cytosolic malic enzyme (maeE). Expression of these genes is dependent on the adjacent two-
component system (TCS), which includes a sensor histidine kinase (maeK) and response
regulator (maeR) (15, 17, 18). This similar organization is observed in the S. pyogenes
chromosome (Fig. 1A), and as noted above, maePE is upregulated by acid stress and infection in
S. pyogenes. In addition, examination of the S. pyogenes profiling data shows that both the
maePE operon and the adjacent TCS had similar patterns of regulation, suggesting that these two
systems function together (10).
Interestingly, while other ME operons are activated by malate (15, 17, 18) and repressed by
glucose (15, 17), regulation by pH has only been described for Lactobacillus casei (18). Whether
this system is regulated by pH in other bacterial species that contain a functional ME pathway,
and the physiological role of this regulation is not understood. Rather, pH regulation is more
commonly associated with the MLF pathway, where it is associated with acid resistance (20, 21).
Examination of the S. pyogenes genome has not revealed the presence of MLF genes (23) so the
significance of pH regulation of the ME pathway and whether it compensates for MLF in acid
tolerance is not clear. In this study, we examined the contribution of malate catabolism and its
53
unique pattern of regulation to S. pyogenes physiology and virulence. This analysis revealed that
S. pyogenes has a functional ME pathway, that catabolism of malate contributes to growth and
that its regulation shares some similarities with other lactic acid bacteria, but also has several
unique features. Finally, we show that the presence or absence of ME genes can influence
virulence in a murine model of soft tissue infection.
54
RESULTS ME is necessary for S. pyogenes malate-enhanced growth. It is unclear why the ME pathway
in S. pyogenes is regulated by pH, as MLF and not ME is typically associated with acid-stress
resistance in other lactic acid species (20, 21). However, S. pyogenes lacks the genes necessary
for MLF (23), so the contribution of the ME pathway to streptococcal physiology was
investigated. The malic enzyme uses NAD+ to oxidize malate to produce CO2, NADH and
pyruvate (Fig. 1B). Since pyruvate can be further metabolized to produce ATP, the signature
function of ME is to allow cells to utilize malate as a carbon source for growth (16). To test this
growth phenotype, S. pyogenes HSC5 was cultured overnight in a carbohydrate-reduced medium
(C medium) in the presence or absence of 0.5% malate. Although cultures had comparable
growth rates in both conditions (t1/2 = 56 min. and 63 min., respectively), 0.5% malate enhanced
growth yields by approximately 50% (Fig. 2A). Additionally, pH measurements of cell-free
supernatants taken throughout growth indicate that malate utilization does not alter the pH of the
media compared to unmodified C medium (Fig. S2A). This is due to the fact that, unlike when
grown in media supplemented with glucose, when grown on malate, the bacteria utilize mixed
acid fermentation, producing large amounts of formate, which has a much higher pKa than the
lactate commonly produced (Fig. S2B).
In-frame deletion mutants in maeP (malate permease), maeE (malic enzyme), maeK
(malate sensor kinase), and maeR (malate response regulator) were constructed and were found
to have identical growth characteristics to wild type in unmodified C medium. However, all
mutants failed to shown an increased growth yield the in the presence of malate (Fig. 2B).
Malate concentrations were measured from cell-free

55
0 200 400 600 800 10000.0
0.2
0.4
0.6
0.8-Malate+Malate
A.
Cul
ture
Den
sity
(OD
600)
Time (min)
C+.5% m
alate
HSC5MaeP
-
MaeE-
MaeK-
MaeR-
0
20
40
60
80
100
120
Mala
te (%
rem
ainin
g)
0
20
40
60
80
100
120
WT MaeP- MaeE- MaeK- MaeR-0.0
0.2
0.4
0.6
0.8
WT MaeP- MaeE- MaeK- MaeR-
C.
WT none vector pMaeE MaeK- MaeKR0.0
0.2
0.4
0.6
0.8
-Malate+Malate
MaeE-
0
50
100
150
WT none vector pMaeE MaeK- MaeKR
MaeE-
D. E.
-Malate+Malate
Cul
ture
Den
sity
(OD
600)
Mal
ate
(% re
mai
ning
)M
alat
e (%
rem
aini
ng)
Cul
ture
Den
sity
(OD
600)
B.
*** *** *** ******
********* *** *** ***
Figure 2. ME mutants are deficient in malate catabolism. (A) WT bacteria were tested for malate utilization by measuring growth over the course of 16 hrs of cultures grown in either unmodified C medium or C medium supplemented with 0.5% malate. Data are presented as means and standard deviations from 3 independent experiments. (B and D) WT and ME mutants were grown in unmodified C medium or C medium supplemented with 0.5% malate. Following 16 hrs of incubation, growth yields were measured by OD600. Data are presented as the means and standard deviations from 3 independent experiments. (C and E) Malate concentrations from cell-free culture supernatants from over-night cultures of WT or ME mutants grown in C medium supplemented with 0.5% malate were measured (see Methods). Data are presented as percent remaining (compared to initial concentration) and are represented as means and standard deviations from 3 biological samples analyzed in duplicate. Asterisks indicate significant differences (***, P < .001) compared to WT in C medium.
56
supernatants of overnight cultures grown in 0.5% malate to determine malate consumption by
wild type (WT) and the four ME mutants. WT cultures exhibited an approximately 80%
reduction from the initial concentration of 37.3 mM, while malate concentrations were
unchanged by growth of the mutants (Fig. 2C). With the exception of maeE, it was not possible
to express the ME genes from a plasmid for complementation. As an alternative, allelic
replacement was used to restore the full-length maeK gene in a ∆MaeK mutant background to
make the reversion strain MaeKR. In this way, we were able to complement at least one gene
from each operon. Complementation of maeE and reversion of maeK restored both enhanced
growth yields in the presence of malate (Fig. 2D) and consumption of malate (Fig. 2E).
Expression of ME genes is dependent on malate and requires MaeK. In other lactic acid
bacteria, expression of ME requires both the presence of malate and the ME TCS (15, 17, 18).
To determine if this common regulatory mechanism is also utilized in S. pyogenes an analysis of
transcript levels of ME genes using real time RT-PCR was performed. The results indicated that
during the exponential phase of growth (OD600 = 0.2), maeE and maeP were highly upregulated
in the presence of malate by 100- and 200-fold, respectively (Fig. 3A). This response was
dependent on MaeK, as transcript levels were equivalent in the presence or absence of malate.
Restoration of the protein in a MaeKR reversion strain also restored malate induced transcription
(3A). Transcription of maeK and maeR was also increased in the presence of malate in WT cells,
with both genes showing an approximately 3-fold increase compared to unmodified media (Fig.
3B).

57
Glucose regulation of ME is CcpA-independent. Malate catabolism in other lactic acid
bacteria is repressed by glucose, indicating this pathway is regulated through a mechanism of
carbon catabolite repression (CCR) (15, 17). CCR allows the bacteria to metabolize preferable
carbon sources in the environment, usually through transcriptional repression of genes involved
in the processing of alternative, and less favorable carbon sources (reviewed in (35-37)). A key
transcriptional regulator of global CCR in Gram-positive bacteria is CcpA (35), which has been
shown to regulate ME in response to glucose in both Lactobacillus casei and Enterococcus
faecalis (15, 17). To test for CCR regulation of the ME pathway in S. pyogenes, transcription of
the four ME genes was analyzed in the absence or presence of glucose (0.2%) by real time RT-
PCR. Results showed a significant repression of 4-6-fold (log2 scale) for all four ME genes (Fig.
4), consistent with observations in other lactic acid species (15, 17). However, in contrast to
these other species, repression occurred independently of CcpA, as the addition of glucose still
0
1
2
3
4
maeK maeRWT MaeK- MaeKR0.1
1
10
100
1000maePmaeE
A. B.
Rel
ativ
e Tra
nscr
iptio
n(F
old-
chan
ge, +
/- M
alat
e)
Rel
ativ
e Tra
nscr
iptio
n(F
old-
chan
ge, +
/- M
alat
e)
Figure 3. MaeK regulates malate-dependent expression of maePE. (A) WT, MaeK-, and MaeKR strains were grown in C medium supplemented with 0.5% malate until exponential phase (OD600 of 0.2). Total RNA was isolated and used for real time RT-PCR analysis of maeP and maeE transcripts. (B) WT bacteria were grown in C medium supplemented with 0.5% malate as described before. Total RNA was isolated and used for real-time RT-PCR analysis of maeK and maeR transcripts. Data presented for all genes are the ratios of transcript abundance in modified medium to that of unmodified C medium and represent the means and standard deviations of 3 biological samples, each analyzed in triplicate.

58
repressed expression of all ME genes in a CcpA- mutant (Fig. 4) (38). Repression does have the
characteristics of CCR, as glucose was repressive even in the presence of malate (Fig. 4),
indicating that S. pyogenes has adopted a CcpA-independent CCR mechanism for regulation of
malate catabolism.
Malate catabolism is regulated by PTS-mediated phosphorylation. An alternative mechanism
of CCR in bacteria is known as induction prevention, which is dependent on the sugar
phosphotransferase (PTS) system and the phosphorylation state of a conserved histidine residue
of the phosphocarrier protein HPr (36), which in the case of S. pyogenes is His15 (39). If the ME
loci are controlled by a mechanism similar to induction prevention, then cells unable to produce
P~His-HPr should be unable to utilize malate. To test this hypothesis, two mutants were
-5
-4
-3
-2
-1
0
GlucoseGlucose+Malate
maeP maeE maeK maeR maeP maeE maeK maeRWT CcpA-
R
elat
ive T
rans
crip
tion
(Fol
d-ch
ange
, log
2 M
od./U
nmod
.)
Figure 4. Carbon catabolite repression of ME genes is CcpA independent. WT and CcpA- bacteria were grown in C medium supplemented with 0.2% glucose until exponential phase (OD600 of 0.2). Total RNA was isolated and used for real-time RT-PCR analysis of the individual mae transcripts. Data are presented as the ratios of transcript abundance in modified media to that in unmodified C medium and represent the means and standard deviations derived from 4 biological samples, each analyzed in triplicate.

59
constructed. The first is an allelic exchange mutant with a swap of a chloramphenicol cassette
with ptsI, which encodes EI, the enzyme responsible for phosphorylation of the His15 site within
the HPr protein. The second mutant contains a single amino-acid substitution in HPr, replacing
His15 with alanine, which has been shown to maintain HPr capability to be phosphorylated at
Ser46 and is functional for sugar transport, but lacking in the ability to participate in regulation
(HPrH15A) (36, 40, 41).
When grown in the presence of malate, both the PtsI- mutant and the HPrH15A mutant have
a significant growth defect compared to WT, resulting in a reduced growth rate and lower final
culture density (Fig. 5A and 5B). To verify that this growth defect was specific for malate
utilization and not a general defect in all conditions, strains were also grown in unmodified C
medium, as well as in C medium supplemented with 0.2% maltose (a non-PTS sugar) (34).
Comparisons of final yield from overnight cultures demonstrate that growth of both the PtsI- and
HPrH15A mutants are similar to WT in unmodified media (Fig. 5B). In addition, upon
supplementation of maltose, all three strains showed an identical increase in growth (Fig. 5B).
Thus, mutations that block formation of P~His-HPr are deficient in malate utilization, but are
still able to utilize non-PTS carbon sources.
Expression of the ME genes was then examined in the presence of malate and it was
discovered that when compared to WT, the HPrH15A mutant had a substantial reduction in
transcript levels for all four ME genes (Fig 5C). Taken together, these data demonstrate that the
ME pathway in S. pyogenes is repressed by glucose through a mechanism similar to induction
prevention.

60
0 200 400 600 800 10000.0
0.2
0.4
0.6
0.8
A. B.Cu
lture
Den
sity
(OD
600)
Time (min)
WTPtsI-
HPrH15A
0.0
0.2
0.4
0.6
0.8-Malate+Malate
A. B.
Cultu
re D
ensit
y (O
D60
0)
WT PtsI- HPrH15A
*
-15
-10
-5
0maeP maeE maeK maeR
Rel
ativ
e Tr
ansc
riptio
n(F
old-
chan
ge, l
og2 H
PrH
15A/W
T)
C.
Figure 5. Carbon catabolite repression of ME genes controlled by P~His-HPr. WT, PtsI-, and HPr H15A strains were grown in unmodified C medium or C medium plus 0.5% malate. (A) Growth of WT and PTS mutants in malate-supplemented medium was measured by OD600 over the course of 16 hrs. Data presented is from a representative experiment. (B) WT and PTS mutants were grown in unmodified C medium or C medium supplemented with 0.5% malate. Following 16 hrs of incubation, growth yields were measured by OD600. Data are presented as the means and standard deviations from 3 independent experiments. Asterisks indicate significant differences (*, P < .05) compared to WT in C medium. (C) WT and HPrH15A strains were grown in C medium supplemented with 0.5% malate until exponential phase (OD600 of 0.2). Total RNA was isolated and used for real-time RT-PCR analysis of transcript abundance of the individual mae transcripts. Data are presented as ratios of transcript abundance of HPrH15A to that of WT and represent the means and standard deviations derived from 3 biological samples, analyzed in triplicate.
61
pH regulation of ME is independent of malate, but dependent on maeK. Prior transcriptional
profiling revealed that maeP and maeE are among the genes most highly regulated by pH in S.
pyogenes (10). Additionally, growth of WT cells in acidified media was enhanced with the
addition of malate, demonstrating that malate catabolism can occur in a low pH environment
(Fig. S3). To further characterize the role of environmental pH on the ME pathway, WT S.
pyogenes was grown in C medium buffered to either low (pH 6.0) or neutral (pH 7.5) pH and
transcription of the ME genes was analyzed by real time RT-PCR. When compared to
unbuffered medium and in the absence of the addition of malate, growth at low pH, but not
neutral pH, enhanced abundance of the maeP and maeE transcripts by approximately 10- and 20-
fold, respectively (Fig. 6A). Neither low nor high pH environments altered expression of maeK
or maeR when compared with unmodified media (Fig. 6B). However, MaeK itself was required
for the enhanced expression of maeP and maeE, as the abundance of these transcripts did not
increase in the MaeK- mutant during growth at low pH, but regulation was restored in the MaeKR
strain (Fig. 6C). Finally, to address the hierarchy of stimuli between malate and pH, quantitative
RT-PCR was performed on cells in the presence of both high malate (0.5%) concentrations and
neutral pH and compared to malate alone. Results show that, for both maeP and maeE,
transcription is dramatically increased in the presence of 0.5% malate, and that this enhanced
expression is unaffected by the pH of the media (Fig. 6D). Overall, this data shows that mae gene
expression is regulated by environmental pH, and that this regulation is mediated through MaeK
and is independent of malate regulation.
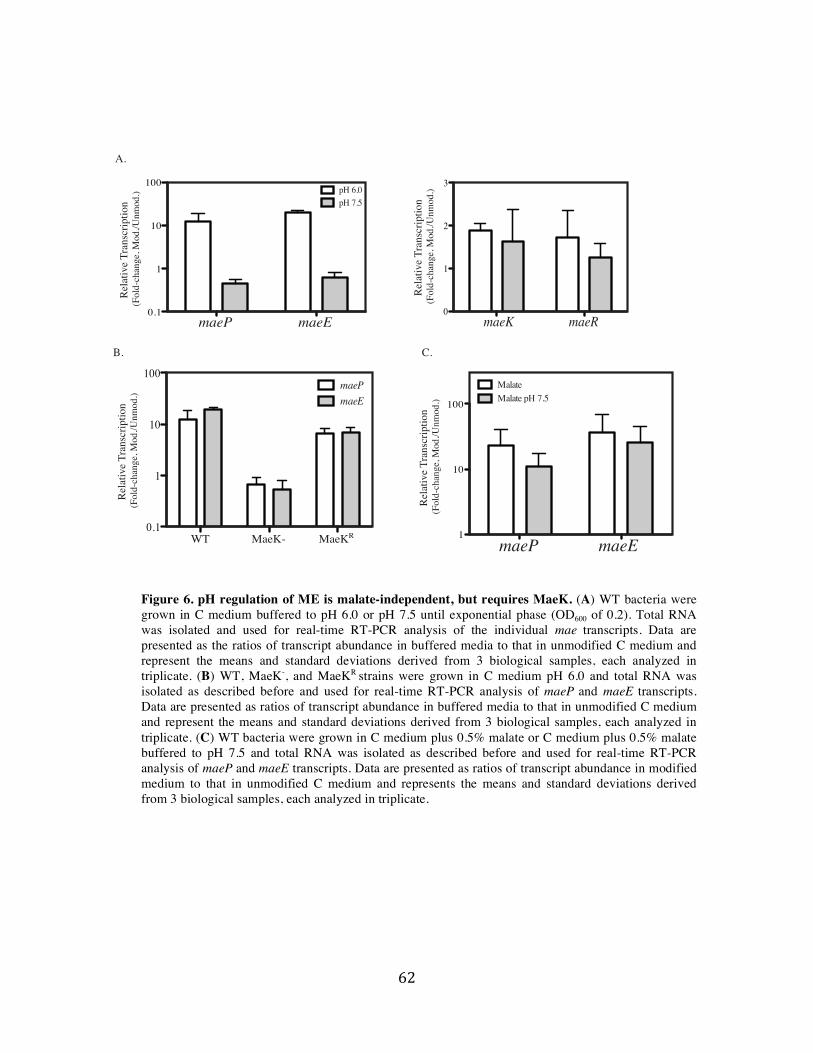
62
0.1
1
10
100pH 6.0pH 7.5
pH 6.0pH 7.5
0
1
2
3
maeP maeE maeK maeR
0.1
1
10
100maePmaeE
WT MaeK- MaeKR 1
10
100
MalateMalate pH 7.5
maeP maeE
A.
B. C.
Re
lativ
e Tra
nscr
iptio
n(F
old-
chan
ge, M
od./U
nmod
.)
Re
lativ
e Tra
nscr
iptio
n(F
old-
chan
ge, M
od./U
nmod
.)
Re
lativ
e Tra
nscr
iptio
n(F
old-
chan
ge, M
od./U
nmod
.)
Re
lativ
e Tra
nscr
iptio
n(F
old-
chan
ge, M
od./U
nmod
.)
Figure 6. pH regulation of ME is malate-independent, but requires MaeK. (A) WT bacteria were grown in C medium buffered to pH 6.0 or pH 7.5 until exponential phase (OD600 of 0.2). Total RNA was isolated and used for real-time RT-PCR analysis of the individual mae transcripts. Data are presented as the ratios of transcript abundance in buffered media to that in unmodified C medium and represent the means and standard deviations derived from 3 biological samples, each analyzed in triplicate. (B) WT, MaeK-, and MaeKR strains were grown in C medium pH 6.0 and total RNA was isolated as described before and used for real-time RT-PCR analysis of maeP and maeE transcripts. Data are presented as ratios of transcript abundance in buffered media to that in unmodified C medium and represent the means and standard deviations derived from 3 biological samples, each analyzed in triplicate. (C) WT bacteria were grown in C medium plus 0.5% malate or C medium plus 0.5% malate buffered to pH 7.5 and total RNA was isolated as described before and used for real-time RT-PCR analysis of maeP and maeE transcripts. Data are presented as ratios of transcript abundance in modified medium to that in unmodified C medium and represents the means and standard deviations derived from 3 biological samples, each analyzed in triplicate.

63
Loss of MaeE causes enhanced virulence in vivo. The in vitro experiments presented in this
work were done with bacterial cultures grown in C medium, which is characterized as having
low carbohydrate concentrations and high salt and peptide levels (10). It has been demonstrated
previously that these conditions are highly analogous to the in vivo milieu of carbon sources
within the murine soft tissue environment (10). Additionally, malate, being one of the
intermediate products of the citric acid cycle, is abundant in host tissue (42). Therefore, the fact
that S. pyogenes is able to utilize malate in vitro when added to C medium lends strong support
that it can also be utilized in vivo during host tissue infections.
Thus, it was of interest to determine if malate utilization and the ME pathway play a role
in virulence. To assess this, a murine soft tissue model was used. Briefly, approximately 107
bacteria were injected subcutaneously into the flank of immunocompetent hairless mice.
Infection of WT S. pyogenes HSC5 produces a localized necrotic lesion and formation of an
escher within 24 hours, but does not cause a systemic infection (33). Lesion size increases over
time, peaking in size at day 3 post-infection (32). Measurement of the lesion area over time is
therefore used as a marker for virulence in this model. For this analysis, mice were infected with
WT, MaeP-, MaeE-, MaeK-, or MaeR- strains and lesion areas were compared 3 days post-
infection. Mice infected with strains MaeK-, MaeR-, and MaeP- all formed lesions that were
significantly smaller than WT (Fig. 7). Conversely, mice infected with the MaeE- strain formed
lesions that were significantly larger than WT (Fig. 7). These results demonstrate that malate
catabolism is an important factor during a soft tissue infection, and that the loss of individual ME
genes can have differential effects on the outcome of an infection.

64
Figure 7. Loss of MaeE causes hypervirulence in vivo. Hairless SKH1 mice were infected subcutaneously with WT or individual ME mutant strains and the resulting lesions formed at day 3 post-infection were measured. Each symbol plotted represents the value derived from an individual animal. Data shown are pooled from at least 2 independent experiments with the mean and standard deviation indicated. Differences between groups were tested for significance using the Mann-Whitney U test (* P < 0.05, ** P < 0.01).
0
50
100
150
200
250
Lesio
n ar
ea (m
m2 )
WT MaeK- MaeR- MaeP- MaeE-
** *** *** **

65
DISCUSSION
In this study we have shown that the ME genes of S. pyogenes allow the bacterium to use
malate as a carbon source for growth. Additionally, we have shown that this pathway is
subjected to regulation by both positive and negative signals, including glucose, malate, and pH.
The former of these is via PTS-mediated phosphorylation, while the latter two signals are
recognized by the MaeKR regulatory system. Finally, these data show that loss of any individual
mae gene can alter the outcome of a soft tissue infection in mice, suggesting that the ability to
transport and utilize malate are both key processes in pathogenesis.
Regulation of ME gene expression in S. pyogenes was found to share features in common
with other bacterial species (15, 17, 18). Most notably is that they are induced by malate and that
induction requires the MaeKR TCS. A prior analysis of the maePE and maeKR promoter regions
in L. casei identified the DNA-binding site for MaeR as a series of direct repeats and a similar
site is shared among other lactic acid bacteria, including S. pyogenes (Fig. S1) (15, 17). Another
common feature to ME pathway regulation is that all species repress ME gene expression in the
presence of glucose, a regulatory mechanism known as carbon catabolite repression (CCR) (36,
37, 43). However, in S. pyogenes, glucose-mediated regulation of the ME loci functions
independently of the major carbon catabolite protein CcpA. In support of this finding is the fact
that, unlike the other characterized lactic acid bacteria, the promoter region in S. pyogenes lacks
any identifiable cre sites (Fig. 1, Fig. S1) (15, 35, 43, 44).
Instead, an alternative method of CCR, induction prevention, is likely regulating ME
genes in S. pyogenes. Evidence to support this idea includes the fact that multiple genetic strains
that are unable to form P~His-HPr (either through loss of the EI enzyme or direct mutation of
HPr) are likewise deficient in ME transcription and malate utilization. This method of regulation,
66
therefore, enables the cell to activate ME genes only in the presence of a high concentration of
P~His-HPr. During normal growth utilizing preferred carbohydrates, levels of intracellular
P~His-HPr would likely be low (36, 45). This is due to either rapid accumulation of P~Ser-HPr
or transfer of the phosphate group on P~His-HPr to downstream PTS transporters to allow
uptake of PTS sugars. In this way, the bacterium is able to preferentially utilize a number of
available PTS sugars before turning on the alternative ME pathway.
In order for this form of regulation to be controlling ME expression, it requires a transfer
of the phosphate from P~His-HPr to an ME regulatory protein. Phosphorylation of non-PTS
protein by P~His-HPr is known to occur in a variety of species (for review see (36)) and often
involves a PTS regulatory domain (PRD)- containing protein. Currently, the only non-PTS
protein shown to act as a phosphate acceptor from P~His-HPr in S. pyogenes is the
transcriptional regulator Mga (46). This protein has been characterized as containing several
unique, but related, PRD domains (PRD_Mga) and previous work has shown that P~His-HPr is
able to phosphorylate specific residues within these domains in vitro (46, 47). Although Mga has
been shown to regulate a large number of target genes (3, 4, 47, 48), the ME cluster has not yet
been identified as part of its regulon. Alternatively, there are two additional transcription
regulators in S. pyogenes HSC5 predicted to include a PRD_Mga domain (Paluscio and Caparon,
unpublished), both within the RofA family of regulators (46, 49-51). It remains possible that one
of these proteins may be necessary for ME gene expression. One likely mechanism for this
regulation would be that the phosphate from the P~His-HPr gets transferred to one of the PRD
transcriptional regulators, which then allows this protein to bind to the promoter region of
maeKR and induce its expression. Further evidence to support this hypothesis is the presence of
several putative regulatory elements within the mae promoter region of S. pyogenes (Fig. S1),

67
which are absent from the promoters of the other lactic acid bacteria. These sequences may serve
as binding sites for one of the PRD-containing regulatory proteins mentioned above.
This work also demonstrated that the maePE operon is regulated by a pH-dependent
mechanism, whereby acidic pH induces transcription of these genes and neutral pH is inhibitory.
In S. pyogenes, it appears that, in addition, the MaeKR TCS was necessary for this regulation, as
the loss of MaeK prevents the pH-dependent expression of maePE seen in wild type cells.
Interestingly, this work is the first to identify a signal other than malate that is recognized by the
MaeKR regulatory system. Though uncommon, MaeK is not the first transcriptional regulator
identified that is able to respond to multiple extracellular signals. In Escherichia coli, the cad
operon is regulated by CadC, which recognizes both acidic pH and lysine to induce transcription
of the cad genes (52, 53). In Streptococcus mutans the AguR protein, which controls the
expression of the agmatine deiminase system (AgDS), recognizes acidic pH and agmatine (54,
55). An important distinction between CadC, AguR, and MaeK is that former two proteins
require both signals to be present in order to allow for activation and transcription of their target
genes. This work has shown, however, that MaeK functions in the presence of either signal and
does not require both for transcriptional activation. Nonetheless, given that all three proteins
respond to multiple signals, one of which is low pH, they may all share some similar
mechanisms of activation. It is hypothesized that for both CadC and AguR the acidic pH
environment induces a conformational change in the protein, and this change then allows for
binding of the substrate (lysine and agmatine, respectively) (53, 54). Likewise, in the presence of
acidic pH, MaeK may undergo a conformational change that induces activation of the protein.
However, unlike CadC and AguR, the MaeK protein likely has a separate malate sensor domain
that can bind malate in the presence or absence of acidic pH. This mechanism would predict that
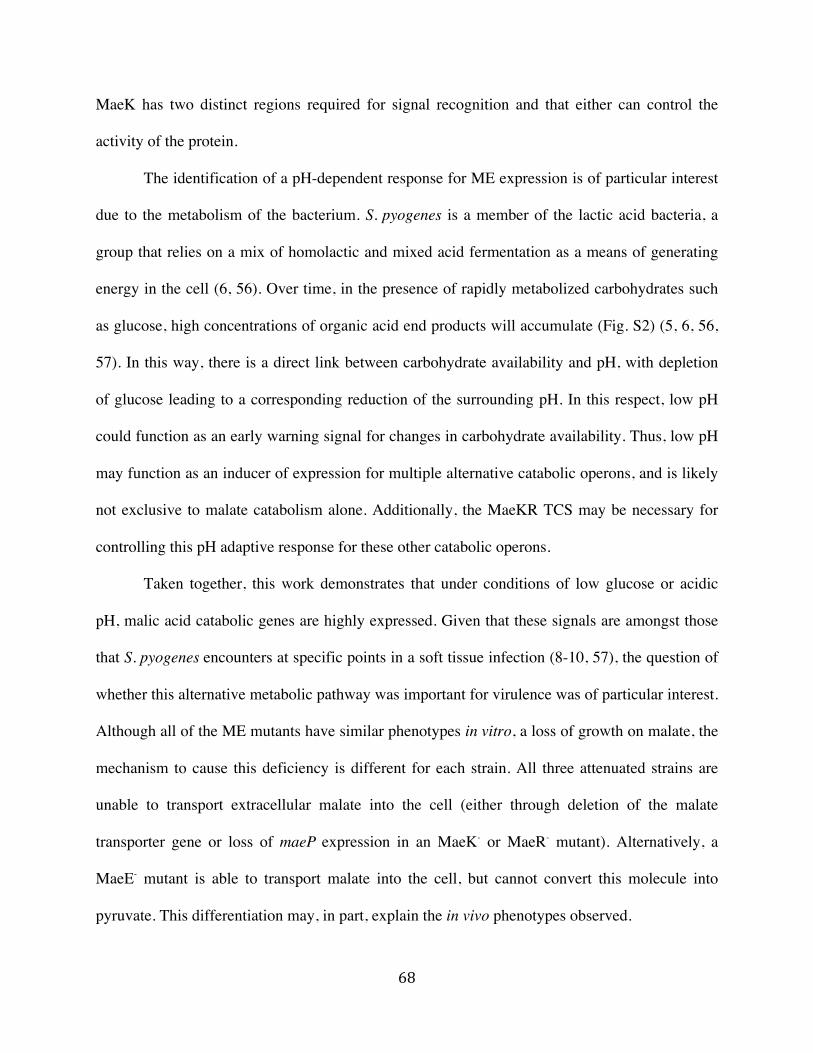
68
MaeK has two distinct regions required for signal recognition and that either can control the
activity of the protein.
The identification of a pH-dependent response for ME expression is of particular interest
due to the metabolism of the bacterium. S. pyogenes is a member of the lactic acid bacteria, a
group that relies on a mix of homolactic and mixed acid fermentation as a means of generating
energy in the cell (6, 56). Over time, in the presence of rapidly metabolized carbohydrates such
as glucose, high concentrations of organic acid end products will accumulate (Fig. S2) (5, 6, 56,
57). In this way, there is a direct link between carbohydrate availability and pH, with depletion
of glucose leading to a corresponding reduction of the surrounding pH. In this respect, low pH
could function as an early warning signal for changes in carbohydrate availability. Thus, low pH
may function as an inducer of expression for multiple alternative catabolic operons, and is likely
not exclusive to malate catabolism alone. Additionally, the MaeKR TCS may be necessary for
controlling this pH adaptive response for these other catabolic operons.
Taken together, this work demonstrates that under conditions of low glucose or acidic
pH, malic acid catabolic genes are highly expressed. Given that these signals are amongst those
that S. pyogenes encounters at specific points in a soft tissue infection (8-10, 57), the question of
whether this alternative metabolic pathway was important for virulence was of particular interest.
Although all of the ME mutants have similar phenotypes in vitro, a loss of growth on malate, the
mechanism to cause this deficiency is different for each strain. All three attenuated strains are
unable to transport extracellular malate into the cell (either through deletion of the malate
transporter gene or loss of maeP expression in an MaeK- or MaeR- mutant). Alternatively, a
MaeE- mutant is able to transport malate into the cell, but cannot convert this molecule into
pyruvate. This differentiation may, in part, explain the in vivo phenotypes observed.

69
In this case, it remains possible that malate may serve a secondary, as yet unknown,
benefit to the bacterial cell independent of increased pyruvate concentrations. Thus, the ability of
a MaeE- mutant to allow uptake of malate may allow for this unused malate to be shuttled into an
alternative pathway, ultimately serving to benefit S. pyogenes during infection. Alternatively,
MaeP-, MaeK-, and MaeR- mutants would be depleted of any internal malate accumulation, and
this loss would ultimately decrease fitness for the cells compared to a WT or a MaeE- mutant. In
this case, it remains possible that malate may serve a secondary, as yet unknown, benefit to the
bacterial cell independent of increased pyruvate concentrations. Thus, the ability of a MaeE-
mutant to allow uptake of malate may allow for this unused malate to be shuttled into an
alternative pathway, ultimately serving to benefit S. pyogenes during infection. Alternatively,
MaeP-, MaeK-, and MaeR- mutants would be depleted of any internal malate accumulation, and
this loss would ultimately decrease fitness for the cells compared to a WT or a MaeE- mutant.
Another possibility is that the accumulation of intracellular malate in the MaeE- mutant may
cause the mis-regulation of virulence factor expression, leading to enhanced virulence. In
preliminary studies, we have found that while expression of the SpeB cysteine protease does not
differ between WT and the MaeE- and MaeP- mutants (Fig. S4A), the addition of malate alters
the temporal pattern of SpeB expression in both mutants as compared to WT (Fig. S4B). Since
this alteration in SpeB expression is similar between the two mutants, it cannot explain the
enhanced virulence of the MaeE- mutant. However, it does support the possibility that alterations
to malate metabolism can result in changes in patterns of virulence factor expression. Further
analyses of virulence factor expression will be required in order to determine is specific factors
are specifically mis-regulated in the MaeE- mutant and whether these factor are responsible for
hypervirulence. This work does, however, provide novel insights into the unique regulatory

70
mechanisms utilized by S. pyogenes for malate degradation, as well as demonstrate for the first
time the importance of this alternative metabolic pathway on influencing pathogenesis.
ACKNOWLEDGEMENTS
We thank Y. Le Breton and K. McIver for providing the plasmid pCRK. This work was
supported by Public Health Service Grant AI070759 from the National Institutes of Health. The
work cited in this publication was performed in a facility supported by NCRR grant C06
RR015502.

71
SD
SD
CATGAAACAACCTCCTTTAGTGATAAGGCTAGTATAAAAGAGAAC
ATGTCAAAAGCATAGTTTATTTAAGTTGTTTAACTACTTTAATTT
TTTCAAGTTATTTAATTAATTTAAGCTAGCAGGTCATTTCTTATC
GTGTTATACTCAATAAAGAGGAGACCTTATG
maeP
maeK
45
90
135
161
mbs1
mbs2 mbs3
A. Streptococcus pyogenes HSC5
CATGCTATTTCCTCCTATAACTTTAATCTATATTCATCATAATGT
AAACGTTTTCTGTAGAGTAGATTATTTAATTAATTTAACTAAAGA
AAAGTTTTTTAACCAATCTTCCTATGCTATACTTTATTTGAAGAG
AAAAGAGGGATGGAATG
maeP45
90
135
151
SD
SD
cre
+1
-10
-10
+1mbs1 mbs2
mbs3
B. Enterococcus faecalis JH2-2
maeK
ATGTTTCCTTACCCCCAATCTTTTGTTCTTACAGCATATTGTAA
GCGCTTCATCAGGGGAAGATTATTTAACTTATTAAACCATAAAC
CCATTTATTTAAGCGATTGTTTTACTATTCACAAGATGGTTTCT
CTACTGAACAGGAGTATGATCATG
maeP
maeK
45
90
135
159
SD
SD
cre -10
-10
mbs1 mbs2
mbs3
C. Lactobacillus casei BL23
Figure S1. Schematic representation of ME promoter regions in lactic acid bacteria. Predicted functional domains of the (A) promoter are compared to those of
(B) and (C) [1, 2]. Predicted elements are shown in grey, while those elements that have been confirmed experimentally are shown in black. Sites are as follows: (+1), transcription start site; (SD), Shine-Delgarno; (-10), the -10 promoter region; (mbs), MaeR-binding sites. Degenerate binding sites are indicated by dotted arrows. Translational start codons are shown in bold font. Predicted cre sites are highlighted in gray.

72
LactateFormate
Conc
entra
tion
of en
d pr
oduc
ts (%
of t
otal)
Unmodified +Malate +Glucose 0
50
100
150
A.
B.
0 2 4 6 80.0
0.5
1.0
1.5
5
6
7
8Unmodified+Malate+Glucose
DO( ytisne
D er utl u C 60
0)) (
pH ( )
Figure S2. Additional characterization of growth in malate-supplemented media. (A) WT bacteria were grown in unmodified C medium, C medium plus 0.5% malate, or C medium plus 0.2% glucose over the course of 8 hrs. Samples were removed every 2 hrs and analyzed for growth (OD600, left axis) and pH was determined in cell-free supernatants (right axis). Data are presented as means and standard deviations from 3 biological samples. (B) Lactate and formate concentrations from cell-free culture supernatants from over-night cultures of WT cells grown in C medium, C medium supplemented with 0.5% malate, or C medium supplemented with 0.2% glucose were measured (see Methods). Data are presented as percent of total organic acid concentrations measured and are repre-sented as means and standard deviations from at least 2 biological samples analyzed in triplicate.
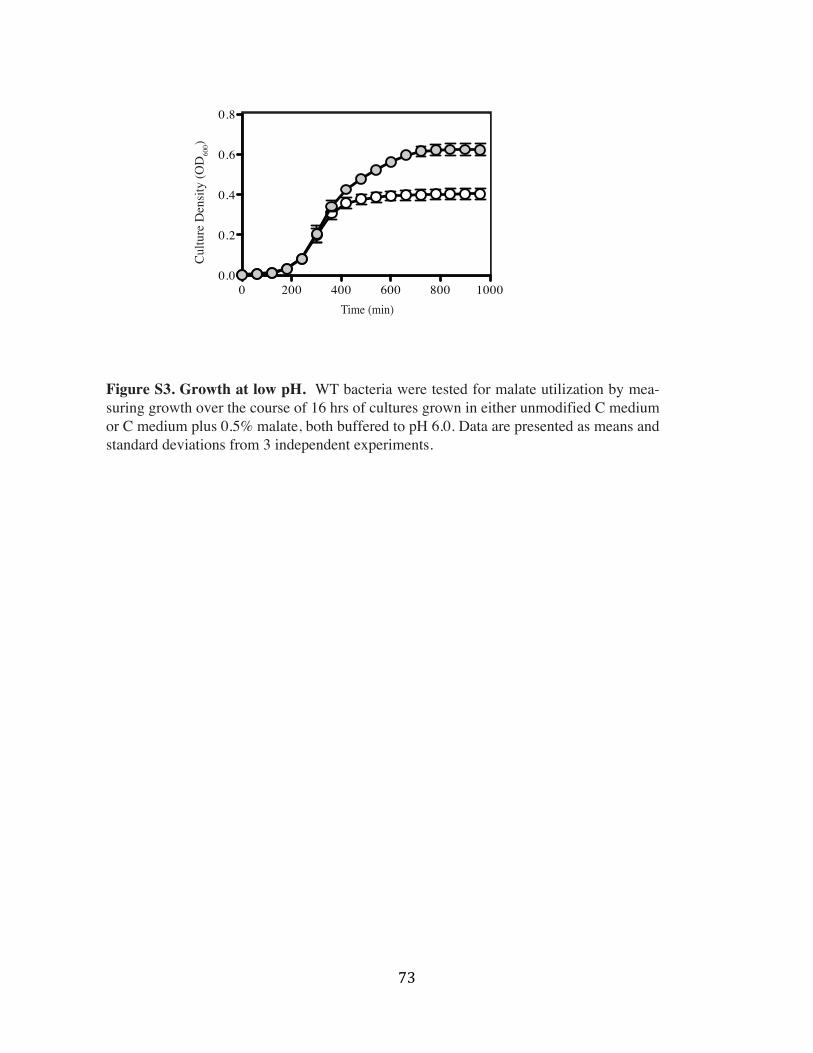
73
Cultu
re D
ensit
y (O
D60
0)
Time (min)
-Malate, pH 6.0+Malate, pH 6.0
0 200 400 600 800 10000.0
0.2
0.4
0.6
0.8
Figure S3. Growth at low pH. WT bacteria were tested for malate utilization by mea-suring growth over the course of 16 hrs of cultures grown in either unmodified C medium or C medium plus 0.5% malate, both buffered to pH 6.0. Data are presented as means and standard deviations from 3 independent experiments.

74
A.
WT MaeP- MaeE- WT MaeP- MaeE-
WT MaeP- MaeE- WT MaeP- MaeE-
24 hrs 48 hrs
-Malate
+Malate
0
2
4
6
N.D. N.D.
WT MaeP- MaeE- WT MaeP- MaeE-
SpeB
Pro
teas
e Act
ivity
Figure S4. SpeB activity of ME mutants. (A) SpeB activity of WT and ME mutants grown in the presence or absence of 0.5% malate. Protease activity is apparent as a zone of clearance around colonies plated on protease indicator plates. (B) Quantification of SpeB activity of WT and ME mutants grown in the presence of 0.5% malate. Data presented are the means and standard devia-tions from 2 independent experiments as determined in (8).
24 hrs48 hrs
B.

75
Table S1. Strains used in this studyStrain Relevant Genotype Mutated Locia Plasmid Descriptionb ReferenceS. pyogenesHSC5 wild-type none wild-type Port, et al. (2013)CKB206 ccpA 02310 none in-frame deletion of ccpA Kietzman, et al. (2010)EP184 maeP 04180 none in-frame deletion of maeP This workEP120 maeE 04185 none in-frame deletion of maeE This workEP121 maeK 04175 none in-frame deletion of maeK This workEP122 maeR 04170 none in-frame deletion of maeR This workEP212 maeP, maeE 04180, 04185 none in frame deletion of maeP in maeE strain This workEP92 ptsI::cat 05585 none Cam, allelic replacement of ptsI with cat This workEP132 ptsHH15A 05590 none allelic replacement of WT ptsH with ptsHH15A This workEP160 maeE pEP66 Complementation of maeE This workEP161 maeE pABG5 empty vector This workEP181 MaeKR none restoration of maeK This worka. Loci are based on the genome HSC5 (Port et al. 2013) and follow the formate L897_xxxxx, where xxxxx are numberedb. antibiotics are abbreviated as follows: chloramphenicol (Cam)
Table S2. Primers used in this studyName Sequenceab Template Plasmid DescriptionmaeP 5' F (BamHI) GGCGGATCCGAGAGGTTGTGACAACAATCATAGATACC HSC5maeP 5' R AAATAGCTGTTTGAGGCATTTTCTTGCTTATTGTTT HSC5maeP 3' F AATGCCTCAAACAGCTATTTTAAGAATTATTTTTAGTTAATCCAA HSC5maeP 3' R (EcoRI) GGCGAATTCCGCAGTACCATCACTGATAACTGC HSC5maeE 5' F (BamHI) GCCGGATCCTTAACATGAACCCAGTGGAAGCAGC HSC5maeE 5' R ACCTGACGCTAAGGGCAAGTTGACCTAATTGATTTTTCAT HSC5maeE 3' F ACTTGCCCTTAGCGTCAGGTCGGTAGTCCTTAAATCATAG HSC5maeE 3' R (EcoRI) GCCGAATTCGAAAACTGGAAAGATTGACGCAACAAGAC HSC5maeK 5' F (BamHI) GCCGGATCCTATTTTGCCATGCTTTTGAATGCTC HSC5maeK 5' R GTTGCCCTCCAACTGGCCCATAAACGTAGTGGTTTTTCAT HSC5maeK 3' F ATGGGCCAGTACACCTTATGTAGGAGGGCAACATGAACGT HSC5maeK 3' R (EcoRI) GCCGAATTCCTTCGCAAGGAATATGCTGAGCACG HSC5maeR 5' F (BamHI) GCCGGATCCTTCAACATGATCAGAATCATTTAATCAGCC HSC5maeR 5' R GACGGCCAACGGGATCATCTTCAATGATTAAAACGTTCAT HSC5maeR 3' F AGATGATCCCGTTGGCCGTCCCTATCGCGTG HSC5maeR 3' R (EcoRI) GCCGAATTCGCCAAGGCCTTACTTCCAGATGAGA HSC5maeE F (EcoRI) GCCGAATTCTCCAAACCAATAAAAAGAGAGGTATTTCCT HSC5maeE R (ClaI) GCCATCGATGCTTCTACTTATTTTGTGATTTAAAGTATAACTTTCTC HSC5HPr F (BamHI) GCGGATCCGCTCTAGCGTTTTGGTGATAGAAGC HSC5HPr R (BamHI) GCGGATCCCGTCTTGTGCAGCTTGGAGTG HSC5HPr H15A F TCACATTGTTGCAGAAACAGGTATTGCTGCGCGTCCAGCG HSC5HPr H15A R CGCTGGACGCGCAGCAATACCTGTTTCTGCAACAATGTGA HSC5maeP RT F CCGATGTTACTTGGAATGGTTTGTGmaeP RT R CGACTCCTGTAATGGCACTGTAACCmaeE RT F TCATATTCCTGTTTTCCATGACGATCmaeE RT R CTGTCACTTTCGTAGCACCTGCTGmaeK RT F CGTCAAAACGCAATTATACCCTGTCTmaeK RT R CCAGCTTTATCTACCACAAATACGGCmaeR RT F GGCAATGGGATTCAATTTTTGGAGmaeR RT R CTGTTGGATGCTTTCTTGAAAGCGa. Engineered restriction sites are underlinedb. Engineered mutation sites are in bold italics
RT primers for maeE
RT primers for maeK
RT primers for maeR
pEP78
pEP50
pEP51
primers for in-frame deletion of maeP
primers for in-frame deletion of maeE
primers for in-frame deletion of maeK
primers for in-frame deletion of maeR
RT primers for maeP
pEP56
primers for complementation of maeE
pEP52
pEP66
primers for His15 to Ala point mutation in ptsH
Table S3. Plasmids used in this studyPlasmid (Resistance)a Description ReferencepGCP213 (Erm) temperature-sensitive shuttle vector, used for allelic replacement Nielsen et al. (2012)pCRK (Kan) temperature-sensitive shuttle vector, used for allelic replacement Le Breton et al. (2013) pABG5 (Kan, Cam) shuttle vector, used for ectopic expression Meehl et al. (2005)
pEP78 (Kan) pCRK:: maeP This workpEP50 (Erm) pGCP213:: maeE This workpEP51 (Erm) pGCP213:: maeK This workpEP52 (Erm) pGCP213:: maeR This workpGCP793 (Erm, Cam) pGCP213:: ptsI::cat Port et al. (2014)pEP56 (Erm) pGCP213::ptsHH15A This workpEP66 (Kan, Cam) pABG5:: maeE (for MaeE complementation) This workpEP74 (Kan) pCRK::maeK (for MaeK restoration) This worka. Antibiotics are abbreviated as follows: kanamycin (Kan), chloramphenicol (Cam), erythromycin (Erm)

76
MATERIALS AND METHODS Bacterial strains, media, and growth conditions. The Escherichia coli strain TOP10
(Invitrogen) was used for cloning using standard molecular biology techniques. The
Streptococcus pyogenes strain HSC5 (23) and mutant derivatives were utilized in this study.
Strains were grown in Todd Hewitt broth (THYB) with 0.2% yeast extract (Difco) or C medium
(24). C medium was adjusted to pH 7.5 as described previously (24). Routine growth conditions
utilized sealed culture tubes incubated at 37°C under static conditions. Streptococcal strains
grown on solid medium containing 1.4% Bacto agar (Difco) were cultured in a sealed jar with a
commercial gas generator (GasPak catalogue no. 70304, BBL). For experiments utilizing malate
supplementation, filter sterilized 5% (w/v) stock solution buffered to pH 7.0 with NaOH (Sigma)
was used to add malate (Sigma) to a final concentration of 0.5% to the media. For experiments
utilizing glucose or maltose supplementation, filter sterilized 20% (w/v) stock solution was used
to add glucose or maltose (Sigma) to a final concentration of 0.2% to the media. For experiments
utilizing buffered media, 1M stock solutions of HEPES (pH 7.5) or MES (pH 6.0) (both obtained
from Sigma) were added to a final concentration of 0.1M to the media. All media used were
sterilized in an autoclave prior to supplementation. When appropriate, antibiotics were added at
the following concentrations: erythromycin 1 mg/mL, kanamycin 250 mg/mL, chloramphenicol
3 mg/ml.
Construction of mutants. All references to genomic loci are based on the genome of HSC5
(23). In-frame deletion mutations in the genes encoding MaeP (L897_04180), MaeE
(L897_04185), MaeR (L897_04170), and MaeK (L897_04175), as well as the modified allele
for HPr (L897_05590) (Table S1) were generated using allelic replacement and the PCR primers
77
listed in Table S2. The deletion alleles were transferred to the HSC5 chromosome using the
allelic replacement vector pGCP213 (25) as described (26) and listed in Table S3. Each deletion
allele was obtained through overlap extension PCR (27) using the primers listed in Table S2. All
molecular constructs and chromosomal structures of all mutants were verified using PCR and
DNA sequencing (Genewiz, South Plainfield, NJ) using oligonucleotide primers (IDT,
Coralville, IA) of the appropriate sequences.
Complementation of ME mutants. To complement the maeE in-frame deletions, DNA
fragments containing maeE from HSC5 in the absence of its promoter was amplified using the
primers listed in Table 2 and inserted under control of the rofA promoter in pABG5 as previously
described (28). The resulting plasmid, pEP66, was then used for ectopic expression of MaeE,
(Table S3). For complementation of the maeK in-frame deletion, a reversion strategy was used to
restore the wild-type locus in the MaeK- mutant background. A DNA fragment containing the
maeK open reading frame and flanking regions was amplified from HSC5 using primers listed in
Table S2 and inserted into the plasmid pCRK (29). The resulting plasmid, pEP74, was then used
to create the strain MaeKR as described previously (30) (Table S1).
Metabolic assays. Malate, lactate, and formate concentrations were measured using
commercially available kits (Sigma). Briefly, cultures of each individual strain tested were
grown overnight in C medium with the appropriate supplement added (see text). Cultures were
then subjected to centrifugation, filtered through 0.22 μm filters (Millipore), and then assessed
per manufacturer’s protocol. Data shown are the means and standard deviation from duplicate
78
determination of three separate biological samples prepared from at least 2 independent
experiments.
Isolation of RNA and transcript analysis. Transcript abundance of selected genes was
analyzed as previously described (31). Briefly, overnight cultures were diluted 1:25 into fresh C
medium with the appropriate supplement added (see text) and harvested at mid-log phase (OD600
0.2). Total RNA was isolated using Qiagen RNeasy Mini kit per the manufacturer’s protocol.
RNA was subjected to reverse transcription (RT) using iScript (Bio-Rad) per manufacturer’s
protocol. RT-PCR analysis of cDNA samples were performed using iQ SYBR Green Supermix
(Bio-Rad) and the primers listed in Table S2. Relative transcript abundance was determined
using the ΔΔCt method using recA transcript as a standard and are presented in comparison to
unmodified C media or in comparison to wild type. The data shown are the means and the
standard deviation from triplicate determinations of at least two separate biological samples
prepared from at least two independent experiments.
Infection of mice. As previously described (32, 33), 5-to-6-week-old female SKH1 hairless mice
(Charles River Labs) were injected subcutaneously with approximately 107 CFU of S. pyogenes
of the strains indicated in the text. Following infection, the resulting ulcers formed were
documented over a period of several days by digital photography and lesion areas measured as
previously described (32). Data presented is pooled from at least two independent experiments
with at least 10 mice per experimental group.

79
Growth rate calculations. Indicated bacterial strains were back-diluted 1:50 into 1 mL of fresh
C medium (unmodified or altered as indicated in text) and their growth monitored at 37°C using
a Tecan Infinite M200 Pro plate reader. During growth the plate was shaken every 10 minutes
for 30s, followed by a 5s wait period and measurement of the OD600. Data was normalized
relative to uninoculated media and growth rates calculated as described previously (34). Growth
rates are reported as doubling time (t1/2) and were determined from a series of 7 time points
collected over a 60 minute period that defines the peak rate of growth, which typically occurred
prior to the culture reaching 15-30% of max OD600. Growth yields were calculated from the
maximum OD600 reached by the culture and are expressed as a percentage relative to the wild
type strain under identical conditions. The average doubling time and percent growth yield was
calculated from each replicate from at least three independent experiments.
Statistical analyses. Differences between mean values obtained for wild type and mutant strains
in in vitro assays were tested for significance using the Student’s t-test. For infection of mice,
differences in lesion area between wild type and individual mutants were tested for significance
using the Mann-Whitney U test. Computation of test statistics utilized Instat (version 3.1) and
Prism (version 6.0) from Graphpad Software (San Diego, CA). For all tests, the null hypothesis
was rejected for P < 0.05.

80
REFERENCES
1. Cunningham MW. 2000. Pathogenesis of group A streptococcal infections. Clinical
microbiology reviews 13:470-511.
2. Churchward G. 2007. The two faces of Janus: virulence gene regulation by CovR/S in
group A streptococci. Mol Microbiol 64:34-41.
3. Hondorp ER, McIver KS. 2007. The Mga virulence regulon: infection where the grass
is greener. Mol Microbiol 66:1056-1065.
4. Kreikemeyer B, McIver KS, Podbielski A. 2003. Virulence factor regulation and
regulatory networks in Streptococcus pyogenes and their impact on pathogen-host
interactions. Trends Microbiol 11:224-232.
5. Martinussen J, Solem C, Holm AK, Jensen PR. 2012. Engineering strategies aimed at
control of acidification rate of lactic acid bacteria. Curr Opin Biotechnol 24:124-129.
6. Neijssel OM, Snoep JL, Teixeira de Mattos MJ. 1997. Regulation of energy source
metabolism in streptococci. Soc Appl Bacteriol Symp Ser 26:12S-19S.
7. Zaunmuller T, Eichert M, Richter H, Unden G. 2006. Variations in the energy
metabolism of biotechnologically relevant heterofermentative lactic acid bacteria during
growth on sugars and organic acids. Appl Microbiol Biotechnol 72:421-429.
8. Graham MR, Virtaneva K, Porcella SF, Barry WT, Gowen BB, Johnson CR,
Wright FA, Musser JM. 2005. Group A Streptococcus transcriptome dynamics during
growth in human blood reveals bacterial adaptive and survival strategies. The American
journal of pathology 166:455-465.

81
9. Graham MR, Virtaneva K, Porcella SF, Gardner DJ, Long RD, Welty DM, Barry
WT, Johnson CA, Parkins LD, Wright FA, Musser JM. 2006. Analysis of the
transcriptome of group A Streptococcus in mouse soft tissue infection. The American
journal of pathology 169:927-942.
10. Loughman JA, Caparon M. 2006. Regulation of SpeB in Streptococcus pyogenes by
pH and NaCl: a model for in vivo gene expression. J Bacteriol 188:399-408.
11. Augagneur Y, Ritt JF, Linares DM, Remize F, Tourdot-Marechal R, Garmyn D,
Guzzo J. 2007. Dual effect of organic acids as a function of external pH in Oenococcus
oeni. Archives of microbiology 188:147-157.
12. Etienne A, Genard M, Lobit P, Mbeguie AMD, Bugaud C. 2013. What controls fleshy
fruit acidity? A review of malate and citrate accumulation in fruit cells. Journal of
experimental botany 64:1451-1469.
13. Kawai S, Suzuki H, Yamamoto K, Inui M, Yukawa H, Kumagai H. 1996.
Purification and characterization of a malic enzyme from the ruminal bacterium
Streptococcus bovis ATCC 15352 and cloning and sequencing of its gene. Appl Environ
Microbiol 62:2692-2700.
14. Kleijn RJ, Buescher JM, Le Chat L, Jules M, Aymerich S, Sauer U. 2009. Metabolic
fluxes during strong carbon catabolite repression by malate in Bacillus subtilis. J Biol
Chem 285:1587-1596.
15. Landete JM, Garcia-Haro L, Blasco A, Manzanares P, Berbegal C, Monedero V,
Zuniga M. 2010. Requirement of the Lactobacillus casei MaeKR two-component system
for L-malic acid utilization via a malic enzyme pathway. Appl Environ Microbiol 76:84-
95.
82
16. London J, Meyer EY. 1970. Malate utilization by a group D Streptococcus: regulation
of malic enzyme synthesis by an inducible malate permease. J Bacteriol 102:130-137.
17. Mortera P, Espariz M, Suarez C, Repizo G, Deutscher J, Alarcon S, Blancato V,
Magni C. 2012. Fine-tuned transcriptional regulation of malate operons in Enterococcus
faecalis. Appl Environ Microbiol 78:1936-1945.
18. Landete JM, Ferrer S, Monedero V, Zuniga M. 2013. Malic enzyme and malolactic
enzyme pathways are functionally linked but independently regulated in Lactobacillus
casei BL23. Appl Environ Microbiol 79:5509-5518.
19. Lemme A, Sztajer H, Wagner-Dobler I. 2010. Characterization of mleR, a positive
regulator of malolactic fermentation and part of the acid tolerance response in
Streptococcus mutans. BMC Microbiol 10:58.
20. Sheng J, Baldeck JD, Nguyen PT, Quivey RG, Jr., Marquis RE. 2010. Alkali
production associated with malolactic fermentation by oral streptococci and protection
against acid, oxidative, or starvation damage. Can J Microbiol 56:539-547.
21. Sheng J, Marquis RE. 2007. Malolactic fermentation by Streptococcus mutans. FEMS
Microbiol Lett 272:196-201.
22. Kawai S, Suzuki H, Yamamoto K, Kumagai H. 1997. Characterization of the L-malate
permease gene (maeP) of Streptococcus bovis ATCC 15352. J Bacteriol 179:4056-4060.
23. Port GC, Paluscio E, Caparon MG. 2013. Complete Genome Sequence of emm Type
14 Streptococcus pyogenes Strain HSC5. Genome announcements 1.
24. Lyon WR, Gibson CM, Caparon MG. 1998. A role for trigger factor and an rgg-like
regulator in the transcription, secretion and processing of the cysteine proteinase of
Streptococcus pyogenes. The EMBO journal 17:6263-6275.

83
25. Nielsen HV, Guiton PS, Kline KA, Port GC, Pinkner JS, Neiers F, Normark S,
Henriques-Normark B, Caparon MG, Hultgren SJ. 2012. The metal ion-dependent
adhesion site motif of the Enterococcus faecalis EbpA pilin mediates pilus function in
catheter-associated urinary tract infection. mBio 3:e00177-00112.
26. Ruiz N, Wang B, Pentland A, Caparon M. 1998. Streptolysin O and adherence
synergistically modulate proinflammatory responses of keratinocytes to group A
streptococci. Mol Microbiol 27:337-346.
27. Horton RM, Cai ZL, Ho SN, Pease LR. 1990. Gene splicing by overlap extension:
tailor-made genes using the polymerase chain reaction. BioTechniques 8:528-535.
28. Meehl MA, Pinkner JS, Anderson PJ, Hultgren SJ, Caparon MG. 2005. A novel
endogenous inhibitor of the secreted streptococcal NAD-glycohydrolase. PLoS pathogens
1:e35.
29. Le Breton Y, Mistry P, Valdes KM, Quigley J, Kumar N, Tettelin H, McIver KS.
2013. Genome-wide identification of genes required for fitness of group A Streptococcus
in human blood. Infect Immun 81:862-875.
30. Watson ME, Jr., Nielsen HV, Hultgren SJ, Caparon MG. 2013. Murine vaginal
colonization model for investigating asymptomatic mucosal carriage of Streptococcus
pyogenes. Infect Immun 81:1606-1617.
31. Cho KH, Caparon MG. 2008. tRNA modification by GidA/MnmE is necessary for
Streptococcus pyogenes virulence: a new strategy to make live attenuated strains. Infect
Immun 76:3176-3186.

84
32. Brenot A, King KY, Janowiak B, Griffith O, Caparon MG. 2004. Contribution of
glutathione peroxidase to the virulence of Streptococcus pyogenes. Infect Immun 72:408-
413.
33. Bunce C, Wheeler L, Reed G, Musser J, Barg N. 1992. Murine model of cutaneous
infection with gram-positive cocci. Infect Immun 60:2636-2640.
34. Port GC, Vega LA, Nylander AB, Caparon MG. 2014. Streptococcus pyogenes
polymyxin B-resistant mutants display enhanced ExPortal integrity. J Bacteriol
196:2563-2577.
35. Gorke B, Stulke J. 2008. Carbon catabolite repression in bacteria: many ways to make
the most out of nutrients. Nat Rev Microbiol 6:613-624.
36. Deutscher J, Francke C, Postma PW. 2006. How phosphotransferase system-related
protein phosphorylation regulates carbohydrate metabolism in bacteria. Microbiol Mol
Biol Rev 70:939-1031.
37. Bruckner R, Titgemeyer F. 2002. Carbon catabolite repression in bacteria: choice of the
carbon source and autoregulatory limitation of sugar utilization. FEMS Microbiol Lett
209:141-148.
38. Kietzman CC, Caparon MG. 2009. CcpA and LacD.1 affect temporal regulation of
Streptococcus pyogenes virulence genes. Infect Immun 78:241-252.
39. Gera K, Le T, Jamin R, Eichenbaum Z, McIver KS. 2014. The PEP
Phosphotransferase System (PTS) in the Group A Streptococcus Acts to Reduce SLS
activity and Lesion Severity During Soft Tissue Infection. Infect Immun. 84:1192-1204.
40. Antunes A, Martin-Verstraete I, Dupuy B. 2011. CcpA-mediated repression of
Clostridium difficile toxin gene expression. Mol Microbiol 79:882-899.

85
41. Deutscher J, Herro R, Bourand A, Mijakovic I, Poncet S. 2005. P-Ser-HPr--a link
between carbon metabolism and the virulence of some pathogenic bacteria. Biochim
Biophys Acta 1754:118-125.
42. Heart E, Cline GW, Collis LP, Pongratz RL, Gray JP, Smith PJ. 2009. Role for
malic enzyme, pyruvate carboxylation, and mitochondrial malate import in glucose-
stimulated insulin secretion. American journal of physiology. Endocrinology and
metabolism 296:E1354-1362.
43. Deutscher J. 2008. The mechanisms of carbon catabolite repression in bacteria. Curr
Opin Microbiol 11:87-93.
44. Fujita Y. 2009. Carbon catabolite control of the metabolic network in Bacillus subtilis.
Biosci Biotechnol Biochem 73:245-259.
45. Monedero V, Maze A, Boel G, Zuniga M, Beaufils S, Hartke A, Deutscher J. 2007.
The phosphotransferase system of Lactobacillus casei: regulation of carbon metabolism
and connection to cold shock response. J Mol Microbiol Biotechnol 12:20-32.
46. Hondorp ER, Hou SC, Hause LL, Gera K, Lee CE, McIver KS. 2013. PTS
phosphorylation of Mga modulates regulon expression and virulence in the group A
streptococcus. Mol Microbiol 88:1176-1193.
47. Hondorp ER, Hou SC, Hempstead AD, Hause LL, Beckett DM, McIver KS. 2012.
Characterization of the Group A Streptococcus Mga virulence regulator reveals a role for
the C-terminal region in oligomerization and transcriptional activation. Mol Microbiol
83:953-967.

86
48. Ribardo DA, McIver KS. 2006. Defining the Mga regulon: Comparative transcriptome
analysis reveals both direct and indirect regulation by Mga in the group A streptococcus.
Mol Microbiol 62:491-508.
49. Jones P, Binns D, Chang HY, Fraser M, Li W, McAnulla C, McWilliam H, Maslen
J, Mitchell A, Nuka G, Pesseat S, Quinn AF, Sangrador-Vegas A, Scheremetjew M,
Yong SY, Lopez R, Hunter S. 2014. InterProScan 5: genome-scale protein function
classification. Bioinformatics 30:1236-1240.
50. Fogg GC, Gibson CM, Caparon MG. 1994. The identification of rofA, a positive-
acting regulatory component of prtF expression: use of an m gamma delta-based shuttle
mutagenesis strategy in Streptococcus pyogenes. Mol Microbiol 11:671-684.
51. Granok AB, Parsonage D, Ross RP, Caparon MG. 2000. The RofA binding site in
Streptococcus pyogenes is utilized in multiple transcriptional pathways. J Bacteriol
182:1529-1540.
52. Neely MN, Olson ER. 1996. Kinetics of expression of the Escherichia coli cad operon as
a function of pH and lysine. J Bacteriol 178:5522-5528.
53. Dell CL, Neely MN, Olson ER. 1994. Altered pH and lysine signalling mutants of cadC,
a gene encoding a membrane-bound transcriptional activator of the Escherichia coli
cadBA operon. Mol Microbiol 14:7-16.
54. Liu Y, Zeng L, Burne RA. 2009. AguR is required for induction of the Streptococcus
mutans agmatine deiminase system by low pH and agmatine. Appl Environ Microbiol
75:2629-2637.
87
55. Liu Y, Burne RA. 2009. Multiple two-component systems of Streptococcus mutans
regulate agmatine deiminase gene expression and stress tolerance. J Bacteriol 191:7363-
7366.
56. Yesilkaya H, Spissu F, Carvalho SM, Terra VS, Homer KA, Benisty R, Porat N,
Neves AR, Andrew PW. 2009. Pyruvate formate lyase is required for pneumococcal
fermentative metabolism and virulence. Infect Immun 77:5418-5427.
57. Cusumano ZT, Watson ME, Jr., Caparon MG. 2013. Streptococcus pyogenes
Arginine and Citrulline Catabolism Promotes Infection and Modulates Innate Immunity.
Infect Immun. 82:233-242.

88
SUPPLEMENTARY REFERENCES
1. Landete JM, Garcia-Haro L, Blasco A, Manzanares P, Berbegal C, Monedero V, Zuniga M. 2010. Requirement of the Lactobacillus casei MaeKR two-component system for L-malic acid utilization via a malic enzyme pathway. Appl Environ Microbiol 76:84-95.
2. Mortera P, Espariz M, Suarez C, Repizo G, Deutscher J, Alarcon S, Blancato V, Magni C.
2012. Fine-tuned transcriptional regulation of malate operons in Enterococcus faecalis. Appl
Environ Microbiol 78:1936-1945.
3. Port GC, Paluscio E, Caparon MG. 2013. Complete Genome Sequence of emm Type 14 Strepto
coccus pyogenes Strain HSC5. Genome announcements 1.
4. Kietzman CC, Caparon MG. 2010. CcpA and LacD.1 affect temporal regulation of Streptococ
cus pyogenes virulence genes. Infect Immun 78:241-252.
5. Nielsen HV, Guiton PS, Kline KA, Port GC, Pinkner JS, Neiers F, Normark S, Hen
riques-Normark B, Caparon MG, Hultgren SJ. 2012. The metal ion-dependent adhesion site
motif of the Enterococcus faecalis EbpA pilin mediates pilus function in catheter-associated
urinary tract infection. mBio 3:e00177-00112.
6. Le Breton Y, Mistry P, Valdes KM, Quigley J, Kumar N, Tettelin H, McIver KS. 2013.
Genome-wide identification of genes required for fitness of group A Streptococcus in human
blood. Infect Immun 81:862-875.
7. Meehl MA, Pinkner JS, Anderson PJ, Hultgren SJ, Caparon MG. 2005. A novel endogenous
inhibitor of the secreted streptococcal NAD-glycohydrolase. PLoS pathogens 1:e35.
8. Port GC, Vega LA, Nylander AB, Caparon MG. 2014. Streptococcus pyogenes polymyxin
B-resistant mutants display enhanced ExPortal integrity. J Bacteriol 196:2563-2577.
89
Chapter III
RocA is Required for Growth-Phase Expression of Virulence Factors SPN and SLO in Streptococcus
pyogenes

90
SUMMARY
The interaction between the NAD+ glycohydrolase SPN and the cholesterol dependent
cytolysin SLO allows for delivery of SPN directly into host cells by a process known as
cytolysin-mediated translocation (CMT). It has also been shown that both proteins play a role in
cytotoxicity, as loss of either protein has reduced virulence in cultured epithelial cells and in vivo
in a mouse model of soft tissue infection. Taken together, these studies demonstrate that both
SPN and SLO play an important role in pathogenesis of S. pyogenes. And although these
secreted proteins have been shown to be involved in virulence of S. pyogenes, little information
is known about how the bacterium regulates their expression. Analysis of expression patterns for
these genes demonstrated that both are growth-phase regulated, with peak expression at
exponential phase. Additionally, this temporal expression pattern is controlled by environmental
pH, where acidic pH has a repressive effect on expression of both genes. Through a transposon
mutagenesis screen a novel regulator of the spn operon, RocA, a predicted histidine kinase, was
identified. An analysis of the RocA protein revealed that, although it does function as a
transcriptional repressor of the spn operon, it is not a histidine kinase. Finally, RocA, along with
the two-component system CovRS, is shown to be essential for the pH regulation of the spn
operon. Taken together, this work sheds light on a regulatory mechanism utilized by S. pyogenes
during adaptation to acid stress.

91
INTRODUCTION
An important factor in the colonization of host tissue by a pathogen is the ability to
monitor changes in their surrounding environment and adapt as needed for survival. This
adaptation is often seen at the level of transcription, resulting in careful spatial and temporal
expression patterns of a number of proteins, including virulence factors. Identifications of
conditions that control gene expression in vitro is, therefore, a useful tool for understanding the
potential regulatory cues sensed by the bacteria during an infection in vivo.
The Gram-positive bacterium Streptococcus pyogenes is an incredibly versatile pathogen,
capable of colonizing numerous sites within the human host and causing a variety of clinical
diseases. These diseases range from mild, self-limiting infections such as impetigo and
pharyngitis, to invasive and systemic diseases including toxic shock and necrotizing fasciitis (1-
3). The ability of S. pyogenes to successfully infect multiple niches in the human body is the
result of careful monitoring of variations in environmental stimuli, which, in turn, lead to global
transcriptional changes in the bacterium (4-6). The regulatory cues that can lead to this
transcriptional remodeling include temperature, pH, osmolarity, and nutrient availability, among
others (5-8)
As a lactic acid bacterium (LAB), S. pyogenes is solely dependent on a simple
fermentative metabolism to generate energy in the cell (9, 10). A by-product of this metabolism
is the production of several organic acid end products that, over the course of growth,
accumulate in high concentrations in the surrounding area (9, 10). This autoacidification process
is significant for several reasons. First, it has been established that pH is a signal used by the
bacterium to induce global transcriptional changes (7, 11, 12). Second, transcriptome studies
have shown that the local tissue environment during later stages of infection is both low in

92
glucose and low in pH (7). Therefore, understanding the regulatory mechanisms utilized by S.
pyogenes in response to variations in environmental pH will provide insight into important
adaptive strategies that the bacterium must use in vivo in infected tissue.
S. pyogenes is known to produce a large number of secreted virulence factors that can
affect host cellular functions in numerous ways (1-3, 13-17). One important secreted factor is the
NAD+ glycohydrolase, SPN. Upon delivery into the host cell cytosol, SPN is able to cleave β-
NAD+ into nicotinamide and adenosine diphosphoribose (ADPr) (14, 18, 19). The process by
which SPN is able to gain access to the host cytosol is a complex process known as cytolysin-
mediated translocation (CMT) (20-22). CMT also requires the cholesterol dependent cytolysin
Streptolysin O (SLO) for the direct translocation of SPN across the host cell membrane (20-22).
It has also been established that both proteins play a role in pathogenesis, as loss of either protein
has reduced virulence in cultured epithelial cells and in vivo in a mouse model of soft tissue
infection (20, 23, 24). While a significant amount of work has been done in understanding the
complex process of CMT, as well characterizing SPN’s effects on the host cell (14, 18, 20-22,
25), little is known about how the bacterium regulates the expression of these important toxins.
While S. pyogenes lacks alternative sigma factors, it encodes a number of two-component
systems (TCS) and stand-alone response regulators, many of which are influenced by both
growth phase and environmental conditions (5, 6, 26-32). One of the most well characterized
transcriptional regulators in GAS is the two-component system (TCS) CovRS. This system
exerts its effect during late exponential and stationary growth, functioning mostly as a repressor
of a number of surface-adhered and secreted virulence factors in response to multiple
environmental stimuli including Mg2+, temperature, pH, and the cathelicidin LL-37 (27, 33-38).

93
CovRS is one of the most well studied TCSs in S. pyogenes and is known to control up to 15% of
the total genes in this bacterium, including spn and slo (33, 35, 38).
spn is the first gene in a 3-gene operon that includes ifs (immunity factor for SPN) and
slo (19, 25, 39). While both SPN and SLO are secreted, IFS is a bacterial cytosolic protein that
binds to SPN’s active site to block its enzymatic activity within the bacterial cell (39). From few
global transcription studies it has been established that expression of the spn/slo operon is
associated with exponential phase of growth (4, 30), indicating that it is growth-phase regulated,
however, the signal controlling this expression remains unclear. Additionally, while it is known
that spn and slo are repressed by CovRS, it is not known if this is through direct or indirect
regulation. Moreover, it remains unknown if any additional transcriptional regulators control the
spn operon.
In this study we examined the regulatory mechanism controlling the growth phase
regulation of the spn/slo operon. The analysis revealed that expression of the spn operon is
controlled by pH and that this regulation requires both the CovRS system as well as a stand-
alone transcriptional regulator, RocA.
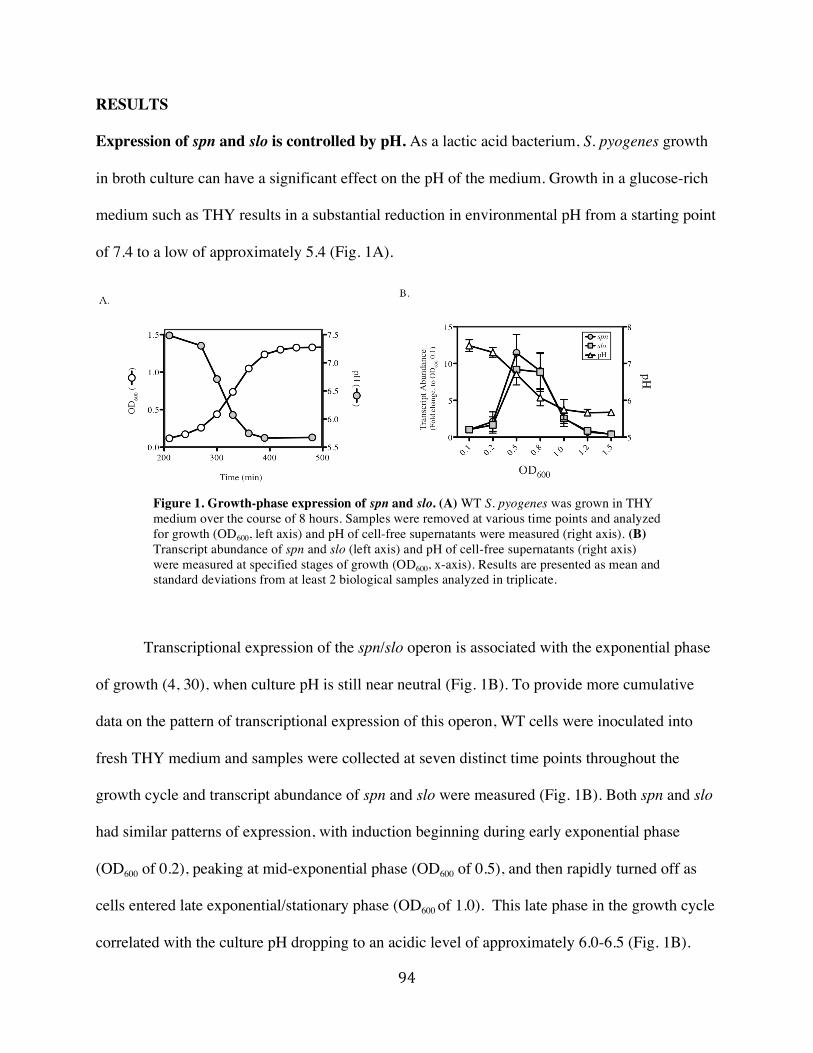
94
RESULTS
Expression of spn and slo is controlled by pH. As a lactic acid bacterium, S. pyogenes growth
in broth culture can have a significant effect on the pH of the medium. Growth in a glucose-rich
medium such as THY results in a substantial reduction in environmental pH from a starting point
of 7.4 to a low of approximately 5.4 (Fig. 1A).
Transcriptional expression of the spn/slo operon is associated with the exponential phase
of growth (4, 30), when culture pH is still near neutral (Fig. 1B). To provide more cumulative
data on the pattern of transcriptional expression of this operon, WT cells were inoculated into
fresh THY medium and samples were collected at seven distinct time points throughout the
growth cycle and transcript abundance of spn and slo were measured (Fig. 1B). Both spn and slo
had similar patterns of expression, with induction beginning during early exponential phase
(OD600 of 0.2), peaking at mid-exponential phase (OD600 of 0.5), and then rapidly turned off as
cells entered late exponential/stationary phase (OD600 of 1.0). This late phase in the growth cycle
correlated with the culture pH dropping to an acidic level of approximately 6.0-6.5 (Fig. 1B).
Figure 1. Growth-phase expression of spn and slo. (A) WT S. pyogenes was grown in THY medium over the course of 8 hours. Samples were removed at various time points and analyzed for growth (OD600, left axis) and pH of cell-free supernatants were measured (right axis). (B) Transcript abundance of spn and slo (left axis) and pH of cell-free supernatants (right axis) were measured at specified stages of growth (OD600, x-axis). Results are presented as mean and standard deviations from at least 2 biological samples analyzed in triplicate.

95
These data led to the hypothesis that transcription of the spn operon is regulated by
environmental pH, where acidic pH is a repressive signal on transcription of these genes.
To test this, WT cells were grown in THY medium buffered to a range of pHs from 7.5 to
6.0. Cell-free supernatants from these overnight cultures were collected and analyzed by Western
blot for expression of both SPN and SLO protein levels (Fig. 2A). Supernatants from cultures
buffered to pH 7.5 had substantially more SPN and SLO than samples from cultures grown in
unmodified THY. Conversely, growth in THY medium buffered to pH 6.5 or 6.0 repress protein
Figure 2. Expression of spn and slo is regulated by pH. (A and B) WT S. pyogenes was grown in THY buffered to specified pH and SPN and SLO protein was measured from cell-free supernatants by Western blot (A) or NADase activity (B). (C and D) Transcript abundance of spn and slo was measured from WT cells grown in THY buffered to pH 6.0 (C) or 7.5 (D). For analysis total RNA was isolated from cultures at exponential phase (C) or stationary phase (D).

96
expression to undetectable levels. As a control to show that general protein secretion is not
affected, supernatants were also tested for levels of SpeB protein, which has been shown to be
positively regulated by low pH (Fig. 2A) (7). As a second measure of SPN production, cell-free
supernatants from cultures grown in unmodified THY or THY buffered to neutral (7.5) or acidic
(6.0) pH were collected and analyzed for β-NAD+ glycohydrolase (NADase) activity (Fig. 2B).
Results of this analysis show that, compared to unmodified THY, neutral buffered media
enhanced NADase activity 2- to 3-fold, while acidic buffered media reduced NADase activity 2-
fold. As a negative control, overnight supernatants of strain HSC5 (which produces an NADase
negative version of SPN) (18). All together, this data demonstrates that low pH is a repressive
signal for SPN and SLO expression and that production of these proteins can be enhanced by
buffering the medium to a neutral pH.
To determine whether the pH regulation of SPN and SLO was occurring at a
transcriptional or post-transcriptional level, WT cells were grown in buffered THY medium and
samples were collected at a specific stage of growth and transcript abundance of the spn and slo
genes were measured (Fig. 2 C and D). WT cells were grown in either acidic buffered THY (pH
6.0) to mid-exponential phase (OD600 of 0.5) or in neutral buffered THY to late
exponential/stationary phase (OD600 of 1.2). Results of this analysis show that growth in acidic
media represses transcription of both spn and slo at exponential phase approximately 4-fold (log2
value) compared to cells grown in unmodified THY (Fig. 2C). Additionally, late
exponential/stationary phase cells grown in neutral buffered media had 4- to 6-fold (log2 value)
increased transcript abundance compared to cells grown in unmodified THY (Fig. 2D). Taken
together, these results demonstrate that pH is an environmental signal controlling the growth

97
phase expression of the virulence genes spn and slo, where low pH is a repressive signal for
transcription of this operon.
Deletion of RocA uncouples spn and slo from pH regulation. A random mutagenesis screen
was performed in order to identify potential regulators involved in controlling the expression of
the spn/slo operon in response to low pH. We screened approximately 2000 transposon mutants
for production of SPN, measured by NADase activity of culture supernatants, after growth in
THY pH 6.0. Within the mutant library, two independently derived transposon mutants were
discovered to have high NADase activity in acidic THY. These mutants both had a transposon
disruption in a gene (L897_06555) annotated in the HSC5 genome as a putative histidine kinase
(Fig. 3A) (40). A BLAST search for related genes in S. pyogenes lead to the identification of the
Figure 3. Deletion of RocA uncouples spn and slo from pH regulation. (A) Schematic of the genomic region containing the rocA gene (L897_06555) in S. pyogenes. Green arrows indicate location of transposon insertion sites. (B and C) The S. pyogenes RocA- mutant was grown in THY buffered to specified pH and SPN and SLO protein was measured from cell-free supernatants by Western blot (C) or NADase activity (D).

98
unknown kinase as the gene rocA, a highly conserved gene present in all sequenced strains of S
pyogenes. RocA was first identified as a transcriptional regulator and was shown to act as a
positive regulator for the covRS operon in JRS4 (40). Examination of the genomic region around
rocA is that it appears to be a stand-alone histidine kinase (Fig. 3A), which is unusual as these
proteins are usually part of a two-component system where both genes are encoded in a single
operon (41). However, this is not the case for this gene of interest.
To verify that the rocA disruption is responsible for the SPN over-expression phenotype,
a strain was made with an in-frame deletion of rocA in a WT background. This strain, RocA-,
was then tested for altered expression patterns for both SPN and SLO. RocA- cells were grown
overnight in THY unmodified or buffered to pH 7.5, 6.5, or 6.0 and supernatants were collected
for Western blot analysis. The results show that, under all conditions tested, RocA- causes
overproduction of both SPN and SLO protein (Fig. 3B). As a second measure of SPN expression,
WT and RocA- strains were grown overnight in THY, THY pH 7.5, or THY pH 6.0 and
supernatants were collected and measured for NADase activity. The results demonstrated that the
RocA- strain had consistently high NADase activity compared to WT under all pH conditions
(Fig. 3C). Thus, loss of the RocA protein uncouples SPN and SLO from pH regulation. To
restore pH repression of SPN and SLO the rocA gene was expressed ectopically on a plasmid
under a constitutive promoter. This plasmid (pRocA) was then used to transform
both WT and a RocA- mutant and NADase activity of supernatants from overnight cultures
grown in unmodified THY medium was measured. Surprisingly, over-expression of RocA
repressed SPN production by 80% in unmodified media (Fig. 4A). Thus, over-expression of
RocA can repress SPN in the absence of any pH signal.

99
RocA is a transcriptional repressor
of spn and slo. As a putative histidine
kinase, RocA would be predicted to be
part of a TCS and, therefore, is likely a
transcriptional regulator. To test this,
total RNA from WT and RocA- strains
grown in unmodified THY was
collected and transcript abundance of
spn and slo were measured by
quantitative RT-PCR (Fig. 4B). The
results show that loss of RocA causes
an increase in transcript of both genes
approximately 10-fold compared to
WT. Additionally, when RocA was
then ectopically expressed on a plasmid
(pRocA) in either a WT or a RocA-
background, transcript levels were
dramatically reduced nearly 10-fold
compared to the non-complemented
strains (Fig. 4B). Additionally, it is
important to note that this experiment was performed with cells grown in unmodified THY,
indicating that overexpression of RocA alone is sufficient to repress transcription of spn and slo
and does not require a strong acidic pH signal to induce this repression. Taken together, this data
Figure 4. RocA is a transcriptional repressor of spn and slo. (A) NADase activity of cell-free supernatants from WT and RocA- cultures containing indicated plasmid was measured. (EV, empty vector) (B) Total RNA from exponential phase cultures slo of WT and RocA- strains containing indicated plasmid was isolated and transcript abundance of spn and was measured. Data presented is means and standard deviation from 3 biological replicates measured in triplicate.
100
shows that RocA is a transcriptional repressor of spn and slo and can function independently of a
pH signal.
RocA is not a histidine kinase. Given how little this protein has been studied at this point, we
sought to further characterize its functional activity. Previously, it has been hypothesized that
RocA is a histidine kinase (42). Using structural prediction software (43), we obtained a putative
structure of the cytoplasmic domain of the RocA protein. Histidine kinases (HK) are
characterized as having three domains, the extracellular sensor domain (which vary among the
different proteins), a transmembrane domain, and a cytosolic enzymatic domain. These last two
domains are highly conserved among HKs (44). An examination of the cytoplasmic domain of
RocA revealed that there was four histidine residues scattered throughout this domain (H247,
H315, H387, H437) (Fig. 5A). To identify the key histidine residue necessary for RocA’s
function, single point mutations were made by directed mutagenesis using the pRocA plasmid,
converting His to Ala independently at all four positions. These new constructs (pRocAH247A,
pRocAH315A, pRocAH387A, pRocAH437A) were transformed into the RocA- mutant and tested for
protein expression and NADase activity (Fig. 5 B and C). The results show that all four pRocA
mutant were able to repress SPN and SLO expression to similar levels as the WT pRocA,
indicating that all four histidine mutants are dispensable for RocA regulatory function.

101
RocA repression of SPN and SLO requires CovRS. Given that RocA was initially identified
as a regulator of the covRS operon (40), and that the CovRS TCS is a known regulator of the
spn/slo operon (33, 35, 38), it was of interest to investigate if RocA-mediated regulation of spn
and slo involved CovRS. To test this, in-frame deletion mutants of covR or covS were made
individually in a WT background and these mutants were tested for altered SPN production by
SPN
SpeB
Figure 5. RocA is not a functional histidine kinase. (A) Structural prediction of RocA’s cytoplasmic domain with individual histidine residues highlighted in red. (B and C). pRocA mutant constructs were tested for regulation of SPN by NADase activity (B) and Western blot (C).

102
measuring NADase activity of culture supernatants (Fig. 6). Results showed that deletion of
either gene lead to significantly higher levels of NADase activity than WT, indicating that both
CovR and CovS are required for repression of SPN. This finding was in agreement with previous
reports of CovRS regulation of the spn/slo operon and appeared identical to a RocA- mutant (33,
35, 38). Lastly, to evaluate the contribution of either protein in the RocA regulatory pathway, the
plasmid pRocA was transformed into both CovR- and CovS- and these strains were tested for
SPN production. NADase activity of overnight supernatants from cultures grown in unmodified
THY broth from strains RocA-, CovR-, CovS-, plus their pRocA complemented strains. The
results show that over-expression of RocA on pRocA can only complement the RocA- mutant,
but neither of the Cov deletion mutants (Fig. 6). Thus, all three components are required for
repression of the spn/slo operon.
Figure 6. RocA repression of SPN requires CovRS NADase activity of cell-free supernatants from WT and mutant and complemented strains was measured.

103
DISCUSSION
In this study we have shown that the virulence factors SPN and SLO, which are co-
transcribed together with the protein IFS in a single operon, are expressed in a growth-phase
pattern of expression, with their peak transcript abundance occurring during exponential phase.
In addition, we have shown that this pattern of regulation is controlled by environmental pH,
where exposure to acidic conditions can repress transcription of this operon and, conversely,
maintenance of a neutral pH can extend transcription through to stationary phase. Furthermore,
we have identified the transcriptional regulator RocA, in addition to the global regulatory TCS
CovRS, as being required for this pH-mediated response. Finally, we have shown that while
RocA is, in fact, a transcriptional regulatory protein, it is likely not a functional histidine kinase
as previously reported. Taken together, these data shed light on the specific growth-phase
regulation of several important virulence factors and further characterizes the contribution of
RocA in S. pyogenes pathogenesis.
Growth-phase expression of virulence factors is a common regulatory strategy used by
multiple pathogenic bacterial species (10, 31, 45). Often times this growth-phase regulation is
linked to metabolism. For example, in S. pyogenes, the catabolite control protein CcpA regulates
a number of virulence factors including the cysteine protease SpeB and the lactate oxidase gene
lctO in response to carbohydrate availability (46). The transcriptional regulator CodY, which
recognizes branched chain amino acids, is responsible for the growth-phase regulation of the
virulence factors pel and sagA (6). We can now add the genes spn and slo to this group. As a
lactic acid bacterium, S. pyogenes ferments glucose, leading to the formation of multiple organic
acids which, when secreted into the environment, cause a significant drop in pH (9, 10, 31, 45,

104
47). Thus, as glucose is consumed, there is a corollary drop in environmental pH. In this way, pH
is an indirect metabolic signal for the bacterial cell.
This work also provides new information on the role of RocA and its involvement with
the CovRS TCS. Although RocA is a highly conserved protein present in all sequenced S.
pyogenes strains, few studies have been done to characterize this protein and it’s role in virulence
regulation and pathogenesis. Previous studies have identified RocA as a regulator of hasA, which
is necessary for capsule synthesis (40, 42), although this is attributed to the fact that RocA is a
regulator of CovR, which is known to repress capsule synthesis genes (27). There is, however,
data that suggests that RocA’s role in transcriptional regulation extends beyond interactions with
CovRS. A proteomics study to identify regulatory targets of RocA identified approximately 30
proteins whose expression were significantly altered in a RocA null mutant compared to WT
(42). Of these 30 targets, only one third of them were determined to be part of the CovRS
regulon. In addition, the majority of these RocA targets, most of which are repressed by the
protein, are involved in metabolism (42). Thus, RocA’s main contribution to the cell may be as a
key metabolic regulator. As previously mentioned, there are a few well-characterized metabolic
regulators in S. pyogenes known to respond to various nutritional cues such as glucose,
carbohydrates, and amino acid starvation (5, 6, 28, 46). An important next step in the study of
RocA would be to determine what conditions or signals it responds to. The work presented here
suggests that pH may be one of those signals, but, like CovRS (34, 36, 38), RocA may recognize
multiple environmental cues.
In addition to identifying the conditions that trigger RocA activation, there is also the
question of how RocA is functioning as a transcriptional regulator. The work presented here
demonstrates that RocA is not a functional histidine kinase, as all histidine residues within the

105
cytoplasmic domain of the protein are dispensable for function. This conclusion is further
supported by previous findings that the RocA protein sequence lacks several key residues
necessary for function in other known histidine kinases (40). Additionally, analysis of the
sequence of the predicted ATPase domain of the protein also revealed mutations to key residues
necessary for enzymatic activity (E. Paluscio and M. Caparon, unpublished). Taken together, this
information suggests that RocA may not possess any enzymatic activity. Additionally, no DNA
binding domains have been identified in RocA, yet there is strong evidence from this work and
other that indicate this protein is involved in transcriptional regulation of multiple target genes
(40, 42).
Given that RocA maintains strong homology to other bacterial histidine kinases, but
lacks the specific residues necessary for phosphorylation, a possible hypothesis is that RocA is a
functional pseudokinase. Pseudokinases can be described as proteins that are classified as part of
a specific enzyme group based on sequence or structural homology, but lack any enzymatic
activity (48). Pseudokinases, which are found in all domains of life, are thought to function in
signaling pathways in several specific ways, including as modulators of kinase and phosphatase
activity (49-52). In the case of RocA and regulation of the spn operon, we hypothesize that this
protein is affecting the phosphorylation state of CovR through modulation of CovS’s enzymatic
activity.
CovS has been shown to maintain both kinase and phosphatase activity (53), thus altering
the phosphorylation state of CovR. Additionally, it has been suggested that CovR’s
phosphorylation state determines its regulatory function, including which target promoters it can
bind to and whether it functions to enhance or repress transcription of its target genes (27, 53,
54). It is possible that for regulation of spn, and possibly additional genes, the interaction

106
between RocA and the CovRS system is necessary for sufficient transcriptional repression. The
concept of a TCS requiring auxiliary proteins for signal transduction is a common mechanism
among both Gram-positive and Gram-negative species and has been associated with a variety of
cellular processes from cell division to virulence factor regulation (50, 51, 55-57). The precise
mechanism by which this is occurring to regulate the growth phase expression of the spn/slo
operon remains unclear. However, the work presented here has established that this regulation is
controlled by environmental pH and provides new insights into virulence gene regulation in S.
pyogenes.

107
MATERIALS AND METHODS
Bacterial strains, media, and growth conditions. The Escherichia coli strain TOP10
(Invitrogen) was used for cloning using standard molecular biology techniques. The
Streptococcus pyogenes strain JOY3 (18), which is an NADase positive version of the strain
HSC5 (58), and mutant derivatives were utilized in this study. Strains were grown in Todd
Hewitt broth (THYB) with 0.2% yeast extract (Difco). Routine growth conditions utilized sealed
culture tubes incubated at 37°C under static conditions. Streptococcal strains grown on solid
medium containing 1.4% Bacto agar (Difco) were cultured in a sealed jar with a commercial gas
generator (GasPak catalogue no. 70304, BBL). For experiments utilizing buffered media, 1M
stock solutions of HEPES (pH 7.5) or MES (pH 6.0) (Sigma) were added to a final concentration
of 0.1M to the media. All media used were sterilized in an autoclave prior to supplementation.
When appropriate, antibiotics were added at the following concentrations: erythromycin 1
mg/mL, kanamycin 250 mg/mL, spectinomycin 100mg/mL.
Mutagenesis strategy. Transposon mutagenesis utilized a modified version of Tn4001
containing a spectinomycin resistance cassette (59). Construction of a transposon mutant library
was conducted as described previously (59). For mutants of interest, the transposon insertion site
was mapped by arbitrary PCR as described (60). Briefly, DNA flanking the transposon insertion
site is enriched through two rounds of amplification using primers specific to the 5’ end of the
transposon and nonspecific primers that can anneal to random sites within the bacterial
chromosome. The first round of PCR was performed using primers ARB1 (5’-
GCCGACCGCTGGACTGTACG-

108
NNNNNNNNNNGTAGC) and OUT3 ((5’- GCGTGCCTACACGTGTCG). The second round
of PCR utilized 5μL of the first-round product as the template and PCR primers ARB2 (5’-
GCCGACCGCTGGACTGTACG) and OUT1 (5’-GTCCTCCTGGGTATGT-
TTTT). Second round PCR products were purified and sequenced using primer OUT1.
Directed mutagenesis and complementation. All references to genomic loci are based on the
genome of HSC5 (58). In-frame deletion mutations in the genes encoding RocA (L897_06555),
CovR (L897_01565), and CovS (L897_01570) (Table 1) were generated using allelic
replacement and the PCR primers listed in Table 2. The deletion alleles were transferred to the
HSC5 chromosome using the allelic replacement vector pGCP213 (61) as described (62) and
listed in Table 3. Each deletion allele was obtained through overlap extension PCR (63) using the
primers listed in Table 2. All molecular constructs and chromosomal structures of all mutants
were verified using PCR and DNA sequencing (Genewiz, South Plainfield, NJ) using
oligonucleotide primers (IDT, Coralville, IA) of the appropriate sequences. To complement the
rocA in-frame deletions, DNA fragments containing rocA from HSC5 in the absence of its
promoter and including an HA tag at the C-terminal end of the protein was amplified using the
primers listed in Table 2 and inserted under control of the rofA promoter in pABG5 as previously
described (39). The resulting plasmid, pEP85, was then used for ectopic expression of RocA-HA
(Table 3). The four RocA mutants (H247A, H315A, H387A, H437A) were made from the WT
rocA sequence in pEP85 using the Quikchange XL II mutagenesis kit (Agilent Technologies).

109
Analysis of protein expression. SPN production was measured by a fluorometric assay
measuring β-NAD+ glycohydrolase activity of cell-free supernatants as described (20). Specific
activity of each strain is reported relative to wild type as described (19). Expression of SPN and
SLO protein was measured from cell-free supernatants as described (22). For all experiments,
samples were normalized to OD600 of overnight cultures.
Isolation of RNA and transcript analysis. Transcript abundance of selected genes was
analyzed as previously described (64). Briefly, overnight cultures were diluted 1:25 into fresh
THY medium with the appropriate supplement added (see text) and harvested at the OD600
indicated in the text. Total RNA was isolated using Qiagen RNeasy Mini kit per the
manufacturer’s protocol. RNA was subjected to reverse-transcription (RT) using iScript (Bio-
Rad) per manufacturer’s protocol. RT-PCR analysis of cDNA samples were performed using iQ
SYBR Green Supermix (Bio-Rad) and the primers listed previously (7). Relative transcript
abundance was determined using the ΔΔCt method using recA transcript as a standard and are
presented in comparison to unmodified THY media or in comparison to wild type. The data
shown are the means and the standard deviation from triplicate determinations of at least two
separate biological samples prepared from at least two independent experiments.

110
Table 1. Strains used in this studyStrain Relevant Genotype Mutated Locia Plasmid Descriptionb ReferenceS. pyogenesJOY3 SPNJ4 00945 none wild-type Chandresakaran, et al. (2013)HSC5 none NAD+ glycohydrolase negative Port, et al. (2013)EP154 ∆rocA 06555 none in-frame deletion of rocA This workEP155 ∆covS 01570 none in-frame deletion of covS This workEP156 ∆covR 01565 none in-frame deletion of covR This workEP177 SPNJ4 00945 pABG5 This workEP180 ∆rocA 06555 pABG5 This workEP178 ∆covS 01570 pABG5 This workEP179 ∆covR 01565 pABG5 This workEP181 SPNJ4 00945 pEP85 This workEP182 ∆rocA 06555 pEP85 This workEP183 ∆covS 01570 pEP85 This workEP184 ∆covR 01565 pEP85 This workEP185 ∆rocA 06555 pEP86 This workEP186 ∆rocA 06555 pEP87 This workEP187 ∆rocA 06555 pEP88 This workEP188 ∆rocA 06555 pEP89 This work
a. Loci are based on the genome HSC5 (Port et al. 2013) and follow the formate L897_xxxxx, where xxxxx are numberedb. antibiotics are abbreviated as follows: chloramphenicol (Cam)

111
REFERENCES
1. Cole JN, Barnett TC, Nizet V, Walker MJ. 2011. Molecular insight into invasive
group A streptococcal disease. Nat Rev Microbiol 9:724-736.
2. Cunningham MW. 2000. Pathogenesis of group A streptococcal infections. Clinical
microbiology reviews 13:470-511.
3. Walker MJ, Barnett TC, McArthur JD, Cole JN, Gillen CM, Henningham A,
Sriprakash KS, Sanderson-Smith ML, Nizet V. 2014. Disease manifestations and
pathogenic mechanisms of group a Streptococcus. Clinical microbiology reviews 27:264-
301.
4. Fiedler T, Sugareva V, Patenge N, Kreikemeyer B. 2010. Insights into Streptococcus
pyogenes pathogenesis from transcriptome studies. Future microbiology 5:1675-1694.
5. Kreikemeyer B, McIver KS, Podbielski A. 2003. Virulence factor regulation and
regulatory networks in Streptococcus pyogenes and their impact on pathogen-host
interactions. Trends in microbiology 11:224-232.
6. Malke H, Steiner K, McShan WM, Ferretti JJ. 2006. Linking the nutritional status of
Streptococcus pyogenes to alteration of transcriptional gene expression: the action of
CodY and RelA. International journal of medical microbiology : IJMM 296:259-275.
7. Loughman JA, Caparon M. 2006. Regulation of SpeB in Streptococcus pyogenes by
pH and NaCl: a model for in vivo gene expression. Journal of bacteriology 188:399-408.
8. Seshasayee AS, Bertone P, Fraser GM, Luscombe NM. 2006. Transcriptional
regulatory networks in bacteria: from input signals to output responses. Current opinion
in microbiology 9:511-519.

112
9. Neijssel OM, Snoep JL, Teixeira de Mattos MJ. 1997. Regulation of energy source
metabolism in streptococci. Soc Appl Bacteriol Symp Ser 26:12S-19S.
10. Yesilkaya H, Spissu F, Carvalho SM, Terra VS, Homer KA, Benisty R, Porat N,
Neves AR, Andrew PW. 2009. Pyruvate formate lyase is required for pneumococcal
fermentative metabolism and virulence. Infection and immunity 77:5418-5427.
11. Cotter PD, Hill C. 2003. Surviving the acid test: responses of gram-positive bacteria to
low pH. Microbiology and molecular biology reviews : MMBR 67:429-453, table of
contents.
12. Park SE, Jiang S, Wessels MR. 2012. CsrRS and environmental pH regulate group B
streptococcus adherence to human epithelial cells and extracellular matrix. Infection and
immunity 80:3975-3984.
13. Dmitriev AV, Chaussee MS. 2010. The Streptococcus pyogenes proteome: maps,
virulence factors and vaccine candidates. Future microbiology 5:1539-1551.
14. Ghosh J, Anderson PJ, Chandrasekaran S, Caparon MG. 2010. Characterization of
Streptococcus pyogenes beta-NAD+ glycohydrolase: re-evaluation of enzymatic
properties associated with pathogenesis. The Journal of biological chemistry 285:5683-
5694.
15. Mitchell TJ. 2003. The pathogenesis of streptococcal infections: from tooth decay to
meningitis. Nat Rev Microbiol 1:219-230.
16. Musser JM, Shelburne SA, 3rd. 2009. A decade of molecular pathogenomic analysis of
group A Streptococcus. The Journal of clinical investigation 119:2455-2463.
17. Olsen RJ, Musser JM. 2010. Molecular pathogenesis of necrotizing fasciitis. Annual
review of pathology 5:1-31.

113
18. Chandrasekaran S, Ghosh J, Port GC, Koh EI, Caparon MG. 2013. Analysis of
polymorphic residues reveals distinct enzymatic and cytotoxic activities of the
Streptococcus pyogenes NAD+ glycohydrolase. The Journal of biological chemistry
288:20064-20075.
19. Ghosh J, Caparon MG. 2006. Specificity of Streptococcus pyogenes NAD(+)
glycohydrolase in cytolysin-mediated translocation. Molecular microbiology 62:1203-
1214.
20. Madden JC, Ruiz N, Caparon M. 2001. Cytolysin-mediated translocation (CMT): a
functional equivalent of type III secretion in gram-positive bacteria. Cell 104:143-152.
21. Magassa N, Chandrasekaran S, Caparon MG. 2010. Streptococcus pyogenes
cytolysin-mediated translocation does not require pore formation by streptolysin O.
EMBO reports 11:400-405.
22. Mozola CC, Magassa N, Caparon MG. 2014. A novel cholesterol-insensitive mode of
membrane binding promotes cytolysin-mediated translocation by Streptolysin O.
Molecular microbiology 94:675-687.
23. Bricker AL, Carey VJ, Wessels MR. 2005. Role of NADase in virulence in
experimental invasive group A streptococcal infection. Infect Immun 73:6562-6566.
24. Michos A, Gryllos I, Hakansson A, Srivastava A, Kokkotou E, Wessels MR. 2006.
Enhancement of streptolysin O activity and intrinsic cytotoxic effects of the group A
streptococcal toxin, NAD-glycohydrolase. The Journal of biological chemistry 281:8216-
8223.

114
25. Riddle DJ, Bessen DE, Caparon MG. 2010. Variation in Streptococcus pyogenes
NAD+ glycohydrolase is associated with tissue tropism. Journal of bacteriology
192:3735-3746.
26. Chaussee MS, Sylva GL, Sturdevant DE, Smoot LM, Graham MR, Watson RO,
Musser JM. 2002. Rgg influences the expression of multiple regulatory loci to
coregulate virulence factor expression in Streptococcus pyogenes. Infection and
immunity 70:762-770.
27. Churchward G. 2007. The two faces of Janus: virulence gene regulation by CovR/S in
group A streptococci. Molecular microbiology 64:34-41.
28. Dmitriev AV, McDowell EJ, Kappeler KV, Chaussee MA, Rieck LD, Chaussee MS.
2006. The Rgg regulator of Streptococcus pyogenes influences utilization of nonglucose
carbohydrates, prophage induction, and expression of the NAD-glycohydrolase virulence
operon. Journal of bacteriology 188:7230-7241.
29. Graham MR, Smoot LM, Migliaccio CA, Virtaneva K, Sturdevant DE, Porcella SF,
Federle MJ, Adams GJ, Scott JR, Musser JM. 2002. Virulence control in group A
Streptococcus by a two-component gene regulatory system: global expression profiling
and in vivo infection modeling. Proceedings of the National Academy of Sciences of the
United States of America 99:13855-13860.
30. Hynes W. 2004. Virulence factors of the group A streptococci and genes that regulate
their expression. Frontiers in bioscience : a journal and virtual library 9:3399-3433.
31. Patenge N, Fiedler T, Kreikemeyer B. 2013. Common regulators of virulence in
streptococci. Current topics in microbiology and immunology 368:111-153.

115
32. Shelburne SA, Olsen RJ, Suber B, Sahasrabhojane P, Sumby P, Brennan RG,
Musser JM. 2010. A combination of independent transcriptional regulators shapes
bacterial virulence gene expression during infection. PLoS pathogens 6:e1000817.
33. Dalton TL, Hobb RI, Scott JR. 2006. Analysis of the role of CovR and CovS in the
dissemination of Streptococcus pyogenes in invasive skin disease. Microbial
pathogenesis 40:221-227.
34. Dalton TL, Scott JR. 2004. CovS inactivates CovR and is required for growth under
conditions of general stress in Streptococcus pyogenes. Journal of bacteriology
186:3928-3937.
35. Engleberg NC, Heath A, Vardaman K, DiRita VJ. 2004. Contribution of CsrR-
regulated virulence factors to the progress and outcome of murine skin infections by
Streptococcus pyogenes. Infection and immunity 72:623-628.
36. Froehlich BJ, Bates C, Scott JR. 2009. Streptococcus pyogenes CovRS mediates
growth in iron starvation and in the presence of the human cationic antimicrobial peptide
LL-37. Journal of bacteriology 191:673-677.
37. Gryllos I, Grifantini R, Colaprico A, Jiang S, Deforce E, Hakansson A, Telford JL,
Grandi G, Wessels MR. 2007. Mg(2+) signalling defines the group A streptococcal
CsrRS (CovRS) regulon. Molecular microbiology 65:671-683.
38. Gryllos I, Levin JC, Wessels MR. 2003. The CsrR/CsrS two-component system of
group A Streptococcus responds to environmental Mg2+. Proceedings of the National
Academy of Sciences of the United States of America 100:4227-4232.

116
39. Meehl MA, Pinkner JS, Anderson PJ, Hultgren SJ, Caparon MG. 2005. A novel
endogenous inhibitor of the secreted streptococcal NAD-glycohydrolase. PLoS pathogens
1:e35.
40. Biswas I, Scott JR. 2003. Identification of rocA, a positive regulator of covR expression
in the group A streptococcus. Journal of bacteriology 185:3081-3090.
41. Stock AM, Robinson VL, Goudreau PN. 2000. Two-component signal transduction.
Annual review of biochemistry 69:183-215.
42. Lynskey NN, Goulding D, Gierula M, Turner CE, Dougan G, Edwards RJ,
Sriskandan S. 2013. RocA truncation underpins hyper-encapsulation, carriage longevity
and transmissibility of serotype M18 group A streptococci. PLoS pathogens 9:e1003842.
43. Kelley LA, Sternberg MJ. 2009. Protein structure prediction on the Web: a case study
using the Phyre server. Nature protocols 4:363-371.
44. Wang C, Sang J, Wang J, Su M, Downey JS, Wu Q, Wang S, Cai Y, Xu X, Wu J,
Senadheera DB, Cvitkovitch DG, Chen L, Goodman SD, Han A. 2013. Mechanistic
insights revealed by the crystal structure of a histidine kinase with signal transducer and
sensor domains. PLoS biology 11:e1001493.
45. Santi I, Grifantini R, Jiang SM, Brettoni C, Grandi G, Wessels MR, Soriani M.
2009. CsrRS regulates group B Streptococcus virulence gene expression in response to
environmental pH: a new perspective on vaccine development. Journal of bacteriology
191:5387-5397.
46. Kietzman CC, Caparon MG. 2009. CcpA and LacD.1 affect temporal regulation of
Streptococcus pyogenes virulence genes. Infection and immunity 78:241-252.

117
47. Cocaign-Bousquet M, Garrigues C, Loubiere P, Lindley ND. 1996. Physiology of
pyruvate metabolism in Lactococcus lactis. Antonie van Leeuwenhoek 70:253-267.
48. Reiterer V, Eyers PA, Farhan H. 2014. Day of the dead: pseudokinases and
pseudophosphatases in physiology and disease. Trends in cell biology 24:489-505.
49. Boudeau J, Miranda-Saavedra D, Barton GJ, Alessi DR. 2006. Emerging roles of
pseudokinases. Trends in cell biology 16:443-452.
50. Childers WS, Xu Q, Mann TH, Mathews, II, Blair JA, Deacon AM, Shapiro L. 2014.
Cell fate regulation governed by a repurposed bacterial histidine kinase. PLoS biology
12:e1001979.
51. Gee CL, Papavinasasundaram KG, Blair SR, Baer CE, Falick AM, King DS, Griffin
JE, Venghatakrishnan H, Zukauskas A, Wei JR, Dhiman RK, Crick DC, Rubin EJ,
Sassetti CM, Alber T. 2012. A phosphorylated pseudokinase complex controls cell wall
synthesis in mycobacteria. Science signaling 5:ra7.
52. Reese ML, Boyle JP. 2012. Virulence without catalysis: how can a pseudokinase affect
host cell signaling? Trends in parasitology 28:53-57.
53. Horstmann N, Sahasrabhojane P, Saldana M, Ajami NJ, Flores AR, Sumby P, Liu
CG, Yao H, Su X, Thompson E, Shelburne SA. 2015. Characterization of the Effect of
the Histidine Kinase CovS on Response Regulator Phosphorylation in Group A
Streptococcus. Infection and immunity 83:1068-1077.
54. Trevino J, Perez N, Ramirez-Pena E, Liu Z, Shelburne SA, 3rd, Musser JM, Sumby
P. 2009. CovS simultaneously activates and inhibits the CovR-mediated repression of
distinct subsets of group A Streptococcus virulence factor-encoding genes. Infection and
immunity 77:3141-3149.

118
55. Jung K, Fried L, Behr S, Heermann R. 2012. Histidine kinases and response regulators
in networks. Current opinion in microbiology 15:118-124.
56. Buelow DR, Raivio TL. 2010. Three (and more) component regulatory systems -
auxiliary regulators of bacterial histidine kinases. Molecular microbiology 75:547-566.
57. Mitrophanov AY, Groisman EA. 2008. Signal integration in bacterial two-component
regulatory systems. Genes & development 22:2601-2611.
58. Port GC, Paluscio E, Caparon MG. 2013. Complete Genome Sequence of emm Type
14 Streptococcus pyogenes Strain HSC5. Genome announcements 1.
59. Lyon WR, Gibson CM, Caparon MG. 1998. A role for trigger factor and an rgg-like
regulator in the transcription, secretion and processing of the cysteine proteinase of
Streptococcus pyogenes. The EMBO journal 17:6263-6275.
60. Barnett TC, Scott JR. 2002. Differential recognition of surface proteins in
Streptococcus pyogenes by two sortase gene homologs. Journal of bacteriology
184:2181-2191.
61. Nielsen HV, Guiton PS, Kline KA, Port GC, Pinkner JS, Neiers F, Normark S,
Henriques-Normark B, Caparon MG, Hultgren SJ. 2012. The metal ion-dependent
adhesion site motif of the Enterococcus faecalis EbpA pilin mediates pilus function in
catheter-associated urinary tract infection. mBio 3:e00177-00112.
62. Ruiz N, Wang B, Pentland A, Caparon M. 1998. Streptolysin O and adherence
synergistically modulate proinflammatory responses of keratinocytes to group A
streptococci. Mol Microbiol 27:337-346.
63. Horton RM, Cai ZL, Ho SN, Pease LR. 1990. Gene splicing by overlap extension:
tailor-made genes using the polymerase chain reaction. BioTechniques 8:528-535.
119
64. Cho KH, Caparon MG. 2008. tRNA modification by GidA/MnmE is necessary for
Streptococcus pyogenes virulence: a new strategy to make live attenuated strains.
Infection and immunity 76:3176-3186.

120
Chapter IV
Alterations of CcpA Activation has Significant Effects on the Outcome of a Streptococcus pyogenes Infection

121
SUMMARY
Streptococcus pyogenes can infect a number of different tissue types within the human
host. Successful adaptation to these varying environments is, in part, due to the bacterium’s
ability to sense changes in environmental signals and rapidly alter its gene expression profile in
response to these changes. Carbon catabolite repression (CCR) allows the bacteria to metabolize
preferable carbon sources in the environment, usually through transcriptional repression of genes
in the processing of alternative, and less favorable, carbon sources. The key transcriptional
regulator of CCR in S. pyogenes is CcpA. This protein has been shown to be a global regulator of
gene expression, affecting transcription of genes involved in both carbon metabolism as well as a
number of known virulence factors. The majority of the identified CcpA-regulated genes are
upregulated in the absence of the protein, demonstrating that the main role of CcpA is in
repression of target genes. A great deal of work has been done to characterize the role of CcpA
in S. pyogenes pathogenesis, however, all of these previous studies utilize CcpA null mutants.
But, given the fact that CcpA acts mostly as a repressor of target genes, these previous studies
are unable to demonstrate the significance of CcpA function on metabolism and pathogenesis. To
provide a more complete analysis of CcpA function, we have designed a constitutively active
CcpA protein, CcpAT307Y. Both a CcpA- and CcpAT307Y mutants were then tested for altered
virulence in a soft tissue infection and in a vaginal mucosal colonization model. Both CcpA
mutants displayed altered virulence phenotypes in both models of infection. Further
characterization of the effects of these mutants on pathogenesis may lead to new insights into the
role of CcpA regulation in S. pyogenes.

122
INTRODUCTION
Carbon catabolite repression (CCR) is the mechanism by which bacteria preferentially
metabolize one carbon source over another from their environment, primarily through
transcriptional repression of genes necessary for processing alternative, and less favorable,
carbon sources. The key transcriptional regulator of CCR in low G+C Gram-positive bacteria is
the catabolite control protein A (CcpA) (1-4). In addition to controlling metabolic genes, CcpA
has been identified as a regulator of several virulence factors in a number of pathogenic bacterial
species (2, 5-8). This indicates that nutrient availability is linked to virulence factor production
and pathogenesis.
In the bacterium Streptococcus pyogenes, CcpA has been shown to be a global regulator of
gene expression, affecting transcription of approximately 20% of the total genome. S. pyogenes
is known to cause a wide variety of infections at numerous different tissue sites within the human
host (9-13). The diseases caused by S. pyogenes range from mild and self-limiting infections
such as impetigo and pharyngitis, to systemic and life threatening diseases such as cellulitis and
necrotizing fasciitis, as well as serious postinfection sequelae such as rheumatic fever and
glomerulonephritis (9, 10, 12, 14). The ability of S. pyogenes to infect a number of different
tissue types within the human host is, in part, due to the bacterium’s ability to sense changes in
environmental signals and rapidly alter its gene expression profile in response to these changes
(15-21). Several studies have demonstrated the ability of S. pyogenes to integrate various
environmental cues as a mechanism for global gene expression changes. These signals include
temperature, osmolarity, pH, and nutrient availability (17, 22-24).
Lacking functional alternative sigma factors, S. pyogenes transcription is under the control of
a number of two component systems and stand-alone response regulators to control gene

123
expression in response to various signals (17, 22, 25-31). Several of these regulators are known
to control gene expression in response to specific nutritional cues. RelA, CodY, and RopB are all
global transcription regulators whose function is linked to amino acid catabolism (29, 30, 32-34).
However, in addition to regulating a number of metabolic genes, all three regulators control a
number of virulence factors (29, 30, 32, 33). LacD.1, which was first identified as a regulator of
the cysteine protease SpeB, functions in response to the levels of the glycolytic intermediates
glucose-6-phosphate and dihydroxyacetone phosphate, indicating that it too functions as a
regulator of carbon catabolic control (35, 36). Additionally, it’s been shown that glucose
concentrations can have a global effect on gene expression in S. pyogenes, affecting both
alternative catabolic operons and numerous virulence factors, and this response largely
controlled through CcpA (5, 7, 8, 37). Taken together, this data indicates that nutrient
availability and virulence factor production are intimately linked through the actions of multiple
global regulatory pathways.
Numerous studies have been undertaken to assess the global effects of CcpA regulation and
its contributions to pathogenesis (2, 5-8). From these studies, several important pieces of
information have been derived. First, microarray analysis has shown that, although a significant
number of CcpA-regulated genes are also glucose-regulated genes, there is also a subset of genes
regulated by CcpA only, demonstrating that CcpA function is controlled by glucose-dependent
and -independent signals (5). Second, although CcpA primarily acts as a transcriptional
repressor, expression of a small subset of genes, including the major virulence factor SpeB, is
positively regulated by CcpA (2, 5). Finally, loss of the ccpA gene results in an attenuated
virulence phenotype in a murine model of soft tissue infection (2, 5). Transcriptional analysis of
CcpA-regulated genes during the course of a 7-day infection with either WT or the CcpA- mutant

124
showed temporal misregulation of targets in the mutant strain including both metabolic and
virulence genes. In particular, patterns of misregulation were most strongly associated with
earlier time points, suggesting that CcpA regulation is crucial during the early stages of
colonization (5). Additionally, the CcpA- mutant has also been shown to be defective in
asymptomatic mucosal carriage using a murine vaginal colonization model, and this defect was
primarily attributed to the dysregulation of the lactate oxidase gene lctO (13). Taken together,
these data demonstrate the significant and complex role that CcpA regulation has in controlling
the outcome of infection in multiple tissue environments.
A caveat to these data, however, is that these studies were limited to utilization of a ccpA
null mutant for analyses, which provides information exclusively on the effects of the loss of
CcpA function. Therefore, to further analyze the effect of CcpA activation and its role in
pathogenesis, we designed and tested a constitutively active mutant allele of CcpA, CcpAT307Y.
The constitutively repressive activity of the CcpAT307Y mutant was verified by analyzing
transcript levels of a series of known CcpA targets in vitro. The CcpAT307Y over-activation
mutant was then tested in vivo using two different mouse models of disease, subcutaneous soft
tissue infection and vaginal mucosal colonization and compared to WT and CcpA-. The results
indicate that over-activation of CcpA causes attenuation of virulence in soft tissue, but allows for
extended carriage during asymptomatic mucosal colonization.
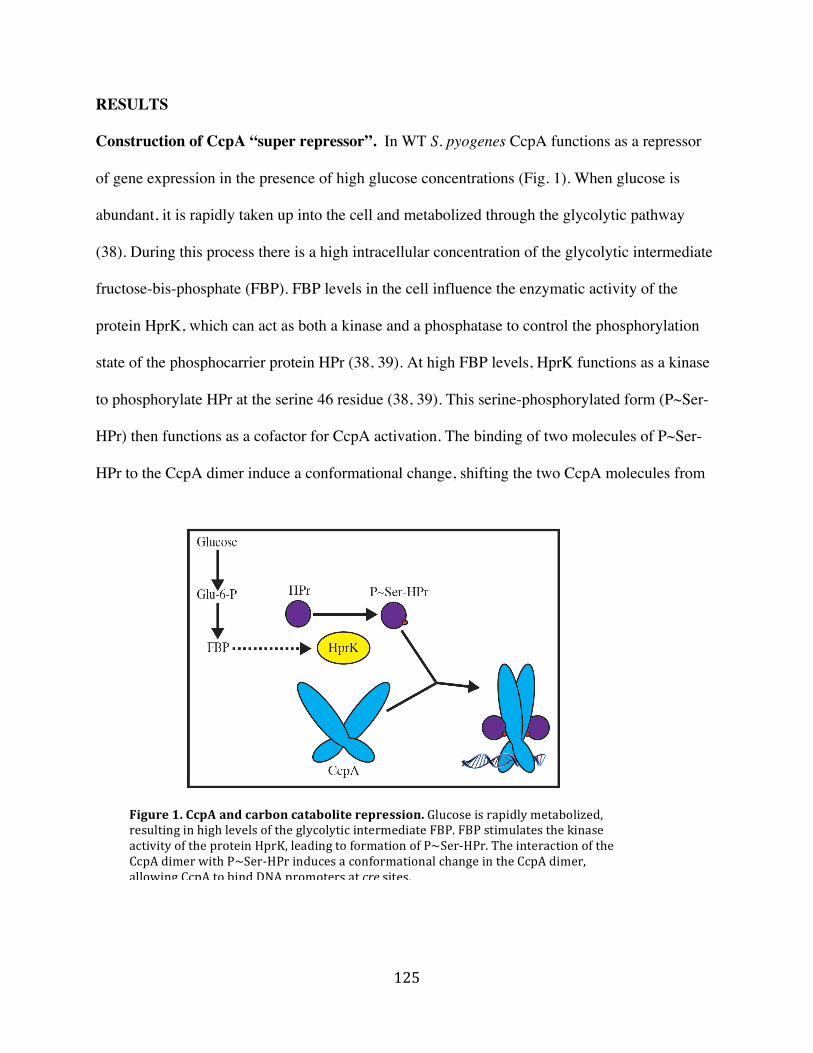
125
RESULTS
Construction of CcpA “super repressor”. In WT S. pyogenes CcpA functions as a repressor
of gene expression in the presence of high glucose concentrations (Fig. 1). When glucose is
abundant, it is rapidly taken up into the cell and metabolized through the glycolytic pathway
(38). During this process there is a high intracellular concentration of the glycolytic intermediate
fructose-bis-phosphate (FBP). FBP levels in the cell influence the enzymatic activity of the
protein HprK, which can act as both a kinase and a phosphatase to control the phosphorylation
state of the phosphocarrier protein HPr (38, 39). At high FBP levels, HprK functions as a kinase
to phosphorylate HPr at the serine 46 residue (38, 39). This serine-phosphorylated form (P~Ser-
HPr) then functions as a cofactor for CcpA activation. The binding of two molecules of P~Ser-
HPr to the CcpA dimer induce a conformational change, shifting the two CcpA molecules from
Figure 1. CcpA and carbon catabolite repression. Glucose is rapidly metabolized, resulting in high levels of the glycolytic intermediate FBP. FBP stimulates the kinase activity of the protein HprK, leading to formation of P~Ser-‐HPr. The interaction of the CcpA dimer with P~Ser-‐HPr induces a conformational change in the CcpA dimer, allowing CcpA to bind DNA promoters at cre sites.

126
an open and inactive conformation to a closed conformation, which can then bind to DNA at
specific promoter sites (Fig. 1, 2A) (40).
We sought to create a constitutively active form of CcpA through the mutation of a single
amino acid, Thr 307. Previously, the crystal structure of CcpA from the Gram-positive bacterium
Bacillus megaterium was solved (40). That work identified a series of amino acids found at the
dimer interface that were involved in the structural rearrangement of the CcpA dimer upon
P~Ser-HPr binding. In particular, they found that replacing the Thr with an amino acid with a
bulky side group would mimic P~Ser-HPr binding and force the CcpA dimer into its active,
closed conformation absent any cofactor binding (40). In S. pyogenes this key residue is Thr307.
Figure 2. Design of constitutively active CcpA. (A) WT CcpA, in the absence of glucose, remains in an open conformation and is unable to bind DNA. In the presence of glucose, a high quantity of serine phosphorylated HPr is formed. The interaction of P~Ser-‐HPr with CcpA switches the regulator into the closed conformation, which can then bind DNA. (B) Mutation of the Thr 307 residue of CcpA to Tyr forces the CcpA dimer into its closed conformation, mimicking P~Ser-‐HPr cofactor binding. CcpAT307Y functions independently from glucose concentrations and is active under all conditions.

127
Therefore, through directed mutagenesis the threonine residue was replaced with a tyrosine to
create the mutant CcpAT307Y (Fig. 2B).
CcpAT307Y is constitutively active in the absence of glucose signal. To test for growth defects
of the CcpA- and CcpAT307Y, both strains plus WT were cultured overnight in both a glucose rich
media (THY) (Fig. 3A) and a low carbohydrate media (C medium) (Fig. 3B). Growth in THY
medium was identical to WT for both CcpA-
and CcpAT307Y, indicating that in glucose
rich conditions these mutants have no
growth defects. When comparing growth in
C medium, both WT and CcpA- mutant
strains grew at a similar rate and reached a
final OD600 of 0.40, however the CcpAT307Y
mutant had a slight growth defect and
reached a final OD600 of 0.35.
To test for the functionality of the
CcpAT307Y mutant, real time RT-PCR was
performed on a series of known CcpA
target genes (2, 5). Previously published
work identified the lactate oxidase gene
lctO as being repressed by CcpA in response to glucose (5). For this analysis WT, CcpA-, and
CcpAT307Y strains were grown in unmodified C medium or C medium supplemented with 0.2%
glucose. Transcript levels were measured from cells grown to exponential phase and normalized
Figure 3. Growth of CcpA mutants in vitro. Growth of WT and CcpA mutants were grown in (A) rich media (THY) or (B) minimal medium (C medium).

128
to WT in unmodified C medium (Fig. 4A). The addition of glucose resulted in a 10-fold
reduction in transcript abundance in WT cells, yet had no effect in a CcpA- strain, indicating that
glucose-dependent CcpA-activation is responsible for lctO repression.
Furthermore, the CcpAT307Y strain,
displayed constitutively low lctO transcript
abundance compared to WT regardless of
glucose content, demonstrating that this
CcpAT307Y mutant is able to repress genes in
the absence of a glucose signal.
Although CcpA primarily acts as a
repressor of gene expression, in some cases
it can enhance transcription (2, 5). One gene
that is positively regulated by CcpA is speB,
the gene that encodes the SpeB cysteine
protease (2). WT and the two CcpA strains
were grown in C medium and transcript
levels were measured from cells at
stationary phase, when speB is maximally
expressed (Fig. 4B). As previously
published, the CcpA- strain displayed reduced transcript levels compared to WT. Interestingly,
the CcpAT307Y mutant displayed an approximately 50-fold increase in speB transcript compared to
WT. Taken together, these data indicate that the CcpAT307Y mutant is constitutively active, and
depending on the target gene, it induces either hyper-repression or hyper-activation.
Figure 4. CcpAT307Y is constitutively active in the absence of glucose signal. WT, CcpA-‐, and CcpAT307Y strains were grown in C medium with or without glucose to exponential phase (OD600 of 0.2). Total RNA was isolated and used for real-‐time RT-‐PCR analysis of lctO (A) or speB (B) transcript.
129
CcpAT307Y is attenuated in a murine soft tissue infection. Loss of CcpA is associated with
attenuation in a murine soft tissue infection model (5). Therefore, we sought to investigate the
effects of constitutive CcpA repression on virulence in this mouse model. For this analysis mice
were infected with WT, CcpA-, or CcpAT307Y and lesion areas were compared at day 3-post
infection (Fig. 5A and B). Comparison of lesion sizes shows that infections with either CcpA
mutants formed significantly smaller lesions than a WT infection. Additionally, lesions were
dissected at day 3 and tissue was plated to count bacterial CFU (Fig. 5C). Although the CcpA-
mutant had significantly reduced CFU, the CcpAT307Y mutant, however, had similar CFU to WT
at day 3 despite the strong attenuation phenotype seen with the lesion data. Taken together, this
data shows that although both the CcpA- mutant and the CcpAT307Y mutant are attenuated in
lesion formation, however, only the CcpA- strain has reduced CFU, suggesting that the cause of
the attenuation of these two strains is unique for each strain.

130
Figure 5. CcpA mutants have reduced virulence in soft tissue infections. Hairless SKH1 mice were infected subcutaneously with WT, CcpA-‐, or CcpAT307Y and the resulting lesions formed (A) and CFU (B) were measured at day 3 post-‐infection. Data shown are pooled from 2 independent experiments. Differences between groups were tested for significance using the Mann-‐Whitney U test (** P < 0.01, *** P < 0.001).

131
CcpA mutants have differential phenotypes in murine mucosal colonization model. In
addition to causing inflammatory infections of the skin, S. pyogenes can asymptomatically
colonize mucosal tissue (13). Recently, a model of asymptomatic carriage in the murine vaginal
mucosa was developed and it was shown that a CcpA- mutant was attenuated in this system (13).
This finding demonstrated that CcpA regulation was essential for long-term mucosal
colonization of S. pyogenes. Given this information, the next question to address is what effects a
CcpAT307Y mutant will have on mucosal colonization. WT, CcpA-, or CcpAT307Y strains were
vaginally inoculated into pre-estrogenized C57BL/6J mice and colonization was monitored by
counting viable CFU from vaginal washes collected over the course of 60 days. WT S. pyogenes
Figure 6. CcpA mutants have differential phenotypes in mucosal colonization model. Estrogenized C57BL/6J mice were vaginally inoculated at day 0 with 1x10⁶ CFU of streptomycin-‐resistant WT, CcpA-‐, or CcpAT307Y mutants. Vaginal washes were collected at the time points indicated and processed for determination of CFU. Each symbol represents the mean and standard error of the mean derived from at least 5 mice per group. A repeated measure analysis was used to compare mutants to WT.

132
maintained a high level of colonization through day 22, after which there was a rapid drop in
CFU (Fig. 6). The CcpA- mutant displayed an immediate drop in CFU, leading to complete
clearance by day 12 (Fig. 6). Conversely, the CcpAT307Y mutant had a distinct phenotype than
either WT or CcpA-. CFU from the CcpAT307Y mutant dropped several logs over the first 14 days,
but maintained higher numbers than the CcpA- mutant. Interestingly, the CcpAT307Y mutant
displayed extended carriage, with approximately 105 CFU detected at day 60 post inoculation,
long after WT was cleared (Fig. 6). This data indicates that enhanced CcpA activity is beneficial
to the bacteria during mucosal colonization.

133
DISCUSSION
For a pathogenic bacterial species such as Streptococcus pyogenes, precise spatial and
temporal expression of virulence factors is essential for the pathogen to achieve maximum
fitness in host tissue. Disruption of various regulatory pathways, leading to misregulation of
numerous target genes, has been shown to be detrimental for the bacterium (2, 13, 18, 41, 42). In
S. pyogenes, the catabolite repressor protein CcpA has been established as an important growth
phase-dependent regulator that is responsible for controlling a large number of metabolic and
virulence genes (2, 5). Although multiple studies have explored the role of CcpA through loss of
function mutants, this study sought to characterize the effects of CcpA activation on
pathogenesis.
In this study we have developed a constitutively active form of CcpA to use as a tool to
explore the role of catabolite repression on virulence in multiple tissue environments. In vitro
transcription levels of two known CcpA target genes demonstrated that the mutant, CcpAT307Y, is
a functional protein, capable of either constitutive repression or constitutive activation of gene
expression, depending on the target gene. In vivo experiments demonstrate that misregulation of
the CcpA regulon, in either a CcpA- or CcpAT307Y mutant, alters the outcome of both the soft
tissue infection and mucosal carriage. In the case of the inflammatory soft tissue model, both
CcpA mutants displayed reduced virulence, but only CcpA- was impaired in growth. In the
vaginal mucosal, CcpA- displayed reduced carriage compared to WT. Conversely, the CcpAT307Y
mutant had an extended carriage phenotype, indicating that excessive catabolite repression may
be beneficial for the bacterium in this environment.
The finding that both CcpA mutants are strongly attenuated in a soft tissue infection
demonstrates the importance of proper temporal control of gene expression to maximize fitness

134
of the bacteria. CcpA-mediated regulation is a dynamic process, linking gene expression to the
constant changes in nutrient availability. Loss of this regulatory system, either through loss of or
hyper-activation of CcpA, appears to be equally detrimental to pathogenesis of S. pyogenes.
However, the specific causes of this attenuation appear to be distinct for each of the CcpA
mutants.
The CcpA- infection lead to reduced lesion areas and fewer recoverable CFUs from lesion
tissue compared to WT. This finding indicates that the CcpA- mutant displayed a growth defect
in vivo that was not observed in vitro, and this defect most likely contributed to the attenuation
phenotype. One possible cause of this defect is that a CcpA- infection induces an altered host
response, leading to more efficient clearance of the bacteria. Preliminary investigations into host
immune response during infection have found that the loss of CcpA resulted in a significant
alteration in cytokine response during infection (C. Kietzman and M. Caparon, unpublished). In
particular, TNFα was significantly upregulated in a CcpA- infection compared to WT (C.
Kietzman and M. Caparon, unpublished). This finding suggests that a CcpA- mutant may be
deficient in producing an as-yet-unknown immune modulating virulence factor, resulting in a
robust TNFα response and more efficient bacterial clearance.
Conversely, an infection with CcpAT307Y created smaller lesions than WT, but had
equivalent amounts of recoverable bacteria from lesion tissue as WT. In this case, the observed
attenuation may be due to repression of one or more virulence factors necessary for the tissue
damage and necrosis that occurs when skin lesions develop. One possible candidate responsible
for this is the cytolysin Streptolysin S (SLS), which is both repressed by CcpA and is associated
with tissue damage and lesion formation (43-47). In a CcpAT307Y infection SLS would
theoretically be constitutively repressed, and without this key virulence factor, less tissue damage

135
would likely occur. It also remains possible that the attenuation of the CcpAT307Y mutant is the
result of excessive repression of multiple virulence factors, including SLS.
Similar to skin infections, the two CcpA mutants displayed distinct phenotypes when
infecting the murine vaginal mucosa. The CcpA- mutant’s rapid depletion and clearance is
similar to what has been seen previously for this mutant in mucosal tissue (13). In that work the
authors demonstrate that the lack of successful colonization is due to over-production of LctO,
leading to toxic levels of hydrogen peroxide production (13). The CcpAT307Y mutant, however,
displayed an initial loss of CFU early in colonization, but had an extended carriage greater than
both the CcpA- strain and WT. This pattern suggests that CcpA-mediated repression may be
detrimental during early stages of mucosal colonization, but beneficial for long-term
colonization. It has been suggested that the bacterial cells could be in a metabolically inactive
state during long-term carriage (13) and, if this were the case, repression of transcription for a
large set of genes would allow the cell to conserve energy and possibly persist longer in the
tissue.
136
MATERIALS AND METHODS
Bacterial strains and growth conditions. Standard molecular cloning techniques utilized the
Escherichia coli strain TOP10 (Invitrogen). Cultures were grown in Luria-Bertani medium at
37°C. Streptococcus pyogenes strain HSC5 (48) and mutant derivatives were utilized in this
study. Strains were grown in Todd Hewitt broth (THYB) with 0.2% yeast extract (Difco) or C
medium, adjusted to pH 7.5 as described previously (49). Routine growth conditions utilized
sealed culture tubes incubated at 37°C under static conditions. Streptococcal strains grown on
solid medium containing 1.4% Bacto agar (Difco) were cultured in a sealed jar with a
commercial gas generator (GasPak catalogue no. 70304, BBL). For experiments utilizing glucose
supplementation, filter sterilized 20% (w/v) stock solution was used to add glucose (Sigma) to a
final concentration of 0.2% to the media. All media used were sterilized in an autoclave prior to
supplementation. When appropriate, antibiotics were added at the following concentrations:
erythromycin 1 mg/mL.
Construction of mutants. All references to genomic loci are based on the genome of HSC5
(48). The mutant strain CcpA- was described previously (2). The modified allele for CcpA
(L897_02310), CcpAT307Y, was generated using the Quikchange XL II mutagenesis kit (Agilent
Technologies) and the PCR primers CcpA T307Y F (5’-
GTGCTGTTAGCATGCGGATGTTGTATAAAATCATGAACAAAAGAAGAGT) and CcpA
T307Y R (5’-ACTCTTCTTTGTTCATGATTTTATACAACATCCGCATGCT- AACAGCAC)
to create plasmid pEP44. The modified allele was transferred to the HSC5 chromosome using the
allelic replacement vector pGCP213 (50) as described (51). All molecular constructs and
chromosomal structures of all mutants were verified using PCR and DNA sequencing (Genewiz,

137
South Plainfield, NJ) using oligonucleotide primers (IDT, Coralville, IA) of the appropriate
sequences.
Isolation of RNA and transcript analysis. Transcript abundance of selected genes was
analyzed as previously described (52). Briefly, overnight cultures were diluted 1:25 into fresh C
medium with the appropriate supplement added (see text) and harvested at mid-log phase (OD600
0.2). Total RNA was isolated using Qiagen RNeasy Mini kit per the manufacturer’s protocol.
RNA was subjected to reverse-transcription (RT) using iScript (Bio-Rad) per manufacturer’s
protocol. RT-PCR analysis of cDNA samples were performed using iQ SYBR Green Supermix
(Bio-Rad). RT-PCR primers for lctO and speB reported previously (2). Relative transcript
abundance was determined using the ΔΔCt method using recA transcript as a standard and are
presented in comparison to wild type. The data shown are the means and the standard deviation
from triplicate determinations of at least two separate biological samples prepared from at least
two independent experiments.
Infection of mice. Infection of murine subcutaneous tissue was conducted as described
previously (53, 54). Briefly, 5-to-6-week-old female SKH1 hairless mice (Charles River Labs)
were injected subcutaneously with approximately 107 CFU of S. pyogenes of the strains indicated
in the text. Following infection, the resulting ulcers formed were monitored over a period of
several days by digital photography and lesion areas measured as previously described (53). Data
presented is pooled from at least two independent experiments with at least 10 mice per
experimental group. The ability of strains to maintain asymptomatic colonization of the murine
vaginal mucosa was measured in C57BL/6 mice, as previously described (13). Colonization was

138
assessed at selected time points over the course of 60 days by monitoring recoverable CFUs in a
50μL vaginal wash. Data presented was collected from a single infection of 3-5 mice per strain.

139
REFERENCES
1. Bruckner R, Titgemeyer F. 2002. Carbon catabolite repression in bacteria: choice of the
carbon source and autoregulatory limitation of sugar utilization. FEMS Microbiol Lett
209:141-148.
2. Kietzman CC, Caparon MG. 2009. CcpA and LacD.1 affect temporal regulation of
Streptococcus pyogenes virulence genes. Infect Immun 78:241-252.
3. Saier MH, Jr., Chauvaux S, Cook GM, Deutscher J, Paulsen IT, Reizer J, Ye JJ.
1996. Catabolite repression and inducer control in Gram-positive bacteria. Microbiology
142 ( Pt 2):217-230.
4. Warner JB, Lolkema JS. 2003. CcpA-dependent carbon catabolite repression in
bacteria. Microbiol Mol Biol Rev 67:475-490.
5. Kietzman CC, Caparon MG. 2010. Distinct time-resolved roles for two catabolite-
sensing pathways during Streptococcus pyogenes infection. Infection and immunity
79:812-821.
6. Kinkel TL, McIver KS. 2008. CcpA-mediated repression of streptolysin S expression
and virulence in the group A streptococcus. Infect Immun 76:3451-3463.
7. Shelburne SA, Davenport MT, Keith DB, Musser JM. 2008. The role of complex
carbohydrate catabolism in the pathogenesis of invasive streptococci. Trends Microbiol
16:318-325.
8. Shelburne SA, 3rd, Keith D, Horstmann N, Sumby P, Davenport MT, Graviss EA,
Brennan RG, Musser JM. 2008. A direct link between carbohydrate utilization and
virulence in the major human pathogen group A Streptococcus. Proc Natl Acad Sci U S
A 105:1698-1703.

140
9. Cole JN, Barnett TC, Nizet V, Walker MJ. 2011. Molecular insight into invasive
group A streptococcal disease. Nat Rev Microbiol 9:724-736.
10. Cunningham MW. 2000. Pathogenesis of group A streptococcal infections. Clinical
microbiology reviews 13:470-511.
11. Nobbs AH, Lamont RJ, Jenkinson HF. 2009. Streptococcus adherence and
colonization. Microbiol Mol Biol Rev 73:407-450, Table of Contents.
12. Walker MJ, Barnett TC, McArthur JD, Cole JN, Gillen CM, Henningham A,
Sriprakash KS, Sanderson-Smith ML, Nizet V. 2014. Disease manifestations and
pathogenic mechanisms of group a Streptococcus. Clinical microbiology reviews 27:264-
301.
13. Watson ME, Jr., Nielsen HV, Hultgren SJ, Caparon MG. 2013. Murine vaginal
colonization model for investigating asymptomatic mucosal carriage of Streptococcus
pyogenes. Infect Immun 81:1606-1617.
14. Cunningham MW. 2012. Streptococcus and rheumatic fever. Current opinion in
rheumatology 24:408-416.
15. Beier D, Gross R. 2006. Regulation of bacterial virulence by two-component systems.
Curr Opin Microbiol 9:143-152.
16. Caparon MG, Geist RT, Perez-Casal J, Scott JR. 1992. Environmental regulation of
virulence in group A streptococci: transcription of the gene encoding M protein is
stimulated by carbon dioxide. J Bacteriol 174:5693-5701.
17. Churchward G. 2007. The two faces of Janus: virulence gene regulation by CovR/S in
group A streptococci. Molecular microbiology 64:34-41.

141
18. Fiedler T, Sugareva V, Patenge N, Kreikemeyer B. 2010. Insights into Streptococcus
pyogenes pathogenesis from transcriptome studies. Future microbiology 5:1675-1694.
19. Froehlich BJ, Bates C, Scott JR. 2009. Streptococcus pyogenes CovRS mediates
growth in iron starvation and in the presence of the human cationic antimicrobial peptide
LL-37. Journal of bacteriology 191:673-677.
20. Graham MR, Virtaneva K, Porcella SF, Barry WT, Gowen BB, Johnson CR,
Wright FA, Musser JM. 2005. Group A Streptococcus transcriptome dynamics during
growth in human blood reveals bacterial adaptive and survival strategies. The American
journal of pathology 166:455-465.
21. Graham MR, Virtaneva K, Porcella SF, Gardner DJ, Long RD, Welty DM, Barry
WT, Johnson CA, Parkins LD, Wright FA, Musser JM. 2006. Analysis of the
transcriptome of group A Streptococcus in mouse soft tissue infection. The American
journal of pathology 169:927-942.
22. Hondorp ER, McIver KS. 2007. The Mga virulence regulon: infection where the grass
is greener. Mol Microbiol 66:1056-1065.
23. Kreikemeyer B, McIver KS, Podbielski A. 2003. Virulence factor regulation and
regulatory networks in Streptococcus pyogenes and their impact on pathogen-host
interactions. Trends in microbiology 11:224-232.
24. Loughman JA, Caparon M. 2006. Regulation of SpeB in Streptococcus pyogenes by
pH and NaCl: a model for in vivo gene expression. Journal of bacteriology 188:399-408.
25. Chaussee MS, Somerville GA, Reitzer L, Musser JM. 2003. Rgg coordinates virulence
factor synthesis and metabolism in Streptococcus pyogenes. J Bacteriol 185:6016-6024.
142
26. Cusumano Z, Caparon M. 2013. Adaptive evolution of the Streptococcus pyogenes
regulatory aldolase LacD.1. J Bacteriol 195:1294-1304.
27. Graham MR, Smoot LM, Migliaccio CA, Virtaneva K, Sturdevant DE, Porcella SF,
Federle MJ, Adams GJ, Scott JR, Musser JM. 2002. Virulence control in group A
Streptococcus by a two-component gene regulatory system: global expression profiling
and in vivo infection modeling. Proceedings of the National Academy of Sciences of the
United States of America 99:13855-13860.
28. Hollands A, Aziz RK, Kansal R, Kotb M, Nizet V, Walker MJ. 2008. A naturally
occurring mutation in ropB suppresses SpeB expression and reduces M1T1 group A
streptococcal systemic virulence. PloS one 3:e4102.
29. McDowell EJ, Callegari EA, Malke H, Chaussee MS. 2012. CodY-mediated
regulation of Streptococcus pyogenes exoproteins. BMC microbiology 12:114.
30. Neely MN, Lyon WR, Runft DL, Caparon M. 2003. Role of RopB in growth phase
expression of the SpeB cysteine protease of Streptococcus pyogenes. J Bacteriol
185:5166-5174.
31. McIver KS. 2009. Stand-alone response regulators controlling global virulence networks
in streptococcus pyogenes. Contributions to microbiology 16:103-119.
32. Malke H, Ferretti JJ. 2007. CodY-affected transcriptional gene expression of
Streptococcus pyogenes during growth in human blood. Journal of medical microbiology
56:707-714.
33. Malke H, Steiner K, McShan WM, Ferretti JJ. 2006. Linking the nutritional status of
Streptococcus pyogenes to alteration of transcriptional gene expression: the action of
CodY and RelA. International journal of medical microbiology : IJMM 296:259-275.

143
34. Podbielski A, Leonard BA. 1998. The group A streptococcal dipeptide permease (Dpp)
is involved in the uptake of essential amino acids and affects the expression of cysteine
protease. Mol Microbiol 28:1323-1334.
35. Loughman JA, Caparon MG. 2006. A novel adaptation of aldolase regulates virulence
in Streptococcus pyogenes. The EMBO journal 25:5414-5422.
36. Loughman JA, Caparon MG. 2007. Comparative functional analysis of the lac operons
in Streptococcus pyogenes. Molecular microbiology 64:269-280.
37. Kansal RG, Nizet V, Jeng A, Chuang WJ, Kotb M. 2003. Selective modulation of
superantigen-induced responses by streptococcal cysteine protease. The Journal of
infectious diseases 187:398-407.
38. Deutscher J. 2008. The mechanisms of carbon catabolite repression in bacteria. Curr
Opin Microbiol 11:87-93.
39. Deutscher J, Francke C, Postma PW. 2006. How phosphotransferase system-related
protein phosphorylation regulates carbohydrate metabolism in bacteria. Microbiol Mol
Biol Rev 70:939-1031.
40. Schumacher MA, Allen GS, Diel M, Seidel G, Hillen W, Brennan RG. 2004.
Structural basis for allosteric control of the transcription regulator CcpA by the
phosphoprotein HPr-Ser46-P. Cell 118:731-741.
41. Carvalho SM, Kloosterman TG, Kuipers OP, Neves AR. 2011. CcpA ensures optimal
metabolic fitness of Streptococcus pneumoniae. PloS one 6:e26707.
42. Dmitriev AV, McDowell EJ, Kappeler KV, Chaussee MA, Rieck LD, Chaussee MS.
2006. The Rgg regulator of Streptococcus pyogenes influences utilization of nonglucose

144
carbohydrates, prophage induction, and expression of the NAD-glycohydrolase virulence
operon. Journal of bacteriology 188:7230-7241.
43. Molloy EM, Cotter PD, Hill C, Mitchell DA, Ross RP. 2011. Streptolysin S-like
virulence factors: the continuing sagA. Nat Rev Microbiol 9:670-681.
44. Betschel SD, Borgia SM, Barg NL, Low DE, De Azavedo JC. 1998. Reduced
virulence of group A streptococcal Tn916 mutants that do not produce streptolysin S.
Infect Immun 66:1671-1679.
45. Mitchell DA, Lee SW, Pence MA, Markley AL, Limm JD, Nizet V, Dixon JE. 2009.
Structural and functional dissection of the heterocyclic peptide cytotoxin streptolysin S.
The Journal of biological chemistry 284:13004-13012.
46. Fontaine MC, Lee JJ, Kehoe MA. 2003. Combined contributions of streptolysin O and
streptolysin S to virulence of serotype M5 Streptococcus pyogenes strain Manfredo.
Infect Immun 71:3857-3865.
47. Sierig G, Cywes C, Wessels MR, Ashbaugh CD. 2003. Cytotoxic effects of streptolysin
o and streptolysin s enhance the virulence of poorly encapsulated group a streptococci.
Infect Immun 71:446-455.
48. Port GC, Paluscio E, Caparon MG. 2013. Complete Genome Sequence of emm Type
14 Streptococcus pyogenes Strain HSC5. Genome announcements 1.
49. Lyon WR, Gibson CM, Caparon MG. 1998. A role for trigger factor and an rgg-like
regulator in the transcription, secretion and processing of the cysteine proteinase of
Streptococcus pyogenes. The EMBO journal 17:6263-6275.
50. Nielsen HV, Guiton PS, Kline KA, Port GC, Pinkner JS, Neiers F, Normark S,
Henriques-Normark B, Caparon MG, Hultgren SJ. 2012. The metal ion-dependent

145
adhesion site motif of the Enterococcus faecalis EbpA pilin mediates pilus function in
catheter-associated urinary tract infection. mBio 3:e00177-00112.
51. Ruiz N, Wang B, Pentland A, Caparon M. 1998. Streptolysin O and adherence
synergistically modulate proinflammatory responses of keratinocytes to group A
streptococci. Mol Microbiol 27:337-346.
52. Cho KH, Caparon MG. 2008. tRNA modification by GidA/MnmE is necessary for
Streptococcus pyogenes virulence: a new strategy to make live attenuated strains.
Infection and immunity 76:3176-3186.
53. Brenot A, King KY, Janowiak B, Griffith O, Caparon MG. 2004. Contribution of
glutathione peroxidase to the virulence of Streptococcus pyogenes. Infect Immun 72:408-
413.
54. Bunce C, Wheeler L, Reed G, Musser J, Barg N. 1992. Murine model of cutaneous
infection with gram-positive cocci. Infect Immun 60:2636-2640.

146
Chapter V
Conclusions

147
CONCLUSIONS Streptococcus pyogenes is an extremely versatile bacterium, as it can colonize numerous
different tissue types within the human host as well as induce an inflammatory or
noninflammatory infection (1-3). A key factor for this versatility lies in the bacterium’s ability to
monitor various environmental signals in the surrounding tissues and rapidly alter its global
transcriptome to adapt itself for survival in a particular niche (4-8).
Through comparisons of gene expression patterns observed in infected tissue to
expression patterns from various in vitro growth conditions, it was previously determined that
the infected tissue environment is low in glucose and is low in pH (10). Additionally, these two
metabolic cues are linked due to the simple fermentative metabolism present in S. pyogenes (11-
14). Glucose fermentation results in the production of a large amount of organic acid end
products, which accumulate in the local environment and cause a significant drop in pH of the
surrounding tissue (11-13). Additionally, both pH and glucose levels have been shown to be
signals utilized by the bacterium to induce global transcriptional changes (10, 15), however the
specific mechanism by which these signals are sensed by the various regulatory pathways
remains largely unclear. The aim of this work was to identify these regulatory pathways and
elucidate their role in S. pyogenes pathogenesis. The major findings of this work include: 1) S.
pyogenes is able to utilize malate as an alternative carbon source through the malic enzyme
pathway, 2) regulation of the ME pathway in S. pyogenes is distinct from other LAB in that it is
positively regulated by low pH and is controlled by a CcpA-independent form of catabolite
repression, 3) loss of any ME genes can alter the outcome of an infection, 4) temporal expression
of the virulence factors SPN and SLO is controlled by environmental pH, 5) pH regulation of spn
and slo require the two-component system CovRS and the protein RocA, 6) RocA is not a

148
histidine kinase as previously reported in the literature, but is involved in a transcriptional
regulatory pathway that includes CovR and CovS, and 7) constitutive activation of CcpA alters
the outcome of disease in two different mouse models, leading to a unique phenotype distinct
from either a WT or CcpA- infection.
These studies provide new insights into the relationship between metabolism and pathogenesis in
S. pyogenes. In particular, it explores the effects of carbon source utilization on local tissue
remodeling and the regulatory mechanisms that the bacterium uses to adapt to these specific
changes.
During the initial stages of a soft tissue infection, glucose levels are at their highest. The
available glucose will be rapidly taken into the bacterial cell and metabolized, leading to
repression of alternative catabolic operons through both CcpA-dependent and –independent
pathways. Also during the early stages of infection the bacterial cells will begin to produce and
secrete toxins SPN and SLO, among others, to induce local tissue damage and cytotoxicity. Over
time, as glucose continues to be metabolized, both the concentration of glucose as well as the pH
begins to decrease. In response to these signals, alternative catabolic genes, such as the malic
enzyme genes, are expressed, as the cell needs to scavenge for alternative carbon sources. At this
point, malate is abundant at the site of infection, likely being released from host cells due to the
expression of several cytotoxic proteins, including SPN and SLO. While the acidic pH induces
expression of the ME genes, it simultaneously acts as a signal to turn off expression of spn and
slo, and this regulation is carried out via RocA and CovRS. Finally, upon depletion of glucose,
CcpA repression is relieved, allowing for expression of genes necessary for late stages of
colonization and dissemination.

149
FUTURE DIRECTIONS
Determine the regulatory pathway involved in activation of malic enzyme expression
The work presented here has established that the malic enzyme genes are under a form of
catabolite repression known as induction prevention, and this process is mediated through a
phosphorelay system that includes the general PTS proteins EI (encoded by the gene ptsI) and
HPr. What is currently unknown is the intermediate step between formation of P~His-HPr and
expression of the maeKR and maePE operons. Determination of the missing link in this
regulatory pathway will provide new insights into alternative carbon catabolite repression
pathways beyond the heavily studied CcpA side of catabolite repression.
One possible scenario is that the phosphate from P~His-HPr would be transferred to
another, currently unknown, transcriptional regulator, which then leads to activation of
transcription of the MaeKR regulatory operon. It has been shown in S. pyogenes and a number of
other bacteria that the phosphate from P~His-HPr can be directly transferred to regulatory
proteins containing a conserved PRD domain (16, 17).
In S. pyogenes there are three transcriptional regulators predicted to contain PRD
domains: Mga, RofA, and an uncharacterized RofA-like protein (RALP). Preliminary data
indicates that neither Mga nor RofA are required for ME expression or malate utilization (data
not shown). Work is currently in progress to investigate the third RALP protein as the possible
intermediate regulator in this regulatory pathway.
An alternative possibility is that a different, non-PRD regulator, or a PRD regulator not
identified via genome annotation or BLAST searches is involved in malate catabolism. We
currently plan to employ a transposon screen to unbiasedly identify mutants that are unable to
utilize malate. We predict to find known genes including all four malate utilization genes (maeE,
150
maeP, maeK and maeR), as well as HPr and PtsI, and any novel genes, including possible
transcriptional regulators. A more direct way to identify this potential regulator would be to
perform a pull-down experiment using the mae promoter region to see what binds to the DNA
sequence, followed by mass spectrometry analysis to identify these proteins.
A final possible hypothesis is that the transcriptional regulator in question is MaeK itself.
I find this unlikely due to the lack of a PRD domain. However, this is still a possibility that
should be tested. The most direct way to do his would by an in vitro kinase assay to look for the
direct transfer of the phosphate from P~His-HPr to MaeK.
Determination of RocA’s functional activity
There has been limited work done on RocA and its role in transcriptional regulation and
virulence. The work presented here refutes the previously published data suggesting that RocA is
a functional histidine kinase, but supports the findings that RocA interacts with the CovRS TCS.
The next step in understanding this regulatory circuit would be to determine what, if any,
enzymatic activity the RocA protein has. Structural prediction software (18) categorizes RocA as
a histidine kinase, based in part on the presence of a putative ATPase domain, among other
features. Data presented here has established that this protein is not functioning as a histidine
kinase, as mutating all histidine residues within the predicted cytoplasmic domain does not affect
RocA’s regulatory activity on SPN and SLO expression. It is also unlikely that the predicted
ATPase domain is functional, as several key residues necessary for its enzymatic activity are
absent in the sequence of RocA. However, these findings have not yet been verified

151
biochemically. What is clear is that RocA is a necessary part of the regulatory system controlling
the spn operon in response to pH.
The next step in this process will be to determine how RocA, CovR, and CovS work
together to coordinate the regulation of this virulence operon. One possibility that I find most
intriguing is that RocA functions as a pseudokinase, a protein that structurally resembles a kinase
but is lacking any enzymatic activity. Pseudokinases are present in all domains of life (9, 19-24)
and all known pseudokinases function in at least one of four mechanisms to modulate cellular
activity (see Fig. 1). Perhaps the most likely mechanism for RocA’s function is modulation of
Figure 1. Mechanism of action for pseudokinases. All identified pseudokinases have been associated with at least one of the four activities: Modulation of kinase/phosphatase activity, competitive inhibitor for substrate binding, anchor protein for substrate localization, or scaffold protein for signal integration. Adapted from (9).

152
the phosphorylation of CovR (Modulator). It’s been shown in previously published work that
CovR’s activity is dependent on its phosphorylation state, where different subsets of genes are
repressed by CovR depending on its phosphorylation state (6, 25). Additionally, CovS is known
to maintain both kinase and phosphatase activity (6, 25). Therefore, the next step in this work
should be to analyze the phosphorylation state of CovR in the presence or absence of RocA.
Finally, it is highly probable that RocA controls the expression of numerous genes in S.
pyogenes. Recent work on RocA function suggests that this protein may also function as a
regulator of a subset of genes independent from the CovRS regulon (26). Additionally, many of
the genes that were identified as being part of the RocA regulon are metabolic genes (26),
suggesting that RocA may be an as-yet unidentified metabolic regulator. To verify this and to
characterize the complete RocA regulon, a microarray or RNA-Seq experiment would provide an
in depth analysis of RocA’s contribution to
transcriptional regulation and virulence. Of particular interest would be to test a WT and RocA
mutant grown in buffered media, either neutral or acidic. If, in fact, RocA is a key regulator for
acid stress response there is likely many more genes being regulated by this protein. I think this
is just the beginning of the RocA story and it has the potential to provide some really interesting
and novel findings, particularly in relation to CovRS.
Analyzing the effect of CcpA activation on fitness and pathogenesis
One avenue to explore with the CcpA mutants is to study the effects of CcpA-mediated
regulation on growth and metabolic fitness. CcpA is a global regulatory protein and is the

153
primary regulator for most of the proteins in the main glycolytic pathway (15) and yet growth of
either of the CcpA mutants was unaffected in vitro under the conditions tested. An interesting
follow-up to those initial experiments would be to test WT and CcpA mutants in a range of
conditions and with several different carbohydrate substrates. Multiple aspects of cell growth
could be measured under these conditions such as final yield, growth rate, metabolic
intermediates, and fermentation end products. Evaluating these different measurements could
provide insights into CcpA regulation and how this control is affecting the overall fitness of the
bacteria.
When considering the effects of CcpA regulation on virulence, the data presented in this
work establishes that both the CcpA- and CcpAT307Y mutants were severely attenuated in a mouse
model of soft tissue infection. It’s been shown previously that CcpA regulates a number of
known virulence factors, some of which have immune modulatory function (15, 27). S. pyogenes
has been shown to induce a number of inflammatory cytokines within the host during an
infection, and work from the Caparon lab has shown that the loss of CcpA results in a significant
alteration in cytokine response during infection. In particular, TNFα was shown to play an
important role in controlling virulence in a CcpA- infection (C. Kietzman and M. Caparon,
unpublished). The previous studies indicate that the loss of CcpA repression has a measurable
effect on transcriptional regulation and host immune response throughout the course of an
infection. An important next step in understanding CcpA and its role in pathogenesis will
therefore be to measure host immune factors during a soft tissue infection with the super-
repressor CcpAT307Y. In particular, we will look for alterations in inflammatory cytokines by
ELISA or real time RT-PCR, as a more robust immune response may be responsible for the
attenuation in the CcpAT307Y mutant.

154
REFERENCES
1. Cole JN, Barnett TC, Nizet V, Walker MJ. 2011. Molecular insight into invasive
group A streptococcal disease. Nat Rev Microbiol 9:724-736.
2. Cunningham MW. 2000. Pathogenesis of group A streptococcal infections. Clinical
microbiology reviews 13:470-511.
3. Walker MJ, Barnett TC, McArthur JD, Cole JN, Gillen CM, Henningham A,
Sriprakash KS, Sanderson-Smith ML, Nizet V. 2014. Disease manifestations and
pathogenic mechanisms of group a Streptococcus. Clinical microbiology reviews 27:264-
301.
4. Carroll RK, Musser JM. 2011. From transcription to activation: how group A
streptococcus, the flesh-eating pathogen, regulates SpeB cysteine protease production.
Mol Microbiol 81:588-601.
5. Chaussee MS, Somerville GA, Reitzer L, Musser JM. 2003. Rgg coordinates virulence
factor synthesis and metabolism in Streptococcus pyogenes. J Bacteriol 185:6016-6024.
6. Churchward G. 2007. The two faces of Janus: virulence gene regulation by CovR/S in
group A streptococci. Molecular microbiology 64:34-41.
7. Fiedler T, Sugareva V, Patenge N, Kreikemeyer B. 2010. Insights into Streptococcus
pyogenes pathogenesis from transcriptome studies. Future microbiology 5:1675-1694.
8. Graham MR, Virtaneva K, Porcella SF, Gardner DJ, Long RD, Welty DM, Barry
WT, Johnson CA, Parkins LD, Wright FA, Musser JM. 2006. Analysis of the
transcriptome of group A Streptococcus in mouse soft tissue infection. The American
journal of pathology 169:927-942.

155
9. Reiterer V, Eyers PA, Farhan H. 2014. Day of the dead: pseudokinases and
pseudophosphatases in physiology and disease. Trends in cell biology 24:489-505.
10. Loughman JA, Caparon M. 2006. Regulation of SpeB in Streptococcus pyogenes by
pH and NaCl: a model for in vivo gene expression. Journal of bacteriology 188:399-408.
11. Cocaign-Bousquet M, Garrigues C, Loubiere P, Lindley ND. 1996. Physiology of
pyruvate metabolism in Lactococcus lactis. Antonie van Leeuwenhoek 70:253-267.
12. Martinussen J, Solem C, Holm AK, Jensen PR. 2012. Engineering strategies aimed at
control of acidification rate of lactic acid bacteria. Curr Opin Biotechnol 24:124-129.
13. Neijssel OM, Snoep JL, Teixeira de Mattos MJ. 1997. Regulation of energy source
metabolism in streptococci. Soc Appl Bacteriol Symp Ser 26:12S-19S.
14. Yesilkaya H, Spissu F, Carvalho SM, Terra VS, Homer KA, Benisty R, Porat N,
Neves AR, Andrew PW. 2009. Pyruvate formate lyase is required for pneumococcal
fermentative metabolism and virulence. Infection and immunity 77:5418-5427.
15. Kietzman CC, Caparon MG. 2010. Distinct time-resolved roles for two catabolite-
sensing pathways during Streptococcus pyogenes infection. Infection and immunity
79:812-821.
16. Deutscher J, Francke C, Postma PW. 2006. How phosphotransferase system-related
protein phosphorylation regulates carbohydrate metabolism in bacteria. Microbiol Mol
Biol Rev 70:939-1031.
17. Hondorp ER, Hou SC, Hause LL, Gera K, Lee CE, McIver KS. 2013. PTS
phosphorylation of Mga modulates regulon expression and virulence in the group A
streptococcus. Mol Microbiol 88:1176-1193.

156
18. Kelley LA, Sternberg MJ. 2009. Protein structure prediction on the Web: a case study
using the Phyre server. Nature protocols 4:363-371.
19. Boudeau J, Miranda-Saavedra D, Barton GJ, Alessi DR. 2006. Emerging roles of
pseudokinases. Trends in cell biology 16:443-452.
20. Taylor SS, Shaw A, Hu J, Meharena HS, Kornev A. 2013. Pseudokinases from a
structural perspective. Biochemical Society transactions 41:981-986.
21. Zeqiraj E, van Aalten DM. 2010. Pseudokinases-remnants of evolution or key allosteric
regulators? Current opinion in structural biology 20:772-781.
22. Gee CL, Papavinasasundaram KG, Blair SR, Baer CE, Falick AM, King DS, Griffin
JE, Venghatakrishnan H, Zukauskas A, Wei JR, Dhiman RK, Crick DC, Rubin EJ,
Sassetti CM, Alber T. 2012. A phosphorylated pseudokinase complex controls cell wall
synthesis in mycobacteria. Science signaling 5:ra7.
23. Reese ML, Boyle JP. 2012. Virulence without catalysis: how can a pseudokinase affect
host cell signaling? Trends in parasitology 28:53-57.
24. Childers WS, Xu Q, Mann TH, Mathews, II, Blair JA, Deacon AM, Shapiro L. 2014.
Cell fate regulation governed by a repurposed bacterial histidine kinase. PLoS biology
12:e1001979.
25. Horstmann N, Sahasrabhojane P, Saldana M, Ajami NJ, Flores AR, Sumby P, Liu
CG, Yao H, Su X, Thompson E, Shelburne SA. 2015. Characterization of the Effect of
the Histidine Kinase CovS on Response Regulator Phosphorylation in Group A
Streptococcus. Infection and immunity 83:1068-1077.
157
26. Lynskey NN, Goulding D, Gierula M, Turner CE, Dougan G, Edwards RJ,
Sriskandan S. 2013. RocA truncation underpins hyper-encapsulation, carriage longevity
and transmissibility of serotype M18 group A streptococci. PLoS pathogens 9:e1003842.
27. Kietzman CC, Caparon MG. 2009. CcpA and LacD.1 affect temporal regulation of
Streptococcus pyogenes virulence genes. Infection and immunity 78:241-252.