Draft Supplemental Environmental Impact Statement - USDA ...
Upload
khangminh22Category
view
1download
0
DRAFT ENVIRONMENTAL IMPACT ASSESSMENT REPORT
OF
THE PROPOSED COLOUR GRANITE QUARRY IN AN AREA OF 9.918 ha
BY
SRI RAGHAVENDRA GRANITES
AT SURVEY NO. 359,
BALLIKURAVA VILLAGE AND MANDAL, PRAKASAM DISTRICT, ANDHRA PRADESH
1. ENVIRONMENTAL IMPACT ASSESSMENT REPORT 2. CLUSTER ENVIRONMENT MANAGEMENT PLAN 3. COMPLIANCE OF TERMS OF REFERENCE 4. ANNEXURE
Terms of Reference: SEIAA/AP/PKM/MIN/12/2018/765 - 304, dt. 14.05.2019 Monitoring Period : February – April 2019 Project Cost : Rs. 80 Lakhs
SUBMITTED TO ANDHRA PRADESH POLLUTION CONTROL BOARD,
REGIONAL OFFICE, ONGOLE
Project No. 1120-01-02 November, 2020
Submitted By Sri Raghavendra Granites Flat No. G6, Sudha Towers, Opposite Seetharamaiah High School, Lakshmipuram Main Road, Guntur – 522 007
Studies and Documentation By TEAM Labs and Consultants NABET – Certificate No: NABET/ EIA/ 1821/ SA 0114, dt.04.09.2020 B-115 to 117& 509, Annapurna Block, Aditya Enclave, Ameerpet, Hyderabad-500 038 Phone: 040-23748 555/616, Telefax: 040-23748666 Email: [email protected]

SRI RAGHAVENDRA GRANITES SURVEY NO. 359, BALLIKURAVA VILLAGE AND MANDAL,
PRAKASAM DISTRICT, ANDHRA PRADESH
1. ENVIRONMENT IMPACT ASSESSMENT REPORT
SUBMITTED TO ANDHRA PRADESH POLLUTION CONTROL BOARD,
REGIONAL OFFICE, ONGOLE
Studies and Documentation By TEAM Labs and Consultants B-115 to 117 & 509, Annapurna Block, Aditya Enclave, Ameerpet, Hyderabad-500 038 Phone: 040-23748 555/616, Telefax: 040-23748666 Email: [email protected]
Submitted By Sri Raghavendra Granites Flat No. G6, Sudha Towers, Opposite Seetharamaiah High School, Lakshmipuram Main Road, Guntur – 522 007

CONTENTS
Section Chapter Page. No
1 Introduction
1.1 Introduction 1-1 1.2 Purpose of the Report 1-1 1.3 Brief Background of the Project 1-2 1.4 Mining Method 1-2 1.5 Mine Location 1-2 1.6 Environmental Impact Assessment 1-5 1.7 Scope of EIA Studies 1-5 1.8 Clearance requirement for the project 1-6
2 Project Description
2.0 Introduction 2-1 2.1 Land use pattern of the mine lease area 2-2 2.2 Geology of the area 2-2
2.2.1 Topography 2-2 2.2.2 Regional Geology 2-2 2.2.3 Local Geology 2-3
2.3 Reserves 2-4 2.4 Conceptual Mining plan 2-6 2.5 Mining Technology 2-7 2.6 Development and production 2-8 2.7 Machinery Requirement 2-10 2.8 Employment Potential 2-10 2.9 Site Services 2-10
2.10 Fire Fighting Facilities 2-11 2.11 Water Requirement 2-11 2.12 Effluent generation and groundwater 2-11 2.13 Crushing and Screening Plant 2-12 2.14 Reclamation and Rehabilitation 2-12 2.15 Details of Cluster Projects 2-12
3.0 Baseline Environmental Status 3.1 Introduction 3-1 3.2 Land Environment 3-1
3.2.1 Physiography 3-1 3.2.2 Geology 3-5 3.2.3 Hydrogeology 3-7 3.2.4 Soils 3-10

Section Chapter Page. No 3.3 Water Environment 3-16
3.3.1 Surface Water Resources 3-16 3.3.1.1 Surface Water Quality 3-16 3.3.1.2 Ground Water Resources 3-18 3.3.1.3 Quality of Ground Water 3-18
3.4 Air Environment 3-23 3.4.1 Meteorology 3-23 3.4.2 Meteorological Station at Mine Lease area 3-26 3.4.3 Ambient Air Quality 3-29 3.4.4 Scope of Field Study 3-31 3.4.5 Description of Sampling Locations 3-33 3.4.6 Ambient Air Quality Status 3-35 3.4.7 Noise Environment 3-37 3.4.8 Traffic Study 3-40
3.5 Socio Economic Environment 3-40 3.5.1 Demography 3-41 3.5.2 Population Distribution 3-41 3.5.3 Literacy 3-42 3.5.4 Employment/Occupation 3-43 3.5.5 Living Standards and Infrastructure 3-45 3.5.6 Land Utilization 3-47 3.5.7 Project Economy 3-48
3.6 Ecology 3-48
4 Anticipated Environment Impacts and Mitigation Measures 4.0 Identification of Impacts 4-1 4.1 Environmental impacts from mining and associated infrastructure 4-1
4.1.1 Impact Networks 4-4 4.2 Prediction and Assessment of Impacts 4-8
4.2.1 Methodology of Rapid Impact Assessment Matrix 4-8 4.2.2 Air Environment 4-13 4.2.3 Details of Mathematical Modeling 4-16 4.2.4 Emissions from Mining activity and transportation 4-18 4.2.5 Air Quality Predictions 4-19
4.3 Occupational Health Hazards Due to Dust Pollution 4-24 4.4 Noise Environment 4-24
4.4.1 Prediction of Impact on Noise Quality 4-25 4.4.2 Occupational Health Hazards of Noise Pollution 4-28
4.5 Water Environment 4-29 4.6 Land Environment 4-33 4.7 Biological Environment 4-36 4.8 Socio-economic Environment 4-41

Section Chapter Page. No 4.9 Prediction of Impact on Vehicular Traffic 4-43
5 Analysis of Alternatives
5.0 Introduction 5-1 5.1 Alternative Sites 5-1 5.2 Alternatives in Technology 5-1
6.0 Environmental Monitoring 6.1 Introduction 6-1
6.1.1 Objectives 6-1 6.1.2 Methodology 6-1 6.1.3 Ambient Air Quality (AAQ) Monitoring 6-2 6.1.4 Water Quality Monitoring 6-3 6.1.5 Noise Level Monitoring 6-7 6.1.6 Responsibility of Monitoring and Reporting System 6-8
6.2 Environmental Monitoring Budget 6-9
7.0 Additional Studies (Risk Assessment) 71 Introduction 7-1 7.2 Objectives and Scope 7-1 7.3 Mining Activity 7-1 7.4 Hazard Identification 7-1 7.5 Hazard Analysis 7-5 7.6 Disaster Management 7-6
7.6.1 Clearance 7-6 7.6.2 Construction of Services 7-6 7.6.3 Drilling 7-6 7.6.4 Failure of Pit Slopes 7-7 7.6.5 Transportation 7-7 7.6.6 House Keeping 7-7
7.7 Disaster Management Plan 7.7.1 Objective of Disaster Management Plan 7-8 7.7.2 Communication System 7-8 7.7.3 Facilities 7-9 7.7.4 Personal 7-9 7.7.5 Operating Procedure 7-9
8.0 Project Benefits 8.0 Introduction 8-1
9.0 Project Benefits 9.0 Introduction 9-1
Section Chapter Page. No 10
Environment Management Plan
10.0
Introduction 10-1 10.1 Sources of Pollution and Control Measures 10-1 10.2
Air Pollution and its Control 10-1
10.3
Greening program 10-2 10.4
Occupational Health and Safety Measures to Control Dust Inhalation 10-2
10.5
Noise pollution and its control 10-3 10.6
Occupational Health and Safety Measures to Control Exposure to Noise
10-3
10.7
Control of Ground Vibrations and Fly Rock Boulder 10-3 10.8
Water Quality Management 10-4
10.8.1
Water Resources Water Resources 10-4 10.8.2
Rain water Harvesting Plan 10-6
10.9
Soil Conservation Measures 10-6 10.10
Afforestation / Greenbelt Plan 10-7
10.11
Waste Management 10-8 10.12
Environmental Management System (EMS) 10-9
10.13
Environment Policy 10-9 10.14
Socio- Economic Development 10-11
10.15
Corporate Environmental Responsibility Action Plan 10-11 10.16
Environment Management Cell 10-12
10.17 Other Management Aspects 10-12 10.18 Occupational Health and Protective Measures 10-13 10.19 Cost proposed for Environmental Protection Measures 10-14 10.20 Environmental Management for the Cluster 10-15
11
Executive Summary
12
Disclosure of Consultants
IV ANNEXURES

Section Chapter Page. No List of Tables
1.1 Salient features of the mine lease location and study area 1-3 1.2 The Geo coordinates of the mine lease area 1-4 1.3 Required Approvals and Applicable statutes 1-9
2.1 Details of the Lease Area 2-2 2.2 Land use Pattern of the Mine Lease Area 2-2 2.3 Geological reserves 2-4 2.4 Year wise production 2-8 2.5 List of Machinery 2-10 2.6 Employment Potential 2-10 2.7 Water Requirement 2-11 2.8 Mine leases within 500m radius 2-14 2.9 Total Reserves, production and life of the mine in the cluster 2-16
2.10 Details of mining Area Utilized for Mining in the Cluster 2-17 2.11 Water Requirement in the cluster 2-18 2.12 Details of Transportation 2-19
3.1 Details of the mine lease location 3-1 3.2 Soil Analysis Data 3-13 3.3 Soil Test Results – Reference Tables 3-15 3.4 Surface water Analysis Data 3-17 3.5 Locations of groundwater sampling 3-18 3.6 Groundwater analysis data 3-21 3.7 Normal climatological table 3-24 3.8 Frequency Distribution of Wind Speed and Wind Direction 3-27 3.9 National Ambient Air Quality Standards 3-32
3.10 Locations of Ambient Air Quality Monitoring Stations 3-33 3.11 Ambient Air Quality Data status 3-35 3.12 AQI Index Showing the Results of Ambient Air Quality 3-36 3.13 Effects on Human Beings at Different Noise Levels 3-39 3.14 Equivalent Noise levels in the Study Area 3-39 3.15 Population Distribution – Study Area 3-41 3.16 Literacy - Study Area 3-42 3.17 Employment - Study Area 3-43 3.18 Main Workers - Study Area 3-45 3.19 Land Utilization Pattern 3-47 3.20 List of Local vegetation 3-55 3.21 List of Fauna & Their Conservation Status Mammals 3-59 3.22 listed birds 3-60 3.23 List of Reptiles either spotted or reported from the study area 3-61 3.24 List of Amphibians either spotted or reported from the study area 3-62

Section Chapter Page. No
4.1
Activity and Environmental Impact (Impact Identification Matrix) - Construction Stage
4-3
4.2
Activity and Environmental Impact (Impact Identification Matrix) - Regular Operation Stage
4-3
4.3
Activity and Environmental Impact (Impact Identification Matrix) - Incidents and Accidents
4-4
4.4
Activity and Environmental Impact (Impact Identification Matrix) - Decommissioning
4-4
4.5 Impacts on Air Environment 4-14 4.6 Impact significance - Air Environment 4-15 4.7 Salient Features of the ISCST3 Model 4-17 4.8 Predicted GLC’s at Monitoring Locations 4-20
4.9 Cumulative AAQ Concentration at various locations in the Impact Area
4-21
4.10 Impacts on Noise Level 4-27 4.11 Impact Significance – Noise Level 4-27 4.12 Noise Exposure Levels and Its Effects 4-28 4.13 Impacts on Surface Water 4-30 4.14 Impacts on Ground Water 4-31 4.15 Impacts Significance - Surface Water 4-31 4.16 Impacts Significance - Ground Water 4-32 4.17 Impacts on Land Environment 4-34 4.18 Impact Significance – Land environment 4-35 4.19 Impacts on Flora 4-38 4.20 Impacts on Fauna 4-39 4.21 Impact Significance – Flora 4-40 4.22 Impact Significance – Fauna 4-40 4.23 Impacts on Socio Economic 4-42 4.24 Impact Significance – Socio Economic 4-43 4.25 Modified level of services for connecting roads due to cluster 4-44
6.1 National Ambient Air Quality standards 6-2 6.2 Indian Standard Drinking water specifications 6-4 6.3 Noise Level Standards 6-7 6.4 Environmental Monitoring Plan 6-8 6.5 Environmental Monitoring Budget 6-9 6.6 Environmental Monitoring Budget – Cluster 6-9
7.1 Details of Mine Lease Area 7-1 7.2 Trend of Accidents in Non-coal Mines - Cause Wise 7-5

Section Chapter Page. No 10.1
List of plants identified for greenbelt and restoration of mine pits 10-7
10.2
CER Plan and Budget 10.3
Frequency of Health Monitoring 10-12
10.4
Environment Management - Cost Estimate 10-14 10.5
Generic Environment Management Measures 10-14
10.6 Cluster EMP Cost estimation 10-16
List of Figures
1.1 Mine Lease area Location and study area map 1-7 1.2 Mine Lease area Boundary Map 1-8 1.3 Mine Lease area photographs 1-8
2.1 Surface, Geological plan 2-3 2.2 Geological Cross Sections 2-4 2.3 Conceptual Plan 2-6 2.4 Conceptual cross sections 2-6 2.5 Year wise Working Plan 2-9 2.6 working cross sections 2-9
3.1 Base map of the study area 3-4 3.2 Geological map of the study area 3-6 3.3 Hydrogeological Map of the study area 3-9
3.4 Land use and land cover of the study area 3-11
3.5 Soil Sampling Locations 3-12
3.6 Drainage pattern of the study area 3-19
3.7 Water Sampling Locations 3-20
3.8 Wind Rose Diagram of the study period at mine lease area 3-28
3.9 Ambient Air Quality Monitoring Locations 3-34
3.10 Noise Sampling Locations 3-36
3.11 Peak Hour Traffic 3-40
3.12 Population distribution of the Study Area 3-42
3.13 Literacy of Study Area 3-43
3.14 Employment of Study Area 3-44
3.15 Reserve forest vegetation photos 3-62
4.1 Conceptual site model of mining activity (Site Preparation) 4-5 4.2 Conceptual site model of mining activity (During Mining) 4-5 4.3 Impacts on Air Environment 4-5 4.4 Impacts on Water Environment 4-6 4.5 Noise Impact on Surrounding Environment 4-6 4.6 Impact of Solid Waste on Soil Quality 4-7 4.7 Socio- Economic Environment 4-7 4.8 PM10 Ground Level Concentrations 4-22 4.9 PM2.5 Ground Level Concentrations 4-23
10.1 Garland drainage 10-5
Sri Raghavendra Granites Environmental Impact Assessment Report
Team Labs and Consultants 1-1
CHAPTER 1.0 INTRODUCTION
1.1 Introduction
Sri Raghavendra Granites obtained a mine lease to extract colour granite in an area
of 9.918 ha using semi mechanized opencast mining at Sy. No. 359, Ballikurava
Village and mandal, Prakasam district, Andhra Pradesh. Colour Granite is an
igneous rock. It forms from the slow crystallization of magma below Earth's surface,
and has been exposed to high temperatures and pressures. Granite is a very common
intrusive igneous rock. Granite is composed mainly of quartz and feldspar with
minor amounts of mica, amphiboles, and other minerals. This mineral composition
usually gives granite a red, pink, gray, or white color with dark mineral grains
visible throughout the rock. It is light-colored granulose plutonic rock composed of
the minerals feldspar, quartz and biotite and muscovite mica. Granite also contains
small amounts of dark brown, dark-green, or colour minerals, such as hornblende
and biotite mica. Granite is very hard and dense. It can be readily cut into very large
blocks and it takes an extremely high polish. Granite has been extensively used as a
dimension stone and as flooring tiles in public and commercial buildings and
monuments. Rough-cut and polished granite is used in buildings, bridges, paving,
monuments and many other exterior projects. Indoors, polished granite slabs and
tiles are used in countertops, tile floors, stair treads and many other practical and
decorative features. Colour Granite are considered as minor mineral and is mainly
used for monuments, Flooring, Pathos and pations, granite kitchen worktops,
gemstones and waste will be used for construction projects and formation of roads.
1.2 Purpose of the Report
The Ministry of Environment, Forest and Climate Change (MoEFCC), Government
of India (GOI) issued notifications vide SO 1533, dt. 14.9.2006, its amendments based
on the directions issued by National Green Tribunal (NGT), New Delhi vide O. A.
No. 16 of 2016, dt.13.09.2018 and vide E.A.NO 55/2018 of O. A. No. 520/2016, dt.
11.12.2018 on Moefcc notification S.O.2269 (E), dt.01.07.2016 and S.O.3977 (E),
dt.14.08.2018 and Office Memorandum dt.12.12.2018 issued in compliance with the
hon’ble NGT orders, New Delhi, mandate prior environmental clearance for all
Sri Raghavendra Granites Environmental Impact Assessment Report
Team Labs and Consultants 1-2
mining leases across the country. The notification and its amendments based on
NGT directions, classify mine lease areas of 5 - 25 ha as category B2 at par with B1,
and stipulate a three-stage process of scoping, public consultation and appraisal by
State Environmental Impact Assessment Authority (SEIAA) to issue prior
environmental clearance. Accordingly scoping for preparation of environmental
impact assessment (EIA) was done by the state expert appraisal committee (SEAC),
which issued terms of reference vide Letter No. SEIAA/AP/PKM/MIN/
12/2018/765-304, dt. 14.05.2019 for a production capacity of 101315.52 m3/annum
(Recovery of colour granite @ 15% - 15197.33 m3/annum and Waste @ 85% - 86118.19
m3/annum) in an area of 9.918 ha. The present study follows the prescribed TOR’s to
prepare draft EIA/EMP report for public consultation, to facilitate informed view on
the project by public/stakeholders.
1.3 Brief Background of the Project
In principle of application of quarry lease notice issued by Director of Mines and
Geology, Ibrahimpatnam, Govt. of Andhra Pradesh, vide Notice no. 5615/R3-2/2018
dated 16.11.2018 for a period of 20 years. The Mining Plan was approved by the
Joint and Deputy Director of Mines and Geology, Guntur, Government of Andhra
Pradesh, Government of Andhra Pradesh, vide Letter No. 5204/MP/CG/OGL/2018
dated 01.12.2018 for a production capacity of production capacity of 101315.52
m3/annum (Recovery of colour granite @ 15% - 15197.33 m3/annum and Waste @
85% - 86118.19 m3/annum). The proposed project is envisaged with a capital cost of
Rs. 80 Lakhs.
1.4 Mining Method
The mining will be opencast semi mechanized mining, drilling, wire Shaw cutting
and without blasting. It involves drilling, excavating and loaded to trucks with the
help of escalator and transported through trucks.
1.5 Mine Location
The salient features of the mine lease location are presented in Table 1.1.
Table 1.1 Salient features of the mine lease location

Sri Raghavendra Granites Environmental Impact Assessment Report
Team Labs and Consultants 1-3
Particulars Details
Name of the Project (s) Semi mechanized opencast mining for Colour granite in area of 9.918 ha with production capacity of 101315.52 m3/annum (Recovery of colour granite @ 15% - 15197.33 m3/annum and Waste @ 85% - 86118.19 m3/annum)
Name of the Applicant Sri Raghavendra Granites
Location of the Project Survey No. 359, Ballikurava Village, Ballikurava Mandal, Prakasam District, Andhra Pradesh State.
Project Sector Non-Coal Mining
S. No. in the schedule 1(a) Mining of minerals
Category of project B1
New / Expansion / Modernization New project
Capital Cost, 80 lakhs
Land Use Pattern (Forest, Agricultural, Grazing, Barren etc.)
Govt. land – 9.918 ha
Latitudes (North) 16° 2'12.50" - 16° 2'25.30"
Longitudes (East) 80° 0'1.20" - 80° 0'17.20"
Survey of India sheet No 65 D/04
Elevation above Mean Sea Level (AMSL), m
74 - 222 m
Seismic zone Seismic Zone: III as per IS: 1893 (part -1): 2002 (RA:2016) and can be classified as Moderate Damage Risk Zone
Site surroundings North : Hillock
East : Open Land
West : Hillock
South : Open Land
Nearest Village Kondayapalem – 1.5 km – South direction
Accessibility to site Road connecting – SE direction
Road access Ballikurava to Kopparam road – 1.5 km - East direction.
Nearest Town Chilakaluripeta – 16.4 km – NE direction
District Head quarters Ongole – 58 km – SE direction
Nearest Railway station Santhamaguluru – 15.5 km – NW direction
Nearest airport Gannavaram Airport – 100 km – NE direction
Nearest Port Krishnapatnam Port – 193 km – S direction
Major Industries (Within 10 km radius)
Nil within 10 km
Water Bodies in buffer area Seasonal Nala Vagu - 4.8 km - South. Seasonal Boddula vagu - 4.9km - NE. Seasonal Vogaru vagu - 6.6 km - NE. Santhamaguluru Canal - 6.0 km - North. Nagarjuna Sagar Right Bank Canal - 7.0 km - SW. Tangedumalli Major Canal - 5.9 km - NE. Kopparam Major Canal - 5.1 km - NE.

Sri Raghavendra Granites Environmental Impact Assessment Report
Team Labs and Consultants 1-4
Particulars Details
Kopparam major Canal - 5.1 km - NW. Pasumarti Major Canal - 1.0 km – North.
the Project / Activity attracts the provisions of CRZ
Not Applicable
Reserve Forest Uppumaguluru RF - 3.2 km - NE
Muktheswaram RF - 5.7 km - SW
Nagarajupalli RF - 7.4 km - SE
Kukutlapalli RF 9.0 km - SW
Archaeological/ Historical/ Ancient Monuments
Nil within 10 km
Inter-state boundary and international boundary
Nil within 10 km
Protected Areas notified under the Wild Life (Protection) Act, 1972
Nil within 10 km
Eco-sensitive areas as notified under section 3 of the E (P) Act, 1986
Nil within 10 km
Critically polluted areas as identified by the Central Pollution Control Board from time to time,
Nil within 10 km
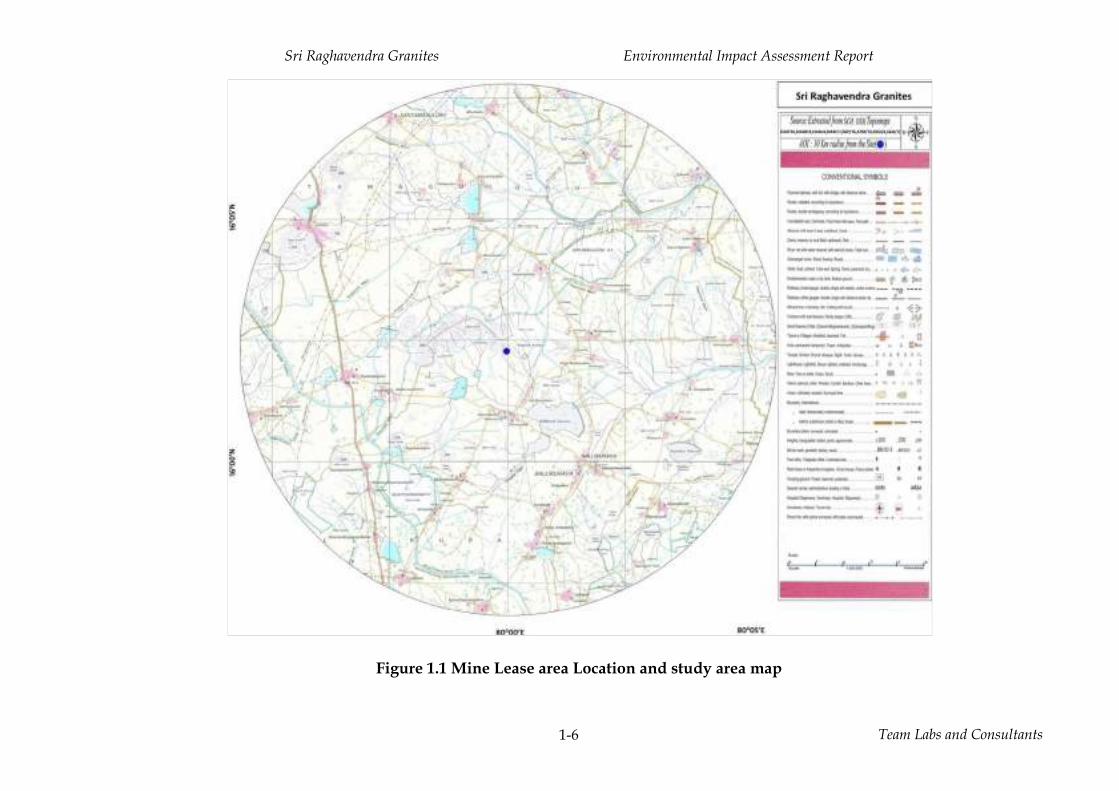
This land is an elevated hill terrain and does not involve forest land except some
shrubs. The Mine lease area location is presented in Figures 1.1. The Geo
coordinates of the mine lease area are presented in Table 1.2. The mine lease area
sketch is presented in Figure 1.2. The site photographs are presented in Figure 1.3.
Table 1.2 The Geo coordinates of the mine lease area
latitude, N longitude, E
16° 2'12.50" 80° 00'1.20"
16° 2'12.70" 80° 00'6.00"
16° 2'13.20" 80°00'11.50"
16° 2'24.50" 80° 00'17.20"
16° 2'25.30" 80° 00'9.80"
1.6 Environmental Impact Assessment
Drilling, Excavation, loading and transportation of colour granite results in
substantial dust and noise emissions apart from dust from haulage roads connected
to approach road. The mining activity shall also have other detrimental
environmental impacts necessitating mitigation measures. Sri Raghavendra Granites
is conscious of their responsibility towards the society in minimizing the pollution
Sri Raghavendra Granites Environmental Impact Assessment Report
Team Labs and Consultants 1-5
load due to this project and accordingly decided to carry out the Environmental
Impact Assessment to identify the negative and positive impacts and to delineate
effective measures to control the pollution and to mitigate the environmental
pollution in addition to identify effective measures to address residual impacts. The
mine lease area is part of a cluster, vide letter. No. 1959/Q/2018, dt.08.02.2019,
issued by AD Mines and Geology. The environmental impact assessment considered
the cumulative impacts due to the cluster (including Sri Andru Suresh Babu,
Maddineni Veeranjaneyulu, Raghavendra Granites, and Chitturi Kedarnath, Bharath
Exports, Sri Eswar Granites, Amaravathi Mines, Kum. M. Raga Sindhuri, Sri S.
Sarath Chandra, Sanjana Exports, Devi Impex and awaiting LOI for Maddineni
Veeranjaneyulu, Raghavendra Granites etc) and accordingly environment
management plan for each mine of the cluster is prepared in addition to the cluster
EMP. Sri Raghavendra Granites has appointed M/s. Team Labs and Consultants for
the preparation of environmental impact assessment report.
The EIA report was prepared on the basis of TOR obtained from SEIAA, AP. The
baseline data for preparation of this report was collected during February - April
2019.
The other studies such as socio-economic profile, land use pattern is based on
secondary data collected from various Government agencies and validated through
primary surveys. Field team of M/s. Team labs and Consultants worked in the
study area during February - April 2019 and base line data for various
environmental components i.e., air, water, soil, noise and flora and fauna and socio
economic status of people was collected in a circular area of 10 km radius by taking
the mine lease area as the center point to assess the existing environmental status as
per the guidelines specified by MoEFCC, GOI. This report presents the results of
environmental impact assessment study along with the environment management
plan, necessary to contain observed environmental impacts of the project.
Sri Raghavendra Granites Environmental Impact Assessment Report
Team Labs and Consultants 1-6
Figure 1.1 Mine Lease area Location and study area map

Sri Raghavendra Granites Environmental Impact Assessment Report
Team Labs and Consultants 1-7
Figure 1.2 Mine Lease Area Boundary Map

Sri Raghavendra Granites Environmental Impact Assessment Report
Team Labs and Consultants 1-8
Figure 1.3 Mine lease area photographs
1.7 Scope of EIA Studies
Environmental impact assessment study involves three basic components;
identification, prediction and evaluation of impacts. The scope of EIA report is
based on the TOR obtained from SEIAA - AP. Brief scope of EIA study is as follows;
➢ An intensive reconnaissance and preliminary collection of environmental
information to plan field study.
➢ Field studies to collect preliminary information, particularly on the quality of the
physical environment. Experienced scientists and engineers will collect the data.
➢ Base line data generation and characterization of air, water, soil, noise, vegetation
and socio-economic status of the people in the 10-kilometer radius area (impact
zone) over a period of three months.

Sri Raghavendra Granites Environmental Impact Assessment Report
Team Labs and Consultants 1-9
➢ A thorough study of the mining activity including provisions for pollution
control, and environmental management that includes prediction of impacts and
relevant mathematical modeling.
➢ A study of cluster of Colour Granite mines in the vicinity considering the
cumulative impacts due to mining, transportation, resource consumption and
waste disposal by the lease holders.
➢ Preparation of Environment Management plan for the cluster and for the present
mine suggesting suitable methods for mitigating and controlling the pollution
levels.
➢ Environmental monitoring plan is suggested for monitoring the pollution loads
due to mining activity in the ML area, cluster area and in the surrounding impact
area to ensure compliance with the statutory requirements and to check adequacy
of environment management measures adopted.
➢ The reporting format shall follow the generic structure mentioned in the SO.1533
dt. 14.9.2006 and its amendments.
1.8 Clearance requirement for the project
The statutory approvals required for this project and the applicability of various acts
which consider environmental management are presented in Table 1.3.
Sri Raghavendra Granites Environmental Impact Assessment Report
Team Labs and Consultants 1-10
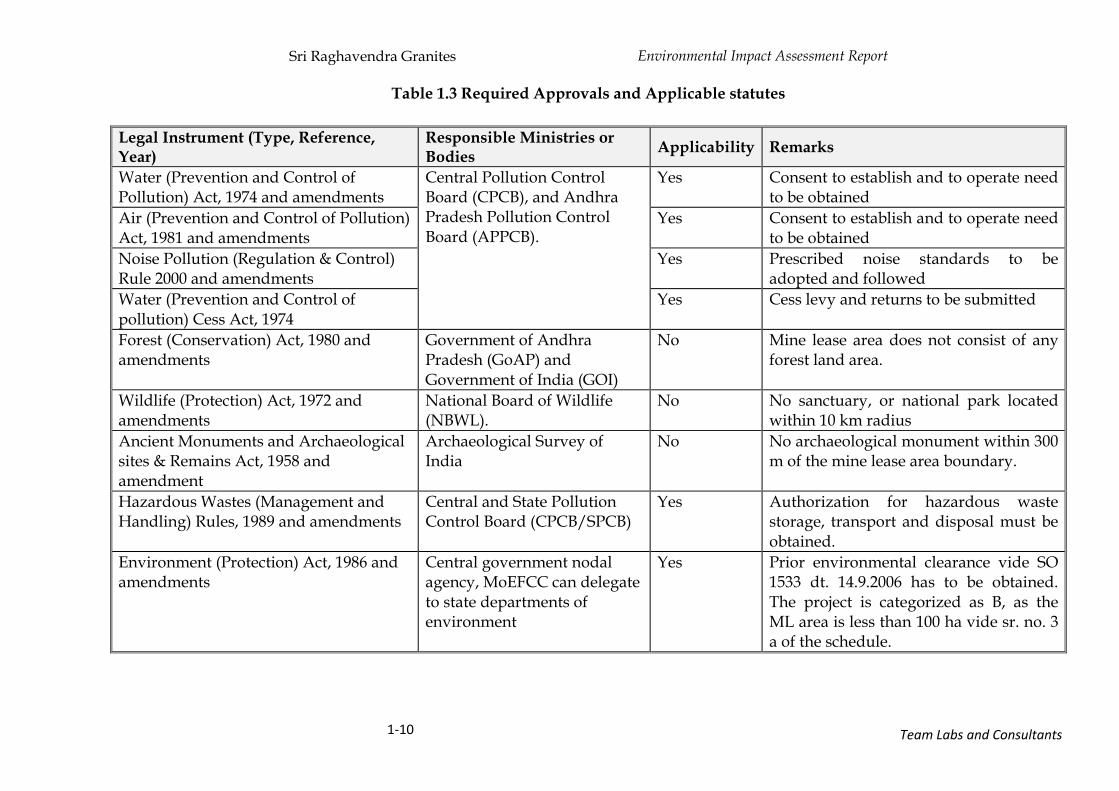
Table 1.3 Required Approvals and Applicable statutes
Legal Instrument (Type, Reference, Year)
Responsible Ministries or Bodies
Applicability Remarks
Water (Prevention and Control of Pollution) Act, 1974 and amendments
Central Pollution Control Board (CPCB), and Andhra Pradesh Pollution Control Board (APPCB).
Yes Consent to establish and to operate need to be obtained
Air (Prevention and Control of Pollution) Act, 1981 and amendments
Yes Consent to establish and to operate need to be obtained
Noise Pollution (Regulation & Control) Rule 2000 and amendments
Yes Prescribed noise standards to be adopted and followed
Water (Prevention and Control of pollution) Cess Act, 1974
Yes Cess levy and returns to be submitted
Forest (Conservation) Act, 1980 and amendments
Government of Andhra Pradesh (GoAP) and Government of India (GOI)
No Mine lease area does not consist of any forest land area.
Wildlife (Protection) Act, 1972 and amendments
National Board of Wildlife (NBWL).
No No sanctuary, or national park located within 10 km radius
Ancient Monuments and Archaeological sites & Remains Act, 1958 and amendment
Archaeological Survey of India
No No archaeological monument within 300 m of the mine lease area boundary.
Hazardous Wastes (Management and Handling) Rules, 1989 and amendments
Central and State Pollution Control Board (CPCB/SPCB)
Yes Authorization for hazardous waste storage, transport and disposal must be obtained.
Environment (Protection) Act, 1986 and amendments
Central government nodal agency, MoEFCC can delegate to state departments of environment
Yes Prior environmental clearance vide SO 1533 dt. 14.9.2006 has to be obtained. The project is categorized as B, as the ML area is less than 100 ha vide sr. no. 3 a of the schedule.

Sri Raghavendra Granites Environmental Impact Assessment Report
Team Labs and Consultants 1-11
Legal Instrument (Type, Reference, Year)
Responsible Ministries or Bodies
Applicability Remarks
Right to Fair Compensation and Transparency in Land Acquisition, Rehabilitation and Resettlement Act, 2013 and amendments
Central / State Government No No displacement of People and no acquisition of land. ML area is government land, leased out by Go AP.
Mineral Conservation and Development Rules, 1988 as amended
Controller of Mines or the Chief Controller of Mines
Yes Implementation of mine plan including environmental management must be assured.
The Metalliferous Mines Regulations, 1961
Government of India (GOI), DGMS
Yes Annual Return for the year ending on the 31st December.
Andhra Pradesh Panchayat Extension to Scheduled Areas Rules, 2011
Govt of Andhra Pradesh No The ML area does not fall under notified scheduled area.
Water, Land and Trees Act, 2002, GOAP (WALTA, act 2002)
Govt of Andhra Pradesh Yes Permission to be obtained for removing trees and also for establishing/registering the bore well.
The Motor Vehicles Act, 1988 State Transport Authority Yes Pollution under control certification for all vehicles plying in and out of the mine lease area.
The Public Liability Insurance Act 1991 Insurance Company Yes Insurance against liability to give relief in the event of injury or fatality and damage to property due to the proposed mining activity.

Sri Raghavendra Granites Environmental Impact Assessment Report
Team Labs and Consultants 2-1
CHAPTER 2.0 PROJECT DESCRIPTION
2.0 Introduction
Sri Raghavendra Granites proposes to conduct semi mechanized opencast method
quarrying for colour granite in an area of 9.918 ha at Sy. No. 359, Ballikurava village
and mandal, Prakasam district, Andhra Pradesh. In principle of application of
quarry lease notice issued by Director of Mines and Geology, Ibrahimpatnam,
Government of Andhra Pradesh for period of 20 years vide notice no. 5615/R3-
2/2018 dated 16.11.2018. Terms of reference for preparing the EIA report as part of
obtaining prior environmental clearance for a production capacity of 101315.52
m3/annum (Recovery of colour granite @ 15% - 15197.33 m3/annum and Waste @
85% - 86118.19 m3/annum) was obtained vide letter no. SEIAA/AP/PKM/MIN/12/
2018/765-304, dt. 14.05.2019 from the Andhra Pradesh State Environmental Impact
Assessment Authority. The Capital cost of the proposed activity of mining is Rs. 80
Lakhs. The Mining Plan was approved by the Deputy Director of Mines and
Geology, Guntur, Government of Andhra Pradesh vide Letter No.
5204/MP/CG/OGL/2018 dated 01.12.2018. The mine lease area forms part of a
cluster (all mine leases within 500 m of the subject mine) with an area of 235.2053 ha.
The details of mining activity in the cluster of mines (including Sri Andru Suresh
Babu, Maddineni Veeranjaneyulu, Raghavendra Granites, and Chitturi Kedarnath,
Bharath Exports, Sri Eswar Granites, Amaravathi Mines, Kum. M. Raga Sindhuri, Sri
S. Sarath Chandra, Sanjana Exports, Devi Impex and awaiting LOI for Maddineni
Veeranjaneyulu, Raghavendra Granites etc), production details and other concepts
as envisaged in the approved mining plans are presented in the following pages. The
report presents cumulative environmental impacts due to the mining cluster and the
environmental management plan to address the same in addition to the impact
assessment and environmental management for this project. The details of Mine
Lease area (MLA) are presented in Table 2.1.
Table 2.1 Details of Mine Lease Area
State and District Mandal Village Lease
Area, ha Ownership of the lease area
Survey number
Andhra Pradesh and Prakasam
Ballikurava Ballikurava 9.918 Govt. Land 359

Sri Raghavendra Granites Environmental Impact Assessment Report
Team Labs and Consultants 2-2
2.1 Land use pattern of the mine lease area (Terms of reference No. 10)
Total land of the lease area is 9.918 ha consisting of active mining area, services,
green belt and haulage road to be used during the plan period, with 0.9 ha of land
area kept for future use. The details of land use are presented in Table 2.2.
Table 2.2 Land use pattern of the Mine Lease Area
S. No Purpose Extent, Ha
1 Area for quarrying 7.293
2 Waste dump area 1.6
3 Road 0.03
4 Infrastructure (Office, rest shelter) 0.02
5 Green belt 0.075
6 Vacant 0.9
Total 9.918
2.2 Geology of the area
2.2.1 Topography
The quarry lease applied area is located on a hillock with a maximum elevation of
225 m msl within the quarry lease applied area with topo relief 135 m. The lowest
contour is 90 m and highest contour is 225 m msl.
2.2.2 Regional Geology
This area constitutes southernmost part of eastern Ghats mobile belt (EGMB), where
the belt is tapering to less than 20 km width. EGMB is trending in NNE-SSW in the
area. In this area EGMB mainly represented by Westren Zone. The succession of
Eastern Ghats Super Group is as follows:
Intrusives Layered Anorthisites and associated Mafics and Chromiferrous Ultra Mafics
Charnockite Group Charnockites with Mega Crystic K - Feldspar Charnockite Two Pyroxene Granulite/Amphibolites
Khondalite Group Calc - Sillicate - Granulites Garnet - Silliminite - Quartz - Biotite -K-Feldspar - Graphite Gneiss (Khondalite) Quartzite - Garnet - Silliminite
Granitoid Suite Granitoid with Mega Crystic K - Feldspar Undifferentiated (with MigmatiticDiaTectite, Augen) Perferoblastic Granite and Gniesses. Garnet - Biotite Homophanus Granite / GniessLeptynite, Local CharnockiteNeosomes and Relics

Sri Raghavendra Granites Environmental Impact Assessment Report
Team Labs and Consultants 2-3
2.2.3 Local Geology
The Q.L area is located on hilly terrain contains charnockitic boulders. The Q.L area
measured with an average length of 430 m and average width of 265 m area
coinciding with ground level with less curved sheet of massive rock. The Colour
Granite can be extracted from the rock available in the quarry lease applied area
which is useful in civil construction purposes and artificial sand i.e., Manufacture
Sand. The surface, geological plan and Geological cross sections are presented in
Figure 2.1 and Figure 2.2.
Figure 2.1 Surface, Geological plan
Sri Raghavendra Granites Environmental Impact Assessment Report
Team Labs and Consultants 2-4
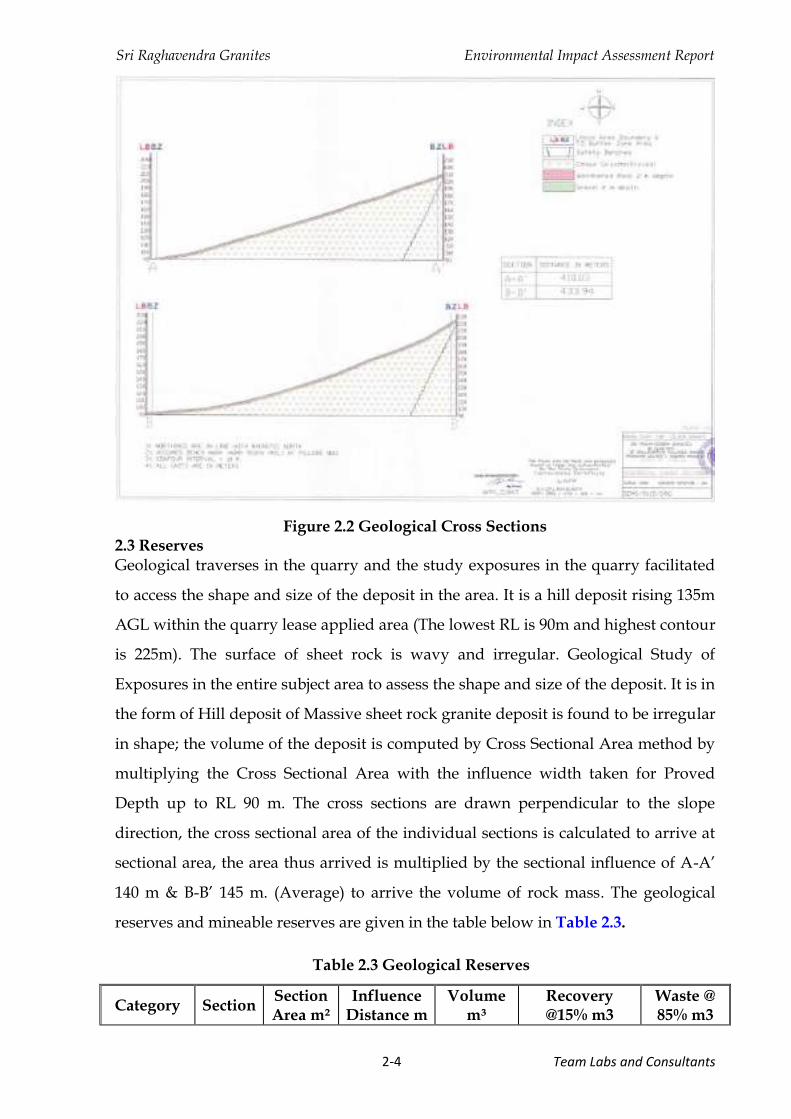
Figure 2.2 Geological Cross Sections 2.3 Reserves Geological traverses in the quarry and the study exposures in the quarry facilitated
to access the shape and size of the deposit in the area. It is a hill deposit rising 135m
AGL within the quarry lease applied area (The lowest RL is 90m and highest contour
is 225m). The surface of sheet rock is wavy and irregular. Geological Study of
Exposures in the entire subject area to assess the shape and size of the deposit. It is in
the form of Hill deposit of Massive sheet rock granite deposit is found to be irregular
in shape; the volume of the deposit is computed by Cross Sectional Area method by
multiplying the Cross Sectional Area with the influence width taken for Proved
Depth up to RL 90 m. The cross sections are drawn perpendicular to the slope
direction, the cross sectional area of the individual sections is calculated to arrive at
sectional area, the area thus arrived is multiplied by the sectional influence of A-A’
140 m & B-B’ 145 m. (Average) to arrive the volume of rock mass. The geological
reserves and mineable reserves are given in the table below in Table 2.3.
Table 2.3 Geological Reserves
Category Section Section Area m²
Influence Distance m
Volume m³
Recovery @15% m3
Waste @ 85% m3
Sri Raghavendra Granites Environmental Impact Assessment Report
Team Labs and Consultants 2-5
A-A’ Proved
22098.4 140 3093774.6 464066.2 2629708.4
B-B1 21750.0 145 3153754.4 473063.2 2680691.2
Total 6247529.0 937129.3 5310399.6
Reserves blocked under benches slopes
Category Section Section Area m²
Influence Distance
m
Volume m³
Recovery @15% m3
Waste @ 85% m3
A-A’ Proved
2637.69 140 369276.6 55391.49 313885.11
B-B1 3495.24 145 506809.8 76021.47 430788.33
Total 876086.4 131412.96 744673.44
Reserves blocked under 7.5m buffer
Category Section Section Area m²
Influence Distance
m
Volume m³
Recovery @15% m3
Waste @ 85% m3
A-A’ Proved
824.52 140 115432.8 17314.92 98117.88
B-B1 940.57 145 136382.65 20457.40 115925.25
Total 251815.45 37772.32 214043.13
Reserves Available for Mining
Description Quantity m3
Total Reserves 937129.3
Reserves blocked under buffer zone 37772.32
Reserves blocked under safety slopes 131412.96
Mineable Reserves 767944.1
Annual Production 15197.33
Life of the Mine: Mineable Reserves/Annual Production 50.5 say 51 Years
.
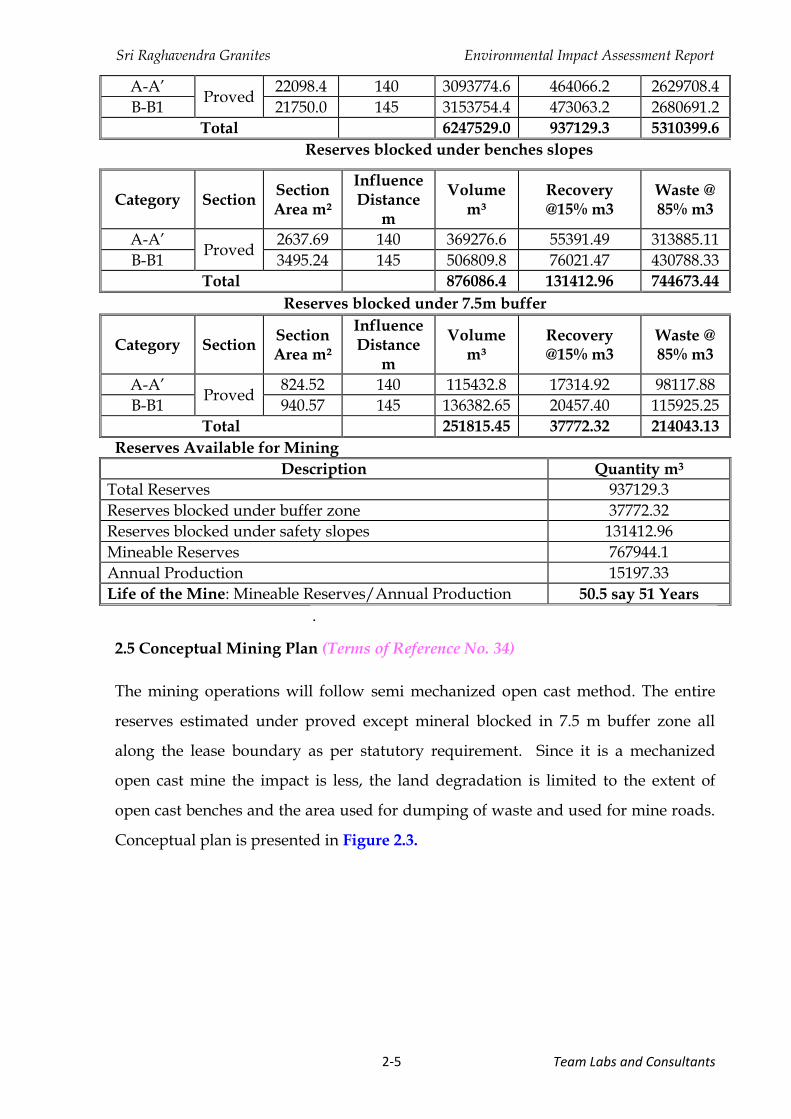
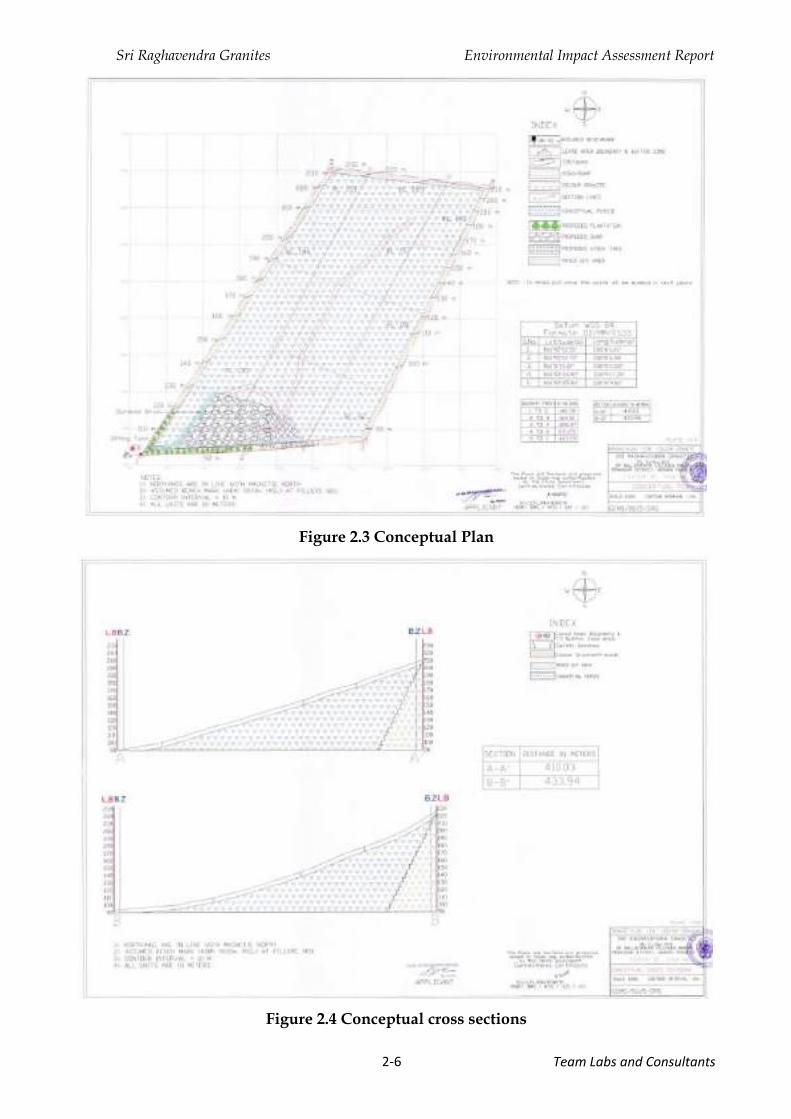
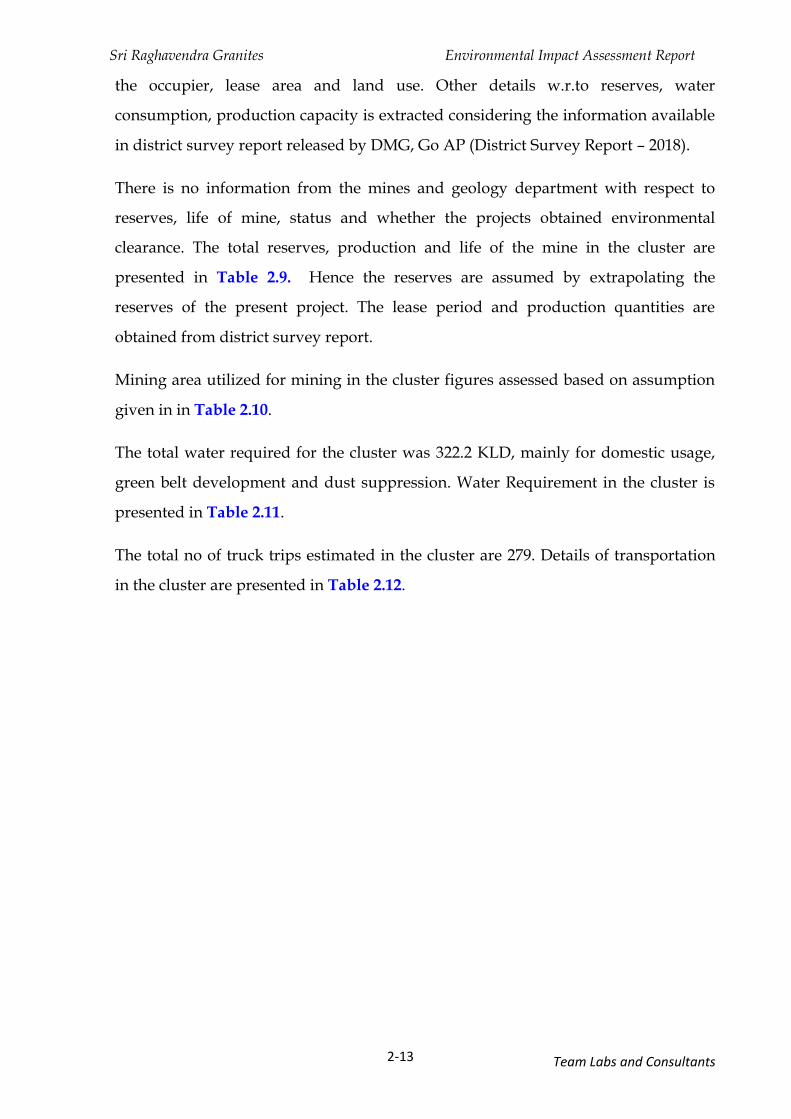
2.5 Conceptual Mining Plan (Terms of Reference No. 34)
The mining operations will follow semi mechanized open cast method. The entire
reserves estimated under proved except mineral blocked in 7.5 m buffer zone all
along the lease boundary as per statutory requirement. Since it is a mechanized
open cast mine the impact is less, the land degradation is limited to the extent of
open cast benches and the area used for dumping of waste and used for mine roads.
Conceptual plan is presented in Figure 2.3.
Sri Raghavendra Granites Environmental Impact Assessment Report
Team Labs and Consultants 2-6
Figure 2.3 Conceptual Plan
Figure 2.4 Conceptual cross sections

Sri Raghavendra Granites Environmental Impact Assessment Report
Team Labs and Consultants 2-7
2.6 Mining Technology
Drilling
Drilling plays vital role in determining the size and shape of rough blocks ie., 2m x
2m cross section with a bench height of 6m. Drilling Pattern is important in
developing a working face and also preparing the rough blocks suitable for their use
in appropriate processing units. There are no important places in and around the
area. Drill-Hole patterns for primary and secondary with Uniform single line
equidistant holes (line drilling) will be deployed for separation of blocks from
mother rock. In the case of sheet rock the primary drilling will be in the form of
equidistant vertical holes to take out blocks of Gang Saw.
Drilling Parameters
i. Drill holes diameter: 32 mm up to 9 m Long
ii. Depth and inclination of the holes: Generally drilled vertically in an alignment,
however in primary cutting in the absence of sheet joints to develop bottom
level horizontal holes also be drilled.
iii. Spacing and Burden: 0.3 m X 1.6 m
Explosive type: Not Applicable. The applicant proposes to use Expansive
powder will be used for splitting the rocks.
2.7 Development and Production
1st Year
In the first year mining will be initiated from North corner towards south side and
covering an area of 16319.22 m2 a bench of 6 m height will be formed and mining
advances North corner towards south side. An area of 16319.22 m2 will be excavated
producing 97915.32 m3 of Rock Mass. 15% (14687.30 m3) of Market Grade Rough
Blocks and 85% (83228.02 m3) of Waste Rock will be generated.
2nd year:
In the second year mining will be initiated from North corner towards south side the
quarry lease area and covering an area of 16610.72 m2 a bench of 6 m height will be
formed and mining advances North corner towards south side. An area of 16610.72
m2 will be excavated producing 99664.32 m3 of Rock Mass. 15% (14949.65 m3) of
Market Grade Rough Blocks and 85% (84714.67 m3) of Waste Rock will be generated.
3rd year:

Sri Raghavendra Granites Environmental Impact Assessment Report
Team Labs and Consultants 2-8
In the third year mining will be initiated from North corner towards south side the
quarry lease area and covering an area of 16123.49 m2 a bench of 6 m height will be
formed and mining advances North corner towards south side. An area of 16123.49
m2 will be excavated producing 96740.94 m3 of Rock Mass. 15% (14511.14 m3) of
Market Grade Rough Blocks and 85% (86118.21 m3) of Waste Rock will be generated.
4th year:
In the fourth year mining will be initiated from North corner towards south side of
the quarry lease area and covering an area of 16885.92 m2 a bench of 6m height will
be formed and the mining advances North corner towards south side. An area of
16885.92 m2 will be excavated producing 101315.538 m3 of Rock Mass. 15% (15197.33
m3) of Market Grade Rough Blocks and 85% (86118.21 m3) of Waste Rock will be
generated.
5th year:
In the fifth year mining will be initiated from North corner towards south side the
quarry lease area and covering an area of 77499.72 m2 a bench of 6 m height will be
formed and the mining advances North corner towards south side. An area of
77499.72 m2 will be excavated producing 77499.72 m3 of Rock Mass. 15% (11624.96
m3) of Market Grade Rough Blocks and 85% (65874.76 m3) of Waste Rock will be
generated.
The development for next 5 years is presented in Table 2.4. Working plan and
sections of the plan period are presented in Figure 2.4 and 2.5.
Table 2.4 Year wise Production
Year Sectional Area m2
Bench Height (m)
Volume m3
Production @100% m3
Granite @15% Waste @85%
1st Year 16319.22 6 97915.32 14687.30 83228.02
2nd Year 16610.72 6 99664.32 14949.65 84714.67
3rd Year 16123.49 6 96740.94 14511.14 82229.80
4th Year 16885.92 6 101315.52 15197.33 86118.19
5th Year 12916.62 6 77499.72 11624.96 65874.76
Grand Total 394770.42 59215.56 335554.86

Sri Raghavendra Granites Environmental Impact Assessment Report
Team Labs and Consultants 2-9
Figure 2.4 Year wise Working Plan
Figure 2.5 working cross sections

Sri Raghavendra Granites Environmental Impact Assessment Report
Team Labs and Consultants 2-10
2.8 Machinery Requirement
The list of machinery required for mining operation is presented in Table 2.5.
Table 2.5 List of Machinery
S. No. Description Quantity No’s
1 Excavator (Hitachi) 300 2
2 Excavator (Hitachi) 400 1
3 Compressor 300 4
4 Jack Hammers 8
5 Tipper 6
6 Dewatering Pumps 4
7 Wire Saw Machine 1
8 Water Tanker 1
2.9 Employment Potential
The proposed method of mining is opencast semi mechanized. Workers are required
for loading of waste material and general purpose only. The employment potential is
presented in Table 2.6.
Table 2.6 Employment Potential
S. No Employee type Quantity
1 Mines Manager (Part Time) 1
2 Supervisors 1
3 Hitachi Operators 4
4 Compressor Operators 3
5 Semi-Skilled & Un-Skilled 25
6 Tipper Operators 6
Total 40
2.10 Site Services (Terms of Reference No. 33)
The following site services i.e., an office cum store room, canteen, first aid room cum
rest shelters, toilets and stock yard with temporary structures in the mine lease area
are proposed. Temporary sheds with cement plastered brick walls and G.I. sheet or
grass roofing are constructed for site services. The workers required shall be
sourced from surrounding villages. Drinking water is obtained from Kondayapalem
village through tankers to mining staff and workers. A tractor mounted tanker is
proposed for sprinkling of water mainly on village roads to suppress the dust

Sri Raghavendra Granites Environmental Impact Assessment Report
Team Labs and Consultants 2-11
generated due to vehicular movement. Fencing is also provided around the working
pit to avoid accidental slippage of men and animals, while the worked-out pit is
used as reservoir for storage of rain water. DG sets will be utilized during load
shutdown by APTRANSCO and the emissions from the DG sets are released into
atmosphere through 2 m height stack as prescribed by CPCB.
2.11 Fire Fighting Facilities
First aid Kit is proposed in the office Room, 24 hours Commander Jeep, 2 fire gas
cylinders and 10 fire Buckets will be available in the site for use during emergency.
primary health center is located at Chilakaluripeta which is at a distance of 16.4 km.
Fire station and police station are located at Chilakaluripeta and are well connected
by roads. The 108 Ambulance services provided by the local authorities may be
utilized by lessee during medical emergency.
2.12 Water Requirement (Terms of Reference No. 24)
Water requirement for the mine is mainly for maintaining green belt, water for dust
suppression on the haulage roads to mitigate dust emissions and for domestic
purposes. The total water requirement is 9.2 KLD shall be drawn from
Kondayapalem village/ storm water storage. The rainwater stored in the worked-
out pit is used for sprinkling, wet drilling and greenbelt development. The water
requirement is presented in Table 2.7.
Table 2.7 Water balance
S. No Water Usage Quantity, KLD
1 Wet drilling operation 3.8
2 Water sprinkling on haul rods 3.2
3 Domestic 1.8
4 Green Belt development 0.4
Total 9.2
2.13 Effluent generation and ground water
The generation of wastewater is from domestic source only; it is expected to be
approximately 1.4 KLD, which is sent to septic tank followed by soak pit. The
ground water is at 20 m near to foothill of the mine lease. The rain water
accumulating at pit bottom in rainy seasons will be diverted to work out pit and

Sri Raghavendra Granites Environmental Impact Assessment Report
Team Labs and Consultants 2-12
reused. A low head diesel pump unit will be deployed to dewatering the working
mine.
2.14 Waste Generation and management (Terms of reference No. 11)
During the plan period operations a total rock mass 473135.82 m3 will be excavated
and 70970.37 m3 of granite blocks will be recoverable from this rock mass and
remaining material of about 402165.45 m3 will go as waste. The waste material will
be shapes of cobble stones, building stones and pavement stones. The maximum
waste will be utilization of available natural mineral and adopt value to increase the
market for the colour granite products in various kinds and shapes.
2.15 Reclamation and Rehabilitation
The mineral bearing area will be mined out up to ultimate depth by maintaining
proposed bench height and width of 6 m and 6 m respectively. After completion of
mining operations and even after backfilling the part of mined out area, the
remaining ditch shall be converted in to a pond. The rainwater will be collected
continuously in the worked-out area and percolate in to the ground. The top bench
shall be afforested with local species and plants.
2.16 Details of Cluster Projects
The MoEFCC through its legislation has issued a notification No. SO 141(E),
dt.15.1.2016 through which it issued cluster guidelines for the purpose of obtaining
Prior Environmental Clearance for the Mines. As per that SO every mine shall obtain
prior EC for its operations and also EC for the entire cluster in case it falls in the
definition of cluster. Accordingly, the present cluster falls under purview of
definition of cluster as per the SO. Hence the present EMP for the whole cluster is
being prepared. As per the S. O. 2269 (E) notification dt. 01.07.2016 and as per
ADMG Letter, following Mines is present within 500 m distance from the mine lease
area. The details of Cluster projects (including the mine lease areas of Sri Maddineni
Veeranjaneyulu and others) are given in Table 2.8. The cluster details are obtained
from AD mines vide letter no. 1959/Q/2018, dt.08.02.2019 spread in area of 235.2053
ha in Kopparapalem, Chennupalli, Ballikurava and Kopparam Villages,
Santhamaguluru and Ballikurava Mandals, Prakasam district, which is enclosed in
the annexure. The letter obtained from AD mine provides the mine lease, name of
Sri Raghavendra Granites Environmental Impact Assessment Report
Team Labs and Consultants 2-13
the occupier, lease area and land use. Other details w.r.to reserves, water
consumption, production capacity is extracted considering the information available
in district survey report released by DMG, Go AP (District Survey Report – 2018).
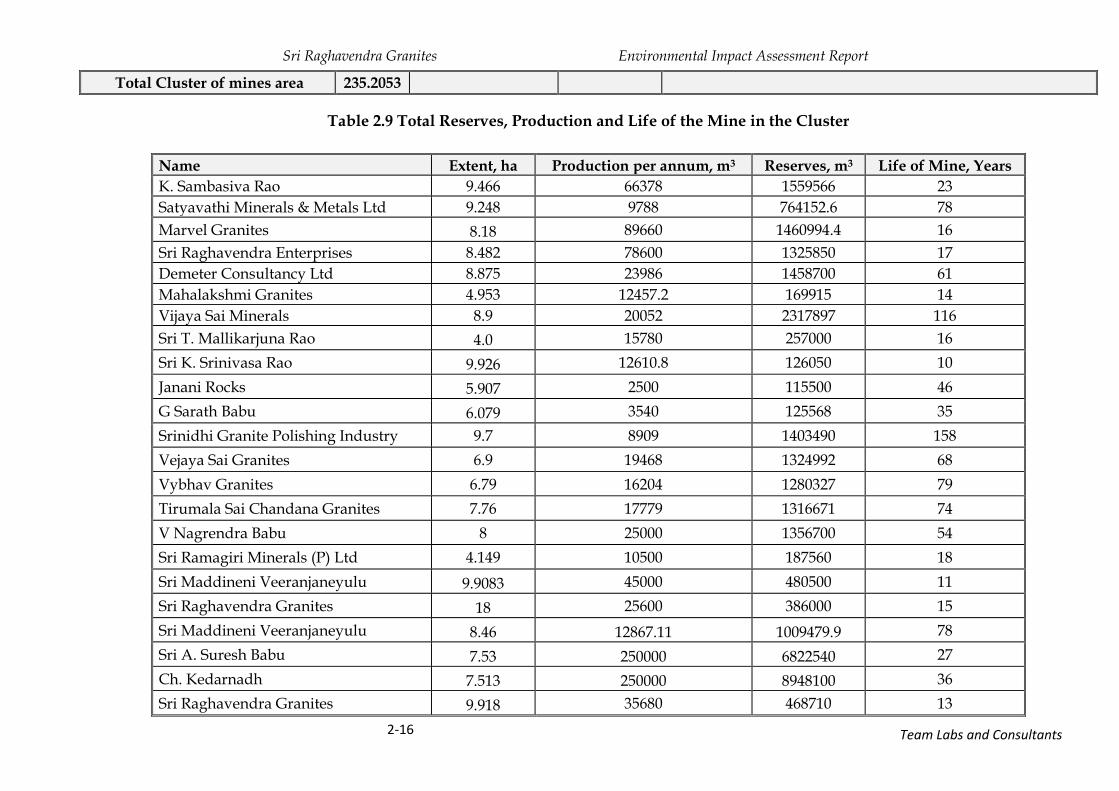
There is no information from the mines and geology department with respect to
reserves, life of mine, status and whether the projects obtained environmental
clearance. The total reserves, production and life of the mine in the cluster are
presented in Table 2.9. Hence the reserves are assumed by extrapolating the
reserves of the present project. The lease period and production quantities are
obtained from district survey report.
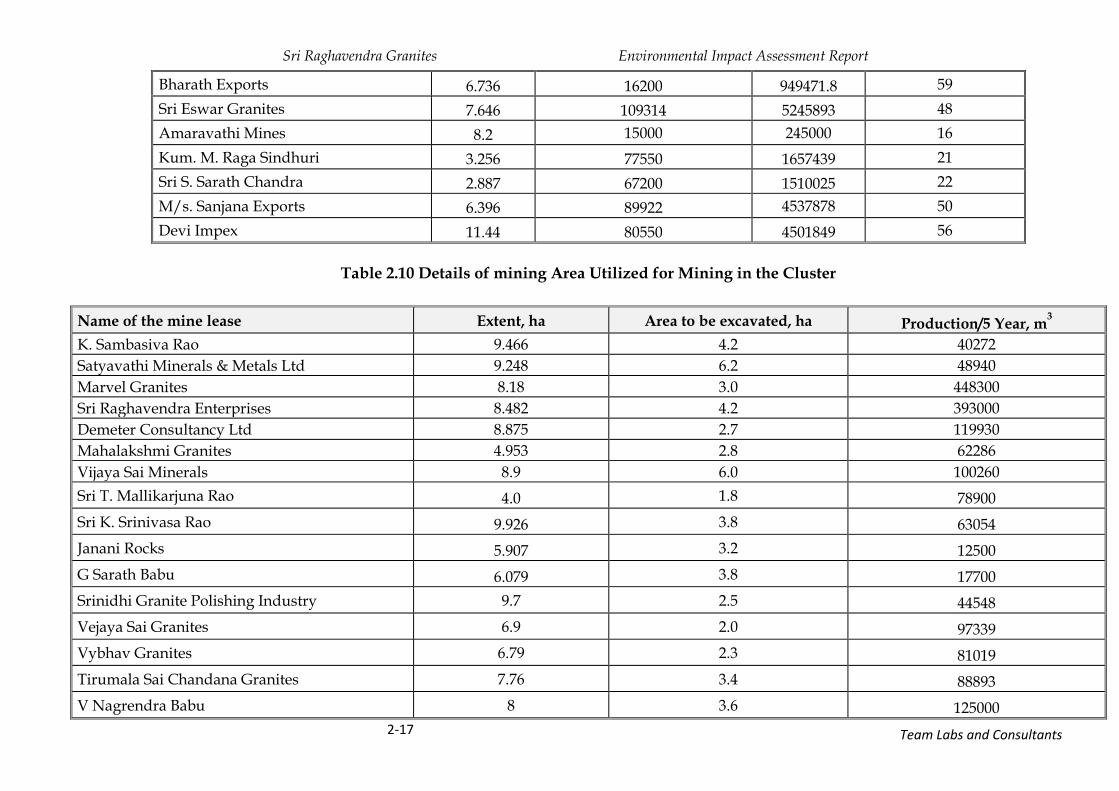
Mining area utilized for mining in the cluster figures assessed based on assumption
given in in Table 2.10.
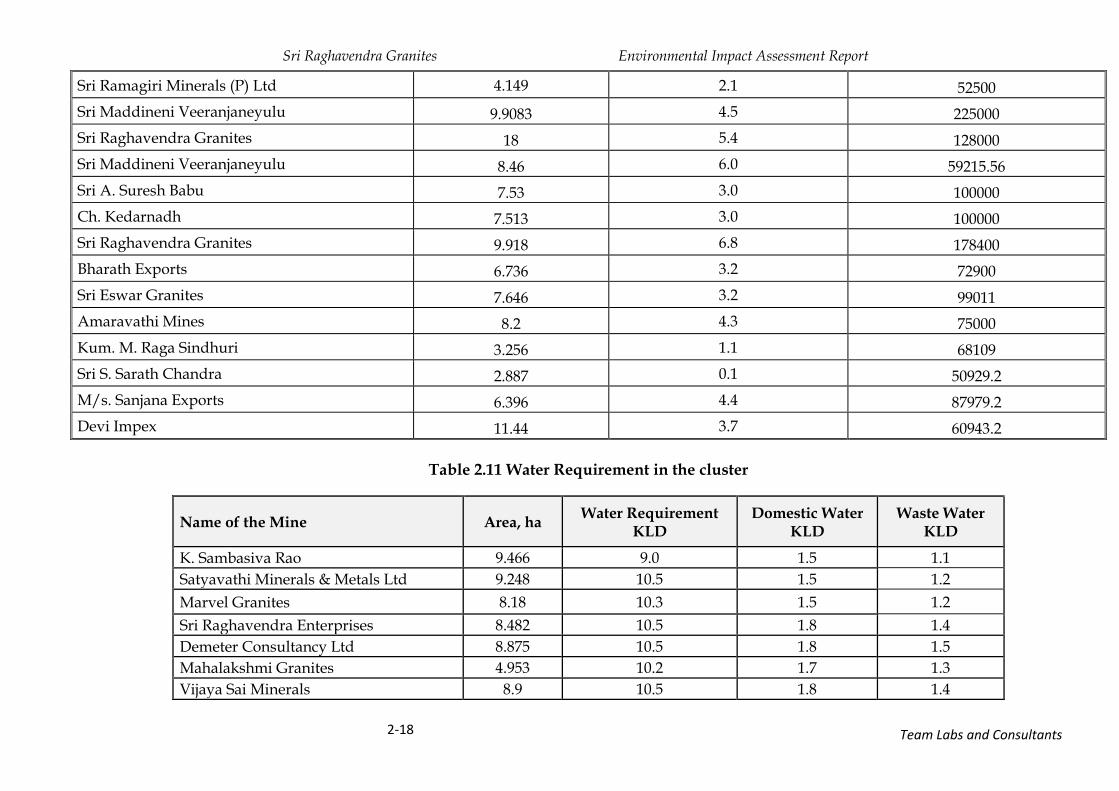
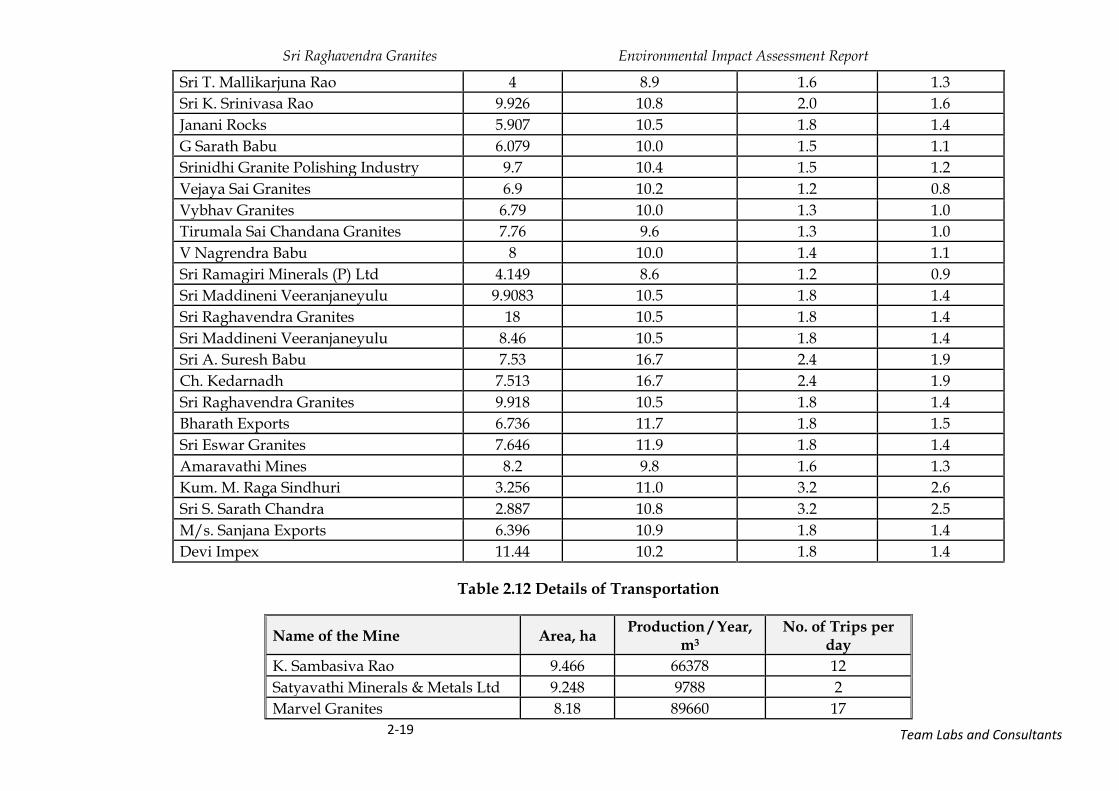
The total water required for the cluster was 322.2 KLD, mainly for domestic usage,
green belt development and dust suppression. Water Requirement in the cluster is
presented in Table 2.11.
The total no of truck trips estimated in the cluster are 279. Details of transportation
in the cluster are presented in Table 2.12.

Sri Raghavendra Granites Environmental Impact Assessment Report
Team Labs and Consultants 2-14
Table 2.8 Mine leases within 500m radius
S. No
Name of the mine lease Extent,
ha
Grant/LOI Mine Lease date
EC Status Location of the Mine Lease Area
1 K. Sambasiva Rao 9.466 20.01.2018 Granted EC Obtained 23.09.2017
Survey No. 282/P, Kopparapalem Village, Ballikurava Mandal, Prakasam District
2 Satyavathi Minerals & Metals Ltd
9.248 29.05.2017 LOI EC Obtained 19.04.2018
Survey No. 282/P, Kopparapalem Village, Ballikurava Mandal, Prakasam District
3 Marvel Granites 8.18 15.05.2017 LOI EC Obtained 17.05.2018
Survey No. 282/P, Kopparapalem Village, Ballikurava Mandal, Prakasam District
4 Sri Raghavendra Enterprises 8.482 07.07.2017 LOI - Survey No. 282/P, Kopparapalem Village, Ballikurava Mandal, Prakasam District
5 Demeter Consultancy Ltd 8.875 01.12.2017 LOI EC Obtained 14.08.2018
Survey No. 282/P, Kopparapalem Village, Ballikurava Mandal, Prakasam District
6 Mahalakshmi Granites 4.953 01.12.2017 LOI ToR Obtained
Survey No. 282/P, Kopparapalem Village, Ballikurava Mandal, Prakasam District
7 Vijaya Sai Minerals 8.9 14.02.2018 Granted EC Obtained 12.10.2017
Survey No. 1/P, Chennupalli Village, Ballikaruva Mandal, Prakasam District
8 Sri T. Mallikarjuna Rao 4.0 07.08.2018 Granted EC Obtained Survey No. 1/P, Chennupalli Village, Ballikaruva Mandal, Prakasam District
9 Sri K. Srinivasa Rao 9.926 25.08.2018 Granted EC Obtained 19.04.2018
Survey No. 359/P, Ballikurava Village and Mandal, Prakasam District
10 Janani Rocks 5.907 10.10.2018 LOI - Survey No. 359, Ballikurava Village, Ballikurava Mandal, Prakasam District
11 G Sarath Babu 6.079 10.10.2018 LOI - Survey No. 359, Ballikurava Village, Ballikurava Mandal, Prakasam District
12 Srinidhi Granite Polishing Industry
9.7 19.06.2017 Grant EC Issued Survey No. 1075/P, Kopparam Village, Santhamaguluru Mandal, Prakasam District
13 Vejaya Sai Granites 6.9 16.05.2019 grant EC Issued Survey No. 1075/P, Kopparam Village, Santhamaguluru Mandal, Prakasam District
14 Vybhav Granites 6.79 16.05.2019 grant - Survey No. 1075/P, Kopparam Village, Santhamaguluru Mandal, Prakasam District

Sri Raghavendra Granites Environmental Impact Assessment Report
Team Labs and Consultants 2-15
15 Tirumala Sai Chandana Granites
7.76 08.06.2018 LOI - Survey No. 1075/P, Kopparam Village, Santhamaguluru Mandal, Prakasam District
16 V Nagrendra Babu 8 20.06.2018 LOI - Survey No. 1075/P, Kopparam Village, Santhamaguluru Mandal, Prakasam District
17 Sri Ramagiri Minerals (P) Ltd
4.149 05.03.2018 LOI - Survey No. 1/P, Chennupalli Village, Ballikurava Mandal, Prakasam District
18 Sri Maddineni Veeranjaneyulu
9.9083 Awaiting for LOI - Survey No. 282(3.669 ha), Kopparapalem Village and Survey No.359(6.293 ha) Ballikurava Village & Mandal, Prakasam District
19 Sri Raghavendra Granites 18.0 Awaiting for LOI - Survey No. 282, Kopparapalem Village, Ballikurava Mandal, Prakasam District
20 Sri Maddineni Veeranjaneyulu
8.46 30.10.2018 LOI Obtained ToR
Survey No. 359/p, Ballikurava Village, Ballikurava Mandal, Prakasam District
21 Sri A. Suresh Babu 7.53 30.10.2018 LOI Obtained ToR
Survey No. 359/P, Ballikurava Village, Ballikurava Mandal, Prakasam District
22 Ch. Kedarnadh 7.513 30.10.2018 LOI Obtained ToR
Survey No. 359/P, Ballikurava Village, Ballikurava Mandal, Prakasam District
23 Sri Raghavendra Granites 9.918 16.11.2018 LOI Obtained ToR
Survey No. 359, Ballikurava Village, Ballikurava Mandal, Prakasam District
24 Bharath Exports 6.736 15.05.2017 LOI Obtained ToR
Survey No. 282/P, Kopparapalem Village, Ballikurava Mandal, Prakasam District
25 Sri Eswar Granites 7.646 28.06.2019 LOI Obtained ToR
Survey No. 282/P, Kopparapalem Village, Ballikurava Mandal, Prakasam District
26 Amaravathi Mines 8.2 08.06.2018 LOI Applied for ToR
Survey No. 282/P, Kopparapalem Village, Ballikurava Mandal, Prakasam District
27 Kum. M. Raga Sindhuri 3.256 24.11.2017 LOI Obtained ToR
Survey No. 1/P, Chennupalli Village, Ballikaruva Mandal, Prakasam District
28 Sri S. Sarath Chandra 2.887 24.11.2017 LOI Obtained ToR
Survey No. 1/P, Chennupalli Village, Ballikaruva Mandal, Prakasam District
29 M/s. Sanjana Exports 6.396 12.06.2019 LOI Obtained ToR
Survey No. 1/P, Chennupalli Village, Ballikurava Mandal, Prakasam District
30 Devi Impex 11.44 07.06.2019 LOI Obtained ToR
Survey No. 1075/P, Kopparam Village, Santhamaguluru Mandal, Prakasam District
Sri Raghavendra Granites Environmental Impact Assessment Report
Team Labs and Consultants 2-16
Total Cluster of mines area 235.2053
Table 2.9 Total Reserves, Production and Life of the Mine in the Cluster
Name Extent, ha Production per annum, m3 Reserves, m3 Life of Mine, Years
K. Sambasiva Rao 9.466 66378 1559566 23
Satyavathi Minerals & Metals Ltd 9.248 9788 764152.6 78
Marvel Granites 8.18 89660 1460994.4 16
Sri Raghavendra Enterprises 8.482 78600 1325850 17
Demeter Consultancy Ltd 8.875 23986 1458700 61
Mahalakshmi Granites 4.953 12457.2 169915 14
Vijaya Sai Minerals 8.9 20052 2317897 116
Sri T. Mallikarjuna Rao 4.0 15780 257000 16
Sri K. Srinivasa Rao 9.926 12610.8 126050 10
Janani Rocks 5.907 2500 115500 46
G Sarath Babu 6.079 3540 125568 35
Srinidhi Granite Polishing Industry 9.7 8909 1403490 158
Vejaya Sai Granites 6.9 19468 1324992 68
Vybhav Granites 6.79 16204 1280327 79
Tirumala Sai Chandana Granites 7.76 17779 1316671 74
V Nagrendra Babu 8 25000 1356700 54
Sri Ramagiri Minerals (P) Ltd 4.149 10500 187560 18
Sri Maddineni Veeranjaneyulu 9.9083 45000 480500 11
Sri Raghavendra Granites 18 25600 386000 15
Sri Maddineni Veeranjaneyulu 8.46 12867.11 1009479.9 78
Sri A. Suresh Babu 7.53 250000 6822540 27
Ch. Kedarnadh 7.513 250000 8948100 36
Sri Raghavendra Granites 9.918 35680 468710 13
Sri Raghavendra Granites Environmental Impact Assessment Report
Team Labs and Consultants 2-17
Bharath Exports 6.736 16200 949471.8 59
Sri Eswar Granites 7.646 109314 5245893 48
Amaravathi Mines 8.2 15000 245000 16
Kum. M. Raga Sindhuri 3.256 77550 1657439 21
Sri S. Sarath Chandra 2.887 67200 1510025 22
M/s. Sanjana Exports 6.396 89922 4537878 50
Devi Impex 11.44 80550 4501849 56
Table 2.10 Details of mining Area Utilized for Mining in the Cluster
Name of the mine lease Extent, ha Area to be excavated, ha Production/5 Year, m3
K. Sambasiva Rao 9.466 4.2 40272
Satyavathi Minerals & Metals Ltd 9.248 6.2 48940
Marvel Granites 8.18 3.0 448300
Sri Raghavendra Enterprises 8.482 4.2 393000
Demeter Consultancy Ltd 8.875 2.7 119930
Mahalakshmi Granites 4.953 2.8 62286
Vijaya Sai Minerals 8.9 6.0 100260
Sri T. Mallikarjuna Rao 4.0 1.8 78900
Sri K. Srinivasa Rao 9.926 3.8 63054
Janani Rocks 5.907 3.2 12500
G Sarath Babu 6.079 3.8 17700
Srinidhi Granite Polishing Industry 9.7 2.5 44548
Vejaya Sai Granites 6.9 2.0 97339
Vybhav Granites 6.79 2.3 81019
Tirumala Sai Chandana Granites 7.76 3.4 88893
V Nagrendra Babu 8 3.6 125000
Sri Raghavendra Granites Environmental Impact Assessment Report
Team Labs and Consultants 2-18
Sri Ramagiri Minerals (P) Ltd 4.149 2.1 52500
Sri Maddineni Veeranjaneyulu 9.9083 4.5 225000
Sri Raghavendra Granites 18 5.4 128000
Sri Maddineni Veeranjaneyulu 8.46 6.0 59215.56
Sri A. Suresh Babu 7.53 3.0 100000
Ch. Kedarnadh 7.513 3.0 100000
Sri Raghavendra Granites 9.918 6.8 178400
Bharath Exports 6.736 3.2 72900
Sri Eswar Granites 7.646 3.2 99011
Amaravathi Mines 8.2 4.3 75000
Kum. M. Raga Sindhuri 3.256 1.1 68109
Sri S. Sarath Chandra 2.887 0.1 50929.2
M/s. Sanjana Exports 6.396 4.4 87979.2
Devi Impex 11.44 3.7 60943.2
Table 2.11 Water Requirement in the cluster
Name of the Mine Area, ha Water Requirement
KLD Domestic Water
KLD Waste Water
KLD
K. Sambasiva Rao 9.466 9.0 1.5 1.1
Satyavathi Minerals & Metals Ltd 9.248 10.5 1.5 1.2
Marvel Granites 8.18 10.3 1.5 1.2
Sri Raghavendra Enterprises 8.482 10.5 1.8 1.4
Demeter Consultancy Ltd 8.875 10.5 1.8 1.5
Mahalakshmi Granites 4.953 10.2 1.7 1.3
Vijaya Sai Minerals 8.9 10.5 1.8 1.4
Sri Raghavendra Granites Environmental Impact Assessment Report
Team Labs and Consultants 2-19
Sri T. Mallikarjuna Rao 4 8.9 1.6 1.3
Sri K. Srinivasa Rao 9.926 10.8 2.0 1.6
Janani Rocks 5.907 10.5 1.8 1.4
G Sarath Babu 6.079 10.0 1.5 1.1
Srinidhi Granite Polishing Industry 9.7 10.4 1.5 1.2
Vejaya Sai Granites 6.9 10.2 1.2 0.8
Vybhav Granites 6.79 10.0 1.3 1.0
Tirumala Sai Chandana Granites 7.76 9.6 1.3 1.0
V Nagrendra Babu 8 10.0 1.4 1.1
Sri Ramagiri Minerals (P) Ltd 4.149 8.6 1.2 0.9
Sri Maddineni Veeranjaneyulu 9.9083 10.5 1.8 1.4
Sri Raghavendra Granites 18 10.5 1.8 1.4
Sri Maddineni Veeranjaneyulu 8.46 10.5 1.8 1.4
Sri A. Suresh Babu 7.53 16.7 2.4 1.9
Ch. Kedarnadh 7.513 16.7 2.4 1.9
Sri Raghavendra Granites 9.918 10.5 1.8 1.4
Bharath Exports 6.736 11.7 1.8 1.5
Sri Eswar Granites 7.646 11.9 1.8 1.4
Amaravathi Mines 8.2 9.8 1.6 1.3
Kum. M. Raga Sindhuri 3.256 11.0 3.2 2.6
Sri S. Sarath Chandra 2.887 10.8 3.2 2.5
M/s. Sanjana Exports 6.396 10.9 1.8 1.4
Devi Impex 11.44 10.2 1.8 1.4
Table 2.12 Details of Transportation
Name of the Mine Area, ha Production / Year,
m3 No. of Trips per
day
K. Sambasiva Rao 9.466 66378 12
Satyavathi Minerals & Metals Ltd 9.248 9788 2
Marvel Granites 8.18 89660 17

Sri Raghavendra Granites Environmental Impact Assessment Report
Team Labs and Consultants 2-20
Sri Raghavendra Enterprises 8.482 78600 15
Demeter Consultancy Ltd 8.875 23986 4
Mahalakshmi Granites 4.953 12457.2 2
Vijaya Sai Minerals 8.9 20052 4
Sri T. Mallikarjuna Rao 4.0 15780 3
Sri K. Srinivasa Rao 9.926 12610.8 2
Janani Rocks 5.907 2500 0
G Sarath Babu 6.079 3540 1
Srinidhi Granite Polishing Industry 9.7 8909 2
Vejaya Sai Granites 6.9 19468 4
Vybhav Granites 6.79 16204 3
Tirumala Sai Chandana Granites 7.76 17779 3
V Nagrendra Babu 8 25000 5
Sri Ramagiri Minerals (P) Ltd 4.149 10500 2
Sri Maddineni Veeranjaneyulu 9.9083 45000 8
Sri Raghavendra Granites 18 25600 5
Sri Maddineni Veeranjaneyulu 8.46 12867.11 2
Sri A. Suresh Babu 7.53 250000 46
Ch. Kedarnadh 7.513 250000 46
Sri Raghavendra Granites 9.918 35680 7
Bharath Exports 6.736 16200 3
Sri Eswar Granites 7.646 109314 20
Amaravathi Mines 8.2 15000 3
Kum. M. Raga Sindhuri 3.256 77550 14
Sri S. Sarath Chandra 2.887 67200 12
M/s. Sanjana Exports 6.396 89922 17
Devi Impex 11.44 80550 15

Sri Raghavendra Granites Environmental Impact Assessment Report
Team Labs and Consultants 3-1
CHAPTER 3.0 DESCRIPTION OF THE ENVIRONMENT
3.1 Introduction
Impact is defined as “The difference between what would happen with the action
and what would happen witout it” by International Association of Impact
Assessment. Hence establishing the current status as base line is an integral aspect of
preparation of Environmental Impact Assessment Report. Baseline data reflects the
present status of environment before the initiation of any activity of the proposed
mining project. The possible effects due to proposed mining activity of the cluster
are estimated and superimposed on the compiled baseline data subsequently to
assess environmental impacts.
The study was conducted in the impact area; 10 km radius area surrounding the
Mine Lease area (MLA) during February - April 2019. Studies were undertaken to
generate baseline data of micrometeorology, ambient air quality (AAQ), water
quality (ground and surfce water), noise levels, flora and fauna, land use and land
cover, soil quality and socio-economic status of the community.
3.2 Land Environment
Land and soil constitute basic components of the physical environment. The
miningactivitymay cause changes in land, land use, soil and denudation processes in
different intensities contingent on spatial proximity of the activity and receptors.
Land and soil may get intensely altered within the mine lease area, and to some
extent within 2km radius and to a lesser extent upto 10 km radial distance due to
development of the mining activity.
3.2.1 Physiography
The details of the mine lease location are presented in Table 3.1.
Table 3.1 Details of the mine lease location
Particulars Details
Name of the Project (s) Semi mechanized opencast mining for Colour granite in area of 9.918 ha with production capacity of 101315.52 m3/annum (Recovery of colour granite @ 15% - 15197.33 m3/annum and Waste @ 85% -

Sri Raghavendra Granites Environmental Impact Assessment Report
Team Labs and Consultants 3-2
Particulars Details
86118.19 m3/annum)
Name of the Applicant Sri Raghavendra Granites
Location of the Project Survey No. 359, Ballikurava Village, Ballikurava Mandal, Prakasam District, Andhra Pradesh State.
Project Sector Non-Coal Mining
S. No. in the schedule 1(a) Mining of minerals
Category of project B1
New / Expansion / Modernization New project
Capital Cost, 80 lakhs
Land Use Pattern (Forest, Agricultural, Grazing, Barren etc.)
Govt. land – 9.918 ha
Latitudes (North) 16° 2'12.50" - 16° 2'25.30"
Longitudes (East) 80° 0'1.20" - 80° 0'17.20"
Survey of India sheet No 65 D/04
Elevation above Mean Sea Level (AMSL), m
74 - 222 m
Seismic zone Seismic Zone: III as per IS: 1893 (part -1): 2002 (RA:2016) and can be classified as Moderate Damage Risk Zone
Site surroundings North : Hillock
East : Open Land
West : Hillock
South : Open Land
Nearest Village Kondayapalem – 1.5 km – South direction
Accessibility to site Road connecting – SE direction
Road access Ballikurava to Kopparam road – 1.5 km - East direction.
Nearest Town Chilakaluripeta – 16.4 km – NE direction
District Head quarters Ongole – 58 km – SE direction
Nearest Railway station Santhamaguluru – 15.5 km – NW direction
Nearest airport Gannavaram Airport – 100 km – NE direction
Nearest Port Krishnapatnam Port – 193 km – S direction
Major Industries (Within 10 km radius)
Nil within 10 km
Water Bodies in buffer area Seasonal Nala Vagu - 4.8 km - South. Seasonal Boddula vagu - 4.9km - NE. Seasonal Vogaru vagu - 6.6 km - NE. Santhamaguluru Canal - 6.0 km - North. Nagarjuna Sagar Right Bank Canal - 7.0 km - SW. Tangedumalli Major Canal - 5.9 km - NE. Kopparam Major Canal - 5.1 km - NE. Kopparam major Canal - 5.1 km - NW. Pasumarti Major Canal - 1.0 km – North.
the Project / Activity attracts the provisions of CRZ
Not Applicable
Reserve Forest Uppumaguluru RF - 3.2 km - NE
Sri Raghavendra Granites Environmental Impact Assessment Report
Team Labs and Consultants 3-3
Particulars Details
Muktheswaram RF - 5.7 km - SW
Nagarajupalli RF - 7.4 km - SE
Kukutlapalli RF 9.0 km - SW
Archaeological/ Historical/ Ancient Monuments
Nil within 10 km
Inter-state boundary and international boundary
Nil within 10 km
Protected Areas notified under the Wild Life (Protection) Act, 1972
Nil within 10 km
Eco-sensitive areas as notified under section 3 of the E (P) Act, 1986
Nil within 10 km
Critically polluted areas as identified by the Central Pollution Control Board from time to time,
Nil within 10 km
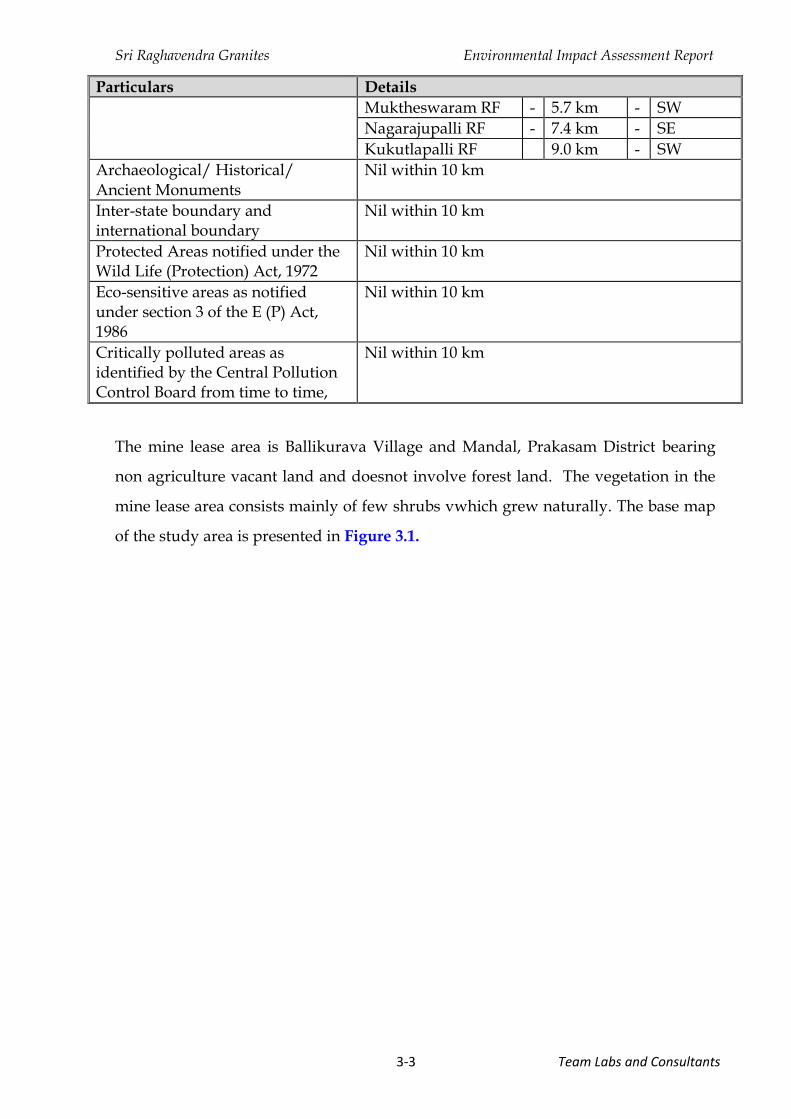
The mine lease area is Ballikurava Village and Mandal, Prakasam District bearing
non agriculture vacant land and doesnot involve forest land. The vegetation in the
mine lease area consists mainly of few shrubs vwhich grew naturally. The base map
of the study area is presented in Figure 3.1.

Sri Raghavendra Granites Environmental Impact Assessment Report
Team Labs and Consultants 3-4
Figure 3.1 Base Map of the study area

Sri Raghavendra Granites Environmental Impact Assessment Report
Team Labs and Consultants 3-5
3.2.2 Geology
The quarry lease applied area constitutes southern most part of Eastern Ghats
Mobile Belt (EGMB), where the belt is tapering to less than 20km width. EGMB is
trending in NNE-SSW in the area. In this area EGMB maily represented by Western
Zone. The succession of Eastren Ghats Super Group is as follows:
Intrusives Layered Anorthosites and associated Mafics and Chromiferrous Ultra Mafics
Charnockite Group Charnockites with Mega Crystic K- Feldspar Charnockite, Pyroxene Granulite/Amphibolite
Khondalite Group
Calc-Sillicate-Granulites Garnet-Silliminate-Quartz-Biotite-K-Feldspar Graphite Gneiss (Khondalite) Quartzite-Garnet-Silliminite
Granitiod Suite
Granitoid with Mega Crystic K-Feldspar Undifferentiated Porphyroblastic Granite and Gniesses Garnet-Biotite Homophanus Granite/Gniess Leptinite, Local Charnockite Neosomes and Relics.
The quarry lease applied area is located on hilly terrain contains Charnockite
boulders. The quarry lease applied area measured with an average length of 549m
and average width of 158m area coinciding with ground level with less curved sheet
of massive rock. The massive sheet formed by single litho unit basically Charnockite
that is particularly coarse grained and Porphyritic in Nature Weathering is seen in
on surface massive sheet rock. Large phenocrysts of K -Feldspar ranging in size from
2 to 25 mm bladed in background mass of pyroxene aesthetic beauty to the rock on
polishing.
Three sets of joints are recorded in the formation
N-W; S-E, Vertical to sub- vertical joints
E- W Vertical to sub vertical
North South vertical trending.
Horizontal / Sheet Joints.

Sri Raghavendra Granites Environmental Impact Assessment Report
Team Labs and Consultants 3-6
Figure 3.2 Geological map of the study area
Sri Raghavendra Granites Environmental Impact Assessment Report
Team Labs and Consultants 3-7
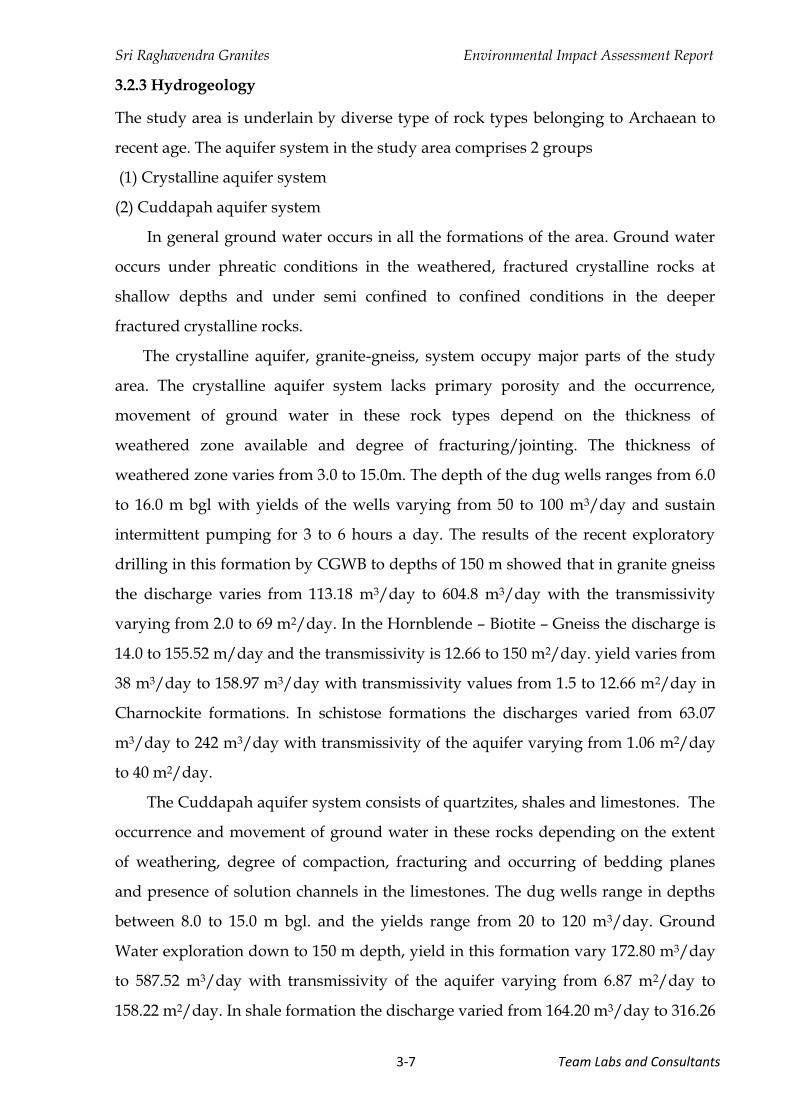
3.2.3 Hydrogeology
The study area is underlain by diverse type of rock types belonging to Archaean to
recent age. The aquifer system in the study area comprises 2 groups
(1) Crystalline aquifer system
(2) Cuddapah aquifer system
In general ground water occurs in all the formations of the area. Ground water
occurs under phreatic conditions in the weathered, fractured crystalline rocks at
shallow depths and under semi confined to confined conditions in the deeper
fractured crystalline rocks.
The crystalline aquifer, granite-gneiss, system occupy major parts of the study
area. The crystalline aquifer system lacks primary porosity and the occurrence,
movement of ground water in these rock types depend on the thickness of
weathered zone available and degree of fracturing/jointing. The thickness of
weathered zone varies from 3.0 to 15.0m. The depth of the dug wells ranges from 6.0
to 16.0 m bgl with yields of the wells varying from 50 to 100 m3/day and sustain
intermittent pumping for 3 to 6 hours a day. The results of the recent exploratory
drilling in this formation by CGWB to depths of 150 m showed that in granite gneiss
the discharge varies from 113.18 m3/day to 604.8 m3/day with the transmissivity
varying from 2.0 to 69 m2/day. In the Hornblende – Biotite – Gneiss the discharge is
14.0 to 155.52 m/day and the transmissivity is 12.66 to 150 m2/day. yield varies from
38 m3/day to 158.97 m3/day with transmissivity values from 1.5 to 12.66 m2/day in
Charnockite formations. In schistose formations the discharges varied from 63.07
m3/day to 242 m3/day with transmissivity of the aquifer varying from 1.06 m2/day
to 40 m2/day.
The Cuddapah aquifer system consists of quartzites, shales and limestones. The
occurrence and movement of ground water in these rocks depending on the extent
of weathering, degree of compaction, fracturing and occurring of bedding planes
and presence of solution channels in the limestones. The dug wells range in depths
between 8.0 to 15.0 m bgl. and the yields range from 20 to 120 m3/day. Ground
Water exploration down to 150 m depth, yield in this formation vary 172.80 m3/day
to 587.52 m3/day with transmissivity of the aquifer varying from 6.87 m2/day to
158.22 m2/day. In shale formation the discharge varied from 164.20 m3/day to 316.26

Sri Raghavendra Granites Environmental Impact Assessment Report
Team Labs and Consultants 3-8
m3/day and the transmissivity values varying from 6.59 m2/day to 22.8 m2. The site
area exist dendritic drainage pattern and any second order streams are not existing
nearby site location. Nagarjuna Sagar Right Bank Canal drains cover in the study
area. Hydrogeological map of the study area is presented in Figure 3.3.

Sri Raghavendra Granites Environmental Impact Assessment Report
Team Labs and Consultants 3-9
Figure 3.3 Hydrogeological Map of the study area
Sri Raghavendra Granites Environmental Impact Assessment Report
Team Labs and Consultants 3-10
3.2.4 Soils (Terms of Reference No. 22)
Soil may be defined as a thin layer of earth’s crust that serves as a natural medium
for the growth of plants. It is the unconsolidated mineral matter that has been
subjected to and influenced by genetic and environmental factors such as parent
materials, climate, organisms and physico-chemical action of wind, water and
sunlight, all acting over a period of time. Soil differs from the parent materials in the
morphological, physical, chemical and biological properties. Also, soil differs
among them in some or all the genetic or environmental factors, therefore, some soils
are yellow, some are black, some are coarse textured. They serve as a reservoir of
nutrients for plants and crop and also provide mechanical anchorage and favorable
tilth.
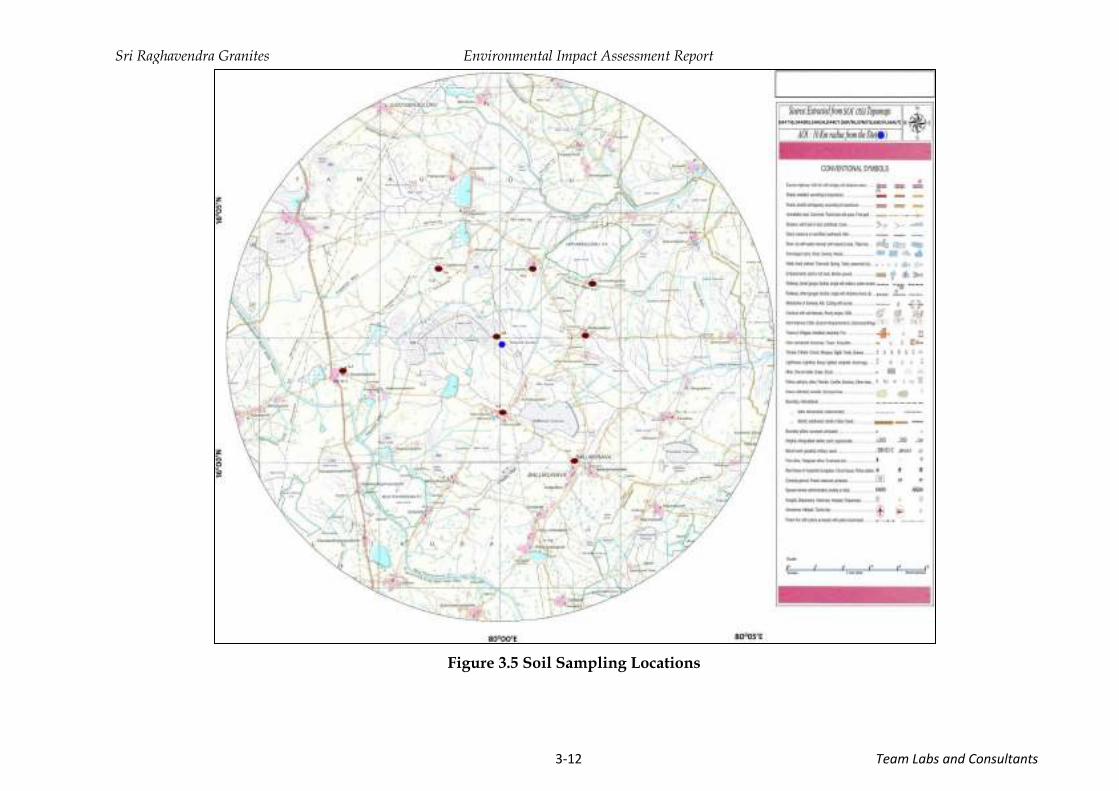
The soil characteristics include both physical and chemical parameters. M/s. Team
Labs and Consultants field team carried out soil survey to assess the soil
characteristics of the study area. The land use and land cover map of the study
areaispresnted in Figure 3.4. (Terms of Reference No .04, 05 &10) It may be noted
that the land use land cover map reflects predominantly forest, agriculture followed
by barren lands. The impact area also has a significant percentage of agriculture
nature of the impact area, and also its dependence on tank for irrigation.
Representative soil sampling was done at various locations and these locations are
shown in Figure 3.5. Analytical data of soil samples is presented in Table 3.2.

Sri Raghavendra Granites Environmental Impact Assessment Report
Team Labs and Consultants 3-11
Figure 3.4 Land Use Land Cover Map of the Study Area
Sri Raghavendra Granites Environmental Impact Assessment Report
Team Labs and Consultants 3-12
Figure 3.5 Soil Sampling Locations
Sri Raghavendra Granites Environmental Impact Assessment Report
Team Labs and Consultants 3-13
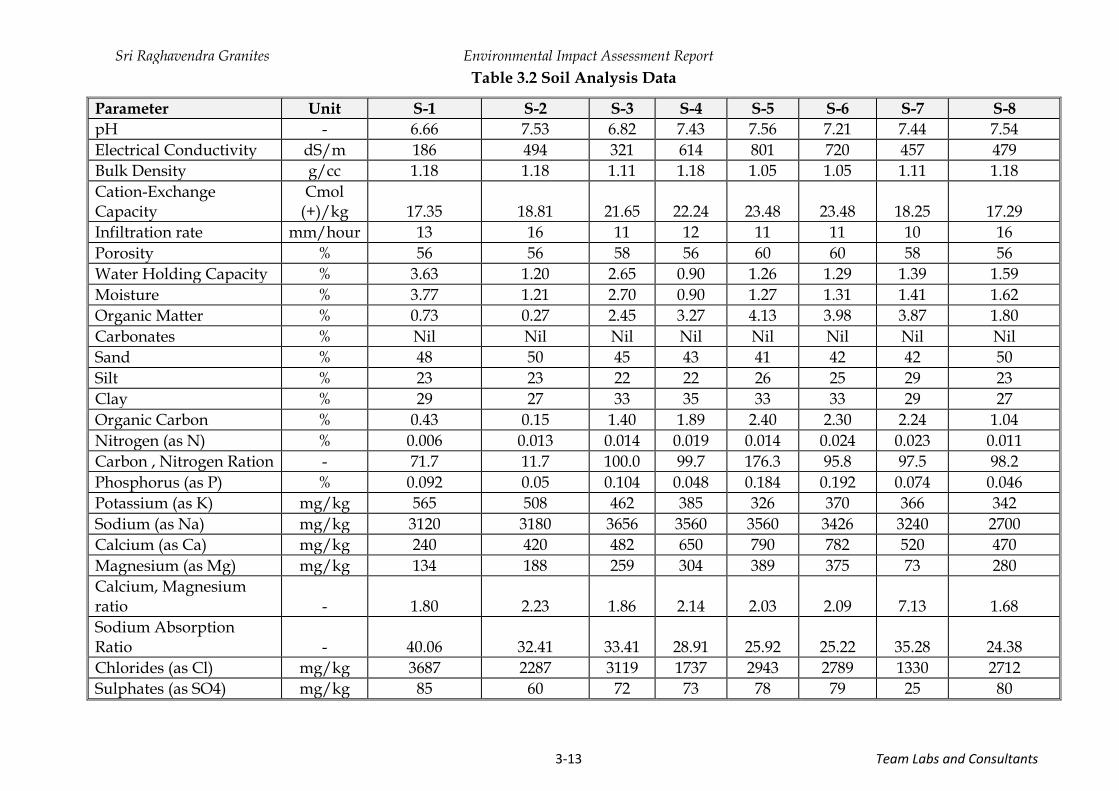
Table 3.2 Soil Analysis Data
Parameter Unit S-1 S-2 S-3 S-4 S-5 S-6 S-7 S-8
pH - 6.66 7.53 6.82 7.43 7.56 7.21 7.44 7.54
Electrical Conductivity dS/m 186 494 321 614 801 720 457 479
Bulk Density g/cc 1.18 1.18 1.11 1.18 1.05 1.05 1.11 1.18
Cation-Exchange Capacity
Cmol (+)/kg 17.35 18.81 21.65 22.24 23.48 23.48 18.25 17.29
Infiltration rate mm/hour 13 16 11 12 11 11 10 16
Porosity % 56 56 58 56 60 60 58 56
Water Holding Capacity % 3.63 1.20 2.65 0.90 1.26 1.29 1.39 1.59
Moisture % 3.77 1.21 2.70 0.90 1.27 1.31 1.41 1.62
Organic Matter % 0.73 0.27 2.45 3.27 4.13 3.98 3.87 1.80
Carbonates % Nil Nil Nil Nil Nil Nil Nil Nil
Sand % 48 50 45 43 41 42 42 50
Silt % 23 23 22 22 26 25 29 23
Clay % 29 27 33 35 33 33 29 27
Organic Carbon % 0.43 0.15 1.40 1.89 2.40 2.30 2.24 1.04
Nitrogen (as N) % 0.006 0.013 0.014 0.019 0.014 0.024 0.023 0.011
Carbon , Nitrogen Ration - 71.7 11.7 100.0 99.7 176.3 95.8 97.5 98.2
Phosphorus (as P) % 0.092 0.05 0.104 0.048 0.184 0.192 0.074 0.046
Potassium (as K) mg/kg 565 508 462 385 326 370 366 342
Sodium (as Na) mg/kg 3120 3180 3656 3560 3560 3426 3240 2700
Calcium (as Ca) mg/kg 240 420 482 650 790 782 520 470
Magnesium (as Mg) mg/kg 134 188 259 304 389 375 73 280
Calcium, Magnesium ratio - 1.80 2.23 1.86 2.14 2.03 2.09 7.13 1.68
Sodium Absorption Ratio - 40.06 32.41 33.41 28.91 25.92 25.22 35.28 24.38
Chlorides (as Cl) mg/kg 3687 2287 3119 1737 2943 2789 1330 2712
Sulphates (as SO4) mg/kg 85 60 72 73 78 79 25 80

Sri Raghavendra Granites Environmental Impact Assessment Report
Team Labs and Consultants 3-14
Parameter Unit S-1 S-2 S-3 S-4 S-5 S-6 S-7 S-8
Aluminium (as Al) mg/kg <10 <10 <10 <10 <10 <10 <10 <10
Arsenic (as As) mg/kg <1.0 <1.0 <1.0 <1.0 <1.0 <1.0 <1.0 <1.0
Boron (as B) mg/kg <10 <10 <10 <10 <10 <10 <10 <10
Cadmium (as Cd) mg/kg <1.0 <1.0 <1.0 <1.0 <1.0 <1.0 <1.0 <1.0
Chromium (as Cr) mg/kg 38 57 40 58 78 42 58 59
Copper (as Cu) mg/kg 16 21 17 21 24 27 26 21
Iron (as Fe) mg/kg 636 602 623 607 616 610 609 628
Lead (as Pb) mg/kg <10 <10 13 <10 16 <11 <10 <10
Manganese (as Mn) mg/kg 204 358 534 574 496 562 366 311
Mercury (as Hg) mg/kg <1.0 <1.0 <1.0 <1.0 <1.0 <1.0 <1.0 <1.0
Nickel (as Ni) mg/kg 18 37 34 38 44 39 45 30
Selenium (as Se) mg/kg <1.0 <1.0 <1.0 <1.0 <1.0 <1.0 <1.0 <1.0
Silver (as Ag) mg/kg <10 <10 <10 <10 <10 <10 <10 <10
Zinc (as Zn) mg/kg 19 29 27 26 24 24 21 29
Texture - Sandy Clay
loam Sandy Clay
loam Clay loam
Clay loam
Clay loam
Clay loam
Clay loam
Sandy Clay loam
S1-Near Mine Lease Area, S2-Chenupalli, S3-Mallayapalem, S4-Kopparapalem, S5-Sommavarapaddu, S6-Sajjapuram, S7-Kommalapadu and S8-Ballikurava.
Sri Raghavendra Granites Environmental Impact Assessment Report
Team Labs and Consultants 3-15
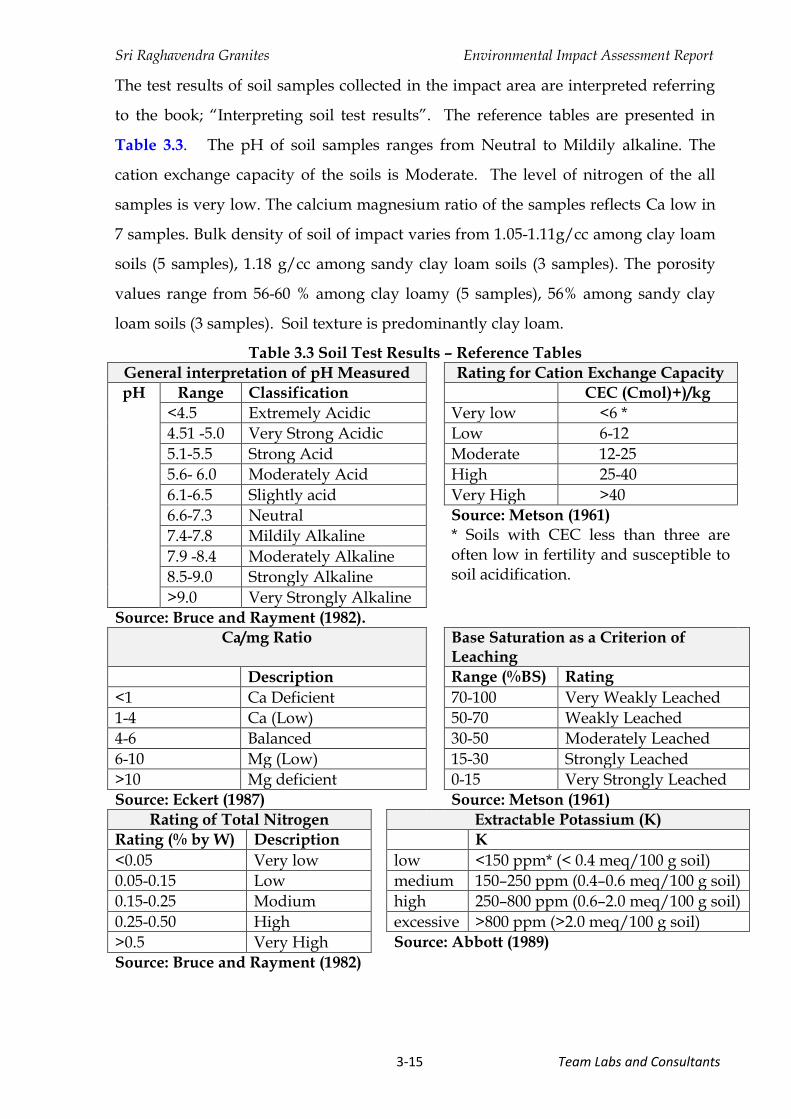
The test results of soil samples collected in the impact area are interpreted referring
to the book; “Interpreting soil test results”. The reference tables are presented in
Table 3.3. The pH of soil samples ranges from Neutral to Mildily alkaline. The
cation exchange capacity of the soils is Moderate. The level of nitrogen of the all
samples is very low. The calcium magnesium ratio of the samples reflects Ca low in
7 samples. Bulk density of soil of impact varies from 1.05-1.11g/cc among clay loam
soils (5 samples), 1.18 g/cc among sandy clay loam soils (3 samples). The porosity
values range from 56-60 % among clay loamy (5 samples), 56% among sandy clay
loam soils (3 samples). Soil texture is predominantly clay loam.
Table 3.3 Soil Test Results – Reference Tables
General interpretation of pH Measured Rating for Cation Exchange Capacity
pH Range Classification CEC (Cmol)+)/kg
<4.5 Extremely Acidic Very low <6 *
4.51 -5.0 Very Strong Acidic Low 6-12
5.1-5.5 Strong Acid Moderate 12-25
5.6- 6.0 Moderately Acid High 25-40
6.1-6.5 Slightly acid Very High >40
6.6-7.3 Neutral Source: Metson (1961) * Soils with CEC less than three are often low in fertility and susceptible to soil acidification.
7.4-7.8 Mildily Alkaline
7.9 -8.4 Moderately Alkaline
8.5-9.0 Strongly Alkaline
>9.0 Very Strongly Alkaline
Source: Bruce and Rayment (1982).
Ca/mg Ratio Base Saturation as a Criterion of Leaching
Description Range (%BS) Rating
<1 Ca Deficient 70-100 Very Weakly Leached
1-4 Ca (Low) 50-70 Weakly Leached
4-6 Balanced 30-50 Moderately Leached
6-10 Mg (Low) 15-30 Strongly Leached
>10 Mg deficient 0-15 Very Strongly Leached Source: Eckert (1987) Source: Metson (1961)
Rating of Total Nitrogen Extractable Potassium (K)
Rating (% by W) Description K
<0.05 Very low low <150 ppm* (< 0.4 meq/100 g soil)
0.05-0.15 Low medium 150–250 ppm (0.4–0.6 meq/100 g soil)
0.15-0.25 Modium high 250–800 ppm (0.6–2.0 meq/100 g soil)
0.25-0.50 High excessive >800 ppm (>2.0 meq/100 g soil)
>0.5 Very High Source: Abbott (1989)
Source: Bruce and Rayment (1982)
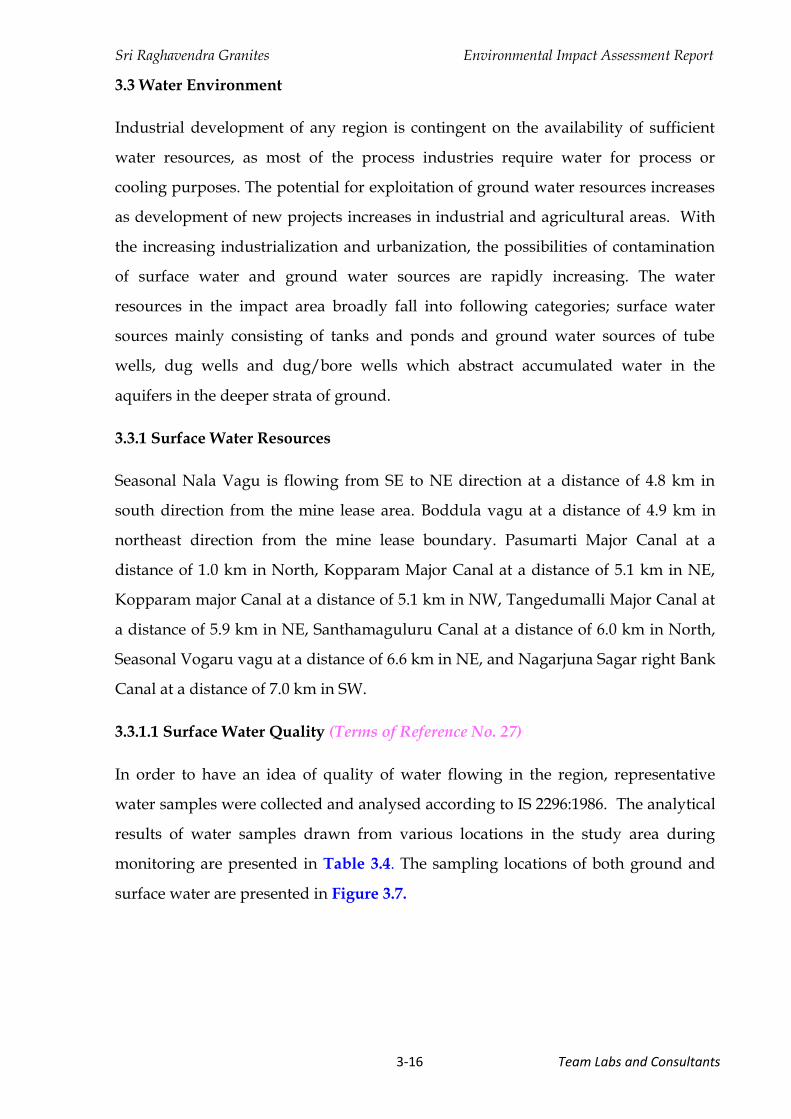
Sri Raghavendra Granites Environmental Impact Assessment Report
Team Labs and Consultants 3-16
3.3 Water Environment
Industrial development of any region is contingent on the availability of sufficient
water resources, as most of the process industries require water for process or
cooling purposes. The potential for exploitation of ground water resources increases
as development of new projects increases in industrial and agricultural areas. With
the increasing industrialization and urbanization, the possibilities of contamination
of surface water and ground water sources are rapidly increasing. The water
resources in the impact area broadly fall into following categories; surface water
sources mainly consisting of tanks and ponds and ground water sources of tube
wells, dug wells and dug/bore wells which abstract accumulated water in the
aquifers in the deeper strata of ground.
3.3.1 Surface Water Resources
Seasonal Nala Vagu is flowing from SE to NE direction at a distance of 4.8 km in
south direction from the mine lease area. Boddula vagu at a distance of 4.9 km in
northeast direction from the mine lease boundary. Pasumarti Major Canal at a
distance of 1.0 km in North, Kopparam Major Canal at a distance of 5.1 km in NE,
Kopparam major Canal at a distance of 5.1 km in NW, Tangedumalli Major Canal at
a distance of 5.9 km in NE, Santhamaguluru Canal at a distance of 6.0 km in North,
Seasonal Vogaru vagu at a distance of 6.6 km in NE, and Nagarjuna Sagar right Bank
Canal at a distance of 7.0 km in SW.
3.3.1.1 Surface Water Quality (Terms of Reference No. 27)
In order to have an idea of quality of water flowing in the region, representative
water samples were collected and analysed according to IS 2296:1986. The analytical
results of water samples drawn from various locations in the study area during
monitoring are presented in Table 3.4. The sampling locations of both ground and
surface water are presented in Figure 3.7.
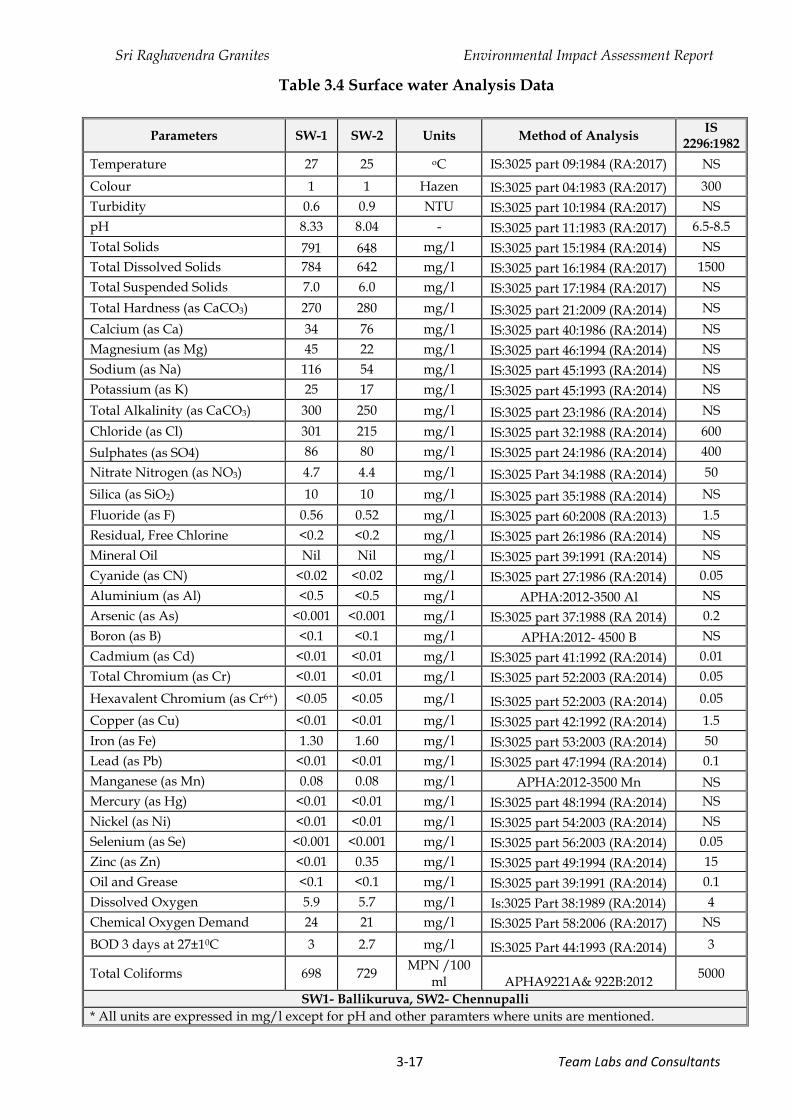
Sri Raghavendra Granites Environmental Impact Assessment Report
Team Labs and Consultants 3-17
Table 3.4 Surface water Analysis Data
Parameters SW-1 SW-2 Units Method of Analysis IS
2296:1982
Temperature 27 25 oC IS:3025 part 09:1984 (RA:2017) NS
Colour 1 1 Hazen IS:3025 part 04:1983 (RA:2017) 300
Turbidity 0.6 0.9 NTU IS:3025 part 10:1984 (RA:2017) NS
pH 8.33 8.04 - IS:3025 part 11:1983 (RA:2017) 6.5-8.5
Total Solids 791 648 mg/l IS:3025 part 15:1984 (RA:2014) NS
Total Dissolved Solids 784 642 mg/l IS:3025 part 16:1984 (RA:2017) 1500
Total Suspended Solids 7.0 6.0 mg/l IS:3025 part 17:1984 (RA:2017) NS
Total Hardness (as CaCO3) 270 280 mg/l IS:3025 part 21:2009 (RA:2014) NS
Calcium (as Ca) 34 76 mg/l IS:3025 part 40:1986 (RA:2014) NS
Magnesium (as Mg) 45 22 mg/l IS:3025 part 46:1994 (RA:2014) NS
Sodium (as Na) 116 54 mg/l IS:3025 part 45:1993 (RA:2014) NS
Potassium (as K) 25 17 mg/l IS:3025 part 45:1993 (RA:2014) NS
Total Alkalinity (as CaCO3) 300 250 mg/l IS:3025 part 23:1986 (RA:2014) NS
Chloride (as Cl) 301 215 mg/l IS:3025 part 32:1988 (RA:2014) 600
Sulphates (as SO4) 86 80 mg/l IS:3025 part 24:1986 (RA:2014) 400
Nitrate Nitrogen (as NO3) 4.7 4.4 mg/l IS:3025 Part 34:1988 (RA:2014) 50
Silica (as SiO2) 10 10 mg/l IS:3025 part 35:1988 (RA:2014) NS
Fluoride (as F) 0.56 0.52 mg/l IS:3025 part 60:2008 (RA:2013) 1.5
Residual, Free Chlorine <0.2 <0.2 mg/l IS:3025 part 26:1986 (RA:2014) NS
Mineral Oil Nil Nil mg/l IS:3025 part 39:1991 (RA:2014) NS
Cyanide (as CN) <0.02 <0.02 mg/l IS:3025 part 27:1986 (RA:2014) 0.05
Aluminium (as Al) <0.5 <0.5 mg/l APHA:2012-3500 Al NS
Arsenic (as As) <0.001 <0.001 mg/l IS:3025 part 37:1988 (RA 2014) 0.2
Boron (as B) <0.1 <0.1 mg/l APHA:2012- 4500 B NS
Cadmium (as Cd) <0.01 <0.01 mg/l IS:3025 part 41:1992 (RA:2014) 0.01
Total Chromium (as Cr) <0.01 <0.01 mg/l IS:3025 part 52:2003 (RA:2014) 0.05
Hexavalent Chromium (as Cr6+) <0.05 <0.05 mg/l IS:3025 part 52:2003 (RA:2014) 0.05
Copper (as Cu) <0.01 <0.01 mg/l IS:3025 part 42:1992 (RA:2014) 1.5
Iron (as Fe) 1.30 1.60 mg/l IS:3025 part 53:2003 (RA:2014) 50
Lead (as Pb) <0.01 <0.01 mg/l IS:3025 part 47:1994 (RA:2014) 0.1
Manganese (as Mn) 0.08 0.08 mg/l APHA:2012-3500 Mn NS
Mercury (as Hg) <0.01 <0.01 mg/l IS:3025 part 48:1994 (RA:2014) NS
Nickel (as Ni) <0.01 <0.01 mg/l IS:3025 part 54:2003 (RA:2014) NS
Selenium (as Se) <0.001 <0.001 mg/l IS:3025 part 56:2003 (RA:2014) 0.05
Zinc (as Zn) <0.01 0.35 mg/l IS:3025 part 49:1994 (RA:2014) 15
Oil and Grease <0.1 <0.1 mg/l IS:3025 part 39:1991 (RA:2014) 0.1
Dissolved Oxygen 5.9 5.7 mg/l Is:3025 Part 38:1989 (RA:2014) 4
Chemical Oxygen Demand 24 21 mg/l IS:3025 Part 58:2006 (RA:2017) NS
BOD 3 days at 27±10C 3 2.7 mg/l IS:3025 Part 44:1993 (RA:2014) 3
Total Coliforms 698 729 MPN /100
ml APHA9221A& 922B:2012 5000
SW1- Ballikuruva, SW2- Chennupalli
* All units are expressed in mg/l except for pH and other paramters where units are mentioned.

Sri Raghavendra Granites Environmental Impact Assessment Report
Team Labs and Consultants 3-18
3.3.1.2. Ground Water Resources
Ground water is the accumulation of water below the ground surface, caused by
rainfall and its subsequent percolation through pores and crevices. Percolated water
accumulates till it reaches an impervious stratum consisting of confined clay
confined clay or confined rocks. Occurrence of ground water is controlled by
landform, structure and lithology. Ground water abstraction is by means of dug
wells, dug cum driven wells, and bore wells. Every village has a number of
traditional wells large and small. The state authorities have also provided tube wells
fitted with hand pump for the drinking water requirement of villages in the study
area. Presently the drinking water needs are mostly met from the ground water
resources.
3.3.1.3 Quality of Ground Water
The representative samples are collected from various dug wells and bore wells in
the study area. There area has few bore wells in the vinicity of mine lease area. The
ground water in the vinicity may be shallow open wells or handpumps with depth
of 2 – 3 m. and quality of shallow well is soft. Unlike saline or hard water in the bore
wells, where water drawn from below 10 m. The list of samplesloations is presented
inTable 3.5. The analytical results of water samples drawn from various locations in
the study area are presented in Table 3.6. The map showing the locations of sample
collection is presented in Figure 3.7. It may be observed that the analytical results are
above the prescribed standads for total hardness and total suspended solids in some
samples.
Table 3.5 Locations of groundwater sampling
S. No Location Name Direction
form ML area Distance from ML Area (Km)
GW-01. Near Mine Lease Area - -
GW-02. Chenupalli S 2.3
GW-03. Mallayapalem NE 1.4
GW-04. Kopparapalem NE 1.3
GW-05. Sommavarapaddu NE 2.3
GW-06. Sajjapuram NW 2.3
GW-07. Kommalapadu SW 5.5
GW-08. Ballikurava SE 4.7
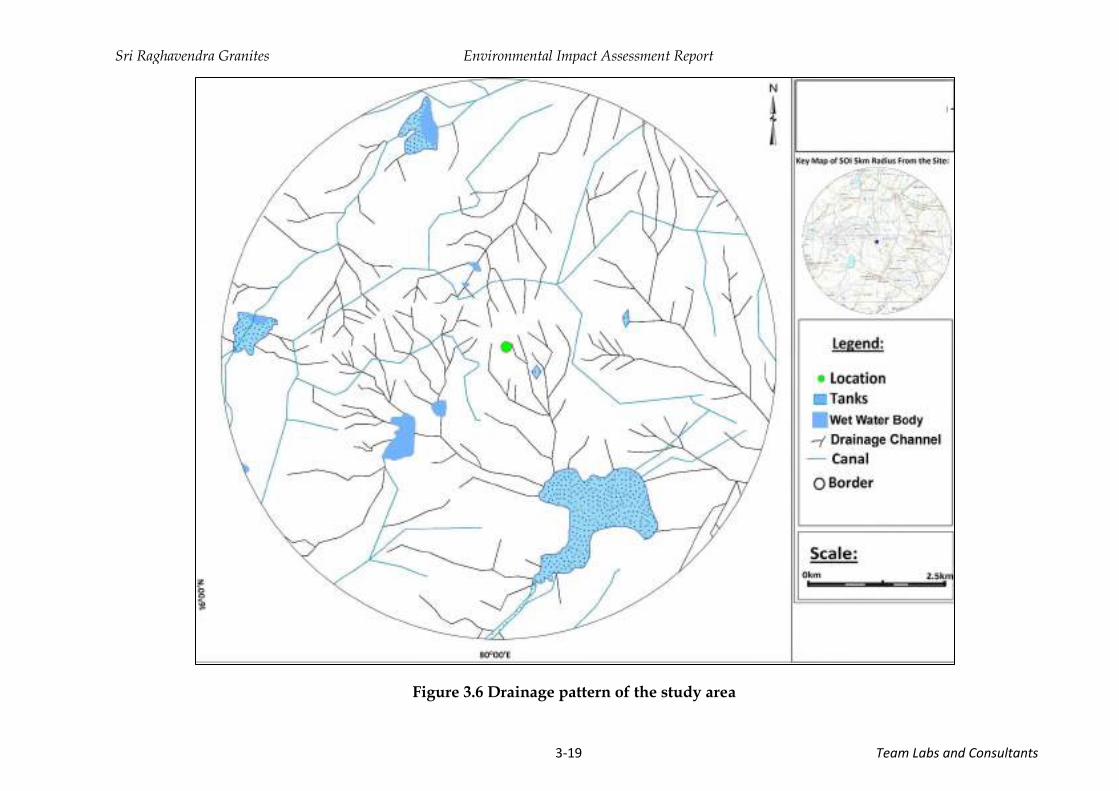
Sri Raghavendra Granites Environmental Impact Assessment Report
Team Labs and Consultants 3-19
Figure 3.6 Drainage pattern of the study area
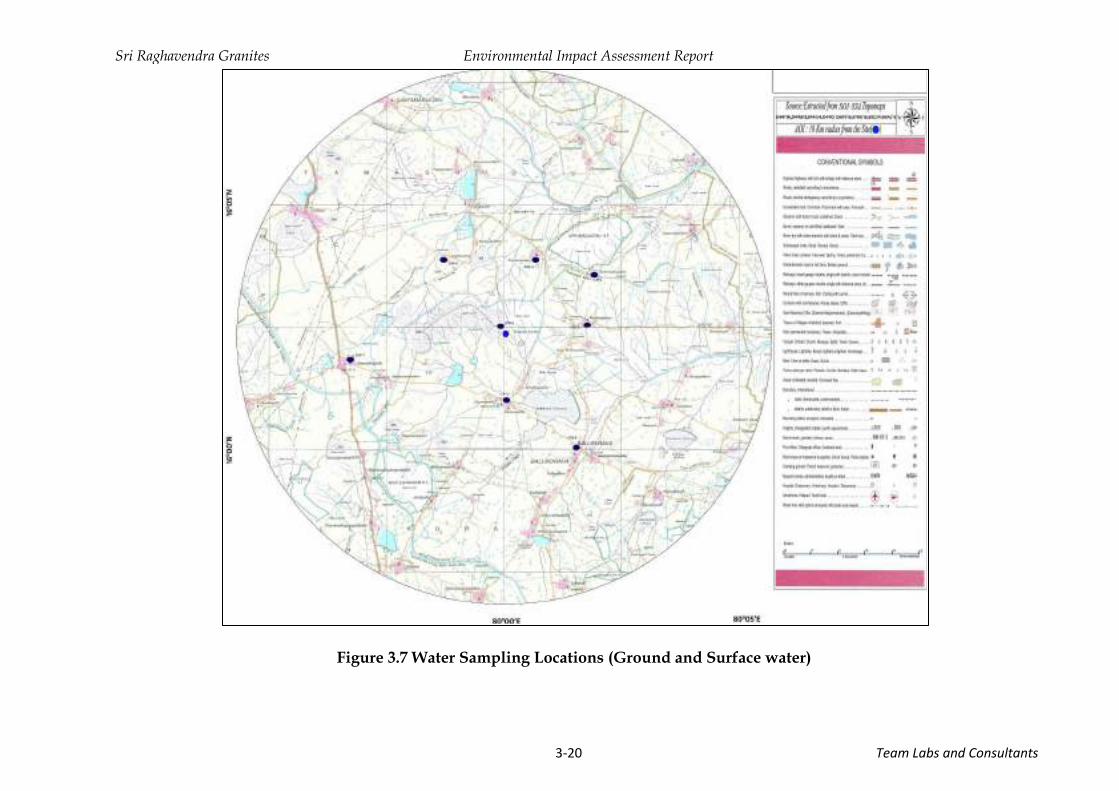
Sri Raghavendra Granites Environmental Impact Assessment Report
Team Labs and Consultants 3-20
Figure 3.7 Water Sampling Locations (Ground and Surface water)
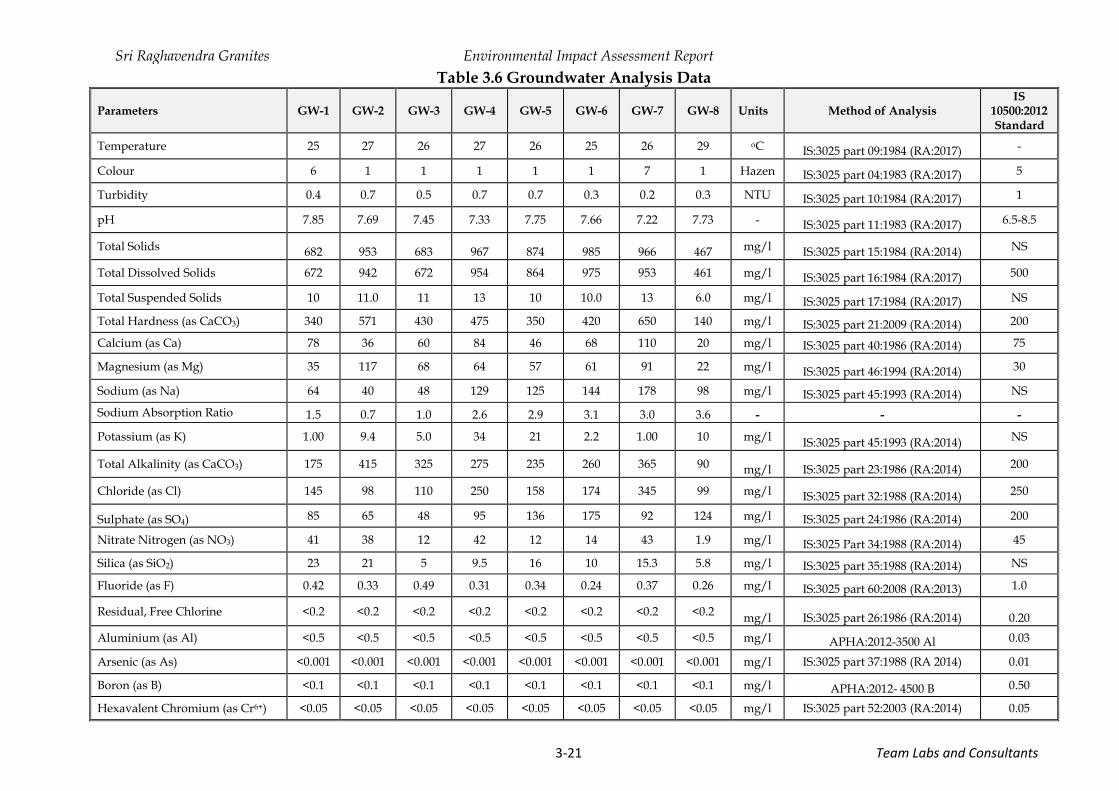
Sri Raghavendra Granites Environmental Impact Assessment Report
Team Labs and Consultants 3-21
Table 3.6 Groundwater Analysis Data
Parameters GW-1 GW-2 GW-3 GW-4 GW-5 GW-6 GW-7 GW-8 Units Method of Analysis IS
10500:2012 Standard
Temperature 25 27 26 27 26 25 26 29 oC IS:3025 part 09:1984 (RA:2017) -
Colour 6 1 1 1 1 1 7 1 Hazen IS:3025 part 04:1983 (RA:2017) 5
Turbidity 0.4 0.7 0.5 0.7 0.7 0.3 0.2 0.3 NTU IS:3025 part 10:1984 (RA:2017) 1
pH 7.85 7.69 7.45 7.33 7.75 7.66 7.22 7.73 - IS:3025 part 11:1983 (RA:2017) 6.5-8.5
Total Solids 682 953 683 967 874 985 966 467 mg/l IS:3025 part 15:1984 (RA:2014) NS
Total Dissolved Solids 672 942 672 954 864 975 953 461 mg/l IS:3025 part 16:1984 (RA:2017) 500
Total Suspended Solids 10 11.0 11 13 10 10.0 13 6.0 mg/l IS:3025 part 17:1984 (RA:2017) NS
Total Hardness (as CaCO3) 340 571 430 475 350 420 650 140 mg/l IS:3025 part 21:2009 (RA:2014) 200
Calcium (as Ca) 78 36 60 84 46 68 110 20 mg/l IS:3025 part 40:1986 (RA:2014) 75
Magnesium (as Mg) 35 117 68 64 57 61 91 22 mg/l IS:3025 part 46:1994 (RA:2014) 30
Sodium (as Na) 64 40 48 129 125 144 178 98 mg/l IS:3025 part 45:1993 (RA:2014) NS
Sodium Absorption Ratio 1.5 0.7 1.0 2.6 2.9 3.1 3.0 3.6 - - -
Potassium (as K) 1.00 9.4 5.0 34 21 2.2 1.00 10 mg/l IS:3025 part 45:1993 (RA:2014)
NS
Total Alkalinity (as CaCO3) 175 415 325 275 235 260 365 90 mg/l IS:3025 part 23:1986 (RA:2014) 200
Chloride (as Cl) 145 98 110 250 158 174 345 99 mg/l IS:3025 part 32:1988 (RA:2014) 250
Sulphate (as SO4) 85 65 48 95 136 175 92 124 mg/l IS:3025 part 24:1986 (RA:2014) 200
Nitrate Nitrogen (as NO3) 41 38 12 42 12 14 43 1.9 mg/l IS:3025 Part 34:1988 (RA:2014) 45
Silica (as SiO2) 23 21 5 9.5 16 10 15.3 5.8 mg/l IS:3025 part 35:1988 (RA:2014) NS
Fluoride (as F) 0.42 0.33 0.49 0.31 0.34 0.24 0.37 0.26 mg/l IS:3025 part 60:2008 (RA:2013) 1.0
Residual, Free Chlorine <0.2 <0.2 <0.2 <0.2 <0.2 <0.2 <0.2 <0.2 mg/l IS:3025 part 26:1986 (RA:2014) 0.20
Aluminium (as Al) <0.5 <0.5 <0.5 <0.5 <0.5 <0.5 <0.5 <0.5 mg/l APHA:2012-3500 Al 0.03
Arsenic (as As) <0.001 <0.001 <0.001 <0.001 <0.001 <0.001 <0.001 <0.001 mg/l IS:3025 part 37:1988 (RA 2014) 0.01
Boron (as B) <0.1 <0.1 <0.1 <0.1 <0.1 <0.1 <0.1 <0.1 mg/l APHA:2012- 4500 B 0.50
Hexavalent Chromium (as Cr6+) <0.05 <0.05 <0.05 <0.05 <0.05 <0.05 <0.05 <0.05 mg/l IS:3025 part 52:2003 (RA:2014) 0.05

Sri Raghavendra Granites Environmental Impact Assessment Report
Team Labs and Consultants 3-22
Parameters GW-1 GW-2 GW-3 GW-4 GW-5 GW-6 GW-7 GW-8 Units Method of Analysis IS
10500:2012 Standard
Copper (as Cu) <0.01 <0.01 <0.01 <0.01 <0.01 <0.01 <0.01 <0.01 mg/l IS:3025 part 42:1992 (RA:2014) 0.05
Iron (as Fe) 0.24 0.14 0.21 0.19 0.29 0.13 0.27 0.18 mg/l IS:3025 part 53:2003 (RA:2014) 0.30
Lead (as Pb) <0.01 <0.01 <0.01 <0.01 <0.01 <0.01 <0.01 <0.01 mg/l IS:3025 part 47:1994 (RA:2014) 0.01
Manganese (as Mn) 0.08 0.08 0.08 0.07 0.08 0.09 0.09 0.08 mg/l APHA:2012-3500 Mn 0.10
Mercury (as Hg) <0.01 <0.01 <0.01 <0.01 <0.01 <0.01 <0.01 <0.01 mg/l IS:3025 part 48:1994 (RA:2014) 0.001
Nickel (as Ni) <0.01 <0.01 <0.01 <0.01 <0.01 <0.01 <0.01 <0.01 mg/l IS:3025 part 54:2003 (RA:2014) 0.02
Selenium (as Se) <0.001 <0.001 <0.001 <0.001 <0.001 <0.001 <0.001 <0.001 mg/l IS:3025 part 56:2003 0.01
Zinc (as Zn) <0.01 1.3 <0.01 0.85 0.01 1.7 <0.01 0.05 mg/l IS:3025 part 49:1994 (RA:2014) 5.0
GW1-Near Mine Lease Area, GW2-Chenupalli, GW3-Mallayapalem, GW4-Kopparapalem, GW5-Sommavarapaddu, GW6-Sajjapuram, GW7-Kommalapadu and GW8-Ballikurava.

Sri Raghavendra Granites Environmental Impact Assessment Report
Team Labs and Consultants 3-23
3.4 Air Environment
3.4.1 Meteorology
Micro meteorological studies are simultaneously conducted with air quality
monitoring. Meteorology plays a vital role in effecting the dispersion of pollutants,
once discharged into the atmosphere, their transport, dispersion and diffusion into
the environment. The meteorological data is very useful for interpretation of the
baseline information and for model study of air quality impacts also. Since
meteorological data show wide fluctuations with time, meaningful interpretation
can only be drawn from long term and reliable data. Such source of data is the India
Meteorological Department (IMD), which maintains a network of meteorological
stations at several important locations. The nearest IMD station is located at Ongole.
The data recorded for IMD station at Ongole is summarized and the salient features
of the summarized data are as follows in the Table 3.7.
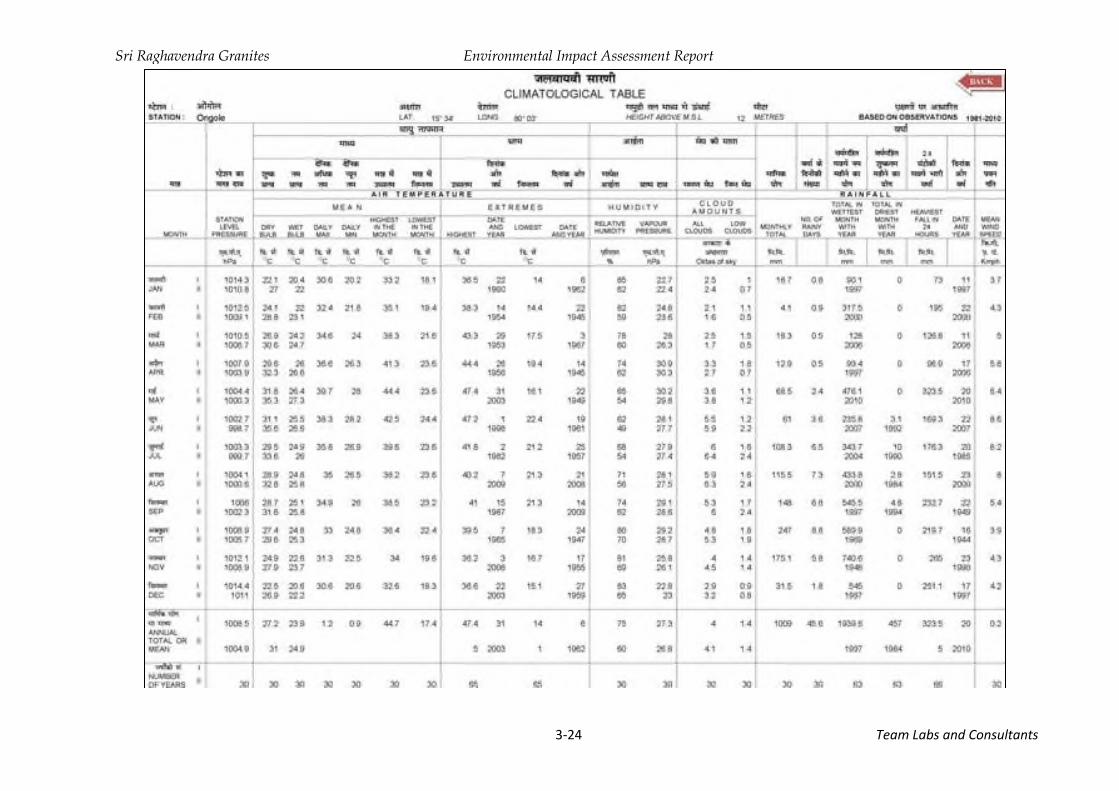
Sri Raghavendra Granites Environmental Impact Assessment Report
Team Labs and Consultants 3-24
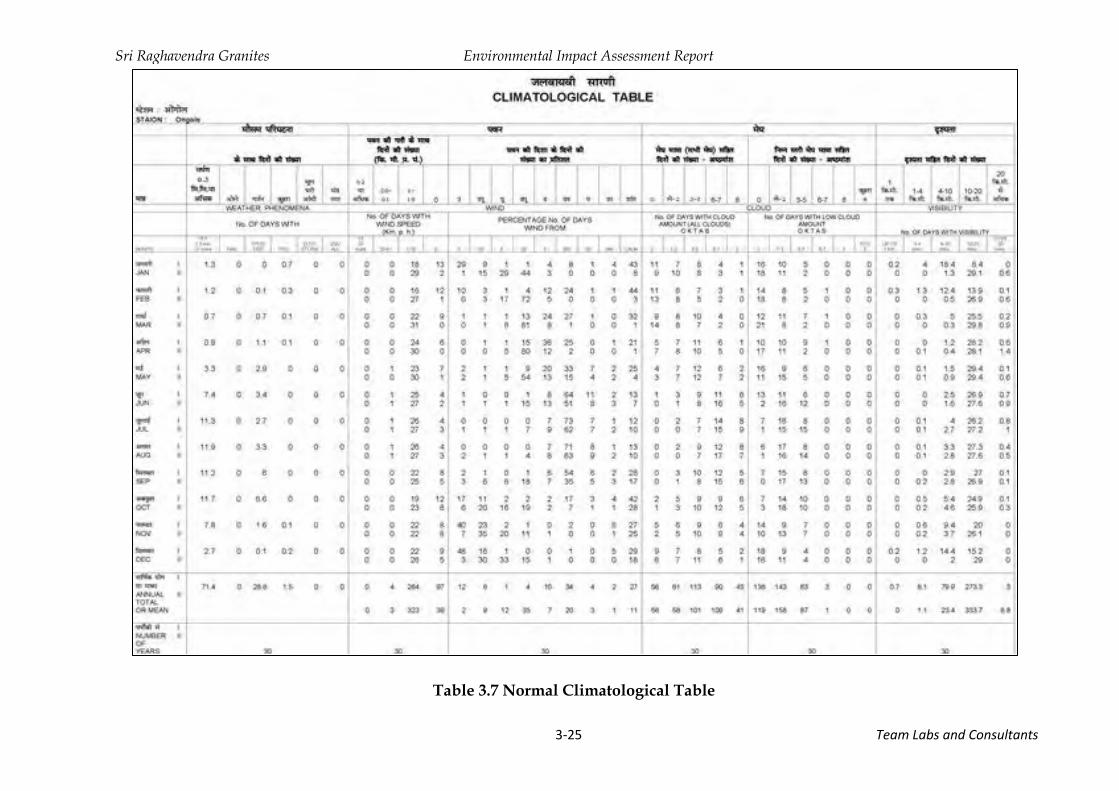
Sri Raghavendra Granites Environmental Impact Assessment Report
Team Labs and Consultants 3-25
Table 3.7 Normal Climatological Table

Sri Raghavendra Granites Environmental Impact Assessment Report
Team Labs and Consultants 3-26
3.4.2 Meteorological Station at Mine Lease area
The micro meteorological data at the ML area is collected simultaneously with
ambient air quality monitoring. The station was installed at height of 10 meters
above the ground level and the same is located in such a way that there are no
obstructions facilitating free flow of wind. Wind speed, wind direction, humidity,
temperature and rainfall are recorded on hourly basis. Salient features of micro
meteorological data collected during study periodare as follows:
1. Wind Direction and Speed:
The hourly wind speed and wind direction observations are computed for the study
period and the same are presented in Table 3.8 and the wind rose diagrams are
presented in Figure 3.8. The following observations can be made from the collected
data;
• There is 0.09 % of Calm period is observed during the time of monitoring.
• The predominant wind direction is southeast.
• Other than predominant wind directions of wind from SSE and S.
• Mostly the wind speeds are observed to be in the range of >15 kmph and 10 - 15
kmph.
The maximum and minimum temperature and relative humidity and total rainfall
are summarized as below. The salient features are discussed in brief as follows
2) Temperature (in0C)
(a) Maximum: 43.80C (b) Minimum: 18.10C (b) Mean: 43.230C
3) Humidity (in %)
The daily relative humidity values are observed to range between 35 to 80%. The
mean value of humidity is 52 %.
4) Rainfall (in mm)
(a) Maximum: 1.2mm (b) Minimum: 0 mm (c) Mean: 3.0 mm
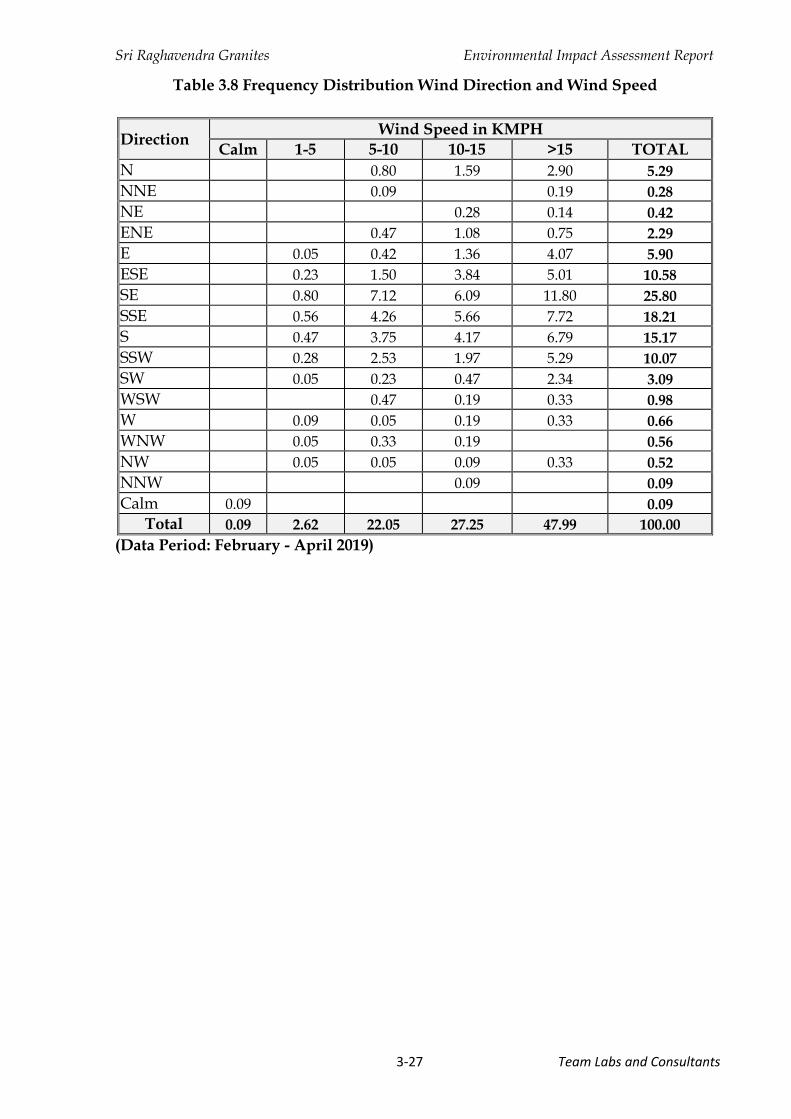
Sri Raghavendra Granites Environmental Impact Assessment Report
Team Labs and Consultants 3-27
Table 3.8 Frequency Distribution Wind Direction and Wind Speed
Direction Wind Speed in KMPH
Calm 1-5 5-10 10-15 >15 TOTAL
N 0.80 1.59 2.90 5.29
NNE 0.09 0.19 0.28
NE 0.28 0.14 0.42
ENE 0.47 1.08 0.75 2.29
E 0.05 0.42 1.36 4.07 5.90
ESE 0.23 1.50 3.84 5.01 10.58
SE 0.80 7.12 6.09 11.80 25.80
SSE 0.56 4.26 5.66 7.72 18.21
S 0.47 3.75 4.17 6.79 15.17
SSW 0.28 2.53 1.97 5.29 10.07
SW 0.05 0.23 0.47 2.34 3.09
WSW 0.47 0.19 0.33 0.98
W 0.09 0.05 0.19 0.33 0.66
WNW 0.05 0.33 0.19 0.56
NW 0.05 0.05 0.09 0.33 0.52
NNW 0.09 0.09
Calm 0.09 0.09
Total 0.09 2.62 22.05 27.25 47.99 100.00
(Data Period: February - April 2019)
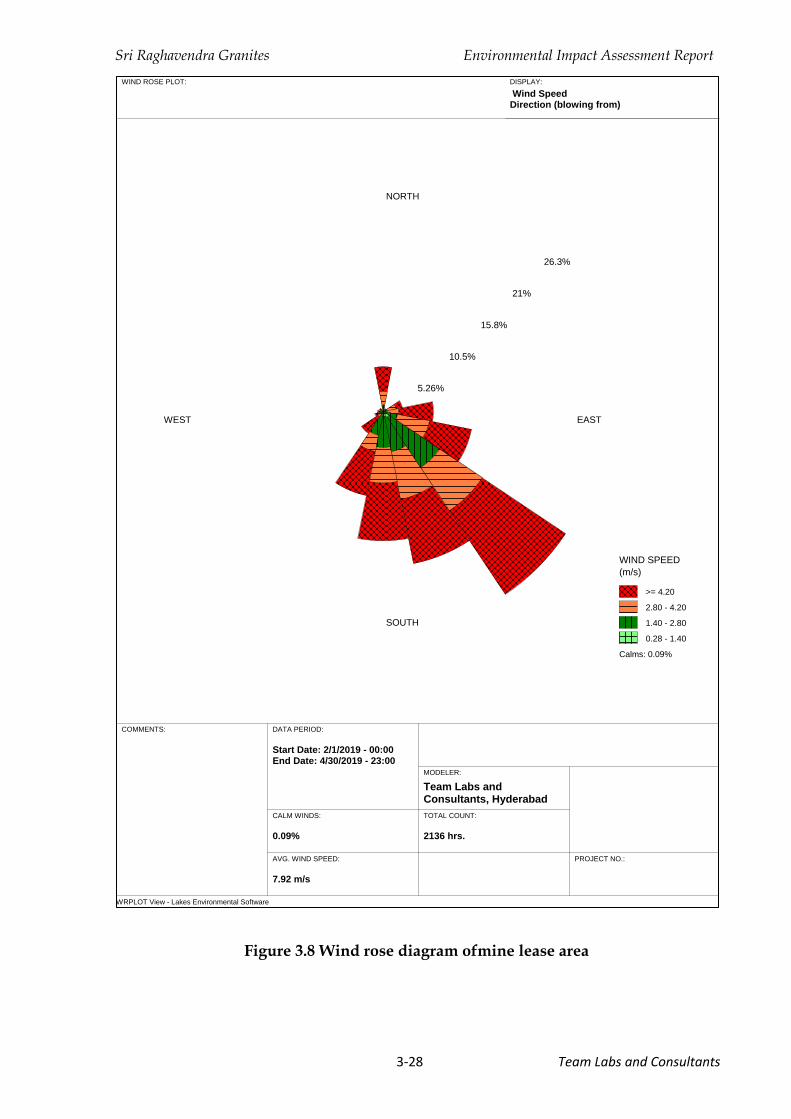
Sri Raghavendra Granites Environmental Impact Assessment Report
Team Labs and Consultants 3-28
Figure 3.8 Wind rose diagram ofmine lease area
WRPLOT View - Lakes Environmental Software
WIND ROSE PLOT:
COMMENTS:
MODELER:
Team Labs and Consultants, Hyderabad
PROJECT NO.:
NORTH
SOUTH
WEST EAST
5.26%
10.5%
15.8%
21%
26.3%
WIND SPEED (m/s)
>= 4.20
2.80 - 4.20
1.40 - 2.80
0.28 - 1.40
Calms: 0.09%
TOTAL COUNT:
2136 hrs.
CALM WINDS:
0.09%
DATA PERIOD:
Start Date: 2/1/2019 - 00:00End Date: 4/30/2019 - 23:00
AVG. WIND SPEED:
7.92 m/s
DISPLAY:
Wind SpeedDirection (blowing from)

Sri Raghavendra Granites Environmental Impact Assessment Report
Team Labs and Consultants 3-29
3.4.3 Ambient Air Quality
Air pollution means the presence in the outdoor atmosphere of one or more
combinations thereof in such quantities and of such duration as are or may tend to
be injurious to human, plant or animal life or property. Air pollutants include
smoke, vapors, soot, fumes, gases, mist, odors, particulate matter, radioactive
material or noxious chemicals. Air pollution produces a number of adverse effects
including offensive smell, loss of atmospheric clarity, soiling of clothes, building and
manufactured goods by smoke and dust. The hazards caused to man, animals,
vegetation, environment and climate have been understood in the past decade. The
effects of air pollution are briefly discussed below.
a) Effect on human beings
Air borne spores, pollen grains, virus, bacteria, fungi, fur and hairs cause various
allergic reactions, bronchial asthma, tuberculosis and other infections. Sulphur
dioxide produces drying of the mouth, scratchy throat and smarting eyes. It also
causes chest constriction, headache, vomiting and death from respiratory diseases.
Sulphur trioxide, Nitrogen oxide and carbon monoxide diffuse in the blood stream.
They combine with haemoglobin and reduce its oxygen carrying capacity. Nitrogen
oxide in high concentration impairs the functioning of lungs by causing
accumulation of water in the air spaces. Hydrocarbons have been reported to cause
cancer in man. Hydrogen sulphide causes nausea and irritates eyes and throat.
Ammonia attacks upper respiratory passages. Ozone causes dryness of mucous
membrane of the mouth, nose and throat. It changes visual capacity, causes
headache, pulmonary congestion and oedema. Arsines damage red cells in blood,
kidney and cause jaundice. Suspended particles like ash, soot and smoke cause eye
irritation, tuberculosis and possible cancer. Fine particles of various metals present
in the air cause a number of diseases. Heavy dust fall is one of the major causes of
asthma, cough and other diseases of lungs and throat. Lead can damage the brain of
young children and may even cause death. It affects the normal functioning of the
nervous system in adults. Cadmium is a respiratory poison and may cause high
blood pressure and a number of heart diseases. Asbestos fibers have been associated
in chronic lung diseases.

Sri Raghavendra Granites Environmental Impact Assessment Report
Team Labs and Consultants 3-30
b) Effect on animals
Air pollution causes wide spread damage to live-stock. The effect of air pollution on
domestic animals living in or near industrial areas is similar to those of human
beings. Live stocks ingest various fluorine compounds which fall on fodder crops
causing abnormal calcification of bones and teeth. It results in lameness, loss of
weight and frequent diarrhea.
c) Effect on plants
Air pollution has serious harmful effects on plants. Sulphur dioxide causes chlorosis.
It results in the death of cells and tissues. Forest trees are worst affected by sulphur
dioxide pollutants. Fluorides damage leafy vegetables such as lettuce and spinach.
Oxides of nitrogen and fluorides reduce crop yields. Photochemical smog bleaches
and blazes foliage of plants. Hydrocarbons cause premature fall of leaves and flower
buds, discolouration of sepals and curling of petals. Ozone damages cereals, fruits
and cotton crops. It also causes premature yellowing and shedding of leaves.
d) Effect on materials
The acid rain and photochemical smog affect metals and buildings. Acid rain
pollutes the soil and water sources. Acidic products of the air pollutant cause
disintegration of textile, paper. Many small industrial units and sources of
locomotive pollutants have been sifted to save the famous marble structure, Taj
Mahal at Agra. Hydrogen sulphide decolorizes silver and lead paints. Ozone
oxidizes rubber goods.
e) Aesthetic loss
Dust and smoke in the air do not allow us to have a clear view of nature’s beauty
and man-made objects. Smoke and foul smells emitted by factories, automobiles,
dirty drains and garbage dumps make the urban life discomfortable. Smoking in
public places affects the health of not only the smoker but also the non-smoker.
f) Change in Climate
A change in the earth’s climate due to atmospheric pollution is an alarming global
concern. It has been observed that in the recent past, the level of CO2 in the
atmosphere has increased from 290 ppm to 330 ppm. Approximately one fourth of
Sri Raghavendra Granites Environmental Impact Assessment Report
Team Labs and Consultants 3-31
this rise has occurred in the past decade. Rapid increase in population, deforestation
and excessive burning of fossil fuel has been responsible for this increase. It is also
predicted that this factor alone could lead to rise in global temperature, causing
“Green House Effect” or “Global Warming”.
Green House effect may be defined as the progressive warming up the earth surface
due to blanketing effect of man-made CO2 in the atmosphere. The thick CO2 layer
functions like the glass panel of a green house preventing re-radiation of heat to
outer space. A rise of global temperature by more than 2 or 3 0C may lead to the
melting of polar ice cap and glaciers. This will cause rise in ocean level and
consequent flooding of costal towns and submersion of many oceanic islands. This
would also affect the rainfall pattern and productivity of agricultural crops.
With proposed mining activity a range of different pollutants, like PM10 and PM2.5
from mining and transportation, SO2, NOx and CO from fuel combustion in the
semi mechanized operations and transportation of mineral, are released into the
atmosphere that are dispersed and have a significant impact on neighborhood air
environment. Thus, collection of base line data of air environment occupies a
predominant role in the impact assessment statement. The ambient air quality status
across the study zone forms basis for prediction of the impacts due to the project.
The building stone and gravel quarryproject is located at Ballikurava Village and
mandal, Prakasam district, Andhra Pradesh. The data required to asses air quality
impacts in and around neighborhood is achieved by designing such a network,
which encompasses micro meteorological conditions, quantity and quality of
emissions, locations, duration, resources/monitoring technology and operational
criteria. The ambient air quality staions were identified considering the above
factors.
3.4.4 Scope of Field study
The scope of baseline status of the ambient air quality can be assessed through a
well-designed ambient air quality stations network. Ambient air quality monitoring
of the study area consisting of 10 km radius with the mine lease area as the center
point was carried out during the study period of February - April 2019. The ambient

Sri Raghavendra Granites Environmental Impact Assessment Report
Team Labs and Consultants 3-32
air quality was monitored at Ninelocations spread over entire study area. Figure 3.9
presents the locations of nineambient air quality-monitoring stations. At each
sampling station monitoring was carried out for 24 hours in a day for 2 days a week
and for three months during post monsoon season. The parameters studied are
Particulate Matter (Size Less than 10µm) or PM10 µg/m3, Particulate Matter (Size
Less than 2.5 µm) or PM2.5 µg/m3, Sulfur dioxide and Oxides of Nitrogen.Sampling
period, monitoring and analysis of the above variables is according to the guidelines
of Central Pollution Control Board (CPCB). National Ambient Air Quality Standards
(NAAQ) is presented in Table 3.9.
Table 3.9 National Ambient Air Quality Standards
Pollutant Time
Weighted Average
Concentration in Ambient Air
IRR ESA Methods of Measurement
Sulphur Dioxide (SO2), μg/m3 Annual* 24 Hours**
50 80
20 80
Improved west and Gaeke Ultraviolet fluorescence
NitrogenDioxide (NO2), μg/m3 Annual* 24 Hours**
40
80
30
80
Modified Jacob & Hochheiser (Nn-Arsenite) Chemiluminescence
Particulate Matter (Size Less than 10µm) or PM10, μg/m3
Annual* 24 Hours**
60 100
60 100
Gravimetic, TOEM Beta Attenuation
Particulate Matter (Size Less than 2.5µm) or PM2.5, μg/m3
Annual* 24 Hours**
40 60
40 60
Gravimetic TOEM Beta Attenuation
Ozone (O3), μg/m3 8 hours** 1 hour**
100
180
100
180
UV Photometric Chemilminescence Chemical Method
Lead (Pb), μg/m3 Annual* 24 hours**
0.50
1.0
0.50
1.0
AAS /ICP method after sampling on EPM 2000 or equivalent filter paper ED - XRF using Teflon filter.
Carbon Monoxide (CO), mg/m3
8 hours** 1 hour**
02 04
02 04
Non Dispersive Infra Red (NDIR)Spectroscopy
Ammonia (NH3), μg/m3 Annual* 24 hours**
100 400
100 400
Chemilminescence Indophenol blue method
Benzene (C6H6), μg/m3 Annual* 05 05
Gas Chromotography based continuous analyzer Absorption and Desorption followed by GC analysis
Benzo (o) Pyrene (BaP)-Particulate Phase only, ng/m3
Annual* 01 01 Solvent extraction followed by HPLC/GC analysis
Arsenic (As), ng/m3 Annual* 06 06 AAS/ICP method after

Sri Raghavendra Granites Environmental Impact Assessment Report
Team Labs and Consultants 3-33
Pollutant Time
Weighted Average
Concentration in Ambient Air
IRR ESA Methods of Measurement
Nickel (Ni), ng/m3 Annual* 20 20 sampling on EPM 2000 or equivalent filter paper
IRR - Industrial, Residential, Rural and Other Area, ESA- Ecological Sensitive Area (Notified by Central Government)
G.S.No.826 (E), dt.16th November, 2009. Vide letter no. F. No. Q-15017/43/2007-CPW. *Annual Arithmetic mean of minimum 104 measurements in a year at a particular site taken twice a week 24 hourly at uniform interval.
**24 hourly/8/1 hourly monitored values as applicable, shall be complied with 98 percent of the time in a year.2% of time they may be exceeded the limits but not on two consecutive days of monitoring.
3.4.5 Description of Sampling Locations
The location of ambient air quality stations is contingent on the meteorological status
of the area. Hence the micro meteorological data was collected before initiating the
ambient air quality monitoring, and the stations were selected within 10 km of the
project site based on wind direction as the mineoperations are limited. Table 3.10
presents the ambient air quality locations and their distances and directions from the
mine lease area.
Table 3.10 Locations of Ambient Air Quality Monitoring Stations
S. No Location Name Direction
form ML area Distance From ML area, km
AAQ-01. Mine Lease Area - -
AAQ-02. Chenupalli S 2.3
AAQ-03. Mallayapalem NE 1.4
AAQ-04. Kopparapalem NE 1.3
AAQ-05. Sommavarapaddu NE 2.3
AAQ-06. Sajjapuram NW 2.3
AAQ-07. Kommalapadu SW 5.5
AAQ-08. Ballikurava SE 4.7
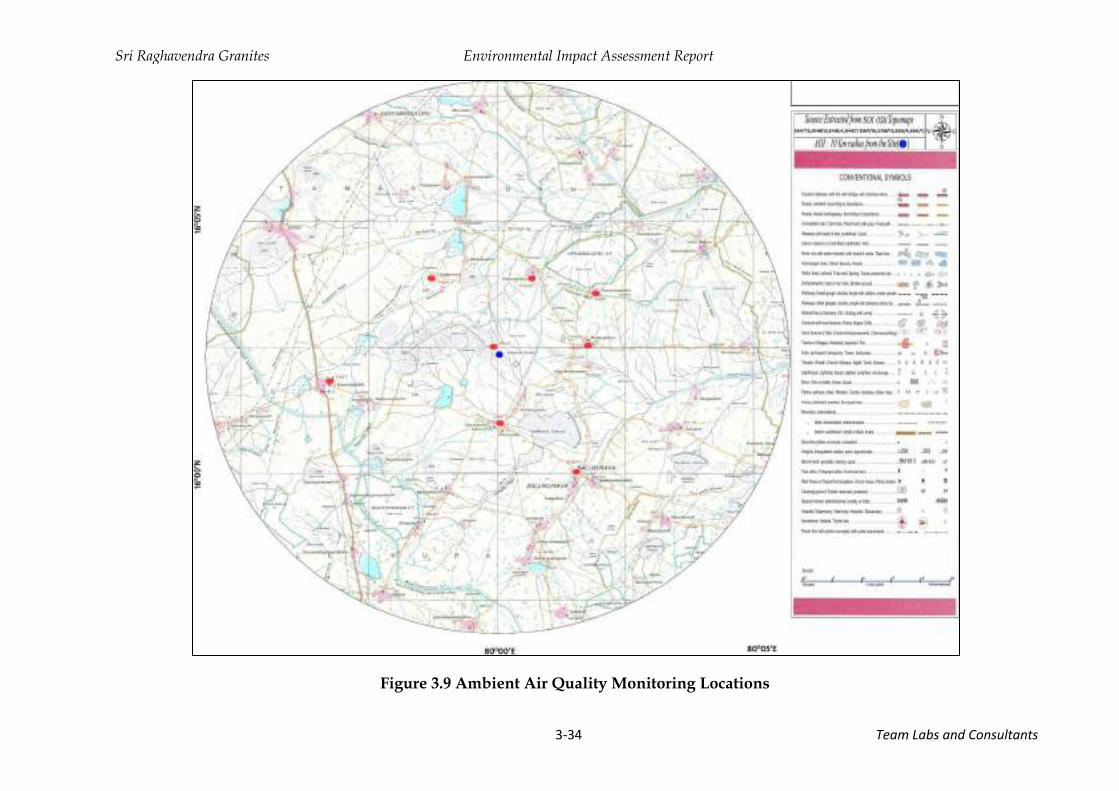
Sri Raghavendra Granites Environmental Impact Assessment Report
Team Labs and Consultants 3-34
Figure 3.9 Ambient Air Quality Monitoring Locations

Sri Raghavendra Granites Environmental Impact Assessment Report
Team Labs and Consultants 3-35
3.4.6 Ambient Air Quality Status (Terms of Reference No. 22)
The existing baseline levels with respect to Particulate Matter (Size Less than 10µm)
or PM10 µg/m3, Particulate Matter (Size Less than 2.5 µg/m3) or PM2.5 µg/m3,
Sulphur dioxide and oxides of nitrogen at 9locations are presented in Table 3.11.
The AAQ baseline data observed values are found to be within the prescribed
NAAQ standards.
Table 3.11 Summary Ambient Air Quality Status
Pollutant Maximum Minimum Mean 98% Percentile
1) Location: Mine Lease Area
PM10 42 37 39.42 42
PM2.5 18 15 16.77 18
SO2 12 8 10.92 12
NOx 13 8 11.15 13
2) Location: Chennupalli
PM10 39 37 38.04 39
PM2.5 19 16 17.31 19
SO2 11 8 10.08 11
NOx 12 8 10.85 12
3) Location: Mallayapalem
PM10 41 0 37.55 41
PM2.5 18 16 17.15 18
SO2 10 7 9.19 10
NOx 14 7 11.42 14
4) Location: Kopparapalem
PM10 43 37 39.77 43
PM2.5 17 15 16.35 17
SO2 12 7 10.58 12
NOx 13 7 11.08 13
5) Location: Sommavarappadu
PM10 42 37 39.08 42
PM2.5 18 16 17.04 18
SO2 13 1 10.54 13
NOx 13 7 11.04 13
6) Location: Sajjapuram
PM10 42 37 38.46 42
PM2.5 19 16 17.54 19
SO2 12 7 10.12 12
NOx 14 7 10.85 14
7) Location: Kommalapadu
PM10 40 37 38.19 40
PM2.5 18 16 16.92 18
SO2 12 7 10.23 12
NOx 11 7 9.88 11
8) Location: Ballikuruva
PM10 44 37 40.12 44
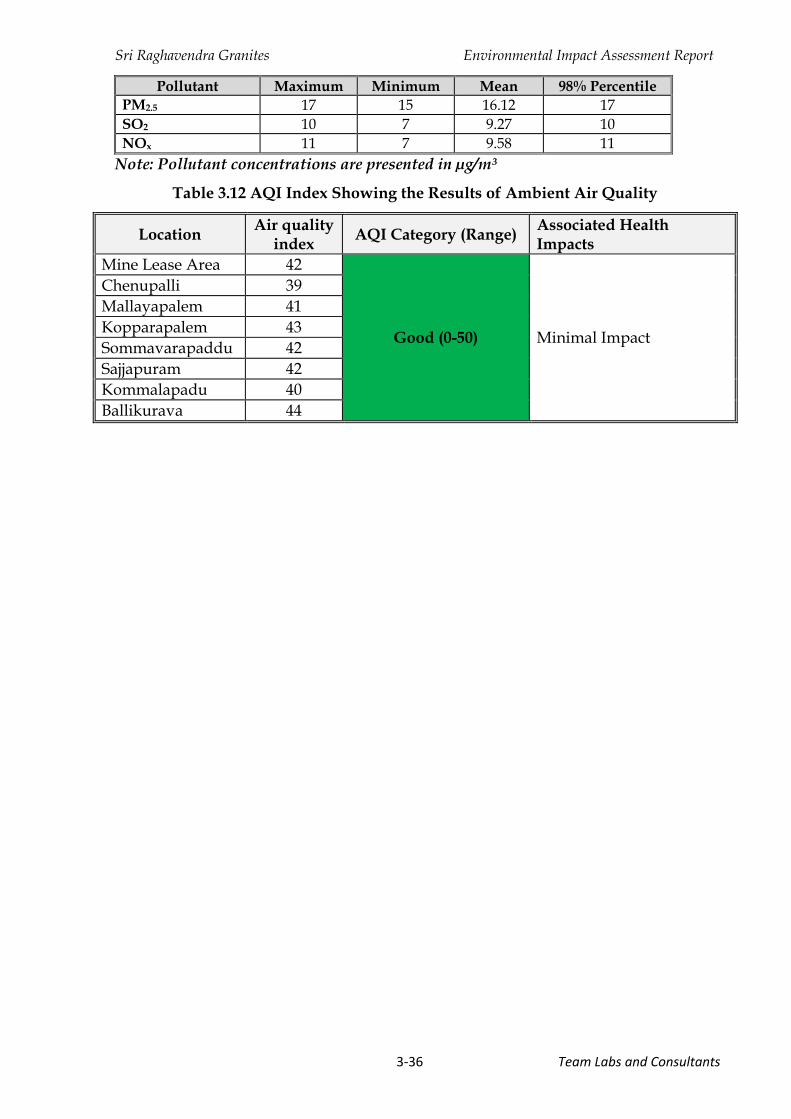
Sri Raghavendra Granites Environmental Impact Assessment Report
Team Labs and Consultants 3-36
Pollutant Maximum Minimum Mean 98% Percentile
PM2.5 17 15 16.12 17
SO2 10 7 9.27 10
NOx 11 7 9.58 11
Note: Pollutant concentrations are presented in µg/m³
Table 3.12 AQI Index Showing the Results of Ambient Air Quality
Location Air quality
index AQI Category (Range)
Associated Health Impacts
Mine Lease Area 42
Good (0-50) Minimal Impact
Chenupalli 39
Mallayapalem 41
Kopparapalem 43
Sommavarapaddu 42
Sajjapuram 42
Kommalapadu 40
Ballikurava 44

Sri Raghavendra Granites Environmental Impact Assessment Report
Team Labs and Consultants 3-37
3.4.7 Noise Environment (Terms of Reference No. 22)
Noise is an unwanted sound without musical quality. Artificial noise impact on
environment, grown apace with advancing human civilization. Noise pollution is
equally hazardous to environment as air, water and other forms of pollution.
Various noise measurement units have been introduced to describe, in a single
number, the response of an average human to a complex sound made up of various
frequencies at different loudness levels. The most common scale is, weighted decibel
dB (A), and measured as the relative intensity level of one sound with respect to
another sound (reference sound).
The impact of noise depends on its characteristics (instantaneous, intermittent or
continuous in nature), time of day (day or night) and location of noise source. Table
3.13 shows the effects of different noise levels on human beings. The environmental
impact of noise can have several effects varying from noise induced hearing loss to
annoying depending on noise levels.
The assessment of noise pollution on neighborhood environment due to the mine
was carried out keeping in view, all the considerations mentioned above. The
existing status of noise levels is measured at ninelocations at various villages within
the study area. Figure 3.10 presents noise level monitoring locations. The monitored
noise levels are shown in Table 3.14. Noise levels are observed to be with in the
prescribed limits of rural and residential areas.

Sri Raghavendra Granites Environmental Impact Assessment Report
Team Labs and Consultants 3-38
Figure 3.10 Noise Monitoring Locations

Sri Raghavendra Granites Environmental Impact Assessment Report
Team Labs and Consultants 3-39
Table 3.13 Effects on Human Beings at Different Noise Levels
Source Noise Level Db(A) Effects
Large Rocket Engine (nearby) 180 Threshold of Pains
Hydraulic Press (1 m) 130
Jet take off (60 m) 120
Maximum vocal effort
Automobile Horn (1m) 120
Construction Noise 110
Jet Take off (600 m) 110
Shout, Punch, Press, Circular Saw 100 Very annoying
Heavy Truck (15m), Farm Machinery,
90 Prolonged exposure
Lathes, Sports Car, Noisy Machines Automobile (15m)
80 endangers hearing loss Annoying
Freeway Traffic (15m) 70 Telephone is difficult,
Loud Conversations 60
Living Room in Home 50 Quiet
Power Station (15m) 50
Bed Room in Home 40
Soft Whisper (5m) 30 Very quiet
Tick of Wall clock (1m) 30
Low radio Reception 20
Whisper 20
Rattling of Leaves by Breeze 10 Barely audible
0 Threshold of hearing
Table 3.14 Equivalent Noise levels in the study area
S. No
Location Direction
form ML area
Distance From
ML area, km
Equivalent Noise Levels dB(A)
Leqday Leqnight
N-1 Mine Lease Area - - 39 32
N-2 Chenupalli S 2.3 42 34
N-3 Mallayapalem NE 1.4 41 33
N-4 Kopparapalem NE 1.3 43 32
N-5 Sommavarapaddu NE 2.3 42 34
N-6 Sajjapuram NW 2.3 44 36
N-7 Kommalapadu SW 5.5 41 35
N-8 Ballikurava SE 4.7 46 36
Note: Daytime is reckoned in between 6.00 a.m to 10.00 p.m. Nighttime is reckoned between 10.00 p.m to 6.00 a.m.

Sri Raghavendra Granites Environmental Impact Assessment Report
Team Labs and Consultants 3-40
3.4.8 Traffic Study
Traffic study was conducted during three alternative days including a holiday to
arrive at peaktraffic hours. Peak traffic was observed during 8 – 9 AM consisting of
mainly passangers traffic was carried on Chennupalli to Mallayapalem road.
Graphical representation of peak traffic is presented in Figure 3.11. The maximum
PCUs observed in an hour are 55. The composition of the peak hour traffic in PCU.
Figure 3.11 Peak Hour Traffic
3.5 Socio Economic Environment
Project development reflects in social development, i.e., growth in infrastructure
facilities, growth in employment rates, increased demands for housing, and other
amenities etc., which will have a bearing on the socio-economic status.
Socio-economic survey is conducted to ascertain the existing socio-economic status
to compare the same with the developments due to the project. Baseline data of
demographic characteristics-occupational status, literacy, health status and the
access to infrastructure facilities for social development in the project area has been
studied from the primary data collected from census department by M/s. Team Labs
and Consultants.
Demographic characteristics of the study area falling within 10 km radius of the
mine lease area have been compiled to assess the pre-project socio-economic status.
Secondary data has been collected from various government agencies i.e., chief
planning officer, Prakasam and Guntur districtsand other government departments

Sri Raghavendra Granites Environmental Impact Assessment Report
Team Labs and Consultants 3-41
of forestry, irrigation etc., and Mandal Development Offices of the relevant
government departments. Census 2011 data was complied and presented as follows.
3.5.1 Demography
The study area falls under the following mandals; Ballikurava, Santhamaguluru,
Martur mandals in Prakasam district, Narasaraopet, Chilakaluripet mandals in
Gunturu district. Study area comprises of 44 revenue villages and 6 hamlets.
3.5.2 Population Distribution
The population distribution of the study area is presented in Table 3.15. The total
population of the area is 22121 consisting of 111918 males and 109333 females. The
population of the scheduled castes is 50202 consists of 25462 males and 24740
females, while the scheduled tribe population is 12200 consists of 6200 males and
6000 females, which is 22.69% and 5.51 % of the total population respectively. The
female (50.6%) population is more compared to male (49.4%) population in the study
area.
Table 3.15 Population Distribution – Study Area
Category
kms Total
0-3 3-5 5-7 7-10
Total Population 2517 10950 19030 188754 221251
Total Population – Male 1261 5568 9691 95398 111918
Total Population – Female 1256 5382 9339 93356 109333 Population <6 years 277 1294 2094 21027 24692
Male <6 years 135 711 1089 10864 12799
Females < 6years 142 583 1005 10163 11893 Scheduled Caste Population - Total 878 2545 4188 42591 50202
Male – SC 447 1282 2149 21584 25462
Female – SC 431 1263 2039 21007 24740 Scheduled Tribe Population Total 96 1078 720 10306 12200
Male – ST 52 550 381 5217 6200
Female – ST 44 528 339 5089 6000

Sri Raghavendra Granites Environmental Impact Assessment Report
Team Labs and Consultants 3-42
Figure 3.12 Population distribution of the study area
3.5.3 Literacy
Census operations consider a person who is above six years old and who can write
and read as literate. Table 3.16 presents literacy levels in the study area. The
population below six years old is 24692 consisting of 12799 males and 11893 females,
which is 11.16 % of the study area population. The percentage of literacy level in the
study area among males is 67.09 and 47.55 among females. It may be observed that
the literacy level among females is comparatively less than males.
Table 3.16 Literacy - Study Area
Category
kms Total
0-3 3-5 5-7 7-10
Total Population 2517 10950 19030 188754 221251
Total Population – Male 1261 5568 9691 95398 111918
Total Population – Female 1256 5382 9339 93356 109333
Population <6 years 277 1294 2094 21027 24692
Male <6 years 135 711 1089 10864 12799
Females < 6years 142 583 1005 10163 11893
Total Literates 1152 5222 9336 97121 112831
Male –Literates 696 3093 5610 57096 66495
Female – Literates 456 2129 3726 40025 46336
Total Illiterates 1365 5728 9694 91633 108420
Male –Illiterate 565 2475 4081 38302 45423
Female – Illiterate 800 3253 5613 53331 62997

Sri Raghavendra Granites Environmental Impact Assessment Report
Team Labs and Consultants 3-43
Figure 3.12 Literacy of Study Area
3.5.4 Employment/Occupation
Work is defined as participation in any economically productive activity – Physical/
mental. The work force is classified into three categories: a) main workers, b)
marginal workers and c) non-workers. Main workers are those who work for a
substantial part of the year for a living such as salaried employees, agricultural labor
etc. Marginal workers are that who worked the previous year but has not worked
for a substantial part of this year. Non-workers constitute students, house wives,
dependents; pensioner’s etc. Table 3.17 presents the population distribution for
employment.
It may be observed that a majority of the study area population falls in the non
workercategoryamong 43.89% of the total population and the marginal workers
from about 7.26% of the total population. The male female difference is also
significant in all the regions and in all the categories. There are few females among
the workers where as there are more non workers and marginal workers among
females.
Table 3.17 Employment – Study Area
Category
kms Total
0-3 3-5 5-7 7-10
Total Population 2517 10950 19030 188754 221251
Total Population – Male 1261 5568 9691 95398 111918
Total Population – Female 1256 5382 9339 93356 109333
Total Workers 1446 6449 11185 105056 124136
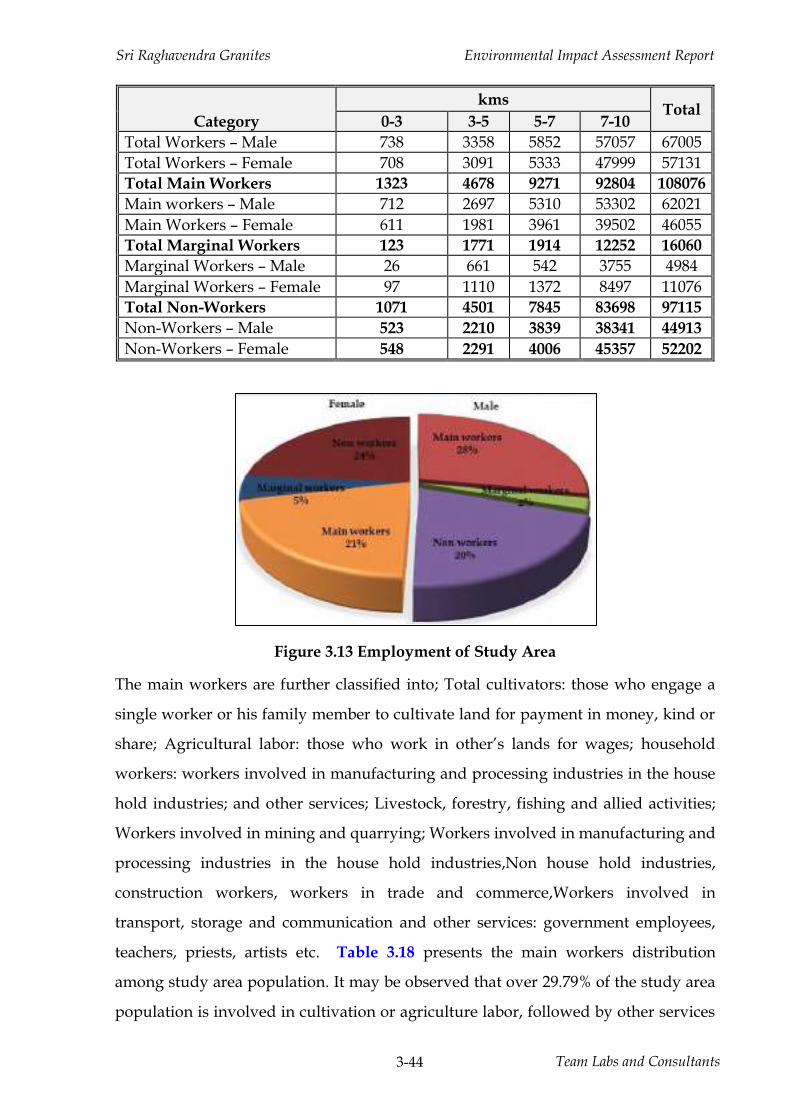
Sri Raghavendra Granites Environmental Impact Assessment Report
Team Labs and Consultants 3-44
Category
kms Total
0-3 3-5 5-7 7-10
Total Workers – Male 738 3358 5852 57057 67005
Total Workers – Female 708 3091 5333 47999 57131
Total Main Workers 1323 4678 9271 92804 108076
Main workers – Male 712 2697 5310 53302 62021
Main Workers – Female 611 1981 3961 39502 46055
Total Marginal Workers 123 1771 1914 12252 16060
Marginal Workers – Male 26 661 542 3755 4984
Marginal Workers – Female 97 1110 1372 8497 11076
Total Non-Workers 1071 4501 7845 83698 97115
Non-Workers – Male 523 2210 3839 38341 44913
Non-Workers – Female 548 2291 4006 45357 52202
Figure 3.13 Employment of Study Area
The main workers are further classified into; Total cultivators: those who engage a
single worker or his family member to cultivate land for payment in money, kind or
share; Agricultural labor: those who work in other’s lands for wages; household
workers: workers involved in manufacturing and processing industries in the house
hold industries; and other services; Livestock, forestry, fishing and allied activities;
Workers involved in mining and quarrying; Workers involved in manufacturing and
processing industries in the house hold industries,Non house hold industries,
construction workers, workers in trade and commerce,Workers involved in
transport, storage and communication and other services: government employees,
teachers, priests, artists etc. Table 3.18 presents the main workers distribution
among study area population. It may be observed that over 29.79% of the study area
population is involved in cultivation or agriculture labor, followed by other services
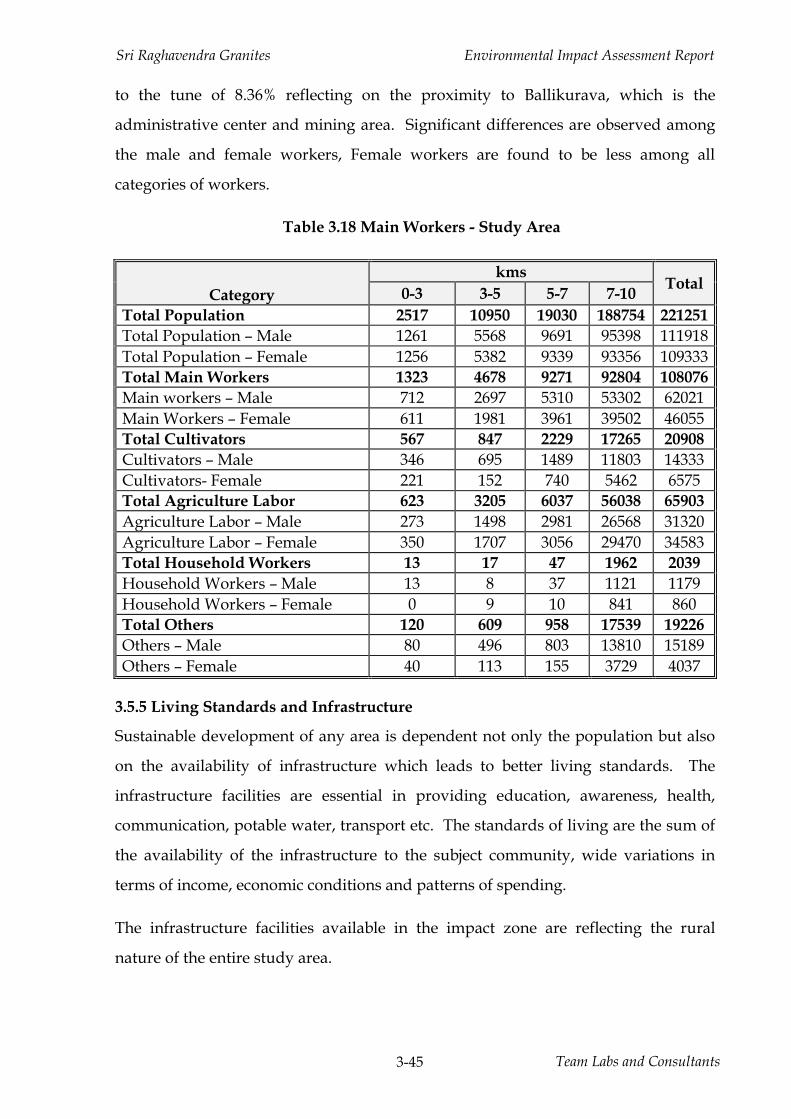
Sri Raghavendra Granites Environmental Impact Assessment Report
Team Labs and Consultants 3-45
to the tune of 8.36% reflecting on the proximity to Ballikurava, which is the
administrative center and mining area. Significant differences are observed among
the male and female workers, Female workers are found to be less among all
categories of workers.
Table 3.18 Main Workers - Study Area
Category
kms Total
0-3 3-5 5-7 7-10
Total Population 2517 10950 19030 188754 221251
Total Population – Male 1261 5568 9691 95398 111918
Total Population – Female 1256 5382 9339 93356 109333
Total Main Workers 1323 4678 9271 92804 108076
Main workers – Male 712 2697 5310 53302 62021
Main Workers – Female 611 1981 3961 39502 46055
Total Cultivators 567 847 2229 17265 20908
Cultivators – Male 346 695 1489 11803 14333
Cultivators- Female 221 152 740 5462 6575
Total Agriculture Labor 623 3205 6037 56038 65903
Agriculture Labor – Male 273 1498 2981 26568 31320
Agriculture Labor – Female 350 1707 3056 29470 34583
Total Household Workers 13 17 47 1962 2039
Household Workers – Male 13 8 37 1121 1179
Household Workers – Female 0 9 10 841 860
Total Others 120 609 958 17539 19226
Others – Male 80 496 803 13810 15189
Others – Female 40 113 155 3729 4037
3.5.5 Living Standards and Infrastructure
Sustainable development of any area is dependent not only the population but also
on the availability of infrastructure which leads to better living standards. The
infrastructure facilities are essential in providing education, awareness, health,
communication, potable water, transport etc. The standards of living are the sum of
the availability of the infrastructure to the subject community, wide variations in
terms of income, economic conditions and patterns of spending.
The infrastructure facilities available in the impact zone are reflecting the rural
nature of the entire study area.
Sri Raghavendra Granites Environmental Impact Assessment Report
Team Labs and Consultants 3-46
I. Educational Facilities
The educational facilities available in the rural areas are meager, despite the
proximity to urban area of Pendurthi. There are 20 primary schools, 28 middle
schools and 2 high schools in the study area. There is no junior college within the
impact area. The higher educational need of the population is met by Narasaraopet /
Guntur / Chilakaluripet.
II. Health facilities
The medical and health facilities available in the rural area of the impact zone are
inadequate; there are 1 Primary Health Centre, 2 Primary Health Sub Centre and
nochild welfare centers and 3 Registered Private Medical Practitionerscenters in the
entire area. While the urban area has a number of health facilities including a
teaching hospital. The health needs of the population in this area are met by quacks
and other semi qualified persons.
III. Availability of Potable Water
The entire population in this area is dependent on ground water for drinking
purposes.
IV. Transport and Communication
Transport is essentially provided by the Andhra Pradesh State Road Transport
Corporation (APSRTC). Most of the study area has excellent road network in all the
villages, which has kacha roads. APSRTC bus facility is available for all the villages.
However, it is observed that a number of private transport vehicles are observed in
the area connecting them to Narasaraopet / Guntur / Chilakaluripet.
V. Sources of Energy and Availability
The primary source of energy in the study area is electricity, and the entire study
area has electricity for agriculture and domestic purpose. The Chillakur area has
LPG facility for their cooking purpose. A significant number of people in the urban
area are also dependent on Kerosene for cooking purposes, which is contingent on
the vagaries of public distribution system. A majority of the rural area is mostly
dependent on LPG gas, dried cow dung cakes, wood from roadside trees for their
domestic energy needs.
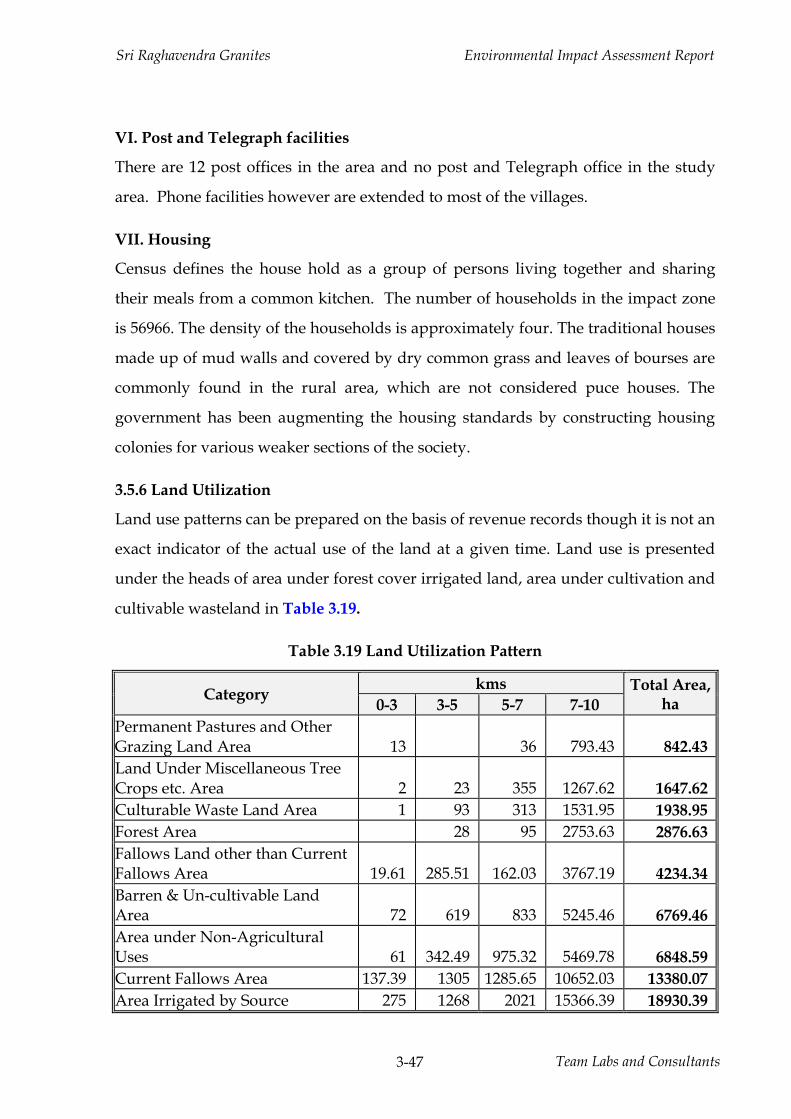
Sri Raghavendra Granites Environmental Impact Assessment Report
Team Labs and Consultants 3-47
VI. Post and Telegraph facilities
There are 12 post offices in the area and no post and Telegraph office in the study
area. Phone facilities however are extended to most of the villages.
VII. Housing
Census defines the house hold as a group of persons living together and sharing
their meals from a common kitchen. The number of households in the impact zone
is 56966. The density of the households is approximately four. The traditional houses
made up of mud walls and covered by dry common grass and leaves of bourses are
commonly found in the rural area, which are not considered puce houses. The
government has been augmenting the housing standards by constructing housing
colonies for various weaker sections of the society.
3.5.6 Land Utilization
Land use patterns can be prepared on the basis of revenue records though it is not an
exact indicator of the actual use of the land at a given time. Land use is presented
under the heads of area under forest cover irrigated land, area under cultivation and
cultivable wasteland in Table 3.19.
Table 3.19 Land Utilization Pattern
Category kms Total Area,
ha 0-3 3-5 5-7 7-10
Permanent Pastures and Other Grazing Land Area 13 36 793.43 842.43
Land Under Miscellaneous Tree Crops etc. Area 2 23 355 1267.62 1647.62
Culturable Waste Land Area 1 93 313 1531.95 1938.95
Forest Area 28 95 2753.63 2876.63
Fallows Land other than Current Fallows Area 19.61 285.51 162.03 3767.19 4234.34
Barren & Un-cultivable Land Area 72 619 833 5245.46 6769.46
Area under Non-Agricultural Uses 61 342.49 975.32 5469.78 6848.59
Current Fallows Area 137.39 1305 1285.65 10652.03 13380.07
Area Irrigated by Source 275 1268 2021 15366.39 18930.39

Sri Raghavendra Granites Environmental Impact Assessment Report
Team Labs and Consultants 3-48
Category kms Total Area,
ha 0-3 3-5 5-7 7-10
Net Area Sown 490 2047 2570 29124.91 34231.91
Total Area 1071 6011 8646 75972.39 91700.39
It may be observed that a majority of the study area is Net Area Sown followed by
Area Irrigated by Source.
3.5.7 Project Economy
It will provide employment additionally. The proposed project will also generate
indirect employment of 40no’sto the locals during mining activity. The employers
will contribute to the provident fund, ESI and provide facilities as per the relevant
labor act.
The proximity of Vizagtown will provide access to the extensive medical facilities
available apart from the ESI medical facilities to the employees and their families.
It may be concluded that satisfactory amenities are available for the population of
the impact zone, while the amenities are available either within the village or at a
minimum distance of 3km. The area also has large tracts of waste lands which can
be utilized for industrial development.
The proposed mining activity will contribute to the growth of the area, which in turn
generates employment, and improve the infrastructure facilities of the area by
strengthening the same economically.
3.6 Ecology (Terms of Reference No. 15, 18)
Biological environment includes the study of the relationships of organisms or
groups of organisms to their environment. Ecology in essence is the study of the
abiotic (non-living) and biotic (living) components, interaction of community and the
environment and exchange of material (energy and nutrient) between living and
non-living parts.
A community includes all organisms in the given area interacting with the abiotic
environment. The main aim of Conservation of Biodiversity is to ensure “No Net
Loss”.
Sri Raghavendra Granites Environmental Impact Assessment Report
Team Labs and Consultants 3-49
The following approach has been chosen by the IAIA to help achieve ‘no net loss’ of
biodiversity:
• Avoidance of irreversible loss of biodiversity.
• Seeking alternative solutions to minimize biodiversity losses.
• Use of mitigation to restore biodiversity resources.
• Compensation for unavoidable loss by providing substitutes of at least similar
biodiversity value.
• Looking for opportunities for enhancement.
This approach can be called “positive planning for biodiversity.” It helps achieve no
net loss by ensuring the safety and survival of rare or endangered or endemic or
threatened (REET) species. This approach has been adopted by the proposed project
in the study under report.
Scope of work is to identify of ecologically sensitive receptors based on
literature survey and field investigations, quantification of impacts on flora and
fauna in core and buffer zones and to suggest appropriate mitigation measures with
conservation and management plan. Biological assessment of the site was done to
identify whether there are any rare, endangered, endemic, threatened (REET)
species of flora or fauna in the project site or core area as well its buffer zone (upto 10
km radius). The study also designed to suggest suitable mitigation measures and
conservation plan if necessary, for REET species if any.
The proposed project falls in
❖ 6D – Deccan Peninsula Deccan Plateau as per the Biogeography Classification
of India.
❖ Hot Semi arid type as per the India's Köppen climate classification.
The vegetation of the study area falls under
✓ 5A: Southern tropical dry deciduous forests C3: Southern dry mixed
deciduous forest;
✓ 6A: Southern tropical thorn forests DS1: Southern thorn scrub, 2S1: Secondary
dry deciduous forest

Sri Raghavendra Granites Environmental Impact Assessment Report
Team Labs and Consultants 3-50
by revised classification of Indian forest types (Champion and Seth, 1968). These
types of forests are seen throughout the Eastern Ghats and few parts of Western
Ghats of the country. The Mine lease area and Dump sites does not encounter with
any kind of forest types like Reserve Forest, Protected forest or un- classed Forest
(declared Protected under “The Indian Forest Act, 1927”) and “Forest (Conservation)
Act, 1980 with Amendments Made in 1988”. (Source: Forest Department). No
wetland notified under “The Ramsar Convention – 1971” or listed under “the
National wetland Conservation Programme – 2009” is reported within 10 km from
project boundary.
Crops raised in the buffer zone: Out of the total croplands, more than 70% was
under Paddy, Maize, Chilies, Red gram, Black gram, Green gram and Groundnut.
Remaining was a current fallow without any crops but ready for cultivation.
Methodology:
The ToR specific detailed survey has been made during Deceber 2019 to understand
the existing situation at ground level and to suggest the mitigation measures based
on impacts quantified. The core zone means the existing Mine lease area and buffer
zone refers to area covered within 10 km radius of Mine lease area. The vegetation
present in the existing mine lease area (MLA), dump site (DS) and Green belt (GB)
were estimated through quadrate sampling method or belt transect method. The
number and type of trees present were calculated through standard statistical
methods. Hence the tree density of the RFs also estimated by quadrate method. The
proposed area for greenbelt and type of species to be planted will be also estimated
and suggest the budgetary terms.
Equipment / Instruments deployed
• Digital Camera (NIKON 42 X zoom)
• GPS (Accurate readings available in Mobile and inbuilt camera)
• Binoculars (OLYMPUS 10 X 50 DPSI)
• Field observation book, Field guides, Pen, Measuring tape etc
• PAST –statistical software for Biodiversity.
Sri Raghavendra Granites Environmental Impact Assessment Report
Team Labs and Consultants 3-51
• MS-Excel for Phyto-sociological calculations and graphs.
Floral analysis:
The vegetation structure of the region was randomly checked at selected
habitats and sampling was done near reserve forests. Most of the buffer zone area is
under cultivation and hence sampling near pond side and road side are restricted to
dense covered regions. To avoid the biased result, statistical analysis done near two
reserve forests. The remaining buffer zone survey was carried out for validating the
secondary data collected at regional level. The status of each identified species was
given in terms of four categories such as “Dominant”, “Common”, “Sporadic”, and
“Rare”. This status is mainly based on Density, Frequency and Abundance estimated
during the field visit for Trees, Shrubs and Herbs.
Phyto-sociological aspects of the study were carried out by perambulating
and sampling through quadrate sampling method. Sample plots were selected in
such a way to get maximum representation of different types of vegetation and plots
were laid out near reserve forest blocks. Belt transect method (100m X 10m) was
followed during the study. In this method, transect (a straight line) of 100 m is
marked with rope and tape. The trees are sampled 5 m on either side of the central
line of transect, while sampling, recorded the Girth at Breast Height (GBH) for trees
with greater than 30 cm GBH. The shrubs, Herbs, Climbers, Grass species and
Hydrophytes are documented with their status availability in all sampling points
along with tree species. Unidentified species in the field are photographed and
given a code for further investigation. Only photographs were taken during the
field survey and no damage is created to flora and fauna during the sampling. None
of the specimens are collected as voucher specimens for herbarium. The plants were
identified using floras by Gamble (1915-36), Saxena and Brahmam (1994-96), Nair
and Henry (1983), Henry et al. (1987), Henry et al. (1989) and also by using updated
check list from www.theplantlist.org.
Standard phyto-sociological methods of Mishra (1968) for density, frequency,
abundance calculated during the present study. Relative values of these were
calculated by following Philips (1959). Important Value Index (IVI) was calculated
Sri Raghavendra Granites Environmental Impact Assessment Report
Team Labs and Consultants 3-52
by adding up these three values of relative frequency, relative density and relative
dominance (Curtis, 1959). In case of shrubs, herbs and saplings abundance status
was given as per direct field observation. Diversity indices such as Shannon –
Wiener Indices of Diversity index, Evenness, Dominance, A/F ratio are also
calculated through standard methods and by using software tools such as PAST.
Faunal analysis:
A random survey for mammals were conducted by in all major habitats and
recorded the species through direct and indirect evidences. Species were identified
using “A pictorial guide to the Mammals of the India” by Vivek menon (2014),
Prater (1997).
For Birds, random based observation followed with point count method was
applied near water bodies and reserve forest s. Birds seen or heard 50 m radius
from has been recorded during survey period. Bird surveys were carried out in
dawn and desk of the field visit days. A special note on migratory status of birds
were also recorded through secondary data. Birds sighted at the study area were
identified using “A field guide to the birds of the Indian Sub-Continent” by Ranjit
Manakadan et.al (2011).
Reptiles were identified by direct or indirect evidences and literature
gathered from the working plans of the forest department and other publications.
The directly observed species are identified using the field book on Indian Reptiles
and Amphibians by J.C. Daniel (2002). Snakes of India by Whitaker (2016).
Amphibians are surveyed both at aquatic and terrestrial systems searching
under the logs and stones, digging through litter and soil, searching short bushes
and tree hollows and under fallen barks. The books referred are Amphibians of
Peninsular India by Ranjit Daniel (2004).
Invertebrates such as Butterflies, Dragonflies and spiders sighted during the
survey period were identified by species-specific field guides. Bugs, Beetles and
other insect data were gathered from publications and forest working plan data.
Vegetation structure and composition During the present study, around 152 floral
species are recorded from primary and secondary sources. The overall study area
consists of agricultural fallow / Barren / uncultivable / wasteland / Reserve forests.

Sri Raghavendra Granites Environmental Impact Assessment Report
Team Labs and Consultants 3-53
Some part of it has commercial mango plantation and few parts are currently used as
grazing land. The list of plant species recorded during field survey and literature
from the study area are given in Table 3.20.
The Wastelands fully covered by Prosopis juliflora and the rest of the area is covered
by rocky uplands with scattered succulents and thorny shrubs. Thus entire buffer
area is either a cropland or current fallow land or a non-forest wasteland. There are
good number is social forestry plantations of Eucalyptus and Casuarina within the
buffer zone.
Reserve forest vegetation:
RFs contain good number of trees such as Buchanania lanzan, Azadirachta indica,
Balanites aegyptiaca, Butea monosperma, Phoenix sylvestris, Acacia nilotica, Dalbergia
sissoo etc and shrubs such as Senna auriculata, Calotropis procera, Caralluma umbellata,
Euphorbia antiquorum, Euphorbia tortillis, Dodonaea viscose Jatropha gossypifolia, Carissa
spinarum, Prosopis juliflora, Acacia nilotica, Acacia leucophloea, and Lantana camara and
other all common herbs and climbers.
Terrestrial Fauna
The presence or absence of an animal or plant in a certain region depends on
its ecological and geographical setting. Wild animals can exist in a region only if
prevailing set of conditions are congenial for their survival and perpetuation.
Diversity of the species and their abundance is largely dependent on the availability
of required habitats.
Terrestrial fauna of the Core area and the Buffer zone:
As the animals, especially vertebrates move from place to place in search of
food, shelter, mate or other biological needs, separate lists for core and buffer areas
are not feasible however, a separate list of fauna pertaining to core and buffer zone
are listed separately. Though there are two reserved forest blocks near dump and in
the buffer zone. As such there are no chances of occurrence of any rare or
endangered or endemic or threatened (REET) species within the core or buffer area.
There are no Sanctuaries, National Parks, Tiger Reserve or Biosphere Reserve or

Sri Raghavendra Granites Environmental Impact Assessment Report
Team Labs and Consultants 3-54
Elephant Corridor or other protected areas within 10 km radius from core area. It is
evident from the available records, reports and circumstantial evidence that the
entire study area including the core and buffer areas were free from any endangered
animals. There were no resident birds other than common bird species such as
Paddy egrets, Green bee eaters, Indian rollers, Parakeets, common babblers, Weaver
birds, Mynas, Black drangos, Crows, Sparrows. The list of Mammalian species
directly sighted or recorded during field survey and from literature reviewed from
the study area are given in Table 3.21. The list of bird species recorded during field
survey and literature from the study area are given in Table 3.22. The list of reptilian
species recorded during field survey and literature from the study area are given in
Table 3.23. The list of Amphibian species recorded during field survey and literature
from the study area are given in Table 3.24. It is apparent from the list that none of
the species either spotted or reported is included in Schedule I of the Wildlife
Protection Act. Similarly, none of them comes under the REET category. Some of the
birds listed were rare locally but they do not fall under any of the REET categories.
Flora and fauna of Aquatic ecosystem
Lemna minor, Ipomoea aquatica, Neptunia oleracea, Typha domingensis are most common
in the study area. There were no threatened category species of aquatic and semi
aquatic plants in the study area. The floristic survey of the existing farming site
witnesses scattered growth of grasses (mainly weeds), rooted hydrophytes,
emerging hydrophytes, shrubs in undisturbed area where human movement is
absent. Among herbaceous species, weeds are commonly reported such as Congress
grass (Parthenium hysterophorus), Lantana (Lantana Camara), and Datura (Datura
stromonium). Rooted hydrophytes are reported along the banks, where water level is
less than a foot or water has recedes after flooding. The commonly reported
hydrophytes are Ipomoea aquatica, Argeratum conyzoides, Typha angustata etc.
Effect on Migratory corridors, Nesting and Breeding sites.
There are no migratory corridors, nesting and breeding sites within the
proposed site or in the core area. No need to take any mitigation measures in this
connection.
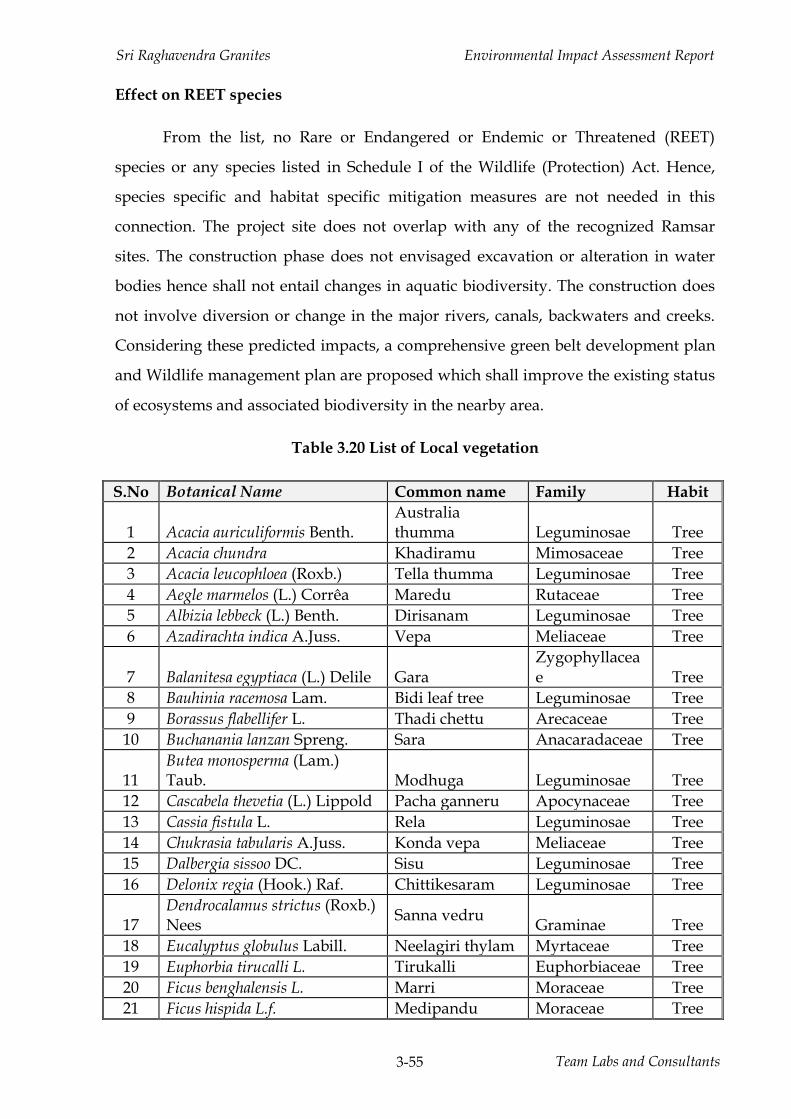
Sri Raghavendra Granites Environmental Impact Assessment Report
Team Labs and Consultants 3-55
Effect on REET species
From the list, no Rare or Endangered or Endemic or Threatened (REET)
species or any species listed in Schedule I of the Wildlife (Protection) Act. Hence,
species specific and habitat specific mitigation measures are not needed in this
connection. The project site does not overlap with any of the recognized Ramsar
sites. The construction phase does not envisaged excavation or alteration in water
bodies hence shall not entail changes in aquatic biodiversity. The construction does
not involve diversion or change in the major rivers, canals, backwaters and creeks.
Considering these predicted impacts, a comprehensive green belt development plan
and Wildlife management plan are proposed which shall improve the existing status
of ecosystems and associated biodiversity in the nearby area.
Table 3.20 List of Local vegetation
S.No Botanical Name Common name Family Habit
1 Acacia auriculiformis Benth. Australia thumma Leguminosae Tree
2 Acacia chundra Khadiramu Mimosaceae Tree
3 Acacia leucophloea (Roxb.) Tella thumma Leguminosae Tree
4 Aegle marmelos (L.) Corrêa Maredu Rutaceae Tree
5 Albizia lebbeck (L.) Benth. Dirisanam Leguminosae Tree
6 Azadirachta indica A.Juss. Vepa Meliaceae Tree
7 Balanitesa egyptiaca (L.) Delile Gara Zygophyllaceae Tree
8 Bauhinia racemosa Lam. Bidi leaf tree Leguminosae Tree
9 Borassus flabellifer L. Thadi chettu Arecaceae Tree
10 Buchanania lanzan Spreng. Sara Anacaradaceae Tree
11 Butea monosperma (Lam.) Taub. Modhuga Leguminosae Tree
12 Cascabela thevetia (L.) Lippold Pacha ganneru Apocynaceae Tree
13 Cassia fistula L. Rela Leguminosae Tree
14 Chukrasia tabularis A.Juss. Konda vepa Meliaceae Tree
15 Dalbergia sissoo DC. Sisu Leguminosae Tree
16 Delonix regia (Hook.) Raf. Chittikesaram Leguminosae Tree
17 Dendrocalamus strictus (Roxb.) Nees
Sanna vedru Graminae Tree
18 Eucalyptus globulus Labill. Neelagiri thylam Myrtaceae Tree
19 Euphorbia tirucalli L. Tirukalli Euphorbiaceae Tree
20 Ficus benghalensis L. Marri Moraceae Tree
21 Ficus hispida L.f. Medipandu Moraceae Tree
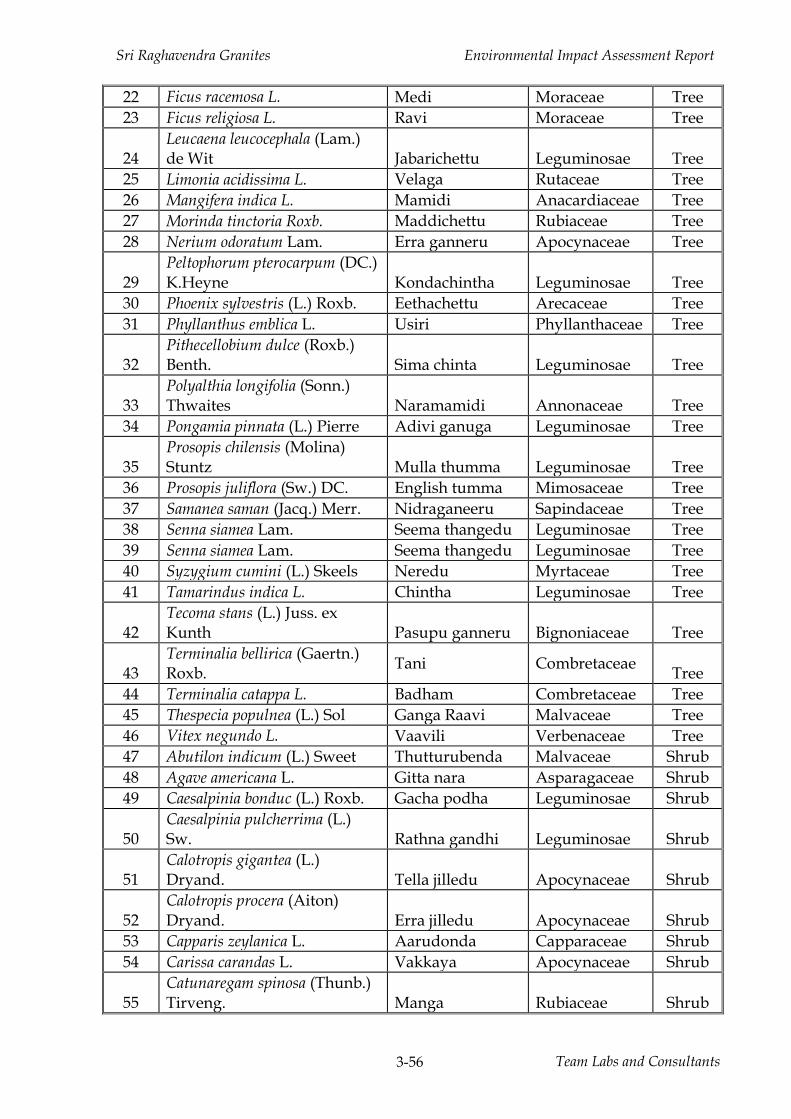
Sri Raghavendra Granites Environmental Impact Assessment Report
Team Labs and Consultants 3-56
22 Ficus racemosa L. Medi Moraceae Tree
23 Ficus religiosa L. Ravi Moraceae Tree
24 Leucaena leucocephala (Lam.) de Wit Jabarichettu Leguminosae Tree
25 Limonia acidissima L. Velaga Rutaceae Tree
26 Mangifera indica L. Mamidi Anacardiaceae Tree
27 Morinda tinctoria Roxb. Maddichettu Rubiaceae Tree
28 Nerium odoratum Lam. Erra ganneru Apocynaceae Tree
29 Peltophorum pterocarpum (DC.) K.Heyne Kondachintha Leguminosae Tree
30 Phoenix sylvestris (L.) Roxb. Eethachettu Arecaceae Tree
31 Phyllanthus emblica L. Usiri Phyllanthaceae Tree
32 Pithecellobium dulce (Roxb.) Benth. Sima chinta Leguminosae Tree
33 Polyalthia longifolia (Sonn.) Thwaites Naramamidi Annonaceae Tree
34 Pongamia pinnata (L.) Pierre Adivi ganuga Leguminosae Tree
35 Prosopis chilensis (Molina) Stuntz Mulla thumma Leguminosae Tree
36 Prosopis juliflora (Sw.) DC. English tumma Mimosaceae Tree
37 Samanea saman (Jacq.) Merr. Nidraganeeru Sapindaceae Tree
38 Senna siamea Lam. Seema thangedu Leguminosae Tree
39 Senna siamea Lam. Seema thangedu Leguminosae Tree
40 Syzygium cumini (L.) Skeels Neredu Myrtaceae Tree
41 Tamarindus indica L. Chintha Leguminosae Tree
42 Tecoma stans (L.) Juss. ex Kunth Pasupu ganneru Bignoniaceae Tree
43 Terminalia bellirica (Gaertn.) Roxb.
Tani Combretaceae Tree
44 Terminalia catappa L. Badham Combretaceae Tree
45 Thespecia populnea (L.) Sol Ganga Raavi Malvaceae Tree
46 Vitex negundo L. Vaavili Verbenaceae Tree
47 Abutilon indicum (L.) Sweet Thutturubenda Malvaceae Shrub
48 Agave americana L. Gitta nara Asparagaceae Shrub
49 Caesalpinia bonduc (L.) Roxb. Gacha podha Leguminosae Shrub
50 Caesalpinia pulcherrima (L.) Sw. Rathna gandhi Leguminosae Shrub
51 Calotropis gigantea (L.) Dryand. Tella jilledu Apocynaceae Shrub
52 Calotropis procera (Aiton) Dryand. Erra jilledu Apocynaceae Shrub
53 Capparis zeylanica L. Aarudonda Capparaceae Shrub
54 Carissa carandas L. Vakkaya Apocynaceae Shrub
55 Catunaregam spinosa (Thunb.) Tirveng. Manga Rubiaceae Shrub

Sri Raghavendra Granites Environmental Impact Assessment Report
Team Labs and Consultants 3-57
56 Clerodendrum phlomidis L.f. Kond-takal Lamiaceae Shrub
57 Datura stramonium L. Ummetha Solanaceae Shrub
58 Dodonaea viscosa Jacq. Bandaru Sapindaceae Shrub
59 Erythroxylum monogynum Roxb.
Dedaraaku Erythroxylaceae Shrub
60 Holarrhena antidysenterica (Roth) girimallika Apocynaceae Shrub
61 Ipomoea carnea Jacq. Rubber mokka
Convolvulaceae Shrub
62 Ixora coccinea Ramabanam Rubiaceae Shrub
63 Jatropha curcas L. Nepalam Euphorbiaceae Shrub
64 Jatropha glandulifera Roxb. Yerranepalamu Euphorbiaceae Shrub
65 Lantana camara L. Pulikampa Verbenaceae Shrub
66 Morinda pubescens Sm. Maddi Rubiaceae Shrub
67 Opuntia dillenii (Ker Gawl.) Haw. Naga jamudu Cactaceae Shrub
68 Phoenix acaulis Roxb. Chitteetha Palmae Shrub
69 Phyllanthus reticulatus Poir. Nallapuli Phyllanthaceae Shrub
70 Randia dumetorum Rubiaceae Shrub
71 Senna auriculata (L.) Roxb. Tangedu Leguminosae Shrub
72 Solanum pubescens Willd. Uchintha Solanaceae Shrub
73 Xanthium strumarium L. Marula-Mathangi Asteraceae Shrub
74 Ximenia americana L. Nekkera Olacaceae Shrub
75 Ziziphus oenopolia (L.) Mill. Parimi Rhamnaceae Shrub
76 Acalypha indica L. Haritha manjari Euphorbiaceae Herb
77 Achyranthes aspera L Uttareni Amaranthaceae Herb
78 Aerva lanata (L.) Juss Thelaga pindi Amaranthaceae Herb
79 Aeschynomene aspera L. Neeti jeeluga Leguminosae Herb
80 Ageratum conyzoides (L.) L. Vasavi Asteraceae Herb
81 Aloe vera (L.) Burm.f. Kithanara Tiliaceae Herb
82 Alternanthera sessilis (L.) R.Br. ex DC. Ponagantiaku
Amaranthaceae Herb
83 Amaranthus spinosus L. Mulla thotakoora Amaranthaceae Herb
84 Amaranthus viridis L. Chilakathotakoora
Amaranthaceae Herb
85 Argemone mexicana L. Brahmadandi Papaveraceae Herb
86 Barleria prionitis L. Pachagorinta Acanthaceae Herb
87 Blumea mollis (D. Don) Merr. Kukkapogaku Asteraceae Herb
88 Boerhavia diffusa L. Atikimamidi Nyctaginaceae Herb
89 Caralluma umbellata
Kundeti kummulu
Apocynaceae Herb

Sri Raghavendra Granites Environmental Impact Assessment Report
Team Labs and Consultants 3-58
90 Catharanthus roseus (L.) G.Don Billaganneru Apocynaceae Herb
91 Celosia virgata Jacq. Guruga Amaranthaceae Herb
92 Cleome viscosa L. Kukka vomintha Cleomaceae Herb
93 Colocasia esculenta (L.) Schott Atuka tiga Araceae Herb
94 Croton bonplandianus Baill. Vana mokka Euphorbiaceae Herb
95 Euphorbia hirta L. Nanubalu Euphorbiaceae Herb
96 Evolvulus alsinoides (L.) L Vishnukrantha
Convolvulaceae Herb
97 Gomphrena serrata L. Tella bendumalli Amaranthaceae Herb
98 Hygrophila auriculata (Schumach.) Heine Mundla gobbi Acanthaceae Herb
99 Justicia procumbens L. Water Willow Acanthaceae Herb
100 Leucas aspera (Willd.) Tummi Lamiaceae Herb
101 Mimosa pudica L. Atthi pathi Leguminosae Herb
102 Ocimum canum Sims Kukka Tulasi Lamiaceae Herb
103 Ocimum sanctum Tulasi Lamiaceae Herb
104 Oldenlandia umbellata L. Chiru veru Rubiaceae Herb
105 Oxalis corniculata L. Indian Sorrel Oxalidaceae Herb
106 Parthenium hysterophorus L. Vayyaribhama Asteraceae Herb
107 Phyllanthus niruri L. Nela Usiri Euphorbiaceae Herb
108 Portulaca oleracea L. Pappu Kura Portulacaceae Herb
109 Senna occidentalis (L.) Link Adavi Chennangi Leguminosae Herb
110 Senna tora (L.) Roxb. Tagarisa Leguminosae Herb
111 Sida acuta Burm.f. Medabirusaku Malvaceae Herb
112 Sida cordifolia L. Chiru Benda Malvaceae Herb
113 Sida spinosa L. Naga bala Malvaceae Herb
114 Solanum surattense Burm. f. Nela vakudu Solanaceae Herb
115 Sphaeranthus indicus L. Bodasaramu Asteraceae Herb
116 Tephrosia purpurea (L.) Pers. Vempali Leguminosae Herb
117 Tribulus terrestris L. Zygophyllaceae Herb
118 Tridax procumbens (L.) L. Gaddichamanthi Asteraceae Herb
119 Urena lobata L. Pedda benda Malvaceae Herb
120 Vanda tessellata (Roxb.) Hook. ex G.Don
Kodikalla chettu Orchidaceae Herb
121 Vernonia cinerea (L.) Less. Gariti Kamma Compositae Herb
122 Waltheria indica L. Nalla Benda Malvaceae Herb
123 Ziziphus mauritiana Lam. Reni Rhamnaceae Herb
124 Aristida hystrix L.f. Gaddi Poaceae Grass
125 Chloris virgata Sw. Gaddi Poaceae Grass
126 Chrysopogon lancearius (Hook.f.) Haines Gaddi Poaceae Grass
127 Cyperus castaneus Willd. Gaddi Poaceae Grass

Sri Raghavendra Granites Environmental Impact Assessment Report
Team Labs and Consultants 3-59
128 Cyperus rotundus L. Gaddi Cyperaceae Grass
129 Fimbristylis cymosa R.Br. Pulupu gaddi Cyperaceae Grass
130 Abrus precatorius L. Gurivinda Leguminosae Climbe
r
131 Asparagus racemosus Willd. Pilli Gaddalu Asparagaceae Climbe
r
132 Cissus quadrangularis L. Nalleru Vitaceae Climbe
r
133 Clitoria ternatea L. Sanku-Pushpamu Leguminosae Climbe
r
134 Cuscuta reflexa Roxb. Convolvulaceae
Climber
135 Dioscorea pentaphylla L. Adavi gunusuthega Dioscoreaceae
Climber
136 Hemidesmus indicus (L.) R. Br. ex Schult Apocynaceae
Climber
137 Ipomoea macrantha Roem. & Schult.
Convolvulaceae
Climber
138 Ipomoea nil (L.) Roth. Convolvulaceae
Climber
139 Ipomoea obscura (L.) Ker Gawl. Convolvulaceae
Climber
140 Merremia tridentata (L.) Hallier f. Elaka chevi
Convolvulaceae
Climber
141 Mucuna pruriens (L.) DC. Dulagondi Leguminosae Climbe
r
142 Pergularia daemia (Forssk.) Chiov. Dustapu-Teega Apocynaceae
Climber
Source: Forest department Working Plan (2004-14) Table 3.21 List of Fauna & Their Conservation Status
Mammals: (* directly sighted animals)
Scientific Name Common Name Family WPA Status
IUCN
Herpestes javanicus Common Indian Mongoose*
Herpestidae Sch II LC
Pipistrellus coromandra Indian Pipistrelle (bat) Chiroptera LC
Pteropus giganteus Indian Flying fox bat Chiroptera LC
Rhinopoma microphyllum Grater Mouse-Tailed Bat
Chiroptera LC
Megaderma spasma lesser false vampire bat
Chiroptera
LC
Pteropus giganteus Indian flying fox Chiroptera LC
Lepus nigricollis Black-naped Hare Leporidae Sch IV LC
Bendicota bengalensis Indian mole rat Muridae LC
Bendicota indica Bandicoot rat Muridae LC
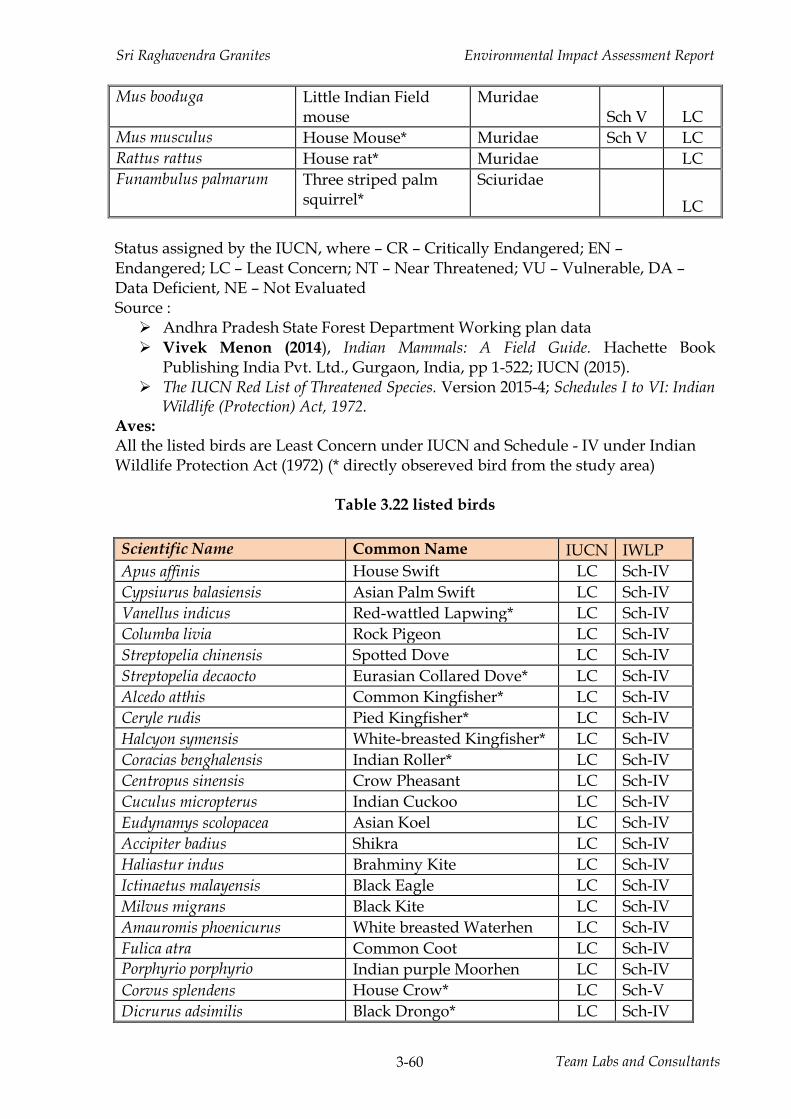
Sri Raghavendra Granites Environmental Impact Assessment Report
Team Labs and Consultants 3-60
Mus booduga Little Indian Field mouse
Muridae Sch V LC
Mus musculus House Mouse* Muridae Sch V LC
Rattus rattus House rat* Muridae LC
Funambulus palmarum Three striped palm squirrel*
Sciuridae
LC
Status assigned by the IUCN, where – CR – Critically Endangered; EN – Endangered; LC – Least Concern; NT – Near Threatened; VU – Vulnerable, DA – Data Deficient, NE – Not Evaluated Source :
➢ Andhra Pradesh State Forest Department Working plan data ➢ Vivek Menon (2014), Indian Mammals: A Field Guide. Hachette Book
Publishing India Pvt. Ltd., Gurgaon, India, pp 1-522; IUCN (2015). ➢ The IUCN Red List of Threatened Species. Version 2015-4; Schedules I to VI: Indian
Wildlife (Protection) Act, 1972. Aves: All the listed birds are Least Concern under IUCN and Schedule - IV under Indian Wildlife Protection Act (1972) (* directly obsereved bird from the study area)
Table 3.22 listed birds
Scientific Name Common Name IUCN IWLP
Apus affinis House Swift LC Sch-IV
Cypsiurus balasiensis Asian Palm Swift LC Sch-IV
Vanellus indicus Red-wattled Lapwing* LC Sch-IV
Columba livia Rock Pigeon LC Sch-IV
Streptopelia chinensis Spotted Dove LC Sch-IV
Streptopelia decaocto Eurasian Collared Dove* LC Sch-IV
Alcedo atthis Common Kingfisher* LC Sch-IV
Ceryle rudis Pied Kingfisher* LC Sch-IV
Halcyon symensis White-breasted Kingfisher* LC Sch-IV
Coracias benghalensis Indian Roller* LC Sch-IV
Centropus sinensis Crow Pheasant LC Sch-IV
Cuculus micropterus Indian Cuckoo LC Sch-IV
Eudynamys scolopacea Asian Koel LC Sch-IV
Accipiter badius Shikra LC Sch-IV
Haliastur indus Brahminy Kite LC Sch-IV
Ictinaetus malayensis Black Eagle LC Sch-IV
Milvus migrans Black Kite LC Sch-IV
Amauromis phoenicurus White breasted Waterhen LC Sch-IV
Fulica atra Common Coot LC Sch-IV
Porphyrio porphyrio Indian purple Moorhen LC Sch-IV
Corvus splendens House Crow* LC Sch-V
Dicrurus adsimilis Black Drongo* LC Sch-IV

Sri Raghavendra Granites Environmental Impact Assessment Report
Team Labs and Consultants 3-61
Nectarinia asiatica Purple Sunbird* LC Sch-IV
Passer domesticus House Sparrow* LC Sch-IV
Ploceus philippininus Baya Weaver* LC Sch-IV
Pycnonotus cafer Red-vented Bulbul* LC Sch-IV
Acridotheres tristis Common Myna* LC Sch-IV
Acrocephalus aedon Thickbilled Warbler* LC Sch-IV
Acrocephalus agricola Paddy field Warblers LC Sch-IV
Turdoides caudatus Common Babbler LC Sch-IV
Turdoides striatus Jungle Babbler* LC Sch-IV
Copsychus saularis Oriental Magpie Robin* LC Sch-IV
Saxicoloides fulicata Indian Robin* LC Sch-IV
Ardea alba Large Egret* LC Sch-IV
Ardea cinerea Grey heron* LC Sch-IV
Ardeola grayii Pond Heron* LC Sch-IV
*Status assigned by the IUCN, where – CR – Critically Endangered; EN – Endangered; LC – Least Concern; NT – Near Threatened; VU – Vulnerable, DA – Data Deficient, NE – Not Evaluated Sources:
➢ Ali, S and Ripley, S.D. 1969.Handbook of the Birds of India and Pakistan together with those of Nepal, Sikkim, Bhutan and Ceylon,3. Stone Curlews to Owls. Oxford University Press, Bombay, 327pp.
➢ BirdLife International 2012. In: IUCN 2012. IUCN Red List of Threatened Species. Version 2012.2. <www.iucnredlist.org>. Downloaded on 11 March 2013.
➢ Grimmett, R., Inskipp, C and T. Inskipp, 2001. Pocket Guides to the Birds of the Indian Subcontinent. Cristopher Helm Publishers, Oxford University Press, 384pp.
Table 3.23 List of Reptiles either spotted or reported from the study area. (* indicates Direct observations)
S. NoNo.
Scientific Name Common Name IUCN IWPA 1. Ahaetulla nasuta Green whip snake LC 2. Naja naja Indian Cobra LC II 3. Daboia siamensis Russel Viper LC II 4. Dendrelaphis tristis Tree Snake LC 5. Ptyas mucosa Common Rat snake LC II 6. Amphiesma stolata Buffstriped keelback LC 7. Trimeresurus gramineus Green pit viper LC IV 8. Typhlops hypomethes Common blind snake LC IV 9. Varanus bengalensis Common Indian
monitor* LC II
10. Chamaeleo zeylanicus Chameleon* LC II 11. Mabuya carinata Common Skink* LC 12. Calotes rouxi Forest Calottes* LC 13. Calotes versicolor Common garden
lizard* LC
14. Hemimidactylus brooki House gecko* LC
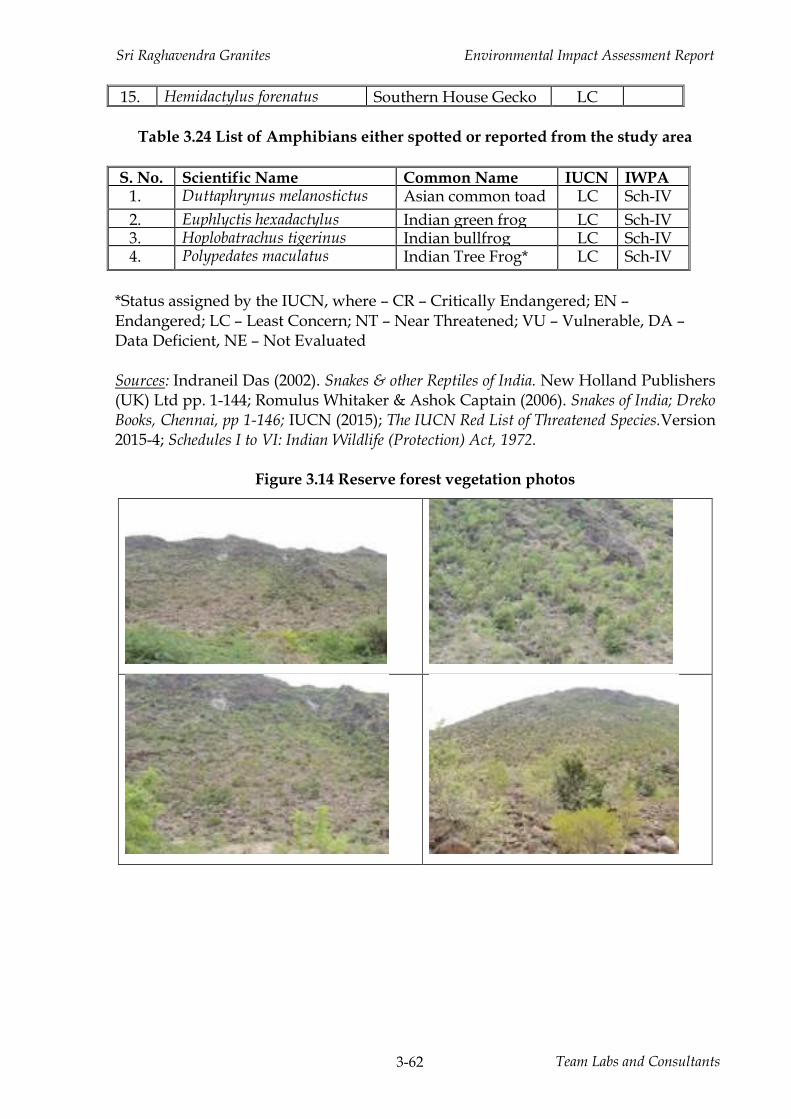
Sri Raghavendra Granites Environmental Impact Assessment Report
Team Labs and Consultants 3-62
15. Hemidactylus forenatus Southern House Gecko LC
Table 3.24 List of Amphibians either spotted or reported from the study area
S. No. Scientific Name Common Name IUCN IWPA 1. Duttaphrynus melanostictus Asian common toad LC Sch-IV
2. Euphlyctis hexadactylus Indian green frog LC Sch-IV 3. Hoplobatrachus tigerinus Indian bullfrog LC Sch-IV 4. Polypedates maculatus Indian Tree Frog* LC Sch-IV
*Status assigned by the IUCN, where – CR – Critically Endangered; EN – Endangered; LC – Least Concern; NT – Near Threatened; VU – Vulnerable, DA – Data Deficient, NE – Not Evaluated Sources: Indraneil Das (2002). Snakes & other Reptiles of India. New Holland Publishers (UK) Ltd pp. 1-144; Romulus Whitaker & Ashok Captain (2006). Snakes of India; Dreko Books, Chennai, pp 1-146; IUCN (2015); The IUCN Red List of Threatened Species.Version 2015-4; Schedules I to VI: Indian Wildlife (Protection) Act, 1972.
Figure 3.14 Reserve forest vegetation photos
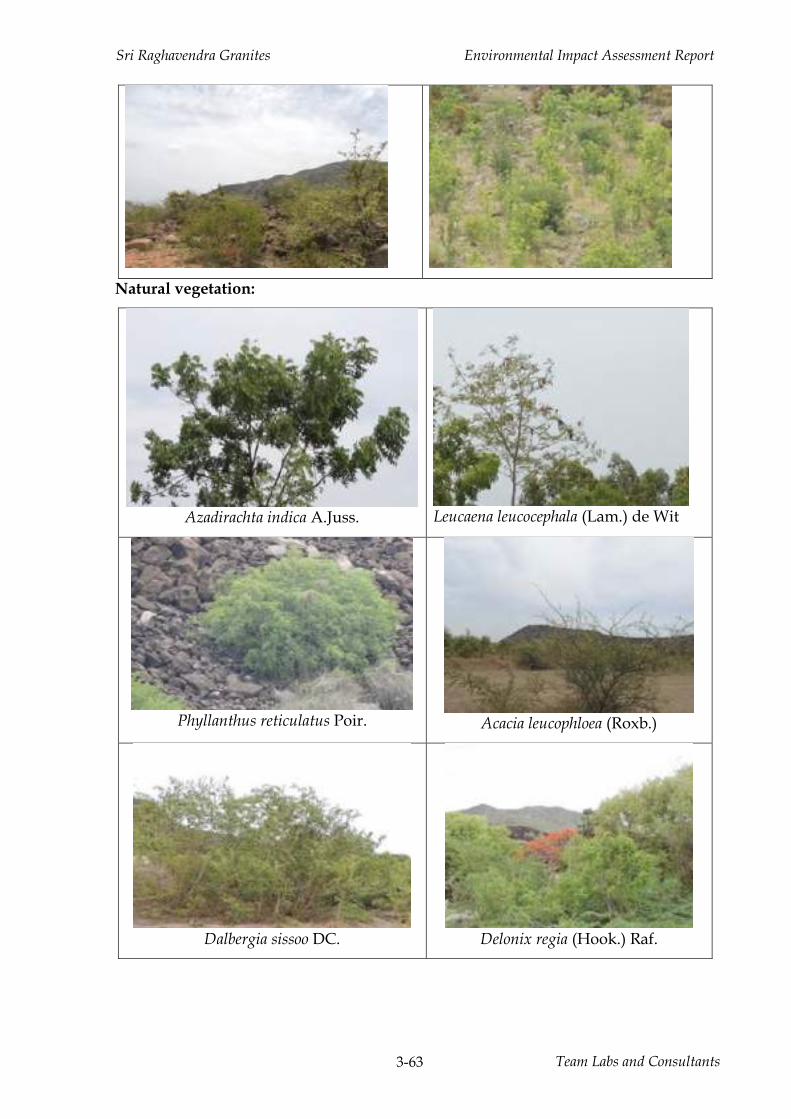
Sri Raghavendra Granites Environmental Impact Assessment Report
Team Labs and Consultants 3-63
Natural vegetation:
Azadirachta indica A.Juss. Leucaena leucocephala (Lam.) de Wit
Phyllanthus reticulatus Poir. Acacia leucophloea (Roxb.)
Dalbergia sissoo DC. Delonix regia (Hook.) Raf.
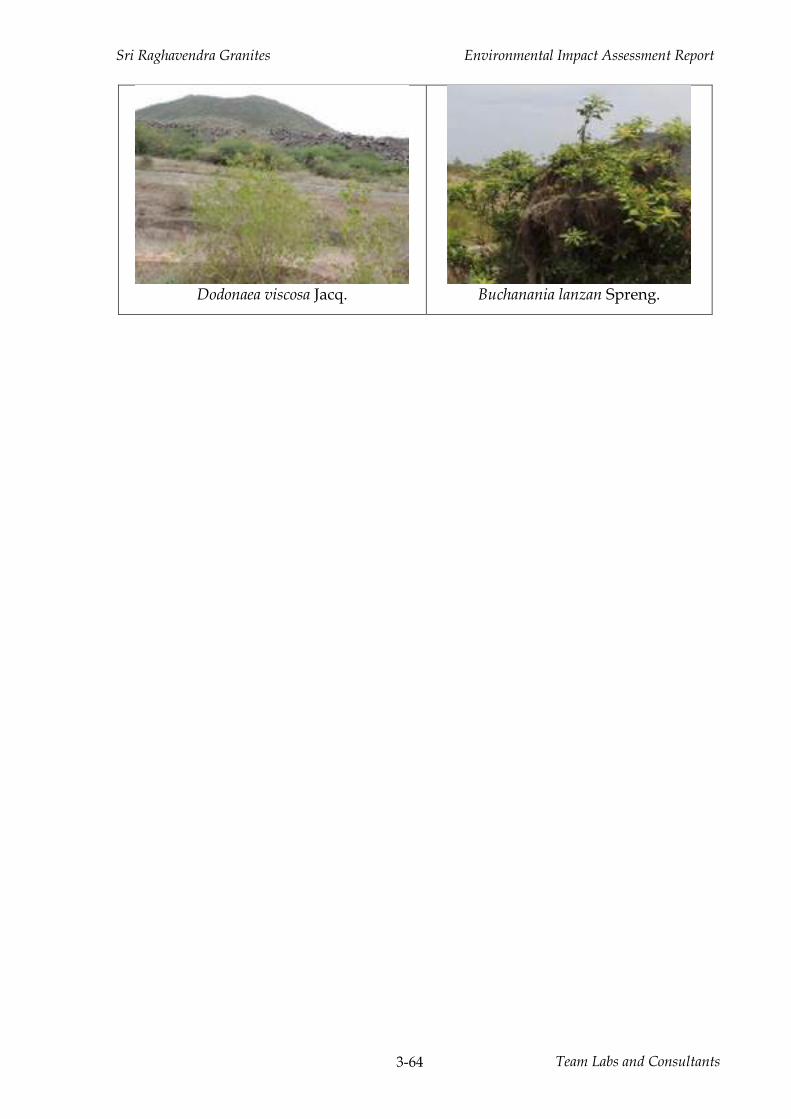
Sri Raghavendra Granites Environmental Impact Assessment Report
Team Labs and Consultants 3-64
Dodonaea viscosa Jacq. Buchanania lanzan Spreng.
Sri Raghavendra Granites Environmental Impact Assessment Report
4-1 Team Labs and Consultants
CHAPTER 4.0 ANTICIPATED ENVIRONMENTAL IMPACTS AND
MITIGATION MEASURES
4.0 Identification of Impacts
Identification of Impacts is one of the basic analytical steps of EIA for subsequent
prediction and evaluation of impacts. Impact is a change in baseline due to interaction
of a development activity with environment, or interaction of environment with
development activity, or change in baseline due to a manmade emergency. The
impacts were assessed for the main three stages of mining cycle i.e., planning and
construction, operations and closure. The exploration and feasibility stage of mine
cycle is not considered as the EIA activity is initiated after completion of exploration
and prefeasibility and obtaining the letter of intent from mines and geology
department, Government of Andhra Pradesh. Initially the assessment was done to
identify impacts due to the proposed mining project and cluster including Sri
Maddineni Veeranjaneyulu, Raghavendra Granites, Andru Suresh Babu, Chitturi
Kedarnath, Bharath Exports, Sri Eswar Granites, Amaravathi Mines, Kum. M. Raga
Sindhuri, Sri S. Sarath Chandra, Sanjana Exports, Devi Impex, Mahalakshmi granites
and awaiting LOI for Maddineni Veeranjaneyulu, Raghavendra Granites and other
leases obtained EC etcusing network method which mainly follows cause condition
and effect relationship. The interaction of project activity on the environment was
assessed by posing questions related to each aspect of project activity envisaged as
part of proposed project the plant. After broad identification of impacts, an interaction
table enumerating the activity vs factors of various environmental components was
prepared for various stages of mining activity implementation considering the entire
life cycle of construction, operation and decommissioning.
4.1 Environmental Impacts from Mining and Construction of Associated
Infrastructure
The mining activity and development of required infrastructure result in potential
impact on environment. The operational stage was considered for both regular
operation and for incidents and emergencies caused by both human errors and
extreme weather phenomena. Table 4.1 to 4.4 present the interaction tables identifying
the environmental factors anticipated to have an impact due to the project and impacts
Sri Raghavendra Granites Environmental Impact Assessment Report
4-2 Team Labs and Consultants
due to environment on the project. It may be noted that the blasting activity in color
granite mining project would limited to construction of haulage road and removal of
over burden, as the mining uses wire saw method.

Sri Raghavendra Granites Environmental Impact Assessment Report
4-3 Team Labs and Consultants
Table 4.1 Activity and Environmental Impact (Impact Identification Matrix) - Construction Stage
Environment Abiotic Biotic
Socio Economic
Others Component Climate Atmosphere Land Water
Factors
Mic
rom
ete
oro
log
y
Air
qu
ali
ty
No
ise a
nd
v
ibra
tio
n
Geo
log
y
So
il
Su
rface
Wate
r
Gro
un
d W
ate
r
Flo
ra
Fau
na
So
cio
Eco
no
mic
Wast
e
Man
ag
em
en
t
Occ
up
ati
on
al
healt
h a
nd
safe
ty
Fir
e S
afe
ty
Cli
mate
Ch
an
ge
Construction Stage
Site clearing, √ √ √ √ √ √ √
Road Formation √ √ √ √ √ √ √
Site services √ √ √ √ √ √ √ √ √
√ Indicates Impact Table 4.2 Activity and Environmental Impact (Impact Identification Matrix) - Regular Operation Stage
Environment Abiotic
Biotic Socio Economic Others Component Climate
Atmosphere Land Water
Factors
Activity Mic
rom
ete
or
olo
gy
Air
qu
ali
ty
No
ise a
nd
vib
rati
on
Geo
log
y
So
il
Su
rface
Wate
r
Gro
un
d
Wate
r
Flo
ra
Fau
na
So
cio
Eco
no
mic
Wast
e
Man
ag
em
en
t
Occ
up
ati
on
al
healt
h a
nd
safe
ty
Fir
e S
afe
ty
Cli
mate
Ch
an
ge
Mining stage Drilling √ √ √ √ √ √ √ √ √ √
Dozing, Loading and Unloading √ √ √ √ √ √ √ √ √ √ Transportation √ √ √ √
√ Indicates Impact

Sri Raghavendra Granites Environmental Impact Assessment Report
4-4 Team Labs and Consultants
Table 4.3 Activity and Environmental Impact (Impact Identification Matrix) - Incidents and Accidents
Environment Abiotic Biotic
Socio Economic
Others Component Climate Atmosphere Land Water
Factors
Mic
rom
ete
o
rolo
gy
Air
qu
ali
ty
No
ise a
nd
v
ibra
tio
n
Geo
log
y
So
il
Su
rface
W
ate
r
Gro
un
d
Wate
r
Flo
ra
Fau
na
So
cio
Eco
no
mic
Wast
e
Man
ag
em
en
t O
ccu
pa
tio
na
l h
ealt
h a
nd
safe
ty
Fir
e S
afe
ty
Cli
mate
Ch
an
ge
Operation Stage
Incidents and Accidents
Machinery Failure √ √
Fire accidents √ √
Accidents during transport of material
√ √
√ √
√
Extreme Weather phenomenon √ √
√ Indicates Impact Table 4.4 Activity and Environmental Impact (Impact Identification Matrix) - Decommissioning
Environment Abiotic Biotic
Socio Economic
Others Component Climate Atmosphere Land Water
Factors
Mic
rom
ete
oro
log
y
Air
qu
ali
ty
No
ise a
nd
vib
rati
on
Geo
log
y
So
il
Su
rface
W
ate
r
Gro
un
d
Wate
r
Flo
ra
Fau
na
So
cio
Eco
no
mic
Wast
e
Man
ag
em
e
nt
Occ
up
ati
on
al
healt
h
an
d s
afe
ty
Fir
e S
afe
ty
Cli
mate
Ch
an
ge
Mine Closure
Removal, Back filling and sealing
√ √ √ √ √ √
√
Removal of structures √ √ √ √
Danger due to inadvertent entry √
√
√ Indicates Impact

Sri Raghavendra Granites Environmental Impact Assessment Report
4-5 Team Labs and Consultants
4.1.1 Impact Networks
The purpose of identifying the impacts is that it aids in making appropriate decision to
mitigate the adverse consequences if any. The degree of extensiveness and scale of
impacts and the consequences based on value judgments are generalized while
identifying impacts; as it is imperative that the impacts normally lead to a chain of
reactions. The construction of network charts brings out to certain extent the
appropriate levels of risks that may occur due to the interventions while interacting
with hydrological, biological and social systems due to the proposed mining activity its
life time of construction, operation and mine closure including emergency scenarios
both natural and manmade. The conceptual site model of mining activity before and
during mining activity area presented in Figure 4.1 – 4.2, while the generic impact
networks for each aspect of environment are presented in Figure 4.3 to 4.7.
Figure 4.1 Conceptual site model of mining activity (Site Preparation)

Sri Raghavendra Granites Environmental Impact Assessment Report
4-6 Team Labs and Consultants
Figure 4.2 Conceptual site model of mining activity (During Mining)
Figure 4.3 Impacts on Air Environment

Sri Raghavendra Granites Environmental Impact Assessment Report
4-7 Team Labs and Consultants
Figure 4.4 Impacts on Water Environment
Figure 4.5 Noise Impact on Surrounding Environment

Sri Raghavendra Granites Environmental Impact Assessment Report
4-8 Team Labs and Consultants
Figure 4.6 Impact of Solid Waste on Soil Quality
Figure 4.7 Socio- Economic Environment
Sri Raghavendra Granites Environmental Impact Assessment Report
4-9 Team Labs and Consultants
4.2 Prediction and Assessment of Impacts
Based on the above images and tables the impacts are identified with respect to the
current mining project. The identified impacts are assessed by posing questions related
to each activity of proposed color granite mining project and their interaction with
environment during the life cycle of the proposed mining activity i.e., construction,
operation and mine closure stages including incident and accidents scenario during
operation stage. The statutory limits of ambient air quality, noise, emissions and
discharges as mandated by the MoEFCC was considered to classify the quantifiable
impacts as acceptable or not acceptable. However, there are few impacts that cannot be
quantified, which need to be qualitatively assessed. There are a number of methods for
qualitatively assessing the impacts to arrive at the significance of impact. The
qualitative assessment of impacts require characterization with respect to its
magnitude, geographic extent, duration, frequency, reversibility, probability of
occurrence, confidence rating and impact rating. The manual published by MOEFCC
prescribes the following process for determining the significance of impact; first, an
impact is qualified as being either negative or positive. Second, the nature of impacts
such as direct, indirect, or cumulative is determined using the impact network. Third, a
scale is used to determine the severity of the effect; for example, an impact is of low,
medium, or high significance. Accordingly, it was proposed to quantify the impacts
which are a direct result of the activities contingent on availability of reliable prediction
tools. In case the quantification is not feasible, a subjective assessment of the impact
significance using Rapid Impact Assessment Matrix (RIAM) was used. Rapid Impact
Assessment Matrix (RIAM) is constructed from a set of well-defined assessment criteria
and a collection of specific environmental indicators or components. The environmental
indicators are carefully chosen for the purpose of evaluating the potential impacts of
the alternatives that are being considered (Pastakia and Jensen, 1998).
4.2.1 Methodology of Rapid Impact Assessment Matrix
The RIAM is suited to EIA where a multi-disciplinary team approach is used, as it
allows for data from different sectors to be analyzed against common important
criteria within a common matrix, thus providing a clear assessment of the major
impacts. With the assessment criteria typically arrayed as the columns of the matrix

Sri Raghavendra Granites Environmental Impact Assessment Report
4-10 Team Labs and Consultants
and the indicators as the rows, the cells are comprised of numbers which provide a
measure of the expected impacts of the indicators when measured against the
assessment criteria. Technically, the assessment process is comprised of four steps that
must be completed in sequence: Step I — create a set of indicators, Step II — provide
numerical values for the indicators, Step III — compute environmental scores and Step
IV — evaluate the alternatives. RIAM is based on the knowledge that certain specific
criteria are common to all impact assessments, and by scaling these criteria it becomes
possible to record the values of the assessments made. RIAM works with both
negative and positive impacts. Not all criteria can be given the same weight, and so
the criteria are divided into two groups: those which individually are important in
their impact; and those that collectively important. The important assessment criteria
fall into two groups: (A) Criteria that are of importance to the condition, and which
can individually change the score obtained. (B) Criteria that are of value to the
situation, but individually should not be capable of changing the score obtained. The
value ascribed to each of these groups of criteria is determined by the use of a series
of simple formulae. These formulae allow the scores for the individual components to
be determined on a defined basis.
The process can be expressed: (a1) x (a2) = aT (b1) + (b2) + (b3) = bT (aT) x (bT) = ES Group (A) criteria
Importance of condition (A1)
A measure of the importance of the condition, which is assessed against the spatial
boundaries or human interests it will affect. The scales are defined:
4 = important to national/international interests
3 = important to regional/national interests
2 = important to areas immediately outside the local condition
1 = important only to the local condition
0 = no importance.

Sri Raghavendra Granites Environmental Impact Assessment Report
4-11 Team Labs and Consultants
Magnitude of change/effect (A2)
Magnitude is defined as a measure of the scale of benefit/dis-benefit of an impact or
a condition:
+ 3 = major positive benefit
+ 2 = significant improvement in status quo
+ 1 = improvement in status quo
0 = no change/status quo
- 1 = negative change to status quo
- 2 = significant negative dis-benefit or change
- 3 = major dis-benefit or change.
Group (B) criteria
Permanence (B1)
This defines whether a condition is temporary or permanent, and should be seen only
as a measure of the temporal status of the condition
1 = no change/not applicable
2 = temporary
3 = permanent.
Reversibility (B2)
This defines whether the condition can be changed and is a measure of the control
over the effect of the condition.
1 = no change/not applicable
2 = reversible
3 = irreversible.
Cumulative (B3)
This is a measure of whether the effect will have a single direct impact or whether
there will be a cumulative effect over time, or a synergistic effect with other conditions.
1 = no change/not applicable
2 = non-cumulative/single
3 = cumulative/synergistic

Sri Raghavendra Granites Environmental Impact Assessment Report
4-12 Team Labs and Consultants
Environmental components
The RIAM requires specific assessment components to be defined through a process
of scoping; and these environmental components fall into one of four categories,
which are defined as follows:
Physical/chemical
Covering all physical and chemical aspects of the environment, including finite (non-
biological) natural resources, and degradation of the physical environment by
pollution.
Biological / ecological
Covering all biological aspects of the environment, including renewable natural
resources, conservation of biodiversity, species interactions, and pollution of the
biosphere.
Sociological / cultural:
Covering all human aspects of the environment, including social issues affecting
individuals and communities; together with cultural aspects, including conservation
of heritage, and human development.
Economic / operational: To qualitatively identify the economic consequences of
environmental change, both temporary and permanent, as well as the complexities of
project management within the context of the project activities. The use of these four
categories can be, in itself, a competent tool for EIA, though each category can be
further sub-divided to identify specific environmental components that better
demonstrate the possible impacts. The degree of sensitivity and detail of the system
can thus be controlled by the selection and definition process for these environmental
components.
Criteria for Significance of Impacts based on Environmental Scores
Environmental Score Range Bands Description of Range Bands
+72 to +108 +E Major Positive Change/Impacts
+36 to + 71 +D Significant Positive Change/Impacts
+19 to + 35 +C Moderately positive change/impacts
+10 to + 18 +B Positive Change/Impacts
+1 to +9 +A Slightly Positive Change/impacts

Sri Raghavendra Granites Environmental Impact Assessment Report
4-13 Team Labs and Consultants
Environmental Score Range Bands Description of Range Bands
0 N No Change/status quo/not applicable
-1 to -9 -A Slightly Negative Change/impacts
-10 to - 18 -B Negative Change/Impacts
-19 to - 35 -C Moderately negative change/impacts
-36 to -71 -D Significant negative change/impacts
-72 to -108 -E Major negative change/impacts
4.2.2 Air Environment
The sources of air pollution in the proposed activity are emissions from drilling, dozing
equipment and transportation vehicles, in addition to wind erosion of stockpiles. The
emissions from drilling activity consists of particulate matter. The emissions from
dozing equipment and transport vehicles consist of particulate matter, sulfur dioxide,
and oxides of nitrogen, which results in change in criteria air contaminants in ambient
air quality. The adoption of mitigation measures like water sprinkling along the
haulage roads, and covering the drill with wet gunny cloth shall reduce the impact to
low levels. Wind erosion of stockpiled mineral may result in particulate pollution in
the immediate surroundings. The anticipated impacts on air environment are presented
in Table 4.5, and Table 4.6 presents significance of each impact based on RIAM. The
impact assessment indicates that the proposed color granite mining activity in the
cluster will have slightly negative change /impacts on visibility, change in odor related
contaminants, and eutrophication of sensitive ecosystems, whereas negative impact is
indicated on change in criteria air pollutants, change in greenhouse gases, and impact
on soil and flora due to wet and dry deposition of pollutants.

Sri Raghavendra Granites Environmental Impact Assessment Report
4-14 Team Labs and Consultants
Table 4.5 Impacts on Air Environment
Impact Activity
Ch
an
ge i
n
Cri
teri
a a
ir
con
tam
inan
ts
Ch
an
ge i
n
healt
h a
nd
o
do
r re
late
d
con
tam
inan
ts
Ch
an
ge i
n
gre
en
ho
use
g
ase
s
Ch
an
ge i
n
vis
ibil
ity
Eff
ect
s o
n
veg
eta
tio
n d
ue
to d
ry a
nd
wet
dep
osi
tio
n
Eff
ect
s o
n s
oil
du
e t
o d
ry a
nd
wet
dep
osi
tio
n
Eu
tro
ph
icati
on
of
sen
siti
ve
eco
syst
em
du
e
N20 d
ep
osi
tio
n
Construction Stage
Site clearing, √
Road Formation √ √ √ √ √ √
Site Services √ √ √ √ √ √
Production stage
Drilling √ √
Dozing, Loading and Unloading √ √ √ √ √ √
Transportation √ √ √ √ √ √ √
Mine Closure
Removal, Back filling and sealing √ √ √ √
Removal of structures √ √ √ √
Danger due to inadvertent entry
√ Indicates Impact
Table 4.6 Impact significance - Air Environment

Sri Raghavendra Granites Environmental Impact Assessment Report
4-15 Team Labs and Consultants
Impact
Imp
ort
an
ce
of
con
dit
ion
(A1)
Mag
nit
ud
e
of
chan
ge /
eff
ect
(A
2)
Perm
an
en
ce
(B1)
Rev
ers
ibil
ity
(B2)
Cu
mu
lati
ve
(B3)
(a1)
x (
a2)
=
aT
(b1)
+ (
b2)
+
(b3)
= b
T
(aT
) x (
bT
) =
E
S
Sig
nif
ican
ce
Change in Criteria air contaminants 2 -1 2 3 3 -2 7 -14 -B
Change in health and odor related contaminants 1 -1 2 3 3 -1 7 -7 -A
Change in greenhouse gases 2 -1 2 3 2 -2 7 -14 -B
change in visibility 1 -1 2 3 2 -1 7 -7 -A
Effects on vegetation due to dry and wet deposition 2 -1 2 3 2 -2 6 -12 -B
Effects on soil due to dry and wet deposition 2 -1 2 3 2 -2 6 -12 -B
Eutrophication of sensitive ecosystem due N20 deposition
1 -1 2 3 2 -1 6 -6 -A

Sri Raghavendra Granites Environmental Impact Assessment Report
4-16 Team Labs and Consultants
4.2.3 Details of Mathematical Modeling
The change in criteria air pollutants is calculated by conducting air quality impact
predictions. A large number of different mathematical models for dispersion
calculations are in practice in many parts of the world. Most of the models for
prediction of downwind concentrations are based on Gaussian dispersion. The
principle behind the Gaussian dispersion models is Gaussian probability distribution
of concentration in both vertical and horizontal cross wind directions about the plume
central line.
Predictions of ground level concentrations of the pollutants were carried out based on
site meteorological data collected during the study period. For calculation of predicted
ground level concentrations, ISCST3 model of Lakes Environmental based on USEPA,
ISCST3 algorithm is used as it has a more sophisticated algorithm incorporating
deposition, better algorithm for area sources, etc.
Overview of New Features in the ISC3 Models
The ISC3 models include several new features. A revised area source algorithm and
revised dry deposition algorithm have been incorporated in the models. The ISC3
models also include an algorithm for modeling impacts of particulate emissions from
open pit sources, such as surface coal mines. The Short-Term model includes a new wet
deposition algorithm, and also incorporates the COMPLEX1 screening model
algorithms for use with complex and intermediate terrain. When both simple and
complex terrain algorithms are included in a Short-Term model run, the model will
select the higher impact from the two algorithms on an hour-by-hour, source-by-source,
and receptor by- receptor basis for receptors located on intermediate terrain, i.e., terrain
located between the release height and the plume height.
Some of the model input options have changed and newer input options have been
added as a result of the new features contained in the ISC3 models. The source
deposition parameters have changed somewhat with the new dry deposition algorithm,
and there are new source parameters needed for the wet deposition algorithm in the
Short-Term model. There are also new meteorology input requirements for use of the

Sri Raghavendra Granites Environmental Impact Assessment Report
4-17 Team Labs and Consultants
new deposition algorithms. The option for specifying elevation units has been extended
to source elevations and terrain grid elevations, in addition to receptor elevations.
The utility programs, STOLDNEW, BINTOASC, and METLIST have not been
updated. While they may continue to be used as before, they are not applicable to the
new deposition algorithms in the ISC3 models. The salient features of the ISCST3
model are presented below Table 4.7. The air quality predictions have been made
using the model evaluation protocol for fugitive dust impact modeling for surface coal
mining operations (EPA 1995, EPA 1994).
Table 4.7 Salient Features of the ISCST3 Model
Item Details
Model name ISCST3 (Based on USEPA algorithm)
Source Types Point, Area, Volume, Open Pits
Dispersion Equation Steady State Gaussian Plume Equation
Diffusion Parameters Pasqual Gifford Co-efficient
Plume Rise Briggs Equation
Time Average 1 hr to Annual/Period Has Short Term and Long-Term modeling options
Deposition Both Dry and Wet Deposition
Application Input data:
(i) Source Data mine coordinates, base elevation, emission rates of pollutants
(ii) Receptor Data Grid interval, number of receptors, receptor elevations
(iii) Meteorological data
Hourly meteorological data i.e. wind speed, direction, ambient temperature, stability and mixing heights
Model Formulation
The model uses the following steady state Gaussian plume equation. The basic
equation for calculating the concentration of pollutants for any point in x, y, z co-
ordinates is given below:
C(x,y,z,H) = Q/2yz U exp[-1/2(y/y)2]x[exp{-1/2(z-h/z)2} + exp {-1/2 (z+H/z)
2}]
Where C= Concentration of pollutants in mg/cu m
Q= Strength of emissions in g/sec.
H= Effective Height (m), i.e., physical height + plume raise
y, z= diffusion coefficients in y and z directions in m.
U= average wind velocity in m/sec.
The following assumptions are made in Gaussian dispersion model.
Sri Raghavendra Granites Environmental Impact Assessment Report
4-18 Team Labs and Consultants
This model assumes no diffusion in the down wind direction and thus applicable to a
plume and not a puff of pollutant. The dispersion parameter values used for
horizontal dispersion coefficient and vertical dispersion coefficients are those given in
the “Work book of atmospheric dispersion estimates”. These dispersion coefficients
assume a sampling time of about 10min., the height values of interest to be in the
lowest several hundred meters of the atmosphere, a surface corresponding to the open
country. The stacks are tall enough to be free from building turbulence so that no
aerodynamic down wash occurs. The given stability exists from ground level to well
above the top of the plume.
The Gaussian dispersion model has been tested extensively for its validity and found
to be reasonably applicable for different atmospheric conditions. BIS has also adopted
this basic plume dispersion model. Hence the same model is adopted for predictions
of downwind concentrations of pollutants in this report.
Meteorological Data
Data recorded by the weather monitoring station at site on wind speed, direction, solar
isolation, temperature and cloud cover at one hourly interval for three months i.e. One
full season has been used for computations.
Mixing Height
The mixing heights for ambient air quality predictions are adopted from Atlas of
Hourly Mixing Height and Assimilative Capacity of Atmosphere in India by S.D Attri,
Siddartha Singh, B. Mukhopadhya and A.K Bhatnagar, Published by Indian
Metrological Department, New Delhi, 2008. The mixing heights range from 650 to
1450 m during summer season. There is no record of inversion for this area (reference:
Atlas of Hourly Mixing Height and Assimilative Capacity of Atmosphere in India by
S.D Attri, Siddartha Singh, B. Mukhopadhya and A.K Bhatnagar, Published by Indian
Metrological Department, New Delhi, 2008). There is no record of inversion in this
area as observed from the IMD data.
4.2.4 Emissions from Mining activity and transportation
The speciation of PM based on the particle size was done using AP-42 emission factors
of USEPA. The emission rate of PM is presented in Annexure.

Sri Raghavendra Granites Environmental Impact Assessment Report
4-19 Team Labs and Consultants
4.2.5 Air Quality Predictions (Terms of Reference No. 23)
Prediction of ground level concentrations of pollutants was carried out based on site
meteorological data collected during the study period. For calculation of ground level
concentrations, a grid of 10 X 10 km with a receptor interval of 400 meters is
considered.
The composition of particulate matter was obtained from USEPA AIRCHIEF AP-42
and the same was considered in determining the source concentration of PM10 and
PM2.5 for prediction purpose. It may be observed that the predicted maximum 24
hourly GLC’s of PM10 and PM10 are 10.55 and 3.62 g/m3 respectively and the
maximum values are observed at mining area only and the cluster including Sri
Maddineni Veeranjaneyulu, Raghavendra Granites, Andru Suresh Babu, Chitturi
Kedarnath, Bharath Exports, Sri Eswar Granites, Amaravathi Mines, Kum. M. Raga
Sindhuri, Sri S. Sarath Chandra, Sanjana Exports, Devi Impex, Mahalakshmi granites and
awaiting LOI for Maddineni Veeranjaneyulu, Raghavendra Granites and other leases
obtained EC etc. The isopleths of predicted ground level concentration are graphically
presented in Figure 4.7 to 4.9. The predicted ground level concentration at various
ambient air quality monitoring locations and the valued eco component of reserve
forests in the impact area are presented in Table 4.8. The cumulative ground level
concentration considering the observed ambient air quality values is presented in
Table 4.9. It may be observed that there is a marginal increase in the ambient air
quality of surrounding area due to proposed mining activity.
The mitigation measures proposed for controlling fugitive dust shall ensure that the
impact is local in scope and their effects can be distinguished from the natural range
of variability in physical, chemical and biological characteristics and processes. The
impact magnitude is low with less than 1 g/m3 change in the ambient air quality,
confined to study area only. The impact occurs continuously during mining
operations and manifests long term throughout operations; however, it is reversible
after mining activity is completed. The certainty of impact is high based on
quantitative evaluation of site-specific data while the level of confidence is high as the
quantitative prediction is considered to be reliable, with a high probability of
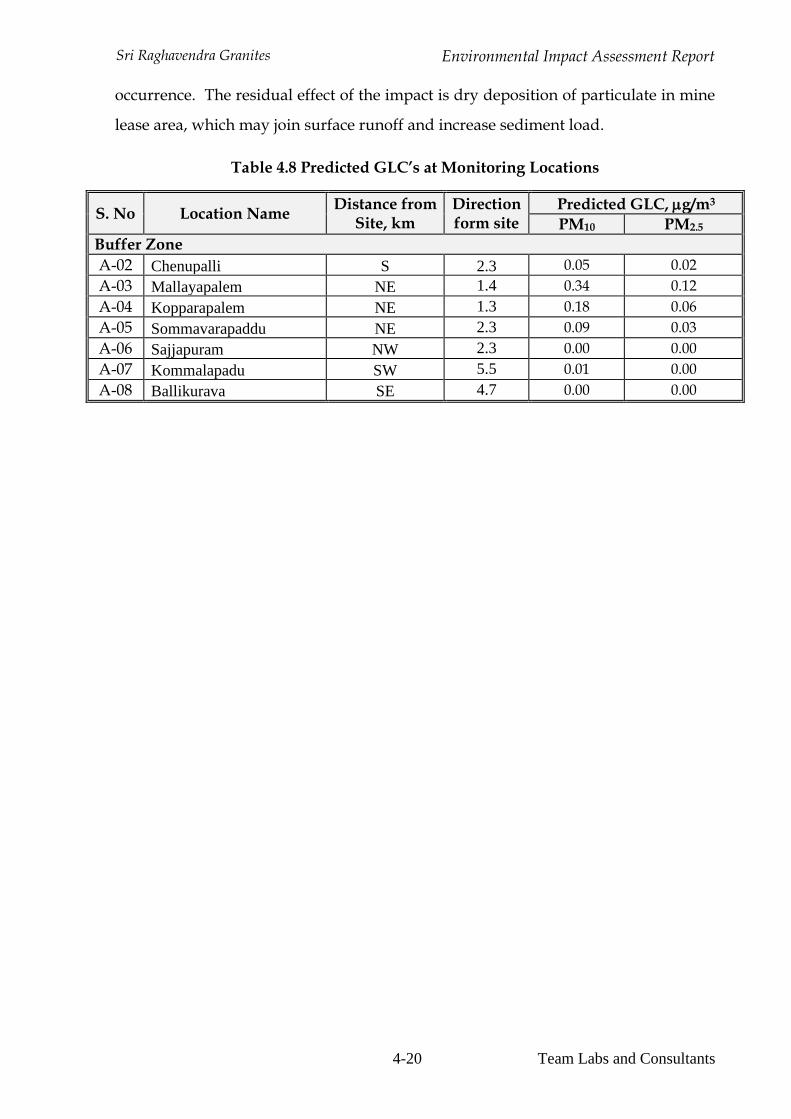
Sri Raghavendra Granites Environmental Impact Assessment Report
4-20 Team Labs and Consultants
occurrence. The residual effect of the impact is dry deposition of particulate in mine
lease area, which may join surface runoff and increase sediment load.
Table 4.8 Predicted GLC’s at Monitoring Locations
S. No Location Name Distance from
Site, km Direction form site
Predicted GLC, g/m3
PM10 PM2.5
Buffer Zone
A-02 Chenupalli S 2.3 0.05 0.02
A-03 Mallayapalem NE 1.4 0.34 0.12
A-04 Kopparapalem NE 1.3 0.18 0.06
A-05 Sommavarapaddu NE 2.3 0.09 0.03
A-06 Sajjapuram NW 2.3 0.00 0.00
A-07 Kommalapadu SW 5.5 0.01 0.00
A-08 Ballikurava SE 4.7 0.00 0.00

Sri Raghavendra Granites Environmental Impact Assessment Report
4-21 Team Labs and Consultants
Table 4.9 Cumulative AAQ Concentration at various locations in the Impact Area
S. No Location Name Distance from
Site, km Direction Form site
Concentration, g/m3 Predicted
GLC, g/m3
Cumulative
Concentration, g/m3
PM10 PM2.5 PM10 PM2.5 PM10 PM2.5
Buffer Zone
A-02 Chenupalli S 2.3 39 19 0.05 0.02 39.05 19.02
A-03 Mallayapalem NE 1.4 41 18 0.34 0.12 41.34 18.12
A-04 Kopparapalem NE 1.3 43 17 0.18 0.06 43.18 17.06
A-05 Sommavarapaddu NE 2.3 42 18 0.09 0.03 42.09 18.03
A-06 Sajjapuram NW 2.3 42 19 0.00 0.00 42.00 19.00
A-07 Kommalapadu SW 5.5 40 18 0.01 0.00 40.01 18.00
A-08 Ballikurava SE 4.7 44 17 0.00 0.00 44.00 17.00
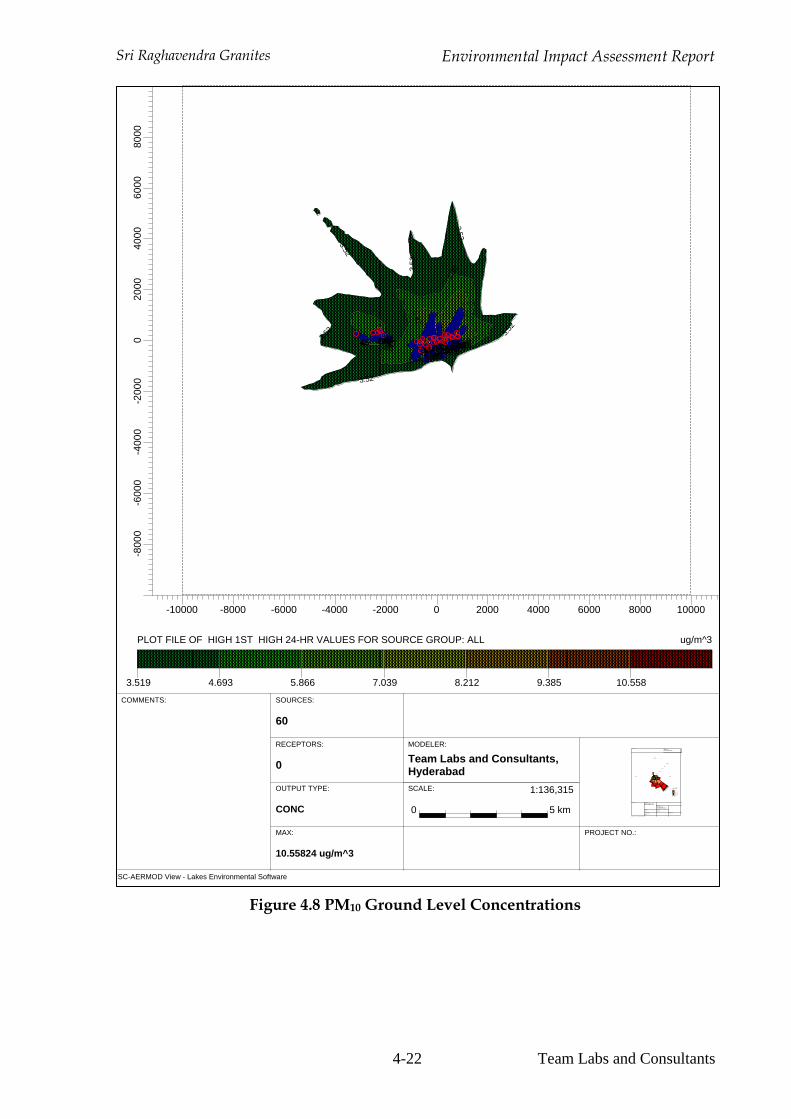
Sri Raghavendra Granites Environmental Impact Assessment Report
4-22 Team Labs and Consultants
Figure 4.8 PM10 Ground Level Concentrations
ISC-AERMOD View - Lakes Environmental Software
PROJECT TITLE:
PROJECT NO.:
SCALE:
0 5 km
1:136,315
COMMENTS:
MODELER:
Team Labs and Consultants, Hyderabad
SOURCES:
60
RECEPTORS:
0
OUTPUT TYPE:
CONC
MAX:
10.55824 ug/m^3
ug/m^3PLOT FILE OF HIGH 1ST HIGH 24-HR VALUES FOR SOURCE GROUP: ALL
3.519 4.693 5.866 7.039 8.212 9.385 10.558
3.52
3.52
3.52
3.52
3.52
3.52
4.69
4.69
5.87
60
595857
56555453
5251504948474645 444342 4140
393837
3635343332319
87654
303
292827
26252423
22212021918171615 1413
12 11101
-10000 -8000 -6000 -4000 -2000 0 2000 4000 6000 8000 10000
-800
0-6
000
-400
0-2
000
020
0040
0060
0080
00
WRPLOT View - Lakes Environmental Software
WIND ROSE PLOT:
COMMENTS:
MODELER:
Team Labs and Consultants, Hyderabad
PROJECT NO.:
NORTH
SOUTH
WEST EAST
5.26%
10.5%
15.8%
21%
26.3%
WIND SPEED (m/s)
>= 4.20
2.80 - 4.20
1.40 - 2.80
0.28 - 1.40
Calms: 0.09%
TOTAL COUNT:
2136 hrs.
CALM WINDS:
0.09%
DATA PERIOD:
Start Date: 2/1/2019 - 00:00End Date: 4/30/2019 - 23:00
AVG. WIND SPEED:
7.92 m/s
DISPLAY:
Wind SpeedDirection (blowing from)

Sri Raghavendra Granites Environmental Impact Assessment Report
4-23 Team Labs and Consultants
Figure 4.9 PM2.5 Ground Level Concentrations
ISC-AERMOD View - Lakes Environmental Software
PROJECT TITLE:
PROJECT NO.:
SCALE:
0 5 km
1:136,315
COMMENTS:
MODELER:
Team Labs and Consultants, Hyderabad
SOURCES:
60
RECEPTORS:
0
OUTPUT TYPE:
CONC
MAX:
3.16746 ug/m^3
ug/m^3PLOT FILE OF HIGH 1ST HIGH 24-HR VALUES FOR SOURCE GROUP: ALL
1.056 1.408 1.760 2.112 2.464 2.816 3.167
1.06
1.06
1.06
1.06
1.06
1.06
1.41
1.41
1.76
60
595857
56555453
5251504948474645 444342 4140
393837
3635343332319
87654
303
292827
26252423
22212021918171615 1413
12 11101
-10000 -8000 -6000 -4000 -2000 0 2000 4000 6000 8000 10000
-800
0-6
000
-400
0-2
000
020
0040
0060
0080
00
WRPLOT View - Lakes Environmental Software
WIND ROSE PLOT:
COMMENTS:
MODELER:
Team Labs and Consultants, Hyderabad
PROJECT NO.:
NORTH
SOUTH
WEST EAST
5.26%
10.5%
15.8%
21%
26.3%
WIND SPEED (m/s)
>= 4.20
2.80 - 4.20
1.40 - 2.80
0.28 - 1.40
Calms: 0.09%
TOTAL COUNT:
2136 hrs.
CALM WINDS:
0.09%
DATA PERIOD:
Start Date: 2/1/2019 - 00:00End Date: 4/30/2019 - 23:00
AVG. WIND SPEED:
7.92 m/s
DISPLAY:
Wind SpeedDirection (blowing from)

Sri Raghavendra Granites Environmental Impact Assessment Report
4-24 Team Labs and Consultants
4.3 Occupational Health Hazards Due to Dust Pollution
The mining activity results in mainly particulate emission and dust pollution.
Progressive disintegration of suspended solid particles or dust results in major health
problems. This micron sized particles, once air-borne, are extremely difficult to be
collected or trapped. Due to the minute size of the particles, the ambient environment
remains clear giving a deceptive sense of security to the workers and the management.
Dust will have impact on the health of the workers and the population of surrounding
villages due to dry deposition of particulates. Lung function is impaired due to both
respirable and non-respirable dust particles. Chronic exposure leads to respiratory
illnesses like asthma, emphysema, severe dyspnea (shortness of breath), and
bronchitis and in extreme cases pneumoconiosis or the black-lung disease of miners.
The effect of dust is harmful to human health, necessitating implementation of
effective occupational health and safety practices. The impact within the mine lease
area is moderate negative with low magnitude, as the impact is localized, and is
reversible with employee rotation, implementation of dust pollution mitigation
measures and occupational health and safety practices. The impact on habitation is
not significant as the predicted ground level concentrations are very low contributing
to minor increase to AAQ, which is within the prescribed NAAQ standards.
4.4 Noise Environment
The source of noise during mining operation is loading, vehicular movement. Loading
operations are intermittent during mine working hours, while vehicle movement is
intermittent. The noise sources contribute to increase in background noise levels. The
monitored values for noise levels are within the prescribed levels of CPCB. The
incremental noise levels due to these activities were predicted and the values reflect
low impact outside the premises. The incremental noise levels however shall have
direct negative impact on the noise levels, with low significance due to mitigation
measures and also due to absence of sensitive receptors within 1400 m of the sources.
The impact significance is calculated using RIAM. The impacts due to various
activities during the life time of the project including the emergency scenarios on noise
levels is presented in Table 4.10. The impact significance on noise levels is presented

Sri Raghavendra Granites Environmental Impact Assessment Report
4-25 Team Labs and Consultants
in Table 4.11. The impact assessment indicates that the proposed color granite mining
activity in the cluster will have slightly negative change/impacts on ambient noise,
whereas negative impact is indicated on change in criteria noise environment, due to
its low magnitude and occasional frequency.
4.4.1 Prediction of Impact on Noise Quality
The change is criteria Noise environment is calculated by conducting noise quality
impact predictions. The sound pressure level generated by noise source decreases
with increasing distance from the source due to wave divergence. An additional
decrease in sound pressure levels also occurs with increasing distance from the source
due to atmospheric effect or interaction with the objects in the transmission path.
This is due to excess attenuation. The sound pressure level is also affected by medium
of travel and environmental conditions. The propagation model has been devised to
take into account these factors and predict the noise levels at various distances round
a single or a multiple source. The model uses the following formula as a basis for such
predictions.
(Lob) = (Lr) - (Ldiv) - (Latm) Where (Lob) = Observed noise level at a distance R from source (Lr) = Noise level of source measured at reference distance r (Ldiv) = Loss due to divergence at distance R from source = 20 log (R/r) (Latm) = Attenuation due to atmosphere at distance R from the source. = a x R/100, where a is atmospheric attenuation coefficient in dB (A)/100m.
For hemispherical wave divergence in a homogenous loss free atmosphere (Latm) = 0.
The total impact of all sources at particular place is then estimated by adding as the
contribution of noise from each of the following sources as follows;
i=n (Lob)i/10
(Leq) = 10 log {10 } i=1
Where n = total number of sources
The calculated noise levels are further super imposed (logarithmically) on the
background noise levels. The model assumes that the noise spectrum is mainly
centered on a spectrum of 1000 Hz and attenuation due to building materials is also
at the same frequency.

Sri Raghavendra Granites Environmental Impact Assessment Report
4-26 Team Labs and Consultants
The major sources of noise generation are excavation, loading, truck moment, DG set,
which emit noise level of maximum 90 dB (A) - 110 dB (A) at a reference distance of
1m from the source. The predicted cumulative noise levels due to the source and the
existing level as calculated from the logarithmic model without noise attenuation
ranged between 55 and 75 Db (A) at distances ranging between 70 to 135 m which
falls within the mine boundary. The impact of noise on the population in the
surrounding area will be negligible, as the nearest habitation is 1.3 m away from the
site.

Sri Raghavendra Granites Environmental Impact Assessment Report
4-27 Team Labs and Consultants
Table 4.10 Impacts on Noise Level
Impact Activity
Noise and vibration
Change in ambient noise
levels
Change in behavior
due to noise
Effects on sensitive receptors leading to gradual impairment
Construction Stage
Site clearing, √ √ √
Road Formation √ √ √
Production stage
Drilling √ √ √ √
Dozing, Loading and Unloading √ √ √ √
Transportation √ √ √ √
Operation Stage - Incidents and Accidents
Accidents during transport of material √
Extreme Weather phenomenon
Mine Closure
Removal, Back filling and sealing
Removal of structures √ √ √
Danger due to inadvertent entry √ √ √
√ Indicates Impact Table 4.11 Impact Significance – Noise Level
Impact
Importance of
condition (A1)
Magnitude of change/ effect (A2)
Permanence (B1)
Reversibility (B2)
Cumu-lative (B3)
(a1) x
(a2) = aT
(b1) + (b2) + (b3) =
bT
(aT) x
(bT) = ES
Signi-ficance
Change in ambient noise levels 1 -1 2 2 3 -1 7 -7 -A
Change in behaviour due to noise 1 -1 2 2 2 -1 6 -6 -A
Effects on sensitive receptors leading to gradual impairment
1 -1 2 2 3 -1 7 -7 -A

Sri Raghavendra Granites Environmental Impact Assessment Report
4-28 Team Labs and Consultants
4.4.2 Occupational Health Hazards of Noise Pollution
Exposure to noise levels, above TLV, has been found to have detrimental effect on the
workers' health. Mineworkers working for more than 4 to 4.5 hours per shift will be
greatly affected, unless suitable mitigation measures are adopted. The health impact
of high noise levels on exposed workers may reflect in annoyance, fatigue, temporary
shift of threshold limit of hearing, permanent loss of hearing, hypertension, high blood
cholesterol and etc. Noise pollution poses a major health risk to the mineworkers.
When noise in the form of waves impinges the eardrum, it begins to vibrate,
stimulating other delicate tissues and organs in the ear. If the magnitude of noise
exceeds the tolerance limits, it is manifested in the form of discomfort leading to
annoyance and in extreme cases to loss of hearing. Detrimental effects of noise
pollution are not only related to sound pressure level and frequency, but also on the
total duration of exposure and the age of the person. Table 4.12 presents frequency
levels and associated mental and physical response of humans. The impact within the
mine lease area is moderately negative with low magnitude, as the impact is localized,
and is reversible with employee rotation, implementation occupational health and
safety practices.
Table 4.12 Noise Exposure Levels and Its Effects
S. No Noise Level dB (A) Exposure Time Effects
1 85 Continuous Safe
2 85-90 Continuous Annoyance and irritation
3 90-100 Short term Temporary shift in hearing threshold, generally with complete recovery.
4 Above 100
Continuous Permanent loss of hearing
Short Term Permanent hearing loss can be avoided
5 100-110 Several years Permanent deafness
6 110-120 Few months Permanent deafness
7 120 Short term Extreme discomfort
8 140 Short term Discomfort with actual pain
9 150 and above Single exposure Mechanical damage to the ear

Sri Raghavendra Granites Environmental Impact Assessment Report
4-29 Team Labs and Consultants
4.5 Water Environment
The mine lease area is a hill terrain. There are no major surface water bodies within
Mine lease area and the proposed mining activity is away from the drain. It is
proposed to utilize groundwater from nearby villages for domestic purpose and it is
proposed to utilize stored storm water for other mining operations like dust
suppression and etc. The release of effluents may change ground water quality, change
in run off quality, change in ground water and surface water interaction, change in
channel morphology leading to deterioration of production levels of both terrestrial
and aquatic flora and fauna, resulting in higher concentrations of chemicals in food
chain. The impacts due to various activities during the life time of the project including
the emergency scenarios on water environment for both surface water and ground
water is presented in Tables 4.13 and 4.14 respectively. The impact significance is
calculated using RIAM and presented in Tables 4.15 and 4.16 respectively for both
surface and ground water environment respectively. The mitigation measure shall
hence ensure that the impact is of low significance.
The impact assessment indicates that the proposed color granite mining activity in the
cluster will have slightly negative change/impacts on runoff quantity, change in
runoff peak flow, and change in erosion and sedimentation, whereas negative impact
is indicated on quality of surface water.

Sri Raghavendra Granites Environmental Impact Assessment Report
4-30 Team Labs and Consultants
Table 4.13 Impacts on Surface Water
Impact Activity
Change in
runoff quantity
Change in
runoff peak flow
Change in
surface drainage pattern
Change in
Surface water
Quality
Change in surface
and ground water
interaction
Change in channel
morphology
Change in erosion and
sedimentation
Dry and wet
deposition leading to
acidity
Construction Stage
Site clearing, √ √ √ √ √
Road Formation √ √ √ √ √ √ √ √
Site Services √ √ √ √
Production stage
Drilling √ √ √ √ √
Dozing, Loading and Unloading √ √ √ √ √
Transportation √ √
Operation Stage - Incidents and Accidents
Accidents during transport of material
√ √
Extreme Weather phenomenon √ √ √ √ √ √
Mine Closure
Removal, Back filling and sealing √ √ √ √ √ √ √
Removal of structures √ √ √ √ √
Danger due to inadvertent entry
√ Indicates Impact
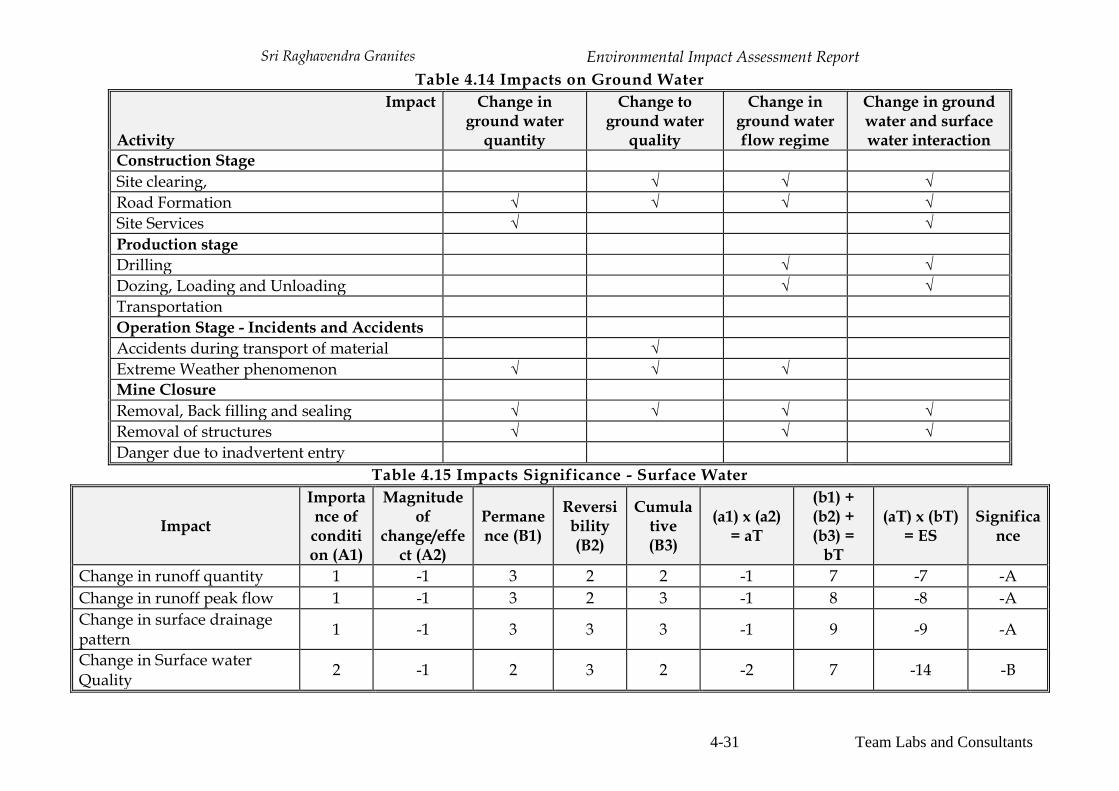
Sri Raghavendra Granites Environmental Impact Assessment Report
4-31 Team Labs and Consultants
Table 4.14 Impacts on Ground Water
Impact Activity
Change in ground water
quantity
Change to ground water
quality
Change in ground water flow regime
Change in ground water and surface water interaction
Construction Stage
Site clearing, √ √ √
Road Formation √ √ √ √
Site Services √ √
Production stage
Drilling √ √
Dozing, Loading and Unloading √ √
Transportation
Operation Stage - Incidents and Accidents
Accidents during transport of material √
Extreme Weather phenomenon √ √ √
Mine Closure
Removal, Back filling and sealing √ √ √ √
Removal of structures √ √ √
Danger due to inadvertent entry
Table 4.15 Impacts Significance - Surface Water
Impact
Importance of condition (A1)
Magnitude of
change/effect (A2)
Permanence (B1)
Reversibility (B2)
Cumulative (B3)
(a1) x (a2) = aT
(b1) + (b2) + (b3) =
bT
(aT) x (bT) = ES
Significance
Change in runoff quantity 1 -1 3 2 2 -1 7 -7 -A
Change in runoff peak flow 1 -1 3 2 3 -1 8 -8 -A
Change in surface drainage pattern
1 -1 3 3 3 -1 9 -9 -A
Change in Surface water Quality
2 -1 2 3 2 -2 7 -14 -B
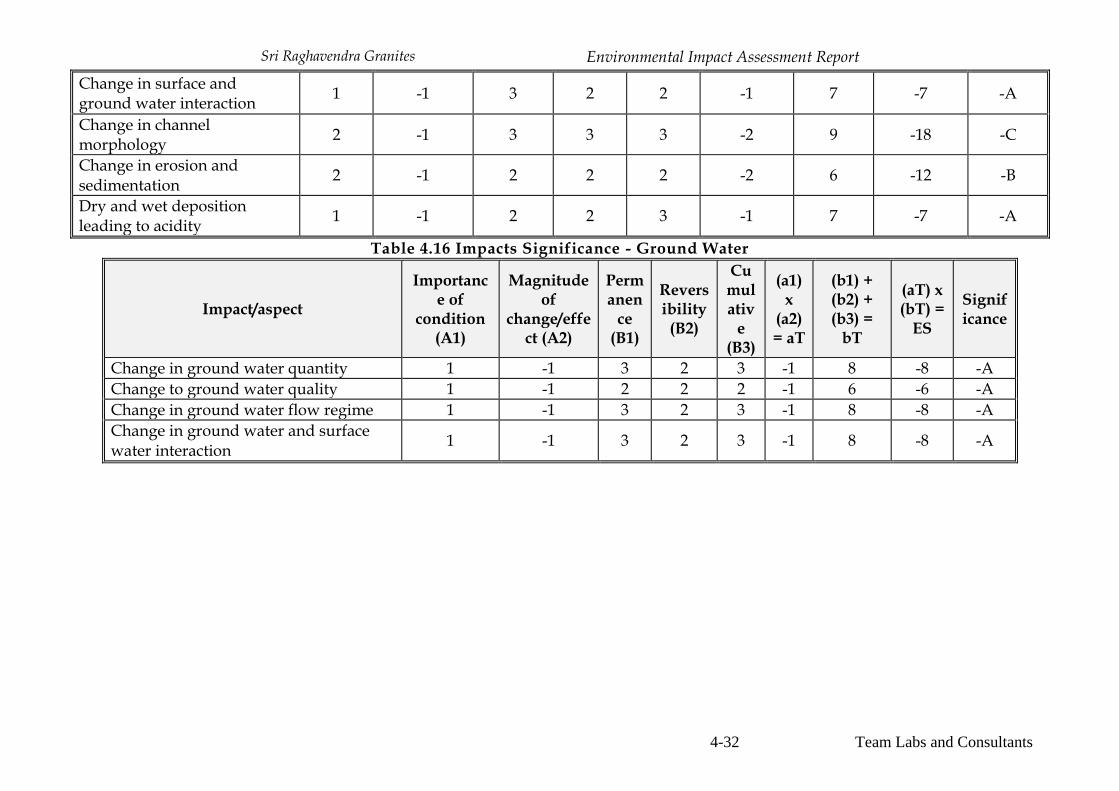
Sri Raghavendra Granites Environmental Impact Assessment Report
4-32 Team Labs and Consultants
Change in surface and ground water interaction
1 -1 3 2 2 -1 7 -7 -A
Change in channel morphology
2 -1 3 3 3 -2 9 -18 -C
Change in erosion and sedimentation
2 -1 2 2 2 -2 6 -12 -B
Dry and wet deposition leading to acidity
1 -1 2 2 3 -1 7 -7 -A
Table 4.16 Impacts Significance - Ground Water
Impact/aspect
Importance of
condition (A1)
Magnitude of
change/effect (A2)
Permanen
ce (B1)
Reversibility (B2)
Cumulativ
e (B3)
(a1) x
(a2) = aT
(b1) + (b2) + (b3) =
bT
(aT) x (bT) =
ES
Significance
Change in ground water quantity 1 -1 3 2 3 -1 8 -8 -A
Change to ground water quality 1 -1 2 2 2 -1 6 -6 -A
Change in ground water flow regime 1 -1 3 2 3 -1 8 -8 -A
Change in ground water and surface water interaction
1 -1 3 2 3 -1 8 -8 -A
Sri Raghavendra Granites Environmental Impact Assessment Report
4-33 Team Labs and Consultants
4.6 Land Environment
The mining cycle in the mine lease area would result in change in land use from
government wasteland to mining. The proposed mining plan involves construction
of site services. There is a major alteration of terrain, as mining activity involves
removal of a hillock. The impact significance is calculated using RIAM. The impacts
due to various activities during the life time of the project including the emergency
scenarios on land environment is presented in Table 4.17. The impact significance
on land environment is presented in Table 4.18.
The impact assessment indicates that the proposed mining activity in the cluster will
have slightly negative change/impacts on soil profile due to its disturbance, change
in erosion, soil bio diversity and ecological integrity: C/N ratio, whereas negative
impact is indicated due to alteration of terrain, Loss of nutrients due to land use
operations, and impact on soil and flora due to wet and dry deposition of pollutants.

Sri Raghavendra Granites Environmental Impact Assessment Report
4-34 Team Labs and Consultants
Table 4.17 Impacts on Land Environment
Impact Activity
Soil profi
le disturban
ce
Erosion
Accidental releases leading to degradation of soil quality
Soil bio diversity
and ecologic
al integrity
: C/N ratio
Alteration of terra
in
Land
capabilit
y effects
Soil compactio
n
Ground
sealing:
change in
water balanc
e
Change in filter function
: permeability
Change in acid buffering function due
to wet and dry deposition:
CEC and base saturation
Loss of emissio
n protecti
on
Factors
Construction Stage
Site clearing, √ √ √ √
Road Formation √ √ √ √ √ √ √ √ √
Site Services construction √ √ √ √ √ √ √ √ √
Production stage
Drilling √ √ √ √ √ √ √
Dozing, Loading and Unloading √ √ √ √ √ √ √
Transportation √ √
Operation Stage - Incidents and Accidents
Accidents during transport of material
√ √
Extreme Weather phenomenon √ √ √
Mine Closure
Removal, Back filling and sealing √ √ √ √ √ √ √ √
Removal of structures √
Danger due to inadvertent entry
√ Indicates Impact
Table 4.18 Impact Significance – Land environment

Sri Raghavendra Granites Environmental Impact Assessment Report
4-35 Team Labs and Consultants
Impact
Importance of
condition (A1)
Magnitude of
change/effect (A2)
Permanence (B1)
Reversibility (B2)
Cumulative (B3)
(a1) x
(a2) = aT
(b1) + (b2) + (b3) =
bT
(aT) x
(bT) = ES
Significance
Soil profile disturbance 1 -3 3 3 2 -3 8 -24 -C
Erosion 1 -1 2 2 3 -1 7 -7 -A
Accidental releases leading to degradation of soil quality
1 -1 2 2 2 -1 6 -6 -A
Soil bio diversity and ecological integrity: C/N ratio
1 -2 3 2 2 -2 7 -14 -B
Alteration of terrain 1 -3 3 2 2 -3 7 -21 -C
Land capability effects 1 -3 3 2 2 -3 7 -21 -C
Soil compaction 1 -1 2 2 2 -1 6 -6 -A
Ground sealing: change in water balance 1 -1 3 2 2 -1 7 -7 -A
Change in filter function: permeability 1 -1 3 2 2 -1 7 -7 -A
Change in acid buffering function due to wet and dry deposition: CEC and base saturation
1 -1
3 2 2 -1 7 -7 -A
Loss of emission protection 1 -1 3 2 2 -1 7 -7 -A
Loss of nutrients due to land use operations 1 -1 3 3 2 -1 7 -7 -A
Sri Raghavendra Granites Environmental Impact Assessment Report
4-36 Team Labs and Consultants
4.7 Biological Environment
The ecological factors that are considered most significant as far as the impact on flora
and fauna concerned are:
1. Whether there shall be any reduction in species diversity?
1. Whether there shall be any habitat loss or fragmentation?
2. Whether there shall be any additional risk or threat to the rare or endangered or
endemic or threatened (REET) species?
3. Whether there shall be any impairment of ecological functions such as
(i) disruption of food chains, decline in species population and or
(ii) Alterations in predator-prey relationships?
4. Whether it is possible to attain the global objectives of ‘no net loss’ of biodiversity?
5. Whether it is possible to improve the biological diversity through the proposed
activity?
There is no direct threat to any rare or endangered or threatened biological species as
indicated by the baseline data, due to the proposed project, as the proposed
construction area has sparse vegetation.
The project is not going to cause any fragmentation of habitat or disruption of food
cycles or destruction of breeding grounds or blockade of migratory routes. The major
impacts of the project are mainly during construction and subsequently on account of
atmospheric pollution. The industry is required to limit its emissions as per the
NAAQ of 2009. It has to strictly adhere to the conditions stipulated by the regulatory
bodies. The project authorities are going to take all steps and measures in order to
strictly comply with National Ambient Air Quality Standards of 2009. The project may
not have impacts on terrestrial flora and fauna. Further, as there are no rare or
endangered or threatened (RET) species within the impact area, the project does not
pose any direct threat to the survival of any rare species. Hence, the proposed project
activity is unlikely to pose any additional threat to REET species in the impact area.
It may be concluded that the impacts are indirect, and positive due to increasing the
density of green belt, and of low significance. The impacts due to various activities
during the life time of the project including the emergency scenarios on flora and
fauna are presented in Tables 4.19 and 4.20 respectively. The impact significance on
Flora and Fauna are presented in Tables 4.21 and 4.22 respectively.

Sri Raghavendra Granites Environmental Impact Assessment Report
4-37 Team Labs and Consultants
The impact assessment indicates that the proposed mining activity in the cluster will
have slightly negative change/impacts on Habitat availability – due to loss or
alteration of habitat, fragmentation of Habitat, and reduced habitat connectivity,
whereas negative impact is indicated due to possible reduction in
abundance/diversity, and impact on soil and flora due to wet and dry deposition of
pollutants.
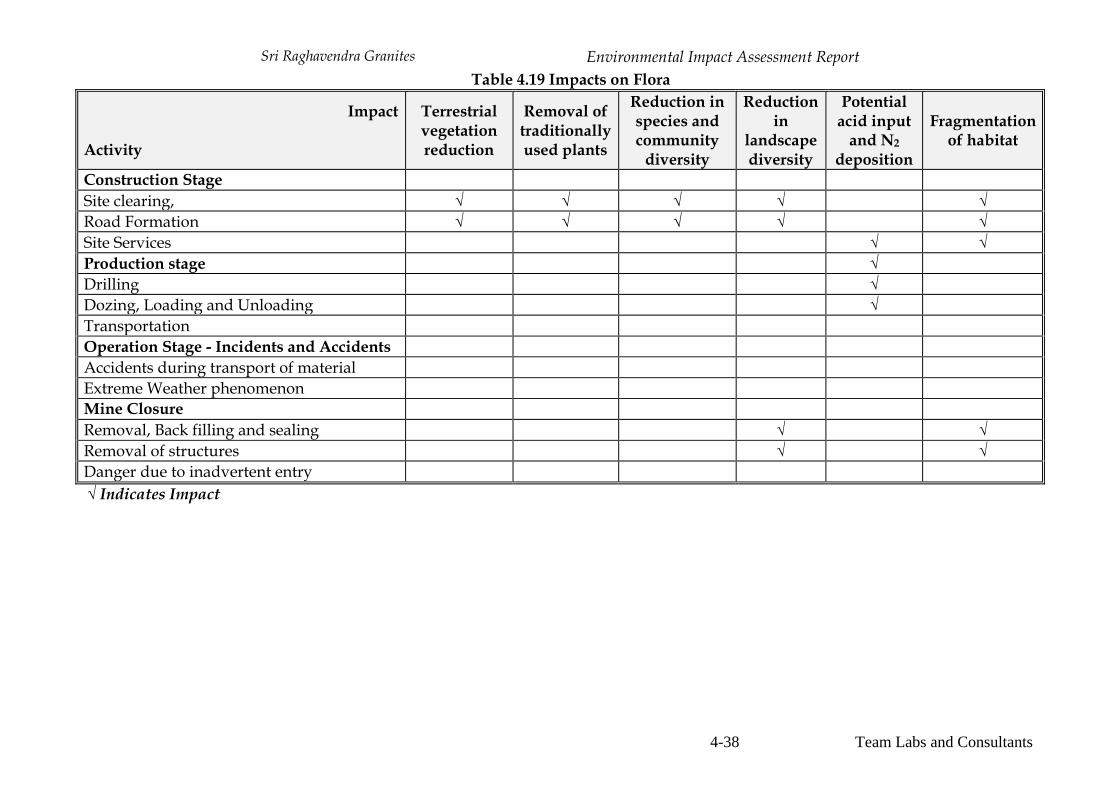
Sri Raghavendra Granites Environmental Impact Assessment Report
4-38 Team Labs and Consultants
Table 4.19 Impacts on Flora
Impact Activity
Terrestrial vegetation reduction
Removal of traditionally used plants
Reduction in species and community
diversity
Reduction in
landscape diversity
Potential acid input
and N2 deposition
Fragmentation of habitat
Construction Stage
Site clearing, √ √ √ √ √
Road Formation √ √ √ √ √
Site Services √ √
Production stage √
Drilling √
Dozing, Loading and Unloading √
Transportation
Operation Stage - Incidents and Accidents
Accidents during transport of material
Extreme Weather phenomenon
Mine Closure
Removal, Back filling and sealing √ √
Removal of structures √ √
Danger due to inadvertent entry
√ Indicates Impact
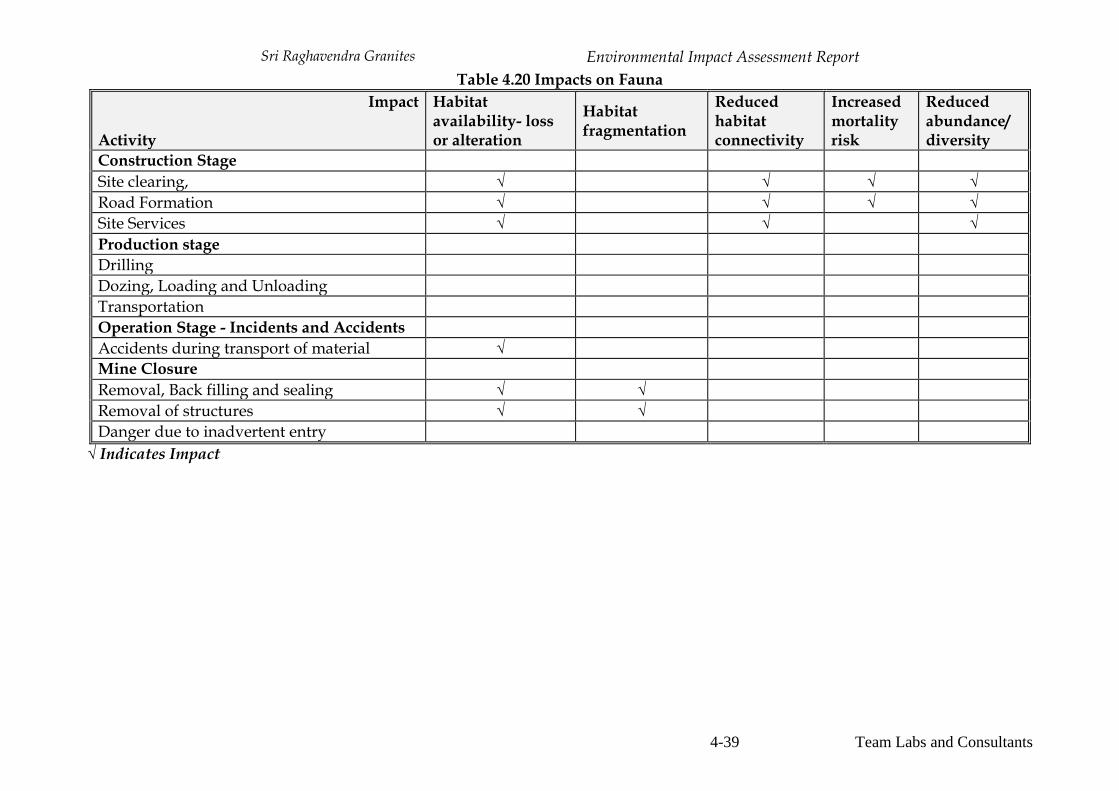
Sri Raghavendra Granites Environmental Impact Assessment Report
4-39 Team Labs and Consultants
Table 4.20 Impacts on Fauna
Impact Activity
Habitat availability- loss or alteration
Habitat fragmentation
Reduced habitat connectivity
Increased mortality risk
Reduced abundance/ diversity
Construction Stage
Site clearing, √ √ √ √
Road Formation √ √ √ √
Site Services √ √ √
Production stage
Drilling
Dozing, Loading and Unloading
Transportation
Operation Stage - Incidents and Accidents
Accidents during transport of material √
Mine Closure
Removal, Back filling and sealing √ √
Removal of structures √ √
Danger due to inadvertent entry
√ Indicates Impact

Sri Raghavendra Granites Environmental Impact Assessment Report
4-40 Team Labs and Consultants
Table 4.21 Impact Significance – Flora
Impact
Imp
ort
an
ce o
f
con
dit
ion
(A
1)
Mag
nit
ud
e o
f
chan
ge/e
ffect
(A
2)
Perm
an
en
ce (
B1)
Rev
ers
ibil
ity
(B2)
Cu
mu
lati
ve (
B3)
(a1)
x (
a2)
= a
T
(b1)
+ (
b2)
+ (
b3)
= b
T
(aT
) x (
bT
) =
ES
Sig
nif
ican
ce
Habitat availability - loss or alteration
1 -1 3 2 3 -1
8 -8 -A
Habitat fragmentation 1 -1 3 2 3 -1 8 -8 -A
Reduced habitat connectivity 1 -1 3 2 2 -1 7 -7 -A
Increased mortality risk 1 -1 3 2 2 -1 7 -7 -A
Reduced abundance/diversity 1 -1 3 2 3 -1 8 -8 -A
Table 4.22 Impact Significance – Fauna
Impact Importance of condition
(A1)
Magnitude of
change/effect (A2)
Permanence (B1)
Reversibility (B2)
Cumulative (B3)
(a1) x
(a2) = aT
(b1) +
(b2) +
(b3) = bT
(aT) x
(bT) = ES
Significance
Habitat availability - loss or alteration
1 -1 3 2 3 -1
8 -8 -A
Habitat fragmentation 1 -1 3 2 3 -1 8 -8 -A
Reduced habitat connectivity
1 -1 3 2 2 -1
7 -7 -A
Increased mortality risk 1 -1 3 2 2 -1 7 -7 -A
Reduced abundance/diversity
1 -1 3 2 3 -1
8 -8 -A
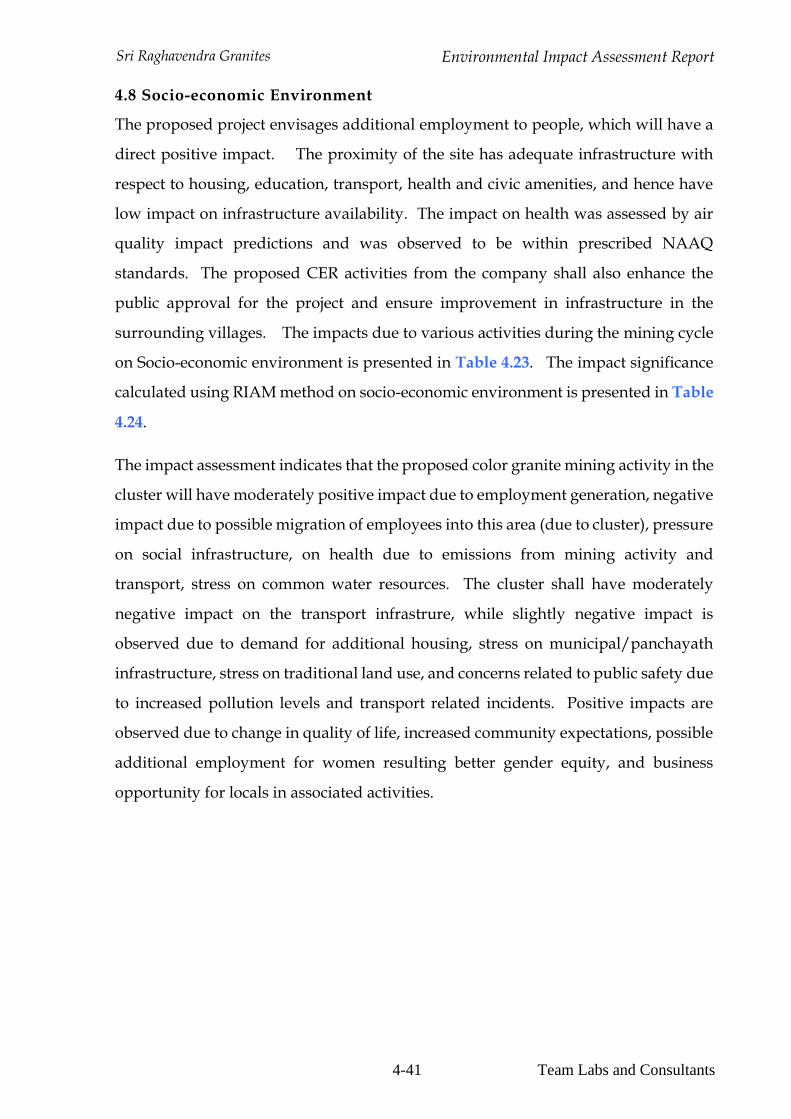
Sri Raghavendra Granites Environmental Impact Assessment Report
4-41 Team Labs and Consultants
4.8 Socio-economic Environment
The proposed project envisages additional employment to people, which will have a
direct positive impact. The proximity of the site has adequate infrastructure with
respect to housing, education, transport, health and civic amenities, and hence have
low impact on infrastructure availability. The impact on health was assessed by air
quality impact predictions and was observed to be within prescribed NAAQ
standards. The proposed CER activities from the company shall also enhance the
public approval for the project and ensure improvement in infrastructure in the
surrounding villages. The impacts due to various activities during the mining cycle
on Socio-economic environment is presented in Table 4.23. The impact significance
calculated using RIAM method on socio-economic environment is presented in Table
4.24.
The impact assessment indicates that the proposed color granite mining activity in the
cluster will have moderately positive impact due to employment generation, negative
impact due to possible migration of employees into this area (due to cluster), pressure
on social infrastructure, on health due to emissions from mining activity and
transport, stress on common water resources. The cluster shall have moderately
negative impact on the transport infrastrure, while slightly negative impact is
observed due to demand for additional housing, stress on municipal/panchayath
infrastructure, stress on traditional land use, and concerns related to public safety due
to increased pollution levels and transport related incidents. Positive impacts are
observed due to change in quality of life, increased community expectations, possible
additional employment for women resulting better gender equity, and business
opportunity for locals in associated activities.
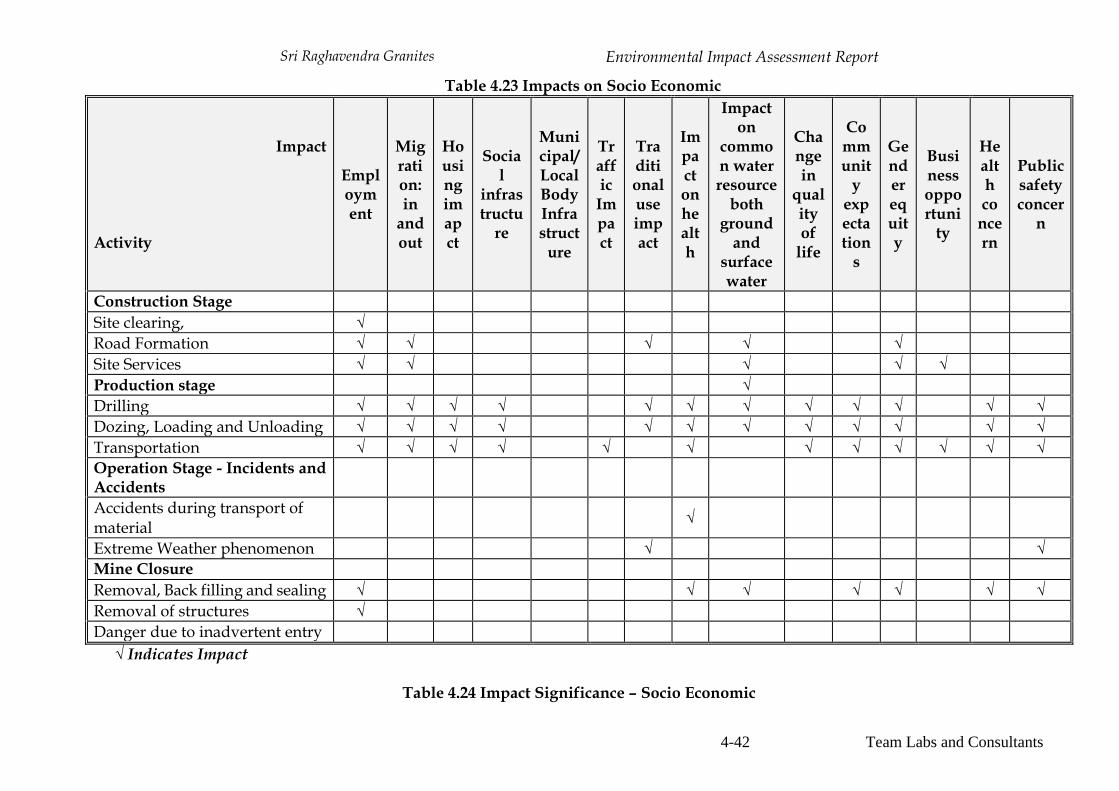
Sri Raghavendra Granites Environmental Impact Assessment Report
4-42 Team Labs and Consultants
Table 4.23 Impacts on Socio Economic
Impact Activity
Employment
Migration: in
and out
Housing imapct
Social
infrastructu
re
Municipal/ Local Body Infrastruct
ure
Traffic Impact
Traditional use impact
Impact on health
Impact on
common water resource
both ground
and surface water
Change in
quality of
life
Communit
y expectation
s
Gender equity
Business opportuni
ty
Health co
ncern
Public safety concer
n
Construction Stage
Site clearing, √
Road Formation √ √ √ √ √
Site Services √ √ √ √ √
Production stage √
Drilling √ √ √ √ √ √ √ √ √ √ √ √
Dozing, Loading and Unloading √ √ √ √ √ √ √ √ √ √ √ √
Transportation √ √ √ √ √ √ √ √ √ √ √ √
Operation Stage - Incidents and Accidents
Accidents during transport of material
√
Extreme Weather phenomenon √ √
Mine Closure
Removal, Back filling and sealing √ √ √ √ √ √ √
Removal of structures √
Danger due to inadvertent entry
√ Indicates Impact
Table 4.24 Impact Significance – Socio Economic
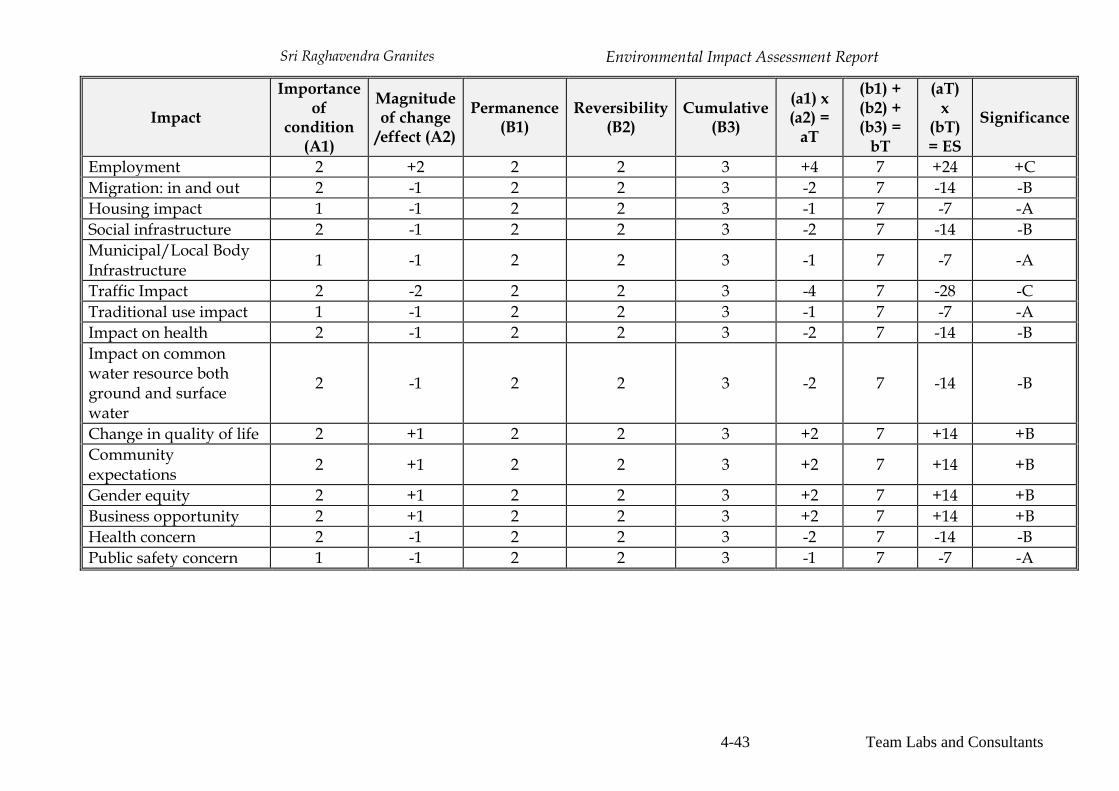
Sri Raghavendra Granites Environmental Impact Assessment Report
4-43 Team Labs and Consultants
Impact
Importance of
condition (A1)
Magnitude of change
/effect (A2)
Permanence (B1)
Reversibility (B2)
Cumulative (B3)
(a1) x (a2) =
aT
(b1) + (b2) + (b3) =
bT
(aT) x
(bT) = ES
Significance
Employment 2 +2 2 2 3 +4 7 +24 +C
Migration: in and out 2 -1 2 2 3 -2 7 -14 -B
Housing impact 1 -1 2 2 3 -1 7 -7 -A
Social infrastructure 2 -1 2 2 3 -2 7 -14 -B
Municipal/Local Body Infrastructure
1 -1 2 2 3 -1 7 -7 -A
Traffic Impact 2 -2 2 2 3 -4 7 -28 -C
Traditional use impact 1 -1 2 2 3 -1 7 -7 -A
Impact on health 2 -1 2 2 3 -2 7 -14 -B
Impact on common water resource both ground and surface water
2 -1 2 2 3 -2 7 -14 -B
Change in quality of life 2 +1 2 2 3 +2 7 +14 +B
Community expectations
2 +1 2 2 3 +2 7 +14 +B
Gender equity 2 +1 2 2 3 +2 7 +14 +B
Business opportunity 2 +1 2 2 3 +2 7 +14 +B
Health concern 2 -1 2 2 3 -2 7 -14 -B
Public safety concern 1 -1 2 2 3 -1 7 -7 -A
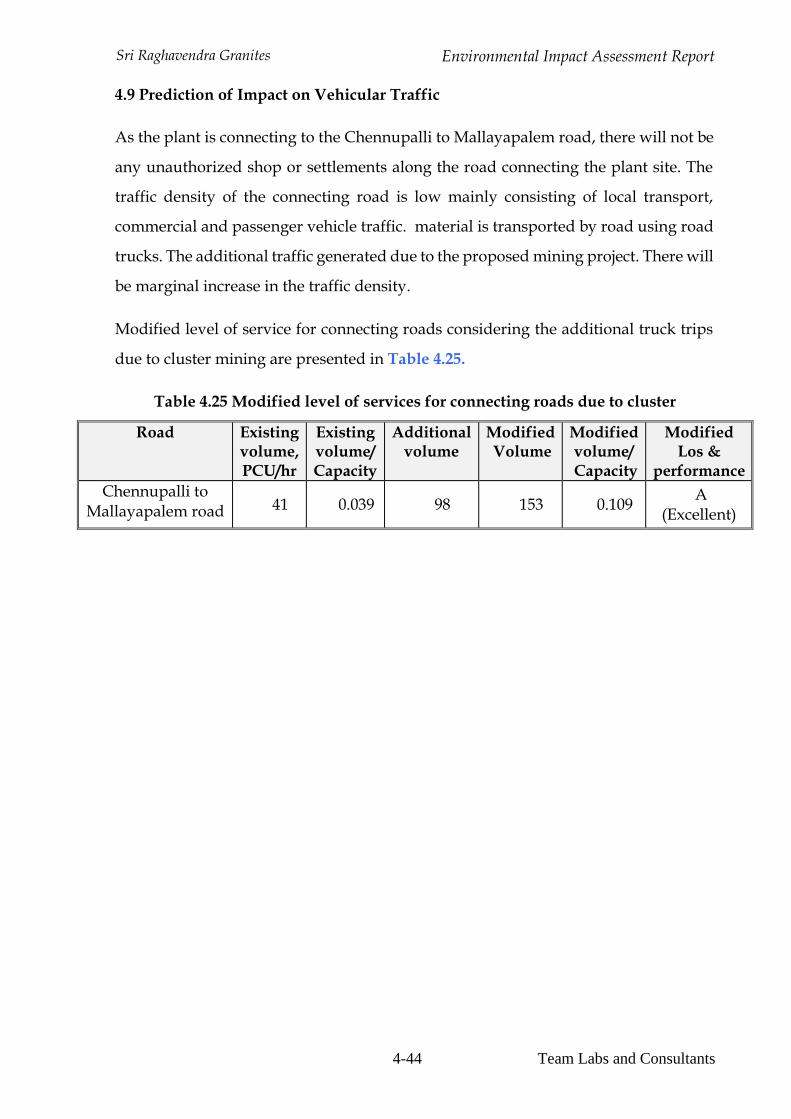
Sri Raghavendra Granites Environmental Impact Assessment Report
4-44 Team Labs and Consultants
4.9 Prediction of Impact on Vehicular Traffic
As the plant is connecting to the Chennupalli to Mallayapalem road, there will not be
any unauthorized shop or settlements along the road connecting the plant site. The
traffic density of the connecting road is low mainly consisting of local transport,
commercial and passenger vehicle traffic. material is transported by road using road
trucks. The additional traffic generated due to the proposed mining project. There will
be marginal increase in the traffic density.
Modified level of service for connecting roads considering the additional truck trips
due to cluster mining are presented in Table 4.25.
Table 4.25 Modified level of services for connecting roads due to cluster
Road Existing volume, PCU/hr
Existing volume/ Capacity
Additional volume
Modified Volume
Modified volume/ Capacity
Modified Los &
performance
Chennupalli to Mallayapalem road 41 0.039 98 153 0.109
A (Excellent)
Sri Raghavendra Granites Environmental Impact Assessment Report
Team Labs and Consultants 5-1
CHAPTER 5.0 ANALYSIS OF ALTERNATIVES
5.0 Introduction
The proposed mining activity is located at Sy. No. 359, Ballikurava Village and
mandal, Prakasam district, Andhra Pradesh in an area of 9.918 ha. Analysis of
alternatives was undertaken to assess sites, process and technology and treatment
options. The mining activity is site specific activity, and the selection of site is
based on availability of mineral. The objective of this assessment is to identify best
available technology not entailing excessive costs, and to reduce pollution loads by
optimizing both raw material and resource consumption.
5.1 Alternative Sites
The availability of colour granite at this site facilitated the mine lease grant from
Government of Andhra Pradesh. The proposed mine lease area is away from any
sensitive locations. The mineral prospecting was done and accordingly a mine plan
was prepared. There are no archaeological, historical, cultural or defence
installation with in 10 km from the mine lease boundary. There is no national park
and wildlife sanctuary/ecologically sensitive areas within 10 km from the mine
lease boundary. The mine lease area is not part of any flood plain.
5.2 Alternatives in Technology
Type of mining is contingent on geological, topographical conditions of the mine
lease area, type of mineral and production capacity envisaged. The present case
has mining with production capacity of 101315.52 m3/annum (Recovery @ 15% -
15197.33 m3/annum and Waste @ 85% - 86118.19 m3/annum). The mining process
was detailed in the mining plan and the same is as follows. The mining cycle
involves removal of top soil, which is a suitable building material known as gravel,
and has high demand for road construction and other building construction.
The process of Colour Granite mining will be opencast semi-mechanized mining
drilling, wire Shaw cutting and without blasting. It involves drilling, excavating
and loaded to trucks with the help of escalator and transported through trucks.

Sri Raghavendra Granites Environmental Impact Assessment Report
Team Labs and Consultants 6-1
CHAPTER 6.0 ENVIRONMENTAL MONITORING PROGRAM
6.1 INTRODUCTION
The environmental monitoring programme provides such information on which
management decision may be taken during mine planning and operation phases. It
provides basis for evaluating the efficiency of mitigation and pollution control
measures and suggest further actions that need to be taken to achieve the desired
effect as part of adaptive management.
The monitoring includes: -
(i) Visual observations;
(ii) Selection of environmental parameters at specific locations;
(iii) Sampling and regular testing of these parameters.
6.1.1 Objectives
The objectives of the environmental monitoring programme are:
• Evaluation of the efficiency of mitigation and pollution control measures;
• Updating of the actions and impacts of baseline data;
• Adoption of additional mitigation measures if the present measures are
insufficient;
• Generating data, which may be incorporated in environmental management plan
in future projects.
6.1.2 Methodology
Monitoring methodology covers the following key aspects:
• Components to be monitored;
• Parameters for monitoring of the above components;
• Monitoring frequency;
• Monitoring standards;
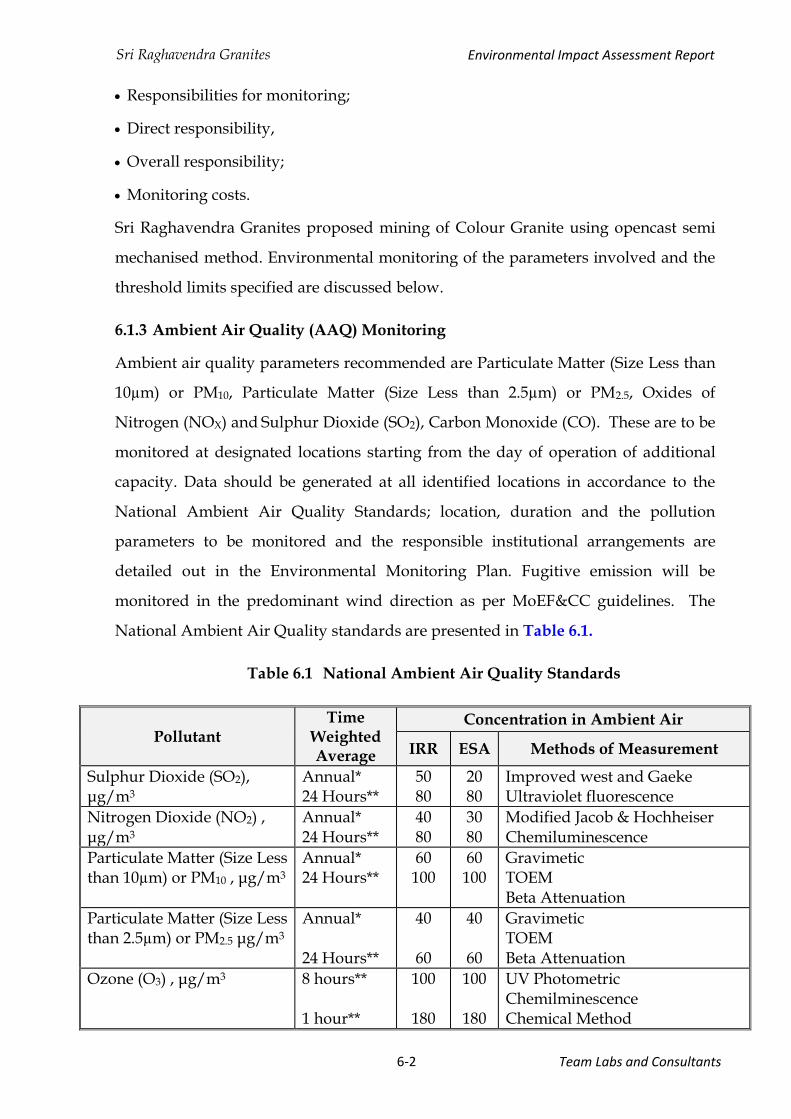
Sri Raghavendra Granites Environmental Impact Assessment Report
Team Labs and Consultants 6-2
• Responsibilities for monitoring;
• Direct responsibility,
• Overall responsibility;
• Monitoring costs.
Sri Raghavendra Granites proposed mining of Colour Granite using opencast semi
mechanised method. Environmental monitoring of the parameters involved and the
threshold limits specified are discussed below.
6.1.3 Ambient Air Quality (AAQ) Monitoring
Ambient air quality parameters recommended are Particulate Matter (Size Less than
10µm) or PM10, Particulate Matter (Size Less than 2.5µm) or PM2.5, Oxides of
Nitrogen (NOX) and Sulphur Dioxide (SO2), Carbon Monoxide (CO). These are to be
monitored at designated locations starting from the day of operation of additional
capacity. Data should be generated at all identified locations in accordance to the
National Ambient Air Quality Standards; location, duration and the pollution
parameters to be monitored and the responsible institutional arrangements are
detailed out in the Environmental Monitoring Plan. Fugitive emission will be
monitored in the predominant wind direction as per MoEF&CC guidelines. The
National Ambient Air Quality standards are presented in Table 6.1.
Table 6.1 National Ambient Air Quality Standards
Pollutant Time
Weighted Average
Concentration in Ambient Air
IRR ESA Methods of Measurement
Sulphur Dioxide (SO2), μg/m3
Annual* 24 Hours**
50 80
20 80
Improved west and Gaeke Ultraviolet fluorescence
Nitrogen Dioxide (NO2) , μg/m3
Annual* 24 Hours**
40 80
30 80
Modified Jacob & Hochheiser Chemiluminescence
Particulate Matter (Size Less than 10µm) or PM10 , μg/m3
Annual* 24 Hours**
60 100
60 100
Gravimetic TOEM Beta Attenuation
Particulate Matter (Size Less than 2.5µm) or PM2.5 μg/m3
Annual* 24 Hours**
40
60
40
60
Gravimetic TOEM Beta Attenuation
Ozone (O3) , μg/m3 8 hours** 1 hour**
100
180
100
180
UV Photometric Chemilminescence Chemical Method

Sri Raghavendra Granites Environmental Impact Assessment Report
Team Labs and Consultants 6-3
Pollutant Time
Weighted Average
Concentration in Ambient Air
IRR ESA Methods of Measurement
Lead (Pb) , μg/m3 Annual* 24 hours**
0.50
1.0
0.50
1.0
AAS after sampling on EPM 2000 or equivalent filter paper ED - XRF using Teflon filter.
Carbon Monoxide (CO) , mg/m3
8 hours** 1 hour**
02 04
02 04
Non Dispersive Infra Red (NDIR) Spectroscopy
Ammonia (NH3), μg/m3 Annual* 24 hours**
100 400
100 400
Chemilminescence Indophenol blue method
Benzene (C6H6), μg/m3 Annual* 05 05
Gas Chromotography based continuous analyzer Absorption and Desorption followed by GC analysis
Benzo (o) Pyrene (BaP) – Particulate Phase only, ng/m3
Annual* 01 01 Solvent extraction followed by HPLC/GC analysis
Arsenic (As), ng/m3 Annual* 06 06 AAS/ICP method after sampling on EPM 2000 or equivalent filter paper
Nickel (Ni), ng/m3 Annual* 20 20
IRR, Industrial, Residential, Rural and ESA-Ecological Sensitive Area.
G.S.No.826 (E) dated 16th November, 2009. Vide letter no. F. No. Q-15017/43/2007-CPW *Annual Arithmetic mean of minimum 104 measurements in a year at a particular site taken twice a week 24 hourly at uniform interval. **24 hourly/8/1 hourly monitored values as applicable, shall be complied with 98 percent of the time in a year.2% of time they may be exceeded the limits but not on two consecutive days of monitoring.
6.1.4 Water Quality Monitoring
The physical and chemical parameters recommended for analysis of water quality
relevant are pH, total solids, total dissolved solids, total suspended solids, oil and
grease, COD. The location, duration and the pollution parameters to be monitored
and the responsible institutional arrangements are detailed in the Environmental
Monitoring Plan. The monitoring of the water quality is to be carried out at all
identified locations in accordance to the Indian Standard Drinking Water
Specification – IS 10500:2012 presented in Table 6.2.
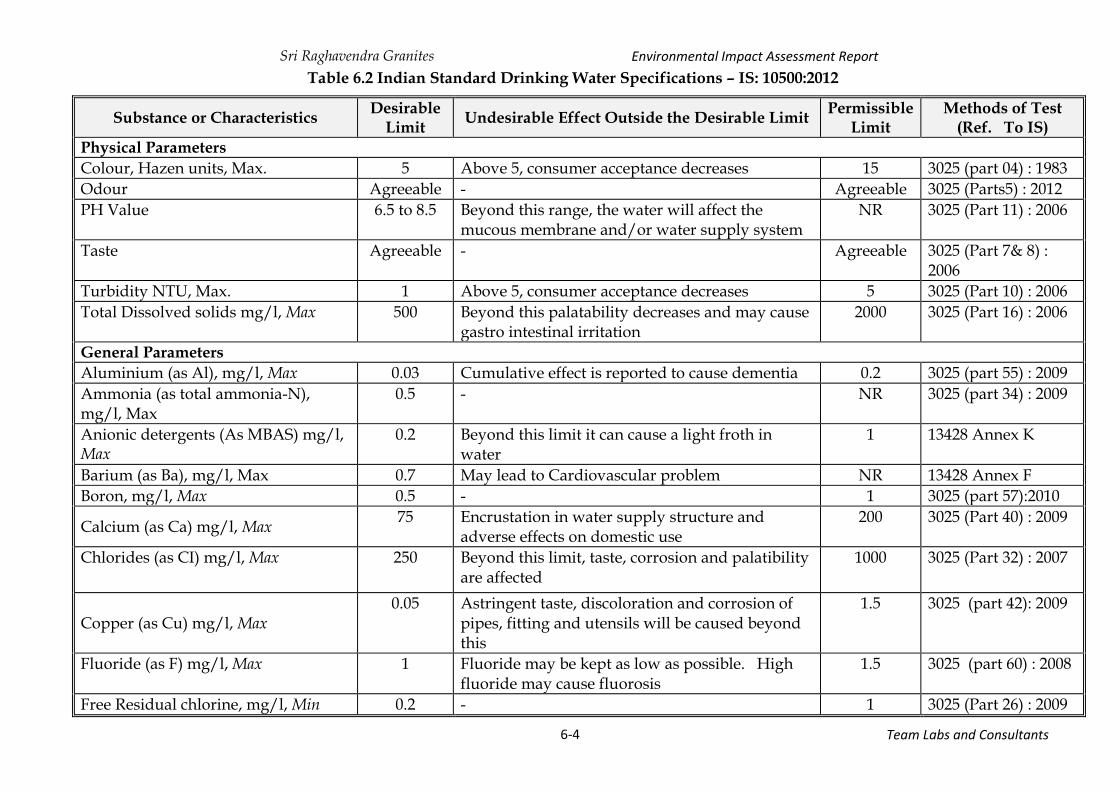
Sri Raghavendra Granites Environmental Impact Assessment Report
Team Labs and Consultants 6-4
Table 6.2 Indian Standard Drinking Water Specifications – IS: 10500:2012
Substance or Characteristics Desirable
Limit Undesirable Effect Outside the Desirable Limit
Permissible Limit
Methods of Test (Ref. To IS)
Physical Parameters
Colour, Hazen units, Max. 5 Above 5, consumer acceptance decreases 15 3025 (part 04) : 1983
Odour Agreeable - Agreeable 3025 (Parts5) : 2012
PH Value 6.5 to 8.5 Beyond this range, the water will affect the mucous membrane and/or water supply system
NR 3025 (Part 11) : 2006
Taste Agreeable - Agreeable 3025 (Part 7& 8) : 2006
Turbidity NTU, Max. 1 Above 5, consumer acceptance decreases 5 3025 (Part 10) : 2006
Total Dissolved solids mg/l, Max 500 Beyond this palatability decreases and may cause gastro intestinal irritation
2000 3025 (Part 16) : 2006
General Parameters
Aluminium (as Al), mg/l, Max 0.03 Cumulative effect is reported to cause dementia 0.2 3025 (part 55) : 2009
Ammonia (as total ammonia-N), mg/l, Max
0.5 - NR 3025 (part 34) : 2009
Anionic detergents (As MBAS) mg/l, Max
0.2 Beyond this limit it can cause a light froth in water
1 13428 Annex K
Barium (as Ba), mg/l, Max 0.7 May lead to Cardiovascular problem NR 13428 Annex F
Boron, mg/l, Max 0.5 - 1 3025 (part 57):2010
Calcium (as Ca) mg/l, Max 75 Encrustation in water supply structure and
adverse effects on domestic use 200 3025 (Part 40) : 2009
Chlorides (as CI) mg/l, Max 250 Beyond this limit, taste, corrosion and palatibility are affected
1000 3025 (Part 32) : 2007
Copper (as Cu) mg/l, Max 0.05 Astringent taste, discoloration and corrosion of
pipes, fitting and utensils will be caused beyond this
1.5 3025 (part 42): 2009
Fluoride (as F) mg/l, Max 1 Fluoride may be kept as low as possible. High fluoride may cause fluorosis
1.5 3025 (part 60) : 2008
Free Residual chlorine, mg/l, Min 0.2 - 1 3025 (Part 26) : 2009
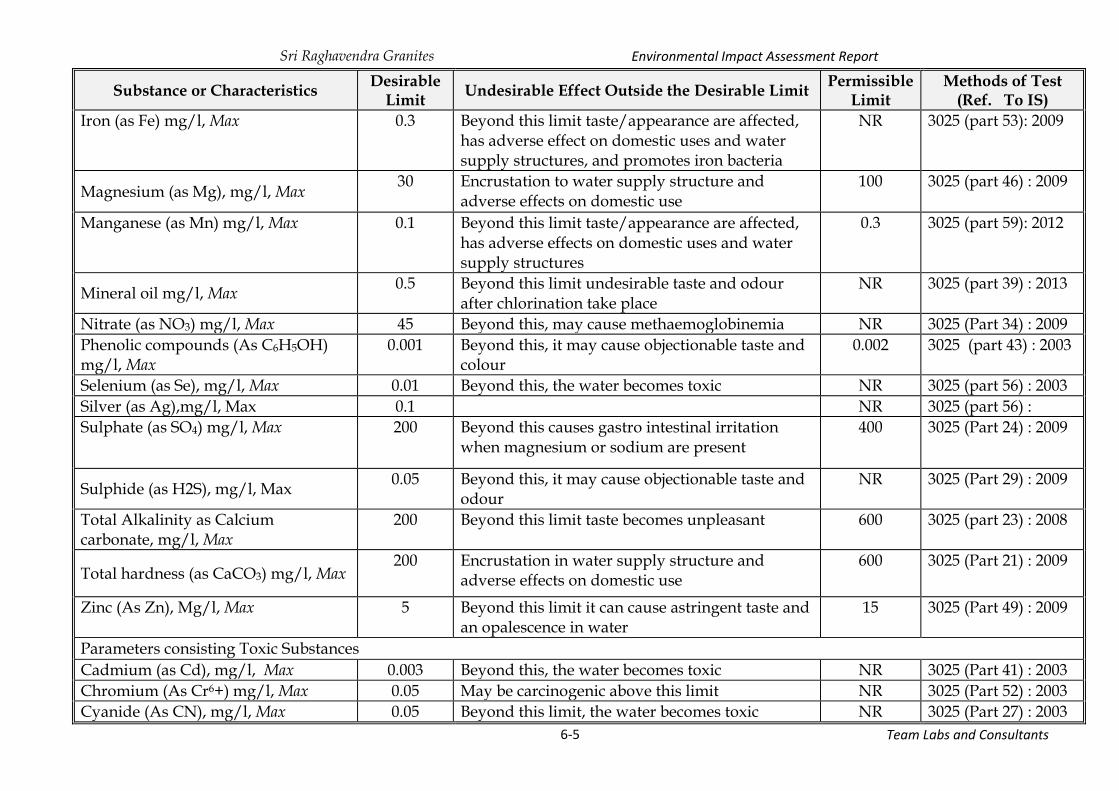
Sri Raghavendra Granites Environmental Impact Assessment Report
Team Labs and Consultants 6-5
Substance or Characteristics Desirable
Limit Undesirable Effect Outside the Desirable Limit
Permissible Limit
Methods of Test (Ref. To IS)
Iron (as Fe) mg/l, Max 0.3 Beyond this limit taste/appearance are affected, has adverse effect on domestic uses and water supply structures, and promotes iron bacteria
NR 3025 (part 53): 2009
Magnesium (as Mg), mg/l, Max 30 Encrustation to water supply structure and
adverse effects on domestic use 100 3025 (part 46) : 2009
Manganese (as Mn) mg/l, Max 0.1 Beyond this limit taste/appearance are affected, has adverse effects on domestic uses and water supply structures
0.3 3025 (part 59): 2012
Mineral oil mg/l, Max 0.5 Beyond this limit undesirable taste and odour
after chlorination take place NR 3025 (part 39) : 2013
Nitrate (as NO3) mg/l, Max 45 Beyond this, may cause methaemoglobinemia NR 3025 (Part 34) : 2009
Phenolic compounds (As C6H5OH) mg/l, Max
0.001 Beyond this, it may cause objectionable taste and colour
0.002 3025 (part 43) : 2003
Selenium (as Se), mg/l, Max 0.01 Beyond this, the water becomes toxic NR 3025 (part 56) : 2003
Silver (as Ag),mg/l, Max 0.1 NR 3025 (part 56) :
Sulphate (as SO4) mg/l, Max 200 Beyond this causes gastro intestinal irritation when magnesium or sodium are present
400 3025 (Part 24) : 2009
Sulphide (as H2S), mg/l, Max 0.05 Beyond this, it may cause objectionable taste and
odour NR 3025 (Part 29) : 2009
Total Alkalinity as Calcium carbonate, mg/l, Max
200 Beyond this limit taste becomes unpleasant 600 3025 (part 23) : 2008
Total hardness (as CaCO3) mg/l, Max 200 Encrustation in water supply structure and
adverse effects on domestic use 600 3025 (Part 21) : 2009
Zinc (As Zn), Mg/l, Max 5 Beyond this limit it can cause astringent taste and an opalescence in water
15 3025 (Part 49) : 2009
Parameters consisting Toxic Substances
Cadmium (as Cd), mg/l, Max 0.003 Beyond this, the water becomes toxic NR 3025 (Part 41) : 2003
Chromium (As Cr6+) mg/l, Max 0.05 May be carcinogenic above this limit NR 3025 (Part 52) : 2003
Cyanide (As CN), mg/l, Max 0.05 Beyond this limit, the water becomes toxic NR 3025 (Part 27) : 2003
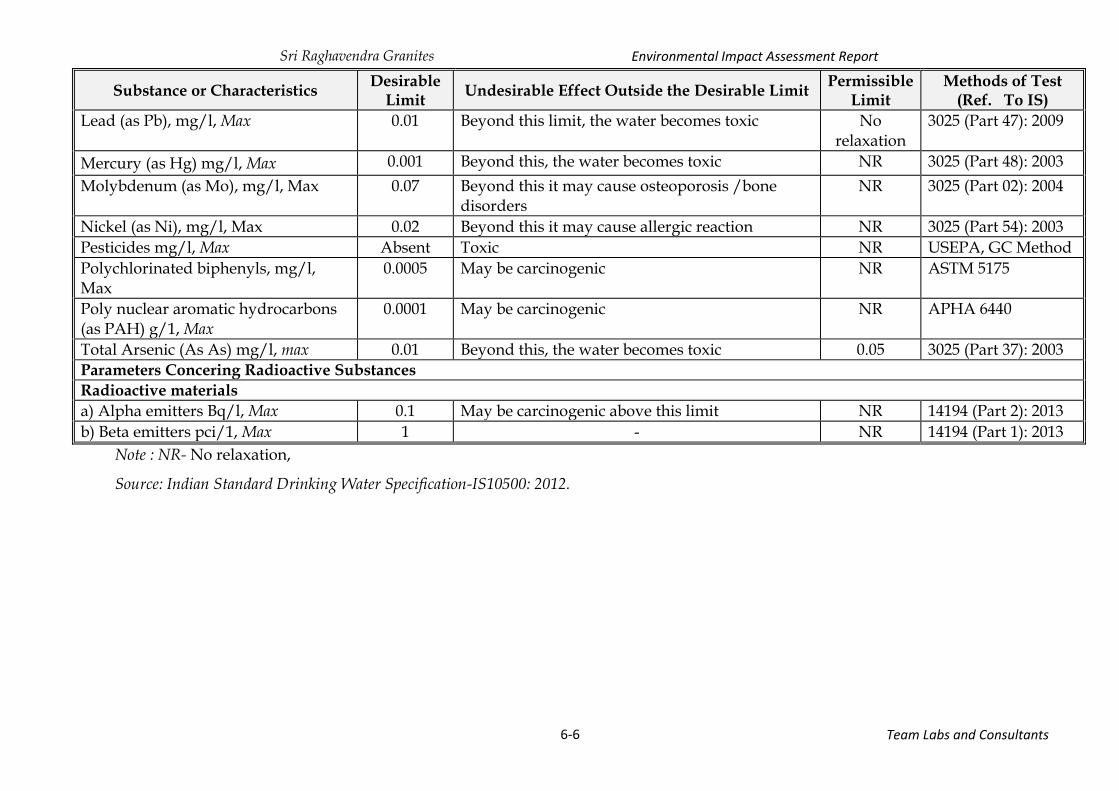
Sri Raghavendra Granites Environmental Impact Assessment Report
Team Labs and Consultants 6-6
Substance or Characteristics Desirable
Limit Undesirable Effect Outside the Desirable Limit
Permissible Limit
Methods of Test (Ref. To IS)
Lead (as Pb), mg/l, Max 0.01 Beyond this limit, the water becomes toxic No relaxation
3025 (Part 47): 2009
Mercury (as Hg) mg/l, Max 0.001 Beyond this, the water becomes toxic NR 3025 (Part 48): 2003
Molybdenum (as Mo), mg/l, Max 0.07 Beyond this it may cause osteoporosis /bone disorders
NR 3025 (Part 02): 2004
Nickel (as Ni), mg/l, Max 0.02 Beyond this it may cause allergic reaction NR 3025 (Part 54): 2003
Pesticides mg/l, Max Absent Toxic NR USEPA, GC Method
Polychlorinated biphenyls, mg/l, Max
0.0005 May be carcinogenic NR ASTM 5175
Poly nuclear aromatic hydrocarbons (as PAH) g/1, Max
0.0001 May be carcinogenic NR APHA 6440
Total Arsenic (As As) mg/l, max 0.01 Beyond this, the water becomes toxic 0.05 3025 (Part 37): 2003
Parameters Concering Radioactive Substances
Radioactive materials
a) Alpha emitters Bq/l, Max 0.1 May be carcinogenic above this limit NR 14194 (Part 2): 2013
b) Beta emitters pci/1, Max 1 - NR 14194 (Part 1): 2013
Note : NR- No relaxation,
Source: Indian Standard Drinking Water Specification-IS10500: 2012.

Sri Raghavendra Granites Environmental Impact Assessment Report
Team Labs and Consultants 6-7
6.1.5 Noise Level Monitoring
The measurements for monitoring noise levels would be carried out at all designated
locations in accordance to the Ambient Noise Standards formulated by Central
Pollution Control Board (CPCB) in 1989 are presented in Table 6.3. Sound pressure
levels would be monitored on twenty-four-hour basis. Noise should be recorded at
an “A” weighted frequency using a “slow time response mode” of the measuring
instrument. The location, duration and the noise pollution parameters to be
monitored and the responsible institutional arrangements are detailed in the
Environmental Monitoring Plan.
Table 6.3 Noise level standards (CPCB)
Type Noise level for Day Time
Leq dB (A) Noise level for Night Time dB (A)
Industrial area 75 70 Commercial area 65 55
Residential area 55 45
Silence zone 50 40
Day time - 6.00 am - 10.00 pm (16 hours), Night time - 10.00 pm - 6.00 am (8 hours)
The monitoring plan along with the environmental parameters and the time frame is
presented in the Table 6.4.
Table 6.4 Environmental Monitoring Plan
Particulars Monitoring Frequency
Standards Duration of Sampling
Important monitoring parameters
Ambient Air Quality Monitoring
At 3 Locations Site office, Chennupalli and Mallayapalem villages
Quarterly Air (Prevention and Control of Pollu-tion) Rules, CPCB, 1994
24 hrs PM10, PM2.5, SO2, NOx
Fugitive Dust Monitoring-4 Areas (Mine face, haul road, Mineral storage, loading)
Quarterly 8 hr SPM, SO2, Nox
Water Quality Monitoring
At 4 locations Working Pit, Chennupalli,
Quarterly IS: 10500 pH, TSS, TH, TDS & metals

Sri Raghavendra Granites Environmental Impact Assessment Report
Team Labs and Consultants 6-8
Particulars Monitoring Frequency
Standards Duration of Sampling
Important monitoring parameters
Kopparapalem and Mallayapalem village
Noise Quality Monitoring
Noise Levels at 3 Locations; Working pit area, Chennupalli and Mallayapalem villages
Quarterly Noise stan-dards by CPCB
8 hrs Equivalent Noise levels in dB (A)
Soil Quality Monitoring
Soil at 3 Locations Mine lease area, Kopparapalem and Mallayapalem villages.
Yearly pH, EC, CEC, Moisture, Texture, Bulk Density etc.
6.1.6 Responsibility of Monitoring and Reporting System
The overall responsibility of monitoring the above parameters lies with the
management. The mine manager shall be responsible for day to day monitoring.
The monitoring shall be conducted by MOEFCC registered laboratory, either in-
house or third party.
Records shall be maintained for the analysis of pit water and effluents, ambient air
quality data and noise levels. These records are not only required for the perusal of
the Pollution Control Board authorities but also to derive at the efficiencies of the
pollution control measures as the objective of the project proponent is not only
compliance with statutory regulations, but also a serious commitment towards clean
environment and sustainable development. The management shall maintain the
records as per the hazardous waste regulations and EPA regulations and apply for
the annual consents for air and water. Reporting system provides the necessary
feedback for project management to ensure quality of the mitigation measures and
that the management plan in implementation. The rationale for a reporting system is
based on accountability to ensure that the measures proposed as part of the
Environmental Management Plan get implemented in the project.

Sri Raghavendra Granites Environmental Impact Assessment Report
Team Labs and Consultants 6-9
6.2 Environmental Monitoring Budget
The budget for environmental monitoring for the parameters mentioned in Table 6.4
is calculated on the basis of CPCB notification of charges for environmental
monitoring and analysis. The cost estimate for environmental monitoring is
presented in Table 6.5.
Table 6.5 Environmental Monitoring Budget - Sri Raghavendra Granites
Component Item Unit Unit Cost,
Rs. Total Cost /
Year, Rs
Air Ambient Air Quality – 3 locations specified in monitoring plan
Quarterly 6000 72000
Fugitive dust – 4 locations specified in monitoring plan
Quarterly 2000 32000
Water quality 4 locations specified in monitoring plan
Quarterly 2000 32000
Noise 3 locations specified in monitoring plan
Quarterly 1200 14400
Soil 3 locations specified in monitoring plan
yearly 1800 5400
Total 155800
Table 6.6 Environmental Monitoring Budget – Cluster
Component Item Unit Unit Cost,
Rs. Total Cost /
Year, Rs.
Air Ambient Air Quality – 5 locations Quarterly 5000 100000
Fugitive dust – 6 locations Quarterly 2000 48000
Water quality 4 locations Once in 6 months
2000 16000
Noise 6 locations Quarterly 1200 28800
Soil 6 locations yearly 1800 10800
Total 203600
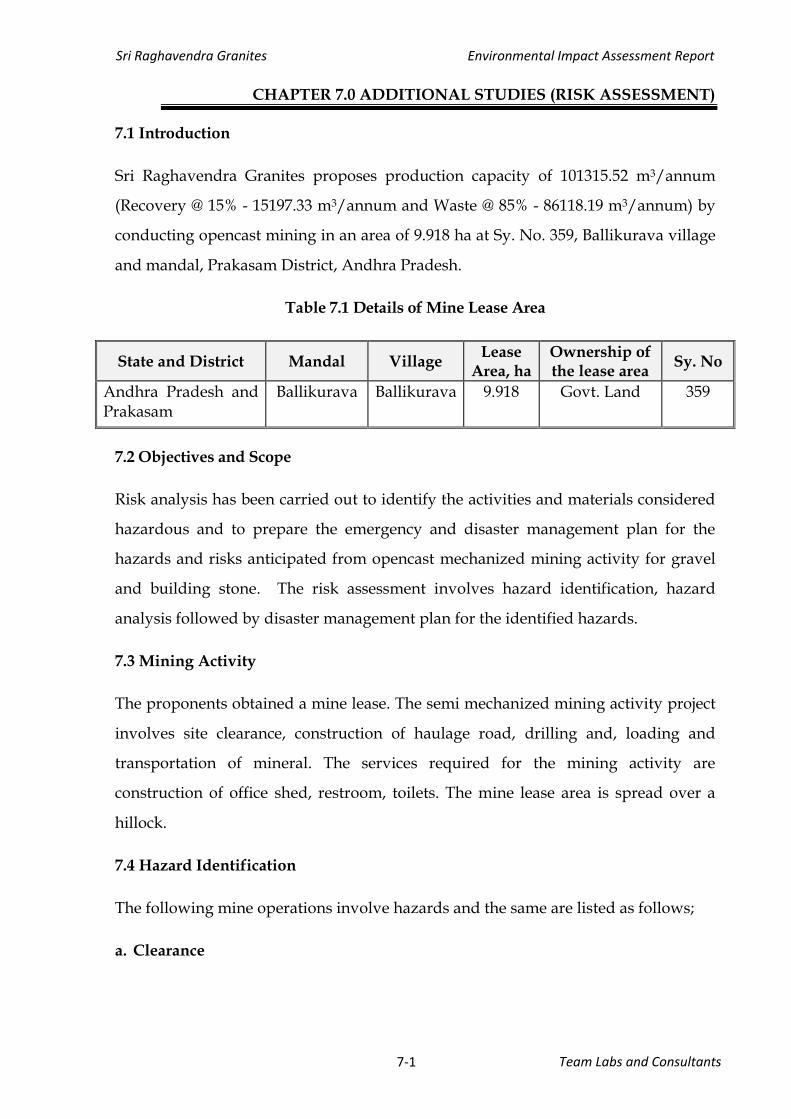
Sri Raghavendra Granites Environmental Impact Assessment Report
Team Labs and Consultants 7-1
CHAPTER 7.0 ADDITIONAL STUDIES (RISK ASSESSMENT)
7.1 Introduction
Sri Raghavendra Granites proposes production capacity of 101315.52 m3/annum
(Recovery @ 15% - 15197.33 m3/annum and Waste @ 85% - 86118.19 m3/annum) by
conducting opencast mining in an area of 9.918 ha at Sy. No. 359, Ballikurava village
and mandal, Prakasam District, Andhra Pradesh.
Table 7.1 Details of Mine Lease Area
State and District Mandal Village Lease
Area, ha Ownership of the lease area
Sy. No
Andhra Pradesh and Prakasam
Ballikurava Ballikurava 9.918 Govt. Land 359
7.2 Objectives and Scope
Risk analysis has been carried out to identify the activities and materials considered
hazardous and to prepare the emergency and disaster management plan for the
hazards and risks anticipated from opencast mechanized mining activity for gravel
and building stone. The risk assessment involves hazard identification, hazard
analysis followed by disaster management plan for the identified hazards.
7.3 Mining Activity
The proponents obtained a mine lease. The semi mechanized mining activity project
involves site clearance, construction of haulage road, drilling and, loading and
transportation of mineral. The services required for the mining activity are
construction of office shed, restroom, toilets. The mine lease area is spread over a
hillock.
7.4 Hazard Identification
The following mine operations involve hazards and the same are listed as follows;
a. Clearance

Sri Raghavendra Granites Environmental Impact Assessment Report
Team Labs and Consultants 7-2
Clearance covers all the activities associated with preparing a site ready for laying
out primary roads for working a face.
It may include tree clearance, and removal of the top layers of earth. In the present
case the mining activity is on a hill top with low vegetation and very less top soil
removal. The primary hazards are being struck by falling trees use of power saws,
and dozers used in the removal of the top layers of soil and plants and dozer usage
to convey it to storage areas.
b. construction of services
The hazards prevalent during the construction of new roads and buildings are falls,
while working at heights and individuals being struck by moving vehicles. One of
the hazards to be assessed is earth moving vehicles such as bulldozers being driven
off the edge of roadways under construction. While all persons working at civil and
construction works are at high risk those working at height or working with cranes,
large earth moving plant will be at greater risk than those persons concerned with
surveying, setting out and conveying supplies to the primary workers or those
working at ground level. If suitable equipment is not used, for example if poor and
badly constructed scaffolding is used there is a much higher probability of persons
falling from heights or the scaffolding collapsing than if good properly constructed
scaffolding is used.
c. Drilling
The main hazards associated with drilling are; falls from the edge of a bench, dust
created during drilling operations, noise and entrapment in or being struck by a
moving part of drilling equipment. The proposed mining activity requires drilling
of 6 holes in a day.
The primary hazard of a driller falling over the edge of a working or abandoned
bench while the risk of minerals or materials falling onto workers at the foot of the
face is a secondary hazard. While others may need to work at or near the edge of a
working bench the person most at risk during the drilling operation is the driller.
However, anyone working within say three meters of the edge would be liable to fall
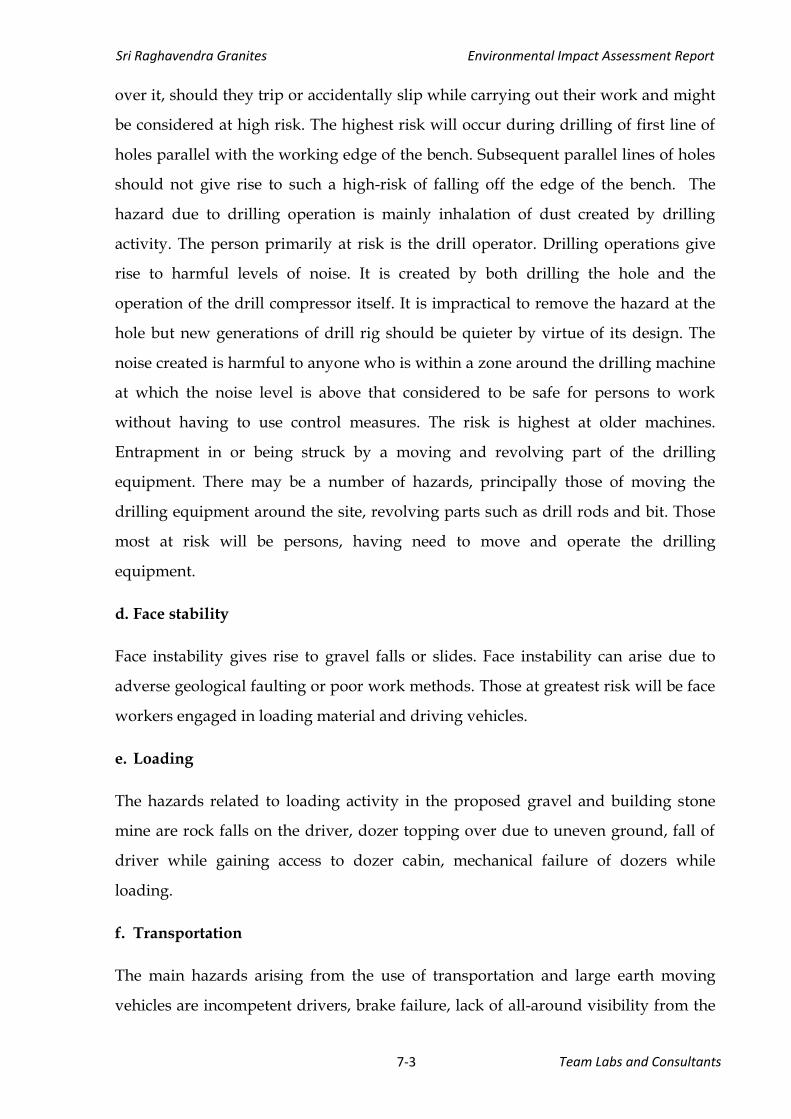
Sri Raghavendra Granites Environmental Impact Assessment Report
Team Labs and Consultants 7-3
over it, should they trip or accidentally slip while carrying out their work and might
be considered at high risk. The highest risk will occur during drilling of first line of
holes parallel with the working edge of the bench. Subsequent parallel lines of holes
should not give rise to such a high-risk of falling off the edge of the bench. The
hazard due to drilling operation is mainly inhalation of dust created by drilling
activity. The person primarily at risk is the drill operator. Drilling operations give
rise to harmful levels of noise. It is created by both drilling the hole and the
operation of the drill compressor itself. It is impractical to remove the hazard at the
hole but new generations of drill rig should be quieter by virtue of its design. The
noise created is harmful to anyone who is within a zone around the drilling machine
at which the noise level is above that considered to be safe for persons to work
without having to use control measures. The risk is highest at older machines.
Entrapment in or being struck by a moving and revolving part of the drilling
equipment. There may be a number of hazards, principally those of moving the
drilling equipment around the site, revolving parts such as drill rods and bit. Those
most at risk will be persons, having need to move and operate the drilling
equipment.
d. Face stability
Face instability gives rise to gravel falls or slides. Face instability can arise due to
adverse geological faulting or poor work methods. Those at greatest risk will be face
workers engaged in loading material and driving vehicles.
e. Loading
The hazards related to loading activity in the proposed gravel and building stone
mine are rock falls on the driver, dozer topping over due to uneven ground, fall of
driver while gaining access to dozer cabin, mechanical failure of dozers while
loading.
f. Transportation
The main hazards arising from the use of transportation and large earth moving
vehicles are incompetent drivers, brake failure, lack of all-around visibility from the
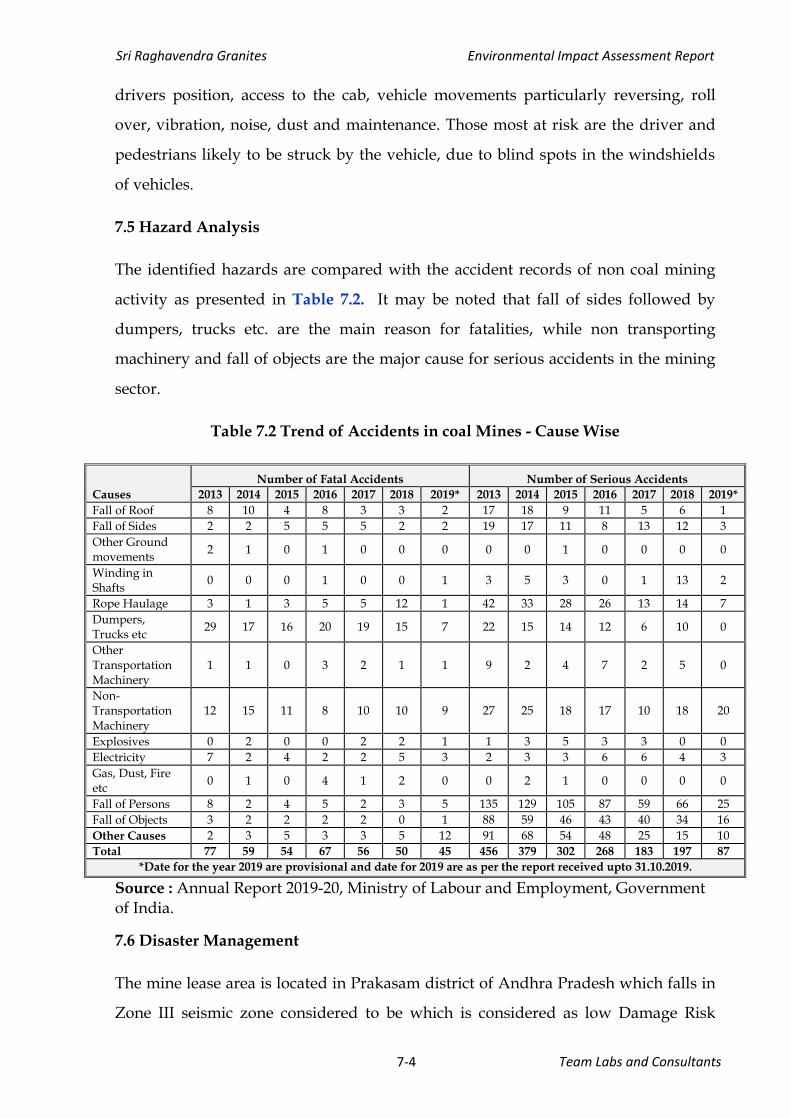
Sri Raghavendra Granites Environmental Impact Assessment Report
Team Labs and Consultants 7-4
drivers position, access to the cab, vehicle movements particularly reversing, roll
over, vibration, noise, dust and maintenance. Those most at risk are the driver and
pedestrians likely to be struck by the vehicle, due to blind spots in the windshields
of vehicles.
7.5 Hazard Analysis
The identified hazards are compared with the accident records of non coal mining
activity as presented in Table 7.2. It may be noted that fall of sides followed by
dumpers, trucks etc. are the main reason for fatalities, while non transporting
machinery and fall of objects are the major cause for serious accidents in the mining
sector.
Table 7.2 Trend of Accidents in coal Mines - Cause Wise
Causes
Number of Fatal Accidents Number of Serious Accidents
2013 2014 2015 2016 2017 2018 2019* 2013 2014 2015 2016 2017 2018 2019*
Fall of Roof 8 10 4 8 3 3 2 17 18 9 11 5 6 1
Fall of Sides 2 2 5 5 5 2 2 19 17 11 8 13 12 3
Other Ground movements
2 1 0 1 0 0 0 0 0 1 0 0 0 0
Winding in Shafts
0 0 0 1 0 0 1 3 5 3 0 1 13 2
Rope Haulage 3 1 3 5 5 12 1 42 33 28 26 13 14 7
Dumpers, Trucks etc
29 17 16 20 19 15 7 22 15 14 12 6 10 0
Other Transportation Machinery
1 1 0 3 2 1 1 9 2 4 7 2 5 0
Non-Transportation Machinery
12 15 11 8 10 10 9 27 25 18 17 10 18 20
Explosives 0 2 0 0 2 2 1 1 3 5 3 3 0 0
Electricity 7 2 4 2 2 5 3 2 3 3 6 6 4 3
Gas, Dust, Fire etc
0 1 0 4 1 2 0 0 2 1 0 0 0 0
Fall of Persons 8 2 4 5 2 3 5 135 129 105 87 59 66 25
Fall of Objects 3 2 2 2 2 0 1 88 59 46 43 40 34 16
Other Causes 2 3 5 3 3 5 12 91 68 54 48 25 15 10
Total 77 59 54 67 56 50 45 456 379 302 268 183 197 87
*Date for the year 2019 are provisional and date for 2019 are as per the report received upto 31.10.2019.
Source : Annual Report 2019-20, Ministry of Labour and Employment, Government of India.
7.6 Disaster Management
The mine lease area is located in Prakasam district of Andhra Pradesh which falls in
Zone III seismic zone considered to be which is considered as low Damage Risk

Sri Raghavendra Granites Environmental Impact Assessment Report
Team Labs and Consultants 7-5
Zone. The mine lease area does not fall under any of the flood plains, and is located
on a hillock. There is no record of flooding at ground level also.
The hazards identified in the preceding paragraphs are addressed and the mitigation
measures for reducing and or avoiding the hazards are presented in the following
paragraphs.
7.6.1 Clearance
There are no major trees in the proposed mine area, and the required activity
involves mainly clearing and grubbing only. It is proposed to use fully protected
power saws in case of their usage, and employees involved in clearing and grubbing
shall be provided with safety helmets, face shields, gloves, and boots.
7.6.2 Construction of Services
The risk of serious injury is high during construction of services, which may be
reduced by planned construction activity incorporating safety measures and
observation during construction. Good well-maintained equipment and machinery
is essential to reduce risk of injuries. Falling from heights which is a major
contributor to accidents in mining sector may be avoided by providing properly
constructed scaffolding, built by experienced persons. The drivers of earth moving
equipment, transporting equipment and their attendants are trained to provide
signals. The lack of training and competence in the use of such equipment is the
biggest cause of failing and accidents involving the use of excavators etc., and the
same shall be reduced by recruiting experienced drivers and also providing them
frequent training.
7.6.3 Drilling
The employees involved in drilling are trained to face towards the open edge of the
bench so any inadvertent backward step is away from the edge. It is advised to
provide suitable portable rail fencing which can be erected between the drilling
operations and the edge of the mine. The hazard of dust inhalation is mitigated by
adopting wet drilling or covering the drill with wet gunny cloth and provision of
face masks and ear muffs to drilling workers, which also reduces noise exposure.
Sri Raghavendra Granites Environmental Impact Assessment Report
Team Labs and Consultants 7-6
7.64 Failure of Pit Slope
Slope failures in mines are mostly associated with circular failure, a result of rock
mechanics, properties such as cohesion, angle of internal friction, joint/shear planes,
ground water flow conditions, rock density and the heights to be maintained. It is
hence proposed to provide benches with a slope angle of 300. Additionally, pit slope
failure is avoided by Regular examination of face and remedial measures to make it
safe if there is any doubt that a collapse may take place. Working is advanced in a
direction taken into account the geology such that face and quarry side remain
stable.
7.6.5 Transportation
Training of drivers in defensive driving incorporating usage of visual aids like rare
view mirrors, avoidance of driving along the edge of haulage road etc. will mitigate
the hazards. Proactive maintenance of vehicles will reduce the chance of brake
failure.
7.6.6 Magazine
The location of magazine away from habitation and also active mine area will
mitigate the hazards related to storage of explosives. Trained and qualified persons
shall be entrusted the responsibility of maintaining and operating the magazine.
7.6.7 House Keeping
The pathways and walkways to the work place will be demarcated with regular
housekeeping to avoid tipping or toppling of men and material. Lack of maintenance
may lead to roadways and walkways being unsuitable for their use.
7.7 Disaster Management Plan (Terms of Reference No. 42)
The mining operation will be carried out under the direction of qualified mines
manager and supervisors, based on the guidelines and directions of Directorate
General of Mines Safety (DGMS) and Indian Bureau of Mines. Code of practice of
different operations will be formulated to ensure safety of men and machines and to
avoid various hazards mentioned above. Mine workers will be provided training on
safe work practices. The following natural/ industrial hazards may occur during
Sri Raghavendra Granites Environmental Impact Assessment Report
Team Labs and Consultants 7-7
normal operation; slope failure at the mine faces; accident due to heavy equipment/
machinery.
In order to take care of above hazards/disasters, the following measures shall be
adopted; all safety precautions and provisions of Mine regulation 1961 are strictly
followed during all mining operations; checking and regular maintenance of garland
drains and earthen bunds to avoid any inflow of surface water into mining area;
entry of unauthorized persons shall be prohibited; fire fighting and first aid
provisions in the mines office and mining Area; provision of all the safety
appliances such as safety boots, helmets, goggles etc. would be made available to the
employees and regular check to ensure their use; training and refresher courses for
all the employees working in the hazardous premises; working of mine as per
approved plan, related amendments and other regulatory provisions; and
suppression of dust on the haulage roads by providing water sprinkling.
7.7.1 Objective of Disaster Management Plan
The objective of disaster management plan is to identify mitigation measures to
avoid hazards turning in to risk, the materials required for implementing the same,
the personnel requirement and their roles and responsibilities, and the
communication and operating procedures to be adopted in case of an emergency.
7.7.2 Communication System
The telephone numbers and addresses of mine sites in the vicinity, nearest fire
station, police station, local hospital, electricity department, ambulance, and local
public representatives and revenue officials shall be prepared and kept in custody of
mines manager.
7.7.3 Facilities
The office shed will have provision of a small rescue room and first aid centre to
provide first aid in the event of an emergency. The office shed will also function as
emergency control room. It will be provided with telephone and mobile phones,
and a vehicle for emergency transport.
Sri Raghavendra Granites Environmental Impact Assessment Report
Team Labs and Consultants 7-8
7.7.4 Personnel
The mines manager is responsible for overall supervision of the disaster
management plan. He will be assisted by supervisors, magazine in charge in
implementing the emergency management plan and procedures.
7.7.5 Operating Procedures
The operating procedures during emergencies are related communication to the
immediate supervisor, who would relay the same to mine manager. The mine
manager may assess the requirement of first aid, external assistance, transportation
to nearby hospital contingent on the emergency. In the absence of mines manager
the senior most supervisor will be made responsible for disaster management.
Sri Raghavendra Granites Environmental Impact Assessment Report
Team Labs and Consultants 8-1
CHPATER 8.0 PROJECT BENEFITS
8.1 Introduction (Terms of Reference No. 43)
Sri Raghavendra Granites proposed to conduct open cast mining at Sy. No. 359,
Ballikurava Village and mandal, Prakasam district, Andhra Pradesh. The proposed
mining activity involves a capital expenditure of Rs. 80 lakhs contributing to the local
economy due to consumption of building construction materials from the surrounding
areas and usage of construction labour from surrounding villages has a significant
positive impact on the socio-economic environment of the area.
The project shall ensure availability of colour granite for monuments, Flooring, Pathos,
granite kitchen worktops, gemstones and waste will be used for construction projects
and formation of roads. The mining project may result in provision of local employment
of 40 people. The project may also generate indirect employment and also transport
contracts to local people. The project may generate tax of approximately Rs. 14.4 lakhs
annually to Government of Andhra Pradesh. The total salary bill annually is Rs. 48
lakhs, which would be spent within the local area, resulting in improved livelihood
opportunities and life style. The project envisages spending 2.0% of the capital cost
towards socio economic development of the neighbouring villages as part of corporate
environment responsibility. The programs shall be identified in consultation with public
representatives and revenue officials.
Sri Raghavendra Granites Environmental Impact Assessment Report
Team Labs and Consultants 9-1
CHAPTER 9.0 ENVIRONMENT COST BENEFIT ANALYSIS
9.0 Introduction
As per EIA Notification S.O.1533, dt. 14.09.2006, the Chapter on the Environmental
Cost Benefit Analysis is applicable only if the same is recommended at the scoping
stage. As per the ToR points issued by SEIAA, Govt of Andhra Pradesh vide letter
no. SEIAA/AP/PKM/MIN/12/2018/765-304, dt. 14.05.2019 for the mining project
activity, the environmental cost benefit analysis and hence the same was not
conducted.

Sri Raghavendra Granites Environnent Management Plan
10-1 Team Labs and Consultants
CHAPTER 10.0 ENVIRONMENT MANAGEMENT PLAN
10.0 Introduction
This section discusses management plan for mitigation / abatement of adverse
environmental impacts and enhancement of beneficial impacts due to colour granite
mining. The mining activity involves clearing and grubbing, construction of haulage
road, construction of site services, drilling, wire saw cutting, excavation, dressing and
transport of mineral to end users. These activities result in air emissions, increase in
ambient air quality levels, alteration of drainage pattern, sediment load from wind
and water erosion, storm water runoff, and dry deposition of pollutants, increase in
noise and vibration levels due to transport, drilling activities etc, as described in the
previous chapters. The EMP has been designed within the framework of various
legislative and regulatory requirements on environmental and socio-economic
aspects. The management plan is drawn in consultation with the registered qualified
person who prepared the mine plan and the project authorities.
10.1 Sources of Pollution and Control Measures
The sources of pollution of air and noise from the proposed activity mainly from
mining, drilling, wire saw cutting, excavation, dressing, loading and unloading of
material and transportation of mineral. Waste material generation, dumping and
restoration.
10.2 Air Pollution and its Control
The granite quarrying does not involve much dust formation. The dust would be
generated during drilling, quarrying and also during handling and transportation of
the material. The dust anticipated at drilling place will be suppressed by putting cloth
around the hole. Use of sharp drill pits for drilling holes and drills with water flushing
systems (wet drilling) to reduce dust generation. Water spraying is adopted at
faces/sites while loading. Personal protective equipment’s like nose mask and goggles
etc will be provided to the workers.

Sri Raghavendra Granites Environnent Management Plan
10-2 Team Labs and Consultants
Regular water spraying on haulage roads during transportation of mineral and waste
by water sprinklers. Over loading of transport trucks should be avoided to prevent
spillage. Also, measures such as covering tarpaulin over the loaded material will
prevent spreading of dust particles from the trucks. Speed controls on vehicle
movements to limited speed on haulage road shall be ensured. Wind reduction control
by plantation in the buffer area shall facilitate secondary mitigation of emission
dispersion. When the over burden dump has reached the optimum size, it will be
covered with top soil and water will spread on top soil and grass will be developed
on the dump, in case the material is not sold as construction material. Limiting the
height and slope of the stockpiles can also reduce wind speed. Regular checking and
maintenance of vehicles will be conducted and pollution under control certificate be
obtained. Periodical monitoring of ambient air quality will help to take steps to control
the pollutants.
10.3 Greening program
Even with various dust suppression measures in place, dust generated from mine
faces, fine dust produced during mining operations are difficult to control. Therefore,
in addition to the above mitigative measures, it is proposed to have a green belt in and
around the mine site loading and unloading facilities, and in abandoned mine area
during reclamation process. Width of the greenbelt will be maintained at 7.5 m.
Additionally, all the exposed soils and other erodible materials will be revegetated or
covered promptly, while all inactive areas shall be revegetated.
10.4 Occupational Health and Safety Measures to Control Dust Inhalation
Despite the above-mentioned mitigation measures for preventing dust generation and
dispersion at site, the worker exposure to dust may lead to occupation health and
safety impacts among workers. Hence workers at dust generation areas/activities like
drilling, loading, unloading, are provided with dust masks. Dust masks would
prevent inhalation of particulate matter, thereby reducing risk of lung diseases and
other respiratory disorders. The workers shall have a medical checkup on
employment and periodically monitored, to ascertain the impact of dust and
emissions on employee health if any. It is proposed to rotate the employees in dust
Sri Raghavendra Granites Environnent Management Plan
10-3 Team Labs and Consultants
generating areas to reduce the duration of exposure.
10.5 Noise pollution and its control
Sources of noise emissions associated with mining may include noise from drilling of
drill holes, machinery and vehicular movement. Additional examples of noise sources
include drilling, transport on haulage roads, and stockpiling of waste dump. The noise
generation may be for any instant, intermittent or continuous periods with varying
noise intensity. The ML area is located on a hillock. The ambient noise levels were
observed to be below the prescribed standards.
The equipment systems will include cabins to ensure that the operators and other
work persons, in and around the operating equipment, have comfortable
workstations. It is proposed to adopt following measures to ensure noise levels within
the permissible limits; Improved silencers, mufflers and closed noise generating parts,
procurement of drill, loaders and dumpers and other equipment with noise proof
system in operator's cabin, periodic maintenance of noise generating machinery
including transport vehicles to maintain low noise levels, location of site office and
other infrastructure away from the noise sources with the probability of sound waves
being directed towards them being least and provision of green belt to mitigate
propagation of noise.
10.6 Occupational Health and Safety Measures to Control Exposure to Noise
It is also proposed to provide ear muffs and ear plugs to employees working near
noise generating sources, and rotation of employees to avoid continuous exposure to
high levels of noise.
10.7 Water Quality Management (Terms of Reference No. 26)
10.7.1 Water Resources Water Resources
The proposed mining activity is carried out from western part towards northeast
direction. The ground water level is observed to be 20 m below ground level (BGL) at
a distance of 0.5 km away from foot hill of mine lease area. Hence there will not be
adverse effect on ground water due to mining. The daily water requirement for the

Sri Raghavendra Granites Environnent Management Plan
10-4 Team Labs and Consultants
mine operations would be approximately 9.2 KLD comprising of requirement for
water sprinkling on mine haulage roads etc consuming 3.2 KLD; Wet drilling
operations consuming about 3.8 KLD; green belt development water consumption of
about 0.4 KLD; and domestic water requirement of 1.8 KLD. The required water is
drawn from nearby village Kondayapalem village/ storm water storage in worked
out pits. The wastewater generated from domestic usage in the order of 1.4 KLD will
be sent to septic tank followed by soak pit. The mineral proposed for mining is granite
and is not known to have any toxic and is not soluble in water. Hence the chance of
acid drainage from this mine are ruled out, however the following measures are
proposed to be adopted to mitigate impact on water resources; sinkholes, cracks, face
collapse is avoided at these cracks and fissures, leak proof containers shall be used to
prevent surface water contamination by oil/grease, floor of oil/grease handling area
will be kept effectively impervious.
Erosion and sedimentation are also a major impact of mining activity as large area of
land is exposed and opened for mineral. The area exposed due to mining shall be
7.293 ha in this project. Water erosion may be caused due to impact of rain drops
(splash erosion), by concentrated flow forming rills, gullies or by sheet flows. Water
erosion may result in sediment entering first order streams on site, and third order
streams away from the site, impacting aquatic life and clogging of water ways. It is
proposed to provide garland drains with rip rap at the discharge point to avoid
sediment joining streams outside the ML area. Garland drainage location presented
in Figure 10.1.

Sri Raghavendra Granites Environnent Management Plan
10-5 Team Labs and Consultants
Figure 10.1 Garland drainage

Sri Raghavendra Granites Environnent Management Plan
10-6 Team Labs and Consultants
10.7.2 Rain water Harvesting Plan
The rainwater of the working area will be collected at worked out area bottom during
rainy seasons and it will be percolated through the joints or bedding plains. Due to
percolation of rainwater from pit bottom, the ground water will get recharged.
10.8 Soil Conservation Measures
The applied area is rocky hill land. Soil in the area is hard and unfertile, therefore,
growth of trees and plants is uncertain and not satisfactory. Hence there are no major
trees in the area. Top soil, if any will be stacked at earmarked dump site with adequate
measures to avoid erosion and the same will be used for reclamation and
rehabilitation of the mined-out areas. To prevent soil erosion and wash-off of dump-
fines from freshly excavated benches and dumps following measures shall be
adopted; garland drains will be provided around the mine wherever required to
arrest any soil from the mine area being carried away by rain water, toe drains with
suitable baffles will be provided all along the toe of the soil dumps to arrest any soil
from the dump slopes being carried away by the rain water, loose material slopes will
be covered by mulch by making contour trenches at 2 m interval to check soil erosion
both due to wind and rain, retaining walls (concrete or local stone) will be provided
around stockpile to support benches or any loose material as well as to arrest sliding
of loose debris.
10.9Afforestation / Greenbelt Plan
Density and width of greenbelt determine mitigation efficiency. Scattered and isolated
trees will not form a greenbelt. Similarly, lawns and few ornamental herbs and shrubs
are not going to make a greenbelt. Ideally, green belt is a thick plantation of at least
7.5 m width on all sides of mining pit. The density of trees will be maintained at least
1500 trees per hectare in 3 m x 3 m or 2m x 2m spacing in an area of 0.075 ha with 115
trees in the mine lease area and 500 trees outside the lease area along connecting roads.
Design and development of a greenbelt
It is the job of a specialist such as a botanist or horticulturist or sylviculturist or an
experienced farmer and a committed gardener. The primary consideration in the

Sri Raghavendra Granites Environnent Management Plan
10-7 Team Labs and Consultants
design and development of the greenbelt is the choice of plant species. It depends on
suitability of soil, climate, and availability of water, extent of land available, nature of
pollutants; its atmospheric emissions and other local circumstances such as the
availability of planting stock.
In the present case, all the natural shrubs growing in the area where no mining is going
to be undertaken shall be allowed to grow. Their growth shall be enhanced by aided
natural regeneration which includes digging of semilunar trenches at a distance of
about 50 cm to 100 cm for trapping water and soil. Large gaps will be filled by sowing
scarified and pelletized (with dung) seeds of the local shrubs.
Stem cuttings of Konda Vepa (Chukrasiata bularis) of about 1.5 to 2 m length and 10
to 20 Cm girth will be planted very closely in a rooting mixture of soil, sand and
organic manure. The distal cut ends will be covered with wet dung as caps. These
cuttings shall be watered and allowed to produce roots and new shoots. Rooted stem
cuttings shall be transplanted in a couple of rows on the bunds of the garland drains
and watered till they establish firmly. This is the cheapest, easiest and fastest way to
develop thick greenery in a dry area like this. This is also the most common local
practice and locals are familiar with the process. It also provides employment to the
locals.
As a matter of regular practice, it is suggested that thick rows of plants should be
grown all along and around the boundary of the proposed mine lease area. Thus,
depending on the local circumstances either greenbelt on all sides or block plantations
within the proposed project site will be taken up and the top soil present as
overburden will be used for reclamation of the areas meant for plantations. The list
of plants identified for green belt based on CPCB guidelines for green belt
development, suitability, desirability and adaptability is presented in Table 10.1.
Table 10.1 List of plants identified for greenbelt and restoration of mine pits
Botanical name Local name Importance
Acacia nilotica Nalla thumma Multipurpose
Achras sapota Sapota Edible fruits
Aegle marmelos Velaga Edible fruits & Medicinal
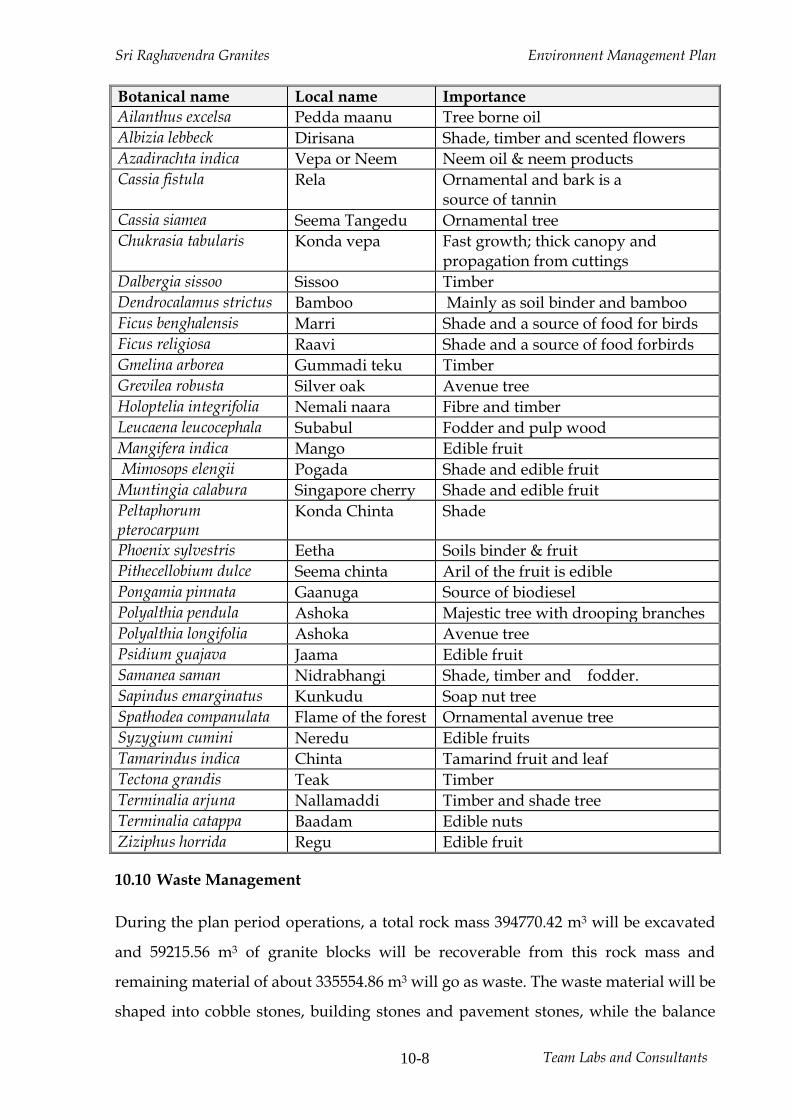
Sri Raghavendra Granites Environnent Management Plan
10-8 Team Labs and Consultants
Botanical name Local name Importance
Ailanthus excelsa Pedda maanu Tree borne oil
Albizia lebbeck Dirisana Shade, timber and scented flowers
Azadirachta indica Vepa or Neem Neem oil & neem products
Cassia fistula Rela Ornamental and bark is a source of tannin
Cassia siamea Seema Tangedu Ornamental tree
Chukrasia tabularis Konda vepa Fast growth; thick canopy and propagation from cuttings
Dalbergia sissoo Sissoo Timber
Dendrocalamus strictus Bamboo Mainly as soil binder and bamboo
Ficus benghalensis Marri Shade and a source of food for birds
Ficus religiosa Raavi Shade and a source of food forbirds
Gmelina arborea Gummadi teku Timber
Grevilea robusta Silver oak Avenue tree
Holoptelia integrifolia Nemali naara Fibre and timber
Leucaena leucocephala Subabul Fodder and pulp wood
Mangifera indica Mango Edible fruit
Mimosops elengii Pogada Shade and edible fruit
Muntingia calabura Singapore cherry Shade and edible fruit
Peltaphorum pterocarpum
Konda Chinta Shade
Phoenix sylvestris Eetha Soils binder & fruit
Pithecellobium dulce Seema chinta Aril of the fruit is edible
Pongamia pinnata Gaanuga Source of biodiesel
Polyalthia pendula Ashoka Majestic tree with drooping branches
Polyalthia longifolia Ashoka Avenue tree
Psidium guajava Jaama Edible fruit
Samanea saman Nidrabhangi Shade, timber and fodder.
Sapindus emarginatus Kunkudu Soap nut tree
Spathodea companulata Flame of the forest Ornamental avenue tree
Syzygium cumini Neredu Edible fruits
Tamarindus indica Chinta Tamarind fruit and leaf
Tectona grandis Teak Timber
Terminalia arjuna Nallamaddi Timber and shade tree
Terminalia catappa Baadam Edible nuts
Ziziphus horrida Regu Edible fruit
10.10 Waste Management
During the plan period operations, a total rock mass 394770.42 m3 will be excavated
and 59215.56 m3 of granite blocks will be recoverable from this rock mass and
remaining material of about 335554.86 m3 will go as waste. The waste material will be
shaped into cobble stones, building stones and pavement stones, while the balance
Sri Raghavendra Granites Environnent Management Plan
10-9 Team Labs and Consultants
material is sold and or used as road construction material, thus ensuring value
addition to the wastes generated.
Dump Area
During the plan period about 335554.86 m3 of waste material will be generated. This
waste will be dumped in the area of about 1.6 ha with an average height of 30 m with
45o slope angle will be formed, within quarry lease area in S side of the quarry lease
area. The waste will be used in the shapes of cobble stones, building stones, pavement
stones and finally left-over waste will be re-handled for backfilling during the
Conceptual Plan period.
10.11 Environmental Management System (EMS)
The mine authority will adopt environmental management system (EMS) which will
assist mine management to meet both current and future environmental requirements
and challenges. EMS will provide a structural view and control of the organization’s
environmental performance that will be applied from planning and exploration to
mine closure.
The following components are being taken to establish an EMS; Organizational
Commitment, Environmental Policy, Environmental Impact Assessment, Objectives
and Targets, Environmental Management Plan (EMP), Documentation,
Responsibilities and Reporting Structure, Training, Environmental Review Audits
and Emission and performance monitoring.
The mine management will follow a comprehensive and systematic health and safety
function which involves all personnel seeking to identify hazards and assessing risk
to prevent and eliminate all accidents/injuries. The mine management will prepare a
detailed reclamation and mine closure plan of mine operation prior to commencement
of the mine operation.
10.12 Environment Policy
In order to protect environment and for sustainable development, an Environmental
Policy will be adopted by Lessee as follows:
Sri Raghavendra Granites Environnent Management Plan
10-10 Team Labs and Consultants
Objective
The Environmental Policy is framed specifically to fulfill the following objectives:
• Create a work environment which enhances/motivates production and
productivity.
• Encourage safe and scientific mining and other engineering practices.
• Promoting awareness amongst employees and neighborhood population for
adopting environmentally acceptable procedures and restricting environmental
degradation and pollution to the barest minimum.
• To achieve Communal harmony and peace amongst employees and the local
villagers for heading fast towards "sustainable development".
• Restoration of post mining land use to pre-mining status, to the extent possible.
• Prevent pollution in its activities associated with mining.
• Continually improve environmental performance and comply with environmental
legislations and regulations.
• Conserving energy and other resources through optimum utilization and waste
minimization. Reducing waste and fugitive pollutants emissions though extensive
mitigation measures.
• Training and involving employees for development of Clean and Green
Environment.
• Evaluate environmental performance through periodic reviews and audits to
ensure that conduct of the organization is consistent with these principles.
Responsibility
The mines manager is responsible for maintaining ecological balance by adequate
environmental protection and environment improvement works. In the event of
observation of non-compliance by any employee, the same is informed to mine
manager and the lessee. These two will identify the cause and implement the

Sri Raghavendra Granites Environnent Management Plan
10-11 Team Labs and Consultants
mitigation measures or engineering controls or work practices required. The Lessee
will monitor the environmental performance and guide the manager and employees
for maintaining good environmental practices and to adopt newer, safe and cleaner
technologies.
10.13 Socio- Economic Development
The project provides an opportunity for the local people to get employment directly
or indirectly and helps in enhancing socioeconomic status of the area. The proposed
activity generates employment to 40 people, and all the semiskilled and unskilled jobs
will be provided to the local villagers. The management commits to involve in
socioeconomic developmental activities in the surrounding community, in
consultation with local stake holders, public representatives and revenue authorities.
Many of the beneficiaries of such programs will include own employees as well. The
goodwill of the local populace can never be ignored. The channels employed may
vary either through direct contact or by means of local organizations. Another
important facet of social environment identified by the project proponents is a green
appearance; hence the management will develop a green belt towards aesthetic
beautification as the same is necessary to be considered as a responsible, social
neighbor. The development of the basic amenities viz. roads, transportation,
electricity, drinking water, proper sanitation, educational institutions, medical
facilities, entertainment, etc. will be assisted by the management.
10.14 Corporate Environmental Responsibility Action Plan
An amount of Rs. 1.6 lakhs are allocated for corporate environmental responsibility
Action Plan, to be spent over a period of 5 years for the proposed project. The social
development programs are identified in consultation with local authorities and
district administration. The activities tentatively identified for social development in
the neighboring area, cost estimate is presented in Table 10.2. The schedule for
implementation of these activities is a maximum of 5 years and the six-monthly
compliance report to be submitted to the MoEFCC may show the scale of completion
of CER activities.
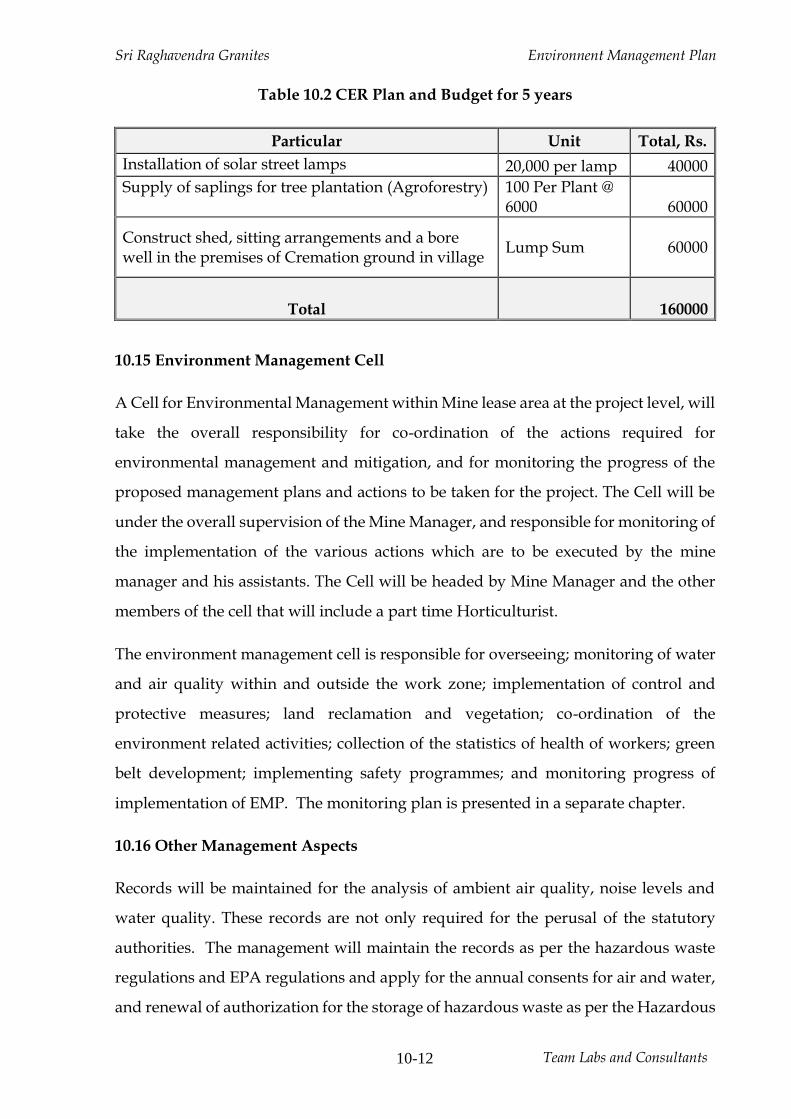
Sri Raghavendra Granites Environnent Management Plan
10-12 Team Labs and Consultants
Table 10.2 CER Plan and Budget for 5 years
Particular Unit Total, Rs.
Installation of solar street lamps 20,000 per lamp 40000
Supply of saplings for tree plantation (Agroforestry) 100 Per Plant @ 6000 60000
Construct shed, sitting arrangements and a bore well in the premises of Cremation ground in village
Lump Sum 60000
Total 160000
10.15 Environment Management Cell
A Cell for Environmental Management within Mine lease area at the project level, will
take the overall responsibility for co-ordination of the actions required for
environmental management and mitigation, and for monitoring the progress of the
proposed management plans and actions to be taken for the project. The Cell will be
under the overall supervision of the Mine Manager, and responsible for monitoring of
the implementation of the various actions which are to be executed by the mine
manager and his assistants. The Cell will be headed by Mine Manager and the other
members of the cell that will include a part time Horticulturist.
The environment management cell is responsible for overseeing; monitoring of water
and air quality within and outside the work zone; implementation of control and
protective measures; land reclamation and vegetation; co-ordination of the
environment related activities; collection of the statistics of health of workers; green
belt development; implementing safety programmes; and monitoring progress of
implementation of EMP. The monitoring plan is presented in a separate chapter.
10.16 Other Management Aspects
Records will be maintained for the analysis of ambient air quality, noise levels and
water quality. These records are not only required for the perusal of the statutory
authorities. The management will maintain the records as per the hazardous waste
regulations and EPA regulations and apply for the annual consents for air and water,
and renewal of authorization for the storage of hazardous waste as per the Hazardous

Sri Raghavendra Granites Environnent Management Plan
10-13 Team Labs and Consultants
Waste (Handling & Management) Rules, 1989. The records of hazardous waste
manifest will be maintained. The mine shall obtain the consent for establishment
(CFE) and consent for operation (CFO) from State Pollution Control Board as required
under section 25/26 of the Water act, 1974 and under section 21/22 of Air Act, 1981,
before commissioning and production from the A.P. Pollution Control Board as
directed by the Hon’ble Supreme Court of India. The CFO will be renewed each year
by the management in consultation with SPCB. The mine will submit environmental
statement every year before September 30. The management ensures that it will
comply with all the directions and regulations issued by the Ministry of environment,
forests and climate change, New Delhi, State and Central Pollution Control Boards.
The Consent for Establishment, Consent for Operation will be displayed in a
conspicuous location for the information of the inspecting authorities of different
departments and all stake holders.
10.17 Occupational Health and Protective Measures (Terms of Reference No. 8,
35)
All the employees will have a medical checkup on recruitment apart from periodic
checkup. All the workers will be provided with gum shoe, and helmets. Workers
near noise generating sources are provided with ear muffs, and workers near dust
generating sources are provided with dust masks. Green belt in and around mining
area will be developed to attenuate noise and dust impact.
Drinking water to employees will be provided by the project authority. The standard
of the drinking water will be as per IS 10500: 2012. Pre placement medical checkup
shall be done and regular health checkup in is planned for all the mine workers. The
frequency of health monitoring is presented in Table 10.3. Barbed Wire fencing will
be provided to avoid undo incidents for cattle and human for protection of mine and
mined-out pits. A safety pit will be excavated with 1.5m and 1m depth to avoid the
trespassing of the human and cattle/wild life into the lease hold area. The pit slope
will be maintained @ 23o in order to protect humans and cattle/wild life protection.
Watchman will be engaged when the mine is temporarily discontinued. A regular
monitoring of the Occupational Health and Safety will reduce the chances of accidents
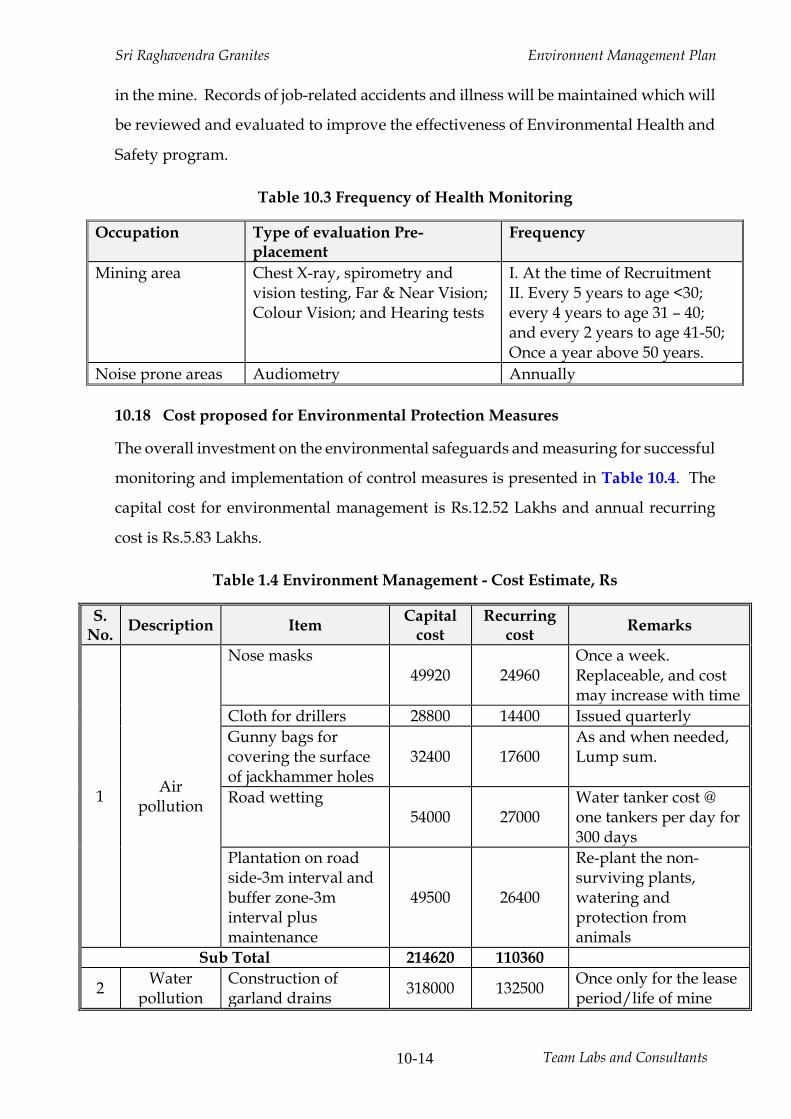
Sri Raghavendra Granites Environnent Management Plan
10-14 Team Labs and Consultants
in the mine. Records of job-related accidents and illness will be maintained which will
be reviewed and evaluated to improve the effectiveness of Environmental Health and
Safety program.
Table 10.3 Frequency of Health Monitoring
Occupation Type of evaluation Pre-placement
Frequency
Mining area Chest X-ray, spirometry and vision testing, Far & Near Vision; Colour Vision; and Hearing tests
I. At the time of Recruitment II. Every 5 years to age <30; every 4 years to age 31 – 40; and every 2 years to age 41-50; Once a year above 50 years.
Noise prone areas Audiometry Annually
10.18 Cost proposed for Environmental Protection Measures
The overall investment on the environmental safeguards and measuring for successful
monitoring and implementation of control measures is presented in Table 10.4. The
capital cost for environmental management is Rs.12.52 Lakhs and annual recurring
cost is Rs.5.83 Lakhs.
Table 1.4 Environment Management - Cost Estimate, Rs
S. No.
Description Item Capital
cost Recurring
cost Remarks
1 Air
pollution
Nose masks 49920 24960
Once a week. Replaceable, and cost may increase with time
Cloth for drillers 28800 14400 Issued quarterly
Gunny bags for covering the surface of jackhammer holes
32400 17600 As and when needed, Lump sum.
Road wetting 54000 27000
Water tanker cost @ one tankers per day for 300 days
Plantation on road side-3m interval and buffer zone-3m interval plus maintenance
49500 26400
Re-plant the non-surviving plants, watering and protection from animals
Sub Total 214620 110360
2 Water
pollution Construction of garland drains
318000 132500 Once only for the lease period/life of mine

Sri Raghavendra Granites Environnent Management Plan
10-15 Team Labs and Consultants
De-silting operations 44800 11520
Yearly and manual operations
Construction of check dams 259200 112320
Once in year, cost incurred is to buy sand bags and filling sand
Construction of retaining wall for waste dump in slope side
143000 55000
Cost of construction of wall around the dip side of the dump.
Sub Total 765000 311340
3 Noise
pollution
Maintenance of machinery suitably
120000 66000 Included in main cost
PPE's like Ear muffs 40000 20000 Once in six months
Sub Total 160000 86000
4
Occupa- tional Safety and
Health
First aid kits - 2 No's Fire extinguishers - 2 No's
7200 3600 Once in year, replace by conducting periodical checkup
PPE's to all employees (hand gloves @ Rs. 30, safety shoe @ Rs. 1500 and helmet @ Rs. 100)
65810 27640
Safety shoe twice in a year, helmets once in three years and hand gloves thrice in a year
Training and awareness programs on risk factors during emergencies by the experts
15000 7500
Once in six months and create sign boards about the risk and safety precautions regularly
Periodical medical checkup and supply of medicines - Rs. 600 per head
24000 8000
Once in a year and supply of medicines for every three months
Sub Total 112010 46740
5
Environ-mental monit- oring
Ambient air quality studies and fugitive dust
- 13600
Will be done through MoEF&CC/NABL
recognized laboratories Water quality studies - 3000
Noise studies - 4400
soil
7800
Sub Total - 28800
Grand Total 1251630 583240
10.19 Environmental Management for the Cluster
The management measures mentioned in the previous paragraphs with respect to air,
noise, water, solid waste, occupational health and greenbelt are generically, applicable

Sri Raghavendra Granites Environnent Management Plan
10-16 Team Labs and Consultants
to all the mine leases in the cluster. The generic measures are presented in Table 10.5.
Additionally, the following measures shall be adopted to mitigate the cumulative
impacts; strengthening of common haulage roads, mining activity during day time
to reduce noise, mineral dispatch on mutual consultation to avoid traffic congestion,
pooling of CER fund to avoid duplication of CER activity, adoption of water
conservation measures and water harvesting measures in common properties of the
surrounding villages after mutual consultation to compensate the water usage from
common properties, plantation along connecting roads, drainage management and
planning to avoid the sediment load and to avoid over flow of storm water into the
connecting drains, mutual support in case of any emergency.
Table 10.5 Generic Environment Management Measures
Project Stage
Project Activity
Environmental Impacts
Proposed Mitigation Measure
Pre
min
ing
Sta
ge
/ C
on
stru
ctio
n s
tag
e
Site clearing, Habitat disturbance NA
Line cutting, Erosion and sedimentation
Water sprinkling using tractor tanker, provision of sediment pond at the drain out lets and Periodic repairs of drain
Road Formation
Any Change in land use (Disturb active mine area, and dump area)
Worked out pits are backfilled with mine waste after completion of working and waste dumps will be stabilized by developing plants
Modification of drainage pattern
No major drain in the active mine area, provision of garland drains.
Emissions from equipment and fugitive dust
Proactive maintenance of vehicles and PUC Certification. Clearing of bushes is manual.
Noise from equipment
Nil in the light of above point and Activity is during day time only. Periodical maintenance of equipment.
Pro
du
ctio
n s
tag
e
Top soil removal
Loss of productive soil, fugitive dust
Top soil is used for greenery purpose
Overburden removal
Habitat disturbance Nil
Erosion and Sedimentation from dumps and during removal
Terracing of waste dump, construction of garland drains and retaining wall.
Water sprinkling on dumps with sprinklers.
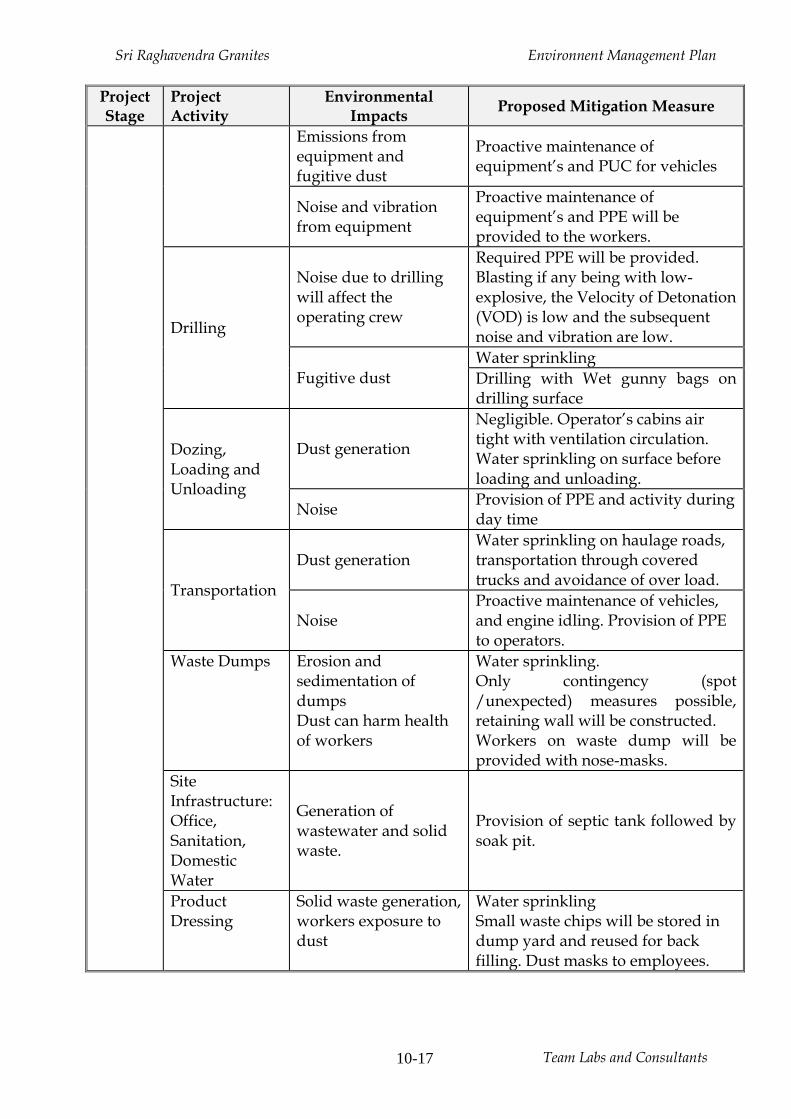
Sri Raghavendra Granites Environnent Management Plan
10-17 Team Labs and Consultants
Project Stage
Project Activity
Environmental Impacts
Proposed Mitigation Measure
Emissions from equipment and fugitive dust
Proactive maintenance of equipment’s and PUC for vehicles
Noise and vibration from equipment
Proactive maintenance of equipment’s and PPE will be provided to the workers.
Drilling
Noise due to drilling will affect the operating crew
Required PPE will be provided. Blasting if any being with low-explosive, the Velocity of Detonation (VOD) is low and the subsequent noise and vibration are low.
Fugitive dust
Water sprinkling
Drilling with Wet gunny bags on drilling surface
Dozing, Loading and Unloading
Dust generation
Negligible. Operator’s cabins air tight with ventilation circulation. Water sprinkling on surface before loading and unloading.
Noise Provision of PPE and activity during day time
Transportation
Dust generation Water sprinkling on haulage roads, transportation through covered trucks and avoidance of over load.
Noise Proactive maintenance of vehicles, and engine idling. Provision of PPE to operators.
Waste Dumps Erosion and sedimentation of dumps Dust can harm health of workers
Water sprinkling. Only contingency (spot /unexpected) measures possible, retaining wall will be constructed. Workers on waste dump will be provided with nose-masks.
Site Infrastructure: Office, Sanitation, Domestic Water
Generation of wastewater and solid waste.
Provision of septic tank followed by soak pit.
Product Dressing
Solid waste generation, workers exposure to dust
Water sprinkling Small waste chips will be stored in dump yard and reused for back filling. Dust masks to employees.

Sri Raghavendra Granites Environnent Management Plan
10-18 Team Labs and Consultants
Project Stage
Project Activity
Environmental Impacts
Proposed Mitigation Measure M
ine
Clo
sure
Removal, Back filling and sealing
Contamination of ground and surface water, Emissions from equipment and transport
No contamination of groundwater is envisaged as the bottom is impervious. Water gets stored and reused for dust suppression.
Removal of structures
Spills, Visual impact, Health and safety of workers
Spreading soil cover and plantation, provision of PPE.
Danger due to inadvertent entry
Animals or person may accidentally enter the closed pit and fall down
Signage and Fencing will be provided.
A guard will be posted all the time.
Table 10.6 Cluster EMP Cost estimation, Rs
Description Capital Cost Recurring Remarks
Road wetting 50000 250000
Water tanker cost @ one tankers per day for 300 days
Plantation on road side - 3m interval and plus maintenance
750000 150000 Re-plantation, watering and protection from animals
Salary 600000 Annual salary
Road Development 1550000 150000 Sign Boards and repairing
Monitoring - 203600
Will be done through recognized laboratories
Total 2250000 1353600
SRI RAGHAVENDRA GRANITES
SURVEY NO. 359, BALLIKURAVA VILLAGE AND MANDAL, PRAKASAM DISTRICT, ANDHRA PRADESH
EXECUTIVE SUMMARY
SUBMITTED TO
ANDHRA PRADESH POLLUTION CONTROL BOARD, REGIONAL OFFICE, ONGOLE
STUDIES AND DOCUMENTATION BY TEAM Labs and Consultants B-115 to 117 & 509, Annapurna Block, Aditya Enclave, Ameerpet, Hyderabad-500 038. Phone: 040-23748 555/616, Telefax: 040-23748666 Email: [email protected]
SUBMITTED BY M/s. Sri Raghavendra Granites Flat No. G6, Sudha Towers, Opposite Seetharamaiah High School, Lakshmipuram Main Road, Guntur – 522 007

Sri Raghavendra Granites Summary and conclusion
11 - 1 Team Labs and Consultants
Chapter 11.0 SUMMARY AND CONCLUSION
11.1 Introduction
Sri Raghavendra Granites obtained mine lease to extract colour granite and dispose
the waste material in an area of 9.918 ha using semi mechanized opencast mining at
sy.no. 359, Ballikurava village and mandal, Prakasam district. Granite has been
extensively used as a dimension stone and as flooring tiles in public and commercial
buildings and monuments. Rough-cut and polished granite is used in buildings,
bridges, paving, monuments and many other exterior projects.
In principle of application of quarry lease notice issued by Director of Mines and
Geology, Ibrahimpatnam, Govt. of Andhra Pradesh, vide Notice no. 5615/R3-2/2018
dated 16.11.2018 for a period of 20 years. The Mining Plan was approved by the Joint
and Deputy Director of Mines and Geology, Guntur, Government of Andhra
Pradesh, vide Letter No. 5204/MP/CG/OGL/2018 dated 01.12.2018. Capital cost for
the proposed mining project is Rs. 80 Lakhs.
The Ministry of Environment, Forest and Climate Change (MoEFCC), Government
of India (GOI) issued notifications vide SO 1533, dt. 14.9.2006, its amendments based
on the directions issued by National Green Tribunal (NGT), New Delhi vide O. A.
No. 16 of 2016, dt.13.09.2018 and vide E.A.NO 55/2018 of O. A. No. 520/2016, dt.
11.12.2018 on Moefcc notification S.O.2269 (E), dt.01.07.2016 and S.O.3977 (E), dt.
14.08.2018 and Office Memorandum dt.12.12.2018 issued in compliance with the
hon’ble NGT orders, New Delhi, which mandate prior environmental clearance for
all mining leases across the country. The project is considered as category B based
on the notification no S.O 2731 (€), dt. 09.09.2013. The notification and its
amendments based on NGT directions, classify mine lease areas of 5 - 25 ha as
category B2 at par with B1, and stipulate a three-stage process of scoping, public
consultation and appraisal by State Environmental Impact Assessment Authority
(SEIAA) to issue prior environmental clearance. Accordingly scoping for preparation
of environmental impact assessment (EIA) was done by the state expert appraisal
committee (SEAC), which issued terms of reference vide Letter No.
SEIAA/AP/PKM/MIN/12/2018/765-304, dt. 14.05.2019 for a production capacity

Sri Raghavendra Granites Summary and conclusion
11 - 2 Team Labs and Consultants
of 101315.52 m3/annum (Recovery of colour granite @ 15% - 15197.33 m3/annum and
Waste @ 85% - 86118.19 m3/annum) in an area of 9.918 ha. Accordingly, the present
study follows the prescribed ToR’s and draft EIA/EMP report for public
consultation, to facilitate informed view on the project by public/stakeholders for
the lease area and other mine leases with a total cluster area of 235.2053 ha. The
report presents cumulative environmental impacts due to the mining cluster and the
environmental management plan to address the same in addition to the impact
assessment and environmental management for this project.
M/s Team Labs and Consultants prepared Environmental Impact Assessment
Report for the proposed activity. The report is prepared using baseline data of
environmental status within 10 km radius of the mine lease area for major
environmental components; water, air, noise, soil, flora, fauna and socio-economic
environment for one season, and the proposed measures to be adopted for
mitigating and controlling pollution.
11.2 Mine Location
The Sailentfeatures of the mine lease location are presented in Table below. Sailentfeatures of the mine lease location
Particulars Details
Name of the Project (s) Semi mechanized opencast mining for Colour granite in area of 9.918 ha with production capacity of 101315.52 m3/annum (Recovery of colour granite @ 15% - 15197.33 m3/annum and Waste @ 85% - 86118.19 m3/annum)
Name of the Applicant Sri Raghavendra Granites
Location of the Project Survey No. 359, Ballikurava Village, Ballikurava Mandal, Prakasam District, Andhra Pradesh State.
Project Sector Non-Coal Mining
S. No. in the schedule 1(a) Mining of minerals
Category of project B1
New / Expansion / Modernization New project
Capital Cost, 80 lakhs
Land Use Pattern (Forest, Agricultural, Grazing, Barren etc.)
Govt. land – 9.918 ha
Latitudes (North) 16° 2'12.50" - 16° 2'25.30"
Longitudes (East) 80° 0'1.20" - 80° 0'17.20"
Survey of India sheet No 65 D/04
Elevation above Mean Sea Level 74 - 222 m

Sri Raghavendra Granites Summary and conclusion
11 - 3 Team Labs and Consultants
Particulars Details
(AMSL), m
Seismic zone Seismic Zone: III as per IS: 1893 (part -1): 2002 (RA:2016) and can be classified as Moderate Damage Risk Zone
Site surroundings North : Hillock
East : Open Land
West : Hillock
South : Open Land
Nearest Village Kondayapalem – 1.5 km – South direction
Accessibility to site Road connecting – SE direction
Road access Ballikurava to Kopparam road – 1.5 km - East direction.
Nearest Town Chilakaluripeta – 16.4 km – NE direction
District Head quarters Ongole – 58 km – SE direction
Nearest Railway station Santhamaguluru – 15.5 km – NW direction
Nearest airport Gannavaram Airport – 100 km – NE direction
Nearest Port Krishnapatnam Port – 193 km – S direction
Major Industries (Within 10 km radius)
Nil within 10 km
Water Bodies in buffer area Seasonal Nala Vagu - 4.8 km - South. Seasonal Boddula vagu - 4.9km - NE. Seasonal Vogaru vagu - 6.6 km - NE. Santhamaguluru Canal - 6.0 km - North. Nagarjuna Sagar Right Bank Canal - 7.0 km - SW. Tangedumalli Major Canal - 5.9 km - NE. Kopparam Major Canal - 5.1 km - NE. Kopparam major Canal - 5.1 km - NW. Pasumarti Major Canal - 1.0 km – North.
the Project / Activity attracts the provisions of CRZ
Not Applicable
Reserve Forest Uppumaguluru RF - 3.2 km - NE
Muktheswaram RF - 5.7 km - SW
Nagarajupalli RF - 7.4 km - SE
Kukutlapalli RF 9.0 km - SW
Archaeological/ Historical/ Ancient Monuments
Nil within 10 km
Inter-state boundary and international boundary
Nil within 10 km
Protected Areas notified under the Wild Life (Protection) Act, 1972
Nil within 10 km
Eco-sensitive areas as notified under section 3 of the E (P) Act, 1986
Nil within 10 km
Critically polluted areas as identified by the Central Pollution
Nil within 10 km
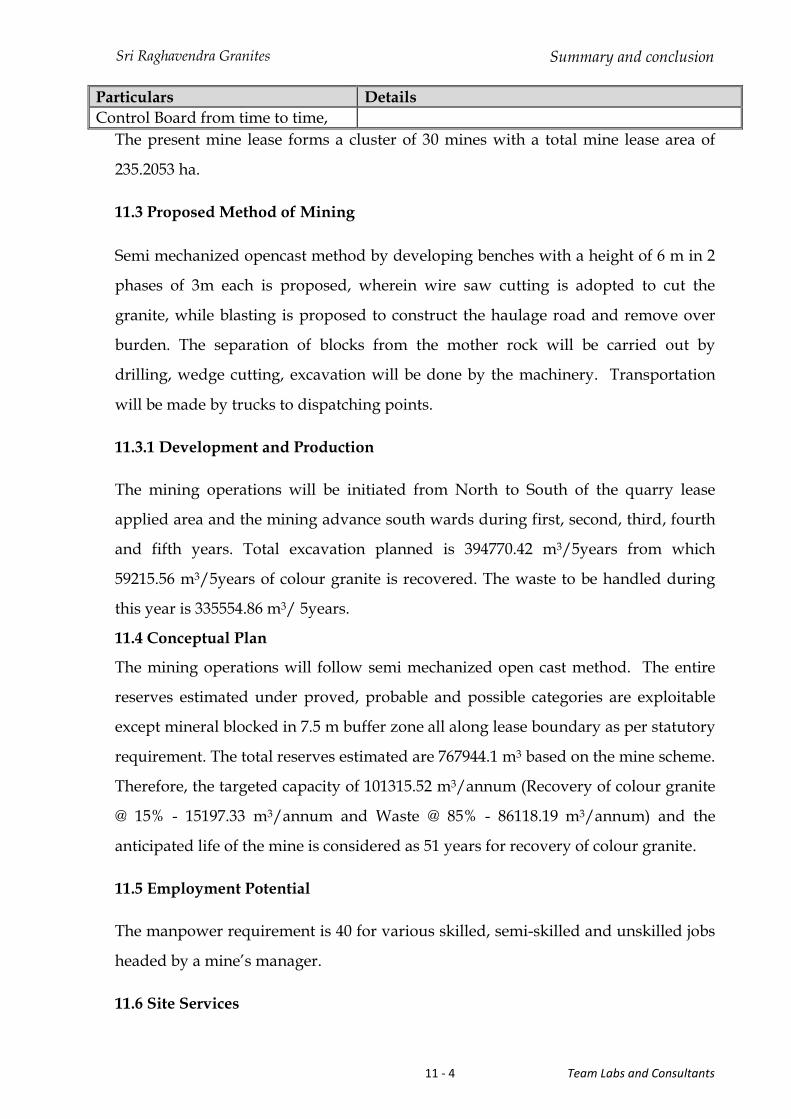
Sri Raghavendra Granites Summary and conclusion
11 - 4 Team Labs and Consultants
Particulars Details
Control Board from time to time,
The present mine lease forms a cluster of 30 mines with a total mine lease area of
235.2053 ha.
11.3 Proposed Method of Mining
Semi mechanized opencast method by developing benches with a height of 6 m in 2
phases of 3m each is proposed, wherein wire saw cutting is adopted to cut the
granite, while blasting is proposed to construct the haulage road and remove over
burden. The separation of blocks from the mother rock will be carried out by
drilling, wedge cutting, excavation will be done by the machinery. Transportation
will be made by trucks to dispatching points.
11.3.1 Development and Production
The mining operations will be initiated from North to South of the quarry lease
applied area and the mining advance south wards during first, second, third, fourth
and fifth years. Total excavation planned is 394770.42 m3/5years from which
59215.56 m3/5years of colour granite is recovered. The waste to be handled during
this year is 335554.86 m3/ 5years.
11.4 Conceptual Plan
The mining operations will follow semi mechanized open cast method. The entire
reserves estimated under proved, probable and possible categories are exploitable
except mineral blocked in 7.5 m buffer zone all along lease boundary as per statutory
requirement. The total reserves estimated are 767944.1 m3 based on the mine scheme.
Therefore, the targeted capacity of 101315.52 m3/annum (Recovery of colour granite
@ 15% - 15197.33 m3/annum and Waste @ 85% - 86118.19 m3/annum) and the
anticipated life of the mine is considered as 51 years for recovery of colour granite.
11.5 Employment Potential
The manpower requirement is 40 for various skilled, semi-skilled and unskilled jobs
headed by a mine’s manager.
11.6 Site Services
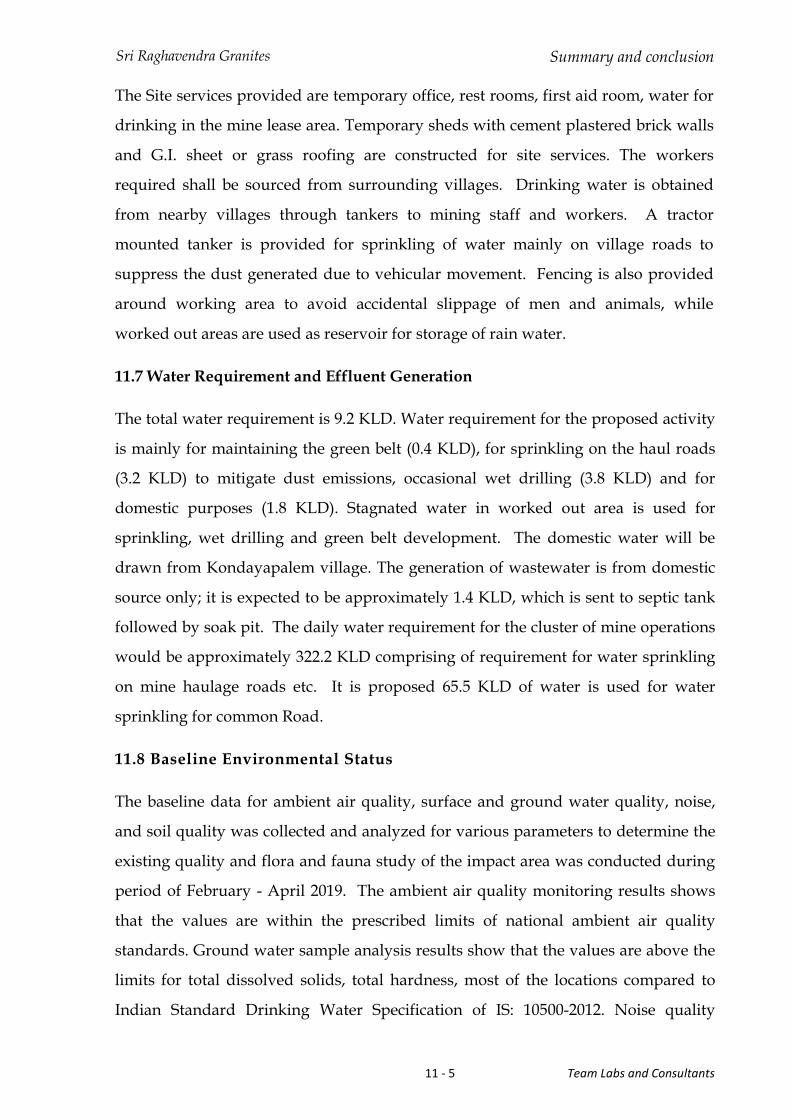
Sri Raghavendra Granites Summary and conclusion
11 - 5 Team Labs and Consultants
The Site services provided are temporary office, rest rooms, first aid room, water for
drinking in the mine lease area. Temporary sheds with cement plastered brick walls
and G.I. sheet or grass roofing are constructed for site services. The workers
required shall be sourced from surrounding villages. Drinking water is obtained
from nearby villages through tankers to mining staff and workers. A tractor
mounted tanker is provided for sprinkling of water mainly on village roads to
suppress the dust generated due to vehicular movement. Fencing is also provided
around working area to avoid accidental slippage of men and animals, while
worked out areas are used as reservoir for storage of rain water.
11.7 Water Requirement and Effluent Generation
The total water requirement is 9.2 KLD. Water requirement for the proposed activity
is mainly for maintaining the green belt (0.4 KLD), for sprinkling on the haul roads
(3.2 KLD) to mitigate dust emissions, occasional wet drilling (3.8 KLD) and for
domestic purposes (1.8 KLD). Stagnated water in worked out area is used for
sprinkling, wet drilling and green belt development. The domestic water will be
drawn from Kondayapalem village. The generation of wastewater is from domestic
source only; it is expected to be approximately 1.4 KLD, which is sent to septic tank
followed by soak pit. The daily water requirement for the cluster of mine operations
would be approximately 322.2 KLD comprising of requirement for water sprinkling
on mine haulage roads etc. It is proposed 65.5 KLD of water is used for water
sprinkling for common Road.
11.8 Baseline Environmental Status
The baseline data for ambient air quality, surface and ground water quality, noise,
and soil quality was collected and analyzed for various parameters to determine the
existing quality and flora and fauna study of the impact area was conducted during
period of February - April 2019. The ambient air quality monitoring results shows
that the values are within the prescribed limits of national ambient air quality
standards. Ground water sample analysis results show that the values are above the
limits for total dissolved solids, total hardness, most of the locations compared to
Indian Standard Drinking Water Specification of IS: 10500-2012. Noise quality
Sri Raghavendra Granites Summary and conclusion
11 - 6 Team Labs and Consultants
parameters in the study area are within prescribed limits of Ambient Noise
Standards. There is no schedule I flora or fauna within the impact area.
11.8.1 Identification and Quantification of Impacts
The project activities that are likely to cause potential impacts on environment are
mining operations, transport and associated infrastructure. Mining operations
involve development of benches, haul roads, drilling, wire saw cutting, excavation,
handling and transportation of mineral and waste materials. The likely effects of
these activities are land degradation, fugitive dust generation, noise and vibration
levels, increased run-off during monsoon and human health risks. There are 30
mines in the cluster area with an area of 235.2053 ha. The cumulative impacts due to
the cluster are also assessed in addition to the impacts due to this project.
ISCST3 model was used for air quality impact predictions. The predicted maximum
24 hourly GLC’s for the cluster were used to predict the ground level concentrations,
and the maximum predicted values of PM10 and PM2.5 are 10.55, and 3.17 g/m3
respectively and the maximum values are observed at center of mining area for the
cluster. The cumulative values (baseline and predicted) are found to be within the
prescribed standards of national ambient air quality.
11.9 Environment Management Plan
The management plan is drawn in consultation with the project proponent, mining
engineer and geologist after evaluating various methods for mitigation and control
of pollution. The environment management plan is drawn to address the impacts
monitored, identified and predicted for the present project and the cluster in which
the present project falls in. The environment management plan addresses the
impacts identified.
11.9.1 Dust Emissions
Dust will be generated during mining, drilling and also during handling and
transportation of the material. Haulage of minerals within lease area will lead to
emissions of fugitive dust in the mining area. It is proposed to provide water
sprinkling in haul roads to reduce the fugitive dust emissions. Tractor mounted

Sri Raghavendra Granites Summary and conclusion
11 - 7 Team Labs and Consultants
sprinkler will be deployed. Dust generated during occasional drilling will be
suppressed by covering the drill rods by wet gunny cloth.
11.9.2 Noise Pollution Control
Major noise sources during operation are mine machineries, equipment, occasional
drilling and vehicular movement. The following measures will be adopted to reduce
noise levels; improved silencers, mufflers and closed noise generating parts, regular
and periodic maintenance of noise generating machinery including transport
vehicles, location of site office and other infrastructures away from the noise sources.
Personal protective equipment like earmuffs, earplugs. Canal caps will be provided
to workers involved in work closer to noise generating sources. The exposure to
noise levels is also mitigated by adopting employee rotation.
11.9.3 Water Resources and Waste Water Generation
The daily water requirement for the mine operations would be approximately 9.2
KLD comprising of requirement for water sprinkling on mine haulage roads etc.
The other major impact anticipated from mining activity is erosion and
sedimentation, as large area of land is exposed to erosion. The area exposed due to
mining shall be 7.293 ha in this project. It is proposed to provide garland drains
with rip rap at the discharge point to avoid sediment joining streams outside the ML
area. The daily water requirement for the cluster of mine operations would be
approximately 322.2 KLD comprising of requirement for water sprinkling on mine
haulage roads etc. it is proposed to use 65.5 KLD of water for water sprinkling for
common road.
11.9.4 Land Management
Land degradation is one of the major adverse impacts of opencast mining in the
form of excavated voids and also in the form of waste dump of 1.6 ha. During plan
period about 7.293 ha area will be occupied by pit, and plantation will cover 0.075 ha
and roads cover an area of 0.03 ha. Other temporary constructions are dismantled
after completion of mine workings.
Sri Raghavendra Granites Summary and conclusion
11 - 8 Team Labs and Consultants
11.9.5 Socio-Economic Environment
There are no settlements in the ML area. Hence no rehabilitation and resettlement
(R&R) is required. The mining activity will improve the economic status of the
people surrounding the mine lease area. The proposed project generates
employment to 40 people, and all the semiskilled and unskilled jobs will be provided
to the local villagers. Apart from employment, the state government and village
panchayath will get royalty due to mining.
11.9.6 Green Belt
Greenbelt is proposed as an additional mitigation measure for dust control in
addition to water sprinkling. It is proposed to have dense green belt in and around
the mine site, loading and unloading facilities, and in abandoned mine area during
reclamation process. About 0.075 ha (115 trees) area will be planted during lease
grant year and 500 tress along connecting road. Precautionary measures like regular
watering, providing manure and fencing will be taken up to achieve 90% of survival
rate of plantation.
11.9.7 Transportation
The required truck trips for transporting the mineral from this mine lease shall be in
the order of 3/day. The surrounding area is forming a cluster of mines producing
granite and total number of truck trips generated due to the cluster is 279/day.
Currently the Mine lease area is connected to Ballikurava to Kopparam by a cart
truck road. The Addanki-Narketpalli road is a 4-lane road and hence, the dispatch of
trucks shall be staggered in consultation with neighboring mine lease proponents to
avoid traffic congestion.
11.9.8 Occupational Health and Safety Measures
Protective equipment will be provided to the employees such as safety shoes,
helmets and dust masks. Dust masks would be provided for the safety of workers at
site, engaged at dust generation points like drills, loading and unloading points, etc.
Dust masks would prevent inhalation of particulate matter thereby reducing the risk
of lung diseases and other respiratory disorders. Regular health monitoring of

Sri Raghavendra Granites Summary and conclusion
11 - 9 Team Labs and Consultants
workers will be carried out. The health impact due to dust shall be addressed by
rotation of employees from dust generating jobs after periodic health monitoring.
11.10 Environmental Monitoring Program
The monitoring program consists of collection and analysis of air, soil, noise and
surface and ground water samples. Environmental monitoring shall be conducted on
quarterly basis to assess the pollution level in the ML area and in the surrounding
areas as well. An Environment Management cell shall be established to look after all
the environment related activities. This cell will be headed by the Mines Manger.
The cell is responsible for all the environmental management activities including
environmental monitoring, greenbelt development and to ensure statutory
compliance with the regulatory authorities. The total capital expenditure envisaged
for environmental monitoring is Rs.1.56 lakhs. The total capital expenditure
envisaged for cluster environmental monitoring is Rs.2.04 lakhs.
11.11 Environment management Plan
The management measures mentioned in the previous paragraphs with respect to
air, noise and vibration, water, solid waste, occupational health and greenbelt are
generically, applicable to both the mine leases in the cluster. Additionally, the
following measures shall be adopted to mitigate the cumulative impacts;
Strengthening of common haulage roads, mining activity during day time to reduce
noise and vibration impact, activity to be conducted at designated times decided on
mutual consultation, mineral dispatch on mutual consultation to avoid traffic
congestion, pooling of CER fund to avoid duplication of CER activity, adoption of
water conservation measures and water harvesting measures in common properties
of the surrounding villages after mutual consultation to compensate the water usage
from common properties, plantation along connecting roads, drainage management
and planning to avoid the sediment load and to avoid over flow of storm water into
the connecting drains, mutual support in case of any emergency. The total capital
expenditure envisaged for environmental management is Rs.12.52 lakhs with annual
recurring expenditure of 5.83 lakhs. The total capital expenditure envisaged for
Sri Raghavendra Granites Summary and conclusion
11 - 10 Team Labs and Consultants
cluster environmental management is Rs.22.5 lakhs with annual recurring
expenditure of 13.54 lakhs.
11.12 Corporate Environment Responsibility (CER)
It is proposed to spend Rs. 1.6 Lakhs in five years for CER activities like provision of
drinking water facility, solar street lamps, trees plantation. The management will
provide training and awareness on job facilities to unemployed graduates and post
graduates, embroidery and tailoring training to backward and weaker section
women and training to local sports persons.
11.13 Mine Closure Plan
The disturbed land including area disturbed due to excavation, dumping,
construction of haul roads, ramps, structures would be reclaimed before finally
abandoning the mine. Thus, the area shall be fully reclaimed during last five years
of life of the mine. During post mining period all the disturbed areas will be
reclaimed before decommissioning / abandoning the mine. The closure involves
the; back filling the over and side burden, fencing around the pit and greenery
development. The top bench shall be afforested with local grass and plants.
11.14 Conclusion
The environmental impact study identified various mining activities that may result
in change in baseline status, and accordingly the proposed mitigation measures
mentioned in mine plan and the environment management plan were observed to be
sufficient to ensure least impact on the surrounding areas. The residual impact due
to mining is mainly loss of habitat which has to be compensated, loss of biodiversity
which can be offset, and worked out mine pit which has to be reclaimed. The
management assures to adopt extensive plantation in surrounding areas to
compensate habitat and biodiversity loss, thereby reducing the impact to the
maximum extent, while taking responsibility for implementing an effective mine
closure plan.
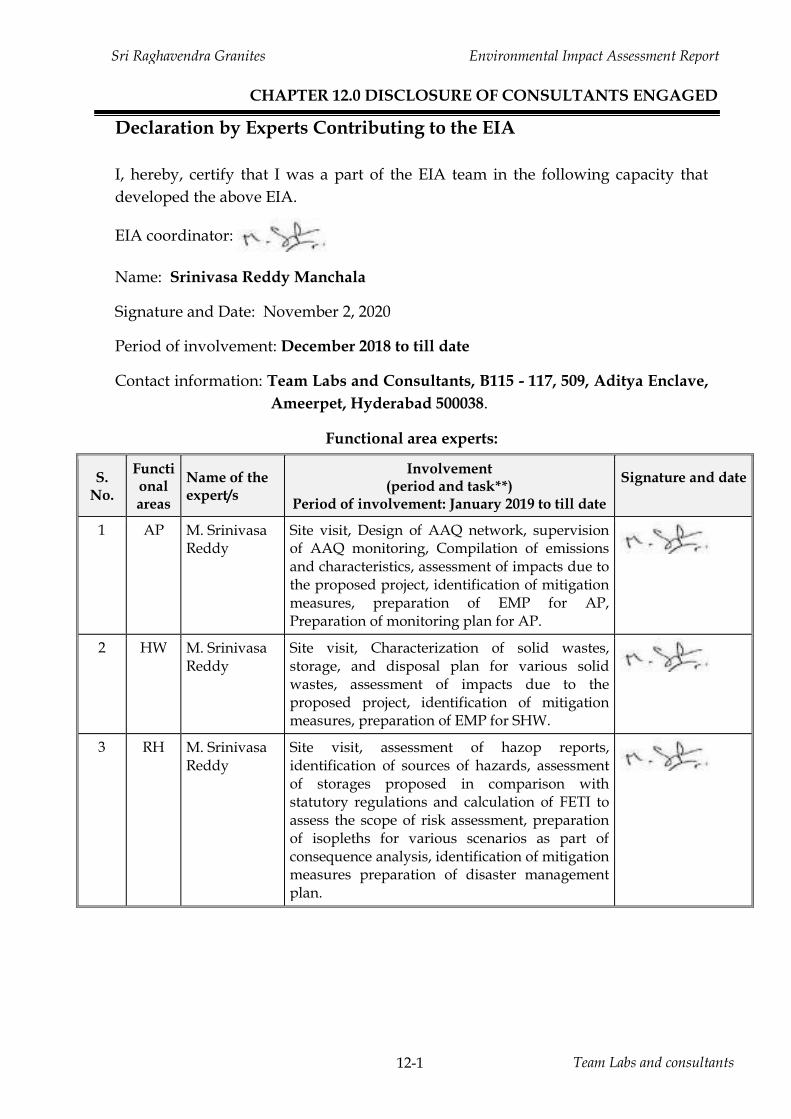
Sri Raghavendra Granites Environmental Impact Assessment Report
Team Labs and consultants 12-1
CHAPTER 12.0 DISCLOSURE OF CONSULTANTS ENGAGED
Declaration by Experts Contributing to the EIA
I, hereby, certify that I was a part of the EIA team in the following capacity that
developed the above EIA.
EIA coordinator:
Name: Srinivasa Reddy Manchala
Signature and Date: November 2, 2020
Period of involvement: December 2018 to till date
Contact information: Team Labs and Consultants, B115 - 117, 509, Aditya Enclave,
Ameerpet, Hyderabad 500038.
Functional area experts:
S. No.
Functional areas
Name of the expert/s
Involvement (period and task**)
Period of involvement: January 2019 to till date
Signature and date
1 AP M. Srinivasa Reddy
Site visit, Design of AAQ network, supervision of AAQ monitoring, Compilation of emissions and characteristics, assessment of impacts due to the proposed project, identification of mitigation measures, preparation of EMP for AP, Preparation of monitoring plan for AP.
2 HW M. Srinivasa Reddy
Site visit, Characterization of solid wastes, storage, and disposal plan for various solid wastes, assessment of impacts due to the proposed project, identification of mitigation measures, preparation of EMP for SHW.
3 RH M. Srinivasa Reddy
Site visit, assessment of hazop reports, identification of sources of hazards, assessment of storages proposed in comparison with statutory regulations and calculation of FETI to assess the scope of risk assessment, preparation of isopleths for various scenarios as part of consequence analysis, identification of mitigation measures preparation of disaster management plan.

Sri Raghavendra Granites Environmental Impact Assessment Report
Team Labs and consultants 12-2
4 WP G.V.Reddy Site visit, identification of monitoring stations, supervision of sampling, Characterization of effluent, effluent treatment, assessment of impacts due to the proposed project, identification of mitigation measures, preparation of EMP for WP, Preparation of monitoring plan for WP.
5 SE G.V.Reddy Site visit, primary and secondary data collection of the impact area, assessment of impacts due to the project on socio economic status and project economy, preparation of CSR plan, Preparation of SE part of EIA report.
6 EB I. Sivarama Krishna
Site visit, primary and secondary data collection related to ecology and biodiversity, assessment of impacts based on IAIA guidelines, preparation of mitigation measures and preparation of green belt plan and cost estimate, preparation of EB part of EIA report.
7 HG G.V.A. Ramakrishna
Identification of water sheds of the area by preparing the drainage map, assessment of ground water potential of the site and impact area, preparation of rain water harvesting plan, assessment of impacts due to ground water abstraction and mitigation measures.
8 SC D. Sundar Rao
Identification of soil sampling locations and characterization of the soils, interpretation of soil analysis reports, assessment of impacts due to spillages, accidental releases of chemicals, effluents etc., and mitigation measures.
9 AQ M. Srinivasa Reddy
Assisting AP FAE in identifying the AAQ monitoring stations by providing normal climatological and other historical data, Identification of Micrometeorological data monitoring station, supervision of met data collection using Automatic weather station, Preparation of emission details, Air quality impact prediction modeling, Calculation of work room concentrations of solvents using box model, Assessment of results and preparation of isopleths, assisting the AP FAE and EIA coordinator in preparation of EMP.
10 LU G.V.A. Ramakrishna
Preparation of land use land cover map using satellite imagery, ground truth study, assessing the impacts due to project.
Sri Raghavendra Granites Environmental Impact Assessment Report
Team Labs and consultants 12-3
Declaration by the Head of the accredited consultant organization/ authorized
person
I, G.V. Reddy hereby, confirm that the above-mentioned experts prepared the
EIA report for Sri Raghavendra Granites. I also confirm that the consultant
organization shall be fully accountable for any mis-leading information mentioned
in this statement.
Signature:
Name : G.V. Reddy
Designation: Director
Name of the EIA consultant organization: Team Labs and Consultants
NABET Certificate No: NABET/ EIA/ 1821/ SA 0114, dt.04.09.2020.
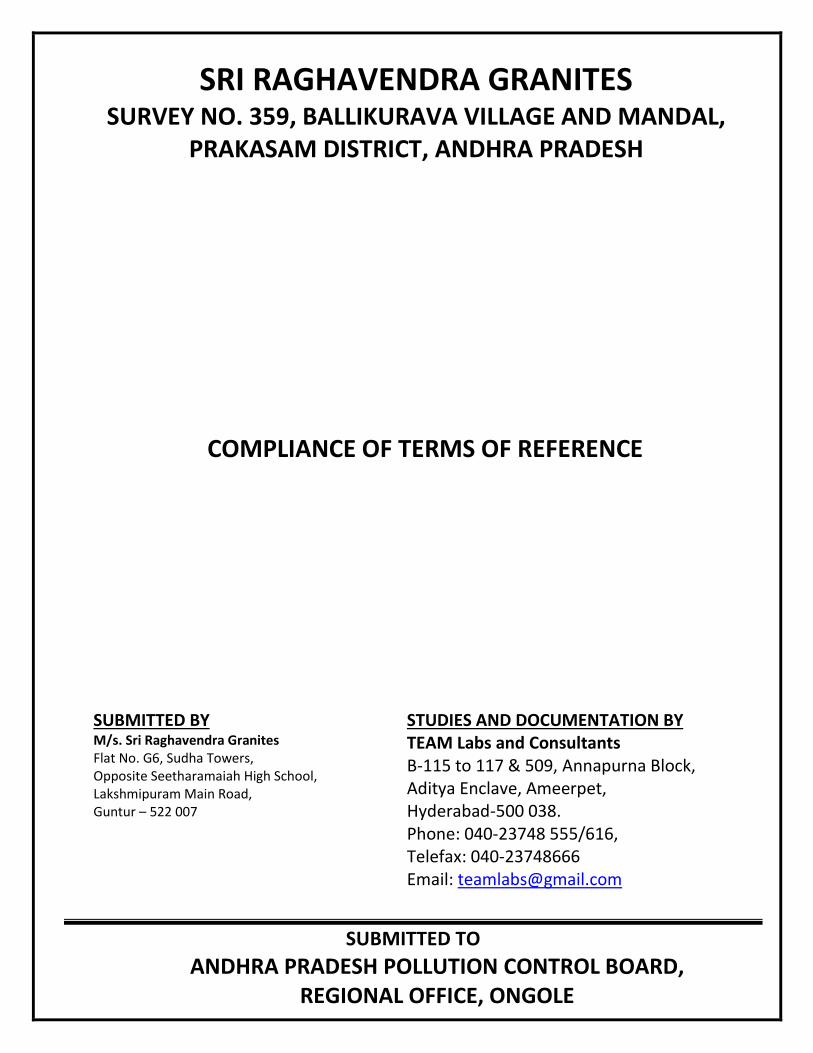
SRI RAGHAVENDRA GRANITES
SURVEY NO. 359, BALLIKURAVA VILLAGE AND MANDAL, PRAKASAM DISTRICT, ANDHRA PRADESH
COMPLIANCE OF TERMS OF REFERENCE
SUBMITTED TO
ANDHRA PRADESH POLLUTION CONTROL BOARD, REGIONAL OFFICE, ONGOLE
STUDIES AND DOCUMENTATION BY TEAM Labs and Consultants B-115 to 117 & 509, Annapurna Block, Aditya Enclave, Ameerpet, Hyderabad-500 038. Phone: 040-23748 555/616, Telefax: 040-23748666 Email: [email protected]
SUBMITTED BY M/s. Sri Raghavendra Granites Flat No. G6, Sudha Towers, Opposite Seetharamaiah High School, Lakshmipuram Main Road, Guntur – 522 007
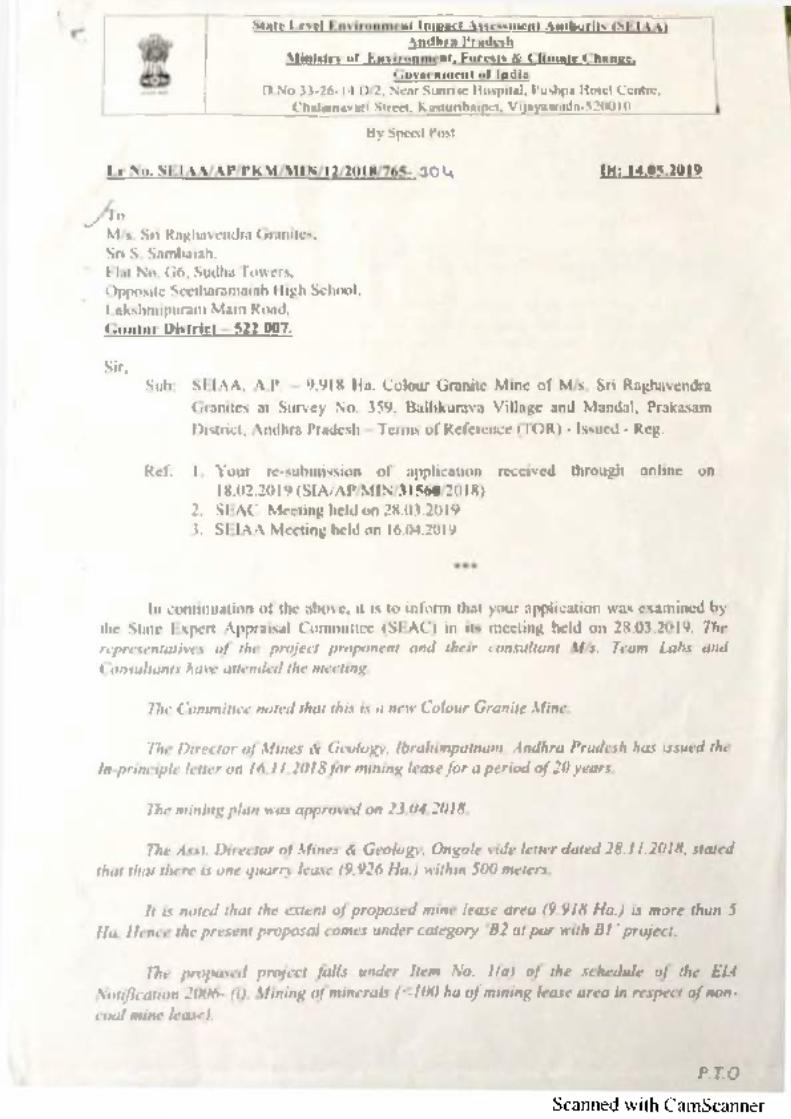
Scanned with CamScanner
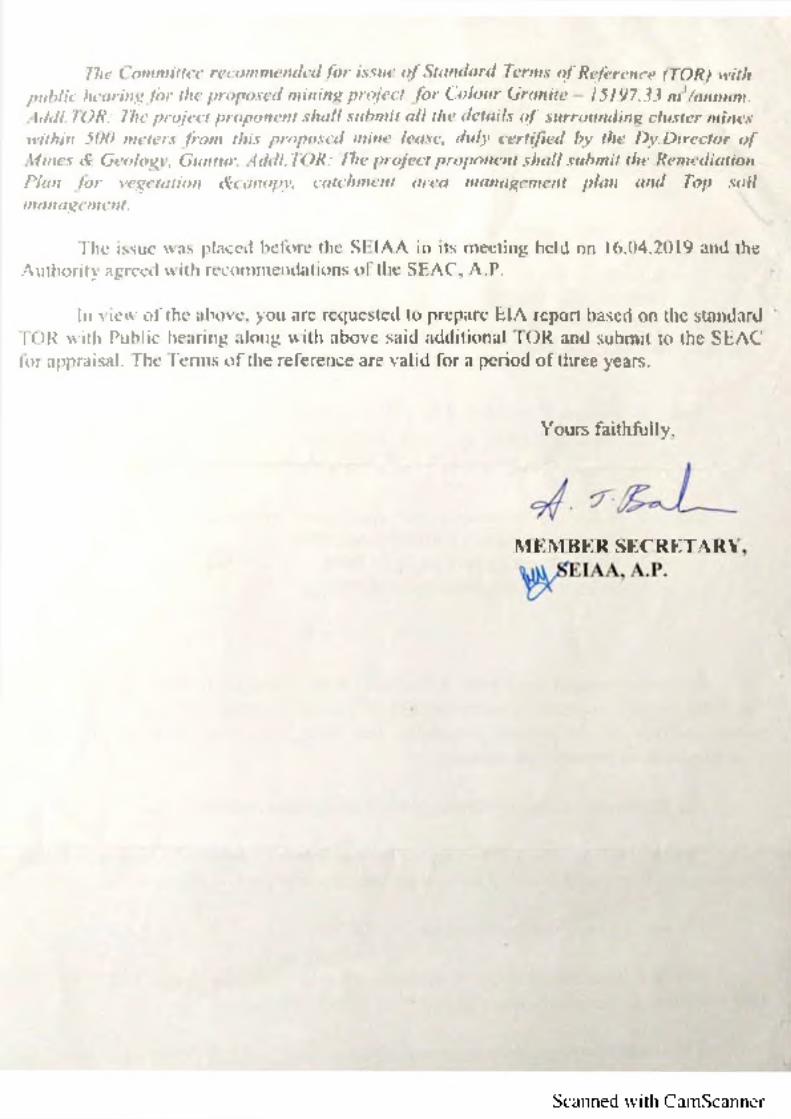
Scanned with CamScanner

Sri Raghavendra Granites Compliance of TOR
C-1 Team Labs and Consultants
Compliance of Terms of Reference Introduction Compliance for the TOR letter Issued by SEIAA, Andhra Pradesh, Govt of India, vide letter no. SEIAA/AP/PKM/MIN/ 12/2018/765-304, dt. 14.05.2019.
Compliance of Terms of Reference
S. No Terms of Reference Compliance
1. Year-wise production details since 1994 should be given, clearly stating the highest production achieved in any one year prior to 1994. It may also be categorically informed whether there had been any increase in production after the EIA Notification, 1994 came into force w.r.t. the highest production achieved prior to 1994.
In principle mine lease notice issued by Department of Mines and Geology, Government of Andhra Pradesh for a period of 20 years (Enclosed as Annexure-1). It is a fresh mine applying for Environmental clearance
2. A copy of the document in support of the fact that the Proponent is the rightful lessee of the mine should be given.
Lease memos order is enclosed as Annexure-1 in EIA report.
3. All documents including approved mine plan, EIA and public hearing should be compatible with one another in terms of the mine lease area, production levels, waste generation and its management and mining technology and should be in the name of the lessee.
The Mining plan has been approved by the Joint and Deputy Director of Mines and Geology, Guntur, Government of Andhra Pradesh, Government of Andhra Pradesh. EIA report is prepared for same extent, same method of mining, same production, waste generation and its management. The final EIA report is submitted after Public hearing. Mine lease area is 10 ha, Mining technology, Production capacity is presented in chapter-2.0 of EIA report.
4. All corner coordinates of the mine lease area, superimposed on a High-Resolution Imagery/toposheet, topographic sheet, geomorphology and geology of the area should be provided. Such an Imagery of the proposed area should clearly show the land use and other ecological features of the study area (core and buffer zone).
Corner coordinates of the mine lease area is superimposed on Survey of India topo sheet and presented in chapter-1 of EIA report. Land use and land cover of the area is presented in chapter-3.0 of EIA report.
5. Information should be provided in Survey of India Toposheet in 1:50,000 scale indicating geological map of the area, geomorphology of land forms of the area, existing minerals and mining history of the area, important water bodies, streams and rivers and soil characteristics.
Land use and land cover of the area is presented in chapter-3.0 of EIA report.
6. Details about the land proposed for mining activities should be given with information as
The present mining lease area is granted to independent entrepreneur.

Sri Raghavendra Granites Compliance of TOR
C-2 Team Labs and Consultants
S. No Terms of Reference Compliance
to whether mining conforms to the land use policy of the State; land diversion for mining should have approval from State land use board or the concerned authority.
He prepared and approved the Environment Policy. Objective and Responsibility of the policy are presented in Environment Management Plan, page no. 10-9.
7. It should be clearly stated whether the proponent company has a well laid down Environment Policy approved by its Board of Directors? If so, it may be spelt out in the EIA report with description of the prescribed operating process/procedures to bring into focus any infringement/deviation/violation of the environmental or forest norms/ conditions? The hierarchical system or administrative order of the Company to deal with the environmental issues and for ensuring compliance with the EC conditions may also be given. The system of reporting of non-compliances / violations of environmental norms to the Board of Directors of the Company and/or shareholders or stakeholders at large may also be detailed in the EIA report.
The present mining lease area is granted to an independent entrepreneur. He has prepared and approved the Environment Policy. Objective and Responsibility of the policy are presented in Environment Management Plan.
8. Issues relating to Mine Safety, including subsidence study in case of underground mining and slope study in case of open cast mining, blasting study etc. should be detailed. The proposed safeguard measures in each case should also be provided.
Occupational Safety and Health measures are presented in EIA report. Subsidence is not anticipated as it is an open cast mining activity.
9. The study area will comprise of 10 km zone around the mine lease from lease periphery and the data contained in the EIA such as waste generation etc should be for the life of the mine / lease period.
The study area considered is 10 km around the periphery of mine lease area (Refer EIA, page no. 1-4). Waste management details are presented in chapter 2.0, EIA report.
10. Land use of the study area delineating forest area, agricultural land, grazing land, wildlife sanctuary, national park, migratory routes of fauna, water bodies, human settlements and other ecological features should be indicated. Land use plan of the mine lease area should be prepared to encompass preoperational, operational and post operational phases and submitted. Impact, if any, of change of land use should be given.
Land use and land cover map of the study area is presented in chapter-3. There is no national park, wildlife sanctuary within 10 km of the mine lease periphery. Land use plan of the mine lease area is presented in chapter 2.0.
11. Details of the land for any Over Burden Dumps outside the mine lease, such as extent of land area, distance from mine lease, its land use, R&R issues, if any, should be given.
Waste management details are presented in chapter 2.0.

Sri Raghavendra Granites Compliance of TOR
C-3 Team Labs and Consultants
S. No Terms of Reference Compliance
12. A Certificate from the Competent Authority in the State Forest Department should be provided, confirming the involvement of forest land, if any, in the project area. In the event of any contrary claim by the Project Proponent regarding the status of forests, the site may be inspected by the State Forest Department along with the Regional Office of the Ministry to ascertain the status of forests, based on which, the Certificate in this regard as mentioned above be issued. In all such cases, it would be desirable for representative of the State Forest Department to assist the Expert Appraisal Committees.
The proposed mine lease area is a government revenue land, no forest land is involved.
13. Status of forestry clearance for the broken up area and virgin forest land involved in the Project including deposition of net present value (NPV) and compensatory afforestation (CA) should be indicated. A copy of the forestry clearance should also be furnished.
The proposed mine lease area is a govt land, no forest land is involved and no permission is required.
14. Implementation status of recognition of forest rights under the Scheduled Tribes and other Traditional Forest Dwellers (Recognition of Forest Rights) Act, 2006 should be indicated.
The proposed mine lease area is a government revenue land and the area does not belong to scheduled tribes and other traditional forest dwellers.
15. The vegetation in the RF / PF areas in the study area, with necessary details, should be given.
Vegetation and flora of the core zone and buffer zone are presented in chapter-3.0 of EIA report.
16. A study shall be got done to ascertain the impact of the Mining Project on wildlife of the study area and details furnished. Impact of the project on the wildlife in the surrounding and any other protected area and accordingly detailed mitigative measures required, should be worked out with cost implications and submitted.
There is no wildlife sanctuary within 10km radius of the lease periphery and there is no wild animal movement in core and buffer zone. There is no schedule-I flora and fauna present in the 10km radius from the mine lease periphery.
17. Location of National Parks, Sanctuaries, Biosphere Reserves, Wildlife Corridors, Ramsar site Tiger/Elephant Reserves (existing as well as proposed), if any, within 10 km of the mine lease should be clearly indicated, supported by a location map duly authenticated by Chief Wildlife Warden. Necessary clearance, as may be applicable to such projects due to proximity of the ecologically sensitive areas as mentioned above, should be obtained from the Standing Committee of National Board of Wildlife and copy furnished.
There is no Ecologically sensitive area like National Park, Wildlife/Bird sanctuary, Biosphere Reserve, Wildlife Corridor, Tiger/Elephant Reserve and Critically Polluted area within the 10 km radius of the mine lease periphery.

Sri Raghavendra Granites Compliance of TOR
C-4 Team Labs and Consultants
S. No Terms of Reference Compliance
18. A detailed biological study of the study area [core zone and buffer zone (10 km radius of the periphery of the mine lease)] shall be carried out. Details of flora and fauna, endangered, endemic and RET Species duly authenticated, separately for core and buffer zone should be furnished based on such primary field survey, clearly indicating the Schedule of the fauna present. In case of any scheduled-I fauna found in the study area, the necessary plan along with budgetary provisions for their conservation should be prepared in consultation with State Forest and Wildlife Department and details furnished. Necessary allocation of funds for implementing the same should be made as part of the project cost.
Biological study of the study area [core zone and buffer zone (10 km radius of the periphery of the mine lease)] is conducted. Flora and fauna of the study area separately for core and buffer zone is presented in chapter-3.0 of EIA report.
19. Proximity to Areas declared as 'Critically Polluted' or the Project areas likely to come under the 'Aravali Range', (attracting court restrictions for mining operations), should also be indicated and where so required, clearance certifications from the 'prescribed Authorities, such as the SPCB or State Mining Dept. should be secured and furnished to the effect that the proposed mining activities could be considered.
There is no Critically Polluted area within the 10 km radius of the mine lease periphery.
20. Similarly, for coastal Projects, A CRZ map duly authenticated by one of the authorized agencies demarcating LTL. HTL, CRZ area, location of the mine lease w.r.t CRZ, coastal features such as mangroves, if any, should be furnished. (Note: The Mining Projects falling under CRZ would also need to obtain approval of the concerned Coastal Zone Management Authority).
Not applicable, The Mine lease area is away from CRZ.
21. R&R Plan/compensation details for the Project Affected People (PAP) should be furnished. While preparing the R&R Plan, the relevant State/National Rehabilitation & Resettlement Policy should be kept in view. In respect of SCs /STs and other weaker sections of the society in the study area, a need based sample survey, family-wise, should be undertaken to assess their requirements, and action programmes prepared and submitted accordingly, integrating the sectoral programmes of line departments of the State Government. It may be clearly brought out whether the village(s)
The proposed mine lease area has no settlements, and hence R&R of village does not arise. The mining lease area does not belong to any scheduled area and other weaker sections of the society.
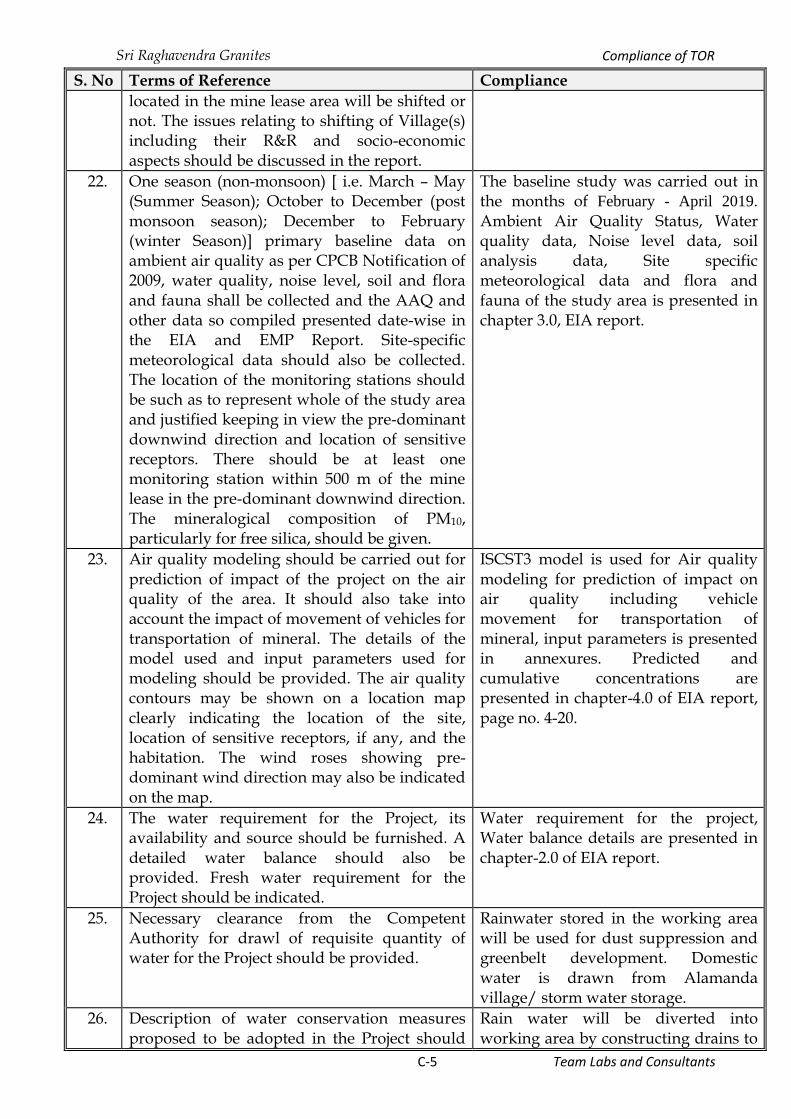
Sri Raghavendra Granites Compliance of TOR
C-5 Team Labs and Consultants
S. No Terms of Reference Compliance
located in the mine lease area will be shifted or not. The issues relating to shifting of Village(s) including their R&R and socio-economic aspects should be discussed in the report.
22. One season (non-monsoon) [ i.e. March – May (Summer Season); October to December (post monsoon season); December to February (winter Season)] primary baseline data on ambient air quality as per CPCB Notification of 2009, water quality, noise level, soil and flora and fauna shall be collected and the AAQ and other data so compiled presented date-wise in the EIA and EMP Report. Site-specific meteorological data should also be collected. The location of the monitoring stations should be such as to represent whole of the study area and justified keeping in view the pre-dominant downwind direction and location of sensitive receptors. There should be at least one monitoring station within 500 m of the mine lease in the pre-dominant downwind direction. The mineralogical composition of PM10, particularly for free silica, should be given.
The baseline study was carried out in the months of February - April 2019. Ambient Air Quality Status, Water quality data, Noise level data, soil analysis data, Site specific meteorological data and flora and fauna of the study area is presented in chapter 3.0, EIA report.
23. Air quality modeling should be carried out for prediction of impact of the project on the air quality of the area. It should also take into account the impact of movement of vehicles for transportation of mineral. The details of the model used and input parameters used for modeling should be provided. The air quality contours may be shown on a location map clearly indicating the location of the site, location of sensitive receptors, if any, and the habitation. The wind roses showing pre-dominant wind direction may also be indicated on the map.
ISCST3 model is used for Air quality modeling for prediction of impact on air quality including vehicle movement for transportation of mineral, input parameters is presented in annexures. Predicted and cumulative concentrations are presented in chapter-4.0 of EIA report, page no. 4-20.
24. The water requirement for the Project, its availability and source should be furnished. A detailed water balance should also be provided. Fresh water requirement for the Project should be indicated.
Water requirement for the project, Water balance details are presented in chapter-2.0 of EIA report.
25. Necessary clearance from the Competent Authority for drawl of requisite quantity of water for the Project should be provided.
Rainwater stored in the working area will be used for dust suppression and greenbelt development. Domestic water is drawn from Alamanda village/ storm water storage.
26. Description of water conservation measures proposed to be adopted in the Project should
Rain water will be diverted into working area by constructing drains to
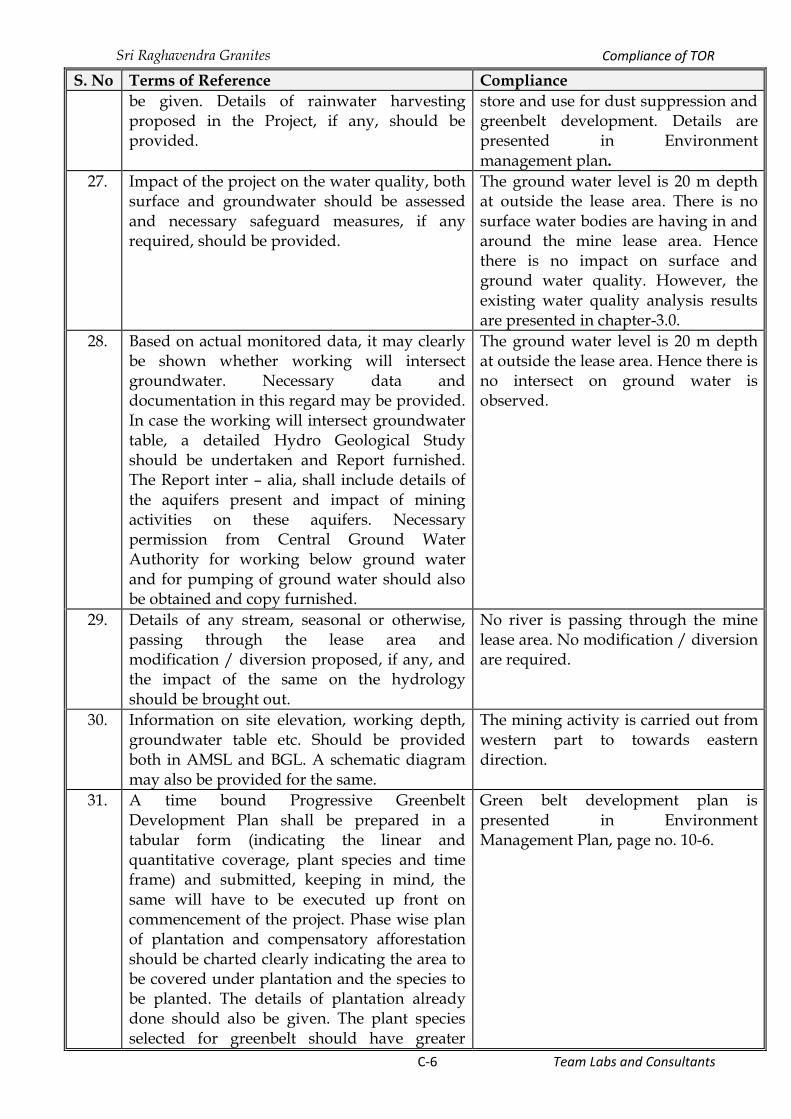
Sri Raghavendra Granites Compliance of TOR
C-6 Team Labs and Consultants
S. No Terms of Reference Compliance
be given. Details of rainwater harvesting proposed in the Project, if any, should be provided.
store and use for dust suppression and greenbelt development. Details are presented in Environment management plan.
27. Impact of the project on the water quality, both surface and groundwater should be assessed and necessary safeguard measures, if any required, should be provided.
The ground water level is 20 m depth at outside the lease area. There is no surface water bodies are having in and around the mine lease area. Hence there is no impact on surface and ground water quality. However, the existing water quality analysis results are presented in chapter-3.0.
28. Based on actual monitored data, it may clearly be shown whether working will intersect groundwater. Necessary data and documentation in this regard may be provided. In case the working will intersect groundwater table, a detailed Hydro Geological Study should be undertaken and Report furnished. The Report inter – alia, shall include details of the aquifers present and impact of mining activities on these aquifers. Necessary permission from Central Ground Water Authority for working below ground water and for pumping of ground water should also be obtained and copy furnished.
The ground water level is 20 m depth at outside the lease area. Hence there is no intersect on ground water is observed.
29. Details of any stream, seasonal or otherwise, passing through the lease area and modification / diversion proposed, if any, and the impact of the same on the hydrology should be brought out.
No river is passing through the mine lease area. No modification / diversion are required.
30. Information on site elevation, working depth, groundwater table etc. Should be provided both in AMSL and BGL. A schematic diagram may also be provided for the same.
The mining activity is carried out from western part to towards eastern direction.
31. A time bound Progressive Greenbelt Development Plan shall be prepared in a tabular form (indicating the linear and quantitative coverage, plant species and time frame) and submitted, keeping in mind, the same will have to be executed up front on commencement of the project. Phase wise plan of plantation and compensatory afforestation should be charted clearly indicating the area to be covered under plantation and the species to be planted. The details of plantation already done should also be given. The plant species selected for greenbelt should have greater
Green belt development plan is presented in Environment Management Plan, page no. 10-6.
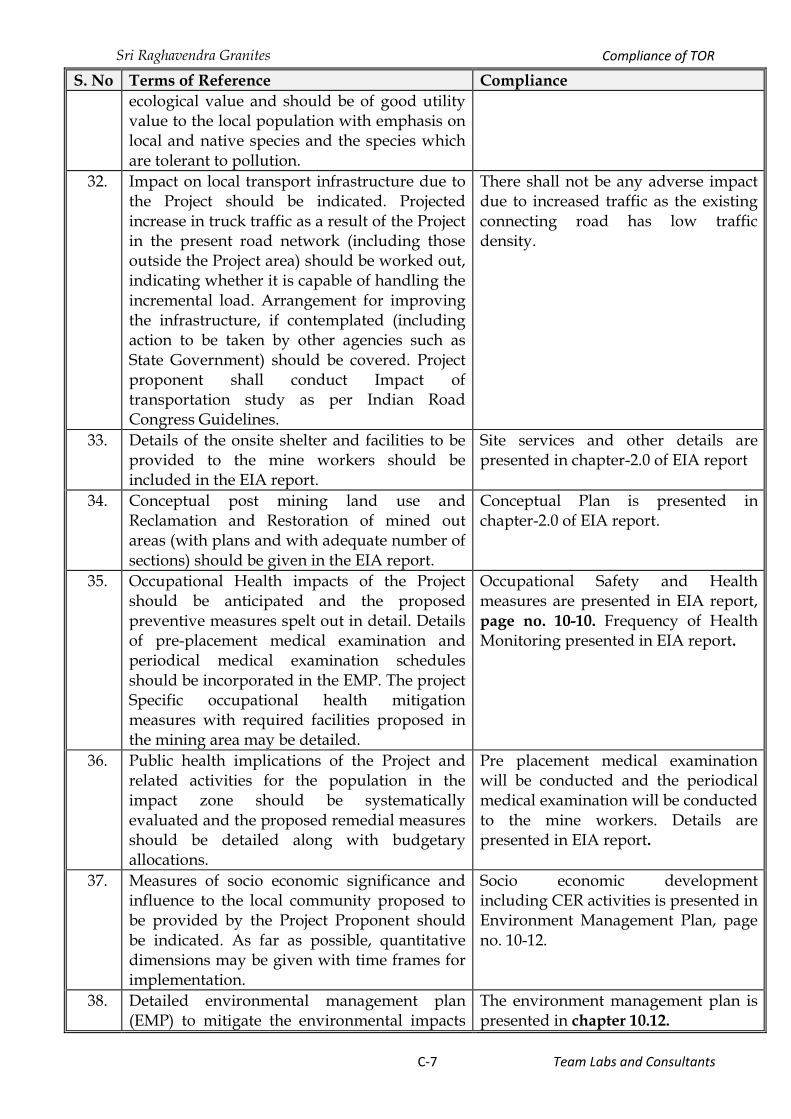
Sri Raghavendra Granites Compliance of TOR
C-7 Team Labs and Consultants
S. No Terms of Reference Compliance
ecological value and should be of good utility value to the local population with emphasis on local and native species and the species which are tolerant to pollution.
32. Impact on local transport infrastructure due to the Project should be indicated. Projected increase in truck traffic as a result of the Project in the present road network (including those outside the Project area) should be worked out, indicating whether it is capable of handling the incremental load. Arrangement for improving the infrastructure, if contemplated (including action to be taken by other agencies such as State Government) should be covered. Project proponent shall conduct Impact of transportation study as per Indian Road Congress Guidelines.
There shall not be any adverse impact due to increased traffic as the existing connecting road has low traffic density.
33. Details of the onsite shelter and facilities to be provided to the mine workers should be included in the EIA report.
Site services and other details are presented in chapter-2.0 of EIA report
34. Conceptual post mining land use and Reclamation and Restoration of mined out areas (with plans and with adequate number of sections) should be given in the EIA report.
Conceptual Plan is presented in chapter-2.0 of EIA report.
35. Occupational Health impacts of the Project should be anticipated and the proposed preventive measures spelt out in detail. Details of pre-placement medical examination and periodical medical examination schedules should be incorporated in the EMP. The project Specific occupational health mitigation measures with required facilities proposed in the mining area may be detailed.
Occupational Safety and Health measures are presented in EIA report, page no. 10-10. Frequency of Health Monitoring presented in EIA report.
36. Public health implications of the Project and related activities for the population in the impact zone should be systematically evaluated and the proposed remedial measures should be detailed along with budgetary allocations.
Pre placement medical examination will be conducted and the periodical medical examination will be conducted to the mine workers. Details are presented in EIA report.
37. Measures of socio economic significance and influence to the local community proposed to be provided by the Project Proponent should be indicated. As far as possible, quantitative dimensions may be given with time frames for implementation.
Socio economic development including CER activities is presented in Environment Management Plan, page no. 10-12.
38. Detailed environmental management plan (EMP) to mitigate the environmental impacts
The environment management plan is presented in chapter 10.12.
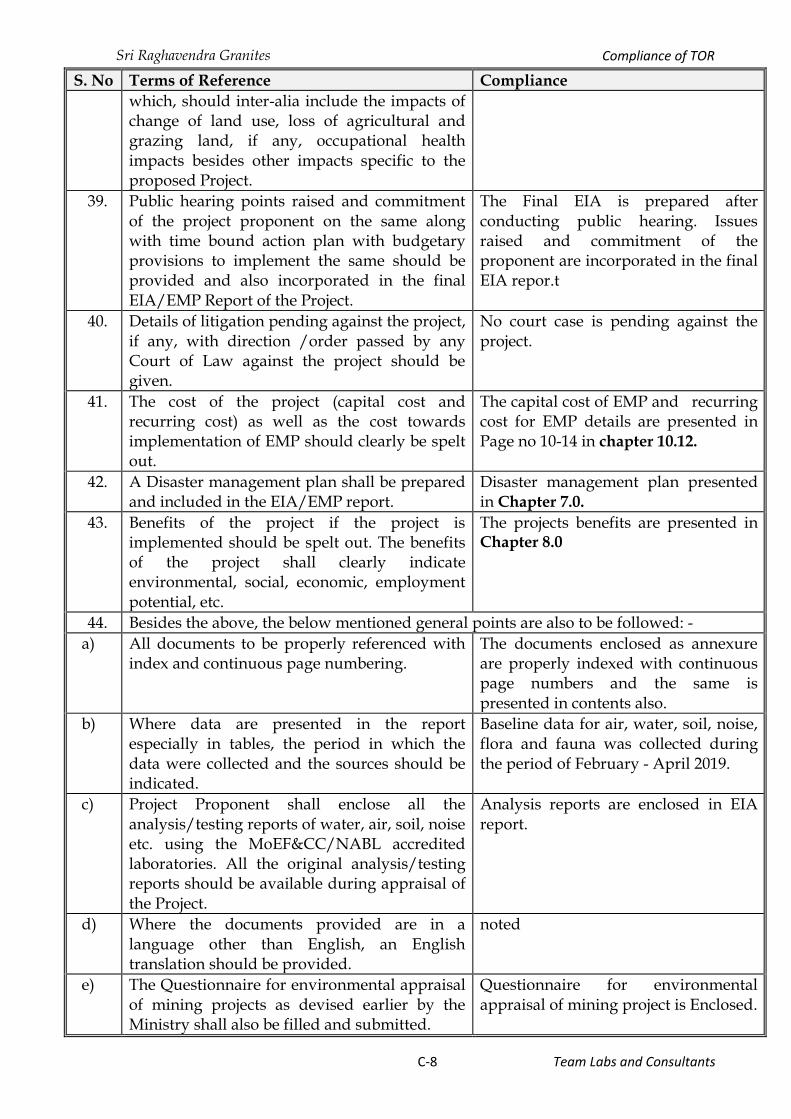
Sri Raghavendra Granites Compliance of TOR
C-8 Team Labs and Consultants
S. No Terms of Reference Compliance
which, should inter-alia include the impacts of change of land use, loss of agricultural and grazing land, if any, occupational health impacts besides other impacts specific to the proposed Project.
39. Public hearing points raised and commitment of the project proponent on the same along with time bound action plan with budgetary provisions to implement the same should be provided and also incorporated in the final EIA/EMP Report of the Project.
The Final EIA is prepared after conducting public hearing. Issues raised and commitment of the proponent are incorporated in the final EIA repor.t
40. Details of litigation pending against the project, if any, with direction /order passed by any Court of Law against the project should be given.
No court case is pending against the project.
41. The cost of the project (capital cost and recurring cost) as well as the cost towards implementation of EMP should clearly be spelt out.
The capital cost of EMP and recurring cost for EMP details are presented in Page no 10-14 in chapter 10.12.
42. A Disaster management plan shall be prepared and included in the EIA/EMP report.
Disaster management plan presented in Chapter 7.0.
43. Benefits of the project if the project is implemented should be spelt out. The benefits of the project shall clearly indicate environmental, social, economic, employment potential, etc.
The projects benefits are presented in Chapter 8.0
44. Besides the above, the below mentioned general points are also to be followed: -
a) All documents to be properly referenced with index and continuous page numbering.
The documents enclosed as annexure are properly indexed with continuous page numbers and the same is presented in contents also.
b) Where data are presented in the report especially in tables, the period in which the data were collected and the sources should be indicated.
Baseline data for air, water, soil, noise, flora and fauna was collected during the period of February - April 2019.
c) Project Proponent shall enclose all the analysis/testing reports of water, air, soil, noise etc. using the MoEF&CC/NABL accredited laboratories. All the original analysis/testing reports should be available during appraisal of the Project.
Analysis reports are enclosed in EIA report.
d) Where the documents provided are in a language other than English, an English translation should be provided.
noted
e) The Questionnaire for environmental appraisal of mining projects as devised earlier by the Ministry shall also be filled and submitted.
Questionnaire for environmental appraisal of mining project is Enclosed.
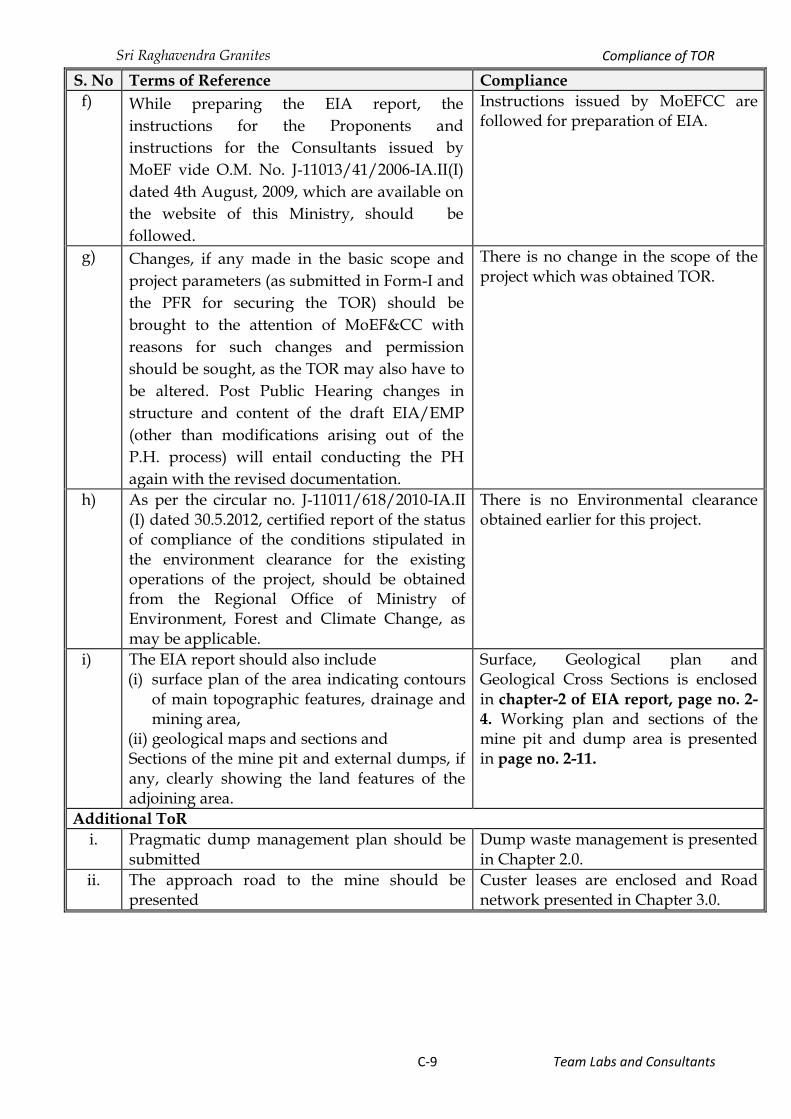
Sri Raghavendra Granites Compliance of TOR
C-9 Team Labs and Consultants
S. No Terms of Reference Compliance
f) While preparing the EIA report, the
instructions for the Proponents and
instructions for the Consultants issued by
MoEF vide O.M. No. J-11013/41/2006-IA.II(I)
dated 4th August, 2009, which are available on
the website of this Ministry, should be
followed.
Instructions issued by MoEFCC are followed for preparation of EIA.
g) Changes, if any made in the basic scope and
project parameters (as submitted in Form-I and
the PFR for securing the TOR) should be
brought to the attention of MoEF&CC with
reasons for such changes and permission
should be sought, as the TOR may also have to
be altered. Post Public Hearing changes in
structure and content of the draft EIA/EMP
(other than modifications arising out of the
P.H. process) will entail conducting the PH
again with the revised documentation.
There is no change in the scope of the project which was obtained TOR.
h) As per the circular no. J-11011/618/2010-IA.II (I) dated 30.5.2012, certified report of the status of compliance of the conditions stipulated in the environment clearance for the existing operations of the project, should be obtained from the Regional Office of Ministry of Environment, Forest and Climate Change, as may be applicable.
There is no Environmental clearance obtained earlier for this project.
i) The EIA report should also include (i) surface plan of the area indicating contours
of main topographic features, drainage and mining area,
(ii) geological maps and sections and Sections of the mine pit and external dumps, if any, clearly showing the land features of the adjoining area.
Surface, Geological plan and Geological Cross Sections is enclosed in chapter-2 of EIA report, page no. 2-
4. Working plan and sections of the mine pit and dump area is presented in page no. 2-11.
Additional ToR
i. Pragmatic dump management plan should be submitted
Dump waste management is presented in Chapter 2.0.
ii. The approach road to the mine should be presented
Custer leases are enclosed and Road network presented in Chapter 3.0.
SRI RAGHAVENDRA GRANITES
SURVEY NO. 359, BALLIKURAVA VILLAGE AND MANDAL, PRAKASAM DISTRICT, ANDHRA PRADESH
4.ANNEXURE
SUBMITTED TO ANDHRA PRADESH POLLUTION CONTROL BOARD,
REGIONAL OFFICE, ONGOLE
Submitted By Sri Raghavendra Granites Flat No. G6, Sudha Towers, Opposite Seetharamaiah High School, Lakshmipuram Main Road, Guntur – 522 007
Studies and Documentation BY TEAM Labs and Consultants B-115 to 117 & 509, Annapurna Block, Aditya Enclave, Ameerpet, Hyderabad-500 038. Phone: 040-23748 555/616, Telefax: 040-23748666 Email: [email protected]

Annexures of EIA/EMP
Team Labs and Consultants
ANNEXURE Google Map
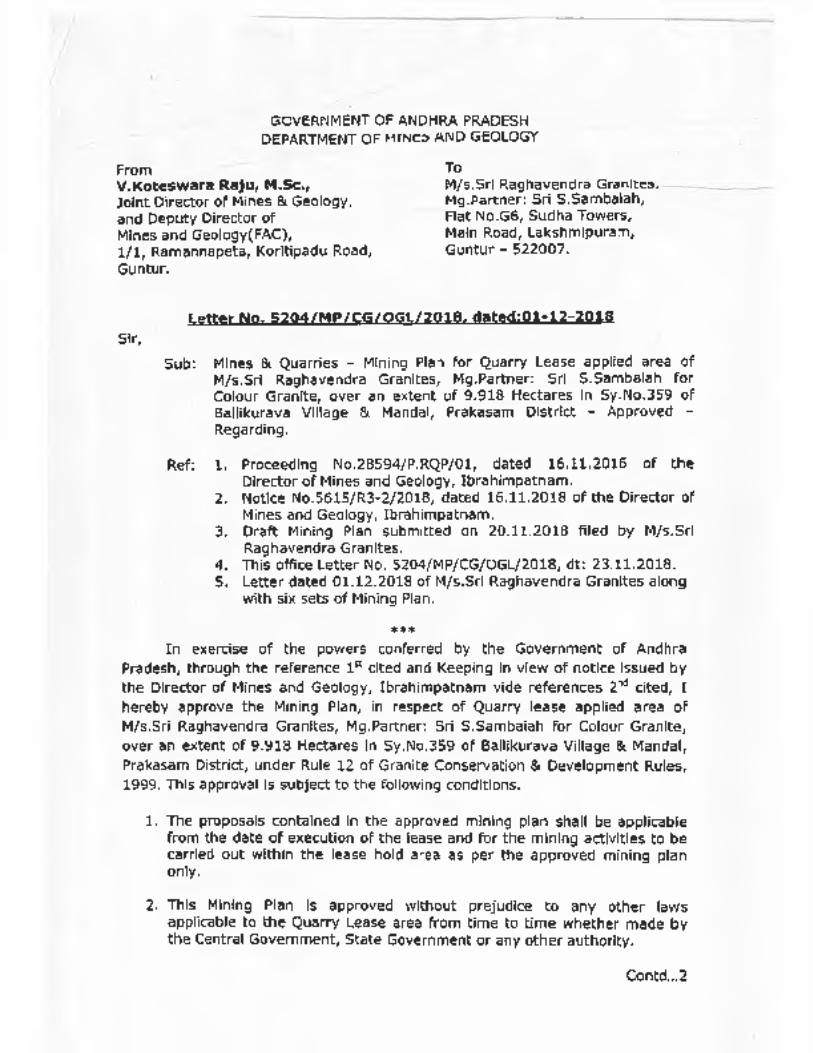


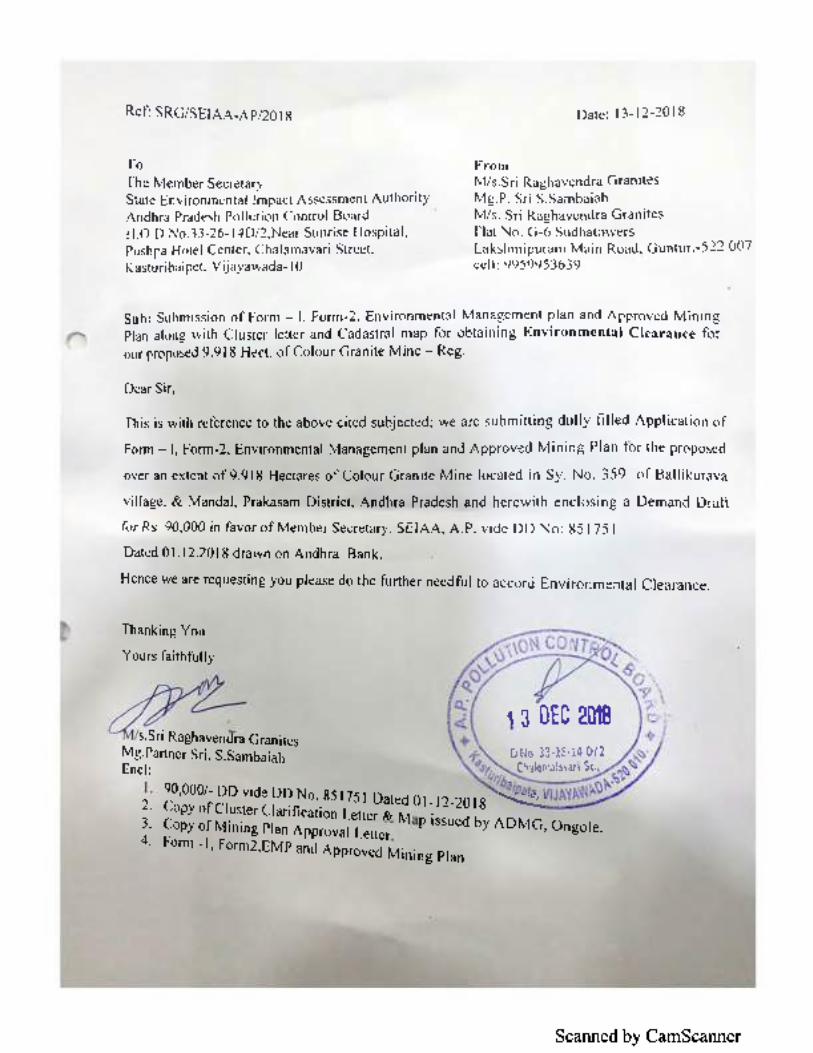
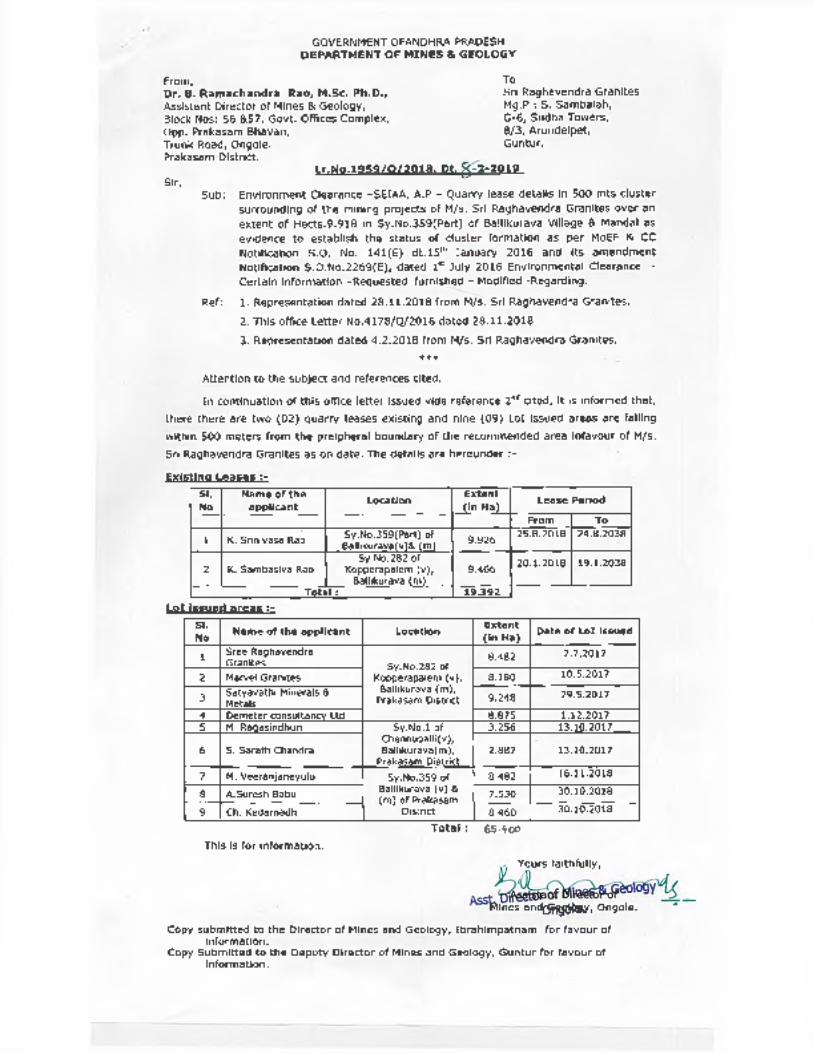


Q-1
PROFORMA FOR ENVIRONMENTAL APPRAISAL OF MINING PROJECTS
(MINING SECTOR PROJECTS)
1. General Information
(a) Name of the project : Sri Raghavendra Granites
(i) Name of the proponent : Sri Raghavendra Granites Mailing Address : House No. 1—3-12, B-74, Plot No.201, Suguna Homes, 4th line, SVN Colony, Chandramouli Nagar, Guntur – 522 007
Telephone :
Fax No. : --
Objective of the project: Semi mechanized opencast mining for colour granite mine in ana area of 9.918 ha - production capacity 101315.52 m3/annum (Recovery of colour granite @ 15% - 15197.33 m3/annum and Waste @ 85% - 86118.19 m3/annum)
(c) Location of mine (s)
State and District
Mandal Village Lease Area, ha
Ownership of the lease area
Sy. No.
Andhra Pradesh and Prakasam
Ballikurava
Ballikurava 9.918 Govt. Land 359
(d) Does the proposal relate to:
(i) New mine Yes No
(ii) Expansion Yes No • Increase in ML area Yes No
• Increase in annual production Yes No
✓
×
×
×
Note 1 : All information to be given in the form of Annex/s should be properly numbered and form part of reply to this proforma.
Note 2 : Please enter √ in appropriate box where answer is Yes / No
Note 3 : No abbreviation to be used - Not available or Not applicable should be clearly
mentioned.
Note 4 : Core zone is the mining lease area.
Buffer zone in case of ML area up to 25 ha is to be considered as 5 km all around the periphery of the core zone and for ML area above 25 ha an area 10 km all
around the periphery of the core zone.
Note 5 : Adopt Scoping process in carrying out EIA study.
Note 6 : Please indicate source of data.
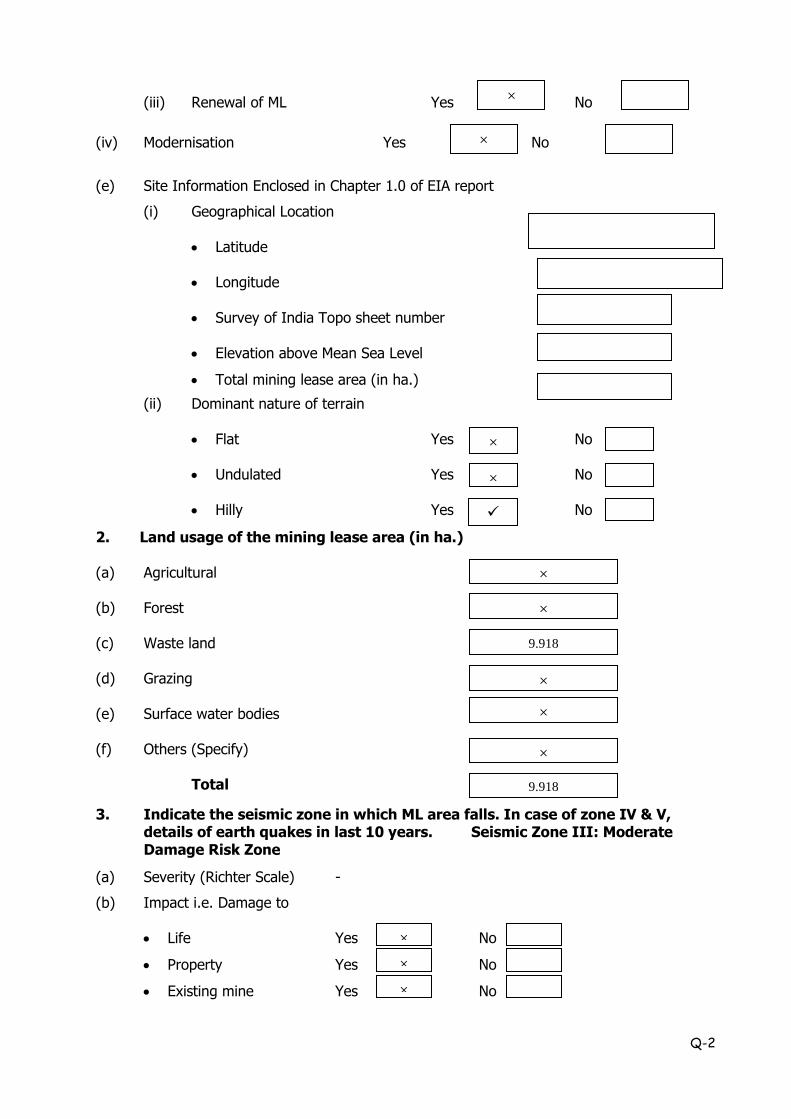
Q-2
(iii) Renewal of ML Yes No
(iv) Modernisation Yes No
(e) Site Information Enclosed in Chapter 1.0 of EIA report
(i) Geographical Location
• Latitude
• Longitude • Survey of India Topo sheet number • Elevation above Mean Sea Level
• Total mining lease area (in ha.)
(ii) Dominant nature of terrain • Flat Yes No
• Undulated Yes No
• Hilly Yes No
2. Land usage of the mining lease area (in ha.) (a) Agricultural (b) Forest (c) Waste land (d) Grazing (e) Surface water bodies (f) Others (Specify)
Total
3. Indicate the seismic zone in which ML area falls. In case of zone IV & V, details of earth quakes in last 10 years. Seismic Zone III: Moderate Damage Risk Zone
(a) Severity (Richter Scale) -
(b) Impact i.e. Damage to • Life Yes No
• Property Yes No
• Existing mine Yes No
×
×
×
×
×
×
✓
×
9.918
×
×
×
9.918
× ×

Q-3
4. Break-up of mining lease area (in ha.) as per approved conceptual plan:
Purpose Mining Lease Area Total Area acquired Area to be acquired
Government Private Government Private Government Private
Forest Others Agri Others Forest Others Agri Others Forest Others Agri Others
1. Area to be excavated × 7.293 × × × × × × × × × × 2. Storage for top soil × x × × × × × × × × × × 3. Overburden / Dumps × 1.6 × × × × × × × × × × 4. Mineral storage × x × × × × × × × × × × 5. Infrastructure (Workshop,
Administrative Building) × 0.02 × × × × × × × × × ×
6. Roads × 0.03 × × × × × × × × × × 7. Railways × × × × × × × × × × × × 8. Green Belt × 0.075 × × × × × × × × × × 9.Tailings pond × × × × × × × × × × × × 10.Effluent treatment plant × × × × × × × × × × × × 11.Coal handling plant /
mineral separation plant × × × × × × × × × × × ×
12. Township area × × × × × × × × × × × × 13.Other (Specify)-vacent × 0.9 × × × × × × × × × ×
TOTAL × 9.918 × × × × × × × × × ×

Q-4
5. Township (outside mining lease) - NA-
(a) Total area (in ha)
(b) No. of dwelling units (c) Distance from mine site
6. Distance of water bodies (in km)
Distance from
River Bank * Other Water bodies * Sea / creek / lake / nalla etc.
(specify)
Mining lease boundary Nil Nil
Ancillary facilities [* From highest flood line / high tide line]
7. For projects falling within the Coastal Regulation Zone (CRZ)
Whether the mineral to be mined is of rare Nature and not available outside CRZ? Yes No
if yes, annex a scaled location map showing low tide line (LTL), high tide line (HTL) duly demarcated by one of the authorized agencies* [ *Director, Space Application Centre, Ahmedabad: Centre for Earth Sciences Studies, Thiruvananthapuram: Institute of Remote Sensing, Anna University, Chennai: Institute of Wetland Management & Ecological Designs, KolKata: Naval Hydrographers’s Office, Dehradun: National Institute of Oceanography, Panjim, Goa: and National Institute of Ocean Technology, Chennai], boundary of mining lease area, distance of ML area from LTL and HTL CRZ boundary and CRZ classification of the project area as per the approved Coastal Zone Management Plan, and settlements, sand dunes, mangroves, forest land/patches, turtles breeding and nesting sites etc., if any, in the project area.
8. Indicate aerial distance from the periphery of core zone / area from the periphery of the buffer zone to the boundary of following (up to 10 km):
S. No.
Areas Name Aerial distance from (in km.)
Core * Buffer* Zone Zone
1. National Park / Sanctuary - - -
2. Biosphere Reserve / Tiger Reserve / Elephant Reserve / any other Reserve
- - -
3. Forest (RF / PF / unclassified) Enclosed in EIA report
4. Habitat for migratory birds - -
5. Corridor for animals of schedule I & II of the Wildlife (Protection) Act, 1972
- -
6. Archaeological sites * Notified
* Others
- -
-
-
-
✓

Q-5
7. Defence Installation - -
8. Industries / Thermal Power Plants - -
9. Other Mines Enclosed -
10. Airport - -
11. Railway Lines - -
12. National / State Highways - - [* Buffer zone in case of ML area up to 25 ha. is to be considered as 5 km all around the periphery of
the core zone and for ML area above 25 ha. an area 10 km all around the periphery of the core zone].
9.Description of flora & fauna separately in the core and buffer zones.* (Enclosed in Chapter-3 of EIA report) [* Consult the Wildlife (Protection) Act, 1972 as amended subsequently and list species with (1)
Common name (2) Scientific name and (3) under which schedule of the Wildlife (Protection) Act the identified species fall. Get the list authenticated by an Expert in the field / credible scientific institute /
University / Chief Wildlife Warden office. Information to be based on field survey.]
A. Flora Core Zone Buffer Zone
1. Agricultural crops
2. Commercial crops
3. Plantation
4. Natural vegetation / forest type
5. Grass lands
6. Endangered species
7. Endemic species
8. Others (Specify)
B. Fauna
1. Total listing of faunal elements
2. Endangered species
3. Endemic species
4. Migratory species
5. Details of aquatic fauna, if applicable
10. Details of mineral reserves (as per approved Mining Plan)
Quantity (in Tons)
(a) Proved (b) Indicated
(c) Inferred (d) Mineable reserves
11. Major geological formation / disturbances in the mining lease area (a) Geological maps submitted Yes No
(b) Geological sections submitted Yes No
(c) Contour map submitted Yes No
(d) Whether the presence, if any, Noted of
937129.3
✓
767944.1
✓
✓

Q-6
(i) Faults Yes No
(ii) Dykes Yes No
(iii) Shear Zone Yes No
[ (iv) Folds Yes No
(v) Other weak zones Yes No
(e) Source of data (Indicate)
12. Production of mineral(s) and life of mine
(a) Rated capacity of mine (Tonnes / annum)
Mineral wise (Tonnes / annum) production capacity of 85780.74 m3/annum (Colour granite - recovery @ 15% - 12867.11 m3/annum and waste @ 85% - 72913.63 m3/annum)
(b) Life of mine at proposed capacity (Years)
(c) Lease period (Years)
(d) Date of expiry of lease (D /M /Y)
(e) Indicate in case of existing mines (Ref: Chapter 2.0, EIA report)
(i) Date of opening of mine (ii) Production in the last 5 years 1st year 5th year
from year 2006 to year 2011 in tonnes.
(iii) Projected production for the next 6th to 10th year 5 years from year 2012 to year
2016 in tonnes.
(iv) Whether mining was suspended after Yes No opening of the mine? If yes, details thereof including last production figure and reason for the same.
(f) Whether plans & sections provided? Yes No 13. Type and method of mining operations
TYPE METHOD
Opencast ✓ Manual
Underground Semi-mechanised ✓
51 years
2038
20
✓
✓
✓
✓ ✓ ✓
✓
Primary Source

Q-7
Both Mechanised
14. Details of ancillary operations for mineral processing
(a) Existing (b) Additional
15. Mine details
(a) Opencast mine *(Mining Operation Details are Enclosed in Chapter-2) (i) Stripping ratio (mineral in tonnes to over burden in m3) (ii) Ultimate working depth (in m bgl) (iii) Indicate present working depth in case of
existing mine (in m bgl) (iv) Thickness of top soil (in m.):
• Minimum
• Maximum
• Average
(v) Thickness of overburden (in m.)
• Minimum
• Maximum
• Average
(vi) Mining Plan
• Height and width of the bench in overburden / waste. • Height & width of the bench in ore body /
coal seam.
• Proposed inclination / slope of the sides of the opencast mine (separately for overburden, coal / ore and overall slope of the pit sides) both while operating the mine as well as at the time of closure of the mine.
• Whether transverse sections across the Yes No Opencast mine at the end of fifth year
and at the end of the life of the mine have been submitted? (vii) Type of blasting, if any, to be adopted.
(b) Underground mine -NA-
×
×
×
×
×
×
✓
×
×
×
Q-8
(i) Seam / Ore body Min.Depth (m) Max. Depth (m) Avg. thickness (m)
Rate of dip in degree Direction of dip
(ii) Mode of entry into the mine
• Shaft
• Adit
• Incline
(iii) Details of machinery
On surface At Face For transportation Others
(iv) Method of stoping (metalliferrous mines)
• Open
• Filled
• Shrinkage
• Caving
• Combination of above
• Others (Specify)
(v) Extraction method [
• Caving
• Stowing
• Partial extraction
(vi) Subsidence
• Predicted max. subsidence (in m)
• Max. value of tensile strain (in mm/m)
• Max. slope change (in mm/m)
• Whether identified possible subsidence area(s) superimposed on Surface Yes No
Plan has been submitted?
• Major impacts on surface features like natural drainage pattern, houses, buildings, water bodies, roads, forest,

Q-9
etc. • Salient features of subsidence
management (monitoring and control). 16. Surface drainage pattern at mine site
(a) Whether the pre-mining surface drainage plan Yes No
submitted?
(b) Do you propose any modification / diversion Yes No in the existing natural drainage pattern at any stage? If yes, when. Provide location map indicating contours, dimensions of water body to be diverted, direction of flow of water and proposed route / changes, if any i.e. realignment of river / nallah / any other water body falling within core zone and
its impact.
17. Embankment and / or weir construction (a) Do you propose, at any stage, construction of
(i) Embankment for protection against flood? Yes No
(ii) Weir for water storage for the mine? Yes No
(b) If so, provide details thereof.
(c) Impact of embankment on HFL and settlement around.-NA.
(d) Impact of weir on down stream users of water. 18. Vehicular traffic density (outside the ML area)
Type of vehicles No. of vehicles per day
(a) Existing
(b) After the proposed activity
(c) Whether the existing road Yes No network is adequate? If no, provide details of alternative proposal?
19. Loading, transportation and unloading of mineral and waste rocks on surface:
(a) Manual Yes No
(b) Tubs, mine cars, etc. Yes No
(c) Scraper, shovels, dumpers / trucks. Yes No ]
✓
✓
46 Trucks
✓
✓
✓
✓
✓ ✓
✓

Q-10
(d) Conveyors (belt, chain, etc.) Yes No
(e) Others (specify)
20. Mineral(s) transportation outside the ML area – (annual)
Qty. (in Tons) Percentage (%) Length (in km)
(a) Road
(b) Rail
(c) Conveyors
(d) Rope way
(e) Water ways
(f) Pipeline
(g) Others (Specify)
Total
100
100
Loader will use for loading

Q-11
21. Baseline Meteorological and Air Quality data (Enclosed in Chapter-3 of EIA report
(a) Micro-meteorological data (Refer Chapter-3 of EIA report) [Continuous monitoring through autographic instrument for one full season other than monsoon]
(i) Wind rose pattern for one full season (16 points of compass i.e. N, NNE, NE, ---) based on 24-hourly data. For coastal area also furnish day-time and night time data.
• Day time
• Night time
• 24 – hours period (ii) Site specific monitored data
Month Wind Speed (kmph) Temperature (oC) Relative Humidity (%) Rain Fall * (mm) Cloud Cover**
(Octas of sky)
Mean Max. % of calm
Mean (Dry Bulb)
Highest Lowest Mean Highest
Lowest Total 24-hours Highest
No. of rainy days
Mean
* 24-hours rainfall should be reported from 08:30 hrs. IST of previous day to 08:30 hrs. IST of the day.
* Rainy day is considered when 24 hrs. Rainfall is 2.5 mm. ** Visual observations of cloud cover should be recorded four times a day at regular intervals.
(iii) Indicate name and distance of the nearest IMD meteorological Ongole
station from which climatological data have been obtained for reporting in the EIA report, if any.
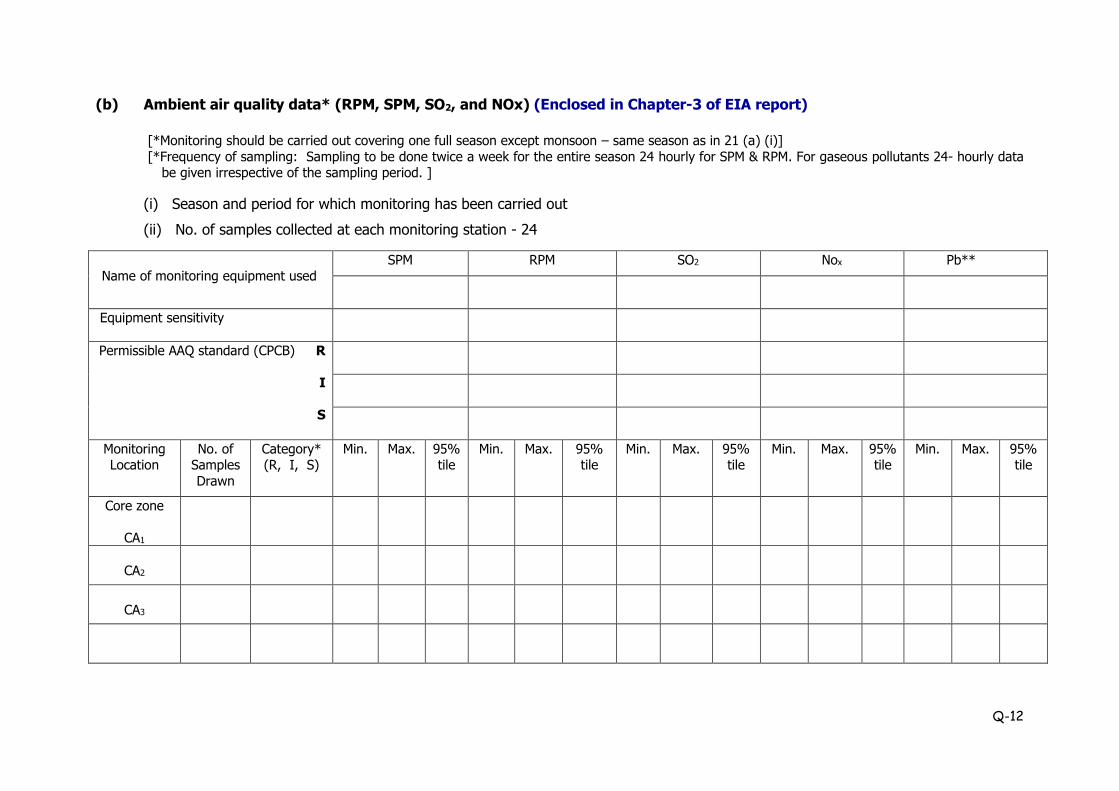
Q-12
(b) Ambient air quality data* (RPM, SPM, SO2, and NOx) (Enclosed in Chapter-3 of EIA report)
[*Monitoring should be carried out covering one full season except monsoon – same season as in 21 (a) (i)]
[*Frequency of sampling: Sampling to be done twice a week for the entire season 24 hourly for SPM & RPM. For gaseous pollutants 24- hourly data be given irrespective of the sampling period. ]
(i) Season and period for which monitoring has been carried out
(ii) No. of samples collected at each monitoring station - 24
Name of monitoring equipment used
SPM RPM SO2 Nox Pb**
Equipment sensitivity
Permissible AAQ standard (CPCB) R
I
S
Monitoring Location
No. of Samples
Drawn
Category* (R, I, S)
Min. Max. 95% tile
Min. Max. 95% tile
Min. Max. 95% tile
Min. Max. 95% tile
Min. Max. 95% tile
Core zone
CA1
CA2
CA3

Q-13
Buffer zone
BA1
BA2
BA3
*R = Residential; I = Industrial; S = Sensitive
**Pb for mineral specific sites only.
# Annex a location map indicating location of AAQ stations, their direction and distance with respect to project site.

Q-14
22. Stack and emission details , if any* -NA-
Sl.
No.
Process / unit of
operation (e.g.
DG Set, Boiler)
Height of
stack (m)
Internal
top dia.
(m)
Flue gas
exit velocity
(m/sec)
Emission rate (kg/hr) Heat
emission rate from
top of stack
(K.cal/hr)
Exhaust / Flue gas
SPM SO2 NOx CO Temp
OC Density Specific
Heat Volumetric flow rate
(m3/hr.)
1
2
23. Details of fugitive emissions during mining operations*: Water sprinkling provided.
24. Air Quality Impact Prediction (AQIP)* (Enclosed in Chapter-4 of EIA report)
(a) Details of model(s) used for AQIP including grid ISCST3 model of Lakes Environmental Based on USEPA, ISCST3 Algorithms size, terrain features, and input meteorological data 1kmX1km, Point, Area, Volume and Open Pits.
(b) Maximum incremental GLC values of pollutants based on prediction exercise
(in μg/m3) S. No. Pollutants
Incremental Value Ambient Air Quality Resultant Air Quality
1. SPM
2**. SO2
3**. NOX
[* Question Number 22, 23 & 24 need not be filled-in for mines having ML area of 25 ha. or less.]
[**Information on item no. 2 & 3 to be provided in cases with captive power generation of 500 KVA and above]

Q-15
25. Water requirement (m3/day) 16.7 KLD, Presented in EIA report page no 2.11.
Purpose Avg. Demand Peak Demand
A. Mine site
1. Mine operation
2. Land reclamation
3. Dust suppression
4. Drinking
5. Green Belt
6. Beneficiation
7. Washeries
8. Fire Service
9. Others (specify)-
domestic
B. Township
1. Green Belt
2. Domestic
3. Other (specify)
Total
26. Source of water supply*
S. No. Source m3/day
1 River (name) ×
2 Ground water 9.2
3 Mine water (sump / pit) 10
4 Other surface water bodies (specify) From nearby villages
[*Annex a copy of sanction letter / permission from the concerned authority (Central Ground
Water Authority in case of ground water abstraction is from notified area / State Ground Water Board in case of non-notified area / State Irrigation Department for surface water pumping) for
drawing water.]
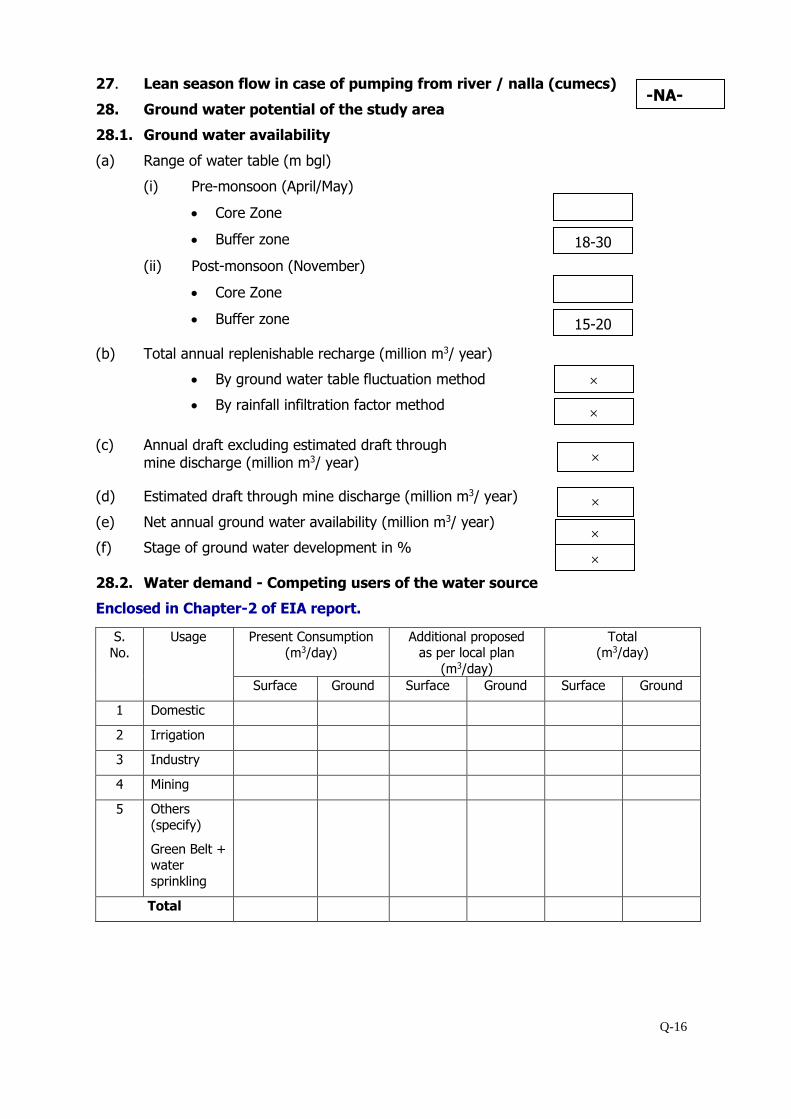
Q-16
27. Lean season flow in case of pumping from river / nalla (cumecs)
28. Ground water potential of the study area
28.1. Ground water availability
(a) Range of water table (m bgl)
(i) Pre-monsoon (April/May)
• Core Zone
• Buffer zone
(ii) Post-monsoon (November)
• Core Zone
• Buffer zone
(b) Total annual replenishable recharge (million m3/ year)
• By ground water table fluctuation method
• By rainfall infiltration factor method
(c) Annual draft excluding estimated draft through mine discharge (million m3/ year)
(d) Estimated draft through mine discharge (million m3/ year)
(e) Net annual ground water availability (million m3/ year)
(f) Stage of ground water development in %
28.2. Water demand - Competing users of the water source
Enclosed in Chapter-2 of EIA report.
S.
No.
Usage Present Consumption
(m3/day)
Additional proposed as per local plan
(m3/day)
Total (m3/day)
Surface Ground Surface Ground Surface Ground
1 Domestic
2 Irrigation
3 Industry
4 Mining
5 Others
(specify)
Green Belt + water
sprinkling
Total
×
-NA-
18-30
15-20
×
×
× ×
×

Q-17
29. Water quality* (Enclosed in Chapter-3 of EIA report
(a) Annex physico -chemical analysis of water at intake point **
(b) In case of existing mine, annex report on quality of water discharge i.e. complete physico - chemical analysis**
[*For non-discharging mines at least four ground water samples to be taken preferably from
downstream direction of the mine in pre-monsoon and post-monsoon periods and analysed. For discharging mines six samples are to be analysed]
**All parameters as per BIS 10500. Indicate name of Methodology, Equipment used for
analysis, and Detection Level (DL) for each parameter. *** Wherever any analytical parameter is below detection level, “BDL” (Below Detection Level)
should be written instead of ‘NIL’.
29. Impact on ground water regime / stream / lake / springs due to mine dewatering *-NA.
Ground water level is 25m BGL and max. depth of mining is 20m.
(a) Radius of influence (in m)
[To be estimated based on analysis of pumping test data and application of empirical formula]
(b) Whether saline water ingress will take place? Yes No (applicable to coastal areas) (c) Impact on stream / lake / springs
[* Provide a comprehensive hydro-geological assessment report if the average mine dewatering is more than 100 m3/day and or going below water table in non-monsoon period.
The report should be based on preferably latest one year pre-monsoon and post-monsoon baseline data covering information on ground water situation, aquifer characteristics, water level
conditions (April – May and November), estimate of ground water resources, predicted impact of the project on ground water regime and detailed remedial / conservation measures such as
artificial recharge of ground water etc. The report should be based on actual field inventory out
of existing wells, at least 30 observation wells in the buffer zone with supplementary information from secondary sources (mention name). For estimation** of ground water resource (refer
question no. 28 above) be designated study area of the buffer zone may be sub-divided into command and non-command areas, watershed-wise (in case of hard rock / consolidated
formations) / block-wise / mandal-wise in case of alluvial / unconsolidated formations)]
[**For estimating ground water resources in the area follow the Ground Water Estimation
Committee recommendations of 1997]
31. Waste Water Management
Mine
(a) Daily average discharge (m3/day) from different sources
(i) Mine water discharge during
• Lean period • Monsoon period
(ii) Workshop
(iii) Domestic (mine site)
Nil
1.4
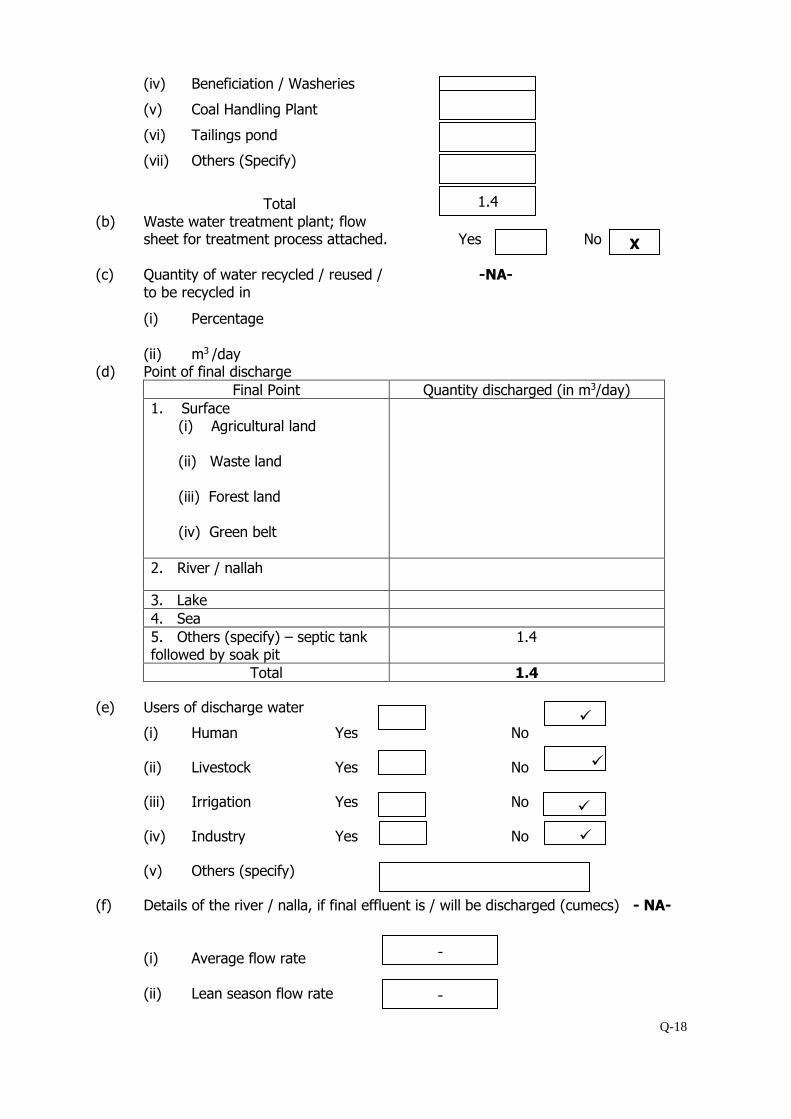
Q-18
(iv) Beneficiation / Washeries
(v) Coal Handling Plant
(vi) Tailings pond
(vii) Others (Specify)
Total
(b) Waste water treatment plant; flow sheet for treatment process attached. Yes No
(c) Quantity of water recycled / reused / -NA- to be recycled in
(i) Percentage
(ii) m3 /day (d) Point of final discharge
Final Point Quantity discharged (in m3/day)
1. Surface (i) Agricultural land (ii) Waste land (iii) Forest land (iv) Green belt
2. River / nallah
3. Lake
4. Sea
5. Others (specify) – septic tank followed by soak pit
1.4
Total 1.4
(e) Users of discharge water
(i) Human Yes No
(ii) Livestock Yes No
(iii) Irrigation Yes No
(iv) Industry Yes No
(v) Others (specify)
(f) Details of the river / nalla, if final effluent is / will be discharged (cumecs) - NA-
(i) Average flow rate
(ii) Lean season flow rate
-
1.4
X
-
✓
✓
✓
✓

Q-19
(iii) Aquatic life
(iv) Analysis of river water 100 meters Yes No upstream and 100 meters downstream of discharge point submitted.
Township
(a) Waste water generation from township (m3/day)
(b) Are you planning to provide sewage Yes No
treatment plant?
(c) Usage of treated water
32. Attach water balance statement in the form of a flow diagram indicating source (s), consumption (Section-wise) and output.
S. No Water Usage Quantity, KLD
1 Wet drilling operation 3.8
2 Water sprinkling on haul rods 3.2
3 Domestic 1.8
4 Green Belt development 0.4
Total 9.2
33. Ambient noise level leq dB (A) (Enclosed in Chapter-3)
Location of sampling station Noise level
Day Time Night Time
A. Core Zone CN1
CN2
B. Buffer Zone
BN1
BN2
34. Solid Waste (a) Top soil and Solid waste quantity and quality
Name (Lump/fines/slurry/
Sludge/others)
Composition Quantity (m3/month)
Method of disposal
Mining activity*
a. Top Soil
-
- -
-
✓
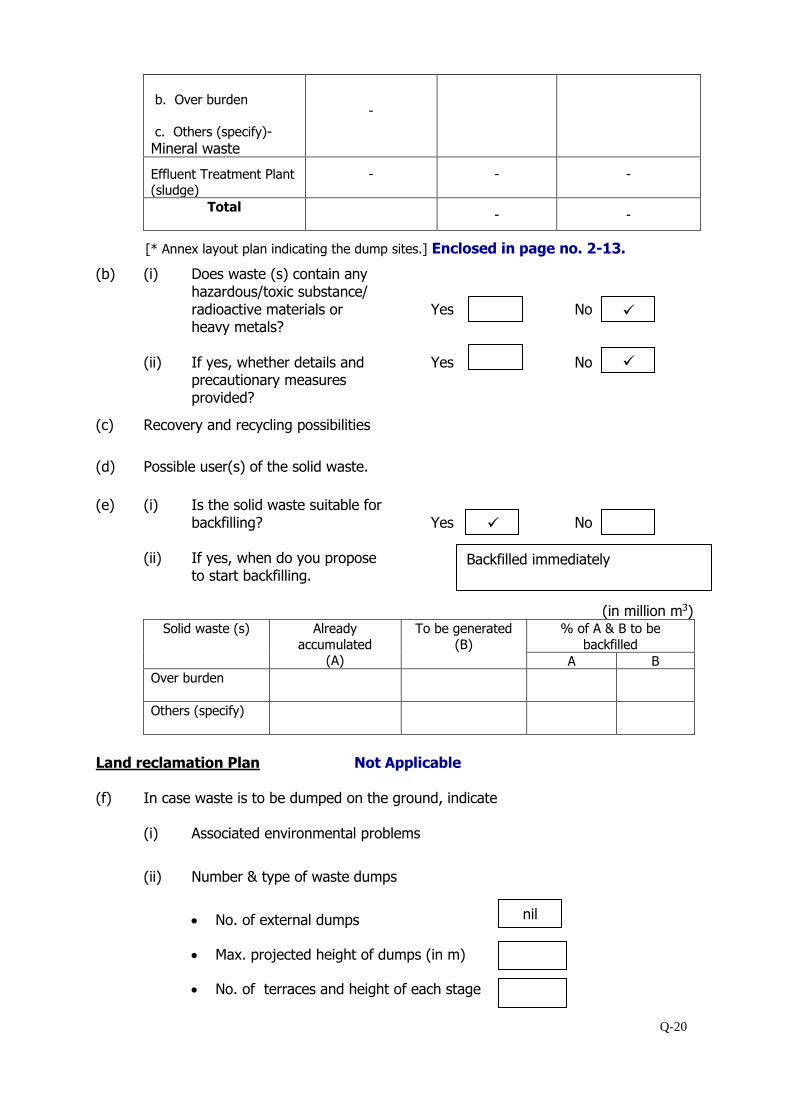
Q-20
b. Over burden
c. Others (specify)- Mineral waste
-
Effluent Treatment Plant (sludge)
- - -
Total - -
[* Annex layout plan indicating the dump sites.] Enclosed in page no. 2-13.
(b) (i) Does waste (s) contain any hazardous/toxic substance/
radioactive materials or Yes No heavy metals?
(ii) If yes, whether details and Yes No
precautionary measures provided?
(c) Recovery and recycling possibilities
(d) Possible user(s) of the solid waste.
(e) (i) Is the solid waste suitable for backfilling? Yes No
(ii) If yes, when do you propose
to start backfilling.
(in million m3) Solid waste (s) Already
accumulated (A)
To be generated
(B)
% of A & B to be
backfilled
A B
Over burden
Others (specify)
Land reclamation Plan Not Applicable
(f) In case waste is to be dumped on the ground, indicate
(i) Associated environmental problems
(ii) Number & type of waste dumps
• No. of external dumps
• Max. projected height of dumps (in m)
• No. of terraces and height of each stage
✓ 12activity* [ a. Top Soil [ b. Over burden [ c. Others (specify)
nil
Backfilled immediately
activity* [
a. Top Soil [ b. Over burden [ c. Others (specify)
✓ ctivity* [
a. Top Soil [ b. Over burden [ c. Others (specify)
✓ tivity* [
a. Top Soil [ b. Over burden [ c. Others (specify)
activity* [ a. Top Soil [ b. Over burden [ c. Others (specify)
activity* [ a. Top Soil [ b. Over burden [ c. Others (specify)
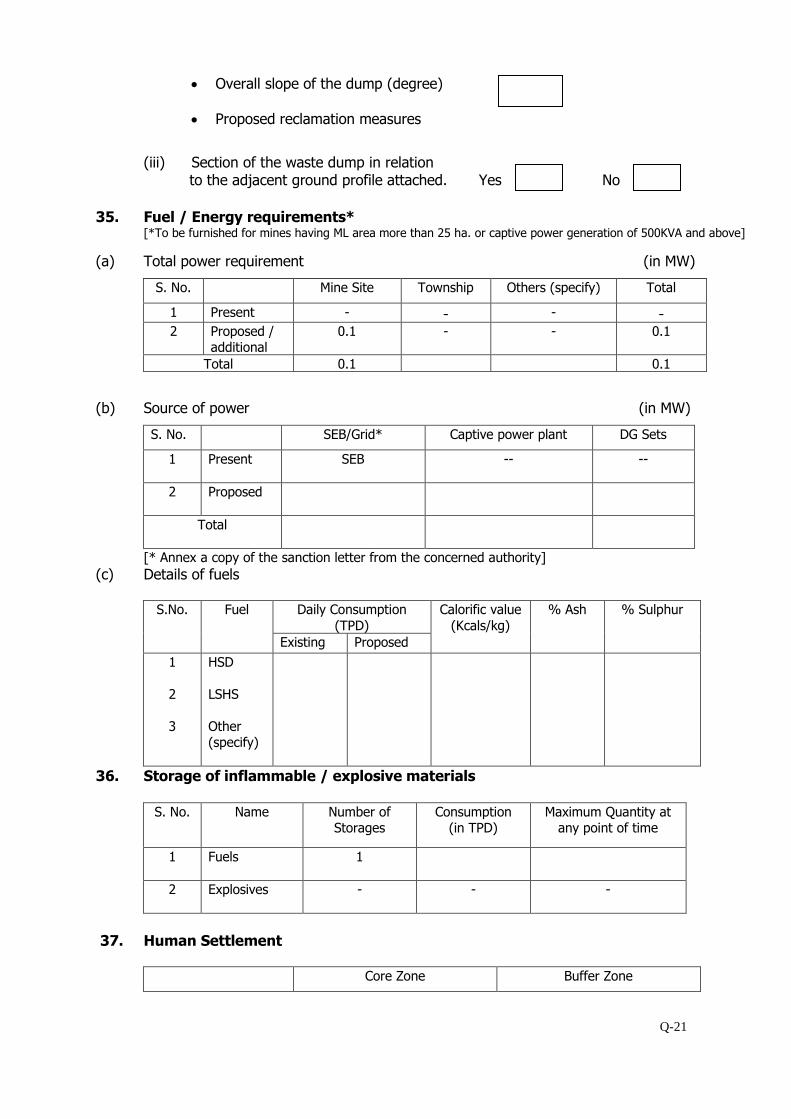
Q-21
• Overall slope of the dump (degree)
• Proposed reclamation measures
(iii) Section of the waste dump in relation to the adjacent ground profile attached. Yes No
35. Fuel / Energy requirements*
[*To be furnished for mines having ML area more than 25 ha. or captive power generation of 500KVA and above]
(a) Total power requirement (in MW)
S. No. Mine Site Township Others (specify) Total
1 Present - - - - 2 Proposed /
additional 0.1 - - 0.1
Total 0.1 0.1
(b) Source of power (in MW)
S. No. SEB/Grid* Captive power plant DG Sets
1 Present
SEB -- --
2 Proposed
Total
[* Annex a copy of the sanction letter from the concerned authority]
(c) Details of fuels
S.No. Fuel Daily Consumption
(TPD)
Calorific value
(Kcals/kg)
% Ash % Sulphur
Existing Proposed
1
2
3
HSD
LSHS
Other (specify)
36. Storage of inflammable / explosive materials
S. No. Name Number of
Storages Consumption
(in TPD) Maximum Quantity at
any point of time
1 Fuels 1
2 Explosives
- - -
37. Human Settlement
Core Zone Buffer Zone

Q-22
Population* 221251 No. of villages 44
Number of households
village-wise
56966
[* As per 2011 census record or actual survey]
38. Rehabilitation & Resettlement (R&R) Plan* NA.
[*Provide a comprehensive rehabilitation plan, if more than 1000 people are likely to be displaced, other-wise a summary plan]
(a) Villages falling within the study area Nil
Villages
Number Name
Core zone
NA
500 m from the blasting site (s)
NA
Buffer zone
NA
Township site
NA
(b) Details of village(s) in the core zone Nil
S. No.
Village name
Population* Average Annual Income Tribal Others
[*As per 2001 census / actual survey]
(c) Population to be displaced and / or Land oustees Nil
Name of village(s) falling within Number of oustees
Land (only) Homestead (only)
Land and Homestead (both)
Mining Lease
Township Site
(d) Whether R&R package has been finalised? NA
If yes, salient features of R&R plan for oustees. (i) Site details where the people are proposed to
be resettled & facilities existing / to be created.
(ii) Funds earmarked for compensation package.
(iii) Agency /Authority responsible for their resettlement.
(iv) Time of commencement of resettlement
of Project Affected People (PAP).
(v) Period by which resettlement of PAP will
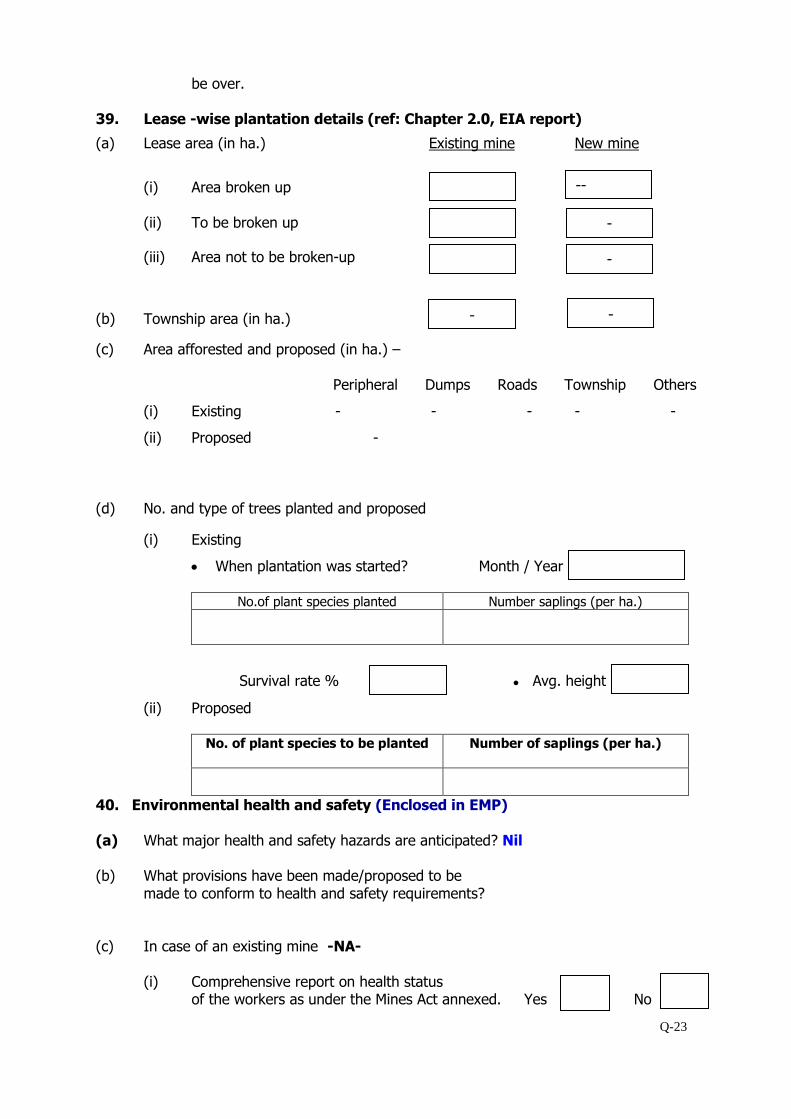
Q-23
be over. 39. Lease -wise plantation details (ref: Chapter 2.0, EIA report)
(a) Lease area (in ha.) Existing mine New mine
(i) Area broken up
(ii) To be broken up
(iii) Area not to be broken-up
(b) Township area (in ha.)
(c) Area afforested and proposed (in ha.) –
Peripheral Dumps Roads Township Others
(i) Existing - - - - -
(ii) Proposed -
(d) No. and type of trees planted and proposed
(i) Existing
• When plantation was started? Month / Year
No.of plant species planted Number saplings (per ha.)
Survival rate % ● Avg. height
(ii) Proposed
No. of plant species to be planted Number of saplings (per ha.)
40. Environmental health and safety (Enclosed in EMP) (a) What major health and safety hazards are anticipated? Nil (b) What provisions have been made/proposed to be
made to conform to health and safety requirements? (c) In case of an existing mine -NA-
(i) Comprehensive report on health status
of the workers as under the Mines Act annexed. Yes No
--
-
-
- -
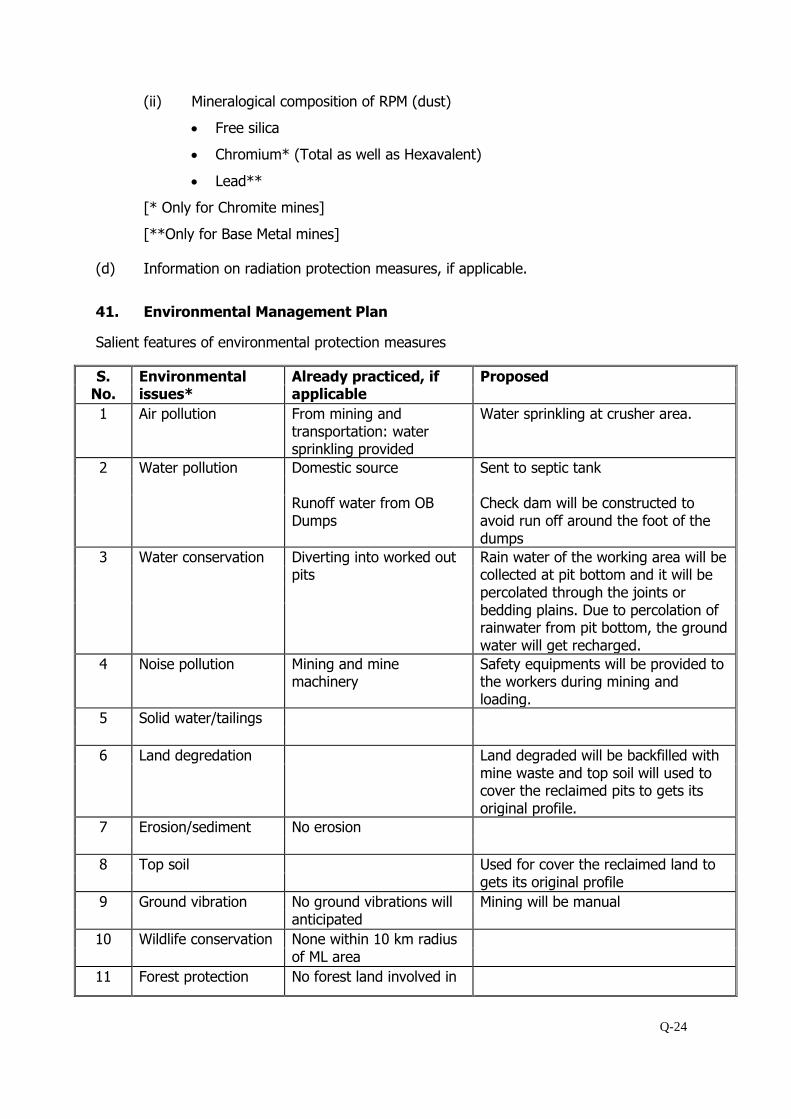
Q-24
(ii) Mineralogical composition of RPM (dust)
• Free silica
• Chromium* (Total as well as Hexavalent)
• Lead**
[* Only for Chromite mines]
[**Only for Base Metal mines]
(d) Information on radiation protection measures, if applicable.
41. Environmental Management Plan
Salient features of environmental protection measures
S. No.
Environmental issues*
Already practiced, if applicable
Proposed
1 Air pollution From mining and transportation: water sprinkling provided
Water sprinkling at crusher area.
2 Water pollution Domestic source Runoff water from OB Dumps
Sent to septic tank Check dam will be constructed to avoid run off around the foot of the dumps
3 Water conservation Diverting into worked out pits
Rain water of the working area will be collected at pit bottom and it will be percolated through the joints or bedding plains. Due to percolation of rainwater from pit bottom, the ground water will get recharged.
4 Noise pollution Mining and mine machinery
Safety equipments will be provided to the workers during mining and loading.
5 Solid water/tailings
6 Land degredation Land degraded will be backfilled with mine waste and top soil will used to cover the reclaimed pits to gets its original profile.
7 Erosion/sediment No erosion
8 Top soil Used for cover the reclaimed land to gets its original profile
9 Ground vibration No ground vibrations will anticipated
Mining will be manual
10 Wildlife conservation None within 10 km radius of ML area
11 Forest protection No forest land involved in
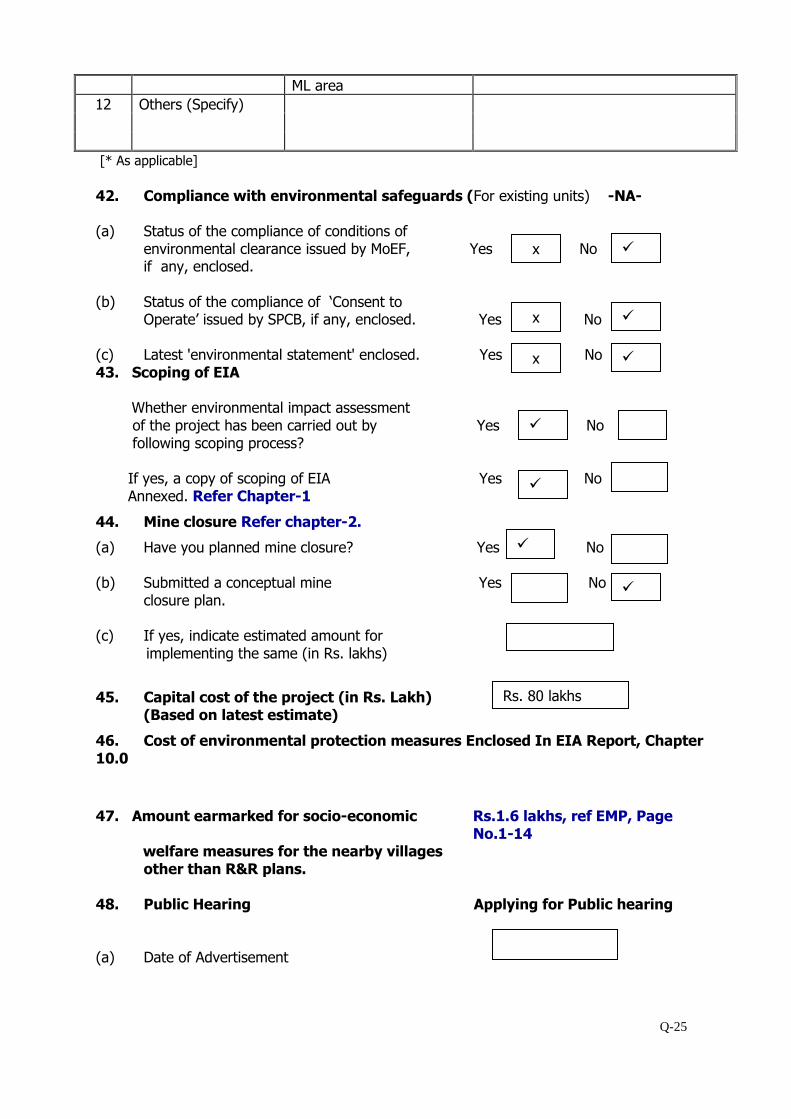
Q-25
ML area
12 Others (Specify)
[* As applicable]
42. Compliance with environmental safeguards (For existing units) -NA- (a) Status of the compliance of conditions of
environmental clearance issued by MoEF, Yes No if any, enclosed.
(b) Status of the compliance of ‘Consent to Operate’ issued by SPCB, if any, enclosed. Yes No
(c) Latest 'environmental statement' enclosed. Yes No 43. Scoping of EIA
Whether environmental impact assessment of the project has been carried out by Yes No following scoping process? If yes, a copy of scoping of EIA Yes No Annexed. Refer Chapter-1
44. Mine closure Refer chapter-2.
(a) Have you planned mine closure? Yes No (b) Submitted a conceptual mine Yes No
closure plan. (c) If yes, indicate estimated amount for implementing the same (in Rs. lakhs)
45. Capital cost of the project (in Rs. Lakh) (Based on latest estimate)
46. Cost of environmental protection measures Enclosed In EIA Report, Chapter 10.0
47. Amount earmarked for socio-economic Rs.1.6 lakhs, ref EMP, Page No.1-14
welfare measures for the nearby villages other than R&R plans.
48. Public Hearing Applying for Public hearing (a) Date of Advertisement
x
✓
✓
x
✓
x
✓
✓
✓
✓
Rs. 80 lakhs
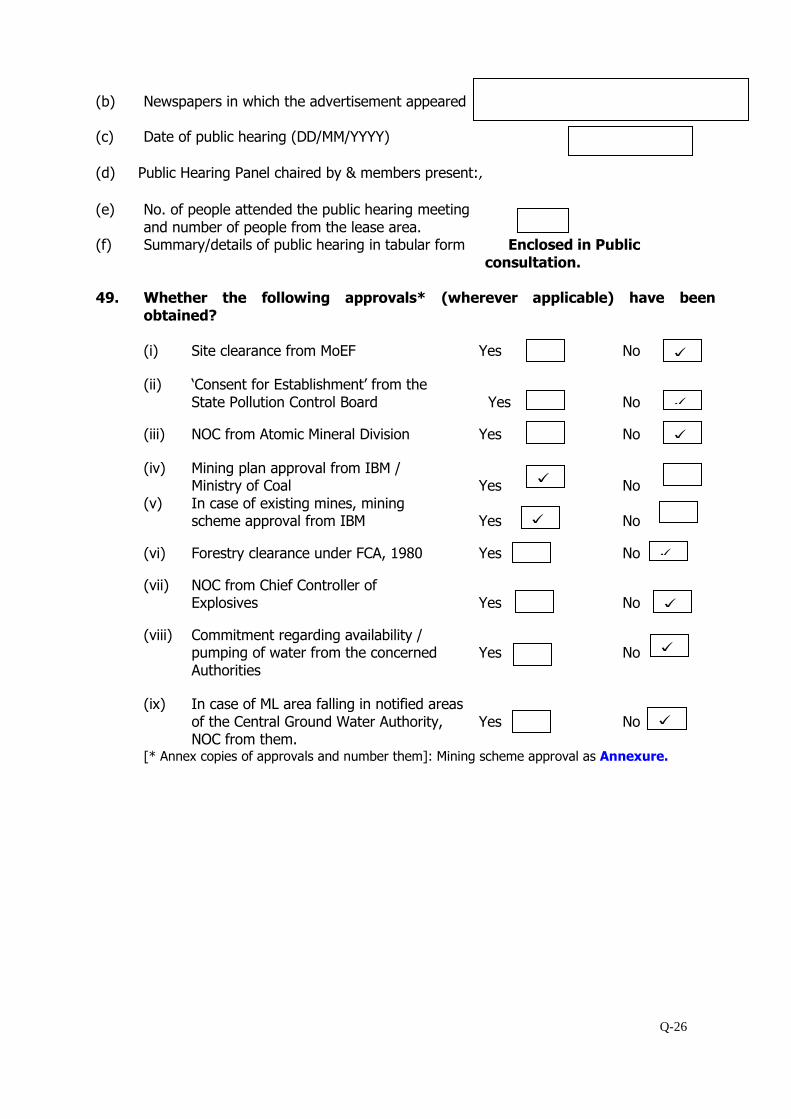
Q-26
(b) Newspapers in which the advertisement appeared (c) Date of public hearing (DD/MM/YYYY)
(d) Public Hearing Panel chaired by & members present:, (e) No. of people attended the public hearing meeting
and number of people from the lease area. (f) Summary/details of public hearing in tabular form Enclosed in Public
consultation. 49. Whether the following approvals* (wherever applicable) have been
obtained?
(i) Site clearance from MoEF Yes No
(ii) ‘Consent for Establishment’ from the State Pollution Control Board Yes No
(iii) NOC from Atomic Mineral Division Yes No
(iv) Mining plan approval from IBM / Ministry of Coal Yes No
(v) In case of existing mines, mining scheme approval from IBM Yes No
(vi) Forestry clearance under FCA, 1980 Yes No
(vii) NOC from Chief Controller of Explosives Yes No
(viii) Commitment regarding availability / pumping of water from the concerned Yes No
Authorities
(ix) In case of ML area falling in notified areas of the Central Ground Water Authority, Yes No
NOC from them. [* Annex copies of approvals and number them]: Mining scheme approval as Annexure.
✓
✓
✓
✓ ✓
✓
✓
✓
✓
Q-27
50. Was / is there any court case relating –NA. to the project or related activities?
If so, provide details present status. Verification: The data and information given in this proforma are true to the best of my
knowledge and belief.
Date: Signature of the applicant* with full name & address Place: [* Owner or his authorized signatory]
Sri Raghavendra Granites Flat No. G6, Sudha Towers, Opposite Seetharamaiah High School, Lakshmipuram Main Road, Guntur – 522 007
Given under the seal of organisation on behalf of whom the applicant is signing
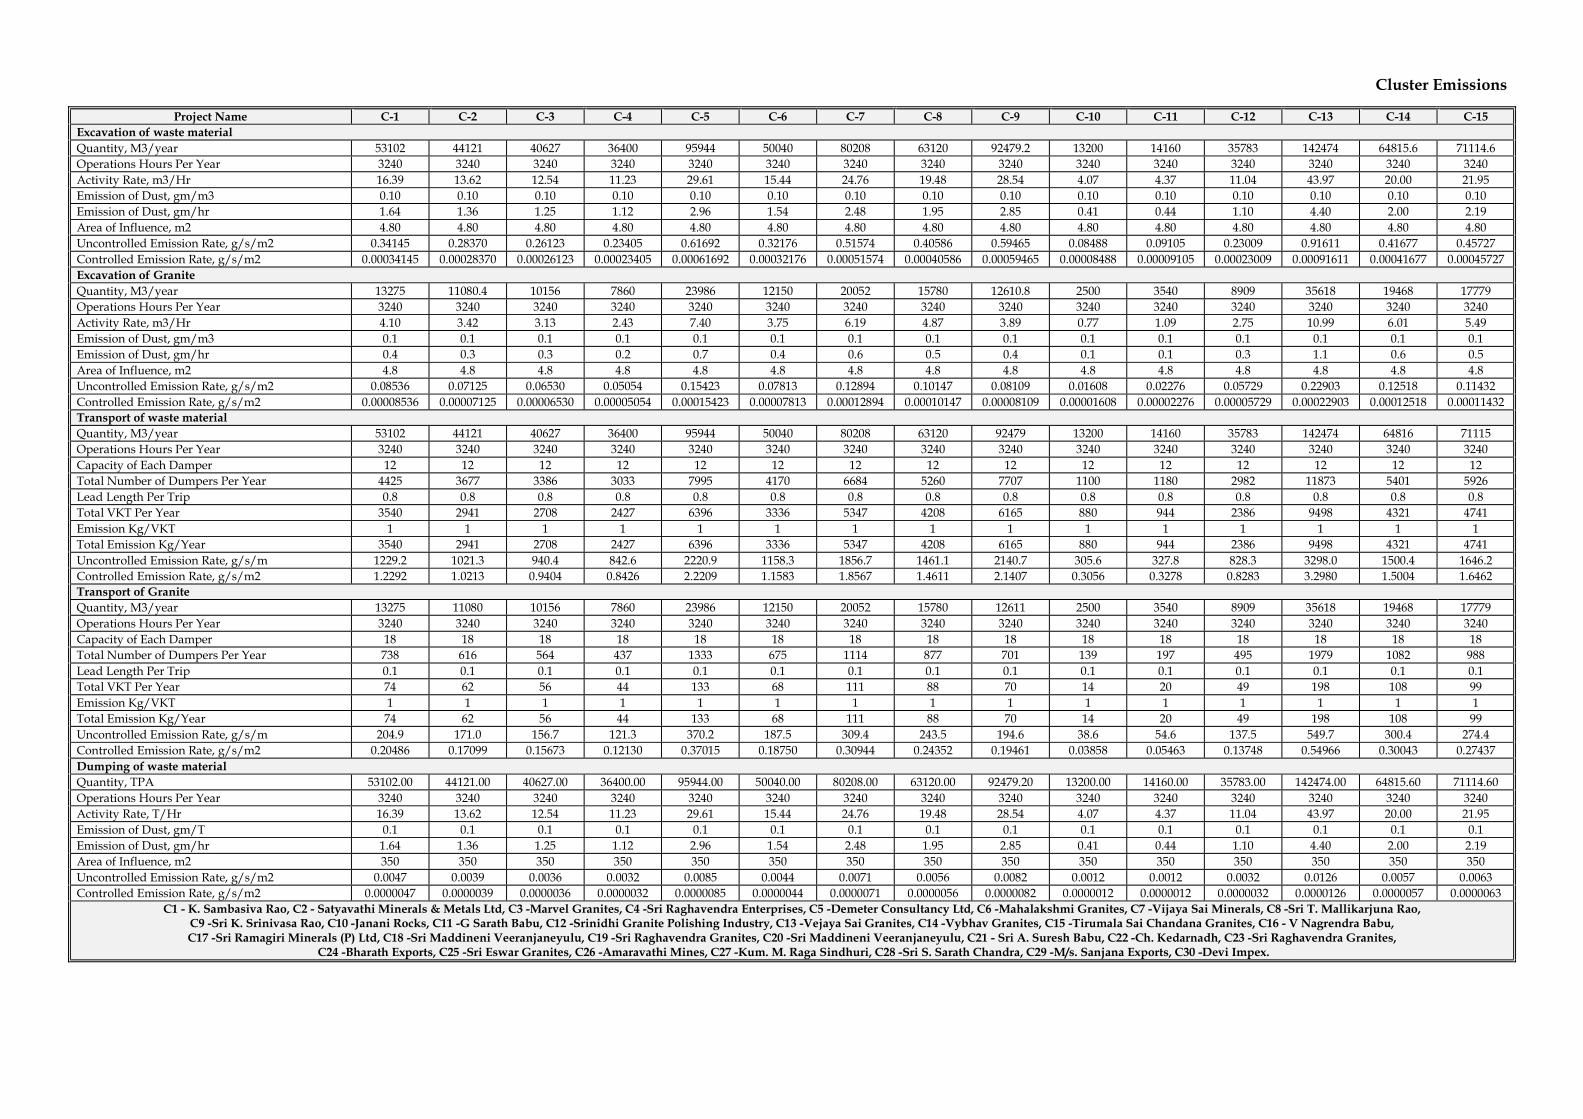
Cluster Emissions
Project Name C-1 C-2 C-3 C-4 C-5 C-6 C-7 C-8 C-9 C-10 C-11 C-12 C-13 C-14 C-15 Excavation of waste material Quantity, M3/year 53102 44121 40627 36400 95944 50040 80208 63120 92479.2 13200 14160 35783 142474 64815.6 71114.6 Operations Hours Per Year 3240 3240 3240 3240 3240 3240 3240 3240 3240 3240 3240 3240 3240 3240 3240 Activity Rate, m3/Hr 16.39 13.62 12.54 11.23 29.61 15.44 24.76 19.48 28.54 4.07 4.37 11.04 43.97 20.00 21.95 Emission of Dust, gm/m3 0.10 0.10 0.10 0.10 0.10 0.10 0.10 0.10 0.10 0.10 0.10 0.10 0.10 0.10 0.10 Emission of Dust, gm/hr 1.64 1.36 1.25 1.12 2.96 1.54 2.48 1.95 2.85 0.41 0.44 1.10 4.40 2.00 2.19 Area of Influence, m2 4.80 4.80 4.80 4.80 4.80 4.80 4.80 4.80 4.80 4.80 4.80 4.80 4.80 4.80 4.80 Uncontrolled Emission Rate, g/s/m2 0.34145 0.28370 0.26123 0.23405 0.61692 0.32176 0.51574 0.40586 0.59465 0.08488 0.09105 0.23009 0.91611 0.41677 0.45727 Controlled Emission Rate, g/s/m2 0.00034145 0.00028370 0.00026123 0.00023405 0.00061692 0.00032176 0.00051574 0.00040586 0.00059465 0.00008488 0.00009105 0.00023009 0.00091611 0.00041677 0.00045727 Excavation of Granite Quantity, M3/year 13275 11080.4 10156 7860 23986 12150 20052 15780 12610.8 2500 3540 8909 35618 19468 17779 Operations Hours Per Year 3240 3240 3240 3240 3240 3240 3240 3240 3240 3240 3240 3240 3240 3240 3240 Activity Rate, m3/Hr 4.10 3.42 3.13 2.43 7.40 3.75 6.19 4.87 3.89 0.77 1.09 2.75 10.99 6.01 5.49 Emission of Dust, gm/m3 0.1 0.1 0.1 0.1 0.1 0.1 0.1 0.1 0.1 0.1 0.1 0.1 0.1 0.1 0.1 Emission of Dust, gm/hr 0.4 0.3 0.3 0.2 0.7 0.4 0.6 0.5 0.4 0.1 0.1 0.3 1.1 0.6 0.5 Area of Influence, m2 4.8 4.8 4.8 4.8 4.8 4.8 4.8 4.8 4.8 4.8 4.8 4.8 4.8 4.8 4.8 Uncontrolled Emission Rate, g/s/m2 0.08536 0.07125 0.06530 0.05054 0.15423 0.07813 0.12894 0.10147 0.08109 0.01608 0.02276 0.05729 0.22903 0.12518 0.11432 Controlled Emission Rate, g/s/m2 0.00008536 0.00007125 0.00006530 0.00005054 0.00015423 0.00007813 0.00012894 0.00010147 0.00008109 0.00001608 0.00002276 0.00005729 0.00022903 0.00012518 0.00011432 Transport of waste material Quantity, M3/year 53102 44121 40627 36400 95944 50040 80208 63120 92479 13200 14160 35783 142474 64816 71115 Operations Hours Per Year 3240 3240 3240 3240 3240 3240 3240 3240 3240 3240 3240 3240 3240 3240 3240 Capacity of Each Damper 12 12 12 12 12 12 12 12 12 12 12 12 12 12 12 Total Number of Dumpers Per Year 4425 3677 3386 3033 7995 4170 6684 5260 7707 1100 1180 2982 11873 5401 5926 Lead Length Per Trip 0.8 0.8 0.8 0.8 0.8 0.8 0.8 0.8 0.8 0.8 0.8 0.8 0.8 0.8 0.8 Total VKT Per Year 3540 2941 2708 2427 6396 3336 5347 4208 6165 880 944 2386 9498 4321 4741 Emission Kg/VKT 1 1 1 1 1 1 1 1 1 1 1 1 1 1 1 Total Emission Kg/Year 3540 2941 2708 2427 6396 3336 5347 4208 6165 880 944 2386 9498 4321 4741 Uncontrolled Emission Rate, g/s/m 1229.2 1021.3 940.4 842.6 2220.9 1158.3 1856.7 1461.1 2140.7 305.6 327.8 828.3 3298.0 1500.4 1646.2 Controlled Emission Rate, g/s/m2 1.2292 1.0213 0.9404 0.8426 2.2209 1.1583 1.8567 1.4611 2.1407 0.3056 0.3278 0.8283 3.2980 1.5004 1.6462 Transport of Granite Quantity, M3/year 13275 11080 10156 7860 23986 12150 20052 15780 12611 2500 3540 8909 35618 19468 17779 Operations Hours Per Year 3240 3240 3240 3240 3240 3240 3240 3240 3240 3240 3240 3240 3240 3240 3240 Capacity of Each Damper 18 18 18 18 18 18 18 18 18 18 18 18 18 18 18 Total Number of Dumpers Per Year 738 616 564 437 1333 675 1114 877 701 139 197 495 1979 1082 988 Lead Length Per Trip 0.1 0.1 0.1 0.1 0.1 0.1 0.1 0.1 0.1 0.1 0.1 0.1 0.1 0.1 0.1 Total VKT Per Year 74 62 56 44 133 68 111 88 70 14 20 49 198 108 99 Emission Kg/VKT 1 1 1 1 1 1 1 1 1 1 1 1 1 1 1 Total Emission Kg/Year 74 62 56 44 133 68 111 88 70 14 20 49 198 108 99 Uncontrolled Emission Rate, g/s/m 204.9 171.0 156.7 121.3 370.2 187.5 309.4 243.5 194.6 38.6 54.6 137.5 549.7 300.4 274.4 Controlled Emission Rate, g/s/m2 0.20486 0.17099 0.15673 0.12130 0.37015 0.18750 0.30944 0.24352 0.19461 0.03858 0.05463 0.13748 0.54966 0.30043 0.27437 Dumping of waste material Quantity, TPA 53102.00 44121.00 40627.00 36400.00 95944.00 50040.00 80208.00 63120.00 92479.20 13200.00 14160.00 35783.00 142474.00 64815.60 71114.60 Operations Hours Per Year 3240 3240 3240 3240 3240 3240 3240 3240 3240 3240 3240 3240 3240 3240 3240 Activity Rate, T/Hr 16.39 13.62 12.54 11.23 29.61 15.44 24.76 19.48 28.54 4.07 4.37 11.04 43.97 20.00 21.95 Emission of Dust, gm/T 0.1 0.1 0.1 0.1 0.1 0.1 0.1 0.1 0.1 0.1 0.1 0.1 0.1 0.1 0.1 Emission of Dust, gm/hr 1.64 1.36 1.25 1.12 2.96 1.54 2.48 1.95 2.85 0.41 0.44 1.10 4.40 2.00 2.19 Area of Influence, m2 350 350 350 350 350 350 350 350 350 350 350 350 350 350 350 Uncontrolled Emission Rate, g/s/m2 0.0047 0.0039 0.0036 0.0032 0.0085 0.0044 0.0071 0.0056 0.0082 0.0012 0.0012 0.0032 0.0126 0.0057 0.0063 Controlled Emission Rate, g/s/m2 0.0000047 0.0000039 0.0000036 0.0000032 0.0000085 0.0000044 0.0000071 0.0000056 0.0000082 0.0000012 0.0000012 0.0000032 0.0000126 0.0000057 0.0000063
C1 - K. Sambasiva Rao, C2 - Satyavathi Minerals & Metals Ltd, C3 -Marvel Granites, C4 -Sri Raghavendra Enterprises, C5 -Demeter Consultancy Ltd, C6 -Mahalakshmi Granites, C7 -Vijaya Sai Minerals, C8 -Sri T. Mallikarjuna Rao, C9 -Sri K. Srinivasa Rao, C10 -Janani Rocks, C11 -G Sarath Babu, C12 -Srinidhi Granite Polishing Industry, C13 -Vejaya Sai Granites, C14 -Vybhav Granites, C15 -Tirumala Sai Chandana Granites, C16 - V Nagrendra Babu, C17 -Sri Ramagiri Minerals (P) Ltd, C18 -Sri Maddineni Veeranjaneyulu, C19 -Sri Raghavendra Granites, C20 -Sri Maddineni Veeranjaneyulu, C21 - Sri A. Suresh Babu, C22 -Ch. Kedarnadh, C23 -Sri Raghavendra Granites,
C24 -Bharath Exports, C25 -Sri Eswar Granites, C26 -Amaravathi Mines, C27 -Kum. M. Raga Sindhuri, C28 -Sri S. Sarath Chandra, C29 -M/s. Sanjana Exports, C30 -Devi Impex.
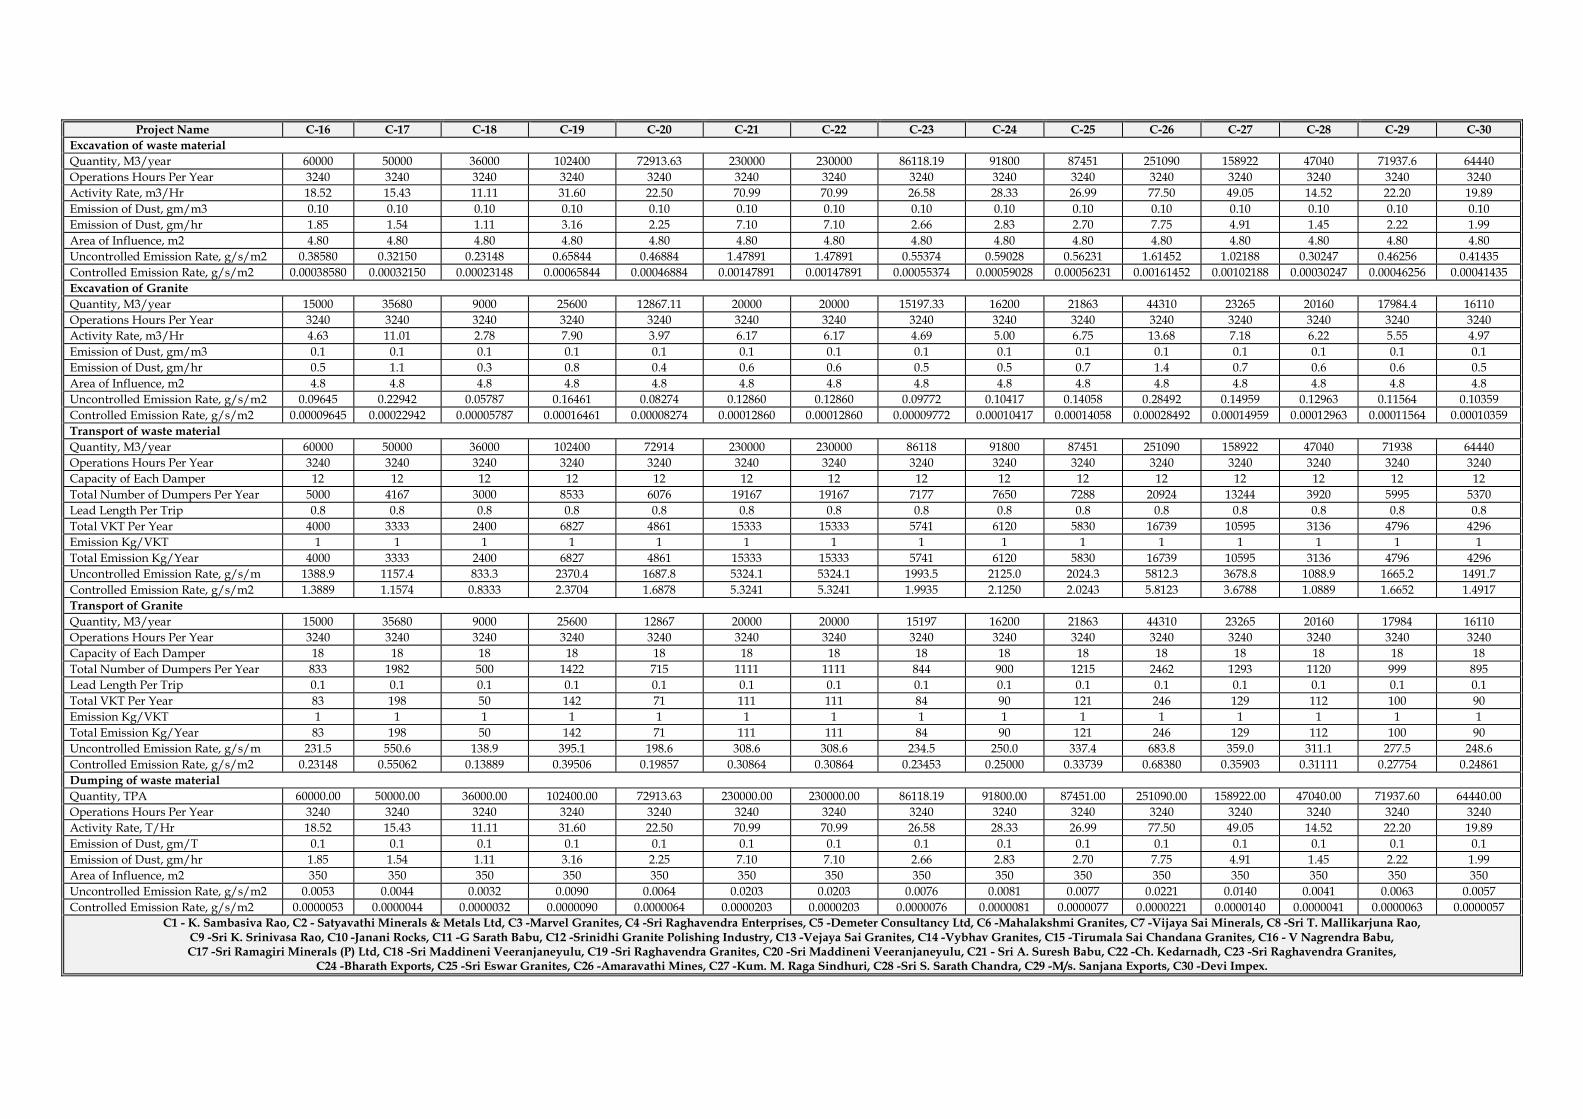
Project Name C-16 C-17 C-18 C-19 C-20 C-21 C-22 C-23 C-24 C-25 C-26 C-27 C-28 C-29 C-30 Excavation of waste material Quantity, M3/year 60000 50000 36000 102400 72913.63 230000 230000 86118.19 91800 87451 251090 158922 47040 71937.6 64440 Operations Hours Per Year 3240 3240 3240 3240 3240 3240 3240 3240 3240 3240 3240 3240 3240 3240 3240 Activity Rate, m3/Hr 18.52 15.43 11.11 31.60 22.50 70.99 70.99 26.58 28.33 26.99 77.50 49.05 14.52 22.20 19.89 Emission of Dust, gm/m3 0.10 0.10 0.10 0.10 0.10 0.10 0.10 0.10 0.10 0.10 0.10 0.10 0.10 0.10 0.10 Emission of Dust, gm/hr 1.85 1.54 1.11 3.16 2.25 7.10 7.10 2.66 2.83 2.70 7.75 4.91 1.45 2.22 1.99 Area of Influence, m2 4.80 4.80 4.80 4.80 4.80 4.80 4.80 4.80 4.80 4.80 4.80 4.80 4.80 4.80 4.80 Uncontrolled Emission Rate, g/s/m2 0.38580 0.32150 0.23148 0.65844 0.46884 1.47891 1.47891 0.55374 0.59028 0.56231 1.61452 1.02188 0.30247 0.46256 0.41435 Controlled Emission Rate, g/s/m2 0.00038580 0.00032150 0.00023148 0.00065844 0.00046884 0.00147891 0.00147891 0.00055374 0.00059028 0.00056231 0.00161452 0.00102188 0.00030247 0.00046256 0.00041435 Excavation of Granite Quantity, M3/year 15000 35680 9000 25600 12867.11 20000 20000 15197.33 16200 21863 44310 23265 20160 17984.4 16110 Operations Hours Per Year 3240 3240 3240 3240 3240 3240 3240 3240 3240 3240 3240 3240 3240 3240 3240 Activity Rate, m3/Hr 4.63 11.01 2.78 7.90 3.97 6.17 6.17 4.69 5.00 6.75 13.68 7.18 6.22 5.55 4.97 Emission of Dust, gm/m3 0.1 0.1 0.1 0.1 0.1 0.1 0.1 0.1 0.1 0.1 0.1 0.1 0.1 0.1 0.1 Emission of Dust, gm/hr 0.5 1.1 0.3 0.8 0.4 0.6 0.6 0.5 0.5 0.7 1.4 0.7 0.6 0.6 0.5 Area of Influence, m2 4.8 4.8 4.8 4.8 4.8 4.8 4.8 4.8 4.8 4.8 4.8 4.8 4.8 4.8 4.8 Uncontrolled Emission Rate, g/s/m2 0.09645 0.22942 0.05787 0.16461 0.08274 0.12860 0.12860 0.09772 0.10417 0.14058 0.28492 0.14959 0.12963 0.11564 0.10359 Controlled Emission Rate, g/s/m2 0.00009645 0.00022942 0.00005787 0.00016461 0.00008274 0.00012860 0.00012860 0.00009772 0.00010417 0.00014058 0.00028492 0.00014959 0.00012963 0.00011564 0.00010359 Transport of waste material Quantity, M3/year 60000 50000 36000 102400 72914 230000 230000 86118 91800 87451 251090 158922 47040 71938 64440 Operations Hours Per Year 3240 3240 3240 3240 3240 3240 3240 3240 3240 3240 3240 3240 3240 3240 3240 Capacity of Each Damper 12 12 12 12 12 12 12 12 12 12 12 12 12 12 12 Total Number of Dumpers Per Year 5000 4167 3000 8533 6076 19167 19167 7177 7650 7288 20924 13244 3920 5995 5370 Lead Length Per Trip 0.8 0.8 0.8 0.8 0.8 0.8 0.8 0.8 0.8 0.8 0.8 0.8 0.8 0.8 0.8 Total VKT Per Year 4000 3333 2400 6827 4861 15333 15333 5741 6120 5830 16739 10595 3136 4796 4296 Emission Kg/VKT 1 1 1 1 1 1 1 1 1 1 1 1 1 1 1 Total Emission Kg/Year 4000 3333 2400 6827 4861 15333 15333 5741 6120 5830 16739 10595 3136 4796 4296 Uncontrolled Emission Rate, g/s/m 1388.9 1157.4 833.3 2370.4 1687.8 5324.1 5324.1 1993.5 2125.0 2024.3 5812.3 3678.8 1088.9 1665.2 1491.7 Controlled Emission Rate, g/s/m2 1.3889 1.1574 0.8333 2.3704 1.6878 5.3241 5.3241 1.9935 2.1250 2.0243 5.8123 3.6788 1.0889 1.6652 1.4917 Transport of Granite Quantity, M3/year 15000 35680 9000 25600 12867 20000 20000 15197 16200 21863 44310 23265 20160 17984 16110 Operations Hours Per Year 3240 3240 3240 3240 3240 3240 3240 3240 3240 3240 3240 3240 3240 3240 3240 Capacity of Each Damper 18 18 18 18 18 18 18 18 18 18 18 18 18 18 18 Total Number of Dumpers Per Year 833 1982 500 1422 715 1111 1111 844 900 1215 2462 1293 1120 999 895 Lead Length Per Trip 0.1 0.1 0.1 0.1 0.1 0.1 0.1 0.1 0.1 0.1 0.1 0.1 0.1 0.1 0.1 Total VKT Per Year 83 198 50 142 71 111 111 84 90 121 246 129 112 100 90 Emission Kg/VKT 1 1 1 1 1 1 1 1 1 1 1 1 1 1 1 Total Emission Kg/Year 83 198 50 142 71 111 111 84 90 121 246 129 112 100 90 Uncontrolled Emission Rate, g/s/m 231.5 550.6 138.9 395.1 198.6 308.6 308.6 234.5 250.0 337.4 683.8 359.0 311.1 277.5 248.6 Controlled Emission Rate, g/s/m2 0.23148 0.55062 0.13889 0.39506 0.19857 0.30864 0.30864 0.23453 0.25000 0.33739 0.68380 0.35903 0.31111 0.27754 0.24861 Dumping of waste material Quantity, TPA 60000.00 50000.00 36000.00 102400.00 72913.63 230000.00 230000.00 86118.19 91800.00 87451.00 251090.00 158922.00 47040.00 71937.60 64440.00 Operations Hours Per Year 3240 3240 3240 3240 3240 3240 3240 3240 3240 3240 3240 3240 3240 3240 3240 Activity Rate, T/Hr 18.52 15.43 11.11 31.60 22.50 70.99 70.99 26.58 28.33 26.99 77.50 49.05 14.52 22.20 19.89 Emission of Dust, gm/T 0.1 0.1 0.1 0.1 0.1 0.1 0.1 0.1 0.1 0.1 0.1 0.1 0.1 0.1 0.1 Emission of Dust, gm/hr 1.85 1.54 1.11 3.16 2.25 7.10 7.10 2.66 2.83 2.70 7.75 4.91 1.45 2.22 1.99 Area of Influence, m2 350 350 350 350 350 350 350 350 350 350 350 350 350 350 350 Uncontrolled Emission Rate, g/s/m2 0.0053 0.0044 0.0032 0.0090 0.0064 0.0203 0.0203 0.0076 0.0081 0.0077 0.0221 0.0140 0.0041 0.0063 0.0057 Controlled Emission Rate, g/s/m2 0.0000053 0.0000044 0.0000032 0.0000090 0.0000064 0.0000203 0.0000203 0.0000076 0.0000081 0.0000077 0.0000221 0.0000140 0.0000041 0.0000063 0.0000057
C1 - K. Sambasiva Rao, C2 - Satyavathi Minerals & Metals Ltd, C3 -Marvel Granites, C4 -Sri Raghavendra Enterprises, C5 -Demeter Consultancy Ltd, C6 -Mahalakshmi Granites, C7 -Vijaya Sai Minerals, C8 -Sri T. Mallikarjuna Rao, C9 -Sri K. Srinivasa Rao, C10 -Janani Rocks, C11 -G Sarath Babu, C12 -Srinidhi Granite Polishing Industry, C13 -Vejaya Sai Granites, C14 -Vybhav Granites, C15 -Tirumala Sai Chandana Granites, C16 - V Nagrendra Babu, C17 -Sri Ramagiri Minerals (P) Ltd, C18 -Sri Maddineni Veeranjaneyulu, C19 -Sri Raghavendra Granites, C20 -Sri Maddineni Veeranjaneyulu, C21 - Sri A. Suresh Babu, C22 -Ch. Kedarnadh, C23 -Sri Raghavendra Granites,
C24 -Bharath Exports, C25 -Sri Eswar Granites, C26 -Amaravathi Mines, C27 -Kum. M. Raga Sindhuri, C28 -Sri S. Sarath Chandra, C29 -M/s. Sanjana Exports, C30 -Devi Impex.

Quality Council of India
National Accreditation Board for Education & Training
Certificate of Accreditation
Team Labs and Consultants B-115, 116, 117 and 509, Annapurna Block, Aditya Enclave, Ameerpet, Hyderabad- 500 038
Accredited as Category - A organization under the QCI-NABET Scheme for Accreditation of EIA Consultant Organizations: Version 3 for preparing EIA-EMP reports in the following Sectors:
Note: Names of approved EIA Coordinators and Functional Area Experts are mentioned in SA AC minutes dated May 29, 2020 posted on QCI-NABET website.
The Accreditation shall remain in force subject to continued compliance to the terms and conditions mentioned in QCI-NABET’s letter of accreditation bearing no. QCI/NABET/ENV/ACO/20/1466 dated September 04, 2020.The accreditation needs to be renewed before the expiry date by Team Labs and Consultants, Hyderabad following due process of assessment.
Sr. Director, NABET Certificate No. Valid up to Dated: Sep. 04, 2020 NABET/EIA/1821/SA 0114 24.09.2021 For the updated List of Accredited EIA Consultant Organizations with approved Sectors please refer to QCI-NABET website.
Sl.No Sector Description Sector (as per)
Cat. NABET MoEFCC
1 Mining of minerals including opencast / underground mining 1 1 (a) (i) A
2 Thermal power plants 4 1 (d) B
3 Mineral beneficiation 7 2 (b) A
4 Metallurgical industries (ferrous & non-ferrous) 8 3 (a) A
5 Cement plants 9 3 (b) B
6 Coke oven plants 11 4 (b) A
7 Chlor-alkali industry 13 4 (d) A
8 Chemical fertilizers 16 5 (a) A
9 Pesticides industry and pesticide specific intermediates (excluding formulations) 17 5 (b) A
10 Synthetic organic chemicals industry (dyes & dye intermediates; bulk drugs and intermediates excluding drug formulations; synthetic rubbers; basic organic chemicals, other synthetic organic chemicals and chemical intermediates)
21 5 (f) A
11 Sugar Industry 25 5 (j) B
12 Industrial estates/ parks/ complexes/areas, export processing Zones(EPZs), Special Economic Zones(SEZs), Biotech Parks, Leather Complexes
31 7 (c) A
13 Highways 34 7 (f) A
14 Building and construction projects 38 8 (a) B
15 Townships and Area development projects 39 8 (b) B
SRI RAGHAVENDRA GRANITES SURVEY NO. 359, BALLIKURAVA VILLAGE AND MANDAL,
PRAKASAM DISTRICT, ANDHRA PRADESH
TEAM Labs and Consultants (An ISO 9001:2008 Certified Organization) NABET – Certificate No: NABET/ EIA/ 1821/ SA 0114, dt.04.09.2020 B-115 to 117 & 509, Annapurna Block, Aditya Enclave, Ameerpet, Hyderabad-500 038. Phone: 040-23748 555/616, Tele fax: 040-23748666 Email: [email protected]
Copyright © 2022 FDOKUMEN