Deep South Expansion Project Draft Environmental Impact ...
418
Draft Deep South Expansion Project Environmental Impact Statement Volume II – Section 3.7 (Paleontological Resources) through Appendices File Number: NVN-067575 (16-1A) DOI-BLM-NV-B010-2016-0052 EIS Bureau of Land Management Battle Mountain District Office Mount Lewis Field Office 50 Bastian Road Battle Mountain, NV 89820 2018 COOPERATING AGENCIES: U.S. Environmental Protection Agency U.S. Fish and Wildlife Service Nevada Department of Wildlife Lander County and Eureka County BLM MOUNT LEWIS FIELD OFFICE Estimated Lead Agency Total Costs Associated with Developing and Producing this Draft EIS $11,000,000
-
Upload
khangminh22 -
Category
Documents
-
view
1 -
download
0
Transcript of Deep South Expansion Project Draft Environmental Impact ...

Draft Deep South Expansion Project Environmental Impact Statement Volume II – Section 3.7 (Paleontological Resources) through Appendices
File Number: NVN-067575 (16-1A) DOI-BLM-NV-B010-2016-0052 EIS
Bureau of Land Management Battle Mountain District Office
Mount Lewis Field Office 50 Bastian Road
Battle Mountain, NV 89820
2018
COOPERATING AGENCIES: U.S. Environmental Protection Agency U.S. Fish and Wildlife Service Nevada Department of Wildlife Lander County and Eureka County
BLM
MO
UN
T LE
WIS
FIE
LD O
FFIC
E
Estimated Lead Agency Total Costs Associated with Developing and Producing this Draft EIS $11,000,000

BLM Mission Statement The Bureau of Land Management is responsible for the stewardship of our public lands. It is committed to manage, protect, and improve these lands in a manner to serve the needs of the American people for all times. Management is based upon the principles of multiple use and sustained yield of our nation’s resources within a framework of environmental responsibility and scientific technology. These resources include recreation, rangelands, timber, minerals, watershed, fish and wildlife, wilderness, air and scenic, scientific, and cultural values.
DOI-BLM-NV-B010-2016-0052 EIS

Deep South Expansion Project EIS Table of Contents i
Draft EIS 2018
Table of Contents VOLUME II
3.7 Paleontological Resources .................................................................................................... 3.7-1 3.7.1 Affected Environment ................................................................................................ 3.7-1 3.7.2 Environmental Consequences .................................................................................. 3.7-5 3.7.3 Cumulative Impacts ................................................................................................... 3.7-7 3.7.4 Monitoring and Mitigation Measures ......................................................................... 3.7-7 3.7.5 Residual Adverse Effects .......................................................................................... 3.7-7
3.8 Cultural Resources .................................................................................................................. 3.8-1 3.8.1 Affected Environment ................................................................................................ 3.8-1 3.8.2 Environmental Consequences .................................................................................. 3.8-9 3.8.3 Cumulative Impacts ................................................................................................. 3.8-13 3.8.4 Monitoring and Mitigation Measures ....................................................................... 3.8-13 3.8.5 Residual Adverse Effects ........................................................................................ 3.8-14
3.9 Native American Traditional Values ........................................................................................ 3.9-1 3.9.1 Affected Environment ................................................................................................ 3.9-1 3.9.2 Environmental Consequences ................................................................................ 3.9-13 3.9.3 Cumulative Impacts ................................................................................................. 3.9-17 3.9.4 Monitoring and Mitigation Measures ....................................................................... 3.9-52 3.9.5 Residual Adverse Effects ........................................................................................ 3.9-52
3.10 Air Quality ............................................................................................................................... 3.10-1 3.10.1 Climate ..................................................................................................................... 3.10-1 3.10.2 Air Quality ................................................................................................................. 3.10-6 3.10.3 Greenhouse Gas Emissions and Climate Trends .................................................. 3.10-8 3.10.4 Environmental Consequences .............................................................................. 3.10-10 3.10.5 Cumulative Impacts ............................................................................................... 3.10-23 3.10.6 Monitoring and Mitigation Measures ..................................................................... 3.10-26 3.10.7 Residual Adverse Impacts ..................................................................................... 3.10-26
3.11 Land Use and Access ........................................................................................................... 3.11-1 3.11.1 Affected Environment .............................................................................................. 3.11-1 3.11.2 Environmental Consequences ................................................................................ 3.11-4 3.11.3 Cumulative Impacts ............................................................................................... 3.11-11 3.11.4 Monitoring and Mitigation Measures ..................................................................... 3.11-12 3.11.5 Residual Adverse Effects ...................................................................................... 3.11-12
3.12 Recreation and Wilderness ................................................................................................... 3.12-1 3.12.1 Affected Environment .............................................................................................. 3.12-1 3.12.2 Environmental Consequences ................................................................................ 3.12-4 3.12.3 Cumulative Impacts ................................................................................................. 3.12-7 3.12.4 Monitoring and Mitigation Measures ....................................................................... 3.12-8 3.12.5 Residual Adverse Effects ........................................................................................ 3.12-8
3.13 Social and Economic Values ................................................................................................. 3.13-1 3.13.1 Affected Environment .............................................................................................. 3.13-1 3.13.2 Environmental Consequences ................................................................................ 3.13-7

Deep South Expansion Project EIS Table of Contents ii
Draft EIS 2018
3.13.3 Cumulative Impacts ............................................................................................... 3.13-11 3.13.4 Monitoring and Mitigation Measures ..................................................................... 3.13-12 3.13.5 Residual Adverse Effects ...................................................................................... 3.13-12
3.14 Environmental Justice ........................................................................................................... 3.14-1 3.14.1 Affected Environment .............................................................................................. 3.14-1 3.14.2 Environmental Consequences ................................................................................ 3.14-3 3.14.3 Cumulative Impacts ................................................................................................. 3.14-5 3.14.4 Monitoring and Mitigation Measures ....................................................................... 3.14-5 3.14.5 Residual Adverse Effects ........................................................................................ 3.14-5
3.15 Visual Resources ................................................................................................................... 3.15-1 3.15.1 Affected Environment .............................................................................................. 3.15-1 3.15.2 Environmental Consequences ................................................................................ 3.15-3 3.15.3 Cumulative Impacts ............................................................................................... 3.15-13 3.15.4 Monitoring and Mitigation Measures ..................................................................... 3.15-14 3.15.5 Residual Adverse Effects ...................................................................................... 3.15-14
3.16 Noise ...................................................................................................................................... 3.16-1 3.16.1 Affected Environment .............................................................................................. 3.16-1 3.16.2 Environmental Consequences ................................................................................ 3.16-3 3.16.3 Cumulative Impacts ................................................................................................. 3.16-7 3.16.4 Monitoring and Mitigation Measures ....................................................................... 3.16-8 3.16.5 Residual Adverse Effects ........................................................................................ 3.16-8
3.17 Hazardous Materials and Solid Waste .................................................................................. 3.17-1 3.17.1 Affected Environment .............................................................................................. 3.17-1 3.17.2 Environmental Consequences ................................................................................ 3.17-3 3.17.3 Cumulative Impacts ................................................................................................. 3.17-7 3.17.4 Monitoring and Mitigation Measures ....................................................................... 3.17-8 3.17.5 Residual Adverse Effects ........................................................................................ 3.17-8
3.18 Relationship Between Short-term Uses of the Human Environment and the Maintenance and Enhancement of Long-term Productivity ................................................. 3.18-1
3.19 Irreversible and Irretrievable Commitment of Resources ..................................................... 3.19-1
4.0 Public Coordination .......................................................................................................................... 4-1
4.1 Public Participation and Scoping................................................................................................ 4-1
4.2 List of Contacts ........................................................................................................................... 4-7 4.2.1 Federal Agencies .......................................................................................................... 4-7 4.2.2 State Agencies .............................................................................................................. 4-7 4.2.3 Local Agencies.............................................................................................................. 4-7

Deep South Expansion Project EIS Table of Contents iii
Draft EIS 2018
4.2.4 Tribal Organizations ...................................................................................................... 4-7 4.2.5 Other Organizations...................................................................................................... 4-7
4.3 EIS Mailing List and EIS Notification and Distribution ............................................................... 4-7
5.0 List of Preparers and Reviewers .................................................................................................... 5-1
5.1 Bureau of Land Management EIS Team ................................................................................... 5-1
5.2 Cooperating Agencies ................................................................................................................ 5-2
5.3 AECOM EIS Team (Third-party Consultant) ............................................................................. 5-3
5.4 Barrick Cortez Inc. Reviewers .................................................................................................... 5-4
6.0 References ......................................................................................................................................... 6-1
7.0 Glossary ............................................................................................................................................. 7-1
List of Appendices Appendix A - Water Resources
Appendix B - Wildlife
Appendix C - Cultural Resources

Deep South Expansion Project EIS List of Tables iv
Draft EIS 2018
List of Tables VOLUME II
Table 3.7-1 Potential Fossil Yield Classification ................................................................................3.7-2
Table 3.9-1 Past, Present, and Reasonably Foreseeable Actions for Native American Traditional Values Regional CESA .............................................................................. 3.9-17
Table 3.9-2 Traditional Use Plants Within the Native American Regional CESA .......................... 3.9-28
Table 3.9-3 Perennial Waters and Potentially Affected Perennial Waters within the Regional CESA ............................................................................................................................ 3.9-36
Table 3.10-1 Monthly Climate Summary ........................................................................................... 3.10-3
Table 3.10-2 National and State of Nevada Ambient Air Quality Standards ................................... 3.10-7
Table 3.10-3 Total Emissions Inventory for the Proposed Project ................................................. 3.10-14
Table 3.10-4 Scenario 1 Model Results and Comparison with AAQS ........................................... 3.10-17
Table 3.10-5 Scenario 2 Model Results and Comparison with AAQS ........................................... 3.10-17
Table 3.10-6 Emissions and Impacts from CGM Operations Area Refractory Ore Processing at the Goldstrike Mill ................................................................................................... 3.10-18
Table 3.10-7 Total Emissions Inventory for the No Action Alternative ........................................... 3.10-23
Table 3.10-8 Emissions from On-site Operations at Nearby Sources ........................................... 3.10-25
Table 3.10-9 Emissions from Off-site Ore Transport and Processing ............................................ 3.10-25
Table 3.10-10 Scenario 1 (Mining Year 1) Cumulative Impact Analysis Results............................. 3.10-27
Table 3.10-11 Scenario 2 (Mining Year 3) Cumulative Impact Analysis Results............................. 3.10-27
Table 3.10-12 Emissions and Impacts from Processing Refractory Ore from the CGM Operations Area and Goldrush Project at the Goldstrike Mill ................................... 3.10-28
Table 3.11-1 Land Use Authorizations and Rights-of-Way in the Project Vicinity ........................... 3.11-2
Table 3.11-2 Current and Historical Traffic Volume on Project Vicinity Roadways ......................... 3.11-4
Table 3.13-1 Population Characteristics............................................................................................ 3.13-1
Table 3.13-2 Non-agricultural Wage and Salary Employment by Sector in 2016 ........................... 3.13-3
Table 3.13-3 Housing Resources – 2015 Census Estimates ........................................................... 3.13-4
Table 3.13-4 County Budgets for Fiscal Year 2016-2017 ................................................................ 3.13-6
Table 3.13-5 Contractor-related Employment, Households, and Population Projections (2018-2030 typical).................................................................................................................. 3.13-8
Table 3.13-6 Economic Effects Associated with the Loss of AUMs ............................................... 3.13-10
Table 3.14-1 2015 Race and Ethnicity by County and Town ........................................................... 3.14-2
Table 3.14-2 2015 Household Income and Poverty Levels .............................................................. 3.14-2
Table 3.15-1 BLM VRM Class Objectives ......................................................................................... 3.15-1
Table 3.16-1 Typical Values of Sound Level of Common Noise Sources ....................................... 3.16-2

Deep South Expansion Project EIS List of Tables v
Draft EIS 2018
Table 3.16-2 Surface Mining Equipment Roster and Associated Noise Emissions ........................ 3.16-4
Table 3.17-1 Potential for Hazardous Material Transportation Accidents/Incidents ........................ 3.17-5
Table 3.19-1 Irreversible and Irretrievable Commitment of Resources by the Proposed Action .... 3.19-1

Deep South Expansion Project EIS List of Figures vi
Draft EIS 2018
List of Figures
VOLUME II
Figure 3.7-1 Draft BLM Potential Fossil Yield Classification Areas ....................................................3.7-3
Figure 3.8-1 Cultural Resources Areas of Potential Effect and CESA ...............................................3.8-3
Figure 3.9-1 Western Shoshone Aboriginal Territory and Contemporary Shoshone Tribal Governments ...................................................................................................................3.9-4
Figure 3.9-2 Past and Present Actions, RFFAs, and Native American Traditional Values CESA ............................................................................................................................ 3.9-23
Figure 3.9-3 Vegetation Communities in the Native American Traditional Values CESA .............. 3.9-31
Figure 3.9-4 Fire Areas 1998-2015 within the Native American Traditional Values CESA ............ 3.9-32
Figure 3.9-5 Perennial Waters and Current Groundwater Drawdown and Mounding .................... 3.9-37
Figure 3.9-6 Areas of Projected Cumulative Impact to Perennial Waters within the Native American Traditional Values CESA ............................................................................. 3.9-38
Figure 3.9-7 Designated Mule Deer Range within the Native American Traditional Values CESA ............................................................................................................................ 3.9-47
Figure 3.9-8 Designated Pronghorn Range within the Native American Traditional Values CESA ............................................................................................................................ 3.9-48
Figure 3.9-9 Designated Bighorn Sheep Range within the Native American Traditional Values CESA ............................................................................................................................ 3.9-49
Figure 3.9-10 Designated Greater Sage-grouse Habitat within the Native American Traditional Values CESA ................................................................................................................ 3.9-50
Figure 3.10-1 Elko, Nevada Wind Rose from 1970 to 2016 .............................................................. 3.10-4
Figure 3.10-2 Cortez Hills Station Wind Rose for 2011 ..................................................................... 3.10-5
Figure 3.10-3 Estimated Ambient Air Quality Impacts ..................................................................... 3.10-15
Figure 3.10-4 Mercury Deposition from Goldstrike Mill Emissions .................................................. 3.10-21
Figure 3.10-5 Air Quality and Other Resources CESAs .................................................................. 3.10-24
Figure 3.11-1 Land Use Authorizations .............................................................................................. 3.11-5
Figure 3.12-1 Wilderness Study Areas and Wilderness CESA ......................................................... 3.12-3
Figure 3.15-1 Visual Resources .......................................................................................................... 3.15-5
Figure 3.15-2 Visual Simulations for KOP #1 ..................................................................................... 3.15-9
Figure 3.15-3 Visual Simulations for KOP #2 ................................................................................... 3.15-10
Figure 3.15-4 Visual Simulations for KOP #3 ................................................................................... 3.15-11
Figure 3.15-5 Visual Simulations for KOP #4 ................................................................................... 3.15-12
Figure 3.15-6 Visual Resources CESA ............................................................................................ 3.15-15

Deep South Expansion Project EIS 3.7 – Paleontological Resources 3.7-1
Draft EIS 2018
3.7 Paleontological Resources 1
The project study area for direct and indirect impacts to paleontological resources encompasses the 2 proposed new disturbance areas within and outside the CGM Operations Area boundary. The CESA 3 encompasses the project study area and includes surface disturbance associated with past and present 4 actions and RFFAs within a 30-mile radius. 5
3.7.1 Affected Environment 6
Paleontological resources identified on public lands are considered by the BLM as constituting a fragile 7 and nonrenewable scientific record of the history of life on earth, and are thus considered to represent an 8 important and critical component of America’s natural heritage. Once damaged, destroyed, or improperly 9 collected, their scientific and educational value may be reduced or lost forever. In addition to their 10 scientific, educational, and recreational values, paleontological resources can be used to inform land 11 managers about interrelationships between the biological and geological components of ecosystems 12 over long periods of time. 13
3.7.1.1 Regulatory Framework 14
The primary statute under which the BLM manages paleontological resources is the Paleontological 15 Resources Preservation Act of 2009 (PRPA) (Public Law 111-11, Title VI, Subtitle D, Sections 6301-16 6312, 123 Stat. 1172, 16 USC 470aaa). The PRPA defines paleontological resources as “any fossilized 17 remains, traces, or imprints of organisms, preserved in or on the earth’s crust, that are of paleontological 18 interest and that provide information about the history of life on earth.” 19
The BLM manages paleontological resources under a number of federal laws including PRPA, which 20 prohibits the excavation, removal, or damage to paleontological resources on federal lands without a 21 permit (16 USC 470aaa-5), and FLPMA Sections 310 and 302(b), which directs the BLM to manage 22 public lands to protect the quality of scientific and other values; 43 CFR 8365.1-5, which prohibits the 23 willful disturbance, removal, and destruction of scientific resources or natural objects; and 43 CFR 3622, 24 which regulates the amount of petrified wood that can be collected for personal, non-commercial 25 purposes without a permit. 26
In addition, fossils on public lands are managed through the use of internal BLM guidance manuals. BLM 27 Manual 8270 (BLM 1998a) and BLM Handbook H-8270-1 (BLM 1998b) contain the BLM's policy and 28 guidance for the management of paleontological resources on public lands. Guidance for the protection 29 of paleontological resources also is contained in IM 2009-011, which provides guidelines for the 30 assessment and mitigation of impacts to paleontological resources (BLM 2008). 31
Fossils occur in a wide variety of sedimentary rocks, including those found in caves, lake bottoms, and 32 older alluvial surfaces. The purpose of paleontological resource location and evaluation is to identify 33 areas that are likely to produce fossils. Classification is a method used to rank areas according to their 34 potential to contain vertebrate fossils, or noteworthy occurrences of invertebrate or plant fossils. These 35 rankings are used by the BLM in its land use planning process, as well as to identify areas that may 36 warrant special management based on their potential to contain such fossils. 37
BLM uses the Potential Fossil Yield Classification (PFYC) system to identify and classify fossil resources 38 on federal lands (BLM 2016). Paleontological resources are closely tied to the geologic units (i.e., 39 formations, members, or beds) that contain them. The probability for finding paleontological resources 40 can be broadly predicted from the geologic units present at or near the surface. Therefore, geologic 41 mapping can be used for assessing the potential for the occurrence of paleontological resources. 42
The PFYC system provides for classification of geologic units based on the relative abundance of 43 vertebrate fossils or scientifically important fossils (plants, vertebrates, and invertebrates) and their 44

Deep South Expansion Project EIS 3.7 – Paleontological Resources 3.7-2
Draft EIS 2018
sensitivity to adverse impacts. A higher class number indicates higher potential for presence. The PFYC 1 system is not intended to be applied to specific paleontological localities or small areas within units. 2 Although important localities occasionally may occur in a geologic unit, a few widely scattered important 3 fossils or localities do not necessarily indicate a higher class. Instead, the relative abundance of 4 scientifically important localities is intended to be the major determinant for the class assignment. 5
The PFYC system is meant to provide baseline guidance for predicting, assessing, and mitigating 6 paleontological resources. The classification should be considered at an intermediate point in the 7 analysis, and should be used to assist in determining the need for further mitigation assessment or 8 actions. Descriptions of the potential fossil yield classes are summarized in Table 3.7-1. The draft BLM 9 PFYC areas in the project study area are shown in Figure 3.7-1. 10
Table 3.7-1 Potential Fossil Yield Classification
Class Description Basis 1 Igneous and metamorphic (tuffs are
excluded from this category) geologic units or units representing heavily disturbed preservation environments that are not likely to contain recognizable fossil remains.
•
• •
Fossils of any kind not known to occur except in the rarest of circumstances. Igneous or metamorphic origin. Landslides and glacial deposits.
2 Sedimentary geologic units unlikely to contain vertebrate fossils or scientifically important invertebrate fossils.
• • • • • •
Vertebrate fossils known to occur very rarely or not at all. Age greater than Devonian. Age younger than 10,000 years before present. Deep marine origin. Aeolian origin. Diagenetic alteration.
3 Fossiliferous sedimentary geologic units where fossil content varies in scientific importance, abundance, and predictable occurrence
•
•
•
Units with sporadic known occurrences of vertebrate fossils. Vertebrate fossils and scientifically important invertebrate fossils known to occur inconsistently; predictability known to be low. Poorly studied or poorly documented. Potential yield cannot be assigned without ground reconnaissance.
4 Class 4 geologic units are Class 5 units (see below) that have lower risks of human-caused adverse impacts and/or lower risk of natural degradation.
•
•
•
•
Substantial soil/vegetative cover; outcrop is not likely to be impacted. Areas of any exposed outcrop are smaller than 2 contiguous acres. Outcrop forms cliffs of sufficient height and slope that most is out of reach by normal means. Other characteristics that lower the vulnerability of both known and unidentified fossil localities.
5 Highly fossiliferous geologic units that regularly and predictably produce vertebrate fossils and/or scientifically important invertebrate fossils, and that are at risk of natural degradation and/or human-caused adverse impacts.
•
• •
• • •
Vertebrate fossils and/or scientifically important invertebrate fossils are known and documented to occur consistently, predictably, and/or abundantly. Unit is exposed; little or no soil/vegetative cover. Outcrop areas are extensive; discontinuous areas are larger than 2 contiguous acres. Outcrop erodes readily; may form badlands. Easy access to extensive outcrop in remote areas. Other characteristics that increase the sensitivity of both known and unidentified fossil localities.
Source: BLM 2016.


Deep South Expansion Project EIS 3.7 – Paleontological Resources 3.7-4
Draft EIS 2018
This page intentionally left blank

Deep South Expansion Project EIS 3.7 – Paleontological Resources 3.7-5
Draft EIS 2018
In addition to the PFYC classes listed above, new classes have been added; however, the new classes 1 (U, W, and I [BLM 2016]) are not applicable to the project study area. 2
Scientifically important paleontological resources are fossils and fossiliferous deposits that include 3 identifiable vertebrate, invertebrate, plant, and trace fossils, that provide scientific information. 4 Paleontological resources are considered to be older than recorded human history or older than middle 5 Holocene (older than approximately 5,000 years) (Society of Vertebrate Paleontology 2010). 6
3.7.1.2 Paleontological Resources in the Study Area 7
Formations in the project study area that have the greatest potential for fossils include the Valmy 8 Formation, Roberts Mountains Formation, and the Slaven Chert which are classified as PFYC 3 9 (Figure 3.7-1). The Valmy contains isolated occurrences of trilobites, gastropods, and beds of shell 10 material (bioclastics) (Western Cordillera 2006). In the Toiyabi and Shoshone ranges, the Roberts 11 Mountains Formation contains graptolites, corals, and bioclastic beds. The Slaven Chert contains 12 brachiopods, corals, and bryozoa. The Valmy and Roberts Mountains formations generally are located in 13 the vicinity of the Gold Acres and Pipeline complexes (Figure 3.1-2). The Slaven Chert outcrops in the 14 area of the Canyon Waste Rock Facility. 15
Exposures of Tertiary age (2 to 24 million years ago) alluvial gravel and sand deposits and Quaternary 16 (present to 2 million years ago) deposits of valley alluvium, alluvial fans flanking the mountains, playa, 17 talus, and landslide deposits are contained within the study area. These deposits are considered PFYC 18 system Class 2, with a low potential for vertebrates or scientifically important fossils (Table 3.7-1). 19
A paleontological resources report that addresses vertebrate and invertebrate fossils in the study area 20 was prepared in April 1991 (BLM 2008; Firby 1991). According to the report, no fossil vertebrate 21 localities were confirmed within the study area or CESA through literature searches, BLM paleontological 22 inventories, or queries to other paleontologists. Additionally, the report states that the potential for the 23 occurrence of vertebrate fossils is considered low. Firby (1991) concluded that the sensitivity ranking for 24 invertebrate fossil localities in the Cortez area would be the least sensitive level. 25
Subsequent to Firby’s (1991) report, a mammoth tusk was discovered in the study area in late 1994 26 during a permitted gravel-quarrying operation. The site was evaluated as insignificant because there 27 were no other fossils located with the mammoth tusk. The tusk was found in a paleo-channel, which 28 indicates that it was transported; therefore, the location where the deposit originated could not be 29 determined. Sporadic and unremarkable mammoth remains are known from many locations in 30 Quaternary lake bed and spring-related sediments throughout Nevada (BLM 1996). 31
3.7.2 Environmental Consequences 32
Impacts to paleontological resources would be considered significant if the resource in a PFYC Class 4 33 or 5 formation is lost, destroyed, damaged, or moved from its original stratigraphic position without 34 documentation by a qualified paleontologist. Factors that determine the degree of the significant impacts 35 would include the scientific value, rarity, or unusual characteristics of the lost resource. 36
The duration and intensity of impacts are heavily dependent on the PFYC classification of the formations 37 in which fossils may occur. The higher the PFYC rank the greater the risk to the resource. Direct impacts 38 would include destruction or unauthorized removal of fossils. Indirect effects may result from project-39 induced erosion or increased access to areas that may facilitate the loss of resources. 40
Effects to paleontological resources were evaluated in terms of intensity, duration, and context based on 41 the following definitions: 42

Deep South Expansion Project EIS 3.7 – Paleontological Resources 3.7-6
Draft EIS 2018
Intensity 1
• Negligible: There would be no measurable effect or loss of scientifically important fossils.2
• Minor: Effects to scientifically important paleontological resources would be detectable.3 However, few fossils would be impacted, and effects would be localized.4
• Moderate: Effects to scientifically important paleontological resources would be readily apparent5 and measurable. Some fossils may be lost; however, the effects would occur over a limited area.6
• Major: Effects to scientifically important paleontological resources would be readily apparent7 over a large area. Many fossils may be lost due to ground-disturbing activities.8
Duration 9
• If scientifically important paleontological resources are impacted, the effect would be permanent.10
Context 11
• Localized: Effects would be limited to the proposed disturbance areas.12
• Regional: Effects would occur beyond the proposed disturbance areas.13
3.7.2.1 Proposed Action 14
Under the Proposed Action, the proposed expansion of the open pits at the Pipeline, Gold Acres, Cortez 15 Hills, and Cortez complexes, and development of the proposed Gold Acres satellite pits, could result in 16 direct impacts to paleontological resources through exposure and destruction of fossil resources. 17 However, the host rock formations that have the potential to contain fossils are not likely to contain 18 scientifically useful specimens because of the alteration associated with emplacement of mineralization. 19 Due to the altered state of these host rocks, they would have a PFYC rank of no more than 2. Therefore, 20 it is unlikely that scientifically important resources would be impacted. 21
The Tertiary-age alluvial gravel and sand deposits and Quaternary deposits of alluvium, valley fill, and 22 alluvial fan deposits within the remainder of the proposed disturbance area are considered to be PFYC 23 Class 2 for paleontological sensitivity and are unlikely to produce vertebrate or invertebrate fossils. In 24 addition, an assessment of paleontological resources through the examination of inventories prepared by 25 the BLM and review of the literature found no known vertebrate or invertebrate localities within the CGM 26 Operations Area. 27
Since fossils usually are buried, their locations cannot be confirmed until excavation associated with 28 project construction and operations occur. As discussed in Section 2.4.13, Applicant-committed 29 Environmental Protection Measures, if vertebrate fossils are discovered during construction, operation, 30 or reclamation, activities would be halted in the area of the discovery. BCI would contact the BLM 31 Authorized Officer and, if requested, also may contact a qualified paleontologist. The BLM Authorized 32 Officer and/or qualified paleontologist would evaluate the discovery within 5 working days of being 33 notified. If the discovered paleontological resource is determined to be scientifically important, 34 appropriate measures would be developed to mitigate potential adverse effects. Construction activities 35 would not resume until a notice to proceed is granted by the BLM Authorized Officer. 36
Based on the foregoing, the intensity of effects on scientifically important paleontological resources 37 would be negligible. 38
3.7.2.2 Gold Acres Pit Partial Backfill Alternative 39
Under the Gold Acres Pit Partial Backfill Alternative, potential impacts to paleontological resources would 40 be the same as described for the Proposed Action. 41

Deep South Expansion Project EIS 3.7 – Paleontological Resources 3.7-7
Draft EIS 2018
3.7.2.3 No Action Alternative 1
Under the No Action Alternative, the proposed Deep South Expansion Project would not be developed, 2 and associated impacts would not occur. Existing mining and processing operations and reclamation 3 activities within the CGM Operations Area would continue to operate under existing authorizations. 4
No new ground-disturbing activities beyond those previously authorized would occur under this 5 alternative. As a result, direct impacts to paleontological resources are not expected to occur beyond 6 those analyzed in previous NEPA documents for existing operations within the CGM Operations Area 7 (BLM 2008, 2004, 2000). Indirect impacts (e.g., erosional effects and potential collecting) would continue 8 to occur at a rate similar to that currently occurring in the area. 9
3.7.3 Cumulative Impacts 10
The CESA for paleontological resources is shown in Figure 3.1-11. The CESA for paleontological 11 resources is consistent with that used in the Cortez Hills Expansion Project Final EIS (BLM 2008) and 12 subsequent NEPA documents for the CGM Operations Area. Past and present actions and RFFAs are 13 identified in Table 2-12 and shown in Figure 2-22. 14
3.7.3.1 Proposed Action 15
The potential for the occurrence of scientifically important or vertebrate fossils is low (PFYC Class 2) in 16 the geologic deposits that would be affected by the Proposed Action. Therefore, the Proposed Action is 17 not anticipated to substantially contribute to cumulative paleontological resources impacts in the CESA. 18
3.7.3.2 Gold Acres Pit Partial Backfill Alternative 19
Cumulative impacts under the Gold Acres Pit Partial Backfill Alternative would be the same as for the 20 Proposed Action. 21
3.7.4 Monitoring and Mitigation Measures 22
No additional monitoring or mitigation is recommended for paleontological resources. 23
3.7.5 Residual Adverse Effects 24
No residual adverse effects to paleontological resources are expected to occur. 25

Deep South Expansion Project EIS 3.7 – Paleontological Resources 3.7-8
Draft EIS 2018
This page intentionally left blank

Deep South Expansion Project EIS 3.8 – Cultural Resources 3.8-1
Draft EIS 2018
3.8 Cultural Resources 1
3.8.1 Affected Environment 2
The project study area for direct and indirect impacts to cultural resources is the same as the area of 3 potential effects (APE). Under Section 106 of the NHPA, the APE is defined as “those areas in which 4 impacts are planned or are likely to occur. Specifically, the APE is defined as the geographical area or 5 areas within which an undertaking may directly or indirectly cause changes in the character or use of 6 historic properties, if any such properties exist. Additionally, the APE is influenced by the scale and 7 nature of an undertaking and may be different for different kinds of effects caused by the undertaking” 8 (36 CFR 800.16[d]). 9
The APE should include: 10
• All locations where the proposed project may result in new ground disturbance; 11
• All alternative locations for all elements of the proposed project; 12
• All locations from which elements of the proposed project may be visible or audible; 13
• All locations where the proposed project may result in changes in traffic patterns, land use, 14 public access, etc.; and 15
• All areas where there may be direct or indirect effects. 16
Only those historic properties located in the APE were reviewed to determine if they would be subject to 17 adverse effects to those qualities for which a property is eligible for the NRHP. 18
APE for the Proposed Action and Alternatives 19
Direct Effects APE. The APE for direct physical effects encompasses all areas of proposed new ground 20 disturbance that would result from the Proposed Action and its alternatives. 21
Indirect Effects APE. The APE for indirect effects is made of several different zones of analysis based on 22 specific categories of effect as determined by BLM and, depending on the category of effect, may extend 23 up to 7 miles from proposed mine facilities in the direct APE. The three categories of indirect effect 24 determined to be appropriate for this analysis include visual, auditory, and vibrational. 25
Indirect Effects APE for Visual. The visual zone of analysis for the cultural resources viewshed analysis 26 includes the direct APE, and an area extending 7 miles from the high points of the proposed new or 27 modified facilities in Crescent, Carico Lake, Grass, and Pine valleys (Figure 3.8-1). Proposed facilities, 28 as viewed from any NRHP-eligible properties greater than 7 miles away, would be barely visible. Mount 29 Tenabo and the Cortez Mountains form a barrier to the east of the proposed project’s new disturbance 30 areas. Crescent Valley to the northeast contains terrain and modern mining facilities, including the 31 facilities at the existing Pipeline, Cortez, Cortez Hills, and Gold Acres complexes (e.g., heap leach pads, 32 tailings facilities, and waste rock facilities), which either would hinder or obstruct the visibility of the 33 proposed facility modifications, or have already altered the landscape such that the proposed 34 modifications in the mine complexes would have no additional effect on any NRHP-eligible properties 35 that may exist outside of the proposed new disturbance areas. The Shoshone Range forms a barrier to 36 the west of the proposed new disturbance areas. The only proposed disturbance areas visible in Grass 37 and Pine valleys would be associated with water management facilities (i.e., RIBs). 38
Indirect Effects APE for Auditory. The auditory zone of analysis extends 3 miles in all directions from the 39 edge of the proposed new disturbance areas. At a distance exceeding 3 miles from the proposed new 40 disturbance areas, auditory changes resulting from the Proposed Action would be reduced to baseline or 41 ambient levels. 42

Deep South Expansion Project EIS 3.8 – Cultural Resources 3.8-2
Draft EIS 2018
Indirect Effects APE for Vibration. The vibrational zone of analysis extends 3,000 feet in all directions 1 around the proposed open pit expansion areas (Gold Acres, Pipeline, Cortez Hills, Cortez pits) where 2 blasting would occur (Figure 3.8-1). The blasting technique currently used for existing operations in the 3 CGM Operations Area would continue to be used under the Proposed Action. Based on historical 4 seismograph data collected at the CGM Operations Area, the blasting technique has resulted in a peak 5 particle velocity of less than 0.1 inch per second at distances greater than 3,000 feet from the blasting 6 areas (BCI 2017) as discussed in Section 3.1, Geology and Minerals. Based on other studies, peak 7 particle velocities below 0.12 inches per second are unlikely to damage fragile historic buildings, ruins, 8 and ancient monuments (Garavaglia Architecture, Inc. 2013). 9
The CESA area includes the area within the CGM Operations Area and surrounding lands from 10 approximately 1 to 6 miles from the boundary, including portions of the Cortez Mountains and the 11 Shoshone and Toiyabe Ranges, the westernmost portion of Pine Valley, and northern portion of Carico 12 Lake Valley (Figure 3.8-1). 13
3.8.1.1 Regulatory Framework 14
Federal law and regulation provide the framework by which historic properties are identified, evaluated 15 for their significance, and protected. NEPA mandates that “federal or federally-assisted projects (federal 16 undertakings) must take into account effects on historic and cultural resources” and alternatives must be 17 considered (40 CFR 1500-1508). The NHPA, 1966 and as amended, requires that federal agencies 18 consider an undertaking’s effects on historic properties, which are defined as prehistoric or historic sites, 19 districts, buildings, structures, or objects that are included in or eligible for inclusion in the NRHP. This 20 legislation also established the Advisory Council on Historic Preservation. A property does not need to 21 be formally listed on the NRHP to warrant consideration; consideration is granted if the property meets 22 the NRHP criteria (see Section 3.8.1.2). NHPA’s implementing regulations (36 CFR 800) define the 23 procedures by which historic properties are identified, documented, and evaluated for the NRHP, and 24 how the effects to historic properties posed by federal undertakings are mitigated. 25
While regulations for implementing Section 106 of NHPA are outlined in 36 CFR 800, program 26 alternatives can be adopted to better fit agency procedures (36 CFR 800.14). A common program 27 alternative is a PA negotiated between the federal agency and the Advisory Council on Historic 28 Preservation (ACHP). The National Programmatic Agreement among the BLM, ACHP, and the National 29 Conference of SHPOs was adopted as the program alternative for BLM. The National Programmatic 30 Agreement is therefore the national BLM authority for meeting requirements of the NHPA. In Nevada, the 31 State Protocol Agreement between BLM and Nevada SHPO (2014) defines how the BLM and SHPO will 32 cooperate under National Programmatic Agreement and how Section 106 of the NHPA will be 33 implemented. 34
A PA for the Cortez Area of Interest was signed in October 2005 by the BLM Battle Mountain and Elko 35 District Offices, Nevada SHPO, and CGM (now BCI) (BLM, SHPO, and CGM 2005), and later was 36 amended to extend it to September 28, 2018 (BLM and SHPO 2017) (Appendix C). The PA covers any 37 mining or exploration projects proposed in the PA’s Area of Interest. This document outlines how 38 resources are identified and evaluated for the NRHP, how adverse effects to resources are identified and 39 minimized or mitigated, and how inadvertent discoveries are addressed. The proposed new disturbance 40 within the CGM Operations Area is located in the Area of Interest for the Cortez PA, (Figure 2-3) and 41 that document is the guiding document for implementation of Section 106 of NHPA. For the proposed 42 new disturbance areas outside of the CGM Operations Area (Figure 2-3), which would be located 43 outside of the Area of Interest, the guidance for implementation of Section 106 would default to the 2014 44 State Protocol Agreement. BLM, SHPO, ACHP, and BCI are currently negotiating a new PA that will 45 become effective prior to the expiration date of the current PA and will govern future cultural resource 46 investigations. 47


Deep South Expansion Project EIS 3.8 – Cultural Resources 3.8-4
Draft EIS 2018
This page intentionally left blank

Deep South Expansion Project EIS 3.8 – Cultural Resources 3.8-5
Draft EIS 2018
3.8.1.2 Eligibility Criteria for the National Register of Historic Places 1
The NRHP is maintained by the NPS, which has established the criteria necessary for a property to be 2 listed or eligible for listing on the NRHP. Properties must be at least 50 years old, they must meet at least 3 one of the four criteria of significance, and they must retain integrity. “The quality of significance in 4 American history, architecture, archaeology, engineering, and culture is present in districts, sites, 5 buildings, structures, and objects that possess integrity of location, design, setting, materials, 6 workmanship, feeling, and association, and that adhere to at least one of the following: 7
• Are associated with events that have made a significant contribution to the broad patterns of our 8 history (Criterion A); or 9
• Are associated with the lives of significant persons in our past (Criterion B); or 10
• Embody the distinctive characteristics of a type, period, or method of construction, or represent 11 the work of a master, or possess high artistic values, or represent a significant and 12 distinguishable entity whose components may lack individual distinction (Criterion C); or 13
• Have yielded or may be likely to yield, information important in history or prehistory (Criterion D)” 14 (NPS 1997).” 15
NRHP eligibility determinations are justified by reference to the prehistoric, historic, or ethnohistoric 16 cultural contexts developed for a particular region or time period. The cultural contexts define “those 17 patterns, themes, or trends in history by which a specific occurrence, property, or site is understood and 18 its meaning (and ultimately its significance) within prehistory or history is made clear” (NPS 1995). 19 Significance is determined through identification of property types, examination of integrity, and a 20 resource’s association with a time, place, or theme important to local, state, or national history. “Time” is 21 the chronological period in which events occurred, “place” is the encompassing geographic area or 22 political subdivision, and “theme” is a broad categorization of the activities taking place. BLM will make a 23 determination of “not eligible” or “eligible” for inclusion in the NRHP for all cultural resources potentially 24 impacted by the Proposed Action. 25
3.8.1.3 Cultural Resource Investigations in the Proposed Project Vicinity 26
Over the last 40 years, more than 250 cultural resource investigations have been conducted in the 27 CESA. These have included Class I, Class II, and Class III investigations to identify cultural resources 28 and assessments of indirect project effects, as well as the development of historic contexts, research 29 designs, and mitigation plans, and the implementation of plans to mitigate effects to historic properties. 30 Class I investigations are literature reviews to determine the extent or prior inquires and the nature and 31 number of previously documented resources. Class II investigations are sample field surveys to identify 32 cultural resources. Class III investigations are intensive level field surveys of areas in which potential 33 impacts are anticipated or are likely to occur. 34
The direct APE for cultural resources consists of all proposed new ground disturbance for the Proposed 35 Action. All areas of proposed new ground disturbance have been covered by Class III inventory to 36 identify cultural resources and evaluate those resources for the NRHP. A total of 56 inventories have 37 been conducted in the direct APE (Appendix C, Table C-1). Both prehistoric and historic sites, as well 38 as ethnographic and multi-component sites, have been identified within the project study area. 39
The results of the inventories have been documented in survey reports that have been submitted to the 40 BLM and SHPO for review and concurrence. The reports contain the cultural and historical overviews of 41 the area; the archaeological field methods used to identify the resources; artifacts analyses, where 42 applicable; and the location, type, and NRHP evaluation of eligibility for the identified resources. 43 Mitigation plans for all NRHP–eligible sites potentially adversely affected by the proposed project have 44 been developed. Detailed descriptions from the survey reports, in particular the descriptions and 45 locations of recorded cultural resources, are held confidential under Section 304 of the NHPA and under 46

Deep South Expansion Project EIS 3.8 – Cultural Resources 3.8-6
Draft EIS 2018
the Archaeological Resources Protection Act (ARPA) for the protection of such resources; however, a 1 general summary is included in this EIS. 2
3.8.1.4 Prehistoric Sites 3
Prehistoric archaeological resources comprise those material remains of human activity (e.g., sites, 4 features, objects, or structures) that pre-date documented historic events or individuals. Prehistoric sites 5 within the project study area could be determined eligible for the NRHP if they possess integrity and 6 possess the potential to yield data that can address the research questions that have been determined 7 relevant to the region. While prehistoric resources can be eligible under any of the four criteria of 8 eligibility (A, B, C, and D), they are most frequently determined eligible under Criterion D, for their 9 research potential. Examples of prehistoric site types identified within the project study area and CESA 10 boundary include task-specific sites and residential locations.. 11
Task-specific Locations 12
Task-specific locations represent localities where individuals or groups conducted specific tasks, which 13 are identified by the materials that remain. These locations often are identified by artifact scatters that 14 may contain flaked or ground stone debris, or ceramics, and represent hunting localities, seed gathering 15 or processing areas, or other resource gathering activities. Occupation of task-specific locations was 16 ephemeral or non-existent. These locations may have been visited once or repeatedly over a number of 17 years. Task-specific locations are the most common prehistoric site type in the project study area and 18 project vicinity, and frequently are the only indications of prehistoric human use of an area. These sites 19 can help shed light on past lifeways by providing information regarding chronology, subsistence and land 20 use patterns, technological organization, and resource acquisition. 21
Residential Locations 22
Archaeological sites indicating past human residential occupation may represent short-term or long-term 23 residence. These sites often contain a wide range of flaked and ground stone items, as well as other 24 processing tools, coinciding with indications of domestic use. Domestic use of a site may be reflected in 25 the presence of ceramics, fire-affected rocks, domestic structures, and/or features such as hearths, rock 26 rings, and storage caches. Long-term residential sites may have been occupied seasonally for 27 comparatively longer periods of time by larger social groups of men, women, and children. Complex 28 occupation sites have the highest potential to contain intact subsurface cultural deposits that can yield a 29 wide array of information regarding past lifeways. These sites are important because they can provide 30 evidence of the range of habitational structure types and preferences, and can provide information about 31 social organization, group size, land use and settlement patterns, and resource acquisition and use. 32
Prehistoric site densities can vary from extremely high in some areas, such as near certain ridge tops 33 and areas near larger, more reliable drainages, to non-existent in other settings. In and near the project 34 study area, most prehistoric settlement activity appears focused on the toe slopes and alluvial pediments 35 that separate the mountainous upland areas from the valley bottoms (McGuire et al. 2007). Such areas 36 are well positioned to take advantage of resources located at both higher elevations and lower 37 elevations. Additionally, these areas also contain the most reliable sources of water. Prehistoric 38 settlement activity also favored upland forested areas; however, only for certain types of occupations 39 directed primarily at hunting and the associated reduction of flaked stone. The valley bottoms appears to 40 be the least sensitive areas for settlement activity and were not preferred as residential encampments. 41 This pattern may correlate to the comparative lack of reliable water sources, or it may reflect natural 42 geomorphological processes that result in high rates of alluvial deposition which bury or destroy fragile 43 archaeological components. 44
3.8.1.5 Historic Sites 45
Historic resources are districts, sites, buildings, structures, or other objects that are associated with or 46 convey some aspect of history, architecture, engineering, and/or culture that post-date written 47

Deep South Expansion Project EIS 3.8 – Cultural Resources 3.8-7
Draft EIS 2018
documentation. Historic resources in the project study area could be eligible for the NRHP if they are 1 directly associated with themes of national, state, regional, or local importance. Themes include, but are 2 not limited to, exploration, transportation, communication, mining, ranching, farming, urban development, 3 or government and political activities. Historic sites can be significant under criteria A, B, C, and/or D. 4 Examples of historic resources identified in the project study area and CESA include charcoal production 5 locations, debris scatters, woodpiles, historic transportation/utility corridors, residential sites, and mining 6 districts. 7
Charcoal Platforms 8
As a result of the need for a large quantity of charcoal to fuel the roasting ovens, a specialized charcoal 9 industry developed in central Nevada to produce charcoal from the local woodlands. At the Cortez 10 townsite, stands of pinyon-juniper and mountain mahogany were intensively harvested between 1884 11 and 1891 to provide cord wood that was converted into charcoal (Hattori and Thompson 1987). The 12 archaeological evidence of this industry ranges from stumps of fallen trees to charcoal burning platforms. 13 Trees were felled with ax or saw, cut into lengths of approximately 3 to 4 feet, and transported by mule to 14 a centralized processing area. The charcoal burning platform was situated in various locations ranging 15 from drainage bottoms to ridge crests. The area generally was prepared by leveling, which could include 16 construction of a retaining wall. The archaeological remains of the charcoal platforms in the project study 17 area and CESA typically are 20 feet in diameter and are indicated by charcoal staining on the ground. 18
Debris Scatters 19
The debris scatter is one of the most commonly encountered historic site types in the project study area. 20 Debris scatters are accumulations of historic-period artifacts, minus associated features, and can range 21 from two artifacts to large and complex dumps containing thousands of artifacts. The latter are often 22 found around the edges of townsites or other settlements. Scatters may represent a single dumping 23 episode or other activity, or span long periods of time, representing numerous activities or episodes of 24 dumping. They may contain a single artifact type (e.g., tin cans) or contain a variety of materials 25 including consumption remnants, domestic or clothing implements, or machinery parts. In general, 26 scatters are found mainly on the surface, although examples of buried dumps or partially buried debris 27 also can occur. 28
Woodpiles 29
Several sites contain axe-cut wood in 2- or 4-foot lengths stacked into piles. This wood was used to run 30 steam engines and fuel the furnaces in the mills between the 1860s and the 1920s when the area was 31 converted to electricity (Hardesty and Hattori 1982). If these wood piles were meant to be used as 32 charcoal or cord wood, then the wood was most likely cut prior to the 1920s. 33
Transportation and Communication/Utility Corridors 34
Transportation sites contain historic roads or trails that contributed to the movement of people, goods, 35 and resources within the Cortez Mining District, and between the district and core settlements like Austin 36 and Beowawe. Transportation sites connected major centers of settlement and industry throughout the 37 CESA boundary. Corridors include the main thoroughfare through Grass Valley that began in the 1870s 38 as a wagon road and eventually became State Highway 21. The highway had feeder roads to Shoshone 39 Wells and the settlement of Cortez. Trails along the Mount Tenabo fan and pediment were used by mule 40 skinners to haul cordwood and charcoal to the mines and mills, and trail systems across the valley in the 41 Toiyabe Range are believed to have been used to carry water and wood. Another early mule trail/wagon 42 road connected the mines on the west face of Mount Tenabo with the district’s first mill in Mill Canyon on 43 the north side of the mountain (Zeier et al. 1993). 44
Utility sites contain features that are directly attributable to electricity, telephone service, and/or water 45 conveyance. Sites and features in the CESA include overhead utilities (poles, wire) and buried pipelines. 46 Two of the sites contain water pumping stations. Simeon Wenban is credited with development of an 47

Deep South Expansion Project EIS 3.8 – Cultural Resources 3.8-8
Draft EIS 2018
elaborate but simple design to deliver water from pumps and springs in Grass Valley and the Toiyabe 1 Range uphill to the Tenabo Mill. Wenban’s system used gravity and steam pumps to deliver a reliable 2 water supply through a series of buried pipes, which lasted (with modifications) from 1886 to the 1940s. 3 The Consolidated Cortez Mill (1922-1930) included an electric power plant, which archaeological and 4 archival evidence suggests created both the first use of electricity in the district and the first telephone 5 system. Electricity was supplied to the settlement of Cortez and possibly Wenban’s house. The total 6 length and breadth of the electric power network within the district remains uncertain. Another telephone 7 line passes through the mining district and connected the Gund Ranch south of the Cortez townsite with 8 the railroad station at Beowawe. A branch telephone line may have gone to the Horse Ranch in Horse 9 Canyon. The ranch telephone system appears to have operated from the 1920s to as late as the 1970s. 10
Historic Residential Sites 11
Historic residential sites contain features indicative of habitation or shelter, or in some cases artifact 12 clusters or other features (e.g., a cooking hearth or oven), suggesting the area may have served as a 13 temporary camp. Sites containing habitation features in the project study area and CESA include 14 flattened areas or rock rings believe to have been used for tents, earth dugouts, and stone ruins. The 15 main settlements of Shoshone Wells and Cortez are outside of the CGM Operations Area but within the 16 indirect APE– the latter contains several extant wood-framed and adobe ruins. Most of the sites with 17 habitation components are small, and probably represent individuals or small work groups employed in a 18 variety of tasks on the periphery of the main mining areas. Woodcutting, charcoal production, and 19 mineral exploration were likely the predominant employment in these marginal areas. Most of the sites 20 likely were occupied for relatively short periods (one or two seasons, or a matter of months); hence, the 21 habitation features reflect expedient construction and a general lack of architectural style. 22
Mining Districts 23
Mining districts in the project study area contain a wide variety of industrial, residential, and other site 24 types that reflect efforts to recover silver, gold, lead, barite, turquoise, and other marketable minerals 25 over the last 130 years. Evidence of this past development is manifest in “property types,” or classes of 26 physical remains, that typify a particular activity. These property types include, but are not limited to, 27 claim markers, cairns, quarries, tunnels, tailings, lime kilns, cordwood, camps, shafts, adits, pits, 28 buildings and residences, cellars, cemeteries, and debris. 29
Precious metal exploration and mining has dominated the history of the project study area and CESA 30 from the mid-19th Century to the present day. Mining within what would become the Cortez Mining 31 District began in 1863, and grew to encompass mines, mills, transportation networks, and residential 32 areas, including the townsites of Shoshone Wells and Cortez. Mining has spanned not only the 33 remainder of the 19th Century, but also the 20th and the beginning of the 21st centuries. The history of 34 the Cortez Mining District includes more than a century of technological developments in mining and 35 milling, and reflects fundamental changes in the human population of the area. This occurred as various 36 Euro-American ethnic groups, as well as Asians and Mexicans, were drawn by the mining industry to the 37 Cortez Mining District, interacting with one another and with the existing Native American community. 38
During the early years of the Cortez Mining District, the two main camps were Shoshone Wells, located 39 at a spring in the south end of Cortez Canyon, and the townsite of Cortez, which had its beginnings in 40 1886 when the Tenabo Mill was built. The Cortez townsite soon became the main commercial center for 41 the mining district and existed in the 1940s or 1950s (Zeier et al. 1993). The settlement had a post office, 42 company store, school, and company boarding house. The main focal point for this community was the 43 Tenabo Mill (1886-1915) and later Consolidated Cortez Mill (1923-1929) (Hardesty and Hattori 1982). 44 Based on the 1890 census records, Chinese mill laborers likely lived in the boarding house near the mill, 45 while Chinese mine laborers lived near a community above the main settlement. Though the Cortez 46 townsite post office was moved to Beowawe in 1923, the town remained viable until the last family 47 moved away in 1942 (Zeier et al. 1993). 48

Deep South Expansion Project EIS 3.8 – Cultural Resources 3.8-9
Draft EIS 2018
The Cortez Mining District was proposed as an NRHP-eligible district in 1992 (Zeier et al. 1993). The 1 NRHP Historic District boundary is approximately 27,300 acres and encompasses Mount Tenabo, the 2 pediment west of Mount Tenabo, Mill Canyon, and the south extension of the Cortez Mountains, as well 3 as much of the proposed Deep South Expansion Project. The NRHP Historic District boundary was 4 never submitted to the Keeper of the NRHP; however, the BLM and Nevada SHPO consider the district 5 eligible under all four criteria (Zeier et al. 1993). The Cortez Mining District is eligible under Criterion A for 6 its association with events related to exploration, settlement, and ethnic heritage and under Criterion B 7 because of its association with Simeon Wenban, an early and the most influential developer in the 8 district. Milling technologies utilized during the late 19th and early 20th centuries reflect important 9 industrial evolutionary developments and constitute the basis for the district’s eligibility under Criterion C. 10 Research issues have been defined for the district, and it is eligible under Criterion D for its ability to 11 address those issues (Hardesty and Hattori 1982; Zeier et al. 1993). Historic properties that are 12 associated with the development of the Cortez Mining District but are outside of the proposed NRHP 13 Historic District boundary may be evaluated for their contribution to the Historic District. 14
3.8.1.6 Ethnographic Sites 15
Ethnographic sites, or Native American sites dating to the historic period, may contain artifacts or 16 features both classically “prehistoric” and classically “historic” in a context that suggests that the 17 materials are related. Whether the two classes of artifacts were in fact deposited at the same time is a 18 primary research issue in the identification of ethnographic sites, which represent a period in which 19 Native Americans were adopting European implements, utensils, and structures and incorporating them 20 into Native American traditional lifeways. Examples of possible ethnohistoric sites identified in the project 21 study area and CESA include: a site containing a historic artifact scatter and tent platform in association 22 with a hearth and metate; a possible pinyon pole associated with a hearth with burned bone and a 23 modified food can; a site containing a mixture of prehistoric materials dating to the Terminal Archaic 24 period, evidenced by trade beads and a Desert Side Notched projectile point, and historic materials 25 dating to the earliest period of exploration (c. 1860s to 1880s) suggesting that they were deposited 26 simultaneously; and a site with a pinyon pole and Desert Side Notched projectile points. Some of these 27 possible ethnographic sites also contain older prehistoric assemblages, suggesting possible repeated 28 and prolonged use of certain areas by indigenous groups. 29
3.8.1.7 Multi-component Sites 30
Multi-component sites are those sites that contain evidence of multiple, un-related human occupations or 31 activities within the same physical locations. Multi-component sites may be the result of chance, in which 32 groups stopped at the same location several hundred or several thousands of years apart, or they may 33 be due to a particular aspect of the landscape that attracted people over thousands of years for the 34 same reason. Reliable sources of water are a common attractive aspect of the landscape that drew un-35 related groups. While these sites can be important because they provide evidence of land use through 36 time, the integrity of older components is often compromised by the overlay of the more recent activity. 37
3.8.2 Environmental Consequences 38
The NHPA requires that federal agencies take into account the effect of a proposed project on historic 39 properties. The National PA, Nevada State Protocol Agreement, and Cortez PA govern the roles and 40 responsibilities of the BLM, ACHP, Nevada SHPO, and BCI for review and comment on the undertaking 41 and effects on historic properties. Historic property, as defined by the regulations implementing Section 42 106 of the NHPA, means “any prehistoric or historic district, site, building, structure, or object included in, 43 or eligible for inclusion in, the NRHP maintained by the NPS.” Potential effects to historic properties are 44 assessed using the “criteria of adverse effect” (36 CFR 800.5[a][1]), as defined in the implementing 45 regulations for the NHPA. “An adverse effect is found when an undertaking may alter, directly or 46 indirectly, any of the characteristics of a historic property that qualify the property for inclusion on the 47 NRHP in a manner that would diminish the integrity of the property’s location, design, setting, materials, 48 workmanship, feeling, or association.” The analysis of effects using these criteria is limited to those 49

Deep South Expansion Project EIS 3.8 – Cultural Resources 3.8-10
Draft EIS 2018
resources that are listed in the NRHP or have been determined eligible or potentially eligible for inclusion 1 in the NRHP. There are five broad categories of effect: 1) physical destruction or alteration of a property 2 or relocation from its historic location; 2) isolation or restriction of access; 3) change in the character of 3 the property’s use or of physical features within the property’s setting, or the introduction of visible, 4 audible, or atmospheric elements out of character with the significant historic features of the property; 5 4) neglect leading to deterioration or vandalism; and 5) transfer, sale, or lease from federal to non-federal 6 control without adequate and legally enforceable restrictions or conditions to ensure preservation of the 7 historic significance of a property. 8
Under NHPA, effects to NRHP-eligible properties can be direct or indirect. Potential direct effects from 9 mining activities can include physical damage resulting from surface-disturbing activities, including 10 access to construction areas by large equipment, development of mine facilities (e.g., open pits, waste 11 rock facilities), improvement of existing access roads, blasting vibrations, demolition activities, use of 12 ancillary areas for storage of equipment and supplies, and future maintenance activities. These physical 13 effects can occur to both known sites and unknown subsurface sites that could be discovered and 14 disturbed during surface disturbing activities. Indirect effects to historic properties often are not 15 quantifiable and can occur within and outside of the direct APE. Potential indirect effects can include 16 changes in erosion patterns due to construction, soil compaction, or vegetation removal; fugitive dust; 17 off-road vehicle traffic associated with construction or maintenance activities; and increased vandalism, 18 including illegal artifact collection, due to increased access. Other potential indirect effects can include 19 the introduction of visual or auditory elements out of character with a property that disrupts the property’s 20 setting. These effects can result from introducing modern structures and associated auditory emissions 21 into an otherwise rural or natural setting. Finally, vibrations from blasting could compromise the structural 22 integrity of standing features. 23
The Proposed Action has the potential to directly or indirectly affect resources that are eligible or 24 potentially eligible for inclusion on the NRHP. Effects to cultural resources are discussed in this EIS in 25 terms of intensity, duration, and context based on the following definitions. Adverse effects may include 26 direct and indirect effects as well as reasonably foreseeable effects caused by the undertaking that may 27 occurred later in time, be farther removed in distance, or be cumulative (36 CFR 800.5[a][1]). 28
Intensity 29
• No Historic Properties Affected: There are no historic properties in the APE, or there are historic 30 properties in the APE but the undertaking would not alter the characteristics that qualify the 31 historic properties for inclusion in or eligibility for the NRHP. 32
• No Adverse Effect: There would be an effect on historic properties by the undertaking; however, 33 the effect would not meet the criteria of adverse effect in 36 CFR 800.5(a)(1) and would not alter 34 any of the characteristics that make the properties eligible for listing in the NRHP in a manner 35 that would diminish the integrity of the historic properties. 36
• Adverse Effect: The undertaking would alter, directly or indirectly, any of the characteristics that 37 qualify the historic properties in the APE for inclusion in the NRHP in a manner that would 38 diminish the integrity of the properties. Adverse effects may be resolved through development of 39 a PA among the project proponent, BLM, SHPO, ACHP, and other consulting or concurring 40 parties, such as American Indian tribes (36 CFR 800.6), and a Historic Properties Treatment 41 Plan (HPTP) that would specify the mitigating actions that would be taken to resolve the adverse 42 effects, as well as the implementation and documentation protocols to be followed. 43

Deep South Expansion Project EIS 3.8 – Cultural Resources 3.8-11
Draft EIS 2018
Duration 1
• Short-term: Effects would last for the duration of the proposed project. 2
• Long-term: Effects would last beyond the duration of the proposed project. 3
Context 4
• Localized: Effects would be limited to NRHP-eligible sites in the APE. 5
• Regional: Effects would occur to NRHP-eligible sites in the CESA. 6
3.8.2.1 Proposed Action 7
Direct and Indirect Impacts 8
Based on the results of Class III inventories, 30 cultural resources (historic, prehistoric, or ethnographic 9 archaeological or architectural resources) are located within the direct APE (Appendix C, Table C-2), of 10 which eight are eligible for the NRHP. Of these eligible properties, one is prehistoric and seven are 11 historic. The prehistoric site is a lithic scatter. Historic sites include five charcoal platforms and charcoal 12 production habitation areas, and two architectural resources. All eight of these eligible properties could 13 be adversely affected by the Proposed Action. As described further below, a HPTP has been developed 14 to resolve adverse effects to these eight properties. 15
The BLM has determined that the Proposed Action would have the potential to adversely affect historic 16 properties outside of the direct APE through visual and auditory changes to existing baseline conditions 17 or through vibrational effects associated with blasting activities required for development of the proposed 18 open pit modification/expansion areas. A study to identify documented and undocumented historic 19 properties that fall within the indirect APE visual, auditory, and vibrational zones of analysis identified in 20 Section 3.8.1 was undertaken by Summit (2018). Previously, 1,627 archaeological sites and 21 31 architectural resources were documented in the indirect zones of analysis. Of the these sites, the 22 study identified 16 archaeological sites, 9 previously documented architectural resources, and 5 23 undocumented architectural resources in these indirect APE zones of analysis with the potential to be 24 indirectly affected by the Proposed Action. The remaining resources were determined not to have the 25 potential to be adversely indirectly impacted by the Proposed Action. BLM has reviewed the results of 26 Summit’s (2018) study and SHPO has concurred (Nevada SHPO 2018). The Cortez cemetery, which 27 falls within the auditory zone of analysis but outside of the vibrational and visual zones of analysis, is 28 located on private land near the historic Cortez townsite and has not been formally documented. 29 Potential auditory effects at the cemetery are discussed in Section 3.16, Noise. 30
Fifteen of the 16 archaeological resources and the 9 documented and 5 undocumented architectural 31 resources that potentially would be indirectly affected by the Proposed Action are located in the auditory 32 zone of analysis. Auditory changes to the landscape impact setting and feeling of archaeological and 33 architectural resources, and may result in adverse effects to historic properties if setting and/or feeling 34 are characteristics for which the resource(s) qualify for inclusion on the NRHP. BLM has determined that 35 the auditory changes to these properties would result from temporary noise associated with construction 36 of the proposed RIBs and pipeline. As these effects would be temporary, indirect adverse effects 37 resulting from auditory changes would not occur. 38
One of the 16 archaeological resources that potentially would be indirectly affected by the Proposed 39 Action is located in the visual zone of analysis. Viewshed changes to the landscape impact setting and 40 feeling of archaeological and architectural resources, and may result in adverse effects to historic 41 properties if setting and/or feeling are characteristics for which the resource(s) qualify for inclusion on the 42 NRHP. BLM has determined that the resource in the visual zone of analysis does not qualify for the 43 NRHP for its aspect of setting or feeling, and therefore, indirect adverse effects resulting from project-44 related visual changes would not occur. 45
Deep South Expansion Project EIS 3.8 – Cultural Resources 3.8-12
Draft EIS 2018
BLM has determined that no archaeological or architectural resources with the potential to be adversely 1 affected by the Proposed Action are located in the vibrational zone of analysis. Therefore, the Proposed 2 Action would not result in indirect vibrational effects to historic properties. 3
Mitigation of Adverse Effects to Historic Properties Under the PA 4
The 2005 Cortez PA was amended in 2017 to extend the term to September 28, 2018. This PA outlines 5 the steps to be taken to: 1) identify cultural resources; 2) evaluate them for eligibility for listing on the 6 NRHP; 3) identify potential adverse effects; 4) develop measures to avoid, reduce, or mitigate adverse 7 effects; and 5) address inadvertent discoveries. Additionally, the PA assigns roles and responsibilities for 8 implementation of the PA, which ensures that all interested parties are given an opportunity to comment 9 on the effects of an undertaking on NRHP-eligible properties and any mitigation for such effects. If 10 during implementation the BLM should determine that the Proposed Action would result in adverse 11 effects to additional historic properties, the PA would be implemented to resolve such adverse effects. 12
In accordance with the PA, a HPTP for mitigation of direct adverse effects to NRHP-eligible historic 13 properties resulting from the Proposed Action has been developed and reviewed by the BLM and 14 Nevada SHPO (McQueen and Lafayette 2017). BLM has determined that the Proposed Action would 15 not result in indirect adverse effects to historic properties in the indirect APE; therefore, a HPTP to 16 mitigate indirect adverse effects would not be required. For historic properties eligible under criteria A, B, 17 and/or C, forms of mitigation considered in the HPTP may include oral history, historic markers, exhibits, 18 interpretive brochures, or publications. Data recovery is deemed the most appropriate treatment 19 measure for historic properties eligible under Criterion D. If the Proposed Action is approved, the BLM 20 would ensure that the HPTP is implemented within the timelines set forth in the plan. 21
Although cultural resource inventories were conducted within the entire direct APE, subsurface sites may 22 be missed during the course of field investigations. The potential for the discovery of unanticipated 23 cultural resources during construction activities exists within proposed disturbance areas and could result 24 in effects. As provided in the PA, if any previously unknown cultural resources are discovered during 25 construction on BLM-administered lands, all construction activities would cease within 300 feet of the 26 discovery, and the BLM Authorized Officer would be notified of the find. Steps would be taken to protect 27 the site from vandalism or further damage until the BLM Authorized Officer can evaluate the nature of 28 the discovery as outlined in the PA. Construction would not resume in the area of the discovery until the 29 BLM Authorized Officer has issued a notice to proceed. 30
If construction or other project personnel discover what may be human remains, funerary objects, or 31 items of cultural patrimony on federal land, construction would cease within 300 feet of the discovery, 32 and the BLM Authorized Officer would be notified of the find. Any discovered Native American human 33 remains, funerary objects, or items of cultural patrimony found on federal land would be handled in 34 accordance with the Native American Graves Protection and Repatriation Act (NAGPRA) and 35 procedures detailed in the PA. Non-Native American human remains would be handled in accordance 36 with Nevada law and the PA. Construction would not resume in the area of the discovery until the BLM 37 Authorized Officer has issued a notice to proceed. 38
If human remains and associated funerary objects are discovered on private land during construction 39 activities, construction would cease within 300 feet of the discovery, and the county coroner or sheriff 40 would be notified of the find. Treatment of any discovered human remains and associated funerary 41 objects found on private land would be handled in accordance with the provisions of applicable Nevada 42 law and the PA. 43
Increases in both surface activities and the number of workers during construction could increase the 44 potential for indirect impacts at archaeological sites. Indirect impacts are difficult to quantify or predict; 45 however, they could include the loss of surface artifacts due to illegal collection and inadvertent 46 destruction. To minimize indirect impacts to historic properties from increased numbers of people in the 47

Deep South Expansion Project EIS 3.8 – Cultural Resources 3.8-13
Draft EIS 2018
area, project personnel have been and would continue to be trained in site avoidance and protection 1 measures, including information on the statutes protecting historic properties and BCI policies. 2
The Proposed Action would result in adverse effects to historic properties. The adverse effects would be 3 limited to NRHP-eligible historic resources within the APE, and would be handled and mitigated through 4 implementation of the PA and HPTP, respectively. The effects would be localized in context. 5
3.8.2.2 Gold Acres Pit Partial Backfill Alternative 6
Under the Gold Acres Pit Partial Backfill Alternative, potential impacts to historic properties would be the 7 same as described for the Proposed Action. 8
3.8.2.3 No Action Alternative 9
Under the No Action Alternative, the proposed Deep South Expansion Project would not be developed, 10 and associated impacts to historic properties would not occur. Existing mining and processing operations 11 and reclamation activities in the current CGM Operations Area, as described in Section 2.5.1.2, No 12 Action Alternative, would continue to operate under the terms of current permits and approvals by the 13 BLM and State of Nevada. No additional ground-disturbing activities beyond those currently authorized 14 would occur under this alternative. Prior to construction of the authorized facilities, adverse effects to 15 NRHP-eligible properties located in the area of the facilities were, or would be, fully mitigated in 16 accordance with Section 106 of the NHPA and NEPA, and the PA. Therefore, no additional effects to 17 historic properties would occur under the No Action Alternative. 18
3.8.3 Cumulative Impacts 19
The CESA for cultural resources is shown in Figure 3.8-1. Past and present actions and RFFAs are 20 identified in Table 2-12 and shown in Figure 2-22. 21
3.8.3.1 Proposed Action 22
Any mining or other ground-disturbing activities within the CESA could affect NRHP-eligible sites in those 23 areas. As directed by law, cultural resources inventories and consultations would be conducted for any 24 projects involving public lands, and adverse effects would be avoided or mitigated as appropriate. All 25 activities associated with the proposed Deep South Expansion Project would be in accordance with 26 guidelines established in the PA (Appendix C). In addition, impacts to known NRHP-eligible properties 27 and any previously unknown NRHP-eligible properties that may be discovered during project 28 construction activities would be mitigated in accordance with the PA. Therefore, the Proposed Action is 29 not expected to contribute to cumulative effects to NRHP-eligible properties. 30
3.8.3.2 Gold Acres Pit Partial Backfill Alternative 31
Cumulative effects to NRHP-eligible properties under the Gold Acres Pit Partial Backfill Alternative would 32 be the same as described for the Proposed Action. 33
3.8.4 Monitoring and Mitigation Measures 34
All adverse effects under the NHPA and NEPA to known NRHP-eligible properties identified within the 35 direct and indirect APE would be mitigated in accordance with the PA and HPTP(s) prepared for the 36 Proposed Action. Any previously unknown NRHP-eligible properties that may be discovered during 37 construction activities would be mitigated in accordance with the PA. Therefore, no additional mitigation 38 or monitoring is recommended. 39

Deep South Expansion Project EIS 3.8 – Cultural Resources 3.8-14
Draft EIS 2018
3.8.5 Residual Adverse Effects 1
No residual adverse effects are anticipated, as adverse effects to all known NRHP-eligible sites would be 2 mitigated in accordance with the PA (Appendix C) and HPTP prepared for the Proposed Action. Any 3 previously unknown NRHP-eligible sites that may be discovered during construction and development 4 activities would be mitigated in accordance with the PA. 5

Deep South Expansion Project EIS 3.9 – Native American Traditional Values 3.9-1
Draft EIS 2018
3.9 Native American Traditional Values 1
The project study area for direct and indirect impacts to Native American traditional values encompasses 2 the proposed new surface disturbance areas within and outside of the CGM Operations Area (see 3 Figure 2-3), as well as Mount Tenabo. The regional CESA for the Native American traditional values 4 cumulative effects analysis encompasses recent hard rock mines in north-central Nevada (Carlin Trend, 5 Cresecent Valley, and Tonkin Springs areas) plus other industrial developments (e.g., large transmission 6 lines), activities, and events (e.g., wildfires) within the Western Shoshone’s traditional homeland in 7 relative proximity to the proposed Deep South Expansion Project. This regional CESA is consistent with 8 the regional CESA used for the Cortez Hills Expansion Project Final EIS (BLM 2008) cumulative effects 9 analysis. The regional CESA was developed at that time in response to comments from the Native 10 American community that previous cumulative effects analyses in mine NEPA documents were too 11 narrow. The regional CESA and updated cumulative effects analysis for this EIS are discussed in 12 Section 3.9.3, Cumulative Impacts. 13
3.9.1 Affected Environment 14
3.9.1.1 Regulatory Framework 15
Federal laws, EOs, and agency guidance require BLM to consult with Native American tribes concerning 16 the identification of cultural values and traditional practices of Native American people that may be 17 affected by actions on BLM-administered lands. This consultation includes the identification of places 18 (i.e., physical locations) of traditional cultural importance to Native American tribes. Places that may be 19 of traditional importance to Native American people include, but are not limited to, locations associated 20 with traditional beliefs concerning tribal origins, cultural history, or the nature of the world; locations 21 where religious practitioners go to perform ceremonial activities based on traditional cultural rules or 22 practice; ancestral habitation sites; trails; burial sites; and places from which plants, animals, minerals, 23 and waters possessing healing powers or used for other subsistence purposes, may be taken. Some of 24 these locations may be considered sacred to particular individuals or tribes. 25
As a federal agency, BLM shares in the general federal trust responsibility articulated by the U.S. 26 Supreme Court. Since the project study area does not include tribally owned lands or mineral resources, 27 or lands or minerals held in trust by the federal government, BLM satisfies its federal trust responsibility 28 by compliance with general regulations and statutes. 29
Various tribes and bands of the Western Shoshone have stated that federal projects and land actions 30 can have widespread effects to their culture and religion, since they consider the landscape as sacred 31 and as a provider. Sites and resources considered sacred or essential to the continuation of tribal 32 traditions include, but are not limited to, prehistoric and historic village sites, pine nut gathering locations, 33 sites of ceremony and prayer, archaeological sites, burial locations, “rock art” sites, medicinal/edible 34 plant gathering locations, areas with creation stories, or any tribally designated cultural property. While 35 potential locations consistent with sites that are sacred or essential to the continuation of tribal tradition 36 may exist in the regional CESA, none have been identified within the project study area for Native 37 American traditional values. 38
The NHPA provides that “properties of traditional religious and cultural importance to an Indian tribe or 39 Native Hawaiian organization may be determined to be eligible for inclusion on the NRHP.” If a place has 40 been identified as having importance in traditional cultural practices and the continuing cultural identity of 41 a community, it may be considered under the NHPA framework to determine eligibility. The term 42 “traditional cultural property” has emerged in practice to refer to such properties. To qualify for inclusion 43 on the NRHP, a traditional cultural property must be more than 50 years old, must be a place with 44 definable boundaries, must retain integrity, and must meet one of the four criteria (A, B, C, or D) required 45 for NRHP eligibility under the NHPA (see Section 3.8 for a discussion of four criteria). 46

Deep South Expansion Project EIS 3.9 – Native American Traditional Values 3.9-2
Draft EIS 2018
During earlier consultation between the BLM Battle Mountain District Office and local Indian Tribes for 1 the Cortez Hills Expansion Project EIS (BLM 2008), areas classified by the Te-Moak Tribe as a single 2 traditional cultural property were identified in and near the then-proposed Cortez Hills Expansion Project. 3 BLM evaluated this traditional cultural property and concluded that portions of this area were eligible for 4 inclusion on the NRHP as places of cultural or religious importance (PCRIs) (BLM 2008). The term PCRI 5 is used to denote an eligible property to avoid confusion with the more general term “traditional cultural 6 property,” which may or may not be eligible for the NRHP. 7
In addition to NRHP eligibility, some PCRIs also must be evaluated to determine if they should be 8 considered under other federal laws, regulations, directives, or policies. These include, but are not 9 limited to, the NAGPRA of 1990, the American Indian Religious Freedom Act (AIRFA) of 1978, the 10 ARPA of 1979, and EO 13007 of 1996. 11
NAGPRA established a means of Native Americans, including Indian Tribes, to request the return of 12 human remains and other sensitive cultural items held by federal agencies or federally assisted 13 museums or institutions. NAGPRA also contains provisions regarding the intentional excavation and 14 removal, inadvertent discovery, and illegal trafficking of Native American human remains and sensitive 15 cultural items. 16
AIRFA established a federal policy of protecting and preserving the inherent right of individual Native 17 Americans to believe, express, and exercise their traditional religions including, but not limited to, access 18 to sites, use and possession of sacred objects, and the freedom to worship through ceremonials and 19 traditional rites. 20
ARPA requires notification of the appropriate Indian tribe before approving a cultural resource use permit 21 for the excavation (testing and data recovery) of archaeological resources, if the responsible federal land 22 manager determines that a location having cultural or religious importance to the tribe may be harmed or 23 destroyed. 24
EO 13007 defines a sacred site as any specific, discrete, narrowly delineated location on federal land 25 that is identified by an Indian tribe, or Indian individual determined to be an appropriately authoritative 26 representative of an Indian religion, as sacred by virtue of its established religious significance to, or 27 ceremonial use by, an Indian religion, provided that the tribe or appropriately authoritative representative 28 has informed the federal agency of the existence of such a site. EO 13007 requires federal agencies “to 29 the extent practicable, permitted by law, and not clearly inconsistent with essential agency functions,” to 30 “(1) accommodate access to and ceremonial use of such sacred sites by Indian religious practitioners 31 and (2) avoid adversely affecting the physical integrity of such sacred sites.” To implement these 32 requirements, federal agencies must, “where practicable and appropriate….. implement procedures….. 33 to ensure reasonable notice is provided for proposed actions or land management policies that may 34 restrict access to or ceremonial use of, or adversely affect the physical integrity of, sacred sites.” 35
3.9.1.2 Native American Consultation and Coordination 36
In compliance with the NHPA, BLM initiated government-to-government consultation for the Deep South 37 Expansion Project EIS on June 12, 2015, by sending letters to the following tribal groups: Duckwater 38 Shoshone Tribe, Battle Mountain Band of Western Shoshone, and South Fork Band of Western 39 Shoshone. The letters were sent to inform the tribes of the proposed Deep South Expansion Project and 40 to solicit their concerns regarding the possible presence of properties of cultural, religious, and/or 41 traditional importance to the tribes in the project study area. In addition, representatives from BLM met 42 with the Environmental Coordinator from Duckwater Shoshone Tribe on July 22, 2015, to visit portions of 43 the Proposed Action. No issues related to Native American traditional values were noted. That tribal 44 organization sent a follow-up letter to BLM on July 29, 2015, stating that they will comment on the EIS 45 when it becomes available. Consultation with Native American tribes is currently ongoing for the 46 proposed project. 47

Deep South Expansion Project EIS 3.9 – Native American Traditional Values 3.9-3
Draft EIS 2018
3.9.1.3 Ethnographic Context 1
The Western Shoshone are the indigenous or aboriginal people of the area including most of Northern 2 Nevada, and specifically the study area and Cortez Canyon (Figure 3.9-1). The Western Shoshone refer 3 to themselves as the “Newe,” which translates to “the people” (Bengston 2003). Their hunter-gatherer 4 ancestors occupied a vast territory in autonomous, highly mobile groups associated with specific home 5 districts, united by a common language and culture. The following context is a summary of the 6 ethnographic information about the Western Shoshone in general, and includes descriptions of places, 7 resources, and practices that are not necessarily located in the study area. 8
Bands and Territories 9
By the time Euro-American fur traders entered the area (ca. 1826), Western Shoshone territory 10 encompassed approximately one-third of what would become the State of Nevada. Thomas et al. (1986) 11 state that: 12
“Western Shoshone country extended from the arid reaches of Death Valley inhabited by the Panamint 13 Shoshone, through the mountainous highlands of central Nevada into northwestern Utah, where it 14 encompassed the area of the Gosiute of Tooele and Skull valleys and Deep Creek and the “Weber Ute.” 15 The northern boundary is rather arbitrarily taken as roughly the divide separating the Humboldt River 16 drainage from the Snake and Salmon River area, where the Northern Shoshone lived; the people of the 17 Duck Valley Reservation are also included.” 18
In his discussion of the Western Shoshone, Steward (1937) notes that “Shoshoni occupied Nevada as 19 far west as Columbus Salt Marsh, Ione Valley, Smith Creek Valley, Reese River Valley, and Battle 20 Mountain.” Although discrete Western Shoshone groups, or “bands,” likely composed of related family 21 members tended to occupy particular areas, it is difficult to determine aboriginal boundaries or areas of 22 habitation based on band organization (Thomas et al. 1986). Steward (1938) states that the Western 23 Shoshone “….lacked bands and any form of land ownership. The only stable social and political unit was 24 the family. Larger groups for social and economic purposes were temporary and shifting. The radical 25 departure of these people from the band patterns, however, is explainable by ecological factors not 26 previously encountered. It has been shown that the unusually great economic importance of seeds 27 largely restricted the economic unit to the family. Communal enterprises did not always align the same 28 families, so that there were no large groups having political unity. It has also been shown that the 29 peculiar occurrence of certain foods, especially seed species, entailed interlocking subsistence areas 30 which militated against land ownership.” 31
Historically, the Western Shoshone were organized in extended family groups identified with loosely 32 defined home districts that were often named for a prominent food source (Clemmer 1999). Harris wrote, 33 “The various Western Shoshonean groups were primarily known by their food supply. The economic 34 character of the area, rather than land-owning or political groups, gave rise to these native names. For 35 example, there were the Squirrel Eaters, Pine Nut Eaters, Antelope Eaters, Rabbit Eaters, etc.” Other 36 names were derived from geographic features or unique resources. These districts, often bordered by 37 crests of mountains, contained settlement areas that were connected to a particular group of resources. 38 Group names usually changed as the group moved on to other areas during seasonal rounds. After 39 Euro-American contact, Western Shoshone “band” names tended to become more permanent. 40
Today, Western Shoshone live on several small reservations and colonies located throughout California, 41 Nevada, and Utah. The nearest Western Shoshone colony is the Battle Mountain Band Colony, located 42 approximately 30 miles to the northeast of the study area (Figure 3.9-1). The nearest Western 43 Shoshone family lives approximately 9.5 miles from the CGM Operations Area boundary. 44
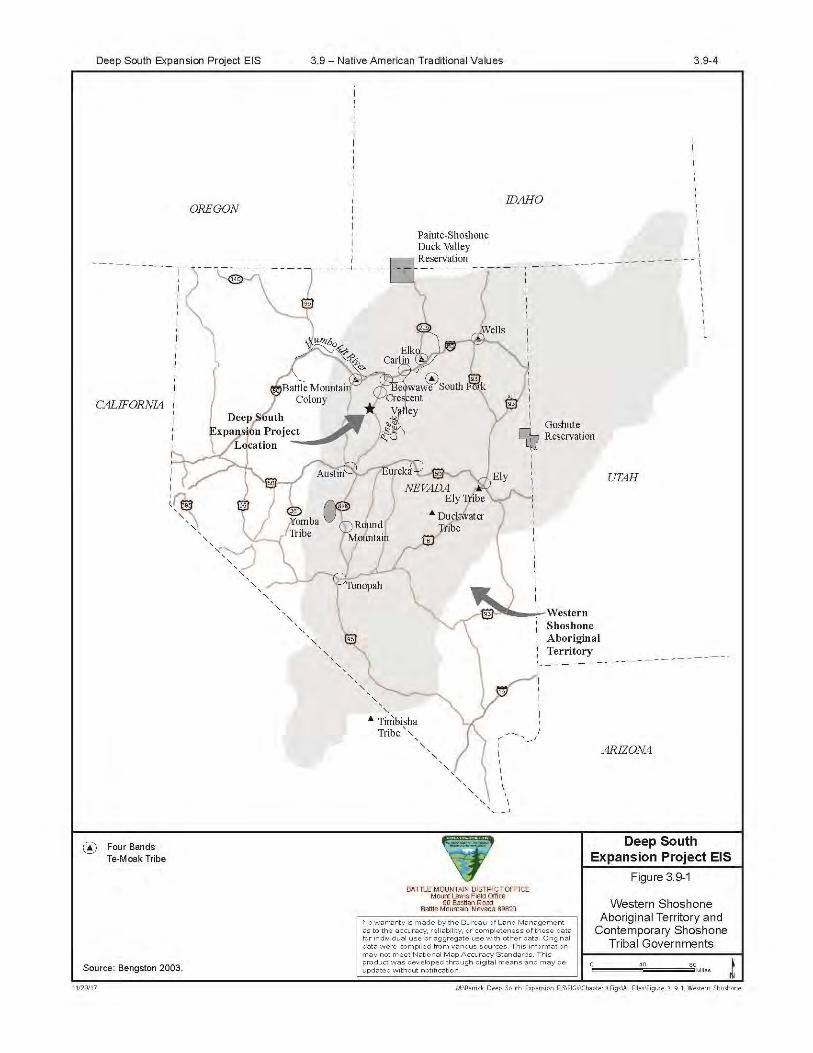

Deep South Expansion Project EIS 3.9 – Native American Traditional Values 3.9-5
Draft EIS 2018
Governmental Organization 1
Seven federally recognized tribes are located in, or have former territory in, northern Nevada. Five of 2 these tribes regularly communicate with BLM regarding projects in the vicinity of the project study area or 3 the regional CESA. These five tribes are the Te-Moak Tribe of Western Shoshone, the Yomba 4 Shoshone Tribe, the Duckwater Shoshone Tribe, the Duck Valley Shoshone-Paiute Tribes of Idaho and 5 Nevada, and the Ely Shoshone Tribe. Each of these tribes has colonies or reservations containing lands 6 held in trust for them by the federal government. Each is organized under a tribal constitution and 7 governed by a tribal council. The Te-Moak Tribe is the closest federally recognized tribe to the project 8 study area. The Te-Moak Tribe is composed of four bands: Battle Mountain, Elko, Wells, and South 9 Fork. Each of the bands has its own tribal council that governs the band’s reservation lands and appoints 10 representatives to the Te-Moak tribal council. 11
Habitation Patterns 12
Traditionally, Western Shoshone families lived a very mobile lifestyle, and individual families established 13 temporary camps throughout their areas for hunting and gathering. They would return to established 14 winter camps each year that were in the same general area as the temporary camps. 15
To meet the needs of the highly mobile lifestyle of the Western Shoshone, dwellings tended to be 16 temporary and easily constructed structures. Thomas et al. (1986) described these structures as follows: 17 “The typical winter house was a conical hut, housing a family of about six. The light frame was covered 18 with slabs of bark, sometimes surrounded with a single tier of stones to keep the supports firmly planted. 19 Since few Western Shoshone structures involved subterranean construction, the only vestiges of such 20 structures are often stone circles, sometimes erroneously considered tepee rings.” 21
Most of these winter houses were dome-shaped; however, some of the Battle Mountain people 22 constructed their lodges by bending willow branches to form a peak or cone. Other structures built by the 23 Western Shoshone included dome-shaped sweat lodges, sun shades, windbreaks, and pine nut caches 24 (Steward 1940). 25
Villages 26
The Tosawihi (“white knives”) whose seasonal rounds took them north to the well-known Tosawihi site 27 opalite quarry and north to the Owyhee River to fish for salmon, were known to winter on the Humboldt 28 River between Battle Mountain and down river as far as Iron Point (Steward 1938). Another group who 29 wintered on the Humboldt River around Battle Mountain was known as the Tonomudza (“greasewood 30 point”). Steward (1938) does not mention any villages in the Crescent Valley, Cortez Range, or Grass 31 Valley area. 32
Other winter encampments are documented on the Humboldt River near Beowawe. For these people, as 33 well as those who wintered as far east as Palisade, Crescent Valley was known as a seed-collecting 34 area (Steward 1938). People from Diamond Valley to the southeast of the Cortez Range would cross the 35 Springs Mountains to Cortez or “Tinaba” (“tina” or white rock and “pa” or water) to “gather roots and 36 seeds, or kill woodchucks, chipmunks, or other small animals.” 37
All of the groups living along the middle reach of the Humboldt River were known to go as far south as 38 Austin to gather pine nuts, often returning the 80 miles or so to their winter camps on the river. Steward 39 (1938) notes that these groups “preferred not to remain in Crescent Valley because the winters were too 40 cold.” Occasionally, they did winter at Cortez, presumably near the mining town in Cortez Canyon or to 41 the south in Grass Valley. Grass Valley was known as a “good place to hunt rabbits in the winter.” The 42 Tosawihi, Tonomudza, and Beowawe groups often held communal rabbit drives at Battle Mountain. For 43 antelope drives, they went to Iron Point and joined the Northern Paiute people who had an antelope 44 shaman. Festivals were held in the winter at both Iron Point and Battle Mountain, and occasionally in 45 Elko. Ceremonial, traditional food collecting, and hunting ranges were not necessarily adjacent to one 46 another. Frequent travel for periodic gatherings and celebrations, cooperative drives, fishing, pine nut 47

Deep South Expansion Project EIS 3.9 – Native American Traditional Values 3.9-6
Draft EIS 2018
harvests, intermarriage, or visits with shamans could last several months or even years, and were 1 undertaken as a family unit or by smaller groups. The traveling patterns created an extensive social 2 network across a broad landscape of varied topography. According to local sources, one trail linked the 3 Tosawihi or White Knife country north of the Humboldt River to Timbisha country in Death Valley, 4 passing through Crescent Valley and Cortez Canyon. Mount Tenabo, the pinyon woodland, and 5 Shoshone Wells were important rest stops for travelers. 6
Subsistence 7
Traditionally, the Western Shoshone were hunter-gatherers. Their economic system consisted of a basic 8 division of labor based on gender so that each family was a self-sufficient economic unit (Steward 1938). 9 Women primarily were responsible for gathering plants; trapping small animals; preparing the food; and 10 making pottery, baskets, and clothing. The men hunted large game; built the conical huts; and made 11 flaked stone tools, digging sticks, and rabbit skin blankets. Additionally, the men helped the women hunt 12 rodents; carry wood and water; transport seeds; and gather materials for making pots, baskets, and 13 metates. Both men and women participated in the pine nut harvest, communal rabbit and antelope 14 drives, and fishing. 15
Due to the diverse environmental and ecological variability throughout their aboriginal territory, seasonal 16 subsistence methods varied from band to band. However, there were general subsistence patterns that 17 were common to all Western Shoshone bands. Seasonal movement in search of favored gathering and 18 hunting areas was conducted by small family groups from spring through fall. During the winter, several 19 families would gather into villages in relatively warm areas near food caches (Thomas et al. 1986). 20
In the spring, family groups dispersed from camps located near caches of stored foods that had been 21 exhausted over the winter, to harvest resources as they become available. Fish spawns were important 22 to populations with access to the Humboldt River and its tributaries later in the spring and early summer. 23 Larger groups would gather for spring and summer spawning runs. Ripening seed crops, maturing bulbs, 24 and berries drew populations back to foraging camps in canyons, such as those located near Mount 25 Tenabo. These camps also were staging areas for forays into the dry valley for seeds or meadows for 26 roots. 27
Plant Resources 28
Of the many plants gathered in the summer, recent accounts emphasize camas bulbs, yampa roots, and 29 the seeds of Indian rice-grass, stickleaf, and sunflowers. Yampa was noted to have been particularly 30 abundant in Four Mile Canyon and Horse Canyon, which also is noted for pinyon, mules’ ear, arrowleaf 31 balsam root, and several medicinal plants. Four Mile Canyon and Horse Canyon are outside of the CGM 32 Operations Area and the project study area, but within the regional CESA. Buckberries, which ripen in 33 August, drew people back along the river between Beowawe and Battle Mountain. These berries and 34 currants and service berries were collected in early fall from higher elevations. Chokecherries were 35 collected in late fall. 36
The fall pine nut harvest, which was critical for winter supplies, was second only to fishing in influencing 37 seasonal movement. Throughout the year, scouts would inform band leaders of locations where the 38 supply of pine nuts looked the most promising. Using this information, groups would schedule their 39 movements in order to arrive in the richest areas during the fall harvest. Those who lived beyond readily 40 accessible pinyon were invited or allowed access to these areas by leaders who organized the harvest 41 and pine nut festival. 42
The Beowawe-Crescent Valley people wintered in the pediment pinyon areas when the pine nut yield 43 was sufficient to get them through the winter. In poorer years, they transported what they had back to 44 their river camps and relied on fish to get through the winter. Occasionally, they would travel north to the 45 headwaters of the Owyhee River for the salmon run, bringing pine nuts with them to trade or use as gifts 46

Deep South Expansion Project EIS 3.9 – Native American Traditional Values 3.9-7
Draft EIS 2018
to their hosts. When the pine nut yield was particularly high, they would invite visitors to the area who 1 then might stay over the winter near their own pine nut caches. 2
Although the Western Shoshone groups had access to habitually visited resource areas with established 3 camps, other less frequented areas provided alternatives for years when production was down or 4 non-existent. Social relations and ties to families in more distant locations provided additional 5 contingencies. Resources that were especially abundant in a given year or place provided opportunities 6 for larger gatherings and reunions. Of particular importance in scheduling movements and length of 7 residence was the imperative to harvest adequate stores for the winter, and the inclination to return to 8 areas for plants that were intensively managed to sustain yields or promote desired growth 9 characteristics. 10
Animal Resources 11
Birds and Other Small Game 12
Golden eagles and bald eagles figure prominently in Western Shoshone mythology as messengers to 13 and from the creator. Feathers were used by Indian shamans, usually as part of the healing ritual. 14 Steward (1938) described traditional means of trapping and keeping eagles for their feathers that 15 included climbing cliffs to capture the young or various means of luring adult birds with bait. Most 16 accounts emphasize the special power required to climb to the aeries and that aeries usually were 17 considered the property of men. 18
Other birds, including sage grouse, mourning dove, and mockingbirds, were trapped in sagebrush 19 country, and red-winged and yellow-headed blackbirds were trapped near wetlands (Fowler 1986; 20 Thomas et al. 1986). Mormon crickets, cicadas, and grasshoppers were collected when abundant. In 21 Ruby Valley, edible water birds including several duck species, Canada goose, and great blue heron 22 were driven out of shallow water and clubbed (Steward 1938). Beaver and muskrat also were hunted. 23
Rabbits 24
Rabbits were commonly taken in large numbers by communal drives, often associated with the fall pine 25 nut harvest. Men, women, and children worked together in driving rabbits into long nets. Rabbits were 26 important for their meat and fur. 27
Big Horn Sheep 28
Big horn sheep are rare in the vicinity of the CGM Operations Area; however, they were once the most 29 important large game of Western Shoshone prehistoric populations (Thomas et al. 1986). In summer and 30 winter, big horn sheep were hunted by various methods, including ambush from permanent blinds and 31 chasing with dogs in the summer; migration hunting in the fall from rock walls, cairns, and blinds, 32 particularly along canyons in precipitous terrain; and by encounters in the winter range when rams would 33 be attracted by mimicking the sound of their fighting by thumping logs together. Big horn sheep were 34 hunted communally, and terrain and other factors dictated the location of these hunts. Communal hunts 35 persisted in Ruby Valley through Euro-American contact, attracting people from settlements in northern 36 Butte and Long valleys. 37
Pronghorn 38
Pronghorn (antelope) were probably the second-ranked large game species and were hunted 39 communally by large numbers of participants drawn to locations where antelope shamans resided 40 (Thomas et al. 1986). This multi-day event required construction of a corral for the drive and had magical 41 associations to the Western Shoshone. Drives were only held every 5 to 12 years to allow the 42 populations to recover between hunts. The Humboldt River area; the north ends of Newark, Long, and 43 Butte valleys; and the southern end of Diamond Valley were noted by Steward as good antelope areas 44 and where antelope shamans were available (Steward 1938). 45

Deep South Expansion Project EIS 3.9 – Native American Traditional Values 3.9-8
Draft EIS 2018
Deer 1
Deer habitat has expanded since Euro-American contact, benefiting from reduced numbers of big horn 2 sheep in the mountains and antelope in the bottom lands, and with game management focused on the 3 popularity of deer as a game species. Deer hunting among the Western Shoshone, occasional and 4 opportunistic in the past, became more important in proportion to the reduction of other game. Deer 5 herds were small and most frequently were hunted with bow and arrow by lone men or by small hunting 6 parties. 7
Fish 8
Although fishing was apparently limited (Thomas et al. 1986), the Humboldt fishery was recognized as 9 one of the most important fisheries in the Great Basin (Fowler 1986; Steward 1938). Steward also 10 reported fishing in Pine Creek and that “Humboldt River fish were very important because they could be 11 taken all winter.” He states that in addition to techniques recorded for Owens Valley, such as diverting 12 streams, stranding, confusing, shooting, spearing, using hooks, baskets, and nets, the Humboldt River 13 Western Shoshone also used harpoons and complicated dams and weirs. The diversity of their strategy 14 suggests that fishing was well integrated into the economy. River fish would have been a more 15 predictable staple than those from ephemeral playas, but low snowfalls periodically affected this fishery 16 as well. 17
Ceremonies and Religion 18
Few ceremony types have been documented for the Western Shoshone. The only documented 19 traditional dance is the Circle or Round Dance. Steward (1941) states “Though varying slightly in details, 20 in seasons held, and in extra purposes such as rainmaking or producing crop fertility, it was substantially 21 uniform throughout the area and may be considered a distinctively Shoshonean dance.” The Round 22 Dance was included in most festivals, which were held during pine nuts festivals, rabbit drives, and 23 pronghorn hunts (Steward 1941). One of the primary places for such festivals was at Battle Mountain 24 (Steward 1938). A few other dances were held by Western Shoshones, such as the Bear Dance, South 25 of Exhibition Dance, Sun Dance, and Ghost or Feather Dance (Steward 1941). 26
The North American native religions are all based on beliefs of an interdependence of human beings 27 with other life forms and with the earth itself. This belief system has been very important in the Great 28 Basin, where a delicate balance must be maintained between human subsistence and an unpredictable, 29 sometimes harsh environment (Clemmer 1999; Hultkrantz 1986). Hultkrantz (1986) describes Great 30 Basin religion as “the result of a unique fusion of ecological and traditional factors…,” adjusted to the 31 biophysical constraints on a small hunting and gathering population. Religious goals are oriented toward 32 “the needs and patterns of subsistence and the small nomadic units that prevailed.” 33
Another central concept in Great Basin religion is the belief that supernatural power (Puha) has 34 permeated the earth since the indigenous Great Basin people were created and brought to their 35 homeland, the age “when animals were people” (Miller 1983). The acquisition and control of power is 36 believed to be a religious duty. Harris (1940) notes specifically for Western Shoshone, the “…richest 37 religious expression for Shoshonean life is to be found in the concept of Puha – supernatural power – 38 and its embodiment in shamanistic practice… Every person must possess Puha, the life principle… to 39 live.” 40
Special powers were believed to be granted in dreams or visions that came, solicited or unsolicited, to 41 some men and women who were afterwards recognized as shamans or people of power. These powers 42 required discipline and strength to use them, and were regarded as potentially dangerous to the user. 43 Special powers were obtained for various specific purposes, such as to heal illness, injuries, and 44 wounds; to aid in the hunting of large game; or to protect the people from dangerous forces in the world. 45 Although power was most commonly used for the good of individuals or the community, it also could be 46
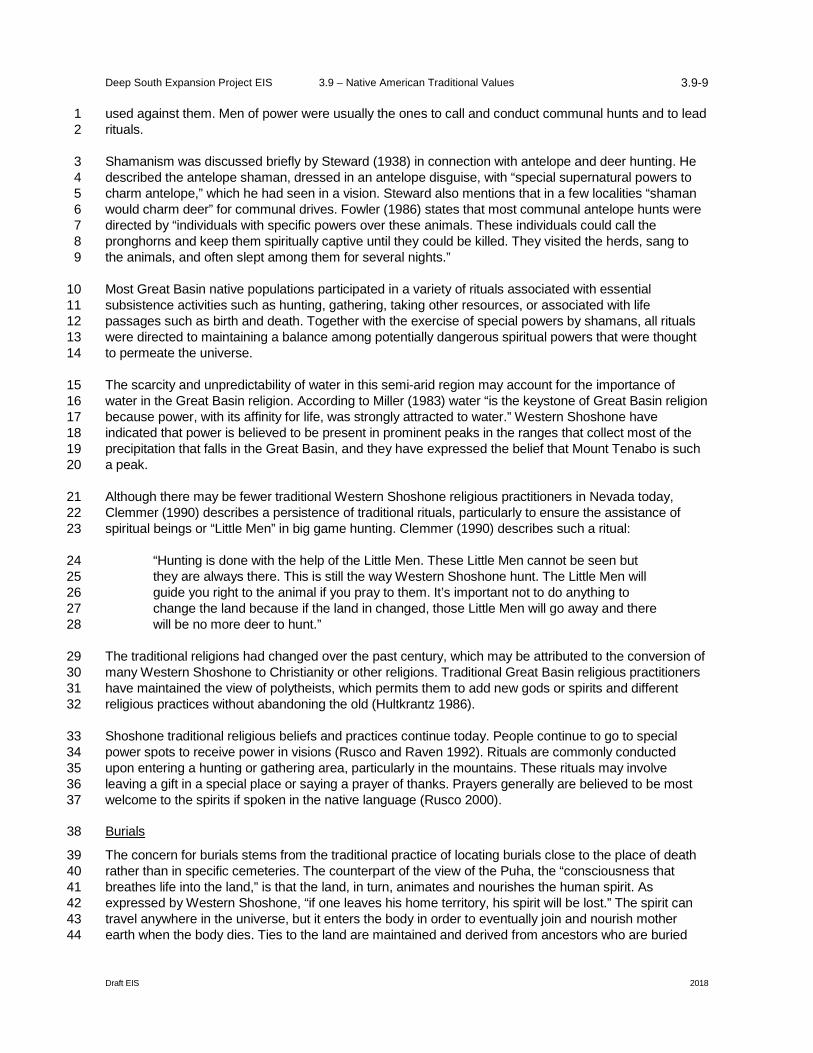
Deep South Expansion Project EIS 3.9 – Native American Traditional Values 3.9-9
Draft EIS 2018
used against them. Men of power were usually the ones to call and conduct communal hunts and to lead 1 rituals. 2
Shamanism was discussed briefly by Steward (1938) in connection with antelope and deer hunting. He 3 described the antelope shaman, dressed in an antelope disguise, with “special supernatural powers to 4 charm antelope,” which he had seen in a vision. Steward also mentions that in a few localities “shaman 5 would charm deer” for communal drives. Fowler (1986) states that most communal antelope hunts were 6 directed by “individuals with specific powers over these animals. These individuals could call the 7 pronghorns and keep them spiritually captive until they could be killed. They visited the herds, sang to 8 the animals, and often slept among them for several nights.” 9
Most Great Basin native populations participated in a variety of rituals associated with essential 10 subsistence activities such as hunting, gathering, taking other resources, or associated with life 11 passages such as birth and death. Together with the exercise of special powers by shamans, all rituals 12 were directed to maintaining a balance among potentially dangerous spiritual powers that were thought 13 to permeate the universe. 14
The scarcity and unpredictability of water in this semi-arid region may account for the importance of 15 water in the Great Basin religion. According to Miller (1983) water “is the keystone of Great Basin religion 16 because power, with its affinity for life, was strongly attracted to water.” Western Shoshone have 17 indicated that power is believed to be present in prominent peaks in the ranges that collect most of the 18 precipitation that falls in the Great Basin, and they have expressed the belief that Mount Tenabo is such 19 a peak. 20
Although there may be fewer traditional Western Shoshone religious practitioners in Nevada today, 21 Clemmer (1990) describes a persistence of traditional rituals, particularly to ensure the assistance of 22 spiritual beings or “Little Men” in big game hunting. Clemmer (1990) describes such a ritual: 23
“Hunting is done with the help of the Little Men. These Little Men cannot be seen but 24 they are always there. This is still the way Western Shoshone hunt. The Little Men will 25 guide you right to the animal if you pray to them. It’s important not to do anything to 26 change the land because if the land in changed, those Little Men will go away and there 27 will be no more deer to hunt.” 28
The traditional religions had changed over the past century, which may be attributed to the conversion of 29 many Western Shoshone to Christianity or other religions. Traditional Great Basin religious practitioners 30 have maintained the view of polytheists, which permits them to add new gods or spirits and different 31 religious practices without abandoning the old (Hultkrantz 1986). 32
Shoshone traditional religious beliefs and practices continue today. People continue to go to special 33 power spots to receive power in visions (Rusco and Raven 1992). Rituals are commonly conducted 34 upon entering a hunting or gathering area, particularly in the mountains. These rituals may involve 35 leaving a gift in a special place or saying a prayer of thanks. Prayers generally are believed to be most 36 welcome to the spirits if spoken in the native language (Rusco 2000). 37
Burials 38
The concern for burials stems from the traditional practice of locating burials close to the place of death 39 rather than in specific cemeteries. The counterpart of the view of the Puha, the “consciousness that 40 breathes life into the land,” is that the land, in turn, animates and nourishes the human spirit. As 41 expressed by Western Shoshone, “if one leaves his home territory, his spirit will be lost.” The spirit can 42 travel anywhere in the universe, but it enters the body in order to eventually join and nourish mother 43 earth when the body dies. Ties to the land are maintained and derived from ancestors who are buried 44

Deep South Expansion Project EIS 3.9 – Native American Traditional Values 3.9-10
Draft EIS 2018
there. The presence of hundreds of generations of ancestors powerfully bonds individuals to the 1 homeland and contributes to its power. 2
Treatment of the body of the deceased varied according to one or several of the following conditions: 3 terrain, season, circumstances of death, and the deceased’s role and personality. Bodies could be left 4 where they had fallen and covered with rocks, buried in the ground with rocks piled on top, buried in talus 5 slopes, placed in rock crevices or caves that could be filled with rock, or placed in a cave and sealed off 6 with stick-and-wattle and brush. If death occurred at a house or in a camp, the body and place was 7 abandoned and sometimes burned, particularly if the death was unusual or the person was feared. 8
The Western Shoshone believe that burials are dangerous due to the associated power of Puha and the 9 sacredness of these sites. Spiritual or supernatural forces associated with burials often are considered to 10 be extremely powerful and often are avoided out of great respect and some fear. Since the majority of 11 burial locations are unknown, part of the perceived danger is the potential for individuals to inadvertently 12 encounter burials. People with rights to an area were most likely to know the places to avoid. If burials 13 were re-visited, it was typically by shamans seeking power. Due to the variety of burial practices and the 14 time span of Western Shoshone in the Great Basin, burials could be located in a variety of places. 15
Some people identified in advance were they wished to be buried and, if possible, relatives would 16 accommodate their requests. These burials involved considerable preparation and included grave 17 offerings and personal clothing. Most possessions were considered dangerous and were burned, 18 disposed of, or interred with the deceased. A man’s horse was sometimes killed and its skin used to 19 wrap the body. Some Western Shoshone believe that revered ancestors were buried in crevices in the 20 white cliffs of Mount Tenabo before this region was affected by historic mining (Rucks 2000). Such 21 difficult to reach or high places generally were reserved for well-regarded individuals. 22
Western Shoshone believe that Mount Tenabo, prior to Euro-American contact, included burials of elite 23 individuals and circumstantial burials associated with seasonal camps on the pediment. According to 24 some contemporary Western Shoshone, the ancestral burials located at the base of the white cliffs were 25 dismantled and pillaged by the Chinese workers who constructed dug-outs at the same location. 26 Although burials are no longer present, the accumulated power (Puha) of these ancestors is believed to 27 contribute to the cumulative power and religious significance of the mountain. 28
Euro-American Contact 29
The first written accounts of contact with Euro-Americans in the regional CESA date from fur trapping 30 expeditions in the late 1820s, and these and later explorations caused land disturbance visible by 1845. 31 In 1849 alone, it is estimated that over 50,000 people traveled to California along the overland route 32 through Western Shoshone country (Crum 1994). Euro-American ranchers and other settlers soon 33 followed, appropriating the resources they did not destroy (Crum 1994). The subsequent years of conflict 34 and displacement led to various federal programs to “mainstream” the Western Shoshone (Crum 1994). 35
By 1857, it was apparent that whites were permanently settling into Western Shoshone territory. As a 36 result, conflicts between whites and Western Shoshone increased. The need to resolve the conflicts led 37 federal agents to set aside an area 6 miles square in Ruby Valley in 1859. The Tosawihi leaders, 38 Shokup, and Temoke, moved their bands to the Ruby Valley reservation, hoping that raising cattle and 39 farming would replace rapidly disappearing native resources. Meanwhile, white immigration and overland 40 travel began encroaching into other parts of Western Shoshone territory with the establishment of the 41 Central Route of the California Trail in 1859, also used by the Pony Express until 1861, and then by the 42 Butterfield Overland mail company. The Western Shoshone in this region also organized retaliatory 43 bands to fight the whites. The largest (about 300 to 400 people) and best known of the retaliatory bands 44 were led by the Tu-tu-wa of the Reese River Valley. 45

Deep South Expansion Project EIS 3.9 – Native American Traditional Values 3.9-11
Draft EIS 2018
Between 1854 and 1859, the U.S. government launched expeditions in an attempt to locate feasible 1 wagon routes to California across Western Shoshone lands. To reduce conflicts between the Nevada 2 tribes and the settlers, Garland Hunt, the Indian Agent assigned to the Nevada area, negotiated the 3 Treaty of Ruby Valley in 1863 with some of the Western Shoshone bands (Clemmer and Stewart 1986). 4 The Western Shoshone agreed to cease hostile actions and to allow “white men” to use routes of travel 5 through Western Shoshone lands and establish military posts, telegraph and stage lines, railroad lines, 6 mines, and ranches. In exchange for the “inconvenience” of these activities, the treaty provided for 7 monetary compensation to the Western Shoshone bands for a period of 20 years. 8
By 1877, Tosawihi leader Captain Sam requested and obtained land in Duck Valley where a Western 9 Shoshone reservation was created. This area was acceptable to the Tosawihi because it was within a 10 traditional resource area. However, most groups remained deeply attached to their own particular 11 geographic areas and did not want to move to the reservation. By 1880, only about a quarter of the 12 Western Shoshone had moved to Duck Valley (Crum 1994). 13
Many Western Shoshone continued to live in traditional bands within their ancestral areas, including 14 Diamond and Pine valleys (Steward 1938). Some traditional activities, such as bartering pine nuts and 15 selling baskets, generated modest income and reinforced cultural identity. During the early part of the 16 20th Century, fandangos (i.e., multi-day cultural celebrations featuring traditional foods, round dances, 17 songs, and hand games) provided a forum for socializing, political discussion, and elections. In later 18 years, the fandango incorporated rodeo and baseball and became associated with federal holidays such 19 as the Fourth of July and Labor Day. 20
The Indian Reorganization Act of 1934 is the centerpiece of the New Deal policies affecting Indians that 21 reversed what has been called the cultural ethnocide of former federal policies (Clemmer and Stewart 22 1986). The Indian Reorganization Act of 1934 granted tribes the means to consolidate allotments and 23 buy lands, organize councils with elected officials, and pursue economic development. Land-based tribal 24 entities could pursue legal action to reclaim lost lands. Cultural pluralism and the revitalization of native 25 customs, including language and religion, was another emphasis. The Indian Reorganization Act of 1934 26 generated three new Western Shoshone tribal organizations: the Te-Moak Tribe of Western Shoshone 27 Indians, the Yomba Shoshone Tribe of the Yomba Reservation, and the Duckwater Shoshone Tribe of 28 the Duckwater Reservation. However, most of the Western Shoshone widely dispersed throughout their 29 ancestral areas and remain unaffiliated, primarily because participation in the Te-Moak organization was 30 perceived as compromising the position of those pursuing recognition of the government’s obligation to 31 meet the terms of the Treaty of Ruby Valley. 32
Following World War II, post-war conservatism led to a new federal policy directed toward “preparing all 33 Indians for termination of federal trust responsibility; abolishing reservations; and providing assistance to 34 nuclear families, rather than to communities, to become integrated into the dominant society” (Clemmer 35 and Stewart 1986). One component was the creation of the Indian Claims Commission in 1946. In short, 36 the purpose was to settle and extinguish claims prior to termination. Only four Western Shoshone tribal 37 organizations considered participating in submitting a claim: Duck Valley, Elko, South Fork, and Battle 38 Mountain. Battle Mountain later withdrew its representative. 39
The Indian Claims Commission determined that Western Shoshone title had been extinguished. This 40 issue and associated compensation have been the subject of numerous lawsuits. While all courts 41 addressing the issues have rejected Western Shoshone claims to continued ownership of these lands, 42 some Western Shoshone still maintain that title to their ancestral lands has not been extinguished. In the 43 1970s, the U.S. adopted a new policy for Indian tribes that emphasizes self-determination and treats 44 federally recognized tribes as sovereign over their internal affairs and reservations. BLM consults with 45 area Indian tribes on a government-to-government basis on issues that potentially affect tribal resources. 46

Deep South Expansion Project EIS 3.9 – Native American Traditional Values 3.9-12
Draft EIS 2018
3.9.1.4 Ethnographic Analyses 1
A number of ethnographic studies have been conducted that identify areas of importance to 2 contemporary Western Shoshone within or near the study area. These studies were conducted in 3 conjunction with mine and transmission line development activities and are briefly summarized below. 4
In a 1992 ethnographic study for the proposed Cortez Gold Mine Expansion Project EIS, Native 5 American consultants identified Mount Tenabo and several additional features on, or in the immediate 6 vicinity of, the mountain as culturally significant to the Western Shoshone (Quick 1995, 1992). These 7 additional features included a cave, pine nut trees, a rock outcrop, turquoise and clay collection areas, 8 and possible burials. 9
Beginning in January 2000, BLM conducted an ethnographic study for CGM’s (now BCI’s) proposed 10 HC/CUEP exploration project (Rusco 2000). At the beginning of the study, the BLM sent a letter to the 11 following tribes and non-governmental organizations (NGOs): Te-Moak Tribe of Western Shoshone, with 12 separate letters also sent to the Battle Mountain, Elko, South Fork, and Wells bands; Duckwater, Ely, 13 and Yomba Shoshone tribes; Shoshone-Paiute Tribes of Duck Valley; Western Shoshone Defense 14 Project; Shundahai Network; and Western Shoshone Historic Preservation Society. Consultants from 15 these tribes and tribal organizations participated in one meeting and two field trips to the HC/CUEP 16 project area. Several culturally significant places were identified or mentioned by tribal consultants during 17 the study. These included a burial in Cherry Creek Canyon, Mount Tenabo, the Shoshone Wells area, 18 and pinyon-juniper stands. Cherry Creek Canyon, Mount Tenabo, and Shoshone Wells are outside of 19 the project study area but within the regional CESA. 20
As a follow up to the HC/CUEP ethnographic study, a more focused investigation was conducted to 21 assist the BLM in determining the eligibility of properties in the vicinity of Mount Tenabo (Rucks 2000). 22 The BLM contacted the same tribes and NGOs as for the previous HC/CUEP study. Consultants from 23 the Te-Moak Tribe of Western Shoshone, Ely Shoshone Tribe, and the Western Shoshone Defense 24 Project participated in a visit to Mount Tenabo and the immediate vicinity. The study broadly identified 25 important places that included springs, deep caves, high mountain places, burials, and places where 26 important medicinal plants are found. Mount Tenabo was identified as having a number of uses 27 including: traditional ceremonies/religious activities, hunting, gathering (food, medicine, and basketry 28 materials). Additionally, the mountain was identified as a named landmark located at the confluence of 29 several Shoshone trails. It was noted that the cave system on the mountain figured in creation stories. 30 Specific culturally significant places identified by tribal consultants during this study included Mount 31 Tenabo, Horse Canyon, Four Mile Canyon, and the Shoshone Wells Camp area, all of which are outside 32 of the project study area but within the regional CESA. 33
Another ethnographic study was conducted in 2002 and involved the previously proposed Pediment 34 Project, which subsequently was incorporated into the Cortez Hills Expansion Project (Rucks 2004). That 35 project included the development of the Cortez Hills Complex and expansion of existing facilities in the 36 Cortez and Pipeline complexes as analyzed in the Cortez Hills Expansion Project Final EIS (BLM 2008). 37 The following tribes and NGOs were contacted for the ethnographic study: Te-Moak Tribe of Western 38 Shoshone, including the Battle Mountain, Elko, South Fork, and Wells bands; Duckwater, Ely, and 39 Yomba Shoshone tribes; Shoshone-Paiute Tribes of Duck Valley; and Western Shoshone Defense 40 Project. Consultants from these groups participated in one meeting and two field visits to the project 41 area. The Te-Moak environmental coordinator subsequently submitted a map of a proposed traditional 42 cultural property that included Horse Canyon, the top of Mount Tenabo, Mill Canyon, Four Mile Canyon, 43 Cortez Canyon, Shoshone Wells, and portions of Pine and Grass Valleys. Concerns expressed by the 44 Western Shoshone consultants during the field trips to Mount Tenabo included visual and access 45 impacts and impacts to individual Native American archaeological sites, as well as issues related to 46 burials and associated Puha (or power), the Shoshone Wells camp area, the “Pediment” (i.e., the 47 pinyon-juniper woodland and location of ancestral camps on the western slope of Mount Tenabo), Horse 48 Canyon, and Mount Tenabo and the White Cliffs. 49

Deep South Expansion Project EIS 3.9 – Native American Traditional Values 3.9-13
Draft EIS 2018
The BLM continued to consult with the participating tribes regarding Mount Tenabo and the other 1 identified culturally significant areas in the vicinity of Mount Tenabo. The BLM reviewed and compiled 2 pertinent information that was gathered over the years. The areas identified by the tribal entities and 3 individuals as having traditional, cultural, and spiritual importance were evaluated using the criteria set 4 forth by NRHP. As a result, the BLM determined that Mount Tenabo, the White Cliffs, and Horse Canyon 5 were eligible for inclusion on the NRHP as a place of cultural and religious importance under criteria A, 6 B, and C (Dixon and McGonagle 2004). Therefore, the analysis of Native American traditional values for 7 the Cortez Hills Expansion Project EIS focused specifically on Mount Tenabo and the White Cliffs. The 8 analysis of Native American traditional values for this EIS also considers the potential effects to Mount 9 Tenabo and the White Cliffs, which are within the project study area, as well as the potential effects to 10 the Horse Canyon PCRI, which is located within the regional CESA. 11
3.9.2 Environmental Consequences 12
Effects of federal undertakings on properties of religious, traditional, or cultural significance to 13 contemporary Native American groups are given consideration under the provisions of EO 13007, the 14 AIRFA, and the NHPA. NHPA allows that “properties of traditional, religious, and cultural importance to 15 an Indian tribe or Native Hawaiian organization may be determined eligible for inclusion on the NRHP.” 16 Section 106 of NHPA requires that federal agencies take into account the effects to historic properties 17 (including those with religious, traditional, or cultural significance) posed by federal undertakings. In 18 addition, under the NAGPRA, culturally affiliated Indian tribes and the BLM jointly may develop 19 procedures to be undertaken when Native American human remains are discovered on federal lands. 20 Project-specific regulations for implementing Section 106 of NHPA for the proposed Deep South 21 Expansion Project are outlined in the PA developed for the Cortez Hills Expansion Project in 2005, and 22 amended in 2017 (Appendix C of this EIS), as discussed in Section 3.8, Cultural Resources. 23
Proposed Action-specific issues for the Native American traditional values effects analysis have not been 24 identified to date during consultation between BLM staff and the tribes (see Section 3.9.1.2, Native 25 American Consultation and Coordination). Issues were identified during public scoping for the proposed 26 Deep South Expansion Project (see Section 4.1, Public Participation and Scoping). Ethnographic 27 impacts would be considered significant if the Proposed Action or other action alternative result in 28 adverse effects to NRHP-eligible properties of cultural and religious importance to Native American 29 tribes. 30
Effects to Native American traditional values are discussed in terms of intensity, duration, and context 31 based on the following definitions. 32
Intensity 33
• Negligible: Effects would be at the lowest levels of detection, barely measurable, with no 34 perceptible consequences either adverse or beneficial to the resources. 35
• Minor: Effects would be measurable or perceptible; however, effects would be slight and affect 36 a limited area of a resource or group of resources. 37
• Moderate: Effects would be measurable and perceptible. 38
• Major: Effects would be substantial, noticeable, and permanent. 39
Duration 40
• Short-term: Effects would last for the duration of the Proposed Action. 41
• Long-term: Effects would last beyond the duration of the Proposed Action. 42

Deep South Expansion Project EIS 3.9 – Native American Traditional Values 3.9-14
Draft EIS 2018
Context 1
• Localized: Effects would be limited to Native American traditional values in the project study 2 area. 3
• Regional: Effects would occur to Native American traditional values in the regional CESA. 4
3.9.2.1 Proposed Action 5
The Proposed Action would result in new surface disturbance totaling 4,380 acres. As discussed in 6 Section 3.9.1.2, Native American Consultation and Coordination, no issues related to Native American 7 traditional values have been noted to date for the Proposed Action. Therefore, direct impacts to known 8 Native American traditional values are not anticipated. However, as discussed in Section 3.9 of the 9 Cortez Hills Expansion Project Final EIS (BLM 2008), the spiritual and religious experience of tribal 10 individuals who visit the top of Mount Tenabo for ceremonial or personal use may be diminished as a 11 result of the increased visual effects on the landscape associated with the development and expansion 12 of mine facilities under the Proposed Action. 13
Impacts to Native American Traditional Values 14
The Mount Tenabo/White Cliffs PCRIis located in the project study area, but outside of proposed new 15 disturbance areas. Mount Tenabo is an important place of renewal, fasting, and prayer; an area for 16 hunting and gathering of food and medicine resources; a source of pine nuts, fuel, and construction 17 material; and may contain burials (Rucks 2000). As a result of the Proposed Action, additional visual 18 impacts to the PCRI, as well as additional impacts related to future pine nut harvesting, springs, and 19 spiritual and religious use could occur. Impacts to the Horse Canyon PCRI are also considered as this 20 resource is located adjacent to the project study area, within the regional CESA. These potential impacts 21 are discussed below. 22
Visual Impacts 23
BLM is responsible for identifying and protecting scenic values on public lands under several provisions 24 of FLPMA and NEPA. The BLM developed its Visual Resource Management (VRM) system to instill a 25 systematic, interdisciplinary approach to what is inherently a somewhat subjective analysis. The VRM 26 system includes an inventory process, based on a matrix of scenic quality, viewer sensitivity to visual 27 change, and viewing distances, which leads to classification of public lands and assignment of visual 28 management objectives. Four VRM classes were established, which serve two purposes: 1) as inventory 29 tools portraying relative value of existing visual resources and 2) as management tools portraying visual 30 management objectives for the respective classified lands. 31
The top of Mount Tenabo and Shoshone Wells are two viewpoints associated with Native American 32 traditional values; they are included in the visual resources analysis for the Proposed Action (see 33 Section 3.15, Visual Resources and Figure 3.15-1). The Shoshone Wells location is surrounded on 34 three sides by currently authorized facilities. Views from Shoshone Wells are dominated by existing 35 project facilities, which rise above the viewpoint from a few hundred feet to over 1,000 feet. Therefore, it 36 is unlikely that any elements of the Proposed Action would be visible from Shoshone Wells because of 37 screening from existing or previously approved facilities. 38
Development of the proposed Deep South Expansion Project would further impact the visual 39 environment of the Mount Tenabo/White Cliffs PCRI. Most, and perhaps all, of the above ground 40 elements of the Proposed Action would be visible from the sensitive viewpoint at the top of Mount 41 Tenabo. However, because the visual character of most of the proposed new and modified project 42 facilities in the four mine complexes would be very similar to existing project facilities, and because the 43 scale of proposed facility modifications is relatively small in the context of existing facilities at all four 44 mine complexes, the visual effects of most of the mine features would be minor as viewed from 45 Mount Tenabo. It is unlikely that a casual observer would notice most of these visual changes. In 46

Deep South Expansion Project EIS 3.9 – Native American Traditional Values 3.9-15
Draft EIS 2018
contrast, approximately the western half of the proposed Rocky Pass Reservoir would be visible from 1 Mount Tenabo over the top of the east ridge of Carico Lake Valley. The reservoir would interject a new 2 and unusual visual feature in the viewshed, although at a distance of approximately 11.5 miles from the 3 mountain top. Although substantially different from the natural visual character of the high desert 4 landscape, the reservoir would be consistent with the VRM Class IV objectives, which allow for major 5 modifications to the landscape. In addition, the reservoir would be a temporary facility that would be in 6 use during the active life of the mine; it would be reclaimed and returned to its natural character during 7 closure and final reclamation. 8
No visual impacts to the Horse Canyon PCRI are anticipated as a result of the development of the 9 proposed Pine Valley RIBs due to topographic screening. 10
Impacts to Pine Nut Harvesting 11
Pinyon trees have provided a major food source for the Western Shoshone for hundreds of years, and 12 many social activities revolve around pinyon trees and pine nut harvests. As discussed in Section 3.4, 13 Vegetation, the Proposed Action would disturb or remove approximately 95 acres of pinyon-juniper 14 woodland located on BLM-administered land and 3 acres on private land, which primarily consists of 15 immature Utah juniper and singleleaf pinyon trees. Of the 95 acres of BLM-administered land, 35 acres 16 would be permanently removed (not reclaimed) where open pit expansions/modifications are proposed. 17 During reclamation, the replanting of singleleaf pinyon seedlings would occur in suitable areas within the 18 proposed disturbance area, and natural re-colonization of the disturbed areas with Utah juniper and 19 singleleaf pinyon would occur over time. However, it would take approximately 75 to 100 years for 20 mature singleleaf pinyon trees to become re-established. 21
Few mature pinyon groves are located in the proposed disturbance area, and therefore, the affected 22 pinyon groves currently provide little pine nut production. There are no data on the quantity of pine nuts 23 that are collected by local Western Shoshone from this area in any given year. However, there would be 24 a permanent loss of potential future pine nut harvesting on the 35 acres of pinyon-juniper woodland that 25 would be affected by the proposed Cortez Hills Pit modification. 26
Per applicant-committed environmental protection measures in Chapter 2.0, singleleaf pinyon-juniper 27 would be cleared in advance of mine construction/development in a manner that would allow utilization 28 of the resource to the extent possible. Funding for the value of the removed firewood would be provided 29 as a contribution to an off-site BLM or NDOW revegetation project. 30
Impacts to Access 31
Currently, vehicle access to Mount Tenabo is via existing mining explorations roads, most of which are 32 on the east side of the mountain. The Proposed Action would not alter or limit access to Mount Tenabo. 33
Impacts to Springs 34
Some Western Shoshone travel to specific springs and collect the water in 5-gallon containers. Water 35 collected at these locations is said to be healthier than “town water” and cleanses the mind, body, and 36 spirit, and keeps a person healthy. According to Western Shoshone, such locations in the project vicinity 37 occur within the Cortez Range (BLM 2008). 38
As discussed in Section 3.2, Water Resources and Geochemistry, springs located within, and within 39 1 mile of, the maximum extent of the projected 10-foot groundwater drawdown contour could be 40 impacted by mine dewatering activities, if the springs are hydraulically connected to the affected aquifer. 41 Existing and proposed contingency mitigation measures for potentially affected springs are identified in 42 Section 2.4.13, Applicant-committed Environmental Protection Measures, and discussed in Section 3.2, 43 Water Resources and Geochemistry. 44

Deep South Expansion Project EIS 3.9 – Native American Traditional Values 3.9-16
Draft EIS 2018
Impacts to the Spiritual and Religious Use of the Area 1
Travel to Mount Tenabo remains important to a few local Western Shoshone as a setting for personal 2 healing, spiritual guidance, renewing doctoring abilities, and acquiring power by a new generation of 3 spiritual practitioners (Rucks 2000). Much of the use is solitary due to the individualistic nature of 4 religious practice and belief as well as the importance of personal religious experience and direct 5 connection to the ancestors and the earth. The spiritual and religious experience of these tribal 6 individuals may be diminished as a result of the increased visual effects on the landscape associated 7 with the development and expansion of mining facilities under the Proposed Action. However, because 8 Western Shoshone consultants have not disclosed to date the number of people who visit the mountain 9 for spiritual or religious use and the frequency and specific locations of their visits to the area are 10 unknown, the level of this impact cannot be quantified. 11
Direct Impacts to Burials and Items of Cultural Patrimony 12
Under NAGPRA, and pursuant to specific procedures in the PA, if construction reveals, or project 13 personnel discover, what may be human remains, funerary objects, or items of cultural patrimony, 14 construction would cease within 300 feet of the discovery, and the BLM Authorized Officer would be 15 notified of the find. Any discovery of human remains, funerary objects, or items of cultural patrimony 16 would be handled in accordance with NAGPRA and the procedures detailed in the PA. Non-Native 17 American human remains would be handled in accordance with Nevada law and the PA. Construction 18 would not resume in the area of the discovery until the BLM Authorized Officer has issued a notice to 19 proceed. 20
Formally trained Western Shoshone tribal observers would be provided the opportunity to be present 21 during project-related construction activities (i.e., new surface disturbance) to provide information and/or 22 recommendations to BLM, as well as during data recovery (i.e., archaeological investigations) within the 23 CGM Operations Area as discussed in Section 2.4.13, Applicant-committed Environmental Protection 24 Measures. 25
Summary 26
The Proposed Action would result in negligible to minor effects to Native American traditional values. The 27 minor effects to Native American traditional values would be both localized and regional in context. The 28 permanent loss of 35 acres of pinyon woodland and the associated potential future pine nut harvesting 29 would be localized to areas within the new proposed disturbance. The loss of future pine nut harvesting 30 areas, while minor, would be permanent and, therefore, long-term. Effects to the visual environment of 31 Mount Tenabo and the Mount Tenabo/White Cliffs PCRI (within the project study area) also would be 32 minor, and effects to the Horse Canyon PCRI (within the regional CESA) would be negligible. These 33 long-term visual effects would be would be localized and regional. The visual effects may diminish the 34 spiritual and religious experiences of individual tribal members that may use these areas; however, the 35 effects cannot be quantified. 36
3.9.2.2 Gold Acres Pit Partial Backfill Alternative 37
Under the Gold Acres Pit Partial Backfill Alternative, potential impacts to Native American traditional 38 values essentially would be the same as described for the Proposed Action. 39
3.9.2.3 No Action Alternative 40
Under the No Action Alternative, the proposed Deep South Expansion Project would not be developed, 41 and associated impacts to Native American traditional values would not occur. Existing mining and 42 processing operations and reclamation activities in the current CGM Operations Area, as described in 43 Section 2.5.1.2, No Action Alternative, would continue to operate under the terms of current permits and 44 approvals by BLM and the State of Nevada. No new ground disturbances beyond that previously 45 authorized would occur under this alternative. As a result, there would be no potential impacts to Native 46 American traditional values. 47

Deep South Expansion Project EIS 3.9 – Native American Traditional Values 3.9-17
Draft EIS 2018
3.9.3 Cumulative Impacts 1
During development of the Cortez Hills Expansion Project EIS (BLM 2008), a regional cumulative effects 2 analysis was developed to address tribal concerns regarding the effects of historic and ongoing mining 3 activities on tribal resources in the region. Previous ethnographic studies and NEPA documents for 4 mines and other major actions within the Carlin Trend, Ivanhoe, Crescent Valley, and Tonkin areas were 5 compiled and analyzed. As a result, the list of past and present actions and RFFAs was expanded for 6 the Native American traditional values cumulative effects analysis to include additional mines, mine 7 exploration projects, and other actions within the regional CESA. 8
Portions of the regional cumulative effect study area have been utilized by the Western Shoshone 9 people for at least 1,200 years (McGuire et al. 2007). Since the first contact with Euro-Americans, the 10 Western Shoshone have competed for resources with trappers, explorers, migrants heading to California 11 along the Humboldt River trail, miners, settlers, and agricultural and transportation interests. In addition, 12 Western Shoshone culture has been impacted by military incursions and the loss of much of their 13 aboriginal homeland. The forces of assimilation and public policy also have affected the Western 14 Shoshone. While BLM acknowledges the effects of these impacts over time, it would be impossible to 15 analyze cumulative impacts on this temporal scale. 16
The regional CESA initially was developed based on review of results of past Section 106 consultation 17 efforts with the area Indian tribes and tribal elders. This review found that the areas of importance to 18 those Western Shoshone people who utilize the project vicinity generally were bounded by the Humboldt 19 River Valley to the north, Pine Valley to the east, the Simpson Park Range and Carico Lake Valley to the 20 south and southwest, and the Reese River Valley to the west. Although outside of the frequent usage 21 range of the Western Shoshone people who utilize the project vicinity, portions of the Sheep Creek 22 Mountains, Boulder Valley, and Tuscarora Mountains were added to the regional CESA in order to 23 include other mining operations in the region that may contribute to cumulative effects to Native 24 American traditional values. The regional CESA boundary was refined further in consultation with the Te-25 Moak Tribe during preparation of the Cortez Hills Expansion Project EIS (BLM 2008). The regional 26 CESA developed for the 2008 EIS was adopted for this EIS (Figure 3.9-2). 27
The past and present actions and RFFAs identified in the Cortez Hills Expansion Project Final EIS 28 (BLM 2008) and subsequent EAs (BLM 2015, 2014) have been updated for this EIS. These actions are 29 identified in Table 3.9-1. Figure 3.9-2 shows the distribution of the primary surface-disturbing actions in 30 the regional cumulative effects study area. 31
Table 3.9-1 Past, Present, and Reasonably Foreseeable Actions for Native American Traditional Values Regional CESA
Action
Past and Present Total
Approved Disturbance
(acres)
RFFA Projected
Disturbance (acres)
Total Approved/ Projected
Disturbance (acres)
Mining Projects
Atlas Gold Bar 1,320 0 1,320
Black Rock Canyon Mine 117 0 117
Bootstrap Project 1,505 0 1,505
Carlin Mine 1,385 0 1,385
Clipper Mine 400 0 400

Deep South Expansion Project EIS 3.9 – Native American Traditional Values 3.9-18
Draft EIS 2018
Table 3.9-1 Past, Present, and Reasonably Foreseeable Actions for Native American Traditional Values Regional CESA
Action
Past and Present Total
Approved Disturbance
(acres)
RFFA Projected
Disturbance (acres)
Total Approved/ Projected
Disturbance (acres)
BCI Buckhorn Mine 820 0 820
BCI CGM Operations Area 16,700 0 16,700
BCI Goldrush Project 0 859 859
BCI Horse Canyon Mine 698 0 698
BCI Mill Canyon 18 0 18
Cortez Silver Mining District1 92 0 92
Elder Creek Mine 143 0 143
Fire Creek Mine 285 0 285
Fox Mine 4 0 4
Gold Quarry Mine/South Operations Area Project 5,750 0 5,750
Goldstrike/Betze Project 4,379 0 4,379
Greystone Mine 242 0 242
Grey Eagle Project 5 0 5
Hot Springs Sulfur Mine 5 0 5
Ivanhoe Project 342 0 342
Leeville Project 486 0 486
May Mine 1 0 1
Meikle Mine 92 0 92
Mud Spring Gulch 10 0 10
Mule Canyon Mine 2,931 0 2,931
Rain/Emigrant Project 383 0 383
South Silicified Project 31 0 31
Utah Mine and Camp 6 0 6
Other 2Mining Projects 113 228 341
Subtotal 38,263 1,087 39,350
Exploration
Notices BLM-Battle Mountain Field Office: 118 expired, 8 pending, and 30 authorized2
265 0 265
3Plans (7) BLM-Battle Mountain Field Office 306 0 306 3Notices (10) BLM-Ely Field Office 50 0 50

Deep South Expansion Project EIS 3.9 – Native American Traditional Values 3.9-19
Draft EIS 2018
Table 3.9-1 Past, Present, and Reasonably Foreseeable Actions for Native American Traditional Values Regional CESA
Action
Past and Present Total
Approved Disturbance
(acres)
RFFA Projected
Disturbance (acres)
Total Approved/ Projected
Disturbance (acres)
BCI HC/CUEP4 549 0 549
BCI West Pine Valley 150 0 150
BCI Joint Venture Area 0 600 600
BCI Hilltop Exploration/ Mine 92 0 92
BCI Pipeline/South Pipeline/Gold Acres Exploration Project Area
50 0 50
BCI Robertson Exploration 12 0 12 BCI Robertson Exploration Project5 294 0 294
Carlin Exploration Project 255 0 255
Dean Mine 67 0 67
Mill Canyon Exploration 250 0 250
Mud Springs 0 10 10
South Roberts 0 3 3
Toiyabe Mine 40 0 40
Tonkin Springs 21 0 21
Uhalde Lease 100 0 100
Other Mining Exploration 1,734 6,681 8,415
Subtotal 4,235 7,294 11,529
Utilities/Communities
SR 306 wide)
and Roads in Northern Carico Lake Valley (100 feet 422 0 244
Gravel Roads Valley (50 feet
in Crescent wide)
Valley and Northern Carico Lake 1,558 0 1,558
Dirt Roads in Crescent Valley and Northern Carico Lake Valley (30 feet wide)
776 0 776
Power lines in Crescent Valley (30 feet wide) 364 0 364
Wells Rural Electric Cooperative future Goldrush Project
power line for potential 0 192 192
BCI Fiber Optic Cable (60 feet wide)6 53 0 53
BCI Jeremy’s Knob Communications Tower and ROW7 0.5 0 0.5
Falcon to Gonder Transmission Line 2,105 0 2,105
Geothermal 8Leasing 0 0 0

Deep South Expansion Project EIS 3.9 – Native American Traditional Values 3.9-20
Draft EIS 2018
Table 3.9-1 Past, Present, and Reasonably Foreseeable Actions for Native American Traditional Values Regional CESA
Past and Total Present Total RFFA Approved/
Approved Projected Projected Disturbance Disturbance Disturbance
Action (acres) (acres) (acres) Oil and Gas Leasing9 0 0 0
Powerlines (60 feet wide) 489 0 489 10 Towns of Crescent Valley and Beowawe 900 0 900
11 Public Land Sale to Carlin City 0 1,329 1,329
Other ROWs (Roads, Mining, Pipeline) 368 360 728
Other Utilities (Electric, Communications, Federal Aviation 10,227 10 10,237 Administration)
Subtotal 17,263 1,891 19,154
Other Development and Actions 12BLM Fuels Reduction Projects 5,641 900 6,541
BLM Land Aquisition13 0 0 0 14Wildfires 978,493 0 978,493
Recreation15 0 0 0
Livestock16 10 53 63
Wildlife 0 0 0
Agriculture Development17 9,750 0 9,750
BCI Additional Irrigation Pivots at Dean Ranch 0 640 640
Lodge at Pine Valley18 30 0 30
Crescent Valley Water Supply 2 0 2
BCI Cottonwood Infiltration Basins19 104 0 104 20 BCI BEA Project Plans 0 46,929 46,929
Subtotal 994,030 48,522 1,042,552
Total 1,053,791 58,794 1,112,585

Deep South Expansion Project EIS 3.9 – Native American Traditional Values 3.9-21
Draft EIS 2018
Footnotes: 1 Historic mining- and exploration-related disturbance first began in 1862, prior to the promulgation of surface land management
laws and regulations governing mining activities on public lands (e.g., FLPMA and 40 CFR 3809). Since there were no laws or regulatory programs in place at that time, there were no regulatory or administrative approvals granted. Therefore, the identified disturbance acreage does not include all historic mining-related disturbance in the area.
2 Includes gold and barium/barite mines and other mineral extraction (e.g., gravel pits). 3 Plans and notices outside of the general Crescent Valley area have not been quantified. 4 The approved plan provides for surface exploration activities and development of twin declines for underground exploration
(BLM 2016b). 5 BCI’s Robertson Exploration Project boundary is located immediately north of, and partially within, the CGM Operations Area
as shown in Figure 2-22. 6 ROW runs from the Lodge at Pine Valley to the southeast boundary of the CGM Operations Area. 7 BCI facility located in T28N, R47E, Section 18 SESE just north of the CGM Operations Area; ROW N-092170. 8 A programmatic EA was prepared by the BLM in 2002 to facilitate geothermal leasing and exploration in the Shoshone-
Eureka Planning Area. The EA provides a framework for the processing of geothermal lease and exploration applications. Any proposed surface disturbing activity would be required to undergo a separate site-specific NEPA analysis before authorization could be granted.
9 Any proposed surface disturbing activity in the oil and gas lease areas would be required to undergo a site-specific NEPA analysis before authorization could be granted.
10 Surface disturbance associated with the towns of Crescent Valley and Beowawe is assumed to be 640 and 160 acres, respectively, with approximately 100 acres of private developed land peripheral to the towns.
11 For analysis purposes, it is assumed that that the entire acreage may be developed or disturbed in the future. 12 Inclusive of acreage associated with the Crescent Valley Wildland Urban Interface Fire Defense System, Tonkin Hazardous
Fuels Reduction Project, and Red Hills Hazardous Fuels Reduction Project. Of the total acreage, planned prescribed burns would affect up to 2,537 acres of pinyon-juniper woodland, and 800 acres of pinyon-juniper woodland would be thinned. Also includes future treatment of 900 acres of encroaching pinyon-juniper woodland for enhancement of greater sage-grouse habitat in the approved HC/CUEP PoO (BLM 2016a,b).
13 BLM land acquisition of three parcels totaling approximately 477 acres is pending. There is no existing disturbance or planned land disturbing activities in these areas.
14 Reflects acreage of vegetation affected by wildland fires from 1998 through 2017 within the vegetation CESA. The acreage is inclusive of approximately 38,312 acres of fire-affected pinyon-juniper woodland.
15 Surface disturbance associated with recreation activities has occurred; however, the acreages have not been quantified. 16 Existing livestock-related surface disturbance acreage is associated with water developments. The surface disturbance
associated with the livestock RFFAs is based on 0.5 acre per water development activity and 43 acres for fencing and cattle guards. The 4,313 acres previously identified for RFFA activities (BLM 2015) inadvertently included acreage of surface occupancy. Livestock-related activities outside of the Carico Lake Allotment have not been quantified.
17 Surface disturbance associated with agricultural development is based on the acreage under irrigation and assumes that a change in vegetation and habitat equates to surface disturbance. Acreage values were based on a February 15, 1998, special hydrographic abstract for Hydrographic Basin No. 054 from the NDWR. These values are based on permitted or authorized use of water and may not reflect actual use in a given year.
18 This facility is located on the JD Ranch Road approximately 4 miles west of SR 278 at the BCI-owned JD Ranch. 19 Surface disturbance located on private (Barrick-owned) land outside of the CGM Operations Area. 20 Includes 37,006 acres for the BEA Public Lands Project Plan and 9,929 acres for the BEA Private Lands Project Plan.
Conservation actions that would be implemented to restore and enhance greater sage-grouse habitat would include tree removal, seeding and planting, establishment of fuel breaks, and improving wet meadows (Barrick 2018).
Sources: BLM 2017a, 2015, 2008; ESRI World Imagery 2017.

Deep South Expansion Project EIS 3.9 – Native American Traditional Values 3.9-22
Draft EIS 2018
As discussed in Section 2.6, Past, Present, and Reasonably Foreseeable Future Actions, cumulative 1 impacts are defined in the CEQ implementing regulations for NEPA as “the impact on the environment 2 which results from the incremental impact of the action when added to other past, present, and 3 reasonably foreseeable future actions regardless of what agency (federal or non-federal) or person 4 undertakes such other actions. Cumulative impacts can result from individually minor but collectively 5 significant actions taking place over a period of time” (40 CFR 1508.7). 6
Ethnographic research, cultural resources inventories, Native American consultation efforts, oral 7 histories, and personal communication and interviews with Western Shoshone individuals have provided 8 documentation that establishes the importance of several identified landmarks, trails, and culturally 9 significant places in Western Shoshone history. Archaeological data on file at the BLM Battle Mountain 10 Lewis Field Office supports Western Shoshone historic and prehistoric use of the regional CESA 11 (Figure 3.9-2) and is consistent with the traditional/cultural use information provided by contemporary 12 Western Shoshone. Past and present traditional, cultural, and spiritual use information, combined with 13 oral and written histories and the archaeology of the area, support prehistoric, historic, and modern use 14 of the area by native practitioners for hundreds if not thousands of years. To quantify to the extent 15 possible the cumulative effects to Native American traditional values, data available in the Cortez Hills 16 Expansion Project Final EIS (BLM 2008) and subsequent EAs (BLM 2015, 2014) was reviewed for 17 applicable information. 18
3.9.3.1 Ethnographic Studies 19
Numerous ethnographic studies have been conducted in the vicinity of, and within, the CESA, and 20 contribute to the current ethnographic analysis (see Section 3.9.1.4, Ethnographic Analyses). 21
• Clemmer (1990) prepared an ethnographic study at the Tosawihi quarry 22
• Rusco and Raven (1992) prepared background ethnographic information for a proposed mining 23 project in the Ivanhoe Mining District 24
• Rusco (1992) conducted an ethnographic study to provide background information for NEPA in 25 the Mule Canyon Project Area 26
• Quick (1995, 1992) conducted an ethnographic study for the Cortez Gold Mine Expansion 27 Project EIS in which Mount Tenabo and other features were identified as culturally significant to 28 the Western Shoshone 29
• Rusco (2000) conducted an ethnographic study for the Horse Canyon Exploration Project 30
• Rucks (2001) prepared an ethnographic study for the Falcon to Gonder 325-kV Transmission 31 Line Project 32
• BLM (McGonagle 2001) documented attempts to define a traditional cultural property boundary 33 for CGM’s (currently BCI’s) HC/CUEP project 34
• Rucks (2004) conducted an ethnographic study of the Mount Tenabo area for the previously 35 proposed Pediment Project 36
These ethnographical studies noted that archaeological sites were located mainly on or near flat and 37 gently sloping surfaces such as alluvial fans, fan piedmonts, fan skirts, alluvial flats, playas, ridge tops, 38 passes, and stream terraces. Sites of noted cultural significance were geyser locations in Whirlwind 39 Valley, Mount Tenabo, the Crescent Valley massacre site, base of Roberts Mountains (major pine nut 40 harvesting area), and the multiple lithic resources, including the Tosawihi Quarry which is a physical 41 expression of Tosawihi cultural identity. 42


Deep South Expansion Project EIS 3.9 – Native American Traditional Values 3.9-24
Draft EIS 2018
This page intentionally left blank

Deep South Expansion Project EIS 3.9 – Native American Traditional Values 3.9-25
Draft EIS 2018
Traditions and cultural practices within the ethnographic study area included pine nut harvesting, edible 1 and medicinal plant gathering, seasonal camps and travel, religious practices, and burials. Crescent 2 Valley was noted for its abundance of seed resources. Also, within the Pine and Diamond Valleys, where 3 the people were known as the “red top grass eaters,” there was a fishing village near Palisades. Certain 4 festivals were said to take place by many Western Shoshone in the Pine and Diamond valleys, with large 5 crops of pine nuts being produced and gathered in the Roberts Mountains and Sulpher Springs Range. 6 The Mineral Hill area was said to contain large quantities of Yampa root. Roots and seed plants were 7 said to be bountiful in the Cortez and “Tinaba” areas along with Newark Valley. Along with pine nut 8 harvesting, antelope drives were said to take place in Diamond, Long, and Butte valleys. Mule deer 9 hunting took place within a migration corridor, which was near Hamilton and Railroad valleys. “StepToe” 10 Valley and the Ely area contained many Shoshone villages and pine nut camps. 11
Oral interviews with tribal members resulted in the identification of the following concerns regarding new 12 mining and other developments: threats to power spots or sources, including the sacred and extremely 13 rare white Tosawihi chert; access limitations to traditional resource areas; cumulative degradation of the 14 cultural and biotic landscape of public lands within Western Shoshone traditional territory; possible direct 15 effects to individual cultural properties from construction and data recovery; increased visibility and 16 accessibility; inadvertent discovery of human remains; and impacts to eagles and sage grouse. 17
3.9.3.2 Proposed Action 18
Visual Impacts 19
The known landmarks considered important by Native American tribes include the top of Mount Tenabo, 20 the White Cliffs on the south half of Mount Tenabo’s west face, and Big Butte near Tuscarora at the 21 north tip of the regional CESA. The Tosawihi Quarry area also is an important landmark to Western 22 Shoshone and, mainly, Tosawihi Shoshone. Other prominent mountain tops or rock outcrops were 23 mentioned as possible landmarks, but none were specifically identified. These landmarks were used by 24 Western Shoshone as visual guides for ancient travel and hunting/trade routes or trails and continue to 25 serve as physical expressions of Western Shoshone cultural identity. Additionally, prominent features 26 often signified locations of certain ceremonies and observances and are associated with Western 27 Shoshone creation stories. 28
The Proposed Action would modify the visual character of the lowest reaches of the western slope of 29 Mount Tenabo and the adjacent canyon and valley lands. It would not modify the northern or eastern 30 parts of the mountain or the upper two-thirds of the mountain, including the White Cliffs. The undisturbed 31 upper reaches of the mountain would be more visually prominent from distant viewpoints. From 32 Shoshone Wells, a closer viewpoint (see Figure 3.15-1), it is unlikely that any of the elements of the 33 Proposed Action would be visible due to screening by existing mine facilities. From the top of Mount 34 Tenabo, most of the elements of the Proposed Action would be visible; however, the scale of the facility 35 modifications would be relatively small in the context of the existing mine facilities (see Section 3.15, 36 Visual Resources). 37
Development of the proposed Deep South Expansion Project incrementally would add to existing 38 impacts to the visual environment of the Mount Tenabo area. Some Native Americans consider the 39 entirety of Mount Tenabo and its surroundings to be an “ethnographic landscape.” The White Cliffs and 40 the top of Mount Tenabo have been combined into one PCRI, which is considered eligible for inclusion in 41 the NRHP (Dixon and McGonagle 2004). 42
Impacts to Plants with Tribal Significance 43
Vegetation within the regional CESA is shown in Figure 3.9-3. The majority of the vegetation consists of 44 shrub-dominated types, which typically occur in basins, valley bottoms, and on mountain slopes. Shrubs 45 commonly associated with these vegetation types include big sagebrush, Wyoming big sagebrush, 46 mountain sagebrush, black sagebrush, low sagebrush, green rabbitbrush, greasewood, four-wing 47

Deep South Expansion Project EIS 3.9 – Native American Traditional Values 3.9-26
Draft EIS 2018
saltbush, shadscale, budsage, and winterfat. A minor understory consisting of a variety of forbs and 1 grasses also occurs with these shrub species. Woodland vegetation types typically occur at higher 2 elevations along mountain ranges and are dominated by coniferous trees including singleleaf pinyon and 3 Utah juniper. Mountain shrubs, including serviceberry and mountain mahogany, also may be intermixed 4 with these conifers. These vegetation types also include a minor understory component consisting of a 5 variety of forbs and grasses. Riparian and wetland vegetation types occur in localized areas within the 6 regional CESA. Riparian vegetation types occur along ephemeral and perennial creeks, whereas 7 wetland vegetation types are associated with seeps, springs, and depressions adjacent to perennial or 8 intermittent creeks. 9
Edible and medicinal plants traditionally used by Native Americans are known to occur in great quantity 10 (and quality) in specific places within the regional CESA, such as Horse Canyon. Edible plants include, 11 but are not limited to, wild onion, chokecherries, Yampa root, pine nuts, cattail bulbs, various berries, and 12 grain-producing grasses. Medicinal plants include, but are not limited to, willow, “Indian” or “Mormon 13 Tea,” and “Doza.” Some plant species serve many purposes, such as the willow, which is used as a pain 14 reliever and as basket-making material. Sagebrush bark was used to make garments. Nineteen 15 traditional use plant species were identified as being of concern, based on the ethnographic studies 16 discussed above and available NEPA documents prepared for past and present actions and RFFAs in 17 the regional CESA. Table 3.9-2 lists these species, their habitat descriptions, the part or parts of the 18 plants used and their uses, and counties within the regional CESA where these plant species are known 19 to occur. 20
Two of the species identified in Table 3.9-2 (giant lomatium and elegant deathcamas) would not be 21 affected by the proposed project, based on the results of baseline surveys (see Section 3.4, Vegetation) 22 and habitat associations and requirements, respectively. Some of the other species in the table were 23 noted during baseline surveys (ERM 2016) for the Proposed Action. Limited information for the species 24 identified in Table 3.9-2 is available in existing NEPA documents for other projects in the regional CESA 25 (Table 3.9-1). Based on the vegetation types that occur in the regional CESA (Figure 3.9-3) and known 26 habitat associations and requirements (Table 3.9-2), some of the other species in the table may have 27 been, or could be, affected by activities associated with past and present actions, RFFAs, and fire in the 28 regional CESA. However, information on these species relative to specific occurrence locations, 29 population sizes, or areal extent of populations was not provided in the existing NEPA documents. 30 Therefore, the potential cumulative impacts to these species cannot be quantified. Most plant resource 31 availability depends on the climate, time of year, and precipitation. Many Western Shoshone have noted 32 a general decline in the availability of plant resources (BLM 2008). 33
Impacts to Pine Nut Harvesting 34
Based on review of existing NEPA documents for past and present actions (Table 3.9-1) and geographic 35 information system data for wildland fire locations within the regional CESA (Figure 3.9-4), an estimated 36 68,330 acres of pinyon-juniper woodland have been removed or affected as a result of development-37 related activities (44 percent) and wildland fire (56 percent). BLM fuels reduction projects also have 38 affected, or would affect, pinyon-juniper woodland in the regional CESA through prescribed burns 39 (2,537 acres) and thinning projects (800 acres). Impacts to pinyon-juniper woodland as a result of 40 RFFAs would include the treatment of 900 acres of encroaching pinyon-juniper woodland for 41 enhancement of greater sage-grouse habitat and a currently unquantifiable acreage associated with 42 future mining-related activities. In total, the quantifiable acreage of removed or affected pinyon-juniper 43 woodland is 72,567 acres. The Proposed Action incrementally would increase surface disturbance-44 related impacts to pinyon-juniper woodland on BLM administered lands in the regional CESA by 45 approximately 95 acres, resulting in 72,662 total cumulative acres of disturbance to pinyon-juniper 46 woodland (38 percent of the pinyon-juniper in the regional CESA). Other unquantifiable natural factors 47 that may affect pinyon groves and pine nut production in the regional CESA include drought and beetle 48 (e.g., Ips beetles), fungus, and mistletoe infestations. Permitted pine nut harvesting and commercial 49

Deep South Expansion Project EIS 3.9 – Native American Traditional Values 3.9-27
Draft EIS 2018
firewood or post cutting on BLM-administered lands within the regional CESA (outside of the CGM 1 Operations Area) also would contribute to cumulative impacts to pinyon groves and pine nut availability. 2
Most plant resource availability, including pine nuts, depends on the climate, time of year, and amount of 3 water. Many Western Shoshone have noted a general decline in the availability of pinyon pine and, 4 specifically, pine nut producing stands. However, not all pinyon trees or stands produce significant crops 5 of pine nuts. The percentage of harvestable pine nuts in the regional CESA that have been, or would be, 6 affected by projects or actions cannot be directly quantified, as the use of pinyon groves as a valued food 7 source by Western Shoshone depends on the availability of the resource (i.e., pine nut production) in 8 any given year. 9
Impacts to pinyon groves as an economic and social resource to Western Shoshone have occurred, and 10 would continue to occur, as a result of mining and other development activities in the regional CESA; 11 however, these cumulative effects are not quantifiable due to the variability of pine nut production from 12 year-to-year and the lack of information relative to specific pinyon grove usage. The Western Shoshone 13 concern about effects to pinyon reflects traditional beliefs, ecological values, and subsistence. Pine nut 14 collection, distribution, and consumption have played, and continue to play, a key role in Western 15 Shoshone cultural identity and cohesion (McGuire et al. 2007). Interviews with Western Shoshone 16 consultants have indicated that pediment pinyon groves were first accessible to the Indian populations 17 traveling south from Beowawe and are most associated with Crescent Valley and northern Grass Valley 18 (Rucks 2004). Pine nut use intensified during the early contact period, when populations increasingly 19 focused on pinyon for subsistence and on the pine nut harvest as a pivotal ceremonial gathering. The 20 pine nut harvest continues today and, according to contemporary Western Shoshone, reinforces their 21 cultural identity and tribal heritage (Rucks 2004). 22
Mining and other activities have affected pinyon trees. Use of these resources most likely would diminish 23 as future projects in the regional CESA are permitted and developed. The pine nut harvest and the social 24 activity associated with the harvest also may diminish over time, with continued regional development, 25 vegetation manipulation, fires, mining, and other activities. It is difficult to quantify cumulative effects to 26 tribal cultural and historical traditions; however, historic literature, ethnographic analysis, and interviews 27 with contemporary Western Shoshone have indicated that effects to Western Shoshone heritage and the 28 values placed on pinyon trees have occurred over time, and it is expected that these impacts would 29 continue. 30
Impacts to Access 31
The regional CESA is served by a sparse network of highways typical of rural Nevada, with a few 32 improved, gravel surface county roads in the valleys. There also is an extensive network of largely 33 unimproved or minimally improved dirt roads crisscrossing public lands in the regional CESA. In addition, 34 there are often improved gravel or dirt surface roads in the vicinity of major mine sites providing access 35 to the mines and transportation among mine facilities. Traffic levels are generally very low on all roads 36 except I-80 or roads serving as commuter routes to a substantial mine. 37
Some Western Shoshone continue to practice lifeways and lifestyles not unlike that of their ancestors, in 38 part or in whole. The cultural resources, sites, and activities discussed above all involve access routes. 39 Continued traditional, cultural, and spiritual use depends on maintaining access to certain locations, and 40 access limitations can cause an adverse effect. Increased public access also can add stresses 41 (increased traffic and human occupation) to cultural sites and activities that were relatively isolated and, 42 thus, secure. 43

Deep South Expansion Project EIS 3.9 – Native American Traditional Values 3.9-28
Draft EIS 2018
Table 3.9-2 Traditional Use Plants Within the Native American Regional CESA
Plant Type Common Name Scientific Name 1Habitat Description 2Part(s) of Plant Used/Uses Counties With Known
3Species Occurances Tree Species
Singeleaf pinyon Pinus monophylla Pinyon-juniper, pinyon, sagebrush, and lower aspen communities at 2,500 to 7,700 feet amsl.
Pine nuts/food; pitch/medicinal uses
Elko, Lander, and Eureka
Shrub Species Currants (squawberry) Ribes spp. Mountain brush, sagebrush, pinyon-juniper
woodland, riparian, aspen, spruce-fir, alpine, and less commonly desert shrub communities at 4,600 to 10,600 feet amsl.
Fruits/food; roots/medicinal uses Elko, Lander, and Eureka
Serviceberry Amelanchier alnifolia Streamsides, meadows, and mountain slopes in sagebrush, oak-serviceberry, aspen, and mixed conifer communities at 3,700 to 8,700 feet amsl.
Fruits/food and medicinal uses Elko, Lander, and Eureka
Chokecherry Prunus virginiana Sagebrush, pinyon-juniper, Rocky Mountain juniper, oak-serviceberry, and aspen communities from 4,200 to 9,200 feet amsl.
Fruits/food; wood and roots/medicinal uses
Elko, Lander, and Eureka
Sagebrush Artemisia spp. Sagebrush, rabbitbrush, shadscale, mountain brush, pinyon-juniper, and aspen communities at 3,000 to 9,200 feet amsl.
Leaves/medicinal uses Elko, Lander, and Eureka
Willow Salix spp. Wetland and riparian communities at 3,000 to Roots, bark, and Elko, Lander, and Eureka 9,000 feet amsl. leaves/medicinal value;
stems/materials for making structures
Mormon tea Ephedra viridis Blackbrush, salt desert scrub, sagebrush, mountain brush, pinyon-juniper, and rabbitbrush communities at 2,700 to 9,000 feet amsl.
Branches/medicinal uses Elko, Lander, and Eureka

Deep South Expansion Project EIS 3.9 – Native American Traditional Values 3.9-29
Draft EIS 2018
Table 3.9-2 Traditional Use Plants Within the Native American Regional CESA
Plant Type Common Name Scientific Name 1Habitat Description 2Part(s) of Plant Used/Uses Counties With Known
3Species Occurances Forb Species
Giant lomatium Lomatium dissectum Sagebrush, pinyon-juniper, aspen-fir, riparian, and rarely greasewood-desert shrub communities at 3,900 to 8,000 feet amsl.
Roots/medicinal uses Elko, Lander, and Eureka
Elegant deathcamas Zigadenus elegans Meadows and streambanks in aspen, lodgepole pine, and spruce-fir communities and in alpine tundra at 6,500 to 10,500 feet amsl.
Bulbs/medicinal uses Elko and Eureka
Foothills deathcamas Zigadenus paniculatus Blackbrush, other warm desert shrub, pinyon-juniper, sagebrush, oak-maple, ponderosa pine, Douglas fir, and grassland communities at 2,600 to 8,100 feet amsl.
Bulbs/medicinal uses Elko, Lander, and Eureka
Bolander’s yampah Perideridia bolanderi Sagebrush, juniper, mountain brush, and streamside communities at 4,600 to 7,000 feet amsl.
Roots/food Elko, Lander, and Eureka
Stickleaf Mentzelia spp. Pinyon-juniper woodland, mountain mahogany, sagebrush, Douglas fir, and aspen communities at 4,700 to 8,600 feet amsl.
Seeds/food and medicinal uses Elko, Lander, and Eureka
Mulesears Wyethia amplexicaulis Sagebrush, oak, pinyon-juniper, aspen-fir, and forb-grass communities at 4,600 to 8,700 feet amsl.
Roots/food and medicinal uses Elko, Lander, and Eureka
Common sunflower Helianthus annuus Saltgrass-muhly grass, desert shrub, pinyon-juniper, and mountain brush communities at 3,600 to 7,400 feet amsl.
Seeds and roots/food and medicinal uses; stems and leaves/medicinal uses
Elko, Lander, and Eureka
Arrowleaf balsamroot Balsamorhiza sagittata Sagebrush, mountain brush, pinyon-juniper, ponderosa pine, Douglas fir, aspen, and fir communities at 4,020 to 9,100 feet amsl.
Roots, stems, and leaves/medicinal uses
Elko and Lander
Wild onion Allium spp. Shadscale, sagebrush, rabbitbrush, greasewood, salt desert scrub, and pinyon-juniper communities at 3,200 to 7,500 feet amsl.
Bulbs and stems/food Elko, Lander, and Eureka

Deep South Expansion Project EIS 3.9 – Native American Traditional Values 3.9-30
Draft EIS 2018
Table 3.9-2 Traditional Use Plants Within the Native American Regional CESA
Plant Type Common Name Scientific Name Habitat Description1 Part(s) of Plant Used/Uses2 Counties With Known Species Occurances3
Grass Indian ricegrass Oryzopsis hymenoides Chiefly dry, open, often sandy sites, in
greasewood, creosote bush, shadscale, sagebrush, mountain brush, pinyon-juniper, and ponderosa pine communities, occasionally at margins of aspen-spruce-fir communities at 2,300 to 8,300 feet amsl.
Seeds/food Elko, Lander, and Eureka
Grass-like Plant Species Cattails Typha spp. Marshy areas at 3,600 to 6,300 feet amsl. Bulbs/food Elko, Lander, and Eureka
Indian spinach Stanleya pinnata Seleniferous soils derived from shales, mudstones, and siltstones with salt desert shrub, sagebrush, pinyon-juniper, and mountain brush communities at 2,700 to 6,800 feet amsl.
Leaves/food Eureka and Lander
1 Welsh et al. 1993. 2 Crow Canyon Archaeological Center 2006; University of Michigan-Dearborn 2006. 3 NRCS 2006.
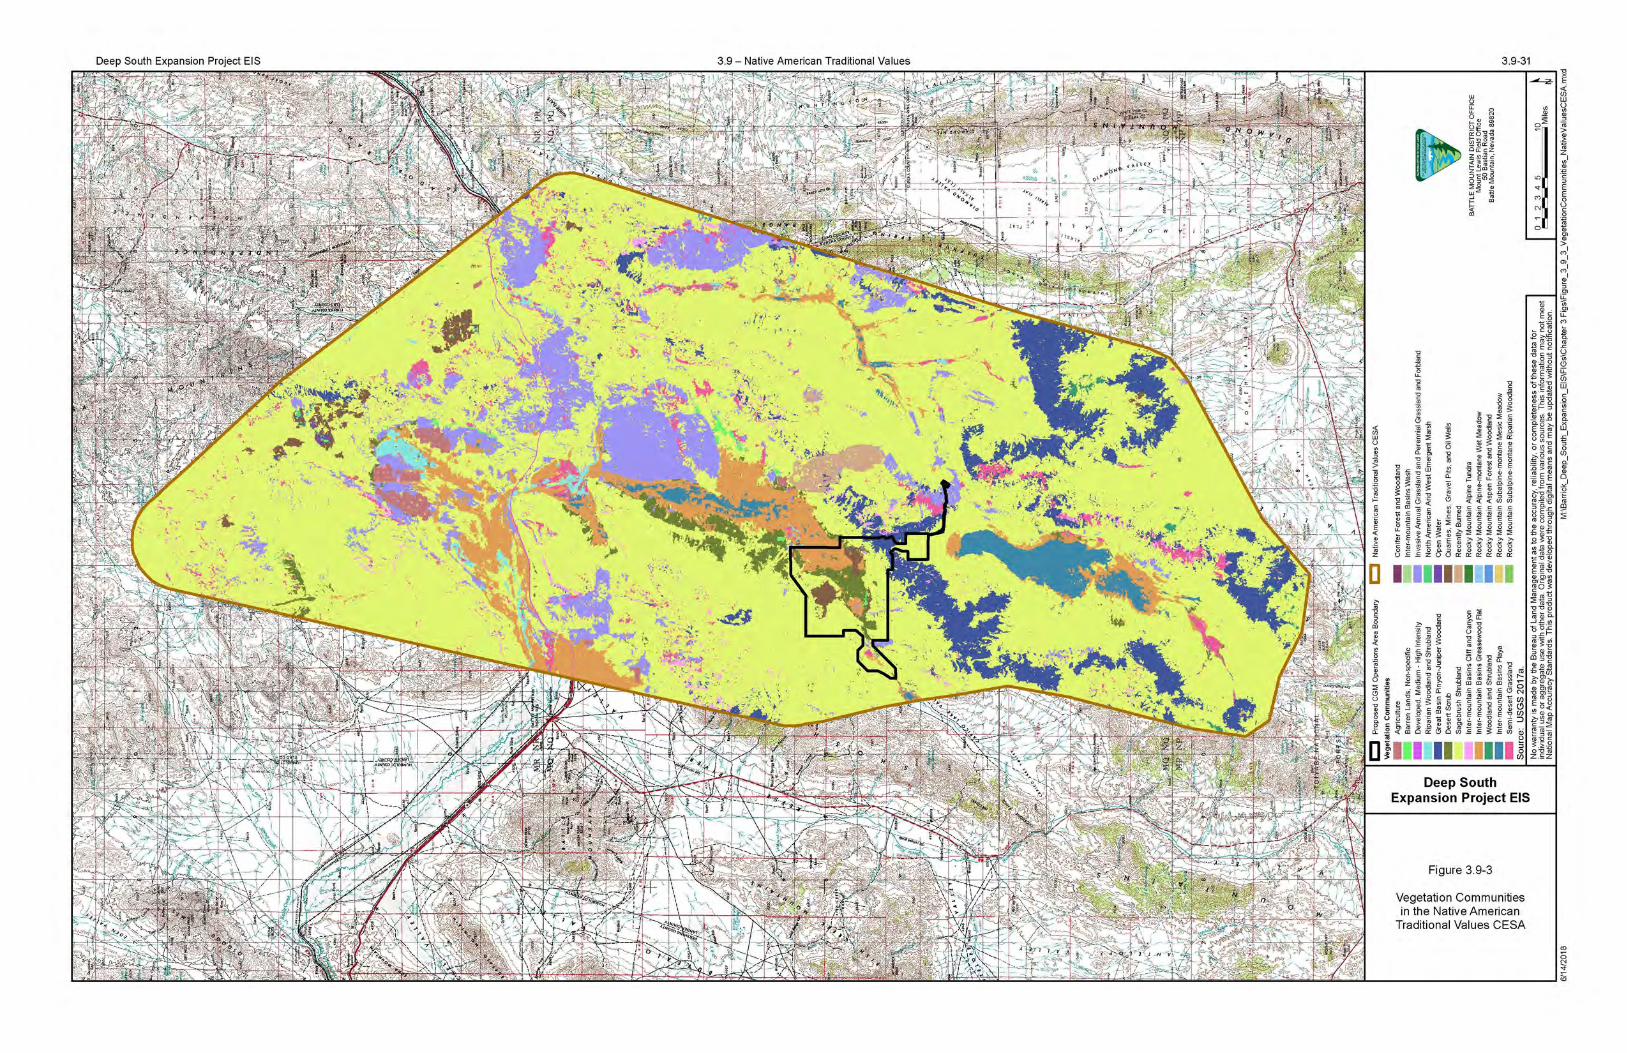


Deep South Expansion Project EIS 3.9 – Native American Traditional Values 3.9-33
Draft EIS 2018
Considering the extensive network of formal and informal roads on public lands in the regional CESA, it 1 is likely that access has remained, and would remain, available to most of the culturally important sites 2 and resource locations traditionally used by Native Americans, although in some cases, access may be 3 less direct than it originally had been. In other cases, increased access in an area also could be 4 beneficial to traditional practitioners. For example, increased access within thick pinyon pine stands, that 5 formerly were inaccessible, may assist the elders in harvesting pine nuts with little or no stress; however, 6 access by the general public also would increase. 7
Essentially all of the past and present actions and RFFAs in the regional CESA temporarily have 8 resulted, or would result, in an increase in people and activity in and near project areas. While there have 9 been impacts to access over time in the regional CESA, the Proposed Action would not add to those 10 impacts. 11
Impacts to Burials and Cultural Sites 12
The Native Americans’ concern for burials stems from the traditional practice of locating burials close to 13 the place of death rather than in specific cemeteries. The burial customs of the Western Shoshone 14 involved different methods of treating the deceased. These methods included cremation, sometimes by 15 burning the deceased’s home with the body inside; burial in rock slides, talus slopes, caves or rock 16 shelters, or in areas of soft dirt; and abandonment without interment, sometimes in the deceased’s 17 house or merely covered with brush. Due to the variety of these practices and the vast expanse of 18 Western Shoshone aboriginal territory, burials could be located almost anywhere within the regional 19 CESA. 20
Western Shoshone consultants have consistently expressed concerns for burials. The traditional 21 Western Shoshone belief that bodies should be returned to “Mother Earth” when buried, and should 22 remain where they were originally placed, has been noted in several ethnographic studies (Rucks 2004; 23 Rusco 2000). Although tribal consultants interviewed for these studies expressed deep concern about 24 the treatment of burials and the desire that they be avoided, few were willing to divulge specific locations 25 of these types of sites. There are no known burial sites in the project study area. 26
There are a large number of prehistoric and ethnohistoric sites documented in the regional CESA. The 27 sites primarily consisted of lithic debitage, tool scatters, and debitage scatters. The tool and debitage 28 scatters contained fragments of stone implements, while debitage scatters were composed of stone 29 waste flakes, which are a byproduct of tool making. Other site types included quarries, camps, and 30 traditional cultural properties identified by tribal consultants. According to the Western Shoshone, cultural 31 sites are associated with the ancestors and considered “physical proof of Shoshone existence” or 32 physical expressions of cultural identity. 33
The Proposed Action impact analysis indicated no adverse impacts to cultural resources, including 34 potential burials, based on compliance with the NAGPRA, NHPA, PA, and implementation of mitigating 35 measures involving inventory, avoidance, or data recovery, along with collection of all important artifacts 36 with detailed recording of their context. Therefore, under NEPA, no cumulative effects to cultural sites or 37 burials would occur as a result of the Proposed Action. However, archaeological excavation is perceived 38 by some Western Shoshone as part of a destructive process that permanently removes Western 39 Shoshone heritage from the landscape (Rucks 2004). Therefore, within the context of Native American 40 concerns, it is anticipated that cumulative effects to cultural sites and burials as a result of mining and 41 other human activity would continue as cultural sites and burials are excavated. 42
Impacts to Spiritual and Religious Use Areas 43
Certain Western Shoshone have expressed concern about past, present, and future activities and their 44 effects on spiritual and religious use areas within their ancestral lands (Rucks 2004). Use of these areas 45 for individual Western Shoshone spiritual or religious renewal has decreased over time as mining and 46 other activities have increased in the regional CESA. In the past, much of the emphasis of Native 47

Deep South Expansion Project EIS 3.9 – Native American Traditional Values 3.9-34
Draft EIS 2018
American studies has been on the short-term effects to spiritual and religious use areas, and not on the 1 larger, long-term impacts imposed on these areas and their resources. 2
Areas of cultural importance to Native Americans include, but are not limited to, locations associated with 3 the traditional beliefs concerning tribal origins, cultural history, or the nature of the world; locations where 4 religious practitioners go, either in the past or in the present, to perform ceremonial activities based on 5 traditional cultural rules of practice; ethnohistoric habitation sites; trails; burial sites; and places from 6 which plants, animals, minerals, and waters possessing healing powers or used for other subsistence 7 purposes may be taken. Past ethnographic and ethnohistoric studies have identified several places of 8 cultural importance to the Western Shoshone. Some of these areas have discrete boundaries while 9 others were mentioned by tribal consultants only as general areas that contain specific property types, 10 such as burials, camp sites, or plant-gathering areas. The following areas were identified through tribal 11 consultation, ethnographic and ethnohistoric studies, and archival research: Mount Tenabo, Four Mile 12 Canyon, pinyon-juniper woodlands, Shoshone Camp in Shoshone Wells, Horse Canyon, Dry Hills, 13 various trails, Toiyabe Mountains, Rock Creek Canyon, and Tosawihi Quarry. 14
Cumulative effects to Western Shoshone places of cultural importance have occurred throughout 15 Western Shoshone history and most likely would continue with modern human development activities, 16 including mining, in the regional CESA. The addition of more development would affect the nature of 17 Western Shoshone spiritual and religious use areas not only through visual intrusions, but through their 18 presence within the landscape. Modern facilities could affect the function of these areas by interrupting 19 the continuity of the ebb and flow of Western Shoshone power, renewal, and spirituality. Changes in the 20 landscape could cumulatively affect the role of the landscape within tribal sacred and historical traditions, 21 and potentially change how the tribes use the landscape. 22
Impacts to Water Resources 23
Hot and cold springs, streams, and rivers are considered by Western Shoshone to be the “life blood of 24 the Earth” and to be associated with certain spiritual beings and healing/cleansing ceremonies. Certain 25 cleansing ceremonies are believed to require the use of specific springs because of their purity and 26 cleanliness. Some Western Shoshone individuals travel to specific springs and collect the water in 27 5-gallon containers. Water collected at these locations is said to be healthier than “town water” and 28 cleanses the mind, body, and spirit, and keeps a person healthy. According to Western Shoshone, such 29 locations occur within Ruby Valley, Louis Canyon, the Cortez Range, and various spring sources near 30 Midas. 31
According to Western Shoshone beliefs, all living things depend on water, and without it, life would 32 cease. Therefore, the drying up of springs or reduction of flow, due to exploration drilling, mine 33 dewatering, and other mining activities, is of great concern to the Western Shoshone, who view water 34 sources as being sacred. Some of the people who were interviewed as part of previous ethnographic 35 studies conducted in the regional CESA noticed there was a decline in the deer, squirrel, ground hog, 36 sage-grouse, and wild horse populations; they attributed the decline to the springs drying up as a result 37 of mining. 38
The primary uses of water in the regional CESA are related to mining and agriculture. Other uses include 39 local domestic and municipal water supplies. The major gold mines in the regional CESA include open 40 pit and underground operations that extend below the pre-mining regional groundwater elevation. Within 41 the regional CESA, major mine dewatering activities have occurred and would continue to occur, in the 42 Carlin Trend and southern Crescent Valley areas. The Carlin Trend mining area of Nevada is a 43 northwest trending mineral belt that extends approximately 50 miles from the Rain/Immigrant mines in 44 the southeast to the Ivanhoe Mine in the northwest. In southern Crescent Valley, mine dewatering 45 activities would continue in the CGM Operations Area in association with the existing operations and at 46 an increased depth with the proposed Deep South Expansion Project. 47

Deep South Expansion Project EIS 3.9 – Native American Traditional Values 3.9-35
Draft EIS 2018
Groundwater pumping is required at these mines to lower the groundwater elevation to facilitate mining. 1 Depending on the hydrogeologic condition, the areal extent of the cone of depression (or groundwater 2 drawdown area) associated with mine dewatering may extend up to several miles beyond the open pit or 3 underground workings. After dewatering ceases, pit lakes are predicted to develop in the deeper pits that 4 extend below the pre-mining groundwater elevation, with the exception of those that would be backfilled 5 up to, or above, the pre-mining groundwater elevation. Perennial surface water sources that occur within 6 the drawdown areas and are hydraulically connected to the regional groundwater system could be 7 impacted by the mine-induced drawdown. 8
There are numerous other historic and active mines located within the regional CESA. Based on 9 available documentation, major mine dewatering generally was not required at these other mines 10 (Sherve 2007). However, many of these mines used groundwater for process and operational activities, 11 and some mines required diversions to control runoff into the pits or around process facilities. Several of 12 these mines included one or more open pits that developed pit lakes after the cessation of mining 13 (including Mule Canyon, Argenta, and Tonkin Springs mines). Although information relative to 14 groundwater drawdown was not provided in the existing EISs for these mines, the limited dewatering and 15 water management requirements suggest that in most cases the potential mine-related impacts to 16 perennial surface water resources probably have been, or would be, localized near or within their specific 17 project boundaries. 18
The CESA includes portions of 14 Nevada Division of Water Resources-designated hydrographic basins 19 (also referred to as groundwater basins) (see Figure 3.9-5). Of these 14 groundwater basins, 12 are part 20 of the Humboldt River flow system, one is a closed basin (Grass Valley), and one (Kobeh Valley) is part 21 of the Diamond Valley regional flow system. 22
For the purpose of this analysis, perennial waters are defined as including stream reaches, springs, and 23 seeps that are known or suspected to exhibit continuous flow in most years (excluding periods of severe 24 or prolonged drought). Baseflow in these perennial waters is assumed to be sustained by groundwater 25 discharged at the surface. As the baseflow in these perennial water sources is sustained by groundwater 26 discharge, drawdown of the groundwater table has the potential to reduce flow or impact these perennial 27 waters. 28
Perennial water resources (i.e., seeps, springs, geothermal springs, and specific stream reaches) within 29 the regional CESA are shown in Figure 3.9-5 and listed in Table 3.9-3. The cumulative impact 30 assessment for currently authorized mine dewatering activities in the Carlin Trend area (BLM 2000a) 31 provides details relative to baseline conditions, analysis methodology, numerical modeling, and impact 32 assessment. The perennial water resources identified in this document were based on a series of field 33 inventory studies designed to map and characterize the flow, chemistry, and hydrogeologic conditions for 34 seeps, springs, and perennial stream reaches. For the southern portion of Crescent Valley, locations 35 were based on the water resources baseline report for the Deep South Expansion Project (SRK 2017). 36 For the remainder of the regional CESA, locations were determined based on the USGS (2017b) 37 National Hydrography Dataset. 38
Perennial Waters North of the Humboldt River 39
In the northern portion of the regional CESA, the majority of the springs occur in higher elevation areas 40 within the Tuscarora Mountains and Marys Mountain along the northeastern margin of the regional 41 CESA. Other springs occur as clusters in the Willow Creek and upper Antelope Creek-Squaw Creek 42 area and east of the Tuscarora Mountains, and in the southern portion of the Sheep Creek Range (BLM 43 2000a). 44

Deep South Expansion Project EIS 3.9 – Native American Traditional Values 3.9-36
Draft EIS 2018
Table 3.9-3 Perennial Waters and Potentially Affected Perennial Waters within the Regional CESA
Perennial Waters within Existing Mine-related Groundwater Drawdown and Mounding1
Perennial Waters within Predicted Mine-related Drawdown and Mounding1
Groundwater
Within Within Existing Predicted Total within
10-foot or Total within Maximum Within Predicted Greater Within Existing 10-foot Predicted Maximum
Groundwater Existing 10-foot or Groundwater Maximum 10-foot or Drawdown 10-foot or Greater Drawdown 10-foot or Greater Total within Contours in Greater Groundwater Total within Contours in Greater Groundwater Predicted Crescent, Groundwater Drawdown Existing Crescent, Groundwater Drawdown Maximum
Total within Carico Lake, Drawdown Contours in Groundwater Carico Lake, Drawdown Contours in Groundwater Perennial Regional Grass, and Contours in the Regional Mounding Grass, and Contours in the Regional Mounding
Waters CESA Pine Valleys Carlin Trend CESA Areas Pine Valleys Carlin Trend CESA Areas Seeps and Springs2 (number)
592 29 52 81 3 91 231 322 64
Geothermal Springs (number)
15 0 0 0 0 0 0 0 0
Perennial Stream Segments (linear miles)
581 5.1 41 46.1 4.6 14 87 101 0.6
1
2
See Figure 3.9-5. Mapped seep/spring locations in the norther portion of the regional CESA (as shown in Figures 3.9-5 this table represent the approximate number of seeps and springs for each of the categories.
and 3.9-6) represent one to several springs/seeps. Hence, the numbers presented in


Deep South Expansion Project EIS 3.9 – Native American Traditional Values 3.9-39
Draft EIS 2018
Most of the springs in this region have flow rates of less than 3 gpm; however, a few springs have flow 1 rates of 10 gpm or greater. No hot springs (greater than 90°F) have been identified in the northern 2 portion of the Tuscarora Range, Boulder Flat, Rock Creek, or Willow Creek groundwater basins. Three 3 hot springs and one warm spring occur near Carlin. This includes the Carlin Hot Spring that discharges 4 directly into the Humboldt River. The largest spring in this region is a warm spring (approximately 68°F) 5 located approximately 4 miles downstream from Carlin immediately north of the Humboldt River with 6 flows greater than 500 gpm (BLM 2000a). 7
In most cases, perennial stream reaches in the regional CESA occur in the headwaters (or higher 8 elevations areas) within the drainages. As these streams enter the alluvial valleys, they commonly lose 9 large amounts of flow through seepage into the channel bed. As a result, flows in the downstream 10 reaches of drainages typically are ephemeral or intermittent. One exception is Rock Creek, the principal 11 drainage in the northwestern portion of the regional CESA, which has both intermittent and perennial 12 reaches interspersed along its length. The flow in Rock Creek, and its tributary Willow Creek, are 13 affected by irrigation diversions and releases from Willow Creek Reservoir (BLM 2000a). Maggie Creek 14 is the principal drainage in the northeastern portion of the regional CESA and drains the east side of the 15 Tuscarora Mountains. Maggie Creek and its tributaries include both perennial and ephemeral reaches 16 and gaining and losing reaches. Susie Creek drains a region located east of the regional CESA and 17 flows into the Humboldt River a few miles upstream from Carlin. This section of Susie Creek is 18 characterized as a losing reach and commonly goes dry in late summer and fall. Marys Creek flows into 19 the Humboldt River a few miles downstream from Carlin. Marys Creek has perennial flows in the 20 headwater area and intermittent or ephemeral flows in the middle and lower reaches, with the exception 21 of the lowermost reach, which is sustained by flows from the Carlin Hot Spring. 22
Humboldt River 23
Within the regional CESA, the Humboldt River is perennial. There are several stream gage stations 24 located along this reach of the river including: the Carlin Gage located immediately upstream of Carlin 25 near the eastern boundary of the regional CESA; the Palisade Gage located immediately downstream 26 from the Pine Creek confluence; and the Argenta Gage located downstream near the western boundary 27 of the regional CESA. Historical records of stream flow data indicate that the flows are highly variable 28 along this reach. Based on the monthly averages, the peak flows typically occur in June, and low flows 29 typically occur in September. Long-term historical flow data (1946-1990) for the river indicate that prior to 30 major mine dewatering and water management activities in the regional CESA, the average peak flow 31 was 1,270 cfs at Carlin and 1,146 cfs at Argenta; the average low flow was 27 cfs at Carlin and 16 cfs at 32 Argenta (Riverside Technology inc. 1998). Evaluation of baseflow data indicates that from Carlin to 33 Palisade the river gains flow, and between Palisade and Argenta the river loses flow (BLM 2000a). 34
Perennial Waters South of the Humboldt River 35
In the central portion of the regional CESA, most of the springs are located within five areas: 36 1) Shoshone Mountain Range; 2) Crescent Valley; 3) Cortez Hills and Toiyabe Range; 4) east side of the 37 Cortez Mountains (i.e., Horse Canyon area); and 5) Rocky Pass area. One additional spring occurs in 38 the Toiyabe Range south of the Rocky Pass area. Geomega (2006) documented flow rates for 103 of 39 the springs in this region. 40
Springs that occur in the southern portion of the regional CESA primarily are clustered in four areas that 41 include from east to west: 1) Carico Lake Valley; 2) Toiyabe Range that bounds the west side of Grass 42 Valley; 3) Simpson Range that bounds the east side of Grass Valley; and 4) Roberts Mountains, a 43 highlands area that forms the divide between Pine Valley (to the north) and Kobeh Valley (to the south). 44

Deep South Expansion Project EIS 3.9 – Native American Traditional Values 3.9-40
Draft EIS 2018
The locations of geothermal springs in the area south of the Humboldt River are shown in Figure 3.9-5. 1 Geothermal springs occur in the central portion of Crescent Valley at Hot Springs Point and near the 2 Dewey Dann Ranch along the eastern margin of the valley. Beowawe Geysers, a major geothermal 3 system, occurs in Whirlwind Valley. Other hot springs occur in the Rocky Pass area located to the 4 southwest of Crescent Valley. 5
Perennial stream reaches in the central and southern portions of the regional CESA were inferred from 6 the USGS (2017b) hydrography database. Perennial stream reaches occur in the headwater areas of 7 the Shoshone and Cortez mountains. Other areas with identified perennial reaches occur in the 8 highlands area at the southern end of Grass Valley, the Simpson Range, Roberts Mountains, and Pinon 9 Range. The only major creek that exhibits perennial flow in its lower reaches is Pine Creek, which flows 10 into the Humboldt River near Palisade. 11
Dewatering and Infiltration Activities for Major Mines 12
Dewatering and infiltration activities as currently permitted or proposed for the major mines in the 13 regional CESA are summarized below. 14
Betze Project and Meikle Mine 15
These mines, collectively part of the Goldstrike Mine, are located on the western flank of the Tuscarora 16 Mountains in the Little Boulder Basin, approximately 23 miles northwest of Carlin, Nevada 17 (Figure 3.9-2). The BLM prepared an EIS for the Betze Project in 1991 (BLM 1991) and an EA for the 18 Meikle Mine in 1993 (BLM 1993a). A Supplemental EIS was prepared for the Betze Project (BLM 2003) 19 to evaluate the environmental effects of ongoing water management operations. 20
Active mine dewatering at the site was initiated in 1990. As of October 2006, dewatering had lowered the 21 groundwater level to 3,575 feet amsl (Barrick Goldstrike 2007), the maximum target drawdown elevation. 22 This represents a total drawdown at the mine of approximately 1,670 feet. Dewatering would continue 23 through the end of mining to maintain the groundwater elevation at 3,575 feet amsl. Excess mine water 24 is conveyed through a pipeline to the TS Ranch Reservoir. During the growing season, most of the 25 excess mine water from the reservoir is used for irrigation. 26
South Operations Area Project 27
The South Operations Area Project includes three open pits: Gold Quarry, Mac, and Tusc. This mining 28 operation is located in the Maggie Creek Basin on the eastern slope of the north-south trending 29 Tuscarora Mountains approximately 6 miles northwest of the Town of Carlin (Figure 3.9-2). The BLM 30 prepared EISs for the South Operations Area Project in 1993 (BLM 1993b) and South Operations Area 31 Project Amendment in 2002 (BLM 2002a), both of which addressed potential impacts to water resources 32 associated with the project’s mine dewatering and water management activities. 33
Active dewatering for the project was initiated in 1994. As of October 2006, dewatering had resulted in a 34 lowering of the groundwater level to 4,303 feet amsl (Newmont Mining Corporation 2006). This 35 represents a total drawdown at the mine of approximately 720 feet. The approved project dewatering 36 and water management activities include continued groundwater pumping to ultimately lower the 37 groundwater elevation to approximately 3,725 feet amsl. This represents a total maximum drawdown of 38 approximately 1,375 feet. A portion of the water produced during dewatering is used for mining and 39 processing and irrigation at Hadley Fields. Excess water is discharged to Maggie Creek and ultimately 40 flows into the Humboldt River near Carlin. 41
Leeville Mine 42
The Leeville Mine is located within the Little Boulder Basin on the western flank of the Tuscarora 43 Mountains approximately 20 miles northwest of Carlin (Figure 3.9-2). The Leeville Mine is an 44 underground mining operation with mine workings permitted to 2,500 feet below the ground surface. An 45

Deep South Expansion Project EIS 3.9 – Native American Traditional Values 3.9-41
Draft EIS 2018
EIS was completed in 2002 (BLM 2002b) that addressed potential impacts to water resources 1 associated with the mine’s dewatering and water management activities. 2
Mine development and dewatering activities for Leeville were initiated in 2003, with a projected mine life 3 of 18 years. As of September 2006, the groundwater levels in the carbonate rocks had been lowered 4 993 feet (Newmont Mining Corporation 2006). The total planned drawdown required for the Leeville Mine 5 is 1,467 feet (BLM 2002b). Excess water not consumed by the mining operation is conveyed by a water 6 pipeline from the Leeville Mine dewatering well system to the Goldstrike water management system at 7 the TS Ranch Reservoir. 8
Cortez Gold Mines Operations Area 9
The CGM Operations Area is located in southern Crescent Valley approximately 30 miles southeast of 10 Battle Mountain (Figure 3.9-2). The most recent NEPA documents for operations in the CGM 11 Operations Area that address potential groundwater drawdown-related impacts to water resources are 12 the South Pipeline Project Final EIS (BLM 2000b), Pipeline/South Pipeline Pit Expansion Project Final 13 Supplemental EIS (BLM 2004), Cortez Mine Underground Exploration Project EA (BLM 2006), and 14 Cortez Hill Expansion Project Final EIS (BLM 2008). Dewatering currently is conducted at the Pipeline 15 and Cortez Hills complexes to facilitate open pit and underground mining. Under current authorizations, 16 dewatering is conducted to maintain the permitted dewatering elevation of 3,400 feet amsl at the Pipeline 17 Complex and 3,800 feet amsl at the Cortez Hills Complex. If approved, dewatering operations under the 18 Proposed Action would extend the period of dewatering in the CGM Operations Area through 19 approximately 2030. The target dewatering elevations would be 3,200 feet amsl at the Pipeline Complex 20 and 2,500 feet amsl at the Cortez Hills Complex. 21
Cumulative Impacts to Date (1990-2015) to Perennial Waters 22
A summary of the perennial waters in the regional CESA that are located within the existing mine-related 23 groundwater drawdown and mounding areas is presented in Table 3.9-3. 24
Carlin Trend Area 25
As shown in Figure 3.9-5, mine dewatering has resulted in the development of three cones of 26 depression in the groundwater surface in the region surrounding the active mine dewatering areas 27 (Goldstrike Mine, Leeville Mine, and South Operations Area Project). The drawdown areas are based on 28 recent groundwater monitoring results (BCI 2017). Overall, the combined drawdown area for the Carlin 29 Trend is approximately 30 miles long and 7 miles wide. 30
Infiltration of excess mine water from mine dewatering operations has resulted in an increase in 31 groundwater levels, or mounding, in the upper Boulder Valley and lower Maggie Creek areas 32 (Figure 3.9-5). As of 2008, the groundwater levels in the Boulder Valley region have risen approximately 33 67 feet in the rhyolite in the Sheep Creek Range and 54 feet in the alluvium in upper Boulder Valley. 34 Several large springs emerged within Boulder Valley as a result of the mines’ infiltration activities 35 (BLM 2003, 2000). Seepage from Maggie Creek Reservoir and infiltration along portions of lower Maggie 36 Creek have resulted in an increase in groundwater levels of up to 45 feet. 37
Seep and spring inventories for the Goldstrike Mine have identified 277 flowing springs and 211 seeps 38 within a 600-square-mile region surrounding the mining operations (Riverside Technology inc. 1994). 39 Annual monitoring is conducted at 35 representative springs located in 9 drainages. As of 2000, 3 of the 40 monitored springs near the mine and within the 10-foot groundwater drawdown area had gone dry. The 41 drying up of these springs was probably the result of mine dewatering activities (BLM 2000a). One 42 additional spring included in the monitoring program has dried up since 1999 (AATA 2006), which also 43 could be related to mine dewatering. The flow and vegetation in Brush Creek, a tributary to Rodeo 44 Creek, have changed substantially since 1993, indicating that this drainage has been impacted by mine 45

Deep South Expansion Project EIS 3.9 – Native American Traditional Values 3.9-42
Draft EIS 2018
dewatering (BLM 2000a). No other impacts to seeps and springs or streams have been identified on the 1 western side of the Tuscarora Mountains or Sheep Creek Range (AATA 2006; Barrick 2007). 2
In the fall of 1990, 74 springs were identified in the region surrounding the Leeville Mine and South 3 Operations Area Project (BLM 2002a,b). Thirty-three seeps and springs have been monitored annually 4 or biannually starting between 1990 and 1992 (Newmont Mining Corporation 2007). Initial surveys 5 included a spring and fall sampling event; this was later modified to only include a fall (October) sampling 6 event. Monitoring results are provided to the BLM in annual seep and spring reports. Review of the flow 7 data for the 33 springs for the fall surveys indicates no material change in flow rates for 28 of the 8 33 springs. Of the remaining 5 springs, 4 have shown a large reduction in flow or have gone dry for one 9 or more years. The flow changes in these springs do not appear to correlate with precipitation patterns 10 (BLM 2008). The four springs with flow reductions occur outside of the mapped 10-foot drawdown 11 contour for bedrock provided in the Maggie Creek Monitoring Plan (Newmont Mining Corporation 2006). 12 The flow reductions in these springs may be attributable to grazing, anthropogenic flow controls, or other 13 factors. One spring exhibited an increase in flow since 2001 due to relocation of its monitoring point 14 (BLM 2008). 15
Southern Crescent Valley Area 16
The model-simulated change in groundwater drawdown in southern Crescent Valley (SRK 2016) 17 (Figure 3.9-5) reflects the effects of mine dewatering between 1996 and 2015. As shown in the figure, 18 mine dewatering has resulted in the development of four separate drawdown areas, including one in the 19 northern Carico Lake Valley hydrographic basin, two in the southern Crescent Valley hydrographic basin 20 (one of which extends into the northern Grass Valley and southwestern Pine Valley hydrographic basins) 21 and one in the southwestern Pine Valley hydrographic basin. Of the two drawdown areas in southern 22 Crescent Valley, one is centered on the Pipeline Pit Complex and the other is centered on the Cortez 23 Hills Complex. The isolated drawdown in northern Carico Lake Valley is a result of evaporation from the 24 Clipper Pit lake at the Clipper Mine (SRK 2016). 25
Infiltration of excess mine water from mine dewatering operations has resulted in an increase in 26 groundwater levels, or mounding, in three locations in the southern Crescent Valley hydrographic basin. 27 These areas are located to the south and east of the Pipeline Complex (Figure 3.9-5). 28
Flow and field water quality parameters are currently monitored at 43 surface water sites within the 29 region surrounding mine operations in the CGM Operations Area (Stantec 2015). This includes 36 sites 30 monitored quarterly and 7 sites monitored semiannually. One of these sites is located on Indian Creek; 31 all of the other sites are located at seeps and springs. Thirty-two of the sites have been monitored 32 continuously since 1996 or 1997; 11 sites have been monitored since 2002 (Stantec 2015). 33
Potential impacts to date to perennial seeps, springs, and streams from dewatering activities were 34 evaluated by reviewing the results of available surface water monitoring over the dewatering period, 35 specifically flow measurements from the late summer and fall, when the majority of the flow is assumed 36 to be baseflow controlled by groundwater discharge. Ten of the monitored springs with measurable flow 37 in 1996 and 1997 exhibited a substantial reduction in flow or dried up for several years or more during 38 the period of record (August 1996 through August 2005). It should be noted that a drought with below 39 normal annual precipitation occurred between 1999 and 2002. Although the specific cause of the flow 40 reductions for individual springs cannot be determined based on available data, it is possible that the 41 flow reductions in several of these springs are related to variations in precipitation. However, some 42 springs exhibited a flow reduction that persisted through 2003, 2004, and 2005, a period with above-43 average annual precipitation. Based on available information, it is unknown if the changes in flow at any 44 of these springs has been related to mine dewatering. 45

Deep South Expansion Project EIS 3.9 – Native American Traditional Values 3.9-43
Draft EIS 2018
Predicted Cumulative Impacts to Perennial Waters 1
The number of seeps and springs and miles of perennial stream reach located within the regional CESA 2 and within the existing and projected future drawdown areas are summarized in Table 3.9-3. 3
Carlin Trend Area 4
As described in the BLM (2000a) cumulative impact assessment for mine water management activities in 5 the Carlin Trend area, numerical modeling was used to estimate the maximum extent of the 10-foot 6 groundwater drawdown contour, irrespective of time, resulting from the past, present, and authorized 7 future dewatering activities at the major dewatering operations in the Carlin Trend. The area within this 8 10-foot drawdown contour represents the estimated area where the groundwater elevations could be 9 reduced by at least 10 feet. This potential groundwater drawdown area, and the known seeps, springs, 10 and perennial stream reaches encompassed within the drawdown area, are shown in Figure 3.9-6. The 11 area within the 10-foot drawdown contour extends approximately 41 miles in a northwest-southeast 12 direction. In comparison to the current drawdown shown in Figure 3.9-5, the model simulation results 13 suggest that the areal extent of the drawdown cone would expand substantially in the future as a result 14 of ongoing mine dewatering. In addition, in two localized areas along the northeastern boundary of the 15 regional CESA, the model simulation results developed for the earlier cumulative impact assessment 16 (BLM 2000a) did not predict drawdown in areas that based on 2006 monitoring results have been 17 affected by drawdown. 18
Within the boundaries of the regional CESA, there are a minimum of 231 perennial seeps and springs 19 and approximately 87 linear miles of perennial stream reaches located within the predicted cumulative 20 10-foot drawdown area in the Carlin Trend. Of these, 147 seeps and springs and approximately 65 linear 21 miles of perennial stream reaches in the Carlin Trend occur in areas predicted to have a higher likelihood 22 of impact (BLM 2000a) (Figure 3.9-6). Other perennial waters located outside of the predicted areas of 23 potential impact, but within the predicted maximum 10-foot cumulative drawdown contour, were 24 determined to have a low probability of impact from mine-related groundwater drawdown (BLM 2000a). 25
Southern Crescent Valley Area 26
Numerical groundwater flow modeling by SRK (2017) simulated the combined effects of past, present, 27 and reasonably foreseeable mine dewatering operations in southern Crescent Valley on the groundwater 28 system. This cumulative analysis also incorporated impacts to the groundwater system associated with 29 future development of pit lakes. 30
The predicted maximum extent of the cumulative 10-foot drawdown contour associated with mining 31 operations in southern Crescent Valley is presented in Figure 3.9-6. The modeling results show three 32 main areas of predicted drawdown. The largest area enclosed within the predicted 10-foot drawdown 33 contour extends approximately 23 miles in a northwest-southeast direction and encompasses portions of 34 the Shoshone Mountains; Crescent, Grass, and Pine valleys; and Cortez Mountains. A smaller 35 drawdown area is predicted to encompass the northwest portion of the Simpson Park Mountains. The 36 predicted drawdown area at the north end of Carico Lake Valley is associated with evaporation from the 37 Clipper Pit Lake. 38
Within the predicted cumulative 10-foot drawdown area, there are 53 identified perennial seeps and 39 springs and approximately 9 linear miles of perennial stream reaches. As discussed in Section 3.2, 40 Water Resources and Geochemistry, 30 springs occur in areas where there would be a potential for 41 drawdown to impact perennial flow. The northwest margin of the drawdown area is predicted to extend 42 beneath the lower perennial stream reaches of Indian, Feris, Elder, and Cooks creeks in the Shoshone 43 Mountains. In addition, the southeast portion of the cumulative drawdown area is predicted to extend 44 beneath portions of perennial reaches of Mill, Horse, and Willow creeks, located in the Cortez Mountains 45 (see Section 3.2, Water Resources and Geochemistry, and Figure 3.2-18). No other perennial stream 46 reaches are known to occur in the predicted cumulative drawdown area. 47

Deep South Expansion Project EIS 3.9 – Native American Traditional Values 3.9-44
Draft EIS 2018
Summary of Cumulative Impacts to Perennial Waters 1
Perennial springs, seeps, and stream reaches are supported by discharge from either the regional 2 groundwater aquifer system or from more isolated or perched aquifers residing above the regional 3 groundwater system. Only those perennial surface water sources that are hydraulically connected to the 4 regional groundwater system potentially would be impacted by mine-induced drawdown. Therefore, 5 impacts to individual seeps and springs and perennial stream reaches that are supported entirely by 6 perched (or hydraulically isolated) aquifers located above the regional groundwater system are not 7 anticipated. Conversely, perennial waters that are hydraulically connected to the regional groundwater 8 system and within drawdown areas would likely experience impacts. 9
The actual impacts to individual seeps, springs, or stream reaches would depend on the source of 10 groundwater that sustains the perennial flow (perched aquifer versus regional groundwater system) and 11 the actual mine-induced drawdown that occurs as a result of mine dewatering. The interconnection (or 12 lack of interconnection) between the perennial surface waters and deeper groundwater sources is 13 controlled in large part by the specific hydrogeologic conditions that occur at each site. Considering the 14 complexity of the hydrogeologic conditions in the region and the inherent uncertainty in numerical 15 modeling predictions relative to the exact areal extent of a predicted cumulative drawdown area, it is not 16 possible to conclusively identify specific springs and seeps that would or would not be impacted by future 17 mine-induced groundwater drawdown. 18
Although it is not possible to conclusively identify specific springs and seeps that would or would not be 19 impacted by future mine-induced drawdown or to predict the areal extent of the cumulative drawdown 20 area resulting from the various mine activities in the regional CESA, it is anticipated that cumulative 21 effects to water sources would occur. The degree to which mine-related impacts to perennial waters in 22 the regional CESA have affected, or would affect, Native American traditional values is not quantifiable. 23 However, Western Shoshone religion is based on the belief that all life is interdependent. Human beings 24 are recognized to have kin ties with other life forms and with the earth itself. This belief system is very 25 important to the Western Shoshone in the Great Basin where a delicate balance must be maintained 26 between human subsistence and an unpredictable, sometimes harsh environment (Rusco 2000). The 27 scarcity and unpredictability of water in this semi-arid region may account for the importance of water in 28 Western Shoshone religion. Water is the keystone of Western Shoshone religion because power (Puha), 29 with its affinity for life, is strongly attracted to water (Rusco 2000). As a result, it is assumed that Western 30 Shoshone traditional lifeways as they relate to perennial waters have been, and would continue to be, 31 cumulatively affected by mine-related activity that has occurred, and would occur, in the regional CESA. 32
Big and Small Game, Sage-grouse, Small Mammals, and Eagles 33
Based on the available ethnographic studies discussed above, wildlife species that have been hunted by 34 Native Americans within the regional CESA include four big game species (i.e., elk, mule deer, 35 pronghorn [antelope], and bighorn sheep), two small game species (i.e., sage-grouse and rabbits), as 36 well as squirrels and “ground hogs” (i.e., yellow-bellied marmots). Eagles also were mentioned as 37 species of concern. These species have provided food and materials for making various items (e.g., 38 tools, clothes, shelters) that were, and continue to be, used by Native Americans. 39
Certain locations in the regional CESA were identified for their exceptional hunting opportunities. The 40 Tosawihi Quarry, Mount Tenabo, Carico Lake Valley, Cortez Mountains, Crescent Valley, and Dean 41 Ranch Rabbit-drive and Resource Area were known for their abundance of small game (e.g., rabbits, 42 squirrels, sage hens, various waterfowl, and “ground hogs”). Big game migration routes (big horn sheep, 43 mule deer, and pronghorn) also were identified as important. Ethnographic studies and archaeological 44 reports appear to support extensive hunting within the Spruce Mountain/Butte Valley migration corridor 45 and winter big game habitat. An abundance of hunting camp locations and artifacts may exist along 46 migration routes and corridors. 47

Deep South Expansion Project EIS 3.9 – Native American Traditional Values 3.9-45
Draft EIS 2018
Mule deer ranges that occur within the regional CESA include, summer, transitional, winter, and year-1 round ranges (Figure 3.9-7). Summer range for mule deer occurs in the Tuscarora Mountains, 2 Shoshone Range, Sulphur Spring Range, Roberts Mountains, and Simpson Park Mountains. Transition 3 range occurs within the Toiyabe Range, Tuscarora Mountains, Roberts Mountains, and Sheep Creek 4 Range. Crucial summer range is found in the Roberts Mountains and Pinon Range. Winter range for 5 mule deer includes the lower elevational area around the Shoshone Range, Simpson Park Mountains, 6 Toiyabe Range, and Roberts Mountains. Crucial winter range is found in the Cortez Mountains, Toiyabe 7 Range, Tuscarora Mountains, Sheep Creek Range, Shosone Range, Pinon Range, and the Dry Hills 8 area. Year-round range is found in the Cortez Mountains, Toiyabe Range, Pinon Range, and Boulder 9 Valley. A limiting factor for mule deer south of I-80 is the quantity and quality of summer range. North of 10 I-80, a limiting factor for mule deer is the quantity and quality of winter range. The primary limiting factor 11 is water. 12
Pronghorn occur in the basins, valley bottoms, and along mountain slopes within the regional CESA 13 including the Boulder, Reese River, Crescent, Grass, Pine, Garden, and Kobeh valleys (Figure 3.9-8). 14 Ongoing reintroduction efforts by NDOW incrementally have increased population numbers within the 15 regional CESA. 16
Historically, elk occurred throughout most of the regional CESA. Currently, elk populations are limited to 17 small, localized herds located primarily in the northern portion of the regional CESA (NDOW 2017c). 18 Bighorn sheep range within the regional CESA includes the Sheep Creek Range along Antelope Creek 19 and Rock Creek (Figure 3.9-9). 20
A total of 151 sage-grouse leks have been identified within the regional CESA, including 29 leks in Elko 21 County, 52 leks in Lander County, and 70 leks in Eureka County. PHMAs (approximately 22 936,804 acres), GHMAs (approximately 747,839 acres), and OHMAs (approximately 566,209 acres) are 23 distributed throughout the regional CESA (Figure 3.9-10). Sage-grouse are of particular importance to 24 the Western Shoshone who not only hunt them as a food resource, but also mimic their courtship 25 displays during traditional dances. 26
White- and black-tailed jackrabbits, Nuttal’s cottontails, various ground and tree squirrels, and yellow-27 bellied marmots are present within a variety of habitats in the regional CESA. White- and black-tailed 28 jackrabbits, Nuttal’s cottontails, and ground squirrels primarily occur in low to mid elevation areas that 29 support shrub-dominated habitats. Other squirrel species occur in mid to high elevation areas that 30 support woodland habitats. Yellow-bellied marmots occur at high elevations (i.e., alpine habitat) in rocky 31 terrain. 32
Bald eagles are known to migrate through, and winter within, the regional CESA. Golden eagles are 33 known to nest within this area. The feathers of both bald and golden eagles are considered extremely 34 powerful symbols of prayer, healing, and strength. Eagle feathers are used during various 35 traditional/cultural/spiritual activities and are said to contain great amounts of healing strength or 36 “medicine.” The eagle itself is considered an extremely powerful spiritual being. 37
Based on the analysis in Section 3.5, Wildlife and Aquatic Biological Resources, the proposed project 38 would not directly or indirectly affect elk or bighorn sheep. Therefore, the proposed project would not 39 contribute to cumulative effects for these two species. Based on the projects identified in Table 3.9-1, 40 potential direct impacts to big game species (i.e., elk, mule deer, pronghorn, and bighorn sheep) from 41 past, present, and reasonably foreseeable future mining actions, wildland fires, and other activities within 42 the regional CESA have contributed, or would contribute, to the incremental short- and long-term 43 reduction of approximately 1,065,656 acres of habitat and the incremental increase of habitat 44 fragmentation. The Proposed Action incrementally would increase habitat disturbance by 4,380 acres 45 (less than 0.01 percent), resulting in a total cumulative disturbance of approximately 1,070,036 acres. A 46 portion of the cumulative disturbance area has been, or would be, reclaimed, or in the case of most 47 areas affected by wildland fires, allowed to recover naturally. The reclaimed areas, areas associated with 48

Deep South Expansion Project EIS 3.9 – Native American Traditional Values 3.9-46
Draft EIS 2018
habitat conversion (e.g., croplands), and areas of natural recovery would be capable of supporting 1 wildlife use; however, species composition and densities would change. 2
The Nevada Sage-grouse Conservation Project (NDOW 2000) and the State of Nevada Sagebrush 3 Ecosystem Program (Sagebrush Ecosystem Council 2016) is a coordinated effort among government 4 agencies and private entities to collect data and develop programs for sage-grouse conservation. A key 5 component of this ongoing program involves monitoring sage-grouse populations and lek trends 6 throughout the study area, which comprises Nevada and eastern California. For 2016, NDOW generated 7 a database with 1,886 leks in the State of Nevada, of which 976 were surveyed. The surveyed leks 8 yielded an estimated 12,661 breeding males, or 24.3 males per lek. This figure was an increase from the 9 prior year (2015), when 11,907 breeding males were counted for an average of 21.3 males per lek. 10
Development and activities within the regional CESA have resulted, and would continue to result, in the 11 incremental long-term reduction of PHMA, GHMA, and OHMA. However, based on the lack of project-12 specific footprints in relation to designated sage-grouse habitat management areas and sagebrush 13 habitat, the cumulative impact to this species as a result of surface-disturbing activities cannot be 14 quantified. 15
Potential cumulative impacts to white- and black-tailed jackrabbits, Nuttal’s cottontails, various ground 16 and tree squirrels, and yellow-bellied marmots would parallel those described above for big game 17 species. 18
Potential cumulative impacts to bald eagles and golden eagles have included, and would include, the 19 short- and long-term loss of foraging habitat and long-term loss of potential breeding and roosting 20 habitat. Based on the analysis in the current document, the proposed project would not affect potential 21 breeding habitat for bald eagles. Therefore, the proposed project would not contribute to cumulative 22 effects for breeding bald eagles. 23
Groundwater drawdown as a result of mining-related dewatering activities has, and would, result in the 24 potential long-term reduction in the amount and extent of available surface water (e.g., seeps, springs, 25 streams) and associated riparian habitats for area wildlife. These effects have been, or would be, 26 restricted to those resources with hydraulic connection to the affected aquifers within discrete areas of 27 the regional CESA as defined by the cumulative mine-related 10-foot groundwater drawdown contours 28 (Figure 3.9-6). 29
Species identified in the ethnographic studies discussed above as being of concern to Native Americans 30 and that likely have been, or would be, impacted by the cumulative reductions of water availability 31 (seeps, springs, and streams) and associated riparian habitats include big game species, small game 32 species, raptors, and nongame mammals. The extent of these indirect effects from groundwater level 33 changes would depend on the species’ use and relative species’ sensitivity. 34
According to Western Shoshone, the development, including mining, in the regional CESA has degraded 35 areas used by Western Shoshone for hunting and gathering. Big game species, small game species, 36 raptors, and nongame mammals are considered important in maintaining the cultural identity of Western 37 Shoshone. Ethnographic analyses conducted for past and present development in the regional CESA 38 have provided information on the importance of these animals to the Western Shoshone, not only as a 39 food source, but as a continuation of a lifeway that has existed for hundreds of years. However, the 40 Western Shoshone consultants involved in previous ethnographic analyses did not provide specific, 41 quantitative data on how many animals annually have been, and currently are, hunted by Western 42 Shoshone; how often tribal members hunted in the past compared to the present; or to what extent 43 Western Shoshone subsistence has been, and is, supplemented by hunting. 44


Deep South Expansion Project EIS 3.9 – Native American Traditional Values 3.9-51
Draft EIS 2018
The degree to which development-related impacts to wildlife species in the regional CESA has affected, 1 and would affect, Native American traditional values is not quantifiable. Nevertheless, it is assumed that 2 Western Shoshone traditional lifeways as they relate to hunting and all living things have been, and 3 would continue to be, cumulatively affected by development that has occurred, and would occur, in the 4 regional CESA. 5
Summary 6
Within the regional CESA, cumulative impacts have occurred within Western Shoshone aboriginal lands 7 that have provided, and continue to provide, sustenance, as well as spiritual and religious renewal, for 8 the indigenous people. Native Americans believe the power that emanates from the land, water, plants, 9 and animals fuels their cultural identity and heritage. Mining-related activities, cattle grazing, construction 10 of transmission lines, wildfires, transportation corridors, and other actions in the regional CESA 11 cumulatively have affected, or would affect, these resources and Western Shoshone culture, tradition, 12 and lifeways. Some Western Shoshone believe that these impacts cannot be satisfactorily mitigated. 13
Direct impacts to prehistoric and ethnohistoric sites and burials as a result of activities associated with 14 past and present actions and RFFAs have been, or would be, mitigated in compliance with federal and 15 state laws. However, some Western Shoshone believe that these impacts cannot be satisfactorily 16 mitigated. These actions have cumulatively impacted, and would continue to impact, their heritage and 17 lifeways. 18
Water, plants, and animals traditionally used for nourishment, growth, power, and subsistence have 19 been, or would be, impacted, or alternately made more accessible as a result of development-related 20 activities, resulting in either a loss or a benefit, respectively, to Western Shoshone. 21
Roads, transmission lines, mines and mine-related facilities, agriculture, and infrastructure and human 22 settlement have created cumulative visual impacts in a landscape that has been part of the Western 23 Shoshone aboriginal lands for centuries. Some of the landmarks traditionally used by Native Americans 24 have been, or would be, visually impacted by development-related activities. As a result, Native 25 Americans view their original use and sacredness as having been devalued. 26
In summary, the Western Shoshone believe that areas once unaffected by development and 27 encompassing the Puha and spirit of their ancestors have been diminished. The Western Shoshone 28 aboriginal lands in the regional CESA, and the resources within, have been, or would be, cumulatively 29 affected by past, present, and reasonably foreseeable development. 30
The Proposed Action would result in negligible to minor effects to Native American traditional values. The 31 Mount Tenabo/White Cliffs PCRI is within the project study area but outside of the proposed disturbance 32 areas. Therefore, no historic properties of Native American traditional value would be directly adversely 33 affected by the Proposed Action. 34
The minor effects to Native American traditional values would be both localized and regional in context. 35 Impacts to pine nut harvesting as a result of the permanent loss of 35 acres of pinyon woodland would 36 be localized to areas within the new proposed disturbance. The permanent loss of future pine nut 37 harvesting areas, while minor, would be permanent and, therefore, long-term. Loss of spiritual and 38 religious use areas in the regional CESA would be regional in context and long-term; however, the extent 39 of such loss cannot be quantified because specific locations have not been identified. 40
3.9.3.3 Gold Acres Pit Partial Backfill Alternative 41
Under the Gold Acres Pit Partial Backfill Alternative, potential cumulative impacts to Native American 42 traditional values would be the same as described for the Proposed Action. 43

Deep South Expansion Project EIS 3.9 – Native American Traditional Values 3.9-52
Draft EIS 2018
3.9.4 Monitoring and Mitigation Measures 1
No mitigation measures have been identified for Native American Traditional Values based on 2 implementation of BCI’s applicant-committed environmental protection measures identified in 3 Section 2.4.13. 4
3.9.5 Residual Adverse Effects 5
Residual impacts to Native American traditional values would result from the long-term/permanent loss 6 of approximately 95 acres of pinyon-juniper woodland on BLM-administered lands due to project 7 construction. This loss would result in associated residual impacts to future supplies of harvestable pine 8 nuts. The percentage of harvestable pine nuts that would be affected and the level to which the loss of 9 this resource would affect the tribes are unknown. 10
No residual adverse impacts to possible burials or PCRIs are anticipated, because all known burials and 11 NRHP-eligible sites and any previously unknown burials and NRHP-eligible sites that may be discovered 12 during ground-disturbing activities in the project disturbance areas would be mitigated in accordance with 13 NHPA, NAGPRA, and the PA. However, some forms of mitigation, such as data recovery, are perceived 14 by some Western Shoshone as part of a destructive process that permanently removes Western 15 Shoshone heritage from the landscape. With implementation of BCI’s applicant-committed environmental 16 protection measures, Native American observers would be present to advise BCI and project 17 archaeologists on cultural resources that may be located during ground-disturbing activities. Native 18 American observers also would be present during data recovery conducted at any ethnohistoric sites for 19 which avoidance is not feasible. 20
Residual adverse visual effects would result from the long-term disturbance associated with project 21 facility construction and operation. Over time, the visual effects gradually would diminish as natural 22 vegetation patterns develop following reclamation of project facilities. 23

Deep South Expansion Project EIS 3.10 – Air Quality 3.10-1
Draft EIS 2018
3.10 Air Quality 1
The project study area for air quality encompasses the proposed facilities modifications, the area within 2 10 km (6.2 miles) of the CGM Operations Area, the transportation route for both the proposed additional 3 off-site shipment of refractory ore to the Goldstrike Mine and proposed additional backhaul of Arturo 4 Mine oxide ore through the Goldstrike Mine to the Pipeline Complex, and the Goldstrike Mill (relative to 5 emissions associated with the proposed modification to refractory ore shipments). The CESA 6 encompasses the Crescent Valley, Grass Valley, Marys Creek, and Maggie Creek hydrographic basins 7 as defined by the NDWR (2012). 8
3.10.1 Climate 9
Nevada lies within the Basin and Range Physiographic Province, which is characterized by a series of 10 north-south trending mountain ranges and intervening basins. This varied and rugged topography 11 (including mountain ranges and narrow valleys) ranges in elevation from approximately 1,500 to more 12 than 10,000 feet amsl. Nevada has climatic diversity ranging from hot lowland desert in the south to cool 13 mountain forests in the north. Large local variations of temperature and rainfall are common. The 14 principal climatic features are bright sunshine, low annual precipitation (averaging 9 inches per year in 15 the valleys and deserts), heavy snowfall in the higher mountains, clean dry air, and exceptionally large 16 daily ranges of temperature. 17
The CGM Operations Area is located near the east-central portion of the Great Basin. The surrounding 18 terrain consists of alternating mountain ranges and sagebrush-covered valleys. The proposed project 19 lies on the western slopes of the Cortez Mountains. The higher elevations in the Cortez Mountains lie 20 north of the CGM Operations Area with the highest peaks reaching elevations over 9,000 feet amsl. 21 Elevations in the study area primarily range from approximately 4,500 to 7,500 feet amsl. 22
3.10.1.1 Regional Climate 23
Nevada lies on the eastern, lee side of the Sierra Nevada Range, a massive mountain barrier that 24 influences the climate of the state. One of the greatest contrasts in precipitation found within a short 25 distance in the U.S. occurs between the western slopes of the Sierra Nevada Mountains in California 26 and the valleys just to the east of this range. The prevailing winds are from the west. As the warm moist 27 air from the Pacific Ocean ascends the western slopes of the Sierra Range, the air cools, condensation 28 takes place, and most of the moisture falls as precipitation. Descending the eastern slope, the air is 29 warmed by compression, and very little precipitation occurs. The effects of this mountain barrier are felt 30 not only in the western portions of Nevada, but throughout the state, with the result that the lowlands are 31 largely desert or steppes. 32
The climate in the project region is classified as arid. An arid climate is characterized by low rainfall, low 33 humidity, clear skies, and relatively large annual and diurnal temperature ranges. Elevations below 34 6,500 feet amsl typically receive the least amount of precipitation (5 to 9 inches per year) while the 35 mountainous areas greater than 6,500 feet amsl are substantially wetter and may receive 11 to 16 plus 36 inches of precipitation annually (WRCC 2017a). 37
Three important meteorological factors influence the dispersion of pollutants in the atmosphere: mixing 38 height, wind (speed and direction), and atmospheric stability. Mixing height is the height above ground 39 within which rising warm air from the surface will mix by convection and turbulence. Local atmospheric 40 conditions, terrain configuration, and source location determine dilution of pollutants in this mixed layer. 41 Mixing heights vary diurnally, with the passage of weather systems and with the season. 42
Wind speed has an important effect on area ventilation and the dilution of pollutant concentrations from 43 individual sources. Light winds in conjunction with large source emissions may lead to an accumulation 44

Deep South Expansion Project EIS 3.10 – Air Quality 3.10-2
Draft EIS 2018
of pollutants that can stagnate or move slowly to downwind areas. Wind direction can indicate the typical 1 directions of pollutant transport. 2
Morning atmospheric conditions tend to be stable due to the rapid cooling of the layers of air nearest the 3 ground. Afternoon conditions, especially during the warmer months, tend to be neutral to unstable 4 because of the rapid heating of the surface under clear skies. During the winter, periods of stable 5 afternoon conditions may persist for several days in the absence of synoptic (continental scale) storm 6 systems to generate higher winds with more turbulence and mixing. A high frequency of inversions at 7 lower elevations during the winter can be attributed to the nighttime cooling and sinking air flowing from 8 higher elevations to the low lying areas in the basins. Although winter inversions generally are quite 9 shallow, they tend to be more stable due to reduced surface heating. Periods with stable conditions tend 10 to result in higher pollutant concentrations than unstable periods. 11
While the terrain relief in the vicinity of the CGM Operations Area is diverse, two relatively nearby 12 meteorological stations provide insight into the climate of the area. The Elko, Nevada, station is located 13 approximately 60 miles northeast of the CGM Operations Area. The Beowawe University of Nevada 14 Ranch observation site is located approximately 15 miles south-southeast of the CGM Operations Area. 15
3.10.1.2 Current Climate and Trends 16
Table 3.10-1 shows the average maximum, mean, and average minimum temperatures recorded at the 17 Beowawe and Elko stations over a 30-year period (1980 through 2010). Both stations show a seasonal 18 weather pattern with warm summers, cold winters, and transitional seasons. Although precipitation is 19 spread throughout the year, most of the annual precipitation falls as snow during the winter months. The 20 average annual precipitation is approximately 10 inches at both the Elko and Beowawe stations. As both 21 these stations are similar in elevation to most of the project area, it can be considered representative of 22 the CGM Operations Area. However, high elevation areas surrounding the CGM Operations Area likely 23 experience cooler temperatures and higher precipitation. 24
No wind data are available from the Beowawe station; however, multi-decade wind data from the Elko 25 station were obtained through the Iowa Environmental Mesonet (2017) data portal. As shown in 26 Figure 3.10-1, the Elko wind rose indicates that winds are predominantly from the west, with a 27 secondary maximum of wind occurrences from the south. It should be noted that winds in the Elko region 28 are likely highly influenced by local terrain. Therefore, it is difficult to confidently say this would be 29 representative of the CGM Operations Area. In comparison, Figure 3.10-2 shows a wind rose generated 30 from 1 year of data collected at the Cortez Hills meteorological station located in the CGM Operations 31 Area. Unlike the Elko wind rose, the Cortez Hills wind rose shows winds predominantly from the north-32 northwest and south-southeast. While this weather station has not collected enough data to contain a 33 detailed climatological record, it does show that winds in the area are diverse and likely influenced by 34 local terrain. It should be noted that the Elko station and Cortez Hills station monitors serve different 35 purposes, and the data collection specifications between the stations are different. Therefore, 36 comparison of the data from the two stations should be done with caution. These wind roses do indicate 37 that there are likely terrain induced flows in the vicinity, and wind flows in the vicinity of the CGM 38 Operations Area are likely variable. 39

Deep South Expansion Project EIS 3.10 – Air Quality 3.10-3
Draft EIS 2018
Table 3.10-1 Monthly Climate Summary
Parameter Station Jan Feb Mar Apr May Jun Jul Aug Sep Oct Nov Dec Annual
Average Maximum Temperature
(°F)
1 Beowawe 40.7 45.2 52.2 58.7 67.8 77.9 87.5 86.3 77.7 66.0 51.8 41.6 62.9
2 Elko 36.3 41.4 51.6 59.4 69.2 80.0 90.3 88.5 78.5 64.5 48.2 37.2 62.2
Mean Temperature
(°F)
1 Beowawe 26.5 31.4 38.4 43.9 52.1 60.7 68.7 66.8 58.0 47.0 35.9 27.3 46.5
2 Elko 25.1 29.9 38.9 45.2 53.4 62.2 70.2 68.2 58.8 46.6 34.7 26.0 46.7
Average Minimum Temperature
(°F)
1 Beowawe 12.4 17.5 24.6 29.1 36.3 43.6 49.8 47.4 38.3 27.9 19.9 13.0 30.1
2 Elko 13.9 18.4 26.2 31.0 37.6 44.4 50.1 47.9 39.1 28.7 21.2 14.7 31.2
Average Total Precipitation
(inches)
3 Beowawe 0.9 0.7 1.1 1.0 1.3 0.8 0.5 0.5 0.6 0.8 0.9 0.9 9.9
4 Elko 1.1 0.8 1.0 1.0 1.0 0.7 0.4 0.4 0.6 0.8 1.1 1.2 9.9
Average Total Snowfall
(inches)
3 Beowawe 6.8 4.2 5.1 3.3 1.4 0.0 0.0 0.0 0.0 0.5 2.1 5.4 28.7
4 Elko 7.8 4.6 3.9 1.8 0.5 0.0 0.0 0.0 0.0 0.5 3.2 6.4 28.7
Average Snow Depth
(inches)
3 Beowawe 0.0 0.0 0.0 0.0 0.0 0.0 0.0 0.0 0.0 0.0 0.0 0.0 0.0
4 Elko 2.0 2.0 0.0 0.0 0.0 0.0 0.0 0.0 0.0 0.0 0.0 1.0 1.0
1 2
3
4
1981 – 2010 monthly climate normals at Beowawe, Nevada (WRCC 2017b).
1981 – 2010 monthly climate normals at Elko Regional Airport, Nevada (WRCC 2017c).
1972 – 2016 Beowawe, Nevada, period of record monthly climate summary (88.1 percent of possible observations for period of record for snowfall and 74.4 percent for snow depth were utilized in this statistic) (WRCC 2017d).
1888 – 2016 Elko Regional Airport, Nevada, period of record monthly climate summary (95.5 percent of possible observations for period of record for snowfall and 90.2 percent for snow depth were utilized in this statistic) (WRCC 2017e).


Deep South Expansion Project EIS 3.10 – Air Quality 3.10-6
Draft EIS 2018
3.10.2 Air Quality 1
Air quality is defined by the concentration of various pollutants and their interactions in the atmosphere. 2 The relative importance of pollutant concentrations can be determined by comparison with appropriate 3 national and/or state AAQS. Air pollutant concentrations that are lower than the standards generally are 4 not considered to be detrimental to public health and welfare. 5
3.10.2.1 Regional Air Quality and Regulatory Framework 6
Pollution effects on receptors have been used to establish a definition of air quality. Both long-term 7 climatic factors and short-term weather fluctuations are considered part of the air quality resource 8 because they control dispersion and affect concentrations. Physical effects of air quality depend on the 9 characteristics of the receptors and the type, amount, and duration of exposure. Air quality standards 10 specify acceptable upper limits of pollutant concentrations and duration of exposure. 11
The existing air quality near the project study area is typical of the largely undeveloped regions of the 12 western U.S. Current sources of air pollutants in the region include several precious metals mines that 13 are sources forPM10 and PM2.5. BCI has operated PM10 monitors at the CGM Operations Area in the 14 past, and results of this monitoring program are discussed in Section 3.10.2. 15
An area is designated by the USEPA as being in attainment for a pollutant if ambient concentrations of 16 that pollutant are below the National Ambient Air Quality Standards (NAAQS). An area is not in 17 attainment if violations of NAAQS for that pollutant occur. Areas where insufficient data are available to 18 make an attainment status designation are listed as unclassifiable and are treated as being in attainment 19 for regulatory purposes. National and state AAQS are presented in Table 3.10-2. 20
The project area has been designated as in attainment for all pollutants that have an AAQS. The closest 21 non-attainment area (for PM10) is Washoe County, Nevada, which is approximately 150 miles west of the 22 CGM Operations Area. In addition, the city of Reno, Nevada, located approximately 170 miles west of 23 the CGM Operations Area, is in non-attainment for CO. 24
New Source Review 25
Established in the Clean Air Act (CAA), New Source Review (NSR) (NAC Chapter 445B) refers to the 26 permitting process which new stationary sources of pollution must undergo before construction. Under 27 NSR, a source may have one or more of the following permitting requirements: 28
• PSD permits, which are required for new major sources or major sources making a major 29 modification in an attainment area. 30
• Non-attainment NSR permits, which are required for new major sources or major sources 31 making a major modification in a non-attainment area. 32
• Minor source permits. 33
NSR is pollutant-specific; therefore, a single stationary source may have requirements under all three 34 programs for different pollutants. The proposed Deep South Expansion Project is not expected to trigger 35 major source permitting requirements under the PSD or non-attainment NSR programs for any pollutant 36 based on the expected types of equipment, projected emissions levels for that equipment, and current 37 attainment status for the project study area. Therefore, PSD is not anticipated to be applicable for the 38 project and has been eliminated from further analysis in this EIS. 39
Ambient air monitoring at the CGM Operations Area is not required by the Class I Air Quality Operating 40 Permit (NDEP-Bureau of Air Quality 2018). 41

Deep South Expansion Project EIS 3.10 – Air Quality 3.10-7
Draft EIS 2018
Table 3.10-2 National and State of Nevada Ambient Air Quality Standards
Pollutant Averaging Time 1 Nevada Standards
(µg/m3) National Standards2
(µg/m3)
Ozone 8-hour 1373 1373 Same as Primary
CO
1-hour 40,500 40,000 --
8-hour CO less than 5,000 feet amsl
10,500 10,000 --
8-hour CO at or greater than 5,000 feet amsl
7,000
SO2
1-hour 1963 1963 --
3-hour 1,300 -- 13093
24-hour 365 -- --
Annual average 80 -- --
Nitrogen dioxide (NO2)
1-hour 1883 1883 --
Annual average 100 1003 Same as Primary
PM10 24-hour 150 150 Same as
Primary
Annual average -- -- --
PM2.5 24-hour 35 35 Same as
Primary
Annual average 12 12 15
Lead Rolling 3-month average 0.15 0.15 Same as Primary
Hydrogen sulfide 1-hour 112 -- -- 1
2 3
Obtained from NAC 445B.22097 Standards of Quality for Ambient Air (NRS 445B.210) and R145-17 (State Environmental Commission 2018) for ozone. 40 CFR Part 50. Standards for these pollutants are given only in units of parts per million or parts per billion. These units were converted to micrograms per cubic meter (µg/m3) assuming reference conditions as defined in 40 CFR 50.3 (25ºC and 760 millimeters of
3mercury) and rounded to nearest µg/m .
3.10.2.2 Mercury and Mercury Emissions 1
Mercury emissions to the atmosphere come from both background and man-made (known as 2 anthropogenic) sources. There are both global and local anthropogenic sources of mercury. Mercury 3 assumes many forms and can be found naturally in the environment as free metallic mercury, chemically 4 combined with other elements in a number of soil or rock types, and in the form of methylmercury in 5 plants and animals. Background sources of mercury occur naturally in many soils, volcanic rocks, and 6 marine and geothermal water sources. When bound in mineral forms that typically appear in ore (e.g., 7 cinnabar), mercury is a stable compound that remains in solid form. Ore processing has the potential to 8 liberate mercury from these stable minerals by dissolving it in process solutions. Because it has a boiling 9 point of 675°F, mercury has the potential to volatilize into a gaseous form when subjected to thermal 10 processes in a recovery and refining circuit. Mercury is generally present in the atmosphere in one of 11 three chemical forms: gaseous elemental mercury, oxidized or reactive gaseous mercury, and particulate 12 mercury. 13

Deep South Expansion Project EIS 3.10 – Air Quality 3.10-8
Draft EIS 2018
Gaseous elemental mercury is a relatively non-reactive chemical form that is not very soluble in water. 1 This form of mercury travels the farthest and can be transported on wind currents for months to years if 2 not oxidized, providing an opportunity for long-range transport and dispersion. Concentrations of mercury 3 in the air are usually low and of little direct concern. However, atmospheric mercury falls to earth through 4 rain or snow and enters lakes, rivers, and estuaries. Once there, it can transform to its most toxic form, 5 methylmercury, and accumulate in fish and animal tissues. 6
Oxidized or reactive gaseous mercury has an average atmospheric residence time of days to weeks 7 (less in the presence of precipitation or bromine compounds often present in saline waterbodies). It is not 8 easily volatilized and is very water-soluble. It is easily taken up in precipitation or adsorbed on small 9 particles in the atmosphere and falls out as wet or dry deposition. This form of mercury has a higher 10 potential to enter the food chain and result in concerns related to fish and waterfowl consumption. 11 Oxidized or reactive gaseous mercury represents a small portion of the mercury emissions from mining 12 sources. 13
Particulate mercury has an average atmospheric residence time of hours to days (depending on the 14 presence or absence of precipitation and the particle size). It has low volatility and is easily taken up in 15 precipitation or adsorbed on small particles, falling out relatively close to the emission source in the 16 presence of precipitation, or as dry deposition that may be transported for longer distances if associated 17 with very small particle sizes. Particle-bound mercury is relatively stable and is not easily converted to 18 methylmercury (USEPA 1997). 19
Mercury is not considered a criteria pollutant, and no NAAQS have been established under the Clean Air 20 Act Amendments for mercury. Mercury is included on the federal list of HAPs, which has been adopted 21 by reference in the Nevada air quality regulations. Nevada air quality regulations (NAC 445B.22013) 22 prohibit the “discharge into the atmosphere from any stationary source of any hazardous air pollutant or 23 toxic regulated air pollutant that threatens the health and safety of the general public, as determined by 24 the director.” The USEPA has issued a final rule on National Emissions Standards for HAPs for gold 25 mines and gold processing facilities (40 CFR 63 Subpart EEEEEEE). The rule establishes National 26 Emissions Standards for HAPs for mercury emissions from gold ore processing facilities. For existing ore 27 pretreatment processes, the emissions limit is no more than 127 pounds of mercury per million tons of 28 ore processed. HAPs are controlled through emissions limits at the source rather than ambient air 29 concentrations. Mercury emissions associated with precious metals operations are regulated and 30 controlled pursuant to the Nevada Mercury Control Program (NAC 445B.3611-3689 Nevada Mercury 31 Control Program). 32
3.10.2.3 Visibility 33
Class I areas (e.g., wilderness areas) have federal protection to minimize visibility impacts. There are no 34 Class I areas within 100 km of the study area. The nearest Class I area to the project study area is the 35 Jarbidge Wilderness Area, which is located approximately 190 km (118 miles) northeast of the project 36 study area. Given the large distance between the project study area and the nearest Class I area, the 37 low level of anticipated emissions, and that the proposed project is not anticipated to trigger PSD permit 38 requirements, a visibility impact assessment is not warranted for the project. 39
3.10.3 Greenhouse Gas Emissions and Climate Trends 40
Climate represents the long-term statistical characterization of daily, seasonal, and annual weather 41 conditions such as temperature, relative humidity, precipitation, cloud cover, solar radiation, and wind 42 speed and direction. Climate is the composite of generally prevailing weather conditions of a particular 43 region throughout the year, averaged over a series of years. A region’s climate is affected by latitude, 44 terrain, and altitude, as well as nearby waterbodies and their currents. 45

Deep South Expansion Project EIS 3.10 – Air Quality 3.10-9
Draft EIS 2018
3.10.3.1 Greenhouse Gases 1
The entrapment of heat in the atmosphere, also known as the greenhouse effect, raises the average 2 surface temperature of the earth (Intergovernmental Panel on Climate Change [IPCC] 2013). Some 3 greenhouse gases (GHGs), such as water vapor, CO2, methane (CH4), and nitrous oxide occur naturally 4 and from anthropogenic activities (i.e., resulting from or produced directly by human activities). Other 5 GHGs, such as hydrofluorocarbons, result only from anthropogenic activities. 6
Anthropogenic source emissions of GHGs to the atmosphere steadily increased due to land use 7 changes and agriculture until the early 1800s (IPCC 2013). Beginning in the mid-19th Century with the 8 boom of the industrial revolution, the combustion of fossil fuels and the construction of urban cities 9 resulted in the prominent growth of CO2 concentrations in the atmosphere. As of December 2016, the 10 average atmospheric concentration of CO2 observed at Mauna Loa Observatory in Hawaii exceeded 11 400 parts per million (400 ppm) (Tans and Keeling 2017) compared to the pre-industrial revolution 12 average concentration below 300 ppm (IPCC 2013). The noticeable increase in the atmospheric CO2 13 concentration has taken form through climate change effects such as increasing regional temperatures 14 due to the greenhouse effect. 15
Greenhouse gases are chemically stable and persist in the atmosphere, typically becoming well mixed 16 throughout the atmosphere before being removed by physical or chemical processes. These GHGs have 17 varying residence times in the atmosphere, but generally take years to fully breakdown. For example, 18 CO2 can take anywhere from 10 to 100 years to leave the atmosphere depending on its ability to be 19 absorbed by vegetation or the ocean or react with other molecules in the atmosphere (IPCC 2013). With 20 longer residence times, atmospheric dispersion of GHGs can travel across different regions. 21 Furthermore, GHGs have varying potencies based on their ability to trap radiative energy (i.e., heat), as 22 well as their residence time in the atmosphere. The potency of different GHGs is determined by their 23 potency relative to CO2 and is referred to as a global warming potential. Based on the global warming 24 potentials published in the FR, CH4 is 25 times more potent and N2O is 298 times more potent than CO2 25 (FR 2014). 26
Sources of GHG emissions in the project study area include wildfires and prescribed burns; vehicles 27 (including off-highway vehicles); construction and operation equipment for mineral, energy, and 28 communications development; and livestock grazing. To the extent that these activities increase, GHGs 29 also are likely to increase and contribute to forecast climate change scenarios which include warmer, 30 more arid conditions across Nevada. 31
It is difficult to assess the impact on climate a particular action with confidence, as downscaled modeling 32 associated with localized climate-changing pollutant emissions and climate change is still in a formative 33 phase. The lack of scientific tools designed to predict climate change on a regional or local scale limits 34 the ability to quantify potential future impacts; therefore, an established methodology does not yet exist 35 to accurately predict the effect of local and regional activities on global climate change. 36
On October 30, 2009, the USEPA issued the final mandatory reporting rule for major sources of GHG 37 emissions (40 CFR Part 98). The rule requires a wide range of sources and source groups to record and 38 report selected GHG emissions, including CO2, CH4, N2O, and some halogenated compounds. 39 Mandatory reporting of GHG emissions is required if sources emit 25,000 tons of carbon dioxide 40 equivalent (CO2e) per year. 41
Climate Change Trends 42
BLM published the final Rapid Ecoregional Assessment (REA) for the Central Basin and Range in 43 June 2013 (Comer et al. 2013). REAs examine climate change and other widespread environmental 44 influences that are affecting western landscapes. REAs look across an ecoregion to more fully 45 understand ecological conditions and trends, natural and human influences, and opportunities for 46

Deep South Expansion Project EIS 3.10 – Air Quality 3.10-10
Draft EIS 2018
resource conservation, restoration, and development. The REAs provide regional information that can 1 inform local management efforts. 2
Over the past 100 years, the weather, vegetation cover, and wildfire regimes of the Central Basin and 3 Range ecoregion have changed, suggesting a change in the ecoregion’s climate. Changes in 4 temperature and precipitation have resulted in changes to vegetation cover and wildfire regimes. 5 Changes are expressed in species composition, changes in vegetation communities, and increasing 6 quantities of invasive species. Many areas once dominated by sagebrush have pinyon-juniper 7 encroachment as well as cheatgrass. 8
The effects of temperature rises, and the extent of such effects, will vary by region. The effects will cause 9 changes in both human and natural ecosystems (IPCC 2014a). An average increase in global 10 temperature of 1.0°C (1.8ºF) may threaten some terrestrial and aquatic ecosystems, result in more 11 extreme weather events such as hurricanes and flooding, and cause restrictions in available water 12 resources (IPCC 2014a). Additional warming beyond 1°C will increase the likelihood of these events. 13 IPCC projects that by the end of the 21st Century under a low emissions scenario where steps are 14 actively being taken to reduce GHG emissions, the global mean temperature will increase by 15 approximately 1.0°C (1.8ºF) compared to the baseline global mean temperature from 1986 to 2005. 16 Furthermore, the IPCC models predict an approximately 4.0°C (7.2ºF) increase under a high emissions 17 scenario where population growth continues to increase at a high rate, as well as continued expansion of 18 fossil fuel use (IPCC 2014b). 19
In the Nevada Central Basin and Range ecoregion, climate models suggest there is no strong trend 20 toward either wetter or drier conditions either in the near future (through the 2020s) or in the long term 21 (through the 2050s) (Comer et al. 2013). However, models show substantial increases in maximum 22 monthly temperatures by 2020, primarily in the summer months (July, August, and September). The 23 highest maximum temperature increase projected is 6°F. These increases are predicted to occur mostly 24 in the southern and northeastern edges of the ecoregion. Forecasts for 2060 predict substantial 25 increases in maximum temperature for all months. Similar to forecasts for 2020, the greatest increases 26 are predicted during the summer months and along the southern and northeastern edges of the 27 ecoregion (Comer et al. 2013). Model forecasts for minimum temperatures show a considerable change 28 in both rate and magnitude over most of the project study area. July through September showed the 29 greatest degree of change over most of the region. 30
Data for precipitation suggest no strong trend toward either wetter or drier conditions in any month for the 31 ecoregion. With the exception of a slight increase in summer monsoon rains toward the south and east, 32 there were no substantial forecasted trends in precipitation for any other months in either the near-term 33 (2020s) or midcentury (2050s) projections (Comer et al. 2013). 34
Potential effects of these forecasts on the landscape could include increased fuel loads in higher 35 elevations, increased frequency and duration of droughts, expansion of invasive species in higher 36 elevations, increased wind erosion, and changes in wildfire regimes (Comer et al. 2013). Greenhouse 37 gas emissions are estimated and reported as a proxy in this EIS to assess the potential impacts of the 38 proposed project on climate change. 39
3.10.4 Environmental Consequences 40
Issues related to air quality include potential impacts associated with project-generated air emissions. 41
Environmental impacts to air resources would be significant if the Proposed Action or other action 42 alternatives result in any of the following: 43

Deep South Expansion Project EIS 3.10 – Air Quality 3.10-11
Draft EIS 2018
• Exceedance of national or state AAQS. 1
• Elevated mercury deposition that contributes to increased mercury levels in waterbodies. 2
• Exposure of sensitive receptors to substantial pollutant concentrations. 3
Effects to air quality are discussed in terms of intensity, duration, and context, based on the following 4 definitions. 5
Intensity 6
• No Substantial Effects: Air emissions temporarily would increase; however, the effects from the 7 project emission levels would be within applicable air quality standards and would not exceed 8 national or state AAQS. 9
• Substantial Effects: The effects from the air emissions would increase substantially and would 10 exceed applicable national or state AAQS. Mitigation would be required and would need to be 11 coordinated and planned with applicable state and federal agencies. 12
Duration 13
• Short-term: Air quality effects would cease following the completion of mine construction, 14 operations, and reclamation. 15
• Long-term: Air quality effects would continue following the completion of mine construction, 16 operations, and reclamation. 17
Context 18
• Localized: Effects from the project-related emissions would not result in exceedance of the 19 national or state AAQS beyond the CGM Operations Area boundary, the off-site ore 20 transportation route between the CGM Operations Area and the Goldstrike Mine, or the 21 Goldstrike Mine site. 22
• Regional: Effects from the project-related emissions would result in exceedance of the national 23 or state AAQS beyond the CGM Operations Area boundary, off-site ore transportation route, or 24 Goldstrike Mine site. 25
3.10.4.1 Methods 26
This section presents a brief overview of the air quality analysis methodology, data sets, and modeling 27 techniques used to estimate the changes in ambient air quality and hazardous air pollutant levels that 28 could result from the proposed project air emissions as outlined in the Barrick Cortez - Deep South 29 Expansion Project NEPA Air Quality Impact Analysis Report (Air Sciences Inc. 2016a). 30
Emission Inventory 31
The emissions inventory for the Proposed Action consists of emissions sources associated with the 32 proposed project activities. The emissions sources that have been quantified for this analysis include 33 construction activities and ore and waste rock handling (fugitive emissions), ongoing processing activities 34 in the CGM Operations Area, off-site refractory ore transport to the Goldstrike Mine and backhaul of 35 Arturo Mine oxide ore to the Pipeline Complex, and processing of CGM Operations Area refractory ore at 36 the Goldstrike Mill. The project emissions were quantified for oxides of nitrogen (NOX), CO, SO2, PM10, 37 PM2.5, volatile organic compounds (VOCs), 20 HAPs (including mercury), and GHG emissions. Of the 38 187 HAPs regulated under Section 112 of the CAA, the following 20 HAPs were analyzed: 1,3-39 butadiene, acetaldehyde, acrolein, arsenic, benzene, beryllium, cadmium, chromium, cobalt, 40 dichlorobenzene, formaldehyde, hexane, lead, manganese, mercury, nickel, polycylic organic matter, 41 selenium, toluene, and xylene. These HAPs were selected for inclusion in the analysis based on their 42 prevalence for the types of activities that would occur as part of the Proposed Action. GHG emissions 43

Deep South Expansion Project EIS 3.10 – Air Quality 3.10-12
Draft EIS 2018
estimates were developed for CO2, CH4, and N2O, as well as the global warming potential in CO2e. GHG 1 emissions were calculated rather than modeled for this analysis, consistent with common practices for 2 NEPA analyses. 3
Criterial Pollutants 4
Process emission sources at the CGM Operations Area consist of material handling, crushing, 5 conveying, refining, building heaters, emergency generators, and other small emission sources. Fugitive 6 emission sources from the CGM Operations Area and/or off-site ore transport/backhaul and off-site 7 processing include: drilling, blasting, material loading, unloading, and hauling; dozing and grading; wind 8 erosion of exposed surfaces; mobile machinery tailpipes; and driving on unpaved/paved roads (Air 9 Sciences Inc. 2016a). The off-site transportation route is shown in Figure 2-15. 10
Fugitive emissions from drilling and blasting were estimated based on the facility-wide maximum 11 production rate. Wind erosion emissions were calculated for each location (e.g., waste rock facilities, 12 stockpile areas, and haul roads) based on surface area and erosion potential. Material-hauling emissions 13 were calculated based on vehicle miles traveled along each road type. The fugitive dust emissions from 14 off-site transporting and transferring of refractory ore were estimated based on the USEPA AP-42 15 emission factors. Emissions associated with off-site refractory ore processing were based on a scaling of 16 total Goldstrike Mill emissions. 17
Modeling 18
A near-field ambient air quality impact assessment was performed by Air Sciences Inc. (2016a) to 19 quantify the project’s criteria pollutants (SO2, NO2, CO, PM10, and PM2.5) impacts using the USEPA 20 regulatory model AERMOD. The purpose of the near-field modeling analysis was to assess potential 21 future air quality impacts that potentially would occur in the immediate vicinity of the CGM Operations 22 Area. In order to evaluate the maximum potential emissions from project activities in the CGM 23 Operations Area, two different mining scenarios were modeled: 24
• Scenario 1 (Mining Year 1) – Maximum production from the Pipeline Pit Complex (Pipeline and 25 Crossroads pits) and Cortez Pit; and 26
• Scenario 2 (Mining Year 3) – Maximum production from the Gold Acres Pit. 27
Modeled impacts subsequently were compared to applicable national and state AAQS. 28
In addition to the assessment of criteria pollutants, previous modeling of mercury deposition for prior 29 NEPA analyses for the CGM Operations Area was used to estimate the proposed project’s potential 30 mercury impacts. 31
3.10.4.2 Proposed Action 32
Activities associated with the Proposed Action that would have the potential to impact air quality include 33 the following: 34
• Expansion of existing open pits and waste rock facilities and development of three new satellite 35 pits, with associated waste rock and ore transport/placement; 36
• Surface support operations and waste rock and ore transport/placement associated with 37 expansion of underground operations; 38
• Construction of the proposed Rocky Pass Reservoir embankment and new RIB facilities; 39
• Ongoing ore processing at the existing Pipeline Mill; and 40
• Transport of refractory ore from the CGM Operations Area to the Goldstrike Mine for mill 41 processing and backhaul of Arturo Mine oxide ore to the Pipeline Complex. 42

Deep South Expansion Project EIS 3.10 – Air Quality 3.10-13
Draft EIS 2018
Currently authorized and proposed mining rates are presented in Table 2-2. No increase in Pipeline Mill 1 throughput is proposed as discussed in Section 2.4.6, Processing and Tailings Facilities. 2
Emissions Inventory 3
The emission inventory for the Proposed Action includes emissions from construction activities, mine 4 operations, and closure and final reclamation activities in the CGM Operations Area, as well as 5 emissions associated with off-site refractory ore transport to the Goldstrike Mine, backhaul of Arturo Mine 6 oxide ore to the Pipeline Complex, and processing of CGM Operations Area refractory ore at the 7 Goldstrike Mill. 8
Construction-related emissions would be associated with construction of the Rocky Pass Reservoir 9 embankment and new RIB facilities. Based on the emissions inventory spreadsheet used by Air 10 Sciences Inc. in the modeling effort (BCI 2017), the emissions from the expansion of facilities, additional 11 stockpiles, and other infrastructure expansion activities were included in the quantification of emissions 12 from mine operations. The mine operations emissions were calculated based on the estimated annual 13 mine production throughout the life of the project. The activities were then modeled using the calculated 14 emissions. The emissions from off-site ore transport and backhaul, and the processing of CGM 15 Operations Area refractory ore at the Goldstrike Mill, were assumed to occur at an even rate throughout 16 of the life of the project. After mine operations cease, the ongoing ore processing, decommissioning, and 17 final reclamation is anticipated to continue for approximately 3 years as discussed in Section 2.4.3, 18 Schedule and Work Force. 19
Table 3.10-3 presents the total annual emissions inventory for the Proposed Action by year, based on 20 the emissions calculated by Air Sciences Inc. (2016a) plus estimated emissions from construction of the 21 Rocky Pass Reservoir embankment and new RIB facilities, reclamation activities, and off-site ore 22 transport/backhaul and processing. PM10 and PM2.5 emissions primarily would be from fugitive dust 23 related to travel on unpaved mine haul roads, surface disturbance, and blasting. NOX, CO, VOC, and 24 SO2 emissions primarily would be from mobile sources and construction equipment. 25
No individual HAP (including mercury) would be emitted in a quantity greater than the major source limit 26 of 10 tpy. Also, the combined HAP emissions would be less than the major source limit of 25 tpy. 27 Therefore, the project would not constitute a major HAP source. 28
The Proposed Action GHG emissions presented in Table 3.10-3 encompass all emissions sources 29 associated with the proposed project and include sources of emissions that are not required to be 30 considered in the reporting rule requirements. As discussed in Section 3.10.3.1, sources that emit more 31 than 25,000 tons of CO2e per year are required to report GHG emissions. As discussed in 32 Section 3.10.2.1, the Proposed Action is not expected to trigger major source permitting requirements 33 under the PSD. 34
The 2016 national annual emissions of GHGs were approximately 6.5 billion tons CO2e (USEPA 2018). 35 Under the Proposed Action, the maximum annual GHG emissions would be 463,192 tpy CO2e (see 36 Table 3.10-3), or approximately 0.00007 percent of the national annual emissions. 37
Modeling 38
Modeling was conducted for five of the criteria air pollutants (i.e., PM10, PM2.5, CO, NO2, and SO2). The 39 NOX emissions shown in Table 3.10-3 were used as input values for the NO2 modeling. As discussed in 40 the modeling report (Air Sciences Inc. 2016a), the dispersion model converts the NOX into NO2. The 41 proposed project would not directly produce ozone, rather ozone would be produced by photo-chemical 42 reactions involving certain VOCs and NOX. The potential for lead or hydrogen sulfide emissions are 43 considered negligible; therefore, they were not considered in the analysis. 44

Deep South Expansion Project EIS 3.10 – Air Quality 3.10-14
Draft EIS 2018
Table 3.10-3 Total Emissions Inventory for the Proposed Project
Project Year
PM10 (tpy)
PM2.5 (tpy) (tpy)
CO
NOX (tpy)
SO2 (tpy)
VOCs (tpy)
Mercury (tpy)
Total 1HAPs
(tpy)
Calculated GHG
(tpy CO2e)
1 1,154.4 260.5 3,134.3 3,202.2 21.3 540.0 0.08 16.1 398,959
2 1,162.6 260.0 3,107.5 3,153.3 21.3 531.4 0.08 16.2 398,959
3 1,226.5 267.5 3,110.5 3,164.5 21.3 532.1 0.08 16.4 398,959
4 1,166.4 260.5 3,111.1 3,166.6 21.3 532.2 0.08 16.2 398,959
5 1,170.6 260.8 3,113.5 3,175.7 21.3 532.8 0.08 16.2 398,959
6 1,001.6 280.8 3,823.4 3,871.8 21.9 651.7 0.09 18.8 463,192
7 984.9 278.8 3,823.4 3,871.7 21.9 651.7 0.09 18.8 463,192
8 984.9 278.8 3,823.4 3,871.7 21.9 651.7 0.09 18.8 463,192
9 984.9 278.8 3,823.4 3,871.7 21.9 651.7 0.09 18.8 463,192
10 194.4 50.9 749.9 752.7 0.8 133.2 0.01 3.0 64,233
11 194.4 50.9 749.9 752.7 0.8 133.2 0.01 3.0 64,233
12 194.4 50.9 749.9 752.7 0.8 133.2 0.01 3.0 64,233 1 Mercury is included in the total HAPs values.
Source: BCI 2017.
Not all of the emissions shown in Table 3.10-3 were reflected in the modeling analysis conducted by Air 1 Sciences Inc. (2016a). The emissions sources selected for inclusion in the modeling analysis to estimate 2 peak impacts were based on those sources that would be the largest emissions sources in the CGM 3 Operations Area that would operate throughout the life of operations. Activities that would result in 4 emissions only during discrete points in time (i.e., construction and reclamation activities) were not 5 included the modeling effort. It is anticipate that the emissions from these construction and reclamation 6 activities would be much lower than the modeled operations sources and, therefore, would likely result in 7 the same or lower impacts than the modeled impacts. 8
The maximum modeled concentrations from on site operations, the estimated total concentrations 9 (modeled concentrations plus background concentrations), and their comparison with the applicable 10 AAQS for model scenarios 1 and 2 are presented in Tables 3.10-4 and 3.10-5, respectively. For 11 completeness, the estimated total concentrations were determined using two potential background 12 concentrations: 1) a background value recommended by NDEP and 2) an alternate background value 13 that is conservatively high based on monitoring stations in other areas of remote Nevada. As shown in 14 Tables 3.10-4 and 3.10-5, the estimated maximum total ambient concentrations for both scenarios are 15 below the applicable AAQS, regardless of the background value used. The locations of the maximum 16 modeled impacts from either scenario using the NDEP background values are shown in Figure 3.10-3. 17 As shown in the figure, Air Sciences Inc. (2016b) reported that the maximum impacts occur at the CGM 18 Operations Area boundary for all pollutants and averaging periods. Ongoing implementation of fugitive 19 dust controls as discussed in Section 2.4.13, Applicant-committed Environmental Protection Measures, 20 and outlined in BCI’s Fugitive Dust Control Plan (BCI 2013), as well as implementation of concurrent 21 reclamation, would help reduce the localized impacts of the PM10 and PM2.5 emissions. No substantial 22 effects would occur under the Proposed Action, and air quality effects would be short-term. 23


Deep South Expansion Project EIS 3.10 – Air Quality 3.10-16
Draft EIS 2018
This page intentionally left blank

Deep South Expansion Project EIS 3.10 – Air Quality 3.10-17
Draft EIS 2018
Table 3.10-4 Scenario 1 Model Results and Comparison with AAQS
Pollutant Averaging
Period
Modeled Impact
3) 1(μg/m
Total Concentrations with NDEP Background
Values (μg/m3)
Total Concentrations with Alternate
Background Values (μg/m3) Applicable
AAQS (μg/m3)
Compliance with
Applicable AAQS
Background 2Values
Total Impact
Background 2Values
Total Impact
CO 38-hour 192.3 0.0 192.3 801.4 993.7 10,000 Yes 31-hour 651.8 0.0 651.8 1,030.4 1,682.2 40,000 Yes
NO2 Annual 5.1 0.0 5.1 1.9 7.0 100 Yes
41-hour 100.6 0.0 100.6 9.2 109.8 188 Yes
PM2.5 Annual 0.5 2.3 2.8 2.3 2.8 12 Yes
524-hour 4.1 8.0 12.1 8.0 12.1 35 Yes
PM10 324-hour 12.8 10.2 23.0 10.2 23.0 150 Yes
SO2 33-hour 0.5 0.0 0.5 0.5 1.0 1,300 Yes 61-hour 0.2 0.0 0.2 0.7 0.9 196 Yes
1 2 3 4 5 6
Based on Air Sciences Inc. modeling data provided by BCI (2017).
Air Sciences Inc. 2017a.
Highest-second-high modeled concentration.
Highest-eighth-high daily maximum 1-hour modeled concentration.
Highest-eighth-high modeled concentration.
Highest-fourth-high modeled concentration.
Table 3.10-5 Scenario 2 Model Results and Comparison with AAQS
Pollutant Averaging
Period
Modeled Impact
3) 1(μg/m
Total Concentrations with NDEP Background
Values (μg/m3)
Total Concentrations with Alternate
Background Values (μg/m3) Applicable
AAQS (μg/m3)
Compliance with
Applicable AAQS
Background 2Values
Total Impact
Background 2Values
Total Impact
CO 38-hour 192.4 0.0 192.4 801.4 993.8 10,000 Yes 31-hour 651.8 0.0 651.8 1,030.4 1,682.2 40,000 Yes
NO2 Annual 8.0 0.0 8.0 1.9 9.9 100 Yes
41-hour 125.2 0.0 125.2 9.2 134.4 188 Yes
PM2.5 Annual 0.8 2.3 3.1 2.3 3.1 12 Yes
524-hour 4.1 8.0 12.1 8.0 12.1 35 Yes
PM10 324-hour 15.8 10.2 26.0 10.2 26.0 150 Yes
SO2 33-hour 0.5 0.0 0.5 0.5 1.0 1,300 Yes 61-hour 0.3 0.0 0.3 0.7 1.0 196 Yes
1 2 3 4 5 6
Based on Air Sciences Inc. modeling data provided by BCI (2017).
Air Sciences Inc. 2017a.
Highest-second-high modeled concentration.
Highest-eighth-high daily maximum 1-hour modeled concentration. Highest-eighth-high modeled concentration.
Highest-fourth-high modeled concentration.

Deep South Expansion Project EIS 3.10 – Air Quality 3.10-18
Draft EIS 2018
As discussed in Section 2.4.8.1, Refractory Ore Shipment, refractory ore sent to Goldstrike for 1 processing would continue to be processed through either the existing roasters or the autoclaves as 2 currently authorized. Impacts associated with processing CGM Operations Area refractory ore at the 3 Goldstrike Mill were estimated by scaling previous emissions and impacts from Goldstrike Mill operations 4 by the portion of the throughput that would be attributable to CGM Operations Area refractory ore under 5 the Proposed Action. Total Goldstrike Mill emissions and impacts, and the emissions and estimated 6 impacts for the processing of CGM Operations Area refractory ore at the Goldstrike Mill as reported by 7 Air Sciences Inc. (2016a) are shown in Table 3.10-6. As shown in Table 3.10-6, the maximum impacts 8 from processing CGM Operations Area refractory ore at Goldstrike would be all well below the applicable 9 AAQS. Because CGM Operations Area refractory ore would displace a portion of the Goldstrike ore in 10 the mill throughput, the Proposed Action impacts shown in Table 3.10-6 are not additive to the 11 Goldstrike ore processing impacts. However, even adding the Proposed Action impacts to the Goldstrike 12 ore processing impacts as a worst-case assumption would not result in total impacts that would exceed 13 the AAQS. 14
Table 3.10-6 Emissions and Impacts from the Goldstrike Mill
CGM Operations Area Refractory Ore Processing at
Pollutant Averaging
Period
Total Goldstrike Emissions and Impacts
Proposed Action Emissions and Impacts from Off-site Ore Processing
Emissions (tpy)
Modeled Impact (μg/m3)
Emissions (tpy)
Estimated Impact (μg/m3)
AAQS (μg/m3)
CO 8-hour
400 38.25
18.38 1.76 40,000
1-hour 216.49 9.95 10,000
NO2 Annual
311 0.83
35.05 0.09 188
1-hour 10.381 1.17 100
PM2.5 Annual
ND2 ND2 28.03 0.51 35
24-hour 0.81 12
PM10 Annual
579 10.62
87.35 1.60 NA
24-hour 16.65 2.51 150
SO2 3-hour
996 13.03
18.22 0.24 196
1-hour 14.48b 0.26 1,300 1 Estimated using the SCREEN3 scaling ratios provided in the AERSCREEN User’s Guide. 2 No data. CGM Operations Area refractory ore processing PM2.5 impacts were scaled from Source: Air Sciences Inc. 2016a.
the Goldstrike PM10 data.
Proposed Action impacts at sensitive receptors were not modeled; however, it is anticipated that impacts 15 at sensitive receptors as a result of proposed modifications in the CGM Operations Area would be lower 16 than previously modeled for the Cortez Hills Expansion Project Final EIS (BLM 2008a). The eight 17 sensitive receptor locations analyzed in the 2008 EIS represented areas frequently visited by the public 18 (e.g., schools), nearby residences, and the Jarbidge Wilderness Area, the nearest Class I area. The 19 2008 EIS modeling results showed all pollutants were within the AAQS at the sensitive receptor 20 locations. As mine production and processing activities in the CGM Operations Area as analyzed in the 21 2008 EIS are similar to those under the Proposed Action, and impacts predicted for the Proposed Action 22 (as shown in Tables 3.10-4, 3.10-5, and 3.10-6) are substantially lower than operational impacts 23 estimated in the 2008 EIS (Table 3.10-6) and 2011 SEIS (Tables 3.10-4, 3.10-7, and 3.10-8), the 24 impacts at the sensitive receptor locations under the Proposed Action also are anticipated to be 25 substantially lower. Therefore, it is anticipated that all pollutants would be below the AAQS and PSD 26

Deep South Expansion Project EIS 3.10 – Air Quality 3.10-19
Draft EIS 2018
Class I increments at the sensitive receptor locations under the Proposed Action. No substantial adverse 1 effect would occur under the Proposed Action, and air quality effects would be short-term. 2
As discussed in Section 2.4.8.1, Refractory Ore Shipment, the number of truck trips for the off-site 3 transport of CGM Operations Area refractory ore to the Goldstrike Mine and backhaul of Arturo Mine 4 oxide ore to the Pipeline Complex would increase from the current 9 round-trips per hour to 18 round-5 trips per hour under the Proposed Action. Emissions impacts associated with the currently authorized 6 ore transport previously were analyzed in prior NEPA documents for the CGM Operations Area 7 (BLM 2015b, 2011). Due to the travel distance involved (approximately 70 miles one way), and because 8 the modeled concentrations for operations in the CGM Operations Area as shown in Tables 3.10-4 9 and 3.10-5 are well below the national and state AAQS, it would be unlikely that the addition of transport-10 related fugitive dust emissions from paved and unpaved roads and transport truck tailpipe emissions 11 would result in a violation of the national or state AAQS for CO, NO2, SO2, PM2.5, or PM10. The additional 12 emissions for all pollutants associated with the ore transport would at most increase by approximately 13 20 percent. These additional emissions would be spread over many miles; therefore, it is unlikely to 14 notably increase the maximum modeled impacts at the CGM Operations Area. Air pollutant 15 concentrations below the AAQS generally are not considered to be detrimental to public health and 16 welfare. 17
Mercury Impacts 18
The mercury emissions from CGM Operations Area refractory ore processing at the Goldstrike Mill were 19 estimated by Air Sciences Inc. (2016a) by scaling the Goldstrike Mill total mercury emissions rates for 20 2014, as reported to NDEP in 2015, by the amount of processed ore that would be attributable to the 21 Proposed Action. The projected mercury emissions from processing CGM Operations Area refractory 22 ore at Goldstrike were estimated based on relative throughputs, independent of the mercury content in 23 the ore, because the roaster and autoclave emission controls at the Goldstrike Mill are designed so that 24 the mercury concentration entering the controls does not affect the mercury emissions (Air Sciences Inc. 25 2016a). As discussed in Section 2.4.8.1, Refractory Ore Shipment, no increase in mill throughput would 26 be required; however, the Proposed Project would extend processing at the Goldstrike Mill by 27 approximately 3 years. The maximum projected mercury emissions attributable to the processing of 28 CGM Operations Area refractory ore at the Goldstrike Mill are 0.04 tpy (80.0 pounds per year) (Air 29 Sciences Inc. 2016a). This represents 14 percent of the total mercury emissions from the Goldstrike Mill 30 operations (588 pounds per year). Assuming a linear relationship, mercury deposition from off-site 31 refractory ore processing at Goldstrike under the Proposed Action would represent approximately 32 14 percent of the total deposition impact attributed to Goldstrike Mill operations (Air Sciences Inc. 33 2016a). 34
REMSAD modeling for mercury deposition rates associated with Goldstike Mill operations previously 35 was conducted in support of a prior NEPA analysis (BLM 2008b) for the Goldstrike Mine site. As shown 36 in Figure 3.10-4, previous REMSAD modeling results showed that mercury deposition rates from 37 Goldstrike Mill operations represent approximately 1 percent of global background deposition at 38 distances between 30 km (18.6 miles) to the southwest and 100 km (62 miles) to the north of the 39 Goldstrike Mine. Therefore, at this 1 percent isopleth, mercury deposition attributable to the processing 40 of CGM Operations Area refractory ore at the Goldstrike Mill would represent approximately 0.14 percent 41 of global background (14 percent of 1 percent) under the Proposed Action. 42
The previous REMSAD modeling effort also examined nearby waterbodies for mercury deposition 43 caused by mercury emissions from Goldstrike. The REMSAD model results indicated that the Goldstrike 44 Mill’s contribution to mercury deposition in the Willow Creek Reservoir region, approximately 32 km 45 (19.9 miles) northwest of Goldstrike, is approximately 10 percent of the global background. The results 46 also indicated that mercury deposition attributable to Goldstrike Mill emissions at the Wildhorse 47 Reservoir area, approximately 90 km (55.9 miles) northeast of Goldstrike, is less than 0.8 percent of the 48 global background (Air Sciences Inc. 2016a). Therefore, it is estimated that off-site refractory ore 49

Deep South Expansion Project EIS 3.10 – Air Quality 3.10-20
Draft EIS 2018
processing at Goldstrike under the Proposed Action would contribute approximately 1.4 percent of the 1 global background at the Willow Creek Reservoir (14 percent of 10 percent) and 0.11 percent of the 2 global background at the Wildhorse Reservoir (14 percent of 0.8 percent). Because CGM Operations 3 Area refractory ore would displace a portion of the Goldstrike Mill throughput, the Proposed Action 4 impacts would not be additive to the Goldstrike ore processing impacts (Air Sciences Inc. 2016a). 5
Under the Proposed Action, oxide ore from the Arturo Mine would displace a portion of the currently 6 authorized throughput at the Pipeline Mill. Mercury emissions (particulate, gaseous elemental, and 7 gaseous reactive) and potential impacts associated with mercury deposition as a result of currently 8 authorized operations in the CGM Operations Area previously were analyzed in the Cortez Hills 9 Expansion Project Final EIS (BLM 2008a). As discussed in that document, material handling (primary, 10 secondary, and tertiary crushing; conveying; and stacking) are potential emission sources of particulate 11 mercury. Controls currently are, and would continue to be, applied to each of the processes to reduce 12 overall particulate emissions (including mercury). Thermal sources of mercury emissions (gaseous 13 elemental and gaseous reactive) associated with the refining process at the Pipeline Mill include the 14 refining furnaces, carbon kilns, retort, and electrowinning cells (BLM 2008a). Mercury emissions from 15 thermal sources currently are, and would continue to be, controlled as described in the Cortez Hills 16 Expansion Project Final EIS (BLM 2008a). As discussed in Section 2.4.8.2, Backhaul of Arturo Oxide 17 Ore for On Site Processing, Arturo oxide ore would be sampled to ensure that only ore suitable for mill or 18 heap leach processing would be backhauled to the Pipeline Complex. In addition, the average mercury 19 content of Arturo oxide ore is approximately 2.3 ppm (BCI 2015), which is lower than the average 20 14.0 ppm of mercury in the ore processed at the Pipeline Mill (BLM 2015b). Based on ongoing 21 implementation of emission controls at the Pipeline Mill, the sampling of Arturo oxide ore prior to 22 shipment to the site, and the average mercury content of the Arturo oxide ore, mercury emissions and 23 potential impacts associated with mercury deposition as a result of the Proposed Action would not be 24 anticipated to increase. 25
3.10.4.3 Gold Acres Pit Partial Backfill Alternative 26
Under the Gold Acres Pit Partial Backfill Alternative, potential impacts to air quality would be similar to 27 those described for the Proposed Action since differences between the alternatives are small. Under this 28 alternative there would be a 72-acre reduction of new surface disturbance at the Gold Acres Complex. 29 This difference would result in approximately a 2 percent reduction of new surface disturbance relative to 30 the Proposed Action. 31
3.10.4.4 No Action Alternative 32
Under the No Action Alternative, the proposed Deep South Expansion Project would not be developed 33 and associated impacts to air quality would not occur. As described in Section 2.5.1.2, No Action 34 Alternative, existing mining and processing operations and reclamation activities within the CGM 35 Operations Area, off-site ore transport/backhaul, and off-site refractory ore processing at the Goldstrike 36 Mill, would continue to operate under the terms of current permits and approvals as authorized by the 37 BLM and State of Nevada. 38
The emissions inventory for the No Action Alternative was calculated for ongoing open pit mining at the 39 Pipeline Pit Complex and the Cortez Hills and Cortez pits, off-site CGM Operations Area refractory ore 40 transport and backhaul of Arturo Mine oxide ore to the Pipeline Complex, and the processing of CGM 41 Operations Area refractory ore at the Goldstrike Mill. As discussed in Section 2.5.1.2, No Action 42 Alternative, all existing operations would cease in 2023 (referred to here as Project Year 4), with ongoing 43 ore processing, decommissioning, and final reclamation completed by 2026 (referred to here as Project 44 Year 7). 45


Deep South Expansion Project EIS 3.10 – Air Quality 3.10-22
Draft EIS 2018
This page intentionally left blank

Deep South Expansion Project EIS 3.10 – Air Quality 3.10-23
Draft EIS 2018
Emission Inventory 1
The mine operations emissions were calculated based on the currently authorized mining rate, which is a 2 combined rate of 540,000 tons per day at the Pipeline Pit Complex and Cortez Hills Pit and 40,000 tons 3 per day at the Cortez Pit. For the off-site refractory ore transport and processing, ore would continue to 4 be transported and processed at the Goldstrike Mill at a rate of up to 1.2 million tpy through 2023 5 (Project Years 1-4). Arturo Mine oxide ore would continue to be backhauled through the Goldstrike Mine 6 to the Pipeline Complex at a rate of up to 600,000 tpy for processing through 2023 (Project Year 4). The 7 off-site ore processing and transport emissions were calculated similar to the approach discussed in 8 Section 3.10.2.1; however, No Action Alternative rates were used instead of the Propose Action values. 9 The annual total emissions by year for the No Action Alternative are provided in Table 3.10-7. The 10 emissions are shown to enable a comparison to the Propose Action. 11
Modeling 12
Activities associated with mine operations and off-site ore transport and processing were not explicitly 13 modeled for the No Action Alternative for this EIS. The activities associated with the No Action 14 Alternative were analyzed in prior NEPA documents for the CGM Operations Area (BLM 2015a, 2011, 15 2008a, 2004, 2000). The values in the No Action Alternative emission inventory (Table 3.10-7) are less 16 than those for the Proposed Action (Table 3.10-3) for all years, with operations ceasing sooner than 17 under the Proposed Action. The Proposed Action modeling predicts concentrations of all criteria 18 pollutants to be below the applicable AAQS and minimal levels of mercury deposition. It is anticipated 19 that impacts under the No Action Alternative would be similar to, or less than, impacts under the 20 Proposed Action. No substantial adverse effect would occur under the No Action Alternative, and air 21 quality effects would be short-term. 22
Table 3.10-7 Total Emissions Inventory for the No Action Alternative
Project Year
PM10 (tpy)
PM2.5 (tpy)
CO (tpy)
NOX (tpy)
SO2 (tpy)
VOC (tpy)
Mercury (tpy)
Total 1 HAPs
(tpy) GHG
(tpy CO2e) 1 1,017.2 227.5 3,086.8 3,090.6 11.7 526.4 0.1 14.6 333,508.9
2 1,017.2 227.5 3,086.8 3,090.6 11.7 526.4 0.1 14.6 333,508.9
3 1,017.2 227.5 3,086.8 3,090.6 11.7 526.4 0.1 14.6 333,508.9
4 1,017.2 227.5 3,086.8 3,090.6 11.7 526.4 0.1 14.6 333,508.9
5 163.9 39.1 713.2 708.6 0.7 119.7 0.0 3.0 64,233.0
6 163.9 39.1 713.2 708.6 0.7 119.7 0.0 3.0 64,233.0
7 163.9 39.1 713.2 708.6 0.7 119.7 0.0 3.0 64,233.0 1 Mercury is included in the total HAPs. Source: AECOM 2017.
3.10.5 Cumulative Impacts 23
The CESA for air quality is shown in Figure 3.10-5. Past and present actions and RFFAs are identified in 24 Table 2-12 and shown in Figure 2-22. 25


Deep South Expansion Project EIS 3.10 – Air Quality 3.10-25
Draft EIS 2018
To quantify cumulative air impacts, major sources of air emissions located within the air quality 1 cumulative effect study area were included in the modeling analysis conducted by Air Sciences Inc. 2 (2017b) The major sources of air emissions located within the CESA include the potential future 3 Goldrush Project and the existing Fire Creek Project. Although the Goldrush Project is currently only in 4 the exploration phase, emissions from maximum production were estimated based on the Air Sciences 5 Inc. (2017b) Technical Memorandum describing the Goldrush Project as a RFFA, along with the 6 associated best currently available information. If permitted and developed, the Goldrush Project would 7 consist of an underground mine, with ore and waste rock transported off-site for storage and processing. 8 The Technical Memorandum for the Goldrush Project RFFA describes the use of either rail or trucks for 9 transporting the ore and waste rock to the CGM Operations Area facilities for storage. The refractory ore 10 then would be trucked to an off-site processing facility (Air Sciences Inc. 2017b). The emissions from the 11 off-site processing also are included in the CESA. 12
3.10.5.1 Proposed Action 13
Emission Inventory 14
The emissions for nearby source emissions used for this cumulative impact analysis are provided in 15 Table 3.10-8. The emissions from the potential future Goldrush Project were estimated assuming only 16 truck transport of ore to provide a conservatively high estimate of potential emissions. The Fire Creek 17 Project emissions were obtained from the Fire Creek Mine Project EA (BLM 2015a). 18
Table 3.10-8 Emissions from On-site Operations at Nearby Sources
PM2.5 PM10 CO NOX SO2 Nearby Source (tpy) (tpy) (tpy) (tpy) (tpy)
Goldrush Project 24 105.9 239.3 260.9 1.6
Fire Creek Project 2.4 15.2 58.3 12.7 0.75
Source: Air Sciences Inc. 2017b.
The cumulative emissions for the off-site transport and processing of refractory ore would include the ore 19 transport and processing under the Proposed Action, No Action Alternative, and potential future 20 Goldrush Project. In addition to the off-site refractory ore transport and processing discussed for the 21 Proposed Action and No Action Alternative, the potential future Goldrush Project would transport up to 22 1.8 million tpy of refractory ore to the Goldstrike Mine for processing. The cumulative emissions for these 23 activities are summarized Table 3.10-9. The emissions were calculated using the same methods as 24 discussed for the Proposed Action. 25
Table 3.10-9 Emissions from Off-site Ore Transport and Processing
Total
Activity PM10 (tpy)
PM2.5 (tpy)
CO (tpy)
NOX (tpy)
SO2 (tpy)
Mercury (tpy)
HAPs (tpy)
CO2e (mtpy)
Off-site ore Transport 262.4 50.9 25.0 102.4 0.27 0.0755 5.1 28,790
Off-site ore Processing 83.6 35.2 25.4 66.1 33.57 -- -- 181,823
Source: Air Sciences Inc. 2017b.

Deep South Expansion Project EIS 3.10 – Air Quality 3.10-26
Draft EIS 2018
Modeling 1
Cumulative modeling was conducted for five of the criteria air pollutants (i.e., PM10, PM2.5, CO, NO2, and 2 SO2). Results of the cumulative impact analysis for the two modeled Proposed Action operating 3 scenarios 1 and 2 are provided in Tables 3.10-10 and 3.10-11, respectively. As shown in the tables, the 4 estimated total concentrations (sum of cumulative impact and background concentration) using the 5 NDEP-Bureau of Air Pollution Control recommended background concentrations are less than the 6 applicable AAQS for each pollutant and averaging period for the both modeled scenarios. Similarly, 7 using the alternative background concentrations based on monitoring stations in other areas of remote 8 Nevada show that predicted cumulative impacts are below the applicable AAQS for each modeling 9 scenario (Air Sciences Inc. 2017b). 10
The same methods as described under the Proposed Action for estimating impacts from processing of 11 CGM Operations Area refractory ore at the Goldstrike Mill were used for the cumulative impacts 12 analysis. As shown in Table 3.10-12, the total emissions and impacts from Goldstrike Mill operations are 13 all well below the AAQS. Because refractory ore from the CGM Operations Area and Goldrush Project 14 would displace a portion of the Goldstrike ore throughput, the estimated cumulative impacts shown in 15 Table 3.10-12 are not additive to the total Goldstrike impacts. The estimated cumulative impacts shown 16 in the table would be well below the AAQS. Additionally, adding estimated cumulative impacts to the total 17 Goldstrike impacts as a worst-case assumption would not result in a total impact that would exceed the 18 AAQS. No substantial adverse effect would occur, and air quality effects would be short-term. 19
Mercury Impacts 20
Following the same methods as used to estimate the Proposed Action impacts, it is estimated that the 21 mercury deposition from processing refractory ore from both the CGM Operations Area and Goldrush 22 Project at the Goldstrike Mill would account for approximately 26 percent of the total deposition impact 23 attributed to the total mercury emissions modeled for Goldstrike. For example, it is estimated that 24 mercury deposition associated with processing CGM Operations Area and Goldrush Project refractory 25 ore at the Goldstrike Mill would contribute 2.6 percent of the global background at the Willow Creek 26 Reservoir (32 km [19 miles] northwest of Goldstrike) and 0.21 percent of the global background at the 27 Wildhorse Reservoir (90 km [55.9 miles] northeast of Goldstrike). As noted previously, because the CGM 28 Operations Area and Goldrush Project refractory ore would displace a portion of the throughput at the 29 Goldstrike Mill, the cumulative impacts are not additive to the total Goldstrike impacts (Air Sciences Inc. 30 2017b). No substantial adverse effect would occur, and air quality effects would be short-term. 31
3.10.5.2 Gold Acres Pit Partial Backfill Alternative 32
Under the Gold Acres Pit Partial Backfill Alternative, potential cumulative impacts to air quality would be 33 similar to the Proposed Action. 34
3.10.6 Monitoring and Mitigation Measures 35
It is assumed that BCI would continue implementing the current meteorological monitoring programs at 36 the CGM Operations Area. No additional monitoring or mitigation measures have been identified, as no 37 significant impacts to air quality are predicted as a result of the proposed project. 38
3.10.7 Residual Adverse Impacts 39
There would be no residual adverse impacts to air quality from the proposed project since reclamation 40 and revegetation would stabilize exposed soil and control fugitive dust emissions. As vegetation 41 becomes established, particulate levels should return to what is typical for a dry desert environment. 42 Once the disturbance ceases and wind erodible surfaces are reclaimed, the resource would return to 43 approximately its pre-mining condition. 44

Deep South Expansion Project EIS 3.10 – Air Quality 3.10-27
Draft EIS 2018
Table 3.10-10 Scenario 1 (Mining Year 1) Cumulative Impact Analysis Results
Pollutant Averaging
Period
Modeled Cumulative
Impact 3)1(μg/m
Total Concentrations NDEP Background
Values (μg/m3)
Total Concentrations Alternate Background
Values 3)2(μg/m Applicable
AAQS (μg/m3)
Compliance with
Applicable AAQS
Background 2Value
Total Impact
Background 2Values
Total Impact
CO 38-hour 194.0 0.0 194.0 801.4 995.4 10,000 Yes 31-hour 653.8 0.0 653.8 1,030.4 1,684.2 40,000 Yes
NO2 Annual 11.1 0.0 11.1 1.9 13.0 100 Yes
41-hour 107.2 0.0 107.2 9.2 116.4 188 Yes
PM2.5 Annual 1.2 2.3 3.5 2.3 3.5 12 Yes
524-hour 4.5 8.0 12.5 8.0 12.5 35 Yes
PM10 324-hour 26.8 10.2 37.0 10.2 37.0 150 Yes
SO2 33-hour 0.6 0.0 0.6 0.5 1.1 1,300 Yes 61-hour 0.3 0.0 0.3 0.7 1.0 196 Yes
1
2
3
4
5
6
BCI 2017.
Air Sciences Inc. 2017b.
Highest-second-high modeled concentration.
Highest-eighth-high daily maximum 1-hour modeled concentration. Highest-eighth-high modeled concentration.
Highest-fourth-high modeled concentration.
Table 3.10-11 Scenario 2 (Mining Year 3) Cumulative Impact Analysis Results
Pollutant Averaging
Period
Modeled Cumulative
Impact 3) 1(μg/m
Total Concentrations with NDEP Background
Values 3)1(μg/m
Total Concentrations with Alternate
Background Values (μg/m3) Applicable
AAQS (μg/m3)
Compliance with
Applicable AAQS
Background 2Values
Total Impact
Background 2Values
Total Impact
CO 38-hour 194.0 0.0 194.0 801.4 995.4 10,000 Yes 31-hour 653.8 0.0 653.8 1,030.4 1,684.2 40,000 Yes
NO2 Annual 11.0 0.0 11.0 1.9 12.9 100 Yes
41-hour 125.2 0.0 125.2 9.2 134.4 188 Yes
PM2.5 Annual 1.2 2.3 3.5 2.3 3.5 12 Yes
524-hour 4.5 8.0 12.5 8.0 12.5 35 Yes
PM10 324-hour 26.8 10.2 37.0 10.2 37.0 150 Yes
SO2 33-hour 0.6 0.0 0.6 0.5 1.1 1,300 Yes 61-hour 0.3 0.0 0.3 0.7 1.0 196 Yes
1
2
3
4
5
6
BCI 2017.
Air Sciences Inc. 2017b.
Highest-second-high modeled concentration.
Highest-eighth-high daily maximum 1-hour modeled concentration. Highest-eighth-high modeled concentration.
Highest-fourth-high modeled concentration.

Deep South Expansion Project EIS 3.10 – Air Quality 3.10-28
Draft EIS 2018
Table 3.10-12 Emissions and Impacts from Processing Refractory Ore from the CGM Operations Area and Goldrush Project at the Goldstrike Mill
Pollutant Averaging
Period
Total Goldstrike Emissions and Impacts
Cumulative Processing Emissions and Impacts
Applicable AAQS (μg/m3)
Emissions (tpy)
Modeled Impact (μg/m3)1
Emissions (tpy)
Estimated Modeled Impact
(μg/m3)1
CO 8-hour
400 38.25
25.37 2.43 40,000
1-hour 216.49 13.73 10,000
NO2 Annual
311 0.83
66.11 0.18 188
1-hour 10.382 2.21 100
PM2.5 Annual
ND3 ND3 35.19 0.654 35
324-hour 1.014 12
PM10 Annual
579 10.62
83.55 1.53 NA
24-hour 16.65 2.40 150
SO2 3-hour
996 13.03
33.57 0.44 196
1-hour 14.482 0.49 1,300 1 BLM 2008a. 2 Estimated using the SCREEN3 scaling ratios provided in the AERSCREEN User’s Guide. 3 No data. 4 Cumulative ore processing PM2.5 impacts are based on the Goldstrike PM10 data. Source: Air Sciences Inc. 2017b

Deep South Expansion Project EIS 3.11 – Land Use and Access 3.11-1
Draft EIS 2018
3.11 Land Use and Access 1
3.11.1 Affected Environment 2
The project study area for land use encompasses the proposed new disturbance areas within and 3 outside the proposed CGM Operations Area boundary and the immediate area within approximately 4 2 miles of the boundary. The project study area for access encompasses the proposed CGM Operations 5 Area boundary and the primary access roads between the project area and the Goldstrike Mine. The 6 CESA for both land use and access encompasses the past and present actions and RFFAs within a 7 30-mile radius of the proposed project, and for access, the primary access roads in the area and 8 between the project area and the Goldstrike Mine (SRs 306 and 766 and I-80). 9
3.11.1.1 Land Use 10
The proposed project is within the jurisdiction of the BLM Shoshone-Eureka RMP (BLM 1986b). The 11 area also is covered by several Lander County plans and regulations, including the Policy Plan for 12 Federally Administered Lands (Lander County 2005), the Lander County Master Plan (Lander County 13 2010), and Lander County Zoning Regulations (Lander County 2013). A small portion of the CGM 14 Operations Area extends into Eureka County, where it falls under the administration of the BLM Elko 15 RMP (BLM 1987, 1986a) administered by the BLM’s Elko Field Office. Eureka County also has a Master 16 Plan (Eureka County 2010), although it provides only general policy guidance and not site-specific 17 control. The applicable management goals of the RMPs and policies and goals identified in the county 18 plans are discussed in Section 1.2, Relationship to BLM and Non-BLM Policies, Plans, and Programs. 19 Also, existing landownership is shown in Figure 1-2 and discussed in Section 2.4.2, Land Ownership 20 and Mining Claims. 21
The BLM Shoshone-Eureka RMP (BLM 1986b), which covers the vast majority of land within the CGM 22 Operations Area boundary, provides that the public lands therein will be open for mining and prospecting 23 unless withdrawn or restricted from mineral entry (see Section 1.2.2, BLM Resource Management Plan). 24 No such withdrawals or restrictions occur within the CGM Operations Area boundary. 25
The Lander County 2005 Policy Plan for Federally Administered Lands emphasizes the county’s support 26 for, and dependence on, mineral resources development. Specifically, Policy 13-1 states: “Retain 27 existing mining areas and promote the expansion of mining operations and areas.” Policy 13-4 28 recommends that federal land management agencies “continue to enforce existing reclamation 29 standards to ensure there is no undue degradation of the federally administered lands.” Policy 13-6 30 recommends that existing reclamation standards should be enforced and should be consistent with the 31 “best possible post mine use for each specific area.” 32
The CGM Operations Area is zoned A-3, Farm and Ranch District, under Lander County’s zoning code 33 (Lander County 2013). The A-3 zone requires the proponent of a mining project to obtain a Special Use 34 Permit from the County Planning Commission; however, a Special Use Permit is not needed for the 35 proposed project as it is an expansion/modification of existing facilities and operations (Morrison 2017). 36 The Lander County Master Plan (Lander County 2010) is policy-oriented and general in nature, focusing 37 primarily on the areas in and around the county’s three major communities. The plan is only generally 38 applicable to the project study area. 39
The Elko RMP (BLM 1986a) states that the objective for minerals is to “maintain public lands open for 40 exploration, development, and production of mineral resources while mitigating conflicts with wildlife, wild 41 horses, recreation, and wilderness resources.” To that end, the entire Elko Resource Area was 42 designated “open to mineral entry for locatable minerals, except for an 11 acre administrative site in the 43 City of Elko” (BLM 1987). 44

Deep South Expansion Project EIS 3.11 – Land Use and Access 3.11-2
Draft EIS 2018
Mining constitutes the dominant land use in the Shoshone Range, the northern Toiyabe Range, and the 1 Cortez Mountains surrounding the south end of Crescent Valley. In addition to BCI’s existing operations, 2 several other mining companies have operated mines in the area or conducted exploration activities, 3 primarily in the Shoshone Range. 4
There are no Indian Reservations within the CGM Operations Area boundary; however, BLM initiated 5 government-to-government consultation for the proposed project with the applicable tribal groups in 6 June 2015. Consultation is ongoing (see Section 3.9, Native American Traditional Values). 7
Livestock grazing is an established use in the area surrounding the project study area, particularly in 8 Crescent Valley and in some foothills areas (see Section 3.6, Range Resources). The land use study 9 area is part of the Carico Lake, Grass Valley, and South Buckhorn allotments. There also is some hay 10 production in Crescent Valley and irrigated pasture in Carico Lake Valley. Additionally, dispersed outdoor 11 recreation consisting of hunting, camping, limited OHV use, sightseeing, photography, hiking, rock 12 climbing, and visiting old mining camps occurs on a seasonal basis. The Cortez townsite, adjacent to the 13 CGM Operations Area boundary, is the nearest historic mining camp. Several residences, a cemetery, 14 and the remnants of mining structures remain on the site. There are eight WSAs, and a portion of 15 another WSA, within a 50-mile radius of the proposed project and project activities. Of the eight, the 16 Roberts Mountain WSA was recommended for wilderness status, and Congress has not yet acted on 17 recommendations for the North Fork of the Little Humboldt River WSA, Little Humboldt WSA, and Red 18 Springs WSA (see Section 3.12, Recreation and Wilderness). Irrigated prime farmland and other 19 irrigated lands occur in a small portion of the study area (see Section 3.3, Soils and Reclamation). 20
Existing ROWs and other land use authorizations in the project vicinity are summarized in Table 3.11-1 21 and shown in Figure 3.11-1. Information on these authorizations was derived from BLM Master Title 22 Plats. In addition to the listed ROWs, there is a gravel surfaced road traversing the study area in a north-23 south direction through Copper Canyon (see Section 3.11.1.2, Access). 24
Table 3.11-1 Land Use Authorizations and Rights-of-Way in the Project Vicinity
Serial Number Grantee Description
Location Row Width (feet) Township Range Section
N-48321 Sierra Pacific Power Company
60-kV overhead power line and substation
27N 26N
48E 46E
7, 18, 19, 30, 31 6, 7, 17, 18, 19, 20
80
N-61182 Cortez Joint Venture
13.5-kV transmission line
27N 27N
47E 46E
6 1, 12, 13, 14, 22, 23
25
N-30650 Nevada Bell Buried telephone line
27N 27N
46E 47E
13, 21, 22, 23, 24 5, 7, 8, 18
10
N-2434 Sierra Pacific Power Company
Transmission line
28N 27N
47E 47E
24, 25, 36 1, 12, 13, 24
40
N-43670 Cortez Joint Venture
Gold Acres Haul Road
28N 27N
47E 47E
31 5, 6, 8, 9, 10, 14, 15, 23, 24
125
N-7803 Nevada Bell Telephone line 28N 27N
47E 47E
31 5, 6, 8, 9, 10, 14, 15, 23, 24
20
N-58510 Lander County CR 225 27N 47E 7, 8, 9, 10, 18 60
R-4269 NA Windmill 27N 47E 8 NA
N-2615 Sierra Pacific Power Company
23-kV Transmission line
28N 47E 13, 14, 23 25

Deep South Expansion Project EIS 3.11 – Land Use and Access 3.11-3
Draft EIS 2018
Table 3.11-1 Land Use Authorizations and Rights-of-Way in the Project Vicinity
Location Row Serial Width
Number Grantee Description Township Range Section (feet) NEV-0- Nevada SR 306 28N 47E 15, 21, 22, 28, 29, 30 400 44669 Department of
Transportation
N-56088 Sierra Pacific 120-kV 28N 47E 28, 29, 30 80 Power Company transmission
line N-2616 Nevada Bell Overhead 28N 47E 24 20
telephone line 27N 48E 5, 8, 17, 18, 19 28N 48E 6, 18, 19, 20, 29, 32 29N 48E 20, 30
N-60542 Lander County SR 306 28N 47E 28, 29, 30 150
N-61283 Placer Dome Geothermal 28N 47E 31, 32 NA lease
N-7348 Cortez Joint 23-kV 28N 47E 13, 14, 22, 23, 27, 28, 31, 32, 25 Venture overhead 33, 34
transmission line
N-46805 Cortez Joint Road 27N 46E 22, 27, 34 60 Venture
N-54304 Nevada Bell Buried fiber 27N 48E 19 10 optic cable
N-92012 BCI Buried fiber 26N 47E 29, 32 20 optic cable 25N 47E 3, 10, 11, 12, 13, 14, 15
25N 49E 4, 5, 6, 7 26N 49E 25, 33, 34, 35, 36 26N 50E 27, 28, 29, 30, 34, 35, 36 26N 51E 31
N-54632 Sierra Pacific 60-kV 27N 48E 18 50 Power Company overhead
transmission line
N-61689 AT&T Mobility, Communicatio 28N 47E 31 100 X LLC/AT&T n site 100 Network Real Estate Admin.
N-65729 Cortez Joint Water pipeline 28N 47E 14, 15, 21, 22, 27, 28, 32, 33 20 Venture
N-74768 Nevada Bell Buried fiber 28N 47E 25, 36 20 optic cable 27N 47E 1, 7, 8, 9, 10, 11, 12, 18
27N 46E 13, 22, 23, 24 N-73991 Cortez Joint Geothermal 27N 47E 31, 32 NA
Venture lease R-0191 NA Improved 27N 48E 19 NA
spring
R-4410 NA Fence 26N 48E 19 NA Source: BLM 2015a, 2008.

Deep South Expansion Project EIS 3.11 – Land Use and Access 3.11-4
Draft EIS 2018
to the west and Elko, Nevada, and Salt Lake City, Utah, to the east. I-80 is approximately 35 miles north 1 of the CGM Operations Area. 2
SR 306 provides access to the project vicinity from I-80 through Beowawe and the Town of Crescent 3 Valley (Figure 2-15). SR 306 is a paved, two-lane highway designated by NDOT as a “major collector” 4 north of Crescent Valley and a “minor collector” south of Crescent Valley (NDOT 2017). SR 306 ends at 5 the existing BCI headquarters parking area. SR 766 provides access to the Barrick Goldstrike mine north 6 from I-80 initiating at the town of Carlin. SR 766 is a paved, two-lane highway designated as a “major 7 collector” by the NDOT (NDOT 2017). 8
CR 225 provides access into the center of the CGM Operations Area from SR 306 (Figure 2-3). On the 9 south side of the Pipeline Complex, CR 225 connects with CR 222 which heads southward through 10 Copper Canyon and continues approximately 55 miles through Grass Valley to U.S. Highway 50 just 11 east of Austin, Nevada. There also is county road access from Grass Valley east across Garden Gate 12 Pass connecting with SR 278. From the intersection with CR 222, CR 225 heads southwesterly along 13 the south side of the existing Pipeline Complex and crosses Rocky Pass through the BCI-owned Filippini 14 Ranch into Carico Lake Valley. The county roads are gravel surfaced and in good to excellent condition 15 elsewhere. 16
Existing traffic conditions on SR 306 near the CGM Operations Area are at a level of service (LOS) “A.” 17 (See Section 3.11.2.1 for a discussion of LOS.) Traffic volumes on that section of roadway averaged 18 750 vehicles per day in 2015, which was 16 percent higher than the 10-year average (Table 3.11-2). 19 Existing traffic conditions on SR 766 near Barrick’s Goldstrike mine north of Carlin are at a LOS “A.” 20 Traffic volume on SR 766 north of Carlin averaged 2,100 vehicles per day in 2015, which was 16 percent 21 less than the 10-year average. Existing traffic conditions on I-80 just west of Carlin also are at LOS “A.” 22 Traffic volumes on that section of roadway averaged 7,600 vehicles per day in 2015, approximately 23 5 percent above the 10-year average. 24
Table 3.11-2 Current and Historical Traffic Volume on Project Vicinity Roadways
Average Average Average 2015 Departure Annual Daily Annual Daily Annual Daily Change 2006- from 10-year
Traffic Traffic Traffic 2015 Average Road 2006 2010 2015 (percent) (percent)
SR 306 470 600 750 60 16
SR 766 2,650 2,500 2,100 -21 -16
I-80 7,250 7,600 7,600 5 3
Source: NDOT 2016.
3.11.2 Environmental Consequences 25
The Proposed Action or alternatives could affect land use and access both directly and indirectly. Direct 26 impacts may include the termination or modification of existing land uses or ROWs in the CGM 27 Operations Area boundary. Indirect impacts may result in altered land use patterns adjacent to or near 28 the CGM Operations Area boundary. Indirect impacts also would occur if the Proposed Action or 29 alternatives stimulated or encouraged the development of land uses not presently anticipated, or 30 conversely, precluded other planned or proposed uses. Direct impacts to access may occur if project-31 related traffic affects the capacity of the roadway systems. 32


Deep South Expansion Project EIS 3.11 – Land Use and Access 3.11-6
Draft EIS 2018
This page intentionally left blank

Deep South Expansion Project EIS 3.11 – Land Use and Access 3.11-7
Draft EIS 2018
Environmental impacts to land use and access would be considered significant if the Proposed Action or 1 other action alternatives result in any of the following: 2
• Changes to land use patterns that would threaten the economic viability of existing private 3 enterprises or uses of public lands (e.g., livestock grazing) operating under existing land use 4 authorizations. 5
• Incapability or inconsistency with land use plans, regulations, or policies adopted by local, state, 6 or federal governments. 7
• A substantial increase in traffic in relation to the existing traffic load and capacity of the roadway 8 system, as measured by compliance with the LOS planning standard for rural highways of 9 LOS D during peak hour periods. 10
• Elimination or severe restriction of public access on existing routes of travel. 11
Effects to land use and access are discussed in terms of intensity, duration, and context as defined 12 below. 13
Intensity 14
• Negligible: No effects to existing land uses or temporary changes to land use in limited areas. 15 No measurable effects public access or LOS. 16
• Minor: Temporary changes in existing land uses over most of the project study area. Short-term 17 effects to public access or LOS may occur. 18
• Moderate: Permanent changes in existing land uses in limited areas. Long-term effects to public 19 access or LOS would occur but effects would not require mitigation. 20
• Major: Permanent changes in existing land uses over most of the project study area. Long-term 21 effects to public access or LOS would occur and would require mitigation. 22
Duration 23
• Short-term: 3 months or less. 24
• Long-term: Greater than 3 months. 25
Context 26
• Localized: Effects would be limited to the project study area. 27
• Regional: Effects would extend beyond the project study area. 28
3.11.2.1 Proposed Action 29
Land Use 30
The modified CGM Operations Area boundary would encompass a total of approximately 62,372 acres, 31 including 58,436 acres (94 percent) of BLM-managed public land and 3,936 acres (6 percent) of BCI-32 owned private lands. Of the 3,846 acres of proposed new surface disturbance within the modified CGM 33 Operations Area, approximately, 2,779 acres (72 percent) would occur on public land. The remainder of 34 the proposed disturbance within the CGM Operations Area, and the approximately 534 acres of 35 proposed surface disturbance outside of the CGM Operations Area, would occur on BCI-owned private 36 land. 37
The Proposed Action would be consistent with BLM plans and policies that designate land use within the 38 CGM Operations Area boundary as open for mineral exploration and development, as articulated in the 39 Shoshone-Eureka Resource Area RMP (BLM 1986b) and the Elko RMP (BLM 1986a).The Proposed 40

Deep South Expansion Project EIS 3.11 – Land Use and Access 3.11-8
Draft EIS 2018
Action would be consistent with Lander County’s preference for continued mineral development 1 expressed in the 2005 Policy Plan for Federally Administered Lands (Lander County 2005). Mining-2 related activities on private lands would be consistent with the Lander County Master Plan (Lander 3 County 2010) and Zoning Ordinance (Lander County 2013), as well as the Eureka County Master Plan, 4 with implementation of any required mitigation (Eureka County 2010). The Proposed Action thus would 5 comply with adopted plans and policies of potentially affected governmental entities. 6
Currently, there is little public use of the study area. As noted above, there is some grazing under the 7 permit stipulations of the Carico Lake, Grass Valley, and South Buckhorn allotments, and there is a 8 modest amount of dispersed recreation use, including visits to the remnants of the historic Cortez 9 townsite. The Cortez cemetery, located within private land near the historic Cortez townsite, periodically 10 is visited by family members of those buried there. There also is some use of roads within the study area 11 by Native Americans for access to other areas for various purposes as discussed in Section 3.9, Native 12 American Traditional Values. The largest numbers of public users are most likely travelers on CR 222 13 moving between I-80 and Grass Valley. 14
The total proposed surface disturbance on approximately 4,380 acres within and outside of the CGM 15 Operations Area would reduce the amount of land available for livestock grazing, although the loss 16 would be small in the context of the area (see Section 3.6, Range Resources). Although dispersed 17 recreation is currently excluded on the approximately 534 acres of proposed disturbance outside of the 18 CGM Operations Area on the BCI-owned Dean Ranch, the approximately 3,846 acres of proposed 19 disturbance within the CGM Operations Area would reduce dispersed recreation to a small extent (see 20 Section 3.12, Recreation and Wilderness). The proposed Rocky Pass Reservoir would be constructed 21 as a temporary facility to contain excess dewatering water during operations and would occupy 22 approximately 1,677 acres. A portion of existing Lander CR 225 would be realigned to provide for public 23 access around the reservoir. Construction and operation of the Rocky Pass Reservoir temporarily would 24 preclude current irrigated pasture or alfalfa (or other crop) production activities in northern Carico Lake 25 Valley (see Section 3.4, Vegetation). 26
Under the Proposed Action, the existing 120-kV power line that currently crosses the existing Cortez 27 Waste Rock Facility may be re-routed along the perimeter of the expanded waste rock facility. This 28 power distribution line is not part of the Nevada Energy power line ROW and would be removed during 29 mine closure and final reclamation. 30
Approximately 4,123 acres of the total proposed disturbance would be reclaimed, with post-reclamation 31 land uses returned to open space, grazing, agriculture, dispersed recreation, and wildlife habitat. These 32 post-mining land uses would be consistent with local and BLM land use plans and guidelines. The 33 remaining 257 acres of proposed disturbance would be associated with open pit modifications, the CR 34 225 reroute, and proposed post-mining water management features that would not be reclaimed, 35 resulting in a permanent change in use. A permanent change in use also would occur on 474 acres of 36 currently authorized disturbance that would be reallocated for open pit development. BCI has committed 37 to constructing barriers around the unreclaimed pits for the safety of the public where it would be safe 38 and practical to do so. 39
Overall, project-related effects to land use would be moderate. The effects would be long-term and 40 localized. 41
Access 42
Traffic generated by the Proposed Action would include ongoing BCI employee commuter traffic, new 43 contract worker commuter traffic, ongoing material deliveries, and increased off-site refractory ore 44 transport to the Goldstrike Mill for processing and backhaul of Arturo Mine oxide ore to the Pipeline 45 Complex for processing. Existing BCI employees currently live in the communities of Crescent Valley, 46 Beowawe, Battle Mountain, Carlin, Elko, and Spring Creek. For analysis purposes, it is assumed that 47

Deep South Expansion Project EIS 3.11 – Land Use and Access 3.11-9
Draft EIS 2018
most of the BCI employees living beyond Crescent Valley would continue to commute in company 1 contracted busses. Additional contractor commuter traffic predominately would consist of automobiles 2 and pickup trucks. Ongoing material deliveries primarily would employ heavy trucks and tractor-trailer 3 rigs. Ore transport would be conducted using over-the-road truck and trailer units. The existing BCI 4 employee commuter traffic and ongoing material deliveries are reflected in the 2015 data presented in 5 Table 3.11-2, and were factored in as part of the background traffic by Matrix Design Group (2017a) in 6 projecting anticipated future traffic levels. 7
Highway traffic effects of the Proposed Action were analyzed using techniques promulgated in the 8 Highway Capacity Manual (Transportation Research Board [TRB] 2000). The standard measure of traffic 9 flow from the Highway Capacity Manual is the LOS for a given segment of roadway. LOS is a method of 10 qualitatively measuring the operational conditions of traffic flows on roadways, and the perception of 11 those conditions by motorists and passengers (TRB 2000). Levels of service are rated A through F; A 12 generally represents free flowing traffic conditions with few restrictions, and “F” represents a “forced or 13 breakdown” flow with queues forming and traffic volumes exceeding theoretical capacity of the roadway 14 (TRB 2000). Generally, level E represents traffic volumes at the capacity of the roadway. 15
Under the Proposed Action, BCI would increase the off-site refractory ore haulage rate from the CGM 16 Operations Area to the Goldstrike Mill for processing from 1.2 to 2.5 million tpy. Also, the backhaul of 17 Arturo Mine oxide ore to the CGM Operations Area would increase from 600,000 to 2.5 million tpy. To 18 facilitate the increase in haulage rates, the truck trip rate would increase from the current 9 round-trips 19 per hour to 18 round-trips per hour. No change in the shipping route or shipping duration would occur 20 under the Proposed Action. 21
Matrix Design Group (2017a) evaluated the potential transportation-related impacts associated with the 22 proposed increase in off-site refractory ore transport to the Goldstrike Mill and backhaul of Arturo Mine 23 oxide ore to the CGM Operations Area, with an assumed peak transport year of 2032. Based on the 24 evaluation, the anticipated 2032 peak hour increases in vehicle trips (including background traffic growth) 25 as compared to 2015 traffic levels include a 21 percent increase in traffic levels on SR 306, a 12 percent 26 increase on SR 766, and an 11 percent increase on I-80. It is estimated that the percent of heavy vehicle 27 traffic on SRs 306 and 766 would increase from 20 percent to 30 percent and from 14 percent to 28 16 percent, respectively. The heavy vehicle traffic on I-80 is projected to remain static at 34 percent of 29 the total traffic volume. 30
The current LOS on SR 306 is LOS A and (for one segment) B during the peak morning and afternoon 31 hours, respectively, and I-80 is LOS A during both peak hours, indicating free flowing or stable traffic flow 32 with a high degree of freedom to maneuver and select desired speed. The current LOS on SR 766 is 33 LOS C during the morning peak hour and a LOS A during the afternoon peak hour. Matrix Design Group 34 (2017a) reported that although most segments of these roadways would retain a LOS A, the LOS on 35 some segments would decrease slightly from LOS A to B. At LOS B, traffic flow would still be within 36 acceptable levels. The LOS on SR 766, however, would drop from C to D during the morning peak hour. 37 This would result in a brief period of high density traffic flow that would restrict speed and freedom of 38 movement. However, the decrease to LOS D would be short lived as the LOS would return to A during 39 the afternoon peak hour, indicating free-flowing traffic. It is estimated that the Proposed Action would 40 only add 2 percent to the projected future traffic volume on SR 766, indicating that the majority of traffic 41 growth on this roadway would stem from increased background traffic growth. There would be no 42 change in the LOS at the I-80 on and off ramps for SRs 306 and 766. Additionally, SR 306 would retain a 43 LOS of A within the community of Crescent Valley during both the peak morning and afternoon hours 44 (Matrix Design Group 2017a). 45
Based on 2011 to 2014 data, crash rates on SRs 306 and 766 were 27 and 67 percent, respectively, 46 below the statewide average for similar roadways (Matrix Design Group 2017a). As reported by Matrix 47 Design Group (2017), it is anticipated that the proposed increase in off-site refractory ore transport to the 48 Goldstrike Mill and backhaul of Arturo Mine oxide ore to the CGM Operations Area would not adversely 49

Deep South Expansion Project EIS 3.11 – Land Use and Access 3.11-10
Draft EIS 2018
impact the safety on SRs 306 and 766. Crash rates for the section of I-80 within the ore transportation 1 route currently are 53 percent higher than the statewide average for a rural interstate. This can be 2 attributed in part to the ascent and descent of Emigrant Pass which translates into more horizontal and 3 vertical road curvature than what is typical on most rural interstates in Nevada (Matrix Design Group 4 2017a). Although the crash rate along this portion of the ore transportation route is higher than other 5 rural interstates in the state, LOS would remain at A under the Proposed Action, indicating an elevated 6 level of highway capacity and free-flowing traffic. Furthermore, the 2032 estimated heavy vehicle 7 percentage of traffic is expected to be the same as existing levels on this stretch of highway (Matrix 8 Design Group 2017a). 9
General light traffic from the new contractor work force conservatively has been assumed to include 10 350 round-trips per day (i.e., one vehicle per new contract worker). For purposes of analysis, it assumed 11 that approximately 15 percent (53 round-trips) of that traffic would occur during the morning and evening 12 peak traffic hours. The contractor work force is anticipated to commute from local communities and 13 would utilize I-80 and SR 306. Matrix Design Group (2017a) did not evaluate the additional contractor 14 traffic; however, impacts from the proposed increase in off-site refractory ore transport to the Goldstrike 15 Mill and back haul of Arturo Mine oxide ore to the CGM Operations Area, in conjunction with the 16 anticipated background rise in regional traffic, were analyzed. Based on the evaluation, the anticipated 17 peak hour increases in vehicle trips (including background traffic growth) would not change the LOS on 18 I-80 or SR 306. These would remain at LOS A and, for one segment on SR 306, LOS B. The further 19 increase of an estimated 53 contractor round-trips consisting of automobiles and pickup trucks would 20 add approximately 9 percent and 29 percent to I-80 and SR 306 peak traffic flow, respectively. These 21 estimated increases would be modest and within the capacity of I-80 and SR 306, resulting in no 22 constraints to the free-flowing nature of the highways. 23
Under the Proposed Action, a portion of Lander CR 225 would be rerouted to provide for public access 24 around the proposed Rocky Pass Reservoir. Although the road is lightly used by the public, public 25 access would be maintained during construction of the CR 225 reroute segment. The realigned road 26 segment would be constructed in accordance with Lander County road standards and would remain as a 27 post-mining feature. No other reroutes or changes to current public access along existing roads 28 (including access to the Cortez cemetery) would occur under the Proposed Action. 29
Transportation safety issues related to highway traffic generated by the Proposed Action would be minor. 30 Development of the proposed project would have no effect on the major intersections. The increase in 31 the mix of heavy vehicles in the traffic stream would remain well within the capacity of the roadway as 32 noted above, and although the LOS would dip to D briefly during the morning peak hour on SR 766, it 33 would quickly recover to A. As such, any increase in the risk of traffic accidents would be minor and 34 proportional to the overall increase in traffic. 35
Overall, project-related effects on access would be minor. The effects would be long term and localized. 36
3.11.2.2 Gold Acres Pit Partial Backfill Alternative 37
Under the Gold Acres Pit Partial Backfill Alternative, potential impacts to land use and access would be 38 similar to those as described for the Proposed Action, with the following exception. The disturbance 39 footprint of the Gold Acres North Waste Rock Facility would be reduced, resulting in 4,308 acres of 40 proposed new disturbance. The land use and access on the 72 acres excluded from the proposed 41 disturbance area would remain in their current or approved conditions under this alternative. 42
3.11.2.3 No Action Alternative 43
Under the No Action Alternative, the proposed Deep South Expansion Project would not be developed, 44 and the associated impacts would not occur. Existing mining and processing operations and reclamation 45 activities in the current CGM Operations Area, as well as the current off-site transport of refractory ore to 46 the Goldstrike Mill for processing and backhaul of Arturo Mine oxide ore to the Pipeline Complex for 47

Deep South Expansion Project EIS 3.11 – Land Use and Access 3.11-11
Draft EIS 2018
processing, as described in Section 2.5.1.2, No Action Alternative, would continue under the terms of 1 current permits and approvals as authorized by the BLM and State of Nevada. 2
Land Use 3
Under the No Action Alternative, 16,700 acres of disturbance previously have been approved in the 4 CGM Operations Area. The associated impacts to land use were analyzed in prior NEPA documents for 5 the site (BLM 2015b, 2014, 2008, 2004, 2000, 1996). Based on these analyses, no conflicts with 6 governmental regulations or policies would be expected under this alternative. 7
Access 8
Most, if not all, of the traffic associated with the No Action Alternative already is occurring on the local 9 road network. It is being accommodated with no measurable adverse effect on the roads, and all roads 10 are well within their capacities to handle traffic. 11
3.11.3 Cumulative Impacts 12
The past and present actions and RFFAs in the CESA are identified in Table 2-12; their locations are 13 shown in Figure 2-22. The CESA for land use is shown in Figure 3.1-14; the CESA for access is shown 14 in Figure 3.10-5. 15
3.11.3.1 Proposed Action 16
Past and present actions in the CESA have a total associated surface disturbance of approximately 17 393,964 acres. RFFAs would disturb an estimated additional 51,529 acres for a total of approximately 18 445,493 acres of cumulative disturbance. The Proposed Action incrementally would add 4,380 acres 19 (approximately 1 percent) to the cumulative disturbance for a total of 449,873 acres. 20
The total cumulative disturbance, which is predominantly related to mineral development and, to a lesser 21 degree, agricultural development, would be consistent with Lander County and BLM plans, policies, and 22 ordinances. The foreseeable increases in agricultural irrigation and range development activities for 23 livestock grazing purposes would be expected to improve the economic viability of farming and ranching 24 in the CESA, partially or wholly offsetting the losses of grazing land from mineral development. 25
Traffic generation data for existing mineral development activities are unknown. However, most of these 26 actions previously have been approved or are affiliated with existing mining operations. Therefore, it is 27 assumed that the associated traffic is reflected in the current (2015) traffic levels as reported by the 28 Matrix Design Group (2017a) and discussed in Section 3.11.2.1. Matrix Design Group (2017b) evaluated 29 cumulative traffic levels and impacts associated with off-site ore transport to the Goldstrike Mill from both 30 the Proposed Action and the potential future Goldrush Project. Under the cumulative scenario, refractory 31 ore shipments to the Goldstrike Mill for processing between 2023 and 2032 would be approximately 32 4.3 million tpy. This would include the proposed 2.5 million tpy under the Proposed Action and a 33 projected 1.8 million tpy from the Goldrush Project. The projected combined trucking rate used in the 34 analysis was 30 round-trips per hour. Based on the Matrix Design Group (2017b) cumulative analysis, 35 the anticipated peak hour increases for 2032 (including background traffic growth) as compared to 2015 36 traffic levels would include a 39 percent increase in traffic levels on SR 306, a 17 percent increase on 37 SR 776, and a 16 percent increase on I-80. The projected effects on LOS for SR 306, SR 776, and I-80 38 would be the same as described for the Proposed Action in Section 3.11.2.1. The cumulative increase in 39 traffic is not anticipated to affect safety on these roadways (Matrix Design Group 2017b). 40
3.11.3.2 Gold Acres Pit Partial Backfill Alternative 41
Cumulative impacts to land use and access under this alternative would be the same as those described 42 for the Proposed Action, with the following exception. The Gold Acres Pit Partial Backfill Alternative 43

Deep South Expansion Project EIS 3.11 – Land Use and Access 3.11-12
Draft EIS 2018
incrementally would add 4,308 acres (approximately 1 percent) to the cumulative disturbance for a total 1 of 402,872 acres. 2
3.11.4 Monitoring and Mitigation Measures 3
Based on the conclusions of the impact analysis, no monitoring or mitigation measures would be 4 required for land use or access. 5
3.11.5 Residual Adverse Effects 6
Residual adverse effects to land use would include the permanent loss of approximately 731 total acres 7 of grazing and wildlife habitat and multiple use lands due to open pit modifications, the CR 225 reroute, 8 and proposed post-mining water management features (257 acres) and due to reallocation of currently 9 authorized disturbance to open pit development (474 acres), which would not be reclaimed. No residual 10 adverse effects to access have been identified. 11

Deep South Expansion Project EIS 3.12 – Recreation and Wilderness 3.12-1
Draft EIS 2018
3.12 Recreation and Wilderness 1
3.12.1 Affected Environment 2
The project study area for recreation encompasses the proposed new disturbance area within and 3 outside the CGM Operations Area boundary and the area within approximately 2 miles of the boundary, 4 plus a 5-mile-wide corridor centered on the transport route from the CGM Operations Area to the 5 Goldstrike Mine. The CESA for recreation encompasses an area that generally includes the southern 6 portions of Crescent Valley and the Cortez Mountains, the northern portion of Grass Valley, and portions 7 of the Shoshone and Toiyabe ranges; an approximately 5-mile-wide corridor centered on the transport 8 route from Goldstrike to the CGM Operations Area; plus the westernmost portion of Pine Valley and 9 northern portion of Carico Lake Valley. The project study area and CESA for wilderness encompass the 10 area within a 50-mile radius of the proposed project modifications and the Goldstrike Mine. 11
3.12.1.1 Recreation 12
There are no developed recreation facilities in or immediately surrounding the CGM Operations Area. 13 The nearest developed BLM facility is the Mill Creek Recreation Area, a small camping, fishing, and 14 picnicking area in the Reese River Valley, more than 35 air miles northwest of the proposed Deep South 15 Expansion Project (Recreation.gov 2014). The Town of Crescent Valley has a park with tennis and 16 basketball courts, a ball field, picnic areas, and a playground (Eureka County 2017). Many current BCI 17 employees live in Elko, Carlin, and Battle Mountain, all of which provide park and recreation facilities for 18 residents. 19
Dispersed outdoor recreation activities are the only recreation uses in the project vicinity. While BLM-20 managed public lands in the project vicinity generally are open for dispersed recreation use, mining 21 areas are fenced off for the protection of the public and to prevent interference with mining activities. 22 Dispersed recreation activities in and near the CGM Operations Area boundary are likely limited to 23 photography and sightseeing at the old Cortez townsite; hiking and camping; firewood collecting; rock 24 collecting; OHV use; and hunting for chukar, sage grouse, and mule deer. 25
According to a phone survey take in 1986 by the Nevada Division of State Parks (Nevada Department of 26 Conservation and Natural Resources – Division of State Parks 1992), the three main recreational 27 activities of Lander County residents are golfing, hunting, and fishing. The three main activities for 28 Lander County visitors are hunting, fishing, and gambling. For nearby counties, the major recreational 29 activities include hunting, fishing, camping, and water sports, as well as more urban activities, such as 30 golf and softball. Surveys conducted for the 2003 State Comprehensive Outdoor Recreation Plan 31 produced only data that does not differentiate Lander County activities from activities enjoyed statewide 32 (Nevada Department of Conservation and Natural Resources – Division of State Parks 2016). 33
3.12.1.2 Wilderness 34
In 1964 Congress established the National Wilderness Preservation System under the Wilderness Act. 35 Federal lands qualifying as wilderness must be designated by Congress through legislation. 36 Management agencies are charged to preserve the natural condition of these lands and provide 37 opportunities for primitive and unconfined wilderness experiences. 38
FLPMA directed the BLM to inventory and study its roadless areas for wilderness characteristics. To be 39 designated as a WSA, an area must encompass at least 5,000 acres of public lands, appear to have 40 been affected primarily by the forces of nature, and provide outstanding opportunities for solitude or 41 primitive and unconfined types of recreation. 42

Deep South Expansion Project EIS 3.12 – Recreation and Wilderness 3.12-2
Draft EIS 2018
In November 1980, the final inventory decision was made for most WSAs in Nevada. A total of 1 103 WSAs were identified and analyzed through the wilderness inventory. In October 1991, the BLM 2 Nevada State Office released the Nevada BLM Statewide Wilderness Report (BLM 1991) documenting 3 the rationale and recommendations for the WSAs. The criteria considered in developing the wilderness 4 recommendations included naturalness, solitude, primitive and unconfined recreation, and special 5 features. The report recommended wilderness designation of 1.9 million acres within 52 of the WSAs 6 and release of 3.2 million acres from WSA management. The President sent the report to Congress in 7 1992. Congress passed the Black Rock Desert – High Rock Canyon Emigrant Trails National 8 Conservation Area Act in December of 2000, which designated 10 new wilderness areas, primarily in the 9 northwest corner of Nevada (BLM 2003). There also have been subsequent actions in Lincoln and Clark 10 counties, but none of the WSAs within 50 miles of the study area have been addressed to date. 11 Currently the Shoshone-Eureka RMP of the Battle Mountain District does not address lands with 12 wilderness characteristics. Lands with wilderness characteristics will be addressed in the upcoming 13 Battle Mountain District RMP. In the interim, the Battle Mountain District (inclusive of the Mount Lewis 14 Field Office) manages the lands with wilderness characteristics for multiple use. 15
Nine WSAs are located within the CESA, including the Cedar Ridge WSA, China Mountain WSA, Tobin 16 Range WSA, Augusta Mountains WSA, Simpson Park WSA, Roberts Mountain WSA, North Fork of the 17 Little Humboldt River WSA, Little Humboldt River WSA, and Red Spring WSA (Figure 3.12-1). The 18 Roberts Mountain WSA was recommended for designation as wilderness in the Statewide Wilderness 19 Report, but the then Secretary of the Interior reversed the recommendation. Five of the WSAs (i.e., 20 Cedar Ridge, China Mountain, Tobin Range, Augusta Mountains, and Simpson Park) were 21 recommended for release from consideration for wilderness designation in the Statewide Wilderness 22 Report (BLM 2000). Congress has not yet acted on the recommendations for the North Fork of the Little 23 Humboldt River WSA, Little Humboldt WSA, or Red Springs WSA (BLM 2017). 24
The Cedar Ridge WSA (NV-010-088) encompasses 10,009 acres. It is located approximately 45 miles 25 northeast of the CGM Operations Area. It has high woodland product values, high potential for oil and 26 gas, and moderate potential for precious metals, uranium, and barite. Wilderness values are present, but 27 not considered outstanding, and management for wilderness would be difficult. On balance, other values 28 were considered more important than wilderness values in this WSA, and the entire acreage was 29 recommended for release from wilderness consideration (BLM 2000). 30
The China Mountain WSA (NV-020-406P) includes 10,358 acres surrounding 80 acres of private lands. 31 The China Mountain WSA is located just less than 50 miles northwest of the CGM Operations Area on 32 the east slope of the Tobin Range. The Statewide Wilderness Report (BLM 1991) recommendation for 33 the China Mountain WSA was to release all 10,358 acres for uses other than wilderness. The mineral 34 and geothermal potential were considered to outweigh the wilderness values (BLM 2000). 35
The Tobin Range WSA (NV-030-406Q) includes 13,107 acres of public lands surrounding 120 acres of 36 private lands. This WSA is located approximately 50 miles west-northwest of the CGM Operations Area 37 in eastern Pershing County. The recommendation for the Tobin Range WSA was to release all 38 13,107 acres for uses other than wilderness. Management emphasizing access to potential mineral 39 resources was selected over management as designated wilderness because of energy and mineral 40 resource potential (BLM 2000). 41
The Augusta Mountains WSA (NV-030-108) encompasses 89,372 acres of public lands with no state or 42 private in-holdings. It is located approximately 45 miles west-southwest of the CGM Operations Area at 43 the common junction of Pershing, Churchill, and Lander counties. The recommendation for the Augusta 44 Mountains WSA was to release all 89,372 acres for uses other than wilderness (BLM 1991). 45 Management emphasizing access to potential mineral resources was selected over management as 46 designated wilderness because of energy and mineral resource potential (BLM 2000). 47


Deep South Expansion Project EIS 3.12 – Recreation and Wilderness 3.12-4
Draft EIS 2018
The Simpson Park WSA (NV-060-428) includes 49,670 acres surrounding 80 acres of private in-1 holdings. It is located approximately 20 miles due south of the CGM Operations Area in the Simpson 2 Park Mountains straddling the Lander-Eureka County line. The Simpson Park WSA was recommended 3 to be released in its entirety for uses other than wilderness because of known barite deposits and high 4 potential for other minerals. In addition, there are numerous intrusions into the WSA including ROWs, 5 spring developments, and the private in-holdings that would make management for wilderness difficult. 6 Implementation of the proposed management recommendation would require use of all practical means 7 to avoid or minimize environmental impacts (BLM 2000). 8
The Roberts Mountain WSA (NV-060-541) encompasses 15,090 acres with no private in-holdings. The 9 WSA is located in the Roberts Mountains 20 miles southeast of the proposed project; it is the closest 10 WSA to the CGM Operations Area. The BLM recommended the entire 15,090 acres for designation as 11 wilderness based on “outstanding wilderness values not common in central Nevada,” including 12 naturalness, unusual vegetative communities, opportunities for primitive and unconfined recreation, 13 prominent Roberts Mountain Thrust geologic features, and unique paleontological probability. Although 14 the BLM recommendation was reversed by the Secretary of the Interior in 1992, a subsequent 15 settlement of a lawsuit provided that this and all other candidate wilderness areas would receive a “fresh 16 look” when Congress considers specific designation bills. The Roberts Mountain WSA is considered to 17 be manageable for wilderness over the long term (BLM 2000). 18
The North Fork of the Little Humboldt River WSA (NV-020-827) includes 69,683 acres surrounding 19 80 acres of private in-holdings. The WSA is located approximately 80 miles north-northwest of the CGM 20 Operations Area and approximately 45 miles northwest of the Goldstrike Mine. The BLM recommended 21 8,900 acres for designation as wilderness. The recommended area is primarily the Humboldt River 22 gorge, with a slight setback from the cliffs. The recommended acreage is “nearly void of human imprints 23 and has outstanding opportunities for primitive recreation.” The WSA also offers outstanding 24 opportunities for solitude, is associated with riparian habitat, and would protect two sensitive plant 25 species. The 60,783 acres recommended to be released includes areas of low wilderness value, historic 26 off-road vehicle use, and moderate geothermal potential (BLM 1991). 27
The Little Humboldt River WSA (NV-010-132) includes 42,213 acres surrounding 480 acres of private in-28 holdings. The WSA is located approximately 70 miles north of the CGM Operations Area and 29 approximately 30 miles northwest of the Goldstrike Mine. The BLM recommended 29,775 acres for 30 designation as wilderness. The recommended area encompasses deep canyon and creek drainages in 31 addition to mesas and high rocky ridges and undulating plains. The WSA also offers diverse wildlife, 32 including California bighorn sheep, mule deer, and Lahontan cutthroat trout, as well as wild and free 33 roaming horses. The 12,438 acres recommended to be released includes areas of high mineral 34 potential, irregular boundaries, and less than outstanding wilderness values (BLM 1991). 35
Red Spring WSA (NV-010-091) includes 7,847 acres with no private in-holdings. The WSA is located 36 approximately 50 miles northeast of the CGM Operations Area and approximately 45 miles southeast of 37 the Goldstrike Mine. The BLM recommended all 7,847 acres as suitable for wilderness designation. The 38 WSA offers outstanding opportunities for solitude, as well as naturalness. Numerous wildlife species 39 including deer, sage-grouse, golden eagles, and other raptors are found within the WSA (BLM 1987). 40
3.12.2 Environmental Consequences 41
The Proposed Action or alternatives could affect recreation and wilderness resources both directly and 42 indirectly. Direct impacts may include elimination or displacement of recreation resources in proposed 43 disturbance areas, or degradation of the recreation experience for users of the resources due to noise, 44 traffic, or excessive dust or other emissions from the proposed Deep South Expansion Project. Indirect 45 impacts may result from changes in demand for limited recreation resources. 46

Deep South Expansion Project EIS 3.12 – Recreation and Wilderness 3.12-5
Draft EIS 2018
Environmental impacts to recreation and wilderness would be considered significant if the Proposed 1 Action or other action alternatives result in any of the following: 2
• Displacement of dispersed recreational use from an area for which there are no reasonable 3 substitutes as a result of decreases in game population, aesthetic experience, loss of access, or 4 other reasons related to the proposed project. 5
• Nonconformance with the Wilderness Act of 1964 or the BLM Manual 6330 – Management of 6 BLM WSAs (BLM 2012). 7
• Substantial degradation or reduction in the quantity or quality of the area available for existing or 8 future recreational opportunities. 9
• Unmitigated loss of a unique recreational resource. 10
Effects to recreation and wilderness are discussed in terms of intensity, duration, and context as defined 11 below. 12
Intensity 13
• Negligible: The majority of recreationists would not notice any effects or changes in recreation 14 patterns and levels, and the effects would not change their experience of recreation resources 15 and values. Mitigation would not be necessary. 16
• Minor: Recreationists might detect the effects of changes in recreation patterns and levels, and 17 the changes might have a slight but detectable effect on their experience of recreation resources 18 and values. Mitigation, if needed, would be relatively simple to implement and would likely be 19 successful. 20
• Moderate: Recreationists would be aware of the effects of changes in recreation patterns and 21 levels, as well as the effects on their experience of recreation resources and values. Some 22 recreationists might feel displaced and need to pursue their desired activity in another recreation 23 area. Mitigation measures would likely be needed to offset adverse effects and would likely be 24 successful. 25
• Major: The majority of recreationists would be highly aware of the effects associated with 26 changes in recreation patterns and levels, as well as the effects on their experience of recreation 27 resources and values. Many recreationists would feel displaced and need to pursue their desired 28 activity in other areas. Mitigation measures would be needed to offset adverse effects, and their 29 success could not be guaranteed. 30
Duration 31
• Short-term: 1 year or less. 32
• Long-term: Greater than 1 year. 33
Context 34
• Localized: Effects would be limited to the project study area. 35
• Regional: Effects would extend beyond the project study area. 36
3.12.2.1 Proposed Action 37
Recreation 38
The modified CGM Operations Area boundary would encompass a total of approximately 62,372 acres, 39 inclusive of 58,436 acres (94 percent) of BLM-managed public lands and 3,936 acres (6 percent) of 40 Barrick owned private lands. Under the Proposed Action, total new surface disturbance within the CGM 41

Deep South Expansion Project EIS 3.12 – Recreation and Wilderness 3.12-6
Draft EIS 2018
Operations Area would occur on approximately 3,846 acres, 2,779 acres (72 percent) of which would be 1 on public land. Outside of the CGM Operations Area, approximately 534 acres of disturbance would 2 occur at the BCI-owned Dean Ranch. 3
The proposed disturbance areas would be removed from public access for recreation purposes during 4 the life of the project. However, there is extensive public land in the immediately surrounding area that 5 would accommodate migration of dispersed recreation activity from the proposed disturbance areas. An 6 example of the likely movement of activity to surrounding areas during the life of the Proposed Action is 7 mule deer hunting, which is one of the most popular recreation activities in the mountainous areas near 8 the proposed project. During the initial development phase, it is likely that mule deer would move away 9 from new areas of project activity and noise (see Section 3.5, Wildlife and Fisheries). As a result, hunters 10 would follow the deer into surrounding areas. However, as potential effects on game species are 11 anticipated to be minor, the overall effect on recreational hunting would be minor, short-term, and 12 localized. 13
Following closure and final reclamation, most of the disturbance areas would be available for dispersed 14 recreation use (see Section 2.4.14, Reclamation). Upon successful revegetation, the reclaimed areas 15 would be expected to provide habitat for wildlife and presumably would attract hunters back to the project 16 vicinity. Areas that would not be available for future uses would include proposed new disturbance areas 17 associated with modifications to open pits, the CR 225 reroute, and post-mining water management 18 features (a total of approximately 257 acres) and currently authorized disturbance areas that are 19 proposed for reallocation to open pit development (approximately 474 acres). Based on the extensive 20 public land in the immediately surrounding area, this long-term, localized effect would be minor. 21
The principal recreation activity that may continue in the area throughout the life of the Proposed Action 22 would be visits to the old townsite of Cortez to explore and photograph the remnants of the ghost town. 23 The townsite would be outside the boundary of the CGM Operations Area and would remain accessible 24 via a short spur road from CR 222 near the southern edge of the Grass Valley Heap Leach Facility. The 25 attractiveness of the townsite during the life of the Proposed Action would depend on the perspective of 26 the potential visitors. Although mine operations-related effects at the Cortez townsite would be similar to 27 those under existing operations, some individuals may find the proximity to ongoing mine operations and 28 the associated round-the-clock mining activities intrusive and, therefore, would find the experience less 29 enjoyable. Other visitors may feel the continuation of mining in an area of historic mining activity would 30 add to the ambience of the visit and would increase their enjoyment. Regardless of public perception, 31 BCI would provide for continued access to the historic Cortez townsite and would maintain directional 32 signage and a marker at the townsite to provide historical information for visitors (see Section 2.4.13, 33 Applicant-committed Environmental Protection Measures). 34
Under the Proposed Action, the addition of the contractor work force may result in a very modest 35 increase in the regional population depending on the availability or lack of qualified local hires to fill the 36 positions (see Section 3.13, Social and Economic Values). The addition of new residents would increase 37 the demand for the recreation resources and opportunities in the region; however, the increase would be 38 very small in the context of the existing population base. There is ample public land in the region to 39 accommodate dispersed recreation needs of the population increase. Adverse effects potentially would 40 be felt at parks and other developed recreation facilities in the communities where the population 41 increment would reside (i.e., Elko, Carlin, Battle Mountain, or Crescent Valley). Such long-term effects 42 would be expected to be negligible to minor. 43
Because there is an ample supply of alternative land for dispersed recreation activities in the vicinity of 44 the Proposed Action, and because no unique recreation resources would be impacted as a result of the 45 proposed project, effects on recreation resources would not be considered significant. Although some 46 visitors may feel the quality of the recreation experience visiting the old Cortez townsite during the life of 47 the project would be degraded due to mine operations-related noise and activities, these effects would 48 cease after the completion of successful reclamation. 49

Deep South Expansion Project EIS 3.12 – Recreation and Wilderness 3.12-7
Draft EIS 2018
Wilderness 1
There would be no direct effects or measurable indirect effects (e.g., air quality) (see Section 3.10, Air 2 Quality) from the proposed project on any of the nine WSAs within 50 miles of the proposed project 3 activities (i.e., operations and processing in the CGM Operations Area, ore transport between the CGM 4 Operations Area and the Goldstrike Mine, and processing of CGM Operations Area refractory ore at the 5 Goldstrike Mill). The Proposed Action would conform to the Wilderness Act of 1964 and the BLM 6 Manual 6330 – Management of WSAs (BLM 2012). 7
3.12.2.2 Gold Acres Pit Partial Backfill Alternative 8
Recreation 9
Under the Gold Acres Pit Partial Backfill Alternative, potential impacts to recreation would be the same 10 as described for the Proposed Action, with one exception. The disturbance footprint of the Gold Acres 11 North Waste Rock Facility would be reduced, resulting in 4,308 acres of proposed disturbance. The 12 potential for dispersed recreation opportunities on the 72 acres excluded from the proposed project 13 would remain unchanged from existing conditions during the life of the project. 14
Wilderness 15
Potential impacts to WSAs under this alternative would be the same as described for the Proposed 16 Action. 17
3.12.2.3 No Action Alternative 18
Under the No Action Alternative, the proposed Deep South Expansion Project would not be developed 19 and associated impacts to recreation and wilderness would not occur. Ongoing activities associated with 20 existing mining and processing operations and reclamation in the CGM Operations Area and the current 21 off -site transport of refractory ore to the Goldstrike Mill for processing and backhaul of Arturo Mine oxide 22 ore to the Pipeline Complex for processing would continue under the terms of current permits and 23 approvals as authorized by the BLM and State of Nevada. 24
Recreation 25
Under this alternative, the existing project-related impacts to recreation as analyzed in prior NEPA 26 documents for the site (BLM 2015, 2014, 2008, 2004, 2000, 1996) would continue through the 27 completion of successful reclamation (approximately 2026),with the exception of the disturbance 28 associated with existing open pits and post-mining water management features that would represent a 29 permanent impact. 30
Wilderness 31
Under the No Action Alternative, there would be no direct effects or measurable indirect effects (e.g., air 32 quality) to WSAs as a result of currently authorized mine-related activities. The No Action Alternative 33 would conform to the Wilderness Act of 1964 and the BLM Manual 6330 – Management of WSAs (BLM 34 2012). 35
3.12.3 Cumulative Impacts 36
Past and present actions and RFFAs are identified in Table 2-12 and shown in Figure 2-22. The CESA 37 for recreation and wilderness are shown in Figures 3.10-5 and 3.12-1, respectively. 38
3.12.3.1 Proposed Action 39
Past and present actions in the CESA have a total approved surface disturbance of approximately 40 393,964 acres. RFFAs would disturb an estimated additional 51,529 acres for a total of approximately 41 445,493 acres of disturbance. Approval of the Proposed Action incrementally would add 4,380 acres to 42

Deep South Expansion Project EIS 3.12 – Recreation and Wilderness 3.12-8
Draft EIS 2018
the cumulative disturbance for a total of 449,873 acres, an approximately 1 percent increase over the 1 total of past, present, and reasonable foreseeable disturbance. 2
Although the cumulative surface disturbance would be considerably greater than the direct disturbance 3 from the Deep South Expansion Project, the vast acreage of public lands in the CESA would be more 4 than sufficient to accommodate dispersed recreation activities displaced by past and present projects 5 and RFFAs in the CESA. The cumulative unreclaimed disturbance area that would remain after 6 completion of the past and present actions and RFFAs would be considerably greater than the 7 unreclaimed disturbance of the Proposed Action (i.e., open pits, the CR 225 reroute, and post-mining 8 water management features). Nevertheless, the total cumulative unreclaimed area would be a small 9 fraction of the total land available for dispersed recreation in the CESA. 10
Past and present actions and RFFAs in the CESA, as well as the Proposed Action, would have no direct 11 or measurable indirect effects on WSAs within 50 miles of the proposed project activities. 12
3.12.3.2 Gold Acres Pit Partial Backfill Alternative 13
Cumulative impacts to recreation and wilderness under this alternative would be similar to those as 14 described for the Proposed Action, with the following exception. The Gold Acres Pit Partial Backfill 15 Alternative incrementally would add 4,308 acres (approximately 1 percent) to the cumulative disturbance 16 for a total of 402,872 acres. 17
3.12.4 Monitoring and Mitigation Measures 18
Based on the conclusions of the impact analysis, no monitoring or mitigation measures have been 19 identified for recreation or wilderness. 20
3.12.5 Residual Adverse Effects 21
Residual adverse effects to recreation would include the permanent loss of approximately 731 total acres 22 wildlife habitat and multiple use lands available for recreation due to open pit modifications, the CR 225 23 reroute, and proposed post-mining water management features (257 acres) and due to reallocation of 24 currently authorized disturbance to open pit development (474 acres), which would not be reclaimed. No 25 residual adverse effects to wilderness have been identified. 26

Deep South Expansion Project EIS 3.13 – Social and Economic Values 3.13-1
Draft EIS 2018
3.13 Social and Economic Values 1
3.13.1 Affected Environment 2
The project study area and CESA for social and economic values include portions of Elko, Eureka, and 3 Lander counties. 4
3.13.1.1 Population 5
Elko County is the largest of the three counties in the project study area and CESA with an estimated 6 2016 population of 52,168. It also was the fastest growing over most of the last four decades, increasing 7 by an average of 3.0 percent per year from 1980 to 2016, although the most dramatic growth occurred in 8 the early years and the growth rate has slowed more recently. The City of Elko is the county’s largest 9 population center with an estimated 20,442 people in 2016. A 2016 population estimate is not available 10 for Spring Creek, although its growth rate continued to outpace other parts of the study area through 11 2010. Table 3.13-1 presents population levels and growth rates for study area counties and major 12 communities from 1980 through 2016. 13
Table 3.13-1 Population Characteristics
Population by Year Average Annual Percent Change
1980- 1990- 2000- 2010-Area 1980 1990 2000 2010 2016 1990 2000 2010 2016
Elko City 8,771 14,736 16,708 18,297 20,442 5.3 1.3 0.9 1.9
Spring Creek CDP1 2,002 5,866 10,548 12,361 NA 11.3 6 1.6 NA
Carlin 1,233 2,220 2,161 2,368 2,307 6.1 -0.3 0.9 -0.4
Elko County 17,269 33,530 45,291 48,818 52,168 6.9 3.1 0.8 1.1
Eureka County 1,198 1,550 1,651 1,987 1,917 2.6 0.6 1.9 -0.6
Battle Mountain CDP1
2,749 3,542 2,871 3,635 3,5592 2.6 -2.1 2.4 -0.4
Lander County 4,076 6,266 5,794 5,775 5,702 4.4 -0.8 0 -0.2
Nevada 800,493 1,201,833 1,998,257 2,700,551 2,940,058 4.1 5.2 3.1 1.4 1 CDP - Census Designated Place. 2 State Demographer’s estimate; U.S. Census Bureau estimate not yet available. NA = not available. Source: U.S. Census Bureau 2017, 2011, 2000, 1981.
Eureka County has lost population at an estimated average of 0.6 percent per year since 2010, declining 14 to an estimated 1,917 people in 2016. 15
Lander County, with an estimated 2016 population of 5,702, has been losing population since 1990. The 16 population declined by 9 percent between 1990 and 2016. Battle Mountain, the county’s largest 17 community, also experienced a population decline, although estimates indicate the long-term pattern 18 there is less consistent. 19
While Elko County grew at modest annual rates from 1990 to the present and other smaller rural 20 counties were declining, the State of Nevada was notably growing. Most of this growth took place in the 21 urban population centers, especially Las Vegas. 22
Ethnically and racially, the study area counties are notably less diverse than the state as a whole with 23 substantially fewer black and Asian residents. The counties do have higher percentages of Native 24

Deep South Expansion Project EIS 3.13 – Social and Economic Values 3.13-2
Draft EIS 2018
Americans than the state does, particularly in Elko and Lander counties with 5.1 and 3.7 percent, 1 respectively, compared with 0.9 percent for the entire state (2015 estimates). People of Hispanic origin of 2 any race are approximately 2.6 percent of the Eureka County population, compared with 27.5 percent of 3 the state; they make up 24.0 and 27.1 percent, respectively, of the Elko County and Lander County 4 populations (U.S. Census Bureau 2017). 5
3.13.1.2 Income 6
Average mining wages and salaries are the highest for any industry in Nevada, averaging $83,740 in 7 2016, more than 78 percent higher than the all industries average of $47,107 (Nevada Department of 8 Employment, Training & Rehabilitation [NDETR] 2017). The differential holds true for the study area, with 9 average natural resources and mining wages reported at $98,030 in Elko County, $99,910 in Eureka 10 County, and $96,676 in Lander County. All industry average wages were reported at $49,046 in Elko 11 County, $96,146 in Eureka County, and $75,804 in Lander County (NDETR 2017). The differential is 12 greatest in Elko County because of the breadth of the overall economy, whereas natural resources and 13 mining comprise over 91 percent of the employment in Eureka County. 14
Although mining wages and salaries typically are higher than average, per capita personal incomes in 15 the study area indicate the relatively high mining wages are not always sufficiently distributed to 16 substantially raise county-wide income levels. Estimates for 2015 indicate that per capita personal 17 incomes in the study area exceed the $41,889 state average by 26.5 percent in Lander County 18 ($52,986) and by 4.5 percent in Elko County ($43,791), but they lag the state average by 10.7 percent in 19 Eureka County ($37,396) (U.S. Bureau of Economic Analysis 2016). 20
Estimated median household incomes in study area counties were above the statewide household 21 income level in 2015. The median household income for the state in 2015 was estimated at $52,544, 22 compared with $76,518 for Elko County (45.6 percent above the state level), $65,459 for Eureka County 23 (24.6 percent above the state level), and $76,713 for Lander County (46.0 percent above the state level) 24 (U.S. Census Bureau 2017). 25
According to the U.S. Census Bureau (2017), an estimated 11.0 percent of Elko County’s population, 26 9.7 percent of Eureka County’s population, and 11.5 percent of Lander County’s population were living 27 below the poverty threshold in 2015. In comparison, the Nevada statewide rate was 15.5 percent in 28 2015. Poverty rates for children and youth under 18 followed a similar pattern with poverty levels of 15.5, 29 1.6, and 20.6 percent for Elko, Eureka, and Lander counties, respectively, compared with 22.1 percent 30 for the state as a whole (U.S. Census Bureau 2017). 31
3.13.1.3 Employment 32
The study area is a major contributor to Nevada’s mining industry. Table 3.13-2 presents a comparison 33 of employment by major industry sector for the three counties and the state. The three counties’ 34 combined natural resources and mining sector employment comprises more than 48 percent of the total 35 statewide employment in that sector, a large majority of which is devoted to metal mining in the state. All 36 of the study area counties are substantially more dependent on mining than is the state as a whole, 37 although the data indicate a distinct difference between Elko County and Eureka and Lander counties. 38 Elko County’s economy is much more diverse, befitting its role as a trade center for northeast Nevada. 39 Elko County has substantial numbers of workers in services, trade and government employment, and 40 just over 9 percent in mining. In contrast, Lander County has 61 percent of its jobs in the mining industry 41 and lesser but still sizable numbers working in government and trade jobs. Eureka County is an extreme 42 case with over 91 percent of its employment coming from mining and under 5 percent coming from 43 government jobs (NDETR 2017). The employment numbers are based on place of work, not place of 44 residence, which explains why Eureka County has more employees in the natural resources and mining 45 sector than it has residents. Several major mines on the Carlin Trend are located in northern Eureka 46 County, but most of those workers live in Elko County. 47

Deep South Expansion Project EIS 3.13 – Social and Economic Values 3.13-3
Draft EIS 2018
Table 3.13-2 Non-agricultural Wage and Salary Employment by Sector in 2016
Sector
State of Nevada Employment
Elko County Employment
Eureka County Employment
Lander County Employment
No. % No. % No. % No. % Private Sector
Goods Producing 135,915 10.6 3,443 16.3 4,092 91.1 2,038 61.8 Natural Resources and Mining
16,682 1.3 1,951 9.2 4,092 91.1 2,021 61.3
Construction 75,716 5.9 1,321 6.3 * -- 17 0.5
Manufacturing 43,517 3.4 171 0.8 * -- * --
Service Providing 995,130 77.5 13,921 65.9 153 3.4 665 20.2 Trade, Transportation
Utilities and 241,433 18.8 4,272 20.2 141 3.1 425 12.9
Information 14,314 1.1 150 0.7 * -- * --
Financial Activities 59,926 4.7 515 2.4 * -- 21 0.6
Professional Services
and Business 175,930 13.7 1,166 5.5 * -- 18 0.5
Educational and Health Services
125,513 9.8 1,585 7.5 12 0.3 17 0.5
Leisure and Hospitality 345,245 26.9 5,656 26.8 * -- 184 5.6
Other Services 32,769 2.6 577 2.7 * -- * --
Unclassified1 1,577 0.1 0 0.0 7 0.2 60 1.8 Subtotal 1,132,622 88.2 17,364 82.2 4,301 95.8 2,763 83.8
Public Sector Service Providing 151,524 11.8 3,753 17.8 190 4.2 534 16.2
Government 151,524 11.8 3,753 17.8 190 4.2 534 16.2
Subtotal 151,524 11.8 3,753 17.8 190 4.2 534 16.2 TOTAL 1,284,146 100.0 21,117 100.0 4,491 100.0 3,297 100.0 1 County unclassified numbers include aggregated data not released by industry for reasons of confidentiality. * Confidential data.Source: NDETR 2017.
The combined labor force in the three counties is currently estimated at 31,270; approximately 30,207 of 1 whom are employed. The remaining 1,063 unemployed individuals represent a 3.4 percent 2 unemployment rate. This level is lower than both the 4.9 percent statewide unemployment rate and the 3 4.4 percent national rate (NDETR 2017). Individual county unemployment rates in September 2017 were 4 estimated at 3.4 percent for Elko County, 2.9 percent for Eureka County, and 3.8 percent for Lander 5 County. Unemployment rates for all three counties have declined substantially from their recessionary 6 highs. 7
3.13.1.4 Housing 8
The 2010 census identified 23,217 housing units in the three counties of the study area: 19,566 units 9 (84 percent) were in Elko County; 2,575 units were in Lander County; and 1,076 units were in Eureka 10 County. At the time of the census, 20,491 of the housing units in the study area were occupied, leaving 11 2,726 (11.7 percent) vacant. The overall vacancy rate can be misleading, however, as some portion of 12

Deep South Expansion Project EIS 3.13 – Social and Economic Values 3.13-4
Draft EIS 2018
the vacant units was primarily used for occasional seasonal and recreational use and not readily 1 available for people seeking housing (U.S. Census Bureau 2010). 2
Census estimates of the status of the housing pool for 2015 suggest a modest softening of the market 3 since 2010, with a minor 2.5 percent increase in the total housing stock and a 1.8 percent increase in the 4 three-county vacancy rate (Table 3.13-3). The overall vacancy rate for the three-county area was 5 estimated at 13.5 percent in 2015, noting again the inclusion of some seasonal and recreational units 6 that are only occasionally occupied. Vacancy rates by type have relatively high margins of error in 7 estimates for years between the decennial census years, especially for small population geographic 8 areas. Nevertheless, they do provide the best information available for estimating available housing 9 units. 10
Table 3.13-3 Housing Resources – 2015 Census Estimates
Geographic Area
Housing Units Vacancy Rate by
(%)1Type
Total Occupied Vacant Vacancy Rate (%)
Homeowner Units
Rental Units
Elko City 7,396 6,726 670 9.1 0.0 8.1
Spring Creek CDP 4,699 4,658 41 0.9 0.0 0.0
Carlin 1,037 751 286 27.6 2.7 16.2
Elko County 20,192 17,696 2,496 12.4 0.1 8.1 Eureka County 1,121 767 354 31.6 1.8 6.7 Battle Mountain CDP 1,397 1,232 165 11.8 0.0 0.0
Lander County 2,484 2,114 370 14.9 1.2 0.0 Counties Total 23,797 20,577 3,220 13.5 NA NA 1 Zero vacancy rates are likely indications of insufficient data rather than no vacancies at all. Source: U.S. Census Bureau 2017.
There are numerous short-term housing opportunities available in the study area. There are two 11 motel/lodging facilities in Carlin and several combination mobile home/recreational vehicle parks in and 12 near the town. There are approximately 35 motels in Elko with a total of over 2,300 rooms. There also 13 are six recreational vehicle parks and several campgrounds in the vicinity of Elko. Lander and vicinity is 14 host to seven motels and two recreational vehicle parks. 15
The residential pattern of the existing project work force is divided among the communities in the study 16 area. Approximately 67 percent live in the Elko/Spring Creek area and 9 percent in Carlin, both in Elko 17 County; 11 percent live in Crescent Valley/Beowawe/Eureka (Eureka County); and 11 percent live in 18 Battle Mountain (Lander County). This distribution results from a combination of housing availability, 19 availability of an attractive combination of public and private services, and a willingness on the part of 20 mining companies to provide commuter busses to attract and keep a qualified work force. 21
3.13.1.5 Public Facilities and Services 22
Water 23
Municipal utilities provide water service to town residents in the study area. Most rural residents obtain 24 water from wells or springs. No domestic water supply capacity or quality issues have been identified for 25 any of the study area communities. Elko has recently increased its maximum daily production capacity 26 by approximately 2,000 gpm (Limberg 2017). The city does have mandatory watering restrictions during 27 the summer months to manage demand and treats waste water to “reclaim” it for use in irrigating city 28

Deep South Expansion Project EIS 3.13 – Social and Economic Values 3.13-5
Draft EIS 2018
parks and golf courses. Elko’s water quality is very good, requiring only standard chlorination treatment 1 for domestic use (Limberg 2017) Spring Creek water is provided by Great Basin Water Company. 2 Testing conducted in 2016 indicated Spring Creek water met or exceeded all water quality standards 3 (Great Basin 2016). Carlin has a plentiful supply of water and adequate storage. Its water quality is 4 “excellent” and, like Elko, Carlin encourages conservation measures in the summer months, although 5 distribution is not metered (Esparza 2017). Battle Mountain has an ample supply of water and has 6 eliminated a previous arsenic problem by drilling three new wells in the last 5 years. Domestic water 7 quality and supply capacity are now both ample for the community (Dimitroff 2017). Domestic water 8 supply and quality are both in good shape in Crescent Valley (Smith 2017). 9
Wastewater Treatment 10
Wastewater treatment capacity is adequate or better for each of the larger communities in the study 11 area. Elko’s system currently is using approximately half of its permitted capacity (Limberg 2017). Carlin 12 expanded its system just a few years ago and currently is operating at less than 75 percent of its 13 permitted capacity (Esparza 2017). Battle Mountain’s wastewater treatment system also is currently 14 operating well within its permitted capacity (Dimitroff 2017). The smaller communities in the study area 15 operate with individual septic systems rather than centralized wastewater treatment systems; no system-16 wide problems have been identified for these communities. 17
Solid Waste Disposal 18
There are public landfill operations in all three counties in the study area. 19
3.13.1.6 Emergency and Health Care Services 20
Generally speaking, law enforcement, fire protection, and ambulance services are adequate in the study 21 area. Law enforcement is provided to the three counties by their respective sheriffs’ personnel, who are 22 based out of Elko, Battle Mountain, and Eureka, with substations in smaller communities, including 23 Crescent Valley. Fire protection and emergency medical staff (mostly volunteers) and ambulances are 24 similarly headquartered in the major communities, with numerous substations dispersed throughout the 25 study area. There are mutual aid agreements among the various emergency response services to 26 provide the most effective response to any particular emergency. 27
Northeastern Nevada Regional Hospital in Elko serves all of northeast Nevada. Battle Mountain General 28 Hospital serves north-central Nevada. There also are clinics in several communities, including Elko, 29 Carlin, and Crescent Valley. 30
3.13.1.7 Public Education 31
School districts in the study area are organized by county, with enrollments for the 2017-2018 school 32 year ranging from Eureka County’s 276 students to Lander County’s 1,004 students and Elko County’s 33 9,813 students. Enrollment trends vary among the districts with both Elko County and Eureka County 34 districts showing modest growth and decline over recent years, but staying essentially fairly consistent. 35 Elko County enrollments are slightly below where they were two decades ago, suggesting some reserve 36 capacity in the system should it be needed. Eureka County schools, located in the town of Eureka, have 37 experienced moderate enrollment growth in recent years. Lander County enrollments have grown by 38 20 percent from the 2014-2015 school year to the 2017-2018 school year, with the growth occurring 39 entirely in the Battle Mountain schools. The Crescent Valley elementary school has experienced very 40 little change during the same period. 41
3.13.1.8 Public Finance 42
Nevada county governments obtain revenues from both local and state shared sources (Table 3.13-4). 43 Local sources include ad valorem property taxes on real and personal property and on the net proceeds 44 of mines in the county. They also collect revenues from fines, licenses and permits, and fees for 45

Deep South Expansion Project EIS 3.13 – Social and Economic Values 3.13-6
Draft EIS 2018
Table 3.13-4 County Budgets for Fiscal Year 2016-2017
Governmental Fund Types and Expendable Trust Funds
Elko County Eureka County Lander County (dollars)
Revenues Property Taxes 15,258,232 8,094,743 11,150,127 Other Taxes 14,000 154,642 500
Licenses and Permits 825,000 8,050 206,885 Intergovernmental Resources 23,066,462 5,707,487 7,773,100
Charges for Services 3,298,318 472,630 835,560 Fines and Forfeits 1,377,000 76,210 206,100
Miscellaneous 962,500 626,350 1,393,305 Total Revenues 44,801,512 15,140,112 21,565,577
Expenditures General Government 11,090,794 7,162,351 40,928,452
Judicial 12,988,467 1,427,075 2,666,017 Public Safety 13,775,661 2,952,200 6,259,875 Public Works 8,853,764 3,673,500 5,797,725
Sanitation1 -- 343,700 -- Health1 472,200 1,075,400 805,565 Welfare 3,792,231 65,500 2,664,670
Culture and Recreation 2,558,421 1,436,450 1,550,895 Community Support 932,852 680,400 166,703
Intergovernmental Expenditures 4,439,648 1,320,000 91,680 Capital Projects -- -- -- Contingencies 300,000 200,000 75,000 Utility Enterprises -- -- --
Hospitals -- -- -- Transit Systems -- -- --
Airports -- -- -- Other Enterprises -- -- --
Debt Service – Principal Retirement 175,000 -- -- Interest Cost 25,000 -- --
Total Expenditures 59,404,038 20,336,576 61,006,582 Excess Revenues Over (Under) Expenditures (14,602,526) (5,196,464) (39,441,005)
1. Sanitation and health are combined in the Elko and Lander counties’ budgets. Source: Nevada Department of Taxation 2017.
1 services. State shared revenues include sales, motor vehicle, fuel, and gaming revenues. Elko County 2 lists intergovernmental transfers as its largest revenue source, whereas both Eureka County and Lander 3 County benefit from higher net proceeds of mines, which generate relatively larger amounts of property 4 taxes. Tax revenues have been a particular concern in rural counties throughout Nevada as the mining 5 industry contracted i n past years. Assessed valuations in Eureka and Lander counties have generally 6 held firm in recent years. Taxable net proceeds from mining have been erratic in Eureka County in the 7 past 3 years; they dropped by 14 percent in Lander County; however, and r ose b y over 46 percent in 8 Elko County. Net proceeds of mines in Elko County represent just 7 percent of the assessed value 9 compared with 28 p ercent in Eureka County and 45 p ercent in Lander County.

Deep South Expansion Project EIS 3.13 – Social and Economic Values 3.13-7
Draft EIS 2018
3.13.2 Environmental Consequences 1
Impacts to social and economic values would be significant if the Proposed Action or other action 2 alternative result in any of the following: 3
• Changes in long-term local population, employment, or earnings associated with operations of4 5 percent or more.5
• Demand for temporary or permanent housing would exceed the expected supply of available6 housing during the scheduled construction and operations periods.7
• The project would affect a number of residences or businesses by displacement or other use of8 the property without fair and reasonable compensation.9
• The project’s effects on public sector fiscal conditions would result in a 5 percent or greater10 reduction in revenues or increase in expenditures, or the underlying fiscal conditions would be11 adversely affected beyond the life of the project.12
• Long-term demands on public services and infrastructure would exceed capacities in these13 systems, either triggering the need for capital expansion beyond the commensurate project-14 related revenue expansion, or resulting in a discernable reduction in the level of service15 provided.16
Potential effects of the Proposed Action and alternatives on social and economic values were evaluated 17 in terms of intensity, duration, and context based on the following definitions. 18
Intensity 19
• Negligible: The project would have a very small effect (less than 1 percent) on the local and20 regional economy. The consequences of the action would have no measurable effect on the21 socioeconomic environment.22
• Minor: The project would result in a minor adverse or beneficial change (1 to 10 percent) on the23 local economy. The action would affect a small sector of the economy and would require a24 substantial effort to measure. The consequences of the action would not be readily apparent.25
• Moderate: The project would measurably affect a relatively small sector of the socioeconomic26 environment (by 11 to 15 percent) or would alter the relationship between sectors of the27 economy. Adverse effects would not prove substantial enough to threaten any economic sector,28 and beneficial effects would not result in major structural shifts.29
• Major: The project would have major effects (over 15 percent) on the regional and local30 economy, which would become readily apparent in the form of beneficial or adverse shifts in the31 socioeconomic structure. In certain cases, entirely new economic sectors would be created or32 established sectors eliminated. Major effects would reverberate throughout the socioeconomic33 environment, substantially altering existing conditions in beneficial or adverse ways.34
Duration 35
• Short-term: The effect would be transitory and would largely disappear in 6 months or less.36
• Long-term: The effect would last longer than 6 months.37
Context 38
• Localized: Effects would be limited to the project study area and limited to the local economy.39
• Regional: Effects would extend beyond the project study area and extend beyond the local40 economy.41

Deep South Expansion Project EIS 3.13 – Social and Economic Values 3.13-8
Draft EIS 2018
3.13.2.1 Proposed Action 1
As discussed in Section 2.4.3, Schedule and Work Force, no increase in BCI’s current work force 2 (approximately 1,250 workers) for existing operations at the CGM Operations Area would be required for 3 the Proposed Action. It is anticipated that an additional contract work force of approximately 350 workers 4 would be required and would be on site throughout the life of the project for construction of facilities and 5 other site preparation activities. Up to 155 of the workers would be required for the final 3 years 6 (approximately 2031 through 2033) of ongoing ore processing and final closure and reclamation. 7
Population 8
The anticipated population increase resulting from implementation of the Proposed Action is presented in 9 Table 3.13-5. The projections include both direct and indirect employment increases together with their 10 family members. 11
In-migrating contract workers and their families would number approximately 463 persons. In addition, 12 families of indirect and induced workers would number approximately 146 persons, for a total increase of 13 609 individuals (Table 3.15-5). This number represents an increase of 1.0 percent over the estimated 14 2016 population of 59,787 in the communities of the three-county study area that are the most likely to 15 experience growth from the proposed action. This level of population increase in the study area would be 16 considered a minor long-term change and would not likely affect the overall local study area adversely. 17 The new population would likely be distributed throughout the study area in a pattern similar to the 18 existing population distribution with the largest number locating in Elko County. 19
Income and Employment 20
No increase in BCI’s existing work force would be required under the Proposed Action. As noted in 21 Section 2.4.3, however, an estimated 350 new contract workers would be employed on site throughout 22 the life of the project. To the extent the requisite skill sets are available in the local work force, the 23 Proposed Action likely would utilize contractor workers from within the three-county study area. Based 24 on 2016 employment data (NDETR 2017), the combined unemployment rate in the three-county study 25 area is very low (3.4 percent) with approximately 1,070 unemployed workers. Therefore, for purposes of 26 this analysis, it is assumed that the existing local labor force would be unlikely to be able to supply all of 27 the required 350 contract workers for the Proposed Action. It is instead assumed that approximately 28 60 percent of the required contract workers would be hired from outside of the three-county study area. 29 Based on these assumptions, approximately 210 of the 350 contract workers required for the project 30 would be non-local hires. This would be considered a moderate long-term effect in the context of the 31 local study area and minor for the regional economy that would be supplying the additional workers. 32
Table 3.13-5 Contractor-related (2018-2030 typical)
Employment, Households, and Population Projections
New Contractor-related Employment Direct1 Indirect and Induced2 Total
Local Non-local Total Local Non-local Total Local Non-local Total 140 210 350 197 66 263 337 276 613
New Contractor-related Households Direct3 Indirect and Induced4 Total New Households
New Non-local Workers 210 66 -- Single 53 17 70 Married - 1 Worker 141 44 185 Married - 2 Workers 8 3 11 New Households 202 64 266

Deep South Expansion Project EIS 3.13 – Social and Economic Values 3.13-9
Draft EIS 2018
Table 3.13-5 Contractor-related Employment, Households, and Population Projections (2018-2030 typical)
New Contractor-related Population
Households
Population5
Adults
6Children Total School-age Other
Single Households 70 70 0 0 78 Married Households 196 392 111 28 531 Total 266 462 111 28 609 1
2
3
4
5 6
Work force was assumed to be 40 percent local and 60 percent non-local. Indirect employment was calculated using an employment multiplier of 0.30, and induced employment was calculated using a multiplier of 0.45. The indirect and induced work force was assumed to be 75 percent local and 25 percent non-local. Non-local direct work force was assumed to be 25 percent single or married without families present; 10 percent of married worker households were assume to be two-worker families. Non-local indirect and induced work force was assumed to be 25 percent single or married without families present; half of married worker households were assume to be two-worker families. Population estimates were based on one person per single family household and 2.71 persons per married household. Eighty percent of children were assumed to be of school age.
Indirect and induced jobs would be smaller in number and less likely to require highly specific skills. 1 Consequently, it is estimated that approximately 75 percent of those jobs would be filled by local 2 individuals and 25 percent - 66 workers - would be non-local (Table 3.13-5). 3
The BCI work force for the Proposed Project would continue at approximately the existing 4 1,250 employees for the first 4 years, after which it would gradually scale down to approximately 5 52 workers in the final 4 years of the project (BCI 2017a). In the final years, BCI workers would be 6 devoted to ongoing ore processing and final closure and reclamation activities as noted in Section 2.4.3. 7
Under the Proposed Action, payment of wages and benefits to employees and contractor workers would 8 continue over the life of the project. In the first year of the Proposed Action, and continuing for 9 approximately 2 additional years, combined payroll and benefits for BCI workers is estimated at 10 approximately $114.7 million. Subsequently, wages and benefits would track employment, declining 11 consistently to approximately $38.5 million in the eighth year, then dropping to $5.8 million in the ninth 12 year and approximately $4.7 million in the project’s final 4 years (BCI 2017b). In addition to the employee 13 payroll and benefits, it is estimated that the average contractor cost would be approximately $13.5 million 14 annually. In the early years of the Proposed Project, the total payroll, benefits, and contractor payments 15 would be approximately $128.2 million (BCI 2017a,b). Each $1.00 of local earnings would indirectly 16 generate approximately $0.37 in earnings to other workers in the local economy (Dobra 1989; U.S. 17 Bureau of Economic Analysis 2013). As a result, the annual indirect impact on earnings would be 18 approximately $47.4 million in addition to the employee and contractor payments, yielding a combined 19 $175.6 million per year in the early years of the proposed project. The economic benefit would decline 20 over time in proportion to the decline in total wages and benefits. It would be expected that a substantial 21 portion of the labor expenditures would be spent on rents and goods and services in the local area 22 throughout the life of the project. This level of financial activity would be a positive and long-term effect 23 for the local economy, but a minor economic effect in the context of the regional economy. 24
Purchases of materials and supplies during the 12-year life of the project would entail expenditures of an 25 estimated $52.8 million per year in Lander County plus a first year expenditure of approximately 26 $30 million in Eureka County (BCI 2017a). The expenditures would benefit the local economy, 27 particularly in the two counties noted, but would represent a minor percentage of the total economic 28 activity in the three-county study area during the 12-year life of the mine. 29

Deep South Expansion Project EIS 3.13 – Social and Economic Values 3.13-10
Draft EIS 2018
As discussed in Section 3.6, Range Resources, proposed surface disturbance under the Proposed 1 Action would result in the temporary (pending the completion of reclamation) and permanent loss of 2 AUMs. Based on the analysis conducted by Resource Concepts, Inc. (2001), the economic value of 3 production per AUM is $53.40 per year, including $29.40 per year of direct and $24.00 per year for 4 indirect or induced value. Applying these economic values to the identified temporary and permanent 5 loss of AUMs would result in the economic effects identified in Table 3.13-6. These effects would be long 6 term and localized and would represent a negligible (less than 1 percent) effect to the overall local 7 economy in the three-county study area. 8
Table 3.13-6 Economic Effects Associated with the Loss of AUMs
Grazing Allotment
Temporary Loss Until Reclamation Completed Permanent Loss
AUMs
Approximate Total Annual Economic
Value AUMs
Approximate Total Annual Economic
Value Carico Lake 27 $1,442 3 $160
Grass Valley 13 $694 0 $0
South Buckhorn 7 $374 3 $160
Public Finance 9
Under the Proposed Action, an estimated total of approximately 2.5 million ounces of gold would be 10 produced from the modified and expanded open pits and expanded underground mine area. This would 11 increase the public revenue to Lander County from net proceeds of mining taxes by an estimated 12 average of $12.0 million per year. Increased purchases of fuels, lubricants, Portland cement, and 13 numerous other materials would be expected to increase annual local and state sales tax payments to 14 Eureka County by approximately $154,000 and to Lander County by approximately $4.0 million. There 15 also would be an increase in ad valorem property taxes of approximately $2.9 million per year, payable 16 to Lander County. Finally, the Proposed Project would pay an estimated tax of $838,500 per year under 17 the Business Tax Act (BCI 2017a). The increased public revenues from these sources would total 18 approximately $19.9 million annually and would be a beneficial effect of the Proposed Action, primarily 19 for Eureka and Lander counties. In addition, Elko County, as the largest commercial center in northeast 20 Nevada, would benefit more broadly from the commerce generated by the proposed project and its 21 employees throughout the life of the Proposed Action. The effects of this increase in economic activity 22 would be long-term in nature, lasting through much of the project life. They would, however, be moderate 23 in the context of the local economy and largely local, although some portion of the benefits would accrue 24 regionally to other areas of Nevada. 25
Public Education 26
The Proposed Action would increase the school-age population in the study area by an estimated 27 111 students (Table 3.13-5). This number would increase enrollment in study area schools by 28 1.0 percent. The number of new students would be greatest in the Elko district. Enrollment in Elko 29 County School District schools commonly varies by from 50 to over 100 students, year-to-year, so the 30 increase is expected to be a minor effect and not unduly difficult for the local district to accommodate. 31 Other districts in the study area appear to have sufficient unused capacity to accommodate the small 32 numbers of new students they may receive. 33
Housing 34
Development of the Proposed Project would generate demand for an estimated maximum of 35 266 housing units for the duration of the proposed project (Table 3.13-5). Based on census estimates for 36 2015, there were over 3,000 vacant housing units in the study area (Table 3.13-3) which, if it is 37

Deep South Expansion Project EIS 3.13 – Social and Economic Values 3.13-11
Draft EIS 2018
reasonably accurate, would indicate there would be more than enough housing available to 1 accommodate the project-related demand. However, the vacancies are not uniform across the housing 2 stock. The owner-occupied housing market is quite tight, with vacancy rates throughout the study area at 3 or below 2.7 percent. In contrast, there were moderate to high vacancy rates in the rental housing stock, 4 which should be sufficient to accommodate the expected project-related demand. It is likely, however, 5 that the availability of suitable housing in Eureka and Lander counties is constrained by the small size of 6 those markets. Assuming this is the case, most of the new project-related households would be likely to 7 locate in Elko County communities. Also, there have been a number of new rental housing projects 8 constructed in Elko County in recent years, some of which may not show up in the vacancy estimates 9 (Kingwell 2017). Overall, it is expected that the effects on housing resources would be minor to 10 moderate, depending on the sector of the market being evaluated. The effects would be local and long 11 term. 12
Other Public Services 13
No significant capacity or service issues have been identified for public facilities or services in the three-14 county study area. Also, there would be no water quality-related impacts to domestic water supply 15 systems (including water supply for the community of Crescent Valley) as a result of the Proposed Action 16 (see Section 3.2, Water Resources). In addition, underlying population growth rates in the study area 17 have softened substantially in the last two decades and, according to estimates, have been negative in 18 Eureka and Lander counties since the 2010 census (Table 3.13-1). Consequently, the relatively small 19 (1.0 percent) project-related addition to the study area population that would be anticipated as a result of 20 the Proposed Action would be considered minor, and would not be expected to adversely affect public 21 services in the area. The effects would be long-term in nature and localized. 22
3.13.2.2 Gold Acres Pit Partial Backfill Alternative 23
Under the Gold Acres Pit Partial Backfill Alternative, social and economic effects essentially would be the 24 same as described for the Proposed Action. 25
3.13.2.3 No Action Alternative 26
Under the No Action Alternative, the proposed Deep South Expansion Project would not be developed, 27 and the associated social and economic effects would not occur. Existing operations and reclamation 28 activities in the current CGM Operations Area would continue under the terms of current permits and 29 approvals as authorized by the BLM and State of Nevada. No additional impacts to public infrastructure 30 or services would occur under this alternative. Accrual of project-related revenues to state and local 31 governments would continue until mining has been completed. 32
3.13.3 Cumulative Impacts 33
The CESA for social and economic values is shown in Figure 3.10-5. Past and present actions and 34 RFFAs are identified in Table 2-12 and shown in Figure 2-22. 35
3.13.3.1 Proposed Action 36
The social and economic effects of past and present actions are reflected in the affected environment 37 description in Section 3.13.1. As a result, potential related cumulative effects are addressed in the 38 discussion of environmental consequences in Section 3.13.2. The anticipated need for approximately an 39 additional 337 local and 276 non-local workers for the Proposed Action suggests a minor positive 40 contribution to cumulative economic effects, with a minor contribution to the demand for housing. Since 41 public facilities and services are generally considered adequate to accommodate the increased 42 population, the project’s contribution to cumulative impacts is expected to be minor, though long-term in 43 nature. The incremental increase in social and economic effects primarily would be positive in the 44 context of the economy of the three local study area counties. Anticipated schedules for increases or 45 decreases in employment for the RFFA projects in the CESA are not known. In the event any of the 46

Deep South Expansion Project EIS 3.13 – Social and Economic Values 3.13-12
Draft EIS 2018
RFFAs should evolve into major development projects requiring substantial numbers of workers, the 1 effects would depend somewhat on the status of other major mining projects in the three-county area at 2 the time of development. If other major projects would be nearing completion and closure, the 3 development of a new project would provide a positive off-set for the effects. Absent offsetting project 4 activities, major new developments would increase employment and economic activity, but also may 5 increase pressure on housing and community facilities and services. 6
3.13.3.2 Gold Acres Pit Partial Backfill Alternative 7
Cumulative effects of the Gold Acres Pit Partial Backfill Alternative would be the same as under the 8 Propose Action. 9
3.13.4 Monitoring and Mitigation Measures 10
No monitoring or mitigation measures are recommended for social and economic values. 11
3.13.5 Residual Adverse Effects 12
For the most part, social and economic effects from the Proposed Action would be long-term in nature, 13 largely continuing throughout the project life, but ending after the proposed project is completed. There 14 would be public and private investment from revenues generated by the project in homes, businesses, 15 and public facilities that would have economic life beyond the life of the project. Such effects would be 16 beneficial, but would be minor to negligible in the long term beyond the life of the project. The 17 approximate total economic value associated with the permanent loss of AUMs ($320 per year) would 18 continue following the completion of mining and reclamation. 19

Deep South Expansion Project EIS 3.14 – Environmental Justice 3.14-1
Draft EIS 2018
3.14 Environmental Justice 1
The environmental justice analysis addresses the potential for the proposed project to adversely affect 2 minority or low income populations to a disproportionate degree, relative to their representation in the 3 larger population. The project study area and CESA for environmental justice include portions of Elko, 4 Eureka, and Lander counties. 5
3.14.1 Affected Environment 6
EO 12898, “Federal Actions to Address Environmental Justice in Minority Populations and Low-Income 7 Populations” was issued February 11, 1994 (59 FR 7629). EO 12898 “is intended to promote 8 nondiscrimination in Federal programs substantially affecting human health and the environment, and to 9 provide minority communities and low-income communities’ access to public information on, and an 10 opportunity for participation in, matters relating to human health and the environment.” It requires each 11 federal agency to achieve environmental justice as part of its mission by identifying and addressing, as 12 appropriate, potential disproportionately high and adverse human health or environmental effects, 13 including social and economic effects, of its programs, policies, and activities on minority and low-income 14 populations. 15
Pursuant to EO 12898, the President’s CEQ prepared “Environmental Justice: Guidance Under the 16 Environmental Policy Act” (1997) to assist Federal agencies with their NEPA procedures “… so that 17 environmental justice concerns are effectively identified and addressed.” This analysis was conducted 18 with the assistance of the CEQ guidance document. 19
EO 12898 states that population groups defined as minorities include: American Indian or Alaskan 20 Native; Asian or Pacific Islander; Black, not of Hispanic/Latino origin; or Hispanic/Latino. CEQ guidelines 21 for evaluating potential adverse environmental justice effects indicate minority populations should be 22 identified when either: 1) a minority population exceeds 50 percent of the population of the affected 23 area, or 2) a minority population represents a “meaningfully greater increment” of the affected area 24 population than the population of some appropriate larger geographic unit, as a whole. 25
Low-income populations are those communities or sets of individuals whose median income is below the 26 current poverty level of the general population. According to the guidance, low-income populations in an 27 affected area should be identified using the annual statistical poverty thresholds from the Bureau of the 28 Census’ Current Population Reports, Series P-60 on Income and Poverty. In identifying low-income 29 populations, federal agencies may consider as a community either a group of individuals living in 30 geographic proximity to one another or a set of individuals (such as migrant workers or Native 31 Americans) where either type of group experiences common conditions of environmental exposure or 32 effect. 33
3.14.1.1 Minority Population 34
All three of the study area counties and Crescent Valley, the only identifiable community nearby, have 35 notably higher percentages of white, non-Hispanic residents than the state as a whole. Eureka County 36 and Crescent Valley, in particular, are over 95 percent white, non-Hispanic, compared with 52 percent 37 for Nevada (Table 3.14-1). All three counties have 1.1 percent or fewer blacks and 1.1 percent or fewer 38 Asians compared with 8.1 percent for each group statewide. All three counties also have lower 39 percentages of Hispanics than the state. All three counties have higher percentages of American Indian, 40 Eskimo, or Aleut populations than the statewide percentage. (Native American consultation conducted 41 for the project and an analysis of identified issues is presented in Section 3.9, Native American 42 Traditional Values.) 43

Deep South Expansion Project EIS 3.14 – Environmental Justice 3.14-2
Draft EIS 2018
Table 3.14-1 2015 Race and Ethnicity by County and Town
Race/Ethnicity Elko
County Eureka County
Lander County
Town of Crescent
Valley State of Nevada
White Not of Hispanic Origin 67.6 95.1 65.2 95.7 52.0
Black Not of Hispanic Origin 1.1 0.1 0.1 0.0 8.1
American Indian, Eskimo, or Aleut 5.1 1.5 3.7 4.3 0.9
Asian or Pacific Islander Non-Hispanic 1.1 0.7 1.0 0.0 8.1
Other and Two or More Races 1.1 0.0 2.9 0.0 3.4
Hispanic Origin of Any Race 24.0 2.6 27.1 0.0 27.5
Source: U.S. Census Bureau 2017a,b.
With reference to the CEQ guidance, no racial or ethnic group exceeds 50 percent of the population of 1 any of the study area counties. The population percentages of American Indians in all three study area 2 counties and the Town of Crescent Valley would be considered “meaningfully greater” than for the state 3 as a whole, however, ranging from 1.7 times greater for Eureka County to 5.7 times greater for Elko 4 County. Therefore, for the purpose of identifying environmental justice concerns, a minority population, 5 as defined by the guidance, exists in the project study area. 6
3.14.1.2 Low-income Population 7
Poverty status is determined by comparing annual household income to poverty thresholds, which vary 8 by family size, number of children, and age of the householder, although not geographically. Poverty 9 thresholds are updated annually, based on changes in the Consumer Price Index. Weighted average 10 poverty thresholds for 2015 ranged from $11,367 for a single individual 65 years and over to $49,177 for 11 a household of nine or more people. Census estimates indicated 15.5 percent of the people in Nevada 12 were in households with incomes below the poverty level in 2015 (U.S. Census Bureau 2017b). 13
With mining as the dominant industry in much of the study area, mining wages and salaries typically are 14 higher than average for the economy as a whole. As shown in Table 3.14-2, the result of this differential 15 is substantially higher median household incomes in the study area counties than statewide. 16 Nevertheless, there are households in all counties with incomes well below the median. The poverty 17 threshold noted in Table 3.14-2 is the weighted average for a three-person household, approximately the 18 average household size for the study area. Official model-based census estimates for 2015 indicate the 19 percentages of both total population and of persons under age 18 in poverty were below, and in some 20 cases well below, the comparable statewide averages. Consequently, county populations in the project 21 study area are not considered to be low-income for EO 12898 purposes according to CEQ guidance. 22
Table 3.14-2 2015 Household Income and Poverty Levels
County/Town/State Median Household
Income Poverty Threshold
3-person HouseholdPopulation in Poverty (%)
Total Under Age 18 Elko County $71,799 $18,871 11.0 15.5
Eureka County $60,250 $18,871 9.7 1.6
Lander County $78,190 $18,871 11.5 20.6
Town of Crescent Valley $93,250 $18,871 1.4 0.0
State of Nevada $51,847 $18,871 15.5 22.1
Source: U.S. Census Bureau 2017b,c.

Deep South Expansion Project EIS 3.14 – Environmental Justice 3.14-3
Draft EIS 2018
3.14.2 Environmental Consequences 1
USEPA’s Final Guidance for Incorporating Environmental Justice Concerns in USEPA’s NEPA 2 Compliance Analyses (USEPA 1998) suggests a screening process to identify environmental justice 3 concerns. This two-step process defines the significance criteria for the environmental justice analysis. If 4 either criterion is unmet, there is little likelihood of environmental justice effects occurring. The two-step 5 process is as follows: 6
1) Does the potentially affected community include minority and/or low-income populations?7
2) Are the environmental impacts likely to fall disproportionately on minority and/or low-income8 members of the community and/or a tribal resource?9
If the two-step process indicates there is a potential for environmental justice effects to occur, the 10 following are to be considered in the analysis: 11
• Whether there exists a potential for disproportionate risk of high and adverse human health or12 environmental effects;13
• Whether communities have been sufficiently involved in the decision-making process; and14
• Whether communities currently suffer, or have historically suffered, from environmental and15 health risks and hazards.16
In order to assess the potential for significant environmental justice effects, the socioeconomic 17 characteristics of the study area counties are first screened for the presence of minority and/or low-18 income populations. Second, if such populations are found to be present based on USEPA’s 19 environmental justice guidance (USEPA 1998), the proposed project and alternatives are evaluated for 20 potential effects that may be expected to disproportionately affect any of the identified populations. If the 21 two-step process indicates that a potential for environmental justice effects exists, additional analyses 22 under the significance criteria are then applied to determine if the adverse effects would be considered 23 significant if the proposed project or an alternative is implemented. 24
Potential effects of the Proposed Action and alternatives on environmental justice were evaluated, in 25 part, in terms of intensity, duration, and context based on the following definitions. 26
Intensity 27
• No Adverse Effect: No discernible adverse environmental, health, or socioeconomic effects on28 minority or low-income communities in the three-county project study area, or if detectable, such29 effects on minority or low-income communities essentially would be the same as the effects on30 the overall population.31
• Adverse Effect: Identifiable adverse environmental, health, or socioeconomic effects would be32 disproportionately borne by minority or low-income communities in the three-county project33 study area.34
Duration 35
• Short-term: The effects would last for the life of the project, but would end upon project36 completion.37
• Long-term: The effects would extend beyond the life of the project.38

Deep South Expansion Project EIS 3.14 – Environmental Justice 3.14-4
Draft EIS 2018
Context 1
• Localized: Effects would be limited to the three-county project study area and the local2 economy.3
• Regional: Effects would extend beyond the three-county project study area and extend beyond4 the local economy.5
3.14.2.1 Proposed Action 6
The potential effects of the Proposed Action would not be expected to disproportionately affect any 7 particular population. The area in the immediate vicinity of the proposed project is very sparsely 8 populated. The nearest residences are a few remote ranches located a few miles from the project area, 9 the nearest of which are owned by Barrick. Residents have not been identified as minority or low-income 10 in nature. The nearest residential area is located in the Town of Crescent Valley, approximately 7.5 miles 11 north of the proposed project. Larger communities are all more than 25 miles from the proposed project. 12 Major population concentrations of American Indians are generally located at considerable distances 13 from the project. The nearest is the South Fork Indian Reservation in Elko County, approximately 14 50 miles northeast of the project. The American Indian population comprises an estimated 4.3 percent of 15 the population of the Crescent Valley community, although that is only approximately 15 individuals out 16 of the 346 total community residents. Any project effects on the Crescent Valley community would be 17 expected to affect the small American Indian population the same as the majority white population. 18 There are no concentrations of low income populations near the proposed project. Consequently, no 19 adverse environmental justice effects have been identified for local communities. 20
Environmental effects that may occur at a greater distance from the proposed project area, such as air 21 quality or traffic effects, would affect the study area’s population essentially equally without regard to 22 race, ethnicity, or income level. Ore truck traffic between the CGM Operations Area and the Goldstrike 23 and Arturo mines would travel primarily on major highways and not through populated communities (see 24 Section 3.11, Land Use and Access). Because any adverse effects would accrue to the entire population 25 to essentially the same degree, no adverse environmental justice effects have been identified for this 26 broader regional area. 27
An additional provision of the environmental justice guidance requires consideration of “impacts that may 28 affect a cultural, historical, or protected resource of value to an Indian tribe or a minority population, even 29 when the population is not concentrated in the vicinity.” Section 3.9, Native American Traditional Values, 30 addresses concerns that have been raised during previous ethnographic surveys and by tribal members 31 and the public regarding how the proposed project might affect nearby areas that are valued by the 32 Western Shoshone culture, including the spiritual and religious use of Mount Tenabo. Based on the 33 analysis in Section 3.9, Native American Traditional Values, increased visual effects to the landscape as 34 a result of the Proposed Action may diminish the experience for some individuals; however, the number 35 of people who visit the top of Mount Tenabo and the frequency of their visits is unknown. Consequently, 36 the effects to Native American traditional values cannot be quantified and a determination of “significant 37 or adverse” effects on American Indian cultural values cannot be determined. 38
Regarding whether “communities have been sufficiently involved in the decision making process,” the 39 BLM held three public scoping meetings and notified the public about the proposed project through a 40 press release on their website and notices in area newspapers, in addition to the formal notice in the FR 41 (see Section 4.1, Public Participation and Scoping). The BLM also has involved Native American tribal 42 groups in the EIS process through formal government-to-government consultation specific to the 43 proposed project (see Section 3.9.1.2, Native American Consultation and Coordination), in addition to 44 prior discussions about resources and sites related to the CGM Operations Area over approximately two 45 decades. 46

Deep South Expansion Project EIS 3.14 – Environmental Justice 3.14-5
Draft EIS 2018
3.14.2.2 Gold Acres Pit Partial Backfill Alternative 1
Potential environmental justice effects under the Gold Acres Pit Partial Backfill Alternative would be the 2 same as described for the Proposed Action. Therefore, development of the project under this alternative 3 would not be expected to disproportionately affect any particular population and no adverse 4 environmental justice effects have been identified for either local or regional communities. 5
3.14.2.3 No Action Alternative 6
Under the No Action Alternative, the proposed Deep South Expansion Project would not be developed. 7 Existing mining-related activities in the current CGM Operations Area would continue under the terms of 8 current permits and approvals as authorized by the BLM and State of Nevada. There would be no 9 measurable change to environmental or socioeconomic effects that would be expected to 10 disproportionately affect a particular population. 11
3.14.3 Cumulative Impacts 12
3.14.3.1 Proposed Action 13
No direct or indirect effects relative to environmental justice would occur under the Proposed Action; 14 therefore, the proposed project would not contribute to cumulative environmental justice impacts. 15
3.14.3.2 Gold Acres Pit Partial Backfill Alternative 16
No direct or indirect effects relative to environmental justice would occur under the Gold Acres Pit Partial 17 Backfill Alternative; therefore, the project development under this alternative would not contribute to 18 cumulative environmental justice impacts. 19
3.14.4 Monitoring and Mitigation Measures 20
No adverse environmental justice effects have been identified; therefore, no monitoring or mitigation 21 measures are recommended. 22
3.14.5 Residual Adverse Effects 23
No residual adverse effects that could affect minority or low-income populations would occur as a result 24 of the Proposed Action. 25

Deep South Expansion Project EIS 3.14 – Environmental Justice 3.14-6
Draft EIS 2018
This page intentionally left blank

Deep South Expansion Project EIS 3.15 – Visual Resources 3.15-1
Draft EIS 2018
3.15 Visual Resources 1
The project study area for direct and indirect visual resources impacts encompasses the proposed 2 modifications in the CGM Operations Area as seen from the four KOPs identified for the project. The 3 CESA encompasses the viewshed of the proposed project or, generally, the area within approximately 4 20 miles of the proposed project modifications from which the project modifications would be visible. 5
3.15.1 Affected Environment 6
The BLM is responsible for identifying and protecting scenic values on public lands under several 7 provisions of FLPMA and NEPA. The BLM VRM system (BLM 1986a) was developed to facilitate the 8 effective discharge of that responsibility in a systematic, interdisciplinary manner. The VRM system 9 includes an inventory process, based on a matrix of scenic quality, viewer sensitivity to visual change, 10 and viewing distances, which leads to classification of public lands and assignment of visual 11 management objectives. Four VRM classes have been established, which serve two purposes: 1) as an 12 inventory tool portraying relative value of existing visual resources and 2) as a management tool 13 portraying visual management objectives for the respective classified lands. The management objectives 14 for each of the VRM classes are displayed in Table 3.15-1. 15
Table 3.15-1 BLM VRM Class Objectives
Class I Objective The objective of this class is to preserve the existing character of the landscape. This class provides for natural ecological changes; however, it does not preclude very limited management activity. The level of change to the characteristic landscape should be very low and must not attract attention.
Class II Objective The objective of this class is to retain the existing character of the landscape. The level of change to the characteristic landscape should be low. Management activities may be seen, but should not attract the attention of the casual observer. Any changes must repeat the basic (design) elements of form, line, color, and texture found in the predominant natural features of the characteristic landscape.
Class III Objective The objective of this class is to partially retain the existing character of the landscape. The level of change to the characteristic landscape should be moderate. Management activities may attract attention, but should not dominate the view of the casual observer. Changes should repeat the basic elements found in the predominant natural features of the characteristic landscape.
Class IV Objective The objective of this class is to provide for management activities, which require major modification of the existing character of the landscape. The level of change to the characteristic landscape can be high. These management activities may dominate the view and be the major focus of viewer attention. However, every attempt should be made to minimize the impact of these activities through careful location, minimal disturbance, and repeating the basic (design) elements.
Source: BLM 1986a.
The VRM system also includes a “contrast rating” procedure for evaluating the potential visual effects of 16 a proposed project or management activity. The VRM system was used to evaluate the visual impact of 17 the proposed project. 18
Under the VRM system, the affected environment for visual resources is characterized using an 19 inventory and evaluation process that addresses scenic quality, viewer sensitivity, and distance between 20 viewers and a proposed modification to the landscape. Landscape characteristics contributing to the 21 inventory process for the project study area are described below. 22

Deep South Expansion Project EIS 3.15 – Visual Resources 3.15-2
Draft EIS 2018
The project study area and CESA are located in the Basin and Range physiographic province as defined 1 by Fenneman (1931). The province is characterized by alternating valleys and low, north-south trending 2 mountain ridges common to central Nevada. The project study area includes parts of four valleys: 3 Crescent Valley, encompassing most of the four mine complexes; Grass Valley to the southeast, 4 extending southerly from the saddle between Mount Tenabo and the north tip of the Toiyabe Range; 5 Pine Valley, extending northeast from Garden Gate Pass on the east side of Grass Valley; and Carico 6 Lake Valley, across a low ridge to the southwest of Crescent Valley. Topography of the CGM Operations 7 Area vicinity is nearly flat in the valleys. The high point on the flats of Grass Valley is at approximately 8 5,750 feet amsl, dropping gradually to the south. Crescent Valley is at an elevation of approximately 9 4,950 feet amsl at its highest (southern) end where the CGM Operations Area is located. Pine Valley 10 declines gradually to the northeast from a high of 5,960 feet amsl at Garden Gate Pass. Carico Lake 11 Valley is at approximately 5,040 feet amsl where Rocky Pass enters the valley at the valley low point, 12 rising gradually to the north, west, and south. Mount Tenabo is the most prominent land form in the 13 project vicinity, rising steeply to the east in a massive buttress and peaking at approximately 9,153 feet 14 amsl. Topography of the Toiyabe Range, southwest of the project study area, is rounded and irregular, 15 peaking at approximately 7,480 feet amsl. The low ridge between Crescent Valley and Carico Lake 16 Valley tops out at just 6,100 feet amsl approximately 1 mile south of Rocky Pass. 17
Vegetation in the vicinity of the project study area is sparse, dominated by small to medium sized pinyon-18 juniper forests with mixed shrubs in the higher elevations. Vegetation colors are predominantly dark 19 green in these areas. Valleys are mostly low sagebrush and grasses. Grasses are short and typically 20 sparse, reflecting the desert conditions of the region. Vegetation colors in the valleys range from silvery 21 gray-green to medium olive. Somewhat brighter greens are in evidence for periods in the spring, with 22 beige, tans, and muted gold during the drier and colder months. 23
Native soils are light beige to pale whitish gray with rock outcrops adding generally muted browns, 24 oranges, and some mauve to purple hues. 25
Color differences, though generally not sharply contrasting, can be easily distinguished at ranges of a 26 mile or more, especially with early morning or late afternoon sun at the viewer's back. Colors blend 27 together and become very subtle or undistinguishable at greater distances and under other light 28 conditions, such as high mid-day sun or the light haze often seen in this part of Nevada. 29
Currently authorized mine facilities in the four mine complexes in the CGM Operations Area (Figure 2-2) 30 include open pits; waste rock, heap leach, and tailings facilities; and linear facilities (e.g., conveyor 31 corridor, roads, power lines). These facilities exhibit strong color contrast with the natural surroundings 32 and moderate to strong line, landform, and surface texture contrast. The light tans and grays of the 33 waste rock facilities and tailings stand out strongly from the natural background, particularly where they 34 are closely backed by natural terrain and vegetation, such as on the west face of Mount Tenabo. They 35 produce slightly less contrast under overcast sky conditions when the light angle or intensity does not 36 emphasize the color differences between exposed rock materials and natural vegetation. Where the pit 37 walls and active waste rock facilities are visible, pit benches and waste rock lifts are predominantly 38 horizontal in character. The individual surfaces of the bench faces generally are smooth textured, 39 although from a distance, the overall visual effect suggests a horizontal “corduroy” ribbed texture. 40
Areas that have been reclaimed show substantial visual mitigating effects of reclamation. The irregular 41 softening and rounding of the slopes mimics to some extent the natural terrain, in contrast to the angle of 42 repose on active waste rock facilities. Reclamation reduces the landform and line contrast to moderate 43 levels. Although shrub growth is naturally slow in the landscape and grasses are characteristically 44 sparse, both help reduce color contrast. 45
Structures in the project study area and vicinity are limited to mining structures; they are geometric in 46 form and light gray to white in color. Road scars are prominent linear man-made features in the vicinity. 47

Deep South Expansion Project EIS 3.15 – Visual Resources 3.15-3
Draft EIS 2018
The project area is visible from SR 306 in Crescent Valley, CR 225 near Rocky Pass, and CR 222 in 1 Grass Valley. These routes are all lightly travelled. Project facilities and activities also are visible from the 2 BCI-owned Dean Ranch, approximately 1 mile to the north, and from the town of Crescent Valley at a 3 distance of 7.5 miles. 4
VRM class designations for the project vicinity were established by the BLM under the VRM system 5 during preparation of the Shoshone-Eureka RMP, which was adopted in 1986. Preparation of a new 6 RMP/EIS that would cover the entire Battle Mountain District currently is in progress. As part of that 7 planning process, an updated Visual Resource Inventory has been prepared for the entire Battle 8 Mountain District; however, action to establish revised VRM class designations has not been completed. 9 Consequently, this analysis has been prepared with reference to the VRM class designations from the 10 Shoshone-Eureka RMP as the most recent formally adopted guidance. An approximately 2.6-square-11 mile portion of the CGM Operations Area is designated VRM Class III (Figure 3.15-1). The remainder of 12 the CGM Operations Area and most of the surrounding area are designated Class IV. Most of the 13 proposed physical landscape modifications for the proposed project would be located in VRM Class IV 14 areas. VRM Class IV is the least restrictive of the four management classes. Portions of proposed 15 landscape modifications in the Cortez Hills Complex would be located in VRM Class III areas, including 16 the Pediment South and Pediment East extensions of the Cortez Hills Pit (Figure 3.15-1). 17
3.15.2 Environmental Consequences 18
Under the Proposed Action, some of the proposed modifications in the CGM Operations Area would 19 occur within currently authorized disturbance areas for which reallocation of use is proposed 20 (Figure 2-4). The visual effects of the previously authorized disturbance were analyzed in prior NEPA 21 documents for the CGM Operations Area (BLM 2015, 2014, 2008, 2004, 2000). The areas for which 22 reallocation of use is proposed would entail relatively modest expansions in the context of the overall 23 existing facilities. Therefore, the visual effects resulting from the Proposed Action primarily would be 24 related to facilities modifications in proposed new disturbance areas. 25
Potential visual impacts associated with the Proposed Action were analyzed using the procedures 26 outlined in the BLM Visual Contrast Rating Handbook H-8431-1 (BLM 1986b). Visual impacts were 27 determined by comparing visual contrast ratings for the proposed new facilities and facilities 28 modifications with the VRM class objectives for the project area, portions of which are designated VRM 29 Class III and Class IV (Figure 3.15-1). The criteria for determination of significance of visual effects are 30 encompassed in the VRM Management Class Objectives (Table 3.15-1). The process involves 31 comparing the degree of visual contrast from the proposed new facilities and facilities modifications with 32 the natural landscape character both during active mining and after reclamation is completed. The 33 contrast rating process employed four KOPs (Figure 3.15-1) as viewpoints for conducting the impact 34 analysis. In keeping with previous visual analyses of facilities in the CGM Operations Area (BLM 2015, 35 2014, 2008), visual effects also were briefly addressed for two “sensitive” viewpoints: Shoshone Wells 36 and the top of Mount Tenabo. 37
KOP #1 is located on SR 306 at the intersection with CR 225 (Figure 3.15-1) approximately 1 mile north 38 of the currently authorized tailings impoundment at the Pipeline Complex. This viewpoint represents the 39 perspective of travelers approaching from the north in close proximity to project features at the Pipeline 40 Complex; it also represents views from Crescent Valley approximately 10 miles farther to the north-41 northeast. KOP #2 is located at the east entrance to Rocky Pass on CR 225 and represents the view of 42 the mine complexes for travelers approaching from Carico Lake Valley. KOP #3 is located on CR 222 43 approximately 1 mile south-southeast of the Lander-Eureka county line and 4.5 miles north-northwest of 44 the intersection with the road to Garden Gate Pass. It represents the view for northbound travelers 45 approaching from Grass Valley or Pine Valley. KOP #4 is located on Mill Creek Road (CR 225) at its 46 intersection with Clipper Haul Road; it represents a view of northern Carico Lake Valley, the location for 47 the proposed Rocky Pass Reservoir. All of these approach routes are lightly traveled, although they are 48 the only improved roads to and through the project area. Most traffic in the area is generated by mineral 49

Deep South Expansion Project EIS 3.15 – Visual Resources 3.15-4
Draft EIS 2018
development or local ranching; however, there also is some traffic generated by recreational activities 1 including hunting, camping, rock hounding, and sightseeing. 2
Views for two additional locations were analyzed for visual effects. These locations are somewhat 3 different than the first four in that they represent sensitive, but very lightly used, viewpoints. The first of 4 these is near Shoshone Wells, at a spot reportedly used by Native Americans for ceremonial purposes. It 5 initially was identified by a ceremonial flag stick (no longer extant) perched on a small raised rock 6 outcrop on the west side of Cortez Canyon Road (CR 222) in Section 1, T26N, R47E, approximately 7 1.4 miles northwest of the old Cortez townsite. The second location is at the top of Mount Tenabo, 8 representing views from a position overlooking the entire project area. This location also has been 9 reported as having ceremonial importance for Native Americans. 10
Significance of visual impacts would be judged as follows: 11
• Significant – Predicted visual contrast that exceeds the VRM class guidelines.12
• Moderate – Predicted visual contrast levels that are fully at the level of change allowed, but that13 do not exceed the VRM guidelines.14
• Low – Predicted visual contrast levels that are clearly below the VRM class allowable thresholds15 for visual change.16
The potential intensity and duration of visual effects were evaluated as defined below. 17
Intensity 18
• Negligible: Effects would not result in any perceptible changes to existing viewsheds. Class I19 and II areas would retain their classifications.20
• Minor: Effects would result in slightly detectable changes to a viewshed or would introduce a21 compatible human-made feature to an existing developed area. Class II and III areas would22 retain their classifications with mitigation; however, a Class I area may not.23
• Moderate: Effects would be readily apparent and would change the character of visual24 resources within a viewshed. Class III areas could retain their classifications with careful25 mitigation; however, Class I and II areas may not.26
• Major: Effects would be highly noticeable or would change the character of visual resources27 within a viewshed by adding human-made features into a mostly undeveloped area. Adverse28 effects to Class I and II areas could not be mitigated, and they would lose their classification.29 Class III areas may be reclassified to Class IV.30
Duration 31
• Short-term: Effects would be temporary and reversible.32
• Long-term: Effects would be permanent.33


Deep South Expansion Project EIS 3.15 – Visual Resources 3.15-6
Draft EIS 2018
This page intentionally left blank

Deep South Expansion Project EIS 3.15 – Visual Resources 3.15-7
Draft EIS 2018
3.15.2.1 Proposed Action 1
Under the Proposed Action, varying components of the proposed facilities modifications for the mine 2 complexes would be visible from three of the KOPs (#1, #2, and #3) (Figure 3.15-1). Because the Gold 3 Acres Complex is visually integrated with the Pipeline Complex, most observers would not typically 4 differentiate the visual effects of one from the other. Construction and operation of the proposed 5 modifications at the Pipeline and Gold Acres complexes would increase the extent of the visual contrast 6 that would occur from currently authorized facilities in comparison with the natural character of the 7 landscape. The primary change in visual effects would result from proposed modifications to the 8 Pipeline/South Pipeline and Gold Acres waste rock facilities and, to a lesser extent, from construction of 9 the Gold Acres refractory ore stockpile and expansion of the existing Pipeline oxide ore stockpile 10 (Figure 2-4). The proposed modifications at the Pipeline and Gold Acres complexes would have similar, 11 but expanded, visual effects to those already occurring from the existing and currently authorized project 12 facilities, including strong color contrast, moderate to strong line and landform contrast, and moderate 13 texture contrast. The degree of change in visual contrast would be considered minor compared with 14 currently authorized facilities. Other elements of the Proposed Action at these two mine complexes either 15 would be screened from view by existing waste rock and heap leach facilities or would include lesser 16 features such as drainage control facilities, water pipelines, roads, and utilities. The visual contrast 17 effects gradually would become less prominent with completion of concurrent and final reclamation 18 activities. The key consideration is the degree of change in the visual impacts, compared with the 19 amount of contrast permissible under the VRM Class IV objectives. 20
The Class IV objective provides for “major modification of the existing character of the landscape,” so the 21 visual disturbance would be in conformance with the objective if “every effort” is made to minimize the 22 visual impact. Figures 3.15-2 and 3.15-3 present simulations of the visual effects of proposed facilities 23 modifications at the Pipeline and Gold Acres complexes both at the height-of-mining and after 24 reclamation as seen from KOP #1 and KOP #2, respectively. Simulated views from KOP #1 25 (Figure 3.15-2) show substantially larger facilities at the height-of-mining than for existing conditions; 26 however, only a relatively small portion of the difference would result from the Proposed Action, while a 27 majority reflects ongoing development of currently authorized facilities. It is estimated that the degree of 28 visual impact from the proposed modifications in the Pipeline and Gold Acres complexes, as observed 29 from the two KOPs, would be rated minor to moderate largely due to the extent of currently authorized 30 disturbance/facilities and the amount of change allowable under the VRM Class IV designation. 31 Consequently, the long-term visual modifications at both the Pipeline and Gold Acres complexes would 32 comply with the Class IV objectives as viewed from both KOP #1 and KOP #2. Proposed modifications 33 at the Pipeline and Gold Acres complexes would not affect views from KOP #3 because the terrain of the 34 Toiyabe Range effectively would screen views of the proposed facilities from that perspective. Similarly, 35 views from KOP #4 would not be affected because of intervening terrain, including Squaw Butte at nearly 36 1,000 feet higher than the KOP. 37
Proposed activities at the Cortez Hills and Cortez complexes would be visually integrated, similar to the 38 way they would be at the Pipeline and Gold Acres complexes. At the Cortez Complex, the most 39 prominent proposed modifications include expansion of the Cortez West Waste Rock Facility and 40 construction of oxide and refractory ore stockpiles (Figure 2-4). There would be several less prominent 41 ancillary facilities, and the proposed Cortez Pit expansion would be screened by other facilities. At the 42 Cortez Hills Complex, the primary change in visual effects would result from the proposed Pediment 43 South and Pediment East extensions of the Cortez Hills Pit. Proposed modification of the Canyon Waste 44 Rock Facility also would be notable, although as with related ancillary facilities, it would not be visually 45 prominent from any of the designated KOPs. The Proposed Action would expand, to some degree, the 46 extent of the visual contrast that currently exists between the authorized facilities and the natural 47 character of the landscape. The primary change in visual effects from the currently authorized facilities 48 would result from the proposed increase in the easterly extension of the Cortez Hills Pit. The southerly pit 49 extension would be less prominent because it would not be on the lower flank of Mount Tenabo. The 50 proposed modifications at the Cortez Hills Complex would have similar, but somewhat expanded, visual 51

Deep South Expansion Project EIS 3.15 – Visual Resources 3.15-8
Draft EIS 2018
effects to those already occurring from the existing permitted project, including strong color contrast, 1 moderate to strong line and landform contrast, and moderate texture contrast. The degree of change 2 would be considered moderate compared with the currently permitted visual disturbance, primarily due to 3 the pit extension; other proposed facilities would not be visually prominent in the context of existing 4 project facilities. The visual contrast effects gradually would become less prominent with completion of 5 concurrent and final reclamation activities (Figure 3.15-1). The key consideration is the degree of 6 change in the visual effects, compared with the contrast permissible under the VRM class objectives. All 7 of the modifications at the Cortez Complex are proposed for location in a VRM Class IV area. However, 8 a portion of the proposed Pediment East Extension and all of the proposed Pediment South Extension of 9 the Cortez Hills Pit, as well as some of the proposed ancillary facilities, would occur in a VRM Class III 10 area with the remainder in a VRM Class IV area. 11
The VRM Class III designation is somewhat more restrictive than the Class IV designation. The objective 12 for Class III states, “the level of change to the characteristic landscape should be moderate,” at worst. 13 Although the Pediment East Extension of the Cortez Hills Pit would be an expansion of the raw “scar” of 14 the existing pit, it would be a modest incremental change, and it would be minimally, if at all, visible from 15 KOP #1. It would be screened by terrain from the other three KOPs. Given these considerations, it is 16 expected that the proposed facility modifications would achieve the requisite “moderate” level of 17 landscape change in the Class III area, as viewed from KOP #1 (Figure 3.15-2) The visual effects of the 18 proposed facilities in the VRM Class IV area, as viewed from KOP #1 (Figure 3.15-2) would not 19 dominate the view because of distance and the scale of the facility modifications relative to Mount 20 Tenabo as the visual backdrop. Consequently, the visual contrast would be minor, and it is expected that 21 the proposed facilities would comply with the Class IV objective as viewed from this perspective. Also, 22 views from KOP #3 (Figure 3.15-4) would achieve the VRM Class IV objective because the only 23 proposed changes in that viewshed would be ancillary facilities that would have minor effects on the 24 landscape character. As noted above, the Class IV objective provides for “major modification of the 25 existing character of the landscape,” so the visual effects in the Class IV portion of the proposed 26 modifications to both the Cortez and Cortez Hills complexes would be in conformance with the objective, 27 though “every effort” should be made to minimize the visual impact as required by the Class IV objective. 28 Proposed modifications at the Cortez and Cortez Hills complexes would not affect views from KOP #2 or 29 KOP #4 (Figures 3.15-3 and 3.15-5) because the terrain of the Toiyabe Range would screen views of 30 the proposed facilities modifications effectively from those perspectives. 31
The Shoshone Wells location is surrounded on three sides by currently authorized facilities, the nearest 32 of which are the administration facilities directly across the road to the east, the Grass Valley Heap 33 Leach Facility approximately 0.5 mile to the southeast, and the Canyon Waste Rock Facility 34 approximately 0.3 mile to the north-northwest. Views from Shoshone Wells are dominated by existing 35 project facilities, which rise above the viewpoint from a few hundred feet to over 1,000 feet at the top of 36 the Cortez Hills Pit. It is unlikely, therefore, that any of the elements of the Proposed Action would be 37 visible from this viewpoint because of screening by existing and/or previously approved project features. 38 Consequently, the visual effects would be negligible. 39
Most, and perhaps all, of the above ground elements of the Proposed Action would be visible from the 40 sensitive viewpoint at the top of Mount Tenabo. Because the visual character of most of the proposed 41 new and revised project elements in the four mine complexes would be very similar to existing project 42 facilities, and because the scale of proposed facility modifications would be relatively small in the context 43 of existing facilities at all four mine complexes, the visual effects of most of the mine features would be 44 minor as viewed from Mount Tenabo. It is unlikely that a casual observer would notice most of these 45 visual changes. In contrast, approximately the western half of the proposed Rocky Pass Reservoir would 46 be visible from Mount Tenabo over the top of the east ridge of Carico Lake Valley. The reservoir would 47 interject a new and unusual visual feature in the viewshed, although at a distance of approximately 48 11.5 miles from the mountain top. Although substantially different from the natural visual character of the 49


Deep South Expansion Project EIS 3.15 – Visual Resources 3.15-13
Draft EIS 2018
high desert landscape, the reservoir would be consistent with the VRM Class IV objectives, which allow 1 for major modifications to the landscape. In addition, the reservoir would be a short-term, temporary 2 facility that would be in use during the active life of the mine, but would be reclaimed and returned to its 3 natural character during closure and final reclamation. 4
The Proposed Action includes a number of water management facilities, including numerous RIBs with 5 associated surface pipelines and, most prominently, the Rocky Pass Reservoir on the west flank of 6 Rocky Pass, to manage dewatering water. The RIBs and related facilities all would be located in VRM 7 Class IV areas. Although they are spread through and beyond the CGM Operations Area boundary, they 8 all would be low profile in character and would be short-term, temporary features that would be removed 9 and reclaimed following the completion of mining. During construction and operations, they would be 10 visible from KOPs #1, #2, and #3, but would not dominate the view from any of those viewpoints. 11 Consequently, the visual effects would be minor to moderate, and they would readily achieve the 12 Class IV objective. 13
The proposed Rocky Pass Reservoir in the Carico Lake Valley (Figure 2-3) temporarily would 14 encompass up to approximately 1,677 acres. A water feature of that scale would inject a substantial 15 change in the visual character of Carico Lake Valley. It would, at maximum scale, constitute a “high level 16 of change” to the existing landscape and would “dominate the view,” but those are within the acceptable 17 level of change as indicated by the VRM Class IV objectives (Table 3.15-1). Also, considering the arid 18 nature of the landscape in Carico Lake Valley, introduction of the reservoir may be considered as adding 19 positive variety to the landscape in the short term. The reservoir would only be visible from KOP #4; it 20 would dominate views from that viewpoint and would likely be a “major focus of viewer attention.” 21 Following the completion of mining, water remaining in the reservoir would be pumped back to the 22 Pipeline Pit, the material from the earthen embankment would be removed and placed in the 23 impoundment footprint from where it was borrowed, and the entire footprint of the reservoir would be 24 revegetated as described in Section 2.4.14, Reclamation. Once vegetation has been re-established, the 25 visual character of Carico Lake Valley would effectively be returned to approximately its original pre-26 project condition. Consequently, the visual effects would be short-term. 27
3.15.2.2 Gold Acres Pit Partial Backfill Alternative 28
Under this alternative, the partial backfill of the Gold Acres Pit and reduction in the size of the Gold Acres 29 North Waste Rock Facility would reduce the effect of the proposed project on the visual environment, 30 resulting in a very minor positive change in visual effects on the landscape. However, in the context of 31 the Gold Acres Complex, in particular, and the CGM Operations Area in its entirety, the visual effects as 32 seen from KOPs #1 and #2 and the sensitive viewpoint at the top of Mount Tenabo essentially would be 33 very difficult to distinguish from the visual effects of the Proposed Action for most observers. 34
3.15.2.3 No Action Alternative 35
Under the No Action Alternative, the proposed Deep South Expansion Project would not be developed 36 and the associated impacts to visual resources would not occur. Existing operations and reclamation 37 activities in the current CGM Operations Area would continue under the terms of current permits and 38 approvals as authorized by the BLM and State of Nevada. The associated measurable changes to visual 39 effects would be consistent with prior NEPA analyses for the CGM Operations Area. 40
3.15.3 Cumulative Impacts 41
The CESA for visual resources is shown in Figure 3.15-6. Past and present actions and RFFAs are 42 identified in Table 2-12 and shown in Figure 2-22. 43

Deep South Expansion Project EIS 3.15 – Visual Resources 3.15-14
Draft EIS 2018
3.15.3.1 Proposed Action 1
Visual effects of past and present actions are reflected in the description of the affected environment 2 (Section 3.15.1). RFFAs that would create visual effects are predominantly mining-related activities, 3 including both exploration and development projects; however, few, if any, of these would occur in the 4 viewshed of the Proposed Action. There also would be a potential increase in dirt roads and agricultural 5 developments, including primarily increased grazing activity. Among these actions, the mining projects 6 would be the most likely to introduce strong visual contrast in the CESA. However, all of the identified 7 future actions would be located in VRM Class IV areas, so it is anticipated that the visual disturbance 8 would be accommodated by the standards of the VRM Class IV objectives, which provide for “major 9 modification” of the landscape. 10
Based on the reclamation plan for the Proposed Action and the assumption that standard reclamation 11 requirements would be specified for permitting of future projects, the cumulative visual effects would be 12 minimized to the degree possible after completion of the projects. 13
3.15.3.2 Gold Acres Pit Partial Backfill Alternative 14
The Gold Acres Pit Partial Backfill Alternative would result in a minimal reduction in visual effects from 15 the Proposed Action and consequently a very minor positive change in the proposed project’s 16 contribution to cumulative effects on the visual character of the cumulative effects area. 17
3.15.4 Monitoring and Mitigation Measures 18
No monitoring or mitigation measures are recommended for visual resources beyond the reclamation 19 activities proposed for the project. 20
3.15.5 Residual Adverse Effects 21
Residual adverse visual effects would result from long-term changes in landform and color contrast 22 associated with the Proposed Action. The color contrast would be minimized by reclamation activities, 23 and the visual effects would diminish gradually over time as natural vegetation patterns develop, thereby 24 helping to mask the landform and color contrasts. However, the landform modifications would result in 25 long-term, permanent visual effects. 26


Deep South Expansion Project EIS 3.15 – Visual Resources 3.15-16
Draft EIS 2018
This page intentionally left blank

Deep South Expansion Project EIS 3.16 – Noise 3.16-1
Draft EIS July 2018
3.16 Noise 1
The project study area and CESA for noise effects encompass an area within a 10-mile buffer of the 2 proposed new disturbance and modified activity areas within and outside of the CGM Operations Area. It 3 also includes a 2-mile-wide corridor centered on the ore transportation route between the CGM 4 Operations Area and the Goldstrike and Arturo mines. 5
3.16.1 Affected Environment 6
Describing the environment potentially affected by noise from the proposed project involves identifying 7 noise-sensitive receptors and existing noise sources in the project study area, characterizing terrain 8 features that may affect noise transmission, and characterizing existing noise levels. 9
The CGM Operations Area, inclusive of the proposed Deep South Expansion Project, is located in a 10 relatively remote area where existing development primarily consists of other mining projects. There are 11 four occupied ranches in the project study area. The Barrick-owned Wintle and Dean ranches are 12 located in Crescent Valley just inside the northeast corner of the CGM Operations Area and 13 approximately 1.0 mile northeast of the CGM Operations Area, respectively. The BCI-owned Filippini 14 Ranch is located on the west side of Rocky Pass within the proposed expanded CGM Operations Area 15 boundary. The privately owned Dann Ranch is located approximately 9.5 miles northeast of the CGM 16 Operations Area. In addition, the community of Crescent Valley is approximately 7.5 miles north of the 17 CGM Operations Area. The Arturo and Goldstrike mine properties are similarly located in a remote area 18 dominated by existing mining operations. 19
Natural sounds, including wind, insects, and birds, are the principal contributors to ambient noise in 20 outlying portions of the study area. Variations in wind speeds can have a dramatic effect on noise levels 21 in the area. Ranching, dispersed recreation, and mining activities in the area generate occasional 22 vehicular noise, although the traffic is light. The principal sources of noise in the vicinity of the proposed 23 project are associated with mining-related heavy equipment and once daily blasting at the existing mine 24 pits. Military aircraft flyovers occur several times a day, often at very low altitudes, and produce noise at 25 extremely high levels relative to all other noise sources in the project vicinity. 26
Terrain in the study area is very irregular and is characterized by alternating valleys and low, north-south 27 trending mountain ridges. The study area overlaps portions of four valleys: Crescent Valley, 28 encompassing most of the four mine complexes; Grass Valley to the southeast, extending southerly from 29 the saddle between Mount Tenabo and the north tip of the Toiyabe Range; Pine Valley, extending 30 northeast from Garden Gate Pass on the east side of Grass Valley; and Carico Lake Valley, across a low 31 ridge to the southwest of Crescent Valley. The topography in the valleys is nearly flat. The southern tip of 32 Crescent Valley is at an elevation of approximately 4,950 feet amsl, dropping at an imperceptible 33 0.2 percent grade to the northeast. The northern end of Grass Valley is higher at approximately 34 5,750 feet amsl, with gradual slopes out of the surrounding mountains and a 1.1 percent grade to the 35 south. Pine Valley declines gradually from southeast to the northeast from a high of 5,960 feet amsl at 36 Garden Gate Pass. Carico Lake Valley is at approximately 5,040 feet amsl where Rocky Pass enters the 37 valley at the valley low point, rising gradually to the north, west, and south. The mountains both east and 38 west of the proposed project boundary are quite rugged, with Mount Tenabo being particularly steep. 39 The Toiyabe Range, southwest of the study area, peaks at approximately 7,480 feet amsl adjacent to the 40 project boundary, although it rises higher to the south. Mount Tenabo, at the southern end of the Cortez 41 Mountains, rises steeply to the east, peaking at 9,153 feet amsl in height. The low ridge between 42 Crescent Valley and Carico Lake Valley tops out at 6,100 feet amsl approximately 1 mile south of Rocky 43 Pass. 44
Noise levels in proximity to the mine complexes in the CGM Operations Area previously were evaluated 45 for the Cortez Hills Expansion Project EIS (BLM 2008). Measurements were taken at seven locations: on 46 the northeast slope of Rocky Pass, at the Dean Ranch headquarters, in the Horse Canyon Haul Road 47

Deep South Expansion Project EIS 3.16 – Noise 3.16-2
Draft EIS July 2018
vicinity, on the south-southeast side of the Pipeline Pit Complex, on the tailings facility at the Cortez 1 Complex, near the Pipeline Heap Leach/Tailings Facility, and in the parking lot of BCI’s headquarters 2 and maintenance yard. Noise levels generally were very low throughout the area. As would be expected 3 in a rural area, levels were highest in high activity areas near the existing mine facilities. 4
Based on the prior noise measurements taken in the CGM Operations Area and surrounding areas 5 (BLM 2008), the highest noise values that occurred for 90 percent of each measurement (L90) were used 6 to approximate ambient conditions. Background noise levels in outlying areas were reported as ranging 7 from 29.5 dBA to 32.6 dBA, which is equivalent to a library. Background levels in close proximity to 8 mining activities were reported as ranging from 41.0 to 53.0 dBA, which is similar to a quiet urban area. 9 The average equivalent continuous noise level was measured for both outlying areas and areas within 10 close proximity to mining activities, with results similar to the L90 values. Outlying measurements included 11 natural sounds as noted above and occasional low-level aircraft flyovers. Measurements taken at the 12 BCI headquarters produced the highest noise levels due to high levels of activity, including heavy 13 equipment movement, maintenance activities, and mill operations. Transient noise from blasting and 14 from the warning sirens that precede it were above the background noise level, although the measured 15 maximum noise level was less than 70 dBA at an effective distance of approximately 10,000 feet. Noise 16 levels near mining activity vary based on the active mining locations in the open pits, depth of activity 17 below the rim of the open pits, and local topography. Table 3.16-1 presents typical noise levels 18 associated with several common indoor and outdoor activities, which are helpful for understanding noise 19 emission levels from the Deep South Expansion Project. 20
Table 3.16-1 Typical Values of Sound Level of Common Noise Sources
Sound Pressure Level (dBA) Common Indoor Noise Levels Common Outdoor Noise Levels
110 Rock band --
105 -- Jet flyover at 1,000 feet
100 Inside New York subway train --
95 -- Gas lawn mower at 3 feet
90 Food blender at 3 feet --
80 Garbage disposal at 3 feet, or shouting at 3 feet
Noisy urban daytime
70 Vacuum cleaner at 10 feet Gas lawn mower at 100 feet
65 Normal speech at 3 feet Commercial area, heavy traffic at 300 feet
60 Large business office --
50 Dishwasher in next room Quiet urban daytime
40 Small theater, large conference room Quiet urban nighttime
35 -- Quiet suburban nighttime
33 Library --
28 Bedroom at night --
25 Concert hall (background) Quiet rural nighttime
15 Broadcast and recording studio --
5 Threshold of hearing --
Source: BLM 2008.

Deep South Expansion Project EIS 3.16 – Noise 3.16-3
Draft EIS July 2018
The study area also includes the current ore transportation route between the CGM Operations Area and 1 the Goldstrike and Arturo mines, which includes SR 306, a portion of I-80, and SR 766. SR 306 passes 2 through the community of Crescent Valley and the community of Beowawe. The community of Crescent 3 Valley is located approximately 19 miles south of I-80, with an estimated population of 392 people in 4 2010 (CensusViewer 2017). An elementary school and park are located approximately 1,000 feet from 5 SR 306. Beowawe has some scattered single family residences and is dominated by a geothermal 6 power plant and railroad tracks running northwest/southeast through the center of the community. The 7 city of Carlin is located along the south side of I-80 at the intersection with SR 766 and, as a result, 8 receives regular heavy traffic. Existing traffic levels on these roadways are discussed in Section 3.11, 9 Land Use and Access. 10
3.16.2 Environmental Consequences 11
Noise impacts commonly are judged according to two general criteria: the extent to which a project 12 would exceed federal, state, or local noise regulations, and the estimated degree of disturbance to 13 people. There are no specific federal, state, or local noise regulations that would govern at the CGM 14 Operations Area. Neither the State of Nevada nor Lander or Eureka counties have noise regulations 15 governing mining operations. 16
Without legislative guidance, the degree of disturbance becomes the key factor in evaluating noise 17 effects. In this case, evaluating disturbance suggests a focus on residents of the four ranches and, from 18 a truck traffic noise perspective, on residents of Crescent Valley. The concept of human disturbance is 19 known to vary with a number of interrelated factors, including not only changes in noise levels, but the 20 presence of other, non-project-related noise sources in the vicinity; peoples' attitudes toward the project; 21 the number of people exposed; and the type of human activity affected (e.g., sleep or quiet conversation 22 as compared to physical work or active recreation). 23
Hard rock mining generates noise from two primary sources: operations of both stationary and mobile 24 heavy equipment, and blasting to loosen overburden and ore for removal by truck and shovel operations. 25 For operations where ore it transported off-site for processing, noise also is generated by over-the-road 26 transport trucks along the transportation route. 27
Noise emissions from mining-related activities, and the potential for related changes in noise levels at 28 sensitive receptors that may cause human disturbance, were taken into consideration in identifying 29 significance criteria for this analysis. Impacts to the noise environment would be considered significant if 30 the Proposed Action or other action alternative result in the following: 31
• Noise levels (excluding short-term blasting-related noise) at sensitive receptors in excess of 32 55 dBA, equivalent continuous sound level 33
• Maximum blasting-related noise levels at sensitive receptors in excess of 70 dBA maximum 34 noise level (Lmax) 35
Effects to noise resources are discussed in terms of intensity, duration, and context based on the 36 following definitions. 37
Intensity 38
• Negligible: Changes to the noise environment would not be perceptible or measureable. 39
• Minor: Noise effects would be barely perceptible or measurable. Noise levels at sensitive 40 receptors would remain below 55 dBA. No mitigation would be required. 41
• Moderate: Noise effects would be perceptible, and noise levels at sensitive receptors would 42 exceed 55 dBA. Mitigation would be needed and most likely would be effective. 43

Deep South Expansion Project EIS 3.16 – Noise 3.16-4
Draft EIS July 2018
• Major: Noise effects would be readily perceptible, measurable, and constitute a substantial 1 change from ambient conditions. Effects from a continuous noise level increase would cause 2 disruption to sensitive receptors and would not be successfully mitigated. 3
Duration 4
• Short-term: 1 year or less. 5
• Long-term: Greater than 1 year. 6
Context 7
• Localized: Effects would be limited to the CGM Operations Area. 8
• Regional: Effects would extend beyond the CGM Operations Area. 9
3.16.2.1 Proposed Action 10
Major noise sources from the Proposed Action would include drilling, blasting, and loading rock and ore; 11 truck hauling; and ore and waste rock placement in the appropriate facilities. An equipment roster for 12 surface mining activities with associated noise emission estimates is presented in Table 3.16-2. Not all 13 equipment would operate in tandem and additional noise sources would be present including transient 14 noise from blasting within the open pits. 15
Table 3.16-2 Surface Mining Emissions
Equipment Roster and Associated Noise
Type of Equipment dBA Electric wire rope shovels 90
Hydraulic shovel 85
Haul trucks (85- to 400-ton) 90
Rotary drills 86
Track bulldozers 85
Rubber tired bulldozers 85
Graders 85
Water trucks 83
Bobcat loader 75
Light plants 78
Blasting trucks 83
Tractor with two 10,000-gallon tanker-trailers 85
Trackhoe 85
Load-haul-dump machines 85
Haul trucks (40- to 60-ton) 80
Development and production drills 86
Flatbed carriers 85
Explosives trucks 83
Road grader 85
Source: BLM 2008.

Deep South Expansion Project EIS 3.16 – Noise 3.16-5
Draft EIS July 2018
The proposed project would be located within the expand CGM Operations Area boundary, with the 1 exception of the proposed Crescent Valley RIBs that would be located on private land outside of the 2 CGM Operations Area. The majority of the project-related noise would continue to originate in several 3 select areas. The main noise-generating activity centers would include the open pit, waste rock facility, 4 and ore stockpile expansion/modification areas at the mine complexes. Proposed activities in the mine 5 complexes would result in a temporal extension of noise emissions from ongoing mining and ore 6 processing. Construction- and final closure/reclamation-related noise would occur at the proposed Rocky 7 Pass Reservoir and RIBs locations, with operations-related noise in these areas limited to maintenance 8 activities. 9
Noise levels at the five sensitive noise receptors in the vicinity of the CGM Operations Area, including the 10 Barrick-owned Wintle, Dean, and Filippini ranches, the Dann Ranch, and the community of Crescent 11 Valley, previously were calculated for the Cortez Hills Expansion Project Final EIS (BLM 2008). For that 12 analysis, equipment units were assigned to the activity centers in the Pipeline, Cortez, and Cortez Hills 13 complexes. The analysis was very conservative, assuming all equipment would be operating at full 14 power simultaneously at all of the activity centers. A simple noise attenuation calculation for distance 15 between the sources and the sensitive receptors was used for the spreading of the sound waves over 16 the distance to the five sensitive noise receptors. As a result, the calculated noise levels were higher 17 than anticipated for actual project-related noise levels. A less conservative, more detailed analysis would 18 adjust the noise emissions downward in relation to the duty cycles of the equipment, increase the 19 attenuation for atmospheric absorption and ground absorption, and adjust the attenuation over time for 20 barrier changes (e.g., increased pit depths, development of waste rock facilities). However, a more 21 detailed evaluation proved unnecessary, because the conservative analysis did not project noise levels 22 in excess of the significance thresholds. 23
While the Proposed Action would result in a temporal extension of noise emissions from the Pipeline, 24 Cortez, and Cortez Hills complexes, the types and locations of noise emissions would be similar to 25 existing operations. Therefore, based on the equipment distribution scenarios developed for the Cortez 26 Hills Expansion Project Final EIS (BLM 2008) analysis, and the conservative assumptions used in the 27 analysis, it is anticipated that the noise levels at the five sensitive receptors as a result of the currently 28 proposed activities at the Pipeline, Cortez, and Cortez Hills complexes would continue to remain below 29 50 dBA, including both project-related noise and background noise. The highest level calculated in the 30 2008 EIS analysis was just below 50 dBA at the Barrick-owned Wintle Ranch. The lowest projected level 31 was just over 38 dBA at the Dann Ranch and just over 43 dBA at Crescent Valley. Projected levels at the 32 Dean Ranch and the Filippini Ranch were 48 dBA and slightly under 45 dBA, respectively. If all the 33 original assumptions mentioned above were to occur, noise levels would be loud enough to be heard at 34 some locations during very low background noise periods, but would not be loud enough to interfere with 35 normal speech communications. Based on the previous noise measurements, field observations, and 36 conservative noise calculations for the 2008 EIS analysis, it is likely that noise from the currently 37 proposed project would be barely discernable above ambient levels at the noise sensitive areas at most 38 times and under most weather conditions. 39
The Gold Acres Complex was not evaluated as part of the Cortez Hills Expansion Project Final EIS 40 (BLM 2008), as no mining activities were proposed for this mine complex at that time. However, the 41 types of activities (open pit and waste rock facility modifications) proposed at the Gold Acres Complex 42 would be similar to those at the other mine complexes, including the immediately adjacent Pipeline 43 Complex which surrounds it on the east and south sides (see Figure 2-4). Noise emissions from the 44 proposed activities at the Gold Acres Complex as compared to noise emissions from the Pipeline 45 Complex would have some additional noise attenuation from the increase in distance to the sensitive 46 receptors in Crescent Valley. While the distance to the Fillipini ranch would be approximately the same, 47 there would be some additional noise attenuation due to the topography on the west/southwest side of 48 Gold Acres Complex. Based on these variables and the very conservative approach used for the 2008 49 EIS analysis that did not take topography, vegetation, and atmospheric absorption into account, it is 50

Deep South Expansion Project EIS 3.16 – Noise 3.16-6
Draft EIS July 2018
anticipated that the proposed activities at the Gold Acres Complex would not impact the Fillipini ranch 1 above the predicted 45 dBA. 2
During the life of the project, the potential for open pit mining-related noise to reach the sensitive noise 3 receptors would decline, because the pit walls increasingly would form their own noise barriers as the 4 pits are deepened. 5
Blasting noise is not included in the noise level estimates noted above, primarily because blasting is 6 typically an extremely brief event occurring an average of once per day in each pit. Although blasts are 7 perceived to be one large explosion, the blasts are a series of smaller, single-hole explosions. Each hole 8 is sequentially delayed and detonated independently of the other holes. Less noise and ground 9 vibrations are generated because several small blasts (delays) are detonated in sequence rather than as 10 one large instantaneous blast. Blasting can be further controlled by varying the amount of explosive, the 11 type of delay, the delay sequence, and the type of explosives. Blasting would take place on a daily basis 12 and would be conducted under strict MSHA safety procedures. 13
Blasting noise measurements taken at the Pipeline Pit Complex in 2003 recorded a Lmax of 69.8 dBA at 14 an estimated equivalent of approximately 10,000 feet from the source, lasting for less than 5 seconds. 15 Based on this noise measurement and observations at the time, the Lmax noise levels from blasting were 16 projected to remain below 61 dBA at the five noise sensitive receptors. The highest level was predicted 17 to be just over 60 dBA at the Wintle Ranch. Levels at other receptors were predicted to range from a low 18 of 51 dBA at Crescent Valley to slightly over 57 dBA at the Dean Ranch (BLM 2008). In addition, as the 19 mine pits increase in depth, the noise from blasting would be increasingly reflected upward by the pit 20 walls, further reducing the noise levels outside the pits. 21
With modern blasting techniques, the blasting would be experienced at the noise sensitive receptors as 22 a brief, somewhat muted clap and roll of thunder preceded by a warning whistle or siren. Public 23 acceptance generally is improved by scheduling blasting at the same time every day to further reduce 24 the “startle factor.” 25
In summary, the Proposed Action would generate high noise levels at the four mine complexes; 26 however, there are no sensitive receptors near enough to experience significant adverse noise effects. 27 Mine-related noise would not exceed the significance thresholds at any of the identified noise sensitive 28 receptors and would cease following the completion of final closure and reclamation (approximately 29 2033). 30
In addition to the expansions/modifications in the four mine complexes in the CGM Operations Area, 31 construction-related noise would occur as a result of the following: installation of additional RIBs and 32 associated infrastructure in Grass Valley, Pine Valley, and Crescent Valley; installation of up to four 33 additional injection wells in Grass Valley; and the construction of the Rocky Pass Reservoir 34 embankment, associated infrastructure, and CR 225 reroute to provide public access around the 35 reservoir. Noise also would be associated with the removal of the reservoir embankment and RIB 36 facilities during final closure and reclamation. These noise impacts primarily would be limited to nearby 37 sensitive receptors and would be temporary in nature. Related noise impacts during operations would be 38 limited to routine maintenance. 39
The Barrick-owned Fillipini ranch is the closest sensitive receptor to the Rocky Pass Reservoir and would 40 experience temporary impacts above the 55 dBA level during embankment construction and subsequent 41 removal during closure and reclamation activities due to its close proximity to the proposed embankment 42 location. As discussed in Section 2.4.7.2, Water Management, embankment construction activities would 43 be conducted 8 hours per day over a period of approximately 7 months. Maintenance activities would 44 have no significant impact on noise levels at the ranch during operations. 45

Deep South Expansion Project EIS 3.16 – Noise 3.16-7
Draft EIS July 2018
As discussed in Section 2.4, Proposed Action, 38-ton over-the-road trucks would continue to be used to 1 transport refractory ore from the CGM Operations Area to the Goldstrike Mill for processing and to 2 backhaul Arturo Mine oxide ore to the Pipeline Complex for processing. Under the Proposed Action, the 3 current trucking rate of 9 round-trips per hour would increase to 18 round-trips per hour to accommodate 4 the proposed increase in the off-site transport/backhaul of ore. The 38-ton trucks that would be used for 5 ore transport/backhaul generate maximum noise levels of approximately 80 dBA at the 50-foot reference 6 distance (USEPA 1971). The nearest residences along the transportation route, or first row receptors, 7 are in Crescent Valley, approximately 200 feet from the roadway. At 200 feet, maximum truck noise 8 would be approximately 68 dBA (USEPA 1971). Because of the nature of truck activity, this level of noise 9 would be experienced only for a brief period for each truck, although as traffic increases, the noise would 10 become more frequent throughout the day. A mitigating factor is the 35-mile-per-hour speed limit through 11 Crescent Valley, suggesting that most trucks would not be operating at maximum levels near the 12 residences. While these impacts would continue into the future (through approximately 2031), these 13 periodic noise events would not cause a significant increase in the ambient levels at the first row 14 receptors. Additional receptors occur in the second and third rows from the main roadway including a 15 school, church, and library. However, these receptors are at a greater distance from the roadway and 16 receive noise mitigation from buildings in the first and second row receptors and would not be 17 significantly impacted from the increase in truck traffic. 18
The deliveries of fuels, chemicals, and other supplies to the CGM Operations Area would continue under 19 the Proposed Action and would result in the temporal extension of related noise impacts along the 20 transportation route. 21
While there would be a temporal extension of mine-related noise at the Cortez cemetery during 22 operations, the noise levels are not expected to increase substantially under the Proposed Action as the 23 distance from the currently authorized and proposed activities would be approximately the same. Also, 24 the Cortez cemetery is located more than 3,000 feet from mine-related blasting activities, a distance at 25 which vibration effects are not anticipated based on the discussions presented in Section 3.1, Geology 26 and Minerals; and Section 3.9, Native American Traditional Values. As discussed in Section 2.4.13, 27 Applicant-committed Environmental Protection Measures, BCI previously conducted an inventory of the 28 condition of the headstones in the Cortez cemetery. During the life of the proposed project, the 29 headstones periodically would be monitored to identify any vibration-related damage so that preventative 30 measures or repairs could be quickly and appropriately accomplished, thus further minimizing the 31 potential for impacts. 32
Overall, noise effects at sensitive receptors would be negligible to minor. Effects would be long-term. 33
3.16.2.2 Gold Acres Pit Partial Backfill Alternative 34
Under the Gold Acres Pit Partial Backfill Alternative, potential noise-related impacts at sensitive 35 receptors would be the same as described for the Proposed Action. 36
3.16.2.3 No Action Alternative 37
Under the No Action Alternative, the proposed Deep South Expansion Project would not be developed, 38 and the associated noise effects would not occur. Existing operations and reclamation activities in the 39 current CGM Operations Area, as described in Section 2.5.1.2, No Action Alternative, would continue to 40 operate under the terms of current permits and approvals as authorized by the BLM and State of 41 Nevada. Noise effects as previously analyzed in prior NEPA documents for the site would cease 42 following the completion of operations and final closure and reclamation (approximately 2026). 43
3.16.3 Cumulative Impacts 44
The CESA for noise impacts is shown in Figure 3.10-5. Currently authorized and proposed actions are 45 summarized in Table 2-12 and shown in Figure 2-22. 46

Deep South Expansion Project EIS 3.16 – Noise 3.16-8
Draft EIS July 2018
3.16.3.1 Proposed Action 1
Past actions would have no effect on noise in the CESA, because noise emissions terminate at the 2 completion of a project or activity. Any potential cumulative noise effects from present actions are 3 reflected in the affected environment discussion above. Noise tends to be localized to an area within 2 to 4 5 miles of an activity. Of the future actions identified in Table 2-12, one underground mine project 5 (Goldrush Project) potentially would be located in proximity to the CGM Operations Area and potentially 6 would overlap temporally with the Proposed Action. Noise emissions from this potential future project are 7 not known at this time; however, they are expected to be similar to the currently authorized Cortez Hills 8 underground mine. However, the cumulative interaction with noise effects from the Proposed Action 9 would be analyzed in a future NEPA document at the time the Goldrush Project is proposed. 10
3.16.3.2 Gold Acres Pit Partial Backfill Alternative 11
Cumulative impacts under the Gold Acres Pit Partial Backfill Alternative would be the same as described 12 for the Proposed Action. 13
3.16.4 Monitoring and Mitigation Measures 14
No significant adverse noise effects that warrant monitoring or mitigation have been identified as a result 15 of the proposed project. 16
3.16.5 Residual Adverse Effects 17
Under the Proposed Action, noise emissions would cease following the completion of final closure and 18 reclamation activities. As a result, there would be no residual adverse noise effects. 19

Deep South Expansion Project EIS 3.17 – Hazardous Materials and Solid Waste 3.17-1
Draft EIS 2018
3.17 Hazardous Materials and Solid Waste 1
The project study area for direct, indirect, and cumulative impacts for hazardous materials and solid 2 waste encompasses the proposed new construction activities and associated facility operations within 3 and outside the CGM Operations Area, plus the main transportation routes to the site, including SR 306 4 to I-80 and the access roads to the mine facilities from SR 306. 5
3.17.1 Affected Environment 6
The affected environment for hazardous materials includes air, water, soil, and biological resources that 7 potentially could be affected by an accidental release of hazardous materials during transportation to and 8 from the mine and during storage and use at the mine. 9
3.17.1.1 Project-related Hazardous Materials 10
The mining and ore processing operations for the proposed project would require the use of the following 11 materials classified as hazardous: 12
• Diesel fuel, gasoline, oils, and antifreeze used for equipment operation and maintenance; 13
• Sodium cyanide, sodium hydroxide, acid, flocculants, lime, and antiscalants used in mineral 14 extraction processes; 15
• Ammonium nitrate and high explosives used for blasting in the open pits; and 16
• Various by-products classified as hazardous waste and chemicals used in the existing assay 17 laboratory. 18
As discussed in Section 2.4.10, Hazardous Materials Management, there would be no change in the 19 current reagent consumption rate at the existing Pipeline Mill to facilitate the processing of a portion of 20 the mill-grade ore mined under the Proposed Action or the processing of additional mill-grade ore from 21 the Arturo Mine. However, the duration of transport and use would be extended approximately 12 years. 22 The materials that would be transported to, and stored and used at, the CGM Operations Area are 23 identified in Table 2-7. 24
3.17.1.2 Regulatory Definitions of Hazardous Materials 25
“Hazardous materials,” which are defined in various ways under a number of regulatory programs, can 26 represent potential risks to both human health and the environment when not properly managed. The 27 term hazardous materials includes the following materials that may be utilized or disposed of in 28 conjunction with mining operations: 29
• Substances covered under OSHA and MSHA Hazard Communication Standards (29 CFR 30 1910.1200 and 30 CFR 42): The types of materials that may be used in mining activities and 31 that would be subject to these regulations would include almost all of the materials identified 32 above. 33
• “Hazardous materials” as defined under USDOT regulations at 49 CFR, Parts 170-177: The 34 types of materials that may be used in mining activities and that would be subject to these 35 regulations would include sodium cyanide, explosives, cement, fuels, and other chemical 36 products. 37
• “Hazardous substances” as defined by CERCLA and listed in 40 CFR Table 302.4: The types of 38 materials that may contain hazardous substances that are used in mining activities and that 39 would be subject to these requirements would include sodium cyanide, acids, and other 40 chemical products. 41

Deep South Expansion Project EIS 3.17 – Hazardous Materials and Solid Waste 3.17-2
Draft EIS 2018
• “Hazardous wastes” as defined in the RCRA: Procedures in 40 CFR 261 are used to determine 1 whether a waste is a hazardous waste. The types of materials used in mining activities and that 2 could be subject to these requirements could include liquid waste materials with a flash point of 3 less than 140°F, spent solvent containing wastes, corrosive liquids, and lab assay wastes. 4 Hazardous wastes are regulated under Subtitle C of RCRA. 5
• Any “hazardous substances” and “extremely hazardous substances” as well as petroleum 6 products such as gasoline and diesel that are subject to reporting requirements if volumes on-7 hand exceed threshold planning quantities under Sections 311 and 312 of SARA: The types of 8 materials that may be used in mining activities and that could be subject to these requirements 9 would include fuels, antifreeze, and acids. 10
• Petroleum products defined as “oil” in the Oil Pollution Act of 1990: The types of materials used 11 in mining activities and that would be subject to these requirements include fuels, lubricants, 12 hydraulic oil, and transmission fluids. 13
• In conjunction with the definitions noted above, the following lists provide information regarding 14 management requirements during transportation, storage, and use of particular hazardous 15 chemicals, substances, or materials: 16
• The SARA Title III List of Lists or the Consolidated List of Chemicals Subject to EPCRA and 17 Section 112(r) of the CAA. 18
• The USDOT listing of hazardous materials in 49 CFR 172.101. 19
Pursuant to regulations promulgated under CERCLA, as amended by SARA, release of a reportable 20 quantity of a hazardous substance to the environment must be reported within 24 hours to the National 21 Response Center (40 CFR Part 302). The NAC (445A.347) also requires immediate reporting of a 22 release of a reportable quantity of a hazardous substance to the Nevada Division of Emergency 23 Management. In addition, under the State of Nevada Water Pollution Control Permit program, all 24 releases of a reportable quantity must be reported as soon as possible, but not later than 24 hours after 25 the event, to the NDEP Bureau of Corrective Actions. Nevada regulates the storage and handling of 26 certain defined “highly hazardous substances” under NAC 459.952-459.9542. 27
Incidental spills of hazardous substances have occurred during previous mining and mineral processing 28 operations at the project site. All reported spills have been mitigated, and contaminated materials have 29 been managed in accordance with federal and state regulations. 30
3.17.1.3 Regulatory Definition of Solid Waste 31
Solid waste consists of a broad range of materials that include garbage, refuse, wastewater treatment 32 plant sludge, non-hazardous industrial waste, and other materials (solid, liquid, or contained gaseous 33 substances) resulting from industrial, commercial, mining, agricultural, and community activities 34 (USEPA 2014). Solid wastes are regulated under different subtitles of RCRA and include hazardous 35 waste (discussed in the previous section) and non-hazardous waste. Non-hazardous waste is regulated 36 under RCRA Subtitle D. In Nevada, solid waste rules are found in the NAC. Disposal of solid waste is 37 regulated under NAC 444.570-444.7499; disposal of hazardous waste is regulated under NAC 444.850-38 444.8746. 39
Certain types of materials, while they may contain potentially hazardous constituents, are specifically 40 exempt from regulation as hazardous wastes. Used oil, for example, may contain toxic metals, but would 41 not be considered a hazardous waste unless it meets certain criteria. Other wastes that might otherwise 42 be classified as hazardous are managed as “universal waste” and are exempted from hazardous waste 43 regulation as long as those materials are handled in ways specifically defined by regulation. An example 44 of a material that could be managed as a universal waste is lead-acid batteries. As long as lead-acid 45 batteries are recycled appropriately, requirements for hazardous waste do not apply. 46

Deep South Expansion Project EIS 3.17 – Hazardous Materials and Solid Waste 3.17-3
Draft EIS 2018
3.17.2 Environmental Consequences 1
The major issues concerning hazardous materials include: 2
• The potential for an accident during transport of hazardous materials; and 3
• The potential impacts of accidental hazardous materials spills or releases. 4
Impacts associated with hazardous materials would be considered significant if the Proposed Action or 5 other action alternative result in the following: 6
• One or more accidents during transport, resulting in the release of a reportable quantity of a 7 hazardous material. 8
• Release of a hazardous material on the site exceeding the storage volume of the containment 9 structure. 10
Potential effects from the transportation and use of hazardous materials were evaluated in terms of 11 intensity, duration, and context based on the following definitions. 12
Intensity 13
The intensity of effects in the event of a potential spill or release of a hazardous material during 14 transportation or use would depend on the toxicity and physical characteristics of the materials and the 15 location of the spill or release. 16
• Negligible: Effects would be barely noticeable and readily would be resolved with little to no 17 intervention needed. There would be no measureable environmental or human health effects. 18
• Minor: Effects would be noticeable; however, minimal intervention would be needed and could 19 be provided on site. Environmental impacts may occur as minor contamination in a very limited 20 area that easily could be remediated in a short time. 21
• Moderate: Effects would be noticeable and may require a few hours to be resolved. Intervention 22 would be needed and could be provided on site. 23
• Major: A spill or release of a hazardous material in excess of the reportable quantity for that 24 material. Effects would be very noticeable, and there would be obvious impact to the 25 environment. Spilled material may impact sensitive environments such as water bodies, 26 wetlands, or important habitat. Impacted media may have to be remediated, under government 27 supervision. 28
Duration 29
• Short-term: 2 days or less. 30
• Long-term: Greater than 2 days. 31
Context 32
• Localized: Effects would be confined to the CGM Operations Area. 33
• Regional: Effects would occur outside of the CGM Operations Area. 34
3.17.2.1 Proposed Action 35
Project-related Hazardous Materials 36
The Proposed Action would require the transport, handling, storage, use, and disposal of materials 37 classified as hazardous under various regulatory frameworks. All hazardous materials would be shipped 38

Deep South Expansion Project EIS 3.17 – Hazardous Materials and Solid Waste 3.17-4
Draft EIS 2018
to and from the site in accordance with applicable USDOT hazardous materials regulations. All shipping 1 containers and vehicles would be USDOT-approved for the specific materials. The proposed rates of use 2 and storage volumes of these substances are listed in Table 2-7. A brief description of the storage, use, 3 and spill response for hazardous materials during operations under the Proposed Action is presented in 4 Section 2.4.10, Hazardous Materials Management. 5
Important issues related to the use of hazardous materials for the proposed project include the potential 6 impacts to the environment from an accidental release of hazardous materials during transport to the 7 CGM Operations Area or a release related to use or storage at the site. The criterion for evaluating 8 hazardous materials impacts is the risk of a potential spill and the associated impacts to sensitive 9 receptors along transportation routes or exposure pathways. 10
If some of the chemicals identified for use during the life of the proposed project were to enter the 11 environment in an uncontrolled manner, there could be associated direct or indirect effects. The 12 environmental effects of a release would depend on the substance, quantity, timing, and location of the 13 release. The event potentially could range from a minor oil spill at the project site where cleanup 14 equipment would be readily available, to a large spill during transport involving a release of sodium 15 cyanide. Some of the chemicals could have immediate, but short-term destructive effects on aquatic 16 resources and water quality if spills were to enter waterways such as the Humboldt River. Spills of 17 hazardous materials could seep into the ground and contaminate the local groundwater. Depending on 18 the proximity of such spills to populated areas or the use of degraded water for human consumption, 19 such accidental spills could affect human health. 20
Transportation 21
Trucks would be used to transport hazardous materials to the project site. Based on the quantity, 22 number of deliveries, and potential hazard, the materials of greatest concern would be sodium cyanide 23 solution and diesel fuel. The Humboldt River would be the major surface water body crossed during 24 transport of these materials on SR 306. 25
Based on the annual transportation rates for hazardous materials as shown in Table 2-7, an 26 approximate load delivery frequency for the materials was determined. Assuming the sodium cyanide 27 would be delivered in 15-ton loads, 204 loads would be delivered each year. Diesel fuel use would 28 require approximately 1,080 loads per year, each load with a nominal volume of 10,000 gallons. 29
In order to evaluate the potential impact of the transport of hazardous materials to the mine site, the risk 30 of a transportation accident resulting in a release of hazardous materials was estimated. Accident and 31 incident rates were derived from national statistics for truck accidents that involve hazardous materials 32 as published by the Federal Motor Carrier Safety Administration (Battelle 2001). Accident/incident rates 33 identified below from Battelle (2001) are for accidents involving releases of hazardous cargo. The 34 accident/incident rate involving the category of toxics (e.g., sodium cyanide) is 0.80 per million miles 35 traveled. The accident rate involving flammable and combustible liquids (including diesel fuel) is 0.70 per 36 million miles traveled. Using these rates, the potential number of transportation-related incidents for 37 these two materials occurring over the life of the project is shown in Table 3.17-1. 38
Hazardous substances would be transported by commercial carriers or vendors in accordance with the 39 requirements of Title 49 of the CFR. Carriers would be licensed and inspected as required by NDOT and 40 USDOT. Tanker trucks would be inspected and would have a Certificate of Compliance issued by the 41 Nevada Motor Vehicle Division. These permits, licenses, and certificates are the responsibility of the 42 carrier. Title 49 of the CFR requires that all shipments of hazardous substances be properly identified 43 and placarded. Shipping papers must be accessible and must include information describing the 44 substance, immediate health hazards, fire and explosion risks, immediate precautions, fire-fighting 45 information, procedures for handling leaks or spills, first aid measures, and emergency response 46 telephone numbers. 47

Deep South Expansion Project EIS 3.17 – Hazardous Materials and Solid Waste 3.17-5
Draft EIS 2018
Table 3.17-1 Potential for Hazardous Material Transportation Accidents/Incidents
Calculated Annual Total Accident/Incident Number of
Quantity Shipment Number of 2Distance Rate per Million Accidents/ Material Shipped 1Quantity 1Shipments (miles) 3Miles 4Incidents
Sodium 3,060 tons 15 tons 3,0605 122,400 8x10⁻⁷ 0.10 Cyanide
Diesel Fuel
10,800,000 gallons
10,000 gallons
16,2006 648,000 7x10⁻⁷ 0.45
1 2 3
4 5
6
Based on information in Table 2-7. Based on a one way distance of approximately 40 miles from I-80 to the project site. Battelle (2001) Table 25, page 4-13 includes accidents and en-route leaks, but not loading/unloading incidents. Number of accidents/incidents = distance X (incident rate). Based on 15 years of ore processing (204 shipments X 15 years). Consumption would be lower during reclamation; however, data conservatively calculated based on 15 years for operations/reclamation (1,080 shipments X 15 years).
In the event of a release during transport to the mine site, the transportation company would be 1 responsible for response and cleanup. Each transportation company is required to have an emergency 2 response plan to address spills and accidental releases of hazardous materials. Local and regional law 3 enforcement and fire protection agencies also may be involved initially to secure the site and protect 4 public safety. Title 49 of the CFR requires that the carrier notify local emergency response personnel, the 5 National Response Center (for discharge of reportable quantities of hazardous substances), and the 6 USDOT in the event of an accident involving hazardous materials. 7
Storage and Use 8
BCI has developed an Emergency Response Plan (Barrick Gold of North America 2016) that would be 9 maintained and implemented, as needed, throughout the life of the project. The plan describes the 10 required level of containment and safety measures associated with storage, handling, and spill clean-up 11 of oil (e.g., petroleum fuels, used oil). Operations conducted in accordance with this plan would ensure 12 that impacts from spills would be minimized and the spilled materials contained and removed. BCI would 13 have the necessary spill containment and cleanup equipment available at the site, and personnel would 14 be able to quickly respond. 15
The Emergency Response Plan provides a detailed discussion of all regulations and procedures that 16 apply to facility drainage, bulk storage tanks, facility transfer operations, pumping and in-plant processes, 17 facility tank truck loading/unloading operations, inspections and records, security, and personnel training 18 requirements. In the event of a major or minor spill of hazardous materials occurring on site, BCI’s 19 Emergency Response Plan establishes procedures for preventing, controlling, and reporting 20 environmental releases within or from facilities in the CGM Operations Area. 21
The existing and proposed facilities that would be used under the Proposed Action were designed to 22 minimize the potential for an upset that could result in a major spill. These facilities are described in 23 Section 2.4, Proposed Action. Implementation of the Emergency Response Plan under the Proposed 24 Action would provide the structures, procedures, and training to minimize the impacts of a potential spill 25 of a hazardous material. 26
All hazardous substances would be handled in accordance with applicable MSHA or OSHA regulations 27 (Titles 30 and 29 of the CFR). The hazardous materials to be used under the Proposed Action would be 28 handled as recommended on the manufacturer's material safety data sheet. Based on the facility’s 29

Deep South Expansion Project EIS 3.17 – Hazardous Materials and Solid Waste 3.17-6
Draft EIS 2018
design features and the operational practices in place, the probability of a major release occurring at the 1 site during the life of the proposed project is considered to be low. Based on the foregoing, there would 2 be a very low potential for a significant impact from storage of hazardous materials. 3
Disposal 4
The procedures for storage, containment, transportation, and handling of hazardous waste are outlined 5 in BCI’s Solid and Hazardous Waste Management Plan (BCI 2015), which would continue to be 6 implemented. 7
Potential Effects of a Release 8
The environmental effects of a release would depend on the material released, the quantity released, 9 and the location of the release. Potential releases could include a small amount of diesel fuel spilled 10 during transfer operations at the mine site or the loss of several thousand gallons of diesel fuel or sodium 11 cyanide into a riparian drainage, such as the Humboldt River, during transport to the project site. In 12 general, the materials of greatest concern would be diesel fuel, sodium cyanide, and corrosives. 13
A large-scale release of fuel, cyanide, or corrosives would have implications for public health and safety. 14 The location of the release would be the primary factor in determining the extent of potential effects. A 15 release in a relatively more populated area could have effects ranging from simple inconvenience during 16 cleanup to potential loss of life if an explosion and fire were involved. However, the probability of a 17 release anywhere along the transportation route is very small, the probability of a release within a 18 populated area is smaller, and the probability of a release involving an injury or fatality is smaller still. 19 USDOT statistics show that for the State of Nevada between 2008 and 2016, no fatalities occurred as a 20 result of a hazardous materials highway incident (USDOT 2016). 21
The release of a hazardous material or waste into other sensitive areas (e.g., stream, wetland) is judged 22 to be very unlikely based on the low number of surface water crossings. Depending on the material 23 released, the amount released, and the location of the release, an accident resulting in a release could 24 affect soils, water, and biological resources. 25
Response to a Release 26
All spills, including transportation and loading/unloading spills occurring on site, would be cleaned up as 27 soon as possible. If a spill exceeds reportable quantities, it would be reported to the Nevada Division of 28 Emergency Management, NDEP, BMRR, USEPA, National Response Center, BLM, and Lander County 29 Emergency Response Coordinator. 30
In the event of a release en-route to the mine site, the transportation company would be responsible for 31 response and cleanup. Law enforcement and fire protection agencies also would be involved to initially 32 secure the site and protect public safety. Hazardous materials transporters are required to maintain an 33 emergency response plan which details the appropriate response, treatment, and cleanup for a material 34 spilled onto land or into water. For example, a release of hydrochloric acid could require neutralizing the 35 spill with lime, flushing the area with water, or removing contaminated soil. Specific procedures would be 36 developed for fuels, acids, and other hazardous materials. Any cleanup would be followed by appropriate 37 restoration of the disturbed area, which could include replacing removed soil, seeding the area to prevent 38 erosion, and the return of the land to its previous use. 39
In summary, potential effects associated with the transportation and use of hazardous materials are 40 expected to be minor to negligible. This conclusion is supported by the low probability for hazardous 41 material transportation incidents and the absence of incidents of record from 2008 to 2016 over the main 42 transportation route (i.e., SR 306 to I-80 and the access roads to the mine facilities from SR 306) that 43 was analyzed. Implementation of BCI’s Solid and Hazardous Waste Management Plan (BCI 2015) would 44 further minimize the risk of the impacts in the event of a potential spill or release on site. The duration 45

Deep South Expansion Project EIS 3.17 – Hazardous Materials and Solid Waste 3.17-7
Draft EIS 2018
and context would depend on the amount and type of material spilled and the location. Except in cases 1 of transportation spills to water bodies which potentially could have long-term regional effects, spills 2 within the CGM Operations Area would not be expected to affect a large area or migrate off-site and, 3 therefore, would be localized and most likely short-term. 4
Project-related Solid Wastes 5
Non-hazardous solid waste would be disposed of in the currently authorized or proposed Class III-6 waivered landfills at the CGM Operations Area. The proposed landfill would be engineered and designed 7 in accordance with State of Nevada solid waste landfill standards, with materials disposed of in 8 accordance with federal, state, and local regulations. Approval for the proposed landfill would be 9 obtained from the NDEP-Bureau of Waste Management prior to construction. Based on the permit-10 regulated standards under which the landfill would be operated, the potential for effects from the on site 11 disposal of solid waste would be negligible. 12
3.17.2.2 Gold Acres Pit Partial Backfill Alternative 13
Under the Gold Acres Pit Partial Backfill Alternative, potential impacts associated with hazardous 14 materials and solid wastes would be the same as described for the Proposed Action. 15
3.17.2.3 No Action 16
Under the No Action Alternative, the proposed Deep South Expansion Project would not be developed, 17 and associated potential impacts relative to hazardous materials transportation, storage, use, and 18 disposal would not occur. Ongoing transport, storage, and use of hazardous materials and solid wastes 19 for existing operations would continue under current authorizations. 20
3.17.3 Cumulative Impacts 21
3.17.3.1 Proposed Action 22
The CESA for hazardous materials and solid waste is shown in Figure 3.1-14. Past and present actions 23 and RFFAs are identified in Table 2-12 and shown in Figure 2-22. 24
Past and present actions in the CESA are described in Section 2.6.1. The Proposed Action incrementally 25 would contribute to the current transportation, storage, use, and disposal of hazardous materials in the 26 CESA for a period of approximately 15 years. Given the low probability of a spill or release and the 27 continued implementation of the Emergency Response and Solid and Hazardous Waste Management 28 plans, it is anticipated that the Proposed Action’s contribution to cumulative impacts would be negligible. 29
Ongoing mineral exploration in the area mainly would result in the consumption of fuels and lubricants 30 and would represent only a fraction of the consumption and use of an operating mine. As discussed in 31 Section 2.6.2, Reasonably Foreseeable Future Actions, it is projected that one RFFA underground mine 32 project (i.e., Goldrush Project) with a projected mine life of approximately 20 years would initiate 33 operations in Pine Valley to the east of the Proposed Action, pending submittal of a plan of operations 34 and subsequent permitting. It is assumed that operations at the Goldrush Project may be 35 contemporaneous with the Proposed Action for a period of approximately 10 years. However, there 36 currently is no information concerning the potential quantity of reagents, chemicals, and fuels that would 37 be used for the Goldrush Project. Therefore, it is not possible to quantify the associated cumulative 38 effects of hazardous material transportation and use. However, the Goldrush Project would represent an 39 incremental increase in the amounts of hazardous materials in the area beyond that contributed by the 40 Proposed Action. 41

Deep South Expansion Project EIS 3.17 – Hazardous Materials and Solid Waste 3.17-8
Draft EIS 2018
3.17.3.2 Gold Acres Pit Partial Backfill Alternative 1
Cumulative impacts under the Gold Acres Pit Partial Backfill Alternative would be the same as described 2 for the Proposed Action. 3
3.17.4 Monitoring and Mitigation Measures 4
Due to the existing legal framework (and associated requirements) that regulates the transportation, 5 storage, and use of hazardous materials and disposal of solid waste, no additional monitoring or 6 mitigation measures have been identified. 7
3.17.5 Residual Adverse Effects 8
Residual adverse effects from the use of hazardous materials under the Proposed Action would depend 9 on the substance, quantity, timing, location, and response involved in the event of an accidental spill or 10 release. Operation in accordance with the Emergency Response Plan for the CGM Operations Area and 11 prompt cleanup of potential spills and releases would minimize the potential for residual adverse effects. 12
Proper disposal of non-hazardous solid waste in an engineered Class III-waivered landfill in accordance 13 with regulations would minimize the potential for residual adverse effects with regard to such materials. 14
3.18 – Relationship Between Short-term Uses of the Human Environment and the Maintenance Deep South Expansion Project EIS and Enhancement of Long-term Productivity 3.18-1
Draft EIS 2018
3.18 Relationship Between Short-term Uses of the Human Environment and the 1 Maintenance and Enhancement of Long-term Productivity 2
This section identifies the tradeoffs between the environmental effects during operation and reclamation 3 (i.e., short-term uses) versus impacts to resource productivity that would extend beyond the end of 4 reclamation (i.e., long-term productivity). For purposes of this comparison, short-term is defined as the 5 12-year operational life of the project and the subsequent 3-year reclamation period; long-term is defined 6 as the future following reclamation (i.e., beyond 15 years). 7
The short-term use of resources during the construction, operation, and reclamation of the proposed 8 project would result in beneficial impacts in the form of additional local employment and the generation of 9 revenue. 10
The proposed project would result in various short-term impacts, such as the temporary loss of soil and 11 vegetation productivity, wildlife impacts from loss of habitat and possible avoidance of the project area, a 12 temporary reduction in livestock grazing area and associated AUMs, temporary increases in fugitive dust 13 emissions, and temporary impacts on dispersed recreation activities. These impacts would be minimized 14 through implementation of applicant-committed environmental protection measures and are expected to 15 end upon completion of operations and successful reclamation. 16
Short-term adverse visual impacts would last a few years beyond mine closure and gradually would be 17 reduced as vegetation becomes more established. The scale and extent of the facilities would continue 18 to alter the local landscape and views in the long term. 19
Impacts to long-term productivity (i.e., following project reclamation) primarily would depend on the 20 effectiveness of the proposed reclamation of the disturbance areas. Successful reclamation would 21 provide for post-mining wildlife and livestock grazing by establishing self-sustaining plant communities. 22 Recontouring, drainage controls, and revegetation also are expected to stabilize disturbed surfaces and 23 control erosion. 24
There would be long-term loss in wetland/riparian vegetation (approximately 0.2 acre) associated with 25 mine-related surface disturbance, as well as a potential long-term loss of wetland/riparian vegetation 26 associated with 141 seeps and springs and 23.8 perennial stream miles within the maximum extent of 27 the projected groundwater drawdown area, if hydraulically connected to the affected aquifer. There also 28 would be a long-term loss in soil and vegetation productivity and associated terrestrial wildlife habitat, a 29 reduction in livestock grazing areas and an associated loss of AUMs, and a reduction in public lands 30 used for dispersed recreation on approximately 731 acres that would not be reclaimed, inclusive of 257 31 acres of proposed disturbance and 474 acres of currently authorized disturbance that would be 32 reallocated to open pits. Long-term effects to resources important to Native Americans would include 33 visual effects and effects to future pine nut harvesting. 34

3.18 – Relationship Between Short-term Uses of the Human Environment and the Maintenance Deep South Expansion Project EIS and Enhancement of Long-term Productivity 3.18-2
Draft EIS 2018
This page intentionally left blank

3.19 – Irreversible and Irretrievable Deep South Expansion Project EIS Commitment of Resources 3.19-1
Draft EIS 2018
3.19 Irreversible and Irretrievable Commitment of Resources 1
The Proposed Action could result in the irreversible commitment of resources (e.g., the loss of future 2 options for resource development or management, especially of nonrenewable resources such as 3 minerals or cultural resources) or the irretrievable commitment of resources (e.g., the lost production or 4 use of renewable natural resources during the life of the operations). Irreversible and irretrievable 5 impacts of the Proposed Action are summarized for each resource in Table 3.19-1. 6
Table 3.19-1 Irreversible and Irretrievable Commitment of Resources by the Proposed Action
Resource Irreversible
Impacts Irretrievable
Impacts Explanation Geology and Minerals Yes Yes Approximately 88.5 million tons of ore would be mined
during operations. This would result in the irreversible and irretrievable commitment of this resource.
Water Resources and Geochemistry
Yes Yes Groundwater levels affected by proposed mine dewatering and infiltration operations are predicted to partially recover in the long term. An estimated 81 percent of the dewatering water extracted during the first year of operations would be re-infiltrated. The percentage of dewatering water that would be re-infiltrated would decrease over the life of the project to approximately 53 percent in the final year of operation. The dewatering water that would not be re-infiltrated over the life of the mine would be permanently removed from the groundwater system. This permanent extraction of groundwater is considered an irretrievable commitment of resources.
Soils Yes Yes Suitable growth media would be salvaged from the mine disturbance areas for use in reclamation. There would be a loss of soil productivity during operations on approximately 4,380 acres, resulting in an irretrievable commitment of this resource. There would be an irreversible commitment of the resource in areas that would not be reclaimed (257 acres of proposed disturbance associated with open pits, the CR 225 reroute, and post-mining water management features, as well as 474 acres of previously authorized disturbance reallocated to open pit development).
Vegetation Yes Yes There would be an irretrievable commitment of vegetation resources on approximately 4,380 acres during operations; vegetation subsequently would be re-established on 4,123 acres. There would be an irreversible commitment of the resource in areas that would not be reclaimed (257 acres of proposed disturbance associated with open pits, the CR 225 reroute, and post-mining water management features, as well as 474 acres of previously authorized disturbance reallocated to open pit development). There would be no irreversible or irretrievable impacts to special status plant species.

3.19 – Irreversible and Irretrievable Deep South Expansion Project EIS Commitment of Resources 3.19-2
Draft EIS 2018
Table 3.19-1 Irreversible and Irretrievable Commitment of Resources by the Proposed Action
Resource Irreversible
Impacts Irretrievable
Impacts Explanation Wildlife and Fisheries Resources
Yes Yes Approximately 4,123 acres of habitat would be irretrievably lost until vegetation has re-established following reclamation. The areas that would not be reclaimed (257 acres of proposed disturbance associated with open pits, the CR 225 reroute, and post-mining water management features, as well as 474 acres of previously authorized disturbance reallocated to open pit development) would be irreversibly lost for game and avian species. Surface disturbance would result in an irretrievable loss of aquatic habitat associated with two springs and approximately 4.6 miles of intermittent streams until reclamation is completed. Impacts to special status wildlife and invertebrate species would parallel those for wildlife in general.
Range Resources Yes Yes There would be an irretrievable loss of 62 AUMs during the life of the project and an irreversible loss of 6 AUMs associated with open pit modification, CR 225 reroute, and post-mining water management features would be permanently lost.
Paleontological Resources
No No It is unlikely that scientifically important resources would be impacted.
paleontological
Cultural Resources Yes No NRHP-eligible sites that may be impacted would be mitigated in accordance with the PA and/or treatment plan.
Native American Traditional Values
Yes Yes The spiritual and religious experience may be diminished on Mount Tenabo as a result of visual disturbance (see Visual Resources).
Air Quality No No Project emissions would not exceed federal or state AAQS. Air quality would return to background conditions after completion of the project.
Land Use and Access Yes Yes There would be an irretrievable loss of 3,846 acres of public land available for some land use opportunities such as recreation and grazing during operations and reclamation; an irreversible loss would occur on approximately 731 acres associated with open pit expansions, the CR 225 reroute, and post-mining water management features.
There would be no irreversible or irretrievable impacts to access; public access patterns would be maintained.

3.19 – Irreversible and Irretrievable Deep South Expansion Project EIS Commitment of Resources 3.19-3
Draft EIS 2018
Table 3.19-1 Irreversible and Irretrievable Commitment of Resources by the Proposed Action
Resource Irreversible
Impacts Irretrievable
Impacts Explanation Recreation and Wilderness
Yes Yes There would be an irretrievable loss of 3,846 acres of public land available for dispersed recreational opportunities during operations and reclamation; an irreversible loss would occur on approximately 731 acres associated with open pit expansions, the CR 225 reroute, and post-mining water management features.
Social and Economic Values
No Yes There would be increased local productivity including jobs for construction workers and a temporal extension of employment for BCI workers during the life of the project. State and local government revenues also would benefit. The loss of AUMs would result in an irretrievable loss of associated economic value (approximately $2,510) per year and irreversible loss of $320 per year.
Environmental Justice No No The proposed project would not disproportionately affect minority or low-income populations.
Visual Resources Yes No Impacts to visual resources would be reduced through successful reclamation procedures and implementation of the environmental protection measures, but permanent changes would result.
Noise No No Noise is not considered irreversible, because it would cease following the completion of mine operations.
Hazardous Materials and Solid Waste
No No No irreversible or irretrievable commitment of resources or impacts are anticipated. However, if a spill were to affect a sensitive resource, an irretrievable impact could occur pending the recovery of the resource.

3.19 – Irreversible and Irretrievable Deep South Expansion Project EIS Commitment of Resources 3.19-4
Draft EIS 2018
This page intentionally left blank

Deep South Expansion Project EIS Chapter 4.0 – Public Coordination 4-1
Draft EIS 2018
4.0 Public Coordination 1
4.1 Public Participation and Scoping 2
Public participation in the NEPA process for the Deep South Expansion Project EIS was initiated with the 3 public scoping process. The purpose of the public scoping process is to solicit comments to identify 4 relevant issues that help direct the approach and depth of the EIS analysis, to identify potential 5 alternatives to be evaluated, and to identify and address the concerns of all interested federal, state, and 6 local agencies; tribes; and the public. 7
The BLM initiated the public scoping process for the Deep South Expansion Project EIS by publishing a 8 Notice of Intent to prepare an EIS in the FR on March 29, 2017 (FR Volume 82, Number 59, pages 9 15539 to 15541). Public scoping meetings for the EIS were held in Battle Mountain, Crescent Valley, and 10 Elko on April 18, 19, and 20, respectively. The comments received during the scoping process were 11 considered in developing this EIS. 12
The scoping comments were summarized and included in the Public Scoping Summary Report. The 13 following are the key issues, concerns, and suggestions expressed in the substantive scoping comments 14 for the proposed project. 15
Process 16
• Consistency with applicable federal, state, and local land use plans and policies 17
• Discuss applicable permits, permit criteria, and mitigation requirements of other jurisdictional 18 agencies 19
• Discuss bonding and financial assurance 20
• Provide opportunities for disproportionately affected communities to provide input into the NEPA 21 process 22
• Evaluate all reasonable alternatives and provide rationale for alternatives eliminated from 23 detailed analysis 24
• Prepare the cumulative impact analysis in accordance with applicable guidance 25
Proposed Action and Alternatives 26
• Identify the preferred underground mining method or identify the timeline for each method that 27 may be used; also describe associated backfill methods 28
• Describe the water management facilities, water treatment and disposal methods, and related 29 monitoring/maintenance 30
• Identify sources of mine water supply and consumption rates 31
• Identify dewatering pumping and disposal rates 32
• Describe the evapotranspiration cells 33
• Describe the tailings and heap leach facilities and associated monitoring 34
• Identify procedures for responding to an accidental release of hazardous materials 35
• Describe waste rock handling and disposal procedures 36
• Identify emergency response plans/procedures 37

Deep South Expansion Project EIS Chapter 4.0 – Public Coordination 4-2
Draft EIS 2018
• Reclamation should return the landscape to pre-mining conditions to the extent possible 1
• Describe the procedures and timing for reclamation of all mines facilities, sources and availability 2 of growth media, and post-reclamation monitoring and maintenance 3
• Recommend the use of only native species for reclamation purposes and the conduct of post-4 reclamation monitoring for at least 5 years 5
• Reclamation of the open pits and underground declines and portals should provide for public 6 safety 7
• Suggest developing alternatives to reduce dewatering requirements and maximize the return of 8 water directly to the deep aquifer 9
• Suggest developing alternatives that incorporate the use of re-injection wells or other methods to 10 reduce the cone of depression and minimize impacts to springs of cultural importance 11
• Suggest developing alternatives to reduce impacts to wildlife and wild horses 12
• Suggest considering alternative designs or configurations for major mining facilities 13
• Suggest considering a smaller project where only some of the proposed actions are approved 14
• Suggest developing an alternative for backfilling the open pits 15
• Suggest developing alternate closure methodologies 16
Geology and Minerals 17
• Potential for land subsidence and related impacts to facilities; identify methods to mitigate 18 impacts 19
• Evaluate the potential for failure of the tailings impoundment and related public safety and 20 environmental impacts; identify preventative measures and mitigation methods 21
Water Resources and Geochemistry 22
• Provide a hydrologic characterization of the project area and cumulative effects study area, 23 incorporating baseline data 24
• Potential direct, indirect, and cumulative surface water and groundwater quality and quantity 25 impacts, both during operations and post-closure 26
• Suggest that the hydrologic model be updated to include data collected since 2008 27
• Identify applicable water quality permits, permit criteria, and designated beneficial uses and 28 discuss associated project compliance 29
• Suggest geochemical analysis of waste rock, heap leach, and tailings materials and methods to 30 handle acid generation as mining proceeds 31
• Discuss acid generation/neutralization potential and leaching potential test results for waste 32 rock, pit wall rock, ore, and other materials as applicable and describe designs/measures to 33 minimize the potential 34
• Potential impacts from meteoric water infiltration into the waste rock facilities during operations 35 and following reclamation 36
• Suggest analysis of potential groundwater quality impacts (e.g., dissolved salts) from use of 37 rapid infiltration basins and identification of monitoring requirements to mitigate impacts 38
• Potential mine-related groundwater quality (arsenic) impacts to Crescent Valley’s public drinking 39 water system 40

Deep South Expansion Project EIS Chapter 4.0 – Public Coordination 4-3
Draft EIS 2018
• Suggest analysis of potential arsenic-related impacts to groundwater in the event of a tailings 1 impoundment failure 2
• Potential subsidence-related impacts to aquifer storage capacity 3
• Potential underground backfill-related impacts to the groundwater system and groundwater 4 quality 5
• Suggest analysis of long-term groundwater drawdown effects from mine dewatering based on 6 site-specific conditions and information 7
• Potential mine-related drawdown impacts on water rights, private wells, and Crescent Valley’s 8 public drinking water system 9
• Discuss and graphically show mine-related groundwater drawdown/mounding and post-closure 10 groundwater level recovery 11
• Potential effects of mine dewatering and dewatering water disposal in Crescent Valley, Pine 12 Valley, and Grass Valley 13
• Potential cumulative groundwater drawdown impacts on regional water use and surface waters 14 (seeps, springs, and surface waters) 15
• Suggest the use of re-injection wells to mitigate impacts to springs with cultural importance 16
• Identify water quality monitoring locations and monitoring and reporting requirements during 17 operations and post-closure 18
• Suggest that the existing water monitoring network be evaluated to ensure the goals of the 19 network continue to be satisfied 20
• Potential impacts to surface water (including seeps and springs) quantity and quality both during 21 operations and after closure 22
• Potential impact to drainage patterns 23
• Potential impacts from resettling of particulate emissions on surface water 24
• Describe the water quality in open ponds at the site (e.g., evapotranspiration cells) 25
• Potential for runoff to transport sediment or contaminants from mine-related disturbance areas to 26 surface waters 27
• Potential impacts in the event of failure of the solution containment systems 28
• Identify designated floodplains and potential related impacts to project facilities 29
• Describe characterization of the rapid infiltration basin sites, quality of water to be infiltrated, 30 potential water quality impacts, and effects of inter-basin water transfers 31
• Describe groundwater and surface water quality monitoring results and trends 32
• Describe remediation activities, if any, required by the jurisdictional agencies 33
• Identify pit lake water chemistry and potential related impacts to groundwater and surface water 34 quality based on modeling 35
• Identify pit lake hydrology effects on groundwater quantity based on modeling results 36
• Describe coordination with the USACE relative to waters of the U.S., including wetlands 37
• Potential impacts to waters of the U.S. and associated mitigation 38
• Describe measures in the SWPPP that would be implemented to minimized surface water and 39 groundwater impacts 40

Deep South Expansion Project EIS Chapter 4.0 – Public Coordination 4-4
Draft EIS 2018
• Potential impacts associated with evaporative loss from Rocky Pass Reservoir and post-mining 1 pit lakes 2
• Describe measures that would be implemented to maintain zero discharge 3
• Suggest developing methods to mitigate pit lake water quality 4
• Identify mitigation measures for impacts to drinking water systems 5
Soils and Reclamation 6
• Suggest restoring the land to its pre-mining appearance to the extent possible 7
• Identify potential impacts to soils from the accidental release of petroleum products and 8 measures to minimize impacts 9
• Evaluate potential for reclamation success and identify additional measures to ensure 10 successful reclamation, if needed 11
• Describe reclamation bonding requirements 12
Vegetation 13
• Potential direct, indirect, and cumulative impacts to vegetation, including special status species 14
• Potential loss of wetland and riparian vegetation as a result of mine-related disturbance or 15 groundwater drawdown 16
• Discuss special status species baseline survey results and follow-up surveys/monitoring, if 17 required 18
• Effects of dust on vegetation 19
• Incorporate the biological assessment/biological opinion by reference or inclusion, if required, 20 and demonstrate the BLM-preferred alternative is consistent with the biological opinion 21
• Identify mitigation for impacts to wetland and riparian vegetation 22
Wildlife and Aquatic Biological Resources 23
• Potential direct, indirect, and cumulative impacts to wildlife, including special status species, and 24 their habitat 25
• Discuss special status species survey results and follow-up surveys/monitoring, if required 26
• Potential impacts to wildlife as a result of mine-related impacts to water sources and wetland 27 and riparian habitats 28
• Potential impacts to wildlife from rapid infiltration basins and post-mining pit lakes 29
• Potential impacts to wildlife migratory routes 30
• Potential direct and cumulative impacts to greater sage-grouse habitat 31
• Identify and evaluate effectiveness of greater sage-grouse protection measures 32
• Identify and evaluate effectiveness of mitigation for impacts to special status species and 33 migratory waterfowl 34
• Identify potential impacts to Lahontan cutthroat trout and methods or actions to minimize or 35 mitigate impacts to this species 36
• Discuss closure and post-closure wildlife protection measure (e.g., fencing) 37

Deep South Expansion Project EIS Chapter 4.0 – Public Coordination 4-5
Draft EIS 2018
• Incorporate the biological assessment/biological opinion by reference or inclusion, if required, 1 and demonstrate the BLM-preferred alternative is consistent with the biological opinion 2
Range Resources 3
• Potential impacts to livestock grazing 4
• Suggest that impacts to livestock grazing be mitigated 5
• Potential direct, indirect, and cumulative impacts to wild horses and their habitat 6
• Potential impacts to wild horses as a result of mine-related impacts to water sources 7
Cultural Resources 8
• Suggest conduct of cultural resource surveys and development of mitigation for identified sites 9
• Potential impacts to the Cortez cemetery, including disturbance, dust, noise, vibration, visual, 10 access, and vandalism 11
Native American Traditional Values 12
• Potential impacts to areas with tribal significance 13
• Potential impacts to Native American traditional values and uses, including cumulative impacts 14 to traditional practices (e.g., pine nut harvesting) and religious practices 15
• Discuss BLM’s government-to-government consultation with the tribes 16
• Suggest that the impact analysis include the Traditional Cultural Property referenced in the 17 Cortez Hills Expansion Project Final EIS (BLM 2008) 18
• Identify impacts to traditional and religious practices and areas with tribal significance as a result 19 of existing operations (i.e., No Action Alternative) 20
• Potential impacts to springs with cultural importance 21
• Identify methods or actions (including the use of re-injection wells) to minimize or mitigate 22 impacts to springs of cultural importance 23
Air Quality and Climate Change 24
• Identify baseline data for analysis of impacts to air quality 25
• Describe the existing air quality in the project area 26
• Potential air quality impacts and associated health effects on residents from increased ore 27 transport 28
• Potential direct and cumulative air quality impacts from all project-related emissions (e.g., 29 fugitive, mercury, and other gaseous emissions) 30
• Discuss compliance with NAAQS based on modeling results 31
• Discuss whether air quality monitoring would be conducted to ensure compliance with permit 32 criteria 33
• Discuss applicability of PSD regulations 34
• Potential air quality and visibility impacts to designated Class I areas 35
• Discuss HAPs (including mercury) sources, estimated emissions, controls, and monitoring 36

Deep South Expansion Project EIS Chapter 4.0 – Public Coordination 4-6
Draft EIS 2018
• Suggest particulate emissions be evaluated relative to inhalation health impacts, visibility 1 impairment, and effects to surface water and vegetation from resettling 2
• Suggest the need for a dust control plan 3
• Identify the project’s contribution to carbon dioxide and other GHG emissions 4
• Identify procedures or mitigation to minimize particulate, fugitive, and mercury emissions 5
• Identify mitigation to minimize impacts to air quality and air quality impacts to sensitive receptors 6
Land Use and Access 7
• Consistency with land use plans, including Eureka County policies, plans, guidance, and 8 Controls 9
• Potential impacts to public access 10
• Suggest that impacts to public access be mitigated 11
• Potential impacts to the Cortez cemetery (e.g., vandalism) from unrestricted public access 12
• Potential impacts from increased ore transport on residents and communities along the 13 transportation route 14
Social and Economic Values 15
• Potential adverse and beneficial impacts to social and economic values 16
• Potential water quality-related impacts on property values in Crescent Valley 17
Environmental Justice 18
• Analyze potential environmental justice impacts in accordance with EO 12898 and other 19 applicable requirements 20
• Identify mitigation for environmental justice impacts 21
Visual Resources 22
• Potential impacts to visual resources 23
Noise 24
• Identify any noise, dust, and vibration monitoring conducted at the Cortez cemetery and 25 mitigation, if needed 26
Hazardous Materials 27
• Describe measures that would be implemented in the event of an accidental release of 28 hazardous materials, including petroleum products 29
Mitigation (non-resource specific) 30
• Identify and describe appropriate mitigation measures and discuss the effectiveness of each 31 measure in mitigating the identified issues 32
• Suggest identifying criteria for determining mitigation effectiveness and discuss follow-up 33 adaptive management options, if needed 34

Deep South Expansion Project EIS Chapter 4.0 – Public Coordination 4-7
Draft EIS 2018
4.2 List of Contacts 1
While preparing the Deep South Expansion Project EIS, the BLM communicated with and received input 2 from various federal, state, and local agencies and private organizations. The following sections list 3 these contacts. Information and data also were obtained from various agency websites during 4 preparation of this EIS, as documented in Chapter 6.0, References. 5
4.2.1 Federal Agencies 6
U.S. Environmental Protection Agency 7
U.S. Fish and Wildlife Service 8
4.2.2 State Agencies 9
Nevada Department of Wildlife 10
Nevada Division of Environmental Protection 11
Nevada Division of Water Resources 12
Nevada Natural Heritage Program 13
State Historic Preservation Officer 14
State of Nevada Sagebrush Ecosystem Program 15
4.2.3 Local Agencies 16
Eureka County Board of Commissioners 17
Lander County Commissioners 18
4.2.4 Tribal Organizations 19
Battle Mountain Band of Western Shoshone 20
Duckwater Shoshone Tribe 21
South Fork Band of Western Shoshone 22
4.2.5 Other Organizations 23
BLM Resource Advisory Councils 24
Friends of Animals 25
Great Basin Resource Watch 26
Nevada Cattlemen’s Association 27
Nevada Congressional Delegation 28
4.3 EIS Mailing List and EIS Notification and Distribution 29
The EIS mailing list includes persons who signed a scoping meeting attendance list; individuals, 30 organizations, and agencies that submitted scoping comments; and persons who expressed interest in 31 being added to the mailing list. Tribal organizations with whom BLM consultation is ongoing for the 32 proposed project also are included in the mailing list. 33

Deep South Expansion Project EIS Chapter 4.0 – Public Coordination 4-8
Draft EIS 2018
The 45-day public review period for the Draft EIS was initiated with publication of the Notice of 1 Availability in the FR. Concurrent with publication of the Notice of Availability in the FR, BLM posted the 2 Draft EIS to the BLM e-Planning website for public review and comment. A notification of the 3 document’s availability was sent to the interested parties on the EIS mailing list. 4

Chapter 5.0 – List of Preparers Deep South Expansion Project EIS and Reviewers 5-1
Draft EIS 2018
5.0 List of Preparers and Reviewers 1
5.1 Bureau of Land Management EIS Team 2
Responsibility Name Degree(s) and Years of
Experience Field Manager Jon Sherve MS Hydrology
BA Biological Sciences 23 years experience
Assistant Field Manager Joseph Moskiewicz BS Agriculture, Major in Natural Resources – Environmental Conservation 40+ years experience
Assistant Field Manager, Renewables John Gant Massy PhD School Forestry Ecology MA Humanities
– Plant
BS Biology 23 years experience
Project Manager/NEPA Coordinator Kevin Hurrell MS Environmental Policy and Management BS Environmental Studies and Applications 20 years experience
Air Quality Carl (Tom) Coulter MS Atmospheric Science BS Atmospheric Science 28 years experience
Craig Nichols
Cultural Resources, Paleontological Resources Madeline Van Der Voort MA Anthropology BA Archaeology and Classical Studies 10 years experience
Water Quality and Quantity, Floodplains, and Riparian Zones
Wetland Justin Ferris PhD Hydrology BS Geology 15 years experience
Migratory Birds, Wildlife, Threatened and Endangered Species, Special Status Species Noise
, Dave Davis MS Biological Science
BA Liberal Arts 10 years experience
Social and Economic Values, Environmental Justice
Julie Suhr-Pierce PhD Environmental, Natural Resource, Public Economics, and Public Land Management MS Economics Honors BA Music 32 years experience
Native American Religious Concerns, Coordination, Consultation
Juan Martinez BS Fisheries and Wildlife 22 years experience

Chapter 5.0 – List of Preparers Deep South Expansion Project EIS and Reviewers 5-2
Draft EIS 2018
Responsibility Name Degree(s) and Years of
Experience Noxious Species
Weeds, Invasive and Non-native Plant Anna O'Brien BS Agriculture 11 years experience
Waste, Hazardous or Solid Rick Singer BS Forestry – Forest Ecology 35 years experience
Range, Grazing, Vegetation, Soils Sam Ault BS Rangeland Management 5 years experience
Land Use Authorizations Jon Kramer MS Criminology 6 years experience
Minerals Scott Distel MS Park and Resource Management BS Environmental Science 12 years experience
Recreation, Visual Resource Management, Wilderness Characteristics Inventory, Lands with Wilderness Characteristics
Paul Amar BS Recreation and Tourism AS Emergency Medical Services 10 years experience
5.2 Cooperating Agencies 1
Agency Name USEPA Patrick J. Kelly
U.S. Fish and Wildlife Service Carolyn Swed
Justin Barrett
Genevieve Skora
Lara Enders
Nevada Department of Wildlife Steve Foree
Lindsey Lesmeister
Lander County Commissioners Keith Westengard
Eureka County Board of Commissioners

Chapter 5.0 – List of Preparers Deep South Expansion Project EIS and Reviewers 5-3
Draft EIS 2018
5.3 AECOM EIS Team (Third-party Consultant) 1
Responsibility Name Degree(s) and Experience Project Manager Dan Gregory MS Geology/Geomorphology
35 years experience
Assistant Project Manager Dolora Koontz BA Biology 31 years experience
Principal-in-Charge Anne Baldrige MBA Finance and Accounting BS Geology 38 years experience
Public Involvement Janet Guinn BA Anthropology BS Psychology 14 years experience
Geology and Minerals, Groundwater Geochemistry
Resources, Patrick Plumley MS Geology BS Geology 37 years experience
Surface Water Resources Jim Burrell MS Civil Engineering BS Forest Management 37 years experience
Soils and Reclamation, Vegetation, Special Status Plants, Noxious Weeds, Noise
Meagan Jones BS Environmental Biology 6 years experience
Paleontology, Hazardous Waste
Materials and Solid Bill Berg MS Geology BS Geology 38 years experience
Air Quality and Climate Change Courtney Taylor MS Atmospheric Science BA Environment, Economics, and Politics
15 years experience
Dustin Rapp MS Atmospheric Science BS Physics 10 years experience
Caitlin Shaw MS Atmospheric Sciences BS Meteorology 7 years experience
Fish and Wildlife, Special Status Species Patti Lorenz BS Wildlife Biology 12 years experience
Spencer Martin MEM Resource Ecology/Conservation Biology BA Biology 28 years experience
Rollin Daggett MS Freshwater and Marine Biology BS Zoology 42 years experience
Cultural Resources, Native American Traditional Values
Barbara Malinky Harmon
MA Anthropology BA Anthropology 14 years experience

Chapter 5.0 – List of Preparers Deep South Expansion Project EIS and Reviewers 5-4
Draft EIS 2018
Responsibility Name Degree(s) and Experience Social and Economic Values, Environmental Justice, Visual Resources
Bernie Strom MCRP City and Regional Planning BS Urban Planning 38 years experience
Visual Simulations Merlyn Paulson MLA Landscape Architecture II BLA Landscape Architecture and Environmental Planning 45 years experience
Range Resources Chris Dunne BS Natural Resource Management 17 years experience
Land Use, Access, Recreation, Wilderness Steve Graber BS Natural Resources Management BA Economics 13 years experience
Document Production Sue Coughenour 2 years General Studies 32 years experience
GIS Ben Tracy BA Humanities/Film BS Natural Resources Minor in GIS 6 years experience
5.4 Barrick Cortez Inc. Reviewers 1
Name Title and Company Steve Schoen Permitting Manager/Barrick Gold of North America
Mark Miller Environmental Manager/Barrick Cortez Mines
Brian Taylor Senior Environmental Engineer/Barrick Cortez Mines
Chris Natoli Cortez Environmental
Jim Butler Legal/Parsons Behle & Latimer

Deep South Expansion Project EIS Chapter 6.0 - References 6-1
Draft EIS 2018
6.0 References 1
Chapter 1.0 INTRODUCTION 2
Barrick Cortez Inc. (BCI). 2016. Barrick Cortez Inc. (NVN-067575 (16-1A)) Deep South Expansion 3 Project Amendment to Plan of Operations and Reclamation Permit Application #0093. 4 Submitted to BLM Mount Lewis Field Office, Battle Mountain, Nevada, and Nevada Division of 5 Environmental Protection, Carson City, Nevada. October 2016. 6
Bureau of Land Management (BLM). 2015. Nevada and Northeastern California Greater Sage-Grouse 7 Approved Resource Management Plan Amendment. Bureau of Land Management Nevada 8 State Office. September 2015. 9
Bureau of Land Management (BLM). 1991. Nevada Cyanide Management Plan, Appendix D. BLM 10 Nevada State Office. August 22, 1991. 11
Bureau of Land Management (BLM). 1990. Instruction Memorandum No. 90-566, Cyanide 12 Management Policy for Activities Authorized under 43 CFR 3802/3809. Washington Office. 13 August 6, 1990. In: Bureau of Land Management (BLM). 1991. Nevada Cyanide Management 14 Plan, Appendix D. BLM Nevada State Office. August 22, 1991. 15
Bureau of Land Management (BLM). 1987. Elko Resource Management Plan Record of Decision. 16 Elko District Office, Elko, Nevada. March 11, 1987. On file, Bureau of Land Management, Elko 17 District Office, Elko, Nevada. 18
Bureau of Land Management (BLM). 1986. Shoshone-Eureka Resource Area Record of Decision. 19 Battle Mountain District, Battle Mountain, Nevada. March 10, 1986. On file, Bureau of Land 20 Management, Mount Lewis Field Office, Battle Mountain, Nevada. 21
Bureau of Land Management, Nevada State Office and California State Office (BLM), Nevada 22 Department of Conservation and Natural Resources (Nevada DCNR), and U.S. Forest 23 Service, Humboldt-Toiyabe National Forest. 2016. Memorandum of Understanding (MOU). 24 March 2016. 25
Bureau of Land Management (BLM), U.S. Fish and Wildlife Service (USFWS), and Barrick Gold of 26 North America. 2015. Barrick Nevada Sage-Grouse Bank Enabling Agreement. March 25, 27 2015. 28
Eureka County. 2010. 2010 Eureka County Master Plan. April 6, 2010. 29
Lander County. 2005. Lander County 2005 Policy Plan for Federally Administered Lands. Prepared by 30 the Lander County Public Land Use Advisory Planning Commission. July 25, 2005. 31
Chapter 2.0 ALTERNATIVES INCLUDING THE PROPOSED ACTION 32
Avian Power Line Interaction Committee (APLIC). 2012. Reducing Avian Collisions with Power Lines: 33 The State of the Art in 2012. Edison Electric Institute. Washington, D.C. December 2012. 34
Avian Power Line Interaction Committee (APLIC). 2006. Suggested Practices for Avian Protection on 35 Power Lines: The State of the Art in 2006. Edison Electric Institute. 36
Avian Power Line Interaction Committee (APLIC) and U.S. Fish and Wildlife Service (USFWS). 2005. 37 Avian Protection Plan Guidelines. April 2005. 38

Deep South Expansion Project EIS Chapter 6.0 - References 6-2
Draft EIS 2018
Barrick Cortez Inc. (BCI). 2018. Email communication from S. Schoen, BCI, to D. Gregory, AECOM. 1 June 7, 2018. 2
Barrick Cortez Inc. (BCI). 2017a. Supporting documentation provided for the Proposed Action. 3 January 31 through June 12, 2017. 4
Barrick Cortez Inc. (BCI). 2017b. 2015/2016 Cortez Rapid Infiltration Basin Investigation Summary. 5 From V. Frei to S. Schoen, G. Fennemore, M. Miller, N. Atiemo, D. Pierce. April 17, 2017. 6
Barrick Cortez Inc. (BCI). 2016a. Stormwater Pollution Prevention Plan. Pursuant to Stormwater 7 General Permit #NVR300000. Revised August 2016. 8
Barrick Cortez Inc. (BCI). 2016b. Barrick Cortez Inc. (NVN-067575 (16-1A)) Deep South Expansion 9 Project Amendment to Plan of Operations and Reclamation Permit Application #0093. 10 Submitted to BLM Mount Lewis Field Office, Battle Mountain, Nevada and Nevada Division of 11 Environmental Protection, Carson City, Nevada. October 2016. 12
Barrick Cortez Inc. (BCI). 2016c. Emergency Response Plan. Revised September 8, 2016. 13
Barrick Cortez Inc. (BCI). 2015. Solid and Hazardous Waste Management Plan. Elko, Nevada. 14 November 2015. 15
Barrick Cortez Inc. (BCI). 2014a. Letter from M. Gili, BCI, to B. Holmgren, Bureau of Mining Regulation 16 and Reclamation, Re: Statutory Requirements Related to Public Non-motorized Access to the 17 Pipeline Pit Lake, Barrick Cortez Inc. Reclamation Permit 0093; BLM Case No. NVN-067575. 18 June 25, 2014. 19
Barrick Cortez Inc. (BCI). 2014b. Barrick Cortez Inc. (NVN-067575 (14-1A)) Amendment 3 to Plan of 20 Operations and Reclamation Permit Application. Submitted to BLM Mount Lewis Field Office, 21 Battle Mountain, Nevada and Nevada Division of Environmental Protection, Carson City, 22 Nevada. Revised October 2014. 23
Barrick Cortez Inc. (BCI). 2012. Barrick Cortez Inc. (NVN-067575 (11-3A)) 2011 Amendment to Plan 24 of Operations and Reclamation Permit Application Proposed North Waste Rock Facility 25 Realignment/Rangeland Fence Addition/Stockpile Relocation/Ancillary Addition. Submitted to 26 BLM Mount Lewis Field Office, Battle Mountain, Nevada and Nevada Division of 27 Environmental Protection, Carson City, Nevada. December 2012. 28
Barrick Cortez Inc. (BCI) and Stantec Consulting Services Inc. (Stantec). 2018. Technical 29 Memorandum Contingency Mitigation Plans for Surface Waters Deep South Expansion 30 Project Lander and Eureka Counties, Nevada. Stantec Project Number 203720412. March 27, 31 2018. 32
Barrick Gold of North America (Barrick). 2018. Bank Enabling Agreement 2017 Annual Report. 33 February 2018. 34
Barrick Gold of North America (Barrick). 2016. Barrick Cortez Mines Emergency Response Plan. 35 Revised September 8, 2016. 36
Bureau of Land Management (BLM). 2018. Information provided by BLM during the Deep South 37 Expansion Project Preliminary Draft EIS comment meeting with U.S. Fish and Wildlife Service. 38 June 13, 2018. 39

Deep South Expansion Project EIS Chapter 6.0 - References 6-3
Draft EIS 2018
Bureau of Land Management (BLM). 2017a. Bureau of Land Management’s Land & Mineral Legacy 1 Rehost 2000 System - LR2000. Internet website: http://www.blm.gov/lr2000/. Accessed 2 January 27, 2017. 3
Bureau of Land Management (BLM). 2017b. GIS Shapefiles for Wildfire Affected Areas in Nevada. 4 May 30, 2017. 5
Bureau of Land Management (BLM). 2017c. Roadside Fuel Break Hazardous Fuels Reduction Project 6 Programmatic Environmental Assessment. BLM Battle Mountain District Office, Battle 7 Mountain, Nevada. November 2017. Internet website: https://eplanning.blm.gov/epl-front-8 office/eplanning/planAndProjectSite.do?methodName=dispatchToPatternPage¤tPageId9 =100213. Accessed July 25, 2018. 10
Bureau of Land Management (BLM). 2017d. Decision Record for Roadside Fuel Break Hazardous 11 Fuels Reduction Project Environmental Assessment. BLM Battle Mountain District Office, 12 Battle Mountain, Nevada. November 17, 2017. Internet website: https://eplanning.blm.gov/epl-13 front-14 office/eplanning/planAndProjectSite.do?methodName=dispatchToPatternPage¤tPageId15 =100213. Accessed July 25, 2018.Bureau of Land Management (BLM). 2016a. Environmental 16 Assessment Barrick Gold Exploration, Inc. Horse Canyon/Cortez Unified Exploration Project 17 Plan of Operations (NVN-066621 [16-1A]) and Reclamation Permit No. 0159 Plan Amendment 18 – Twin Declines for Underground Exploration. Battle Mountain District Office, Mount Lewis 19 Field Office. Battle Mountain, Nevada. July 20, 2016. 20
Bureau of Land Management (BLM). 2016b. Decision Environmental Assessment Barrick Gold 21 Exploration, Inc. Horse Canyon/Cortez Unified Exploration Project Plan of Operations (NVN-22 066621 [16-1A]) and Reclamation Permit No. 0159 Plan Amendment – Twin Declines for 23 Underground Exploration. Mount Lewis Field Office, Battle Mountain, Nevada. September 9, 24 2016. On file, Bureau of Land Management, Mount Lewis Field Office, Battle Mountain, 25 Nevada. 26
Bureau of Land Management (BLM). 2016c. Sagebrush Ecosystem Management Environmental 27 Assessment. DOI-BLM-NV-B000-2017-0001-EA. November 22, 2016. Internet website: 28 https://eplanning.blm.gov/epl-front-29 office/eplanning/planAndProjectSite.do?methodName=dispatchToPatternPage¤tPageId30 =99220. Accessed July 25, 2018. 31
Bureau of Land Management (BLM). 2015a. Environmental Assessment Barrick Cortez Inc. (NVN-32 067575 [14-1A]) Amendment 3 to Plan of Operations and Reclamation Permit Application. 33 Battle Mountain District Office, Mount Lewis Field Office, Battle Mountain, Nevada. July 2015. 34
Bureau of Land Management (BLM). 2015b. Decision/Finding of No Significant Impact Barrick Cortez 35 Inc. Amendment to the Plan of Operations Approval Determination of Required Financial 36 Guarantee. Mount Lewis Field Office, Battle Mountain, Nevada. September 11, 2015. 37
Bureau of Land Management (BLM). 2014a. Environmental Assessment for Barrick Cortez Inc. (NVN-38 67575 [11-3A]) 2011 Amendment to Plan of Operations and Reclamation Permit Application 39 Proposed North Waste Rock Facility Realignment/Rangeland Fence Addition/Stockpile 40 Relocation/Ancillary Addition. Battle Mountain District, Mount Lewis Field Office, Battle 41 Mountain, Nevada. February 2014. 42
Bureau of Land Management (BLM). 2014b. Decision/Finding of No Significant Impact Cortez Gold 43 Mines Project Amendment to the Plan of Operations Approval Determination of Required 44 Financial Guarantee. Mount Lewis Field Office, Battle Mountain, Nevada. February 24, 2014. 45

Deep South Expansion Project EIS Chapter 6.0 - References 6-4
Draft EIS 2018
Bureau of Land Management (BLM). 2013a. Robertson Exploration Project Environmental 1 Assessment. Mountain Lewis Field Office, Battle Mountain, Nevada. August 2013. On file, 2 Bureau of Land Management, Mount Lewis Field Office, Battle Mountain, Nevada. 3
Bureau of Land Management (BLM). 2013b. Decision/Finding of No Significant Impact Robertson 4 Exploration Project. Mountain Lewis Field Office, Battle Mountain, Nevada. September 2013. 5 On file, Bureau of Land Management, Mount Lewis Field Office, Battle Mountain, Nevada. 6
Bureau of Land Management (BLM). 2011a. Cortez Hills Expansion Project Final Supplemental 7 Impact Statement. Battle Mountain District Office, Battle Mountain, Nevada. January 2011. 8
Bureau of Land Management (BLM). 2011b. Cortez Hills Expansion Project Record of Decision and 9 Plan of Operations Amendment Approval. Battle Mountain District Office, Battle Mountain, 10 Nevada. March 2011. 11
Bureau of Land Management (BLM). 2008a. Cortez Hills Expansion Project Final Impact Statement. 12 Battle Mountain District Office, Battle Mountain, Nevada. September 2008. 13
Bureau of Land Management (BLM). 2008b. Cortez Hills Expansion Project Record of Decision and 14 Plan of Operations Amendment Approval. BLM Battle Mountain District, Battle Mountain, 15 Nevada. November 2008. 16
Bureau of Land Management (BLM). 2008c. BLM National Environmental Policy Act (NEPA) 17 Handbook, H-1790-1. Washington, D.C. January 2008. On file, Bureau of Land Management, 18 Mount Lewis Field Office, Battle Mountain, Nevada. 19
Bureau of Land Management (BLM). 2006a. Cortez Gold Mines, Cortez Mine Underground 20 Explorations Project Environmental Assessment. Battle Mountain Field Office, Battle 21 Mountain, Nevada. February 2006. On file, Bureau of Land Management, Mount Lewis Field 22 Office, Battle Mountain, Nevada. 23
Bureau of Land Management (BLM). 2006b. Decision/Finding of No Significant Impact, Cortez Gold 24 Mines, Cortez Mine Underground Explorations Project Environmental Assessment. Battle 25 Mountain Field Office, Battle Mountain, February 2006. On file, Bureau of Land Management, 26 Mount Lewis Field Office, Battle Mountain, Nevada. 27
Bureau of Land Management (BLM). 2005. Pipeline/South Pipeline Pit Expansion Project SEIS: 28 Record of Decision. Battle Mountain Field Office, Battle Mountain Nevada. On file, Bureau of 29 Land Management, Mount Lewis Field Office, Battle Mountain, Nevada. 30
Bureau of Land Management (BLM). 2004. Pipeline/South Pipeline Pit Expansion Project Final 31 Supplemental Environmental Impact Statement. Battle Mountain Field Office, Battle Mountain, 32 Nevada. December 2004. 33
Bureau of Land Management (BLM). 2001. Environmental Assessment, Cortez Gold Mines, Inc. Horse 34 Canyon/Cortez Unified Exploration Project. Battle Mountain Field Office, Battle Mountain, 35 Nevada. August 2001. On file, Bureau of Land Management, Mount Lewis Field Office, Battle 36 Mountain, Nevada. 37
Bureau of Land Management (BLM). 2000a. South Pipeline Project Final Environmental Impact 38 Statement. Battle Mountain District, Battle Mountain, Nevada. February 2000. 39

Deep South Expansion Project EIS Chapter 6.0 - References 6-5
Draft EIS 2018
Bureau of Land Management (BLM). 2000b. South Pipeline Project Final EIS: Record of Decision. 1 Battle Mountain Field Office, Battle Mountain, Nevada. June 27, 2000. On file, Bureau of Land 2 Management, Mount Lewis Field Office, Battle Mountain, Nevada. 3
Bureau of Land Management (BLM). 1999a. Pipeline Infiltration Project Environmental Assessment. 4 Battle Mountain Field Office, Battle Mountain, Nevada. On file, Bureau of Land Management, 5 Mount Lewis Field Office, Battle Mountain, Nevada. 6
Bureau of Land Management (BLM). 1999b. Decision Record for the Pipeline Infiltration Project. Battle 7 Mountain Field Office, Battle Mountain, Nevada. March 12, 1999. On file, Bureau of Land 8 Management, Mount Lewis Field Office, Battle Mountain, Nevada. 9
Bureau of Land Management (BLM). 1996a.Cortez Pipeline Gold Deposit, Final Environmental Impact 10 Statement – Volume 1. U.S. Department of the Interior, Bureau of Land Management, Battle 11 Mountain District, Shoshone – Eureka Resource Area. January 1996. 12
Bureau of Land Management (BLM). 1996b. Record of Decision for the Cortez Pipeline Deposit Final 13 EIS. Battle Mountain District, Battle Mountain, Nevada. March 4, 1996. On file, Bureau of Land 14 Management, Mount Lewis Field Office, Battle Mountain, Nevada. 15
Bureau of Land Management (BLM). 1993. Final Environmental Impact Statement, Cortez Gold Mine 16 Expansion Project. Prepared in cooperation with Nevada Department of Conservation and 17 Natural Resources, Division of Environmental Protection. Battle Mountain District Office. 18 August 1993. 19
Bureau of Land Management (BLM). 1988. Shoshone-Eureka Rangeland Program Summary. Battle 20 Mountain District Office, Battle Mountain, Nevada. On file, Bureau of Land Management, 21 Mount Lewis Field Office, Battle Mountain, Nevada. 22
Bureau of Land Management (BLM), U.S. Fish and Wildlife Service (USFWS), and Barrick Gold of 23 North America (Barrick). 2015. Barrick Nevada Sage-Grouse Bank Enabling Agreement. 24 March 25, 2015. 25
Cortez Gold Mines (CGM) and SRK Consulting (SRK). 2008. Amendment to the Pipeline/South 26 Pipeline Plan of Operations for the Cortez Hills Expansion Project and Modification to 27 Reclamation Permit Application. July 2008. On file, Bureau of Land Management, Mount 28 Lewis Field Office, Battle Mountain, Nevada. 29
ESRI World Imagery. 2017. GIS Application for Satellite Imagery. May 17, 2017. 30
Geomega Inc. (Geomega). 2016a. Memorandum: Cortez Deep South Expansion – Sub-3,800 ft 31 Groundwater Characterization. February 23, 2016. 32
Geomega Inc. (Geomega).2016b. Deep South Expansion Project Waste Rock Management Plan. 33 Prepared for: Barrick Cortez Inc. August 1, 2016. In: Barrick Cortez Inc. (BCI). 2016. Barrick 34 Cortez Inc. (NVN-067575 (16-1A)) Deep South Expansion Project Amendment to Plan of 35 Operations and Reclamation Permit Application #0093, Appendix 2. October 2016. 36
Geomega Inc. (Geomega). 2006. Cortez Hills Expansion Project Baseline Characterization Report. 37 Prepared for Cortez Gold Mines. September 12, 2016. In: Bureau of Land Management 38 (BLM). 2008a. Cortez Hills Expansion Project Final Impact Statement. Battle Mountain District 39 Office, Battle Mountain, Nevada. September 2008. 40

Deep South Expansion Project EIS Chapter 6.0 - References 6-6
Draft EIS 2018
Itasca Denver, Inc. (Itasca). 2016. 2016 Integrated Monitoring Plan. Prepared for Barrick Cortez Inc. 1 #1912-16. April 2016. In: Barrick Cortez Inc. (BCI). 2016. Barrick Cortez Inc. (NVN-067575 2 (16-1A)) Deep South Expansion Project Amendment to Plan of Operations and Reclamation 3 Permit Application #0093, Appendix 6. October 2016. 4
Lamp, R. 2006. Biologist III – Nevada Department of Wildlife. Personnel communication with D. 5 Koontz, ENSR. August 8, 2006. In: Bureau of Land Management (BLM). 2008a. Cortez Hills 6 Expansion Project Final Impact Statement. Battle Mountain District Office, Battle Mountain, 7 Nevada. September 2008. 8
Matrix Design Group. 2017. Barrick Cortez, Inc. Traffic Impact Study. Prepared for Knight Piésold and 9 Co. Matrix Project No.: 17.786.002. March 2, 2017. 10
Nevada Division of Water Resources (NDWR) – Office of the State Engineer. 2017. Orders 1283 and 11 1284 Amending the Conditions and Provisions of Permits Issued to Cortez Joint Venture. 12
Pagel, J. E., D. M. Whittington, G. T. Allen. 2010. Interim Golden Eagle Inventory and Monitoring 13 Protocols; and Other Recommendations. U.S. Fish and Wildlife Service. February 2010. 14
Smith Environmental & Engineering. 2015. Soils Investigation of the Deep South Study Area in Eureka 15 and Lander Counties, Nevada. Prepared for ERM and Barrick Cortez. Smith Project No. 2015-16 967. September 2015. In: Environmental Resources Management. 2016. Baseline Biological 17 Report for the Deep South Project. Presented to: Barrick Cortez Inc. Appendix H. July 2016. 18
SRK Consulting, Inc. (SRK). 2016. Groundwater Flow Model Report, Deep South Expansion Project, 19 Crescent Valley, Nevada. Report prepared for Barrick Cortez, Inc. August 2016. 20
SRK Consulting (SRK). 2014. Noxious Weed Management Plan. Prepared for Barrick Cortez Inc. SRK 21 Project Number 460100.020. July 2014. In: Barrick Cortez Inc. (BCI). 2016. Barrick Cortez Inc. 22 (NVN-067575 (16-1A)) Deep South Expansion Project Amendment to Plan of Operations and 23 Reclamation Permit Application #0093, Appendix 7. October 2016. 24
SRK Consulting, Inc. (SRK). 2004. Geochemical Evaluation of Heap Rinsing of the Gold Acres Heap, 25 Cortez Joint Venture, Nevada. Prepared for Cortez Gold Mines. September 2004. In: Bureau 26 of Land Management (BLM). 2008. Cortez Hills Expansion Project Final Impact Statement. 27 Battle Mountain District Office, Battle Mountain, Nevada. September 2008. 28
U.S. Census Bureau. 2017. TIGER/Line Shapefile, Roads-Lander County. Internet website: 29 ftp://ftp2.census.gov/geo/tiger/TGRGDB13/. November 11, 2009. Accessed May 17, 2017. 30
U.S. Department of Agriculture (USDA), Natural Resources Conservation Service (NRCS). 2017. The 31 PLANTS Database. National Plant Data Team, Greensboro, North Carolina 27401-4901 USA. 32 Internet website: http://plants.usda.gov. March 13, 2017. 33
Chapter 3.0 AFFECTED ENVIRONMENT AND ENVIRONMENTAL CONSEQUENCES 34
3.0 Introduction 35
Bureau of Land Management (BLM). 2015. Environmental Assessment Barrick Cortez Inc. (NVN-36 067575 [14-1A]) Amendment 3 to Plan of Operations and Reclamation Permit Application. 37 Battle Mountain District Office, Mount Lewis Field Office, Battle Mountain, Nevada. July 2015. 38
Bureau of Land Management (BLM). 2014. Environmental Assessment for Barrick Cortez Inc. (NVN-39 67575 [11-3A]) 2011 Amendment to Plan of Operations and Reclamation Permit Application 40

Deep South Expansion Project EIS Chapter 6.0 - References 6-7
Draft EIS 2018
Proposed North Waste Rock Facility Realignment/Rangeland Fence Addition/Stockpile 1 Relocation/Ancillary Addition. Battle Mountain District, Mount Lewis Field Office, Battle 2 Mountain, Nevada. February 2014. 3
Bureau of Land Management (BLM). 2008a. Cortez Hills Expansion Project Final Impact Statement. 4 Battle Mountain District Office, Battle Mountain, Nevada. September 2008. 5
Bureau of Land Management (BLM). 2008b. BLM National Environmental Policy Act (NEPA) 6 Handbook, H-1790-1. Washington, D.C. January 2008. 7
Bureau of Land Management (BLM). 2004. Pipeline/South Pipeline Pit Expansion Project Final 8 Supplemental Environmental Impact Statement. Battle Mountain Field Office, Battle Mountain, 9 Nevada. December 2004. 10
Bureau of Land Management (BLM). 2000. South Pipeline Project Final Environmental Impact 11 Statement. Battle Mountain District, Battle Mountain, Nevada. February 2000. 12
3.1 Geology and Minerals 13
AKANA. 2015. Technical Memorandum. Water Storage Reservoir Scoping Study, Akana Project 14 No. 15-138. Task 4 Deliverable – Dam Conceptual Design Alternatives. Submitted to Barrick 15 Cortez, Inc. Crescent Valley, Nevada. September 22, 2015. 16
AMEC Foster Wheeler Environment & Infrastructure, Inc. (AMEC). 2016. 2015 Annual Ground 17 Subsidence and Earth Fissure Monitoring Report. Pipeline/South Pipeline Project, Lander 18 County, Nevada. April 2016. 19
AMEC Earth & Environmental, Inc.(AMEC). 2005. In: Synthetic Aperture Radar (SAR) Evaluation for 20 Ground Subsidence and Earth Fissure Monitoring 2004. Pipeline/South Pipeline Project, 21 Cortez Gold Mines, Lander County, Nevada. July 28, 2005. In: Bureau of Land Management 22 (BLM). 2008a. Cortez Hills Expansion Project Final Impact Statement. Battle Mountain District 23 Office, Battle Mountain, Nevada. September 2008. 24
AMEC Earth & Environmental, Inc. (AMEC). 2003. Preliminary Report Ground Subsidence and Earth 25 Fissure Evaluation, Pipeline/South Pipeline Project, Cortez Gold Mines, Lander County, 26 Nevada. In: Bureau of Land Management (BLM). 2008a. Cortez Hills Expansion Project Final 27 Impact Statement. Battle Mountain District Office, Battle Mountain, Nevada. September 2008. 28
Barrick Cortez Inc. (BCI). 2017a. Supplemental geotechnical data provided by S. Schoen, BCI, to D. 29 Koontz, AECOM, in response to an AECOM data requested. March 6, 2017. 30
Barrick Cortez Inc. (BCI). 2017b. Email submittal from S. Schoen, BCI, to K. Hurrell, BLM, D. Gregory, 31 AECOM, and D. Koontz, AECOM, regarding blasting-related vibration. August 1, 2017. 32
Barrick Cortez Inc. (BCI). 2016. Barrick Cortez Inc. (NVN-067575 [16-1A]) Deep South Expansion 33 Project Amendment to Plan of Operations and Reclamation Permit Application #0093. 34 Submitted to BLM Mount Lewis Field Office, Battle Mountain, Nevada and Nevada Division of 35 Environmental Protection, Carson City, Nevada. October 2016. 36
Bell, J. W. 2013. InSAR Studies in the Crescent Valley Area Final Technical Report to Barrick Gold of 37 North America. Nevada Bureau of Mines and Geology University of Nevada, Reno. 38 December5, 2013. 39

Deep South Expansion Project EIS Chapter 6.0 - References 6-8
Draft EIS 2018
Bureau of Land Management (BLM). 2015. Environmental Assessment Barrick Cortez Inc. 1 (NVN-067575 [14-1A]) Amendment 3 to Plan of Operations and Reclamation Permit 2 Application. Battle Mountain District Office, Mount Lewis Field Office, Battle Mountain, 3 Nevada. July 2015. 4
Bureau of Land Management (BLM). 2014. Environmental Assessment for Barrick Cortez Inc. 5 (NVN-67575 [11-3A]) 2011 Amendment to Plan of Operations and Reclamation Permit 6 Application Proposed North Waste Rock Facility Realignment/Rangeland Fence 7 Addition/Stockpile Relocation/Ancillary Addition. Battle Mountain District, Mount Lewis Field 8 Office, Battle Mountain, Nevada. February 2014. 9
Bureau of Land Management (BLM). 2013. Instructional Memorandum No. NV-2013-046 Nevada 10 Bureau of Land Managements. Rock Characterization and Water Resources Analysis 11 Guidance for Mining Activities. Reno, Nevada. September 19, 2013. 12
Bureau of Land Management (BLM). 2008a. Cortez Hills Expansion Project Final Impact Statement. 13 Battle Mountain District Office, Battle Mountain, Nevada. September 2008. 14
Bureau of Land Management (BLM). 2008b. Cortez Hills Expansion Project Record of Decision and 15 Plan of Operations Amendment Approval. BLM Battle Mountain District, Battle Mountain, 16 Nevada. November 2008. 17
Bureau of Land Management (BLM). 2006. Cortez Mine Underground Exploration Project 18 Environmental Assessment. Battle Mountain Field Office, Battle Mountain, Nevada. 19 February 2006. 20
Bureau of Land Management (BLM). 2004. Pipeline/South Pipeline Pit Expansion Project Final 21 Supplemental Environmental Impact Statement. NVN-067575(01-1A); NV063-EIS01-70. 22 Battle Mountain Field Office, Battle Mountain, Nevada. December 2004. 23
Bureau of Land Management (BLM). 2000. South Pipeline Project Final Environmental Impact 24 Statement. NV64-93-001P(96-2A); NV063-EIS98-014. Battle Mountain Field Office, Battle 25 Mountain, Nevada. February 2000. 26
Bureau of Land Management (BLM). 1996. Cortez Pipeline Gold Deposit Final Environmental Impact 27 Statement - Volume 1. U.S. Department of the Interior, Bureau of Land Management, Battle 28 Mountain District, Shoshone - Eureka Resource Area. January 1996. 29
Bureau of Land Management (BLM). 1994. Cortez Pipeline Gold Deposit Draft Environmental Impact 30 Statement. Battle Mountain District. Shoshone-Eureka Resource Area, Battle Mountain, 31 Nevada. July 1994. 32
Cortez Gold Mines (CGM). 2005. Monitoring Plan for Ground Subsidence and Related Earth Fissure 33 Development near the Pipeline Mine. Unpublished report submitted to BLM. July 7, 2005. In: 34 Bureau of Land Management (BLM). 2008. Cortez Hills Expansion Project Final Impact 35 Statement. Battle Mountain District Office, Battle Mountain, Nevada. September 2008. 36
Crafford, A. E J. 2007. Geologic Map of Nevada: U.S. Geological Survey Data Series 249. 37
Dohrenwend, J. C. and B. C. Moring. 1991. Reconnaissance Photogeologic Map of Young Faults in 38 the Winnemucca 1º by 2º Quadrangle, Nevada. U.S. Geological Survey Miscellaneous Field 39 Studies Map MF-2175, 1:250,000. 40

Deep South Expansion Project EIS Chapter 6.0 - References 6-9
Draft EIS 2018
Dohrenwend, J. C., B. A. Schell, C. M. Menges, B. C. Moring, and M. A. McKittrick. 1995. 1 Reconnaissance Photogeologic Map of Young (Quaternary and Late Tertiary) Faults in 2 Nevada. USGS Open-File Report 95-xxxl, 38:1 sheet at scale 1:1,000,000. In: Bureau of Land 3 Management (BLM). 2008a. Cortez Hills Expansion Project Final Impact Statement. Battle 4 Mountain District Office, Battle Mountain, Nevada. September 2008. 5
Foo, S. T., R. C. Hays, Jr., and J. K. McCormack. 1996. Geology and Mineralization of the South 6 Pipeline Gold Deposit, Lander County, Nevada. In: A. R. Coyner, and P. L. Fahey, editors. 7 Geology and Ore Deposits of the American Cordillera: Reno, Geological Society of Nevada 8 Symposium 1995 Proceedings, p. 95-109. In: Bureau of Land Management (BLM). 2008a. 9 Cortez Hills Expansion Project Final Impact Statement. Battle Mountain District Office, Battle 10 Mountain, Nevada. September 2008. 11
Garside, L. J., R. H. Hess, K. L. Fleming, and B. S. Weimer. 1988. Oil and Gas Developments in 12 Nevada. Nevada Bureau of Mines and Geology Bulletin 104. 8 pp. 13
Geomega. 2006. Cortez Hills Expansion Project Baseline Characterization Report. In: Bureau of Land 14 Management (BLM). 2008. Cortez Hills Expansion Project Final Impact Statement. Battle 15 Mountain District Office, Battle Mountain, Nevada. September 2008. 16
Heilweil, V. M. and L. E. Brooks, editors. 2011. Conceptual Model of the Great Basin Carbonate and 17 Alluvial Aquifer System: U.S. Geological Survey Scientific Investigations Report 2010-5193. 18 191 p. 19
Itasca Denver, Inc. (Itasca). 2016. Barrick Cortez Four-Basin (Carico Lake Valley, Crescent Valley, 20 Grass Valley, and Pine Valley) Groundwater Flow Model Report. January 2016. 21
McCormack, J. C. and R. C. Hays. 1996. Crescent Valley: A Model for Reconstruction of District 22 Mineralization in the Basin and Range. In: A. R. Coyner, and P. L. Fahey, editors. Geology 23 and Ore Deposits of the American Cordillera: Reno, Geological Society of Nevada 24 Symposium 1995 Proceedings, p. 635-646. In: Bureau of Land Management (BLM). 2008a. 25 Cortez Hills Expansion Project Final Impact Statement. Battle Mountain District Office, Battle 26 Mountain, Nevada. September 2008. 27
Muffler, L. J. P. 1964. Geology of the Frenchie Creek Quadrangle North-Central Nevada. U.S. 28 Geological Survey Bulletin 1179. 99 p. 29
Piteau Associates USA, Ltd. 2016a. Memorandum: Stability Analysis Results for the Post-Closure 30 Cortez Hills East Wall. March 22, 2016. 31
Piteau Associates USA, Ltd. 2016b. Memorandum: Slope Stability Assessment – Pipeline and CHOP 32 Waste Rock Facilities. February 2, 2016, revised May 6, 2016. 33
Poland, J. F. 1984. Guidebook to Studies of Land Subsidence Due to Ground-water Withdrawal. 34 Prepared for the International Hydrological Programme, Working Group 8.4. UNESCO Studies 35 and Reports in Hydrology. 36
Roberts, R. J., K. M. Montgomery, and R. E. Lehner. 1967. Geology and Mineral Resources of Eureka 37 County, Nevada. Prepared cooperatively by the United States Geological Survey. Nevada 38 Bureau of Mines and Geology Bulletin 64. 152 p. 39
Siskind. D. E., M. S. Stagg, J. W.Kopp, and C. H. Dowding. 1980. Structure Response and Damage 40 Produced by Ground Vibration from Surface Mine Blasting. Bureau of Mines. Report of 41 Investigations 8507. 42

Deep South Expansion Project EIS Chapter 6.0 - References 6-10
Draft EIS 2018
SRK Consulting, Inc. (SRK). 2017a. Deep South Expansion Project – Cumulative Effects, Subsidence 1 Report. Prepared for Barrick Cortez Inc. March 2017. 2
SRK Consulting, Inc. (SRK). 2017b. Deep South Expansion Project – Cumulative Effects, 3 Groundwater Flow Modeling Report. Prepared for Barrick Cortez Inc. March 2017. 4
SRK Consulting Inc. (SRK). 2016a. Technical Memorandum: Results of Land Subsidence Predictions 5 in Pipeline and Cortez/Cortez Hills Complexes for the Deep South Expansion Project. August 6 2016. 7
SRK Consulting, Inc. 2016b. Groundwater Flow Model Report Deep South Expansion Project 8 Crescent Valley, Nevada. Prepared for Barrick Cortez, Inc. August 2016. 9
SRK Consulting, Inc. (SRK). 2016c. Cortez Hills Underground Mine Closure Plan. Prepared for Barrick 10 Cortez, Inc. December 2016. 11
Stewart, J. H. 1980. Geology of Nevada: A Discussion to Accompany the Geologic Map of Nevada. 12 Prepared in cooperation with the United States Geological Survey. Nevada Bureau of Mines 13 and Geology Special Publication 4. 136 p. 14
Stewart, J. H. and E. H. McKee. 1977. Geology and Mineral Deposits of Lander County, Nevada, 15 Part 1, Geology. Prepared in cooperation with the United States Geological Survey. Nevada 16 Bureau of Mines and Geology Bulletin 88. 106 p. 17
U.S. Geological Survey (USGS). 2018. Earthquake Hazards Program – Search Earthquake Catalog. 18 Internet website: https://earthquake.usgs.gov/earthquakes/search/. Accessed June 4, 2018. 19
U.S. Geological Survey (USGS). 2017. Mineral Resources Data System (MRDS), Online spatial data 20 system accessed to review available geologic and mineral data online for the Gold Acres 21 (ID 10310461), Pipeline/South Pipeline (ID 10310340), and Cortez Mine (ID 10310410) 22 Deposits. Internet website: https://mrdata.usgs.gov/mrds/. Accessed August 10, 2017. 23
3.2 Water Resources and Geochemistry 24
Barrick Cortez Inc. (BCI). 2018. BCI water rights information provided by S. Shoen, BCI, to D. 25 Gregory, AECOM. April 4, 2018. 26
Barrick Cortez Inc. (BCI). 2017a. Integrated Monitoring Plan – 4th Quarter 2016. Prepared for Bureau 27 of Land Management, Battle Mountain Field Office. January 2017. 28
Barrick Cortez Inc. (BCI). 2017b. Water rights information and GIS files and updated water rights table 29 provided by S. Schoen, BCI, to D. Gregory, AECOM. January 26 and February 24, 2017. 30
Barrick Cortez Inc. (BCI). 2017c. Intergrated Monitoring Plan Reports extending from 1st Quarter 2011 31 through the 4th Quarter 2016 Report. 32
Barrick Cortez Inc. (BCI). 2016a. Barrick Cortez Inc. Water Pollution Control Permit NEV00931019 33 Renewal Application. September 2016. 34
Barrick Cortez Inc. (BCI). 2016b. Barrick Cortez Inc. (NVN-067575 (16-1A)) Deep South Expansion 35 Project Amendment to Plan of Operations and Reclamation Permit Application #0093, 36 Appendix 4. Submitted to BLM Mount Lewis Field Office, Battle Mountain, Nevada and 37 Nevada Division of Environmental Protection, Carson City, Nevada. October 2016. 38

Deep South Expansion Project EIS Chapter 6.0 - References 6-11
Draft EIS 2018
Barrick Cortez Inc. (BCI) and Stantec Consulting Services Inc. (Stantec). 2018. Technical 1 Memorandum Contingency Mitigation Plans for Surface Waters Deep South Expansion 2 Project Lander and Eureka Counties, Nevada. Stantec Project Number 203720412. March 27, 3 2018. 4
Barrick Nevada. 2017. 2015/2016 Cortez Rapid Infiltration Basin Investigations Summary. April 17, 5 2017. 6
Belcher, W. R., P. E. Elliot, and A. L. Geldon. 2001. Hydraulic-property Estimates for Use with a 7 Transient Ground-water Flow Model of the Death Valley Regional Groundwater Flow System, 8 Nevada and California Water-Resources Investigation Report 01-4210. 9
Berger, D. L. 2000a. Water Budgets for Pine Valley, Carico Lake Valley, and Upper Reese River 10 Valley Hydrographic Areas, Middle Humboldt River Basin, North-Central Nevada – Methods 11 for Estimation and Results. U.S. Geological Survey Water-Resources Investigations Report 12 99-4272. Prepared in cooperation with the Nevada Division of Water Resources. 13
Berger, D. L. 2000b. Water-Budget Estimates for the 14 Hydrographic Areas in the Middle Humboldt 14 River Basin, North-Central Nevada. U.S. Geological Survey Water-Resources Investigations 15 Report 00-4168. Prepared in cooperation with the Nevada Division of Water Resources. 16
Bureau of Land Management (BLM). 2011. Cortez Hills Expansion Project Final Supplemental Impact 17 Statement. Battle Mountain District Office, Battle Mountain, Nevada. January 2011. 18
Bureau of Land Management (BLM). 2008. Cortez Hills Expansion Project Final Impact Statement. 19 Battle Mountain District Office, Battle Mountain, Nevada. September 2008. 20
Bureau of Land Management (BLM). 2004. Pipeline/South Pipeline Pit Expansion Project Final 21 Supplemental Environmental Impact Statement. Battle Mountain Field Office, Battle Mountain, 22 Nevada. December 2004. 23
Bureau of Land Management (BLM). 2000. South Pipeline Project Final Environmental Impact 24 Statement. Battle Mountain District, Battle Mountain, Nevada. February 2000. 25
Bureau of Land Management (BLM). 1996. Cortez Pipeline Gold Deposit, Final Environmental Impact 26 Statement – Volume 1. U.S. Department of the Interior, Bureau of Land Management, Battle 27 Mountain District, Shoshone-Eureka Resource Area. January 1996. 28
Federal Emergency Management Agency (FEMA). 2017. FEMA Flood Map Service Center, 29 Floodzone Maps for Eureka and Lander Counties, Nevada, Unincorporated Areas. Eureka 30 County Panels 32011C0550D and 32011C0675D; Lander County Panels 32015C1100G, 31 32015C1250G, and 32015C1275G. Internet website: 32 https://msc.fema.gov/portal/advanceSearch#searchresultsanchor. Accessed January and 33 February 2017. 34
Fennemore, G. G., A. Davis, L Goss, and A. W. Warrick. 2001. A Rapid Screening-Level Method to 35 Optimize Location of Infiltration Ponds. Ground Water March-April 2003. pp 230-238. 36
Geomega Inc. 2017a. Memorandum: Kinetic Test Program Results for the Deep South Expansion 37 Project CHUE Project Through Week 116. February 15, 2017. 38
Geomega Inc. 2017b. Crescent-Grass-Pine Valley New RIB Material Characterization. Prepared for: 39 Barrick Cortez, Inc. May 8, 2017. 40

Deep South Expansion Project EIS Chapter 6.0 - References 6-12
Draft EIS 2018
Geomega Inc.2017c. Carico Valley / Rocky Pass Reservoir Material Characterization. November 10, 1 2017. 2
Geomega Inc. 2016a. Memorandum from A. Davis and M. Lengke, Geomega, to S. Schoen, 3 N. Atiemo, and M. Miller, Barrick, regarding: Cortez Deep South Expansion – Sub-3,800 ft 4 Groundwater Characterization. February 23, 2016. 5
Geomega Inc. 2016b. Cortez Deep South Expansion Pit Lake and Backfill Pore Water Chemistry. 6 Prepared for Barrick Cortez, Inc. September 15, 2016. 7
Geomega Inc. 2016c. Characterization, Reactivity and Tunnel Aqueous Geochemistry in the Deep 8 South Expansion, Cortez Underground Mine, Nevada. October 18, 2016. 9
Geomega Inc. 2016d. Deep South Expansion Project Waste Rock Management Plan. Prepared for 10 Barrick Cortez, Inc. August 1, 2016. In: Barrick Cortez Inc. (BCI). 2016c. Barrick Cortez Inc. 11 (NVN-067575 (16-1A)) Deep South Expansion Project Amendment to Plan of Operations and 12 Reclamation Permit Application #0093. Submitted to BLM Mount Lewis Field Office, Battle 13 Mountain, Nevada and Nevada Division of Environmental Protection, Carson City, Nevada. 14 Appendix 2. October 2016. 15
Geomega Inc. 2007. Cortez Hills Expansion Project Waste Rock Assessment. Report prepared for 16 Cortez Gold Mines. February 20, 2007. In: Bureau of Land Management (BLM). 2008. Cortez 17 Hills Expansion Project Final Impact Statement. Battle Mountain District Office, Battle 18 Mountain, Nevada. September 2008. 19
Geomega Inc. 2006. Cortez Hills Expansion Project Baseline Characterization Report. Prepared for 20 Cortez Gold Mines. September 12, 2006. In: Bureau of Land Management (BLM). 2008. 21 Cortez Hills Expansion Project Final Impact Statement. Battle Mountain District Office, Battle 22 Mountain, Nevada. September 2008. 23
Gilluly, J. and H. Masursky. 1965. Geology of the Cortez Quadrangle Nevada. U.S. Geological Survey 24 Bulletin 1175. 117 p. 25
Harrill, J. R. and D. E. Prudic. 1998. Aquifer Systems in the Great Basin Region of Nevada, Utah, and 26 Adjacent States – Summary Report. U.S. Geological Survey Professional Paper 1409-A. 27
HDR Engineering, Inc. (HDR). 2015. Goldrush Seep and Spring Monitoring Annual Report 28 2015 - Draft. Prepared for Barrick Gold of North America, Elko, Nevada. Eureka and Lander 29 Counties, Nevada. December 9, 2015. 30
Heggeness, J. O. 2014a. Supervisor, Water Quality Standards and Monitoring, Bureau of Water 31 Quality Planning, Nevada Division of Environmental Protection. Carson City, Nevada. Letter of 32 April 7, 2014, to Melissa Barbanell, Barrick Gold of North America, Inc., regarding Comments 33 of Barrick Goldstrike Mines, Inc. on the Draft Nevada 2012 Integrated Report 34
Heggeness, J. O. 2014b. Supervisor, Water Quality Standards and Monitoring, Bureau of Water 35 Quality Planning, Nevada Division of Environmental Protection. Carson City, Nevada. Letter of 36 April 7, 2014 to Tim Crowley, President, Nevada Mining Association, regarding Comments of 37 the Nevada Mining Association on the Draft Nevada 2012 Integrated Report 38
HydroGeoLogic, Inc. 2011. MODHMS/MODFLOW-SURFACT: A comprehensive MODFLOW-based 39 hydrologic modeling system, version 4.0 code documentation report. Reston, VA: 40 HydroGeoLogic Inc. 41

Deep South Expansion Project EIS Chapter 6.0 - References 6-13
Draft EIS 2018
HydroGeo Group (HGG). 2017a. Technical Memo from A. L. Mayo, HydroGeo Group, to S. Schoen, 1 Barrick, Re: Springs Investigation. August 23, 2017. 2
HydroGeo Group (HGG). 2017b. Technical Memo from A. L. Mayo, HydroGeo Group, to S. Schoen, 3 Barrick, Re: Isotopes Investigation. August 22, 2017. 4
Itasca Denver, Inc. (Itasca). 2016a. Barrick Cortez Four-Basin (Carico Lake Valley, Crescent Valley, 5 Grass Valley, and Pine Valley) Groundwater Flow Model Report. Prepared for Barrick Cortez, 6 Inc. January 2016. 7
Itasca Denver, Inc. (Itasca). 2016b. Barrick Cortez Inc. 2016 Integrated Monitoring Plan. Prepared for 8 Barrick Cortez, Inc. Crescent Valley, Nevada. April 2016. 9
JBR Environmental Consultants, Inc. (JBR). 2012. Recommended Monitoring Locations Report, 10 Goldrush Seep and Spring Project, Eureka County, Nevada. June. Elko, Nevada. In: HDR 11 Engineering, Inc. (2015). Goldrush Seep and Spring Monitoring Annual Report 2015 - Draft. 12 December 9, 2015. 13
JBR Environmental Consultants, Inc. (JBR) 2007. Cortez Gold Mines Pediment Project, Seep & Spring 14 Monitoring, Fall Quarter 2006. October 28, 2005. In: Bureau of Land Management (BLM). 15 2008. Cortez Hills Expansion Project Final Impact Statement. Battle Mountain District Office, 16 Battle Mountain, Nevada. September 2008. 17
Maurer, D. K., R. W. Plume, J. M. Thomas, and A. K. Johnson. 1996. Water Resources and Effects of 18 Changes in Ground-Water Use Along the Carlin Trend, North-Central Nevada. 19 U.S. Geological Survey Water-Resources Investigations Report 96-4134. 20
McDonald, M. G. and A. W. Harbaugh. 1988. A modular three-dimensional finite-difference ground-21 water flow model. In: Techniques of Water-Resources Investigations, Book 6. Washington, 22 D.C.: U.S. Geological Survey/U.S. Government Printing Office. Internet website: 23 http://pubs.usgs.gov/twri/index090905.html. 24
Muffler, L. J. P. 1964. Geology of the Frenchie Creek Quadrangle North-Central Nevada. Geological 25 Survey Bulletin 1179, 99 p. 26
Nevada Division of Environmental Protection (NDEP). 2018. Pit Lake Water Quality Characterization 27 Program NDEP Profile III. Internet website: 28 https://ndep.nv.gov/uploads/documents/PIT_LAKE_WATER_QUALITY_SAMPLING_PROGR29 AM.pdf. Accessed March 2018. 30
Nevada Division of Environmental Protection, Bureau of Mining Regulation and Reclamation (NDEP-31 BMRR). 2014. Waste Rock, Overburden, and Ore Evaluation. February 28, 2014. 32
Nevada Division of Environmental Protection, Bureau of Water Quality Planning (NDEP-BWQP). 2016. 33 Water Quality Standards and Monitoring Branch, access to NAC 445A WQ Standards. 34
Nevada Division of Water Resources (NDWR). 2018. Hydrographic Abstracts (Water Rights 35 Database) for Crescent Valley, Carico Lake Valley, and Pine Valley. Internet website: 36 http://water.nv.gov/hydrographicabstract.aspx. Accessed January 2, 2018. 37
Nevada Division of Water Resources (NDWR). 2017a. Designated Groundwater Basins of Nevada, 38 March 2017. Internet website: http://water.nv.gov/mapping/maps/designated_basinmap.pdf 39

Deep South Expansion Project EIS Chapter 6.0 - References 6-14
Draft EIS 2018
Nevada Division of Water Resources (NDWR). 2017b. Hydrographic Area Summaries for Crescent 1 Valley, Carico Lake Valley, Pine Valley, and Grass Valley. Internet website: 2 http://water.nv.gov/undergroundactive.aspx Accessed September 28, 2017. 3
Nevada State Legislature. 2016. Water Controls, Standards Applicable to all Surface Waters, Nevada 4 Administrative Code (NAC) Chapter 445A.221. Revised June 2016. Internet website: 5 www.leg.state.nv.us. Accessed December 28, 2016. 6
Plume, R. W. 1996. Hydrogeologic Framework of the Great Basin Region of Nevada, Utah, and 7 Adjacent States. U.S. Geological Survey Professional Paper 1409-B. 8
Resource Concepts Inc. 2018. Email from K. Sylvia, RCI, to S. Schoen, BCI, regarding reserved water 9 rights. April 24, 2018. 10
SRK Consulting, (U.S.) Inc. (SRK). 2017. Deep South Expansion Project – Cumulative Effects, 11 Groundwater Flow Modeling Report. Prepared for Barrick Cortez Inc. March 2017. 12
SRK Consulting, Inc. (SRK). 2016. Groundwater Flow Model Report, Deep South Expansion Project, 13 Crescent Valley, Nevada. Report prepared for Barrick Cortez, Inc. August 2016. 14
Stantec Consulting Services, Inc. (Stantec). 2015a. 2015 Waters of the U.S. Delineation Deep South 15 Expansion Project, Lander and Eureka Counties, Nevada. Prepared for Barrick Cortez, Inc., 16 Crescent Valley, Nevada. November 10, 2015. 17
Stantec Consulting Services Inc. 2015b. Seep and Spring Quarterly Monitoring 2015 Fourth Quarter 18 Barrick Cortez, Inc. Prepared for Barrick Cortez, Inc. November 16, 2015. 19
Stantec Consulting Services Inc. 2015c. 2015 Seep and Spring Baseline Survey Carico Valley Barrick 20 Cortez, Inc. Prepared for Barrick Cortez, Inc. December 17, 2015. 21
Stone, W. T., T. Leeds, R. C. Tunney, G. A. Cusack, and S. A. Skidmore. 1991. Hydrology of the 22 Carlin Trend, Northeastern Nevada – a preliminary report. Carlin, Nevada: Newmont Gold 23 Company. In: Bureau of Land Management (BLM). 2008. Cortez Hills Expansion Project Final 24 Impact Statement. Battle Mountain District Office, Battle Mountain, Nevada. September 2008. 25
Struhsacker, D. W. 1986. Geology and Mineralization of the Beowawe-White Canyon Area, Eureka 26 and Lander Counties, Nevada. In: J. V. Tingley and H. F. Bonham, Jr., editors. Precious-27 metal Mineralization in Hot Springs Systems, Nevada-California, Report 41. Nevada Bureau of 28 Mines and Geology, Reno, Nevada. 29
Tetra Tech. 2015. Cortez Pipeline/Pediment Surface Water Monitoring Annual Report – 2015. 30 Prepared for Barrick Cortez, Inc., Crescent Valley, Nevada. December 2015. Tetra Tech 31 Project No. 114-540368. Tetra Tech, Boise, Idaho. 32
TopoQuest. 2017. U.S. Geological Survey 15-minute or 7.5-minute topographic quadrangle images for 33 Nevada, including the following quadrangles: Carico Lake North, Cortez, Ferris Creek, Pete 34 Hanson Creek, Rocky Pass. Internet website: http://www.topoquest.com. Accessed 35 January 13, 2017. 36
U.S. Army Corps of Engineers. 2016. Jurisdictional determination letter for the Deep South Expansion 37 Project from J. Gipson, USACE, to M.Gili, Barrick Cortez Inc. SPK-2015-01039, February 10, 38 2016. 39

Deep South Expansion Project EIS Chapter 6.0 - References 6-15
Draft EIS 2018
U.S. Environmental Protection Agency (USEPA). 2016. Watershed Quality Assessment Report for 1 Nevada, Pine Watershed. Internet website: 2 https://iaspub.epa.gov/tmdl_waters10/attains_waterbody.control?p_list_id=NV04-HR-3 83_00&p_cycle=2012&p_state=NV&p_report_type=T. Pine Creek Internet website: 4 https://iaspub.epa.gov/tmdl_waters10/attains_watershed.control?p_huc=16040104&p_cycle=5 &p_report_type=T. Accessed December 28, 2016. 6
U.S. Environmental Protection Agency (USEPA). 1994. Technical Document: Acid Mine Drainage 7 Prediction. EPA530-R-94-036; NTIS PB94-201829. Office of Solid Waste, Special Waste 8 Branch. Washington, D.C. 9
U.S. Geological Survey (USGS). 2018. The Reston Groundwater Dating Laboratory: 3H/3He Dating 10 Background (Tritium). Internet website: https://water.usgs.gov/lab/3h3he/background/. 11 Accessed February 3, 2018. 12
U.S. Geological Survey (USGS). 2017. Monthly Mean Discharge, USGS Gaging Station 10322800 - 13 Pine Creek at Modarelli Mine Road near Hay Ranch, Nevada; and Available Data for USGS 14 gaging stations 10322500 - Humboldt River at Palisade, Nevada; and 10323425 - Humboldt 15 River at Old U.S. 40 Bridge at Dunphy, Nevada. USGS Water Data for the Nation, National 16 Water Information Service, Surface Water, Nevada. 17
U.S. Geological Survey (USGS). 2016. Monthly Mean Discharge, USGS Gaging Station 18 10322505 - Horse Creek at Horse Creek Canyon near Garden Gate Pass, Nevada. USGS 19 Water Data for the Nation, National Water Information Service. 20
Water Management Consultants, Inc. 1992. Pipeline Gold Project, Preliminary Assessment of the 21 Impact of Mining on Regional Water Resources. Denver, Colorado. In: Bureau of Land 22 Management (BLM). 2008. Cortez Hills Expansion Project Final Impact Statement. Battle 23 Mountain District Office, Battle Mountain, Nevada. September 2008. 24
Western Regional Climate Center (WRCC). 2018. Average Annual Precipitation Nevada. Internet 25 website: wrcc.dri.edu/htmlfiles/nv/vn.ppt.html. Accessed January 4, 2018. 26
Winograd, I. J. and W. Thordarson. 1975. Hydrogeologic and Hydrochemical Framework, South-27 central Great Basin, Nevada-California, with Special Reference to the Nevada Test Site. 28 Geological Survey Professional Paper 712-C. Prepared on behalf of the U.S. Atomic Energy 29 Commission. 30
Zones, C. P. 1961. Groundwater Potentialities in the Crescent Valley, Eureka and Lander Counties, 31 Nevada. U.S. Geological Survey Water-Supply Paper 1581. 32
3.3 Soils and Reclamation 33
Bureau of Land Management (BLM). 2015. Environmental Assessment Barrick Cortez Inc. (NVN-34 067575 [14-1A]) Amendment 3 to Plan of Operations and Reclamation Permit Application. 35 Battle Mountain District Office, Mount Lewis Field Office, Battle Mountain, Nevada. July 2015. 36
Bureau of Land Management (BLM). 2008. Cortez Hills Expansion Project Final Impact Statement. 37 Battle Mountain District Office, Battle Mountain, Nevada. September 2008. 38
Bureau of Land Management (BLM). 2004. Pipeline/South Pipeline Pit Expansion Project Final 39 Supplemental Environmental Impact Statement. Battle Mountain Field Office, Battle Mountain, 40 Nevada. December 2004. 41

Deep South Expansion Project EIS Chapter 6.0 - References 6-16
Draft EIS 2018
Bureau of Land Management (BLM). 2000. South Pipeline Project Final Environmental Impact 1 Statement. Battle Mountain District, Battle Mountain, Nevada. February 2000. 2
Bureau of Land Management (BLM). 1996. Cortez Pipeline Gold Deposit, Final Environmental Impact 3 Statement – Volume 1. U.S. Department of the Interior, Bureau of Land Management, Battle 4 Mountain District, Shoshone – Eureka Resource Area. January 1996. 5
Environmental Resource Management (ERM). 2016. Baseline Biological Report for the Deep South 6 Project. July 2016. 7
Natural Resources Conservation Service (NRCS). 2017. Geospatial Data Gateway, Soil Survey for 8 Lander and Eureka Counties, Nevada. U.S. Department of Agriculture. Internet website: 9 http://datagateway.nrcs.usda.gov/ . Accessed April 19, 2017. 10
U.S. Department of Agriculture, Natural Resources Conservation Service. 2006. Land Resource 11 Regions and Major Land Resource Areas of the United States, the Caribbean, and the Pacific 12 Basin. U.S. Department of Agriculture Handbook 296. 13
3.4 Vegetation 14
Barrick Cortez Inc. (BCI). 2017. 2016 noxious weed monitoring/treatment results provided by 15 S. Schoen, BCI, to D. Gregory, AECOM,. January 9, 2017. 16
Bureau of Land Management (BLM). 2015. Environmental Assessment Barrick Cortez Inc. 17 (NVN-067575 [14-1A]) Amendment 3 to Plan of Operations and Reclamation Permit 18 Application. Battle Mountain District Office, Mount Lewis Field Office, Battle Mountain, 19 Nevada. July 2015. 20
Bureau of Land Management (BLM). 2008. Cortez Hills Expansion Project Final Environmental Impact 21 Statement. Battle Mountain District Office, Battle Mountain, Nevada. September 2008. 22
Bureau of Land Management (BLM). 2004. Pipeline/South Pipeline Pit Expansion Project Final 23 Supplemental Environmental Impact Statement. Battle Mountain Field Office, Battle Mountain, 24 Nevada. December 2004. 25
Bureau of Land Management (BLM). 2000. South Pipeline Project Final Environmental Impact 26 Statement. Battle Mountain District, Battle Mountain, Nevada. February 2000. 27
Bureau of Land Management (BLM). 1996. Cortez Pipeline Gold Deposit, Final Environmental Impact 28 Statement – Volume 1. U.S. Department of the Interior, Bureau of Land Management, Battle 29 Mountain District, Shoshone – Eureka Resource Area. January 1996. 30
Bureau of Land Management (BLM). 1992. BLM Manual 9015 – Integrated Weed Management. In: 31 Bureau of Land Management (BLM). 2015. Environmental Assessment Barrick Cortez Inc. 32 (NVN-067575 [14-1A]) Amendment 3 to Plan of Operations and Reclamation Permit 33 Application. Battle Mountain District Office, Mount Lewis Field Office, Battle Mountain, 34 Nevada. July 2015. 35
Environmental Resource Management (ERM). 2016. Baseline Biological Report for the Deep South 36 Project. Prepared for Barrick Cortez, Inc. July 2016. 37
JBR Environmental Consultants, Inc. (JBR). 2005. Cortez Hills/Pediment Baseline Study. Cortez Gold 38 Mines, Crescent Valley, Nevada. December 2005. In: Bureau of Land Management (BLM). 39

Deep South Expansion Project EIS Chapter 6.0 - References 6-17
Draft EIS 2018
2008. Cortez Hills Expansion Project Final Environmental Impact Statement. Battle Mountain 1 District Office, Battle Mountain, Nevada. September 2008. 2
JBR Environmental Consultants, Inc. (JBR). 2002. Field Survey Results for Lomatium dissectum 3 Cortez Mountains Eureka County, Nevada. Prepared for Cortez Gold Mine, Crescent Valley, 4 Nevada. August 8, 2002. In: Bureau of Land Management (BLM). 2008. Cortez Hills 5 Expansion Project Final Impact Statement. Battle Mountain District Office, Battle Mountain, 6 Nevada. September 2008. 7
JBR Environmental Consultants, Inc. (JBR). 2000. Vegetation Baseline Survey, Pediment Study Area. 8 Cortez Gold Mines, Lander County, Nevada. August 2000. In: Bureau of Land Management 9 (BLM). 2008. Cortez Hills Expansion Project Final Impact Statement. Battle Mountain District 10 Office, Battle Mountain, Nevada. September 2008. 11
Natural Resources Conservation Services (NRCS). 2017. Ecological Site Description, Section I: 12 Ecological Site Characteristics. Internet website: https://esis.sc.egov.usda.gov/Default.aspx. 13 Accessed August 9, 2017. 14
Nevada Department of Agriculture (NDA). 2017. Nevada Noxious Weed List. Internet website: 15 http://agri.nv.gov/Plant/Noxious_Weeds/Noxious_Weed_List/. Accessed October 3, 2017. 16
Nevada Department of Agriculture (NDA). 2007. Chapter 555 – Control of Insects, Pests and 17 Noxious Weeds. Internet website: http://www.leg.state.nv.us/NRS/NRS-555.html. Accessed 18 May 5, 2017. 19
Nevada Natural Heritage Program (NNHP). 2017. Personal communication between E. Miskow 20 (NNHP) and A. Gilboy (AECOM) regarding data request for the Barrick Deep South Expansion 21 Project EIS. 22
Nevada Natural Heritage Program (NNHP). 2016. Personnal communication between E. Miskow, 23 NNHP, and P. Hunter, Environmental Resource Management, regarding special status 24 species occurrence for the Deep South Project. In: Environmental Resource Management 25 (ERM). 2016. Baseline Biological Report for the Deep South Project. Appendix A. July 2016. 26
SRK Consulting, Inc. (SRK). 2014. Barrick Cortez Inc. Noxious Weed Management Plan. Prepared for 27 Barrick Cortez Inc. July 2014. 28
Stantec. 2015. 2015. Waters of the U.S. Delineation Deep South Expansion Project Lander and 29 Eureka Counties, Nevada. Prepared for Barrick Cortez, Inc. November 10, 2015. 30
U.S Fish and Wildlife Service (USFWS). 2017. Information for Planning and Conservation (IPaC). List 31 of threatened and endangered species that may occur in your proposed project location, 32 and/or may be affected by your proposed project. Consultation Code: 08ENVD00-2017-SLI-33 0131. Letter dated January 5, 2017. 34
U.S. Geological Survey (USGS). 2011. Gap Analysis Program, National Land Cover, Version 2. May 35 2011. Internet website: https://gapanalysis.usgs.gov/gaplandcover/data/. Accessed June 36 2017. 37
West, A.G. 2006. The Influence of Seasonal Precipitation Patterns on Transpiration in Piñon-Juniper 38 Woodlands. Ph.D. Thesis. Department of Biology, University of Utah, Salt Lake City, 198 p. 39
3.5 Wildlife and Aquatic Biological Resources 40

Deep South Expansion Project EIS Chapter 6.0 - References 6-18
Draft EIS 2018
Adams, R. A. 2003. Bats of the Rocky Mountain West. Natural History, Ecology, and Conservation. 1 University Press of Colorado. 2
Altenbach, J. S., W. Amy, P. V. Bradley, P. E. Brown, K. Dewberry, D. B. Hall, J. Jeffers, B. Lund, 3 J. E. Newmark, M. J. O’Farrell, M. Rahn, R. E. Sherwin, C. R. Tomlinson, and J. A. Williams. 4 2002. Nevada Bat Conservation Plan, Nevada Bat Working Group. Austin, Nevada. 188 pp. 5
American Ornithologists' Union (AOU). 1998. Check-list of North American Birds, 7th edition. 6 American Ornithologists’ Union, Washington, D.C. 7
ARCADIS. 2014a. Baseline Biological Resources Report for Barrick Cortez Inc. May 2014. 8
ARCADIS. 2014b. Horse Canyon/Cortez Unified Exploration Project II – Bat Survey Report. October. 9 In: Environmental Resources Management (ERM). 2016. Baseline Biological Report for the 10 Deep South Project. Prepared for Barrick Cortez, Inc., July 2016. 11
Arizona Game and Fish Department (AGFD). 1993. Bats of Arizona. Arizona Wildlife Views, 12 Volume 36, No. 8. August 1993. 13
Avian Power Line Interaction Committee (APLIC). 2012. Reducing Avian Collisions with Power Lines: 14 The State of the Art in 2012. Edison Electric Institute. Washington, D.C. December 2012. 15
Avian Power Line Interaction Committee (APLIC). 2006. Suggested Practices for Avian Protection on 16 Power Lines: The State of the Art in 2006. Edison Electric Institute. 17
Avian Power Line Interaction Committee (APLIC) and U.S. Fish and Wildlife Service (USFWS). 2005. 18 Avian Protection Plan Guidelines. April 2005. 19
Barrick Cortez Inc. (BCI). 2018. Email transmittal of GIS files for reclaimed areas to date from S. 20 Schoen, BCI, to D. Gregory, AECOM. June 26, 2018. 21
Barrick Gold of North America (Barrick). 2018. Bank Enabling Agreement 2017 Annual Report. 22 February 2018. 23
Blickley, J. L., D. Blackwood, and G. L. Patricelli. 2012. Experimental Evidence for the Effects of 24 Chronic Anthropogenic Noise on Abundance of Greater Sage-grouse at Leks. Conservation 25 Biology 26:461–471. 26
Bradley, P. V., M. J. O’Farrell, J. A. Williams, and J. E. Newmark. Editors. 2006. The Revised Nevada 27 Bat Conservation Plan. Nevada Bat Working Group. Reno, Nevada. 216 pp. 28
Braun, C. E., M. F. Baker, R. L. Eng, J. W. Gashwiler, and M. H. Schroeder. 1976. Conservation 29 Committee Report on Effects of Alternation of Sagebrush Communities on the Associated 30 Avifauna. Wilson Bulletin 88(1):165-171. 31
Bureau of Land Management (BLM). 2015a. Nevada and Northeastern California Greater Sage-32 Grouse Proposed Land Use Plan Amendment and Final Environmental Impact Statement. 33 Volume II: Chapters 3 and 4. U.S. Department of the Interior, Bureau of Land Management, 34 U.S. Department of Agriculture Forest Service. June 2015. 240 pp. 35
Bureau of Land Management (BLM). 2015b. Nevada and Northeastern California Greater 36 Sage-Grouse Approved Resource Management Plan Amendment. Attachment 2 from the 37 USDI 2015 Record of Decision and Approved Resource Management Plan Amendments for 38 the Great Basin Region including the Greater Sage-Grouse Sub-Regions of: Idaho and 39

Deep South Expansion Project EIS Chapter 6.0 - References 6-19
Draft EIS 2018
Southwestern Montana, Nevada and Northeastern California, Oregon, and Utah. 1 U.S. Department of the Interior, Bureau of Land Management Nevada State Office. 2 September 2015. 104 pp. 3
Bureau of Land Management (BLM). 2011. Updated Bureau of Land Management (BLM) Sensitive 4 Species List for Nevada. Instructional Memorandum NV-2011-059. 5
Bureau of Land Management (BLM). 2008. Cortez Hills Expansion Project Final Environmental Impact 6 Statement. Battle Mountain District Office, Battle Mountain, Nevada. September 2008. 7
Bureau of Land Management (BLM). 2004. Pipeline/South Pipeline Pit Expansion Project Final 8 Supplemental Environmental Impact Statement. NVN-067575(01-1A); NV063-EIS01-70. 9 Battle Mountain Field Office, Battle Mountain, Nevada. December 2004. 10
Bureau of Land Management (BLM). 2002. Phoenix Project Final Environmental Impact Statement. 11 Battle Mountain Field Office, Battle Mountain, Nevada. January 2002. In: Bureau of Land 12 Management (BLM). 2008. Cortez Hills Expansion Project Final Impact Statement. Battle 13 Mountain District Office, Battle Mountain, Nevada. September 2008. 14
Bureau of Land Management (BLM). 2001. Environmental Assessment, Cortez Gold Mines, Inc. Horse 15 Canyon/Cortez Unified Exploration Project. Battle Mountain Field Office, Battle Mountain, 16 Nevada. August 2001. In: Bureau of Land Management (BLM). 2008. Cortez Hills Expansion 17 Project Final Impact Statement. Battle Mountain District Office, Battle Mountain, Nevada. 18 September 2008. 19
Bureau of Land Management (BLM). 2000. South Pipeline Project Final Environmental Impact 20 Statement. NV64-93-001P(96-2A); NV063-EIS98-014. Battle Mountain Field Office, Battle 21 Mountain, Nevada. February 2000. 22
Bureau of Land Management (BLM). 1996. Cortez Pipeline Gold Deposit, Final Environmental Impact 23 Statement - Volume 1. U.S. Department of the Interior, Bureau of Land Management, Battle 24 Mountain District, Shoshone - Eureka Resource Area. January 1996. 25
Bureau of Land Management (BLM). 1992. Cortez Gold Mine Expansion Project Draft Environmental 26 Impact Statement. U.S. Department of the Interior, Bureau of Land Management, Battle 27 Mountain District, Battle Mountain, Nevada. December 1992. 28
Bureau of Land Management (BLM), U.S. Fish and Wildlife Service (USFWS), and Barrick Gold of 29 North America (Barrick). 2016. First Amendment to the Barrick Nevada Sage-Grouse Bank 30 Enabling Agreement. April 27, 2016. 4 pp. 31
Bureau of Land Management (BLM), U.S. Fish and Wildlife Service (USFWS), and Barrick Gold of 32 North America (Barrick). 2015. Barrick Nevada Sage-Grouse Bank Enabling Agreement. 33 March 25, 2015. 34
Connelly, J. W., E. T. Rinkes, and C. E. Braun. 2011. Characteristics of Greater Sage-grouse Habitats: 35 A Landscape Species at Micro- and Macroscales. Pages 69-83 In: S. T. Knick and 36 J. W. Connelly (editors). Greater Sage-Grouse: Ecology of a Landscape Species and its 37 Habitats. Cooper Ornithological Union, University of California Press, Berkeley. 38
Connelly, J. W., S. T. Knick, M. A. Schroeder, and S. J. Stiver. 2004. Conservation Assessment of 39 Greater Sage-grouse and Sagebrush Habitats. Western Association of Fish and Wildlife 40 Agencies. Unpublished Report. Cheyenne, Wyoming. 41

Deep South Expansion Project EIS Chapter 6.0 - References 6-20
Draft EIS 2018
Connelly, J. W., M. A. Schroeder, A. R. Sands, and C. E. Braun. 2000a. Guidelines to Manage Sage 1 Grouse Populations and their Habitats. Wildlife Society Bulletin 28(4):967-985. 2
Connelly, J. W., A. D. Apa, R. B. Smith, and K. P. Reese. 2000b. Effects of Predation and Hunting on 3 Adult Sage Grouse (Centrocercus urophasianus) in Idaho. Wildlife Biology 6(4):227-232. 4
Dewson, Z. S., A. B. W. James, and R. G. Death. 2007. A Review of the Consequences of Decreased 5 Flow for Instream Habitat and Macroinvertebrates. Journal of North American Benthological 6 Society 26(3):401-415. 7
Environmental Resources Management (ERM). 2016a. Baseline Biological Report for the Deep South 8 Project. Prepared for Barrick Cortez, Inc., July 2016. 9
Environmental Resources Management (ERM). 2016b. Greater Sage-grouse Baseline Report for the 10 Deep South Expansion Project. August 2016. 82 pp. 11
Environmental Resources Management (ERM). 2015. Carico Valley Spring Snail Sampling Report. 12 Prepared for Barrick Cortez Inc. October 2015. 13
Erman, N. A. 2002. Lessons from a Long-term Study of Springs and Spring Invertebrates (Sierra 14 Nevada, California, U.S.A) and Implications for Conservation and Management. Conference 15 Proceedings. Spring-fed Wetlands: Important Scientific and Cultural Resources of the 16 Intermountain Region, 2002. 17
Geomega. 2016. Cortez Deep South Expansion Pit Lake and Backfill Pore Water Chemistry. Prepared 18 for Barrick Cortez, Inc. September 15, 2016. 19
Great Basin Bird Observatory (GBBO). 2010. Nevada Comprehensive Bird Conservation Plan, 20 ver. 1.0. Great Basin Bird Observatory, Reno, NV. Internet website: 21 http://www.gbbodata.org/pdf/bcp/NV_Bird_Conservation_Plan_ver1.0_Dec2010.pdf. 22 Accessed September 9, 2017. 23
Great Basin Ecology, Inc. (GBE). 2015. Cortez Mines 2015 Raptor Survey. September 2015. 24 Appendix E In: Environmental Resources Management (ERM). 2016. Baseline Biological 25 Report for the Deep South Project. July 2016. 26
Grindal, S. D., J. L. Morissette, and R. M. Brigham. 1999. Concentration of Bat Activity in Riparian 27 Habitats Over an Elevational Gradient. Canadian Journal of Zoology 77:972-977. 28
Hagen, C. A. 2011. Greater Sage-Grouse Conservation Assessment and Strategy for Oregon: A Plan 29 to Maintain and Enhance Populations and Habitat. Oregon Department of Fish and Wildlife, 30 Bend, Oregon. April 22, 2011. 207 pp. 31
Hall, D. B. 2000. Bat Monitoring on the Nevada Test Site in South-central Nevada. Transactions of the 32 Western Section of the Wildlife Society 36:8-14. In: Bureau of Land Management (BLM). 33 2008. Cortez Hills Expansion Project Final Environmental Impact Statement. Battle Mountain 34 District Office, Battle Mountain, Nevada. September 2008. 35
Harvey, M. J., J. S. Altenbach, and T. L. Best. 1999. Bats of the United States. Arkansas Game & Fish 36 Commission, Little Rock, Arkansas. 37
HDR Engineering, Inc. (HDR). 2015. Goldrush Seep and Spring Monitoring Annual Report 38 2015 - Draft. Prepared for Barrick Gold of North America, Elko, Nevada. Eureka and Lander 39 Counties, Nevada. December 9, 2015. 40

Deep South Expansion Project EIS Chapter 6.0 - References 6-21
Draft EIS 2018
Herron, G. B., C. A. Mortimore, and M. S. Rawlings. 1985. Nevada Raptors - Their Biology and 1 Management. Biological Bulletin No. 8. Nevada Department of Wildlife. 114 pp. 2
JBR Environmental Consultants, Inc. (JBR). 2007. Letter Regarding Clarification of Threatened, 3 Endangered, Sensitive, and Candidate Species for the Cortez Hills Pediment Baseline Area, 4 April 19, 2007. In: Bureau of Land Management (BLM). 2008. Cortez Hills Expansion Project 5 Final Environmental Impact Statement. Battle Mountain District Office, Battle Mountain, 6 Nevada. September 2008. 7
JBR Environmental Consultants, Inc. (JBR). 2005. Cortez Hills/Pediment Baseline Study. Cortez Gold 8 Mines, Crescent Valley, Nevada. December 2005. In: Bureau of Land Management (BLM). 9 2008. Cortez Hills Expansion Project Final Environmental Impact Statement. Battle Mountain 10 District Office, Battle Mountain, Nevada. September 2008. 11
JBR Environmental Consultants, Inc. (JBR). 2004. Cortez Gold Mines Pediment Bat Survey Southern 12 Cortez Range Lander County, Nevada. November 22, 2004. In: Bureau of Land Management 13 (BLM). 2008. Cortez Hills Expansion Project Final Environmental Impact Statement. Battle 14 Mountain District Office, Battle Mountain, Nevada. September 2008. 15
JBR Environmental Consultants, Inc. (JBR). 2000. Wildlife Baseline Survey Pediment Study 16 Area - Cortez Gold Mines. Lander County, Nevada. Prepared for Cortez Gold Mines. JBR 17 Report Number 272 FINAL, JBR Project Number Cortez-24. August 2000. In: Bureau of Land 18 Management (BLM). 2008. Cortez Hills Expansion Project Final Environmental Impact 19 Statement. Battle Mountain District Office, Battle Mountain, Nevada. September 2008. 20
Lamp, R. 2005. Biologist III – Nevada Department of Wildlife. Written correspondence to C. Johnson, 21 ENSR. November 2005. 22
Lyon, A. G. and S. H. Anderson. 2003. Potential Gas Development Impacts on Sage Grouse Nest 23 Initiation and Movement. Wildlife Society Bulletin 31(2):486-491. 24
Merritt, R. W. and K. W. Cummins, Editors. 1988. An Introduction to the Aquatic Insects of North 25 America. Second Edition, Kendall/Hunt Publishing Company, 722 pp. 26
Miller, R. F., S. T. Knick, D. A. Pyke, C. W. Meinke, S. E. Hanser, M. J. Wisdom, and A. L. Hild. 2011. 27 Characteristics of Sagebrush Habitats and Limitations to Long-term Conservation. 28 Pages 145-184 In: Greater Sage-Grouse: Ecology and Conservation of a Landscape Species 29 and its Habitats. S. T. Knick and J. W. Connelly (editors). Studies in Avian Biology No. 38. 30 Cooper Ornithological Union, University of California Press, Berkeley. 31
Nevada Administrative Code (NAC). 2016. Chapter 503. Hunting, Fishing and Trapping, 32 Miscellaneous Protection Measures. Revised December 2, 2016. Internet website: 33 https://www.leg.state.nv.us/nac/nac-503.html. Accessed September 12, 2017. 34
Nevada Division of Environmental Protection (NDEP). 2013. Pit Lake Water Quality Characterization 35 Program NDEP Profile III. Reno, NV. In: Geomega. 2016c. Cortez Deep South Expansion Pit 36 Lake and Backfill Pore Water Chemistry. Prepared for Barrick Cortez, Inc. September 37 15, 2016. 38
Nevada Department of Wildlife (NDOW). 2018a. Nevada Department of Wildlife 2017-2018 Big Game 39 Status. 40

Deep South Expansion Project EIS Chapter 6.0 - References 6-22
Draft EIS 2018
Nevada Department of Wildlife (NDOW). 2018b. Email transmittal of GIS files with mule deer and 1 pronghorn collar data and greater sage-grouse lek locations from L. Lesmeister, NDOW, to P. 2 Lorenz, AECOM. June 27, 2018. 3
Nevada Department of Wildlife (NDOW). 2018c. Lek Attendance Data. Cortez_Shoshone_ 4 PUM_LekData_1998-2018. Reno, Nevada. 5
Nevada Department of Wildlife (NDOW). 2018d. Email transmittal of 2015 greater sage-grouse 6 population estimates from S. Espinosa, NDOW, to P. Lorenz, AECOM. July 12, 2018. 7
Nevada Department of Wildlife (NDOW). 2017a. NDOW GIS Data Clearinghouse, Mule Deer 8 Distribution. Internet website: http://gis.ndow.nv.gov/ndowdata/. Data updated 2014. Accessed 9 July 9, 2017. 10
Nevada Department of Wildlife (NDOW). 2017b. NDOW GIS Data Clearinghouse, Pronghorn 11 Distribution. Internet website: http://gis.ndow.nv.gov/ndowdata/. Data updated 2010. Accessed 12 July 9, 2017. 13
Nevada Department of Wildlife (NDOW). 2017c. Barrick Cortez Deep South Expansion Project EIS – 14 Lek Counts and Sage-grouse Leks Data. Letter from NDOW to Spencer Martin of AECOM 15 responding to request for greater sage-grouse lek data within 5 miles of the project 16 disturbance area. January 23, 2017. 17
Nevada Department of Wildlife (NDOW). 2017d. Conservation Agreement for Springsnails in Nevada 18 and Utah. December 21, 2017. 19
Nevada Department of Wildlife (NDOW). 2016a. Nevada Game Management Units. Projection: UTM 20 Zone 11 North, NAD83. October 20, 2016. 21
Nevada Department of Wildlife (NDOW). 2016b. Letter Response Regarding Occurrence of Wildlife 22 Resources in the Vicinity of the Barrick Deep South Expansion Project. December 27, 2016. 23
Nevada Department of Wildlife (NDOW). 2014. Nevada Department of Wildlife. 2013-2014 Big Game 24 Status. 25
Nevada Department of Wildlife (NDOW). 2013. Nevada Occupied Mountain Quail Distribution (2013). 26
Nevada Department of Wildlife (NDOW). 2005. Wildlife Scoping, Cortez Hills Expansion Project, 27 Placer Dome U.S., Inc. – BLM. Letter to C. Johnson, ENSR. November 28, 2005. In: Bureau 28 of Land Management (BLM). 2008. Cortez Hills Expansion Project Final Environmental Impact 29 Statement. Battle Mountain District Office, Battle Mountain, Nevada. September 2008. 30
Nevada Natural Heritage Program (NNHP). 2017. NNHP Sensitive Species Data Response and 31 Shapefiles from E. S, Miskow (NNHP) to A. Gilboy (AECOM). January 11, 2017. 32
Nevada Natural Heritage Program (NNHP). 2016. Personnal communication between E. Miskow 33 (NNHP) and P. Hunter (ERM) regarding special status species occurrence for the Deep South 34 Project. In: Environmental Resource Management (ERM). 2016. Baseline Biological Report 35 for the Deep South Project. Appendix A. Prepared for Barrick Cortez, Inc. July 2016. 36
Nevada Partners in Flight. 1999. Nevada Partners in Flight Bird Conservation Plan. Edited by Larry 37 Neel. November 29, 1999. In: Bureau of Land Management (BLM). 2008. Cortez Hills 38 Expansion Project Final Environmental Impact Statement. Battle Mountain District Office, 39 Battle Mountain, Nevada. September 2008. 40

Deep South Expansion Project EIS Chapter 6.0 - References 6-23
Draft EIS 2018
Nevada Administrative Code (NAC). 2016. Nevada Administrative Code Chapter503. Hunting, Fishing 1 and Trapping, Miscellaneous Protective Measures. Revised December 2, 2016. Internet 2 website: https://www.leg.state.nv.us/nac/nac-503.html. Accessed September 12, 2017. 3
O’Farrell, M. J. and A. R. Blaustein. 1974. Microdipodops megacephalus. Mammalian Species 46:1-3. 4 Published by The American Society of Mammalogists. 5
Patterson, R. L. 1952. The Sage Grouse in Wyoming. Wyoming Game and Fish Commission. Sage 6 Books Inc. Denver, Colorado. 7
Poff, N. L. and J. K. H. Zimmerman. 2010. Ecological Responses to Altered Flow Regimes: A 8 Literature Review to Inform the Science and Management of Environmental Flows. 9 Freshwater Biology 55:194-205. 10
Provencher, L, K. Badik, T. Anderson, L. Munn, and M. Cameron. 2017. Sage‐Grouse Conservation 11 Forecasting for Barrick’s Bank Study Area and Deep South Expansion Projects Plan of 12 Operations Study Area. Report by The Nature Conservancy in Nevada to Barrick Gold Corp., 13 Elko, Nevada, Version 1.0. The Nature Conservancy, Reno, Nevada. 14
Schmidt, S. L. 1999. Activity Patterns of California Leaf-nosed and Other Bats at Wildlife Water 15 Developments in the Sonoran Desert. Thesis submitted to the School of Renewable Natural 16 Resources, University of Arizona, Tucson, Arizona. 119 pp. In: Bureau of Land Management 17 (BLM). 2008. Cortez Hills Expansion Project Final Environmental Impact Statement. Battle 18 Mountain District Office, Battle Mountain, Nevada. September 2008. 19
Schroeder, M. A., J. R. Young, and C. E. Braun. 1999. Greater Sage-Grouse (Centrocercus 20 urophasianus), Birds of North America Online. Internet website: https://birdsna.org/Species-21 Account/bna/species/saggro. Accessed September 18 2017. 22
South Central Planning Team. 2004. The South Central Nevada Sage Grouse Conservation Plan. 23 Draft 4.5. May 2004. 24
Stantec. 2015. Waters of the U.S. Delineation Deep South Expansion Project Lander and Eureka 25 Counties, Nevada. Prepared for Barrick Cortez, Inc. November 10, 2015. 26
Studier, E. H., J. W. Procter, and D. J. Howell. 1970. Diurnal Body Weight Loss and Tolerance of 27 Weight Loss in Five Species of Myotis. Journal of Mammalogy 51(2):302-309. 28
Tack, J. D. 2009. Sage Grouse and the Human Footprint: Implications for Conservation of Small and 29 Declining Populations. Theses, Dissertations, Professional Papers. Paper 856. 30
Terres, J. K. 1991. The Audubon Society Encyclopedia of North American Birds. New York. 1,109 pp. 31
Thompson, T. R. 2006. Dispersal Ecology of Greater Sage-Grouse in Northwestern Colorado: 32 Evidence from Genetic and Demographic Data: 2006 Annual Progress Report (March through 33 December 2006). 34
U.S. Fish and Wildlife Service (USFWS). 2017. Information for Planning and Conservation (IPaC). List 35 of threatened and endangered species that may occur in proposed project location, and/or 36 may be affected by proposed project. Consultation Code: 08ENVD00-2017-SLI-0131. Letter 37 dated January 5, 2017. 38
U.S. Fish and Wildlife Service (USFWS). 2015a. Greater Sage-Grouse: 2015 Not Warranted Finding 39 Under the Endangered Species Act. Region 6, Mountain Prairie Region. Internet website: 40

Deep South Expansion Project EIS Chapter 6.0 - References 6-24
Draft EIS 2018
https://www.fws.gov/greaterSageGrouse/PDFs/GrSG_Finding_FINAL.pdf. Accessed 1 April 24, 2017. 2
U.S. Fish and Wildlife Service (USFWS). 2015b. Northern Leopard Frog (Rana pipiens).USFWS, 3 Pacific Southwest Region. Internet website: 4 https://www.fws.gov/nevada/nv_species/nleopard_frog.html. Accessed July 31, 2017. 5
U.S. Fish and Wildlife Service (USFWS). 2014. Lahontan Cutthroat Trout (Oncorhynchus clarkia 6 henshawi).USFWS, Pacific Southwest Region. Internet website: 7 https://www.fws.gov/nevada/protected_species/fish/species/lct.html. Accessed July 31, 2017. 8
U.S. Fish and Wildlife Service (USFWS). 2013. Greater Sage-Grouse (Centrocercus urophasianus) 9 Conservation Objectives: Final Report. February 2013. 10
U.S. Fish and Wildlife Service (USFWS). 2008. Birds of Conservation Concern 2008. United States 11 Department of the Interior, Fish and Wildlife Service, Division of Migratory Bird Management, 12 Arlington, Virginia. 85 pp. Internet website: http://www.fws.gov/migratorybirds. Accessed 13 April 27, 2017. 14
U.S. Fish and Wildlife Service (USFWS). 2006. Written correspondence from R. D. Williams, USFWS 15 Field Supervisor, to C. Johnson, ENSR. File No. 1-5-06-SP-042. January 2006. In: Bureau of 16 Land Management (BLM). 2008. Cortez Hills Expansion Project Final Environmental Impact 17 Statement. Battle Mountain District Office, Battle Mountain, Nevada. September 2008. 18
U.S. Fish and Wildlife Service (USFWS). 1986. Recovery Plan for the Pacific Bald Eagle. U. S. Fish 19 and Wildlife Service, Portland, Oregon. 160 pp. 20
U.S. Geological Survey (USGS). 2017. Shapefile for 2015 Nevada-California Approved Resource 21 Management Plan Greater Sage-grouse Habitat. Western Ecological Research Center, Dixon 22 Field Station, P. S. Coates. Internet website: https://catalog.data.gov/dataset/blm-nvca-armpa-23 grsg-habitat-blm-land-only. Accessed July 13, 2017. 24
Western Association of Fish and Wildlife Agencies. 2016. Mule Deer Working Group. Fact Sheet. 25 Winter Range Disturbance, Fact Sheet #17. January 2016. 26
Wildlife Action Plan Team. 2012. Nevada Wildlife Action Plan. Nevada Department of Wildlife, Reno. 27
Williams, D. D. 1996. Environmental Constraints in Temporary Fresh Waters and their Consequences 28 for the Insect Fauna. Journal of North American Benthological Society 15(4):634-650. 29
3.6 Range Resources 30
Alberta Agriculture and Food. 2007. Agri-Facts: Using the Animal Unit Month (AUM) Effectively. 31 Revised August 2007. 32
Bureau of Land Management (BLM). 2017. Email communication between S. Ault, BLM, and C. 33 Dunne, AECOM, regarding the Grass Valley Allotment. December 13, 2017. 34
Bureau of Land Management (BLM). 2015. Environmental Assessment Barrick Cortez Inc. (NVN-35 067575 [14-1A]) Amendment 3 to Plan of Operations and Reclamation Permit Application. 36 Battle Mountain District Office, Mount Lewis Field Office, Battle Mountain, Nevada. July 2015. 37
Bureau of Land Management (BLM). 2008. Cortez Hills Expansion Project Final Environmental Impact 38 Statement. Battle Mountain Field Office, Battle Mountain, Nevada. September 2008. 39

Deep South Expansion Project EIS Chapter 6.0 - References 6-25
Draft EIS 2018
SRK Consulting, Inc. (SRK). 2014. Barrick Cortez Inc. Noxious Weed Management Plan. Prepared for 1 Barrick Cortez Inc. July 2014. 2
3.7 Paleontological Resources 3
Bureau of Land Management (BLM). 2018. GIS files for draft BLM potential fossil yield classification 4 areas provided by M. Van Der Voort, BLM, to D. Gregory, AECOM. June 28, 2018. 5
Bureau of Land Management (BLM). 2016. Instructional Memorandum No. 2016-124. Potential Fossil 6 Yield Classification (PFYC) System for Paleontological Resources on Public Lands. Internet 7 website: https://www.blm.gov/policy/im-2016-124. Accessed June 5, 2017. 8
Bureau of Land Management (BLM). 2008. Cortez Hills Expansion Project. Final Environmental 9 Impact Statement. Battle Mountain Field Office. Battle Mountain, Nevada. 10
Bureau of Land Management (BLM). 2004. Pipeline/South Pipeline Pit Expansion Project Final 11 Supplemental Environmental Impact Statement. Battle Mountain Field Office, Battle Mountain, 12 Nevada. December 2004. 13
Bureau of Land Management (BLM). 2000. South Pipeline Project Final Environmental Impact 14 Statement. NV64-93-001P(96-2A); NV063-EIS98-014. Battle Mountain Field Office, Battle 15 Mountain, Nevada. February 2000. 16
Bureau of Land Management (BLM). 1998a. BLM Manual 8270. Paleontological Resource 17 Management. 18
Bureau of Land Management (BLM). 1998b. BLM Handbook H-8270-1 – General Procedural 19 Guidance for Paleontological Resource Management. 20
Bureau of Land Management (BLM). 1996. Cortez Pipeline Gold Deposit. Final Environmental Impact 21 Statement. BLM/BM/PL-96/001+1610. Battle Mountain District Shoshone – Eureka Resource 22 Area, Battle Mountain, Nevada. January 1996. 23
Firby, J. R. 1991. Paleontological Assessment of the Cortez District within Portions of the Battle 24 Mountain and Elko Bureau of Land Management Districts, Nevada. Appendix A In: Cortez 25 Pipeline Gold Deposit Draft Environmental Impact Statement. Shoshone-Eureka Resource 26 Area, Battle Mountain, Nevada. July 1994. 27
Gilluly, J. and H. Masursky. 1965. Geology of the Cortez Quadrangle, Nevada: U.S. Geological Survey 28 Bulletin 1175. Washington, D.C. 29
Society of Vertebrate Paleontology. 2010. Standard Procedures for the Assessment and Mitigation of 30 Adverse Impacts to Paleontological Resources Society of Vertebrate Paleontology Impact 31 Mitigation Guidelines Revision Committee. 32
Western Cordillera. 2006. Integrated Petroleum Evaluation of Northeastern Nevada. Internet website: 33 http://westerncordillera.com/study_introduction.htm. Accessed July 6, 2018. 34
3.8 Cultural Resources 35
Barrick Cortez Inc. (BCI). 2017. Email submittal from S. Schoen, BCI, to K. Hurrell, BLM, D. Gregory, 36 AECOM, and D. Koontz, AECOM, regarding blasting-related vibration. August 1, 2017. 37

Deep South Expansion Project EIS Chapter 6.0 - References 6-26
Draft EIS 2018
Bureau of Land Management (BLM) and Nevada State Historic Preservation Office (SHPO). 2017. 1 Amendment Two, Programmatic Agreement Among the Bureau of Land Management Battle 2 Mountain and Elko Field Offices, the Nevada State Historic Preservation Office, and Cortez 3 Joint Venture dba Cortez Gold Mines Regarding the Treatment of Historic Properties during 4 Cortez Gold Mines Mineral Exploration and Development in Eureka and Lander Counties, 5 Nevada. 6
Bureau of Land Management (BLM) and Nevada State Historic Preservation Office (SHPO). 2014. 7 State Protocol Agreement between The Bureau of Land Management, Nevada and The 8 Nevada State Historic Preservation Officer for Implementing the National Historic Preservation 9 Act. Revised December 22, 2014. 10
Bureau of Land Management (BLM), Nevada State Historic Preservation Office (SHPO), and Cortez 11 Gold Mines. 2005. Programmatic Agreement among the Bureau of Land Management, Battle 12 Mountain and Elko Field Offices, the Nevada State Historic Preservation Office and Cortez 13 Joint Venture dba Cortez Gold Mines Regarding the Treatment of Historic Properties during 14 Cortez Gold Mines Mineral Exploration and Development in Eureka and Lander Counties, 15 Nevada. 16
Garavaglia Architecture, Inc. 2013. Marysville Historic Commercial District: Historic Structure Impact 17 Report. Prepared for HDR, Inc. Internet website; 18 http://www.spk.usace.army.mil/Portals/12/documents/civil_works/MarysvilleRingLevee/Marysv19 ille%20Historic%20Commercial%20District%20Historic%20Structure%20Impact%20Report%20 20-%202013-01-30%20Final.pdf. Accessed December 13, 2017. 21
Hardesty, D. and E. M. Hattori. 1982. Archeological Studies in the Cortez Mining District, 1981. 22 Technical Report 8. Bureau of Land Management, Nevada. Contributions to the Study of 23 Cultural Resources. 24
Hattori, E. M. and M. S. Thompson. 1987. Using Dendrochronology for Historical Reconstruction in the 25 Cortez Mining District, North Central Nevada. In: An Historic Context for the Cortez Joint 26 Venture Project Area, Lander and Elko Counties, Nevada. Prepared by K. R. McGuire, 27 V. Bengston, R. Reno, and C. Zeier. Pp. 110-112. 28
McGuire, K. R., V. Bengston, M. Memmott, R. Reno, and C. Zeier. 2007. An Historic Context for the 29 Cortez Joint Venture Project Area, Eureka and Lander Counties, Nevada. On file, Bureau of 30 Land Management, Mount Lewis Field Office, Battle Mountain, Nevada. 31
McQueen, R. and L. Lafayette. 2017. A Historic Properties Treatment Plan for the Deep South 32 Expansion Project, Eureka and Lander Counties, Nevada. On file, Bureau of Land 33 Management, Mount Lewis Field Office, Battle Mountain, Nevada. Report No. BLM6-3154-2. 34
National Park Service (NPS). 1997. National Register Bulletin 15: How to Apply the National Register 35 Criteria for Evaluation. Internet website: http://www.cr.nps.gov/nr/publications/bulletins/nrb15/. 36 Accessed September 20, 2017. 37
National Park Service (NPS). 1995. National Register Bulletin 15: How to Apply the National Register 38 Criteria for Evaluation. Revised. National Park Service Interagency Resources Division, 39 National Register Branch, Washington, D. C. 40
Nevada State Historic Preservation Office. 2018. Letter from R. K. Reed, Deputy State Historic 41 Preservation Officer, to J. D. Sherve, Bureau of Land Management Mount Lewis Field Office 42 Manager, Re: Barrick Deep South Expansion Project Indirect Effects Analysis, BLM6-3154-4 / 43 8100 (NVB0100), Eureka and Lander Counties, Nevada; UT 2010-0487. July 26, 2018. 44

Deep South Expansion Project EIS Chapter 6.0 - References 6-27
Draft EIS 2018
Summit. 2018. Barrick Deep South Expansion Project Indirect Effects Analysis. BLM6-3154-4. Summit 1 1376-0109. June 2018. On file, Bureau of Land Management, Mount Lewis Field Office, Battle 2 Mountain, Nevada. 3
Zeier, C., D. L. Hardesty, M. Brodhead, and E. M. Hattori. 1993. A Historic Context for the Cortez 4 Mining District, Eureka and Lander Counties, Nevada. On file, Bureau of Land Management, 5 Mount Lewis Field Office, Battle Mountain, Nevada. 6
3.9 Native American Traditional Values 7
AATA. 2006. Betze-Post Mine, Seep & Spring Study, Fall 2005; Prepared for Barrick Goldstrike Mines, 8 Inc. April, 2006. 9
Barrick Cortez, Inc. (BCI). 2017. Email from S. Schoen, BCI, to D. Gregory, AECOM, with updated 10 information and shapefiles for groundwater level changes in the Goldstrike Betze Area. 11 September 11, 2017. 12
Barrick Goldstrike. 2007. Boulder Valley Monitoring Plan, 2nd Quarter 2006, 3rd Quarter 2006. 13 January 2007. 14
Bengston, G. 2003. Northern Paiute and Western Shoshone Land Use in Northern Nevada: A Class I 15 Ethnographic/Ethnohistoric Overview. U.S. Department of the Interior. Cultural Resource 16 Series No. 12. In: Bureau of Land Management (BLM). 2008. Cortez Hills Expansion Project 17 Final Environmental Impact Statement. Battle Mountain District Office, Battle Mountain, 18 Nevada. September 2008. 19
Bureau of Land Management (BLM). 2017a. Bureau of Land Management’s Land & Mineral Legacy 20 Rehost 2000 System - LR2000. Internet website: http://www.blm.gov/lr2000/. Accessed 21 January 27, 2017. 22
Bureau of Land Management (BLM). 2017b. GIS Shapefiles for Wildfire Affected Areas in Nevada. 23 May 20, 2017. 24
Bureau of Land Management (BLM). 2016a. Environmental Assessment Barrick Gold Exploration, Inc. 25 Horse Canyon/Cortez Unified Exploration Project Plan of Operations (NVN-066621 [16-1A]) 26 and Reclamation Permit No. 0159 Plan Amendment – Twin Declines for Underground 27 Exploration. Battle Mountain District Office, Mount Lewis Field Office. Battle Mountain, 28 Nevada. July 20, 2016. 29
Bureau of Land Management (BLM). 2016b. Decision Environmental Assessment Barrick Gold 30 Exploration, Inc. Horse Canyon/Cortez Unified Exploration Project Plan of Operations (NVN-31 066621 [16-1A]) and Reclamation Permit No. 0159 Plan Amendment – Twin Declines for 32 Underground Exploration. Mount Lewis Field Office, Battle Mountain, Nevada. September 9, 33 2016. 34
Bureau of Land Management (BLM). 2015. Environmental Assessment Barrick Cortez Inc. (NVN-35 067575 [14-1A]) Amendment 3 to Plan of Operations and Reclamation Permit Application. 36 Battle Mountain District Office, Mount Lewis Field Office, Battle Mountain, Nevada. July 2015. 37
Bureau of Land Management (BLM). 2014. Environmental Assessment for Barrick Cortez Inc. 38 (NVN-67575 [11-3A]) 2011 Amendment to Plan of Operations and Reclamation Permit 39 Application Proposed North Waste Rock Facility Realignment/Rangeland Fence 40 Addition/Stockpile Relocation/Ancillary Addition. Battle Mountain District, Mount Lewis Field 41 Office, Battle Mountain, Nevada. February 2014 (Final). 42

Deep South Expansion Project EIS Chapter 6.0 - References 6-28
Draft EIS 2018
Bureau of Land Management (BLM). 2008. Cortez Hills Expansion Project. Final Environmental 1 Impact Statement. Battle Mountain Field Office. Battle Mountain, Nevada. September 2008. 2
Bureau of Land Management (BLM). 2006. Cortez Gold Mines, Cortez Mine Underground 3 Explorations Project Environmental Assessment. Battle Mountain Field Office, Battle 4 Mountain, Nevada. February 2006. 5
Bureau of Land Management (BLM). 2004. Pipeline/South Pipeline Pit Expansion Project Final 6 Supplemental Environmental Impact Statement. Battle Mountain Field Office, Battle Mountain, 7 Nevada. December 2004. 8
Bureau of Land Management (BLM). 2003. Final Supplemental Environmental Impact Statement 9 Betze Project Barrick Goldstrike Mines, Inc. Bureau of Land Management, Elko Field Office, 10 Elko, Nevada. January 2003. 11
Bureau of Land Management (BLM). 2002a. Final Environmental Impact Statement Newmont Mining 12 Corporation’s South Operations Area Project Amendment. Elko District Office, Elko, Nevada. 13 April 2002. 14
Bureau of Land Management (BLM). 2002b. Draft Environmental Impact Statement Leeville Project. 15 Elko District Office, Elko, Nevada. March 2002. 16
Bureau of Land Management (BLM). 2000a. Cumulative Impact Analysis of Dewatering and Water 17 Management Operations for the Betze Project, South Operations Area Project Amendment, 18 and Leeville Project. Elko Field Office, Elko, Nevada. In: Bureau of Land Management (BLM). 19 2008. Cortez Hills Expansion Project Final Environmental Impact Statement. Battle Mountain 20 District Office, Battle Mountain, Nevada. September 2008. 21
Bureau of Land Management (BLM). 2000b. South Pipeline Project Final Environmental Impact 22 Statement. Battle Mountain District, Battle Mountain, Nevada. February 2000. 23
Bureau of Land Management (BLM). 1993a. Environmental Assessment Miekle Mine Development. 24 Elko District Office, Elko, Nevada. May 1993. In: Bureau of Land Management (BLM). 2008. 25 Cortez Hills Expansion Project Final Environmental Impact Statement. Battle Mountain District 26 Office, Battle Mountain, Nevada. September 2008. 27
Bureau of Land Management (BLM). 1993b. Draft Environmental Impact Statement Newmont Gold 28 Company’s South Operations Area Project. Elko District Office, Elko, Nevada. May 1993. In: 29 Bureau of Land Management (BLM). 2008. Cortez Hills Expansion Project Final 30 Environmental Impact Statement. Battle Mountain District Office, Battle Mountain, Nevada. 31 September 2008. 32
Bureau of Land Management (BLM). 1991. Final Environmental Impact Statement Betze Project, 33 Barrick Goldstrike Mines. Elko District Office, Elko, Nevada. June 1991. In: Bureau of Land 34 Management (BLM). 2008. Cortez Hills Expansion Project Final Environmental Impact 35 Statement. Battle Mountain District Office, Battle Mountain, Nevada. September 2008. 36
Clemmer, R. 1999. Anthropologists and Their Totems: Profiling and Paradigming in Great Basin 37 Anthropology. In: Rucks, M. 2004. An Ethnographic Study Completed for the Cortez Gold 38 Mines Pediment Project. pp. 1-44.On file, Department of Anthropology, Nevada State 39 Museum, Carson City, Nevada. 40
Clemmer, R. 1990. From Ethene to Ethnicity: Conditions Affecting White Knife Shoshone Culture and 41 Identity in Reservation Era. In: An Ethnographic Study Completed for the Cortez Gold Mines 42

Deep South Expansion Project EIS Chapter 6.0 - References 6-29
Draft EIS 2018
Pediment Project. On file, Department of Anthropology, Nevada State Museum, Carson City, 1 Nevada. 2
Clemmer, R. O. and O. C. Stewart. 1986. Treaties, Reservations, and Claims. In: Great Basin, Vol. 11, 3 edited by Warren L. d’Azevedo, pp. 525-557. Handbook of North American Indians, W. G. 4 Sturtevant, general editor. Smithsonian Institution, Washington, D.C. 5
Crow Canyon Archaeological Center. 2006. Research Reports–Archaeobotanical. Internet website: 6 http://www.crowcanyon.org/researchreports/archaeobotanical/plant_uses/qryEthnobotanical. 7 In: Bureau of Land Management (BLM). 2008. Cortez Hills Expansion Project Final 8 Environmental Impact Statement. Battle Mountain District Office, Battle Mountain, Nevada. 9 September 2008. 10
Crum, S. J. 1994. The Road on Which We Came: A History of the Western Shoshone. University of 11 Utah Press, Salt Lake City, Utah. In: Bureau of Land Management, 2001, Falcon to Gonder 12 345-kV Transmission Project, Final Environmental Impact Statement. pp. 3.19-1 – 3.19-6. 13
Dixon, T. and R. McGonagle. 2004. Mount Tenabo Properties of Cultural and Religious Importance 14 Determinations of Eligibility for the National Register of Historic Places. BLM Report No. 6-15 2352-1. On file, Bureau of Land Management, Mount Lewis Field Office, Battle Mountain, 16 Nevada. 17
Environmental Resource Management (ERM). 2016. Baseline Biological Report for the Deep South 18 Project. Prepared for Barrick Cortez, Inc., July 2016. 19
ESRI World Imagery. 2017. GIS Application for Satellite Imagery. May 17, 2017. 20
Fowler, C. S. 1986. Subsistence. In: Great Basin, Vol. 11, edited by W. L. d’Azevedo, pp. 64-98. 21 Handbook of North American Indians, W. G. Sturtevant, general editor. Smithsonian 22 Institution, Washington, D.C. 23
Geomega. 2006. Cortez Hills Expansion Project Baseline Characterization Report. Prepared for 24 Cortez Gold Mines, September 12, 2006. In: Bureau of Land Management (BLM). 2008. 25 Cortez Hills Expansion Project Final Environmental Impact Statement. Battle Mountain District 26 Office, Battle Mountain, Nevada. September 2008. 27
Harris, J. 1940. The White Knife Shoshoni of Nevada. In: Acculturation in Seven American Indian 28 Tribes, edited by R. Linton. Appleton-Century Company, New York. 29
Hultkrantz, A. 1986. Mythology and Religious Concepts. In: Great Basin, Handbook of North American 30 Indians, W. C. Sturtevant, General Editor. Volume 11, W. L. d-Azevedo, Volume Editor. 31 Smithsonian Institution, Washington, D.C. 32
McGonagle, R. 2001. Addendum to Ethnographic Report BLM6-2174, BLM6-2175-2, Government to 33 Government Consultation, Cortez Joint Venture Horse Canyon/Cortez Unified Exploration 34 Project. NVN066621. On file with Bureau of Land Management, Battle Mountain District. 35
McGuire, K., V. Bengston, M. Memmott, R. Reno, and C. Zeier. 2007. An Historic Context for the 36 Cortez Joint Venture Project Area, Lander and Eureka Counties, Nevada. Prepared for Cortez 37 Gold Mines. In: Bureau of Land Management (BLM). 2008. Cortez Hills Expansion Project 38 Final Environmental Impact Statement. Battle Mountain District Office, Battle Mountain, 39 Nevada. September 2008. 40

Deep South Expansion Project EIS Chapter 6.0 - References 6-30
Draft EIS 2018
Miller, J. 1983. Basin Religion and Theology: A Comparative Study of Power (Puha). Journal of 1 California and Great Basin Anthropology 5(1 and 2):66-86. 2
Natural Resource Conservation Service (NRCS). 2006. Soil Survey Staff, United States Department of 3 Agriculture. Soil Survey Geographic (SSURGO) Database for Lander and Eureka Counties, 4 Nevada. Internet website: http://solidatamart.nrcs.usda.gov. Accessed 2006. In: Bureau of 5 Land Management (BLM). 2008. Cortez Hills Expansion Project Final Environmental Impact 6 Statement. Battle Mountain District Office, Battle Mountain, Nevada. September 2008. 7
Nevada Department of Wildlife (NDOW). 2017a. NDOW GIS Data Clearinghouse, Mule Deer 8 Distribution. Internet website: http://gis.ndow.nv.gov/ndowdata/. Data updated 2014. Accessed 9 July 9, 2017. 10
Nevada Department of Wildlife (NDOW). 2017b. NDOW GIS Data Clearinghouse, Pronghorn 11 Distribution. Internet website: http://gis.ndow.nv.gov/ndowdata/. Data updated 2010. Accessed 12 July 9, 2017. 13
Nevada Department of Wildlife (NDOW). 2017c. NDOW GIS Data Clearinghouse, Big Horn Sheep 14 Distribution. Internet website: http://gis.ndow.nv.gov/ndowdata/. Data updated 2016. Accessed 15 January 15, 2017. 16
Nevada Department of Wildlife (NDOW). 2000. Nevada’s Greater Sage-grouse Conservation Project. 17
Newmont Mining Corporation. 2007. Spring Survey, Gold Quarry, Fall 2006. . In: Bureau of Land 18 Management (BLM). 2008. Cortez Hills Expansion Project Final Environmental Impact 19 Statement. Battle Mountain District Office, Battle Mountain, Nevada. September 2008. 20
Newmont Mining Corporation. 2006. Maggie Creek Basin Monitoring Plan, 2nd Quarter 2006, and 3rd 21 Quarter 2006 Report. Newmont Mining/Hydrology Department. In: Bureau of Land 22 Management (BLM). 2008. Cortez Hills Expansion Project Final Environmental Impact 23 Statement. Battle Mountain District Office, Battle Mountain, Nevada. September 2008. 24
Quick, P. 1995. Summary Report: Native American Consultation for Cortez Pipeline Project, ICF 25 Kaiser Engineers. On file, Bureau of Land Management, Mount Lewis Field Office, Battle 26 Mountain, Nevada. 27
Quick, P. 1992. Summary of Native American Consultation Activities for Cortez EIS. On file, Bureau of 28 Land Management, Mount Lewis Field Office, Battle Mountain, Nevada. 29
Riverside Technology Inc.1998. Preliminary Evaluation of Potential Change in Flow in the Humboldt 30 River from the Projected Barrick Goldstrike Mine Discharge. Fort Collins, Colorado. In: Bureau 31 of Land Management (BLM). 2008. Cortez Hills Expansion Project Final Environmental Impact 32 Statement. Battle Mountain District Office, Battle Mountain, Nevada. September 2008. 33
Riverside Technology Inc.1994. Seep, Spring and Stream Inventory, Barrick Goldstrike Mine 34 Dewatering Study Area, Volumes I and II. Fort Collins, Colorado. In: Bureau of Land 35 Management (BLM). 2008. Cortez Hills Expansion Project Final Environmental Impact 36 Statement. Battle Mountain District Office, Battle Mountain, Nevada. September 2008. 37
Rucks, M. 2004. An Ethnographic Study Completed for the Cortez Gold Mines Pediment Project. 38 Summit Environsolutions, Inc., Carson City, Nevada. April 23, 2004. In: Bureau of Land 39 Management (BLM). 2008. Cortez Hills Expansion Project Final Environmental Impact 40 Statement. Battle Mountain District Office, Battle Mountain, Nevada. September 2008. 41

Deep South Expansion Project EIS Chapter 6.0 - References 6-31
Draft EIS 2018
Rucks, M. 2001. Report on Ethnographic Study Conducted to Facilitate Consultation with Western 1 Shoshone Tribal Governments of Central Nevada for the Sierra Pacific Power Falcon to 2 Gonder 325 kV Transmission Line. Summit Envirosolutions, Inc., Carson City, Nevada. In: 3 Bureau of Land Management (BLM). 2008. Cortez Hills Expansion Project Final 4 Environmental Impact Statement. Battle Mountain District Office, Battle Mountain, Nevada. 5 September 2008. 6
Rucks, M. 2000. A Report on Ethnographic Study Conducted to Assist the Bureau of Land 7 Management in the Evaluation of Traditional Cultural Properties in the Mt. Tenabo Area of 8 Lander and Eureka Counties, Nevada. Summit Envirosolutions, Inc., Carson City, Nevada. In: 9 Bureau of Land Management (BLM). 2008. Cortez Hills Expansion Project Final 10 Environmental Impact Statement. Battle Mountain District Office, Battle Mountain, Nevada. 11 September 2008. 12
Rusco, M. 2000. Background Ethnographic Study for Cortez Joint Venture. Prepared for JBR 13 Environmental Consultants, Inc. In: Bureau of Land Management (BLM). 2008. Cortez Hills 14 Expansion Project Final Environmental Impact Statement. Battle Mountain District Office, 15 Battle Mountain, Nevada. September 2008. 16
Rusco, M. 1992. Background Study for BLM Consultation with Native Americans on Proposed Mining 17 Development in the Mule Canyon Project Area, Shoshone Range within the Traditional 18 Territory of the Tosawihi People, Western Shoshone Nation. Archaeological Research 19 Services, Inc., Virginia City, Nevada. On file, Bureau of Land Management, Elko District 20 Office, Elko, Nevada. September 23, 1992. In: Bureau of Land Management (BLM). 2008. 21 Cortez Hills Expansion Project Final Environmental Impact Statement. Battle Mountain District 22 Office, Battle Mountain, Nevada. September 2008. 23
Rusco, M. and S. Raven. 1992. Background Study for BLM Consultation with Native Americans on 24 Proposed Mining Development in the Tosawihi (White Knife) Quarry North of Battle Mountain, 25 Nevada, in the Traditional Land of the Tosawihi People, Western Shoshone Nation. 26 Archaeological Research Services, Virginia City, Nevada. On file, Bureau of Land 27 Management, Elko District Office, Elko, Nevada. In: Bureau of Land Management (BLM). 28 2008. Cortez Hills Expansion Project Final Environmental Impact Statement. Battle Mountain 29 District Office, Battle Mountain, Nevada. September 2008. 30
Sagebrush Ecosystem Council. 2016. Sagebrush Ecosystem Program Progress Report: December 31 2016. Sagebrush Ecosystem Council, State of Nevada. 32
Sherve, J. 2007. Bureau of Land Management, Battle Mountain Field Office. Personal communication 33 with P. Plumley, ENSR, regarding dewatering and water management activities at mines 34 within the Native American traditional values regional cumulative effects study area. 35 February 26, 2007. In: Bureau of Land Management (BLM). 2008. Cortez Hills Expansion 36 Project Final Environmental Impact Statement. Battle Mountain District Office, Battle 37 Mountain, Nevada. September 2008. 38
SRK Consulting, (U.S.) Inc. (SRK). 2017. Deep South Expansion Project – Cumulative Effects, 39 Groundwater Flow Modeling Report. Prepared for Barrick Cortez Inc. March 2017. 40
SRK Consulting, (U.S.) Inc. (SRK). 2016. Groundwater Flow Model Report Deep South Expansion 41 Project Crescent Valley, Nevada. Prepared for Barrick Cortez, Inc. August 2016. 42
Stantec. 2015. Seep and Spring Quarterly Monitoring 2015 Fourth Quarter Barrick Cortez, Inc. 43 Prepared for Barrick Cortez, Inc. November 16, 2015. 44

Deep South Expansion Project EIS Chapter 6.0 - References 6-32
Draft EIS 2018
Steward, J. 1941. Culture Element Distribution, XIII: Nevada Shoshone. University of California 1 Anthropological Records 4(2):209-360. In: McGuire et al. 2005. An Historic Context for the 2 Cortez Joint Venture Project Area, Lander and Elko Counties, Nevada. pp 47-55. In: Bureau of 3 Land Management (BLM). 2008. Cortez Hills Expansion Project Final Environmental Impact 4 Statement. Battle Mountain District Office, Battle Mountain, Nevada. September 2008. 5
Steward, J. 1940. Native Cultures of the Intermontane (Great Basin) Area. In: Essays in Historical 6 Anthropology of North America. Smithsonian Miscellaneous Collections 100. Washington, 7 D.C. In: Bureau of Land Management (BLM). 2008. Cortez Hills Expansion Project Final 8 Environmental Impact Statement. Battle Mountain District Office, Battle Mountain, Nevada. 9 September 2008. 10
Steward, J. H. 1938. Basin-Plateau Aboriginal Sociopolitical Groups. Bureau of American Ethnology 11 Bulletin 120. Reprinted in 1997. University of Utah Press, Salt Lake City, Utah. In: Bureau of 12 Land Management (BLM). 2008. Cortez Hills Expansion Project Final Environmental Impact 13 Statement. Battle Mountain District Office, Battle Mountain, Nevada. September 2008. 14
Steward, J. H. 1937. Linguistic Distributions and Political Groups of the Great Basin Shoshoneans. 15 American Anthropologist 39(4):625-634. 16
Thomas, D. H., L. S. A. Pendleton, and S. C. Cappanari. 1986. Western Shoshone. . In: Great Basin, 17 Handbook of North American Indians, W. C. Sturtevant, General Editor. Volume 11, 18 W. L. d-Azevedo, Volume Editor. Smithsonian Institution, Washington, D.C. 19
University of Michigan-Dearborn. 2006. Native American Ethnobotany. Internet website: 20 http://herb.umd.umich.edu/herb/search.pl. In: Bureau of Land Management (BLM). 2008. 21 Cortez Hills Expansion Project Final Environmental Impact Statement. Battle Mountain District 22 Office, Battle Mountain, Nevada. September 2008. 23
U.S. Geological Survey (USGS). 2017a. Gap Analysis Program, National Land Cover, Version 2. May 24 2011. Internet website: https://gapanalysis.usgs.gov/gaplandcover/data/. Accessed June 25 2017. 26
U.S. Geological Survey (USGS). 2017b. National Hydrography Dataset. Internet website: 27 https://nhd.usgs.gov/NHD_High_Resolution.html. Accessed July 1, 2017. 28
U.S. Geological Survey (USGS). 2017c. Shapefile for 2015 Nevada-California Approved Resource 29 Management Plan Greater Sage-grouse Habitat. Western Ecological Research Center, Dixon 30 Field Station, P. S. Coates. Internet website: https://catalog.data.gov/dataset/blm-nvca-armpa-31 grsg-habitat-blm-land-only. Accessed July 13, 2017. 32
Welsh, S. L., N. O. Atwood, S. Goodrich, and L. C. Higgins. 1993. A Utah Flora. 986 pp. In: Bureau of 33 Land Management (BLM). 2008. Cortez Hills Expansion Project Final Environmental Impact 34 Statement. Battle Mountain District Office, Battle Mountain, Nevada. September 2008. 35
3.10 Air Quality 36
AECOM. 2017. No Action Alternative emissions inventory based on the file: CGM Deep South EI 37 Workbook (2017-06-29).xlsx provided by S. Schoen, BCI, to D. Gregory, AECOM. August 8, 38 2017. 39
Air Sciences Inc. 2017a. Technical Memorandum Representative Background Concentrations. 40 Prepared for Barrick Cortez Inc. May 10, 2017. 41

Deep South Expansion Project EIS Chapter 6.0 - References 6-33
Draft EIS 2018
Air Sciences Inc. 2017b. Technical Addendum: Barrick Cortez-Deep South Expansion Project NEPA 1 Air Quality Impact Analysis Report. Prepared for Barrick Cortez Inc. June 29, 2017. 2
Air Sciences Inc. 2016a. Barrick Cortez - Deep South Expansion Project NEPA Air Quality Impact 3 Analysis Report. Prepared for Barrick Cortez Inc. January 8, 2016. 4
Air Sciences Inc. 2016b. Attachment A – Supporting Information; Air quality model result by scenario 5 and GIS files for mercury deposition at Goldstrike. Received from BCI December 12, 2016. 6
Barrick Cortez Inc. (BCI). 2017. Email from S. Schoen, Barrick, to D. Gregory, AECOM, providing Air 7 Sciences Inc.’s workbook and modeling data for the Proposed Action. August 8, 2017. 8
Barrick Cortez Inc. (BCI). 2015. Documentation from S. Schoen, BCI, to D. Koontz, AECOM, relative 9 to Arturo Mine oxide ore mercury content. May 15, 2015. In: Bureau of Land Management 10 (BLM). 2015. Environmental Assessment Barrick Cortez Inc. (NVN-067575 [14-1A]) 11 Amendment 3 to Plan of Operations and Reclamation Permit Application. Battle Mountain 12 District Office, Mount Lewis Field Office, Battle Mountain, Nevada. July 2015. 13
Barrick Cortez Inc. (BCI). 2013. Surface Area Disturbance Fugitive Dust Control Plan. February 2013. 14
Bureau of Land Management (BLM). 2015a. Environmental Assessment. Klondex Gold & Silver 15 Mining Company Fire Creek Mine Project, Lander County, Nevada. File Number: NVN-16 091111. December 2015. 17
Bureau of Land Management (BLM). 2015b. Environmental Assessment Barrick Cortez Inc. (NVN-18 067575 [14-1A]) Amendment 3 to Plan of Operations and Reclamation Permit Application. 19 Battle Mountain District Office, Mount Lewis Field Office, Battle Mountain, Nevada. July 2015. 20
Bureau of Land Management (BLM). 2011. Cortez Hills Expansion Project Final Supplemental Impact 21 Statement. Battle Mountain District Office, Battle Mountain, Nevada. January 2011. 22
Bureau of Land Management (BLM). 2008a. Cortez Hills Expansion Project Final Impact Statement. 23 Battle Mountain District Office, Battle Mountain, Nevada. September 2008. 24
Bureau of Land Management (BLM). 2008b. Draft Supplemental Environmental Impact Statement 25 Betze Pit Expansion Project. Bureau of Land Management, Elko District Office. 26
Bureau of Land Management (BLM). 2004. Pipeline/South Pipeline Pit Expansion Project Final 27 Supplemental Environmental Impact Statement. Battle Mountain Field Office, Battle Mountain, 28 Nevada. December 2004. 29
Bureau of Land Management (BLM). 2000. South Pipeline Project Final Environmental Impact 30 Statement. Battle Mountain District, Battle Mountain, Nevada. February 2000. 31
Comer, P., P. Crist, M. Reid, J. Hak, H. Hamilton, D. Braun, G. Kittel, I. Varley, B. Unnasch, S. Auer, 32 M. Creutzburg, D. Theobald, and L. Kutner. 2012. Central Basin and Range Rapid 33 Ecoregional Assessment Report. Final Report. Prepared for the U.S. Department of the 34 Interior, Bureau of Land Management. September 2012. 35
Federal Register (FR). 2014. Greenhouse Gas Reporting Program: Addition of Global Warming 36 Potentials to the General Provisions and Amendments and Confidentiality Determinations for 37 Fluorinated Gas Production; Final Rule. 40 CFR Part 98, Volume 79, No. 238, 73750–73796. 38 EPA–HQ–OAR–2009–0927; FRL–9919–70–OAR; RIN 2060–AR78. 39

Deep South Expansion Project EIS Chapter 6.0 - References 6-34
Draft EIS 2018
Intergovernmental Panel on Climate Change (IPCC). 2014a. Summary for policymakers. In: Climate 1 Change 2014: Impacts, Adaptation, and Vulnerability. Part A: Global and Sectoral Aspects. 2 Contribution of Working Group II to the Fifth Assessment Report of the Intergovernmental 3 Panel on Climate Change [Field, C. B., V. R. Barros, D. J. Dokken, K. J. Mach, 4 M. D. Mastrandrea, T. E. Bilir, M. Chatterjee, K. L. Ebi, Y. O. Estrada, R. C. Genova, B. Girma, 5 E. S. Kissel, A. N. Levy, S. MacCracken, P. R. Mastrandrea, and L. L. White (eds.)]. 6 Cambridge University Press, Cambridge, United Kingdom and New York, NY, USA, pp. 1-32. 7
Intergovernmental Panel on Climate Change (IPCC). 2014b. Climate Change 2014: Impacts, 8 Adaptation, and Vulnerability. Part A: Global and Sectoral Aspects. Contribution of Working 9 Group II to the Fifth Assessment Report of the Intergovernmental Panel on Climate Change 10 [Field, C. B., V. R. Barros, D. J. Dokken, K. J. Mach, M. D. Mastrandrea, T. E. Bilir, 11 M. Chatterjee, K. L. Ebi, Y. O. Estrada, R. C. Genova, B. Girma, E. S. Kissel, A. N. Levy, 12 S. MacCracken, P. R. Mastrandrea, and L. L. White (eds.)]. Cambridge University Press, 13 Cambridge, United Kingdom and New York, NY, USA, pp. 35-94. 14
Intergovernmental Panel on Climate Change (IPCC). 2013. Summary for Policymakers. In: Climate 15 Change 2013: The Physical Science Basis. Contribution of Working Group I to the Fifth 16 Assessment Report of the Intergovernmental Panel on Climate Change [Stocker, T.F., D. Qin, 17 G.-K. Plattner, M. Tignor, S.K. Allen, J. Boschung, A. Nauels, Y. Xia, V. Bex and P.M. Midgley 18 (eds.)]. Cambridge University Press, Cambridge, United Kingdom and New York, NY, USA. 19
Iowa Environmental Mesonet (IEM). 2017. Elko, Nevada Wind Rose. Iowa Environment Mesonet. 20 Internet website: 21 https://mesonet.agron.iastate.edu/sites/windrose.phtml?station=EKO&network=NV_ASOS. 22 Accessed October 4, 2017. 23
Nevada Division of Environmental Protection (NDEP) – Bureau of Air Quality. 2018. Permit Guidance. 24 Class I Air Quality Operating Permit. Internet website: http://ndep.nv.gov/air/permitting/permit-25 guidance. 26
Nevada Division of Water Resources (NDWR). 2012. Map of Designated Groundwater Basins of 27 Nevada. Internet website: http://water.nv.gov/mapping/maps/designated_basinmap.pdf . 28 Accessed November 5, 2012. 29
State Environmental Commission. 2018. Permanent Regulation No. R145-17. Adopted February 21, 30 2018. Internet website: https://www.leg.state.nv.us/Register/2017Register/R145-17NI.pdf. 31 Accessed June 14, 2018. 32
Tans, P. and D. Keeling. 2017. Trends in Atmospheric Carbon Dioxide. National Oceanic and 33 Atmospheric Administration. Internet website: https://www.esrl.noaa.gov/gmd/ccgg/trends/. 34 Accessed October 4, 2017. 35
U.S. Environmental Protection Agency (USEPA). 2018. Draft Inventory of U.S. Greenhouse Gas 36 Emissions and Sinks: 1990 – 2016. EPA 430-P-18-001. February 6, 2018. 37
U.S. Environmental Protection Agency (USEPA). 1997. Mercury Study Report to Congress. Volume I: 38 Executive Summary. EPA-452/R-97-003. Office of Air Quality Planning and Standards and 39 Office of Research and Development. December 1997. 40
Western Regional Climate Center (WRCC). 2017a. Average Annual Precipitation Nevada. Western 41 Regional Climate Center. 42

Deep South Expansion Project EIS Chapter 6.0 - References 6-35
Draft EIS 2018
Western Regional Climate Center (WRCC). 2017b. Beowawe U of N RCH, Nevada Monthly Normals. 1 Western Regional Climate Center. Internet website: http://www.wrcc.dri.edu/cgi-2 bin/cliNORMNCDC2010.pl?nv0800. Accessed October 4, 2017. 3
Western Regional Climate Center (WRCC). 2017c. Elko RGNL AP, Nevada Monthly Normals. 4 Western Regional Climate Center. Internet website: http://www.wrcc.dri.edu/cgi-5 bin/cliNORMNCDC2010.pl?nv2573. Accessed October 4, 2017. 6
Western Regional Climate Center (WRCC). 2017d. Beowawe U of N RCH, Nevada Monthly Climate 7 Summary. Western Regional Climate Center. Internet website: http://www.wrcc.dri.edu/cgi-8 bin/cliRECtM.pl?nv2573. Accessed October 4, 2017. 9
Western Regional Climate Center (WRCC). 2017e. Elko RGNL AP, Nevada Monthly Climate 10 Summary. Western Regional Climate Center. Internet website: https://wrcc.dri.edu/cgi-11 bin/cliNORMNCDC2010.pl?nv2573. Accessed December 1, 2017. 12
World Health Organization (WHO). 2000. WHO Air Quality Guidelines for Europe, 2nd Edition. 13
3.11 Land Use and Access 14
Bureau of Land Management (BLM). 2015a. Barrick Cortez Inc. Fiber Optic Cable Project 15 Environmental Assessment. Battle Mountain District Office, Mount Lewis Field Office, Battle 16 Mountain, Nevada. June 2015. 17
Bureau of Land Management (BLM). 2015b. Environmental Assessment Barrick Cortez Inc. (NVN-18 067575 [14-1A]) Amendment 3 to Plan of Operations and Reclamation Permit Application. 19 Battle Mountain District Office, Mount Lewis Field Office, Battle Mountain, Nevada. July 2015. 20
Bureau of Land Management (BLM). 2014. Environmental Assessment for Barrick Cortez Inc. (NVN-21 67575 [11-3A]) 2011 Amendment to Plan of Operations and Reclamation Permit Application 22 Proposed North Waste Rock Facility Realignment/Rangland Fence Addition/Stockpile 23 Relocation/Ancillary Addition. Battle Mountain District, Mount Lewis Field Office, Battle 24 Mountain, Nevada. February 2014. 25
Bureau of Land Management (BLM). 2008. Cortez Hills Expansion Project Final Environmental Impact 26 Statement. Battle Mountain District Office, Battle Mountain, Nevada. September 2008. 27
Bureau of Land Management (BLM). 2004. Pipeline/South Pipeline Pit Expansion Project Final 28 Supplemental Environmental Impact Statement. Battle Mountain Field Office, Battle Mountain, 29 Nevada. December 2004. 30
Bureau of Land Management (BLM). 2000. South Pipeline Project Final Environmental Impact 31 Statement. Battle Mountain District, Battle Mountain, Nevada. February 2000. 32
Bureau of Land Management (BLM). 1996. Cortez Pipeline Gold Deposit, Final Environmental Impact 33 Statement – Volume 1. U.S. Department of the Interior, Bureau of Land Management, Battle 34 Mountain District, Shoshone – Eureka Resource Area. January 1996. 35
Bureau of Land Management (BLM). 1987. Elko Resource Management Plan Record of Decision, 36 Elko District, Elko, Nevada. On file, Bureau of Land Management, Elko District Office, Elko, 37 Nevada. 38

Deep South Expansion Project EIS Chapter 6.0 - References 6-36
Draft EIS 2018
Bureau of Land Management (BLM). 1986a. Elko Proposed Resource Management Plan Amendment 1 and Final Environment Impact Statement. Elko District Office. Elko, Nevada. On file, Bureau of 2 Land Management, Elko District Office, Elko, Nevada. 3
Bureau of Land Management (BLM). 1986b. Shoshone-Eureka Proposed Resource Management 4 Plan Amendment and Final Environmental Impact Statement. Battle Mountain District Office. 5 Battle Mountain, Nevada. On file, Bureau of Land Management, Mount Lewis Field Office, 6 Battle Mountain, Nevada. 7
Eureka County. 2010. Eureka County Master Plan – 2010. Internet website: 8 http://www.co.eureka.nv.us/PDF/Master_Plan_Final%20_2010.pdf. Accessed 9 January 11, 2017. 10
Lander County. 2013. Lander County Zoning Ordinance (Ordinance 2013-03, Title 17 - Zoning). Battle 11 Mountain, Nevada. Internet website: 12 http://www.landercountynv.org/images/stories/county_files/Lander_County_Code/T17%20-13 %20Title%2017%20%20ZONING.pdf. Accessed January 11, 2017. 14
Lander County. 2010. Lander County Master Plan - 2010. Internet website: 15 http://landercountynv.org/images/stories/general_files/Planning_and_Zoning/LanderMasterPla16 nfinalall.pdf. Accessed January 11, 2017. 17
Lander County. 2005. Policy Plan for Federally Administered Lands - 2005. Prepared by: The Lander 18 County Public Land Use Advisory Planning Commission. Internet website: 19 http://lands.nv.gov/docs/SLUPA/Lander%20Policy%20Plan%202005.pdf. Accessed 20 January 11, 2017. 21
Matrix Design Group. 2017a. Barrick Cortez, Inc. Traffic Impact Study. Prepared for Knight Piésold 22 and Co. Matrix Project No.: 17.786.002. March 2, 2017. 23
Matrix Design Group. 2017b. Barrick Cortez, Inc. Traffic Impact Study. Prepared for Knight Piésold 24 and Co. Matrix Project No.: 17.786.002. December 22, 2017. 25
Morrison, J. 2017. Community Services Director, Lander County Planning Zoning, Economic 26 Development. Email correspondence between Jan Morrison and Steve Graber (AECOM) 27 regarding Deep South Expansion special use permit. January 20, 2017. 28
Nevada Department of Transportation (NDOT). 2017. Functional Classification Maps. Internet website: 29 https://www.nevadadot.com/doing-business/about-ndot/ndot-divisions/planning/roadway-30 systems/functional-classification-maps/eureka-county. Accessed October 25, 2017. 31
Nevada Department of Transportation (NDOT). 2016. 2015 Annual Traffic Report. Internet website: 32 http://www.nevadadot.com/doing-business/about-ndot/ndot-divisions/operations/traffic-33 information/-folder-200 Accessed January 11, 2017. 34
Transportation Research Board (TRB). 2000. Highway Capacity Manual 2000. Washington, D.C. 35 2000. 36
3.12 Recreation and Wilderness 37
Bureau of Land Management (BLM). 2017. Wilderness and Wilderness Study Area Geographic 38 Information System Data. Last updated July 3, 2017. Internet website: 39 https://catalog.data.gov/dataset/bureau-of-land-management-wilderness-study-areas. 40 Accessed July 3, 2017. 41

Deep South Expansion Project EIS Chapter 6.0 - References 6-37
Draft EIS 2018
Bureau of Land Management (BLM). 2015. Environmental Assessment Barrick Cortez Inc. (NVN-1 067575 [14-1A]) Amendment 3 to Plan of Operations and Reclamation Permit Application. 2 Battle Mountain District Office, Mount Lewis Field Office, Battle Mountain, Nevada. July 2015. 3
Bureau of Land Management (BLM). 2014. Environmental Assessment for Barrick Cortez Inc. (NVN-4 67575 [11-3A]) 2011 Amendment to Plan of Operations and Reclamation Permit Application 5 Proposed North Waste Rock Facility Realignment/Rangland Fence Addition/Stockpile 6 Relocation/Ancillary Addition. Battle Mountain District, Mount Lewis Field Office, Battle 7 Mountain, Nevada. February 2014. 8
Bureau of Land Management (BLM). 2012. Manual 6330 – Management of BLM Wilderness Study 9 Areas. July 13, 2012. 10
Bureau of Land Management (BLM). 2008. Cortez Hills Expansion Project Final Environmental Impact 11 Statement. Battle Mountain District Office, Battle Mountain, Nevada. September 2008. 12
Bureau of Land Management (BLM). 2004. Pipeline/South Pipeline Pit Expansion Project Final 13 Supplemental Environmental Impact Statement. Battle Mountain Field Office, Battle Mountain, 14 Nevada. December 2004. 15
Bureau of Land Management (BLM). 2003. Proposed Resource Management Plan and Final 16 Environmental Impact Statement for the Black Rock Desert-High Rock Canyon Emigrant 17 Trails National Conservation Area (NCA) and Associated Wilderness and Other Contiguous 18 Lands in Nevada. Winnemucca Field Office, Nevada, and Surprise Field Office, California. On 19 file, Bureau of Land Management, Winnemucca Field Office, Winnemucca, Nevada. 20
Bureau of Land Management (BLM). 2000. Wilderness Study Areas, Nevada Field Offices. 21
Bureau of Land Management (BLM). 1996.Cortez Pipeline Gold Deposit, Final Environmental Impact 22 Statement – Volume 1. U.S. Department of the Interior, Bureau of Land Management, Battle 23 Mountain District, Shoshone – Eureka Resource Area. January 1996. 24
Bureau of Land Management (BLM). 1991. Nevada BLM Statewide Wilderness Report. October 1991. 25 Internet website: 26 https://ia800802.us.archive.org/17/items/nevadablmstatewi01unit/nevadablmstatewi01unit.pdf. 27 Accessed January 11, 2017. 28
Bureau of Land Management (BLM). 1987. Elko Resource Area Record of Decision, Elko District, 29 Elko, Nevada. On file, Bureau of Land Management, Elko District Office, Elko, Nevada. 30
Eureka County. 2017. Crescent Valley. Internet website: 31 http://www.co.eureka.nv.us/crescent/crescent.htm . Accessed January 11, 2017. 32
Nevada Department of Conservation and Natural Resources – Division of State Parks. 2016. Nevada 33 Comprehensive Outdoor Recreation Plan – 2016-2021. 34
Nevada Department of Conservation and Natural Resources – Division of State Parks. 1992. 35 Recreation in Nevada. Carson City, Nevada. In: Bureau of Land Management (BLM). 2008. 36 Cortez Hills Expansion Project Final Environmental Impact Statement. Battle Mountain District 37 Office, Battle Mountain, Nevada. September 2008. 38
Recreation.gov. 2014. Mill Creek Recreation Area, NV. Internet website: 39 https://www.recreation.gov/recreationalAreaDetails.do?contractCode=NRSO&parkId=2027&re40 cAreaId=2027&agencyCode=70901. Accessed January 11, 2017. 41

Deep South Expansion Project EIS Chapter 6.0 - References 6-38
Draft EIS 2018
3.13 Social and Economic Values 1
Barrick Cortez Inc. (BCI). 2017a. Email from S. Schoen, BCI, to D. Koontz, AECOM, in response to 2 AECOM social and economic data request. November 28, 2017. 3
Barrick Cortez Inc. (BCI). 2017b. Email from S. Schoen, BCI, to D. Koontz, AECOM, regarding projected 4 employment and payroll/benefits. December 7, 2017. 5
Dimitroff, T. 2017. Personal communication between T. Dimitroff, Administrative Assistant to Public 6 Works Department, Barrick, and B. Strom, Planera, Inc., regarding water and sewer 7 capacity/use. December 7, 2017. 8
Dobra, J. 1989. The Economic Impacts of Nevada’s Mineral Industry: 1988 Update. Nevada Bureau of 9 Mines and Geology Special Publication L-9. University of Nevada-Reno, MacKay School of 10 Mines. Reno, Nevada. In: Bureau of Land Management (BLM). 2008. Cortez Hills Expansion 11 Project Final Environmental Impact Statement. Battle Mountain District Office, Battle 12 Mountain, Nevada. September 2008. 13
Esparza, C. 2017. Personal communication between C. Esparza, Director, City of Carlin Public Works 14 Department. Carlin, Nevada, and B. Strom, Planera, Inc. regarding water and sewer 15 capacity/quality. December 7, 2017. 16
Great Basin Water Co. 2016. Your 2016 Annual Water Report: Spring Creek Housing Section (PWS 17 I.D. #NV0000036). Spring Creek Division. Pahrump, Nevada. Internet website: 18 https://www.uiwater.com/docs/default-source/nevada/2016/springcreek-16ccr-19 403h(851)719a47e5853362838a44ff0000903d3d.pdf?sfvrsn=6. Accessed December 8, 2017. 20
Kingwell, J. 2017. Personal communication between J. Kingwell, Director, Elko County Planning & 21 Zoning, Elko, Nevada, and B. Strom, Planera, Inc., regarding housing availability/vacancy. 22 December 5, 2017. 23
Limberg, R. 2017. Personal communication between R. Limberg, Utilities Director, City of Elko Water 24 and Sewer Department. Elko, Nevada, and B. Strom, Planera, Inc., regarding water and sewer 25 capacity/use. December 7, 2017. 26
Nevada Department of Employment, Training & Rehabilitation (NDETR). 2017. Nevada Employment 27 and Payrolls: 2016. Research and Analysis Bureau. State of Nevada. Carson City, Nevada. 28 Internet website: http://nevadaworkforce.com/Portals/139/Other%20Publications/ 29 Employment%20and%20Payrolls/2016%20E%20and%20P%20Final.pdf/. Accessed 30 October 31, 2017. 31
Nevada Department of Taxation. 2017. Final Budget Forms Schedules S-1 through S-3 for Elko, 32 Eureka and Lander Counties’ FY 2016 to 2017 budgets. Division of Local Government 33 Services, Local Government Finance Section. Carson City, Nevada. Internet website: 34 http://budget.nv.gov/StateBudget/TaxpayersReport/Report_to_Taxpayers/. Accessed 35 November 1, 2017. 36
Resource Concepts, Inc. 2001. Nevada Grazing Statistics Report and Economic Analysis for Federal 37 Lands in Nevada. Prepared for: State of Nevada Department of Agriculture and Nevada 38 Association of Counties. March 26, 2001. 39
Smith, L. 2017. Personal communication between L. Smith, Senior Department Assistant. Eureka 40 County/Crescent Valley Public Works/Water Department. Eureka, Nevada, and B. Strom, 41 Planera, Inc., regarding Crescent Valley Utilities. December 7, 2017. 42

Deep South Expansion Project EIS Chapter 6.0 - References 6-39
Draft EIS 2018
U.S. Bureau of Economic Analysis. 2016. Local Area Personal Income: 2015. Department of 1 Commerce. Washington, D.C. Internet website: 2 www.bea.gov/newsreleases/regional/lapi/2016/pdf/lapi1116.pdf. Accessed October 30, 2017. 3
U.S. Bureau of Economic Analysis. 2013. RIMS II: An Essential Tool for Regional Developers and 4 Planners. U.S. Department of Commerce. Washington, D.C. December 2013. Internet 5 website: https://www.bea.gov/regional/pdf/rims/RIMSII_User_Guide.pdf. Accessed 6 November 6, 2017. 7
U.S. Census Bureau. 2017. Annual Estimates of the Resident Population: April 1, 2010 to 8 July 1, 2016: 2016 Population Estimates (PEPANNRES). U.S. Census Bureau, American 9 FactFinder, Department of Commerce, Washington, D.C. Internet website: 10 https://factfinder.census.gov/faces/tableservices/js f/pages/productview.xhtml?src=CF. 11 Accessed October 30, 2017. 12
U.S. Census Bureau. 2011. Profile of General Population and Housing Characteristics: 2010. 2010 13 Demographic Profile Data (Battle Mountain CDP, Nevada). U.S. Census Bureau, American 14 FactFinder, Department of Commerce, Washington, D.C. Internet website: 15 https://factfinder.census.gov/faces/tableservices/jsf/pages/productview.xhtml?fpt=table. 16 Accessed November 1, 2017. 17
U.S. Census Bureau. 2010. Profile of General Population and Housing Characteristics: 2010. 2010 18 Demographic Profile Data (Lander County, Nevada). U.S. Census Bureau, American 19 FactFinder, Department of Commerce, Washington, D.C. Internet website: 20 https://factfinder.census.gov/faces/tableservices/jsf/pages/productview.xhtml?fpt=table. 21 Accessed October 30, 2017. 22
U.S. Census Bureau. 2000. Profiles of General Demographic Characteristics: 2000 Census of 23 Population and Housing: Nevada. U.S. Census Bureau, Department of Commerce. 24 Washington, D.C. Internet website: https://www.census.gov/prod/cen2000/dp1/2kh32.pdf. 25 Accessed October 29, 2017. 26
U.S. Census Bureau. 1981. 1980 Census of Population. Volume 1: Characteristics of the Population: 27 Number of Inhabitants: Nevada (PC80-1-A30). U.S. Census Bureau, Department of 28 Commerce. Washington, D.C. Internet website: 29 https://www.census.gov/prod/www/decennial.html. Accessed October 29, 2017. 30
3.14 Environmental Justice 31
U.S. Census Bureau. 2017a. ACS Demographic and Housing Estimates: 2011-2015 American 32 Community Survey 5-Year Estimates (DP05). U.S. Department of Commerce. Washington, 33 D.C. Internet website: 34 https://factfinder.census.gov/faces/tableservices/jsf/pages/productview.xhtml?pid=ACS_15_535 YR_DP05&src=pt. Accessed October 2, 2017. 36
U.S. Census Bureau. 2017b. ACS Selected Economic Characteristics: 2011-2015 American 37 Community Survey Selected Population Tables (DP03). U.S. Department of Commerce. 38 Washington, D.C. Internet website: 39 https://factfinder.census.gov/faces/tableservices/jsf/pages/productview.xhtml?fpt=table. 40 Accessed November 15, 2017. 41
U.S. Census Bureau. 2017c. Small Area Income and Poverty Estimates (SAIPE) Program (2015 – 42 Nevada – All Counties). U.S. Department of Commerce. Washington, D.C. Internet website: 43 https://www.census.gov/did/www/saipe/data/interactive/saipe.html?s_appName=saipe&map_y44

Deep South Expansion Project EIS Chapter 6.0 - References 6-40
Draft EIS 2018
earSelector=2015&map_geoSelector=aa_c&s_state=32&s_county=32007,32009,32011,32011 5&menu=grid_proxy&s_measures=mhi_snc. Accessed October 2, 2017. 2
U.S. Environmental Protection Agency (USEPA). 1998. Final Guidance for Incorporating 3 Environmental Justice Concerns in EPA’s NEPA Compliance Analyses. U.S. Environmental 4 Protection Agency, Office of Federal Activities. Washington, D.C. April 1998. Internet website: 5 https://www.epa.gov/sites/production/files/2015-04/documents/ej-guidance-nepa-compliance-6 analyses.pdf. Accessed November 20, 2017. 7
3.15 Visual Resources 8
Bureau of Land Management (BLM). 2015. Environmental Assessment Barrick Cortez Inc. (NVN-9 067575 [14-1A]) Amendment 3 to Plan of Operations and Reclamation Permit Application. 10 Battle Mountain District Office, Mount Lewis Field Office, Battle Mountain, Nevada. July 2015. 11
Bureau of Land Management (BLM). 2014. Environmental Assessment for Barrick Cortez Inc. (NVN-12 67575 [11-3A]) 2011 Amendment to Plan of Operations and Reclamation Permit Application 13 Proposed North Waste Rock Facility Realignment/Rangland Fence Addition/Stockpile 14 Relocation/Ancillary Addition. Battle Mountain District, Mount Lewis Field Office, Battle 15 Mountain, Nevada. February 2014. 16
Bureau of Land Management (BLM). 2008. Cortez Hills Expansion Project Final Impact Statement. 17 Battle Mountain District Office, Battle Mountain, Nevada. September 2008. 18
Bureau of Land Management (BLM). 2004. Pipeline/South Pipeline Pit Expansion Project Final 19 Supplemental Environmental Impact Statement. Battle Mountain Field Office, Battle Mountain, 20 Nevada. December 2004. 21
Bureau of Land Management (BLM). 2000. South Pipeline Project Final Environmental Impact 22 Statement. Battle Mountain District, Battle Mountain, Nevada. February 2000. 23
Bureau of Land Management (BLM). 1986a. BLM Manual 8400: Visual Resource Management 24 System. U.S. Department of the Interior, Bureau of Land Management, Washington D.C. 25
Bureau of Land Management (BLM). 1986b. Visual Resource Contrast Rating. BLM Manual Handbook 26 H-8431-1. 27
Fenneman, N. M. 1931. Physiography of the Western United States. McGraw-Hill Book Company, 28 New York, New York. 29
3.16 Noise 30
Bureau of Land Management (BLM). 2008. Cortez Hills Expansion Project Final Environmental Impact 31 Statement. Battle Mountain District Office, Battle Mountain, Nevada. September 2008. 32
CensusViewer. 2017. Crescent Valley, Nevada Population: Census 2010 and 2000 Interactive Map, 33 Demographics, Statistics, Quick Facts. Internet website: 34 http://censusviewer.com/city/NV/Crescent%20Valley. Accessed December 28, 2017. 35
U.S. Environmental Protection Agency (USEPA). 1971. Noise from Construction Equipment and 36 Operations, Building Equipment, and Home Appliances. Prepared by Bolt, Beranek and 37 Newman for the Office of Noise Abatement and Control, U.S. Environmental Protection 38 Agency. Washington, D.C. December 31, 1971. 39

Deep South Expansion Project EIS Chapter 6.0 - References 6-41
Draft EIS 2018
3.17 Hazardous Materials and Solid Waste 1
Barrick Cortez Inc. (BCI). 2015. Solid and Hazardous Waste Management Plan. Elko, Nevada. 2 November 2015. 3
Barrick Gold of North America. 2016. Barrick Cortez Mines Emergency Response Plan. Revised 4 September 8, 2016. 5
Battelle. 2001. Comparative Risks of Hazardous Materials and Non-Hazardous Materials Truck 6 Shipment Accidents/Incidents. Final Report Prepared for Federal Motor Carrier Safety 7 Administration, March 2001. Internet website: https://www.phmsa.dot.gov/hazmat/library. 8 Accessed September 11, 2017. 9
U.S. Department of Transportation (USDOT). 2016. Pipeline and Hazardous Materials Safety 10 Administration, Office of Hazardous Material Safety, yearly incidents summary reports 11 database. Internet website: http://www.phmsa.dot.gov/hazmat/library/data-stats/incidents. 12 Accessed December 20, 2016. 13
U.S. Environmental Protection Agency (USEPA). 2014. Resource Conservation and Recovery Act 14 (RCRA) Orientation Manual. USEPA, Office of Resource Conservation and Recovery Program 15 Management, Communications, and Analysis Office Washington, D.C. EPA 530-F-11-003, 16 October 2014. Internet website: https://www.epa.gov/hwgenerators/resource-conservation-17 and-recovery-act-rcra-orientation-manual. Accessed December 21, 2014. 18
Chapter 4.0 PUBLIC COORDINATION 19
Bureau of Land Management (BLM). 2008. Cortez Hills Expansion Project Final Impact Statement. 20 Battle Mountain District Office, Battle Mountain, Nevada. September 2008. 21

Deep South Expansion Project EIS Chapter 6.0 - References 6-42
Draft EIS 2018
This page intentionally left blank

Deep South Expansion Project EIS Chapter 7.0 – Glossary 7-1
Draft EIS 2018
7.0 Glossary
Acre-feet The volume of water required to cover 1 acre to a depth of 1 foot; equivalent to a volume of 43,560 cubic feet.
Adverse Effect (under the National Historic Preservation Act)
An adverse effect is found when an undertaking may alter, directly or indirectly, any of the characteristics of a historic property that qualify the property for inclusion in the National Register of Historic Places in a manner that would diminish the integrity of the property’s location, design, setting, materials, workmanship, feeling, or association.
Allotment A unit of land suitable and available for livestock grazing that is managed as one grazing unit.
Alluvial Pertaining to material or processes associated with transportation or deposition of soil and rock by flowing water (e.g., streams and rivers).
Alluvium Unconsolidated or poorly consolidated gravel, sands, and clays deposited by streams and rivers on riverbeds, floodplains, and alluvial fans.
Ambient The environment as it exists at the point of measurement and against which changes or impacts are measured.
Ambient Noise Total, all-encompassing noise associated with a given environment and time.
American Indian Religious Freedom Act of 1978
Act establishing national policy to protect and preserve for Native Americans their inherent right of freedom to believe, express, and exercise their traditional religions, including the rights of access to religious sites, use and possession of sacred objects, and freedom to worship through traditional ceremonies and rites.
Animal Unit Months Grazing of a cow/calf, sheep/lamb, or other animal pair for 1 month.
Archaeological Resources Protection Act (ARPA)
A federal law, passed in 1979 to protect archaeological resources on public and Indian lands.
Area of Potential Effect (APE) Defined in Section 106 regulations as the geographic area or areas within which an undertaking may directly or indirectly cause alterations in the character or use of historic properties, if any such properties exist.
Aquifer A body of rock that is sufficiently permeable to conduct groundwater and to yield economically significant quantities of water to wells and springs.
Average annual daily traffic Total volume of vehicle traffic of a highway or road for a year divided by 365 days.

Deep South Expansion Project EIS Chapter 7.0 – Glossary 7-2
Draft EIS 2018
Background Noise Noise from all sources other than that from a particular source of interest (e.g., other than mining noise if mining noise were being investigated).
Barren Solution In a metallurgical process, the solution left after the mineral value has been removed.
Bedrock Any solid rock exposed at the surface or overlain by unconsolidated material.
Code of Federal Regulations The compilation of federal regulations adopted by federal agencies through a rule-making process.
Carrying Capacity The maximum population of an animal that an ecosystem can support without being degraded.
Community Noise Equivalent Level
Leq for a 24-hour, midnight to midnight period with 5 dBA added to the sound levels from 7:00 p.m. to 10:00 p.m. and 10 dBA added to the sound levels between 10:00 p.m. and 7:00 a.m.
Cone of Depression The depression of groundwater levels around a pumping well caused by the withdrawal of water.
Critical Habitat Habitat that is present in minimum amounts and is the determining factor in the potential for population maintenance and growth.
Cultural Resources Archaeological sites, architectural structures or features, traditional use areas, and Native American sacred sites or special use areas.
Cumulative Effects The combined environmental impacts that accrue over time and space from a series of similar or related individual actions, contaminants, or projects. Although each action may seem to have a negligible impact, the combined effect can be significant. Included are activities of the past, present, and reasonably foreseeable future; synonymous with cumulative impacts.
Decibel (dB) A unit used in expressing ratios of electric or acoustic power; the relative loudness of sound.
Decibel, A-weighting (dBA) The most commonly used frequency weighting measure; simulates human sound perception and correlates well with human perception of the annoying aspects of noise.
Direct Impacts (under the National Environmental Policy Act)
Impacts that are caused by the action and occur at the same time and place (40 Code of Federal Regulations 1508.7); synonymous with direct effects.
Disturbed Area An area where natural vegetation and soils have been removed.
Drainage The natural channel through which water flows some time of the year; natural and artificial means for affecting discharge of water as by a system of surface and subsurface passages.

Deep South Expansion Project EIS Chapter 7.0 – Glossary 7-3
Draft EIS 2018
Drawdown The lowering of the water level in a well as a result of withdrawal; the reduction in groundwater level at a point caused by the withdrawal of water from an aquifer.
Effect (under the National Historic Preservation Act)
An effect on one of the characteristics that may make a historic property eligible for inclusion in the National Register of Historic Places.
Effective Perceived Noise Level Measurements consisting of a frequency weighting scheme considerably more complicated that the A-weighting filter used to determine sound exposure levels (SELs). They incorporate a penalty for the presence of pure tones to account for people’s increased annoyance with single frequencies, such as the tones emanating from the compressor of turbofan engines. Thus, although specific values must be determined by computer analysis of a signal, effective perceived noise levels has been adopted for certain specialized uses involving the noise of individual aircraft over-flights.
Endangered Species Any species in danger of extinction throughout all or a significant portion of its range. Plant or animal species identified by the Secretary of the Interior as endangered in accordance with the 1973 Endangered Species Act.
Ephemeral Stream A stream or portion of a stream that flows briefly in direct response to precipitation in the immediate vicinity and whose channel is at all times above the water table.
Erosion The wearing away of soil and rock by weathering, mass wasting, and the action of streams, glaciers, waves, wind, and groundwater.
Exploration The search for economic deposits of minerals, ore, and other materials through practices of geology, geochemistry, geophysics, drilling, and/or mapping.
Fault A fracture in rock units along which there has been displacement.
Flocculant A reagent added to water to aggregate minute suspended particles so that they may precipitate out of suspension.
Floodplain That portion of a river valley, adjacent to the channel, that is built of sediments deposited during the present regimen of the stream and that is covered with water when the river overflows its banks at flood stages.
Fugitive Dust Dust particles suspended randomly in the air from various sources including road travel, excavation, and rock loading operations.
Geochemistry The study of the distribution and amounts of the chemical elements in minerals, ores, rocks, soils, water, and the atmosphere, and their circulation in nature on the basis of the properties of their atoms and ions.

Deep South Expansion Project EIS Chapter 7.0 – Glossary 7-4
Draft EIS 2018
Geotechnical A branch of engineering concerned with the engineering design aspects of slope stability, settlement, earth pressures, bearing capacity, seepage control, and erosion.
Groundwater Recovery An increase in groundwater levels such that the groundwater elevations rise above initial baseline groundwater elevations. Used to refer to an increase in water levels following drawdown.
Groundwater Table The surface between the zone of saturation and the zone of aeration; that surface of a body of unconfined groundwater at which the pressure is equal to that of the atmosphere.
Habitat A specific set of physical conditions that surround a single species, a group of species, or a large community. In wildlife management, the major components of habitat are considered to be food, water, cover, and living space.
Heap Leaching The process of recovering gold and other metals from low-grade ores by leaching ore that has been mined and placed on a specially prepared pad. A chemical solution is applied through low volume emitters, and the metal-bearing leachate solution percolates and is collected.
Historic Property Defined by the National Historic Preservation Act as any property included in or eligible for the National Register of Historic Places.
Hydraulic Conductivity The capacity of a rock to transmit water. It is expressed as the volume of water at the existing kinematic viscosity that will move in unit time under a unit hydraulic gradient through a unit area measured at right angles to the direction of flow.
Hydrostratigraphic Unit Grouping of stratified, mainly sedimentary rocks that have similar hydrologic properties.
Impact A modification in the status of the environment brought about by the proposed action or an alternative.
Indian Sacred Sites Defined in Executive Order 13007 as “any specific, discrete, narrowly delineated location on Federal land that is identified by an Indian tribe, or individual determined to be an appropriately authoritative representative of an Indian religion, as sacred by virtue of its established religious significance to, or ceremonial use by, an Indian religion; provided that the tribe or appropriately authoritative representative of an Indian religion has informed the agency of the existence of such a site.”
Indirect Impacts (under the National Environmental Policy Act)
Impacts that are caused by the action and are later in time or farther removed in distance, but are still reasonably foreseeable (40 Code of Federal Regulations 1508.8); synonymous with indirect effects.
Infiltration The movement of water or some other liquid into the soil or rock through pores or other openings.

Deep South Expansion Project EIS Chapter 7.0 – Glossary 7-5
Draft EIS 2018
Irretrievable Applies primarily to the lost production of renewable natural resources during the life of the project.
Irreversible Applies primarily to the use of nonrenewable resources, such as minerals, cultural resources, wetlands, or to those factors that are renewable only over long time spans, such as soil productivity. Irreversible also includes loss of future options.
Jurisdictional Wetland A wetland area identified and delineated by specific technical criteria, field indicators, and other information for purposes of public agency jurisdiction. The public agencies that administer jurisdictional wetlands are the U.S. Army Corps of Engineers, the U.S. Environmental Protection Agency, the U.S. Fish and Wildlife Service, and the U.S. Natural Resources Conservation Service.
Key Observation Point “One or a series of points on a travel route or at a use area or a potential use area, where the view of a management activity would be most revealing” (BLM 1986c). KOPs are commonly selected to represent the most sensitive viewpoints for a proposed management activity based on the number of people who would experience them or the frequency and duration of viewing.
Ld Day average sound level. Leq for the daytime period from 7:00 a.m. to 10:00 p.m.
Ldn Day-night average sound level. Leq for a 24-hour, midnight to midnight period with 10 dBA added to the sound levels from 10:00 p.m. to 7:00 a.m.
Leachate A solution obtained by leaching as in downward percolation of water through soil or waste.
Leq Equivalent continuous sound level. Level of steady state sound that, in a specific time period, has an equal amount of sound energy as the actual time-varying sound.
Lmax Maximum sound level. The greatest sound level measured on a sound level meter during a designated time interval or event, using “fast” time averaging on the meter.
Ln Night average sound level. Leq for the nighttime period from midnight to 7:00 a.m. and from 10:00 p.m. to midnight.
Lp or Sound Pressure Level A measure of the change in atmospheric pressure induced by sound; depends not only on the power of the sound source, but also on the distance from the source and on the acoustical characteristics of the space surrounding the source. In decibels, 20 times the logarithm (base 10) of the ratio of a sound pressure to the reference sound pressure of 20 micropascals.
Lpk Peak sound level: Maximum instantaneous sound level during a specified time interval or event.

Deep South Expansion Project EIS Chapter 7.0 – Glossary 7-6
Draft EIS 2018
LW Sound Power Level: A measure of the acoustic energy output of a sound source. In decibels, 10 times the logarithm (base 10) of the ratio of a given power to the reference poser of 1 picowatt.
L1 Sound level exceeded 1 percent of the time during a given period.
L10 Sound level exceeded 10 percent of the time during a given period; often represents a short-term noise event associated with passing vehicles or airplanes flying over.
L50 Sound level exceeded 50 percent of the time during a given period; the median sound level.
L90 Sound level exceeded 90 percent of the time during a given period; sometimes used as an approximation for background noise.
Mineralization The process by which a valuable mineral or minerals are introduced into a rock.
Mitigate, Mitigation To cause to become less severe or harmful; actions to avoid, minimize, rectify, reduce or eliminate, and compensate for impacts to environmental resources.
Monitor To systematically and repeatedly watch, observe, or measure environmental conditions in order to track changes.
National Environmental Policy Act (NEPA)
The National Environmental Policy Act (NEPA) of 1969; the national Policy charter for protecting the environment. NEPA establishes policy, sets goals, and provides means for carrying out the policy. Regulations from 40 Code of Federal Regulations 1500-1508 implement the act.
National Historic Preservation Act of 1966, as amended (NHPA)
Act directing federal agencies to consider the effects of their programs and projects on properties listed on or eligible for the National Register of Historic Places. If a proposed action might impact any archaeological, historical, or architectural resource, this act mandates consultation with the proper agencies.
National Pollutant Discharge Elimination System
A part of the Clean Water Act that requires point source dischargers to obtain permits. These permits are referred to as National Pollutant Discharge Elimination System (NPDES) permits and are administered by the U.S. Environmental Protection Agency.
National Register of Historic Places (NRHP)
A register maintained by the National Park Service (NPS) that lists districts, sites, buildings, structures, and objects significant in American history, architecture, archaeology, engineering and culture that meet criteria set forth in 36 Code of Federal Regulations 60.
Native American Graves Protection Act (NAGPRA)
A federal law, passed in 1990 that provides for the return of certain sacred and ceremonial objects held by museums and other repositories to the Native American peoples from which they were originally acquired.

Deep South Expansion Project EIS Chapter 7.0 – Glossary 7-7
Draft EIS 2018
Native Species Plants that originated in the area in which they are found (i.e., they naturally occur in that area).
Nevada Administrative Code (NAC)
The text of the regulations implementing the laws passed by the Nevada legislature.
Nevada Revised Statutes (NRS) The text of laws passed by the Nevada legislature.
Noise Unwanted sound; one that interferes with one’s hearing of something; a sound that lacks agreeable musical quality or is noticeably unpleasant.
Ore A deposit of rock from which a valuable mineral or minerals can be economically extracted.
Overburden Material that must be removed to allow access to an orebody, particularly in a surface mining operation.
Paleozoic The span of time between approximately 570 and 245 million years ago.
Particulate(s) Minute, separate particles, such as dust or other air pollutants.
Perennial Stream A stream or reach of a stream that flows throughout the year.
Physiographic Province Region in which all parts have similar geologic structure and climate and whose landforms differ significantly from those of other regions.
Pregnant Solution Solution derived from the leaching process that contains dissolved metals.
Project Alternatives Alternatives to the Proposed Action developed through the National Environmental Policy Act (NEPA) process.
Properties of Cultural and Religious Importance (PCRI)
A “property of cultural or religious importance” that is a historic property eligible for the National Register of Historic Places and associated with the cultural practices of an Indian tribe or other cultural or ethnic community.
Raptor A bird of prey (e.g., eagle, hawk, falcon, and owl).
Recovery (Groundwater) An increase in groundwater levels such that the groundwater elevations rise above initial baseline groundwater elevations. Refers to an increase in water levels following drawdown.
Reserves Identified resources of mineral-bearing rock from which the mineral can be extracted profitably with existing technology and under present economic conditions.
Right-of-Way (ROW) Strip of land or corridor over which a power line, access road, or maintenance road would pass.

Deep South Expansion Project EIS Chapter 7.0 – Glossary 7-8
Draft EIS 2018
Riparian Situated on or pertaining to the bank of a river, stream, or other body of water. Riparian is normally used to refer to plants of all types that grow along streams, rivers, or at spring and seep sites.
Run-of-Mine Ore Ore that is taken from a mine or pit directly to a mill for processing.
Runoff That part of precipitation that appears in surface streams; precipitation that is not retained on the site where it falls and is not absorbed by the soil.
Sediment Material suspended in or settling to the bottom of a liquid. Sediment input comes from natural sources, such as soil erosion and rock weathering, construction activities, or anthropogenic sources, such as forest or agricultural practices.
Sediment Load The amount of sediment (sand, silt, and fine particles) carried by a stream or river.
Seismicity The likelihood of an area being subject to earthquakes; the phenomenon of earth movements.
Sensitive Receptors (Noise) Activities or land uses that are more susceptible than others to noise interference.
Sensitive Viewpoint Similar to a Key Observation Point, but of lesser sensitivity due to infrequency of use, small numbers of viewers, or similar mitigating circumstances.
Sound Power The total sound energy radiated by a source per unit time. The unit of measurement is the watt or some fraction of a watt.
Sound Pressure The instantaneous difference between the actual pressure produced by a sound wave and the average or barometric pressure at a given point in space.
Species A group of individuals of common ancestry that closely resemble each other structurally and physiologically, and in nature interbreed producing fertile offspring.
Stratigraphy Form, arrangement, geographic distribution, chronological succession, classification, and relationships of rock strata.
Subsidence Sinking or downward settling of the earth’s surface.
Tertiary The span of time between 65 and 10 million years ago.
Threatened Species Any species of plant or animal that is likely to become endangered within the foreseeable future throughout all or a significant portion of its range.
Total Dissolved Solids (TDS) The total amount of dissolved material, organic or inorganic, contained in a sample of water.

Deep South Expansion Project EIS Chapter 7.0 – Glossary 7-9
Draft EIS 2018
Total Suspended Solids The amount of undissolved particles suspended in a sample of water.
Traditional Cultural Property A site or resource that is eligible for inclusion in the National Register of Historic Places because of its association with cultural practices or beliefs of a living community.
Transmissivity The rate at which water of the prevailing kinematic viscosity is transmitted through a unit width of an aquifer under a unit hydraulic gradient; it equals the hydraulic conductivity multiplied by the aquifer thickness.
Visual Resource The composite of basic terrain, geologic features, water features, vegetation patterns, and land use effects that typify a land unit and influence the visual appeal the unit may have for viewers.
Visual Resource Management (VRM) Classes
A classification of landscapes according to the kinds of structures and changes that are acceptable to meet established visual goals (BLM).
Water Table The level in the saturated zone at which the pressure is equal to the atmospheric pressure.
Waters of the United States A jurisdictional term from Section 404 of the Clean Water Act referring to water bodies such as lakes, rivers, streams (including intermittent streams), mudflats, sandflats, wetlands, sloughs, prairie potholes, wet meadows, playa lakes, or natural ponds. The use, degradation, or destruction of these waters could affect interstate or foreign commerce.
Wetlands Areas that are inundated by surface or groundwater with a frequency sufficient to support (and under normal circumstances do or would support) a prevalence of vegetation or aquatic life that requires saturated or seasonally saturated soil conditions for growth and reproduction.
Wind Rose A graphical representation of wind direction and wind speed frequencies.

Deep South Expansion Project EIS Chapter 7.0 – Glossary 7-10
Draft EIS 2018
This page intentionally left blank

Appendix A Deep South Expansion Project EIS Water Resources
Draft EIS 2018
Appendix A
Water Resources

Appendix A Deep South Expansion Project EIS Water Resources
Draft EIS 2018
This page intentionally left blank

Appendix A Deep South Expansion Project EIS Water Resources A-1
Draft EIS 2018
Table A-1 Inventoried Springs
Hydrographic Basin 1 Spring GroupMap ID Spring ID Type
BCI Monitoring Program
Elevation (feet amsl)
Crescent Valley Brock Canyon 36 28-49-30-231 Seep/Spring Wetland Monitored 5,606
Crescent Valley Brock Canyon 37 28-49-30-443 Seep/Spring Wetland Monitored 5,550
Crescent Valley Brock Canyon 38 27-49-14-413 Seep/Spring Wetland Monitored 6,757
Carico Lake Valley Carico Lake North 14 WCCC-12 Spring Not Monitored 6,971
Carico Lake Valley Carico Lake North 15 WCCC-10 Spring Not Monitored 6,888
Carico Lake Valley Carico Lake North 16 WCCC-13 Spring Not Monitored 6,878
Carico Lake Valley Carico Lake North 17 WCCC-9 Spring Not Monitored 6,849
Carico Lake Valley Carico Lake North 18 WCCC-7 Spring Not Monitored 6,774
Carico Lake Valley Carico Lake North 19 WCCC-1 Spring Not Monitored 6,754
Carico Lake Valley Carico Lake North 20 WCCC-6 Spring Not Monitored 6,963
Carico Lake Valley Carico Lake North 21 WCCC-5 Spring Not Monitored 6,983
Carico Lake Valley Carico Lake North 22 WCCC-3 Spring Not Monitored 6,043
Carico Lake Valley Carico Lake North 23 WCCC-11 Spring Not Monitored 6,414
Carico Lake Valley Carico Lake North 24 WCCC-14 Spring Not Monitored 6,463
Carico Lake Valley Carico Lake South 71 WCCC-15 Spring Not Monitored 6,112
Carico Lake Valley Carico Lake South 72 WCCC-2 Spring Not Monitored 6,091
Carico Lake Valley Carico Lake South 73 WCCC-4 Spring Not Monitored 5,571
Carico Lake Valley Carico Lake South 74 WCCC-8 Spring Not Monitored 5,285
Carico Lake Valley Carico Lake South 75 CL-20 Spring Not Monitored 5,093
Carico Lake Valley Carico Lake South 76 CL-403 Spring Not Monitored 5,091
Carico Lake Valley Carico Lake South 77 CL-7 Spring Not Monitored 5,096
Carico Lake Valley Carico Lake South 78 CL-405 Spring Not Monitored 5,091
Carico Lake Valley Carico Lake South 79 CL-8 Spring Not Monitored 5,093
Carico Lake Valley Carico Lake South 80 CL-15 Spring Not Monitored 5,091
Carico Lake Valley Carico Lake South 81 CL-16 Spring Not Monitored 5,092

Appendix A Deep South Expansion Project EIS Water Resources A-2
Draft EIS 2018
Table A-1 Inventoried Springs
Hydrographic Basin 1 Spring GroupMap ID Spring ID Type
BCI Monitoring Program
Elevation (feet amsl)
Carico Lake Valley Carico Lake South 82 CL-1 Spring Not Monitored 5,091
Carico Lake Valley Carico Lake South 83 CL-2 Spring Not Monitored 5,090
Carico Lake Valley Carico Lake South 84 CL-9 Spring Not Monitored 5,093
Carico Lake Valley Carico Lake South 85 CL-21 Spring Not Monitored 5,091
Carico Lake Valley Carico Lake South 86 CL-404 Spring Not Monitored 5,093
Carico Lake Valley Carico Lake South 87 CL-3 Spring Not Monitored 5,095
Carico Lake Valley Carico Lake South 88 CL-17 Spring Not Monitored 5,103
Carico Lake Valley Carico Lake South 89 CL-401 Spring Not Monitored 5,103
Carico Lake Valley Carico Lake South 90 CL-4 Spring Not Monitored 5,103
Carico Lake Valley Carico Lake South 91 CL-5 Spring Not Monitored 5,104
Carico Lake Valley Carico Lake South 92 CL-13 Spring Not Monitored 5,103
Carico Lake Valley Carico Lake South 93 CL-18 Spring Not Monitored 5,103
Carico Lake Valley Carico Lake South 94 CL-402 Spring Not Monitored 5,103
Carico Lake Valley Carico Lake South 95 CL-14 Spring Not Monitored 5,103
Crescent Valley Cortez Hills 96 27-48-30-412 Spring Not Monitored 5,751
Crescent Valley Cortez Hills 97 27-48-30-421 Spring Not Monitored 5,767
Crescent Valley Cortez Hills 98 27-48-30-423 Spring Not Monitored 5,785
Crescent Valley Cortez Hills 99 27-48-30-44 Spring Not Monitored 6,068
Crescent Valley Cortez Hills 100 27-47-35-32 Spring Not Monitored 5,457
Crescent Valley Cortez Hills 101 27-47-35-324 Spring Not Monitored 5,498
Crescent Valley Cortez Hills 102 27-47-36-431 Spring Not Monitored 5,605
Crescent Valley Cortez Hills 103 27-47-36-433 Spring Not Monitored 5,641
Crescent Valley Cortez Hills 104 26-47-1-212 Spring Not Monitored 5,681
Crescent Valley Cortez Hills 105 26-47-1-214 Spring Not Monitored 5,718
Crescent Valley Cortez Hills 106 26-47-1-41 Spring Not Monitored 5,842

Appendix A Deep South Expansion Project EIS Water Resources A-3
Draft EIS 2018
Table A-1 Inventoried Springs
Hydrographic Basin 1 Spring GroupMap ID Spring ID Type
BCI Monitoring Program
Elevation (feet amsl)
Crescent Valley Cortez Hills 107 26-47-1-43 Spring Not Monitored 6,024
Crescent Valley Cortez Hills 108 26-47-12-21 Spring Not Monitored 5,937
Crescent Valley Cottonwood Canyon 25 28-49-20-241 Seep/Spring Wetland Monitored 5,527
Crescent Valley Cottonwood Canyon 26 28-49-21-314 Seep/Spring Wetland Monitored 5,689
Crescent Valley Cottonwood Canyon 27 28-49-20-442 Seep/Spring Wetland Monitored 5,959
Crescent Valley Cottonwood Canyon 28 28-49-28-123 Seep/Spring Wetland Monitored 5,988
Crescent Valley Cottonwood Canyon 29 28-49-35-311 Seep/Spring Wetland Monitored 6,497
Crescent Valley Cottonwood Canyon 30 28-49-36-322 Seep/Spring Wetland Monitored 6,950
Crescent Valley Cottonwood Canyon 31 28-49-36-323 Seep/Spring Wetland Monitored 6,872
Crescent Valley Cottonwood Canyon 32 27-49-12-112 Seep/Spring Wetland Monitored 6,950
Crescent Valley Cottonwood Canyon 33 27-49-12-114 Seep/Spring Wetland Monitored 7,016
Crescent Valley Cottonwood Canyon 34 27-49-12-122 Seep/Spring Wetland Monitored 7,002
Crescent Valley Cottonwood Canyon 35 27-49-12-141 Seep/Spring Wetland Monitored 7,074
Crescent Valley Cottonwood Canyon 245 CCCV-1 Spring Monitored 6,132
Crescent Valley Cottonwood Canyon 247 DCPC-1 Spring Monitored 6,692
Pine Valley Dry Creek 65 27-49-30-132 Seep/Spring Wetland Monitored 7,259
Pine Valley Dry Creek 66 27-48-24-421 Seep/Spring Wetland Monitored 7,485
Pine Valley Dry Creek 67 27-49-29-413 Seep/Spring Wetland Monitored 6,462
Pine Valley Dry Creek 68 27-49-32-111 Seep/Spring Wetland Monitored 6,565
Pine Valley Dry Creek 69 27-49-32-121 Seep/Spring Wetland Monitored 6,446
Pine Valley Dry Creek 70 27-49-31-244 Seep/Spring Wetland Monitored 6,541
Pine Valley Dry Hills 217 26-48-23-211A Seep/Spring Wetland Monitored 6,607
Pine Valley Dry Hills 218 26-48-23-211B Seep/Spring Wetland Monitored 6,592
Pine Valley Dry Hills 219 26-48-23-242 Seep/Spring Wetland Monitored 6,439
Pine Valley Dry Hills 220 26-48-24-133 Seep/Spring Wetland Monitored 6,403

Appendix A Deep South Expansion Project EIS Water Resources A-4
Draft EIS 2018
Table A-1 Inventoried Springs
Hydrographic Basin 1 Spring GroupMap ID Spring ID Type
BCI Monitoring Program
Elevation (feet amsl)
Pine Valley Dry Hills 221 26-48-24-134 Seep/Spring Wetland Monitored 6,394
Pine Valley Dry Hills 222 26-48-23-313A Seep/Spring Wetland Monitored 6,797
Pine Valley Dry Hills 223 26-48-23-313B Seep/Spring Wetland Monitored 6,794
Pine Valley Dry Hills 224 26-48-26-123B Seep/Spring Wetland Monitored 6,477
Pine Valley Dry Hills 225 26-48-26-123A Seep/Spring Wetland Monitored 6,477
Pine Valley Dry Hills 240 26-48-23-321 Spring Not Monitored 6,762
Pine Valley Dry Hills 241 26-48-26-111 Spring Not Monitored 6,557
Pine Valley Dry Hills 242 26-48-26-122 Spring Not Monitored 6,514
Pine Valley Dry Hills 243 26-48-26-132 Spring Not Monitored 6,575
Crescent Valley Fourmile Canyon 53 27-48-16-31 Spring Not Monitored 5,348
Crescent Valley Fourmile Canyon 54 27-48-14-313 Seep/Spring Wetland Monitored 5,781
Crescent Valley Fourmile Canyon 55 27-48-22-222A Seep/Spring Wetland Monitored 5,956
Crescent Valley Fourmile Canyon 56 27-48-23-244 Seep/Spring Wetland Monitored 7,039
Crescent Valley Fourmile Canyon 57 27-48-23-234 Seep/Spring Wetland Monitored 6,721
Crescent Valley Fourmile Canyon 58 27-48-35-112 Seep/Spring Wetland Monitored 7,775
Pine Valley Horse Creek 157 26-48-03-221 Seep/Spring Wetland Monitored 7,312
Pine Valley Horse Creek 158 26-48-03-213 Seep/Spring Wetland Monitored 7,208
Pine Valley Horse Creek 159 26-48-3-114 Spring Not Monitored 7,583
Pine Valley Horse Creek 160 26-48-03-134 Seep/Spring Wetland Monitored 7,289
Pine Valley Horse Creek 161 26-48-3-143 Spring Not Monitored 7,213
Pine Valley Horse Creek 163 26-48-02-322 Seep/Spring Wetland Monitored 7,515
Pine Valley Horse Creek 164 26-48-03-321 Seep/Spring Wetland Monitored 7,198
Pine Valley Horse Creek 165 26-48-03-413A Seep/Spring Wetland Monitored 7,034
Pine Valley Horse Creek 166 26-48-03-413B Seep/Spring Wetland Monitored 7,021
Pine Valley Horse Creek 168 26-48-02-423B Seep/Spring Wetland Monitored 7,395

Appendix A Deep South Expansion Project EIS Water Resources A-5
Draft EIS 2018
Table A-1 Inventoried Springs
Hydrographic Basin 1 Spring GroupMap ID Spring ID Type
BCI Monitoring Program
Elevation (feet amsl)
Pine Valley Horse Creek 169 26-48-02-423A Seep/Spring Wetland Monitored 7,397
Pine Valley Horse Creek 170 26-48-03-443 Seep/Spring Wetland Monitored 6,794
Pine Valley Horse Creek 171 26-48-03-444 Seep/Spring Wetland Monitored 6,739
Pine Valley Horse Creek 172 26-48-11-142 Seep/Spring Wetland Monitored 6,758
Pine Valley Horse Creek 173 26-48-10-142 Seep/Spring Wetland Monitored 7,022
Pine Valley Horse Creek 174 26-48-10-232 Seep/Spring Wetland Monitored 6,921
Pine Valley Horse Creek 175 26-48-11-144A(26-48-02-144A)
Seep/Spring Wetland Monitored 7,050
Pine Valley Horse Creek 176 26-48-11-144B(26-48-02-144B)
Seep/Spring Wetland Monitored 7,044
Pine Valley Horse Creek 177 26-48-11-312 Seep/Spring Wetland Monitored 6,720
Pine Valley Horse Creek 178 26-48-12-324 Seep/Spring Wetland Monitored 6,859
Pine Valley Horse Creek 179 26-48-12-341 Seep/Spring Wetland Monitored 6,852
Pine Valley Horse Creek 180 26-48-12-414 Seep/Spring Wetland Monitored 6,724
Pine Valley Horse Creek 181 26-48-12-432 Seep/Spring Wetland Monitored 6,743
Pine Valley Horse Creek 182 26-48-10-441 Seep/Spring Wetland Monitored 6,768
Pine Valley Horse Creek 183 26-48-11-422 Spring Not Monitored 6,633
Pine Valley Horse Creek 184 26-48-10-442 Seep/Spring Wetland Monitored 6,737
Pine Valley Horse Creek 185 26-49-18-331 Seep/Spring Wetland Monitored 6,486
Pine Valley Horse Creek 186 26-49-18-332 Seep/Spring Wetland Monitored 6,441
Pine Valley Horse Creek 187 26-48-10-444 Seep/Spring Wetland Monitored 6,678
Pine Valley Horse Creek 188 26-48-10-344 Seep/Spring Wetland Monitored 6,840
Pine Valley Horse Creek 189 26-48-10-433 Seep/Spring Wetland Monitored 6,831
Pine Valley Horse Creek 190 26-48-13-324 Seep/Spring Wetland Monitored 6,314
Pine Valley Horse Creek 191 26-48-13-323 Seep/Spring Wetland Monitored 6,310
Pine Valley Horse Creek 192 26-48-13-432 Seep/Spring Wetland Monitored 6,291

Appendix A Deep South Expansion Project EIS Water Resources A-6
Draft EIS 2018
Table A-1 Inventoried Springs
Hydrographic Basin 1 Spring GroupMap ID Spring ID Type
BCI Monitoring Program
Elevation (feet amsl)
Pine Valley Horse Creek 193 26-48-13-431 Seep/Spring Wetland Monitored 6,283
Pine Valley Horse Creek 194 26-48-13-342 Seep/Spring Wetland Monitored 6,283
Pine Valley Horse Creek 195 26-48-24-221 Seep/Spring Wetland Monitored 6,230
Pine Valley Horse Creek 236 26-48-12-323 Spring Not Monitored 6,870
Pine Valley Horse Creek 237 26-48-14-412 Spring Not Monitored 6,550
Pine Valley Horse Creek 238 26-48-14-424 Spring Not Monitored 6,523
Pine Valley Horse Creek 239 26-49-30-112 Spring Not Monitored 6,123
Crescent Valley Indian Creek 13 IC-1 Spring Not Monitored 5,158
Crescent Valley Mill Canyon 59 27-48-21-421 Seep/Spring Wetland Monitored 6,593
Crescent Valley Mill Canyon 60 27-48-28-211 Seep/Spring Wetland Monitored 6,129
Crescent Valley Mill Canyon 61 27-48-27-134A Seep/Spring Wetland Monitored 6,978
Crescent Valley Mill Canyon 62 27-48-27-134 Seep/Spring Wetland Monitored 7,059
Crescent Valley Mill Canyon 63 27-48-28-441A Seep/Spring Wetland Monitored 6,727
Crescent Valley Mill Canyon 64 27-48-28-441 Seep/Spring Wetland Monitored 6,764
Grass Valley North Toiyabe Range East 208 26-47-12-314A Seep/Spring Wetland Monitored 6,070
Grass Valley North Toiyabe Range East 209 26-47-11-433B Seep/Spring Wetland Monitored 6,387
Grass Valley North Toiyabe Range East 210 26-47-14-141 Seep/Spring Wetland Monitored 6,498
Grass Valley North Toiyabe Range East 211 26-47-23-314B Seep/Spring Wetland Monitored 6,223
Grass Valley North Toiyabe Range East 212 26-47-23-314A Seep/Spring Wetland Monitored 6,231
Grass Valley North Toiyabe Range East 213 26-47-23-344B Seep/Spring Wetland Monitored 6,086
Grass Valley North Toiyabe Range East 214 26-47-27-324 Seep/Spring Wetland Monitored 6,469
Grass Valley North Toiyabe Range East 215 26-47-35-134 Seep/Spring Wetland Monitored 5,845
Grass Valley North Toiyabe Range East 216 26-47-33-422 Seep/Spring Wetland Monitored 6,282
Grass Valley North Toiyabe Range East 248 HSCC-1 Spring Monitored 6,111

Appendix A Deep South Expansion Project EIS Water Resources A-7
Draft EIS 2018
Table A-1 Inventoried Springs
Hydrographic Basin 1 Spring GroupMap ID Spring ID Type
BCI Monitoring Program
Elevation (feet amsl)
Crescent Valley North Toiyabe Range West
196 27-47-27-43 Spring Not Monitored 5,072
Crescent Valley North Toiyabe Range West
197 27-47-33-42 Spring Not Monitored 5,321
Crescent Valley North Toiyabe Range West
198 26-47-4-24 Spring Not Monitored 5,461
Crescent Valley North Toiyabe Range West
199 26-47-16-212C Spring Not Monitored 5,803
Crescent Valley North Toiyabe Range West
200 26-47-16-212B Seep/Spring Wetland Monitored 5,827
Crescent Valley North Toiyabe Range West
201 26-47-16-212D Seep/Spring Wetland Monitored 5,837
Crescent Valley North Toiyabe Range West
202 26-47-16-212A Seep/Spring Wetland Monitored 5,828
Crescent Valley North Toiyabe Range West
203 26-47-16-211 Seep/Spring Wetland Monitored 5,758
Crescent Valley North Toiyabe Range West
205 26-47-16-434 Seep/Spring Wetland Monitored 6,079
Crescent Valley North Toiyabe Range West
206 26-47-20-342 Seep/Spring Wetland Monitored 5,955
Crescent Valley North Toiyabe Range West
207 26-47-29-244 Seep/Spring Wetland Monitored 6,197
Crescent Valley North Toiyabe Range West
246 CSFAF-1 Spring Monitored 7,011
Crescent Valley Peripheral Area 226 26-46-21-12 Spring Not Monitored 5,459
Grass Valley Rocky Hills 229 25-48-25-341 Seep/Spring Wetland Monitored 6,285
Pine Valley Rocky Hills 227 25-49-11-423 Seep/Spring Wetland Monitored 6,064
Pine Valley Rocky Hills 228 25-49-29-213 Seep/Spring Wetland Monitored 6,817
Carico Lake Valley Rocky Pass 49 27-46-16-11 Spring Not Monitored 5,231

Appendix A Deep South Expansion Project EIS Water Resources A-8
Draft EIS 2018
Table A-1 Inventoried Springs
Hydrographic Basin 1 Spring GroupMap ID Spring ID Type
BCI Monitoring Program
Elevation (feet amsl)
Carico Lake Valley Rocky Pass 52 27-46-28-11 Spring Not Monitored 5,022
Crescent Valley Rocky Pass 50 27-46-28-221 Spring Not Monitored 4,995
Crescent Valley Rocky Pass 51 27-46-28-224 Spring Not Monitored 4,993
Crescent Valley SE Crescent Valley 39 28-48-28-14 Spring Not Monitored 4,747
Crescent Valley SE Crescent Valley 40 28-48-28-342 Spring Not Monitored 4,771
Crescent Valley SE Crescent Valley 41 28-48-32-33 Spring Not Monitored 4,760
Crescent Valley SE Crescent Valley 42 28-48-32-34 Spring Not Monitored 4,760
Crescent Valley SE Crescent Valley 43 28-48-28-343 Spring Not Monitored 4,760
Crescent Valley SE Crescent Valley 44 28-48-28-43 Spring Not Monitored 4,768
Crescent Valley SE Crescent Valley 45 28-48-32-32 Spring Not Monitored 4,771
Crescent Valley SE Crescent Valley 46 28-48-32-24 Spring Not Monitored 4,772
Crescent Valley SE Crescent Valley 47 27-48-19-24 Spring Not Monitored 5,040
Crescent Valley SE Crescent Valley 48 HDR-27-48-19-24 Seep/Spring Wetland Monitored 5,050
Carico Lake Valley Shoshone 9 28-46-7-31 Spring Not Monitored 7,157
Carico Lake Valley Shoshone 10 28-46-17-11 Spring Not Monitored 6,718
Carico Lake Valley Shoshone 12 28-46-21-11 Spring Not Monitored 6,155
Crescent Valley Shoshone 1 29-46-29-22 Spring Not Monitored 6,295
Crescent Valley Shoshone 2 29-46-29-234 Spring Not Monitored 6,415
Crescent Valley Shoshone 3 29-46-29-31 Spring Not Monitored 6,631
Crescent Valley Shoshone 4 29-46-31-22 Spring Not Monitored 7,210
Crescent Valley Shoshone 5 29-46-31-434 Spring Not Monitored 7,251
Crescent Valley Shoshone 6 28-46-5-42 Spring Not Monitored 6,291
Crescent Valley Shoshone 7 28-46-4-33 Spring Not Monitored 6,226
Crescent Valley Shoshone 8 28-46-2-34 Spring Not Monitored 5,728
Crescent Valley Shoshone 11 28-46-15-32 Spring Not Monitored 6,226

Appendix A Deep South Expansion Project EIS Water Resources A-9
Draft EIS 2018
Table A-1 Inventoried Springs
Hydrographic Basin 1 Spring GroupMap ID Spring ID Type
BCI Monitoring Program
Elevation (feet amsl)
Pine Valley Willow Creek 109 27-48-25-244 Seep/Spring Wetland Monitored 7,238
Pine Valley Willow Creek 110 27-48-25-143 Seep/Spring Wetland Monitored 7,631
Pine Valley Willow Creek 111 27-48-25-411 Seep/Spring Wetland Monitored 7,448
Pine Valley Willow Creek 112 27-48-25-324A Seep/Spring Wetland Monitored 7,440
Pine Valley Willow Creek 113 27-48-25-324 Seep/Spring Wetland Monitored 7,412
Pine Valley Willow Creek 114 27-48-25-313 Seep/Spring Wetland Monitored 7,676
Pine Valley Willow Creek 115 27-49-31-344 Seep/Spring Wetland Monitored 6,808
Pine Valley Willow Creek 116 27-48-25-334 Seep/Spring Wetland Monitored 7,556
Pine Valley Willow Creek 117 26-49-06-211 Seep/Spring Wetland Monitored 6,620
Pine Valley Willow Creek 118 26-49-06-213 Seep/Spring Wetland Monitored 6,603
Pine Valley Willow Creek 119 27-48-35-234 Seep/Spring Wetland Monitored 7,317
Pine Valley Willow Creek 120 27-48-36-321A Seep/Spring Wetland Monitored 7,086
Pine Valley Willow Creek 121 27-48-35-311 Seep/Spring Wetland Monitored 7,477
Pine Valley Willow Creek 122 27-48-34-421 Spring Not Monitored 7,588
Pine Valley Willow Creek 123 27-48-34-322B Seep/Spring Wetland Monitored 7,648
Pine Valley Willow Creek 124 27-48-34-412 Spring Not Monitored 7,629
Pine Valley Willow Creek 125 27-48-34-322A Seep/Spring Wetland Monitored 7,681
Pine Valley Willow Creek 126 27-48-35-441B Seep/Spring Wetland Monitored 7,335
Pine Valley Willow Creek 127 26-49-05-324 Seep/Spring Wetland Monitored 6,239
Pine Valley Willow Creek 128 27-48-35-441 Spring Not Monitored 7,329
Pine Valley Willow Creek 129 27-48-35-442B Seep/Spring Wetland Monitored 7,321
Pine Valley Willow Creek 130 26-49-07-221 Seep/Spring Wetland Monitored 6,434
Pine Valley Willow Creek 131 26-49-07-111 Seep/Spring Wetland Monitored 6,824
Pine Valley Willow Creek 132 26-48-01-212B Seep/Spring Wetland Monitored 7,042
Pine Valley Willow Creek 133 26-48-02-224 Seep/Spring Wetland Monitored 7,506

Appendix A Deep South Expansion Project EIS Water Resources A-10
Draft EIS 2018
Table A-1 Inventoried Springs
Hydrographic Basin 1 Spring GroupMap ID Spring ID Type
BCI Monitoring Program
Elevation (feet amsl)
Pine Valley Willow Creek 134 26-49-07-222 Seep/Spring Wetland Monitored 6,358
Pine Valley Willow Creek 135 26-48-01-223 Seep/Spring Wetland Monitored 6,912
Pine Valley Willow Creek 136 26-49-07-114B Seep/Spring Wetland Monitored 6,699
Pine Valley Willow Creek 137 26-48-01-224 Seep/Spring Wetland Monitored 6,841
Pine Valley Willow Creek 138 26-48-01-241 Seep/Spring Wetland Monitored 6,834
Pine Valley Willow Creek 139 26-48-01-131 Seep/Spring Wetland Monitored 7,370
Pine Valley Willow Creek 140 26-49-08-114A Seep/Spring Wetland Monitored 6,284
Pine Valley Willow Creek 141 26-49-07-114 Seep/Spring Wetland Monitored 6,643
Pine Valley Willow Creek 142 26-48-01-141 Seep/Spring Wetland Monitored 7,166
Pine Valley Willow Creek 143 26-49-07-141 Seep/Spring Wetland Monitored 6,916
Pine Valley Willow Creek 144 26-48-01-234 Seep/Spring Wetland Monitored 6,917
Pine Valley Willow Creek 230 27-48-35-423 Spring Not Monitored 7,237
Pine Valley Willow Creek 231 26-48-01-142 Spring Not Monitored 7,033
Pine Valley Willow Creek 244 26-48-01-212 Spring Not Monitored 7,080
Pine Valley Willow Springs 145 26-48-01-313B Seep/Spring Wetland Monitored 7,284
Pine Valley Willow Springs 146 26-48-01-323 Seep/Spring Wetland Monitored 7,198
Pine Valley Willow Springs 147 26-49-07-331 Seep/Spring Wetland Monitored 6,678
Pine Valley Willow Springs 148 26-49-07-343 Seep/Spring Wetland Monitored 6,479
Pine Valley Willow Springs 149 26-49-18-111 Seep/Spring Wetland Monitored 6,672
Pine Valley Willow Springs 150 26-49-18-134 Seep/Spring Wetland Monitored 6,519
Pine Valley Willow Springs 151 26-49-18-423 Seep/Spring Wetland Monitored 6,161
Pine Valley Willow Springs 152 26-49-17-432 Seep/Spring Wetland Monitored 5,923
Pine Valley Willow Springs 153 26-49-20-122A Seep/Spring Wetland Monitored 5,937
Pine Valley Willow Springs 154 26-49-20-122 Seep/Spring Wetland Monitored 5,925
Pine Valley Willow Springs 155 26-49-20-122B Seep/Spring Wetland Monitored 5,928
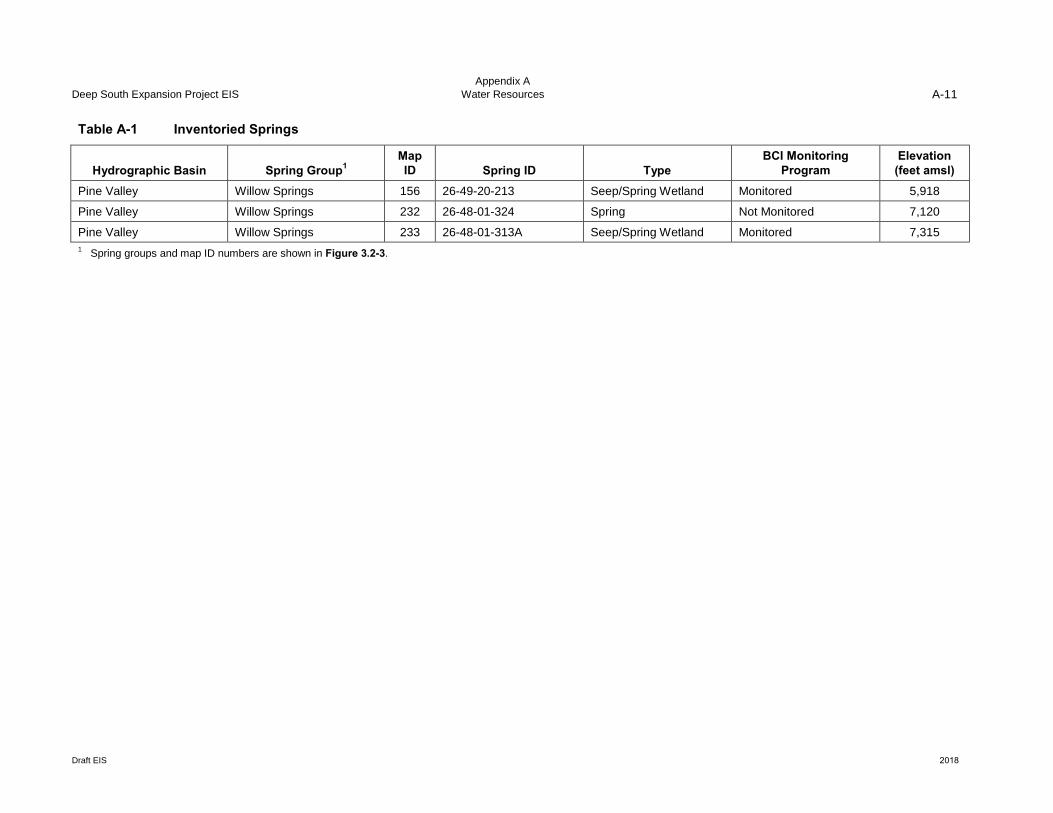
Appendix A Deep South Expansion Project EIS Water Resources A-11
Draft EIS 2018
Table A-1 Inventoried Springs
Hydrographic Basin 1 Spring GroupMap ID Spring ID Type
BCI Monitoring Program
Elevation (feet amsl)
Pine Valley Willow Springs 156 26-49-20-213 Seep/Spring Wetland Monitored 5,918
Pine Valley Willow Springs 232 26-48-01-324 Spring Not Monitored 7,120
Pine Valley Willow Springs 233 26-48-01-313A Seep/Spring Wetland Monitored 7,315 1 Spring groups and map ID numbers are shown in Figure 3.2-3.

Appendix A Deep South Expansion Project EIS Water Resources A-12
Draft EIS 2018
Table A-2 Surface Water Sites within the Drawdown Area
1Spring Group Map ID
1Number Spring or
Stream Site ID
Sites Within the Projected Drawdown Area (Maximum Extent of 10-foot Groundwater Drawdown
Contour Plus 1-mile Buffer) Mitigation Plans
No Action Alternative
Proposed Action and Gold Acres Pit Partial
Backfill Alternative Cumulative
Sites Included in 2011 Final
SEIS Mitigation (Table 3.2-1)2
Sites Included in 2018 Contingent
3Mitigation Plan Springs Rocky Hills 229 25-48-25-341 x x
Rocky Hills 227 25-49-11-423 x x
Rocky Hills 228 25-49-29-213 x x x x
Peripheral Area 226 26-46-21-12 x x x x
Cortez Hills 104 26-47-01-212 x x x x
Cortez Hills 105 26-47-01-214 x x x x
Cortez Hills 106 26-47-01-41 x x x x
Cortez Hills 107 26-47-01-43 x x x x
North Toiyabe Range West 198 26-47-04-24 x x x x
North Toiyabe Range East 209 26-47-11-433B x x x x
Cortez Hills 108 26-47-12-21 x x x x
North Toiyabe Range East 208 26-47-12-314A x x x x
North Toiyabe Range East 210 26-47-14-141 x x x x
North Toiyabe Range West 203 26-47-16-211 x x x x
North Toiyabe Range West 202 26-47-16-212A x x x x
North Toiyabe Range West 200 26-47-16-212B x x x x
North Toiyabe Range West 199 26-47-16-212C x x x x
North Toiyabe Range West 201 26-47-16-212D x x x x
North Toiyabe Range West 205 26-47-16-434 x x x x
North Toiyabe Range West 206 26-47-20-342 x x x

Appendix A Deep South Expansion Project EIS Water Resources A-13
Draft EIS 2018
Table A-2 Surface Water Sites within the Drawdown Area
1Spring Group Map ID
1Number Spring or
Stream Site ID
Sites Within the Projected Drawdown Area (Maximum Extent of 10-foot Groundwater Drawdown
Contour Plus 1-mile Buffer) Mitigation Plans
No Action Alternative
Proposed Action and Gold Acres Pit Partial
Backfill Alternative Cumulative
Sites Included in 2011 Final
SEIS Mitigation (Table 3.2-1)2
Sites Included in 2018 Contingent
3Mitigation Plan North Toiyabe Range East 212 26-47-23-314A x x x x
North Toiyabe Range East 211 26-47-23-314B x x x x
North Toiyabe Range East 213 26-47-23-344B x x x x
North Toiyabe Range East 214 26-47-27-324 x x x x
North Toiyabe Range West 207 26-47-29-244 x x
North Toiyabe Range East 215 26-47-35-134 x x x
Willow Creek 139 26-48-01-131 x x x x
Willow Creek 142 26-48-01-141 x x x x
Willow Creek 231 26-48-01-142 x x x x
Willow Creek 244 26-48-01-212 x x x x
Willow Creek 132 26-48-01-212B x x x x
Willow Creek 135 26-48-01-223 x x x x
Willow Creek 137 26-48-01-224 x x x x
Willow Creek 144 26-48-01-234 x x x x
Willow Creek 138 26-48-01-241 x x x x
Willow Springs 233 26-48-01-313A x x x x
Willow Springs 145 26-48-01-313B x x x x
Willow Springs 146 26-48-01-323 x x x x
Willow Springs 232 26-48-01-324 x x x x
Willow Creek 133 26-48-02-224 x x x x
Horse Creek 163 26-48-02-322 x x x x

Appendix A Deep South Expansion Project EIS Water Resources A-14
Draft EIS 2018
Table A-2 Surface Water Sites within the Drawdown Area
1Spring Group Map ID
1Number Spring or
Stream Site ID
Sites Within the Projected Drawdown Area (Maximum Extent of 10-foot Groundwater Drawdown
Contour Plus 1-mile Buffer) Mitigation Plans
No Action Alternative
Proposed Action and Gold Acres Pit Partial
Backfill Alternative Cumulative
Sites Included in 2011 Final
SEIS Mitigation (Table 3.2-1)2
Sites Included in 2018 Contingent
3Mitigation Plan Horse Creek 169 26-48-02-423A x x x x
Horse Creek 168 26-48-02-423B x x x x
Horse Creek 160 26-48-03-134 x x x x
Horse Creek 161 26-48-03-143 x x x x
Horse Creek 158 26-48-03-213 x x x x
Horse Creek 157 26-48-03-221 x x x
Horse Creek 164 26-48-03-321 x x x x
Horse Creek 165 26-48-03-413A x x x x
Horse Creek 166 26-48-03-413B x x x x
Horse Creek 170 26-48-03-443 x x x x
Horse Creek 171 26-48-03-444 x x x x
Horse Creek 173 26-48-10-142 x x x x
Horse Creek 174 26-48-10-232 x x x x
Horse Creek 188 26-48-10-344 x x x x
Horse Creek 189 26-48-10-433 x x x x
Horse Creek 182 26-48-10-441 x x x x
Horse Creek 184 26-48-10-442 x x x x
Horse Creek 187 26-48-10-444 x x x x
Horse Creek 172 26-48-11-142 x x x x
Horse Creek 175 26-48-11-144A(26-48-02-144A)
x x x x

Appendix A Deep South Expansion Project EIS Water Resources A-15
Draft EIS 2018
Table A-2 Surface Water Sites within the Drawdown Area
1Spring Group Map ID
1Number Spring or
Stream Site ID
Sites Within the Projected Drawdown Area (Maximum Extent of 10-foot Groundwater Drawdown
Contour Plus 1-mile Buffer) Mitigation Plans
No Action Alternative
Proposed Action and Gold Acres Pit Partial
Backfill Alternative Cumulative
Sites Included in 2011 Final
SEIS Mitigation (Table 3.2-1)2
Sites Included in 2018 Contingent
3Mitigation Plan
Horse Creek 176 26-48-11-144B(26-48-02-144B) x x x x
Horse Creek 177 26-48-11-312 x x x x
Horse Creek 183 26-48-11-422 x x x x
Horse Creek 236 26-48-12-323 x x x x
Horse Creek 178 26-48-12-324 x x x x
Horse Creek 179 26-48-12-341 x x x x
Horse Creek 180 26-48-12-414 x x x x
Horse Creek 181 26-48-12-432 x x x x
Horse Creek 191 26-48-13-323 x x x x
Horse Creek 190 26-48-13-324 x x x x
Horse Creek 194 26-48-13-342 x x x x
Horse Creek 193 26-48-13-431 x x x x
Horse Creek 192 26-48-13-432 x x x x
Horse Creek 237 26-48-14-412 x x x x
Horse Creek 238 26-48-14-424 x x x x
Dry Hills 217 26-48-23-211A x x x x
Dry Hills 218 26-48-23-211B x x x x
Dry Hills 219 26-48-23-242 x x x x
Dry Hills 222 26-48-23-313A x x x x
Dry Hills 223 26-48-23-313B x x x x
Dry Hills 240 26-48-23-321 x x x x

Appendix A Deep South Expansion Project EIS Water Resources A-16
Draft EIS 2018
Table A-2 Surface Water Sites within the Drawdown Area
1Spring Group Map ID
1Number Spring or
Stream Site ID
Sites Within the Projected Drawdown Area (Maximum Extent of 10-foot Groundwater Drawdown
Contour Plus 1-mile Buffer) Mitigation Plans
No Action Alternative
Proposed Action and Gold Acres Pit Partial
Backfill Alternative Cumulative
Sites Included in 2011 Final
SEIS Mitigation (Table 3.2-1)2
Sites Included in 2018 Contingent
3Mitigation Plan Dry Hills 220 26-48-24-133 x x x x
Dry Hills 221 26-48-24-134 x x x x
Horse Creek 195 26-48-24-221 x x x x
Dry Hills 241 26-48-26-111 x x x x
Dry Hills 242 26-48-26-122 x x x x
Dry Hills 225 26-48-26-123A x x x x
Dry Hills 224 26-48-26-123B x x x x
Dry Hills 243 26-48-26-132 x x x x
Horse Creek 159 26-48-03-114 x x x x
Willow Creek 127 26-49-05-324 x x x
Willow Creek 117 26-49-06-211 x x x x
Willow Creek 118 26-49-06-213 x x x x
Willow Creek 131 26-49-07-111 x x x x
Willow Creek 141 26-49-07-114 x x x x
Willow Creek 136 26-49-07-114B x x x x
Willow Creek 143 26-49-07-141 x x x x
Willow Creek 130 26-49-07-221 x x x x
Willow Creek 134 26-49-07-222 x x x x
Willow Springs 147 26-49-07-331 x x x x
Willow Springs 148 26-49-07-343 x x x x
Willow Creek 140 26-49-08-114A x x x x

Appendix A Deep South Expansion Project EIS Water Resources A-17
Draft EIS 2018
Table A-2 Surface Water Sites within the Drawdown Area
1Spring Group Map ID
1Number Spring or
Stream Site ID
Sites Within the Projected Drawdown Area (Maximum Extent of 10-foot Groundwater Drawdown
Contour Plus 1-mile Buffer) Mitigation Plans
No Action Alternative
Proposed Action and Gold Acres Pit Partial
Backfill Alternative Cumulative
Sites Included in 2011 Final
SEIS Mitigation (Table 3.2-1)2
Sites Included in 2018 Contingent
3Mitigation Plan Willow Springs 152 26-49-17-432 x x
Willow Springs 149 26-49-18-111 x x x x
Willow Springs 150 26-49-18-134 x x x x
Horse Creek 185 26-49-18-331 x x x x
Horse Creek 186 26-49-18-332 x x x x
Willow Springs 151 26-49-18-423 x x x x
Willow Springs 154 26-49-20-122 x x x
Willow Springs 153 26-49-20-122A x x x
Willow Springs 155 26-49-20-122B x x x
Willow Springs 156 26-49-20-213 x x x
Horse Creek 239 26-49-30-112 x x x
Rocky Pass 49 27-46-16-11 x x x x
Rocky Pass 52 27-46-28-11 x x x x
Rocky Pass 50 27-46-28-221 x x x x
Rocky Pass 51 27-46-28-224 x x x x
North Toiyabe Range West 196 27-47-27-43 x x x x
North Toiyabe Range West 197 27-47-33-42 x x x x
Cortez Hills 100 27-47-35-32 x x x x
Cortez Hills 101 27-47-35-324 x x x x
Cortez Hills 102 27-47-36-431 x x x x
Cortez Hills 103 27-47-36-433 x x x x

Appendix A Deep South Expansion Project EIS Water Resources A-18
Draft EIS 2018
Table A-2 Surface Water Sites within the Drawdown Area
1Spring Group Map ID
1Number Spring or
Stream Site ID
Sites Within the Projected Drawdown Area (Maximum Extent of 10-foot Groundwater Drawdown
Contour Plus 1-mile Buffer) Mitigation Plans
No Action Alternative
Proposed Action and Gold Acres Pit Partial
Backfill Alternative Cumulative
Sites Included in 2011 Final
SEIS Mitigation (Table 3.2-1)2
Sites Included in 2018 Contingent
3Mitigation Plan Fourmile Canyon 54 27-48-14-313 x x x x
Fourmile Canyon 53 27-48-16-31 x x x x
SE Crescent Valley 47 27-48-19-24 x x x x
Mill Canyon 59 27-48-21-421 x x x x
Fourmile Canyon 55 27-48-22-222A x x x x
Fourmile Canyon 57 27-48-23-234 x x x x
Fourmile Canyon 56 27-48-23-244 x x x x
Dry Creek 66 27-48-24-421 x x x x
Willow Creek 110 27-48-25-143 x x x x
Willow Creek 109 27-48-25-244 x x x x
Willow Creek 114 27-48-25-313 x x x x
Willow Creek 113 27-48-25-324 x x x x
Willow Creek 112 27-48-25-324A x x x x
Willow Creek 116 27-48-25-334 x x x x
Willow Creek 111 27-48-25-411 x x x x
Mill Canyon 62 27-48-27-134 x x x x
Mill Canyon 61 27-48-27-134A x x x x
Mill Canyon 60 27-48-28-211 x x x x
Mill Canyon 64 27-48-28-441 x x x x
Mill Canyon 63 27-48-28-441A x x x x
Cortez Hills 96 27-48-30-412 x x x x

Appendix A Deep South Expansion Project EIS Water Resources A-19
Draft EIS 2018
Table A-2 Surface Water Sites within the Drawdown Area
1Spring Group Map ID
1Number Spring or
Stream Site ID
Sites Within the Projected Drawdown Area (Maximum Extent of 10-foot Groundwater Drawdown
Contour Plus 1-mile Buffer) Mitigation Plans
No Action Alternative
Proposed Action and Gold Acres Pit Partial
Backfill Alternative Cumulative
Sites Included in 2011 Final
SEIS Mitigation (Table 3.2-1)2
Sites Included in 2018 Contingent
3Mitigation Plan Cortez Hills 97 27-48-30-421 x x x x
Cortez Hills 98 27-48-30-423 x x x x
Cortez Hills 99 27-48-30-44 x x x x
Willow Creek 125 27-48-34-322A x x x x
Willow Creek 123 27-48-34-322B x x x x
Willow Creek 124 27-48-34-412 x x x x
Willow Creek 122 27-48-34-421 x x x x
Fourmile Canyon 58 27-48-35-112 x x x x
Willow Creek 119 27-48-35-234 x x x x
Willow Creek 121 27-48-35-311 x x x x
Willow Creek 230 27-48-35-423 x x x x
Willow Creek 128 27-48-35-441 x x x x
Willow Creek 126 27-48-35-441B x x x x
Willow Creek 129 27-48-35-442B x x x x
Willow Creek 120 27-48-36-321A x x x x
Dry Creek 67 27-49-29-413 x x
Dry Creek 65 27-49-30-132 x x
Dry Creek 70 27-49-31-244 x x
Willow Creek 115 27-49-31-344 x x x x
Dry Creek 68 27-49-32-111 x x
Dry Creek 69 27-49-32-121 x x

Appendix A Deep South Expansion Project EIS Water Resources A-20
Draft EIS 2018
Table A-2 Surface Water Sites within the Drawdown Area
1Spring Group Map ID
1Number Spring or
Stream Site ID
Sites Within the Projected Drawdown Area (Maximum Extent of 10-foot Groundwater Drawdown
Contour Plus 1-mile Buffer) Mitigation Plans
No Action Alternative
Proposed Action and Gold Acres Pit Partial
Backfill Alternative Cumulative
Sites Included in 2011 Final
SEIS Mitigation (Table 3.2-1)2
Sites Included in 2018 Contingent
3Mitigation Plan Shoshone 8 28-46-02-34 x x x x
Shoshone 11 28-46-15-32 x x x x
Shoshone 12 28-46-21-11 x x x x
SE Crescent Valley 39 28-48-28-14 x x x
SE Crescent Valley 40 28-48-28-342 x x x
SE Crescent Valley 43 28-48-28-343 x x x
SE Crescent Valley 44 28-48-28-43 x x x x
SE Crescent Valley 46 28-48-32-24 x x x x
SE Crescent Valley 45 28-48-32-32 x x x x
SE Crescent Valley 41 28-48-32-33 x x x
SE Crescent Valley 42 28-48-32-34 x x x
SE Crescent Valley 48 HDR-27-48-19-24 x x x x
Carico Lake North 19 WCCC-01 x x
Carico Lake North 22 WCCC-03 x x
Carico Lake North 21 WCCC-05 x x
Carico Lake North 20 WCCC-06 x x
Carico Lake North 18 WCCC-07 x x
Carico Lake North 17 WCCC-09 x x
Carico Lake North 15 WCCC-10 x x
Carico Lake North 23 WCCC-11 x x
Carico Lake North 14 WCCC-12 x x

Appendix A Deep South Expansion Project EIS Water Resources A-21
Draft EIS 2018
Table A-2 Surface Water Sites within the Drawdown Area
1Spring Group Map ID
1Number Spring or
Stream Site ID
Sites Within the Projected Drawdown Area (Maximum Extent of 10-foot Groundwater Drawdown
Contour Plus 1-mile Buffer) Mitigation Plans
No Action Alternative
Proposed Action and Gold Acres Pit Partial
Backfill Alternative Cumulative
Sites Included in 2011 Final
SEIS Mitigation (Table 3.2-1)2
Sites Included in 2018 Contingent
3Mitigation Plan Carico Lake North 16 WCCC-13 x x
Total Springs 144 168 188 27 161 Total springs excluding those covered in the 2011 Final SEIS mitigation2 122 141 161 -- -- Stream Sites Ferris Creek Stream S-07 FER-01 x x x
Fourmile Canyon S-08 FOU-01-HDR x x x
Fourmile Canyon S-09 FOU-01-JBR x x x
Fourmile Canyon S-10 FOU-02 x x x
Horse Creek S-11 HOR-01 x x
Horse Creek S-12 HOR-02D x x x x
Horse Creek S-13 HOR-05T x x x x
Horse Creek S-14 HOR-05U x x x x
Indian Creek 13 IC-1 x x x
Indian Creek S-16 IND-01D x x x
Indian Creek S-17 IND-01U x x x
Mill Canyon S-18 MIL-01 x x x x
Mill Canyon S-19 MIL-02 x x x x
Mill Canyon S-20 MIL-02A x x x x
Mill Canyon S-21 MIL-03 x x x x
Willow Creek S-25 WIL-06D x x
Total Stream Sites 7 14 16 5 11

Appendix A Deep South Expansion Project EIS Water Resources A-22
Draft EIS 2018
Table A-2 Surface Water Sites within the Drawdown Area
1Spring Group Map ID
1Number Spring or
Stream Site ID
Sites Within the Projected Drawdown Area (Maximum Extent of 10-foot Groundwater Drawdown
Contour Plus 1-mile Buffer) Mitigation Plans
No Action Alternative
Proposed Action and Gold Acres Pit Partial
Backfill Alternative Cumulative
Sites Included in 2011 Final
SEIS Mitigation (Table 3.2-1)2
Sites Included in 2018 Contingent
3Mitigation Plan Streams (Mapped Perennial Reaches)
Cooks Creek x
Elder Creek x x x
Ferris Creek x x x
Horse Creek x x
Indian Creek x x x
Mill Creek x x x
South Fork Mill Creek x
Willow Creek (tributaries) x x
Total Streams 4 6 8 1
2
3
Spring groups and map ID numbers are shown in Figure 3.2-3. Current mitigation presented in Table 3.2-1 in the Cortez Hills Expansion Project Final SEIS (BLM 2011). Proposed contingent mitigation presented in Table 2 in the Contingency Mitigation Plan (BCI and Stantec 2018).

Appendix A Deep South Expansion Project EIS Water Resources A-23
Draft EIS 2018
Table A-3 Mitigation Triggers and Contingency Mitigation 1by 2011 Final SEIS Mitigation
Measures for Drawdown Impacts to Surface Water Resources Not Covered
2Spring Group Map ID
2Number Spring or Stream
Site ID Site Description
Estimated Riparian/
Hydrophytic Vegetation
(acres) Mitigation Trigger
Type Contingency
3Mitigation Plan
Proposed Flow Augmentation
4Rates (gpm)
Effectiveness of Site-specific
Mitigation Plan
Springs
Rocky Hills 229 25-48-25-341
Spring source developed with pipes; supports large wet meadow.
6.068
Reduction of flow below established threshold coincident with a reduction in groundwater levels in the area as determined from groundwater monitoring.
Pipe from new or existing well.
1.0 Mitigation plan would be highly effective at maintaining a water supply for livestock, wildlife, and habitat diversity.
Rocky Hills 227 25-49-11-423
Spring source flowing from a hillside and piped into a cattle trough.
0
Reduction of flow below established threshold coincident with a reduction in groundwater levels in the area as determined from groundwater monitoring.
Pipe from new or existing well.
0.5 Mitigation plan would be highly effective at maintaining a water supply for livestock and wildlife.
Rocky Hills 228 25-49-29-213
Spring pipe and trough with fence surrounding main spring area.
0.158
Reduction of flow below established threshold coincident with a reduction in groundwater levels in the area as determined from groundwater monitoring.
Pipe from new or existing well.
1.1 Mitigation plan would be highly effective at maintaining a water supply for livestock, wildlife, and habitat diversity.

Appendix A Deep South Expansion Project EIS Water Resources A-24
Draft EIS 2018
Table A-3 Mitigation Triggers and Contingency Mitigation 1by 2011 Final SEIS Mitigation
Measures for Drawdown Impacts to Surface Water Resources Not Covered
2Spring Group Map ID
2Number Spring or Stream
Site ID Site Description
Estimated Riparian/
Hydrophytic Vegetation
(acres) Mitigation Trigger
Type Contingency
3Mitigation Plan
Proposed Flow Augmentation
4Rates (gpm)
Effectiveness of Site-specific
Mitigation Plan
Peripheral Area 226 26-46-21-12Developed source piped to trough.
0
Reduction of flow below established threshold coincident with a reduction in groundwater levels in the area as determined from groundwater monitoring.
Pipe from new or existing well.
0.2 Mitigation plan would be highly effective at maintaining a water supply for livestock and wildlife.
North Toiyabe Range East
209 26-47-11-433B
Basin seep on a hillside; reported as dry or no flow in 6 of 7 years during fall monitoring.
0
None
None
Not applicable. Not applicable.
North Toiyabe Range East
208 26-47-12-314ASpring has a spring pipe and trough.
0.024
Reduction of flow below established threshold coincident with a reduction in groundwater levels in the area as determined from groundwater monitoring.
Pipe from new or existing well.
0.3 Mitigation plan would be highly effective at maintaining a water supply for livestock, wildlife, and habitat diversity.
North Toiyabe Range East
210 26-47-14-141Hillside seep with inconsistent flow.
0 None
None Not applicable. Not applicable.

Appendix A Deep South Expansion Project EIS Water Resources A-25
Draft EIS 2018
Table A-3 Mitigation Triggers and Contingency Mitigation 1by 2011 Final SEIS Mitigation
Measures for Drawdown Impacts to Surface Water Resources Not Covered
2Spring Group Map ID
2Number Spring or Stream
Site ID Site Description
Estimated Riparian/
Hydrophytic Vegetation
(acres) Mitigation Trigger
Type Contingency
3Mitigation Plan
Proposed Flow Augmentation
4Rates (gpm)
Effectiveness of Site-specific
Mitigation Plan
North Toiyabe Range West
203 26-47-16-211
Two spring discharge source areas feed into the same wetland complex.
0.172
Reduction of hydrophytic vegetation below established threshold coincident with a reduction in groundwater levels in the area as determined from groundwater monitoring.
Pipe from new or existing well.
0.5 Mitigation plan would be highly effective at maintaining a water supply for livestock, wildlife, and habitat diversity.
North Toiyabe Range West
202 26-47-16-212ASeep associated with a larger wetland complex.
0.003
Reduction of hydrophytic vegetation below established threshold coincident with a reduction in groundwater levels in the area as determined from groundwater monitoring.
Pipe from new or existing well.
0.5 Mitigation plan would be highly effective at maintaining a water supply for livestock, wildlife, and habitat diversity.

Appendix A Deep South Expansion Project EIS Water Resources A-26
Draft EIS 2018
Table A-3 Mitigation Triggers and Contingency Mitigation 1by 2011 Final SEIS Mitigation
Measures for Drawdown Impacts to Surface Water Resources Not Covered
2Spring Group Map ID
2Number Spring or Stream
Site ID Site Description
Estimated Riparian/
Hydrophytic Vegetation
(acres) Mitigation Trigger
Type Contingency
3Mitigation Plan
Proposed Flow Augmentation
4Rates (gpm)
Effectiveness of Site-specific
Mitigation Plan
North Toiyabe Range West
200 26-47-16-212BSeep associated with a larger wetland complex.
0.532*
Reduction of hydrophytic vegetation below established threshold coincident with a reduction in groundwater levels in the area as determined from groundwater monitoring.
Pipe from new or existing well.
0.5 Mitigation plan would be highly effective at maintaining a water supply for livestock, wildlife, and habitat diversity.
North Toiyabe Range West
199 26-47-16-212C
Seep with standing water associated with a larger wetland complex.
0.333
Reduction of hydrophytic vegetation below established threshold coincident with a reduction in groundwater levels in the area as determined from groundwater monitoring.
Pipe from new or existing well.
0.5 Mitigation plan would be highly effective at maintaining a water supply for livestock, wildlife, and habitat diversity.

Appendix A Deep South Expansion Project EIS Water Resources A-27
Draft EIS 2018
Table A-3 Mitigation Triggers and Contingency Mitigation 1by 2011 Final SEIS Mitigation
Measures for Drawdown Impacts to Surface Water Resources Not Covered
2Spring Group Map ID
2Number Spring or Stream
Site ID Site Description
Estimated Riparian/
Hydrophytic Vegetation
(acres) Mitigation Trigger
Type Contingency
3Mitigation Plan
Proposed Flow Augmentation
4Rates (gpm)
Effectiveness of Site-specific
Mitigation Plan
North Toiyabe Range West
201 26-47-16-212D
Seep associated with a larger wetland complex. Heavy livestock use observed.
0.0532*
Reduction of hydrophytic vegetation below established threshold coincident with a reduction in groundwater levels in the area as determined from groundwater monitoring.
Pipe from new or existing well.
0.5 Mitigation plan would be highly effective at maintaining a water supply for livestock, wildlife, and habitat diversity.
North Toiyabe Range West
205 26-47-16-434
Seep reported as dry in 3 of 5 years during fall monitoring. Noted to support willows.
0
Reduction of hydrophytic vegetation below established threshold coincident with a reduction in groundwater levels in the area as determined from groundwater monitoring.
Pipe from new or existing well.
0.5 Mitigation plan would be highly effective at maintaining a water supply for habitat diversity.

Appendix A Deep South Expansion Project EIS Water Resources A-28
Draft EIS 2018
Table A-3 Mitigation Triggers and Contingency Mitigation 1by 2011 Final SEIS Mitigation
Measures for Drawdown Impacts to Surface Water Resources Not Covered
2Spring Group Map ID
2Number Spring or Stream
Site ID Site Description
Estimated Riparian/
Hydrophytic Vegetation
(acres) Mitigation Trigger
Type Contingency
3Mitigation Plan
Proposed Flow Augmentation
4Rates (gpm)
Effectiveness of Site-specific
Mitigation Plan
North Toiyabe Range West
206 26-47-20-342
Site located in a heavily trampled drainage area. Flow is inconsistent (i.e., reported as no flow or dry in 4 of 5 years during fall monitoring).
0.075
Reduction of hydrophytic vegetation below established threshold coincident with a reduction in groundwater levels in the area as determined from groundwater monitoring.
Pipe from new or existing well.
0.5 Mitigation plan would be highly effective at maintaining a water supply for livestock, wildlife, and habitat diversity.
North Toiyabe Range East
212 26-47-23-314A
Spring located on a side hill that flows down a drainage. Flow is inconsistent (i.e., no flow observed in 4 of 7 years during fall monitoring).
0.017*
Reduction of hydrophytic vegetation below established threshold coincident with a reduction in groundwater levels in the area as determined from groundwater monitoring.
Pipe from new or existing well.
0.5 Mitigation plan would be highly effective at maintaining a water supply for livestock, wildlife, and habitat diversity.

Appendix A Deep South Expansion Project EIS Water Resources A-29
Draft EIS 2018
Table A-3 Mitigation Triggers and Contingency Mitigation 1by 2011 Final SEIS Mitigation
Measures for Drawdown Impacts to Surface Water Resources Not Covered
2Spring Group Map ID
2Number Spring or Stream
Site ID Site Description
Estimated Riparian/
Hydrophytic Vegetation
(acres) Mitigation Trigger
Type Contingency
3Mitigation Plan
Proposed Flow Augmentation
4Rates (gpm)
Effectiveness of Site-specific
Mitigation Plan
North Toiyabe Range East
211 26-47-23-314B
Spring located on a side hill and flows down a drainage. Flow is inconsistent (i.e., reported as dry in 4 of 5 years during fall monitoring).
0.017*
Reduction of hydrophytic vegetation below established threshold coincident with a reduction in groundwater levels in the area as determined from groundwater monitoring.
Pipe from new or existing well.
0.5 Mitigation plan would be highly effective at maintaining a water supply for livestock, wildlife, and habitat diversity.
North Toiyabe Range East
213 26-47-23-344B
Seep associated with hydrophytic vegetation. No flow has been observed at this site.
0.001
Reduction of hydrophytic vegetation below established threshold coincident with a reduction in groundwater levels in the area as determined from groundwater monitoring.
Pipe from new or existing well.
0.5 Mitigation plan would be highly effective at maintaining habitat diversity.
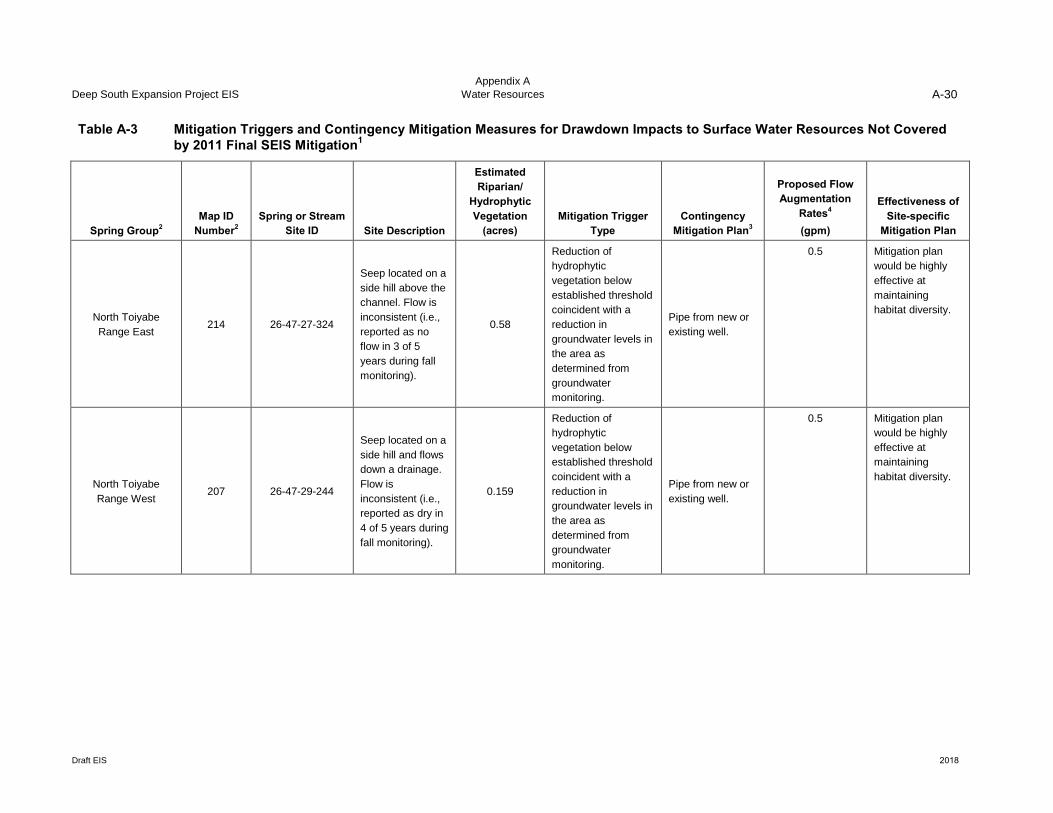
Appendix A Deep South Expansion Project EIS Water Resources A-30
Draft EIS 2018
Table A-3 Mitigation Triggers and Contingency Mitigation 1by 2011 Final SEIS Mitigation
Measures for Drawdown Impacts to Surface Water Resources Not Covered
2Spring Group Map ID
2Number Spring or Stream
Site ID Site Description
Estimated Riparian/
Hydrophytic Vegetation
(acres) Mitigation Trigger
Type Contingency
3Mitigation Plan
Proposed Flow Augmentation
4Rates (gpm)
Effectiveness of Site-specific
Mitigation Plan
North Toiyabe Range East
214 26-47-27-324
Seep located on a side hill above the channel. Flow is inconsistent (i.e., reported as no flow in 3 of 5 years during fall monitoring).
0.58
Reduction of hydrophytic vegetation below established threshold coincident with a reduction in groundwater levels in the area as determined from groundwater monitoring.
Pipe from new or existing well.
0.5 Mitigation plan would be highly effective at maintaining habitat diversity.
North Toiyabe Range West
207 26-47-29-244
Seep located on a side hill and flows down a drainage. Flow is inconsistent (i.e., reported as dry in 4 of 5 years during fall monitoring).
0.159
Reduction of hydrophytic vegetation below established threshold coincident with a reduction in groundwater levels in the area as determined from groundwater monitoring.
Pipe from new or existing well.
0.5 Mitigation plan would be highly effective at maintaining habitat diversity.

Appendix A Deep South Expansion Project EIS Water Resources A-31
Draft EIS 2018
Table A-3 Mitigation Triggers and Contingency Mitigation 1by 2011 Final SEIS Mitigation
Measures for Drawdown Impacts to Surface Water Resources Not Covered
2Spring Group Map ID
2Number Spring or Stream
Site ID Site Description
Estimated Riparian/
Hydrophytic Vegetation
(acres) Mitigation Trigger
Type Contingency
3Mitigation Plan
Proposed Flow Augmentation
4Rates (gpm)
Effectiveness of Site-specific
Mitigation Plan
North Toiyabe Range East
215 26-47-35-134
Seep with standing water that goes dry in some years. Flow has never been recorded.
0.001
Reduction of hydrophytic vegetation below established threshold coincident with a reduction in groundwater levels in the area as determined from groundwater monitoring.
Pipe from new or existing well.
0.5 Mitigation plan would be highly effective at maintaining habitat diversity.
Willow Creek 139 26-48-01-131
Seep area defined by vegetation. Flow has never been recorded.
0.75
Reduction of hydrophytic vegetation below established threshold coincident with a reduction in groundwater levels in the area as determined from groundwater monitoring.
Pipe from new or existing well.
0.5 Mitigation plan would be highly effective at maintaining habitat diversity.

Appendix A Deep South Expansion Project EIS Water Resources A-32
Draft EIS 2018
Table A-3 Mitigation Triggers and Contingency Mitigation 1by 2011 Final SEIS Mitigation
Measures for Drawdown Impacts to Surface Water Resources Not Covered
2Spring Group Map ID
2Number Spring or Stream
Site ID Site Description
Estimated Riparian/
Hydrophytic Vegetation
(acres) Mitigation Trigger
Type Contingency
3Mitigation Plan
Proposed Flow Augmentation
4Rates (gpm)
Effectiveness of Site-specific
Mitigation Plan
Willow Creek 142 26-48-01-141
Seep area defined by vegetation. Monitoring from 2008 -2017 indicates site is typically dry.
0.016
Reduction of hydrophytic vegetation below established threshold coincident with a reduction in groundwater levels in the area as determined from groundwater monitoring.
Pipe from new or existing well.
0.5 Mitigation plan would be highly effective at maintaining habitat diversity.
Willow Creek 231 26-48-01-142
Seasonally influenced site located in a drainage bottom. Monitoring data indicate the site is consistently dry during the low flow period (late summer through fall).
0
None
None
Not applicable. Not applicable.

Appendix A Deep South Expansion Project EIS Water Resources A-33
Draft EIS 2018
Table A-3 Mitigation Triggers and Contingency Mitigation 1by 2011 Final SEIS Mitigation
Measures for Drawdown Impacts to Surface Water Resources Not Covered
2Spring Group Map ID
2Number Spring or Stream
Site ID Site Description
Estimated Riparian/
Hydrophytic Vegetation
(acres) Mitigation Trigger
Type Contingency
3Mitigation Plan
Proposed Flow Augmentation
4Rates (gpm)
Effectiveness of Site-specific
Mitigation Plan
Willow Creek 244 26-48-01-212
Seasonally influenced site located in a rocky drainage bottom. Monitoring data indicate the site is consistently dry during the low flow period (late summer through fall).
0.008
Reduction of hydrophytic vegetation below established threshold coincident with a reduction in groundwater levels in the area as determined from groundwater monitoring.
Pipe from new or existing well.
0.5 Mitigation plan would be highly effective at maintaining habitat diversity.
Willow Creek 132 26-48-01-212B
Seasonally influenced site located in a dry ephemeral channel that is tributary to Willow Creek. Monitoring data indicate the site is typically dry during the annual fall sampling event.
0.014
Reduction of hydrophytic vegetation below established threshold coincident with a reduction in groundwater levels in the area as determined from groundwater monitoring.
Pipe from new or existing well.
0.5 Mitigation plan would be highly effective at maintaining habitat diversity.

Appendix A Deep South Expansion Project EIS Water Resources A-34
Draft EIS 2018
Table A-3 Mitigation Triggers and Contingency Mitigation 1by 2011 Final SEIS Mitigation
Measures for Drawdown Impacts to Surface Water Resources Not Covered
2Spring Group Map ID
2Number Spring or Stream
Site ID Site Description
Estimated Riparian/
Hydrophytic Vegetation
(acres) Mitigation Trigger
Type Contingency
3Mitigation Plan
Proposed Flow Augmentation
4Rates (gpm)
Effectiveness of Site-specific
Mitigation Plan
Willow Creek 135 26-48-01-223
Seasonally influenced site located in a dry ephemeral channel that is tributary to Willow Creek. Monitoring data indicate the site is typically dry during the annual fall sampling.
0.015
Reduction of hydrophytic vegetation below established threshold coincident with a reduction in groundwater levels in the area as determined from groundwater monitoring.
Pipe from new or existing well.
0.5 Mitigation plan would be highly effective at maintaining habitat diversity.
Willow Creek 137 26-48-01-224
Site located in a dry ephemeral channel that is tributary to Willow Creek. Monitoring data indicate flow has never been recorded or observed during the annual fall sampling.
0.098*
Reduction of hydrophytic vegetation below established threshold coincident with a reduction in groundwater levels in the area as determined from groundwater monitoring.
Pipe from new or existing well.
0.5 Mitigation plan would be highly effective at maintaining habitat diversity.

Appendix A Deep South Expansion Project EIS Water Resources A-35
Draft EIS 2018
Table A-3 Mitigation Triggers and Contingency Mitigation 1by 2011 Final SEIS Mitigation
Measures for Drawdown Impacts to Surface Water Resources Not Covered
2Spring Group Map ID
2Number Spring or Stream
Site ID Site Description
Estimated Riparian/
Hydrophytic Vegetation
(acres) Mitigation Trigger
Type Contingency
3Mitigation Plan
Proposed Flow Augmentation
4Rates (gpm)
Effectiveness of Site-specific
Mitigation Plan
Willow Creek 144 26-48-01-234
Site located in a dry ephemeral channel that is tributary to Willow Creek. Monitoring data indicate the site is typically dry during the annual fall sampling.
0.003
Reduction of hydrophytic vegetation below established threshold coincident with a reduction in groundwater levels in the area as determined from groundwater monitoring.
Pipe from new or existing well.
0.5 Mitigation plan would be highly effective at maintaining habitat diversity.
Willow Creek 138 26-48-01-241
Site located in a dry ephemeral channel that is tributary to Willow Creek. Monitoring data indicate the site is typically dry during the annual fall sampling.
0.098*
Reduction of hydrophytic vegetation below established threshold coincident with a reduction in groundwater levels in the area as determined from groundwater monitoring.
Pipe from new or existing well.
0.5 Mitigation plan would be highly effective at maintaining habitat diversity.

Appendix A Deep South Expansion Project EIS Water Resources A-36
Draft EIS 2018
Table A-3 Mitigation Triggers and Contingency Mitigation 1by 2011 Final SEIS Mitigation
Measures for Drawdown Impacts to Surface Water Resources Not Covered
2Spring Group Map ID
2Number Spring or Stream
Site ID Site Description
Estimated Riparian/
Hydrophytic Vegetation
(acres) Mitigation Trigger
Type Contingency
3Mitigation Plan
Proposed Flow Augmentation
4Rates (gpm)
Effectiveness of Site-specific
Mitigation Plan
Willow Springs 233 26-48-01-313A
Seep located in drainage channel. Monitoring data indicate flow has never been recorded or observed during the annual fall sampling.
0.014
Reduction of hydrophytic vegetation below established threshold coincident with a reduction in groundwater levels in the area as determined from groundwater monitoring.
Pipe from new or existing well.
0.5 Mitigation plan would be highly effective at maintaining habitat diversity.
Willow Springs 145 26-48-01-313B
Seep located hillside east of Horse Canyon. Monitoring data indicate flow has never been recorded or observed during the annual fall sampling.
0.292
Reduction of hydrophytic vegetation below established threshold coincident with a reduction in groundwater levels in the area as determined from groundwater monitoring.
Pipe from new or existing well.
0.5 Mitigation plan would be highly effective at maintaining habitat diversity.

Appendix A Deep South Expansion Project EIS Water Resources A-37
Draft EIS 2018
Table A-3 Mitigation Triggers and Contingency Mitigation 1by 2011 Final SEIS Mitigation
Measures for Drawdown Impacts to Surface Water Resources Not Covered
2Spring Group Map ID
2Number Spring or Stream
Site ID Site Description
Estimated Riparian/
Hydrophytic Vegetation
(acres) Mitigation Trigger
Type Contingency
3Mitigation Plan
Proposed Flow Augmentation
4Rates (gpm)
Effectiveness of Site-specific
Mitigation Plan
Willow Springs 146 26-48-01-323
Seep located hillside east of Horse Canyon. Monitoring data indicate flow has never been recorded or observed at this site.
0.152
Reduction of hydrophytic vegetation below established threshold coincident with a reduction in groundwater levels in the area as determined from groundwater monitoring.
Pipe from new or existing well.
0.5 Mitigation plan would be highly effective at maintaining habitat diversity.
Willow Springs 232 26-48-01-324
Seep located in drainage channel. Monitoring data indicate the site is typically dry during the annual fall sampling.
0
Reduction of hydrophytic vegetation below established threshold coincident with a reduction in groundwater levels in the area as determined from groundwater monitoring.
Pipe from new or existing well.
0.5 Mitigation plan would be highly effective at maintaining habitat diversity.

Appendix A Deep South Expansion Project EIS Water Resources A-38
Draft EIS 2018
Table A-3 Mitigation Triggers and Contingency Mitigation 1by 2011 Final SEIS Mitigation
Measures for Drawdown Impacts to Surface Water Resources Not Covered
2Spring Group Map ID
2Number Spring or Stream
Site ID Site Description
Estimated Riparian/
Hydrophytic Vegetation
(acres) Mitigation Trigger
Type Contingency
3Mitigation Plan
Proposed Flow Augmentation
4Rates (gpm)
Effectiveness of Site-specific
Mitigation Plan
Willow Creek 133 26-48-02-224
Seep located on a hillside above a drainage. Horses and cattle observed in area. Flow has never been recorded at the site.
0.057
Reduction of hydrophytic vegetation below established threshold coincident with a reduction in groundwater levels in the area as determined from groundwater monitoring.
Pipe from new or existing well.
0.5 Mitigation plan would be highly effective at maintaining habitat diversity.
Horse Creek 163 26-48-02-322
Seep located on a hillside adjacent to mine reclamation area. Flow has never been recorded at this site.
0.014
Reduction of hydrophytic vegetation below established threshold coincident with a reduction in groundwater levels in the area as determined from groundwater monitoring.
Pipe from new or existing well.
0.5 Mitigation plan would be highly effective at maintaining habitat diversity.

Appendix A Deep South Expansion Project EIS Water Resources A-39
Draft EIS 2018
Table A-3 Mitigation Triggers and Contingency Mitigation 1by 2011 Final SEIS Mitigation
Measures for Drawdown Impacts to Surface Water Resources Not Covered
2Spring Group Map ID
2Number Spring or Stream
Site ID Site Description
Estimated Riparian/
Hydrophytic Vegetation
(acres) Mitigation Trigger
Type Contingency
3Mitigation Plan
Proposed Flow Augmentation
4Rates (gpm)
Effectiveness of Site-specific
Mitigation Plan
Horse Creek 169 26-48-02-423A
Perennial spring located on a hillside at the top of a wide channel with an old cattle trough. Monitoring indicates flow is seasonally influences but persists during the low flow period (late summer through fall).
0.612
Reduction of flow below established threshold coincident with a reduction in groundwater levels in the area as determined from groundwater monitoring.
Pipe from new or existing well.
2.1 Mitigation plan would be highly effective at maintaining a water supply for livestock and wildlife.
Horse Creek 168 26-48-02-423B
Perennial spring located on a hillside that flows into a drainage that supports a large wet area. Monitoring indicates evidence of flow persists during the low flow period (late summer through fall).
0.314
Reduction of flow below established threshold coincident with a reduction in groundwater levels in the area as determined from groundwater monitoring.
Pipe from new or existing well.
0.5 Mitigation plan would be highly effective at maintaining a water supply for livestock and wildlife.

Appendix A Deep South Expansion Project EIS Water Resources A-40
Draft EIS 2018
Table A-3 Mitigation Triggers and Contingency Mitigation 1by 2011 Final SEIS Mitigation
Measures for Drawdown Impacts to Surface Water Resources Not Covered
2Spring Group Map ID
2Number Spring or Stream
Site ID Site Description
Estimated Riparian/
Hydrophytic Vegetation
(acres) Mitigation Trigger
Type Contingency
3Mitigation Plan
Proposed Flow Augmentation
4Rates (gpm)
Effectiveness of Site-specific
Mitigation Plan
Horse Creek 160 26-48-03-134
Seep located at the base of a small cliff in upper Horse Canyon. Flow never recorded.
0.013
Reduction of hydrophytic vegetation below established threshold coincident with a reduction in groundwater levels in the area as determined from groundwater monitoring.
Pipe from new or existing well.
0.5 Mitigation plan would be highly effective at maintaining habitat diversity.
Horse Creek 161 26-48-03-143
Seasonally influenced spring located on a steep slope. Flow is typically dry during the fall sampling period.
0.017
Reduction of flow below established threshold coincident with a reduction in groundwater levels in the area as determined from groundwater monitoring.
Pipe from new or existing well.
0.5 Mitigation plan would be highly effective at maintaining a water supply for livestock and wildlife.
Horse Creek 158 26-48-03-213
Spring located within a wide channel in Horse Canyon. Flow monitoring indicates strong seasonal influence and spring reported dry in some years.
1.684
Reduction of flow below established threshold coincident with a reduction in groundwater levels in the area as determined from groundwater monitoring.
Pipe from new or existing well.
0.8 Mitigation plan would be highly effective at maintaining a water supply for livestock and wildlife.

Appendix A Deep South Expansion Project EIS Water Resources A-41
Draft EIS 2018
Table A-3 Mitigation Triggers and Contingency Mitigation 1by 2011 Final SEIS Mitigation
Measures for Drawdown Impacts to Surface Water Resources Not Covered
2Spring Group Map ID
2Number Spring or Stream
Site ID Site Description
Estimated Riparian/
Hydrophytic Vegetation
(acres) Mitigation Trigger
Type Contingency
3Mitigation Plan
Proposed Flow Augmentation
4Rates (gpm)
Effectiveness of Site-specific
Mitigation Plan
Horse Creek 157 26-48-03-221
Spring located in channel in upper Horse Canyon. Flow has varied from 0.0 to over 50 gpm.
0.039
Reduction of hydrophytic vegetation below established threshold coincident with a reduction in groundwater levels in the area as determined from groundwater monitoring.
Pipe from new or existing well.
0.5 Mitigation plan would be highly effective at maintaining a water supply for livestock and wildlife.
Horse Creek 164 26-48-03-321
Perennial spring that emerges from a steep, rocky slope in upper Horse Canyon. Flow has varied from 0.45 to 450 gpm.
0.048
Reduction of flow below established threshold coincident with a reduction in groundwater levels in the area as determined from groundwater monitoring.
Install guzzler.
Not applicable. Mitigation plan would be effective at maintaining a water supply for wildlife.

Appendix A Deep South Expansion Project EIS Water Resources A-42
Draft EIS 2018
Table A-3 Mitigation Triggers and Contingency Mitigation 1by 2011 Final SEIS Mitigation
Measures for Drawdown Impacts to Surface Water Resources Not Covered
2Spring Group Map ID
2Number Spring or Stream
Site ID Site Description
Estimated Riparian/
Hydrophytic Vegetation
(acres) Mitigation Trigger
Type Contingency
3Mitigation Plan
Proposed Flow Augmentation
4Rates (gpm)
Effectiveness of Site-specific
Mitigation Plan
Horse Creek 165 26-48-03-413A
Spring located within the main channel of upper Horse Canyon. Flow has varied between 0.00 and 27.01 gpm. Flows reported as dry or up to less than 1 gpm since November 2010.
0.068
Reduction of hydrophytic vegetation below established threshold coincident with a reduction in groundwater levels in the area as determined from groundwater monitoring.
Pipe from new or existing well.
0.5 Mitigation plan would be highly effective at maintaining habitat diversity.
Horse Creek 166 26-48-03-413B
Seep located on a hillside above the main channel of upper Horse Canyon. Typically dry in the fall monitoring period except in unusually wet years.
0.066
Reduction of hydrophytic vegetation below established threshold coincident with a reduction in groundwater levels in the area as determined from groundwater monitoring.
Pipe from new or existing well.
0.5 Mitigation plan would be highly effective at maintaining habitat diversity.

Appendix A Deep South Expansion Project EIS Water Resources A-43
Draft EIS 2018
Table A-3 Mitigation Triggers and Contingency Mitigation 1by 2011 Final SEIS Mitigation
Measures for Drawdown Impacts to Surface Water Resources Not Covered
2Spring Group Map ID
2Number Spring or Stream
Site ID Site Description
Estimated Riparian/
Hydrophytic Vegetation
(acres) Mitigation Trigger
Type Contingency
3Mitigation Plan
Proposed Flow Augmentation
4Rates (gpm)
Effectiveness of Site-specific
Mitigation Plan
Horse Creek 170 26-48-03-443
Spring located within a dry channel in the main Horse Canyon drainage. Highly variable flow. Reported as dry during the fall monitoring between 2012 and 2016.
0.272
Reduction of hydrophytic vegetation below established threshold coincident with a reduction in groundwater levels in the area as determined from groundwater monitoring.
Pipe from new or existing well.
0.5 Mitigation plan would be highly effective at maintaining habitat diversity.
Horse Creek 171 26-48-03-444
Seep located within a dry meadow along the main channel of Horse Canyon. Flow has never been recorded at this site.
0.518
Reduction of hydrophytic vegetation below established threshold coincident with a reduction in groundwater levels in the area as determined from groundwater monitoring.
Pipe from new or existing well.
0.5 Mitigation plan would be highly effective at maintaining habitat diversity.

Appendix A Deep South Expansion Project EIS Water Resources A-44
Draft EIS 2018
Table A-3 Mitigation Triggers and Contingency Mitigation 1by 2011 Final SEIS Mitigation
Measures for Drawdown Impacts to Surface Water Resources Not Covered
2Spring Group Map ID
2Number Spring or Stream
Site ID Site Description
Estimated Riparian/
Hydrophytic Vegetation
(acres) Mitigation Trigger
Type Contingency
3Mitigation Plan
Proposed Flow Augmentation
4Rates (gpm)
Effectiveness of Site-specific
Mitigation Plan
Horse Creek 173 26-48-10-142
Perennial spring locate within a tributary on the western side of Horse Canyon. Spring flow piped to a trough.
0.124
Reduction of flow below established threshold coincident with a reduction in groundwater levels in the area as determined from groundwater monitoring.
Pipe from new or existing well.
0.5 Mitigation plan would be highly effective at maintaining a water supply for livestock, and wildlife.
Horse Creek 174 26-48-10-232
Seep located within a tributary on the west side of Horse Canyon. Flow has never been recorded at this site.
0.033
Reduction of hydrophytic vegetation below established threshold coincident with a reduction in groundwater levels in the area as determined from groundwater monitoring.
Pipe from new or existing well.
0.5 Mitigation plan would be highly effective at maintaining habitat diversity.

Appendix A Deep South Expansion Project EIS Water Resources A-45
Draft EIS 2018
Table A-3 Mitigation Triggers and Contingency Mitigation 1by 2011 Final SEIS Mitigation
Measures for Drawdown Impacts to Surface Water Resources Not Covered
2Spring Group Map ID
2Number Spring or Stream
Site ID Site Description
Estimated Riparian/
Hydrophytic Vegetation
(acres) Mitigation Trigger
Type Contingency
3Mitigation Plan
Proposed Flow Augmentation
4Rates (gpm)
Effectiveness of Site-specific
Mitigation Plan
Horse Creek 188 26-48-10-344
Spring located within a tributary on the west side of Horse Canyon. Highly variable flow suggests spring is strongly influenced by seasonal runoff. Dry during the fall sampling event since 2013.
0.568*
Reduction of hydrophytic vegetation below established threshold coincident with a reduction in groundwater levels in the area as determined from groundwater monitoring.
Pipe from new or existing well.
0.5 Mitigation plan would be highly effective at maintaining habitat diversity.
Horse Creek 189 26-48-10-433
Spring located within a tributary on the west side of Horse Canyon. Spring reported as dry in 2 of 4 years during the fall sampling event.
0.568*
Reduction of flow below established threshold coincident with a reduction in groundwater levels in the area as determined from groundwater monitoring.
Pipe from new or existing well.
0.2 Mitigation plan would be highly effective at maintaining a water supply for livestock and wildlife.

Appendix A Deep South Expansion Project EIS Water Resources A-46
Draft EIS 2018
Table A-3 Mitigation Triggers and Contingency Mitigation 1by 2011 Final SEIS Mitigation
Measures for Drawdown Impacts to Surface Water Resources Not Covered
2Spring Group Map ID
2Number Spring or Stream
Site ID Site Description
Estimated Riparian/
Hydrophytic Vegetation
(acres) Mitigation Trigger
Type Contingency
3Mitigation Plan
Proposed Flow Augmentation
4Rates (gpm)
Effectiveness of Site-specific
Mitigation Plan
Horse Creek 182 26-48-10-441
Seep located within a tributary on the west side of Horse Canyon. Flow has never been reported but site is occasionally wet.
0.02
Reduction of hydrophytic vegetation below established threshold coincident with a reduction in groundwater levels in the area as determined from groundwater monitoring.
Pipe from new or existing well.
0.5 Mitigation plan would be highly effective at maintaining habitat diversity.
Horse Creek 184 26-48-10-442
Seep located within a tributary on the west side of Horse Canyon. Flow has never been reported at this site.
0.028
Reduction of hydrophytic vegetation below established threshold coincident with a reduction in groundwater levels in the area as determined from groundwater monitoring.
Pipe from new or existing well.
0.5 Mitigation plan would be highly effective at maintaining habitat diversity.

Appendix A Deep South Expansion Project EIS Water Resources A-47
Draft EIS 2018
Table A-3 Mitigation Triggers and Contingency Mitigation 1by 2011 Final SEIS Mitigation
Measures for Drawdown Impacts to Surface Water Resources Not Covered
2Spring Group Map ID
2Number Spring or Stream
Site ID Site Description
Estimated Riparian/
Hydrophytic Vegetation
(acres) Mitigation Trigger
Type Contingency
3Mitigation Plan
Proposed Flow Augmentation
4Rates (gpm)
Effectiveness of Site-specific
Mitigation Plan
Horse Creek 187 26-48-10-444
Seep located within a tributary on the west side of Horse Canyon. Flow (<1gpm) reported in 2 of 10 years in the late summer-fall sampling.
0.016
Reduction of hydrophytic vegetation below established threshold coincident with a reduction in groundwater levels in the area as determined from groundwater monitoring.
Pipe from new or existing well.
0.5 Mitigation plan would be highly effective at maintaining habitat diversity.
Horse Creek 172 26-48-11-142
Site located on a hillside on the eastern slope of Horse Canyon. Flow (<2gpm) reported in 2 of 10 years in the late summer-fall sampling.
0.037
Reduction of hydrophytic vegetation below established threshold coincident with a reduction in groundwater levels in the area as determined from groundwater monitoring.
Pipe from new or existing well.
0.5 Mitigation plan would be highly effective at maintaining habitat diversity.

Appendix A Deep South Expansion Project EIS Water Resources A-48
Draft EIS 2018
Table A-3 Mitigation Triggers and Contingency Mitigation 1by 2011 Final SEIS Mitigation
Measures for Drawdown Impacts to Surface Water Resources Not Covered
2Spring Group Map ID
2Number Spring or Stream
Site ID Site Description
Estimated Riparian/
Hydrophytic Vegetation
(acres) Mitigation Trigger
Type Contingency
3Mitigation Plan
Proposed Flow Augmentation
4Rates (gpm)
Effectiveness of Site-specific
Mitigation Plan
Horse Creek 175 26-48-11-144A
(26-48-02-144A)
Seep located on the northern slope of Horse Canyon. Disturbed by fire and cattle use. Flow (<~1gpm) measured in 4 of 10 years in the late summer-fall sampling.
0.384*
Reduction of hydrophytic vegetation below established threshold coincident with a reduction in groundwater levels in the area as determined from groundwater monitoring.
Pipe from new or existing well.
0.5 Mitigation plan would be highly effective at maintaining habitat diversity.
Horse Creek 176 26-48-11-144B(26-48-02-144B)
Seep located on the northern slope of Horse Canyon and connected to the same wetland complex as 26-48-11-144A.Disturbed by fireand cattle use.Wet area orstanding waterpersists in mostyears.
0.384*
Reduction of hydrophytic vegetation below established threshold coincident with a reduction in groundwater levels in the area as determined from groundwater monitoring.
Pipe from new or existing well.
0.5 Mitigation plan would be highly effective at maintaining water supply for livestock and wildlife and habitat diversity.

Appendix A Deep South Expansion Project EIS Water Resources A-49
Draft EIS 2018
Table A-3 Mitigation Triggers and Contingency Mitigation 1by 2011 Final SEIS Mitigation
Measures for Drawdown Impacts to Surface Water Resources Not Covered
2Spring Group Map ID
2Number Spring or Stream
Site ID Site Description
Estimated Riparian/
Hydrophytic Vegetation
(acres) Mitigation Trigger
Type Contingency
3Mitigation Plan
Proposed Flow Augmentation
4Rates (gpm)
Effectiveness of Site-specific
Mitigation Plan
Horse Creek 177 26-48-11-312
Seep located on the northern slope of Horse Canyon. Flow or saturated soil persists in most years.
0.072
Reduction of hydrophytic vegetation below established threshold coincident with a reduction in groundwater levels in the area as determined from groundwater monitoring.
Pipe from new or existing well.
0.5 Mitigation plan would be highly effective at maintaining water supply for livestock and wildlife and habitat diversity.
Horse Creek 183 26-48-11-422
Seep with non-functioning trough and piping in heavily disturbed area. Fall monitoring data indicates flow (<2 gpm) in 2011 and 2012; dry in 2013 and 2014.
0.214
Reduction of hydrophytic vegetation below established threshold coincident with a reduction in groundwater levels in the area as determined from groundwater monitoring.
Pipe from new or existing well.
0.5 Mitigation plan would be highly effective at maintaining habitat diversity.

Appendix A Deep South Expansion Project EIS Water Resources A-50
Draft EIS 2018
Table A-3 Mitigation Triggers and Contingency Mitigation 1by 2011 Final SEIS Mitigation
Measures for Drawdown Impacts to Surface Water Resources Not Covered
2Spring Group Map ID
2Number Spring or Stream
Site ID Site Description
Estimated Riparian/
Hydrophytic Vegetation
(acres) Mitigation Trigger
Type Contingency
3Mitigation Plan
Proposed Flow Augmentation
4Rates (gpm)
Effectiveness of Site-specific
Mitigation Plan
Horse Creek 236 26-48-12-323
Seep located on a slope. Flow never recorded at this site.
0.064
Reduction of hydrophytic vegetation below established threshold coincident with a reduction in groundwater levels in the area as determined from groundwater monitoring.
Pipe from new or existing well.
0.5 Mitigation plan would be highly effective at maintaining habitat diversity.
Horse Creek 178 26-48-12-324
Seep located on a hillside above a tributary to Willow Creek. Area is disturbed by horse and cattle grazing. Noted as wet area or has measurable flow (<0.5 gpm) during the fall in most years
0.168
Reduction of hydrophytic vegetation below established threshold coincident with a reduction in groundwater levels in the area as determined from groundwater monitoring.
Pipe from new or existing well.
0.5 Mitigation plan would be highly effective at maintaining habitat diversity.

Appendix A Deep South Expansion Project EIS Water Resources A-51
Draft EIS 2018
Table A-3 Mitigation Triggers and Contingency Mitigation 1by 2011 Final SEIS Mitigation
Measures for Drawdown Impacts to Surface Water Resources Not Covered
2Spring Group Map ID
2Number Spring or Stream
Site ID Site Description
Estimated Riparian/
Hydrophytic Vegetation
(acres) Mitigation Trigger
Type Contingency
3Mitigation Plan
Proposed Flow Augmentation
4Rates (gpm)
Effectiveness of Site-specific
Mitigation Plan
Horse Creek 179 26-48-12-341
Seep located on a hillside above a tributary to Willow Creek. Area is disturbed by horse and cattle grazing. Noted as either dry or wet area during the fall sampling.
0.047
Reduction of hydrophytic vegetation below established threshold coincident with a reduction in groundwater levels in the area as determined from groundwater monitoring.
Pipe from new or existing well.
0.5 Mitigation plan would be highly effective at maintaining habitat diversity.
Horse Creek 180 26-48-12-414Seep located on a hillside that feeds a larger wet area.
0.726
Reduction of hydrophytic vegetation below established threshold coincident with a reduction in groundwater levels in the area as determined from groundwater monitoring.
Pipe from new or existing well.
0.5 Mitigation plan would be highly effective at maintaining habitat diversity.

Appendix A Deep South Expansion Project EIS Water Resources A-52
Draft EIS 2018
Table A-3 Mitigation Triggers and Contingency Mitigation 1by 2011 Final SEIS Mitigation
Measures for Drawdown Impacts to Surface Water Resources Not Covered
2Spring Group Map ID
2Number Spring or Stream
Site ID Site Description
Estimated Riparian/
Hydrophytic Vegetation
(acres) Mitigation Trigger
Type Contingency
3Mitigation Plan
Proposed Flow Augmentation
4Rates (gpm)
Effectiveness of Site-specific
Mitigation Plan
Horse Creek 181 26-48-12-432
Seep located within a tributary channel to Willow Creek. Flow has never been recorded at this site.
0.027
Reduction of hydrophytic vegetation below established threshold coincident with a reduction in groundwater levels in the area as determined from groundwater monitoring.
Pipe from new or existing well.
0.5 Mitigation plan would be highly effective at maintaining habitat diversity.
Horse Creek 191 26-48-13-323
Site is located within a large wet meadow with highly variable flow.
15.720*
Reduction of hydrophytic vegetation below established threshold coincident with a reduction in groundwater levels in the area as determined from groundwater monitoring.
Pipe from new or existing well.
0.5 Mitigation plan would be highly effective at maintaining a water supply for livestock and wildlife.

Appendix A Deep South Expansion Project EIS Water Resources A-53
Draft EIS 2018
Table A-3 Mitigation Triggers and Contingency Mitigation 1by 2011 Final SEIS Mitigation
Measures for Drawdown Impacts to Surface Water Resources Not Covered
2Spring Group Map ID
2Number Spring or Stream
Site ID Site Description
Estimated Riparian/
Hydrophytic Vegetation
(acres) Mitigation Trigger
Type Contingency
3Mitigation Plan
Proposed Flow Augmentation
4Rates (gpm)
Effectiveness of Site-specific
Mitigation Plan
Horse Creek 190 26-48-13-324
Site is located within a large wet meadow with highly variable flow.
15.720*
Reduction of flow below established threshold coincident with a reduction in groundwater levels in the area as determined from groundwater monitoring.
Pipe from new or existing well.
14.3 Mitigation plan would be highly effective at maintaining a water supply for livestock and wildlife.
Horse Creek 194 26-48-13-342
Site is located within a large wet meadow with highly variable flow.
15.720*
Reduction of flow below established threshold coincident with a reduction in groundwater levels in the area as determined from groundwater monitoring.
Pipe from new or existing well.
3.7 Mitigation plan would be highly effective at maintaining a water supply for livestock and wildlife.
Horse Creek 193 26-48-13-431
Site is located on the northern boundary of a large wet meadow. Flow data indicates that the site persisted as a wet area between 2008 and 2011, and was dry in 2014-2017.
1.288
Reduction of hydrophytic vegetation below established threshold coincident with a reduction in groundwater levels in the area as determined from groundwater monitoring.
Pipe from new or existing well.
0.5 Mitigation plan would be highly effective at maintaining a water supply for livestock and wildlife.
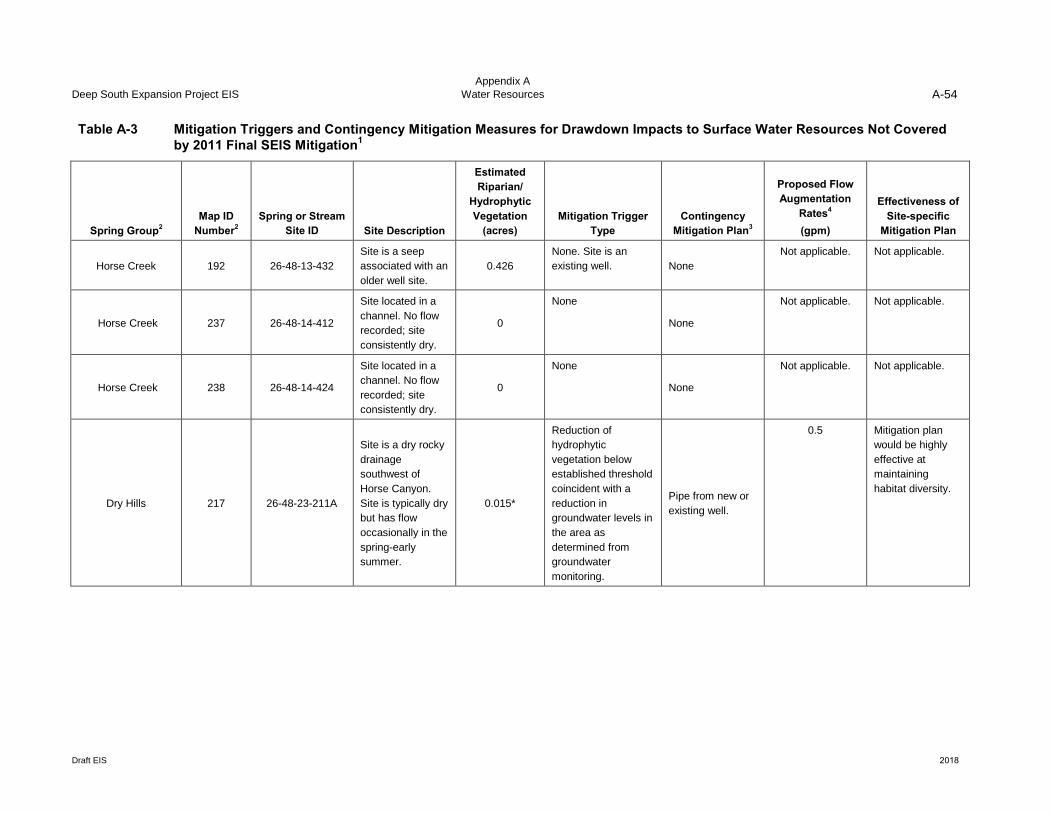
Appendix A Deep South Expansion Project EIS Water Resources A-54
Draft EIS 2018
Table A-3 Mitigation Triggers and Contingency Mitigation 1by 2011 Final SEIS Mitigation
Measures for Drawdown Impacts to Surface Water Resources Not Covered
2Spring Group Map ID
2Number Spring or Stream
Site ID Site Description
Estimated Riparian/
Hydrophytic Vegetation
(acres) Mitigation Trigger
Type Contingency
3Mitigation Plan
Proposed Flow Augmentation
4Rates (gpm)
Effectiveness of Site-specific
Mitigation Plan
Horse Creek 192 26-48-13-432Site is a seep associated with an older well site.
0.426 None. Site is an existing well. None
Not applicable. Not applicable.
Horse Creek 237 26-48-14-412
Site located in a channel. No flow recorded; site consistently dry.
0
None
None
Not applicable. Not applicable.
Horse Creek 238 26-48-14-424
Site located in a channel. No flow recorded; site consistently dry.
0
None
None
Not applicable. Not applicable.
Dry Hills 217 26-48-23-211A
Site is a dry rocky drainage southwest of Horse Canyon. Site is typically dry but has flow occasionally in the spring-early summer.
0.015*
Reduction of hydrophytic vegetation below established threshold coincident with a reduction in groundwater levels in the area as determined from groundwater monitoring.
Pipe from new or existing well.
0.5 Mitigation plan would be highly effective at maintaining habitat diversity.

Appendix A Deep South Expansion Project EIS Water Resources A-55
Draft EIS 2018
Table A-3 Mitigation Triggers and Contingency Mitigation 1by 2011 Final SEIS Mitigation
Measures for Drawdown Impacts to Surface Water Resources Not Covered
2Spring Group Map ID
2Number Spring or Stream
Site ID Site Description
Estimated Riparian/
Hydrophytic Vegetation
(acres) Mitigation Trigger
Type Contingency
3Mitigation Plan
Proposed Flow Augmentation
4Rates (gpm)
Effectiveness of Site-specific
Mitigation Plan
Dry Hills 218 26-48-23-211B
Site located just down channel from 26-48-23-211A and has similar flow characteristics.
0.015*
Reduction of hydrophytic vegetation below established threshold coincident with a reduction in groundwater levels in the area as determined from groundwater monitoring.
Pipe from new or existing well.
0.5 Mitigation plan would be highly effective at maintaining habitat diversity.
Dry Hills 219 26-48-23-242
Site is a dry channel southwest of Horse Canyon. Between 9/23/2011 -9/08/2017 the site was dry except for 5/14/2016 (0.45 gpm).
0.018
Reduction of hydrophytic vegetation below established threshold coincident with a reduction in groundwater levels in the area as determined from groundwater monitoring.
Pipe from new or existing well.
0.5 Mitigation plan would be highly effective at maintaining habitat diversity.

Appendix A Deep South Expansion Project EIS Water Resources A-56
Draft EIS 2018
Table A-3 Mitigation Triggers and Contingency Mitigation 1by 2011 Final SEIS Mitigation
Measures for Drawdown Impacts to Surface Water Resources Not Covered
2Spring Group Map ID
2Number Spring or Stream
Site ID Site Description
Estimated Riparian/
Hydrophytic Vegetation
(acres) Mitigation Trigger
Type Contingency
3Mitigation Plan
Proposed Flow Augmentation
4Rates (gpm)
Effectiveness of Site-specific
Mitigation Plan
Dry Hills 222 26-48-23-313A
Site is a dry channel southwest of Horse Canyon. Between 8/27/2008 -9/08/2017 the site was dry except for 5/05/2009 (1.93 gpm).
0.012
Reduction of hydrophytic vegetation below established threshold coincident with a reduction in groundwater levels in the area as determined from groundwater monitoring.
Pipe from new or existing well.
0.5 Mitigation plan would be highly effective at maintaining habitat diversity.
Dry Hills 223 26-48-23-313B
Site is located just down channel from 26-48-23-313A at a cattle trough fed by a spring pipe. Flow was recorded as dry between 9/16/2010 - 09/08/2017 except for 5/16/2016 (0.45 gpm).
0.021
Reduction of hydrophytic vegetation below established threshold coincident with a reduction in groundwater levels in the area as determined from groundwater monitoring.
Pipe from new or existing well.
0.5 Mitigation plan would be highly effective at maintaining habitat diversity.
Dry Hills 240 26-48-23-321
Site is located on a hillside and not identified as a spring or seep in recent survey in 2018.
0
None
None
Not applicable. Not applicable.

Appendix A Deep South Expansion Project EIS Water Resources A-57
Draft EIS 2018
Table A-3 Mitigation Triggers and Contingency Mitigation 1by 2011 Final SEIS Mitigation
Measures for Drawdown Impacts to Surface Water Resources Not Covered
2Spring Group Map ID
2Number Spring or Stream
Site ID Site Description
Estimated Riparian/
Hydrophytic Vegetation
(acres) Mitigation Trigger
Type Contingency
3Mitigation Plan
Proposed Flow Augmentation
4Rates (gpm)
Effectiveness of Site-specific
Mitigation Plan
Dry Hills 220 26-48-24-133
Site located within a drainage southwest of Horse Canyon. Site reported as dry in the fall monitoring between 2011and 2017.
0.006
Reduction of hydrophytic vegetation below established threshold coincident with a reduction in groundwater levels in the area as determined from groundwater monitoring.
Pipe from new or existing well.
0.5 Mitigation plan would be highly effective at maintaining habitat diversity.
Dry Hills 221 26-48-24-134
Site is a dry channel downstream from 26-48-24-133. Sitereported as dry inthe fall monitoringbetween 2011 and2017.
0.007
Reduction of hydrophytic vegetation below established threshold coincident with a reduction in groundwater levels in the area as determined from groundwater monitoring.
Pipe from new or existing well.
0.5 Mitigation plan would be highly effective at maintaining habitat diversity.

Appendix A Deep South Expansion Project EIS Water Resources A-58
Draft EIS 2018
Table A-3 Mitigation Triggers and Contingency Mitigation 1by 2011 Final SEIS Mitigation
Measures for Drawdown Impacts to Surface Water Resources Not Covered
2Spring Group Map ID
2Number Spring or Stream
Site ID Site Description
Estimated Riparian/
Hydrophytic Vegetation
(acres) Mitigation Trigger
Type Contingency
3Mitigation Plan
Proposed Flow Augmentation
4Rates (gpm)
Effectiveness of Site-specific
Mitigation Plan
Horse Creek 195 26-48-24-221
Site is located on near the southern boundary of a large wet meadow. Flow data indicate that the site persisted as a wet area between 2008-2011; and was dry in 2014-2017.
3.87
Reduction of hydrophytic vegetation below established threshold coincident with a reduction in groundwater levels in the area as determined from groundwater monitoring.
Pipe from new or existing well.
0.5 Mitigation plan would be highly effective at maintaining habitat diversity.
Dry Hills 241 26-48-26-111
Seep located in drainage channel. Monitoring data indicate flow has never been recorded or observed during the annual fall sampling.
0.007
Reduction of hydrophytic vegetation below established threshold coincident with a reduction in groundwater levels in the area as determined from groundwater monitoring.
Pipe from new or existing well.
0.5 Mitigation plan would be highly effective at maintaining habitat diversity.

Appendix A Deep South Expansion Project EIS Water Resources A-59
Draft EIS 2018
Table A-3 Mitigation Triggers and Contingency Mitigation 1by 2011 Final SEIS Mitigation
Measures for Drawdown Impacts to Surface Water Resources Not Covered
2Spring Group Map ID
2Number Spring or Stream
Site ID Site Description
Estimated Riparian/
Hydrophytic Vegetation
(acres) Mitigation Trigger
Type Contingency
3Mitigation Plan
Proposed Flow Augmentation
4Rates (gpm)
Effectiveness of Site-specific
Mitigation Plan
Dry Hills 242 26-48-26-122
Seep located in drainage channel. Monitoring data indicates flow has never been recorded or observed during the annual fall sampling.
0
Reduction of hydrophytic vegetation below established threshold coincident with a reduction in groundwater levels in the area as determined from groundwater monitoring.
Pipe from new or existing well.
0.5 Mitigation plan would be highly effective at maintaining habitat diversity.
Dry Hills 225 26-48-26-123A
Site with cattle trough located within a drainage south of Horse Canyon. Site reported as dry in the fall monitoring between 2008 and 2017, with the exception of 2011 when flow was insufficient for sampling.
0.020*
Reduction of hydrophytic vegetation below established threshold coincident with a reduction in groundwater levels in the area as determined from groundwater monitoring.
Pipe from new or existing well.
0.5 Mitigation plan would be highly effective at maintaining habitat diversity.

Appendix A Deep South Expansion Project EIS Water Resources A-60
Draft EIS 2018
Table A-3 Mitigation Triggers and Contingency Mitigation 1by 2011 Final SEIS Mitigation
Measures for Drawdown Impacts to Surface Water Resources Not Covered
2Spring Group Map ID
2Number Spring or Stream
Site ID Site Description
Estimated Riparian/
Hydrophytic Vegetation
(acres) Mitigation Trigger
Type Contingency
3Mitigation Plan
Proposed Flow Augmentation
4Rates (gpm)
Effectiveness of Site-specific
Mitigation Plan
Dry Hills 224 26-48-26-123B
Seep located in drainage channel downstream from 26-48-26-123A.Monitoring dataindicate the sitewas dry during theannual fallsampling (2008-2017).
0.020*
Reduction of hydrophytic vegetation below established threshold coincident with a reduction in groundwater levels in the area as determined from groundwater monitoring.
Pipe from new or existing well.
0.5 Mitigation plan would be highly effective at maintaining habitat diversity.
Dry Hills 243 26-48-26-132
Seep located in drainage channel. Monitoring data indicate the site is typically dry during the annual fall sampling (2008-2011).
0
Reduction of hydrophytic vegetation below established threshold coincident with a reduction in groundwater levels in the area as determined from groundwater monitoring.
Install guzzler.
Not applicable. Mitigation plan would be effective at maintaining the hydrophytic vegetation.

Appendix A Deep South Expansion Project EIS Water Resources A-61
Draft EIS 2018
Table A-3 Mitigation Triggers and Contingency Mitigation 1by 2011 Final SEIS Mitigation
Measures for Drawdown Impacts to Surface Water Resources Not Covered
2Spring Group Map ID
2Number Spring or Stream
Site ID Site Description
Estimated Riparian/
Hydrophytic Vegetation
(acres) Mitigation Trigger
Type Contingency
3Mitigation Plan
Proposed Flow Augmentation
4Rates (gpm)
Effectiveness of Site-specific
Mitigation Plan
Horse Creek 159 26-48-03-114
Site is a dry rocky drainage southwest of Horse Canyon. Site is typically dry but has flow occasionally in the spring-early summer.
0.007
Reduction of hydrophytic vegetation below established threshold coincident with a reduction in groundwater levels in the area as determined from groundwater monitoring.
Pipe from new or existing well.
0.5 Mitigation plan would be highly effective at maintaining the hydrophytic vegetation.
Willow Creek 127 26-49-05-324
Seep area defined by vegetation. Flow has never been recorded.
0.011
Reduction of hydrophytic vegetation below established threshold coincident with a reduction in groundwater levels in the area as determined from groundwater monitoring.
Pipe from new or existing well.
0.5 Mitigation plan would be highly effective at maintaining the hydrophytic vegetation.

Appendix A Deep South Expansion Project EIS Water Resources A-62
Draft EIS 2018
Table A-3 Mitigation Triggers and Contingency Mitigation 1by 2011 Final SEIS Mitigation
Measures for Drawdown Impacts to Surface Water Resources Not Covered
2Spring Group Map ID
2Number Spring or Stream
Site ID Site Description
Estimated Riparian/
Hydrophytic Vegetation
(acres) Mitigation Trigger
Type Contingency
3Mitigation Plan
Proposed Flow Augmentation
4Rates (gpm)
Effectiveness of Site-specific
Mitigation Plan
Willow Creek 117 26-49-06-211
Seep source area located above retention basin. Fall monitoring indicates site is wet with no measurable flow.
1.549
Reduction of hydrophytic vegetation below established threshold coincident with a reduction in groundwater levels in the area as determined from groundwater monitoring.
Pipe from new or existing well.
0.5 Mitigation plan would be highly effective at maintaining the hydrophytic vegetation.
Willow Creek 118 26-49-06-213
Seep located downstream of a retention basin that supports vegetation. Fall monitoring indicates that except for 2013 (0.45 gpm), the site is wet with no measurable flow (2014-2017).
0.469
Reduction of hydrophytic vegetation below established threshold coincident with a reduction in groundwater levels in the area as determined from groundwater monitoring.
Pipe from new or existing well.
0.5 Mitigation plan would be highly effective at maintaining the hydrophytic vegetation.

Appendix A Deep South Expansion Project EIS Water Resources A-63
Draft EIS 2018
Table A-3 Mitigation Triggers and Contingency Mitigation 1by 2011 Final SEIS Mitigation
Measures for Drawdown Impacts to Surface Water Resources Not Covered
2Spring Group Map ID
2Number Spring or Stream
Site ID Site Description
Estimated Riparian/
Hydrophytic Vegetation
(acres) Mitigation Trigger
Type Contingency
3Mitigation Plan
Proposed Flow Augmentation
4Rates (gpm)
Effectiveness of Site-specific
Mitigation Plan
Willow Creek 131 26-49-07-111
Seep in wet drainage channel. Fall monitoring (2011-2017) indicates site is typically wet and occasionally has measurable flow.
0.215
Reduction of hydrophytic vegetation below established threshold coincident with a reduction in groundwater levels in the area as determined from groundwater monitoring.
Pipe from new or existing well.
0.5 Mitigation plan would be highly effective at maintaining the hydrophytic vegetation.
Willow Creek 141 26-49-07-114
Seep located in a dry rocky drainage that is tributary to Willow Creek. Flow never recorded at this site (2011-2017).
0.005
Reduction of hydrophytic vegetation below established threshold coincident with a reduction in groundwater levels in the area as determined from groundwater monitoring.
Pipe from new or existing well.
0.5 Mitigation plan would be highly effective at maintaining the hydrophytic vegetation.

Appendix A Deep South Expansion Project EIS Water Resources A-64
Draft EIS 2018
Table A-3 Mitigation Triggers and Contingency Mitigation 1by 2011 Final SEIS Mitigation
Measures for Drawdown Impacts to Surface Water Resources Not Covered
2Spring Group Map ID
2Number Spring or Stream
Site ID Site Description
Estimated Riparian/
Hydrophytic Vegetation
(acres) Mitigation Trigger
Type Contingency
3Mitigation Plan
Proposed Flow Augmentation
4Rates (gpm)
Effectiveness of Site-specific
Mitigation Plan
Willow Creek 136 26-49-07-114B
Seep located on a hillside above a drainage. Site is typically wet with no measurable flow during fall sampling.
0.041
Reduction of hydrophytic vegetation below established threshold coincident with a reduction in groundwater levels in the area as determined from groundwater monitoring.
Pipe from new or existing well.
0.5 Mitigation plan would be highly effective at maintaining the hydrophytic vegetation.
Willow Creek 143 26-49-07-141
Seep area located in a channel that is tributary to Willow Creek defined by vegetation. Flow has never been recorded (2011-2017).
0.118
Reduction of hydrophytic vegetation below established threshold coincident with a reduction in groundwater levels in the area as determined from groundwater monitoring.
Pipe from new or existing well.
0.5 Mitigation plan would be highly effective at maintaining the hydrophytic vegetation.

Appendix A Deep South Expansion Project EIS Water Resources A-65
Draft EIS 2018
Table A-3 Mitigation Triggers and Contingency Mitigation 1by 2011 Final SEIS Mitigation
Measures for Drawdown Impacts to Surface Water Resources Not Covered
2Spring Group Map ID
2Number Spring or Stream
Site ID Site Description
Estimated Riparian/
Hydrophytic Vegetation
(acres) Mitigation Trigger
Type Contingency
3Mitigation Plan
Proposed Flow Augmentation
4Rates (gpm)
Effectiveness of Site-specific
Mitigation Plan
Willow Creek 130 26-49-07-221
Seep area located in a channel that is tributary to Willow Creek defined by vegetation. Flow has never been recorded (2011-2017); standing water noted in fall sampling events in 2012 and 2012.
0.285
Reduction of hydrophytic vegetation below established threshold coincident with a reduction in groundwater levels in the area as determined from groundwater monitoring.
Pipe from new or existing well.
0.5 Mitigation plan would be highly effective at maintaining the hydrophytic vegetation.
Willow Creek 134 26-49-07-222
Seep area located in a channel that is tributary to Willow Creek defined by vegetation. Small flows (<2gpm) recorded in 3 of 7 years fall sampling events (2011-2017).
0.031
Reduction of hydrophytic vegetation below established threshold coincident with a reduction in groundwater levels in the area as determined from groundwater monitoring.
Pipe from new or existing well.
0.5 Mitigation plan would be highly effective at maintaining the hydrophytic vegetation.

Appendix A Deep South Expansion Project EIS Water Resources A-66
Draft EIS 2018
Table A-3 Mitigation Triggers and Contingency Mitigation 1by 2011 Final SEIS Mitigation
Measures for Drawdown Impacts to Surface Water Resources Not Covered
2Spring Group Map ID
2Number Spring or Stream
Site ID Site Description
Estimated Riparian/
Hydrophytic Vegetation
(acres) Mitigation Trigger
Type Contingency
3Mitigation Plan
Proposed Flow Augmentation
4Rates (gpm)
Effectiveness of Site-specific
Mitigation Plan
Willow Springs 147 26-49-07-331
Seep area located on a side hill that supports vegetation. Site recorded small flows (<4 gpm) or standing water in pools in most years during fall sampling events (2011-2017).
0.224
Reduction of hydrophytic vegetation below established threshold coincident with a reduction in groundwater levels in the area as determined from groundwater monitoring.
Pipe from new or existing well.
0.5 Mitigation plan would be highly effective at maintaining the hydrophytic vegetation.
Willow Springs 148 26-49-07-343
Seep located on a hillside at the head of a large wet channel. Site was noted to be wet or had small measurable flows (<3.5 gpm) in all of the annual fall sampling events (2011-2017).
0.175
Reduction of flow below established threshold coincident with a reduction in groundwater levels in the area as determined from groundwater monitoring.
Pipe from new or existing well.
1.1 Mitigation plan would be highly effective at maintaining a water supply for livestock and wildlife.

Appendix A Deep South Expansion Project EIS Water Resources A-67
Draft EIS 2018
Table A-3 Mitigation Triggers and Contingency Mitigation 1by 2011 Final SEIS Mitigation
Measures for Drawdown Impacts to Surface Water Resources Not Covered
2Spring Group Map ID
2Number Spring or Stream
Site ID Site Description
Estimated Riparian/
Hydrophytic Vegetation
(acres) Mitigation Trigger
Type Contingency
3Mitigation Plan
Proposed Flow Augmentation
4Rates (gpm)
Effectiveness of Site-specific
Mitigation Plan
Willow Creek 140 26-49-08-114A
Seep in wet drainage channel that is tributary to Willow Creek. Fall monitoring (2013-2017) indicates site is typically wet and occasionally has measurable flow (<3 gpm).
0.449
Reduction of hydrophytic vegetation below established threshold coincident with a reduction in groundwater levels in the area as determined from groundwater monitoring.
Pipe from new or existing well.
0.5 Mitigation plan would be highly effective at maintaining the hydrophytic vegetation.
Willow Springs 152 26-49-17-432
Seep area defined by vegetation. Flow has never been recorded.
0.036
Reduction of hydrophytic vegetation below established threshold coincident with a reduction in groundwater levels in the area as determined from groundwater monitoring.
Pipe from new or existing well.
0.5 Mitigation plan would be highly effective at maintaining the hydrophytic vegetation.

Appendix A Deep South Expansion Project EIS Water Resources A-68
Draft EIS 2018
Table A-3 Mitigation Triggers and Contingency Mitigation 1by 2011 Final SEIS Mitigation
Measures for Drawdown Impacts to Surface Water Resources Not Covered
2Spring Group Map ID
2Number Spring or Stream
Site ID Site Description
Estimated Riparian/
Hydrophytic Vegetation
(acres) Mitigation Trigger
Type Contingency
3Mitigation Plan
Proposed Flow Augmentation
4Rates (gpm)
Effectiveness of Site-specific
Mitigation Plan
Willow Springs 149 26-49-18-111
Spring area located on a side hill that supports vegetation. Spring pipe with cattle trough present. Site recorded variable flows up to 12.2 gpm or wet conditions without measurable flow during fall sampling events (2011-2017).
0.39
Reduction of flow below established threshold coincident with a reduction in groundwater levels in the area as determined from groundwater monitoring.
Pipe from new or existing well.
3.6 Mitigation plan would be highly effective at maintaining a water supply for livestock, and wildlife.
Willow Springs 150 26-49-18-134
Spring / seep area located on a side hill above tributary drainage. Site recorded variable flows up to 1 gpm or wet conditions without measurable flow during fall sampling events (2011-2017).
0.438
Reduction of hydrophytic vegetation below established threshold coincident with a reduction in groundwater levels in the area as determined from groundwater monitoring.
Pipe from new or existing well.
0.5 Mitigation plan would be highly effective at maintaining the hydrophytic vegetation.

Appendix A Deep South Expansion Project EIS Water Resources A-69
Draft EIS 2018
Table A-3 Mitigation Triggers and Contingency Mitigation 1by 2011 Final SEIS Mitigation
Measures for Drawdown Impacts to Surface Water Resources Not Covered
2Spring Group Map ID
2Number Spring or Stream
Site ID Site Description
Estimated Riparian/
Hydrophytic Vegetation
(acres) Mitigation Trigger
Type Contingency
3Mitigation Plan
Proposed Flow Augmentation
4Rates (gpm)
Effectiveness of Site-specific
Mitigation Plan
Horse Creek 185 26-49-18-331
Seep located on a hillside that supports vegetation. Fall monitoring (2011-2017) recorded saturated soil with no flow in most years.
0.065
Reduction of hydrophytic vegetation below established threshold coincident with a reduction in groundwater levels in the area as determined from groundwater monitoring.
Pipe from new or existing well.
0.5 Mitigation plan would be highly effective at maintaining the hydrophytic vegetation.
Horse Creek 186 26-49-18-332
Spring area located on a side hill that supports vegetation. Site recorded variable flows up to 7.58 gpm or wet conditions without measurable flow most years (2008-2017).
0.574
Reduction of flow below established threshold coincident with a reduction in groundwater levels in the area as determined from groundwater monitoring.
Pipe from new or existing well.
1.7 Mitigation plan would be highly effective at maintaining a water supply for livestock and wildlife.

Appendix A Deep South Expansion Project EIS Water Resources A-70
Draft EIS 2018
Table A-3 Mitigation Triggers and Contingency Mitigation 1by 2011 Final SEIS Mitigation
Measures for Drawdown Impacts to Surface Water Resources Not Covered
2Spring Group Map ID
2Number Spring or Stream
Site ID Site Description
Estimated Riparian/
Hydrophytic Vegetation
(acres) Mitigation Trigger
Type Contingency
3Mitigation Plan
Proposed Flow Augmentation
4Rates (gpm)
Effectiveness of Site-specific
Mitigation Plan
Willow Springs 151 26-49-18-423
Seep located in a tributary channel to Willow Creek. Site is typically wet without measurable flow (2011-2017).
0.036
Reduction of hydrophytic vegetation below established threshold coincident with a reduction in groundwater levels in the area as determined from groundwater monitoring.
Install guzzler.
Not applicable. Mitigation plan would be effective at maintaining the hydrophytic vegetation.
Willow Springs 154 26-49-20-122
Site is a monitoring location within a wet meadow. Flow has never been recorded at the site (2011-2017).
0.08
Reduction of hydrophytic vegetation below established threshold coincident with a reduction in groundwater levels in the area as determined from groundwater monitoring.
Pipe from new or existing well.
0.5 Mitigation plan would be highly effective at maintaining the hydrophytic vegetation.

Appendix A Deep South Expansion Project EIS Water Resources A-71
Draft EIS 2018
Table A-3 Mitigation Triggers and Contingency Mitigation 1by 2011 Final SEIS Mitigation
Measures for Drawdown Impacts to Surface Water Resources Not Covered
2Spring Group Map ID
2Number Spring or Stream
Site ID Site Description
Estimated Riparian/
Hydrophytic Vegetation
(acres) Mitigation Trigger
Type Contingency
3Mitigation Plan
Proposed Flow Augmentation
4Rates (gpm)
Effectiveness of Site-specific
Mitigation Plan
Willow Springs 153 26-49-20-122A
Site located within a dry water retention basin in Willow Springs. Fall monitoring data indicate site was dry in 2 of 5 years (2011-2015).
0.888*
Reduction of hydrophytic vegetation below established threshold coincident with a reduction in groundwater levels in the area as determined from groundwater monitoring.
Pipe from new or existing well.
0.5 Mitigation plan would be highly effective at maintaining the hydrophytic vegetation.
Willow Springs 155 26-49-20-122B
Site located within a large wet meadow area that has been heavily impacted by cattle. Fall monitoring data (2013-2016) indicate wet conditions with flow ranging from 0.0 to 0.45 gpm.
0.888*
Reduction of hydrophytic vegetation below established threshold coincident with a reduction in groundwater levels in the area as determined from groundwater monitoring.
Pipe from new or existing well.
0.5 Mitigation plan would be highly effective at maintaining the hydrophytic vegetation.

Appendix A Deep South Expansion Project EIS Water Resources A-72
Draft EIS 2018
Table A-3 Mitigation Triggers and Contingency Mitigation 1by 2011 Final SEIS Mitigation
Measures for Drawdown Impacts to Surface Water Resources Not Covered
2Spring Group Map ID
2Number Spring or Stream
Site ID Site Description
Estimated Riparian/
Hydrophytic Vegetation
(acres) Mitigation Trigger
Type Contingency
3Mitigation Plan
Proposed Flow Augmentation
4Rates (gpm)
Effectiveness of Site-specific
Mitigation Plan
Willow Springs 156 26-49-20-213
Seep area located within a meadow. Fall monitoring events (2011-2017) recorded wet conditions with no measurable flow or flow up to 0.75 gpm
0.116
Reduction of hydrophytic vegetation below established threshold coincident with a reduction in groundwater levels in the area as determined from groundwater monitoring.
Pipe from new or existing well.
0.5 Mitigation plan would be highly effective at maintaining the hydrophytic vegetation.
Horse Creek 239 26-49-30-112
Site located in a broad flat area. Flow has never been recorded.
0
None
None
Not applicable. Not applicable.
Rocky Pass 49 27-46-16-11
Site is a dug-out area in a hillside. Site was noted to have either a trickle of flow, or as wet area, or ponded area in most years (1996-2017).
0
None
None
Not applicable. Not applicable.

Appendix A Deep South Expansion Project EIS Water Resources A-73
Draft EIS 2018
Table A-3 Mitigation Triggers and Contingency Mitigation 1by 2011 Final SEIS Mitigation
Measures for Drawdown Impacts to Surface Water Resources Not Covered
2Spring Group Map ID
2Number Spring or Stream
Site ID Site Description
Estimated Riparian/
Hydrophytic Vegetation
(acres) Mitigation Trigger
Type Contingency
3Mitigation Plan
Proposed Flow Augmentation
4Rates (gpm)
Effectiveness of Site-specific
Mitigation Plan
Rocky Pass 52 27-46-28-11
Site is a disturbed area immediately downstream of a culvert that is fenced off to prevent livestock use.
0
None
None
Not applicable. Not applicable.
Rocky Pass 50 27-46-28-221Spring source piped to a trough.
0
Mitigation previously implemented (well drilled to supply water).
None
Not applicable. Not applicable.
Cortez Hills 100 27-47-35-32
Spring site altered by prior construction activities. Spring developed as a spring box upstream from original site. Variable flow or saturated soil recorded (1996-2017).
0.066
Reduction of flow below established threshold coincident with a reduction in groundwater levels in the area as determined from groundwater monitoring.
Pipe from new or existing well.
0.5 Mitigation plan would be highly effective at maintaining a water supply for livestock and wildlife.

Appendix A Deep South Expansion Project EIS Water Resources A-74
Draft EIS 2018
Table A-3 Mitigation Triggers and Contingency Mitigation 1by 2011 Final SEIS Mitigation
Measures for Drawdown Impacts to Surface Water Resources Not Covered
2Spring Group Map ID
2Number Spring or Stream
Site ID Site Description
Estimated Riparian/
Hydrophytic Vegetation
(acres) Mitigation Trigger
Type Contingency
3Mitigation Plan
Proposed Flow Augmentation
4Rates (gpm)
Effectiveness of Site-specific
Mitigation Plan
Cortez Hills 101 27-47-35-324
Site located on a steep, terraced slope adjacent to the county road. Fall monitoring (2011-2017) indicates consistent wet conditions with variable flow (0.0 - 5.26 gpm).
0.137
Reduction of hydrophytic vegetation below established threshold coincident with a reduction in groundwater levels in the area as determined from groundwater monitoring.
Pipe from new or existing well.
0.5 Mitigation plan would be highly effective at maintaining the hydrophytic vegetation.
Fourmile Canyon 54 27-48-14-313
Large seep area located within the main channel of Fourmile Canyon. Fall monitoring (2013-2017) indicates consistent wet conditions with variable flow (0.0 - 0.5 gpm).
0.769*
Reduction of flow below established threshold coincident with a reduction in groundwater levels in the area as determined from groundwater monitoring.
Pipe from new or existing well.
0.5 Mitigation plan would be highly effective at maintaining a water supply for livestock and wildlife.

Appendix A Deep South Expansion Project EIS Water Resources A-75
Draft EIS 2018
Table A-3 Mitigation Triggers and Contingency Mitigation 1by 2011 Final SEIS Mitigation
Measures for Drawdown Impacts to Surface Water Resources Not Covered
2Spring Group Map ID
2Number Spring or Stream
Site ID Site Description
Estimated Riparian/
Hydrophytic Vegetation
(acres) Mitigation Trigger
Type Contingency
3Mitigation Plan
Proposed Flow Augmentation
4Rates (gpm)
Effectiveness of Site-specific
Mitigation Plan
Mill Canyon 59 27-48-21-421
Site located on hillslope and supports small wetland. Fall monitoring (2013-2017) indicates consistent wet conditions with variable flow (0.0 - 0.45 gpm).
0.118
Reduction of hydrophytic vegetation below established threshold coincident with a reduction in groundwater levels in the area as determined from groundwater monitoring.
Pipe from new or existing well.
0.5 Mitigation plan would be highly effective at maintaining the hydrophytic vegetation.
Fourmile Canyon 55 27-48-22-222A
Site located within the main channel of Fourmile Canyon that feeds a small wetland area. Fall monitoring (2013-2017) indicates consistent wet conditions with variable flow (0.0 - 0.5 gpm).
1.039
Reduction of hydrophytic vegetation below established threshold coincident with a reduction in groundwater levels in the area as determined from groundwater monitoring.
Pipe from new or existing well.
0.5 Mitigation plan would be highly effective at maintaining the hydrophytic vegetation.

Appendix A Deep South Expansion Project EIS Water Resources A-76
Draft EIS 2018
Table A-3 Mitigation Triggers and Contingency Mitigation 1by 2011 Final SEIS Mitigation
Measures for Drawdown Impacts to Surface Water Resources Not Covered
2Spring Group Map ID
2Number Spring or Stream
Site ID Site Description
Estimated Riparian/
Hydrophytic Vegetation
(acres) Mitigation Trigger
Type Contingency
3Mitigation Plan
Proposed Flow Augmentation
4Rates (gpm)
Effectiveness of Site-specific
Mitigation Plan
Fourmile Canyon 57 27-48-23-234
Site located within and upper tributary to Fourmile Canyon that feeds a small wetland area. Fall monitoring (2013-2017) indicates consistent wet conditions with variable flow (0.0 - 0.5 gpm).
0.259
Reduction of hydrophytic vegetation below established threshold coincident with a reduction in groundwater levels in the area as determined from groundwater monitoring.
Pipe from new or existing well.
0.5 Mitigation plan would be highly effective at maintaining the hydrophytic vegetation.
Fourmile Canyon 56 27-48-23-244
Seep located in channel at the uppermost reaches of a tributary to Fourmile Canyon. Fall monitoring (2013-2017) indicates consistent wet conditions with variable flow (0.0 - 3.0 gpm).
0.647
Reduction of flow below established threshold coincident with a reduction in groundwater levels in the area as determined from groundwater monitoring.
Pipe from new or existing well.
0.5 Mitigation plan would be highly effective at maintaining a water supply for livestock and wildlife.

Appendix A Deep South Expansion Project EIS Water Resources A-77
Draft EIS 2018
Table A-3 Mitigation Triggers and Contingency Mitigation 1by 2011 Final SEIS Mitigation
Measures for Drawdown Impacts to Surface Water Resources Not Covered
2Spring Group Map ID
2Number Spring or Stream
Site ID Site Description
Estimated Riparian/
Hydrophytic Vegetation
(acres) Mitigation Trigger
Type Contingency
3Mitigation Plan
Proposed Flow Augmentation
4Rates (gpm)
Effectiveness of Site-specific
Mitigation Plan
Dry Creek 66 27-48-24-421
Seep located at the top of a long wet channel with a large wet perimeter. Fall monitoring (2013-2017) indicates consistent wet conditions with variable flow (0.0 - 0.5 gpm).
0.585
Reduction of hydrophytic vegetation below established threshold coincident with a reduction in groundwater levels in the area as determined from groundwater monitoring.
Pipe from new or existing well.
0.5 Mitigation plan would be highly effective at maintaining the hydrophytic vegetation.
Willow Creek 110 27-48-25-143
Seep located within a tributary to Willow Creek. Fall monitoring (2013-2017) indicates consistent wet conditions with variable flow (0.0 - 0.45 gpm).
0.282
Reduction of hydrophytic vegetation below established threshold coincident with a reduction in groundwater levels in the area as determined from groundwater monitoring.
Pipe from new or existing well.
0.5 Mitigation plan would be highly effective at maintaining the hydrophytic vegetation.

Appendix A Deep South Expansion Project EIS Water Resources A-78
Draft EIS 2018
Table A-3 Mitigation Triggers and Contingency Mitigation 1by 2011 Final SEIS Mitigation
Measures for Drawdown Impacts to Surface Water Resources Not Covered
2Spring Group Map ID
2Number Spring or Stream
Site ID Site Description
Estimated Riparian/
Hydrophytic Vegetation
(acres) Mitigation Trigger
Type Contingency
3Mitigation Plan
Proposed Flow Augmentation
4Rates (gpm)
Effectiveness of Site-specific
Mitigation Plan
Willow Creek 109 27-48-25-244
Seep located at the head of a long wetland area adjacent to a small reclaimed mining area. Fall monitoring (2013-2017) indicates consistent wet conditions with variable flow (0.0 - 5 gpm).
1.738
Reduction of flow below established threshold coincident with a reduction in groundwater levels in the area as determined from groundwater monitoring.
Pipe from new or existing well.
0.5 Mitigation plan would be highly effective at maintaining a water supply for livestock and wildlife.
Willow Creek 114 27-48-25-313
Hillside seep that supports a wetland complex. Fall monitoring (2013-2017) indicates consistent wet or saturated soil conditions with variable flow (0.0 - 0.45 gpm).
0.137
Reduction of hydrophytic vegetation below established threshold coincident with a reduction in groundwater levels in the area as determined from groundwater monitoring.
Pipe from new or existing well.
0.5 Mitigation plan would be highly effective at maintaining the hydrophytic vegetation.

Appendix A Deep South Expansion Project EIS Water Resources A-79
Draft EIS 2018
Table A-3 Mitigation Triggers and Contingency Mitigation 1by 2011 Final SEIS Mitigation
Measures for Drawdown Impacts to Surface Water Resources Not Covered
2Spring Group Map ID
2Number Spring or Stream
Site ID Site Description
Estimated Riparian/
Hydrophytic Vegetation
(acres) Mitigation Trigger
Type Contingency
3Mitigation Plan
Proposed Flow Augmentation
4Rates (gpm)
Effectiveness of Site-specific
Mitigation Plan
Willow Creek 113 27-48-25-324
Small seep within a larger area of wetland vegetation. Fall monitoring (2013-2017) has not recorded measurable flow at this site.
1.322
Reduction of hydrophytic vegetation below established threshold coincident with a reduction in groundwater levels in the area as determined from groundwater monitoring.
Pipe from new or existing well.
0.5 Mitigation plan would be highly effective at maintaining the hydrophytic vegetation.
Willow Creek 112 27-48-25-324A
Hillside seep that supports saturated soil. Fall monitoring (2013-2017) indicates flow not recorded at this site.
0
Reduction of hydrophytic vegetation below established threshold coincident with a reduction in groundwater levels in the area as determined from groundwater monitoring.
Pipe from new or existing well.
0.5 Mitigation plan would be highly effective at maintaining the hydrophytic vegetation.

Appendix A Deep South Expansion Project EIS Water Resources A-80
Draft EIS 2018
Table A-3 Mitigation Triggers and Contingency Mitigation 1by 2011 Final SEIS Mitigation
Measures for Drawdown Impacts to Surface Water Resources Not Covered
2Spring Group Map ID
2Number Spring or Stream
Site ID Site Description
Estimated Riparian/
Hydrophytic Vegetation
(acres) Mitigation Trigger
Type Contingency
3Mitigation Plan
Proposed Flow Augmentation
4Rates (gpm)
Effectiveness of Site-specific
Mitigation Plan
Willow Creek 116 27-48-25-334
Hillside seep that supports a wetland complex. Fall monitoring (2013-2017) indicates consistent wet or saturated soil conditions with variable flow (0.0 - 0.45 gpm).
0.334
Reduction of hydrophytic vegetation below established threshold coincident with a reduction in groundwater levels in the area as determined from groundwater monitoring.
Pipe from new or existing well.
0.5 Mitigation plan would be highly effective at maintaining the hydrophytic vegetation.
Willow Creek 111 27-48-25-411
Hillside seep that supports a wetland area. Fall monitoring (2013-2017) indicates consistent wet or saturated soil conditions with variable flow (0.0 - 0.5 gpm).
0.197
Reduction of hydrophytic vegetation below established threshold coincident with a reduction in groundwater levels in the area as determined from groundwater monitoring.
Pipe from new or existing well.
0.5 Mitigation plan would be highly effective at maintaining the hydrophytic vegetation.

Appendix A Deep South Expansion Project EIS Water Resources A-81
Draft EIS 2018
Table A-3 Mitigation Triggers and Contingency Mitigation 1by 2011 Final SEIS Mitigation
Measures for Drawdown Impacts to Surface Water Resources Not Covered
2Spring Group Map ID
2Number Spring or Stream
Site ID Site Description
Estimated Riparian/
Hydrophytic Vegetation
(acres) Mitigation Trigger
Type Contingency
3Mitigation Plan
Proposed Flow Augmentation
4Rates (gpm)
Effectiveness of Site-specific
Mitigation Plan
Mill Canyon 62 27-48-27-134
Seep located side slope within a tributary to Mill Canyon. Fall monitoring (2013-2017) indicates variable conditions ranging from dry (2016, 2017), to no flow but saturated (2013, 2015), to flowing (0.45 in 2014).
0.23
Reduction of hydrophytic vegetation below established threshold coincident with a reduction in groundwater levels in the area as determined from groundwater monitoring.
Pipe from new or existing well.
0.5 Mitigation plan would be highly effective at maintaining the hydrophytic vegetation.
Mill Canyon 61 27-48-27-134A
Site located downstream from 27-48-27-134. Fallmonitoring (2013-2017) indicatesgenerally wetconditions (exceptfor 2015 when itwas dry) with flowranging from 0.0to 0.5 gpm.
0.329
Reduction of hydrophytic vegetation below established threshold coincident with a reduction in groundwater levels in the area as determined from groundwater monitoring.
Pipe from new or existing well.
0.5 Mitigation plan would be highly effective at maintaining the hydrophytic vegetation.

Appendix A Deep South Expansion Project EIS Water Resources A-82
Draft EIS 2018
Table A-3 Mitigation Triggers and Contingency Mitigation 1by 2011 Final SEIS Mitigation
Measures for Drawdown Impacts to Surface Water Resources Not Covered
2Spring Group Map ID
2Number Spring or Stream
Site ID Site Description
Estimated Riparian/
Hydrophytic Vegetation
(acres) Mitigation Trigger
Type Contingency
3Mitigation Plan
Proposed Flow Augmentation
4Rates (gpm)
Effectiveness of Site-specific
Mitigation Plan
Mill Canyon 60 27-48-28-211
Side hill seep impounded by Mill Canyon road that supports a wet area. Fall monitoring (2013-2017) had not recorded flow.
5.245
Reduction of hydrophytic vegetation below established threshold coincident with a reduction in groundwater levels in the area as determined from groundwater monitoring.
Pipe from new or existing well.
0.5 Mitigation plan would be highly effective at maintaining the hydrophytic vegetation.
Mill Canyon 64 27-48-28-441
Cherry Tree Spring (noted on USGS topo map). Fall monitoring (2013-2017) indicates consistent wet or saturated soil conditions with variable flow (0.0 - 1.5 gpm).
0.009
Reduction of flow below established threshold coincident with a reduction in groundwater levels in the area as determined from groundwater monitoring.
Pipe from new or existing well.
0.2 Mitigation plan would be highly effective at maintaining a water supply for livestock and wildlife.

Appendix A Deep South Expansion Project EIS Water Resources A-83
Draft EIS 2018
Table A-3 Mitigation Triggers and Contingency Mitigation 1by 2011 Final SEIS Mitigation
Measures for Drawdown Impacts to Surface Water Resources Not Covered
2Spring Group Map ID
2Number Spring or Stream
Site ID Site Description
Estimated Riparian/
Hydrophytic Vegetation
(acres) Mitigation Trigger
Type Contingency
3Mitigation Plan
Proposed Flow Augmentation
4Rates (gpm)
Effectiveness of Site-specific
Mitigation Plan
Mill Canyon 63 27-48-28-441A
Site located downstream from 27-48-28-441 andis supported bythe same springsource. Fallmonitoring (2013-2017) reports sitehas no water withno fieldmeasurements.
0.005
Reduction of hydrophytic vegetation below established threshold coincident with a reduction in groundwater levels in the area as determined from groundwater monitoring.
Pipe from new or existing well.
0.5 Mitigation plan would be highly effective at maintaining the hydrophytic vegetation.
Willow Creek 125 27-48-34-322A
Spring located in a drainage area in the upper reaches of Willow Creek. Fall monitoring data (2008-2017) indicates site typically has measurable flow (<2gpm) in most years.
0.032
Reduction of flow below established threshold coincident with a reduction in groundwater levels in the area as determined from groundwater monitoring.
Pipe from new or existing well.
1.0 Mitigation plan would be highly effective at maintaining a water supply for livestock and wildlife.

Appendix A Deep South Expansion Project EIS Water Resources A-84
Draft EIS 2018
Table A-3 Mitigation Triggers and Contingency Mitigation 1by 2011 Final SEIS Mitigation
Measures for Drawdown Impacts to Surface Water Resources Not Covered
2Spring Group Map ID
2Number Spring or Stream
Site ID Site Description
Estimated Riparian/
Hydrophytic Vegetation
(acres) Mitigation Trigger
Type Contingency
3Mitigation Plan
Proposed Flow Augmentation
4Rates (gpm)
Effectiveness of Site-specific
Mitigation Plan
Willow Creek 123 27-48-34-322B
Site located downstream from 27-48-24-322Aand is a fringewetland adjacentto Willow Creek.Fall monitoring(2008-2017)indicates generallywet or saturatedsoil conditions.
0.018
Reduction of hydrophytic vegetation below established threshold coincident with a reduction in groundwater levels in the area as determined from groundwater monitoring.
Pipe from new or existing well.
0.5 Mitigation plan would be highly effective at maintaining the hydrophytic vegetation.
Willow Creek 124 27-48-34-412
Seep adjacent to drainage. Fall monitoring (2008-2017) indicates variable conditions ranging from dry to wet without measurable flow.
0.011
Reduction of hydrophytic vegetation below established threshold coincident with a reduction in groundwater levels in the area as determined from groundwater monitoring.
Pipe from new or existing well.
0.5 Mitigation plan would be highly effective at maintaining the hydrophytic vegetation.

Appendix A Deep South Expansion Project EIS Water Resources A-85
Draft EIS 2018
Table A-3 Mitigation Triggers and Contingency Mitigation 1by 2011 Final SEIS Mitigation
Measures for Drawdown Impacts to Surface Water Resources Not Covered
2Spring Group Map ID
2Number Spring or Stream
Site ID Site Description
Estimated Riparian/
Hydrophytic Vegetation
(acres) Mitigation Trigger
Type Contingency
3Mitigation Plan
Proposed Flow Augmentation
4Rates (gpm)
Effectiveness of Site-specific
Mitigation Plan
Willow Creek 122 27-48-34-421
Seep located in drainage channel. Fall monitoring data(2008-2014) indicate the site observations ranged from damp or "insufficient water for sampling" to low flow (0.10 gpm recorded in 2011).
0.002
Reduction of hydrophytic vegetation below established threshold coincident with a reduction in groundwater levels in the area as determined from groundwater monitoring.
Pipe from new or existing well.
0.5 Mitigation plan would be highly effective at maintaining the hydrophytic vegetation.
Fourmile Canyon 58 27-48-35-112
Site located on a hillside just above a reclaimed road in the uppermost reaches of Fourmile Canyon. Fall monitoring (2013-2017) indicates site is typically wet or saturated soil conditions with variable flow (0.0 - 0.5 gpm) were observed.
0
Reduction of hydrophytic vegetation below established threshold coincident with a reduction in groundwater levels in the area as determined from groundwater monitoring.
Install guzzler.
Not applicable. Mitigation plan would be highly effective at maintaining site use by wildlife.

Appendix A Deep South Expansion Project EIS Water Resources A-86
Draft EIS 2018
Table A-3 Mitigation Triggers and Contingency Mitigation 1by 2011 Final SEIS Mitigation
Measures for Drawdown Impacts to Surface Water Resources Not Covered
2Spring Group Map ID
2Number Spring or Stream
Site ID Site Description
Estimated Riparian/
Hydrophytic Vegetation
(acres) Mitigation Trigger
Type Contingency
3Mitigation Plan
Proposed Flow Augmentation
4Rates (gpm)
Effectiveness of Site-specific
Mitigation Plan
Willow Creek 119 27-48-35-234
Seep located in the main channel of Willow Creek. Fall monitoring (2013-2017) indicates site was dry in 4 of the 7 years.
0.162
Reduction of hydrophytic vegetation below established threshold coincident with a reduction in groundwater levels in the area as determined from groundwater monitoring.
Pipe from new or existing well.
0.5 Mitigation plan would be highly effective at maintaining the hydrophytic vegetation.
Willow Creek 121 27-48-35-311
Perennial spring located adjacent to the upper reaches of the Willow Creek drainage. Fall monitoring (2013-2017) indicates site is typically wet or saturated soil conditions with variable flow (0.0 - 0.5 gpm) were observed.
0.036
Reduction of flow below established threshold coincident with a reduction in groundwater levels in the area as determined from groundwater monitoring.
Pipe from new or existing well.
1.3 Mitigation plan would be highly effective at maintaining a water supply for livestock and wildlife.

Appendix A Deep South Expansion Project EIS Water Resources A-87
Draft EIS 2018
Table A-3 Mitigation Triggers and Contingency Mitigation 1by 2011 Final SEIS Mitigation
Measures for Drawdown Impacts to Surface Water Resources Not Covered
2Spring Group Map ID
2Number Spring or Stream
Site ID Site Description
Estimated Riparian/
Hydrophytic Vegetation
(acres) Mitigation Trigger
Type Contingency
3Mitigation Plan
Proposed Flow Augmentation
4Rates (gpm)
Effectiveness of Site-specific
Mitigation Plan
Willow Creek 230 27-48-35-423
Seep area adjacent to drainage. Monitoring data (2008-2011) indicates site is strongly influenced by seasonal flow and reported as dry during the fall sampling events.
0.239
Reduction of hydrophytic vegetation below established threshold coincident with a reduction in groundwater levels in the area as determined from groundwater monitoring.
Pipe from new or existing well.
0.5 Mitigation plan would be highly effective at maintaining the hydrophytic vegetation.
Willow Creek 128 27-48-35-441
Seep located on steep side hill above the main channel of Willow Creek. Monitoring (2008-2014) indicates site is typically dry in most years during the fall sampling events.
0.071
Reduction of hydrophytic vegetation below established threshold coincident with a reduction in groundwater levels in the area as determined from groundwater monitoring.
Pipe from new or existing well.
0.5 Mitigation plan would be highly effective at maintaining the hydrophytic vegetation.

Appendix A Deep South Expansion Project EIS Water Resources A-88
Draft EIS 2018
Table A-3 Mitigation Triggers and Contingency Mitigation 1by 2011 Final SEIS Mitigation
Measures for Drawdown Impacts to Surface Water Resources Not Covered
2Spring Group Map ID
2Number Spring or Stream
Site ID Site Description
Estimated Riparian/
Hydrophytic Vegetation
(acres) Mitigation Trigger
Type Contingency
3Mitigation Plan
Proposed Flow Augmentation
4Rates (gpm)
Effectiveness of Site-specific
Mitigation Plan
Willow Creek 126 27-48-35-441B
Seep located on side hill above the main channel of Willow Creek. Fall monitoring (2011-2017) indicates site is typically wet or has standing water without measurable flow.
0.008
Reduction of hydrophytic vegetation below established threshold coincident with a reduction in groundwater levels in the area as determined from groundwater monitoring.
Pipe from new or existing well.
0.5 Mitigation plan would be highly effective at maintaining the hydrophytic vegetation.
Willow Creek 129 27-48-35-442B
Seep is a dry silty basin located above the main channel of Willow Creek. Fall monitoring (2011-2017) indicates the site was dry except for 2017.
0.028
Reduction of hydrophytic vegetation below established threshold coincident with a reduction in groundwater levels in the area as determined from groundwater monitoring.
Pipe from new or existing well.
0.5 Mitigation plan would be highly effective at maintaining the hydrophytic vegetation.

Appendix A Deep South Expansion Project EIS Water Resources A-89
Draft EIS 2018
Table A-3 Mitigation Triggers and Contingency Mitigation 1by 2011 Final SEIS Mitigation
Measures for Drawdown Impacts to Surface Water Resources Not Covered
2Spring Group Map ID
2Number Spring or Stream
Site ID Site Description
Estimated Riparian/
Hydrophytic Vegetation
(acres) Mitigation Trigger
Type Contingency
3Mitigation Plan
Proposed Flow Augmentation
4Rates (gpm)
Effectiveness of Site-specific
Mitigation Plan
Willow Creek 120 27-48-36-321A
Seep located within an ephemeral channel. Fall monitoring (2013-2017) indicates the site is typically wet but no flow has ever been recorded.
0.026
Reduction of hydrophytic vegetation below established threshold coincident with a reduction in groundwater levels in the area as determined from groundwater monitoring.
Pipe from new or existing well.
0.5 Mitigation plan would be highly effective at maintaining the hydrophytic vegetation.
Dry Creek 67 27-49-29-413
Seep that feeds a small, hillside wetland. Fall monitoring data (2013-2017) indicates that flow has not been recorded at this site.
0.87
Reduction of hydrophytic vegetation below established threshold coincident with a reduction in groundwater levels in the area as determined from groundwater monitoring.
Install guzzler.
Not applicable Mitigation plan would be highly effective at maintaining the hydrophytic vegetation.

Appendix A Deep South Expansion Project EIS Water Resources A-90
Draft EIS 2018
Table A-3 Mitigation Triggers and Contingency Mitigation 1by 2011 Final SEIS Mitigation
Measures for Drawdown Impacts to Surface Water Resources Not Covered
2Spring Group Map ID
2Number Spring or Stream
Site ID Site Description
Estimated Riparian/
Hydrophytic Vegetation
(acres) Mitigation Trigger
Type Contingency
3Mitigation Plan
Proposed Flow Augmentation
4Rates (gpm)
Effectiveness of Site-specific
Mitigation Plan
Dry Creek 65 27-49-30-132
Spring site located at the top of a large wet area. Fall monitoring data (2013-2017) indicates that the site is wet although measurable flow was only reported in 2016.
0.661
Reduction of hydrophytic vegetation below established threshold coincident with a reduction in groundwater levels in the area as determined from groundwater monitoring.
Pipe from new or existing well.
0.5 Mitigation plan would be highly effective at maintaining the hydrophytic vegetation.
Dry Creek 70 27-49-31-244
Perennial spring discharges from a spring pipe downslope from the old Buckhorn Mine. Water flowing from pipe supports a large wetland complex. Fall monitoring data (2013-2017) recorded flows ranging from 0.75 - 7.17 gpm.
2.215
Reduction of flow below established threshold coincident with a reduction in groundwater levels in the area as determined from groundwater monitoring.
Pipe from new or existing well.
2.8 Mitigation plan would be highly effective at maintaining a water supply for livestock and wildlife.

Appendix A Deep South Expansion Project EIS Water Resources A-91
Draft EIS 2018
Table A-3 Mitigation Triggers and Contingency Mitigation 1by 2011 Final SEIS Mitigation
Measures for Drawdown Impacts to Surface Water Resources Not Covered
2Spring Group Map ID
2Number Spring or Stream
Site ID Site Description
Estimated Riparian/
Hydrophytic Vegetation
(acres) Mitigation Trigger
Type Contingency
3Mitigation Plan
Proposed Flow Augmentation
4Rates (gpm)
Effectiveness of Site-specific
Mitigation Plan
Willow Creek 115 27-49-31-344
Seep located on a hillside. Fall monitoring data (2013-2017) indicates flow has never been recorded.
0
Reduction of hydrophytic vegetation below established threshold coincident with a reduction in groundwater levels in the area as determined from groundwater monitoring.
Pipe from new or existing well.
0.5 Mitigation plan would be highly effective at maintaining the localized hydrophytic vegetation.
Dry Creek 68 27-49-32-111
Seep located on a hillside that supports vegetation. Fall monitoring (2013-2017) recorded saturated soil with no flow in most years.
0.02
Reduction of hydrophytic vegetation below established threshold coincident with a reduction in groundwater levels in the area as determined from groundwater monitoring.
Pipe from new or existing well.
0.5 Mitigation plan would be highly effective at maintaining the hydrophytic vegetation.

Appendix A Deep South Expansion Project EIS Water Resources A-92
Draft EIS 2018
Table A-3 Mitigation Triggers and Contingency Mitigation 1by 2011 Final SEIS Mitigation
Measures for Drawdown Impacts to Surface Water Resources Not Covered
2Spring Group Map ID
2Number Spring or Stream
Site ID Site Description
Estimated Riparian/
Hydrophytic Vegetation
(acres) Mitigation Trigger
Type Contingency
3Mitigation Plan
Proposed Flow Augmentation
4Rates (gpm)
Effectiveness of Site-specific
Mitigation Plan
Dry Creek 69 27-49-32-121
Seep located on a hillside above a shallow channel. Fall monitoring data (2013-2017) indicates flow has never been recorded.
0
Reduction of hydrophytic vegetation below established threshold coincident with a reduction in groundwater levels in the area as determined from groundwater monitoring.
Pipe from new or existing well.
0.5 Mitigation plan would be highly effective at maintaining the localized hydrophytic vegetation.
Shoshone 12 28-46-21-11
Perennial spring source that emerges below a rock outcrop and collects in a small stock pond. Fall monitoring (1996-2017) indicates the site conditions typically vary from ponded area without measurable flow to small recorded flows (<0.2 gpm).
0.032
Reduction of hydrophytic vegetation below established threshold coincident with a reduction in groundwater levels in the area as determined from groundwater monitoring.
Pipe from new or existing well.
0.5 Mitigation plan would be highly effective at maintaining a water supply for livestock and wildlife.

Appendix A Deep South Expansion Project EIS Water Resources A-93
Draft EIS 2018
Table A-3 Mitigation Triggers and Contingency Mitigation 1by 2011 Final SEIS Mitigation
Measures for Drawdown Impacts to Surface Water Resources Not Covered
2Spring Group Map ID
2Number Spring or Stream
Site ID Site Description
Estimated Riparian/
Hydrophytic Vegetation
(acres) Mitigation Trigger
Type Contingency
3Mitigation Plan
Proposed Flow Augmentation
4Rates (gpm)
Effectiveness of Site-specific
Mitigation Plan
SE Crescent Valley 48 HDR-27-48-19-24
Perennial spring that supports a large wetland area at the toe of a slope just west of the entrance to Mill Canyon. Fall monitoring (2014-2017) indicates consistent flows ranging from 0.45 - 3.81 gpm.
0.379
Reduction of flow below established threshold coincident with a reduction in groundwater levels in the area as determined from groundwater monitoring.
Pipe from new or existing well.
1.7 Mitigation plan would be highly effective at maintaining a water supply for livestock and wildlife.
Carico Lake North 19 WCCC-01
Spring located on a hillside near the headwaters of Cooks Creek. Fall monitoring in 2016-2017 indicates flows ranging from 0.125 - 4.76 gpm.
0.072
Reduction of hydrophytic vegetation below established threshold coincident with a reduction in groundwater levels in the area as determined from groundwater monitoring.
Pipe from new or existing well.
0.5 Mitigation plan would be highly effective at maintaining the hydrophytic vegetation.

Appendix A Deep South Expansion Project EIS Water Resources A-94
Draft EIS 2018
Table A-3 Mitigation Triggers and Contingency Mitigation 1by 2011 Final SEIS Mitigation
Measures for Drawdown Impacts to Surface Water Resources Not Covered
2Spring Group Map ID
2Number Spring or Stream
Site ID Site Description
Estimated Riparian/
Hydrophytic Vegetation
(acres) Mitigation Trigger
Type Contingency
3Mitigation Plan
Proposed Flow Augmentation
4Rates (gpm)
Effectiveness of Site-specific
Mitigation Plan
Carico Lake North 22 WCCC-03
Seep located in a wide valley bottom close to historic mining. Flows recorded in 2016-2017 ranged from 0.0 - 2.43 gpm.
0.33
Reduction of hydrophytic vegetation below established threshold coincident with a reduction in groundwater levels in the area as determined from groundwater monitoring.
Pipe from new or existing well.
0.5 Mitigation plan would be highly effective at maintaining the hydrophytic vegetation.
Carico Lake North 21 WCCC-05
Bank seep adjacent to a dry drainage bottom north of Greystone Mine. Flows recorded in 2016-2017 ranged from 0.0 - 3.24 gpm.
0.008
Reduction of hydrophytic vegetation below established threshold coincident with a reduction in groundwater levels in the area as determined from groundwater monitoring.
Pipe from new or existing well.
0.5 Mitigation plan would be highly effective at maintaining the hydrophytic vegetation.

Appendix A Deep South Expansion Project EIS Water Resources A-95
Draft EIS 2018
Table A-3 Mitigation Triggers and Contingency Mitigation 1by 2011 Final SEIS Mitigation
Measures for Drawdown Impacts to Surface Water Resources Not Covered
2Spring Group Map ID
2Number Spring or Stream
Site ID Site Description
Estimated Riparian/
Hydrophytic Vegetation
(acres) Mitigation Trigger
Type Contingency
3Mitigation Plan
Proposed Flow Augmentation
4Rates (gpm)
Effectiveness of Site-specific
Mitigation Plan
Carico Lake North 20 WCCC-06
Seep emerges in a drainage bottom north of the Greystone Mine. Flows recorded in 2016-2017 ranged from 0.76 - 3.23 gpm.
0.02
Reduction of hydrophytic vegetation below established threshold coincident with a reduction in groundwater levels in the area as determined from groundwater monitoring.
Pipe from new or existing well.
0.5 Mitigation plan would be highly effective at maintaining the hydrophytic vegetation.
Carico Lake North 18 WCCC-07
Seep emerges from a hillside near the headwaters of Cooks Creek. Flows recorded in 2016-2017 ranged from 0.29 - 0.68 gpm.
0.137
Reduction of hydrophytic vegetation below established threshold coincident with a reduction in groundwater levels in the area as determined from groundwater monitoring.
Pipe from new or existing well.
0.5 Mitigation plan would be highly effective at maintaining the hydrophytic vegetation.

Appendix A Deep South Expansion Project EIS Water Resources A-96
Draft EIS 2018
Table A-3 Mitigation Triggers and Contingency Mitigation 1by 2011 Final SEIS Mitigation
Measures for Drawdown Impacts to Surface Water Resources Not Covered
2Spring Group Map ID
2Number Spring or Stream
Site ID Site Description
Estimated Riparian/
Hydrophytic Vegetation
(acres) Mitigation Trigger
Type Contingency
3Mitigation Plan
Proposed Flow Augmentation
4Rates (gpm)
Effectiveness of Site-specific
Mitigation Plan
Carico Lake North 17 WCCC-09
Seep located at the headwaters of Cooks Creek. Flows recorded in 2016-2017 ranged from 1.57 - 3.88 gpm.
0.047
Reduction of hydrophytic vegetation below established threshold coincident with a reduction in groundwater levels in the area as determined from groundwater monitoring.
Pipe from new or existing well.
0.5 Mitigation plan would be highly effective at maintaining the hydrophytic vegetation.
Carico Lake North 15 WCCC-10
Seep located at the headwaters of Cooks Creek. Flows recorded in 2016-2017 ranged from 1.28 - 10.32 gpm.
0.029
Reduction of hydrophytic vegetation below established threshold coincident with a reduction in groundwater levels in the area as determined from groundwater monitoring.
Pipe from new or existing well.
0.5 Mitigation plan would be highly effective at maintaining the hydrophytic vegetation.

Appendix A Deep South Expansion Project EIS Water Resources A-97
Draft EIS 2018
Table A-3 Mitigation Triggers and Contingency Mitigation 1by 2011 Final SEIS Mitigation
Measures for Drawdown Impacts to Surface Water Resources Not Covered
2Spring Group Map ID
2Number Spring or Stream
Site ID Site Description
Estimated Riparian/
Hydrophytic Vegetation
(acres) Mitigation Trigger
Type Contingency
3Mitigation Plan
Proposed Flow Augmentation
4Rates (gpm)
Effectiveness of Site-specific
Mitigation Plan
Carico Lake North 23 WCCC-11
Seep located on a gentle slope that drains towards Cooks Creek. Flows recorded in 2016-2017 ranged from 1.04 - 1.71 gpm.
0.147
Reduction of hydrophytic vegetation below established threshold coincident with a reduction in groundwater levels in the area as determined from groundwater monitoring.
Pipe from new or existing well.
0.5 Mitigation plan would be highly effective at maintaining the hydrophytic vegetation.
Carico Lake North 14 WCCC-12
Seep located at the headwaters of Cooks Creek. Flows recorded in 2016-2017 ranged from 0.0 - 0.63 gpm.
0.094
Reduction of hydrophytic vegetation below established threshold coincident with a reduction in groundwater levels in the area as determined from groundwater monitoring.
Pipe from new or existing well.
0.5 Mitigation plan would be highly effective at maintaining the hydrophytic vegetation.

Appendix A Deep South Expansion Project EIS Water Resources A-98
Draft EIS 2018
Table A-3 Mitigation Triggers and Contingency Mitigation 1by 2011 Final SEIS Mitigation
Measures for Drawdown Impacts to Surface Water Resources Not Covered
2Spring Group Map ID
2Number Spring or Stream
Site ID Site Description
Estimated Riparian/
Hydrophytic Vegetation
(acres) Mitigation Trigger
Type Contingency
3Mitigation Plan
Proposed Flow Augmentation
4Rates (gpm)
Effectiveness of Site-specific
Mitigation Plan
Carico Lake North 16 WCCC-13
Seep located at the headwaters of Cooks Creek. Flows recorded in 2016-2017 ranged from 0.0 - 2.83 gpm.
0.108
Reduction of hydrophytic vegetation below established threshold coincident with a reduction in groundwater levels in the area as determined from groundwater monitoring.
Pipe from new or existing well.
0.5 Mitigation plan would be highly effective at maintaining the hydrophytic vegetation.
Stream Sites
Fourmile Canyon S-08 FOU-01-HDR
Located near the midpoint of Fourmile Canyon immediately upstream of a major tributary. Flow monitoring (2013-2017) indicates the site flow is ephemeral.
0.335
Reduction of hydrophytic vegetation below established threshold coincident with a reduction in groundwater levels in the area as determined from groundwater monitoring.
Pipe from new or existing well.
0.5 Mitigation plan would be highly effective at maintaining the hydrophytic vegetation.
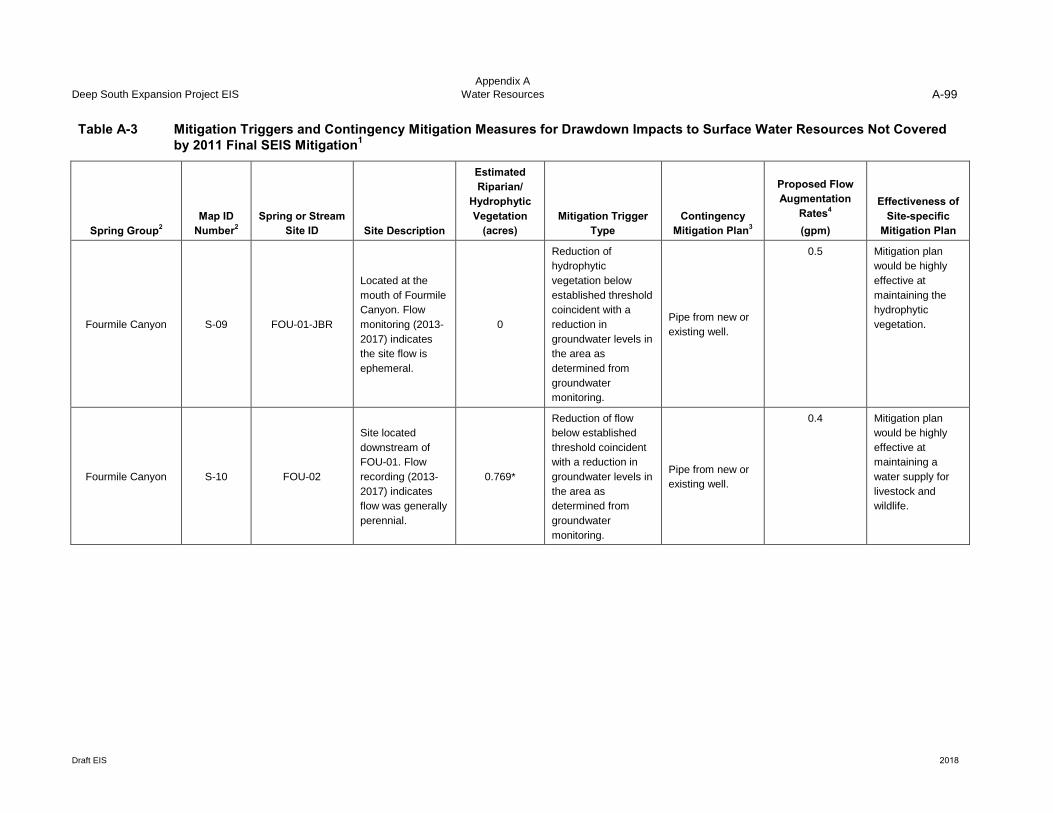
Appendix A Deep South Expansion Project EIS Water Resources A-99
Draft EIS 2018
Table A-3 Mitigation Triggers and Contingency Mitigation 1by 2011 Final SEIS Mitigation
Measures for Drawdown Impacts to Surface Water Resources Not Covered
2Spring Group Map ID
2Number Spring or Stream
Site ID Site Description
Estimated Riparian/
Hydrophytic Vegetation
(acres) Mitigation Trigger
Type Contingency
3Mitigation Plan
Proposed Flow Augmentation
4Rates (gpm)
Effectiveness of Site-specific
Mitigation Plan
Fourmile Canyon S-09 FOU-01-JBR
Located at the mouth of Fourmile Canyon. Flow monitoring (2013-2017) indicates the site flow is ephemeral.
0
Reduction of hydrophytic vegetation below established threshold coincident with a reduction in groundwater levels in the area as determined from groundwater monitoring.
Pipe from new or existing well.
0.5 Mitigation plan would be highly effective at maintaining the hydrophytic vegetation.
Fourmile Canyon S-10 FOU-02
Site located downstream of FOU-01. Flow recording (2013-2017) indicates flow was generally perennial.
0.769*
Reduction of flow below established threshold coincident with a reduction in groundwater levels in the area as determined from groundwater monitoring.
Pipe from new or existing well.
0.4 Mitigation plan would be highly effective at maintaining a water supply for livestock and wildlife.

Appendix A Deep South Expansion Project EIS Water Resources A-100
Draft EIS 2018
Table A-3 Mitigation Triggers and Contingency Mitigation 1by 2011 Final SEIS Mitigation
Measures for Drawdown Impacts to Surface Water Resources Not Covered
2Spring Group Map ID
2Number Spring or Stream
Site ID Site Description
Estimated Riparian/
Hydrophytic Vegetation
(acres) Mitigation Trigger
Type Contingency
3Mitigation Plan
Proposed Flow Augmentation
4Rates (gpm)
Effectiveness of Site-specific
Mitigation Plan
Horse Creek S-11 HOR-01
Stream site located in Horse Creek. Flow data (2008-2017) indicates flow was perennial between 2008 and 2012; and ephemeral to intermittent between May 2013 and December 2017.
0
Reduction of hydrophytic vegetation below established threshold coincident with a reduction in groundwater levels in the area as determined from groundwater monitoring.
Pipe from new or existing well.
0.5 Mitigation plan would be highly effective at maintaining the hydrophytic vegetation.
Horse Creek S-12 HOR-02D
Stream site located in Horse Creek. Flow data (2008-2017) indicate flow was typically ephemeral.
0
Reduction of flow below established threshold coincident with a reduction in groundwater levels in the area as determined from groundwater monitoring.
Pipe from new or existing well.
4.4 Mitigation plan would be highly effective at maintaining a water supply for livestock and wildlife.
Horse Creek S-13 HOR-05T
Stream site located in Horse Creek. Flow data (2008-2017) indicate flow was typically ephemeral.
0.017
Reduction of flow below established threshold coincident with a reduction in groundwater levels in the area as determined from groundwater monitoring.
Pipe from new or existing well.
1.3 Mitigation plan would be highly effective at maintaining a water supply for livestock and wildlife.

Appendix A Deep South Expansion Project EIS Water Resources A-101
Draft EIS 2018
Table A-3 Mitigation Triggers and Contingency Mitigation 1by 2011 Final SEIS Mitigation
Measures for Drawdown Impacts to Surface Water Resources Not Covered
2Spring Group Map ID
2Number Spring or Stream
Site ID Site Description
Estimated Riparian/
Hydrophytic Vegetation
(acres) Mitigation Trigger
Type Contingency
3Mitigation Plan
Proposed Flow Augmentation
4Rates (gpm)
Effectiveness of Site-specific
Mitigation Plan
Horse Creek S-14 HOR-05U
Stream site located in Horse Creek. Flow data (2008-2017) indicate flow was variable and typically exhibited perennial characteristics except for periods when the stream was reported dry in portions of 2008 and 2015.
0.014
Reduction of flow below established threshold coincident with a reduction in groundwater levels in the area as determined from groundwater monitoring.
Pipe from new or existing well.
18.2 Mitigation plan would be highly effective at maintaining a water supply for livestock and wildlife.
Mill Canyon S-19 MIL-02
Stream site located 0.75 mile upgradient from the mouth of Mill Canyon. Flow data (2014-2017) exhibited ephemeral to intermittent flow characteristics.
0.713
Reduction of hydrophytic vegetation below established threshold coincident with a reduction in groundwater levels in the area as determined from groundwater monitoring.
Pipe from new or existing well.
0.5 Mitigation plan would be highly effective at maintaining the hydrophytic vegetation.

Appendix A Deep South Expansion Project EIS Water Resources A-102
Draft EIS 2018
Table A-3 Mitigation Triggers and Contingency Mitigation 1by 2011 Final SEIS Mitigation
Measures for Drawdown Impacts to Surface Water Resources Not Covered
2Spring Group Map ID
2Number Spring or Stream
Site ID Site Description
Estimated Riparian/
Hydrophytic Vegetation
(acres) Mitigation Trigger
Type Contingency
3Mitigation Plan
Proposed Flow Augmentation
4Rates (gpm)
Effectiveness of Site-specific
Mitigation Plan
Mill Canyon S-20 MIL-02A
Stream site located near the mouth of Mill Canyon. Flow data (2013-2017) exhibited perennial flow characteristics.
1.805
Reduction of flow below established threshold coincident with a reduction in groundwater levels in the area as determined from groundwater monitoring.
Pipe from new or existing well.
24.2 Mitigation plan would be highly effective at maintaining a water supply for livestock and wildlife.
Mill Canyon S-21 MIL-03
Stream site located within Mill Canyon. Flow data (2013-2017) exhibited perennial flow characteristics.
2.76
Reduction of flow below established threshold coincident with a reduction in groundwater levels in the area as determined from groundwater monitoring.
Pipe from new or existing well.
7.0 Mitigation plan would be highly effective at maintaining a water supply for livestock and wildlife.

Appendix A Deep South Expansion Project EIS Water Resources A-103
Draft EIS 2018
Table A-3 Mitigation Triggers and Contingency Mitigation 1by 2011 Final SEIS Mitigation
Measures for Drawdown Impacts to Surface Water Resources Not Covered
2Spring Group Map ID
2Number Spring or Stream
Site ID Site Description
Estimated Riparian/
Hydrophytic Vegetation
(acres) Mitigation Trigger
Type Contingency
3Mitigation Plan
Proposed Flow Augmentation
4Rates (gpm)
Effectiveness of Site-specific
Mitigation Plan
Willow Creek S-25 WIL-06D
Stream site located at the upper confluence of Willow Creek and its first main tributary. Flow data (2011-2017) exhibited
0.839
Reduction of flow below established threshold coincident with a reduction in groundwater levels in the area as determined from groundwater
Pipe from new or existing well.
13.6 Mitigation plan would be highly effective at maintaining a water supply for livestock and wildlife.
predominantly perennial flow characteristics in 2013, 2014, 2016, and 2017.
monitoring.
1
2
3
4
Based on the Contingency Mitigation Plan (BCI and Stantec 2018). The 2011 Final SEIS mitigation is presented in the Cortez Hills Expansion Project Final SEIS (BLM 2011). Spring groups and map ID numbers are shown in Figure 3.2-3. New disturbance associated with mitigation implementation would range from 0.05 to 2.60 acres (as identified in the Contingency Mitigation Plan [BCI and Stantec 2018]) depending on the type of mitigation implemented and site-specific conditions. Flow rates rounded to the nearest 0.1 gpm. Flow rate estimates per Table 2 of the proposed Contingency Mitigation Plan (BCI and Stantec 2018).

Appendix A Deep South Expansion Project EIS Water Resources A-104
Draft EIS 2018
Table A-4a Predicted Crossroads Pit Lake Scenario 2 - Total Pit Lake Chemistry
Pit Lake Chemistry
Background Groundwater
Runoff Chemist
NDEP Profile III 1 Year of 2 Years of 5 Years of 10 Years 25 Years 50 Years 100 Years 200 Years
Parameter Units Standard Infilling Infilling Infilling of Infilling of Infilling of Infilling of Infilling of Infilling Chemistry ry
pH 1 su 6.5-8.5 8.34 8.34 8.35 8.35 8.36 8.38 8.41 8.47 7.68 8.45
Total dissolved solids mg/L 7,000 475 477 480 485 501 525 577 698 594 367
Alkalinity (total) mg/L -- 198 199 200 202 208 217 237 281 231 168.8
Bicarbonate (HCO3) mg/L -- 238 239 240 242 250 260 285 337 272 202.5
Aluminum mg/L 4.47 0.01 0.01 0.01 0.02 0.03 0.04 0.06 0.13 0.01 0.2
Antimony mg/L 0.29 0.002 0.003 0.004 0.004 0.004 0.004 0.004 0.01 0.002 0.002
Arsenic mg/L 0.2 0.01 0.01 0.01 0.01 0.01 0.01 0.02 0.03 0.01 0.005
Barium mg/L 23.1 0.05 0.05 0.05 0.05 0.06 0.06 0.07 0.09 0.05 0.06
Beryllium mg/L 2.83 0.001 0.001 0.001 0.001 0.001 0.001 0.001 0.002 0.001 0.001
Boron mg/L 5 0.3 0.3 0.3 0.3 0.3 0.33 0.36 0.44 0.3 0.16
Cadmium mg/L 0.05 0.001 0.001 0.001 0.001 0.001 0.001 0.001 0.002 0.001 0.001
Calcium mg/L -- 66.6 66.9 67.5 69 72 77 86 113 66 49
Chloride mg/L -- 75.7 76.0 76.6 77.4 79.6 83.6 92.5 112 76 33
Chromium mg/L 1 0.005 0.005 0.005 0.005 0.005 0.006 0.006 0.009 0.005 0.005
Copper mg/L 0.5 0.005 0.005 0.005 0.005 0.006 0.006 0.007 0.009 0.005 0.007
Fluoride mg/L 2 2.2 2.2 2.2 2.3 2.4 2.5 2.7 3.3 2.2 0.5
Iron mg/L -- 3.0 3.0 3.0 3.0 3.1 3.2 3.6 4.3 2.97 0.14
Lead mg/L 0.1 0.001 0.001 0.001 0.001 0.002 0.003 0.004 0.007 0.001 0.001
Lithium mg/L 40.3 0.21 0.21 0.21 0.21 0.22 0.23 0.26 0.31 0.21 0.005
Magnesium mg/L -- 21 21 21 21 22 23 25 30 20.9 20
Manganese mg/L 377 0.54 0.54 0.54 0.55 0.57 0.59 0.65 0.79 0.54 0.009
Mercury mg/L 0.01 0.0005 0.001 0.0005 0.0005 0.001 0.0006 0.0006 0.0008 0.0005 0.002
Molybdenum mg/L 0.6 0.011 0.011 0.012 0.012 0.021 0.023 0.027 0.037 0.011 0.005

Appendix A Deep South Expansion Project EIS Water Resources A-105
Draft EIS 2018
Table A-4a Predicted Crossroads Pit Lake Scenario 2 - Total Pit Lake Chemistry
Pit Lake Chemistry
Background Groundwater
Chemistry
Runoff Chemist
ry Parameter Units
NDEP Profile III Standard
1 Year of Infilling
2 Years of Infilling
5 Years of Infilling
10 Years of Infilling
25 Years of Infilling
50 Years of Infilling
100 Years of Infilling
200 Years of Infilling
Nickel mg/L 171 0.005 0.005 0.005 0.005 0.006 0.006 0.006 0.011 0.005 0.005
NO2/NO3-N mg/L 100 2.7 2.7 2.8 2.8 2.9 3.0 3.3 4.1 2.7 0.05
Phosphorous mg/L -- 0.05 0.05 0.05 0.05 0.05 0.06 0.06 0.08 0.05 0.05
Potassium mg/L -- 16.1 16.1 16.2 16.4 16.9 17.6 19.3 23.3 16 3.2
Selenium mg/L 0.05 0.003 0.003 0.003 0.003 0.003 0.003 0.003 0.008 0.003 0.003
Silver mg/L -- 0.005 0.005 0.005 0.005 0.005 0.006 0.006 0.008 0.005 0.005
Sodium mg/L 2,000 79 79 80 81 84 87 96 115 79 41.3
Strontium mg/L 1,127 0.6 0.64 0.64 0.65 0.67 0.7 0.77 0.93 0.64 0.005
Sulfate mg/L -- 87 88 88 89 92 96 106 125 87 79
Thallium mg/L 0.03 0.0005 0.0005 0.0005 0.0006 0.0007 0.001 0.001 0.002 0.0005 0.002
Tin mg/L 29 0.01 0.01 0.02 0.03 0.03 0.04 0.05 0.09 0.005 0.005
Uranium mg/L 6.995 0.003 0.003 0.003 0.003 0.003 0.004 0.004 0.005 0.003 0.001
Vanadium mg/L 0.1 0.006 0.006 0.006 0.006 0.007 0.007 0.008 0.01 0.006 0.005
Zinc mg/L 25 0.006 0.006 0.006 0.006 0.006 0.008 0.012 0.07 0.006 0.005 1 su = standard units.
Note: Bold indicates values
Source: Geomega 2016b.
above the NDEP Profile III water quality standard.

Appendix A Deep South Expansion Project EIS Water Resources A-106
Draft EIS 2018
Table A-4b Predicted Crossroads Pit Lake Scenario 2 - Dissolved Pit Lake Chemistry
Pit Lake Chemistry
Background Groundwater
Chemistry Runoff
Chemistry Parameter Units
NDEP Profile II Standard
NDEP Profile III Standard
1 Year of Infilling
2 Years of Infilling
5 Years of Infilling
10 Years of Infilling
25 Years of Infilling
50 Years of Infilling
100 Years of Infilling
200 Years of Infilling
pH su 6.5-8.5 6.5-8.5 8.19 8.19 8.19 8.19 8.19 8.19 8.19 8.17 7.68 8.45
Total dissolved solids mg/L 1,000 7,000 464 465 467 470 479 493 527 597 594 367
Alkalinity (total) mg/L -- -- 137 137 137 137 137 136 137 133 231 168.8
Bicarbonate (HCO3) mg/L -- -- 165 165 165 165 164 163 164 160 272 202.5
Aluminum mg/L 0.2 4.47 0.01 0.01 0.01 0.02 0.02 0.02 0.02 0.02 0.01 0.2
Antimony mg/L 0.006 0.29 0.002 0.003 0.004 0.004 0.004 0.004 0.004 0.01 0.0022 0.002
Arsenic mg/L 0.01 0.2 0.00003 0.00003 0.00003 0.00003 0.00003 0.00005 0.00004 0.00006 0.01 0.005
Barium mg/L 2 23.1 0.04 0.04 0.04 0.04 0.04 0.04 0.04 0.03 0.05 0.06
Beryllium mg/L 0.004 2.83 0.000002 0.000002 0.000002 0.000002 0.000002 0.000003 0.000003 0.000009 0.001 0.001
Boron mg/L -- 5 0.30 0.30 0.303 0.31 0.31 0.33 0.36 0.44 0.30 0.16
Cadmium mg/L 0.005 0.05 0.0005 0.0005 0.0005 0.0005 0.0006 0.0007 0.0008 0.0015 0.0010 0.001
Calcium mg/L -- -- 41.1 41.2 41.2 41 42 43 44 48 66 49
Chloride mg/L 400 -- 75.7 76.0 76.6 77.4 79.6 83.6 92.5 112 76 33
Chromium mg/L 0.1 1 0.005 0.005 0.005 0.005 0.005 0.005 0.006 0.008 0.005 0.005
Copper mg/L 1.0 0.5 0.0004 0.0004 0.0004 0.0004 0.0005 0.0005 0.0005 0.0010 0.005 0.007
Fluoride mg/L 4 2 2.21 2.22 2.24 2.26 2.4 2.5 2.7 3.3 2.22 0.5
Iron mg/L 0.6 -- 0.00004 0.00004 0.00004 0.00004 0.00004 0.00004 0.00004 0.00004 2.97 0.14
Lead mg/L 0.02 0.1 0.000002 0.000002 0.000003 0.000003 0.000007 0.00002 0.00003 0.0003 0.001 0.001
Lithium mg/L -- 40.3 0.21 0.21 0.21 0.21 0.22 0.23 0.26 0.31 0.21 0.005
Magnesium mg/L 150 -- 21 21 21 21 22 23 25 30 20.9 20
Manganese mg/L 0.1 377 0.0000003 0.0000003 0.0000003 0.0000003 0.0000003 0.0000003 0.0000003 0.0000003 0.54 0.009
Mercury mg/L 0.002 0.01 0.0005 0.000 0.0005 0.0005 0.001 0.0006 0.0006 0.0008 0.0005 0.002
Molybdenum mg/L -- 0.6 0.011 0.011 0.012 0.012 0.021 0.023 0.027 0.037 0.011 0.005

Appendix A Deep South Expansion Project EIS Water Resources A-107
Draft EIS 2018
Table A-4b Predicted Crossroads Pit Lake Scenario 2 - Dissolved Pit Lake Chemistry
Pit Lake Chemistry
Background Groundwater
Chemistry Runoff
Chemistry Parameter Units
NDEP Profile II Standard
NDEP Profile III Standard
1 Year of Infilling
2 Years of Infilling
5 Years of Infilling
10 Years of Infilling
25 Years of Infilling
50 Years of Infilling
100 Years of Infilling
200 Years of Infilling
Nickel mg/L 0.1 171 0.003 0.003 0.003 0.003 0.003 0.003 0.004 0.008 0.005 0.005
NO2/NO3-N mg/L 10 100 2.7 2.7 2.8 2.8 2.9 3.0 3.3 4.1 2.7 0.05
Phosphorous mg/L -- -- 0.02 0.02 0.02 0.02 0.02 0.02 0.02 0.03 0.05 0.05
Potassium mg/L -- -- 16.1 16.1 16.2 16.4 16.9 17.6 19.3 23.3 16 3.2
Selenium mg/L 0.05 0.05 0.003 0.003 0.003 0.003 0.003 0.003 0.003 0.008 0.003 0.003
Silver mg/L 0.1 -- 0.005 0.005 0.005 0.005 0.005 0.006 0.006 0.008 0.005 0.005
Sodium mg/L -- 2,000 79 79 80 81 84 87 96 115 79 41.3
Strontium mg/L -- 1,127 0.6 0.64 0.64 0.65 0.67 0.7 0.77 0.93 0.64 0.005
Sulfate mg/L 500 -- 87 87 88 89 92 96 106 125 87 79
Thallium mg/L 0.002 0.03 0.0005 0.0005 0.0005 0.0006 0.0007 0.001 0.001 0.002 0.0005 0.002
Tin mg/L -- 29 0.005 0.01 0.02 0.03 0.03 0.04 0.05 0.09 0.005 0.005
Uranium mg/L NA 6.995 0.003 0.003 0.003 0.003 0.003 0.004 0.004 0.005 0.003 0.001
Vanadium mg/L -- 0.1 0.00003 0.00003 0.00003 0.00003 0.00003 0.00003 0.00003 0.00004 0.006 0.005
Zinc mg/L 5 25 0.001 0.001 0.001 0.001 0.002 0.004 0.006 0.05 0.006 0.005
Bold indicates values above the NDEP Profile III
Source: Geomega 2016b.
water quality standard. Shading indicates values above the NDEP Profile II water quality standard.

Appendix A Deep South Expansion Project EIS Water Resources A-108
Draft EIS 2018
Table A-4c Predicted Pipeline Pit Lake Scenario 2 - Total Pit Lake Chemistry
Pit Lake Chemistry
Background Groundwater
Chemistry
Runoff Chemist
ry Parameter Units
NDEP Profile III Standard
1 Year of Infilling
2 Years of Infilling
5 Years of Infilling
10 Years of Infilling
25 Years of Infilling
50 Years of Infilling
100 Years of Infilling
200 Years of Infilling
pH su 6.5-8.5 8.35 8.35 8.35 8.39 8.41 8.43 8.49 8.60 7.68 8.45
Total dissolved solids mg/L 7,000 529 522 552 616 661 711 841 1141 594 367
Alkalinity (total) mg/L -- 202 199 203 224 234 249 292 391 231 168.8
Bicarbonate (HCO3) mg/L -- 242 239 243 269 281 298 350 469 272 202.5
Aluminum mg/L 4.47 0.19 0.14 0.09 0.12 0.12 0.12 0.13 0.26 0.01 0.2
Antimony mg/L 0.29 0.004 0.004 0.005 0.006 0.011 0.015 0.021 0.03 0.002 0.002
Arsenic mg/L 0.2 0.03 0.03 0.03 0.03 0.04 0.05 0.04 0.05 0.01 0.005
Barium mg/L 23.1 0.07 0.06 0.06 0.07 0.08 0.09 0.10 0.14 0.05 0.06
Beryllium mg/L 2.83 0.002 0.002 0.001 0.002 0.003 0.004 0.004 0.005 0.001 0.001
Boron mg/L 5 0.26 0.25 0.28 0.30 0.33 0.36 0.43 0.60 0.30 0.16
Cadmium mg/L 0.05 0.001 0.001 0.001 0.002 0.003 0.004 0.004 0.005 0.001 0.001
Calcium mg/L -- 64.6 64.2 67.8 76 87 96 114 156 66 49
Chloride mg/L -- 59.6 58.9 68.3 75.2 82.5 90.4 108.5 149 76 33
Chromium mg/L 1 0.007 0.007 0.006 0.007 0.009 0.010 0.012 0.015 0.005 0.005
Copper mg/L 0.5 0.011 0.01 0.009 0.017 0.015 0.016 0.016 0.019 0.005 0.007
Fluoride mg/L 2 1.7 1.6 2 2.54 2.8 3.0 3.4 4.5 2.22 0.5
Iron mg/L -- 1.8 1.8 2.4 2.8 3.1 3.4 4.0 5.4 2.97 0.14
Lead mg/L 0.1 0.002 0.002 0.002 0.005 0.009 0.012 0.013 0.016 0.001 0.001
Lithium mg/L 40.3 0.12 0.12 0.17 0.21 0.25 0.28 0.34 0.44 0.21 0.005
Magnesium mg/L -- 22 22 22 23 25 27 32 44 20.9 20
Manganese mg/L 377 0.35 0.33 0.44 0.52 0.61 0.70 0.81 1.07 0.54 0.009
Mercury mg/L 0.01 0.0012 0.001 0.0009 0.0009 0.001 0.0009 0.0011 0.0015 0.0005 0.002
Molybdenum mg/L 0.6 0.025 0.023 0.023 0.075 0.074 0.063 0.060 0.278 0.011 0.005

Appendix A Deep South Expansion Project EIS Water Resources A-109
Draft EIS 2018
Table A-4c Predicted Pipeline Pit Lake Scenario 2 - Total Pit Lake Chemistry
Pit Lake Chemistry
Background Groundwater
Chemistry
Runoff Chemist
ry Parameter Units
NDEP Profile III Standard
1 Year of Infilling
2 Years of Infilling
5 Years of Infilling
10 Years of Infilling
25 Years of Infilling
50 Years of Infilling
100 Years of Infilling
200 Years of Infilling
Nickel mg/L 171 0.008 0.008 0.007 0.008 0.011 0.014 0.018 0.023 0.005 0.005
NO2/NO3-N mg/L 100 1.6 1.6 2.2 2.6 3.0 3.4 4.2 5.7 2.7 0.05
Phosphorous mg/L -- 0.08 0.06 0.06 0.09 0.15 0.13 0.13 0.17 0.05 0.05
Potassium mg/L -- 12.0 11.5 14.2 16.4 18.1 19.6 23.0 31.0 16 3.2
Selenium mg/L 0.05 0.008 0.008 0.01 0.01 0.08 0.06 0.048 0.06 0.003 0.003
Silver mg/L -- 0.006 0.006 0.006 0.007 0.009 0.010 0.011 0.015 0.005 0.005
Sodium mg/L 2,000 69 68 75 89 94 101 119 161 79 41.3
Strontium mg/L 1,127 0.4 0.38 0.52 0.63 0.71 0.8 0.91 1.23 0.64 0.005
Sulfate mg/L -- 93 92 93 102 109 116 137 188 87 79
Thallium mg/L 0.03 0.0012 0.0012 0.0010 0.0012 0.0015 0.002 0.002 0.003 0.0005 0.002
Tin mg/L 29 0.02 0.02 0.02 0.07 0.11 0.19 0.26 0.38 0.005 0.005
Uranium mg/L 6.995 0.002 0.002 0.003 0.004 0.005 0.005 0.007 0.008 0.003 0.001
Vanadium mg/L 0.1 0.007 0.007 0.007 0.010 0.011 0.011 0.012 0.016 0.006 0.005
Zinc mg/L 25 0.11 0.06 0.06 0.09 0.15 0.22 0.20 0.20 0.006 0.005
Bold indicates values above the NDEP Profile III
Source: Geomega 2016b.
water quality standard.

Appendix A Deep South Expansion Project EIS Water Resources A-110
Draft EIS 2018
Table A-4d Predicted Crossroads/Pipeline Pit Lake Scenario 3 - Total Pit Lake Chemistry
Pit Lake Chemistry
Background Groundwater
Chemistry
Runoff Chemist
ry Parameter Units
NDEP Profile III Standard
1 Year of Infilling
2 Years of Infilling
5 Years of Infilling
10 Years of Infilling
25 Years of Infilling
50 Years of Infilling
100 Years of Infilling
200 Years of Infilling
pH su 6.5-8.5 8.34 8.34 8.35 8.35 8.36 8.38 8.42 8.50 7.68 8.45
Total dissolved solids mg/L 7,000 552 552 557 563 586 622 704 886 594 367
Alkalinity (total) mg/L -- 198 198 200 202 208 220 246 301 231 168.8
Bicarbonate (HCO3) mg/L -- 238 238 240 242 250 263 295 361 272 202.5
Aluminum mg/L 4.47 0.01 0.01 0.01 0.02 0.04 0.07 0.13 0.26 0.01 0.2
Antimony mg/L 0.29 0.003 0.003 0.004 0.004 0.006 0.007 0.01 0.017 0.002 0.002
Arsenic mg/L 0.2 0.01 0.01 0.01 0.01 0.02 0.02 0.02 0.03 0.01 0.005
Barium mg/L 23.1 0.05 0.05 0.05 0.05 0.06 0.07 0.08 0.11 0.05 0.06
Beryllium mg/L 2.83 0.001 0.001 0.001 0.001 0.001 0.002 0.002 0.003 0.001 0.001
Boron mg/L 5 0.3 0.3 0.3 0.3 0.3 0.3 0.4 0.5 0.3 0.16
Cadmium mg/L 0.05 0.001 0.001 0.001 0.001 0.001 0.001 0.002 0.003 0.001 0.001
Calcium mg/L -- 66.5 66.5 67.1 68 73 80 93 127 66 49
Chloride mg/L -- 75 75 76 77 79 84 95 119 76 33
Chromium mg/L 1 0.005 0.005 0.005 0.005 0.006 0.006 0.008 0.01 0.005 0.005
Copper mg/L 0.5 0.005 0.005 0.005 0.005 0.006 0.007 0.009 0.01 0.005 0.007
Fluoride mg/L 2 2.2 2.2 2.2 2.2 2.3 2.5 2.8 3.5 2.2 0.5
Iron mg/L -- 2.9 2.9 2.9 3.0 3.1 3.2 3.6 4.4 2.97 0.14
Lead mg/L 0.1 0.001 0.001 0.001 0.001 0.002 0.003 0.004 0.01 0.001 0.001
Lithium mg/L 40.3 0.21 0.21 0.21 0.21 0.22 0.24 0.27 0.34 0.21 0.005
Magnesium mg/L -- 21 21 21 21 22 24 27 34 20.9 20
Manganese mg/L 377 0.53 0.53 0.53 0.54 0.57 0.60 0.68 0.85 0.54 0.009
Mercury mg/L 0.01 0.0005 0.001 0.0005 0.0005 0.001 0.0006 0.0007 0.0009 0.0005 0.002
Molybdenum mg/L 0.6 0.01 0.01 0.01 0.01 0.05 0.1 0.18 0.29 0.011 0.005

Appendix A Deep South Expansion Project EIS Water Resources A-111
Draft EIS 2018
Table A-4d Predicted Crossroads/Pipeline Pit Lake Scenario 3 - Total Pit Lake Chemistry
Pit Lake Chemistry
Background Groundwater
Chemistry
Runoff Chemist
ry Parameter Units
NDEP Profile III Standard
1 Year of Infilling
2 Years of Infilling
5 Years of Infilling
10 Years of Infilling
25 Years of Infilling
50 Years of Infilling
100 Years of Infilling
200 Years of Infilling
Nickel mg/L 171 0.005 0.005 0.005 0.005 0.007 0.007 0.01 0.014 0.005 0.005
NO2/NO3-N mg/L 100 2.7 2.7 2.7 2.8 2.9 3.1 3.5 4.6 2.7 0.05
Phosphorous mg/L -- 0.05 0.05 0.05 0.05 0.06 0.06 0.07 0.09 0.05 0.05
Potassium mg/L -- 15.8 15.8 16.0 16.2 16.9 17.8 20 24.7 16 3.2
Selenium mg/L 0.05 0.003 0.003 0.003 0.003 0.006 0.007 0.009 0.015 0.003 0.003
Silver mg/L -- 0.005 0.005 0.005 0.005 0.006 0.006 0.007 0.01 0.005 0.005
Sodium mg/L 2,000 79 79 79 80 83 88 99 124 79 41.3
Strontium mg/L 1,127 0.6 0.6 0.6 0.6 0.7 0.7 0.8 0.97 0.64 0.005
Sulfate mg/L -- 87 87 88 89 93 98 112 141 87 79
Thallium mg/L 0.03 0.0005 0.0005 0.0006 0.0006 0.0007 0.001 0.001 0.002 0.0005 0.002
Tin mg/L 29 0.009 0.009 0.019 0.028 0.04 0.05 0.08 0.17 0.005 0.005
Uranium mg/L 6.995 0.003 0.003 0.003 0.003 0.003 0.004 0.004 0.006 0.003 0.001
Vanadium mg/L 0.1 0.006 0.006 0.006 0.006 0.007 0.008 0.009 0.011 0.006 0.005
Zinc mg/L 25 0.006 0.006 0.006 0.006 0.03 0.04 0.07 0.09 0.006 0.005
Bold indicates values above the NDEP Profile III
Source: Geomega 2016b.
water quality standard.

Appendix A Deep South Expansion Project EIS Water Resources A-112
Draft EIS 2018
Table A-4e Predicted Cortez Pit Lake Scenario 3 - Total Pit Lake Chemistry
Pit Lake Chemistry
Background Groundwater
Chemistry
Runoff Chemist
ry Parameter Units
NDEP Profile III Standard
1 Year of Infilling
2 Years of Infilling
5 Years of Infilling
10 Years of Infilling
25 Years of Infilling
50 Years of Infilling
100 Years of Infilling
200 Years of Infilling
pH su 6.5-8.5 8.35 8.34 8.32 8.31 8.34 8.43 8.46 8.43 8.30 8.45
Total dissolved solids mg/L 7,000 462 456 448 444 463 583 648 601 415 367
Alkalinity (total) mg/L -- 198 193 185 182 192 242 268 245 180 168.8
Bicarbonate (HCO3) mg/L -- 238 232 222 219 230 291 322 294 216 202.5
Aluminum mg/L 4.47 0.2 0.1 0.1 0.1 0.1 0.2 0.2 0.1 0.01 0.2
Antimony mg/L 0.29 0.002 0.002 0.003 0.003 0.003 0.003 0.003 0.003 0.0028 0.002
Arsenic mg/L 0.2 0.01 0.01 0.02 0.02 0.02 0.02 0.02 0.02 0.03 0.005
Barium mg/L 23.1 0.07 0.07 0.38 0.72 1.01 1.00 2.14 6.17 0.05 0.06
Beryllium mg/L 2.83 0.001 0.002 0.002 0.002 0.002 0.002 0.004 0.002 0.001 0.001
Boron mg/L 5 0.18 0.19 0.21 0.22 0.21 0.26 0.28 0.27 0.24 0.16
Cadmium mg/L 0.05 0.001 0.001 0.002 0.002 0.001 0.002 0.003 0.002 0.001 0.001
Calcium mg/L -- 56.5 55.1 54.0 52 55 71 81 71 49 49
Chloride mg/L -- 38.7 37.7 35.8 35.5 37.5 47.9 53.2 49 34 33
Chromium mg/L 1 0.006 0.006 0.007 0.006 0.006 0.008 0.010 0.008 0.005 0.005
Copper mg/L 0.5 0.008 0.007 0.006 0.006 0.007 0.009 0.011 0.009 0.005 0.007
Fluoride mg/L 2 0.56 0.69 0.93 0.97 0.9 1.0 1.1 1.1 1.15 0.5
Iron mg/L -- 0.2 0.1 0.1 0.1 0.1 0.2 0.2 0.1 0.01 0.14
Lead mg/L 0.1 0.001 0.001 0.001 0.001 0.001 0.002 0.002 0.002 0.001 0.001
Lithium mg/L 40.3 0.01 0.04 0.11 0.13 0.10 0.09 0.17 0.18 0.14 0.005
Magnesium mg/L -- 23 22 19 18 20 27 30 26 15.5 20
Manganese mg/L 377 0.01 0.009 0.007 0.007 0.008 0.01 0.01 0.01 0.005 0.009
Mercury mg/L 0.01 0.0019 0.002 0.0010 0.0009 0.001 0.002 0.002 0.002 0.0005 0.002
Molybdenum mg/L 0.6 0.006 0.006 0.006 0.006 0.006 0.008 0.009 0.008 0.005 0.005

Appendix A Deep South Expansion Project EIS Water Resources A-113
Draft EIS 2018
Table A-4e Predicted Cortez Pit Lake Scenario 3 - Total Pit Lake Chemistry
Pit Lake Chemistry
Background Groundwater
Chemistry
Runoff Chemist
ry Parameter Units
NDEP Profile III Standard
1 Year of Infilling
2 Years of Infilling
5 Years of Infilling
10 Years of Infilling
25 Years of Infilling
50 Years of Infilling
100 Years of Infilling
200 Years of Infilling
Nickel mg/L 171 0.006 0.006 0.006 0.005 0.006 0.008 0.009 0.007 0.005 0.005
NO2/NO3-N mg/L 100 0.1 0.4 1.0 1.1 0.8 0.8 0.7 1.0 1.6 0.05
Phosphorous mg/L -- 0.06 0.06 0.05 0.05 0.06 0.07 0.08 0.07 0.05 0.05
Potassium mg/L -- 3.8 4.7 6.4 6.7 6.1 6.9 7.3 7.6 8 3.2
Selenium mg/L 0.05 0.003 0.003 0.008 0.01 0.01 0.01 0.04 0.07 0.003 0.003
Silver mg/L -- 0.006 0.006 0.006 0.005 0.006 0.01 0.01 0.01 0.005 0.005
Sodium mg/L 2,000 48 50 55 55 55 67 73 70 59 41.3
Strontium mg/L 1,127 0.0 0.14 0.38 0.42 0.33 0.29 0.27 0.38 0.62 0.005
Sulfate mg/L -- 92 92 90 90 94 118 130 121 89 79
Thallium mg/L 0.03 0.0019 0.0016 0.001 0.001 0.001 0.0019 0.002 0.0017 0.0005 0.002
Tin mg/L 29 0.01 0.01 0.07 0.12 0.16 0.15 0.38 0.88 0.005 0.005
Uranium mg/L 6.995 0.001 0.001 0.002 0.002 0.002 0.002 0.002 0.003 0.003 0.001
Vanadium mg/L 0.1 0.006 0.006 0.006 0.005 0.006 0.007 0.009 0.007 0.005 0.005
Zinc mg/L 25 0.006 0.007 0.006 0.006 0.006 0.008 0.01 0.008 0.005 0.005
Bold indicates values above the
Source: Geomega 2016b.
NDEP Profile III water quality standard.

Appendix A Deep South Expansion Project EIS Water Resources A-114
Draft EIS 2018
Table A-4f Predicted Cortez Pit Lake Scenario 3 - Dissolved Pit Lake Chemistry
Pit Lake Chemistry
Background Groundwater
Chemistry Runoff
Chemistry Parameter Units
NDEP Profile II Standard
NDEP Profile III Standard
1 Year of Infilling
2 Years of Infilling
5 Years of Infilling
10 Years of Infilling
25 Years of Infilling
50 Years of Infilling
100 Years of Infilling
200 Years of Infilling
pH su 6.5-8.5 6.5-8.5 8.23 8.22 8.22 8.22 8.22 8.25 8.25 8.25 8.30 8.45
Total dissolved solids mg/L 1,000 7,000 389 389 388 388 395 456 486 463 415 367
Alkalinity (total) mg/L -- -- 147 146 143 144 146 155 158 156 180 169
Bicarbonate (HCO3) mg/L -- -- 176 175 172 173 175 186 189 187 216 202.5
Aluminum mg/L 0.2 4.47 0.02 0.02 0.02 0.02 0.02 0.02 0.02 0.02 0.01 0.2
Antimony mg/L 0.006 0.29 0.002 0.002 0.003 0.003 0.003 0.003 0.003 0.003 0.003 0.002
Arsenic mg/L 0.01 0.2 0.002 0.007 0.018 0.020 0.014 0.012 0.012 0.017 0.03 0.005
Barium mg/L 2 23.1 0.04 0.04 0.04 0.04 0.04 0.03 0.03 0.03 0.05 0.06
Beryllium mg/L 0.004 2.83 0.0001 0.0002 0.0006 0.0005 0.0001 0.0002 0.0007 0.0003 0.001 0.001
Boron mg/L -- 5 0.18 0.19 0.214 0.22 0.21 0.26 0.28 0.27 0.24 0.16
Cadmium mg/L 0.005 0.05 0.001 0.001 0.0018 0.0015 0.0014 0.0019 0.003 0.002 0.001 0.001
Calcium mg/L -- -- 34.8 35.1 36.4 36 35 33 33 33 49 49
Chloride mg/L 400 -- 38.7 37.7 35.8 35.5 37.5 47.9 53.2 49 34 33
Chromium mg/L 0.1 1 0.006 0.006 0.007 0.006 0.006 0.008 0.010 0.008 0.005 0.005
Copper mg/L 1.0 0.5 0.006 0.006 0.006 0.006 0.006 0.008 0.009 0.008 0.005 0.007
Fluoride mg/L 4 2 0.6 0.69 0.93 0.97 0.89 1.0 1.1 1.1 1.15 0.5
Iron mg/L 0.6 -- 0.00004 0.00004 0.00004 0.00004 0.00004 0.00004 0.00004 0.00004 0.01 0.14
Lead mg/L 0.02 0.1 0.0005 0.0007 0.001 0.001 0.0007 0.001 0.001 0.001 0.001 0.001
Lithium mg/L -- 40.3 0.01 0.04 0.11 0.13 0.10 0.09 0.17 0.18 0.14 0.005
Magnesium mg/L 150 -- 23 22 19 18 20 27 30 26 15.5 20
Manganese mg/L 0.1 377 0.0000003 0.0000003 0.0000003 0.0000003 0.0000003 0.0000003 0.0000003 0.0000003 0.005 0.009
Mercury mg/L 0.002 0.01 0.0019 0.0016 0.001 0.0009 0.0012 0.0018 0.0021 0.0017 0.0005 0.002
Molybdenum mg/L -- 0.6 0.006 0.006 0.006 0.006 0.006 0.008 0.009 0.008 0.005 0.005

Appendix A Deep South Expansion Project EIS Water Resources A-115
Draft EIS 2018
Table A-4f Predicted Cortez Pit Lake Scenario 3 - Dissolved Pit Lake Chemistry
Pit Lake Chemistry
Background Groundwater
Chemistry Runoff
Chemistry Parameter Units
NDEP Profile II Standard
NDEP Profile III Standard
1 Year of Infilling
2 Years of Infilling
5 Years of Infilling
10 Years of Infilling
25 Years of Infilling
50 Years of Infilling
100 Years of Infilling
200 Years of Infilling
Nickel mg/L 0.1 171 0.006 0.006 0.006 0.005 0.006 0.008 0.009 0.007 0.005 0.005
NO2/NO3-N mg/L 10 100 0.1 0.4 1.0 1.1 0.8 0.8 0.7 1.0 1.6 0.05
Phosphorous mg/L -- -- 0.06 0.1 0.1 0.1 0.1 0.1 0.1 0.1 0.05 0.05
Potassium mg/L -- -- 3.8 4.7 6.4 6.7 6.1 6.9 7.3 7.6 8 3.2
Selenium mg/L 0.05 0.05 0.003 0.003 0.008 0.013 0.015 0.014 0.04 0.07 0.003 0.003
Silver mg/L 0.1 -- 0.006 0.006 0.006 0.005 0.006 0.007 0.009 0.007 0.005 0.005
Sodium mg/L -- 2,000 48 50 55 55 55 67 73 70 59 41.3
Strontium mg/L -- 1,127 0.0 0.14 0.38 0.42 0.33 0.29 0.27 0.38 0.62 0.005
Sulfate mg/L 500 -- 92 92 90 90 93 117 129 117 89 79
Thallium mg/L 0.002 0.03 0.0019 0.0016 0.001 0.001 0.001 0.0019 0.002 0.0017 0.0005 0.002
Tin mg/L -- 29 0.006 0.011 0.067 0.124 0.162 0.155 0.380 0.879 0.005 0.005
Uranium mg/L NA 6.995 0.001 0.001 0.002 0.002 0.002 0.002 0.002 0.003 0.003 0.001
Vanadium mg/L -- 0.1 0.003 0.004 0.005 0.005 0.005 0.006 0.006 0.006 0.005 0.005
Zinc mg/L 5 25 0.006 0.006 0.006 0.006 0.006 0.008 0.009 0.008 0.005 0.005
Bold indicates values above the NDEP Profile III
Source: Geomega 2016b.
water quality standard. Shading indicates values above the NDEP Profile II water quality standard.

Appendix A Deep South Expansion Project EIS Water Resources A-116
Draft EIS 2018
This page intentionally left blank

Appendix B Deep South Expansion Project EIS Wildlife
Draft EIS 2018
Appendix B
Wildlife

Appendix B Deep South Expansion Project EIS Wildlife
Draft EIS 2018
This page intentionally left blank

Appendix B Deep South Expansion Project EIS Wildlife B-1
Draft EIS 2018
Table B-1 Special Status Species Identified for the Deep South Expansion Project
Common Name/ Scientific Name 1 Status Range Habitat Requirements
Potential for Occurrence on 2Near the Project Area
or 2Eliminated From Detailed Analysis
BIRDS
Western least bittern BLM Range: Throughout Nevada as a rare None. Yes. No potentially suitable nesting Ixobrychus exilis migrant and breeding species. habitat occurs within or near the study hesperis
Habitat: Requires dense emergent vegetation within wetlands and marshes. Nests over water in dense emergent vegetation.
area. The closest habitat occurs along the Humboldt River (approximately 30 miles north of the project boundary). Occurrence within the project area would be limited to migrating individuals.
Northern goshawk BLM Range: Throughout Nevada. None. Yes. No suitable nesting or foraging Accipiter gentilis
Habitat: Generally occupies montane forests in spring and summer, with some altitudinal migration into foothills and valleys in the winter. Montane and foothill aspen groves are the species’ preferred nesting sites in Nevada, generally near perennial streams. In Nevada, forages in open sagebrush adjacent to riparian aspen.
habitat occurs within the study area, and the species has not been observed to date.
Bald eagle BLM; State Range: Throughout Nevada. Yes. No suitable nesting or No. Haliaeetus Endangered roosting habitat occurs within leucocephalus Habitat: Nests in close association with
water; winters where abundant food is available, generally feeding near large bodies of water with appropriate roosting trees nearby.
the study area. However, suitable upland foraging habitat occurs within the study area.
Golden eagle Aquila chrysaetos
BLM Range: Throughout Nevada and the West. Habitat: Occupies a variety of habitats. Nest on cliffs or rock outcrops, less commonly in trees, usually in isolated undisturbed areas.
Yes. Nest sites and individuals have been documented within and surrounding the CGM Operations Area.
No.

Appendix B Deep South Expansion Project EIS Wildlife B-2
Draft EIS 2018
Table B-1 Special Status Species Identified for the Deep South Expansion Project
Common Name/ Scientific Name 1 Status Range Habitat Requirements
Potential for Occurrence on 2Near the Project Area
or 2Eliminated From Detailed Analysis
Ferruginous hawk Buteo regalis
BLM Range: Primarily in eastern and central Nevada.
Habitat: Edge of pinyon-juniper habitat at interface with low shrub grasslands.
Yes. Two nest sites have been documented within 1 mile of the CGM Operations Area boundary.
No.
Swainson’s hawk Buteo swainsonii
BLM Range: Throughout Nevada and the west.
Habitat: Open habitats, including agricultural areas. Generally nests in trees overlooking these habitats, particularly in cottonwoods overlooking pasture and agricultural lands.
Yes. This species was documented during the 2015 raptor surveys.
No.
Prairie falcon Falco mexicanus
BLM Range: Throughout Nevada and the west.
Habitat: Nests primarily on ledges and outcrops in steep cliff-faces bordered by desert valleys and agricultural areas.
Yes. Prairie falcons have been documented within CGM Operations Area boundary. Suitable nesting and foraging habitat occurs within the CGM Operations Area.
No.
Peregrine falcon Falco peregrinus
BLM Range: Throughout Nevada and the west.
None. Yes. Suitable nesting and foraging habitat is not present within the study area.
Habitat: Nests exclusively on cliffs and utilizes various adjacent open environments including open water, desert shrub, and marshes, also mountains, open forested regions, and human population centers.

Appendix B Deep South Expansion Project EIS Wildlife B-3
Draft EIS 2018
Table B-1 Special Status Species Identified for the Deep South Expansion Project
Common Name/ Scientific Name 1 Status Range Habitat Requirements
Potential for Occurrence on 2Near the Project Area
or 2Eliminated From Detailed Analysis
Greater sage-grouse BLM Range: Throughout Nevada where Yes. Potential sagebrush No. Centrocercus sagebrush occurs. habitat occurs within and urophasianus surrounding the study area.
Habitat: The species occurs in healthy sagebrush habitats. Leks are located in open areas. Nesting is within sagebrush
Greater sage-grouse are known to occur within the project vicinity.
habitats near leks. Chicks are raised in moist meadows within sagebrush communities.
Mountain quail BLM Range: Western Nevada and the Sierras None. Yes. NDOW indicates that the study area Oreortyx pictus and has been reported from the Toiyabe
Range in central Nevada.
Habitat: Frequents areas of dense vegetation on steep mountain slopes and dense shrub vegetation along mountain streams.
is currently outside the occupied distribution for this species.
Snowy plover BLM Range: Much of the Great Basin portion of None. Yes. No potentially suitable nesting Charadrius nivosus Nevada.
Habitat: The species selects barren salt pans or dry mudflats for nesting, usually at playas in the valley bottoms.
habitat occurs within or near the study area. The closest habitat occurs along the Humboldt River (approximately 30 miles north of the project). Occurrence within the project area would be limited to migrating individuals.
Yellow-billed cuckoo FC; BLM Range: Primarily the eastern U.S. with None. Yes. No suitable nesting or foraging Coccyzus americanus isolated occurrences in suitable habitat in habitat occurs within the study area. occidentalis the western states.
Habitat: In the west, the yellow-billed cuckoo nests in dense and extensive riverine riparian habitat along larger streams and rivers, usually with extensive cottonwood groves.
Occurrence within the project area would be limited to migrating individuals.

Appendix B Deep South Expansion Project EIS Wildlife B-4
Draft EIS 2018
Table B-1 Special Status Species Identified for the Deep South Expansion Project
Common Name/ Scientific Name 1 Status Range Habitat Requirements
Potential for Occurrence on 2Near the Project Area
or 2Eliminated From Detailed Analysis
Sage thrasher Oreoscoptes montanus
BLM Range: Breeds throughout the Great Basin and winters in the desert southwest and Mexico.
Yes. This species was observed during baseline biological surveys in 2015.
No.
Habitat: Sagebrush shrubland.
Brewer’s sparrow Spizella breweri
BLM Range: Breeds primarily throughout the intermountain West; winters in the desert scrub of the southwestern U.S. and northern Mexico.
Yes. This species was observed during baseline biological surveys in 2015.
No.
Habitat: Sagebrush shrubland.
Western burrowing owl Athene cunicularia hypugaea
BLM Range: Throughout Nevada and the West.
Habitat: The owls select open areas with low vegetation in grassland, shrubland, and agricultural areas. The owls often select cut banks or berms along roads and fields and cut banks along washes. Nest sites include abandoned burrows of prairies dogs, ground squirrels, foxes, and badgers.
Yes. Occupied nests were observed near a dirt road within the study area.
No.
Lewis’s woodpecker Melanerpes lewis
BLM Range: Throughout the Great Basin and the West.
Yes. Suitable nesting or foraging habitat occurs within the study area.
No.
Habitat: Requires areas of trees interspersed with open areas. Primary breeding habitat is open ponderosa and Jeffrey pine forests, but also occurs in logged or burned coniferous forests and in open mountain mahogany, aspen, and cottonwood groves.

Appendix B Deep South Expansion Project EIS Wildlife B-5
Draft EIS 2018
Table B-1 Special Status Species Identified for the Deep South Expansion Project
Common Name/ Scientific Name 1 Status Range Habitat Requirements
Potential for Occurrence on 2Near the Project Area
or 2Eliminated From Detailed Analysis
Southwestern willow flycatcher Empidonax traillii extimus
FE; BLM Range: The breeding range of the southwestern willow flycatcher includes southern California, Arizona, New Mexico, extreme southern portions of Nevada and Utah, far western Texas, perhaps southwestern Colorado, and extreme northwestern Mexico. In Nevada this subspecies can be found along the Virgin River, lower Muddy River, Colorado River, and Pahranagat Valley.
Habitat: This species is a riparian obligate. Occupied southwestern willow flycatcher habitats always have dense vegetation in the interior that often are interspersed with small clearings, open water, or areas of sparse shrubs.
None. Yes. No suitable nesting or foraging habitat occurs within the study area. The project area is outside the known range for this species.
Pinyon jay Gymnorhinus cyanocephalus
BLM Range: A common and abundant year- round resident throughout the Great Basin.
Habitat: The species is closely associated with pinyon-juniper habitats, but also is found in association with other pines such as Jeffrey pine.
Yes. This species has been commonly observed within the study area.
No.

Appendix B Deep South Expansion Project EIS Wildlife B-6
Draft EIS 2018
Table B-1 Special Status Species Identified for the Deep South Expansion Project
Common Name/ Scientific Name 1 Status Range Habitat Requirements
Potential for Occurrence on 2Near the Project Area
or 2Eliminated From Detailed Analysis
Loggerhead shrike Lanius ludovicianus
BLM Range: Throughout the west and U.S.
Habitat: The shrike is a common, but not abundant, summer resident of the Great Basin. It frequents open county in the valleys and foothills of the Great Basin, using a variety of shrub and grassland habitats, perching conspicuously on shrubs and fences, and nesting in dense shrubs.
Yes. This species was observed during baseline biological surveys in 2015.
No.
Black rosy finch Leucosticte atrata
BLM Range: Throughout the Great Basin and the west.
Habitat: Breeding habitat includes open meadows and tundra above tree-line in the western mountains.
None. Yes. No suitable nesting or foraging habitat occurs within the study area. Also, the study area is outside of the elevational range of this species.
MAMMALS
Pallid bat Antrozous pallidus
BLM; State Protected
Range: Widespread throughout much of the west.
Habitat: Arid deserts and grasslands, often near rocky outcrops and water. Less abundant in evergreen and mixed conifer woodland. Usually roosts in rock crevice or building, less often in caves, tree hollows, mines, etc.
Yes. The species has been observed east of the study area. Abandoned mine shafts and adits within or near the study area contain potentially suitable habitat for the species.
No.

Appendix B Deep South Expansion Project EIS Wildlife B-7
Draft EIS 2018
Table B-1 Special Status Species Identified for the Deep South Expansion Project
Common Name/ Scientific Name 1 Status Range Habitat Requirements
Potential for Occurrence on 2Near the Project Area
or 2Eliminated From Detailed Analysis
Big brown bat Eptesicus fuscus
BLM Range: Widespread throughout the U.S. Yes. This species was in the study area.
recorded No.
Habitat: Various wooded and semi-open habitats, including cities. Summer roosts generally are in buildings; also hollow trees, rock crevices, tunnels, and cliff swallow nests. Maternity colonies form in attics, barns, tree cavities, rock crevices, caves.
Townsend’s big- eared bat Corynorhinus townsendii
BLM; State Sensitive
Range: Most of Nevada and the west.
Habitat: Maternity and hibernation colonies typically are in caves and mine tunnels. Prefers relatively cold places for hibernation, often near entrances and in well-ventilated areas. Forages over a wide variety of habitats from coniferous forests to sagebrush to grasslands.
Yes. The species has been recorded in the study area.
No.
Silver-haired bat Lasionycteris noctivagans
BLM Range: Throughout much of the western U.S.
Yes. This species was recorded in the study area.
No.
Habitat: Primarily in forested areas, but does forage over meadows and in riparian zones along streams. Maternity roosts occur almost exclusively in trees. Hibernates in trees, rock crevices, buildings, mines, and caves.
Small-footed myotis Myotis ciliolabrum
BLM Range: Most of Nevada and the west.
Habitat: Roosts in caves, tunnels, mines, buildings, and rock crevices. Primarily uses grassland and desert scrub habitats.
Yes. This species has been observed near the study area. Abandoned mine shafts and adits within or near the study area contain suitable habitat for the species.
No.

Appendix B Deep South Expansion Project EIS Wildlife B-8
Draft EIS 2018
Table B-1 Special Status Species Identified for the Deep South Expansion Project
Common Name/ Scientific Name 1 Status Range Habitat Requirements
Potential for Occurrence on 2Near the Project Area
or 2Eliminated From Detailed Analysis
Long-eared myotis Myotis evotis
BLM Range: Widespread over the western U.S. Apparently occurs regularly in low numbers throughout the range.
Yes. The species has been recorded within the project area.
No.
Habitat: Roosts in a wide variety of situations—caves, tunnels, and under tree bark. Primarily uses coniferous forest habitats, but does occur over shrublands.
Fringed myotis Myotis thysanodes
BLM; State Protected
Range: Throughout Nevada and the west. Thought to normally occur in low numbers throughout range.
Yes. This species was documented during the 2015 acoustical monitoring surveys for the project.
No.
Habitat: Uses a variety of habitats, forests, shrublands, and agricultural land. Roosts in a variety of habitats, caves, tunnels, mines, and trees.
Long-legged myotis Myotis volans
BLM Range: Widespread distribution in western North America; considered locally abundant.
Habitat: Primarily in montane coniferous forests, seasonally in riparian and desert habitats. Roosts in exfoliating tree bark, tree snags, and rock crevices. Hibernates in tunnels and mines.
Yes. This species was documented during the 2015 acoustical monitoring surveys for the project.
No.
Hoary Bat Lasiurus cinereus
BLM Range: The distribution of this species throughout Nevada is patchy with roosting locations not well known.
Yes. This species was documented during the 2015 acoustical monitoring surveys for the project.
No.
Habitat. This species is associated with trees and found primarily in forested upland and riparian habitats.

Appendix B Deep South Expansion Project EIS Wildlife B-9
Draft EIS 2018
Table B-1 Special Status Species Identified for the Deep South Expansion Project
Common Name/ Scientific Name 1 Status Range Habitat Requirements
Potential for Occurrence on 2Near the Project Area
or 2Eliminated From Detailed Analysis
Spotted bat Euderrna maculatum
BLM; State Threatened
Range: Widespread throughout Nevada.
Habitat: Roosts in cliff crevices but can be found in a variety of habitats and elevations including sagebrush, pinyon-juniper woodlands, coniferous forests, riparian areas, and urban habitats.
Yes. This species has not been recorded at the site during bat surveys but is thought to occur in the area. Suitable habitat for this species does occur within the project area.
No.
Western red bat Lasiurus blossevillii
BLM; State Sensitive
Range: This species is only known from few historic occurrences throughout Nevada.
Habitat: Western red bats are primarily found in wooded habitats, including mesquite bosque and cottonwood/willow riparian areas. This species roosts in tree foliage and possibly in leaf litter on the ground.
Yes. This species was documented during the 2015 acoustical monitoring surveys for the project.
No.
Western pipistrelle Pipistrellus hesperus
BLM Range: Throughout Nevada.
Habitat: Deserts and lowlands, desert mountain ranges, desert scrub flats, and rocky canyons. Day and night roosts include rock crevices, under rocks, burrows, and sometimes buildings or mines. May hibernate in caves, mines, or rock crevices.
Yes. This species was documented during the 2015 acoustical monitoring surveys for the project.
No.
Little brown bat Myotis lucifugus
BLM Range: Found primarily in the northern portions of Nevada.
Habitat: Associated primarily with coniferous forests near lakes and streams. Roost sites include hollow trees, rock outcrops, buildings, and occasionally in mines and caves. Hibernates in mines and
Yes. This species was documented during the 2015 acoustical monitoring surveys for the project.
No.
caves.

Appendix B Deep South Expansion Project EIS Wildlife B-10
Draft EIS 2018
Table B-1 Special Status Species Identified for the Deep South Expansion Project
Common Name/ Scientific Name 1 Status Range Habitat Requirements
Potential for Occurrence on 2Near the Project Area
or 2Eliminated From Detailed Analysis
Brazilian free-tailed bat Tadarida brasiliensis
BLM; State Protected
Range: Throughout Nevada.
Habitat: Found in a wide variety of habitats from low desert to high mountain habitats. Utilizes a variety of roost sites including cliffs, mines, caves, buildings, bridges, and hollow trees.
Yes. This species was documented during the 2015 acoustical monitoring surveys for the project.
No.
California myotis Myotis californicus
BLM Range: Throughout Nevada.
Habitat: Occurs in a variety of habitats from Lower Sonoran desert scrub to forests. This species typically roosts singly or in small groups. Roost sites include mines, buildings, rock crevices, hollow trees, and under exfoliating bark.
Yes. This species was documented during the 2015 acoustical monitoring surveys for the project.
No.
Yuma myotis Myotis yumanensis
BLM Range: Found primarily in the southern and western half of Nevada.
Habitat: Occurs in a wide variety of habitats, including sagebrush, salt desert scrub, agriculture, playa, and riparian habitats. Roost sites include buildings, trees, mines, caves, bridges, and rock crevices.
Yes. The species has not been recorded at the site; however, previous bat surveys recorded several unidentified myotis calls. Also, suitable habitat exits within the project area.
No.
Pika Ochotona princeps
BLM Range: This species occurs throughout the mountain ranges of the west.
None. Yes. No suitable habitat occurs within the study area.
Habitat: Restricted to rocky talus slopes. Found near or above timberline; however, some populations exist in areas well below treeline.

Appendix B Deep South Expansion Project EIS Wildlife B-11
Draft EIS 2018
Table B-1 Special Status Species Identified for the Deep South Expansion Project
Common Name/ Scientific Name 1 Status Range Habitat Requirements
Potential for Occurrence on 2Near the Project Area
or 2Eliminated From Detailed Analysis
Pygmy rabbit BLM; State Range: Throughout the range of sagebrush Yes. Suitable habitat for this No. Brachylagus Protected in the intermountain West. species occurs within and idahoensis
Habitat: Consists of dense Great Basin sagebrush with a dense understory and having soils suitable for burrowing. The rabbit’s burrows are distinctive and typically are placed at the base of sagebrush.
adjacent to the Cortez Hills Complex and proposed Pine Valley RIB facilities within the study area. Pygmy rabbits, burrows, and sign have been observed within and adjacent tthe study area.
o
Dark Kangaroo Mouse BLM; State Range: Northwestern and Central Nevada. None. Suitable habitat does not Yes. Microdipodops Protected occur within the study area. megacephalus Habitat: Inhabits stabilized dunes and other
sandy soils in valley bottoms and alluvial fans dominated by big sagebrush, rabbitbrush, and horsebrush. Typically occurs in sandy habitats below the elevation where pinyon-juniper occur and above those habitats where greasewood and saltbush predominate. They may occur in sand dunes near the margins of their range. Although restricted to sand, it displays a broad tolerance for varying amounts of gravel. Underground when inactive.
Pale Kangaroo Mouse Microdipodops pallidus
BLM; State Protected
Range: This species is restricted to the west-central portion of the state.
Habitat: Restricted to fine sands and alkali sink and desert scrub.
None. Yes. The project is outside the known range for the species. No suitable habitat occurs within the study area.

Appendix B Deep South Expansion Project EIS Wildlife B-12
Draft EIS 2018
Table B-1 Special Status Species Identified for the Deep South Expansion Project
Common Name/ Scientific Name 1 Status Range Habitat Requirements
Potential for Occurrence on 2Near the Project Area
or 2Eliminated From Detailed Analysis
Fish Spring pocket gopher Thomomys bottae abstrusus
BLM Range: Valley pocket gophers occupy the southwestern United States and Mexico, but the concise distribution in Nevada is unknown.
Habitat: Pocket gophers are found in a wide variety of habitats and soil types. Habitat types include cropland, desert, grassland, savanna, chaparral, and woodland (NDOW.org).
None. Yes. The current distribution is limited to Nye County, outside the study area.
San Antonio pocket gopher Thomomys bottae curatus
BLM Range: Valley pocket gophers occupy the southwestern U.S. and Mexico, but the concise distribution in Nevada is unknown.
Habitat: Pocket gophers are found in a wide variety of habitats and soil types. Habitat types include cropland, desert, grassland, savanna, chaparral, and woodland (NDOW.org).
None. Yes. The current distribution is limited to Nye County, outside the study area.
Bighorn Sheep (Ovis Canadensis)
BLM Range: Mountain ranges throughout the west.
Habitat: Steep rugged terrain in mountains, foothills, and canyons.
None. Yes. The current occupied bighorn sheep distribution is outside of the study area.
FISH
Lahontan cutthroat trout (Oncorynchus clarkia henshawi)
FE Range: This species is a native species in the Lahontan Basin in northern Nevada, eastern California, and southern Oregon.
Habitat: Wide variety of coldwater habitats including lakes, rivers, and headwater streams.
None. Yes. The closest known occurrence is Birch and Pete Hansen creeks in the Pine Creek watershed, which are located approximately 6 miles from the study area.

Appendix B Deep South Expansion Project EIS Wildlife B-13
Draft EIS 2018
Table B-1 Special Status Species Identified for the Deep South Expansion Project
Common Name/ Scientific Name 1 Status Range Habitat Requirements
Potential for Occurrence on 2Near the Project Area
or 2Eliminated From Detailed Analysis
AMPHIBIANS
Northern leopard frog (Lithbates pipiens)
BLM Range: This species occurs in the northern tier U.S., western U.S., and the southern Canadian provinces.
Habitat: Variety of aquatic habitats including streams, wetlands, permanent or temporary pools, beaver ponds, stock tanks, and borrow pits.
None. Yes. No known occurrences within study area.
the
INVERTEBRATES
Elongate Cain Spring pyrg (Pyrgulopsis augusta)
No 3Status Range: This springsnail species occurs in Reese River Valley on the west side of the Tioyabe Range.
Habitat: Springs.
Yes. Potential habitat occurs within the project and cumulative study areas based on springsnail surveys.
No.
Southern duckwater pyrg (Pyrgulopsis anatine)
BLM Range: This springsnail species occurs Nye County.
Habitat: Springs.
in None. Yes. No known occurrences within study area.
the
Large-gland Carico pyrg (Pyrgulopsis basiglans)
BLM Range: This springsnail species occurs Nye County.
Habitat: Springs.
in None. Yes. No known occurrences within the study area.
Carinate duckwater pyrg (Pyrgulopsis carinata)
BLM Range: This springsnail species occurs Nye County.
Habitat: Springs.
in None. Yes. No known occurrences within the study area.

Appendix B Deep South Expansion Project EIS Wildlife B-14
Draft EIS 2018
Table B-1 Special Status Species Identified for the Deep South Expansion Project
Common Name/ Scientific Name 1 Status Range Habitat Requirements
Potential for Occurrence on or 2 Near the Project Area 2 Eliminated From Detailed Analysis
Dixie Valley pyrg (Pyrgulopsis dixensis)
BLM Range: This springsnail species occurs in drainages in the Dixie Basin.
None. Yes. No known occurrences within the study area.
Habitat: Springs.
Oasis Valley pyrg (Pyrgulopsis micrococcus)
BLM Range: This springsnail species occurs in drainages in the Oasis Valley Basin.
None. Yes. No known occurrences within the study area.
Habitat: Springs.
Wongs pyrg (Pyrgulopsis ongi)
BLM Range: This springsnail species occurs in basins in Death Valley, the Carson River and Walker River basins, and other isolated basins within the Great Basin.
Yes. Potential habitat occurs within the study area based on springsnail surveys.
No.
Habitat: Springs
Ovate Cain Spring pyrg (Pyrgulopsis pictilis)
3 No Status Range: This springsnail species occurs in Reese River Valley on the west side of the Tioyabe Range.
Yes. Potential habitat occurs within the study area based on springsnail surveys.
No.
Habitat: Springs.
1 Status: FE = Federally endangered species.
FC = Federal candidate species. BLM = BLM sensitive species.
BLM SC = BLM sensitive species. 2 The project study area and cumulative effects study area as defined in Section 3.5, Wildlife and Aquatic Biological Resources, are collectively referred to here as the study area. 3 Species included in the analysis due to the overall importance of springs.
Sources: Altenbach et al. 2002; AOU 1998; BLM 2011, 2008, 2004, 2002; ERM 2016a; JBR 2005, 2004, 2000; NDOW 2013, 2005; NNHP 2017, 2016; USFWS 2017, 2015b, 2014, 2006;.Wildlife Action Plan Team 2012.

Appendix C Deep South Expansion Project EIS Cultural Resources
Appendix C Cultural Resources
Draft EIS 2018

Appendix C Deep South Expansion Project EIS Cultural Resources
This page intentionally left blank
Draft EIS 2018

C-1Appendix C
Deep South Expansion Project EIS Cultural Resources
Appendix C-1
Cultural Resources Tables
Draft EIS 2018

C-2Appendix C
Deep South Expansion Project EIS Cultural Resources
This page intentionally left blank
Draft EIS 2018

Appendix C Deep South Expansion Project EIS Cultural Resources C-3
Draft EIS 2018
Table C-1 Class III Inventories Completed to Data in Project APE
Report Number Report Title Author
Report Date
1-2491 / 6-2554
Cortez Gold Mine Monitor Well McQueen, Robert 2005
1-2584 2006-2007 Fire Seasons Cultural Resource Inventories and Damage Assessments
Jensen, Jill 2008
1-2706 Intensive Cultural Resources Inventory of the Dry Hills Fuel Break, Eureka County, Nevada
Fawcett, Willam 2010
1-2777 A Class III Inventory of 19 Seep/Spring Locations Lander and Eureka Counties, Nevada
McQueen, Robert and Melissa Murphy
2010
1-2855 A Class III Cultural Resource Inventory of 19 Coreholes, Boreholes, and Section Corners for Cortez Gold Mines, Eureka County, Nevada
McQueen, Robert and Shaun Richey
2011
1-2893 Cultural Resource Inventory Negative Report Pipeline and Spring Exclosure
Filippini Howell, R. 2013
1-3144 A Class III Cultural Resources Inventory of Two Parcels for the Deep South Expansion Project, Eureka County
McQueen, Robert and Linsie Lafayette
2016
1-3169 A Class III Cultural Resources Inventory of 4,187 Additional Acres for the Deep South Expansion Project, Eureka County
McQueen, Robert and Linsie Lafayette
2016
6-24 Cultural Resources Report: Grass Valley Fence (N6R-4410): BLM 6-24(P) (from NADB)
McGonagle, Roberta L.
1976
6-119 Continental Oil Company Seismic Test Line #3 in Grass Valley, Lander and Eureka Counties, Nevada
Seelinger, T. 1977
6-142 Geophysical Services, Inc., Seismic Test Lines #2 and #2 in Crescent Valley, Lander and Eureka Counties, Nevada
Calloway, C 1978
6-184 Cultural Resources Report: BLM 6-184 (N): Earth Power Geothermal Gradient Holes, Carico Lake Valley (Genoi-N6-3-79)
Lentz, Rodney T. 1979
6-361 Eureka Land Sale Crabtree, Robert No date
6-783 Material Site Clearance for Free Use Permit for the Lander County Road Department
Whitcomb, Charles W.
1985
6-936 SR 306 Betterment Lander County Bunch, James H. 1987
6-1110 A Cultural Resources Survey of GEO Seismic Services Antlers Prospect, Eureka and Lander Counties, Nevada
Zerga and Price 1988
6-1368 A Cultural Resources Inventory of 5676.9 Acres in Eureka and Lander Counties, Nevada
Raven, Shelly and Allen McCabe
1991
6-1368-1 A Cultural Resources Inventory for the Proposed Cortez Gold Mines Expansion Area in Lander County, Nevada: Addendum
McCabe, Allen 1991
6-1368-2 A Cultural Resources Inventory for the Gold Acres Pipeline Project in Crescent Valley, Lander County, Nevada
McCabe, Allen 1992
6-1368-3 A Cultural Resources Inventory for the Gold Acres Pipeline Expansion Project in Crescent Valley, Lander County, Nevada: Addendum 3
McCabe, Allen 1993
6-1368-4 A Cultural Resources Inventory for the Gold Acres Pipeline Extension Project in Crescent Valley, Lander County, Nevada: Addendum 4
McCabe, Allen 1993

Appendix C Deep South Expansion Project EIS Cultural Resources C-4
Draft EIS 2018
Table C-1 Class III Inventories Completed to Data in Project APE
Report Number Report Title Author
Report Date
6-1381 A Class II Sample Survey for the Cortez Cumulative Effects Study Area, Lander and Eureka Counties, Nevada
Gilreath, A., P. Bouey, and M. Hall
1992
6-1381-1 A Sample Design for the Cortez Cumulative Effects Study Area
Delacorte, et al. 1992
6-1528 The Whirlwind Project: A Cultural Resource Inventory of 37 Miles of 120kV Route in Lander County, Nevada for Sierra Pacific Power Company
Johnson, F. 1992
6-1711 Cortez Haul Road Inventory Hause, Larry 1994
6-1716 A Cultural Resources Inventory of Five Parcels Totaling 95 Acres for Cortez Gold Mines in Southern Crescent Valley, Lander County, Nevada
Hause, Larry 1994
6-1753 A Cultural Resources Inventory of a 750 ac Parcel for Cortez Gold Mines' South Cortez Mine Area in Lander County, Nevada
McCabe, Allen 1995
6-1909 Class III Inventory of a Proposed 550 Acre Gravel Source Area in Southern Crescent Valley, Lander County, Nevada
Burke, T. 1995
6-1935 The Carico Lake Ranch of Lander County: An Architectural Assessment
Owen 1996
6-1982 Cortez Gold Mines Dewatering Infiltration Area McCabe, Allen 1997
6-1986 A Class III Inventory of a 1050 Acre Dewatering Infiltration Area in Southern Crescent Valley, Lander County, Nevada
N/A 1998
6-1986-1 A Class III Inventory of a 322 Acre Parcel for Cortez Gold Mines in Lander County, Nevada
McQueen, Robert and Paul Sanchez
No date
6-1998 A Class III Inventory of Two Dewatering Infiltration Parcels at the South End of Crescent Valley, Lander County, Nevada
McCabe, Allen 1998
6-1998-1(P) A Class III Inventory of a 940 Acre Parcel for Cortez Gold Mines, Lander County, Nevada
McQueen, Robert; Paul Sanchez
2008
6-2131 A Class III Cultural Resources Inventory of the Sierra Pacific Resources Falcon Project 345kV Transmission Line
Ataman et al. 2002
6-2153 A Class III Cultural Resources Inventory of 550 Acres for Cortez Gold Mines, Lander Country, Nevada
N/A 1999
6-2185 / 1-2056
Walking the Fence: A Cultural Resources Survey of Fence Line Routes Through Public Lands in Battle Mountain, Nevada
Hutchins and Kautz 2000
6-2369 A Class III Inventory of Two Additional Parcels for Cortez Gold Mines Pediment Project Lander County, Nevada
McCabe and Obermyer
2003
6-2442 A Class III Inventory for CGM Southern Crescent Valley Alluvial Fan Survey, Lander County, Nevada
McCabe 200
6-2454-0 / 1-2532-0
Cortez Hills Expansions Project Cultural Resource Fieldwork Completion Report, and Request for Issuance of a Notice to Proceed
McQueen, Robert No date
6-2494 On the Margins of the Upper Cortez: A Class III Cultural Resources Inventory in Grass Valley and Cortez Canyon, Lander County, Nevada
McQueen, Robert, Ataman, and S. Livingston
K. 2006

Appendix C Deep South Expansion Project EIS Cultural Resources C-5
Draft EIS 2018
Table C-1 Class III Inventories Completed to Data in Project APE
Report Number Report Title Author
Report Date
6-2556 / 1-2523
A Class III Inventory of 14 Parcels for Cortez Gold Mines Cortez Hills Expansion Project, Lander and Eureka Counties, Nevada
McQueen, Robert 2008
6-2556-1 A Class III Inventory of Five Parcels for the Cortez Hills Expansion Project, Lander County, Nevada
McQueen, Robert 2008
6-2560 Cortez Gold Mines Crescent Valley Overhead Utility Corridor McQueen, Robert 2008
6-2700 A Cultural Resource Inventory of 50 Proposed Drill Locations and Access Routes for Nevada Pacific Gold, Lander County, Nevada
Vierra, Robert K. 2008
6-2752 Results from a Limited Testing Plan on Historic Residential Sites for the Cortez Hills Expansion Project, Lander and Eureka Counties, Nevada
McQueen, Robert and Pete Thorburn
2008
6-2773 A Plan for Collection of Wood Samples from Charcoal Production and Cordwood Sites in the Cortez Mining District, Lander and Eureka Counties, Nevada
McQueen, Robert 2008
6-3019 Class III Survey for the Robertson Mine Nevada
Lander County, Memmott, Margo, et al.
2013
6-3051 A Class III Inventory of Approximately 6,019 Acres in the Dry Hills, Cortez Mountains Eureka County, Nevada
McQueen, Robert and C. Shaun Richey
2011
6-3055 A Class III Inventory of Approximately 11,648 Acres for the West Pine Valley 3D Seismic Project, Eureka County, Nevada
Sigler and McQueen 2014
6-3154 A Class III Cultural Resources Inventory of Four Parcels for the Deep South Expansion Project, Lander and Eureka Counties
McQueen, Robert and Linsie Lafayette
2016
6-3154-1 A Class III Cultural Resources Inventory of 865 Additional Acres for the Deep South Expansion Project, Lander and Eureka Counties
McQueen, Robert and Linsie Lafayette
2016
6-3154-2 A Historic Properties Treatment Plan for the Deep South Expansion Project, Eureka and Lander Counties, Nevada
McQueen, Robert and Linsie Lafayette
2017
6-3154-3 A Class III Cultural Resources Inventory of 14 Acres for the Deep South Expansion Project, Lander and Eureka Counties
McQueen, Robert 2017
6-3180 / 1-3026
A Class III Cultural Resources Inventory of 871 Acres in the Cortez Mountains for Barrick Gold Mines Harrys Point Project, Eureka County, Nevada
Richey, C. Shaun and Robert McQueen
2016
6-3154-4 Barrick Deep South Expansion Project Indirect Effects Analysis
Summit Envirosolutions, Inc.
2018

Appendix C Deep South Expansion Project EIS Cultural Resources C-6
Draft EIS 2018
Table C-2 Cultural Resources Identified in the Direct APE During Class III Inventories
Nevada State
Number BLM Number Site Description NRHP Eligibility 1 Report No.26Eu2614 CrNV-12-12448 Charcoal and habitation
features Eligible (A and D) 1-3144
26Eu2615 CrNV-12-12449 Charcoal and habitation features
Eligible (A, C, and D)
1-3144
26Eu2617 CrNV-12-12461 Charcoal platform Eligible (A, C, and D)
1-3144
26Eu2618 CrNV-12-12462 Charcoal platform Eligible (A, C, and D)
1-3144
26Eu2619 CrNV-12-12463 Charcoal platform Eligible (A, C, and D)
1-3144
26Eu6116 CrNV-12-18365 Road Not eligible 1-3169/1-3144
26Eu7474 CrNV-62-16199 Road Not eligible 6-3055
26Eu7575 CrNV-62-16058 Road Not eligible 6-3154
26Eu7761 CrNV-12-18361 Dann Frenchie Road Not eligible 1-3169/1-3144
26Eu7764 CrNV-12-18364 Debris scatter Not eligible 1-3144
26Eu7780 CrNV-12-18483 Lithic scatter Not eligible 1-3169
26Eu7785 CrNV-12-18488 Irrigation ditch Not eligible 1-3169
26La2889 CrNV-62-6448 Small historic campsite Not eligible 6-3154-3
26La3626 CrNV-62-9391 Road Not eligible 6-3154-1
26La4909 CrNV-62-11757 Road Not eligible 6-3154
26La4911 CrNV-62-11759 Road Not eligible 6-3154
26La4922 CrNV-62-9656/CrNV-11-17803
Road Not eligible 6-3154-3
26La6807 CrNV-62-8479 Carico Lake Ranch Not eligible 6-3154
26La6814 CrNV-62-20115 Road Not eligible 6-3154/6-3154-1
26La6815 CrNV-62-20116 Basin Valley/Carico Valley Road
Not eligible 6-3154/6-3154-1
26La6816 CrNV-62-20117 Red Rock Canyon Road Not eligible 6-3154/6-3154-1
26La6817 CrNV-62-20118 Road Not eligible 6-3154
26La6818 CrNV-62-20119 Elder Creek Road Not eligible 6-3154
26La6819 CrNV-62-20120 Road Not eligible 6-3154/6-3154-1
26La6820 CrNV-62-20121 Lithic and ground stone scatter
Not eligible 6-3154
26La6821 CrNV-62-20122 Lithic scatter Not eligible 6-3154
26La6822 CrNV-62-20123 Lithic scatter Eligible (D) 6-3154

Appendix C Deep South Expansion Project EIS Cultural Resources C-7
Draft EIS 2018
Table C-2 Cultural Resources Identified in the Direct APE During Class III Inventories
Nevada State
Number BLM Number Site Description NRHP Eligibility 1 Report No.26La6823 CrNV-62-20124 Ditch Not eligible 6-3154
26La6824 CrNV-62-20125 Debris scatter Not eligible 6-3154
C40 n/a Carico Lake Ranch Bunkhouse
Eligible (C and D) 6-3154
C41 n/a Carico Lake Ranch Cellar Eligible (C and D) 6-3154 1 Full citations for the survey reports are included in Table C-1.

C-8Appendix C
Deep South Expansion Project EIS Cultural Resources
This page intentionally left blank
Draft EIS 2018

C-9Appendix C
Deep South Expansion Project EIS Cultural Resources
Appendix C-2
Programmatic Agreement Amendment Two
Draft EIS 2018

C-10Appendix C
Deep South Expansion Project EIS Cultural Resources
This page intentionally left blank
Draft EIS 2018

Appendix C
Deep South Expansion Project EIS Cultural Resources C-11
Pagel of2
AMENDMENT TWO
PROGRAMMATIC AGREEMENT AMONG THE BUREAU OF LANO MANAGEMENT, BATTLE MOUNTAfN AND ELKO
FIELD OFFICES, THE NEVADA STAT E HISTORIC PRESoERVATION OFFIC E AND CORTEZ JOINT VENTURE dba CORTEZ GOLD MINES REGARDING THE TREATMENT
OF HISTORlC PROPERTIES DURING CORTEZ GOLD MINES MINERAL EXPLORATION ANO DEVELOPMENT IN EUREKA AND LANDER COUNTIES,
NEVADA
WHEREAS, the Programmatic Agreement {Agreement) was execuled on September 28, 2005 and amended on August 6, 2015; and
WHERoEAS, this amendment is required because the Agreement will expire on September 28, 2017, prior to the completion of the Undertaking and the implementation of a new Agreement; and
WHEREAS, the signatories are negotiating a new Agreement for the Undertaking to address possible modifications to the Undertaking and revisions to the Protocol, law and regulation, and Bureau of Land Management (BLM) policies since the original execution of the Agreement in
2005 and the amendment in 2015; and
WHEREAS, BLM will send a copy of this executed amendment to the ACHP; and
NOW THEREFORE, in accordance with Stipulation G of the Agreement, BLM and the State Historic Preservation Office (SHPO) agree to amend the Agreement as follows:
I.ooAmend Stipulation H so it reads as follows:oo
This Agreement shall be Effective as the Effective Date and wilt automatically terminateooon the thirteenth nnniversnry thereo� unless each of th e BLM, SHPO and Cortez agree toooextend the term hereof. Any of Cortez. SHPO, or the BLM may tenninate this Agreementooby providing 30 days' notice to the other parties, provided that the parties will consultoo
during the period prior to termination to seek agreement on amendments or other actionsoothat would avoid termination.oo
Amendment Two for the Programmatic Agreement Regarding the Cortez Gold Mines Mineral Exploration and Development in Eureka and Lander Counties, Nevada
Draft EIS July2018

Appendix C
Deep South Expansion Project EIS Cultural Resources C-12
Page2of2
SIGNATORIES
Bureau of Land M agement, Battle Mountain Field Office J�By: �A,� Date: e-/,r/�,7
Title: Mount Lewis Field Manager
Bureau of Land Management, Elko Field Office
By:11)1}� Date: � oh,·/17
Title: Tuscarora Field Manager
Amendment Two for the Programmatic Agreement Regarding the Cortez Gold Mines Mineral Exploration and Development in Eureka and Lander Counties, Nevada
Draft EIS 2018

C-13
PROGRA!vIMATIC AGREEMENT AMONG THE BUREAU OF LAI",;'D MANAGENIBNT, BATTLE
MOUNT Am AND ELKO FIELD OFFICES, THE NEV ADA STATE HISTORIC PRESERVATION OFFICE AND CORTEZ JOINT VENTURE dba CORTEZ GOLD MINES REGARDING
THE TREATNIBNT OF HISTORIC PROPERTIES DURING CORTEZ GOLD MINES MINERAL EXPLORATION AND DEVELOP!vffiNT IN EUREKA AND LANDER COUNTIES,
NEVADA
This PROGRAMMATIC AGREEMENT ("Agreement"), effective as of date of SHPO signature, ("Effective Date"), is by and among the Battle Mountain and the Elko Field Offices of the Bureau of Land Management (collectively, the "BLM"), the Nevada State Historic Preservation Office ("SHPO"), consulting parties, and Cortez Joint Venture dba Cortez Gold Mines ("Cortez"), concurring party. The BLM is the lead Federal agency for all activities under this Agreement.
RECITALS
WHEREAS, the BLM has determined that the development of mining and exploration projects by Cortez may have an effect upon properties eligible for inclusion ·in the National Register of Historic Places, and has consulted with SHPO pursuant to Section VI.B.l.b., c. & d. of the State Protocol Agreement dated June 4, 1999 between the Nevada State Office of the Bureau of Land Management, and the SHPO ("Protocol");
WHEREAS, the Battle Mountain Field Office of the Bureau of Land Management, Cortez, SHPO and the Advisory Council on Historic Preservation (the "Council") are parties to that certain Programmatic Agreement effective May 8, 1992 ("Original PA"), regarding the treatment of historic properties during Cortez mineral exploration and development;
WHEREAS, the Battle Mountain Field Office of the Bureau of Land Management, the Council, Cortez and SHPO desire to terminate the Original PA and the BLM, Cortez, and SHPO desire to enter into this Agreement;
WHEREAS, Cortez is the operator of projects in the area of interest defined in Section B hereof ("Area of Interest"), has participated in this consultation and has been invited to be a concurring party to this Agreement;
WHEREAS, Tribes with ancestral ties to the Area of Interest have been consulted regarding this Agreement, are invited to concur in this Agreement, and will be contacted and consulted, as appropriate, regarding any Undertaking proposed by Cortez under this Agreement;

C-14
WHEREAS, Cortez has previously filed plans of operations under 43 C.F.R. §3809.11 to conduct mineral exploration and extraction activities in the Area of Interest that are multi-year in scope;
WHEREAS, effects on historic properties in the Area of Interest cannot be fully determined and the Parties desire to enter into this Agreement to set 'forth procedures to 'be followed to comply with the requirements of Section 106 of the National Historic Preservation Act ("Section 106")
for Cortez Undertakings in the Area of Interest; and
WHEREAS, this Agreement is intended to cover all aspects of compliance with Section 106 associated with Cortez Undertakings in the Area of Interest.
AGREE1\1ENT
NOW THEREFORE, the parties agree that cultural resource issues involved with the development of mining projects in the Area of Interest shall be addressed in accordance with the following in satisfaction of the BLM's Section 106 responsibilities. Capitalized terms used herein and not defined herein have the meanings given them in 36 C.F.R. § 800.2 (1986) or in the definitions set forth in Appendix B, attached hereto.
A. PURPOSE AND INTENT.
The purpose of this Agreement is to establish procedures for use by the BLM, SHPO and Cortez regarding compliance with Section 106 for Undertakings proposed and developed by Cortez in the Area of Interest, however this agreement does not apply to projects conducted solely on private land. This Agreement defines general and specific measures that will be undertaken by the BLM, SHPO and Cortez to ensure that the BLM's objectives and responsibilities under the NHP A will be fulfilled.
B. AREA OF INTEREST.
The Area of Interest consists of lands administered by the BLM in Lander and Eureka Counties as set forth in Appendix A.
C. IDENTIFICATION AND INVOLVEl\fENT.OF,IN:fERESTED ·PARTIES.
The BLM (i) has identified interested parties pursuant to 36 C.F.R. §800.1 ( 1986), (ii) will notify them, as appropriate, of Undertakings proposed under this Agreement, and (iii) will involve such interested parties, as appropriate, in consultation pursuant to Section 106 for each such Undertaking.
D. STIPULATIONS. The BLM shall ensure that the following stipulations are followed:
1. Development of Historic Context for Area of Interest. As soon as practicable after the Effective Date of this Agreement, Cortez will complete, or cause to be

C-15
completed, a general Historic Context for the Area of Interest. Evaluation of project-specific proposals submitted prior to completion of a Historic Context may proceed concurrently with development of the Historic Context. For the avoidance of doubt, project-specific cultural resource evaluation and project approvals may proceed prior to completion of the Historic Context provided that cultural resources that cannot be evaluated without the Historic Context will be treated as if eligible and avoided or mitigated.
2. SHPO Involvement. Determination of whether an Undertaking proposed hereunder requires SHPO involvement shall be governed by the Protocol, provided that either the BLM or Cortez may request SHPO involvement at any time, whether or not such involvement is required by the Protocol. By way of example only, routine environmental assessments and preliminary exploration under an exploration plan of operations generally do not require SHPO involvement while close-spaced drilling under exploration plans of operations and mining plans of operation may require SHPO involvement.
3. Designation of APEs. The BLM shall designate specific APEs associated with Undertakings under this Agreement, unless consultation with SHPO is required under the Protocol, in which case BLM shall consult with SHPO before designating any such APE. Cortez may propose Undertaking-specific APEs for the convenience of the BLM and SHPO, but final detennination of an APE shall be made by the BLM.
4. Procedures for Compliance with 36 C.F.R. Part 800.
a. Identification. Except as specified in Section 4.a.i(c), or at the request of the BLM or Cortez, identification efforts generally do not require SHPO involvement.
1. Preparation of Class III Inventories. Areas of proposed disturbance in an APE designated by the BLM hereunder shall be inventoried at the Class ill level. Such Class III Inventories shall be conducted in accordance with the following:
(a) Recordation of Cultural Resources. Contractor(s) will record all new I y identified Cultural Resources, and update previously recorded sites as directed by the BLM, all according to the Protocol.
(b) Collection of Artifacts. Artifacts will only be collected when authorized by the BLM Authorized Officer.
(c) Cultural Resources Extending Outside of Surveyed Area. Cultural Resources extending outside the survey area will be recorded unless the BLM and SHPO agree that an
C-16
alternative approach is sufficient for an Eligibility determination.
(d) Linear Sites. Linear Sites will be recorded in accordance with Appendix D of the Protocol. Linear Sites will be recorded outside of the survey area only to the extent necessary to determine Eligibility.
b. Resolving Eligibility. Eligibility determinations are made by the BLM, unless consultation with SHPO is required under the Protocol, in which case BLM shall consult with SHPO before making any such Eligibility determination. Where Cultural Resources have been identified pursuant to identification efforts, the BLM shall ensure that the following procedures are followed:
i. National Register Criteria. The BLM shall apply the National Register Criteria to identified Cultural Resources and determine whether such Cultural Resources are Eligible. The BLM may require that the Contractor conducting the Class ill Inventory make initial recommendations regarding Eligibility, but determinations of Eligibility will be made by the BLM in consultation with SHPO when required under the Protocol. If SHPO and the BLM cannot reach agreement regarding Eligibility, the BLM shall seek a formal determination of Eligibility from the Keeper in accordance with 36 C.F.R. § 800.4(b)(4) [1986]. The Keeper's determination will be binding on BLM and SHPO.
ii. Properties of Cultural or Religious Importance to Indian Tribes. The BLM shall apply the National Register Criteria to properties which may be of cultural or religious importance to an Indian tribe and, with the SHPO's concurrence, determine whether such properties are Eligible. If SHPO and the BLM cannot reach agreement regarding Eligibility, the BLM shall seek a formal determination of Eligibility from the Keeper in accordance with 36 C.F.R. § 800.4(b)(4)(1986). The Keeper's determination will be binding on BLM and SHPO.
111. Historic Districts. If a proposed Undertaking is in a previously defined Historic District, all Historic Properties in the Historic District will be evaluated and classified as either contributing or noncontributing to the Eligibility of the Historic District.
1v. Test Excavation. Information gathered by the Class III Inventory may be inadequate for determining Eligibility. In such cases, the BLM may, after obtaining SHPO's concurrence, authorize an evaluation plan (which may include subsurface testing) under

C-17
ARP A. In developing a subsurface evaluation plan, the BLM shall ensure that any testing is limited to defining the nature, density and distribution of materials of the Cultural Resources in order to provide the minimum data necessary to make final evaluations of Eligibility and to devise appropriate treatment options.
v. Resources Outside of APE. Cultural Resources located completely outside of an APE do not require evaluation under this Agreement.
v1. Determination Made Prior to Activity. The BLM shall ensure that Cultural Resources identified in an APE are evaluated for Eligibility prior to initiation of activities that may have an Adverse Effect on such resources.
vii. Notice of Determination. The BLM will inform Cortez of Eligibility determinations within 20 days of such determination.
c. Effects and Treatment. Where Historic Properties have been identified pursuant to a Class III Inventory, the BLM shall ensure that the following procedures are followed in determining Effects on Historic Properties and treatment of Adverse Effects, if any.
i. Determination of Effects.
(a) The BLM shall determine the nature of Effects that a proposed Undertaking will have on Historic Properties identified in an APE.
(b) If the BLM finds that the Undertaking will have no Effect on Historic Properties, the BLM may issue a Notice to Proceed (as defined in Section D.7).
(c) If the BLM finds that an Undertaking will have a potential Adverse Effect, the BLM will determine whether standard avoidance measures, monitoring or other measures contained in the Protocol could be reasonably implemented to reduce a potential Adverse Effect to a "no Effect" determination or a determination that any Effect of the Undertaking would be less than an Adverse Effect. If such measures are successful in reducing potential Adverse Effects to a "no Effect" determination or a determination that any Effect of the Undertaking would be less than an Adverse Effect, the BLM may issue a Notice to Proceed.
(d) If avoidance and monitoring procedures contained in the Protocol are not appropriate or effective, the BLM will

C-18
·
consult with SHPO on appropriate treatment or mitigation of such Adverse Effect. If the BLM and SHPO determine that appropriate treatment or mitigation of Adverse Effects has been completed, the BLM may issue a Notice to Proceed.
(e) If no Adverse Effect is found, the BLM may issue a Notice to Proceed.
ii. Treatment Plans and Other Mitigation. Recognizing that avoidance may not be reasonably practicable, the BLM, in consultation with SHPO and Cortez, shall develop an appropriate treatment plan designed to lessen or mitigate project-related Adverse Effects to Historic Properties. For properties Eligible under National Register criteria A. through C., other forms of mitigation may be considered in the treatment plan in lieu of, or in addition to, data recovery (e.g. oral history, historic markers, exhibits, interpretive brochures, publications, etc.).
(a) Data Recovery. When data recovery is the preferred treatment option for an Historic Property, the BLM shall ensure that the Contractor develops a treatment plan based on an appropriate research design and that the treatment plan is submitted to SHPO for a 30 day review and comment period. Data recovery plans shall be consistent with the standards in the Department of Interior's Formal Standards for Final Report of Data Recovery Programs (42 FR 5377-79) (the "Data Recovery Standards").
(b) Implementation. Upon completion of consultation with SHPO and Cortez on a treatment plan, the BLM shall ensure that the treatment plan is implemented within the timelines set forth in the treatment plan.
d. Records; Curation.
i. Records and Curation. The BLM shall ensure that all records and material resulting from identification and treatment are curated in accordance with 36 C.F.R. §79 in a BLM approved facility in Nevada, and that all material to be returned to their owners will be maintained in accordance with 36 C.F.R. § 79 until analysis is complete and the materials are returned. Unless otherwise negotiated, all materials must be curated or returned to their owners when the final report is accepted by the BLM.
� ,,

C-19
11. Reports. The BLM shall ensure that all final archaeological reports resulting from actions pursuant to this Agreement will be provided to SHPO and Cortez. The BLM shall ensure that all such reports conform to contemporary professional standards and the Data Recovery Standards. Precise .Historic Property location data may be provided in a separate appendix if the BLM determines pursuant to Section 304 of the NHP A that release of such data could jeopardize Historic Properties.
e. Discovery Situations. Cultural Resources, not previously identified, which are discovered while conducting activities pursuant to an Exploration or Mining Plan shall be handled as follows:
i. Discovery Situations. If a Cultural Resource is discovered during an Undertaking, mining-related activities within a 100 meter buffer zone (the "Avoidance Boundaries") surrounding the discovered Cultural Resource will cease immediately and Cortez shall · notify the BLM Authorized Officer within 24 hours (the "Discovery Notice"). The Cortez officials that are authorized to stop work are listed in Appendix D attached hereto. Within 48 hours of delivery of the Discovery Notice, a BLM Authorized Officer will visit the discovery site to determine whether proceeding with activities in the buff er zone will harm the discovered Cultural Resource or whether the buffer zone may be safely reduced to allow activity outside of such reduced buffer zone without harm to the discovered Cultural Resource.
ii. Consultation with SHPO. Within 48 hours of delivery of the Discovery Notice, the BLM shall notify SHPO of the discovery (the "SHPO Notice"). SHPO shall give its comments to the BLM within 2 working days of receipt of the SHPO Notice. If the BLM has not received SHPO comments within 2 working days of the SHPO Notice, the BLM shall presume SHPO concurrence with any BLM recommendation in the SHPO Notice or that SHPO has declined to participate in any consultation regarding the discovery, and the BLM may make a decision regarding the discovered Cultural Resource without further SHPO consultation.
m. BLM Notice to Cortez. Within 4 working days of delivery of the SHPO Notice, or 6 working days of delivery of the Discovery Notice, whichever comes first, the BLM shall notify Cortez of the BLM's decision whether to (i) allow mining related activities to proceed without mitigation, (ii) require mitigation of the discovery or (iii) allow mining related activities to proceed during mitigation of the discovery (the "Mitigation Decision Notice").

v.
C-20
1v. Mitigation. The BLM will have 7 working days from delivery of a Mitigation Decision Notice requiring mitigation to consult with Cortez and SHPO and decide the nature and extent of mitigating measures required. The BLM shall notify Cortez and SHPO of the BLM's decision regarding mitigation within 10 days of delivery of a Mitigation Decision Notice and will ensure that any required mitigating measures are implemented.
Human Remains. Human remains and associated artifacts may be discovered during project development or during controlled archaeological excavations. Discovery of such items will be handled in accordance with the following procedures.
(a) Federal Lands. If human remains, funerary objects, or items of cultural patrimony or sacred objects are discovered on federal lands, Cortez and the Contractor(s) will comply with the discovery and notification requirements of the Native American Graves Protection and Repatriation Act of 1979, 25 U.S.C. §3001 et. seq. ("NAGPRA"), and its implementing regulations. Such resources discovered on federal lands will be secured by Cortez until such time as the BLM has secured the area or has taken custody of such
·resmrrces,"· up ·to ·48 hours. ·Cortez "Shall maintain the Avoidance Boundaries set forth in Section D.4.e.i.
(b) Private Lands. Human remains and associated funerary objects found on private or state lands will be handled according to the provisions of applicable Nevada law (NRS 383). Cortez will notify the relevant county coroner or sheri
5. Other Considerations
ff, the SHPO and the BLM of any such discovery.
� Third Party Contractors. Cortez shall bear the reasonable expense of Contractors to perform Section 106 compliance under this Agreement. Such costs may include pre-field planning, fieldwork, post-fieldwork analysis, research, report preparation, interim and summary report preparation, and costs associated with the curation of artifacts. The BLM shall ensure that historic, architectural and archaeological work conducted by Contractors pursuant to this Agreement is carried out by, or under the direct supervision of, persons meeting the Secretary of Interior's Professional Qualification Standards (48 FR 44738-39) and BLM Guidelines.
b. Inclusion of Stipulations in Plans. The requirements under Section D.4.e regarding discoveries will be included in construction, operations and

C-21
maintenance plans. Cortez will brief field personnel and any Contractor hired by Cortez regarding these requirements.
c. Exemption of Modifications to Exploration or Mining Plans. Modifications to approved Exploration Plans and Mining Plans are categorically exempt from the Section 106 Process under Appendix C of the Protocol, provided that any such modification does not involve additional surface disturbance or have an Effect on Historic Properties.
6. Reports and Monitoring
a. Reports and Time Frames. The BLM shall ensure that reports are completed in a timely manner and conform to the BLM Guidelines and the Data Recovery Standards.
1. Contractors' draft final reports of identification, evaluation, treatment or other mitigative activities shall be submitted to the BLM within the time frames specified in the BLM Guidelines unless otherwise agreed in writing.
ii. Unless otherwise agreed in writing, the BIM, SHPO, Cortez and Contractors shall adhere to the timelines set forth herein.
iii. Within 20 days of receipt of the draft final report from the Contractor, the BLM shall review and comment for revision. The BLM shall submit all final reports to SHPO.
iv. If SHPO's concurrence is required under the Protocol, SHPO shall review and comment on the final reports within 30 days of such submission by the BLM. If SHPO does not respond within 30 days, the BLM shall be entitled to presume SHPO concurrence with the BLM's findings and recommendations as detailed in the final report, and may proceed with the Undertaking.
v. If consultation with SHPO is not required under the Protocol, the BL\1 may proceed.
vi. The BLM shall provide SHPO with a copy of any reports prepared under this Agreement.
b. Monitoring. The BLM and SHPO may monitor actions carried out pursuant to this Agreement in accordance with the Protocol.
1. BLM may require an appropriate monitor in any areas identified as sensitive by BLM, in consultation with SHPO, during project

C-22
activities in those areas. Treatment Plans will contain monitoring plans as needed.
7. Notices to Proceed. The BLM will issue to Cortez a notice that it may proceed with an activity (a "Notice to Proceed") under any one of the following conditions:
a. The proposed disturbance area in an APE has been inventoried and the BLM has determined that there are no Historic Properties in such inventoried area;
b. Evaluation of the Eligibility of identified Cultural Resources has been conducted and the BLM, and SHPO, if required under the Protocol, has determined that the Cultural Resources are not Eligible;
c. The BLM determines that a project activity will not have an Effect on Historic Properties, or when Historic Properties are avoided pursuant to Section D.4.c. and measures set forth in the Protocol;
d. The BLM determines that any Effect on an Historic Property will not be an Adverse Effect or may be effectively avoided or mitigated according to standard ,procedures·in the Protocol;· or
e. Treatment options for Historic Properties affected by the activity have been approved by the BLM after consultation with SHPO; provided that if a treatment option selected requires fieldwork, the BLM may authorize Cortez to proceed with specific mining activities that would affect Historic Properties after:
i. The fieldwork phase of the treatment option has been completed;
ii. The BLM has accepted a summary description of the fieldwork performed·and a·reporting schedule for that work; and
111.f
Cortez has ·posted a "surety ·acceptable to the· :BLM as set- orth in Section D.8 below for post-fieldwork costs of the treatment plan.
8. Surety Bonds
a. Bond Amount. Cortez will post a surety bond with the BLM in an amount sufficient to cover reasonable curation and post-fieldwork costs associated with implementing a treatment plan or other mitigative activities.

C-23
b. Forfeiture. The bond posted shall be subject to forfeiture if postfieldwork tasks are not completed within time periods established by the treatment plan, provided, however, that the BLM and Cortez may agree at any time to ex.tend any such time periods. The BLM may not deny a reasonable request by Cortez for extension of such time periods. The BLM shall notify Cortez that the bond is subject to forfeiture and shall allow Cortez 45 days to take corrective action before the BLM acts to forfeit the bond.
c. Release. The bond shall be released in whole or part as specified curation and post-fieldwork tasks are completed and accepted by the BLM.
E. NATIVE Al\1ERICAN CONSULTATION.
1. Identification of Interested Indian Tribes. The BLM has identified Indian tribes that may attach religious or cultural significance to areas in the Area of Interest. Such tribes are listed on Appendix C hereto and have been (i) given an opportunity to participate in consultation regarding this Agreement and (ii) invited to concur in this Agreement. Such tribes will be consulted, as appropriate, regarding any Undertaking proposed by Cortez under this Agreement.
2. Consultation. In connection with evaluation of Undertakings proposed under this Agreement, the BLM will identify and evaluate properties in the Area of Interest to which Native Americans may attach religious or cultural significance through consultation with the Indian tribes listed on Appendix C. Cortez may provide for a Contractor to assist the BLM in gathering data and identifying and evaluating such areas. The BLM will formally consult with tribal governments, as needed, in accordance with Executive Order 13175 on Consultation and Coordination with Indian Tribal Governments, dated November 6, 2000 (65 FR 67249) and Memorandum of April 29, 1994, "Government-to-Government Relations with Native American Tribal Governments" (59 FR 22951). Identification, evaluation and treatment efforts will be consistent with the BLM Manual 8160 and the BLM Handbook 8160-1, each as issued by the BLM.
3. Confidentiality. Information gathered through consultation considered confidential or proprietary by an Indian tribe or tribes may be held confidential to the extent allowed by Federal law.
F. DISPUTE RESOLUTION.
1. Disputes Between the BLM and SHPO. Any disputes or objections ansmg during identification, evaluation, or discovery situations that cannot be resolved between the BLM and SHPO shall be referred to the Council for comment.
a. To facilitate this process, the BLM will provide the Council with copies of relevant information on the dispute. In addition, consultation with the

C-24
Council shall be by the most expeditious means available, including telephone, email, or fax.
b. Council comments will be considered by the BLM in its decision-making, and the BLM will notify the Council, SHPO and Cortez of its resolution of the dispute.
c. Except as set forth in this Section F. l.c., Cortez may continue all previously approved actions under any Mining Plan or Exploration Plan. The BLM shall notify Cortez in writing of any suspension of activity required by law pending dispute resolution under this Section F.l.
2. Disputes Between Cortez and the BLM. Cortez and the BLM shall endeavor to resolve all disputes between or among them by consultation and negotiation. Any disputes or objections arising under this Agreement between the BLM and Cortez shall be referred to SHPO for comment.
3. No Waiver. Nothing in this Agreement, including the provisions of this Section F, shall waive or otherwise limit any administrative or judicial remedy or right of review available under applicable law or regulation.
G. AMEND1\1ENT.
No amendment, modification or change to-this Agreement shall be enforceable unless executed by the BLM, SHPO and Cortez.
H. TERM AND TERMINATION.
This Agreement shall be effective as of the Effective Date and will automatically terminate on the tenth anniversary thereof, unless each of the BLM, SHPO and Cortez agree to extend the term hereof. Any of Cortez, SHPO or the BLM may terminate this Agreement by providing 30 days notice to the other parties, provided that the parties will consult during the period prior to termination to seek agreement on amendments or other actions that would avoid termination.
I. SECTION 106 COMPLIANCE.
Implementation of this Agreement evidences that the BLM has satisfied its Section 106 responsibilities for all actions associated with Cortez's mining exploration and development projects in the Area of Interest.
J. PARTIES IN INTEREST; NO THIRD PARTY BENEFICIARY.
The obligations of Cortez created by this Agreement are enforceable only by the BLM against Cortez. This Agreement creates no independent right or private right of action by any person or entity to enforce any obligation hereunder against Cortez.

C-25
K. TERMINATION OF ORIGINAL PA.
Upon execution of this Agreement, the Original PA will be terminated and of no further force or effect, and this Agreement supercedes the Original PA in its entirety.
IN WITNESS WHEREOF, the parties have executed this Agreement on the dates set forth below, to be effective as of the Effective Date.
CONSUL TING PARTIES
NT, BATTLE MOUNTAIN FIELD OFFICE
By:--=--..l....,..1-JLJ���L.L..:���=t...k-------Date:_-=j_-_/_f_-_tJ_l/ _ Name: v
..___
Title: Field Manager
B AU OF LAND MANAGE�NT, ELKO FIELD OFFICE
4::::::
,M 7?1. Date:------
€,--J3--
,k� M-� � Title: Field Manager
NEVADA STATE IDSTORIC PRESERVATION OFFICER
By: tly7J m.6�1d��c:'- Date:Name: 2lu_d f)1C� �
--------
Title: State Historic P�servation Officer v 0
CONCURRING PARTIES
CORTEZ GOLD MINES- IJ1
��e, JJk1:!2&-- Date: '7 · 2. · �
Title: H,tlC 4�J.leAAL MM�

C-26
TE-MOAK TRIBE OF THE WESTER..1"'1 SHOSHONE
By:____________________ Date: _______ Name:___________________ Title: Tribal Chair
YOlVIBA SHOSHONE TRIBE
By .____________________ Date:______ _ Name: ___________________ Title: Tribal Chair
DUCKW ATER SHOSHONE TRIBE
By:____________________ Date:______ _ Name: ___________________ Title: Tribal Chair
ELY SHOSHONE TRIBE
By: ____________________ Date:_______ Name:__________________ _ Title: Tribal Chair
SHOSHONE-PAIUTE TRIBES OF DUCK VALLEY
By:____________________ Date:______ _ Name: __________________ _ Title: Tribal Chair
.

C-27
APPENDIX A
Township 25N, Ranges 44E, 45E, 46E, 47E, 48E, 49E, and SOE; Township 26N, Ranges 44E, 4SE, 46E, 47E, 48E, 49E, and SOE; Township 27N, Ranges 44E, 4SE, 46E, 47E, 48E, 49E, and SOE; Township 28N, Ranges 44E, 4SE, 46E, 47E, 48E, 49E, and SOE; Township 29N, Ranges 44E, 4SE, 46E, and 47E; and Township 3ON, Ranges 44E, 45E,
46E, and 47E.
Map of area covered by this programmatic agreement:
20 0 20 40 Mile�
NArea Boundary
App. A-I

C-28
APPENDIXB
AGREE1\1ENT-SPECIFIC DEFINITIONS
A. DEFINITIONS.
Adverse Effect. As defined in 36 C.F.R. § 800.9(b) (1986).
Agreement. As defined in the introductory paragraph.
APE. An "Area of Potential Effect" as set forth in 36 C.F.R. § 800.2 (1986) (attached as Appendix A).
Area of Interest. As defined in the Recitals and more particularly described in Appendix A.
ARPA. The Archeological Resources Protection Act of 1979, 16 U.S.C. § 470aa et. seq.
Avoidance. Preventing a potential Adverse Effect on an Historic Property from occurring by partial or complete relocation of a proposed land use as set forth in the Protocol.
Avoidance Boundaries. As defined in SectionD.4.e.i
BLM. As defined in the introductory·paragraph.
BLM Authorized Officer. For purposes of Cortez obligations to give notice to the BLM, an Authorized Officer, as used herein, shall mean the Field Manager, the Assistant Field Manager, the Cultural Resources Specialist or the Archeologist at either the Battle Mountain or Elko BLM Field Offices.
4BLM Guidelines. The Nevada BLM Cultural Resources Inventory General Guidelines ( th
edition, January 1990).
BLM Manual. The BLM Manual, 8100 Series, issued by the BLM.
Class I Survey. A professionally conducted review of.published historic and archeolo_gical material about a geographic area compiled pursuant to the BL"l\.1 Guidelines.
Class ID Inventory. A professionally conducted continuous intensive survey pursuant to the BLM Guidelines.
Concurring Parties. As defined in the introductory paragraph and Stipulation I.E.l.
Contractor. The BLM's third party contractor, or any other third party contractor engaged by the BLM or Cortez to perform Section 106 compliance work hereunder.

C-29
Cortez. As defined in the introductory paragraph.
Council. As defined in the Recitals.
Cultural Resource. A definite location of human activity, occupation, or use identifiable through field inventory, historical documentation or oral evidence. The term includes archeological, historic, or architectural sites, structures, or places with important public or scientific uses, and may include definite locations (sites or places) of traditional cultural or religious importance to specified social and/or cultural groups. Cultural Resources are concrete, material places and things that are located, classified, ranked and managed through a system of identification and protection set forth in the BLM Manual. A Cultural Resource may or may not be Eligible for the National Register.
Data Recovery Standards. As defined in Section D.4.c.ii.a.
Discovery Notice. As defined in Section D.4.e.i.
Effect. As defined in 36 C.F.R. § 800.9(a) (1986).
Effective Date. As defined in the introductory paragraph.
Eligible or Eligibility. A detemrination that a Cultural Resource meets the National Register Criteria.
Exploration Plan. A plan of operations submitted to the BLM under 43 C.F.R. § 3809.400 et seq. for exploration activity that involves more than 5 acres of surface disturbance.
Historic Context. An organizing structure for interpreting history gleaned from a Class I Survey that organizes information about Historic Properties that share a common theme, common geographic area, and a common time period.
Historic District. A district listed in the National Register.
Historic Property. As defined in 36 C.F.R. § 800.2(e) (1986). For the purposes of this Agreement, "Historic Property" shall include unevaluated Cultural Resources and Cultural Resources properties eligible for listingir.i the.National Register.
Indian tribe(s). An Indian tribe as defined in 36 C.F.R. § 800.2. (1986)
Keeper. The Keeper of the National Register of Historic Places, as defined in 36 CFR 60.3(f).
Linear Site. A Cultural Resource with linear features, such as an irrigation ditch or road.
Mining Plan. A plan of operations submitted to the BLM under 43 C.F.R. § 3809.400 et seq. for mining activity.

C-30
Mitigation Decision Notice. As defined in Section D.4.e.iii.
NAGPRA. The Native_Arnerican Graves Protection and Repatriation Act of 1979, 25 U.S.C. § 3001 et seq.
National Register. As defined in 36 C.F.R. §800.2(k) (1986).
National Register Criteria. As defined in 36 C.F.R. 800.2(1) (1986).
NHPA. The National Historic Preservation Act, 16 U.S.C. §470 et seq.
Notice to Proceed. As defined in Section D.7.
Original PA. As defined in the recital.
Party or Parties. As defined in the introductory paragraph.
Protocol. As defined in the Recitals.
Secretary. As defined in 36 C.F.R. 800.2(m). (1986)
Secretary's Standards. The Secretary of the Interior's Standards and Guidelines for Archaeology and Historic Preser-vation (48 FR.447.16"'.:37).
Section 106. Section 106 of the NHPA, codified as 16 U.S.C. 470f.
SHPO. As defined in the introductory paragraph.
Undertaking. As defined in 36 C.F.R. §800.2(0). (1986)

C-31
APPENDIX C
NOTIFIED TRIBES
Te-Moak Tribe of the Western Shoshone Yomba Shoshone Tribe Duckwater Shoshone Tribe Ely Shoshone Tribe Shoshone-Paiute Tribes of Duck Valley

C-32
This page intentionally left blank