Draft NEPA Environmental Assessment Westover Metropolitan ...
403
Draft NEPA Environmental Assessment Westover Metropolitan Airport – Modifications to Civil Aviation Operations An environmental assessment prepared according to the National Environmental Policy Act and the U.S Air Force NEPA analysis process (EIAP) July 5, 2018 Prepared for: Westover Metropolitan Development Corporation (WMDC) Prepared by: Stantec Consulting Services Inc.
-
Upload
khangminh22 -
Category
Documents
-
view
0 -
download
0
Transcript of Draft NEPA Environmental Assessment Westover Metropolitan ...
Draft NEPA Environmental Assessment Westover Metropolitan Airport – Modifications to Civil Aviation Operations
An environmental assessment prepared according to the National Environmental Policy Act and the U.S Air Force NEPA analysis process (EIAP)
July 5, 2018
Prepared for: Westover Metropolitan Development Corporation (WMDC) Prepared by: Stantec Consulting Services Inc.

Revision Description Author Quality Check Independent Review
Project Cover Sheet
Draft NEPA Environmental Assessment
Modification to Civil Air Operations at Westover Metropolitan Airport (CEF)
1. Applicant: Westover Metropolitan Development Corporation (WMDC)
2. Consultant Team: Stantec Consulting Services, Inc. and HNTB Corporation
3. Federal Agency: United States Air Force (USAF)
4. Federal Agency: Federal Aviation Administration (New England Division)
5. Report Title: Draft Environmental Assessment (Draft EA)
6. Additional Information: Further information on this document may be obtained from:
Stantec Consulting Services, Inc.
Attn: Randall P. Christensen – Senior Environmental Scientist
136 West Street, Suite 203
Northampton, MA 01060-3711
email: [email protected]
phone: (413)584-4776
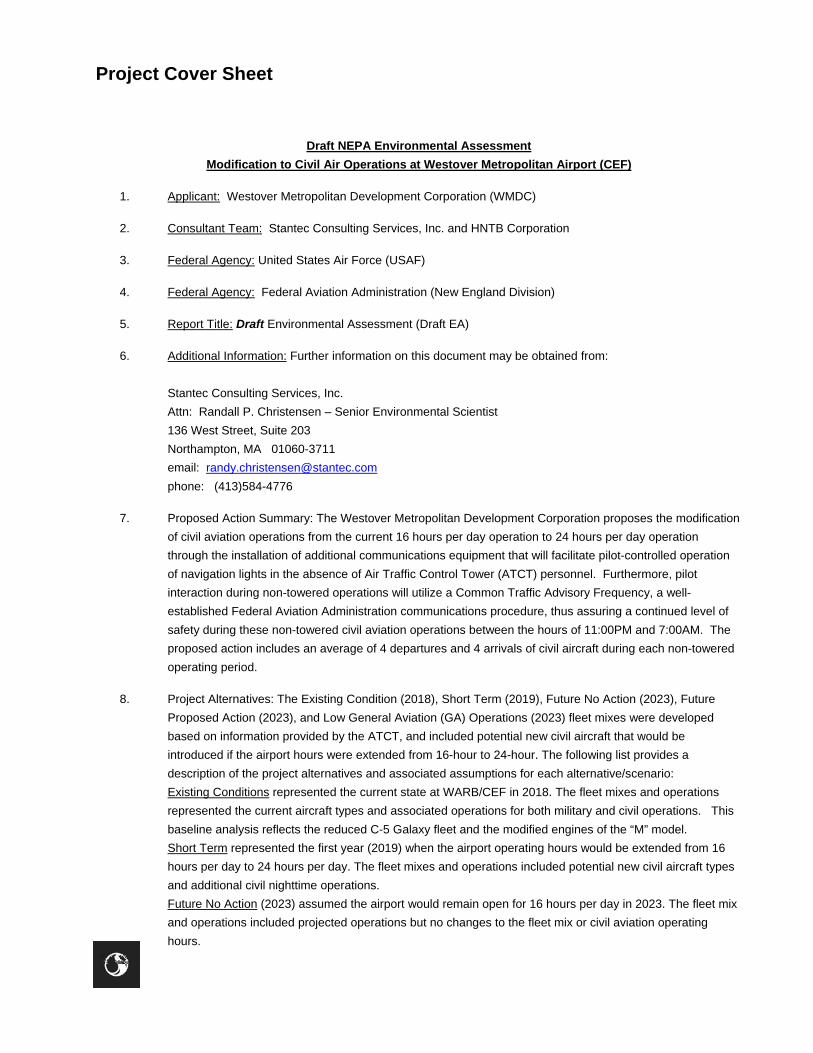
7. Proposed Action Summary: The Westover Metropolitan Development Corporation proposes the modification
of civil aviation operations from the current 16 hours per day operation to 24 hours per day operation
through the installation of additional communications equipment that will facilitate pilot-controlled operation
of navigation lights in the absence of Air Traffic Control Tower (ATCT) personnel. Furthermore, pilot
interaction during non-towered operations will utilize a Common Traffic Advisory Frequency, a well-
established Federal Aviation Administration communications procedure, thus assuring a continued level of
safety during these non-towered civil aviation operations between the hours of 11:00PM and 7:00AM. The
proposed action includes an average of 4 departures and 4 arrivals of civil aircraft during each non-towered
operating period.
8. Project Alternatives: The Existing Condition (2018), Short Term (2019), Future No Action (2023), Future
Proposed Action (2023), and Low General Aviation (GA) Operations (2023) fleet mixes were developed
based on information provided by the ATCT, and included potential new civil aircraft that would be
introduced if the airport hours were extended from 16-hour to 24-hour. The following list provides a
description of the project alternatives and associated assumptions for each alternative/scenario:
Existing Conditions represented the current state at WARB/CEF in 2018. The fleet mixes and operations
represented the current aircraft types and associated operations for both military and civil operations. This
baseline analysis reflects the reduced C-5 Galaxy fleet and the modified engines of the “M” model.
Short Term represented the first year (2019) when the airport operating hours would be extended from 16
hours per day to 24 hours per day. The fleet mixes and operations included potential new civil aircraft types
and additional civil nighttime operations.
Future No Action (2023) assumed the airport would remain open for 16 hours per day in 2023. The fleet mix
and operations included projected operations but no changes to the fleet mix or civil aviation operating
hours.
Project Cover Sheet
Future Proposed Action (2023) assumed the airport operating hours would be extended from 16 hours per
day to 24 hours per day in 2023 for civil aviation operations. The civil fleet mixes and operations included
potential new civil aircraft types and additional nighttime operations. It was assumed that the nighttime flights
would increase by an additional 4 arrivals and 4 departures each night; a total of 8 civil operations.
Future Low GA Operations (2023) assumed the airport operating hours would be extended from 16 hours
per day to 24 hours per day in 2023. The civil fleet mixes and operations included potential new civil aircraft
types and additional nighttime operations. It was assumed that the nighttime flights would increase by an
additional 2 arrivals and 2 departures each night, or half of the operations contained in the Future Proposed
Action (2023). This scenario shows the resultant impacts if the full projected use of the extended operating
hours was not realized.
9. Abstract: This EA was prepared by the Westover Metropolitan Development Corporation (WMDC) in
accordance with the National Environmental Policy Act (NEPA) of 1969 (42 United States Code [USC] 4321
et seq.), as implemented by the Council on Environmental Quality (CEQ) regulations (40 Code of Federal
Regulations [CFR] 1500–1508), and Air Force Instruction (AFI) 32-7061 and 32 CFR Part 989, “The
Environmental Impact Analysis Process” (EIAP). WMDC has prepared this EA to determine potential
environmental consequences of a modification to civil aviation operations at CEF, with an emphasis on
changes in the extent of critical noise contours surrounding the airport relative to existing land uses and
known sensitive receptors. WMDC assessed two alternatives to the proposed action; a “no action”
alternative and a “low operations” alternative to properly evaluate the impacts of the proposed action. Critical
environmental resources evaluated for the action focused on noise, land use and air quality. Since the
project proposed no construction, soil disturbance, vegetation clearing or building demolition, several
environmental resource categories were eliminated from detailed investigation for this EA.
DRAFT NEPA ENVIRONMENTAL ASSESSMENT WESTOVER REGIONAL AIRPORT – MODIFICATIONS TO CIVIL AVIATION OPERATIONS
July 5, 2018
Table of Contents
FINDING OF NO SIGNIFICANT IMPACT (DRAFT)...................................................................... I
ABBREVIATIONS ......................................................................................................................... I
1.0 PURPOSE OF AND NEED FOR ACTION ..................................................................... 1.1 1.1 PROJECT BACKGROUND AND RELEVANT DOCUMENTS ....................................... 1.4
1.1.1 1987 USAF Environmental Impact Statement .............................................. 1.4 1.1.2 1995 USAF Environmental Impact Statement .............................................. 1.4 1.1.3 2003 and 2014 FAR Part 150 Noise Compatibility Planning Updates .......... 1.6 1.1.4 Westover Metropolitan Airport 2008 Master Plan Update ............................ 1.7 1.1.5 KC-46A Third Main Operating Base (MOB 3) Beddown Environmental
Impact Statement (EIS) - April 2017 ............................................................. 1.7 1.1.6 Westover Air Reserve Base/Metropolitan Airport Noise Exposure Map
(NEM) & Noise Compatibility Plan (NCP) Update (DRAFT June 2018) ....... 1.8
2.0 PROPOSED ACTION AND ALTERNATIVES ............................................................. 2.11
3.0 AFFECTED ENVIRONMENT ...................................................................................... 3.12 3.1 SCOPE OF THE ENVIRONMENTAL ASSESSMENT ................................................. 3.12 3.2 NOISE (ACOUSTIC ENVIRONMENT)......................................................................... 3.15 3.3 AIR QUALITY ............................................................................................................... 3.19 3.4 LAND USE ................................................................................................................... 3.20 3.5 CULTURAL RESOURCES .......................................................................................... 3.20
4.0 ENVIRONMENTAL CONSEQUENCES ...................................................................... 4.22 4.1 INTRODUCTION .......................................................................................................... 4.22 4.2 NOISE .......................................................................................................................... 4.22
4.2.1 Existing Conditions (2018) .......................................................................... 4.22 4.2.2 Short Term Proposed Action (2019) ........................................................... 4.23 4.2.3 Future No Action (2023) ............................................................................. 4.23 4.2.4 Future Proposed Action (2023) .................................................................. 4.23 4.2.5 Future Low Civil Air Operations (2023) ...................................................... 4.23 4.2.6 Noise Contour Summary ............................................................................ 4.23 4.2.7 Supplemental Noise Metrics ....................................................................... 4.24
4.3 AIR QUALITY ............................................................................................................... 4.25 4.4 LAND USE ................................................................................................................... 4.26 4.5 CULTURAL RESOURCES .......................................................................................... 4.28
5.0 REFERENCES ............................................................................................................. 5.29
LIST OF TABLES
Table 3-1: Generalized Land Uses within the Existing (2018) "No Action" Conditions - 65 DNL Noise Exposure Contour at WARB/CEF ........................................................... 3.15
Table 3-2: Generalized Land Uses within the Future (2023) "No Action" Conditions - 65 DNL Noise Exposure Contour at WARB/CEF ........................................................... 3.16
DRAFT NEPA ENVIRONMENTAL ASSESSMENT WESTOVER REGIONAL AIRPORT – MODIFICATIONS TO CIVIL AVIATION OPERATIONS
July 5, 2018
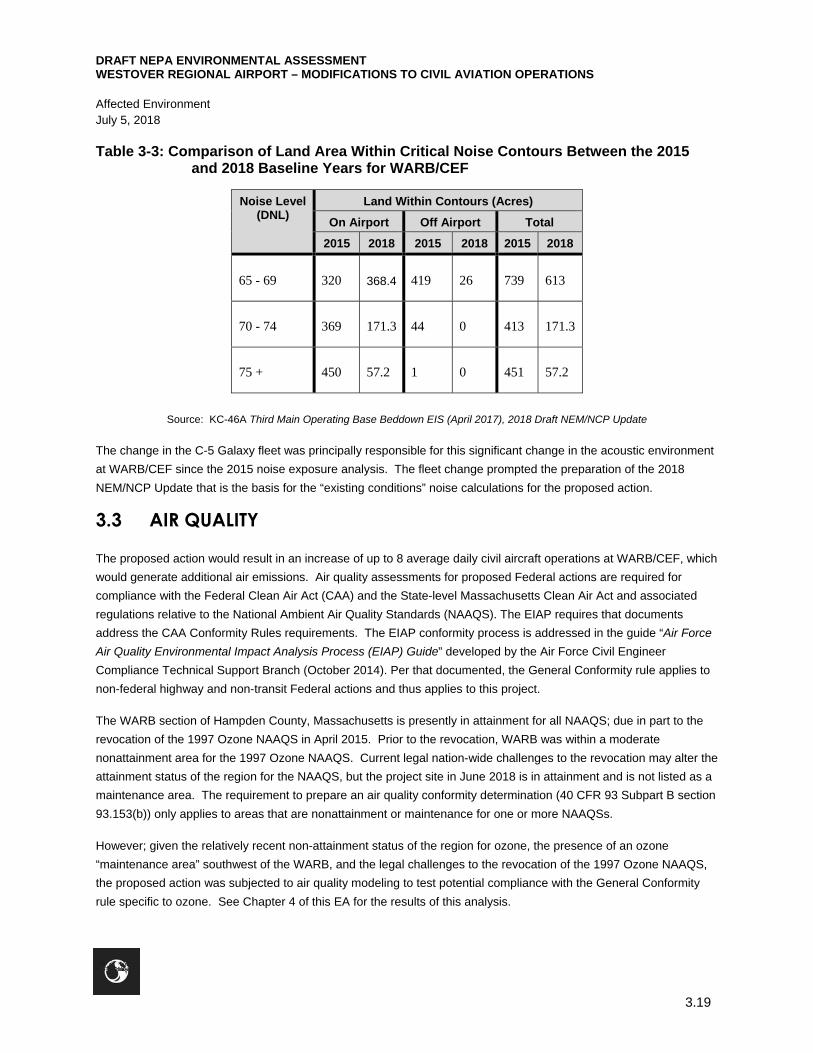
Table 3-3: Comparison of Land Area Within Critical Noise Contours Between the 2015 and 2018 Baseline Years for WARB/CEF ................................................................. 3.19
Table 4-1: Summary Table of Land Area Within the Critical Noise Contours for the Project Alternatives ................................................................................................... 4.24
Table 4-2: Clean Air Act Conformity Rule Emission Rate Thresholds for Maintenance Areas ......................................................................................................................... 4.25
Table 4-4: Air Pollutant Emission Comparison Between the No Action and Proposed Action Alternatives ..................................................................................................... 4.26
LIST OF FIGURES
Figure 1-1 Vicinity Map .............................................................................................................. 1.2 Figure 1-2 Airport Map ............................................................................................................... 1.3 Figure 1-3 2014 NEM Update vs. 2018 NEM Update Noise Contours .................................... 1.10 Figure 3-1 Existing Conditions (2018) Noise Contours ............................................................ 3.17 Figure 3-2 Future Conditions (2023) Noise Contours .............................................................. 3.18 Figure 3-3 Land Use Plan ........................................................................................................ 3.21 Figure 4-1 Proposed Action Noise Contours and Land Use Plan ............................................ 4.27
LIST OF APPENDICES
APPENDIX A 2018 NEM/NCP UPDATE (DRAFT) ............................................................ A.1
APPENDIX B CORRESPONDENCE ................................................................................. B.1
APPENDIX C NOISE ANALYSIS – TECHNICAL MEMO ................................................. C.1
DRAFT NEPA ENVIRONMENTAL ASSESSMENT WESTOVER REGIONAL AIRPORT – MODIFICATIONS TO CIVIL AVIATION OPERATIONS
July 5, 2018
i
Finding of No Significant Impact (Draft)
Finding of No Significant Impact – Proposed Modification to Civil Aviation Operations at the Westover Air Reserve
Base and Westover Metropolitan Airport. Chicopee, Massachusetts.
This Finding of No Significant Impact (FONSI) was prepared in accordance with the National Environmental Policy
Act of 1969, the Council on Environmental Quality (CEQ) regulations (40 Code of Federal Regulations (CFR) 1500-
1508), and the Air Force Environmental Impact Analysis Process (32 CFR 989). The decisions included in this FONSI
are based upon information contained in the Environmental Assessment (EA), Modification to Civil Aviation
Operations, Westover Metropolitan Airport (CEF) located in Chicopee, Massachusetts. The EA analyzed potential
environmental consequences that could result from implementation of the Proposed Action (including two action
Alternatives) or the No Action Alternative.
Purpose and Need - This Civil Aviation Action will extend the hours of civil aviation operations at CEF from the
current 16 hours per day (7 a.m. to 11 p.m.) to 24 hours per day to facilitate the continued development of civil
aviation operations in accordance with the WMDC mission as established and defined in the 1974 WMDC enacting
legislation (Massachusetts) which reads, in part, “it is the purpose of the Westover Metropolitan Development
Corporation created by this Act to aid private enterprise in the speedy and orderly conversion and redevelopment of
lands formerly used for certain activities at said base to nonmilitary uses, including, but not limited to, industrial,
commercial, or manufacturing uses, in order to prevent blight, economic dislocation, and additional unemployment
and to aid private enterprise fully to utilize opportunities to alleviate unemployment.” Furthermore, this extension of
operating hours will provide for flexibility in scheduling and capability to accommodate maintenance and weather
delays considered necessary to facilitate development of civil aviation operations at CEF to levels sufficient to sustain
an economically viable civil aviation program. This purpose is supported by the goals and objectives of the 2008 CEF
Master Plan Update which includes improvement of civil air operations to assist the WMDC and CEF in becoming a
self-sustaining entity.
Project Alternatives - The Existing Condition (2018), Short Term (2019), Future No Action (2023), Future Proposed
Action (2023), and Low General Aviation (GA) Operations (2023) fleet mixes were developed based on information
provided by the ATCT, and included potential new civil aircraft that would be introduced if the airport hours were
extended from 16-hour to 24-hour. The following list provides a description of the project alternatives and associated
assumptions for each alternative/scenario:
Existing Conditions represented the current state at WARB/CEF in 2018. The fleet mixes and operations
represented the current aircraft types and associated operations for both military and civil operations. This baseline
analysis reflects the reduced C-5 Galaxy fleet and the modified engines of the “M” model.
Short Term represented the first year (2019) when the airport operating hours would be extended from 16 hours per
day to 24 hours per day. The fleet mixes and operations included potential new civil aircraft types and additional civil
nighttime operations.
Future No Action (2023) assumed the airport would remain open for 16 hours per day in 2023. The fleet mix and
operations included projected operations but no changes to the fleet mix or civil aviation operating hours.
Future Proposed Action (2023) assumed the airport operating hours would be extended from 16 hours per day to
24 hours per day in 2023 for civil aviation operations. The civil fleet mixes and operations included potential new civil
DRAFT NEPA ENVIRONMENTAL ASSESSMENT WESTOVER REGIONAL AIRPORT – MODIFICATIONS TO CIVIL AVIATION OPERATIONS
July 5, 2018
ii
aircraft types and additional nighttime operations. It was assumed that the nighttime flights would increase by an
additional 4 arrivals and 4 departures each night; a total of 8 civil operations.
Future Low GA Operations (2023) assumed the airport operating hours would be extended from 16 hours per day
to 24 hours per day in 2023. The civil fleet mixes and operations included potential new civil aircraft types and
additional nighttime operations. It was assumed that the nighttime flights would increase by an additional 2 arrivals
and 2 departures each night, or half of the operations contained in the Future Proposed Action (2023). This scenario
shows the resultant impacts if the full projected use of the extended operating hours was not realized.
EA Determination – The proposed modification to civil aviation operations at WARB/CEF was assessed relative to
potential direct and indirect impacts to various sensitive environmental resources for a proposed action in the short
term (2019) and long term (2023), and for “no action” alternative in the long term (2023). Furthermore, a reduced
proposed action was also assessed. Based on the outcome of the impact assessment relative to the WMDC purpose
and need, the Future (2023) Proposed Action of an average daily increase in non-towered nighttime operations of 4
arrivals and 4 departures (8 operations) was selected as the preferred alternative.
The proposed action involved no construction, demolition, soil or vegetation disturbance resulting in a narrowly
focused scope for the EA. Noise, air quality, land use and cultural resources were determined to have potential
impacts from the proposed action and thus were analyzed further in the EA. The following categories were found to
be unlikely to be impacted by the proposed action and thus were eliminated from detailed investigation; topography,
geology, soils (including protected farmland), water resources (including Wild and Scenic rivers), wetlands, floodplain,
water quality, biological resources (including rare species), infrastructure, traffic congestion and transportation, solid
waste generation, hazardous waste, safety and occupational health, socioeconomics, environmental justice, and
children’s health and safety risks.
No significant impacts to the assessed resource categories were identified from the selected alternative. Detailed
noise modeling was completed for all alternatives and no incompatible uses were identified within the proposed
critical noise contours. The change in the noise contours due to the proposed action are minimal and do not
encompass any residential areas or other sensitive receptors. Air quality conformity analysis resulted in compliance
with the General Conformity rule should the area become a non-attainment area in the future. Currently the area is in
attainment for the NAAQS and not subject to the General Conformity Rule.
Coordination and Public Involvement – Preparation of this EA involved consultation and coordination with several
entities critical to the assessment of the scoped natural resource categories. Coordination with tribal and
Massachusetts SHPOs on cultural resources and the Massachusetts Department of Environmental Protection and
USEPA sources on air quality were completed. Noise contour generation included extensive local coordination with
planning/zoning departments, as well as other officials and local planners through the Joint Land Use Study steering
committee. The JLUS also represents a direct conduit to the concerned public through the Pioneer Valley Planning
Commission; the PVPC conducts the JLUS steering committee meetings and provides information on the WARB
through their website. The draft EA was distributed to the PVPC and JLUS and was placed in several public
locations (libraries) within adjacent communities. A 30-day public comment period was advertised in a local (daily)
newspaper, announced at a FAR Part 150 public meeting on July 5th, and advertised on various websites.
Comments received were assessed and addressed in the Final version of the EA.

DRAFT NEPA ENVIRONMENTAL ASSESSMENT WESTOVER REGIONAL AIRPORT – MODIFICATIONS TO CIVIL AVIATION OPERATIONS
July 5, 2018
iii
Conclusion - In accordance with Council of Environmental Quality regulations implementing the National
Environmental Policy Act of 1969 (as amended) and the USAF Environmental Impact Analysis Process, 32 CFR 989,
the USAF concludes that the Proposed Action will have no significant impact on the quality of the natural or human
environment and a FONSI is the appropriate level of NEPA determination; thus preparation of an Environmental
Impact Statement (EIS) is not necessary.
DRAFT NEPA ENVIRONMENTAL ASSESSMENT WESTOVER REGIONAL AIRPORT – MODIFICATIONS TO CIVIL AVIATION OPERATIONS
July 5, 2018
i
Abbreviations
ATCT Air Traffic Control Tower
AICUZ Air Installation Compatible Use Zone
AIM Aeronautical Information Manual
CAA Federal Clean Air Act
CEF Westover Metropolitan Airport
CTAF Common Traffic Advisory Frequency
DNL Day-Night Noise Level
EA Environmental Assessment (pursuant to NEPA)
EIS Environmental Impact Statement (pursuant to NEPA)
FAA Federal Aviation Administration
FONSI Finding of No Significant Impact
EIAP (USAF) Environmental Impact Analysis Process
JLUS Joint Land Use Study
NAAQS National Ambient Air Quality Standards
NEM Noise Exposure Map
NEPA National Environmental Policy Act1969 (42 United States Code 4321 et seq.)
NCP Noise Compatibility Program (pursuant to FAR Part 150)
Part 150 FAA Regulations 14 CFR Part 150, Airport Noise Compatibility Planning
PVPC Pioneer Valley Planning Commission
DRAFT NEPA ENVIRONMENTAL ASSESSMENT WESTOVER REGIONAL AIRPORT – MODIFICATIONS TO CIVIL AVIATION OPERATIONS
July 5, 2018
ii
ROD Record of Decision (on an EIS)
USAF United States Air Force
WARB Westover Air Reserve Base
WMDC Westover Metropolitan Development Corporation
DRAFT NEPA ENVIRONMENTAL ASSESSMENT WESTOVER REGIONAL AIRPORT – MODIFICATIONS TO CIVIL AVIATION OPERATIONS
Purpose of and Need for Action July 5, 2018
1.1
1.0 PURPOSE OF AND NEED FOR ACTION
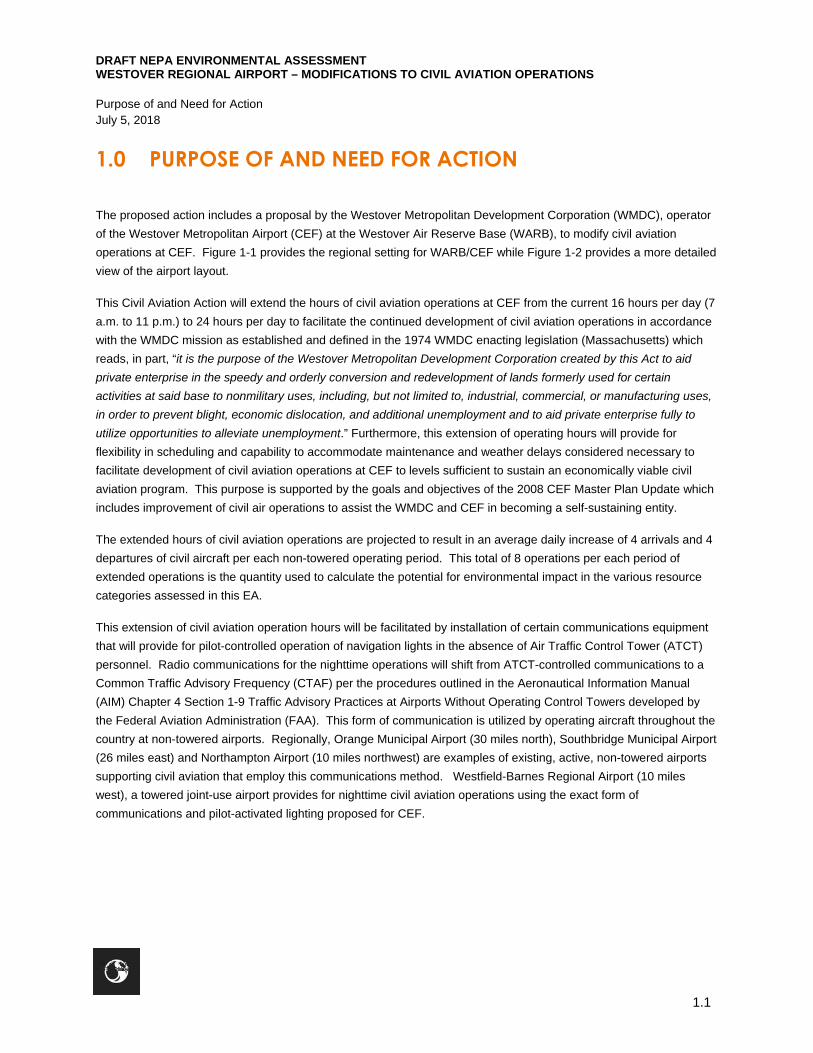
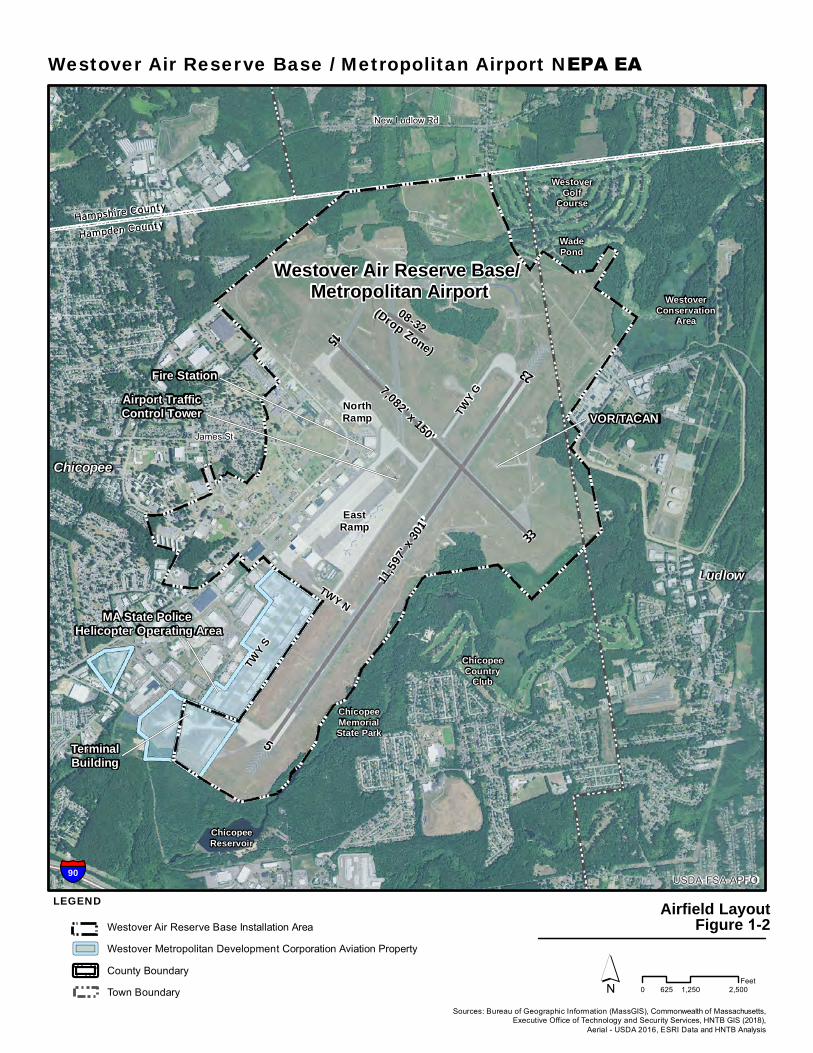
The proposed action includes a proposal by the Westover Metropolitan Development Corporation (WMDC), operator
of the Westover Metropolitan Airport (CEF) at the Westover Air Reserve Base (WARB), to modify civil aviation
operations at CEF. Figure 1-1 provides the regional setting for WARB/CEF while Figure 1-2 provides a more detailed
view of the airport layout.
This Civil Aviation Action will extend the hours of civil aviation operations at CEF from the current 16 hours per day (7
a.m. to 11 p.m.) to 24 hours per day to facilitate the continued development of civil aviation operations in accordance
with the WMDC mission as established and defined in the 1974 WMDC enacting legislation (Massachusetts) which
reads, in part, “it is the purpose of the Westover Metropolitan Development Corporation created by this Act to aid
private enterprise in the speedy and orderly conversion and redevelopment of lands formerly used for certain
activities at said base to nonmilitary uses, including, but not limited to, industrial, commercial, or manufacturing uses,
in order to prevent blight, economic dislocation, and additional unemployment and to aid private enterprise fully to
utilize opportunities to alleviate unemployment.” Furthermore, this extension of operating hours will provide for
flexibility in scheduling and capability to accommodate maintenance and weather delays considered necessary to
facilitate development of civil aviation operations at CEF to levels sufficient to sustain an economically viable civil
aviation program. This purpose is supported by the goals and objectives of the 2008 CEF Master Plan Update which
includes improvement of civil air operations to assist the WMDC and CEF in becoming a self-sustaining entity.
The extended hours of civil aviation operations are projected to result in an average daily increase of 4 arrivals and 4
departures of civil aircraft per each non-towered operating period. This total of 8 operations per each period of
extended operations is the quantity used to calculate the potential for environmental impact in the various resource
categories assessed in this EA.
This extension of civil aviation operation hours will be facilitated by installation of certain communications equipment
that will provide for pilot-controlled operation of navigation lights in the absence of Air Traffic Control Tower (ATCT)
personnel. Radio communications for the nighttime operations will shift from ATCT-controlled communications to a
Common Traffic Advisory Frequency (CTAF) per the procedures outlined in the Aeronautical Information Manual
(AIM) Chapter 4 Section 1-9 Traffic Advisory Practices at Airports Without Operating Control Towers developed by
the Federal Aviation Administration (FAA). This form of communication is utilized by operating aircraft throughout the
country at non-towered airports. Regionally, Orange Municipal Airport (30 miles north), Southbridge Municipal Airport
(26 miles east) and Northampton Airport (10 miles northwest) are examples of existing, active, non-towered airports
supporting civil aviation that employ this communications method. Westfield-Barnes Regional Airport (10 miles
west), a towered joint-use airport provides for nighttime civil aviation operations using the exact form of
communications and pilot-activated lighting proposed for CEF.

§¦90
§¦90
§¦291
§¦391
§¦91
§¦91
§¦91
£¤5
£¤202
£¤5
£¤20
UV21
UV33
UV141
UV10
£¤20
Westover ARB/Metropolitan Airport
Granby
South Hadley
Chicopee
Ludlow
Springfield
Belchertown
WilbrahamWestSpringfield
Holyoke
Westfield
Hampden County
Hampshire County
USDA-FSA-APFO
Westover Air Reserve Base / Metropolitan Airport NEPA EA
´ 0 6,000 12,0003,000Feet
Vicinity Map Figure 1-1
LEGENDWestover Air Reserve Base Installation AreaWestover Metropolitan Development Corporation Aviation PropertyCounty BoundaryTown Boundary
Long Island Sound
Atlantic Ocean
Westover ARB/Metropolitan Airport
Maine
New York
Vermont New Hampshire
Massachusetts
ConnecticutRhode Island
Copyright:© 2014 Esri
Sources: Bureau of Geographic Information (MassGIS),Commonwealth of Massachusetts,
Executive Office of Technology and Security Services,WMDC 2018, HNTB GIS (2018),
Aerial - USDA 2016, ESRI
!(
!(
!(
!(
08-32(Drop Zone)
Westover Air Reserve Base/ Metropolitan Airport
Hampshire County
Hampden County
§¦90
New Ludlow Rd
James St
5
23
33
15
ChicopeeMemorialState Park
ChicopeeCountry
Club
WestoverConservation
Area
WadePond
WestoverGolf
Course
ChicopeeReservoir
VOR/TACAN
TerminalBuilding
Airport TrafficControl Tower
11,597
' x 301
'
7,082' x 150'
Fire Station
TWY G
TWY N
TWY S
EastRamp
MA State Police Helicopter Operating Area
NorthRamp
Chicopee
Ludlow
USDA-FSA-APFO
LEGENDWestover Air Reserve Base Installation Area
Westover Metropolitan Development Corporation Aviation Property
County Boundary
Town Boundary
Westover Air Reserve Base / Metropolitan Airport NEPA EA
´Sources: Bureau of Geographic Information (MassGIS), Commonwealth of Massachusetts,
Executive Office of Technology and Security Services, HNTB GIS (2018),Aerial - USDA 2016, ESRI Data and HNTB Analysis
Airfield Layout Figure 1-2
Page 59
0 1,250 2,500625Feet
DRAFT NEPA ENVIRONMENTAL ASSESSMENT WESTOVER REGIONAL AIRPORT – MODIFICATIONS TO CIVIL AVIATION OPERATIONS
Purpose of and Need for Action July 5, 2018
1.4
The project as proposed would not result in disturbance to soils or vegetation, require any building demolition or
modification, or require the installation of new structures or facilities. No physical construction activities are
associated with the proposed action. No change in workforce would result from the proposed action. The physical
action associated with the project is limited to the installation of the pilot communications equipment, thus allowing for
the non-ATCT operations to commence. The equipment is installed in existing electrical vaults, navigational aids and
the ATCT; no new trenching, ground disturbance or structures are necessary to accommodate the new equipment.
Procedural updates and changes to the airport data as maintained by the FAA would be necessary prior to the
initiation of non-towered civil operations. Modification and update of the Joint-Use Agreement between the WMDC
and the U.S. Air Force (USAF) would also be necessary; the current Joint-Use Agreement is dated April 1994 and
does not provide for the scope of non-towered nighttime civil aviation operations defined in this EA.
1.1 PROJECT BACKGROUND AND RELEVANT DOCUMENTS
Several past planning and permitting processes and associated documents provide important background information
for the proposed action of modifying civil aviation operations at CEF to include non-towered operations between the
hours of 11:00PM and 6:00AM. A brief summary is provided of the more significant actions that have guided the
current proposal and this investigation of environmental impact. The documents referenced in this section are
generally available through the WARB and WMDC and the Pioneer Valley Planning Commission (PVPC). They are
incorporated herein by reference only, as they are too voluminous to attach to the EA and much of the information is
not pertinent to the proposed action.
1.1.1 1987 USAF Environmental Impact Statement
The WMDC has previously proposed changes to civil air operational hours at CEF to include 24-hour operations. An
Environmental Impact Statement (EIS) in 1987 for the USAF/WARB mission change from C-130 to C-5A aircraft
addressed a request by the WMDC to expand tower operations to 24 hours per day to permit development of civil
aviation operations with emphasis, at that time, on cargo operations. The civil aviation project Purpose and Need in
that EIS is substantially similar to that contained in this EA. The Record of Decision (ROD) for the 1987 EIS did not
include an environmental determination for the civil air proposed action, thus the changes were not approved
pursuant to NEPA. Of significance in the 1987 EIS was the modeling of the change in civil aviation operations
concurrently with the proposed military change from the C-130 to the C-5A cargo aircraft. The impact on the critical
noise contours resulting from the change in the military fleet mix resulted in locally significant expansion of noise
contours, thus any additional operational increase (even civil operations) would only contribute to the already-
significant environmental impacts of the proposed action. In particular, the critical noise contours extended well off
the airport property for the proposed action and into noise-sensitive land uses.
The 1987 EIS is significant to this current EA due to the similarities in the Civil Aviation proposed action.
1.1.2 1995 USAF Environmental Impact Statement
In 1995 the USAF developed a Supplemental EIS providing for a re-assessment of air operations and procedures at
the WARB in the wake of Operations Desert Shield and Desert Storm and associated changes in training operations.
The two proposed actions in the 1995 SEIS included two proposed actions:
DRAFT NEPA ENVIRONMENTAL ASSESSMENT WESTOVER REGIONAL AIRPORT – MODIFICATIONS TO CIVIL AVIATION OPERATIONS
Purpose of and Need for Action July 5, 2018
1.5
Military Action - Evaluation of the impacts of current, projected, and potential military aircraft operations to
permit optimum utilization of available resources while reducing associated impacts to the lowest practicable
level consistent with maintenance of unit readiness and accomplishment of mission requirements in both
peacetime and contingency operations.
Civil Aviation Action - Response to a revised request from the Westover Metropolitan Development
Corporation (WMDC) to extend the hours of tower operations from the current 16 hours per day (hr/day) (7
a.m. to 11 p.m.) to 24 hr/day to facilitate development of civil aviation operations.
The Civil Aviation Action described in the 1995 EIS relied upon the control tower to be staffed and open 24 hours per
day to facilitate the nighttime civil operations. In that proposal, the tower would not be staffed unless an aircraft were
known to need the airport during the expanded hours. When needed, WMDC would request that the USAF schedule
personnel to remain on duty or report early to accommodate the aircraft arrival or departure.
In 1995, WMDC believed that the immediate result would be to create a more flexible operating environment for the
existing airport users. The long-term expectation was that the added flexibility would result in an increase in activity to
the levels projected in a (then) new five-year aviation forecast through expansion of existing aviation services and
possibly the attraction of new aviation services. At that time, the WMDC projected that civil aviation operations would
increase to approximately 18,600 operations per year. 1995 civil aviation activity at CEF was reported to be less than
3,900 operations per year.
The Record of Decision (ROD) on the 1995 EIS signed on August 8, 1995 provided for the following relative to a
change in civil aviation operations:
Expansion of hours for civil aviation flights is granted as detailed below, subject to the following conditions.
This expansion of hours will not take place until after the Joint Use Agreement between WMDC and the US
Air Force is revised or modified as necessary to incorporate the change in civil operations, including but not
limited to, assumption of liability for any claims arising out of said expansion of hours of civil operations.
Currently, civil aircraft operations are authorized use during normal airfield operating hours (6:00 a.m. and
midnight). Civil aircraft will be authorized to operate between midnight and 6:00 a.m. local time when
required because of either, mechanical problems, air traffic delays, time constraints, etc. Flights will not be
regularly scheduled for operation between midnight and 6:00 a.m. local time. When use is required between
midnight and 6:00 a.m. local time, WMDC will request that the Air Force schedule personnel to remain on
duty or report early to accommodate the civil aircraft arrival or departure. All civil aircraft operations are to be
conducted consistent with the Joint Use Agreement then in force, FAA requirements, and mitigation
measures adopted via the completed Massachusetts Environmental Policy Act (MEPA) and FAA FAR Part
150 processes.
The 1995 SEIS and the ROD discuss mitigation measures that were attached to this decision meant to reduce
environmental impacts to acceptable levels and/or to minimize these impacts. Several of these measures were
incorporated into later studies and documents to address aircraft noise on sensitive receptors surrounding the WARB.
While the ROD provided for some civil aviation operations, the special conditions of the ROD limited the benefits of
the decision relative to the WMDC objectives.

DRAFT NEPA ENVIRONMENTAL ASSESSMENT WESTOVER REGIONAL AIRPORT – MODIFICATIONS TO CIVIL AVIATION OPERATIONS
Purpose of and Need for Action July 5, 2018
1.6
The 1995 EIS is significant to this current EA due to the similarities in the proposed Civil Aviation action, and the EIS
ROD that provided for some extension of the civil aviation operating hours. The impact assessment is dissimilar to
the current EA in that the critical noise contours extended well off the WARB property into incompatible land uses at
the time the EIS was prepared.
1.1.3 2003 and 2014 FAR Part 150 Noise Compatibility Planning Updates
14 CFR Part 150, Airport Noise Compatibility Planning, established the airport noise compatibility planning program
and its guiding criteria was promulgated by the FAA in 1981. The regulation sets forth the requirements that program
sponsors must develop a facility Noise Exposure Map (NEM) through identification of the current and anticipated
noise exposure patterns at the airport, based on annual average conditions, using tools and methodologies
prescribed by the regulation. Secondly, the sponsor may prepare a Noise Compatibility Program (NCP) for review
and approval by the FAA to make noise mitigation projects eligible for federal funding. These mitigation projects may
include property acquisition in areas of significant noise exposure, modification of flight patterns, structures, and
facilities to mitigate noise, and sound insulation programs.
The Westover Metropolitan Development Corporation (WMDC) first completed an NEM and NCP under 14 CFR Part
150 for the Airport in 1994. An NEM/NCP was prepared in 1996, with updates conducted in 2003 and again in 2014.
These provided important operational data for both military and civilian uses and updated the critical noise contours
for the airport relative to sensitive environmental receptors. Significant changes in military operations typically
prompted the updates such as the change in the critical aircraft, changes in operation numbers and/or a fleet size
reduction. A Part 150 Study is the FAA’s directed way to evaluate aircraft noise and land use compatibility. It is a
voluntary aircraft noise and land use compatibility study that identifies existing and future aircraft noise levels, land
use compatibility and develops alternatives to abate or mitigate aircraft noise over noise sensitive uses. WMDC has
conducted several mitigation projects under their Part 150 program.
Of significance in these documents are the raw data and resultant NEMs for the WARB and CEF. The data includes
aircraft identification, flight tracks, flight stage length, number of operations, time-of-day information and runway
usage to develop the critical noise contours and determine the extent of incompatible land uses within the critical
contours for the present day and the near-term future (5 years out from the base year of the NEM). These
documents provide information regarding the extent of land use incompatibility for past operational years at WARB.
Comparison of present day operations (2018) and proposed actions to these past NEMs is a critical measurement of
relative environmental impact for the airport. In the past, the critical noise contours extended well off the WARB
property and into incompatible land use areas. This is not the case for present day operations at WARB.
Additionally, the update of the NCP in these documents demonstrates progress on noise mitigation strategies. The
NCP updates reflect completed mitigation tasks and identifies new mitigation approaches and targets to match
changes in airport operations.
1.1.3.1 Joint Land Use Studies
Preceding the NEM/NCP updates and providing critical information for them are Joint Land Use Studies (JLUS).
Managed by the Department of Defense (DoD) Office of Economic Adjustment (OEA), JLUS is a “cooperative land-
use planning effort between affected local government and the military installation”. The recommendations developed
DRAFT NEPA ENVIRONMENTAL ASSESSMENT WESTOVER REGIONAL AIRPORT – MODIFICATIONS TO CIVIL AVIATION OPERATIONS
Purpose of and Need for Action July 5, 2018
1.7
from the JLUS provide the policy framework to support adoption and implementation of compatible development near
the WARB; often contributing greatly to the NCP language. JLUS operates under the premise that local land-use
planning and zoning is one of the most effective tools available to resolve incompatible development issues. JLUS
updates were prepared in 1990, 1995, 2004 and 2018, and were used extensively as information for the above-
referenced NEM/NCP Updates. The JLUS Steering Committee (comprised of WARB, WMDC and municipal
officials) working with the Pioneer Valley Planning Commission (PVPC) develop the JLUS updates. The individual
updates are available at the PVPC website http://www.pvpc.org/westover_jlus .
The JLUS are significant reference documents for this EA, particularly for the update and maintenance of the existing
land uses surrounding the WARB and forecasts of land use changes. Furthermore, the influence of the JLUS on the
NCP updates is critical in unifying interested parties in the analysis of WARB activities relative to potential local and
regional environmental impacts. The JLUS/PVPC land use plan, recently updated, is the base map for figures in the
2018 WARB/CEF NEM/NCP Update that provides the foundation for this EA.
1.1.3.2 2013 Air Installation Compatible Use Zone (AICUZ) Study Westover Air Reserve Base, Massachusetts
As with the JLUS discussed above, the 2013 AICUZ study was a significant contributor to the 2014 NEM/NCP
Update and provided an additional review and modeling of critical noise contours for the 2013 WARB/CEF operations
relative to the surrounding land use. As with the 2014 NEM/NCP update, the results of the 2013 AICUZ study reflect
a different aviation environment at the WARB, since the 16-aircraft fleet of C-5B Galaxy aircraft continued to operate
at that time. The 439th Airlift Wing currently operates 8 C-5M Super-Galaxy aircraft; a significant change from the
conditions analyzed in the 2013 AICUZ study with a resultant change in noise contour geometry.
1.1.4 Westover Metropolitan Airport 2008 Master Plan Update
The most current version of the CEF master plan contains the goals and objectives of the WMDC in their operation of
the airport and further development of civil aviation operations. Of importance to this EA is the documented focus of
the WMDC on improving the civil aviation environment as a means of making CEF a self-sustaining civil aviation
operation. This reoccurring theme further supports the Purpose and Need for the proposed action in this EA.
1.1.5 KC-46A Third Main Operating Base (MOB 3) Beddown Environmental Impact Statement (EIS) - April 2017
WARB was a considered alternative location for the basing of 12 KC-46A refueling aircraft, with associated facilities
and infrastructure, and workforce. The proposed action in the EIS was to provide a fully capable, combat operational
KC-46A aerial refueling squadron to accomplish aerial refueling and related missions. Basing this squadron at
WARB was investigated in the NEPA EIS, complete with an assessment of environmental impacts. Current and
forecasted WARB aircraft operations were subjected to noise and air quality analysis for existing conditions (2017 “no
action” alternative) and for a future condition with the entire operational KC-46A squadron present at the airport. This
would have been a complete new squadron in addition to the C-5 Galaxy aircraft already present at WARB. Noise
and air quality analyses were conducted on a recent (2017) operational climate at WARB, which proved useful
information for this (2018) EA.
DRAFT NEPA ENVIRONMENTAL ASSESSMENT WESTOVER REGIONAL AIRPORT – MODIFICATIONS TO CIVIL AVIATION OPERATIONS
Purpose of and Need for Action July 5, 2018
1.8
Data in this EIS reflected operations at WARB when the 439th Airlift Wing operated 16 C-5B Galaxy aircraft. The
439th Airlift Wing currently operates 8 C-5M Super-Galaxy aircraft; a significant change from the conditions analyzed
in the EIS. The reduction in the C-5 fleet and the engine upgrade from the “B” to the “M” model was significant from a
noise and air quality perspective, and thus a major factor prompting the development of the 2018 NEM/NCP Update
and the 2018 JLUS. This information contained in this 2017 EIS is significant for this EA in that it provides a look at
total airport operations just preceding the major change in the C-5 Galaxy fleet. Furthermore, it contains recent
agency correspondence and natural resource information for the WARB environment. The agency responses are
helpful in identifying the presence of sensitive environmental resources, and in providing recent agency reaction to
projects at WARB. The EIS historical/archeological and tribal coordination documentation was of particular interest
relative to the proposed action of this EA.
WARB was not the selected alternative in this EIS to base the KC-46A refueling squadron. A ROD was issued on
April 14, 2017.
1.1.6 Westover Air Reserve Base/Metropolitan Airport Noise Exposure Map (NEM) & Noise Compatibility Plan (NCP) Update (DRAFT June 2018)
A current, draft NEM/NCP Update has been prepared by the WMDC; it is attached as Appendix A to this EA. It
contains updated noise exposure map contours for the present (2018) military/civil operations at WARB and
forecasted operations out to 2023. It is the first noise exposure map update since the significant change in the C-5
Galaxy fleet at the WARB and contains significant differences in the critical noise contours from the 2014 NEM
Update and the 2013 AICUZ study. It also contains the most up-to-date land use plan for the area, as developed by
the JLUS/PVPC. The land use plan forms the base map for most of the figures contained in the document. The
information in the Draft 2018 NEM/NCP Update provides the baseline noise contours for the “no action” alternatives
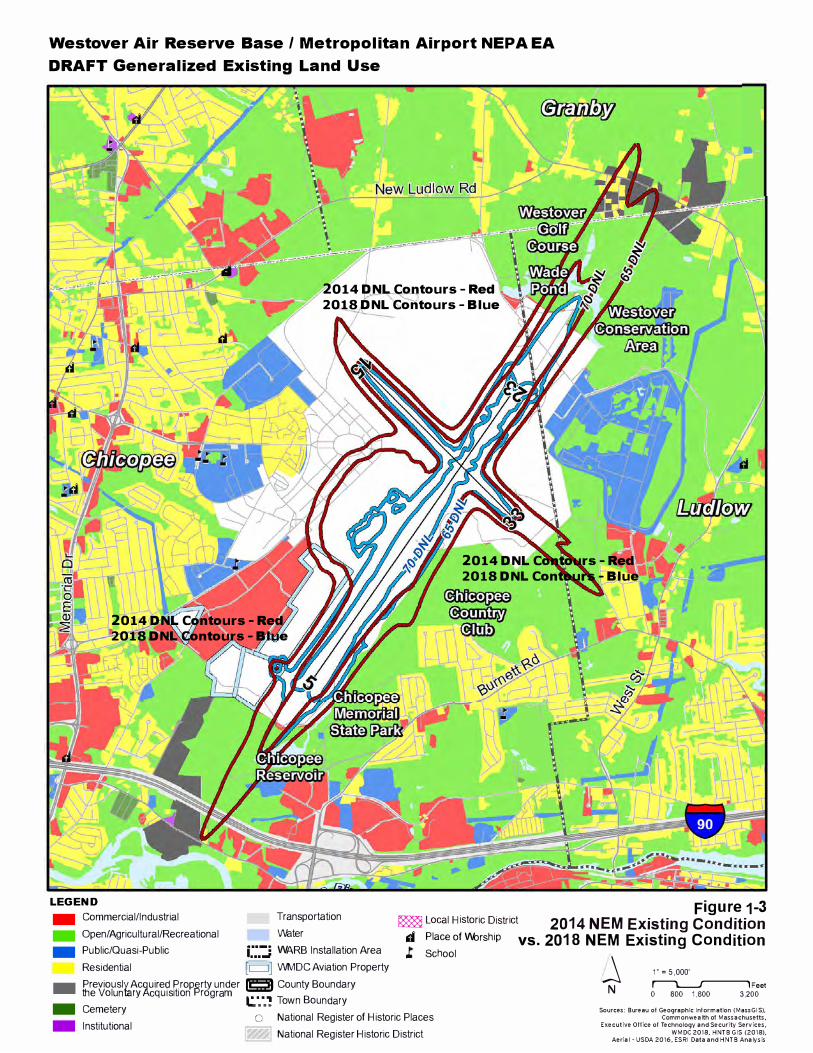
assessed in this EA. Figure 1-3 provides a comparison of the noise contours between the 2014 NEM Update and the
2018 conditions.
The Draft 2018 NEM/NCP Update provides details on the noise model prescribed by the FAA and USAF for
developing noise contours at WARB. Analysis of the existing and short-term noise contours are provided along with
an analysis of incompatible land uses within the critical noise contours. The area (in acres) of each contour is
presented, along with a differentiation between on-airport and off-airport areas. These baseline contours form the “no
action” alternative for this EA, representing existing and future noise conditions at WARB in the absence of the
proposed change in civil aviation operations.
This EA includes substantial information from, and reference to, the Draft 2018 NEM/NCP Update, and thus the
document is included in its entirety in Appendix A. The document includes the following sections: Chapter 1 provides
an introduction to the NEM/NCP process, Section 1.1 of the chapter provides an overview of the Part 150 process.
Section 1.2 reviews the requirements of Noise Exposure Map (NEM) submittals, Section 1.3 discusses Noise
Compatibility Program(NCP) measures, Section 1.4 discusses the project roles and responsibilities, and Section 1.5
explains the study goals. Chapter Two presents the existing and forecast operations data used in determining the
noise environment around WARB. Chapter Three discusses land use and compatibility criteria. Chapter Four
includes the updated NEMs for 2018 and 2023; Figures 4-1 and 4-2 provide the critical noise contours superimposed
over the current land use plan. Chapter Five details the impact to the existing NCP based on the NEMs, and Chapter
DRAFT NEPA ENVIRONMENTAL ASSESSMENT WESTOVER REGIONAL AIRPORT – MODIFICATIONS TO CIVIL AVIATION OPERATIONS
Purpose of and Need for Action July 5, 2018
1.9
Six provides a summary of consultation completed throughout the 2018 NEM/NCP Update process. Appendices A
through E of the Draft 2018 NEM/NCP Update provides supporting material relevant to the study.
In general, the Draft 2018 NEM/NCP Update concludes that for both the 2018 and (future) 2023 conditions at
WARB/CEF, “the 65+ DNL noise exposure contour does not include any residential or recreational land uses. No
population counts were needed as no residences appear to exist within the 65+ DNL noise exposure contour.
According to the Regional Land Use Plan Map associated with the most recent PVPC comprehensive plan (Valley
Vision 4), future land uses within the 65-70 DNL noise exposure contour off Airport property include Existing
Protected Land and Open Water only; uses that are not considered incompatible with the FAA’s Part 150 land use
guidelines.” The document conclusion is based on the acoustical environment without the change in civil air
operations to 24-hour operations. However; as is stated later in this EA, the proposed action results in a similar
conclusion relative to the critical noise contours.
Westover Air Reserve Base / Metropolitan Airport NEPA EA
DRAFT Generalized Existing Land Use
LEGEND
I !
t""""'_.,11
• • \
•
- Commercial/Industrial Transportation - Open/Agricultural/Recreational Water
mlocalHistoricDistrict Figure 1-3
2014 NEM Existing Conditiond Place ofW orship vs. 2018 NEM Existing Condition
- Public/Quasi-Public [."."J WARB Installation Area Residential [�J WMDCAviation Property
- Previouslr, Aciuirec;J property under � County Boundarythe Volun ary cqu1s1t1on Program l:.,, 'I Town Boundary
,t School
6 1" = 5,000'
�Feet
- Cemetery �· • National Register of Historic Places - Institutional
National Register Historic District
N 0 800 1,600 3,200
Sources: Bureau of Geographic Information (MassG1S), Commonwealth of Massachusetts,
Executive Office of Technology and Securi ty Services, WMDC 2018, HNTB GJS (2018),
Aerial- USDA 2016, ESRI Data and HNTB Analysis
2014 DNL Contours - Red2018 DNL Contours - Blue
2014 DNL Contours - Red2018 DNL Contours - Blue
2014 DNL Contours - Red2018 DNL Contours - Blue
DRAFT NEPA ENVIRONMENTAL ASSESSMENT WESTOVER REGIONAL AIRPORT – MODIFICATIONS TO CIVIL AVIATION OPERATIONS
proposed action and alternatives July 5, 2018
2.11
2.0 PROPOSED ACTION AND ALTERNATIVES
The proposed action includes a proposal by the Westover Metropolitan Development Corporation (WMDC), operator
of the Westover Metropolitan Airport (CEF) at the Westover Air Reserve Base (WARB), to modify civil aviation
operations at CEF. This Civil Aviation Action will extend the hours of civil aviation operations at CEF from the current
16 hours per day (7 a.m. to 11 p.m.) to 24 hours per day to facilitate the continued development of the civil aviation
program. The extended hours of civil aviation operations are projected to result in an average of 4 arrivals and 4
departures (8 operations) of civil aircraft per non-towered operating period. Based on this proposed action, a number
of alternative scenarios were investigated for this EA, including Existing Conditions, Short Term Proposed Action,
Future “No Action, Future Proposed Action and a Future Low GA Operations. Each is described below. The
alternatives were developed in concert with WMDC, the USAF WARB and the consultant teams. The list is
consistent with the USAF EIAP section for alternatives development at 32 CFR Part 989 section 989.8.
The Existing Condition (2018), Short Term (2019), Future No Action (2023), Future Proposed Action (2023), and Low
General Aviation (GA) Operations (2023) fleet mixes were developed based on information provided by the ATCT,
and included potential new civil aircraft that would be introduced if the airport hours were extended from 16-hour to
24-hour. The civil fleet mixes were developed by Stantec and WMDC for use by HNTB. The following list provides a
description of the project alternatives and associated assumptions for each alternative/scenario:
1. Existing Conditions represented the current state at WARB/CEF in 2018. The fleet mixes and operations
represented the current aircraft types and associated operations for both military and civil operations. This
baseline analysis reflects the reduced C-5 Galaxy fleet and the modified engines of the “M” model.
2. Short Term represented the first year (2019) when the airport operating hours would be extended from 16
hours per day to 24 hours per day. The fleet mixes and operations included potential new civil aircraft types
and additional civil nighttime operations.
3. Future No Action (2023) assumed the airport would remain open for 16 hours per day in 2023. The fleet mix
and operations included projected operations but no changes to the fleet mix or civil aviation operating
hours.
4. Future Proposed Action (2023) assumed the airport operating hours would be extended from 16 hours per
day to 24 hours per day in 2023 for civil aviation operations. The civil fleet mixes and operations included
potential new civil aircraft types and additional nighttime operations. It was assumed that the nighttime flights
would increase by an additional 4 arrivals and 4 departures each night; a total of 8 civil operations.
5. Future Low GA Operations (2023) assumed the airport operating hours would be extended from 16 hours
per day to 24 hours per day in 2023. The civil fleet mixes and operations included potential new civil aircraft
types and additional nighttime operations. It was assumed that the nighttime flights would increase by an
additional 2 arrivals and 2 departures each night, or half of the operations contained in the Future Proposed
Action (2023). This scenario shows the resultant impacts if the full projected use of the extended operating
hours was not realized.
DRAFT NEPA ENVIRONMENTAL ASSESSMENT WESTOVER REGIONAL AIRPORT – MODIFICATIONS TO CIVIL AVIATION OPERATIONS
Affected Environment July 5, 2018
3.12
3.0 AFFECTED ENVIRONMENT
Typical airport projects involve a variety of environmentally impactful elements from the construction stage through
the operating stage, thus requiring study and analysis of the full range of protected environmental resources
prescribed by NEPA. Typical construction-phase project elements, including demolition, construction, soil
disturbance, vegetation clearing, and modification of elevations, ground slope and soil coverage, result in short-term
impacts to the project environment. Typical operation-phase project elements, including changes in noise, workforce,
surface traffic, staffing, waste material generation and site stormwater characteristics result in longer-term changes to
the project environment. Clearly, the project scope and magnitude dictate the extent and range of these
environmental impacts. It is not practical to apply the same range of impact analysis to each project, and this is
recognized by the USAF NEPA regulations at 32 CFR Part 989, “The Environmental Impact Analysis Process”
(EIAP). For EAs, the EIAP recognizes this in section 989.14 where it is specified “The length of an EA should be as
short and concise as possible, while matching the magnitude of the proposal. An EA briefly discusses the need for
the proposed action, reasonable alternatives to the proposed action, the affected environment, the environmental
impacts of the proposed action and alternatives (including the “no action” alternative), and a listing of agencies and
persons consulted during preparation.” Considering this direction, the following narrative provides the scope of this
EA.
3.1 SCOPE OF THE ENVIRONMENTAL ASSESSMENT
The proposed action of this EA involves no construction or demolition activities and is restricted to operation-phase
elements only. The installation of the necessary communications equipment and the administrative updated of
agreements and airport data are the necessary pre-operation steps to the proposed modification to the civil aviation
operations. Following a cursory evaluation of potential impacts to the prescribed environmental resource categories,
including the definition of the “Area of Potential Effect” as the limits of the critical noise contours, the following list of
resources will be assessed in detail for the project alternatives in this EA:
1. Noise (Acoustic Environment): This is the principle impact category assessed in this EA. The proposed
action will generate a minimal additional number of aircraft operations during nighttime hours thus having the
potential to modify the critical noise contours and impact sensitive receptors.
2. Air Quality: Additional aircraft operations, complete with the ground-associated equipment and
transportation, will result in air emissions over the “no action” alternative. Assessment of these additional
emissions relative to the Conformity Rule is necessary.
3. Land Use: Changes in the critical noise contours off the airport property can impact existing incompatible
land uses and interfere with future land use planning.
4. Historical, Architectural, Archaeological and Cultural Resources: The presence of these resources within an
expanded critical noise contour could lead to impacts. A review of the known resources relative to the Area
of Potential Effect is necessary for the proposed action and the alternatives to determine the potential for
impact.
DRAFT NEPA ENVIRONMENTAL ASSESSMENT WESTOVER REGIONAL AIRPORT – MODIFICATIONS TO CIVIL AVIATION OPERATIONS
Affected Environment July 5, 2018
3.13
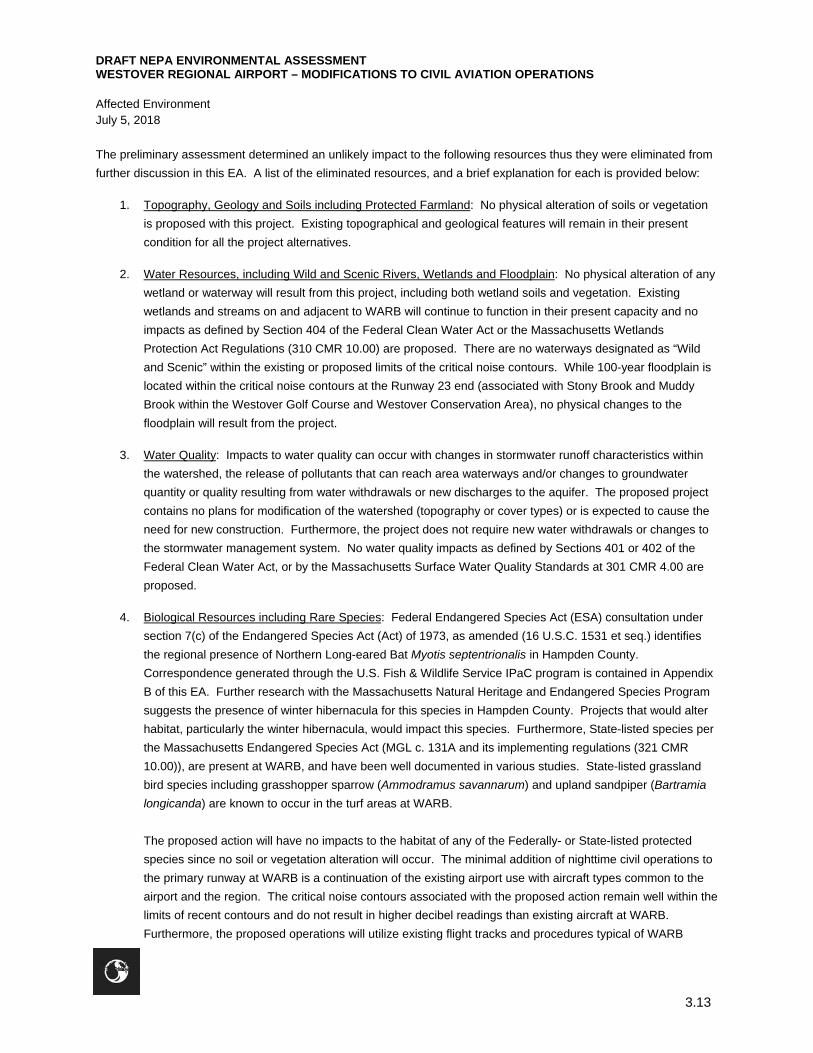
The preliminary assessment determined an unlikely impact to the following resources thus they were eliminated from
further discussion in this EA. A list of the eliminated resources, and a brief explanation for each is provided below:
1. Topography, Geology and Soils including Protected Farmland: No physical alteration of soils or vegetation
is proposed with this project. Existing topographical and geological features will remain in their present
condition for all the project alternatives.
2. Water Resources, including Wild and Scenic Rivers, Wetlands and Floodplain: No physical alteration of any
wetland or waterway will result from this project, including both wetland soils and vegetation. Existing
wetlands and streams on and adjacent to WARB will continue to function in their present capacity and no
impacts as defined by Section 404 of the Federal Clean Water Act or the Massachusetts Wetlands
Protection Act Regulations (310 CMR 10.00) are proposed. There are no waterways designated as “Wild
and Scenic” within the existing or proposed limits of the critical noise contours. While 100-year floodplain is
located within the critical noise contours at the Runway 23 end (associated with Stony Brook and Muddy
Brook within the Westover Golf Course and Westover Conservation Area), no physical changes to the
floodplain will result from the project.
3. Water Quality: Impacts to water quality can occur with changes in stormwater runoff characteristics within
the watershed, the release of pollutants that can reach area waterways and/or changes to groundwater
quantity or quality resulting from water withdrawals or new discharges to the aquifer. The proposed project
contains no plans for modification of the watershed (topography or cover types) or is expected to cause the
need for new construction. Furthermore, the project does not require new water withdrawals or changes to
the stormwater management system. No water quality impacts as defined by Sections 401 or 402 of the
Federal Clean Water Act, or by the Massachusetts Surface Water Quality Standards at 301 CMR 4.00 are
proposed.
4. Biological Resources including Rare Species: Federal Endangered Species Act (ESA) consultation under
section 7(c) of the Endangered Species Act (Act) of 1973, as amended (16 U.S.C. 1531 et seq.) identifies
the regional presence of Northern Long-eared Bat Myotis septentrionalis in Hampden County.
Correspondence generated through the U.S. Fish & Wildlife Service IPaC program is contained in Appendix
B of this EA. Further research with the Massachusetts Natural Heritage and Endangered Species Program
suggests the presence of winter hibernacula for this species in Hampden County. Projects that would alter
habitat, particularly the winter hibernacula, would impact this species. Furthermore, State-listed species per
the Massachusetts Endangered Species Act (MGL c. 131A and its implementing regulations (321 CMR
10.00)), are present at WARB, and have been well documented in various studies. State-listed grassland
bird species including grasshopper sparrow (Ammodramus savannarum) and upland sandpiper (Bartramia
longicanda) are known to occur in the turf areas at WARB.
The proposed action will have no impacts to the habitat of any of the Federally- or State-listed protected
species since no soil or vegetation alteration will occur. The minimal addition of nighttime civil operations to
the primary runway at WARB is a continuation of the existing airport use with aircraft types common to the
airport and the region. The critical noise contours associated with the proposed action remain well within the
limits of recent contours and do not result in higher decibel readings than existing aircraft at WARB.
Furthermore, the proposed operations will utilize existing flight tracks and procedures typical of WARB
DRAFT NEPA ENVIRONMENTAL ASSESSMENT WESTOVER REGIONAL AIRPORT – MODIFICATIONS TO CIVIL AVIATION OPERATIONS
Affected Environment July 5, 2018
3.14
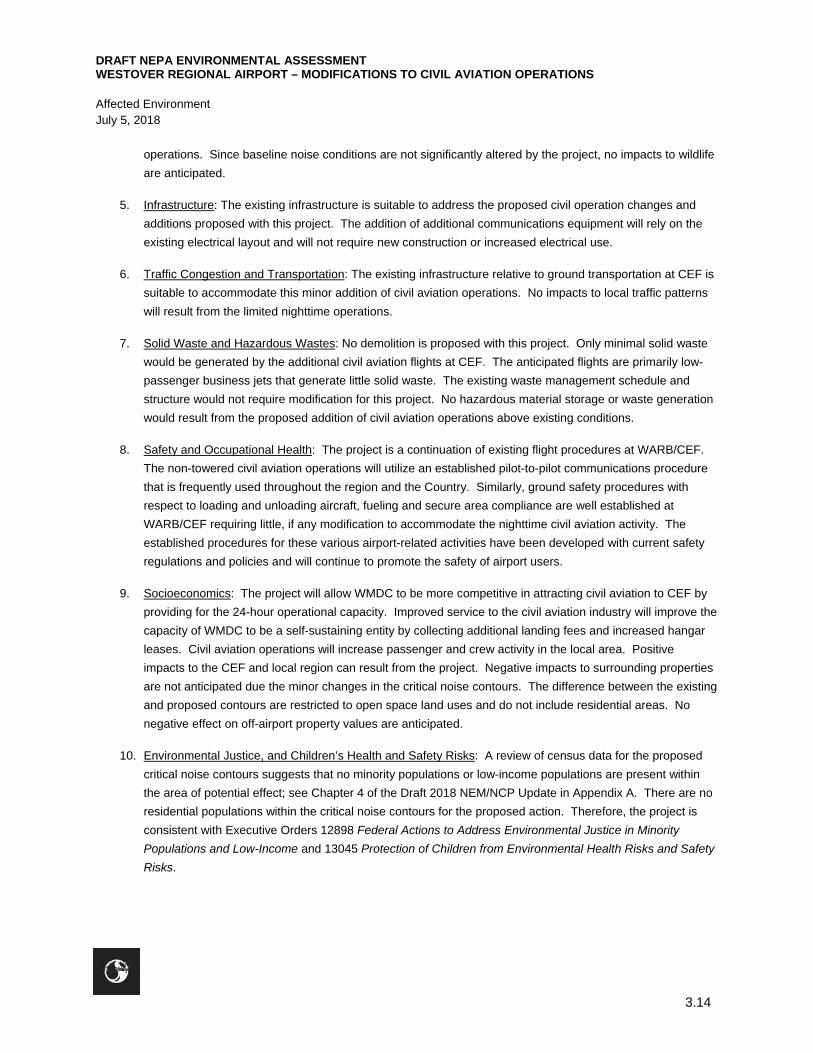
operations. Since baseline noise conditions are not significantly altered by the project, no impacts to wildlife
are anticipated.
5. Infrastructure: The existing infrastructure is suitable to address the proposed civil operation changes and
additions proposed with this project. The addition of additional communications equipment will rely on the
existing electrical layout and will not require new construction or increased electrical use.
6. Traffic Congestion and Transportation: The existing infrastructure relative to ground transportation at CEF is
suitable to accommodate this minor addition of civil aviation operations. No impacts to local traffic patterns
will result from the limited nighttime operations.
7. Solid Waste and Hazardous Wastes: No demolition is proposed with this project. Only minimal solid waste
would be generated by the additional civil aviation flights at CEF. The anticipated flights are primarily low-
passenger business jets that generate little solid waste. The existing waste management schedule and
structure would not require modification for this project. No hazardous material storage or waste generation
would result from the proposed addition of civil aviation operations above existing conditions.
8. Safety and Occupational Health: The project is a continuation of existing flight procedures at WARB/CEF.
The non-towered civil aviation operations will utilize an established pilot-to-pilot communications procedure
that is frequently used throughout the region and the Country. Similarly, ground safety procedures with
respect to loading and unloading aircraft, fueling and secure area compliance are well established at
WARB/CEF requiring little, if any modification to accommodate the nighttime civil aviation activity. The
established procedures for these various airport-related activities have been developed with current safety
regulations and policies and will continue to promote the safety of airport users.
9. Socioeconomics: The project will allow WMDC to be more competitive in attracting civil aviation to CEF by
providing for the 24-hour operational capacity. Improved service to the civil aviation industry will improve the
capacity of WMDC to be a self-sustaining entity by collecting additional landing fees and increased hangar
leases. Civil aviation operations will increase passenger and crew activity in the local area. Positive
impacts to the CEF and local region can result from the project. Negative impacts to surrounding properties
are not anticipated due the minor changes in the critical noise contours. The difference between the existing
and proposed contours are restricted to open space land uses and do not include residential areas. No
negative effect on off-airport property values are anticipated.
10. Environmental Justice, and Children’s Health and Safety Risks: A review of census data for the proposed
critical noise contours suggests that no minority populations or low-income populations are present within
the area of potential effect; see Chapter 4 of the Draft 2018 NEM/NCP Update in Appendix A. There are no
residential populations within the critical noise contours for the proposed action. Therefore, the project is
consistent with Executive Orders 12898 Federal Actions to Address Environmental Justice in Minority
Populations and Low-Income and 13045 Protection of Children from Environmental Health Risks and Safety
Risks.

DRAFT NEPA ENVIRONMENTAL ASSESSMENT WESTOVER REGIONAL AIRPORT – MODIFICATIONS TO CIVIL AVIATION OPERATIONS
Affected Environment July 5, 2018
3.15
3.2 NOISE (ACOUSTIC ENVIRONMENT)
Quantification of existing (2018) aircraft noise exposure at the WARB was the subject of the 2018 NEM/NCP Update
contained in Appendix A of this EA. The document provides details on aircraft types, flight tracks, operations, runway
use, and weather considerations used to generate the critical noise contours surrounding the airport based on current
airport use. These critical contours are then compared to the airport property line and regional land use to determine
the extent of various uses within the critical noise contours and ultimately presenting the status of incompatible land
uses within the critical contours. Reviewers of this EA are directed to Chapter 2 of the 2018 NEM/NCP Update for
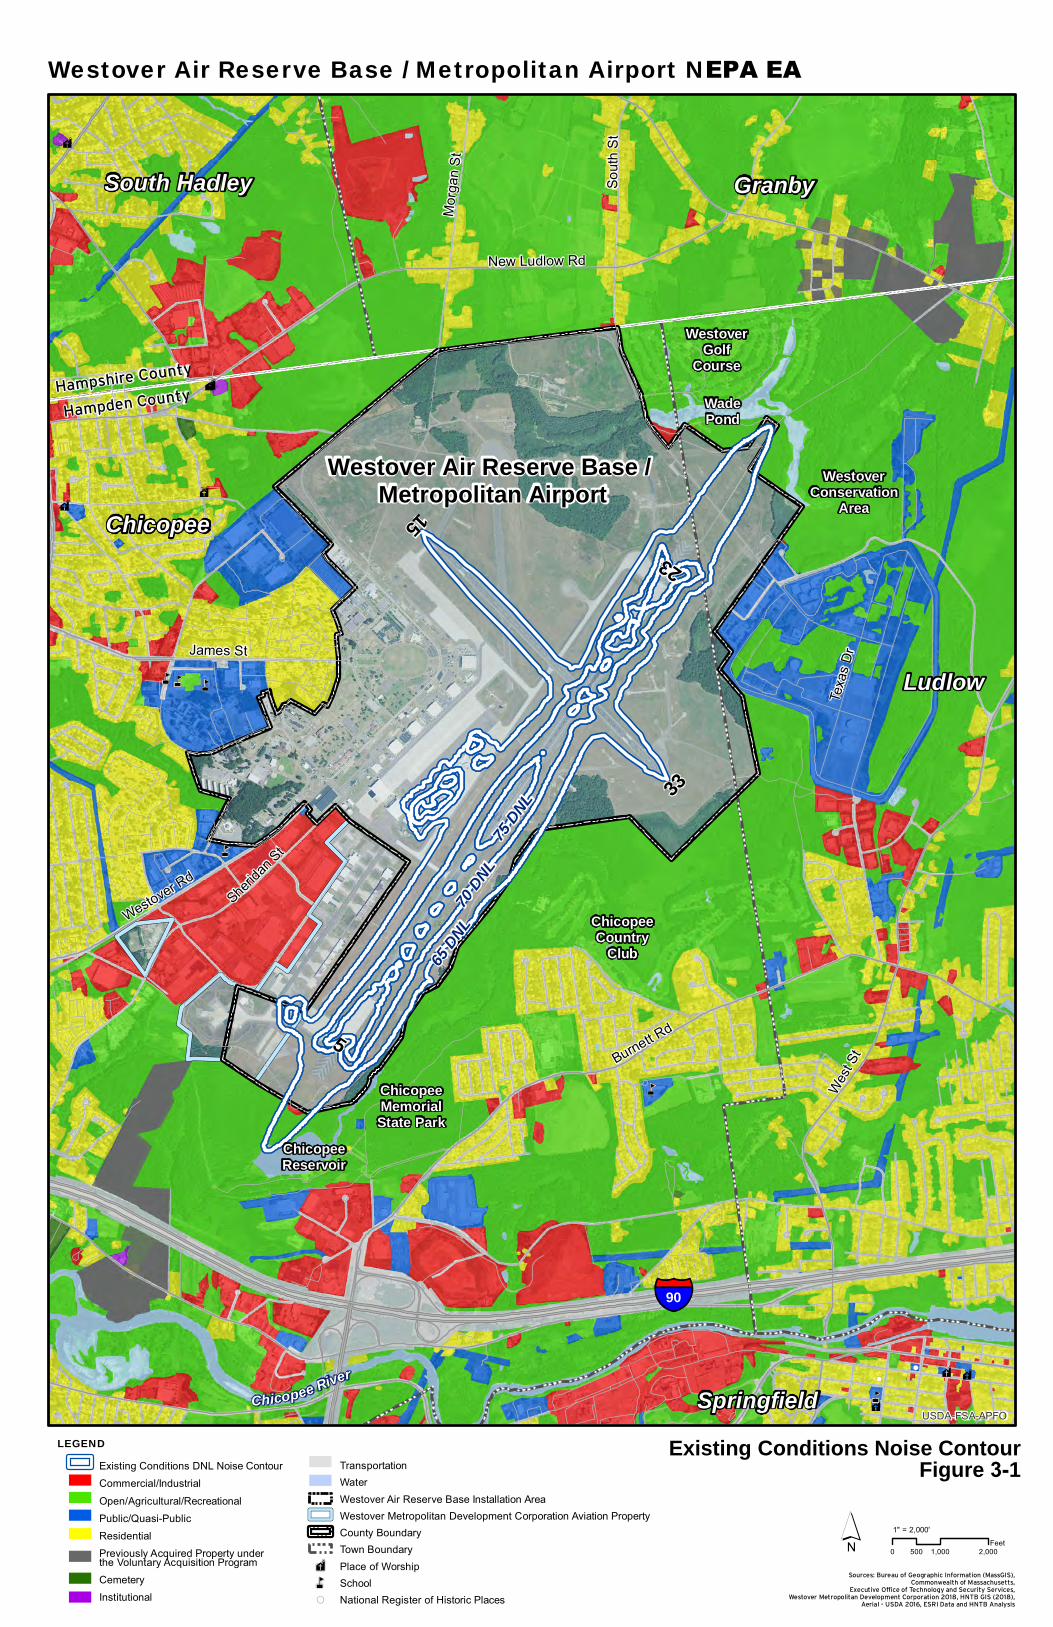
the input to the acoustical models used to generate the critical noise contours, Figure 4-1 for the depiction of the
critical noise contours over the airport property and adjacent land uses, and Figure 4-2 for a forecasted view of the
critical contours for the future (2023) “no action” condition. For convenience, these two noise contour figures from the
Draft 2018 NEM/NCP are provided in this EA as Figures 3-1 and 3-2.
Tables 3-1 and 3-2 (reproduced from the Draft 2018 NEM/NCP Update) provide acreage of various land use within
the critical 65 DNL contour for the 2018 and future 2023 condition. Note the extent of the critical contours that remain
on airport property and lack of any coverage within residential areas. The lack of incompatible land uses within the
critical contours for existing operations at WARB/CEF is significant relative to Part 150 and this NEPA analysis.
Table 3-1: Generalized Land Uses within the Existing (2018) "No Action" Conditions - 65 DNL Noise Exposure Contour at WARB/CEF
Generalized Land Use Land within Contour (acres)
65-70 DNL
70-75 DNL
75+ DNL Total (65+ DNL)
Airport Property 368.4 171.3 57.2 596.9
Commercial/Industrial 1.7 0 0 1.7
Open/Agricultural 13.8 0 0 13.8
Recreational 0 0 0 0
Residential 0 0 0 0
Transportation/Utility 0 0 0 0
Voluntary Acquisition Property 0 0 0 0
Water 0.6 0 0 0.6
Wetland 0 0 0 0
Total 384.5 171.3 57.2 613.0
Source: MassGIS, Draft 2018 NEM/NCP Update.
DRAFT NEPA ENVIRONMENTAL ASSESSMENT WESTOVER REGIONAL AIRPORT – MODIFICATIONS TO CIVIL AVIATION OPERATIONS
Affected Environment July 5, 2018
3.16
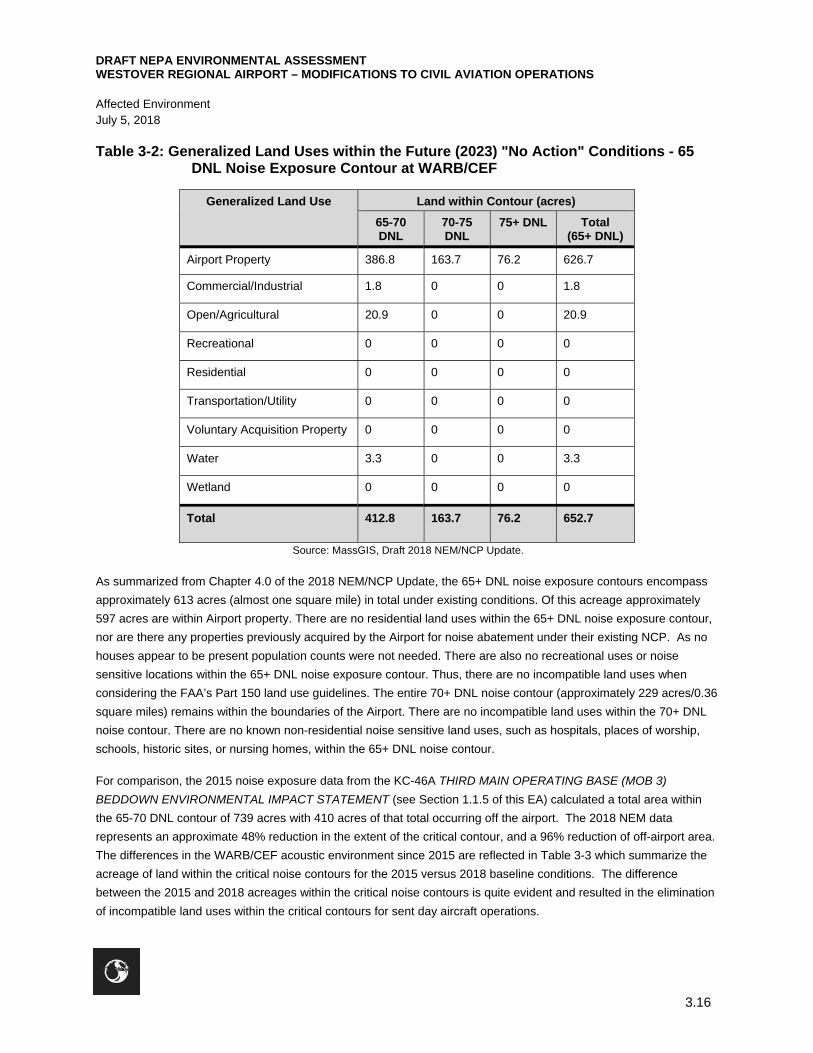
Table 3-2: Generalized Land Uses within the Future (2023) "No Action" Conditions - 65 DNL Noise Exposure Contour at WARB/CEF
Generalized Land Use Land within Contour (acres)
65-70 DNL
70-75 DNL
75+ DNL Total (65+ DNL)
Airport Property 386.8 163.7 76.2 626.7
Commercial/Industrial 1.8 0 0 1.8
Open/Agricultural 20.9 0 0 20.9
Recreational 0 0 0 0
Residential 0 0 0 0
Transportation/Utility 0 0 0 0
Voluntary Acquisition Property 0 0 0 0
Water 3.3 0 0 3.3
Wetland 0 0 0 0
Total 412.8 163.7 76.2 652.7
Source: MassGIS, Draft 2018 NEM/NCP Update.
As summarized from Chapter 4.0 of the 2018 NEM/NCP Update, the 65+ DNL noise exposure contours encompass
approximately 613 acres (almost one square mile) in total under existing conditions. Of this acreage approximately
597 acres are within Airport property. There are no residential land uses within the 65+ DNL noise exposure contour,
nor are there any properties previously acquired by the Airport for noise abatement under their existing NCP. As no
houses appear to be present population counts were not needed. There are also no recreational uses or noise
sensitive locations within the 65+ DNL noise exposure contour. Thus, there are no incompatible land uses when
considering the FAA’s Part 150 land use guidelines. The entire 70+ DNL noise contour (approximately 229 acres/0.36
square miles) remains within the boundaries of the Airport. There are no incompatible land uses within the 70+ DNL
noise contour. There are no known non-residential noise sensitive land uses, such as hospitals, places of worship,
schools, historic sites, or nursing homes, within the 65+ DNL noise contour.
For comparison, the 2015 noise exposure data from the KC-46A THIRD MAIN OPERATING BASE (MOB 3)
BEDDOWN ENVIRONMENTAL IMPACT STATEMENT (see Section 1.1.5 of this EA) calculated a total area within
the 65-70 DNL contour of 739 acres with 410 acres of that total occurring off the airport. The 2018 NEM data
represents an approximate 48% reduction in the extent of the critical contour, and a 96% reduction of off-airport area.
The differences in the WARB/CEF acoustic environment since 2015 are reflected in Table 3-3 which summarize the
acreage of land within the critical noise contours for the 2015 versus 2018 baseline conditions. The difference
between the 2015 and 2018 acreages within the critical noise contours is quite evident and resulted in the elimination
of incompatible land uses within the critical contours for sent day aircraft operations.
î
î
î
î
î
î
î
î
î
î
å
å
å
å
å
å
å
å
å
å
å
å
å å
å
å
å
å
å
å
!(
!(
Westover Air Reserve Base / Metropolitan Airport
Hampshire County
Hampden County
§¦90
New Ludlow Rd
Wes
t StBurnett R
d
Texa
s D
r
Westover Rd
Sherid
an St
James St
Mor
gan
St
Sout
h S
t
523
3315
ChicopeeMemorialState Park
ChicopeeCountry
Club
WestoverConservation
Area
WadePond
WestoverGolf
Course
ChicopeeReservoir
Chicopee River
GranbySouth Hadley
Chicopee
Ludlow
Springfield
65 DNL
70 DNL
75 DNL
USDA-FSA-APFO
Sources: Bureau of Geographic Information (MassGIS),Commonwealth of Massachusetts,
Executive Office of Technology and Security Services,Westover Metropolitan Development Corporation 2018, HNTB GIS (2018),
Aerial - USDA 2016, ESRI Data and HNTB Analysis
LEGENDExisting Conditions DNL Noise Contour
Commercial/Industrial
Open/Agricultural/Recreational
Public/Quasi-Public
Residential
Previously Acquired Property underthe Voluntary Acquisition Program
Cemetery
Institutional
TransportationWaterWestover Air Reserve Base Installation AreaWestover Metropolitan Development Corporation Aviation PropertyCounty BoundaryTown BoundaryPlace of WorshipSchoolNational Register of Historic Places
Westover Air Reserve Base / Metropolitan Airport NEPA EA
Existing Conditions Noise Contour Figure 3-1
åî
!(
0 1,000 2,000500Feet
1" = 2,000'

î
î
î
î
î
î
î
î
î
î
å
å
å
å
å
å
å
å
å
å
å
å
å å
å
å
å
å
å
å
!(
!(
75 DNL
Westover Air Reserve Base / Metropolitan Airport
Hampshire County
Hampden County
§¦90
New Ludlow Rd
Wes
t StBurnett R
d
Texa
s D
r
Westover Rd
Sherid
an St
James St
Mor
gan
St
Sout
h S
t
523
3315
ChicopeeMemorialState Park
ChicopeeCountry
Club
WestoverConservation
Area
WadePond
WestoverGolf
Course
ChicopeeReservoir
Chicopee River
GranbySouth Hadley
Chicopee
Ludlow
Springfield
65 DNL
70 DNL
USDA-FSA-APFO
Sources: Bureau of Geographic Information (MassGIS),Commonwealth of Massachusetts,
Executive Office of Technology and Security Services,Westover Metropolitan Development Corporation 2018, HNTB GIS (2018),
Aerial - USDA 2016, ESRI Data and HNTB Analysis
LEGENDNo Action Alternative DNL Noise Contour
Commercial/Industrial
Open/Agricultural/Recreational
Public/Quasi-Public
Residential
Previously Acquired Property underthe Voluntary Acquisition Program
Cemetery
Institutional
TransportationWaterWestover Air Reserve Base Installation AreaWestover Metropolitan Development Corporation Aviation PropertyCounty BoundaryTown BoundaryPlace of WorshipSchoolNational Register of Historic Places
Westover Air Reserve Base / Metropolitan Airport NEPA EA
No Action (2023) Alternative Noise Contour Figure 3-2
åî
!(
0 1,000 2,000500Feet
1" = 2,000'
DRAFT NEPA ENVIRONMENTAL ASSESSMENT WESTOVER REGIONAL AIRPORT – MODIFICATIONS TO CIVIL AVIATION OPERATIONS
Affected Environment July 5, 2018
3.19
Table 3-3: Comparison of Land Area Within Critical Noise Contours Between the 2015 and 2018 Baseline Years for WARB/CEF
Noise Level (DNL)
Land Within Contours (Acres)
On Airport Off Airport Total
2015 2018 2015 2018 2015 2018
65 - 69 320 368.4 419 26 739 613
70 - 74 369 171.3 44 0 413 171.3
75 + 450 57.2 1 0 451 57.2
Source: KC-46A Third Main Operating Base Beddown EIS (April 2017), 2018 Draft NEM/NCP Update
The change in the C-5 Galaxy fleet was principally responsible for this significant change in the acoustic environment
at WARB/CEF since the 2015 noise exposure analysis. The fleet change prompted the preparation of the 2018
NEM/NCP Update that is the basis for the “existing conditions” noise calculations for the proposed action.
3.3 AIR QUALITY
The proposed action would result in an increase of up to 8 average daily civil aircraft operations at WARB/CEF, which
would generate additional air emissions. Air quality assessments for proposed Federal actions are required for
compliance with the Federal Clean Air Act (CAA) and the State-level Massachusetts Clean Air Act and associated
regulations relative to the National Ambient Air Quality Standards (NAAQS). The EIAP requires that documents
address the CAA Conformity Rules requirements. The EIAP conformity process is addressed in the guide “Air Force
Air Quality Environmental Impact Analysis Process (EIAP) Guide” developed by the Air Force Civil Engineer
Compliance Technical Support Branch (October 2014). Per that documented, the General Conformity rule applies to
non-federal highway and non-transit Federal actions and thus applies to this project.
The WARB section of Hampden County, Massachusetts is presently in attainment for all NAAQS; due in part to the
revocation of the 1997 Ozone NAAQS in April 2015. Prior to the revocation, WARB was within a moderate
nonattainment area for the 1997 Ozone NAAQS. Current legal nation-wide challenges to the revocation may alter the
attainment status of the region for the NAAQS, but the project site in June 2018 is in attainment and is not listed as a
maintenance area. The requirement to prepare an air quality conformity determination (40 CFR 93 Subpart B section
93.153(b)) only applies to areas that are nonattainment or maintenance for one or more NAAQSs.
However; given the relatively recent non-attainment status of the region for ozone, the presence of an ozone
“maintenance area” southwest of the WARB, and the legal challenges to the revocation of the 1997 Ozone NAAQS,
the proposed action was subjected to air quality modeling to test potential compliance with the General Conformity
rule specific to ozone. See Chapter 4 of this EA for the results of this analysis.
DRAFT NEPA ENVIRONMENTAL ASSESSMENT WESTOVER REGIONAL AIRPORT – MODIFICATIONS TO CIVIL AVIATION OPERATIONS
Affected Environment July 5, 2018
3.20
3.4 LAND USE
The current and potential land uses within the project area have been documented in the Draft 2018 NEM/NCP
Update located in Appendix A of this EA; review of Section 3.3 of that document is necessary to comprehend the
noise impact analysis conducted in this EA and the conclusions of that analysis. Figure 3-3 depicts the existing land
uses in the project area. The Draft 2018 NEM/NCP Update provides a land use discussion relative to FAR Part 150,
discussing the current status of incompatible land uses within the current critical noise contours at WARB/CEF. The
document concludes that, “The 65+ DNL noise exposure contour does not include any residential or recreational land
uses. No population counts were needed as no residences appear to exist within the 65+ DNL noise exposure
contour. According to the Regional Land Use Plan Map associated with the most recent PVPC comprehensive plan
(Valley Vision 4), future land uses within the 65-70 DNL noise exposure contour off Airport property include Existing
Protected Land and Open Water only; uses that are not considered incompatible with the FAA’s Part 150 land use
guidelines.”
3.5 CULTURAL RESOURCES
As the project does not propose any construction, demolition, excavation, soil disturbance or vegetation impacts, the
potential for cultural resource impacts are minimal. They are investigated in this EA due to the slight increase in the
noise contours with the proposed action, which have some potential to disrupt enjoyment of historic sites on public
property. The area of potential effect is considered to be that area of potential noise increase off the airport property
at the ends of Runway 5 and 23 where slight increases of the critical noise contours are possible. The discussion of
cultural resources is thus commensurate with the potential area of effect. This section contains a general discussion
of the project area while Section 4.5 provides an analysis of potential impacts.
The Massachusetts Cultural Resource Information System (MCRIS) developed by the Massachusetts Historical
Commission (the State Historic Preservation Officer for Massachusetts) was consulted for the presence of various
cultural resources within the critical noise contours associated with the project. Several buildings and land areas
within WARB are eligible for inclusion on the National Register of Historic Places and thus subject to protection under
the National Historic Preservation Act. There is a recognized Historic District within the WARB surrounding many of
the listed structures and areas on the MCRIS list. These sites are generally west of the runway environment.
Tribal consultation was conducted to determine the presence of sensitive traditional resources within the APE. Four
tribal contacts were initiated and two responses were received; see Appendix B. Based on the responses, and
review of a similar consultation completed with the same tribes for the KC-46A Third Main Operating Base Beddown
EIS (April 2017), there are no known tribal sacred sites or properties within the APE.
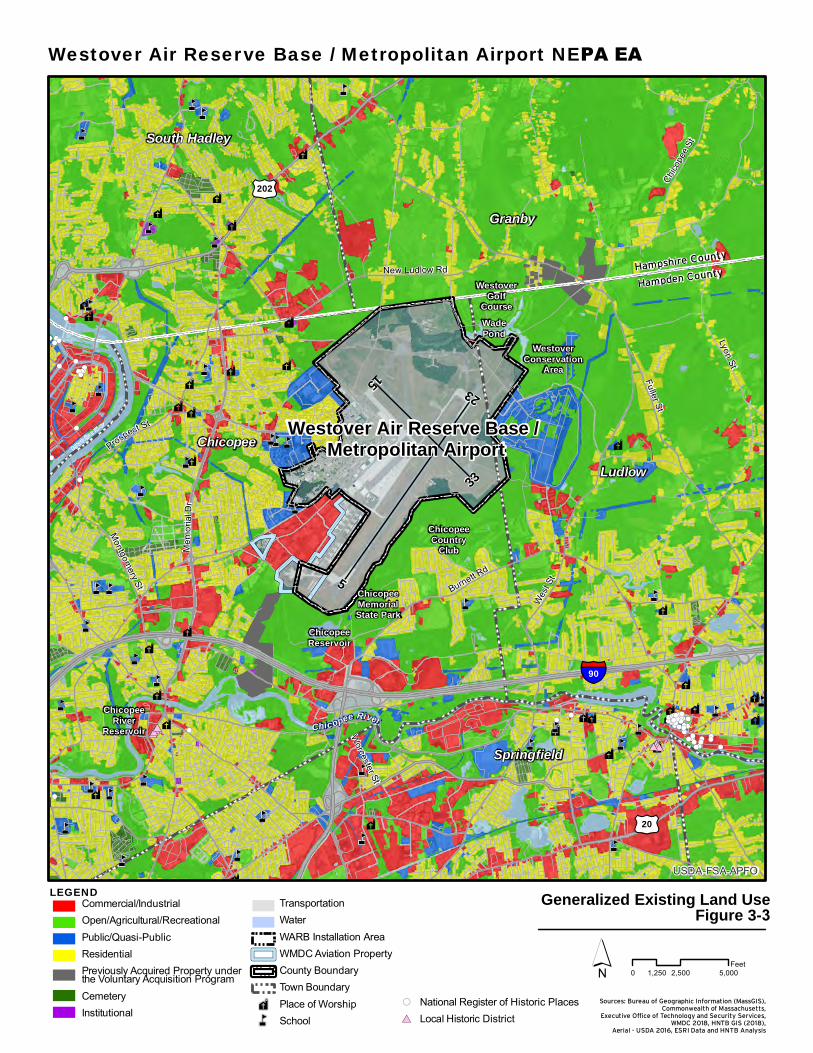
î
î
î
î
î
î
î
î
îîî
î
î
î
î
î
î
î
î
î
îî
î
î
î î
î
î
î
î
î
î î
îî
îî
î
î
î
å
å
å
åå
å
å
å
å
å
å
å
å
å
åå
å
å
å
å
å
å
å
å
å
åå
åå
å
å å å
å
å
å
å
å
å
å
å
å
å
å
å
å
å
å
å
å
å
å
åå
å
å
å
å
å
å
å
å
å
å
å
å
å
å
å
å
å
å
!(!(!(
!(
!(
!(
!(!(!(
!(!(
!(!(
!(!(
!( !(!(
!(
!(
!(
!(
!(
!(
!(
!(!(!(
!(
!(
!(
#*#*
!(
!(
!(!(!(!(
#*
!(
!(
!(
!(!(
!(!(
!(!(
!(
!(!(
#*!(!(
!(
!(!(
!(!(
!(
!( !(!(!(
!(
!(!(
!(
!(
!(
!(!(!(
!(
!(!(
!(
!(
!( !(
!(!(
!(
!(
!(
!(
!(
!(!(!(
!(
!(
!(!(!(!(!(
!(
!(
!(
#*
!(!(
!(
!(
!(
!(!(!(
!(
!(
!(
#*#*
!(!(
!(
!(!(!(
!(!(
!(
!(
!(!(
!(
!( !(!(
!(
!(
!(
!(
#*!(
!(
!(
!(
!(
!(
!(
Westover Air Reserve Base / Metropolitan Airport
Hampshire County
Hampden County
§¦90
£¤202
£¤20
Mem
oria
l Dr
Connecticut River
New Ludlow Rd
Fuller St
Chico
pee
St
Lyon St
Wes
t St
Burnett Rd
Montgom
ery St
Worcester St
5
23
33
15
ChicopeeRiver
Reservoir
ChicopeeMemorialState Park
ChicopeeCountry
Club
WestoverConservation
Area
WadePond
WestoverGolf
Course
ChicopeeReservoir
Chicopee River
Prospect St
Granby
South Hadley
ChicopeeLudlow
Springfield
USDA-FSA-APFO
Sources: Bureau of Geographic Information (MassGIS),Commonwealth of Massachusetts,
Executive Office of Technology and Security Services,WMDC 2018, HNTB GIS (2018),
Aerial - USDA 2016, ESRI Data and HNTB Analysis
LEGENDCommercial/IndustrialOpen/Agricultural/RecreationalPublic/Quasi-PublicResidentialPreviously Acquired Property underthe Voluntary Acquisition ProgramCemeteryInstitutional
TransportationWaterWARB Installation AreaWMDC Aviation PropertyCounty BoundaryTown BoundaryPlace of WorshipSchool
Westover Air Reserve Base / Metropolitan Airport NEPA EA
Generalized Existing Land Use Figure 3-3
åî National Register of Historic Places
Local Historic District!(
#*
0 2,500 5,0001,250Feet
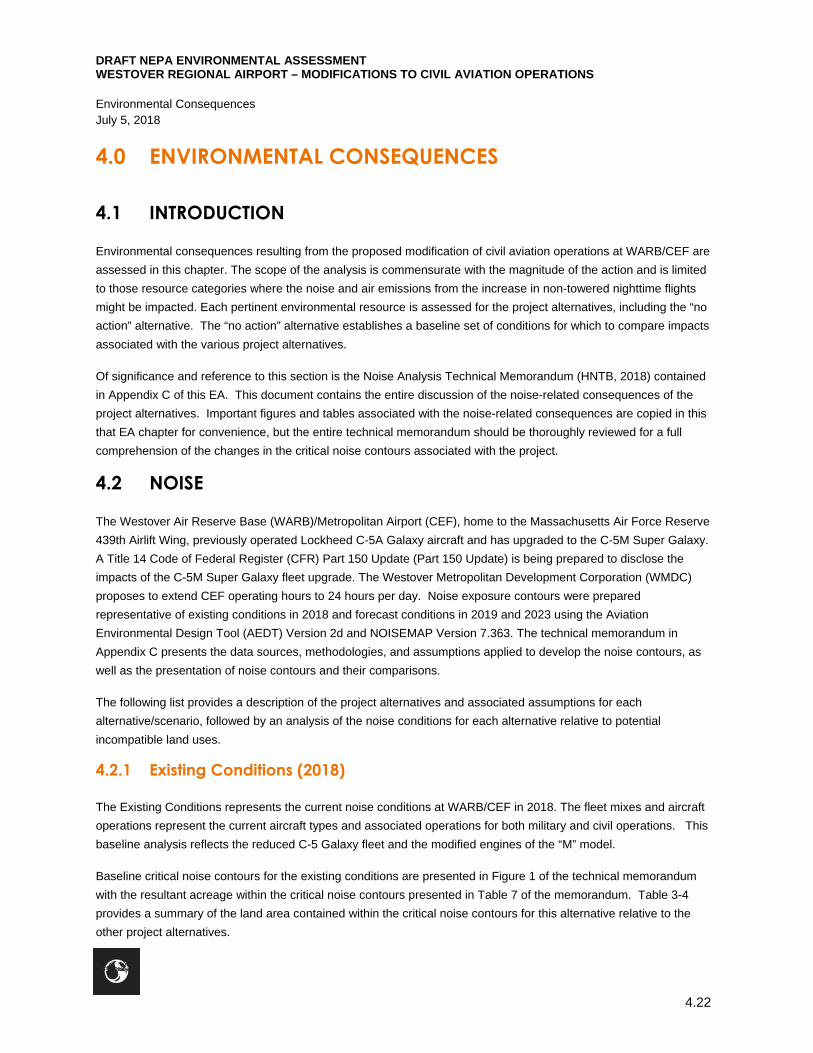
DRAFT NEPA ENVIRONMENTAL ASSESSMENT WESTOVER REGIONAL AIRPORT – MODIFICATIONS TO CIVIL AVIATION OPERATIONS
Environmental Consequences July 5, 2018
4.22
4.0 ENVIRONMENTAL CONSEQUENCES
4.1 INTRODUCTION
Environmental consequences resulting from the proposed modification of civil aviation operations at WARB/CEF are
assessed in this chapter. The scope of the analysis is commensurate with the magnitude of the action and is limited
to those resource categories where the noise and air emissions from the increase in non-towered nighttime flights
might be impacted. Each pertinent environmental resource is assessed for the project alternatives, including the “no
action” alternative. The “no action” alternative establishes a baseline set of conditions for which to compare impacts
associated with the various project alternatives.
Of significance and reference to this section is the Noise Analysis Technical Memorandum (HNTB, 2018) contained
in Appendix C of this EA. This document contains the entire discussion of the noise-related consequences of the
project alternatives. Important figures and tables associated with the noise-related consequences are copied in this
that EA chapter for convenience, but the entire technical memorandum should be thoroughly reviewed for a full
comprehension of the changes in the critical noise contours associated with the project.
4.2 NOISE
The Westover Air Reserve Base (WARB)/Metropolitan Airport (CEF), home to the Massachusetts Air Force Reserve
439th Airlift Wing, previously operated Lockheed C-5A Galaxy aircraft and has upgraded to the C-5M Super Galaxy.
A Title 14 Code of Federal Register (CFR) Part 150 Update (Part 150 Update) is being prepared to disclose the
impacts of the C-5M Super Galaxy fleet upgrade. The Westover Metropolitan Development Corporation (WMDC)
proposes to extend CEF operating hours to 24 hours per day. Noise exposure contours were prepared
representative of existing conditions in 2018 and forecast conditions in 2019 and 2023 using the Aviation
Environmental Design Tool (AEDT) Version 2d and NOISEMAP Version 7.363. The technical memorandum in
Appendix C presents the data sources, methodologies, and assumptions applied to develop the noise contours, as
well as the presentation of noise contours and their comparisons.
The following list provides a description of the project alternatives and associated assumptions for each
alternative/scenario, followed by an analysis of the noise conditions for each alternative relative to potential
incompatible land uses.
4.2.1 Existing Conditions (2018)
The Existing Conditions represents the current noise conditions at WARB/CEF in 2018. The fleet mixes and aircraft
operations represent the current aircraft types and associated operations for both military and civil operations. This
baseline analysis reflects the reduced C-5 Galaxy fleet and the modified engines of the “M” model.
Baseline critical noise contours for the existing conditions are presented in Figure 1 of the technical memorandum
with the resultant acreage within the critical noise contours presented in Table 7 of the memorandum. Table 3-4
provides a summary of the land area contained within the critical noise contours for this alternative relative to the
other project alternatives.
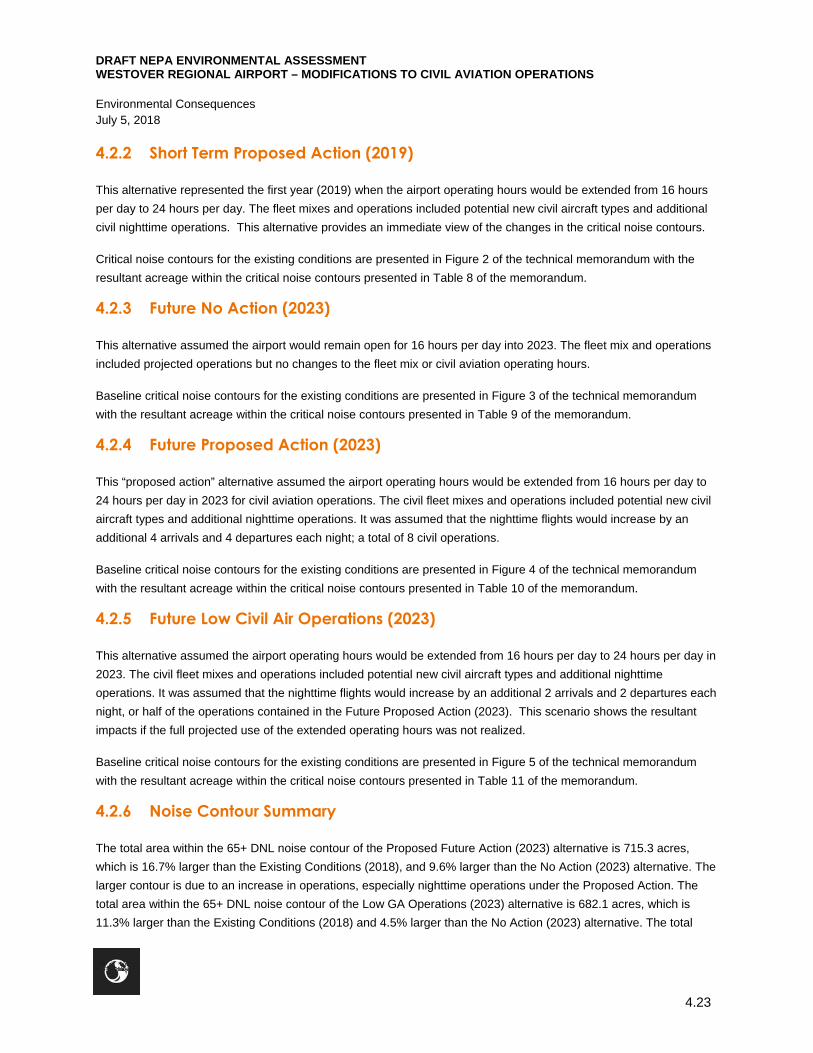
DRAFT NEPA ENVIRONMENTAL ASSESSMENT WESTOVER REGIONAL AIRPORT – MODIFICATIONS TO CIVIL AVIATION OPERATIONS
Environmental Consequences July 5, 2018
4.23
4.2.2 Short Term Proposed Action (2019)
This alternative represented the first year (2019) when the airport operating hours would be extended from 16 hours
per day to 24 hours per day. The fleet mixes and operations included potential new civil aircraft types and additional
civil nighttime operations. This alternative provides an immediate view of the changes in the critical noise contours.
Critical noise contours for the existing conditions are presented in Figure 2 of the technical memorandum with the
resultant acreage within the critical noise contours presented in Table 8 of the memorandum.
4.2.3 Future No Action (2023)
This alternative assumed the airport would remain open for 16 hours per day into 2023. The fleet mix and operations
included projected operations but no changes to the fleet mix or civil aviation operating hours.
Baseline critical noise contours for the existing conditions are presented in Figure 3 of the technical memorandum
with the resultant acreage within the critical noise contours presented in Table 9 of the memorandum.
4.2.4 Future Proposed Action (2023)
This “proposed action” alternative assumed the airport operating hours would be extended from 16 hours per day to
24 hours per day in 2023 for civil aviation operations. The civil fleet mixes and operations included potential new civil
aircraft types and additional nighttime operations. It was assumed that the nighttime flights would increase by an
additional 4 arrivals and 4 departures each night; a total of 8 civil operations.
Baseline critical noise contours for the existing conditions are presented in Figure 4 of the technical memorandum
with the resultant acreage within the critical noise contours presented in Table 10 of the memorandum.
4.2.5 Future Low Civil Air Operations (2023)
This alternative assumed the airport operating hours would be extended from 16 hours per day to 24 hours per day in
2023. The civil fleet mixes and operations included potential new civil aircraft types and additional nighttime
operations. It was assumed that the nighttime flights would increase by an additional 2 arrivals and 2 departures each
night, or half of the operations contained in the Future Proposed Action (2023). This scenario shows the resultant
impacts if the full projected use of the extended operating hours was not realized.
Baseline critical noise contours for the existing conditions are presented in Figure 5 of the technical memorandum
with the resultant acreage within the critical noise contours presented in Table 11 of the memorandum.
4.2.6 Noise Contour Summary
The total area within the 65+ DNL noise contour of the Proposed Future Action (2023) alternative is 715.3 acres,
which is 16.7% larger than the Existing Conditions (2018), and 9.6% larger than the No Action (2023) alternative. The
larger contour is due to an increase in operations, especially nighttime operations under the Proposed Action. The
total area within the 65+ DNL noise contour of the Low GA Operations (2023) alternative is 682.1 acres, which is
11.3% larger than the Existing Conditions (2018) and 4.5% larger than the No Action (2023) alternative. The total
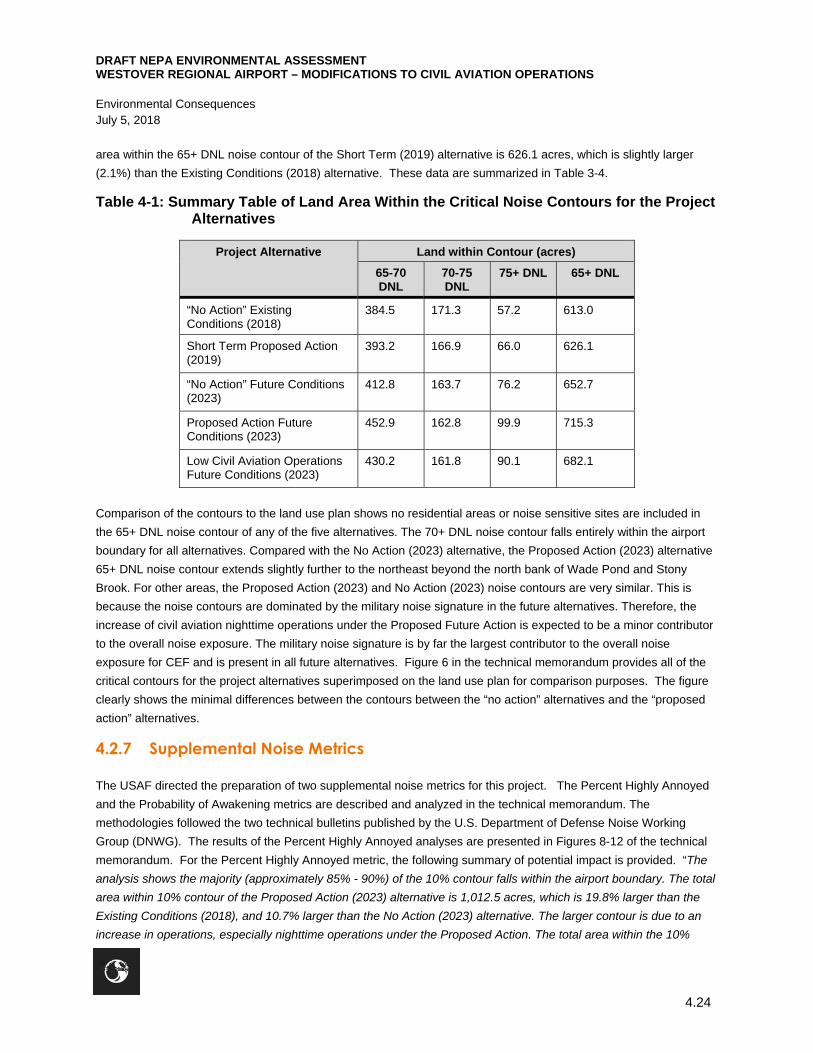
DRAFT NEPA ENVIRONMENTAL ASSESSMENT WESTOVER REGIONAL AIRPORT – MODIFICATIONS TO CIVIL AVIATION OPERATIONS
Environmental Consequences July 5, 2018
4.24
area within the 65+ DNL noise contour of the Short Term (2019) alternative is 626.1 acres, which is slightly larger
(2.1%) than the Existing Conditions (2018) alternative. These data are summarized in Table 3-4.
Table 4-1: Summary Table of Land Area Within the Critical Noise Contours for the Project Alternatives
Project Alternative Land within Contour (acres)
65-70 DNL
70-75 DNL
75+ DNL 65+ DNL
“No Action” Existing Conditions (2018)
384.5 171.3 57.2 613.0
Short Term Proposed Action (2019)
393.2 166.9 66.0 626.1
“No Action” Future Conditions (2023)
412.8 163.7 76.2 652.7
Proposed Action Future Conditions (2023)
452.9 162.8 99.9 715.3
Low Civil Aviation Operations Future Conditions (2023)
430.2 161.8 90.1 682.1
Comparison of the contours to the land use plan shows no residential areas or noise sensitive sites are included in
the 65+ DNL noise contour of any of the five alternatives. The 70+ DNL noise contour falls entirely within the airport
boundary for all alternatives. Compared with the No Action (2023) alternative, the Proposed Action (2023) alternative
65+ DNL noise contour extends slightly further to the northeast beyond the north bank of Wade Pond and Stony
Brook. For other areas, the Proposed Action (2023) and No Action (2023) noise contours are very similar. This is
because the noise contours are dominated by the military noise signature in the future alternatives. Therefore, the
increase of civil aviation nighttime operations under the Proposed Future Action is expected to be a minor contributor
to the overall noise exposure. The military noise signature is by far the largest contributor to the overall noise
exposure for CEF and is present in all future alternatives. Figure 6 in the technical memorandum provides all of the
critical contours for the project alternatives superimposed on the land use plan for comparison purposes. The figure
clearly shows the minimal differences between the contours between the “no action” alternatives and the “proposed
action” alternatives.
4.2.7 Supplemental Noise Metrics
The USAF directed the preparation of two supplemental noise metrics for this project. The Percent Highly Annoyed
and the Probability of Awakening metrics are described and analyzed in the technical memorandum. The
methodologies followed the two technical bulletins published by the U.S. Department of Defense Noise Working
Group (DNWG). The results of the Percent Highly Annoyed analyses are presented in Figures 8-12 of the technical
memorandum. For the Percent Highly Annoyed metric, the following summary of potential impact is provided. “The
analysis shows the majority (approximately 85% - 90%) of the 10% contour falls within the airport boundary. The total
area within 10% contour of the Proposed Action (2023) alternative is 1,012.5 acres, which is 19.8% larger than the
Existing Conditions (2018), and 10.7% larger than the No Action (2023) alternative. The larger contour is due to an
increase in operations, especially nighttime operations under the Proposed Action. The total area within the 10%

DRAFT NEPA ENVIRONMENTAL ASSESSMENT WESTOVER REGIONAL AIRPORT – MODIFICATIONS TO CIVIL AVIATION OPERATIONS
Environmental Consequences July 5, 2018
4.25
contour of the Low GA Operations (2023) alternative is 964.5 acres, which is 14.1% larger than the Existing
Conditions (2018) and 5.5% larger than the No Action (2023) alternative. The total area within the 10% contour of the
Short Term (2019) alternative is 626.1 acres, which is slightly larger (2.1%) than the Existing Conditions (2018)
alternative.” No existing incompatible land uses are located within the critical contours of this metric.
The results of the Probability of Awakening metric are presented in Figure 13 of the technical memorandum; it was
conducted on the Proposed Future Action alternative only. The critical contour for this metric remains completely on
airport property for the proposed action, thus analysis of the reduced and no action alternatives is not necessary.
4.3 AIR QUALITY
The proposed action was evaluated relative to the existing attainment status of the region and the General
Conformity Rule. Conformity Rules (40 CFR Subpart B section 93.153) apply only to areas that are designated by
the USEPA as non-attainment and maintenance areas. Conformity is intended to ensure that a Federal action is
consistent with a state implementation plan to control a priority pollutant and address violations to the NAAQS.
The project is within USEPA designated attainment area for the NAAQS and is not currently listed as a maintenance
area. It is designated as an ozone transfer region, and the site was within a non-attainment area for ozone prior to
the revocation of the 1997 NAAQS. Consultation with the USAF suggested that an evaluation of the proposed action
relative to the emission thresholds for maintenance areas be completed to evaluate conformity should the region be
changed to non-attainment for ozone in the near future. These thresholds for maintenance areas are reproduced
from 40 CFR Subpart B section 93.153(b)(2) in Table 4-1.
Table 4-2: Clean Air Act Conformity Rule Emission Rate Thresholds for Maintenance Areas
Pollutant Tons/year
Ozone (NOX), SO2 or NO2:
All maintenance areas 100
Ozone (VOC's)
Maintenance areas inside an ozone transport region 50
Maintenance areas outside an ozone transport region 100
Carbon monoxide: All maintenance areas 100
PM10: All maintenance areas 100
PM2.5 (direct emissions, SO2, NOX, VOC, and Ammonia) 100
All maintenance areas 100
Pb: All maintenance areas 25
Source: 40 CFR Subpart B section 93.153(b)(2)
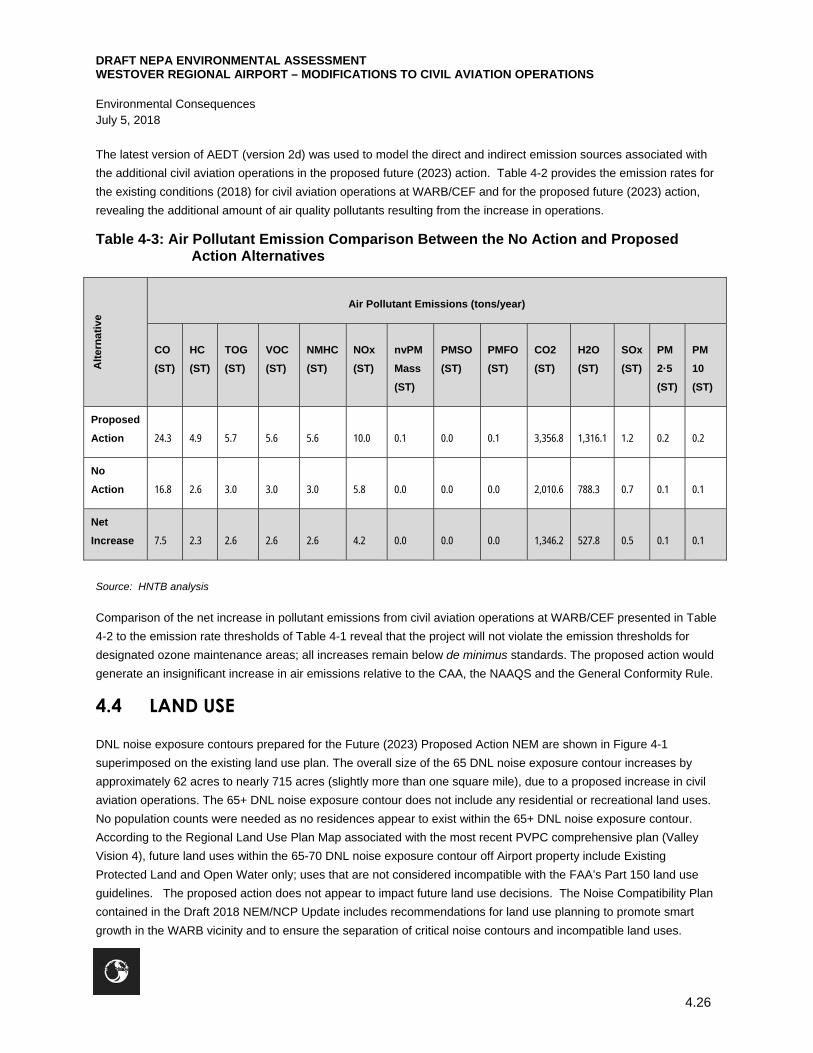
DRAFT NEPA ENVIRONMENTAL ASSESSMENT WESTOVER REGIONAL AIRPORT – MODIFICATIONS TO CIVIL AVIATION OPERATIONS
Environmental Consequences July 5, 2018
4.26
The latest version of AEDT (version 2d) was used to model the direct and indirect emission sources associated with
the additional civil aviation operations in the proposed future (2023) action. Table 4-2 provides the emission rates for
the existing conditions (2018) for civil aviation operations at WARB/CEF and for the proposed future (2023) action,
revealing the additional amount of air quality pollutants resulting from the increase in operations.
Table 4-3: Air Pollutant Emission Comparison Between the No Action and Proposed Action Alternatives
Alt
ern
ati
ve
Air Pollutant Emissions (tons/year)
CO
(ST)
HC
(ST)
TOG
(ST)
VOC
(ST)
NMHC
(ST)
NOx
(ST)
nvPM
Mass
(ST)
PMSO
(ST)
PMFO
(ST)
CO2
(ST)
H2O
(ST)
SOx
(ST)
PM
2·5
(ST)
PM
10
(ST)
Proposed
Action 24.3
4.9
5.7
5.6
5.6
10.0
0.1
0.0
0.1
3,356.8
1,316.1
1.2
0.2
0.2
No
Action 16.8
2.6
3.0
3.0
3.0
5.8
0.0
0.0
0.0
2,010.6
788.3
0.7
0.1
0.1
Net
Increase 7.5
2.3
2.6
2.6
2.6
4.2
0.0
0.0
0.0
1,346.2
527.8
0.5
0.1
0.1
Source: HNTB analysis
Comparison of the net increase in pollutant emissions from civil aviation operations at WARB/CEF presented in Table
4-2 to the emission rate thresholds of Table 4-1 reveal that the project will not violate the emission thresholds for
designated ozone maintenance areas; all increases remain below de minimus standards. The proposed action would
generate an insignificant increase in air emissions relative to the CAA, the NAAQS and the General Conformity Rule.
4.4 LAND USE
DNL noise exposure contours prepared for the Future (2023) Proposed Action NEM are shown in Figure 4-1
superimposed on the existing land use plan. The overall size of the 65 DNL noise exposure contour increases by
approximately 62 acres to nearly 715 acres (slightly more than one square mile), due to a proposed increase in civil
aviation operations. The 65+ DNL noise exposure contour does not include any residential or recreational land uses.
No population counts were needed as no residences appear to exist within the 65+ DNL noise exposure contour.
According to the Regional Land Use Plan Map associated with the most recent PVPC comprehensive plan (Valley
Vision 4), future land uses within the 65-70 DNL noise exposure contour off Airport property include Existing
Protected Land and Open Water only; uses that are not considered incompatible with the FAA’s Part 150 land use
guidelines. The proposed action does not appear to impact future land use decisions. The Noise Compatibility Plan
contained in the Draft 2018 NEM/NCP Update includes recommendations for land use planning to promote smart
growth in the WARB vicinity and to ensure the separation of critical noise contours and incompatible land uses.

î
î
î
î
î
î
î
î
î
î
å
å
å
å
å
å
å
å
å
å
å
å
å å
å
å
å
å
å
å
!(
!(
Westover Air Reserve Base / Metropolitan Airport
Hampshire County
Hampden County
§¦90
New Ludlow Rd
Wes
t StBurnett R
d
Texa
s D
r
Westover Rd
Sherid
an St
James St
Mor
gan
St
Sout
h S
t
523
3315
ChicopeeMemorialState Park
ChicopeeCountry
Club
WestoverConservation
Area
WadePond
WestoverGolf
Course
ChicopeeReservoir
Chicopee River
GranbySouth Hadley
Chicopee
Ludlow
Springfield
65 DNL
70 DNL
75 DNL
USDA-FSA-APFO
Sources: Bureau of Geographic Information (MassGIS),Commonwealth of Massachusetts,
Executive Office of Technology and Security Services,Westover Metropolitan Development Corporation 2018, HNTB GIS (2018),
Aerial - USDA 2016, ESRI Data and HNTB Analysis
LEGENDProposed Action Alternative DNL Noise Contour
Commercial/Industrial
Open/Agricultural/Recreational
Public/Quasi-Public
Residential
Previously Acquired Property underthe Voluntary Acquisition Program
Cemetery
Institutional
TransportationWaterWestover Air Reserve Base Installation AreaWestover Metropolitan Development Corporation Aviation PropertyCounty BoundaryTown BoundaryPlace of WorshipSchoolNational Register of Historic Places
Westover Air Reserve Base / Metropolitan Airport NEPA EA
Proposed Action Alternative Noise Contour Figure 4-1
åî
!(
0 1,000 2,000500Feet
1" = 2,000'
DRAFT NEPA ENVIRONMENTAL ASSESSMENT WESTOVER REGIONAL AIRPORT – MODIFICATIONS TO CIVIL AVIATION OPERATIONS
Environmental Consequences July 5, 2018
4.28
4.5 CULTURAL RESOURCES
No off-airport cultural resources were identified within the limits of the critical noise contour for the proposed action.
Since the project does not include demolition, construction, soil disturbance or vegetation clearing, impacts to cultural
resources are avoided. Increased noise over historic sites can impact the cultural setting of such sites. Review of the
slight expansion of the critical noise contours for the Future (2023) Proposed Action reveals no historic sites withing
the area of potential effect. Furthermore, tribal consultation for the subject did not reveal any concerns for sensitive
tribal resources.
DRAFT NEPA ENVIRONMENTAL ASSESSMENT WESTOVER REGIONAL AIRPORT – MODIFICATIONS TO CIVIL AVIATION OPERATIONS
References July 5, 2018
5.29
5.0 REFERENCES
Code of Federal Regulations, 32 CFR 989 – Environmental Impact Analysis Process
HNTB 2008. Westover Metropolitan Airport Master Plan Update. June 2008.
HNTB 2014. Westover Air Reserve Base/Metropolitan Airport Noise Exposure Map (NEM) & Noise Compatibility
Plan (NCP) Update. Prepared for the Westover Metropolitan Development Corp. By; HNTB Corporation 2014.
HNTB 2018. Westover Air Reserve Base (WARB)/Metropolitan Airport (CEF) Title 14 C.F.R. Part 150 and EA
Studies – Noise Contour Development – Technical Memorandum. By; Yue Xu, Ph.D., P.E. Aviation/Environmental
Planner. May 25, 2018.
HNTB 2018. Westover Air Reserve Base/Metropolitan Airport Noise Exposure Map (NEM) & Noise Compatibility
Plan (NCP) Update (Draft Final). Prepared for the Westover Metropolitan Development Corp. June 2018.
MADEP 2018. Massachusetts Air Quality Attainment Designations and Attainment. Retrieved from
https://www.mass.gov/service-details/designations-attainment . June 2018.
MADFW 2018. Massachusetts Division of Fisheries and Wildlife. Natural Heritage & Endangered Species Program.
State-listed Rare Species Critical Habitat. Retrieved from the Massachusetts Geographic Information System – Rare
Species Data Layer. June 2018.
USAF 1987. U.S. Air Force. Final EIS, Proposed Air Force Reserve Mission Change (C-130 to C-5A Aircraft) and
Westover Metropolitan Development Corporation Expansion of Civil Aviation Operations through 1995 at Westover
Air Force Base. April 1987.
USAF 1995. U.S. Air Force. Supplemental EIS, Military and Civil Aircraft Operations at West-over Air Reserve Base,
Massachusetts. January 1995.
USAF 2013. U.S. Air Force. Air Installation Compatible Use Zone Study (AICUZ). Westover Air Reserve Base,
Massachusetts. February 2013.
USAF 2015. U.S. Air Force. Final Environmental Assessment Westover Air Reserve Base, Chicopee, Massachusetts,
Manage Airfield Vegetation to Protect Flight Safety. April 2015.
USAF 2017. Final EIS, U.S. Air Force. Main Operating Base (MOB) 3 KC-46A Beddown Westover ARB, April 2017.
USFWS 2018. U.S. Fish and Wildlife Service. U.S. Fish and Wildlife Service (USFWS) Information for Planning and
Conservation (IPaC) Online System. Hampden County, Massachusetts. June 2018.
Westover ARB 2004b. Westover Air Reserve Base. Westover Air Reserve Base/ Westover Metropolitan Airport Joint
Land Use Study (JLUS) Update. October 2004.

DRAFT NEPA ENVIRONMENTAL ASSESSMENT WESTOVER REGIONAL AIRPORT – MODIFICATIONS TO CIVIL AVIATION OPERATIONS
Appendix A 2018 NEM/NCP Update (DRAFT) July 5, 2018
A.1
Appendix A 2018 NEM/NCP UPDATE (DRAFT)
Westover Air Reserve Base/ Metropolitan Airport Noise Exposure Map (NEM) & Noise Compatibility Plan (NCP) Update This document provides an update to the 2014 NEM and 2014 NCP.
June 1, 2018
Prepared for: Westover Metropolitan Redevelopment Authority Prepared by: Stantec Consulting Services and HNTB Corporation


Westover Air Reserve Base / Metropolitan Airport NEM/NCP Update
Draft i June 2018
Table of Contents Page
Chapter 1: Introduction ........................................................................................................... 1
1.1 14 CFR Part 150 .......................................................................................................... 1
1.2 Noise Exposure Maps .................................................................................................. 2
1.3 Noise Compatibility Program ........................................................................................ 2
1.4 Project Roles and Responsibilities .............................................................................. 2
Westover Metropolitan Development Corporation ................................................. 3
439th Airlift Wing of the Air Force Reserve ............................................................ 3
Pioneer Valley Planning Commission ................................................................... 3
Massachusetts Department of Transportation - Aeronautics Division .................... 3
Consultant ............................................................................................................ 3
Federal Aviation Administration (FAA) .................................................................. 3
1.5 NEM/NCP Update Study Goals.................................................................................... 4
Chapter 2: Existing and Forecast Flight Operations ................................................................ 5
2.1 Airport Location and Layout ......................................................................................... 6
General information .............................................................................................. 6
Users .................................................................................................................... 6
Weather and Climate ............................................................................................ 7
Airspace and Air Traffic Control ............................................................................ 7
2.2 Existing (2018) Conditions ........................................................................................... 7
Flight Operations and Fleet Mix ............................................................................ 8
Aircraft Flight Profiles ...........................................................................................14
Runway Use ........................................................................................................14
Flight Track Locations and Use ............................................................................15
Run-up/Maintenance Operations .........................................................................16
2.3 Future (2023) Conditions ............................................................................................16
Flight Operations and Fleet Mix ...........................................................................16
Aircraft Flight Profiles ...........................................................................................16
Runway Use ........................................................................................................16
Flight Track Locations and Use ............................................................................16
Run-up/Maintenance Operations .........................................................................16
Chapter 3: Noise and Land Use Compatibility .......................................................................22
DRAFT
Westover Air Reserve Base / Metropolitan Airport NEM/NCP Update
Draft ii June 2018
3.1 Land Use Guidelines ...................................................................................................22
Federal Guidelines ...............................................................................................22
Local Land Use Guidelines ..................................................................................25
3.2 Development of Land Use and Population Data ..........................................................25
3.3 Existing Generalized Land Use ...................................................................................26
Noise-Sensitive Resources ..................................................................................26
3.4 Existing Generalized Zoning .......................................................................................26
3.5 Future Land Use .........................................................................................................27
Chapter 4: Noise Exposure Maps ..........................................................................................28
4.1 Land Use Base Map ...................................................................................................28
4.2 Noise Exposure Map for Existing Conditions (2018) ...................................................28
4.3 Noise Exposure Map for Future Conditions (2023)......................................................29
Chapter 5: Noise Compatibility Program ................................................................................31
5.1 History of Noise Compatibility Planning at the Airport .................................................31
5.2 2014 Noise Compatibility Program ..............................................................................32
Noise Abatement Measures .................................................................................32
Land Use Measures .............................................................................................35
Implementation, Monitoring, and Review Measures .............................................39
Chapter 6: Record of Consultation ........................................................................................42
6.1 Meetings and Coordination .........................................................................................42
6.2 Draft NEM/NCP Update Document .............................................................................42
6.3 Public Information Workshop ......................................................................................42
6.4 Comments on the Draft Document ..............................................................................42
DRAFT

Westover Air Reserve Base / Metropolitan Airport NEM/NCP Update
Draft iii June 2018
List of Tables
Table 2.1 2018 Average Annual Day Fleet Mix ..................................................................... 9 Table 2.2 Overall Runway Usage ........................................................................................15 Table 2.3 2023 Average Annual Day Fleet Mix ....................................................................17 Table 3.1 Part 150 Noise and Land Use Compatibility Guidelines .......................................23 Table 4.1 Generalized Land Uses within the Existing (2018) Conditions 65 DNL Noise
Exposure Contour ................................................................................................29 Table 4.2 Generalized Land Uses within the Future (2023) Conditions 65 DNL Noise
Exposure Contour .................................................................................................30
List of Figures
Figure 2-1 Vicinity Map .......................................................................................................... 6 Figure 2-2 Airfield Layout ....................................................................................................... 7 Figure 2-3 Flight Tracks – Civilian Fixed Wing Arrival ...........................................................15 Figure 2-4 Flight Tracks – Civilian Fixed Wing Departure......................................................15 Figure 2-5 Flight Tracks – Civilian Helicopter Arrival .............................................................15 Figure 2-6 Flight Tracks – Civilian Helicopter Departure .......................................................15 Figure 3-1 Generalized Existing Land Use ............................................................................26 Figure 3-2 Generalized Zoning..............................................................................................26 Figure 3-3 Regional Land Use Plan Map ..............................................................................27 Figure 4-1 Existing (2018) Conditions Noise Exposure Map .................................................28 Figure 4-2 Future (2023) Conditions Noise Exposure Map ....................................................29 Figure 5-1 Proposed Rezoning of Residential Parcels with 2023 NEM .................................37
Appendices
Appendix A: Part 150 NEM and NCP Checklists
Appendix B: 1996 and 2015 FAA Records of Approval (ROA)
Appendix C: AEE Coordination
Appendix D: Noise and its Effect on People
Appendix E: Record of Consultation
DRAFT
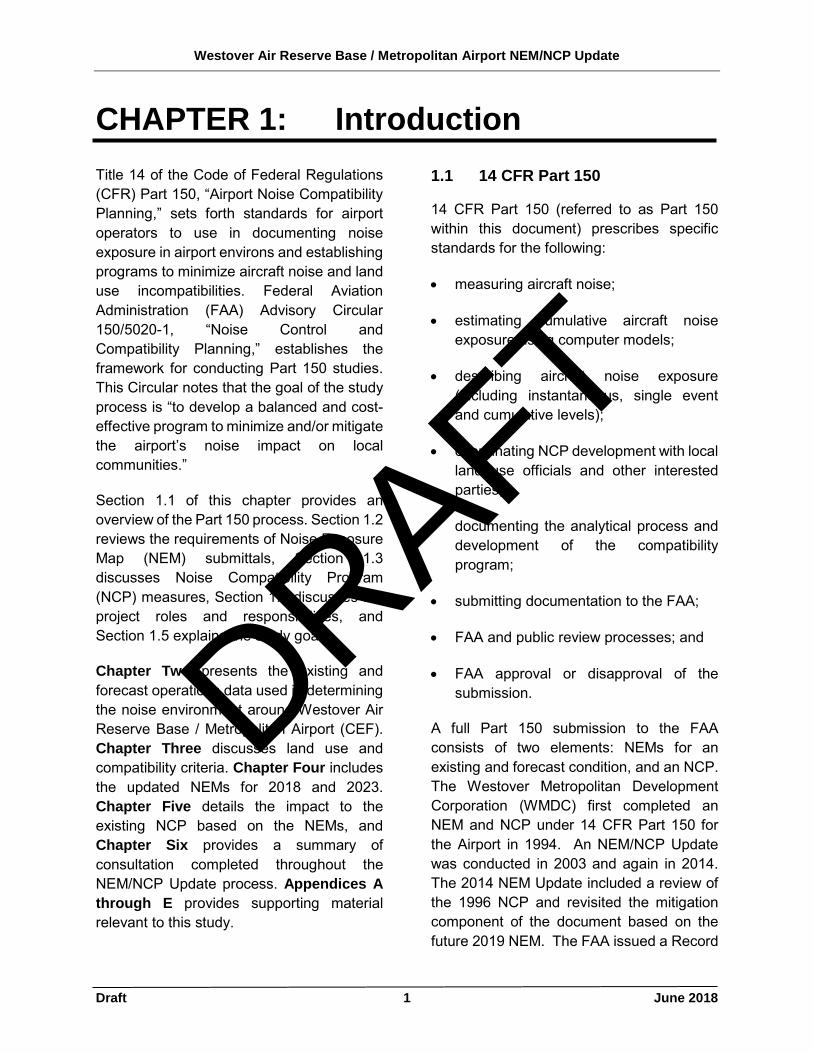
Westover Air Reserve Base / Metropolitan Airport NEM/NCP Update
Draft 1 June 2018
CHAPTER 1: Introduction Title 14 of the Code of Federal Regulations (CFR) Part 150, “Airport Noise Compatibility Planning,” sets forth standards for airport operators to use in documenting noise exposure in airport environs and establishing programs to minimize aircraft noise and land use incompatibilities. Federal Aviation Administration (FAA) Advisory Circular 150/5020-1, “Noise Control and Compatibility Planning,” establishes the framework for conducting Part 150 studies. This Circular notes that the goal of the study process is “to develop a balanced and cost-effective program to minimize and/or mitigate the airport’s noise impact on local communities.”
Section 1.1 of this chapter provides an overview of the Part 150 process. Section 1.2 reviews the requirements of Noise Exposure Map (NEM) submittals, Section 1.3 discusses Noise Compatibility Program (NCP) measures, Section 1.4 discusses the project roles and responsibilities, and Section 1.5 explains the study goals.
Chapter Two presents the existing and forecast operations data used in determining the noise environment around Westover Air Reserve Base / Metropolitan Airport (CEF). Chapter Three discusses land use and compatibility criteria. Chapter Four includes the updated NEMs for 2018 and 2023. Chapter Five details the impact to the existing NCP based on the NEMs, and Chapter Six provides a summary of consultation completed throughout the NEM/NCP Update process. Appendices A through E provides supporting material relevant to this study.
1.1 14 CFR Part 150
14 CFR Part 150 (referred to as Part 150 within this document) prescribes specific standards for the following:
• measuring aircraft noise;
• estimating cumulative aircraft noise exposure using computer models;
• describing aircraft noise exposure (including instantaneous, single event and cumulative levels);
• coordinating NCP development with local land use officials and other interested parties;
• documenting the analytical process and development of the compatibility program;
• submitting documentation to the FAA;
• FAA and public review processes; and
• FAA approval or disapproval of the submission.
A full Part 150 submission to the FAA consists of two elements: NEMs for an existing and forecast condition, and an NCP. The Westover Metropolitan Development Corporation (WMDC) first completed an NEM and NCP under 14 CFR Part 150 for the Airport in 1994. An NEM/NCP Update was conducted in 2003 and again in 2014. The 2014 NEM Update included a review of the 1996 NCP and revisited the mitigation component of the document based on the future 2019 NEM. The FAA issued a Record
DRAFT
Westover Air Reserve Base / Metropolitan Airport NEM/NCP Update
Draft 2 June 2018
of Approval (ROA) for the 2014 NEM/NCP Update in February 2015.
This document provides an update to the 2014 and 2019 NEMs and provides a review of an update to the 2014 NCP.
1.2 Noise Exposure Maps
The FAA developed a checklist for use in reviewing NEM submittals, which must be completed before submission of the final NEM. A copy of the FAA checklist is provided in Appendix A. The checklist provides specific requirements for approval of NEMs, along with section references indicating the location in the document where the requirements are addressed.
The NEM documentation describes the airport layout and operation, aircraft-related noise exposure, land uses in the airport environs, and the resulting aircraft noise and land use compatibility status. NEMs include graphic depictions of existing and forecast (i.e., future) noise exposure levels resulting from aircraft operations and land uses in the airport environs. The NEM documentation also describes the data collection and analyses undertaken in its development.
NEMs must address two timeframes: the year of submission (the “existing condition”) and the fifth calendar year following the year of submission (the “forecast condition”). The submission year for this NEM/NCP Update is 2018 and a Future (2023) NEM represents the 5-year forecast noise exposure. Upon acceptance by the FAA, the NEMs replace previously accepted maps from the 2014 NEM Update.
1.3 Noise Compatibility Program
A review of the Airport’s FAA-approved NCP was conducted to evaluate the implementation of the recommended and
approved NCP measures. The NCP analysis also considers the most recent NEMs and how the implementation of the mitigation program would be affected. Appendix B provides the FAA’s ROA of the 1996 and 2014 NCPs completed for the Airport. An NCP checklist for this document is provided in Appendix A following the NEM checklist.
The NCP is a list of the actions the airport operator, airport users, local governments, and FAA propose to undertake to minimize existing and future aircraft noise and land use incompatibility. The NCP documentation must recount the development of the program, including a description of all measures considered, the reasons that individual measures were accepted or rejected, how measures will be implemented and funded, and the predicted effectiveness of individual measures and the overall program.
1.4 Project Roles and Responsibilities
As discussed below, several groups had major roles in the Part 150 process, including the WMDC, the 439th Airlift Wing of the Air Force Reserve, the project consultant team (Stantec and HNTB Corporation (HNTB)), the Pioneer Valley Planning Commission (PVPC), the Massachusetts Department of Transportation (MassDOT), and the FAA.
The Airport hosts both civilian and military activity. WMDC manages civilian operations at the Airport, while the Air Force Reserve manages military operations. The facility is operated under a joint use agreement with the USAF hosting the WMDC, a quasi-public non-profit development corporation established in 1974.
DRAFT
Westover Air Reserve Base / Metropolitan Airport NEM/NCP Update
Draft 3 June 2018
Westover Metropolitan Development Corporation
As the recognized sponsor of the civilian side of the airport by the FAA, WMDC is the project sponsor and has responsibility for the entire NEM/NCP Update. Using the information provided by the consulting team, the WMDC, in consultation with the FAA, also reviews the previous NCP with the updated NEMs to ensure that these two components of Part 150 are aligned.
439th Airlift Wing of the Air Force Reserve
The 439th Airlift Wing is based at Westover and operates eight C-5M Super Galaxy aircraft. As the primary user of the Airport, the 439th Airlift Wing provided information on military flight operations and procedures.
In February 2013, the Air Force Reserve finalized an Air Installation Compatible Use Zone (AICUZ) Study update. The purpose of the AICUZ program is to promote compatible land development in areas subject to aircraft noise and accident potential. The Study reaffirmed Air Force policy of promoting public health, safety, and general welfare in areas surrounding the Airport. The report presented changes in flight operations since the previous AICUZ Study (1996) and provided current noise zones and future noise zones and compatible use guidelines for land areas.
The Westover Airport Traffic Control Tower (ATCT or Westover Tower) is operated by the USAF and provided significant input into several areas, including existing and future operational procedures and trends.
Pioneer Valley Planning Commission
The PVPC is the regional planning body for the jurisdictions surrounding the Airport.
PVPC serves the member governments within its district and provided land use compatibility assistance for this NEM/NCP Update.
Massachusetts Department of Transportation - Aeronautics Division
The Massachusetts Department of Transportation-Aeronautics Division of Aeronautics provided funding assistance for this NEM/NCP Update and provided a review of the document.
Consultant
The WMDC retained Stantec Consulting Services (Stantec) who in turn retained the services of HNTB to conduct the technical work required to fulfill Part 150 analysis and documentation requirements. Stantec is responsible for the overall document submittal, as well as the forecasting effort. HNTB completed the development of the NEMs and the analysis and update of the NCP program.
Federal Aviation Administration (FAA)
The FAA has ultimate review authority over the NEMs submitted under Part 150. FAA review includes an assessment of both the adequacy of the technical documentation and the broader issues related to satisfying the Part 150 process requirements.
FAA’s participation includes the following:
• When the Airport submits the Part 150 documentation to the FAA for review, the FAA’s New England Region–Airports Division will conduct an initial, local review to determine if it satisfies all NEM and NCP checklist requirements.
DRAFT
Westover Air Reserve Base / Metropolitan Airport NEM/NCP Update
Draft 4 June 2018
• The FAA’s New England Region – Airports Division is responsible for the final review of the NEM documentation for adequacy in satisfying technical and legal requirements and approval of any revisions to the NCP.
1.5 NEM/NCP Update Study Goals
The overall goal of the NEM/NCP Update is to develop an existing condition (2018) and a forecast future condition (2023) NEM, and to update the Airport’s NCP thereby defining necessary continued implementation of mitigation programs currently underway. The previous NEMs represented existing (2014) and future (2019) conditions and were accepted by the FAA in September 2014. The WMDC’s ongoing voluntary acquisition program uses boundaries established in the existing (2014) NEM.
Several goals have been identified to guide the development of the 14 CFR Part 150 NEM/NCP Update. These goals include:
• Develop an understanding of probable future noise levels including any potential changes to the C-5M mission;
• To characterize and present to the public, local jurisdictions, and other interested parties the existing and reasonably foreseeable future noise levels associated with aircraft activity at the Airport;
• To identify existing and potentially non-compatible land uses within the existing and future 65 and above Day-Night Average Sound Level (DNL) noise exposure contours;
• To identify the status of the measures that were recommended and
previously approved in the Airport’s NCP; and
• To identify boundaries for the continuation of the WMDC, MassDOT and FAA-sponsored voluntary acquisition program, if any, based on the revised 65 DNL noise exposure contours and remaining within the context of Federal regulations and eligibility criteria, financial feasibility, and fairness to aviation and non-aviation interests.
DRAFT
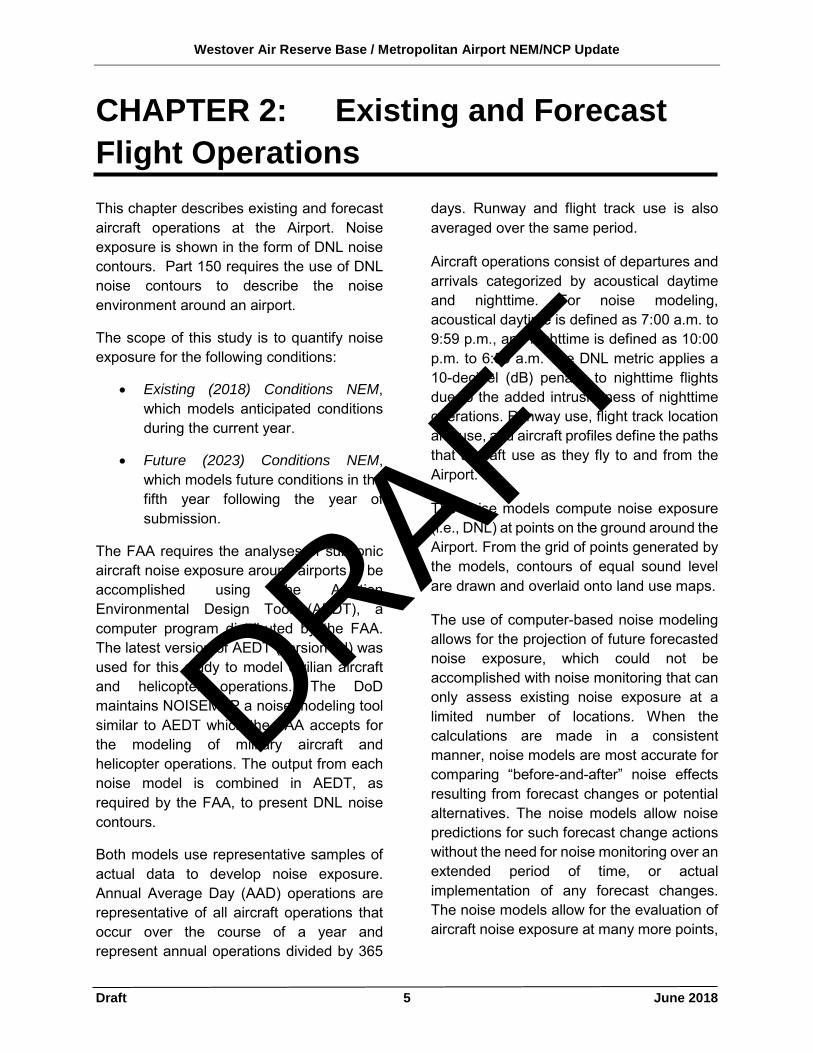
Westover Air Reserve Base / Metropolitan Airport NEM/NCP Update
Draft 5 June 2018
CHAPTER 2: Existing and Forecast Flight Operations This chapter describes existing and forecast aircraft operations at the Airport. Noise exposure is shown in the form of DNL noise contours. Part 150 requires the use of DNL noise contours to describe the noise environment around an airport.
The scope of this study is to quantify noise exposure for the following conditions:
• Existing (2018) Conditions NEM, which models anticipated conditions during the current year.
• Future (2023) Conditions NEM, which models future conditions in the fifth year following the year of submission.
The FAA requires the analyses of subsonic aircraft noise exposure around airports to be accomplished using the Aviation Environmental Design Tool (AEDT), a computer program distributed by the FAA. The latest version of AEDT (version 2d) was used for this study to model civilian aircraft and helicopter operations. The DoD maintains NOISEMAP a noise modeling tool similar to AEDT which the FAA accepts for the modeling of military aircraft and helicopter operations. The output from each noise model is combined in AEDT, as required by the FAA, to present DNL noise contours.
Both models use representative samples of actual data to develop noise exposure. Annual Average Day (AAD) operations are representative of all aircraft operations that occur over the course of a year and represent annual operations divided by 365
days. Runway and flight track use is also averaged over the same period.
Aircraft operations consist of departures and arrivals categorized by acoustical daytime and nighttime. For noise modeling, acoustical daytime is defined as 7:00 a.m. to 9:59 p.m., and nighttime is defined as 10:00 p.m. to 6:59 a.m. The DNL metric applies a 10-decibel (dB) penalty to nighttime flights due to the added intrusiveness of nighttime operations. Runway use, flight track location and use, and aircraft profiles define the paths that aircraft use as they fly to and from the Airport.
The noise models compute noise exposure (i.e., DNL) at points on the ground around the Airport. From the grid of points generated by the models, contours of equal sound level are drawn and overlaid onto land use maps.
The use of computer-based noise modeling allows for the projection of future forecasted noise exposure, which could not be accomplished with noise monitoring that can only assess existing noise exposure at a limited number of locations. When the calculations are made in a consistent manner, noise models are most accurate for comparing “before-and-after” noise effects resulting from forecast changes or potential alternatives. The noise models allow noise predictions for such forecast change actions without the need for noise monitoring over an extended period of time, or actual implementation of any forecast changes. The noise models allow for the evaluation of aircraft noise exposure at many more points,
DRAFT
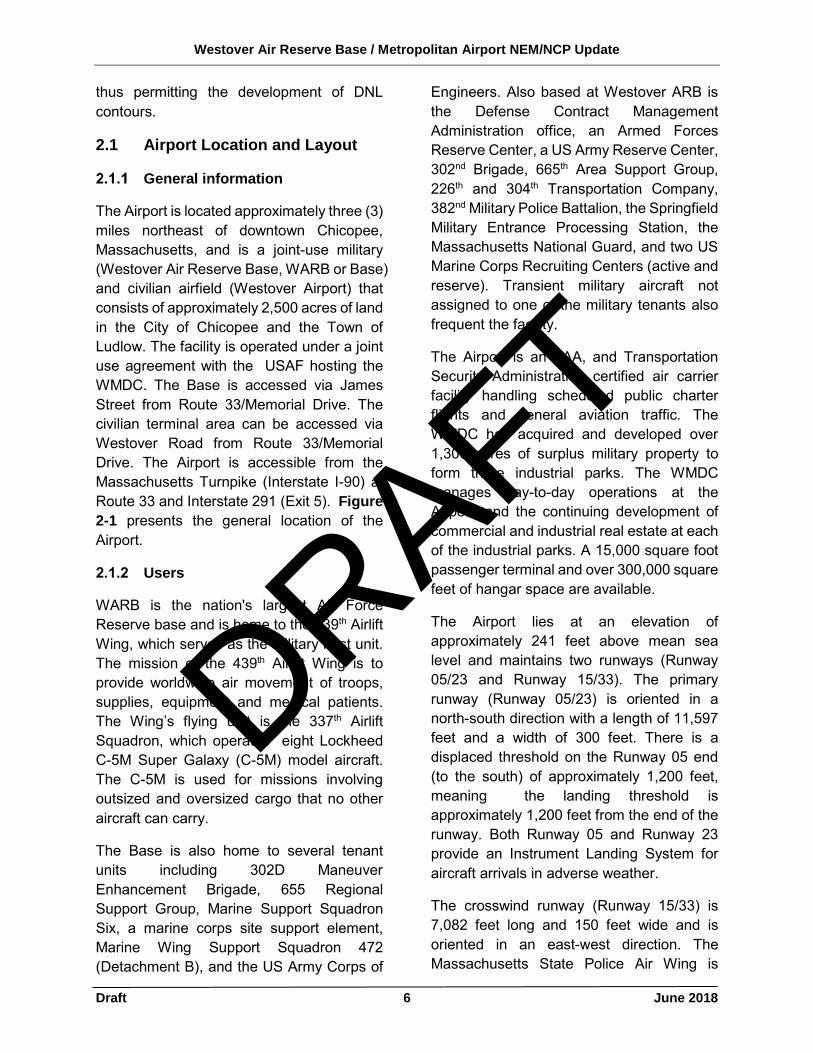
Westover Air Reserve Base / Metropolitan Airport NEM/NCP Update
Draft 6 June 2018
thus permitting the development of DNL contours.
2.1 Airport Location and Layout
General information
The Airport is located approximately three (3) miles northeast of downtown Chicopee, Massachusetts, and is a joint-use military (Westover Air Reserve Base, WARB or Base) and civilian airfield (Westover Airport) that consists of approximately 2,500 acres of land in the City of Chicopee and the Town of Ludlow. The facility is operated under a joint use agreement with the USAF hosting the WMDC. The Base is accessed via James Street from Route 33/Memorial Drive. The civilian terminal area can be accessed via Westover Road from Route 33/Memorial Drive. The Airport is accessible from the Massachusetts Turnpike (Interstate I-90) at Route 33 and Interstate 291 (Exit 5). Figure 2-1 presents the general location of the Airport.
Users
WARB is the nation's largest Air Force Reserve base and is home to the 439th Airlift Wing, which serves as the military host unit. The mission of the 439th Airlift Wing is to provide worldwide air movement of troops, supplies, equipment and medical patients. The Wing’s flying unit is the 337th Airlift Squadron, which operates eight Lockheed C-5M Super Galaxy (C-5M) model aircraft. The C-5M is used for missions involving outsized and oversized cargo that no other aircraft can carry.
The Base is also home to several tenant units including 302D Maneuver Enhancement Brigade, 655 Regional Support Group, Marine Support Squadron Six, a marine corps site support element, Marine Wing Support Squadron 472 (Detachment B), and the US Army Corps of
Engineers. Also based at Westover ARB is the Defense Contract Management Administration office, an Armed Forces Reserve Center, a US Army Reserve Center, 302nd Brigade, 665th Area Support Group, 226th and 304th Transportation Company, 382nd Military Police Battalion, the Springfield Military Entrance Processing Station, the Massachusetts National Guard, and two US Marine Corps Recruiting Centers (active and reserve). Transient military aircraft not assigned to one of the military tenants also frequent the facility.
The Airport is an FAA, and Transportation Security Administration certified air carrier facility handling scheduled public charter flights and general aviation traffic. The WMDC has acquired and developed over 1,300 acres of surplus military property to form three industrial parks. The WMDC manages day-to-day operations at the Airport, and the continuing development of commercial and industrial real estate at each of the industrial parks. A 15,000 square foot passenger terminal and over 300,000 square feet of hangar space are available.
The Airport lies at an elevation of approximately 241 feet above mean sea level and maintains two runways (Runway 05/23 and Runway 15/33). The primary runway (Runway 05/23) is oriented in a north-south direction with a length of 11,597 feet and a width of 300 feet. There is a displaced threshold on the Runway 05 end (to the south) of approximately 1,200 feet, meaning the landing threshold is approximately 1,200 feet from the end of the runway. Both Runway 05 and Runway 23 provide an Instrument Landing System for aircraft arrivals in adverse weather.
The crosswind runway (Runway 15/33) is 7,082 feet long and 150 feet wide and is oriented in an east-west direction. The Massachusetts State Police Air Wing is
DRAFT
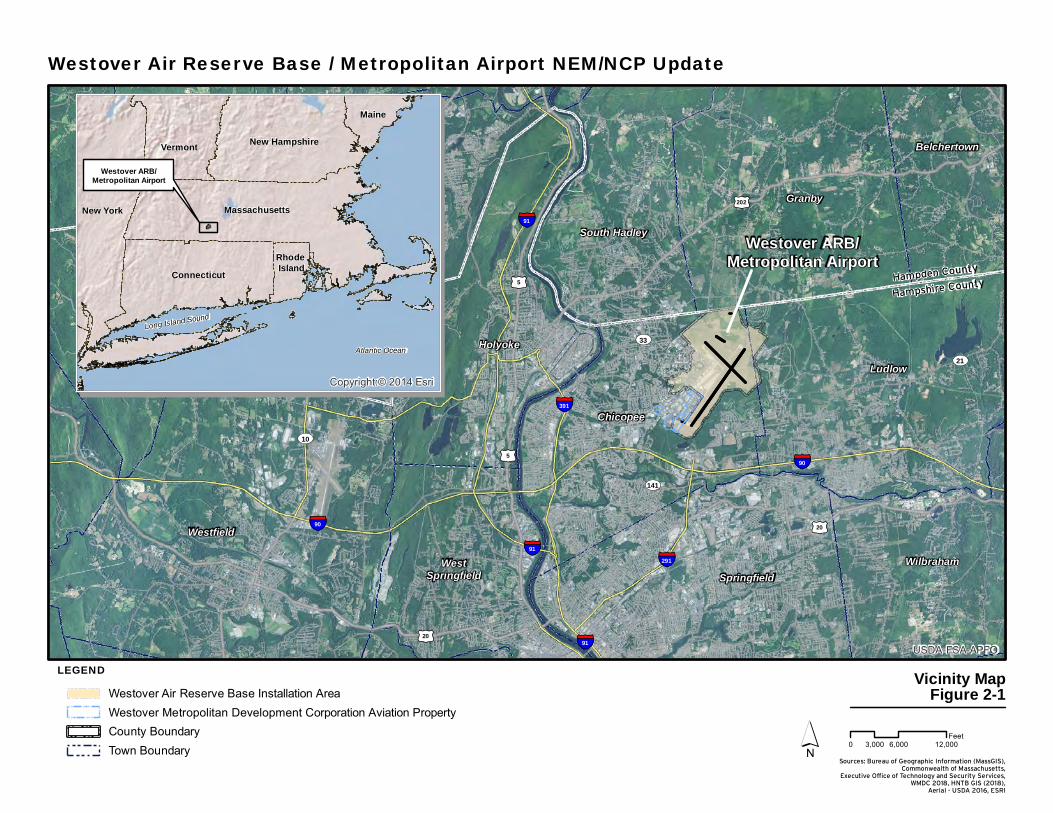
§¦90
§¦90
§¦291
§¦391
§¦91
§¦91
§¦91
£¤5
£¤202
£¤5
£¤20
UV21
UV33
UV141
UV10
£¤20
Westover ARB/Metropolitan Airport
Granby
South Hadley
Chicopee
Ludlow
Springfield
Belchertown
WilbrahamWestSpringfield
Holyoke
Westfield
Hampden County
Hampshire County
USDA-FSA-APFO
Westover Air Reserve Base / Metropolitan Airport NEM/NCP Update
´ 0 6,000 12,0003,000Feet
Vicinity MapFigure 2-1
LEGENDWestover Air Reserve Base Installation AreaWestover Metropolitan Development Corporation Aviation PropertyCounty BoundaryTown Boundary
Long Island Sound
Atlantic Ocean
Westover ARB/Metropolitan Airport
Maine
New York
Vermont New Hampshire
Massachusetts
ConnecticutRhode Island
Copyright:© 2014 Esri
Sources: Bureau of Geographic Information (MassGIS),Commonwealth of Massachusetts,
Executive Office of Technology and Security Services,WMDC 2018, HNTB GIS (2018),
Aerial - USDA 2016, ESRI
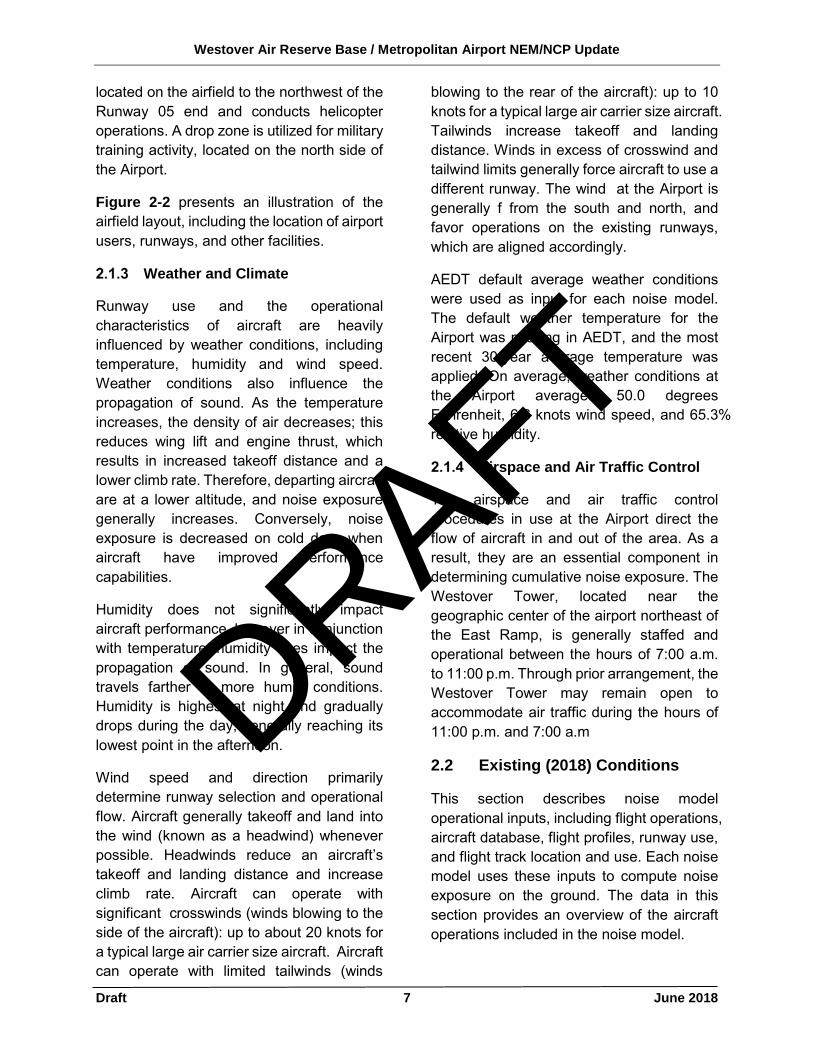
Westover Air Reserve Base / Metropolitan Airport NEM/NCP Update
Draft 7 June 2018
located on the airfield to the northwest of the Runway 05 end and conducts helicopter operations. A drop zone is utilized for military training activity, located on the north side of the Airport.
Figure 2-2 presents an illustration of the airfield layout, including the location of airport users, runways, and other facilities.
Weather and Climate
Runway use and the operational characteristics of aircraft are heavily influenced by weather conditions, including temperature, humidity and wind speed. Weather conditions also influence the propagation of sound. As the temperature increases, the density of air decreases; this reduces wing lift and engine thrust, which results in increased takeoff distance and a lower climb rate. Therefore, departing aircraft are at a lower altitude, and noise exposure generally increases. Conversely, noise exposure is decreased on cold days when aircraft have improved performance capabilities.
Humidity does not significantly impact aircraft performance, however in conjunction with temperature; humidity does impact the propagation of sound. In general, sound travels farther in more humid conditions. Humidity is highest at night and gradually drops during the day, generally reaching its lowest point in the afternoon.
Wind speed and direction primarily determine runway selection and operational flow. Aircraft generally takeoff and land into the wind (known as a headwind) whenever possible. Headwinds reduce an aircraft’s takeoff and landing distance and increase climb rate. Aircraft can operate with significant crosswinds (winds blowing to the side of the aircraft): up to about 20 knots for a typical large air carrier size aircraft. Aircraft can operate with limited tailwinds (winds
blowing to the rear of the aircraft): up to 10 knots for a typical large air carrier size aircraft. Tailwinds increase takeoff and landing distance. Winds in excess of crosswind and tailwind limits generally force aircraft to use a different runway. The wind at the Airport is generally f from the south and north, and favor operations on the existing runways, which are aligned accordingly.
AEDT default average weather conditions were used as input for each noise model. The default weather temperature for the Airport was missing in AEDT, and the most recent 30-year average temperature was applied. On average, weather conditions at the Airport averaged 50.0 degrees Fahrenheit, 6.6 knots wind speed, and 65.3% relative humidity.
Airspace and Air Traffic Control
The airspace and air traffic control procedures in use at the Airport direct the flow of aircraft in and out of the area. As a result, they are an essential component in determining cumulative noise exposure. The Westover Tower, located near the geographic center of the airport northeast of the East Ramp, is generally staffed and operational between the hours of 7:00 a.m. to 11:00 p.m. Through prior arrangement, the Westover Tower may remain open to accommodate air traffic during the hours of 11:00 p.m. and 7:00 a.m
2.2 Existing (2018) Conditions
This section describes noise model operational inputs, including flight operations, aircraft database, flight profiles, runway use, and flight track location and use. Each noise model uses these inputs to compute noise exposure on the ground. The data in this section provides an overview of the aircraft operations included in the noise model.
DRAFT

!(
!(
!(
!(
08-32(Drop Zone)
Westover Air Reserve Base/ Metropolitan Airport
Hampshire County
Hampden County
§¦90
New Ludlow Rd
James St
5
23
33
15
ChicopeeMemorialState Park
ChicopeeCountry
Club
WestoverConservation
Area
WadePond
WestoverGolf
Course
ChicopeeReservoir
VOR/TACAN
TerminalBuilding
Airport TrafficControl Tower
11,597
' x 301
'
7,082' x 150'
Fire Station
TWY G
TWY N
TWY S
EastRamp
MA State Police Helicopter Operating Area
NorthRamp
Chicopee
Ludlow
USDA-FSA-APFO
LEGENDWestover Air Reserve Base Installation Area
Westover Metropolitan Development Corporation Aviation Property
County Boundary
Town Boundary
Westover Air Reserve Base / Metropolitan Airport NEM/NCP Update
´Sources: Bureau of Geographic Information (MassGIS), Commonwealth of Massachusetts,
Executive Office of Technology and Security Services, HNTB GIS (2018),Aerial - USDA 2016, ESRI Data and HNTB Analysis
Airfield LayoutFigure 2-2
Page 59
0 1,250 2,500625Feet
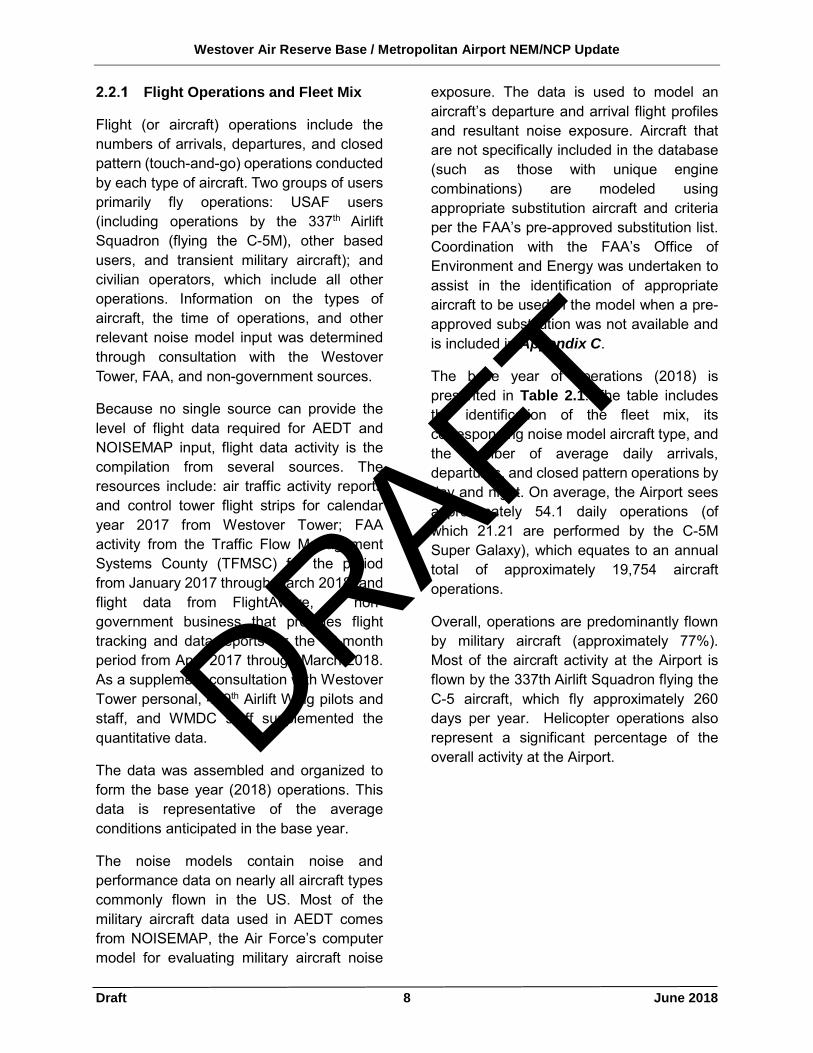
Westover Air Reserve Base / Metropolitan Airport NEM/NCP Update
Draft 8 June 2018
Flight Operations and Fleet Mix
Flight (or aircraft) operations include the numbers of arrivals, departures, and closed pattern (touch-and-go) operations conducted by each type of aircraft. Two groups of users primarily fly operations: USAF users (including operations by the 337th Airlift Squadron (flying the C-5M), other based users, and transient military aircraft); and civilian operators, which include all other operations. Information on the types of aircraft, the time of operations, and other relevant noise model input was determined through consultation with the Westover Tower, FAA, and non-government sources.
Because no single source can provide the level of flight data required for AEDT and NOISEMAP input, flight data activity is the compilation from several sources. The resources include: air traffic activity reports and control tower flight strips for calendar year 2017 from Westover Tower; FAA activity from the Traffic Flow Management Systems County (TFMSC) for the period from January 2017 through March 2018; and flight data from FlightAware, a non-government business that provides flight tracking and data reports for the 12-month period from April 2017 through March 2018. As a supplement consultation with Westover Tower personal, 439th Airlift Wing pilots and staff, and WMDC staff supplemented the quantitative data.
The data was assembled and organized to form the base year (2018) operations. This data is representative of the average conditions anticipated in the base year.
The noise models contain noise and performance data on nearly all aircraft types commonly flown in the US. Most of the military aircraft data used in AEDT comes from NOISEMAP, the Air Force’s computer model for evaluating military aircraft noise
exposure. The data is used to model an aircraft’s departure and arrival flight profiles and resultant noise exposure. Aircraft that are not specifically included in the database (such as those with unique engine combinations) are modeled using appropriate substitution aircraft and criteria per the FAA’s pre-approved substitution list. Coordination with the FAA’s Office of Environment and Energy was undertaken to assist in the identification of appropriate aircraft to be used in the model when a pre-approved substitution was not available and is included in Appendix C.
The base year of operations (2018) is presented in Table 2.1. The table includes the identification of the fleet mix, its corresponding noise model aircraft type, and the number of average daily arrivals, departures, and closed pattern operations by day and night. On average, the Airport sees approximately 54.1 daily operations (of which 21.21 are performed by the C-5M Super Galaxy), which equates to an annual total of approximately 19,754 aircraft operations.
Overall, operations are predominantly flown by military aircraft (approximately 77%). Most of the aircraft activity at the Airport is flown by the 337th Airlift Squadron flying the C-5 aircraft, which fly approximately 260 days per year. Helicopter operations also represent a significant percentage of the overall activity at the Airport.
DRAFT
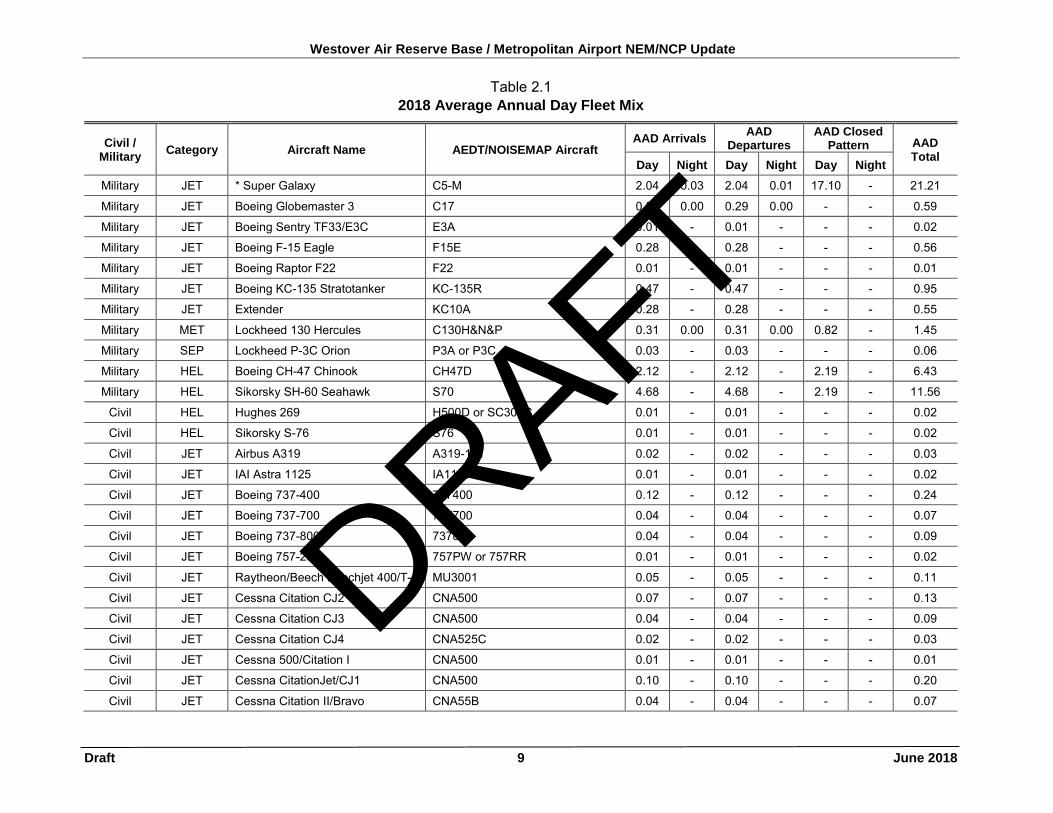
Westover Air Reserve Base / Metropolitan Airport NEM/NCP Update
Draft 9 June 2018
Table 2.1 2018 Average Annual Day Fleet Mix
Civil / Military Category Aircraft Name AEDT/NOISEMAP Aircraft
AAD Arrivals AAD Departures
AAD Closed Pattern AAD
Total Day Night Day Night Day Night Military JET * Super Galaxy C5-M 2.04 0.03 2.04 0.01 17.10 - 21.21
Military JET Boeing Globemaster 3 C17 0.29 0.00 0.29 0.00 - - 0.59
Military JET Boeing Sentry TF33/E3C E3A 0.01 - 0.01 - - - 0.02
Military JET Boeing F-15 Eagle F15E 0.28 - 0.28 - - - 0.56
Military JET Boeing Raptor F22 F22 0.01 - 0.01 - - - 0.01
Military JET Boeing KC-135 Stratotanker KC-135R 0.47 - 0.47 - - - 0.95
Military JET Extender KC10A 0.28 - 0.28 - - - 0.55
Military MET Lockheed 130 Hercules C130H&N&P 0.31 0.00 0.31 0.00 0.82 - 1.45
Military SEP Lockheed P-3C Orion P3A or P3C 0.03 - 0.03 - - - 0.06
Military HEL Boeing CH-47 Chinook CH47D 2.12 - 2.12 - 2.19 - 6.43
Military HEL Sikorsky SH-60 Seahawk S70 4.68 - 4.68 - 2.19 - 11.56
Civil HEL Hughes 269 H500D or SC300C 0.01 - 0.01 - - - 0.02
Civil HEL Sikorsky S-76 S76 0.01 - 0.01 - - - 0.02
Civil JET Airbus A319 A319-131 0.02 - 0.02 - - - 0.03
Civil JET IAI Astra 1125 IA1125 0.01 - 0.01 - - - 0.02
Civil JET Boeing 737-400 737400 0.12 - 0.12 - - - 0.24
Civil JET Boeing 737-700 737700 0.04 - 0.04 - - - 0.07
Civil JET Boeing 737-800 737800 0.04 - 0.04 - - - 0.09
Civil JET Boeing 757-200 757PW or 757RR 0.01 - 0.01 - - - 0.02
Civil JET Raytheon/Beech Beechjet 400/T-1 MU3001 0.05 - 0.05 - - - 0.11
Civil JET Cessna Citation CJ2 CNA500 0.07 - 0.07 - - - 0.13
Civil JET Cessna Citation CJ3 CNA500 0.04 - 0.04 - - - 0.09
Civil JET Cessna Citation CJ4 CNA525C 0.02 - 0.02 - - - 0.03
Civil JET Cessna 500/Citation I CNA500 0.01 - 0.01 - - - 0.01
Civil JET Cessna CitationJet/CJ1 CNA500 0.10 - 0.10 - - - 0.20
Civil JET Cessna Citation II/Bravo CNA55B 0.04 - 0.04 - - - 0.07
DRAFT
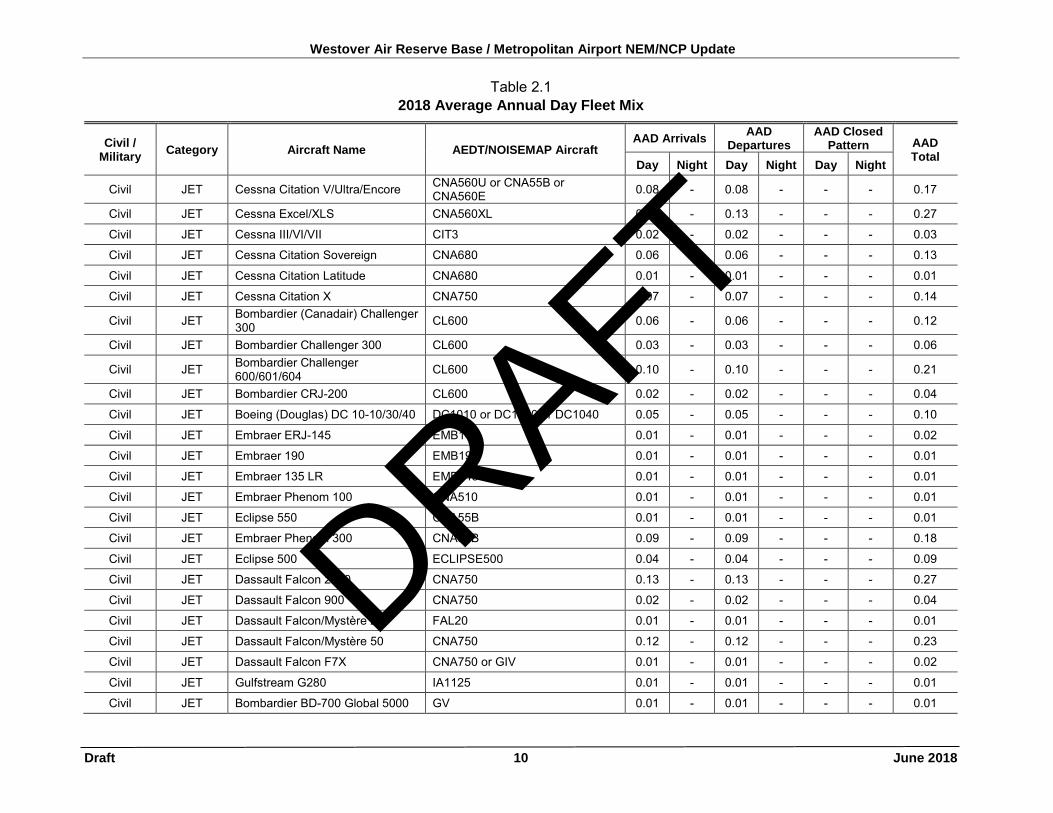
Westover Air Reserve Base / Metropolitan Airport NEM/NCP Update
Draft 10 June 2018
Table 2.1 2018 Average Annual Day Fleet Mix
Civil / Military Category Aircraft Name AEDT/NOISEMAP Aircraft
AAD Arrivals AAD Departures
AAD Closed Pattern AAD
Total Day Night Day Night Day Night
Civil JET Cessna Citation V/Ultra/Encore CNA560U or CNA55B or CNA560E 0.08 - 0.08 - - - 0.17
Civil JET Cessna Excel/XLS CNA560XL 0.13 - 0.13 - - - 0.27
Civil JET Cessna III/VI/VII CIT3 0.02 - 0.02 - - - 0.03
Civil JET Cessna Citation Sovereign CNA680 0.06 - 0.06 - - - 0.13
Civil JET Cessna Citation Latitude CNA680 0.01 - 0.01 - - - 0.01
Civil JET Cessna Citation X CNA750 0.07 - 0.07 - - - 0.14
Civil JET Bombardier (Canadair) Challenger 300 CL600 0.06 - 0.06 - - - 0.12
Civil JET Bombardier Challenger 300 CL600 0.03 - 0.03 - - - 0.06
Civil JET Bombardier Challenger 600/601/604 CL600 0.10 - 0.10 - - - 0.21
Civil JET Bombardier CRJ-200 CL600 0.02 - 0.02 - - - 0.04
Civil JET Boeing (Douglas) DC 10-10/30/40 DC1010 or DC1030 or DC1040 0.05 - 0.05 - - - 0.10
Civil JET Embraer ERJ-145 EMB145 0.01 - 0.01 - - - 0.02
Civil JET Embraer 190 EMB190 0.01 - 0.01 - - - 0.01
Civil JET Embraer 135 LR EMB145 0.01 - 0.01 - - - 0.01
Civil JET Embraer Phenom 100 CNA510 0.01 - 0.01 - - - 0.01
Civil JET Eclipse 550 CNA55B 0.01 - 0.01 - - - 0.01
Civil JET Embraer Phenom 300 CNA55B 0.09 - 0.09 - - - 0.18
Civil JET Eclipse 500 ECLIPSE500 0.04 - 0.04 - - - 0.09
Civil JET Dassault Falcon 2000 CNA750 0.13 - 0.13 - - - 0.27
Civil JET Dassault Falcon 900 CNA750 0.02 - 0.02 - - - 0.04
Civil JET Dassault Falcon/Mystère 20 FAL20 0.01 - 0.01 - - - 0.01
Civil JET Dassault Falcon/Mystère 50 CNA750 0.12 - 0.12 - - - 0.23
Civil JET Dassault Falcon F7X CNA750 or GIV 0.01 - 0.01 - - - 0.02
Civil JET Gulfstream G280 IA1125 0.01 - 0.01 - - - 0.01
Civil JET Bombardier BD-700 Global 5000 GV 0.01 - 0.01 - - - 0.01
DRAFT
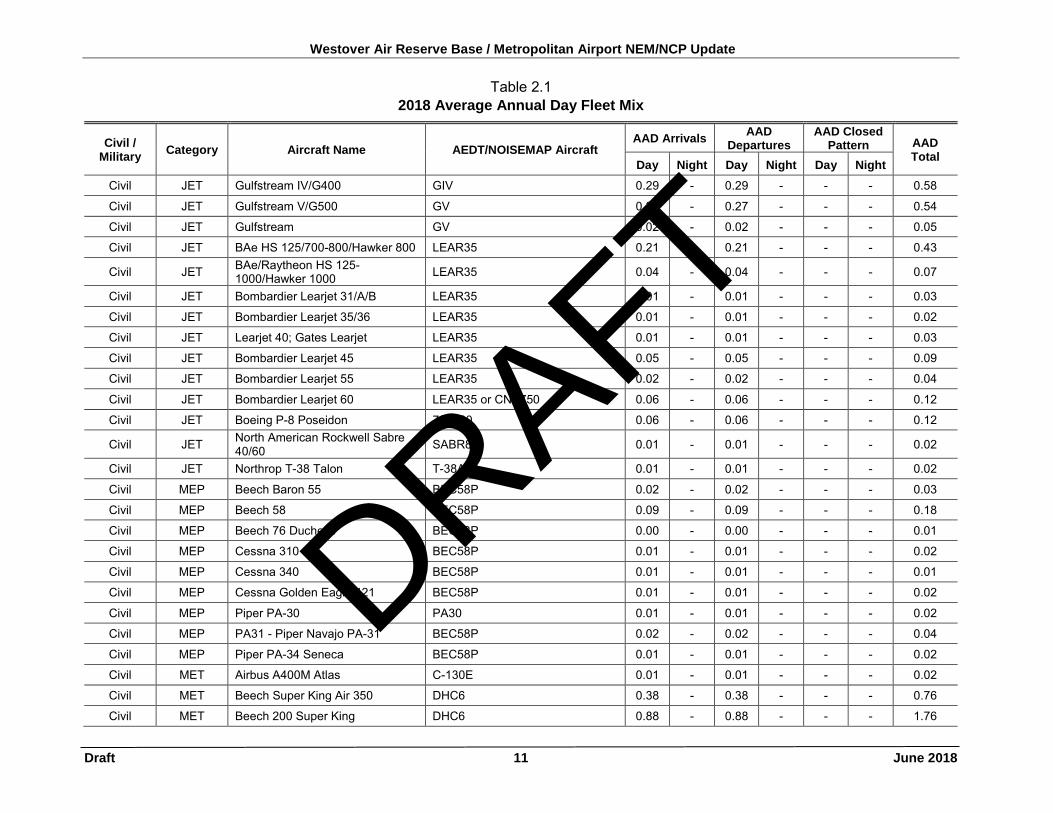
Westover Air Reserve Base / Metropolitan Airport NEM/NCP Update
Draft 11 June 2018
Table 2.1 2018 Average Annual Day Fleet Mix
Civil / Military Category Aircraft Name AEDT/NOISEMAP Aircraft
AAD Arrivals AAD Departures
AAD Closed Pattern AAD
Total Day Night Day Night Day Night Civil JET Gulfstream IV/G400 GIV 0.29 - 0.29 - - - 0.58
Civil JET Gulfstream V/G500 GV 0.27 - 0.27 - - - 0.54
Civil JET Gulfstream GV 0.02 - 0.02 - - - 0.05
Civil JET BAe HS 125/700-800/Hawker 800 LEAR35 0.21 - 0.21 - - - 0.43
Civil JET BAe/Raytheon HS 125-1000/Hawker 1000 LEAR35 0.04 - 0.04 - - - 0.07
Civil JET Bombardier Learjet 31/A/B LEAR35 0.01 - 0.01 - - - 0.03
Civil JET Bombardier Learjet 35/36 LEAR35 0.01 - 0.01 - - - 0.02
Civil JET Learjet 40; Gates Learjet LEAR35 0.01 - 0.01 - - - 0.03
Civil JET Bombardier Learjet 45 LEAR35 0.05 - 0.05 - - - 0.09
Civil JET Bombardier Learjet 55 LEAR35 0.02 - 0.02 - - - 0.04
Civil JET Bombardier Learjet 60 LEAR35 or CNA750 0.06 - 0.06 - - - 0.12
Civil JET Boeing P-8 Poseidon 737800 0.06 - 0.06 - - - 0.12
Civil JET North American Rockwell Sabre 40/60 SABR80 0.01 - 0.01 - - - 0.02
Civil JET Northrop T-38 Talon T-38A 0.01 - 0.01 - - - 0.02
Civil MEP Beech Baron 55 BEC58P 0.02 - 0.02 - - - 0.03
Civil MEP Beech 58 BEC58P 0.09 - 0.09 - - - 0.18
Civil MEP Beech 76 Duchess BEC58P 0.00 - 0.00 - - - 0.01
Civil MEP Cessna 310 BEC58P 0.01 - 0.01 - - - 0.02
Civil MEP Cessna 340 BEC58P 0.01 - 0.01 - - - 0.01
Civil MEP Cessna Golden Eagle 421 BEC58P 0.01 - 0.01 - - - 0.02
Civil MEP Piper PA-30 PA30 0.01 - 0.01 - - - 0.02
Civil MEP PA31 - Piper Navajo PA-31 BEC58P 0.02 - 0.02 - - - 0.04
Civil MEP Piper PA-34 Seneca BEC58P 0.01 - 0.01 - - - 0.02
Civil MET Airbus A400M Atlas C-130E 0.01 - 0.01 - - - 0.02
Civil MET Beech Super King Air 350 DHC6 0.38 - 0.38 - - - 0.76
Civil MET Beech 200 Super King DHC6 0.88 - 0.88 - - - 1.76
DRAFT
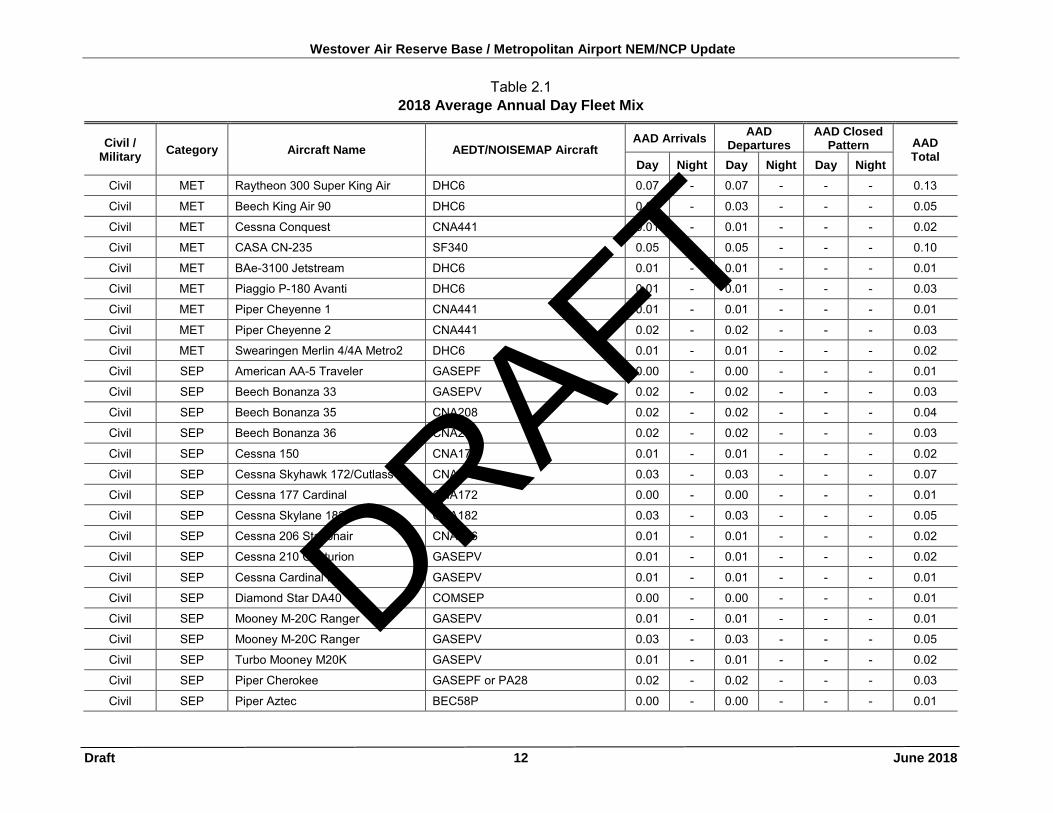
Westover Air Reserve Base / Metropolitan Airport NEM/NCP Update
Draft 12 June 2018
Table 2.1 2018 Average Annual Day Fleet Mix
Civil / Military Category Aircraft Name AEDT/NOISEMAP Aircraft
AAD Arrivals AAD Departures
AAD Closed Pattern AAD
Total Day Night Day Night Day Night Civil MET Raytheon 300 Super King Air DHC6 0.07 - 0.07 - - - 0.13
Civil MET Beech King Air 90 DHC6 0.03 - 0.03 - - - 0.05
Civil MET Cessna Conquest CNA441 0.01 - 0.01 - - - 0.02
Civil MET CASA CN-235 SF340 0.05 - 0.05 - - - 0.10
Civil MET BAe-3100 Jetstream DHC6 0.01 - 0.01 - - - 0.01
Civil MET Piaggio P-180 Avanti DHC6 0.01 - 0.01 - - - 0.03
Civil MET Piper Cheyenne 1 CNA441 0.01 - 0.01 - - - 0.01
Civil MET Piper Cheyenne 2 CNA441 0.02 - 0.02 - - - 0.03
Civil MET Swearingen Merlin 4/4A Metro2 DHC6 0.01 - 0.01 - - - 0.02
Civil SEP American AA-5 Traveler GASEPF 0.00 - 0.00 - - - 0.01
Civil SEP Beech Bonanza 33 GASEPV 0.02 - 0.02 - - - 0.03
Civil SEP Beech Bonanza 35 CNA208 0.02 - 0.02 - - - 0.04
Civil SEP Beech Bonanza 36 CNA208 0.02 - 0.02 - - - 0.03
Civil SEP Cessna 150 CNA172 0.01 - 0.01 - - - 0.02
Civil SEP Cessna Skyhawk 172/Cutlass CNA172 0.03 - 0.03 - - - 0.07
Civil SEP Cessna 177 Cardinal CNA172 0.00 - 0.00 - - - 0.01
Civil SEP Cessna Skylane 182 CNA182 0.03 - 0.03 - - - 0.05
Civil SEP Cessna 206 Stationair CNA206 0.01 - 0.01 - - - 0.02
Civil SEP Cessna 210 Centurion GASEPV 0.01 - 0.01 - - - 0.02
Civil SEP Cessna Cardinal RG GASEPV 0.01 - 0.01 - - - 0.01
Civil SEP Diamond Star DA40 COMSEP 0.00 - 0.00 - - - 0.01
Civil SEP Mooney M-20C Ranger GASEPV 0.01 - 0.01 - - - 0.01
Civil SEP Mooney M-20C Ranger GASEPV 0.03 - 0.03 - - - 0.05
Civil SEP Turbo Mooney M20K GASEPV 0.01 - 0.01 - - - 0.02
Civil SEP Piper Cherokee GASEPF or PA28 0.02 - 0.02 - - - 0.03
Civil SEP Piper Aztec BEC58P 0.00 - 0.00 - - - 0.01
DRAFT
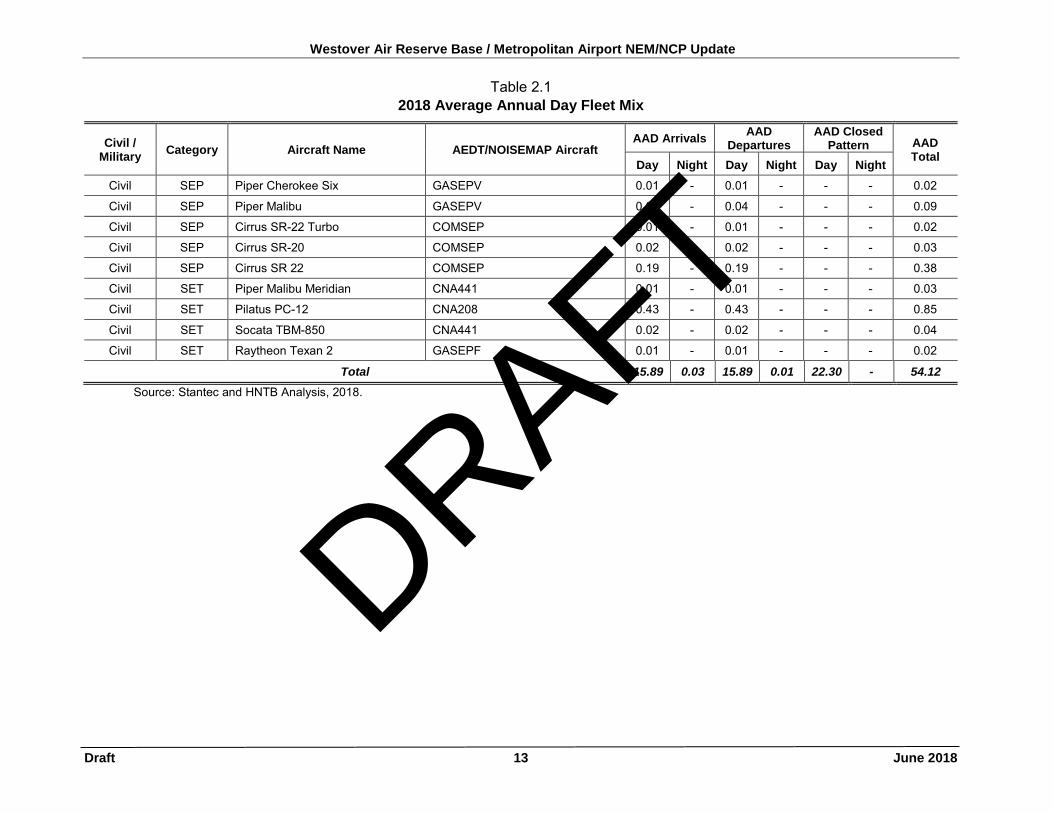
Westover Air Reserve Base / Metropolitan Airport NEM/NCP Update
Draft 13 June 2018
Table 2.1 2018 Average Annual Day Fleet Mix
Civil / Military Category Aircraft Name AEDT/NOISEMAP Aircraft
AAD Arrivals AAD Departures
AAD Closed Pattern AAD
Total Day Night Day Night Day Night Civil SEP Piper Cherokee Six GASEPV 0.01 - 0.01 - - - 0.02
Civil SEP Piper Malibu GASEPV 0.04 - 0.04 - - - 0.09
Civil SEP Cirrus SR-22 Turbo COMSEP 0.01 - 0.01 - - - 0.02
Civil SEP Cirrus SR-20 COMSEP 0.02 - 0.02 - - - 0.03
Civil SEP Cirrus SR 22 COMSEP 0.19 - 0.19 - - - 0.38
Civil SET Piper Malibu Meridian CNA441 0.01 - 0.01 - - - 0.03
Civil SET Pilatus PC-12 CNA208 0.43 - 0.43 - - - 0.85
Civil SET Socata TBM-850 CNA441 0.02 - 0.02 - - - 0.04
Civil SET Raytheon Texan 2 GASEPF 0.01 - 0.01 - - - 0.02
Total 15.89 0.03 15.89 0.01 22.30 - 54.12 Source: Stantec and HNTB Analysis, 2018.
DRAFT
Westover Air Reserve Base / Metropolitan Airport NEM/NCP Update
Draft 14 June 2018
Aircraft Flight Profiles
Flight profiles model the vertical paths of aircraft during departure and arrival to determine the altitude, speed, and engine thrust of an aircraft at any point along a flight track. The noise model uses this information to calculate noise exposure on the ground along each track section.
Profiles are unique to each aircraft type and are based on operating procedures, temperature, and aircraft operating weight. Detailed information on aircraft flight profiles, under varying conditions, is stored in the noise model aircraft database.
The climb rate and flight profile of departing aircraft can vary considerably. New, modern aircraft have higher thrust engines and improved wing designs which results in an increased climb rate as compared to older aircraft. Modern jet engines are also much quieter than their predecessors, even though they can produce more thrust. Temperature, takeoff weight, and airline operating procedures are also important factors that affect climb rate.
The AEDT aircraft database groups aircraft-specific profiles by stage length, which refers to the length of the trip to be made by the aircraft type. For departures, AEDT assumes aircraft weight increases with stage, or trip length, because of the need for more fuel and that each aircraft type’s takeoff distance and climb performance is different for each stage length. High-weight (long trip, high stage length) aircraft have increased takeoff distances and lower climb rates than lighter (short trip) aircraft for a given aircraft type.
Arriving civilian aircraft do not use stage lengths, as they are modeled using a standard three-degree approach path. AEDT has a database of standard arrival flight profiles for each modeled aircraft type.
When the 2013 AICUZ and the 2014 NEM studies were developed, there were 16 C-5A/Bs based at CEF. The first C-5B left CEF for an upgrade to a C-5M in 2015. Due to budget cuts in 2015, the number of the based C-5s were reduced from 16 to eight. In January 2017, the last C-5B left CEF for the scheduled upgrade. Ever since, all eight C-5Bs have been upgraded to C-5Ms and returned to CEF.
Information for the operations flown by the C-5A/B aircraft were collected and modeled in the 2013 AICUZ study. After consultation with a 439th Airlift Wing C-5M pilot, the flight paths modeled in the 2013 AICUZ study were confirmed to remain valid for the C-5M.1 The C-5M standard flight profiles were provided by the USAF noise modeling team and were also confirmed by the C-5M pilot.
Runway Use
Runway use is determined by several factors, including safety, wind, weather, traffic demand, runway capacity, direction of flight, and prescribed runway use procedures. The Westover Tower assigns runway use with consideration to all of these factors. Runway use was evaluated based on a series of categories, including by military and civilian operations, and by aircraft type including jets, single and multi-engine turboprop, single- and multi-engine piston, and helicopter operations. Table 2.2 presents the overall runway use, including military and civilian operations.
DRAFT
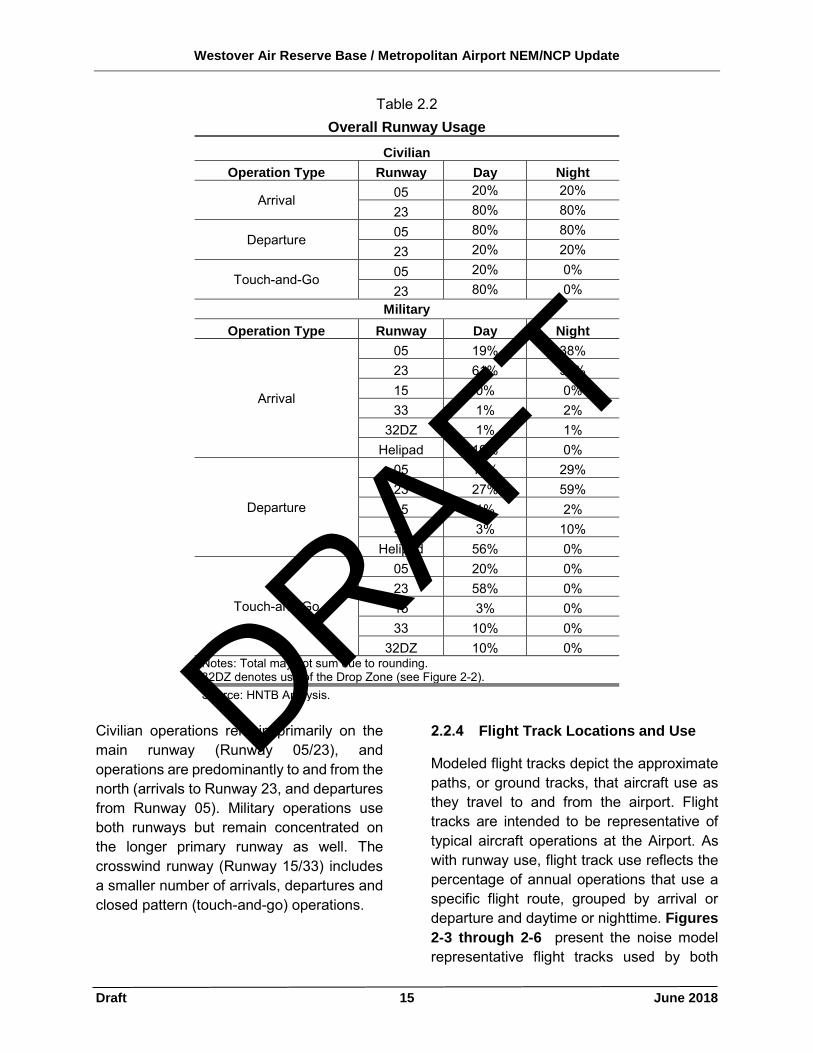
Westover Air Reserve Base / Metropolitan Airport NEM/NCP Update
Draft 15 June 2018
Table 2.2 Overall Runway Usage
Civilian Operation Type Runway Day Night
Arrival 05 20% 20% 23 80% 80%
Departure 05 80% 80% 23 20% 20%
Touch-and-Go 05 20% 0% 23 80% 0%
Military Operation Type Runway Day Night
Arrival
05 19% 38% 23 61% 59% 15 0% 0% 33 1% 2%
32DZ 1% 1% Helipad 19% 0%
Departure
05 13% 29% 23 27% 59% 15 1% 2% 33 3% 10%
Helipad 56% 0%
Touch-and-Go
05 20% 0% 23 58% 0% 15 3% 0% 33 10% 0%
32DZ 10% 0% Notes: Total may not sum due to rounding. 32DZ denotes use of the Drop Zone (see Figure 2-2). Source: HNTB Analysis.
Civilian operations remain primarily on the main runway (Runway 05/23), and operations are predominantly to and from the north (arrivals to Runway 23, and departures from Runway 05). Military operations use both runways but remain concentrated on the longer primary runway as well. The crosswind runway (Runway 15/33) includes a smaller number of arrivals, departures and closed pattern (touch-and-go) operations.
Flight Track Locations and Use
Modeled flight tracks depict the approximate paths, or ground tracks, that aircraft use as they travel to and from the airport. Flight tracks are intended to be representative of typical aircraft operations at the Airport. As with runway use, flight track use reflects the percentage of annual operations that use a specific flight route, grouped by arrival or departure and daytime or nighttime. Figures 2-3 through 2-6 present the noise model representative flight tracks used by both
DRAFT
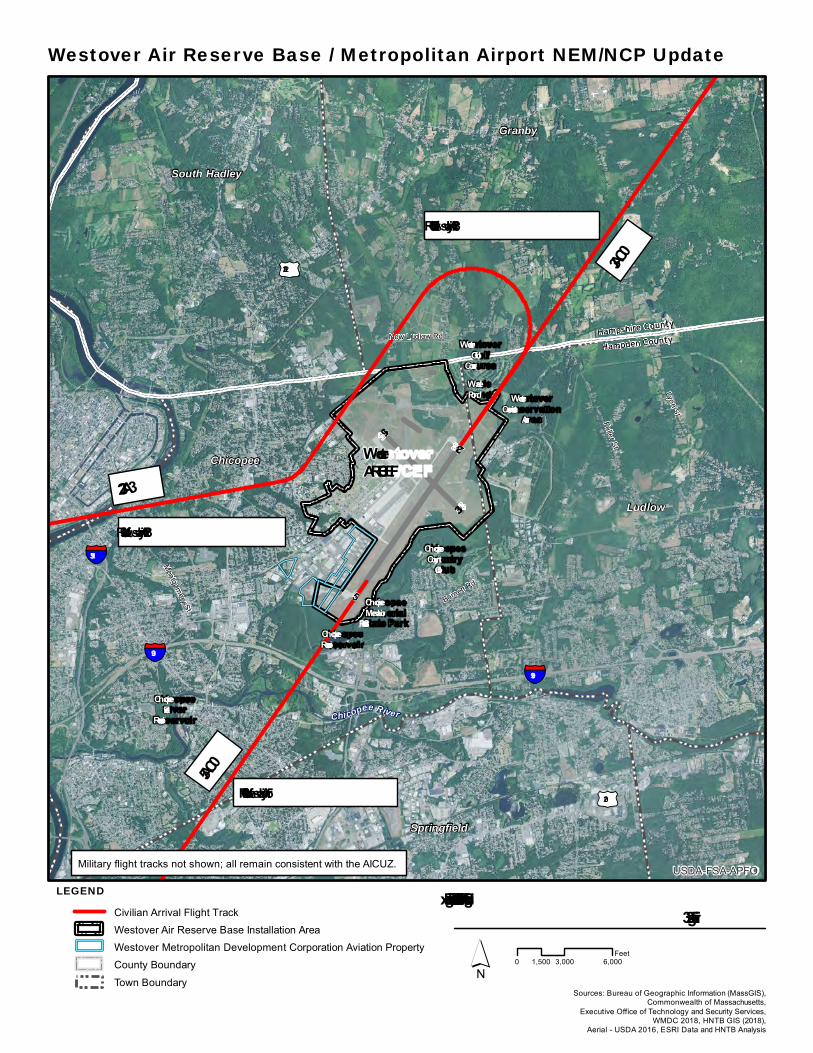
100% for Rw y 5 Arrivals
98.1% for Rw y 23 Arrivals5AC0
3AC0
23A3WestoverARB/CEF
Hampshire County
Hampden County
§¦90§¦90
§¦291
§¦391
£¤202
£¤20
Montgom
ery St
Burnett Rd
New Ludlow Rd
Fuller St
Lyon St
523
33
15
Ch icopeeRiver
Reservoir Chicopee River
Ch icopeeReservoir
Ch icopeeMemorialState Park
WestoverGolfCourseWadePond Westover
ConservationArea
Ch icopeeCountryClub
1.9% for Rw y 23 Arrivals
Granby
South Hadley
Chicopee
Ludlow
Springfield
USDA-FSA-APFO
Westover Air Reserve Base / Metropolitan Airport NEM/NCP Update
´ 0 3,000 6,0001,500Feet
Sources: Bureau of Geographic Information (MassGIS),Commonwealth of Massachusetts,
Executive Office of Technology and Security Services,WMDC 2018, HNTB GIS (2018),
Aerial - USDA 2016, ESRI Data and HNTB Analysis
Fligh t Tracks – Civilian Fix ed Wing ArrivalFigure 2-3
LEGENDCivilian Arrival Flight Track
Westover Air Reserve Base Installation Area
Westover Metropolitan Development Corporation Aviation Property
County Boundary
Town Boundary
Military flight tracks not shown; all remain consistent with the AICUZ.
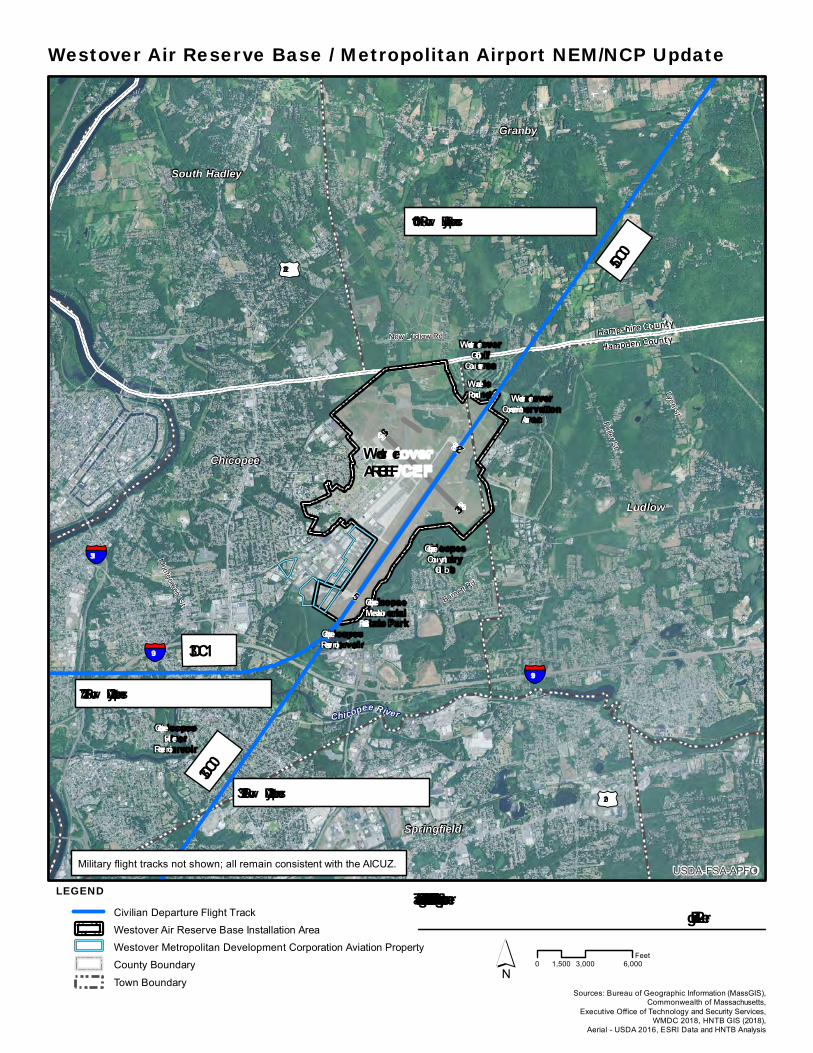
72.3% for Rw y 23 Departu res
100% for Rw y 05 Departu res3DC0
5DC0
3DC1
27.7% for Rw y 23 Departu res
Westov erARB/CEF
Hampshire County
Hampden County
§¦90§¦90
§¦291
§¦391
£¤202
£¤20
Montgom
ery St Burnett Rd
New Ludlow Rd
Fuller St
Lyon St
523
33
15
ChicopeeRiv er
Reserv oir
Chicopee River
ChicopeeReserv oir
ChicopeeMemorialState Park
Westov erGolfCou rseWadePond Westov er
Conserv ationArea
ChicopeeCou ntryClu b
Granby
South Hadley
Chicopee
Ludlow
Springfield
USDA-FSA-APFO
Westover Air Reserve Base / Metropolitan Airport NEM/NCP Update
Flight Tracks – Civ ilian Fixed Wing Departu reFigu re 2-4
LEGENDCivilian Departure Flight Track
Westover Air Reserve Base Installation Area
Westover Metropolitan Development Corporation Aviation Property
County Boundary
Town Boundary
Military flight tracks not shown; all remain consistent with the AICUZ.
´ 0 3,000 6,0001,500Feet
Sources: Bureau of Geographic Information (MassGIS),Commonwealth of Massachusetts,
Executive Office of Technology and Security Services,WMDC 2018, HNTB GIS (2018),
Aerial - USDA 2016, ESRI Data and HNTB Analysis
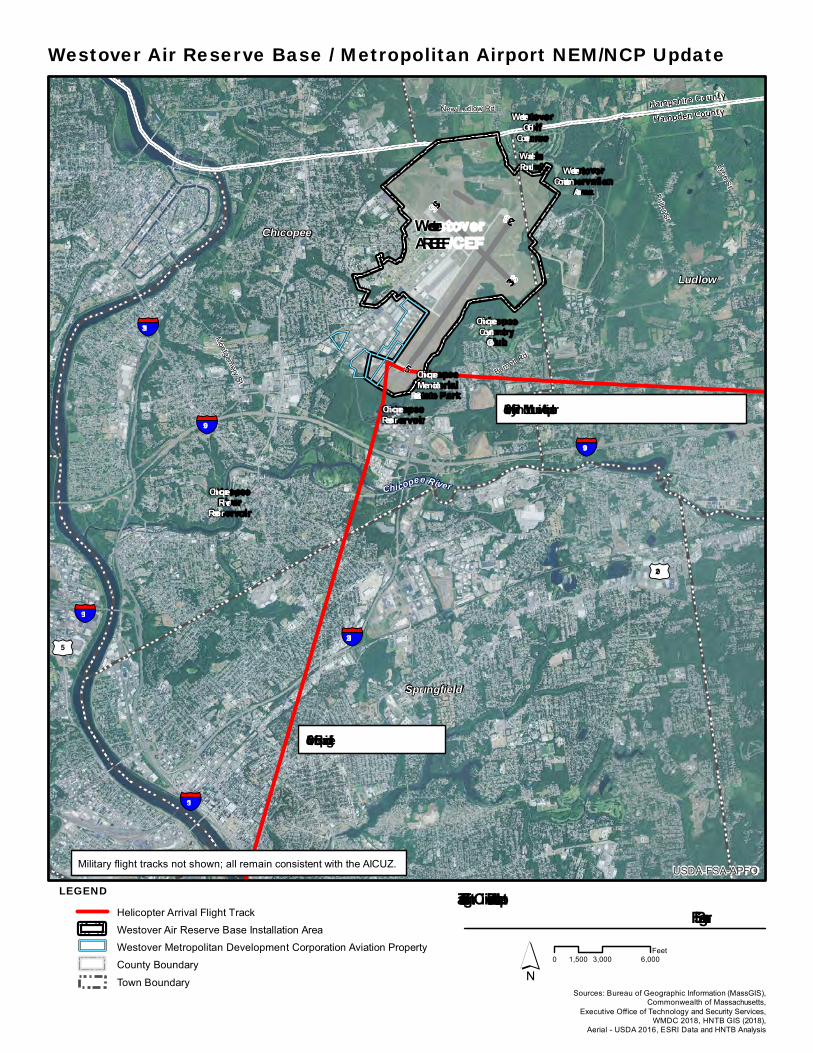
50% from Springfield
50% from Plymouth Municipal Airport
WestoverARB/CEF
Hampshire County
Hampden County
§¦90§¦90
§¦291
§¦391
§¦91
§¦91
£¤5
£¤20M
ontgomery St
Burnett Rd
New Ludlow Rd
Fuller St
Lyon St
5
23
33
15
ChicopeeRiver
Reservoir
Chicopee River
ChicopeeReservoir
ChicopeeMemorialState Park
WestoverGolfCourseWadePond Westover
ConservationArea
ChicopeeCountryClub
Chicopee
Ludlow
Springfield
USDA-FSA-APFO
Westover Air Reserve Base / Metropolitan Airport NEM/NCP Update
Flight Tracks – Civilian Helicopter ArrivalFigure 2-5
LEGENDHelicopter Arrival Flight Track
Westover Air Reserve Base Installation Area
Westover Metropolitan Development Corporation Aviation Property
County Boundary
Town Boundary
Military flight tracks not shown; all remain consistent with the AICUZ.
´ 0 3,000 6,0001,500Feet
Sources: Bureau of Geographic Information (MassGIS),Commonwealth of Massachusetts,
Executive Office of Technology and Security Services,WMDC 2018, HNTB GIS (2018),
Aerial - USDA 2016, ESRI Data and HNTB Analysis
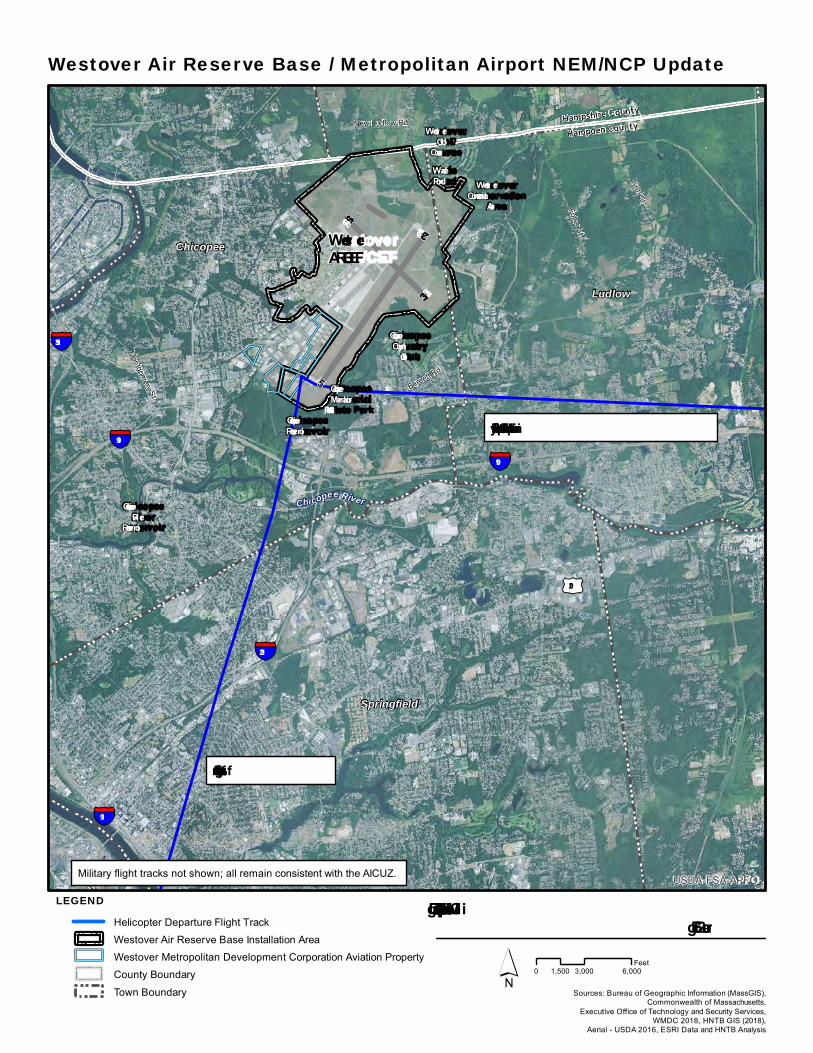
50% to Spring field
50% to Plymouth Municipal Airport
WestoverARB/CEF
Hampshire County
Hampden County
§¦90§¦90
§¦291
§¦391
§¦91
£¤20
Montgom
ery St
Burnett Rd
New Ludlow Rd
Fuller St
Lyon St
5
23
33
15
ChicopeeRiver
Reservoir
Chicopee River
ChicopeeReservoir
ChicopeeMemorialState Park
WestoverGolfCourseWadePond Westover
ConservationArea
ChicopeeCountryClub
Chicopee
Ludlow
Springfield
USDA-FSA-APFO
Flig ht Tracks – Civilian Helicopter DepartureFig ure 2-6
LEGENDHelicopter Departure Flight Track
Westover Air Reserve Base Installation Area
Westover Metropolitan Development Corporation Aviation Property
County Boundary
Town Boundary
Military flight tracks not shown; all remain consistent with the AICUZ.
Westover Air Reserve Base / Metropolitan Airport NEM/NCP Update
´ 0 3,000 6,0001,500Feet
Sources: Bureau of Geographic Information (MassGIS),Commonwealth of Massachusetts,
Executive Office of Technology and Security Services,WMDC 2018, HNTB GIS (2018),
Aerial - USDA 2016, ESRI Data and HNTB Analysis
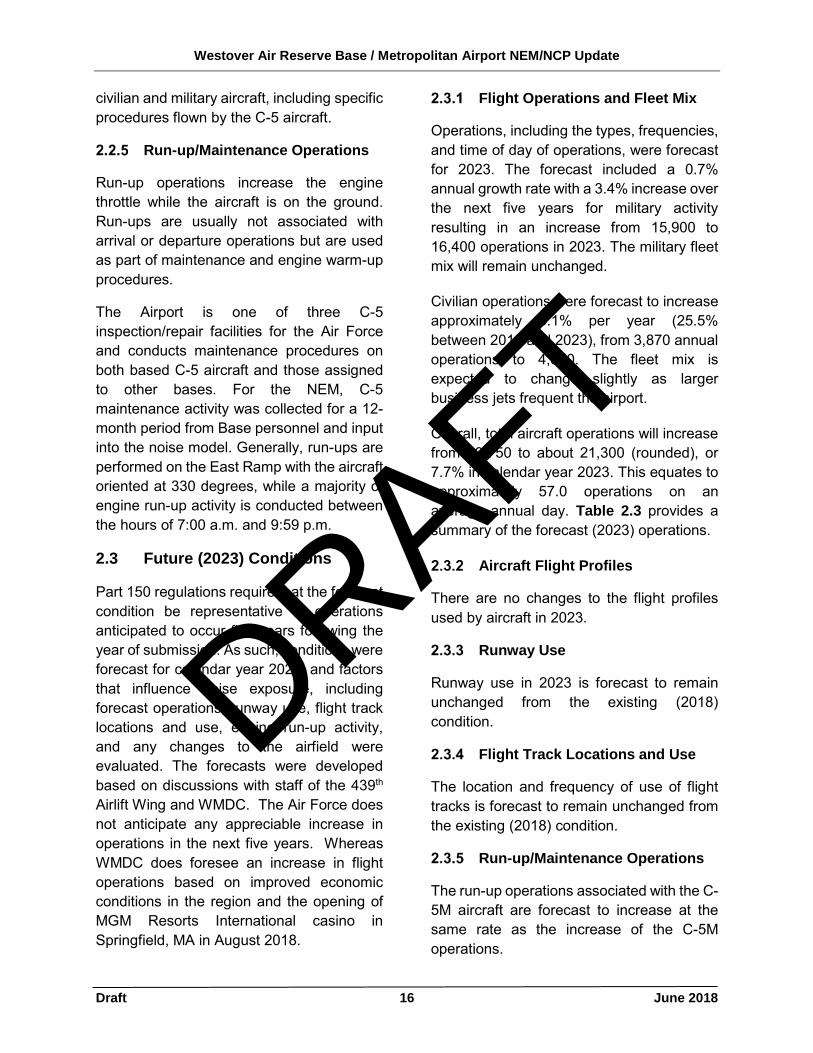
Westover Air Reserve Base / Metropolitan Airport NEM/NCP Update
Draft 16 June 2018
civilian and military aircraft, including specific procedures flown by the C-5 aircraft.
Run-up/Maintenance Operations
Run-up operations increase the engine throttle while the aircraft is on the ground. Run-ups are usually not associated with arrival or departure operations but are used as part of maintenance and engine warm-up procedures.
The Airport is one of three C-5 inspection/repair facilities for the Air Force and conducts maintenance procedures on both based C-5 aircraft and those assigned to other bases. For the NEM, C-5 maintenance activity was collected for a 12-month period from Base personnel and input into the noise model. Generally, run-ups are performed on the East Ramp with the aircraft oriented at 330 degrees, while a majority of engine run-up activity is conducted between the hours of 7:00 a.m. and 9:59 p.m.
2.3 Future (2023) Conditions
Part 150 regulations require that the forecast condition be representative of operations anticipated to occur five years following the year of submission. As such, conditions were forecast for calendar year 2023, and factors that influence noise exposure, including forecast operations, runway use, flight track locations and use, engine run-up activity, and any changes to the airfield were evaluated. The forecasts were developed based on discussions with staff of the 439th Airlift Wing and WMDC. The Air Force does not anticipate any appreciable increase in operations in the next five years. Whereas WMDC does foresee an increase in flight operations based on improved economic conditions in the region and the opening of MGM Resorts International casino in Springfield, MA in August 2018.
Flight Operations and Fleet Mix
Operations, including the types, frequencies, and time of day of operations, were forecast for 2023. The forecast included a 0.7% annual growth rate with a 3.4% increase over the next five years for military activity resulting in an increase from 15,900 to 16,400 operations in 2023. The military fleet mix will remain unchanged.
Civilian operations were forecast to increase approximately 5.1% per year (25.5% between 2018 and 2023), from 3,870 annual operations to 4,850. The fleet mix is expected to change slightly as larger business jets frequent the airport.
Overall, total aircraft operations will increase from 19,750 to about 21,300 (rounded), or 7.7% in calendar year 2023. This equates to approximately 57.0 operations on an average annual day. Table 2.3 provides a summary of the forecast (2023) operations.
Aircraft Flight Profiles
There are no changes to the flight profiles used by aircraft in 2023.
Runway Use
Runway use in 2023 is forecast to remain unchanged from the existing (2018) condition.
Flight Track Locations and Use
The location and frequency of use of flight tracks is forecast to remain unchanged from the existing (2018) condition.
Run-up/Maintenance Operations
The run-up operations associated with the C-5M aircraft are forecast to increase at the same rate as the increase of the C-5M operations.
DRAFT
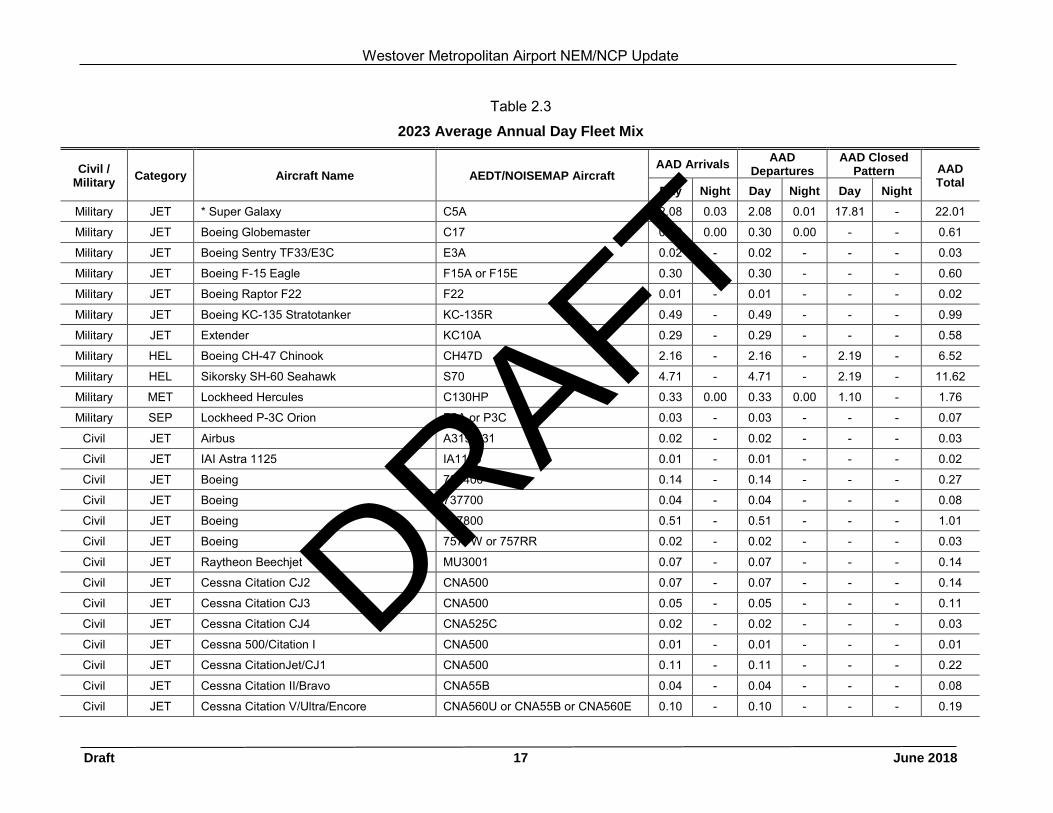
Westover Metropolitan Airport NEM/NCP Update
Draft 17 June 2018
Table 2.3
2023 Average Annual Day Fleet Mix
Civil / Military Category Aircraft Name AEDT/NOISEMAP Aircraft
AAD Arrivals AAD Departures
AAD Closed Pattern AAD
Total Day Night Day Night Day Night
Military JET * Super Galaxy C5A 2.08 0.03 2.08 0.01 17.81 - 22.01
Military JET Boeing Globemaster C17 0.30 0.00 0.30 0.00 - - 0.61
Military JET Boeing Sentry TF33/E3C E3A 0.02 - 0.02 - - - 0.03
Military JET Boeing F-15 Eagle F15A or F15E 0.30 - 0.30 - - - 0.60
Military JET Boeing Raptor F22 F22 0.01 - 0.01 - - - 0.02
Military JET Boeing KC-135 Stratotanker KC-135R 0.49 - 0.49 - - - 0.99
Military JET Extender KC10A 0.29 - 0.29 - - - 0.58
Military HEL Boeing CH-47 Chinook CH47D 2.16 - 2.16 - 2.19 - 6.52
Military HEL Sikorsky SH-60 Seahawk S70 4.71 - 4.71 - 2.19 - 11.62
Military MET Lockheed Hercules C130HP 0.33 0.00 0.33 0.00 1.10 - 1.76
Military SEP Lockheed P-3C Orion P3A or P3C 0.03 - 0.03 - - - 0.07
Civil JET Airbus A319-131 0.02 - 0.02 - - - 0.03
Civil JET IAI Astra 1125 IA1125 0.01 - 0.01 - - - 0.02
Civil JET Boeing 737400 0.14 - 0.14 - - - 0.27
Civil JET Boeing 737700 0.04 - 0.04 - - - 0.08
Civil JET Boeing 737800 0.51 - 0.51 - - - 1.01
Civil JET Boeing 757PW or 757RR 0.02 - 0.02 - - - 0.03
Civil JET Raytheon Beechjet MU3001 0.07 - 0.07 - - - 0.14
Civil JET Cessna Citation CJ2 CNA500 0.07 - 0.07 - - - 0.14
Civil JET Cessna Citation CJ3 CNA500 0.05 - 0.05 - - - 0.11
Civil JET Cessna Citation CJ4 CNA525C 0.02 - 0.02 - - - 0.03
Civil JET Cessna 500/Citation I CNA500 0.01 - 0.01 - - - 0.01
Civil JET Cessna CitationJet/CJ1 CNA500 0.11 - 0.11 - - - 0.22
Civil JET Cessna Citation II/Bravo CNA55B 0.04 - 0.04 - - - 0.08
Civil JET Cessna Citation V/Ultra/Encore CNA560U or CNA55B or CNA560E 0.10 - 0.10 - - - 0.19
DRAFT
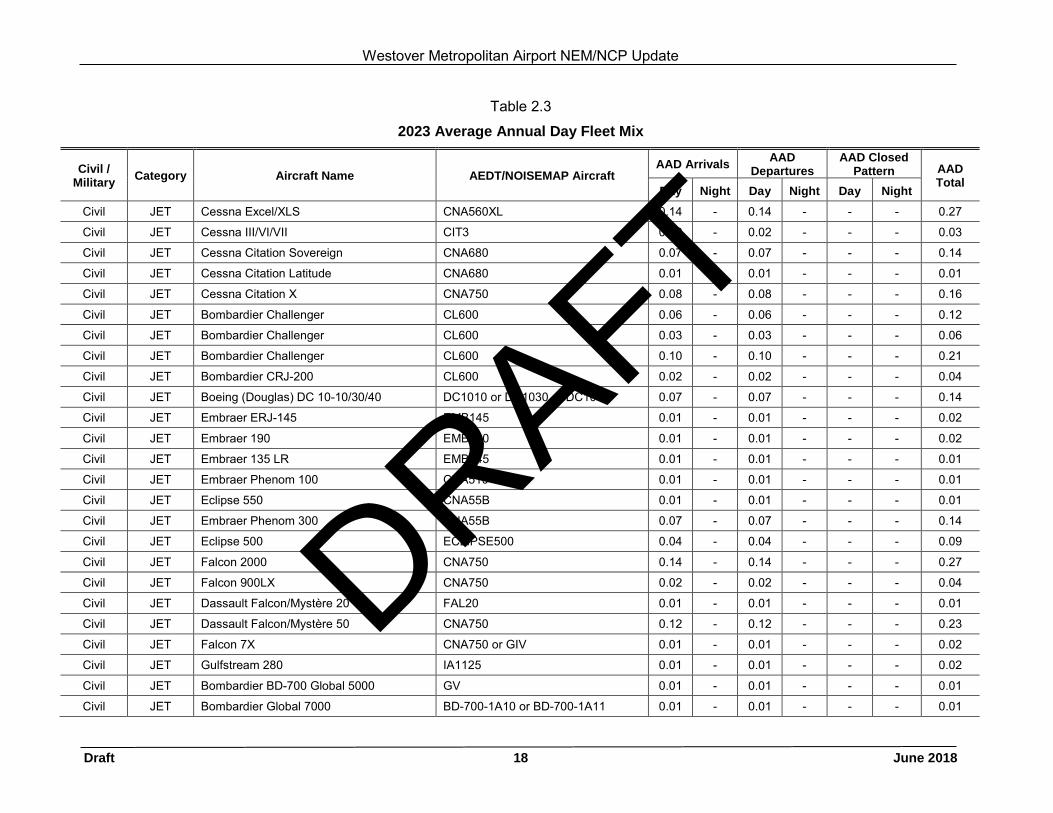
Westover Metropolitan Airport NEM/NCP Update
Draft 18 June 2018
Table 2.3
2023 Average Annual Day Fleet Mix
Civil / Military Category Aircraft Name AEDT/NOISEMAP Aircraft
AAD Arrivals AAD Departures
AAD Closed Pattern AAD
Total Day Night Day Night Day Night
Civil JET Cessna Excel/XLS CNA560XL 0.14 - 0.14 - - - 0.27
Civil JET Cessna III/VI/VII CIT3 0.02 - 0.02 - - - 0.03
Civil JET Cessna Citation Sovereign CNA680 0.07 - 0.07 - - - 0.14
Civil JET Cessna Citation Latitude CNA680 0.01 - 0.01 - - - 0.01
Civil JET Cessna Citation X CNA750 0.08 - 0.08 - - - 0.16
Civil JET Bombardier Challenger CL600 0.06 - 0.06 - - - 0.12
Civil JET Bombardier Challenger CL600 0.03 - 0.03 - - - 0.06
Civil JET Bombardier Challenger CL600 0.10 - 0.10 - - - 0.21
Civil JET Bombardier CRJ-200 CL600 0.02 - 0.02 - - - 0.04
Civil JET Boeing (Douglas) DC 10-10/30/40 DC1010 or DC1030 or DC1040 0.07 - 0.07 - - - 0.14
Civil JET Embraer ERJ-145 EMB145 0.01 - 0.01 - - - 0.02
Civil JET Embraer 190 EMB190 0.01 - 0.01 - - - 0.02
Civil JET Embraer 135 LR EMB145 0.01 - 0.01 - - - 0.01
Civil JET Embraer Phenom 100 CNA510 0.01 - 0.01 - - - 0.01
Civil JET Eclipse 550 CNA55B 0.01 - 0.01 - - - 0.01
Civil JET Embraer Phenom 300 CNA55B 0.07 - 0.07 - - - 0.14
Civil JET Eclipse 500 ECLIPSE500 0.04 - 0.04 - - - 0.09
Civil JET Falcon 2000 CNA750 0.14 - 0.14 - - - 0.27
Civil JET Falcon 900LX CNA750 0.02 - 0.02 - - - 0.04
Civil JET Dassault Falcon/Mystère 20 FAL20 0.01 - 0.01 - - - 0.01
Civil JET Dassault Falcon/Mystère 50 CNA750 0.12 - 0.12 - - - 0.23
Civil JET Falcon 7X CNA750 or GIV 0.01 - 0.01 - - - 0.02
Civil JET Gulfstream 280 IA1125 0.01 - 0.01 - - - 0.02
Civil JET Bombardier BD-700 Global 5000 GV 0.01 - 0.01 - - - 0.01
Civil JET Bombardier Global 7000 BD-700-1A10 or BD-700-1A11 0.01 - 0.01 - - - 0.01
DRAFT
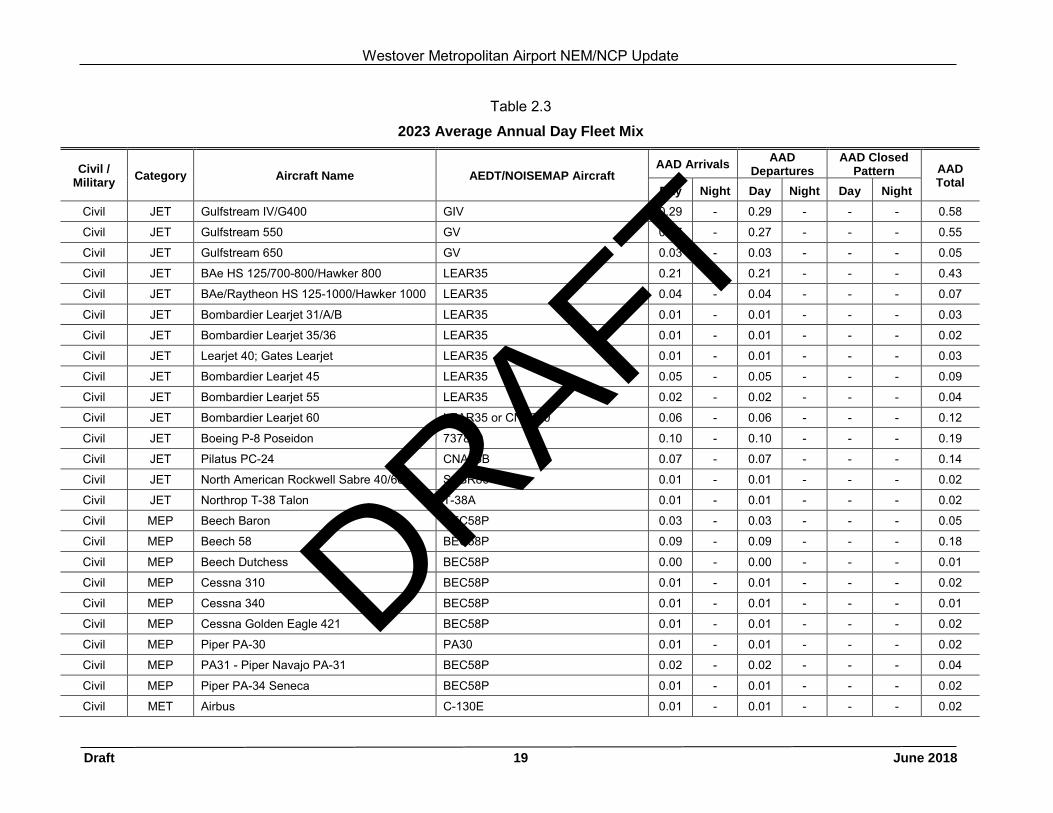
Westover Metropolitan Airport NEM/NCP Update
Draft 19 June 2018
Table 2.3
2023 Average Annual Day Fleet Mix
Civil / Military Category Aircraft Name AEDT/NOISEMAP Aircraft
AAD Arrivals AAD Departures
AAD Closed Pattern AAD
Total Day Night Day Night Day Night
Civil JET Gulfstream IV/G400 GIV 0.29 - 0.29 - - - 0.58
Civil JET Gulfstream 550 GV 0.27 - 0.27 - - - 0.55
Civil JET Gulfstream 650 GV 0.03 - 0.03 - - - 0.05
Civil JET BAe HS 125/700-800/Hawker 800 LEAR35 0.21 - 0.21 - - - 0.43
Civil JET BAe/Raytheon HS 125-1000/Hawker 1000 LEAR35 0.04 - 0.04 - - - 0.07
Civil JET Bombardier Learjet 31/A/B LEAR35 0.01 - 0.01 - - - 0.03
Civil JET Bombardier Learjet 35/36 LEAR35 0.01 - 0.01 - - - 0.02
Civil JET Learjet 40; Gates Learjet LEAR35 0.01 - 0.01 - - - 0.03
Civil JET Bombardier Learjet 45 LEAR35 0.05 - 0.05 - - - 0.09
Civil JET Bombardier Learjet 55 LEAR35 0.02 - 0.02 - - - 0.04
Civil JET Bombardier Learjet 60 LEAR35 or CNA750 0.06 - 0.06 - - - 0.12
Civil JET Boeing P-8 Poseidon 737800 0.10 - 0.10 - - - 0.19
Civil JET Pilatus PC-24 CNA55B 0.07 - 0.07 - - - 0.14
Civil JET North American Rockwell Sabre 40/60 SABR80 0.01 - 0.01 - - - 0.02
Civil JET Northrop T-38 Talon T-38A 0.01 - 0.01 - - - 0.02
Civil MEP Beech Baron BEC58P 0.03 - 0.03 - - - 0.05
Civil MEP Beech 58 BEC58P 0.09 - 0.09 - - - 0.18
Civil MEP Beech Dutchess BEC58P 0.00 - 0.00 - - - 0.01
Civil MEP Cessna 310 BEC58P 0.01 - 0.01 - - - 0.02
Civil MEP Cessna 340 BEC58P 0.01 - 0.01 - - - 0.01
Civil MEP Cessna Golden Eagle 421 BEC58P 0.01 - 0.01 - - - 0.02
Civil MEP Piper PA-30 PA30 0.01 - 0.01 - - - 0.02
Civil MEP PA31 - Piper Navajo PA-31 BEC58P 0.02 - 0.02 - - - 0.04
Civil MEP Piper PA-34 Seneca BEC58P 0.01 - 0.01 - - - 0.02
Civil MET Airbus C-130E 0.01 - 0.01 - - - 0.02
DRAFT
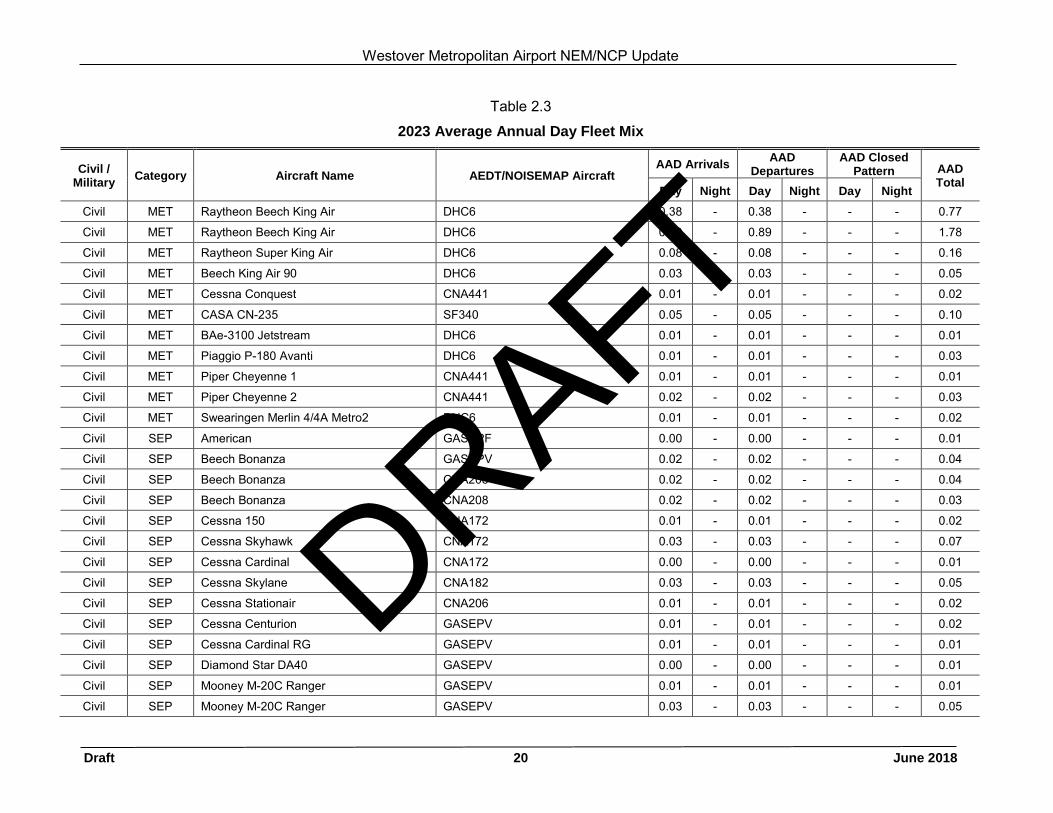
Westover Metropolitan Airport NEM/NCP Update
Draft 20 June 2018
Table 2.3
2023 Average Annual Day Fleet Mix
Civil / Military Category Aircraft Name AEDT/NOISEMAP Aircraft
AAD Arrivals AAD Departures
AAD Closed Pattern AAD
Total Day Night Day Night Day Night
Civil MET Raytheon Beech King Air DHC6 0.38 - 0.38 - - - 0.77
Civil MET Raytheon Beech King Air DHC6 0.89 - 0.89 - - - 1.78
Civil MET Raytheon Super King Air DHC6 0.08 - 0.08 - - - 0.16
Civil MET Beech King Air 90 DHC6 0.03 - 0.03 - - - 0.05
Civil MET Cessna Conquest CNA441 0.01 - 0.01 - - - 0.02
Civil MET CASA CN-235 SF340 0.05 - 0.05 - - - 0.10
Civil MET BAe-3100 Jetstream DHC6 0.01 - 0.01 - - - 0.01
Civil MET Piaggio P-180 Avanti DHC6 0.01 - 0.01 - - - 0.03
Civil MET Piper Cheyenne 1 CNA441 0.01 - 0.01 - - - 0.01
Civil MET Piper Cheyenne 2 CNA441 0.02 - 0.02 - - - 0.03
Civil MET Swearingen Merlin 4/4A Metro2 DHC6 0.01 - 0.01 - - - 0.02
Civil SEP American GASEPF 0.00 - 0.00 - - - 0.01
Civil SEP Beech Bonanza GASEPV 0.02 - 0.02 - - - 0.04
Civil SEP Beech Bonanza CNA208 0.02 - 0.02 - - - 0.04
Civil SEP Beech Bonanza CNA208 0.02 - 0.02 - - - 0.03
Civil SEP Cessna 150 CNA172 0.01 - 0.01 - - - 0.02
Civil SEP Cessna Skyhawk CNA172 0.03 - 0.03 - - - 0.07
Civil SEP Cessna Cardinal CNA172 0.00 - 0.00 - - - 0.01
Civil SEP Cessna Skylane CNA182 0.03 - 0.03 - - - 0.05
Civil SEP Cessna Stationair CNA206 0.01 - 0.01 - - - 0.02
Civil SEP Cessna Centurion GASEPV 0.01 - 0.01 - - - 0.02
Civil SEP Cessna Cardinal RG GASEPV 0.01 - 0.01 - - - 0.01
Civil SEP Diamond Star DA40 GASEPV 0.00 - 0.00 - - - 0.01
Civil SEP Mooney M-20C Ranger GASEPV 0.01 - 0.01 - - - 0.01
Civil SEP Mooney M-20C Ranger GASEPV 0.03 - 0.03 - - - 0.05
DRAFT
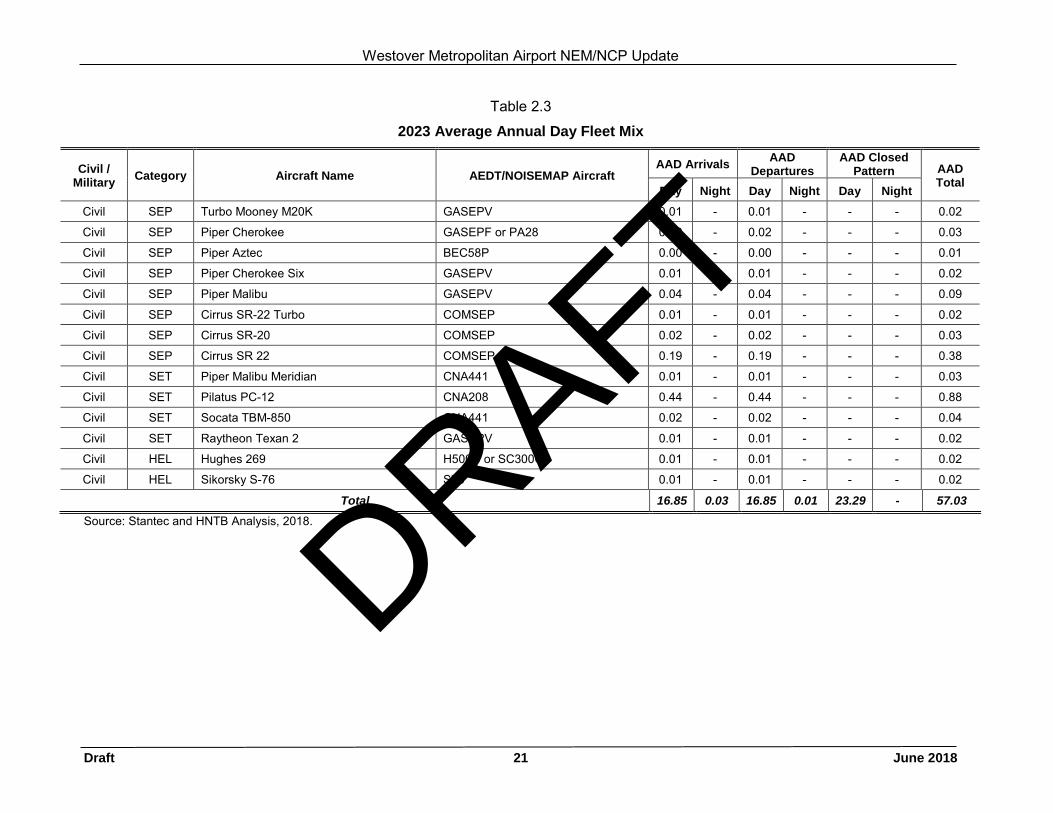
Westover Metropolitan Airport NEM/NCP Update
Draft 21 June 2018
Table 2.3
2023 Average Annual Day Fleet Mix
Civil / Military Category Aircraft Name AEDT/NOISEMAP Aircraft
AAD Arrivals AAD Departures
AAD Closed Pattern AAD
Total Day Night Day Night Day Night
Civil SEP Turbo Mooney M20K GASEPV 0.01 - 0.01 - - - 0.02
Civil SEP Piper Cherokee GASEPF or PA28 0.02 - 0.02 - - - 0.03
Civil SEP Piper Aztec BEC58P 0.00 - 0.00 - - - 0.01
Civil SEP Piper Cherokee Six GASEPV 0.01 - 0.01 - - - 0.02
Civil SEP Piper Malibu GASEPV 0.04 - 0.04 - - - 0.09
Civil SEP Cirrus SR-22 Turbo COMSEP 0.01 - 0.01 - - - 0.02
Civil SEP Cirrus SR-20 COMSEP 0.02 - 0.02 - - - 0.03
Civil SEP Cirrus SR 22 COMSEP 0.19 - 0.19 - - - 0.38
Civil SET Piper Malibu Meridian CNA441 0.01 - 0.01 - - - 0.03
Civil SET Pilatus PC-12 CNA208 0.44 - 0.44 - - - 0.88
Civil SET Socata TBM-850 CNA441 0.02 - 0.02 - - - 0.04
Civil SET Raytheon Texan 2 GASEPV 0.01 - 0.01 - - - 0.02
Civil HEL Hughes 269 H500D or SC300C 0.01 - 0.01 - - - 0.02
Civil HEL Sikorsky S-76 S76 0.01 - 0.01 - - - 0.02
Total 16.85 0.03 16.85 0.01 23.29 - 57.03 Source: Stantec and HNTB Analysis, 2018.
DRAFT
Westover Metropolitan Airport NEM/NCP Update
Draft 22 June 2018
CHAPTER 3: Noise and Land Use Compatibility This section reviews the Federal and local land use guidelines related to compatibility with aircraft noise exposure and aeronautical uses, and the development of land use data needed for the analyses required in Part 150. Note that Appendix D presents an introduction to the relevant fundamentals of acoustics and noise terminology and the effects of noise on human activity.
A discussion of existing and future land use compatibility relative to the Existing (2018) and Future (2023) NEMs is included in Chapter Four.
3.1 Land Use Guidelines
Land use guidelines provide the primary means of preventing new non-compatible development within the 65 db DNL noise contours. The following sections provide a description of federal and local land use guidelines.
Federal Guidelines
The degree of annoyance that people experience from aircraft noise varies, depending on their activities at any given time. For example, people are usually less disturbed by aircraft noise when they are shopping, working, or driving than when they are at home. Transient hotel and motel residents seldom express as much concern with aircraft noise as do permanent residents of an area. The concept of “land use compatibility” has arisen from this systematic variation in community reaction to noise.
In a Part 150 Study, DNL noise values have the following two principal uses:
• Provide a basis for comparing existing noise conditions to the effects of noise abatement procedures and/or forecast changes in airport activity; and
• Provide a quantitative basis for identifying potential noise impacts and mitigation.
Both of these functions require the application of objective criteria for evaluating noise impacts. Reproduced in Table 3.1, Part 150 provides the FAA’s recommended guidelines for noise and land use compatibility evaluation. In setting the various compatibility guidelines, however, the regulations state that the designations do not constitute a Federal determination that any use of land covered by the [noise compatibility] program is acceptable or unacceptable under federal, state, or local law. The responsibility for determining the acceptable and permissible land uses and the relationship between specific properties and specific noise contours rests with the local authorities. FAA determinations under Part 150 are not intended to substitute federally determined land uses for those determined to be appropriate by local authorities in response to locally determined needs and values in achieving noise compatible land uses.
The FAA’s guidelines represent a compilation of the results of scientific research into noise-related activity interference and attitudinal response.
DRAFT
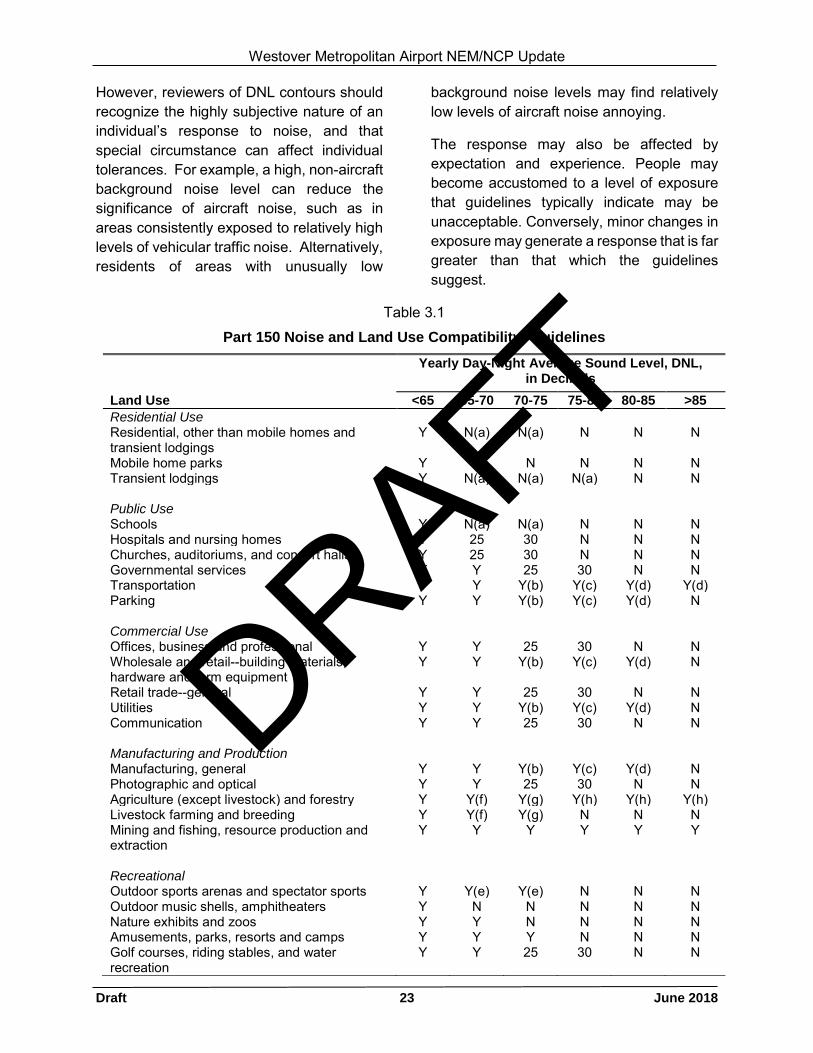
Westover Metropolitan Airport NEM/NCP Update
Draft 23 June 2018
However, reviewers of DNL contours should recognize the highly subjective nature of an individual’s response to noise, and that special circumstance can affect individual tolerances. For example, a high, non-aircraft background noise level can reduce the significance of aircraft noise, such as in areas consistently exposed to relatively high levels of vehicular traffic noise. Alternatively, residents of areas with unusually low
background noise levels may find relatively low levels of aircraft noise annoying.
The response may also be affected by expectation and experience. People may become accustomed to a level of exposure that guidelines typically indicate may be unacceptable. Conversely, minor changes in exposure may generate a response that is far greater than that which the guidelines suggest.
Table 3.1
Part 150 Noise and Land Use Compatibility* Guidelines
Yearly Day-Night Average Sound Level, DNL, in Decibels
Land Use <65 65-70 70-75 75-80 80-85 >85 Residential Use Residential, other than mobile homes and transient lodgings
Y N(a) N(a) N N N
Mobile home parks Y N N N N N Transient lodgings Y N(a) N(a) N(a) N N Public Use Schools Y N(a) N(a) N N N Hospitals and nursing homes Y 25 30 N N N Churches, auditoriums, and concert halls Y 25 30 N N N Governmental services Y Y 25 30 N N Transportation Y Y Y(b) Y(c) Y(d) Y(d) Parking Y Y Y(b) Y(c) Y(d) N Commercial Use Offices, business and professional Y Y 25 30 N N Wholesale and retail--building materials, hardware and farm equipment
Y Y Y(b) Y(c) Y(d) N
Retail trade--general Y Y 25 30 N N Utilities Y Y Y(b) Y(c) Y(d) N Communication Y Y 25 30 N N Manufacturing and Production Manufacturing, general Y Y Y(b) Y(c) Y(d) N Photographic and optical Y Y 25 30 N N Agriculture (except livestock) and forestry Y Y(f) Y(g) Y(h) Y(h) Y(h) Livestock farming and breeding Y Y(f) Y(g) N N N Mining and fishing, resource production and extraction
Y Y Y Y Y Y
Recreational Outdoor sports arenas and spectator sports Y Y(e) Y(e) N N N Outdoor music shells, amphitheaters Y N N N N N Nature exhibits and zoos Y Y N N N N Amusements, parks, resorts and camps Y Y Y N N N Golf courses, riding stables, and water recreation
Y Y 25 30 N N
DRAFT
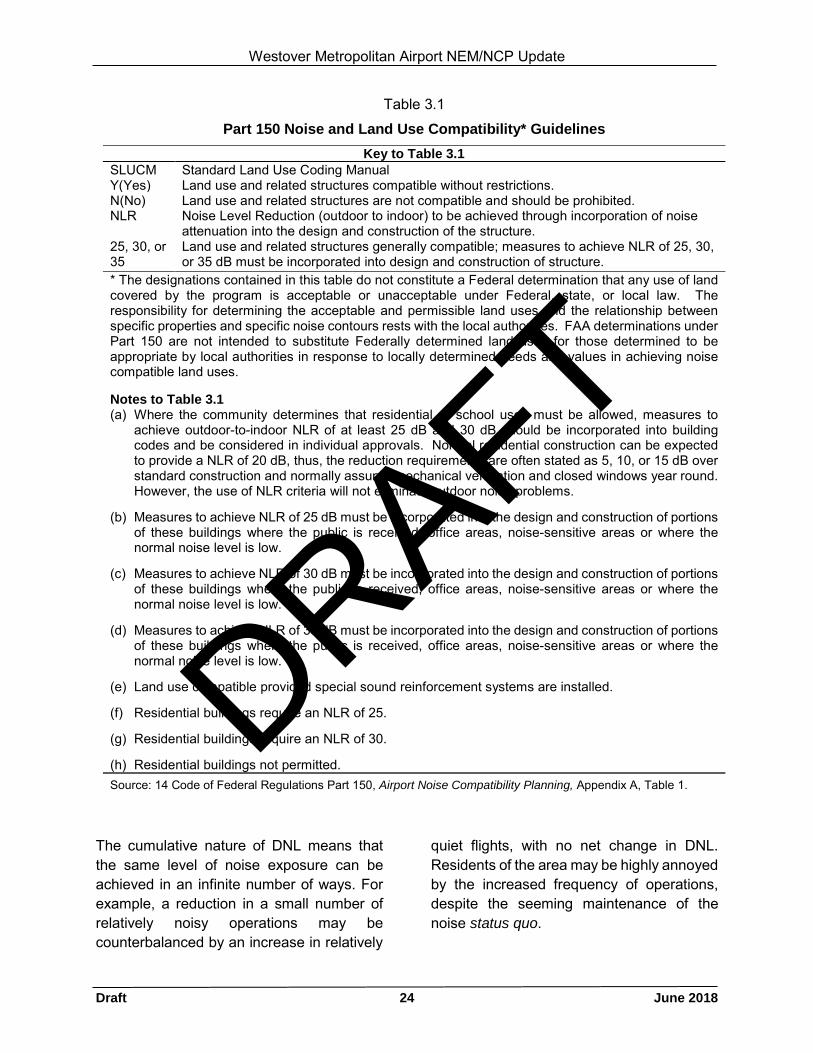
Westover Metropolitan Airport NEM/NCP Update
Draft 24 June 2018
Table 3.1
Part 150 Noise and Land Use Compatibility* Guidelines Key to Table 3.1
SLUCM Standard Land Use Coding Manual Y(Yes) Land use and related structures compatible without restrictions. N(No) Land use and related structures are not compatible and should be prohibited. NLR Noise Level Reduction (outdoor to indoor) to be achieved through incorporation of noise
attenuation into the design and construction of the structure. 25, 30, or 35
Land use and related structures generally compatible; measures to achieve NLR of 25, 30, or 35 dB must be incorporated into design and construction of structure.
* The designations contained in this table do not constitute a Federal determination that any use of land covered by the program is acceptable or unacceptable under Federal, state, or local law. The responsibility for determining the acceptable and permissible land uses and the relationship between specific properties and specific noise contours rests with the local authorities. FAA determinations under Part 150 are not intended to substitute Federally determined land uses for those determined to be appropriate by local authorities in response to locally determined needs and values in achieving noise compatible land uses.
Notes to Table 3.1 (a) Where the community determines that residential or school uses must be allowed, measures to
achieve outdoor-to-indoor NLR of at least 25 dB and 30 dB should be incorporated into building codes and be considered in individual approvals. Normal residential construction can be expected to provide a NLR of 20 dB, thus, the reduction requirements are often stated as 5, 10, or 15 dB over standard construction and normally assume mechanical ventilation and closed windows year round. However, the use of NLR criteria will not eliminate outdoor noise problems.
(b) Measures to achieve NLR of 25 dB must be incorporated into the design and construction of portions
of these buildings where the public is received, office areas, noise-sensitive areas or where the normal noise level is low.
(c) Measures to achieve NLR of 30 dB must be incorporated into the design and construction of portions
of these buildings where the public is received, office areas, noise-sensitive areas or where the normal noise level is low.
(d) Measures to achieve NLR of 35 dB must be incorporated into the design and construction of portions
of these buildings where the public is received, office areas, noise-sensitive areas or where the normal noise level is low.
(e) Land use compatible provided special sound reinforcement systems are installed. (f) Residential buildings require an NLR of 25. (g) Residential buildings require an NLR of 30. (h) Residential buildings not permitted. Source: 14 Code of Federal Regulations Part 150, Airport Noise Compatibility Planning, Appendix A, Table 1.
The cumulative nature of DNL means that the same level of noise exposure can be achieved in an infinite number of ways. For example, a reduction in a small number of relatively noisy operations may be counterbalanced by an increase in relatively
quiet flights, with no net change in DNL. Residents of the area may be highly annoyed by the increased frequency of operations, despite the seeming maintenance of the noise status quo.
DRAFT
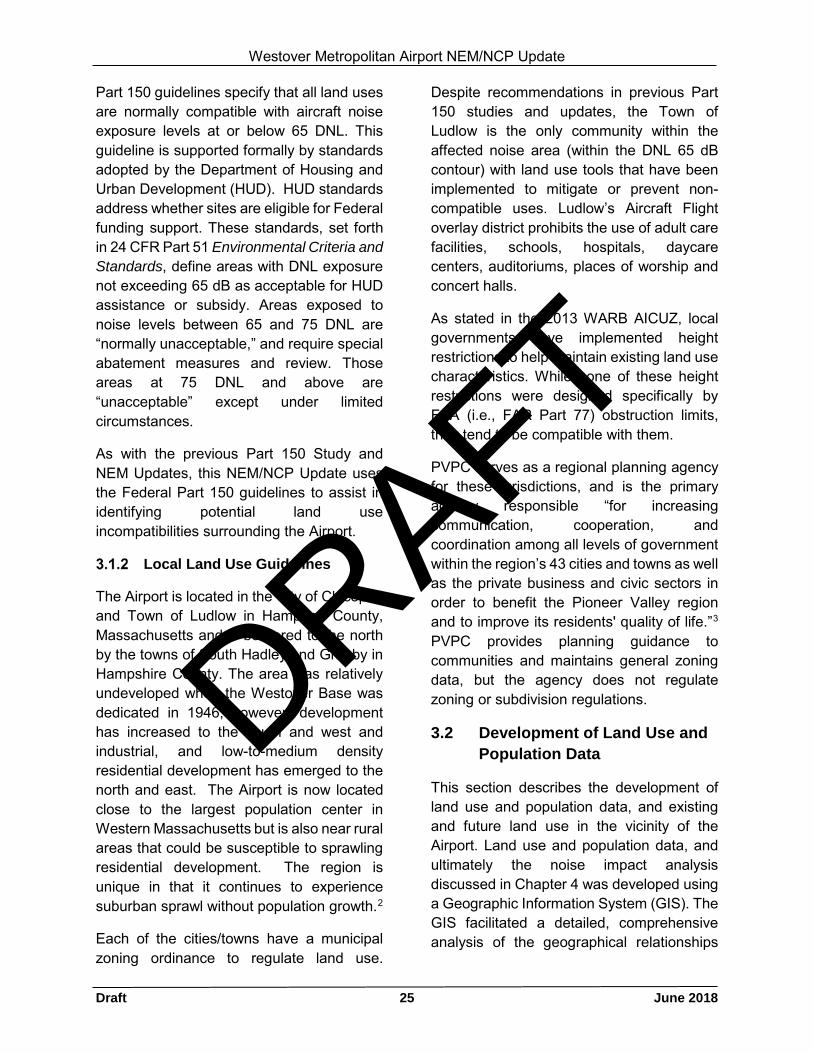
Westover Metropolitan Airport NEM/NCP Update
Draft 25 June 2018
Part 150 guidelines specify that all land uses are normally compatible with aircraft noise exposure levels at or below 65 DNL. This guideline is supported formally by standards adopted by the Department of Housing and Urban Development (HUD). HUD standards address whether sites are eligible for Federal funding support. These standards, set forth in 24 CFR Part 51 Environmental Criteria and Standards, define areas with DNL exposure not exceeding 65 dB as acceptable for HUD assistance or subsidy. Areas exposed to noise levels between 65 and 75 DNL are “normally unacceptable,” and require special abatement measures and review. Those areas at 75 DNL and above are “unacceptable” except under limited circumstances.
As with the previous Part 150 Study and NEM Updates, this NEM/NCP Update uses the Federal Part 150 guidelines to assist in identifying potential land use incompatibilities surrounding the Airport.
Local Land Use Guidelines
The Airport is located in the City of Chicopee and Town of Ludlow in Hampden County, Massachusetts and is bordered to the north by the towns of South Hadley and Granby in Hampshire County. The area was relatively undeveloped when the Westover Base was dedicated in 1946; however, development has increased to the south and west and industrial, and low-to-medium density residential development has emerged to the north and east. The Airport is now located close to the largest population center in Western Massachusetts but is also near rural areas that could be susceptible to sprawling residential development. The region is unique in that it continues to experience suburban sprawl without population growth.2
Each of the cities/towns have a municipal zoning ordinance to regulate land use.
Despite recommendations in previous Part 150 studies and updates, the Town of Ludlow is the only community within the affected noise area (within the DNL 65 dB contour) with land use tools that have been implemented to mitigate or prevent non-compatible uses. Ludlow’s Aircraft Flight overlay district prohibits the use of adult care facilities, schools, hospitals, daycare centers, auditoriums, places of worship and concert halls.
As stated in the 2013 WARB AICUZ, local governments have implemented height restrictions to help maintain existing land use characteristics. While none of these height restrictions were designed specifically by FAA (i.e., FAR Part 77) obstruction limits, they tend to be compatible with them.
PVPC serves as a regional planning agency for these jurisdictions, and is the primary agency responsible “for increasing communication, cooperation, and coordination among all levels of government within the region’s 43 cities and towns as well as the private business and civic sectors in order to benefit the Pioneer Valley region and to improve its residents' quality of life.”3 PVPC provides planning guidance to communities and maintains general zoning data, but the agency does not regulate zoning or subdivision regulations.
3.2 Development of Land Use and Population Data
This section describes the development of land use and population data, and existing and future land use in the vicinity of the Airport. Land use and population data, and ultimately the noise impact analysis discussed in Chapter 4 was developed using a Geographic Information System (GIS). The GIS facilitated a detailed, comprehensive analysis of the geographical relationships
DRAFT
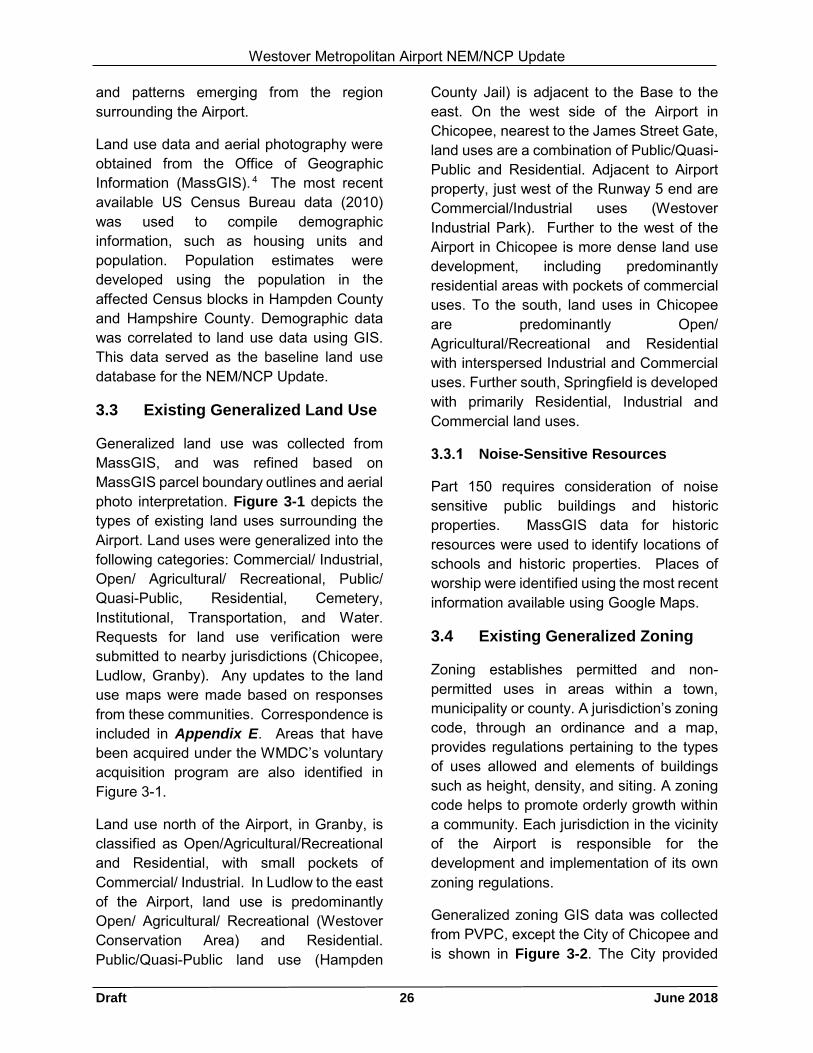
Westover Metropolitan Airport NEM/NCP Update
Draft 26 June 2018
and patterns emerging from the region surrounding the Airport.
Land use data and aerial photography were obtained from the Office of Geographic Information (MassGIS). 4 The most recent available US Census Bureau data (2010) was used to compile demographic information, such as housing units and population. Population estimates were developed using the population in the affected Census blocks in Hampden County and Hampshire County. Demographic data was correlated to land use data using GIS. This data served as the baseline land use database for the NEM/NCP Update.
3.3 Existing Generalized Land Use
Generalized land use was collected from MassGIS, and was refined based on MassGIS parcel boundary outlines and aerial photo interpretation. Figure 3-1 depicts the types of existing land uses surrounding the Airport. Land uses were generalized into the following categories: Commercial/ Industrial, Open/ Agricultural/ Recreational, Public/ Quasi-Public, Residential, Cemetery, Institutional, Transportation, and Water. Requests for land use verification were submitted to nearby jurisdictions (Chicopee, Ludlow, Granby). Any updates to the land use maps were made based on responses from these communities. Correspondence is included in Appendix E. Areas that have been acquired under the WMDC’s voluntary acquisition program are also identified in Figure 3-1.
Land use north of the Airport, in Granby, is classified as Open/Agricultural/Recreational and Residential, with small pockets of Commercial/ Industrial. In Ludlow to the east of the Airport, land use is predominantly Open/ Agricultural/ Recreational (Westover Conservation Area) and Residential. Public/Quasi-Public land use (Hampden
County Jail) is adjacent to the Base to the east. On the west side of the Airport in Chicopee, nearest to the James Street Gate, land uses are a combination of Public/Quasi-Public and Residential. Adjacent to Airport property, just west of the Runway 5 end are Commercial/Industrial uses (Westover Industrial Park). Further to the west of the Airport in Chicopee is more dense land use development, including predominantly residential areas with pockets of commercial uses. To the south, land uses in Chicopee are predominantly Open/ Agricultural/Recreational and Residential with interspersed Industrial and Commercial uses. Further south, Springfield is developed with primarily Residential, Industrial and Commercial land uses.
Noise-Sensitive Resources
Part 150 requires consideration of noise sensitive public buildings and historic properties. MassGIS data for historic resources were used to identify locations of schools and historic properties. Places of worship were identified using the most recent information available using Google Maps.
3.4 Existing Generalized Zoning
Zoning establishes permitted and non-permitted uses in areas within a town, municipality or county. A jurisdiction’s zoning code, through an ordinance and a map, provides regulations pertaining to the types of uses allowed and elements of buildings such as height, density, and siting. A zoning code helps to promote orderly growth within a community. Each jurisdiction in the vicinity of the Airport is responsible for the development and implementation of its own zoning regulations.
Generalized zoning GIS data was collected from PVPC, except the City of Chicopee and is shown in Figure 3-2. The City provided
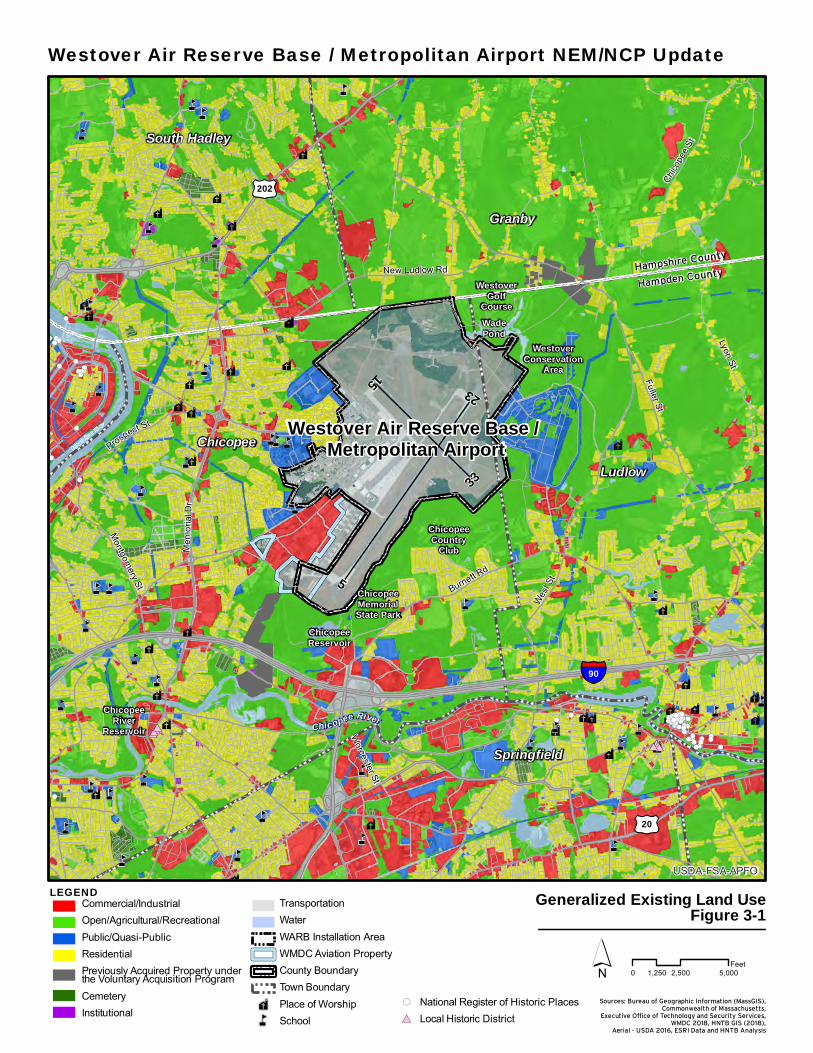
î
î
î
î
î
î
î
î
îîî
î
î
î
î
î
î
î
î
î
îî
î
î
î î
î
î
î
î
î
î î
îî
îî
î
î
î
å
å
å
åå
å
å
å
å
å
å
å
å
å
åå
å
å
å
å
å
å
å
å
å
åå
åå
å
å å å
å
å
å
å
å
å
å
å
å
å
å
å
å
å
å
å
å
å
å
åå
å
å
å
å
å
å
å
å
å
å
å
å
å
å
å
å
å
å
!(!(!(
!(
!(
!(
!(!(!(
!(!(
!(!(
!(!(
!( !(!(
!(
!(
!(
!(
!(
!(
!(
!(!(!(
!(
!(
!(
#*#*
!(
!(
!(!(!(!(
#*
!(
!(
!(
!(!(
!(!(
!(!(
!(
!(!(
#*!(!(
!(
!(!(
!(!(
!(
!( !(!(!(
!(
!(!(
!(
!(
!(
!(!(!(
!(
!(!(
!(
!(
!( !(
!(!(
!(
!(
!(
!(
!(
!(!(!(
!(
!(
!(!(!(!(!(
!(
!(
!(
#*
!(!(
!(
!(
!(
!(!(!(
!(
!(
!(
#*#*
!(!(
!(
!(!(!(
!(!(
!(
!(
!(!(
!(
!( !(!(
!(
!(
!(
!(
#*!(
!(
!(
!(
!(
!(
!(
Westover Air Reserve Base / Metropolitan Airport
Hampshire County
Hampden County
§¦90
£¤202
£¤20
Mem
oria
l Dr
Connecticut River
New Ludlow Rd
Fuller St
Chico
pee
St
Lyon St
Wes
t St
Burnett Rd
Montgom
ery St
Worcester St
5
23
33
15
ChicopeeRiver
Reservoir
ChicopeeMemorialState Park
ChicopeeCountry
Club
WestoverConservation
Area
WadePond
WestoverGolf
Course
ChicopeeReservoir
Chicopee River
Prospect St
Granby
South Hadley
ChicopeeLudlow
Springfield
USDA-FSA-APFO
Sources: Bureau of Geographic Information (MassGIS),Commonwealth of Massachusetts,
Executive Office of Technology and Security Services,WMDC 2018, HNTB GIS (2018),
Aerial - USDA 2016, ESRI Data and HNTB Analysis
LEGENDCommercial/IndustrialOpen/Agricultural/RecreationalPublic/Quasi-PublicResidentialPreviously Acquired Property underthe Voluntary Acquisition ProgramCemeteryInstitutional
TransportationWaterWARB Installation AreaWMDC Aviation PropertyCounty BoundaryTown BoundaryPlace of WorshipSchool
Westover Air Reserve Base / Metropolitan Airport NEM/NCP Update
Generalized Existing Land UseFigure 3-1
åî National Register of Historic Places
Local Historic District!(
#*
0 2,500 5,0001,250Feet
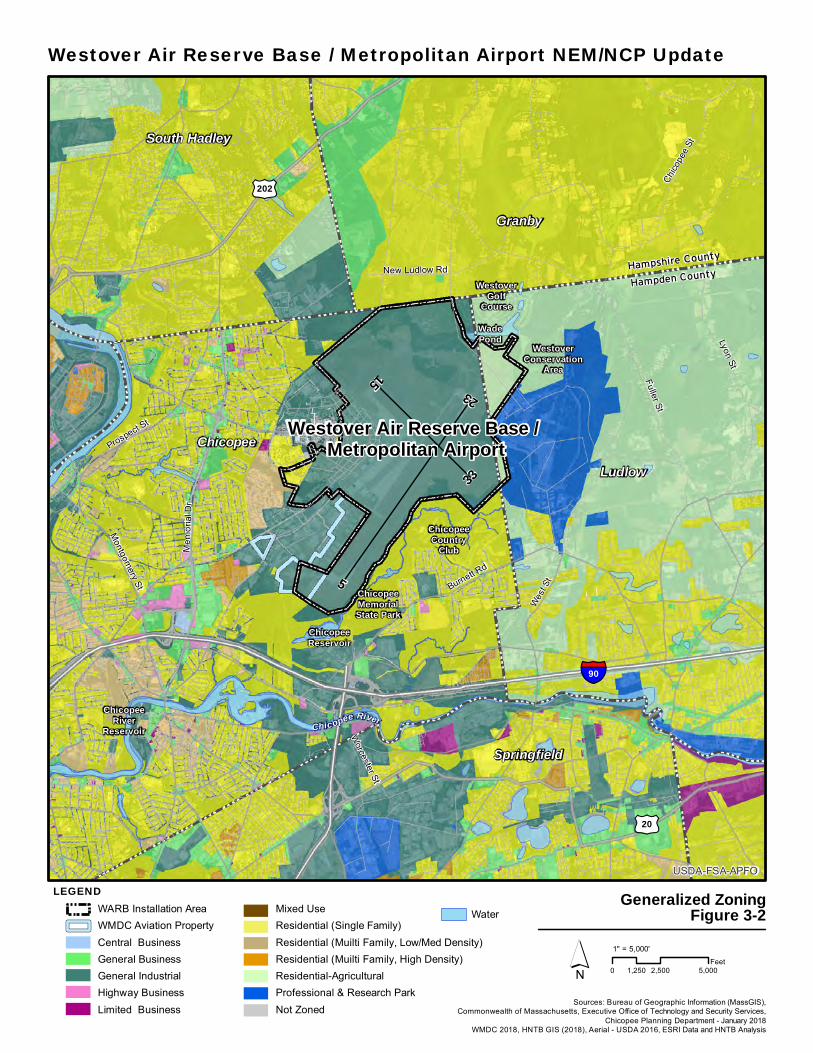
Westover Air Reserve Base / Metropolitan Airport
Hampshire County
Hampden County
§¦90
£¤202
£¤20
Mem
oria
l Dr
Prospect St
New Ludlow Rd
Fuller St
Chico
pee
St
Lyon St
Wes
t St
Burnett Rd
Montgom
ery St
Worcester St
5
23
33
15
ChicopeeRiver
Reservoir
ChicopeeMemorialState Park
ChicopeeCountry
Club
WestoverConservation
Area
WadePond
WestoverGolf
Course
ChicopeeReservoir
Chicopee River
Granby
South Hadley
ChicopeeLudlow
Springfield
USDA-FSA-APFO
´
LEGEND Generalized ZoningFigure 3-2
0 2,500 5,0001,250Feet
1" = 5,000'
WARB Installation AreaWMDC Aviation PropertyCentral BusinessGeneral BusinessGeneral IndustrialHighway BusinessLimited Business
Mixed UseResidential (Single Family)Residential (Muilti Family, Low/Med Density)Residential (Muilti Family, High Density)Residential-AgriculturalProfessional & Research ParkNot Zoned
Water
Sources: Bureau of Geographic Information (MassGIS),Commonwealth of Massachusetts, Executive Office of Technology and Security Services,
Chicopee Planning Department - January 2018WMDC 2018, HNTB GIS (2018), Aerial - USDA 2016, ESRI Data and HNTB Analysis
Westover Air Reserve Base / Metropolitan Airport NEM/NCP Update
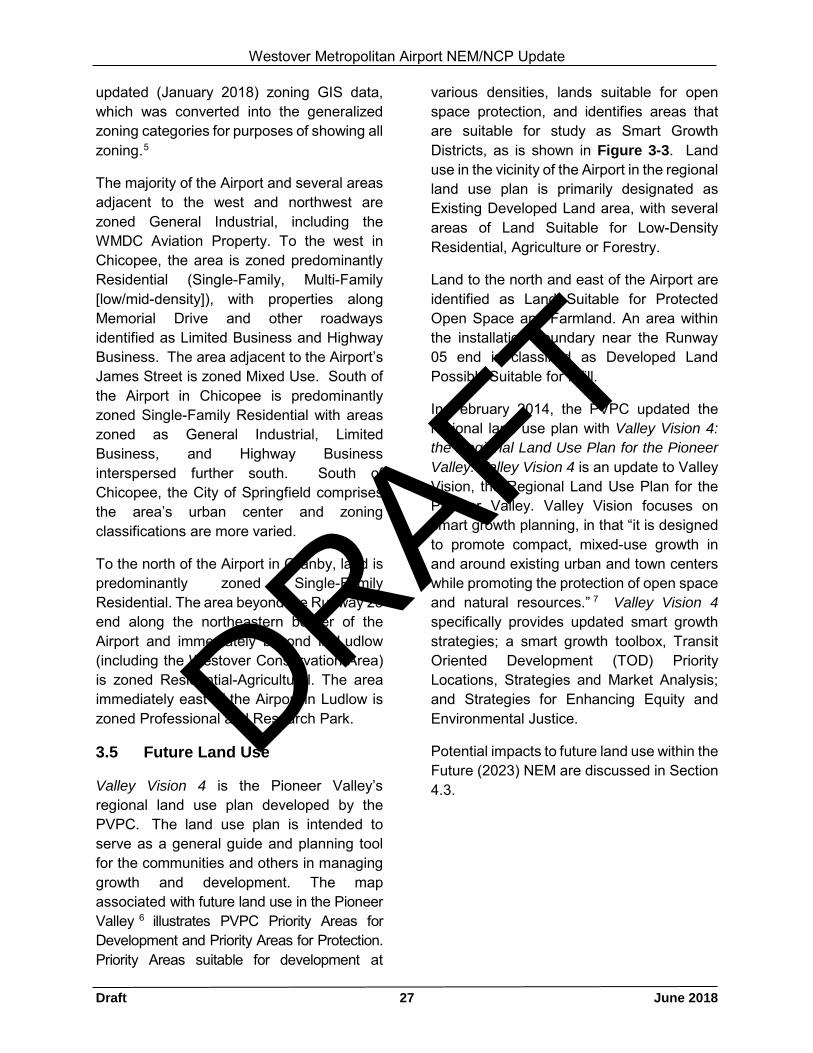
Westover Metropolitan Airport NEM/NCP Update
Draft 27 June 2018
updated (January 2018) zoning GIS data, which was converted into the generalized zoning categories for purposes of showing all zoning.5
The majority of the Airport and several areas adjacent to the west and northwest are zoned General Industrial, including the WMDC Aviation Property. To the west in Chicopee, the area is zoned predominantly Residential (Single-Family, Multi-Family [low/mid-density]), with properties along Memorial Drive and other roadways identified as Limited Business and Highway Business. The area adjacent to the Airport’s James Street is zoned Mixed Use. South of the Airport in Chicopee is predominantly zoned Single-Family Residential with areas zoned as General Industrial, Limited Business, and Highway Business interspersed further south. South of Chicopee, the City of Springfield comprises the area’s urban center and zoning classifications are more varied.
To the north of the Airport in Granby, land is predominantly zoned Single-Family Residential. The area beyond the Runway 23 end along the northeastern border of the Airport and immediately beyond in Ludlow (including the Westover Conservation Area) is zoned Residential-Agricultural. The area immediately east of the Airport in Ludlow is zoned Professional and Research Park.
3.5 Future Land Use
Valley Vision 4 is the Pioneer Valley’s regional land use plan developed by the PVPC. The land use plan is intended to serve as a general guide and planning tool for the communities and others in managing growth and development. The map associated with future land use in the Pioneer Valley 6 illustrates PVPC Priority Areas for Development and Priority Areas for Protection. Priority Areas suitable for development at
various densities, lands suitable for open space protection, and identifies areas that are suitable for study as Smart Growth Districts, as is shown in Figure 3-3. Land use in the vicinity of the Airport in the regional land use plan is primarily designated as Existing Developed Land area, with several areas of Land Suitable for Low-Density Residential, Agriculture or Forestry.
Land to the north and east of the Airport are identified as Land Suitable for Protected Open Space and Farmland. An area within the installation boundary near the Runway 05 end is classified as Developed Land Possibly Suitable for Infill.
In February 2014, the PVPC updated the regional land use plan with Valley Vision 4: the Regional Land Use Plan for the Pioneer Valley. Valley Vision 4 is an update to Valley Vision, the Regional Land Use Plan for the Pioneer Valley. Valley Vision focuses on smart growth planning, in that “it is designed to promote compact, mixed-use growth in and around existing urban and town centers while promoting the protection of open space and natural resources.” 7 Valley Vision 4 specifically provides updated smart growth strategies; a smart growth toolbox, Transit Oriented Development (TOD) Priority Locations, Strategies and Market Analysis; and Strategies for Enhancing Equity and Environmental Justice.
Potential impacts to future land use within the Future (2023) NEM are discussed in Section 4.3.
DRAFT
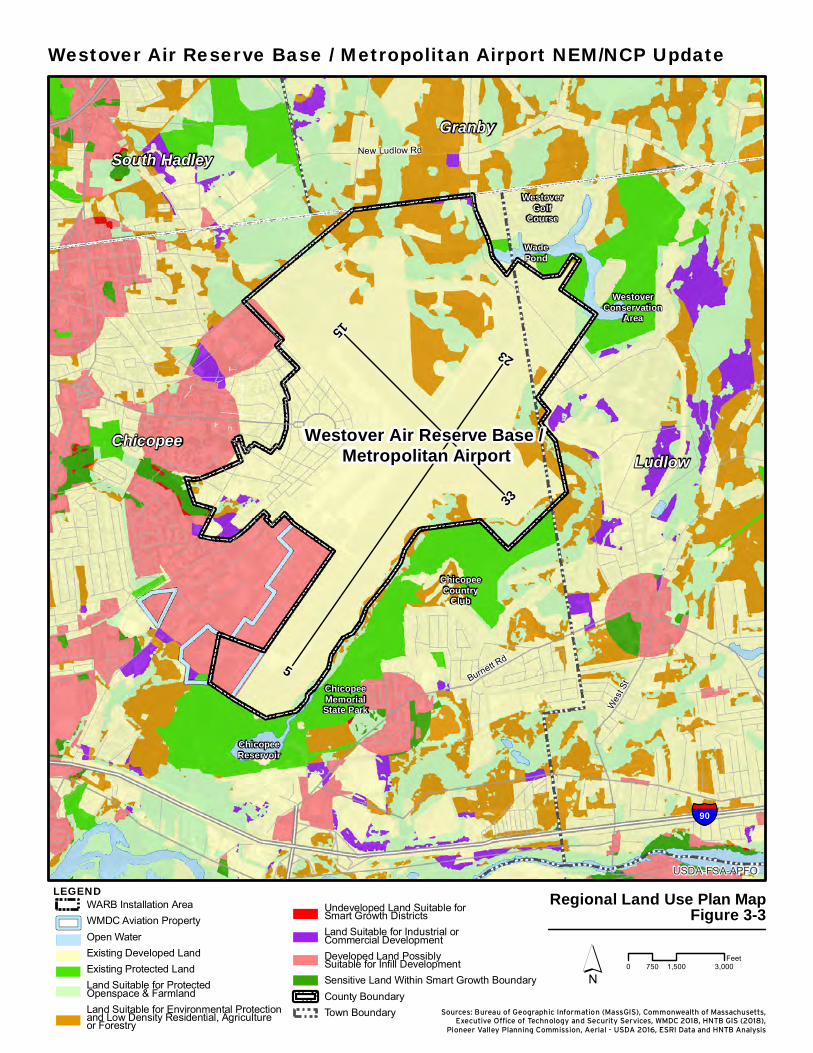
Westover Air Reserve Base / Metropolitan Airport
Hampshire County
§¦90
New Ludlow Rd
Wes
t StBurnett R
d523
33
15
ChicopeeMemorialState Park
ChicopeeCountry
Club
WestoverConservation
Area
WadePond
WestoverGolf
Course
ChicopeeReservoir
GranbySouth Hadley
ChicopeeLudlow
USDA-FSA-APFO
´Sources: Bureau of Geographic Information (MassGIS), Commonwealth of Massachusetts,
Executive Office of Technology and Security Services, WMDC 2018, HNTB GIS (2018),Pioneer Valley Planning Commission, Aerial - USDA 2016, ESRI Data and HNTB Analysis
LEGEND Regional Land Use Plan MapFigure 3-3WARB Installation Area
WMDC Aviation PropertyOpen WaterExisting Developed LandExisting Protected LandLand Suitable for Protected Openspace & FarmlandLand Suitable for Environmental Protection and Low Density Residential, Agriculture or Forestry
Undeveloped Land Suitable for Smart Growth DistrictsLand Suitable for Industrial or Commercial DevelopmentDeveloped Land Possibly Suitable for Infill DevelopmentSensitive Land Within Smart Growth BoundaryCounty BoundaryTown Boundary
0 1,500 3,000750Feet
Westover Air Reserve Base / Metropolitan Airport NEM/NCP Update
Westover Metropolitan Airport NEM/NCP Update
Draft 28 June 2018
CHAPTER 4: Noise Exposure Maps This chapter presents the land use information for the geographic area within the 65 DNL contour for the Existing (2018) and Future (2023) NEMs. The 65 DNL is the Federal significance threshold for aviation noise analysis.
Section 4.1 summarizes the development of the base map. Section 4.2 presents and discusses the graphic and tabular information for the Existing (2018) NEM. Section 4.3 presents the graphic and tabular information for the Future (2023) NEM.
4.1 Land Use Base Map
Noise exposure contours, when superimposed on the land use map, allow assessment of the underlying land use compatibility for existing and forecast noise exposure conditions. As discussed in Section 3.2, land use data and aerial photography were obtained from MassGIS.8 US Census Bureau data was not used or needed to compile demographic information for this NEM/NCP Update, as there are no residences (or population) within the 65+ DNL contours of the Existing (2018) or Future (2023) NEMs, as discussed in Sections 4.2 and 4.3.
As noted in Section 3.3, existing land uses in the vicinity of the Airport include Commercial/Industrial, Open/Agricultural/ Public/ Quasi-Public, Recreational, Residential, Cemetery, Institutional, Water, and Wetland.
The land uses within the affected noise area (within the 65+ DNL noise contours) fall within the jurisdictions of Chicopee and Ludlow, in Hampden County.
4.2 Noise Exposure Map for Existing Conditions (2018)
Figure 4-1 represents the existing conditions for the year of submission (2018), with the existing aircraft flight procedures, airport layout, aircraft operations, and other noise modeling assumptions described in Chapter 2.
The 65+ DNL noise exposure contours encompass approximately 613 acres (almost one square mile) in total. Of this acreage, approximately 597 acres are within Airport property. Table 4.1 presents the range of land uses encompassed by the 65+ DNL noise exposure contour under the existing conditions. There are no residential land uses within the 65+ DNL noise exposure contour, nor are there any properties previously acquired by the Airport for noise abatement. An aerial map was also reviewed to determine if any houses exist within the 65+ DNL noise exposure contour. As no houses appear to be present, population counts were not needed. There are also no recreational uses or noise-sensitive locations within the 65+ DNL noise exposure contour. Thus there are no incompatible land uses when considering the FAA’s Part 150 land use guidelines.
The entire 70+ DNL noise contour (approximately 229 acres/0.36 square miles) remains within the boundaries of the Airport. There are no incompatible land uses within the 70+ DNL noise contour.
There are no known non-residential noise-sensitive land uses, such as hospitals, places of worship, schools, historic sites, or nursing homes, within the 65+ DNL noise contours.
DRAFT
î
îî
î
î
î
î
î
î
î
î
î
î
î
å
å
å
å
å
å
å
å
å
å
åå
å
å
å
å å
å
å
å
å
å
å
å
å
å
å
!(
!(
Westover Air Reserve Base / Metropolitan Airport
Hampshire County
Hampden County
§¦90
Mem
oria
l Dr
New Ludlow Rd
Wes
t StBurnett R
d5
23
33
15
ChicopeeMemorialState Park
ChicopeeCountry
Club
WestoverConservation
Area
WadePond
WestoverGolf
Course
ChicopeeReservoir
Chicopee River
Granby
South Hadley
Chicopee
Ludlow
65 DN
L
70 DNL
USDA-FSA-APFO
Sources: Bureau of Geographic Information (MassGIS),Commonwealth of Massachusetts,
Executive Office of Technology and Security Services,WMDC 2018, HNTB GIS (2018),
Aerial - USDA 2016, ESRI Data and HNTB Analysis
LEGEND2018 DNL Noise ContourCommercial/IndustrialOpen/Agricultural/RecreationalPublic/Quasi-PublicResidentialPreviously Acquired Property underthe Voluntary Acquisition ProgramCemetery
InstitutionalTransportationWaterWARB Installation AreaWMDC Aviation PropertyCounty BoundaryTown BoundaryPlace of Worship
Existing (2018) ConditionsNoise Exposure Map
Figure 4-1
å
î
SchoolNational Register of Historic PlacesLocal Historic District
!(
#*
Westover Air Reserve Base / Metropolitan Airport NEM/NCP Update
0 1,500 3,000750Feet
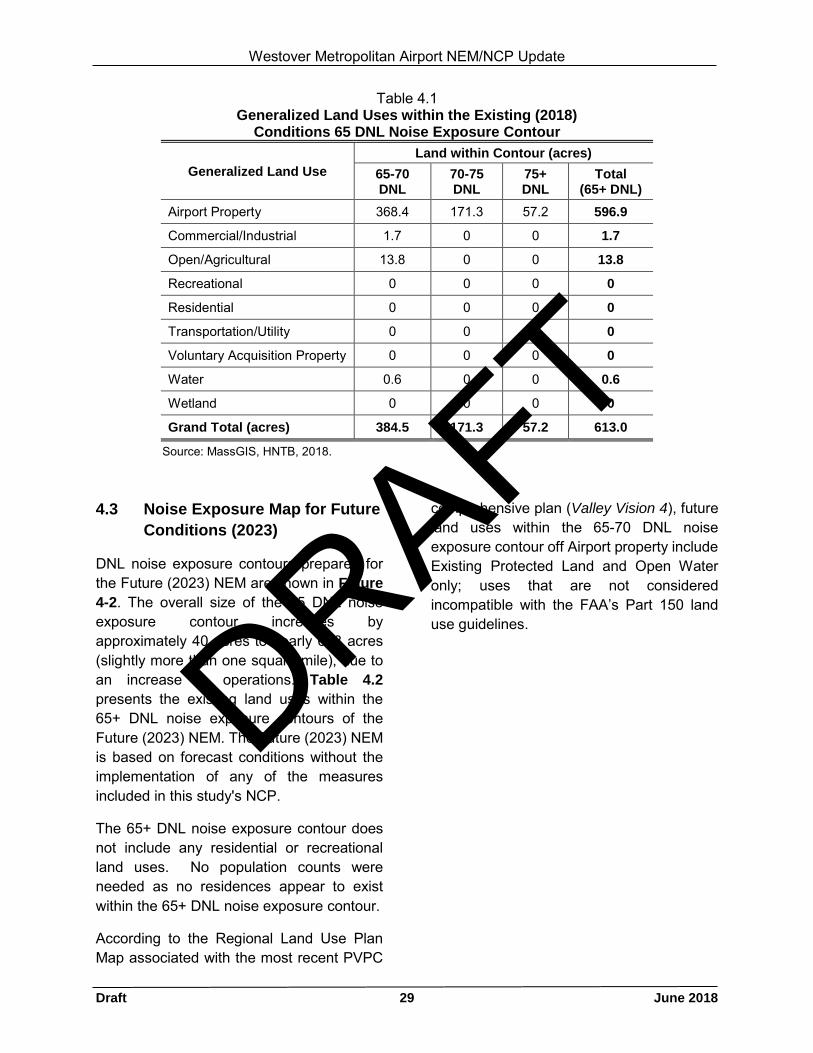
Westover Metropolitan Airport NEM/NCP Update
Draft 29 June 2018
Table 4.1 Generalized Land Uses within the Existing (2018)
Conditions 65 DNL Noise Exposure Contour
Generalized Land Use Land within Contour (acres)
65-70 DNL
70-75 DNL
75+ DNL
Total (65+ DNL)
Airport Property 368.4 171.3 57.2 596.9
Commercial/Industrial 1.7 0 0 1.7
Open/Agricultural 13.8 0 0 13.8
Recreational 0 0 0 0
Residential 0 0 0 0
Transportation/Utility 0 0 0 0
Voluntary Acquisition Property 0 0 0 0
Water 0.6 0 0 0.6
Wetland 0 0 0 0
Grand Total (acres) 384.5 171.3 57.2 613.0
Source: MassGIS, HNTB, 2018. 4.3 Noise Exposure Map for Future
Conditions (2023)
DNL noise exposure contours prepared for the Future (2023) NEM are shown in Figure 4-2. The overall size of the 65 DNL noise exposure contour increases by approximately 40 acres to nearly 653 acres (slightly more than one square mile), due to an increase in operations. Table 4.2 presents the existing land uses within the 65+ DNL noise exposure contours of the Future (2023) NEM. The Future (2023) NEM is based on forecast conditions without the implementation of any of the measures included in this study's NCP.
The 65+ DNL noise exposure contour does not include any residential or recreational land uses. No population counts were needed as no residences appear to exist within the 65+ DNL noise exposure contour.
According to the Regional Land Use Plan Map associated with the most recent PVPC
comprehensive plan (Valley Vision 4), future land uses within the 65-70 DNL noise exposure contour off Airport property include Existing Protected Land and Open Water only; uses that are not considered incompatible with the FAA’s Part 150 land use guidelines.
DRAFT

î
îî
î
î
î
î
î
î
î
î
î
î
î
å
å
å
å
å
å
å
å
å
å
åå
å
å
å
å å
å
å
å
å
å
å
å
å
å
å
!(
!(
Westover Air Reserve Base / Metropolitan Airport
Hampshire County
Hampden County
§¦90
Mem
oria
l Dr
New Ludlow Rd
Wes
t StBurnett R
d5
23
33
15
ChicopeeMemorialState Park
ChicopeeCountry
Club
WestoverConservation
Area
WadePond
WestoverGolf
Course
ChicopeeReservoir
Chicopee River
Granby
South Hadley
Chicopee
Ludlow
65 DN
L
70 DNL
USDA-FSA-APFO
Sources: Bureau of Geographic Information (MassGIS),Commonwealth of Massachusetts,
Executive Office of Technology and Security Services,WMDC 2018, HNTB GIS (2018),
Aerial - USDA 2016, ESRI Data and HNTB Analysis
LEGEND2023 DNL Noise ContourCommercial/IndustrialOpen/Agricultural/RecreationalPublic/Quasi-PublicResidentialPreviously Acquired Property underthe Voluntary Acquisition ProgramCemetery
InstitutionalTransportationWaterWARB Installation AreaWMDC Aviation PropertyCounty BoundaryTown BoundaryPlace of Worship
Westover Air Reserve Base / Metropolitan Airport NEM/NCP Update
Future (2023) ConditionsNoise Exposure Map
Figure 4-2
å
î
SchoolNational Register of Historic PlacesLocal Historic District
!(
#*
0 1,500 3,000750Feet
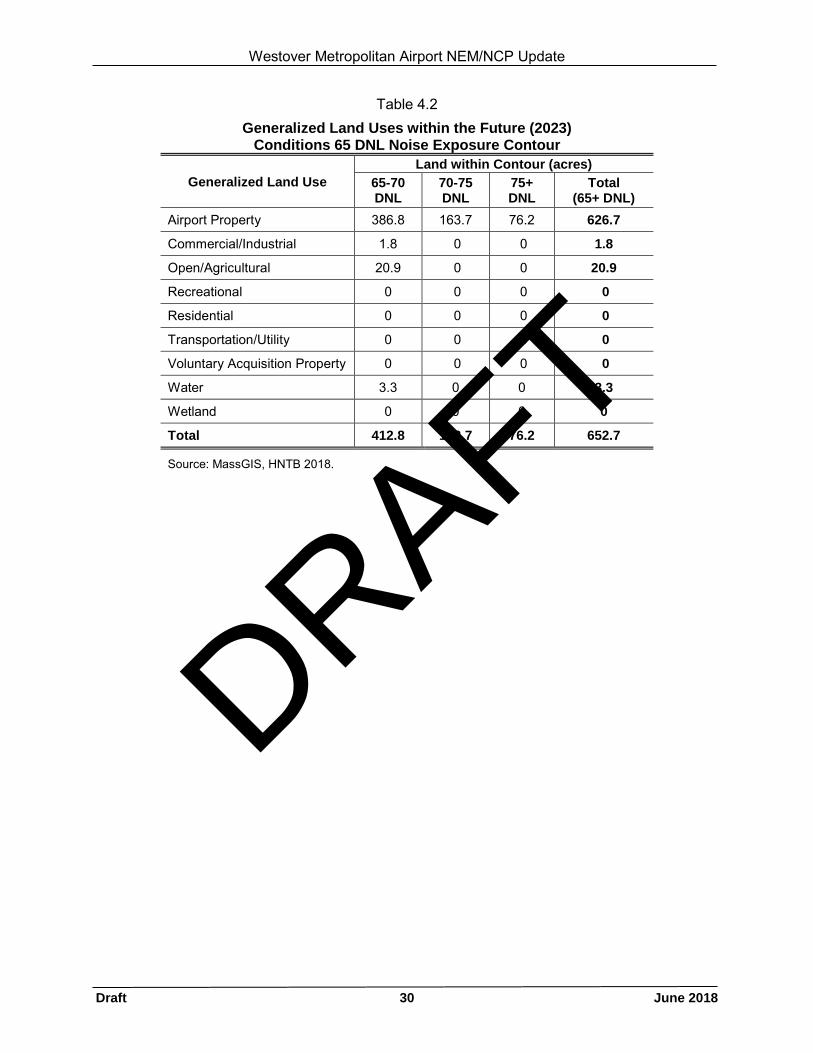
Westover Metropolitan Airport NEM/NCP Update
Draft 30 June 2018
Table 4.2 Generalized Land Uses within the Future (2023)
Conditions 65 DNL Noise Exposure Contour
Generalized Land Use Land within Contour (acres)
65-70DNL
70-75DNL
75+ DNL
Total (65+ DNL)
Airport Property 386.8 163.7 76.2 626.7
Commercial/Industrial 1.8 0 0 1.8
Open/Agricultural 20.9 0 0 20.9
Recreational 0 0 0 0
Residential 0 0 0 0
Transportation/Utility 0 0 0 0
Voluntary Acquisition Property 0 0 0 0
Water 3.3 0 0 3.3
Wetland 0 0 0 0
Total 412.8 163.7 76.2 652.7
Source: MassGIS, HNTB 2018.
DRAFT

Westover Metropolitan Airport NEM/NCP Update
Draft 31 June 2018
CHAPTER 5: Noise Compatibility Program 5.1 History of Noise Compatibility
Planning at the Airport
Noise compatibility planning surrounding CEF began in earnest in the early 1990s through a series of joint studies. A Joint Land Use Study (JLUS) led by the PVPC was completed in 1995.
The JLUS was followed shortly thereafter by the Airport’s first 14 CFR Part 150 Noise Compatibility Program study, sponsored by the WMDC. The JLUS recommendations were incorporated into the measures submitted to the FAA under the Part 150 NCP. The NEMs (for existing 1993 and forecast 1998 conditions) were completed in 1995. The FAA issued a Record of Approval of the NCP on January 26, 1996.
In 2001, a JLUS Update was undertaken. The JLUS Update coincided with an update of NEMs, developed for the FAA by HNTB Corporation. The updated land compatibility maps in the JLUS Project include the results of the NEM update. Work began in December 2001, and the final report was completed in October 2004. NEMs under the Part 150 study were prepared for existing 2003 and forecast 2008 conditions. A JLUS Update is currently under development as a cooperative land use planning effort by the USAF, PVPC, and WARB.9
The land use mitigation recommendations of the 2004 JLUS Update were included in the NEM Update for the Airport, consistent with the NCP that the FAA had reviewed in 1996. The FAA’s responsibility for review of the NCP focused on the eligibility of the mitigation components (voluntary acquisition
and sound insulation). The FAA’s comments and approval status of each of the measures are discussed under the detailed description of each.
In 2013, the USAF completed an AICUZ study, which included the development of a 2009 Noise Exposure Contour and a 2014 Forecast Noise Exposure Contour. Following completion of the AICUZ, an NEM/NCP Update was conducted with existing 2014 and future 2019 conditions. The purpose of resubmitting that NCP was to gain FAA approval of revising the voluntary acquisition program to include properties located in the future 2019 NEM. The FAA accepted the NEMs in September 2014 and issued a Record of Approval of the NCP on February 6, 2015.
This NEM/NCP Update is being conducted in response to a change in the fleet mix that was anticipated to result in a possible change to the noise contour. Since the last NEM/NCP Update in 2014, the 439th Airlift Wing transitioned from the C-5A/B Galaxy to the C-5M Super Galaxy, an upgraded version with new (quieter) engines and improved avionics. Due to the reduced size of the noise contours, it is prudent to update the NCP, and specifically the Airport’s noise mitigation program.
It should be noted that this document only discusses those elements of the recommended NCP submitted in 1996, and the updated NCP approved in 2015. Other land use management strategies, as recommended by the previous or ongoing JLUS Update or AICUZ, are not discussed in
DRAFT
Westover Metropolitan Airport NEM/NCP Update
Draft 32 June 2018
this document. It should also be noted that the FAA evaluation of these measures is done within the context of the Existing (2018) and forecast Future (2023) NEMs, and the reader should recognize that noise exposure can and will fluctuate based on the fleet mix at the Airport as well as the types and frequency of operations.
Noise programs at the Airport are funded through a combination of Federal, State and local funding. Nearly $21 million has been used for noise studies and land acquisition through 2017. Of this funding amount, the FAA has contributed $19.53 million, the MassDOT Aeronautics Division has contributed $824,000, and the WMDC has contributed $522,000.
5.2 2014 Noise Compatibility Program
The 2014 NCP consisted of an update to the 1996 NCP based on the noise contours of the existing 2014 and future 2019 NEMs. The Study provided an overview of all the noise mitigation measures previously approved in the 1996 ROA, with one proposed change; the WMDC proposed to expand the noise-land acquisition boundary from the 70 DNL noise contour, out to the 65 DNL noise contour. This measure was approved. All other previously approved (1996) measures were reviewed for their updated status, and for consistency with Part 150.
In February 2015, the FAA approved the NCP, which was submitted following the FAA’s acceptance of the NEMs. The FAA’s 1996 and 2015 Records of Approval are included in Appendix B.
The NCP included noise abatement measures, compatible land use measures, and program measures designed to abate
and mitigate the impacts of aircraft noise surrounding the Airport.
The following sections provide an overview and status update of each of the measures recommended in the NCP, including noise abatement, compatible land use planning, and program or implementation measures.
Noise Abatement Measures
Noise abatement measures are procedures or techniques used by aircraft to minimize the impact of noise on surrounding communities. Noise abatement measures are evaluated based on their feasibility, including regarding the aircraft’s performance capabilities, the air traffic control environment, and their potential to reduce noise impacts within the 65 DNL noise contour.
The 2014 NCP evaluated the approved noise abatement measures originally included in the 1996 NCP. These measures were initially modeled and compared to the noise exposure contours developed under the 1996 Study, and those which provided a benefit (a reduction in the number of residences and estimated population within the 65 DNL noise contour) were included in the Airport’s recommended plan submitted to the FAA. For the 1996 NCP, each of the four approved measures included consultation with the Westover Tower and Bradley Approach Control, the air traffic facility whose jurisdiction surrounds that of the Westover Tower. As part of the 2014 NCP review, the FAA disapproved two of the noise abatement measures, as they “provided no measurable benefit inside the 65 DNL noise contour:” the noise abatement departure procedures for civilian aircraft on Runway 23 and noise abatement departure procedures for civilian aircraft on Runway 05.
Measures were proposed for both civilian and military operations. The following
DRAFT
Westover Metropolitan Airport NEM/NCP Update
Draft 33 June 2018
sections describe each of the measures, the FAA’s conclusions at the time (approval or disapproval) and evaluates the procedure in the current environment.
Nighttime Preferential Runway Use for Civilian Aircraft
Description: This measure calls for civilian aircraft to use Runway 05 for departures and Runway 23 for arrivals to the maximum extent practicable. The WMDC Board of Directors first adopted this preferential runway use in 1987. Thus, the recommended pattern of civilian operations would be departures to the north and arrivals from the north, taking advantage of the lower density of residential land uses in Granby and Ludlow. If nighttime operations increased to levels predicted at the time, the WMDC would reevaluate the measure to achieve a more balanced level of runway use.
This non-mandatory measure was recommended in part to assist noise abatement efforts once the Westover Tower remained open for 24 hours per day. At the time, civilian operations could not operate at the Airport when the Westover Tower was closed (11:00 p.m. to 7:00 a.m.) without prior arrangement. The 1996 NCP included the assumption that the Westover Tower would begin 24-hour operations, although this has not yet occurred. Implementing this measure was forecast to reduce the estimated population within the 65 DNL noise contour south of the Airport.
FAA Finding 1996: The FAA approved this measure as voluntary.
FAA Finding 2015: Re-approved.
Current Status: Preferential runway use for civilian operations remains consistent, mostly due to the location of the general aviation facilities (FBO/terminal area).
Approximately 80% of civilian operations occur to or from the north. The Westover Tower remains closed to civilian operations from 11:00 p.m. to 7:00 a.m., although the WMDC can request a waiver for the Westover Tower to open before 7:00 a.m. or remain open past 11:00 p.m. if needed.
Costs associated with implementing this measure would be administrative, and the timeline for implementation would be dependent upon FAA and/or other responsible agency(ies) requirements for approval.
Noise Abatement Departure Procedures for Military Aircraft on Runway 23
The 1996 NCP proposed that select military C-5M departures from Runway 23 follow a noise abatement procedure. Military operations primarily depart from Runway 23 (south). At the time of the study, C-5M Runway 23 departures were required to climb on runway heading (approximately 230 degrees) until radar contact is confirmed with Bradley Approach Control, located 20 miles south of Westover. Due to the distance between the radar and aircraft, this sometimes resulted in the overflight of heavily populated areas until radar contact was established and aircraft were instructed to turn towards their destination. The proposed flight paths included earlier left or right turns, coordinated with the Bradley Approach Control.
FAA Finding 1996: The FAA approved this measure as voluntary, as implementation was shown to reduce the estimated population within the 65 DNL noise contour.
FAA Finding 2015: Re-approved.
Current Status: The military continues to use Runway 23 as the primary departure runway. C-5M operations use an early turn to
DRAFT
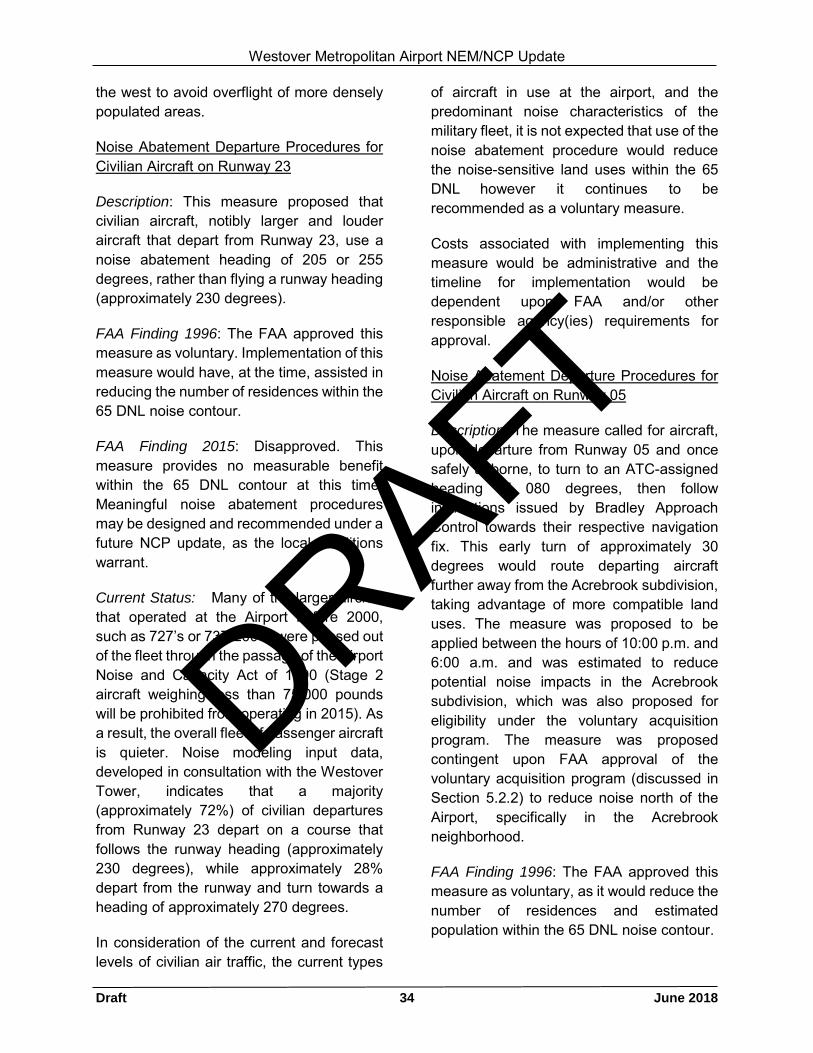
Westover Metropolitan Airport NEM/NCP Update
Draft 34 June 2018
the west to avoid overflight of more densely populated areas.
Noise Abatement Departure Procedures for Civilian Aircraft on Runway 23
Description: This measure proposed that civilian aircraft, notibly larger and louder aircraft that depart from Runway 23, use a noise abatement heading of 205 or 255 degrees, rather than flying a runway heading (approximately 230 degrees).
FAA Finding 1996: The FAA approved this measure as voluntary. Implementation of this measure would have, at the time, assisted in reducing the number of residences within the 65 DNL noise contour.
FAA Finding 2015: Disapproved. This measure provides no measurable benefit within the 65 DNL contour at this time. Meaningful noise abatement procedures may be designed and recommended under a future NCP update, as the local conditions warrant.
Current Status: Many of the larger aircraft that operated at the Airport before 2000, such as 727’s or 737-200’s, were phased out of the fleet through the passage of the Airport Noise and Capacity Act of 1990 (Stage 2 aircraft weighing less than 75,000 pounds will be prohibited from operating in 2015). As a result, the overall fleet of passenger aircraft is quieter. Noise modeling input data, developed in consultation with the Westover Tower, indicates that a majority (approximately 72%) of civilian departures from Runway 23 depart on a course that follows the runway heading (approximately 230 degrees), while approximately 28% depart from the runway and turn towards a heading of approximately 270 degrees.
In consideration of the current and forecast levels of civilian air traffic, the current types
of aircraft in use at the airport, and the predominant noise characteristics of the military fleet, it is not expected that use of the noise abatement procedure would reduce the noise-sensitive land uses within the 65 DNL however it continues to be recommended as a voluntary measure.
Costs associated with implementing this measure would be administrative and the timeline for implementation would be dependent upon FAA and/or other responsible agency(ies) requirements for approval.
Noise Abatement Departure Procedures for Civilian Aircraft on Runway 05
Description: The measure called for aircraft, upon departure from Runway 05 and once safely airborne, to turn to an ATC-assigned heading of 080 degrees, then follow instructions issued by Bradley Approach Control towards their respective navigation fix. This early turn of approximately 30 degrees would route departing aircraft further away from the Acrebrook subdivision, taking advantage of more compatible land uses. The measure was proposed to be applied between the hours of 10:00 p.m. and 6:00 a.m. and was estimated to reduce potential noise impacts in the Acrebrook subdivision, which was also proposed for eligibility under the voluntary acquisition program. The measure was proposed contingent upon FAA approval of the voluntary acquisition program (discussed in Section 5.2.2) to reduce noise north of the Airport, specifically in the Acrebrook neighborhood.
FAA Finding 1996: The FAA approved this measure as voluntary, as it would reduce the number of residences and estimated population within the 65 DNL noise contour.
DRAFT
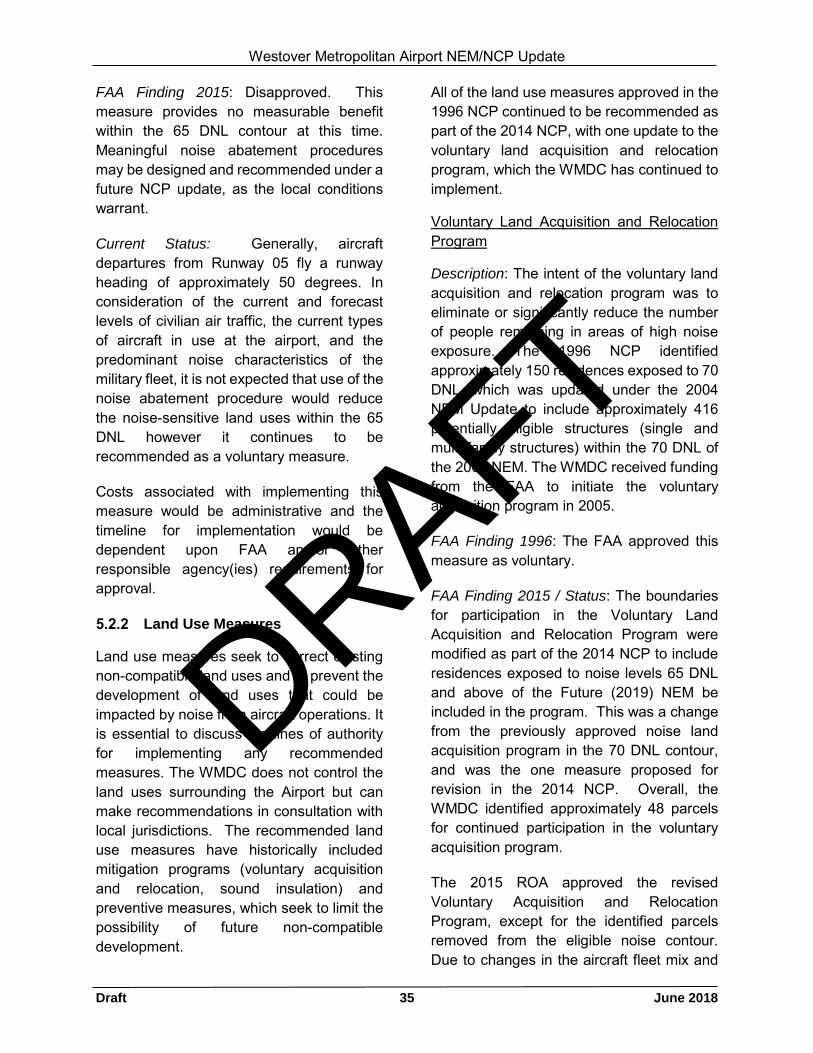
Westover Metropolitan Airport NEM/NCP Update
Draft 35 June 2018
FAA Finding 2015: Disapproved. This measure provides no measurable benefit within the 65 DNL contour at this time. Meaningful noise abatement procedures may be designed and recommended under a future NCP update, as the local conditions warrant.
Current Status: Generally, aircraft departures from Runway 05 fly a runway heading of approximately 50 degrees. In consideration of the current and forecast levels of civilian air traffic, the current types of aircraft in use at the airport, and the predominant noise characteristics of the military fleet, it is not expected that use of the noise abatement procedure would reduce the noise-sensitive land uses within the 65 DNL however it continues to be recommended as a voluntary measure.
Costs associated with implementing this measure would be administrative and the timeline for implementation would be dependent upon FAA and/or other responsible agency(ies) requirements for approval.
Land Use Measures
Land use measures seek to correct existing non-compatible land uses and to prevent the development of land uses that could be impacted by noise from aircraft operations. It is essential to discuss the lines of authority for implementing any recommended measures. The WMDC does not control the land uses surrounding the Airport but can make recommendations in consultation with local jurisdictions. The recommended land use measures have historically included mitigation programs (voluntary acquisition and relocation, sound insulation) and preventive measures, which seek to limit the possibility of future non-compatible development.
All of the land use measures approved in the 1996 NCP continued to be recommended as part of the 2014 NCP, with one update to the voluntary land acquisition and relocation program, which the WMDC has continued to implement.
Voluntary Land Acquisition and Relocation Program
Description: The intent of the voluntary land acquisition and relocation program was to eliminate or significantly reduce the number of people remaining in areas of high noise exposure. The 1996 NCP identified approximately 150 residences exposed to 70 DNL, which was updated under the 2004 NEM Update to include approximately 416 potentially eligible structures (single and multi-family structures) within the 70 DNL of the 2003 NEM. The WMDC received funding from the FAA to initiate the voluntary acquisition program in 2005.
FAA Finding 1996: The FAA approved this measure as voluntary.
FAA Finding 2015 / Status: The boundaries for participation in the Voluntary Land Acquisition and Relocation Program were modified as part of the 2014 NCP to include residences exposed to noise levels 65 DNL and above of the Future (2019) NEM be included in the program. This was a change from the previously approved noise land acquisition program in the 70 DNL contour, and was the one measure proposed for revision in the 2014 NCP. Overall, the WMDC identified approximately 48 parcels for continued participation in the voluntary acquisition program.
The 2015 ROA approved the revised Voluntary Acquisition and Relocation Program, except for the identified parcels removed from the eligible noise contour. Due to changes in the aircraft fleet mix and
DRAFT
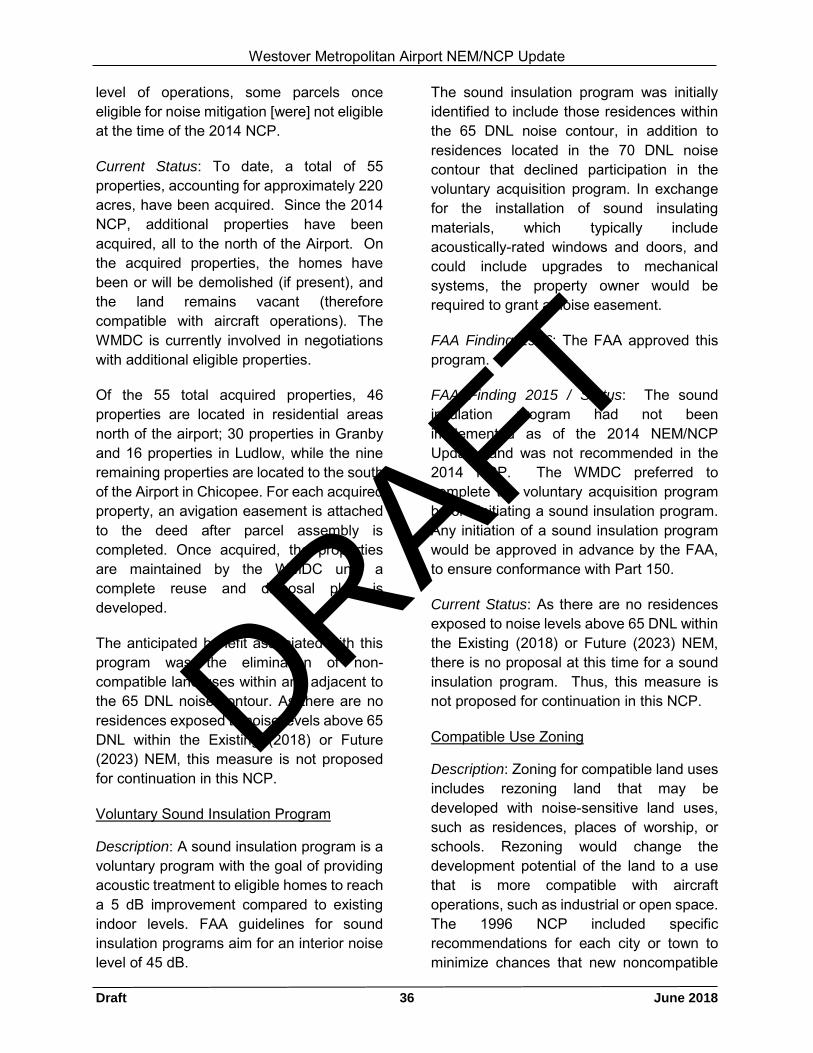
Westover Metropolitan Airport NEM/NCP Update
Draft 36 June 2018
level of operations, some parcels once eligible for noise mitigation [were] not eligible at the time of the 2014 NCP.
Current Status: To date, a total of 55 properties, accounting for approximately 220 acres, have been acquired. Since the 2014 NCP, additional properties have been acquired, all to the north of the Airport. On the acquired properties, the homes have been or will be demolished (if present), and the land remains vacant (therefore compatible with aircraft operations). The WMDC is currently involved in negotiations with additional eligible properties.
Of the 55 total acquired properties, 46 properties are located in residential areas north of the airport; 30 properties in Granby and 16 properties in Ludlow, while the nine remaining properties are located to the south of the Airport in Chicopee. For each acquired property, an avigation easement is attached to the deed after parcel assembly is completed. Once acquired, the properties are maintained by the WMDC until a complete reuse and disposal plan is developed.
The anticipated benefit associated with this program was the elimination of non-compatible land uses within and adjacent to the 65 DNL noise contour. As there are no residences exposed to noise levels above 65 DNL within the Existing (2018) or Future (2023) NEM, this measure is not proposed for continuation in this NCP.
Voluntary Sound Insulation Program
Description: A sound insulation program is a voluntary program with the goal of providing acoustic treatment to eligible homes to reach a 5 dB improvement compared to existing indoor levels. FAA guidelines for sound insulation programs aim for an interior noise level of 45 dB.
The sound insulation program was initially identified to include those residences within the 65 DNL noise contour, in addition to residences located in the 70 DNL noise contour that declined participation in the voluntary acquisition program. In exchange for the installation of sound insulating materials, which typically include acoustically-rated windows and doors, and could include upgrades to mechanical systems, the property owner would be required to grant a noise easement.
FAA Finding 1996: The FAA approved this program.
FAA Finding 2015 / Status: The sound insulation program had not been implemented as of the 2014 NEM/NCP Update, and was not recommended in the 2014 NCP. The WMDC preferred to complete the voluntary acquisition program before initiating a sound insulation program. Any initiation of a sound insulation program would be approved in advance by the FAA, to ensure conformance with Part 150.
Current Status: As there are no residences exposed to noise levels above 65 DNL within the Existing (2018) or Future (2023) NEM, there is no proposal at this time for a sound insulation program. Thus, this measure is not proposed for continuation in this NCP.
Compatible Use Zoning
Description: Zoning for compatible land uses includes rezoning land that may be developed with noise-sensitive land uses, such as residences, places of worship, or schools. Rezoning would change the development potential of the land to a use that is more compatible with aircraft operations, such as industrial or open space. The 1996 NCP included specific recommendations for each city or town to minimize chances that new noncompatible
DRAFT
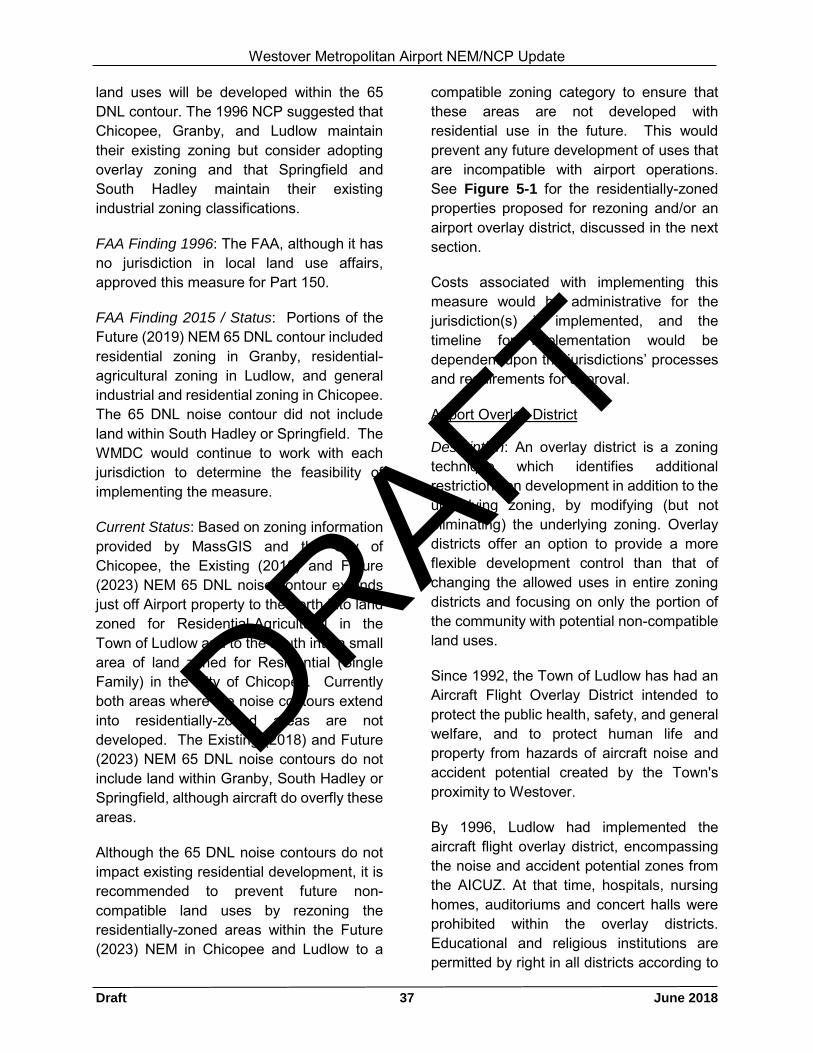
Westover Metropolitan Airport NEM/NCP Update
Draft 37 June 2018
land uses will be developed within the 65 DNL contour. The 1996 NCP suggested that Chicopee, Granby, and Ludlow maintain their existing zoning but consider adopting overlay zoning and that Springfield and South Hadley maintain their existing industrial zoning classifications.
FAA Finding 1996: The FAA, although it has no jurisdiction in local land use affairs, approved this measure for Part 150.
FAA Finding 2015 / Status: Portions of the Future (2019) NEM 65 DNL contour included residential zoning in Granby, residential-agricultural zoning in Ludlow, and general industrial and residential zoning in Chicopee. The 65 DNL noise contour did not include land within South Hadley or Springfield. The WMDC would continue to work with each jurisdiction to determine the feasibility of implementing the measure.
Current Status: Based on zoning information provided by MassGIS and the City of Chicopee, the Existing (2018) and Future (2023) NEM 65 DNL noise contour extends just off Airport property to the north into land zoned for Residential-Agricultural in the Town of Ludlow and to the south into a small area of land zoned for Residential (Single Family) in the City of Chicopee. Currently both areas where the noise contours extend into residentially-zoned areas are not developed. The Existing (2018) and Future (2023) NEM 65 DNL noise contours do not include land within Granby, South Hadley or Springfield, although aircraft do overfly these areas.
Although the 65 DNL noise contours do not impact existing residential development, it is recommended to prevent future non-compatible land uses by rezoning the residentially-zoned areas within the Future (2023) NEM in Chicopee and Ludlow to a
compatible zoning category to ensure that these areas are not developed with residential use in the future. This would prevent any future development of uses that are incompatible with airport operations. See Figure 5-1 for the residentially-zoned properties proposed for rezoning and/or an airport overlay district, discussed in the next section.
Costs associated with implementing this measure would be administrative for the jurisdiction(s) if implemented, and the timeline for implementation would be dependent upon the jurisdictions’ processes and requirements for approval.
Airport Overlay District
Description: An overlay district is a zoning technique which identifies additional restrictions on development in addition to the underlying zoning, by modifying (but not eliminating) the underlying zoning. Overlay districts offer an option to provide a more flexible development control than that of changing the allowed uses in entire zoning districts and focusing on only the portion of the community with potential non-compatible land uses.
Since 1992, the Town of Ludlow has had an Aircraft Flight Overlay District intended to protect the public health, safety, and general welfare, and to protect human life and property from hazards of aircraft noise and accident potential created by the Town's proximity to Westover.
By 1996, Ludlow had implemented the aircraft flight overlay district, encompassing the noise and accident potential zones from the AICUZ. At that time, hospitals, nursing homes, auditoriums and concert halls were prohibited within the overlay districts. Educational and religious institutions are permitted by right in all districts according to
DRAFT
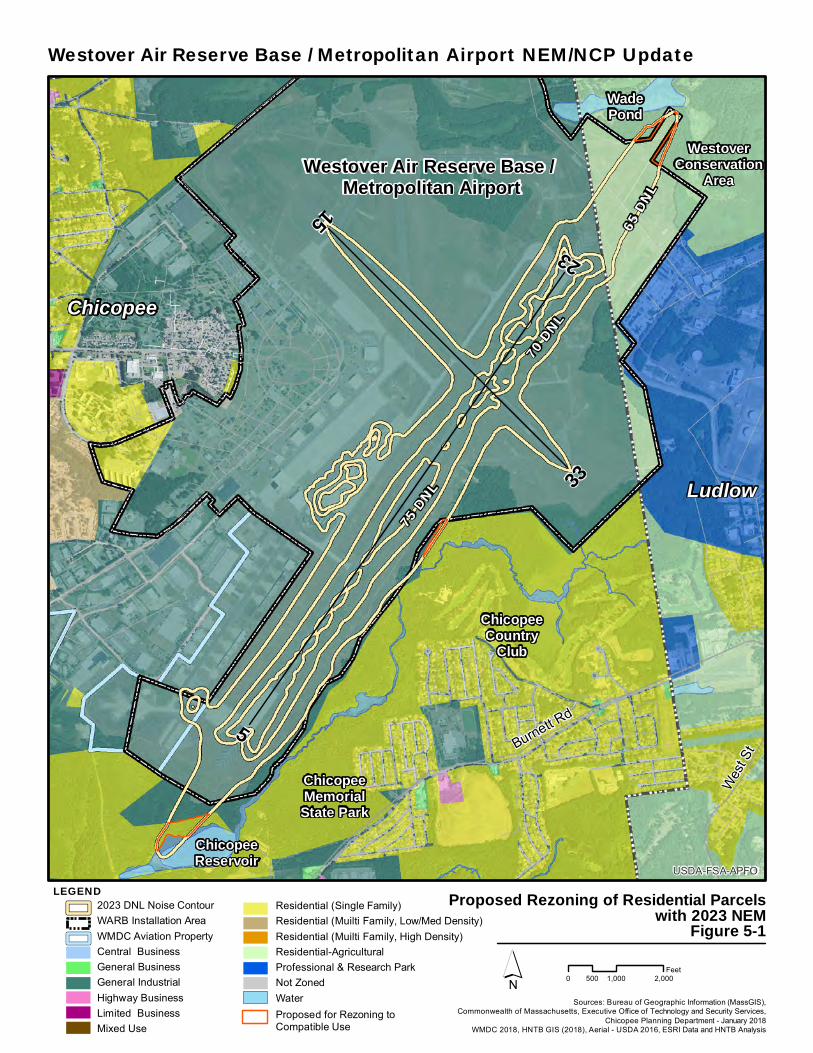
Westover Air Reserve Base / Metropolitan Airport
Wes
t StBurnett R
d5
23
33
15
ChicopeeMemorialState Park
ChicopeeCountry
Club
WestoverConservation
Area
WadePond
ChicopeeReservoir
Chicopee
Ludlow
65 DNL
70 DNL
75 DNL
USDA-FSA-APFO
´
LEGEND Proposed Rezoning of Residential Parcelswith 2023 NEM
Figure 5-12023 DNL Noise ContourWARB Installation AreaWMDC Aviation PropertyCentral BusinessGeneral BusinessGeneral IndustrialHighway BusinessLimited BusinessMixed Use
Residential (Single Family)Residential (Muilti Family, Low/Med Density)Residential (Muilti Family, High Density)Residential-AgriculturalProfessional & Research ParkNot ZonedWater Sources: Bureau of Geographic Information (MassGIS),
Commonwealth of Massachusetts, Executive Office of Technology and Security Services,Chicopee Planning Department - January 2018
WMDC 2018, HNTB GIS (2018), Aerial - USDA 2016, ESRI Data and HNTB Analysis
Westover Air Reserve Base / Metropolitan Airport NEM/NCP Update
0 1,000 2,000500Feet
Proposed for Rezoning toCompatible Use
Westover Metropolitan Airport NEM/NCP Update
Draft 38 June 2018
the Massachusetts Zoning Enabling Act, and the Town had sought and received home rule authority from the state legislature to allow restriction of development of schools, day care centers, and houses of worship within accident potential zones. The existing overlay district does not prohibit residential land uses or impose sound insulating requirements on residential lands.
The initial NCP recommended that Chicopee and Granby adopt an airport overlay district which encompasses land within the 65 DNL contour and that the Town of Ludlow change the boundaries of its airport overlay district to include all of the land within the forecasted 1998 contour.
FAA Finding 1996: The FAA, although it has no jurisdiction in local land use affairs, approved this measure for the purposes of Part 150.
FAA Finding 2015 / Status: No changes to the Town of Ludlow’s overlay district had been implemented, and no other jurisdictions had developed an overlay district to date. The 65 DNL noise contour of the Future (2019) NEM extended into Ludlow, Granby and Chicopee. The WMDC would continue to work with each jurisdiction to determine the feasibility of implementing this measure.
Current Status: Changes to the Town of Ludlow’s overlay district have still not been implemented, and no other jurisdictions have developed an overlay district to date. Although the Existing (2018) and Future (2023) NEM 65 DNL noise contours do not impact existing residential areas, implementation of an airport overlay district within the residentially-zoned areas of the Future (2023) NEM contour is recommended as it offers an additional level of protection and safety for residents. An overlay zone would prevent any future noncompatible
uses with airport operations. See Figure 5-1 for the residentially-zoned properties proposed for rezoning and/or an airport overlay district.
Costs associated with implementing this measure would be administrative for the jurisdiction(s) if implemented, and the timeline for implementation would be dependent upon the jurisdictions’ processes and requirements for approval.
Subdivision Regulations
Description: Subdivision regulations describe the procedures and standards for the division of parcels of land, most notably for sale or development as smaller parcels. The use of subdivision regulations by a municipality prescribes certain conditions that must be met by a developer before receipt and recordation of a plat. Generally, amending subdivision regulations is most practical when large amounts of undeveloped land are present.
The 1996 NCP recommended that the Town of Granby, as the jurisdiction with the most notable assemblage of undeveloped land within the 65 DNL noise contour, amend their subdivision regulations to require noise easements to be obtained on newly created lots within the 65 DNL noise contour.
FAA Finding 1996: The FAA, although it has no jurisdiction in local land use affairs, approved this measure for Part 150.
FAA Finding 2015 / Status: The Town of Granby had not included the recommendations requiring noise easements into their subdivision regulations. The 65 DNL noise exposure contour of the Future (2019) NEM extended into Granby, in areas where the WMDC was offering voluntary acquisition at the time. The WMDC
DRAFT
Westover Metropolitan Airport NEM/NCP Update
Draft 39 June 2018
would work with Granby to determine the feasibility of implementing this measure.
Current Status: The 65 DNL noise exposure contour of the Existing (2018) and Future (2023) NEMs do not extend into the Town of Granby; thus, this measure is not proposed for continuation for this NCP.
Implementation, Monitoring, and Review Measures
Implementation, monitoring, and review measures are those that can be undertaken by the WMDC to track the progress of the recommended noise compatibility program. They include measures that are designed to increase awareness of noise abatement and mitigation, and provisions for the continued monitoring of noise surrounding an Airport.
The 1996 NCP identified four measures for inclusion in the program, as described in the following sections. The status of the measures was updated as part of the 2014 NCP. The current status provides the current update for this NCP.
Pilot Awareness Program
Description: This measure identified that the WMDC would publish a pamphlet of noise abatement practices to be distributed to civilian pilots through the aviation services provider and WMDC’s airport management. The pamphlet would include a map of noise sensitive areas around the airport and describe the operational measures which WMDC has adopted for noise abatement, including the use of noise abatement departure procedures recommended by the National Business Aircraft Association or by individual aircraft manufacturers. The measure suggested that the WMDC would install signs in all terminal areas frequented by civilian pilots and along ramp and taxiway
areas controlled by WMDC, instructing pilots to follow noise abatement procedures.
FAA Finding 1996: This measure was approved by the FAA, with the caveat that the location and content of signs may be subject to FAA approval.
FAA Finding 2015 / Status: The WMDC had installed signs in the terminal area pilot lounge and in areas leading to airside facilities directing pilots to be aware of noise-sensitive locations around the Airport. The WMDC would further evaluate the feasibility of installing more permanent signs encouraging the use of the noise abatement procedures for civilian aircraft from Runways 5 and 23.
Current Status: No new signs have been added to encourage the use of the noise abatement procedures for civilian aircraft from Runways 5 and 23.
Costs associated with implementing this measure would be administrative and the timeline for implementation would be dependent upon FAA and/or other responsible agency(ies) requirements for approval.
Public Awareness Program
Description: This measure served to increase public awareness in the surrounding communities regarding the latest developments in the noise compatibility program.
FAA Finding 1996: The FAA approved this measure.
FAA Finding 2015 / Status: As part of the voluntary acquisition program, the WMDC had maintained contact with property owners within the 65 DNL noise contours of the previous NEMs.
DRAFT
Westover Metropolitan Airport NEM/NCP Update
Draft 40 June 2018
Current Status: Although the Voluntary Acquisition and Relocation Program is not proposed as part of this NCP as there are no residences within the 65 DNL contours, it is recommended that the WMDC continue to maintain contact with property owners within past program areas.
Costs associated with implementing this measure would be administrative and minimal to continue.
Monitoring Nighttime Operations and Runway Use
Description: This measure was intended to assist in the identification and quantification of nighttime aircraft activity, specifically during the hours in which the Westover Tower was closed. Information to be collected included the time, type of aircraft, registration/flight number, landing or take-off, runway used, and wind and weather conditions. The information would be used to determine compliance with WMDC’s nighttime noise rule and to help provide guidance to Air Force contract tower personnel to determine compliance with the preferential runway use program.
FAA Finding 1996: The FAA approved in part and disapproved in part this measure. The FAA stated that using the data to ensure compliance with any rules that would essentially limit aircraft operations would require an additional noise study.
FAA Finding 2015 / Status: The Westover Tower tracked operations during hours the tower is open. Minimum operations occur during nighttime hours (10:00 p.m. to 7:00 a.m.). The additional information noted in the 1996 FAA Finding was not submitted, and therefore the partial disapproval remained in effect.
Current Status: The Westover Tower tracks operations during hours the tower is open.
Minimum operations occur during nighttime hours (10:00 p.m. to 7:00 a.m.).
However, the Airport is currently considering opening the Westover Airport for 24 hours per day and an Environmental Assessment is underway to evaluate potential impacts. Monitoring nighttime operations and runway use would help determine compliance with WMDC’s nighttime noise rule and to help guide Air Force tower personnel to determine compliance with the preferential runway use program, if more nighttime operations were to occur. This measure is therefore carried forward.
Costs associated with implementing this measure would be administrative, and the timeline for implementation would be dependent upon FAA and/or other responsible agency(ies) requirements for approval.
Periodic Updates of Noise Exposure
Description: This measure recommended the ongoing monitoring of changes in noise exposure at the Airport, primarily by focusing on the changes that would likely have the greatest impact to cause an increase in cumulative noise exposure. The original measure identified, as primary potential drivers of noise exposure, any planned changes in scheduled jet operations by civilian aircraft, any planned changes in nighttime operations by civil aircraft, or annual changes in total civil operations. Further, once noise exposure reached levels forecasted in the original NEM, the WMDC would update the Part 150 study.
1996 FAA Finding: The FAA approved this measure.
FAA Finding 2015 / Status: The WMDC has completed or supported multiple evaluations of noise exposure as a result of changes in
DRAFT
Westover Metropolitan Airport NEM/NCP Update
Draft 41 June 2018
operations, including the 2014 NEM/NCP Update.
Current Status: As indicated in the introduction to the NCP in this chapter, the WMDC has completed or supported multiple evaluations of noise exposure as a result of changes in operations, including this update. WMDC will provide periodic NEM updates as required by law and regulation.
Costs associated with implementing this measure would be administrative, and the timeline for implementation would be dependent upon FAA and/or other responsible agency(ies) requirements for approval.
DRAFT
Westover Metropolitan Airport NEM/NCP Update
Draft 42 June 2018
CHAPTER 6: Record of Consultation The following sections describe the consultation with various parties as required by 14 CFR Part 150, including coordination meetings and plans for public involvement via public review of the Draft NEM/NCP Update document and a subsequent public meeting.
6.1 Meetings and Coordination
Multiple meetings and teleconferences were held throughout the development of the NEMs and update to the NCP to obtain and share information to ensure the most accurate information was available and incorporated into the NEMs. Consultation was undertaken with the 439th Airlift Wing to ensure C-5M flight paths from the 2013 AICUZ study and the standard C-5M flight procedures in the noise model are accurate. Site visits and multiple teleconferences were held with the Westover Tower to collect data on aircraft operations, including the frequency, types, and times of day of operations. Consultation was undertaken with other operators at the Airport, including the Massachusetts State Police Air Wing.
Land use verification letters were submitted to the nearby jurisdictions of Chicopee, Ludlow, and Granby to confirm the use of the most recent land use data available. To date, Ludlow and Chicopee have responded to confirm the existing land use mapping. Ludlow provided several updates to the Town’s land use which were incorporated into the land use mapping. Correspondence with these jurisdictions is included in Appendix E.
6.2 Draft NEM/NCP Update Document
The updated NEMs, NCP, and related study data will be made available to the public for review and comment to satisfy Part 150 public involvement requirements. This opportunity for comment on the NEMs and NCP will be provided with the publication of the Draft NEM/NCP Update document and at a subsequent public meeting.
The locations where the hard copies of the Draft NEM/NCP Update are provided will be included in the Final NEM/NCP Update.
6.3 Public Information Workshop
This section will be updated with Public Information Workshop information once available. This workshop is intended to provide the public the opportunity to discuss the draft NEMs and NCP with project team members and to provide comments. Appendix E will provide copies of sign-in sheets, newspaper advertisements, meeting handouts, display boards and comments received.
The range of topics discussed at the public meeting will include the draft existing and future NEMs, a review of the Airport’s existing NCP, and proposed revisions to the NCP.
6.4 Comments on the Draft Document
The publishing of the Draft document will include a 30-day comment period. A summary table of the comments and a response to each comment will be provided in the Final NEM/NCP Update. The comment letters will be provided in Appendix E.
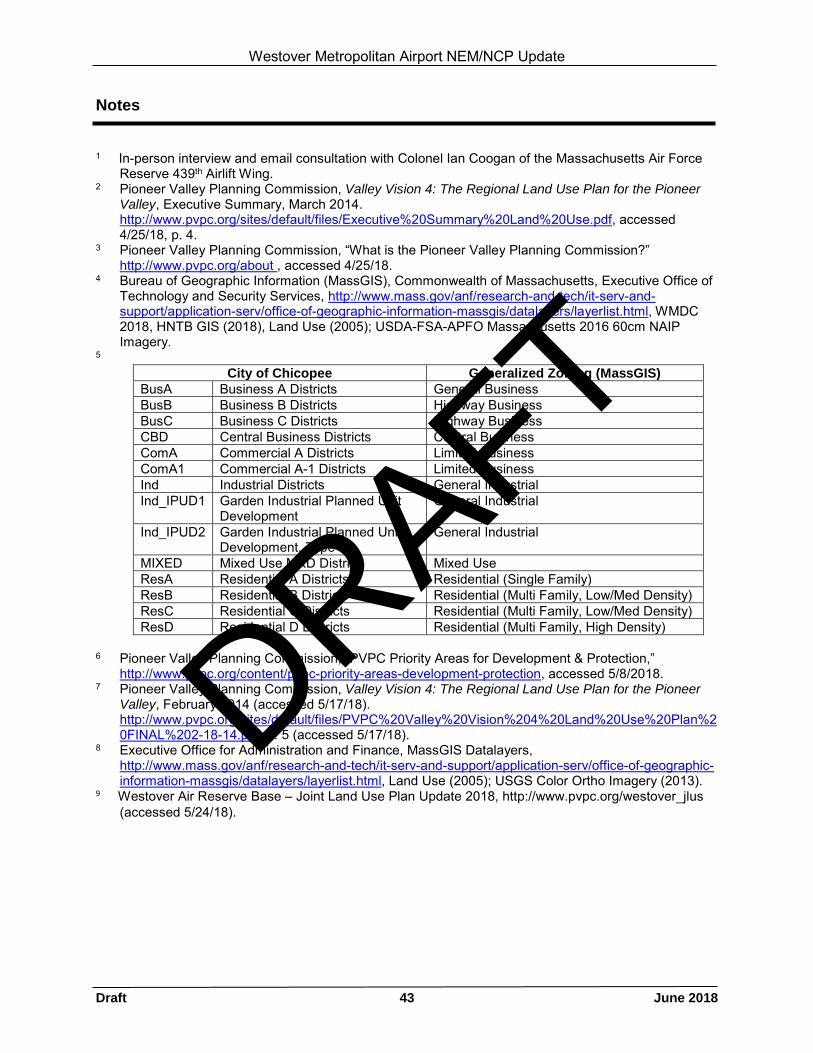
Westover Metropolitan Airport NEM/NCP Update
Draft 43 June 2018
Notes
1 In-person interview and email consultation with Colonel Ian Coogan of the Massachusetts Air Force Reserve 439th Airlift Wing.
2 Pioneer Valley Planning Commission, Valley Vision 4: The Regional Land Use Plan for the Pioneer Valley, Executive Summary, March 2014. http://www.pvpc.org/sites/default/files/Executive%20Summary%20Land%20Use.pdf, accessed 4/25/18, p. 4.
3 Pioneer Valley Planning Commission, “What is the Pioneer Valley Planning Commission?” http://www.pvpc.org/about , accessed 4/25/18.
4 Bureau of Geographic Information (MassGIS), Commonwealth of Massachusetts, Executive Office of Technology and Security Services, http://www.mass.gov/anf/research-and-tech/it-serv-and-support/application-serv/office-of-geographic-information-massgis/datalayers/layerlist.html, WMDC 2018, HNTB GIS (2018), Land Use (2005); USDA-FSA-APFO Massachusetts 2016 60cm NAIP Imagery.
5 City of Chicopee Generalized Zoning (MassGIS)
BusA Business A Districts General Business BusB Business B Districts Highway Business BusC Business C Districts Highway Business CBD Central Business Districts Central Business ComA Commercial A Districts Limited Business ComA1 Commercial A-1 Districts Limited Business Ind Industrial Districts General Industrial Ind_IPUD1 Garden Industrial Planned Unit
Development General Industrial
Ind_IPUD2 Garden Industrial Planned Unit Development, Type II
General Industrial
MIXED Mixed Use MXD District Mixed Use ResA Residential A Districts Residential (Single Family) ResB Residential B Districts Residential (Multi Family, Low/Med Density) ResC Residential C Districts Residential (Multi Family, Low/Med Density) ResD Residential D Districts Residential (Multi Family, High Density)
6 Pioneer Valley Planning Commission, “PVPC Priority Areas for Development & Protection,”
http://www.pvpc.org/content/pvpc-priority-areas-development-protection, accessed 5/8/2018. 7 Pioneer Valley Planning Commission, Valley Vision 4: The Regional Land Use Plan for the Pioneer
Valley, February 2014 (accessed 5/17/18). http://www.pvpc.org/sites/default/files/PVPC%20Valley%20Vision%204%20Land%20Use%20Plan%20FINAL%202-18-14.pdf, p. 5 (accessed 5/17/18).
8 Executive Office for Administration and Finance, MassGIS Datalayers, http://www.mass.gov/anf/research-and-tech/it-serv-and-support/application-serv/office-of-geographic-information-massgis/datalayers/layerlist.html, Land Use (2005); USGS Color Ortho Imagery (2013).
9 Westover Air Reserve Base – Joint Land Use Plan Update 2018, http://www.pvpc.org/westover_jlus (accessed 5/24/18).
DRAFT

APPENDIX A
Part 150 NEM and NCP Checklists
DRAFT

[This page is left intentionally blank]
DRAFT
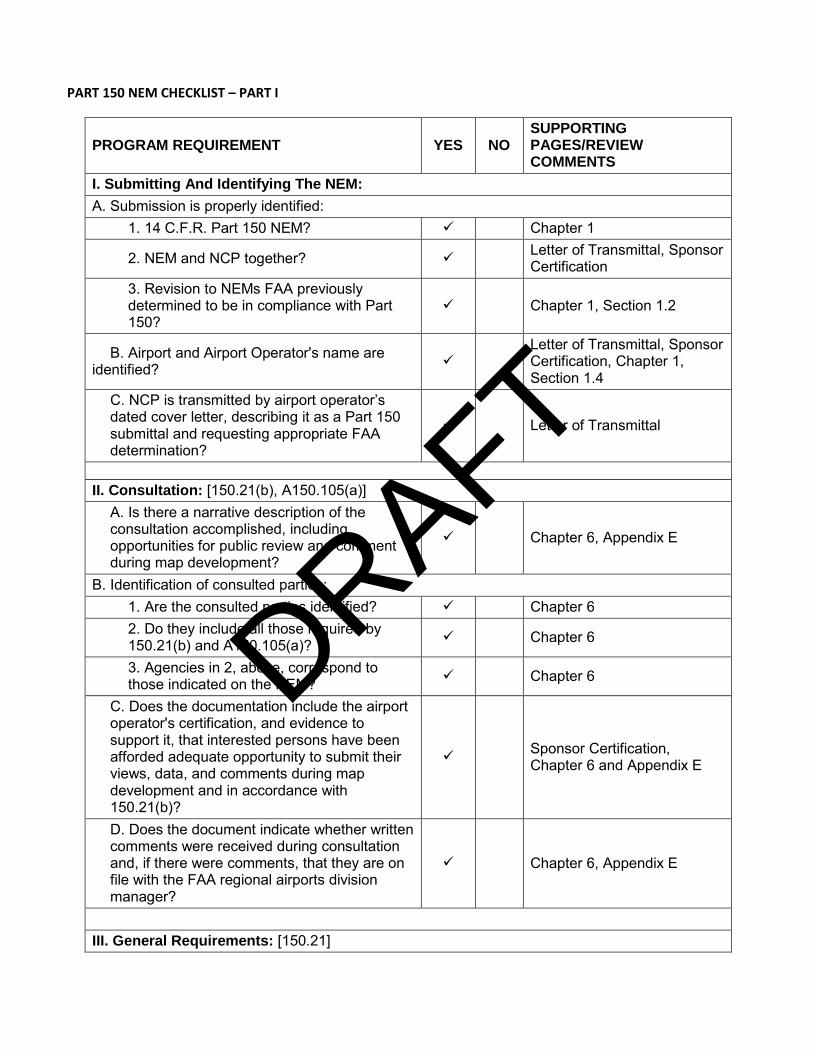
PART 150 NEM CHECKLIST – PART I
PROGRAM REQUIREMENT YES NO SUPPORTING PAGES/REVIEW COMMENTS
I. Submitting And Identifying The NEM: A. Submission is properly identified:
1. 14 C.F.R. Part 150 NEM? ✓
Chapter 1
2. NEM and NCP together? ✓
Letter of Transmittal, Sponsor Certification
3. Revision to NEMs FAA previously determined to be in compliance with Part 150?
✓
Chapter 1, Section 1.2
B. Airport and Airport Operator's name are identified? ✓
Letter of Transmittal, Sponsor Certification, Chapter 1, Section 1.4
C. NCP is transmitted by airport operator’s dated cover letter, describing it as a Part 150 submittal and requesting appropriate FAA determination?
✓
Letter of Transmittal
II. Consultation: [150.21(b), A150.105(a)]
A. Is there a narrative description of the consultation accomplished, including opportunities for public review and comment during map development?
✓
Chapter 6, Appendix E
B. Identification of consulted parties: 1. Are the consulted parties identified? ✓
Chapter 6
2. Do they include all those required by 150.21(b) and A150.105(a)? ✓
Chapter 6
3. Agencies in 2, above, correspond to those indicated on the NEM? ✓
Chapter 6
C. Does the documentation include the airport operator's certification, and evidence to support it, that interested persons have been afforded adequate opportunity to submit their views, data, and comments during map development and in accordance with 150.21(b)?
✓
Sponsor Certification, Chapter 6 and Appendix E
D. Does the document indicate whether written comments were received during consultation and, if there were comments, that they are on file with the FAA regional airports division manager?
✓
Chapter 6, Appendix E
III. General Requirements: [150.21]
DRAFT
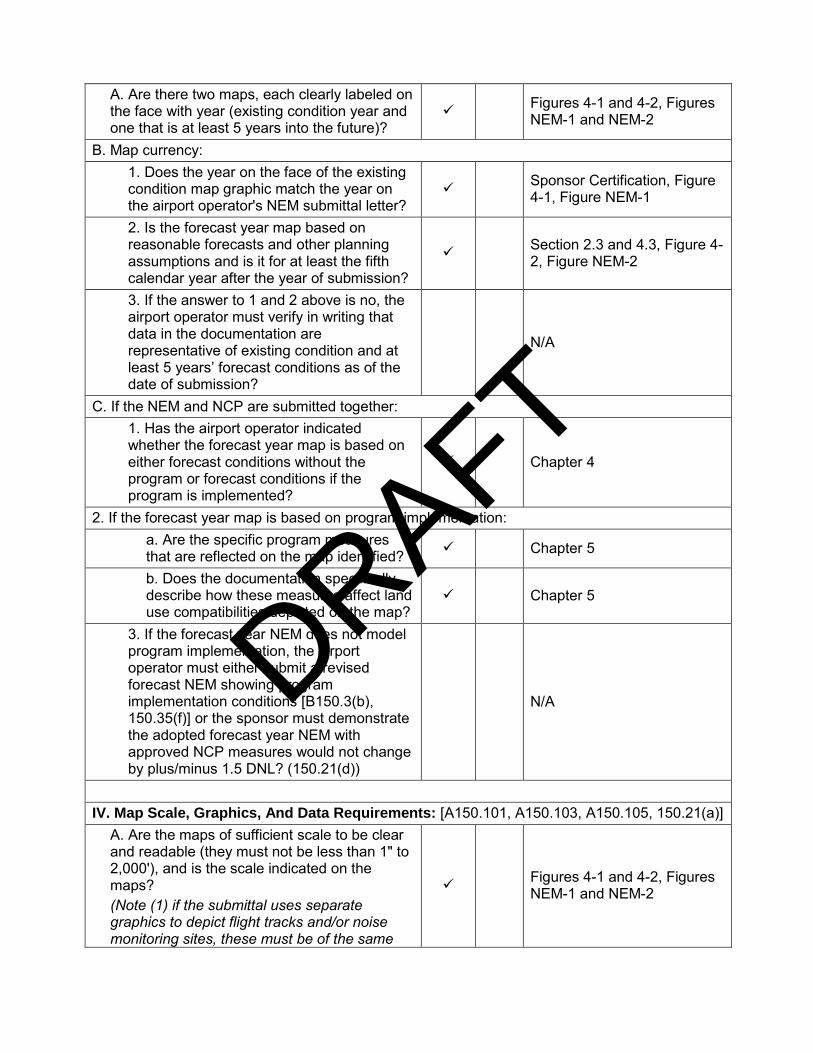
A. Are there two maps, each clearly labeled on the face with year (existing condition year and one that is at least 5 years into the future)?
✓
Figures 4-1 and 4-2, Figures NEM-1 and NEM-2
B. Map currency: 1. Does the year on the face of the existing condition map graphic match the year on the airport operator's NEM submittal letter?
✓
Sponsor Certification, Figure 4-1, Figure NEM-1
2. Is the forecast year map based on reasonable forecasts and other planning assumptions and is it for at least the fifth calendar year after the year of submission?
✓
Section 2.3 and 4.3, Figure 4-2, Figure NEM-2
3. If the answer to 1 and 2 above is no, the airport operator must verify in writing that data in the documentation are representative of existing condition and at least 5 years’ forecast conditions as of the date of submission?
N/A
C. If the NEM and NCP are submitted together: 1. Has the airport operator indicated whether the forecast year map is based on either forecast conditions without the program or forecast conditions if the program is implemented?
✓
Chapter 4
2. If the forecast year map is based on program implementation: a. Are the specific program measures that are reflected on the map identified? ✓ Chapter 5
b. Does the documentation specifically describe how these measures affect land use compatibilities depicted on the map?
✓ Chapter 5
3. If the forecast year NEM does not model program implementation, the airport operator must either submit a revised forecast NEM showing program implementation conditions [B150.3(b), 150.35(f)] or the sponsor must demonstrate the adopted forecast year NEM with approved NCP measures would not change by plus/minus 1.5 DNL? (150.21(d))
N/A
IV. Map Scale, Graphics, And Data Requirements: [A150.101, A150.103, A150.105, 150.21(a)]
A. Are the maps of sufficient scale to be clear and readable (they must not be less than 1" to 2,000'), and is the scale indicated on the maps? (Note (1) if the submittal uses separate graphics to depict flight tracks and/or noise monitoring sites, these must be of the same
✓ Figures 4-1 and 4-2, Figures NEM-1 and NEM-2
DRAFT
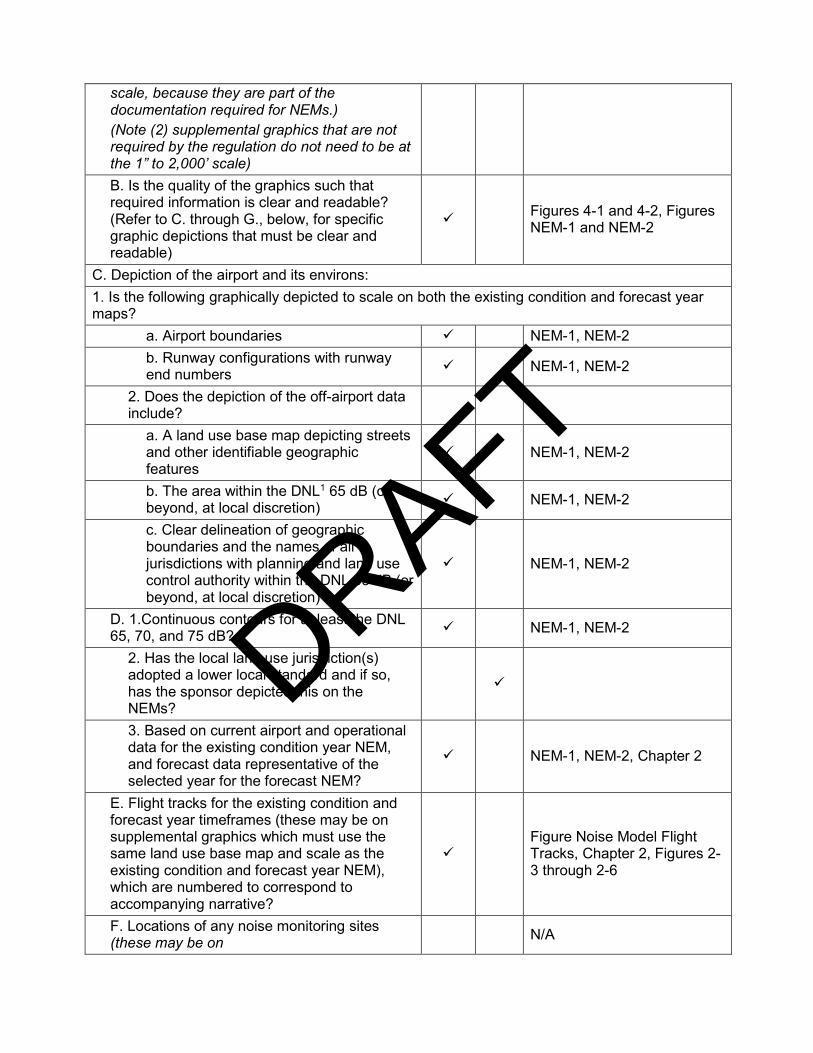
scale, because they are part of the documentation required for NEMs.) (Note (2) supplemental graphics that are not required by the regulation do not need to be at the 1” to 2,000’ scale) B. Is the quality of the graphics such that required information is clear and readable? (Refer to C. through G., below, for specific graphic depictions that must be clear and readable)
✓ Figures 4-1 and 4-2, Figures NEM-1 and NEM-2
C. Depiction of the airport and its environs: 1. Is the following graphically depicted to scale on both the existing condition and forecast year maps?
a. Airport boundaries ✓ NEM-1, NEM-2 b. Runway configurations with runway end numbers ✓ NEM-1, NEM-2
2. Does the depiction of the off-airport data include?
a. A land use base map depicting streets and other identifiable geographic features
✓ NEM-1, NEM-2
b. The area within the DNL1 65 dB (or beyond, at local discretion) ✓ NEM-1, NEM-2
c. Clear delineation of geographic boundaries and the names of all jurisdictions with planning and land use control authority within the DNL 65 dB (or beyond, at local discretion)
✓ NEM-1, NEM-2
D. 1.Continuous contours for at least the DNL 65, 70, and 75 dB? ✓ NEM-1, NEM-2
2. Has the local land use jurisdiction(s) adopted a lower local standard and if so, has the sponsor depicted this on the NEMs?
✓
3. Based on current airport and operational data for the existing condition year NEM, and forecast data representative of the selected year for the forecast NEM?
✓ NEM-1, NEM-2, Chapter 2
E. Flight tracks for the existing condition and forecast year timeframes (these may be on supplemental graphics which must use the same land use base map and scale as the existing condition and forecast year NEM), which are numbered to correspond to accompanying narrative?
✓ Figure Noise Model Flight Tracks, Chapter 2, Figures 2-3 through 2-6
F. Locations of any noise monitoring sites (these may be on N/A
DRAFT
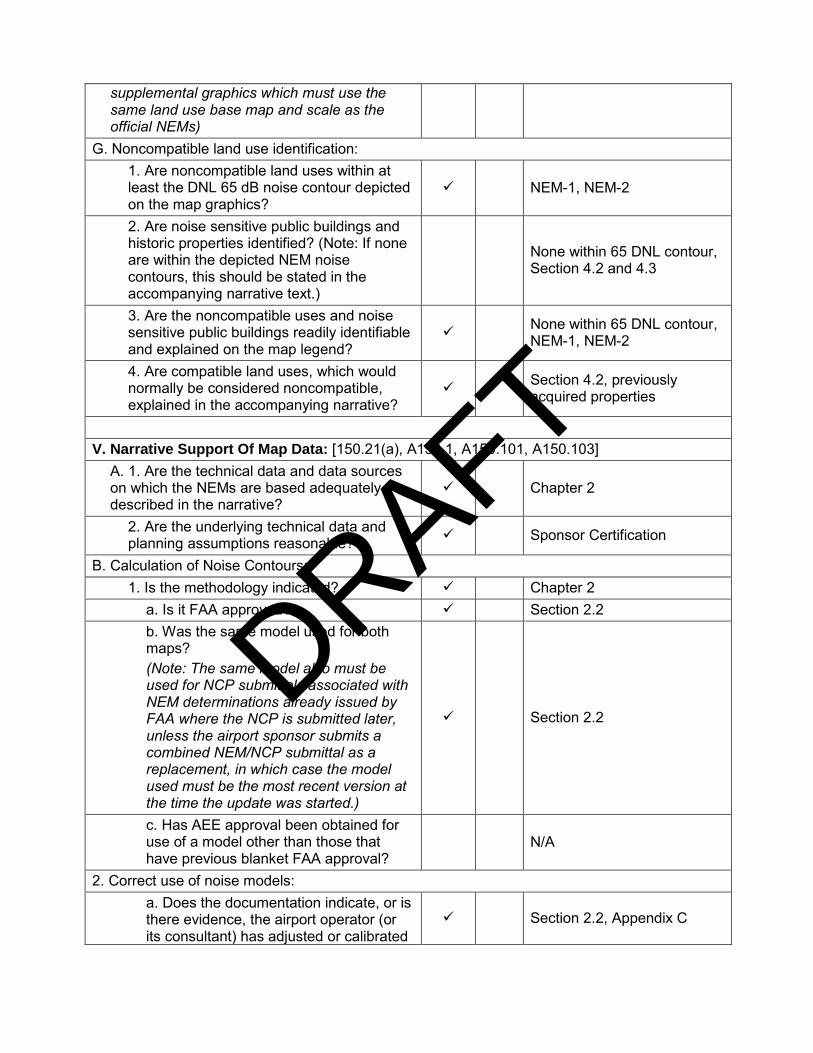
supplemental graphics which must use the same land use base map and scale as the official NEMs)
G. Noncompatible land use identification: 1. Are noncompatible land uses within at least the DNL 65 dB noise contour depicted on the map graphics?
✓ NEM-1, NEM-2
2. Are noise sensitive public buildings and historic properties identified? (Note: If none are within the depicted NEM noise contours, this should be stated in the accompanying narrative text.)
None within 65 DNL contour, Section 4.2 and 4.3
3. Are the noncompatible uses and noise sensitive public buildings readily identifiable and explained on the map legend?
✓ None within 65 DNL contour, NEM-1, NEM-2
4. Are compatible land uses, which would normally be considered noncompatible, explained in the accompanying narrative?
✓ Section 4.2, previously acquired properties
V. Narrative Support Of Map Data: [150.21(a), A150.1, A150.101, A150.103]
A. 1. Are the technical data and data sources on which the NEMs are based adequately described in the narrative?
✓ Chapter 2
2. Are the underlying technical data and planning assumptions reasonable? ✓ Sponsor Certification
B. Calculation of Noise Contours: 1. Is the methodology indicated? ✓ Chapter 2
a. Is it FAA approved? ✓ Section 2.2 b. Was the same model used for both maps? (Note: The same model also must be used for NCP submittals associated with NEM determinations already issued by FAA where the NCP is submitted later, unless the airport sponsor submits a combined NEM/NCP submittal as a replacement, in which case the model used must be the most recent version at the time the update was started.)
✓ Section 2.2
c. Has AEE approval been obtained for use of a model other than those that have previous blanket FAA approval?
N/A
2. Correct use of noise models: a. Does the documentation indicate, or is there evidence, the airport operator (or its consultant) has adjusted or calibrated
✓ Section 2.2, Appendix C
DRAFT
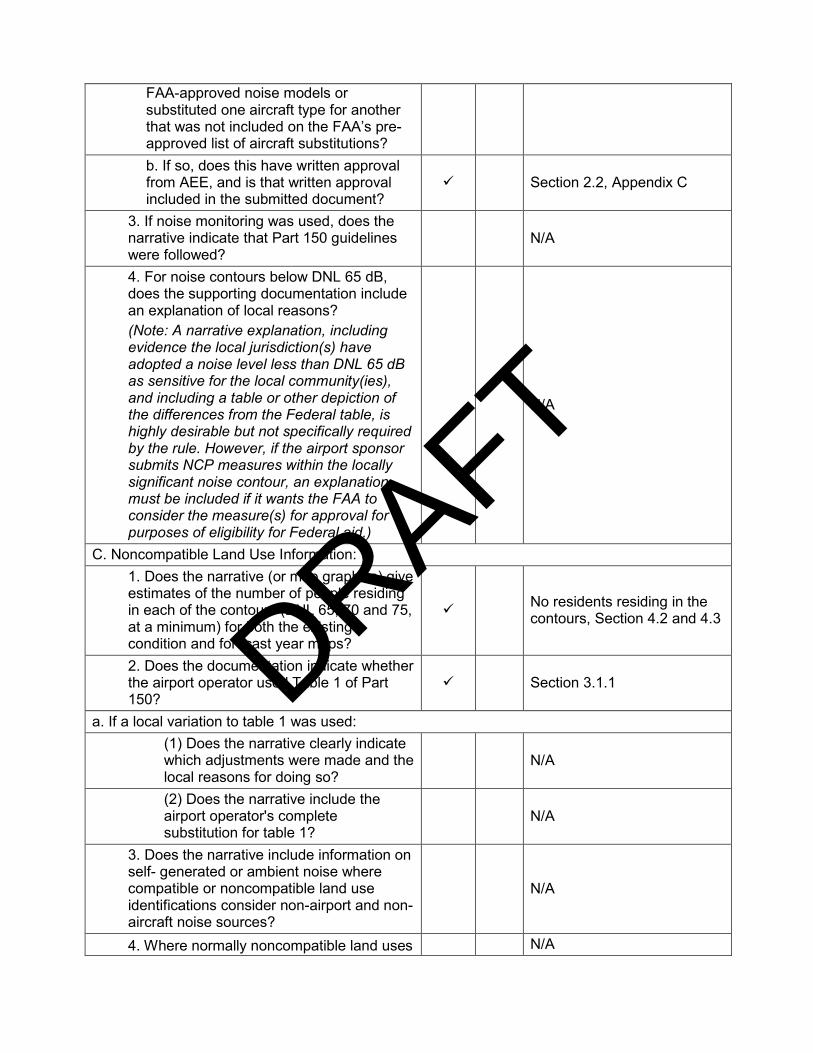
FAA-approved noise models or substituted one aircraft type for another that was not included on the FAA’s pre-approved list of aircraft substitutions? b. If so, does this have written approval from AEE, and is that written approval included in the submitted document?
✓ Section 2.2, Appendix C
3. If noise monitoring was used, does the narrative indicate that Part 150 guidelines were followed?
N/A
4. For noise contours below DNL 65 dB, does the supporting documentation include an explanation of local reasons? (Note: A narrative explanation, including evidence the local jurisdiction(s) have adopted a noise level less than DNL 65 dB as sensitive for the local community(ies), and including a table or other depiction of the differences from the Federal table, is highly desirable but not specifically required by the rule. However, if the airport sponsor submits NCP measures within the locally significant noise contour, an explanation must be included if it wants the FAA to consider the measure(s) for approval for purposes of eligibility for Federal aid.)
N/A
C. Noncompatible Land Use Information: 1. Does the narrative (or map graphics) give estimates of the number of people residing in each of the contours (DNL 65, 70 and 75, at a minimum) for both the existing condition and forecast year maps?
✓ No residents residing in the contours, Section 4.2 and 4.3
2. Does the documentation indicate whether the airport operator used Table 1 of Part 150?
✓ Section 3.1.1
a. If a local variation to table 1 was used: (1) Does the narrative clearly indicate which adjustments were made and the local reasons for doing so?
N/A
(2) Does the narrative include the airport operator's complete substitution for table 1?
N/A
3. Does the narrative include information on self- generated or ambient noise where compatible or noncompatible land use identifications consider non-airport and non-aircraft noise sources?
N/A
4. Where normally noncompatible land uses N/A
DRAFT
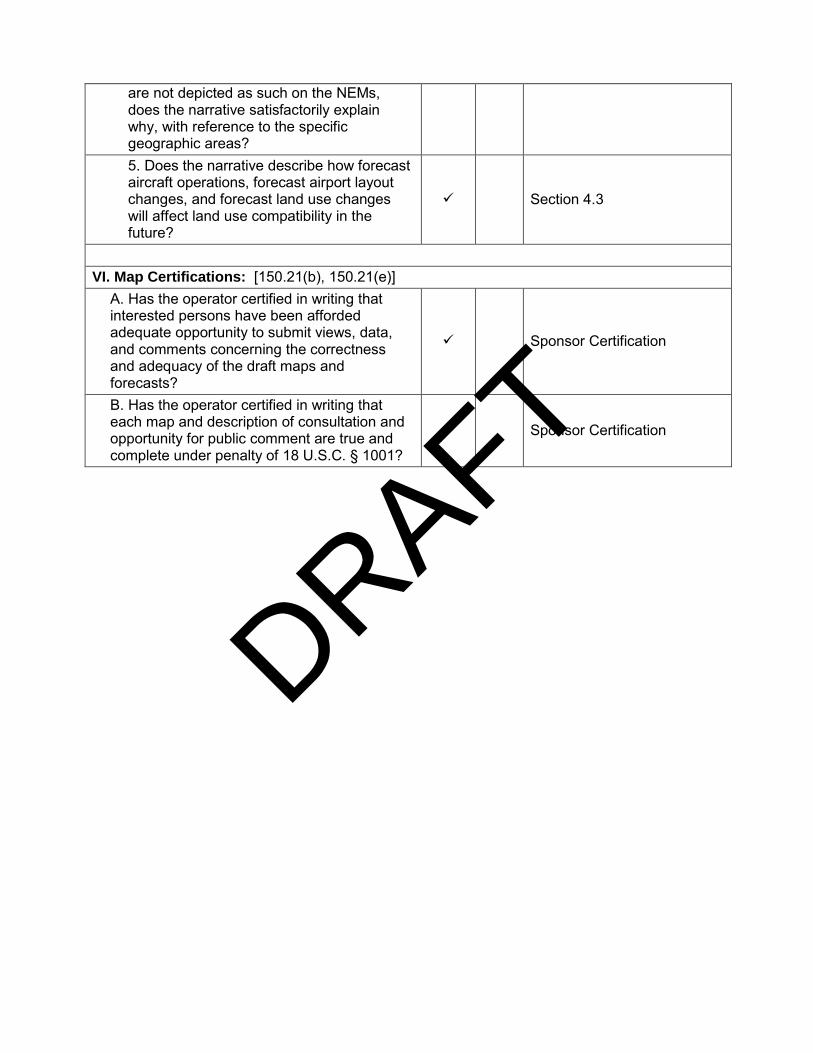
are not depicted as such on the NEMs, does the narrative satisfactorily explain why, with reference to the specific geographic areas? 5. Does the narrative describe how forecast aircraft operations, forecast airport layout changes, and forecast land use changes will affect land use compatibility in the future?
✓ Section 4.3
VI. Map Certifications: [150.21(b), 150.21(e)]
A. Has the operator certified in writing that interested persons have been afforded adequate opportunity to submit views, data, and comments concerning the correctness and adequacy of the draft maps and forecasts?
✓ Sponsor Certification
B. Has the operator certified in writing that each map and description of consultation and opportunity for public comment are true and complete under penalty of 18 U.S.C. § 1001?
✓ Sponsor Certification
DRAFT
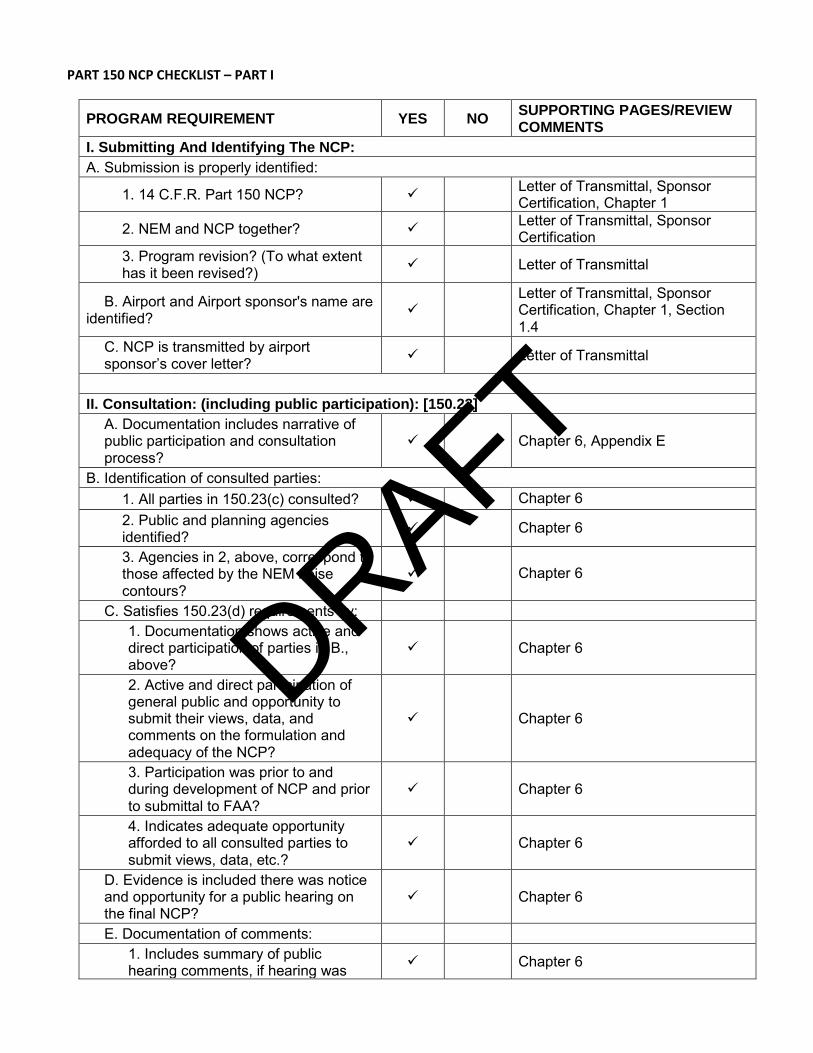
PART 150 NCP CHECKLIST – PART I
PROGRAM REQUIREMENT YES NO SUPPORTING PAGES/REVIEW COMMENTS
I. Submitting And Identifying The NCP: A. Submission is properly identified:
1. 14 C.F.R. Part 150 NCP? ✓ Letter of Transmittal, Sponsor Certification, Chapter 1
2. NEM and NCP together? ✓ Letter of Transmittal, Sponsor Certification
3. Program revision? (To what extent has it been revised?) ✓ Letter of Transmittal
B. Airport and Airport sponsor's name are identified? ✓
Letter of Transmittal, Sponsor Certification, Chapter 1, Section 1.4
C. NCP is transmitted by airport sponsor’s cover letter? ✓ Letter of Transmittal
II. Consultation: (including public participation): [150.23]
A. Documentation includes narrative of public participation and consultation process?
✓ Chapter 6, Appendix E
B. Identification of consulted parties: 1. All parties in 150.23(c) consulted? ✓ Chapter 6 2. Public and planning agencies identified? ✓ Chapter 6
3. Agencies in 2, above, correspond to those affected by the NEM noise contours?
✓ Chapter 6
C. Satisfies 150.23(d) requirements by: 1. Documentation shows active and direct participation of parties in B., above?
✓ Chapter 6
2. Active and direct participation of general public and opportunity to submit their views, data, and comments on the formulation and adequacy of the NCP?
✓ Chapter 6
3. Participation was prior to and during development of NCP and prior to submittal to FAA?
✓ Chapter 6
4. Indicates adequate opportunity afforded to all consulted parties to submit views, data, etc.?
✓ Chapter 6
D. Evidence is included there was notice and opportunity for a public hearing on the final NCP?
✓ Chapter 6
E. Documentation of comments: 1. Includes summary of public hearing comments, if hearing was ✓ Chapter 6
DRAFT
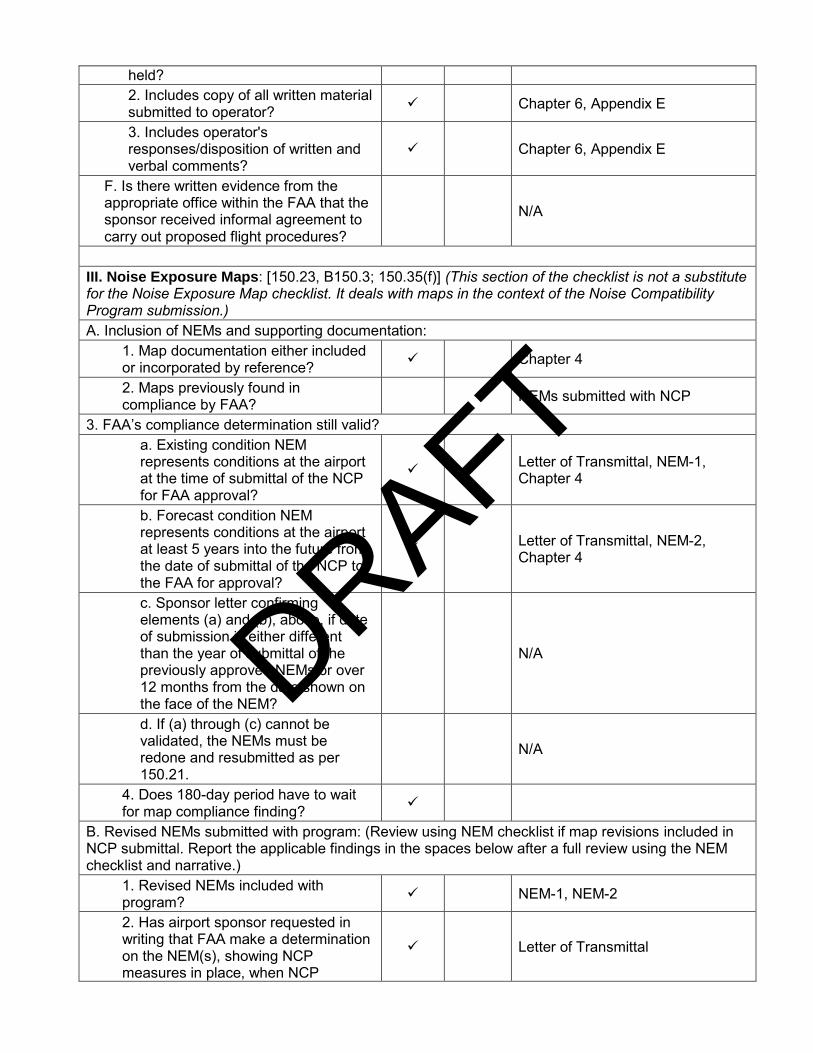
held? 2. Includes copy of all written material submitted to operator? ✓ Chapter 6, Appendix E
3. Includes operator's responses/disposition of written and verbal comments?
✓ Chapter 6, Appendix E
F. Is there written evidence from the appropriate office within the FAA that the sponsor received informal agreement to carry out proposed flight procedures?
N/A
III. Noise Exposure Maps: [150.23, B150.3; 150.35(f)] (This section of the checklist is not a substitute for the Noise Exposure Map checklist. It deals with maps in the context of the Noise Compatibility Program submission.) A. Inclusion of NEMs and supporting documentation:
1. Map documentation either included or incorporated by reference? ✓ Chapter 4
2. Maps previously found in compliance by FAA? NEMs submitted with NCP
3. FAA’s compliance determination still valid? a. Existing condition NEM represents conditions at the airport at the time of submittal of the NCP for FAA approval?
✓ Letter of Transmittal, NEM-1, Chapter 4
b. Forecast condition NEM represents conditions at the airport at least 5 years into the future from the date of submittal of the NCP to the FAA for approval?
✓ Letter of Transmittal, NEM-2, Chapter 4
c. Sponsor letter confirming elements (a) and (b), above, if date of submission is either different than the year of submittal of the previously approved NEMs or over 12 months from the date shown on the face of the NEM?
N/A
d. If (a) through (c) cannot be validated, the NEMs must be redone and resubmitted as per 150.21.
N/A
4. Does 180-day period have to wait for map compliance finding? ✓
B. Revised NEMs submitted with program: (Review using NEM checklist if map revisions included in NCP submittal. Report the applicable findings in the spaces below after a full review using the NEM checklist and narrative.)
1. Revised NEMs included with program? ✓ NEM-1, NEM-2
2. Has airport sponsor requested in writing that FAA make a determination on the NEM(s), showing NCP measures in place, when NCP
✓ Letter of Transmittal
DRAFT
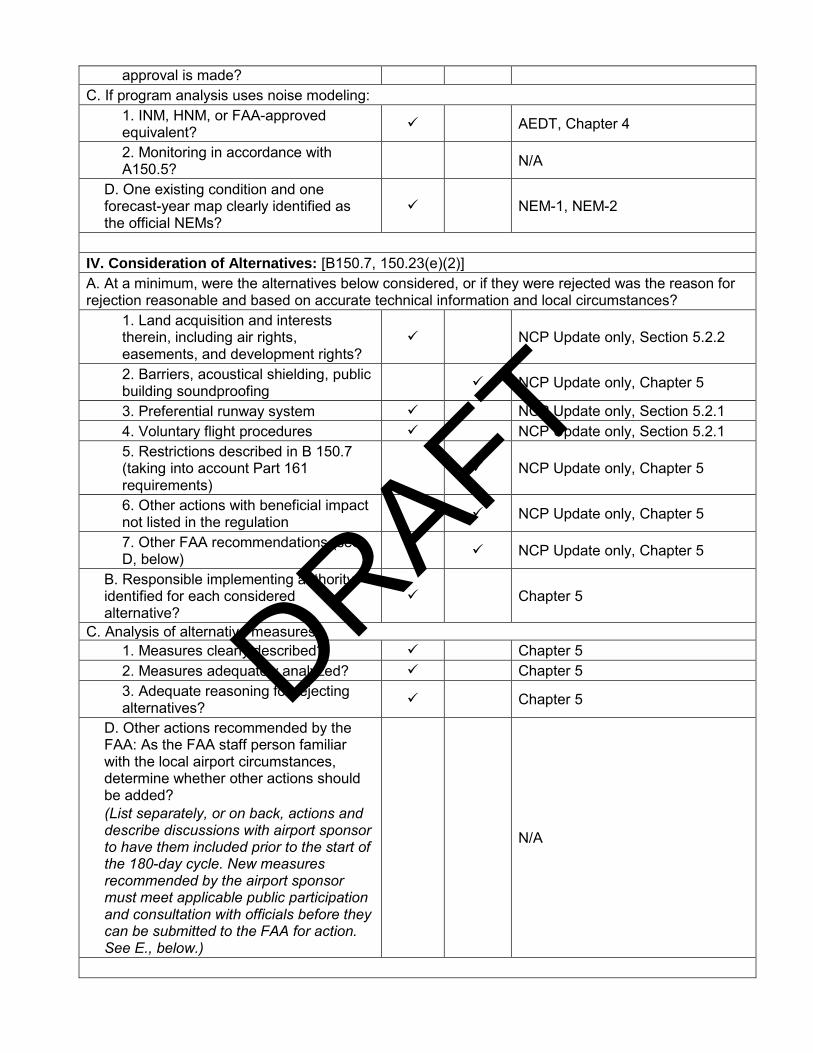
approval is made? C. If program analysis uses noise modeling:
1. INM, HNM, or FAA-approved equivalent? ✓ AEDT, Chapter 4
2. Monitoring in accordance with A150.5? N/A
D. One existing condition and one forecast-year map clearly identified as the official NEMs?
✓ NEM-1, NEM-2
IV. Consideration of Alternatives: [B150.7, 150.23(e)(2)] A. At a minimum, were the alternatives below considered, or if they were rejected was the reason for rejection reasonable and based on accurate technical information and local circumstances?
1. Land acquisition and interests therein, including air rights, easements, and development rights?
✓ NCP Update only, Section 5.2.2
2. Barriers, acoustical shielding, public building soundproofing ✓ NCP Update only, Chapter 5
3. Preferential runway system ✓ NCP Update only, Section 5.2.1 4. Voluntary flight procedures ✓ NCP Update only, Section 5.2.1 5. Restrictions described in B 150.7 (taking into account Part 161 requirements)
✓ NCP Update only, Chapter 5
6. Other actions with beneficial impact not listed in the regulation ✓ NCP Update only, Chapter 5
7. Other FAA recommendations (see D, below) ✓ NCP Update only, Chapter 5
B. Responsible implementing authority identified for each considered alternative?
✓ Chapter 5
C. Analysis of alternative measures: 1. Measures clearly described? ✓ Chapter 5 2. Measures adequately analyzed? ✓ Chapter 5 3. Adequate reasoning for rejecting alternatives? ✓ Chapter 5
D. Other actions recommended by the FAA: As the FAA staff person familiar with the local airport circumstances, determine whether other actions should be added? (List separately, or on back, actions and describe discussions with airport sponsor to have them included prior to the start of the 180-day cycle. New measures recommended by the airport sponsor must meet applicable public participation and consultation with officials before they can be submitted to the FAA for action. See E., below.)
N/A
DRAFT
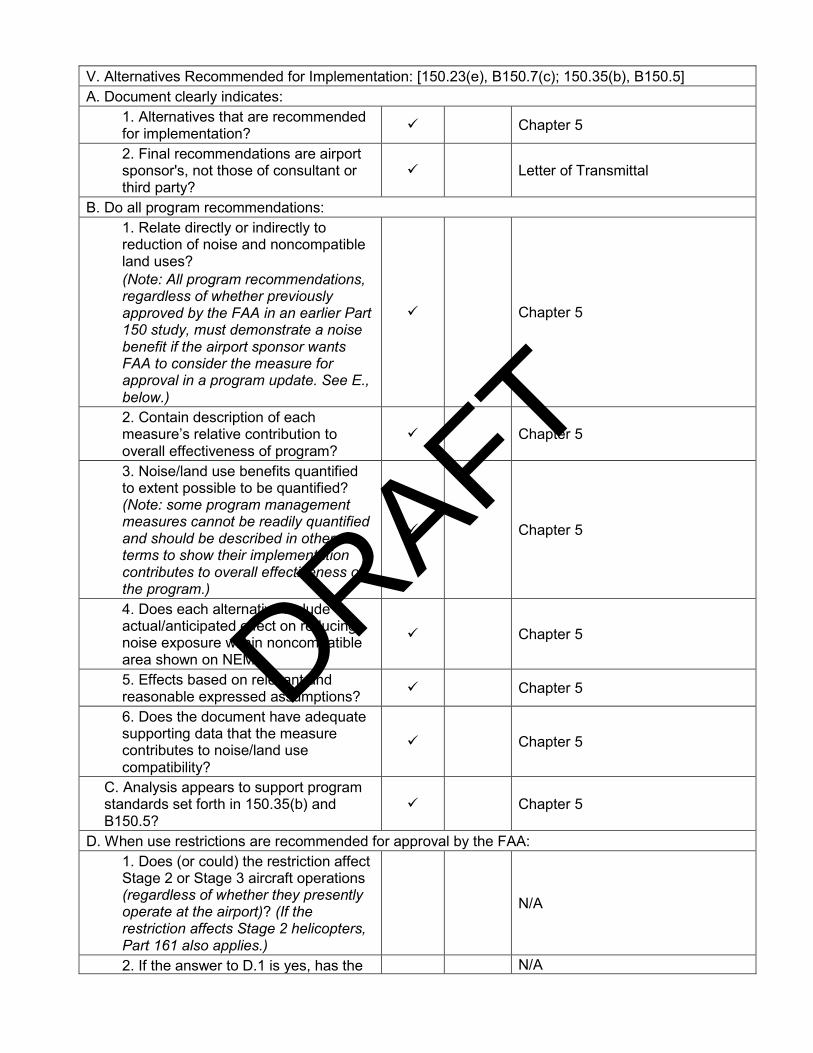
V. Alternatives Recommended for Implementation: [150.23(e), B150.7(c); 150.35(b), B150.5] A. Document clearly indicates:
1. Alternatives that are recommended for implementation? ✓ Chapter 5
2. Final recommendations are airport sponsor's, not those of consultant or third party?
✓ Letter of Transmittal
B. Do all program recommendations: 1. Relate directly or indirectly to reduction of noise and noncompatible land uses? (Note: All program recommendations, regardless of whether previously approved by the FAA in an earlier Part 150 study, must demonstrate a noise benefit if the airport sponsor wants FAA to consider the measure for approval in a program update. See E., below.)
✓ Chapter 5
2. Contain description of each measure’s relative contribution to overall effectiveness of program?
✓ Chapter 5
3. Noise/land use benefits quantified to extent possible to be quantified? (Note: some program management measures cannot be readily quantified and should be described in other terms to show their implementation contributes to overall effectiveness of the program.)
✓ Chapter 5
4. Does each alternative include actual/anticipated effect on reducing noise exposure within noncompatible area shown on NEM?
✓ Chapter 5
5. Effects based on relevant and reasonable expressed assumptions? ✓ Chapter 5
6. Does the document have adequate supporting data that the measure contributes to noise/land use compatibility?
✓ Chapter 5
C. Analysis appears to support program standards set forth in 150.35(b) and B150.5?
✓ Chapter 5
D. When use restrictions are recommended for approval by the FAA: 1. Does (or could) the restriction affect Stage 2 or Stage 3 aircraft operations (regardless of whether they presently operate at the airport)? (If the restriction affects Stage 2 helicopters, Part 161 also applies.)
N/A
2. If the answer to D.1 is yes, has the N/A
DRAFT
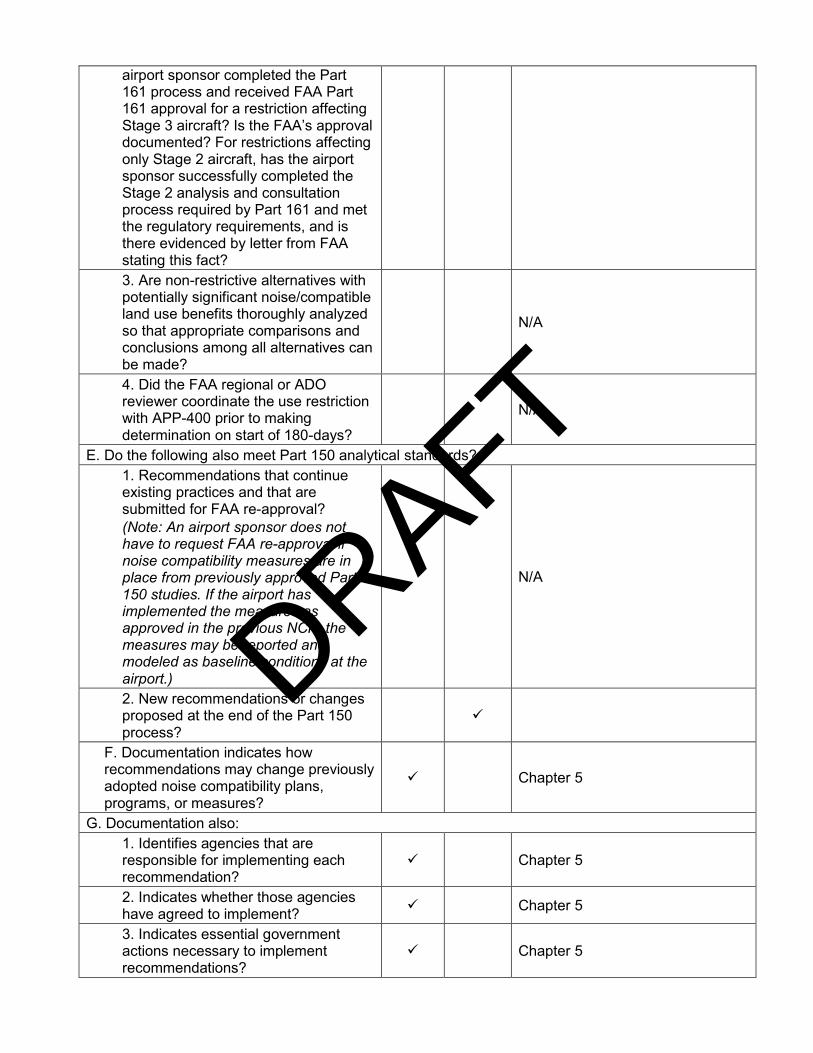
airport sponsor completed the Part 161 process and received FAA Part 161 approval for a restriction affecting Stage 3 aircraft? Is the FAA’s approval documented? For restrictions affecting only Stage 2 aircraft, has the airport sponsor successfully completed the Stage 2 analysis and consultation process required by Part 161 and met the regulatory requirements, and is there evidenced by letter from FAA stating this fact? 3. Are non-restrictive alternatives with potentially significant noise/compatible land use benefits thoroughly analyzed so that appropriate comparisons and conclusions among all alternatives can be made?
N/A
4. Did the FAA regional or ADO reviewer coordinate the use restriction with APP-400 prior to making determination on start of 180-days?
N/A
E. Do the following also meet Part 150 analytical standards? 1. Recommendations that continue existing practices and that are submitted for FAA re-approval? (Note: An airport sponsor does not have to request FAA re-approval if noise compatibility measures are in place from previously approved Part 150 studies. If the airport has implemented the measures as approved in the previous NCP, the measures may be reported and modeled as baseline conditions at the airport.)
N/A
2. New recommendations or changes proposed at the end of the Part 150 process?
✓
F. Documentation indicates how recommendations may change previously adopted noise compatibility plans, programs, or measures?
✓ Chapter 5
G. Documentation also: 1. Identifies agencies that are responsible for implementing each recommendation?
✓ Chapter 5
2. Indicates whether those agencies have agreed to implement? ✓ Chapter 5
3. Indicates essential government actions necessary to implement recommendations?
✓ Chapter 5
DRAFT
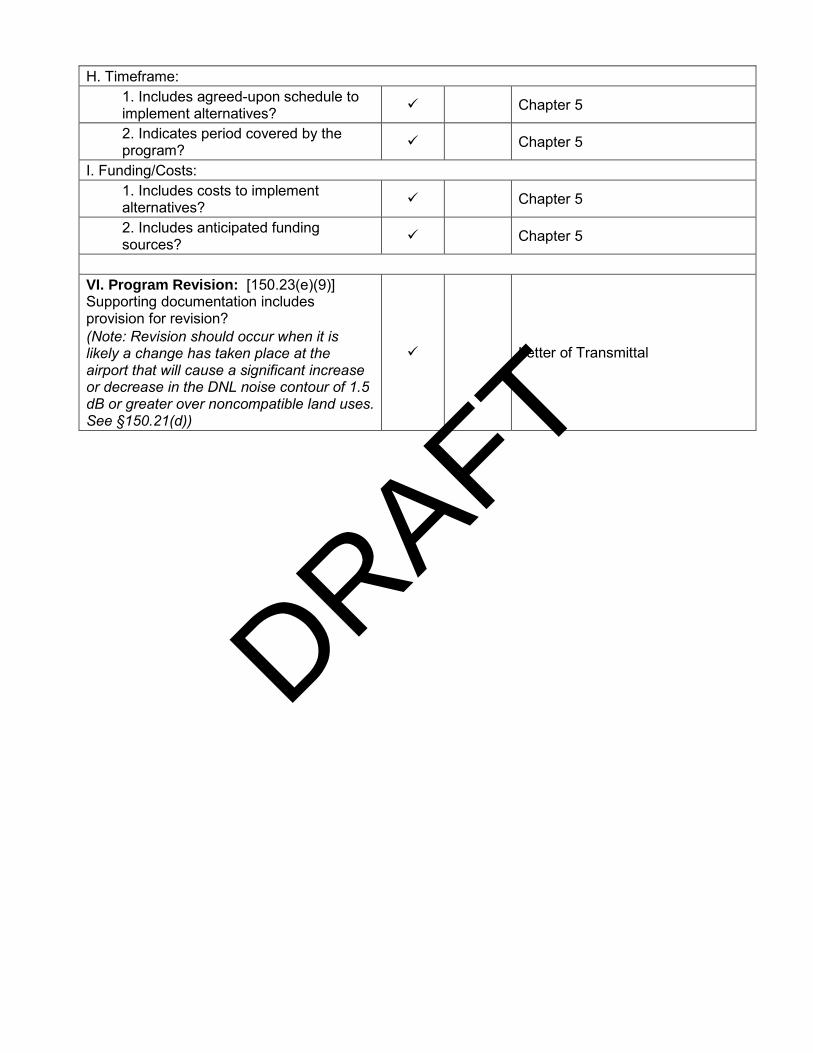
H. Timeframe: 1. Includes agreed-upon schedule to implement alternatives? ✓ Chapter 5
2. Indicates period covered by the program? ✓ Chapter 5
I. Funding/Costs: 1. Includes costs to implement alternatives? ✓ Chapter 5
2. Includes anticipated funding sources? ✓ Chapter 5
VI. Program Revision: [150.23(e)(9)] Supporting documentation includes provision for revision? (Note: Revision should occur when it is likely a change has taken place at the airport that will cause a significant increase or decrease in the DNL noise contour of 1.5 dB or greater over noncompatible land uses. See §150.21(d))
✓ Letter of Transmittal
DRAFT

APPENDIX B
1996 and 2015 FAA Record of Approval (ROA)
DRAFT

[This page is left intentionally blank]
DRAFT
Part 150: Records of Approval
Westover Air Reserve Base, Chicopee Falls, Massachusetts
Approved on 1/26/96
1.0 INTRODUCTION
The Westover Metropolitan Development Corporation sponsored an Airport Noise Compatibility Planning Study under a Federal Aviation Administration (FAA) grant, in compliance with Federal Aviation Regulations (FAR), Part 150. The Noise Exposure Maps (NEM) were developed and submitted to FAA on January 26, 1994. The NEM was determined to be in compliance on July 31, 1995. The determination was announced in the Federal Register on August 11, 1995. The Noise Compatibility Program (NCP) was submitted to FAA for review and approval on June 2, 1995 and notice of FAA’s review of the NCP was announced concurrently in the August 11, 1995, Federal Register.
The Part 150 Study was closely monitored by an advisory committee which represented area municipalities, airport users, and community residents. A series of advisory committee meetings was held, with the airport's consultant presenting material and findings. Two public information meetings were held. The consultant addressed comments at all of these meetings, and subsequent written comments as well.
The study focused on defining an optimum set of noise and land use mitigation measures to improve compatibility between airport operations and community land use, presently and in the future.
The resultant program is described in detail in the "Noise Compatibility Program" section of the study, sections 2 and 3. Section 2 describes the NCP elements and Section 3 analyzes alternatives and contains an implementation plan. The program elements below summarize as closely as possible the airport operator's recommendations in the noise compatibility program and are cross-referenced to the program. The statements contained within the summarized recommendations and before the indicated FAA approval, disapproval, or other determinations do not represent the opinions or decisions of the FAA.
The approvals which follow include actions which the Westover Metropolitan Development Corporation recommends be taken by FAA. It should be noted that these approvals indicate only that the actions would, if implemented, be consistent with the purposes of Part 150. These approvals do not constitute decisions to implement the actions. Later decisions concerning possible implementation of these actions may be subject to applicable environmental or other procedures or requirements.
2.0 PROGRAM ELEMENTS
2.1 Noise Abatement Elements
2.1.1. Extension of Existing Civil Aircraft Preferential Runway (Runway 5 for departures and Runway 23 for landings) when the tower begins operations on a full 24-hour schedule. Use from
DRAFT
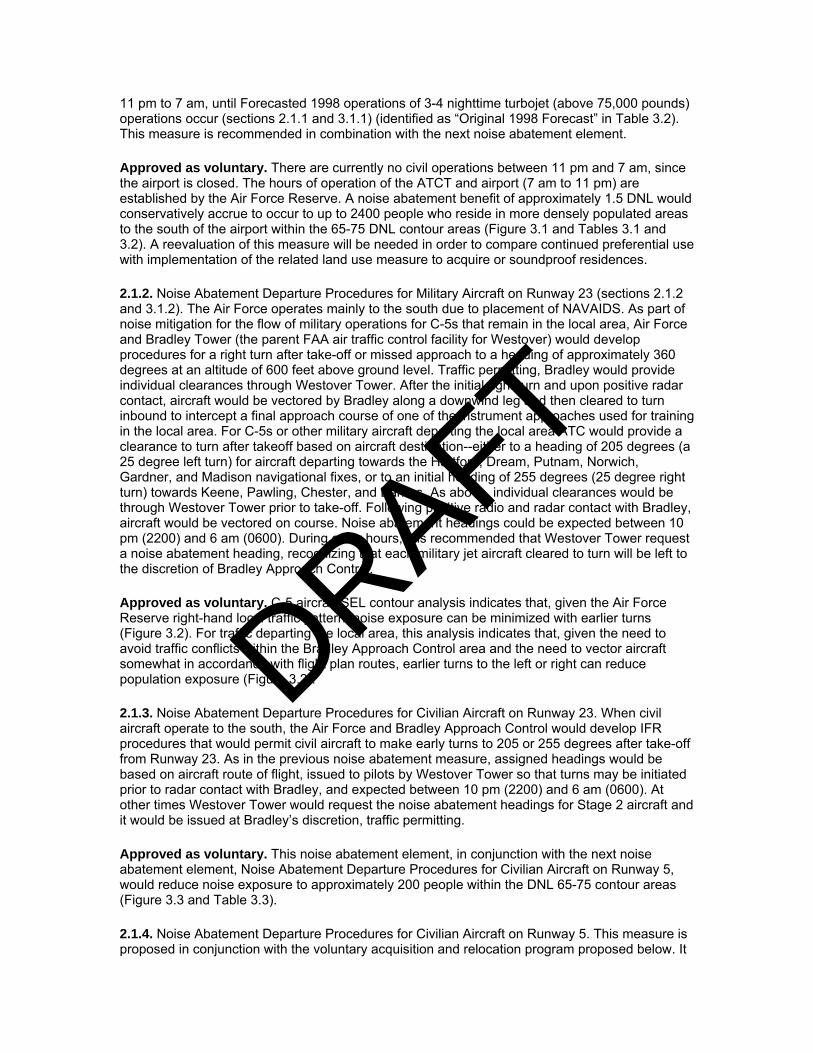
11 pm to 7 am, until Forecasted 1998 operations of 3-4 nighttime turbojet (above 75,000 pounds) operations occur (sections 2.1.1 and 3.1.1) (identified as “Original 1998 Forecast” in Table 3.2). This measure is recommended in combination with the next noise abatement element.
Approved as voluntary. There are currently no civil operations between 11 pm and 7 am, since the airport is closed. The hours of operation of the ATCT and airport (7 am to 11 pm) are established by the Air Force Reserve. A noise abatement benefit of approximately 1.5 DNL would conservatively accrue to occur to up to 2400 people who reside in more densely populated areas to the south of the airport within the 65-75 DNL contour areas (Figure 3.1 and Tables 3.1 and 3.2). A reevaluation of this measure will be needed in order to compare continued preferential use with implementation of the related land use measure to acquire or soundproof residences.
2.1.2. Noise Abatement Departure Procedures for Military Aircraft on Runway 23 (sections 2.1.2 and 3.1.2). The Air Force operates mainly to the south due to placement of NAVAIDS. As part of noise mitigation for the flow of military operations for C-5s that remain in the local area, Air Force and Bradley Tower (the parent FAA air traffic control facility for Westover) would develop procedures for a right turn after take-off or missed approach to a heading of approximately 360 degrees at an altitude of 600 feet above ground level. Traffic permitting, Bradley would provide individual clearances through Westover Tower. After the initial right turn and upon positive radar contact, aircraft would be vectored by Bradley along a downwind leg and then cleared to turn inbound to intercept a final approach course of one of the instrument approaches used for training in the local area. For C-5s or other military aircraft departing the local area ATC would provide a clearance to turn after takeoff based on aircraft destination--either to a heading of 205 degrees (a 25 degree left turn) for aircraft departing towards the Hartford, Dream, Putnam, Norwich, Gardner, and Madison navigational fixes, or to an initial heading of 255 degrees (25 degree right turn) towards Keene, Pawling, Chester, and Barnes. As above, individual clearances would be through Westover Tower prior to take-off. Following positive radio and radar contact with Bradley, aircraft would be vectored on course. Noise abatement headings could be expected between 10 pm (2200) and 6 am (0600). During other hours, it is recommended that Westover Tower request a noise abatement heading, recognizing that each military jet aircraft cleared to turn will be left to the discretion of Bradley Approach Control.
Approved as voluntary. C-5 aircraft SEL contour analysis indicates that, given the Air Force Reserve right-hand local traffic pattern, noise exposure can be minimized with earlier turns (Figure 3.2). For traffic departing the local area, this analysis indicates that, given the need to avoid traffic conflicts within the Bradley Approach Control area and the need to vector aircraft somewhat in accordance with flight plan routes, earlier turns to the left or right can reduce population exposure (Figure 3.2).
2.1.3. Noise Abatement Departure Procedures for Civilian Aircraft on Runway 23. When civil aircraft operate to the south, the Air Force and Bradley Approach Control would develop IFR procedures that would permit civil aircraft to make early turns to 205 or 255 degrees after take-off from Runway 23. As in the previous noise abatement measure, assigned headings would be based on aircraft route of flight, issued to pilots by Westover Tower so that turns may be initiated prior to radar contact with Bradley, and expected between 10 pm (2200) and 6 am (0600). At other times Westover Tower would request the noise abatement headings for Stage 2 aircraft and it would be issued at Bradley’s discretion, traffic permitting.
Approved as voluntary. This noise abatement element, in conjunction with the next noise abatement element, Noise Abatement Departure Procedures for Civilian Aircraft on Runway 5, would reduce noise exposure to approximately 200 people within the DNL 65-75 contour areas (Figure 3.3 and Table 3.3).
2.1.4. Noise Abatement Departure Procedures for Civilian Aircraft on Runway 5. This measure is proposed in conjunction with the voluntary acquisition and relocation program proposed below. It
DRAFT
would be applicable between 10 pm (2200) and 6 am (0600) and consists of a departure heading of 080 degrees, extended as practical to 205 or 255 degrees for traffic with clearance toward Hartford and Pawling, respectively. Traffic with clearance toward Chester would be given a subsequent left turn when at least 3 DME from the Westover VOR (in order to remain clear of the Acrebrook subdivision). Clearances would be issued by Westover Tower after agreement on departure clearance procedures with Bradley Approach Control. They would be issued by Westover Tower to pilots prior to take-off so that turns may be initiated as soon as possible , prior to radar contact with Bradley.
Approved as voluntary. As stated in the approval of the previous measure, this noise abatement element, in conjunction with Noise Abatement Departure Procedures for Civilian Aircraft on Runway 23, would reduce noise exposure to approximately 200 people within the 65-75 DNL contour areas (Figure 3.3 and Table 3.3).
2.2 Land Use Elements
2.2.1. Voluntary Land Acquisition and Relocation Program. For approximately 150 residences exposed to 70 DNL or above, the Westover Metropolitan Development Corporation (WMDC) proposes to implement a voluntary purchase and relocation program to eliminate or significantly reduce the number of people remaining in areas of high noise exposure after implementation of all other operational noise abatement elements. WMDC would consider including additional homes in the purchase program on a case-by-case basis. A noise easement would be secured on all acquired property.
Approved. It is not considered within the meaning of the Uniform Act, to be a “voluntary” transaction if the homeowners’ property is destroyed and converted to other compatible land uses. If the property’s use will be the same, it is considered a voluntary transaction under the Uniform Act, but the homeowner does not qualify for relocation payments. Only tenant occupants would be eligible for relocation payments.
2.2.2. Voluntary Sound Insulation Program. This measure would apply to approximately 900 residences within the 65 DNL contour, as well as those within the 70 DNL contour but not sold under the voluntary acquisition program. A noise easement would be acquired in exchange for sound insulation.
Approved.
2.2.3. Compatible Use Zoning. To minimize chances that new noncompatible land uses will be developed within the DNL 65 dB contour, it is proposed that each of the five communities of Chicopee, Granby, Ludlow, Springfield, and South Hadley consider adopting suitable zoning to limit residential use in high noise exposed areas. Approved. FAA strongly discourages new noncompatible development within the DNL 65 dB contour, and new development may not be eligible for future mitigation using Federal funding.
2.2.4. Airport Overlay District. WMDC would recommend that the communities of Chicopee and Granby adopt an airport overlay district which encompasses land within the 65 DNL contour. They would also recommend that the town of Ludlow change the boundaries of its airport overlay district to include all of the land within the forecasted 1998 contour.
Approved.
Subdivision Regulations. WMDC would recommend that the town of Granby amend its subdivision regulations to require noise easements on all newly created lots within the airport’s 65
DRAFT
DNL contour. WMDC would work with town officials in preparing amendments to the Bylaws of the Town of Granby, Volume IV, Chapter XXII.
Approved. FAA strongly discourages new noncompatible development within the DNL 65 dB contour, and new development may not be eligible for future mitigation using Federal funding.
2.3 Implementation, Monitoring, and Review Elements
2.3.1 Pilot Awareness Program. WMDC would publish a pamphlet of noise abatement practices to be distributed to civilian pilots through the Fixed Base Operator and WMDC’s airport management. The pamphlet would include a map of noise sensitive areas around the airport and describe the operational measures which WMDC has adopted for noise abatement, including use of noise abatement departure procedures recommended by the National Business Aircraft Association or by individual aircraft manufacturers. WMDC would also install signs in all terminal areas frequented by civilian pilots and along ramp and taxiway areas controlled by WMDC, instructing pilots to follow noise abatement procedures.
Approved. The content and location of airfield signs are subject to specific approval by appropriate FAA officials outside of the Part 150 process and are not approved in advance by this action. Such signs must not be construed as mandatory air traffic procedures.
2.3.2 Public Awareness Program. To promote good public relations WMDC would issue from time to time public releases, which it would send to local papers, town libraries, and other public facilities, describing the latest developments in its noise compatibility program.
Approved.
2.3.3 Monitoring Nighttime Operations and Runway Use. WMDC would log nighttime activity between 10 pm (2200) and 7 am (0700). Logs would include time, type aircraft, registration/flight number, landing or take-off, runway used, and wind and weather conditions. The information would be used to determine compliance with WMDC’s nighttime noise rule and to help provide guidance to Air Force contract tower personnel to determine compliance with the preferential runway use program.
Approved in part; disapproved in part, pending submission of additional information to make an informed analysis. This measure is approved for purposes of Part 150, except with respect to the information being used to determine compliance with the nighttime noise rule. The WMDC has not submitted for review under Part 150 either the current nighttime restriction or the proposed amendments to its nighttime noise rule (pages 13-15 and 39-42 of the NCP). There is insufficient information for the FAA to determine whether compliance with the noise rule would meet the approval standards contained in 14 CFR Part 150.
Airport noise and access restrictions proposed after October 1, 1990, must be adopted in compliance with the Airport Noise and Capacity Act of 1990 (recodified at P.L. 103-272), 49 USC 47521 (hereinafter referred to as “ANCA”), as implemented by 14 CFR Part 161.
2.3.4 Using a basic spreadsheet program, WMDC would compute estimates of changes in noise exposure related to changes in scheduled civil jet operations, changes in civil nighttime operations, or changes in total nighttime civil operations. WMDC would submit an Environmental Notification Form (ENF) to the Massachusetts Secretary of Environmental Affairs for any change in noise exposure greater than 1.5 dBA above the forecasted exposure included in the noise compatibility planning program and would initiate a review of its Noise Compatibility Program. Finally, if noise exposure reaches that forecasted in the noise exposure map, WMDC would initiate an update to the noise compatibility planning study in 1999 and 5-year intervals thereafter.
DRAFT

Each update would address fully the noise exposure and incompatible land use existing at the time.
Approved. A basic spreadsheet program may be used as a screening tool. A screening tool, such as the FAA’s Area Equivalent Method, may be a useful indicator as to whether there has been a significant change in the noise environment warranting a revision to the NEM per section 150.21 of Part 150.
DRAFT
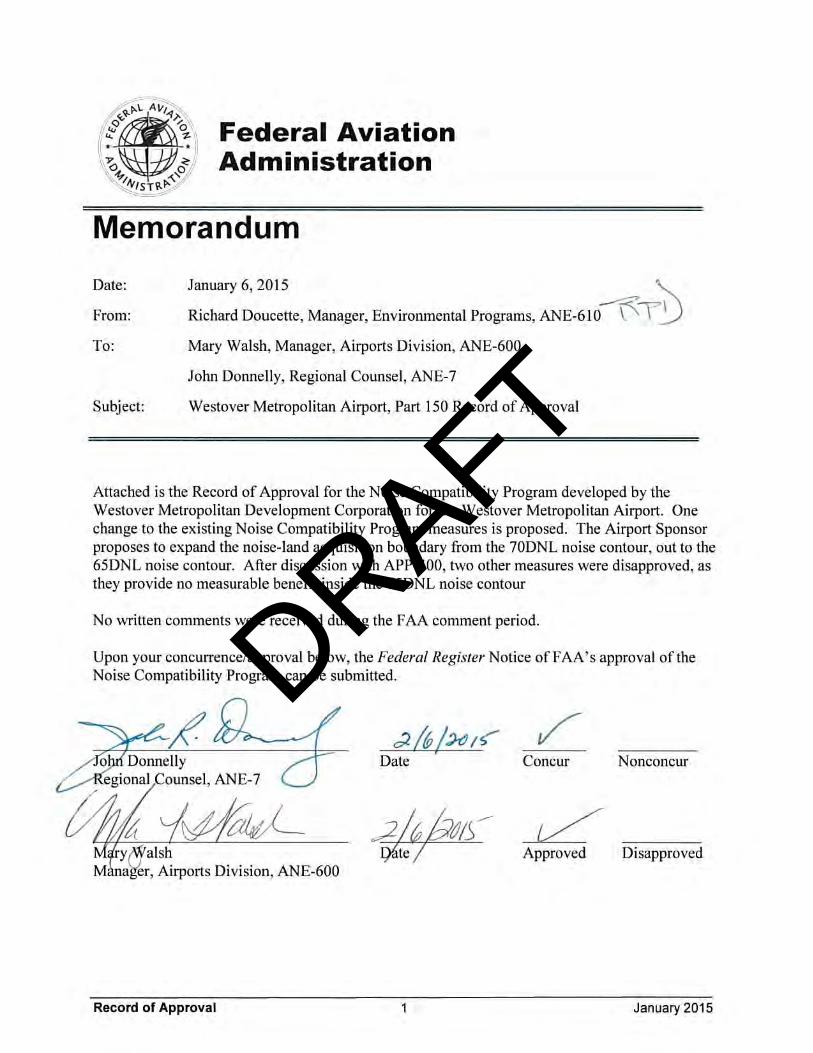
DRAFT
DRAFT
DRAFT
DRAFT
DRAFT
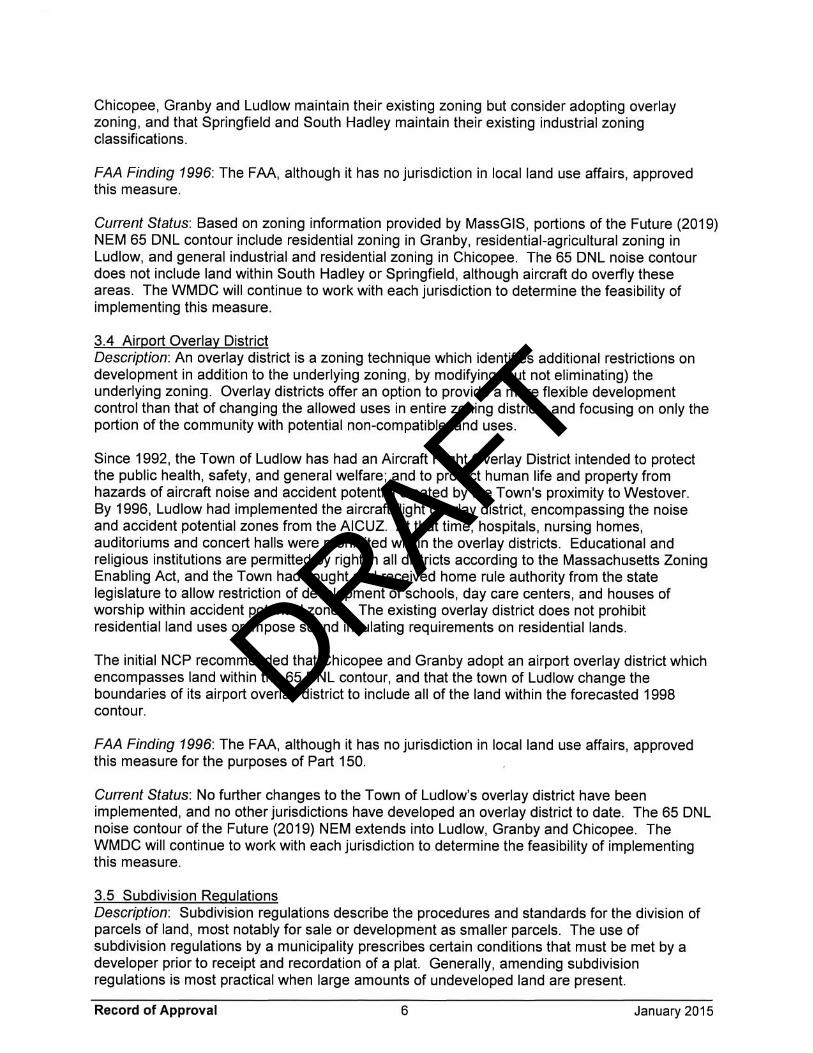
DRAFT
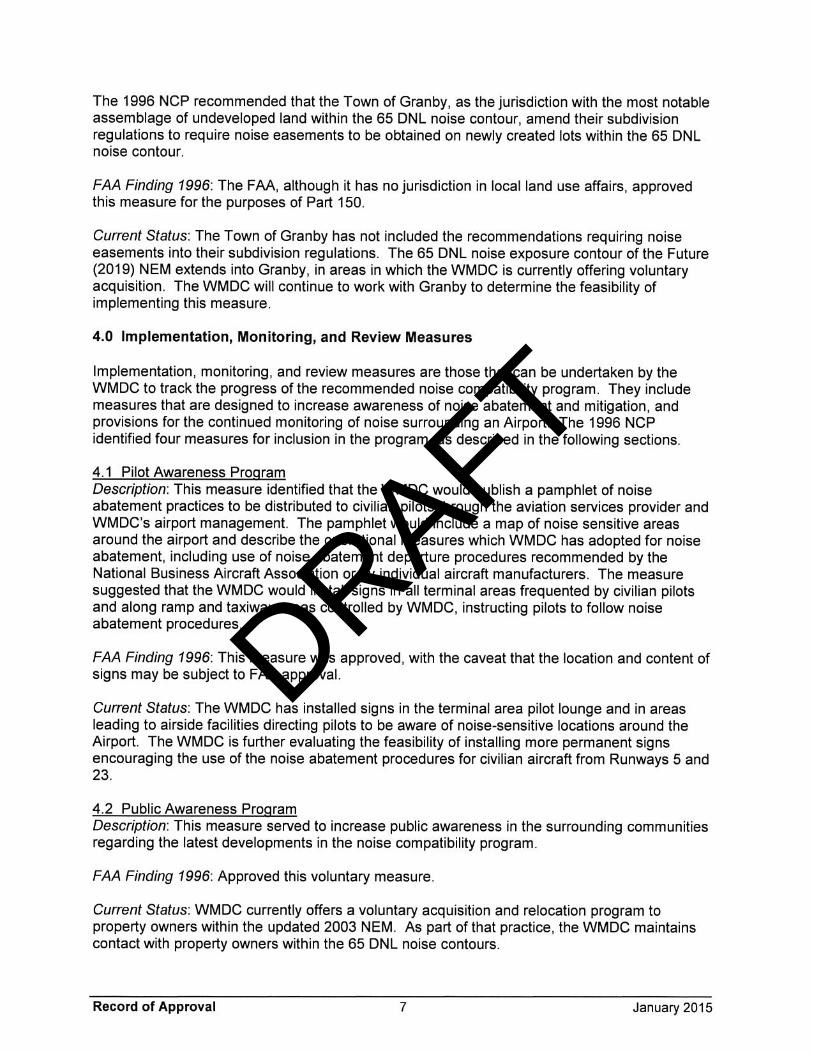
DRAFT

DRAFT

APPENDIX C
AEE Coordination
DRAFT

[This page is left intentionally blank]
DRAFT
Page 1
The Westover Metropolitan Development Corporation (WMDC) has initiated a Part 150 Update and an Environmental Assessment (EA) for Westover Air Reserve Base (WARB)/Metropolitan Airport (CEF), with the assistance of Stantec Consulting Services and HNTB Corporation. The WMDC oversees civilian operations at CEF which is currently open 16 hours per day. The Airport is also home to the Massachusetts Air Force Reserve 439th Airlift Wing, which previously operated Lockheed C-5A Galaxy aircraft and has upgraded to the C-5M Super Galaxy. The Part 150 Update is being prepared to assess the impacts of the C-5M Super Galaxy fleet upgrade. The WMDC has proposed to extend CEF operating hours to 24 hours per day and the EA is being prepared to assess the potential environmental impacts of this proposed change in operating hours. HNTB is preparing noise exposure contours representative of existing conditions in 2018 and forecast conditions in 2023 using the Aviation Environmental Design Tool (AEDT) 2d and NOISEMAP Version 7.363 for both the Part 150 Update and EA. Four aircraft identified in the existing and forecast fleet mixes do not have direct AEDT type or pre-approved AEDT substitutions, as shown in Table 1. This request is in accordance with the required protocol to obtain approval of non-standard aircraft substitution related to AEDT1.
1 Guidance on Using the Aviation Environmental Design Tool (AEDT) to Conduct Environmental Modeling for FAA Actions Subject to NEPA, FAA, October 27, 2017.
MEMORANDUM
To From Richard Doucette Environmental Program Manager New England Region Federal Aviation Administration 12 New England Executive Park Burlington, MA 01803
Yue Xu, HNTB
Cc Gordon Hutchinson, WMDC Ervin Deck, Stantec Randall Christensen, Stantec Kim Hughes, HNTB Subject Request for Non-standard Substitution Aircraft and Weather Parameters for Westover Air Reserve/Metropolitan Airport Noise Exposure Map Update and EA
Date April 19, 2018
DRAFT
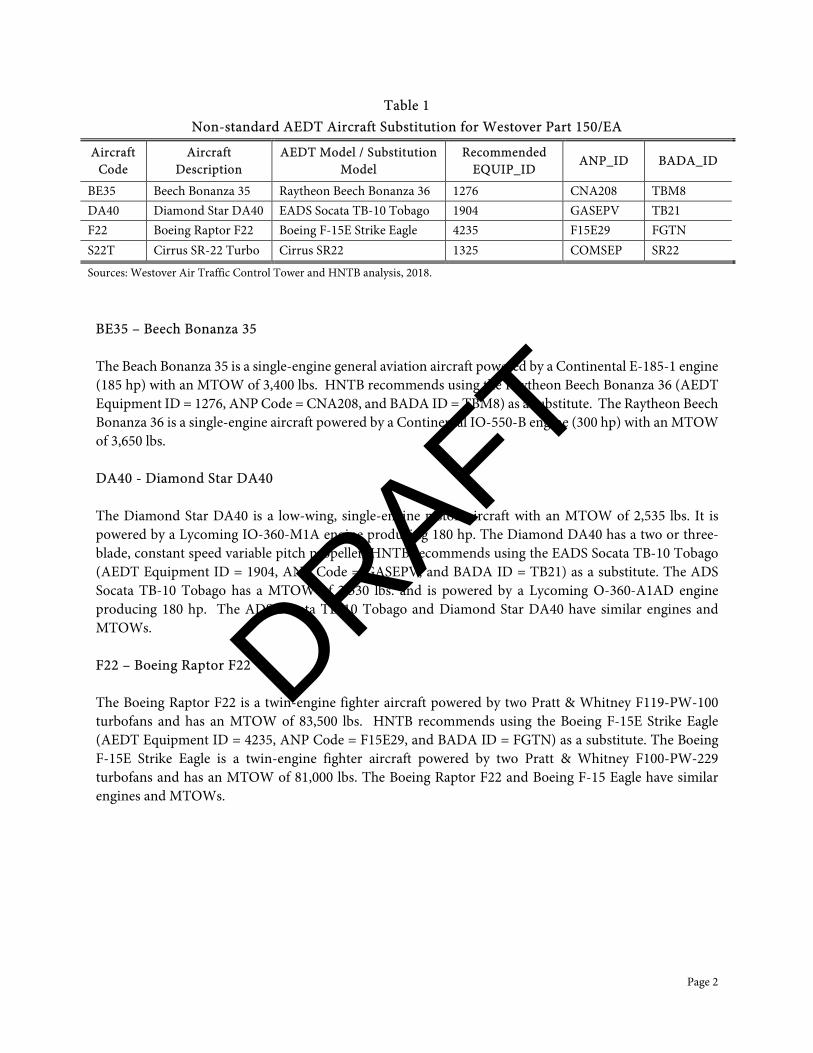
Page 2
Table 1 Non-standard AEDT Aircraft Substitution for Westover Part 150/EA
Aircraft Code
Aircraft Description
AEDT Model / Substitution Model
Recommended EQUIP_ID
ANP_ID BADA_ID
BE35 Beech Bonanza 35 Raytheon Beech Bonanza 36 1276 CNA208 TBM8 DA40 Diamond Star DA40 EADS Socata TB-10 Tobago 1904 GASEPV TB21 F22 Boeing Raptor F22 Boeing F-15E Strike Eagle 4235 F15E29 FGTN S22T Cirrus SR-22 Turbo Cirrus SR22 1325 COMSEP SR22
Sources: Westover Air Traffic Control Tower and HNTB analysis, 2018.
BE35 – Beech Bonanza 35 The Beach Bonanza 35 is a single-engine general aviation aircraft powered by a Continental E-185-1 engine (185 hp) with an MTOW of 3,400 lbs. HNTB recommends using the Raytheon Beech Bonanza 36 (AEDT Equipment ID = 1276, ANP Code = CNA208, and BADA ID = TBM8) as a substitute. The Raytheon Beech Bonanza 36 is a single-engine aircraft powered by a Continental IO-550-B engine (300 hp) with an MTOW of 3,650 lbs. DA40 - Diamond Star DA40 The Diamond Star DA40 is a low-wing, single-engine piston aircraft with an MTOW of 2,535 lbs. It is powered by a Lycoming IO-360-M1A engine producing 180 hp. The Diamond DA40 has a two or three-blade, constant speed variable pitch propeller. HNTB recommends using the EADS Socata TB-10 Tobago (AEDT Equipment ID = 1904, ANP Code = GASEPV, and BADA ID = TB21) as a substitute. The ADS Socata TB-10 Tobago has a MTOW of 2,530 lbs. and is powered by a Lycoming O-360-A1AD engine producing 180 hp. The ADS Socata TB-10 Tobago and Diamond Star DA40 have similar engines and MTOWs. F22 – Boeing Raptor F22 The Boeing Raptor F22 is a twin-engine fighter aircraft powered by two Pratt & Whitney F119-PW-100 turbofans and has an MTOW of 83,500 lbs. HNTB recommends using the Boeing F-15E Strike Eagle (AEDT Equipment ID = 4235, ANP Code = F15E29, and BADA ID = FGTN) as a substitute. The Boeing F-15E Strike Eagle is a twin-engine fighter aircraft powered by two Pratt & Whitney F100-PW-229 turbofans and has an MTOW of 81,000 lbs. The Boeing Raptor F22 and Boeing F-15 Eagle have similar engines and MTOWs.
DRAFT
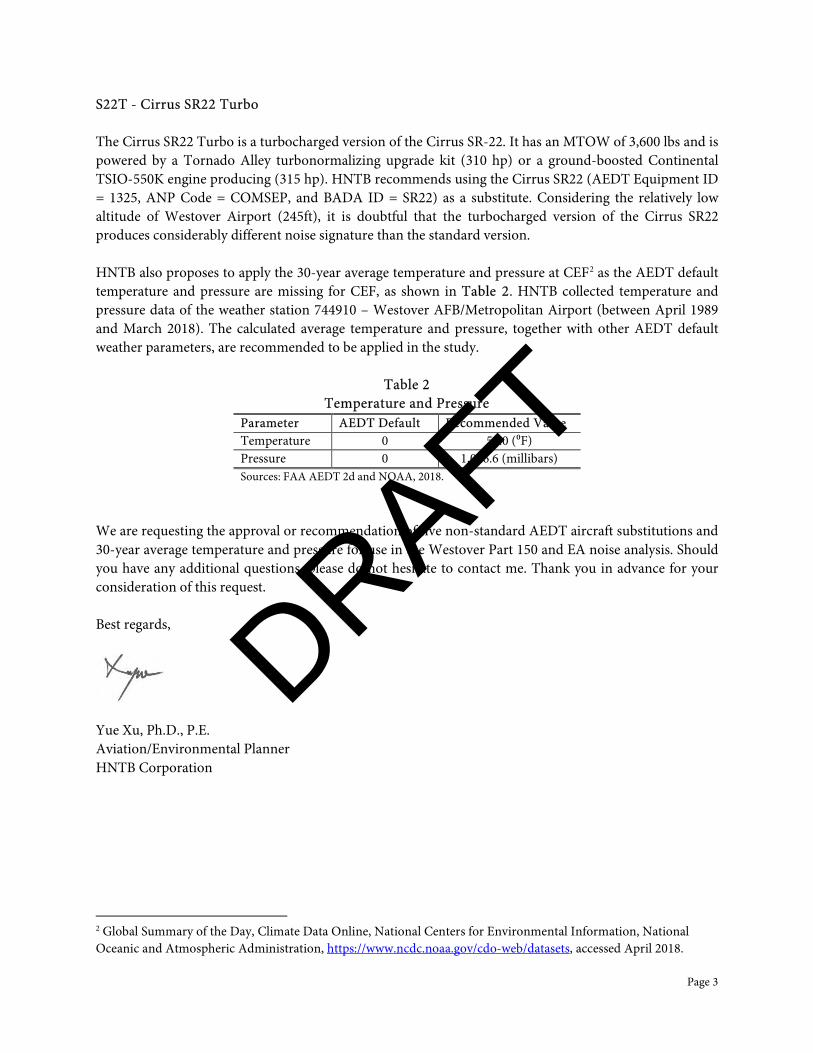
Page 3
S22T - Cirrus SR22 Turbo The Cirrus SR22 Turbo is a turbocharged version of the Cirrus SR-22. It has an MTOW of 3,600 lbs and is powered by a Tornado Alley turbonormalizing upgrade kit (310 hp) or a ground-boosted Continental TSIO-550K engine producing (315 hp). HNTB recommends using the Cirrus SR22 (AEDT Equipment ID = 1325, ANP Code = COMSEP, and BADA ID = SR22) as a substitute. Considering the relatively low altitude of Westover Airport (245ft), it is doubtful that the turbocharged version of the Cirrus SR22 produces considerably different noise signature than the standard version. HNTB also proposes to apply the 30-year average temperature and pressure at CEF2 as the AEDT default temperature and pressure are missing for CEF, as shown in Table 2. HNTB collected temperature and pressure data of the weather station 744910 – Westover AFB/Metropolitan Airport (between April 1989 and March 2018). The calculated average temperature and pressure, together with other AEDT default weather parameters, are recommended to be applied in the study.
Table 2 Temperature and Pressure
Parameter AEDT Default Recommended Value Temperature 0 50.0 (⁰F) Pressure 0 1,006.6 (millibars) Sources: FAA AEDT 2d and NOAA, 2018.
We are requesting the approval or recommendation of five non-standard AEDT aircraft substitutions and 30-year average temperature and pressure for use in the Westover Part 150 and EA noise analysis. Should you have any additional questions, please do not hesitate to contact me. Thank you in advance for your consideration of this request. Best regards,
Yue Xu, Ph.D., P.E. Aviation/Environmental Planner HNTB Corporation
2 Global Summary of the Day, Climate Data Online, National Centers for Environmental Information, National Oceanic and Atmospheric Administration, https://www.ncdc.noaa.gov/cdo-web/datasets, accessed April 2018.
DRAFT
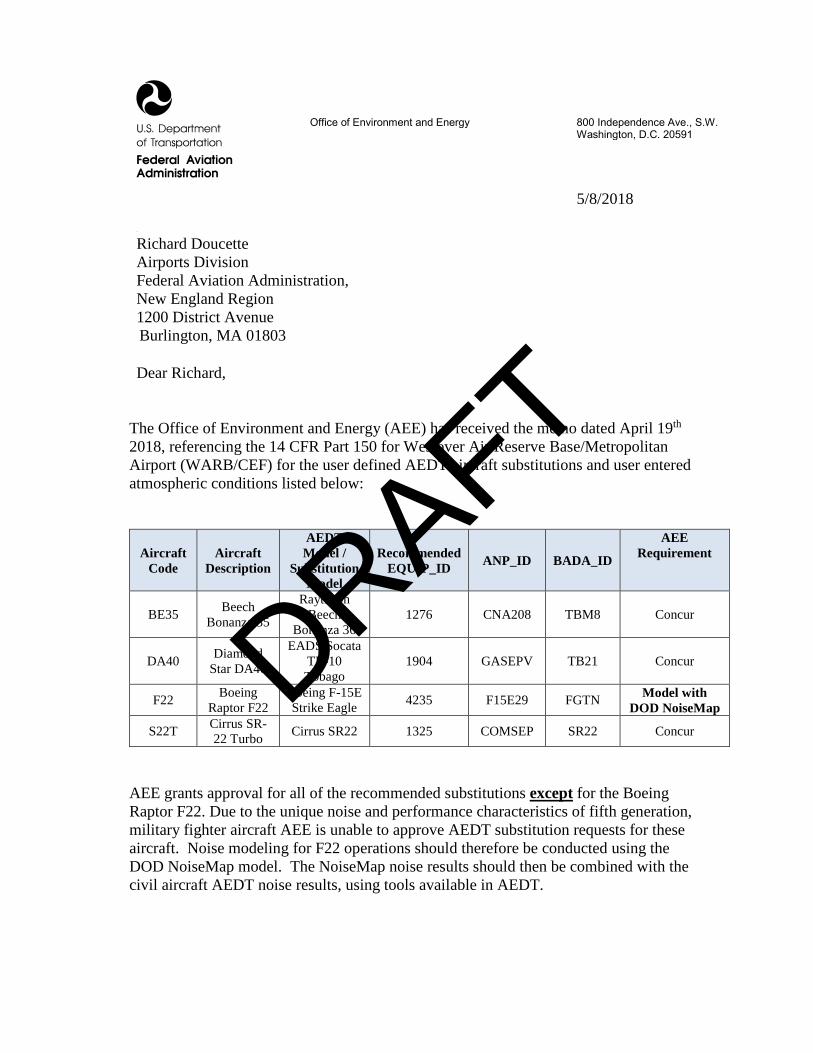
Office of Environment and Energy 800 Independence Ave., S.W. Washington, D.C. 20591 5/8/2018
km
Richard Doucette Airports Division Federal Aviation Administration, New England Region 1200 District Avenue Burlington, MA 01803 Dear Richard,
The Office of Environment and Energy (AEE) has received the memo dated April 19th 2018, referencing the 14 CFR Part 150 for Westover Air Reserve Base/Metropolitan Airport (WARB/CEF) for the user defined AEDT aircraft substitutions and user entered atmospheric conditions listed below:
Aircraft Code
Aircraft Description
AEDT Model /
Substitution Model
Recommended EQUIP_ID ANP_ID BADA_ID
AEE Requirement
BE35 Beech Bonanza 35
Raytheon Beech
Bonanza 36 1276 CNA208 TBM8 Concur
DA40 Diamond Star DA40
EADS Socata TB-10 Tobago
1904 GASEPV TB21 Concur
F22 Boeing Raptor F22
Boeing F-15E Strike Eagle 4235 F15E29 FGTN Model with
DOD NoiseMap
S22T Cirrus SR-22 Turbo Cirrus SR22 1325 COMSEP SR22 Concur
AEE grants approval for all of the recommended substitutions except for the Boeing Raptor F22. Due to the unique noise and performance characteristics of fifth generation, military fighter aircraft AEE is unable to approve AEDT substitution requests for these aircraft. Noise modeling for F22 operations should therefore be conducted using the DOD NoiseMap model. The NoiseMap noise results should then be combined with the civil aircraft AEDT noise results, using tools available in AEDT.
DRAFT

DRAFT
APPENDIX D
Noise and Its Effect on People
DRAFT
Westover Air Reserve Base / Metropolitan Airport NEM/NCP Update
Noise and Its Effect on People i
TABLE OF CONTENTS
Page D.1 Noise and its Metrics ........................................................................................................... 1
D.1.1 The Decibel (dB) ...................................................................................................... 1
D.1.2 A-Weighted Decibel (dBA) ........................................................................................ 2
D.1.3 Maximum Sound Level (Lmax) ................................................................................... 4
D.1.4 Sound Exposure Level (SEL) ................................................................................... 7
D.1.5 Equivalent Sound Level (Leq) .................................................................................... 8
D.1.6 Day-Night Average Sound Level (DNL) .................................................................... 8
D.1.7 Time-Above a Specified Level (TA) .........................................................................10
D.2 The Effects of Aircraft Noise on People ............................................................................. 10
D.2.1 Community Annoyance ...........................................................................................10
D.2.2 Speech Interference ................................................................................................12
D.2.3 Sleep Disturbance ...................................................................................................13
LIST OF FIGURES Page
Figure D-1 Frequency Response Characteristics of Various Weighting Networks .................................. 3
Figure D-2 Sound Levels of Typical Noise Sources (dBA) ...................................................................... 5
Figure D-3 Variation of Community Noise in a Suburban Neighborhood ................................................ 5
Figure D-4 Common Aircraft Departure Noise Levels .............................................................................. 6
Figure D-5 Relationship Between Single Event Noise Metrics ................................................................ 7
Figure D-6 Typical Range of Outdoor Community Day Night Average Sound Levels ............................. 9
Figure D-7 Relationship Between Annoyance and Day Night Average Sound Level ............................ 11
Figure D-8 Percent Sentence Intelligibility ............................................................................................. 13
Figure D-9 Sleep Disturbance Dose Response Relationship ................................................................ 14
DRAFT
Westover Air Reserve Base / Metropolitan Airport NEM/NCP Update
Noise and Its Effect on People D-1 Appendix D
APPENDIX D Noise and Its Effect on People
Aircraft noise exposure in this document is primarily addressed using the Day-Night Average Sound Level (DNL) metric. This study also involves the use of supplemental noise metrics in addition to DNL to provide comprehensive analysis for quantifying a specific situation. To assist reviewers in interpreting complex noise metrics, this appendix presents an introduction to the relevant fundamentals of acoustics and noise terminology, and the effects of noise on human activity.
D.1 Noise and its Metrics
Noise, often defined as unwanted sound, is one of the most common environmental issues associated with aircraft operations. Of course, aircraft are not the only sources of noise in an urban or suburban surrounding, where interstate and local roadway traffic, rail, industrial and neighborhood sources may also intrude on the everyday quality of life. Nevertheless, aircraft are readily identifiable to those affected by their noise and are typically singled out for criticism. Consequently, aircraft noise problems often dominate analyses of environmental impacts.
A “metric” is defined as something “of, involving, or used in measurement.” As used in environmental noise analyses, a metric refers to the unit or quantity that quantitatively measures the effect of noise on the environment. Noise studies have typically involved a confusing proliferation of noise metrics used by individual researchers who have attempted to understand and represent the effects of
noise. As a result, literature describing environmental noise or environmental noise abatement has included many different metrics.
Various federal agencies involved in environmental noise mitigation have agreed on common metrics for environmental impact analysis documents. Furthermore, the Federal Aviation Administration (FAA) has specified which metrics, such as DNL, should be used for federal aviation noise assessments.
This section discusses the following acoustic terms and metrics:
• Decibel (dB)
• A-Weighted Decibel (dBA)
• Maximum Sound Level (Lmax)
• Sound Exposure Level (SEL)
• Equivalent Sound Level (Leq)
• Day-Night Average Sound Level (DNL)
• Time-Above a Specified Level (TA)
D.1.1 The Decibel (dB)
All sounds come from a sound source—a musical instrument, a speaking voice, or an airplane passing overhead. It takes energy to produce sound. The sound energy produced by any sound source is transmitted through the air in sound waves—tiny, quick oscillations of pressure just above and just below atmospheric
DRAFT
Westover Air Reserve Base / Metropolitan Airport NEM/NCP Update
Noise and Its Effect on People D-2 Appendix D
pressure. These oscillations, or sound pressures, impinge on the ear creating the sound we hear.
Our ears are sensitive to a wide range of sound pressures. The loudest sound that we hear without pain has about one trillion times more energy than the quietest sounds we hear. On a linear scale, this range is unwieldy. Therefore we compress the total range of sound pressures to a more meaningful range by introducing the concept of sound pressure level (SPL) and its logarithmic unit of decibel (dB).
SPL is a measure of the sound pressure of a given noise source relative to a standard reference value (typically the quietest sound that a young person with good hearing can detect). Decibels are logarithmic quantities —logarithms of the ratio of the two pressures, the numerator being the pressure of the sound source of interest, and the denominator being the reference pressure (the quietest sound we can hear).
The logarithmic conversion of sound pressure to SPL means that the quietest sound we can hear (the reference pressure) has a SPL of about zero decibels, while the loudest sounds we hear without pain have SPLs less than or equal to about 120 dB. Most sounds in our day-to-day environment have SPLs from 30 to 100 dB.
Because decibels are logarithmic quantities, they require logarithmic math and not simple (linear) addition and subtraction. For example, if two sound sources each produce 100 dB and are operated together, they produce only 103 dB—not 200 dB as might be expected. Four equal sources operating simultaneously result in a total SPL of 106 dB. In fact, for every doubling of the number of equal sources, the SPL (of all of the sources combined) increases another three decibels. A ten-fold increase in the
number of sources makes the SPL increase by 10 dB. A hundredfold increase makes the level increase by 20 dB, and it takes a thousand equal sources to increase the level by 30 dB.
If one source is much louder than another, the two sources together will produce the same SPL (and sound to our ears) as if the louder source were operating alone. For example, a 100 dB source plus an 80 dB source produce 100 dB when operating together. The louder source “masks” the quieter one. But if the quieter source gets louder, it will have an increasing effect on the total SPL. When the two sources are equal, as described above, they produce a level 3 decibels above the sound level of either one by itself.
From these basic concepts, note that one hundred 80 dB sources will produce a combined level of 100 dB; if a single 100 dB source is added, the group will produce a total SPL of 103 dB. Clearly, the loudest source has the greatest effect on the total.
There are two useful rules of thumb to remember when comparing SPLs: (1) most of us perceive a 6 to 10 dB increase in the SPL to be an approximate doubling of loudness, and (2) changes in SPL of less than about 3 dB are not readily detectable outside of a laboratory environment.
D.1.2 A-Weighted Decibel (dBA)
Another important characteristic of sound is its frequency, or “pitch.” This is the rate of repetition of the sound pressure oscillations as they reach our ear. Frequency can be expressed in units of cycles per second (cps) or Hertz (Hz). Although cps and Hz are equivalent, Hz is the preferred scientific unit and terminology.
DRAFT

Westover Air Reserve Base / Metropolitan Airport NEM/NCP Update
Noise and Its Effect on People D-3 Appendix D
A very good ear can hear sounds with frequencies from 16 Hz to 20,000 Hz. However, most people hear from approximately 20 Hz to approximately 10,000-15,000 Hz. People respond to sound most readily when the predominant frequency is in the range of normal conversation, around 1,000 to 4,000 Hz. Acousticians have developed and applied “filters” or “weightings” to SPLs to match our ears’ sensitivity to the pitch of sounds and to help us judge the relative loudness of sounds made up of different frequencies. Two such filters, “A” and “C,” are most applicable to environmental noises.
A-weighting significantly de-emphasizes noise at low and high frequencies (below approximately 500 Hz and above approximately 10,000 Hz) where we do not hear as well. The filter has little or no effect at intervening frequencies where our hearing is most efficient. Figure D-1 shows a graph of the A-weighting as a function of frequency and its aforementioned characteristics. Because this filter generally matches our ears’ sensitivity, sounds having higher A-weighted sound levels are usually judged to be louder than those with lower A-weighted sound levels, a relationship which does not always hold true for unweighted levels. Therefore, A-weighted sound levels are normally used to evaluate environmental noise. SPLs measured through this filter are referred to as A-weighted decibels (dBA).
Figure D-1 Frequency Response Characteristics of Various Weighting Networks
Source: ANSI S1.4-1983 “Specification of Sound Level Meters.”
DRAFT
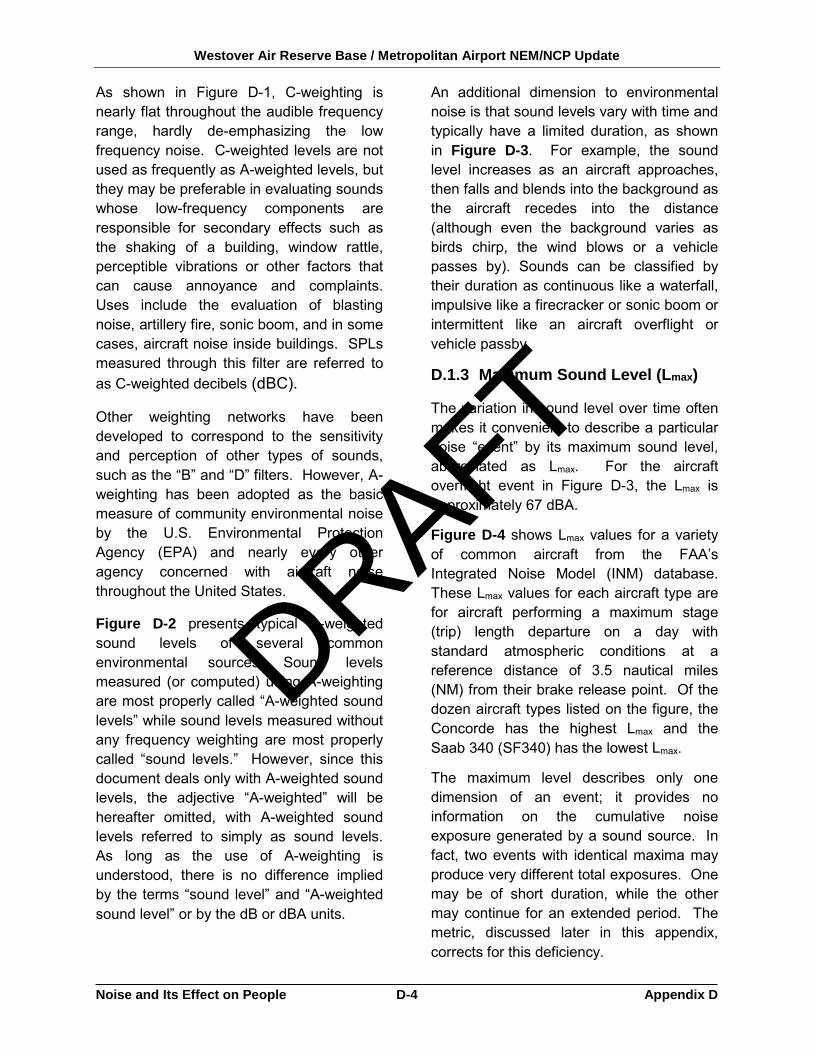
Westover Air Reserve Base / Metropolitan Airport NEM/NCP Update
Noise and Its Effect on People D-4 Appendix D
As shown in Figure D-1, C-weighting is nearly flat throughout the audible frequency range, hardly de-emphasizing the low frequency noise. C-weighted levels are not used as frequently as A-weighted levels, but they may be preferable in evaluating sounds whose low-frequency components are responsible for secondary effects such as the shaking of a building, window rattle, perceptible vibrations or other factors that can cause annoyance and complaints. Uses include the evaluation of blasting noise, artillery fire, sonic boom, and in some cases, aircraft noise inside buildings. SPLs measured through this filter are referred to as C-weighted decibels (dBC).
Other weighting networks have been developed to correspond to the sensitivity and perception of other types of sounds, such as the “B” and “D” filters. However, A-weighting has been adopted as the basic measure of community environmental noise by the U.S. Environmental Protection Agency (EPA) and nearly every other agency concerned with aircraft noise throughout the United States.
Figure D-2 presents typical A-weighted sound levels of several common environmental sources. Sound levels measured (or computed) using A-weighting are most properly called “A-weighted sound levels” while sound levels measured without any frequency weighting are most properly called “sound levels.” However, since this document deals only with A-weighted sound levels, the adjective “A-weighted” will be hereafter omitted, with A-weighted sound levels referred to simply as sound levels. As long as the use of A-weighting is understood, there is no difference implied by the terms “sound level” and “A-weighted sound level” or by the dB or dBA units.
An additional dimension to environmental noise is that sound levels vary with time and typically have a limited duration, as shown in Figure D-3. For example, the sound level increases as an aircraft approaches, then falls and blends into the background as the aircraft recedes into the distance (although even the background varies as birds chirp, the wind blows or a vehicle passes by). Sounds can be classified by their duration as continuous like a waterfall, impulsive like a firecracker or sonic boom or intermittent like an aircraft overflight or vehicle passby.
D.1.3 Maximum Sound Level (Lmax)
The variation in sound level over time often makes it convenient to describe a particular noise “event” by its maximum sound level, abbreviated as Lmax. For the aircraft overflight event in Figure D-3, the Lmax is approximately 67 dBA.
Figure D-4 shows Lmax values for a variety of common aircraft from the FAA’s Integrated Noise Model (INM) database. These Lmax values for each aircraft type are for aircraft performing a maximum stage (trip) length departure on a day with standard atmospheric conditions at a reference distance of 3.5 nautical miles (NM) from their brake release point. Of the dozen aircraft types listed on the figure, the Concorde has the highest Lmax and the Saab 340 (SF340) has the lowest Lmax.
The maximum level describes only one dimension of an event; it provides no information on the cumulative noise exposure generated by a sound source. In fact, two events with identical maxima may produce very different total exposures. One may be of short duration, while the other may continue for an extended period. The metric, discussed later in this appendix, corrects for this deficiency.
DRAFT
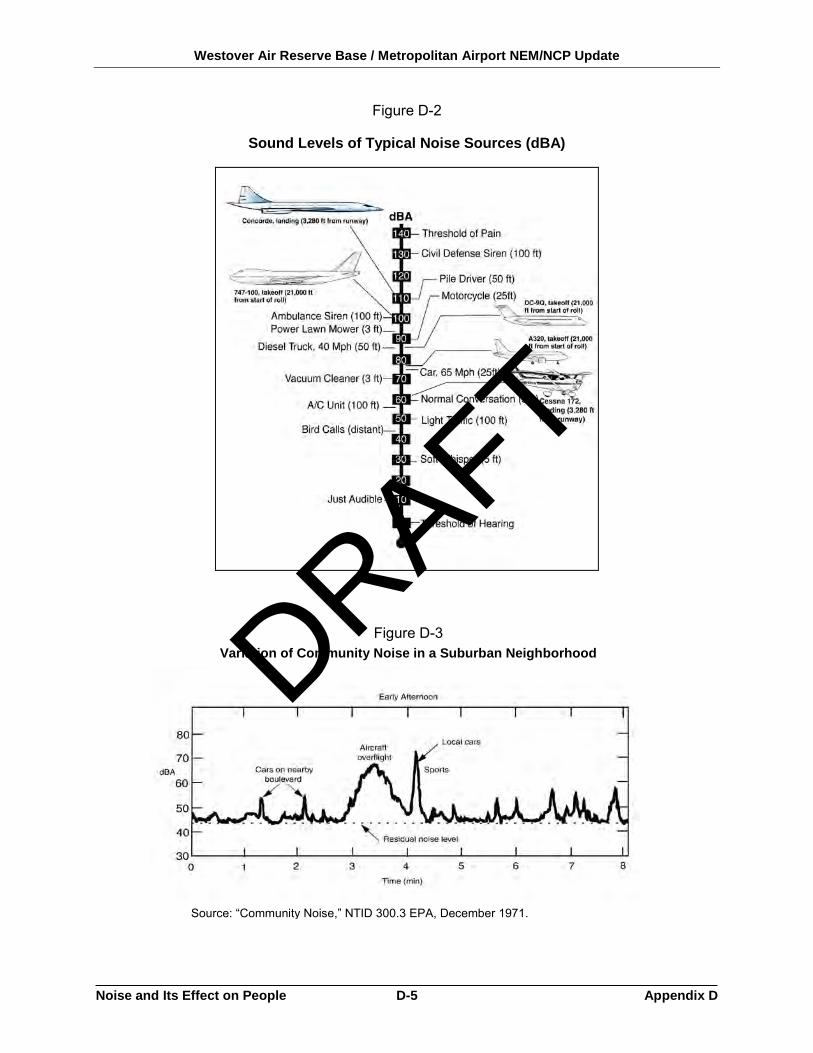
Westover Air Reserve Base / Metropolitan Airport NEM/NCP Update
Noise and Its Effect on People D-5 Appendix D
Figure D-2
Sound Levels of Typical Noise Sources (dBA)
Source: “Community Noise,” NTID 300.3 EPA, December 1971.
Figure D-3 Variation of Community Noise in a Suburban Neighborhood
DRAFT
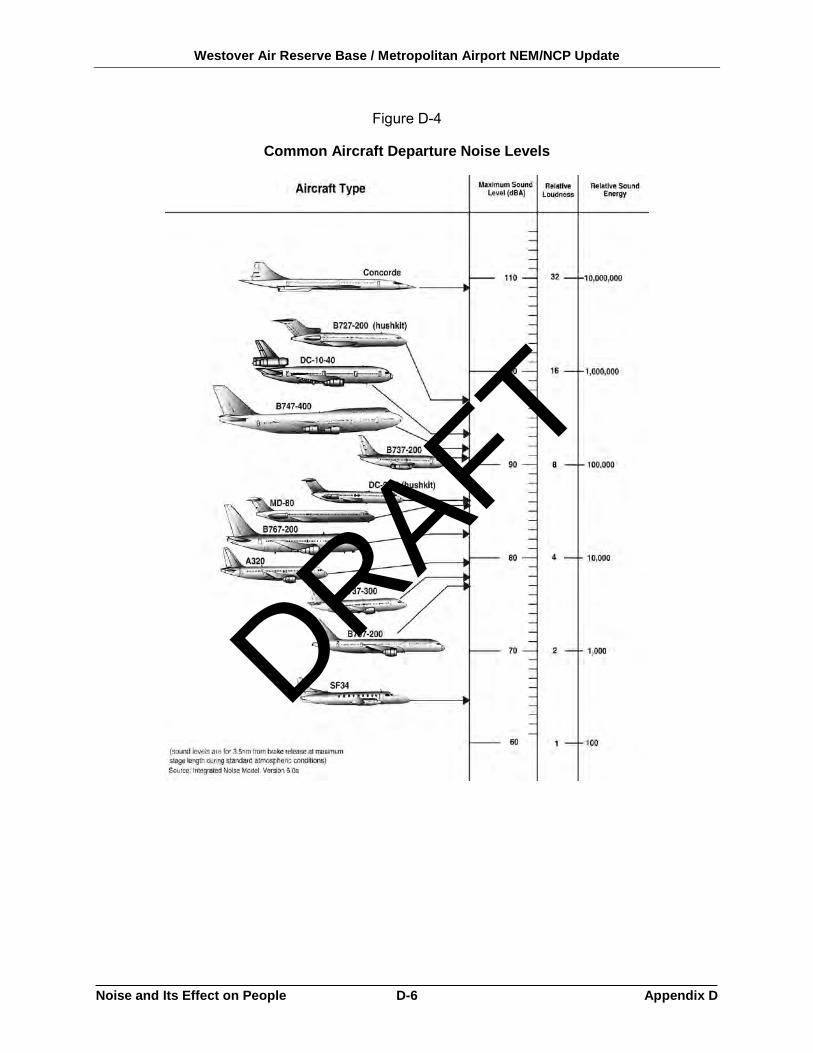
Westover Air Reserve Base / Metropolitan Airport NEM/NCP Update
Noise and Its Effect on People D-6 Appendix D
Figure D-4
Common Aircraft Departure Noise Levels
DRAFT
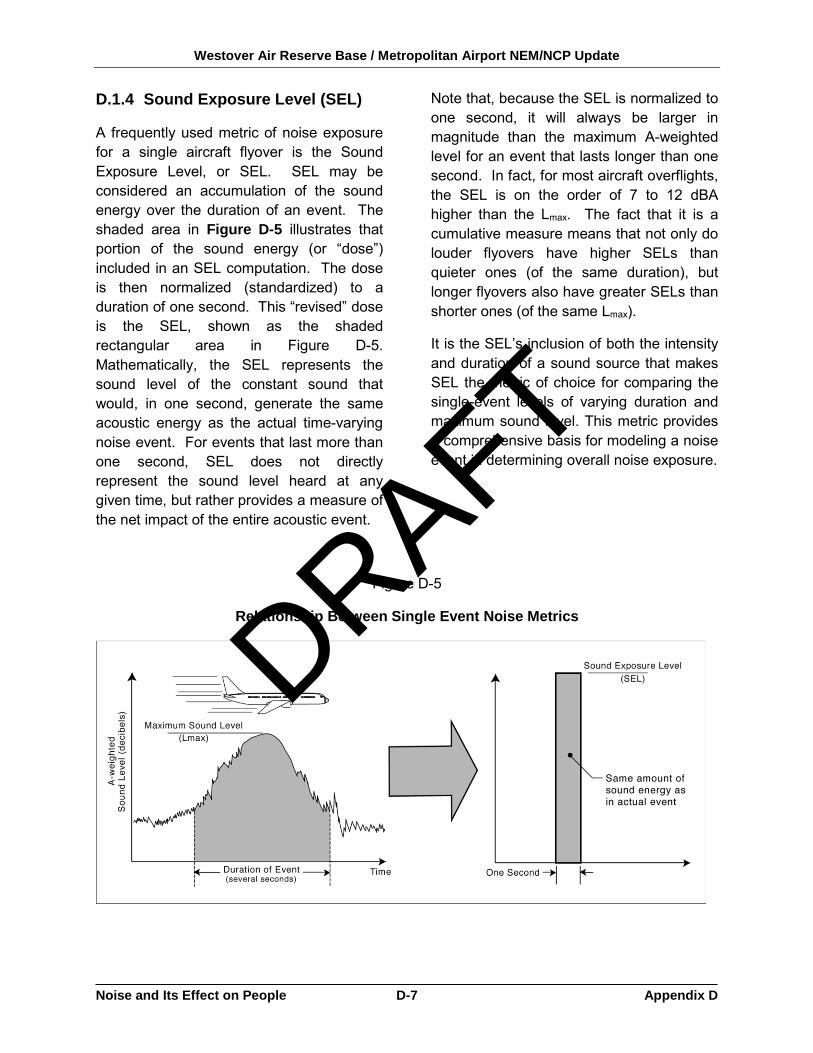
Westover Air Reserve Base / Metropolitan Airport NEM/NCP Update
Noise and Its Effect on People D-7 Appendix D
D.1.4 Sound Exposure Level (SEL)
A frequently used metric of noise exposure for a single aircraft flyover is the Sound Exposure Level, or SEL. SEL may be considered an accumulation of the sound energy over the duration of an event. The shaded area in Figure D-5 illustrates that portion of the sound energy (or “dose”) included in an SEL computation. The dose is then normalized (standardized) to a duration of one second. This “revised” dose is the SEL, shown as the shaded rectangular area in Figure D-5. Mathematically, the SEL represents the sound level of the constant sound that would, in one second, generate the same acoustic energy as the actual time-varying noise event. For events that last more than one second, SEL does not directly represent the sound level heard at any given time, but rather provides a measure of the net impact of the entire acoustic event.
Note that, because the SEL is normalized to one second, it will always be larger in magnitude than the maximum A-weighted level for an event that lasts longer than one second. In fact, for most aircraft overflights, the SEL is on the order of 7 to 12 dBA higher than the Lmax. The fact that it is a cumulative measure means that not only do louder flyovers have higher SELs than quieter ones (of the same duration), but longer flyovers also have greater SELs than shorter ones (of the same Lmax).
It is the SEL’s inclusion of both the intensity and duration of a sound source that makes SEL the metric of choice for comparing the single-event levels of varying duration and maximum sound level. This metric provides a comprehensive basis for modeling a noise event in determining overall noise exposure.
Figure D-5
Relationship Between Single Event Noise Metrics
DRAFT
Westover Air Reserve Base / Metropolitan Airport NEM/NCP Update
Noise and Its Effect on People D-8 Appendix D
D.1.5 Equivalent Sound Level (Leq)
Maximum A-weighted level and SEL are used to measure the noise associated with individual events. The following metrics apply to longer-term cumulative noise exposure that often includes many events.
The first cumulative noise metric, the Equivalent Sound Level (abbreviated Leq), is a measure of the exposure resulting from the accumulation of A-weighted sound levels over a particular period of interest (e.g., an hour, an 8-hour school day, nighttime or a full 24-hour day). However, because the length of the period can be different depending on the time frame of interest, the applicable period should always be identified or clearly understood when discussing the metric. Such durations are often identified through a subscript, for example Leq(8) or Leq(24).
As for its application to aircraft noise issues, Leq is often presented for consecutive 1-hour periods to illustrate how the hourly noise dose rises and falls throughout a 24-hour period, as well as how certain hours are significantly affected by a few loud aircraft. Since the period of interest for this study is in a full 24-hour day, Leq(24) is the proper nomenclature.
Conceptually, Leq may be thought of as a constant sound level over the period of interest that contains as much sound energy as the actual time-varying sound level with its normal “peaks” and “valleys,” as illustrated in Figure D-3. In the context of noise from typical aircraft flight events and as noted earlier for SEL, Leq does not represent the sound level heard at any particular time, but rather represents the total sound exposure for the period of interest. Also, it should be noted that the “average” sound level suggested by Leq is
not an arithmetic value, but a logarithmic, or “energy-averaged,” sound level. Thus, loud events tend to dominate the noise environment described by the Leq metric.
D.1.6 Day-Night Average Sound Level (DNL)
DNL is the same as Leq (an energy-average noise level over a 24-hour period) except that 10 dB is added to those noise events occurring at night (between 10 p.m. and 7 a.m.). This weighting reflects the added intrusiveness of nighttime noise events attributable to the fact that community background noise levels typically decrease by about 10 dB during those nighttime hours. DNL does not represent the sound level heard at any particular time, but rather represents the total (and partially weighted) sound exposure.
Typical DNL values for a variety of noise environments are shown in Figure D-6 to indicate the range of noise exposure levels usually encountered.
Due to the DNL metric’s excellent correlation with the degree of community annoyance from aircraft noise, DNL has been formally adopted by most federal agencies for measuring and evaluating aircraft noise for land use planning and noise impact assessment. Federal interagency committees such as the Federal Interagency Committee on Urban Noise (FICUN) and the Federal Interagency Committee on Noise (FICON) which include the EPA, FAA, Department of Defense, Department of Housing and Urban Development (HUD), and Veterans Administration, found DNL to be the best metric for land use planning. They also found no new cumulative sound descriptors or metrics of sufficient scientific standing to substitute for DNL. Other cumulative
DRAFT

Westover Air Reserve Base / Metropolitan Airport NEM/NCP Update
Noise and Its Effect on People D-9 Appendix D
metrics could be used only to supplement, not replace DNL. Furthermore, FAA Order 1050.1E for environmental documents requires that DNL be used in describing cumulative noise exposure and in identifying aircraft noise/land use compatibility issues.1 2 3 4 5
Measurements of DNL are practical only for obtaining values for a relatively limited number of points. Instead, many noise studies, including this document, are based on estimates of DNL using an FAA-approved computer-based noise model.
Figure D-6
Typical Range of Outdoor Community Day-Night Average Sound Levels
DRAFT
Westover Air Reserve Base / Metropolitan Airport NEM/NCP Update
Noise and Its Effect on People D-10 Appendix D
D.1.7 Time-Above a Specified Level (TA)
The Time-Above a Specified Level (TA) metric describes the total number of minutes that instantaneous sound levels (usually from aircraft) are above a given threshold. For example, if 65 dB is the specified threshold, the metric would be referred to as “TA65.” Like DNL, the TA metric is typically associated with a 24-hour annual average day or only for the DNL nighttime period of 10 p.m. to 7 a.m.
When the TA calculation is expressed as a percentage of the day it is referred to as “%TA.” Although the threshold chosen for the TA calculation is arbitrary, it is usually the ambient level for the location of interest or 65 dB for comparison to a level of 65 dB DNL.
D.2 The Effects of Aircraft Noise on People
To many people, aircraft noise can be an annoyance and a nuisance. It can interfere with conversation and listening to television, disrupt classroom activities in schools and disrupt sleep. Relating these effects to specific noise metrics aids in the understanding of how and why people react to their environment. This section addresses three ways we are potentially affected by aircraft noise: annoyance, interference of speech and disturbance of sleep.
D.2.1 Community Annoyance
The primary potential effect of aircraft noise on exposed communities is one of annoyance. The U.S. EPA defines noise annoyance as any negative subjective reaction on the part of an individual or group.1
Scientific studies 1 2 3 6 7 and a large number of social/attitudinal surveys 8 9 have been conducted to appraise the U.S. and inter-national community of annoyance due to all types of environmental noise, especially aircraft events. These studies and surveys have found the DNL to be the best measure of that annoyance.
This relation between community annoyance and time-average sound level has been confirmed, even for infrequent aircraft noise events.10 For helicopter overflights occurring at a rate of 1 to 52 per day, the stated reactions of community individuals correlated with the daily time-average sound levels of the helicopter overflights.
The relationship between annoyance and DNL that has been determined by the scientific community and endorsed by many federal agencies, including the FAA, is shown in Figure D-7. Two lines in Figure D-7 represent two large sets of social/ attitudinal surveys: one for a curve fit of 161 data points compiled by an individual researcher, Ted Schultz, in 19788 and one for a curve fit of 400 data points (which include Schultz’s 161 points) compiled in 1992 by the U.S. Air Force.11 The agreement of these two curves simply means that when one combines the more recent studies with the early landmark surveys in 1978, the results of the early surveys (i.e., the quantified effect of noise on annoyance) are confirmed.
Figure D-7 shows the percentage of people “highly annoyed” by a given DNL. For example, the two curves in the figure yield a value of about 13% for the percentage of people that would be highly annoyed by a DNL exposure of 65 dB. The figure also shows that at very low values of DNL, such as 45 dB or less, 1% or less of the exposed
DRAFT
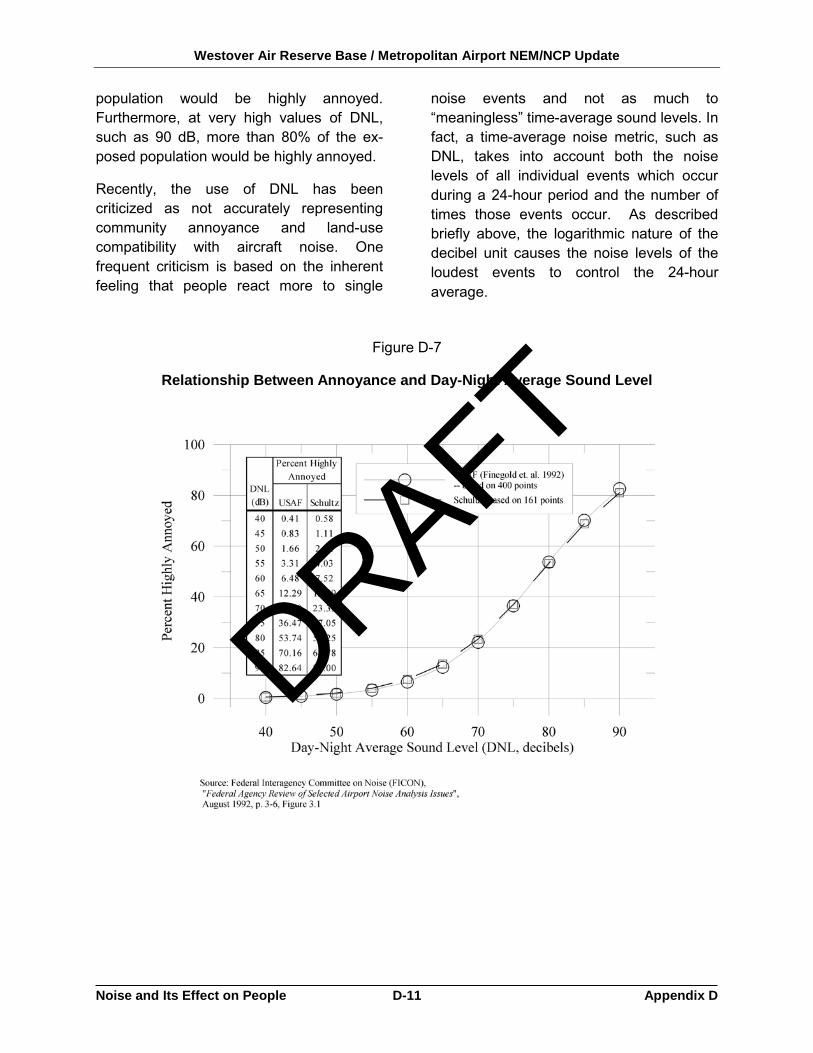
Westover Air Reserve Base / Metropolitan Airport NEM/NCP Update
Noise and Its Effect on People D-11 Appendix D
population would be highly annoyed. Furthermore, at very high values of DNL, such as 90 dB, more than 80% of the ex-posed population would be highly annoyed.
Recently, the use of DNL has been criticized as not accurately representing community annoyance and land-use compatibility with aircraft noise. One frequent criticism is based on the inherent feeling that people react more to single
noise events and not as much to “meaningless” time-average sound levels. In fact, a time-average noise metric, such as DNL, takes into account both the noise levels of all individual events which occur during a 24-hour period and the number of times those events occur. As described briefly above, the logarithmic nature of the decibel unit causes the noise levels of the loudest events to control the 24-hour average.
Figure D-7
Relationship Between Annoyance and Day-Night Average Sound Level
DRAFT
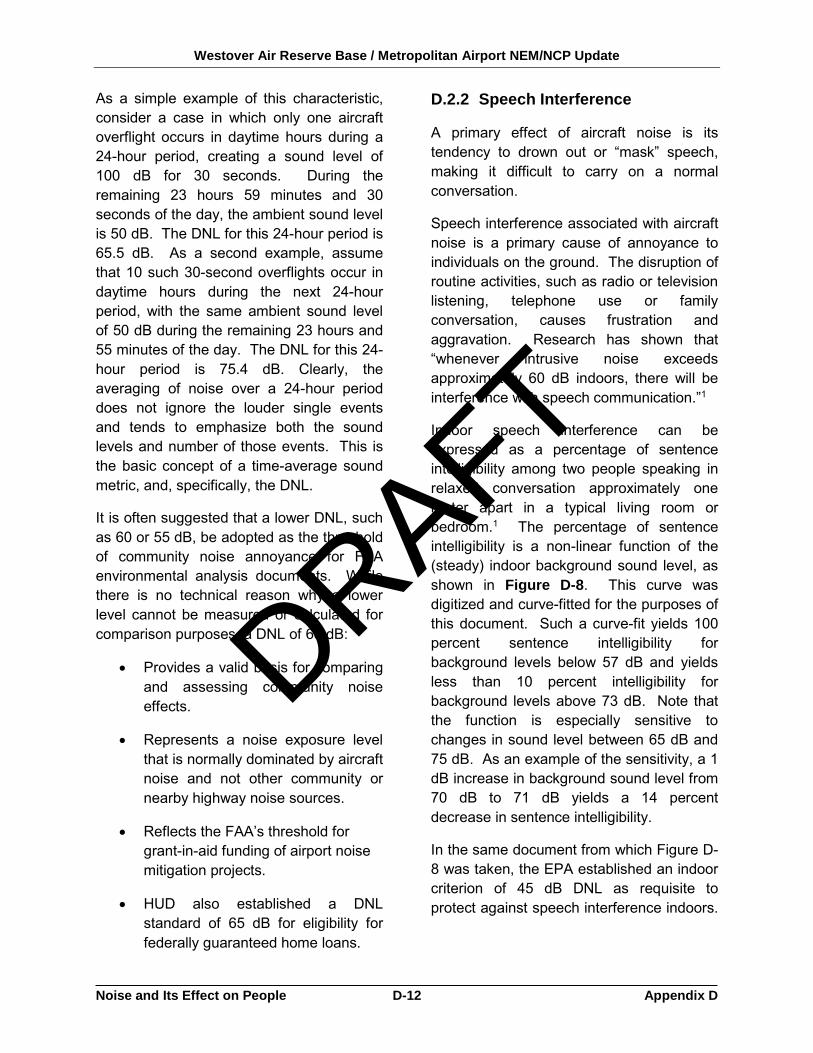
Westover Air Reserve Base / Metropolitan Airport NEM/NCP Update
Noise and Its Effect on People D-12 Appendix D
As a simple example of this characteristic, consider a case in which only one aircraft overflight occurs in daytime hours during a 24-hour period, creating a sound level of 100 dB for 30 seconds. During the remaining 23 hours 59 minutes and 30 seconds of the day, the ambient sound level is 50 dB. The DNL for this 24-hour period is 65.5 dB. As a second example, assume that 10 such 30-second overflights occur in daytime hours during the next 24-hour period, with the same ambient sound level of 50 dB during the remaining 23 hours and 55 minutes of the day. The DNL for this 24-hour period is 75.4 dB. Clearly, the averaging of noise over a 24-hour period does not ignore the louder single events and tends to emphasize both the sound levels and number of those events. This is the basic concept of a time-average sound metric, and, specifically, the DNL.
It is often suggested that a lower DNL, such as 60 or 55 dB, be adopted as the threshold of community noise annoyance for FAA environmental analysis documents. While there is no technical reason why a lower level cannot be measured or calculated for comparison purposes, a DNL of 65 dB:
• Provides a valid basis for comparing and assessing community noise effects.
• Represents a noise exposure level that is normally dominated by aircraft noise and not other community or nearby highway noise sources.
• Reflects the FAA’s threshold for grant-in-aid funding of airport noise mitigation projects.
• HUD also established a DNL standard of 65 dB for eligibility for federally guaranteed home loans.
D.2.2 Speech Interference
A primary effect of aircraft noise is its tendency to drown out or “mask” speech, making it difficult to carry on a normal conversation.
Speech interference associated with aircraft noise is a primary cause of annoyance to individuals on the ground. The disruption of routine activities, such as radio or television listening, telephone use or family conversation, causes frustration and aggravation. Research has shown that “whenever intrusive noise exceeds approximately 60 dB indoors, there will be interference with speech communication.”1
Indoor speech interference can be expressed as a percentage of sentence intelligibility among two people speaking in relaxed conversation approximately one meter apart in a typical living room or bedroom.1 The percentage of sentence intelligibility is a non-linear function of the (steady) indoor background sound level, as shown in Figure D-8. This curve was digitized and curve-fitted for the purposes of this document. Such a curve-fit yields 100 percent sentence intelligibility for background levels below 57 dB and yields less than 10 percent intelligibility for background levels above 73 dB. Note that the function is especially sensitive to changes in sound level between 65 dB and 75 dB. As an example of the sensitivity, a 1 dB increase in background sound level from 70 dB to 71 dB yields a 14 percent decrease in sentence intelligibility.
In the same document from which Figure D-8 was taken, the EPA established an indoor criterion of 45 dB DNL as requisite to protect against speech interference indoors.
DRAFT
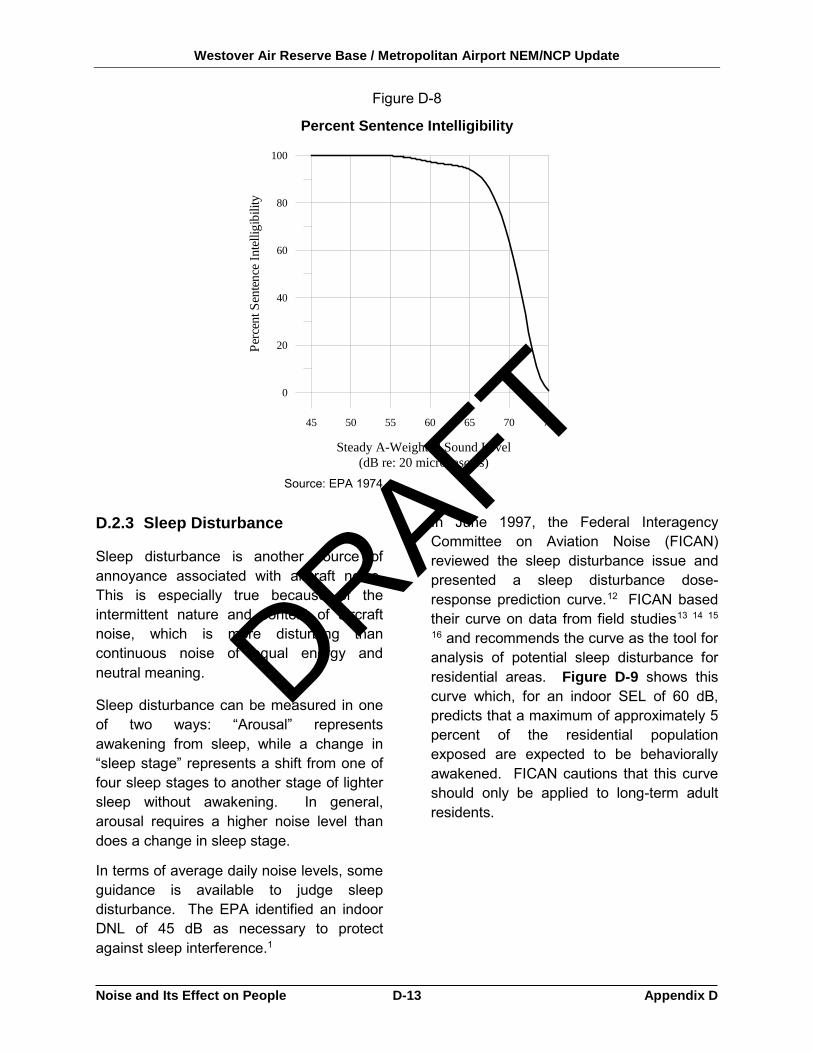
Westover Air Reserve Base / Metropolitan Airport NEM/NCP Update
Noise and Its Effect on People D-13 Appendix D
Figure D-8
Percent Sentence Intelligibility
45 50 55 60 65 70 75
Steady A-Weighted Sound Level(dB re: 20 micropascals)
0
20
40
60
80
100
Perc
ent S
ente
nce
Inte
lligi
bilit
y
D.2.3 Sleep Disturbance
Sleep disturbance is another source of annoyance associated with aircraft noise. This is especially true because of the intermittent nature and content of aircraft noise, which is more disturbing than continuous noise of equal energy and neutral meaning.
Sleep disturbance can be measured in one of two ways: “Arousal” represents awakening from sleep, while a change in “sleep stage” represents a shift from one of four sleep stages to another stage of lighter sleep without awakening. In general, arousal requires a higher noise level than does a change in sleep stage.
In terms of average daily noise levels, some guidance is available to judge sleep disturbance. The EPA identified an indoor DNL of 45 dB as necessary to protect against sleep interference.1
In June 1997, the Federal Interagency Committee on Aviation Noise (FICAN) reviewed the sleep disturbance issue and presented a sleep disturbance dose-response prediction curve.12 FICAN based their curve on data from field studies13 14 15
16 and recommends the curve as the tool for analysis of potential sleep disturbance for residential areas. Figure D-9 shows this curve which, for an indoor SEL of 60 dB, predicts that a maximum of approximately 5 percent of the residential population exposed are expected to be behaviorally awakened. FICAN cautions that this curve should only be applied to long-term adult residents.
Source: EPA 1974
DRAFT
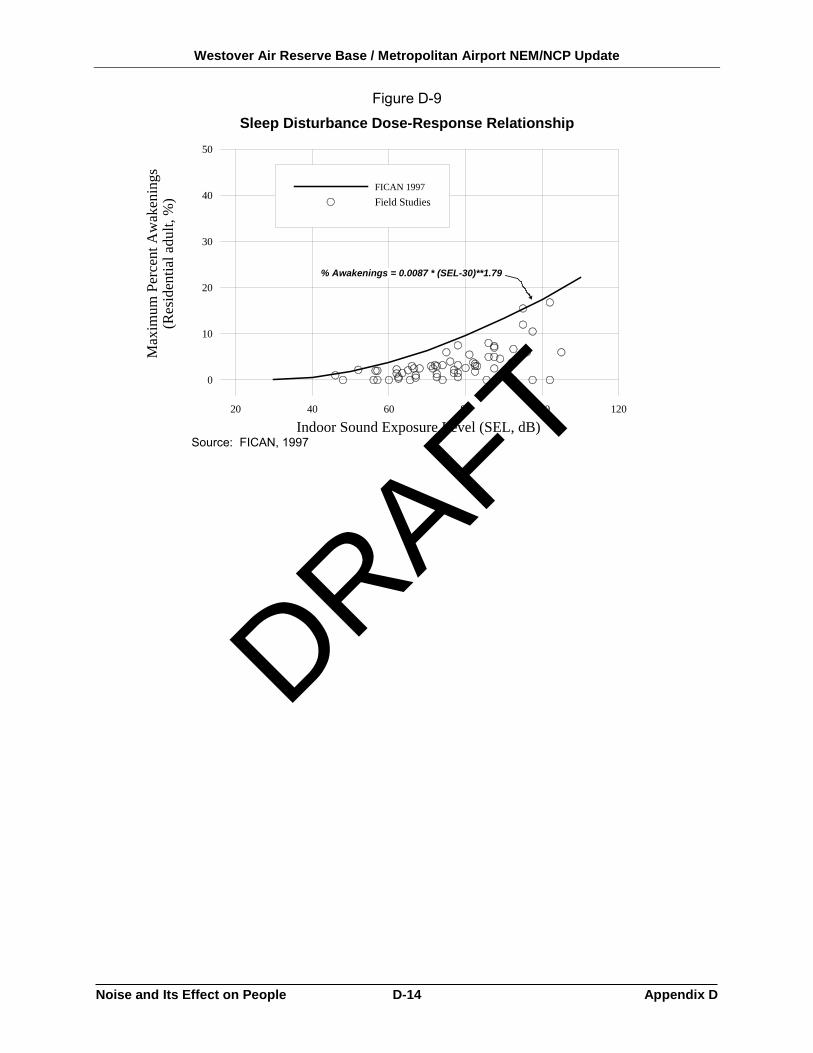
Westover Air Reserve Base / Metropolitan Airport NEM/NCP Update
Noise and Its Effect on People D-14 Appendix D
Figure D-9 Sleep Disturbance Dose-Response Relationship
20 40 60 80 100 120
Indoor Sound Exposure Level (SEL, dB)
0
10
20
30
40
50M
axim
um P
erce
nt A
wak
enin
gs(R
esid
entia
l adu
lt, %
)FICAN 1997Field Studies
% Awakenings = 0.0087 * (SEL-30)**1.79
Source: FICAN, 1997
DRAFT
Westover Air Reserve Base / Metropolitan Airport NEM/NCP Update
Noise and Its Effect on People D-15 Appendix D
Endnotes
1 U.S. Environmental Protection Agency, “Information on Levels of Environmental Noise Requisite to
Protect the Public Health and Welfare with an Adequate Margin of Safety,” Report 550/9-74-004, March 1974.
2 “Guidelines for Considering Noise in Land Use Planning and Control,” Federal Interagency Committee on Urban Noise (FICUN), June 1980.
3 “Federal Agency Review of Selected Airport Noise Analysis Issues,” Federal Interagency Committee on Noise (FICON), August 1992.
4 14 CFR Part 150, Airport Noise Compatibility Planning, Amendment 150-3, Updated April 2012. 5 FAA Order 1050.1E, Chg 1, Environmental Impacts: Policies and Procedures, Department of
Transportation, Federal Aviation Administration, March 20, 2006. 6 “Sound Level Descriptors for Determination of Compatible Land Use,” American National Standards
Institute Standard ANSI S3.23-1980. 7 “Quantities and Procedures for Description and Measurement of Environmental Sound, Part I,”
American National Standards Institute Standard ANSI S21.9-1988. 8 Schultz, T.J., “Synthesis of Social Surveys on Noise Annoyance,” J. Acoust. Soc. Am., 64, 377-405,
August 1978. 9 Fidell, S., Barger, D.S., Schultz, T.J., “Updating a Dosage-Effect Relationship for the Prevalence of
Annoyance Due to General Transportation Noise.” J. Acoust. Soc. Am., 89, 221-233, January 1991. 10 “Community Reactions to Helicopter Noise: Results from an Experimental Study,” J. Acoust. Soc. Am.,
479-492, August 1987. 11 Finegold, L.S., C.S. Harris, H.E. VonGierke., "Applied Acoustical Report: Criteria for Assessment of
Noise Impacts on People." J. Acoust. Soc. Am., June 1992. 12 Federal Interagency Committee on Aviation Noise (FICAN), “Effects of Aviation Noise on Awakenings
from Sleep,” June 1997. 13 Pearson, K.S., Barber, D.S., Tabachnick, B.G., “Analyses of the Predictability of Noise-Induced Sleep
Disturbance,” USAF Report HSD-TR-89-029, October 1989. 14 Ollerhead, J.B., Jones, C.J., Cadous, R.E., Woodley, A., Atkinson, B.J., Horne, J.A., Pankhurst, F.,
Reyner, L, Hume, K.I., Van, F., Watson, A., Diamond, I.D., Egger, P., Holmes, D., McKean, J., “Report of a Field Study of Aircraft Noise and Sleep Disturbance.” London Department of Safety, Environment, and Engineering, 1992.
15 Fidell, S., Pearsons, K., Howe, R., Tabachnick, B., Silvati, L., Barber, D.S. “Noise-Induced Sleep Disturbance in Residential Settings,” AL/OH-TR-1994-0131, Wright Patterson AFB, OH, Armstrong Laboratory, Occupational and Environmental Health Division, 1994.
16 Fidell, S., Howe, R., Tabachnick, B., Pearsons, K., Sneddon, M., “Noise-Induced Sleep Disturbance in Residences Near Two Civil Airports,” Langley Research Center, 1995.
DRAFT

APPENDIX E
Record of Consultation
DRAFT

[This page is left intentionally blank]
DRAFT
Westover Air Reserve Base / Metropolitan Airport NEM/NCP Update
Record of Consultation E-1 Appendix E
APPENDIX E Record of Consultation This appendix includes the following attachments:
1. Land Use Verification Letters to City of Chicopee, Town of Granby, and Town of Ludlow (May 3, 2018)
2. Land Use Verification Response from Town of Ludlow (May 7, 2018)
3. Public Notice of Draft Document Availability and Public Meeting Documents (to be provided)
DRAFT

[This page is left intentionally blank]
DRAFT
Westover Air Reserve Base / Metropolitan Airport NEM/NCP Update
Record of Consultation Appendix E
Attachment 1: Land Use Verification Letters
to City of Chicopee, Town of Granby, and Town of Ludlow May 3, 2018
DRAFT

HNTB Corporation 2900 S. Quincy Street Telephone (703) 824-5100 Engineers Architects Planners Suite 600 Facsimile (703) 671-6210 Arlington, Virginia 22206 www.hntb.com
Lee M. Pouliot, ASLA
Director, Planning Department City of Chicopee 274 Front Street 4th Floor Annex Chicopee, MA 01013
May 3, 2018
Dear Mr. Pouliot, The Westover Metropolitan Development Corporation (WMDC) is conducting an update to the Title 14 Code of Federal Regulations (CFR) Part 150 Noise Compatibility Study (Part 150 Study) at Westover Air Reserve Base/ Metropolitan Airport (CEF). The Airport is operated under a joint-use agreement with the Department of Defense (DoD) and the WMDC. Title 14 CFR Part 150, Airport Noise Compatibility Planning, is the primary Federal regulation guiding and controlling planning for aviation noise compatibility on and around airports. The general purpose of a Part 150 Study is to recommend a program of airport operations and land use controls that will help to reduce aircraft noise and prevent future development which would be incompatible with airport noise. The WMDC completed a Part 150 Study Update including updated noise exposure maps in 2014 with a Record of Approval (ROA) issued by the Federal Aviation Administration (FAA) in early 2015. Due to technology upgrades in aircraft and improved avionics at CEF an update to the Part 150 Study is proposed due to the potential to change the airport’s noise contours. Stantec and HNTB are assisting the WMDC in the development of the Part 150 Study Update. In order to evaluate demographic and land use impacts, the enclosed Figure 1 has been developed to depict the generalized land use for the area surrounding the Airport. Land uses are generalized into the following categories: Commercial/ Industrial, Open/ Agricultural/ Recreational, Public/ Quasi-Public, Residential, Cemetery, Institutional, Water, and Transportation. Noise sensitive locations such as schools, places of worship and historic resources are also identified. This map was developed using generalized land use data from the Bureau of Geographic Information (MassGIS), and was refined based on MassGIS parcel boundary outlines and aerial photo interpretation. Areas that have been acquired under the WMDC’s voluntary acquisition program are also identified. We are aware of the combined efforts of the Westover Joint Land Use (JLUS) Steering Committee and the Pioneer Valley Planning Commission (PVPC) to review and update current “Land Use” GIS data in the PVPC system. We intend to remain in communication with the JLUS/PVPC up until our project deadlines to ensure inclusion of any updated data they may generate in this interim period. We are requesting that the Planning Department at the City of Chicopee review the attached land use map to confirm the land use information is accurate and satisfactory to the City’s standards. Any comments or information that is provided will be corrected, and will be pertinent to the overall quality and accuracy of the study. HNTB is submitting the Draft Part 150 Study Update to the WMDC (Airport Sponsor) for review in May. Given that this is a draft submittal, any comments or changes the City submits to HNTB by May 21, 2018 will be considered prior to the final submission of the Part 150 Study Update. If you
DRAFT

DRAFT
Page 3 of 3
On behalf of the City of Chicopee Planning Department, I verify that the land use information shown on Figure 1 provided by HNTB is accurate to the best of my knowledge. _________________________________ __________________ Lee M. Pouliot, ASLA (or designee) Date Planning Department City of Chicopee
DRAFT

HNTB Corporation 2900 S. Quincy Street Telephone (703) 824-5100 Engineers Architects Planners Suite 600 Facsimile (703) 671-6210 Arlington, Virginia 22206 www.hntb.com
Cathy Leonard
Town Administrator’s Assistant / Planning Board Contact Town Hall/ Senior Center Building 10-B West State Street 2nd Floor Granby, MA 01033
May 3, 2018
Dear Ms. Leonard, The Westover Metropolitan Development Corporation (WMDC) is conducting an update to the Title 14 Code of Federal Regulations (CFR) Part 150 Noise Compatibility Study (Part 150 Study) at Westover Air Reserve Base/ Metropolitan Airport (CEF). The Airport is operated under a joint-use agreement with the Department of Defense (DoD) and the WMDC. Title 14 CFR Part 150, Airport Noise Compatibility Planning, is the primary Federal regulation guiding and controlling planning for aviation noise compatibility on and around airports. The general purpose of a Part 150 Study is to recommend a program of airport operations and land use controls that will help to reduce aircraft noise and prevent future development which would be incompatible with airport noise. The WMDC completed a Part 150 Study Update including updated noise exposure maps in 2014 with a Record of Approval (ROA) issued by the Federal Aviation Administration (FAA) in early 2015. Due to technology upgrades in aircraft and improved avionics at CEF an update to the Part 150 Study is proposed due to the potential to change the airport’s noise contours. Stantec and HNTB are assisting the WMDC in the development of the Part 150 Study Update. In order to evaluate demographic and land use impacts, the enclosed Figure 1 has been developed to depict the generalized land use for the area surrounding the Airport. Land uses are generalized into the following categories: Commercial/ Industrial, Open/ Agricultural/ Recreational, Public/ Quasi-Public, Residential, Cemetery, Institutional, Water, and Transportation. Noise sensitive locations such as schools, places of worship and historic resources are also identified. This map was developed using generalized land use data from the Bureau of Geographic Information (MassGIS), and was refined based on MassGIS parcel boundary outlines and aerial photo interpretation. Areas that have been acquired under the WMDC’s voluntary acquisition program are also identified. We are aware of the combined efforts of the Westover Joint Land Use (JLUS) Steering Committee and the Pioneer Valley Planning Commission (PVPC) to review and update current “Land Use” GIS data in the PVPC system. We intend to remain in communication with the JLUS/PVPC up until our project deadlines to ensure inclusion of any updated data they may generate in this interim period. We are requesting that the Town of Granby review the attached land use map to confirm the land use information is accurate and satisfactory to the Town’s standards. Any comments or information that is provided will be corrected, and will be pertinent to the overall quality and accuracy of the study. HNTB is submitting the Draft Part 150 Study Update to the WMDC (Airport Sponsor) for review in May. Given that this is a draft submittal, any comments or changes the Town submits to HNTB by May 21, 2018 will be considered prior to the final submission of the Part 150 Study Update. If you agree with the land uses shown on Figure 1, please sign below and return to HNTB, 2900 S. Quincy Street, Suite 600, Arlington,
DRAFT

DRAFT
Page 3 of 3
On behalf of the Town of Granby Planning Department, I verify that the land use information shown on Figure 1 provided by HNTB is accurate to the best of my knowledge. _________________________________ __________________ Cathy Leonard (or designee) Date Town of Granby
DRAFT

HNTB Corporation 2900 S. Quincy Street Telephone (703) 824-5100 Engineers Architects Planners Suite 600 Facsimile (703) 671-6210 Arlington, Virginia 22206 www.hntb.com
Douglas J. Stefancik
Town Planner Town of Ludlow 488 Chapin Street Ludlow, MA 01056
May 3, 2018
Dear Mr. Stefancik, The Westover Metropolitan Development Corporation (WMDC) is conducting an update to the Title 14 Code of Federal Regulations (CFR) Part 150 Noise Compatibility Study (Part 150 Study) at Westover Air Reserve Base/ Metropolitan Airport (CEF). The Airport is operated under a joint-use agreement with the Department of Defense (DoD) and the WMDC. Title 14 CFR Part 150, Airport Noise Compatibility Planning, is the primary Federal regulation guiding and controlling planning for aviation noise compatibility on and around airports. The general purpose of a Part 150 Study is to recommend a program of airport operations and land use controls that will help to reduce aircraft noise and prevent future development which would be incompatible with airport noise. The WMDC completed a Part 150 Study Update including updated noise exposure maps in 2014 with a Record of Approval (ROA) issued by the Federal Aviation Administration (FAA) in early 2015. Due to technology upgrades in aircraft and improved avionics at CEF an update to the Part 150 Study is proposed due to the potential to change the airport’s noise contours. Stantec and HNTB are assisting the WMDC in the development of the Part 150 Study Update. In order to evaluate demographic and land use impacts, the enclosed Figure 1 has been developed to depict the generalized land use for the area surrounding the Airport. Land uses are generalized into the following categories: Commercial/ Industrial, Open/ Agricultural/ Recreational, Public/ Quasi-Public, Residential, Cemetery, Institutional, Water, and Transportation. Noise sensitive locations such as schools, places of worship and historic resources are also identified. This map was developed using generalized land use data from the Bureau of Geographic Information (MassGIS), and was refined based on MassGIS parcel boundary outlines and aerial photo interpretation. Areas that have been acquired under the WMDC’s voluntary acquisition program are also identified. We are aware of the combined efforts of the Westover Joint Land Use (JLUS) Steering Committee and the Pioneer Valley Planning Commission (PVPC) to review and update current “Land Use” GIS data in the PVPC system. We intend to remain in communication with the JLUS/PVPC up until our project deadlines to ensure inclusion of any updated data they may generate in this interim period. We are requesting that the Planning Department at the Town of Ludlow review the attached land use map to confirm the land use information is accurate and satisfactory to the Town’s standards. Any comments or information that is provided will be corrected, and will be pertinent to the overall quality and accuracy of the study. HNTB is submitting the Draft Part 150 Study Update to the WMDC (Airport Sponsor) for review in May. Given that this is a draft submittal, any comments or changes the Town submits to HNTB by May 21, 2018 will be considered prior to the final submission of the Part 150 Study Update. If you agree with the land uses shown on Figure 1, please sign below and return to HNTB, 2900 S. Quincy
DRAFT

DRAFT

Page 3 of 3
On behalf of the Town of Ludlow Planning Department, I verify that the land use information shown on Figure 1 provided by HNTB is accurate to the best of my knowledge. _________________________________ __________________ Douglas J. Stefancik (or designee) Date Planning Department Town of Ludlow
DRAFT

î
î
î
î
î
î
î
î
îîî
î
î
î
î
î
î
î
î
î
îî
î
î
î î
î
î
î
î
î
î î
îî
îî
î
î
î
å
å
å
åå
å
å
å
å
å
å
å
å
å
åå
å
å
å
å
å
å
å
å
å
åå
åå
å
å å å
å
å
å
å
å
å
å
å
å
å
å
å
å
å
å
å
å
å
å
åå
å
å
å
å
å
å
å
å
å
å
å
å
å
å
å
å
å
å
!(!(!(
!(
!(
!(
!(!(!(
!(!(
!(
!(
!(
!(
!(!(
!(
!(
!(!(
!(
!(
Westover Air Reserve Base / Metropolitan Airport
Hampshire County
Hampden County
§¦90
£¤202
£¤20
Mem
oria
l Dr
Connecticut R
iver
New Ludlow Rd
Fuller St
Chico
pee
St
Lyon St
Wes
t St
Burnett Rd
Montgom
ery St
Worcester St
5
23
33
15
ChicopeeRiver
Reservoir
ChicopeeMemorialState Park
ChicopeeCountry
Club
WestoverConservation
Area
WadePond
WestoverGolf
Course
ChicopeeReservoir
Chicopee River
Prospect St
Granby
South Hadley
ChicopeeLudlow
Springfield
USDA-FSA-APFO
Sources: Bureau of Geographic Information (MassGIS),Commonwealth of Massachusetts,
Executive Office of Technology and Security Services,WMDC 2018, HNTB GIS (2018),
Aerial - USDA 2016, ESRI Data and HNTB Analysis
LEGENDCommercial/IndustrialOpen/Agricultural/RecreationalPublic/Quasi-PublicResidentialPreviously Acquired Property underthe Voluntary Acquisition ProgramCemeteryInstitutional
TransportationWaterWARB Installation AreaWMDC Aviation PropertyCounty BoundaryTown BoundaryNational Register of Historic PlacesNational Register Historic District
Westover Air Reserve Base / Metropolitan AirportDRAFT Generalized Existing Land Use
Figure 1
0 2,500 5,0001,250Feet
1" = 5,000'åî
!(
Local Historic DistrictPlace of WorshipSchool
DRAFT

[This page is left intentionally blank]
DRAFT
Westover Air Reserve Base / Metropolitan Airport NEM/NCP Update
Record of Consultation Appendix E
Attachment 2: Land Use Verification
Response from Town of Ludlow May 7, 2018
DRAFT

DRAFT
Westover Air Reserve Base / Metropolitan Airport NEM/NCP Update
Record of Consultation Appendix E
Attachment 3: Public Notice of Draft Document Availability
and Public Meeting Documents
(to be provided)
DRAFT

[This page is left intentionally blank]
DRAFT
APPENDIX E
Record of Consultation
DRAFT

[This page is left intentionally blank]
DRAFT
Westover Air Reserve Base / Metropolitan Airport NEM/NCP Update
Record of Consultation E-1 Appendix E
APPENDIX E Record of Consultation This appendix includes the following attachments:
1. Land Use Verification Letters to City of Chicopee, Town of Granby, and Town of Ludlow (May 3, 2018)
2. Land Use Verification Responses
3. Public Notice of Draft Document Availability and Public Meeting Documents (to be provided)
DRAFT

[This page is left intentionally blank]
DRAFT

Westover Air Reserve Base / Metropolitan Airport NEM/NCP Update
Record of Consultation Appendix E
Attachment 1: Land Use Verification Letters
to City of Chicopee, Town of Granby, and Town of Ludlow May 3, 2018
DRAFT
HNTB Corporation 2900 S. Quincy Street Telephone (703) 824-5100 Engineers Architects Planners Suite 600 Facsimile (703) 671-6210 Arlington, Virginia 22206 www.hntb.com
Lee M. Pouliot, ASLA
Director, Planning Department City of Chicopee 274 Front Street 4th Floor Annex Chicopee, MA 01013
May 3, 2018
Dear Mr. Pouliot, The Westover Metropolitan Development Corporation (WMDC) is conducting an update to the Title 14 Code of Federal Regulations (CFR) Part 150 Noise Compatibility Study (Part 150 Study) at Westover Air Reserve Base/ Metropolitan Airport (CEF). The Airport is operated under a joint-use agreement with the Department of Defense (DoD) and the WMDC. Title 14 CFR Part 150, Airport Noise Compatibility Planning, is the primary Federal regulation guiding and controlling planning for aviation noise compatibility on and around airports. The general purpose of a Part 150 Study is to recommend a program of airport operations and land use controls that will help to reduce aircraft noise and prevent future development which would be incompatible with airport noise. The WMDC completed a Part 150 Study Update including updated noise exposure maps in 2014 with a Record of Approval (ROA) issued by the Federal Aviation Administration (FAA) in early 2015. Due to technology upgrades in aircraft and improved avionics at CEF an update to the Part 150 Study is proposed due to the potential to change the airport’s noise contours. Stantec and HNTB are assisting the WMDC in the development of the Part 150 Study Update. In order to evaluate demographic and land use impacts, the enclosed Figure 1 has been developed to depict the generalized land use for the area surrounding the Airport. Land uses are generalized into the following categories: Commercial/ Industrial, Open/ Agricultural/ Recreational, Public/ Quasi-Public, Residential, Cemetery, Institutional, Water, and Transportation. Noise sensitive locations such as schools, places of worship and historic resources are also identified. This map was developed using generalized land use data from the Bureau of Geographic Information (MassGIS), and was refined based on MassGIS parcel boundary outlines and aerial photo interpretation. Areas that have been acquired under the WMDC’s voluntary acquisition program are also identified. We are aware of the combined efforts of the Westover Joint Land Use (JLUS) Steering Committee and the Pioneer Valley Planning Commission (PVPC) to review and update current “Land Use” GIS data in the PVPC system. We intend to remain in communication with the JLUS/PVPC up until our project deadlines to ensure inclusion of any updated data they may generate in this interim period. We are requesting that the Planning Department at the City of Chicopee review the attached land use map to confirm the land use information is accurate and satisfactory to the City’s standards. Any comments or information that is provided will be corrected, and will be pertinent to the overall quality and accuracy of the study. HNTB is submitting the Draft Part 150 Study Update to the WMDC (Airport Sponsor) for review in May. Given that this is a draft submittal, any comments or changes the City submits to HNTB by May 21, 2018 will be considered prior to the final submission of the Part 150 Study Update. If you
DRAFT
DRAFT

Page 3 of 3
On behalf of the City of Chicopee Planning Department, I verify that the land use information shown on Figure 1 provided by HNTB is accurate to the best of my knowledge. _________________________________ __________________ Lee M. Pouliot, ASLA (or designee) Date Planning Department City of Chicopee
DRAFT

HNTB Corporation 2900 S. Quincy Street Telephone (703) 824-5100 Engineers Architects Planners Suite 600 Facsimile (703) 671-6210 Arlington, Virginia 22206 www.hntb.com
Cathy Leonard
Town Administrator’s Assistant / Planning Board Contact Town Hall/ Senior Center Building 10-B West State Street 2nd Floor Granby, MA 01033
May 3, 2018
Dear Ms. Leonard, The Westover Metropolitan Development Corporation (WMDC) is conducting an update to the Title 14 Code of Federal Regulations (CFR) Part 150 Noise Compatibility Study (Part 150 Study) at Westover Air Reserve Base/ Metropolitan Airport (CEF). The Airport is operated under a joint-use agreement with the Department of Defense (DoD) and the WMDC. Title 14 CFR Part 150, Airport Noise Compatibility Planning, is the primary Federal regulation guiding and controlling planning for aviation noise compatibility on and around airports. The general purpose of a Part 150 Study is to recommend a program of airport operations and land use controls that will help to reduce aircraft noise and prevent future development which would be incompatible with airport noise. The WMDC completed a Part 150 Study Update including updated noise exposure maps in 2014 with a Record of Approval (ROA) issued by the Federal Aviation Administration (FAA) in early 2015. Due to technology upgrades in aircraft and improved avionics at CEF an update to the Part 150 Study is proposed due to the potential to change the airport’s noise contours. Stantec and HNTB are assisting the WMDC in the development of the Part 150 Study Update. In order to evaluate demographic and land use impacts, the enclosed Figure 1 has been developed to depict the generalized land use for the area surrounding the Airport. Land uses are generalized into the following categories: Commercial/ Industrial, Open/ Agricultural/ Recreational, Public/ Quasi-Public, Residential, Cemetery, Institutional, Water, and Transportation. Noise sensitive locations such as schools, places of worship and historic resources are also identified. This map was developed using generalized land use data from the Bureau of Geographic Information (MassGIS), and was refined based on MassGIS parcel boundary outlines and aerial photo interpretation. Areas that have been acquired under the WMDC’s voluntary acquisition program are also identified. We are aware of the combined efforts of the Westover Joint Land Use (JLUS) Steering Committee and the Pioneer Valley Planning Commission (PVPC) to review and update current “Land Use” GIS data in the PVPC system. We intend to remain in communication with the JLUS/PVPC up until our project deadlines to ensure inclusion of any updated data they may generate in this interim period. We are requesting that the Town of Granby review the attached land use map to confirm the land use information is accurate and satisfactory to the Town’s standards. Any comments or information that is provided will be corrected, and will be pertinent to the overall quality and accuracy of the study. HNTB is submitting the Draft Part 150 Study Update to the WMDC (Airport Sponsor) for review in May. Given that this is a draft submittal, any comments or changes the Town submits to HNTB by May 21, 2018 will be considered prior to the final submission of the Part 150 Study Update. If you agree with the land uses shown on Figure 1, please sign below and return to HNTB, 2900 S. Quincy Street, Suite 600, Arlington,
DRAFT
DRAFT

Page 3 of 3
On behalf of the Town of Granby Planning Department, I verify that the land use information shown on Figure 1 provided by HNTB is accurate to the best of my knowledge. _________________________________ __________________ Cathy Leonard (or designee) Date Town of Granby
DRAFT

HNTB Corporation 2900 S. Quincy Street Telephone (703) 824-5100 Engineers Architects Planners Suite 600 Facsimile (703) 671-6210 Arlington, Virginia 22206 www.hntb.com
Douglas J. Stefancik
Town Planner Town of Ludlow 488 Chapin Street Ludlow, MA 01056
May 3, 2018
Dear Mr. Stefancik, The Westover Metropolitan Development Corporation (WMDC) is conducting an update to the Title 14 Code of Federal Regulations (CFR) Part 150 Noise Compatibility Study (Part 150 Study) at Westover Air Reserve Base/ Metropolitan Airport (CEF). The Airport is operated under a joint-use agreement with the Department of Defense (DoD) and the WMDC. Title 14 CFR Part 150, Airport Noise Compatibility Planning, is the primary Federal regulation guiding and controlling planning for aviation noise compatibility on and around airports. The general purpose of a Part 150 Study is to recommend a program of airport operations and land use controls that will help to reduce aircraft noise and prevent future development which would be incompatible with airport noise. The WMDC completed a Part 150 Study Update including updated noise exposure maps in 2014 with a Record of Approval (ROA) issued by the Federal Aviation Administration (FAA) in early 2015. Due to technology upgrades in aircraft and improved avionics at CEF an update to the Part 150 Study is proposed due to the potential to change the airport’s noise contours. Stantec and HNTB are assisting the WMDC in the development of the Part 150 Study Update. In order to evaluate demographic and land use impacts, the enclosed Figure 1 has been developed to depict the generalized land use for the area surrounding the Airport. Land uses are generalized into the following categories: Commercial/ Industrial, Open/ Agricultural/ Recreational, Public/ Quasi-Public, Residential, Cemetery, Institutional, Water, and Transportation. Noise sensitive locations such as schools, places of worship and historic resources are also identified. This map was developed using generalized land use data from the Bureau of Geographic Information (MassGIS), and was refined based on MassGIS parcel boundary outlines and aerial photo interpretation. Areas that have been acquired under the WMDC’s voluntary acquisition program are also identified. We are aware of the combined efforts of the Westover Joint Land Use (JLUS) Steering Committee and the Pioneer Valley Planning Commission (PVPC) to review and update current “Land Use” GIS data in the PVPC system. We intend to remain in communication with the JLUS/PVPC up until our project deadlines to ensure inclusion of any updated data they may generate in this interim period. We are requesting that the Planning Department at the Town of Ludlow review the attached land use map to confirm the land use information is accurate and satisfactory to the Town’s standards. Any comments or information that is provided will be corrected, and will be pertinent to the overall quality and accuracy of the study. HNTB is submitting the Draft Part 150 Study Update to the WMDC (Airport Sponsor) for review in May. Given that this is a draft submittal, any comments or changes the Town submits to HNTB by May 21, 2018 will be considered prior to the final submission of the Part 150 Study Update. If you agree with the land uses shown on Figure 1, please sign below and return to HNTB, 2900 S. Quincy
DRAFT
DRAFT

Page 3 of 3
On behalf of the Town of Ludlow Planning Department, I verify that the land use information shown on Figure 1 provided by HNTB is accurate to the best of my knowledge. _________________________________ __________________ Douglas J. Stefancik (or designee) Date Planning Department Town of Ludlow
DRAFT
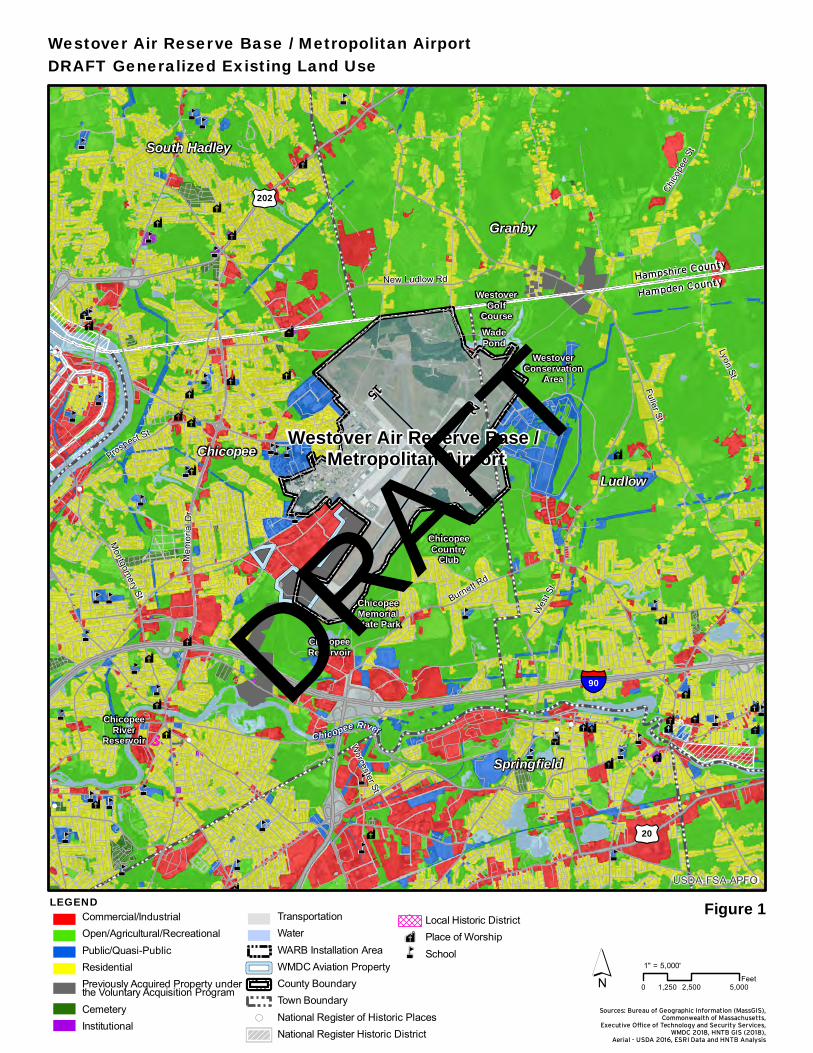
î
î
î
î
î
î
î
î
îîî
î
î
î
î
î
î
î
î
î
îî
î
î
î î
î
î
î
î
î
î î
îî
îî
î
î
î
å
å
å
åå
å
å
å
å
å
å
å
å
å
åå
å
å
å
å
å
å
å
å
å
åå
åå
å
å å å
å
å
å
å
å
å
å
å
å
å
å
å
å
å
å
å
å
å
å
åå
å
å
å
å
å
å
å
å
å
å
å
å
å
å
å
å
å
å
!(!(!(
!(
!(
!(
!(!(!(
!(!(
!(
!(
!(
!(
!(!(
!(
!(
!(!(
!(
!(
Westover Air Reserve Base / Metropolitan Airport
Hampshire County
Hampden County
§¦90
£¤202
£¤20
Mem
oria
l Dr
Connecticut R
iver
New Ludlow Rd
Fuller St
Chico
pee
St
Lyon St
Wes
t St
Burnett Rd
Montgom
ery St
Worcester St
5
23
33
15
ChicopeeRiver
Reservoir
ChicopeeMemorialState Park
ChicopeeCountry
Club
WestoverConservation
Area
WadePond
WestoverGolf
Course
ChicopeeReservoir
Chicopee River
Prospect St
Granby
South Hadley
ChicopeeLudlow
Springfield
USDA-FSA-APFO
Sources: Bureau of Geographic Information (MassGIS),Commonwealth of Massachusetts,
Executive Office of Technology and Security Services,WMDC 2018, HNTB GIS (2018),
Aerial - USDA 2016, ESRI Data and HNTB Analysis
LEGENDCommercial/IndustrialOpen/Agricultural/RecreationalPublic/Quasi-PublicResidentialPreviously Acquired Property underthe Voluntary Acquisition ProgramCemeteryInstitutional
TransportationWaterWARB Installation AreaWMDC Aviation PropertyCounty BoundaryTown BoundaryNational Register of Historic PlacesNational Register Historic District
Westover Air Reserve Base / Metropolitan AirportDRAFT Generalized Existing Land Use
Figure 1
0 2,500 5,0001,250Feet
1" = 5,000'åî
!(
Local Historic DistrictPlace of WorshipSchool
DRAFT

[This page is left intentionally blank]
DRAFT
Westover Air Reserve Base / Metropolitan Airport NEM/NCP Update
Record of Consultation Appendix E
Attachment 2: Land Use Verification Responses
DRAFT
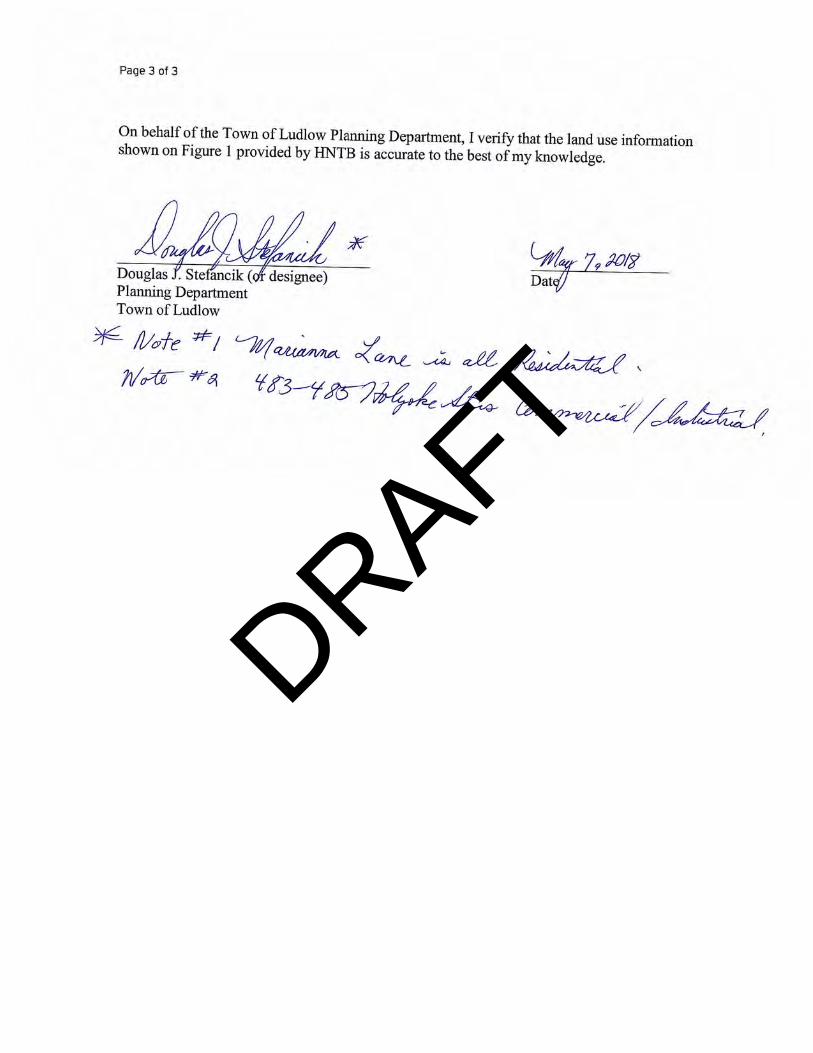
DRAFT
DRAFT
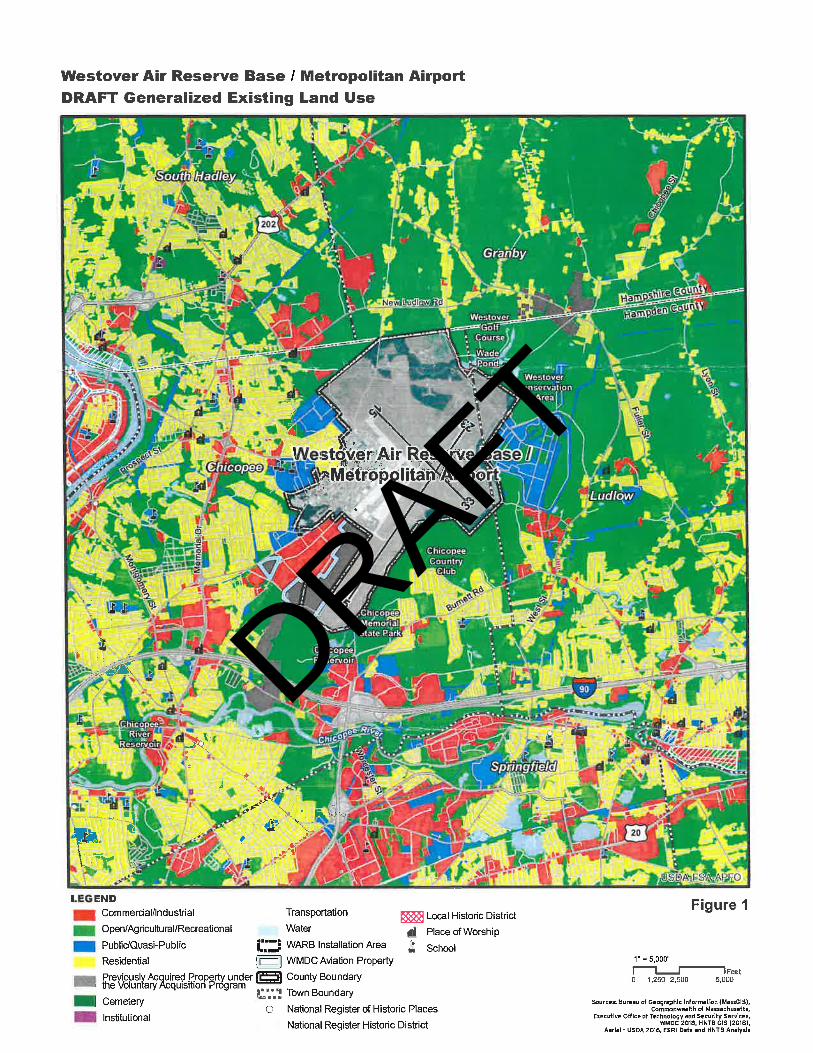
DRAFT
DRAFT

Westover Air Reserve Base / Metropolitan Airport NEM/NCP Update
Record of Consultation Appendix E
Attachment 3: Public Notice of Draft Document Availability
and Public Meeting Documents
(to be provided)
DRAFT

B.1
DRAFT NEPA ENVIRONMENTAL ASSESSMENT WESTOVER REGIONAL AIRPORT – MODIFICATIONS TO CIVIL AVIATION OPERATIONS
Appendix B Correspondence July 5, 2018
Appendix B CORRESPONDENCE

TRIBAL AND HISTORICAL RESOURCES INFORMATION
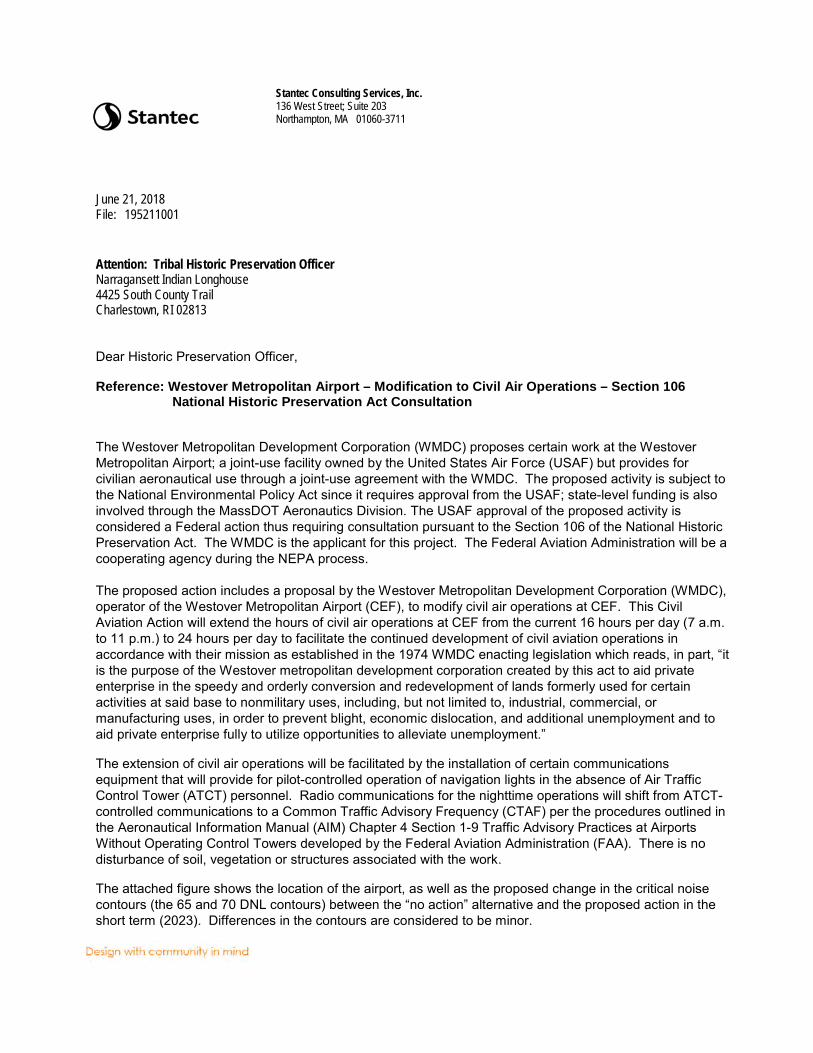
Stantec Consulting Services, Inc. 136 West Street; Suite 203 Northampton, MA 01060-3711
June 21, 2018 File: 195211001
Attention: Tribal Historic Preservation Officer Narragansett Indian Longhouse 4425 South County Trail Charlestown, RI 02813
Dear Historic Preservation Officer,
Reference: Westover Metropolitan Airport – Modification to Civil Air Operations – Section 106 National Historic Preservation Act Consultation
The Westover Metropolitan Development Corporation (WMDC) proposes certain work at the Westover Metropolitan Airport; a joint-use facility owned by the United States Air Force (USAF) but provides for civilian aeronautical use through a joint-use agreement with the WMDC. The proposed activity is subject to the National Environmental Policy Act since it requires approval from the USAF; state-level funding is also involved through the MassDOT Aeronautics Division. The USAF approval of the proposed activity is considered a Federal action thus requiring consultation pursuant to the Section 106 of the National Historic Preservation Act. The WMDC is the applicant for this project. The Federal Aviation Administration will be a cooperating agency during the NEPA process. The proposed action includes a proposal by the Westover Metropolitan Development Corporation (WMDC), operator of the Westover Metropolitan Airport (CEF), to modify civil air operations at CEF. This Civil Aviation Action will extend the hours of civil air operations at CEF from the current 16 hours per day (7 a.m. to 11 p.m.) to 24 hours per day to facilitate the continued development of civil aviation operations in accordance with their mission as established in the 1974 WMDC enacting legislation which reads, in part, “it is the purpose of the Westover metropolitan development corporation created by this act to aid private enterprise in the speedy and orderly conversion and redevelopment of lands formerly used for certain activities at said base to nonmilitary uses, including, but not limited to, industrial, commercial, or manufacturing uses, in order to prevent blight, economic dislocation, and additional unemployment and to aid private enterprise fully to utilize opportunities to alleviate unemployment.”
The extension of civil air operations will be facilitated by the installation of certain communications equipment that will provide for pilot-controlled operation of navigation lights in the absence of Air Traffic Control Tower (ATCT) personnel. Radio communications for the nighttime operations will shift from ATCT-controlled communications to a Common Traffic Advisory Frequency (CTAF) per the procedures outlined in the Aeronautical Information Manual (AIM) Chapter 4 Section 1-9 Traffic Advisory Practices at Airports Without Operating Control Towers developed by the Federal Aviation Administration (FAA). There is no disturbance of soil, vegetation or structures associated with the work.
The attached figure shows the location of the airport, as well as the proposed change in the critical noise contours (the 65 and 70 DNL contours) between the “no action” alternative and the proposed action in the short term (2023). Differences in the contours are considered to be minor.
June 21, 2018 Tribal Historic Preservation Officer Page 2 of 2
Reference: Westover Metropolitan Airport – Modification to Civil Air Operations – Section 106 National Historic Preservation Act Consultation
Please review this action for potential impacts to sensitive traditional, religious and/or cultural artifacts or properties, or other environmental resources protected under Section 106 of the National Historic Preservation Act.
Regards,
Stantec Consulting Services, Inc.
Randy Christensen M.S. Senior Environmental Scientist/Project Manager Phone: (413)584-4776 Fax: (413)584-3157 [email protected]
Attachment: Site Locus, existing and proposed noise contours c. Westover Air Reserve Base; Attn: Mr. Jack Moriarty cr v:\1952\temp\westover 24-hour operations env study\ea materials\let_thpo narragansett_rpc_20180612.docx

§¦90
§¦90
§¦291
§¦391
§¦91
§¦91
§¦91
£¤5
£¤202
£¤5
£¤20
UV21
UV33
UV141
UV10
£¤20
Westover ARB/Metropolitan Airport
Granby
South Hadley
Chicopee
Ludlow
Springfield
Belchertown
WilbrahamWestSpringfield
Holyoke
Westfield
Hampden County
Hampshire County
USDA-FSA-APFO
Westover Air Reserve Base / Metropolitan Airport NEM/NCP Update
´ 0 6,000 12,0003,000Feet
Vicinity MapFigure 2-1
LEGENDWestover Air Reserve Base Installation AreaWestover Metropolitan Development Corporation Aviation PropertyCounty BoundaryTown Boundary
Long Island Sound
Atlantic Ocean
Westover ARB/Metropolitan Airport
Maine
New York
Vermont New Hampshire
Massachusetts
ConnecticutRhode Island
Copyright:© 2014 Esri
Sources: Bureau of Geographic Information (MassGIS),Commonwealth of Massachusetts,
Executive Office of Technology and Security Services,WMDC 2018, HNTB GIS (2018),
Aerial - USDA 2016, ESRI

!(
!(
!(
!(
08-32(Drop Zone)
Westover Air Reserve Base/ Metropolitan Airport
Hampshire County
Hampden County
§¦90
New Ludlow Rd
James St
5
23
33
15
ChicopeeMemorialState Park
ChicopeeCountry
Club
WestoverConservation
Area
WadePond
WestoverGolf
Course
ChicopeeReservoir
VOR/TACAN
TerminalBuilding
Airport TrafficControl Tower
11,597
' x 301
'
7,082' x 150'
Fire Station
TWY G
TWY N
TWY S
EastRamp
MA State Police Helicopter Operating Area
NorthRamp
Chicopee
Ludlow
USDA-FSA-APFO
LEGENDWestover Air Reserve Base Installation Area
Westover Metropolitan Development Corporation Aviation Property
County Boundary
Town Boundary
Westover Air Reserve Base / Metropolitan Airport NEM/NCP Update
´Sources: Bureau of Geographic Information (MassGIS), Commonwealth of Massachusetts,
Executive Office of Technology and Security Services, HNTB GIS (2018),Aerial - USDA 2016, ESRI Data and HNTB Analysis
Airfield LayoutFigure 2-2
Page 59
0 1,250 2,500625Feet
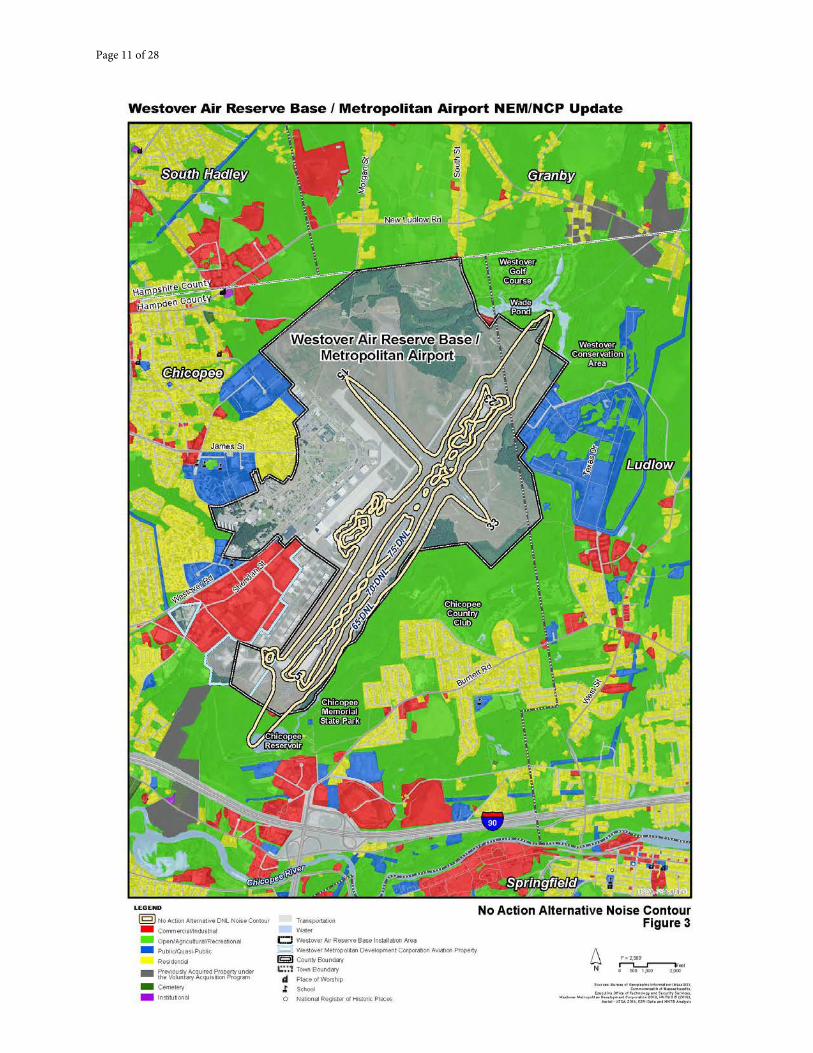
Page 11 of 28

Page 12 of 28

Stantec Consulting Services, Inc. 136 West Street; Suite 203 Northampton, MA 01060-3711
June 21, 2018 File: 195211001
Attention: Tribal Historic Preservation Officer Stockbridge-Munsee Mohican Tribal Historic Preservation, New York Office 65 1st Street Troy, NY 12180
Dear Historic Preservation Officer,
Reference: Westover Metropolitan Airport – Modification to Civil Air Operations – Section 106 National Historic Preservation Act Consultation
The Westover Metropolitan Development Corporation (WMDC) proposes certain work at the Westover Metropolitan Airport; a joint-use facility owned by the United States Air Force (USAF) but provides for civilian aeronautical use through a joint-use agreement with the WMDC. The proposed activity is subject to the National Environmental Policy Act since it requires approval from the USAF; state-level funding is also involved through the MassDOT Aeronautics Division. The USAF approval of the proposed activity is considered a Federal action thus requiring consultation pursuant to the Section 106 of the National Historic Preservation Act. The WMDC is the applicant for this project. The Federal Aviation Administration will be a cooperating agency during the NEPA process. The proposed action includes a proposal by the Westover Metropolitan Development Corporation (WMDC), operator of the Westover Metropolitan Airport (CEF), to modify civil air operations at CEF. This Civil Aviation Action will extend the hours of civil air operations at CEF from the current 16 hours per day (7 a.m. to 11 p.m.) to 24 hours per day to facilitate the continued development of civil aviation operations in accordance with their mission as established in the 1974 WMDC enacting legislation which reads, in part, “it is the purpose of the Westover metropolitan development corporation created by this act to aid private enterprise in the speedy and orderly conversion and redevelopment of lands formerly used for certain activities at said base to nonmilitary uses, including, but not limited to, industrial, commercial, or manufacturing uses, in order to prevent blight, economic dislocation, and additional unemployment and to aid private enterprise fully to utilize opportunities to alleviate unemployment.”
The extension of civil air operations will be facilitated by the installation of certain communications equipment that will provide for pilot-controlled operation of navigation lights in the absence of Air Traffic Control Tower (ATCT) personnel. Radio communications for the nighttime operations will shift from ATCT-controlled communications to a Common Traffic Advisory Frequency (CTAF) per the procedures outlined in the Aeronautical Information Manual (AIM) Chapter 4 Section 1-9 Traffic Advisory Practices at Airports Without Operating Control Towers developed by the Federal Aviation Administration (FAA). There is no disturbance of soil, vegetation or structures associated with the work.
The attached figure shows the location of the airport, as well as the proposed change in the critical noise contours (the 65 and 70 DNL contours) between the “no action” alternative and the proposed action in the short term (2023). Differences in the contours are considered to be minor.
June 21, 2018 Tribal Historic Preservation Officer Page 2 of 2
Reference: Westover Metropolitan Airport – Modification to Civil Air Operations – Section 106 National Historic Preservation Act Consultation
Please review this action for potential impacts to sensitive traditional, religious and/or cultural artifacts or properties, or other environmental resources protected under Section 106 of the National Historic Preservation Act.
Regards,
Stantec Consulting Services, Inc.
Randy Christensen M.S. Senior Environmental Scientist/Project Manager Phone: (413)584-4776 Fax: (413)584-3157 [email protected]
Attachment: Site Locus, existing and proposed noise contours c. Westover Air Reserve Base; Attn: Mr. Jack Moriarty cr v:\1952\temp\westover 24-hour operations env study\ea materials\let_thpo stockbridge-munsee mohican_rpc_20180612.docx

Stantec Consulting Services, Inc. 136 West Street; Suite 203 Northampton, MA 01060-3711
June 21, 2018 File: 195211001
Attention: Tribal Historic Preservation Officer Wampanoag Tribe of Gay Head (Aquinnah) 20 Black Brook Road Aquinnah, MA 02535
Dear Historic Preservation Officer,
Reference: Westover Metropolitan Airport – Modification to Civil Air Operations – Section 106 National Historic Preservation Act Consultation
The Westover Metropolitan Development Corporation (WMDC) proposes certain work at the Westover Metropolitan Airport; a joint-use facility owned by the United States Air Force (USAF) but provides for civilian aeronautical use through a joint-use agreement with the WMDC. The proposed activity is subject to the National Environmental Policy Act since it requires approval from the USAF; state-level funding is also involved through the MassDOT Aeronautics Division. The USAF approval of the proposed activity is considered a Federal action thus requiring consultation pursuant to the Section 106 of the National Historic Preservation Act. The WMDC is the applicant for this project. The Federal Aviation Administration will be a cooperating agency during the NEPA process. The proposed action includes a proposal by the Westover Metropolitan Development Corporation (WMDC), operator of the Westover Metropolitan Airport (CEF), to modify civil air operations at CEF. This Civil Aviation Action will extend the hours of civil air operations at CEF from the current 16 hours per day (7 a.m. to 11 p.m.) to 24 hours per day to facilitate the continued development of civil aviation operations in accordance with their mission as established in the 1974 WMDC enacting legislation which reads, in part, “it is the purpose of the Westover metropolitan development corporation created by this act to aid private enterprise in the speedy and orderly conversion and redevelopment of lands formerly used for certain activities at said base to nonmilitary uses, including, but not limited to, industrial, commercial, or manufacturing uses, in order to prevent blight, economic dislocation, and additional unemployment and to aid private enterprise fully to utilize opportunities to alleviate unemployment.”
The extension of civil air operations will be facilitated by the installation of certain communications equipment that will provide for pilot-controlled operation of navigation lights in the absence of Air Traffic Control Tower (ATCT) personnel. Radio communications for the nighttime operations will shift from ATCT-controlled communications to a Common Traffic Advisory Frequency (CTAF) per the procedures outlined in the Aeronautical Information Manual (AIM) Chapter 4 Section 1-9 Traffic Advisory Practices at Airports Without Operating Control Towers developed by the Federal Aviation Administration (FAA). There is no disturbance of soil, vegetation or structures associated with the work.
The attached figure shows the location of the airport, as well as the proposed change in the critical noise contours (the 65 and 70 DNL contours) between the “no action” alternative and the proposed action in the short term (2023). Differences in the contours are considered to be minor.

June 21, 2018 Tribal Historic Preservation Officer Page 2 of 2
Reference: Westover Metropolitan Airport – Modification to Civil Air Operations – Section 106 National Historic Preservation Act Consultation
Please review this action for potential impacts to sensitive traditional, religious and/or cultural artifacts or properties, or other environmental resources protected under Section 106 of the National Historic Preservation Act.
Regards,
Stantec Consulting Services, Inc.
Randy Christensen M.S. Senior Environmental Scientist/Project Manager Phone: (413)584-4776 Fax: (413)584-3157 [email protected]
Attachment: Site Locus, existing and proposed noise contours c. Westover Air Reserve Base; Attn: Mr. Jack Moriarty cr v:\1952\temp\westover 24-hour operations env study\ea materials\let_thpo wampanoag - gay head_rpc_20180612.docx

Stantec Consulting Services, Inc. 136 West Street; Suite 203 Northampton, MA 01060-3711
June 21, 2018 File: 195211001
Attention: Tribal Historic Preservation Officer Mashpee Wampanoag Tribe 483 Great Neck Road South Mashpee, MA 02649
Dear Historic Preservation Officer,
Reference: Westover Metropolitan Airport – Modification to Civil Air Operations – Section 106 National Historic Preservation Act Consultation
The Westover Metropolitan Development Corporation (WMDC) proposes certain work at the Westover Metropolitan Airport; a joint-use facility owned by the United States Air Force (USAF) but provides for civilian aeronautical use through a joint-use agreement with the WMDC. The proposed activity is subject to the National Environmental Policy Act since it requires approval from the USAF; state-level funding is also involved through the MassDOT Aeronautics Division. The USAF approval of the proposed activity is considered a Federal action thus requiring consultation pursuant to the Section 106 of the National Historic Preservation Act. The WMDC is the applicant for this project. The Federal Aviation Administration will be a cooperating agency during the NEPA process. The proposed action includes a proposal by the Westover Metropolitan Development Corporation (WMDC), operator of the Westover Metropolitan Airport (CEF), to modify civil air operations at CEF. This Civil Aviation Action will extend the hours of civil air operations at CEF from the current 16 hours per day (7 a.m. to 11 p.m.) to 24 hours per day to facilitate the continued development of civil aviation operations in accordance with their mission as established in the 1974 WMDC enacting legislation which reads, in part, “it is the purpose of the Westover metropolitan development corporation created by this act to aid private enterprise in the speedy and orderly conversion and redevelopment of lands formerly used for certain activities at said base to nonmilitary uses, including, but not limited to, industrial, commercial, or manufacturing uses, in order to prevent blight, economic dislocation, and additional unemployment and to aid private enterprise fully to utilize opportunities to alleviate unemployment.”
The extension of civil air operations will be facilitated by the installation of certain communications equipment that will provide for pilot-controlled operation of navigation lights in the absence of Air Traffic Control Tower (ATCT) personnel. Radio communications for the nighttime operations will shift from ATCT-controlled communications to a Common Traffic Advisory Frequency (CTAF) per the procedures outlined in the Aeronautical Information Manual (AIM) Chapter 4 Section 1-9 Traffic Advisory Practices at Airports Without Operating Control Towers developed by the Federal Aviation Administration (FAA). There is no disturbance of soil, vegetation or structures associated with the work.
The attached figure shows the location of the airport, as well as the proposed change in the critical noise contours (the 65 and 70 DNL contours) between the “no action” alternative and the proposed action in the short term (2023). Differences in the contours are considered to be minor.

June 21, 2018 Tribal Historic Preservation Officer Page 2 of 2
Reference: Westover Metropolitan Airport – Modification to Civil Air Operations – Section 106 National Historic Preservation Act Consultation
Please review this action for potential impacts to sensitive traditional, religious and/or cultural artifacts or properties, or other environmental resources protected under Section 106 of the National Historic Preservation Act.
Regards,
Stantec Consulting Services, Inc.
Randy Christensen M.S. Senior Environmental Scientist/Project Manager Phone: (413)584-4776 Fax: (413)584-3157 [email protected]
Attachment: Site Locus, existing and proposed noise contours c. Westover Air Reserve Base; Attn: Mr. Jack Moriarty cr v:\1952\temp\westover 24-hour operations env study\ea materials\let_thpo wampanoag - mashpee_rpc_20180612.docx
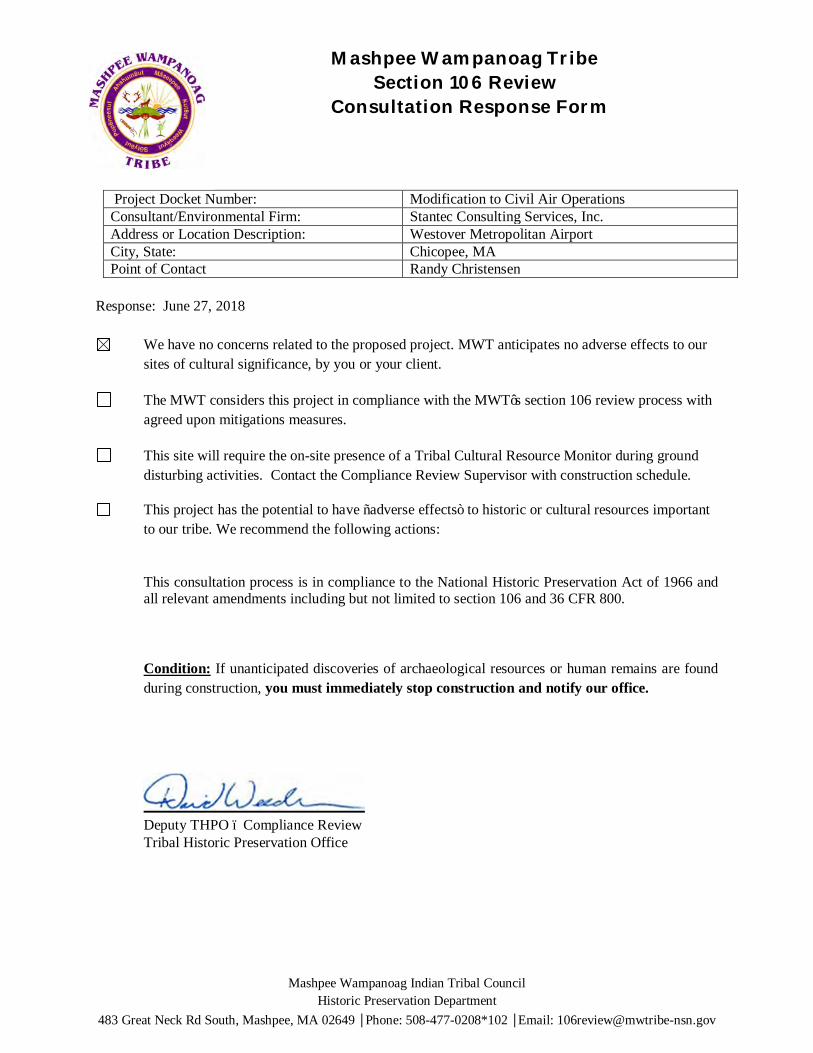
Mashpee Wampanoag Indian Tribal Council
Historic Preservation Department
483 Great Neck Rd South, Mashpee, MA 02649 │Phone: 508-477-0208*102 │Email: [email protected]
Mashpee Wampanoag Tribe Section 106 Review Consultation Response Form
Project Docket Number: Modification to Civil Air Operations
Consultant/Environmental Firm: Stantec Consulting Services, Inc.
Address or Location Description: Westover Metropolitan Airport
City, State: Chicopee, MA
Point of Contact Randy Christensen
Response: June 27, 2018
We have no concerns related to the proposed project. MWT anticipates no adverse effects to our
sites of cultural significance, by you or your client.
The MWT considers this project in compliance with the MWT’s section 106 review process with
agreed upon mitigations measures.
This site will require the on-site presence of a Tribal Cultural Resource Monitor during ground
disturbing activities. Contact the Compliance Review Supervisor with construction schedule.
This project has the potential to have “adverse effects” to historic or cultural resources important
to our tribe. We recommend the following actions:
This consultation process is in compliance to the National Historic Preservation Act of 1966 and all relevant amendments including but not limited to section 106 and 36 CFR 800.
Condition: If unanticipated discoveries of archaeological resources or human remains are found
during construction, you must immediately stop construction and notify our office.
Deputy THPO – Compliance Review
Tribal Historic Preservation Office
From: [email protected]: Christensen, RandallSubject: RE: Westover Airport Changes to Civil Air Operations - Sec 106 Consultation - Narragansett TribeDate: Monday, June 25, 2018 10:45:30 PM
Randall,
Please accept this email as proof that NITHPO has completed Section 106 review of theWestover Metropolitan Airport project. We have found no findings and have no furthercomments to make regarding the above mentioned project.
As such this email concludes our review of your project.
Sincerely,
John Brown, NITHPO
Sent from AOL Mobile MailGet the new AOL app: mail.mobile.aol.com
On Monday, June 25, 2018, Christensen, Randall <[email protected]> wrote:
Good Morning John.
Thank you for our phone conversation last Friday regarding the below-noted project at the WestoverMetropolitan Airport; I’m pleased I was able to provide you with sufficient information for you to makeyour project determination. As we discussed, an email response from you would be appreciatedregarding our NHPA Part 106 discussion.
I remain available to address any further requests for information.
Randall P. Christensen M.S.
Associate, Senior Environmental Scientist
Direct: 413-387-4508Mobile: 413-519-2587Fax: [email protected]
Stantec
The content of this email is the confidential property of Stantec and should not be copied, modified, retransmitted, or used for any purpose except with Stantec'swritten authorization. If you are not the intended recipient, please delete all copies and notify us immediately.
From: Christensen, Randall Sent: Thursday, June 21, 2018 3:24 PMTo: '[email protected]' <[email protected]>; '[email protected]'<[email protected]>Subject: Westover Airport Changes to Civil Air Operations - Sec 106 Consultation -Narragansett Tribe
Dear Tribal Historic Preservation Officer:
Please find attached our request for project review pursuant to Section 106 of the National HistoricPreservation Act. The attachment contains details concerning a proposed change to Civil AirOperations at the Westover Metropolitan Airport; a joint-use facility with the United States Air Forceand the Westover Air Reserve Base. The project entails a change in air operations and involves nodisturbance of soils, vegetation or structures. No construction is involved. The change to civil airoperations will cause a slight increase in the off-airport extent of critical noise contours over the “noaction” alternative. No other impacts are envisioned from this proposal.
Please review the attached information and contact me with any questions. Thank you for yourassistance with this project.
Randall P. Christensen M.S.
Associate, Senior Environmental Scientist
Direct: 413-387-4508Mobile: 413-519-2587Fax: [email protected]
Stantec

The content of this email is the confidential property of Stantec and should not be copied, modified, retransmitted, or used for any purpose except with Stantec'swritten authorization. If you are not the intended recipient, please delete all copies and notify us immediately.
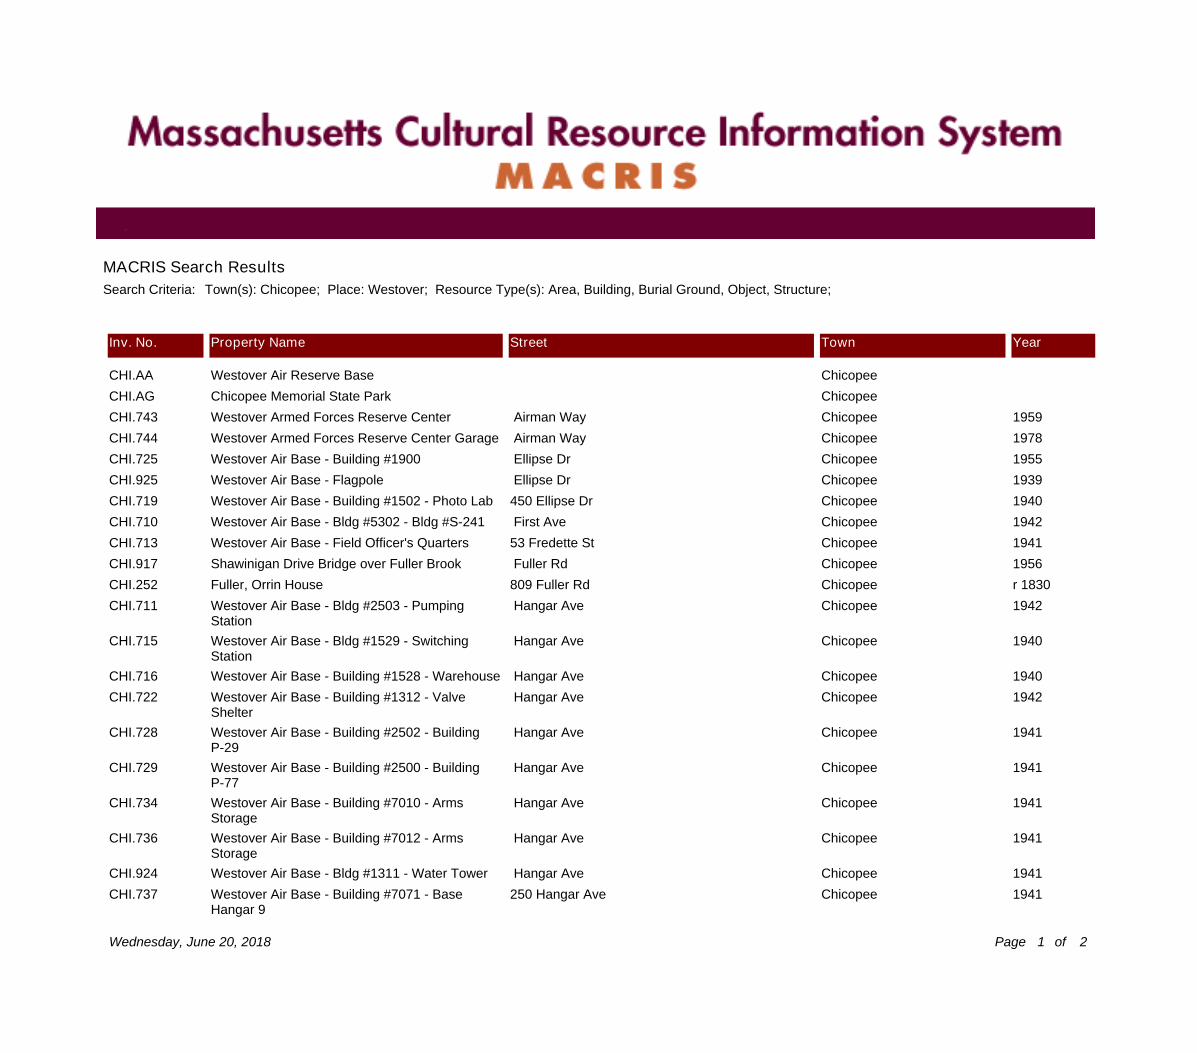
MACRIS Search ResultsTown(s): Chicopee; Place: Westover; Resource Type(s): Area, Building, Burial Ground, Object, Structure; Search Criteria:
CHI.AA Westover Air Reserve Base Chicopee
CHI.AG Chicopee Memorial State Park Chicopee
CHI.743 Westover Armed Forces Reserve Center Airman Way Chicopee 1959
CHI.744 Westover Armed Forces Reserve Center Garage Airman Way Chicopee 1978
CHI.725 Westover Air Base - Building #1900 Ellipse Dr Chicopee 1955
CHI.925 Westover Air Base - Flagpole Ellipse Dr Chicopee 1939
CHI.719 Westover Air Base - Building #1502 - Photo Lab 450 Ellipse Dr Chicopee 1940
CHI.710 Westover Air Base - Bldg #5302 - Bldg #S-241 First Ave Chicopee 1942
CHI.713 Westover Air Base - Field Officer's Quarters 53 Fredette St Chicopee 1941
CHI.917 Shawinigan Drive Bridge over Fuller Brook Fuller Rd Chicopee 1956
CHI.252 Fuller, Orrin House 809 Fuller Rd Chicopee r 1830
CHI.711 Westover Air Base - Bldg #2503 - Pumping Station
Hangar Ave Chicopee 1942
CHI.715 Westover Air Base - Bldg #1529 - Switching Station
Hangar Ave Chicopee 1940
CHI.716 Westover Air Base - Building #1528 - Warehouse Hangar Ave Chicopee 1940
CHI.722 Westover Air Base - Building #1312 - Valve Shelter
Hangar Ave Chicopee 1942
CHI.728 Westover Air Base - Building #2502 - Building P-29
Hangar Ave Chicopee 1941
CHI.729 Westover Air Base - Building #2500 - Building P-77
Hangar Ave Chicopee 1941
CHI.734 Westover Air Base - Building #7010 - Arms Storage
Hangar Ave Chicopee 1941
CHI.736 Westover Air Base - Building #7012 - Arms Storage
Hangar Ave Chicopee 1941
CHI.924 Westover Air Base - Bldg #1311 - Water Tower Hangar Ave Chicopee 1941
CHI.737 Westover Air Base - Building #7071 - Base Hangar 9
250 Hangar Ave Chicopee 1941
Inv. No. Property Name Street Town Year
Wednesday, June 20, 2018 1 2Page of
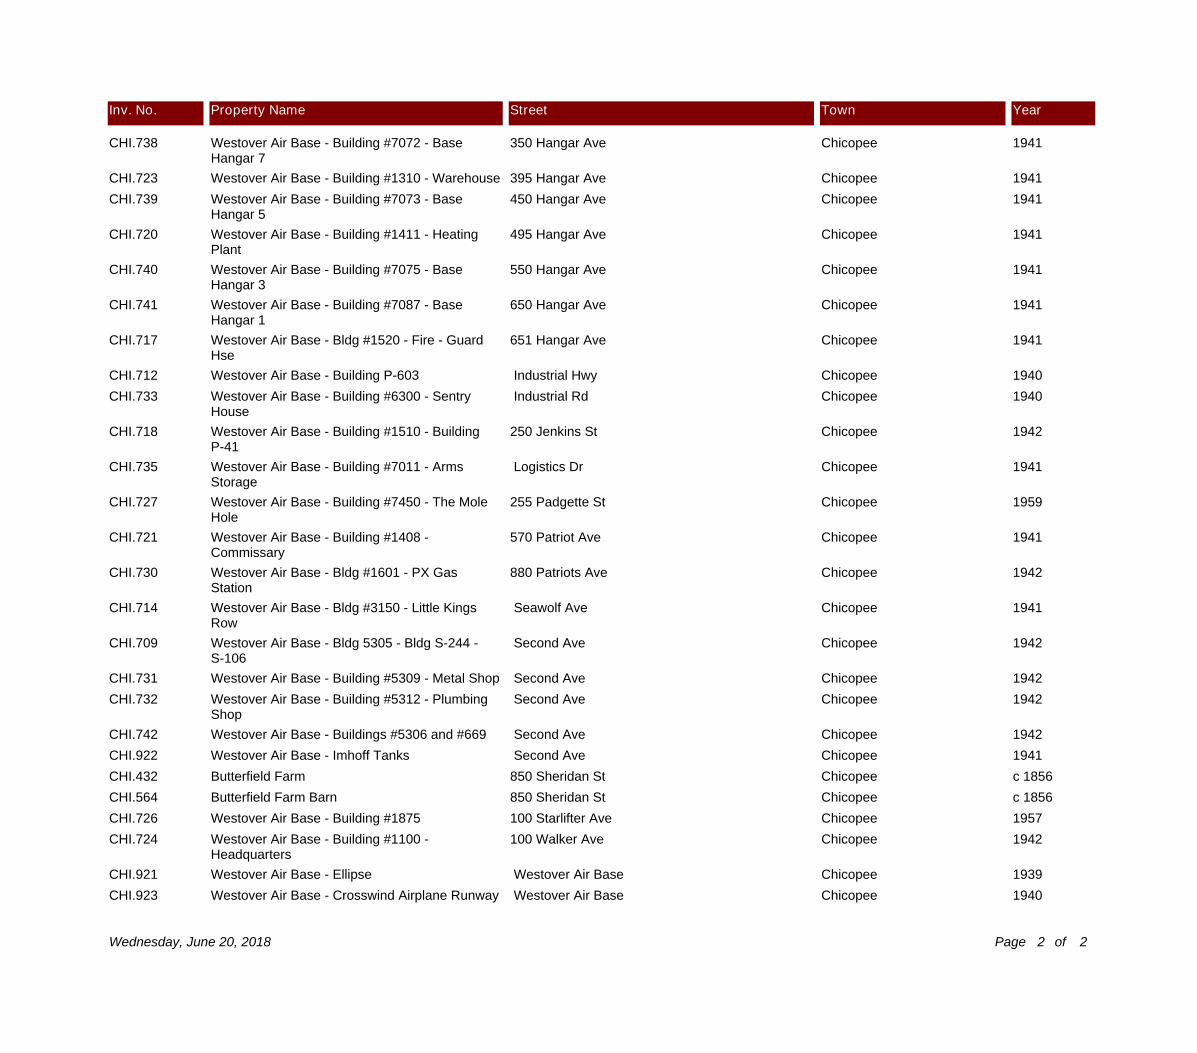
CHI.738 Westover Air Base - Building #7072 - Base Hangar 7
350 Hangar Ave Chicopee 1941
CHI.723 Westover Air Base - Building #1310 - Warehouse 395 Hangar Ave Chicopee 1941
CHI.739 Westover Air Base - Building #7073 - Base Hangar 5
450 Hangar Ave Chicopee 1941
CHI.720 Westover Air Base - Building #1411 - Heating Plant
495 Hangar Ave Chicopee 1941
CHI.740 Westover Air Base - Building #7075 - Base Hangar 3
550 Hangar Ave Chicopee 1941
CHI.741 Westover Air Base - Building #7087 - Base Hangar 1
650 Hangar Ave Chicopee 1941
CHI.717 Westover Air Base - Bldg #1520 - Fire - Guard Hse
651 Hangar Ave Chicopee 1941
CHI.712 Westover Air Base - Building P-603 Industrial Hwy Chicopee 1940
CHI.733 Westover Air Base - Building #6300 - Sentry House
Industrial Rd Chicopee 1940
CHI.718 Westover Air Base - Building #1510 - Building P-41
250 Jenkins St Chicopee 1942
CHI.735 Westover Air Base - Building #7011 - Arms Storage
Logistics Dr Chicopee 1941
CHI.727 Westover Air Base - Building #7450 - The Mole Hole
255 Padgette St Chicopee 1959
CHI.721 Westover Air Base - Building #1408 - Commissary
570 Patriot Ave Chicopee 1941
CHI.730 Westover Air Base - Bldg #1601 - PX Gas Station
880 Patriots Ave Chicopee 1942
CHI.714 Westover Air Base - Bldg #3150 - Little Kings Row
Seawolf Ave Chicopee 1941
CHI.709 Westover Air Base - Bldg 5305 - Bldg S-244 - S-106
Second Ave Chicopee 1942
CHI.731 Westover Air Base - Building #5309 - Metal Shop Second Ave Chicopee 1942
CHI.732 Westover Air Base - Building #5312 - Plumbing Shop
Second Ave Chicopee 1942
CHI.742 Westover Air Base - Buildings #5306 and #669 Second Ave Chicopee 1942
CHI.922 Westover Air Base - Imhoff Tanks Second Ave Chicopee 1941
CHI.432 Butterfield Farm 850 Sheridan St Chicopee c 1856
CHI.564 Butterfield Farm Barn 850 Sheridan St Chicopee c 1856
CHI.726 Westover Air Base - Building #1875 100 Starlifter Ave Chicopee 1957
CHI.724 Westover Air Base - Building #1100 - Headquarters
100 Walker Ave Chicopee 1942
CHI.921 Westover Air Base - Ellipse Westover Air Base Chicopee 1939
CHI.923 Westover Air Base - Crosswind Airplane Runway Westover Air Base Chicopee 1940
Inv. No. Property Name Street Town Year
Wednesday, June 20, 2018 2 2Page of

PROTECTED SPECIES INFORMATION
United States Department of the Interior
FISH AND WILDLIFE SERVICENew England Ecological Services Field Office
70 Commercial Street, Suite 300
Concord, NH 03301-5094
Phone: (603) 223-2541 Fax: (603) 223-0104
http://www.fws.gov/newengland
In Reply Refer To:
Consultation Code: 05E1NE00-2018-SLI-2154
Event Code: 05E1NE00-2018-E-04987
Project Name: Westover Metropolitan Airport (CEF) Modification to General Aviation
Operations
Subject: List of threatened and endangered species that may occur in your proposed project
location, and/or may be affected by your proposed project
To Whom It May Concern:
The enclosed species list identifies threatened, endangered, proposed and candidate species, as
well as proposed and final designated critical habitat, that may occur within the boundary of your
proposed project and/or may be affected by your proposed project. The species list fulfills the
requirements of the U.S. Fish and Wildlife Service (Service) under section 7(c) of the
Endangered Species Act (Act) of 1973, as amended (16 U.S.C. 1531 et seq.).
New information based on updated surveys, changes in the abundance and distribution of
species, changed habitat conditions, or other factors could change this list. Please feel free to
contact us if you need more current information or assistance regarding the potential impacts to
federally proposed, listed, and candidate species and federally designated and proposed critical
habitat. Please note that under 50 CFR 402.12(e) of the regulations implementing section 7 of the
Act, the accuracy of this species list should be verified after 90 days. This verification can be
completed formally or informally as desired. The Service recommends that verification be
completed by visiting the ECOS-IPaC website at regular intervals during project planning and
implementation for updates to species lists and information. An updated list may be requested
through the ECOS-IPaC system by completing the same process used to receive the enclosed list.
The purpose of the Act is to provide a means whereby threatened and endangered species and the
ecosystems upon which they depend may be conserved. Under sections 7(a)(1) and 7(a)(2) of the
Act and its implementing regulations (50 CFR 402 et seq.), Federal agencies are required to
utilize their authorities to carry out programs for the conservation of threatened and endangered
species and to determine whether projects may affect threatened and endangered species and/or
designated critical habitat.
June 20, 2018
06/20/2018 Event Code: 05E1NE00-2018-E-04987 2
A Biological Assessment is required for construction projects (or other undertakings having
similar physical impacts) that are major Federal actions significantly affecting the quality of the
human environment as defined in the National Environmental Policy Act (42 U.S.C. 4332(2)
(c)). For projects other than major construction activities, the Service suggests that a biological
evaluation similar to a Biological Assessment be prepared to determine whether the project may
affect listed or proposed species and/or designated or proposed critical habitat. Recommended
contents of a Biological Assessment are described at 50 CFR 402.12.
If a Federal agency determines, based on the Biological Assessment or biological evaluation, that
listed species and/or designated critical habitat may be affected by the proposed project, the
agency is required to consult with the Service pursuant to 50 CFR 402. In addition, the Service
recommends that candidate species, proposed species and proposed critical habitat be addressed
within the consultation. More information on the regulations and procedures for section 7
consultation, including the role of permit or license applicants, can be found in the "Endangered
Species Consultation Handbook" at:
http://www.fws.gov/endangered/esa-library/pdf/TOC-GLOS.PDF
Please be aware that bald and golden eagles are protected under the Bald and Golden Eagle
Protection Act (16 U.S.C. 668 et seq.), and projects affecting these species may require
development of an eagle conservation plan (http://www.fws.gov/windenergy/
eagle_guidance.html). Additionally, wind energy projects should follow the wind energy
guidelines (http://www.fws.gov/windenergy/) for minimizing impacts to migratory birds and
bats.
Guidance for minimizing impacts to migratory birds for projects including communications
towers (e.g., cellular, digital television, radio, and emergency broadcast) can be found at: http://
www.fws.gov/migratorybirds/CurrentBirdIssues/Hazards/towers/towers.htm; http://
www.towerkill.com; and http://www.fws.gov/migratorybirds/CurrentBirdIssues/Hazards/towers/
comtow.html.
We appreciate your concern for threatened and endangered species. The Service encourages
Federal agencies to include conservation of threatened and endangered species into their project
planning to further the purposes of the Act. Please include the Consultation Tracking Number in
the header of this letter with any request for consultation or correspondence about your project
that you submit to our office.
Attachment(s):
▪ Official Species List
06/20/2018 Event Code: 05E1NE00-2018-E-04987 1
Official Species ListThis list is provided pursuant to Section 7 of the Endangered Species Act, and fulfills the
requirement for Federal agencies to "request of the Secretary of the Interior information whether
any species which is listed or proposed to be listed may be present in the area of a proposed
action".
This species list is provided by:
New England Ecological Services Field Office
70 Commercial Street, Suite 300
Concord, NH 03301-5094
(603) 223-2541
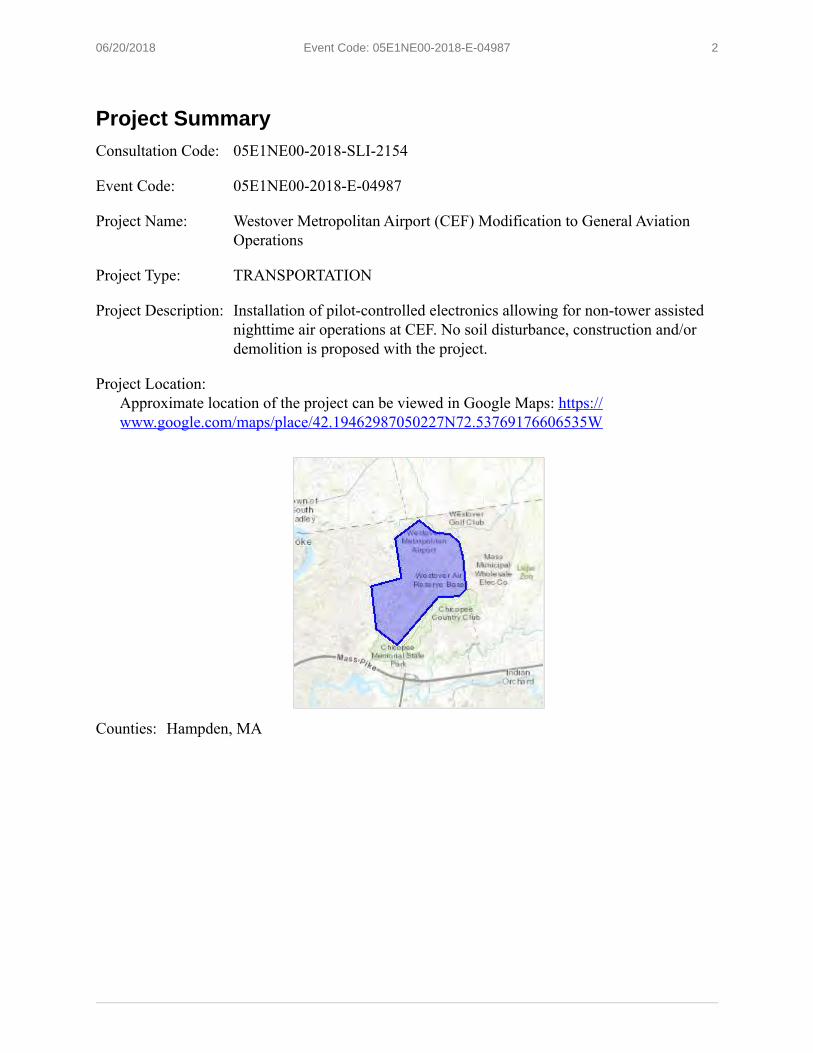
06/20/2018 Event Code: 05E1NE00-2018-E-04987 2
Project SummaryConsultation Code: 05E1NE00-2018-SLI-2154
Event Code: 05E1NE00-2018-E-04987
Project Name: Westover Metropolitan Airport (CEF) Modification to General Aviation
Operations
Project Type: TRANSPORTATION
Project Description: Installation of pilot-controlled electronics allowing for non-tower assisted
nighttime air operations at CEF. No soil disturbance, construction and/or
demolition is proposed with the project.
Project Location:
Approximate location of the project can be viewed in Google Maps: https://
www.google.com/maps/place/42.19462987050227N72.53769176606535W
Counties: Hampden, MA
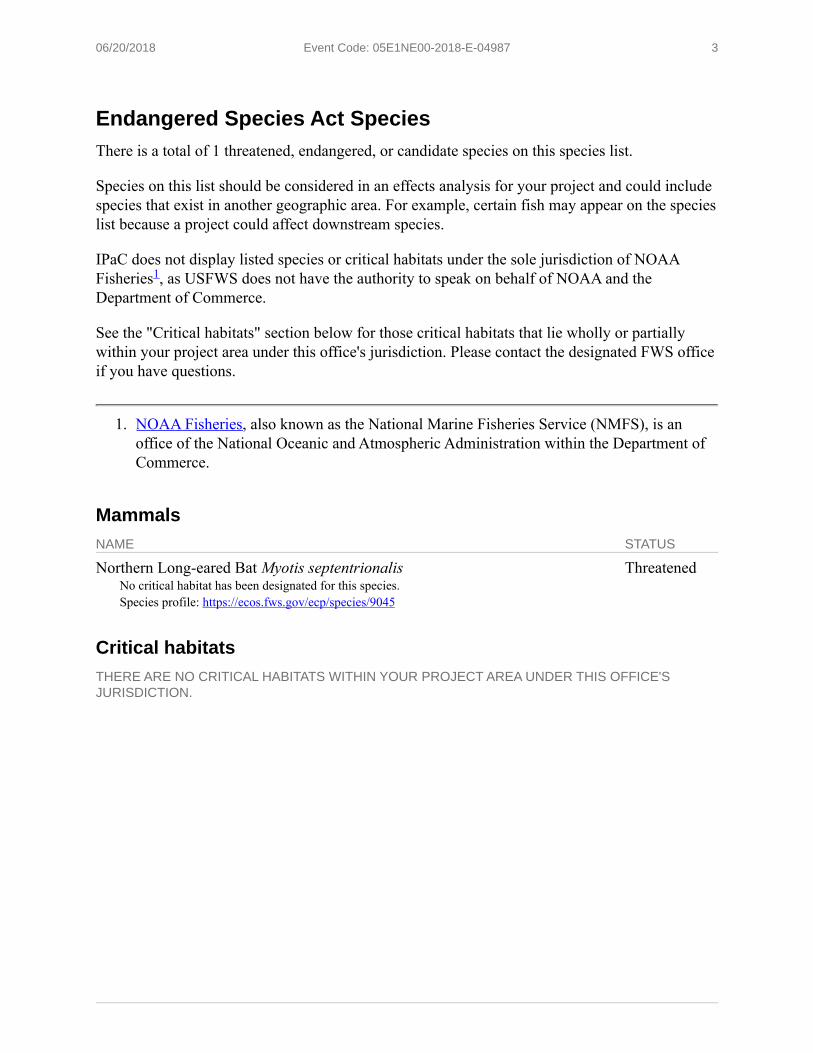
06/20/2018 Event Code: 05E1NE00-2018-E-04987 3
Endangered Species Act SpeciesThere is a total of 1 threatened, endangered, or candidate species on this species list.
Species on this list should be considered in an effects analysis for your project and could include
species that exist in another geographic area. For example, certain fish may appear on the species
list because a project could affect downstream species.
IPaC does not display listed species or critical habitats under the sole jurisdiction of NOAA
Fisheries , as USFWS does not have the authority to speak on behalf of NOAA and the
Department of Commerce.
See the "Critical habitats" section below for those critical habitats that lie wholly or partially
within your project area under this office's jurisdiction. Please contact the designated FWS office
if you have questions.
1. NOAA Fisheries, also known as the National Marine Fisheries Service (NMFS), is an
office of the National Oceanic and Atmospheric Administration within the Department of
Commerce.
MammalsNAME STATUS
Northern Long-eared Bat Myotis septentrionalisNo critical habitat has been designated for this species.
Species profile: https://ecos.fws.gov/ecp/species/9045
Threatened
Critical habitatsTHERE ARE NO CRITICAL HABITATS WITHIN YOUR PROJECT AREA UNDER THIS OFFICE'S JURISDICTION.
1
DRAFT NEPA ENVIRONMENTAL ASSESSMENT WESTOVER REGIONAL AIRPORT – MODIFICATIONS TO CIVIL AVIATION OPERATIONS
Appendix C Noise Analysis – Technical Memo July 5, 2018
C.1
Appendix C NOISE ANALYSIS – TECHNICAL MEMO
Page 1 of 28
Ervin Deck, Senior Associate, Aviation Planning – Transportation Randall Christensen, Associate, Senior Environmental Scientist Stantec Consulting Services Inc. 482 Payne Road Scarborough Court Scarborough, ME 04074-8929
May 25, 2018 Westover Air Reserve Base (WARB)/Metropolitan Airport (CEF) Title 14 C.F.R. Part 150 and EA Studies – Noise Contour Development 1. Introduction
The Westover Air Reserve Base (WARB)/Metropolitan Airport (CEF), home to the Massachusetts Air Force Reserve 439th Airlift Wing, previously operated Lockheed C-5A Galaxy aircraft and has upgraded to the C-5M Super Galaxy. A Title 14 Code of Federal Register (CFR) Part 150 Update (Part 150 Update) is being prepared to disclose the impacts of the C-5M Super Galaxy fleet upgrade. The Westover Metropolitan Development Corporation (WMDC) proposes to extend CEF operating hours to 24 hours per day and an Environmental Assessment (EA) is being prepared to assess the potential environmental impacts of this change in operating hours.
To assist with the Part 150 Update and EA, HNTB prepared noise exposure contours representative of existing conditions in 2018, and forecast conditions in 2019 and 2023 using the Aviation Environmental Design Tool (AEDT) Version 2d and NOISEMAP Version 7.363. This technical memorandum presents the data sources, methodologies, and assumptions applied to develop the noise contours, as well as the presentation of noise contours and their comparisons.
2. Data Sources, Methodologies, and Assumptions
The data sources applied in the noise contour development included information collected and presented in the 2013 Air Installation Compatible Use Zone (AICUZ) Studyi (2013 AICUZ Study), the 2014 14 CFR Part 150 Noise Compatibility Study (2014 Part 150 Study), operations data from 2017 and 2018 as provided by the CEF Airport Traffic Control Tower (ATCT), coordination with the Federal Aviation Administration (FAA) and U.S. Air Forces (USAF), and various other sources.
2.1 Alternatives, Fleet Mixes and Operations
The Existing Condition (2018), Short Term (2019), Future No Action (2023), Future Proposed Action (2023), and Low General Aviation (GA) Operations (2023) fleet mixes were developed based on information provided by the ATCT, and included potential new aircraft that would be introduced if the airport hours were extended from 16-hour to 24-hour. The fleet mixes were developed by Stantec for use by HNTB. The Part 150 Update applies the Existing Condition
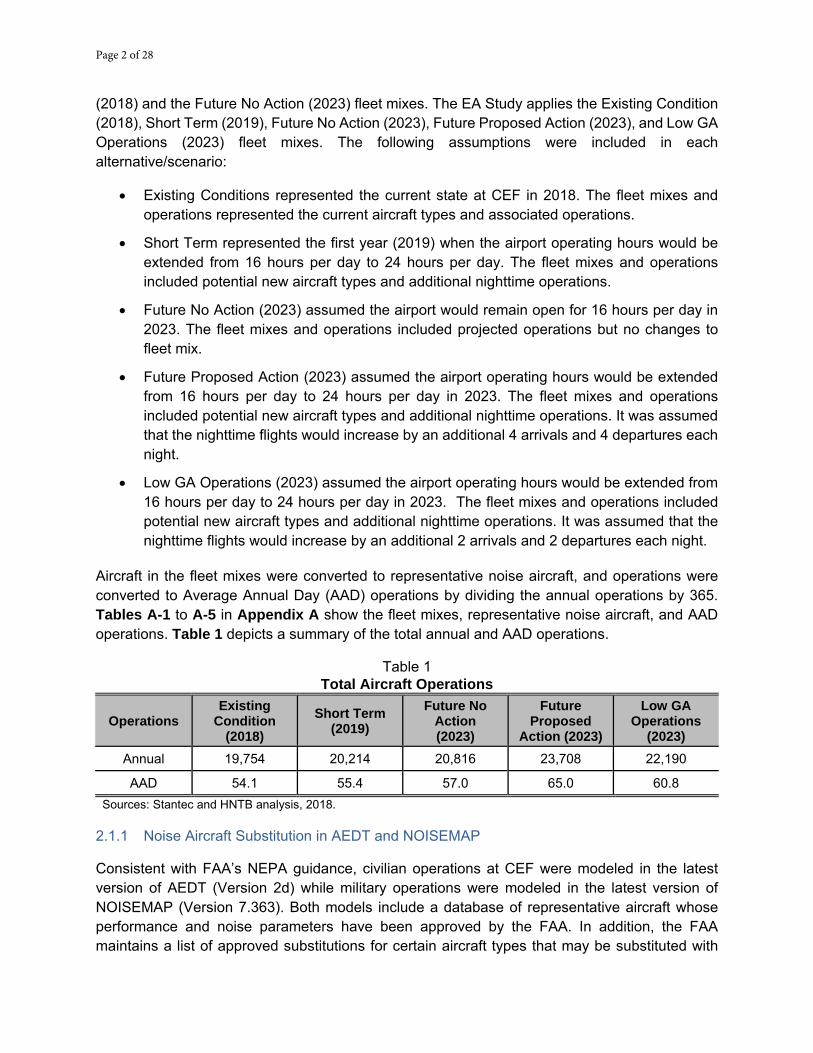
Page 2 of 28
(2018) and the Future No Action (2023) fleet mixes. The EA Study applies the Existing Condition (2018), Short Term (2019), Future No Action (2023), Future Proposed Action (2023), and Low GA Operations (2023) fleet mixes. The following assumptions were included in each alternative/scenario:
• Existing Conditions represented the current state at CEF in 2018. The fleet mixes and operations represented the current aircraft types and associated operations.
• Short Term represented the first year (2019) when the airport operating hours would be extended from 16 hours per day to 24 hours per day. The fleet mixes and operations included potential new aircraft types and additional nighttime operations.
• Future No Action (2023) assumed the airport would remain open for 16 hours per day in 2023. The fleet mixes and operations included projected operations but no changes to fleet mix.
• Future Proposed Action (2023) assumed the airport operating hours would be extended from 16 hours per day to 24 hours per day in 2023. The fleet mixes and operations included potential new aircraft types and additional nighttime operations. It was assumed that the nighttime flights would increase by an additional 4 arrivals and 4 departures each night.
• Low GA Operations (2023) assumed the airport operating hours would be extended from 16 hours per day to 24 hours per day in 2023. The fleet mixes and operations included potential new aircraft types and additional nighttime operations. It was assumed that the nighttime flights would increase by an additional 2 arrivals and 2 departures each night.
Aircraft in the fleet mixes were converted to representative noise aircraft, and operations were converted to Average Annual Day (AAD) operations by dividing the annual operations by 365. Tables A-1 to A-5 in Appendix A show the fleet mixes, representative noise aircraft, and AAD operations. Table 1 depicts a summary of the total annual and AAD operations.
Table 1 Total Aircraft Operations
Operations Existing
Condition (2018)
Short Term (2019)
Future No Action (2023)
Future Proposed
Action (2023)
Low GA Operations
(2023) Annual 19,754 20,214 20,816 23,708 22,190
AAD 54.1 55.4 57.0 65.0 60.8 Sources: Stantec and HNTB analysis, 2018.
2.1.1 Noise Aircraft Substitution in AEDT and NOISEMAP
Consistent with FAA’s NEPA guidance, civilian operations at CEF were modeled in the latest version of AEDT (Version 2d) while military operations were modeled in the latest version of NOISEMAP (Version 7.363). Both models include a database of representative aircraft whose performance and noise parameters have been approved by the FAA. In addition, the FAA maintains a list of approved substitutions for certain aircraft types that may be substituted with
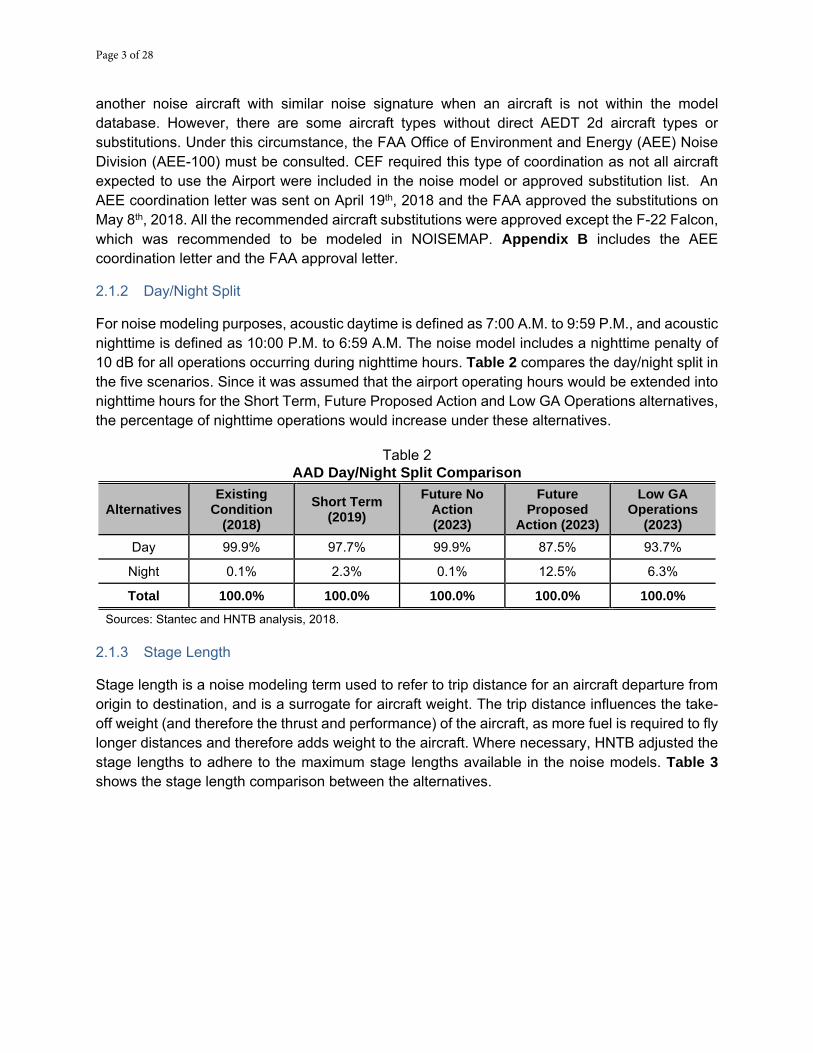
Page 3 of 28
another noise aircraft with similar noise signature when an aircraft is not within the model database. However, there are some aircraft types without direct AEDT 2d aircraft types or substitutions. Under this circumstance, the FAA Office of Environment and Energy (AEE) Noise Division (AEE-100) must be consulted. CEF required this type of coordination as not all aircraft expected to use the Airport were included in the noise model or approved substitution list. An AEE coordination letter was sent on April 19th, 2018 and the FAA approved the substitutions on May 8th, 2018. All the recommended aircraft substitutions were approved except the F-22 Falcon, which was recommended to be modeled in NOISEMAP. Appendix B includes the AEE coordination letter and the FAA approval letter.
2.1.2 Day/Night Split
For noise modeling purposes, acoustic daytime is defined as 7:00 A.M. to 9:59 P.M., and acoustic nighttime is defined as 10:00 P.M. to 6:59 A.M. The noise model includes a nighttime penalty of 10 dB for all operations occurring during nighttime hours. Table 2 compares the day/night split in the five scenarios. Since it was assumed that the airport operating hours would be extended into nighttime hours for the Short Term, Future Proposed Action and Low GA Operations alternatives, the percentage of nighttime operations would increase under these alternatives.
Table 2 AAD Day/Night Split Comparison
Alternatives Existing
Condition (2018)
Short Term (2019)
Future No Action (2023)
Future Proposed
Action (2023)
Low GA Operations
(2023) Day 99.9% 97.7% 99.9% 87.5% 93.7%
Night 0.1% 2.3% 0.1% 12.5% 6.3%
Total 100.0% 100.0% 100.0% 100.0% 100.0% Sources: Stantec and HNTB analysis, 2018.
2.1.3 Stage Length
Stage length is a noise modeling term used to refer to trip distance for an aircraft departure from origin to destination, and is a surrogate for aircraft weight. The trip distance influences the take-off weight (and therefore the thrust and performance) of the aircraft, as more fuel is required to fly longer distances and therefore adds weight to the aircraft. Where necessary, HNTB adjusted the stage lengths to adhere to the maximum stage lengths available in the noise models. Table 3 shows the stage length comparison between the alternatives.
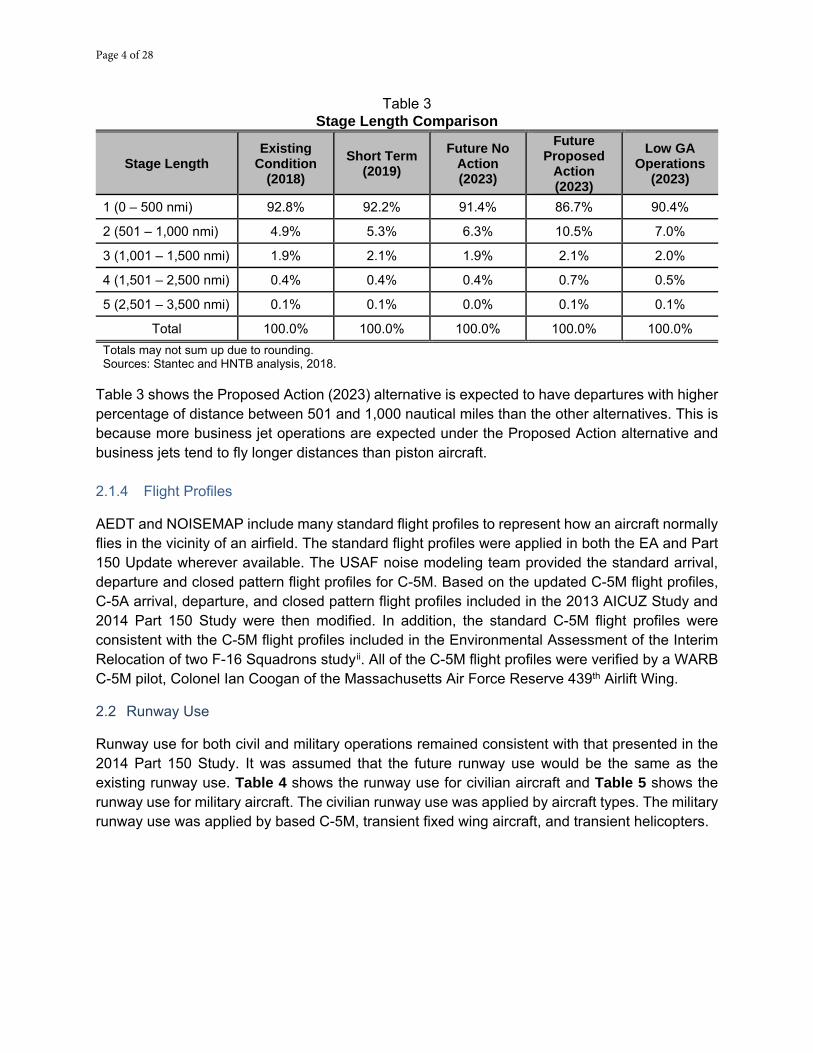
Page 4 of 28
Table 3 Stage Length Comparison
Stage Length Existing
Condition (2018)
Short Term (2019)
Future No Action (2023)
Future Proposed
Action (2023)
Low GA Operations
(2023)
1 (0 – 500 nmi) 92.8% 92.2% 91.4% 86.7% 90.4%
2 (501 – 1,000 nmi) 4.9% 5.3% 6.3% 10.5% 7.0%
3 (1,001 – 1,500 nmi) 1.9% 2.1% 1.9% 2.1% 2.0%
4 (1,501 – 2,500 nmi) 0.4% 0.4% 0.4% 0.7% 0.5%
5 (2,501 – 3,500 nmi) 0.1% 0.1% 0.0% 0.1% 0.1%
Total 100.0% 100.0% 100.0% 100.0% 100.0% Totals may not sum up due to rounding. Sources: Stantec and HNTB analysis, 2018.
Table 3 shows the Proposed Action (2023) alternative is expected to have departures with higher percentage of distance between 501 and 1,000 nautical miles than the other alternatives. This is because more business jet operations are expected under the Proposed Action alternative and business jets tend to fly longer distances than piston aircraft. 2.1.4 Flight Profiles
AEDT and NOISEMAP include many standard flight profiles to represent how an aircraft normally flies in the vicinity of an airfield. The standard flight profiles were applied in both the EA and Part 150 Update wherever available. The USAF noise modeling team provided the standard arrival, departure and closed pattern flight profiles for C-5M. Based on the updated C-5M flight profiles, C-5A arrival, departure, and closed pattern flight profiles included in the 2013 AICUZ Study and 2014 Part 150 Study were then modified. In addition, the standard C-5M flight profiles were consistent with the C-5M flight profiles included in the Environmental Assessment of the Interim Relocation of two F-16 Squadrons studyii. All of the C-5M flight profiles were verified by a WARB C-5M pilot, Colonel Ian Coogan of the Massachusetts Air Force Reserve 439th Airlift Wing.
2.2 Runway Use
Runway use for both civil and military operations remained consistent with that presented in the 2014 Part 150 Study. It was assumed that the future runway use would be the same as the existing runway use. Table 4 shows the runway use for civilian aircraft and Table 5 shows the runway use for military aircraft. The civilian runway use was applied by aircraft types. The military runway use was applied by based C-5M, transient fixed wing aircraft, and transient helicopters.
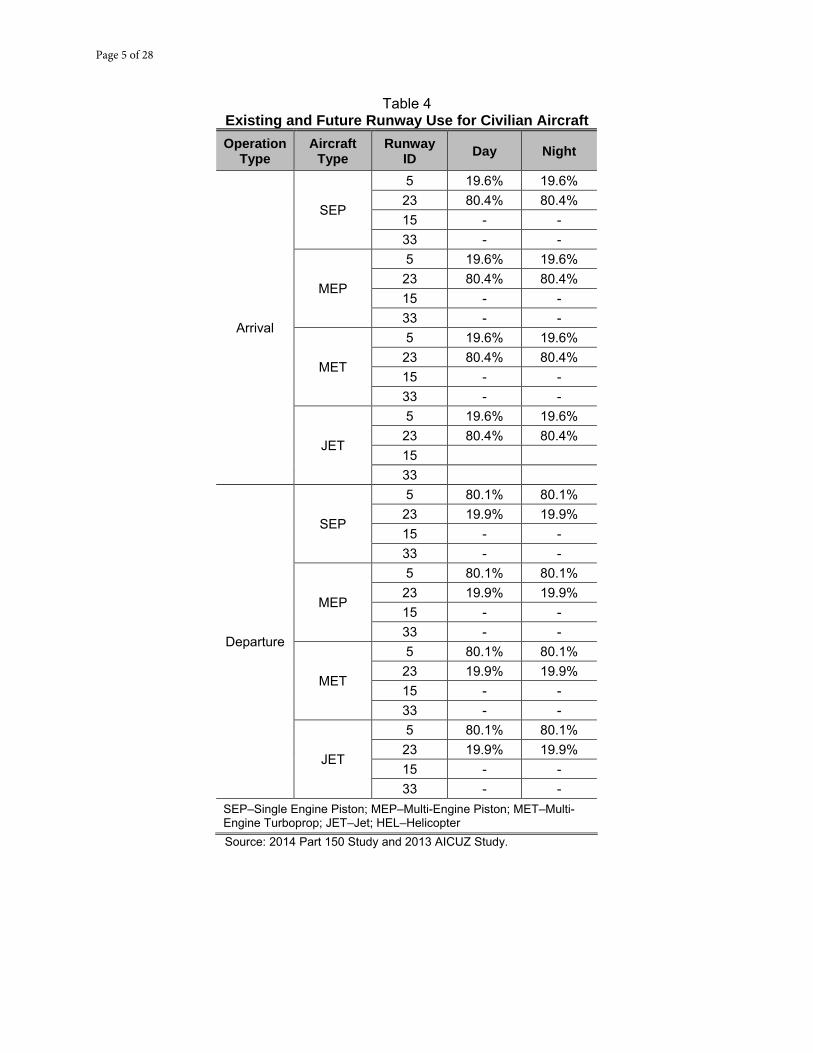
Page 5 of 28
Table 4 Existing and Future Runway Use for Civilian Aircraft Operation
Type Aircraft
Type Runway
ID Day Night
Arrival
SEP
5 19.6% 19.6% 23 80.4% 80.4% 15 - - 33 - -
MEP
5 19.6% 19.6% 23 80.4% 80.4% 15 - - 33 - -
MET
5 19.6% 19.6% 23 80.4% 80.4% 15 - - 33 - -
JET
5 19.6% 19.6% 23 80.4% 80.4% 15 33
Departure
SEP
5 80.1% 80.1% 23 19.9% 19.9% 15 - - 33 - -
MEP
5 80.1% 80.1% 23 19.9% 19.9% 15 - - 33 - -
MET
5 80.1% 80.1% 23 19.9% 19.9% 15 - - 33 - -
JET
5 80.1% 80.1% 23 19.9% 19.9% 15 - - 33 - -
SEP–Single Engine Piston; MEP–Multi-Engine Piston; MET–Multi-Engine Turboprop; JET–Jet; HEL–Helicopter Source: 2014 Part 150 Study and 2013 AICUZ Study.
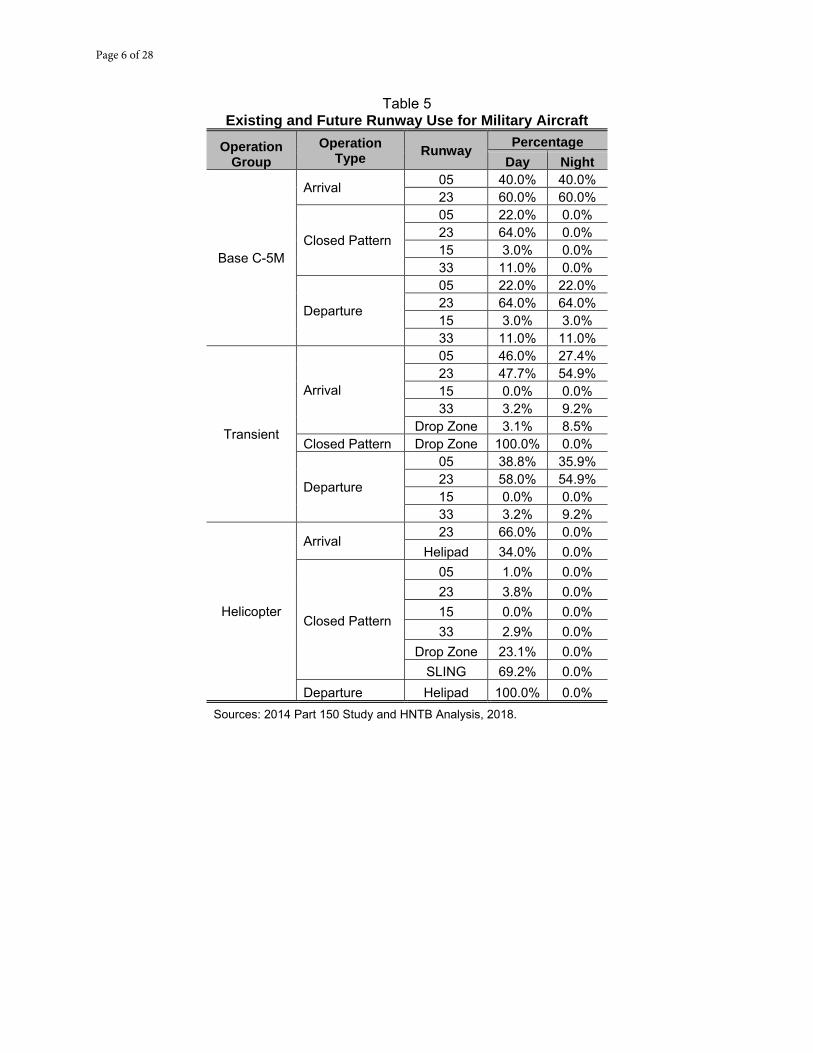
Page 6 of 28
Table 5 Existing and Future Runway Use for Military Aircraft
Operation Group
Operation Type Runway Percentage
Day Night
Base C-5M
Arrival 05 40.0% 40.0% 23 60.0% 60.0%
Closed Pattern
05 22.0% 0.0% 23 64.0% 0.0% 15 3.0% 0.0% 33 11.0% 0.0%
Departure
05 22.0% 22.0% 23 64.0% 64.0% 15 3.0% 3.0% 33 11.0% 11.0%
Transient
Arrival
05 46.0% 27.4% 23 47.7% 54.9% 15 0.0% 0.0% 33 3.2% 9.2%
Drop Zone 3.1% 8.5% Closed Pattern Drop Zone 100.0% 0.0%
Departure
05 38.8% 35.9% 23 58.0% 54.9% 15 0.0% 0.0% 33 3.2% 9.2%
Helicopter
Arrival 23 66.0% 0.0%
Helipad 34.0% 0.0%
Closed Pattern
05 1.0% 0.0% 23 3.8% 0.0% 15 0.0% 0.0% 33 2.9% 0.0%
Drop Zone 23.1% 0.0% SLING 69.2% 0.0%
Departure Helipad 100.0% 0.0% Sources: 2014 Part 150 Study and HNTB Analysis, 2018.
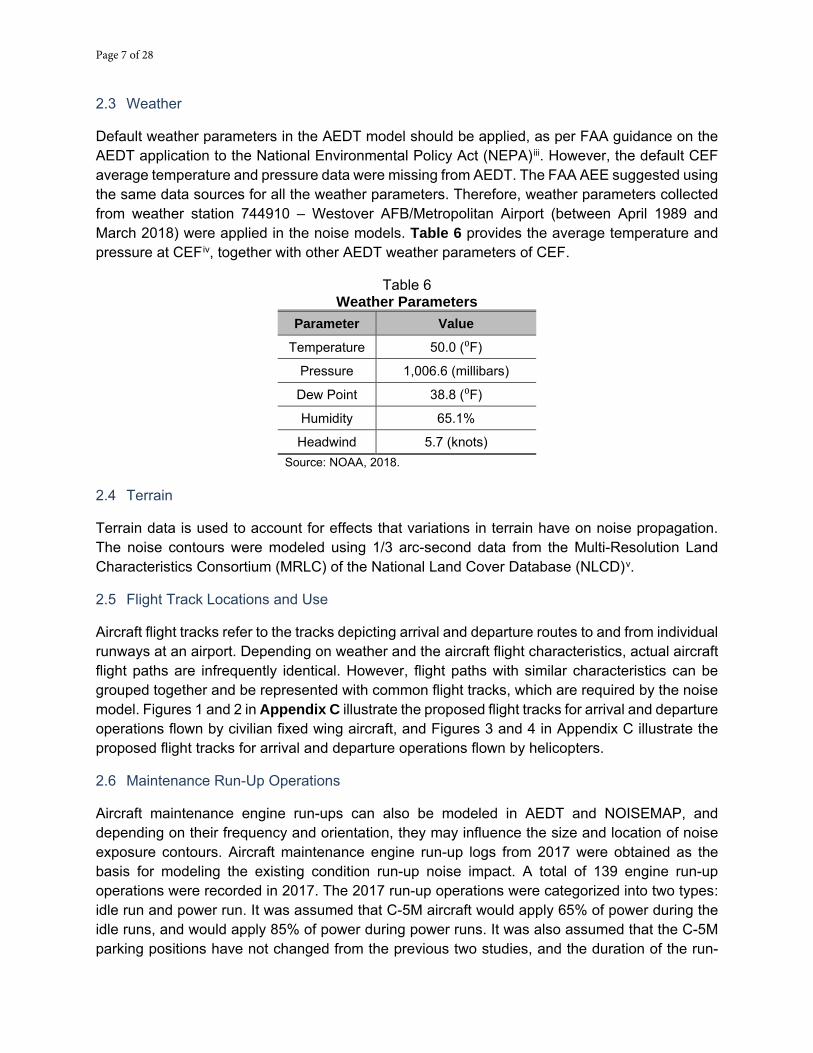
Page 7 of 28
2.3 Weather
Default weather parameters in the AEDT model should be applied, as per FAA guidance on the AEDT application to the National Environmental Policy Act (NEPA)iii. However, the default CEF average temperature and pressure data were missing from AEDT. The FAA AEE suggested using the same data sources for all the weather parameters. Therefore, weather parameters collected from weather station 744910 – Westover AFB/Metropolitan Airport (between April 1989 and March 2018) were applied in the noise models. Table 6 provides the average temperature and pressure at CEFiv, together with other AEDT weather parameters of CEF.
Table 6 Weather Parameters
Parameter Value
Temperature 50.0 (⁰F)
Pressure 1,006.6 (millibars)
Dew Point 38.8 (⁰F)
Humidity 65.1%
Headwind 5.7 (knots) Source: NOAA, 2018.
2.4 Terrain
Terrain data is used to account for effects that variations in terrain have on noise propagation. The noise contours were modeled using 1/3 arc-second data from the Multi-Resolution Land Characteristics Consortium (MRLC) of the National Land Cover Database (NLCD)v.
2.5 Flight Track Locations and Use
Aircraft flight tracks refer to the tracks depicting arrival and departure routes to and from individual runways at an airport. Depending on weather and the aircraft flight characteristics, actual aircraft flight paths are infrequently identical. However, flight paths with similar characteristics can be grouped together and be represented with common flight tracks, which are required by the noise model. Figures 1 and 2 in Appendix C illustrate the proposed flight tracks for arrival and departure operations flown by civilian fixed wing aircraft, and Figures 3 and 4 in Appendix C illustrate the proposed flight tracks for arrival and departure operations flown by helicopters.
2.6 Maintenance Run-Up Operations
Aircraft maintenance engine run-ups can also be modeled in AEDT and NOISEMAP, and depending on their frequency and orientation, they may influence the size and location of noise exposure contours. Aircraft maintenance engine run-up logs from 2017 were obtained as the basis for modeling the existing condition run-up noise impact. A total of 139 engine run-up operations were recorded in 2017. The 2017 run-up operations were categorized into two types: idle run and power run. It was assumed that C-5M aircraft would apply 65% of power during the idle runs, and would apply 85% of power during power runs. It was also assumed that the C-5M parking positions have not changed from the previous two studies, and the duration of the run-
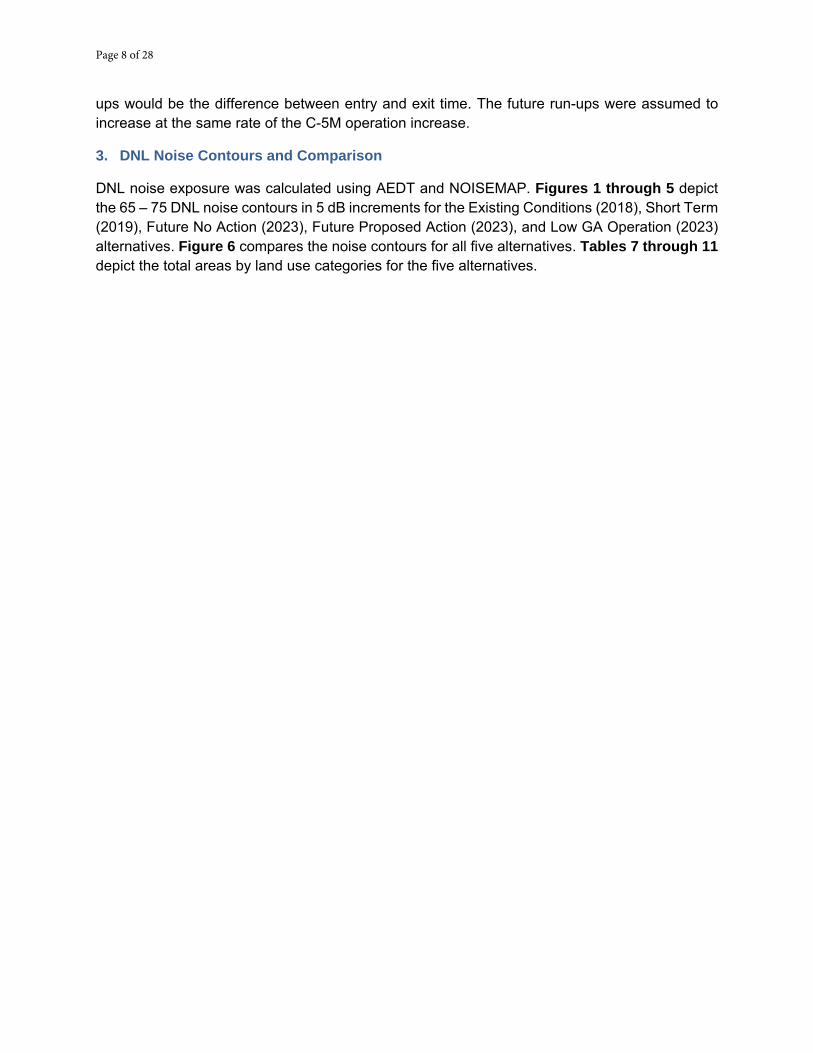
Page 8 of 28
ups would be the difference between entry and exit time. The future run-ups were assumed to increase at the same rate of the C-5M operation increase.
3. DNL Noise Contours and Comparison
DNL noise exposure was calculated using AEDT and NOISEMAP. Figures 1 through 5 depict the 65 – 75 DNL noise contours in 5 dB increments for the Existing Conditions (2018), Short Term (2019), Future No Action (2023), Future Proposed Action (2023), and Low GA Operation (2023) alternatives. Figure 6 compares the noise contours for all five alternatives. Tables 7 through 11 depict the total areas by land use categories for the five alternatives.
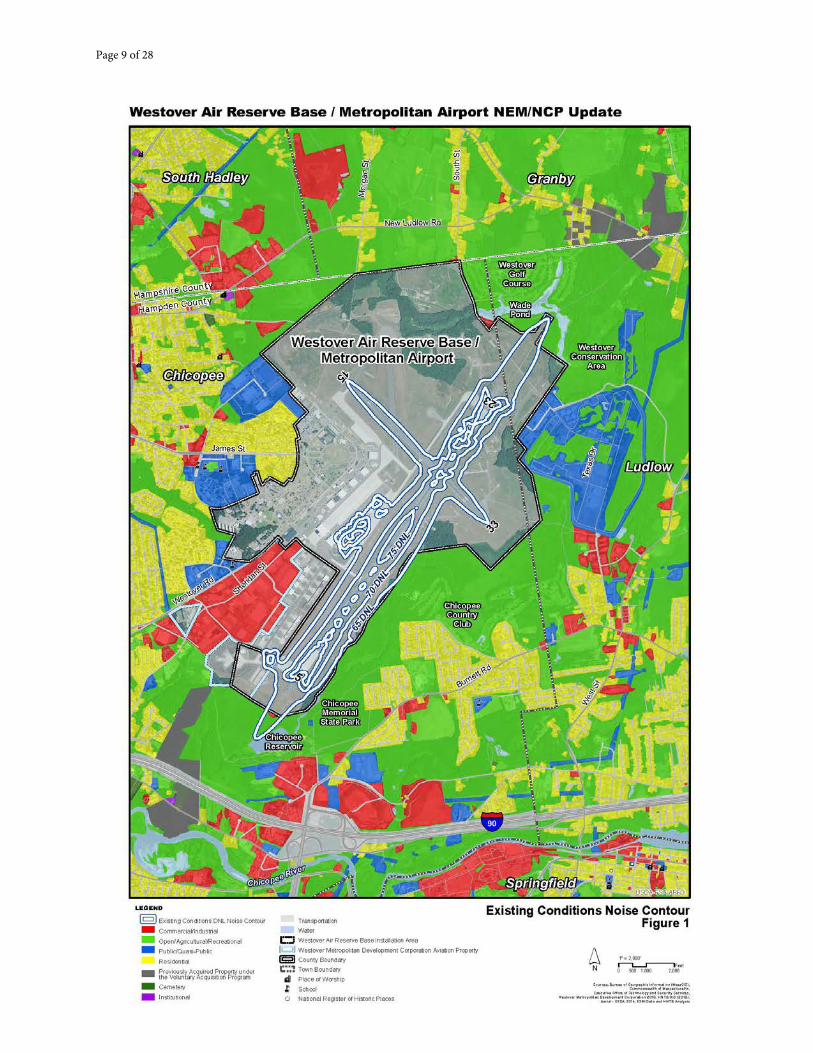
Page 9 of 28
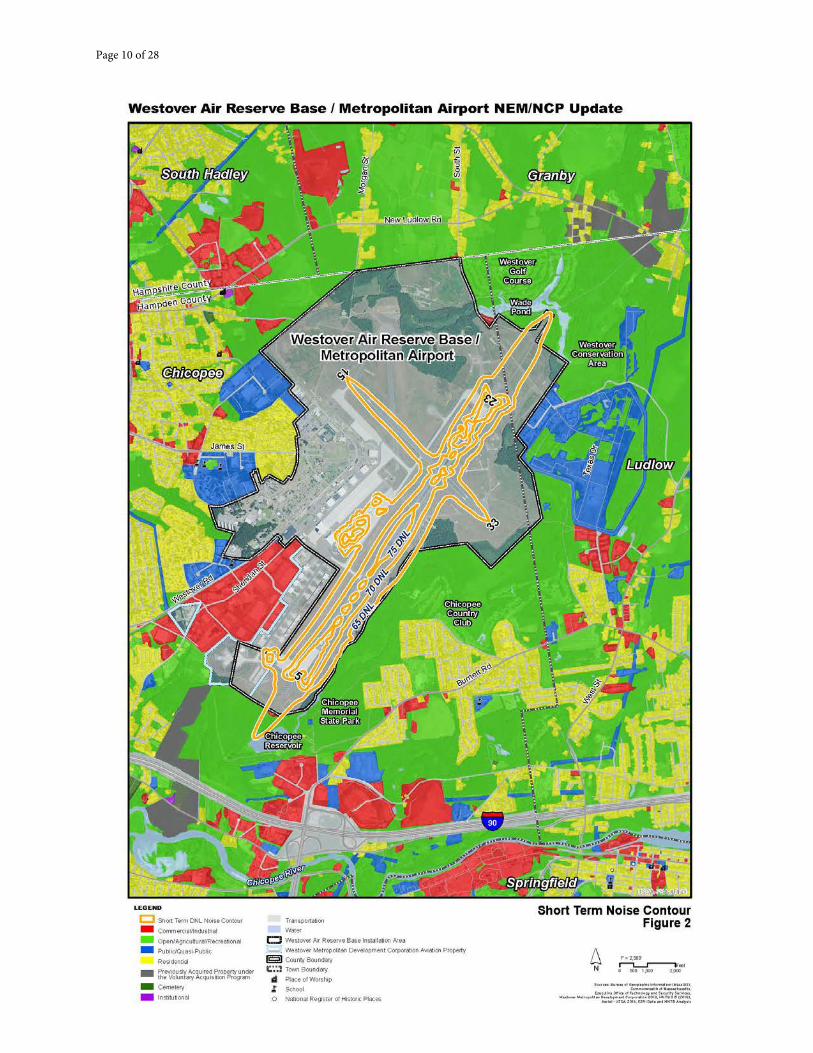
Page 10 of 28

Page 11 of 28
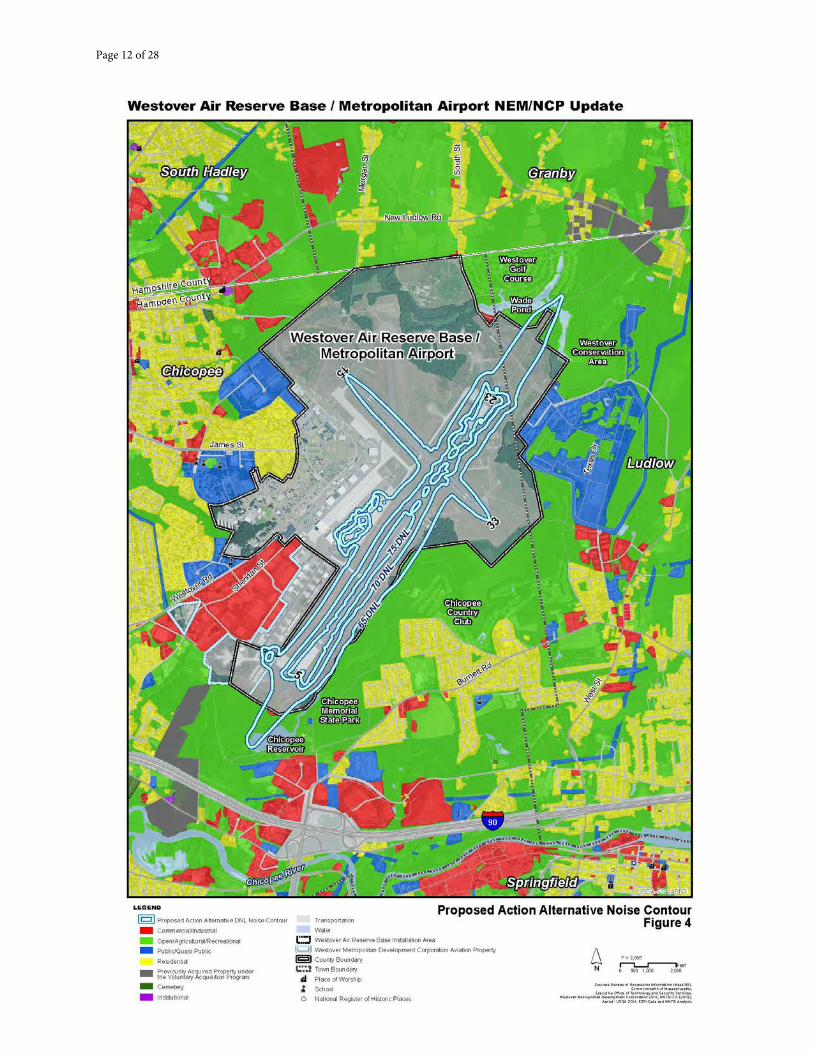
Page 12 of 28
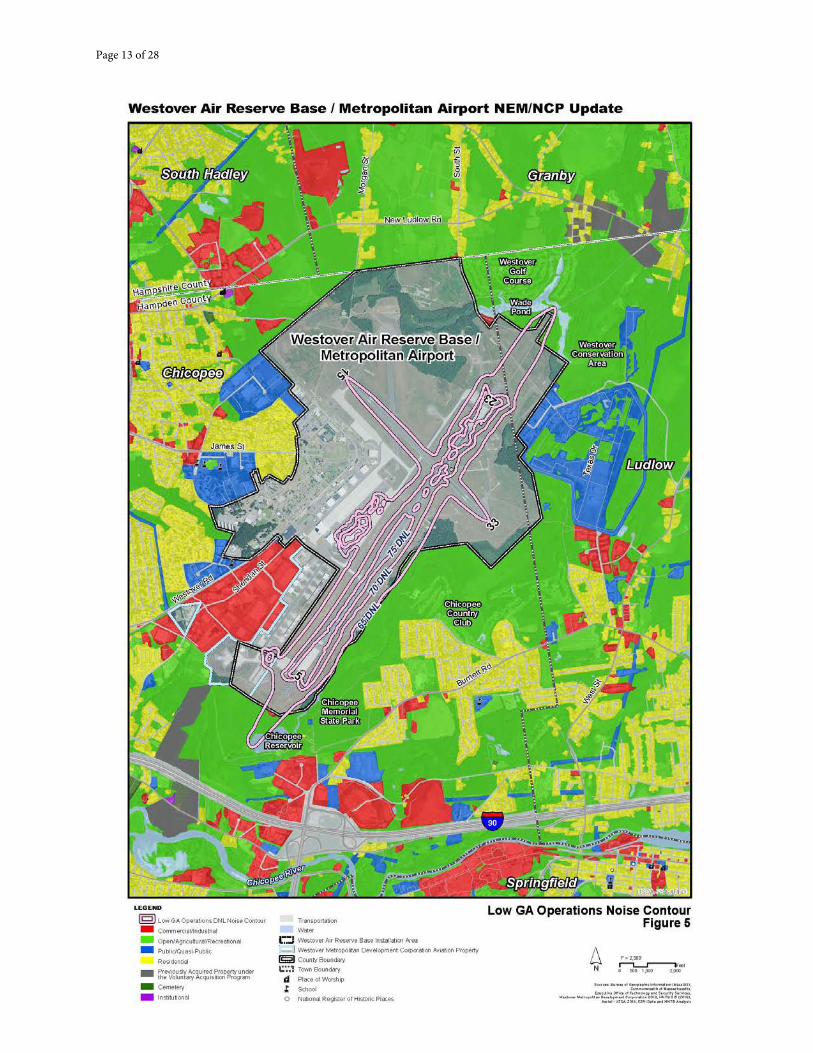
Page 13 of 28
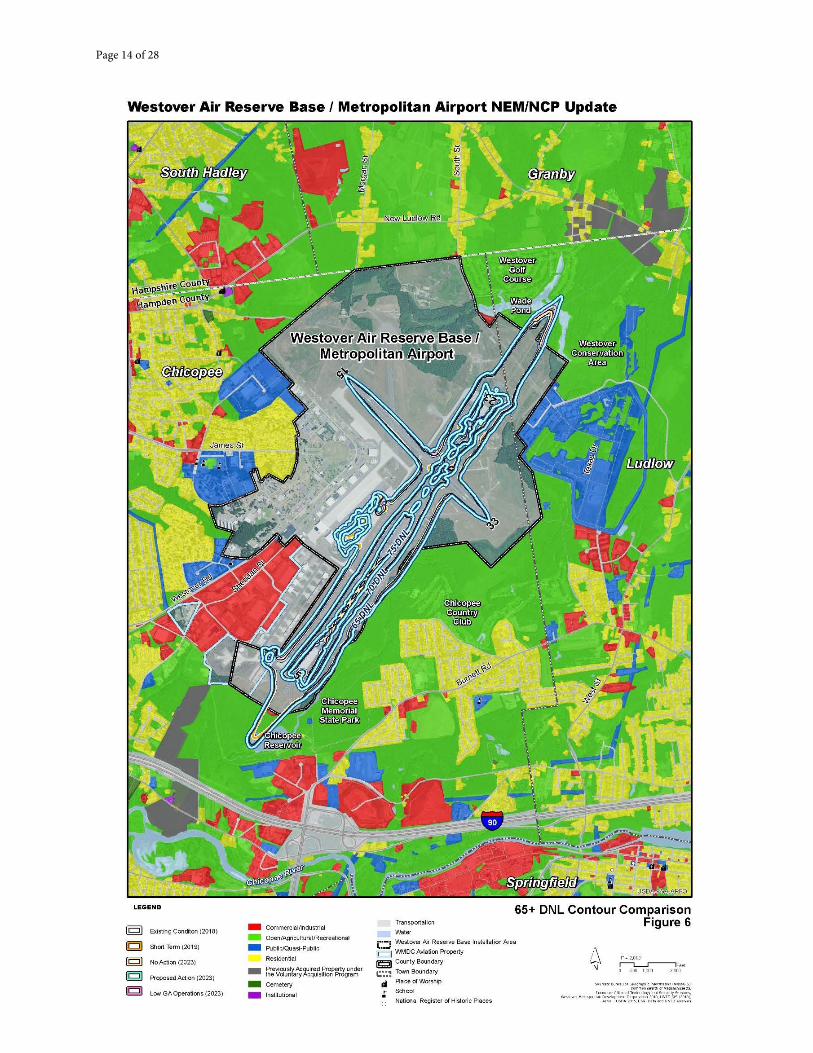
Page 14 of 28
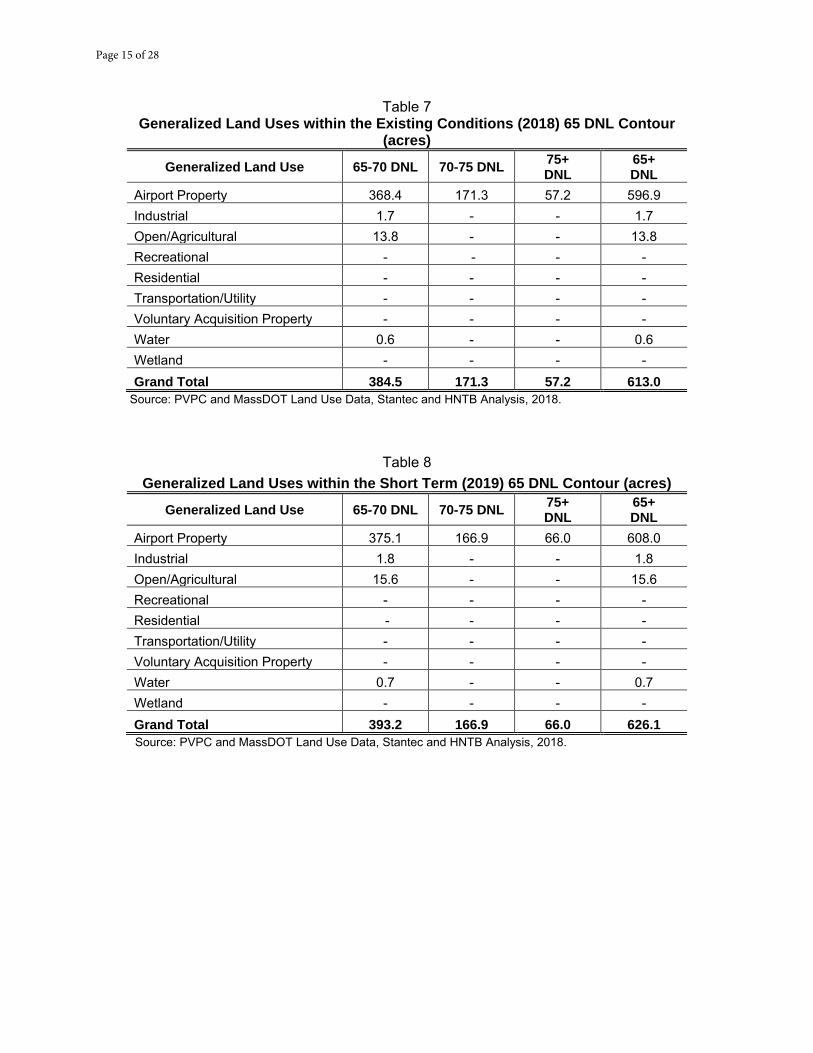
Page 15 of 28
Table 7 Generalized Land Uses within the Existing Conditions (2018) 65 DNL Contour
(acres)
Generalized Land Use 65-70 DNL 70-75 DNL 75+ DNL
65+ DNL
Airport Property 368.4 171.3 57.2 596.9 Industrial 1.7 - - 1.7 Open/Agricultural 13.8 - - 13.8 Recreational - - - - Residential - - - - Transportation/Utility - - - - Voluntary Acquisition Property - - - - Water 0.6 - - 0.6 Wetland - - - - Grand Total 384.5 171.3 57.2 613.0
Source: PVPC and MassDOT Land Use Data, Stantec and HNTB Analysis, 2018.
Table 8 Generalized Land Uses within the Short Term (2019) 65 DNL Contour (acres)
Generalized Land Use 65-70 DNL 70-75 DNL 75+ DNL
65+ DNL
Airport Property 375.1 166.9 66.0 608.0 Industrial 1.8 - - 1.8 Open/Agricultural 15.6 - - 15.6 Recreational - - - - Residential - - - - Transportation/Utility - - - - Voluntary Acquisition Property - - - - Water 0.7 - - 0.7 Wetland - - - - Grand Total 393.2 166.9 66.0 626.1 Source: PVPC and MassDOT Land Use Data, Stantec and HNTB Analysis, 2018.
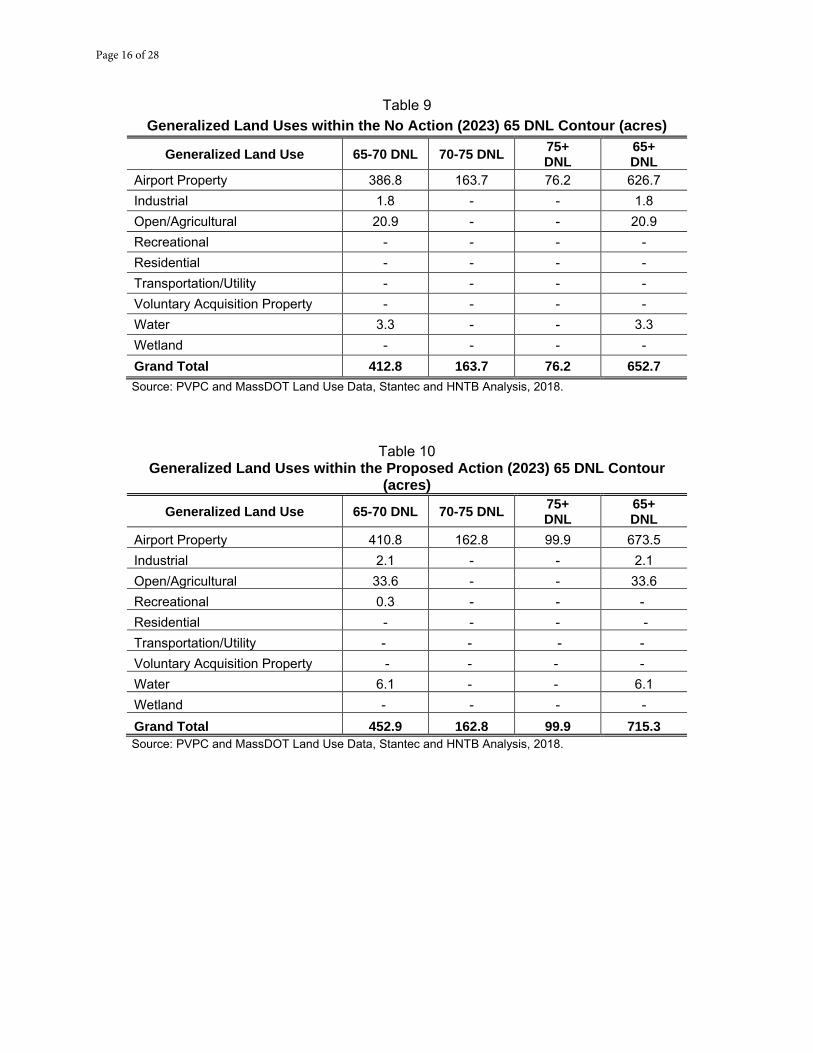
Page 16 of 28
Table 9 Generalized Land Uses within the No Action (2023) 65 DNL Contour (acres)
Generalized Land Use 65-70 DNL 70-75 DNL 75+ DNL
65+ DNL
Airport Property 386.8 163.7 76.2 626.7 Industrial 1.8 - - 1.8 Open/Agricultural 20.9 - - 20.9 Recreational - - - - Residential - - - - Transportation/Utility - - - - Voluntary Acquisition Property - - - - Water 3.3 - - 3.3 Wetland - - - - Grand Total 412.8 163.7 76.2 652.7 Source: PVPC and MassDOT Land Use Data, Stantec and HNTB Analysis, 2018.
Table 10 Generalized Land Uses within the Proposed Action (2023) 65 DNL Contour
(acres)
Generalized Land Use 65-70 DNL 70-75 DNL 75+ DNL
65+ DNL
Airport Property 410.8 162.8 99.9 673.5 Industrial 2.1 - - 2.1 Open/Agricultural 33.6 - - 33.6 Recreational 0.3 - - - Residential - - - - Transportation/Utility - - - - Voluntary Acquisition Property - - - - Water 6.1 - - 6.1 Wetland - - - - Grand Total 452.9 162.8 99.9 715.3 Source: PVPC and MassDOT Land Use Data, Stantec and HNTB Analysis, 2018.
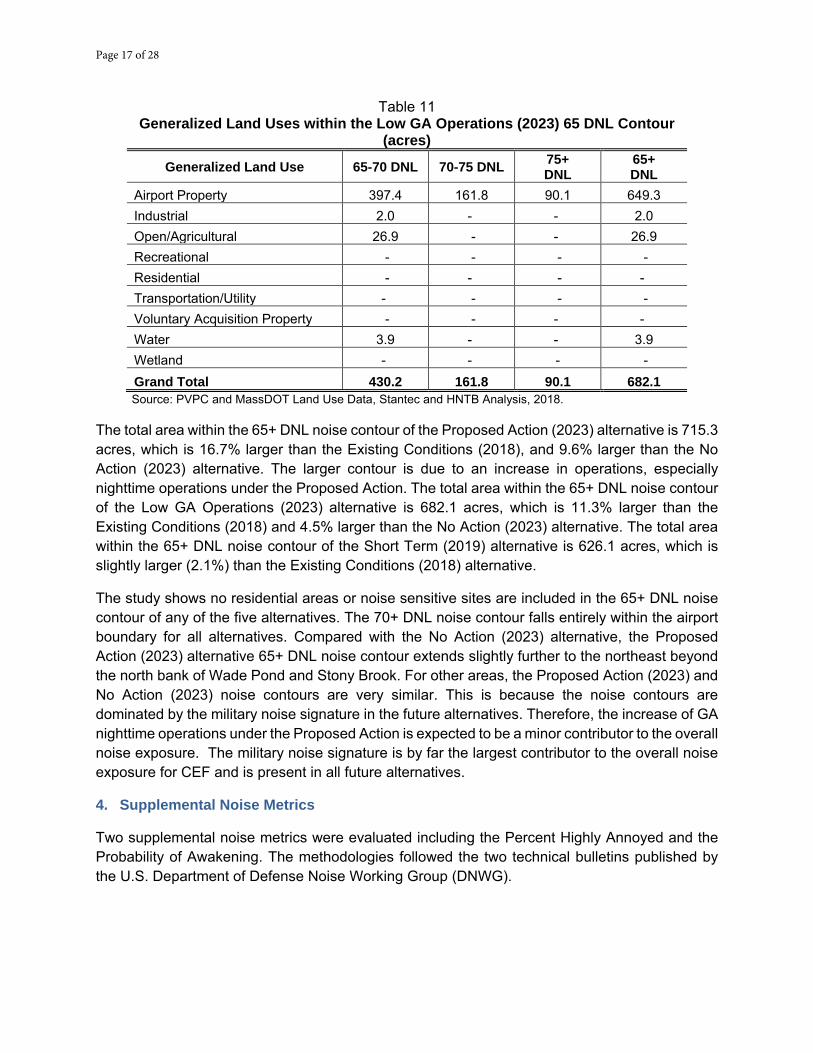
Page 17 of 28
Table 11 Generalized Land Uses within the Low GA Operations (2023) 65 DNL Contour
(acres)
Generalized Land Use 65-70 DNL 70-75 DNL 75+ DNL
65+ DNL
Airport Property 397.4 161.8 90.1 649.3 Industrial 2.0 - - 2.0 Open/Agricultural 26.9 - - 26.9 Recreational - - - - Residential - - - - Transportation/Utility - - - - Voluntary Acquisition Property - - - - Water 3.9 - - 3.9 Wetland - - - - Grand Total 430.2 161.8 90.1 682.1 Source: PVPC and MassDOT Land Use Data, Stantec and HNTB Analysis, 2018.
The total area within the 65+ DNL noise contour of the Proposed Action (2023) alternative is 715.3 acres, which is 16.7% larger than the Existing Conditions (2018), and 9.6% larger than the No Action (2023) alternative. The larger contour is due to an increase in operations, especially nighttime operations under the Proposed Action. The total area within the 65+ DNL noise contour of the Low GA Operations (2023) alternative is 682.1 acres, which is 11.3% larger than the Existing Conditions (2018) and 4.5% larger than the No Action (2023) alternative. The total area within the 65+ DNL noise contour of the Short Term (2019) alternative is 626.1 acres, which is slightly larger (2.1%) than the Existing Conditions (2018) alternative.
The study shows no residential areas or noise sensitive sites are included in the 65+ DNL noise contour of any of the five alternatives. The 70+ DNL noise contour falls entirely within the airport boundary for all alternatives. Compared with the No Action (2023) alternative, the Proposed Action (2023) alternative 65+ DNL noise contour extends slightly further to the northeast beyond the north bank of Wade Pond and Stony Brook. For other areas, the Proposed Action (2023) and No Action (2023) noise contours are very similar. This is because the noise contours are dominated by the military noise signature in the future alternatives. Therefore, the increase of GA nighttime operations under the Proposed Action is expected to be a minor contributor to the overall noise exposure. The military noise signature is by far the largest contributor to the overall noise exposure for CEF and is present in all future alternatives.
4. Supplemental Noise Metrics
Two supplemental noise metrics were evaluated including the Percent Highly Annoyed and the Probability of Awakening. The methodologies followed the two technical bulletins published by the U.S. Department of Defense Noise Working Group (DNWG).
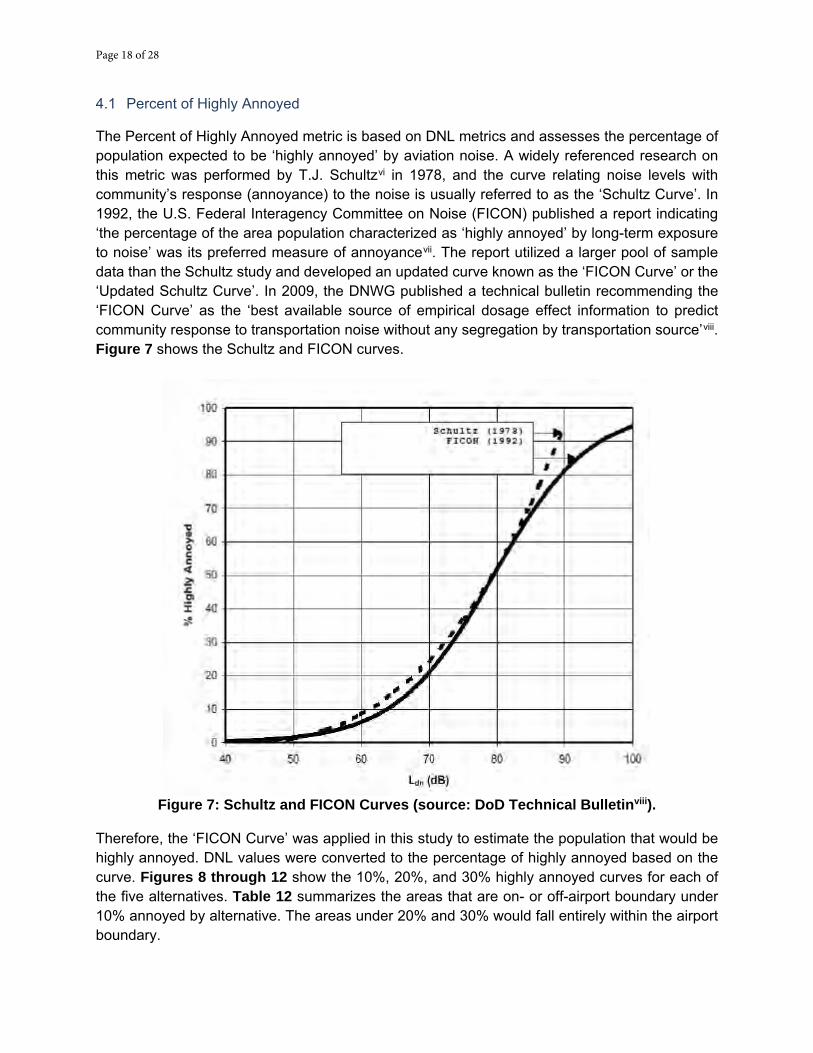
Page 18 of 28
4.1 Percent of Highly Annoyed
The Percent of Highly Annoyed metric is based on DNL metrics and assesses the percentage of population expected to be ‘highly annoyed’ by aviation noise. A widely referenced research on this metric was performed by T.J. Schultzvi in 1978, and the curve relating noise levels with community’s response (annoyance) to the noise is usually referred to as the ‘Schultz Curve’. In 1992, the U.S. Federal Interagency Committee on Noise (FICON) published a report indicating ‘the percentage of the area population characterized as ‘highly annoyed’ by long-term exposure to noise’ was its preferred measure of annoyancevii. The report utilized a larger pool of sample data than the Schultz study and developed an updated curve known as the ‘FICON Curve’ or the ‘Updated Schultz Curve’. In 2009, the DNWG published a technical bulletin recommending the ‘FICON Curve’ as the ‘best available source of empirical dosage effect information to predict community response to transportation noise without any segregation by transportation source’viii. Figure 7 shows the Schultz and FICON curves.
Figure 7: Schultz and FICON Curves (source: DoD Technical Bulletinviii).
Therefore, the ‘FICON Curve’ was applied in this study to estimate the population that would be highly annoyed. DNL values were converted to the percentage of highly annoyed based on the curve. Figures 8 through 12 show the 10%, 20%, and 30% highly annoyed curves for each of the five alternatives. Table 12 summarizes the areas that are on- or off-airport boundary under 10% annoyed by alternative. The areas under 20% and 30% would fall entirely within the airport boundary.
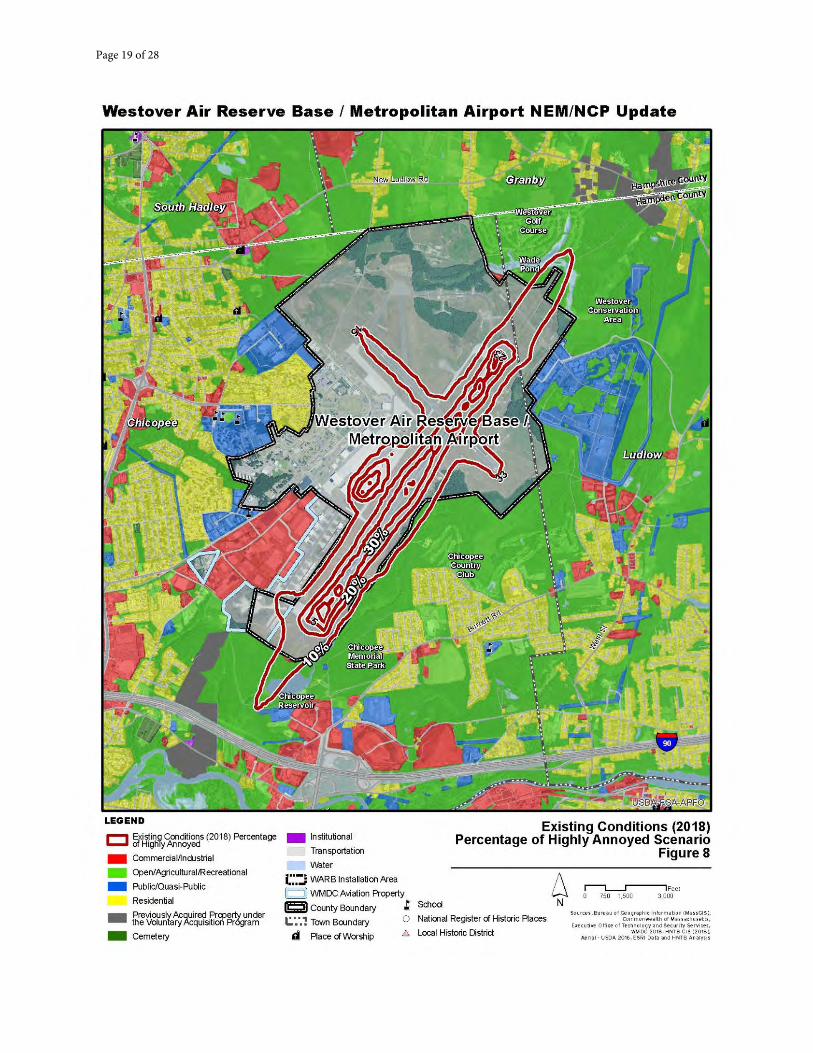
Page 19 of 28
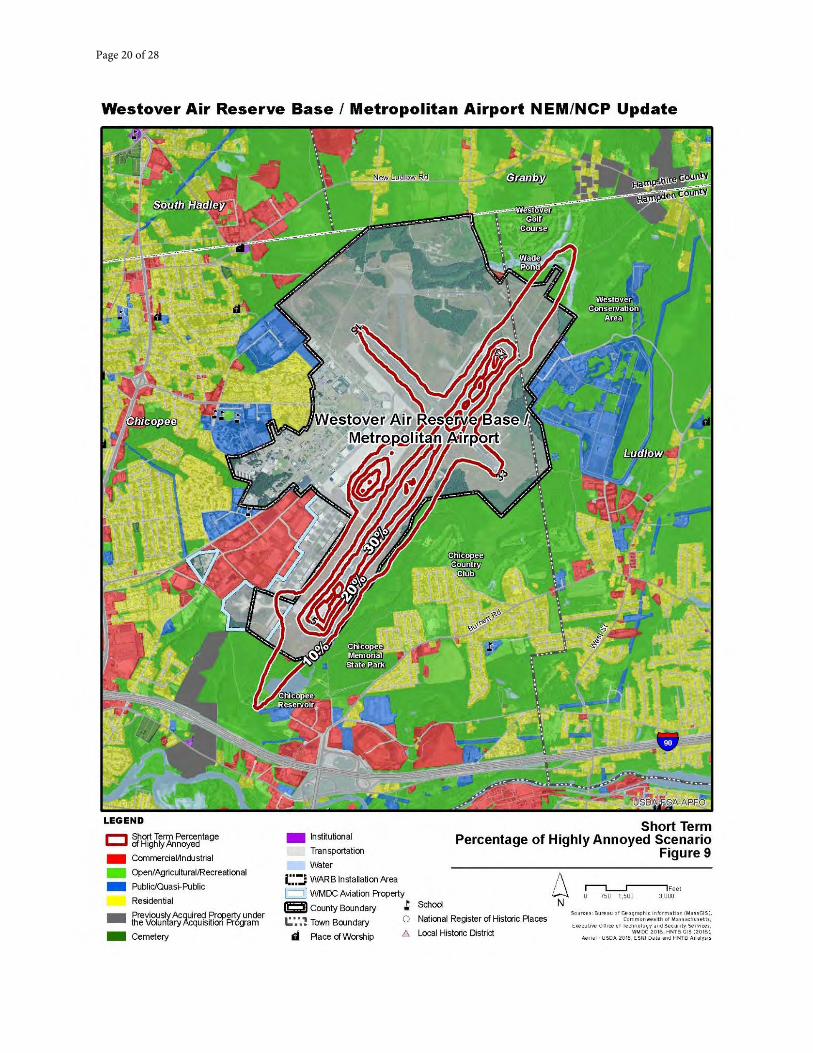
Page 20 of 28
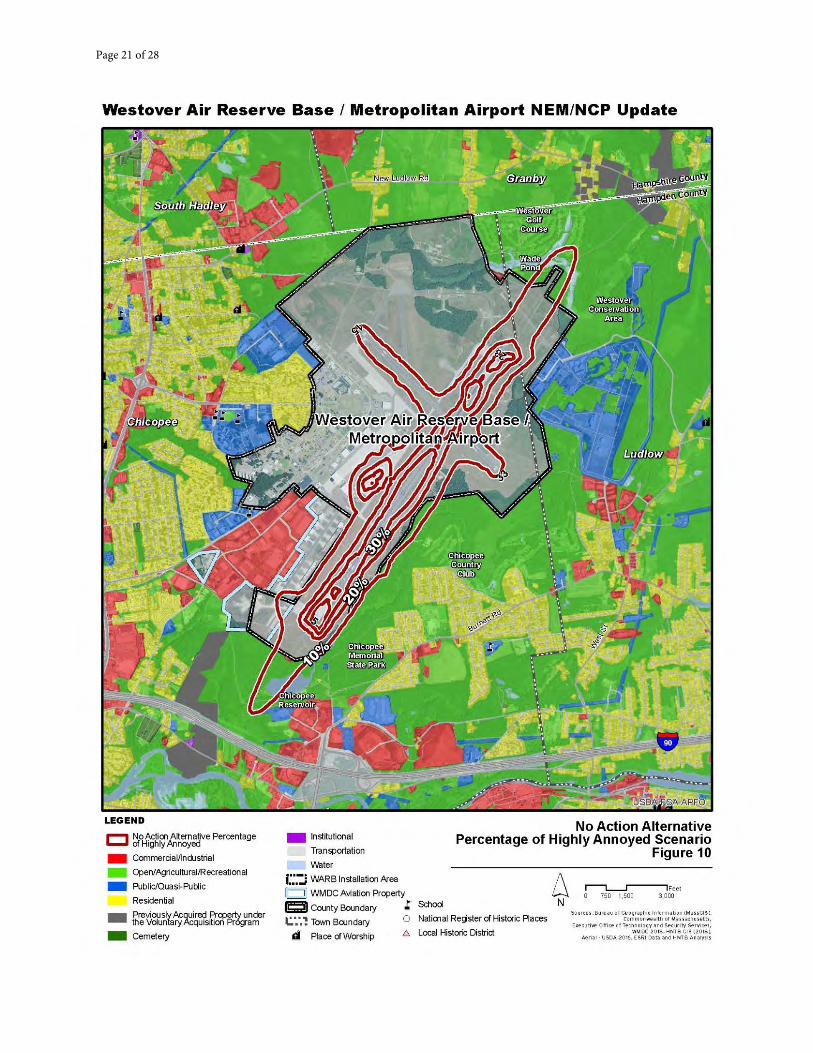
Page 21 of 28
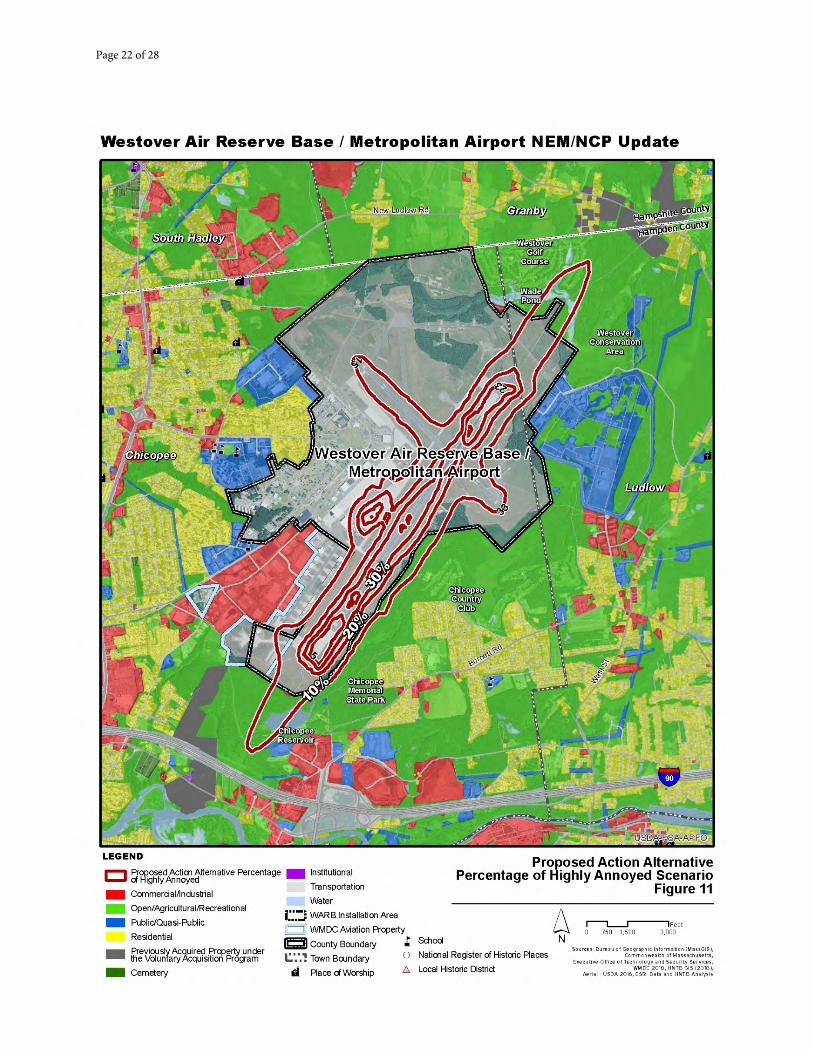
Page 22 of 28

Page 23 of 28
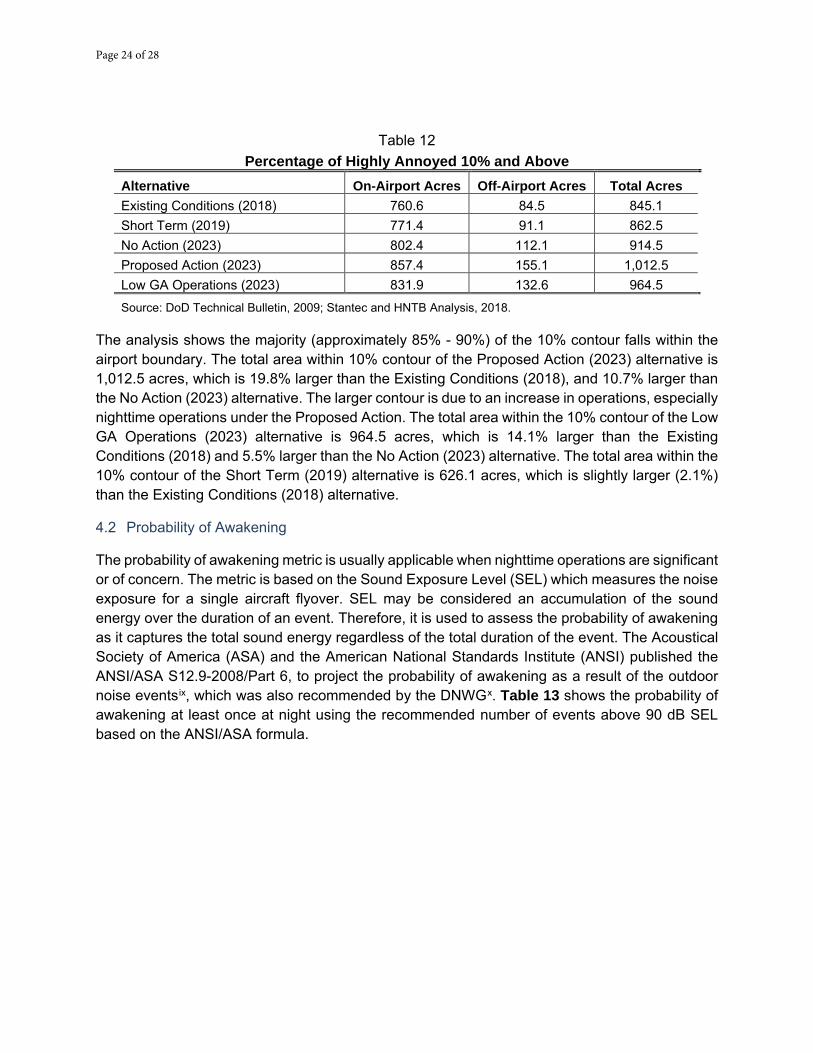
Page 24 of 28
Table 12 Percentage of Highly Annoyed 10% and Above
Alternative On-Airport Acres Off-Airport Acres Total Acres Existing Conditions (2018) 760.6 84.5 845.1 Short Term (2019) 771.4 91.1 862.5 No Action (2023) 802.4 112.1 914.5 Proposed Action (2023) 857.4 155.1 1,012.5 Low GA Operations (2023) 831.9 132.6 964.5
Source: DoD Technical Bulletin, 2009; Stantec and HNTB Analysis, 2018. The analysis shows the majority (approximately 85% - 90%) of the 10% contour falls within the airport boundary. The total area within 10% contour of the Proposed Action (2023) alternative is 1,012.5 acres, which is 19.8% larger than the Existing Conditions (2018), and 10.7% larger than the No Action (2023) alternative. The larger contour is due to an increase in operations, especially nighttime operations under the Proposed Action. The total area within the 10% contour of the Low GA Operations (2023) alternative is 964.5 acres, which is 14.1% larger than the Existing Conditions (2018) and 5.5% larger than the No Action (2023) alternative. The total area within the 10% contour of the Short Term (2019) alternative is 626.1 acres, which is slightly larger (2.1%) than the Existing Conditions (2018) alternative.
4.2 Probability of Awakening
The probability of awakening metric is usually applicable when nighttime operations are significant or of concern. The metric is based on the Sound Exposure Level (SEL) which measures the noise exposure for a single aircraft flyover. SEL may be considered an accumulation of the sound energy over the duration of an event. Therefore, it is used to assess the probability of awakening as it captures the total sound energy regardless of the total duration of the event. The Acoustical Society of America (ASA) and the American National Standards Institute (ANSI) published the ANSI/ASA S12.9-2008/Part 6, to project the probability of awakening as a result of the outdoor noise eventsix, which was also recommended by the DNWGx. Table 13 shows the probability of awakening at least once at night using the recommended number of events above 90 dB SEL based on the ANSI/ASA formula.
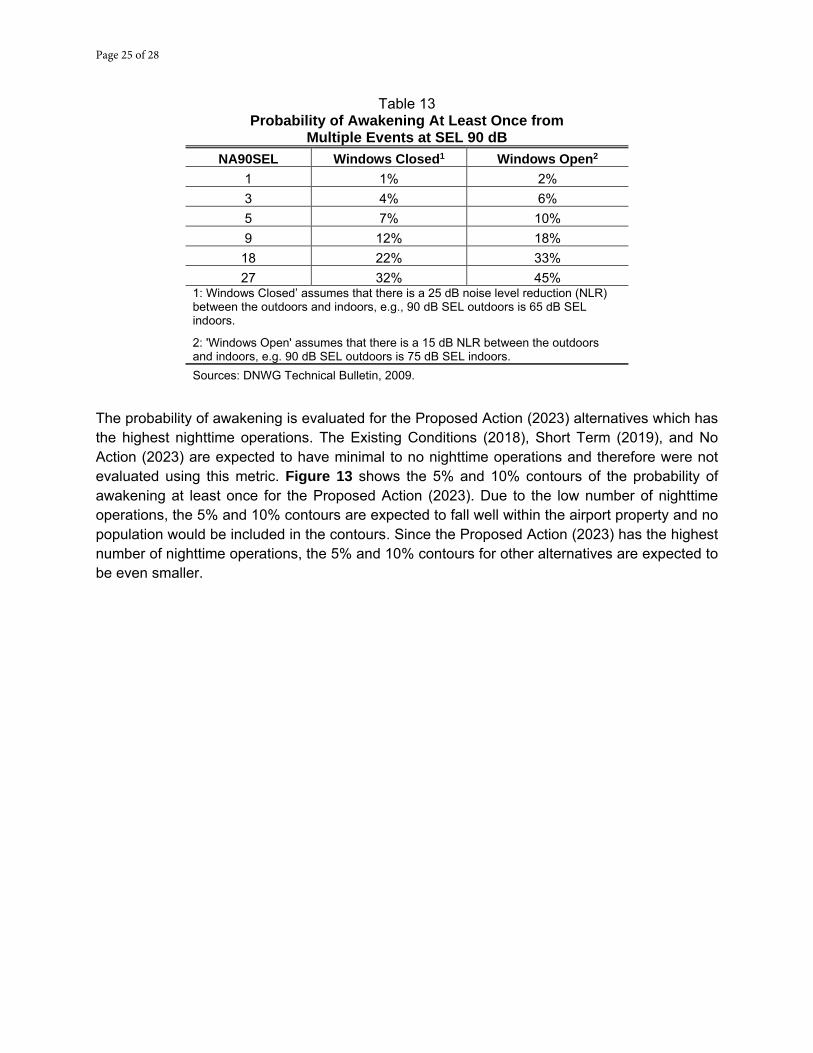
Page 25 of 28
Table 13 Probability of Awakening At Least Once from
Multiple Events at SEL 90 dB NA90SEL Windows Closed1 Windows Open2
1 1% 2% 3 4% 6% 5 7% 10% 9 12% 18% 18 22% 33% 27 32% 45%
1: Windows Closed’ assumes that there is a 25 dB noise level reduction (NLR) between the outdoors and indoors, e.g., 90 dB SEL outdoors is 65 dB SEL indoors.
2: 'Windows Open' assumes that there is a 15 dB NLR between the outdoors and indoors, e.g. 90 dB SEL outdoors is 75 dB SEL indoors. Sources: DNWG Technical Bulletin, 2009.
The probability of awakening is evaluated for the Proposed Action (2023) alternatives which has the highest nighttime operations. The Existing Conditions (2018), Short Term (2019), and No Action (2023) are expected to have minimal to no nighttime operations and therefore were not evaluated using this metric. Figure 13 shows the 5% and 10% contours of the probability of awakening at least once for the Proposed Action (2023). Due to the low number of nighttime operations, the 5% and 10% contours are expected to fall well within the airport property and no population would be included in the contours. Since the Proposed Action (2023) has the highest number of nighttime operations, the 5% and 10% contours for other alternatives are expected to be even smaller.
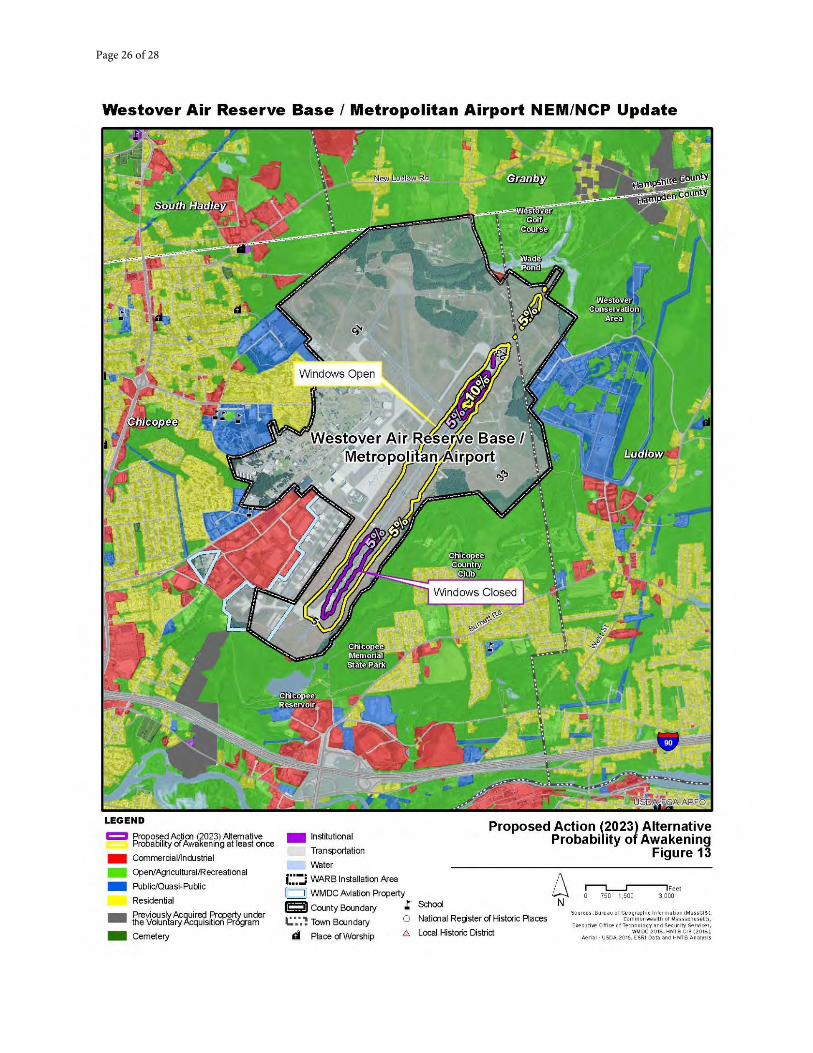
Page 26 of 28
Page 27 of 28
This technical memorandum presents the data sources, methodologies, and assumptions applied to develop the noise contours and supplemental metrics, as well as the presentation of noise contours and supplemental metrics, as well as their comparisons. if you have any questions or comments, please do not hesitate to send me an email [email protected] or call me at 703-253-5829.
Best Regards,
Yue Xu, Ph.D., P.E. Aviation/Environmental Planner HNTB Corporation Cc: Kim Hughes, HNTB Caroline Pinegar, HNTB

Page 28 of 28
i Air Installation Compatible Use Zone (AICUZ) Study, Westover Air Reserve Base, Massachusetts, United States Air Force, February 2013. ii Interim Relocation of Two F-16 Squadrons – Environmental Assessment, Draft, U.S. Air Force, April 2017. iii Guidance on Using the Aviation Environmental Design Tool (AEDT) to Conduct Environmental Modeling for FAA Actions Subject to NEPA, FAA, revised Oct 27, 2017. iv Global Summary of the Day, Climate Data Online, National Centers for Environmental Information, National Oceanic and Atmospheric Administration, https://www.ncdc.noaa.gov/cdo-web/datasets, accessed April 2018. v Multi-Resolution Land Characteristics Consortium (MRLC), National Land Cover Database, U.S. Geological Survey, U.S. Department of Interior, https://www.mrlc.gov/about.php, accessed April 2018. vi Synthesis of Social Surveys on Noise Annoyance, Schultz, T.J., Journal of Acoustical Society of America, Volume 64, P377-405, 1978. vii Federal Interagency Committee on Noise (FICON). Federal Agency Review of Selected Airport Noise Analysis Issues, Report for the Department of Defense, Washington, DC, 1992. viii Noise Working Group Technical Bulletin, Community Annoyance Caused by Noise from Military Aircraft Operations, Department of Defense, December 2009. ix Quantities and Procedures for Description and Measurement of Environmental Sound - Part 6: Methods for Estimating of Awakenings Associated with Outdoor Noise Events Heard in Homes, ANSI/ASA S12.9-2008/Part 6, the Acoustical Society of America (ASA) and the American National Standards Institute (ANSI), 2008. x Noise Working Group Technical Bulletin, Using Supplemental Noise Metrics and Analysis Tools, Department of Defense, December 2009.
Appendix A – Detailed AEDT Aircraft and Operations
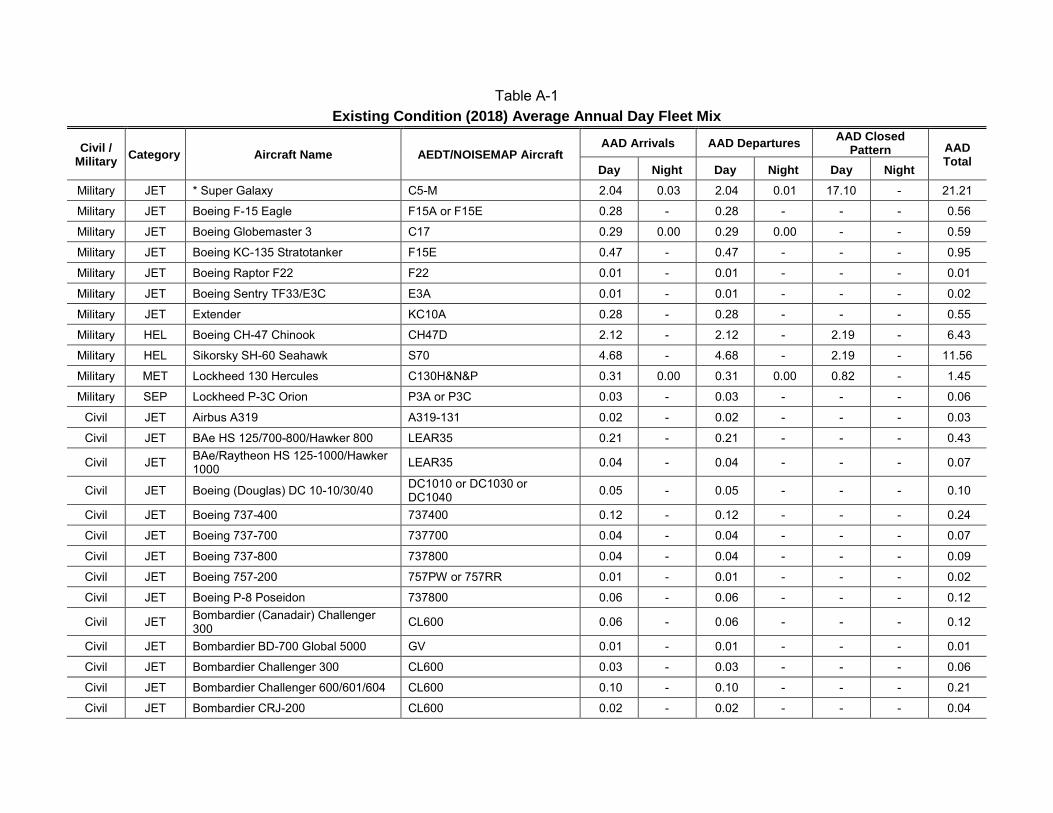
Table A-1 Existing Condition (2018) Average Annual Day Fleet Mix
Civil / Military Category Aircraft Name AEDT/NOISEMAP Aircraft
AAD Arrivals AAD Departures AAD Closed Pattern AAD
Total Day Night Day Night Day Night
Military JET * Super Galaxy C5-M 2.04 0.03 2.04 0.01 17.10 - 21.21
Military JET Boeing F-15 Eagle F15A or F15E 0.28 - 0.28 - - - 0.56
Military JET Boeing Globemaster 3 C17 0.29 0.00 0.29 0.00 - - 0.59
Military JET Boeing KC-135 Stratotanker F15E 0.47 - 0.47 - - - 0.95
Military JET Boeing Raptor F22 F22 0.01 - 0.01 - - - 0.01
Military JET Boeing Sentry TF33/E3C E3A 0.01 - 0.01 - - - 0.02
Military JET Extender KC10A 0.28 - 0.28 - - - 0.55
Military HEL Boeing CH-47 Chinook CH47D 2.12 - 2.12 - 2.19 - 6.43
Military HEL Sikorsky SH-60 Seahawk S70 4.68 - 4.68 - 2.19 - 11.56
Military MET Lockheed 130 Hercules C130H&N&P 0.31 0.00 0.31 0.00 0.82 - 1.45
Military SEP Lockheed P-3C Orion P3A or P3C 0.03 - 0.03 - - - 0.06
Civil JET Airbus A319 A319-131 0.02 - 0.02 - - - 0.03
Civil JET BAe HS 125/700-800/Hawker 800 LEAR35 0.21 - 0.21 - - - 0.43
Civil JET BAe/Raytheon HS 125-1000/Hawker 1000 LEAR35 0.04 - 0.04 - - - 0.07
Civil JET Boeing (Douglas) DC 10-10/30/40 DC1010 or DC1030 or DC1040 0.05 - 0.05 - - - 0.10
Civil JET Boeing 737-400 737400 0.12 - 0.12 - - - 0.24
Civil JET Boeing 737-700 737700 0.04 - 0.04 - - - 0.07
Civil JET Boeing 737-800 737800 0.04 - 0.04 - - - 0.09
Civil JET Boeing 757-200 757PW or 757RR 0.01 - 0.01 - - - 0.02
Civil JET Boeing P-8 Poseidon 737800 0.06 - 0.06 - - - 0.12
Civil JET Bombardier (Canadair) Challenger 300 CL600 0.06 - 0.06 - - - 0.12
Civil JET Bombardier BD-700 Global 5000 GV 0.01 - 0.01 - - - 0.01
Civil JET Bombardier Challenger 300 CL600 0.03 - 0.03 - - - 0.06
Civil JET Bombardier Challenger 600/601/604 CL600 0.10 - 0.10 - - - 0.21
Civil JET Bombardier CRJ-200 CL600 0.02 - 0.02 - - - 0.04
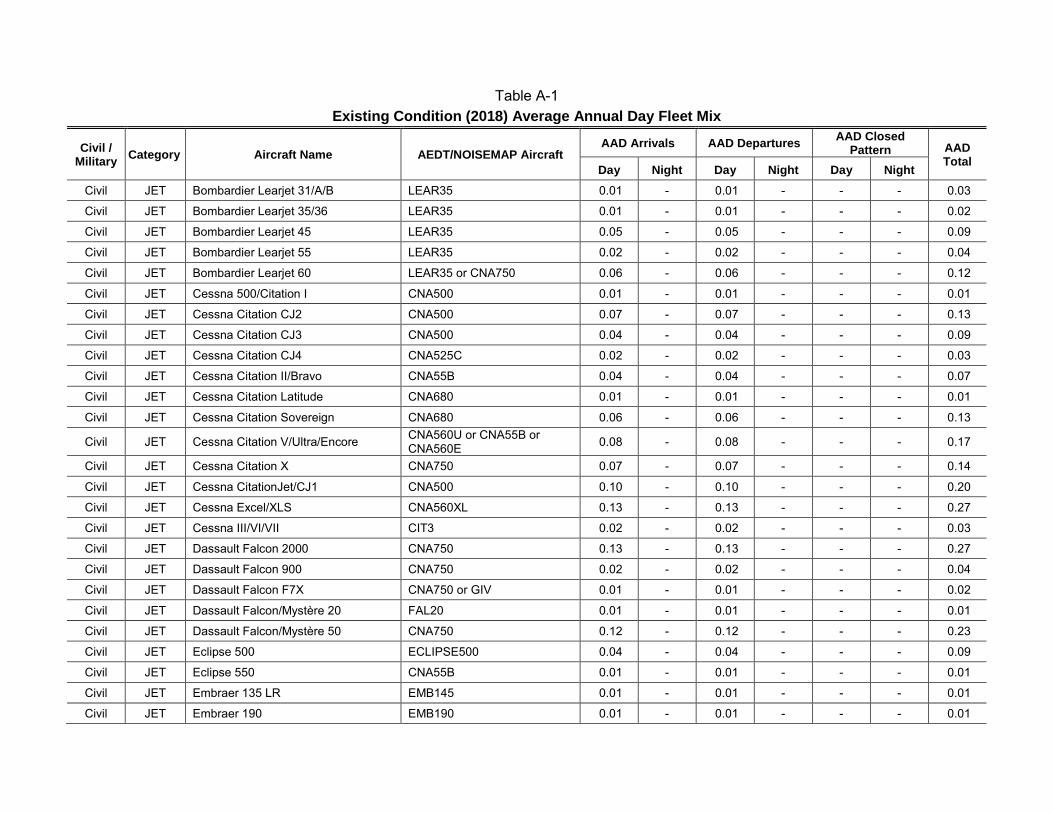
Table A-1 Existing Condition (2018) Average Annual Day Fleet Mix
Civil / Military Category Aircraft Name AEDT/NOISEMAP Aircraft
AAD Arrivals AAD Departures AAD Closed Pattern AAD
Total Day Night Day Night Day Night
Civil JET Bombardier Learjet 31/A/B LEAR35 0.01 - 0.01 - - - 0.03
Civil JET Bombardier Learjet 35/36 LEAR35 0.01 - 0.01 - - - 0.02
Civil JET Bombardier Learjet 45 LEAR35 0.05 - 0.05 - - - 0.09
Civil JET Bombardier Learjet 55 LEAR35 0.02 - 0.02 - - - 0.04
Civil JET Bombardier Learjet 60 LEAR35 or CNA750 0.06 - 0.06 - - - 0.12
Civil JET Cessna 500/Citation I CNA500 0.01 - 0.01 - - - 0.01
Civil JET Cessna Citation CJ2 CNA500 0.07 - 0.07 - - - 0.13
Civil JET Cessna Citation CJ3 CNA500 0.04 - 0.04 - - - 0.09
Civil JET Cessna Citation CJ4 CNA525C 0.02 - 0.02 - - - 0.03
Civil JET Cessna Citation II/Bravo CNA55B 0.04 - 0.04 - - - 0.07
Civil JET Cessna Citation Latitude CNA680 0.01 - 0.01 - - - 0.01
Civil JET Cessna Citation Sovereign CNA680 0.06 - 0.06 - - - 0.13
Civil JET Cessna Citation V/Ultra/Encore CNA560U or CNA55B or CNA560E 0.08 - 0.08 - - - 0.17
Civil JET Cessna Citation X CNA750 0.07 - 0.07 - - - 0.14
Civil JET Cessna CitationJet/CJ1 CNA500 0.10 - 0.10 - - - 0.20
Civil JET Cessna Excel/XLS CNA560XL 0.13 - 0.13 - - - 0.27
Civil JET Cessna III/VI/VII CIT3 0.02 - 0.02 - - - 0.03
Civil JET Dassault Falcon 2000 CNA750 0.13 - 0.13 - - - 0.27
Civil JET Dassault Falcon 900 CNA750 0.02 - 0.02 - - - 0.04
Civil JET Dassault Falcon F7X CNA750 or GIV 0.01 - 0.01 - - - 0.02
Civil JET Dassault Falcon/Mystère 20 FAL20 0.01 - 0.01 - - - 0.01
Civil JET Dassault Falcon/Mystère 50 CNA750 0.12 - 0.12 - - - 0.23
Civil JET Eclipse 500 ECLIPSE500 0.04 - 0.04 - - - 0.09
Civil JET Eclipse 550 CNA55B 0.01 - 0.01 - - - 0.01
Civil JET Embraer 135 LR EMB145 0.01 - 0.01 - - - 0.01
Civil JET Embraer 190 EMB190 0.01 - 0.01 - - - 0.01
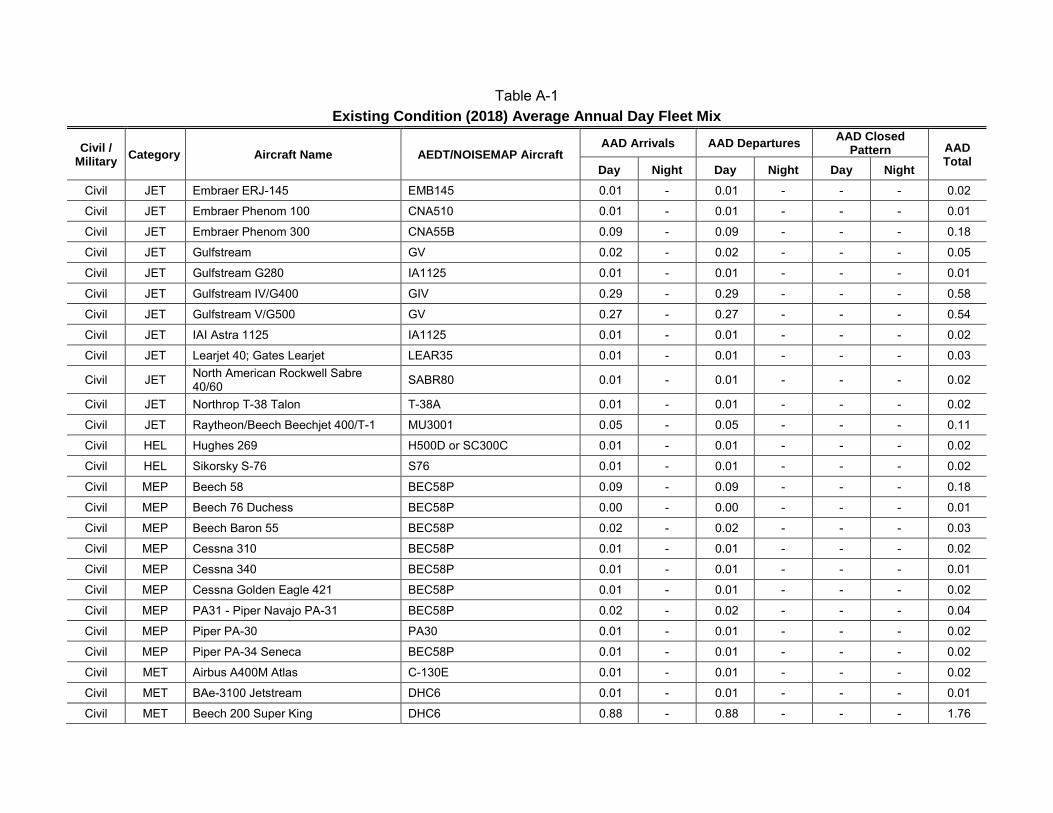
Table A-1 Existing Condition (2018) Average Annual Day Fleet Mix
Civil / Military Category Aircraft Name AEDT/NOISEMAP Aircraft
AAD Arrivals AAD Departures AAD Closed Pattern AAD
Total Day Night Day Night Day Night
Civil JET Embraer ERJ-145 EMB145 0.01 - 0.01 - - - 0.02
Civil JET Embraer Phenom 100 CNA510 0.01 - 0.01 - - - 0.01
Civil JET Embraer Phenom 300 CNA55B 0.09 - 0.09 - - - 0.18
Civil JET Gulfstream GV 0.02 - 0.02 - - - 0.05
Civil JET Gulfstream G280 IA1125 0.01 - 0.01 - - - 0.01
Civil JET Gulfstream IV/G400 GIV 0.29 - 0.29 - - - 0.58
Civil JET Gulfstream V/G500 GV 0.27 - 0.27 - - - 0.54
Civil JET IAI Astra 1125 IA1125 0.01 - 0.01 - - - 0.02
Civil JET Learjet 40; Gates Learjet LEAR35 0.01 - 0.01 - - - 0.03
Civil JET North American Rockwell Sabre 40/60 SABR80 0.01 - 0.01 - - - 0.02
Civil JET Northrop T-38 Talon T-38A 0.01 - 0.01 - - - 0.02
Civil JET Raytheon/Beech Beechjet 400/T-1 MU3001 0.05 - 0.05 - - - 0.11
Civil HEL Hughes 269 H500D or SC300C 0.01 - 0.01 - - - 0.02
Civil HEL Sikorsky S-76 S76 0.01 - 0.01 - - - 0.02
Civil MEP Beech 58 BEC58P 0.09 - 0.09 - - - 0.18
Civil MEP Beech 76 Duchess BEC58P 0.00 - 0.00 - - - 0.01
Civil MEP Beech Baron 55 BEC58P 0.02 - 0.02 - - - 0.03
Civil MEP Cessna 310 BEC58P 0.01 - 0.01 - - - 0.02
Civil MEP Cessna 340 BEC58P 0.01 - 0.01 - - - 0.01
Civil MEP Cessna Golden Eagle 421 BEC58P 0.01 - 0.01 - - - 0.02
Civil MEP PA31 - Piper Navajo PA-31 BEC58P 0.02 - 0.02 - - - 0.04
Civil MEP Piper PA-30 PA30 0.01 - 0.01 - - - 0.02
Civil MEP Piper PA-34 Seneca BEC58P 0.01 - 0.01 - - - 0.02
Civil MET Airbus A400M Atlas C-130E 0.01 - 0.01 - - - 0.02
Civil MET BAe-3100 Jetstream DHC6 0.01 - 0.01 - - - 0.01
Civil MET Beech 200 Super King DHC6 0.88 - 0.88 - - - 1.76
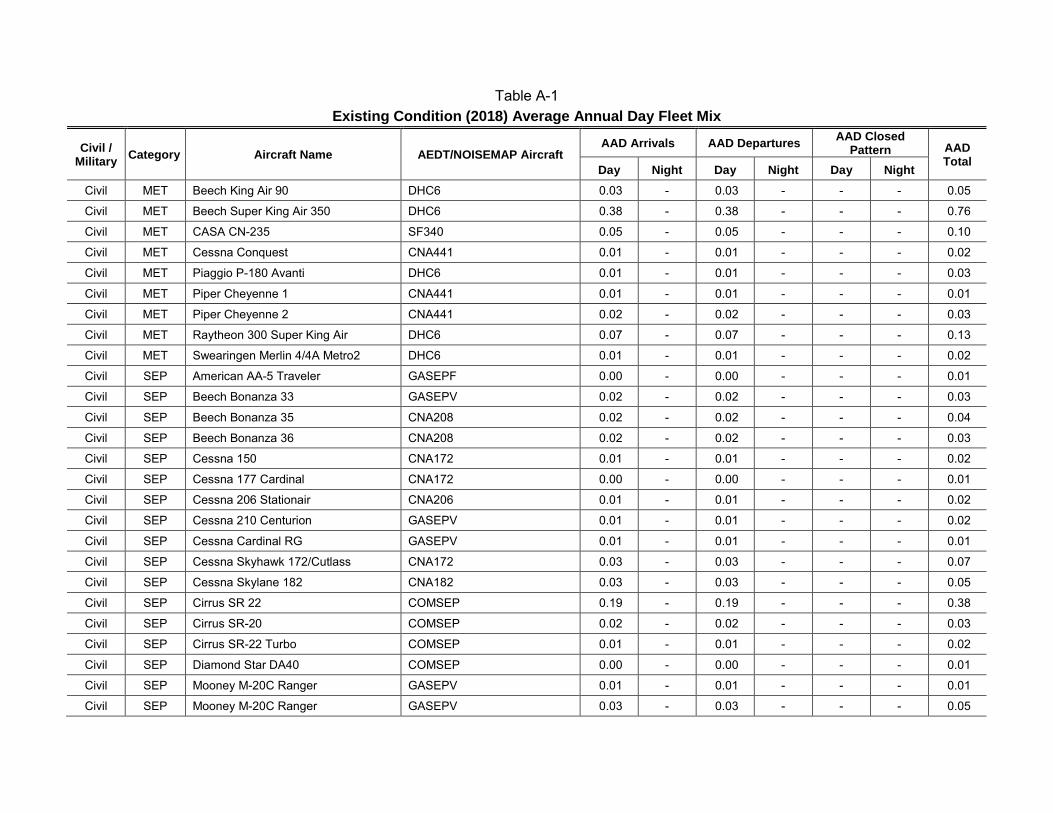
Table A-1 Existing Condition (2018) Average Annual Day Fleet Mix
Civil / Military Category Aircraft Name AEDT/NOISEMAP Aircraft
AAD Arrivals AAD Departures AAD Closed Pattern AAD
Total Day Night Day Night Day Night
Civil MET Beech King Air 90 DHC6 0.03 - 0.03 - - - 0.05
Civil MET Beech Super King Air 350 DHC6 0.38 - 0.38 - - - 0.76
Civil MET CASA CN-235 SF340 0.05 - 0.05 - - - 0.10
Civil MET Cessna Conquest CNA441 0.01 - 0.01 - - - 0.02
Civil MET Piaggio P-180 Avanti DHC6 0.01 - 0.01 - - - 0.03
Civil MET Piper Cheyenne 1 CNA441 0.01 - 0.01 - - - 0.01
Civil MET Piper Cheyenne 2 CNA441 0.02 - 0.02 - - - 0.03
Civil MET Raytheon 300 Super King Air DHC6 0.07 - 0.07 - - - 0.13
Civil MET Swearingen Merlin 4/4A Metro2 DHC6 0.01 - 0.01 - - - 0.02
Civil SEP American AA-5 Traveler GASEPF 0.00 - 0.00 - - - 0.01
Civil SEP Beech Bonanza 33 GASEPV 0.02 - 0.02 - - - 0.03
Civil SEP Beech Bonanza 35 CNA208 0.02 - 0.02 - - - 0.04
Civil SEP Beech Bonanza 36 CNA208 0.02 - 0.02 - - - 0.03
Civil SEP Cessna 150 CNA172 0.01 - 0.01 - - - 0.02
Civil SEP Cessna 177 Cardinal CNA172 0.00 - 0.00 - - - 0.01
Civil SEP Cessna 206 Stationair CNA206 0.01 - 0.01 - - - 0.02
Civil SEP Cessna 210 Centurion GASEPV 0.01 - 0.01 - - - 0.02
Civil SEP Cessna Cardinal RG GASEPV 0.01 - 0.01 - - - 0.01
Civil SEP Cessna Skyhawk 172/Cutlass CNA172 0.03 - 0.03 - - - 0.07
Civil SEP Cessna Skylane 182 CNA182 0.03 - 0.03 - - - 0.05
Civil SEP Cirrus SR 22 COMSEP 0.19 - 0.19 - - - 0.38
Civil SEP Cirrus SR-20 COMSEP 0.02 - 0.02 - - - 0.03
Civil SEP Cirrus SR-22 Turbo COMSEP 0.01 - 0.01 - - - 0.02
Civil SEP Diamond Star DA40 COMSEP 0.00 - 0.00 - - - 0.01
Civil SEP Mooney M-20C Ranger GASEPV 0.01 - 0.01 - - - 0.01
Civil SEP Mooney M-20C Ranger GASEPV 0.03 - 0.03 - - - 0.05

Table A-1 Existing Condition (2018) Average Annual Day Fleet Mix
Civil / Military Category Aircraft Name AEDT/NOISEMAP Aircraft
AAD Arrivals AAD Departures AAD Closed Pattern AAD
Total Day Night Day Night Day Night
Civil SEP Piper Aztec BEC58P 0.00 - 0.00 - - - 0.01
Civil SEP Piper Cherokee GASEPF or PA28 0.02 - 0.02 - - - 0.03
Civil SEP Piper Cherokee Six GASEPV 0.01 - 0.01 - - - 0.02
Civil SEP Piper Malibu GASEPV 0.04 - 0.04 - - - 0.09
Civil SEP Turbo Mooney M20K GASEPV 0.01 - 0.01 - - - 0.02
Civil SET Pilatus PC-12 CNA208 0.43 - 0.43 - - - 0.85
Civil SET Piper Malibu Meridian CNA441 0.01 - 0.01 - - - 0.03
Civil SET Raytheon Texan 2 GASEPF 0.01 - 0.01 - - - 0.02
Civil SET Socata TBM-850 CNA441 0.02 - 0.02 - - - 0.04
Total 15.89 0.03 15.89 0.01 22.30 - 54.12
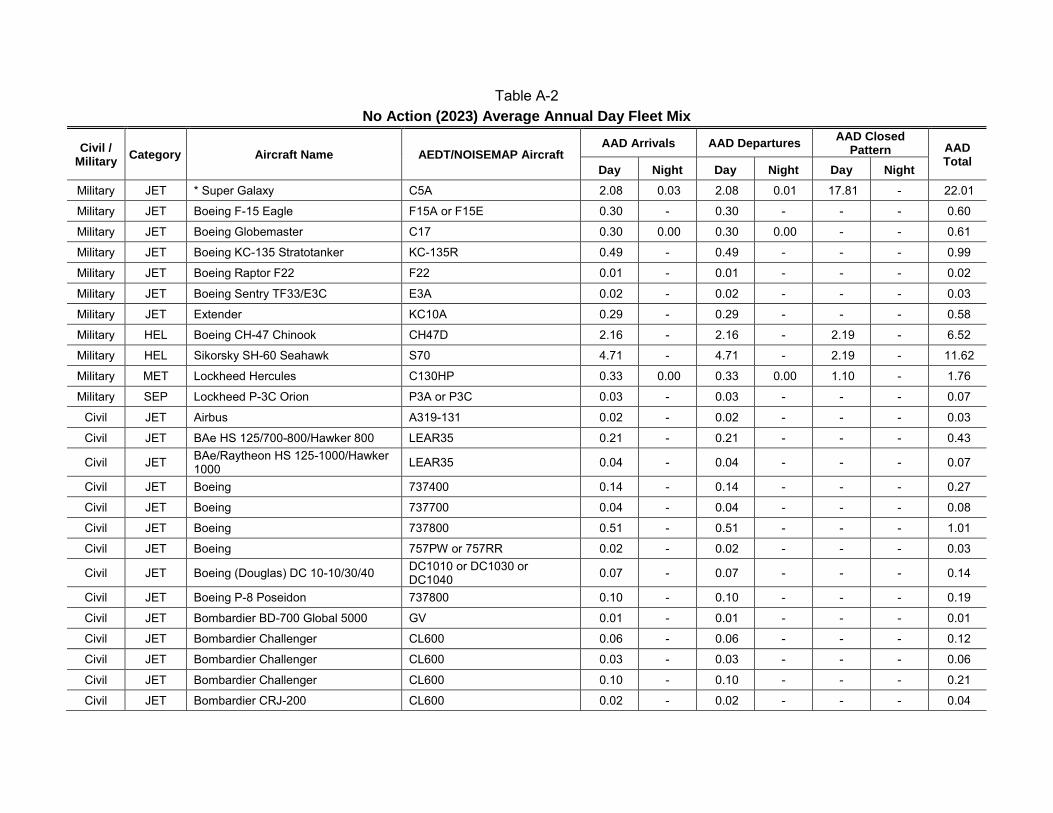
Table A-2 No Action (2023) Average Annual Day Fleet Mix
Civil / Military Category Aircraft Name AEDT/NOISEMAP Aircraft
AAD Arrivals AAD Departures AAD Closed Pattern AAD
Total Day Night Day Night Day Night
Military JET * Super Galaxy C5A 2.08 0.03 2.08 0.01 17.81 - 22.01
Military JET Boeing F-15 Eagle F15A or F15E 0.30 - 0.30 - - - 0.60
Military JET Boeing Globemaster C17 0.30 0.00 0.30 0.00 - - 0.61
Military JET Boeing KC-135 Stratotanker KC-135R 0.49 - 0.49 - - - 0.99
Military JET Boeing Raptor F22 F22 0.01 - 0.01 - - - 0.02
Military JET Boeing Sentry TF33/E3C E3A 0.02 - 0.02 - - - 0.03
Military JET Extender KC10A 0.29 - 0.29 - - - 0.58
Military HEL Boeing CH-47 Chinook CH47D 2.16 - 2.16 - 2.19 - 6.52
Military HEL Sikorsky SH-60 Seahawk S70 4.71 - 4.71 - 2.19 - 11.62
Military MET Lockheed Hercules C130HP 0.33 0.00 0.33 0.00 1.10 - 1.76
Military SEP Lockheed P-3C Orion P3A or P3C 0.03 - 0.03 - - - 0.07
Civil JET Airbus A319-131 0.02 - 0.02 - - - 0.03
Civil JET BAe HS 125/700-800/Hawker 800 LEAR35 0.21 - 0.21 - - - 0.43
Civil JET BAe/Raytheon HS 125-1000/Hawker 1000 LEAR35 0.04 - 0.04 - - - 0.07
Civil JET Boeing 737400 0.14 - 0.14 - - - 0.27
Civil JET Boeing 737700 0.04 - 0.04 - - - 0.08
Civil JET Boeing 737800 0.51 - 0.51 - - - 1.01
Civil JET Boeing 757PW or 757RR 0.02 - 0.02 - - - 0.03
Civil JET Boeing (Douglas) DC 10-10/30/40 DC1010 or DC1030 or DC1040 0.07 - 0.07 - - - 0.14
Civil JET Boeing P-8 Poseidon 737800 0.10 - 0.10 - - - 0.19
Civil JET Bombardier BD-700 Global 5000 GV 0.01 - 0.01 - - - 0.01
Civil JET Bombardier Challenger CL600 0.06 - 0.06 - - - 0.12
Civil JET Bombardier Challenger CL600 0.03 - 0.03 - - - 0.06
Civil JET Bombardier Challenger CL600 0.10 - 0.10 - - - 0.21
Civil JET Bombardier CRJ-200 CL600 0.02 - 0.02 - - - 0.04
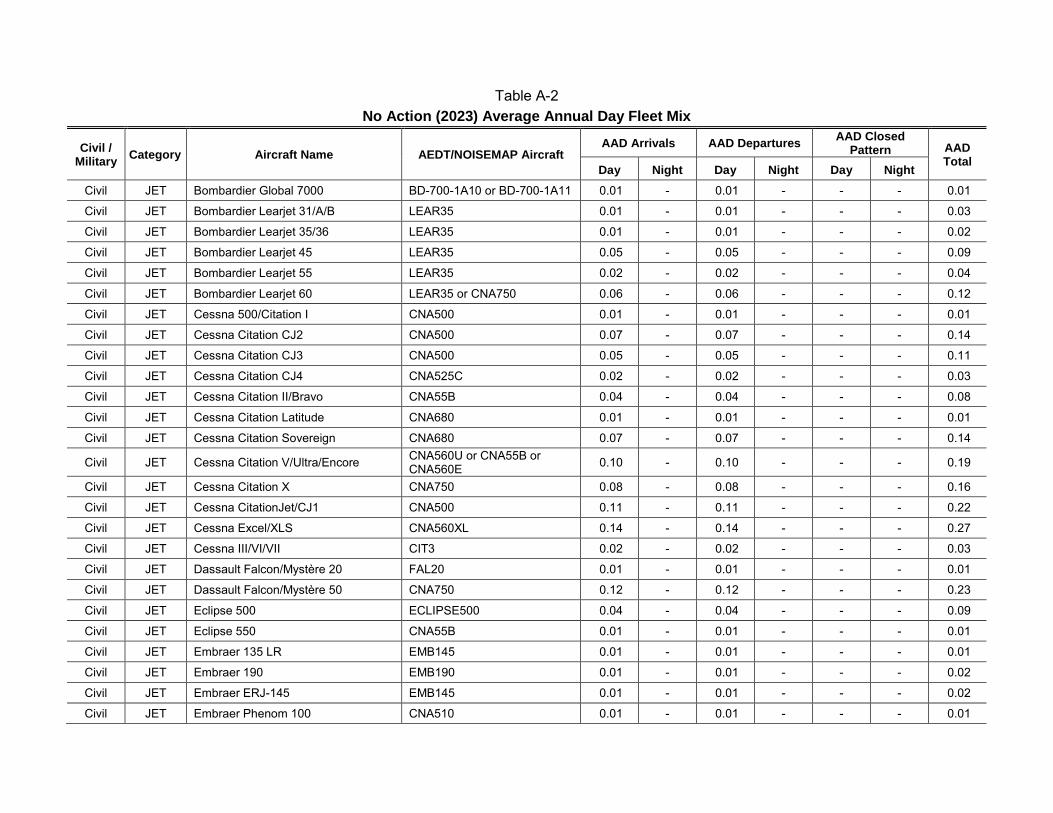
Table A-2 No Action (2023) Average Annual Day Fleet Mix
Civil / Military Category Aircraft Name AEDT/NOISEMAP Aircraft
AAD Arrivals AAD Departures AAD Closed Pattern AAD
Total Day Night Day Night Day Night
Civil JET Bombardier Global 7000 BD-700-1A10 or BD-700-1A11 0.01 - 0.01 - - - 0.01
Civil JET Bombardier Learjet 31/A/B LEAR35 0.01 - 0.01 - - - 0.03
Civil JET Bombardier Learjet 35/36 LEAR35 0.01 - 0.01 - - - 0.02
Civil JET Bombardier Learjet 45 LEAR35 0.05 - 0.05 - - - 0.09
Civil JET Bombardier Learjet 55 LEAR35 0.02 - 0.02 - - - 0.04
Civil JET Bombardier Learjet 60 LEAR35 or CNA750 0.06 - 0.06 - - - 0.12
Civil JET Cessna 500/Citation I CNA500 0.01 - 0.01 - - - 0.01
Civil JET Cessna Citation CJ2 CNA500 0.07 - 0.07 - - - 0.14
Civil JET Cessna Citation CJ3 CNA500 0.05 - 0.05 - - - 0.11
Civil JET Cessna Citation CJ4 CNA525C 0.02 - 0.02 - - - 0.03
Civil JET Cessna Citation II/Bravo CNA55B 0.04 - 0.04 - - - 0.08
Civil JET Cessna Citation Latitude CNA680 0.01 - 0.01 - - - 0.01
Civil JET Cessna Citation Sovereign CNA680 0.07 - 0.07 - - - 0.14
Civil JET Cessna Citation V/Ultra/Encore CNA560U or CNA55B or CNA560E 0.10 - 0.10 - - - 0.19
Civil JET Cessna Citation X CNA750 0.08 - 0.08 - - - 0.16
Civil JET Cessna CitationJet/CJ1 CNA500 0.11 - 0.11 - - - 0.22
Civil JET Cessna Excel/XLS CNA560XL 0.14 - 0.14 - - - 0.27
Civil JET Cessna III/VI/VII CIT3 0.02 - 0.02 - - - 0.03
Civil JET Dassault Falcon/Mystère 20 FAL20 0.01 - 0.01 - - - 0.01
Civil JET Dassault Falcon/Mystère 50 CNA750 0.12 - 0.12 - - - 0.23
Civil JET Eclipse 500 ECLIPSE500 0.04 - 0.04 - - - 0.09
Civil JET Eclipse 550 CNA55B 0.01 - 0.01 - - - 0.01
Civil JET Embraer 135 LR EMB145 0.01 - 0.01 - - - 0.01
Civil JET Embraer 190 EMB190 0.01 - 0.01 - - - 0.02
Civil JET Embraer ERJ-145 EMB145 0.01 - 0.01 - - - 0.02
Civil JET Embraer Phenom 100 CNA510 0.01 - 0.01 - - - 0.01
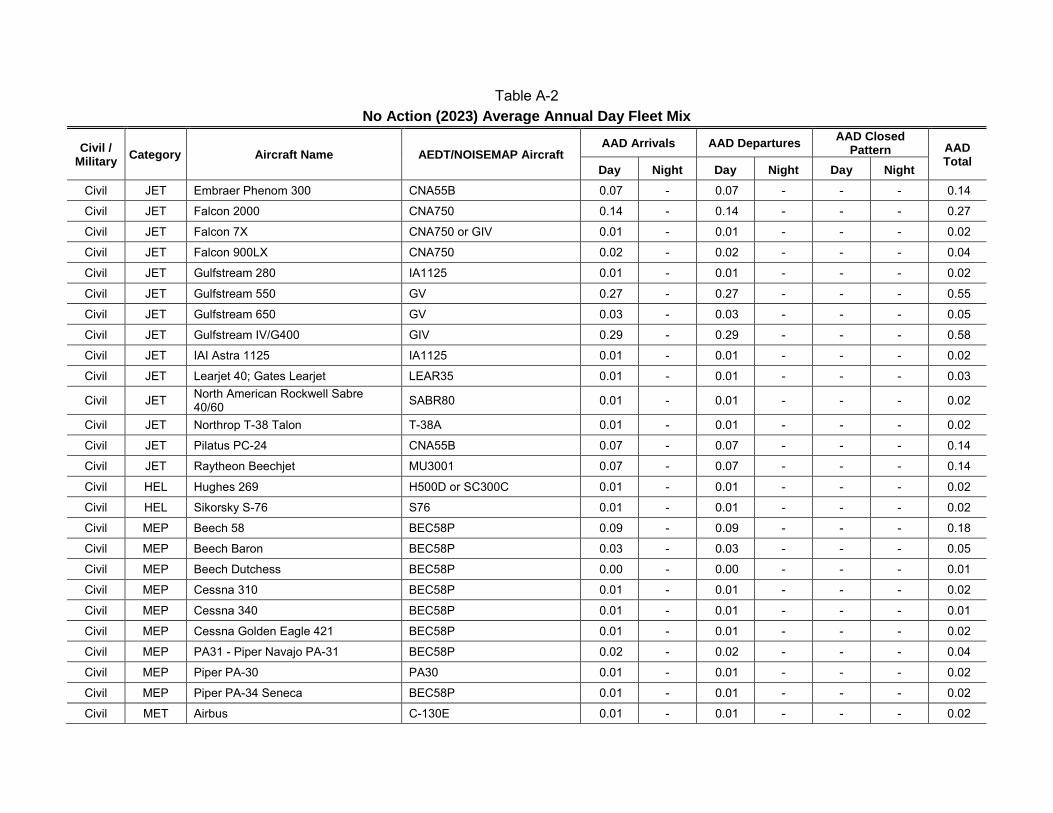
Table A-2 No Action (2023) Average Annual Day Fleet Mix
Civil / Military Category Aircraft Name AEDT/NOISEMAP Aircraft
AAD Arrivals AAD Departures AAD Closed Pattern AAD
Total Day Night Day Night Day Night
Civil JET Embraer Phenom 300 CNA55B 0.07 - 0.07 - - - 0.14
Civil JET Falcon 2000 CNA750 0.14 - 0.14 - - - 0.27
Civil JET Falcon 7X CNA750 or GIV 0.01 - 0.01 - - - 0.02
Civil JET Falcon 900LX CNA750 0.02 - 0.02 - - - 0.04
Civil JET Gulfstream 280 IA1125 0.01 - 0.01 - - - 0.02
Civil JET Gulfstream 550 GV 0.27 - 0.27 - - - 0.55
Civil JET Gulfstream 650 GV 0.03 - 0.03 - - - 0.05
Civil JET Gulfstream IV/G400 GIV 0.29 - 0.29 - - - 0.58
Civil JET IAI Astra 1125 IA1125 0.01 - 0.01 - - - 0.02
Civil JET Learjet 40; Gates Learjet LEAR35 0.01 - 0.01 - - - 0.03
Civil JET North American Rockwell Sabre 40/60 SABR80 0.01 - 0.01 - - - 0.02
Civil JET Northrop T-38 Talon T-38A 0.01 - 0.01 - - - 0.02
Civil JET Pilatus PC-24 CNA55B 0.07 - 0.07 - - - 0.14
Civil JET Raytheon Beechjet MU3001 0.07 - 0.07 - - - 0.14
Civil HEL Hughes 269 H500D or SC300C 0.01 - 0.01 - - - 0.02
Civil HEL Sikorsky S-76 S76 0.01 - 0.01 - - - 0.02
Civil MEP Beech 58 BEC58P 0.09 - 0.09 - - - 0.18
Civil MEP Beech Baron BEC58P 0.03 - 0.03 - - - 0.05
Civil MEP Beech Dutchess BEC58P 0.00 - 0.00 - - - 0.01
Civil MEP Cessna 310 BEC58P 0.01 - 0.01 - - - 0.02
Civil MEP Cessna 340 BEC58P 0.01 - 0.01 - - - 0.01
Civil MEP Cessna Golden Eagle 421 BEC58P 0.01 - 0.01 - - - 0.02
Civil MEP PA31 - Piper Navajo PA-31 BEC58P 0.02 - 0.02 - - - 0.04
Civil MEP Piper PA-30 PA30 0.01 - 0.01 - - - 0.02
Civil MEP Piper PA-34 Seneca BEC58P 0.01 - 0.01 - - - 0.02
Civil MET Airbus C-130E 0.01 - 0.01 - - - 0.02
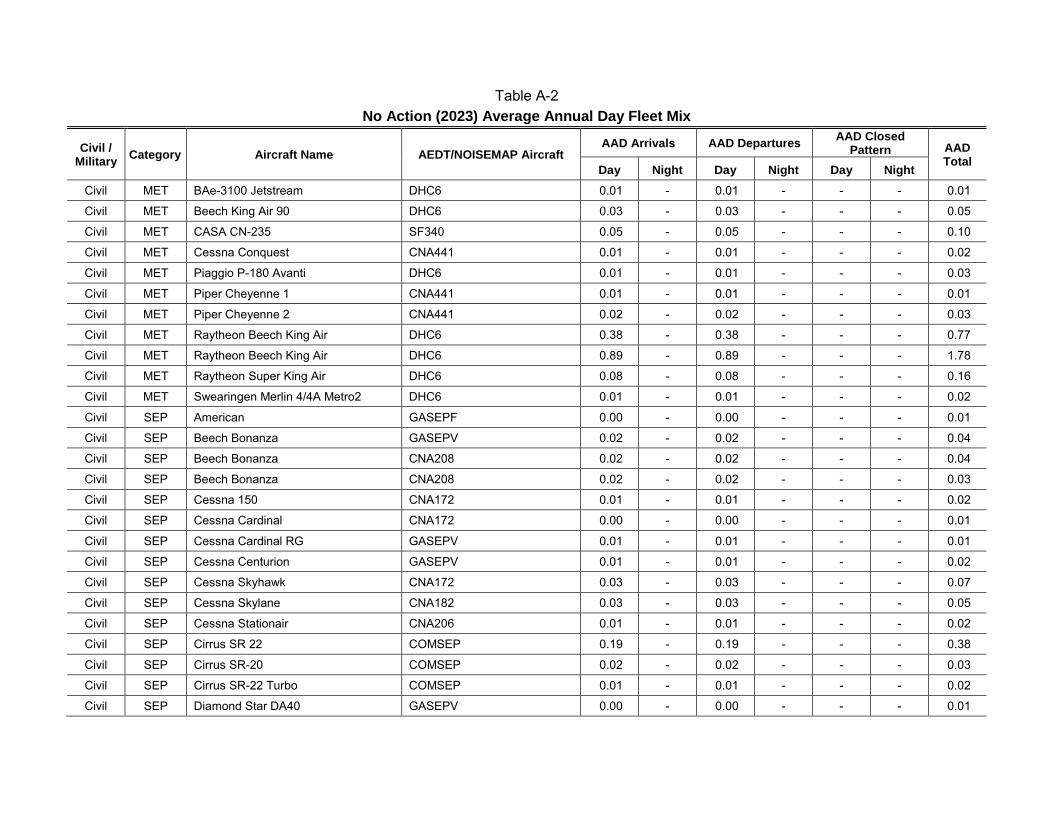
Table A-2 No Action (2023) Average Annual Day Fleet Mix
Civil / Military Category Aircraft Name AEDT/NOISEMAP Aircraft
AAD Arrivals AAD Departures AAD Closed Pattern AAD
Total Day Night Day Night Day Night
Civil MET BAe-3100 Jetstream DHC6 0.01 - 0.01 - - - 0.01
Civil MET Beech King Air 90 DHC6 0.03 - 0.03 - - - 0.05
Civil MET CASA CN-235 SF340 0.05 - 0.05 - - - 0.10
Civil MET Cessna Conquest CNA441 0.01 - 0.01 - - - 0.02
Civil MET Piaggio P-180 Avanti DHC6 0.01 - 0.01 - - - 0.03
Civil MET Piper Cheyenne 1 CNA441 0.01 - 0.01 - - - 0.01
Civil MET Piper Cheyenne 2 CNA441 0.02 - 0.02 - - - 0.03
Civil MET Raytheon Beech King Air DHC6 0.38 - 0.38 - - - 0.77
Civil MET Raytheon Beech King Air DHC6 0.89 - 0.89 - - - 1.78
Civil MET Raytheon Super King Air DHC6 0.08 - 0.08 - - - 0.16
Civil MET Swearingen Merlin 4/4A Metro2 DHC6 0.01 - 0.01 - - - 0.02
Civil SEP American GASEPF 0.00 - 0.00 - - - 0.01
Civil SEP Beech Bonanza GASEPV 0.02 - 0.02 - - - 0.04
Civil SEP Beech Bonanza CNA208 0.02 - 0.02 - - - 0.04
Civil SEP Beech Bonanza CNA208 0.02 - 0.02 - - - 0.03
Civil SEP Cessna 150 CNA172 0.01 - 0.01 - - - 0.02
Civil SEP Cessna Cardinal CNA172 0.00 - 0.00 - - - 0.01
Civil SEP Cessna Cardinal RG GASEPV 0.01 - 0.01 - - - 0.01
Civil SEP Cessna Centurion GASEPV 0.01 - 0.01 - - - 0.02
Civil SEP Cessna Skyhawk CNA172 0.03 - 0.03 - - - 0.07
Civil SEP Cessna Skylane CNA182 0.03 - 0.03 - - - 0.05
Civil SEP Cessna Stationair CNA206 0.01 - 0.01 - - - 0.02
Civil SEP Cirrus SR 22 COMSEP 0.19 - 0.19 - - - 0.38
Civil SEP Cirrus SR-20 COMSEP 0.02 - 0.02 - - - 0.03
Civil SEP Cirrus SR-22 Turbo COMSEP 0.01 - 0.01 - - - 0.02
Civil SEP Diamond Star DA40 GASEPV 0.00 - 0.00 - - - 0.01
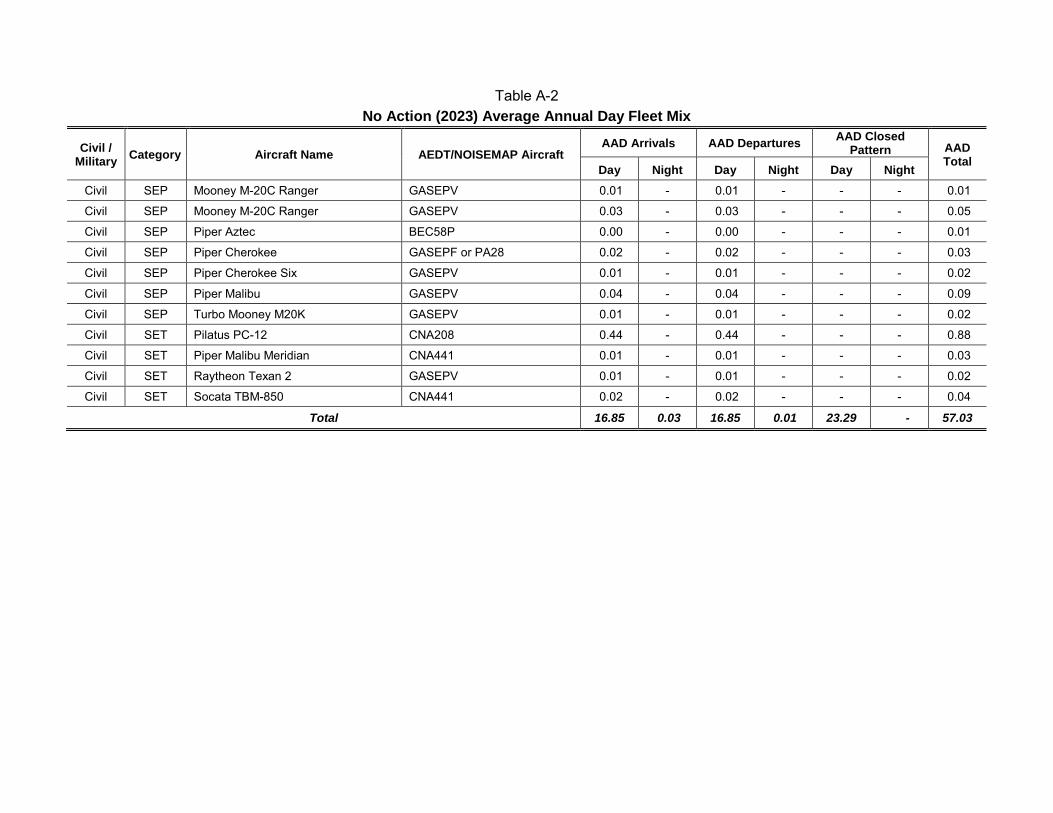
Table A-2 No Action (2023) Average Annual Day Fleet Mix
Civil / Military Category Aircraft Name AEDT/NOISEMAP Aircraft
AAD Arrivals AAD Departures AAD Closed Pattern AAD
Total Day Night Day Night Day Night
Civil SEP Mooney M-20C Ranger GASEPV 0.01 - 0.01 - - - 0.01
Civil SEP Mooney M-20C Ranger GASEPV 0.03 - 0.03 - - - 0.05
Civil SEP Piper Aztec BEC58P 0.00 - 0.00 - - - 0.01
Civil SEP Piper Cherokee GASEPF or PA28 0.02 - 0.02 - - - 0.03
Civil SEP Piper Cherokee Six GASEPV 0.01 - 0.01 - - - 0.02
Civil SEP Piper Malibu GASEPV 0.04 - 0.04 - - - 0.09
Civil SEP Turbo Mooney M20K GASEPV 0.01 - 0.01 - - - 0.02
Civil SET Pilatus PC-12 CNA208 0.44 - 0.44 - - - 0.88
Civil SET Piper Malibu Meridian CNA441 0.01 - 0.01 - - - 0.03
Civil SET Raytheon Texan 2 GASEPV 0.01 - 0.01 - - - 0.02
Civil SET Socata TBM-850 CNA441 0.02 - 0.02 - - - 0.04
Total 16.85 0.03 16.85 0.01 23.29 - 57.03
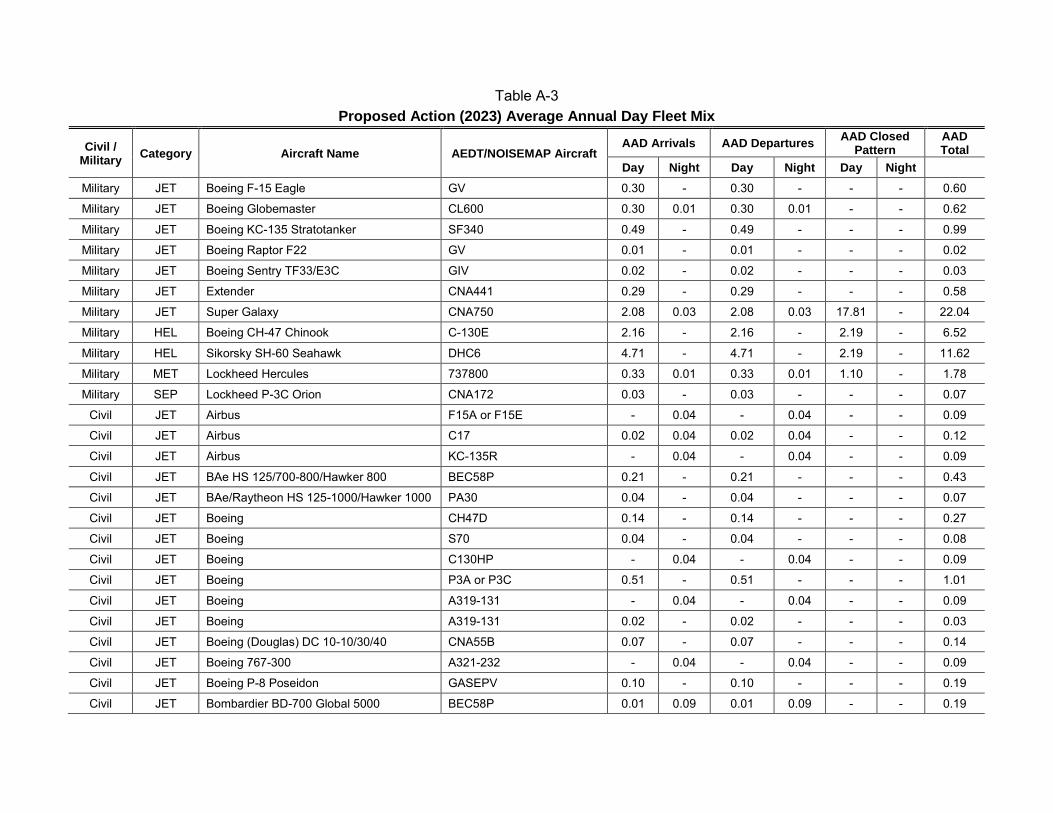
Table A-3 Proposed Action (2023) Average Annual Day Fleet Mix
Civil / Military Category Aircraft Name AEDT/NOISEMAP Aircraft
AAD Arrivals AAD Departures AAD Closed Pattern
AAD Total
Day Night Day Night Day Night
Military JET Boeing F-15 Eagle GV 0.30 - 0.30 - - - 0.60
Military JET Boeing Globemaster CL600 0.30 0.01 0.30 0.01 - - 0.62
Military JET Boeing KC-135 Stratotanker SF340 0.49 - 0.49 - - - 0.99
Military JET Boeing Raptor F22 GV 0.01 - 0.01 - - - 0.02
Military JET Boeing Sentry TF33/E3C GIV 0.02 - 0.02 - - - 0.03
Military JET Extender CNA441 0.29 - 0.29 - - - 0.58
Military JET Super Galaxy CNA750 2.08 0.03 2.08 0.03 17.81 - 22.04
Military HEL Boeing CH-47 Chinook C-130E 2.16 - 2.16 - 2.19 - 6.52
Military HEL Sikorsky SH-60 Seahawk DHC6 4.71 - 4.71 - 2.19 - 11.62
Military MET Lockheed Hercules 737800 0.33 0.01 0.33 0.01 1.10 - 1.78
Military SEP Lockheed P-3C Orion CNA172 0.03 - 0.03 - - - 0.07
Civil JET Airbus F15A or F15E - 0.04 - 0.04 - - 0.09
Civil JET Airbus C17 0.02 0.04 0.02 0.04 - - 0.12
Civil JET Airbus KC-135R - 0.04 - 0.04 - - 0.09
Civil JET BAe HS 125/700-800/Hawker 800 BEC58P 0.21 - 0.21 - - - 0.43
Civil JET BAe/Raytheon HS 125-1000/Hawker 1000 PA30 0.04 - 0.04 - - - 0.07
Civil JET Boeing CH47D 0.14 - 0.14 - - - 0.27
Civil JET Boeing S70 0.04 - 0.04 - - - 0.08
Civil JET Boeing C130HP - 0.04 - 0.04 - - 0.09
Civil JET Boeing P3A or P3C 0.51 - 0.51 - - - 1.01
Civil JET Boeing A319-131 - 0.04 - 0.04 - - 0.09
Civil JET Boeing A319-131 0.02 - 0.02 - - - 0.03
Civil JET Boeing (Douglas) DC 10-10/30/40 CNA55B 0.07 - 0.07 - - - 0.14
Civil JET Boeing 767-300 A321-232 - 0.04 - 0.04 - - 0.09
Civil JET Boeing P-8 Poseidon GASEPV 0.10 - 0.10 - - - 0.19
Civil JET Bombardier BD-700 Global 5000 BEC58P 0.01 0.09 0.01 0.09 - - 0.19
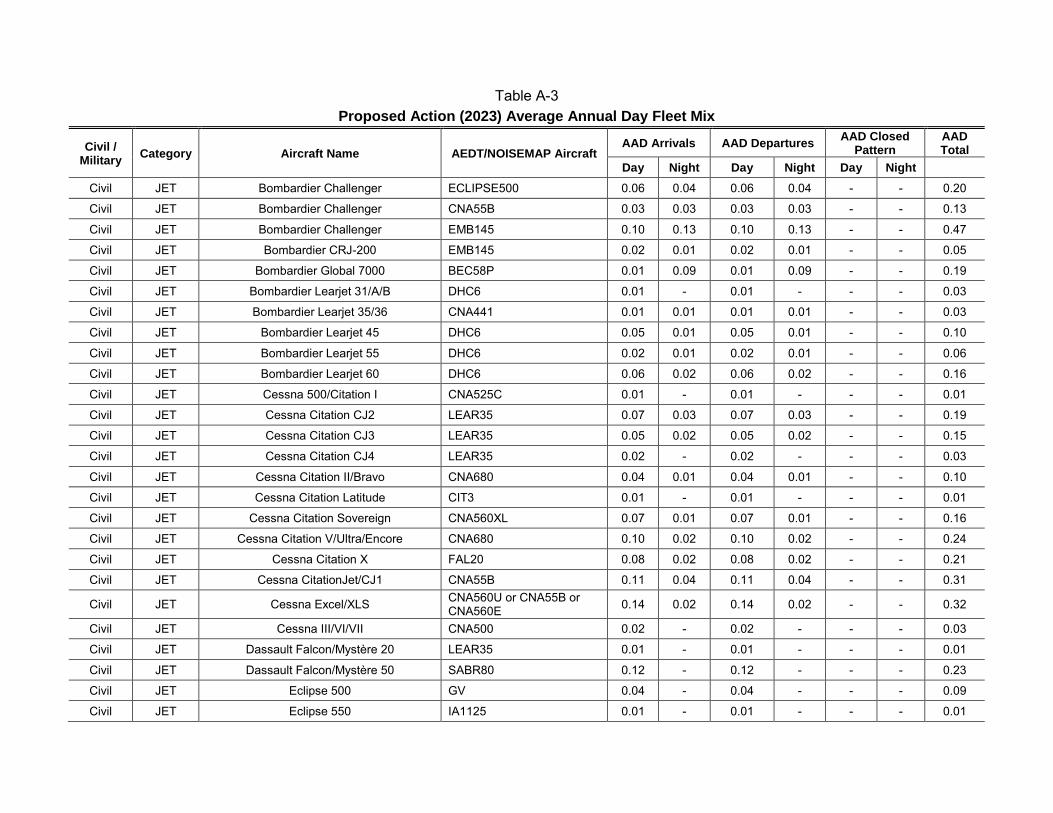
Table A-3 Proposed Action (2023) Average Annual Day Fleet Mix
Civil / Military Category Aircraft Name AEDT/NOISEMAP Aircraft
AAD Arrivals AAD Departures AAD Closed Pattern
AAD Total
Day Night Day Night Day Night
Civil JET Bombardier Challenger ECLIPSE500 0.06 0.04 0.06 0.04 - - 0.20
Civil JET Bombardier Challenger CNA55B 0.03 0.03 0.03 0.03 - - 0.13
Civil JET Bombardier Challenger EMB145 0.10 0.13 0.10 0.13 - - 0.47
Civil JET Bombardier CRJ-200 EMB145 0.02 0.01 0.02 0.01 - - 0.05
Civil JET Bombardier Global 7000 BEC58P 0.01 0.09 0.01 0.09 - - 0.19
Civil JET Bombardier Learjet 31/A/B DHC6 0.01 - 0.01 - - - 0.03
Civil JET Bombardier Learjet 35/36 CNA441 0.01 0.01 0.01 0.01 - - 0.03
Civil JET Bombardier Learjet 45 DHC6 0.05 0.01 0.05 0.01 - - 0.10
Civil JET Bombardier Learjet 55 DHC6 0.02 0.01 0.02 0.01 - - 0.06
Civil JET Bombardier Learjet 60 DHC6 0.06 0.02 0.06 0.02 - - 0.16
Civil JET Cessna 500/Citation I CNA525C 0.01 - 0.01 - - - 0.01
Civil JET Cessna Citation CJ2 LEAR35 0.07 0.03 0.07 0.03 - - 0.19
Civil JET Cessna Citation CJ3 LEAR35 0.05 0.02 0.05 0.02 - - 0.15
Civil JET Cessna Citation CJ4 LEAR35 0.02 - 0.02 - - - 0.03
Civil JET Cessna Citation II/Bravo CNA680 0.04 0.01 0.04 0.01 - - 0.10
Civil JET Cessna Citation Latitude CIT3 0.01 - 0.01 - - - 0.01
Civil JET Cessna Citation Sovereign CNA560XL 0.07 0.01 0.07 0.01 - - 0.16
Civil JET Cessna Citation V/Ultra/Encore CNA680 0.10 0.02 0.10 0.02 - - 0.24
Civil JET Cessna Citation X FAL20 0.08 0.02 0.08 0.02 - - 0.21
Civil JET Cessna CitationJet/CJ1 CNA55B 0.11 0.04 0.11 0.04 - - 0.31
Civil JET Cessna Excel/XLS CNA560U or CNA55B or CNA560E 0.14 0.02 0.14 0.02 - - 0.32
Civil JET Cessna III/VI/VII CNA500 0.02 - 0.02 - - - 0.03
Civil JET Dassault Falcon/Mystère 20 LEAR35 0.01 - 0.01 - - - 0.01
Civil JET Dassault Falcon/Mystère 50 SABR80 0.12 - 0.12 - - - 0.23
Civil JET Eclipse 500 GV 0.04 - 0.04 - - - 0.09
Civil JET Eclipse 550 IA1125 0.01 - 0.01 - - - 0.01
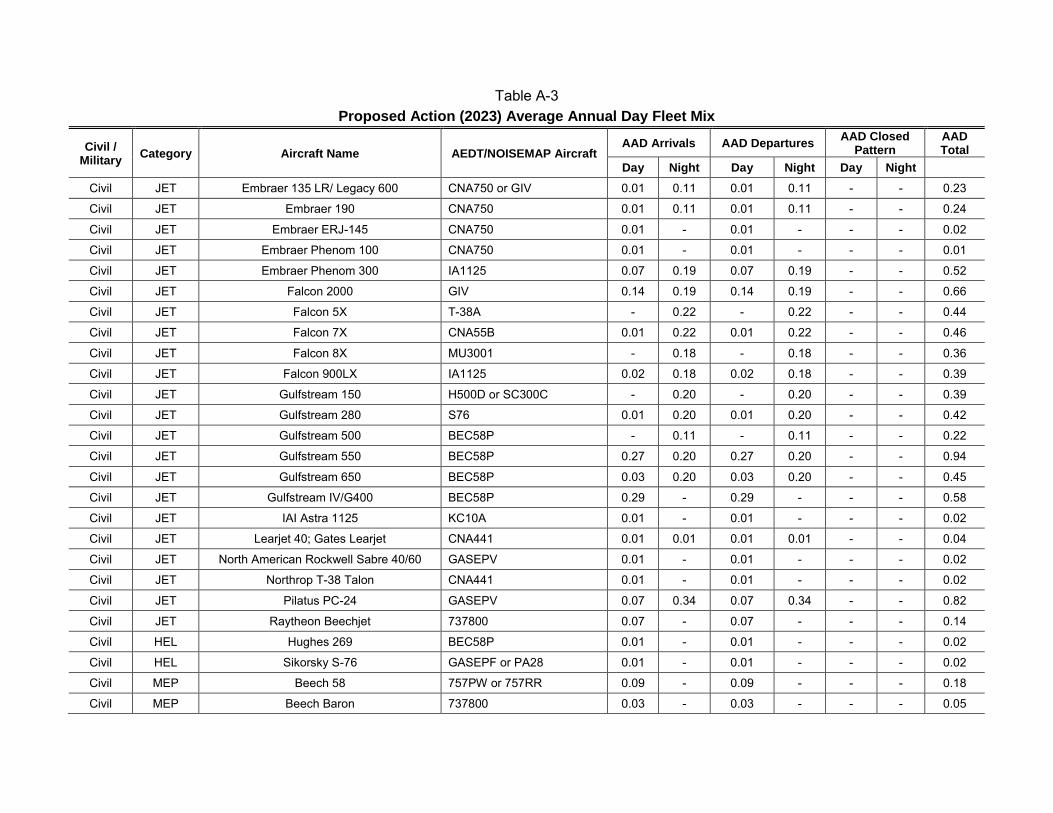
Table A-3 Proposed Action (2023) Average Annual Day Fleet Mix
Civil / Military Category Aircraft Name AEDT/NOISEMAP Aircraft
AAD Arrivals AAD Departures AAD Closed Pattern
AAD Total
Day Night Day Night Day Night
Civil JET Embraer 135 LR/ Legacy 600 CNA750 or GIV 0.01 0.11 0.01 0.11 - - 0.23
Civil JET Embraer 190 CNA750 0.01 0.11 0.01 0.11 - - 0.24
Civil JET Embraer ERJ-145 CNA750 0.01 - 0.01 - - - 0.02
Civil JET Embraer Phenom 100 CNA750 0.01 - 0.01 - - - 0.01
Civil JET Embraer Phenom 300 IA1125 0.07 0.19 0.07 0.19 - - 0.52
Civil JET Falcon 2000 GIV 0.14 0.19 0.14 0.19 - - 0.66
Civil JET Falcon 5X T-38A - 0.22 - 0.22 - - 0.44
Civil JET Falcon 7X CNA55B 0.01 0.22 0.01 0.22 - - 0.46
Civil JET Falcon 8X MU3001 - 0.18 - 0.18 - - 0.36
Civil JET Falcon 900LX IA1125 0.02 0.18 0.02 0.18 - - 0.39
Civil JET Gulfstream 150 H500D or SC300C - 0.20 - 0.20 - - 0.39
Civil JET Gulfstream 280 S76 0.01 0.20 0.01 0.20 - - 0.42
Civil JET Gulfstream 500 BEC58P - 0.11 - 0.11 - - 0.22
Civil JET Gulfstream 550 BEC58P 0.27 0.20 0.27 0.20 - - 0.94
Civil JET Gulfstream 650 BEC58P 0.03 0.20 0.03 0.20 - - 0.45
Civil JET Gulfstream IV/G400 BEC58P 0.29 - 0.29 - - - 0.58
Civil JET IAI Astra 1125 KC10A 0.01 - 0.01 - - - 0.02
Civil JET Learjet 40; Gates Learjet CNA441 0.01 0.01 0.01 0.01 - - 0.04
Civil JET North American Rockwell Sabre 40/60 GASEPV 0.01 - 0.01 - - - 0.02
Civil JET Northrop T-38 Talon CNA441 0.01 - 0.01 - - - 0.02
Civil JET Pilatus PC-24 GASEPV 0.07 0.34 0.07 0.34 - - 0.82
Civil JET Raytheon Beechjet 737800 0.07 - 0.07 - - - 0.14
Civil HEL Hughes 269 BEC58P 0.01 - 0.01 - - - 0.02
Civil HEL Sikorsky S-76 GASEPF or PA28 0.01 - 0.01 - - - 0.02
Civil MEP Beech 58 757PW or 757RR 0.09 - 0.09 - - - 0.18
Civil MEP Beech Baron 737800 0.03 - 0.03 - - - 0.05
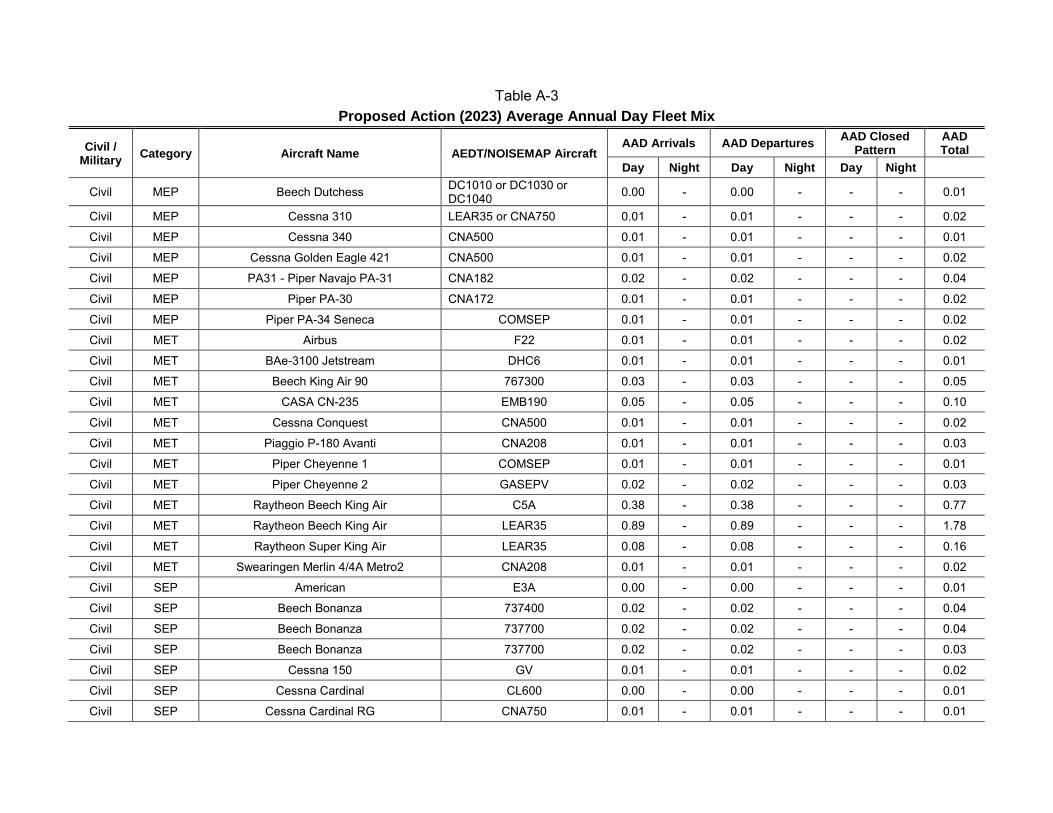
Table A-3 Proposed Action (2023) Average Annual Day Fleet Mix
Civil / Military Category Aircraft Name AEDT/NOISEMAP Aircraft
AAD Arrivals AAD Departures AAD Closed Pattern
AAD Total
Day Night Day Night Day Night
Civil MEP Beech Dutchess DC1010 or DC1030 or DC1040 0.00 - 0.00 - - - 0.01
Civil MEP Cessna 310 LEAR35 or CNA750 0.01 - 0.01 - - - 0.02
Civil MEP Cessna 340 CNA500 0.01 - 0.01 - - - 0.01
Civil MEP Cessna Golden Eagle 421 CNA500 0.01 - 0.01 - - - 0.02
Civil MEP PA31 - Piper Navajo PA-31 CNA182 0.02 - 0.02 - - - 0.04
Civil MEP Piper PA-30 CNA172 0.01 - 0.01 - - - 0.02
Civil MEP Piper PA-34 Seneca COMSEP 0.01 - 0.01 - - - 0.02
Civil MET Airbus F22 0.01 - 0.01 - - - 0.02
Civil MET BAe-3100 Jetstream DHC6 0.01 - 0.01 - - - 0.01
Civil MET Beech King Air 90 767300 0.03 - 0.03 - - - 0.05
Civil MET CASA CN-235 EMB190 0.05 - 0.05 - - - 0.10
Civil MET Cessna Conquest CNA500 0.01 - 0.01 - - - 0.02
Civil MET Piaggio P-180 Avanti CNA208 0.01 - 0.01 - - - 0.03
Civil MET Piper Cheyenne 1 COMSEP 0.01 - 0.01 - - - 0.01
Civil MET Piper Cheyenne 2 GASEPV 0.02 - 0.02 - - - 0.03
Civil MET Raytheon Beech King Air C5A 0.38 - 0.38 - - - 0.77
Civil MET Raytheon Beech King Air LEAR35 0.89 - 0.89 - - - 1.78
Civil MET Raytheon Super King Air LEAR35 0.08 - 0.08 - - - 0.16
Civil MET Swearingen Merlin 4/4A Metro2 CNA208 0.01 - 0.01 - - - 0.02
Civil SEP American E3A 0.00 - 0.00 - - - 0.01
Civil SEP Beech Bonanza 737400 0.02 - 0.02 - - - 0.04
Civil SEP Beech Bonanza 737700 0.02 - 0.02 - - - 0.04
Civil SEP Beech Bonanza 737700 0.02 - 0.02 - - - 0.03
Civil SEP Cessna 150 GV 0.01 - 0.01 - - - 0.02
Civil SEP Cessna Cardinal CL600 0.00 - 0.00 - - - 0.01
Civil SEP Cessna Cardinal RG CNA750 0.01 - 0.01 - - - 0.01
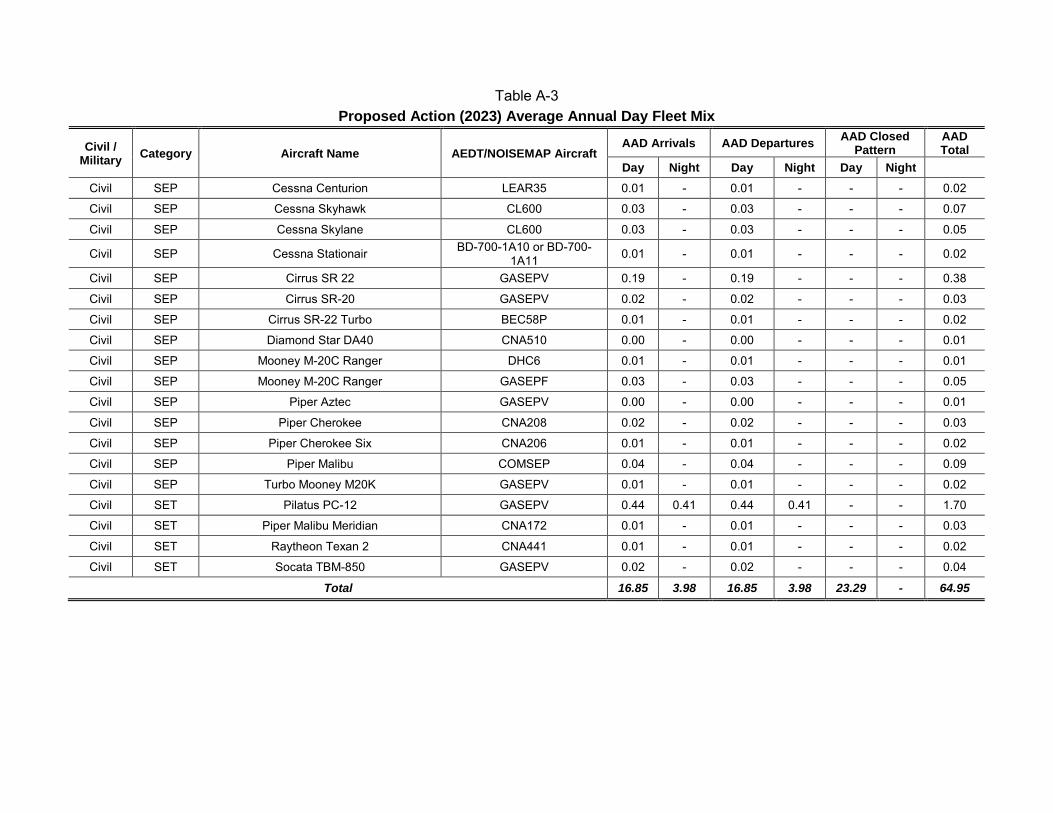
Table A-3 Proposed Action (2023) Average Annual Day Fleet Mix
Civil / Military Category Aircraft Name AEDT/NOISEMAP Aircraft
AAD Arrivals AAD Departures AAD Closed Pattern
AAD Total
Day Night Day Night Day Night
Civil SEP Cessna Centurion LEAR35 0.01 - 0.01 - - - 0.02
Civil SEP Cessna Skyhawk CL600 0.03 - 0.03 - - - 0.07
Civil SEP Cessna Skylane CL600 0.03 - 0.03 - - - 0.05
Civil SEP Cessna Stationair BD-700-1A10 or BD-700-1A11 0.01 - 0.01 - - - 0.02
Civil SEP Cirrus SR 22 GASEPV 0.19 - 0.19 - - - 0.38
Civil SEP Cirrus SR-20 GASEPV 0.02 - 0.02 - - - 0.03
Civil SEP Cirrus SR-22 Turbo BEC58P 0.01 - 0.01 - - - 0.02
Civil SEP Diamond Star DA40 CNA510 0.00 - 0.00 - - - 0.01
Civil SEP Mooney M-20C Ranger DHC6 0.01 - 0.01 - - - 0.01
Civil SEP Mooney M-20C Ranger GASEPF 0.03 - 0.03 - - - 0.05
Civil SEP Piper Aztec GASEPV 0.00 - 0.00 - - - 0.01
Civil SEP Piper Cherokee CNA208 0.02 - 0.02 - - - 0.03
Civil SEP Piper Cherokee Six CNA206 0.01 - 0.01 - - - 0.02
Civil SEP Piper Malibu COMSEP 0.04 - 0.04 - - - 0.09
Civil SEP Turbo Mooney M20K GASEPV 0.01 - 0.01 - - - 0.02
Civil SET Pilatus PC-12 GASEPV 0.44 0.41 0.44 0.41 - - 1.70
Civil SET Piper Malibu Meridian CNA172 0.01 - 0.01 - - - 0.03
Civil SET Raytheon Texan 2 CNA441 0.01 - 0.01 - - - 0.02
Civil SET Socata TBM-850 GASEPV 0.02 - 0.02 - - - 0.04
Total 16.85 3.98 16.85 3.98 23.29 - 64.95
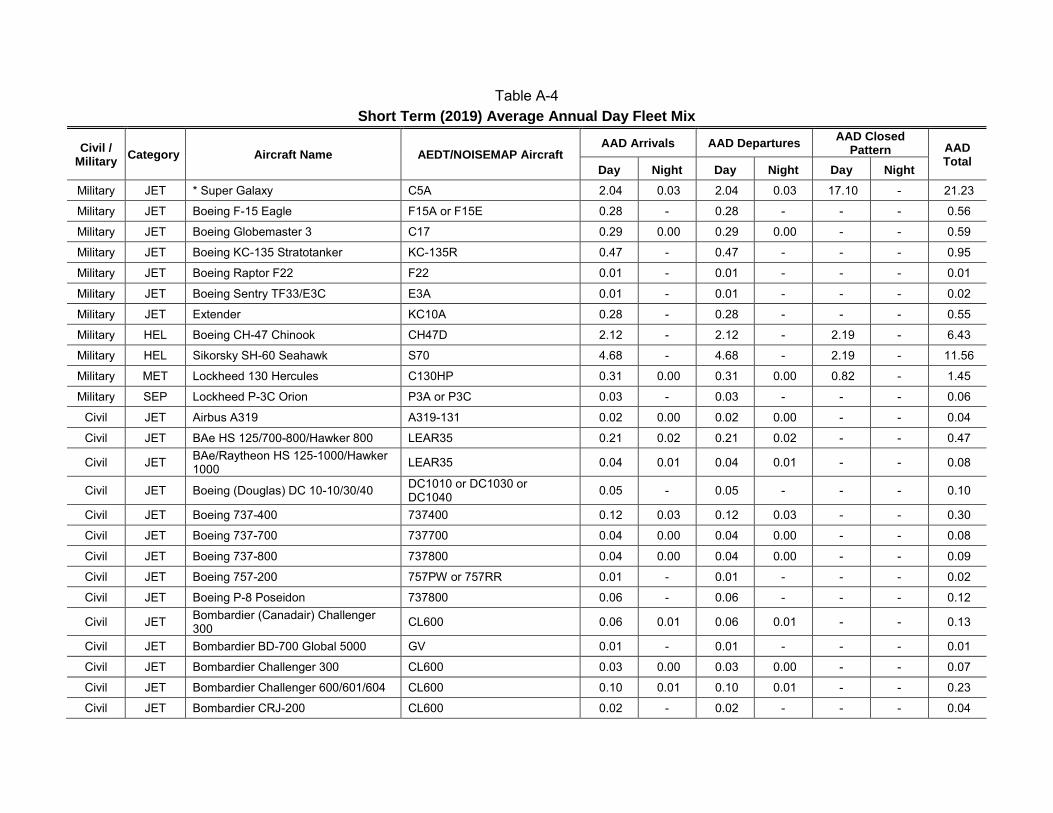
Table A-4 Short Term (2019) Average Annual Day Fleet Mix
Civil / Military Category Aircraft Name AEDT/NOISEMAP Aircraft
AAD Arrivals AAD Departures AAD Closed Pattern AAD
Total Day Night Day Night Day Night
Military JET * Super Galaxy C5A 2.04 0.03 2.04 0.03 17.10 - 21.23
Military JET Boeing F-15 Eagle F15A or F15E 0.28 - 0.28 - - - 0.56
Military JET Boeing Globemaster 3 C17 0.29 0.00 0.29 0.00 - - 0.59
Military JET Boeing KC-135 Stratotanker KC-135R 0.47 - 0.47 - - - 0.95
Military JET Boeing Raptor F22 F22 0.01 - 0.01 - - - 0.01
Military JET Boeing Sentry TF33/E3C E3A 0.01 - 0.01 - - - 0.02
Military JET Extender KC10A 0.28 - 0.28 - - - 0.55
Military HEL Boeing CH-47 Chinook CH47D 2.12 - 2.12 - 2.19 - 6.43
Military HEL Sikorsky SH-60 Seahawk S70 4.68 - 4.68 - 2.19 - 11.56
Military MET Lockheed 130 Hercules C130HP 0.31 0.00 0.31 0.00 0.82 - 1.45
Military SEP Lockheed P-3C Orion P3A or P3C 0.03 - 0.03 - - - 0.06
Civil JET Airbus A319 A319-131 0.02 0.00 0.02 0.00 - - 0.04
Civil JET BAe HS 125/700-800/Hawker 800 LEAR35 0.21 0.02 0.21 0.02 - - 0.47
Civil JET BAe/Raytheon HS 125-1000/Hawker 1000 LEAR35 0.04 0.01 0.04 0.01 - - 0.08
Civil JET Boeing (Douglas) DC 10-10/30/40 DC1010 or DC1030 or DC1040 0.05 - 0.05 - - - 0.10
Civil JET Boeing 737-400 737400 0.12 0.03 0.12 0.03 - - 0.30
Civil JET Boeing 737-700 737700 0.04 0.00 0.04 0.00 - - 0.08
Civil JET Boeing 737-800 737800 0.04 0.00 0.04 0.00 - - 0.09
Civil JET Boeing 757-200 757PW or 757RR 0.01 - 0.01 - - - 0.02
Civil JET Boeing P-8 Poseidon 737800 0.06 - 0.06 - - - 0.12
Civil JET Bombardier (Canadair) Challenger 300 CL600 0.06 0.01 0.06 0.01 - - 0.13
Civil JET Bombardier BD-700 Global 5000 GV 0.01 - 0.01 - - - 0.01
Civil JET Bombardier Challenger 300 CL600 0.03 0.00 0.03 0.00 - - 0.07
Civil JET Bombardier Challenger 600/601/604 CL600 0.10 0.01 0.10 0.01 - - 0.23
Civil JET Bombardier CRJ-200 CL600 0.02 - 0.02 - - - 0.04
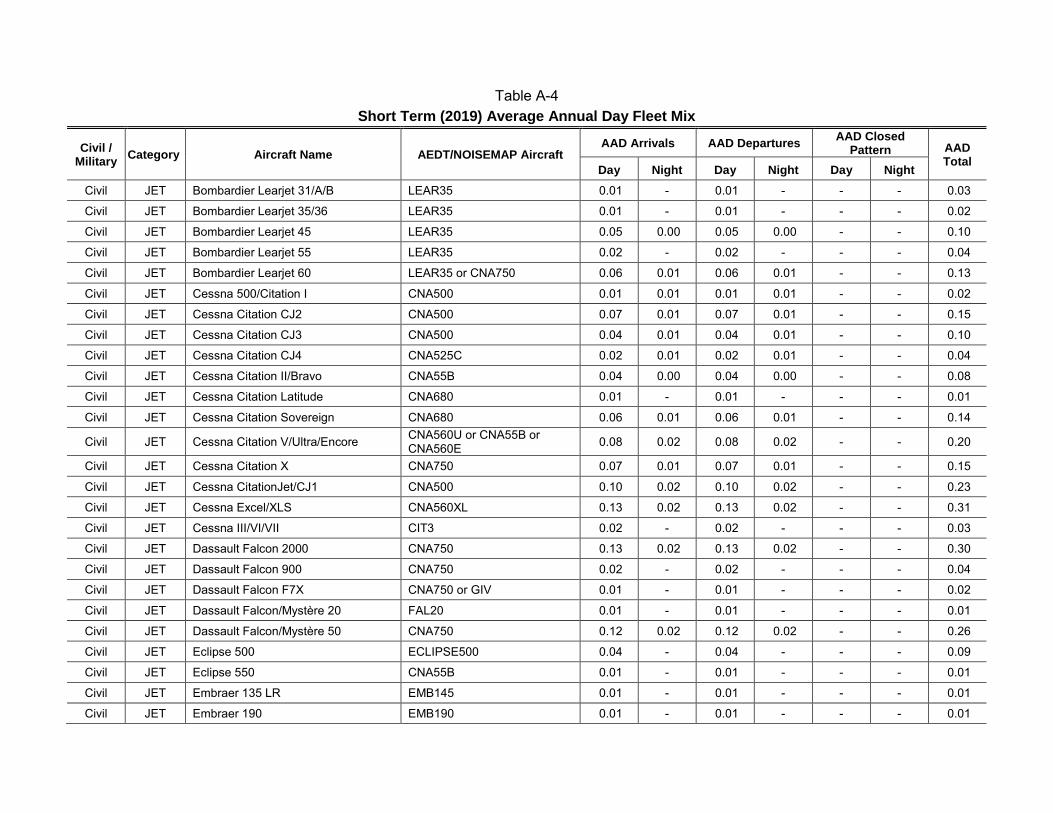
Table A-4 Short Term (2019) Average Annual Day Fleet Mix
Civil / Military Category Aircraft Name AEDT/NOISEMAP Aircraft
AAD Arrivals AAD Departures AAD Closed Pattern AAD
Total Day Night Day Night Day Night
Civil JET Bombardier Learjet 31/A/B LEAR35 0.01 - 0.01 - - - 0.03
Civil JET Bombardier Learjet 35/36 LEAR35 0.01 - 0.01 - - - 0.02
Civil JET Bombardier Learjet 45 LEAR35 0.05 0.00 0.05 0.00 - - 0.10
Civil JET Bombardier Learjet 55 LEAR35 0.02 - 0.02 - - - 0.04
Civil JET Bombardier Learjet 60 LEAR35 or CNA750 0.06 0.01 0.06 0.01 - - 0.13
Civil JET Cessna 500/Citation I CNA500 0.01 0.01 0.01 0.01 - - 0.02
Civil JET Cessna Citation CJ2 CNA500 0.07 0.01 0.07 0.01 - - 0.15
Civil JET Cessna Citation CJ3 CNA500 0.04 0.01 0.04 0.01 - - 0.10
Civil JET Cessna Citation CJ4 CNA525C 0.02 0.01 0.02 0.01 - - 0.04
Civil JET Cessna Citation II/Bravo CNA55B 0.04 0.00 0.04 0.00 - - 0.08
Civil JET Cessna Citation Latitude CNA680 0.01 - 0.01 - - - 0.01
Civil JET Cessna Citation Sovereign CNA680 0.06 0.01 0.06 0.01 - - 0.14
Civil JET Cessna Citation V/Ultra/Encore CNA560U or CNA55B or CNA560E 0.08 0.02 0.08 0.02 - - 0.20
Civil JET Cessna Citation X CNA750 0.07 0.01 0.07 0.01 - - 0.15
Civil JET Cessna CitationJet/CJ1 CNA500 0.10 0.02 0.10 0.02 - - 0.23
Civil JET Cessna Excel/XLS CNA560XL 0.13 0.02 0.13 0.02 - - 0.31
Civil JET Cessna III/VI/VII CIT3 0.02 - 0.02 - - - 0.03
Civil JET Dassault Falcon 2000 CNA750 0.13 0.02 0.13 0.02 - - 0.30
Civil JET Dassault Falcon 900 CNA750 0.02 - 0.02 - - - 0.04
Civil JET Dassault Falcon F7X CNA750 or GIV 0.01 - 0.01 - - - 0.02
Civil JET Dassault Falcon/Mystère 20 FAL20 0.01 - 0.01 - - - 0.01
Civil JET Dassault Falcon/Mystère 50 CNA750 0.12 0.02 0.12 0.02 - - 0.26
Civil JET Eclipse 500 ECLIPSE500 0.04 - 0.04 - - - 0.09
Civil JET Eclipse 550 CNA55B 0.01 - 0.01 - - - 0.01
Civil JET Embraer 135 LR EMB145 0.01 - 0.01 - - - 0.01
Civil JET Embraer 190 EMB190 0.01 - 0.01 - - - 0.01
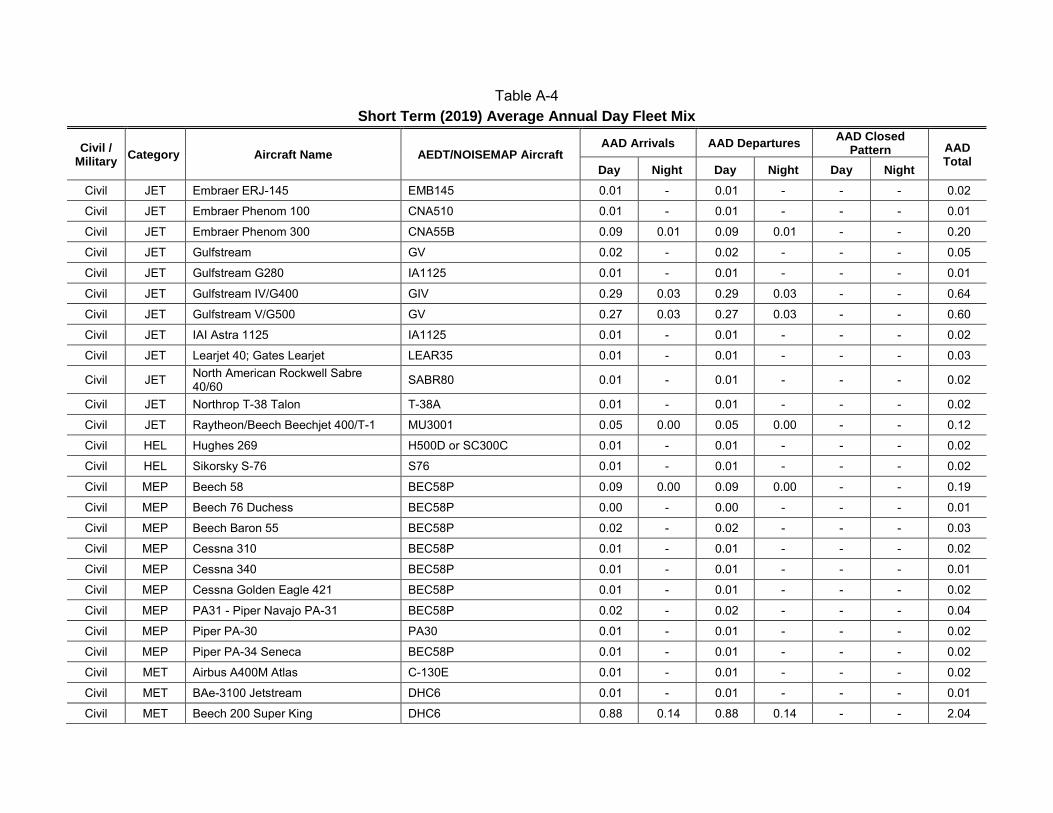
Table A-4 Short Term (2019) Average Annual Day Fleet Mix
Civil / Military Category Aircraft Name AEDT/NOISEMAP Aircraft
AAD Arrivals AAD Departures AAD Closed Pattern AAD
Total Day Night Day Night Day Night
Civil JET Embraer ERJ-145 EMB145 0.01 - 0.01 - - - 0.02
Civil JET Embraer Phenom 100 CNA510 0.01 - 0.01 - - - 0.01
Civil JET Embraer Phenom 300 CNA55B 0.09 0.01 0.09 0.01 - - 0.20
Civil JET Gulfstream GV 0.02 - 0.02 - - - 0.05
Civil JET Gulfstream G280 IA1125 0.01 - 0.01 - - - 0.01
Civil JET Gulfstream IV/G400 GIV 0.29 0.03 0.29 0.03 - - 0.64
Civil JET Gulfstream V/G500 GV 0.27 0.03 0.27 0.03 - - 0.60
Civil JET IAI Astra 1125 IA1125 0.01 - 0.01 - - - 0.02
Civil JET Learjet 40; Gates Learjet LEAR35 0.01 - 0.01 - - - 0.03
Civil JET North American Rockwell Sabre 40/60 SABR80 0.01 - 0.01 - - - 0.02
Civil JET Northrop T-38 Talon T-38A 0.01 - 0.01 - - - 0.02
Civil JET Raytheon/Beech Beechjet 400/T-1 MU3001 0.05 0.00 0.05 0.00 - - 0.12
Civil HEL Hughes 269 H500D or SC300C 0.01 - 0.01 - - - 0.02
Civil HEL Sikorsky S-76 S76 0.01 - 0.01 - - - 0.02
Civil MEP Beech 58 BEC58P 0.09 0.00 0.09 0.00 - - 0.19
Civil MEP Beech 76 Duchess BEC58P 0.00 - 0.00 - - - 0.01
Civil MEP Beech Baron 55 BEC58P 0.02 - 0.02 - - - 0.03
Civil MEP Cessna 310 BEC58P 0.01 - 0.01 - - - 0.02
Civil MEP Cessna 340 BEC58P 0.01 - 0.01 - - - 0.01
Civil MEP Cessna Golden Eagle 421 BEC58P 0.01 - 0.01 - - - 0.02
Civil MEP PA31 - Piper Navajo PA-31 BEC58P 0.02 - 0.02 - - - 0.04
Civil MEP Piper PA-30 PA30 0.01 - 0.01 - - - 0.02
Civil MEP Piper PA-34 Seneca BEC58P 0.01 - 0.01 - - - 0.02
Civil MET Airbus A400M Atlas C-130E 0.01 - 0.01 - - - 0.02
Civil MET BAe-3100 Jetstream DHC6 0.01 - 0.01 - - - 0.01
Civil MET Beech 200 Super King DHC6 0.88 0.14 0.88 0.14 - - 2.04

Table A-4 Short Term (2019) Average Annual Day Fleet Mix
Civil / Military Category Aircraft Name AEDT/NOISEMAP Aircraft
AAD Arrivals AAD Departures AAD Closed Pattern AAD
Total Day Night Day Night Day Night
Civil MET Beech King Air 90 DHC6 0.03 0.01 0.03 0.01 - - 0.07
Civil MET Beech Super King Air 350 DHC6 0.38 0.11 0.38 0.11 - - 0.98
Civil MET CASA CN-235 SF340 0.05 0.00 0.05 0.00 - - 0.10
Civil MET Cessna Conquest CNA441 0.01 - 0.01 - - - 0.02
Civil MET Piaggio P-180 Avanti DHC6 0.01 - 0.01 - - - 0.03
Civil MET Piper Cheyenne 1 CNA441 0.01 - 0.01 - - - 0.01
Civil MET Piper Cheyenne 2 CNA441 0.02 - 0.02 - - - 0.03
Civil MET Raytheon 300 Super King Air DHC6 0.07 0.01 0.07 0.01 - - 0.14
Civil MET Swearingen Merlin 4/4A Metro2 DHC6 0.01 - 0.01 - - - 0.02
Civil SEP American AA-5 Traveler GASEPF 0.00 - 0.00 - - - 0.01
Civil SEP Beech Bonanza 33 GASEPV 0.02 - 0.02 - - - 0.03
Civil SEP Beech Bonanza 35 CNA208 0.02 - 0.02 - - - 0.04
Civil SEP Beech Bonanza 36 CNA208 0.02 - 0.02 - - - 0.03
Civil SEP Cessna 150 CNA172 0.01 - 0.01 - - - 0.02
Civil SEP Cessna 177 Cardinal CNA172 0.00 - 0.00 - - - 0.01
Civil SEP Cessna 206 Stationair CNA206 0.01 - 0.01 - - - 0.02
Civil SEP Cessna 210 Centurion GASEPV 0.01 - 0.01 - - - 0.02
Civil SEP Cessna Cardinal RG GASEPV 0.01 - 0.01 - - - 0.01
Civil SEP Cessna Skyhawk 172/Cutlass CNA172 0.03 - 0.03 - - - 0.07
Civil SEP Cessna Skylane 182 CNA182 0.03 - 0.03 - - - 0.05
Civil SEP Cirrus SR 22 COMSEP 0.19 - 0.19 - - - 0.38
Civil SEP Cirrus SR-20 COMSEP 0.02 - 0.02 - - - 0.03
Civil SEP Cirrus SR-22 Turbo COMSEP 0.01 - 0.01 - - - 0.02
Civil SEP Diamond Star DA40 COMSEP 0.00 - 0.00 - - - 0.01
Civil SEP Mooney M-20C Ranger GASEPV 0.01 - 0.01 - - - 0.01
Civil SEP Mooney M-20C Ranger GASEPV 0.03 - 0.03 - - - 0.05
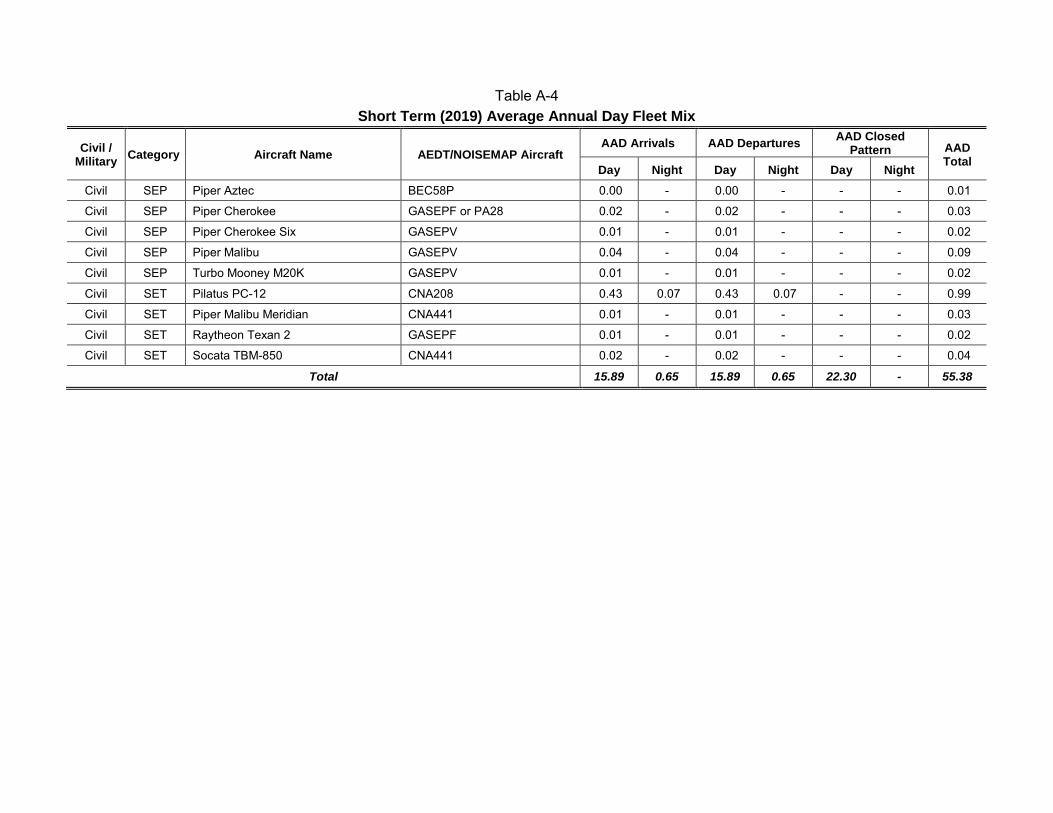
Table A-4 Short Term (2019) Average Annual Day Fleet Mix
Civil / Military Category Aircraft Name AEDT/NOISEMAP Aircraft
AAD Arrivals AAD Departures AAD Closed Pattern AAD
Total Day Night Day Night Day Night
Civil SEP Piper Aztec BEC58P 0.00 - 0.00 - - - 0.01
Civil SEP Piper Cherokee GASEPF or PA28 0.02 - 0.02 - - - 0.03
Civil SEP Piper Cherokee Six GASEPV 0.01 - 0.01 - - - 0.02
Civil SEP Piper Malibu GASEPV 0.04 - 0.04 - - - 0.09
Civil SEP Turbo Mooney M20K GASEPV 0.01 - 0.01 - - - 0.02
Civil SET Pilatus PC-12 CNA208 0.43 0.07 0.43 0.07 - - 0.99
Civil SET Piper Malibu Meridian CNA441 0.01 - 0.01 - - - 0.03
Civil SET Raytheon Texan 2 GASEPF 0.01 - 0.01 - - - 0.02
Civil SET Socata TBM-850 CNA441 0.02 - 0.02 - - - 0.04
Total 15.89 0.65 15.89 0.65 22.30 - 55.38
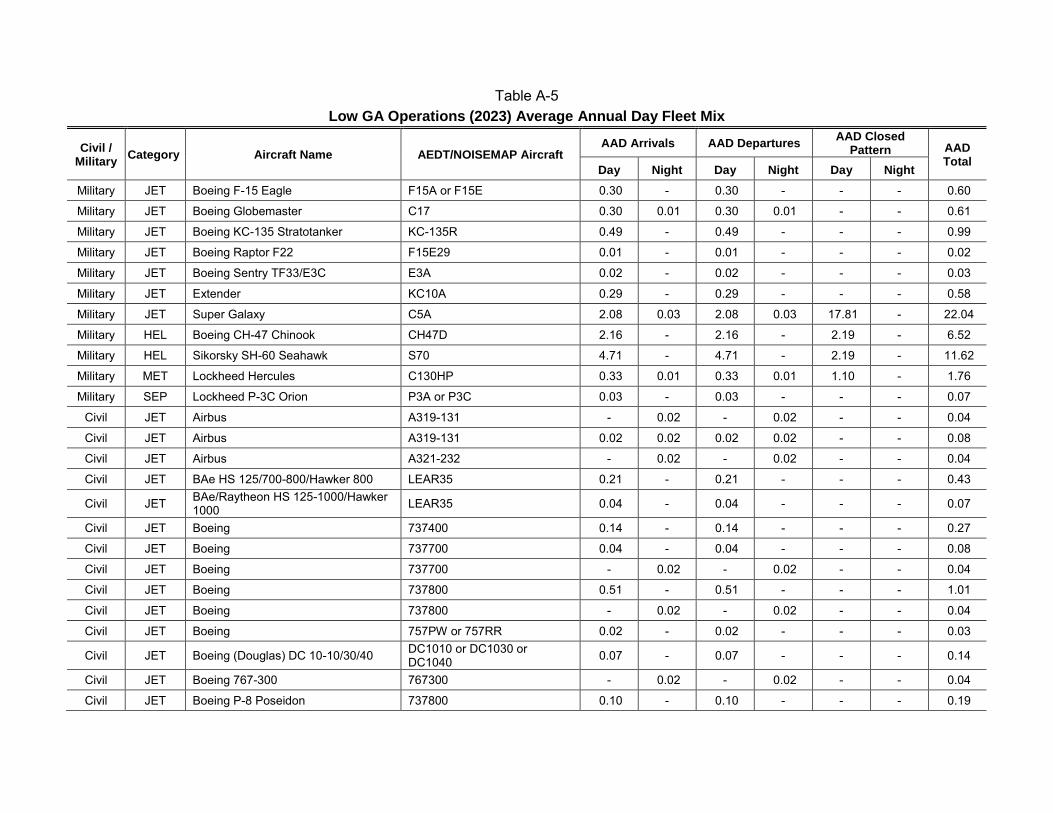
Table A-5 Low GA Operations (2023) Average Annual Day Fleet Mix
Civil / Military Category Aircraft Name AEDT/NOISEMAP Aircraft
AAD Arrivals AAD Departures AAD Closed Pattern AAD
Total Day Night Day Night Day Night
Military JET Boeing F-15 Eagle F15A or F15E 0.30 - 0.30 - - - 0.60
Military JET Boeing Globemaster C17 0.30 0.01 0.30 0.01 - - 0.61
Military JET Boeing KC-135 Stratotanker KC-135R 0.49 - 0.49 - - - 0.99
Military JET Boeing Raptor F22 F15E29 0.01 - 0.01 - - - 0.02
Military JET Boeing Sentry TF33/E3C E3A 0.02 - 0.02 - - - 0.03
Military JET Extender KC10A 0.29 - 0.29 - - - 0.58
Military JET Super Galaxy C5A 2.08 0.03 2.08 0.03 17.81 - 22.04
Military HEL Boeing CH-47 Chinook CH47D 2.16 - 2.16 - 2.19 - 6.52
Military HEL Sikorsky SH-60 Seahawk S70 4.71 - 4.71 - 2.19 - 11.62
Military MET Lockheed Hercules C130HP 0.33 0.01 0.33 0.01 1.10 - 1.76
Military SEP Lockheed P-3C Orion P3A or P3C 0.03 - 0.03 - - - 0.07
Civil JET Airbus A319-131 - 0.02 - 0.02 - - 0.04
Civil JET Airbus A319-131 0.02 0.02 0.02 0.02 - - 0.08
Civil JET Airbus A321-232 - 0.02 - 0.02 - - 0.04
Civil JET BAe HS 125/700-800/Hawker 800 LEAR35 0.21 - 0.21 - - - 0.43
Civil JET BAe/Raytheon HS 125-1000/Hawker 1000 LEAR35 0.04 - 0.04 - - - 0.07
Civil JET Boeing 737400 0.14 - 0.14 - - - 0.27
Civil JET Boeing 737700 0.04 - 0.04 - - - 0.08
Civil JET Boeing 737700 - 0.02 - 0.02 - - 0.04
Civil JET Boeing 737800 0.51 - 0.51 - - - 1.01
Civil JET Boeing 737800 - 0.02 - 0.02 - - 0.04
Civil JET Boeing 757PW or 757RR 0.02 - 0.02 - - - 0.03
Civil JET Boeing (Douglas) DC 10-10/30/40 DC1010 or DC1030 or DC1040 0.07 - 0.07 - - - 0.14
Civil JET Boeing 767-300 767300 - 0.02 - 0.02 - - 0.04
Civil JET Boeing P-8 Poseidon 737800 0.10 - 0.10 - - - 0.19
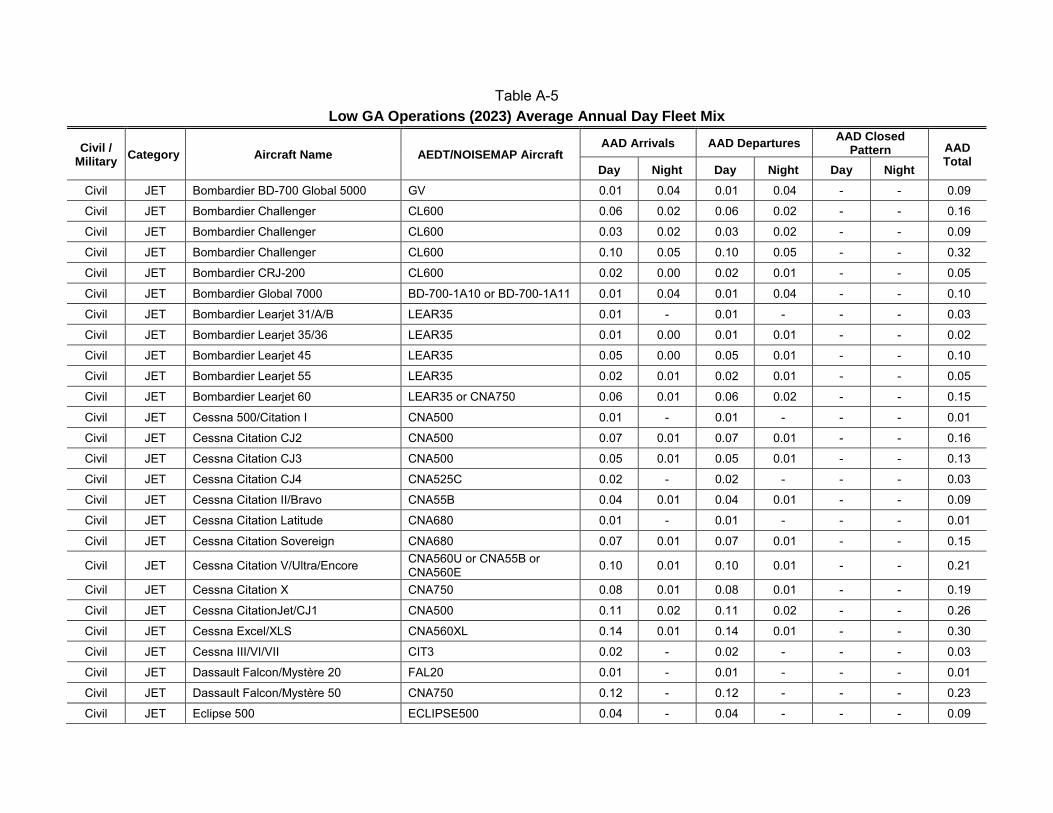
Table A-5 Low GA Operations (2023) Average Annual Day Fleet Mix
Civil / Military Category Aircraft Name AEDT/NOISEMAP Aircraft
AAD Arrivals AAD Departures AAD Closed Pattern AAD
Total Day Night Day Night Day Night
Civil JET Bombardier BD-700 Global 5000 GV 0.01 0.04 0.01 0.04 - - 0.09
Civil JET Bombardier Challenger CL600 0.06 0.02 0.06 0.02 - - 0.16
Civil JET Bombardier Challenger CL600 0.03 0.02 0.03 0.02 - - 0.09
Civil JET Bombardier Challenger CL600 0.10 0.05 0.10 0.05 - - 0.32
Civil JET Bombardier CRJ-200 CL600 0.02 0.00 0.02 0.01 - - 0.05
Civil JET Bombardier Global 7000 BD-700-1A10 or BD-700-1A11 0.01 0.04 0.01 0.04 - - 0.10
Civil JET Bombardier Learjet 31/A/B LEAR35 0.01 - 0.01 - - - 0.03
Civil JET Bombardier Learjet 35/36 LEAR35 0.01 0.00 0.01 0.01 - - 0.02
Civil JET Bombardier Learjet 45 LEAR35 0.05 0.00 0.05 0.01 - - 0.10
Civil JET Bombardier Learjet 55 LEAR35 0.02 0.01 0.02 0.01 - - 0.05
Civil JET Bombardier Learjet 60 LEAR35 or CNA750 0.06 0.01 0.06 0.02 - - 0.15
Civil JET Cessna 500/Citation I CNA500 0.01 - 0.01 - - - 0.01
Civil JET Cessna Citation CJ2 CNA500 0.07 0.01 0.07 0.01 - - 0.16
Civil JET Cessna Citation CJ3 CNA500 0.05 0.01 0.05 0.01 - - 0.13
Civil JET Cessna Citation CJ4 CNA525C 0.02 - 0.02 - - - 0.03
Civil JET Cessna Citation II/Bravo CNA55B 0.04 0.01 0.04 0.01 - - 0.09
Civil JET Cessna Citation Latitude CNA680 0.01 - 0.01 - - - 0.01
Civil JET Cessna Citation Sovereign CNA680 0.07 0.01 0.07 0.01 - - 0.15
Civil JET Cessna Citation V/Ultra/Encore CNA560U or CNA55B or CNA560E 0.10 0.01 0.10 0.01 - - 0.21
Civil JET Cessna Citation X CNA750 0.08 0.01 0.08 0.01 - - 0.19
Civil JET Cessna CitationJet/CJ1 CNA500 0.11 0.02 0.11 0.02 - - 0.26
Civil JET Cessna Excel/XLS CNA560XL 0.14 0.01 0.14 0.01 - - 0.30
Civil JET Cessna III/VI/VII CIT3 0.02 - 0.02 - - - 0.03
Civil JET Dassault Falcon/Mystère 20 FAL20 0.01 - 0.01 - - - 0.01
Civil JET Dassault Falcon/Mystère 50 CNA750 0.12 - 0.12 - - - 0.23
Civil JET Eclipse 500 ECLIPSE500 0.04 - 0.04 - - - 0.09
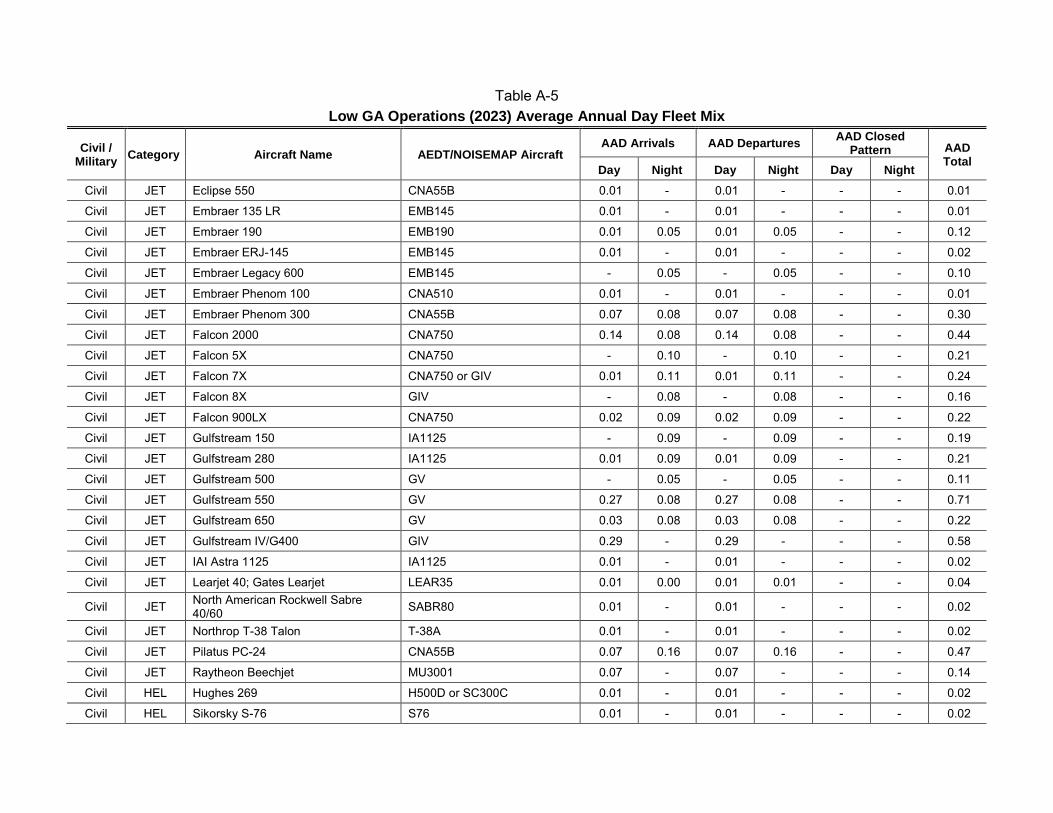
Table A-5 Low GA Operations (2023) Average Annual Day Fleet Mix
Civil / Military Category Aircraft Name AEDT/NOISEMAP Aircraft
AAD Arrivals AAD Departures AAD Closed Pattern AAD
Total Day Night Day Night Day Night
Civil JET Eclipse 550 CNA55B 0.01 - 0.01 - - - 0.01
Civil JET Embraer 135 LR EMB145 0.01 - 0.01 - - - 0.01
Civil JET Embraer 190 EMB190 0.01 0.05 0.01 0.05 - - 0.12
Civil JET Embraer ERJ-145 EMB145 0.01 - 0.01 - - - 0.02
Civil JET Embraer Legacy 600 EMB145 - 0.05 - 0.05 - - 0.10
Civil JET Embraer Phenom 100 CNA510 0.01 - 0.01 - - - 0.01
Civil JET Embraer Phenom 300 CNA55B 0.07 0.08 0.07 0.08 - - 0.30
Civil JET Falcon 2000 CNA750 0.14 0.08 0.14 0.08 - - 0.44
Civil JET Falcon 5X CNA750 - 0.10 - 0.10 - - 0.21
Civil JET Falcon 7X CNA750 or GIV 0.01 0.11 0.01 0.11 - - 0.24
Civil JET Falcon 8X GIV - 0.08 - 0.08 - - 0.16
Civil JET Falcon 900LX CNA750 0.02 0.09 0.02 0.09 - - 0.22
Civil JET Gulfstream 150 IA1125 - 0.09 - 0.09 - - 0.19
Civil JET Gulfstream 280 IA1125 0.01 0.09 0.01 0.09 - - 0.21
Civil JET Gulfstream 500 GV - 0.05 - 0.05 - - 0.11
Civil JET Gulfstream 550 GV 0.27 0.08 0.27 0.08 - - 0.71
Civil JET Gulfstream 650 GV 0.03 0.08 0.03 0.08 - - 0.22
Civil JET Gulfstream IV/G400 GIV 0.29 - 0.29 - - - 0.58
Civil JET IAI Astra 1125 IA1125 0.01 - 0.01 - - - 0.02
Civil JET Learjet 40; Gates Learjet LEAR35 0.01 0.00 0.01 0.01 - - 0.04
Civil JET North American Rockwell Sabre 40/60 SABR80 0.01 - 0.01 - - - 0.02
Civil JET Northrop T-38 Talon T-38A 0.01 - 0.01 - - - 0.02
Civil JET Pilatus PC-24 CNA55B 0.07 0.16 0.07 0.16 - - 0.47
Civil JET Raytheon Beechjet MU3001 0.07 - 0.07 - - - 0.14
Civil HEL Hughes 269 H500D or SC300C 0.01 - 0.01 - - - 0.02
Civil HEL Sikorsky S-76 S76 0.01 - 0.01 - - - 0.02
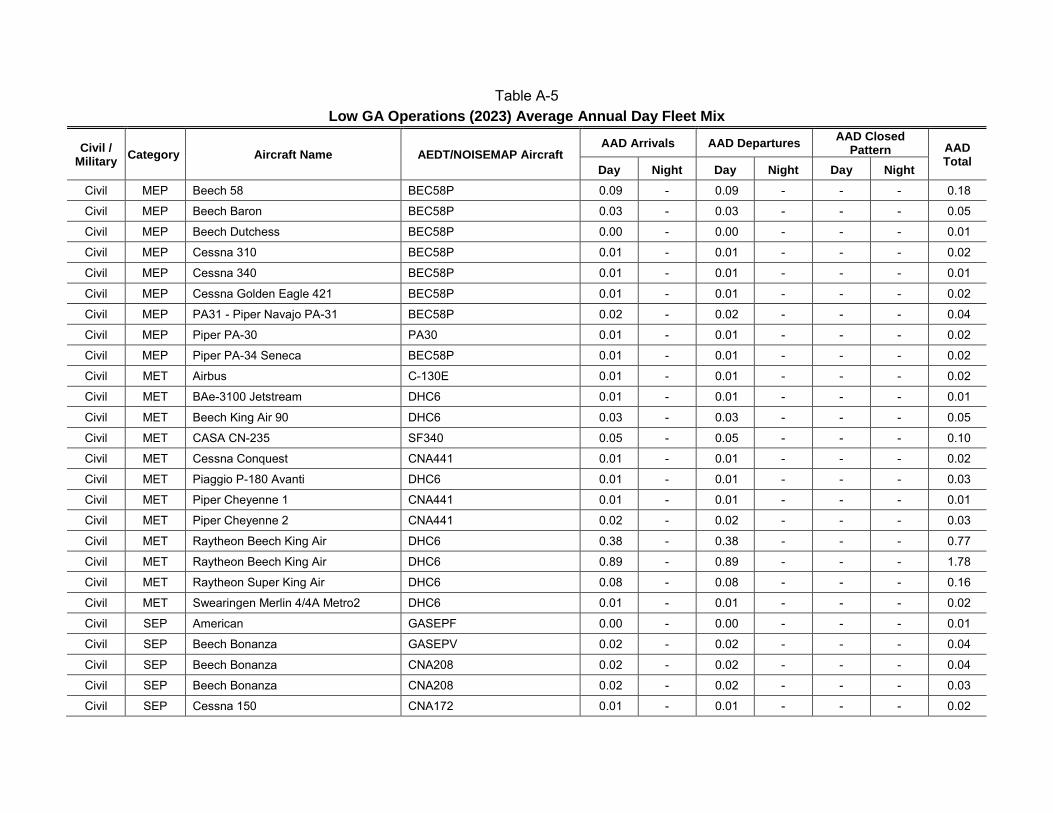
Table A-5 Low GA Operations (2023) Average Annual Day Fleet Mix
Civil / Military Category Aircraft Name AEDT/NOISEMAP Aircraft
AAD Arrivals AAD Departures AAD Closed Pattern AAD
Total Day Night Day Night Day Night
Civil MEP Beech 58 BEC58P 0.09 - 0.09 - - - 0.18
Civil MEP Beech Baron BEC58P 0.03 - 0.03 - - - 0.05
Civil MEP Beech Dutchess BEC58P 0.00 - 0.00 - - - 0.01
Civil MEP Cessna 310 BEC58P 0.01 - 0.01 - - - 0.02
Civil MEP Cessna 340 BEC58P 0.01 - 0.01 - - - 0.01
Civil MEP Cessna Golden Eagle 421 BEC58P 0.01 - 0.01 - - - 0.02
Civil MEP PA31 - Piper Navajo PA-31 BEC58P 0.02 - 0.02 - - - 0.04
Civil MEP Piper PA-30 PA30 0.01 - 0.01 - - - 0.02
Civil MEP Piper PA-34 Seneca BEC58P 0.01 - 0.01 - - - 0.02
Civil MET Airbus C-130E 0.01 - 0.01 - - - 0.02
Civil MET BAe-3100 Jetstream DHC6 0.01 - 0.01 - - - 0.01
Civil MET Beech King Air 90 DHC6 0.03 - 0.03 - - - 0.05
Civil MET CASA CN-235 SF340 0.05 - 0.05 - - - 0.10
Civil MET Cessna Conquest CNA441 0.01 - 0.01 - - - 0.02
Civil MET Piaggio P-180 Avanti DHC6 0.01 - 0.01 - - - 0.03
Civil MET Piper Cheyenne 1 CNA441 0.01 - 0.01 - - - 0.01
Civil MET Piper Cheyenne 2 CNA441 0.02 - 0.02 - - - 0.03
Civil MET Raytheon Beech King Air DHC6 0.38 - 0.38 - - - 0.77
Civil MET Raytheon Beech King Air DHC6 0.89 - 0.89 - - - 1.78
Civil MET Raytheon Super King Air DHC6 0.08 - 0.08 - - - 0.16
Civil MET Swearingen Merlin 4/4A Metro2 DHC6 0.01 - 0.01 - - - 0.02
Civil SEP American GASEPF 0.00 - 0.00 - - - 0.01
Civil SEP Beech Bonanza GASEPV 0.02 - 0.02 - - - 0.04
Civil SEP Beech Bonanza CNA208 0.02 - 0.02 - - - 0.04
Civil SEP Beech Bonanza CNA208 0.02 - 0.02 - - - 0.03
Civil SEP Cessna 150 CNA172 0.01 - 0.01 - - - 0.02
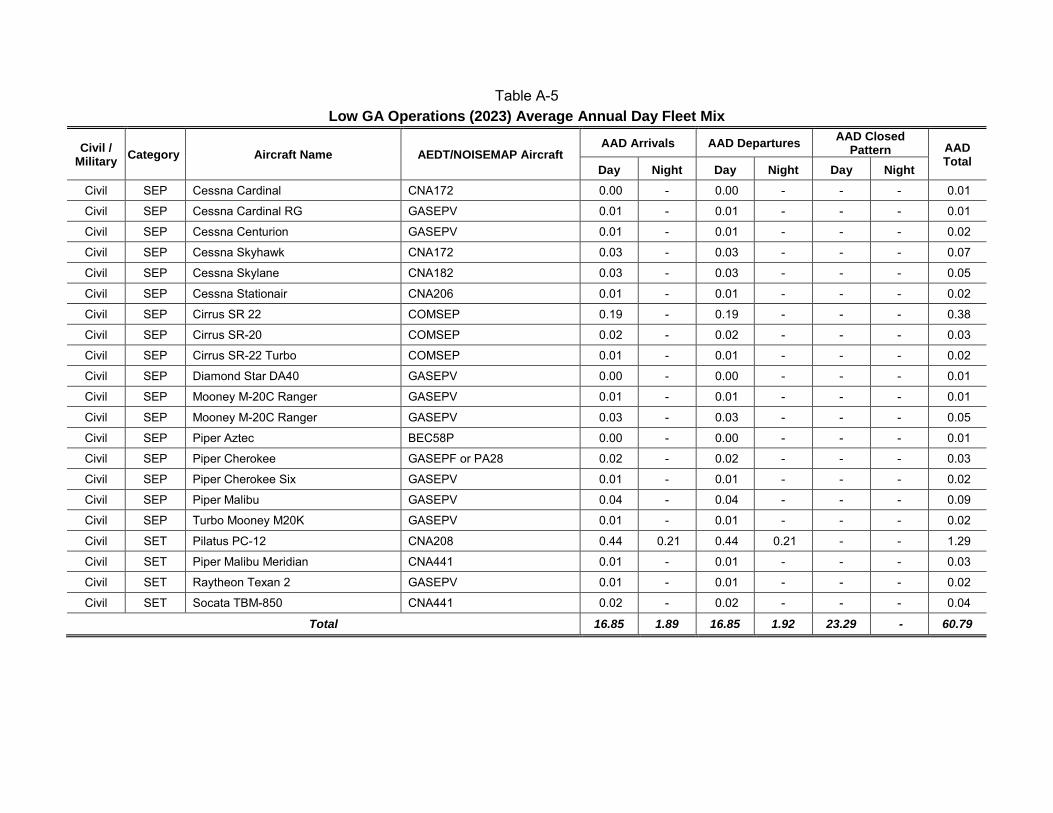
Table A-5 Low GA Operations (2023) Average Annual Day Fleet Mix
Civil / Military Category Aircraft Name AEDT/NOISEMAP Aircraft
AAD Arrivals AAD Departures AAD Closed Pattern AAD
Total Day Night Day Night Day Night
Civil SEP Cessna Cardinal CNA172 0.00 - 0.00 - - - 0.01
Civil SEP Cessna Cardinal RG GASEPV 0.01 - 0.01 - - - 0.01
Civil SEP Cessna Centurion GASEPV 0.01 - 0.01 - - - 0.02
Civil SEP Cessna Skyhawk CNA172 0.03 - 0.03 - - - 0.07
Civil SEP Cessna Skylane CNA182 0.03 - 0.03 - - - 0.05
Civil SEP Cessna Stationair CNA206 0.01 - 0.01 - - - 0.02
Civil SEP Cirrus SR 22 COMSEP 0.19 - 0.19 - - - 0.38
Civil SEP Cirrus SR-20 COMSEP 0.02 - 0.02 - - - 0.03
Civil SEP Cirrus SR-22 Turbo COMSEP 0.01 - 0.01 - - - 0.02
Civil SEP Diamond Star DA40 GASEPV 0.00 - 0.00 - - - 0.01
Civil SEP Mooney M-20C Ranger GASEPV 0.01 - 0.01 - - - 0.01
Civil SEP Mooney M-20C Ranger GASEPV 0.03 - 0.03 - - - 0.05
Civil SEP Piper Aztec BEC58P 0.00 - 0.00 - - - 0.01
Civil SEP Piper Cherokee GASEPF or PA28 0.02 - 0.02 - - - 0.03
Civil SEP Piper Cherokee Six GASEPV 0.01 - 0.01 - - - 0.02
Civil SEP Piper Malibu GASEPV 0.04 - 0.04 - - - 0.09
Civil SEP Turbo Mooney M20K GASEPV 0.01 - 0.01 - - - 0.02
Civil SET Pilatus PC-12 CNA208 0.44 0.21 0.44 0.21 - - 1.29
Civil SET Piper Malibu Meridian CNA441 0.01 - 0.01 - - - 0.03
Civil SET Raytheon Texan 2 GASEPV 0.01 - 0.01 - - - 0.02
Civil SET Socata TBM-850 CNA441 0.02 - 0.02 - - - 0.04
Total 16.85 1.89 16.85 1.92 23.29 - 60.79

Appendix B - AEE Coordination
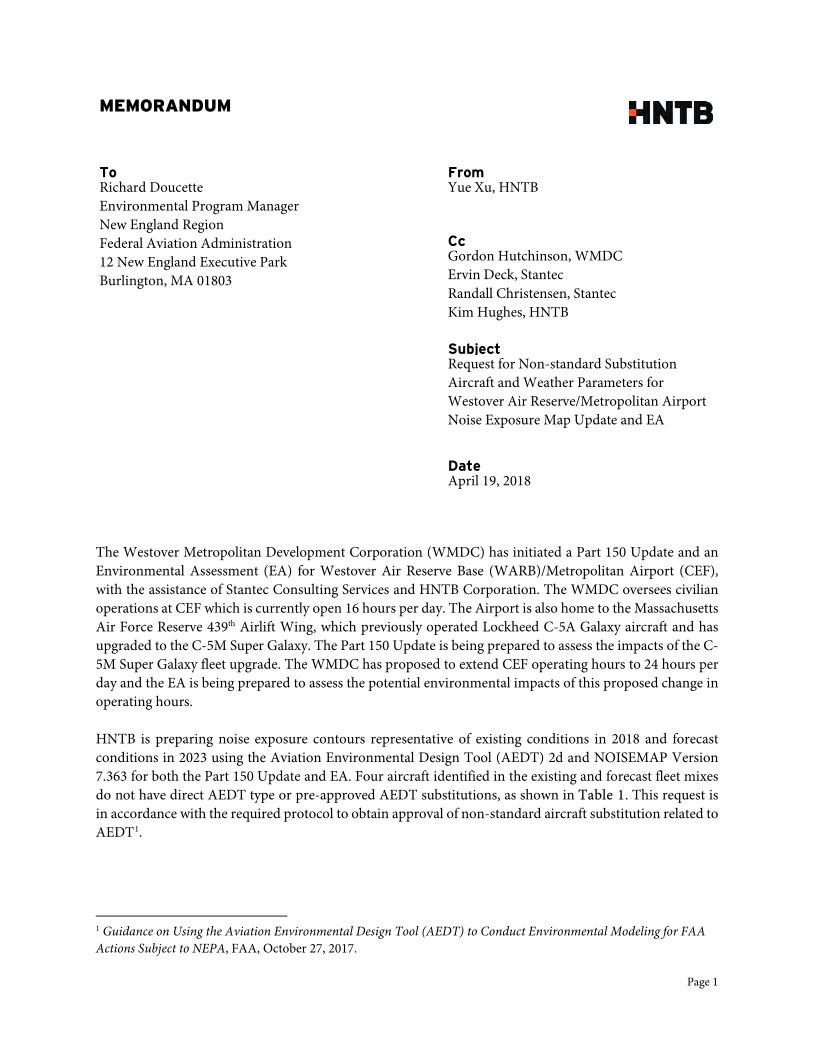
Page 1
The Westover Metropolitan Development Corporation (WMDC) has initiated a Part 150 Update and an Environmental Assessment (EA) for Westover Air Reserve Base (WARB)/Metropolitan Airport (CEF), with the assistance of Stantec Consulting Services and HNTB Corporation. The WMDC oversees civilian operations at CEF which is currently open 16 hours per day. The Airport is also home to the Massachusetts Air Force Reserve 439th Airlift Wing, which previously operated Lockheed C-5A Galaxy aircraft and has upgraded to the C-5M Super Galaxy. The Part 150 Update is being prepared to assess the impacts of the C-5M Super Galaxy fleet upgrade. The WMDC has proposed to extend CEF operating hours to 24 hours per day and the EA is being prepared to assess the potential environmental impacts of this proposed change in operating hours. HNTB is preparing noise exposure contours representative of existing conditions in 2018 and forecast conditions in 2023 using the Aviation Environmental Design Tool (AEDT) 2d and NOISEMAP Version 7.363 for both the Part 150 Update and EA. Four aircraft identified in the existing and forecast fleet mixes do not have direct AEDT type or pre-approved AEDT substitutions, as shown in Table 1. This request is in accordance with the required protocol to obtain approval of non-standard aircraft substitution related to AEDT1.
1 Guidance on Using the Aviation Environmental Design Tool (AEDT) to Conduct Environmental Modeling for FAA Actions Subject to NEPA, FAA, October 27, 2017.
MEMORANDUM
To From Richard Doucette Environmental Program Manager New England Region Federal Aviation Administration 12 New England Executive Park Burlington, MA 01803
Yue Xu, HNTB
Cc Gordon Hutchinson, WMDC Ervin Deck, Stantec Randall Christensen, Stantec Kim Hughes, HNTB Subject Request for Non-standard Substitution Aircraft and Weather Parameters for Westover Air Reserve/Metropolitan Airport Noise Exposure Map Update and EA
Date April 19, 2018
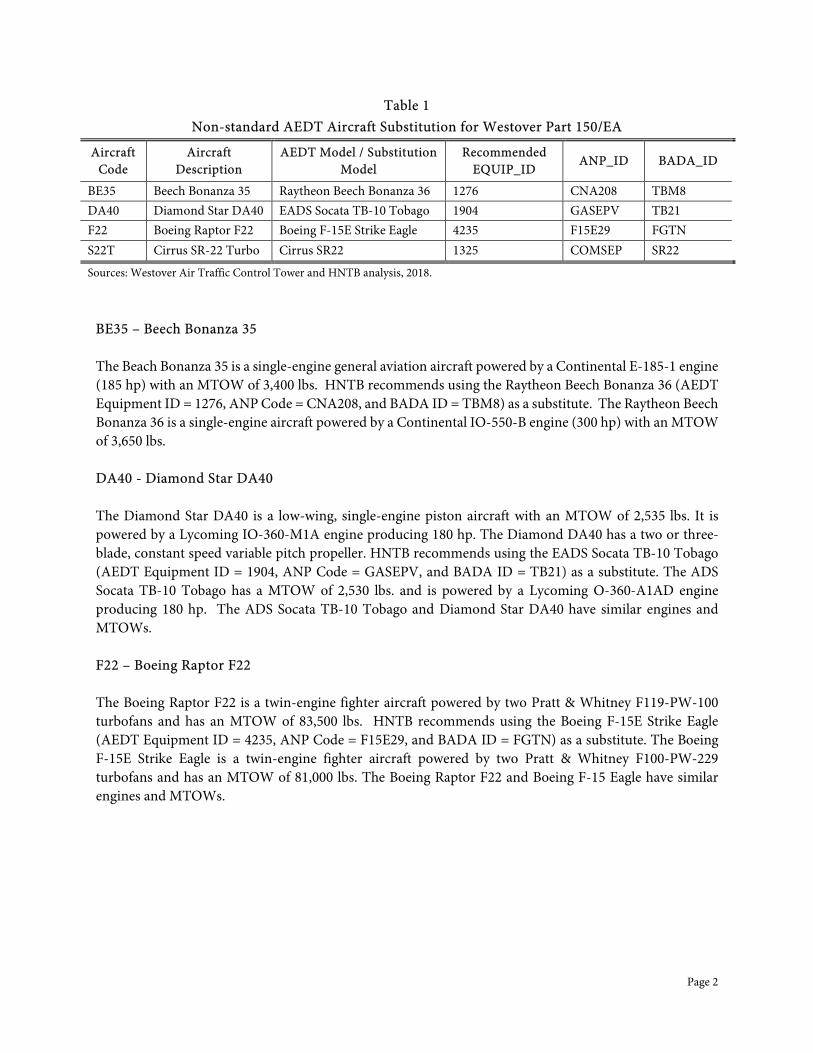
Page 2
Table 1 Non-standard AEDT Aircraft Substitution for Westover Part 150/EA
Aircraft Code
Aircraft Description
AEDT Model / Substitution Model
Recommended EQUIP_ID
ANP_ID BADA_ID
BE35 Beech Bonanza 35 Raytheon Beech Bonanza 36 1276 CNA208 TBM8 DA40 Diamond Star DA40 EADS Socata TB-10 Tobago 1904 GASEPV TB21 F22 Boeing Raptor F22 Boeing F-15E Strike Eagle 4235 F15E29 FGTN S22T Cirrus SR-22 Turbo Cirrus SR22 1325 COMSEP SR22
Sources: Westover Air Traffic Control Tower and HNTB analysis, 2018.
BE35 – Beech Bonanza 35 The Beach Bonanza 35 is a single-engine general aviation aircraft powered by a Continental E-185-1 engine (185 hp) with an MTOW of 3,400 lbs. HNTB recommends using the Raytheon Beech Bonanza 36 (AEDT Equipment ID = 1276, ANP Code = CNA208, and BADA ID = TBM8) as a substitute. The Raytheon Beech Bonanza 36 is a single-engine aircraft powered by a Continental IO-550-B engine (300 hp) with an MTOW of 3,650 lbs. DA40 - Diamond Star DA40 The Diamond Star DA40 is a low-wing, single-engine piston aircraft with an MTOW of 2,535 lbs. It is powered by a Lycoming IO-360-M1A engine producing 180 hp. The Diamond DA40 has a two or three-blade, constant speed variable pitch propeller. HNTB recommends using the EADS Socata TB-10 Tobago (AEDT Equipment ID = 1904, ANP Code = GASEPV, and BADA ID = TB21) as a substitute. The ADS Socata TB-10 Tobago has a MTOW of 2,530 lbs. and is powered by a Lycoming O-360-A1AD engine producing 180 hp. The ADS Socata TB-10 Tobago and Diamond Star DA40 have similar engines and MTOWs. F22 – Boeing Raptor F22 The Boeing Raptor F22 is a twin-engine fighter aircraft powered by two Pratt & Whitney F119-PW-100 turbofans and has an MTOW of 83,500 lbs. HNTB recommends using the Boeing F-15E Strike Eagle (AEDT Equipment ID = 4235, ANP Code = F15E29, and BADA ID = FGTN) as a substitute. The Boeing F-15E Strike Eagle is a twin-engine fighter aircraft powered by two Pratt & Whitney F100-PW-229 turbofans and has an MTOW of 81,000 lbs. The Boeing Raptor F22 and Boeing F-15 Eagle have similar engines and MTOWs.
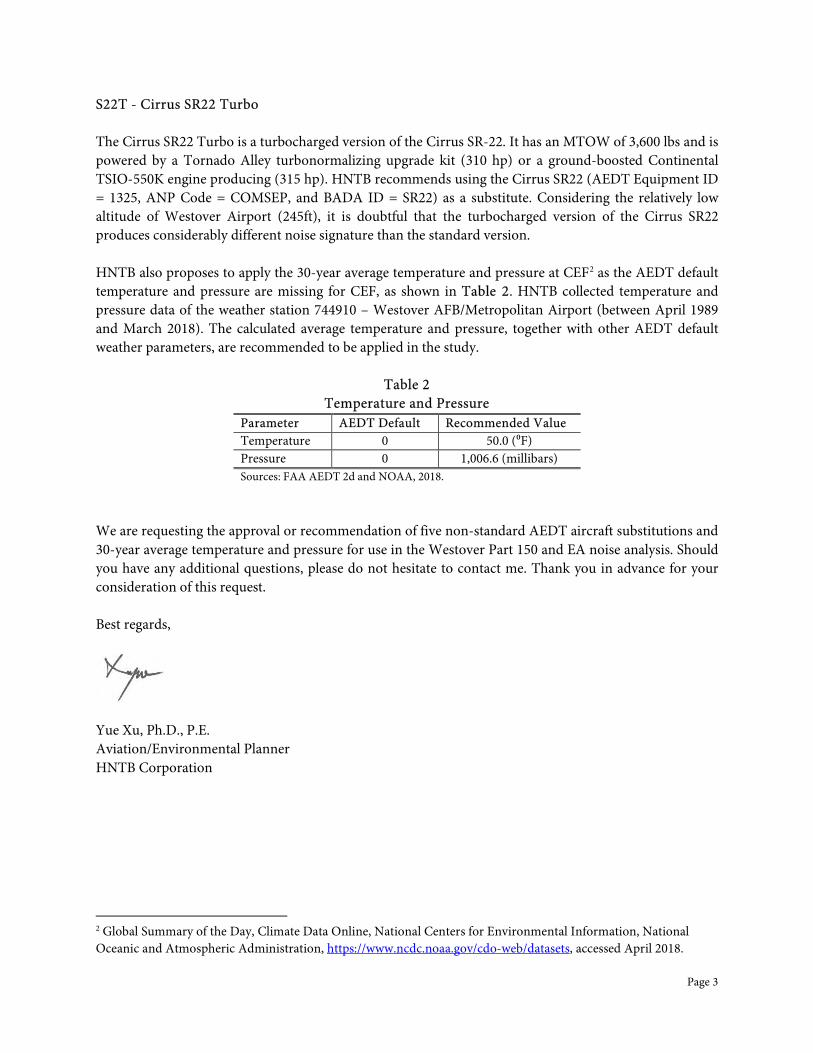
Page 3
S22T - Cirrus SR22 Turbo The Cirrus SR22 Turbo is a turbocharged version of the Cirrus SR-22. It has an MTOW of 3,600 lbs and is powered by a Tornado Alley turbonormalizing upgrade kit (310 hp) or a ground-boosted Continental TSIO-550K engine producing (315 hp). HNTB recommends using the Cirrus SR22 (AEDT Equipment ID = 1325, ANP Code = COMSEP, and BADA ID = SR22) as a substitute. Considering the relatively low altitude of Westover Airport (245ft), it is doubtful that the turbocharged version of the Cirrus SR22 produces considerably different noise signature than the standard version. HNTB also proposes to apply the 30-year average temperature and pressure at CEF2 as the AEDT default temperature and pressure are missing for CEF, as shown in Table 2. HNTB collected temperature and pressure data of the weather station 744910 – Westover AFB/Metropolitan Airport (between April 1989 and March 2018). The calculated average temperature and pressure, together with other AEDT default weather parameters, are recommended to be applied in the study.
Table 2 Temperature and Pressure
Parameter AEDT Default Recommended Value Temperature 0 50.0 (⁰F) Pressure 0 1,006.6 (millibars) Sources: FAA AEDT 2d and NOAA, 2018.
We are requesting the approval or recommendation of five non-standard AEDT aircraft substitutions and 30-year average temperature and pressure for use in the Westover Part 150 and EA noise analysis. Should you have any additional questions, please do not hesitate to contact me. Thank you in advance for your consideration of this request. Best regards,
Yue Xu, Ph.D., P.E. Aviation/Environmental Planner HNTB Corporation
2 Global Summary of the Day, Climate Data Online, National Centers for Environmental Information, National Oceanic and Atmospheric Administration, https://www.ncdc.noaa.gov/cdo-web/datasets, accessed April 2018.
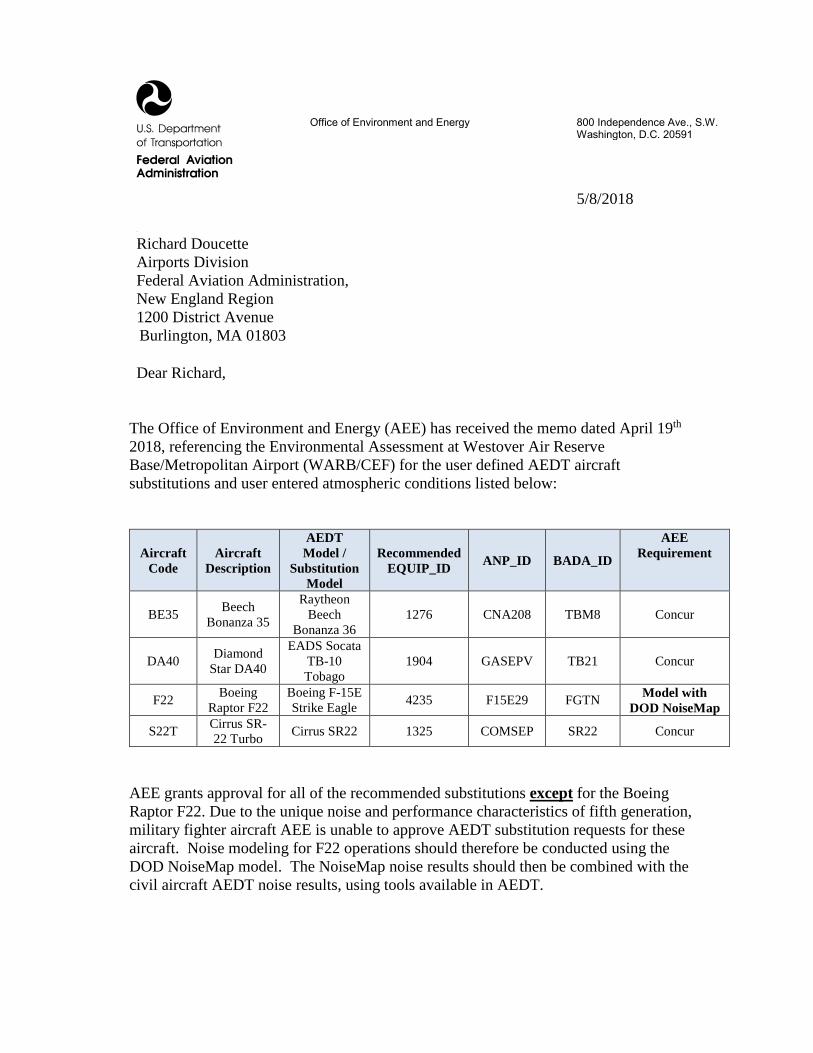
Office of Environment and Energy 800 Independence Ave., S.W. Washington, D.C. 20591 5/8/2018
km
Richard Doucette Airports Division Federal Aviation Administration, New England Region 1200 District Avenue Burlington, MA 01803 Dear Richard,
The Office of Environment and Energy (AEE) has received the memo dated April 19th 2018, referencing the Environmental Assessment at Westover Air Reserve Base/Metropolitan Airport (WARB/CEF) for the user defined AEDT aircraft substitutions and user entered atmospheric conditions listed below:
Aircraft Code
Aircraft Description
AEDT Model /
Substitution Model
Recommended EQUIP_ID ANP_ID BADA_ID
AEE Requirement
BE35 Beech Bonanza 35
Raytheon Beech
Bonanza 36 1276 CNA208 TBM8 Concur
DA40 Diamond Star DA40
EADS Socata TB-10 Tobago
1904 GASEPV TB21 Concur
F22 Boeing Raptor F22
Boeing F-15E Strike Eagle 4235 F15E29 FGTN Model with
DOD NoiseMap
S22T Cirrus SR-22 Turbo Cirrus SR22 1325 COMSEP SR22 Concur
AEE grants approval for all of the recommended substitutions except for the Boeing Raptor F22. Due to the unique noise and performance characteristics of fifth generation, military fighter aircraft AEE is unable to approve AEDT substitution requests for these aircraft. Noise modeling for F22 operations should therefore be conducted using the DOD NoiseMap model. The NoiseMap noise results should then be combined with the civil aircraft AEDT noise results, using tools available in AEDT.
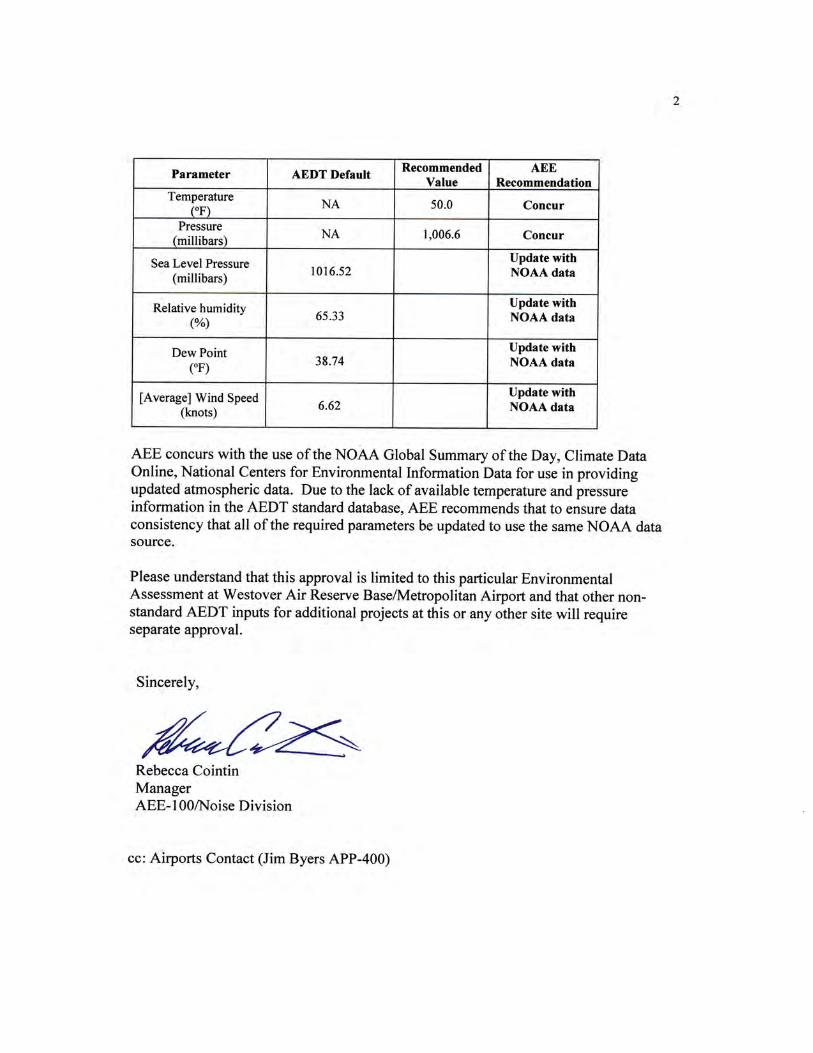
Office of Environment and Energy 800 Independence Ave., S.W. Washington, D.C. 20591 5/8/2018
km
Richard Doucette Airports Division Federal Aviation Administration, New England Region 1200 District Avenue Burlington, MA 01803 Dear Richard,
The Office of Environment and Energy (AEE) has received the memo dated April 19th 2018, referencing the 14 CFR Part 150 for Westover Air Reserve Base/Metropolitan Airport (WARB/CEF) for the user defined AEDT aircraft substitutions and user entered atmospheric conditions listed below:
Aircraft Code
Aircraft Description
AEDT Model /
Substitution Model
Recommended EQUIP_ID ANP_ID BADA_ID
AEE Requirement
BE35 Beech Bonanza 35
Raytheon Beech
Bonanza 36 1276 CNA208 TBM8 Concur
DA40 Diamond Star DA40
EADS Socata TB-10 Tobago
1904 GASEPV TB21 Concur
F22 Boeing Raptor F22
Boeing F-15E Strike Eagle 4235 F15E29 FGTN Model with
DOD NoiseMap
S22T Cirrus SR-22 Turbo Cirrus SR22 1325 COMSEP SR22 Concur
AEE grants approval for all of the recommended substitutions except for the Boeing Raptor F22. Due to the unique noise and performance characteristics of fifth generation, military fighter aircraft AEE is unable to approve AEDT substitution requests for these aircraft. Noise modeling for F22 operations should therefore be conducted using the DOD NoiseMap model. The NoiseMap noise results should then be combined with the civil aircraft AEDT noise results, using tools available in AEDT.

Appendix C – Flight Tracks and Profiles
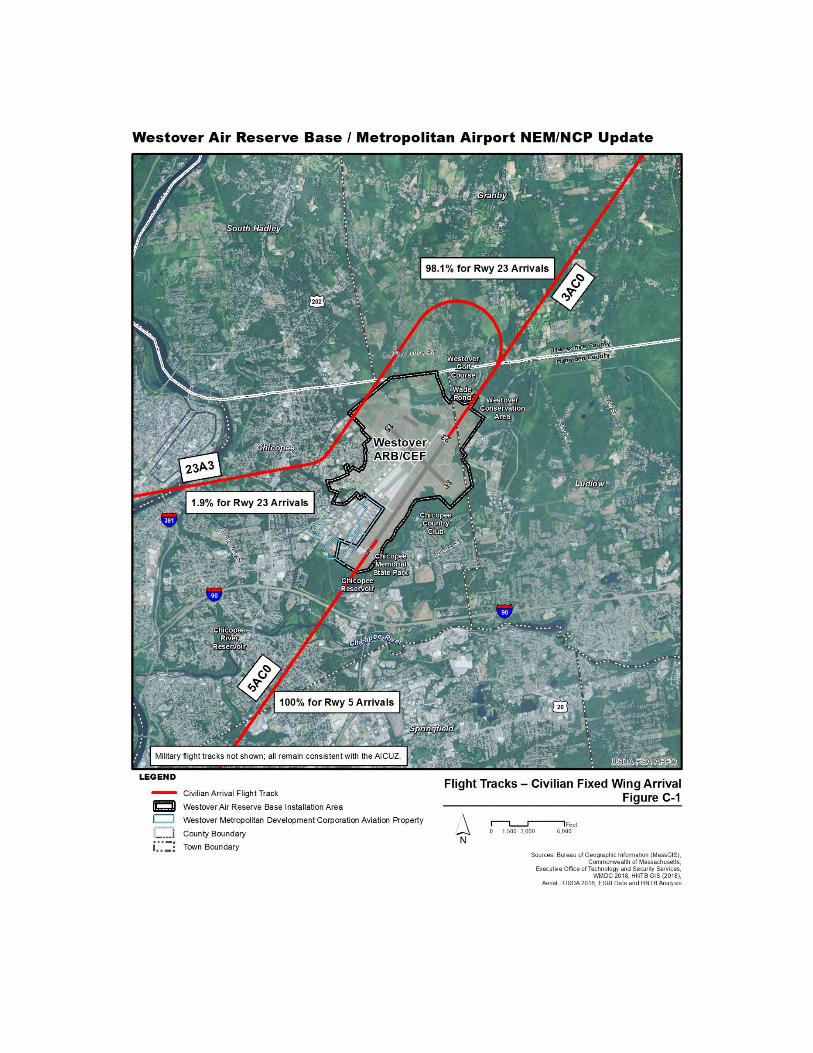
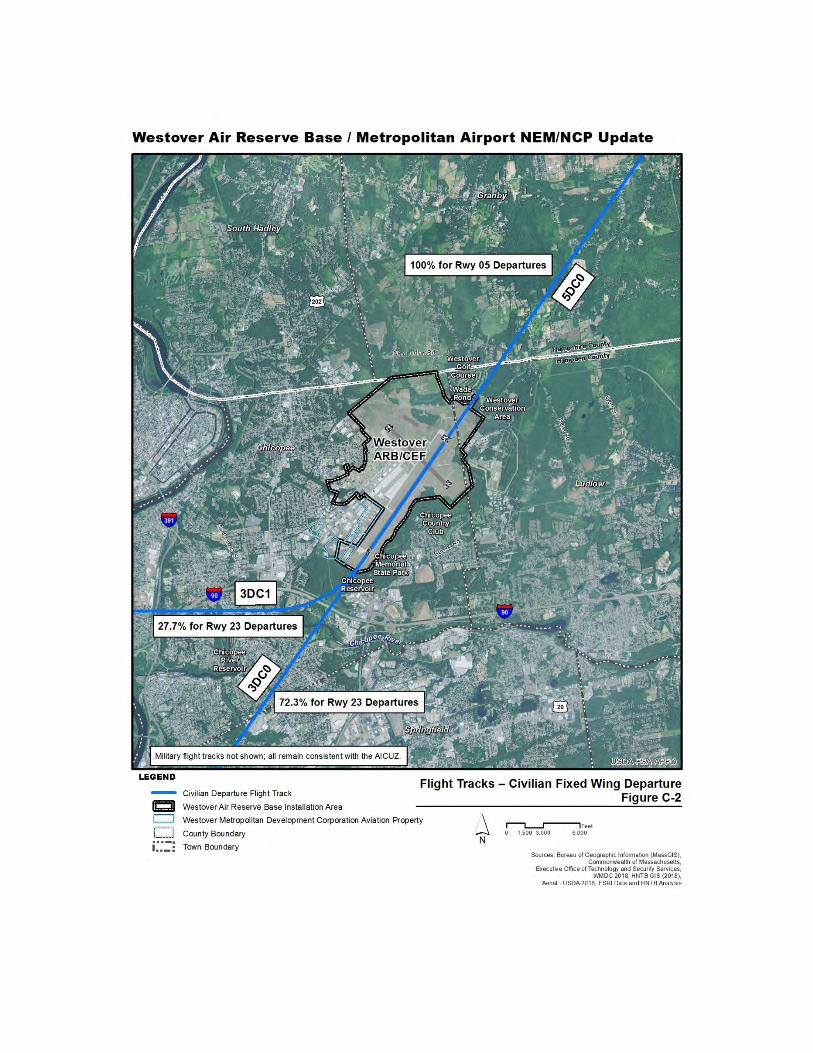
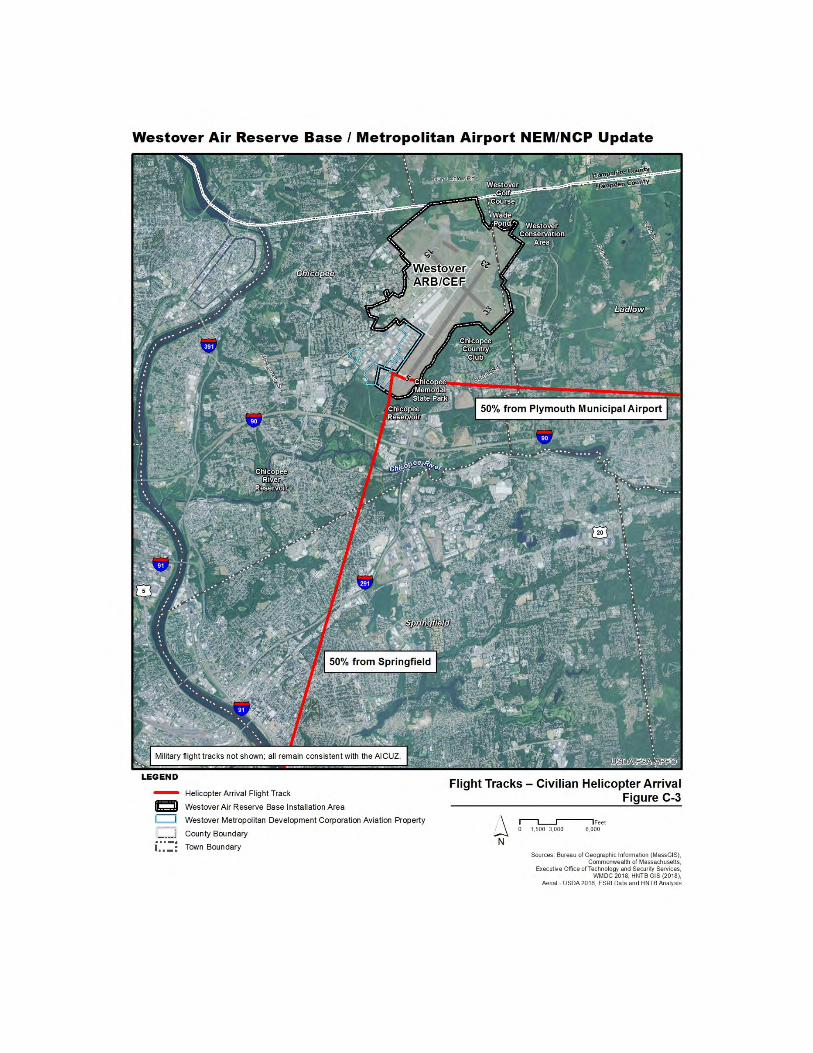
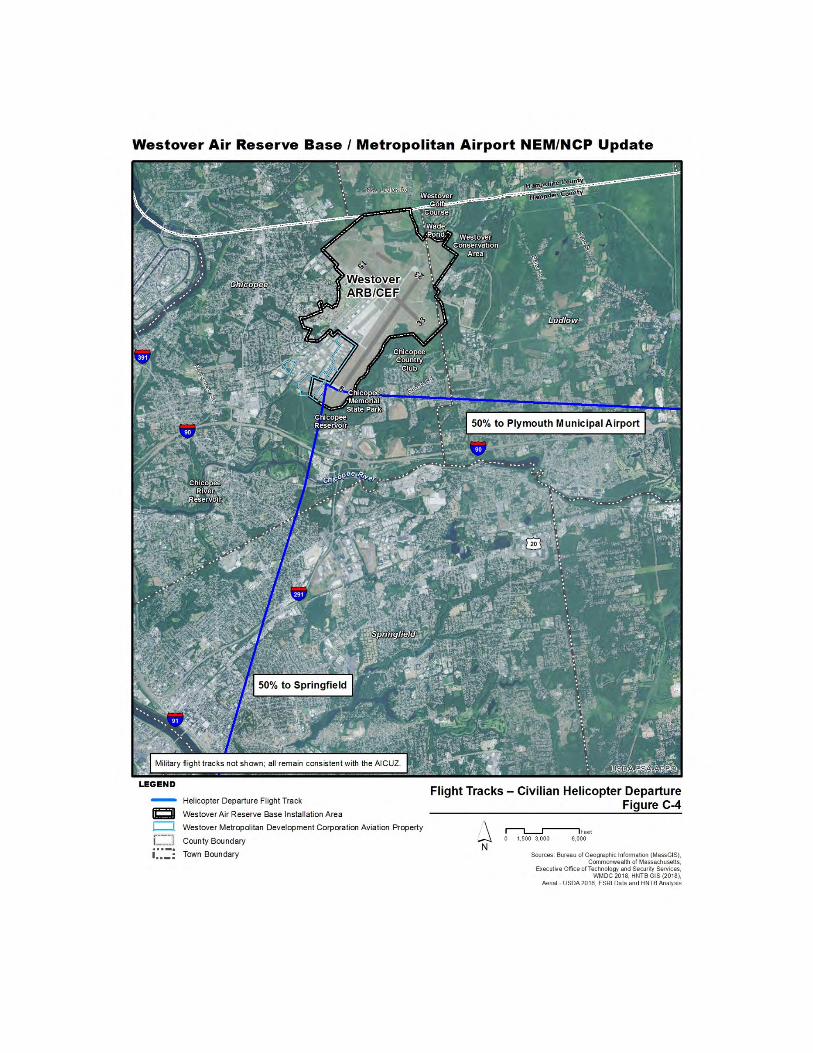
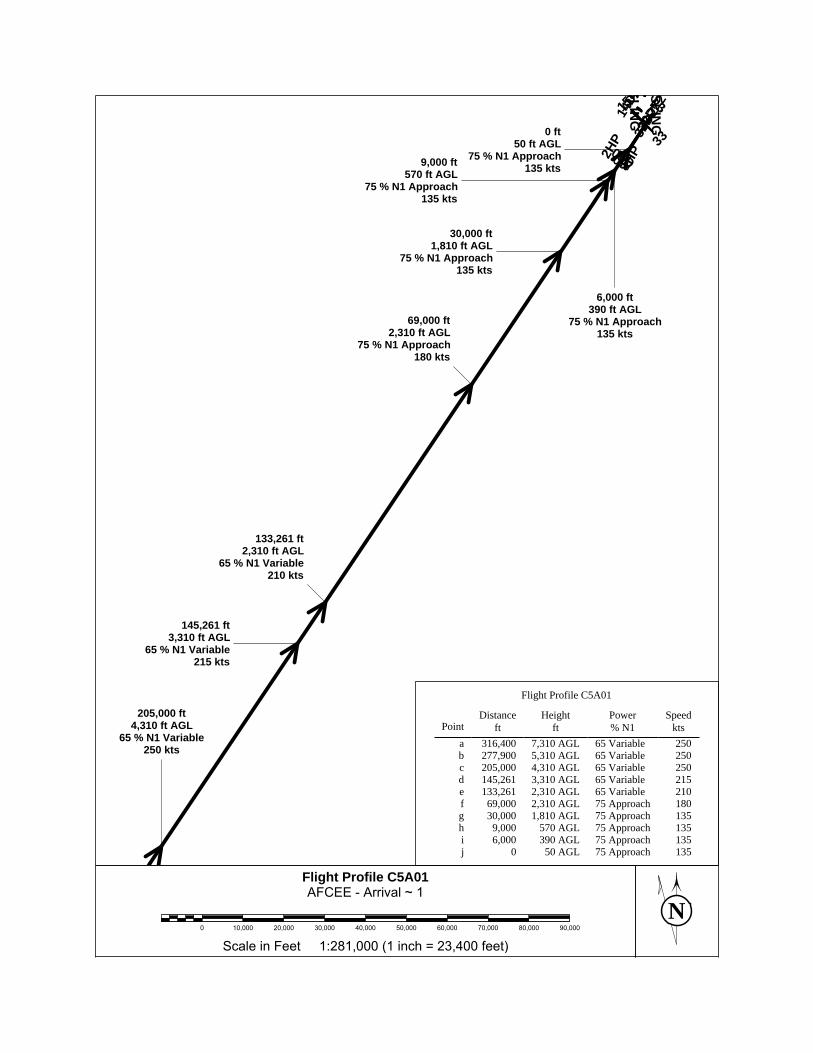
NScale in Feet 1:281,000 (1 inch = 23,400 feet)
0 10,000 20,000 30,000 40,000 50,000 60,000 70,000 80,000 90,000
1~Arrival-AFCEE
C5A01ProfileFlight
1HP2H
P
0505D
14DZ15 23
32DZ
32DZ
_233
SLING
SLING
0 ft50 ft AGL
75 % N1 Approach135 kts
6,000 ft390 ft AGL
75 % N1 Approach135 kts
9,000 ft570 ft AGL
75 % N1 Approach135 kts
30,000 ft1,810 ft AGL
75 % N1 Approach135 kts
69,000 ft2,310 ft AGL
75 % N1 Approach180 kts
133,261 ft2,310 ft AGL
65 % N1 Variable210 kts
145,261 ft3,310 ft AGL
65 % N1 Variable215 kts
205,000 ft4,310 ft AGL
65 % N1 Variable250 kts
135Approach75 50 AGL0j135Approach75 390 AGL6,000i135Approach75 570 AGL9,000h135Approach75 1,810 AGL30,000g180Approach75 2,310 AGL69,000f210Variable65 2,310 AGL133,261e215Variable65 3,310 AGL145,261d250Variable65 4,310 AGL205,000c250Variable65 5,310 AGL277,900b250Variable65 7,310 AGL316,400a
ktsSpeed
% N1Power
ftHeight
ftDistance
Point
Flight Profile C5A01
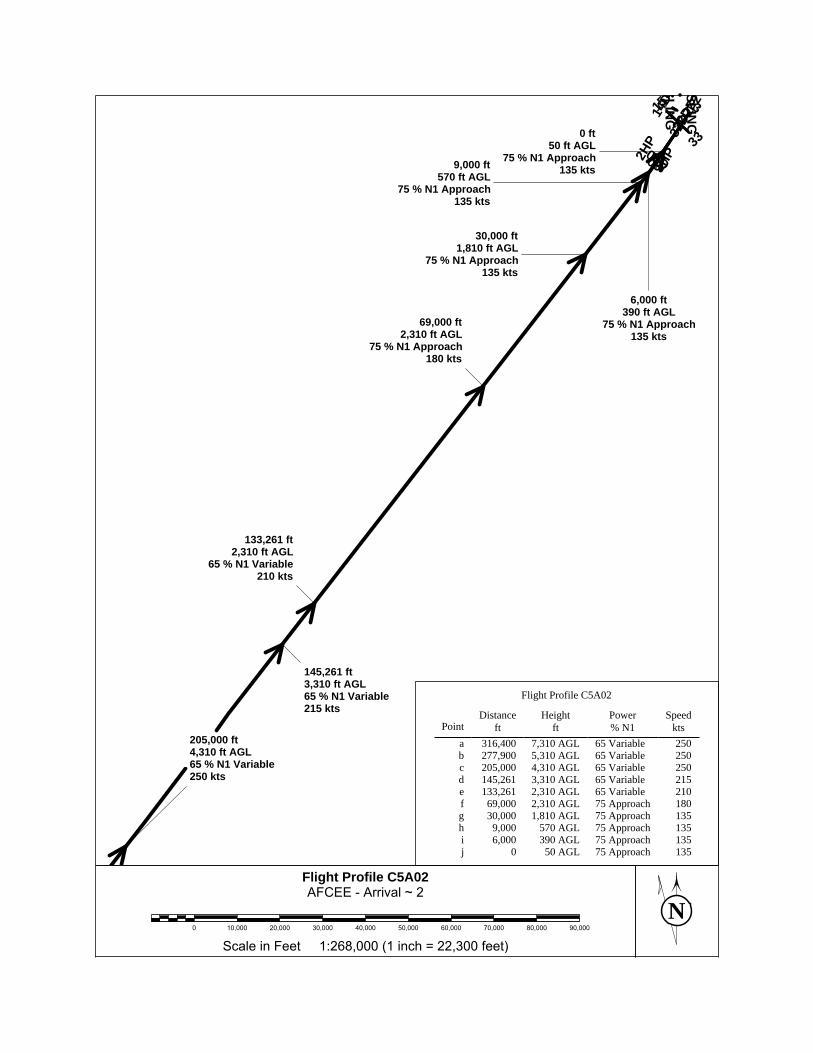
NScale in Feet 1:268,000 (1 inch = 22,300 feet)
0 10,000 20,000 30,000 40,000 50,000 60,000 70,000 80,000 90,000
2~Arrival-AFCEE
C5A02ProfileFlight
1HP2H
P
0505D
14DZ15 23
32DZ
32DZ
_233
SLING
SLING
0 ft50 ft AGL
75 % N1 Approach135 kts
6,000 ft390 ft AGL
75 % N1 Approach135 kts
9,000 ft570 ft AGL
75 % N1 Approach135 kts
30,000 ft1,810 ft AGL
75 % N1 Approach135 kts
69,000 ft2,310 ft AGL
75 % N1 Approach180 kts
133,261 ft2,310 ft AGL
65 % N1 Variable210 kts
145,261 ft3,310 ft AGL65 % N1 Variable215 kts
205,000 ft4,310 ft AGL65 % N1 Variable250 kts
135Approach75 50 AGL0j135Approach75 390 AGL6,000i135Approach75 570 AGL9,000h135Approach75 1,810 AGL30,000g180Approach75 2,310 AGL69,000f210Variable65 2,310 AGL133,261e215Variable65 3,310 AGL145,261d250Variable65 4,310 AGL205,000c250Variable65 5,310 AGL277,900b250Variable65 7,310 AGL316,400a
ktsSpeed
% N1Power
ftHeight
ftDistance
Point
Flight Profile C5A02
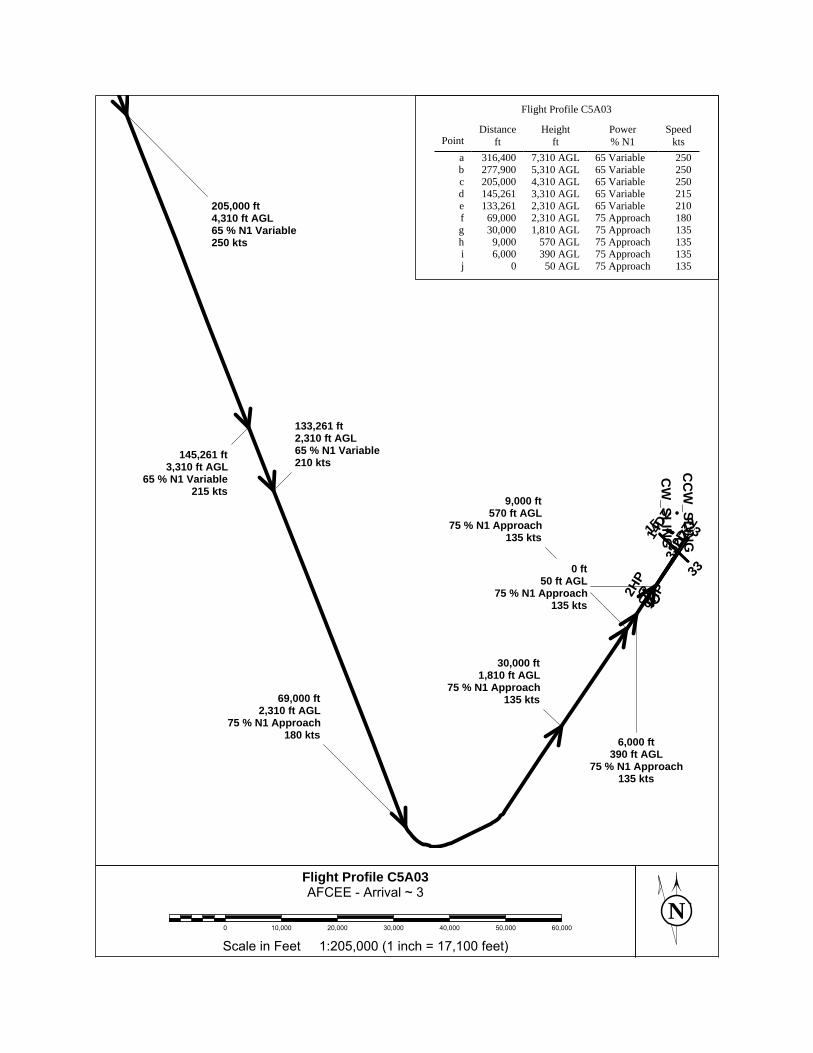
NScale in Feet 1:205,000 (1 inch = 17,100 feet)0 10,000 20,000 30,000 40,000 50,000 60,000
3~Arrival-AFCEE
C5A03ProfileFlight
1HP2H
P
0505D
14DZ15 23
32DZ
32DZ
_233
CC
W_SLIN
GC
W_SLIN
G
0 ft50 ft AGL
75 % N1 Approach135 kts
6,000 ft390 ft AGL
75 % N1 Approach135 kts
9,000 ft570 ft AGL
75 % N1 Approach135 kts
30,000 ft1,810 ft AGL
75 % N1 Approach135 kts69,000 ft
2,310 ft AGL75 % N1 Approach
180 kts
133,261 ft2,310 ft AGL65 % N1 Variable210 kts
145,261 ft3,310 ft AGL
65 % N1 Variable215 kts
205,000 ft4,310 ft AGL65 % N1 Variable250 kts
135Approach75 50 AGL0j135Approach75 390 AGL6,000i135Approach75 570 AGL9,000h135Approach75 1,810 AGL30,000g180Approach75 2,310 AGL69,000f210Variable65 2,310 AGL133,261e215Variable65 3,310 AGL145,261d250Variable65 4,310 AGL205,000c250Variable65 5,310 AGL277,900b250Variable65 7,310 AGL316,400a
ktsSpeed
% N1Power
ftHeight
ftDistance
Point
Flight Profile C5A03
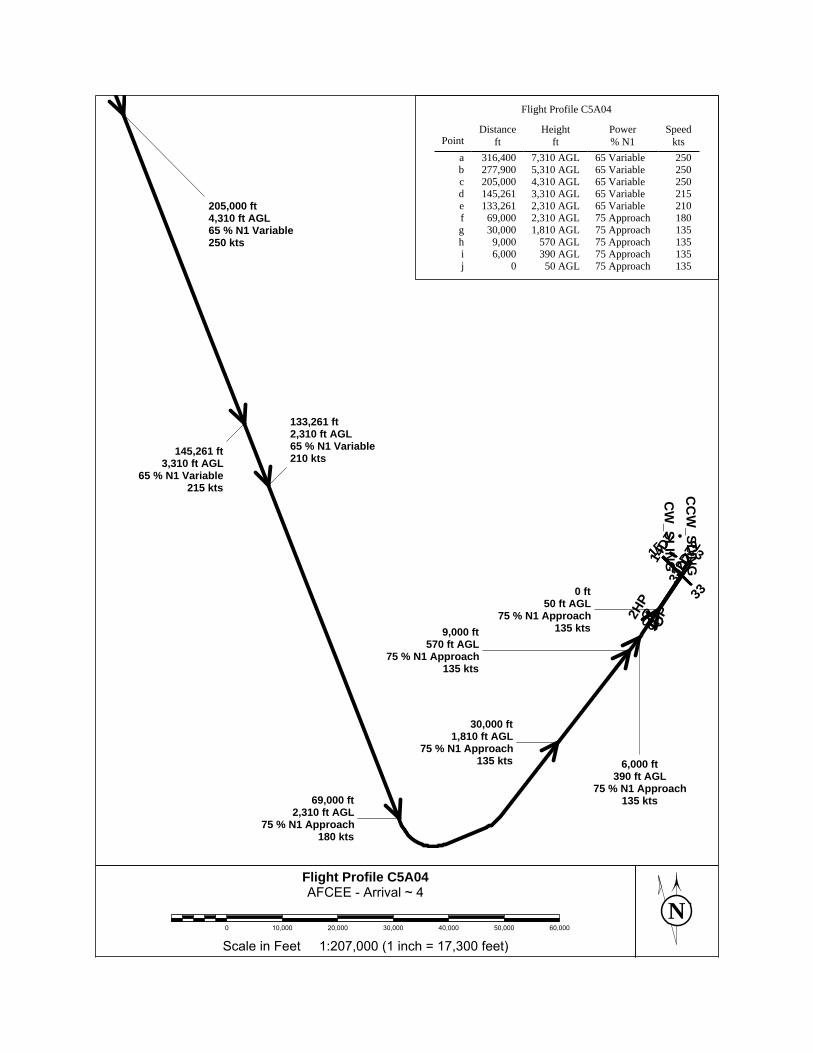
NScale in Feet 1:207,000 (1 inch = 17,300 feet)0 10,000 20,000 30,000 40,000 50,000 60,000
4~Arrival-AFCEE
C5A04ProfileFlight
1HP2H
P0505D
14DZ15 23
32DZ
32DZ
_233
CC
W_SLIN
GC
W_SLIN
G
0 ft50 ft AGL
75 % N1 Approach135 kts
6,000 ft390 ft AGL
75 % N1 Approach135 kts
9,000 ft570 ft AGL
75 % N1 Approach135 kts
30,000 ft1,810 ft AGL
75 % N1 Approach135 kts
69,000 ft2,310 ft AGL
75 % N1 Approach180 kts
133,261 ft2,310 ft AGL65 % N1 Variable210 kts145,261 ft
3,310 ft AGL65 % N1 Variable
215 kts
205,000 ft4,310 ft AGL65 % N1 Variable250 kts
135Approach75 50 AGL0j135Approach75 390 AGL6,000i135Approach75 570 AGL9,000h135Approach75 1,810 AGL30,000g180Approach75 2,310 AGL69,000f210Variable65 2,310 AGL133,261e215Variable65 3,310 AGL145,261d250Variable65 4,310 AGL205,000c250Variable65 5,310 AGL277,900b250Variable65 7,310 AGL316,400a
ktsSpeed
% N1Power
ftHeight
ftDistance
Point
Flight Profile C5A04
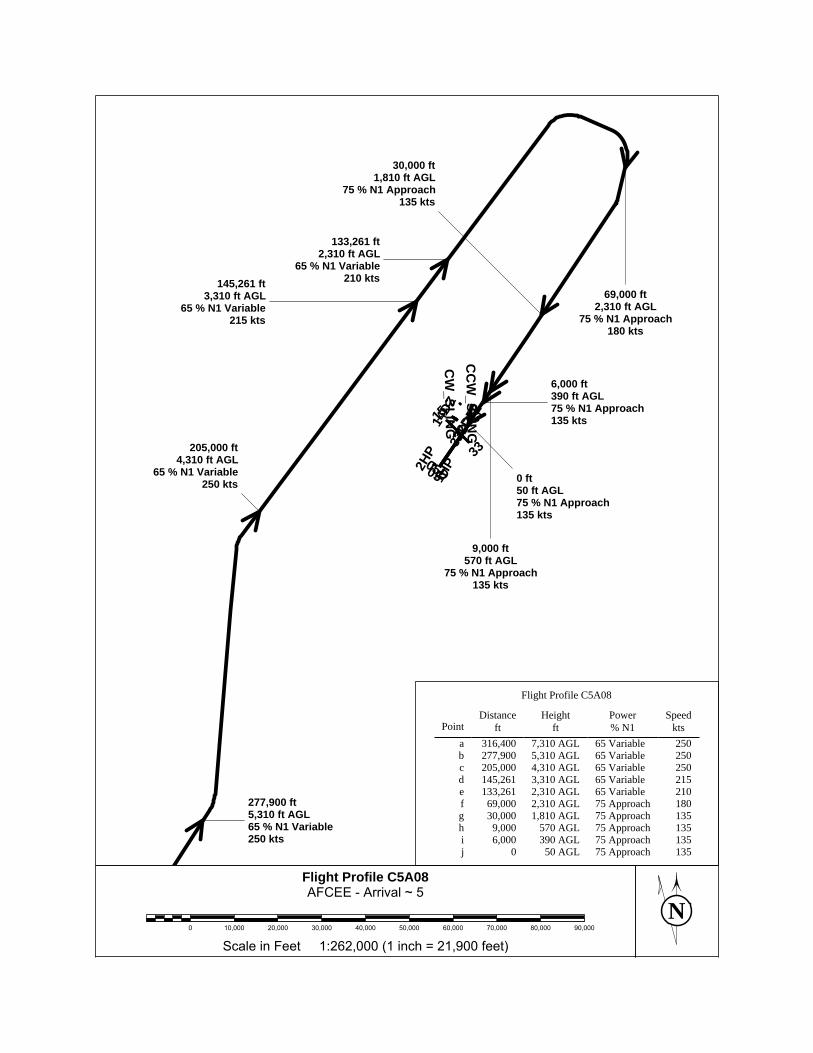
NScale in Feet 1:262,000 (1 inch = 21,900 feet)
0 10,000 20,000 30,000 40,000 50,000 60,000 70,000 80,000 90,000
5~Arrival-AFCEE
C5A08ProfileFlight
1HP2H
P
0505D
14DZ15 23
32DZ
32DZ
_233
CC
W_SLIN
GC
W_SLIN
G
0 ft50 ft AGL75 % N1 Approach135 kts
6,000 ft390 ft AGL75 % N1 Approach135 kts
9,000 ft570 ft AGL
75 % N1 Approach135 kts
30,000 ft1,810 ft AGL
75 % N1 Approach135 kts
69,000 ft2,310 ft AGL
75 % N1 Approach180 kts
133,261 ft2,310 ft AGL
65 % N1 Variable210 kts145,261 ft
3,310 ft AGL65 % N1 Variable
215 kts
205,000 ft4,310 ft AGL
65 % N1 Variable250 kts
277,900 ft5,310 ft AGL65 % N1 Variable250 kts
135Approach75 50 AGL0j135Approach75 390 AGL6,000i135Approach75 570 AGL9,000h135Approach75 1,810 AGL30,000g180Approach75 2,310 AGL69,000f210Variable65 2,310 AGL133,261e215Variable65 3,310 AGL145,261d250Variable65 4,310 AGL205,000c250Variable65 5,310 AGL277,900b250Variable65 7,310 AGL316,400a
ktsSpeed
% N1Power
ftHeight
ftDistance
Point
Flight Profile C5A08
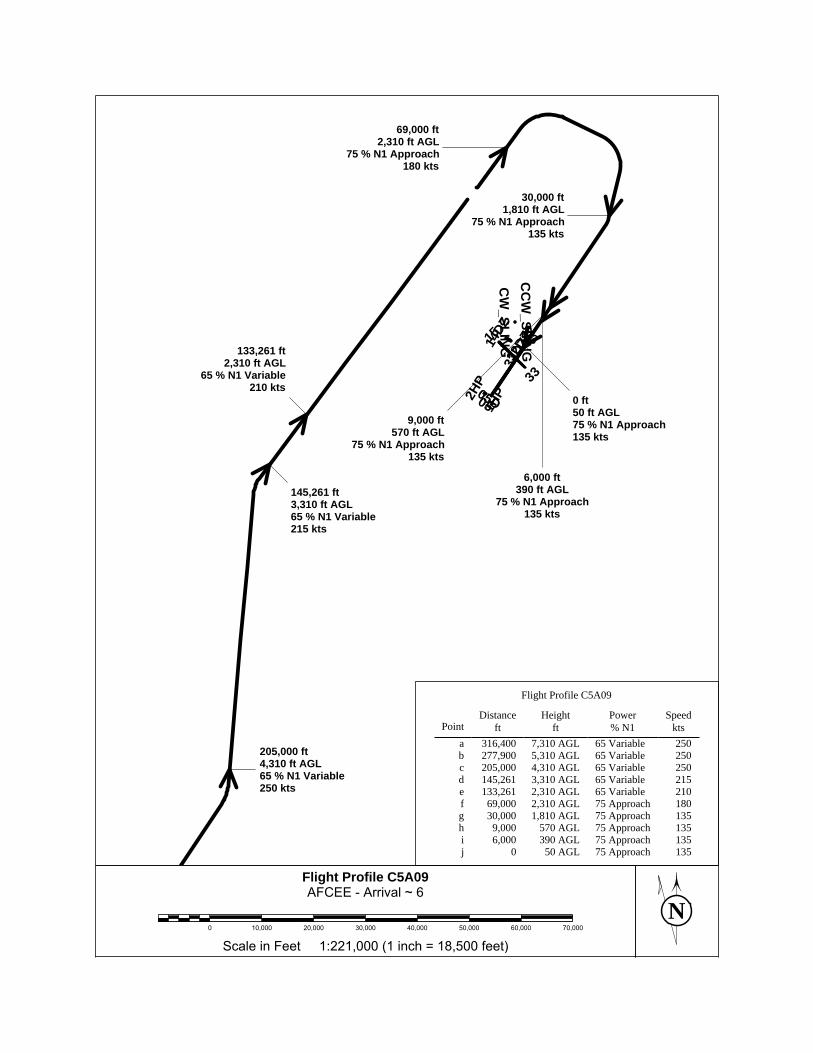
NScale in Feet 1:221,000 (1 inch = 18,500 feet)
0 10,000 20,000 30,000 40,000 50,000 60,000 70,000
6~Arrival-AFCEE
C5A09ProfileFlight
1HP2H
P
0505D
14DZ15 23
32DZ
32DZ
_233
CC
W_SLIN
GC
W_SLIN
G
0 ft50 ft AGL75 % N1 Approach135 kts
6,000 ft390 ft AGL
75 % N1 Approach135 kts
9,000 ft570 ft AGL
75 % N1 Approach135 kts
30,000 ft1,810 ft AGL
75 % N1 Approach135 kts
69,000 ft2,310 ft AGL
75 % N1 Approach180 kts
133,261 ft2,310 ft AGL
65 % N1 Variable210 kts
145,261 ft3,310 ft AGL65 % N1 Variable215 kts
205,000 ft4,310 ft AGL65 % N1 Variable250 kts
135Approach75 50 AGL0j135Approach75 390 AGL6,000i135Approach75 570 AGL9,000h135Approach75 1,810 AGL30,000g180Approach75 2,310 AGL69,000f210Variable65 2,310 AGL133,261e215Variable65 3,310 AGL145,261d250Variable65 4,310 AGL205,000c250Variable65 5,310 AGL277,900b250Variable65 7,310 AGL316,400a
ktsSpeed
% N1Power
ftHeight
ftDistance
Point
Flight Profile C5A09
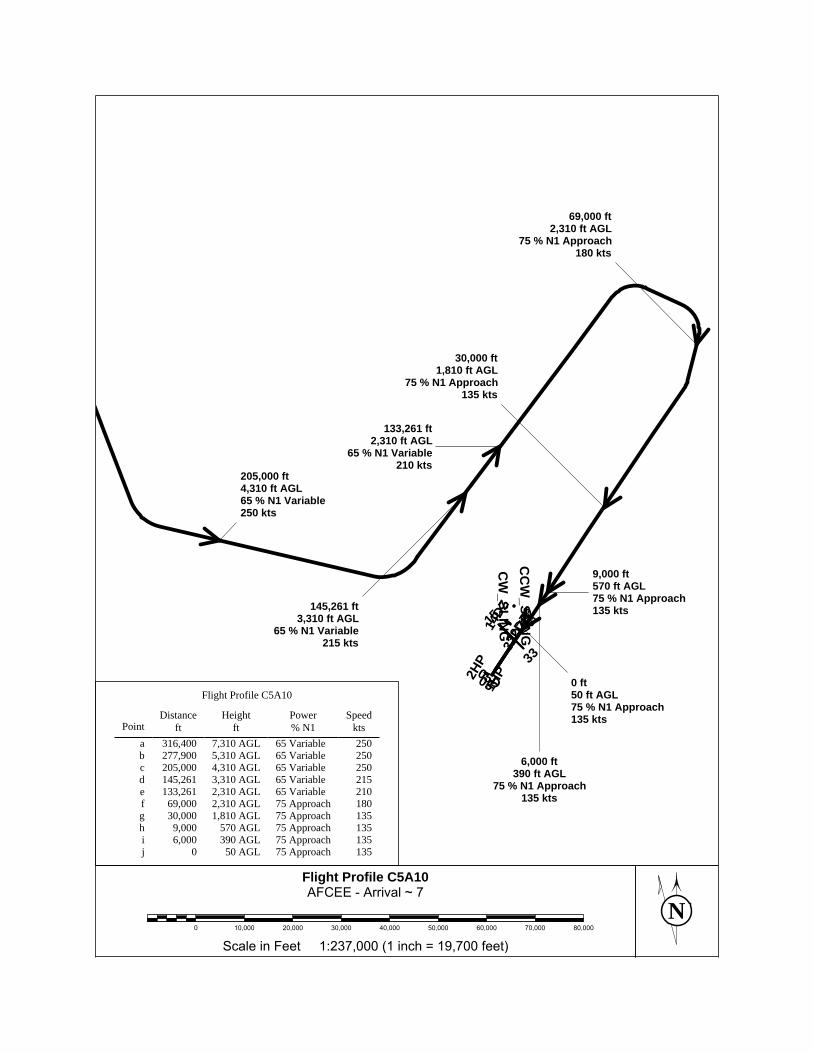
NScale in Feet 1:237,000 (1 inch = 19,700 feet)
0 10,000 20,000 30,000 40,000 50,000 60,000 70,000 80,000
7~Arrival-AFCEE
C5A10ProfileFlight
1HP2H
P
0505D
14DZ15 23
32DZ
32DZ
_233
CC
W_SLIN
GC
W_SLIN
G
0 ft50 ft AGL75 % N1 Approach135 kts
6,000 ft390 ft AGL
75 % N1 Approach135 kts
9,000 ft570 ft AGL75 % N1 Approach135 kts
30,000 ft1,810 ft AGL
75 % N1 Approach135 kts
69,000 ft2,310 ft AGL
75 % N1 Approach180 kts
133,261 ft2,310 ft AGL
65 % N1 Variable210 kts
145,261 ft3,310 ft AGL
65 % N1 Variable215 kts
205,000 ft4,310 ft AGL65 % N1 Variable250 kts
135Approach75 50 AGL0j135Approach75 390 AGL6,000i135Approach75 570 AGL9,000h135Approach75 1,810 AGL30,000g180Approach75 2,310 AGL69,000f210Variable65 2,310 AGL133,261e215Variable65 3,310 AGL145,261d250Variable65 4,310 AGL205,000c250Variable65 5,310 AGL277,900b250Variable65 7,310 AGL316,400a
ktsSpeed
% N1Power
ftHeight
ftDistance
Point
Flight Profile C5A10
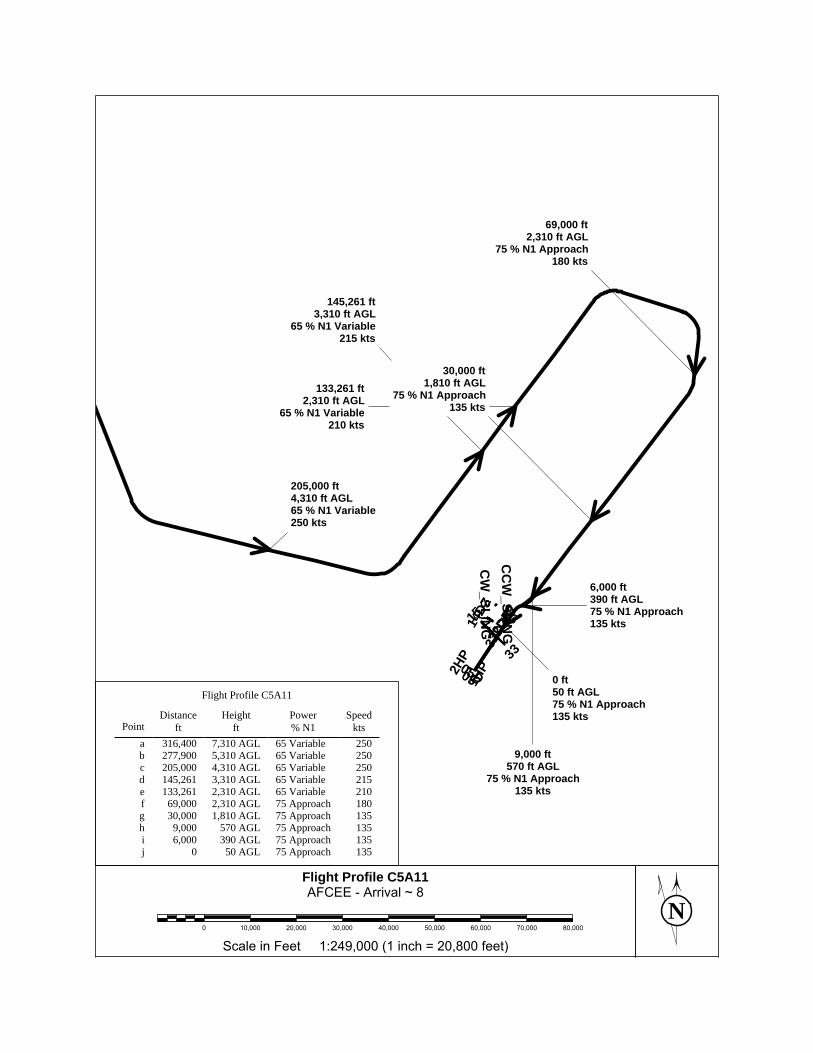
NScale in Feet 1:249,000 (1 inch = 20,800 feet)
0 10,000 20,000 30,000 40,000 50,000 60,000 70,000 80,000
8~Arrival-AFCEE
C5A11ProfileFlight
1HP2H
P
0505D
14DZ15 23
32DZ
32DZ
_233
CC
W_SLIN
GC
W_SLIN
G
0 ft50 ft AGL75 % N1 Approach135 kts
6,000 ft390 ft AGL75 % N1 Approach135 kts
9,000 ft570 ft AGL
75 % N1 Approach135 kts
30,000 ft1,810 ft AGL
75 % N1 Approach135 kts
69,000 ft2,310 ft AGL
75 % N1 Approach180 kts
133,261 ft2,310 ft AGL
65 % N1 Variable210 kts
145,261 ft3,310 ft AGL
65 % N1 Variable215 kts
205,000 ft4,310 ft AGL65 % N1 Variable250 kts
135Approach75 50 AGL0j135Approach75 390 AGL6,000i135Approach75 570 AGL9,000h135Approach75 1,810 AGL30,000g180Approach75 2,310 AGL69,000f210Variable65 2,310 AGL133,261e215Variable65 3,310 AGL145,261d250Variable65 4,310 AGL205,000c250Variable65 5,310 AGL277,900b250Variable65 7,310 AGL316,400a
ktsSpeed
% N1Power
ftHeight
ftDistance
Point
Flight Profile C5A11
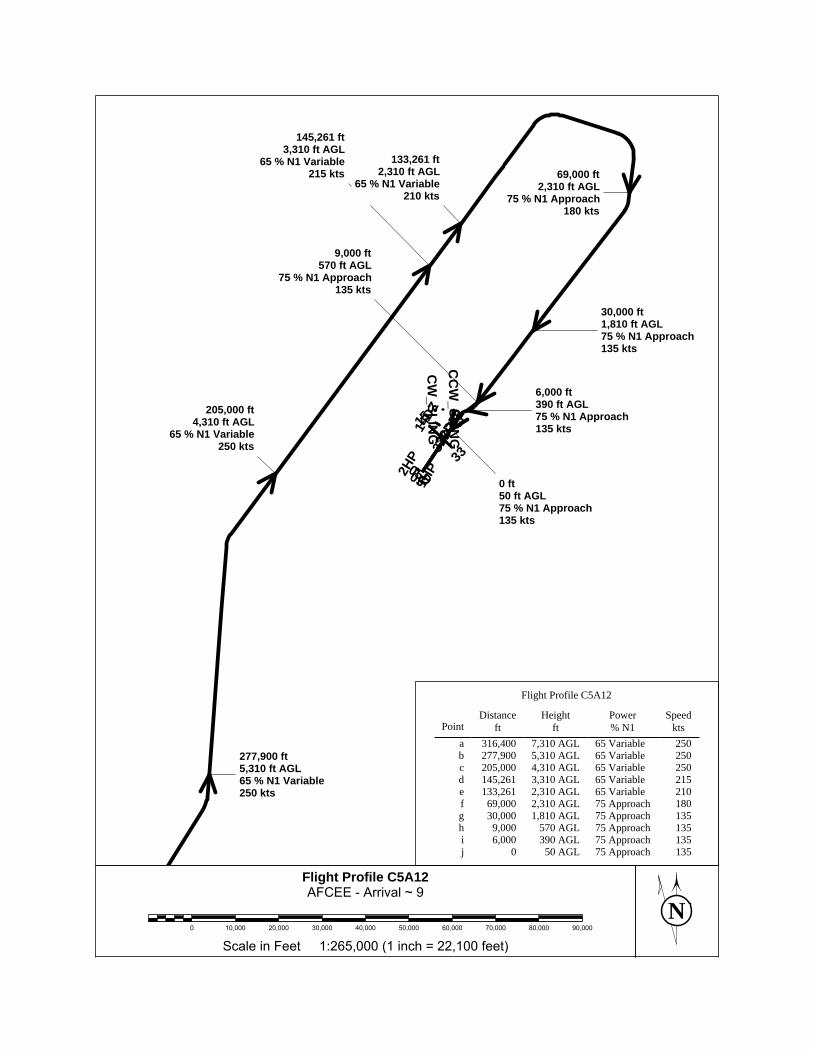
NScale in Feet 1:265,000 (1 inch = 22,100 feet)
0 10,000 20,000 30,000 40,000 50,000 60,000 70,000 80,000 90,000
9~Arrival-AFCEE
C5A12ProfileFlight
1HP2H
P
0505D
14DZ15 23
32DZ
32DZ
_233
CC
W_SLIN
GC
W_SLIN
G
0 ft50 ft AGL75 % N1 Approach135 kts
6,000 ft390 ft AGL75 % N1 Approach135 kts
9,000 ft570 ft AGL
75 % N1 Approach135 kts
30,000 ft1,810 ft AGL75 % N1 Approach135 kts
69,000 ft2,310 ft AGL
75 % N1 Approach180 kts
133,261 ft2,310 ft AGL
65 % N1 Variable210 kts
145,261 ft3,310 ft AGL
65 % N1 Variable215 kts
205,000 ft4,310 ft AGL
65 % N1 Variable250 kts
277,900 ft5,310 ft AGL65 % N1 Variable250 kts
135Approach75 50 AGL0j135Approach75 390 AGL6,000i135Approach75 570 AGL9,000h135Approach75 1,810 AGL30,000g180Approach75 2,310 AGL69,000f210Variable65 2,310 AGL133,261e215Variable65 3,310 AGL145,261d250Variable65 4,310 AGL205,000c250Variable65 5,310 AGL277,900b250Variable65 7,310 AGL316,400a
ktsSpeed
% N1Power
ftHeight
ftDistance
Point
Flight Profile C5A12
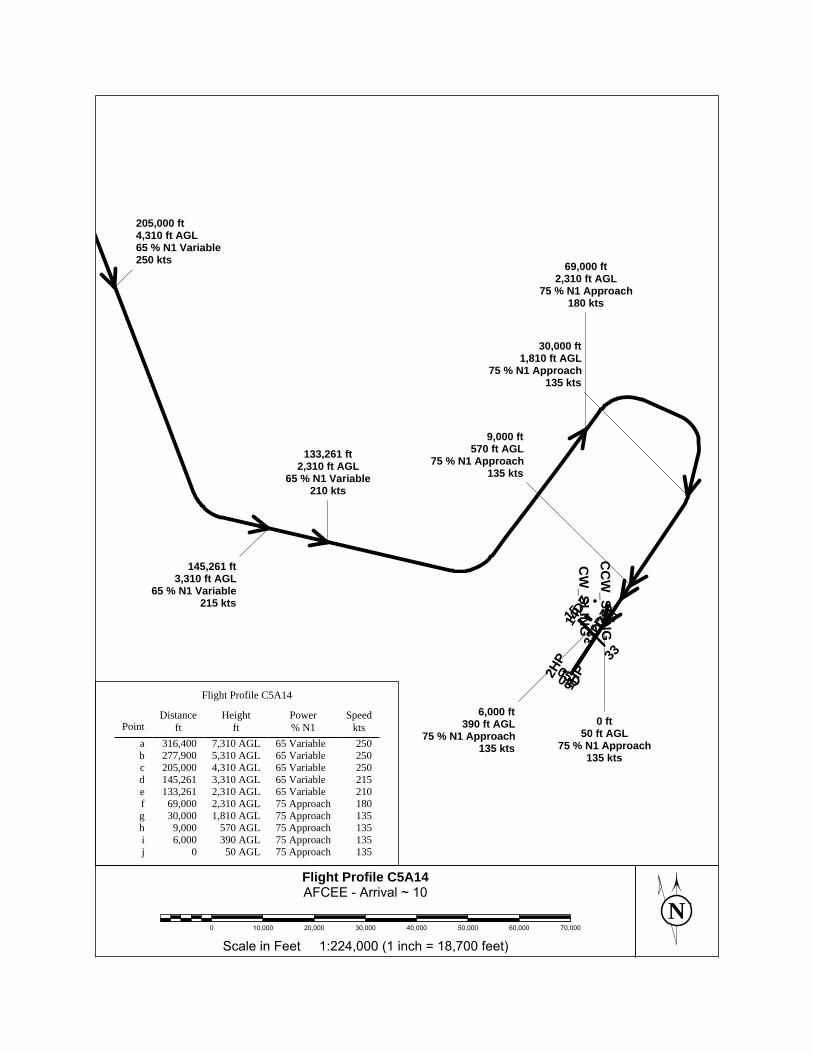
NScale in Feet 1:224,000 (1 inch = 18,700 feet)
0 10,000 20,000 30,000 40,000 50,000 60,000 70,000
10~Arrival-AFCEE
C5A14ProfileFlight
1HP2H
P
0505D
14DZ15 23
32DZ
32DZ
_233
CC
W_SLIN
GC
W_SLIN
G
0 ft50 ft AGL
75 % N1 Approach135 kts
6,000 ft390 ft AGL
75 % N1 Approach135 kts
9,000 ft570 ft AGL
75 % N1 Approach135 kts
30,000 ft1,810 ft AGL
75 % N1 Approach135 kts
69,000 ft2,310 ft AGL
75 % N1 Approach180 kts
133,261 ft2,310 ft AGL
65 % N1 Variable210 kts
145,261 ft3,310 ft AGL
65 % N1 Variable215 kts
205,000 ft4,310 ft AGL65 % N1 Variable250 kts
135Approach75 50 AGL0j135Approach75 390 AGL6,000i135Approach75 570 AGL9,000h135Approach75 1,810 AGL30,000g180Approach75 2,310 AGL69,000f210Variable65 2,310 AGL133,261e215Variable65 3,310 AGL145,261d250Variable65 4,310 AGL205,000c250Variable65 5,310 AGL277,900b250Variable65 7,310 AGL316,400a
ktsSpeed
% N1Power
ftHeight
ftDistance
Point
Flight Profile C5A14
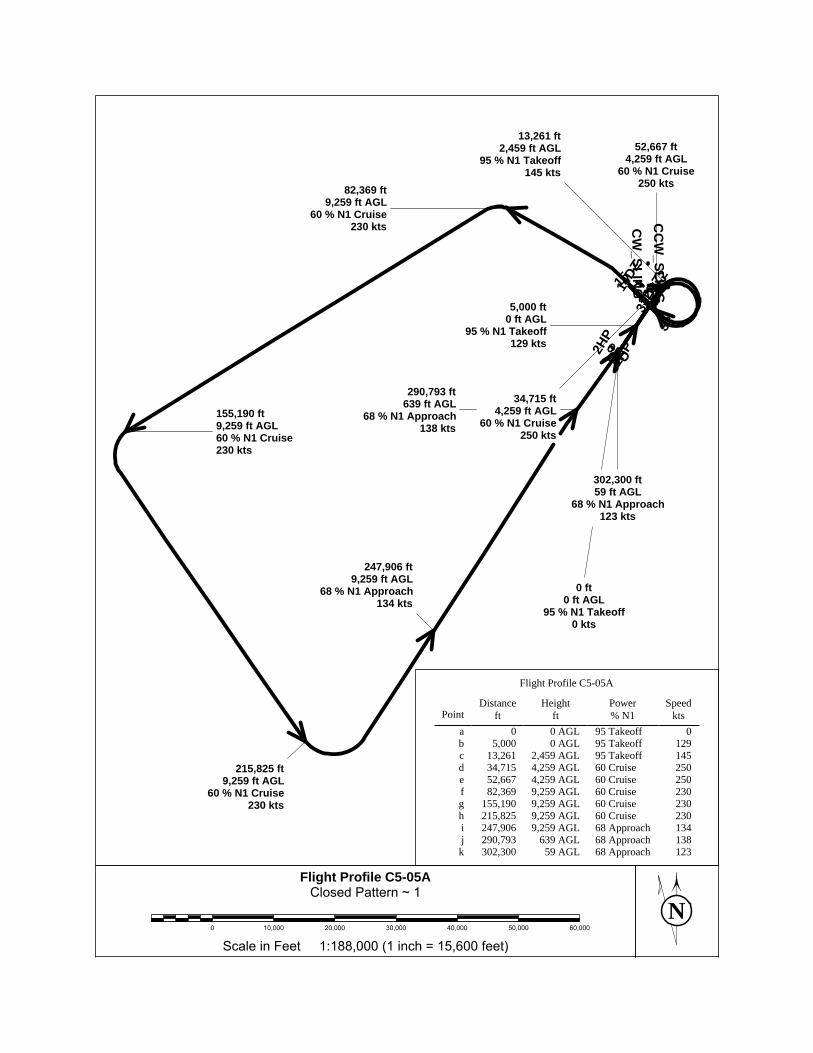
NScale in Feet 1:188,000 (1 inch = 15,600 feet)
0 10,000 20,000 30,000 40,000 50,000 60,000
1~PatternClosed
C5-05AProfileFlight
1HP2H
P
0505D
14DZ15 23
32DZ
32DZ
_233
CC
W_SLIN
GC
W_SLIN
G
0 ft0 ft AGL
95 % N1 Takeoff0 kts
5,000 ft0 ft AGL
95 % N1 Takeoff129 kts
13,261 ft2,459 ft AGL
95 % N1 Takeoff145 kts
34,715 ft4,259 ft AGL
60 % N1 Cruise250 kts
52,667 ft4,259 ft AGL
60 % N1 Cruise250 kts82,369 ft
9,259 ft AGL60 % N1 Cruise
230 kts
155,190 ft9,259 ft AGL60 % N1 Cruise230 kts
215,825 ft9,259 ft AGL
60 % N1 Cruise230 kts
247,906 ft9,259 ft AGL
68 % N1 Approach134 kts
290,793 ft639 ft AGL
68 % N1 Approach138 kts
302,300 ft59 ft AGL
68 % N1 Approach123 kts
123Approach68 59 AGL302,300k138Approach68 639 AGL290,793j134Approach68 9,259 AGL247,906i230Cruise60 9,259 AGL215,825h230Cruise60 9,259 AGL155,190g230Cruise60 9,259 AGL82,369f250Cruise60 4,259 AGL52,667e250Cruise60 4,259 AGL34,715d145Takeoff95 2,459 AGL13,261c129Takeoff95 0 AGL5,000b
0Takeoff95 0 AGL0akts
Speed% N1Power
ftHeight
ftDistance
Point
Flight Profile C5-05A
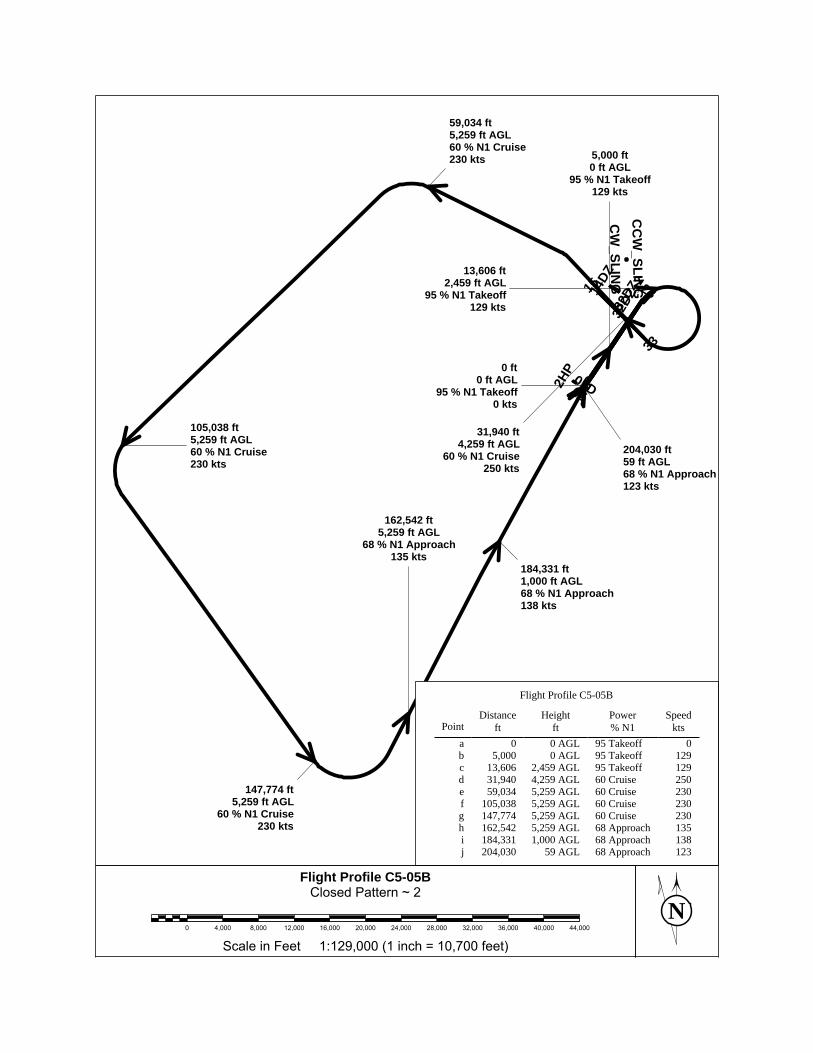
NScale in Feet 1:129,000 (1 inch = 10,700 feet)
0 4,000 8,000 12,000 16,000 20,000 24,000 28,000 32,000 36,000 40,000 44,000
2~PatternClosed
C5-05BProfileFlight
1HP2H
P
0505D
14DZ
15 23
32DZ
32DZ
_233
CC
W_SLIN
G
CW
_SLING
204,030 ft59 ft AGL68 % N1 Approach123 kts
0 ft0 ft AGL
95 % N1 Takeoff0 kts
5,000 ft0 ft AGL
95 % N1 Takeoff129 kts
13,606 ft2,459 ft AGL
95 % N1 Takeoff129 kts
31,940 ft4,259 ft AGL
60 % N1 Cruise250 kts
59,034 ft5,259 ft AGL60 % N1 Cruise230 kts
105,038 ft5,259 ft AGL60 % N1 Cruise230 kts
147,774 ft5,259 ft AGL
60 % N1 Cruise230 kts
162,542 ft5,259 ft AGL
68 % N1 Approach135 kts
184,331 ft1,000 ft AGL68 % N1 Approach138 kts
123Approach68 59 AGL204,030j138Approach68 1,000 AGL184,331i135Approach68 5,259 AGL162,542h230Cruise60 5,259 AGL147,774g230Cruise60 5,259 AGL105,038f230Cruise60 5,259 AGL59,034e250Cruise60 4,259 AGL31,940d129Takeoff95 2,459 AGL13,606c129Takeoff95 0 AGL5,000b
0Takeoff95 0 AGL0akts
Speed% N1Power
ftHeight
ftDistance
Point
Flight Profile C5-05B
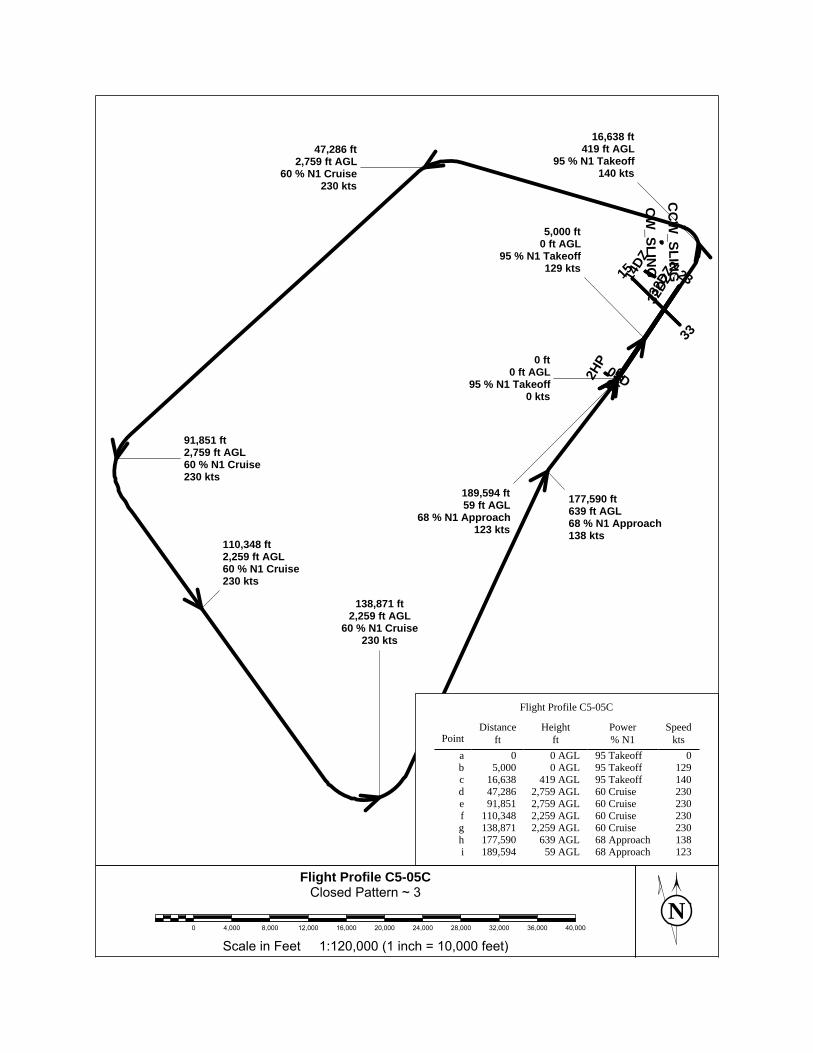
NScale in Feet 1:120,000 (1 inch = 10,000 feet)
0 4,000 8,000 12,000 16,000 20,000 24,000 28,000 32,000 36,000 40,000
3~PatternClosed
C5-05CProfileFlight
1HP2H
P
0505D
14DZ
15 23
32DZ
32DZ
_233
CC
W_SLIN
G
CW
_SLING
0 ft0 ft AGL
95 % N1 Takeoff0 kts
5,000 ft0 ft AGL
95 % N1 Takeoff129 kts
16,638 ft419 ft AGL
95 % N1 Takeoff140 kts
47,286 ft2,759 ft AGL
60 % N1 Cruise230 kts
91,851 ft2,759 ft AGL60 % N1 Cruise230 kts
110,348 ft2,259 ft AGL60 % N1 Cruise230 kts
138,871 ft2,259 ft AGL
60 % N1 Cruise230 kts
177,590 ft639 ft AGL68 % N1 Approach138 kts
189,594 ft59 ft AGL
68 % N1 Approach123 kts
123Approach68 59 AGL189,594i138Approach68 639 AGL177,590h230Cruise60 2,259 AGL138,871g230Cruise60 2,259 AGL110,348f230Cruise60 2,759 AGL91,851e230Cruise60 2,759 AGL47,286d140Takeoff95 419 AGL16,638c129Takeoff95 0 AGL5,000b
0Takeoff95 0 AGL0akts
Speed% N1Power
ftHeight
ftDistance
Point
Flight Profile C5-05C
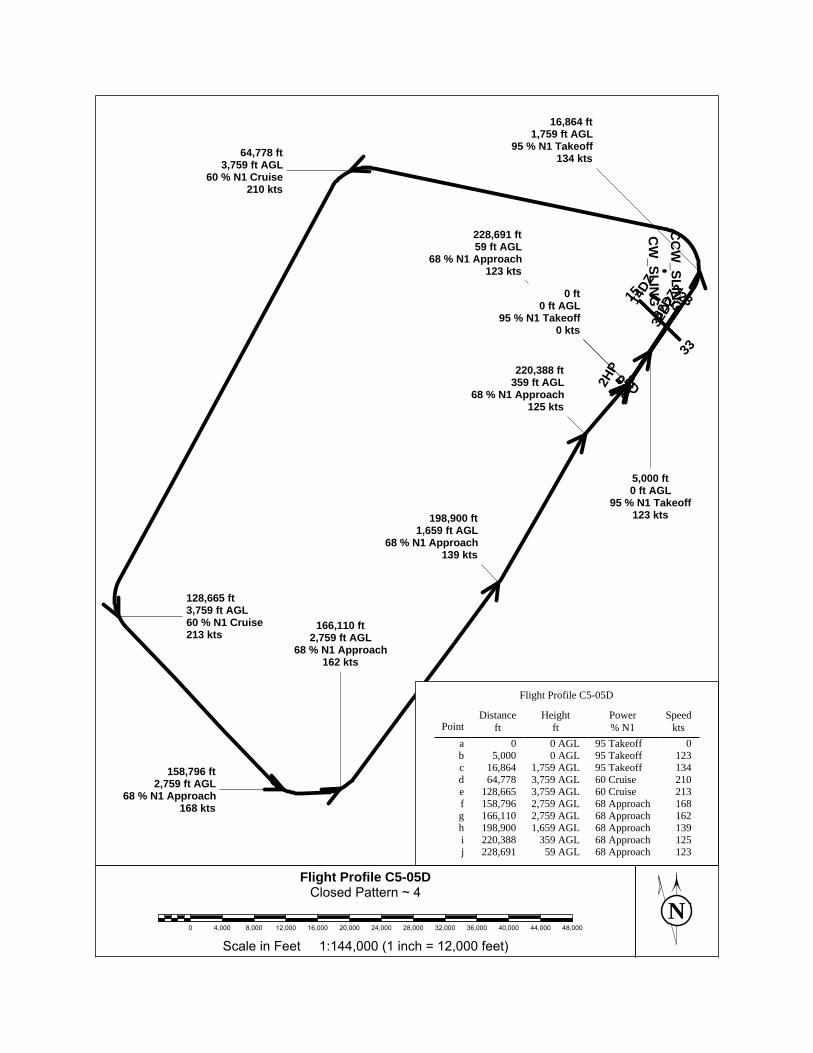
NScale in Feet 1:144,000 (1 inch = 12,000 feet)
0 4,000 8,000 12,000 16,000 20,000 24,000 28,000 32,000 36,000 40,000 44,000 48,000
4~PatternClosed
C5-05DProfileFlight
1HP2H
P
0505D
14DZ15 23
32DZ
32DZ
_233
CC
W_SLIN
G
CW
_SLING0 ft
0 ft AGL95 % N1 Takeoff
0 kts
5,000 ft0 ft AGL
95 % N1 Takeoff123 kts
16,864 ft1,759 ft AGL
95 % N1 Takeoff134 kts64,778 ft
3,759 ft AGL60 % N1 Cruise
210 kts
128,665 ft3,759 ft AGL60 % N1 Cruise213 kts
158,796 ft2,759 ft AGL
68 % N1 Approach168 kts
166,110 ft2,759 ft AGL
68 % N1 Approach162 kts
198,900 ft1,659 ft AGL
68 % N1 Approach139 kts
220,388 ft359 ft AGL
68 % N1 Approach125 kts
228,691 ft59 ft AGL
68 % N1 Approach123 kts
123Approach68 59 AGL228,691j125Approach68 359 AGL220,388i139Approach68 1,659 AGL198,900h162Approach68 2,759 AGL166,110g168Approach68 2,759 AGL158,796f213Cruise60 3,759 AGL128,665e210Cruise60 3,759 AGL64,778d134Takeoff95 1,759 AGL16,864c123Takeoff95 0 AGL5,000b
0Takeoff95 0 AGL0akts
Speed% N1Power
ftHeight
ftDistance
Point
Flight Profile C5-05D

NScale in Feet 1:159,000 (1 inch = 13,300 feet)
0 10,000 20,000 30,000 40,000 50,000
5~PatternClosed
C5-05FProfileFlight
1HP2H
P
0505D
14DZ15 23
32DZ
32DZ
_233
CC
W_SLIN
G
CW
_SLING
0 ft0 ft AGL
95 % N1 Takeoff0 kts
5,000 ft0 ft AGL
95 % N1 Takeoff123 kts
16,985 ft1,759 ft AGL
95 % N1 Takeoff134 kts
65,282 ft3,759 ft AGL
60 % N1 Cruise210 kts
127,973 ft3,759 ft AGL60 % N1 Cruise213 kts
158,144 ft2,759 ft AGL
68 % N1 Approach168 kts
166,535 ft2,759 ft AGL
68 % N1 Approach162 kts
198,671 ft1,659 ft AGL
68 % N1 Approach139 kts
220,300 ft959 ft AGL
68 % N1 Approach150 kts
255,342 ft959 ft AGL
68 % N1 Approach150 kts
264,102 ft959 ft AGL
68 % N1 Approach140 kts
269,226 ft59 ft AGL
68 % N1 Approach123 kts
123Approach68 59 AGL269,226l140Approach68 959 AGL264,102k150Approach68 959 AGL255,342j150Approach68 959 AGL220,300i139Approach68 1,659 AGL198,671h162Approach68 2,759 AGL166,535g168Approach68 2,759 AGL158,144f213Cruise60 3,759 AGL127,973e210Cruise60 3,759 AGL65,282d134Takeoff95 1,759 AGL16,985c123Takeoff95 0 AGL5,000b
0Takeoff95 0 AGL0akts
Speed% N1Power
ftHeight
ftDistance
Point
Flight Profile C5-05F

NScale in Feet 1:141,000 (1 inch = 11,800 feet)
0 4,000 8,000 12,000 16,000 20,000 24,000 28,000 32,000 36,000 40,000 44,000 48,000
6~PatternClosed
C5-05GProfileFlight
1HP2H
P
0505D
14DZ15 23
32DZ
32DZ
_233
CC
W_SLIN
G
CW
_SLING0 ft
0 ft AGL95 % N1 Takeoff
0 kts
5,000 ft0 ft AGL
95 % N1 Takeoff123 kts
13,795 ft1,759 ft AGL
95 % N1 Takeoff134 kts
61,267 ft3,759 ft AGL
60 % N1 Cruise210 kts
123,050 ft3,759 ft AGL60 % N1 Cruise213 kts
155,353 ft2,759 ft AGL
68 % N1 Approach169 kts
166,535 ft2,759 ft AGL
68 % N1 Approach162 kts
198,138 ft1,659 ft AGL
68 % N1 Approach137 kts
225,364 ft59 ft AGL
68 % N1 Approach123 kts
123Approach68 59 AGL225,364i137Approach68 1,659 AGL198,138h162Approach68 2,759 AGL166,535g169Approach68 2,759 AGL155,353f213Cruise60 3,759 AGL123,050e210Cruise60 3,759 AGL61,267d134Takeoff95 1,759 AGL13,795c123Takeoff95 0 AGL5,000b
0Takeoff95 0 AGL0akts
Speed% N1Power
ftHeight
ftDistance
Point
Flight Profile C5-05G
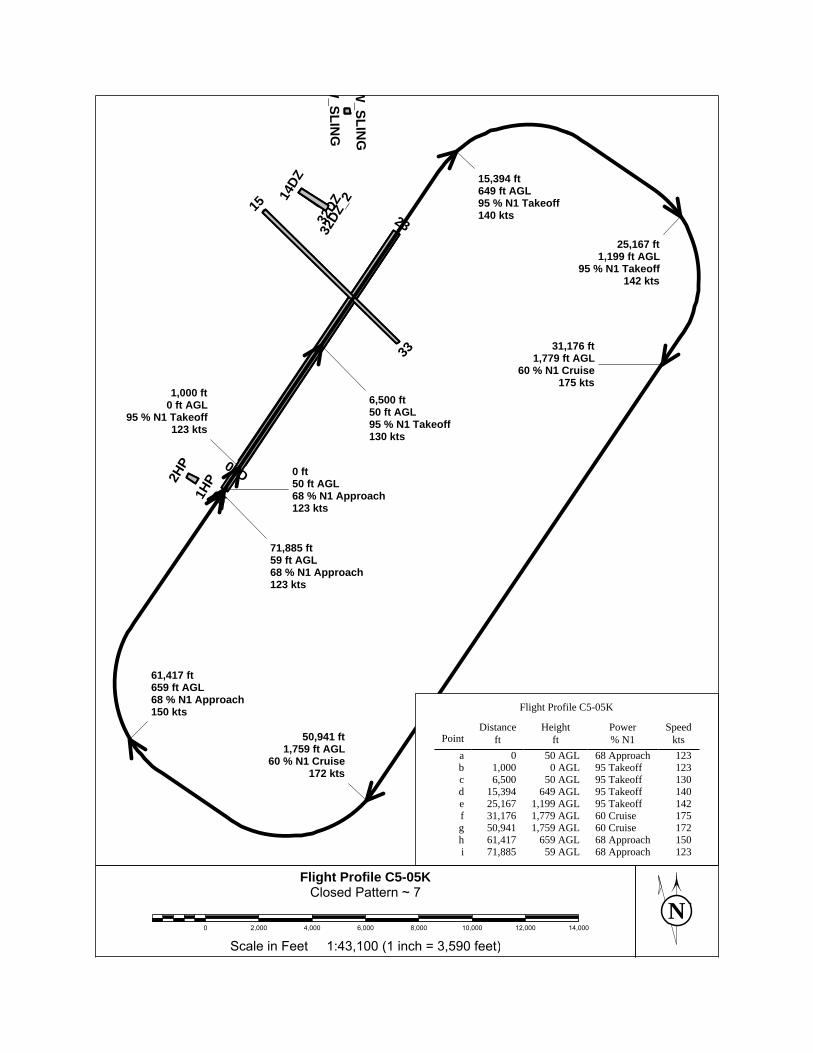
NScale in Feet 1:43,100 (1 inch = 3,590 feet)
0 2,000 4,000 6,000 8,000 10,000 12,000 14,000
7~PatternClosed
C5-05KProfileFlight
1HP2H
P
05
05D
14DZ
15
2332DZ
32DZ
_2
33
W_SLIN
G
W_SLIN
G0 ft50 ft AGL68 % N1 Approach123 kts
1,000 ft0 ft AGL
95 % N1 Takeoff123 kts
6,500 ft50 ft AGL95 % N1 Takeoff130 kts
15,394 ft649 ft AGL95 % N1 Takeoff140 kts
25,167 ft1,199 ft AGL
95 % N1 Takeoff142 kts
31,176 ft1,779 ft AGL
60 % N1 Cruise175 kts
50,941 ft1,759 ft AGL
60 % N1 Cruise172 kts
61,417 ft659 ft AGL68 % N1 Approach150 kts
71,885 ft59 ft AGL68 % N1 Approach123 kts
123Approach68 59 AGL71,885i150Approach68 659 AGL61,417h172Cruise60 1,759 AGL50,941g175Cruise60 1,779 AGL31,176f142Takeoff95 1,199 AGL25,167e140Takeoff95 649 AGL15,394d130Takeoff95 50 AGL6,500c123Takeoff95 0 AGL1,000b123Approach68 50 AGL0a
ktsSpeed
% N1Power
ftHeight
ftDistance
Point
Flight Profile C5-05K
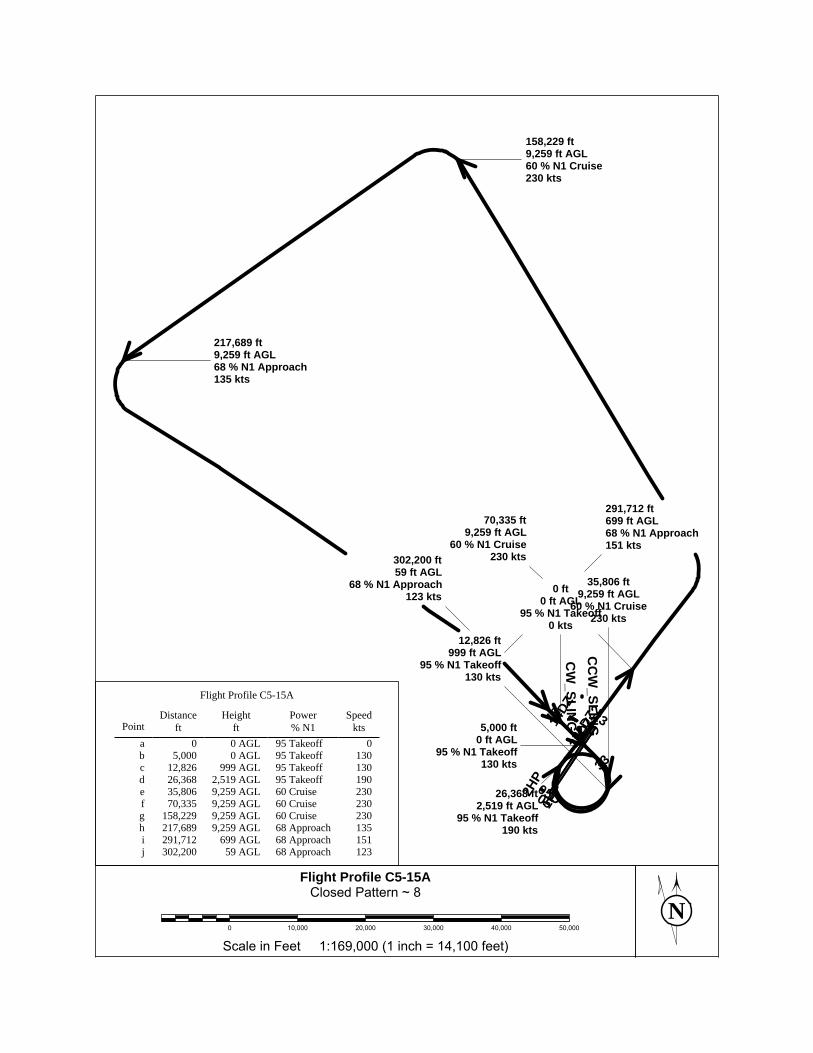
NScale in Feet 1:169,000 (1 inch = 14,100 feet)
0 10,000 20,000 30,000 40,000 50,000
8~PatternClosed
C5-15AProfileFlight
1HP2H
P
0505D
14DZ15 23
32DZ
32DZ
_233
CC
W_SLIN
GC
W_SLIN
G
0 ft0 ft AGL
95 % N1 Takeoff0 kts
5,000 ft0 ft AGL
95 % N1 Takeoff130 kts
12,826 ft999 ft AGL
95 % N1 Takeoff130 kts
26,368 ft2,519 ft AGL
95 % N1 Takeoff190 kts
35,806 ft9,259 ft AGL
60 % N1 Cruise230 kts
70,335 ft9,259 ft AGL
60 % N1 Cruise230 kts
158,229 ft9,259 ft AGL60 % N1 Cruise230 kts
217,689 ft9,259 ft AGL68 % N1 Approach135 kts
291,712 ft699 ft AGL68 % N1 Approach151 kts
302,200 ft59 ft AGL
68 % N1 Approach123 kts
123Approach68 59 AGL302,200j151Approach68 699 AGL291,712i135Approach68 9,259 AGL217,689h230Cruise60 9,259 AGL158,229g230Cruise60 9,259 AGL70,335f230Cruise60 9,259 AGL35,806e190Takeoff95 2,519 AGL26,368d130Takeoff95 999 AGL12,826c130Takeoff95 0 AGL5,000b
0Takeoff95 0 AGL0akts
Speed% N1Power
ftHeight
ftDistance
Point
Flight Profile C5-15A

NScale in Feet 1:111,000 (1 inch = 9,230 feet)
0 4,000 8,000 12,000 16,000 20,000 24,000 28,000 32,000 36,000
9~PatternClosed
C5-15BProfileFlight
1HP2H
P
0505D
14DZ
15 23
32DZ
32DZ
_233
CC
W_SLIN
G
CW
_SLING
0 ft0 ft AGL
95 % N1 Takeoff0 kts
5,000 ft0 ft AGL95 % N1 Takeoff130 kts
12,826 ft999 ft AGL95 % N1 Takeoff130 kts
27,477 ft2,519 ft AGL95 % N1 Takeoff190 kts
38,288 ft5,259 ft AGL
95 % N1 Takeoff230 kts
72,004 ft5,259 ft AGL
60 % N1 Cruise230 kts
118,072 ft5,259 ft AGL60 % N1 Cruise230 kts
159,714 ft5,259 ft AGL60 % N1 Cruise230 kts 169,149 ft
5,259 ft AGL68 % N1 Approach136 kts
198,008 ft659 ft AGL
68 % N1 Approach140 kts
210,888 ft59 ft AGL68 % N1 Approach123 kts
123Approach68 59 AGL210,888k140Approach68 659 AGL198,008j136Approach68 5,259 AGL169,149i230Cruise60 5,259 AGL159,714h230Cruise60 5,259 AGL118,072g230Cruise60 5,259 AGL72,004f230Takeoff95 5,259 AGL38,288e190Takeoff95 2,519 AGL27,477d130Takeoff95 999 AGL12,826c130Takeoff95 0 AGL5,000b
0Takeoff95 0 AGL0akts
Speed% N1Power
ftHeight
ftDistance
Point
Flight Profile C5-15B

NScale in Feet 1:123,000 (1 inch = 10,300 feet)
0 4,000 8,000 12,000 16,000 20,000 24,000 28,000 32,000 36,000 40,000
10~PatternClosed
C5-15CProfileFlight
1HP2H
P
0505D
14DZ
15 23
32DZ
32DZ
_233
CC
W_SLIN
G
CW
_SLING
0 ft0 ft AGL
95 % N1 Takeoff0 kts
5,000 ft0 ft AGL95 % N1 Takeoff130 kts
10,867 ft1,429 ft AGL
95 % N1 Takeoff147 kts
44,114 ft2,259 ft AGL
60 % N1 Cruise230 kts
89,987 ft2,259 ft AGL
60 % N1 Cruise230 kts
122,902 ft2,259 ft AGL60 % N1 Cruise230 kts
162,333 ft959 ft AGL
60 % N1 Cruise230 kts
172,035 ft659 ft AGL
68 % N1 Approach140 kts
184,817 ft59 ft AGL68 % N1 Approach123 kts
123Approach68 59 AGL184,817i140Approach68 659 AGL172,035h230Cruise60 959 AGL162,333g230Cruise60 2,259 AGL122,902f230Cruise60 2,259 AGL89,987e230Cruise60 2,259 AGL44,114d147Takeoff95 1,429 AGL10,867c130Takeoff95 0 AGL5,000b
0Takeoff95 0 AGL0akts
Speed% N1Power
ftHeight
ftDistance
Point
Flight Profile C5-15C
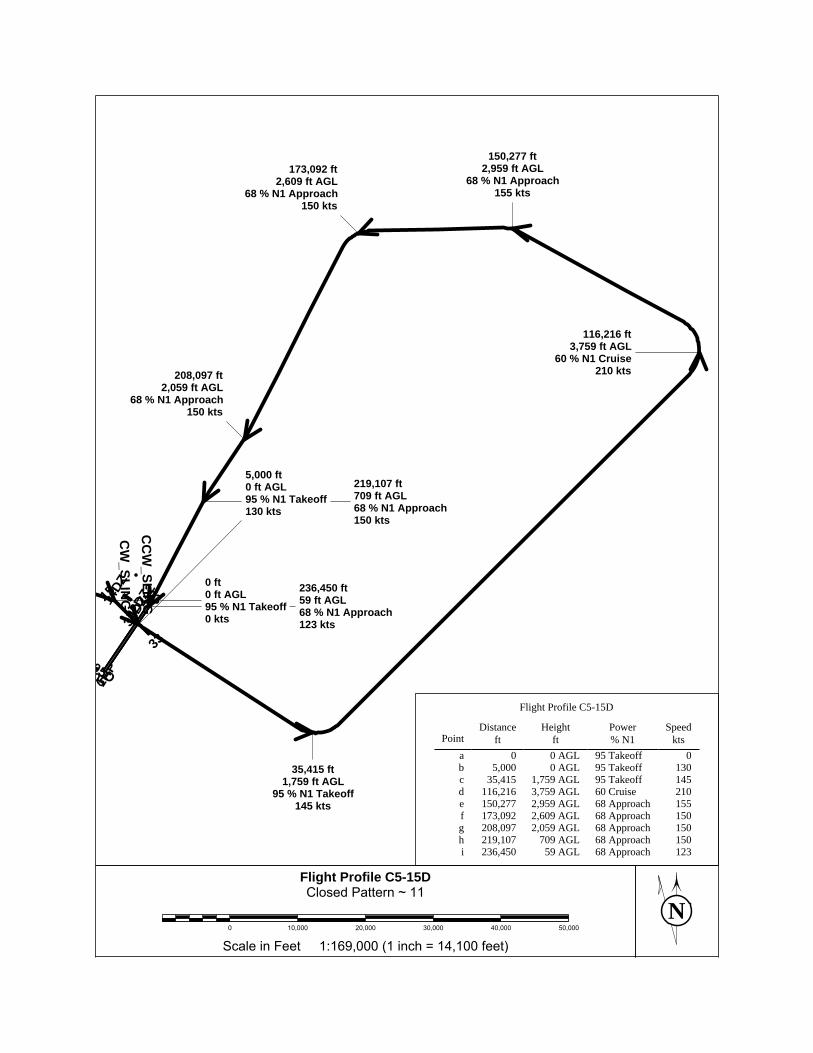
NScale in Feet 1:169,000 (1 inch = 14,100 feet)
0 10,000 20,000 30,000 40,000 50,000
11~PatternClosed
C5-15DProfileFlight
1HP
P
0505D
14DZ15 23
32DZ
32DZ
_233
CC
W_SLIN
GC
W_SLIN
G
0 ft0 ft AGL95 % N1 Takeoff0 kts
5,000 ft0 ft AGL95 % N1 Takeoff130 kts
35,415 ft1,759 ft AGL
95 % N1 Takeoff145 kts
116,216 ft3,759 ft AGL
60 % N1 Cruise210 kts
150,277 ft2,959 ft AGL
68 % N1 Approach155 kts
173,092 ft2,609 ft AGL
68 % N1 Approach150 kts
208,097 ft2,059 ft AGL
68 % N1 Approach150 kts
219,107 ft709 ft AGL68 % N1 Approach150 kts
236,450 ft59 ft AGL68 % N1 Approach123 kts
123Approach68 59 AGL236,450i150Approach68 709 AGL219,107h150Approach68 2,059 AGL208,097g150Approach68 2,609 AGL173,092f155Approach68 2,959 AGL150,277e210Cruise60 3,759 AGL116,216d145Takeoff95 1,759 AGL35,415c130Takeoff95 0 AGL5,000b
0Takeoff95 0 AGL0akts
Speed% N1Power
ftHeight
ftDistance
Point
Flight Profile C5-15D
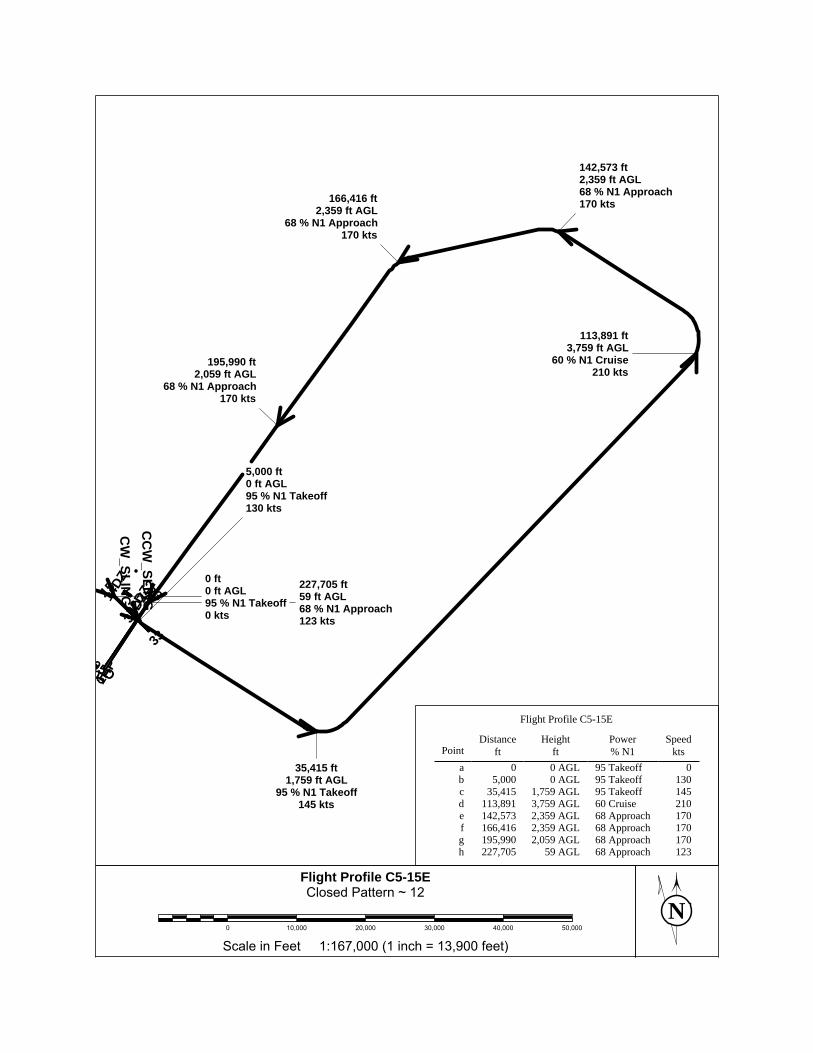
NScale in Feet 1:167,000 (1 inch = 13,900 feet)0 10,000 20,000 30,000 40,000 50,000
12~PatternClosed
C5-15EProfileFlight
1HP
P
0505D
14DZ15 23
32DZ
32DZ
_233
CC
W_SLIN
GC
W_SLIN
G
0 ft0 ft AGL95 % N1 Takeoff0 kts
5,000 ft0 ft AGL95 % N1 Takeoff130 kts
35,415 ft1,759 ft AGL
95 % N1 Takeoff145 kts
113,891 ft3,759 ft AGL
60 % N1 Cruise210 kts
142,573 ft2,359 ft AGL68 % N1 Approach170 kts166,416 ft
2,359 ft AGL68 % N1 Approach
170 kts
195,990 ft2,059 ft AGL
68 % N1 Approach170 kts
227,705 ft59 ft AGL68 % N1 Approach123 kts
123Approach68 59 AGL227,705h170Approach68 2,059 AGL195,990g170Approach68 2,359 AGL166,416f170Approach68 2,359 AGL142,573e210Cruise60 3,759 AGL113,891d145Takeoff95 1,759 AGL35,415c130Takeoff95 0 AGL5,000b
0Takeoff95 0 AGL0akts
Speed% N1Power
ftHeight
ftDistance
Point
Flight Profile C5-15E
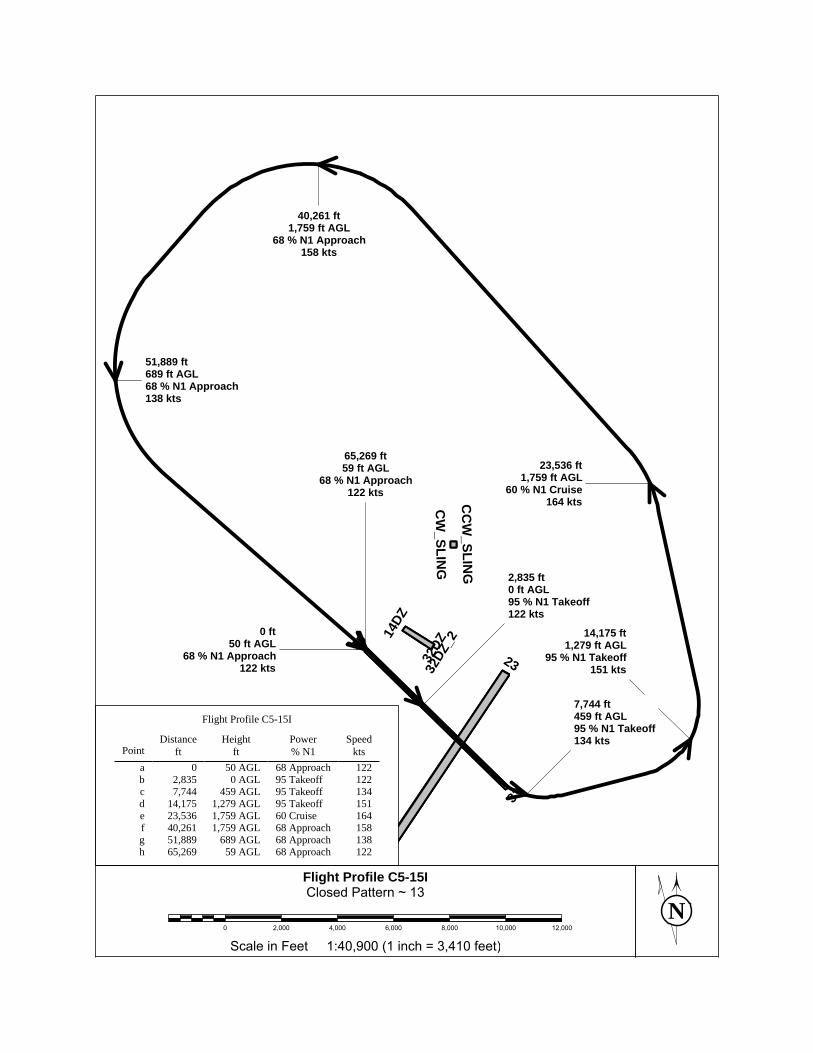
NScale in Feet 1:40,900 (1 inch = 3,410 feet)
0 2,000 4,000 6,000 8,000 10,000 12,000
13~PatternClosed
C5-15IProfileFlight
14DZ
15
2332DZ
32DZ
_2
33
CC
W_SLIN
G
CW
_SLING
0 ft50 ft AGL
68 % N1 Approach122 kts
2,835 ft0 ft AGL95 % N1 Takeoff122 kts
7,744 ft459 ft AGL95 % N1 Takeoff134 kts
14,175 ft1,279 ft AGL
95 % N1 Takeoff151 kts
23,536 ft1,759 ft AGL
60 % N1 Cruise164 kts
40,261 ft1,759 ft AGL
68 % N1 Approach158 kts
51,889 ft689 ft AGL68 % N1 Approach138 kts
65,269 ft59 ft AGL
68 % N1 Approach122 kts
122Approach68 59 AGL65,269h138Approach68 689 AGL51,889g158Approach68 1,759 AGL40,261f164Cruise60 1,759 AGL23,536e151Takeoff95 1,279 AGL14,175d134Takeoff95 459 AGL7,744c122Takeoff95 0 AGL2,835b122Approach68 50 AGL0a
ktsSpeed
% N1Power
ftHeight
ftDistance
Point
Flight Profile C5-15I
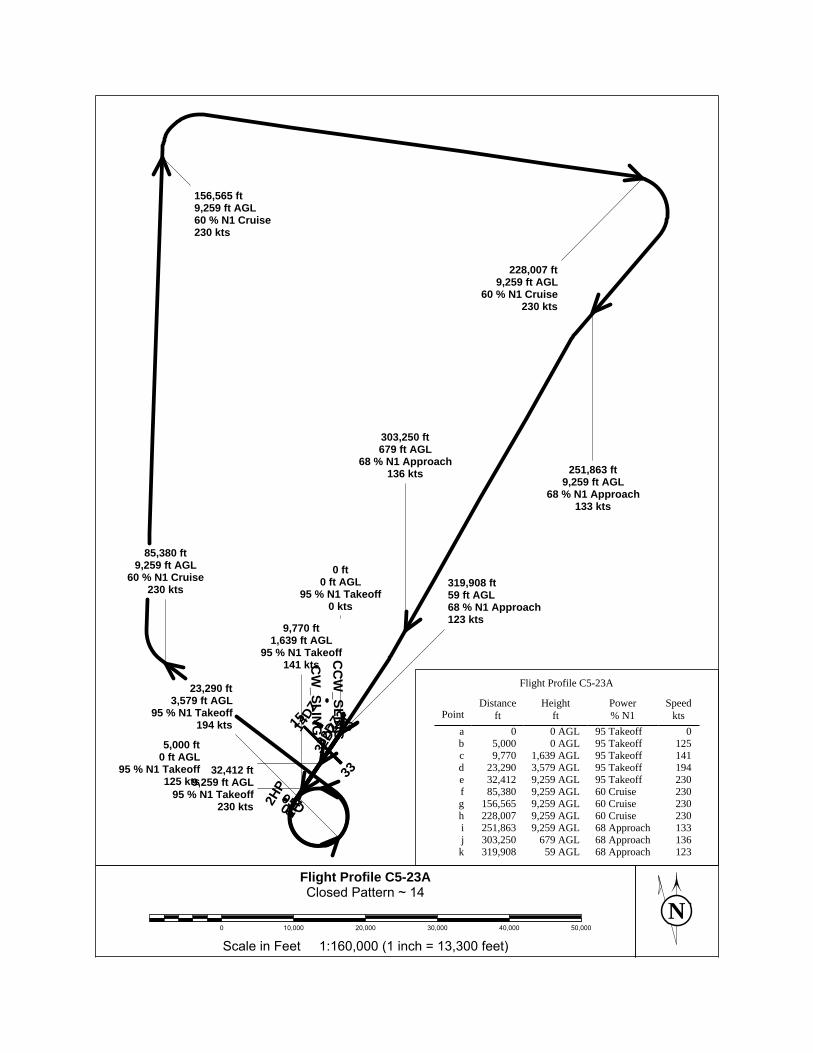
NScale in Feet 1:160,000 (1 inch = 13,300 feet)
0 10,000 20,000 30,000 40,000 50,000
14~PatternClosed
C5-23AProfileFlight
1HP2H
P
0505D
14DZ15 23
32DZ
32DZ
_233
CC
W_SLIN
GC
W_SLIN
G
0 ft0 ft AGL
95 % N1 Takeoff0 kts
5,000 ft0 ft AGL
95 % N1 Takeoff125 kts
9,770 ft1,639 ft AGL
95 % N1 Takeoff141 kts
23,290 ft3,579 ft AGL
95 % N1 Takeoff194 kts
32,412 ft9,259 ft AGL
95 % N1 Takeoff230 kts
85,380 ft9,259 ft AGL
60 % N1 Cruise230 kts
156,565 ft9,259 ft AGL60 % N1 Cruise230 kts
228,007 ft9,259 ft AGL
60 % N1 Cruise230 kts
251,863 ft9,259 ft AGL
68 % N1 Approach133 kts
303,250 ft679 ft AGL
68 % N1 Approach136 kts
319,908 ft59 ft AGL68 % N1 Approach123 kts
123Approach68 59 AGL319,908k136Approach68 679 AGL303,250j133Approach68 9,259 AGL251,863i230Cruise60 9,259 AGL228,007h230Cruise60 9,259 AGL156,565g230Cruise60 9,259 AGL85,380f230Takeoff95 9,259 AGL32,412e194Takeoff95 3,579 AGL23,290d141Takeoff95 1,639 AGL9,770c125Takeoff95 0 AGL5,000b
0Takeoff95 0 AGL0akts
Speed% N1Power
ftHeight
ftDistance
Point
Flight Profile C5-23A
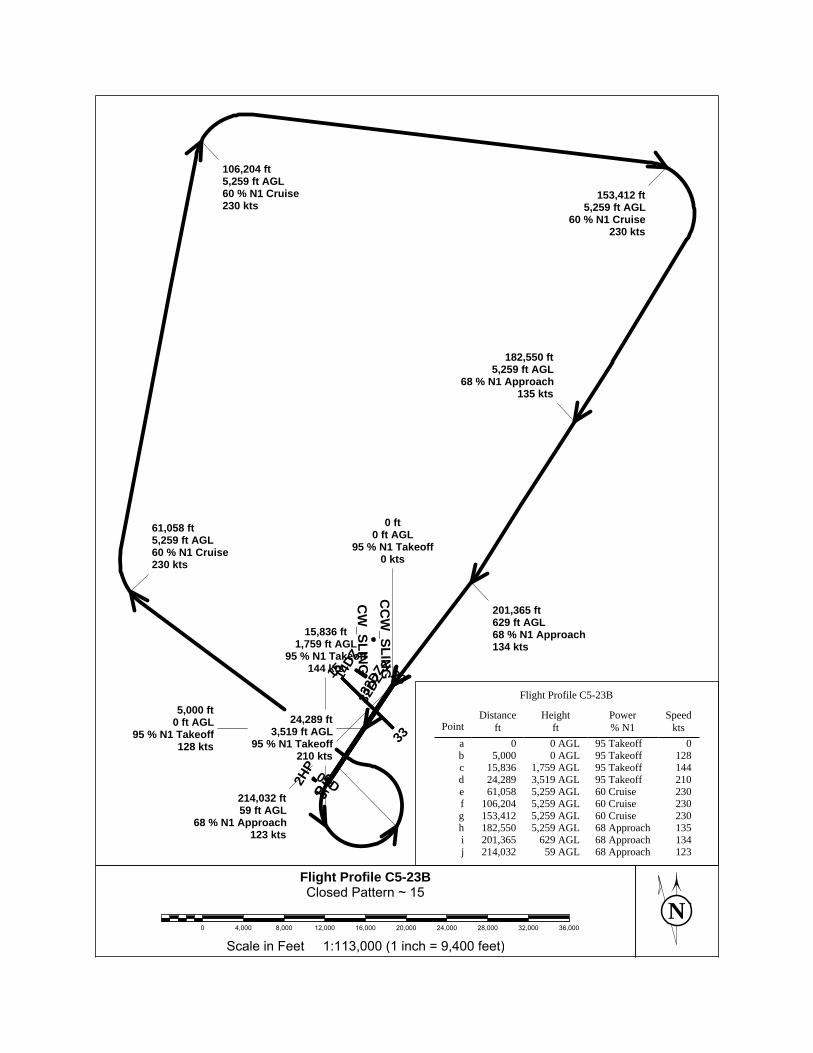
NScale in Feet 1:113,000 (1 inch = 9,400 feet)
0 4,000 8,000 12,000 16,000 20,000 24,000 28,000 32,000 36,000
15~PatternClosed
C5-23BProfileFlight
1HP2H
P
0505D
14DZ
15 23
32DZ
32DZ
_233
CC
W_SLIN
G
CW
_SLING
0 ft0 ft AGL
95 % N1 Takeoff0 kts
5,000 ft0 ft AGL
95 % N1 Takeoff128 kts
15,836 ft1,759 ft AGL
95 % N1 Takeoff144 kts
24,289 ft3,519 ft AGL
95 % N1 Takeoff210 kts
61,058 ft5,259 ft AGL60 % N1 Cruise230 kts
106,204 ft5,259 ft AGL60 % N1 Cruise230 kts
153,412 ft5,259 ft AGL
60 % N1 Cruise230 kts
182,550 ft5,259 ft AGL
68 % N1 Approach135 kts
201,365 ft629 ft AGL68 % N1 Approach134 kts
214,032 ft59 ft AGL
68 % N1 Approach123 kts
123Approach68 59 AGL214,032j134Approach68 629 AGL201,365i135Approach68 5,259 AGL182,550h230Cruise60 5,259 AGL153,412g230Cruise60 5,259 AGL106,204f230Cruise60 5,259 AGL61,058e210Takeoff95 3,519 AGL24,289d144Takeoff95 1,759 AGL15,836c128Takeoff95 0 AGL5,000b
0Takeoff95 0 AGL0akts
Speed% N1Power
ftHeight
ftDistance
Point
Flight Profile C5-23B
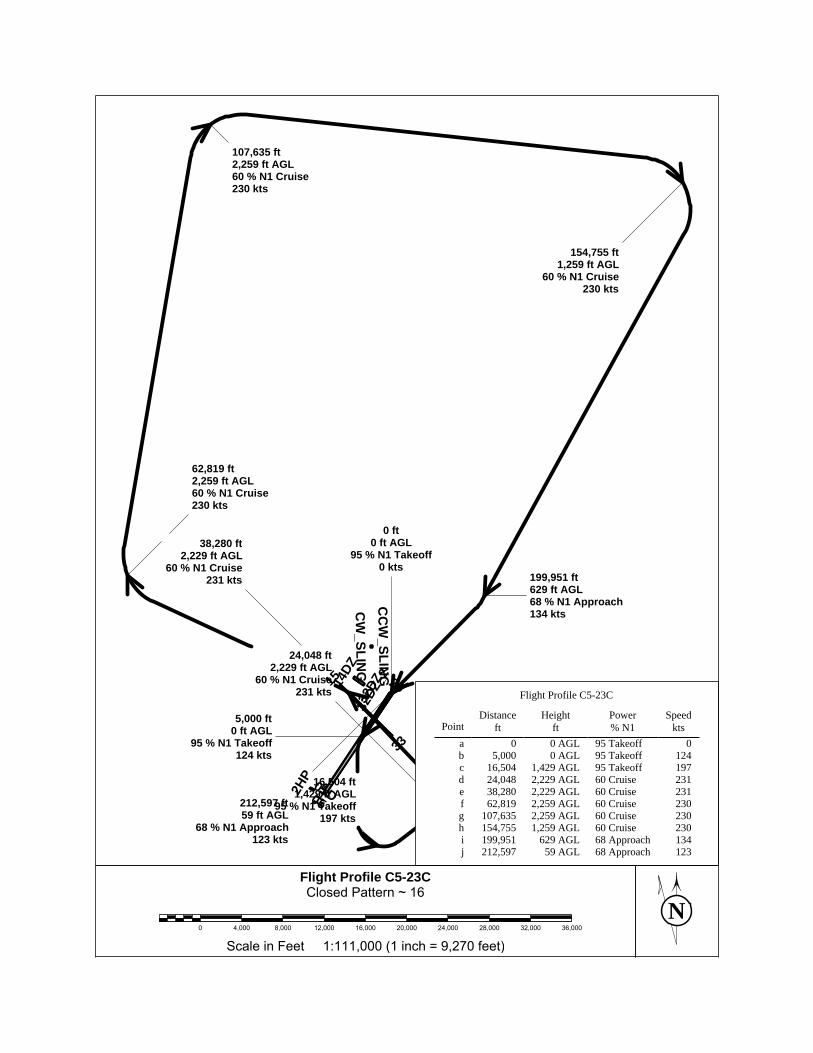
NScale in Feet 1:111,000 (1 inch = 9,270 feet)
0 4,000 8,000 12,000 16,000 20,000 24,000 28,000 32,000 36,000
16~PatternClosed
C5-23CProfileFlight
1HP2H
P
0505D
14DZ
15 23
32DZ
32DZ
_233
CC
W_SLIN
G
CW
_SLING
0 ft0 ft AGL
95 % N1 Takeoff0 kts
5,000 ft0 ft AGL
95 % N1 Takeoff124 kts
16,504 ft1,429 ft AGL
95 % N1 Takeoff197 kts
24,048 ft2,229 ft AGL
60 % N1 Cruise231 kts
38,280 ft2,229 ft AGL
60 % N1 Cruise231 kts
62,819 ft2,259 ft AGL60 % N1 Cruise230 kts
107,635 ft2,259 ft AGL60 % N1 Cruise230 kts
154,755 ft1,259 ft AGL
60 % N1 Cruise230 kts
199,951 ft629 ft AGL68 % N1 Approach134 kts
212,597 ft59 ft AGL
68 % N1 Approach123 kts
123Approach68 59 AGL212,597j134Approach68 629 AGL199,951i230Cruise60 1,259 AGL154,755h230Cruise60 2,259 AGL107,635g230Cruise60 2,259 AGL62,819f231Cruise60 2,229 AGL38,280e231Cruise60 2,229 AGL24,048d197Takeoff95 1,429 AGL16,504c124Takeoff95 0 AGL5,000b
0Takeoff95 0 AGL0akts
Speed% N1Power
ftHeight
ftDistance
Point
Flight Profile C5-23C
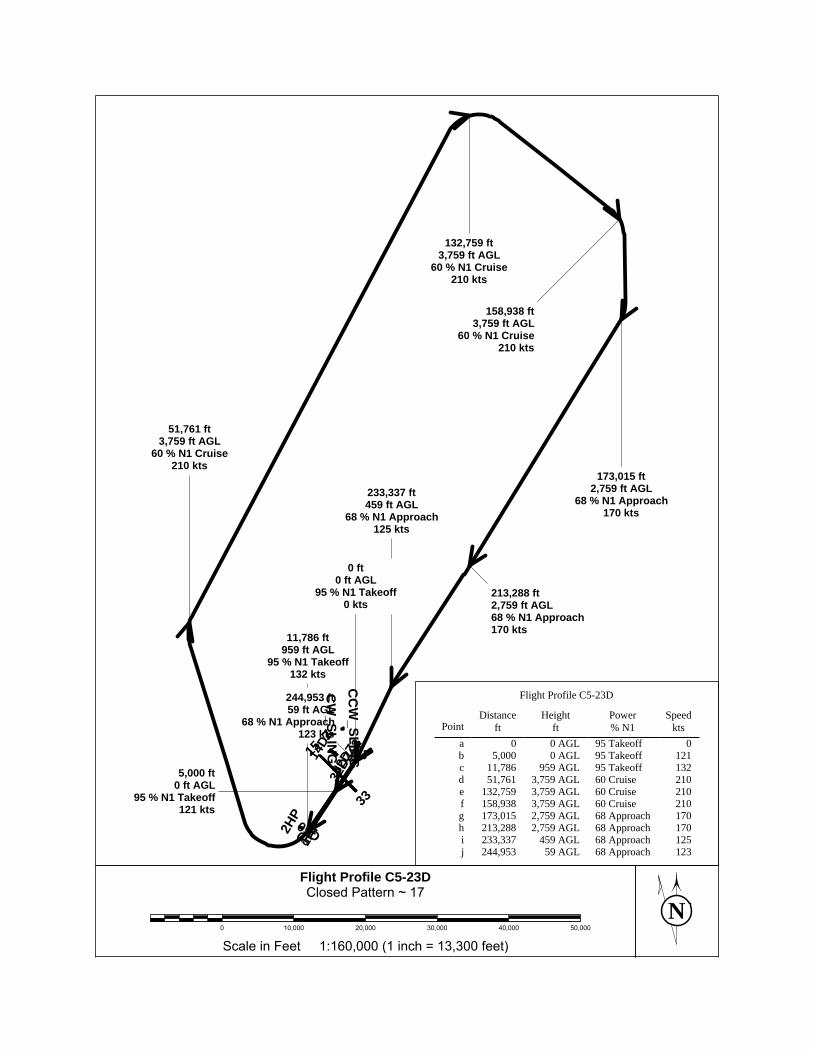
NScale in Feet 1:160,000 (1 inch = 13,300 feet)
0 10,000 20,000 30,000 40,000 50,000
17~PatternClosed
C5-23DProfileFlight
1HP2H
P
0505D
14DZ15 23
32DZ
32DZ
_233
CC
W_SLIN
G
CW
_SLING
0 ft0 ft AGL
95 % N1 Takeoff0 kts
5,000 ft0 ft AGL
95 % N1 Takeoff121 kts
11,786 ft959 ft AGL
95 % N1 Takeoff132 kts
51,761 ft3,759 ft AGL
60 % N1 Cruise210 kts
132,759 ft3,759 ft AGL
60 % N1 Cruise210 kts
158,938 ft3,759 ft AGL
60 % N1 Cruise210 kts
173,015 ft2,759 ft AGL
68 % N1 Approach170 kts
213,288 ft2,759 ft AGL68 % N1 Approach170 kts
233,337 ft459 ft AGL
68 % N1 Approach125 kts
244,953 ft59 ft AGL
68 % N1 Approach123 kts
123Approach68 59 AGL244,953j125Approach68 459 AGL233,337i170Approach68 2,759 AGL213,288h170Approach68 2,759 AGL173,015g210Cruise60 3,759 AGL158,938f210Cruise60 3,759 AGL132,759e210Cruise60 3,759 AGL51,761d132Takeoff95 959 AGL11,786c121Takeoff95 0 AGL5,000b
0Takeoff95 0 AGL0akts
Speed% N1Power
ftHeight
ftDistance
Point
Flight Profile C5-23D
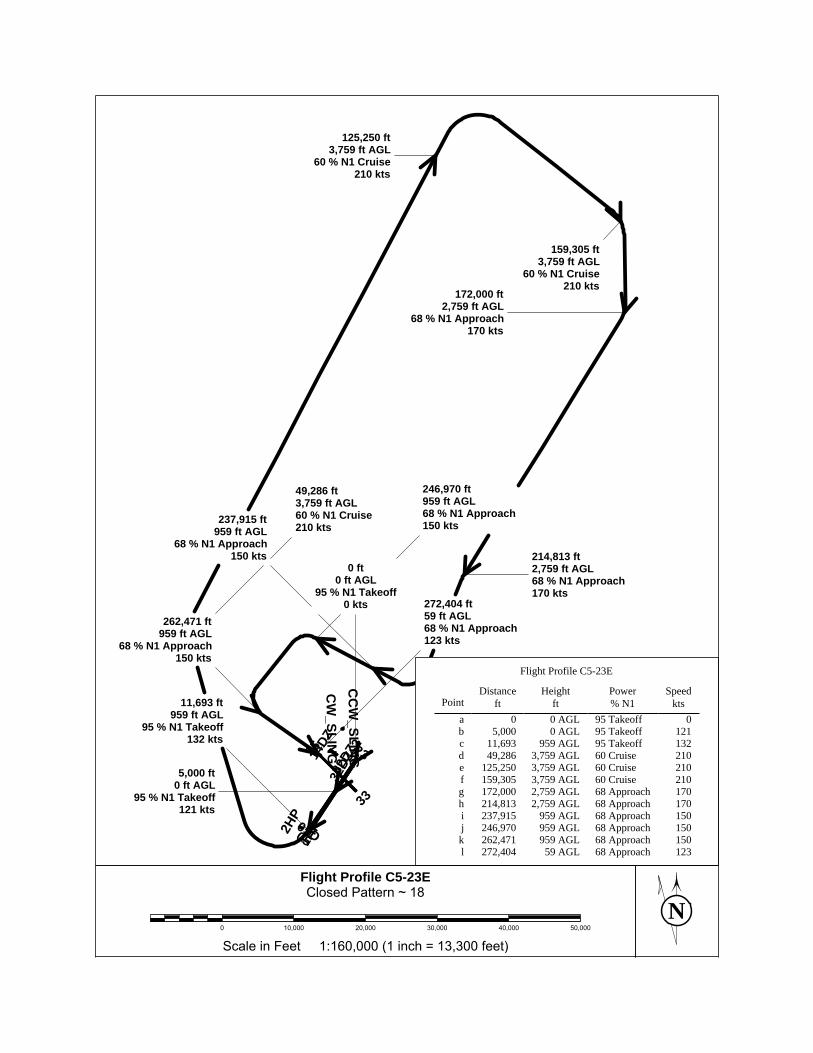
NScale in Feet 1:160,000 (1 inch = 13,300 feet)
0 10,000 20,000 30,000 40,000 50,000
18~PatternClosed
C5-23EProfileFlight
1HP2H
P
0505D
14DZ15 23
32DZ
32DZ
_233
CC
W_SLIN
G
CW
_SLING
0 ft0 ft AGL
95 % N1 Takeoff0 kts
5,000 ft0 ft AGL
95 % N1 Takeoff121 kts
11,693 ft959 ft AGL
95 % N1 Takeoff132 kts
49,286 ft3,759 ft AGL60 % N1 Cruise210 kts
125,250 ft3,759 ft AGL
60 % N1 Cruise210 kts
159,305 ft3,759 ft AGL
60 % N1 Cruise210 kts
172,000 ft2,759 ft AGL
68 % N1 Approach170 kts
214,813 ft2,759 ft AGL68 % N1 Approach170 kts
237,915 ft959 ft AGL
68 % N1 Approach150 kts
246,970 ft959 ft AGL68 % N1 Approach150 kts
262,471 ft959 ft AGL
68 % N1 Approach150 kts
272,404 ft59 ft AGL68 % N1 Approach123 kts
123Approach68 59 AGL272,404l150Approach68 959 AGL262,471k150Approach68 959 AGL246,970j150Approach68 959 AGL237,915i170Approach68 2,759 AGL214,813h170Approach68 2,759 AGL172,000g210Cruise60 3,759 AGL159,305f210Cruise60 3,759 AGL125,250e210Cruise60 3,759 AGL49,286d132Takeoff95 959 AGL11,693c121Takeoff95 0 AGL5,000b
0Takeoff95 0 AGL0akts
Speed% N1Power
ftHeight
ftDistance
Point
Flight Profile C5-23E
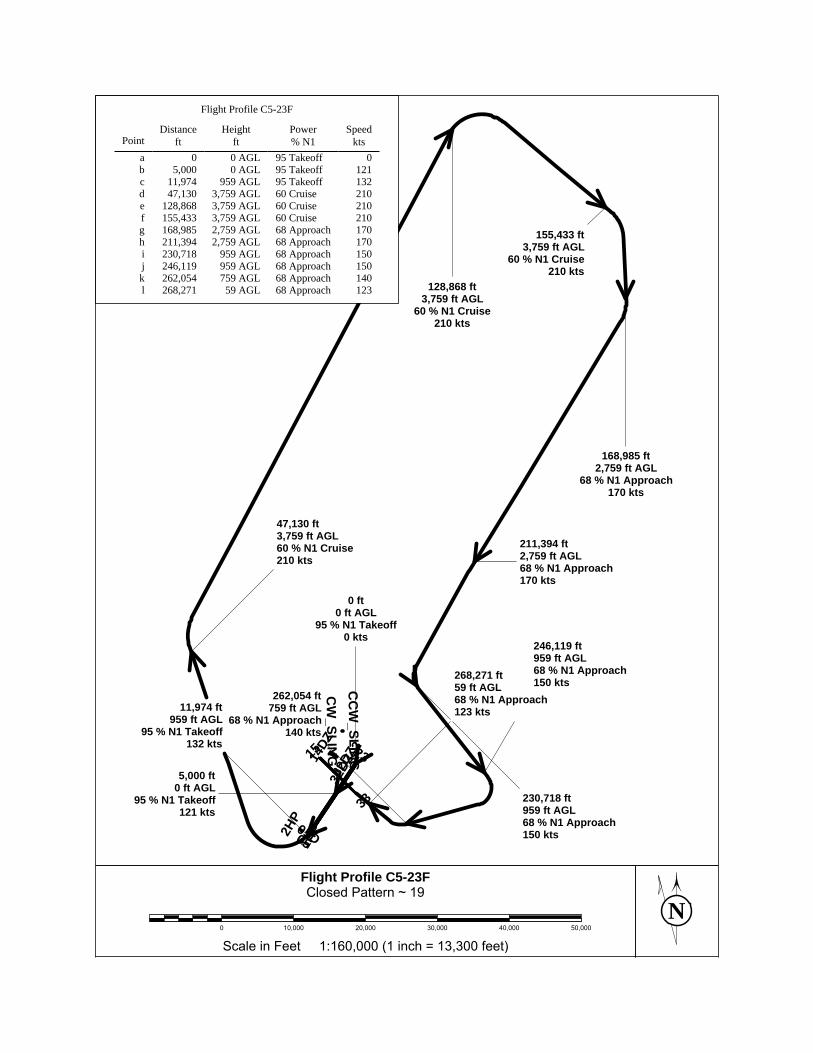
NScale in Feet 1:160,000 (1 inch = 13,300 feet)
0 10,000 20,000 30,000 40,000 50,000
19~PatternClosed
C5-23FProfileFlight
1HP2H
P
0505D
14DZ15 23
32DZ
32DZ
_233
CC
W_SLIN
GC
W_SLIN
G
246,119 ft959 ft AGL68 % N1 Approach150 kts
0 ft0 ft AGL
95 % N1 Takeoff0 kts
5,000 ft0 ft AGL
95 % N1 Takeoff121 kts
11,974 ft959 ft AGL
95 % N1 Takeoff132 kts
47,130 ft3,759 ft AGL60 % N1 Cruise210 kts
128,868 ft3,759 ft AGL
60 % N1 Cruise210 kts
155,433 ft3,759 ft AGL
60 % N1 Cruise210 kts
168,985 ft2,759 ft AGL
68 % N1 Approach170 kts
211,394 ft2,759 ft AGL68 % N1 Approach170 kts
230,718 ft959 ft AGL68 % N1 Approach150 kts
262,054 ft759 ft AGL
68 % N1 Approach140 kts
268,271 ft59 ft AGL68 % N1 Approach123 kts
123Approach68 59 AGL268,271l140Approach68 759 AGL262,054k150Approach68 959 AGL246,119j150Approach68 959 AGL230,718i170Approach68 2,759 AGL211,394h170Approach68 2,759 AGL168,985g210Cruise60 3,759 AGL155,433f210Cruise60 3,759 AGL128,868e210Cruise60 3,759 AGL47,130d132Takeoff95 959 AGL11,974c121Takeoff95 0 AGL5,000b
0Takeoff95 0 AGL0akts
Speed% N1Power
ftHeight
ftDistance
Point
Flight Profile C5-23F
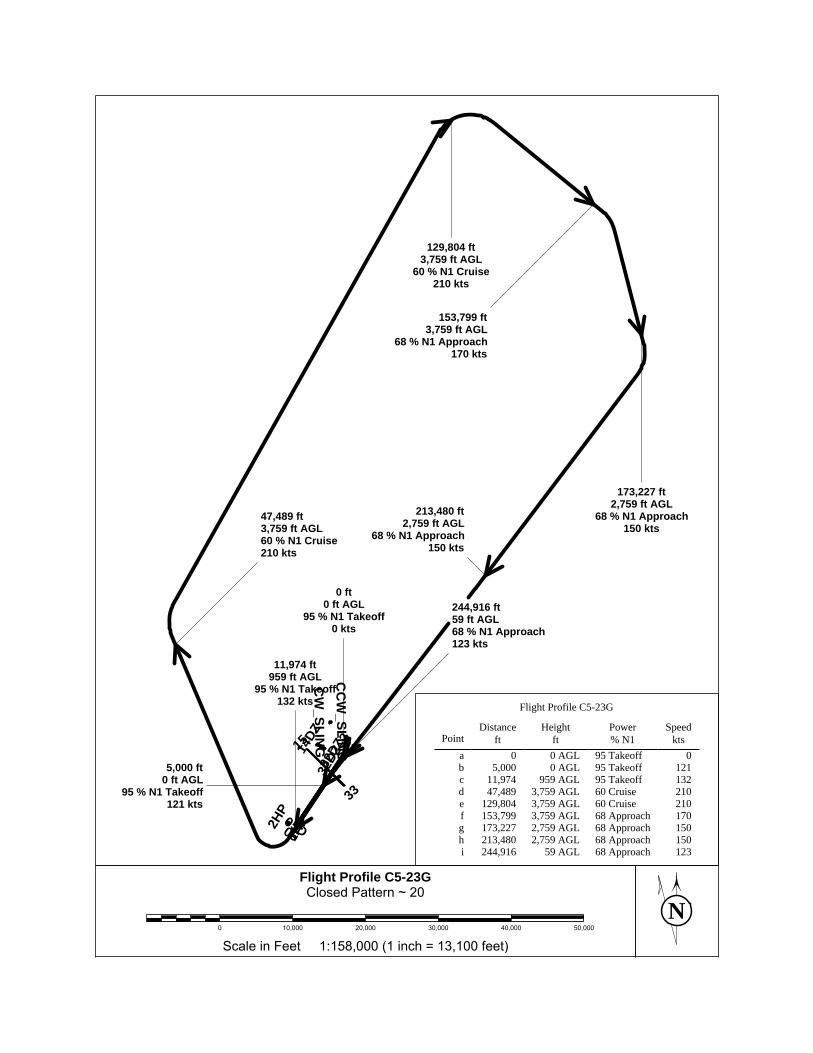
NScale in Feet 1:158,000 (1 inch = 13,100 feet)
0 10,000 20,000 30,000 40,000 50,000
20~PatternClosed
C5-23GProfileFlight
1HP2H
P
0505D
14DZ15 23
32DZ
32DZ
_233
CC
W_SLIN
G
CW
_SLING
0 ft0 ft AGL
95 % N1 Takeoff0 kts
5,000 ft0 ft AGL
95 % N1 Takeoff121 kts
11,974 ft959 ft AGL
95 % N1 Takeoff132 kts
47,489 ft3,759 ft AGL60 % N1 Cruise210 kts
129,804 ft3,759 ft AGL
60 % N1 Cruise210 kts
153,799 ft3,759 ft AGL
68 % N1 Approach170 kts
173,227 ft2,759 ft AGL
68 % N1 Approach150 kts
213,480 ft2,759 ft AGL
68 % N1 Approach150 kts
244,916 ft59 ft AGL68 % N1 Approach123 kts
123Approach68 59 AGL244,916i150Approach68 2,759 AGL213,480h150Approach68 2,759 AGL173,227g170Approach68 3,759 AGL153,799f210Cruise60 3,759 AGL129,804e210Cruise60 3,759 AGL47,489d132Takeoff95 959 AGL11,974c121Takeoff95 0 AGL5,000b
0Takeoff95 0 AGL0akts
Speed% N1Power
ftHeight
ftDistance
Point
Flight Profile C5-23G
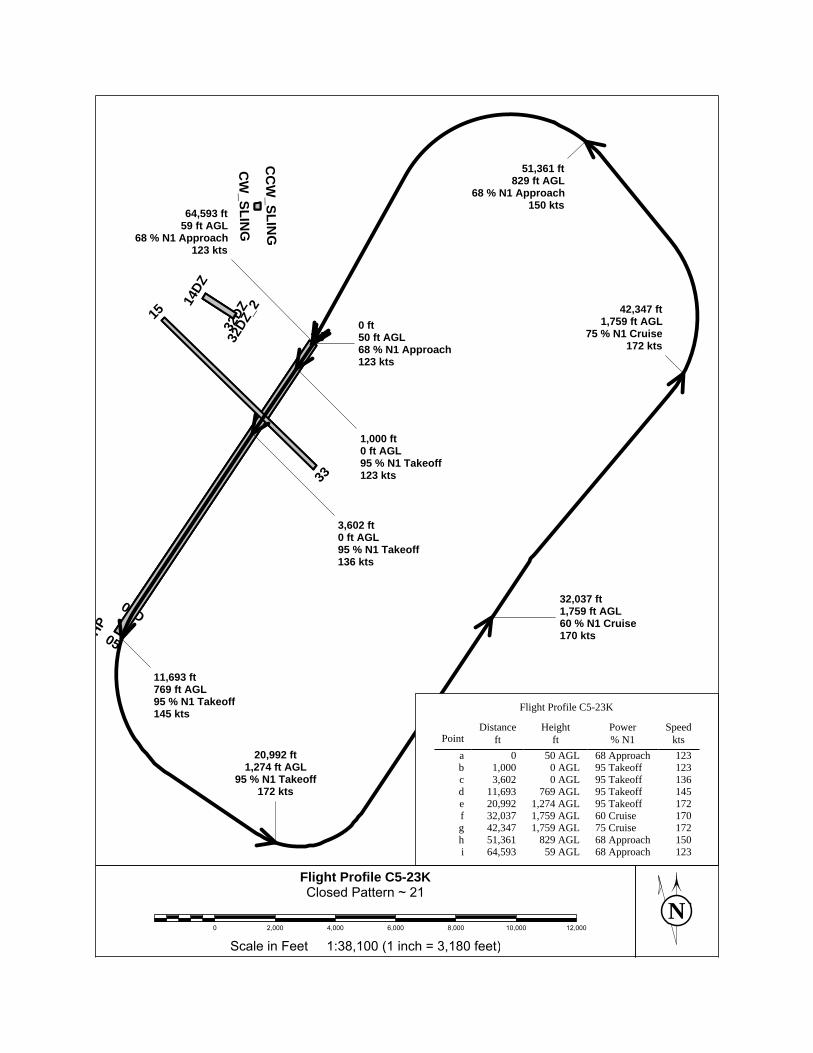
NScale in Feet 1:38,100 (1 inch = 3,180 feet)
0 2,000 4,000 6,000 8,000 10,000 12,000
21~PatternClosed
C5-23KProfileFlight
HP05
05D
14DZ
15
2332DZ
32DZ
_2
33
CC
W_SLIN
G
CW
_SLING
0 ft50 ft AGL68 % N1 Approach123 kts
1,000 ft0 ft AGL95 % N1 Takeoff123 kts
3,602 ft0 ft AGL95 % N1 Takeoff136 kts
11,693 ft769 ft AGL95 % N1 Takeoff145 kts
20,992 ft1,274 ft AGL
95 % N1 Takeoff172 kts
32,037 ft1,759 ft AGL60 % N1 Cruise170 kts
42,347 ft1,759 ft AGL
75 % N1 Cruise172 kts
51,361 ft829 ft AGL
68 % N1 Approach150 kts
64,593 ft59 ft AGL
68 % N1 Approach123 kts
123Approach68 59 AGL64,593i150Approach68 829 AGL51,361h172Cruise75 1,759 AGL42,347g170Cruise60 1,759 AGL32,037f172Takeoff95 1,274 AGL20,992e145Takeoff95 769 AGL11,693d136Takeoff95 0 AGL3,602c123Takeoff95 0 AGL1,000b123Approach68 50 AGL0a
ktsSpeed
% N1Power
ftHeight
ftDistance
Point
Flight Profile C5-23K
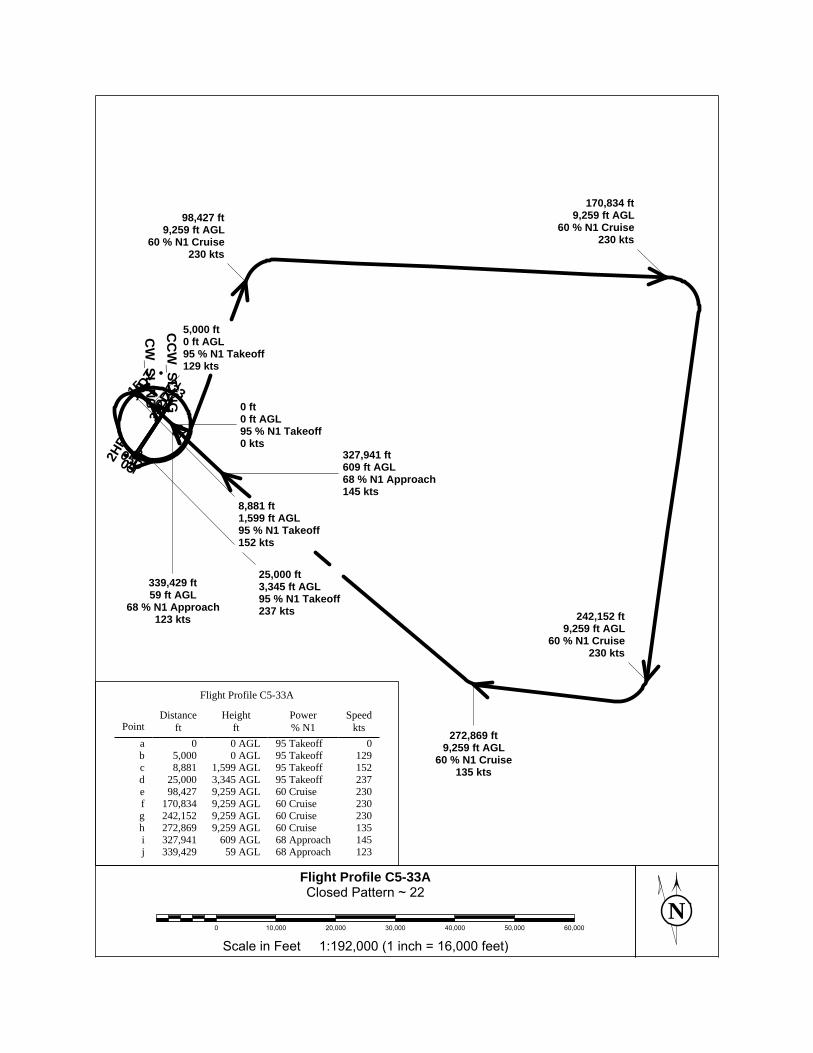
NScale in Feet 1:192,000 (1 inch = 16,000 feet)
0 10,000 20,000 30,000 40,000 50,000 60,000
22~PatternClosed
C5-33AProfileFlight
1HP2H
P
0505D
14DZ15 23
32DZ
32DZ
_233
CC
W_SLIN
GC
W_SLIN
G
0 ft0 ft AGL95 % N1 Takeoff0 kts
5,000 ft0 ft AGL95 % N1 Takeoff129 kts
8,881 ft1,599 ft AGL95 % N1 Takeoff152 kts
25,000 ft3,345 ft AGL95 % N1 Takeoff237 kts
98,427 ft9,259 ft AGL
60 % N1 Cruise230 kts
170,834 ft9,259 ft AGL
60 % N1 Cruise230 kts
242,152 ft9,259 ft AGL
60 % N1 Cruise230 kts
272,869 ft9,259 ft AGL
60 % N1 Cruise135 kts
327,941 ft609 ft AGL68 % N1 Approach145 kts
339,429 ft59 ft AGL
68 % N1 Approach123 kts
123Approach68 59 AGL339,429j145Approach68 609 AGL327,941i135Cruise60 9,259 AGL272,869h230Cruise60 9,259 AGL242,152g230Cruise60 9,259 AGL170,834f230Cruise60 9,259 AGL98,427e237Takeoff95 3,345 AGL25,000d152Takeoff95 1,599 AGL8,881c129Takeoff95 0 AGL5,000b
0Takeoff95 0 AGL0akts
Speed% N1Power
ftHeight
ftDistance
Point
Flight Profile C5-33A
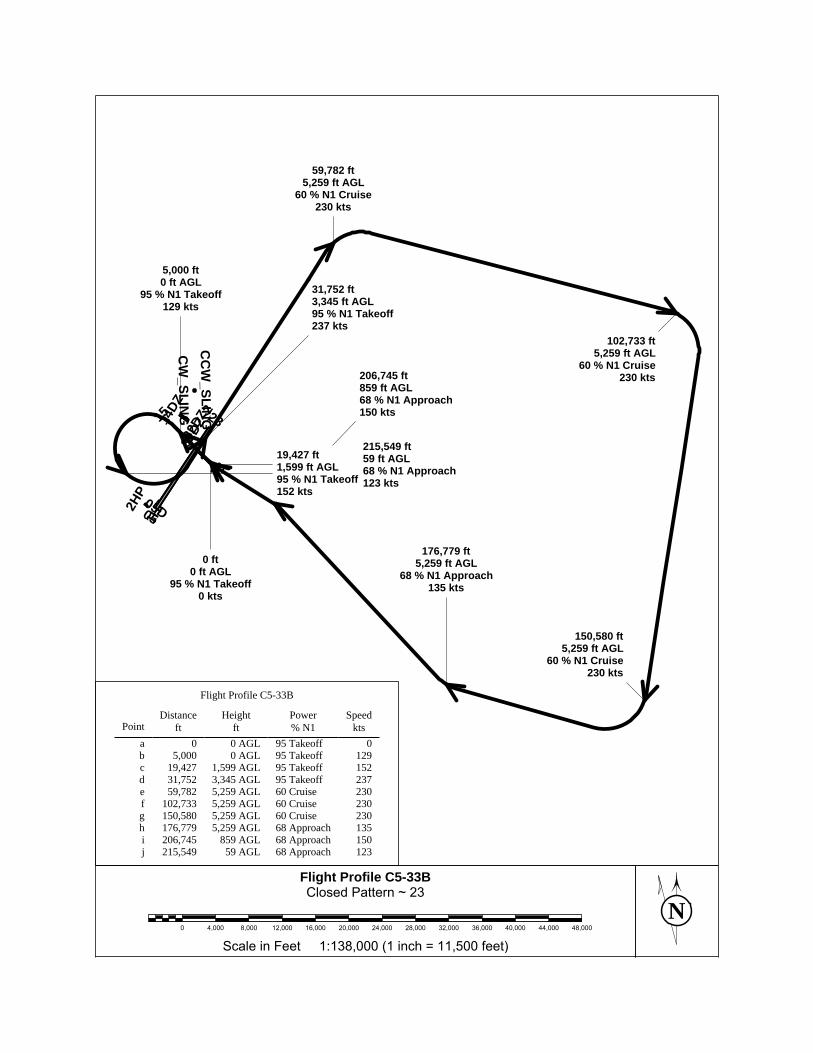
NScale in Feet 1:138,000 (1 inch = 11,500 feet)
0 4,000 8,000 12,000 16,000 20,000 24,000 28,000 32,000 36,000 40,000 44,000 48,000
23~PatternClosed
C5-33BProfileFlight
1HP2H
P
0505D
14DZ
15 23
32DZ
32DZ
_233
CC
W_SLIN
G
CW
_SLING
0 ft0 ft AGL
95 % N1 Takeoff0 kts
5,000 ft0 ft AGL
95 % N1 Takeoff129 kts
19,427 ft1,599 ft AGL95 % N1 Takeoff152 kts
31,752 ft3,345 ft AGL95 % N1 Takeoff237 kts
59,782 ft5,259 ft AGL
60 % N1 Cruise230 kts
102,733 ft5,259 ft AGL
60 % N1 Cruise230 kts
150,580 ft5,259 ft AGL
60 % N1 Cruise230 kts
176,779 ft5,259 ft AGL
68 % N1 Approach135 kts
206,745 ft859 ft AGL68 % N1 Approach150 kts
215,549 ft59 ft AGL68 % N1 Approach123 kts
123Approach68 59 AGL215,549j150Approach68 859 AGL206,745i135Approach68 5,259 AGL176,779h230Cruise60 5,259 AGL150,580g230Cruise60 5,259 AGL102,733f230Cruise60 5,259 AGL59,782e237Takeoff95 3,345 AGL31,752d152Takeoff95 1,599 AGL19,427c129Takeoff95 0 AGL5,000b
0Takeoff95 0 AGL0akts
Speed% N1Power
ftHeight
ftDistance
Point
Flight Profile C5-33B
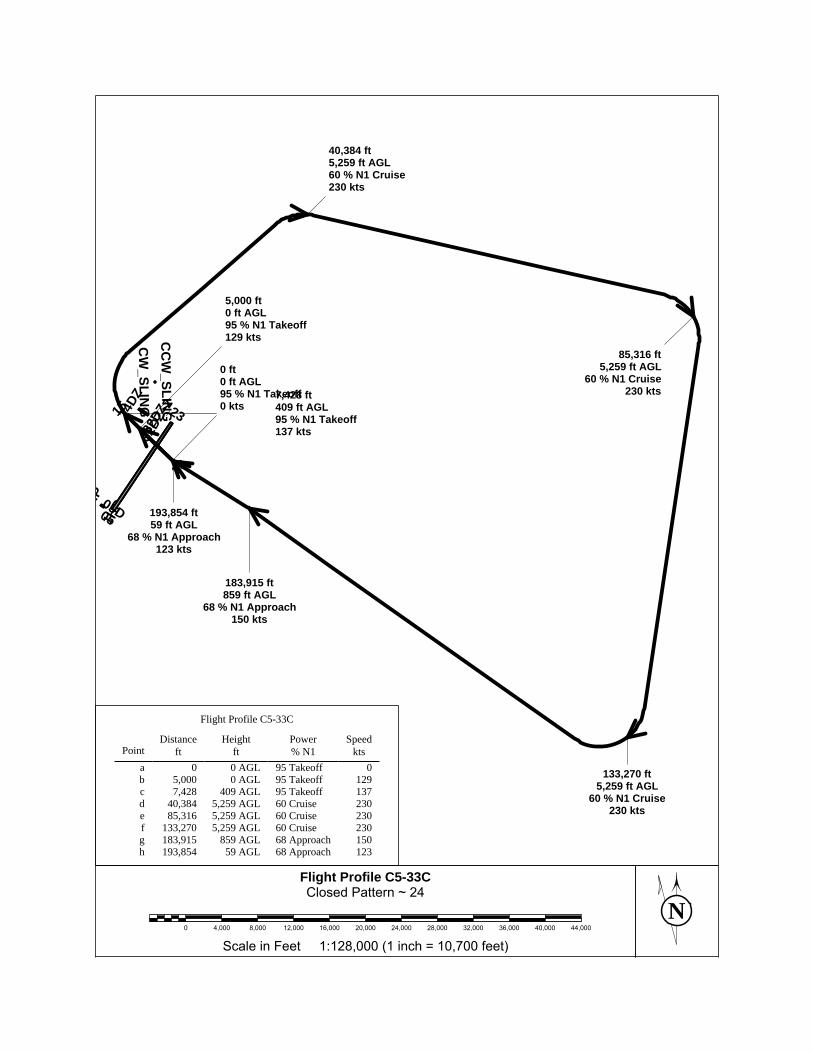
NScale in Feet 1:128,000 (1 inch = 10,700 feet)
0 4,000 8,000 12,000 16,000 20,000 24,000 28,000 32,000 36,000 40,000 44,000
24~PatternClosed
C5-33CProfileFlight
1HPHP
0505D
14DZ
15 23
32DZ
32DZ
_233
CC
W_SLIN
G
CW
_SLING
0 ft0 ft AGL95 % N1 Takeoff0 kts
5,000 ft0 ft AGL95 % N1 Takeoff129 kts
7,428 ft409 ft AGL95 % N1 Takeoff137 kts
40,384 ft5,259 ft AGL60 % N1 Cruise230 kts
85,316 ft5,259 ft AGL
60 % N1 Cruise230 kts
133,270 ft5,259 ft AGL
60 % N1 Cruise230 kts
183,915 ft859 ft AGL
68 % N1 Approach150 kts
193,854 ft59 ft AGL
68 % N1 Approach123 kts
123Approach68 59 AGL193,854h150Approach68 859 AGL183,915g230Cruise60 5,259 AGL133,270f230Cruise60 5,259 AGL85,316e230Cruise60 5,259 AGL40,384d137Takeoff95 409 AGL7,428c129Takeoff95 0 AGL5,000b
0Takeoff95 0 AGL0akts
Speed% N1Power
ftHeight
ftDistance
Point
Flight Profile C5-33C
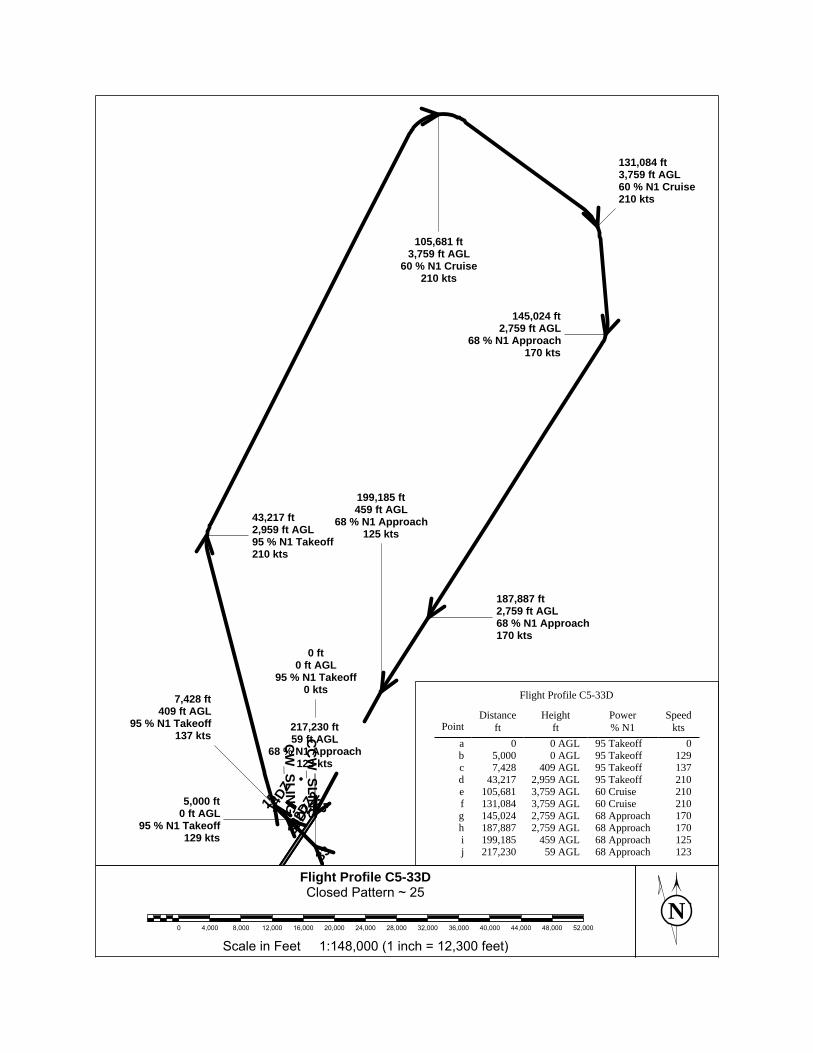
NScale in Feet 1:148,000 (1 inch = 12,300 feet)
0 4,000 8,000 12,000 16,000 20,000 24,000 28,000 32,000 36,000 40,000 44,000 48,000 52,000
25~PatternClosed
C5-33DProfileFlight
14DZ15 23
32DZ
32DZ
_233
CC
W_SLIN
G
CW
_SLING
0 ft0 ft AGL
95 % N1 Takeoff0 kts
5,000 ft0 ft AGL
95 % N1 Takeoff129 kts
7,428 ft409 ft AGL
95 % N1 Takeoff137 kts
43,217 ft2,959 ft AGL95 % N1 Takeoff210 kts
105,681 ft3,759 ft AGL
60 % N1 Cruise210 kts
131,084 ft3,759 ft AGL60 % N1 Cruise210 kts
145,024 ft2,759 ft AGL
68 % N1 Approach170 kts
187,887 ft2,759 ft AGL68 % N1 Approach170 kts
199,185 ft459 ft AGL
68 % N1 Approach125 kts
217,230 ft59 ft AGL
68 % N1 Approach123 kts
123Approach68 59 AGL217,230j125Approach68 459 AGL199,185i170Approach68 2,759 AGL187,887h170Approach68 2,759 AGL145,024g210Cruise60 3,759 AGL131,084f210Cruise60 3,759 AGL105,681e210Takeoff95 2,959 AGL43,217d137Takeoff95 409 AGL7,428c129Takeoff95 0 AGL5,000b
0Takeoff95 0 AGL0akts
Speed% N1Power
ftHeight
ftDistance
Point
Flight Profile C5-33D
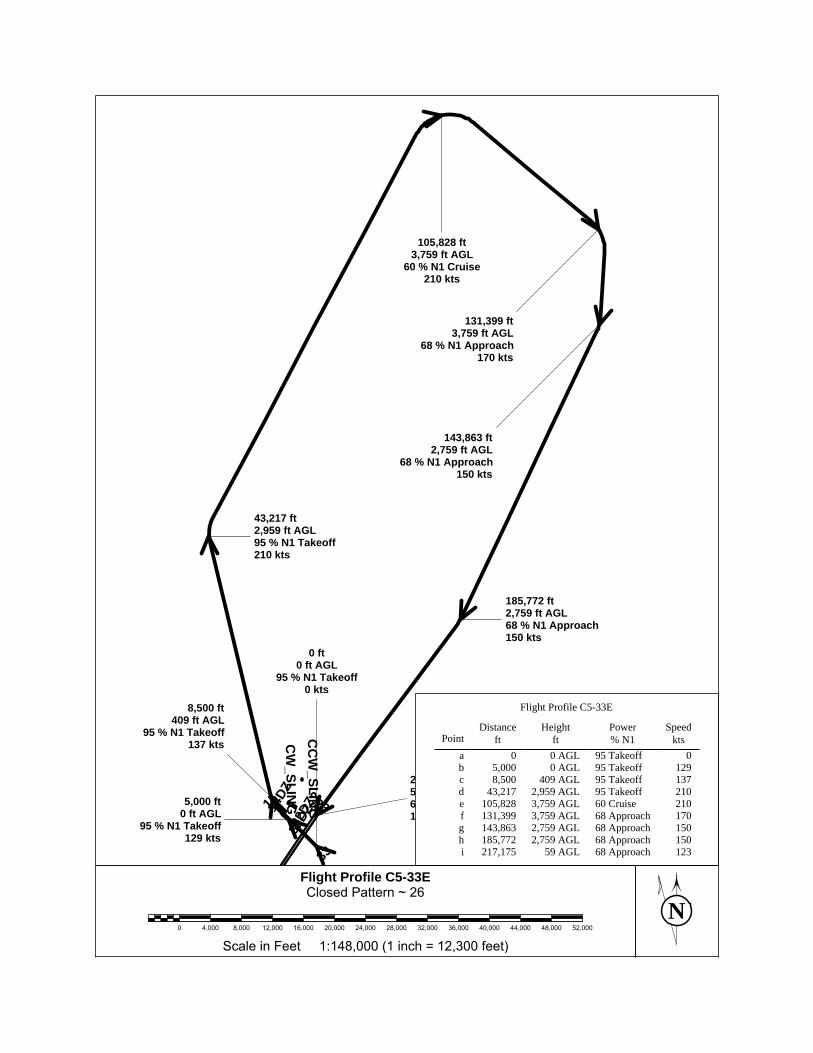
NScale in Feet 1:148,000 (1 inch = 12,300 feet)
0 4,000 8,000 12,000 16,000 20,000 24,000 28,000 32,000 36,000 40,000 44,000 48,000 52,000
26~PatternClosed
C5-33EProfileFlight
14DZ15 23
32DZ
32DZ
_233
CC
W_SLIN
G
CW
_SLING
217,175 ft59 ft AGL68 % N1 Approach123 kts
0 ft0 ft AGL
95 % N1 Takeoff0 kts
5,000 ft0 ft AGL
95 % N1 Takeoff129 kts
8,500 ft409 ft AGL
95 % N1 Takeoff137 kts
43,217 ft2,959 ft AGL95 % N1 Takeoff210 kts
105,828 ft3,759 ft AGL
60 % N1 Cruise210 kts
131,399 ft3,759 ft AGL
68 % N1 Approach170 kts
143,863 ft2,759 ft AGL
68 % N1 Approach150 kts
185,772 ft2,759 ft AGL68 % N1 Approach150 kts
123Approach68 59 AGL217,175i150Approach68 2,759 AGL185,772h150Approach68 2,759 AGL143,863g170Approach68 3,759 AGL131,399f210Cruise60 3,759 AGL105,828e210Takeoff95 2,959 AGL43,217d137Takeoff95 409 AGL8,500c129Takeoff95 0 AGL5,000b
0Takeoff95 0 AGL0akts
Speed% N1Power
ftHeight
ftDistance
Point
Flight Profile C5-33E
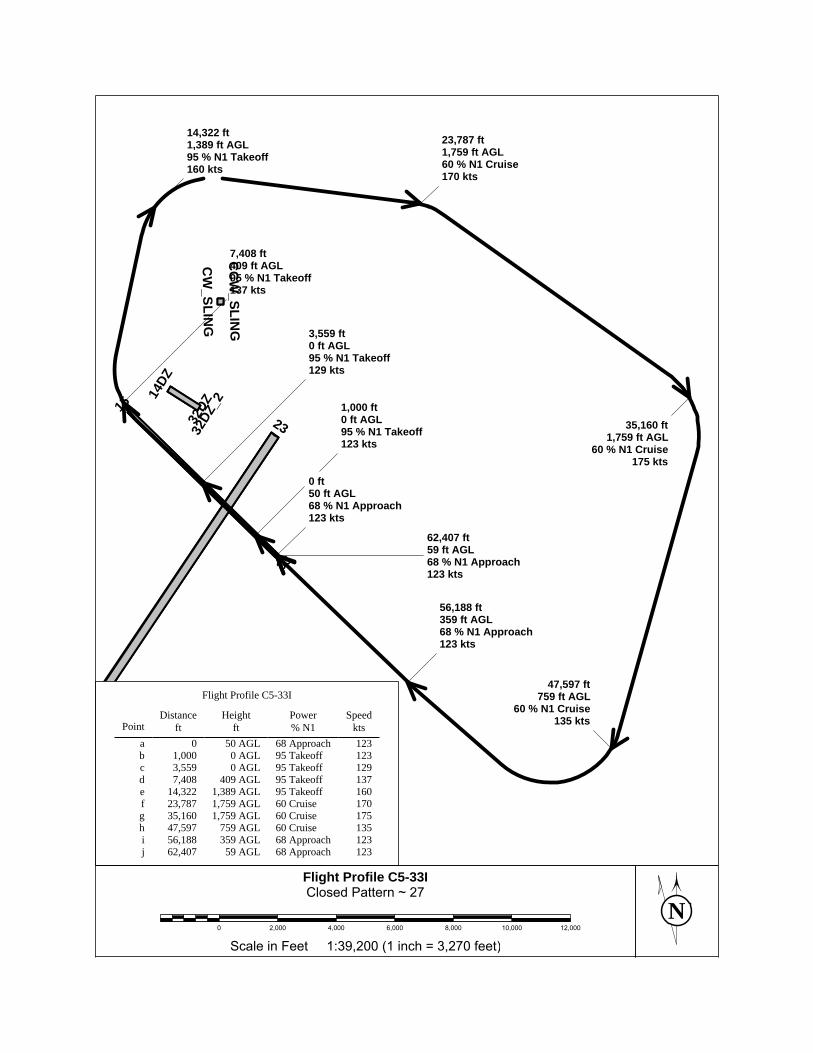
NScale in Feet 1:39,200 (1 inch = 3,270 feet)
0 2,000 4,000 6,000 8,000 10,000 12,000
27~PatternClosed
C5-33IProfileFlight
05D
14DZ
15
2332DZ
32DZ
_2
33
CC
W_SLIN
G
CW
_SLING
0 ft50 ft AGL68 % N1 Approach123 kts
1,000 ft0 ft AGL95 % N1 Takeoff123 kts
3,559 ft0 ft AGL95 % N1 Takeoff129 kts
7,408 ft409 ft AGL95 % N1 Takeoff137 kts
14,322 ft1,389 ft AGL95 % N1 Takeoff160 kts
23,787 ft1,759 ft AGL60 % N1 Cruise170 kts
35,160 ft1,759 ft AGL
60 % N1 Cruise175 kts
47,597 ft759 ft AGL
60 % N1 Cruise135 kts
56,188 ft359 ft AGL68 % N1 Approach123 kts
62,407 ft59 ft AGL68 % N1 Approach123 kts
123Approach68 59 AGL62,407j123Approach68 359 AGL56,188i135Cruise60 759 AGL47,597h175Cruise60 1,759 AGL35,160g170Cruise60 1,759 AGL23,787f160Takeoff95 1,389 AGL14,322e137Takeoff95 409 AGL7,408d129Takeoff95 0 AGL3,559c123Takeoff95 0 AGL1,000b123Approach68 50 AGL0a
ktsSpeed
% N1Power
ftHeight
ftDistance
Point
Flight Profile C5-33I

NScale in Feet 1:78,100 (1 inch = 6,510 feet)
0 4,000 8,000 12,000 16,000 20,000 24,000
1~Departure
C5-05HProfileFlight
1HP2H
P
0505D
14DZ
15 23
32DZ
32DZ
_2
33
CC
W_SLIN
G
CW
_SLING
0 ft0 ft AGL102 % N1 Takeoff0 kts
5,000 ft0 ft AGL
95 % N1 Takeoff130 kts
20,550 ft1,000 ft AGL
95 % N1 Takeoff160 kts
38,550 ft3,310 ft AGL
95 % N1 Takeoff250 kts
70,000 ft4,310 ft AGL95 % N1 Takeoff250 kts
250Takeoff95 12,300 AGL200,000f250Takeoff95 4,310 AGL70,000e250Takeoff95 3,310 AGL38,550d160Takeoff95 1,000 AGL20,550c130Takeoff95 0 AGL5,000b
0Takeoff102 0 AGL0akts
Speed% N1Power
ftHeight
ftDistance
Point
Flight Profile C5-05H

NScale in Feet 1:101,000 (1 inch = 8,390 feet)
0 4,000 8,000 12,000 16,000 20,000 24,000 28,000 32,000
2~Departure
C5-05IProfileFlight
1HP2H
P
0505D
14DZ
15 23
32DZ
32DZ
_233
CC
W_SLIN
G
CW
_SLING
0 ft0 ft AGL
102 % N1 Takeoff0 kts
5,000 ft0 ft AGL
95 % N1 Takeoff130 kts
20,550 ft1,000 ft AGL
95 % N1 Takeoff160 kts
38,550 ft3,310 ft AGL
95 % N1 Takeoff250 kts
70,000 ft4,310 ft AGL95 % N1 Takeoff250 kts
250Takeoff95 12,300 AGL200,000f250Takeoff95 4,310 AGL70,000e250Takeoff95 3,310 AGL38,550d160Takeoff95 1,000 AGL20,550c130Takeoff95 0 AGL5,000b
0Takeoff102 0 AGL0akts
Speed% N1Power
ftHeight
ftDistance
Point
Flight Profile C5-05I
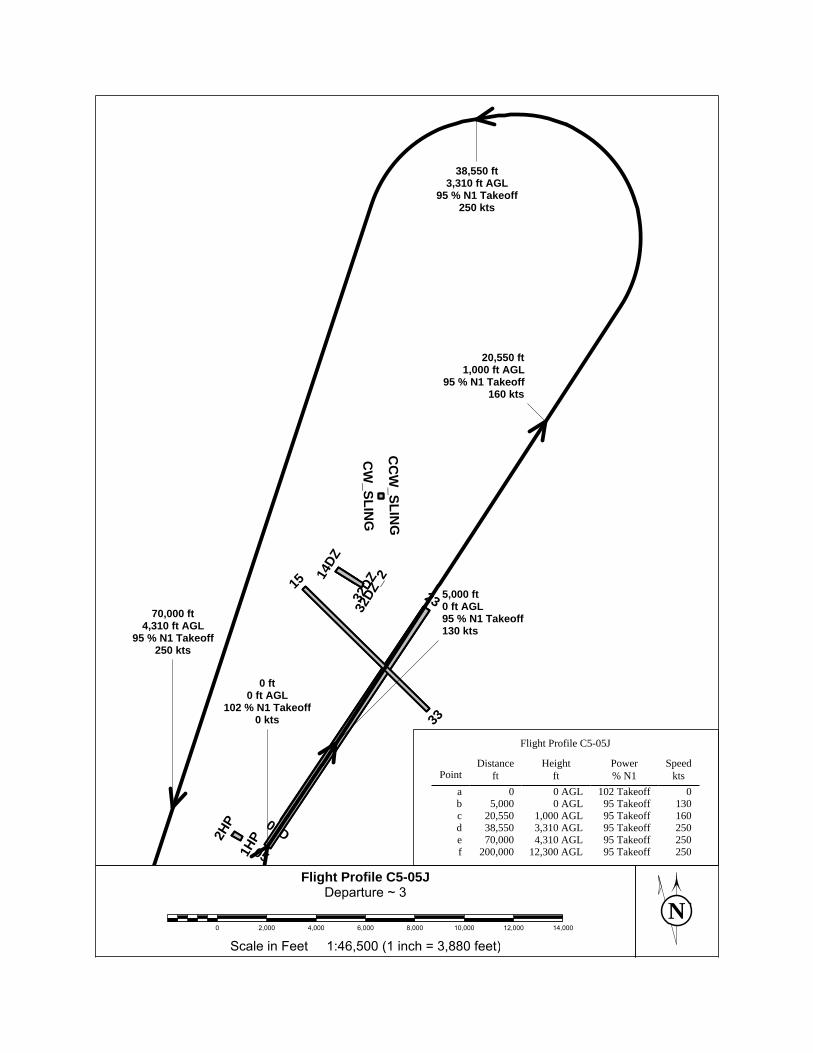
NScale in Feet 1:46,500 (1 inch = 3,880 feet)
0 2,000 4,000 6,000 8,000 10,000 12,000 14,000
3~Departure
C5-05JProfileFlight
1HP2H
P
05
05D
14DZ
15
2332DZ
32DZ
_2
33C
CW
_SLING
CW
_SLING
0 ft0 ft AGL
102 % N1 Takeoff0 kts
5,000 ft0 ft AGL95 % N1 Takeoff130 kts
20,550 ft1,000 ft AGL
95 % N1 Takeoff160 kts
38,550 ft3,310 ft AGL
95 % N1 Takeoff250 kts
70,000 ft4,310 ft AGL
95 % N1 Takeoff250 kts
250Takeoff95 12,300 AGL200,000f250Takeoff95 4,310 AGL70,000e250Takeoff95 3,310 AGL38,550d160Takeoff95 1,000 AGL20,550c130Takeoff95 0 AGL5,000b
0Takeoff102 0 AGL0akts
Speed% N1Power
ftHeight
ftDistance
Point
Flight Profile C5-05J
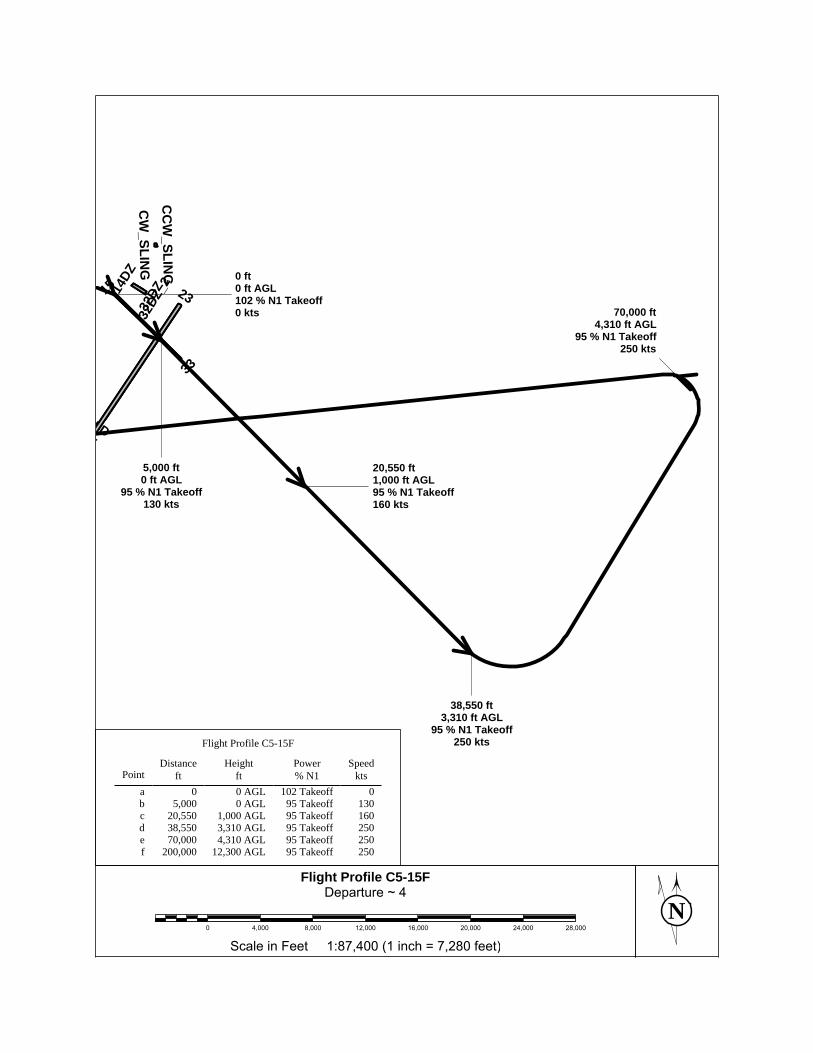
NScale in Feet 1:87,400 (1 inch = 7,280 feet)
0 4,000 8,000 12,000 16,000 20,000 24,000 28,000
4~Departure
C5-15FProfileFlight
P
505D
14DZ
15 23
32DZ
32DZ
_233
CC
W_SLIN
G
CW
_SLING
0 ft0 ft AGL102 % N1 Takeoff0 kts
5,000 ft0 ft AGL
95 % N1 Takeoff130 kts
20,550 ft1,000 ft AGL95 % N1 Takeoff160 kts
38,550 ft3,310 ft AGL
95 % N1 Takeoff250 kts
70,000 ft4,310 ft AGL
95 % N1 Takeoff250 kts
250Takeoff95 12,300 AGL200,000f250Takeoff95 4,310 AGL70,000e250Takeoff95 3,310 AGL38,550d160Takeoff95 1,000 AGL20,550c130Takeoff95 0 AGL5,000b
0Takeoff102 0 AGL0akts
Speed% N1Power
ftHeight
ftDistance
Point
Flight Profile C5-15F
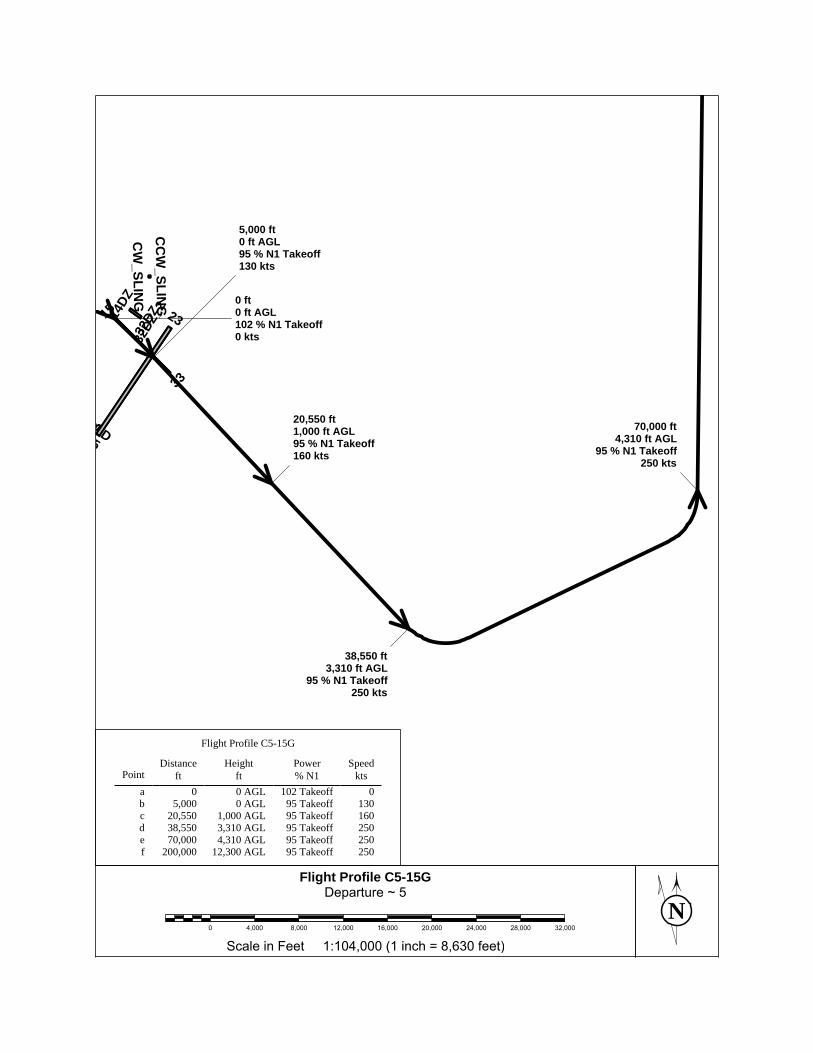
NScale in Feet 1:104,000 (1 inch = 8,630 feet)
0 4,000 8,000 12,000 16,000 20,000 24,000 28,000 32,000
5~Departure
C5-15GProfileFlight
HP505D
14DZ
15 23
32DZ
32DZ
_233
CC
W_SLIN
G
CW
_SLING 0 ft
0 ft AGL102 % N1 Takeoff0 kts
5,000 ft0 ft AGL95 % N1 Takeoff130 kts
20,550 ft1,000 ft AGL95 % N1 Takeoff160 kts
38,550 ft3,310 ft AGL
95 % N1 Takeoff250 kts
70,000 ft4,310 ft AGL
95 % N1 Takeoff250 kts
250Takeoff95 12,300 AGL200,000f250Takeoff95 4,310 AGL70,000e250Takeoff95 3,310 AGL38,550d160Takeoff95 1,000 AGL20,550c130Takeoff95 0 AGL5,000b
0Takeoff102 0 AGL0akts
Speed% N1Power
ftHeight
ftDistance
Point
Flight Profile C5-15G
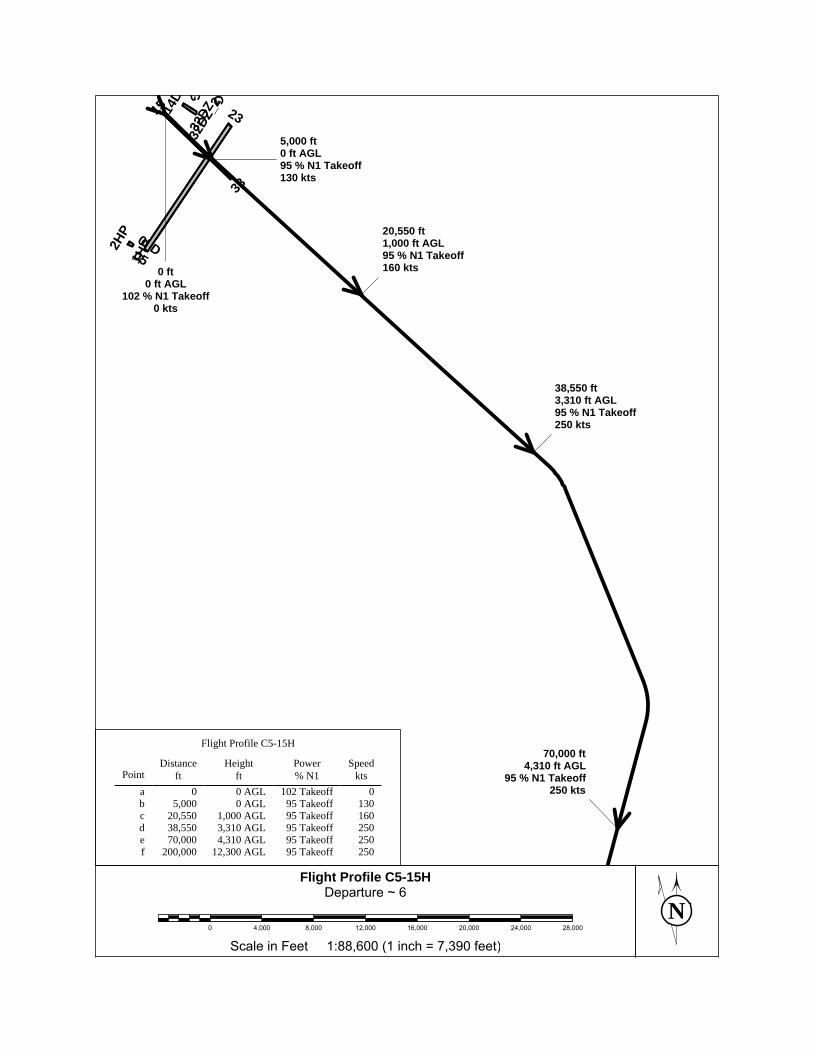
NScale in Feet 1:88,600 (1 inch = 7,390 feet)
0 4,000 8,000 12,000 16,000 20,000 24,000 28,000
6~Departure
C5-15HProfileFlight
1HP2H
P
0505D
14D
15 23
32DZ
32DZ
_233
GG
0 ft0 ft AGL
102 % N1 Takeoff0 kts
5,000 ft0 ft AGL95 % N1 Takeoff130 kts
20,550 ft1,000 ft AGL95 % N1 Takeoff160 kts
38,550 ft3,310 ft AGL95 % N1 Takeoff250 kts
70,000 ft4,310 ft AGL
95 % N1 Takeoff250 kts
250Takeoff95 12,300 AGL200,000f250Takeoff95 4,310 AGL70,000e250Takeoff95 3,310 AGL38,550d160Takeoff95 1,000 AGL20,550c130Takeoff95 0 AGL5,000b
0Takeoff102 0 AGL0akts
Speed% N1Power
ftHeight
ftDistance
Point
Flight Profile C5-15H
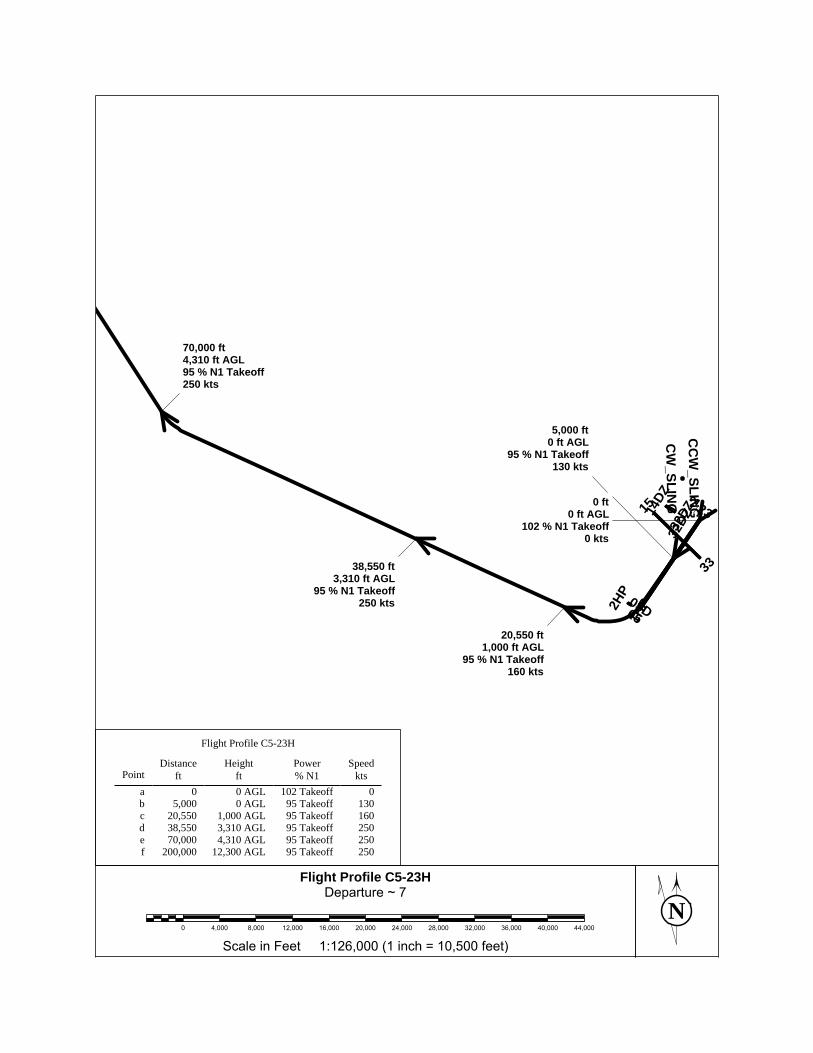
NScale in Feet 1:126,000 (1 inch = 10,500 feet)
0 4,000 8,000 12,000 16,000 20,000 24,000 28,000 32,000 36,000 40,000 44,000
7~Departure
C5-23HProfileFlight
1HP2H
P0505D
14DZ
15 23
32DZ
32DZ
_233
CC
W_SLIN
G
CW
_SLING0 ft
0 ft AGL102 % N1 Takeoff
0 kts
5,000 ft0 ft AGL
95 % N1 Takeoff130 kts
20,550 ft1,000 ft AGL
95 % N1 Takeoff160 kts
38,550 ft3,310 ft AGL
95 % N1 Takeoff250 kts
70,000 ft4,310 ft AGL95 % N1 Takeoff250 kts
250Takeoff95 12,300 AGL200,000f250Takeoff95 4,310 AGL70,000e250Takeoff95 3,310 AGL38,550d160Takeoff95 1,000 AGL20,550c130Takeoff95 0 AGL5,000b
0Takeoff102 0 AGL0akts
Speed% N1Power
ftHeight
ftDistance
Point
Flight Profile C5-23H
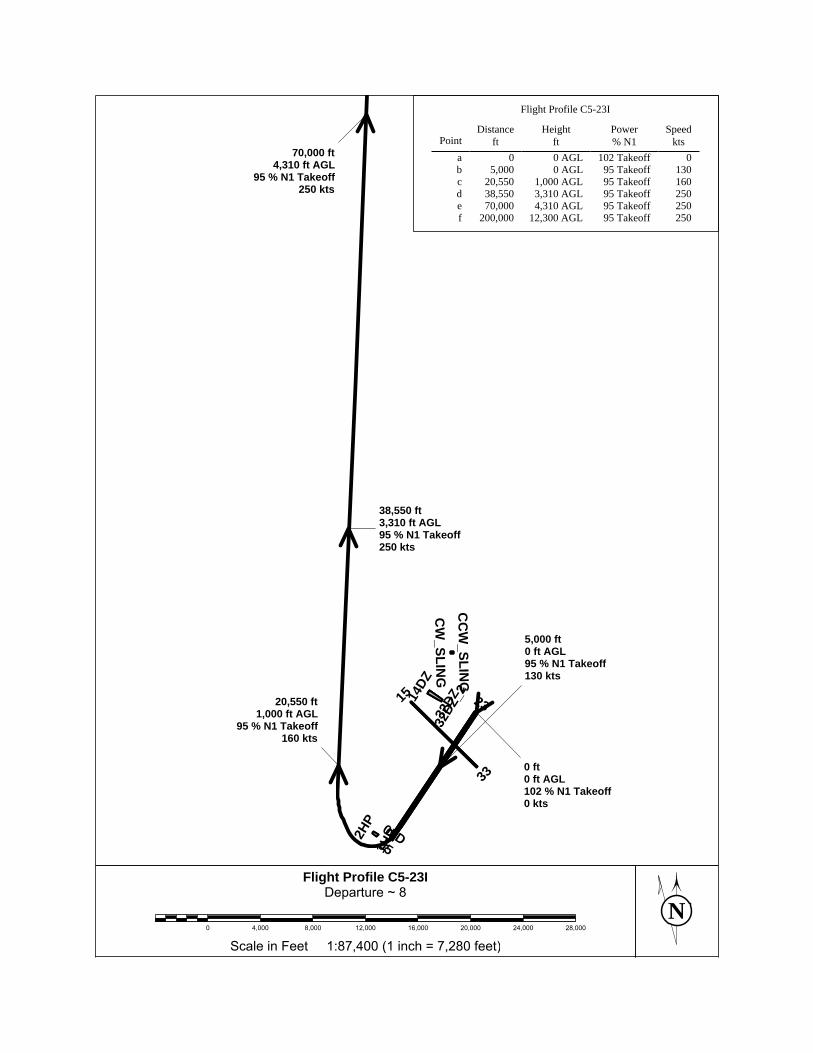
NScale in Feet 1:87,400 (1 inch = 7,280 feet)
0 4,000 8,000 12,000 16,000 20,000 24,000 28,000
8~Departure
C5-23IProfileFlight
1HP2H
P
0505D
14DZ
15 23
32DZ
32DZ
_233
CC
W_SLIN
G
CW
_SLING
0 ft0 ft AGL102 % N1 Takeoff0 kts
5,000 ft0 ft AGL95 % N1 Takeoff130 kts
20,550 ft1,000 ft AGL
95 % N1 Takeoff160 kts
38,550 ft3,310 ft AGL95 % N1 Takeoff250 kts
70,000 ft4,310 ft AGL
95 % N1 Takeoff250 kts
250Takeoff95 12,300 AGL200,000f250Takeoff95 4,310 AGL70,000e250Takeoff95 3,310 AGL38,550d160Takeoff95 1,000 AGL20,550c130Takeoff95 0 AGL5,000b
0Takeoff102 0 AGL0akts
Speed% N1Power
ftHeight
ftDistance
Point
Flight Profile C5-23I
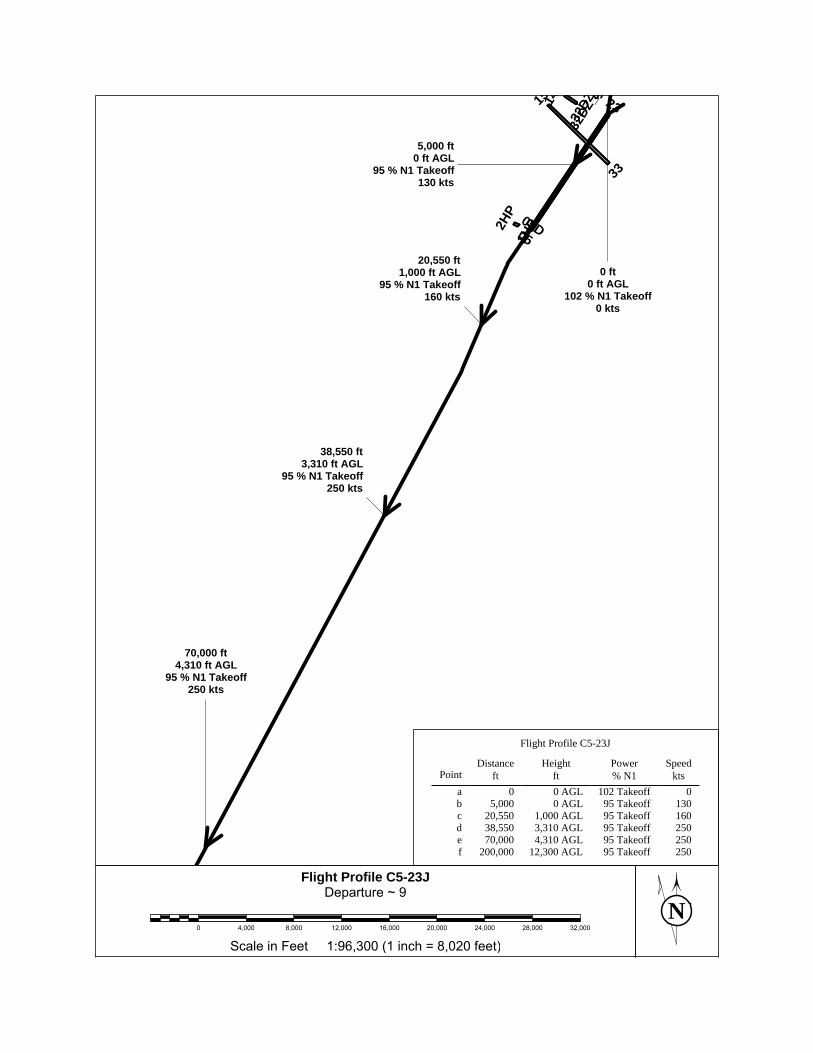
NScale in Feet 1:96,300 (1 inch = 8,020 feet)
0 4,000 8,000 12,000 16,000 20,000 24,000 28,000 32,000
9~Departure
C5-23JProfileFlight
1HP2H
P
0505D
1415 23
32DZ
32DZ
_233
G
0 ft0 ft AGL
102 % N1 Takeoff0 kts
5,000 ft0 ft AGL
95 % N1 Takeoff130 kts
20,550 ft1,000 ft AGL
95 % N1 Takeoff160 kts
38,550 ft3,310 ft AGL
95 % N1 Takeoff250 kts
70,000 ft4,310 ft AGL
95 % N1 Takeoff250 kts
250Takeoff95 12,300 AGL200,000f250Takeoff95 4,310 AGL70,000e250Takeoff95 3,310 AGL38,550d160Takeoff95 1,000 AGL20,550c130Takeoff95 0 AGL5,000b
0Takeoff102 0 AGL0akts
Speed% N1Power
ftHeight
ftDistance
Point
Flight Profile C5-23J
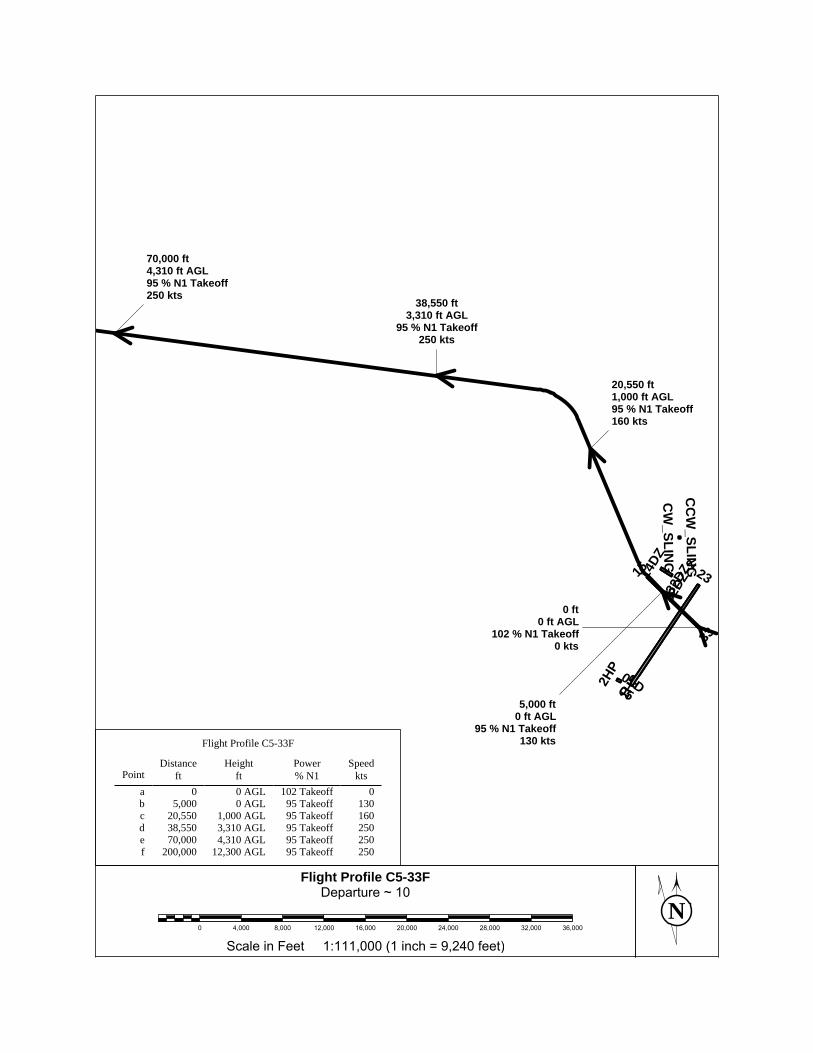
NScale in Feet 1:111,000 (1 inch = 9,240 feet)
0 4,000 8,000 12,000 16,000 20,000 24,000 28,000 32,000 36,000
10~Departure
C5-33FProfileFlight
1HP2H
P
0505D
14DZ
15 23
32DZ
32DZ
_233
CC
W_SLIN
G
CW
_SLING
0 ft0 ft AGL
102 % N1 Takeoff0 kts
5,000 ft0 ft AGL
95 % N1 Takeoff130 kts
20,550 ft1,000 ft AGL95 % N1 Takeoff160 kts
38,550 ft3,310 ft AGL
95 % N1 Takeoff250 kts
70,000 ft4,310 ft AGL95 % N1 Takeoff250 kts
250Takeoff95 12,300 AGL200,000f250Takeoff95 4,310 AGL70,000e250Takeoff95 3,310 AGL38,550d160Takeoff95 1,000 AGL20,550c130Takeoff95 0 AGL5,000b
0Takeoff102 0 AGL0akts
Speed% N1Power
ftHeight
ftDistance
Point
Flight Profile C5-33F
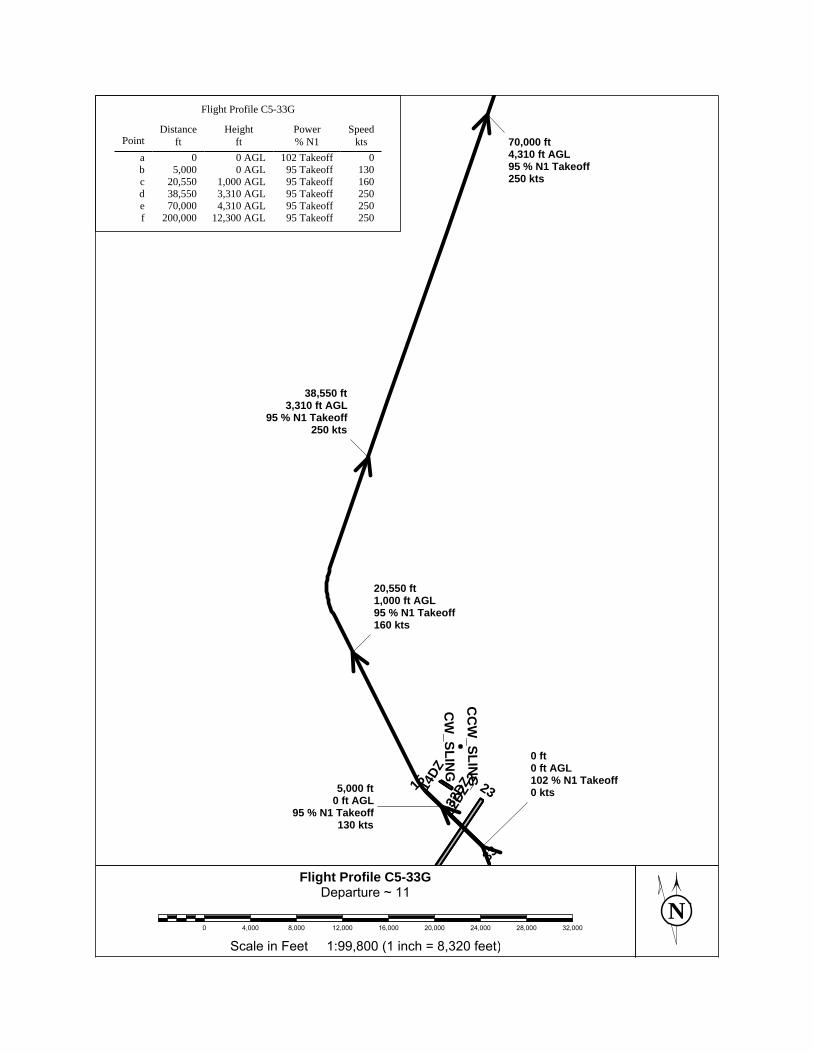
NScale in Feet 1:99,800 (1 inch = 8,320 feet)
0 4,000 8,000 12,000 16,000 20,000 24,000 28,000 32,000
11~Departure
C5-33GProfileFlight
14DZ
15 23
32DZ
32DZ
_233
CC
W_SLIN
G
CW
_SLING
0 ft0 ft AGL102 % N1 Takeoff0 kts5,000 ft
0 ft AGL95 % N1 Takeoff
130 kts
20,550 ft1,000 ft AGL95 % N1 Takeoff160 kts
38,550 ft3,310 ft AGL
95 % N1 Takeoff250 kts
70,000 ft4,310 ft AGL95 % N1 Takeoff250 kts
250Takeoff95 12,300 AGL200,000f250Takeoff95 4,310 AGL70,000e250Takeoff95 3,310 AGL38,550d160Takeoff95 1,000 AGL20,550c130Takeoff95 0 AGL5,000b
0Takeoff102 0 AGL0akts
Speed% N1Power
ftHeight
ftDistance
Point
Flight Profile C5-33G

NScale in Feet 1:59,300 (1 inch = 4,940 feet)
0 2,000 4,000 6,000 8,000 10,000 12,000 14,000 16,000 18,000 20,000
12~Departure
C5-33HProfileFlight
1HP2H
P
05
05D
14DZ
15 2332DZ
32DZ
_2
33
CC
W_SLIN
G
CW
_SLING
0 ft0 ft AGL
102 % N1 Takeoff0 kts
5,000 ft0 ft AGL
95 % N1 Takeoff130 kts
20,550 ft1,000 ft AGL95 % N1 Takeoff160 kts
38,550 ft3,310 ft AGL
95 % N1 Takeoff250 kts
70,000 ft4,310 ft AGL95 % N1 Takeoff250 kts
250Takeoff95 12,300 AGL200,000f250Takeoff95 4,310 AGL70,000e250Takeoff95 3,310 AGL38,550d160Takeoff95 1,000 AGL20,550c130Takeoff95 0 AGL5,000b
0Takeoff102 0 AGL0akts
Speed% N1Power
ftHeight
ftDistance
Point
Flight Profile C5-33H
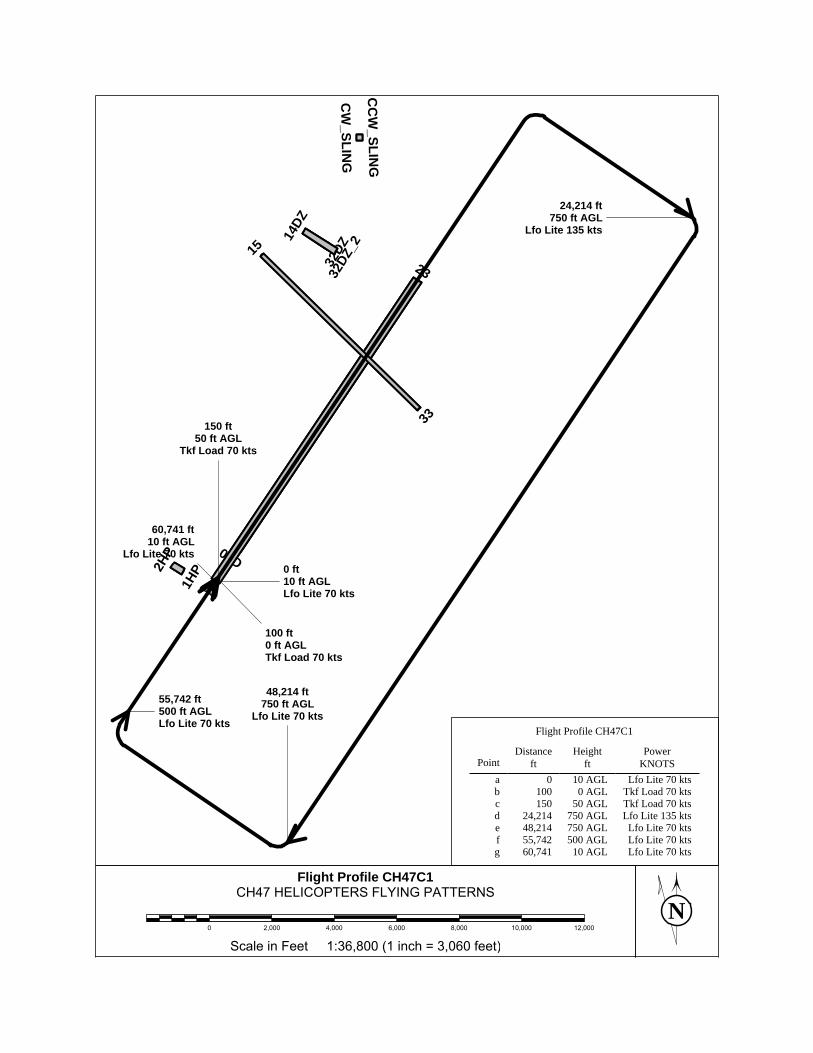
NScale in Feet 1:36,800 (1 inch = 3,060 feet)
0 2,000 4,000 6,000 8,000 10,000 12,000
PATTERNSFLYINGHELICOPTERSCH47
CH47C1ProfileFlight
1HP2H
P
05
05D
14DZ
152332
DZ32
DZ_2
33C
CW
_SLING
CW
_SLING
0 ft10 ft AGLLfo Lite 70 kts
100 ft0 ft AGLTkf Load 70 kts
150 ft50 ft AGL
Tkf Load 70 kts
24,214 ft750 ft AGL
Lfo Lite 135 kts
48,214 ft750 ft AGL
Lfo Lite 70 kts55,742 ft500 ft AGLLfo Lite 70 kts
60,741 ft10 ft AGL
Lfo Lite 70 kts
Lfo Lite 70 kts10 AGL60,741gLfo Lite 70 kts500 AGL55,742fLfo Lite 70 kts750 AGL48,214e
Lfo Lite 135 kts750 AGL24,214dTkf Load 70 kts50 AGL150cTkf Load 70 kts0 AGL100bLfo Lite 70 kts10 AGL0a
KNOTSPower
ftHeight
ftDistance
Point
Flight Profile CH47C1
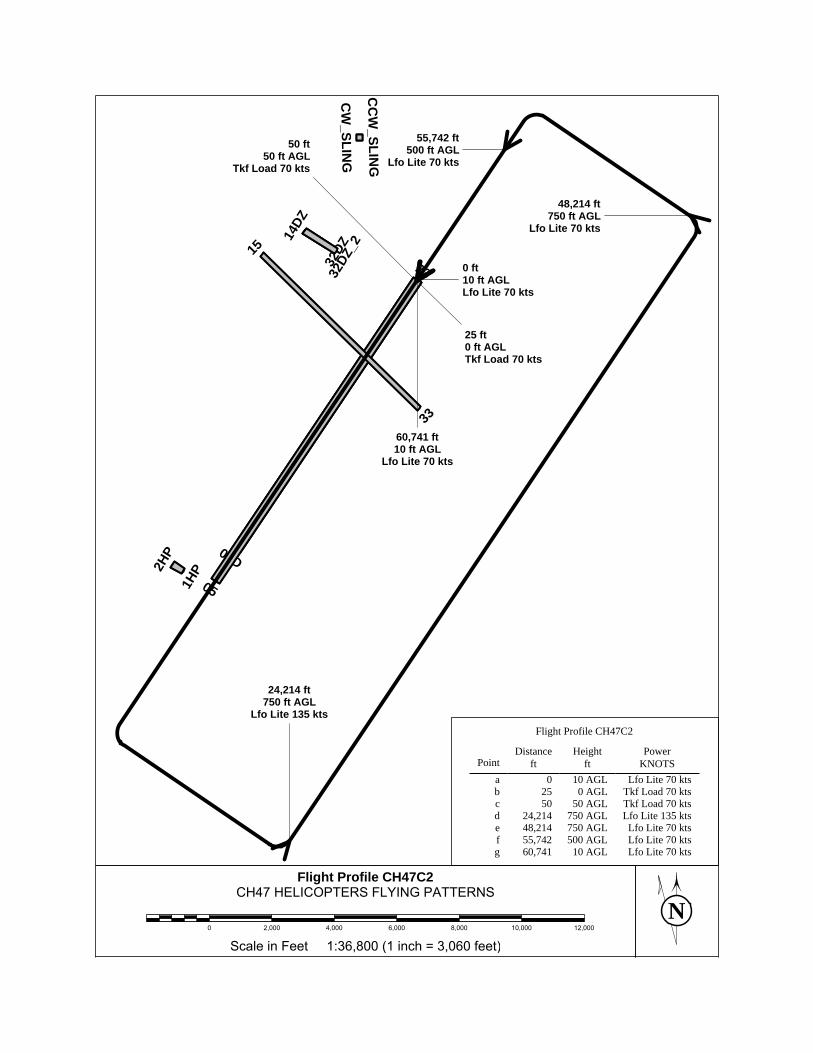
NScale in Feet 1:36,800 (1 inch = 3,060 feet)
0 2,000 4,000 6,000 8,000 10,000 12,000
PATTERNSFLYINGHELICOPTERSCH47
CH47C2ProfileFlight
1HP2H
P
05
05D
14DZ
152332
DZ32
DZ_2
33C
CW
_SLING
CW
_SLING
0 ft10 ft AGLLfo Lite 70 kts
25 ft0 ft AGLTkf Load 70 kts
50 ft50 ft AGL
Tkf Load 70 kts
24,214 ft750 ft AGL
Lfo Lite 135 kts
48,214 ft750 ft AGL
Lfo Lite 70 kts
55,742 ft500 ft AGL
Lfo Lite 70 kts
60,741 ft10 ft AGL
Lfo Lite 70 kts
Lfo Lite 70 kts10 AGL60,741gLfo Lite 70 kts500 AGL55,742fLfo Lite 70 kts750 AGL48,214e
Lfo Lite 135 kts750 AGL24,214dTkf Load 70 kts50 AGL50cTkf Load 70 kts0 AGL25bLfo Lite 70 kts10 AGL0a
KNOTSPower
ftHeight
ftDistance
Point
Flight Profile CH47C2
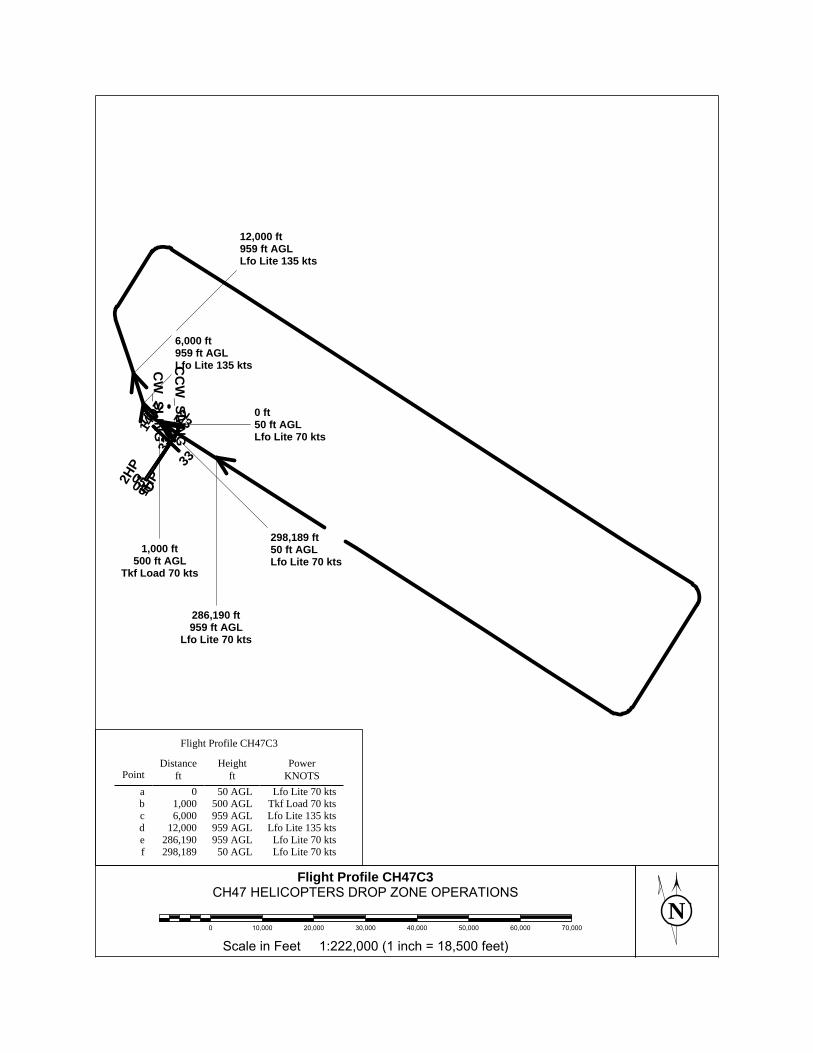
NScale in Feet 1:222,000 (1 inch = 18,500 feet)
0 10,000 20,000 30,000 40,000 50,000 60,000 70,000
OPERATIONSZONEDROPHELICOPTERSCH47
CH47C3ProfileFlight
1HP2H
P
0505D
14DZ15 23
32DZ
32DZ
_233
CC
W_SLIN
GC
W_SLIN
G
0 ft50 ft AGLLfo Lite 70 kts
1,000 ft500 ft AGL
Tkf Load 70 kts
6,000 ft959 ft AGLLfo Lite 135 kts
12,000 ft959 ft AGLLfo Lite 135 kts
286,190 ft959 ft AGL
Lfo Lite 70 kts
298,189 ft50 ft AGLLfo Lite 70 kts
Lfo Lite 70 kts50 AGL298,189fLfo Lite 70 kts959 AGL286,190e
Lfo Lite 135 kts959 AGL12,000dLfo Lite 135 kts959 AGL6,000cTkf Load 70 kts500 AGL1,000bLfo Lite 70 kts50 AGL0a
KNOTSPower
ftHeight
ftDistance
Point
Flight Profile CH47C3
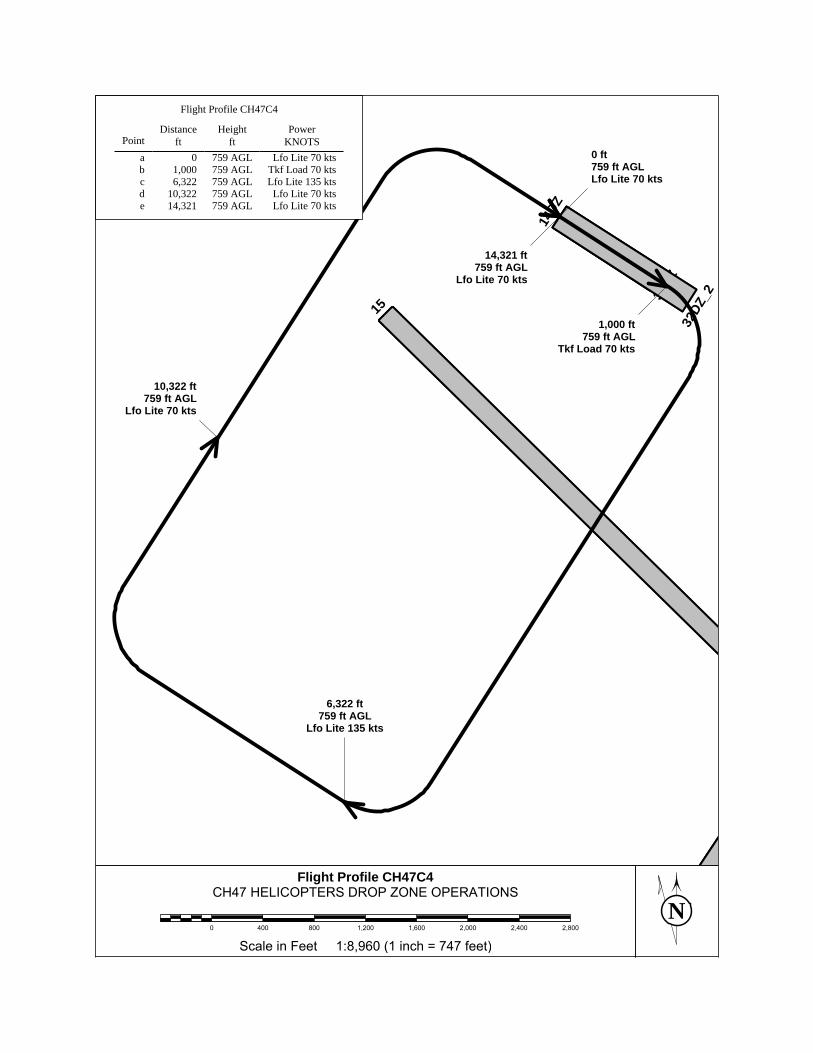
NScale in Feet 1:8,960 (1 inch = 747 feet)
0 400 800 1,200 1,600 2,000 2,400 2,800
OPERATIONSZONEDROPHELICOPTERSCH47
CH47C4ProfileFlight
14DZ
15
32DZ
32DZ
_2
0 ft759 ft AGLLfo Lite 70 kts
1,000 ft759 ft AGL
Tkf Load 70 kts
6,322 ft759 ft AGL
Lfo Lite 135 kts
10,322 ft759 ft AGL
Lfo Lite 70 kts
14,321 ft759 ft AGL
Lfo Lite 70 kts
Lfo Lite 70 kts759 AGL14,321eLfo Lite 70 kts759 AGL10,322d
Lfo Lite 135 kts759 AGL6,322cTkf Load 70 kts759 AGL1,000bLfo Lite 70 kts759 AGL0a
KNOTSPower
ftHeight
ftDistance
Point
Flight Profile CH47C4

NScale in Feet 1:8,960 (1 inch = 747 feet)
0 400 800 1,200 1,600 2,000 2,400 2,800
OPERATIONSZONEDROPHELICOPTERSCH47
CH47C5ProfileFlight
14DZ
15
32DZ
32DZ
_2
0 ft759 ft AGL
Lfo Lite 70 kts
1,000 ft759 ft AGLTkf Load 70 kts
6,322 ft759 ft AGLLfo Lite 135 kts
10,322 ft759 ft AGL
Lfo Lite 70 kts
14,321 ft759 ft AGL
Lfo Lite 70 kts
Lfo Lite 70 kts759 AGL14,321eLfo Lite 70 kts759 AGL10,322d
Lfo Lite 135 kts759 AGL6,322cTkf Load 70 kts759 AGL1,000bLfo Lite 70 kts759 AGL0a
KNOTSPower
ftHeight
ftDistance
Point
Flight Profile CH47C5

NScale in Feet 1:28,200 (1 inch = 2,350 feet)
0 1,000 2,000 3,000 4,000 5,000 6,000 7,000 8,000 9,000
PATTERNSFLYINGHELICOPTERSCH47
CH47C6ProfileFlight1HP
05D
14DZ
15
23
32DZ
32DZ
_2
33
CC
W_SLIN
G
CW
_SLING
0 ft10 ft AGLLfo Lite 70 kts
25 ft0 ft AGL
Tkf Load 70 kts
50 ft50 ft AGL
Tkf Load 70 kts
16,378 ft750 ft AGLLfo Lite 135 kts
31,528 ft750 ft AGL
Lfo Lite 70 kts
35,842 ft500 ft AGL
Lfo Lite 70 kts
40,841 ft10 ft AGL
Lfo Lite 70 kts
Lfo Lite 70 kts10 AGL40,841gLfo Lite 70 kts500 AGL35,842fLfo Lite 70 kts750 AGL31,528e
Lfo Lite 135 kts750 AGL16,378dTkf Load 70 kts50 AGL50cTkf Load 70 kts0 AGL25bLfo Lite 70 kts10 AGL0a
KNOTSPower
ftHeight
ftDistance
Point
Flight Profile CH47C6
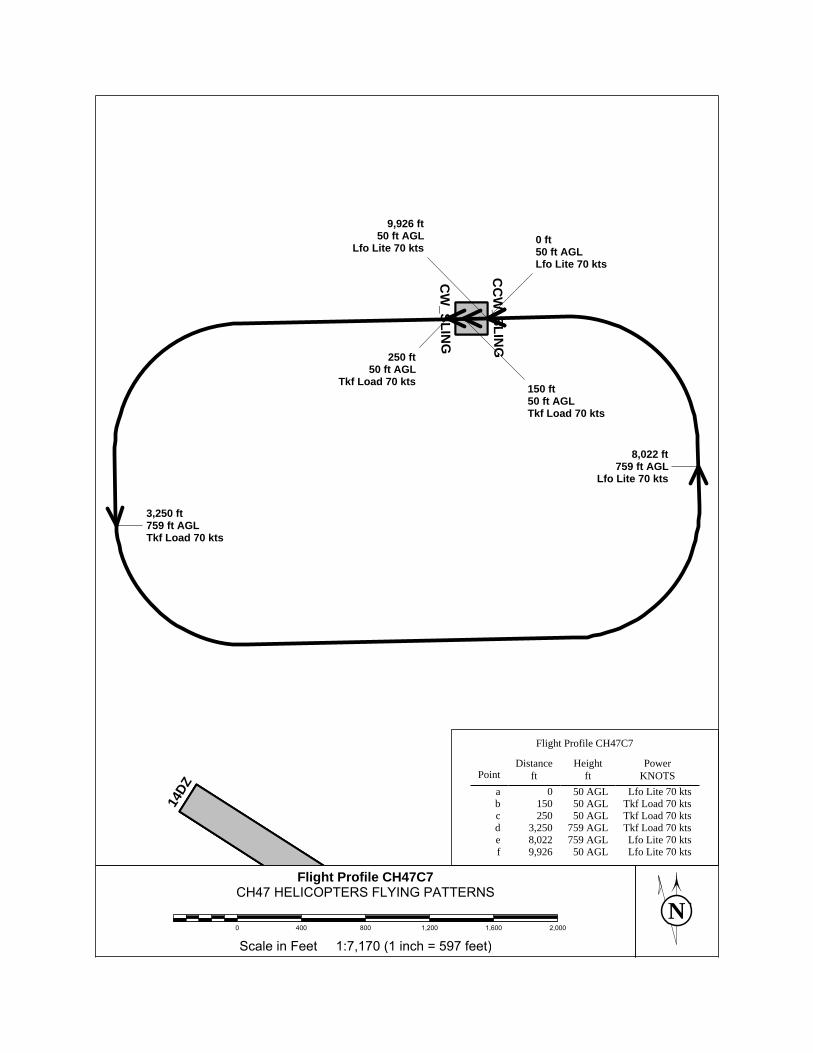
NScale in Feet 1:7,170 (1 inch = 597 feet)
0 400 800 1,200 1,600 2,000
PATTERNSFLYINGHELICOPTERSCH47
CH47C7ProfileFlight
14DZ
ZC
CW
_SLING
CW
_SLING
0 ft50 ft AGLLfo Lite 70 kts
150 ft50 ft AGLTkf Load 70 kts
250 ft50 ft AGL
Tkf Load 70 kts
3,250 ft759 ft AGLTkf Load 70 kts
8,022 ft759 ft AGL
Lfo Lite 70 kts
9,926 ft50 ft AGL
Lfo Lite 70 kts
Lfo Lite 70 kts50 AGL9,926fLfo Lite 70 kts759 AGL8,022e
Tkf Load 70 kts759 AGL3,250dTkf Load 70 kts50 AGL250cTkf Load 70 kts50 AGL150bLfo Lite 70 kts50 AGL0a
KNOTSPower
ftHeight
ftDistance
Point
Flight Profile CH47C7

NScale in Feet 1:7,170 (1 inch = 597 feet)
0 400 800 1,200 1,600 2,000
PATTERNSFLYINGHELICOPTERSCH47
CH47C8ProfileFlight
14DZ
Z
CC
W_SLIN
G
CW
_SLING
0 ft50 ft AGL
Lfo Lite 70 kts
150 ft50 ft AGL
Tkf Load 70 kts 250 ft50 ft AGLTkf Load 70 kts
3,250 ft759 ft AGL
Tkf Load 70 kts
8,022 ft759 ft AGLLfo Lite 70 kts 9,926 ft
50 ft AGLLfo Lite 70 kts
Lfo Lite 70 kts50 AGL9,926fLfo Lite 70 kts759 AGL8,022e
Tkf Load 70 kts759 AGL3,250dTkf Load 70 kts50 AGL250cTkf Load 70 kts50 AGL150bLfo Lite 70 kts50 AGL0a
KNOTSPower
ftHeight
ftDistance
Point
Flight Profile CH47C8
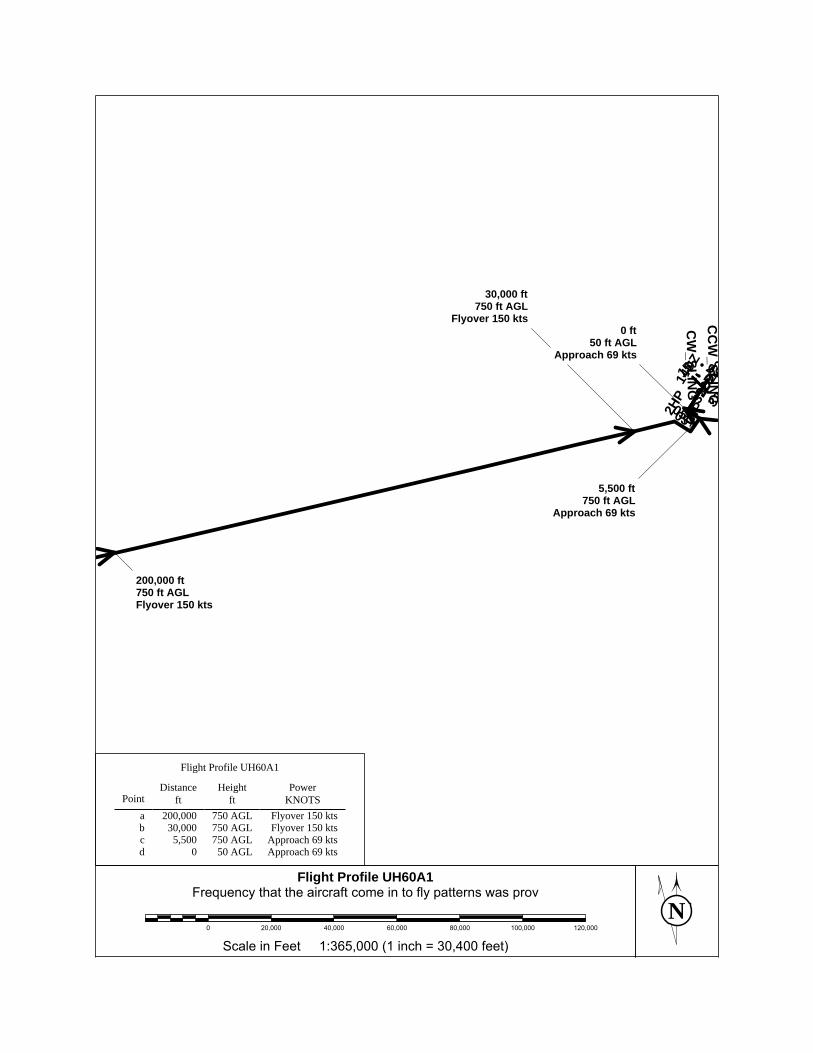
NScale in Feet 1:365,000 (1 inch = 30,400 feet)
0 20,000 40,000 60,000 80,000 100,000 120,000
provwaspatternsflytoincomeaircraftthethatFrequency
UH60A1ProfileFlight
1HP2H
P
0505D
14DZ15 23
32DZ
32DZ
_233
CC
W_SLIN
GC
W_SLIN
G
0 ft50 ft AGL
Approach 69 kts
5,500 ft750 ft AGL
Approach 69 kts
30,000 ft750 ft AGL
Flyover 150 kts
200,000 ft750 ft AGLFlyover 150 kts
Approach 69 kts50 AGL0dApproach 69 kts750 AGL5,500cFlyover 150 kts750 AGL30,000bFlyover 150 kts750 AGL200,000a
KNOTSPower
ftHeight
ftDistance
Point
Flight Profile UH60A1
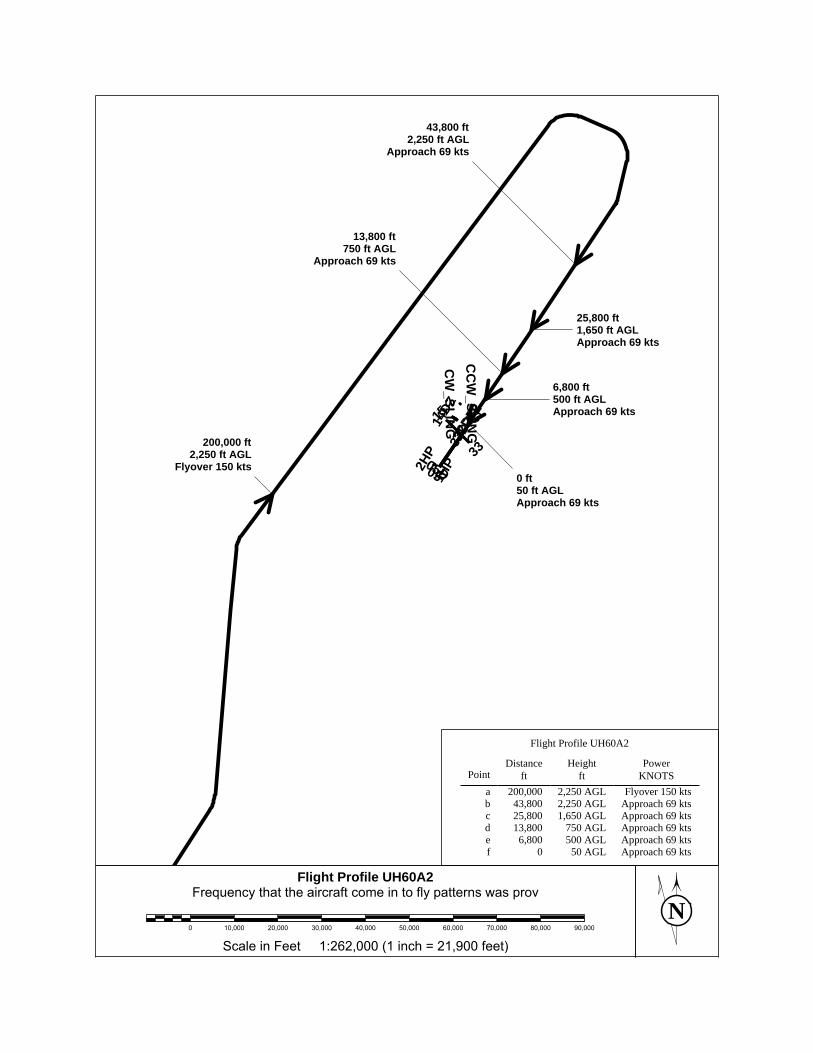
NScale in Feet 1:262,000 (1 inch = 21,900 feet)
0 10,000 20,000 30,000 40,000 50,000 60,000 70,000 80,000 90,000
provwaspatternsflytoincomeaircraftthethatFrequency
UH60A2ProfileFlight
1HP2H
P
0505D
14DZ15 23
32DZ
32DZ
_233
CC
W_SLIN
GC
W_SLIN
G
0 ft50 ft AGLApproach 69 kts
6,800 ft500 ft AGLApproach 69 kts
13,800 ft750 ft AGL
Approach 69 kts
25,800 ft1,650 ft AGLApproach 69 kts
43,800 ft2,250 ft AGL
Approach 69 kts
200,000 ft2,250 ft AGL
Flyover 150 kts
Approach 69 kts50 AGL0fApproach 69 kts500 AGL6,800eApproach 69 kts750 AGL13,800dApproach 69 kts1,650 AGL25,800cApproach 69 kts2,250 AGL43,800bFlyover 150 kts2,250 AGL200,000a
KNOTSPower
ftHeight
ftDistance
Point
Flight Profile UH60A2
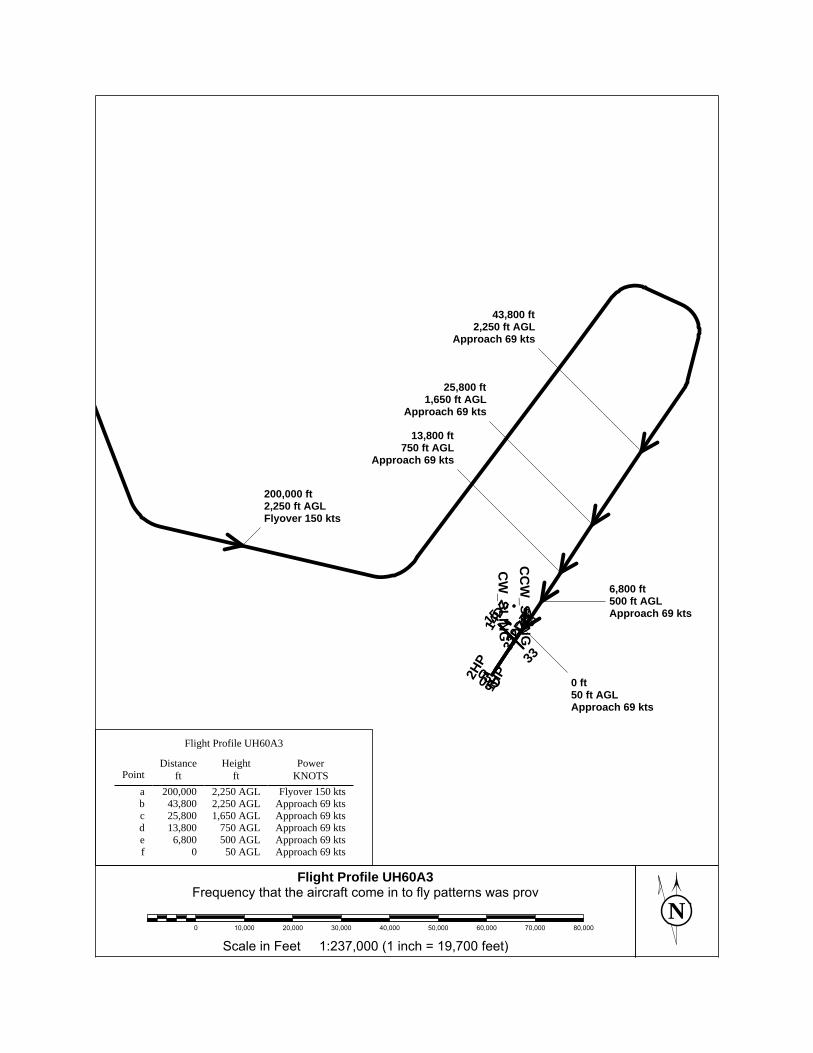
NScale in Feet 1:237,000 (1 inch = 19,700 feet)
0 10,000 20,000 30,000 40,000 50,000 60,000 70,000 80,000
provwaspatternsflytoincomeaircraftthethatFrequency
UH60A3ProfileFlight
1HP2H
P
0505D
14DZ15 23
32DZ
32DZ
_233
CC
W_SLIN
GC
W_SLIN
G
0 ft50 ft AGLApproach 69 kts
6,800 ft500 ft AGLApproach 69 kts
13,800 ft750 ft AGL
Approach 69 kts
25,800 ft1,650 ft AGL
Approach 69 kts
43,800 ft2,250 ft AGL
Approach 69 kts
200,000 ft2,250 ft AGLFlyover 150 kts
Approach 69 kts50 AGL0fApproach 69 kts500 AGL6,800eApproach 69 kts750 AGL13,800dApproach 69 kts1,650 AGL25,800cApproach 69 kts2,250 AGL43,800bFlyover 150 kts2,250 AGL200,000a
KNOTSPower
ftHeight
ftDistance
Point
Flight Profile UH60A3
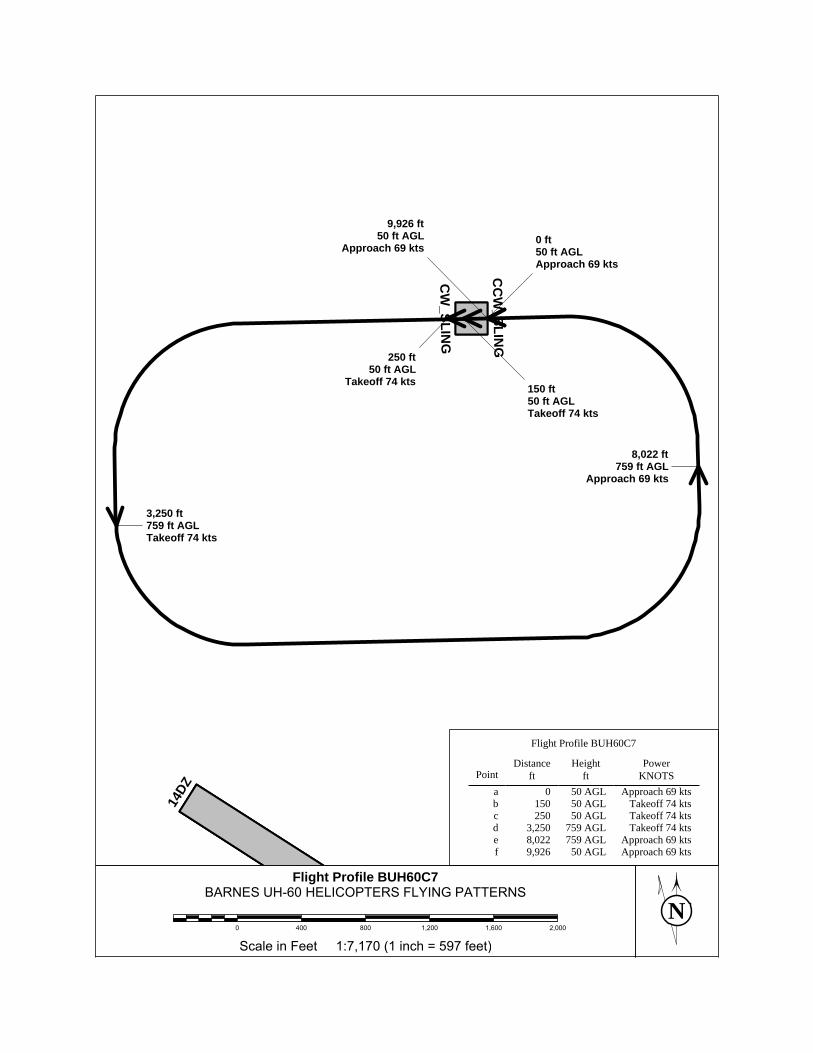
NScale in Feet 1:7,170 (1 inch = 597 feet)
0 400 800 1,200 1,600 2,000
PATTERNSFLYINGHELICOPTERSUH-60BARNES
BUH60C7ProfileFlight
14DZ
ZC
CW
_SLING
CW
_SLING
0 ft50 ft AGLApproach 69 kts
150 ft50 ft AGLTakeoff 74 kts
250 ft50 ft AGL
Takeoff 74 kts
3,250 ft759 ft AGLTakeoff 74 kts
8,022 ft759 ft AGL
Approach 69 kts
9,926 ft50 ft AGL
Approach 69 kts
Approach 69 kts50 AGL9,926fApproach 69 kts759 AGL8,022e
Takeoff 74 kts759 AGL3,250dTakeoff 74 kts50 AGL250cTakeoff 74 kts50 AGL150b
Approach 69 kts50 AGL0aKNOTSPower
ftHeight
ftDistance
Point
Flight Profile BUH60C7

NScale in Feet 1:7,170 (1 inch = 597 feet)
0 400 800 1,200 1,600 2,000
PATTERNSFLYINGHELICOPTERSUH-60BARNES
BUH60C8ProfileFlight
14DZ
Z
CC
W_SLIN
G
CW
_SLING
0 ft50 ft AGL
Approach 69 kts
150 ft50 ft AGL
Takeoff 74 kts 250 ft50 ft AGLTakeoff 74 kts
3,250 ft759 ft AGL
Takeoff 74 kts
8,022 ft759 ft AGLApproach 69 kts 9,926 ft
50 ft AGLApproach 69 kts
Approach 69 kts50 AGL9,926fApproach 69 kts759 AGL8,022e
Takeoff 74 kts759 AGL3,250dTakeoff 74 kts50 AGL250cTakeoff 74 kts50 AGL150b
Approach 69 kts50 AGL0aKNOTSPower
ftHeight
ftDistance
Point
Flight Profile BUH60C8
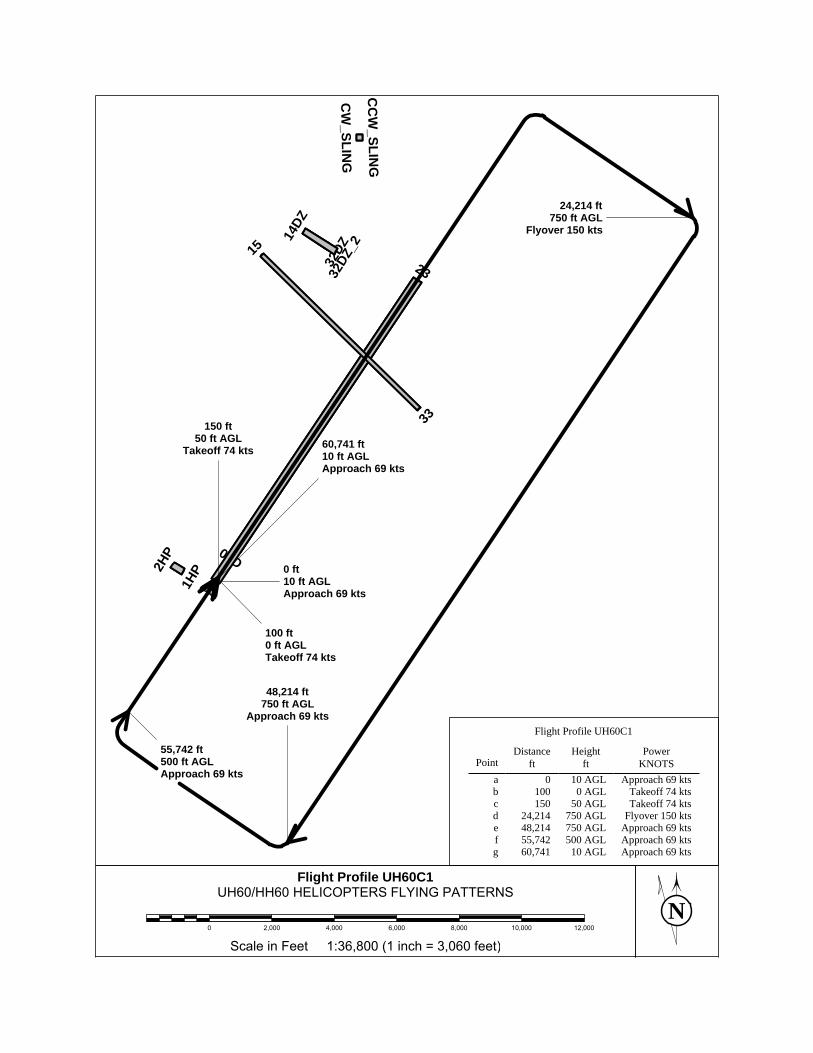
NScale in Feet 1:36,800 (1 inch = 3,060 feet)
0 2,000 4,000 6,000 8,000 10,000 12,000
PATTERNSFLYINGHELICOPTERSUH60/HH60
UH60C1ProfileFlight
1HP2H
P
05
05D
14DZ
152332
DZ32
DZ_2
33C
CW
_SLING
CW
_SLING
0 ft10 ft AGLApproach 69 kts
100 ft0 ft AGLTakeoff 74 kts
150 ft50 ft AGL
Takeoff 74 kts
24,214 ft750 ft AGL
Flyover 150 kts
48,214 ft750 ft AGL
Approach 69 kts
55,742 ft500 ft AGLApproach 69 kts
60,741 ft10 ft AGLApproach 69 kts
Approach 69 kts10 AGL60,741gApproach 69 kts500 AGL55,742fApproach 69 kts750 AGL48,214eFlyover 150 kts750 AGL24,214dTakeoff 74 kts50 AGL150cTakeoff 74 kts0 AGL100b
Approach 69 kts10 AGL0aKNOTSPower
ftHeight
ftDistance
Point
Flight Profile UH60C1

NScale in Feet 1:36,800 (1 inch = 3,060 feet)
0 2,000 4,000 6,000 8,000 10,000 12,000
PATTERNSFLYINGHELICOPTERSUH60/HH60
UH60C2ProfileFlight
1HP2H
P
05
05D
14DZ
152332
DZ32
DZ_2
33C
CW
_SLING
CW
_SLING
0 ft10 ft AGLApproach 69 kts
25 ft0 ft AGLTakeoff 74 kts
50 ft50 ft AGL
Takeoff 74 kts
24,214 ft750 ft AGL
Flyover 150 kts
48,214 ft750 ft AGL
Approach 69 kts
55,742 ft500 ft AGL
Approach 69 kts
60,741 ft10 ft AGL
Approach 69 kts
Approach 69 kts10 AGL60,741gApproach 69 kts500 AGL55,742fApproach 69 kts750 AGL48,214eFlyover 150 kts750 AGL24,214dTakeoff 74 kts50 AGL50cTakeoff 74 kts0 AGL25b
Approach 69 kts10 AGL0aKNOTSPower
ftHeight
ftDistance
Point
Flight Profile UH60C2
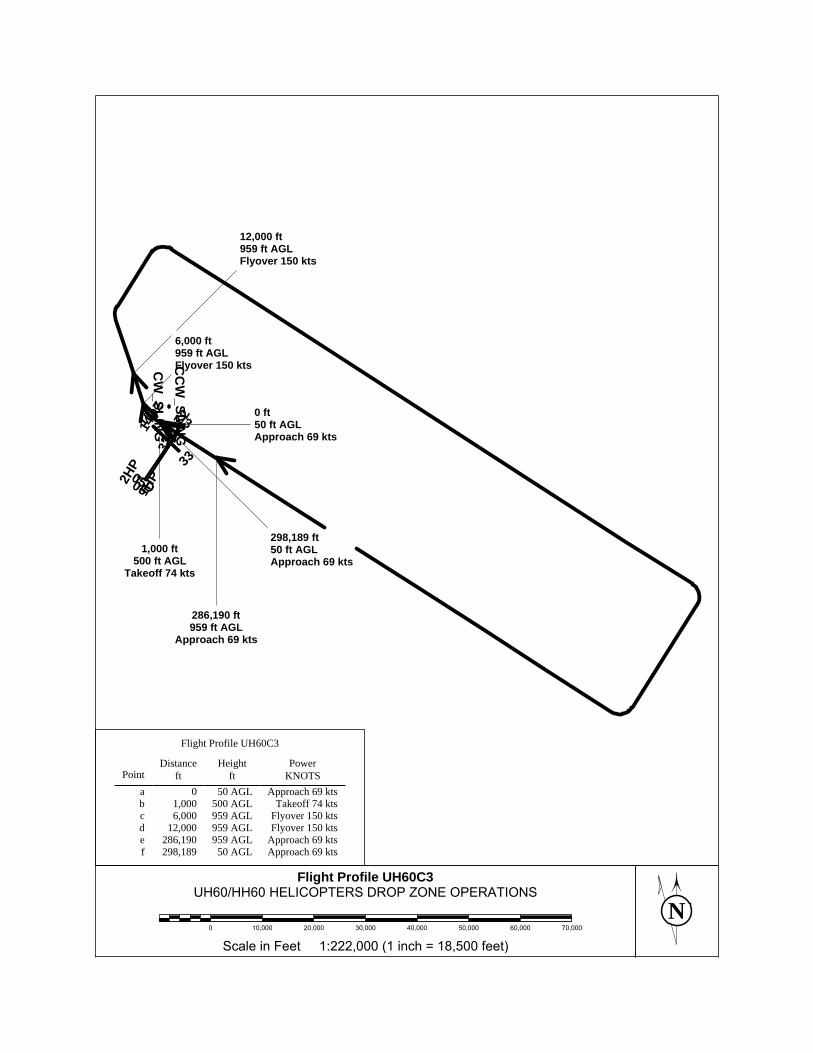
NScale in Feet 1:222,000 (1 inch = 18,500 feet)
0 10,000 20,000 30,000 40,000 50,000 60,000 70,000
OPERATIONSZONEDROPHELICOPTERSUH60/HH60
UH60C3ProfileFlight
1HP2H
P
0505D
14DZ15 23
32DZ
32DZ
_233
CC
W_SLIN
GC
W_SLIN
G
0 ft50 ft AGLApproach 69 kts
1,000 ft500 ft AGL
Takeoff 74 kts
6,000 ft959 ft AGLFlyover 150 kts
12,000 ft959 ft AGLFlyover 150 kts
286,190 ft959 ft AGL
Approach 69 kts
298,189 ft50 ft AGLApproach 69 kts
Approach 69 kts50 AGL298,189fApproach 69 kts959 AGL286,190eFlyover 150 kts959 AGL12,000dFlyover 150 kts959 AGL6,000cTakeoff 74 kts500 AGL1,000b
Approach 69 kts50 AGL0aKNOTSPower
ftHeight
ftDistance
Point
Flight Profile UH60C3
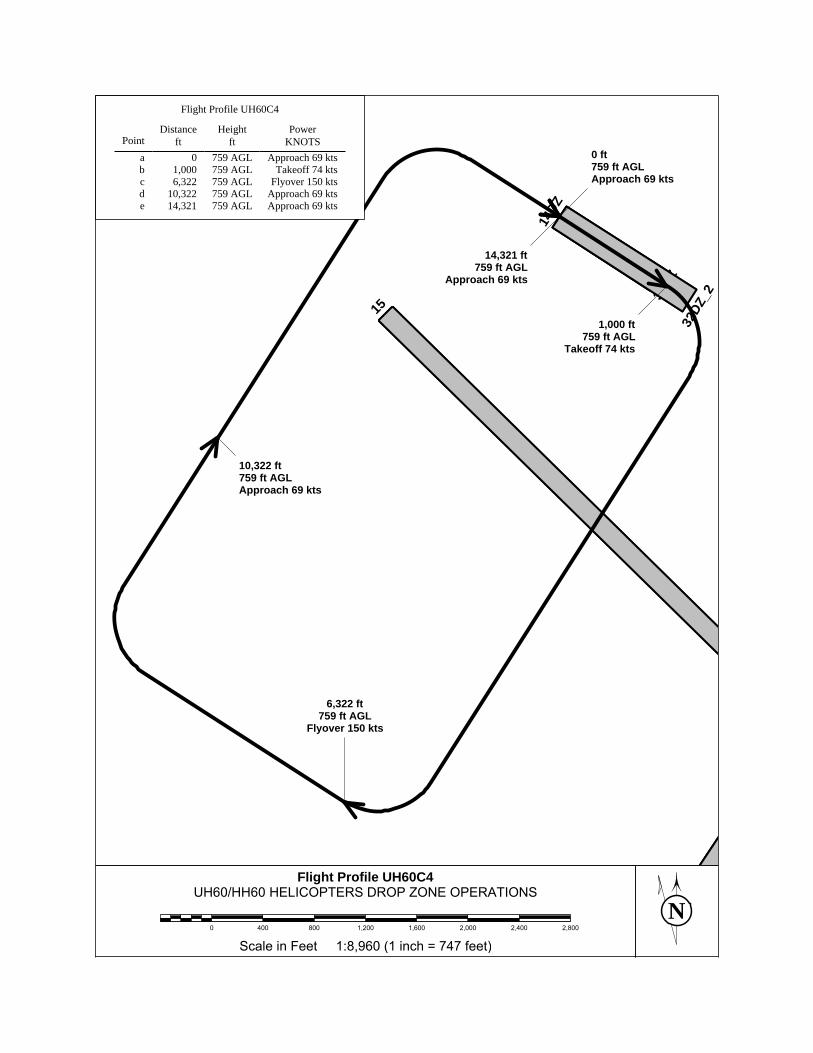
NScale in Feet 1:8,960 (1 inch = 747 feet)
0 400 800 1,200 1,600 2,000 2,400 2,800
OPERATIONSZONEDROPHELICOPTERSUH60/HH60
UH60C4ProfileFlight
14DZ
15
32DZ
32DZ
_2
0 ft759 ft AGLApproach 69 kts
1,000 ft759 ft AGL
Takeoff 74 kts
6,322 ft759 ft AGL
Flyover 150 kts
10,322 ft759 ft AGLApproach 69 kts
14,321 ft759 ft AGL
Approach 69 kts
Approach 69 kts759 AGL14,321eApproach 69 kts759 AGL10,322dFlyover 150 kts759 AGL6,322cTakeoff 74 kts759 AGL1,000b
Approach 69 kts759 AGL0aKNOTSPower
ftHeight
ftDistance
Point
Flight Profile UH60C4
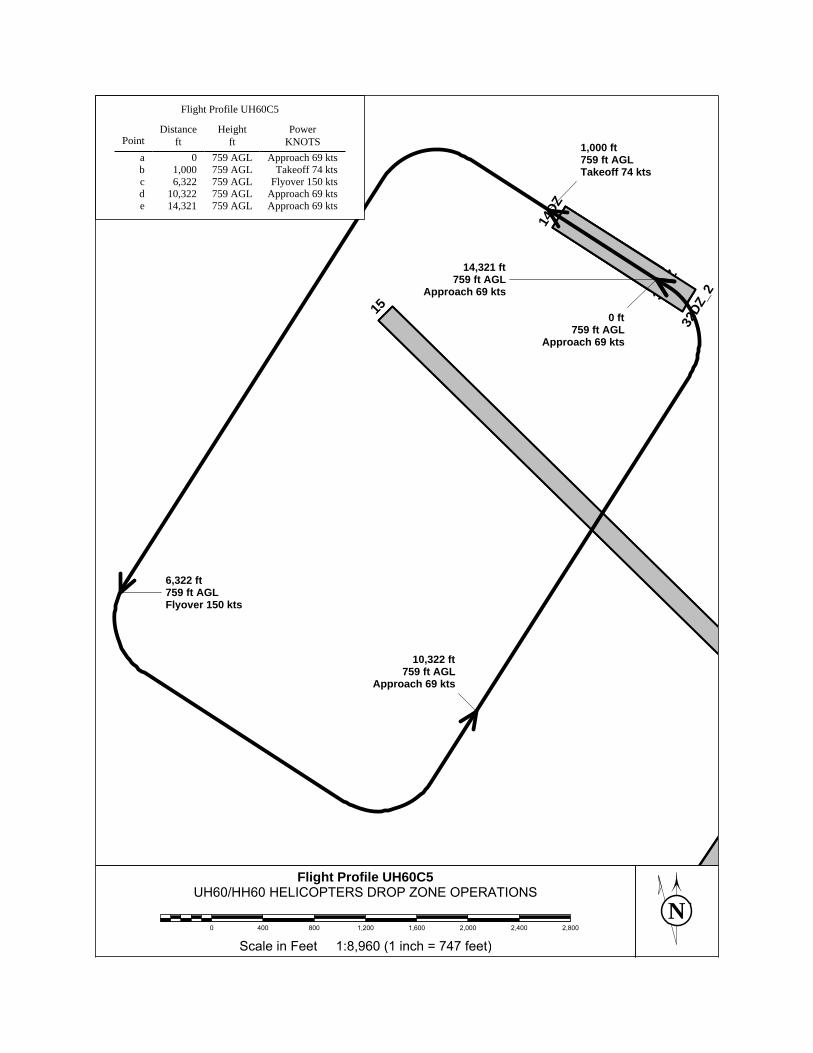
NScale in Feet 1:8,960 (1 inch = 747 feet)
0 400 800 1,200 1,600 2,000 2,400 2,800
OPERATIONSZONEDROPHELICOPTERSUH60/HH60
UH60C5ProfileFlight
14DZ
15
32DZ
32DZ
_2
0 ft759 ft AGL
Approach 69 kts
1,000 ft759 ft AGLTakeoff 74 kts
6,322 ft759 ft AGLFlyover 150 kts
10,322 ft759 ft AGL
Approach 69 kts
14,321 ft759 ft AGL
Approach 69 kts
Approach 69 kts759 AGL14,321eApproach 69 kts759 AGL10,322dFlyover 150 kts759 AGL6,322cTakeoff 74 kts759 AGL1,000b
Approach 69 kts759 AGL0aKNOTSPower
ftHeight
ftDistance
Point
Flight Profile UH60C5
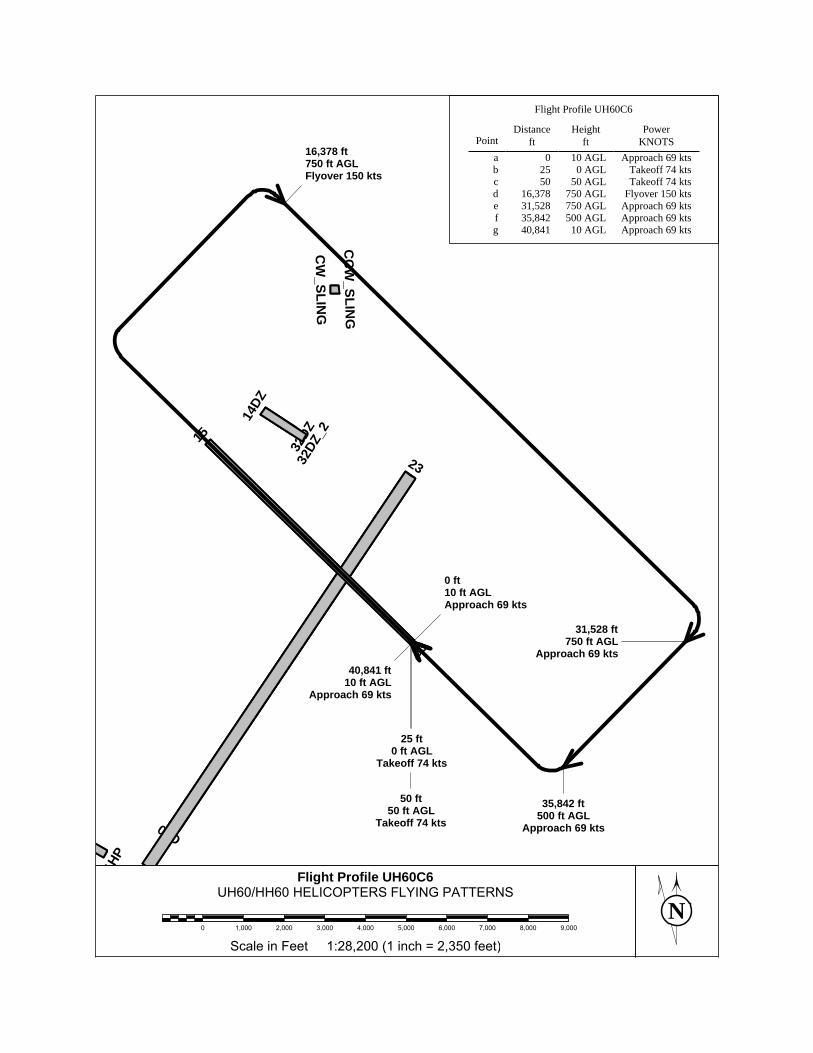
NScale in Feet 1:28,200 (1 inch = 2,350 feet)
0 1,000 2,000 3,000 4,000 5,000 6,000 7,000 8,000 9,000
PATTERNSFLYINGHELICOPTERSUH60/HH60
UH60C6ProfileFlight1HP
05D
14DZ
15
23
32DZ
32DZ
_2
33
CC
W_SLIN
G
CW
_SLING
0 ft10 ft AGLApproach 69 kts
25 ft0 ft AGL
Takeoff 74 kts
50 ft50 ft AGL
Takeoff 74 kts
16,378 ft750 ft AGLFlyover 150 kts
31,528 ft750 ft AGL
Approach 69 kts
35,842 ft500 ft AGL
Approach 69 kts
40,841 ft10 ft AGL
Approach 69 kts
Approach 69 kts10 AGL40,841gApproach 69 kts500 AGL35,842fApproach 69 kts750 AGL31,528eFlyover 150 kts750 AGL16,378dTakeoff 74 kts50 AGL50cTakeoff 74 kts0 AGL25b
Approach 69 kts10 AGL0aKNOTSPower
ftHeight
ftDistance
Point
Flight Profile UH60C6
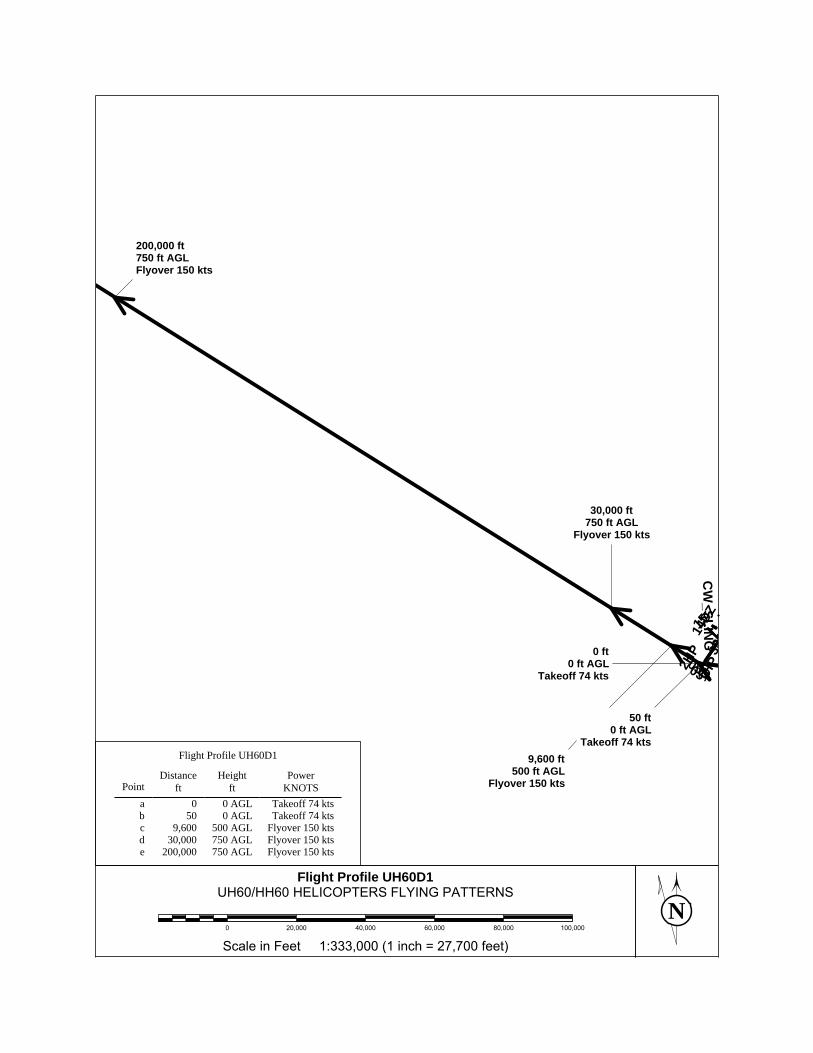
NScale in Feet 1:333,000 (1 inch = 27,700 feet)0 20,000 40,000 60,000 80,000 100,000
PATTERNSFLYINGHELICOPTERSUH60/HH60
UH60D1ProfileFlight
1HP2H
P0505D
14DZ15
3232D
CW
_SLING
0 ft0 ft AGL
Takeoff 74 kts
50 ft0 ft AGL
Takeoff 74 kts9,600 ft
500 ft AGLFlyover 150 kts
30,000 ft750 ft AGL
Flyover 150 kts
200,000 ft750 ft AGLFlyover 150 kts
Flyover 150 kts750 AGL200,000eFlyover 150 kts750 AGL30,000dFlyover 150 kts500 AGL9,600cTakeoff 74 kts0 AGL50bTakeoff 74 kts0 AGL0a
KNOTSPower
ftHeight
ftDistance
Point
Flight Profile UH60D1
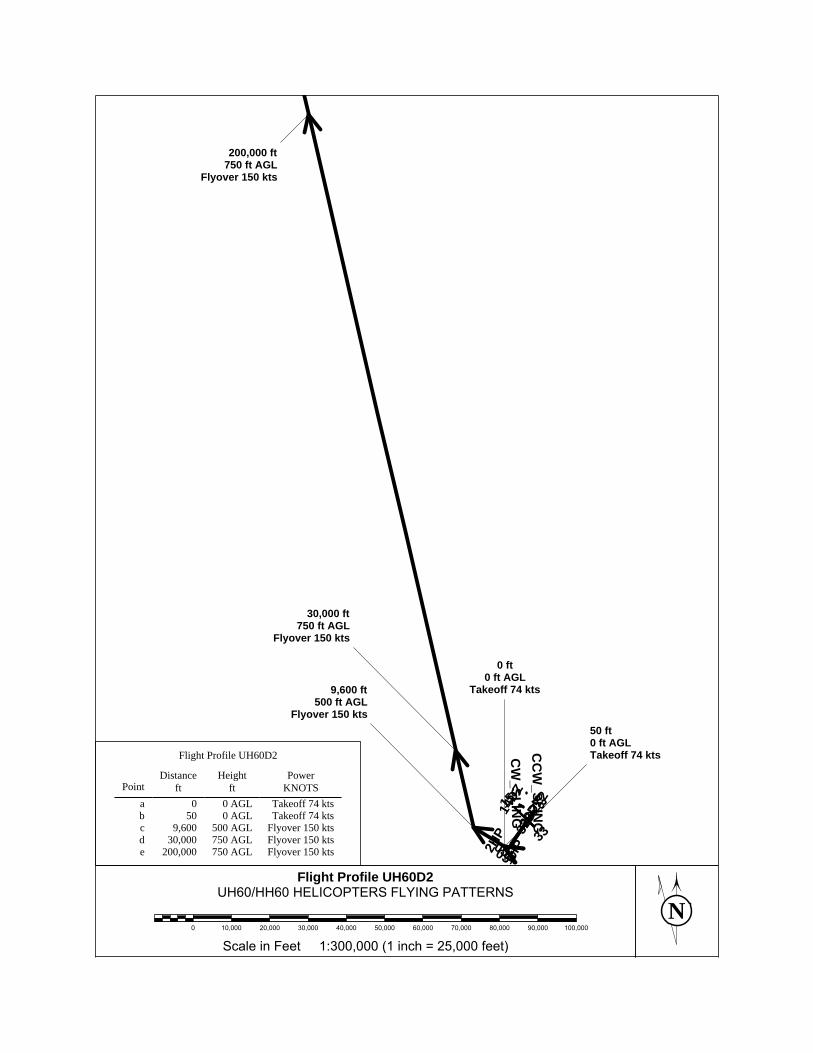
NScale in Feet 1:300,000 (1 inch = 25,000 feet)
0 10,000 20,000 30,000 40,000 50,000 60,000 70,000 80,000 90,000 100,000
PATTERNSFLYINGHELICOPTERSUH60/HH60
UH60D2ProfileFlight
1HP2H
P
0505D
14DZ15 23
32DZ
32DZ
_233
CC
W_SLIN
GC
W_SLIN
G
0 ft0 ft AGL
Takeoff 74 kts
50 ft0 ft AGLTakeoff 74 kts
9,600 ft500 ft AGL
Flyover 150 kts
30,000 ft750 ft AGL
Flyover 150 kts
200,000 ft750 ft AGL
Flyover 150 kts
Flyover 150 kts750 AGL200,000eFlyover 150 kts750 AGL30,000dFlyover 150 kts500 AGL9,600cTakeoff 74 kts0 AGL50bTakeoff 74 kts0 AGL0a
KNOTSPower
ftHeight
ftDistance
Point
Flight Profile UH60D2
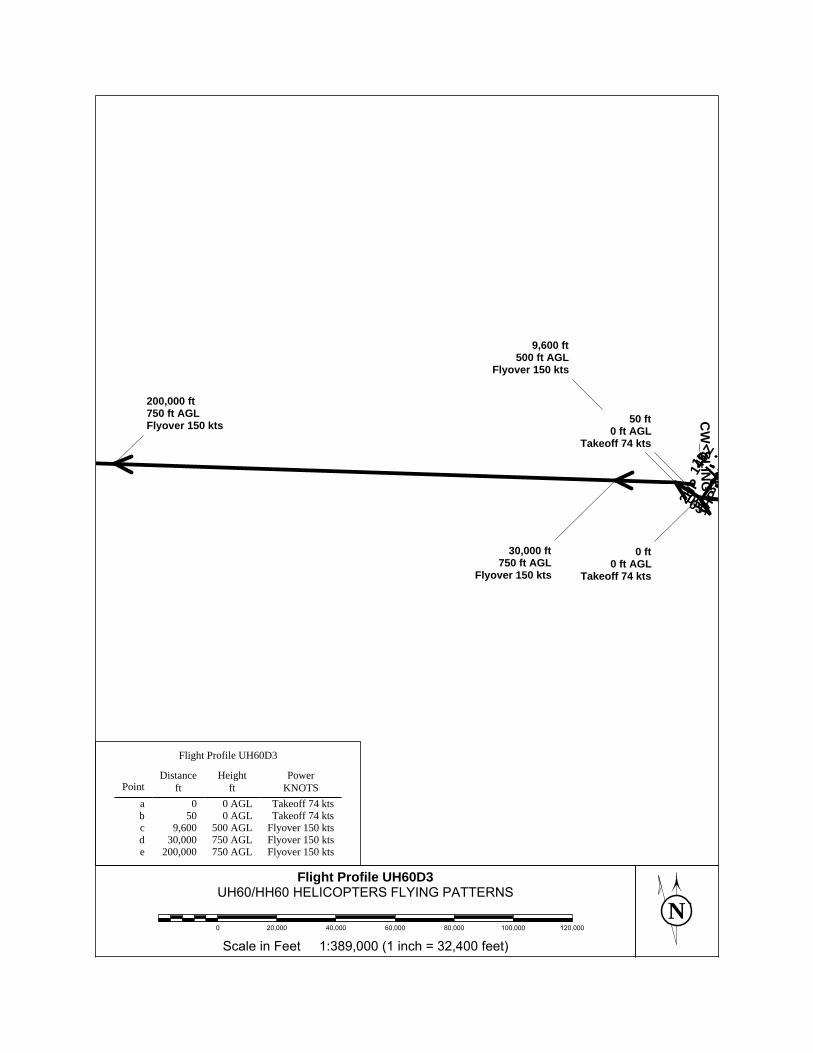
NScale in Feet 1:389,000 (1 inch = 32,400 feet)
0 20,000 40,000 60,000 80,000 100,000 120,000
PATTERNSFLYINGHELICOPTERSUH60/HH60
UH60D3ProfileFlight
1HP2H
P
0505D
14DZ15
32D
32D
CW
_SLING
0 ft0 ft AGL
Takeoff 74 kts
50 ft0 ft AGL
Takeoff 74 kts
9,600 ft500 ft AGL
Flyover 150 kts
30,000 ft750 ft AGL
Flyover 150 kts
200,000 ft750 ft AGLFlyover 150 kts
Flyover 150 kts750 AGL200,000eFlyover 150 kts750 AGL30,000dFlyover 150 kts500 AGL9,600cTakeoff 74 kts0 AGL50bTakeoff 74 kts0 AGL0a
KNOTSPower
ftHeight
ftDistance
Point
Flight Profile UH60D3
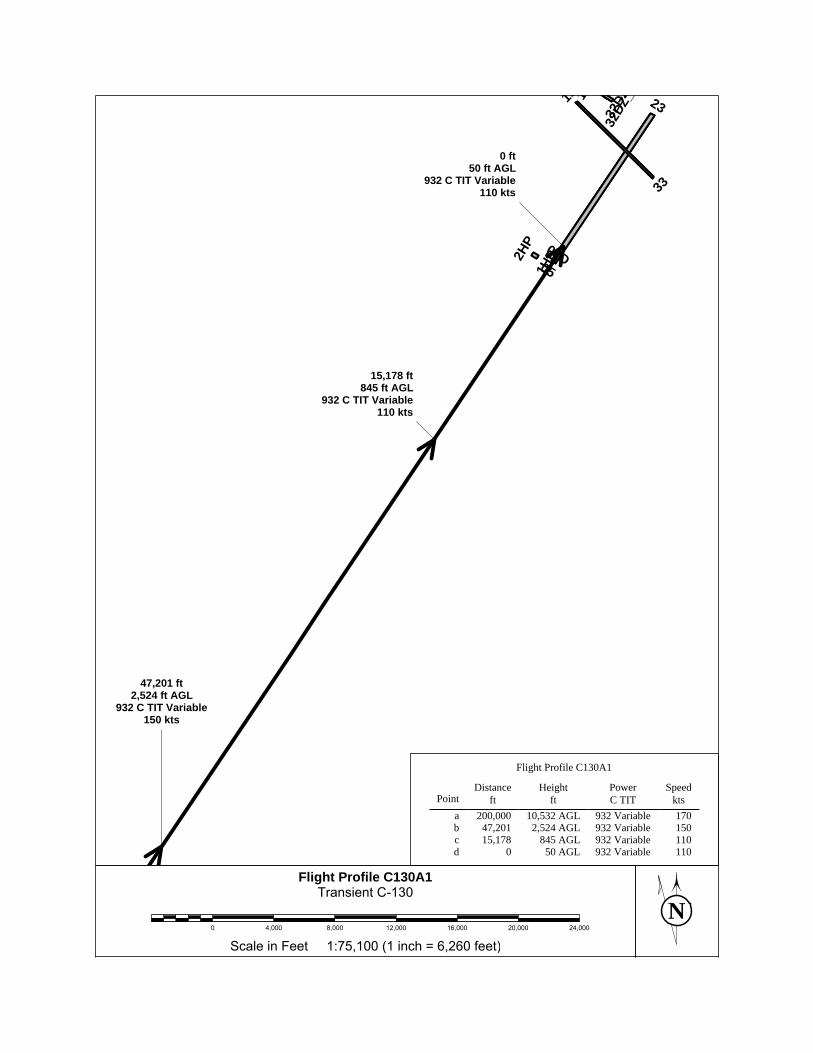
NScale in Feet 1:75,100 (1 inch = 6,260 feet)
0 4,000 8,000 12,000 16,000 20,000 24,000
C-130TransientC130A1ProfileFlight
1HP2H
P
0505D
115 23
32DZ
32DZ
_
33
0 ft50 ft AGL
932 C TIT Variable110 kts
15,178 ft845 ft AGL
932 C TIT Variable110 kts
47,201 ft2,524 ft AGL
932 C TIT Variable150 kts
110Variable932 50 AGL0d110Variable932 845 AGL15,178c150Variable932 2,524 AGL47,201b170Variable932 10,532 AGL200,000a
ktsSpeed
C TITPower
ftHeight
ftDistance
Point
Flight Profile C130A1
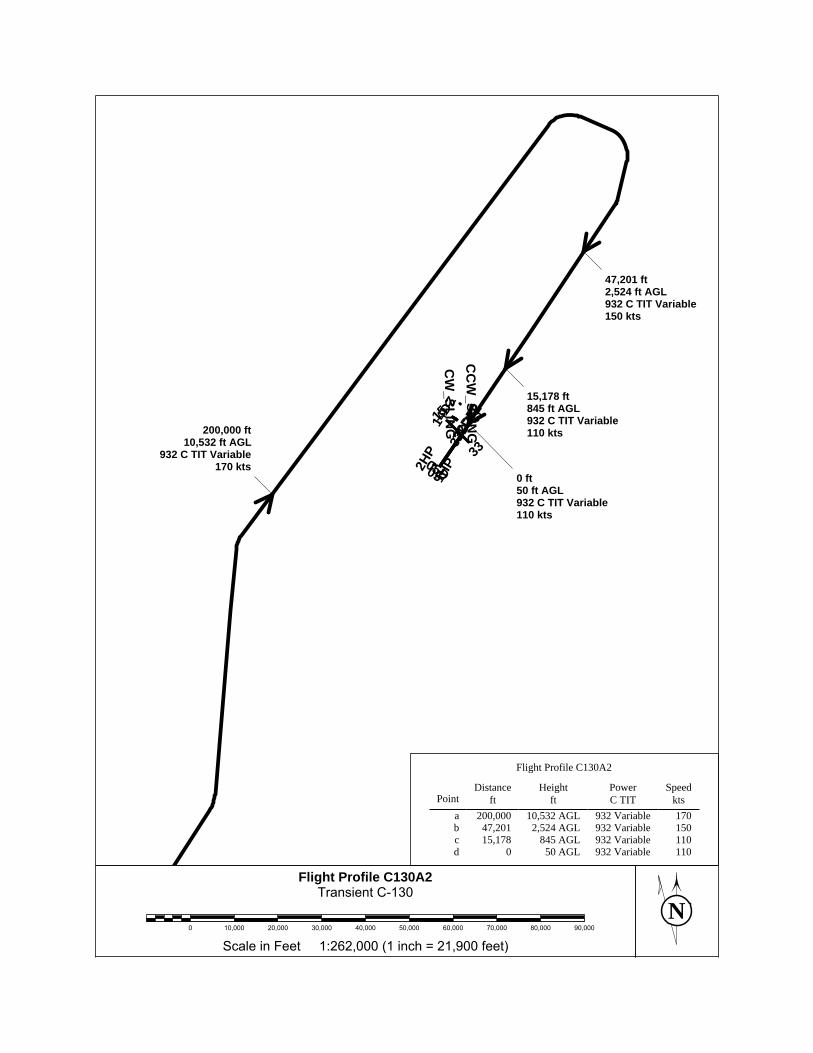
NScale in Feet 1:262,000 (1 inch = 21,900 feet)
0 10,000 20,000 30,000 40,000 50,000 60,000 70,000 80,000 90,000
C-130TransientC130A2ProfileFlight
1HP2H
P
0505D
14DZ15 23
32DZ
32DZ
_233
CC
W_SLIN
GC
W_SLIN
G
0 ft50 ft AGL932 C TIT Variable110 kts
15,178 ft845 ft AGL932 C TIT Variable110 kts
47,201 ft2,524 ft AGL932 C TIT Variable150 kts
200,000 ft10,532 ft AGL
932 C TIT Variable170 kts
110Variable932 50 AGL0d110Variable932 845 AGL15,178c150Variable932 2,524 AGL47,201b170Variable932 10,532 AGL200,000a
ktsSpeed
C TITPower
ftHeight
ftDistance
Point
Flight Profile C130A2
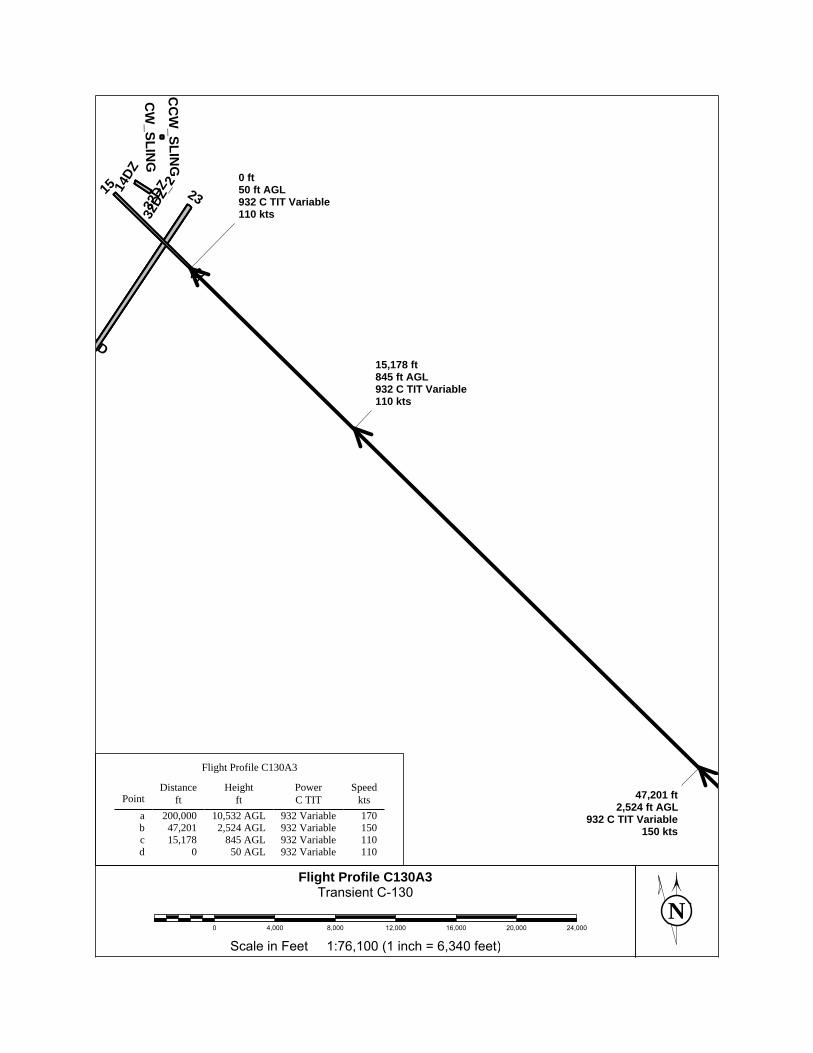
NScale in Feet 1:76,100 (1 inch = 6,340 feet)
0 4,000 8,000 12,000 16,000 20,000 24,000
C-130TransientC130A3ProfileFlight
5D
14DZ
15 23
32DZ
32DZ
_2
33
CC
W_SLIN
G
CW
_SLING
0 ft50 ft AGL932 C TIT Variable110 kts
15,178 ft845 ft AGL932 C TIT Variable110 kts
47,201 ft2,524 ft AGL
932 C TIT Variable150 kts
110Variable932 50 AGL0d110Variable932 845 AGL15,178c150Variable932 2,524 AGL47,201b170Variable932 10,532 AGL200,000a
ktsSpeed
C TITPower
ftHeight
ftDistance
Point
Flight Profile C130A3
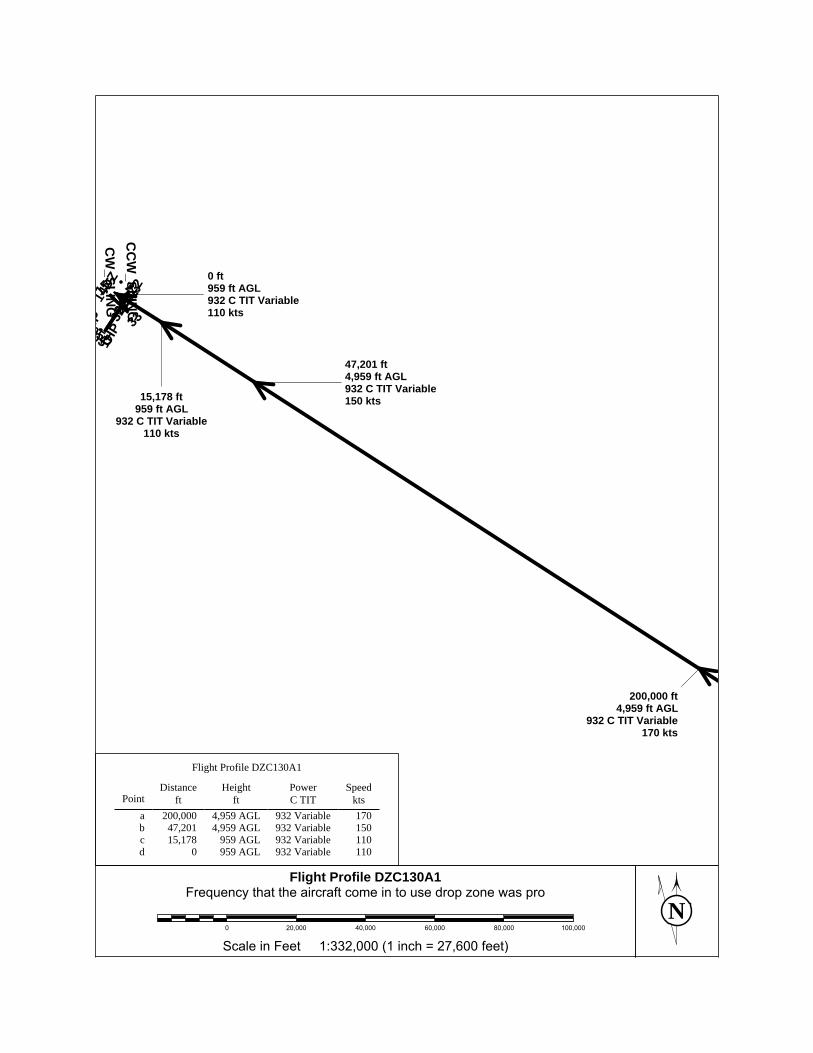
NScale in Feet 1:332,000 (1 inch = 27,600 feet)0 20,000 40,000 60,000 80,000 100,000
prowaszonedropusetoincomeaircraftthethatFrequency
DZC130A1ProfileFlight
1HPHP05
05D
14DZ15 23
32DZ
32DZ
_233
CC
W_SLIN
GC
W_SLIN
G
0 ft959 ft AGL932 C TIT Variable110 kts
15,178 ft959 ft AGL
932 C TIT Variable110 kts
47,201 ft4,959 ft AGL932 C TIT Variable150 kts
200,000 ft4,959 ft AGL
932 C TIT Variable170 kts
110Variable932 959 AGL0d110Variable932 959 AGL15,178c150Variable932 4,959 AGL47,201b170Variable932 4,959 AGL200,000a
ktsSpeed
C TITPower
ftHeight
ftDistance
Point
Flight Profile DZC130A1

NScale in Feet 1:222,000 (1 inch = 18,500 feet)
0 10,000 20,000 30,000 40,000 50,000 60,000 70,000
MSL1000atOperationsZoneDrop-C-130Transient
DZC130C1ProfileFlight
1HP2H
P
0505D
14DZ15 23
32DZ
32DZ
_233
CC
W_SLIN
GC
W_SLIN
G
0 ft1,000 ft AGL977 C TIT Variable140 kts
3,000 ft1,000 ft AGL977 C TIT Variable140 kts
15,000 ft2,750 ft AGL932 C TIT Variable170 kts
190,000 ft2,750 ft AGL
932 C TIT Variable170 kts
200,000 ft500 ft AGL
932 C TIT Variable150 kts
274,000 ft759 ft AGL
932 C TIT Variable150 kts
278,000 ft759 ft AGL
932 C TIT Variable150 kts
298,189 ft759 ft AGL932 C TIT Variable140 kts
140Variable932 759 AGL298,189h150Variable932 759 AGL278,000g150Variable932 759 AGL274,000f150Variable932 500 AGL200,000e170Variable932 2,750 AGL190,000d170Variable932 2,750 AGL15,000c140Variable977 1,000 AGL3,000b140Variable977 1,000 AGL0a
ktsSpeed
C TITPower
ftHeight
ftDistance
Point
Flight Profile DZC130C1
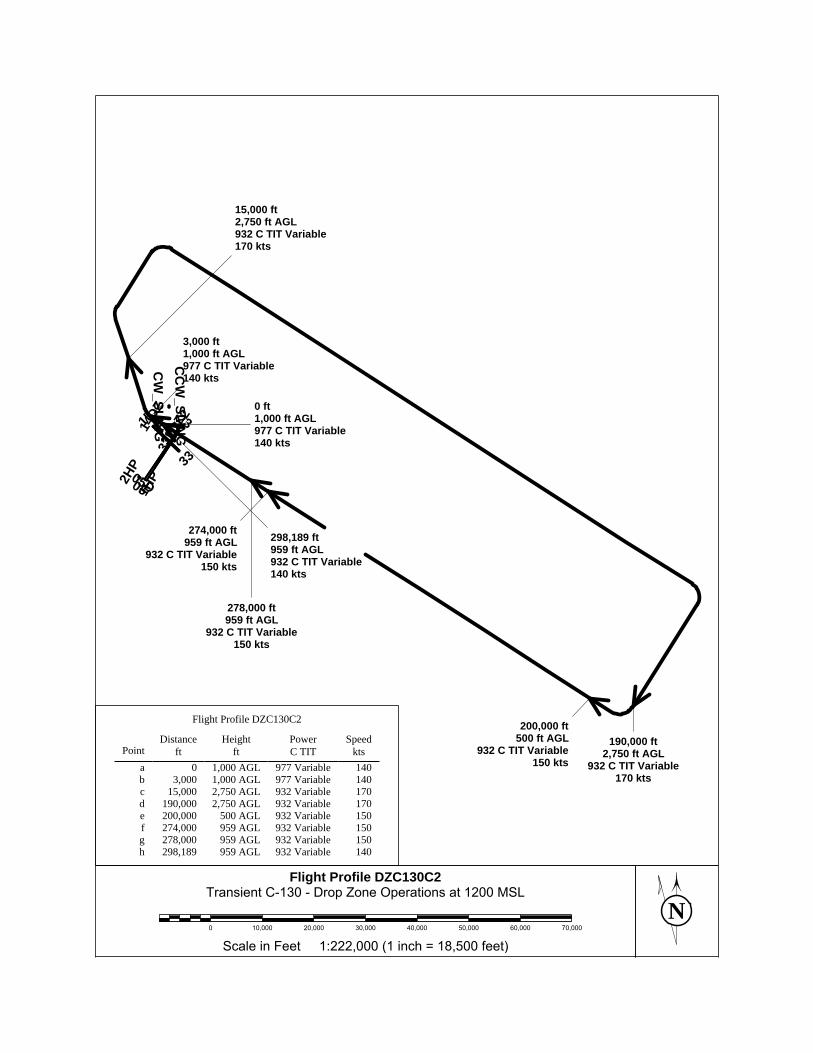
NScale in Feet 1:222,000 (1 inch = 18,500 feet)
0 10,000 20,000 30,000 40,000 50,000 60,000 70,000
MSL1200atOperationsZoneDrop-C-130Transient
DZC130C2ProfileFlight
1HP2H
P
0505D
14DZ15 23
32DZ
32DZ
_233
CC
W_SLIN
GC
W_SLIN
G
0 ft1,000 ft AGL977 C TIT Variable140 kts
3,000 ft1,000 ft AGL977 C TIT Variable140 kts
15,000 ft2,750 ft AGL932 C TIT Variable170 kts
190,000 ft2,750 ft AGL
932 C TIT Variable170 kts
200,000 ft500 ft AGL
932 C TIT Variable150 kts
274,000 ft959 ft AGL
932 C TIT Variable150 kts
278,000 ft959 ft AGL
932 C TIT Variable150 kts
298,189 ft959 ft AGL932 C TIT Variable140 kts
140Variable932 959 AGL298,189h150Variable932 959 AGL278,000g150Variable932 959 AGL274,000f150Variable932 500 AGL200,000e170Variable932 2,750 AGL190,000d170Variable932 2,750 AGL15,000c140Variable977 1,000 AGL3,000b140Variable977 1,000 AGL0a
ktsSpeed
C TITPower
ftHeight
ftDistance
Point
Flight Profile DZC130C2
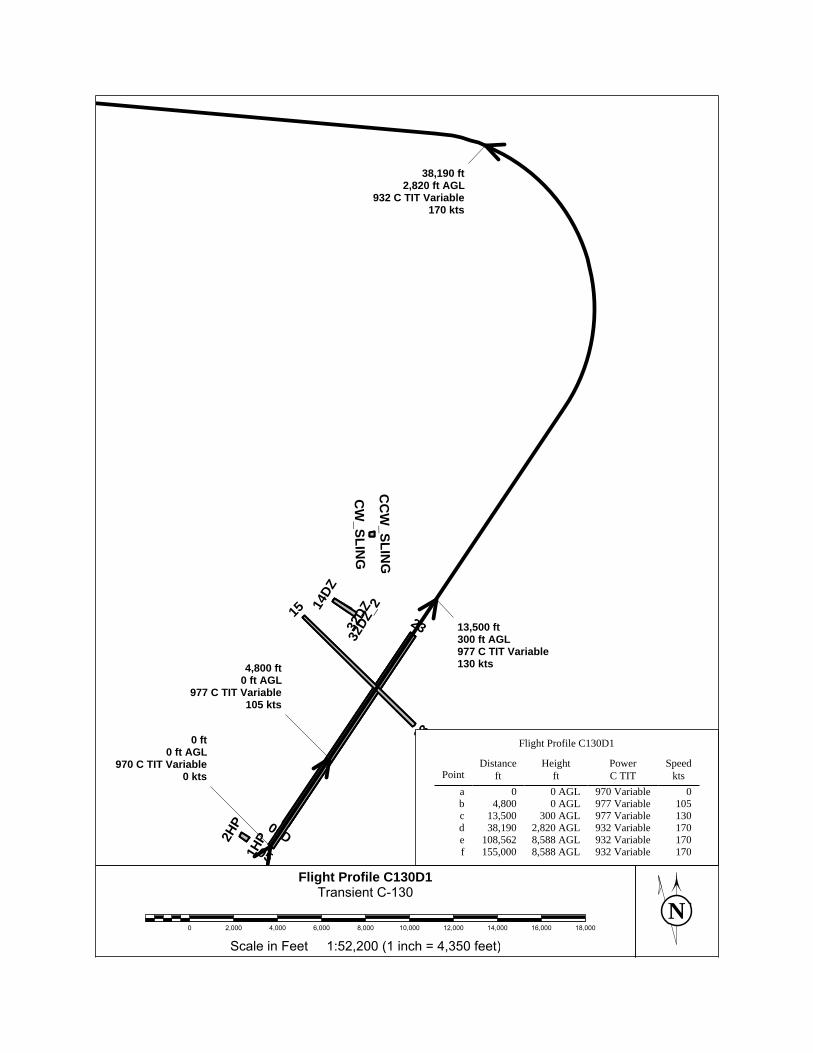
NScale in Feet 1:52,200 (1 inch = 4,350 feet)
0 2,000 4,000 6,000 8,000 10,000 12,000 14,000 16,000 18,000
C-130TransientC130D1ProfileFlight
1HP2H
P
05
05D
14DZ
15 2332DZ
32DZ
_2
33C
CW
_SLING
CW
_SLING
0 ft0 ft AGL
970 C TIT Variable0 kts
4,800 ft0 ft AGL
977 C TIT Variable105 kts
13,500 ft300 ft AGL977 C TIT Variable130 kts
38,190 ft2,820 ft AGL
932 C TIT Variable170 kts
170Variable932 8,588 AGL155,000f170Variable932 8,588 AGL108,562e170Variable932 2,820 AGL38,190d130Variable977 300 AGL13,500c105Variable977 0 AGL4,800b
0Variable970 0 AGL0akts
SpeedC TITPower
ftHeight
ftDistance
Point
Flight Profile C130D1
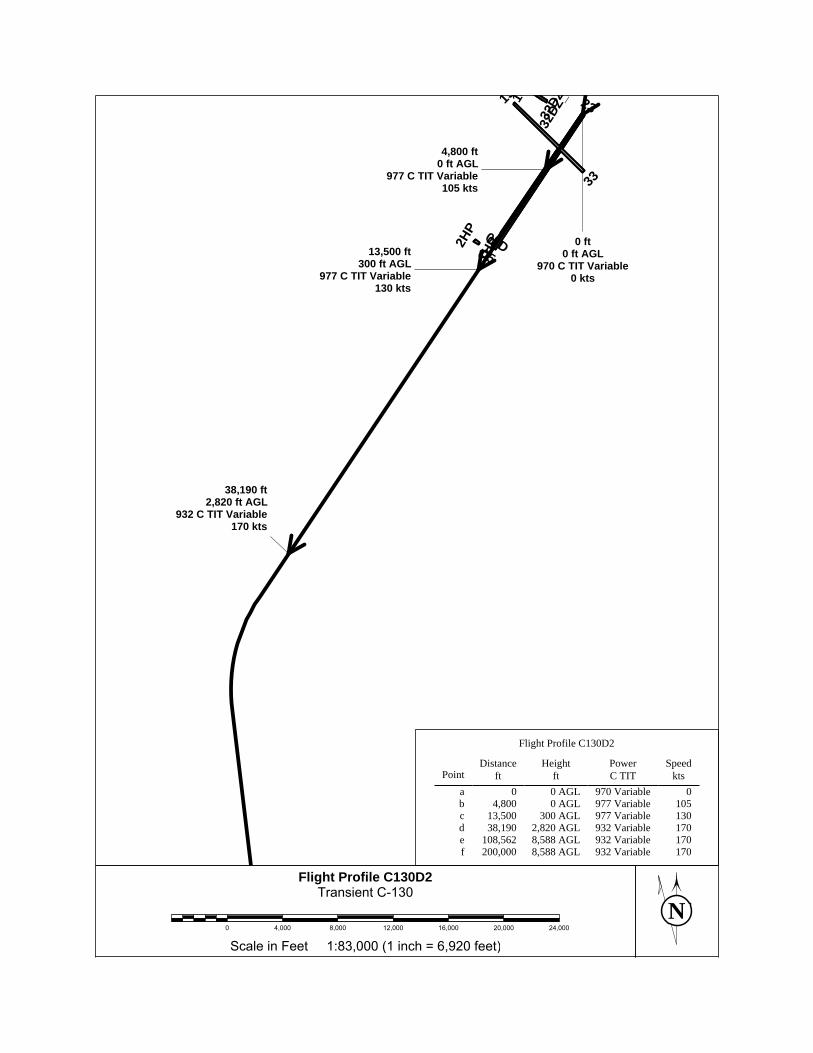
NScale in Feet 1:83,000 (1 inch = 6,920 feet)
0 4,000 8,000 12,000 16,000 20,000 24,000
C-130TransientC130D2ProfileFlight
1HP2H
P
0505D
1415 23
32DZ
32DZ
_233
0 ft0 ft AGL
970 C TIT Variable0 kts
4,800 ft0 ft AGL
977 C TIT Variable105 kts
13,500 ft300 ft AGL
977 C TIT Variable130 kts
38,190 ft2,820 ft AGL
932 C TIT Variable170 kts
170Variable932 8,588 AGL200,000f170Variable932 8,588 AGL108,562e170Variable932 2,820 AGL38,190d130Variable977 300 AGL13,500c105Variable977 0 AGL4,800b
0Variable970 0 AGL0akts
SpeedC TITPower
ftHeight
ftDistance
Point
Flight Profile C130D2
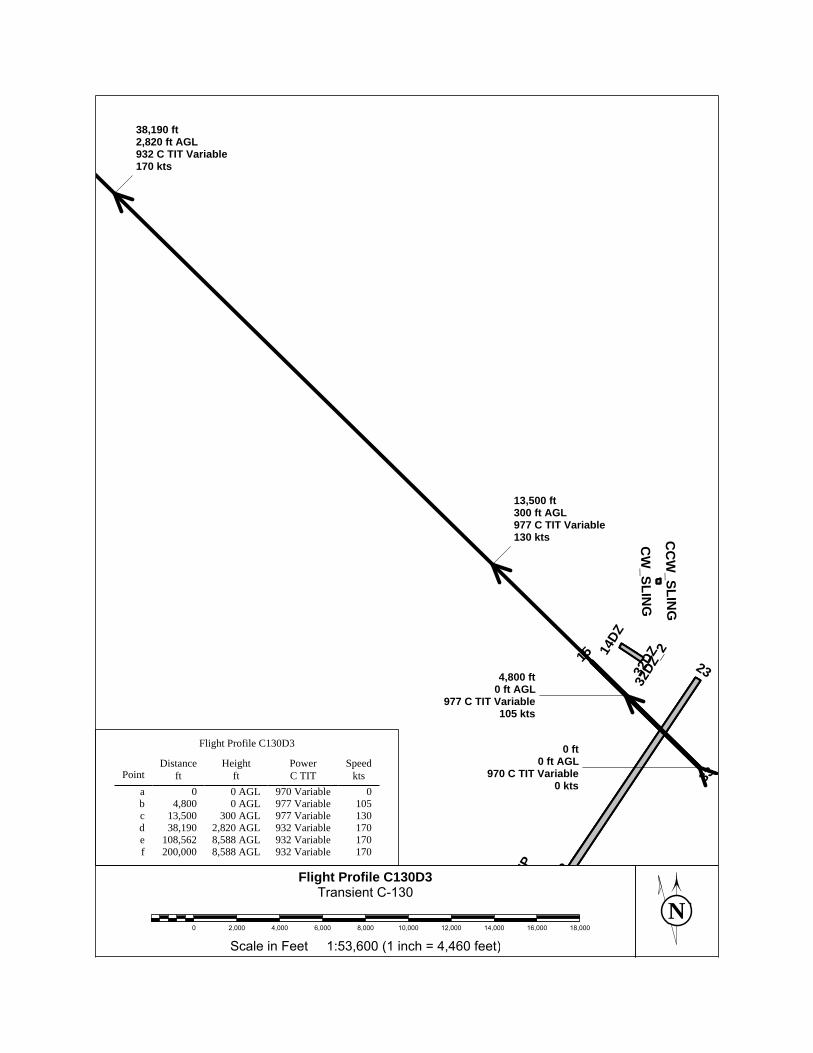
NScale in Feet 1:53,600 (1 inch = 4,460 feet)
0 2,000 4,000 6,000 8,000 10,000 12,000 14,000 16,000 18,000
C-130TransientC130D3ProfileFlight HP 0
14DZ
15 2332DZ
32DZ
_2
33
CC
W_SLIN
G
CW
_SLING
0 ft0 ft AGL
970 C TIT Variable0 kts
4,800 ft0 ft AGL
977 C TIT Variable105 kts
13,500 ft300 ft AGL977 C TIT Variable130 kts
38,190 ft2,820 ft AGL932 C TIT Variable170 kts
170Variable932 8,588 AGL200,000f170Variable932 8,588 AGL108,562e170Variable932 2,820 AGL38,190d130Variable977 300 AGL13,500c105Variable977 0 AGL4,800b
0Variable970 0 AGL0akts
SpeedC TITPower
ftHeight
ftDistance
Point
Flight Profile C130D3
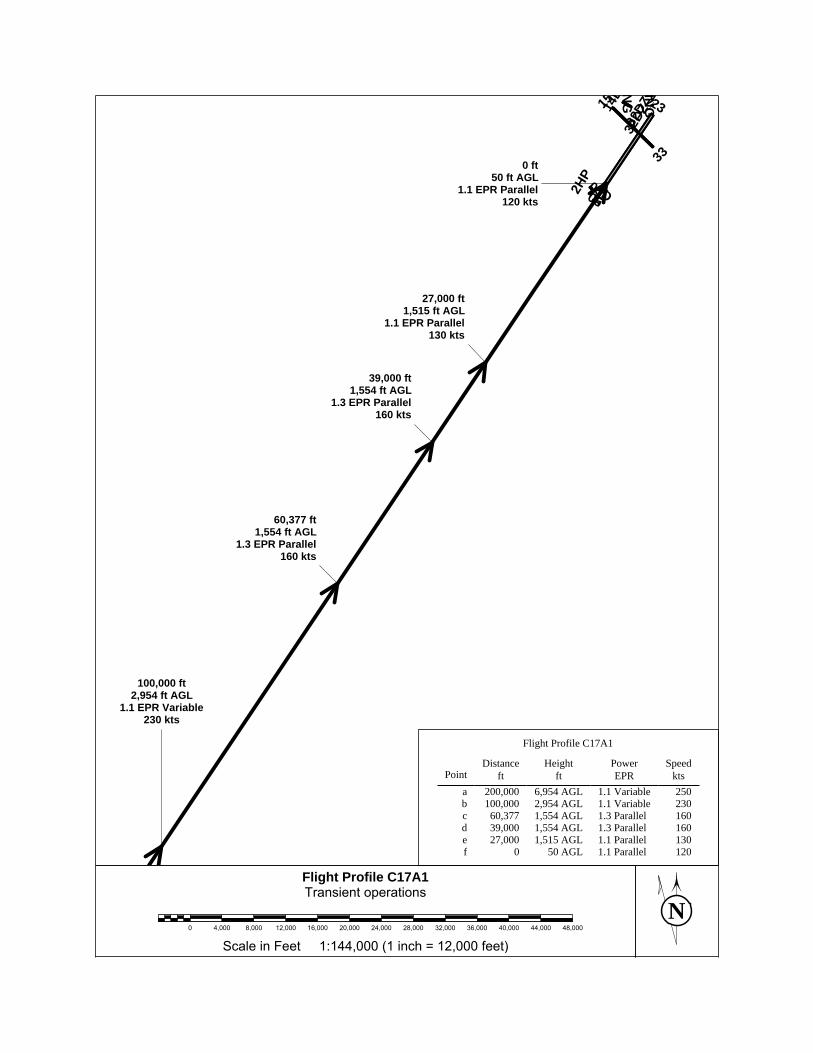
NScale in Feet 1:144,000 (1 inch = 12,000 feet)
0 4,000 8,000 12,000 16,000 20,000 24,000 28,000 32,000 36,000 40,000 44,000 48,000
operationsTransient
C17A1ProfileFlight
1HP2H
P
0505D
14D15 23
32DZ
32DZ
_233
ING
NG
0 ft50 ft AGL
1.1 EPR Parallel120 kts
27,000 ft1,515 ft AGL
1.1 EPR Parallel130 kts
39,000 ft1,554 ft AGL
1.3 EPR Parallel160 kts
60,377 ft1,554 ft AGL
1.3 EPR Parallel160 kts
100,000 ft2,954 ft AGL
1.1 EPR Variable230 kts
120Parallel1.1 50 AGL0f130Parallel1.1 1,515 AGL27,000e160Parallel1.3 1,554 AGL39,000d160Parallel1.3 1,554 AGL60,377c230Variable1.1 2,954 AGL100,000b250Variable1.1 6,954 AGL200,000a
ktsSpeed
EPRPower
ftHeight
ftDistance
Point
Flight Profile C17A1
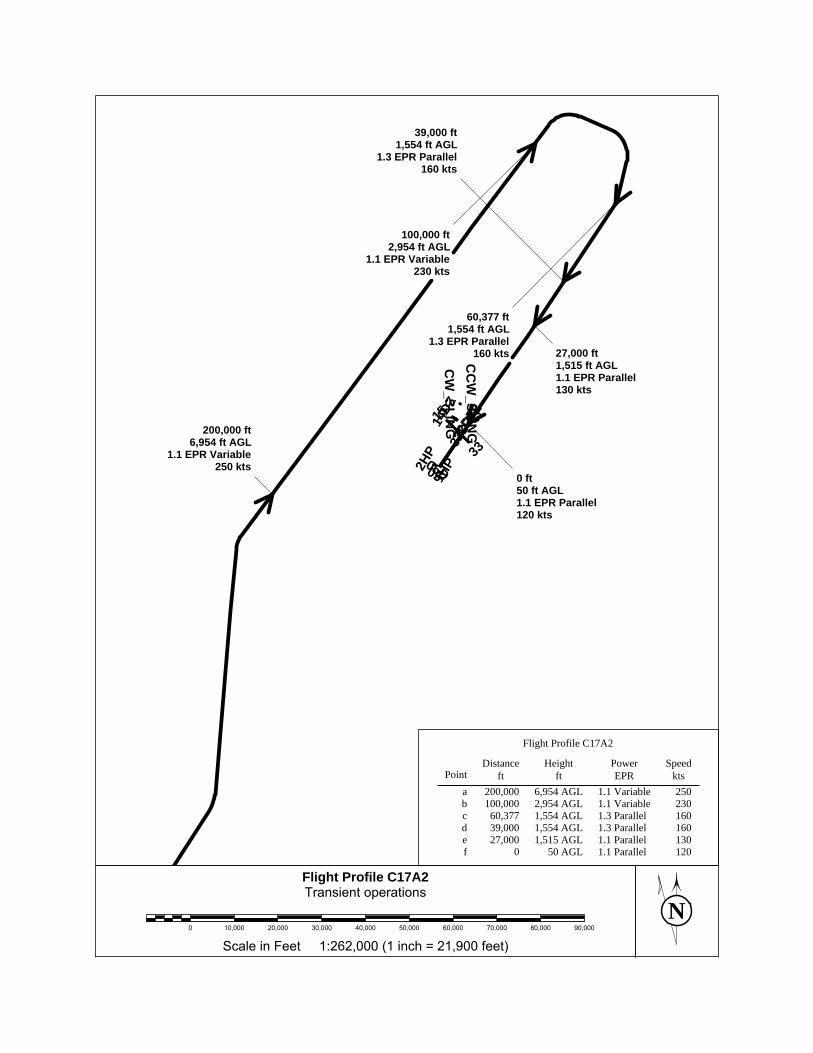
NScale in Feet 1:262,000 (1 inch = 21,900 feet)
0 10,000 20,000 30,000 40,000 50,000 60,000 70,000 80,000 90,000
operationsTransient
C17A2ProfileFlight
1HP2H
P
0505D
14DZ15 23
32DZ
32DZ
_233
CC
W_SLIN
GC
W_SLIN
G
0 ft50 ft AGL1.1 EPR Parallel120 kts
27,000 ft1,515 ft AGL1.1 EPR Parallel130 kts
39,000 ft1,554 ft AGL
1.3 EPR Parallel160 kts
60,377 ft1,554 ft AGL
1.3 EPR Parallel160 kts
100,000 ft2,954 ft AGL
1.1 EPR Variable230 kts
200,000 ft6,954 ft AGL
1.1 EPR Variable250 kts
120Parallel1.1 50 AGL0f130Parallel1.1 1,515 AGL27,000e160Parallel1.3 1,554 AGL39,000d160Parallel1.3 1,554 AGL60,377c230Variable1.1 2,954 AGL100,000b250Variable1.1 6,954 AGL200,000a
ktsSpeed
EPRPower
ftHeight
ftDistance
Point
Flight Profile C17A2

NScale in Feet 1:150,000 (1 inch = 12,500 feet)
0 4,000 8,000 12,000 16,000 20,000 24,000 28,000 32,000 36,000 40,000 44,000 48,000 52,000
operationsTransient
C17A3ProfileFlight
1HP05
05D
14DZ15 23
32DZ
32DZ
_233
CC
W_SLIN
G
CW
_SLING
0 ft50 ft AGL1.1 EPR Parallel120 kts
27,000 ft1,515 ft AGL1.1 EPR Parallel130 kts
39,000 ft1,554 ft AGL
1.3 EPR Parallel160 kts
60,377 ft1,554 ft AGL1.3 EPR Parallel160 kts
100,000 ft2,954 ft AGL
1.1 EPR Variable230 kts
120Parallel1.1 50 AGL0f130Parallel1.1 1,515 AGL27,000e160Parallel1.3 1,554 AGL39,000d160Parallel1.3 1,554 AGL60,377c230Variable1.1 2,954 AGL100,000b250Variable1.1 6,954 AGL200,000a
ktsSpeed
EPRPower
ftHeight
ftDistance
Point
Flight Profile C17A3
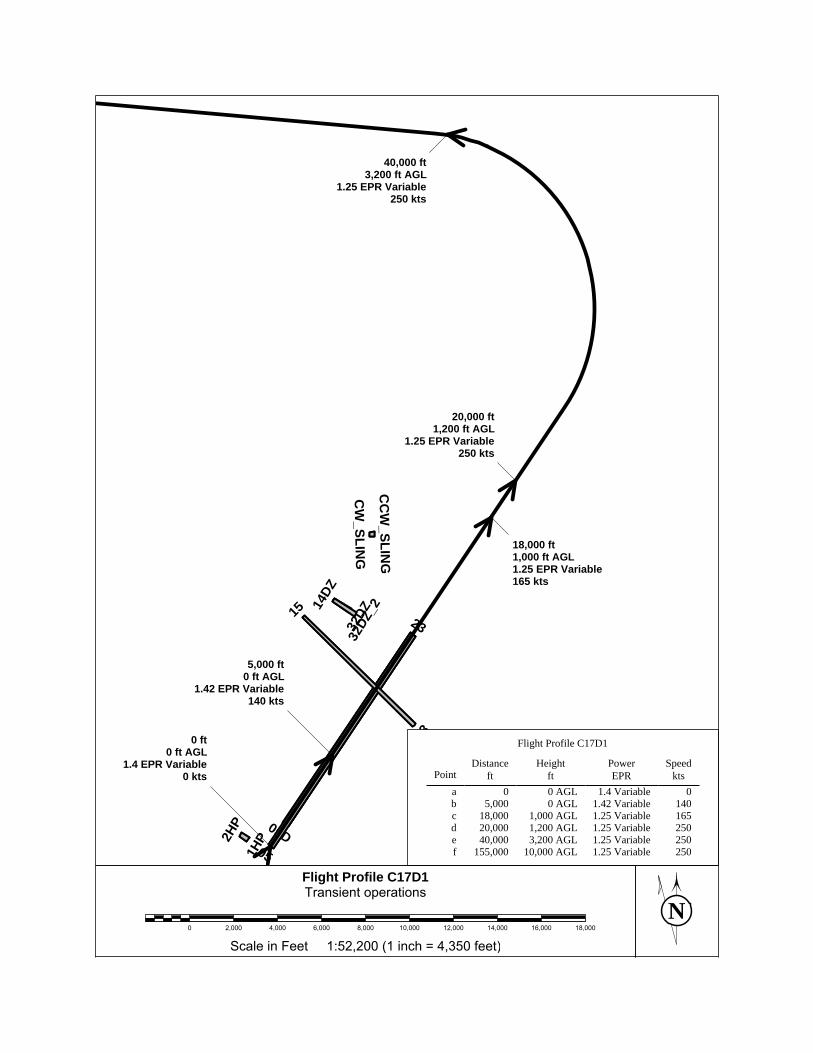
NScale in Feet 1:52,200 (1 inch = 4,350 feet)
0 2,000 4,000 6,000 8,000 10,000 12,000 14,000 16,000 18,000
operationsTransient
C17D1ProfileFlight
1HP2H
P
05
05D
14DZ
15 2332DZ
32DZ
_2
33C
CW
_SLING
CW
_SLING
0 ft0 ft AGL
1.4 EPR Variable0 kts
5,000 ft0 ft AGL
1.42 EPR Variable140 kts
18,000 ft1,000 ft AGL1.25 EPR Variable165 kts
20,000 ft1,200 ft AGL
1.25 EPR Variable250 kts
40,000 ft3,200 ft AGL
1.25 EPR Variable250 kts
250Variable1.25 10,000 AGL155,000f250Variable1.25 3,200 AGL40,000e250Variable1.25 1,200 AGL20,000d165Variable1.25 1,000 AGL18,000c140Variable1.42 0 AGL5,000b
0Variable1.4 0 AGL0akts
SpeedEPR
Powerft
Heightft
DistancePoint
Flight Profile C17D1
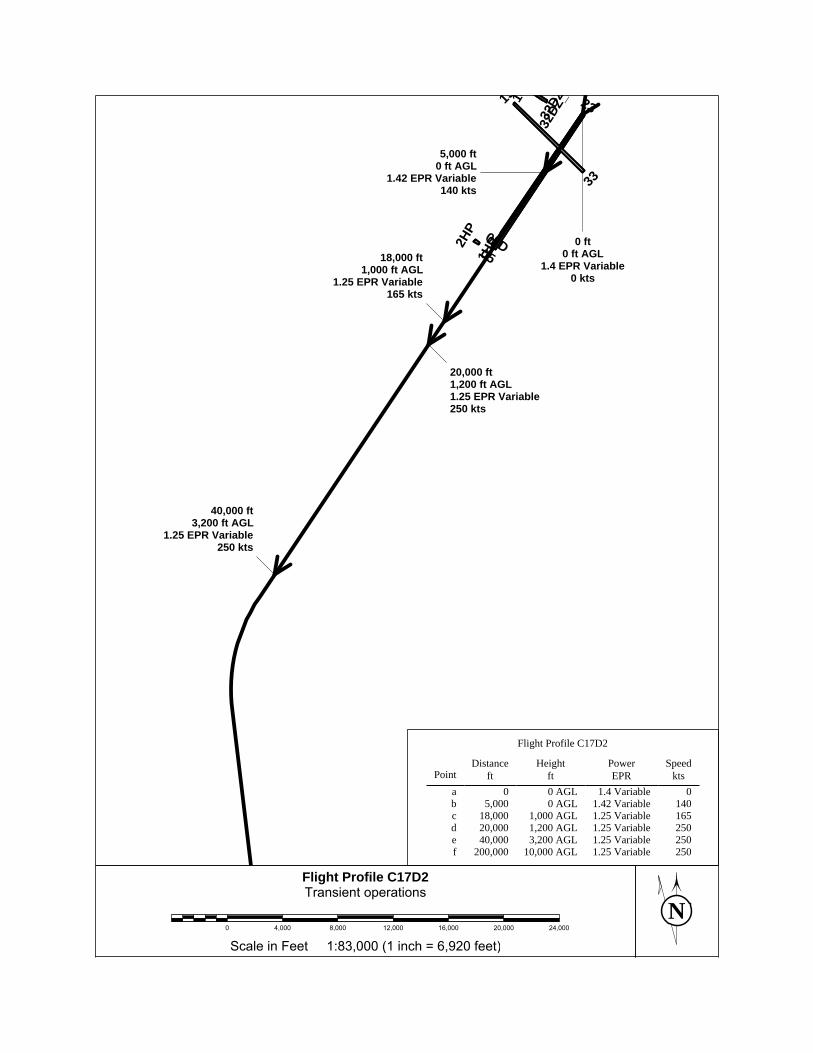
NScale in Feet 1:83,000 (1 inch = 6,920 feet)
0 4,000 8,000 12,000 16,000 20,000 24,000
operationsTransient
C17D2ProfileFlight
1HP2H
P
0505D
1415 23
32DZ
32DZ
_233
0 ft0 ft AGL
1.4 EPR Variable0 kts
5,000 ft0 ft AGL
1.42 EPR Variable140 kts
18,000 ft1,000 ft AGL
1.25 EPR Variable165 kts
20,000 ft1,200 ft AGL1.25 EPR Variable250 kts
40,000 ft3,200 ft AGL
1.25 EPR Variable250 kts
250Variable1.25 10,000 AGL200,000f250Variable1.25 3,200 AGL40,000e250Variable1.25 1,200 AGL20,000d165Variable1.25 1,000 AGL18,000c140Variable1.42 0 AGL5,000b
0Variable1.4 0 AGL0akts
SpeedEPR
Powerft
Heightft
DistancePoint
Flight Profile C17D2
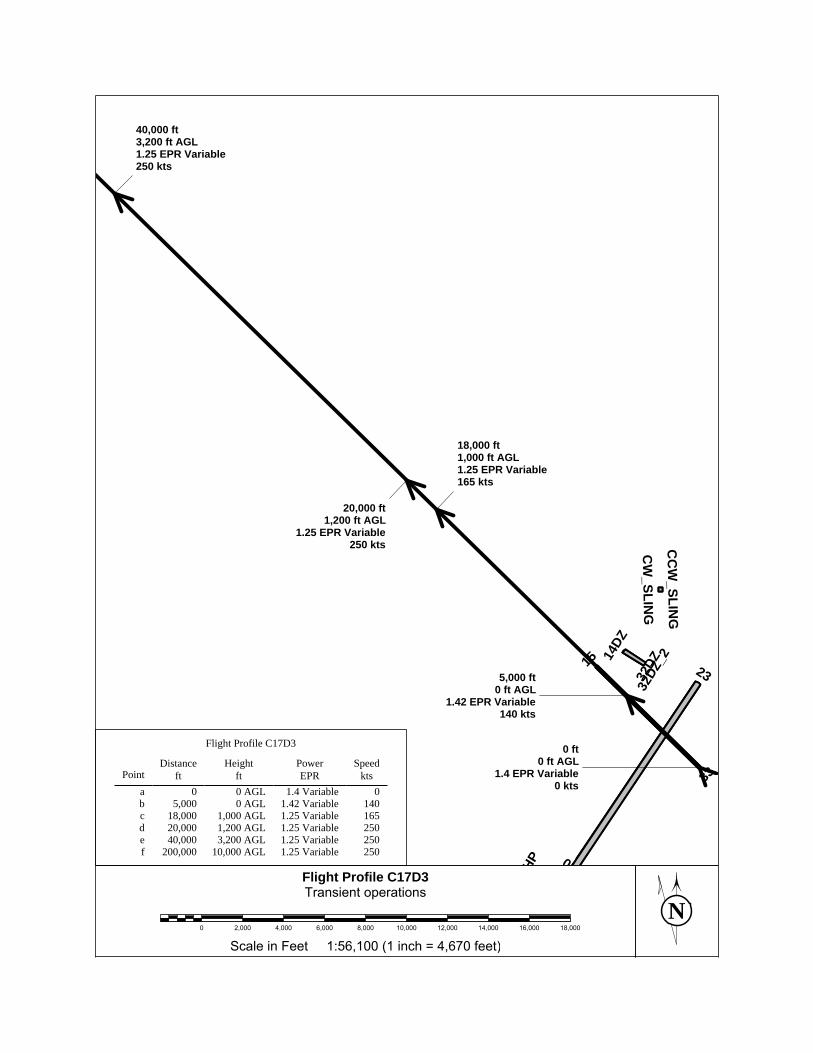
NScale in Feet 1:56,100 (1 inch = 4,670 feet)
0 2,000 4,000 6,000 8,000 10,000 12,000 14,000 16,000 18,000
operationsTransient
C17D3ProfileFlight
HP 05
14DZ
15 2332DZ
32DZ
_2
33
CC
W_SLIN
G
CW
_SLING
0 ft0 ft AGL
1.4 EPR Variable0 kts
5,000 ft0 ft AGL
1.42 EPR Variable140 kts
18,000 ft1,000 ft AGL1.25 EPR Variable165 kts
20,000 ft1,200 ft AGL
1.25 EPR Variable250 kts
40,000 ft3,200 ft AGL1.25 EPR Variable250 kts
250Variable1.25 10,000 AGL200,000f250Variable1.25 3,200 AGL40,000e250Variable1.25 1,200 AGL20,000d165Variable1.25 1,000 AGL18,000c140Variable1.42 0 AGL5,000b
0Variable1.4 0 AGL0akts
SpeedEPR
Powerft
Heightft
DistancePoint
Flight Profile C17D3

NScale in Feet 1:123,000 (1 inch = 10,300 feet)
0 4,000 8,000 12,000 16,000 20,000 24,000 28,000 32,000 36,000 40,000
1~ArrivalE3A1ProfileFlight
1HP2H
P
0505D
14D
15 23
32DZ
32DZ
_233
NG
NG
0 ft50 ft AGL
1.5 EPR Variable135 kts
36,000 ft1,900 ft AGL
1.6 EPR Variable150 kts
84,000 ft4,400 ft AGL
1.5 EPR Variable220 kts
135Variable1.5 50 AGL0d150Variable1.6 1,900 AGL36,000c220Variable1.5 4,400 AGL84,000b250Variable1.12 9,850 AGL200,000a
ktsSpeed
EPRPower
ftHeight
ftDistance
Point
Flight Profile E3A1
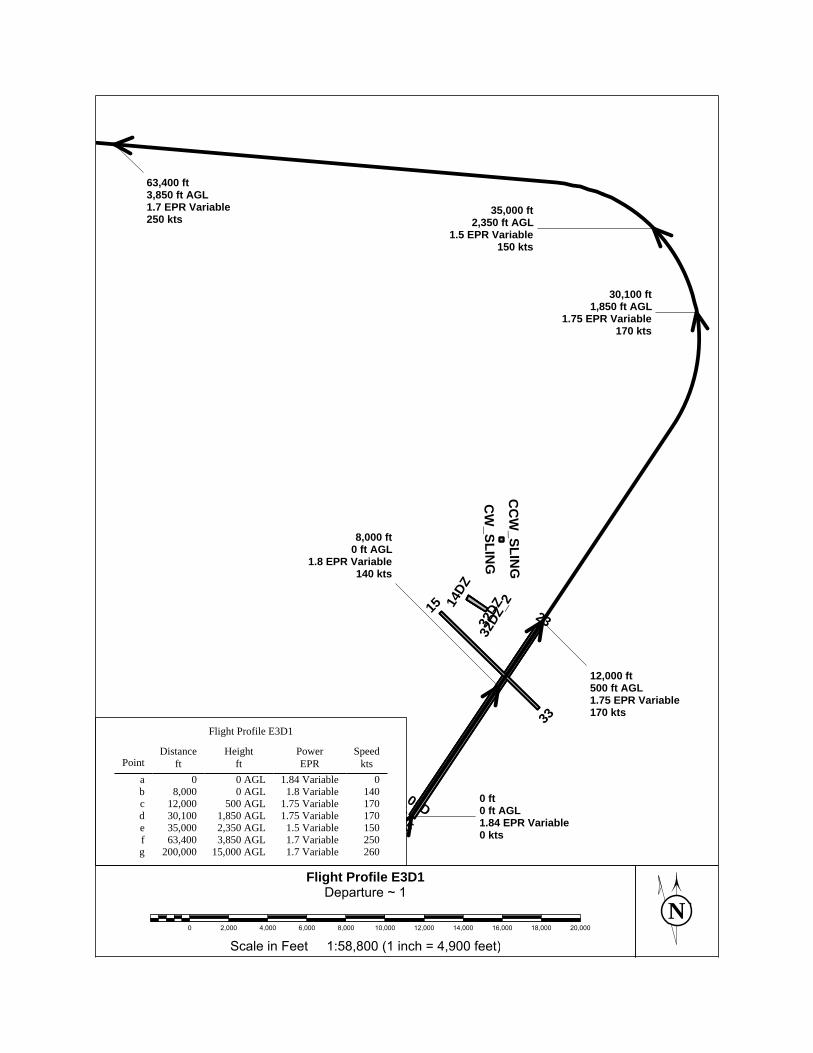
NScale in Feet 1:58,800 (1 inch = 4,900 feet)
0 2,000 4,000 6,000 8,000 10,000 12,000 14,000 16,000 18,000 20,000
1~Departure
E3D1ProfileFlight
1HP2H
P
05
05D
14DZ
15 2332DZ
32DZ
_2
33
CC
W_SLIN
G
CW
_SLING
0 ft0 ft AGL1.84 EPR Variable0 kts
8,000 ft0 ft AGL
1.8 EPR Variable140 kts
12,000 ft500 ft AGL1.75 EPR Variable170 kts
30,100 ft1,850 ft AGL
1.75 EPR Variable170 kts
35,000 ft2,350 ft AGL
1.5 EPR Variable150 kts
63,400 ft3,850 ft AGL1.7 EPR Variable250 kts
260Variable1.7 15,000 AGL200,000g250Variable1.7 3,850 AGL63,400f150Variable1.5 2,350 AGL35,000e170Variable1.75 1,850 AGL30,100d170Variable1.75 500 AGL12,000c140Variable1.8 0 AGL8,000b
0Variable1.84 0 AGL0akts
SpeedEPR
Powerft
Heightft
DistancePoint
Flight Profile E3D1
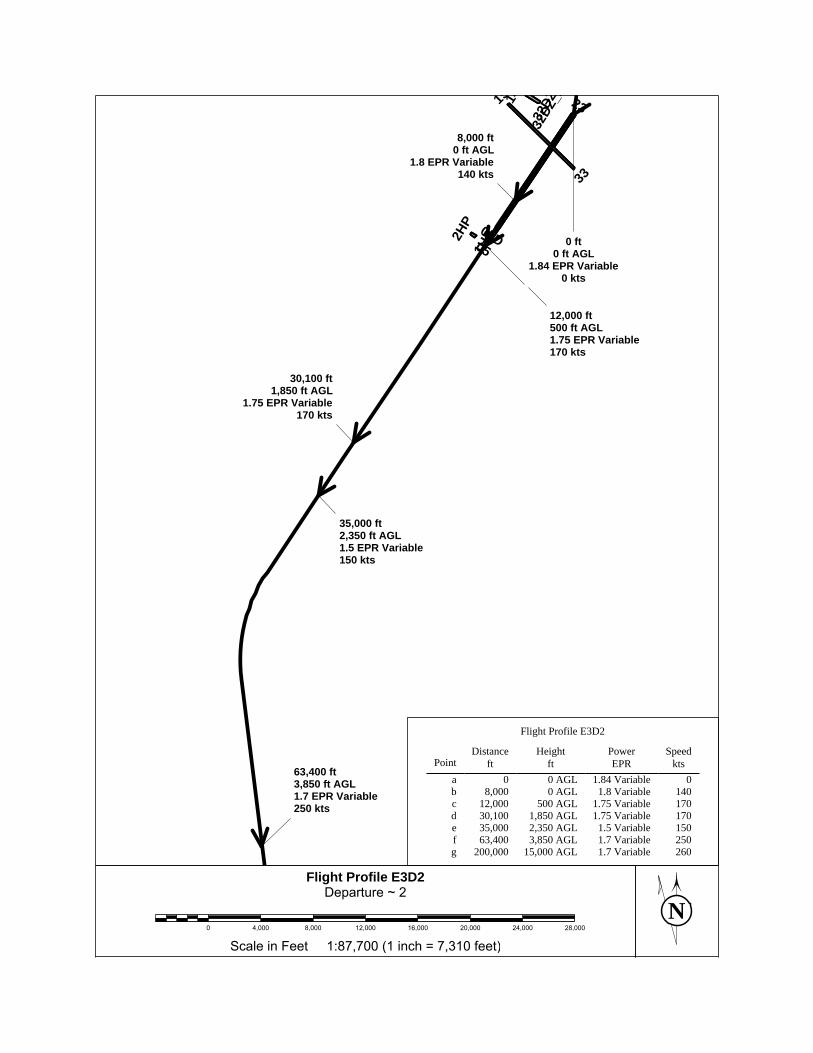
NScale in Feet 1:87,700 (1 inch = 7,310 feet)
0 4,000 8,000 12,000 16,000 20,000 24,000 28,000
2~Departure
E3D2ProfileFlight
1HP2H
P
0505D
1415 23
32DZ
32DZ
_233
0 ft0 ft AGL
1.84 EPR Variable0 kts
8,000 ft0 ft AGL
1.8 EPR Variable140 kts
12,000 ft500 ft AGL1.75 EPR Variable170 kts
30,100 ft1,850 ft AGL
1.75 EPR Variable170 kts
35,000 ft2,350 ft AGL1.5 EPR Variable150 kts
63,400 ft3,850 ft AGL1.7 EPR Variable250 kts
260Variable1.7 15,000 AGL200,000g250Variable1.7 3,850 AGL63,400f150Variable1.5 2,350 AGL35,000e170Variable1.75 1,850 AGL30,100d170Variable1.75 500 AGL12,000c140Variable1.8 0 AGL8,000b
0Variable1.84 0 AGL0akts
SpeedEPR
Powerft
Heightft
DistancePoint
Flight Profile E3D2
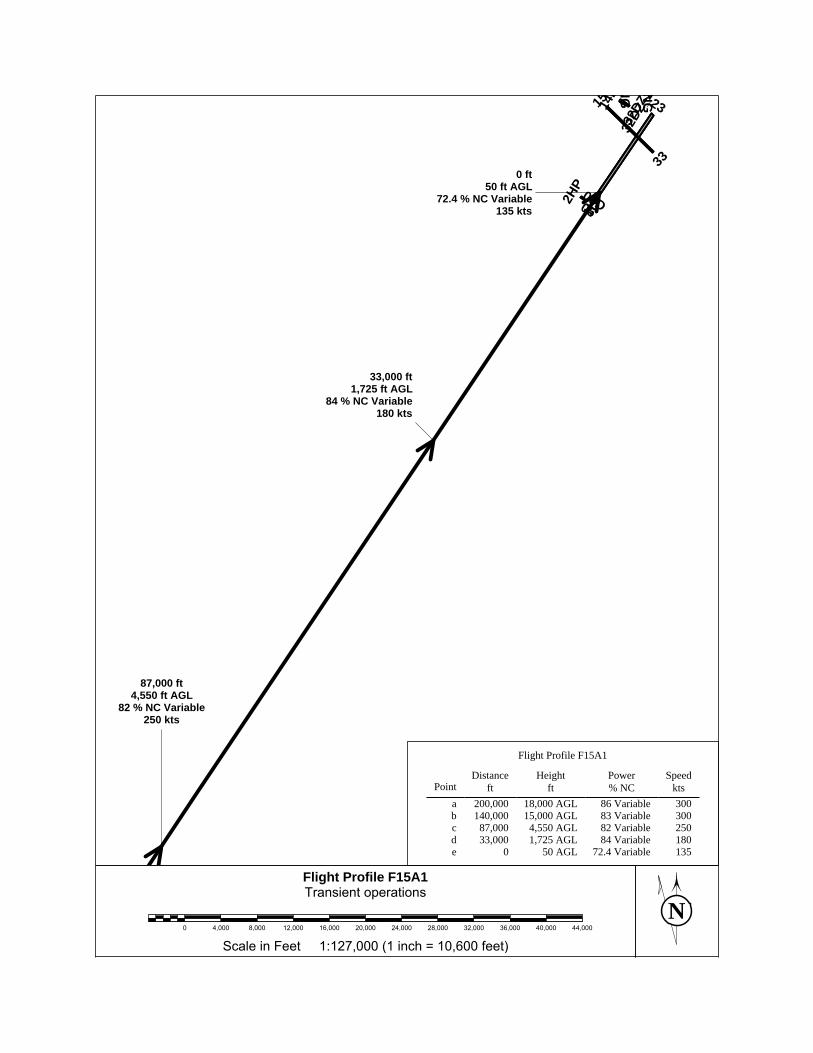
NScale in Feet 1:127,000 (1 inch = 10,600 feet)
0 4,000 8,000 12,000 16,000 20,000 24,000 28,000 32,000 36,000 40,000 44,000
operationsTransient
F15A1ProfileFlight
1HP2H
P
0505D
14D
15 23
32DZ
32DZ
_233
NG
NG
0 ft50 ft AGL
72.4 % NC Variable135 kts
33,000 ft1,725 ft AGL
84 % NC Variable180 kts
87,000 ft4,550 ft AGL
82 % NC Variable250 kts
135Variable72.4 50 AGL0e180Variable84 1,725 AGL33,000d250Variable82 4,550 AGL87,000c300Variable83 15,000 AGL140,000b300Variable86 18,000 AGL200,000a
ktsSpeed
% NCPower
ftHeight
ftDistance
Point
Flight Profile F15A1
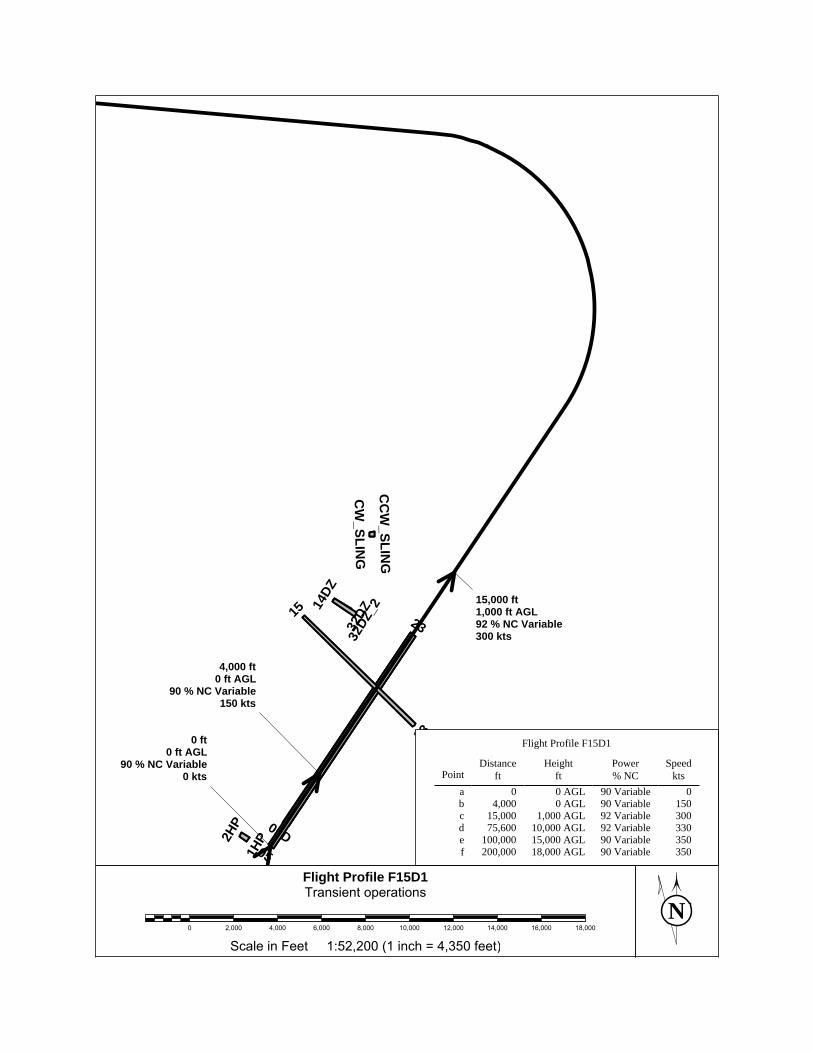
NScale in Feet 1:52,200 (1 inch = 4,350 feet)
0 2,000 4,000 6,000 8,000 10,000 12,000 14,000 16,000 18,000
operationsTransient
F15D1ProfileFlight
1HP2H
P
05
05D
14DZ
15 2332DZ
32DZ
_2
33C
CW
_SLING
CW
_SLING
0 ft0 ft AGL
90 % NC Variable0 kts
4,000 ft0 ft AGL
90 % NC Variable150 kts
15,000 ft1,000 ft AGL92 % NC Variable300 kts
350Variable90 18,000 AGL200,000f350Variable90 15,000 AGL100,000e330Variable92 10,000 AGL75,600d300Variable92 1,000 AGL15,000c150Variable90 0 AGL4,000b
0Variable90 0 AGL0akts
Speed% NCPower
ftHeight
ftDistance
Point
Flight Profile F15D1

NScale in Feet 1:83,000 (1 inch = 6,920 feet)
0 4,000 8,000 12,000 16,000 20,000 24,000
operationsTransient
F15D2ProfileFlight
1HP2H
P
0505D
1415 23
32DZ
32DZ
_233
0 ft0 ft AGL
90 % NC Variable0 kts
4,000 ft0 ft AGL
90 % NC Variable150 kts
15,000 ft1,000 ft AGL92 % NC Variable300 kts
350Variable90 18,000 AGL200,000f350Variable90 15,000 AGL100,000e330Variable92 10,000 AGL75,600d300Variable92 1,000 AGL15,000c150Variable90 0 AGL4,000b
0Variable90 0 AGL0akts
Speed% NCPower
ftHeight
ftDistance
Point
Flight Profile F15D2

NScale in Feet 1:127,000 (1 inch = 10,600 feet)
0 4,000 8,000 12,000 16,000 20,000 24,000 28,000 32,000 36,000 40,000 44,000
TransientF22
ArrivalF22ProfileFlight
1HP2H
P
0505D
14D
15 23
32DZ
32DZ
_233
NG
NG
0 ft50 ft AGL
72.4 % ETR Variable135 kts
33,000 ft1,725 ft AGL
84 % ETR Variable180 kts
87,000 ft4,550 ft AGL
82 % ETR Variable250 kts
135Variable72.4 50 AGL0e180Variable84 1,725 AGL33,000d250Variable82 4,550 AGL87,000c300Variable83 15,000 AGL140,000b300Variable86 18,000 AGL200,000a
ktsSpeed
% ETRPower
ftHeight
ftDistance
Point
Flight Profile F22 Arrival
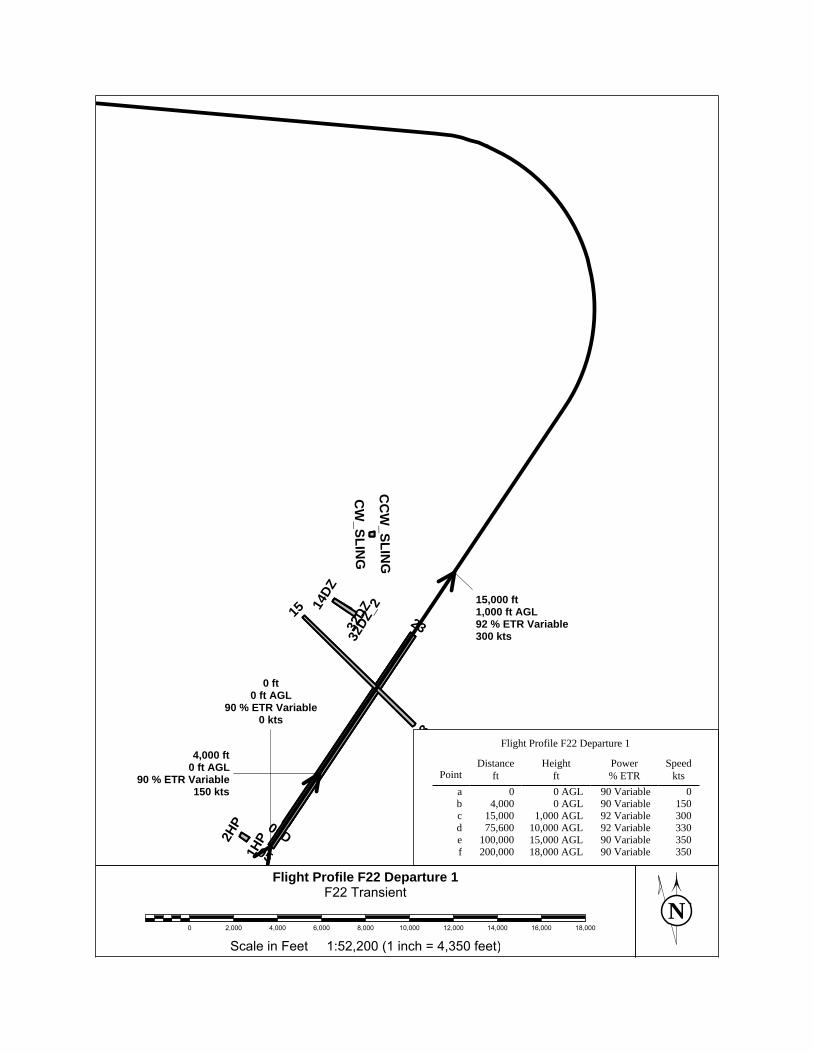
NScale in Feet 1:52,200 (1 inch = 4,350 feet)
0 2,000 4,000 6,000 8,000 10,000 12,000 14,000 16,000 18,000
TransientF22
1DepartureF22ProfileFlight
1HP2H
P
05
05D
14DZ
15 2332DZ
32DZ
_2
33C
CW
_SLING
CW
_SLING
0 ft0 ft AGL
90 % ETR Variable0 kts
4,000 ft0 ft AGL
90 % ETR Variable150 kts
15,000 ft1,000 ft AGL92 % ETR Variable300 kts
350Variable90 18,000 AGL200,000f350Variable90 15,000 AGL100,000e330Variable92 10,000 AGL75,600d300Variable92 1,000 AGL15,000c150Variable90 0 AGL4,000b
0Variable90 0 AGL0akts
Speed% ETRPower
ftHeight
ftDistance
Point
Flight Profile F22 Departure 1
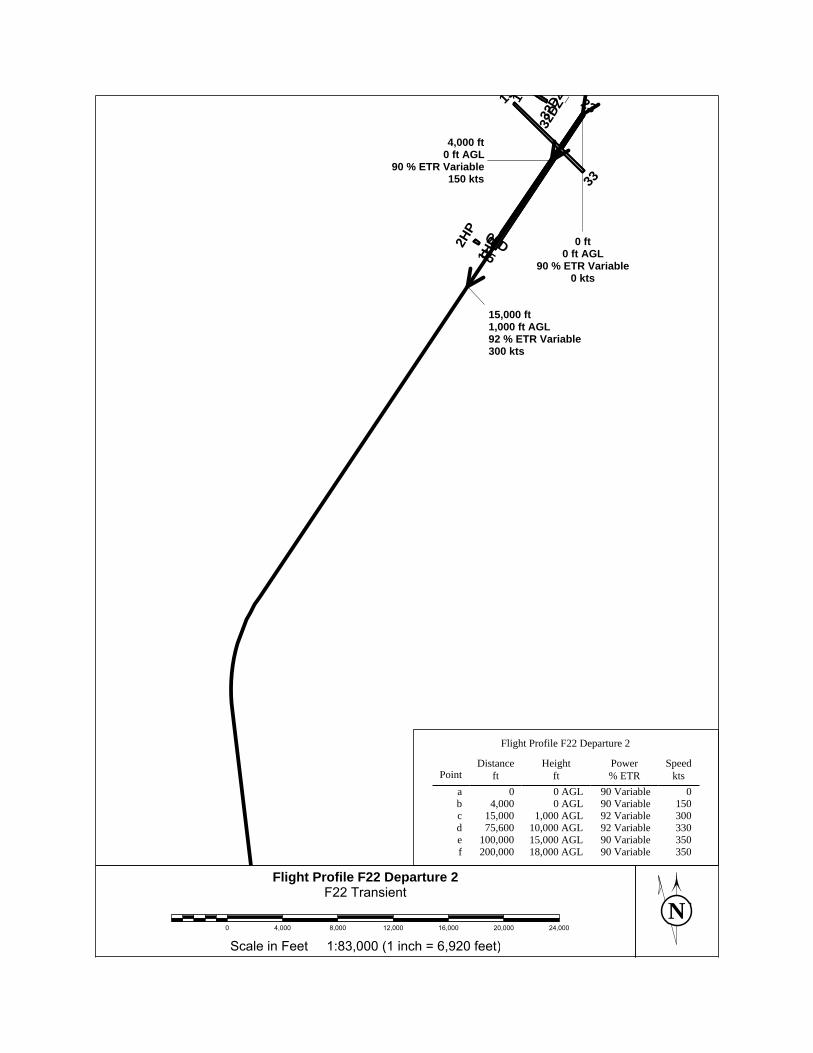
NScale in Feet 1:83,000 (1 inch = 6,920 feet)
0 4,000 8,000 12,000 16,000 20,000 24,000
TransientF22
2DepartureF22ProfileFlight
1HP2H
P
0505D
1415 23
32DZ
32DZ
_233
0 ft0 ft AGL
90 % ETR Variable0 kts
4,000 ft0 ft AGL
90 % ETR Variable150 kts
15,000 ft1,000 ft AGL92 % ETR Variable300 kts
350Variable90 18,000 AGL200,000f350Variable90 15,000 AGL100,000e330Variable92 10,000 AGL75,600d300Variable92 1,000 AGL15,000c150Variable90 0 AGL4,000b
0Variable90 0 AGL0akts
Speed% ETRPower
ftHeight
ftDistance
Point
Flight Profile F22 Departure 2
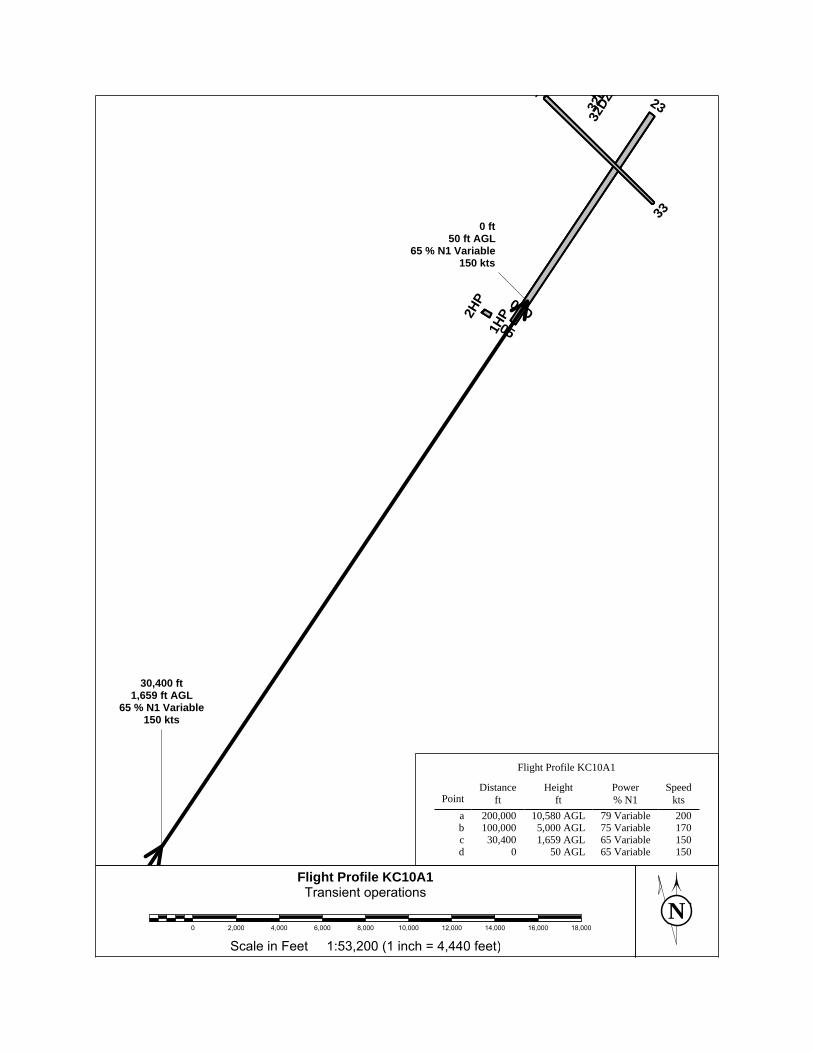
NScale in Feet 1:53,200 (1 inch = 4,440 feet)
0 2,000 4,000 6,000 8,000 10,000 12,000 14,000 16,000 18,000
operationsTransient
KC10A1ProfileFlight
1HP2H
P
05
05D
1 2332D
32DZ
_
33
0 ft50 ft AGL
65 % N1 Variable150 kts
30,400 ft1,659 ft AGL
65 % N1 Variable150 kts
150Variable65 50 AGL0d150Variable65 1,659 AGL30,400c170Variable75 5,000 AGL100,000b200Variable79 10,580 AGL200,000a
ktsSpeed
% N1Power
ftHeight
ftDistance
Point
Flight Profile KC10A1
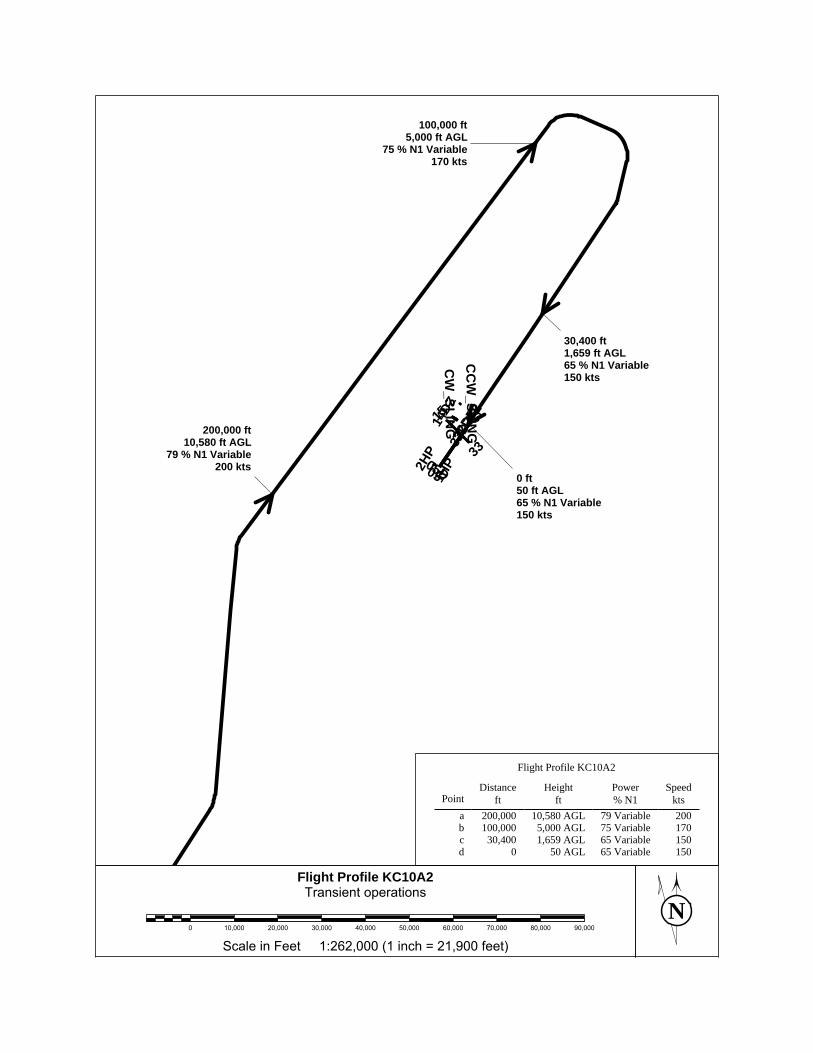
NScale in Feet 1:262,000 (1 inch = 21,900 feet)
0 10,000 20,000 30,000 40,000 50,000 60,000 70,000 80,000 90,000
operationsTransient
KC10A2ProfileFlight
1HP2H
P
0505D
14DZ15 23
32DZ
32DZ
_233
CC
W_SLIN
GC
W_SLIN
G
0 ft50 ft AGL65 % N1 Variable150 kts
30,400 ft1,659 ft AGL65 % N1 Variable150 kts
100,000 ft5,000 ft AGL
75 % N1 Variable170 kts
200,000 ft10,580 ft AGL
79 % N1 Variable200 kts
150Variable65 50 AGL0d150Variable65 1,659 AGL30,400c170Variable75 5,000 AGL100,000b200Variable79 10,580 AGL200,000a
ktsSpeed
% N1Power
ftHeight
ftDistance
Point
Flight Profile KC10A2
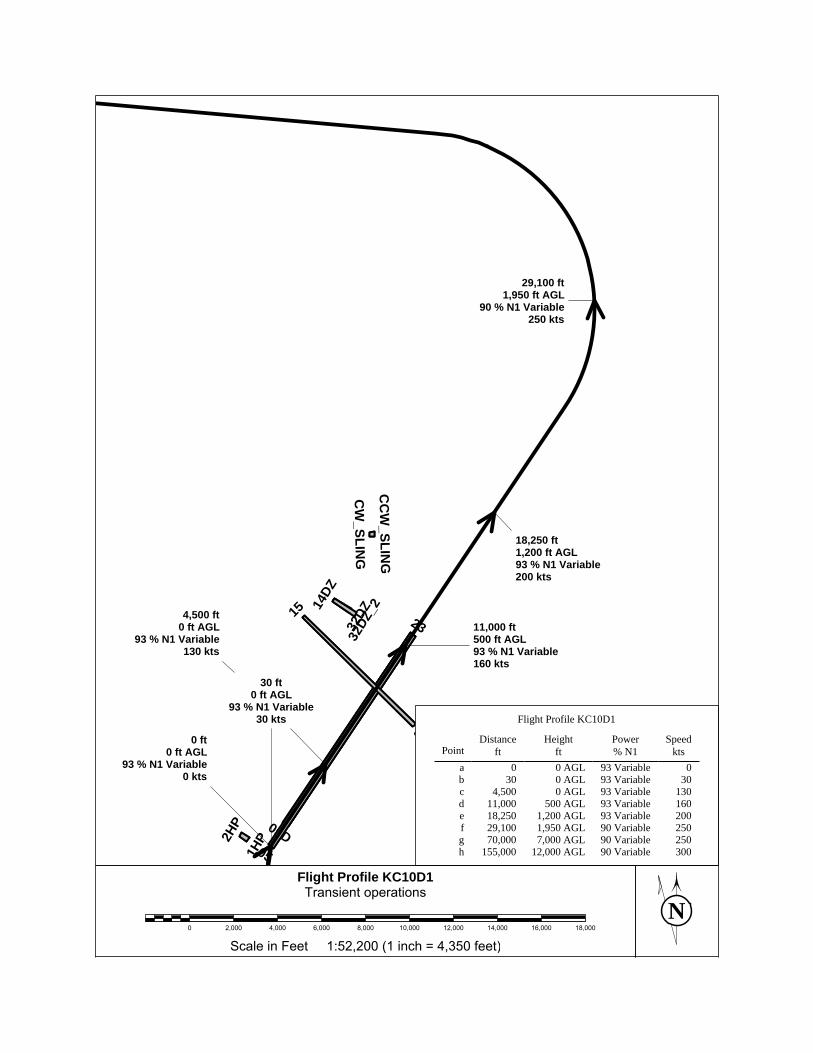
NScale in Feet 1:52,200 (1 inch = 4,350 feet)
0 2,000 4,000 6,000 8,000 10,000 12,000 14,000 16,000 18,000
operationsTransient
KC10D1ProfileFlight
1HP2H
P
05
05D
14DZ
15 2332DZ
32DZ
_2
33C
CW
_SLING
CW
_SLING
0 ft0 ft AGL
93 % N1 Variable0 kts
30 ft0 ft AGL
93 % N1 Variable30 kts
4,500 ft0 ft AGL
93 % N1 Variable130 kts
11,000 ft500 ft AGL93 % N1 Variable160 kts
18,250 ft1,200 ft AGL93 % N1 Variable200 kts
29,100 ft1,950 ft AGL
90 % N1 Variable250 kts
300Variable90 12,000 AGL155,000h250Variable90 7,000 AGL70,000g250Variable90 1,950 AGL29,100f200Variable93 1,200 AGL18,250e160Variable93 500 AGL11,000d130Variable93 0 AGL4,500c
30Variable93 0 AGL30b0Variable93 0 AGL0a
ktsSpeed
% N1Power
ftHeight
ftDistance
Point
Flight Profile KC10D1
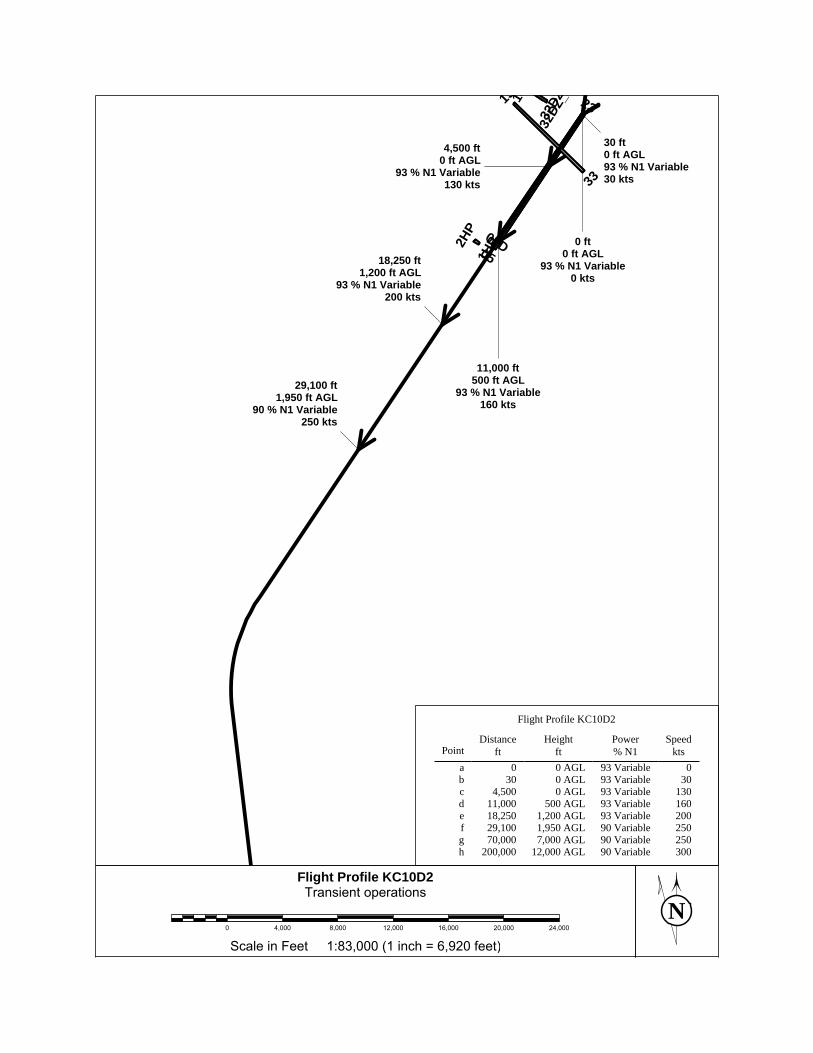
NScale in Feet 1:83,000 (1 inch = 6,920 feet)
0 4,000 8,000 12,000 16,000 20,000 24,000
operationsTransient
KC10D2ProfileFlight
1HP2H
P
0505D
1415 23
32DZ
32DZ
_233
0 ft0 ft AGL
93 % N1 Variable0 kts
30 ft0 ft AGL93 % N1 Variable30 kts
4,500 ft0 ft AGL
93 % N1 Variable130 kts
11,000 ft500 ft AGL
93 % N1 Variable160 kts
18,250 ft1,200 ft AGL
93 % N1 Variable200 kts
29,100 ft1,950 ft AGL
90 % N1 Variable250 kts
300Variable90 12,000 AGL200,000h250Variable90 7,000 AGL70,000g250Variable90 1,950 AGL29,100f200Variable93 1,200 AGL18,250e160Variable93 500 AGL11,000d130Variable93 0 AGL4,500c
30Variable93 0 AGL30b0Variable93 0 AGL0a
ktsSpeed
% N1Power
ftHeight
ftDistance
Point
Flight Profile KC10D2
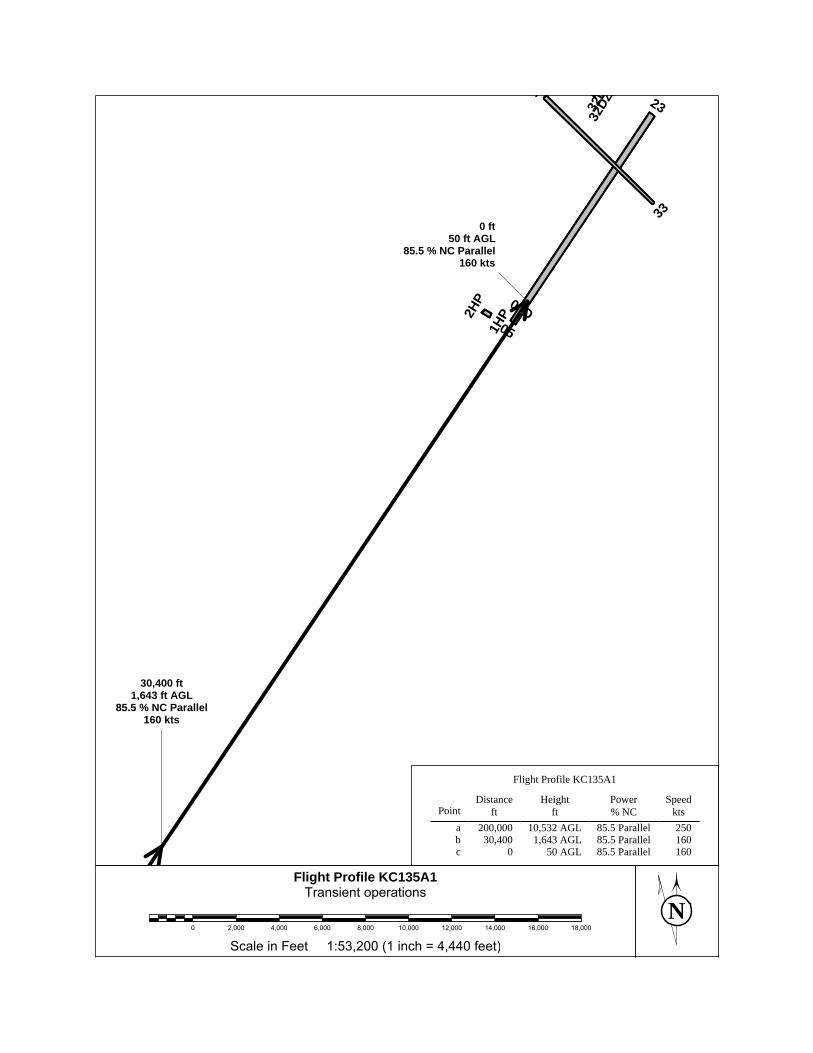
NScale in Feet 1:53,200 (1 inch = 4,440 feet)
0 2,000 4,000 6,000 8,000 10,000 12,000 14,000 16,000 18,000
operationsTransient
KC135A1ProfileFlight
1HP2H
P
05
05D
1 2332D
32DZ
_
33
0 ft50 ft AGL
85.5 % NC Parallel160 kts
30,400 ft1,643 ft AGL
85.5 % NC Parallel160 kts
160Parallel85.5 50 AGL0c160Parallel85.5 1,643 AGL30,400b250Parallel85.5 10,532 AGL200,000a
ktsSpeed
% NCPower
ftHeight
ftDistance
Point
Flight Profile KC135A1

NScale in Feet 1:262,000 (1 inch = 21,900 feet)
0 10,000 20,000 30,000 40,000 50,000 60,000 70,000 80,000 90,000
operationsTransient
KC135A2ProfileFlight
1HP2H
P
0505D
14DZ15 23
32DZ
32DZ
_233
CC
W_SLIN
GC
W_SLIN
G
0 ft50 ft AGL85.5 % NC Parallel160 kts
30,400 ft1,643 ft AGL85.5 % NC Parallel160 kts
200,000 ft10,532 ft AGL
85.5 % NC Parallel250 kts
160Parallel85.5 50 AGL0c160Parallel85.5 1,643 AGL30,400b250Parallel85.5 10,532 AGL200,000a
ktsSpeed
% NCPower
ftHeight
ftDistance
Point
Flight Profile KC135A2
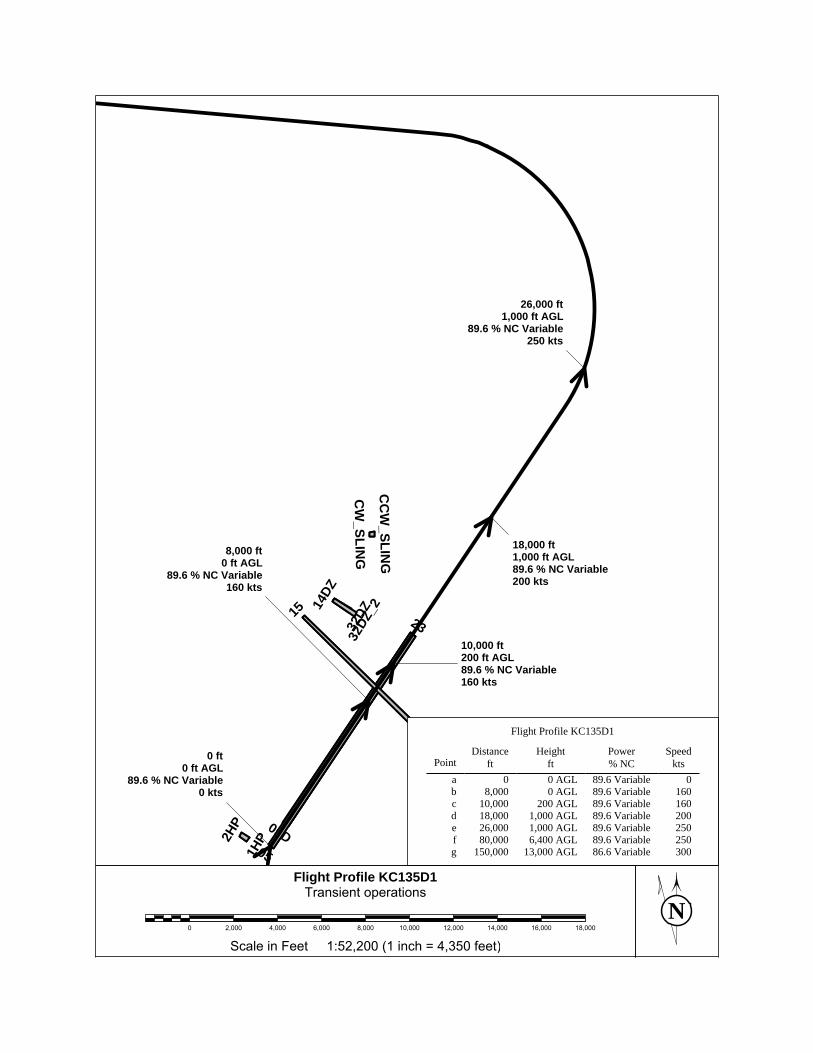
NScale in Feet 1:52,200 (1 inch = 4,350 feet)
0 2,000 4,000 6,000 8,000 10,000 12,000 14,000 16,000 18,000
operationsTransient
KC135D1ProfileFlight
1HP2H
P
05
05D
14DZ
15 2332DZ
32DZ
_2
33C
CW
_SLING
CW
_SLING
0 ft0 ft AGL
89.6 % NC Variable0 kts
8,000 ft0 ft AGL
89.6 % NC Variable160 kts
10,000 ft200 ft AGL89.6 % NC Variable160 kts
18,000 ft1,000 ft AGL89.6 % NC Variable200 kts
26,000 ft1,000 ft AGL
89.6 % NC Variable250 kts
300Variable86.6 13,000 AGL150,000g250Variable89.6 6,400 AGL80,000f250Variable89.6 1,000 AGL26,000e200Variable89.6 1,000 AGL18,000d160Variable89.6 200 AGL10,000c160Variable89.6 0 AGL8,000b
0Variable89.6 0 AGL0akts
Speed% NCPower
ftHeight
ftDistance
Point
Flight Profile KC135D1
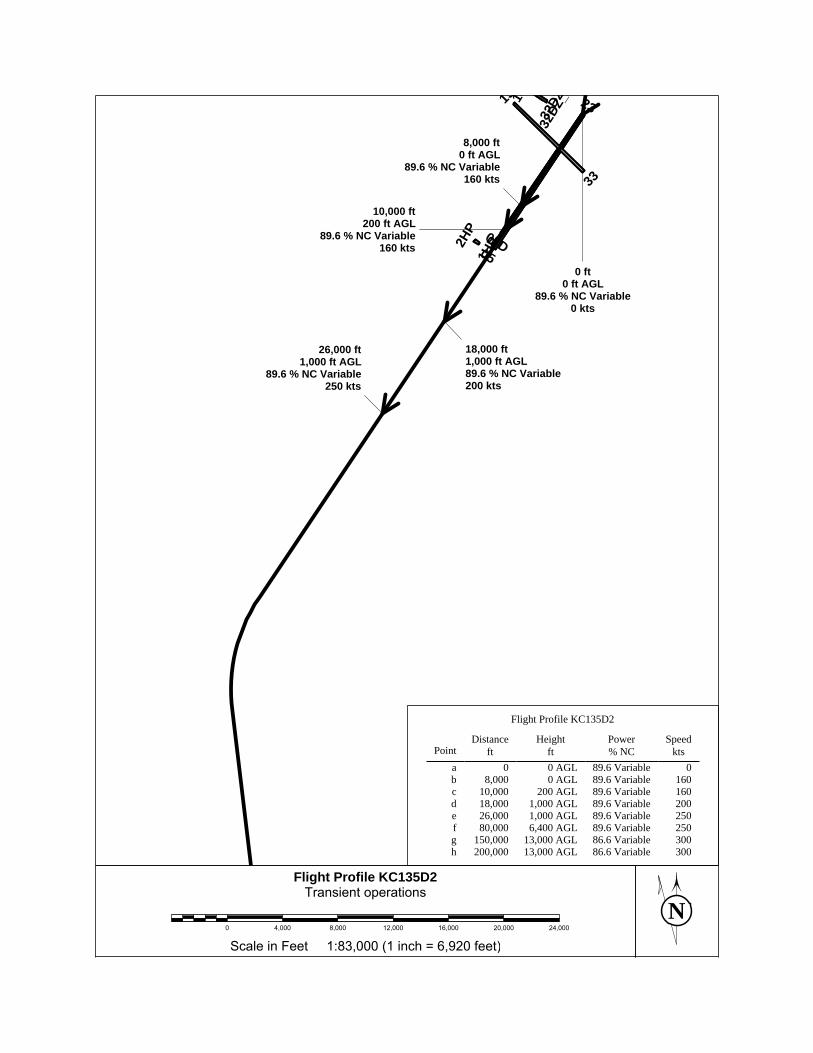
NScale in Feet 1:83,000 (1 inch = 6,920 feet)
0 4,000 8,000 12,000 16,000 20,000 24,000
operationsTransient
KC135D2ProfileFlight
1HP2H
P
0505D
1415 23
32DZ
32DZ
_233
0 ft0 ft AGL
89.6 % NC Variable0 kts
8,000 ft0 ft AGL
89.6 % NC Variable160 kts
10,000 ft200 ft AGL
89.6 % NC Variable160 kts
18,000 ft1,000 ft AGL89.6 % NC Variable200 kts
26,000 ft1,000 ft AGL
89.6 % NC Variable250 kts
300Variable86.6 13,000 AGL200,000h300Variable86.6 13,000 AGL150,000g250Variable89.6 6,400 AGL80,000f250Variable89.6 1,000 AGL26,000e200Variable89.6 1,000 AGL18,000d160Variable89.6 200 AGL10,000c160Variable89.6 0 AGL8,000b
0Variable89.6 0 AGL0akts
Speed% NCPower
ftHeight
ftDistance
Point
Flight Profile KC135D2
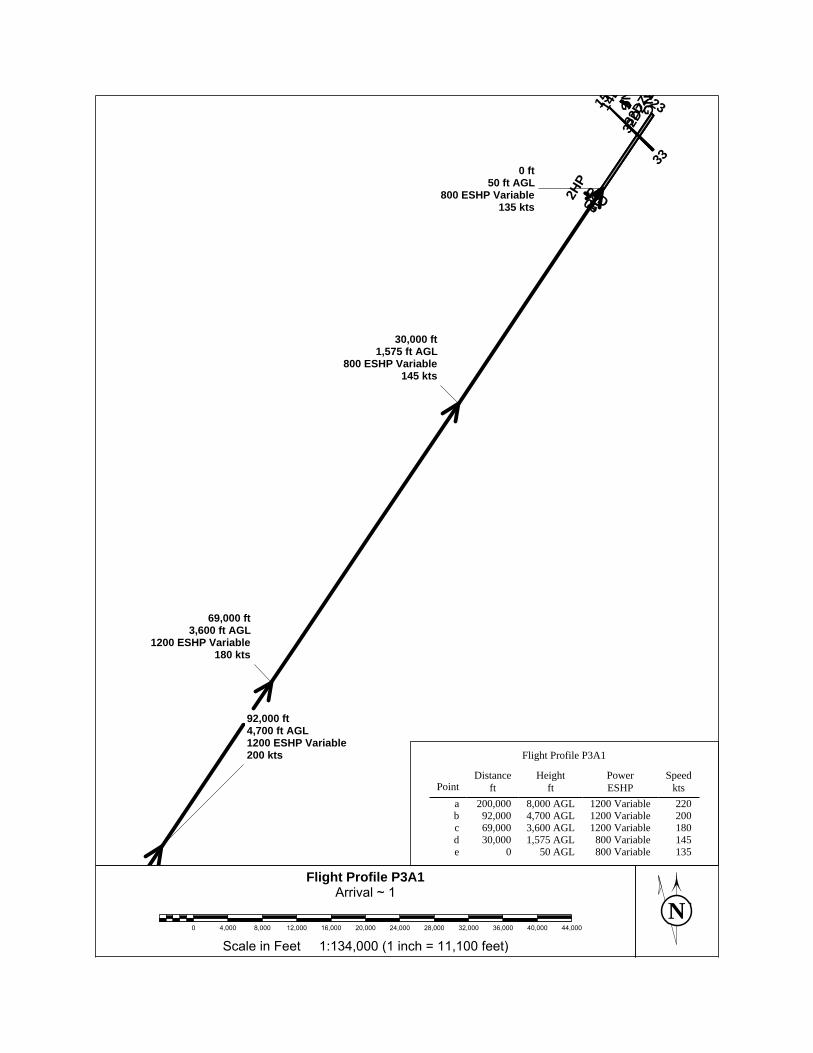
NScale in Feet 1:134,000 (1 inch = 11,100 feet)
0 4,000 8,000 12,000 16,000 20,000 24,000 28,000 32,000 36,000 40,000 44,000
1~ArrivalP3A1ProfileFlight
1HP2H
P
0505D
14D
15 23
32DZ
32DZ
_233
NG
NG
0 ft50 ft AGL
800 ESHP Variable135 kts
30,000 ft1,575 ft AGL
800 ESHP Variable145 kts
69,000 ft3,600 ft AGL
1200 ESHP Variable180 kts
92,000 ft4,700 ft AGL1200 ESHP Variable200 kts
135Variable800 50 AGL0e145Variable800 1,575 AGL30,000d180Variable1200 3,600 AGL69,000c200Variable1200 4,700 AGL92,000b220Variable1200 8,000 AGL200,000a
ktsSpeed
ESHPPower
ftHeight
ftDistance
Point
Flight Profile P3A1
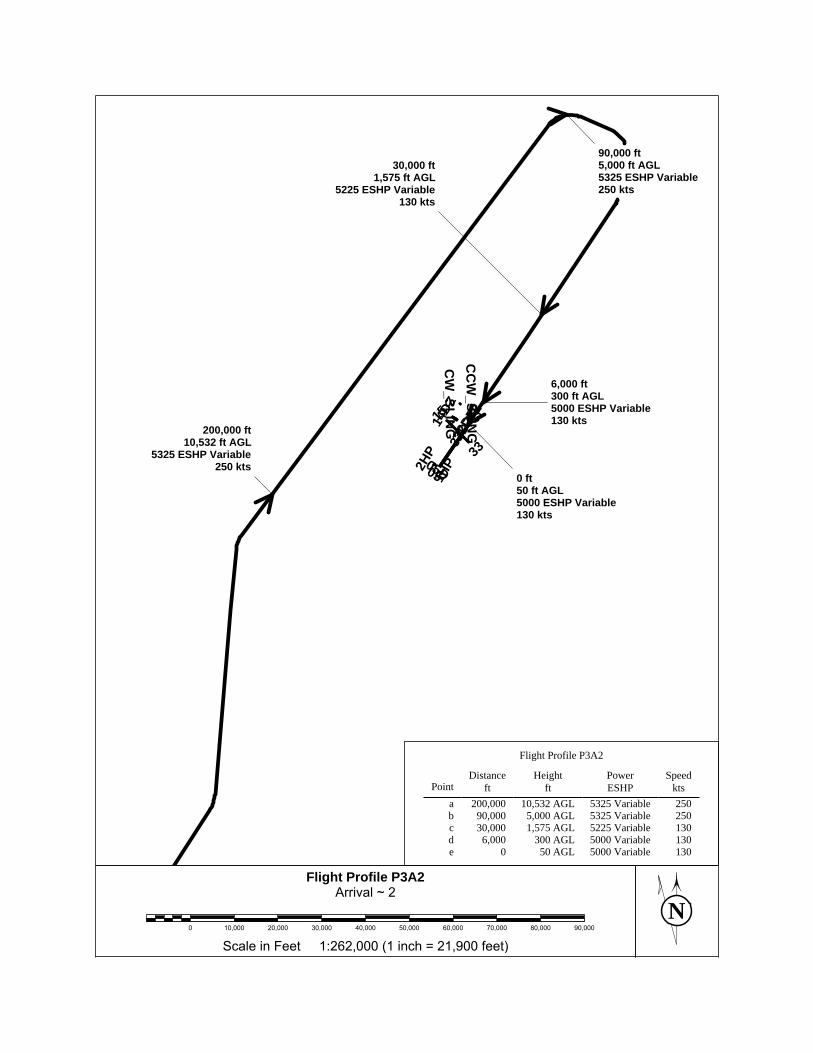
NScale in Feet 1:262,000 (1 inch = 21,900 feet)
0 10,000 20,000 30,000 40,000 50,000 60,000 70,000 80,000 90,000
2~ArrivalP3A2ProfileFlight
1HP2H
P
0505D
14DZ15 23
32DZ
32DZ
_233
CC
W_SLIN
GC
W_SLIN
G
0 ft50 ft AGL5000 ESHP Variable130 kts
6,000 ft300 ft AGL5000 ESHP Variable130 kts
30,000 ft1,575 ft AGL
5225 ESHP Variable130 kts
90,000 ft5,000 ft AGL5325 ESHP Variable250 kts
200,000 ft10,532 ft AGL
5325 ESHP Variable250 kts
130Variable5000 50 AGL0e130Variable5000 300 AGL6,000d130Variable5225 1,575 AGL30,000c250Variable5325 5,000 AGL90,000b250Variable5325 10,532 AGL200,000a
ktsSpeed
ESHPPower
ftHeight
ftDistance
Point
Flight Profile P3A2
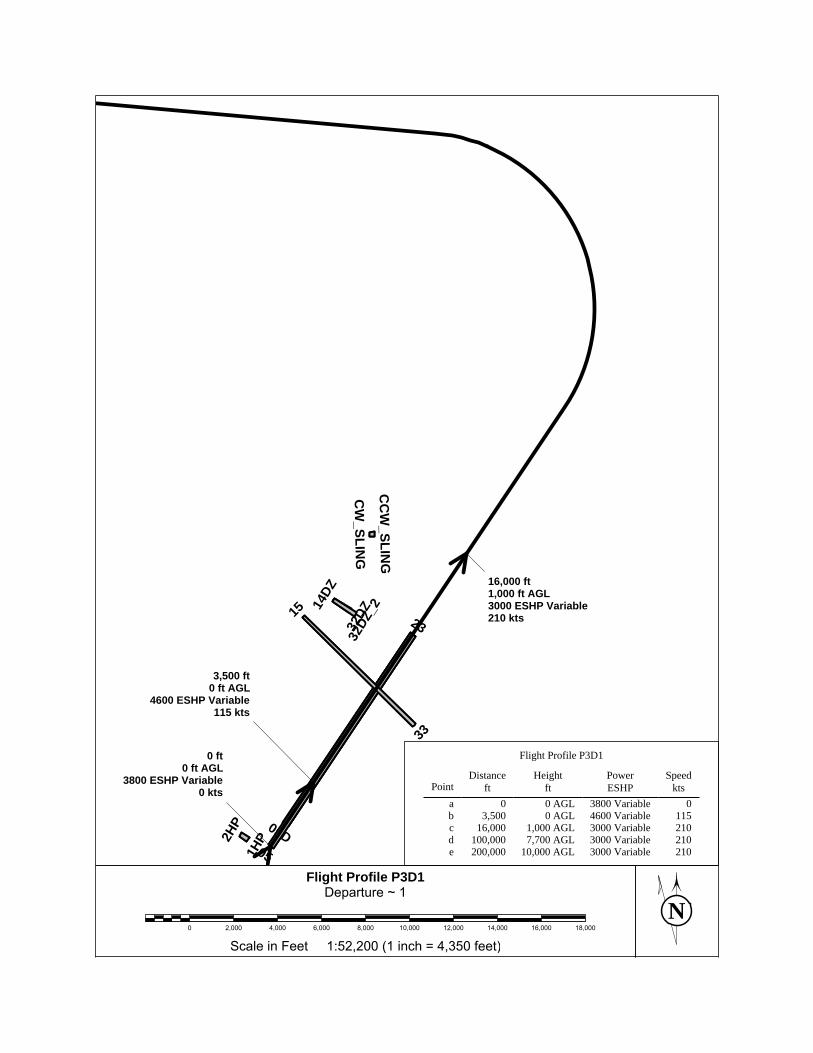
NScale in Feet 1:52,200 (1 inch = 4,350 feet)
0 2,000 4,000 6,000 8,000 10,000 12,000 14,000 16,000 18,000
1~Departure
P3D1ProfileFlight
1HP2H
P
05
05D
14DZ
15 2332DZ
32DZ
_2
33C
CW
_SLING
CW
_SLING
0 ft0 ft AGL
3800 ESHP Variable0 kts
3,500 ft0 ft AGL
4600 ESHP Variable115 kts
16,000 ft1,000 ft AGL3000 ESHP Variable210 kts
210Variable3000 10,000 AGL200,000e210Variable3000 7,700 AGL100,000d210Variable3000 1,000 AGL16,000c115Variable4600 0 AGL3,500b
0Variable3800 0 AGL0akts
SpeedESHPPower
ftHeight
ftDistance
Point
Flight Profile P3D1
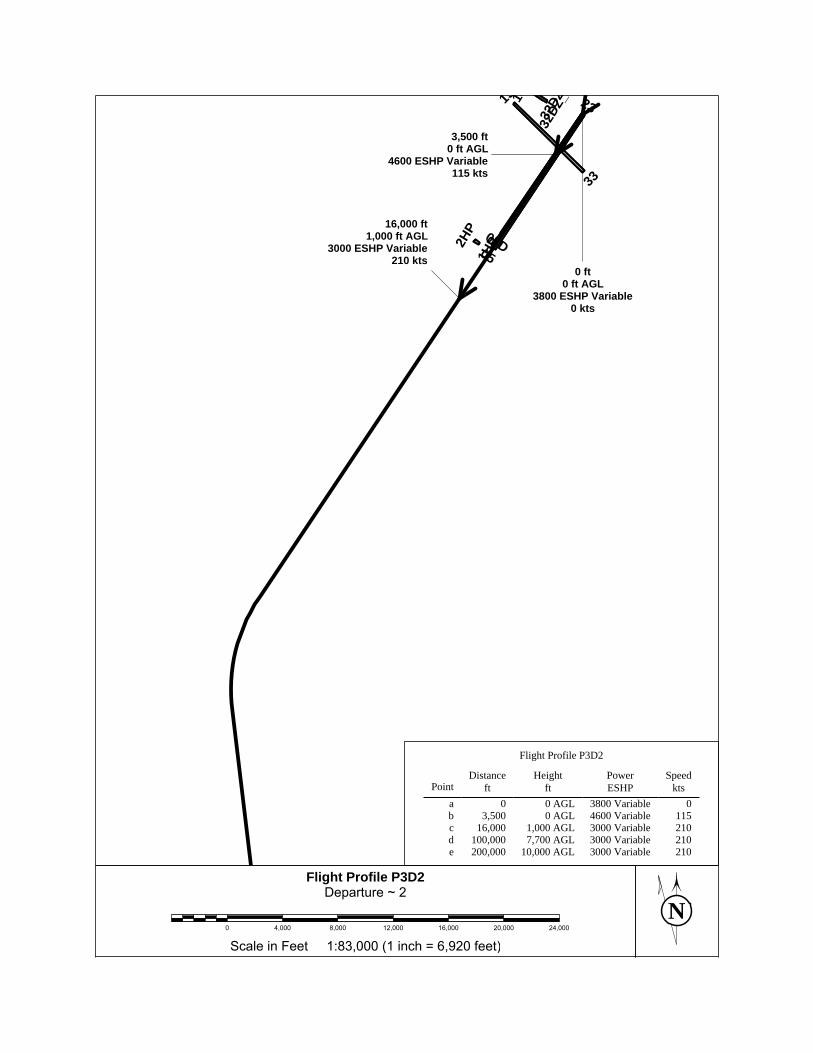
NScale in Feet 1:83,000 (1 inch = 6,920 feet)
0 4,000 8,000 12,000 16,000 20,000 24,000
2~Departure
P3D2ProfileFlight
1HP2H
P
0505D
1415 23
32DZ
32DZ
_233
0 ft0 ft AGL
3800 ESHP Variable0 kts
3,500 ft0 ft AGL
4600 ESHP Variable115 kts
16,000 ft1,000 ft AGL
3000 ESHP Variable210 kts
210Variable3000 10,000 AGL200,000e210Variable3000 7,700 AGL100,000d210Variable3000 1,000 AGL16,000c115Variable4600 0 AGL3,500b
0Variable3800 0 AGL0akts
SpeedESHPPower
ftHeight
ftDistance
Point
Flight Profile P3D2
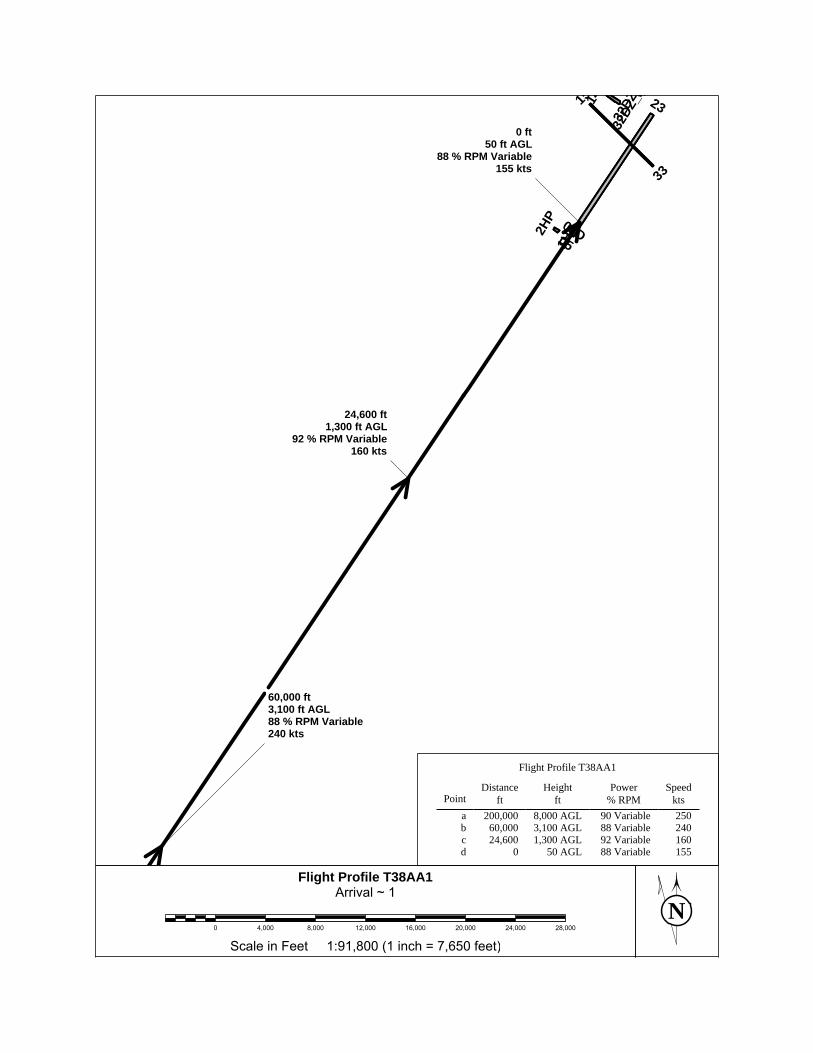
NScale in Feet 1:91,800 (1 inch = 7,650 feet)
0 4,000 8,000 12,000 16,000 20,000 24,000 28,000
1~Arrival
T38AA1ProfileFlight
1HP2H
P
0505D
1415 23
32DZ
32DZ
_233
G
0 ft50 ft AGL
88 % RPM Variable155 kts
24,600 ft1,300 ft AGL
92 % RPM Variable160 kts
60,000 ft3,100 ft AGL88 % RPM Variable240 kts
155Variable88 50 AGL0d160Variable92 1,300 AGL24,600c240Variable88 3,100 AGL60,000b250Variable90 8,000 AGL200,000a
ktsSpeed
% RPMPower
ftHeight
ftDistance
Point
Flight Profile T38AA1
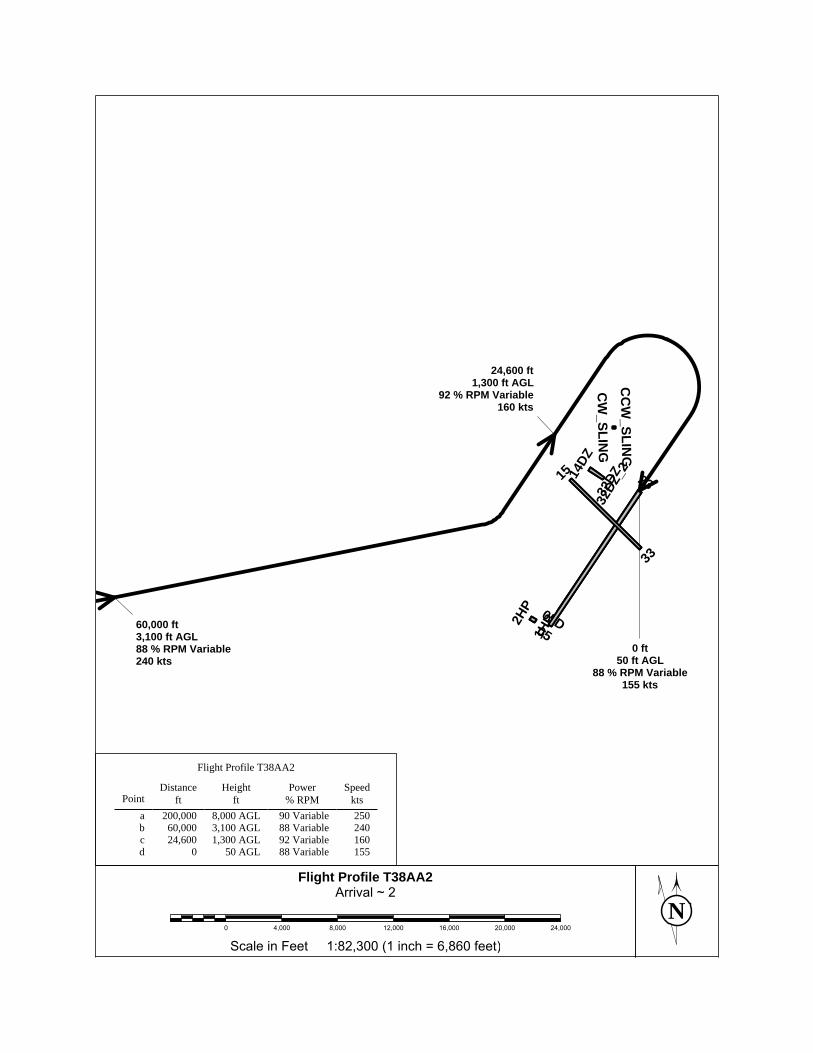
NScale in Feet 1:82,300 (1 inch = 6,860 feet)
0 4,000 8,000 12,000 16,000 20,000 24,000
2~Arrival
T38AA2ProfileFlight
1HP2H
P
0505D
14DZ
15 23
32DZ
32DZ
_233
CC
W_SLIN
G
CW
_SLING
0 ft50 ft AGL
88 % RPM Variable155 kts
24,600 ft1,300 ft AGL
92 % RPM Variable160 kts
60,000 ft3,100 ft AGL88 % RPM Variable240 kts
155Variable88 50 AGL0d160Variable92 1,300 AGL24,600c240Variable88 3,100 AGL60,000b250Variable90 8,000 AGL200,000a
ktsSpeed
% RPMPower
ftHeight
ftDistance
Point
Flight Profile T38AA2
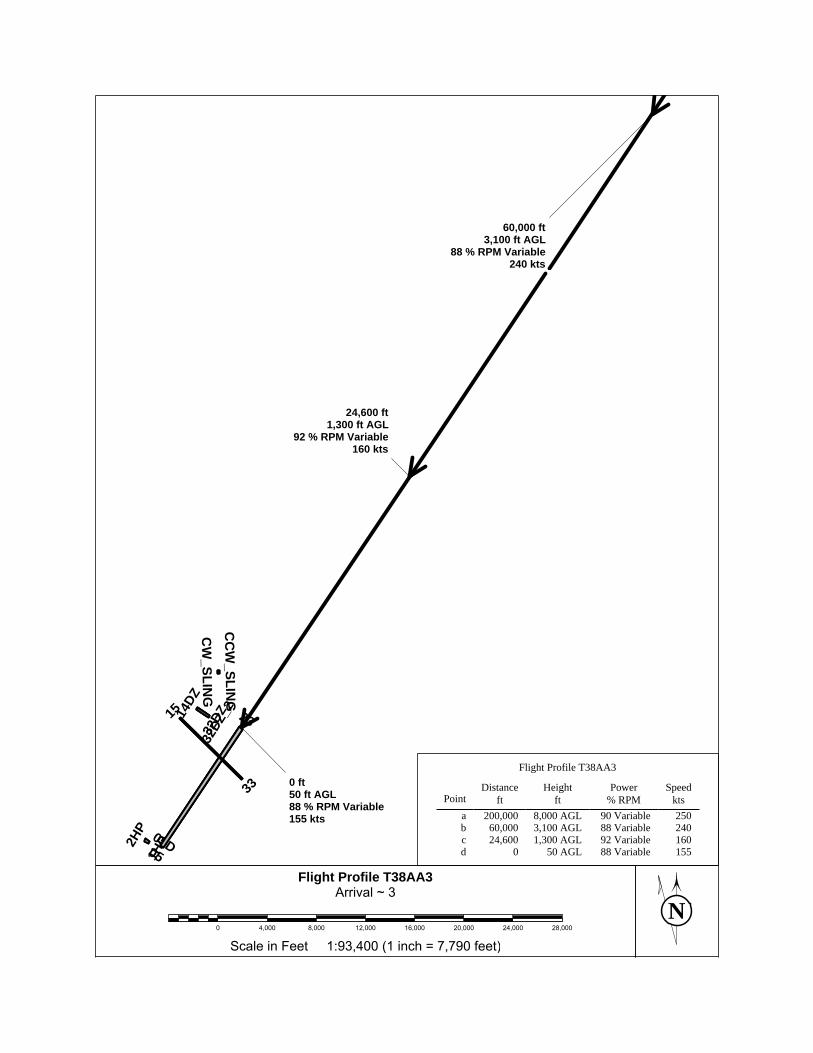
NScale in Feet 1:93,400 (1 inch = 7,790 feet)
0 4,000 8,000 12,000 16,000 20,000 24,000 28,000
3~Arrival
T38AA3ProfileFlight
1HP2H
P
0505D
14DZ
15 23
32DZ
32DZ
_233
CC
W_SLIN
G
CW
_SLING
0 ft50 ft AGL88 % RPM Variable155 kts
24,600 ft1,300 ft AGL
92 % RPM Variable160 kts
60,000 ft3,100 ft AGL
88 % RPM Variable240 kts
155Variable88 50 AGL0d160Variable92 1,300 AGL24,600c240Variable88 3,100 AGL60,000b250Variable90 8,000 AGL200,000a
ktsSpeed
% RPMPower
ftHeight
ftDistance
Point
Flight Profile T38AA3
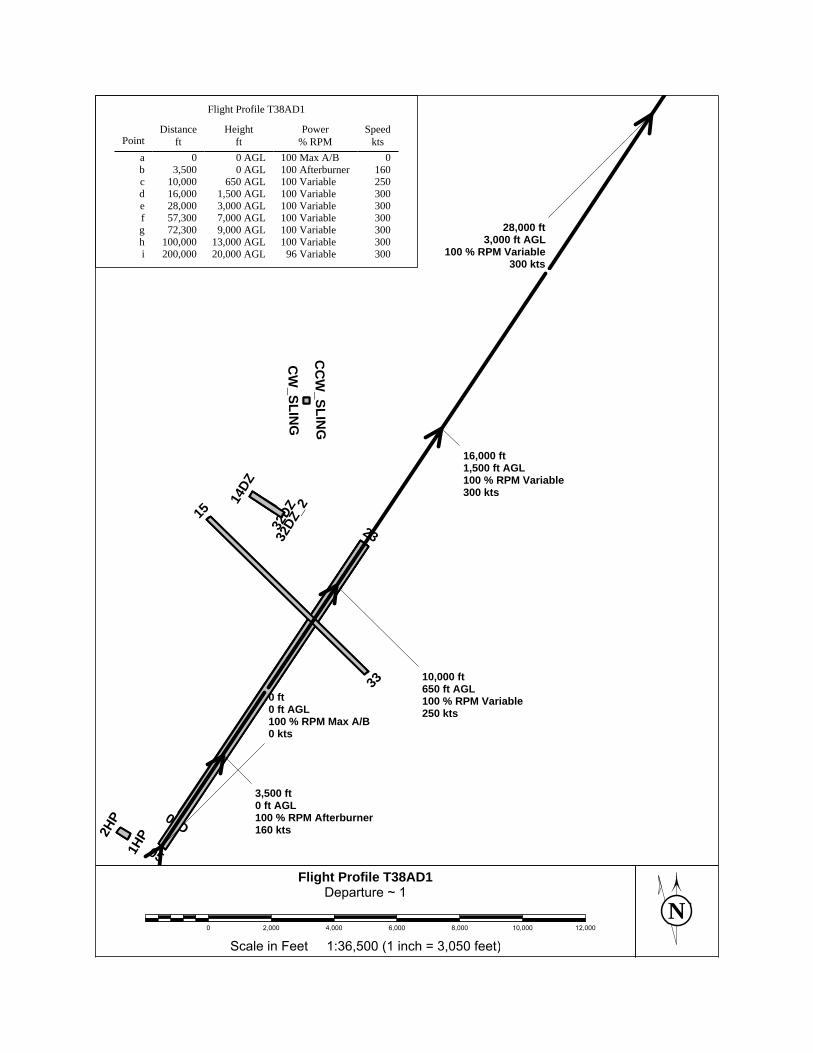
NScale in Feet 1:36,500 (1 inch = 3,050 feet)
0 2,000 4,000 6,000 8,000 10,000 12,000
1~Departure
T38AD1ProfileFlight
1HP2H
P
05
05D
14DZ
15
2332DZ
32DZ
_2
33
CC
W_SLIN
G
CW
_SLING
0 ft0 ft AGL100 % RPM Max A/B0 kts
3,500 ft0 ft AGL100 % RPM Afterburner160 kts
10,000 ft650 ft AGL100 % RPM Variable250 kts
16,000 ft1,500 ft AGL100 % RPM Variable300 kts
28,000 ft3,000 ft AGL
100 % RPM Variable300 kts
300Variable96 20,000 AGL200,000i300Variable100 13,000 AGL100,000h300Variable100 9,000 AGL72,300g300Variable100 7,000 AGL57,300f300Variable100 3,000 AGL28,000e300Variable100 1,500 AGL16,000d250Variable100 650 AGL10,000c160Afterburner100 0 AGL3,500b
0Max A/B100 0 AGL0akts
Speed% RPMPower
ftHeight
ftDistance
Point
Flight Profile T38AD1
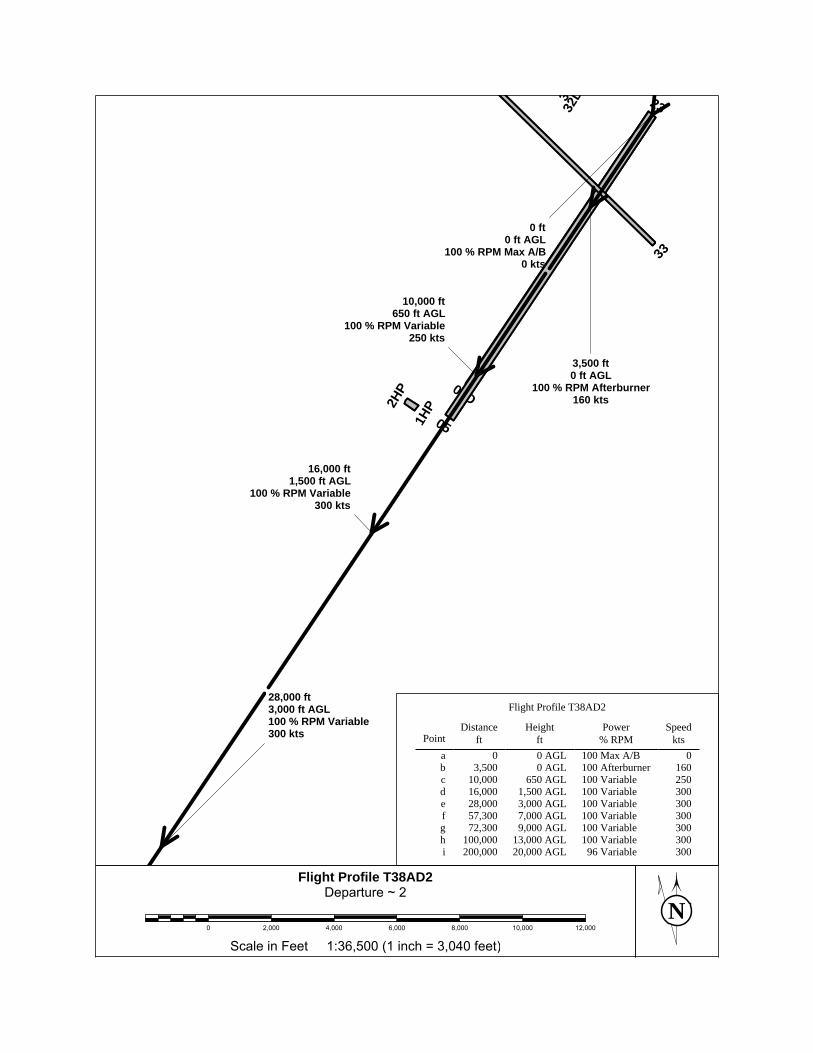
NScale in Feet 1:36,500 (1 inch = 3,040 feet)
0 2,000 4,000 6,000 8,000 10,000 12,000
2~Departure
T38AD2ProfileFlight
1HP2H
P05
05D
233232
D
33
0 ft0 ft AGL
100 % RPM Max A/B0 kts
3,500 ft0 ft AGL
100 % RPM Afterburner160 kts
10,000 ft650 ft AGL
100 % RPM Variable250 kts
16,000 ft1,500 ft AGL
100 % RPM Variable300 kts
28,000 ft3,000 ft AGL100 % RPM Variable300 kts
300Variable96 20,000 AGL200,000i300Variable100 13,000 AGL100,000h300Variable100 9,000 AGL72,300g300Variable100 7,000 AGL57,300f300Variable100 3,000 AGL28,000e300Variable100 1,500 AGL16,000d250Variable100 650 AGL10,000c160Afterburner100 0 AGL3,500b
0Max A/B100 0 AGL0akts
Speed% RPMPower
ftHeight
ftDistance
Point
Flight Profile T38AD2
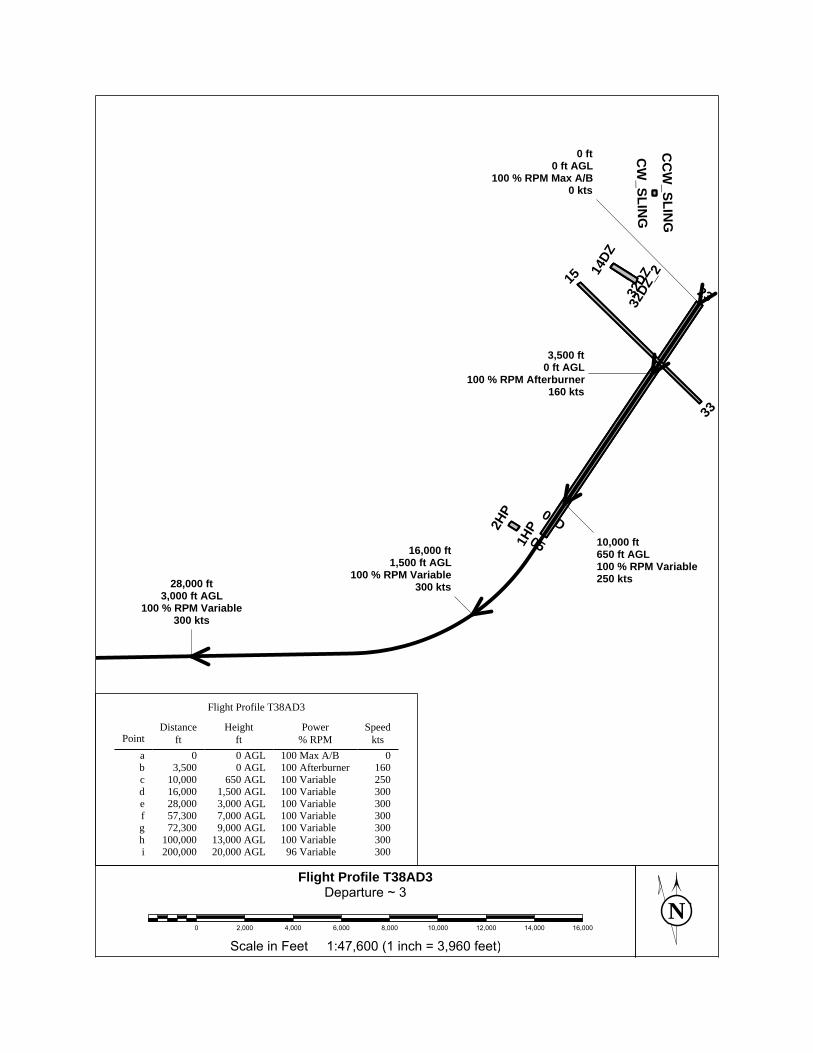
NScale in Feet 1:47,600 (1 inch = 3,960 feet)
0 2,000 4,000 6,000 8,000 10,000 12,000 14,000 16,000
3~Departure
T38AD3ProfileFlight
1HP2H
P
05
05D
14DZ
15
2332DZ
32DZ
_2
33
CC
W_SLIN
G
CW
_SLING
0 ft0 ft AGL
100 % RPM Max A/B0 kts
3,500 ft0 ft AGL
100 % RPM Afterburner160 kts
10,000 ft650 ft AGL100 % RPM Variable250 kts
16,000 ft1,500 ft AGL
100 % RPM Variable300 kts28,000 ft
3,000 ft AGL100 % RPM Variable
300 kts
300Variable96 20,000 AGL200,000i300Variable100 13,000 AGL100,000h300Variable100 9,000 AGL72,300g300Variable100 7,000 AGL57,300f300Variable100 3,000 AGL28,000e300Variable100 1,500 AGL16,000d250Variable100 650 AGL10,000c160Afterburner100 0 AGL3,500b
0Max A/B100 0 AGL0akts
Speed% RPMPower
ftHeight
ftDistance
Point
Flight Profile T38AD3