DIGITAL TELEVISION TRANSITION - NAB Pilot
53
DIGITAL TELEVISION TRANSITION Digital-to-Analog Converter Box Evaluation December 15, 2008
-
Upload
khangminh22 -
Category
Documents
-
view
0 -
download
0
Transcript of DIGITAL TELEVISION TRANSITION - NAB Pilot

DIGITAL TELEVISION TRANSITIONDigital-to-Analog Converter Box EvaluationDecember 15, 2008

Executive Summary
The Association for Maximum Service Television (MSTV) and the National Association of Broadcasters (NAB) evaluated a total of 18 different manufacturer/brand models of commercially available digital-to-analog converter boxes, including several with the analog pass-through feature.1 The boxes were acquired at physical or online retail outlets, and all are certified as coupon-eligible under the National Telecommunications and Information Administration (NTIA) converter box coupon program. They were evaluated based on Radio Frequency (RF) performance, ease of use, packaging and instructional literature included as well as external features2. The evaluation program was conducted during the summer of 2008.
The results found that the RF performance of these boxes met or
exceeded the minimum performance requirements adopted by NTIA for certification eligibility. However, some of the boxes failed to achieve the levels of ease of installation, operation and use needed to satisfy the target consumer population. Lack of uniformity in the design and labeling of the various box features, along with generally poor instructional literature included with the packaging, could impact overall consumer satisfaction with these converter boxes.
Listed below are the major findings and observations for each evaluation category:
A. RF Performance The RF performance category included an assessment of over-the-air
reception capability relative to the NAB/MSTV prototype.
• All 18 boxes equaled or exceeded the NTIA adjacent channel immunity minimum performance specification.
• All 18 boxes equaled or exceeded the NTIA threshold of reception minimum performance specification.
• Some boxes handled multipath conditions (or ghosting) better than others to an extent significant enough to make a difference in the availability of local channels for some consumers with challenging
1 The digital converter boxes evaluated and place purchased were as follows: Sansonic FT-300A,Tivax STB-T9, Lasonic LTA-260, MicroGEM MG2000, Philco TB100HH9, Artec T3A Pro, RCA DTA800, Magnavox B100MW, Insignia NS-DXA19, Zenith DTT900/1, Access HD DTA1010D, Digital Stream DTX9900, Channel Master CM700, GE Model 22730, Coship N9988T, Winegard RC-DT09, Echostar/DTVpal TR-40, Apex DT-250. 2 Technical Evaluation of some of these boxes was conducted by the firms of Wavetech Services and Meintel, Sgrignoli & Wallace.
2

reception conditions. But all boxes met or exceeded the NTIA multipath minimum performance specification.
• The amount of analog signal loss as a result of implementing the analog pass-through feature varied between models, but all passed the NTIA criteria of having less than 4 dB loss.
B. User Interface and Ease of Use
The user interface and ease of use category assessed various features
associated with the installation and operation of these boxes, including the initial powering/setting-up of the converter box, functionality of the remote control, availability of an advanced program guide and closed captioning, channel scanning and the ability to manually add channels after scanning.
• Powering/Setting-Up Procedures: The complexity of the initial
powering/setting-up procedures of the converter boxes varied significantly by manufacturer. All manufacturers implemented a menu-driven program that walks the user through the initial set-up and installation of the converter box. The menu is displayed on the television screen, and the remote control is used to navigate the menu. The software to execute the set-up commands varied in length and complexity from one box to another, and the instructions furnished with the boxes were either limited or generally confusing to complete installation. While some boxes have a default set-up feature that helped with the initial installation of the box, it limited the functionality of some of the other features, described below, for normal operation.
• Remote Control: The number of features and functions on the remote control varied significantly by manufacturer. More than half of the boxes had no branding mark on their remote controls, and the total number of buttons on the remote controls varied widely from 26 to 35 buttons. Button labels for the same function were not uniform across manufacturers. For example, some remote controls included a “dash” button to distinguish major and minor channel numbers, while others used a “dot” rather than a dash. Some did not include a button at all, instead electing to use the up/down button to change channels, including minor channels from the same major channel signal. A few manufacturers included inactive buttons on the remote.
Wording on the remotes to describe the same function also differed. For example, some manufacturers used “zoom”, “wide” and “display” interchangeably to change a program’s aspect ratio, while others used those words to execute different settings on the display. Moreover, the instructions furnished with the boxes were either limited or difficult to comprehend by an average consumer.
3

• Scanning and Manually Adding Channels: All boxes included a channel scan feature, but the amount of time required to complete a full scan varied significantly by manufacturer. A full scan ranged from as low as 40 seconds to as high as seven minutes and 30 seconds. Moreover, the ability of the boxes to detect all DTV channels during scanning varied from manufacturer to manufacturer, and the length of the scan did not correlate with the box’s ability to detect DTV channels. For some boxes, the automated scan feature was the only way to add new channels or channels that were not detected during the original scan, while the remote control could be used for others. This feature, however, requires the consumer to know the actual RF channel of the DTV station, not the channel by which Program and System Information Protocol (PSIP) major and minor channel numbers identify the station. Many of the set-top boxes do not permanently store manually added channels, which are thus lost once the converter box is turned off. Some can permanently store manually added channels, but require a lengthy and somewhat complicated process of navigating through the menu to add them permanently. Here again, the instructions furnished with the boxes for these features were generally limited in detail or difficult to comprehend by an average consumer.
• Program Guide: Most manufacturers included a program guide, although a few did not. The majority included a simple program guide capable of carrying a minimum of six hours of programming. A few included a full and complete guide comparable to an electronic GEMSTAR TV Guide. Accessing the program guide using the remote was simple, but navigating the guide was generally somewhat complicated. Moreover, the instructions furnished with the boxes for these features were generally limited in detail or difficult to comprehend by an average consumer.
• Closed Captioning: All manufacturers implemented closed captioning (CEA 608/708 capable). Most boxes had a closed captioning button, but a few did not and required the user to navigate a menu to activate it. Most boxes also included a button for a secondary audio channel.
• Energy Star Features and Automatic Shut-off: All boxes implemented a four-hour automatic shut-off feature. While some boxes allow the user to disable this feature via a remote control button, others do not and require accessing the menu to reset this feature. Some boxes did not permit disabling this feature, but allowed resetting it to a shorter or longer period not to exceed eight hours.
4

C. External Features, Accessories and Packaging
The external features, accessories and packaging category included an assessment of the size, weight and shape/construction of the converter boxes, as well as front and back panel features, accessories and instructional literature included in the packaging.
• Size, Weight, Shape and External Features: The size, weight and shape/construction of the converter boxes, as well as the features on the front and back panels, varied significantly by manufacturer. The box size varied from small to quite large. Some had built-in power supplies, while others used external “brick” power supplies. They varied in weight and construction (plastic versus metal) and on the number of features on the front and back panel of the box. Labeling for the same function/feature on the box differed among manufacturers, which could be a potential source of confusion during initial installation. The instructions furnished with the boxes were generally adequate to resolve the labeling problem.
• Accessories, Instructional Literature and Packaging: Some manufacturers included an Audio/Visual (AV) and RF cable in the packaging; others only included an RF cable. Some included both an installation and operation manual, while others provided an installation manual only. The manuals were generally too technical for the average consumer, and most did not detail step-by-step installation or troubleshooting instructions. The outer packaging of the boxes was typically used for extensive marketing of the converter box and its features. The messaging on the packaging was prominent and colorful, In many cases, five sides of the packaging displayed marketing and/or informational material.
D. Conclusion
Based on the results of this evaluation program, it appears that coupon-eligible digital converter boxes currently available in the marketplace are likely to meet the minimum RF performance requirements specified by NTIA for its coupon eligibility program. However, there are significant performance differences among boxes, which may affect consumers’ access to their local DTV stations in challenging reception conditions or may require different antenna configurations than are currently in place for their analog TVs. Generally, setting up and operating the converter boxes are not intuitive and may be confusing for some of the targeted consumer populations, resulting in consumers seeking outside assistance to maintain their local television reception.
5

Digital-to-Analog Converter Box Evaluation Program
1. Introduction
In the summer and fall of 2008, the Association for Maximum Service Television
(MSTV) and the National Association of Broadcasters (NAB) undertook a testing and evaluation program on a selected number of commercially available digital-to-analog converter boxes. A total of eighteen different manufacturer/brand models (including several with the analog pass-through feature) were acquired at physical or online retail outlets and tested to evaluate their RF performance, ease of use, and the packaging and instructional literature included as well as the external features and functions on these boxes. All of the converter boxes evaluated were certified for coupon eligibility under the National Telecommunications and Information Administration (NTIA) converter box coupon program. The staff of both MSTV and NAB conducted an initial evaluation of all eighteen brands models. The firms of Meintel, Sgrignoli & Wallace and Wavetech Services conducted additional testing and evaluation on some of these boxes. 2. Description of the Testing and Evaluation Program
The joint MSTV/NAB testing and evaluation program was designed to examine three separate categories of the digital-to-analog converter box. The first category, RF performance, was intended to assess the over-the-airreception capability of these boxes relative to the performance of the original MSTV/NAB prototype hardware developed by LG/Zenith in 2006, and the technical specifications established by NTIA for certifying these boxes as coupon eligible. The second category, the user interface and ease of use category, was intended to assess various features associated with the installation and operation of these boxes, including the initial powering/setting-up of the converter box, functionality of the remote control, availability of an advanced program guide and closed captioning, channel scanning and the ability to manually add channels after scanning. The last category, the external features, accessories and packaging category, was intended to assess the size, weight, shape and construction of the converter boxes, as well as front and back panel features, accessories and instructional literature included in the packaging.
The MSTV/NAB program conducted an initial in-house evaluation of all eighteen digital-to-analog converter boxes to determine the relative RF performance ranking of these boxes, and select boxes for further in-depth evaluation by a professional testing laboratory. A total of eight boxes were selected for the in-depth evaluation. The evaluations were conducted
6

by the firms of Meintel, Sgrignoli & Wallace, and Wavetech Services and their findings are included in the report attached to this document.
Table 1 lists the digital-to-analog converter boxes used in the evaluation.
Three out of the eighteen boxes used in the evaluation included an analog pass through connection.
Table 1
Manufacturer Model Number Serial Number
Sansonic * FT-300A FD300A0081404287
Tivax STB-T9 Tivax 1207-009014
Lasonic LTA-260 FD300A0081100402
MicroGEM MG2000 HCC8C2DMGET0DTADE002748
Philco (Funai) TB100HH9 U14833710
Artec T3A Pro V1201W0811007518
RCA* DTA800 PA111J135B0875
Magnavox (Funai) TB100MW9 U15828856
Insignia* NS-DXA1 802SHXJ058170
Zenith*,** DTT901 803SHDP156546
Access HD* DTA1010D ETA0803010322
Digital Stream*,** DTX9900
Channel Master CM-7000 7OOO807040100
GE Model 22730 40011888CBB
Coship N9988T 4O000944500655
Winegard RC-DT09 HM100HD190161
Echostar/DTVpal TR-40 E4ETCT00210C
Apex*,** DT-250 CF162018578
* These boxes were selected for in-depth professional evaluation **These boxes included an analog pass-through connection 3. Evaluation of Digital- to-Analog Converter Boxes As stated earlier, the in-house evaluation encompassed the testing of these boxes’ RF performance, user interface and ease of use, and the packaging and instructional literature included as well as the boxes external features and functions.
7

a. RF Performance
The RF performance evaluation consisted of over-the-air signal testing of these boxes and comparing their performance to the performance of the original MSTV/NAB prototype hardware from LG/Zenith. The over-the-air TV signals used were signals of opportunity in the Washington, DC area as well as a subset of the ATSC A/74 RF signal captures. Three separate tests were conducted. The first two, the threshold and received signal tests, used local TV broadcast signals that were severely attenuated to simulate weak and near threshold signal levels. The third test used a subset of the ATSC RF captures that were identified as difficult captures to demodulate, to evaluate the multipath performance of these boxes. Specifically, eight out of the fifty ATSC RF captures selected were identified as difficult or impossible to demodulate with the latest generation of equalizers. The results of these tests were then compared to the MSTV/NAB prototpe and displayed in Table 2 below. All eighteen boxes equaled or exceeded the MSTV/NAB prototype RF performance.
Table 2 Manufacturer Threshold Received TV Channels Missed
TV Channels
Missed RF
CapturesMSTV/NAB Prototype
Baseline 4,5,7*,9,14*,20*,32,50* 22, 26 3
Sansonic 4 dB better 4,5,7*,9,14,20*,26*,32,50* 22 3 Tivax 2 dB better 4,5, 7*,9, 14,20*,26*,32*,50 22 3 Lasonic 4 dB better 4,5,7*,9,14,20*,26*,32* 22, 50 3 MicroGEM 1 dB better 4,57,,9,20, 26*,32*, 50 14,22 3 Philco (Funai) 1 dB better 4,5,9,14*, 20*, 26*, 32, 50* 7, 22 2 Artec 2 dB better 4,5,7*,9,14,20,22*,26*,32,50 3 RCA Same as
baseline 4,5,7*,9*,14,20,26*,32,50* 22 Not tested
Magnavox (Funai)
2 dB better 4,5,7,9*,14*,20,22*,26*,32, 50
3
Insignia 2 dB better 4,5,7,9*,14*,20,26*,32,50 22 3 Zenith 2 dB better 4,5,7,9*,14*,20,26*,32,50 22 3 Access HD 3 dB better 4,5,7,9,20,32,50 14,22,26 3 Digital Stream 4 dB better 4,5,7,9,14,20,32,50 22,26 3 Channel Master 3 dB better 4,5,7,9,14,20,32,50 22,26 2 GE 3 dB better 4,5,7,9,14,20,26,32,50 22 2 Coship 1 dB better 4,5,7,9,14*,20,32,50 22,26 3 Winegard 3 dB better 4,5,7,9*,14*,20,32,50* 22,26 3 Echostar/DTVpal 2 dB better 4,5,7*,9,14,20,26, 32,50 22 3 Apex 1 dB better 4,5,7,9,14, 20*, 26*,32, 50 22 3
*Reception with a few errors
8

b. User Interface and Ease of Use The user interface and ease of use category examined the various
features associated with the installation and operation of these boxes, including the initial powering/setting-up of the converter box, functionality of the remote control, availability of an advanced program guide and closed captioning, channel scanning and the ability to manually add channels after scanning.
The initial examination included how these boxes initially power up and their
set-up procedures. The complexity of the initial power/set-up procedures of the converter boxes varied significantly by manufacturer. All manufacturers implemented a menu-driven program that walks the user through the initial set-up and installation of the converter box. The menu is displayed on the television screen, and the remote control is used to navigate the menu. The software to execute the set-up commands varied in length and complexity from one box to another, and the instructions furnished with the boxes were either limited or generally confusing to complete installation. While some boxes have a default set-up feature that helped with the initial installation of the box, it limited the functionality of some of the other features for normal operation.
Table 3-A lists the number of features and functions on the remote control
and the Energy Star features required by law. The number of features and functions varied significantly by manufacturer. More than half of the boxes had no branding mark on their remote controls, and the total number of buttons on the remote controls varied widely from 26 to 35 buttons. Button labels for the same function were not uniform across manufacturers. For example, some remote controls included a “dash” button to distinguish major and minor channel numbers, while others used a “dot” rather than a dash. Some did not include a button at all, instead electing to use the up/down button to change channels, including minor channels from the same major channel signal. A few manufacturers included inactive buttons on the remote.
Wording on the remotes to describe the same function also differed. For
example, some manufacturers used “zoom”, “wide” and “display” interchangeably to change a program’s aspect ratio, while others used those words to execute different settings on the display. Moreover, the instructions furnished with the boxes were either limited or difficult to comprehend by an average consumer.
To meet the federally-mandated Energy Star requirements, Table 3-A lists that feature. All boxes implemented an automatic shut-off as a stand-alone feature or a sleep set-up option. All boxes were initially configured with a four-hour automatic shut-off feature. While some boxes allow the user to disable this feature via a remote control button, others do not and require accessing the menu to reset this feature. Some boxes did not permit disabling this feature, but allowed resetting it to a shorter or longer period not to exceed eight hours.
9

Table 3-A
Manufacturer Model
Number Remote Control
Button Energy Star Features Automatic Turn Off
MSTV/NAB Prototype
Baseline N/A Not implemented
Sansonic FT-300A 27 buttons, not branded, CC, mute, no dash, info, signal level
As a sleep mode function that could be set to "off" and default at 240 mins (4 hours). Could be incremented in 30 minutes intervals
Tivax STB-T9 31 buttons, branded, CC, mute dash, info, signal level, guide, indicator, exit, aspect, menu
Yes. Default 4 hours. Option Off, 2, 4 hours
Lasonic LTA-260 27 buttons, no branded, CC mute, no dash, info, signal level
As a sleep mode function that could be set to "off" and default at 240 mins. Could be incremented in 30 minutes intervals
MicroGEM MG2000 30 buttons, branded, EPG, signal indicator, dash, aspect, "I", caption
Yes. Default 4 hours. Option Off, 2, 4 hours
Philco (Funai) TB100HH9 26 buttons, branded, EPG, dot no volume control, display, alternate ch.
Yes. Default 4 hours. Options off, 1, 2, 4, 8 hours
Artec T3A Pro 28 buttons, not branded, dash, signal, info, EPG
Yes. Sleep Default 4 Hrs Options off, 2, 4 hours
RCA DTA800 27 buttons, no branded, dash, PGM, dash/cc, menu, Info
Yes. Default 4 hours. Options Off, 4, 8, 12 Hrs
Magnavox (Funai)
TB100MW9
26 buttons, branding no volume control, dot, display, EPG, alternate ch.
Yes. Default 4 hours. Options Off, 1, 2 and 4 hours
Insignia NS-DXA1 34 buttons, branded, Guide, signal level, CCD, dash, display, zoom, exit, menu
Yes. Default 4 hours. Option Off, 1, 2, 3, 4 hours
Zenith DTT901 34 buttons, branded, Guide, signal level, CCD, dash, display, zoom, exit, menu
Yes. Default 4 hours. Option Off, 1, 2, 3, 4 hours
Access HD DTA1010D 31 buttons, branded, CC, mute dash, info, signal level, guide, indicator, exit, aspect, menu
Yes. Default 4 hours. Option Off, 2, 4 hours
Digital Stream DTX9900 35 buttons, not branded, EPG, zoom, Fav, previous, Back, menu, zoom, Audio, CC, Info, mute, dot, "meter"
Yes. Default 4 hours. Options off, 1, 2, 4, 8 hours
10

Table 3-A (continued)
Manufacturer Model Number
Remote Control Button
Energy Star Features Automatic Turn Off
MSTV/NAB Prototype
Baseline N/A Not implemented
Channel Master
CM-7000 35 buttons, branded, subtitle, no dash, info, signal level indicator, EPG, exit, wide, menu, info, guide, option, fav, Pgup, Pgdn, text
Yes. Default 4 hours. Options off, 1, 2, 4 hours. Additional Warning setting 5 to 59 minutes
GE Model 22730
31 buttons, branded, CC, EPG, mute, dash, signal level indicator, exit, zoom, menu
Yes. Default 4 hours. Options 15 mins, 30 mins,1, 2 and 4 hours
Coship N9988T 35 buttons, not branded recall, menu, ratio, Audio, CC, Info, mute, dash, text, sleep, exit, "group", EPG, signal, PG+, PG- ,info
Yes. Default 4 hours. Options off, 1, 2, 4,8 hours
Winegard RC-DT09 27 buttons, not branded, CC, mute, dot, info, signal level, menu , exit, info
Yes. Default 4 hours. Options off, 1, 2, 4, 8 hours
Echostar/DTVpal TR-40 31 Buttons, No branding guide, analog pass through, view tv, info, sys info, recall, "star", menu, # , cancel, mute, picture format , select
Yes. Default 4 hrs. Disable features, Option 4,5,6,7,8 hours
Apex DT-250 30 buttons, branded, mute, menu, guide, favorite+,-, display, zoom, mts, ccd, recall, ccd, dash, volume+,-
Yes. Default 4 hours Options, off, 1, 2, 3 and 4 hours
Table 3-B below provides information on channel scan time, program
guide and other functions that are essential to the operation of these boxes and their ease of use. All boxes included a channel scan feature, but the amount of time required to complete a full scan varied significantly by manufacturer. A full scan ranged from as low as 40 seconds to as high as seven minutes and 30 seconds. Moreover, the ability of the boxes to detect all DTV channels during scanning varied from manufacturer to manufacturer, and the length of the scan did not correlate with the box’s ability to detect DTV channels. For some boxes, the automated scan feature was the only way to add new channels or channels that were not detected during the original scan, while the remote control could be used for others. This feature, however, requires the consumer to know the actual RF channel of the DTV station, not the channel by which Program and System Information Protocol (PSIP) major and minor channel numbers identify the station. Many of the set-top boxes do not permanently store manually added
11

channels, which are thus lost once the converter box is turned off. Some can permanently store manually added channels, but require a lengthy and somewhat complicated process of navigating through the menu to add them permanently. The instructions furnished with the boxes for these features were generally limited in detail or difficult to comprehend by an average consumer.
Most manufacturers included a program guide, although a few did not. The majority included a simple program guide capable of carrying a minimum of six hours of programming. A few included a full and complete guide comparable to an electronic GEMSTAR TV Guide. Accessing the program guide using the remote was simple, but navigating the guide was generally somewhat complicated. Moreover, the instructions furnished with the boxes for these features were generally limited in detail or difficult to comprehend by an average consumer.
All manufacturers implemented closed captioning (CEA 608/708 capable). Most boxes had a closed captioning button, but a few did not and required the user to navigate a menu to activate it. Most boxes also included a button for a secondary audio channel.
Table 3-B Manufacturer Model
Number Guide Channel
Scan time Adding
Ch. CC 608/ 708
MSTV/NAB Prototype
Baseline Guide with 2 hours 50 sec yes yes
Sansonic FT-300A No guide 1 min 47 sec no yes Tivax STB-T9 Simple guide with
minimum of 6 hours Fast scan: 1 min 07 sec Full scan: 3 min 50 sec
yes yes
Lasonic LTA-260 No guide 1 min 50 sec no. yes MicroGEM MG2000 Simple guide with
minimum of 6 hours Fast scan: 1 min 07 sec Full scan: 4 min 10 sec
yes yes
Philco (Funai) TB100HH9 Simple guide with minimum of 6 hours
44 sec yes yes
Artec T3A Pro Simple guide with two hours of update
50 sec yes yes
RCA DTA800 Full guide with real time program built and channel list
1 min 35 sec no yes
Magnavox (Funai)
TB100MW9
Simple guide with minimum of 6 hours
49 sec yes yes
Insignia NS-DXA1 Guide with 2 hours 55 sec yes yes
12

Table 3-B (continued)
Manufacturer Model
Number Guide Channel
Scan time Adding
Ch. CC 608/ 708
MSTV/NAB Prototype
Baseline Guide with 2 hours 50 sec yes yes
Zenith DTT901 Guide with 2 hours 57 sec yes yes Access HD DTA1010D Simple guide with
minimum of 6 hours Fast scan: 1 min 04 sec Full scan: 5 min 08 sec
yes yes
Digital Stream DTX9900 Full guide with real time program built and with 6 hours
1 min 40 sec difficult to figure
out
yes
Channel Master
CM-7000 Full guide with real time program built and with 6 hours
1 min 10 sec yes yes
GE Model 22730
Full guide with real time program built and with 6 hours
3 min 12 sec yes yes
Coship N9988T Guide with 2 hours 45 sec yes yes Winegard RC-DT09 No guide 45 sec yes yes Echostar/DTVpal TR-40 Echo star guide 1min 20 sec yes yes Apex DT-250 Guide with 2 hours 7 min 30 sec yes yes
C. External Features, Accessories and Packaging The external features, accessories and packaging category included an
examination of the size and shape/construction of the converter boxes, as well as front and back panel features, accessories and instructional literature included in the packaging.
Tables 4 and 5 list the size and shape/construction of the converter boxes. They also list the features and functions on the front and back panels of these boxes. These features varied significantly by manufacturer. The box size varied from small to quite large. Some had built-in power supplies, while others used external “brick” power supplies. They varied in weight and construction (plastic versus metal) and on the number of features on the front and back panel of the box. Labeling for the same function/feature on the box differed among manufacturers, which could be a potential source of confusion during initial installation. The instructions furnished with the boxes were generally adequate to resolve the labeling problem. Some manufacturers included an Audio/Visual (AV) and RF cable in the packaging; others only included an RF cable. Some included both an installation and operation manual, while others provided an installation manual only. The manuals were judged to be generally too technical for the average consumer, and most did not detail step-by-step installation or troubleshooting
13

instructions. The outer packaging of the boxes was typically used for extensive marketing of the converter box and its features. The messaging on the packaging was prominent and colorful. In many cases, five sides of the packaging displayed marketing and/or informational material.
Table 4 Manufacturer Model
Number Dimension Internal
Packaging Power Supply
MSTV/NAB prototype
baseline Small Metal
RF cable, A/V cable, Battery, Manual, Remote
External/ 6 volts
Sansonic FT-300A Very small Metal
RF cable, Battery, Manual Remote
External/ 5 volts
Tivax STB-T9 Medium/Large Plastic
RF cable, A/V cable, Battery, Manual , Remote
Integrated
Lasonic LTA-260 Very small Metal
RF cable, Battery, Manual Remote
External/ 5 volts
MicroGEM MG2000 Super small Cheap plastic
RF cable, Battery, Manual Remote
External/ 6.5 volts
Philco (Funai) TB100HH9 Medium/Large Plastic
RF cable, Battery, Manual Remote
Integrated
Artec T3A Pro Small/stylish Plastic
RF cable, Battery. Remote
External/ 12 volts
RCA DTA800 Small/stylish stand on side Plastic
RF cable, Battery, Manual Remote
Integrated
Magnavox (Funai)
TB100MW9
Medium/Large Plastic
RF cable, Battery, Manual Remote
Integrated
Insignia NS-DXA1 Medium Metal
RF cable, A/V cable, Battery, Manual, Remote
Integrated
Zenith DTT901 Medium Metal
RF cable, A/V cable, Battery, Manual, Remote
Integrated
Access HD DTA1010D Medium/Large Plastic
RF cable, A/V cable, Battery, Manual, Remote
Integrated
Digital Stream DTX9900 Small Plastic
RF cable, Battery, Manual Remote
Integrated
Channel Master
CM-7000 Medium/Large Plastic
RF cable, Battery, Manual Remote
Integrated
GE Model 22730
Small/stylish Heavy plastic
RF cable, Battery, Manual Remote
Integrated
Coship N9988T Small Metal
Battery, Manual, Remote Integrated
Winegard RC-DT09 Small Metal
RF cable, Battery, Manual Remote
Extrenal/ 5 volts
Echostar/DTVpal TR-40 Small Plastic
RF cable, Battery, Manual Remote
External/ 5 volts
Apex DT-250 Medium Metal
RF cable, Battery, Manual Remote, AV cable
Integrated
14
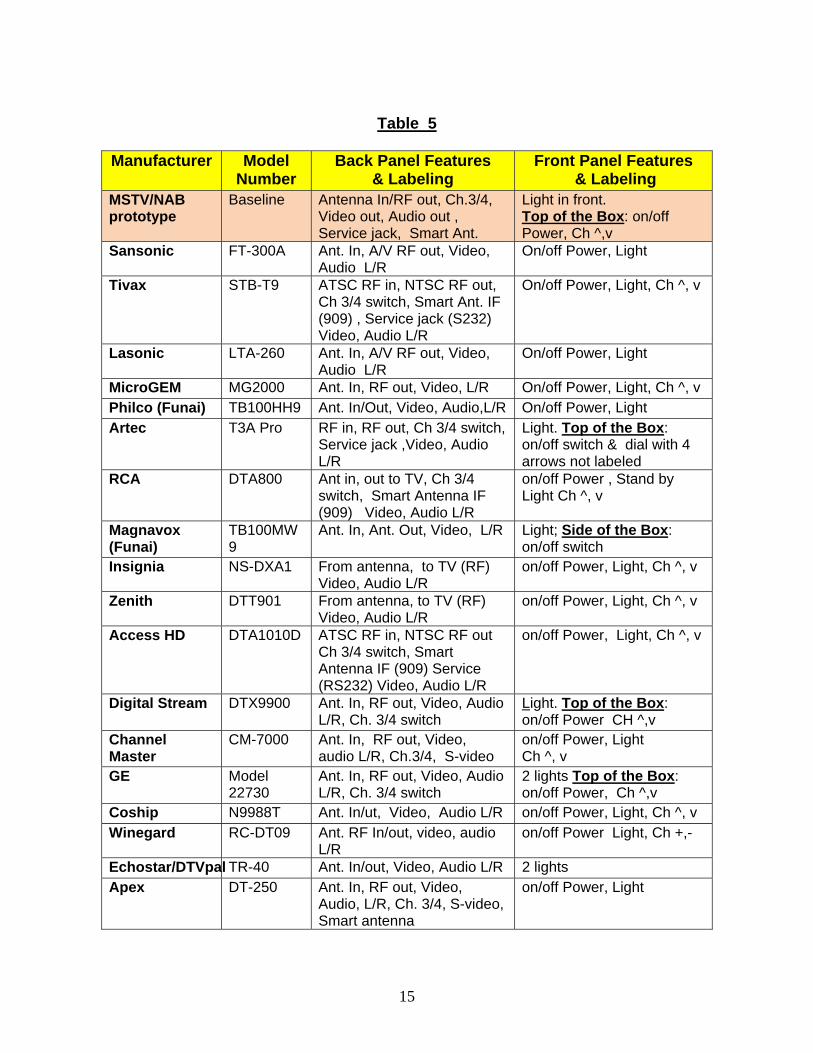
Table 5
Manufacturer Model
Number Back Panel Features
& Labeling Front Panel Features
& Labeling MSTV/NAB prototype
Baseline Antenna In/RF out, Ch.3/4, Video out, Audio out , Service jack, Smart Ant.
Light in front. Top of the Box: on/off Power, Ch ^,v
Sansonic FT-300A Ant. In, A/V RF out, Video, Audio L/R
On/off Power, Light
Tivax STB-T9 ATSC RF in, NTSC RF out, Ch 3/4 switch, Smart Ant. IF (909) , Service jack (S232) Video, Audio L/R
On/off Power, Light, Ch ^, v
Lasonic LTA-260 Ant. In, A/V RF out, Video, Audio L/R
On/off Power, Light
MicroGEM MG2000 Ant. In, RF out, Video, L/R On/off Power, Light, Ch ^, v Philco (Funai) TB100HH9 Ant. In/Out, Video, Audio,L/R On/off Power, Light Artec T3A Pro RF in, RF out, Ch 3/4 switch,
Service jack ,Video, Audio L/R
Light. Top of the Box: on/off switch & dial with 4 arrows not labeled
RCA DTA800 Ant in, out to TV, Ch 3/4 switch, Smart Antenna IF (909) Video, Audio L/R
on/off Power , Stand by Light Ch ^, v
Magnavox (Funai)
TB100MW9
Ant. In, Ant. Out, Video, L/R Light; Side of the Box: on/off switch
Insignia NS-DXA1 From antenna, to TV (RF) Video, Audio L/R
on/off Power, Light, Ch ^, v
Zenith DTT901 From antenna, to TV (RF) Video, Audio L/R
on/off Power, Light, Ch ^, v
Access HD DTA1010D ATSC RF in, NTSC RF out Ch 3/4 switch, Smart Antenna IF (909) Service (RS232) Video, Audio L/R
on/off Power, Light, Ch ^, v
Digital Stream DTX9900 Ant. In, RF out, Video, Audio L/R, Ch. 3/4 switch
Light. Top of the Box: on/off Power CH ^,v
Channel Master
CM-7000 Ant. In, RF out, Video, audio L/R, Ch.3/4, S-video
on/off Power, Light Ch ^, v
GE Model 22730
Ant. In, RF out, Video, Audio L/R, Ch. 3/4 switch
2 lights Top of the Box: on/off Power, Ch ^,v
Coship N9988T Ant. In/ut, Video, Audio L/R on/off Power, Light, Ch ^, v Winegard RC-DT09 Ant. RF In/out, video, audio
L/R on/off Power Light, Ch +,-
Echostar/DTVpal TR-40 Ant. In/out, Video, Audio L/R 2 lights Apex DT-250 Ant. In, RF out, Video,
Audio, L/R, Ch. 3/4, S-video, Smart antenna
on/off Power, Light
15

4. Conclusion
Based on the results of the in-house and external evaluation of the digital-to-analog converter boxes, all eighteen boxes equaled or exceeded the MSTV/NAB prototype RF performance. It also appears that coupon-eligible digital converter boxes currently available in the marketplace are likely to meet the minimum RF performance requirements specified by NTIA for its coupon eligibility program. However, there are significant performance differences between the boxes which may affect consumers’ access to their local DTV stations in challenging reception conditions, or require different antenna configurations than currently in place for their analog TVs. Generally, set-up and operation of the converter boxes are not intuitive and may be confusing for some of the target consumer population, resulting in the need for outside assistance in order for these consumers to maintain access to local television reception.
In addition to this report, MSTV and NAB is making available in electronic form (PDF Files) all the user manuals for the digital-to-analog brand models tested.
16

17
ATTACHMENT

MSTV CECB Lab Test Results MSTV_R1_Lab_Test_Report _09_26_08.DOC 9/26/08
MSTV 1 of 36 MSW
Prepared By:
Gary Sgrignoli Meintel, Sgrignoli, & Wallace, LLC
1282 Smallwood Drive Suite 372
Waldorf, Maryland 20603 (202) 251-7589
A Report to
Association for Maximum Service Television (MSTV)
Regarding
Laboratory Test Results of
Various Digital-to-Analog Converter Boxes for
Compliance with NTIA CECB Specifications
September 26, 2008

MSTV CECB Lab Test Results MSTV_R1_Lab_Test_Report _09_26_08.DOC 9/26/08
MSTV 2 of 36 MSW
MSTV D/A CONVERTER BOX LABORATORY TEST REPORT
Introduction
In the summer of 2008, the Association for Maximum Service Tele vision (MSTV) acquired a large collection of coupon eligible converter boxes (CECB) that were being sold in the consumer marketplace. These digital-to-analog (D/A) set-top boxes (STB) are compatible with the ATSC digital terrestrial transmission system that employs 8-level vestigial sideband (8-VSB) modulation. Their primary purpose is to provide D/A conversion in order for analog NTSC television sets to continue functioning after the end of the February 17, 2009 digital transition when full service over-the-air (OTA) analog broadcasts cease. These converter boxes perform this function by tuning to any terrestrial DTV channel, demodulating the 8-VSB signal, decoding the MPEG-2 digital video and Dolby AC-3 audio along with the related PSIP data, and finally converting this signal to an analog NTSC signal with a 4:3 standard definition (480I) video signal and a stereo audio signal. The analog NTSC signal can be provided as baseband video and audio signals on color-coded RCA jacks as well as an RF signal on CH 3 or CH 4 (selectable) via a 75-Ohm female F-connector.
While there are no specific performance specifications required by the government to sell such a box to the general public, there are very specific mandated performance specifications required in order to sell this type of box as part of the government’s special CECB program that is being administered by the NTIA. General information on the NTIA coupon program can be found on the NTIA website at http://www.ntia.doc.gov/otiahome/dtv/index.html . Additionally, general manufacturing information and requirements can be found at http://www.ntia.doc.gov/dtvcoupon/manufacturer.html, while specific manufacturing information and requirements can be found at http://www.ntia.doc.gov/dtvcoupon/DTVmanufacturers.pdf. One additional location for additional information that is helpful to interpret their technical rules is their Frequently Asked Questions (FAQ) section at http://www.ntia.doc.gov/dtvcoupon/manufacturerFAQ.html .
MSTV desired to laboratory test a small sample (e.g., 8) of these CECB receivers to verify some of the RF performance parameters of these converter boxes relative to the NTIA rules and performance standard, which is based on the ATSC Recommended Practices: Receiver Performance Guidelines (ATSC Document A/74). In addition to the RF performance, MSTV sought to compare some of the non-RF box features that would be used by typical viewers. The firm of Meintel, Sgrignoli, and Wallace (MSW) was retained to provide laboratory testing of these D/A converter boxes, which was completed using the MSW fully-equipped laboratory facilities in the Washington DC area, and the test results are reported in this document. Note that due to t ime constraints, the RCA unit was not tested due to its inability to directly tune to a specified physical RF channel and its inability to display laboratory test signals without PSIP.
This written laboratory test report provides: (1) detailed lab test data, (2) a summary of the test results with explanations, and (3) a general comparison to the NTIA compliance specifications.
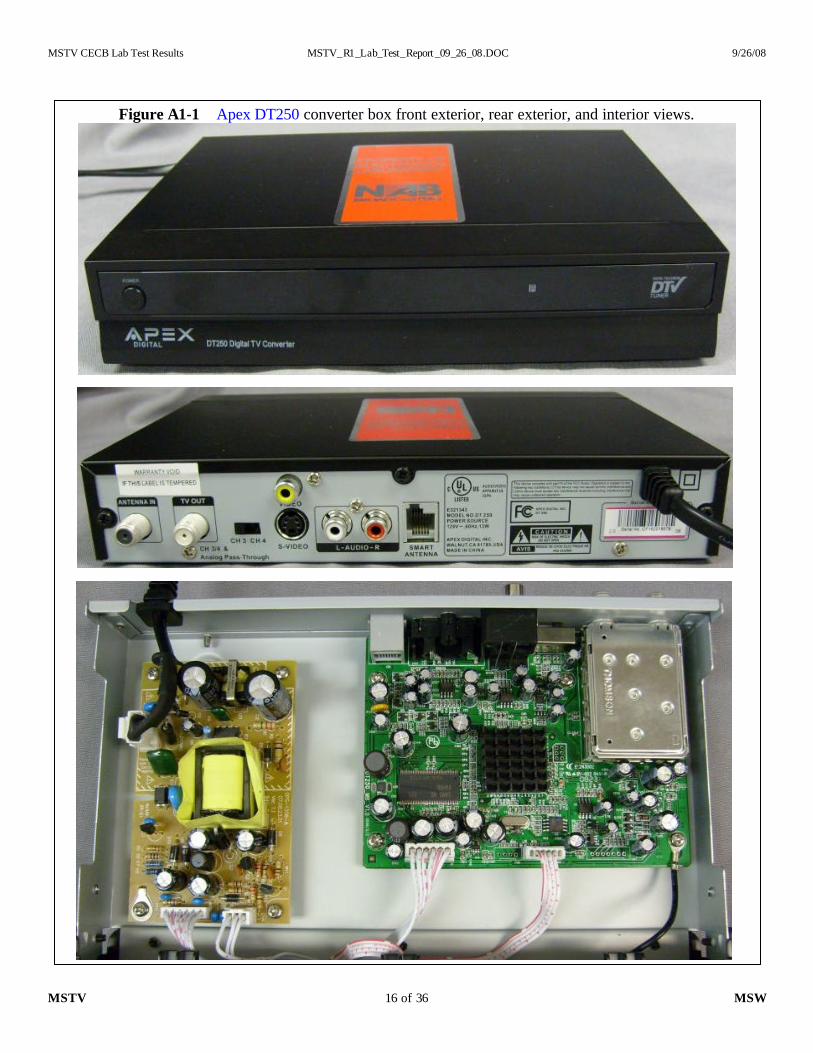
DEVICE UNDER TEST DESCRIPTION Eight devices under test (DUTs) are described below in Table 1, including some of the important internal RF components such as the tuner and VSB decoder modules. Each of the DTV receivers, which operated on 120 VAC, had an RF input via a female F-connector at a 75-Ohm terminal and provided analog composite baseband signals (composite video signal as well as stereo left and right audio signals ) on color-coded RCA jacks. Likewise, a selectable CH 3 & 4 modulated RF output signal on a female F-connector was available as well. It should be noted that it is believed that six of the seven CECB units tested at MSW had single-chip designs for 8-VSB and MPEG/AC-3 decoding (#1 - #6), while the seventh unit (#7) had the traditional two-chip approach.
Appendix 1 contains pictures of the various CECB units that were tested in MSW laboratories (external front and rear vie ws as well as an internal PC board view). Note the logos and pushbuttons (on/off or channel up/down) and LEDs (power) that exist on the front panel as well as the connectors (RF and baseband) and switches (CH 3 or CH 4) on the rear panel. Appendix 2 contains a summary of the pertinent features for the CECB units that were tested, and Appendix 3 contains photos of screen shots taken on a legacy analog NTSC receiver depicting the various signal quality meters observed on the CECB units.

MSTV CECB Lab Test Results MSTV_R1_Lab_Test_Report _09_26_08.DOC 9/26/08
MSTV 3 of 36 MSW
Table 1 Eight CECB units from MSTV tested in MSW Laboratories.
# Manufacturer Model # Serial # Tuner Demod 1 Apex DT250 CF162018578 Thomson DTT76852 Zoran 2 Digital Stream DTX9950 X0006560 Thomson DTT76852 LG LGDT1111T 3 Zenith DTT901 805SHHZ206569 LG TDVG-H151F LG LGDT1111T 4 Access HD DTA1010D ETA0803010322 Thomson DTT76850 Zoran 5 Insignia NS-DXA1 802SHXJ058170 Sanyo UBA00AL LG LGDT1111D 6 Magnavox TB100MW9 U15828857 Unknown (Sanyo?) Renesas 7 Sansonic FT-300A FD300A0080500106 Microtune MT2131F Auvitek AU8515AA 8 RCA DTA800 PA111J135B0875 Thomson DTT76808 Broadcom BCM3543
Test Plan The complete NTIA test plan covers both RF tests and non-RF tests (e.g., video formats, PSIP, LED indicator, closed captioning, EAS, and V-chip) as well as some miscellaneous requirements that do not involve testing at all (e.g., owners manual, connector types, and coaxial cable inclusion). For MSTV, MSW recommended a subset of the required NTIA RF tests, and a superset of the non-RF tests . This proposal was accepted by MSTV.
MSW carefully conducted these tests in the MSW laboratories following ATSC A/74 test guidelines as well as those guidelines utilized previously from the ACATS/ATTC test laboratory, the Model Station Project, the Communication Research Center (CRC) laboratory, and the NTIA. Wherever there was a lack of guidance, good engineering practice was followed.
A summary of the MSTV laboratory RF performance test plan, as implemented by MSW, is shown in Table 2 below.
Table 2 MSTV laboratory test plan
Test #
Test Category
Specific Test Description
Test Description
Test CH
# of Tests
1 General Sensitivity Minimum Desired Signal Level (dB) 2, 4, 6, 7, 12, 17, 27, 37, 47, 57 10
2 Overload Maximum Desired Signal Level (dB) 2, 4, 6, 7, 12, 17, 27, 37, 47, 57 10
3 RF Output VSB or DSB; signal levels, V/A ratio 3, 4 2
4 Analog Pass-thru Insertion Loss Plot, Worst-Case CHs in each band (dB) 2 thru 69 sweep 1
5 Signal Quality Indicator Signal level, added noise, multipath 30 1
6 Interference D-into-D Adjacent Channel N±1 (dB, D/U) @ 28, -53, -68 dBm 29, 31 6
7 D-into-D Taboo Channels N±2, N±3, N±4, N±7, N±14, N±15 (dB. D/U) @ -28, -53, -68 dBm,
15, 16, 23, 26, 27, 28, 32, 33, 34, 37, 44, 45
36
8 Impairments White Noise Threshold Added White Gaussian Noise: SNR@TOV (dB) 30 1
9 NTIA Echo Profile -50, -40, -20, -10, -5, 0, 10, 20, 40, 50 µs 30 10
10 Pilot Echo Null 3 µs @ 180 deg at pilot 30 1
11 RF Captures RF Playback 26 47
12 Non-RF Manual Addition of CHs Yes or No * 1
13 Add-On Scan Yes or No * 1
14 Direct RF Tuning Yes or No * 1
15 Channel Program Guide Info List informatio n; display screen captures * 1
16 LED Indicator # of states, LED colors used * 1
17 Type of NTSC Outputs RF, CVBS/stereo baseband, S-Video * 1
18 Analog Pass-Through Yes or No * 1
19 Output Scaler Choices 4:3, 16:9, Auto * 1
20 RF Output Selectio n Mechanical Switch or Menu * 1
21 BTSC Output Yes or No * 1
22 Smart Antenna Interface Yes or No * 1
24 Physical Dimensions L x W x H * 1

MSTV CECB Lab Test Results MSTV_R1_Lab_Test_Report _09_26_08.DOC 9/26/08
MSTV 4 of 36 MSW
Test Results A brief overview of the laboratory test results follows, most of which can be found in tabular form in Appendix 4. The test number refers to the numbers used in Table 2 in the Test Plan section.
GENERAL TESTS
1) Sensitivity: The CECB sensitivity was measured by applying a clean 8-VSB signal to the CECB and then decreasing the signal level until threshold of visible errors (TOV) is reached. While the normal NTIA sensitivity lab tests are performed on all 67 RF channels, these MSTV tests were performed on only 10 RF channels (3 low-VHF, 2 high-VHF, and 5 UHF) to reduce the testing time yet still give a flavor of any RF performance differences among the various CECB units. All 7 of the MSTV-provided boxes that were tested easily passed the NTIA certified sensitivity test specification. The median on-channel RF sensitivity values, when considering each CECB unit across all the tested RF channels (low-VHF, high-VHF, and UHF) varied from -85.0 dBm (unit #1) to -86.8 dBm (unit #6), thus providing reasonable margin beyond the NTIA spec of -83.0 dBm. Even analysis across all CECB units on the same channel showed that there is very little difference among RF channel frequencies across the three television bands: -85.2 dBm (CH 2) to -86.7 dBm (CH 6). Importantly, no sensitivity problems existed in the low-VHF band where previous FCC lab testing showed problems on some of the early DTV receivers.
It should be pointed out that this test is performed in a very carefully controlled and calibrated test bed, where the source impedances are reasonably close to the desired 75 Ohms (i.e., very little impedance mismatch from the RF source). Thus all the CECB units exhibited good low-level (sensitivity) RF performance.
The raw data is found in Table A4-1.
2) Overload: The CECB sensitivity was measured by applying a clean 8-VSB signal to the CECB and then increasing the signal level until TOV is reached. While the normal NTIA overload lab tests are performed on all 67 RF channels, these MSTV tests were performed on only 10 RF channels (3 low-VHF, 2 high-VHF, and 5 UHF) to reduce the testing time yet still give a flavor of any RF performance differences among the various CECB units. All 7 of the MSTV-provided boxes that were tested easily passed the NTIA certified overload test specification. The median on-channel RF overload values, when considering each CECB unit across all the tested RF channels (low-VHF, high-VHF, and UHF) was +1.3 dBm for all the CECB units, thus providing good margin beyond the NTIA spec of -5.0 dBm. It should be noted that these median values would have been even larger (and varied between units) had it not been for the fact that almost all of the large-signal thresholds reached the limits (˜ +1 to +2 dBm) of the laboratory test bed. Even analysis across all CECB units by channel showed that there is very little difference among RF channel frequencies across the three television bands: +0.7 dBm (CH 2 & CH 4) to +1.9 dBm (CH 27 & CH 57).
It should be pointed out once again that this test is performed in a very carefully controlled and calibrated test bed, where the source impedances are reasonably close to the desired 75 Ohms. Thus all the CECB units exhibited good high-level (overload) RF performance. Combined with the sensitivity tests, all the CECB units had more than 80 dB of dynamic range.
The raw data is found in Table A4-2.
3) RF Output: The CECB RF analog output signals were measured with a spectrum analyzer and evaluated. The NTSC visual carrier (peak envelope power) and the frequency-modulated aural carrier were documented for each CECB. The CH 3 and CH 4 visual carrier levels (which were typically within 1 dB of each other) collectively varied between -43 dBm and -35 dBm, with a median value of -40.1 dBm. All the CECB units provided a double-sideband visual carrier signal (for cost effectiveness) since spectral bandwidth compression is not critical at the legacy analog television’s input. The FM aural carriers varied between -60 dBm and -48 dBm, with a median of -56.4 dBm. This much larger variation represents differences in visual-to-aural (V/A) ratio designs, which varied from 13 dB to 18 dB. The visual depth of modulation was quickly checked for each CECB unit and found to be acceptable. These NTSC RF values are acceptable for producing good quality (potentially > 50 dB SNR) NTSC signals on legacy analog television receivers.
The raw data is found in Table A4-3.
4) Analog Pass-Through Insertion Loss: The analog pass-through feature was only present on three of the CECB units under test (#1, #2, #3). With the unit plugged in (i.e., power applied), but the box turned off, the analog pass-through feature became active and the CH 3/CH 4 RF outputs were turned off. A frequency sweep signal was applied to the CECB RF input and the resulting signal on the RF output was measured and recorded. Two of the three CECB units (#1 and #2) had overall gain while the third unit had loss. The two units with gain were in the range of 1.5 dB to 4 dB while the one unit with loss

MSTV CECB Lab Test Results MSTV_R1_Lab_Test_Report _09_26_08.DOC 9/26/08
MSTV 5 of 36 MSW
was in the range between 2 dB and 4 dB. Nevertheless, all three of these units met the NTIA recommended spec suggested in NTIA FAQ #47 (i.e., < 4 dB of loss), and were found adequate to supply decent video on legacy analog television sets.
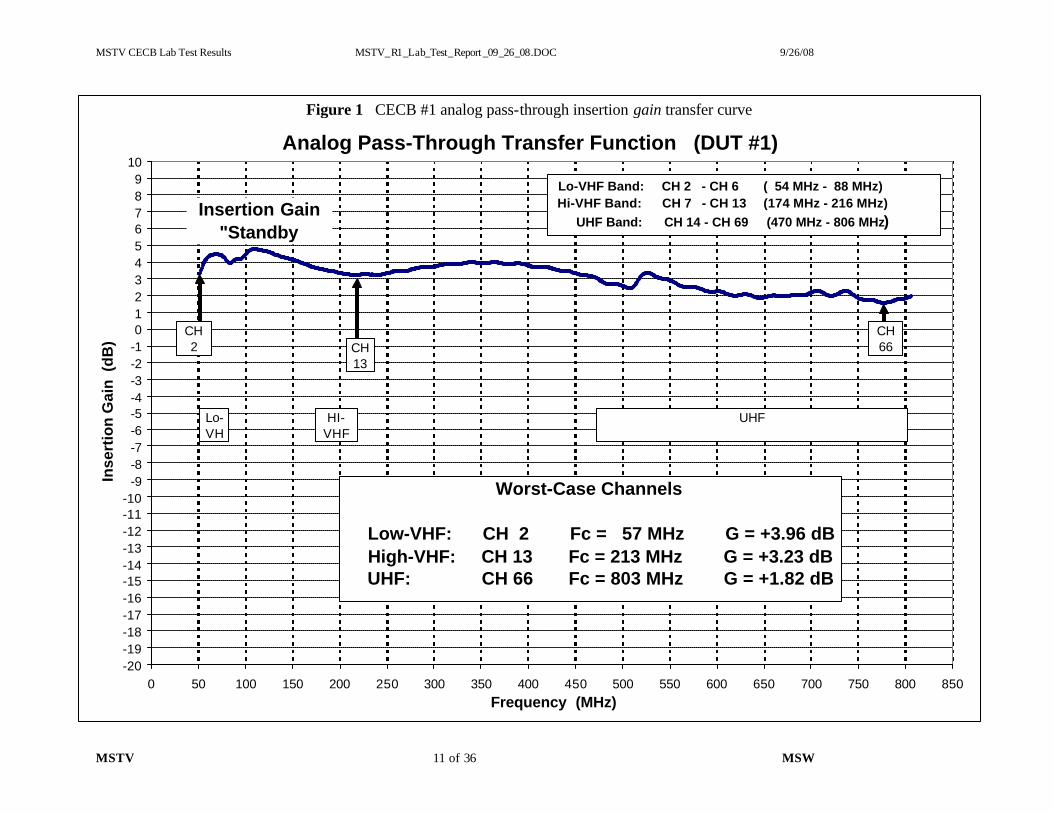
A summary of the insertion gain values is found in Table A4-4. Transfer plots of the insertion gain for all three analog pass-through CECB units can be found in Figure 1, Figure 2, and Figure 3.
5) Signal Quality Indicator: The signal quality meter is one of the most important “tools” that the viewer has available for properly adjusting an antenna (e.g., outdoor antenna on a rotor or an indoor antenna manually). Therefore, ease of use and relative accuracy are important to parameters to evaluate. All the CECB units have a single button (labeled either “signal”, “meter”, “display”, or “ant level”) on the remote control unit that, when depressed, will immediately activate the on-screen signal quality meter. Each of the CECB units has a signal indicator that is based on SNR after the equalizer since similar results are obtained whether the signal level is decreased to achieve TOV or the signal level is moderate and white nois e is added to achieve TOV. Likewise, significant echo amplitudes do not degrade the signal quality indicator meter if the echo is within the cancellation capability of the equalizer. Some units employ both a linear numeric scale (0% – 100%) with colored-coded (red, yellow, green, etc.) numbers combined with descriptive words (e.g. excellent, good, normal, bad, weak, etc.).
However, some units have signal quality indicators that are more stable and provide a better indication of signal quality than others. Units #1, #2, #3, #5, and #6 all provided reasonably accurate and helpful signal quality information. On the other hand, units #4 and #7 exhibited some inconsistent and unstable signal quality monitoring for strong undistorted signals (#4), moderate 25 dB SNR (#7), or severe (-3 dB) multipath (#4, #7).
Another interesting note is that two of the CECB units (#1, #4) required re -acquisition in order to achieve maximum stability of the signal quality meter (i.e., so the numbers would not jump between 90 and 100) when the undistorted RF signal level was changed. One unit (#7) even provided two indicators, one for signal strength and one for signal quality. This method is actually one of the best ways for the viewer to understand what is happening with the incoming DTV signal since it immediately indicates whether problem reception is due to broadband signal fading or severe dynamic multipath. However, during the lab testing experience, while the signal strength meter worked well, this particular signal quality meter (in unit #7) jumped around between large and small numbers and was not very stable. Nevertheless, this dual meter approach is a good idea if implemented properly.
Another unit (#6) had a long integration time (5 – 10 seconds) before displaying the signal quality meter, which might make adjusting an antenna cumbersome due to the delay in the visual feedback.
Finally, an interesting implementation of the signal quality meter was observed on two of the units (#3, #5). Activation of the signal quality meter also activated a pulsating audio tone that increased in repetition rate (i.e., pitch) with increasing signal quality so that a viewer can adjust his antenna without seeing the on-screen signal quality meter.
A summary of the signal quality indicator performance is shown below in Table 3 while the raw data is found in Table A4-5. Screen shots showing examples of these CECB signal quality meters can be found in Appendix 3.

MSTV CECB Lab Test Results MSTV_R1_Lab_Test_Report _09_26_08.DOC 9/26/08
MSTV 6 of 36 MSW
TABLE 3 Summary of CECB signal quality indicator features Unit Remote Control Type of Display Reception
# Label (dB) Good Poor 1 Signal Tri-Color Bar Graph (Quality)
Numeric Values: 0 – 100% Text: Weak, Good, Excellent
= 90 Excellent Note 1
= 30 Weak Note 1
2 Meter Tri-Color Bar Graph (Quality) Numeric Values: 0 – 100%
Text: NONE
= 90 -----
= 35 -----
3 Signal Tri-Color Bar Graph (Quality)
Numerical Values: NONE Text: Bad, Good
= 90 Good
= 40 Bad
4 Signal Tri-Color Bar Graph (Quality)
Numeric Values: 0 – 100% Text:: Weak, Normal, Good
= 90 Note 2
= 40 Note 3
5 Signal Tri-Color Bar Graph (Quality)
Numerical Values: NONE Text: Bad. Good
= 90
Good
= 40
Bad 6 Display Tri-Color Bar Graph (Quality)
Numeric Values: 0 – 100% Text: NONE
= 85
Note 4
= 20
Note 4 7 Ant Level Tri-Color Bar Graph (Quality & Level)
Numeric Values: 0 – 100% Text: NONE
= 80
Note 1
= 30
Note 1, 3
Note 1: Unit must re-acquire for stable and accurate signal quality display value for distortion-free signals. Note 2: Inconsistent signal quality display values for various undistorted signal levels
Note 3: Inconsistent signal quality display values for severe multipath levels Note 4: Long integration time (5-10 seconds) for signal quality indicator
INTERFERENCE TESTS 6) D-into-D Adjacent Channel Interference: The CECB D-into-D first adjacent channel interference test was performed on
CH 30 at three different desired signal levels (weak @ -68 dBm, moderate @ -53 dBm, strong @ -28 dBm). The adjacent channel (N+1, N-1) interfering DTV test signals were well filtered to provide minimal adjacent channel splatter interference to the desired DTV signal. All the CECB units easily passed the NTIA specs for both upper and lower adjacent channels, and for all three desired signal levels. The required NTIA spec of – 33 dB, D/U was easily met since the spec was essentially selected to be only 6 dB better (with no test bed splatter) than the ˜ 27 dB FCC planning factor that assumes the presence of allowable transmitter splatter energy equal to the FCC’s rigid emission mask. The FCC-allowed adjacent channel splatter is typically the limiting factor in first adjacent channel interference. Also, note that each CECB had nearly equal D/U interference threshold at both weak and moderate desired signal levels, indicating the presence of broadband tuner AGC.
The raw data is found in Table A4-6.
7) D-into-D Taboo Channel Interference: The CECB D-into-D taboo channel interference test was performed on CH 30 for N±2, N±3, N±4, N±7, N±14, and N±15, and at three different desired signal levels (weak @ -68 dBm, moderate @ -53 dBm, strong @ -28 dBm). The interfering taboo DTV test signals had their associated upconverter’s broadband white noise minimized by a CH 30 band-reject filter.
All the CECB units passed the NTIA specs for all taboo channels that were tested at three different desired signal levels. However, a few of the taboo channels passed by less than 1 dB: #6 for N+2, #5 for N-2, and #7 for N-7. The traditional “problem” taboos passed with reasonable margin, such as N+4 (half-IF, assuming 44 MHz IF frequency), N+7 (single-conversion oscillator influence), and N+14/N+15 (single-conversion tuner image frequencies).
The raw data is found in Table A4-7.
IMPAIRMENT TESTS 8) White Noise Threshold: The CECB white noise threshold test was performed on CH 30 at a moderate signal level (-53
dBm). A white Gaussian noise source provided the white noise interference signal that was added to the desired signal in 0.25 dB steps until TOV was reached. All CECB units easily passed the NTIA spec (SNR @TOV = 15.5 dB), with measured values varying from 14.75 dB to 15.25 dB. The Auvitek VSB decoder had the best (lowest) value and the Zoran VSB decoder had the worst (highest) value. The rest of the CECB units were right in the middle with 15.00 dB threshold values.

MSTV CECB Lab Test Results MSTV_R1_Lab_Test_Report _09_26_08.DOC 9/26/08
MSTV 7 of 36 MSW
This data indicates that the modern day VSB receivers (5G and 6G) do not sacrifice white noise threshold for improved multipath cancellation performance.
The raw data is found in Table A4-8.
9) Quasi-Static Echo Profile: The CECB quasi-static echo profile testing was performed on CH 30 according to the NTIA requirements. A single, quasi-static echo with a pre-determined delay, rotating in phase with a Doppler rate of 0.05 Hz, is applied to each CECB unit. The echo amplitude was increased (in 0.5 dB steps) until TOV was reached. The echo delays, according to the NTIA specs, were -50, -40, -20, -10, -5, 0, 10, 20, 40, and 50 µsecs.
All the CECB units passed the NTIA specs with one slight exception (#7 for -5 µsecs). However, it only missed it by 0.5 dB. Since 0.5 dB steps were used in the testing, the amount of error is probably closer to 0.25 dB, which is insignificant.
Figure 4 compares the echo profile of all the CECB units. The raw data is found in Table A4-9.
10) Pilot Echo Null: The CECB pilot echo null testing was performed by creating a single 3-usec static echo at 180 degrees (defined at the pilot). This creates a null at the pilot and every 1/3 MHz across the channel bandwidth. All the CECB units worked acceptably, i.e., error-free operation for 3 dB/180 degree echoes and with signal acquisition. Five of the CECB units worked with 1 dB echoes (90%). However, two of the units only worked with either 2 dB echo amplitudes (#6) or with 3 dB (#5).
The raw data is found in Table A4-10.
11) RF Captures: The CECB RF data captures utilize 50 previously captured RF signals that were obtained in the field at difficult locations within Washington DC and New York City. These single-channel captures were approximately 30 seconds long, and were played back repetitively through special playback equipment on CH 26. Each RF capture was viewed by an expert observer three times for its entire 30-second duration (i.e., there were three 30-second playback trials). Each time, an expert observer determined a performance rating for that trial according to the following scale: (0) no video or recovery at all, (1) heavy or continuous errors, (2) moderate errors, (3), only 1 or 2 short errors, and (4) no errors providing clean video and sound.
To analyze the CECB performance data in multiple ways, both a “linear” and a “binary” methodology are used as well as a combination of both. The first analysis method is the binary method, and is used to provide a simple “go/no go” result for each data capture similar to the required NTIA spec. In this analysis, a performance rating of 3 or 4 is considered a passing grade for a trial according to the NTIA rules, since only a maximum of 2 short (i.e., 2 seconds or less) video disturbances are allowed according to NTIA rules. Therefore, if 2 or 3 trials pass (i.e., a simple majority), then the RF data capture passes, and if 30 or more of the 50 ATSC data captures pass (i.e., = 60% of the captures), then the NTIA specs are met. (NOTE: there are three data captures out of the 50 that have no video on them, and therefore are given automatic passes per NTIA rules). The second analysis method is a combination of both linear and binary methods that allows some further differentiation among the various CECB units. Instead of just counting the number of data captures that passed, the number of passing trials are counted and compared with the maximum total value (3 x 50 = 150) to provide a percentage rating. This allows credit for some of the failed captures where only 1 trial passed and the other two may have just missed. Also, a passing capture with only two passed trials will be differentiated from a capture that had three solid passed trials. Finally, the third analysis method is purely linear in that it just averages all of the linear performance ratings for all of the trials, and provides the highest level of comparison among CECB units. All three of these methods are used in the following analysis , and each is represented in percentage form.
The RF data capture results indicate a strong similarity in RF performance among all 7 CECB units that were tested at MSW. All 7 of the units passed the required NTIA test of 60% of the captures (i.e., 30 of the 50 captures), with the worst performing units (#1 and #4) having an acceptable 74% success rate (i.e., 37 out of 50 captures), and still very close in performance to most of the other units. The best performing unit (#6) decoded 82% of the captures (i.e., 41 out of the 50 captures). The number of passed trials had very similar results since a vast majority of captures had the same number of trials passed and average ratings. Therefore, all 7 CECB units performed very similarly to one another in the RF data capture lab test, with the expectation that they would perform similarly in the field.
Some other observations were made during this data capture testing regarding both good and poor performance. On the positive side, CECB units (#2, #3, and #5) that contained the LGE VSB decoder chip set behaved very similarly to each other as expected, even though one of the units (#5) had a different version of the decoder IC (i.e., a D suffix) than the other two, as well as the fact that it may have been possible that this unit had different firmware that possibly could have selected different VSB decoder parameters for different performance tradeoffs. These units with the LGE decoder also had fast lock-up times,

MSTV CECB Lab Test Results MSTV_R1_Lab_Test_Report _09_26_08.DOC 9/26/08
MSTV 8 of 36 MSW
which made for very quick channel changes that would be desirable for the viewer at home. The two units (#1 and #4) with the two Zoran VSB decoders also performed similarly to each other as expected.
On the negative side, unit #4 had an annoying habit of momentarily “blanking out” the audio immediately after the error dialog box with the toll-free number disappears from the screen following an error. Unit #7 exhibited some dramatic instability on certain data captures and appeared to not converge on the optimum solution every time. This same unit also was prone to some audio drop-outs and severe lip-sync problems immediately after it encountered a significant error.
The RF data capture overall summary is shown in Table 4 below. The raw data is found in Table A4 -11.
Table 4 RF data capture Performance Summary
CECB Captures Passed Trials Passed Average Rating # (%) (%) (%)
1 74.0 74.0 78.7 2 80.0 80.0 83.0 3 80.0 79.3 82.7 4 74.0 74.0 78.2 5 78.0 78.0 83.2 6 82.0 82.0 85.0 7 80.0 80.7 84.2
NON-RF TESTS
The test results are summarized in Appendix 2 .
12) Manual Addition of Channels: This is a convenient and essential feature that allows a viewer to manually add channels that were not found during a complete scan. All of the CECB units tested included this feature. However, the mechanism for manually adding RF channels was often not obvious or not documented. Therefore, it is unlikely that the viewer will be able to use these features without some further education. This is particularly important and especially helpful in areas where different antenna orientations are required for a small number of DTV channels.
13) Add-On Scan: Only three of the CECB units (#2, #3, #5) had the capability of allowing the user to perform a complete scan that does NOT erase already-memorized channels from the list, but rather just adds new channels. This automatic feature is particularly useful when different stations or groups of stations are located in significantly different directions requiring re-aiming of the outdoor or indoor antenna.
14) Direct RF Tuning: All but one (#8) of the CECB units has some form of direct tuning that allows the viewer to type in the actual digital RF channel to tune it in. Whether the box automatically enables the equivalent virtual (analog) channel after direct tuning varies from one box to the next. This is not useful to those viewers who do not know the actual digital RF channels, but can become very useful in the days just before and just after the February full-service analog shutoff date to help people solve some of their reception problems. However, this would take further public education.
15) Channel Program Guide Info: The channel program guide has the goal to provide the viewer with many helpful pieces of information regarding the incoming signal, the programming it carries, and the type of signal that it is. The CECB units had many types of information that were common to each another, but the units did not provide all the same information since some of this information is not standardized and therefore not required by the NTIA. For instance, displaying the major and minor channel numbers, with the call letters, the date and time, the program name and time slot, the V-chip program rating, was very common. But the video format or aspect ratio, as well as the sound mode, were not always displayed on some of the CECB units. Some of the CECB units even displayed the signal quality meter when the program guide was requested. A review of Appendix 2 is one way to easily compare all of these units.
16) LED Indicator: All the CECB units have LEDs on the front panel to indicate the status of the converter box. Most use red to indicate the box is plugged in but turned off (#1 - #5), although one unit (#6) uses green to indicate this mode and another (#7) just turns off the LED. When the box is turned on, the LED status changes, either to green (#1, #2, #4), to blue (#3, #5), to orange (#6), or to red (#7).
17) Type of NTSC Outputs: All the CECB units provided a double-sideband (not VSB) modulated RF output on either CH 3 or CH 4 to the legacy analog television set. All the units had CVBS baseband outputs as well, but only one unit (#1) had an

MSTV CECB Lab Test Results MSTV_R1_Lab_Test_Report _09_26_08.DOC 9/26/08
MSTV 9 of 36 MSW
S-Video output (luminance and chrominance on separate lines that can potentially provide the best looking picture into a legacy analog NTSC set that is equipped to receive this signal).
18) Analog Pass-Through: Only three of the CECB units (#1, #2, and #3) had this analog pass-through option where the input signal is passed around the DTV receiver when it is turned off, and placed on the RF output in lieu of the CH 3 or CH 4 modulated output. This allows viewers after February 17, 2009 to watch analog LPTV programs that are not required to transition to digital on the same schedule as the full-service stations.
19) Output Scaler Choices: The output scaler choices allow the viewer to determine how various aspect ratio signals received by the D/A converter box are displayed on their legacy 4:3 analog television sets. While most of the sets that will be used by viewers are 4:3, some older SD monitors are 16:9, and therefore these CECB units allow that option to be considered. However, this is one of the most confusing aspects of all the features, as can be seen in the Appendix 2 table. The CECB units tend to use different words (e.g., full, zoom, letterbox, cropped, squeezed, wide, cinema, etc) to describe various effects that can be obtained, thus potentially causing mass confusion or frustration. This situation is not covered in this basic laboratory test report, but would warrant another complete study to analyze the likely results of viewers watching “postage stamp” pictures.
20) RF Output Selection: Each CECB had CH 3 and CH 4 RF output capability, which could be selected by the viewer. However, there were different means by which this could be done. The simplest way was an accessible switch on the rear panel (#1, #2, #4, and #8). Others had a menu option (#3, #5, #7) assuming that the viewer is able to see the menu on the legacy analog television set. The last unit (#6) required holding down the “setup” button on the remote, which means the viewer is required to read the printed setup directions (if available) or the manual.
21) BTSC Output: The legacy analog NTSC stereo system that uses a 15.734 kHz subcarrier to carry the extra “high-fidelity” audio channel and SAP signals, was not found on any of the CECB units. Therefore, the only way to deliver stereo audio into the legacy analog television set is via the baseband left and right baseband audio jacks.
22) Smart Antenna Interface: The CEA -907 smart antenna interface, which allows the unit to control parameters (e.g., gain or directionality) on a smart antenna connected to its RF input, was present in only three CECB units (#1, #4, #8).
23) Physical Dimensions : All the CECB units were relatively smaller and lightweight so that they could fit on top of many of the legacy analog television sets. The largest dimension on any of the CECB units was 9.25” wide, but most were narrower than 8.5”.The box depth was typically less than 6” (max was 6.5”).
Summary The CECB units that were evaluated in the MSW laboratory all performed well in the RF testing. RF Interference as well as multipath and white noise impairments were all readily handled by these CECB units. While there were some differences in performance, all the CECB units passed the required NTIA performance specs that were tested. If they are used properly in a reasonable receive system environment (i.e., good antenna pointed properly), they will most likely work well in the field. But it should be understood that these CECB units are not stand-alone devices, but rather are part of a receive system (i.e., properly aimed antenna with enough gain and directivity, possible robust preamplifier, reasonable loss feedline, modern 5G or 6G robust DTV receiver, and an appropriate legacy analog NTSC monitor), and, therefore, other components of the system are also important to consider.
On the other hand, the CECB features, while certainly functional, were not always helpful or easy to use in all the CECB units (signal quality meters, program guides, direct tuning, etc.). There will likely be some confusion regarding the operational modes of the units, such as add-on scanning channels or selecting video output formats for various types of display monitors. This will be compounded by a lack of over-the-air television reception experience or knowledge, especially in selecting and adjusting outdoor or indoor antennas. In order to achieve the best performance of these new converters in a good home receiving system environment, a significant amount of consumer education will be required regarding converter usage as well as in over-the-air reception techniques.
This lab testing also revealed that some of these CECB units have user interface features that have been implemented poorly and may be difficult for consumers to use. Broadcasters may be able to take certain actions to mitigate some of the limitations of these features, but before a plan of action can be determined, further evaluation and study is needed in the following areas:
Output Format Options (all units)
Active Format Descriptors (Zenith & Insignia units)
Channel Scan Options (all units)
Multiple RF interferors (all units)

MSTV CECB Lab Test Results MSTV_R1_Lab_Test_Report _09_26_08.DOC 9/26/08
MSTV 10 of 36 MSW
N+1/N+2 N-1/N-2 N+2/N+4 N-2/N-4
Signal Quality Indicator (all units or just on units #1, #4, #6, #7) Re-acquisition requirement Instability in strong undistorted signals Instability in moderate SNR Instability in severe multipath Long integration time
MSTV CECB Lab Test Results MSTV_R1_Lab_Test_Report _09_26_08.DOC 9/26/08
MSTV 11 of 36 MSW
Figure 1 CECB #1 analog pass-through insertion gain transfer curve
Analog Pass-Through Transfer Function (DUT #1)
-20-19-18-17-16-15-14-13-12-11-10
-9-8-7-6-5-4-3-2-10123456789
10
0 50 100 150 200 250 300 350 400 450 500 550 600 650 700 750 800 850Frequency (MHz)
Inse
rtio
n G
ain
(d
B)
Insertion Gain"Standby
Lo-VHF
HI-VHF
UHF
Worst-Case Channels
Low-VHF: CH 2 Fc = 57 MHz G = +3.96 dB High-VHF: CH 13 Fc = 213 MHz G = +3.23 dB UHF: CH 66 Fc = 803 MHz G = +1.82 dB
CH2
Lo-VHF Band: CH 2 - CH 6 ( 54 MHz - 88 MHz) Hi-VHF Band: CH 7 - CH 13 (174 MHz - 216 MHz) UHF Band: CH 14 - CH 69 (470 MHz - 806 MHz)
CH13
CH66
VHF

MSTV CECB Lab Test Results MSTV_R1_Lab_Test_Report _09_26_08.DOC 9/26/08
MSTV 12 of 36 MSW
Figure 2 CECB #2 analog pass-through insertion gain transfer curve
Analog Pass-Through Transfer Function (DUT #2)
-20-19-18-17-16-15-14-13-12-11-10
-9-8-7-6-5-4-3-2-10123456789
10
0 50 100 150 200 250 300 350 400 450 500 550 600 650 700 750 800 850Frequency (MHz)
Inse
rtio
n G
ain
(d
B)
Insertion Gain"Standby
Lo-VHF
HI-VHF
UHF
Worst-Case Channels
Low-VHF: CH 2 Fc = 57 MHz G = +4.04 dB High-VHF: CH 13 Fc = 213 MHz G = +3.24 dB UHF: CH 69 Fc = 803 MHz G = +1.59 dB
CH2
Lo-VHF Band: CH 2 - CH 6 ( 54 MHz - 88 MHz) Hi-VHF Band: CH 7 - CH 13 (174 MHz - 216 MHz) UHF Band: CH 14 - CH 69 (470 MHz - 806 MHz)
CH13
CH69
VHF

MSTV CECB Lab Test Results MSTV_R1_Lab_Test_Report _09_26_08.DOC 9/26/08
MSTV 13 of 36 MSW
Figure 3 CECB #3 analog pass-through insertion gain transfer curve
Analog Pass-Through Transfer Function (DUT #3)
-25-24-23-22-21-20-19-18-17-16-15-14-13-12-11-10
-9-8-7-6-5-4-3-2-1012345
0 50 100 150 200 250 300 350 400 450 500 550 600 650 700 750 800 850Frequency (MHz)
Inse
rtio
n G
ain
(d
B)
Insertion Gain"Standby
Lo-VHF
HI-VHF
UHF
Worst-Case Channels
Low-VHF: CH 2 Fc = 57 MHz G = - 3.76 dB High-VHF: CH 13 Fc = 213 MHz G = - 2.11 dB UHF: CH 69 Fc = 803 MHz G = - 3.77 dB
CH2
Lo-VHF Band: CH 2 - CH 6 ( 54 MHz - 88 MHz) Hi-VHF Band: CH 7 - CH 13 (174 MHz - 216 MHz) UHF Band: CH 14 - CH 69 (470 MHz - 806 MHz)
CH13
CH69
VHF

MSTV CECB Lab Test Results MSTV_R1_Lab_Test_Report _09_26_08.DOC 9/26/08
MSTV 14 of 36 MSW
Figure 4 Quasi-static echo profiles for CECB units #1 - #7
Quasi-Static Echo Profile Comparison
-16
-15
-14
-13
-12
-11
-10
-9
-8
-7
-6
-5
-4
-3
-2
-1
0
-50 -40 -30 -20 -10 0 10 20 30 40 50Echo Delay (usec)
Ech
o A
mp
litu
de
@ T
OV
(d
B)
#1#2#3#4#5#6#7

MSTV CECB Lab Test Results MSTV_R1_Lab_Test_Report _09_26_08.DOC 9/26/08
MSTV 15 of 36 MSW
APPENDIX 1 CECB EXTERIOR AND INTERIOR PICTURES
The pictures of the 8 CECB units provided by MSTV are shown below. Three views are presented: (1) exterior front view, (2) exterior rear view, and (3) interior board view. Note the switches and LEDs on the front panel and the connectors and switches on the rear panel. Also note the interior layout of the PC board and its components.
MSTV CECB Lab Test Results MSTV_R1_Lab_Test_Report _09_26_08.DOC 9/26/08
MSTV 16 of 36 MSW
Figure A1-1 Apex DT250 converter box front exterior, rear exterior, and interior views.

MSTV CECB Lab Test Results MSTV_R1_Lab_Test_Report _09_26_08.DOC 9/26/08
MSTV 17 of 36 MSW
Figure A1-2 Digital Stream DTX9950 converter box front exterior, rear exterior, and interior views.

MSTV CECB Lab Test Results MSTV_R1_Lab_Test_Report _09_26_08.DOC 9/26/08
MSTV 18 of 36 MSW
Figure A1-3 Zenith DTT901 converter box front exterior, rear exterior, and interior views.

MSTV CECB Lab Test Results MSTV_R1_Lab_Test_Report _09_26_08.DOC 9/26/08
MSTV 19 of 36 MSW
Figure A1-4 Access HD DTA 1010 converter box front exterior, rear exterior, and interior views.

MSTV CECB Lab Test Results MSTV_R1_Lab_Test_Report _09_26_08.DOC 9/26/08
MSTV 20 of 36 MSW
Figure A1-5 Insignia NS-DXA1 converter box front exterior, rear exterior, and interior views.

MSTV CECB Lab Test Results MSTV_R1_Lab_Test_Report _09_26_08.DOC 9/26/08
MSTV 21 of 36 MSW
Figure A1-6 Magnavox TB100MW9 converter box front exterior, rear exterior, and interior views.

MSTV CECB Lab Test Results MSTV_R1_Lab_Test_Report _09_26_08.DOC 9/26/08
MSTV 22 of 36 MSW
Figure A1-7 Sansonic FT-300A converter box front exterior, rear exterior, and interior views.

MSTV CECB Lab Test Results MSTV_R1_Lab_Test_Report _09_26_08.DOC 9/26/08
MSTV 23 of 36 MSW
Figure A1-8 RCA DTA 800B converter box front exterior, rear exterior, and interior views.

MSTV CECB Lab Test Results MSTV_R1_Lab_Test_Report _09_26_08.DOC 9/26/08
MSTV 24 of 36 MSW
APPENDIX 2 Summary of CECB Features
Feature Details #1 #2 #3 #4 #5 #6 #7 #8 Manual Addition of CHs Yes or No Y(4) Y(5) Y Y(4) Y Y Y(5) Add-On Scan Yes or No N Y Y N Y N N Direct RF Tuning Yes or No Y Y Y Y Y Y Y N Channel Program Guide Info CH # (major & minor) Y Y Y Y Y Y Y Date Y Y Y Y Y * * Time Y Y Y Y Y * Y Station Call Letters Y Y Y Y Y Y Y V-CHIP Rating Y Y Y Y Y Y Y Current Program Name Y Y Y Y Y Y Y Program Time Slot Y Y Y Y Y * Y Sound Mode Y Y * Y * * * Video Resolution * Y(6) * Y * * Y Video Aspect Ratio * Y Y * Y * Y Signal Quality Meter Y Y * Y * Y * Closed Captioning * Y Y * Y Y Y Parental Control * Y * Y Y * Language * * * * * Y Y Detailed Program Description. Y Y Y Y Y Y * LED Indicator Power applied & OFF RED RED RED RED RED GRN OFF Power applied & ON GRN GRN BLU GRN BLU ORG RED Type of NTSC Outputs RF Y Y Y Y Y Y Y CVBS/Stereo Baseband Y Y Y Y Y Y(3) Y S-Video Y N N N N N N Analog Pass-Through Yes or No Y Y Y N N N N Output Scaler Choices Selection 1 Normal Wide 16:9 Set By Program Normal Set By Program Letterbox 16:9 Selection 2 Zoom Wide 14:9 Letterbox Zoom Letterbox Zoom 4:3LB Selection 3 Fill Zoom Cropped Wide Cropped Full 4:3PS Selection 4 * Anamorphic Squeezed Cinema Squeezed * * RF Output Selection Switch or Menu Switch Switch Menu Switch Menu Remote(1) Menu Switch BTSC RF Output Yes or No N N N N N N N N Smart Antenna Interface Yes or No Y N N Y N N N Y Physical Dimensions Depth (inches) 6 4.25 6.5 6.5 6.5 6 4.25 5(2) Width (inches) 9 7.5 8.5 8.75 8.5 9.25 7 7.5 Height (inches) 1.5 1.25 1.5 1.5 1.5 1.5 1 1.5
(1) DUT #6 RF output channel could only be changed by holding down the "setup" button on the remote control for 3 seconds. (2) DUT #8 may be mounted either horizontally ("flat") or vertically ("on edge"). (3) DUT #6 has some wording in the manual that implies that the output is mono (i.e., not true stereo) despite the presence of two connectors (more investigation is required). (4) This feature is not documented in the manual for the viewer. (5) Manually adding channels is a cumbersome procedure for the viewer. (6) This display did not show video format resolution, but rather just an HD or an SD.

MSTV CECB Lab Test Results MSTV_R1_Lab_Test_Report _09_26_08.DOC 9/26/08
MSTV 25 of 36 MSW
APPENDIX 3 CECB NTSC Video Screen Shots
The pictures of screen shots from the 8 CECB units provided by MSTV are shown below. These pictures represent the on-screen display seen on the legacy analog NTSC receiver when the display (or similarly named) button is depressed on the remote control, showing the signal quality meter.

MSTV CECB Lab Test Results MSTV_R1_Lab_Test_Report _09_26_08.DOC 9/26/08
MSTV 26 of 36 MSW
Figure A3-1 Apex and Digital Stream converter box signal quality meter screen shots.
Apex
Digital Stream

MSTV CECB Lab Test Results MSTV_R1_Lab_Test_Report _09_26_08.DOC 9/26/08
MSTV 27 of 36 MSW
Figure A3-2 Zenith & Access HD converter box signal quality meter screen shots,
Access HD
Zenith

MSTV CECB Lab Test Results MSTV_R1_Lab_Test_Report _09_26_08.DOC 9/26/08
MSTV 28 of 36 MSW
Figure A3-3 Access HD & Insignia converter box signal quality meter screen shots..
Access HD
Insignia
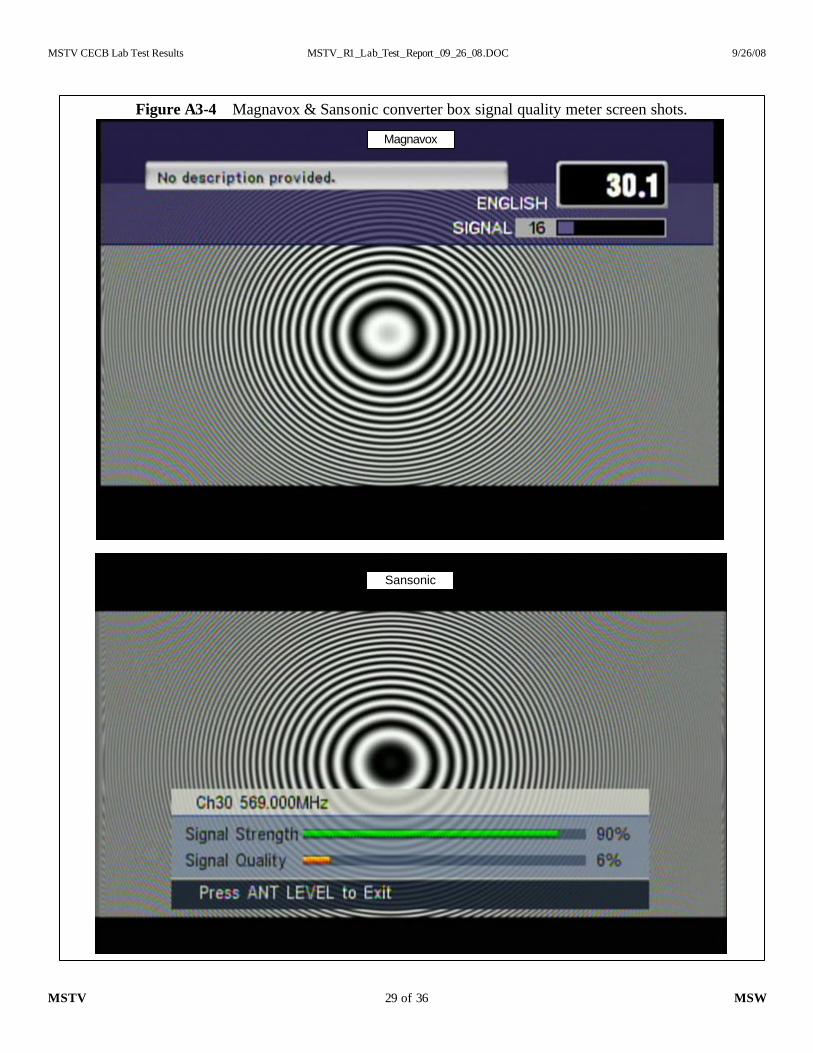
MSTV CECB Lab Test Results MSTV_R1_Lab_Test_Report _09_26_08.DOC 9/26/08
MSTV 29 of 36 MSW
Figure A3-4 Magnavox & Sansonic converter box signal quality meter screen shots.
Magnavox
Sansonic

MSTV CECB Lab Test Results MSTV_R1_Lab_Test_Report _09_26_08.DOC 9/26/08
MSTV 30 of 36 MSW
Appendix 4 CECB LAB TEST DATA
The following tables represent the data taken according to the test plan described in Table 1 of the text. The raw test data from all of the CECB units can be easily compared to one another.
TABLE A4-1 Sensitivity test results on CH 30
TABLE A4-2 Overload test results on CH 30
CH # #1 #2 #3 #4 #5 #6 #7 Median NTIA Units 2 0.0 -0.5 0.7 0.7 0.7 0.7 0.7 0.7 -5.0 dBm 4 0.7 0.7 0.7 0.7 0.7 0.7 0.7 0.7 -5.0 dBm 6 0.8 0.8 0.8 0.8 0.8 0.8 0.8 0.8 -5.0 dBm 7 0.9 0.9 0.9 0.9 0.9 0.9 0.9 0.9 -5.0 dBm 12 1.0 1.0 1.0 1.0 1.0 1.0 1.0 1.0 -5.0 dBm 17 1.5 1.5 1.5 1.5 1.5 1.5 1.5 1.5 -5.0 dBm 27 1.9 1.9 1.9 1.9 1.9 1.9 1.9 1.9 -5.0 dBm 37 1.6 1.6 1.6 1.6 1.6 1.6 1.6 1.6 -5.0 dBm 47 1.8 1.8 1.8 1.8 1.8 1.8 1.8 1.8 -5.0 dBm 57 1.9 1.9 1.9 1.9 1.9 1.9 1.9 1.9 -5.0 dBm
Median 1.3 1.3 1.3 1.3 1.3 1.3 1.3 * 1.3 dBm
CH # #1 #2 #3 #4 #5 #6 #7 Median NTIA Units 2 -84.2 -84.7 -85.1 -85.2 -86.2 -85.9 -85.2 -85.2 -83.0 dBm 4 -85.1 -85.6 -88.0 -86.3 -86.6 -86.9 -86.1 -86.3 -83.0 dBm 6 -85.5 -86.0 -87.9 -87.0 -86.9 -86.7 -86.5 -86.7 -83.0 dBm 7 -84.8 -85.4 -85.8 -85.6 -85.8 -86.2 -85.5 -85.6 -83.0 dBm 12 -85.2 -85.3 -86.3 -85.4 -86.3 -86.9 -85.8 -85.8 -83.0 dBm 17 -85.2 -85.4 -84.3 -85.6 -85.8 -86.7 -85.1 -85.4 -83.0 dBm 27 -84.5 -85.3 -84.8 -85.7 -85.8 -87.2 -85.1 -85.3 -83.0 dBm 37 -84.4 -85.4 -85.4 -85.1 -85.4 -87.1 -85.6 -85.4 -83.0 dBm 47 -84.7 -85.1 -85.2 -85.2 -85.1 -86.8 -85.1 -85.1 -83.0 dBm 57 -85.6 -85.6 -85.5 -84.8 -85.6 -86.6 -85.3 -85.6 -83.0 dBm
Median -85.0 -85.4 -85.5 -85.5 -85.8 -86.8 -85.4 * -83.0 dBm

MSTV CECB Lab Test Results MSTV_R1_Lab_Test_Report _09_26_08.DOC 9/26/08
MSTV 31 of 36 MSW
TABLE A4-3 RF Output test results (unit turned ON) on CH 3 and CH 4
Parameter #1 #2 #3 #4 #5 #6 #7 ALL Units CH 3 CH 4 CH 3 CH 4 CH 3 CH 4 CH 3 CH 4 CH 3 CH 4 CH 3 CH 4 CH 3 CH 4 Median
Visual Carrier Level -42 -43 -42 -43 -41 -41 -41 -42 -39 -40 -42 -42 -35 -35 -41.5 dBm Aural Carrier Level -58 -60 -59 -60 -57 -58 -57 -58 -57 -57 -59 -59 -48 -48 -58.0 dBm
Visual/Aural Carrier Ratio 16 17 17 17 16 17 16 16 18 17 17 17 13 13 17.0 dB Visual Depth of Modulation OK OK OK OK OK OK OK OK OK OK OK OK OK OK * %
TABLE A4-4 Analog pass-through worst-case insertion gain test results (unit turned OFF) from CH 2 – CH 69
Band #1 #2 #3 #4 #5 #6 #7 NTIA Loss CH Loss CH Loss CH Loss CH Loss CH Loss CH Loss CH
(dB) (#) (dB) (#) (dB) (#) (dB) (#) (dB) (#) (dB) (#) (dB) (#) (dB) Low-VHF 3.96 2 4.04 2 -3.76 2 N.A. N.A. N.A. N.A. N.A. N.A. N.A. N.A. > -4 High-VHF 3.23 13 3.24 13 -2.11 13 N.A N.A N.A N.A N.A N.A N.A N.A > -4
UHF 1.82 66 1.59 69 -3.77 69 N.A N.A N.A N.A N.A N.A N.A N.A > -4
Note: CECB unit #3exhibited negative gain, i.e., there was signal loss from the input to the output.

MSTV CECB Lab Test Results MSTV_R1_Lab_Test_Report _09_26_08.DOC 9/26/08
MSTV 32 of 36 MSW
TABLE A4-5 Signal quality indicator results on CH 30 (signal level, SNR, echo amplitude variations)
Parameter #1 #2 #3 #4 #5 #6 #7 Signal Level Quality Level Quality Level Quality Level Quality Level Quality Level Quality Level Quality Level
-8 dBm Excellent 97 92 Good/Blue 95% Good 92-100 Good/Blue 95% 100 100% 100% -28 dBm Excellent 97 91 Good/Blue 95% Good 92-100 Good/Blue 95% 98 100% 90% -53 dBm Excellent 97 92 Good/Blue 95% Good 92-100 Good/Blue 95% 100 100% 80% -68 dBm Excellent 92 89 Good/Blue 90% Good 100 Good/Blue 90% 85 100% 40% -83 dBm Weak 30 35 Bad/Green 50% Normal 40 Bad/Green 60% 19 9% 10%
SNR Quality Level Quality Level Quality Level Quality Level Quality Level Quality Level Quality Level 25 dB Excellent 67 63 Good/Blue 75% Normal 63 Good/Blue 75% 40 100% 80% 15 dB Weak 17 27 Good/Green 45% Normal 39 Bad/Green 45% 15 6% 80%
Echo Amplitude Quality Level Quality Level Quality Level Quality Level Quality Level Quality Level Quality Level -15 dB Excellent 97 90 Good/Blue 95% Good 100 Good/Blue 95% 96 100% 80% -6 dB Excellent 97 90 Good/Blue 90% Good 100 Good/Blue 90% 86 100% 85% -3 dB Excellent 97 85 Good/Blue 90% Good 90-95 Good/Blue 90% 80 100% 90%
TABLE A4-6 DTV-into-DTV for Adjacent Channel Interference Tests on desired CH 30
D-into-D Signal Level #1 #2 #3 #4 #5 #6 #7 NTIA Adjacent CH (dBm) (dB, D/U) (dB, D/U) (dB, D/U) (dB, D/U) (dB, D/U) (dB, D/U) (dB, D/U) (dB, D/U)
Upper Adjacent -68 dBm -41.3 -41.2 -40.2 -41.2 -41.2 -40.2 -41.4 <-33 -53 dBm -39.9 -38.9 -39.9 -40.9 -43.8 -40.9 -41.0 <-33 -28 dBm -23.0 -23.0 -23.0 -23.0 -23.0 -23.0 -23.0 <-20
Lower Adjacent -68 dBm -39.9 -40.6 -40.9 -40.9 -40.0 -39.9 -41.1 <-33 -53 dBm -38.4 -38.2 -38.3 -40.6 -39.4 -39.4 -40.7 <-33 -28 dBm -22.7 -22.2 -22.8 -22.8 -22.8 -22.8 -22.8 <-20
Note : The maximum interfering signal level was capped at about -5 dBm, which means the test platform D/U ratio limits are approximately -23 dB (strong), -48 dB (moderate), and -63 dB (weak).

MSTV CECB Lab Test Results MSTV_R1_Lab_Test_Report _09_26_08.DOC 9/26/08
MSTV 33 of 36 MSW
TABLE A4-7 DTV-into-DTV D/U ratios for Taboo Channel D/U Interference Tests on desired CH 30
D-into-D Signal Level #1 #2 #3 #4 #5 #6 #7 NTIA Taboo CH (dBm) (dBm) (dBm) (dBm) (dBm) (dBm) (dBm) (dBm) (dBm)
D+2 -68 -53.1 -53.1 -50.2 -53.0 -52.0 -44.1 -46.3 < -44 D+2 -53 -47.9 -47.9 -47.8 -47.8 -47.9 -43.9 -47.7 < -40 D+2 -28 -22.9 -22.9 -22.8 -22.8 -22.8 -22.8 -22.7 < -20 D-2 -68 -50.2 -50.0 -50.1 -51.6 -44.1 -45.1 -46.1 < -44 D-2 -53 -48.0 -47.9 -47.9 -47.8 -44.9 -46.7 -44.8 < -40 D-2 -28 -23.0 -22.9 -22.9 -22.8 -22.9 -22.9 -22.8 < -20 D+3 -68 -63.0 -63.0 -56.6 -63.0 -56.5 -50.6 -52.6 < -48 D+3 -53 -47.8 -47.8 -47.7 -47.8 -47.8 -47.7 -47.6 < -40 D+3 -28 -22.8 -22.8 -22.7 -22.8 -22.7 -22.7 -22.6 < -20 D-3 -68 -62.7 -63.2 -58.7 -63.0 -52.4 -55.6 -51.6 < -48 D-3 -53 -48.0 -48.0 -47.9 -47.8 -48.0 -47.9 -47.8 <-40 D-3 -28 -23.0 -23.0 -22.9 -22.8 -22.9 -22.9 -22.8 <-20 D+4 -68 -63.1 -63.1 -63.1 -62.9 -62.3 -56.6 -59.2 < -52 D+4 -53 -47.9 -47.9 -47.8 -47.8 -47.9 -47.8 -47.7 < -40 D+4 -28 -22.9 -22.9 -22.8 -22.8 -22.8 -22.8 -22.7 < -20 D-4 -68 -63.2 -63.2 -63.2 -57.6 -58.5 -61.6 -60.5 < -52 D-4 -53 -48.0 -48.0 -47.9 -47.8 -48.0 -47.9 -47.8 < -40 D-4 -28 -23.0 -23.0 -22.9 -22.8 -22.9 -22.9 -22.8 <-20 D+7 -68 -62.8 -62.8 -62.8 -63.1 -62.7 -62.7 -57.1 < -57 D+7 -53 -47.6 -47.6 -47.6 -47.8 -47.6 -47.5 -47.4 < -45 D+7 -28 -22.6 -22.5 -22.5 -22.8 -22.6 -22.5 -22.4 < -20 D-7 -68 -63.0 -63.0 -63.0 -63.1 -62.9 -62.9 -58.0 < -57 D-7 -53 -47.8 -47.8 -47.8 -47.8 -47.8 -47.7 -47.6 < -45 D-7 -28 -22.8 -22.7 -22.7 -22.8 -22.8 -22.7 -22.6 < -20
D+14 -68 -62.8 -55.9 -62.9 -63.1 -54.9 -59.9 -62.7 < -46 D+14 -53 -47.7 -47.7 -47.7 -47.8 -47.7 -47.6 -47.5 < -45 D+14 -28 -22.7 -22.6 -22.6 -22.8 -22.7 -22.6 -22.5 < -20 D-14 -68 -62.8 -62.8 -62.8 -63.1 -62.7 -62.7 -56.9 < -46 D-14 -53 -47.6 -47.6 -47.6 -47.8 -47.6 -47.5 -47.4 < -45 D-14 -28 -22.6 -22.5 -22.5 -22.8 -22.6 -22.5 -22.4 < -20 D+15 -68 -57.8 -52.9 -60.9 -62.0 -52.8 -56.8 -62.7 < -46 D+15 -53 -47.7 -47.7 -47.7 -47.8 -47.7 -47.6 -47.5 < -45 D+15 -28 -22.7 -22.6 -22.6 -22.8 -22.7 -22.6 -22.5 < -20 D-15 -68 -62.7 -62.7 -62.7 -63.1 -60.7 -62.6 -56.6 < -46 D-15 -53 -47.5 -47.5 -47.5 -47.8 -47.5 -47.4 -47.3 < -45 D-15 -28 -22.5 -22.4 -22.4 -22.8 -22.5 -22.4 -22.3 < -20
Note : The maximum interfering signal level was capped at about -5 dBm, which means the test platform D/U ratio limits are approximately -23 dB (strong), -48 dB (moderate), and -63 dB (weak).

MSTV CECB Lab Test Results MSTV_R1_Lab_Test_Report _09_26_08.DOC 9/26/08
MSTV 34 of 36 MSW
TABLE A4-8 Added White Gaussian Noise (AWGN) threshold of visible (TOV) errors on CH 30
Noise Type Test Condition #1 #2 #3 #4 #5 #6 #7 NTIA Units AWGN D = -28 dBm, Min D/U 15.25 15.00 15.00 15.25 15.00 15.00 14.75 N.A. dB
TABLE A4-9 Quasi-static (= 0.2 Hz) Echo Profile for moderate-level CH 30
Echo Delay Signal Level #1 #2 #3 #4 #5 #6 #7 NTIA Units (µs) (dBm) (dB) (dB) (dB) (dB) (dB) (dB) (dB) (dB) -50 -53 -15.5 -7.0 -7.5 -15.0 -7.0 -10.0 -7.0 -16 dB -40 -53 -8.0 -7.0 7.0 -8.5 -7.0 -8.0 -7.0 -12 dB -20 -53 -4.5 -3.0 3.0 -4.5 -3.0 -4.5 -4.5 -6 dB -10 -53 -2.5 -1.5 1.5 -2.0 -1.5 -1.5 -3.5 -5 dB -5 -53 -1.0 -0.5 1.0 -1.0 -0.5 -1.5 -2.5 -2 dB 0 -53 -0.5 -0.5 0.5 -0.5 -0.5 -0.5 -0.5 -1 dB 10 -53 -1.0 -1.0 1.0 -1.0 -1.5 -1.5 -1.5 -2 dB 20 -53 -1.0 -1.5 2.0 -3.0 -3.0 -2.0 -1.0 -3 dB 40 -53 -1.5 -3.0 4.0 -1.5 -6.5 -2.5 -1.5 -10 dB 50 -53 -1.0 -3.0 4.0 -1.5 -7.0 -8.0 -1.0 -16 dB
Note : the -5 µsec echo test for CECB #7 only misses the NTIA specs by 0.5 dB or less.
TABLE A4-10 Pilot-nulled multipath threshold of visible (TOV) errors on CH 30
Pilot Null Test Condition #1 #2 #3 #4 #5 #6 #7 NTIA Units Echo amplitude -28 dBm, 3 us, 180 deg, TOV with acquisition & no errors 1.0 1.0 1.0 1.0 3.0 2.0 0.5 1.0 dB Echo amplitude -28 dBm, 3 us, 180 deg, TOV without acquisition & mo errors 0.5 0.5 0.5 0.5 2.5 1.5 0.5 ----- dB

MSTV CECB Lab Test Results MSTV_R1_Lab_Test_Report _09_26_08.DOC 9/26/08
MSTV 35 of 36 MSW
TABLE A4-11 ATSC RF Data Capture Results
# RF Capture Test #1 #2 #3 #4 #5 #6 #7
Capture File Name Capt Pass
Trials Pass
Ave Rating
Capt Pass
Trials Pass
Ave Rating
Capt Pass
Trials Pass
Ave Rating
Capt Pass
Trials Pass
Ave Rating
Capt Pass
Trials Pass
Ave Rating
Capt Pass
Trials Pass
Ave Rating
Capt Pass
Trials . Pass
Ave Rating
1 NYC_200_44_10272000_DBT1 1 3 4.0 1 3 4.0 1 3 4.0 1 3 4.0 1 3 4.0 1 3 4.0 1 3 4.0 2 NYC_200_44_10272000_LOOP1 0 0 1.0 0 0 2.0 0 0 2.0 0 0 1.0 0 0 2.0 0 0 2.0 0 0 1.0 3 NYC_200_44_10272000_MEGA1 1 3 4.0 1 3 4.0 1 3 4.0 1 3 4.0 1 3 4.0 1 3 4.0 1 3 4.0 4 NYC_200_44_10272000_RAB1 1 3 4.0 1 3 4.0 1 3 4.0 1 3 4.0 1 3 4.0 1 3 4.0 1 3 4.0 5 NYC_200_44_10272000_SSEN1 1 3 3.7 1 3 4.0 1 3 4.0 1 3 3.3 1 3 4.0 1 3 4.0 1 3 4.0 6 NYC_200_44_10272000_SSEN2 1 3 4.0 1 3 4.0 1 3 3.7 1 3 4.0 1 3 4.0 1 3 4.0 1 3 4.0 7 NYC_200_44_10272000_SSEN3 0 0 1.0 0 0 1.0 0 0 1.0 0 0 1.0 0 0 1.0 0 0 1.0 0 0 1.0 8 NYC_200_44_10272000_YAGI1 1 3 4.0 1 3 4.0 1 3 4.0 1 3 4.0 1 3 4.0 1 3 4.0 1 3 4.0 9 NYC_200_56_10272000_BWT1 1 3 3.0 1 3 4.0 1 3 4.0 1 3 3.0 1 3 4.0 1 3 4.0 0 0 0.0 10 NYC_200_56_10272000_DBT2 1 3 4.0 1 3 4.0 1 3 4.0 1 3 4.0 1 3 4.0 1 3 3.7 1 3 4.0 11 NYC_200_56_10272000_DSEN1 1 3 4.0 1 3 4.0 1 3 4.0 1 3 4.0 1 3 4.0 1 3 4.0 0 1 2.0 12 NYC_200_56_10272000_DSEN2 1 3 4.0 1 3 3.0 1 3 4.0 1 3 4.0 1 3 3.3 1 3 3.0 1 3 3.3 13 NYC_200_56_10272000_LOOP1 1 3 4.0 1 3 4.0 1 3 4.0 1 3 4.0 1 3 4.0 1 3 4.0 1 3 3.0 14 NYC_200_56_10272000_MEGA1 1 3 4.0 1 3 4.0 1 3 4.0 1 3 4.0 1 3 4.0 1 3 4.0 1 3 4.0 15 NYC_200_56_10272000_RAB1 1 3 4.0 1 3 4.0 1 3 4.0 1 3 4.0 1 3 4.0 1 3 4.0 1 3 4.0 16 NYC_200_56_10272000_SSEN1 1 3 3.0 1 3 3.0 1 3 3.0 1 3 3.0 1 3 3.0 1 3 3.0 0 0 2.0 17 NYC_200_56_10272000_YAG1 1 3 4.0 1 3 4.0 1 3 4.0 1 3 4.0 1 3 4.0 1 3 4.0 1 3 4.0 18 WAS_06_34_06092000_REF 1 3 4.0 1 3 3.0 1 3 3.0 1 3 3.3 1 3 3.0 1 3 3.7 1 3 4.0 19 WAS_23_34_06072000_OPT 1 3 4.0 1 3 4.0 1 3 4.0 1 3 4.0 1 3 4.0 1 3 4.0 1 3 4.0 20 WAS_23_48_06072000_OPT 0 0 2.0 0 0 2.0 0 0 2.0 0 0 2.0 0 0 2.0 0 0 2.0 0 0 2.0 21 WAS_3_27_06022000_REF 1 3 4.0 1 3 4.0 1 3 4.0 1 3 4.0 1 3 4.0 1 3 4.0 1 3 4.0 22 WAS_3_35_06022000_REF 1 3 4.0 1 3 4.0 1 3 4.0 1 3 4.0 1 3 4.0 1 3 4.0 1 3 4.0 23 WAS_311_34_06052000_OPT 0 0 0.7 0 0 0.0 0 0 0.0 0 0 1.0 0 0 1.0 0 0 0.0 0 0 1.0 24 WAS_311_35_06052000_REF 1 3 4.0 1 3 4.0 1 3 4.0 1 3 4.0 1 3 4.0 1 3 4.0 1 3 4.0 25 WAS_311_36_06052000_REF 1 3 4.0 1 3 4.0 1 3 4.0 1 3 4.0 1 3 4.0 1 3 4.0 1 3 4.0
Note : Impaired DTV signal has amplitude of approximately -28 dBm on CH 26.

MSTV CECB Lab Test Results MSTV_R1_Lab_Test_Report _09_26_08.DOC 9/26/08
MSTV 36 of 36 MSW
TABLE A4-11 (cont) ATSC RF Data Capture Results
# RF Captu re Test #1 #2 #3 #4 #5 #6 #7
Capture File Name Capt Pass
Trials Pass
Ave Rating
Capt Pass
Trials Pass
Ave Rating
Capt Pass
Trials Pass
Ave Rating
Capt Pass
Trials Pass
Ave Rating
Capt Pass
Trials Pass
Ave Rating
Capt Pass
Trials Pass
Ave Rating
Capt Pass
Trials . Pass
Ave Rating
26 WAS_311_39_06052000_OPT 0 0 0.0 0 0 0.0 0 0 0.0 0 0 0.0 0 0 0.0 0 0 0.0 1 3 4.0 27 WAS_311_48_06052000_REF 1 3 3.0 1 3 4.0 1 3 3.7 1 3 3.0 1 3 4.0 1 3 4.0 1 3 4.0 28 WAS_32_48_06012000_OPT 0 0 1.0 0 0 1.0 0 0 2.0 0 0 1.0 0 0 1.0 0 0 2.0 0 0 2.0 29 WAS_34_27_06082000_OPT 1 3 4.0 1 3 4.0 1 3 3.0 1 3 4.0 1 3 4.0 1 3 4.0 1 3 3.7 30 WAS_34_35_06082000_OPT 1 3 4.0 1 3 4.0 1 3 4.0 1 3 4.0 1 3 4.0 1 3 4.0 1 3 4.0 31 WAS_34_48_06082000_OPT 1 3 3.3 1 3 3.0 1 3 3.0 1 3 3.0 1 3 3.0 1 3 3.7 1 3 3.3 32 WAS_38_34_05312000_OPT 1 3 4.0 1 3 4.0 1 3 4.0 1 3 4.0 1 3 4.0 1 3 4.0 1 3 4.0 33 WAS_38_34_05312000_REF 1 3 4.0 1 3 4.0 1 3 4.0 1 3 4.0 1 3 4.0 1 3 4.0 1 3 4.0 34 WAS_38_36_05312000_OPT 1 3 4.0 1 3 4.0 1 3 4.0 1 3 4.0 1 3 4.0 1 3 4.0 1 3 4.0 35 WAS_47_48_06132000_OPT 1 3 4.0 1 3 4.0 1 3 4.0 1 3 4.0 1 3 4.0 1 3 4.0 1 3 4.0 36 WAS_49_34_06142000_OPT 0 0 0.0 0 0 0.0 0 0 1.0 0 0 1.0 0 0 1.0 0 0 1.0 0 0 1.0 37 WAS_49_39_06142000_OPT 1 3 4.0 1 3 4.0 1 3 4.0 1 3 4.0 1 3 4.0 1 3 3.7 1 3 4.0 38 WAS_51_35_05242000_REF 0 0 1.0 1 3 4.0 1 2 2.7 0 0 1.0 1 3 3.0 1 3 3.3 1 3 4.0 39 WAS_63_34_06212000_OPT 1 3 3.0 1 3 3.0 1 3 3.0 1 3 3.0 1 3 3.0 1 3 4.0 1 3 3.0 40 WAS_68_36_05232000_REF 0 0 2.0 0 0 2.0 0 0 2.0 0 0 2.0 0 0 2.0 0 0 2.0 1 3 3.0 41 WAS_75_35_06162000_OPT 0 0 2.0 0 0 2.0 0 0 2.0 0 0 2.0 0 0 2.0 1 3 3.0 1 3 3.0 42 WAS_75_36_06162000_OPT 0 0 1.0 0 0 2.0 0 0 2.0 0 0 1.0 0 0 2.0 0 0 2.0 0 0 2.0 43 WAS_75_39_06162000_OPT 1 3 4.0 1 3 4.0 1 3 4.0 1 3 4.0 1 3 4.0 1 3 4.0 1 3 4.0 44 WAS_80_35_06152000_OPT 1 3 4.0 1 3 4.0 1 3 4.0 1 3 4.0 1 3 4.0 1 3 4.0 1 3 4.0 45 WAS_81_36_06192000_OPT 1 3 3.7 1 3 4.0 1 3 4.0 1 3 3.7 1 3 4.0 1 3 4.0 1 3 4.0 46 WAS_82_35_06202000_OPT 1 3 4.0 1 3 4.0 1 3 4.0 1 3 3.0 1 3 4.0 1 3 4.0 1 3 4.0 47 WAS_83_36_06222000_OPT 1 3 4.0 1 3 4.0 1 3 4.0 1 3 4.0 1 3 4.0 1 3 4.0 1 3 4.0 48 WAS_83_39_06222000_OPT 1 3 4.0 1 3 4.0 1 3 4.0 1 3 4.0 1 3 4.0 1 3 4.0 1 3 4.0 49 WAS_86_36_07122000_OPT 0 0 2.0 1 3 3.7 1 3 3.3 0 0 2.0 1 3 4.0 1 3 4.0 1 3 4.0 50 WAS_86_48_07122000_REF 0 0 1.0 1 3 3.3 1 3 3.0 0 0 1.0 0 0 2.0 1 3 3.0 1 3 4.0
Note : Impaired DTV signal has amplitude of approximately -28 dBm on CH 26.