Differential chromatin proteomics of the MMS-induced DNA damage response in yeast
14
RESEARCH Open Access Differential chromatin proteomics of the MMS-induced DNA damage response in yeast Dong Ryoung Kim 1 , Rohan D Gidvani 1 , Brian P Ingalls 2 , Bernard P Duncker 1 and Brendan J McConkey 1* Abstract Background: Protein enrichment by sub-cellular fractionation was combined with differential-in-gel-electrophoresis (DIGE) to address the detection of the low abundance chromatin proteins in the budding yeast proteome. Comparisons of whole-cell extracts and chromatin fractions were used to provide a measure of the degree of chromatin association for individual proteins, which could be compared across sample treatments. The method was applied to analyze the effect of the DNA damaging agent methyl methanesulfonate (MMS) on levels of chromatin-associated proteins. Results: Up-regulation of several previously characterized DNA damage checkpoint-regulated proteins, such as Rnr4, Rpa1 and Rpa2, was observed. In addition, several novel DNA damage responsive proteins were identified and assessed for genotoxic sensitivity using either DAmP (decreased abundance by mRNA perturbation) or knockout strains, including Acf2, Arp3, Bmh1, Hsp31, Lsp1, Pst2, Rnr4, Rpa1, Rpa2, Ste4, Ycp4 and Yrb1. A strain in which the expression of the Ran-GTPase binding protein Yrb1 was reduced was found to be hypersensitive to genotoxic stress. Conclusion: The described method was effective at unveiling chromatin-associated proteins that are less likely to be detected in the absence of fractionation. Several novel proteins with altered chromatin abundance were identified including Yrb1, pointing to a role for this nuclear import associated protein in DNA damage response. Keywords: chromatin, fractionation, DIGE, differential, proteomics, MMS, DNA damage Background Within many proteomic studies, protein abundance and complexity can affect practical detection sensitivity, even with advances in differential in-gel electrophoresis (DIGE) [1] and MS-based approaches [2]. For example, certain functional classes of proteins such as transcription factors and cell cycle proteins are present at low abundance in whole cell extracts compared to other structural and meta- bolic proteins [3]. In response to the issues of low abun- dance and dynamic range limitations of quantitative proteomics methods (e.g. LC-MS or DIGE), one strategy is to minimize sample complexity through enrichment approaches, such as affinity capture of protein complexes (e.g. tandem affinity purification) [4], selection of phospho- peptides [5], and sub-cellular fractionation [6-8]. Although targeted affinity-based methods can lead to high levels of enrichment, they have a high probability of excluding rele- vant proteins. An attractive alternative approach is a sub- cellular fractionation, where overall protein complexity and stoichiometry can be largely retained during the frac- tionation. Based on this rationale, cellular organelles have been subjected to proteomic analysis, including mitochon- dria and chloroplasts [6-8], demonstrating that the combi- nation of sub-cellular fractionation and proteomics techniques provides a practical means for the analysis of low-abundance proteins localized in discrete regions of the cell. Though it is not a separate organelle per se, chromatin is physically organized in the cell and, due to the impor- tance of chromatin in molecular analyses of DNA replica- tion and epigenetics, procedures to separate chromatin from other cellular components have become well estab- lished in budding yeast [9-11]. By using fractionated chro- matin samples, MS-based approaches have been employed to identify a wide range of chromatin-associated proteins, including those from developing Xenopus embryos [12] * Correspondence: [email protected] 1 Department of Biology, University of Waterloo, 200 University Avenue, Waterloo, ON, Canada Full list of author information is available at the end of the article Kim et al. Proteome Science 2011, 9:62 http://www.proteomesci.com/content/9/1/62 © 2011 Kim et al; licensee BioMed Central Ltd. This is an Open Access article distributed under the terms of the Creative Commons Attribution License (http://creativecommons.org/licenses/by/2.0), which permits unrestricted use, distribution, and reproduction in any medium, provided the original work is properly cited.
-
Upload
independent -
Category
Documents
-
view
9 -
download
0
Transcript of Differential chromatin proteomics of the MMS-induced DNA damage response in yeast
RESEARCH Open Access
Differential chromatin proteomics of theMMS-induced DNA damage response in yeastDong Ryoung Kim1, Rohan D Gidvani1, Brian P Ingalls2, Bernard P Duncker1 and Brendan J McConkey1*
Abstract
Background: Protein enrichment by sub-cellular fractionation was combined with differential-in-gel-electrophoresis(DIGE) to address the detection of the low abundance chromatin proteins in the budding yeast proteome.Comparisons of whole-cell extracts and chromatin fractions were used to provide a measure of the degree ofchromatin association for individual proteins, which could be compared across sample treatments. The methodwas applied to analyze the effect of the DNA damaging agent methyl methanesulfonate (MMS) on levels ofchromatin-associated proteins.
Results: Up-regulation of several previously characterized DNA damage checkpoint-regulated proteins, such asRnr4, Rpa1 and Rpa2, was observed. In addition, several novel DNA damage responsive proteins were identifiedand assessed for genotoxic sensitivity using either DAmP (decreased abundance by mRNA perturbation) orknockout strains, including Acf2, Arp3, Bmh1, Hsp31, Lsp1, Pst2, Rnr4, Rpa1, Rpa2, Ste4, Ycp4 and Yrb1. A strain inwhich the expression of the Ran-GTPase binding protein Yrb1 was reduced was found to be hypersensitive togenotoxic stress.
Conclusion: The described method was effective at unveiling chromatin-associated proteins that are less likely tobe detected in the absence of fractionation. Several novel proteins with altered chromatin abundance wereidentified including Yrb1, pointing to a role for this nuclear import associated protein in DNA damage response.
Keywords: chromatin, fractionation, DIGE, differential, proteomics, MMS, DNA damage
BackgroundWithin many proteomic studies, protein abundance andcomplexity can affect practical detection sensitivity, evenwith advances in differential in-gel electrophoresis (DIGE)[1] and MS-based approaches [2]. For example, certainfunctional classes of proteins such as transcription factorsand cell cycle proteins are present at low abundance inwhole cell extracts compared to other structural and meta-bolic proteins [3]. In response to the issues of low abun-dance and dynamic range limitations of quantitativeproteomics methods (e.g. LC-MS or DIGE), one strategy isto minimize sample complexity through enrichmentapproaches, such as affinity capture of protein complexes(e.g. tandem affinity purification) [4], selection of phospho-peptides [5], and sub-cellular fractionation [6-8]. Althoughtargeted affinity-based methods can lead to high levels of
enrichment, they have a high probability of excluding rele-vant proteins. An attractive alternative approach is a sub-cellular fractionation, where overall protein complexityand stoichiometry can be largely retained during the frac-tionation. Based on this rationale, cellular organelles havebeen subjected to proteomic analysis, including mitochon-dria and chloroplasts [6-8], demonstrating that the combi-nation of sub-cellular fractionation and proteomicstechniques provides a practical means for the analysis oflow-abundance proteins localized in discrete regions ofthe cell.Though it is not a separate organelle per se, chromatin
is physically organized in the cell and, due to the impor-tance of chromatin in molecular analyses of DNA replica-tion and epigenetics, procedures to separate chromatinfrom other cellular components have become well estab-lished in budding yeast [9-11]. By using fractionated chro-matin samples, MS-based approaches have been employedto identify a wide range of chromatin-associated proteins,including those from developing Xenopus embryos [12]
* Correspondence: [email protected] of Biology, University of Waterloo, 200 University Avenue,Waterloo, ON, CanadaFull list of author information is available at the end of the article
Kim et al. Proteome Science 2011, 9:62http://www.proteomesci.com/content/9/1/62
© 2011 Kim et al; licensee BioMed Central Ltd. This is an Open Access article distributed under the terms of the Creative CommonsAttribution License (http://creativecommons.org/licenses/by/2.0), which permits unrestricted use, distribution, and reproduction inany medium, provided the original work is properly cited.
and C. elegans sperm [13]. As demonstrated in such stu-dies based on chromatography and/or mass spectrometry-based analysis of digested peptides, initial fractionationcoupled with downstream proteomics methods is extre-mely valuable for addressing the relatively low abundanceof many chromatin-associated proteins, especially in thecontext of large-scale protein identification. However, itcan still be challenging to address differential expressionusing fractionated chromatin, as technical variability dur-ing its preparation can interfere with multiplex samplingand stringent statistical evaluation is needed to minimizefalse discovery rates. In addressing this aspect, gel-basedproteomics is a promising approach to accommodate mul-tiplex experimentation effectively while minimizing sys-temic experimental variation. In addition, the DIGEmethod is extremely useful for identifying various proteinforms resulting from posttranslational modifications suchas phosphorylation [14] and evaluating their relativeabundance.Chromatin-associated proteins mediate a multitude of
biological processes such as DNA replication, repair, andtranscription [15-17], through complex regulatorymechanisms. The structure of chromatin changes as afunction of the cell cycle, adopting a more condensed con-formation during mitotic phase relative to interphase,when DNA is duplicated. When chromatin integrity iscompromised as a result of exposure to genotoxic agents,the cellular repair machinery is recruited to sites of DNAdamage [18,19]. The appropriate regulation of each pro-cess requires a multitude of mechanisms such as histonemodification [20], chromatin remodeling [21], and forma-tion of diverse protein complexes. In studies of biologicalmechanisms, the qualitative and quantitative analyses ofinteractions and/or binding with chromatin are crucial inorder to investigate protein function, signaling pathways,and modular networks [22]. Therefore, global proteomicprofiling of chromatin provides an effective means to gainvaluable information about these central biological pro-cesses [22], and has widespread applications such as accel-eration of pharmaceutical development [20].In this study, we have conducted an analysis of differ-
ential protein expression using 2D-DIGE in combinationwith chromatin fractionation of budding yeast. We firstassessed the effectiveness of our approach in isolatingand detecting chromatin-associated proteins using DIGE.The combination of DIGE with fractionation allows bothidentification of differential abundance due to an appliedtreatment, and additionally provides a means to estimatechanges in protein localization, or in this case, chromatinaffinity. The potential utility of this novel approach wasthen confirmed by applying the method to screen for dif-ferentially expressed proteins following treatment withthe DNA damaging methyl methanesulfonate (MMS),
resulting in the detection of both known and novel DNAdamage response proteins.
Results and discussionInitial DIGE based identification of chromatin fractionproteinsYeast protein extracts from whole cells and from chroma-tin enrichment were compared using DIGE. Candidateproteins were selected for identification on the basis ofchromatin enrichment factor (EF), defined for a given spotas the average ratio of spot volume in the chromatin frac-tion vs. the whole cell extract in DIGE images [AdditionalFile 1, Figure S1]. Enrichment factors were calculated forpaired chromatin and WCE samples in the four DIGE gelsusing the BVA analysis module within the DeCyder™software package. P-values were also calculated for proteinspots, but as two different sample types are being com-pared these provide only a relative measure of variabilityand enrichment. As the initial fractionation procedureretained 2.1% of the total cellular protein on average, thetheoretical upper limit of the enrichment factor is approxi-mately 50 fold.To verify that the fractionation was successful at target-
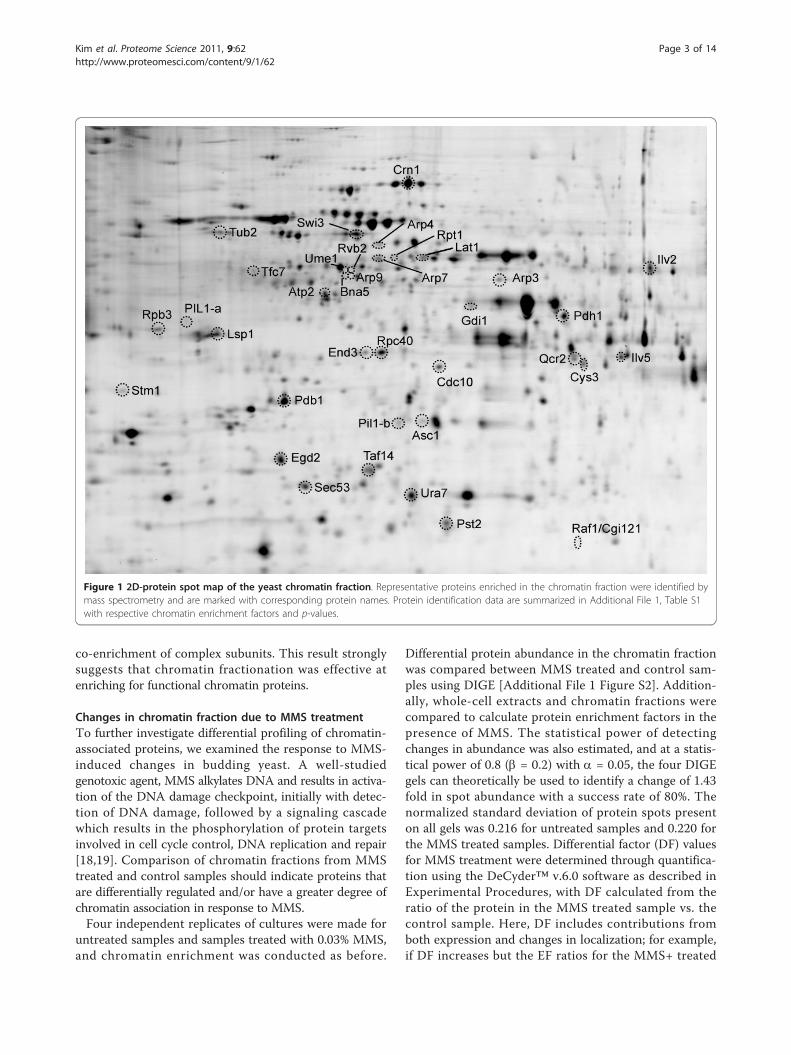
ing chromatin-associated proteins, a subset of enrichedprotein spots was analyzed by mass spectrometry. A Coo-massie-stained gel was prepared from a chromatin-enriched yeast fraction for protein identification (Figure 1).Spots with an experimental enrichment factor greater than1.4 fold were selected for MS analysis, and 33 of these wereidentified (Table 1, Additional File 1, Tables S1). Based onannotations from the Saccharomyces Genome Databasehttp://www.yeastgenome.org, the organelle database http://organelledb.lsi.umich.edu, and literature sources, themajority have been previously identified as localizing to thenucleus and include many functionally important chroma-tin proteins. Estimated protein copy number per cell [3] isshown in Table 1 for known chromatin-associated proteinsidentified in the chromatin fraction [Additional File 1,Figure S1]. Overall, the fractionation procedure was effec-tive at enriching low-abundance chromatin associated pro-teins. Interestingly, a number of the identified proteins hadvery low expected cellular levels (e.g. 1070 copies/cell forArp4 and 1360 for Arp7) based on previous GFP fusionexperiments [3].Among the identified proteins, some belong to well-
known complexes involved in chromatin remodeling, suchas SWI/SNF and INO80 [23]. These include Swi3, Taf14,Arp4, Arp7, Arp9, and Rvb2. Members of RNA polymer-ase complexes [24,25] were also identified, including theproteins Rpc40, Rpb3, and Tfc7. In addition, some pro-teins important for telomere capping and remodeling werefound, such as Stm1 [26] and Cgi121 [27]. In many cases,proteins were identified along with other factors theynormally interact with, implying good retention and
Kim et al. Proteome Science 2011, 9:62http://www.proteomesci.com/content/9/1/62
Page 2 of 14
co-enrichment of complex subunits. This result stronglysuggests that chromatin fractionation was effective atenriching for functional chromatin proteins.
Changes in chromatin fraction due to MMS treatmentTo further investigate differential profiling of chromatin-associated proteins, we examined the response to MMS-induced changes in budding yeast. A well-studiedgenotoxic agent, MMS alkylates DNA and results in activa-tion of the DNA damage checkpoint, initially with detec-tion of DNA damage, followed by a signaling cascadewhich results in the phosphorylation of protein targetsinvolved in cell cycle control, DNA replication and repair[18,19]. Comparison of chromatin fractions from MMStreated and control samples should indicate proteins thatare differentially regulated and/or have a greater degree ofchromatin association in response to MMS.Four independent replicates of cultures were made for
untreated samples and samples treated with 0.03% MMS,and chromatin enrichment was conducted as before.
Differential protein abundance in the chromatin fractionwas compared between MMS treated and control sam-ples using DIGE [Additional File 1 Figure S2]. Addition-ally, whole-cell extracts and chromatin fractions werecompared to calculate protein enrichment factors in thepresence of MMS. The statistical power of detectingchanges in abundance was also estimated, and at a statis-tical power of 0.8 (b = 0.2) with a = 0.05, the four DIGEgels can theoretically be used to identify a change of 1.43fold in spot abundance with a success rate of 80%. Thenormalized standard deviation of protein spots presenton all gels was 0.216 for untreated samples and 0.220 forthe MMS treated samples. Differential factor (DF) valuesfor MMS treatment were determined through quantifica-tion using the DeCyder™ v.6.0 software as described inExperimental Procedures, with DF calculated from theratio of the protein in the MMS treated sample vs. thecontrol sample. Here, DF includes contributions fromboth expression and changes in localization; for example,if DF increases but the EF ratios for the MMS+ treated
Figure 1 2D-protein spot map of the yeast chromatin fraction. Representative proteins enriched in the chromatin fraction were identified bymass spectrometry and are marked with corresponding protein names. Protein identification data are summarized in Additional File 1, Table S1with respective chromatin enrichment factors and p-values.
Kim et al. Proteome Science 2011, 9:62http://www.proteomesci.com/content/9/1/62
Page 3 of 14
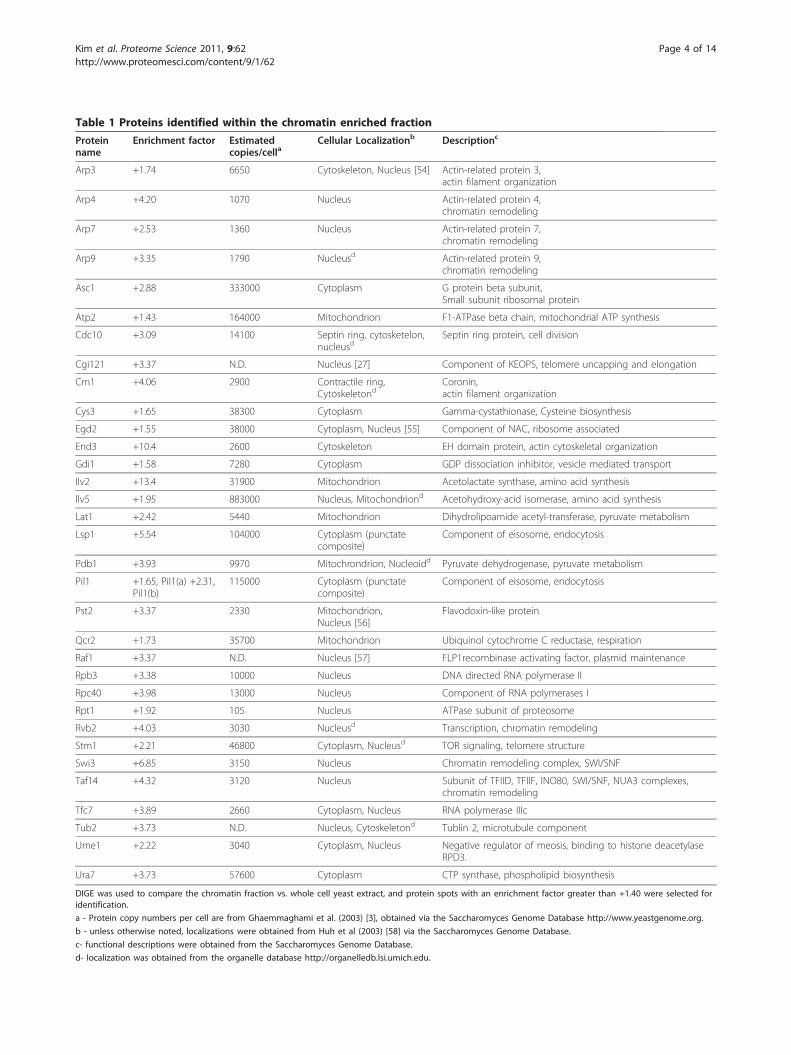
Table 1 Proteins identified within the chromatin enriched fraction
Proteinname
Enrichment factor Estimatedcopies/cella
Cellular Localizationb Descriptionc
Arp3 +1.74 6650 Cytoskeleton, Nucleus [54] Actin-related protein 3,actin filament organization
Arp4 +4.20 1070 Nucleus Actin-related protein 4,chromatin remodeling
Arp7 +2.53 1360 Nucleus Actin-related protein 7,chromatin remodeling
Arp9 +3.35 1790 Nucleusd Actin-related protein 9,chromatin remodeling
Asc1 +2.88 333000 Cytoplasm G protein beta subunit,Small subunit ribosomal protein
Atp2 +1.43 164000 Mitochondrion F1-ATPase beta chain, mitochondrial ATP synthesis
Cdc10 +3.09 14100 Septin ring, cytosketelon,nucleusd
Septin ring protein, cell division
Cgi121 +3.37 N.D. Nucleus [27] Component of KEOPS, telomere uncapping and elongation
Crn1 +4.06 2900 Contractile ring,Cytoskeletond
Coronin,actin filament organization
Cys3 +1.65 38300 Cytoplasm Gamma-cystathionase, Cysteine biosynthesis
Egd2 +1.55 38000 Cytoplasm, Nucleus [55] Component of NAC, ribosome associated
End3 +10.4 2600 Cytoskeleton EH domain protein, actin cytoskeletal organization
Gdi1 +1.58 7280 Cytoplasm GDP dissociation inhibitor, vesicle mediated transport
Ilv2 +13.4 31900 Mitochondrion Acetolactate synthase, amino acid synthesis
Ilv5 +1.95 883000 Nucleus, Mitochondriond Acetohydroxy-acid isomerase, amino acid synthesis
Lat1 +2.42 5440 Mitochondrion Dihydrolipoamide acetyl-transferase, pyruvate metabolism
Lsp1 +5.54 104000 Cytoplasm (punctatecomposite)
Component of eisosome, endocytosis
Pdb1 +3.93 9970 Mitochrondrion, Nucleoidd Pyruvate dehydrogenase, pyruvate metabolism
Pil1 +1.65, Pil1(a) +2.31,Pil1(b)
115000 Cytoplasm (punctatecomposite)
Component of eisosome, endocytosis
Pst2 +3.37 2330 Mitochondrion,Nucleus [56]
Flavodoxin-like protein
Qcr2 +1.73 35700 Mitochondrion Ubiquinol cytochrome C reductase, respiration
Raf1 +3.37 N.D. Nucleus [57] FLP1recombinase activating factor, plasmid maintenance
Rpb3 +3.38 10000 Nucleus DNA directed RNA polymerase II
Rpc40 +3.98 13000 Nucleus Component of RNA polymerases I
Rpt1 +1.92 105 Nucleus ATPase subunit of proteosome
Rvb2 +4.03 3030 Nucleusd Transcription, chromatin remodeling
Stm1 +2.21 46800 Cytoplasm, Nucleusd TOR signaling, telomere structure
Swi3 +6.85 3150 Nucleus Chromatin remodeling complex, SWI/SNF
Taf14 +4.32 3120 Nucleus Subunit of TFIID, TFIIF, INO80, SWI/SNF, NUA3 complexes,chromatin remodeling
Tfc7 +3.89 2660 Cytoplasm, Nucleus RNA polymerase IIIc
Tub2 +3.73 N.D. Nucleus, Cytoskeletond Tublin 2, microtubule component
Ume1 +2.22 3040 Cytoplasm, Nucleus Negative regulator of meosis, binding to histone deacetylaseRPD3.
Ura7 +3.73 57600 Cytoplasm CTP synthase, phospholipid biosynthesis
DIGE was used to compare the chromatin fraction vs. whole cell yeast extract, and protein spots with an enrichment factor greater than +1.40 were selected foridentification.
a - Protein copy numbers per cell are from Ghaemmaghami et al. (2003) [3], obtained via the Saccharomyces Genome Database http://www.yeastgenome.org.
b - unless otherwise noted, localizations were obtained from Huh et al (2003) [58] via the Saccharomyces Genome Database.
c- functional descriptions were obtained from the Saccharomyces Genome Database.
d- localization was obtained from the organelle database http://organelledb.lsi.umich.edu.
Kim et al. Proteome Science 2011, 9:62http://www.proteomesci.com/content/9/1/62
Page 4 of 14

and control samples are similar, the change is largely dueto expression. It is also possible that DF to be positiveand the EF ratio to decrease, indicating an increased pro-tein expression and increased amount in the chromatinfraction, but a larger increase in non-chromatin asso-ciated protein. A total of 1763 spots were matched acrossthe four replicates in the differential MMS experiment, ofwhich 455 showed significant changes (increased ordecreased) at p < 0.05 with FDR correction. Comparingthe calculated EF values from chromatin enrichment forthese 455 spots, 217 were both differentially regulatedand enriched in chromatin fractions.
Identification of MMS responsive proteinsProtein spots from the MMS DIGE experiment wereprioritized for identification according to the degree ofchromatin enrichment (EF) and changes in observedabundance (’differential factor’, DF). Spots that showedboth positive EF and DF values (among the 217 describedabove) were of particular interest, as they indicated bothchromatin-association and induction by MMS treatment,respectively. A preparative Coomassie-stained gel wasmade using chromatin fractions of the MMS treated sam-ples (Figure 2), and protein spots were excised for identifi-cation by mass spectrometry. Identifications were madefor 23 DF+ proteins and 12 DF- proteins (Table 2, Addi-tional File 1, Table S2). A subgroup of identified proteinscorresponds to known checkpoint-regulated proteins,including Rnr4, Rpa1, and Rpa2. Rpa1 and Rpa2 are subu-nits of the hetero-trimeric replication factor A complex,which plays an integral role in DNA replication andcheckpoint responses [19,28-30]. Among the spots withnegative enrichment factors, Rnr4 isoforms exhibitedsome of the largest responses to MMS treatment asreflected by DF values (Table 2). The RNR complex con-trols the nucleotide pool for DNA synthesis and is adownstream target of the Rad53 checkpoint kinase [31,32].Along with the previously well-characterized proteins
above, several additional DNA damage-associated proteinswere identified as differentially expressed on MMS treat-ment including Bmh1, Pst2 Vma2, and Vma4 (see Table2). Bmh1 is a 14-3-3 protein family member, which hasbeen shown to directly modulate Rad53 activity [33]. Pst2,a predicted oxidative response protein, has also been impli-cated in DNA damage responses [29]. Vacuolar-type H+ATPase subunits Vma2 and Vma4 have been shown toplay a role in DNA damage responses following treatmentwith MMS and cisplatin [34]. In addition, several otherproteins were identified that have not been well character-ized in terms of their potential role following DNAdamage, including Acf2, Arp3, Hsp31, Lsp1, Ste4, Ycp4,and Yrb1. Several proteins with low chromatin association(low EF values) and showing a differential response toMMS treatment were also identified (Table, 2, Additional
File 1, Table S2). While these proteins are not chromatinassociated per se, some (e.g. metabolic enzymes Ald6 andPdc1) are consistent with a stress response in which yeastcells have a lowered metabolic activity and concomitantreduced growth competency. This observation is consistentwith the model of suppressed protein synthesis upon DNAdamage checkpoint execution or cellular stress [35]. It isalso possible that for some of these factors the effect ofMMS may not have been due to DNA damage, since thisalkylating agent can also act directly on proteins [36,37]. Anumber of key DNA damage response factors includingthe kinases Mec1, Tel1, Rad53 and Chk1, and members ofthe 9-1-1 complex (Rad17, Mec3, Ddc1) (reviewed in [19])were not among the proteins that we identified in thisscreen. However, this is not surprising as we characterizedonly a subset of proteins that were chromatin- and/orMMS-enriched in our samples.
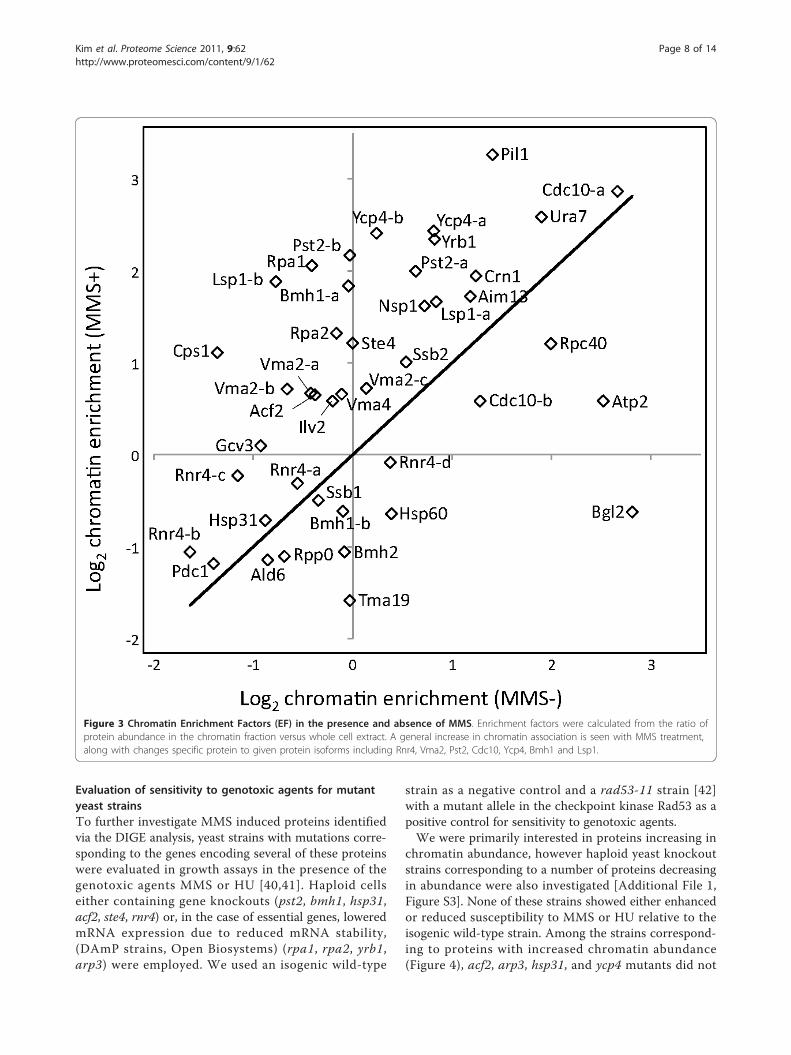
Changes in chromatin association and localization due toMMS treatmentThe MMS DIGE experiment provided a direct measure ofchanges in protein abundance within the chromatinenriched fraction. This can represent a change in expres-sion of the protein of interest, a change in the degree ofchromatin association (including direct binding to DNA,interaction with DNA binding proteins, or simple inclu-sion in the chromatin pellet), or some combination ofthese factors. Here, the calculated EF ratios for MMS trea-ted and control samples can be compared and changes inEF values can provide an estimate of changes in the degreeof chromatin association (i.e. localization). The EF ratiosfor the control (MMS-) and treated (MMS+) samples arecompared in Figure 3. The majority of proteins increasedtheir degree of chromatin association in response to MMStreatment. Interestingly, different forms of the same pro-tein often exhibited different changes in expression andchromatin association, including Rnr4, Vma2, Pst2, Lsp1,Ycp4, Cdc10 and Bmh1 (Table 2, Additional File 1, TableS2). For example, four isoforms of Rnr4 were detected, allof which increased in chromatin abundance in response toMMS treatment [Additional File 1, Figure S2]. Rnr4 waspreviously reported to undergo increased translocation tothe cytoplasm under genotoxic stress [32]. Consistent withthis, we find that the isoform with the highest chromatinassociation, Rnr4-d, showed a decrease in the proportionof Rnr4-d associated with chromatin on MMS treatmentas reflected by the decrease in enrichment factor from+1.30 to -1.06. However, the total amount of all forms ofRnr4 binding chromatin increased, as all forms had posi-tive DF values. The most abundant isoform, Rnr4-b [Addi-tional File 1, Figure S2], had minimal association withchromatin with or without MMS treatment (Table 2). Theobserved values of DF and EF indicate a complexresponse, with some isoforms increasing and others
Kim et al. Proteome Science 2011, 9:62http://www.proteomesci.com/content/9/1/62
Page 5 of 14

decreasing relative degree of chromatin association (EF),while the total amount of cellular Rnr4 apparently increas-ing on MMS exposure.All Vma2 isoforms demonstrated greater chromatin
association (EF) as a consequence of MMS treatment, butisoforms Vma2-a and b, showed a more dramatic increasethan Vma2-c. Comparing the DF and EF values in Table2, the change in chromatin abundance can be largelyattributed to an increase in chromatin association forVma2 as opposed to increased cellular protein levels. Simi-larly, Rpa1 demonstrated a pronounced increase in chro-matin association on MMS exposure, suggesting that theobserved increase in chromatin abundance (DF) can belargely attributed to a change in cellular localization(Table 2). Conversely, Cdc10-b exhibited a small netincrease in abundance in the chromatin fraction on MMStreatment (DF +1.38) but a decrease in EF from +2.43 to+1.50. This is consistent with an increase in cellular
expression of Cdc10-b, but a smaller proportion of Cdc10-b associating with chromatin.It has previously been observed that genes that are
induced by DNA damaging agents are not those that areidentified as protecting cells against DNA damage [38].However, as proteins can respond more rapidly thangenes through post-translational modifications orchanges in localization, there may be a closer relationshipbetween increased chromatin association and DNA-pro-tective proteins. In contrast to gene expression data [38],we find that almost half of the proteins identified (10 of22) were previously identified as responding to genotoxicagents in high-throughput screening studies. Specifically,acf2, aim13, gcv3, and ycp4 knockout strains were identi-fied as having significant fitness defects (p < 0.05) onMMS exposure, with aim13, bmh1, cdc10, cps1, gcv3,pil1, pst2, rnr4 knockout strains having fitness defects onexposure to hydroxyurea [39].
Figure 2 2D-protein spot map showing differentially expressed proteins identified in the MMS treated yeast chromatin fraction.Proteins with statistically significant changes abundance on MMS treatment were identified by mass spectrometry and are marked withcorresponding protein names. Protein identification data are summarized in Additional File 1, Table S2.
Kim et al. Proteome Science 2011, 9:62http://www.proteomesci.com/content/9/1/62
Page 6 of 14
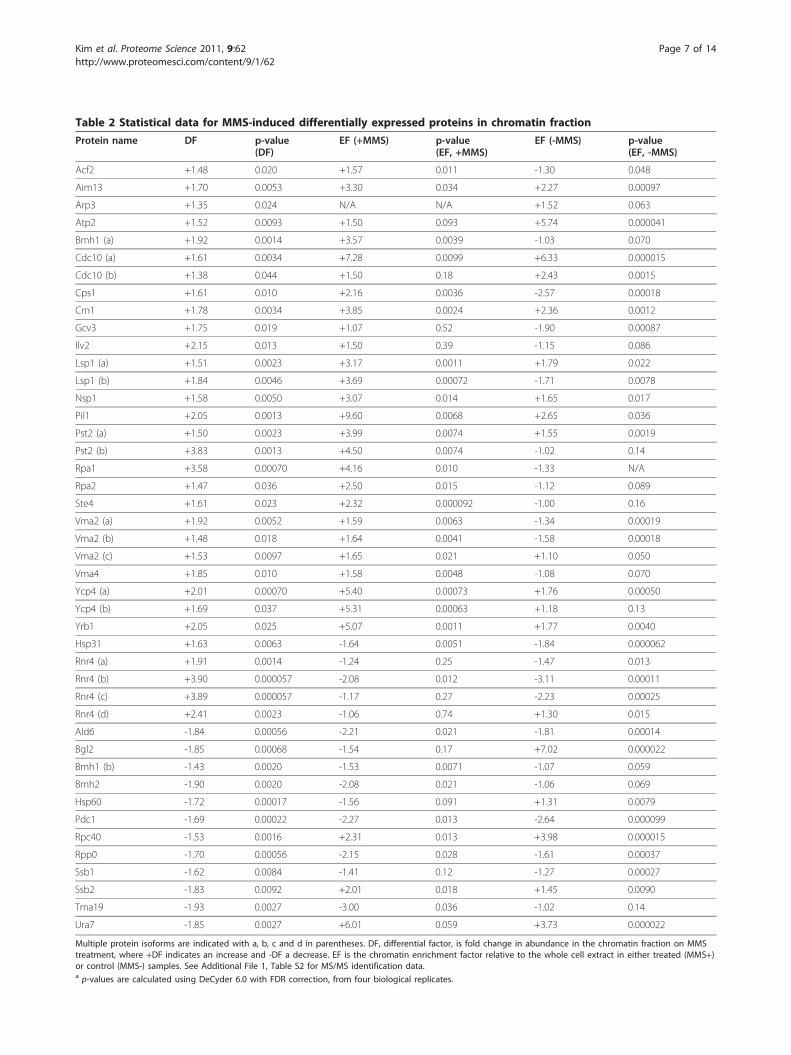
Table 2 Statistical data for MMS-induced differentially expressed proteins in chromatin fraction
Protein name DF p-value(DF)
EF (+MMS) p-value(EF, +MMS)
EF (-MMS) p-value(EF, -MMS)
Acf2 +1.48 0.020 +1.57 0.011 -1.30 0.048
Aim13 +1.70 0.0053 +3.30 0.034 +2.27 0.00097
Arp3 +1.35 0.024 N/A N/A +1.52 0.063
Atp2 +1.52 0.0093 +1.50 0.093 +5.74 0.000041
Bmh1 (a) +1.92 0.0014 +3.57 0.0039 -1.03 0.070
Cdc10 (a) +1.61 0.0034 +7.28 0.0099 +6.33 0.000015
Cdc10 (b) +1.38 0.044 +1.50 0.18 +2.43 0.0015
Cps1 +1.61 0.010 +2.16 0.0036 -2.57 0.00018
Crn1 +1.78 0.0034 +3.85 0.0024 +2.36 0.0012
Gcv3 +1.75 0.019 +1.07 0.52 -1.90 0.00087
Ilv2 +2.15 0.013 +1.50 0.39 -1.15 0.086
Lsp1 (a) +1.51 0.0023 +3.17 0.0011 +1.79 0.022
Lsp1 (b) +1.84 0.0046 +3.69 0.00072 -1.71 0.0078
Nsp1 +1.58 0.0050 +3.07 0.014 +1.65 0.017
Pil1 +2.05 0.0013 +9.60 0.0068 +2.65 0.036
Pst2 (a) +1.50 0.0023 +3.99 0.0074 +1.55 0.0019
Pst2 (b) +3.83 0.0013 +4.50 0.0074 -1.02 0.14
Rpa1 +3.58 0.00070 +4.16 0.010 -1.33 N/A
Rpa2 +1.47 0.036 +2.50 0.015 -1.12 0.089
Ste4 +1.61 0.023 +2.32 0.000092 -1.00 0.16
Vma2 (a) +1.92 0.0052 +1.59 0.0063 -1.34 0.00019
Vma2 (b) +1.48 0.018 +1.64 0.0041 -1.58 0.00018
Vma2 (c) +1.53 0.0097 +1.65 0.021 +1.10 0.050
Vma4 +1.85 0.010 +1.58 0.0048 -1.08 0.070
Ycp4 (a) +2.01 0.00070 +5.40 0.00073 +1.76 0.00050
Ycp4 (b) +1.69 0.037 +5.31 0.00063 +1.18 0.13
Yrb1 +2.05 0.025 +5.07 0.0011 +1.77 0.0040
Hsp31 +1.63 0.0063 -1.64 0.0051 -1.84 0.000062
Rnr4 (a) +1.91 0.0014 -1.24 0.25 -1.47 0.013
Rnr4 (b) +3.90 0.000057 -2.08 0.012 -3.11 0.00011
Rnr4 (c) +3.89 0.000057 -1.17 0.27 -2.23 0.00025
Rnr4 (d) +2.41 0.0023 -1.06 0.74 +1.30 0.015
Ald6 -1.84 0.00056 -2.21 0.021 -1.81 0.00014
Bgl2 -1.85 0.00068 -1.54 0.17 +7.02 0.000022
Bmh1 (b) -1.43 0.0020 -1.53 0.0071 -1.07 0.059
Bmh2 -1.90 0.0020 -2.08 0.021 -1.06 0.069
Hsp60 -1.72 0.00017 -1.56 0.091 +1.31 0.0079
Pdc1 -1.69 0.00022 -2.27 0.013 -2.64 0.000099
Rpc40 -1.53 0.0016 +2.31 0.013 +3.98 0.000015
Rpp0 -1.70 0.00056 -2.15 0.028 -1.61 0.00037
Ssb1 -1.62 0.0084 -1.41 0.12 -1.27 0.00027
Ssb2 -1.83 0.0092 +2.01 0.018 +1.45 0.0090
Tma19 -1.93 0.0027 -3.00 0.036 -1.02 0.14
Ura7 -1.85 0.0027 +6.01 0.059 +3.73 0.000022
Multiple protein isoforms are indicated with a, b, c and d in parentheses. DF, differential factor, is fold change in abundance in the chromatin fraction on MMStreatment, where +DF indicates an increase and -DF a decrease. EF is the chromatin enrichment factor relative to the whole cell extract in either treated (MMS+)or control (MMS-) samples. See Additional File 1, Table S2 for MS/MS identification data.a p-values are calculated using DeCyder 6.0 with FDR correction, from four biological replicates.
Kim et al. Proteome Science 2011, 9:62http://www.proteomesci.com/content/9/1/62
Page 7 of 14
Evaluation of sensitivity to genotoxic agents for mutantyeast strainsTo further investigate MMS induced proteins identifiedvia the DIGE analysis, yeast strains with mutations corre-sponding to the genes encoding several of these proteinswere evaluated in growth assays in the presence of thegenotoxic agents MMS or HU [40,41]. Haploid cellseither containing gene knockouts (pst2, bmh1, hsp31,acf2, ste4, rnr4) or, in the case of essential genes, loweredmRNA expression due to reduced mRNA stability,(DAmP strains, Open Biosystems) (rpa1, rpa2, yrb1,arp3) were employed. We used an isogenic wild-type
strain as a negative control and a rad53-11 strain [42]with a mutant allele in the checkpoint kinase Rad53 as apositive control for sensitivity to genotoxic agents.We were primarily interested in proteins increasing in
chromatin abundance, however haploid yeast knockoutstrains corresponding to a number of proteins decreasingin abundance were also investigated [Additional File 1,Figure S3]. None of these strains showed either enhancedor reduced susceptibility to MMS or HU relative to theisogenic wild-type strain. Among the strains correspond-ing to proteins with increased chromatin abundance(Figure 4), acf2, arp3, hsp31, and ycp4 mutants did not
Figure 3 Chromatin Enrichment Factors (EF) in the presence and absence of MMS. Enrichment factors were calculated from the ratio ofprotein abundance in the chromatin fraction versus whole cell extract. A general increase in chromatin association is seen with MMS treatment,along with changes specific protein to given protein isoforms including Rnr4, Vma2, Pst2, Cdc10, Ycp4, Bmh1 and Lsp1.
Kim et al. Proteome Science 2011, 9:62http://www.proteomesci.com/content/9/1/62
Page 8 of 14
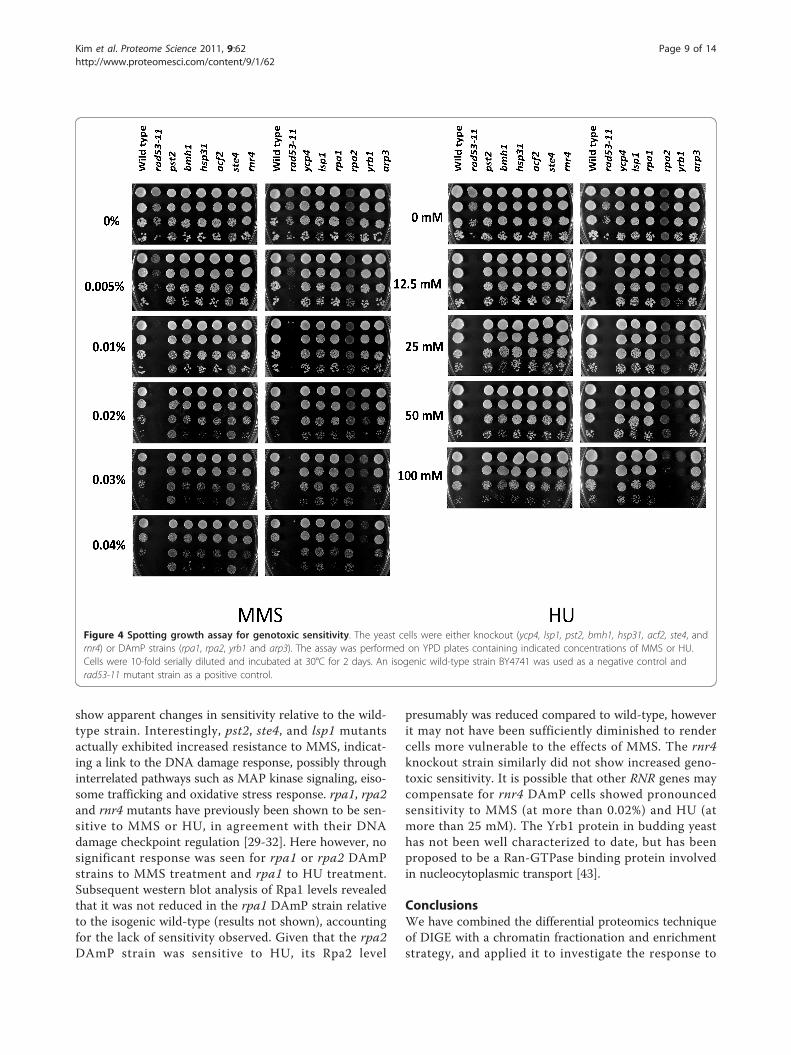
show apparent changes in sensitivity relative to the wild-type strain. Interestingly, pst2, ste4, and lsp1 mutantsactually exhibited increased resistance to MMS, indicat-ing a link to the DNA damage response, possibly throughinterrelated pathways such as MAP kinase signaling, eiso-some trafficking and oxidative stress response. rpa1, rpa2and rnr4 mutants have previously been shown to be sen-sitive to MMS or HU, in agreement with their DNAdamage checkpoint regulation [29-32]. Here however, nosignificant response was seen for rpa1 or rpa2 DAmPstrains to MMS treatment and rpa1 to HU treatment.Subsequent western blot analysis of Rpa1 levels revealedthat it was not reduced in the rpa1 DAmP strain relativeto the isogenic wild-type (results not shown), accountingfor the lack of sensitivity observed. Given that the rpa2DAmP strain was sensitive to HU, its Rpa2 level
presumably was reduced compared to wild-type, howeverit may not have been sufficiently diminished to rendercells more vulnerable to the effects of MMS. The rnr4knockout strain similarly did not show increased geno-toxic sensitivity. It is possible that other RNR genes maycompensate for rnr4 DAmP cells showed pronouncedsensitivity to MMS (at more than 0.02%) and HU (atmore than 25 mM). The Yrb1 protein in budding yeasthas not been well characterized to date, but has beenproposed to be a Ran-GTPase binding protein involvedin nucleocytoplasmic transport [43].
ConclusionsWe have combined the differential proteomics techniqueof DIGE with a chromatin fractionation and enrichmentstrategy, and applied it to investigate the response to
Figure 4 Spotting growth assay for genotoxic sensitivity. The yeast cells were either knockout (ycp4, lsp1, pst2, bmh1, hsp31, acf2, ste4, andrnr4) or DAmP strains (rpa1, rpa2, yrb1 and arp3). The assay was performed on YPD plates containing indicated concentrations of MMS or HU.Cells were 10-fold serially diluted and incubated at 30°C for 2 days. An isogenic wild-type strain BY4741 was used as a negative control andrad53-11 mutant strain as a positive control.
Kim et al. Proteome Science 2011, 9:62http://www.proteomesci.com/content/9/1/62
Page 9 of 14
genotoxic agents in budding yeast cells. Our approachfacilitated the selective screening of important chromatin-associated proteins that can otherwise be difficult toobserve by typical proteomics approaches, and was suc-cessful in identifying functionally relevant target proteins.Moreover, the method was effective for the differentialanalysis of yeast cells following chemical treatment, asdemonstrated by the MMS exposure experiment. Whilethe fractionation method used was effective at enrichmentof chromatin binding factors, a number of the observedproteins were likely mitochondrial, suggesting that morespecific fractionation methods could be applied. One pos-sible approach would be to first isolate nuclei prior tochromatin enrichment. Overall, the described method wassuccessful in permitting the differential analysis of chro-matin binding proteins using a gel-based proteomics tech-nique, largely overcoming the technical limitations foranalyzing lower-abundance chromatin proteins.While the methodology was effective at identifying
known and potentially novel proteins involved in DNAdamage response, the technique does not provide compre-hensive coverage. Future refinements to the methodologymay be able to increase the number of factors identified insimilar studies. The gel methods could be expanded toincrease the pH range over which proteins can be sepa-rated effectively, more sensitive mass spectrometers maybe used to increase the success rate of protein identifica-tion, a greater degree of replication and experimental pre-cision may be utilized to detect proteins undergoing smallchanges in abundance and/or localization.Characterization of differentially expressed proteins
based on DF analysis was extended using an analysis ofthe chromatin enrichment factors (EF), providing a quan-titative estimate of protein localization not typically avail-able within proteomics studies. The method was alsoinformative in addressing changes in protein localization,as demonstrated in the change of enrichment factordepending on treatment. Chromatin fractionation wasable to consistently reveal a large population of chroma-tin-associated proteins using a relatively straightforwardsampling procedure, in which intact complexes are main-tained, as indicated by the co-detection of functionallyrelated chromatin proteins (i.e. Tables 1 and 2). A techni-cal strength of DIGE itself, compared to MS-based meth-ods, is that it is able to distinguish differences in responseto compounds such as MMS for different protein iso-forms or post-translational variants, as revealed in theRnr4 isoforms in this study. In contrast, quantitative MS-based methods largely rely on digested peptides [44],making it more challenging to distinguish variable forms,as the peptides on which the change is located need to becorrectly identified, quantified, and compared with pep-tides representing other forms of the protein.
With respect to the budding yeast DNA damageresponse, this study was in broad agreement with previoushigh-throughput studies on this response, using a varietyof approaches such as microarray analysis [45], phenotyp-ing of deletion strains [46] and quantitative phosphopro-teomics [5]. The microarray study showed the over-expression of the RNR complex (which is composed offour subunits Rnr1, Rnr2, Rnr3 and Rnr4) as the most sig-nificantly changed along with other key proteins such asDin7, Dun1, Rad54 and Rad51. The phosphoproteomestudy screened the possible phosphorylation-mediated tar-gets of Mec1/Tel1 and Rad53 kinases [5], and identifiedproteins involved in DNA replication, cytokinesis, tran-scription, mitosis, RNA export, stress response, transcrip-tion, and nuclear transport. Compared to the abovestudies, our approach focused on a subset of the buddingyeast proteome that is highly associated with chromatin.In addition to the confirmation of known checkpoint-regulated factors (e.g. Rpa1, Rpa2, Rnr4), several new pro-teins related to DNA damage response pathways havebeen identified. One such factor is the Ran-GTPase bind-ing protein Yrb1, a component of the nuclear import-export system [43], in which the ternary complex of Gsp1,Yrb1 and Rna1 controls the GTP/GDP balance across thenuclear membrane. We propose here that Yrb1 proteinmay represent a link between the nuclear transport systemand DNA damage responses, as implied by a recent modelfor G1-S cell cycle arrest during checkpoint execution[47]. It will now be of interest to determine which proteinsdependent on Yrb1-mediated nucleocytoplasmic traffick-ing act downstream of this factor in affording protectionto genotoxic agents.In conclusion, we present a simple fractionation and
DIGE-based approach for chromatin proteomics, whichcan be broadly applied to investigate biological responsesto chemical stress and other factors. This method was suc-cessfully applied to investigate changes that occur follow-ing exposure to the genotoxic agent MMS, confirmingthat it is effective in identifying novel proteins involved incellular processes, such as the response to DNA damage.
MethodsYeast strainsWild-type haploid Saccharomyces cerevisae strain BY4733(MATa, his3Δ200, leu2Δ0, met15Δ0, trp1Δ63, ura3Δ0),purchased from Open Biosystems (Thermo Fisher Scienti-fic Inc.), was used for all DIGE experiments. For genotoxicsensitivity assays, wild-type haploid strain BY4741 (MATa,his3Δ1, leu2Δ0, met15Δ0, ura3Δ0), isogenic MATa hap-loid DAmP strains YAR007c (rpa1), YNL312w (rpa2),YDR002w (yrb1), YJR065c (arp3), and isogenic haploidknock-out strains YCR004c (ycp4), YPL004c (lsp1),YDR032c (pst2), YER177w (bmh1), YDR533c (hsp31),
Kim et al. Proteome Science 2011, 9:62http://www.proteomesci.com/content/9/1/62
Page 10 of 14
YLR144c (acf2), YOR212w (ste4), YGR180c (rnr4) werepurchased from Open Biosystems. A rad53-11 strain(MATa, ura3, leu2, trp1, his3, rad53-11::URA3) was usedas a control for genotoxic sensitivity [42].Cell cultureFor large-scale cultures, a single colony was used to inocu-late 10 ml YPD medium (1% yeast extract, 2% peptone, 2%glucose) in a 50 ml Falcon tube, which was then incubatedat 30°C overnight with shaking. 10-20 μl of saturated seedculture was transferred to 300 ml YPD medium in a 2 Lflask and incubated with shaking at 30°C until a cell den-sity of 2-3 × 10⁷/ml was achieved. For MMS treatmentexperiments, the 300 ml sample was centrifuged, the cellpellet was resuspended in 600 ml fresh YPD medium, andthen divided equally into two 2 L flasks, and then furthercultured at 30°C for 2 hrs. MMS was added to 0.03% forone of the flasks, and both were cultured at 30°C foranother 90 min. The final cell density was not more than3 × 107/ml.Chromatin preparationChromatin fractionation was based on the method ofLiang and Stillman [11] with minor modifications. Cellcultures (300 ml in 2L flask) at a density of ~3 × 10⁷/mlwere harvested in six 50 ml Falcon tubes and centrifugedat 4200 rpm for 5 min, washed with 40 ml dH2O. Cell pel-lets were resuspended in 5 ml 0.1 M EDTA-KOH (pH8.0), 10 mM DTT, and incubated in a water bath for15 min at 30°C. Cells were then centrifuged, resuspendedin 5 ml of YPD, 1.1 M sorbitol 0.5 mg/ml Zymolase 20T™(Sekagaku, Japan), 0.2 mg/ml Lyticase™ (Sigma), andincubated in a shaking water bath at 30°C for 20-30 min.Spheroplasts were collected by centrifugation at 2000 rpmfor 3 min and washed once with 20 ml YPD, 1.1 M sorbi-tol, and 0.5 mM PMSF. The pellet was resuspended in1 ml wash buffer (5 mM Tris-HCl (pH 7.4), 20 mM KCl,2 mM EDTA, 0.12 mM spermidine, 0.05 mM spermine,1 M sorbitol, 1% thiodiglycol, and Complete Mini™EDTA-free protease inhibitor cocktail (1 tablet/10 ml)(Roche)) and transferred to two 1.5 ml centrifuge tubes onice. Cells were centrifuged at 300 g for 1 min., washedtwice with wash buffer, and centrifuged again. The pelletwas then resuspended in 0.4 ml of lysis buffer (5 mMTris-HCl (pH 7.4), 20 mM KCl, 2 mM EDTA, 0.12 mMspermidine, 0.05 mM spermine, 0.4 M sorbitol, 1% thiodi-glycol, Complete Mini™ EDTA-free protease inhibitorcocktail (1 tablet/10 ml) (Roche)) and mixed with 0.5 mlof lysis buffer containing 2% (v/v) Triton X-100. For wholecell extracts (WCE), 200 μl of lysate from each sample wasset aside and 2% SDS and 50 mM DTT added to maintainsolubility. The remaining protein suspension was incu-bated on ice for a minimum of 10 min, followed by centri-fugation at 16,000 g for 10 min to pellet chromatin, andthe supernatant removed. The quality of the chromatinfractionation was verified by performing western blots for
aliquots of the initial WCE, as well as chromatin andsupernatant fractions, with antibodies for Orc2 and his-tone H2B which should both be chromatin-bound, as wellas a-tubulin, which should be in the supernatant [11][Additional File 1, Figure S4].Protein extractionChromatin pellets from the chromatin preparation wereresuspended in two volumes of extraction buffer (50 mMTris-HCl (pH 8.5), 2% (w/v) SDS, 50 mM DTT), and incu-bated in a boiling water bath for 10 min. Protein extractswere separated by centrifugation at 14,000 g for 10 min.The supernatants were collected then desalted using a 2-DClean-Up kit (Amersham Biosciences). Protein pelletsfrom the 2-D Clean-Up treatment were dissolved in IEFrehydration buffer (7 M urea, 2 M thiourea, 4% (w/v)CHAPS). Protein concentration was measured using theBio-Rad protein assay (Bio-Rad). Protein yield of the chro-matin fraction was calculated based on the amount in thechromatin preparation compared to the total amount inthe WCE. A typical 300 ml culture at ~3 × 10⁷cells/mlyielded approximately 200 +/- 100 μg of protein in thechromatin fraction.
Differential-in-gel-electrophoresis (DIGE)DIGE was performed based on recommended protocols ofthe manufacturer (GE Healthcare) using minimal labelingCyDye™ DIGE Fluors of Cy2, Cy3 and Cy5. For theCyDye™ labeling reaction, 40 μg of protein sample in50 μl of rehydration buffer containing 25 mM Tris-HCl(pH 8.5) was used for each dye. 1 μl CyDye™ solution(200 pmol/μl in 100% dimethylformamide) was added tosamples on ice. The reaction was incubated for 40 min onice, after which 1 μl of 10 mM lysine was added to stopthe reaction. After incubation for 10 min, three sets of50 μl samples (labeled with Cy2, Cy3 and Cy5) were com-bined and mixed with 45 μl of 1 M DTT, 4.5 μl of 1%(v/v) IEF buffer 4-7, 1 μl of 1% (w/v) bromophenol blue(BPB) and 250 μl of the rehydration buffer.Immobiline™ DryStrip gels (IPG pH4-7/24 cm) (GE
Healthcare) were used for isoelectric focusing as the firstdimensional separation. The strips were passively rehy-drated with 450 μl of labeled protein sample in the rehy-dration buffer overnight at room temperature. Isoelectricfocusing (IEF) was performed using an Ettan™ IPGphor IIsystem (GE Healthcare) with oil immersion and paperwicks at electrode contacts. The voltage profile used forIEF was as follows: hold at 500 V for 1 hr, gradient to1,000 V for 3 hrs, gradient to 3,000 V for 3 hrs, hold at3,000 V for 2 hrs, gradient to 8,000 V for 3 hrs, at 8,000 Vfor 10.5 hrs, and step to a final voltage of 500 V.After the 1st dimension separation, IEF strips were incu-
bated in equilibration buffer (6 M urea, 2% (w/v) SDS,50 mM Tris-HCl (pH 8.8), 30% (v/v) glycerol, 0.002%(w/v) BPB) containing DTT (10 mg/ml) for 20 min and
Kim et al. Proteome Science 2011, 9:62http://www.proteomesci.com/content/9/1/62
Page 11 of 14
then a further 20 min with the same buffer containingiodoacetamide (25 mg/ml). The strips were loaded onto10% Tris-glycine SDS-polyacrylamide gels and run at15 W per gel by using an Ettan™ DALTsix electrophor-esis unit (GE Healthcare). Scanning of the DIGE gels wasdone using Typhoon 9400™ Variable Mode Imager (GEHealthcare).We employed the three-dye system with four biologi-
cally independent replicates using an independent Cy2 dyechannel as internal standard for each gel. The internalstandard was composed of an equal mixture of controland test samples. The control and test samples used eitherCy3 or Cy5 with dye swapping. Gel image analysis wasperformed using DeCyder™ 2-D differential analysis soft-ware version 6.0 (GE Healthcare), with the peak detectionthreshold set to an expected value of 2500 spots. Proteinspots were quantified using peak volumes calculated bythe DeCyder™ software. Each gel was normalized basedon the independent Cy2 channel using the differential in-gel analysis (DIA) module. Biological variation analysis(BVA) was done for four replicates, including 4 internalstandards, 4 controls and 4 test samples. Statistical analysisof spots was performed by the Student’s t-test with FDR(false discovery rate) correction as previously described[48,49]. Average spot ratios for treated to control sampleswere calculated based on spot volumes for each matchedspot, along with p-values. For the chromatin enrichmentanalysis, we defined the average ratio normalized spotvolumes for the chromatin fraction vs. WCE as the enrich-ment factor (EF). EF values were calculated by the DeCy-der software as fold change (EF = chromatin abundance/WCE) when chromatin abundance exceeded WCE abun-dance for the target protein, and as a negative fold change(EF = -WCE/chromatin abundance) otherwise. For experi-ments comparing the MMS-treated vs. non-treated chro-matin fraction, differential factors (DF) were similarlycalculated, where DF = (MMS treated/control) when trea-ted ≥ control, and as a negative fold change (DF = -con-trol/MMS treated) otherwise. As with the chromatinabundance experiment, the average ratio of spot volumesof the two DIGE channels being compared is reported.Calculated enrichment factors (EF) provide a measure ofchromatin association (protein localization) independentof total protein abundance, whereas the differential factors(DF) measure changes in abundance in the chromatinfraction, including both changes in total abundance in thecell and changes in protein localization. For graphical pre-sentation, a log scale is used and values are presented aslog2 (treated/control). To determine the magnitude ofchange that is likely to be detected, a post-hoc power ana-lysis was conducted using the statistical analysis package R[50]. Standard deviations were calculated for all spotsappearing on 10 or more gel image channels (i.e. 10 from
12 total on 4 gels), and used to estimate the expecteddetectable fold change with a power of 0.80 (b = 0.20).
Preparative 2D-PAGEFor preparative 2D-PAGE, 0.7 to 1.0 mg protein was sepa-rated on large-format gels using a 24 cm IPG 4-7 strip for1st dimension separation and an SDS-PAGE gel for thesecond dimension as described above. Preparative gelswere visualized by the colloidal Coomassie-stainingmethod [51] and scanned using a Typhoon 9400™ Vari-able Mode Imager (GE Healthcare). Spots of interest werematched between DIGE images and the preparative gel,and spots manually excised for protein identification.Spots were prioritized for identification using an FDR cor-rected p-value cut-off of 0.05 and a change in expressionof 1.4 or greater.
Mass spectrometryProtein spots excised from the preparative gel were cutinto approximately 1 mm3 pieces, then reduced and alky-lated by treatment with 10 mM DTT and 55 mM iodoace-tamide in 50 mM ammonium bicarbonate buffer [52]. Gelpieces were washed with 50 mM ammonium bicarbonatebuffer and dehydrated in a SpeedVac® concentrator(Savant) for 1 hr, soaked with 3-10 μl of 20 ng/μl trypsinsolution (sequencing grade modified trypsin, Promega) in50 mM acetic acid on ice for 20 min, then washed againwith buffer. Protein digestion was performed in the samebuffer (50 μl) overnight at 35°C. Reaction supernatant wasrecovered and gel pieces were further extracted by 2×sonication in 50 μl 50% acetonitrile/1% trifluroacetic acid,and then dried using a SpeedVac® concentrator (Savant).Mass spectrometry for higher abundance spots was per-formed using a Waters micromass quadrupole time offlight (Q-TOF) Ultima mass spectrometer with a nanos-pray ESI injection at mass spectrometry facility in Univer-sity of Waterloo. Samples analyzed using the Q-Tof weredesalted prior to analysis using C18 ZipTip
® pipette tips(Millipore) and eluted using 50% acetonitrile in water with0.2% formic acid. For lower abundance spots, trypsin-digested peptides were analyzed (without ZipTip desalting)using an Applied Biosystems Q-Trap mass spectrometrysystem at the Proteomics Core Facility of DalhousieUniversity (Halifax, Nova Scotia).Protein identificationProtein identification was performed using Peaks Studio(version 2.4, Bioinformatics Solutions, Waterloo), whichcombines auto de novo sequencing and homology-baseddatabase searching, with the non-redundant MSDB data-base (Dr. D.N Perkins, Imperial College London, Release20063108, 3239079 sequences). Mass error tolerances ofparental and fragment ions were set at 0.1 for Q-TOFspectra and 0.3 or 0.4 for Q-Trap spectra, with 0.3 used if
Kim et al. Proteome Science 2011, 9:62http://www.proteomesci.com/content/9/1/62
Page 12 of 14
a more restrictive search was required. Confidence ofprotein identifications were based on the Peaks databasesearch score (%) according to the algorithm of Ma et al.(2005) [53]. Protein identifications were accepted if thehomology search score was higher than 80% (i.e. extre-mely high confidence) and identified a single yeast pro-tein. For Peaks scores less than 80%, protein identity wasadditionally confirmed using the web-based Mascotsearch engine (version 4) in the MS/MS ion search mod-ule (Matrix Science, http://www.matrixscience.com) withMSDB by restricted to Saccharomyces cerevisiae (10742sequences) as the target organism. Protein matches wereretained if the Mascot search had a significance thresholdof p < 0.05, with default mass error tolerances of 1.2 and0.6 Da for parental and fragment ions, respectively.Finally, the false discovery rate (threshold set to 0.01) wasconfirmed by performing the Mascot decoy databasesearch. For both the Peaks and Mascot database searches,trypsin was set as the digestive protease allowing onemissed cleavage, and carbamidomethylation of cysteineand oxidation of methionine were set as the fixed andvariable modifications, respectively. For counting numberof unique peptides matching to hit proteins, only peptideions that are doubly or triply charged were included. Pep-tide sequence coverage (%) was obtained based on thematching peptide sequences from Peaks.Genotoxic sensitivity assaysTo identify potential genotoxic effects of targeted proteins,a spotting growth assay was performed to assess MMS orhydroxyurea (HU) resistance [40,41] in gene knockout celllines or cells with lowered mRNA expression. Haploidknockout and DAmP cell lines in a BY4741 backgroundwere purchased from Open Biosystems (Thermo FisherScientific Inc.). BY4741 wild type and DNA damagecheckpoint compromised rad53-11 [42] strains were usedas controls. Cultures of cells were grown to saturation (~2× 10⁸ cells/ml) and serial 10-fold dilutions, ranging from107 cells/ml to 104 cells/ml, were prepared for each strain.5 μl of each dilution was spotted onto a series of YPDplates with varying concentrations of MMS (up to 0.04%)or HU (up to 100 mM). The plates were incubated at 30°Cfor 2 days.
Additional material
Additional file 1: Supplementary figures 1-4, Supplementary Tables1 and 2. Figure S1. DIGE gel image comparing chromatin fraction andwhole cell extract. Figure S2. DIGE gel image comparing MMS treatedand control chromatin fractions. Figure S3. Additional spotting growthassay for genotoxic sensitivity. Figure S4. Western blot analysis ofchromatin fractionation samples. Table S1. Mass spectrometry data forproteins identified in chromatin enriched sample. Table S2. Massspectrometric identification of MMS-induced differentially expressedproteins.
AcknowledgementsWe would like to thank Owen Woody and Zhenyu Cheng for technicalassistance, and Dr. Richard Smith (University of Waterloo) and EldenRowland (Dalhousie University) for assistance with mass spectrometryanalysis. This work was supported by grant ITG-70195 from the CanadianInstitutes of Health Research.
Author details1Department of Biology, University of Waterloo, 200 University Avenue,Waterloo, ON, Canada. 2Department of Applied Mathematics, University ofWaterloo, 200 University Avenue, Waterloo, ON, Canada.
Authors’ contributionsDRK conducted the proteomics analysis and yeast genetics experiments anddrafted the manuscript. RDG assisted with proteomics analysis and yeastgenetics experiments. BPI, BPD, and BJM conceived the study, assisted withexperimental design, and contributed to preparation of the manuscript. Allauthors have read and approved the final manuscript.
Competing interestsThe authors declare that they have no competing interests.
Received: 5 May 2011 Accepted: 4 October 2011Published: 4 October 2011
References1. Tonge R, Shaw J, Middleton B, Rowlinson R, Rayner S, Young J, Pognan F,
Hawkins E, Currie I, Davison M: Validation and development offluorescence two-dimensional differential gel electrophoresis proteomicstechnology. Proteomics 2001, 1:377-396.
2. Aerbersold R, Mann M: Mass spectrometry-based proteomics. Nature 2003,422:198-207.
3. Ghaemmaghami S, Huh W-K, Bower K, Howson RW, Belle A, Dephoure N,O’shea EK, Weissman JS: Global analysis of protein expression in yeast.Nature 2003, 425:737-741.
4. Gavin AC, Bösche M, Krause R, Grandi P, Marzioch M, Bauer A, Schultz J,Rick JM, Michon AM, Cruciat CM, Remor M, Höfert C, Schelder M,Brajenovic M, Ruffner H, Merino A, Klein K, Hudak M, Dickson D, Rudi T,Gnau V, Bauch A, Bastuck S, Huhse B, Leutwein C, Heurtier MA, Copley RR,Edelmann A, Querfurth E, Rybin V, Drewes G, Raida M, Bouwmeester T,Bork P, Seraphin B, Kuster B, Neubauer G, Superti-Furga G: Functionalorganization of yeast proteome by systematic analysis of proteincomplexes. Nature 2002, 415:141-147.
5. Smolka MB, Albuquerque CP, Chen S-H, Zhou H: Proteome-wideidentification of in vivo targets of DNA damage checkpoint kinases. ProcNatl Acad Sci USA 2007, 104:10364-10369.
6. Yates JR III, Gilchrist A, Howell KE, Bergeron JJ: Proteomics of organellesand large cellular structure. Nat Rev Mol Cell Biol 2005, 6:702-714.
7. Forner F, Foster LJ, Campanaro S, Valle G, Mann M: Quantitative proteomiccomparison of rat mitochondria from muscle, heart, and liver. Mol CellProteomics 2006, 5:608-619.
8. Andersen J, Mann M: Organellar proteomics: turning inventories intoinsights. EMBO rep 2006, 9:874-879.
9. Rattner JB, Saunders C, Davie JR, Hamkalo BA: Ultrastructural organizationof yeast chromatin. J Cell Biol 1982, 92:217-222.
10. Szent-Gyorgyi C, Isenberg I: The organization of oligonucleosome inyeast. Nucleic Acids Res 1983, 11:3717-3736.
11. Liang C, Stillman B: Persistent inhibition of DNA replication andchromatin-bound MCM proteins during the cell cycle in cdc6 mutants.Genes Dev 1997, 11:3375-3386.
12. Khoudoli GA, Gillespie PJ, Stewart G, Andersen JS, Swedlow JR, Blow JJ:Temporal profiling of the chromatin proteome reveals system-wideresponses to replication inhibition. Curr Biol 2008, 18:838-843.
13. Chu DS, Liu H, Nix P, Wu TF, Ralston EJ, Yates JR, Meyer BJ: Spermchromatin proteomics identifies evolutionarily conserved fertility factors.Nature 2006, 443:101-105.
14. Tang W, Deng Z, Oses-Prieto JA, Suzuki N, Zhu S, Zhang X, Burlingame AL,Wang ZY: Proteomics studies of brassinosteroid signal transduction usingprefractionation and two-dimensional DIGE. Mol Cell Proteomics 2008,7:728-738.
Kim et al. Proteome Science 2011, 9:62http://www.proteomesci.com/content/9/1/62
Page 13 of 14
15. Bernstein BE, Schreiber SL: Global approaches to chromatin. Chem Biol2002, 9:1167-1173.
16. Sclafani RA, Holzen TM: Cell cycle regulation of DNA replication. Annu RevGenet 2007, 41:237-280.
17. Morgan DO, Loog M: Cyclin specificity in the phosphorylation of cyclin-dependent kinase substrates. Nature 2005, 434:104-108.
18. Koundrioukoff S, Polo S, Almouzni G: Interplay between chromatin andcell cycle checkpoints in the context of ATR/ATM-dependentcheckpoints. DNA repair 2004, 3:969-978.
19. Harrison JC, Haber JE: Surviving the breakup: the DNA damagecheckpoint. Annu Rev Genet 2006, 40:209-235.
20. Jiang Y-H, Bressler J, Beaudet AL: Epigenetics and human disease. AnnuRev Genomics Hum Genet 2004, 5:479-510.
21. Pollard KJ, Peterson CL: Chromatin remodeling: a marriage between twofamilies. Bioessay 1998, 20:771-780.
22. Rodriguez BAT, Huang TDM: Tilling the chromatin landscape: emergingmethods for the discovery and profiling of protein DNA interactions.Biochem Cell Biol 2005, 83:525-534.
23. Saha A, Wittmeyer J, Cairns BR: Chromatin remodeling: the industrialrevolution of DNA around histones. Nature Rev Mol Cell Biol 2006,7:437-447.
24. Lalo D, Carles C, Sentenac A, Thuriaux P: Interactions between threecommon subunits of yeast RNA polymerase I and III. Proc Natl Acad SciUSA 1993, 90:5524-5528.
25. Jourdain S, Acker J, Ducrot C, Sentenac A, Lefebvre O: The tau95 subunitof yeast TFIIIC influences upstream and downstream functions of TFIIIC.DNA complexes. J Biol Chem 2003, 278:10450-10457.
26. Nelson LD, Musso M, Van Dyke MW: The yeast STM1 gene encodes apurine motif triple helical DNA-binding protein. J Biol Chem 2000,275:5573-5581.
27. Downey M, Houlsworth R, Maringele L, Rollie A, Brehme M, Galicia S,Cuillard S, Partington M, Zubko ML, Krogan NJ, Emili A, Greenblatt JF,Harrington L, Lydall D, Durocher D: A genome-wide screen identifies theevolutionary conserved KEOPS complex as a telomere regulator. Cell2006, 124:1155-1168.
28. Longhese MP, Neecke H, Paciotti V, Lucchini G, Plevani P: The 70 kDasubunit of replication protein A is required for the G1/S and intra-S DNAdamage checkpoints in budding yeast. Nucleic Acids Res 1996,24:3533-3537.
29. Umezu K, Sugawara N, Chen C, Haber JE, Kolodner RD: Genetic analysis ofyeast RPA1 reveals its multiple functions in DNA metabolism. Genetics1998, 148:989-1005.
30. Santocanale C, Neecke H, Longhese MP, Lucchini G, Plevani P: Mutations inthe gene encoding the 34 kDa subunit of yeast replication protein Acause defective S phase progression. J Mol Biol 1995, 254:595-607.
31. Huang M, Elledge SJ: Identification of RNR4, encoding a second essentialsmall subunit of ribonucleotide reductase in Saccharomyces cerevisiae.Mol Cell Biol 1997, 17:6105-6113.
32. Yao R, Zhang Z, An X, Bucci B, Perlstein DL, Stubble J, Huang M:Subcellular localization of yeast ribonucleotide reductase regulated bythe DNA replication and damage checkpoint pathways. Proc Natl AcadSci USA 2003, 100:6628-6633.
33. Usui T, Petrini JHJ: The Saccharomyces cerevisiae 14-3-3 proteins Bmh1and Bmh2 directly influence the DNA damage-dependent functions ofRad53. Proc Natl Acad Sci USA 2003, 104:2797-2802.
34. Liao C, Hu B, Arno MJ, Panaretou B: Genomic screening in vivo revealsthe role played by vacuolar H+ ATPase and cytosolic acidification insensitivity to DNA-damaging agents such as cisplatin. Mol Pharmacol2006, 71:416-425.
35. Hinnebusch AG, Natarajan K: Gcn4p, a master regulator of geneexpression, is controlled at multiple levels by diverse signals ofstarvation and stress. Eukaryot Cell 2002, 1:22-32.
36. Norman JO, Joe CO, Busbee DL: Inhibition of DNA polymerase activity bymethyl methanesulfonate. Mutat Res 1986, 165:71-79.
37. Shin I, Kam Y, Ha K, Kang K, Joe CO: Inhibition of the phosphorylation ofa myristoylated alanine-rich C kinase substrate by methylmethanesulfonate in cultured NIH 3T3 cells. Mutat Res 1996, 351:163-171.
38. Birrell GW, Brown JA, Wu HI, Giaever G, Chu AM, Davis RW, Brown JM:Transcriptional response of Saccharomyces cerevisiae to DNA-damagingagents does not identify the genes that protect against these agents.Proc Natl Acad Sci USA 2002, 99:8778-8783.
39. Hillenmeyer ME, Fung E, Wildenhain J, Pierce SE, Hoon S, Lee W, Proctor M,St Onge RP, Tyers M, Koller D, Altman RB, Davis RW, Nislow C, Giaever G:The chemical genomic portrait of yeast: uncovering a phenotype for allgenes. Science 2008, 320:362-365.
40. Varrin AE, Prasad AA, Scholz R-P, Ramer MD, Duncker BP: A mutation inDbf4 motif M impairs interactions with DNA replication factors andconfers increased resistance to genotoxic agents. Mol Cell Biol 205,25:7494-7504.
41. Hanway D, Chin JK, Xia G, Oshiro G, Winzeler EA, Romesberg FE: Previouslyuncharacterized genes in the UV- and MMS-induced DNA damageresponse in yeast. Proc Natl Acad Sci USA 2002, 99:10605-10610.
42. Santocanale C, Diffley JFX: A Mec1- and Rad53-dependent checkpointcontrols late-firing origins of DNA replication. Nature 1998, 395:615-618.
43. Künzler M, Trueheart J, Sette C, Hurt E, Thorner J: Mutations in the YRB1gene encoding yeast Ran-binding-protein-1 that impairnucelocytoplasmic transport and suppress yeast mating defects. Genetics2001, 157:1089-1105.
44. Ong S-E, Mann M: Mass spectrometry-based proteomics turnsquantitative. Nat Chem Biol 2005, 1:252-262.
45. Gasch AP, Huang M, Metzner S, Botstein D, Elledge SJ, Brown PO: Genomicexpression response to DNA-damaging agents and the regulatory roleof the yeast ATR homolog Mec1p. Mol Biol Cell 2001, 12:2987-3003.
46. Begley TJ, Rosenbach AS, Ideker T, Samson LD: Damage recoverypathways in Saccharomyces cerevisiae revealed by genomicphenotyping and interactome mapping. Mol Cancer Res 2002, 1:103-112.
47. Ghavidel A, Kislinger T, Pogoutse O, Sopko R, Jurisica I, Emili A: ImpairedtRNA nuclear export links DNA damage and cell-cycle checkpoint. Cell2007, 131:915-926.
48. Karp NA, McCormick PS, Russell MR, Lilley KS: Experimental and statisticalconsiderations to avoid false conclusions in proteomics studies usingdifferential in-gel electrophoresis. Mol Cell Proteomics 2007, 6:1354-1364.
49. Molloy MP, Brzezinski EE, Hang J, McDowell MT, VanBogelen RA:Overcoming technical variation and biological variation in quantitativeproteomics. Proteomics 2003, 3:1912-1919.
50. Team RDC: R: A Language and Environment for Statistical Computing. RFoundation for Statistical Computing.[http://www.r-project.org].
51. Candiano G, Bruschi M, Musante L, Ghiggeri GM, Carnemolla B, Orecchia P,Zardi L, Righetti PG: Blue silver: a very sensitive colloidal Coomassie G-250 staining for proteome analysis. Electrophoresis 2004, 25:1327-1333.
52. Granvogl B, Plöcher M, Eichacker LA: Sample preparation by in-geldigestion for mass spectrometry-based proteomics. Anal Bioanal Chem2007, 389:991-1002.
53. Ma B, Zhang K, Liang C: An effective algorithm for peptide de novosequencing from MS/MS spectra. J Comput System Sci 2005, 70:418-430.
54. Yoo YD, Xu X, Guan J-L: A novel role of the actin-nucleating Arp2/3complex in the regulation of RNA polymerase II-dependenttranscription. J Biol Chem 2006, 282:7616-7623.
55. Franke J, Reimann B, Hartmann E, Köhlerl M, Wiedmann B: Evidence for anuclear passage of nascent polypeptide-associated complex subunits inyeast. J Cell Sci 2001, 114:2641-2648.
56. Valencia-Burton M, Oki M, Johnson J, Seier TA, Kamakaka R, Haber JE:Different mating-type-regulated genes affect the DNA repair defects ofSaccharomyces Rad51, Rad52 and Rad55 mutants. Genetics 2006,174:41-55.
57. Murray JA, Scarpa M, Rossi N, Cesareni G: Antagonistic controls regulatecopy number of the yeast mu plasmid. EMBO J 1987, 6:4205-4212.
58. Huh WK, Falvo JV, Gerke LC, Carroll AS, Howson RW, Weissman JS,O’Shea EK: Global analysis of protein localization in budding yeast.Nature 2003, 425:686-691.
doi:10.1186/1477-5956-9-62Cite this article as: Kim et al.: Differential chromatin proteomics of theMMS-induced DNA damage response in yeast. Proteome Science 20119:62.
Kim et al. Proteome Science 2011, 9:62http://www.proteomesci.com/content/9/1/62
Page 14 of 14