MMS Project #642 - Final Report Feb 2010
142
ASSESSMENT OF DAMAGE AND FAILURE MECHANISMS FOR OFFSHORE STRUCTURES AND PIPELINES IN HURRICANES GUSTAV AND IKE FINAL REPORT February 2010 Prepared for: U.S. Department of the Interior Mineral Management Service Engineering and Research Branch 381 Elden Street Herndon, VA 20170 Prepared by: Energo Engineering 1300 W Sam Houston Pkwy. S, Suite 100 Houston, Texas 77042 MMS TAR No.: 642 Energo Engineering Project No.: E09180 A Registered Texas Engineering Firm No: F-10973
-
Upload
khangminh22 -
Category
Documents
-
view
1 -
download
0
Transcript of MMS Project #642 - Final Report Feb 2010

ASSESSMENT OF DAMAGE AND FAILURE
MECHANISMS FOR OFFSHORE STRUCTURES AND
PIPELINES IN HURRICANES GUSTAV AND IKE
FINAL REPORT February 2010
Prepared for:
U.S. Department of the Interior
Mineral Management Service
Engineering and Research Branch
381 Elden Street
Herndon, VA 20170
Prepared by:
Energo Engineering
1300 W Sam Houston Pkwy. S, Suite 100
Houston, Texas 77042
MMS TAR No.: 642
Energo Engineering Project No.: E09180
A Registered Texas Engineering Firm No: F-10973

MMS
Assessment of Offshore Structures and Pipelines in Hurricanes Gustav and Ike February 2010
Energo Engineering 1300 W Sam Houston Pkwy S, Suite 100 Houston, TX 77042 USA Tel: 713-532-2900 Fax: 713-532-2922
www.energoeng.com
(This Page Was Intentionally Left Blank)

MMS
Assessment of Offshore Structures and Pipelines in Hurricanes Gustav and Ike February 2010
Energo Engineering 1300 W Sam Houston Pkwy S, Suite 100 Houston, TX 77042 USA Tel: 713-532-2900 Fax: 713-532-2922
www.energoeng.com
Disclaimer This report has been reviewed by the Minerals Management Service and approved for
publication. Approval does not signify that the contents necessarily reflect the views and
policies of the Service, nor does mention of trade names or commercial products constitute
endorsement or recommendation for use

MMS Page i
Assessment of Offshore Structures and Pipelines in Hurricanes Gustav and Ike February 2010
Energo Engineering 1300 W Sam Houston Pkwy S, Suite 100 Houston, TX 77042 USA Tel: 713-532-2900 Fax: 713-532-2922
www.energoeng.com
TABLE OF CONTENTS
EXECUTIVE SUMMARY .................................................................................................................... iv
1.0 INTRODUCTION ........................................................................................................................1
1.1 Background ................................................................................................................................. 1
1.2 Objectives ................................................................................................................................... 1
1.3 Project Team ............................................................................................................................... 1
2.0 HURRICANE CHARACTERISTICS ..........................................................................................3
2.1 Path of Hurricanes ...................................................................................................................... 3
2.2 Hurricane Gustav Storm Characteristics..................................................................................... 3
2.3 Hurricane Ike Storm Characteristics ........................................................................................... 3
3.0 DATA COLLECTION .................................................................................................................6
4.0 DATA EVALUATION - DESTROYED PLATFORMS .............................................................7
4.1 Number of Platforms Destroyed ................................................................................................. 7
4.2 Destroyed Platforms by Location ............................................................................................. 12
4.3 Destroyed Platforms by Vintage ............................................................................................... 14
4.4 Destroyed Platforms by Structure Type.................................................................................... 20
5.0 PLATFORM COMPARISON TO DESIGN STANDARDS .....................................................23
5.1 Destroyed Platforms by API Category ..................................................................................... 23
5.2 Hindcast Data Comparisons ..................................................................................................... 28
5.2.1 Hindcast Wave Comparison to API Category ..................................................................... 28
5.2.2 Hindcast Wave Comparison to Deck Height ...................................................................... 38
5.2.3 Hindcast Crest Comparison to API Minimum Elevation of Underside of Deck ................ 47
5.3 Jacket Structure Pancake Leg ................................................................................................... 55
5.3.1 Background .......................................................................................................................... 55
5.3.2 Comparison to API Member Design Approach .................................................................. 60
5.3.3 Comparison to Analysis ...................................................................................................... 61
6.0 PLATFORM DAMAGE OBSERVATIONS .............................................................................64
6.1 General Types of Observed Damage ........................................................................................ 64
6.1.1 Observed Floating Platform Damage ................................................................................. 64
6.1.2 Observed Fixed Platform Damage ..................................................................................... 67
6.2 Example Mitigation Options ..................................................................................................... 74
7.0 PIPELINE PERFORMANCE.....................................................................................................82

MMS Page ii
Assessment of Offshore Structures and Pipelines in Hurricanes Gustav and Ike February 2010
Energo Engineering 1300 W Sam Houston Pkwy S, Suite 100 Houston, TX 77042 USA Tel: 713-532-2900 Fax: 713-532-2922
www.energoeng.com
7.2 Summary Information ............................................................................................................... 82
7.3 Causes of Damage .................................................................................................................... 92
7.4 Mudslides .................................................................................................................................. 96
7.5 Currents .................................................................................................................................. 102
7.6 Summary and Recommendations ........................................................................................... 104
8.0 SUMMARY OF RESULTS .....................................................................................................105
9.0 REFERENCES .........................................................................................................................109
APPENDIX A - Platforms Destroyed by Gustav
APPENDIX B - Platforms Destroyed by Ike

MMS Page iii
Assessment of Offshore Structures and Pipelines in Hurricanes Gustav and Ike February 2010
Energo Engineering 1300 W Sam Houston Pkwy S, Suite 100 Houston, TX 77042 USA Tel: 713-532-2900 Fax: 713-532-2922
www.energoeng.com
ABBREVIATIONS
ABAQUS a finite element analysis software package
API American Petroleum Institute
Bul API abbreviation for Bulletin
CE Carbon Equivalent
CGF Conductor Guide Framing
CBD Consequence Based Design
FEA finite element analysis
HD Horizontal Diagonal
Hmax Maximum Wave Height
HZ Horizontal Brace
MMS Minerals Management Service
NTL Notice To Lessees
OOC Offshore Operators Committee
OSTS Office of Structural and Technical Support
RP API abbreviation for Recommended Practice
RP2A API Recommended Practice 2A for Planning, Designing and
Constructing Fixed Offshore Platforms, 21st Edition
RP 2TD API Recommended Practice on Guidelines for Tie-downs on Offshore
Production Facilities for Hurricane Season
SACS (Structural Analysis Computer System) is a finite element structural
analysis suite of programs for the offshore and civil engineering
industries.
Section 2 Section within RP 2A 21st Edition that covers design of new platforms
Section 17 Section within RP 2A 21st Edition that covers assessment of existing
platforms
ULS Ultimate Limit Strength
VD Vertical Diagonal
WID Wave In Deck
See also Table 7.1 for special pipeline related acronyms.
TERMS AND DEFINITIONS
Saffir-Simpson Intensity Scale (SSI) – 1-5 category rating based on a hurricane's sustained
wind intensity and its potential for damage to shore side infrastructure.
Forristall Distribution – A probabilistic distribution used to describe the maximum wave
height during a storm
CONVERSIONS
1 foot (ft) = 0.305 meters (m)
1 mile (mi) = 1.609 kilometers (km)
1 knot (kn) = 0.514 meters/second (m/s)

MMS Page iv
Assessment of Offshore Structures and Pipelines in Hurricanes Gustav and Ike February 2010
Energo Engineering 1300 W Sam Houston Pkwy S, Suite 100 Houston, TX 77042 USA Tel: 713-532-2900 Fax: 713-532-2922
www.energoeng.com
EXECUTIVE SUMMARY
Hurricanes Gustav and Ike affected approximately 3,000 platforms and thousands of miles of
pipelines in the Gulf of Mexico (GOM) during the fall of 2008. This report represents a
comprehensive study of the performance of fixed and floating platforms and pipelines in
Gustav and Ike. While most of these performed adequately, numerous platforms and
pipelines were destroyed or damaged.
The overall findings, as in past studies, indicate that there was no life-loss or major
environmental problems as a direct result of the hurricanes. This is attributable to the prior
evacuation of the platforms and to the use of sub-surface safely valves and shut-in of wells
prior to the hurricane arrival.
This project has evaluated large amounts of data and information related to how fixed and
floating platforms and pipelines performed in hurricanes Gustav and Ike. Some of these
evaluations and findings were similar to other studies of platform and pipeline performance in
hurricanes.
The following summarizes specific key results and associated recommendations identified by
this study. The description is intentionally brief since this is a summary of prior discussion
elsewhere in this report. See the indicated section for full details. The findings are listed in
relative order of importance for Platforms or Pipelines.
Platforms:
1. Performance of Tripod Platforms.
Result – There were five recent vintage tripods destroyed during Gustav and Ike, a
surprisingly high number. One was an L-1 structure and 4 were L-2 structures. While tripods
lack redundancy, offering little in way of alternative load paths in the event they are damaged,
they also are also more dynamically sensitive especially in deeper waters (i.e., greater than
200 feet). See Section 4.4.
Recommendation – Further investigation into the tripod failures, and damage where data is
available. Limits on the use of tripods in deeper water should be considered as well as a
“robustness” check to ensure that the tripod can still function adequately should it sustain
damage to the jacket or foundation.
2. Platform Robustness.
Result – Numerous platforms experienced storm conditions greater than 50 year L-2 and 100
year L-1 design practice. While most performed as expected or better since they experienced
an event larger than their design, it is clear that offshore structures require “robustness” that
not only allows them to survive, but perhaps sustain damage if the elastic design event is
exceeded. While the 50 or 100 year design approach provides inherent factors of safety,
additional checks are required to ensure that the platform will survive extreme conditions.
For example, checks for efficient load paths and redundancy. See Section 5.2.1.
MMS Page v
Assessment of Offshore Structures and Pipelines in Hurricanes Gustav and Ike February 2010
Energo Engineering 1300 W Sam Houston Pkwy S, Suite 100 Houston, TX 77042 USA Tel: 713-532-2900 Fax: 713-532-2922
www.energoeng.com
Recommendation – A second check be performed during the initial design of offshore
platforms to ensure they will survive extreme hurricanes such as Ike, that may exceed the
platform elastic design criteria. This is especially important for High Consequence platforms.
See Item 5 below.
3. Performance of Floating Structures.
Result – Deepwater floating structures performed well in both hurricanes with only one
structure suffering major damage due to a toppled drill rig. There was minor damage to other
structures, mostly from high winds and wave run-up on the structure.
Recommendation – Operators should follow API guidance on tie-down of rigs, such as RP
2TD, especially on floating structures which have large motions in hurricanes.
4. Performance of A-2 manned-evacuated platforms.
Result – The majority of the A-2 manned-evacuated platforms that were destroyed
experienced metocean conditions equal to, but predominately larger than, the Section 17 A-2
Ultimate Strength Criteria. On average these platforms experienced conditions 5 to 10 feet
greater than this criteria. This finding confirms that these structures which could be manned
during a Sudden Hurricane and should be able to withstand the API defined Sudden Hurricane
conditions. See Section 5.2.1.
Recommendation – API is still investigating the Sudden Hurricane conditions and if they have
changed then the findings of this report need to be reconfirmed. Initial indications are that the
Sudden Hurricane conditions are the same as before Ike and Gustav and even Katrina and
Rita.
5. Performance of L-1 platforms
Result - There was one L-1 platform that was destroyed during Ike which was a deepwater
tripod. As no damage data was available for this study, the number of damaged L-1
platforms, if any, is unknown. L-1 represents the High Consequence API exposure category
for fixed platforms and also the latest API approach for metocean loading including design to
100 year conditions. Much like Katrina and Rita, Gustav and Ike essentially “proof loaded”
these platforms to loads at or above the L-1 criteria and the majority of platforms survived.
This validates the L-1 design approach. See Section 5.2.1 and Item 1 above.
Recommendation – As a result of over 50% of these platforms seeing conditions greater than
the 100 year design and it is recommended robustness checks in Item 2 above be performed
on new High Consequence structures in order to ensure they will survive extreme hurricanes.
6. Pancake Leg Damage.
Result: To date there have been 21 documented cases of this type of damage. In most cases
the D/t ratio was over 60 and the average thickness transition between joint can and nominal
leg was 5/8 inches. It is likely that several of the destroyed platforms had this issue which
ultimately resulted in their destruction. See Section 5.2.3.
Recommendation: Additional study is recommended to better understand this type of damage
and modify the new platform design process accordingly (e.g., establish D/t limits for legs).
In addition, guidelines should be developed to determine if an existing platform is susceptible

MMS Page vi
Assessment of Offshore Structures and Pipelines in Hurricanes Gustav and Ike February 2010
Energo Engineering 1300 W Sam Houston Pkwy S, Suite 100 Houston, TX 77042 USA Tel: 713-532-2900 Fax: 713-532-2922
www.energoeng.com
to this problem (e.g., thin walled legs) and recommendations developed to prevent the
problem from occurring, such as grouting the legs.
7. Crest Comparison to Required Deck Height.
Result: Over 40% of the platforms exposed were expected to see wave in deck if their deck
height was set at the recommended API deck height. The majority of these are classified as
A-2 platforms and their deck heights are checked per Section 17 based on Sudden Hurricane
conditions which are much less than 100 year conditions. In contrast, High Consequence L-1
and A-1 platforms and Medium Consequence L-2 platforms which have their deck elevations
established according to 100 year conditions, had a low percentage of platforms that would
have expected to see WID. See Section 5.2.2.
Recommendation: The API A-2 deck elevation curves are an indicator if a platform will
survive a sudden hurricane, but they are not a good indicator if the platform will be damaged
or destroyed in larger hurricanes. Platform owners should be educated on the destruction or
damage and associated potential downtime that can occur for platforms that have low decks,
especially A-2 platforms, or when critical production or other equipment and systems are
located on lower decks that can be impacted by waves. Consideration should be given to
relocate such equipment to higher decks.
8. Foundations.
Result: Numerous leaning platforms were observed including several with suspected pile
foundation failures. These were some of the first documented pile foundation failures in
hurricanes. In terms of vintage, the majority of the observations were of recent design and
installed in the last 10 years, with more tripods contributing to the structure type. See Item 1
above and Section 6.1.2.
Recommendation: The guidance in MMS TAR Study 612 which provides an in-depth study
of the performance of foundations in hurricanes, including Ike, should be followed for
platform design and assessment. In particular, the document provides an improved approach
for assessment of the foundations of existing platforms as well as guidance to include pile
flexibility in determining pile penetration for new platform design.
9. Crown Shims.
Result: Several jacket pile shim connections failed and proved to be the “weak link” in the
platform design. The majority of these failures are attributed to an overloaded connection that
was poorly designed. It is likely that this is the initiating flaw in several of the destroyed
platforms. See Section 6.1.2.
Recommendation: It is recommended further study be performed to provide improved
guidance on design of this connection for both strength and fatigue (low cycle, high stress) for
new platforms. The guidance should also include an approach to determine if an existing
platform has this type of flaw so that corrective action can be taken.

MMS Page vii
Assessment of Offshore Structures and Pipelines in Hurricanes Gustav and Ike February 2010
Energo Engineering 1300 W Sam Houston Pkwy S, Suite 100 Houston, TX 77042 USA Tel: 713-532-2900 Fax: 713-532-2922
www.energoeng.com
Pipelines:
1. Performance of Pipelines and Risers.
Result: Numerous pipelines and risers experienced movements similar to prior hurricanes.
More risers were damaged in Ike than Katrina. Bottom currents were larger than predicted in
some cases and perhaps the reason for numerous pipeline movements. See Section 7.4
Recommendation: Apply the new modeling and calibration work for storm surges and
currents to predict the loads on pipelines and risers, to assess the potential for damage, and to
compare the predictions with observations.

MMS Page 1
Assessment of Offshore Structures and Pipelines in Hurricanes Gustav and Ike February 2010
Energo Engineering 1300 W Sam Houston Pkwy S, Suite 100 Houston, TX 77042 USA Tel: 713-532-2900 Fax: 713-532-2922
www.energoeng.com
1.0 INTRODUCTION
1.1 Background
Hurricanes Gustav and Ike impacted over 3,000 platforms and thousands of miles of pipelines
in the Gulf of Mexico (GOM) during 2008. Gustav was a fast moving storm that made
landfall in the central region of the GOM near Cocodrie, Louisiana and resulted in minimal
platform destruction and damage, although several pipelines were damaged likely as a result
of mudslides. In contrast, Ike was a slow moving storm that moved across a large portion of
the GOM Outer Continental Shelf (OCS) before it made landfall near Galveston, Texas. Ike’s
path was similar to that of hurricane Rita in 2005, and similar to Rita, Ike destroyed and
damaged a large number of platforms and pipelines. There was no life loss and no significant
pollution in either Gustav or Ike.
1.2 Objectives
The objectives are to catalogue and evaluate platform and pipeline damage and destruction
caused by hurricanes Gustav and Ike. Both fixed and floating platforms are considered here.
The work evaluated technically what went right and what went wrong in order to identify
issues that can be changed in design codes so these problems do not occur again on new
structures (platforms and pipelines) or to identify issues with existing infrastructure that can
be identified in advance and remedied prior to future hurricanes. Part of the work scope
includes identification of common mitigation methods that can be used to repair damaged
structures or can be used proactively to prevent destruction and minimize damage in future
hurricanes.
This information is beneficial to the MMS and industry to further understand how platforms
and pipelines perform in extreme hurricanes so that changes can be input to design standards
to improve performance.
Recommendations are made related to specific items that the MMS and the offshore industry,
particularly API, may consider in terms of advanced preparation and response to future
hurricanes.
1.3 Project Team
The project was performed and managed by Energo Engineering of Houston, Texas. Mr.
Frank Puskar, PE, was the Principal Investigator. Mr. Puskar was also the Principal
Investigator for the similar Andrew, Lili, Ivan and Katrina and Rita studies. Mr. Sean Verret
of Energo was the Lead Engineer for the study. Other Energo staff assisted on the project as
necessary.

MMS Page 2
Assessment of Offshore Structures and Pipelines in Hurricanes Gustav and Ike February 2010
Energo Engineering 1300 W Sam Houston Pkwy S, Suite 100 Houston, TX 77042 USA Tel: 713-532-2900 Fax: 713-532-2922
www.energoeng.com
The University of Texas (UT) at Austin also worked on the project via Dr. Robert Gilbert,
assisted by Mrs. Jeongyeon Cheon and Mr. Jiun-Yih Chen. Dr. Gilbert is well known in the
offshore industry for his work in reliability, specifically foundations. UT provided analysis
and input of the performance of pile foundations and pipeline assessments.
Participating from the MMS were Mr. B.J. Kruse, Mr. Alex Alvarado, Ms. Lori Medley
(COTR), Mr. Sid Falk, Ms. Vanessa Bertrand, and Mr. Jason Mathews.
The project was conducted from May 2009 to February 2010.
MMS Page 3
Assessment of Offshore Structures and Pipelines in Hurricanes Gustav and Ike February 2010
Energo Engineering 1300 W Sam Houston Pkwy S, Suite 100 Houston, TX 77042 USA Tel: 713-532-2900 Fax: 713-532-2922
www.energoeng.com
2.0 HURRICANE CHARACTERISTICS
2.1 Path of Hurricanes
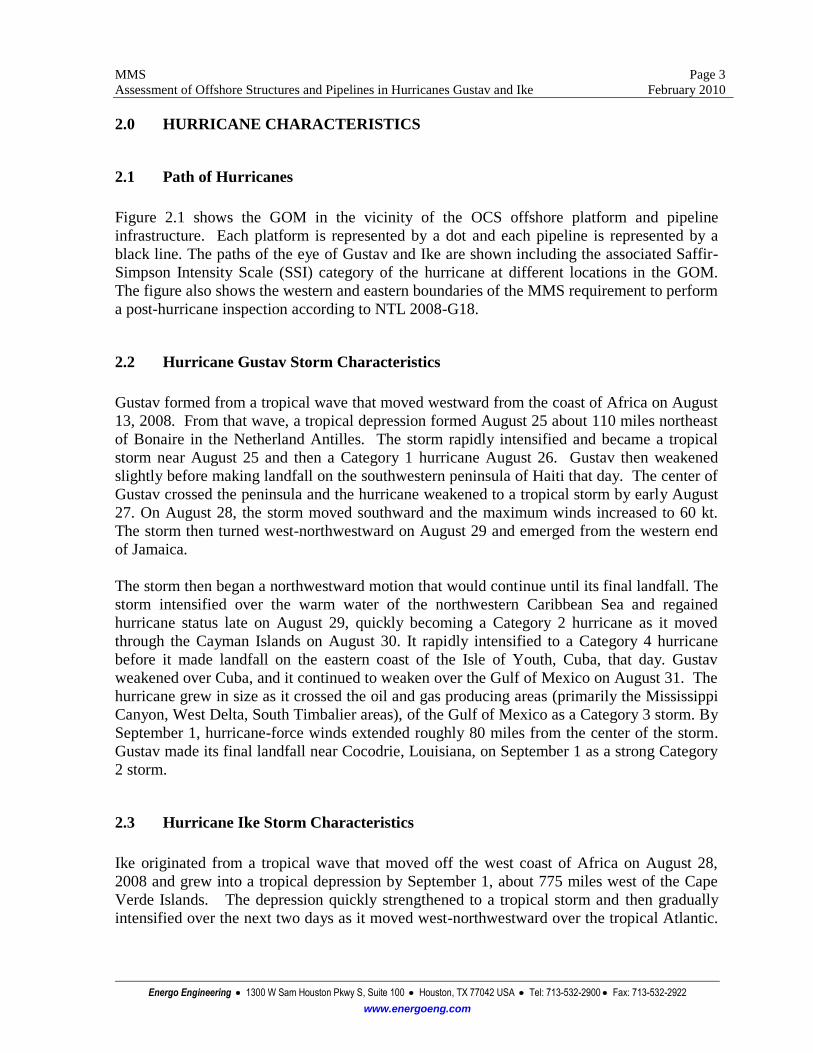
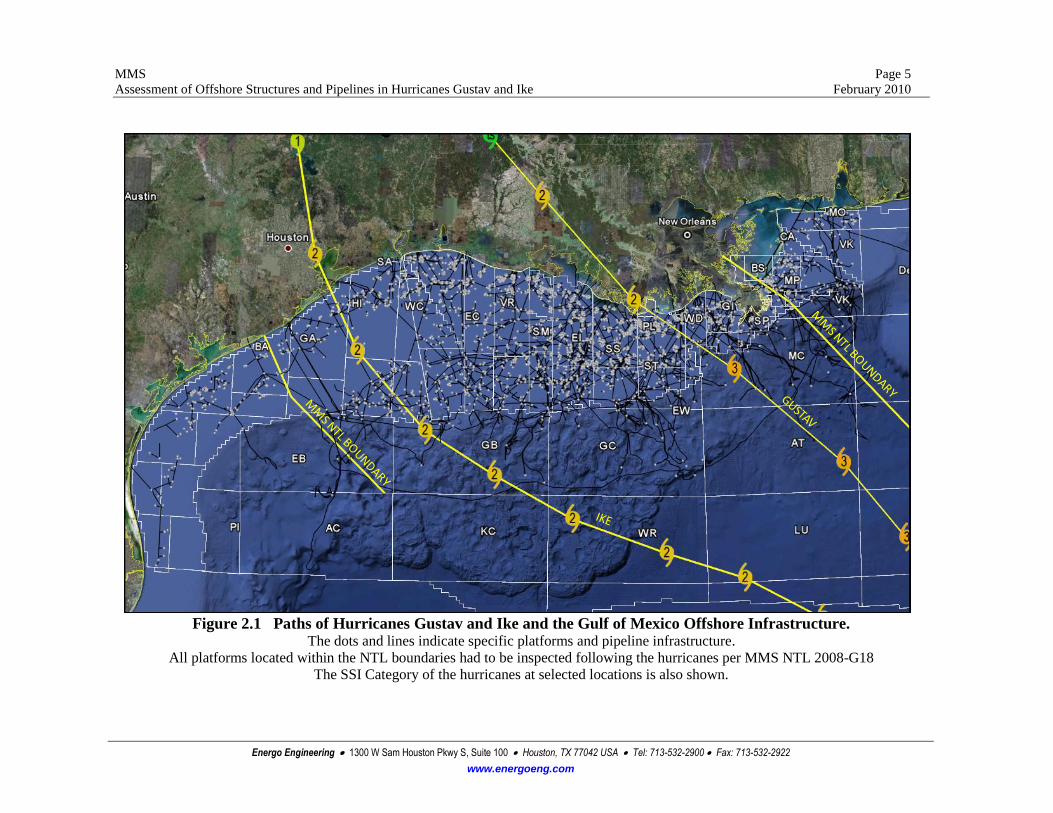
Figure 2.1 shows the GOM in the vicinity of the OCS offshore platform and pipeline
infrastructure. Each platform is represented by a dot and each pipeline is represented by a
black line. The paths of the eye of Gustav and Ike are shown including the associated Saffir-
Simpson Intensity Scale (SSI) category of the hurricane at different locations in the GOM.
The figure also shows the western and eastern boundaries of the MMS requirement to perform
a post-hurricane inspection according to NTL 2008-G18.
2.2 Hurricane Gustav Storm Characteristics
Gustav formed from a tropical wave that moved westward from the coast of Africa on August
13, 2008. From that wave, a tropical depression formed August 25 about 110 miles northeast
of Bonaire in the Netherland Antilles. The storm rapidly intensified and became a tropical
storm near August 25 and then a Category 1 hurricane August 26. Gustav then weakened
slightly before making landfall on the southwestern peninsula of Haiti that day. The center of
Gustav crossed the peninsula and the hurricane weakened to a tropical storm by early August
27. On August 28, the storm moved southward and the maximum winds increased to 60 kt.
The storm then turned west-northwestward on August 29 and emerged from the western end
of Jamaica.
The storm then began a northwestward motion that would continue until its final landfall. The
storm intensified over the warm water of the northwestern Caribbean Sea and regained
hurricane status late on August 29, quickly becoming a Category 2 hurricane as it moved
through the Cayman Islands on August 30. It rapidly intensified to a Category 4 hurricane
before it made landfall on the eastern coast of the Isle of Youth, Cuba, that day. Gustav
weakened over Cuba, and it continued to weaken over the Gulf of Mexico on August 31. The
hurricane grew in size as it crossed the oil and gas producing areas (primarily the Mississippi
Canyon, West Delta, South Timbalier areas), of the Gulf of Mexico as a Category 3 storm. By
September 1, hurricane-force winds extended roughly 80 miles from the center of the storm.
Gustav made its final landfall near Cocodrie, Louisiana, on September 1 as a strong Category
2 storm.
2.3 Hurricane Ike Storm Characteristics
Ike originated from a tropical wave that moved off the west coast of Africa on August 28,
2008 and grew into a tropical depression by September 1, about 775 miles west of the Cape
Verde Islands. The depression quickly strengthened to a tropical storm and then gradually
intensified over the next two days as it moved west-northwestward over the tropical Atlantic.

MMS Page 4
Assessment of Offshore Structures and Pipelines in Hurricanes Gustav and Ike February 2010
Energo Engineering 1300 W Sam Houston Pkwy S, Suite 100 Houston, TX 77042 USA Tel: 713-532-2900 Fax: 713-532-2922
www.energoeng.com
On September 3, an eye became apparent and Ike became a hurricane when it was centered
about 700 miles east-northeast of the northern Leeward Islands. After Ike reached its peak
intensity, an upper-level high located northwest of the hurricane over the western Atlantic
began to strengthen and contributed to wind shear, causing the cloud pattern to become
asymmetric. The hurricane turned the west on September 4 and then redeveloped and quickly
returned to Category 4 status on September 6. Ike then weakened slightly to Category 3 status
before making landfall in the southeastern Bahamas September 7. Ike weakened a little more
but once again re-strengthened to Category 4 status on Sept 8 and made landfall at that
intensity in Cuba. Ike gradually lost strength, emerging over the waters of the northwestern
Caribbean Sea as a Category 1 hurricane. Over the next day or so, Ike moved westward and
maintained its status as a Category 1 hurricane, making a second landfall in Cuba on
September 9.
Ike’s interaction with Cuba caused much of the hurricane’s inner core to become disrupted,
and the wind field expanded as the hurricane moved into the Gulf of Mexico. The storm
moved slowly northwestward on September 10 over the southeastern Gulf, but did not rapidly
intensify, strengthening to barely a Category 2 on September 10. In addition, the extent of
hurricane force winds increased, reaching as far as 115 miles from the center. At this point,
Hurricane Ike was well within the producing regions where most of the platforms are located.
On September 12, Ike turned back to the west-northwest then turned to the northwest towards
the upper Texas coast (Ike’s path passed directly through the Garden Bank and High Island
areas but affected platforms in many more areas). Ike turned to the north-northwest, and its
center made landfall along the north end of Galveston Island, Texas, on September 13, 2008.
At landfall, Ike had strengthened to a strong Category 2 hurricane with maximum winds at 95
kt. The hurricane’s center continued up through Galveston Bay, just east of Houston, then
northward across eastern Texas. Ike weakened to a tropical storm by September 13 just east
of Palestine, Texas.
MMS Page 5
Assessment of Offshore Structures and Pipelines in Hurricanes Gustav and Ike February 2010
Energo Engineering 1300 W Sam Houston Pkwy S, Suite 100 Houston, TX 77042 USA Tel: 713-532-2900 Fax: 713-532-2922
www.energoeng.com
Figure 2.1 Paths of Hurricanes Gustav and Ike and the Gulf of Mexico Offshore Infrastructure.
The dots and lines indicate specific platforms and pipeline infrastructure.
All platforms located within the NTL boundaries had to be inspected following the hurricanes per MMS NTL 2008-G18
The SSI Category of the hurricanes at selected locations is also shown.

MMS Page 6
Assessment of Offshore Structures and Pipelines in Hurricanes Gustav and Ike February 2010
Energo Engineering 1300 W Sam Houston Pkwy S, Suite 100 Houston, TX 77042 USA Tel: 713-532-2900 Fax: 713-532-2922
www.energoeng.com
3.0 DATA COLLECTION
The project team was tasked with obtaining all the data available for both platforms
(fixed and floating) and pipelines (risers included). There were three key sources of data
used for the project. The first was the MMS files, which supplied a majority of the data
used for this study. The second was supplied data via contacts made by the Project Team
with specific operators requesting information about their platforms and pipelines. The
third was from data available in the public domain. All of this data was held confidential
by Project and the results put into a generic format as reported throughout this document.
Shortly following Hurricane Ike, the MMS issued NTL 2008-G18 that required API
RP2A Level I above water and Level II underwater inspections of all platforms to the
east of approximately Galveston (The NTL boundaries are shown in Figure 2.1). This
area included 3,185 of the approximately 4,000 offshore platforms in the Gulf of Mexico,
including all platforms in offshore Louisiana (not including platforms in state waters).
Operators submitted the results of these inspections to the MMS and some of this data
was used for the study. Note that the number of exposed platforms was actually 3,245,
but since 60 were destroyed, only 3,185 had to be inspected.
Platform configuration data was also available to the study via the MMS files, such as
water depth, year installed, number of legs, cellar deck elevation, etc. The combination
of the post-hurricane inspection data and the platform configuration data provided a
useful set of information to understand how platforms performed in the hurricanes.
The Gustav and Ike hurricane conditions data used in the study were based on a hindcast
of each hurricane developed and acquired from Oceanweather [Oceanweather, 2008].
The hindcasts are proprietary information that must be acquired directly from
Oceanweather and only limited hindcast condition data is shown in this study. In some
cases, the platform Operator provided to the study a more detailed specific hindcast of the
hurricane conditions at their platform or pipeline location.
Some of the data was supplied via operators directly to the Project Team via summary
tables, inspection reports, engineering reports, and interviews. In several cases, this was
to obtain clarification of data obtained via the MMS. This data was also appropriately
sanitized.

MMS Page 7
Assessment of Offshore Structures and Pipelines in Hurricanes Gustav and Ike February 2010
Energo Engineering 1300 W Sam Houston Pkwy S, Suite 100 Houston, TX 77042 USA Tel: 713-532-2900 Fax: 713-532-2922
www.energoeng.com
4.0 DATA EVALUATION - DESTROYED PLATFORMS
This section describes the destroyed platforms including their characteristics and general
trends. The majority of the data collected for this study was mainly related to the
destroyed platforms. Some limited data was collected on the damaged platforms and is
discussed in Section 6.0.
4.1 Number of Platforms Destroyed
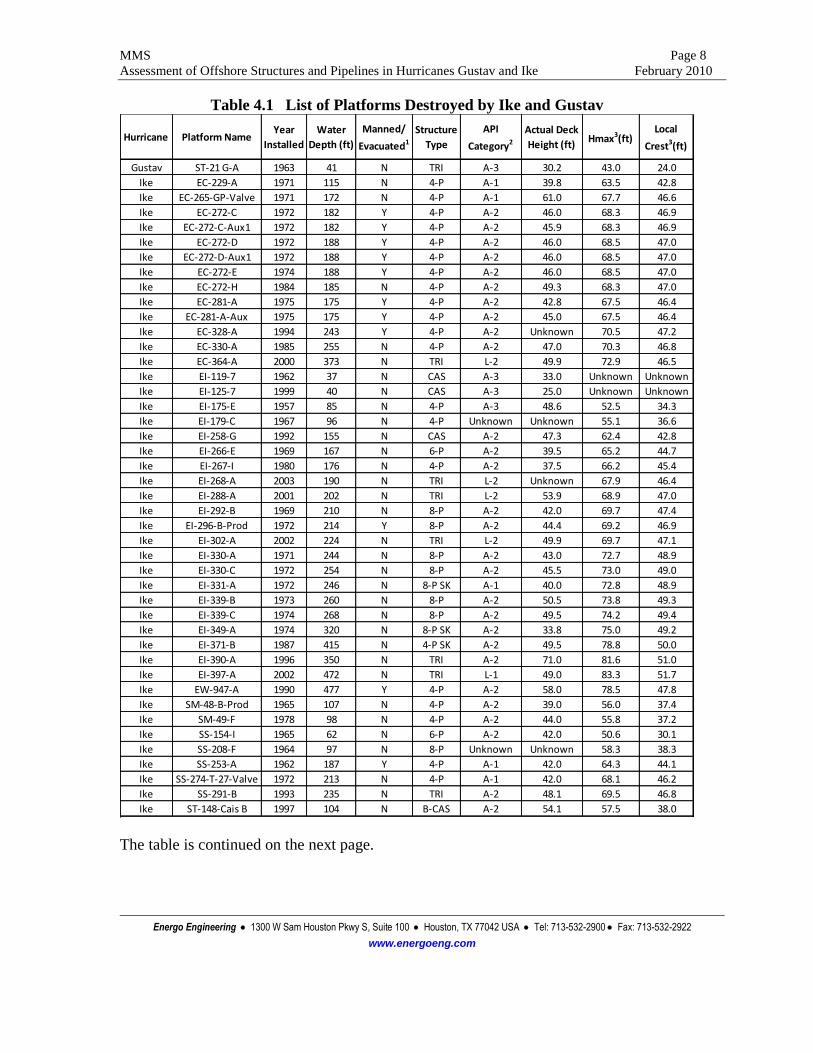
There were a total of 60 destroyed fixed platforms in Gustav and Ike as officially
reported by the MMS [MMS, 2008]. No floating platforms were destroyed. Table 4.1
shows the list of the destroyed fixed platforms defined by the MMS as well as additional
information on each platform added to the list by this study. The list includes specific
details such as year installed, water depth, deck elevation, Gustav or Ike wave hindcast
conditions, etc. The hurricane wave conditions are based on the Oceanweather hindcasts
previously noted. This table is discussed in more detail in later sections of this document.
In many cases it was clearly evident that a platform was destroyed, such as completely
toppled leaving nothing remaining above the sea surface or severely leaning or damaged.
Figures 4.1 to 4.3 show examples of heavily damaged platforms that were still standing
above the waterline, but were considered destroyed. These three platforms experienced
hurricane wave inundation (wave-in-deck) in their decks. Figures 4.4 and 4.5 show a
side-scan sonar image and an Echoscope survey image, respectively, of a toppled
platform that is lying on the seafloor.
It is difficult to arrive at a firm number of destroyed platforms as a result of these
hurricanes. This is because in some cases, a platform may have been damaged and the
owner requires additional time to determine if it is economical to replace the platform. In
other cases, the damage may not have been found in the initial inspection, and when
located, the owner may elect to remove the platform at a later date. In other words, the
platform may never restart production or its other operations after the hurricanes. In a
certain sense, these platforms can also be termed destroyed by the hurricanes. However,
it was decided to freeze the number of destroyed platforms based upon the official list of
destroyed platforms published by the MMS in November 2008. This list contained a
total of 60 destroyed fixed platforms as shown in Table 4.1.
MMS Page 8
Assessment of Offshore Structures and Pipelines in Hurricanes Gustav and Ike February 2010
Energo Engineering 1300 W Sam Houston Pkwy S, Suite 100 Houston, TX 77042 USA Tel: 713-532-2900 Fax: 713-532-2922
www.energoeng.com
Table 4.1 List of Platforms Destroyed by Ike and Gustav
Hurricane Platform NameYear
Installed
Water
Depth (ft)
Manned/
Evacuated1
Structure
Type
API
Category2
Actual Deck
Height (ft)Hmax3(ft)
Local
Crest3(ft)
Gustav ST-21 G-A 1963 41 N TRI A-3 30.2 43.0 24.0
Ike EC-229-A 1971 115 N 4-P A-1 39.8 63.5 42.8
Ike EC-265-GP-Valve 1971 172 N 4-P A-1 61.0 67.7 46.6
Ike EC-272-C 1972 182 Y 4-P A-2 46.0 68.3 46.9
Ike EC-272-C-Aux1 1972 182 Y 4-P A-2 45.9 68.3 46.9
Ike EC-272-D 1972 188 Y 4-P A-2 46.0 68.5 47.0
Ike EC-272-D-Aux1 1972 188 Y 4-P A-2 46.0 68.5 47.0
Ike EC-272-E 1974 188 Y 4-P A-2 46.0 68.5 47.0
Ike EC-272-H 1984 185 N 4-P A-2 49.3 68.3 47.0
Ike EC-281-A 1975 175 Y 4-P A-2 42.8 67.5 46.4
Ike EC-281-A-Aux 1975 175 Y 4-P A-2 45.0 67.5 46.4
Ike EC-328-A 1994 243 Y 4-P A-2 Unknown 70.5 47.2
Ike EC-330-A 1985 255 N 4-P A-2 47.0 70.3 46.8
Ike EC-364-A 2000 373 N TRI L-2 49.9 72.9 46.5
Ike EI-119-7 1962 37 N CAS A-3 33.0 Unknown Unknown
Ike EI-125-7 1999 40 N CAS A-3 25.0 Unknown Unknown
Ike EI-175-E 1957 85 N 4-P A-3 48.6 52.5 34.3
Ike EI-179-C 1967 96 N 4-P Unknown Unknown 55.1 36.6
Ike EI-258-G 1992 155 N CAS A-2 47.3 62.4 42.8
Ike EI-266-E 1969 167 N 6-P A-2 39.5 65.2 44.7
Ike EI-267-I 1980 176 N 4-P A-2 37.5 66.2 45.4
Ike EI-268-A 2003 190 N TRI L-2 Unknown 67.9 46.4
Ike EI-288-A 2001 202 N TRI L-2 53.9 68.9 47.0
Ike EI-292-B 1969 210 N 8-P A-2 42.0 69.7 47.4
Ike EI-296-B-Prod 1972 214 Y 8-P A-2 44.4 69.2 46.9
Ike EI-302-A 2002 224 N TRI L-2 49.9 69.7 47.1
Ike EI-330-A 1971 244 N 8-P A-2 43.0 72.7 48.9
Ike EI-330-C 1972 254 N 8-P A-2 45.5 73.0 49.0
Ike EI-331-A 1972 246 N 8-P SK A-1 40.0 72.8 48.9
Ike EI-339-B 1973 260 N 8-P A-2 50.5 73.8 49.3
Ike EI-339-C 1974 268 N 8-P A-2 49.5 74.2 49.4
Ike EI-349-A 1974 320 N 8-P SK A-2 33.8 75.0 49.2
Ike EI-371-B 1987 415 N 4-P SK A-2 49.5 78.8 50.0
Ike EI-390-A 1996 350 N TRI A-2 71.0 81.6 51.0
Ike EI-397-A 2002 472 N TRI L-1 49.0 83.3 51.7
Ike EW-947-A 1990 477 Y 4-P A-2 58.0 78.5 47.8
Ike SM-48-B-Prod 1965 107 N 4-P A-2 39.0 56.0 37.4
Ike SM-49-F 1978 98 N 4-P A-2 44.0 55.8 37.2
Ike SS-154-I 1965 62 N 6-P A-2 42.0 50.6 30.1
Ike SS-208-F 1964 97 N 8-P Unknown Unknown 58.3 38.3
Ike SS-253-A 1962 187 Y 4-P A-1 42.0 64.3 44.1
Ike SS-274-T-27-Valve 1972 213 N 4-P A-1 42.0 68.1 46.2
Ike SS-291-B 1993 235 N TRI A-2 48.1 69.5 46.8
Ike ST-148-Cais B 1997 104 N B-CAS A-2 54.1 57.5 38.0
The table is continued on the next page.

MMS Page 9
Assessment of Offshore Structures and Pipelines in Hurricanes Gustav and Ike February 2010
Energo Engineering 1300 W Sam Houston Pkwy S, Suite 100 Houston, TX 77042 USA Tel: 713-532-2900 Fax: 713-532-2922
www.energoeng.com
Hurricane Platform NameYear
Installed
Water
Depth (ft)
Manned/
Evacuated1
Structure
Type
API
Category2
Actual Deck
Height (ft)Hmax3(ft)
Local
Crest3(ft)
Ike ST-175-T-22-Valve 1972 135 N 4-P A-1 46.0 60.1 40.9
Ike ST-195-A 1988 100 N 4-P A-2 48.0 60.4 40.7
Ike ST-196-A 1971 105 Y 4-P A-2 41.0 59.4 39.2
Ike VR-122-B 2003 76 N B-CAS L-2 Unknown 54.1 34.3
Ike VR-131-14 1979 57 N 4-P A-3 32.0 46.9 28.4
Ike VR-201-B 2008 110 N B-CAS 2DG-L-2 Unknown 61.8 40.9
Ike VR-217-C 1993 121 N TRI A-2 Unknown 62.2 42.0
Ike VR-217-F 2006 123 N B-CAS L-2 Unknown 62.4 42.2
Ike VR-267-C 1971 169 N 8-P A-2 42.9 67.1 46.1
Ike VR-281-A 1997 176 Y TRI A-1 Unknown 68.0 46.8
Ike VR-284-A 1990 186 Y 4-P A-2 53.0 68.8 47.2
Ike VR-320-C 1998 207 N TRI A-2 55.3 70.2 47.9
Ike VR-329-A 1977 220 N 4-P A-2 45.8 72.1 48.9
Ike VR-386-B 1979 324 Y 4-P A-2 47.8 73.6 47.8
Ike WC-248-2 1990 80 N CAS A-3 52.3 57.8 35.5
Ike WC-473-A 1996 130 N B-CAS A-2 53.5 62.3 42.6 1. Manned/Evacuated refers to API’s category for life safety. The “Y” implies the platform is
usually manned; however, it will be evacuated during a design event such as a hurricane. The
“N” implies the platform is not normally manned.
2. API Category provided by Operator to MMS
3. Based on the greater of Gustav and Ike hindcast values.

MMS Page 10
Assessment of Offshore Structures and Pipelines in Hurricanes Gustav and Ike February 2010
Energo Engineering 1300 W Sam Houston Pkwy S, Suite 100 Houston, TX 77042 USA Tel: 713-532-2900 Fax: 713-532-2922
www.energoeng.com
Figure 4.1 Destroyed Platform in the Eugene Island Area
Figure 4.2 Destroyed Platform in the Eugene Island Area

MMS Page 11
Assessment of Offshore Structures and Pipelines in Hurricanes Gustav and Ike February 2010
Energo Engineering 1300 W Sam Houston Pkwy S, Suite 100 Houston, TX 77042 USA Tel: 713-532-2900 Fax: 713-532-2922
www.energoeng.com
Figure 4.3 Destroyed Platform in the East Cameron Area
Figure 4.4 Side Scan Sonar of a Destroyed Platform in the Ewing Banks Area

MMS Page 12
Assessment of Offshore Structures and Pipelines in Hurricanes Gustav and Ike February 2010
Energo Engineering 1300 W Sam Houston Pkwy S, Suite 100 Houston, TX 77042 USA Tel: 713-532-2900 Fax: 713-532-2922
www.energoeng.com
Figure 4.5 Echoscope Survey of a Destroyed Platform in the Ewing Banks Area
4.2 Destroyed Platforms by Location
Figure 4.6 shows the destroyed platform locations in relation to the paths of the eye of the
hurricanes. Also shown is the relative size of the hurricanes at selected locations based
upon the SSI Hurricane Category.
Ike destroyed the majority of the platforms with only one destroyed platform being
attributed to Gustav (the platform to the right of the Gustavo path). This may be because
in prior years, Hurricanes Andrew (1992) and Katrina (2005) went through the general
region of Gustav either destroying or severely damaging numerous platforms. All
destroyed platforms were located to the east of the eye paths, as expected, since the east
side of an Atlantic Hurricane contains the highest winds and waves.
In general, there seems to be no clear correlation of the eye path and distance to the
destroyed platform or location. If all platforms were of equal strength, then this indeed
may be the case since metocean conditions are greatest near the eye path. However, the
destruction is primarily based upon a combination of hurricane conditions and the
platform strength, which varies by location.

MMS Page 13
Assessment of Offshore Structures and Pipelines in Hurricanes Gustav and Ike February 2010
Energo Engineering 1300 W Sam Houston Pkwy S, Suite 100 Houston, TX 77042 USA Tel: 713-532-2900 Fax: 713-532-2922
www.energoeng.com
Figure 4.6 Location of Destroyed Platforms Compared to Path of Hurricanes.
The red dots indicate destroyed platforms. The SSI Category of the hurricanes at select locations is also indicated.
Note that some locations have multiple dots on top of each other where destroyed platforms were closely located.
All platforms were destroyed by Ike except for the one platform to the right of the Gustav path.

MMS Page 14
Assessment of Offshore Structures and Pipelines in Hurricanes Gustav and Ike February 2010
Energo Engineering 1300 W Sam Houston Pkwy S, Suite 100 Houston, TX 77042 USA Tel: 713-532-2900 Fax: 713-532-2922
www.energoeng.com
4.3 Destroyed Platforms by Vintage
This section discusses the number of platforms destroyed according to install date or “vintage”.
API RP2A was first introduced in 1969. Prior to the 1st edition, asset owners had no
recommended practice to follow. In the years leading up to the 1st Edition industry
experienced several storms that lead to forming a group to develop recommended practices
such as RP 2A based on their lessons learned. Table 4.2 shows all major storms that occurred
since platforms were installed in the Gulf of Mexico, the estimated number of platforms
destroyed and industry’s response.
Table 4.2 Hurricanes and Industry response
No. Hurricane Year Structures
Destroyed**
Industry Response or Source
1 Grand Isle 1948 2* Limited number of platforms in service
2 Carla 1961 3*
3 Hilda 1964 14* Several operators start to use a 100 year
return period design wave
4 Betsy 1965 8*
5 Camille 1969 3* 1st ed. API RP2A for fixed platform design
6 Carmen 1974 2*
7 Frederic 1979 3* Wave load recipe provided in RP2A
8 Juan 1985 3* Assess-Inspect-Maintain (AIM) Joint
Industry Projects for existing platforms
9 Andrew 1992 28 / 47 / 75 PMB, Andrew JIP, 1996.
10 Lili 2002 8 / 0 /8 Puskar, et.al., OTC 16802, 2004.
11 Ivan 2004 6 /1 / 7 MMS TAR No. 549, Energo, 2006
12 Katrina 2005 45 / 0 / 45 MMS TAR No. 578, Energo, 2007.
13 Rita 2005 56 / 18 / 74 MMS TAR No. 578, Energo, 2007
14 Gustav 2008 1 /0 / 1 MMS New Release November 2008
15 Ike 2008 50 / 9 / 59 MMS News Release November 2008
Total Historical GOM 232 / 75 / 307 * Platform failures based upon published reports at the time (no data on caissons). Additional failures may have
occurred but not reported in literature.
** Data shown as Platforms / Caissons / Total
Figure 4.7 illustrates the number of platforms destroyed during Gustav and Ike sorted by the
decade the platform was installed. Figure 4.8 shows the total number of platforms exposed
during Gustav and Ike sorted by the decade the platform was installed (excluding platforms
with an unknown API category). Shown on both of the Figures are the key dates and editions
of API RP2A as previously discussed. Also shown are the platform’s API Category, discussed
further in Section 5.1.
Figure 4.7 shows that the majority of the platforms destroyed were installed before the 1980’s.
This trend continues to compare well with previous studies [Puskar, et.al 1994; Puskar, et.al,
2004; Puskar, et.al. 2006, Puskar, et.al. 2007].

MMS Page 15
Assessment of Offshore Structures and Pipelines in Hurricanes Gustav and Ike February 2010
Energo Engineering 1300 W Sam Houston Pkwy S, Suite 100 Houston, TX 77042 USA Tel: 713-532-2900 Fax: 713-532-2922
www.energoeng.com
0
5
10
15
20
25
30
1950 - 59 1960 - 69 1970 - 79 1980 - 89 1990 - 99 2000+
1
5
1
4
18
5
10
1
2
1
2
1
7
2
Nu
mb
er o
f Pla
tfo
rms
Platform Vintage (Year)
1st EditionAPI RP 2A1969
9th EditionAPI RP 2A1977
21st EditionAPI RP 2A2000
L-1
L-2A-2
A-3
A-2
A-2
A-3
A-1
A-3
A-1A-3
Unknown
A-2
A-1
Figure 4.7 Destroyed Platforms by Vintage and API Category
0
100
200
300
400
500
600
700
800
900
1000
1950 - 59 1960 - 69 1970 - 79 1980 - 89 1990 - 99 2000+
7 2565 47 44
2
54
133
306
284238
41
179
136 215284
65
250
186
Nu
mb
er
of
Pla
tfo
rms
Platform Vintage (Year)
1st EditionAPI RP 2A1969
9th EditionAPI RP 2A1977
21st EditionAPI RP 2A 2000
A-3
A-2
A-1A-1A-2
A-3
A-1
A-2
A-3
A-1
A-2
A-3
A-1
A-2
A-3
A-1
L-1
L-2
L-3
Figure 4.8 Exposed Platforms by Vintage and API Category
Excludes Platforms with an Unknown API Category

MMS Page 16
Assessment of Offshore Structures and Pipelines in Hurricanes Gustav and Ike February 2010
Energo Engineering 1300 W Sam Houston Pkwy S, Suite 100 Houston, TX 77042 USA Tel: 713-532-2900 Fax: 713-532-2922
www.energoeng.com
The 1960’s and earlier platforms were designed and installed prior to any industry design
standard. These platforms generally had low deck elevations, lacked strengthened connections
(joint cans) and in some cases were designed to only a 25 year return period wave. The first
edition of RP2A was developed and published in 1969, as shown by the box in the upper left
hand side of the figure, and provided an improvement in both platform design and platform
fabrication standards. However, several key ingredients were still missing, including guidance
on minimum deck elevation, a consistent design recipe to determine wave loads, the lack of
specific 100 year design wave heights and limited guidance on design of joints, member
slenderness and other platform structural details. It is therefore no surprise that numerous
1970 vintage platforms, designed to these early RP2A standards, were also destroyed and
damaged in Gustav and Ike [see also Energo, 2007].
Table 4.3 shows that there were 26 platforms destroyed that were installed post 1980. The
table shows the details of these platforms including key platform and hurricane characteristics.
These platforms represent a vintage of platforms designed to the post-9th edition of RP2A,
published in 1977 as shown by the box in the upper middle of Figures 4.7 and 4.8, considered
to be the time at which the RP2A platform design recipe had developed into a consistent and
accurate approach. A key addition of the 9th edition was the inclusion of a specific wave load
recipe including 100 year wave height criteria as a function of water depth. This allowed for a
consistent design of all platforms to the same hurricane design loads.
However, while there is a clear difference in the number of destroyed platforms pre- and post-
1980, there were still 26 platforms installed post 1980 that were destroyed. This is in part
perhaps because the path of Ike was similar to the path of Hurricane Rita in 2005, as shown in
Figure 4.9. Rita likely caused unaccounted or unaddressed platform damage to some
platforms, with Ike passing through essentially the same the area three years later causing
additional damage and resulting in destruction. Another reason may be since Ike, even though
a Category 2 hurricane, exhibited an unusually large wind field, with hurricane force winds
extending more than 100 miles from the eye, causing an increase in the overall wave height.
This contributed to the many platforms which saw wave-in-deck, known to be detrimental to
platforms, as discussed further in Section 5.

MMS Page 17
Assessment of Offshore Structures and Pipelines in Hurricanes Gustav and Ike February 2010
Energo Engineering 1300 W Sam Houston Pkwy S, Suite 100 Houston, TX 77042 USA Tel: 713-532-2900 Fax: 713-532-2922
www.energoeng.com
Figure 4.9 Hurricanes Ike and Rita Path Comparison
All existing platforms at the time of Hurricane Ike are shown for reference
MMS Page 18
Assessment of Offshore Structures and Pipelines in Hurricanes Gustav and Ike February 2010
Energo Engineering 1300 W Sam Houston Pkwy S, Suite 100 Houston, TX 77042 USA Tel: 713-532-2900 Fax: 713-532-2922
www.energoeng.com
When looking at platforms installed in the 1980s compared to the 1990s there is an increase in
the number of destroyed platforms from 5 to 13, mostly consisting of A-2 structures. This is
somewhat puzzling since it is generally thought that the 1980 and 1990 vintage platforms are
similar in design and construction. One possibility is that a larger number of 1990s platforms
were exposed to hurricane conditions that were greater than their design (this was not
verifiable since actual design values were not available for all the platforms).
Lastly, there were 8 platforms destroyed that were installed from the year 2000 and later. This
is surprising in that relatively “new” platforms such as these were destroyed. The installation
date of the newest platform that was destroyed is 2008, although this particular platform was
destroyed by a Jackup rig that was performing work next to the platform and collapsed onto it.
The failure of these recent vintage platforms, predominately L-2s, is partly due to a change in
the RP2A design approach that occurred in the late 1990s, that allowed L-2 platforms to be
designed with 50 year return period hurricane conditions, compared to the 100 year return
period conditions used for L-1 platforms. This is evidenced by the fact that there was only one
L-1 platform that was destroyed; a tripod installed in 2002 which likely saw wave-in-deck.
This change in the API design approach was known as Consequence Based Design (CBD) and
is discussed further in Section 5.

MMS Page 19
Assessment of Offshore Structures and Pipelines in Hurricanes Gustav and Ike February 2010
Energo Engineering 1300 W Sam Houston Pkwy S, Suite 100 Houston, TX 77042 USA Tel: 713-532-2900 Fax: 713-532-2922
www.energoeng.com
Table 4.3 Destroyed Platforms – Post 1980 Installation
Hurricane Platform NameYear
Installed
Water
Depth (ft)
Manned/
Evacuated
Structure
Type
API
Category
Actual Deck
Height (ft)Hmax (ft)
Local
Crest (ft)
Ike EI-267-I 1980 176 N 4-P A-2 37.5 66.2 45.4
Ike EC-272-H 1984 185 N 4-P A-2 49.3 68.3 47.0
Ike EC-330-A 1985 255 N 4-P A-2 47.0 70.3 46.8
Ike EI-371-B 1987 415 N 4-P SK A-2 49.5 78.8 50.0
Ike ST-195-A 1988 100 N 4-P A-2 48.0 60.4 40.7
Ike EW-947-A 1990 477 Y 4-P A-2 58.0 78.5 47.8
Ike VR-284-A 1990 186 Y 4-P A-2 53.0 68.8 47.2
Ike WC-248-2 1990 80 N CAS A-3 52.3 57.8 35.5
Ike EI-258-G 1992 155 N CAS A-2 47.3 62.4 42.8
Ike SS-291-B 1993 235 N TRI A-2 48.1 69.5 46.8
Ike VR-217-C 1993 121 N TRI A-2 Unknown 62.2 42.0
Ike EC-328-A 1994 243 Y 4-P A-2 Unknown 70.5 47.2
Ike EI-390-A 1996 350 N TRI A-2 71.0 81.6 51.0
Ike WC-473-A 1996 130 N B-CAS A-2 53.5 62.3 42.6
Ike ST-148-Cais B 1997 104 N B-CAS A-2 54.1 57.5 38.0
Ike VR-281-A 1997 176 Y TRI A-1 Unknown 68.0 46.8
Ike VR-320-C 1998 207 N TRI A-2 55.3 70.2 47.9
Ike EI-125-7 1999 40 N CAS A-3 25.0 Unknown Unknown
Ike EC-364-A 2000 373 N TRI L-2 49.9 72.9 46.5
Ike EI-288-A 2001 202 N TRI L-2 53.9 68.9 47.0
Ike EI-302-A 2002 224 N TRI L-2 49.9 69.7 47.1
Ike EI-397-A 2002 472 N TRI L-1 49.0 83.3 51.7
Ike EI-268-A 2003 190 N TRI L-2 Unknown 67.9 46.4
Ike VR-122-B 2003 76 N B-CAS L-2 Unknown 54.1 34.3
Ike VR-217-F 2006 123 N B-CAS L-2 Unknown 62.4 42.2
Ike VR-201-B 2008 110 N B-CAS 2DG-L-2 Unknown 61.8 40.9 Notes:
VR 201 B was destroyed by a Jackup rig that was performing work on location.
Actual Deck Height is the bottom of steel of the cellar deck as reported by the platform owner to the
MMS.
Some data is Unknown as indicated.
Hmax is the maximum wave height at the location for the indicated hurricane determined by
Oceanweather (2008).
Local Crest is the estimated maximum crest elevation at the platform site. See Section 6 determined by
Oceanweather (2008).
Manned/Evacuated refers to API’s category for life safety. The “Y” implies the platform is usually
manned; however, it will be evacuated during a design event such as a hurricane. The “N” implies the
platform is not normally manned.

MMS Page 20
Assessment of Offshore Structures and Pipelines in Hurricanes Gustav and Ike February 2010
Energo Engineering 1300 W Sam Houston Pkwy S, Suite 100 Houston, TX 77042 USA Tel: 713-532-2900 Fax: 713-532-2922
www.energoeng.com
4.4 Destroyed Platforms by Structure Type
Table 4.4 and Figure 4.10 show the destroyed and exposed platforms with known structure
type. The figure also shows the exposed platforms (platforms located within the MMS NTL
boundaries) for comparison. Figure 4.11 shows a graph which gives a visual comparison of
destroyed vs. exposed.
4-Pile structures accounted for the majority of the destroyed platforms with tripods accounting
for the next largest destroyed structure type. This is not a surprise as 4-Pile platforms make up
the largest fleet of those platforms exposed as can be seen in Figure 4.10. There were 919 4-
Pile platforms exposed to Gustav and Ike and 27 were destroyed which accounts for
approximately 3% of that structure type.
Tripods make up the next group with 11 destroyed out of 237 exposed. This equates to
approximately 5% of the Tripod fleet exposed destroyed, representing almost the highest
percentage of structure type failures during Gustav and Ike. Note that 8-pile platforms actually
had a higher percentage of destroyed (5.3%) but this was a much more limited dataset of 38
structures and the two destroyed were of early 1970s design with low deck elevations (under
45 ft).
The number of Tripods is surprisingly high and this should be investigated further. One
consideration is that these types of structures have little redundancy in that if one of the braces
or legs or piles is damaged, there are few alternative load paths. Deeper water versions of
Tripods, in say more than 200 ft water depth, are dynamically sensitive and this may also be a
concern in large storms in terms of dynamic amplification of loading.
Table 4.4 Destroyed and Exposed Platforms by Structure Type
Structure Type Exposed Destroyed % Destroyed
Caisson 819 9 1.1%
Tripod 237 11 4.6%
4-Pile 919 27 2.9%
4-Pile (Skirt) 26 1 3.8%
6-Pile 90 2 2.2%
6-Pile (Skirt) 1 0 0.0%
8-Pile 304 8 2.6%
8-Pile (Skirt) 38 2 5.3%
10-Pile 12 0 0.0%
12-Pile 14 0 0.0%
Over 12-Pile 25 0 0.0%
TOTAL 2485 60 2.4%

MMS Page 21
Assessment of Offshore Structures and Pipelines in Hurricanes Gustav and Ike February 2010
Energo Engineering 1300 W Sam Houston Pkwy S, Suite 100 Houston, TX 77042 USA Tel: 713-532-2900 Fax: 713-532-2922
www.energoeng.com
Caisson, 828, 32%
Tripod, 248, 10%
4-Pile, 946, 37%
4-Pile (Skirt), 27, 1%
6-Pile, 92, 4%6-Pile (Skirt), 1, 0%
8-Pile, 312, 12%
8-Pile (Skirt), 40, 2%
10-Pile, 12, 0%
12-Pile, 14, 1%
Over 12-Pile, 25, 1%
Exposed Platforms (Includes Destroyed)
Caisson, 9, 15%
Tripod, 11, 18%
4-Pile, 27, 45%
4-Pile (Skirt), 1, 2%
6-Pile, 2, 3%
8-Pile, 8, 14%
8-Pile (Skirt), 2, 3%
Destroyed Platforms
Figure 4.10 Exposed and Destroyed Platforms by Structure Type

MMS Page 22
Assessment of Offshore Structures and Pipelines in Hurricanes Gustav and Ike February 2010
Energo Engineering 1300 W Sam Houston Pkwy S, Suite 100 Houston, TX 77042 USA Tel: 713-532-2900 Fax: 713-532-2922
www.energoeng.com
0
100
200
300
400
500
600
700
800
900
1000
Caisson Tripod 4-Pile 4-Pile (Skirt)
6-Pile 6-Pile (Skirt)
8-Pile 8-Pile (Skirt)
10-Pile 12-Pile Over 12-Pile
819
237
919
2690 1
304
38 12 14 25
9
11
27
1
2
8
2
Destroyed
Exposed
Figure 4.11 Exposed and Destroyed Platforms by Structure Type (Bar Graph)
The red number indicates number of destroyed.

MMS Page 23
Assessment of Offshore Structures and Pipelines in Hurricanes Gustav and Ike February 2010
Energo Engineering 1300 W Sam Houston Pkwy S, Suite 100 Houston, TX 77042 USA Tel: 713-532-2900 Fax: 713-532-2922
www.energoeng.com
5.0 PLATFORM COMPARISON TO DESIGN STANDARDS
This section compares the platform fleet exposed to Hurricanes Gustav and Ike to design
standards. It uses API categorization and associated design and assessment criteria to make
the comparison to observed performance.
Per RP2A, platforms designed after 2000 are classified per RP2A Section 2 and carry an “L”
designation. The categories are L-1 high consequence, L-2 medium consequence or L-3 low
consequence. Platforms designed before 2000 carry an “A” designation and are classified per
RP2A Section 17. These categories are defined as A-1 for high consequence, A-2 for medium
consequence and A-3 as low consequence. The formal definitions are contained in RP2A.
5.1 Destroyed Platforms by API Category
Table 5.1 and Figure 5.1 shows destroyed and exposed platforms by API Category. As a
general observation platform performance by API Category seems to compare well with
previous platform performance by API category studies [Puskar, et.al. 2006, Puskar, et.al.
2007]. As shown in Table 5.1 A-2 platforms suffered the most destruction with a total of 37
platforms destroyed. The next API categories with the highest number of platforms destroyed
were in the A-1 and L-2 platform fleet, followed by A-3 platforms and for the first time an L-1
platform was destroyed.
Table 5.1 Exposed and Destroyed Platforms by API Category
API Category Exposed Destroyed % Destroyed
A-1 190 7 3.7%
A-2 1015 37 3.6%
A-3 856 6 0.7%
L-1 65 1 1.5%
L-2 252 7 2.8%
L-3 186 0 0.0%
Unknown 681 2 -
TOTAL 3245 60 1.8%

MMS Page 24
Assessment of Offshore Structures and Pipelines in Hurricanes Gustav and Ike February 2010
Energo Engineering 1300 W Sam Houston Pkwy S, Suite 100 Houston, TX 77042 USA Tel: 713-532-2900 Fax: 713-532-2922
www.energoeng.com
A-1, 190, 7%
A-2, 1015, 40%
A-3, 856, 33%
L-1, 65, 3%
L-2, 252, 10%
L-3, 186, 7%
Exposed Platforms (Includes Destroyed)
A-1, 7, 12% A-2, 37, 64%
A-3, 6, 10%
L-1, 1, 2%
L-2, 7, 12%
Destroyed Platforms
Figure 5.1 Exposed and Destroyed Platforms by API Category Platforms with an unknown API Category not shown
MMS Page 25
Assessment of Offshore Structures and Pipelines in Hurricanes Gustav and Ike February 2010
Energo Engineering 1300 W Sam Houston Pkwy S, Suite 100 Houston, TX 77042 USA Tel: 713-532-2900 Fax: 713-532-2922
www.energoeng.com
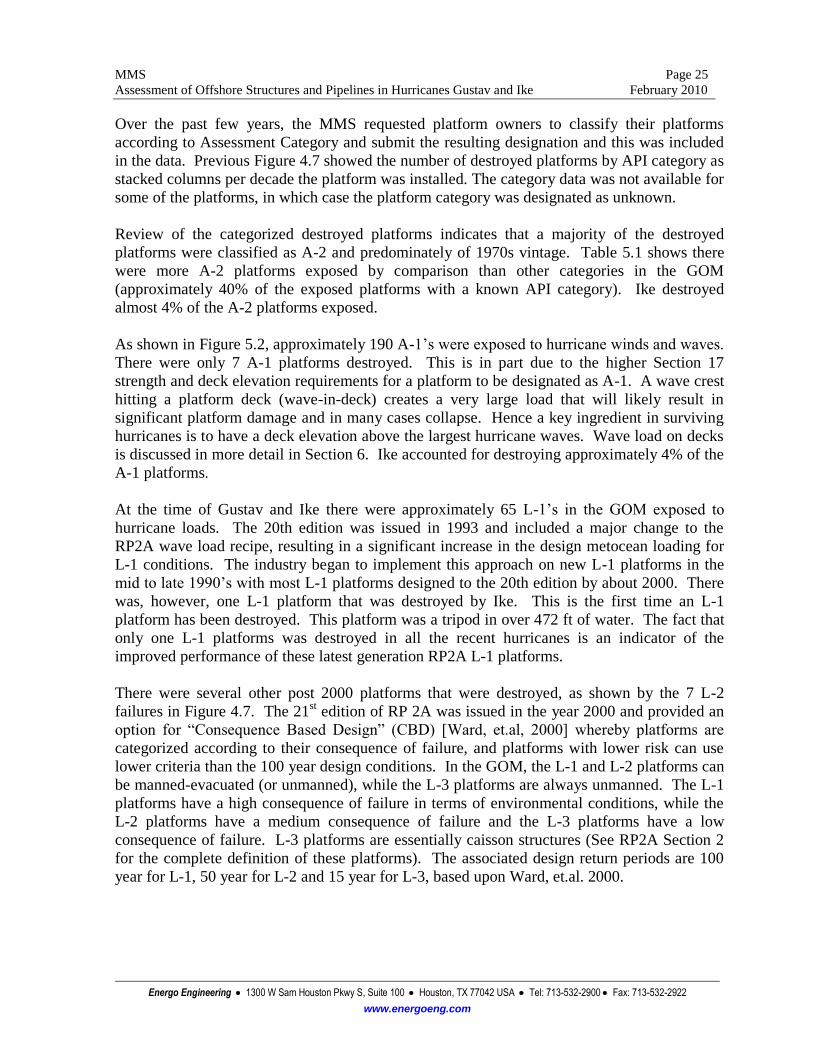
Over the past few years, the MMS requested platform owners to classify their platforms
according to Assessment Category and submit the resulting designation and this was included
in the data. Previous Figure 4.7 showed the number of destroyed platforms by API category as
stacked columns per decade the platform was installed. The category data was not available for
some of the platforms, in which case the platform category was designated as unknown.
Review of the categorized destroyed platforms indicates that a majority of the destroyed
platforms were classified as A-2 and predominately of 1970s vintage. Table 5.1 shows there
were more A-2 platforms exposed by comparison than other categories in the GOM
(approximately 40% of the exposed platforms with a known API category). Ike destroyed
almost 4% of the A-2 platforms exposed.
As shown in Figure 5.2, approximately 190 A-1’s were exposed to hurricane winds and waves.
There were only 7 A-1 platforms destroyed. This is in part due to the higher Section 17
strength and deck elevation requirements for a platform to be designated as A-1. A wave crest
hitting a platform deck (wave-in-deck) creates a very large load that will likely result in
significant platform damage and in many cases collapse. Hence a key ingredient in surviving
hurricanes is to have a deck elevation above the largest hurricane waves. Wave load on decks
is discussed in more detail in Section 6. Ike accounted for destroying approximately 4% of the
A-1 platforms.
At the time of Gustav and Ike there were approximately 65 L-1’s in the GOM exposed to
hurricane loads. The 20th edition was issued in 1993 and included a major change to the
RP2A wave load recipe, resulting in a significant increase in the design metocean loading for
L-1 conditions. The industry began to implement this approach on new L-1 platforms in the
mid to late 1990’s with most L-1 platforms designed to the 20th edition by about 2000. There
was, however, one L-1 platform that was destroyed by Ike. This is the first time an L-1
platform has been destroyed. This platform was a tripod in over 472 ft of water. The fact that
only one L-1 platforms was destroyed in all the recent hurricanes is an indicator of the
improved performance of these latest generation RP2A L-1 platforms.
There were several other post 2000 platforms that were destroyed, as shown by the 7 L-2
failures in Figure 4.7. The 21st edition of RP 2A was issued in the year 2000 and provided an
option for “Consequence Based Design” (CBD) [Ward, et.al, 2000] whereby platforms are
categorized according to their consequence of failure, and platforms with lower risk can use
lower criteria than the 100 year design conditions. In the GOM, the L-1 and L-2 platforms can
be manned-evacuated (or unmanned), while the L-3 platforms are always unmanned. The L-1
platforms have a high consequence of failure in terms of environmental conditions, while the
L-2 platforms have a medium consequence of failure and the L-3 platforms have a low
consequence of failure. L-3 platforms are essentially caisson structures (See RP2A Section 2
for the complete definition of these platforms). The associated design return periods are 100
year for L-1, 50 year for L-2 and 15 year for L-3, based upon Ward, et.al. 2000.

MMS Page 26
Assessment of Offshore Structures and Pipelines in Hurricanes Gustav and Ike February 2010
Energo Engineering 1300 W Sam Houston Pkwy S, Suite 100 Houston, TX 77042 USA Tel: 713-532-2900 Fax: 713-532-2922
www.energoeng.com
Figure 4.7 shows that almost all of the platforms destroyed that were installed post-2000 were
L-2 platforms (designed to 50 year criteria). Hence, most of the post-2000 installation
platforms were not designed to the 100 year conditions so failure is not unexpected in an
extreme storm like Ike or Gustav. Per Figure 5.2, the number of L-2’s exposed during Gustav
and Ike was approximately 252 and the number of L-3 platforms exposed was approximately
186.
As the name “consequence based design” implies, the L-2 and L-3 platforms are more
susceptible to the consequences of damage and destruction in hurricanes. Platform owners
need to be aware of the fact that design to L-2 or L-3 conditions may result in the failure or
damage of even the newest platforms. However, it should be noted a key observation was that
there were no L-3 platforms destroyed in the hurricanes. As previously discussed, L-3
platforms are mainly caisson type structures and are limited to water depths of 100 ft or less.
As a result of this water depth limitation, these structures tend to be closer to land where waves
tend to break due to their interaction with the seafloor, and therefore the waves are generally
the same maximum size, even for the largest hurricanes.

MMS Page 27
Assessment of Offshore Structures and Pipelines in Hurricanes Gustav and Ike February 2010
Energo Engineering 1300 W Sam Houston Pkwy S, Suite 100 Houston, TX 77042 USA Tel: 713-532-2900 Fax: 713-532-2922
www.energoeng.com
7, 4%
190, 96%
A-1 Platforms
Destroyed A-1
All A-1
37, 4%
1015, 96%
A-2 Platforms
Destroyed A-2
All A-2
6, 1%
856, 99%
A-3 Platforms
Destroyed A-3
All A-3
1, 2%
65, 98%
L-1 Platforms
Destroyed L-1
All L-1
7, 3%
252, 97%
L-2 Platforms
Destroyed L-2
All L-2
2, 0.3%
681, 99.7%
Unknown Category
Destroyed "Unknown"
All "Unknown"
186, 100%
L-3 Platforms
All L-3
Figure 5.2 Exposed and Destroyed Platforms by API Category
Note: There were no L-3 category structures destroyed.

MMS Page 28
Assessment of Offshore Structures and Pipelines in Hurricanes Gustav and Ike February 2010
Energo Engineering 1300 W Sam Houston Pkwy S, Suite 100 Houston, TX 77042 USA Tel: 713-532-2900 Fax: 713-532-2922
www.energoeng.com
5.2 Hindcast Data Comparisons
Sections 5.2.1 through 5.2.3 compares Hindcast wave and crest data to the entire Gulf of
Mexico platform fleet. For these sections, the objective was not only to look at platforms
within the NTL boundaries but also those outside the boundaries as these boundaries were set
based on the wind fields of the hurricanes and not wave heights. Due to the long duration and
large fetch of the hurricanes, especially Ike, a larger set of platforms, including those outside
the MMS NTL boundaries, was used for the data in this section. Furthermore, the MMS
inquired whether the NTL boundary was set appropriately in order to check if the size of the
inspection zone should be increased.
5.2.1 Hindcast Wave Comparison to API Category
In order to determine how platforms performed during the hurricanes, the platforms were
binned in their respective API category and were compared to the appropriate recommended
practice design/assessment criteria. In this section, a platform’s performance is gauged by
comparing platform Hindcast maximum wave (Hmax) data [Oceanweather, 2008] vs. the API
recommended maximum wave height defined for its API category.
It should be noted, for this data set, a platform must have Hindcast data available and a
calculable API recommended wave height (a function of API category and water depth). In
some cases the water depth is too shallow or the platform is in a special location and there is
no Hindcast or API design wave height information available. Consequently, only those
platforms that have Hindcast data and calculable wave heights are presented here. Plots for
these comparisons are provided at the end of the section and are examined below.
Figure 5.4 shows 46 of the L-1’s that were exposed to Ike and Gustav. Of these, 20 saw
conditions less than the API recommended design wave height while 26 saw conditions greater
than their design wave; 1 of which was destroyed. As previously mentioned, this is the first
time that an L-1 platform was destroyed in a hurricane (it was a tripod). Overall, the L-1 fleet
performed well considering Figure 5.4 shows over 50% of these platforms saw waves greater
than the API recommended design wave and survived. Perhaps some of these might have been
damaged, but at the time of this report this could not be verified. As so many platforms saw
waves exceeding the L-1 criteria (100 year return period), it is recommended API look at
additional design guidance to ensure that platforms have sufficient robustness to survive
conditions greater than L-1.
Figure 5.5 shows 157 of the A-1 platforms that were exposed to Ike and Gustav. Of these, 123
saw waves less than the API recommended wave height; 5 of which were destroyed.
Additionally, there were 34 platforms which experienced waves greater than the API
recommended wave; 2 of which were destroyed. It is not expected, but it is possible that the 5
destroyed which saw waves less than the API recommended design wave were not A-1’s, as
determined by analysis, but rather only set by deck height. However, further study would be
needed to confirm this.

MMS Page 29
Assessment of Offshore Structures and Pipelines in Hurricanes Gustav and Ike February 2010
Energo Engineering 1300 W Sam Houston Pkwy S, Suite 100 Houston, TX 77042 USA Tel: 713-532-2900 Fax: 713-532-2922
www.energoeng.com
Figure 5.6 shows 257 of the L-2 platforms that were exposed to Ike and Gustav. Of these, 67
saw waves less than the API recommended design wave height and there were 190 platforms
which saw waves greater than the API recommended design wave; 7 of which were destroyed.
It should be noted that the destroyed platforms all saw waves in excess of the recommended
wave and, therefore, these failures should be expected. Also note that, while the L-2’s are
designed to lower criteria than an L-1 platform, the API required deck height is the same.
Therefore, if the storm wave height does not exceed the deck height (no wave-in-deck), less
destroyed platforms are expected. This is explored further in Sections 5.2.2 and 5.2.3.
Figure 5.7 shows 924 of the A-2 platforms that were exposed to Ike and Gustav. Of these, 188
saw waves less than the API recommended design wave height and there were 736 platforms
which saw waves greater than the API recommended design wave; 35 of which were
destroyed. Of the 736 that saw a wave greater than the API recommended design wave, 517
(approximately 70%) saw a wave more than 5 ft over the API recommended design wave; 175
(approximately 24%) saw a wave more than 10 ft over the API recommended design wave; 12
(approximately 2%) saw a wave more than 15 ft over the API recommended design wave; and
1 platform saw a wave more than 20 ft over the API recommended wave. This is a particularly
good finding as the data shows that most A-2 platforms saw Hindcast waves larger that the
API recommended wave height and most saw waves in the range of 5-10 ft over the
recommended wave height. Over 80% of the known A-2 fleet was therefore “proof loaded”
above the API A-2 recommended wave. Note that of the 736 exposed A-2 platforms that saw
a wave greater than the API recommended wave, approximately 40% are manned/evacuated.
A-2 platforms are required by API to be able to survive a “sudden” hurricane that forms in
such a manner that evacuation is not possible. The fact that so many A-2 platforms saw waves
in excess of API recommendation and survived is good news.
Figure 5.8 shows 125 of the L-3 platforms that were exposed to Ike and Gustav. Of these, 11
saw waves less than the API recommended design wave height and there were 114 platforms
which saw waves greater than the API recommended design wave. However, there were no
destroyed L-3 platforms. This may be partly explained by the fact that a large percentage of
L-3 platforms are designed for wave inundation as they are boat access only. However, given
the fact that most L-3 platforms experienced waves greater than the API recommended wave it
is surprising that there were not any destroyed L-3 platforms. Therefore, damage is expected to
the L-3 platform fleet but there was no data to support this at the time of this report.
Figure 5.9 shows 358 of the A-3 platforms that were exposed to Ike and Gustav. Of these, 47
saw waves less than the API recommended design wave height and there were 311 platforms
which saw waves greater than the API recommended design wave; 4 of which were destroyed.
Even though the A-3 fleet performed well (with relatively few losses), the high number of
platforms which saw greater than the API recommended design wave suggests that overall
damage to A-3 platforms could be widespread. Perhaps this is the case, but at the time of this
report that could not be confirmed.

MMS Page 30
Assessment of Offshore Structures and Pipelines in Hurricanes Gustav and Ike February 2010
Energo Engineering 1300 W Sam Houston Pkwy S, Suite 100 Houston, TX 77042 USA Tel: 713-532-2900 Fax: 713-532-2922
www.energoeng.com
Table 5.2 and Figure 5.3 summarize by API category the count of platforms where the
Hindcast wave was greater than the API recommended wave.
Table 5.2 Summary of Hindcast Waves vs. API Recommended Waves
Comparison L-1 A-1 L-2 A-2 L-3 A-3 TOTAL
Hindcast Wave ≥ API
Recommended Design Wave 26 34 190 736 114 311 1411
Hindcast Wave < API
Recommended Design Wave 20 123 67 188 11 47 456
Overall, considering the number of platforms that saw waves higher than the API
recommended wave (1411 of 1867; approximately 75%), it is surprising that there were only
60 destroyed platforms. However, it suggests that a large number of platforms might be
damaged. This may be the case but at the time of this report that statistic could not be
confirmed. Furthermore, it seems the NTL Inspection boundary captured the majority of
platforms that saw the larger waves.

MMS Page 31
Assessment of Offshore Structures and Pipelines in Hurricanes Gustav and Ike February 2010
Energo Engineering 1300 W Sam Houston Pkwy S, Suite 100 Houston, TX 77042 USA Tel: 713-532-2900 Fax: 713-532-2922
www.energoeng.com
Exposed Platforms (Includes Destroyed)
A-1, 34, 2%
A-2, 736, 52%
A-3, 311, 22%L-1, 26, 2%
L-2, 190, 14%
L-3, 114, 8%
A-1, 2, 4%
A-2, 35, 72%
A-3, 4, 8%
L-1, 1, 2%
L-2, 7, 14%
Destroyed Platforms
Figure 5.3 Hindcast Wave vs. API Recommended Wave for Exposed and Destroyed Platforms

MMS Page 32
Assessment of Offshore Structures and Pipelines in Hurricanes Gustav and Ike February 2010
Energo Engineering 1300 W Sam Houston Pkwy S, Suite 100 Houston, TX 77042 USA Tel: 713-532-2900 Fax: 713-532-2922
www.energoeng.com
L-1 Platforms Destroyed by Hurricane Ike/Gustav Hmax ≥ L-1 Wave Height (1)
L-1 Platforms where Hurricane Ike/Gustav Hmax < L-1 Wave Height (20)
L-1 Platforms where Hurricane Ike/Gustav Hmax ≥ L-1 Wave Height (25)
Figure 5.4 Hindcast Hmax vs. API Recommended Design Wave for L-1 Platform
Note: Shown are only those platforms with a calculable hindcast and recommended wave

MMS Page 33
Assessment of Offshore Structures and Pipelines in Hurricanes Gustav and Ike February 2010
Energo Engineering 1300 W Sam Houston Pkwy S, Suite 100 Houston, TX 77042 USA Tel: 713-532-2900 Fax: 713-532-2922
www.energoeng.com
A-1 Platforms Destroyed by Hurricane Ike/Gustav Hmax < A-1 ULS Wave Height (5)
A-1 Platforms Destroyed by Hurricane Ike/Gustav Hmax ≥ A-1 ULS Wave Height (2)
A-1 Platforms where Hurricane Ike/Gustav Hmax < A-1 ULS Wave Height (118)
A-1 Platforms where Hurricane Ike/Gustav Hmax ≥ A-1 ULS Wave Height (32)
Figure 5.5 Hindcast Hmax vs. API Recommended Wave for A-1 Platform
Note: Shown are only those platforms with a calculable hindcast and recommended wave

MMS Page 34
Assessment of Offshore Structures and Pipelines in Hurricanes Gustav and Ike February 2010
Energo Engineering 1300 W Sam Houston Pkwy S, Suite 100 Houston, TX 77042 USA Tel: 713-532-2900 Fax: 713-532-2922
www.energoeng.com
L-2 Platforms Destroyed by Hurricane Ike/Gustav Hmax ≥ L-2 Wave Height (7)
L-2 Platforms where Hurricane Ike/Gustav Hmax < L-2 Wave Height (67)
L-2 Platforms where Hurricane Ike/Gustav Hmax ≥ L-2 Wave Height (183)
Figure 5.6 Hindcast Hmax vs. API Recommended Design Wave for L-2 Platform
Note: Shown are only those platforms with a calculable hindcast and recommended wave

MMS Page 35
Assessment of Offshore Structures and Pipelines in Hurricanes Gustav and Ike February 2010
Energo Engineering 1300 W Sam Houston Pkwy S, Suite 100 Houston, TX 77042 USA Tel: 713-532-2900 Fax: 713-532-2922
www.energoeng.com
A-2 Platforms Destroyed by Hurricane Ike/Gustav Hmax ≥ A-2 ULS Wave Height (35)
A-2 Platforms where Hurricane Ike/Gustav Hmax < A-2 ULS Wave Height (188)
A-2 Platforms where Hurricane Ike/Gustav Hmax ≥ A-2 ULS Wave Height (701)
Figure 5.7 Hindcast Hmax vs. API Recommended Wave for A-2 Platforms
Note: Shown are only those platforms with a calculable hindcast and recommended wave
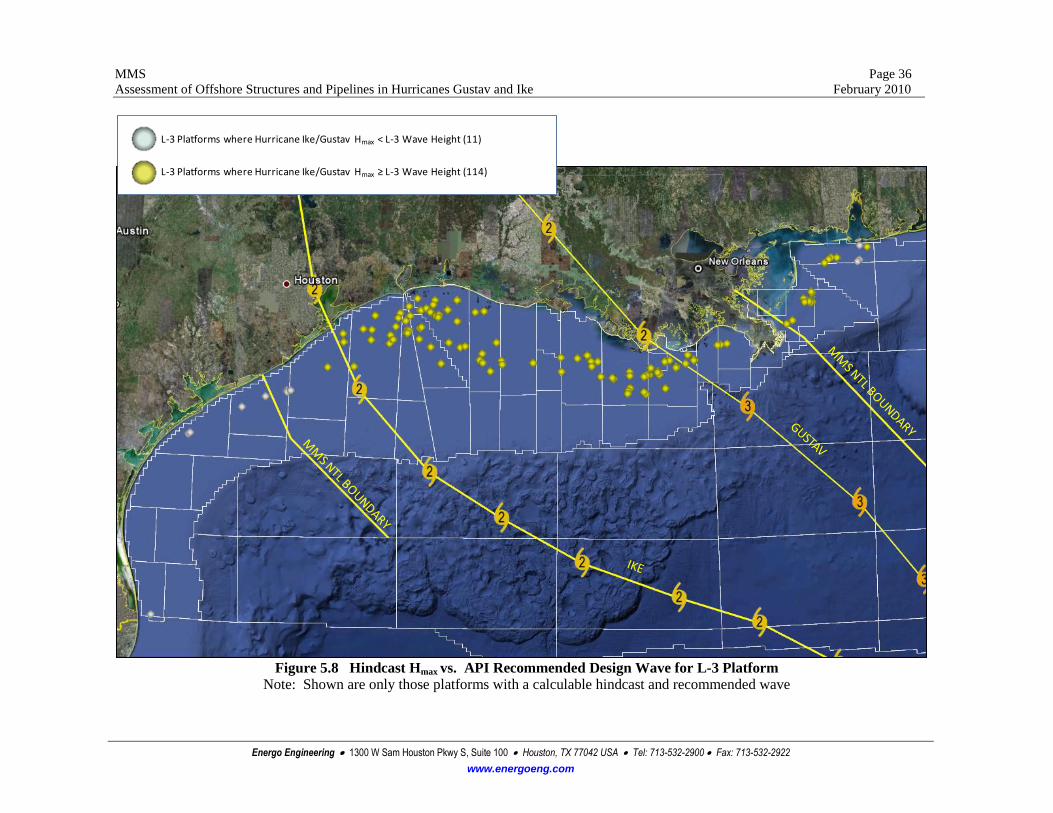
MMS Page 36
Assessment of Offshore Structures and Pipelines in Hurricanes Gustav and Ike February 2010
Energo Engineering 1300 W Sam Houston Pkwy S, Suite 100 Houston, TX 77042 USA Tel: 713-532-2900 Fax: 713-532-2922
www.energoeng.com
L-3 Platforms where Hurricane Ike/Gustav Hmax < L-3 Wave Height (11)
L-3 Platforms where Hurricane Ike/Gustav Hmax ≥ L-3 Wave Height (114)
Figure 5.8 Hindcast Hmax vs. API Recommended Design Wave for L-3 Platform
Note: Shown are only those platforms with a calculable hindcast and recommended wave

MMS Page 37
Assessment of Offshore Structures and Pipelines in Hurricanes Gustav and Ike February 2010
Energo Engineering 1300 W Sam Houston Pkwy S, Suite 100 Houston, TX 77042 USA Tel: 713-532-2900 Fax: 713-532-2922
www.energoeng.com
A-3 Platforms Destroyed by Hurricane Ike/Gustav Hmax ≥ A-3 ULS Wave Height (4)
A-3 Platforms where Hurricane Ike/Gustav Hmax < A-3 ULS Wave Height (47)
A-3 Platforms where Hurricane Ike/Gustav Hmax ≥ A-3 ULS Wave Height (307)
Figure 5.9 Hindcast Hmax vs. API Recommended Wave for A-3 Platform
Note: Shown are only those platforms with a calculable hindcast and recommended wave
MMS Page 38
Assessment of Offshore Structures and Pipelines in Hurricanes Gustav and Ike February 2010
Energo Engineering 1300 W Sam Houston Pkwy S, Suite 100 Houston, TX 77042 USA Tel: 713-532-2900 Fax: 713-532-2922
www.energoeng.com
5.2.2 Hindcast Crest Comparison to Deck Height
In this section, a platform’s performance is gauged by comparing the Hindcast maximum
crest elevation [Oceanweather, 2008] vs. the actual (reported) deck height. If a platform saw
a Hindcast wave crest elevation below its actual deck height, it is expected that the platform
saw no wave-in-deck. If the crest exceeds the platforms actual deck height, it is expected that
the platform saw wave-in-deck and likely incurred some damage. Plots for these comparisons
are provided at the end of the section and are examined below.
It should be noted, for this data set, a platform must have Hindcast crest elevation data
available and a deck height reported to the MMS. Consequently, only those that have hindcast
data and reported deck heights are presented here. Plots for these comparisons are provided at
the end of the section and are examined below.
Figure 5.11 shows 16 of the L-1’s that were exposed to Ike and Gustav. Of these, 9 saw a
Hindcast wave crest with no wave-in-deck while 7 saw wave-in-deck; 1 of which was
destroyed (approximately 14%). Note that approximately 44% of the 16 platforms exposed
did see wave-in-deck. However, due to the low number of L-1 platforms destroyed (1)
compared with the 65 L-1 platforms exposed, it is clear that wave-in-deck was, in general, not
an issue for L-1 platforms. Perhaps this suggests that some of the L-1 platforms (16) may
have deck heights higher than their reported deck heights. Careful examination of L-1
damage statistics not available at the time of this report would be required to confirm whether
a platform saw wave-in-deck (see Section 5.2.3 for further discussion).
Figure 5.12 shows 187 of the A-1 platforms that were exposed to Ike and Gustav. Of these,
163 saw no wave-in-deck; 2 of which were destroyed. Additionally, there were 24 platforms
which saw wave-in-deck; 4 of which were destroyed (approximately 17%). Note
approximately 87% of the 187 A-1 platforms exposed saw no wave-in-deck based on their
reported deck heights. This, also taking into account that Section 5.2.1 revealed that
approximately 78% of A-1 platforms did not see a Hindcast wave greater than the API
recommended wave, suggests that overall A-1 platform damage may not be widespread.
Figure 5.13 shows 112 of the L-2 platforms that were exposed to Ike and Gustav. Of these,
91 saw no wave-in-deck; 3 of which were destroyed. Additionally, there were 21 platforms
which saw wave-in-deck. It is expected that most L-2 platforms would not have seen wave-
in-deck since the API minimum required deck height for an L-2 platform is the same as L-1
platform. Therefore, it is not unexpected that the destroyed L-2 platforms saw no wave-in-
deck. This suggests factors other than wave-in-deck are involved in the destroyed L-2
platforms (see Section 5.2.1).
Figure 5.14 shows 931 of the A-2 platforms that were exposed to Ike and Gustav. Of these,
849 saw no wave-in-deck; 17 of which were destroyed. Additionally, there were 82 platforms
which saw wave-in-deck; 18 of which were destroyed. While approximately 90% of the 931
A-2 platforms did not see wave-in-deck, approximately 10% did. Of the 82 platforms which
saw wave-in-deck, 18 were destroyed (approximately 22%). Therefore, as was expected, the

MMS Page 39
Assessment of Offshore Structures and Pipelines in Hurricanes Gustav and Ike February 2010
Energo Engineering 1300 W Sam Houston Pkwy S, Suite 100 Houston, TX 77042 USA Tel: 713-532-2900 Fax: 713-532-2922
www.energoeng.com
data suggests that if a platform experiences wave-in-deck, it stands a good chance of incurring
damage in a major storm.
Figure 5.15 shows 74 of the L-3 platforms that were exposed to Ike and Gustav. Of these, 47
saw no wave-in-deck and 27 platforms did see wave-in-deck. Note again, however, that there
were no destroyed L-3 platforms. As stated previously, this may be partly explained by the
fact that most L-3 platforms are designed for wave inundation. However, approximately 36%
of L-3 platforms did see wave-in-deck on their reported deck heights, therefore additional
damaged L-3 platforms are expected.
Figure 5.16 shows 368 of the A-3 platforms that were exposed to Ike and Gustav. Of these,
278 saw no wave-in-deck; 4 of which were destroyed. Additionally, there were 90 platforms
which saw wave-in-deck. The data suggests that wave-in-deck did not play a major role in
the destruction of the A-3 platforms. Also consider that Section 5.2.1 showed that
approximately 87% of A-3 platforms exposed saw a wave height greater than or equal to the
A-3 recommended wave. Taken together, the Hindcast wave and crest elevation comparisons
suggest that while there wasn’t a large number of A-3 platforms destroyed, there is likely a
large number which incurred damage.
Table 5.3 and Figure 5.10 summarize the destroyed and exposed platforms where a Hindcast
wave was greater than the actual platform deck height.
Table 5.3 Summary of Hindcast Crest Elevation vs. Actual Deck Height
Comparison L-1 A-1 L-2 A-2 L-3 A-3 TOTAL
Hindcast Crest Elevation ≥
Actual Deck Height 7 24 21 82 27 90 252
Hindcast Crest Elevation <
Actual Deck Height 9 163 91 849 47 278 1437
Overall, approximately 15% (252) of the exposed platforms saw wave-in-deck loading. Of
that 252, 25 platforms that were destroyed saw wave-in-deck loading. Therefore,
approximately 10% of platforms which saw wave-in-deck were destroyed. This suggests a
larger percentage of platforms which saw wave-in-deck were damaged. This is further
evidence which suggest that if a platform sees wave-in-deck loading, there is a good chance
of destruction or substantial damage occurring. Furthermore the Inspection boundaries
seemed to bound those that were expected to see wave in deck.
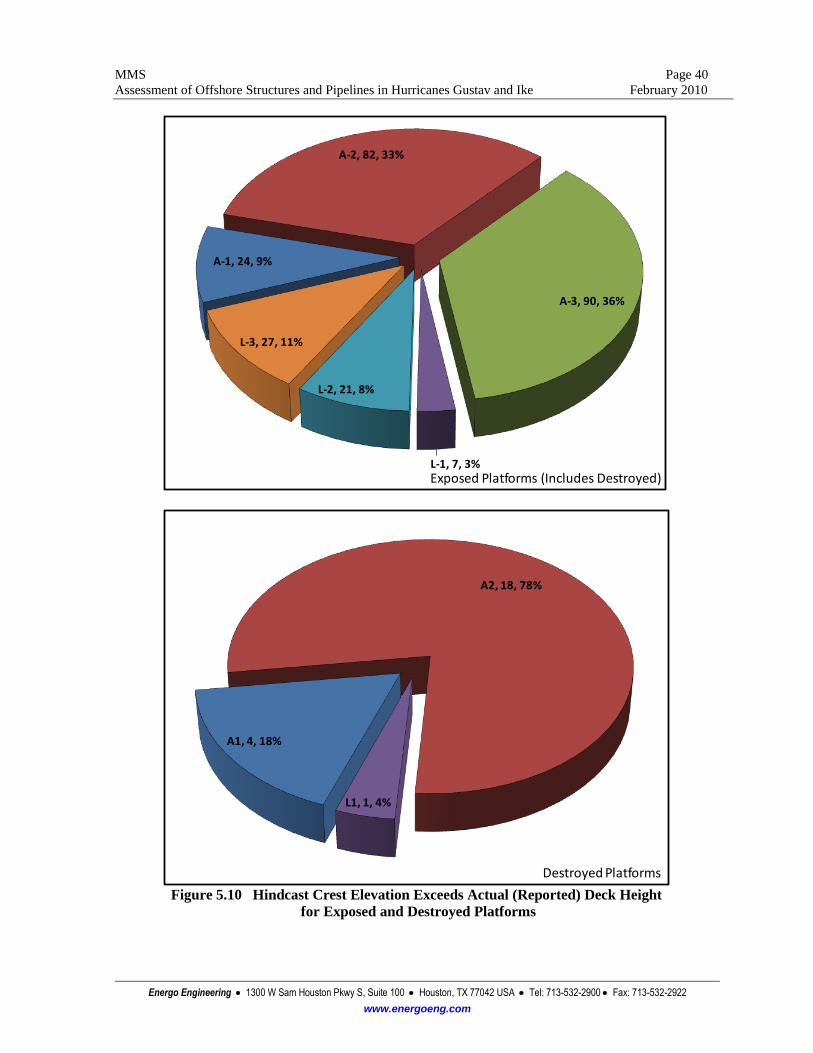
MMS Page 40
Assessment of Offshore Structures and Pipelines in Hurricanes Gustav and Ike February 2010
Energo Engineering 1300 W Sam Houston Pkwy S, Suite 100 Houston, TX 77042 USA Tel: 713-532-2900 Fax: 713-532-2922
www.energoeng.com
A-1, 24, 9%
A-2, 82, 33%
A-3, 90, 36%
L-1, 7, 3%
L-2, 21, 8%
L-3, 27, 11%
Exposed Platforms (Includes Destroyed)
Destroyed Platforms
A1, 4, 18%
A2, 18, 78%
L1, 1, 4%
Figure 5.10 Hindcast Crest Elevation Exceeds Actual (Reported) Deck Height
for Exposed and Destroyed Platforms

MMS Page 41
Assessment of Offshore Structures and Pipelines in Hurricanes Gustav and Ike February 2010
Energo Engineering 1300 W Sam Houston Pkwy S, Suite 100 Houston, TX 77042 USA Tel: 713-532-2900 Fax: 713-532-2922
www.energoeng.com
L-1 Platforms Destroyed, Ike/Gustav hindcast Crest Elevation ≥ Actual Deck Height (1)
L-1 Platforms where Ike/Gustav Hindcast Crest Elevation < Actual Deck Height (9)
L-1 Platforms where Ike/Gustav Hindcast Crest Elevation ≥ Actual Deck Height (6)
Figure 5.11 Hindcast Crest Elevation vs. Actual (Reported) Deck Height for L-1 Platforms
Note: Shown are only those platforms with a calculable hindcast and a reported deck height
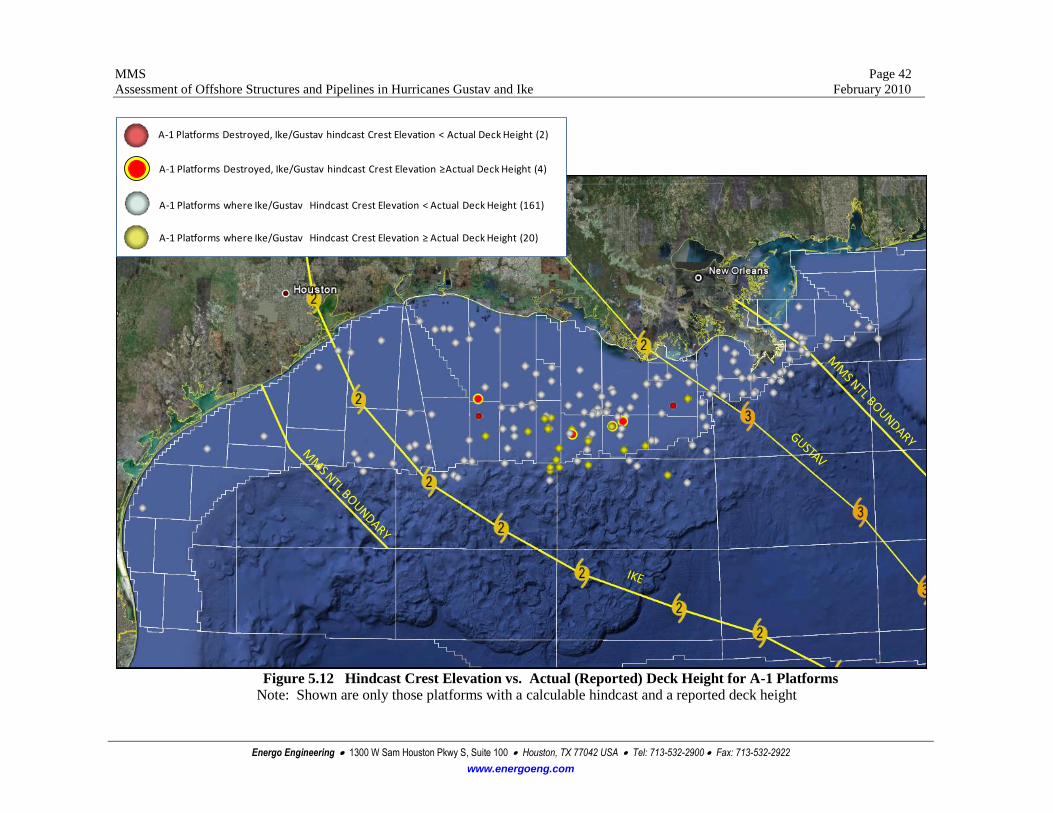
MMS Page 42
Assessment of Offshore Structures and Pipelines in Hurricanes Gustav and Ike February 2010
Energo Engineering 1300 W Sam Houston Pkwy S, Suite 100 Houston, TX 77042 USA Tel: 713-532-2900 Fax: 713-532-2922
www.energoeng.com
A-1 Platforms Destroyed, Ike/Gustav hindcast Crest Elevation < Actual Deck Height (2)
A-1 Platforms Destroyed, Ike/Gustav hindcast Crest Elevation ≥Actual Deck Height (4)
A-1 Platforms where Ike/Gustav Hindcast Crest Elevation < Actual Deck Height (161)
A-1 Platforms where Ike/Gustav Hindcast Crest Elevation ≥ Actual Deck Height (20)
Figure 5.12 Hindcast Crest Elevation vs. Actual (Reported) Deck Height for A-1 Platforms
Note: Shown are only those platforms with a calculable hindcast and a reported deck height

MMS Page 43
Assessment of Offshore Structures and Pipelines in Hurricanes Gustav and Ike February 2010
Energo Engineering 1300 W Sam Houston Pkwy S, Suite 100 Houston, TX 77042 USA Tel: 713-532-2900 Fax: 713-532-2922
www.energoeng.com
L-2 Platforms where Ike/Gustav Hindcast Crest Elevation < Actual Deck Height (88)
L-2 Platforms where Ike/Gustav Hindcast Crest Elevation ≥ Actual Deck Height (21)
L-2 Platforms Destroyed, Ike/Gustav hindcast Crest Elevation < Actual Deck Height (3)
Figure 5.13 Hindcast Crest Elevation vs. Actual (Reported) Deck Height for L-2 Platforms
Note: Shown are only those platforms with a calculable hindcast and a reported deck height

MMS Page 44
Assessment of Offshore Structures and Pipelines in Hurricanes Gustav and Ike February 2010
Energo Engineering 1300 W Sam Houston Pkwy S, Suite 100 Houston, TX 77042 USA Tel: 713-532-2900 Fax: 713-532-2922
www.energoeng.com
A-2 Platforms Destroyed, Ike/Gustav hindcast Crest Elevation < Actual Deck Height (17)
A-2 Platforms Destroyed, Ike/Gustav hindcast Crest Elevation ≥Actual Deck Height (18)
A-2 Platforms where Ike/Gustav Hindcast Crest Elevation < Actual Deck Height (832)
A-2 Platforms where Ike/Gustav Hindcast Crest Elevation ≥ Actual Deck Height (64)
Figure 5.14 Hindcast Crest Elevation vs. Actual (Reported) Deck Height for A-2 Platforms
Note: Shown are only those platforms with a calculable hindcast and a reported deck height

MMS Page 45
Assessment of Offshore Structures and Pipelines in Hurricanes Gustav and Ike February 2010
Energo Engineering 1300 W Sam Houston Pkwy S, Suite 100 Houston, TX 77042 USA Tel: 713-532-2900 Fax: 713-532-2922
www.energoeng.com
L-3 Platforms where Ike/Gustav Hindcast Crest Elevation < Actual Deck Height (47)
L-3 Platforms where Ike/Gustav Hindcast Crest Elevation ≥ Actual Deck Height (27)
Figure 5.15 Hindcast Crest Elevation vs. Actual (Reported) Deck Height for L-3 Platforms
Note: Shown are only those platforms with a calculable hindcast and a reported deck height

MMS Page 46
Assessment of Offshore Structures and Pipelines in Hurricanes Gustav and Ike February 2010
Energo Engineering 1300 W Sam Houston Pkwy S, Suite 100 Houston, TX 77042 USA Tel: 713-532-2900 Fax: 713-532-2922
www.energoeng.com
A-3 Platforms Destroyed, Ike/Gustav hindcast Crest Elevation < Actual Deck Height (4)
A-3 Platforms where Ike/Gustav Hindcast Crest Elevation < Actual Deck Height (274)
A-3 Platforms where Ike/Gustav Hindcast Crest Elevation ≥ Actual Deck Height (90)
Figure 5.16 Hindcast Crest Elevation vs. Actual (Reported) Deck Height for A-3 Platforms
Note: Shown are only those platforms with a calculable hindcast and a reported deck height

MMS Page 47
Assessment of Offshore Structures and Pipelines in Hurricanes Gustav and Ike February 2010
Energo Engineering 1300 W Sam Houston Pkwy S, Suite 100 Houston, TX 77042 USA Tel: 713-532-2900 Fax: 713-532-2922
www.energoeng.com
5.2.3 Hindcast Crest Comparison to API Minimum Elevation of Underside of Deck
In this section, a comparison of Hindcast maximum crest elevation [Oceanweather, 2008] vs.
the API minimum elevation of underside of deck (API recommended deck height) and not the
actual reported deck height. If the platforms had their decks set to minimum API
requirements and the Hindcast wave crest elevation is below the API recommended deck
height for a platform, it is expected that the platform saw no wave-in-deck. If the crest
exceeds the API recommended deck height it is expected that the platform would have seen
wave-in-deck if the deck was set at the API recommended elevation. Note that a comparison
for L-3 platforms is not included since this type comparison cannot be made without further
information on each platform since there is not an individual API recommended deck height
for L-3. Plots for these comparisons are provided at the end of the section and are examined
below.
It should be noted, for this data set, a platform must have Hindcast crest elevation data
available and a calculable API recommended deck height (a function of API category and
water depth). Consequently, only those that have hindcast data and calculable deck heights are
presented here. Plots for these comparisons are provided at the end of the section and are
examined below.
Figure 5.18 shows 47 of the L-1’s that were exposed to Ike and Gustav. Of these, 42 saw a
Hindcast wave crest with no expected wave-in-deck while 5 would be expected to see wave-
in-deck; 1 of which was destroyed. The data shows that most L-1 platforms were not
expected to see wave-in-deck. However, the 5 L-1 platforms that were expected to have seen
wave-in-deck are located primarily on the shelf edge. Prior studies on hurricane Ivan and
Rita/Katrina also noted this observation [Energo, 2005 and 2007]. This suggests that further
investigation into the effects of the platform location to this boundary may be warranted. This
is also the location of the largest Ike waves and perhaps there are more breaking waves or
other influence from the sudden decrease in water depth in this region as waves transition
from deep water at the shelf edge.
Figure 5.19 shows 157 of the A-1 platforms that were exposed to Ike and Gustav. Of these,
122 saw no wave-in-deck; 3 of which were destroyed. Additionally, there were 35 platforms
which would be expected to see wave-in-deck; 4 of which were destroyed. Again, note the
proximity of the platforms which were expected to see wave-in-deck to the shelf boundary.
Overall, approximately 78% of the 157 A-1 platforms were expected to see no wave-in-deck.
Again the location of these platforms to the shelf edge suggests that further investigation into
the effects from the sudden decrease in water depth in this region is warranted.
Figure 5.20 shows 258 of the L-2 platforms that were exposed to Ike and Gustav. Of these,
252 saw no wave-in-deck; 4 of which were destroyed. Additionally, there are 6 platforms
which would be expected to see wave-in-deck. Again, it is expected that most L-2 platforms
would not have seen wave-in-deck since the API minimum required deck height for an L-2
platform is the same as L-1 platform. However, consider that Section 5.2.1 reveals that

MMS Page 48
Assessment of Offshore Structures and Pipelines in Hurricanes Gustav and Ike February 2010
Energo Engineering 1300 W Sam Houston Pkwy S, Suite 100 Houston, TX 77042 USA Tel: 713-532-2900 Fax: 713-532-2922
www.energoeng.com
approximately 74% of L-2 platforms saw waves larger than their API recommended design
wave.
Figure 5.21 shows 943 of the A-2 platforms that were exposed to Ike and Gustav. Of these,
499 saw no wave-in-deck; 3 of which were destroyed. Additionally, there were 444 platforms
which would be expected to see wave-in-deck; 32 of which were destroyed. Since the data
shows that approximately 90% A-2 platforms which were destroyed were expected to see
wave-in-deck, the data suggests that wave-in-deck likely played a larger role in the destroyed
A-2 platforms than Section 5.2.2 (comparison to actual deck height) suggested.
Figure 5.22 shows 371 of the A-3 platforms that were exposed to Ike and Gustav. Of these,
135 saw no wave-in-deck; 1 of which was destroyed. Additionally, there were 236 platforms
which would be expected to see wave-in-deck; 3 of which were destroyed. Since the data
shows that approximately 64% of A-3 platforms were expected to see wave-in-deck it’s
suggested that most A-3 platforms do not have adequate deck heights. Section 5.2.2
suggested that approximately 25% of A-3 platforms saw wave-in-deck when looking at the
reported deck heights. Therefore, damage statistics not available at the time of this report
would likely show a high percentage of A-3 platforms damaged. The data suggests that
wave-in-deck did not play a major role in the destruction of the A-3 platforms. Also consider
that Section 5.2.1 showed that approximately 87% of A-3 platforms exposed saw a wave
height greater than or equal to the A-3 recommended design wave. Taken together, the
Hindcast wave and crest elevation comparisons suggest that while there wasn’t a large
number of A-3 platforms destroyed, there may have been a large number which incurred
damage.
Figure 5.17 and Table 5.4 summarizes the destroyed and exposed platforms where a Hindcast
wave was greater than the API recommended deck height.
Table 5.4 Summary of Hindcast Crest Elevation vs. API Recommended Deck Height
Comparison L-1 A-1 L-2 A-2 A-3 TOTAL
Hindcast Crest Elevation ≥ API
Recommended Deck Height 5 35 6 444 236 726
Hindcast Crest Elevation < API
Recommended Deck Height 42 122 252 499 135 1050
Overall, the data shows that approximately 40% (726) of the platforms exposed were
expected to see wave-in-deck loading if their decks were set at the current API minimum deck
elevation. This is not supported by Section 5.2.2 which stated that approximately 15% of
platforms exposed saw wave-in-deck loading. Even removing L-3 platforms from the Section
5.2.2 data set (since they’re not included in this sections data set), Section 5.2.2 suggest
approximately 17% of exposed platforms saw wave-in-deck. This suggest that some of the
decks might have been set higher than the minimum required and thus the reason there was
not as much damage as expected. Platform owners often set decks at higher heights.

MMS Page 49
Assessment of Offshore Structures and Pipelines in Hurricanes Gustav and Ike February 2010
Energo Engineering 1300 W Sam Houston Pkwy S, Suite 100 Houston, TX 77042 USA Tel: 713-532-2900 Fax: 713-532-2922
www.energoeng.com
A-1355%
A-2, 444, 61%
A-3, 236, 32%
L-1, 5, 1%
L-2, 6, 1%
Exposed Platforms (Includes Destroyed)
A-1, 4, 10%
A-2, 32, 80%
A-3, 3, 7%
L-1, 1, 3%
Destroyed Platforms
Figure 5.17 Crest Elevation Exceeds API Recommended Deck Height
for Exposed and Destroyed Platforms

MMS Page 50
Assessment of Offshore Structures and Pipelines in Hurricanes Gustav and Ike February 2010
Energo Engineering 1300 W Sam Houston Pkwy S, Suite 100 Houston, TX 77042 USA Tel: 713-532-2900 Fax: 713-532-2922
www.energoeng.com
L-1 Platforms Destroyed, Ike/Gustav hindcast Crest Elevation ≥L -1 Deck Height (1)
L-1 Platforms where Ike/Gustav Hindcast Crest Elevation < L-1 Deck Height (42)
L-1 Platforms where Ike/Gustav Hindcast Crest Elevation ≥ L -1 Deck Height (4)
Figure 5.18 Hindcast Crest Elevation Vs API Recommended Deck Height for L-1 Platforms
Note: Shown are only those platforms with a Calculable Hindcast and API Deck Height
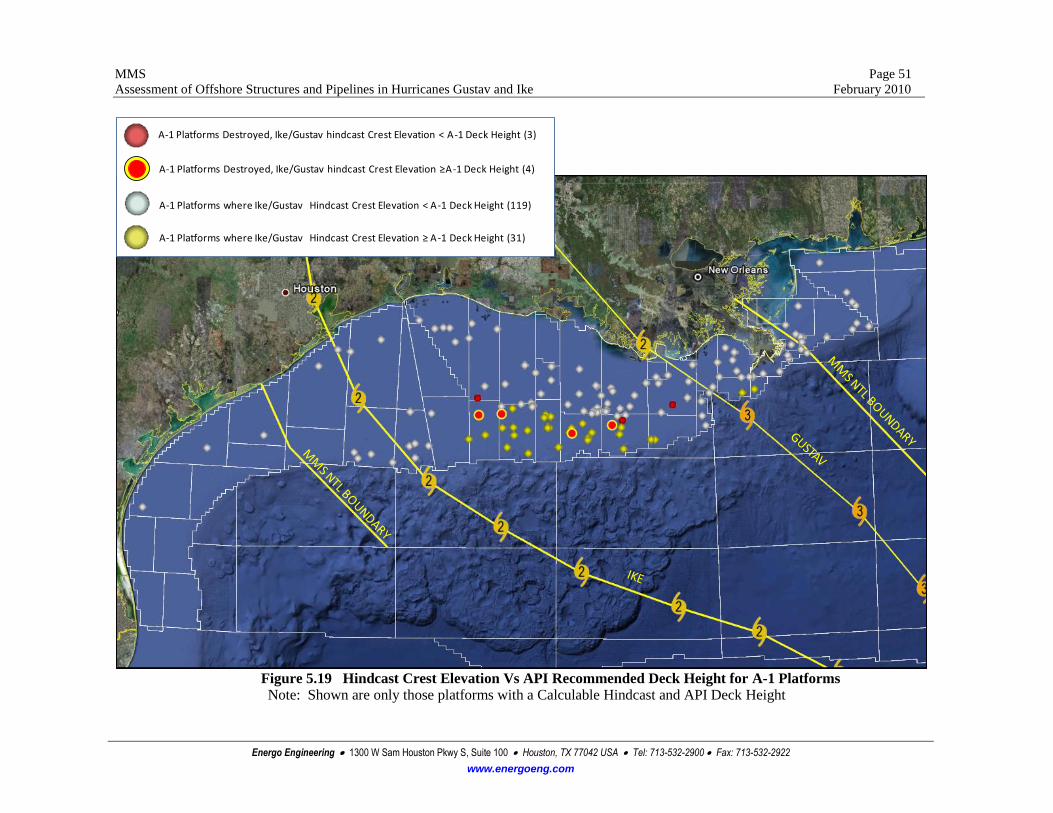
MMS Page 51
Assessment of Offshore Structures and Pipelines in Hurricanes Gustav and Ike February 2010
Energo Engineering 1300 W Sam Houston Pkwy S, Suite 100 Houston, TX 77042 USA Tel: 713-532-2900 Fax: 713-532-2922
www.energoeng.com
A-1 Platforms Destroyed, Ike/Gustav hindcast Crest Elevation < A-1 Deck Height (3)
A-1 Platforms Destroyed, Ike/Gustav hindcast Crest Elevation ≥A-1 Deck Height (4)
A-1 Platforms where Ike/Gustav Hindcast Crest Elevation < A-1 Deck Height (119)
A-1 Platforms where Ike/Gustav Hindcast Crest Elevation ≥ A -1 Deck Height (31)
Figure 5.19 Hindcast Crest Elevation Vs API Recommended Deck Height for A-1 Platforms
Note: Shown are only those platforms with a Calculable Hindcast and API Deck Height

MMS Page 52
Assessment of Offshore Structures and Pipelines in Hurricanes Gustav and Ike February 2010
Energo Engineering 1300 W Sam Houston Pkwy S, Suite 100 Houston, TX 77042 USA Tel: 713-532-2900 Fax: 713-532-2922
www.energoeng.com
L-2 Platforms Destroyed, Ike/Gustav hindcast Crest Elevation < L-2 Deck Height (4)
L-2 Platforms where Ike/Gustav Hindcast Crest Elevation < L-2 Deck Height (248)
L-2 Platforms where Ike/Gustav Hindcast Crest Elevation ≥ L -2 Deck Height (6)
Figure 5.20 Hindcast Crest Elevation Vs API Recommended Deck Height for L-2 Platforms
Note: Shown are only those platforms with a Calculable Hindcast and API Deck Height
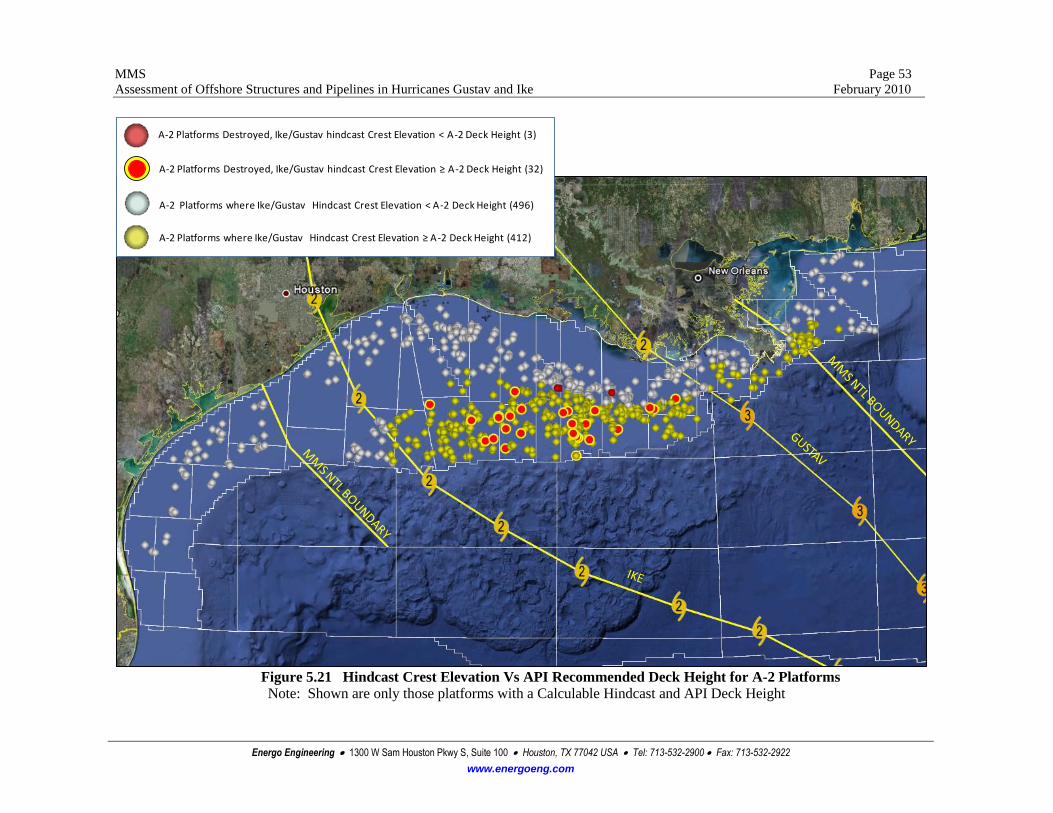
MMS Page 53
Assessment of Offshore Structures and Pipelines in Hurricanes Gustav and Ike February 2010
Energo Engineering 1300 W Sam Houston Pkwy S, Suite 100 Houston, TX 77042 USA Tel: 713-532-2900 Fax: 713-532-2922
www.energoeng.com
A-2 Platforms Destroyed, Ike/Gustav hindcast Crest Elevation < A-2 Deck Height (3)
A-2 Platforms Destroyed, Ike/Gustav hindcast Crest Elevation ≥ A-2 Deck Height (32)
A-2 Platforms where Ike/Gustav Hindcast Crest Elevation < A-2 Deck Height (496)
A-2 Platforms where Ike/Gustav Hindcast Crest Elevation ≥ A -2 Deck Height (412)
Figure 5.21 Hindcast Crest Elevation Vs API Recommended Deck Height for A-2 Platforms
Note: Shown are only those platforms with a Calculable Hindcast and API Deck Height

MMS Page 54
Assessment of Offshore Structures and Pipelines in Hurricanes Gustav and Ike February 2010
Energo Engineering 1300 W Sam Houston Pkwy S, Suite 100 Houston, TX 77042 USA Tel: 713-532-2900 Fax: 713-532-2922
www.energoeng.com
A-3 Platforms Destroyed, Ike/Gustav hindcast Crest Elevation < A-3 Deck Height (1)
A-3 Platforms Destroyed, Ike/Gustav hindcast Crest Elevation ≥A-3 Deck Height (3)
A-3 Platforms where Ike/Gustav Hindcast Crest Elevation < A-3 Deck Height (134)
A-3 Platforms where Ike/Gustav Hindcast Crest Elevation ≥ A -3 Deck Height (233)
Figure 5.22 Hindcast Crest Elevation Vs API Recommended Deck Height for A-3 Platforms
Note: Shown are only those platforms with a Calculable Hindcast and API Deck Height

MMS Page 55
Assessment of Offshore Structures and Pipelines in Hurricanes Gustav and Ike February 2010
Energo Engineering 1300 W Sam Houston Pkwy S, Suite 100 Houston, TX 77042 USA Tel: 713-532-2900 Fax: 713-532-2922
www.energoeng.com
5.3 Jacket Structure Pancake Leg
5.3.1 Background
First observed in Hurricane Lili and tentatively called “pancake leg”, this damage has been
observed in every major storm since Lili, including Ike. There are 21 platforms known to
have this damage. In some cases a platform has more than one bulge or pancake separation
(sever) of the leg. While the total presented here is from those found to be damaged it is
suspected some of the destroyed platforms perhaps failed as a result of this type of damage.
Figure 5.23 shows a photo of this type of damage.
Pile
Joint Can
Nominal Leg
Figure 5.23 Vermillion Area Pancake Leg Damage (VR 1)
As first suggested in the Katrina and Rita study [Energo, 2007] the damage seems to develop as a
result of the significant stiffness change between nominal section of the jacket leg and the joint
can section.
Figure 5.24 shows the initiating local buckle for this type of damage that occurs in the thin wall
leg section just above the thicker joint can. This is caused by excessive loads in the nominal leg
section due to the hurricane loading. Note that a thicker leg wall section here (perhaps by as little
as ¼ inch) or a grouted leg-pile annulus would have prevented this initial buckle from ever
occurring. Figure 5.25 illustrates the next phase of the damage, usually found in the proximity of
a longitudinal weld seam, although typically not at the weld. As the jacket leg begins to acquire
more loading, the leg will usually separate within the heat affected zone between the two
differing wall thicknesses. After the jacket leg separates the pancaking of the leg occurs as was

MMS Page 56
Assessment of Offshore Structures and Pipelines in Hurricanes Gustav and Ike February 2010
Energo Engineering 1300 W Sam Houston Pkwy S, Suite 100 Houston, TX 77042 USA Tel: 713-532-2900 Fax: 713-532-2922
www.energoeng.com
previously shown in Figure 5.23 and also shown in Figure 5.26. Back and forth motion of the
platform due to waves, coupled with the fact that the jacket leg is no longer connected and
platform movement is significantly increased, allows the platform to hammer the separated
sections into each other resulting in the flattened pancake region [Energo, 2007]. At this point
the platform is in a precarious position as longer duration or small increase in wave height would
most likely result in platform collapse.
Longitudinal Seam Weld
Local Buckle
Figure 5.24 Pancake Leg Damage – Initial Damage Configuration (EI 2)

MMS Page 57
Assessment of Offshore Structures and Pipelines in Hurricanes Gustav and Ike February 2010
Energo Engineering 1300 W Sam Houston Pkwy S, Suite 100 Houston, TX 77042 USA Tel: 713-532-2900 Fax: 713-532-2922
www.energoeng.com
Figure 5.25 Pancake Leg Damage – Leg Separation Configuration (ST 1)
Figure 5.26 Pancake Leg Damage – Final Damage Configuration (VR 1)

MMS Page 58
Assessment of Offshore Structures and Pipelines in Hurricanes Gustav and Ike February 2010
Energo Engineering 1300 W Sam Houston Pkwy S, Suite 100 Houston, TX 77042 USA Tel: 713-532-2900 Fax: 713-532-2922
www.energoeng.com
Table 5.5 contains a sanitized list of the structures that have had this type of damage. The list
contains parameters like install date, damage type, damage depth and the hurricane that caused it.
It also contains the D/t ratio in the damaged area and the joint can in the vicinity of the damage.
The platforms that experienced this type of damage were older 60’s and 70’s vintage platforms
with several from both the 80’s and 90’s. While it would not seem that there would be this type
of damage in the more modern platforms, it’s not a surprise as platform design was advancing
and becoming more efficient to reduce total weight, which can be reduced substantially by
decreasing the wall thickness of the legs between joint cans. It seems however, to be a detriment
to the robustness of the platform.
Another observation is that the damage is not a consequence of a specific type of hurricane (e.g.,
long duration Ike) since it has occurred in every major hurricane since Lili. While storm
duration is a key element, it seems to be more a factor of overall platform performance once the
damage has occurred (i.e., will it fail or not).
The majority of platforms that experienced this type of damage were “through the leg” 4 or 8
pile platforms, with only a few platforms that have skirt piles. To date this type of damage has
not been found platforms where there is no “through the leg” pile (i.e. skirt piled only). It is not
clear if this type of damage would occur on a platform that did not have piles through the leg.
The majority of platforms that experienced this damage mechanism where in water depths
greater than 100 feet with most greater than 200 feet. Only one shallower water platform (ST
1) experienced this type of damage. The damage still seems to be located in the upper two
bays of the platform or in the bottom bay.
In some platforms, the legs had external ring stiffeners, yet the buckle still occurred. Buckles
were observed both close to the ring stiffeners as well as far away. The ring stiffeners seem to
have no effect on the buckles in term of prevention. It is not clear from the original
documentation for these platforms if the ring stiffeners were intended to prevent this type of
buckling, or if they were intended for other issues such as to prevent hydrostatic collapse
during installation.

MMS Page 59
Assessment of Offshore Structures and Pipelines in Hurricanes Gustav and Ike February 2010
Energo Engineering 1300 W Sam Houston Pkwy S, Suite 100 Houston, TX 77042 USA Tel: 713-532-2900 Fax: 713-532-2922
www.energoeng.com
Table 5.5 Platforms With Pancake Leg Damage
Diameter
(in)
Thickness
(in)
Diameter
(in)
Thickness
(in)
1 EC 1 Pancake 1988 4-P * * * * * * 67 307 Ike 72.2
2 EI 1 Pancake 1963 8-P * * * * * * 139 140 Rita 61.6
3 EI 2 Bulge 1973 4-P 51.5 0.75 53 1.5 69 35 50 153 Ike 62.7
4 EI 3 Pancake 1976 4-P 39 0.5 39 1.25 78 31 18 153 Ike N/A
5 EI 4 Pancake 1971 4-P * * * * * * 22 172 Lili N/A
6 EI 5 Bulge 1973 4-P/4-SK 53 0.625 54 1.625 85 33 88 244 Rita 71.8
7 EI 6 Pancake 1990 ? * * * * * * * 260 Lili N/A
8 EI 7 Pancake 1971 8-P 51.25 0.625 53.5 1.75 82 31 65 248 Rita 72.6
9 EI 8 Bulge 1972 8-P 39 0.5 40 1 78 40 76 & 126 246 Ike 72.8
10 EI 9 Pancake 1984 ? 33 0.75 33 0.75 44 44 * 414 Ike 78.8
11 MC 1 Pancake 1978 8-P/4-SK * * * * * * 35 425 Katrina 71.2
12 MP 1 Pancake 1997 4-P * * * * * * 6& 58 307 Ivan 76.9
13 MP 2 Bulge 1977 4-P/4-SK * * * * * * 86 293 Ivan 74.4
14 SP 1 Bulge 1967 8-P * * * * * * N/A 340 Ivan 72.4
15 SP 2 Bulge 1968 8-P * * * * * * N/A 322 Ivan 72.6
16 SP 3 Bulge 1968 8-P/8-SK * * * * * * 277 328 Ivan 72.3
17 SS 1 Pancake & Bulge 1969 4-P * * * * * * 22 & 28 157 Ike 63.2
18 ST 1 Pancake 1985 4-P * * * * * * 38 56 Rita 42
19 VR 1 Pancake 1984 4-P 51.25 0.625 52.5 1.25 82 42 46 212 Ike 71.9
20 VR 2 Pancake 1996 4-P 51.25 0.625 53.5 1.75 82 31 84 300 Rita 75.5
21 WD 1 Pancake 1970 8-P/8-SK 51.75 0.625 52.25 1.125 82.8 46 320 370 Katrina 75.2
Hmax during
Hurricane (ft)
Sanized
NameCount
Leg D/t
(at Joint
Can)
Elevation of
Damage (ft)
Water
Depth (ft)Hurricane
Leg Dimensions
(at damage)
Leg Joint Can
Dimensions Leg D/t
(at Damage)
Platform
Type
Install
DateDamage Type
Note:
*- data was not available at the time of this report
.

MMS Page 60
Assessment of Offshore Structures and Pipelines in Hurricanes Gustav and Ike February 2010
Energo Engineering 1300 W Sam Houston Pkwy S, Suite 100 Houston, TX 77042 USA Tel: 713-532-2900 Fax: 713-532-2922
www.energoeng.com
5.3.2 Comparison to API Member Design Approach
For this section, a more in-depth study was conducted to determine if engineering practice is able
to predict this type of damage. Section 3.2 in API RP2A 21st Edition contains equations that
check for column buckling which is based in part on D/t ratios [API, 2005]. For members with
D/t ratios equal to or less than 60, Equations 3.2.2-1 and 3.2.2-2 apply. These are the normal
AISC formulas for members subjected to axial compression and their failure is governed by
either Euler buckling or overall material yield. For members with D/t ratios greater than 60,
failures are driven by local buckling. RP2A provides formulas for calculating the critical local
buckling stress; however, the formulas are empirical and based on results of laboratory buckling
tests [API, 2005]. Equations 3.2.2-3 and 3.2.2-4 calculate the elastic and inelastic critical local
buckling stress due to axial compression loads. This smaller of the elastic or inelastic critical
buckling stress is then used to replace the material yield strength in Equations 3.2.2-1 or 3.2.2-2.
Of the 21 platforms in Table 5.5 that experienced this type of damage drawings were available
for nine. Eight of these had D/t greater than 60 in the region of the damage with only one having
a D/t in the range where normal AISC buckling formulas apply. Hence, based on the platforms
where data is available, the data indicate that the local buckling formulas apply. As can be seen
it Figure 5.24, the pancake leg is initiated by a local buckle in the leg.
In order to verify that the damage is predictable, the hindcast criteria for the storm which caused
the damage was used in combination with the API formulas. SACS structural models were
available for two of the platforms namely VR 1 and VR 2. A design level analysis was run to
determine if this type of damage is predictable analytically and in the location where it was
found. Wind, wave, current, surge/tide, direction, etc was used in the analysis in order to get a
representation of the loads the leg experienced.
For both VR 1 and VR 2 axial stresses above allowable was predictable. Figure 5.27 is a screen
shot of the Member Review and Redesign feature in SACS. This feature allows the user to view
member properties along with the actual and allowable stresses along with the Unity Checks
(UC) Ratios for any member selected. As seen in Figure 5.28 in both platforms the actual axial
stress is higher than the allowable stress. For VR 1 the actual stress was 30.3 ksi and the
allowable stress was 18.5 ksi, resulting in stresses considerably above allowable. For VR 2 the
actual stress was 46.0 ksi and the allowable stress was 18.5 ksi, again resulting in stresses above
allowable. A hand calculation confirmed the allowable axial stress was calculated taking into
account the critical buckling stress as found in RP2A.

MMS Page 61
Assessment of Offshore Structures and Pipelines in Hurricanes Gustav and Ike February 2010
Energo Engineering 1300 W Sam Houston Pkwy S, Suite 100 Houston, TX 77042 USA Tel: 713-532-2900 Fax: 713-532-2922
www.energoeng.com
Figure 5.27 Member Review
5.3.3 Comparison to Analysis
As another check a global finite element analysis was performed in the form of an ultimate
strength analysis on both VR 1 and VR 2 to determine if the damage was predictable. Again,
hindcast conditions were used to develop the loading and SACS COLLAPSE was used to
perform the analysis. The analysis for both platforms was able to predict the damage. SACS
COLLAPSE predicts high plasticity in the model in the general location of the observed leg
pancake.
High Axial Stresses in Leg
Figure 5.28 SACS COLLAPSE Plot of VR 1 & 2

MMS Page 62
Assessment of Offshore Structures and Pipelines in Hurricanes Gustav and Ike February 2010
Energo Engineering 1300 W Sam Houston Pkwy S, Suite 100 Houston, TX 77042 USA Tel: 713-532-2900 Fax: 713-532-2922
www.energoeng.com
Finally, a more local finite element analysis (FEA) with shell elements was generated to
determine if the damage was predictable. The FEA was performed using ABAQUS. Thin
shell elements were used to develop the FEA model. Since it is a member ultimate capacity
estimate, the FEA considered large deformation, nonlinear geometry, material plasticity, and
buckling. Forces and moments where obtained from the SACS model and applied to the FEA
model.
The undamaged leg was analyzed using boundary conditions representing the in-place
structure. Figures 5.29 show the deformed shape and Von Mises stress contour of the
undamaged as-design leg and at the last load step before it fails. Results indicate the leg will
fail in buckling, with the first few local buckles initiating the global failure. Note that for this
platform there are ring stiffeners on the leg in the vicinity of the buckles (both the analytical
and actual observed). The ring stiffeners did not prevent the local buckles from occurring.
Figure 5.29 VR 2 FEA
To summarize, both the member design approach and the finite element theory approach were
able to predict the damage. SACS and FEA predicted stresses above allowable in both cases.
It does not always predict damage in the exact location along the length of the member where
the damage occurred. But it does identify the correct bay where the damage occurred. One
explanation might be that the inelastic formulas are based on theoretical and experimental
data. These formula’s accounts for initial imperfections; however, the location of these
imperfections and residual stresses vary from platform to platform and even on a smaller scale
from can section to can section within the nominal leg section.
Another observation is the hindcast wave heights in every damage case found in Table 5.5 are
very close to API’s 100 year design criteria (i.e. L-1). While these damages seem to be
predictable using API formulas, storm loading sensitivity studies are recommended to know

MMS Page 63
Assessment of Offshore Structures and Pipelines in Hurricanes Gustav and Ike February 2010
Energo Engineering 1300 W Sam Houston Pkwy S, Suite 100 Houston, TX 77042 USA Tel: 713-532-2900 Fax: 713-532-2922
www.energoeng.com
whether or not a small increase in storm loading will cause this damage. For high
consequence platforms it is suggested a limiting value for D/t be introduced as a robustness
check. A check using a higher return period should also illuminate the problem.
Another area of concern is the transition from joint can to nominal leg section. As can be
seen in Table 2 the transitions from joint can to nominal can be significant. For the 9
platforms where the data was available the average change in thickness is 0.625”. This
change in thickness causes an eccentricity in the load path, inducing a small local moment.
This moment is also suspected in causing the initial buckle that may result in the pancaking
effect. Figure 5.30 is a schematic and a picture of VR 1 platform which shows this transition.
Joint Can52 1/2" x 1.25"
Nominal Leg51 1/4" x 0.625"
Pile
Figure 5.30 VR 1 Picture
As noted above, the “pancake” problem can be eliminated in new platform designs by
implementing a maximum D/t limit on critical large diameter platform members such as the
jacket legs or deck legs. A value on order of 50-60 may be sufficient, but this needs to be
determined based upon further work. Existing platforms with this problem can be identified
based upon high D/t in the nominal section of the leg (between joint cans). It appears that
thick joint cans with thin walled leg sections increase the likelihood of this problem due to the
local moment at the transition from thin to thick wall thickness. If an existing platform is
identified with this problem, it can be cost effectively mitigated by grouting the pile-leg
annulus. It is recommended that this phenomenon be investigated further and the appropriate
design guidance be developed for new platforms and that guidance be developed to identify
this problem on existing platforms.

MMS Page 64
Assessment of Offshore Structures and Pipelines in Hurricanes Gustav and Ike February 2010
Energo Engineering 1300 W Sam Houston Pkwy S, Suite 100 Houston, TX 77042 USA Tel: 713-532-2900 Fax: 713-532-2922
www.energoeng.com
6.0 PLATFORM DAMAGE OBSERVATIONS
6.1 General Types of Observed Damage
Studies of post storm damage and destruction to platforms always yield spectacular above and
below water photos of damage [Energo, 2007]. Gustav and Ike were no exception. In
general, the damage has been the same as reported in the prior hurricanes, with bent deck
beams, buckled braces, cracked joints, cracked legs, etc., all of which have been primarily due
to strength overload.
The general types of platform damage both to main structure and secondary structure are as
follows.
Braces. Buckles, dents, holes, cracks, tears, out-of-plane bowing, severed members.
Legs. Buckles, dents, holes, cracks, tears, pancake leg sever (see Section 5.2.3),
broken crown shim at top-of-jacket.
Joints. Cracks at weld, cracks into chord, cracks into brace, punch-through of brace,
pull out of brace (including a piece (coupon) of the leg material, leaving a hole in the
leg), buckled nodes.
Conductor trays. Cracks at joints (typically at 6 and 12 o’clock), conductor torn loose
from guide, tray drops and jams between conductors.
Deck. Bent wide flange beams, bent deck legs, bent stairways and landings.
Miscellaneous. Usually at first elevation above waterline (+10 ft to +15 ft). Broken
or missing walkways, boat landings, riser guards, boat bumpers and damage to other
non-structural items.
6.1.1 Observed Floating Platform Damage
Figure 6.1 shows the floating platform fleet exposed to hurricanes Gustav and Ike. There
were 35 floating platforms in the GOM at the time of Gustav and Ike of which 19 sustained
minor to moderate topsides damage. Damage mainly consisted of minor non-structural
damage. Items like cable trays, handrails, lighting fixtures, tubing took most of the brunt with
several reports of umbilical termination assemblies having varying forms of damage. One
floater had major damage in that it lost its drilling rig package. API developed RP 2TD (tie
downs) to provide guidance in order to prevent such failures following hurricanes Katrina and
Rita. Damage examples can be seen in Figures 6.2 - 6.4.

MMS Page 65
Assessment of Offshore Structures and Pipelines in Hurricanes Gustav and Ike February 2010
Energo Engineering 1300 W Sam Houston Pkwy S, Suite 100 Houston, TX 77042 USA Tel: 713-532-2900 Fax: 713-532-2922
www.energoeng.com
Figure 6.1 Gulf of Mexico Floating Platform Fleet
White dots indicate floating platform location with no damage reported
Yellow dots indicate floating platform location with damage reported

MMS Page 66
Assessment of Offshore Structures and Pipelines in Hurricanes Gustav and Ike February 2010
Energo Engineering 1300 W Sam Houston Pkwy S, Suite 100 Houston, TX 77042 USA Tel: 713-532-2900 Fax: 713-532-2922
www.energoeng.com
Figure 6.2 Handrail and Cable Damage from Green Water
Figure 6.3 Missing Grating around Risers in Moon Pool

MMS Page 67
Assessment of Offshore Structures and Pipelines in Hurricanes Gustav and Ike February 2010
Energo Engineering 1300 W Sam Houston Pkwy S, Suite 100 Houston, TX 77042 USA Tel: 713-532-2900 Fax: 713-532-2922
www.energoeng.com
Figure 6.4 Cable Tray Damage Top of hull
6.1.2 Observed Fixed Platform Damage
Figure 6.5 shows the fixed platform fleet exposed to Gustav and Ike. According to the MMS
[MMS 2008] 31 fixed platforms sustained extensive damage and another 93 sustained
moderate damage. Further review determined the damage to be mainly to the platforms
topsides structural and process equipment. While there is little doubt there is extensive
damage below, the data was not available at the time of this report to run statistics.

MMS Page 68
Assessment of Offshore Structures and Pipelines in Hurricanes Gustav and Ike February 2010
Energo Engineering 1300 W Sam Houston Pkwy S, Suite 100 Houston, TX 77042 USA Tel: 713-532-2900 Fax: 713-532-2922
www.energoeng.com
Figure 6.5 Gulf of Mexico Fixed Platform Fleet
White dots indicate fixed platform location with no damage reported
Yellow dots indicate fixed platform location with moderate damage reported
Orange dots indicate fixed platform location with extensive damage reported
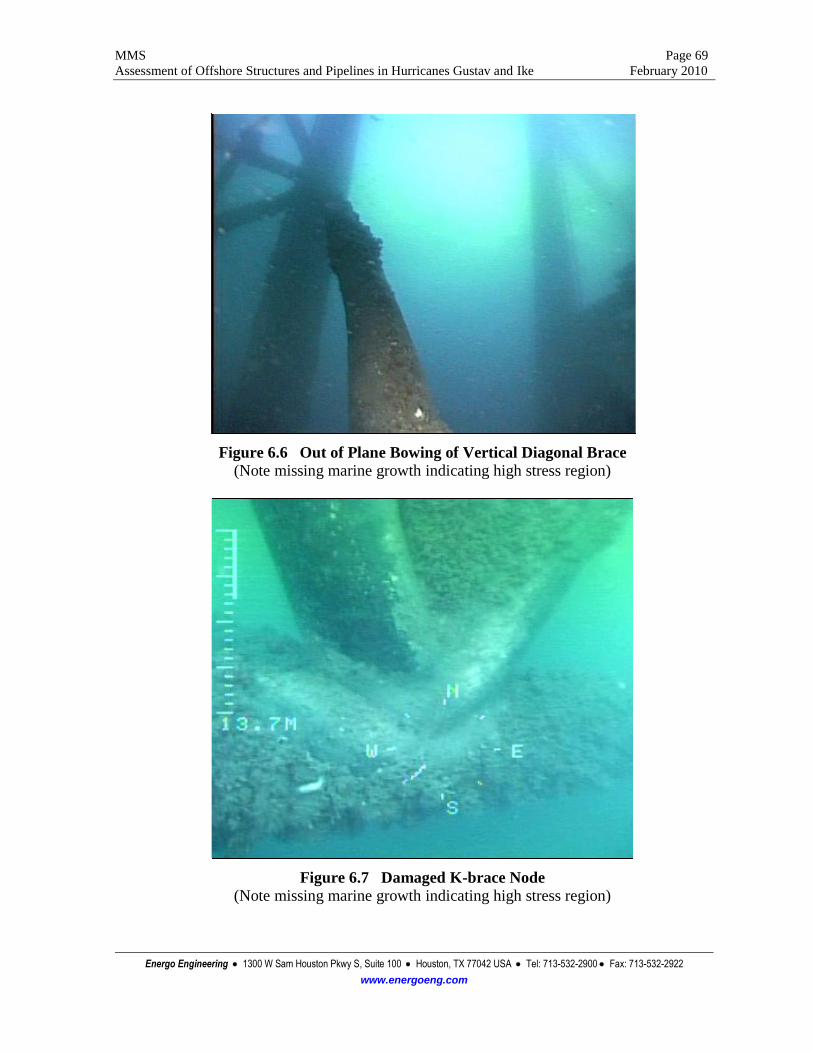
MMS Page 69
Assessment of Offshore Structures and Pipelines in Hurricanes Gustav and Ike February 2010
Energo Engineering 1300 W Sam Houston Pkwy S, Suite 100 Houston, TX 77042 USA Tel: 713-532-2900 Fax: 713-532-2922
www.energoeng.com
Figure 6.6 Out of Plane Bowing of Vertical Diagonal Brace
(Note missing marine growth indicating high stress region)
Figure 6.7 Damaged K-brace Node
(Note missing marine growth indicating high stress region)

MMS Page 70
Assessment of Offshore Structures and Pipelines in Hurricanes Gustav and Ike February 2010
Energo Engineering 1300 W Sam Houston Pkwy S, Suite 100 Houston, TX 77042 USA Tel: 713-532-2900 Fax: 713-532-2922
www.energoeng.com
Figure 6.8 Crushed X-brace node
(Note missing marine growth indicating high stress region)

MMS Page 71
Assessment of Offshore Structures and Pipelines in Hurricanes Gustav and Ike February 2010
Energo Engineering 1300 W Sam Houston Pkwy S, Suite 100 Houston, TX 77042 USA Tel: 713-532-2900 Fax: 713-532-2922
www.energoeng.com
Figure 6.9 Missing Member with Coupon Torn from Chord
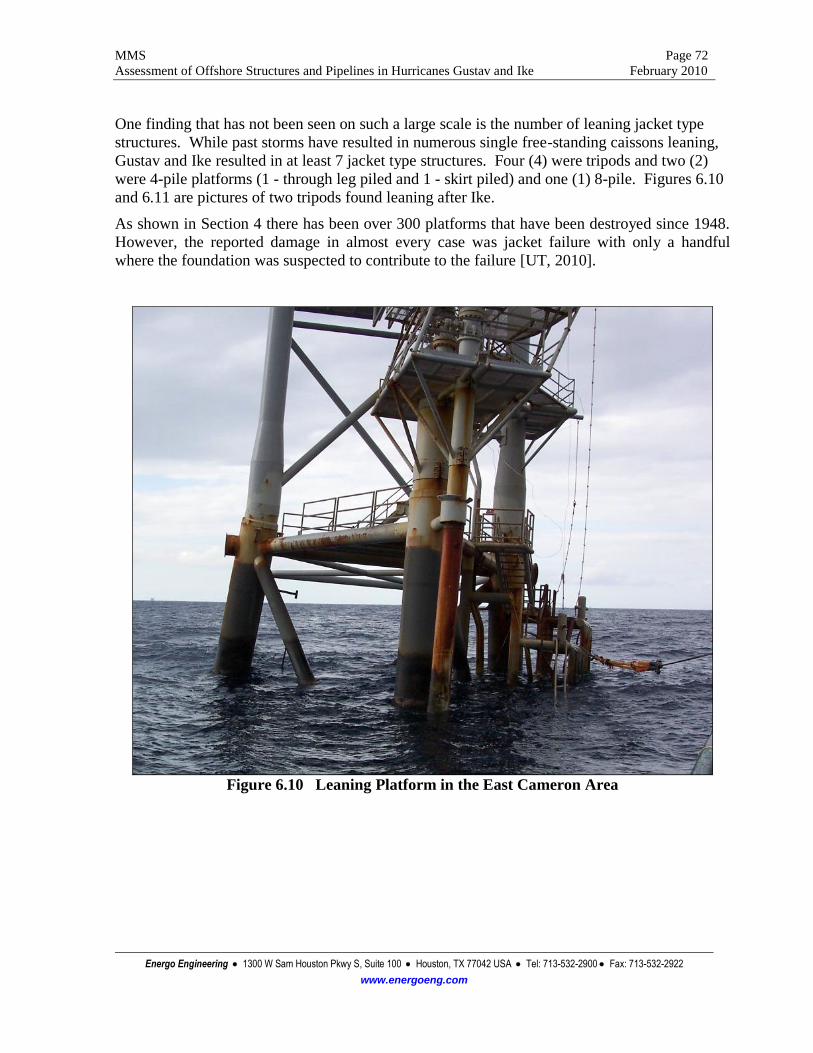
MMS Page 72
Assessment of Offshore Structures and Pipelines in Hurricanes Gustav and Ike February 2010
Energo Engineering 1300 W Sam Houston Pkwy S, Suite 100 Houston, TX 77042 USA Tel: 713-532-2900 Fax: 713-532-2922
www.energoeng.com
One finding that has not been seen on such a large scale is the number of leaning jacket type
structures. While past storms have resulted in numerous single free-standing caissons leaning,
Gustav and Ike resulted in at least 7 jacket type structures. Four (4) were tripods and two (2)
were 4-pile platforms (1 - through leg piled and 1 - skirt piled) and one (1) 8-pile. Figures 6.10
and 6.11 are pictures of two tripods found leaning after Ike.
As shown in Section 4 there has been over 300 platforms that have been destroyed since 1948.
However, the reported damage in almost every case was jacket failure with only a handful
where the foundation was suspected to contribute to the failure [UT, 2010].
Figure 6.10 Leaning Platform in the East Cameron Area

MMS Page 73
Assessment of Offshore Structures and Pipelines in Hurricanes Gustav and Ike February 2010
Energo Engineering 1300 W Sam Houston Pkwy S, Suite 100 Houston, TX 77042 USA Tel: 713-532-2900 Fax: 713-532-2922
www.energoeng.com
Figure 6.11 Leaning Tripod Platform in the Eugene Island Area
While crown shims have not been an area prone to failure in the past Gustav and Ike has
introduced at least 3 jacket type structures where crown shims failed (i.e. cracked, sheared, etc).
Two of these failures where a result of overload of shims and weld with one case attributed to
incomplete weld. Figure 6.12 shows an example of an incomplete weld.
It is suggested all pile-jacket shim connections be complete 360 degree welded connection. The
crown shims should be designed as smooth curved shims to reduce stress-concentrations which
affect fatigue life. It is also suggested the connection be designed to transfer the ultimate

MMS Page 74
Assessment of Offshore Structures and Pipelines in Hurricanes Gustav and Ike February 2010
Energo Engineering 1300 W Sam Houston Pkwy S, Suite 100 Houston, TX 77042 USA Tel: 713-532-2900 Fax: 713-532-2922
www.energoeng.com
capacity of the pile not just the design load as this is the primary load transfer point between the
jacket and the pile.
Figure 6.12 Crown Shim Failure due to Inadequate Welding
6.2 Example Mitigation Options
There are numerous repair techniques that can be safely deployed to address underwater
structural damage and this section will present example mitigation options for some of the more
typical underwater damage found on offshore platforms post hurricanes. While these
techniques have been performed on numerous platforms they are not necessarily the only
mitigation option for a particular damage.
Below is a list of typical repair options listed in order of least complex to more complex. A
brief explanation is provided along with example figures.

MMS Page 75
Assessment of Offshore Structures and Pipelines in Hurricanes Gustav and Ike February 2010
Energo Engineering 1300 W Sam Houston Pkwy S, Suite 100 Houston, TX 77042 USA Tel: 713-532-2900 Fax: 713-532-2922
www.energoeng.com
Drill Stop – A hole drilled into material at tip of crack (Figure 6.13).
Grinding – Grind surface cracks to smooth surface to prevent further growth (Figure
6.14).
Grouting – Grout interior of member to increase strength (Figure 6.15).
Wet Welding – Weld on doublers, shear pups, and other secondary structure to reinforce
member in region of damage. Key concerns with wet welding are that the weld is not as
strong as an above water dry weld (Figures 6.16 and 6.19).
Stressed Clamping – A bolted clamp using contact stress of member to clamp and repair
damage.
Dry Habitat Welding – Enclose the damage in an underwater habitat and dewater to
perform dry weld (Figure 6.18).
Stress Grouted Clamping – stressed clamp with grout inserted in the annulus between
the member and clamp to account for deformations and fit-up tolerance. Clamp is
”stressed” by tightening bolts after the annulus is grouted. (Figures 6.20 and 6.21)

MMS Page 76
Assessment of Offshore Structures and Pipelines in Hurricanes Gustav and Ike February 2010
Energo Engineering 1300 W Sam Houston Pkwy S, Suite 100 Houston, TX 77042 USA Tel: 713-532-2900 Fax: 713-532-2922
www.energoeng.com
Figure 6.13 Drill Stops to Prevent Crack Propagation
Figure 6.14 Grinding to Prevent Crack Propagation at Connection
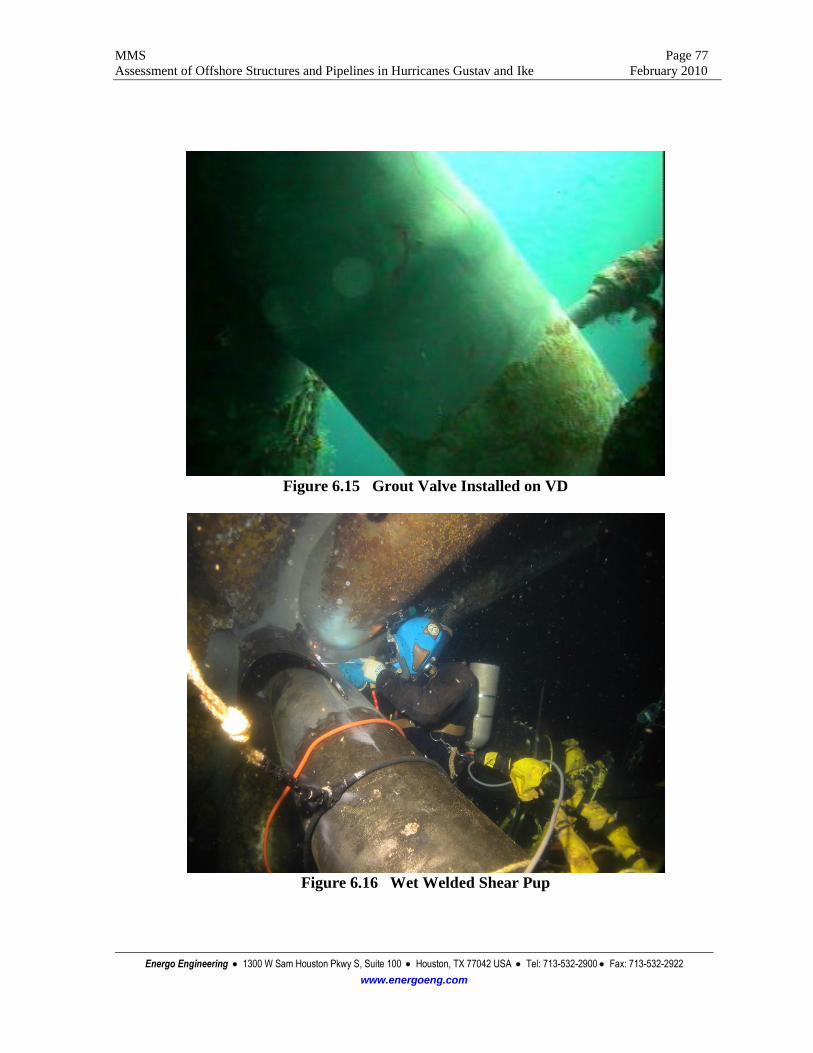
MMS Page 77
Assessment of Offshore Structures and Pipelines in Hurricanes Gustav and Ike February 2010
Energo Engineering 1300 W Sam Houston Pkwy S, Suite 100 Houston, TX 77042 USA Tel: 713-532-2900 Fax: 713-532-2922
www.energoeng.com
Figure 6.15 Grout Valve Installed on VD
Figure 6.16 Wet Welded Shear Pup

MMS Page 78
Assessment of Offshore Structures and Pipelines in Hurricanes Gustav and Ike February 2010
Energo Engineering 1300 W Sam Houston Pkwy S, Suite 100 Houston, TX 77042 USA Tel: 713-532-2900 Fax: 713-532-2922
www.energoeng.com
Figure 6.17 Habitat installed to perform dry welds

MMS Page 79
Assessment of Offshore Structures and Pipelines in Hurricanes Gustav and Ike February 2010
Energo Engineering 1300 W Sam Houston Pkwy S, Suite 100 Houston, TX 77042 USA Tel: 713-532-2900 Fax: 713-532-2922
www.energoeng.com
Figure 6.18 Welding inside Habitat
Figure 6.19 Wet Welded Doubler

MMS Page 80
Assessment of Offshore Structures and Pipelines in Hurricanes Gustav and Ike February 2010
Energo Engineering 1300 W Sam Houston Pkwy S, Suite 100 Houston, TX 77042 USA Tel: 713-532-2900 Fax: 713-532-2922
www.energoeng.com
Figure 6.20 Stress Grouted X-brace Clamp
Figure 6.21 Stress Grouted Leg Clamp

MMS Page 81
Assessment of Offshore Structures and Pipelines in Hurricanes Gustav and Ike February 2010
Energo Engineering 1300 W Sam Houston Pkwy S, Suite 100 Houston, TX 77042 USA Tel: 713-532-2900 Fax: 713-532-2922
www.energoeng.com
Observations pertaining to mitigations:
Once repair methods have been decided upon, prior to detailed design of repairs it is
recommended further underwater inspections be performed. Numerous projects have run
across more damage than initially considered as a result of missed damage or the need to
use nearby structure for final mitigation.
Another area of consideration that has been an issue is time period between inspection
and the repair. This is especially crucial if the damage occurs in the hurricane season and
is not repaired until the following spring or summer, with the platform still in the
damaged condition during the winter season. It has been an area of discussion on projects
that the repair takes place during better weather and when they get back they discover
more damage (i.e. new or existing).

MMS Page 82
Assessment of Offshore Structures and Pipelines in Hurricanes Gustav and Ike February 2010
Energo Engineering 1300 W Sam Houston Pkwy S, Suite 100 Houston, TX 77042 USA Tel: 713-532-2900 Fax: 713-532-2922
www.energoeng.com
7.0 PIPELINE PERFORMANCE
Information about damage to pipelines and risers is summarized and analyzed here to better
understand the causes of damage and identify opportunities to improve performance in future
events.
7.1 Summary Information
Data about damage to pipelines and risers was obtained from the MMS Database, which was
sanitized to remove specific information about facility designations and owners/operators. These
data were compiled from damage reports submitted by operators of platforms and pipelines, and
the level of detail and completeness varies significantly from entry to entry. Therefore,
classifications of the type and particularly the cause of damage are subjective and approximate.
Operators were also contacted to obtain further detail about causes, but we were generally
unsuccessful in obtaining more information.
The total number of damage reports for pipelines and risers is shown in Figure 7.1, including
hurricanes from Andrew through Ike. Information for the hurricanes before 2008 was obtained
from Southwest Research (1995), Stress Engineering (2005), DnV (2006) and DnV (2007). The
number of damage reports for Ike is nearly the same as that for Katrina. As with the platforms, it
is difficult to distinguish easily between damage caused by Gustav and damage caused by Ike
since they occurred just weeks apart and impacted a similar area. For the damage reports that
were attributed to a combination of Gustav and Ike (there are 17 reports, 6 for pipelines and 11
for risers), they are included in the summary statistics for both Gustav and Ike.
A breakdown of the reported damages for pipelines versus risers is shown in Figure 7.2. The vast
majority of the damage reports are classified as risers versus pipelines (86 percent for risers
versus 14 percent pipelines). Interestingly, there is more damage attributed to risers in Ike than
for hurricanes Ivan, Katrina or Rita (Figure 7.2).
The locations of damaged pipelines and risers are shown in Figures 7.3 and 7.4, respectively. For
pipelines, the location is shown to the level of precision available; in some cases, a long segment
is the best information we have about the location. For risers, multiple risers are commonly
damaged at a single location, such as when the damage is caused by toppling of the platform, so
the number of locations in Figure 7.4 is substantially smaller than the number of damage reports.

MMS Page 83
Assessment of Offshore Structures and Pipelines in Hurricanes Gustav and Ike February 2010
Energo Engineering 1300 W Sam Houston Pkwy S, Suite 100 Houston, TX 77042 USA Tel: 713-532-2900 Fax: 713-532-2922
www.energoeng.com
Figure 7.1 Total Number of Damage Reports
Figure 7.2 Damage Reports for Pipelines versus Risers

MMS Page 84
Assessment of Offshore Structures and Pipelines in Hurricanes Gustav and Ike February 2010
Energo Engineering 1300 W Sam Houston Pkwy S, Suite 100 Houston, TX 77042 USA Tel: 713-532-2900 Fax: 713-532-2922
www.energoeng.com
Figure 7.3 Pipeline Damage Locations for Hurricanes Gustav and Ike
Figure 7.4 Riser Damage Locations for Hurricanes Gustav and Ike
Statistics for the size of damaged pipelines and risers in Hurricanes Gustav and Ike are shown in
Figures 7.5 and 7.6. The percentage of damaged pipelines greater than 18 inches in diameter, 25

MMS Page 85
Assessment of Offshore Structures and Pipelines in Hurricanes Gustav and Ike February 2010
Energo Engineering 1300 W Sam Houston Pkwy S, Suite 100 Houston, TX 77042 USA Tel: 713-532-2900 Fax: 713-532-2922
www.energoeng.com
percent (Figure 7.5), is about two times greater than for Ivan, Katrina and Rita. Most of the
larger diameter pipelines that were damaged in Ike and Gustav carried gas or gas condensate.
Statistics for the age of damaged pipelines and risers are shown in Figures 7.7 and 7.8. Statistics
for the product carried by the damaged pipelines and risers are summarized in Table 7.1 and
shown in Figures 7.9 and 7.10.
Figure 7.5 Diameter of Damaged Pipelines
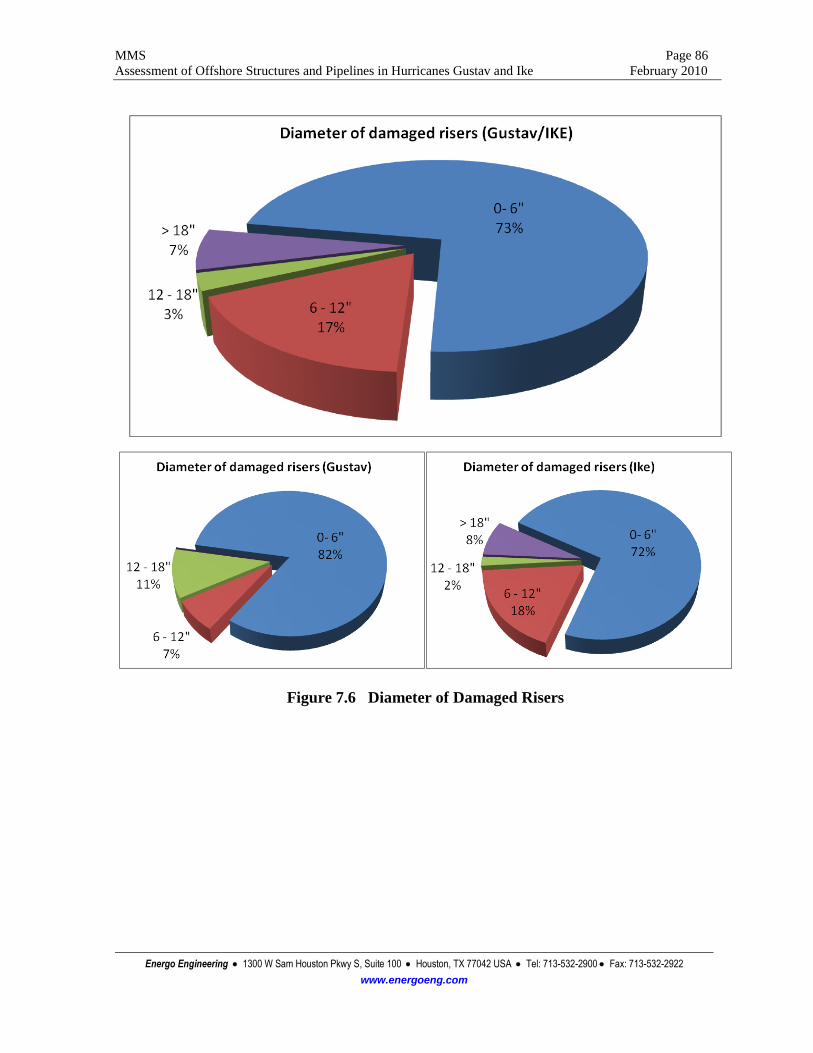
MMS Page 86
Assessment of Offshore Structures and Pipelines in Hurricanes Gustav and Ike February 2010
Energo Engineering 1300 W Sam Houston Pkwy S, Suite 100 Houston, TX 77042 USA Tel: 713-532-2900 Fax: 713-532-2922
www.energoeng.com
Figure 7.6 Diameter of Damaged Risers

MMS Page 87
Assessment of Offshore Structures and Pipelines in Hurricanes Gustav and Ike February 2010
Energo Engineering 1300 W Sam Houston Pkwy S, Suite 100 Houston, TX 77042 USA Tel: 713-532-2900 Fax: 713-532-2922
www.energoeng.com
Figure 7.7 Age of Damaged Pipelines
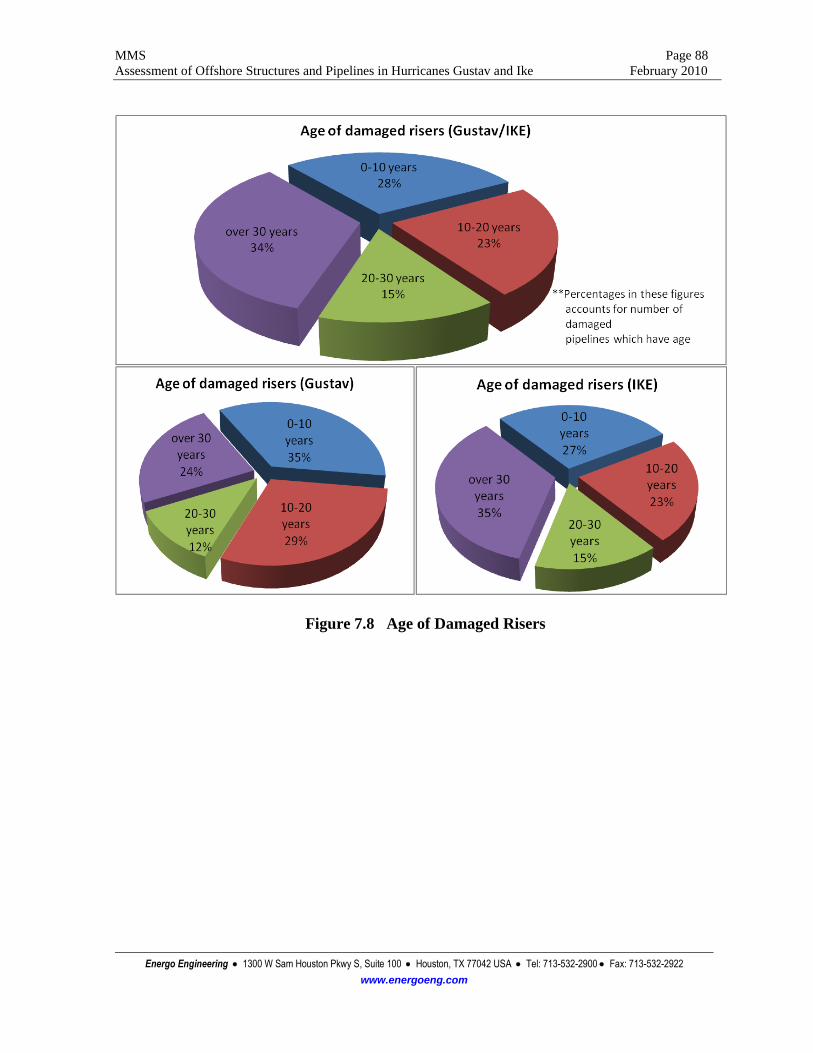
MMS Page 88
Assessment of Offshore Structures and Pipelines in Hurricanes Gustav and Ike February 2010
Energo Engineering 1300 W Sam Houston Pkwy S, Suite 100 Houston, TX 77042 USA Tel: 713-532-2900 Fax: 713-532-2922
www.energoeng.com
Figure 7.8 Age of Damaged Risers

MMS Page 89
Assessment of Offshore Structures and Pipelines in Hurricanes Gustav and Ike February 2010
Energo Engineering 1300 W Sam Houston Pkwy S, Suite 100 Houston, TX 77042 USA Tel: 713-532-2900 Fax: 713-532-2922
www.energoeng.com
Table 7.1 Damage Reports by Product Code
Product
Code Product Code Definition
Number of
Damaged
Pipelines
Number of
Damaged
Risers
AIR Pneumatic (gas) 1 0
BLGH Bulk gas with trace levels of hydrogen sulfide (gas) 0 0
BLKG Bulk gas – full well stream production from gas well(s)
prior to first processing (gas) 2 58
BLKO Bulk oil – full well stream production from oil well(s) prior
to first processing (liquid) 5 40
CHEM Corrosion inhibitor or other chemicals (liquid) 0 0
COND Condensate or distillate transported downstream of first
processing (liquid) 0 0
FLG Flare gas (gas) 0 3
G/C Gas and condensate service after first processing (liquid) 10 16
G/O Gas and oil service after first processing (gas or liquid) 0 9
GAS Gas transported after first processing (gas) 7 32
GASH Processed gas with trace levels of hydrogen sulfide (gas) 0 0
INJ Gas injection (gas) 0 0
LIFT Gas lift (gas) 7 33
NGER Natural gas enhanced recovery (gas) 0 0
O/W Oil and water transported after first processing (liquid) 1 0
OIL Oil transported after first processing (liquid) 10 54
SPLY Supply Gas (gas) 4 3
TEST Test (gas or liquid) 0 2
UMB Umbilical line usually includes pneumatic or hydraulic
control lines (gas or liquid) 0 33

MMS Page 90
Assessment of Offshore Structures and Pipelines in Hurricanes Gustav and Ike February 2010
Energo Engineering 1300 W Sam Houston Pkwy S, Suite 100 Houston, TX 77042 USA Tel: 713-532-2900 Fax: 713-532-2922
www.energoeng.com
Figure 7.9 Product Carried by Damaged Pipelines

MMS Page 91
Assessment of Offshore Structures and Pipelines in Hurricanes Gustav and Ike February 2010
Energo Engineering 1300 W Sam Houston Pkwy S, Suite 100 Houston, TX 77042 USA Tel: 713-532-2900 Fax: 713-532-2922
www.energoeng.com
Figure 7.10 Product Carried by Damaged Risers

MMS Page 92
Assessment of Offshore Structures and Pipelines in Hurricanes Gustav and Ike February 2010
Energo Engineering 1300 W Sam Houston Pkwy S, Suite 100 Houston, TX 77042 USA Tel: 713-532-2900 Fax: 713-532-2922
www.energoeng.com
7.2 Causes of Damage
An attempt was made to classify the cause of damage for pipelines and risers. The causes are
difficult to categorize due to the uneven quality of damage reports and how the information from
these reports is summarized in the MMS Database. In the database itself, the cause for every
entry is listed as Natural Hazard for the primary cause and Storm/Hurricane for the secondary
cause. However, the type of damage and the description of the damage provide insight into the
potential causes. We also consulted previous studies on pipeline and riser damage (e.g., Stress
Engineering 2005 and DnV 2006 and 2007) for guidance.
For pipelines, we classified the cause of damage into the categories described in Table 7.2. The
two categories with the most incidents are Movement and Unknown (Figure 7.11). We suspect
that many of the records classified as Unknown were caused by movement of the pipeline, but
there is not enough information provided to make that classification. The damage records
categorized as Platform Connection may belong in the Riser Database rather than the Pipeline
Database. One of the two damage records categorized as Mudslide is unlikely to have been
associated with a mudslide because it is not located in an area where the soils are weak enough
for mudslide activity (see Section 7.3); however, it is kept in that category here because the
description in the database refers specifically to a mudslide.
Table 7.2 Categories for Causes of Pipeline Damage for Hurricanes Gustav and Ike
Cause Description Number of
Reports
Movement Movement of the pipeline on the sea floor causing a
rupture, kink or misalignment 14
Impact Impact from a toppled platform, a toppled jack-up rig, a
dragged anchor or debris causing a rupture, kink or dent 7
Pipeline Crossing
Interaction
Crossing pipelines rub or bang causing a rupture, kink or
dent 3
Platform
Connection
Pipeline parted at or above water line at connection with
platform (possibly should be classified as riser damage) 2
Mudslide Seafloor instability causing a span, rupture, kink or
misalignment 2
Unknown Not possible to discern the cause from the information
available 13

MMS Page 93
Assessment of Offshore Structures and Pipelines in Hurricanes Gustav and Ike February 2010
Energo Engineering 1300 W Sam Houston Pkwy S, Suite 100 Houston, TX 77042 USA Tel: 713-532-2900 Fax: 713-532-2922
www.energoeng.com
Movement, 34%
Mudslide, 5%
Impact, 17%
Pipeline Crossing Interaction, 7%
Platform
Connection, 5%
Uknown, 32%
Causes of Pipeline Damage
Figure 7.11 Causes of Pipeline Damage for Hurricanes Gustav and Ike
The causes of pipeline damage by location are shown in Figure 7.12. Two features are notable in
this map. First, the pipeline damage caused by impact tends to be in a narrower band than the
overall damage (Figure 7.12) and seems to be closely associated with the right-hand side of the
hurricanes. Second, the pipeline damage caused by movement (including unknown since these
likely are due to movement) occurs over a relatively broad band that incorporates the entire
region where pipeline damage occurred.

MMS Page 94
Assessment of Offshore Structures and Pipelines in Hurricanes Gustav and Ike February 2010
Energo Engineering 1300 W Sam Houston Pkwy S, Suite 100 Houston, TX 77042 USA Tel: 713-532-2900 Fax: 713-532-2922
www.energoeng.com
Figure 7.12 Locations of Pipeline Damage by Cause for Hurricanes Gustav and Ike
For risers, the causes of damage are classified into the categories described in Table 7.3. The
majority of damage to risers was caused by toppled platforms (Figure 7.13). The distinction
between damage caused by wave action or by pipeline movement on the seafloor is not always
clear based on the available information. We generally classified damage as due to wave action
when the damage was near the waterline or a specific reference to wave action was made in the
record. Damage due to pipeline movement was generally associated with the riser parting,
bending or pulling from the clamps near the sea floor (Figure 7.14). This damage could be due to
the pipeline pulling on the riser, but it could also be due to the riser breaking free from the
clamps and then pulling on the pipeline.

MMS Page 95
Assessment of Offshore Structures and Pipelines in Hurricanes Gustav and Ike February 2010
Energo Engineering 1300 W Sam Houston Pkwy S, Suite 100 Houston, TX 77042 USA Tel: 713-532-2900 Fax: 713-532-2922
www.energoeng.com
Table 7.3 Categories for Causes of Riser Damage for Hurricanes Gustav and Ike
Cause Description Number of
Reports
Platform Platform toppled or severely damaged 165
Waves Wave action causing bend, dislocation or rupture 27
Impact Impact by floating or falling objects causing
bend, dislocation or rupture 6
Pipeline
Movement
Pipeline movement causing dislocation
(separation from clamps) or rupture 18
Unknown Not possible to discern the cause from the
information available 57
Platform, 60%
Waves, 10%
Impact, 2%
Pipeline Movement, 7%
Unknown, 21%
Causes of Riser Damage
Figure 7.13 Causes of Riser Damage for Hurricanes Gustav and Ike

MMS Page 96
Assessment of Offshore Structures and Pipelines in Hurricanes Gustav and Ike February 2010
Energo Engineering 1300 W Sam Houston Pkwy S, Suite 100 Houston, TX 77042 USA Tel: 713-532-2900 Fax: 713-532-2922
www.energoeng.com
Figure 7.14 Example of Riser Pulled from Leg Clamp
7.3 Mudslides
Wave-induced mudslides caused damage to pipelines in hurricanes Camille (1969), Ivan (2004)
and Katrina (2005) (Nodine et al. 2006, 2007 and 2008). A product of the most recent work was
a methodology to assess the potential for mudslides based on the wave heights and wave periods
from the hurricane hindcast. Since damage to pipelines due to mudslides was reported for Gustav
and not Ike, these storms provide an opportunity to investigate how well the methodology works.
Wave-induced mudslides are caused by differential bottom pressures underneath waves (Figure
7.15). The pressure difference imparts shear stresses in the soil; if these shear stresses together
with the in situ shear stresses due to the weight of the soil on a slope exceed the shear strength of
the soil, then a rotational slip will occur (Figure 7.16). The depth of the slip will be
approximately 50 to 100 feet deep and it will cover an area in plan that is several thousand feet
across (Nodine et al. 2008). Therefore, a large mass of soil will move and can cause significant
damage to a pipeline or even a platform if the mudslide intersects the platform. The types of
damaged caused by a mudslide to a pipeline include the pipeline left spanning across hundreds

MMS Page 97
Assessment of Offshore Structures and Pipelines in Hurricanes Gustav and Ike February 2010
Energo Engineering 1300 W Sam Houston Pkwy S, Suite 100 Houston, TX 77042 USA Tel: 713-532-2900 Fax: 713-532-2922
www.energoeng.com
of feet (if it is on the head scarp side of the rotation), the pipeline buried under tens of feet of soil
(if it is on the toe side of the rotation), or the pipeline being displaced or ruptured due to high
tensile and bending stresses.
Figure 7.15 Differential Bottom Pressure under Wave (from Nodine et al. 2009)
p
Su
W
Figure 7.16 Failure Mechanism for Wave-Induced Mudslide
The soils are weak enough to be susceptible to wave-induced mudslides only within the
Mississippi Delta where the sediment has been deposited recently and has not yet come to
equilibrium with the overburden stress (or it is underconsolidated). This mudslide prone region
is shown in Figure 7.17.
Shear Strength of Soil
Weight of Soil
Bottom Pressure

MMS Page 98
Assessment of Offshore Structures and Pipelines in Hurricanes Gustav and Ike February 2010
Energo Engineering 1300 W Sam Houston Pkwy S, Suite 100 Houston, TX 77042 USA Tel: 713-532-2900 Fax: 713-532-2922
www.energoeng.com
Figure 7.17 Mudslide-Prone Area (from Nodine et al. 2008)
The potential for mudslides is driven by the wave-induced bottom pressures. An estimate for the
maximum bottom pressure is obtained as follows:
max
w maxmax 3D
H
Hp I
22cosh( d)
L
(1)
where maxH is the peak wave height from the hindcast,
maxHL is the wave length associated with
maxH , d is the water depth, and 3DI is an adjustment factor to account for the three-dimensional
shape of a wave (a value of 0.84 was recommended by Nodine et al. 2008). The wave length
associated with the largest wave is approximated by the following equation

MMS Page 99
Assessment of Offshore Structures and Pipelines in Hurricanes Gustav and Ike February 2010
Energo Engineering 1300 W Sam Houston Pkwy S, Suite 100 Houston, TX 77042 USA Tel: 713-532-2900 Fax: 713-532-2922
www.energoeng.com
max
max
2
PH
H
g(0.9T ) 2 dL tanh( )
2 L
(2)
where g is the acceleration of gravity and Tp is the peak wave period from the hurricane
hindcast.
Estimated values for the maximum or peak bottom pressure are shown in Figure 7.18 for Gustav
and Ike in the mudslide-prone area. The bottom pressures tend to increase with decreasing water
depth. The bottom pressures in this region were greater for Gustav than Ike.
The potential for mudslides is quantified in Figure 7.19 as the chance that a mudslide would
happen during the peak waves within any particular 4,000-foot by 4,000-foot area. This chance
depends on the hurricane waves, the water depth, the average bottom slope and the shear
strength of the soil. To account for variability in the strength of the soil, the frequency that
different soil strengths occur throughout this mudslide-prone area is used; therefore, the chance
for a mudslide in this map does not represent the site-specific potential at a location where the
soil strength is known. Details for this calculation are provided in Nodine et al. (2007).
A comparison of Gustav and Ike shows that the potential for mudslides was greater in Gustav
than for Ike (Figure 7.19). This result is consistent with the reports of mudslides damaging
pipelines in Gustav but not Ike. For context, a comparison of Ivan (mudslides reported), Katrina
(mudslides reported), Gustav (mudslide reported) and Ike (no mudslides reported) is shown in
Figure 7.20.
The report of a mudslide does not necessarily mean that a mudslide actually occurred. For
example, one of the reports for a mudslide damaging a pipeline in Gustav corresponds to a
pipeline in Ship Shoal that is well to the west of the mudslide-prone area. It is possible that this
damage was caused by bottom currents moving the pipeline or the shallow soil around the
pipeline, but not a rotational mudslide. In addition, a lack of a report of a mudslide does not
necessarily mean that a mudslide did not occur. To discern a mudslide, it generally takes a
detailed investigation with side scan sonar over a relatively large region (about a mile across)
around the vicinity of the pipeline. One of the reports for pipeline damage in Gustav is for a
location in the mudslide-prone area and describes a pipeline that is spanning for 200 feet in
either direction of a subsea tie-in. This damage may well be due to a mudslide. There are at least
four other damage reports within the mudslide-prone area that may be associated with a
mudslide if investigated further (Figure 7.19 shows the locations). Finally, mudslides may have
occurred within the mudslide-prone area during either Gustav or Ike, but they are not known
about because they did impact a facility.

MMS Page 100
Assessment of Offshore Structures and Pipelines in Hurricanes Gustav and Ike February 2010
Energo Engineering 1300 W Sam Houston Pkwy S, Suite 100 Houston, TX 77042 USA Tel: 713-532-2900 Fax: 713-532-2922
www.energoeng.com
(a) Hurricane Gustav
(b) Hurricane Ike
Figure 7.18 Relative Magnitudes for Maximum Bottom Pressure in Mississippi Delta for
Hurricanes Gustav and Ike

MMS Page 101
Assessment of Offshore Structures and Pipelines in Hurricanes Gustav and Ike February 2010
Energo Engineering 1300 W Sam Houston Pkwy S, Suite 100 Houston, TX 77042 USA Tel: 713-532-2900 Fax: 713-532-2922
www.energoeng.com
(a) Hurricane Gustav
(b) Hurricane Ike
Figure 7.19 Mudslide Potential Maps for Hurricanes Gustav and Ike

MMS Page 102
Assessment of Offshore Structures and Pipelines in Hurricanes Gustav and Ike February 2010
Energo Engineering 1300 W Sam Houston Pkwy S, Suite 100 Houston, TX 77042 USA Tel: 713-532-2900 Fax: 713-532-2922
www.energoeng.com
Figure 7.20 Comparison of Mudslide Potential for Hurricanes Ivan, Katrina,
Gustav and Ike
7.4 Currents
Currents below the sea surface and at the seafloor play an important role in loading pipelines and
risers during hurricanes. Historically, the focus in the offshore oil industry has been on
modeling, measuring and predicting winds and waves from hurricanes. Recently, due to the
severe storm surge in Katrina, there has been an intense effort to better understand the forces
moving the water toward the coastline, including currents. A numerical model, ADCIRC (2006),
has been adapted and combined with models for waves in order to better predict storm surges
and currents. This model has been calibrated using Katrina and Rita (e.g., IPET 2008) and is
now being applied to Gustav and Ike.
In order to better understand the potential forces on pipelines and risers, currents have been
predicted with these state-of-the art numerical models based on all available hindcast data for
Ike. This work is ongoing and the results presented here are preliminary. The U.S. Army Corps
of Engineers, the Federal Emergency Management Agency and the National Oceanographic and
Atmospheric Administration are sponsoring the work. Acknowledgment is due to Prof. Rick

MMS Page 103
Assessment of Offshore Structures and Pipelines in Hurricanes Gustav and Ike February 2010
Energo Engineering 1300 W Sam Houston Pkwy S, Suite 100 Houston, TX 77042 USA Tel: 713-532-2900 Fax: 713-532-2922
www.energoeng.com
Leuttich from the University of North Carolina, Prof. Joannes Westerink from Notre Dame, and
Prof. Clint Dawson from the University of Texas at Austin for sharing these results.
The results to date are for the depth-averaged current speed. The depth-averaged current is
representative of the current profile across the entire depth of water, and will be smaller than the
current speed at the surface. The maximum depth-averaged current speeds at different locations
are shown in Figure 7.21 for Ike. The magnitudes for these depth-averaged currents are
unexpectedly large. The location in Figure 7.21 where the maximum depth-averaged current
speed is 2.3 m/s (South Timbalier 211) is in about 150 feet of water. For comparison, the depth-
averaged current speed corresponding to the 100-year design conditions in this water depth is
less than 1.5 m/s. Therefore, these depth-averaged current speeds are unexpectedly large and
may explain why there was so much damage to pipelines and risers in Ike (Figure 7.1).
The directions for the maximum currents tend to be perpendicular to the damaged pipelines
(Figure 7.21), which is consistent with the damage being caused by the current either lifting and
moving the pipeline or scouring the soil around the pipeline. The product in the pipeline is
shown in Figure 7.22, which also suggests that high bottom currents may have moved around the
lighter (gas) pipelines in this hurricane.
Figure 7.21 Maximum Depth-Averaged Current Magnitude and Direction for Hurricane
Ike with Damaged Pipeline Locations

MMS Page 104
Assessment of Offshore Structures and Pipelines in Hurricanes Gustav and Ike February 2010
Energo Engineering 1300 W Sam Houston Pkwy S, Suite 100 Houston, TX 77042 USA Tel: 713-532-2900 Fax: 713-532-2922
www.energoeng.com
Figure 7.22 Maximum Depth-Averaged Current Magnitude and Direction for Hurricane
and Damaged Pipeline Types
7.5 Summary and Recommendations
There was considerable damage to pipelines and risers in hurricanes Gustav and Ike. More risers
were damaged in Ike than Katrina. The most prevalent cause of damage to pipelines is
movement that can rupture pipelines, pull pipelines from risers and pull risers from clamps. The
most prevalent cause of damage to risers is toppling of the platform. There is evidence that
wave-induced mudslides occurred in Gustav but not Ike, which is consistent with the predicted
potential for mudslides based on the hindcast data. Current speeds below the water surface and at
the bottom in Ike were possibly substantially larger than expected based on design assumptions.
The following recommendations are provided in order to improve understanding of the causes
for riser and pipeline damage:
1. Require more consistent and more detailed information be provided in damage
reports concerning the location of the damage, the type of damage and any evidence
about the cause of damage.
2. Apply the new modeling and calibration work for storm surges and currents to predict
the loads on pipelines and risers, to assess the potential for damage, and to compare
the predictions with observations.
3. Perform analyses considering pipelines and risers that were not damaged together
with those that were damaged to better understand the causes of damage and what
measures might best mitigate those causes.

MMS Page 105
Assessment of Offshore Structures and Pipelines in Hurricanes Gustav and Ike February 2010
Energo Engineering 1300 W Sam Houston Pkwy S, Suite 100 Houston, TX 77042 USA Tel: 713-532-2900 Fax: 713-532-2922
www.energoeng.com
8.0 SUMMARY OF RESULTS
This project has evaluated large amounts of data and information related to the performance of
fixed and floating platforms and pipelines in hurricanes Gustav and Ike. The overall findings, as
in past studies, indicate that there was no life-loss or major environmental problems as a direct
result of the hurricanes. This is attributable to the prior evacuation of the platforms and to the
use of sub-surface safely valves and shut-in of wells prior to the hurricane arrival.
Some of these evaluations and findings were similar to those from other studies of fixed platform
performance in hurricanes. For example, the finding that most of the destroyed platforms were
classified as A-2. Also most destroyed platforms were older vintage structures of the 1950s
through 1970s where there was little or no industry guidance on how to properly design an
offshore structure. Other findings are new to these storms. For example the number of tripods
destroyed. Another finding is there was one L-1 High Consequence platform that was destroyed.
This is the first such instance where a L-1 has been destroyed.
The following summarizes specific key results and associated recommendations identified by
this study. The description is intentionally brief since this is a summary of prior discussion
elsewhere in this report. See the indicated section for full details. The findings are listed in
general order of importance.
Platforms:
1. Performance of Tripod Platforms.
Result – There were five recent vintage tripods destroyed during Gustav and Ike, a surprisingly
high number. One was an L-1 structure and 4 were L-2 structures. While tripods lack
redundancy, offering little in way of alternative load paths in the event they are damaged, they
also are also more dynamically sensitive especially in deeper waters (i.e., greater than 200 feet).
See Section 4.4.
Recommendation – Further investigation into the tripod failures, and damage where data is
available. Limits on the use of tripods in deeper water should be considered as well as a
“robustness” check to ensure that the tripod can still function adequately should it sustain
damage to the jacket or foundation.
2. Platform Robustness.
Result – Numerous platforms experienced storm conditions greater than 50 year L-2 and 100
year L-1 design practice. While most performed as expected or better since they experienced an
event larger than their design, it is clear that offshore structures require “robustness” that not
only allows them to survive, but perhaps sustain damage if the elastic design event is exceeded.
While the 50 or 100 year design approach provides inherent factors of safety, additional checks
are required to ensure that the platform will survive extreme conditions. For example, checks for
efficient load paths and redundancy. See Section 5.2.1.

MMS Page 106
Assessment of Offshore Structures and Pipelines in Hurricanes Gustav and Ike February 2010
Energo Engineering 1300 W Sam Houston Pkwy S, Suite 100 Houston, TX 77042 USA Tel: 713-532-2900 Fax: 713-532-2922
www.energoeng.com
Recommendation – A second check be performed during the initial design of offshore platforms
to ensure they will survive extreme hurricanes such as Ike, that may exceed the platform elastic
design criteria. This is especially important for High Consequence platforms. See Item 5 below.
3. Performance of Floating Structures.
Result – Deepwater floating structures performed well in both hurricanes with only one structure
suffering major damage due to a toppled drill rig. There was minor damage to other structures,
mostly from high winds and wave run-up on the structure.
Recommendation – Operators should follow API guidance on tie-down of rigs, such as RP 2TD,
especially on floating structures which have large motions in hurricanes.
4. Performance of A-2 manned-evacuated platforms.
Result – The majority of the A-2 manned-evacuated platforms that were destroyed experienced
metocean conditions equal to, but predominately larger than, the Section 17 A-2 Ultimate
Strength Criteria. On average these platforms experienced conditions 5 to 10 feet greater than
this criteria. This finding confirms that these structures which could be manned during a
Sudden Hurricane and should be able to withstand the API defined Sudden Hurricane conditions.
See Section 5.2.1.
Recommendation – API is still investigating the Sudden Hurricane conditions and if they have
changed then the findings of this report need to be reconfirmed. Initial indications are that the
Sudden Hurricane conditions are the same as before Ike and Gustav and even Katrina and Rita.
5. Performance of L-1 platforms
Result - There was one L-1 platform that was destroyed during Ike which was a deepwater
tripod. As no damage data was available for this study, the number of damaged L-1 platforms, if
any, is unknown. L-1 represents the High Consequence API exposure category for fixed
platforms and also the latest API approach for metocean loading including design to 100 year
conditions. Much like Katrina and Rita, Gustav and Ike essentially “proof loaded” these
platforms to loads at or above the L-1 criteria and the majority of platforms survived. This
validates the L-1 design approach. See Section 5.2.1 and Item 1 above.
Recommendation – As a result of over 50% of these platforms seeing conditions greater than the
100 year design and it is recommended robustness checks in Item 2 above be performed on new
High Consequence structures in order to ensure they will survive extreme hurricanes.
6. Pancake Leg Damage.
Result: To date there have been 21 documented cases of this type of damage. In most cases the
D/t ratio was over 60 and the average thickness transition between joint can and nominal leg was
5/8 inches. It is likely that several of the destroyed platforms had this issue which ultimately
resulted in their destruction. See Section 5.2.3.
Recommendation: Additional study is recommended to better understand this type of damage
and modify the new platform design process accordingly (e.g., establish D/t limits for legs). In
addition, guidelines should be developed to determine if an existing platform is susceptible to
this problem (e.g., thin walled legs) and recommendations developed to prevent the problem
from occurring, such as grouting the legs.

MMS Page 107
Assessment of Offshore Structures and Pipelines in Hurricanes Gustav and Ike February 2010
Energo Engineering 1300 W Sam Houston Pkwy S, Suite 100 Houston, TX 77042 USA Tel: 713-532-2900 Fax: 713-532-2922
www.energoeng.com
7. Crest Comparison to Required Deck Height.
Result: Over 40% of the platforms exposed were expected to see wave in deck if their deck
height was set at the recommended API deck height. The majority of these are classified as A-2
platforms and their deck heights are checked per Section 17 based on Sudden Hurricane
conditions which are much less than 100 year conditions. In contrast, High Consequence L-1
and A-1 platforms and Medium Consequence L-2 platforms which have their deck elevations
established according to 100 year conditions, had a low percentage of platforms that would have
expected to see WID. See Section 5.2.2.
Recommendation: The API A-2 deck elevation curves are an indicator if a platform will survive
a sudden hurricane, but they are not a good indicator if the platform will be damaged or
destroyed in larger hurricanes. Platform owners should be educated on the destruction or
damage and associated potential downtime that can occur for platforms that have low decks,
especially A-2 platforms, or when critical production or other equipment and systems are located
on lower decks that can be impacted by waves. Consideration should be given to relocate such
equipment to higher decks.
8. Foundations.
Result: Numerous leaning platforms were observed including several with suspected pile
foundation failures. These were some of the first documented pile foundation failures in
hurricanes. In terms of vintage, the majority of the observations were of recent design and
installed in the last 10 years, with more tripods contributing to the structure type. See Item 1
above and Section 6.1.2.
Recommendation: The guidance in MMS TAR Study 612 which provides an in-depth study of
the performance of foundations in hurricanes, including Ike, should be followed for platform
design and assessment. In particular, the document provides an improved approach for
assessment of the foundations of existing platforms as well as guidance to include pile flexibility
in determining pile penetration for new platform design.
9. Crown Shims.
Result: Several jacket pile shim connections failed and proved to be the “weak link” in the
platform design. The majority of these failures are attributed to an overloaded connection that
was poorly designed. It is likely that this is the initiating flaw in several of the destroyed
platforms. See Section 6.1.2.
Recommendation: It is recommended further study be performed to provide improved guidance
on design of this connection for both strength and fatigue (low cycle, high stress) for new
platforms. The guidance should also include an approach to determine if an existing platform
has this type of flaw so that corrective action can be taken.

MMS Page 108
Assessment of Offshore Structures and Pipelines in Hurricanes Gustav and Ike February 2010
Energo Engineering 1300 W Sam Houston Pkwy S, Suite 100 Houston, TX 77042 USA Tel: 713-532-2900 Fax: 713-532-2922
www.energoeng.com
Pipelines:
1. Performance of Pipelines and Risers.
Result: Numerous pipelines and risers experienced movements similar to prior hurricanes.
More risers were damaged in Ike than Katrina. Bottom currents were larger than predicted in
some cases and perhaps the reason for numerous pipeline movements. See Section 7.4
Recommendation: Apply the new modeling and calibration work for storm surges and currents to
predict the loads on pipelines and risers, to assess the potential for damage, and to compare the
predictions with observations.

MMS Page 109
Assessment of Offshore Structures and Pipelines in Hurricanes Gustav and Ike February 2010
Energo Engineering 1300 W Sam Houston Pkwy S, Suite 100 Houston, TX 77042 USA Tel: 713-532-2900 Fax: 713-532-2922
www.energoeng.com
9.0 REFERENCES
ABS Consulting, Hurricane Lili’s Impact on Fixed Platforms, Final Report to MMS, June 2004.
ADCIRC (2006), User’s Manual for A (PARALLEL) ADVANCED CIRCULATION MODEL
FOR OCEANIC,COASTAL AND ESTUARINE WATERS, Developed by R. Leuttich and J.
Westerink.
API, 2002, Recommended Practice for Planning, Designing and Constructing Fixed Offshore
Platforms, API RP 2A, Twenty-First Edition, American Petroleum Institute (API), Washington,
D.C., 2002.
API, 2005, Recommended Practice for Planning, Designing and Constructing Fixed Offshore
Platforms – Working Stress Design, API RP 2A-WSD, Twenty-First Edition Errata and
Supplement 2, American Petroleum Institute (API), Washington, D.C., October 2005.
Coleman, J.M., Prior, D.B., and Garrison, L. (1980), Minerals Management Service Open File
Report 80-02, Maps 1-8.
DnV (2006), Pipeline Damage Assessment from Hurricane Ivan in the Gulf of Mexico, Report
No. 44038570, Det Norske Veritas, Prepared for Minerals Management Service, 64 pp.
DnV (2007), “Pipeline Damage Assessment from Hurricanes Katrina and Rita in the Gulf of
Mexico,” Report No. 448141183, Det Norske Veritas, Prepared for Minerals Management
Service, 104 pp.
Energo, 2006, Assessment of Fixed Offshore Platform performance in Hurricanes Andrew, Lili
and Ivan, report to MMS by Energo Engineering, Inc., TAR No 549, January 2006.
Energo, 2007, Assessment of Fixed Offshore Platform performance in Hurricanes Katrina and
Rita, report to MMS by Energo Engineering, Inc. TAR No 578, May 2007.
IPET (2008), Performance Evaluation of the New Orleans and Southeast Louisiana Hurricane
Protection System, Draft Final Report of the Interagency Performance Evaluation Task Force,
U.S. Army Corps of Engineers, https://IPET.wes.army.mil.
MMS, MMS Completes Assessment of Destroyed and Damaged Facilities from Hurricanes
Gustav and Ike, News Release #R-08-3932, November 26 2008
Nodine, M.C., Gilbert, R.B., Wright, S.G., Cheon, J.Y., Wrzyszczynski, M., Coyne, M. and
Ward, E.G. (2007), “Impact of Hurricane-Induced Mudslides on Pipelines,” Proc. Offshore
Technology Conference, Houston, Texas, OTC Paper No. 18983.
MMS Page 110
Assessment of Offshore Structures and Pipelines in Hurricanes Gustav and Ike February 2010
Energo Engineering 1300 W Sam Houston Pkwy S, Suite 100 Houston, TX 77042 USA Tel: 713-532-2900 Fax: 713-532-2922
www.energoeng.com
Nodine, M. C., Gilbert, R. B., Cheon, Jeong Yeon, Wright, S. G. and Ward, E. G. (2009), “Risk
Analysis for Hurricane Wave Induced Submarine Mudslides,” Proceedings, Submarine Mass
Movements and Their Consequences, 4th International Symposium, Springer, 335-352.
Nodine, M. C., Wright, S. G. and Gilbert, R. B. (2006), “Mudflows and Mudslides during
Hurricane Ivan,” Proceedings, Offshore Technology Conference, OTC 18328.
Nodine, M. C., Wright, S. G., Gilbert, R. B., Ward, E. G., Cheon, J. Y. (2008), Mudslides
During Hurricane Ivan and an Assessment of the Potential for Future Mudslides in the Gulf of
Mexico, Final Project Report, Offshore Technology Research Center, Prepared for Minerals
Management Service, 190 pp.
Oceaneering, W. Jack Couch, Options for Making Underwater Repairs to Offshore Platforms,
American Welding Society – Welding Journal, January 2010, 36 pp.
Oceanweather Inc., Fast Delivery Hindcast of Hurricane Gustav (2008) in the Northern Gulf of
Mexico, Sept 9, 2008
Oceanweather Inc., Fast Delivery Hindcast of Hurricane Ike (2008) in the Northern Gulf of
Mexico, Sept 19, 2008
PMB Engineering, Inc., Hurricane Andrew – Effects on Offshore Platforms, Final Report to the
Joint Industry Project, October 1993.
PMB Engineering, Inc., Hurricane Andrew Effects on Offshore Platforms, Phase II Joint
Industry Project, January 1996, PMB Engineering, Inc.
Puskar, F. J., Aggarwal, R. K., Cornell, C. A., Moses, F. and Petrauskas, C., 1994. A
Comparison of Analytical Predicted Platform Damage During Hurricane Andrew, Proceedings,
26th Offshore Technology Conference, OTC No. 7473.
Puskar, F.J., Ku, A. and Sheppard, R.E., Hurricane Lili’s Impact on Fixed Platforms and
Calibration of Platform Performance to API RP 2A, Proceedings, Offshore Technology
Conference, OTC No. 16802, May 2004.
Southwest Research Institute, 1995, Evaluation of Hurricane-Induced Damage to Offshore
Pipelines, Final Report, Prepared for Minerals Management Service, 63 pp.
Stress Engineering, 2005, Evaluation and Comparison of Hurricane-Induced Damage to
Offshore GOM Pipelines from Hurricane Lili, Stress Engineering Services, Inc., Prepared for
Minerals Management Service, 46 pp.
University of Texas (UT), Comparison of Observed and Predicted Performance for Jacket Pile
Foundations in Hurricanes, OTC 20861-PP, May 2010 (Pending)

MMS Page 111
Assessment of Offshore Structures and Pipelines in Hurricanes Gustav and Ike February 2010
Energo Engineering 1300 W Sam Houston Pkwy S, Suite 100 Houston, TX 77042 USA Tel: 713-532-2900 Fax: 713-532-2922
www.energoeng.com
Ward et. al., 2000, Consequence-Based Criteria for the Gulf of Mexico: Philosophy & Results,
E. G. Ward, G. C. Lee, D. L. Botelho, J. W. Turner, F. Dyhrkopp, and R. A. Hall, Offshore
Technology Conference, OTC Paper 11885, May 2000.
Ward et. al., 2000, Consequence-Based Criteria for the Gulf of Mexico: Development and
Calibration of Criteria, E. G. Ward, G. C. Lee, D. L. Botelho, J. W. Turner, F. Dyhrkopp, and R.
A. Hall, Offshore Technology Conference, OTC Paper 11886, May 2000.

MMS Appendices
Assessment of Offshore Structures and Pipelines in Hurricanes Gustav and Ike February 2010
Energo Engineering 1300 W Sam Houston Pkwy S, Suite 100 Houston, TX 77042 USA Tel: 713-532-2900 Fax: 713-532-2922
www.energoeng.com
Appendix A
Platforms Destroyed by Gustav

MMS Appendices
Assessment of Offshore Structures and Pipelines in Hurricanes Gustav and Ike February 2010
Energo Engineering 1300 W Sam Houston Pkwy S, Suite 100 Houston, TX 77042 USA Tel: 713-532-2900 Fax: 713-532-2922
www.energoeng.com
Figure D.1 – ST 21 ”GA” – Pre-Gustav

MMS Appendices
Assessment of Offshore Structures and Pipelines in Hurricanes Gustav and Ike February 2010
Energo Engineering 1300 W Sam Houston Pkwy S, Suite 100 Houston, TX 77042 USA Tel: 713-532-2900 Fax: 713-532-2922
www.energoeng.com
Appendix B
Platforms Destroyed by Ike

MMS Appendices
Assessment of Offshore Structures and Pipelines in Hurricanes Gustav and Ike February 2010
Energo Engineering 1300 W Sam Houston Pkwy S, Suite 100 Houston, TX 77042 USA Tel: 713-532-2900 Fax: 713-532-2922
www.energoeng.com
Figure E.1 - EC 272 “D”, “D-Aux”, and “E” – Pre-Ike
Figure E.2 - EC 272 H – Pre-Ike

MMS Appendices
Assessment of Offshore Structures and Pipelines in Hurricanes Gustav and Ike February 2010
Energo Engineering 1300 W Sam Houston Pkwy S, Suite 100 Houston, TX 77042 USA Tel: 713-532-2900 Fax: 713-532-2922
www.energoeng.com
Figure E.3 - EI 339 “B” – Pre-Ike
Figure E.4 - EI 339 “C” – Pre-Ike

MMS Appendices
Assessment of Offshore Structures and Pipelines in Hurricanes Gustav and Ike February 2010
Energo Engineering 1300 W Sam Houston Pkwy S, Suite 100 Houston, TX 77042 USA Tel: 713-532-2900 Fax: 713-532-2922
www.energoeng.com
Figure E.5 - EI 330 “C” – Pre-Ike
Figure E.6 - EI 258 “G” – Pre-Ike

MMS Appendices
Assessment of Offshore Structures and Pipelines in Hurricanes Gustav and Ike February 2010
Energo Engineering 1300 W Sam Houston Pkwy S, Suite 100 Houston, TX 77042 USA Tel: 713-532-2900 Fax: 713-532-2922
www.energoeng.com
Figure E.7 - EC 330 “A” – Pre-Ike
Figure E.8 - EI 397 “A” – Pre-Ike
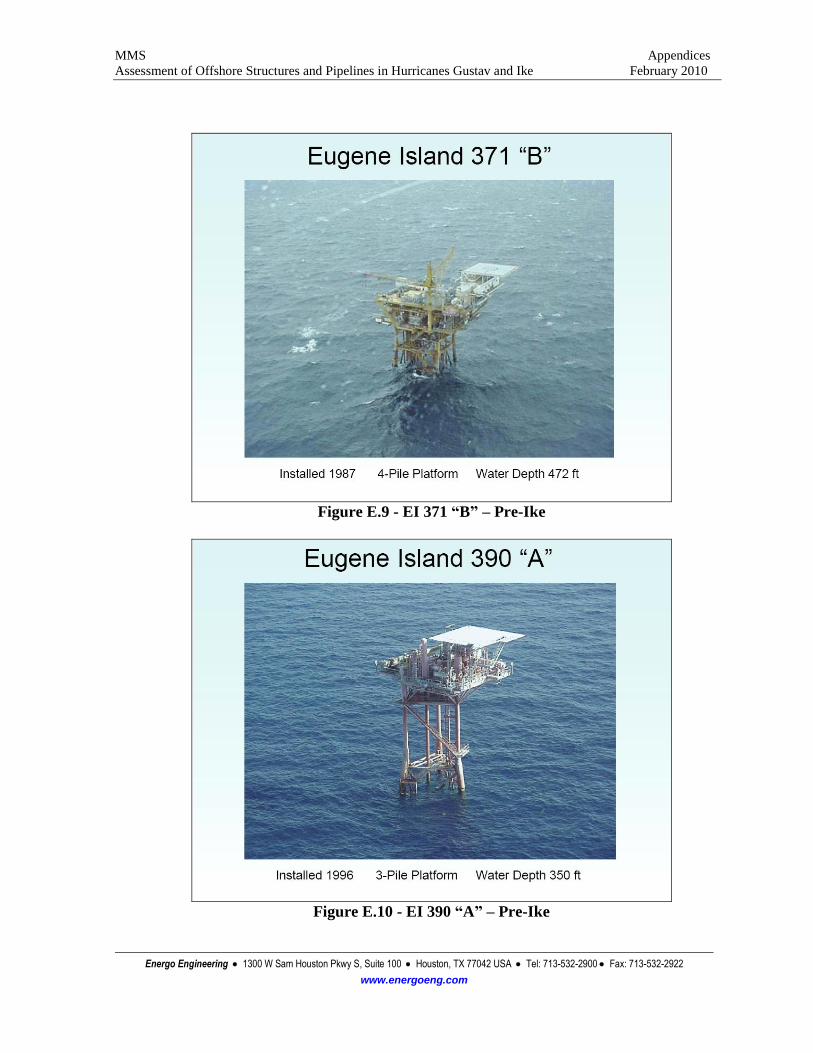
MMS Appendices
Assessment of Offshore Structures and Pipelines in Hurricanes Gustav and Ike February 2010
Energo Engineering 1300 W Sam Houston Pkwy S, Suite 100 Houston, TX 77042 USA Tel: 713-532-2900 Fax: 713-532-2922
www.energoeng.com
Figure E.9 - EI 371 “B” – Pre-Ike
Figure E.10 - EI 390 “A” – Pre-Ike

MMS Appendices
Assessment of Offshore Structures and Pipelines in Hurricanes Gustav and Ike February 2010
Energo Engineering 1300 W Sam Houston Pkwy S, Suite 100 Houston, TX 77042 USA Tel: 713-532-2900 Fax: 713-532-2922
www.energoeng.com
Figure E.11 - EW 947 “A” – Pre-Ike
Figure E.12 - SM 49 “F” – Pre-Ike

MMS Appendices
Assessment of Offshore Structures and Pipelines in Hurricanes Gustav and Ike February 2010
Energo Engineering 1300 W Sam Houston Pkwy S, Suite 100 Houston, TX 77042 USA Tel: 713-532-2900 Fax: 713-532-2922
www.energoeng.com
Figure E.13 - VR 122 “B” – Pre-Ike
Figure E.14 - VR 267 “C” – Pre-Ike

MMS Appendices
Assessment of Offshore Structures and Pipelines in Hurricanes Gustav and Ike February 2010
Energo Engineering 1300 W Sam Houston Pkwy S, Suite 100 Houston, TX 77042 USA Tel: 713-532-2900 Fax: 713-532-2922
www.energoeng.com
Figure E.15 - VR 329 “A” – Pre-Ike
Figure E.16 - EC 328 “A” – Pre-Ike

MMS Appendices
Assessment of Offshore Structures and Pipelines in Hurricanes Gustav and Ike February 2010
Energo Engineering 1300 W Sam Houston Pkwy S, Suite 100 Houston, TX 77042 USA Tel: 713-532-2900 Fax: 713-532-2922
www.energoeng.com
Figure E.17 - EI 179 “C” – Pre-Ike
Figure E.18 - SS 154 “I” – Pre-Ike

MMS Appendices
Assessment of Offshore Structures and Pipelines in Hurricanes Gustav and Ike February 2010
Energo Engineering 1300 W Sam Houston Pkwy S, Suite 100 Houston, TX 77042 USA Tel: 713-532-2900 Fax: 713-532-2922
www.energoeng.com
Figure E.19 - ST 196 “A” – Pre-Ike
Figure E.20 - VR 386 “B” – Pre-Ike
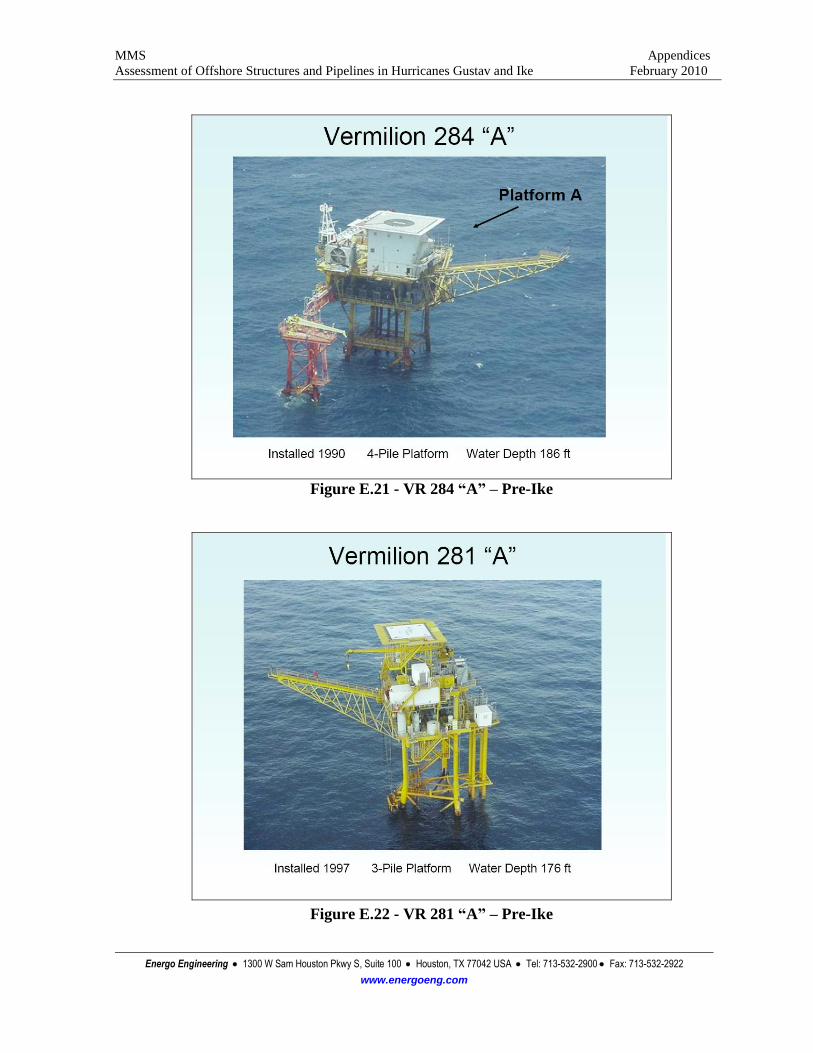
MMS Appendices
Assessment of Offshore Structures and Pipelines in Hurricanes Gustav and Ike February 2010
Energo Engineering 1300 W Sam Houston Pkwy S, Suite 100 Houston, TX 77042 USA Tel: 713-532-2900 Fax: 713-532-2922
www.energoeng.com
Figure E.21 - VR 284 “A” – Pre-Ike
Figure E.22 - VR 281 “A” – Pre-Ike

MMS Appendices
Assessment of Offshore Structures and Pipelines in Hurricanes Gustav and Ike February 2010
Energo Engineering 1300 W Sam Houston Pkwy S, Suite 100 Houston, TX 77042 USA Tel: 713-532-2900 Fax: 713-532-2922
www.energoeng.com
Figure E.23 - EI 292 “B” – Pre-Ike
Figure E.24 - EI 266 “E” – Pre-Ike

MMS Appendices
Assessment of Offshore Structures and Pipelines in Hurricanes Gustav and Ike February 2010
Energo Engineering 1300 W Sam Houston Pkwy S, Suite 100 Houston, TX 77042 USA Tel: 713-532-2900 Fax: 713-532-2922
www.energoeng.com
Figure E.25 - WC 473 “A” – Pre-Ike
Figure E.26 - EC 281 “A” and “A-AUX” – Pre-Ike

MMS Appendices
Assessment of Offshore Structures and Pipelines in Hurricanes Gustav and Ike February 2010
Energo Engineering 1300 W Sam Houston Pkwy S, Suite 100 Houston, TX 77042 USA Tel: 713-532-2900 Fax: 713-532-2922
www.energoeng.com
Figure E.27 - ST 195 “A” – Pre-Ike
Figure E.28 - SM 48 “B-PRD” – Pre-Ike

MMS Appendices
Assessment of Offshore Structures and Pipelines in Hurricanes Gustav and Ike February 2010
Energo Engineering 1300 W Sam Houston Pkwy S, Suite 100 Houston, TX 77042 USA Tel: 713-532-2900 Fax: 713-532-2922
www.energoeng.com
Figure E.29 - EC 229 “A” – Pre-Ike
Figure E.30 - EI 296 “B-PRD” – Pre-Ike

MMS Appendices
Assessment of Offshore Structures and Pipelines in Hurricanes Gustav and Ike February 2010
Energo Engineering 1300 W Sam Houston Pkwy S, Suite 100 Houston, TX 77042 USA Tel: 713-532-2900 Fax: 713-532-2922
www.energoeng.com
Figure E.31 - EI 330 “A” – Pre-Ike

MMS Appendices
Assessment of Offshore Structures and Pipelines in Hurricanes Gustav and Ike February 2010
Energo Engineering 1300 W Sam Houston Pkwy S, Suite 100 Houston, TX 77042 USA Tel: 713-532-2900 Fax: 713-532-2922
www.energoeng.com
Figure E.32 - EI 349 “A” – Pre-Ike
Figure E.33 - EI 331 “A” – Pre-Ike

MMS Appendices
Assessment of Offshore Structures and Pipelines in Hurricanes Gustav and Ike February 2010
Energo Engineering 1300 W Sam Houston Pkwy S, Suite 100 Houston, TX 77042 USA Tel: 713-532-2900 Fax: 713-532-2922
www.energoeng.com
Photos unavailable for the following platforms
1. EC-265-GP-Valve
2. EC-272-C
3. EC-272-C-Aux1
4. EC-281-A
5. EC-364-A
6. EI-119-7
7. EI-125-7
8. EI-175-E
9. EI-268-A
10. EI-288-A
11. EI-302-A
12. SS-208-F
13. SS-253-A
14. SS-274-T-27-Valve
15. SS-291-B
16. ST-148-Cais B
17. ST-175-T-22-Valve
18. VR-131-14
19. VR-201-B
20. VR-217-C
21. VR-217-F
22. VR-320-C
23. WC-248-2
24. EI-267-I