AMINAH BUKENYA 15.MMS.27.KLA.DAY.0220.pdf - Uganda ...
113
i PUBLIC PARTICIPATION AND PRIMARY EDUCATION SERVICE DELIVERY IN BUGAMBE SUB COUNTY, HOIMA DISTRICT BY AMINAH BUKENYA 15/MMS/27/KLA/DAY/0220 A DISSERTATION SUBMITTED TO SCHOOL OF MANAGEMENT SCIENCES IN PARTIAL FULFILLMENT OF THE REQUIREMENTS FOR THE AWARD OF MASTER’S OF MANAGEMENT STUDIES (PUBLIC ADMINISTRATION AND MANAGEMENT) OF UGANDA MANAGEMENT INSTITUTE MARCH, 2018
-
Upload
khangminh22 -
Category
Documents
-
view
2 -
download
0
Transcript of AMINAH BUKENYA 15.MMS.27.KLA.DAY.0220.pdf - Uganda ...

i
PUBLIC PARTICIPATION AND PRIMARY EDUCATION SERVICE
DELIVERY IN BUGAMBE SUB COUNTY, HOIMA DISTRICT
BY
AMINAH BUKENYA
15/MMS/27/KLA/DAY/0220
A DISSERTATION SUBMITTED TO SCHOOL OF MANAGEMENT SCIENCES
IN PARTIAL FULFILLMENT OF THE REQUIREMENTS FOR THE AWARD
OF MASTER’S OF MANAGEMENT STUDIES (PUBLIC ADMINISTRATION
AND MANAGEMENT) OF UGANDA MANAGEMENT INSTITUTE
MARCH, 2018

ii
DECLARATION
I, Aminah Bukenya, hereby declare that this dissertation entitled “Public Participation
and Primary Education Service Delivery: A Case of Selected Primary Schools in
Bugambe Sub County, Hoima District” is my original work and it has not been submitted
to any other institution for any award.
Signature…………….…………………
Date………………………………………..
iii
APPROVAL
This piece of work has been submitted under our supervision, guidance and our approval
as Uganda Management Institute’s supervisors.
Signed………………………………………….Date………………………………
SUPERVISORS
Signature………………………………… Date………………………
Dr. Stella Kyohairwe (PhD)
Signature………………………………… Date………………………
Mr. Robert Mugabe

iv
DEDICATION
This dissertation is dedicated to my Mr & Mrs Bukenya, Dr. Lwanga Yasin and my
children, Shanaya, Sharlene and Shaheed.
.

v
ACKNOWLEDGMENT
My sincere gratitude to my supervisors namely Dr. Stella Kyohairwe and Mr. Robert
Mugabe for their dedication towards this task, thank you for the guidance which made my
research work a success.
I also thank all my lecturers at UMI for their theoretical and practical skills extended to
me during the course of my degree program. These have helped not only in my academic
life but also the practical one. I cannot for forget to acknowledge my course participants
for their contribution and support to me during academic discussions and life in general.
I also thank my family for all the perseverance, endurance, understanding and support
rendered to me especially when I could not afford to be with them during weekend time
that often coincided with my busy study hours. My God Almighty grant you long life and
great success in whatever you set your hearts to do. Dr. Lwanga Yasin, you were such
great support throughout the process. May God reward you for your love and care. Mr.
and Mrs. Bukenya (my parents), this Masters belongs to you in entirety.
Finally, I thank the respondents who participated in this study as they had to put aside
what they were doing in order to give me the information that was required to complete
the writing of this dissertation. Thank you very much for your contribution.
May God reward you all those who contributed to my academic life.
vi
TABLE OF CONTENTS
DECLARATION................................................................................................................ ii
APPROVAL ......................................................................................................................iii
DEDICATION................................................................................................................... iv
ACKNOWLEDGMENT ................................................................................................... v
TABLE OF CONTENTS ................................................................................................. vi
LIST OF TABLES ........................................................................................................... xii
LIST OF FIGURES ........................................................................................................xiii
ACRONYMS ................................................................................................................... xiv
ABSTRACT ...................................................................................................................... xv
CHAPTER ONE: INTRODUCTION .............................................................................. 1
1.1 Introduction ......................................................................................................... 1
1.2 Background of the study ..................................................................................... 1
1.2.1 Historical background .................................................................................... 1
1.2.2 Theoretical background .................................................................................. 6
1.2.3 Conceptual background .................................................................................. 9
1.2.4 Contextual background .................................................................................. 9
1.3 Problem Statement ............................................................................................ 11
1.4 Purpose of the study .......................................................................................... 12
1.5 Objectives of the Study ..................................................................................... 13
1.6 Research Questions ........................................................................................... 13
1.7 Hypotheses ........................................................................................................ 13
1.8 Conceptual Framework ..................................................................................... 14
1.9 Significance of the Study .................................................................................. 15
1.10 Justification ....................................................................................................... 16
1.11 Scope of the Study ............................................................................................ 16

vii
1.11.1 Geographical scope ...................................................................................... 16
1.11.2 Content scope ............................................................................................... 17
1.11.3 Time scope ................................................................................................... 17
1.12 Operational Definitions ..................................................................................... 17
CHAPTER TWO: LITERATURE REVIEW ............................................................... 19
2.1 Introduction ....................................................................................................... 19
2.2 Theoretical Review ........................................................................................... 19
2.3 Public Participation in Program Planning and Service Delivery ...................... 22
2.3.1 Problem identification and primary education service delivery ................... 22
2.3.2 Needs assessment and primary education service delivery .......................... 23
2.3.3 Decision making and primary education service delivery ........................... 24
2.4 Public Participation in Program Implementation and Service Delivery ........... 25
2.4.1 Resource mobilization and service delivery ................................................. 25
2.4.2 Implementation commitment and organizational performance.................... 26
2.5 Public Participation in Program Monitoring and Evaluation and Service
Delivery ............................................................................................................. 28
2.5.1 Quality assurance and primary education service delivery .......................... 28
2.5.2 Corrective action and primary education service delivery ........................... 28
2.6 Summary of the literature.................................................................................. 29
CHAPTER THREE: METHODOLOGY ..................................................................... 31
3.1 Introduction ....................................................................................................... 31
3.2 Research Design ................................................................................................ 31
3.3 Study Population ............................................................................................... 31
3.4 Sample Size ....................................................................................................... 32
3.5 Sampling Techniques and Procedure ................................................................ 32
3.5.1 Simple random sampling .............................................................................. 32
viii
3.5.2 Census sampling ........................................................................................... 33
3.6 Data Collection Methods................................................................................... 33
3.6.1 Questionnaire survey method ....................................................................... 33
3.6.2 Face to face interview .................................................................................. 33
3.7 Data Collection Instruments .............................................................................. 34
3.7.1 Questionnaire ............................................................................................... 34
3.7.2 Interview guide ............................................................................................. 35
3.8 Data Quality Control ......................................................................................... 35
3.8.1 Validity .............................................................................................................. 35
3.8.2 Reliability .......................................................................................................... 36
3.9 Procedure of Data Collection ............................................................................ 37
3.10 Data Analysis .................................................................................................... 38
3.10.1 Quantitative data analysis ............................................................................. 38
3.10.2 Qualitative data analysis ............................................................................... 39
3.11 Measurement of Variables ................................................................................ 39
3.12 Ethical Considerations ...................................................................................... 39
CHAPTER FOUR: PRESENTATION, ANALYSIS AND INTERPRETATION
OF RESULTS ................................................................................................................... 41
4.0 Introduction ....................................................................................................... 41
4.1 Response Rate ................................................................................................... 41
4.2 Respondents’ Background ................................................................................ 42
4.2.1 Respondents’ gender .................................................................................... 42
4.2.2 Respondents’ level of education................................................................... 43
4.2.3 Respondents years associated with school with the school .......................... 43
4.2.4 Age of respondents ....................................................................................... 44

ix
4.2 Public Participation in Program Planning and Primary Education Service
Delivery ............................................................................................................. 44
4.2.1 Descriptive results about public participation in program planning Primary
education service delivery ............................................................................ 45
4.2.2 Descriptive results about primary education service delivery...................... 49
4.2.3 Testing first hypothesis ................................................................................ 50
4.3 Public Participation in Program Implementation and Primary Education
Service Delivery ................................................................................................ 53
4.3.1 Descriptive statistics on public participation in program implementation ... 53
4.3.2 Testing second hypothesis ............................................................................ 56
4.4 Public Participation in program monitoring and Primary Education Service
Delivery ............................................................................................................. 59
4.4.1 Descriptive results about public participation in program monitoring and
evaluation ..................................................................................................... 59
4.4.2 Testing third hypothesis ............................................................................... 62
CHAPTER FIVE: SUMMARY, DISCUSSION, CONCLUSION AND
RECOMMENDATIONS ................................................................................................. 65
5.0 Introduction ..................................................................................................... 65
5.1 Summary ........................................................................................................... 65
5.1.1 Public participation in program planning and primary education service
delivery ......................................................................................................... 65
5.1.2 Public participation in program implementation and primary education
service delivery ............................................................................................ 66
5.1.3 Public participation in program monitoring and primary education service
delivery ......................................................................................................... 67
5.2 Discussion ......................................................................................................... 68

x
5.2.1 Public participation in program planning and primary education service
delivery ......................................................................................................... 68
5.2.2 Public participation in program implementation and primary education
service delivery ............................................................................................ 71
5.2.3 Public participation in program monitoring and primary education service
delivery ......................................................................................................... 73
5.3 Conclusions ....................................................................................................... 76
5.3.1 Public participation in program planning and primary education service
delivery ......................................................................................................... 76
5.3.2 Public participation in program implementation and primary education
service delivery ............................................................................................ 76
5.3.3 Public participation in program monitoring and primary education service
delivery ......................................................................................................... 77
5.4 Recommendations ............................................................................................. 77
5.4.1 Public participation in program planning and primary education service
delivery ......................................................................................................... 77
5.4.2 Public participation in program implementation and primary education
service delivery ............................................................................................ 78
5.4.3 Public participation in program monitoring and primary education service
delivery ......................................................................................................... 78
5.5 Researcher’s Contribution to the Body of Knowledge ..................................... 78
5.6 Areas of Further Study ...................................................................................... 79
5.7 Limitations of the Study .................................................................................... 79
REFERENCES ................................................................................................................. 81
APPENDICES ..................................................................................................................... i
Appendix 1: Table for determining sample size from a given population ............... i

xi
Appendix 2: Questionnaire for headteachers, teachers and school community
members ................................................................................................................... ii
Appendix 3: Interview guide ................................................................................. vii
Appendix 4: Work Plan ........................................................................................viii
Appendix 5: Budget ................................................................................................ ix
xii
LIST OF TABLES
Table 3.1: Sample size and selection ................................................................................. 32
Table 3.2: Validity of questionnaire .................................................................................. 36
Table 3.3: Reliability of questionnaire............................................................................... 37
Table 4.1: Response rate .................................................................................................... 41
Table 4.2: Respondents according to gender ..................................................................... 42
Table 4.5: Age of respondents ........................................................................................... 44
Table 4.6: Findings about public participation in program planning................................. 45
Table 4.7: Findings about primary education service delivery .......................................... 49
Table 4.8: Correlation matrix for public participation in program planning and primary
education service delivery...................................................................................... 51
Table 4.9: Findings about public participation in program implementation ..................... 54
Table 4.12: Correlation matrix for public participation in program monitoring and
primary education service delivery ........................................................................ 62

xiii
LIST OF FIGURES
Figure 1.1: Relationship between public participation and primary education service
delivery .................................................................................................................. 14

xiv
ACRONYMS
CVI : Content Validity Index
CVT : Civic Voluntarism Theory
DEO : District Education Officer
DIS : District Inspector of Schools
EO : Education Officer
FAO : Food and Agriculture Organization
HDLG : Hoima District Local Government
LGA : Local Government Act
NA : Needs assessment
PDP : Participatory Development Program
SAQs : Self-administered questionnaires
SPSS : Special Package for Social Scientists
UNDP : United Nations Development Programme
UNEP : United Nations Environment Programme
USAID : United States Agency for International Development
xv
ABSTRACT
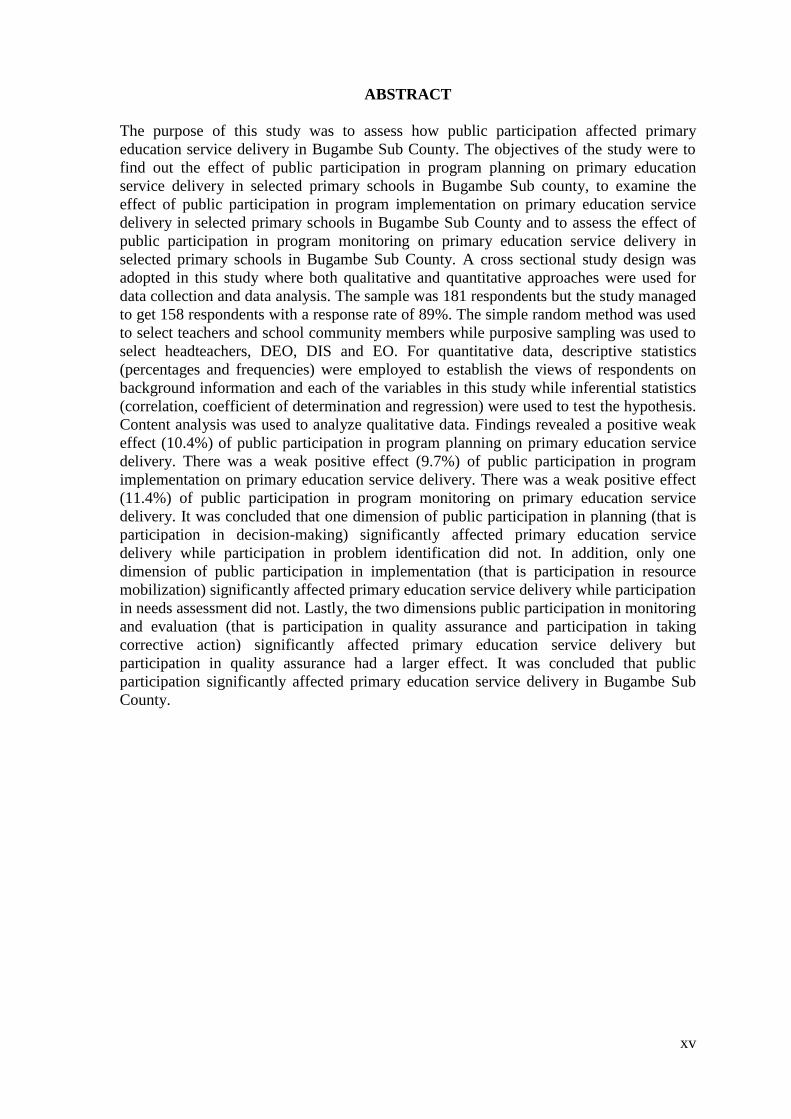
The purpose of this study was to assess how public participation affected primary
education service delivery in Bugambe Sub County. The objectives of the study were to
find out the effect of public participation in program planning on primary education
service delivery in selected primary schools in Bugambe Sub county, to examine the
effect of public participation in program implementation on primary education service
delivery in selected primary schools in Bugambe Sub County and to assess the effect of
public participation in program monitoring on primary education service delivery in
selected primary schools in Bugambe Sub County. A cross sectional study design was
adopted in this study where both qualitative and quantitative approaches were used for
data collection and data analysis. The sample was 181 respondents but the study managed
to get 158 respondents with a response rate of 89%. The simple random method was used
to select teachers and school community members while purposive sampling was used to
select headteachers, DEO, DIS and EO. For quantitative data, descriptive statistics
(percentages and frequencies) were employed to establish the views of respondents on
background information and each of the variables in this study while inferential statistics
(correlation, coefficient of determination and regression) were used to test the hypothesis.
Content analysis was used to analyze qualitative data. Findings revealed a positive weak
effect (10.4%) of public participation in program planning on primary education service
delivery. There was a weak positive effect (9.7%) of public participation in program
implementation on primary education service delivery. There was a weak positive effect
(11.4%) of public participation in program monitoring on primary education service
delivery. It was concluded that one dimension of public participation in planning (that is
participation in decision-making) significantly affected primary education service
delivery while participation in problem identification did not. In addition, only one
dimension of public participation in implementation (that is participation in resource
mobilization) significantly affected primary education service delivery while participation
in needs assessment did not. Lastly, the two dimensions public participation in monitoring
and evaluation (that is participation in quality assurance and participation in taking
corrective action) significantly affected primary education service delivery but
participation in quality assurance had a larger effect. It was concluded that public
participation significantly affected primary education service delivery in Bugambe Sub
County.
1
CHAPTER ONE
INTRODUCTION
1.1 Introduction
Public service operates in the heart of people’s basic human needs (Serban, 2002). This
implies that in planning for improvement and expansion of public service, the community
should be consulted. Thus, this study was about public participation and primary education
service delivery in Bugambe sub county, Hoima District. In this study, public participation
was conceived as independent variable and education service delivery as dependent variable.
Public participation was measured in terms of participation in program planning,
participation in program implementation and participation in program monitoring. On the
hand, primary education public service delivery was measured in terms of timeliness,
quality, quantity and responsiveness in education service delivery. Chapter one presents the
study background, problem statement, general objective, specific objectives, research
questions, hypotheses, conceptual framework, significance of the study, justification of the
study, as well as operational definitions.
1.2 Background of the study
1.2.1 Historical background
The problem of poor service delivery has been a major concern to policy makers and
implementers all over the world (Cullen, 2006)s. Most developing countries’ school systems
have persistently failed to deliver quality primary education to children, which have resulted
into approximately 100 million primary age children have either failed enter or complete
primary school (Cullen, 2006). In the 1970s and 1980s, majority policy makers became
concerned with education service delivery in developing countries. While there were
impressive gains in enrolment in several parts across the world, the Sub Saharan African
region inclusive, poor education service delivery led to the awareness that several children

2
completed school without the expected benefits. Increasing concern with the quality of
education was intensely echoed in the protocols of World Conference on Education for All
in Jomtien, Thailand in 1990 as well as the World Education Forum which took place in
Daker, Senegal in 2000. In South Africa, a durable legacy from the past has been low
education quality (Van der Berg, Taylor, Gustafsson, Spaull & Armstrong, 2011). This poor
quality of services has become a source of widespread dissatisfaction.
Because of the concerns highlighted in the previous paragraph, public participation has been
generally considered a core value in enhancing education service delivery (Cullen, 2006;
Area Development Management Limited, 2006). The importance of public participation in
education service delivery has for long time been recognized. Aristotle noted that public
participation was vital for the fulfillment and development of the human personality for
better education service delivery (Kenny, 2007).
According to Rahnema (cited in Mohammad, 2010), the roots of public participation
ideology can be drawn to third world development. Considering the failure to achieve public
education institutions’ objectives leading poor education service delivery during 1950s and
1960s, calls by field activists and social workers became increasingly high, targeting to
enhance implementation of public education institutions’ objectives. The assumptions for the
concerns about poor education service delivery were then that local populations were at the
peripheral of education decision making process and as such the population did not own up
the implementation of education activities as it would have if it participated in such decision-
making. Hence, participation as a mechanism to enable the achievement of intended
education objectives through inclusion (empowerment) was proposed.
3
The idea of public participation in government education activities has gained momentum to
improve education service delivery (Mohammad, 2010). Modern scholars involved in
education development have been advocating for people's participation in public education
activity implementation because they believe public education objectives many not be
attained if people do not meaningfully get involved in the decision-making and
implementation of education activities (Mohammad, 2010). According to Simonovic and
Akter (2006), decision making in education ought to consider various stakeholders as well as
shades of opinions if decision outcomes of education are to uphold a high quality.
The roots in advancing governance directing countries to embrace “participatory democracy”
the world over have increased pressure for public participation in education activities (Wight
& Grindle, 2007). The increased pressure towards public participation is coming both from
international agencies and citizens. For the later, the reason is that the citizens have realized
the need to be part of decisions affecting their lives (Smith, 2003). Mohammad (2010) stated
that the decentralization is a widely adopted technique to ensure that people participate in
local development and the most appropriate institutions are the Local Government bodies
that can offer a wide range of people’s participation at the community level.
One of the advantages of public participation is a public that is better education. In addition
to leaning about the subject matter, participants also learn the way and why governments
make their decisions (Creighton, 2005: Creighton, 2005; Plummer: 2000). The community is
an important part of the governance process; significantly, the community affects the
decisions of the government aimed at the community. This influence informs the public
administrators of their role towards the community, which helps to improve the standard of
service delivery in local communities. It continually puts the government into check on how
they should handle communal affairs (Plummer: 2000).
4
Thus, because of such benefits, many developing countries, African countries such Senegal,
Malawi, Tanzania, Mozambique, Zimbabwe, Cote d’Ivoire, Ghana and Uganda, were
pressured around the 1980s by aid agencies to adopt administrative decentralization reforms
and programmes (Cohen & Peterson, 2009). One of the aims was to enhance the local
communities to participate education development programmes to improve education service
delivery.
One of the education reforms gaining momentum in Africa Public has been participation
through the decentralization of government (Winkler Gershberg, 2003). With the purpose of
enhancing more efficiency and accountability in education service delivery, several African
countries have been embracing elected local governments where they have transferred to
them more responsibilities and resources (Hanson, 2007). The education sector has not been
exempted from being rocked by the same winds of change. Because of the increasing decline
education service delivery that has resulted into decade of declining access to schooling,
countries in Africa are empowering schools and communities to manage education service
delivery. Public participation through decentralization of education in Africa spans a cross a
range of limited deconcentration of systems from the central offices of Ministry of Education
to regional offices and communities, managing and financing their own schools (Welsh &
McGinn, 2008). A few countries in Africa have decentralized the delivery of education to
regional and local governments as well as community boards. However, the most successful
and common devolution has resulted from the community where local community members
manage and finance their own schools, but not from government policy (Winkler Gershberg,
2003). This has a result of the community response to inadequate access to schooling for
children arising from the failure of government to provide the most basic services. However,
this form of public participation in education activities is usually associated with inequitable
5
because access to education services is weaker in the poorest people but also an indicator of
the commitment people has to education and a indicator that poor illiterate citizens can also
manage schools (Winkler, 2003).
In Uganda, promotion of communality participation in primary education through
decentralization to enhance primary education service delivery is not totally new. Efforts to
increase people participation can be traced way back in 1966 four years after independence
with the abolition of regional governments, particularly in form of chiefdoms and
monarchies (Mushemeza, 2003). A legal framework to re-decentralize based on regional
governments was proposed during Uganda’s post independence constitution although it
never kick-started. In the early 1980s, the present Ugandan Government while still a guerilla
force named the National Resistance Army (NRA) administered some decentralization such
increased public participation in primary education for better primary education service
delivery in the areas under its control. In 1986, when it came to power and from NRA to
National Resistance (NRM) Movement government, it adopted country-wide
decentralization among other policies with support from multinational donor agencies like
the United Nations Development Program (UNDP) and the World Bank to promote public
participation in primary education for better primary education service delivery. According
to Kayuza (2013), the supporting Local Government Act (LGA) and the Ugandan
Constitution provide for the structures and system of people’s participation in the
development process of a country. The Participatory Development Program (PDP) is a
deliberate effort of the government to build mutual trust and hence, the willingness of Local
Authorities such as Bugambe Sub County local officials through Hoima District Local
Government, to respect and provide response to the decisions taken and identification of
needs through citizen’s participation process (Kayuza, 2013). Bugambe Sub County is
situated within Hoima District Local Government, which is among districts in Uganda that

6
have undergone the administrative decentralization reforms to increase public participation
in the district local government’ activities to enhance education service delivery.
1.2.2 Theoretical background
This study was guided by the ladder of participation theory (Arnstein, 1960). According to
Arnstein (1960) “there is a critical difference between going through the empty ritual of
participation and having the real power needed to affect the outcome of the process” (Burns,
Hambleton and Hoggett, 2004, p. 156). Arnstein’s contention point is the stakeholder on the
receiving end of programs or projects. She highlights the difference between “stakeholder
power” at the top (such as partnership and delegated power, stakeholder control), “tokenism”
in the middle (such as placation, informing and consultation) and non-participation at the
bottom (including manipulation and therapy). Arnstein’s work is important to this study
because in her theoretical explanation, she clearly recognized various participation levels
from therapy or manipulation of stakeholders through to consultation as well as genuine
participation (Dewachter, 2007). Thus, as applied in the context of this study, it is argued
low levels public participation may be explanatory to the poor public education service
delivery. This is because Arnstein argued that at the low level participation, the outcome
participation is likely not be effectively achieved while at the high level participation is high,
the outcome participation is likely to be effectively achieved (Strömblad & Bengtsson,
2015). Like any other academic work, Arnstein’s framework has not been exempted from
limitations. Some critics have argued that each of the steps of Arnstein’s framework
represents a very broad category which can linked to a wide range of experiences
(Rosenstone & Hansen, 2012; Green & Gerber, 2001). For instance, at the level of
“informing”, there may be major variations in the quality and type of information flow. In
reality therefore, participation levels may reflex a more multifaceted scale than a simple
series of steps.

7
Thus, this study adopted the Civic Voluntarism Theory (CVT) to explain how public
participation affected service delivery. The CVT was first known as the resources with its
origin in the works of Verba and Nie in 1972 (Verba, Schlozman & Brady, 2005). The CVT
is anchored on a socio-economic model of participation, which emphasizes three factors to
account for participation. The assumptions of the CVT are that low public participation may
be due to lack resources as one of the explanatory factors. The second factor is that it may be
because the people lack psychological engagement in activities. The third factor it that it
may be because people are outside the recruitment community networks which bring people
into are outside the recruitment community networks that enable people to participate in
activities. Thus, a lack of one of these factors or all will contribute low public participation
in any activity.
The resources aspect is defined in terms of time, money and civic skills. Verba et al., (2005)
conceptualize resources widely, not limited to human and educational resources, but time
resources as well. They explained that low public participation may be because some people
have limited time to participate in the education activities because they are so busy with non-
education activities. Generally, the individual’s social status - the education, job and income
- will determine the extent of the individual participation in education activities: the better
the people are educated, more they are affluent and the more they are in middle to high class,
the more likely they will get involved (Verba et at., 2005; Brady, Verba & Schlozman, 2005;
Parry et al., 2002).
The psychological engagement aspect focuses principally on the individuals’ sense of
efficacy (usefulness) in participation. According to Verba et al. (2005), citizens’ sense of

8
efficacy is important because are more willing to participate in any activity if they feel their
opinions and actions as are recognized as useful in influencing the outcome of decisions.
The recruitment networks aspect is focuses on the extent to which people receive requests
for participation in any activity. Individuals may receive such request for participation from
friends, relatives or acquaintances at work, in church, in the community or in organization.
Verba et al., (2005) emphasizes the necessity of mobilization. They explained that people
may fail to participate even when they have resources. For example, people may have a lot
of free time and possess a singnificant sense of have plenty of efficacy (in other words, they
are resource reach) but fail to participate if they are not networked or mobilized. This is
because they may not be aware of how important their involvement is, or nobody has drawn
their attention. Being called upon to get involved by other people is a vital facilitator for
individual participation.
This Civic Voluntarism Theory is relevant to this study because it highlights that if
community members lack the resources to participate, or feel their participation is not valued
or are not linked to the network of people to convince them to participate, then they will not
participate and this will compromise the public education service delivery. Put in the context
of the study, it emphasizes that if the Hoima district community have the resources for
participating in the district’s education activities or a sense of efficacy (usefulness) in
participation in the district’s education activities or are mobilized into participating in the
district’s education activities, then education service delivery in the district will be better. On
the contrary, if one aspect is lacking or all of the three aspects are lacking, public education
service delivery in the district will be poor. On the other hand, Civic Voluntarism Theory has
its own weaknesses and have been discussed in chapter two section 2.2 where the theory is
discussed in detail.
9
1.2.3 Conceptual background
It was conceptualized in this study that more and relevant public participation would
contribute to better primary education service delivery. On the other hand, less and irrelevant
public participation would contribute to poor primary education service delivery. Public
participation is a rich concept which varies with its definition and application (Simon-
Vandenbergen, 2007; Lotz-Sisitka & O’Donoghue, 2008; Fraser et al., 2006). In this study,
the applicable definition was adopted from Ribot (2007) who defined public participation as
that ability for communities to participate in program execution and having control or
powers over the program which affect the entire community. On the other hand, education
service delivery may be defined in terms of timeliness and responsiveness of the education
services offered by government entities (Hernon & Nitecki, 2001; Yong, 2000; Hernon &
Nitecki, 2001; Bebko, 2000). Zeithaml, Parasuraman and Berry (2000) defines education
service delivery as the provision of education services by governments or an organization or
a group of individuals and ensuring that they reach those places and people to which they are
intended. In this study, it will be measured in terms of number of quality of education
service delivery, timeliness of education service delivery and quantity of education service
delivery. The assumption of this study was that poor public participation in program
planning, community program implementation and program monitoring would contribute to
poor timeliness, quality, quantity and responsiveness of education services. On the other
hand, better public participation in program planning, community program implementation
and program monitoring would contribute to better timeliness, quality, quantity and
responsiveness of education services.
1.2.4 Contextual background
This study was conducted in Bugambe Sub County in Hoima district in western Uganda. The
sub county has four parishes and 70 villages. In Bugambe Sub County, the PDP is supposed

10
to enhance the community’s participation in local education government programs to
improve primary education service delivery. It is guided by the principles of awareness and
knowledge of the Government education policies as well as priorities by citizens, self
reliance, inclusiveness, transparency, openness, as well as downward and upward
accountability. The program is structured to strengthen education institutions and Local
Government to enhance decentralization to the grassroots. It is implemented by Local
Governments and Ministry of Local Government with support from UNDP, Uganda.
Because of the PDP, there has been improvement in primary education service delivery
indicators in Bugambe Sub County with 7 primary schools with an estimated enrolment rate
of 3,920, classroom-pupil ratio at 1:57 with 4 schools without a complete and single
permanent classroom (Advocates Coalition for Development and Environment, 2016).
Despite the improved statistics, the education sector in Bugambe Sub County continues to
encounter several educational challenges including high absenteeism levels, high dropout,
inadequate facilities and limited parents and community participation (Advocates Coalition
for Development and Environment, 2016).
On the other hand, there has been passive citizens’ participation in education decision
making in Bugambe Sub County on development matters that affect their children (Kayuza,
2013). This is based on the perceived or real failure of local authorities to deliver the
education services as expected in Bugambe Sub County. Generally, the involvement of
people in education activities has been described as one-time consultations. This has been
the case where education officials engage the community once in a long period and
especially when there is problem affecting education service delivery. Usually this kind of
involvement of the local community in education activities can be described as passive and
manipulative but not genuine because it only enables the local authorities to exercise their
11
rights to be heard. The public participation is supply focused and thus not inclusive. This is
because the elite dominate the decision-making while the local community are either
consulted about the problem or informed about decisions arrived at others who consider
themselves experts. Furthermore, these public participations are hindered by negative
attitudes and mistrust from both the communities themselves and the upstream technocrats.
Because of the mistrust the local community members are not allowed to the people to
influence policy marking in Local Governments. Therefore, the needs of people are not
identified accurately to inform education policy decision making processes which results
into situations of resentment as well as demonstrations due to development decisions made
by local authorities (Kayuza, 2013). This often calls for costly and tireless interventions to
solicit people’s support of education decisions that are already taken. In most cases, the
education decisions are reversed painfully. It is against this background that interests aroused
to investigate public participation and education service delivery in Bugambe Sub County in
Hoima district local government.
1.3 Problem Statement
Public participation in education is seen as a way of improving education service delivery
through increased resources mobilization, improved schools’ accountability to communities
that they serve, ensuring a more cost effective utilization of resources and, importantly, be
responsive to local needs (Pauline, 2003). Efforts to promote public participation in
education programs in Uganda local governments have taken the form policy frameworks as
well as the development of implementation modalities such as the enactment of the Local
Council Statute of 1993, a mechanism of increasing citizen’s participation. Bugambe Sub
County is under Hoima District Local Government (HDLG), which is mandated to provide
and deliver quality education services efficiently. The government of Uganda through
decentralization, Participatory Development Program (PDP) and UNDP has tried to improve

12
public participation in Hoima District Local Government’s education programs to enhance
education service delivery (Kayuza, 2013). The decentralized education system in District
Local Government is supposed to offer opportunities for increased beneficiaries’
involvement in the direct decision making process in education services prioritization,
quality, cost and preferences (Kayuza, 2013). This is attributed to the fact that, Hoima
District Local Government is more acquainted to the beneficiaries’ requirements, responsive
to new developments and is in contact with communities in Bugambe Sub County.
Devolution and delegation of power to Hoima District Local Government was expected to
encourage more public participation in education decision making and to hold education
policy makers accountable for the quality of education service provided.
Despite improvement in some education service areas such as enrolment rate of 3,920,
classroom-pupil ratio at 1:57 (Advocates Coalition for Development and Environment,
2016) in Bugambe Sub County, primary schools still faced with numerous challenges
including high dropout at 10.1% and high levels of absenteeism at 22.6% (Kayuza, 2013).
Thus, poor primary education service delivery implies the value obtained from the public
funds is not worthy and in addition, such service delivery negatively affects the image of the
primary schools, local government and the central government. Therefore, this study was
carried out to access how local public participation in the development activities affected
primary education service delivery in Bugambe Sub County in Hoima District Local
Government. This owed to the important connections between public participation and the
key goals of allocative efficiency, technical efficiency, quality of service and improved
mechanisms of accountability.
1.4 Purpose of the study
The purpose of the study was to assess how public participation affects primary education
service delivery in Bugambe Sub County.

13
1.5 Objectives of the Study
The study was guided by the following objectives:
1. To establish the effect of public participation in program planning on primary education
service delivery in selected primary schools in Bugambe Sub County.
2. To examine the effect of public participation in program implementation on primary
education service delivery in selected primary schools in Bugambe Sub County.
3. To assess the effect of public participation in program monitoring on primary education
service delivery in selected primary schools in Bugambe Sub County.
1.6 Research Questions
The following research questions were answered:
1. What has been the effect of public participation in program planning on primary
education service delivery in selected primary schools in Bugambe Sub County?
2. What has been the effect of public participation in program implementation on primary
education service delivery in selected primary schools in Bugambe Sub County?
3. What has been the effect of public participation in program monitoring on primary
education service delivery in selected primary schools in Bugambe Sub County?
1.7 Hypotheses
The following null hypothesis (Ho) and alternative hypothesis (H1) were tested:
Ho: Public participation in program planning has no significant positive effect on primary
education service delivery in selected primary schools in Bugambe Sub County.
Ho: There is no significant positive effect of public participation in program implementation
on primary education service delivery in selected primary schools in Bugambe Sub
County

14
Ho: Public participation in program monitoring has no significant positive effect on primary
education service delivery in selected primary schools in Bugambe Sub County
1.8 Conceptual Framework
The conceptual framework shows the relationship between public participation and primary
education service delivery.
Figure 1.1: Relationship between public participation and primary education service
delivery
Source: Based on Verba et al. (2005) Civic Voluntarism Theory (CVT)
The conceptual framework illustrates the effect of public participation (the independent
variable) on primary education service delivery (the dependent variable). It was
conceptualized that public participation has the following dimensions: public participation in
program planning, public participation in program implementation and public participation
in program monitoring. On the other hand, primary education service delivery has the
following dimensions: children per classroom, student-teacher ratio, textbooks provision,
teacher absence rate, time children are in school being taught and basic infrastructure
provision).
Independent variable
Public participation Dependent variable
Public participation in program
planning
Problem identification
Needs assessment
Decision making
Primary education service
delivery
Children per classroom
Student-teacher ratio
Textbooks provision
Teacher absence rate
Time children are in school
being taught
Basic infrastructure provision
Public participation in program
implementation
Resource mobilization
Commitment
Public participation in program
monitoring
Quality assurance
Taking corrective action
15
The Civic Voluntarism Theory (CVT) is used to explain how public participation affects
education service delivery as depicted in the conceptual framework. According to the theory,
members of the public have the resources for participating in the district’s education
activities or a sense of efficacy (usefulness) in participation in the district’s education
activities or are mobilized into participating in the district’s education activities, then
education service delivery in the district will be better. Thus, the conceptual framework
shows that lack of or less public participation would contribute to poor education service
delivery while more public participation would contribute to better education service
delivery as shown in the following scholarly work. Embracing participatory planning has a
significant positive impact on education service delivery because it makes sure that the
intervention has more credibility in all community segments sine it will have been planned
by a group that represents all community segments (Liffman, 2002). In addition, during
education program implementation, reflecting the choices and decisions for the whole
community can lead to improved education service delivery (Morgan, 2003). Lastly, FAO
(2007) asserted that community participatory monitoring is not only aimed at measuring the
program’s effectiveness but also towards taking corrective action and building ownership to
enhance outcomes and performance.
1.9 Significance of the Study
Study findings may be helpful to policymakers in institutions in Uganda. This is because the
findings may be used to formulate education policies that may be implemented to improve
the public participation in education activities for better service delivery. Study findings may
be helpful to institutions in Uganda. This is because the findings may help the institutions
understand how public participation affects their primary education service delivery and thus
help them improve the public participation in terms of providing value-for-money services.

16
It is expected that the study findings may also suggest other areas that may need further
research by the academicians who like to explore more about public participation. Findings
may help the academicians enrich their knowledge about the effect of public participation on
primary education service delivery, which knowledge may be used in their various
professions.
1.10 Justification
Critical analysis of literature on public participation suggests that it paves way for
organizations to be responsive to community needs and better service delivery (Mansuri &
Rao, 2003). Community participation offers information about its preferences and obtains
information which can influence its best choice. Both kinds of information may lead to better
service delivery by organizations serving the community.
This study was also justified on the ground that if primary education service delivery in
Bugambe Sub County remained poor, it may have negative consequences to the central
government, district local authority and the beneficiaries of the education services in the
district. For example, wastage of resources (for example, financial, human and time) may
continue yet these resources could be invested in other development activities. In addition, if
the children do not get the best education, they may end a problem to the local community
because they may fail to get employment and turn to theft and drunkenness. Hence, this
study is required to come with solutions that may prevent such negative consequences.
1.11 Scope of the Study
1.11.1 Geographical scope
The study was conducted in ten private and government primary schools in Bugambe Sub
County in Hoima District. Hoima District is situated in Western Uganda. It is bordered by

17
Masindi District to the northeast, Buliisa District to the north, Kyankwanzi District to the
east, Ntoroko District to the southwest, Kibaale District to the south as well as the
Democratic Republic of Congo across Lake Albert to the west.
1.11.2 Content scope
The study covered the underlying key issues concerning public participation and primary
education service delivery. Specific emphasis on public participation was put on public
participation in program planning of programs, public participation in program
implementation and public participation in program monitoring while primary education
service delivery was restricted to timeliness in service delivery, quality, quantity and
responsiveness of service delivery.
1.11.3 Time scope
The study utilized data for 5 years from 2011-2016. This is because complaints about public
participation and poor primary education service delivery had been registered in this period.
This period was enough to be able to give empirical evidence of the effects of public
participation and success of programs.
1.12 Operational Definitions
Implementation: Will refer to the process of execution, practice of a plan or any deight that
is aimed at doing something (Klein et al., 2012).
Monitoring: Referred to the continuous tracking of major elements of program success by
way of record keeping, regular surveillance and reporting systems as well as surveys and
observation (World Bank, 2007).

18
Planning: Referred to the process of stating how to complete school activities within a
certain timeframe, usually with defined stages, and with designated resources (Barnes,
2007).
Public participation: This refers to the process whereby an organization consults and
involves the interested or affected individuals as well as government entities before decision
making (Simon-Vandenbergen, 2007)
Public: Referred to ordinary people in general - the community residing in Bugambe Sub
County and who served by primary schools found in this sub county (Pauline, 2003).
19
CHAPTER TWO
LITERATURE REVIEW
2.1 Introduction
Doing a careful and thorough review of literature is essential when writing about research.
This is because it helps to create a rapport with audience to the research and to sharpen the
research focus including identification of the research gap in the current study. Thus, in this
chapter, literature related to the study was reviewed. The chapter provides knowledge with
which the research made observations, identifying gaps that needed to be filled and learned
lessons. The introduction is followed by theoretical review to give a backbone to the chapter.
This is followed by the actual literature review comprising of the subsections of how public
participation planning, implementation and monitoring affects service delivery.
2.2 Theoretical Review
Theories can be used as point of reference to distinguish the amount and kinds of
participation including their outcome. This study adopted the Civic Voluntarism Theory
(CVT) to explain how public participation contributes to service delivery. In the CVT,
resources are paramount in influencing individual participation in activities to enhance
service delivery, although the individuals’ psychological attitudes and mobilization are also
recognized as key players in explaining participation as well. Resources are the overriding
factors in explaining participation though the attitudes are also important (Verba et al.,
2015). First, even when people have a positive psychological attitude such as willing to
participate but not have participatory resources will less likely participate in the activity and
therefore will have difficult in improving service delivery (Dewachter, 2007). These
resources include money, time and individual skills: those who have more available time,
higher incomes and the required skills will more participate in activities to improve service
delivery compared to those who do not have. However, the researcher of this study did not
20
agree with the argument that resources are the overriding factors determining an individual’s
participation an activity to improve service delivery. This is because an individual may have
the resources (the time, money and the skills) but so long as the individuals is not willing to
participate due to lack of interest or if people are not invited/mobilized to do so, they will
not. Thus, it was argued in this study that all the three factors were more or less equally
important to determine the quality of public participation that would education service
delivery.
Second, psychological engagement is a factor that increases an individual’s participation
(Strömblad & Bengtsson, 2015). Verba et al. (2015) argued that people who are more
interested in the activities that take place around them and more endowed with knowledge
about the same activities have a higher chance of taking an active role in participating to
improve service delivery. Apart from having interest in and knowledge about the activities,
people’s participation will be higher if they have greater psychological attachment to the
activities. Thus, taking into consideration the two major factors so far reviewed, the idea the
CVT puts forward is that people who feel that they have the necessary resources (that is are
personally qualified/skilled to participate in activities and have more money and time to
invest in the activities) and those who are more psychologically engaged (that is they have a
great attachment to the activities) are more likely to involved in the activities, compared with
those who feel limited resources or are less attached to the activities (Strömblad &
Bengtsson, 2015).
The third factor determining an individual’s degree of participation in an activity is
recruitment community networks. Verba et al. (2015) argued that under their CVT argued
that people do not simply choose to participate on their own but dependent to their
recruitment community networks associated with the activities executed to improve service
21
delivery. The argument is the more an individual is social networked with people involved in
an activity intended to improve service delivery whether networking is at either home,
workplace, religious gathering or any other social gathering, the chances of such a person
being invited/mobilized to participate in the said activity are higher compared to another
person with limited social network (Rosenstone & Hansen, 2012; Green & Gerber, 2001).
The application of the CVT has been in several research works that have sought to explain
why people in certain settings have low public participation levels compared to others in
different institutions and cultural settings. Some the findings of these research works have
emphasized the distinction between individual and group resources in promoting public
participation in activities trying to address problems that affect the community. One clear
issue that comes out of the findings is the bondage that develops in groups where by the
groups bound together by ideological ties are able to overcome the lack of individual
resources of their members and this promotes the participation of their members in activities.
The theory has been widely quoted and emphasized, and it is probably the most important
theory of participation in the literature today.
However, like most other theories, CVT has its own limitations. One of the limitations of
CVT is that it uses the socioeconomic status in predicting of participation of the local
community and determining the civic values of the people from the local community.
Various authors have concluded from their studies that people who usually participate in an
activity are generally higher-status individuals compared to non-participants. For example,
Verba et al. (2015) in their study established that in the category of active participants, there
were more while and in the category of in-active participants, there were fewer individuals
of high-status. However, the reality is that there are societies such as in the developed
countries with more middle class and better educated people who still find it difficult to
22
participate in activity for some reason such as having no time to do so. Even here in Uganda,
more wealth and educated people are found in the capital city but still some fail to participate
in an activity for one reason or another. This is a paradox of using socioeconomic status as
an important determinant of participation.
Another limitation of the CVT is explained by verba et al (2015). They write:
The socioeconomic status explanation is weak in its theoretical underpinnings. It
fails to provide a coherent rationale for the connection between the explanatory
socioeconomic variables and participation. Numerous intervening factors are
invoked - resources, norms, stake in the outcome, psychological involvement, greater
opportunities, favorable legal status and so forth. However, there is no clear
specified mechanism linking socioeconomic statuses to activity (Verbal et al, 2015).
They go further to argue that according to the CVT, people who have more resources are
will participate in activity more than those with fewer resources. For example, the people
who are rich and have plenty of time according to CVT are more likely to contribute money
to an activity and have time to participate in such an activity. Yet this is not true because in
many cases because individuals who rich and have plenty of leisure time would rather go for
vacationing, playing sports or watching television instead participating in certain activities.
Thus, based on these arguments, other theories are considered in this study and are reviewed
in the following sub-sections.
2.3 Public Participation in Program Planning and Service Delivery
2.3.1 Problem identification and primary education service delivery
Problem identification helps in determining where the constraints in service delivery occur,
when the constraints occur, how the constraints occur, and why the constraints occur
(Barnes, 2007). The purpose of problem identification to understand the constraints in
service delivery and factors causing constraints in service delivery so that effective
interventions are develop to reduce or eliminate the problem and to design evaluation
mechanisms to measure changes in problem severity and to manage influences. By involving
23
the community to identify their problems, it helps the school managers to design the
approaches that are best suiting the community’s needs (Berkowitz, 2012).
2.3.2 Needs assessment and primary education service delivery
Needs assessment is a precise procedure to get an exact, exhaustive picture of a system’s
qualities and shortcomings, with a specific end goal to enhance it and address existing and
future challenges (Edwards & Gaventa, 2001). A community needs assessment appraisal
distinguishes assets accessible and qualities in the group to address the issues of youth, kids
and families. The assessment concentrates on the community’s abilities as well as its
subjects/citizens, societies, and organizations. It provides a system to identifying and
creating services and solutions as well as building communities which help and sustain
children together with families. A community assessment can be restricted to an arrangement
of statistic data from enumeration records, consequences of reviews led by others as well as
causal criticism from group accomplices (Giele, Stone & Vaugeois, 2006). Assessments can
be extended to integrate concentration bunch discourses, interviews with partners, town
gatherings, mail or phone studies to the community and partnership members.
Needs assessment (NA) are carried out to to ensure that the genuine needs of groups are
tended to by the education programmes (Liffman, 2002). It involves research and methodical
meeting with group partners and school recipients before the instruction program is outlined
and actualized. NA distinguishes problems and needs and involves the people who are meant
to benefit from the education program. Potential issues can be distinguished early and a good
NA will gauge responses, inclinations and needs before any ultimate conclusions are made.
NA must consolidate getting the actualities and also the suppositions of a representative
sample of must consolidate getting the actualities and also the suppositions of an agent test
of recipients and different partners to guarantee that their worries are heard and incorporated

24
into the education program and policy formulation. As indicated by Edwards and Gaventa
(2001), the principle reasons for a NA are to:
• Provide decision-makers and communities with actualities and information to enable
them to settle on rectify choices;
• Undertake precise listening, which "offers voice" to poor and other difficult to-achieve
recipients/beneficiaries;
• Obtain feedback on preferences and priorities with the goal that government can plan to
utilize limited resources in the most ideal way. The community assumes a major part in
establishing their needs.
2.3.3 Decision making and primary education service delivery
Decision making in communities is a procedure of engaging and empowering communities
to identify their requirements, design activity, oversee and manage school activities and
assess the consequences of their activities (Burtler, 2007). Community decision-making is
inherent to community development. School community members make their own choices;
they choose how much outside help they need. A community may be geographically based,
for example, an area, city, or country town, a system of connections based around a typical
character, for example, ethnicity, or intrigue, for example, game or music. For a group to
take control of its own improvement, a gathering of individuals must be set up to cooperate
to seek after their objectives (Chatty, Baas and Fleig, 2003). Regularly these gatherings are
lawful elements, for example, fused social orders or altruistic trusts. Other starting
gatherings might be little and approximately organized. As per Tekman, Ebru Deniz et al.
(2012), bunches fluctuate by they way they decide. A few gatherings, particularly littler
ones, lean toward non-progressive structures and aggregate basic leadership. Formal
associations will have paid staff, including directors, and may have a representing board. In
some extremely nearby groups, the perspectives of older folks might be especially huge.
25
This is in concurrence with Wilcox's (2010) continuum contribution hypothesis of open
support, which gives choosing together as one the five levels of public participation.
2.4 Public Participation in Program Implementation and Service Delivery
2.4.1 Resource mobilization and service delivery
Resources are the money related and non-monetary supplies that assistance to satisfy
instructive requirements. They incorporate cash, the aptitudes, time commitments and
administrations of people, and gear and materials. Asset assembly is the way toward
distinguishing and acquiring assets for the training program. Training program require both
money related and non-budgetary assets. SHAFOCS (2011) battles that asset preparation is
giving individuals the chance to give". It isn't an end itself yet rather a procedure where
assets are exchanged from the individuals who control and can provide for the program. He
includes that assets are empowering agents of program exercises. In help of Sera, Kleymeye
(2009) watches that asset assembly is the procedure by which assets are requested by the
program and gave by contributors and groups.
USAID (2002) watched that various wellsprings of subsidizing could build your freedom
and adaptability to execute programs and lessen dependence on outer financing. UNEP
(2006) watches that asset activation is far reaching process including vital making
arrangements for program financing. They include that asset activation gives answers to the
accompanying inquiries, in what capacity can an association raise the salary expected to
complete the program mission, where are the required assets, how would you manage your
association and work.
Partner subsidizing is one of the methods for asset activation. Partner commitments are
either done in real money or kind e.g. arrive, staff, office space from groups is an indication

26
of sense of duty regarding the program objective (Edwards and Gaventa, 2001). It exhibits a
substantial way that our accomplices put on the normal advantages. To guarantee that duties
for partner commitment are respected, DEO, DIS and EO ought to sufficiently examine the
arranging, spending plan and money related administration frameworks with which
accomplice offices are working without misconception of the arranging and monetary
condition. The capacity of nearby groups to assume control obligation of putting resources
into and managing program benefits are not to be viably surveyed or bolstered (Liffman,
2002). At the point when groups are empowered to meet their commitment inside the
subsidizing arrangement, benefit conveyance through open cooperation can be ensured. In
perspective of this disclosure, it is prescribed that groups must be arranged and actualize
operation and upkeep intends to guarantee that the high feeling of proprietorship showed
through the installment of partner subsidizing could be converted into better administration
conveyance.
2.4.2 Implementation commitment and organizational performance
Organizations may have the most consistent arrangement comprehensible for accomplishing
its goals and the arrangement may pass cost/advantage investigations with distinction,
however in the event that school group individuals in charge of doing it are unwilling or
unfit to do as such, little will happen (Klein et al., 2012). This conclusion, regularly
connected with base up researchers, is, indeed, additionally vital to the best down point of
view - frequently under the title of 'manner' (Klein and Sorra, 2007). While both view the
variable as 'basic' to powerful usage, a hard-line top-down point of view would see
implementer duty being formed fundamentally by the substance of the arrangement and its
ability (asset) arrangements - both of which can as far as anyone knows be 'controlled' from
the best. A fundamentalist base up view would tend to see duty as being impacted
substantially more by the institutional setting, and hierarchical partners.
27
In general, commitment improves the implementation of organizational strategic plans
(Mantere & Vaara, 2008; Korsgaard et al., 2005; Kim & Mauborgne, 2009). Commitment
leads to engagement of organizational members to implementing organizational objectives
(Klein et al., 2012). The more one is committed, the more one would tend to psychologically
and emotionally engage in one's role within the organization too. Commitment typically
results in action so it is relevant to examine when looking at strategy issues that involve
doing, such as strategy implementation. Commitment generally refers to intending to
continue in a line of action (Agnew, 2009). More specifically, commitment to an object in
the workplace denotes a strong bond reflecting dedication and responsibility for a target
(Klein et al., 2012).
As indicated by the administration inquire about, the accomplishment of any exertion of the
association is emphatically connected with the group duty. It is extremely laborious to
accomplish authoritative destinations without the help of school group individuals (Ahire et
al., 2007). It has been contended that accomplishment of authoritative goals will be more
effective if the school group individuals are conferred (Senge, 2000). It is additionally
noticed that school group individuals assume a basic part in forming the accomplishment of
vital changes in associations. School people group individuals assume an unequivocal part in
outlook changes in basic zones (Hoffman and Hagerty, 2004).
Numerous quality writings examine the significance of school group individuals' dedication
in the executing procedure to the execution firms. It has been recommended that school
group individuals' dedication is one of the significant determinants of fruitful execution
(Kim and Mauborgne, 2009). Research has recommended that the adequacy of the
authoritative endeavors is dictated by clearness of value objectives for an association (Senge,

28
2000; Stalk et al., 2002). This examination set up that administration/representative sense of
duty regarding execution fundamentally influenced authoritative execution.
2.5 Public Participation in Program Monitoring and Evaluation and Service
Delivery
2.5.1 Quality assurance and primary education service delivery
Quality ISO 9000 (2005) states that quality affirmation is a training procedure which
endeavors to stop mistakes occurring in the projects procedure enabling it to be correct first
time. It includes recognizing the regions of concern, the correct control focuses to be
assessed at restorative activities set up and the documentation supporting this to be recorded
and kept. Quality affirmation is a continuous procedure that guarantees the conveyance of
concurred guidelines. These concurred guidelines should make each program, of which the
quality is guaranteed has the potential capacity to accomplish a high caliber of substance.
The objective of value affirmation is to enhance administrations and subsequently it should
happen on at all levels and be a consistent procedure.
As the program develops, its operations and quality process must advance and be refined to
keep pace with the progressions. To guarantee reliable quality in this powerful condition, a
continuous sense of duty regarding development and change is basic. This sense of duty
regarding constant change is exhibited through recorded quality confirmation, instruments
(National Planning Authority, 2005).
2.5.2 Corrective action and primary education service delivery
USAID (2004) asserts that restorative activity is a change that is executed to address a
shortcoming distinguished in a program administration framework. Ordinarily remedial
activities are executed because of group grievance, unusual levels of interior non similarity,
29
non congruities distinguished amid inside, unfriendly, or insecure patterns in item and
process observing. The way toward deciding a restorative activity requires ID of moves that
can be made to avert or relieve the shortcoming. These activities are regularly alluded to as
counter measures. Adequacy is by and large idea to be enhanced by tending to the main
drivers of the issue (now and again the underlying driver of event and non-discovery are
thought about independently.
Nonetheless, where conceivable an investigation is attempted to recognize different
territories, items procedures or administrations, which might be influenced by same issue
and survey the plausibility of conveying the counter measures crosswise over to those
procedures. Further, these might be frameworks set up to guarantee that the issue is
considered in future episodes where new items, procedures or administrations are presented,
or existing items, procedures or administrations are altered. This can be accomplished
through change of the disappointment modes and impacts (National Planning Authority,
2005).
2.6 Summary of the literature
The literature shows how public participation in program planning, implementation and
monitoring/evaluation affects service delivery. Barnes (2007) and Berkowitz (2012)
explained how lack of involving the community in problem identification could compromise
service delivery. Edwards and Gaventa (2001) emphasized the importance of public
participation in needs assessment in relation to service delivery. Tekman et al. (2012)
focused on the contribution of poor public participation in decision-making towards poor
service delivery. Edwards and Gaventa (2001) expounded on public participation in resource
mobilization enabling more resources for better service delivery. Kim and Mauborgne
(2009) showed how community implementation commitment is important in enhancing

30
service delivery. National Planning Authority (2005) emphasized the role of public
participation in quality assurance and corrective action. However, all these studies by other
researchers focused on effect of public participation on education service delivery in other
countries or areas of service delivery such as participation poverty reduction processes,
development, learning, strategy, health, democracy, project success to mention some.
However, none of the studies specifically focused on assessing the contribution of effect of
public participation on primary education service delivery in Bugambe Sub County, a gap
which this study sought to fill.

31
CHAPTER THREE
METHODOLOGY
3.1 Introduction
A methodology is needed to explain why a research wants to do the research in a particular
way. It helps others know that the researcher knows what he/she is doing. It is a systematic
way to solve a problem. Chapter three presents the methodology which was employed in the
study. its includes the research design, population of the study, sample size and sample
selection, techniques used to sample respondents, procedure, methods of data collection,
instruments used to collect data, quality control (reliability and validity) and data analysis.
3.2 Research Design
This study adopted a cross-sectional study design combining both quantitative and
qualitative techniques to collect and analyze data. The cross-section research enabled the
researcher to carry out the study at a particular time across different categories of
respondents. The quantitative approach was used to collect data using a coded questionnaire
so that it can be statistically manipulated into number while qualitative approach was used to
collect data using interview guides such that the data collected was presented in narrative
format given that it was not easy to manipulate it statistically as Mugenda and Mugenda
(1999) suggested. It has been argued that when both quantitative and qualitative approaches
are triangulated they help in enriching the interpretation of findings of the study, as it was
the case in this study.
3.3 Study Population
The study population included ten primary schools, Hoima District Local government
official and Bugambe Sub County school community members. Therefore, the population
study will include 1 District Education Officer (DEO), 2, District Inspector of Schools

32
(DIS), 1 Education Officer (EO) Special Needs, 10 headteachers, 98 primary teachers and
120 school community members. Thus, the total population in this study was 232.
3.4 Sample Size
A sample size of 181 respondents was determined using a table provided by Krejcie and
Morgan (See Appendix 1) as cited in Amin (2005). The sample size and selection is further
presented in Table 3.1 below.
Table 3.1: Sample size and selection
Staff Category Population Sample Sample Technique
DEO 1 1 Census sampling
DIS 2 2 Census sampling
EO 1 1 Census sampling
Headteachers 10 7 Simple random sampling
Primary school teachers 98 78 Simple random sampling
School community members 120 92 Simple random sampling
Total 232 181
Source: Adopted from Hoima District Human Resource Department (2012) and guided
by Krejcie and Morgan (1970) sampling technique
From Table 3.1, the first column presents the various categories of people the study targeted.
The second column shows the total population of the targeted categories of people. The third
column shows sample of people that were selected from the targeted category of people. The
last column shows how the various category samples were selected.
3.5 Sampling Techniques and Procedure
3.5.1 Simple random sampling
This method was employed to select teachers and school community members. Simple
random sampling is a probability sampling technique that involves selecting respondents
from a given population by chance (DiCicco-Bloom & Crabtree, 2006). Simple sampling
was used in this study because it gave an equal chance of headteachers, teachers and school
33
community members to be selected given that number was big and not all headteachers,
teachers and school community members were selected.
3.5.2 Census sampling
Census sampling was used to select head teachers, DEO, DIS and EO. Census sampling is a
non-probability sampling technique that involves selecting all respondents in population to
participate in the study (DiCicco-Bloom & Crabtree, 2006). This was because the census
sampling techniques helped the research to collect information about the study variable from
everyone in a particular population.
3.6 Data Collection Methods
Two methods of data collection were employed during the study. These were questionnaire
survey and face-to-face interview, which are briefly elucidated in the next sub section.
3.6.1 Questionnaire survey method
Questionnaire survey method is a data collection method used to collect data from particular
groups of people using questionnaires that have been standardized (Amin, 2005). Therefore,
the questionnaire survey was used to collect data from headteachers, teachers and school
community members in a systematic way. The reason for using the questionnaire survey to
collect data from head teachers, teachers and school community members was to save on
time for collecting data since their number was big to interview.
3.6.2 Face to face interview
This method of data collection was used to collect data from head teachers, DEO, DIS and
EO because it enabled the researcher to establish rapport with these categories of
respondents (Amin, 2005). The rapport that was established helped the researcher to gain the

34
cooperation of head teachers, DEO, DIS and EO while seeking information related to issues
that were investigated. The face-to-face interview data collection method furthermore
allowed the researcher to obtain in depth data through probing and clarify ambiguous
questions (Mugenda & Mugenda, 2009). In this study, semi-structured interviews were
designed to collect data. Open-ended questions were used to allow the researcher to ask
other questions depending on the information that emerged from the dialogue between the
interviewee and interviews. Semi structured interview are the mostly used interview formats
for qualitative research (DiCicco-Bloom & Crabtree, 2006). In this study, the probing
interviewing tactic was used extensively to obtain a deeper explanation of the issue at hand
from the respondents. This was largely due to the fact that the respondents often required
stimuli to clarify or expand their own ideas and answers more widely, in order to reach a
broader understanding during the study.
3.7 Data Collection Instruments
During the study, the researcher used two data collection instruments, which included
interview guides and questionnaires as explained below.
3.7.1 Questionnaire
A questionnaire is a data collection instrument where a set of questions are developed to
enable the researcher collect data from a significant number of subjects (Mugenda &
Mugenda, 2009). A questionnaire contains written questions to be answered by respondents.
In this study, closed-ended questions or “closed question” were adopted to enable
respondents to choose an appropriate response from list of responses already determined by
the researcher, which enabled to obtain quantitative data. The questionnaire was self-
administered in that respondents responded to the questions on his/her own with minimal
help from the researcher when it was required (Mugenda & Mugenda, 2005). Self-

35
administered questionnaires (SAQs) accompanied with a Lirket scale using ordinal labels
from 1 = strongly disagree, 2 = disagree, 3 = not sure, 4 = agree to 5 = strongly agree was
used to collect quantitative data from headteachers, teachers and school community
members. The reason for using SAQs to collect data from headteachers, teachers and school
community members was to save on time because their number was big to interview.
3.7.2 Interview guide
An interview guide is a data collection instrument that contains a list of open-ended
structured questions to be responded to by the interviewee (Amin, 2005). The interview
guide involves a face-to-face conversation in which the interviewer asks for information
based on a certain question from interviewee. Interview guides were used to collect
qualitative data from DEO, DIS and EO. The reason for using the interviewee guide for this
category of respondents was that they were in position to provide in-depth information
through probing. Questions were presented to the DEO, DIS and EO by the researcher who
wrote down their views in a notebook. Data obtained during the interview was used to
supplement that obtained through the questionnaire to enrich interpretation of the findings.
3.8 Data Quality Control
3.8.1 Validity
Prior to using the research instruments to collect data from the field, a validity test was
conducted to determine whether the questions were capable of obtaining information that
was required to answer the objectives of this study. To achieve this, two lecturers at UMI
conversant with study area of this study were requested to review the questions to see
whether they were capable of obtaining information that was required to answer the
objectives of this study. After the lecturers reviewed and rated questions they perceived as
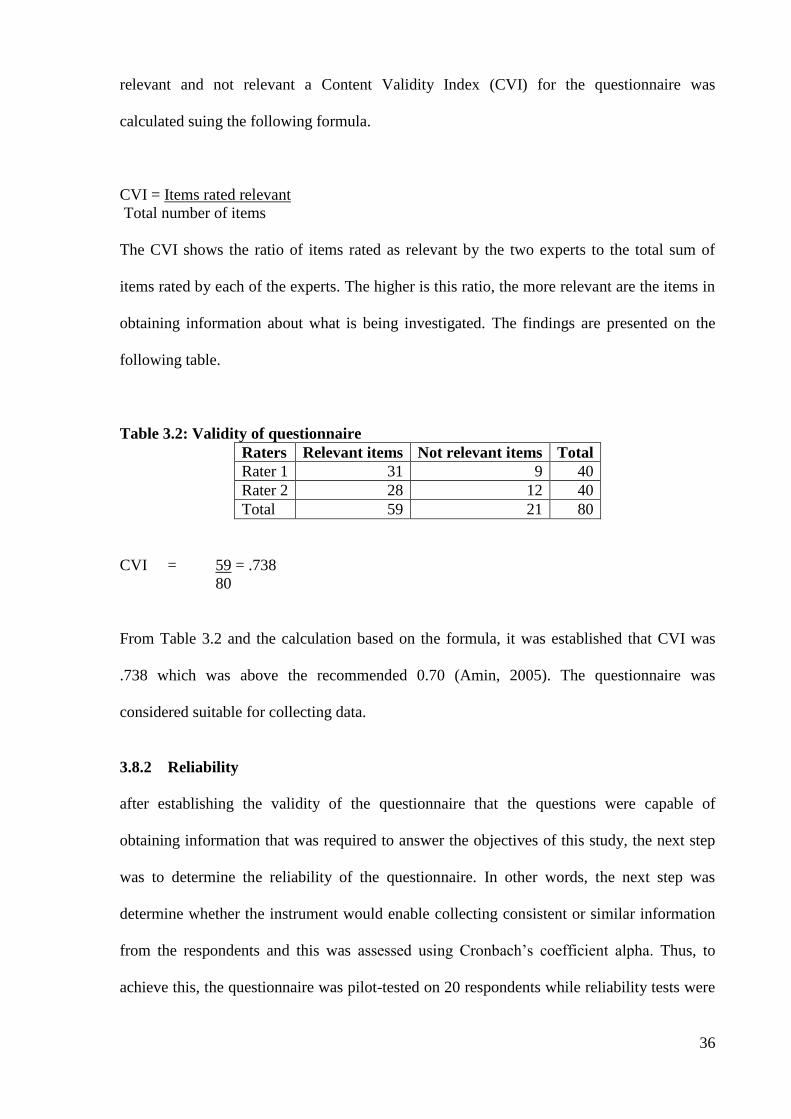
36
relevant and not relevant a Content Validity Index (CVI) for the questionnaire was
calculated suing the following formula.
CVI = Items rated relevant
Total number of items
The CVI shows the ratio of items rated as relevant by the two experts to the total sum of
items rated by each of the experts. The higher is this ratio, the more relevant are the items in
obtaining information about what is being investigated. The findings are presented on the
following table.
Table 3.2: Validity of questionnaire
Raters Relevant items Not relevant items Total
Rater 1 31 9 40
Rater 2 28 12 40
Total 59 21 80
CVI = 59 = .738
80
From Table 3.2 and the calculation based on the formula, it was established that CVI was
.738 which was above the recommended 0.70 (Amin, 2005). The questionnaire was
considered suitable for collecting data.
3.8.2 Reliability
after establishing the validity of the questionnaire that the questions were capable of
obtaining information that was required to answer the objectives of this study, the next step
was to determine the reliability of the questionnaire. In other words, the next step was
determine whether the instrument would enable collecting consistent or similar information
from the respondents and this was assessed using Cronbach’s coefficient alpha. Thus, to
achieve this, the questionnaire was pilot-tested on 20 respondents while reliability tests were

37
computed with the aid of SPSS package using the following formula to establish the
Cronbach’s Coefficient Alpha.
α = k 1 - ∑SDi2
k-1 ∑ SDt2
Where α = coefficient alpha
∑SDi2 = sum variance of items
∑SDt2 = sum variance of scale
The Cronbach’s coefficient alpha (α) reliability shows the extent to which the research
instrument is able to obtain consistent information about what is being investigated. The
higher α value shows higher consistence in the information obtained. The findings are
presented on the following table.
Table 3.3: Reliability of questionnaire
Variable Alpha No. of items
Public participation in program planning . 723 14
Public participation in program implementation . 740 8
Public participation in program M&E .789 8
Education service delivery 750 10
Table 3.3 shows that the Cronbach reliability coefficients for the variables the questionnaire
was above the recommended .70 (Amin, 2005). Because of this, the questionnaire was
considered reliable for collecting data.
3.9 Procedure of Data Collection
When Uganda Management Institute (UMI) approved the proposal, the researcher obtained a
letter of introduction from UMI which was presented to Bugambe Sub County to be
permitted to carry out the study in the district. The researcher developed a letter of consent
that was presented to the respondents to request them indicate that freely accepted to
participate in the study by providing the required information to issues that study sought to

38
answer after respondents consented, questionnaires were distributed. Adequate time was
given to the respondents to respond to the questionnaires which were collected upon there
were completely filled. The researcher sorted them and coded them for analysis.
3.10 Data Analysis
3.10.1 Quantitative data analysis
Coded (quantitative) information was entered in a PC program known as a Special Package
for Social Scientists (SPSS) for analysis. Descriptive statistics were used were used to
determine insights about the respondents responded to various questions to decide the
dissemination of respondents on individual data and on the questions under each of the
variable (Mugenda & Mugenda, 2009). Inferential measurements were utilized to test the
assumptions under each of the hypotheses. Spearman rank request connection and coefficient
of assurance were utilized to test the hypotheses given that the scales utilized as a part of the
survey were ordinal (Sekaran, 2003). The connection coefficient (rho) was utilized to decide
the quality of the association between the factors because the scale (that is strongly disagree,
disagree, not sure, agree and strongly agree) used in the survey was ordinal. It is suggested
that with an ordinal scale, Spearman rank is appropriate for deciding associations since it
does not include means and standard deviations, which are insignificant with ordinal
information (Amin, 2005). The coefficient of determination was utilized to decide the impact
of one variable on another variable given that the correlation coefficient just decides
relationship. The sign of the correlation coefficient (+ or -) was utilized to decide the nature
of relationship. The significance of the correlation (p) was utilized to decide the extent to
which the independent variables affected the dependent variable. The regression coefficient
(R) decided the straight association between indicators of the independent variables and the
dependent variable (Mugenda & Mugenda, 2009). This was then be squared and adjusted to

39
determine how much variance is in the dependent variable was caused by the dimensions of
the independent variables as per hypothesis.
3.10.2 Qualitative data analysis
Content analysis was used to analyze qualitative data (Mugenda & Mugenda, 2009). During
content analysis, a thematic approach was used to edit and reorganize the qualitative data it
into meaningful phrases and themes, categories and patterns were identified. The themes that
emerged in relation to each guiding question from the interviews, were presented as
quotations in the results for illustrations to accompany the quantitative data.
3.11 Measurement of Variables
The likert scale with standardized response which ranges from scale of five to one as
strongly agree to strongly disagree respectively was used to measure the extent to which
respondents agree or disagree with the statement. The response over several items and
respondents were summed up to give the overall level of agreement or disagreement. The
variables in the interviews and observation schedules were categorized using nominal scale.
3.12 Ethical Considerations
The standards of research morals - educated assent, protection and secrecy, and exactness
were clung to amid the investigation. Members got full revelation of the idea of the
examination, the dangers, advantages and options, with a stretched out chance to make
appropriate inquiries in regards to the exploration. The scientist treated all data gave by
members greatest secrecy. Genuineness was kept up all through the exploration procedure:
In revealing information, results, techniques and methods keeping in mind the end goal to
stay away from creation, distortion, or deception of information. All citations utilized and
sources counseled were unmistakably recognized and recognized by methods for references.

40
A letter of approval from the division of higher degrees was given as a demand to
authorization to direct the examination. A covering letter went with the examination
instruments clarifying the reason for the investigation and the surveys were conveyed
straightforwardly to the respondents in their particular zones for filling and were gathered
quickly the filling in was finished. The introductory letter was likewise used to give access
to the meeting procedure, which was done on arrangement.

41
CHAPTER FOUR
PRESENTATION, ANALYSIS AND INTERPRETATION OF RESULTS
4.0 Introduction
This chapter presents the background characteristics of respondents, study findings, analysis
and interpretation, basing on objectives of the study.
4.1 Response Rate
Response rate (otherwise called fulfillment rate or return rate) in overview look into alludes
to the quantity of individuals who addressed the study partitioned by the quantity of
individuals in the example. It is generally communicated as a rate. A low reaction rate can
offer ascent to examining inclination if the non-reaction is unequal among the members in
regards to introduction as well as result. In this investigation, the example was 181
respondents yet the examination figured out how to get 158 respondents. The break down is
shown in the following table.
Table 4.1: Response rate
Respondents Sampled size Responses received Percentage %
DEO 1 1 100
DIS 2 1 50
EO 1 1 100
Headteachers 7 7 100
Primary school teachers 78 67 86
School community members 92 81 88
Total 181 158 89
Source: Data from field
Table 4.1 shows the response rates were above the recommended two-thirds (67%) response
rate (Amin, 2005; Mugenda & Mugenda, 1999). According to Amin (2005) and Mugenda
and Mugenda (1999), a 33% non-response is acceptable. According to Mundy (2002), a
study of a general population which aims to describe knowledge or behaviors, a 60%
response rate might be acceptable, although 70% would be preferable. Thus, a 11% non-

42
response rate in this study was considered acceptable given that it falls within the
recommended response rates because it gives a response rate of 89%, which is above 67% by
Amin (2005) and Mugenda and Mugenda (1999), above 60% and 70% by Mundy (2002).
Therefore, the results were considered representative of what would have been obtained
from the population.
4.2 Respondents’ Background
Respondents were asked about their gender, highest education, years associated with school
and age. Findings are presented in the following sub sections.
4.2.1 Respondents’ gender
Gender is a vital aspect in any social situation that is variably affected by any economic or
social phenomenon (Guest, 2012). Therefore, the researcher established respondents’ gender.
Results are presented in Table 4.2
Table 4.2: Respondents according to gender
Gender Frequency Percentage
Female 51 32.9
Male 104 67.1
Total 155 100.0
Source: Data from field
Results in Table 4.2 show that the majority 67.1% who participated in the study were males
compared to female respondents. This is due to the fact that the proportion of male
respondents associated with school activities is higher compared to that of female ones.
Thus, the implication of these findings is that information about public participation in
program planning, public participation in program implementation, public participation in
program monitoring and primary education service delivery using the sample was not gender
biased.
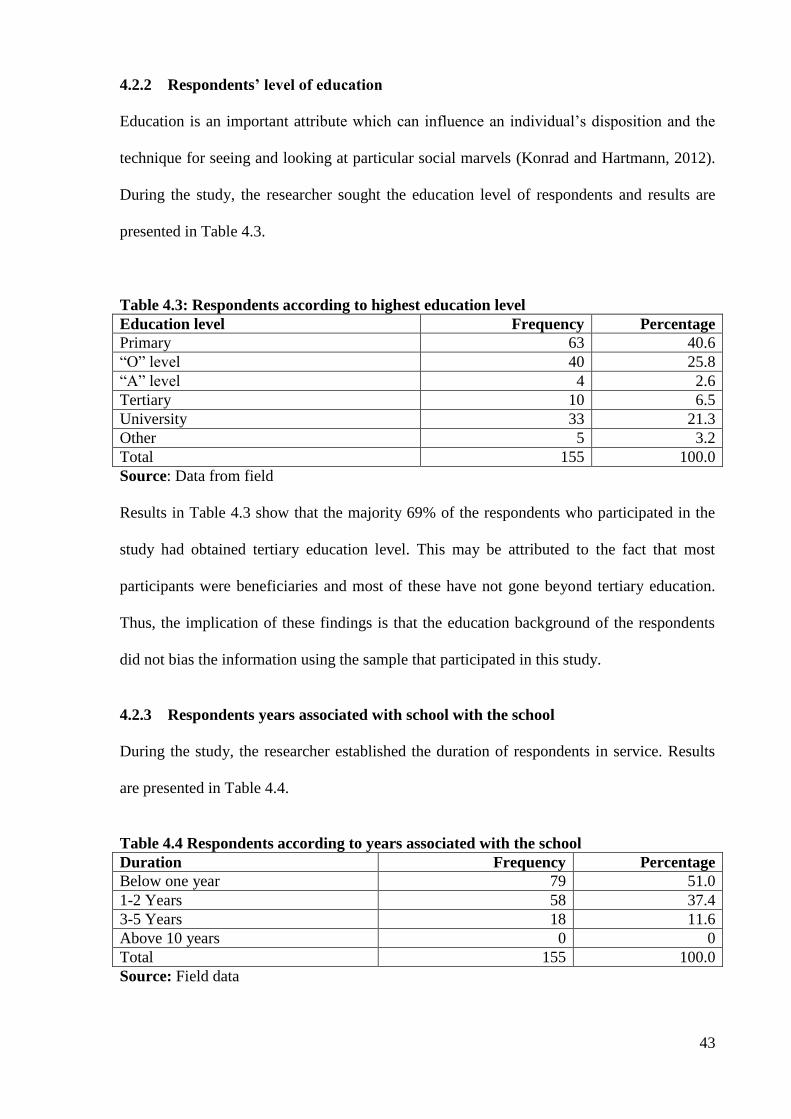
43
4.2.2 Respondents’ level of education
Education is an important attribute which can influence an individual’s disposition and the
technique for seeing and looking at particular social marvels (Konrad and Hartmann, 2012).
During the study, the researcher sought the education level of respondents and results are
presented in Table 4.3.
Table 4.3: Respondents according to highest education level
Education level Frequency Percentage
Primary 63 40.6
“O” level 40 25.8
“A” level 4 2.6
Tertiary 10 6.5
University 33 21.3
Other 5 3.2
Total 155 100.0
Source: Data from field
Results in Table 4.3 show that the majority 69% of the respondents who participated in the
study had obtained tertiary education level. This may be attributed to the fact that most
participants were beneficiaries and most of these have not gone beyond tertiary education.
Thus, the implication of these findings is that the education background of the respondents
did not bias the information using the sample that participated in this study.
4.2.3 Respondents years associated with school with the school
During the study, the researcher established the duration of respondents in service. Results
are presented in Table 4.4.
Table 4.4 Respondents according to years associated with the school
Duration Frequency Percentage
Below one year 79 51.0
1-2 Years 58 37.4
3-5 Years 18 11.6
Above 10 years 0 0
Total 155 100.0
Source: Field data

44
Results in Table 4.4 indicate that all respondents (100%) worked with schools for not more
than five years. This is because the school was introduced in 2007. Thus, to the present, the
school has been in existence for a period of five years.
4.2.4 Age of respondents
During the study, the researcher sought the age of respondents. Age of the respondents was
important in that it helped determine whether the sample that participated in this study
represented the age population distribution of the respondents. Results are presented in Table
4.3.
Table 4.3: Age of respondents
Age Frequency Percentage
20-30 years 58 37.4
31-39 years 40 25.8
40-49 years 23 14.8
Above 49 years 34 21.9
Total 155 100.0
Source: Field data
Results in Table 4.3 indicate that the majority respondents (over 60%) were aged 20-39
years. This is attributed to the fact that these are most activities age group at the school.
Thus, the implication of these findings is that information using the sample was not biased
age of the respondents.
4.2 Public Participation in Program Planning and Primary Education Service
Delivery
It is recommended that before testing hypotheses, descriptive statistics should be first
computed for each of the variables (Plonsky, 2007). Therefore, the researcher adopted this
approach whereby descriptive statistics used were percentages and frequencies since the
questionnaire was accompanied by an ordinal scale.

45
4.2.1 Descriptive results about public participation in program planning Primary
education service delivery
During the study, the researcher presented to respondents fourteen items about public
participation in program planning by showing their opinion on each item using a five-point
Likert Scale as indicated in Table 4.4. After data presentation, the researcher made an
analysis and interpretation of findings.
Table 4.4: Findings about public participation in program planning
Items about participation in decision making SD D NS A SA
1. The community participates in the decision-making of
schools
55
(35%)
58
(38%)
7
(5%)
10
(6%)
25
(16%)
2. The community work together with officials to make
decisions of schools
47
(30%)
62
(41%)
5
(3%)
30
(19%)
11
(7%)
3. The community of schools is involved from the
beginning rather after decisions are made
39
(25%)
83
(54%)
6
(4%)
10
(6%)
17
(11%)
4. The community of schools has a clear idea of making
decisions for the school program
40
(26%)
78
(50%)
3
(2%)
13
(8%)
21
(14%)
5. The community of schools generates ideas for the school
program
43
(28%)
70
(44%)
7
(5%)
7
(5%)
28
(18%)
6. The community of schools participates in organizing
ideas into goals for the of the school program
51
(33%)
67
(43%)
8
(5%)
21
(14%)
8
(5%)
Items about participation in problem
identification
SD D NS A SA
7. The community of schools is informed about the
problems of the school program
30
(19%)
78
(50%)
6
(4%)
12
(8%)
29
(19%)
8. The community of schools is consulted about problems
of the school program
34
(22%)
75
(48%)
4
(3%)
17
(11%)
25
(16%)
9. The community of schools involved in identifying
problems of the school program
50
(32%)
64
(41%)
4
(3%)
17
(11%)
20
(13%)
10. The community of schools is empowered to identify
problems of school
31
(20%)
70
(45%)
7
(5%)
37
(24%)
10
(6%)
Items about participation in education needs
assessment
SD D NS A SA
11. The community of schools is informed about the
education needs assessment of school activities
33
(21%)
66
(43%)
7
(5%)
19
(12%)
30
(19%)
12. The community of schools is consulted about the
education needs assessment of school activities
33
(21%)
67
(43%)
7
(5%)
21
(14%)
27
(17%)
13. The community of schools is involved in actual
education needs assessment of school activities
50
(32%)
56
(36%)
4
(3%)
22
(14%)
23
(15%)
14. The community of schools is empowered to conduct
education needs assessment of school activities
34
(22%)
62
(40%)
8
(5%)
42
(27%)
9
(6%)
Source: Data from field
Key: SD= Strongly Disagree; D= Disagree; NS=Not Sure; A=Agree, SA=Strongly Agree
In Table 4.4, respondents who strongly agreed and those who agreed were combined to form
one category of respondents who consented with the statement. On the other hand,
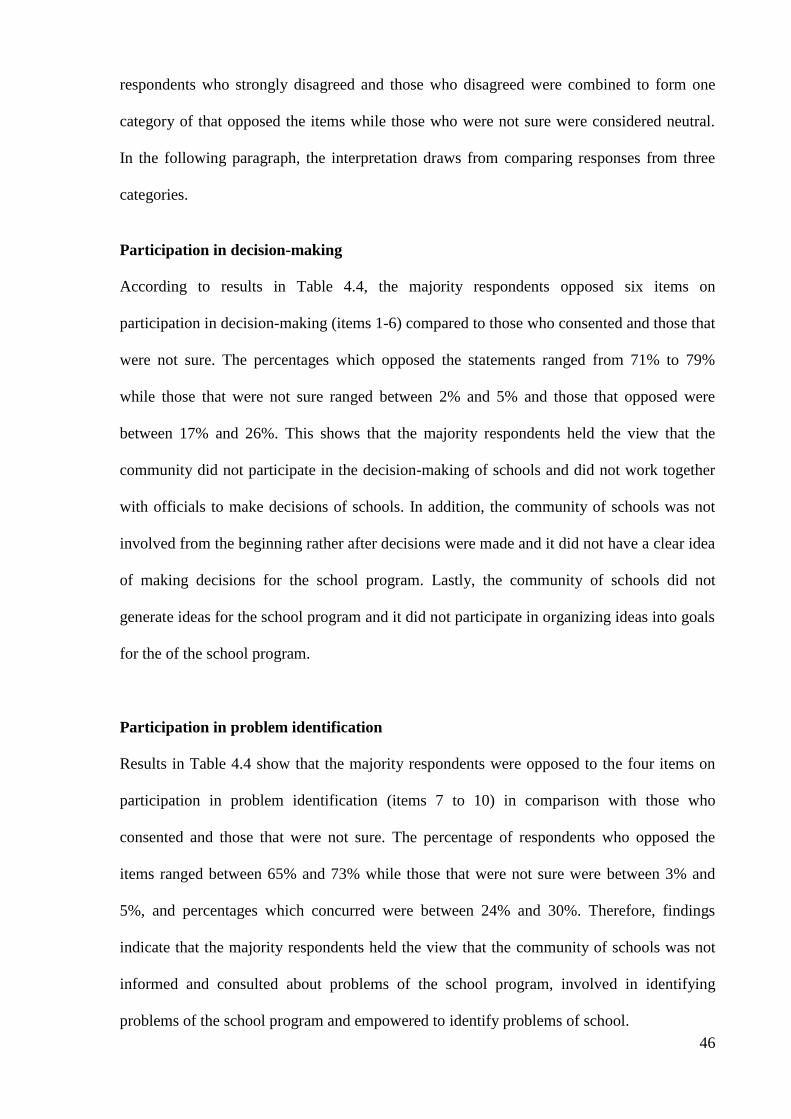
46
respondents who strongly disagreed and those who disagreed were combined to form one
category of that opposed the items while those who were not sure were considered neutral.
In the following paragraph, the interpretation draws from comparing responses from three
categories.
Participation in decision-making
According to results in Table 4.4, the majority respondents opposed six items on
participation in decision-making (items 1-6) compared to those who consented and those that
were not sure. The percentages which opposed the statements ranged from 71% to 79%
while those that were not sure ranged between 2% and 5% and those that opposed were
between 17% and 26%. This shows that the majority respondents held the view that the
community did not participate in the decision-making of schools and did not work together
with officials to make decisions of schools. In addition, the community of schools was not
involved from the beginning rather after decisions were made and it did not have a clear idea
of making decisions for the school program. Lastly, the community of schools did not
generate ideas for the school program and it did not participate in organizing ideas into goals
for the of the school program.
Participation in problem identification
Results in Table 4.4 show that the majority respondents were opposed to the four items on
participation in problem identification (items 7 to 10) in comparison with those who
consented and those that were not sure. The percentage of respondents who opposed the
items ranged between 65% and 73% while those that were not sure were between 3% and
5%, and percentages which concurred were between 24% and 30%. Therefore, findings
indicate that the majority respondents held the view that the community of schools was not
informed and consulted about problems of the school program, involved in identifying
problems of the school program and empowered to identify problems of school.
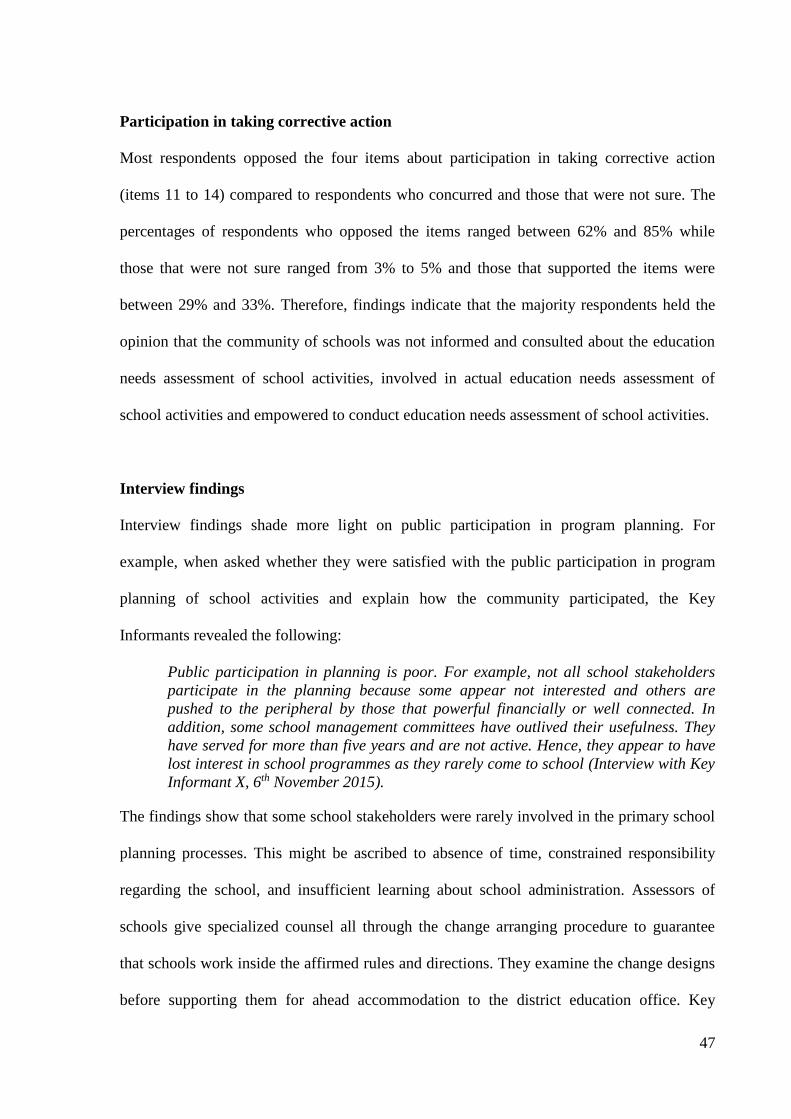
47
Participation in taking corrective action
Most respondents opposed the four items about participation in taking corrective action
(items 11 to 14) compared to respondents who concurred and those that were not sure. The
percentages of respondents who opposed the items ranged between 62% and 85% while
those that were not sure ranged from 3% to 5% and those that supported the items were
between 29% and 33%. Therefore, findings indicate that the majority respondents held the
opinion that the community of schools was not informed and consulted about the education
needs assessment of school activities, involved in actual education needs assessment of
school activities and empowered to conduct education needs assessment of school activities.
Interview findings
Interview findings shade more light on public participation in program planning. For
example, when asked whether they were satisfied with the public participation in program
planning of school activities and explain how the community participated, the Key
Informants revealed the following:
Public participation in planning is poor. For example, not all school stakeholders
participate in the planning because some appear not interested and others are
pushed to the peripheral by those that powerful financially or well connected. In
addition, some school management committees have outlived their usefulness. They
have served for more than five years and are not active. Hence, they appear to have
lost interest in school programmes as they rarely come to school (Interview with Key
Informant X, 6th November 2015).
The findings show that some school stakeholders were rarely involved in the primary school
planning processes. This might be ascribed to absence of time, constrained responsibility
regarding the school, and insufficient learning about school administration. Assessors of
schools give specialized counsel all through the change arranging procedure to guarantee
that schools work inside the affirmed rules and directions. They examine the change designs
before supporting them for ahead accommodation to the district education office. Key

48
Informant Y reported, “The inspectors have helped schools to put in place strategies to
address weak areas in the course of implementing the plan (Interview with Key Informant Y,
7th November 2015)”.
Pupils’ involvement in improvement planning encourages cooperation and helps in
implementation of school activities. Interview findings revealed that in some schools, pupils
were engaged in several school activities of improvement planning such as attending school
performance review meetings, maintaining discipline and involvement in fundraising. For
example, Key Informant Z had this to say, “Pupils’ participation in some schools begins
with the school performance review meeting, which is attended by the head girl, head boy
and prefects, to present the pupils’ views to the stakeholders (Interview with Key Informant
Z, 8th November 2015)”. However, pupils’ participation level varies according to school
priorities and the micro politics as Key Informant Z reported, “Pupils are not involved in
designing the plan, but are involved in carrying out some of the set targets in the
improvement plan (Interview with Key Informant Z, 8th November 2015)”. Sharing of duties
among partners, including understudies, is a piece of circulated initiative that advances
successful school administration. Students' association in change arranging is a piece of
participatory arranging, which encourages them to comprehend school needs,
accomplishments and difficulties. Insufficient cooperation of group individuals restrains the
degree to which schools can accomplish the set focuses in change designs. Key Informant Y
reported, “Some of the parents and community members do not understand what the school
development is all about. However much you explain some do not understand and unable to
participate in the planning (Interview with Key Informant Y, 7th November 2015)”.
Thus, it can be observed that the findings from interviews support findings obtained using
the questionnaires. What comes out is that the community participated in the planning of
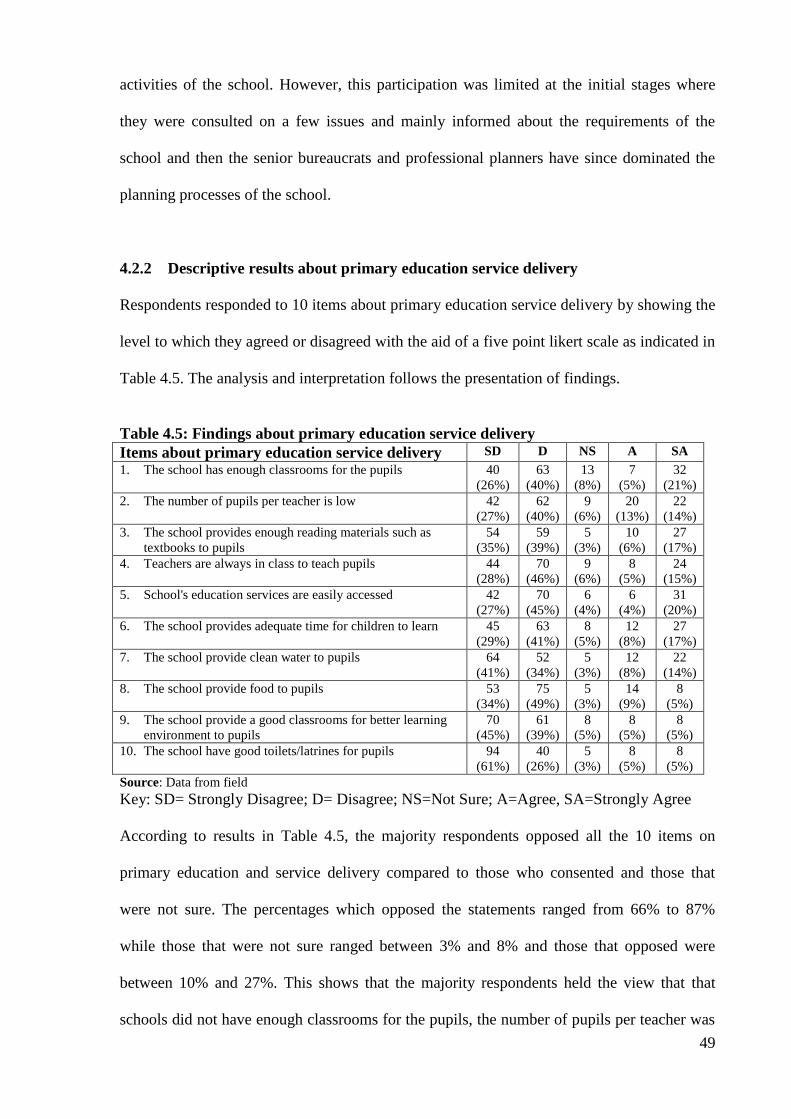
49
activities of the school. However, this participation was limited at the initial stages where
they were consulted on a few issues and mainly informed about the requirements of the
school and then the senior bureaucrats and professional planners have since dominated the
planning processes of the school.
4.2.2 Descriptive results about primary education service delivery
Respondents responded to 10 items about primary education service delivery by showing the
level to which they agreed or disagreed with the aid of a five point likert scale as indicated in
Table 4.5. The analysis and interpretation follows the presentation of findings.
Table 4.5: Findings about primary education service delivery
Items about primary education service delivery SD D NS A SA
1. The school has enough classrooms for the pupils 40
(26%)
63
(40%)
13
(8%)
7
(5%)
32
(21%)
2. The number of pupils per teacher is low 42
(27%)
62
(40%)
9
(6%)
20
(13%)
22
(14%)
3. The school provides enough reading materials such as
textbooks to pupils
54
(35%)
59
(39%)
5
(3%)
10
(6%)
27
(17%)
4. Teachers are always in class to teach pupils 44
(28%)
70
(46%)
9
(6%)
8
(5%)
24
(15%)
5. School's education services are easily accessed 42
(27%)
70
(45%)
6
(4%)
6
(4%)
31
(20%)
6. The school provides adequate time for children to learn 45
(29%)
63
(41%)
8
(5%)
12
(8%)
27
(17%)
7. The school provide clean water to pupils 64
(41%)
52
(34%)
5
(3%)
12
(8%)
22
(14%)
8. The school provide food to pupils 53
(34%)
75
(49%)
5
(3%)
14
(9%)
8
(5%)
9. The school provide a good classrooms for better learning
environment to pupils
70
(45%)
61
(39%)
8
(5%)
8
(5%)
8
(5%)
10. The school have good toilets/latrines for pupils 94
(61%)
40
(26%)
5
(3%)
8
(5%)
8
(5%)
Source: Data from field
Key: SD= Strongly Disagree; D= Disagree; NS=Not Sure; A=Agree, SA=Strongly Agree
According to results in Table 4.5, the majority respondents opposed all the 10 items on
primary education and service delivery compared to those who consented and those that
were not sure. The percentages which opposed the statements ranged from 66% to 87%
while those that were not sure ranged between 3% and 8% and those that opposed were
between 10% and 27%. This shows that the majority respondents held the view that that
schools did not have enough classrooms for the pupils, the number of pupils per teacher was

50
low and school did not provide enough reading materials such as textbooks to pupils. In
addition, teachers were always in class to teach pupils, school's education services were not
easily accessed and schools did not provide adequate time for children to learn including
clean water, enough food to pupils, better learning environment and good toilets/latrines for
pupils.
Thus, after establishing the views of respondents on each variable under objective one, the
researcher used inferential statistics to test the first hypothesis whether public participation
in program planning affected primary education service delivery. Findings are presented in
section 4.2.3.
4.2.3 Testing first hypothesis
The first null hypothesis stated, “Public participation in program planning has no significant
positive effect on primary education service delivery in selected primary schools in
Bugambe Sub County” while the first alternative hypothesis stated, “Public participation in
program planning has a significant positive effect on primary education service delivery in
selected primary schools in Bugambe Sub County”. The researcher used Spearman rank
order correlation coefficient (rho) to determine the strength of the relationship between
public participation in program planning and the primary education service delivery. The
coefficient of determination was employed to establish the effect of public participation in
program planning on the primary education service delivery. The significance of the
coefficient (p) was employed to test the hypotheses through comparing p to the level of
significance at 0.05. This procedure was used to test other hypotheses; hence lengthy
introduction was not repeated in the subsequent sections of testing hypothesis. Table 4.6
shows results from the first hypotheses.

51
Table 4.6: Correlation matrix for public participation in program planning and
primary education service delivery
Public participation in program planning
Primary education service
delivery rho = .323
rho2 = .104
P=.000
n=155 Source: Field data
Findings show that there was a weak positive correlation (rho = .323) between public
participation in program planning and primary education service delivery. The coefficient of
determination, which is a square of the correlation coefficient (rho2 = .104) was calculated
and expressed as a percentage in order to determine the variation in primary education
service delivery due to public participation in program planning. Thus, findings show that
public participation in program planning accounted for 10.4% variance in primary education
service delivery. The findings were tested to establish the level of significance (p) and it is
indicated that level of significance of the correlation (p = .000) which is below the
recommended level of significance at 0.05. Therefore, there was a significant effect. This the
null hypothesis, “Public participation in program planning has no significant positive effect
on primary education service delivery in selected primary schools in Bugambe Sub County”
was rejected while alternative hypothesis “Public participation in program planning has a
significant positive effect on primary education service delivery in selected primary schools
in Bugambe Sub County” was accepted.
These findings imply that the weak correlation means that a change in public participation in
program planning was related to a small change in primary education service delivery. The
positive nature of the correlation signified that the change in public participation in program
planning and primary education service delivery was in the same direction whereby better
public participation in program planning was related to better primary education service
delivery and poor public participation in program planning was related to poor primary
education service delivery.

52
A regression analysis was further conducted to determine the effect of the dimensions of
public participation in program planning (participation in decision making and participation
in problem identification) on primary education service delivery. Findings are presented in
Table 4.7, accompanied with an analysis and interpretation.
Table 4.7: Effect of dimensions of public participation in program planning on primary
education service delivery
Regression Statistics
Multiple R .449
R Square .202
Adjusted R Square .191
Standard Error 7.736
Observations 155
ANOVA
df SS MS F Sig F
Regression 2 2298.81 1149.41 19.21 .000
Residual 152 9095.94 59.84
Total 154 11394.75
Coefficients Standard Error t Stat P-value
Intercept 24.95 2.49 10.03 .000
Participation in decision making .80 .14 5.56 .000
Participation in problem identification -.10 .19 -.55 .583
Source: Data from field
Findings in Table 4.7 show a moderate linear relationship (Multiple R = .449) between the
combination of dimensions of public participation in program planning (participation in
decision making and participation in problem identification) and primary education service
delivery. Going by the adjusted R Square, it is shown that the combination of dimensions of
public participation in program planning (participation in decision making and participation
in problem identification) account for 19.1% variance in primary education service delivery.
These findings were subjected to an ANOVA test, which showed that the significance (Sig F
= .000) of the Fishers ratio (F = 19.21) was less than the critical significance at .05. Hence,
the findings were accepted.
53
The coefficients findings show that only participation in decision-making singularly had a
significant effect on primary education service delivery because the significant p-value (p-
value = .000) was less than the critical significance at 0.05. Participation in problem
identification did not significantly affect primary education service delivery given that the
significant p-value (p-value = .583) was greater than the critical significance at 0.05.
4.3 Public Participation in Program Implementation and Primary Education
Service Delivery
Before testing hypothesis two; the researcher presented descriptive statistics relating to
public participation in program implementation which were presented, analyzed and
interpreted. Results are presented in the next subsection.
4.3.1 Descriptive statistics on public participation in program implementation
The researcher presented to respondents eight items about public participation in program
implementation. They indicated their level of agreement or disagreement using a five-point
likert scale as indicated in Table 4.8. The analysis and interpretation follows the presentation
of findings.

54
Table 4.8: Findings about public participation in program implementation
Items about participation in resource mobilization SD D NS A SA
1. The community of schools is informed about the resource
mobilization for the school activities
30
(19%)
75
(49%)
5
(3%)
14
(9%)
31
(20%)
2. The community of schools is consulted about the resource
mobilization for the school activities
36
(23%)
65
(42%)
5
(3%)
21
(14%)
28
(18%)
3. The community of schools is involved in actual resource
mobilization for the school activities
52
(34%)
64
(40%)
4
(3%)
15
(10%)
20
(13%)
4. The community of schools is empowered in the resource
mobilization for the school activities
45
(29%)
69
(45%)
5
(3%)
24
(15%)
12
(8%)
Items about community implementation
commitment
SD D NS A SA
5. School community members have been committed to
contributing financially to school activities
34
(22%)
78
(50%)
6
(4%)
11
(7%)
26
(17%)
6. School community members have been committed to
contributing materially to school activities
33
(21%)
71
(46%)
6
(4%)
22
(14%)
23
(15%)
7. School community members have been committed to
contributing morally to school activities
49
(32%)
62
(39%)
4
(3%)
19
(12%)
21
(14%)
8. School community members have been committed to help
their children with school requirement
64
(41%)
56
(36%)
7
(5%)
19
(12%)
9
(6%)
Source: Data from field
Key: SD= Strongly Disagree; D= Disagree; NS=Not Sure; A=Agree, SA=Strongly Agree
Participation in resource mobilization
According to results in Table 4.8, the majority respondents opposed all the items on
participation in resource mobilization (items 1 to 4) compared to those who consented and
those that were not sure. The percentages of respondents who opposed the statements ranged
from 65% to 74% while those that were not sure constituted 3% and those that consented
were between 23 to 32%. This shows that the majority respondents held the view that the
community of schools was not informed and consulted about the resource mobilization for
the school activities, involved in actual resource mobilization for the school activities and
empowered in the resource mobilization for the school activities.
Community implementation commitment
According to results in Table 4.8, the majority respondents opposed four items on
community implementation commitment (items 5 to 8) compared to those who consented
and those that were not sure. The percentages of respondents who opposed the statements
ranged from 65% to 74% while those that were not sure who ranged between 3% and 5%

55
and those that consented were between 18% and 29%. This shows that the majority
respondents held the view that school community members were not committed to
contributing financially, materially and morally to school activities and were not committed
to help their children with school requirement.
Interview findings
Interview findings shade some light on how the community participated in implementing the
school. For example, when the Key Informants were asked the extent the community
participated in implementation of the school activities, Key Informant X reported
The community participates in collecting local materials. It was easier to collect
materials than contribute money due to poverty and ignorance. Sometimes the local
community contributes materials for construction of classroom blocks… contributes
sand, stones, bricks, money, or physical labor (Interview with Key Informant X, 6th
November 2015)”.
The community acts as the main witness to all important ceremonies and functions which
take place at schools. Key Informant Y reported, “The community is always invited to attend
meetings and school functions such as speech days, school open days, music festivals, games
and sports competitions to witness and evaluate school performance (Interview with Key
Informant Y, 7th November 2015)”.
However, public participation is also limited by some factors which include ignorance,
illiteracy as well as political interference. Key Informant Z said:
Some members of the community are illiterate and do not know the value of
education, hence withdraw children from school. In addition, politicians interfere in
school management and discourage the local community from participating in some
programme for example contributing money towards construction of classrooms and
paying for children to have lunch at school (Interview with Key Informant Z, 8th
November 2015).
The local people participation in development of the primary school is very essential to
improve education. However, community participation is still very low. There is low turn-up
of the local people to involve themselves in development processes. The community does
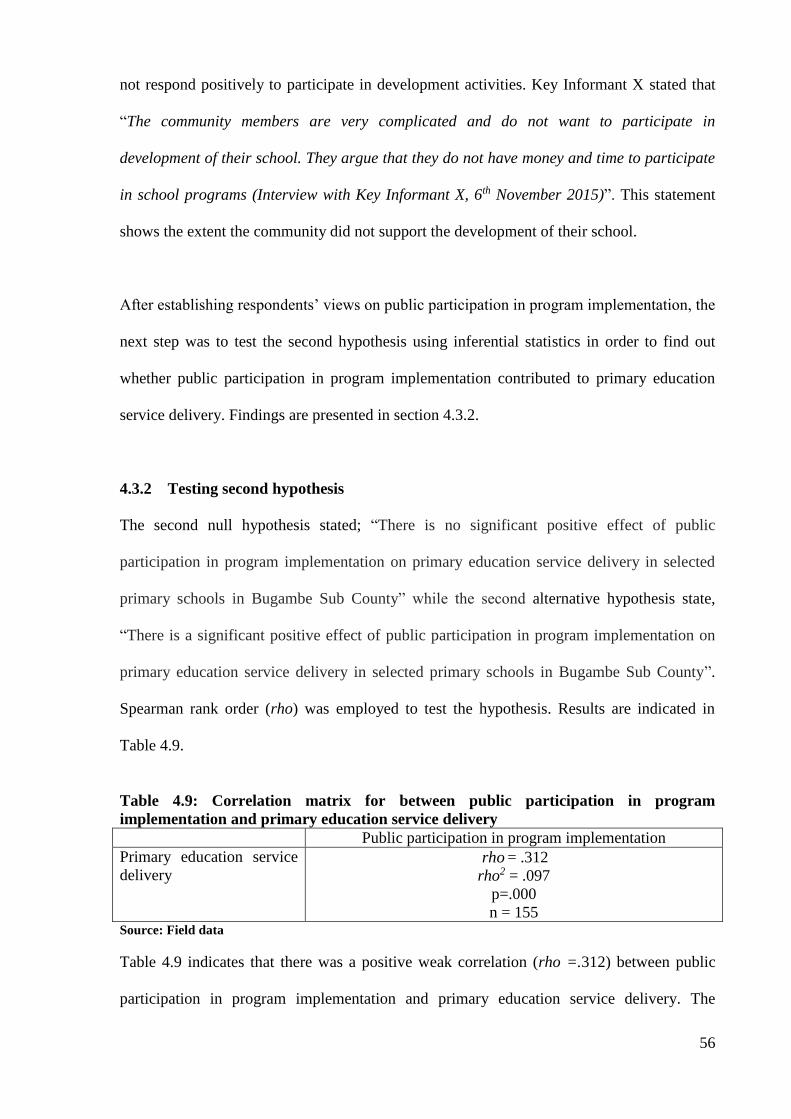
56
not respond positively to participate in development activities. Key Informant X stated that
“The community members are very complicated and do not want to participate in
development of their school. They argue that they do not have money and time to participate
in school programs (Interview with Key Informant X, 6th November 2015)”. This statement
shows the extent the community did not support the development of their school.
After establishing respondents’ views on public participation in program implementation, the
next step was to test the second hypothesis using inferential statistics in order to find out
whether public participation in program implementation contributed to primary education
service delivery. Findings are presented in section 4.3.2.
4.3.2 Testing second hypothesis
The second null hypothesis stated; “There is no significant positive effect of public
participation in program implementation on primary education service delivery in selected
primary schools in Bugambe Sub County” while the second alternative hypothesis state,
“There is a significant positive effect of public participation in program implementation on
primary education service delivery in selected primary schools in Bugambe Sub County”.
Spearman rank order (rho) was employed to test the hypothesis. Results are indicated in
Table 4.9.
Table 4.9: Correlation matrix for between public participation in program
implementation and primary education service delivery
Public participation in program implementation
Primary education service
delivery rho = .312
rho2 = .097
p=.000
n = 155 Source: Field data
Table 4.9 indicates that there was a positive weak correlation (rho =.312) between public
participation in program implementation and primary education service delivery. The
57
coefficient of determination ( rho 2 = .097) shows that public participation in program
implementation accounted for 9.7% variance in primary education service delivery. The
findings were tested to establish the level of significance (p) and it is indicated that level of
significance of the correlation (p=.000) which is below the recommended level of
significance; 0.05. Therefore, there was a significant effect. From the results obtained, the
null hypothesis; “There is no significant positive effect of public participation in program
implementation on primary education service delivery in selected primary schools in
Bugambe Sub County” was rejected while the alternative hypothesis “There is a significant
positive effect of public participation in program implementation on primary education
service delivery in selected primary schools in Bugambe Sub County” was accepted.
The weak correlation implies that a change in public participation in program
implementation was related to a small change in primary education service delivery. The
positive nature of the correlation signifies that a change in public participation in program
implementation and primary education service delivery was in the same direction whereby
better public participation in program implementation was related to better primary
education service delivery and vice versa.
The coefficients findings show that only participation in resource mobilization singularly
had a significant effect on primary education service delivery because the significant p-value
(p-value = .000) was less than the critical significance at 0.05. Participation in needs
assessment did not significantly affect primary education service delivery given that the
significant p-value (p-value = .746) was greater than the critical significance at 0.05.
A regression analysis was further conducted to determine the effect of the dimensions of
public participation in program implementation (participation in needs assessment and

58
participation in resource mobilization) on primary education service delivery. Findings are
presented in Table 4.10, accompanied with an analysis and interpretation.
Table 4.10: Effect of dimensions of public participation in program implementation on
primary education service delivery
Regression Statistics
Multiple R .504
R Square .254
Adjusted R Square .244
Standard Error 7.477
Observations 155
ANOVA
df SS MS F Sig F
Regression 2 2896.84 1448.42 25.91 .000
Residual 152 8497.91 55.91
Total 154 11394.75
Coefficients Standard Error t Stat P-value
Intercept 24.83 2.23 11.13 .000
Participation in needs assessment .07 .22 .32 .746
Participation in resource mobilization 1.04 .20 5.10 .000
Source: Data from field
Findings in Table 4.10 show a moderate linear relationship (Multiple R = .504) between the
combination of dimensions of public participation in program implementation (participation
in needs assessment and participation in resource mobilization) and primary education
service delivery. Going by the adjusted R Square, it is shown that the combination of
dimensions of public participation in program implementation (participation in needs
assessment and participation in resource mobilization) account for 24.4% variance in
primary education service delivery. These findings were subjected to an ANOVA test, which
showed that the significance (Sig F = .000) of the Fishers ratio (F = 25.91) was less than the
critical significance at .05. Hence, the findings were accepted.
The coefficients findings show that only participation in resource mobilization singularly
had a significant effect on primary education service delivery because the significant p-value
(p-value = .000) was less than the critical significance at 0.05. Participation in needs
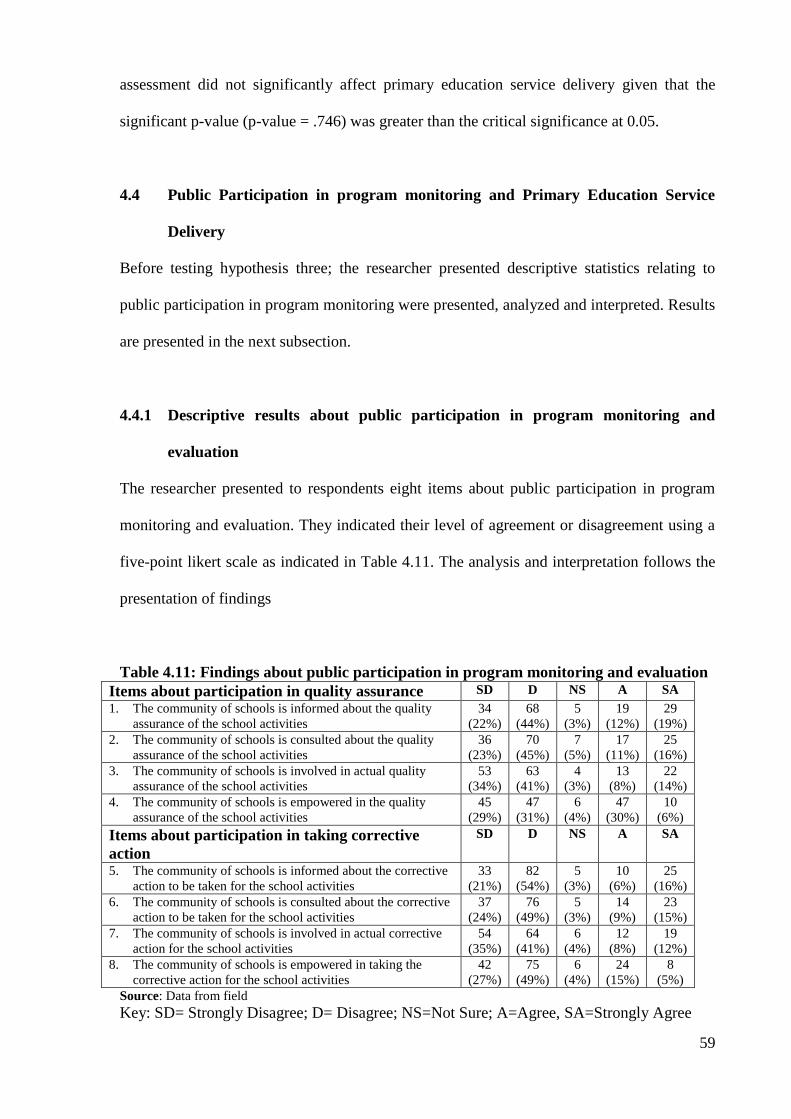
59
assessment did not significantly affect primary education service delivery given that the
significant p-value (p-value = .746) was greater than the critical significance at 0.05.
4.4 Public Participation in program monitoring and Primary Education Service
Delivery
Before testing hypothesis three; the researcher presented descriptive statistics relating to
public participation in program monitoring were presented, analyzed and interpreted. Results
are presented in the next subsection.
4.4.1 Descriptive results about public participation in program monitoring and
evaluation
The researcher presented to respondents eight items about public participation in program
monitoring and evaluation. They indicated their level of agreement or disagreement using a
five-point likert scale as indicated in Table 4.11. The analysis and interpretation follows the
presentation of findings
Table 4.11: Findings about public participation in program monitoring and evaluation
Items about participation in quality assurance SD D NS A SA
1. The community of schools is informed about the quality
assurance of the school activities
34
(22%)
68
(44%)
5
(3%)
19
(12%)
29
(19%)
2. The community of schools is consulted about the quality
assurance of the school activities
36
(23%)
70
(45%)
7
(5%)
17
(11%)
25
(16%)
3. The community of schools is involved in actual quality
assurance of the school activities
53
(34%)
63
(41%)
4
(3%)
13
(8%)
22
(14%)
4. The community of schools is empowered in the quality
assurance of the school activities
45
(29%)
47
(31%)
6
(4%)
47
(30%)
10
(6%)
Items about participation in taking corrective
action
SD D NS A SA
5. The community of schools is informed about the corrective
action to be taken for the school activities
33
(21%)
82
(54%)
5
(3%)
10
(6%)
25
(16%)
6. The community of schools is consulted about the corrective
action to be taken for the school activities
37
(24%)
76
(49%)
5
(3%)
14
(9%)
23
(15%)
7. The community of schools is involved in actual corrective
action for the school activities
54
(35%)
64
(41%)
6
(4%)
12
(8%)
19
(12%)
8. The community of schools is empowered in taking the
corrective action for the school activities
42
(27%)
75
(49%)
6
(4%)
24
(15%)
8
(5%)
Source: Data from field
Key: SD= Strongly Disagree; D= Disagree; NS=Not Sure; A=Agree, SA=Strongly Agree
60
Participation in quality assurance
According to results in Table 4.11, the majority respondents opposed four items on
participation in quality assurance (items 1 to 4) compared to those who consented and those
that were not sure. The percentages of respondents who opposed the statements ranged from
60% to 75% while those that were not sure who ranged between 3% and 5% and those that
consented were between 22% and 36%. This shows that the majority respondents held the
view that most of the respondents were of the view that the community of schools was not
informed and consulted about the quality assurance of the school activities nor was it
involved in actual quality assurance and empowered in the quality assurance of the school
activities.
Participation in taking corrective action
According to results in Table 4.11, the majority respondents opposed four items on
corrective action (items 5 to 8) compared to those who consented and those that were not
sure. The percentages of respondents who opposed the statements ranged from 73% to 76%
while those that were not sure who ranged between 3% and 4% and those that consented
were between 20% and 24%. This shows that the majority respondents held the view that the
community of schools was not informed and consulted about the corrective action to be
taken for the school activities. In addition, it was not involved in actual corrective action for
the school activities and empowered in taking the corrective action for the school activities.
Interview findings
In support of the findings obtained using the questionnaire were interview findings. For
example, when asked whether community participated in monitoring and evaluation of
school activities, the Key Informant X responded as follows, “It is only the chairperson of
the SMC who is vigilant and actually comes to monitor to see what is on the ground. This is

61
because he is someone who is more enlightened compared to others (Interview with Key
Informant X, 6th November 2015)”.
In addition, Key Y revealed how the inspectors monitor school activities and how other
stakeholders were involved in monitoring as follows:
The Inspector of schools makes choices about the schools to monitor based on the
available resources and location. The involvement of other stakeholders, such as
sub-county leaders, school management committees and political leaders in school
inspection is limited. The motorcycles inspectors use are old and are always
complaining of lack of facilitation. Failure to inspect schools accounts for poor
teaching and learning in our schools (Interview with Key Informant Y, 7th November
2015).
Thus, the poor monitoring of schools by schools’ inspectors did not keep school managers
vigilant but as well not focused on targets and priorities. The number of schools compared to
inspectors available made it hard to offer technical support to head teachers, teachers as well
as conduct routine monitoring. School inspectors are hence not capable of monitoring and
supervising all schools. Key informant Z reported, “They are very few inspectors compared
to the existing schools; hence some rural schools can spend a whole year without seeing an
inspector. The district should recruit more inspectors so that schools are inspected
effectively (Interview with Key Informant Z, 8th November 2015)”. Thus, findings show that
the community participated in monitoring and evaluation of school activities. However,
where it necessitates technical capabilities, the community did not participate in monitoring
and evaluation of school activities.
After establishing respondents’ views on public participation in program monitoring, the
next step was to test the second hypothesis using inferential statistics. Findings are presented
in section 4.4.2.
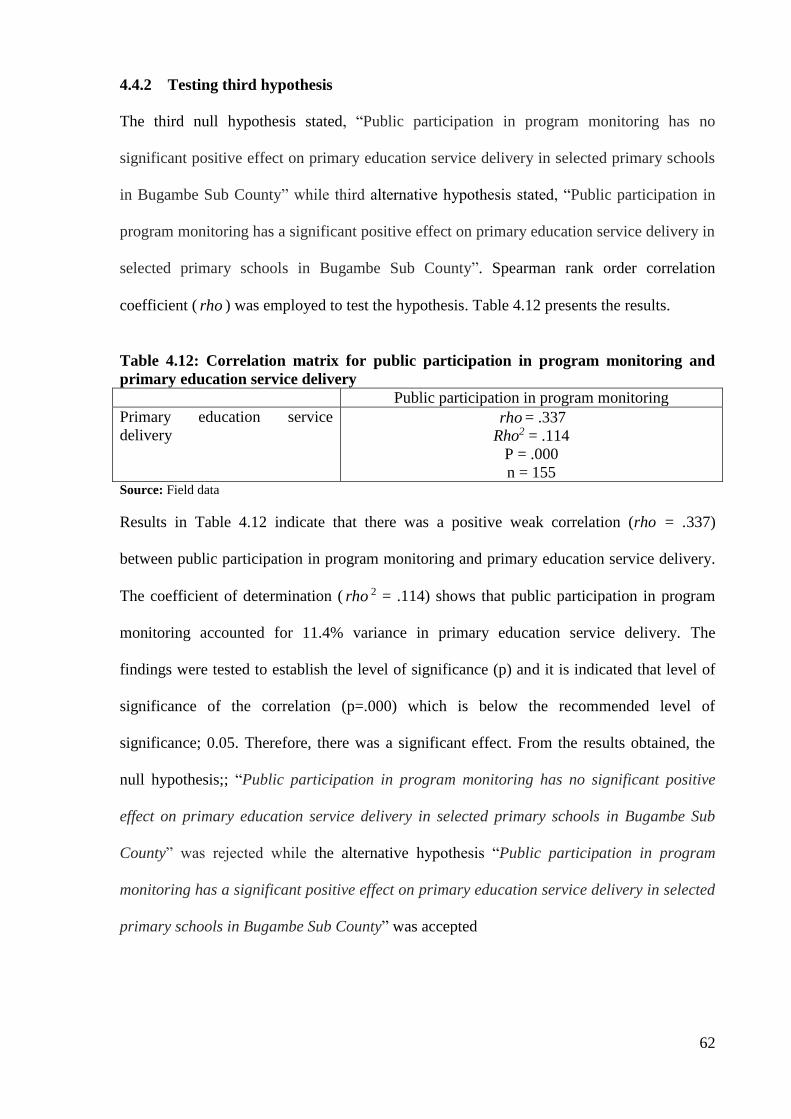
62
4.4.2 Testing third hypothesis
The third null hypothesis stated, “Public participation in program monitoring has no
significant positive effect on primary education service delivery in selected primary schools
in Bugambe Sub County” while third alternative hypothesis stated, “Public participation in
program monitoring has a significant positive effect on primary education service delivery in
selected primary schools in Bugambe Sub County”. Spearman rank order correlation
coefficient ( rho ) was employed to test the hypothesis. Table 4.12 presents the results.
Table 4.12: Correlation matrix for public participation in program monitoring and
primary education service delivery
Public participation in program monitoring
Primary education service
delivery rho = .337
Rho2 = .114
P = .000
n = 155 Source: Field data
Results in Table 4.12 indicate that there was a positive weak correlation (rho = .337)
between public participation in program monitoring and primary education service delivery.
The coefficient of determination ( rho 2 = .114) shows that public participation in program
monitoring accounted for 11.4% variance in primary education service delivery. The
findings were tested to establish the level of significance (p) and it is indicated that level of
significance of the correlation (p=.000) which is below the recommended level of
significance; 0.05. Therefore, there was a significant effect. From the results obtained, the
null hypothesis;; “Public participation in program monitoring has no significant positive
effect on primary education service delivery in selected primary schools in Bugambe Sub
County” was rejected while the alternative hypothesis “Public participation in program
monitoring has a significant positive effect on primary education service delivery in selected
primary schools in Bugambe Sub County” was accepted

63
Thus, the weak correlation implies that a change in public participation in program
monitoring was related to a small change in primary education service delivery. The positive
nature of the correlation signified that the change in public participation in program
monitoring and primary education service delivery was in the same direction whereby better
public participation in program monitoring was related to better primary education service
delivery and vice versa.
A regression analysis was further conducted to determine the effect of the dimensions of
public participation in program monitoring and evaluation (participation in quality assurance
and participation in taking corrective action) on primary education service delivery. Findings
are presented in Table 4.13, accompanied with an analysis and interpretation.
Table 4.13: Effect of dimensions of public participation in program monitoring and
evaluation on primary education service delivery
Regression Statistics
Multiple R .600
R Square .360
Adjusted R Square .352
Standard Error 6.926
Observations 155
ANOVA
df SS MS F Sig F
Regression 2.00 4102.38 2051.1
9
42.75 .000
Residual 152.00 7292.37 47.98
Total 154.00 11394.75
Coefficient
s
Standard
Error
t Stat P-
value
Intercept 17.65 2.39 7.39 .000
Participation in quality assurance 1.21 0.16 7.80 .000
Participation in taking corrective
action
0.33 0.14 2.26 .025
Source: Data from field
Findings in Table 4.13 show a moderate linear relationship (Multiple R = .600) between the
combination of dimensions of public participation in program monitoring and evaluation
(participation in quality assurance and participation in taking corrective action) and primary

64
education service delivery. Going by the adjusted R Square, it is shown that the combination
of dimensions of public participation in program monitoring and evaluation (participation in
quality assurance and participation in taking corrective action) account for 35.2% variance in
primary education service delivery. These findings were subjected to an ANOVA test, which
showed that the significance (Sig F = .000) of the Fishers ratio (F = 42.75) was less than the
critical significance at .05. Hence, the findings were accepted.
The coefficients findings show that both participation in quality assurance and participation
in taking corrective action singularly had a significant effect on primary education service
delivery because the significant p-values (p-value = .000 and -value = .025) were less than
the critical significance at 0.05. Participation in quality assurance affected primary education
service delivery more than participation in taking corrective action did because it had the
least significant p-value.

65
CHAPTER FIVE
SUMMARY, DISCUSSION, CONCLUSION AND RECOMMENDATIONS
5.0 Introduction
This chapter presents the summary of study findings, discussion, conclusions and
recommendations based on objectives of the study.
5.1 Summary
5.1.1 Public participation in program planning and primary education service
delivery
The first objective of this study was “To find out how public participation in program
planning affects primary education service delivery in selected primary schools in Bugambe
Sub County”. The research question was, “How has public participation in program planning
affected primary education service delivery in selected primary schools in Bugambe Sub
County?” The study tested the hypothesis, “Public participation in program planning has a
significant positive effect on primary education service delivery in selected primary schools
in Bugambe Sub County” which was accepted. Findings revealed a positive weak
relationship between public participation in program planning and primary education service
delivery whereby better public participation in program planning was related to better
primary education service delivery. On the other hand, poor public participation in program
planning was related to poor primary education service delivery. Public participation in
program planning accounted for 10.4% variance in primary education service delivery. A
further analysis using a regression established a moderate linear relationship between
participation in decision making, participation in problem identification and primary
education service delivery. Findings further revealed that participation in decision making
and participation in problem identification accounted for 19.1% variance in primary
education service delivery. However, only participation in decision-making singularly had a
66
significant effect on primary education service delivery. Participation in problem
identification did not significantly affect primary education service delivery. Interview
findings collaborated the quantitative findings in that they revealed that despite some school
stakeholders participated in the planning, other stakeholders were rarely involved in the
primary school planning processes due lack of time, limited commitment to the school, and
inadequate knowledge about school management.
5.1.2 Public participation in program implementation and primary education service
delivery
The second objective of this study was “To examine how public participation in program
implementation affects primary education service delivery in selected primary schools in
Bugambe Sub County”. The research question was, “What has been the effect of public
participation in program implementation on primary education service delivery in selected
primary schools in Bugambe Sub County?” The hypothesis were the tested stated, “There is
a significant positive effect of public participation in program implementation on primary
education service delivery in selected primary schools in Bugambe Sub County” which was
accepted. This was because the study established a weak positive relationship between
public participation in program implementation and primary education service delivery
whereby better public participation in program implementation was related to better primary
education service delivery. On the other hand, poor public participation in program
implementation was related to poor primary education service delivery. Public participation
in program implementation accounted for 9.7% variance in primary education service
delivery. A further analysis using a regression established a moderate linear relationship
between participation in needs assessment, participation in resource mobilization and
primary education service delivery. Participation in needs assessment and participation in
resource mobilization accounted for 24.4% variance in primary education service delivery.

67
However, only participation in resource mobilization singularly had a significant effect on
primary education service delivery. Participation in needs assessment did not significantly
affect primary education service delivery. Interview findings also showed that the
community acted as key witness to all important functions and ceremonies that take place at
schools. Furthermore, interview findings revealed that the community was always invited to
attend meetings and school functions such as speech days, school open days, music festivals,
games and sports competitions to witness and evaluate school performance. However,
community involvement is also limited by certain factors including poverty, illiteracy,
ignorance and political interference.
5.1.3 Public participation in program monitoring and primary education service
delivery
The third objective of this study was “To assess how public participation in program
monitoring affects primary education service delivery in selected primary schools in
Bugambe Sub County”. The research question was, “How does public participation in
program monitoring affect primary education service delivery in selected primary schools in
Bugambe Sub County?” The hypotheses tested stated, “Public participation in program
monitoring has a significant positive effect on primary education service delivery in selected
primary schools in Bugambe Sub County” which was accepted. This was because findings
revealed a weak positive relationship between public participation in program monitoring
and primary education service delivery whereby better public participation in program
monitoring was related to better primary education service delivery. On the other hand, poor
public participation in program monitoring was related to poor primary education service
delivery. Public participation in program monitoring accounted for 11.4% variance in
primary education service delivery. A further analysis using a regression established a
moderate linear relationship between participation in quality assurance, participation in

68
taking corrective action and primary education service delivery. Participation in quality
assurance and participation in taking corrective action accounted for 35.2% variance in
primary education service delivery. Both participation in quality assurance and participation
in taking corrective action singularly had a significant effect on primary education service
delivery. However, participation in quality assurance affected primary education service
delivery more than participation in taking corrective action did because it had the least
significant p-value. Interview findings revealed that the poor monitoring of schools by
inspectors of schools did not keep school managers vigilant, but also not focused on
priorities and targets. The number of schools, compared to available inspectors made it
difficult to offer technical support to teachers, head teachers, and conduct routine
monitoring.
5.2 Discussion
5.2.1 Public participation in program planning and primary education service
delivery
The study centred around the participation of key stakeholders in the process of school
program planning, that it; school management committees, community members, pupils and
school inspectors. The stakeholders are responsible for a range of duties and responsibilities
during the process of school program planning. This study categorized stakeholders into
three separate groups with different duties. These included the professionals inspectors who
acted as enforcers/regulators, volunteers (school management committees) who acted as
custodians of moral guidance, school values and consumers (Community and pupils) who
were recipients of education services. The categories appear to elucidate the varying levels
of public participation in several stages as well as the duties they play in planning. The
reviewed literature showed that stakeholders’ participation in planning creates a sense of

69
commitment, ownership as well as continuation of education service delivery (Hargreaves &
Hopkins, 2001).
The study established although there was public participation in some aspects of school
planning, the some school stakeholders did not participate in the decision-making of schools
and did not work together with officials to make decisions of schools. Furthermore, it was
established that some school stakeholders were not involved from the beginning rather after
decisions were made, did not have a clear idea of making decisions for the school program,
did not generate ideas for the school program and did not participate in organizing ideas into
goals for the of the school program. Mubyazi abd Hutton (2003) argued that lack of or low
public participation in program planning occurs due to several causes or factors. These
factors include challenges in the choice if appropriate mix of representatives to make sure
that public views are integrated in decision making and a lack of a lack of regular approach
on the way to involve such communities. The latter partly occurs because of lacking
knowledge amongst the personnel in charge of planning.
The levels of participation in school program planning of varying actors vary according to
responsibilities and roles. The involvement of school management committees in school
program planning depended on the commitment of members to serve the community.
Schools have passive and active members who determine the extent to which members
participated in program planning. Pupils rarely or never participated in main stages of
improvement planning due to the fact that they were more recipients of activities that are
planned that implementers. Sharing duties among stakeholders, pupils inclusive was part of
distributed leadership which enhances efficient primary education service delivery
(Mugenyi, 2015). The participation of pupils in improvement planning is part of

70
participatory planning that aids them to comprehend achievements, school priorities as well
as challenges.
Findings from this study showed that proper working relationship between other
stakeholders and teachers outside and within the school are critical in the managing the
process of school program planning. However, certain schools whose working relationship
with governing body, school inspectors as well as politicians experienced challenges in
management of program planning. This study affirmed findings from previous studies which
reealed that friendly and collegiality working relationships with stakeholders are important
factors in the process of school program planning (Hargreaves & Hopkins, 2001; IOB, 2008;
MacGilchrist & Mortimore, 2007).
One of the reasons why there was a positive relationship between public participation in
program planning and primary education service delivery can be based on Lewis and Hinton
(2008) observation that public participation in planning offers a framework and process for
the public to explore core values, establish a future goal as well as work towards attaining
that goal. Findings of this study support Bamaberger (2001) who observed that public
participation in school program planning can aid the who community by creating positive
change in education service delivery. This is because it empowers the community in running
of school activities. The community becomes more aware of school activities and has the
equipment to provide feedback to change in school programs in an efficient way. It leads to
informed decision-making among various school stakeholders, puts together fragmented
efforts, minimizes duplication, enables efficient resource utilization and identifies and solves
problems of the school. It identifies the stakeholders' priorities for the use of school
resources in an effective manner.

71
5.2.2 Public participation in program implementation and primary education service
delivery
This study established that most school stakeholders were not informed and consulted about
the resource mobilization for the school activities, involved in actual resource mobilization
for the school activities and empowered in the resource mobilization for the school activities.
Thus, given the positive relationship between school program implementation and primary
education service delivery established in this study, these shortcomings in public
participation in school program implementation compromised primary education service
delivery.
It was established that inspectors of schools, community and school management
committees were more involved in the implementation of school programs compared to
other stakeholders. The community members and pupils (as consumers) were least involved
in the implementation of school programs. This suggests that enforcers and implementers
were accountable to local community members. These findings were in agreement with
previous research carried out in the UK by Giles (2005) which established that pupils were
least involved while teachers and head teachers were usually involved. The involvement of
school management committees in implementation of school programs varied. Reasons
similar to those found in England accounted for low participation of some of the school
stakeholders in Bugambe Sub County, like personal attitude, community path, lack of
confidence and knowledge of the planning process, lack of training and language barriers
(MacGilchrist & Mortimore, 2007).
The findings of this study support the argument extended by authors that the failure to
involve people in the implementation and design of school programs leads to limited success
of several school initiatives (Cernea, 2001; FAO, 2000; Hinchcliffe et al., 2005; Kottak,

72
2001; Oakley, 2001; Uphoff, 2001; World Bank, 2008). Public participation in school
program implementation makes sure that there is reflection of community needs and
priorities in school activities and motivates communities into operating and maintaining
school activities after school completion (Mwesigey, 2011).
The positive relationship between public participation in school program implementation
and primary education service delivery established in this study support Abasiekong (2002)
who observed that public participation in school program implementation reduce delays in
execution of school activities. This is because public participation in school program
implementation can be used to increase the agreement and understanding of cost sharing
(physical and financial contribution). In addition, public participation may be used to
stimulate agreement and cooperation as well as prevent conflicts between different actors
(Thwala, 2010).
The reason why a positive relationship exists between public participation in school program
implementation and primary education service delivery is that public participation gives
people a chance to initiate and devise strategies to enhance their situation. Empowerment is a
process through which communities or/and individuals gain self-esteem, confidence, power
and understanding necessary to articulate their concerns to make sure that action is taken to
address them and more widely obtain control over their lives (Afsar, 2007).
Public participation in school program implementation plays a role of improving
accountability, which contributes positively to primary education service delivery
(Finsterbusch & Warren 2009). It involves creating increased transparency from community
involvement in the school program implementation. According to Narayan (2005),
community involvement in school program implementation ensures that school programs
73
implemented respond to the needs of the community. It also contributes towards community
ownership of school programs. Public participation in school program implementation in the
community is a means of mobilizing human and material resources - all directed to
improving primary education service delivery.
Findings of this study support a study carried out by Akpomuvie (2010) which established
that that school programs managed and executive by the community to outlive those
imposed by a sponsor with no or limited public participation. Success indicator for the
realization of school programs is high degree of community involvement which only can be
assured when the initiative of the people is sufficiently stimulated to arouse their enthusiasm
and wholehearted involvement in school program implementation (Anyanwu, 2002). The
rationale is that if those directly concerned are properly engaged in implementation of school
programs, there is an assurance of remarkable success.
5.2.3 Public participation in program monitoring and primary education service
delivery
The positive relationship between public participation in school program monitoring and
primary education service delivery established in this study supports Khwaja (2003) who
observed that studies have found that participation of the stakeholders in monitoring and
evaluation school programs improves program quality. It enhances a sense of stakeholders’
ownership of school program activities and eventually promotes the possibility that school
program activities as well as their impact could be sustainable.
The limited number of school inspectors affected monitoring of schools and support
supervision to enhance the quality of service delivery. This shows that school inspectors
offer limited support and guidance during the process of monitoring school activities which

74
results into the failure to regulate certain school programs. In line with IOB (2008)
inadequate funds and inspectorate staff limit support services and school supervision.
Consequently some schools are hardly inspected. However, where school inspection is
carried out, it works as a catalyst to improve the school in education service delivery.
The following are the reasons that may explain why this study established a positive
relationship between public participation in school program monitoring and primary
education service delivery. According to Aubel (2009), public participation in school
program monitoring ensures that school activities are relevant to students. Aubel (2009)
further argued that it leads to effective school program implementation and enhances
stakeholders’ understanding of stakeholders of school program processes and strategy; what
does not work, what works and why. The UNDP (2007) argued that such a positive
relationship exists because public participation in school program monitoring contributes
towards improved collaboration and communication between program actors who work at
different levels of program implementation, promotes effective resource allocation and
enhances accountability to stakeholders.
Other reasons that can explain the positive relationship between public participation in
school program monitoring and education service delivery established in this study include
the following. Some would consider public participation in school program monitoring to be
an ideal form of participation, whereby school stakeholders themselves initiate the
monitoring and play a major role in its implementation. Internally led public participation in
school program monitoring is perceived as contributing to school capacity building and
organizational strengthening (Rubin, 2005). As school stakeholders gain greater control over
the monitoring and evaluation process, internally initiated monitoring and evaluation are also
considered more likely to become sustained and integral part of school activities.

75
Findings of this study revealed that there are efforts to involve the school stakeholders in the
monitoring and evaluation of the school. However, some stakeholders of the school were not
consulted about the corrective action to be taken for the school and were not empowered in
taking the corrective action for the school. Thus, public participation in school program
monitoring and evaluation of the school was compromised. Basing on the positive
relationship between public participation in school program monitoring and primary
education service delivery, then primary education service delivery was also compromised.
The short falls identified in this study about public participation in the monitoring run
contrary to Isham, Narayan and Pritchett (2005) who observed that public participation in
school program monitoring and evaluation should not merely use the stakeholders for data
but also encourages them to voice and express their concerns, realities and the extent to
which a given school program has impacted and improved education service delivery.
The finding about failure to empower some school stakeholders in taking the corrective
action for the school programs runs contrary to the “Principle of Learning”. The concept of
leaning is the main underlying principle of public participation in the monitoring and
evaluation. PRIA (2005) characterized stakeholder participatory evaluation as a process of
collective and individual learning, describing it as an educational experience for several
parties engaged in school development. People became more conscious and aware of their
weaknesses and strength, their visions and wider social realities and perspectives of school
outcomes. This process of learning creates conducive conditions to action and change
leading to empowerment of the school stakeholders in monitoring and evaluation of school
programs.

76
In addition, findings of this study show public participation in school program monitoring
and evaluation did not lead to local capacity building given that the failure to empower the
school stakeholders in taking the corrective action. The process of learning in stakeholder
participation in monitoring and evaluation is considered as a means for capacity building
(Estrella & Gaventa, 2009). Participants engaged in monitoring and evaluation acquire skills
that strengthen their capacities for problem solving, decision making and planning
(Wadsworth, 2001; UPWARD, 2007). Participants acquire greater understanding of several
factors (external and internal) which affect the dynamics and conditions of the schools, the
basis for their failures and successes, and the potential solutions or alternative actions
(Campos & Coupal 2006).
5.3 Conclusions
5.3.1 Public participation in program planning and primary education service
delivery
This study emphasizes the importance of public participation in school program planning as
far as primary education service delivery is concerned. In this study, it was established that
some stakeholders were involved in the planning of the school programs but not in all
aspects. Because of this, primary education service delivery was compromised.
5.3.2 Public participation in program implementation and primary education service
delivery
The study demonstrated the importance of public participation in school program
implementation in that it creates a sense of ownership of school programs amongst
stakeholders. In addition, limited public participation in school program implementation did
not empower some stakeholders to enforce accountability and transparency among people

77
executing school activities. This contributed to wastage of school resources through
unethical behavior.
5.3.3 Public participation in program monitoring and primary education service
delivery
The third research question was answered and the hypothesis was accepted. This was
because the study established a positive relationship between public participation in school
program monitoring and primary education service delivery. This showed that public
participation in school program monitoring plays an important role in primary education
service delivery. Interview findings revealed that public participation in school program
monitoring and evaluation of the school activities contributed to primary education service
delivery but the contribution was not that big.
5.4 Recommendations
5.4.1 Public participation in program planning and primary education service
delivery
Primary school administrators and boards of governors should improve public participation
in school program planning to enhance primary education service delivery. This can be
achieved through involving the school stakeholders in organizing ideas into goals for the
school, informing and consulting the school stakeholders about the problems of the school
activities, involving the school stakeholders in identifying problems of the school, and
avoiding dominance by professionals of the school program plan-making process.
78
5.4.2 Public participation in program implementation and primary education service
delivery
Primary school administrators and boards of governors should improve public participation
in school program implementation to enhance primary education service delivery. This can
be achieved through consulting the school stakeholders about implementation processes and
needs assessment of the school including resource mobilization for the school. In addition,
Primary school administrators and boards of governors should avoid dominance by
professionals in the implementation of the school and inform the school stakeholders about
implementation the school activities.
5.4.3 Public participation in program monitoring and primary education service
delivery
Primary school administrators and boards of governors should improve public participation
in school program monitoring and evaluation to enhance primary education service delivery.
This can be achieved through consulting the school stakeholders about the corrective action
to be taken for the school program activities, empowering the school stakeholders in taking
the corrective action for the school programs.
5.5 Researcher’s Contribution to the Body of Knowledge
Other studies had been conducted in other parts of world about how public participation
affects primary education service delivery but not the context of Bugambe Sub County in
Uganda. Thus, there was no evidence how public participation affected primary education
service delivery in Bugambe Sub County. Moreover, other studies used different dimensions
to measure public participation and primary education service delivery. Therefore, this study
contributes new knowledge to the body of literature by providing evidence of the effect
public participation on primary education service delivery in Bugambe Sub County.

79
5.6 Areas of Further Study
This research sought to establish the extent of and reasons for public participation and non
participation in school program planning, school program implementation, monitoring and
evaluation of school program activities in Bugambe Sub County. However, public
participation is broad and as such, this study did not focus other aspects of public
participation which will need further investigations. Future research studies based more on
qualitative methods than quantitative methods are suggested. More specifically research on
public participation in school sustainably, public participation in problem solving and public
participation in school design are particularly encouraged due to the potential need to
involve the school stakeholders to enhance education service delivery.
5.7 Limitations of the Study
During the course of carrying out the study, some challenges were faced. Subjectivity of
respondents was one of the limitations of this research. Regardless of how carefully tested or
written, each research is vulnerable to varying question interpretation, thus this particular
limitation was recognized and accepted in this study. Looking at the scope of the study,
some of the considered participants were too busy to attend to the research needs of the
study given the nature of their work. Another challenge was related to time. Some
respondents took long to allow to be interviewed and that it is possible that when they later
accepted they could have not provided all the required information.

80
81
REFERENCES
Van der Berg, S., Taylor, S. Gustafsson, M. Spaull, N. & Armstrong, P. (2011). Improving
Education Quality in South Africa. Department of Economics, University of
Stellenbosch.
Abasiekong, E. M. (2002). Mass Participation: An Essentials Element for Rural
Development Programme in Developing Countries. Calabar: Scholar Press.
Afsar, R. (2007). The State of Urban Governance and People’s Participation in Bangladesh,
The Journal of Local Government, Vol. 28, No. 2.
Agnew, C. R. (2009). Commitment theory and typologies, in Reis, H. T. and Sprecher, S. K.,
Eucyclopidia of Human Relationships, 1st ed. California: Sage Publications,
Thousand Oaks, pg. 245-248.
Ahire, S., Golhar, D. & Waller, M. (2007). Development and validation of Implementation
constructs, Decision Sciences, Vol. 27, No. 1, pp 23-56.
Akpomuvie, O. B. (2010). Self-Help as a Strategy for Rural Development in Nigeria: A
Bottom-up Approach. Journal of Alternative Perspectives in the Social Sciences,
2(1):88-111.
Amin E. M. (2005). Social Science Research: Conception, methodology and Analysis.
Makerere University. Kampala
Anyanwu, C. N. (2002). Community Development: The Nigerian Perspective. Ibadan:
Educational Publishers.
Arbel, J. (2004). Participatory Program Evaluation Manual – Involving Program
Stakeholders in the Evaluation Process, Catholic Relief Services, Child Survival and
Technical Support Project, Second Edition, December 2004.
Area Development Management Ltd. (ADM, 2007). Local Development Strategies for
Disadvantaged Areas: Evaluation of the Global Grant in Ireland (2002-2007), A
Report prepared by Trutz Haase, Kieran McKeown and Stephen Rourke.
82
Arora, R. K. (2007). People’s Participation in Development Process. Jaipur: HCM SIPA.
Asnarukhadi, A. S. & Fariborz, A. (2009). People’s Participation in Community
Development: A Case Study in a Planned Village Settlement in Malaysia. World
Rural Observation, 1(2): 45 – 54.
Aubel, J. (2009). Participatory Program Evaluation Manual – Involving Program
Stakeholders in the Evaluation Process, Catholic Relief Services, Child Survival and
Technical Support Project, Second Edition, December 2009.
Bamaberger, M. (2001). The Importance of Community Participation. Public Administration
and Development, 2.
Barnes, M. (2007). Power, Participation and Political Renewal: Case Studies In Public
Participation, Bristol: Policy Ltd.
Bebko, C. P. (2000). Service intangibility and its impact on consumer expectations of service
quality. Journal of Service Marketing, vol. 14, pp. 9-26
Berkowitz, B. (2012). Participatory approaches to planning community interventions. The
Community Tool Box. University of Kansas.
Brady, H. E., Verba, S. & Schlozman, K. L. (2005). Beyond SES: A resource model of
political participation. American Political Science Review, 89, 271–94.
Burns, B., Hambleton, R. & Hoggett, P. (2004). The politics of decentralization. London;
Macmillan.
Burtler, P (2007). When planning, how do you design a community project? Community
Project Design Guidelines for Leaders. Retrieved 2 November 2012 from
http://cec.vcn.bc.ca/ cmp/modules/pd-pd.htm.
Campos, J. & Coupal, F. P. (2006), Participatory Evaluation, Prepared for the UNDP.
Cernea, M. M. (2001). Putting People First: Sociological Variables in Rural Development,
New York: Oxford University Press.

83
Chatty, D. Baas, S. & Fleig, A. (2003). Participatory Processes Towards Co-Management of
Natural Resources in Pastoral Areas of the Middle East: A Training of Trainers
Source Book Based on the Principles of Participatory Methods and Approaches.
FAO, Economic and Social Development Department.
Cheetham, N. (2002). Community participation: What is it? Transitions Community
Participation, Volume 14, No. 3, April 2002.
Cohen, J. & Peterson, S. (2010). Administrative Decentralization: Strategies for Developing
Countries. United States of America, Kumarian Press, Inc.
Creighton, J. L. (2005). The Public Participation Handbook: Making Better Decisions
through Citizen Involvement. Josey-Bass: San Francisco
Cullen, B. (2007). Community Development Fund Review Report, Dublin, Combat Poverty
Agency.
Dewachter, S. (2007). Civil Society Participation in Poverty Reduction Processes: Who is
Getting a Seat at the Pro-Poor Table? Antwerpen, Belgium.
DiCicco-Bloom, B., & Crabtree, B. (2006). The Qualitative Research Interview. Medical
Education , 40 (4), 314-321.
Edwards, M. & Gaventa, J. (2001). Handing over the Stick: The Global Spread of
Participatory Approaches to Development, Global Citizen Action. Boulder: Lynne
Rienner Publishers.
Estrella, M. & Gaventa, J. (2009). Who Counts Reality? Participatory Monitoring And
Evaluation: A Literature Review, IDS Working Paper 70.
Finsterbusch, K. & Warren A., (2009). Beneficiary Participation in Development Projects:
Empirical Test of Popular Theories. Economic Development and Cultural Change.
University of Chicago.
Food and Agriculture Organization (FAO) (2000). Participation in Practice: Lessons from
the FAO People's Participation Programme, Rome: FAO.
84
Food and Agriculture Organization (FAO) (2008). Participation in Practice: Lessons from
the FAO People's Participation Programme, Rome: FAO.
Fraser et al., M. (2006). Bottom up and top down: Analysis of participatory processes for
sustainability indicator identification as a pathway to community empowerment and
sustainable environmental management. Journal of Environmental Management
114,120.
Giele, R., Stone, C. & Vaugeois, N. L. (2006). A Rapid Rural Appraisal of Taylor, British
Columbia “Where Peace and Prosperity Meet". Tourism Research Innovation
Project: Case study. Malaspina University-College.
Giles, C. (2005) School based planning: Are UK schools grasping the strategic initiative?
International Journal of Educational Management, 9(4), 4-7
Glicken, M. D. (2002). Social research: A simple guide. Boston, MA: Allyn and Bacon.
Green, D. & Gerber, A. (2001). Getting Out the Youth Vote: Results from Randomized Field
Experiments.” Report to the Pew Charitable Trusts. Retrieved 28 May 2016 from
http://www.yale.edu/isps/publications/voter.html.
Hanson, M. E. (2008). Educational Decentralization: Issues and Challenges. Occasional
Paper No. 9. Santiago, Chile: Partnership for Educational Revitalization in the
Americas.
Hargreaves, D. H. & Hopkins, D. (2001). The Empowered School: The Management and
Practice of Improvement planning. London: Cassell.
Hernon, P. & Nitecki, D. (2001). Service quality: A concept not fully explored. Library
Trends, 49, 687-708.
Hinchcliffe, F., Guijt, I Pretty, J. N. & Shah. P. (2005). New Horizons: The Economic,
Social and Environmental Impacts of Participatory Watershed Development,
Gatekeeper Series No. 50, London: International Institute for Environment and
Development (IIED): London.

85
Hoffman, R. C. & Hagerty, H. (2004). Top management influence on innovation: effects of
executive characteristics and social culture, Journal of Management, Vol. 19 No. 3,
pp. 549-74.
IOB (2008). Primary Education in Uganda: IOB Impact Evaluation, No. 311, The Hague:
IOB.
Isham, J., Narayan, D. & Pritchett, L. (2005). Does Participation Improve Performance?
Establishing Causality with Subjective Data. World Bank Economic Review, 9, 175-
200.
Kayuza, J. (2013). Participatory Development Management-Uganda Experience. Kampala:
Ministry Of Local Government, Uganda.
Kenny, M. (2008). Participation in Development: The Question, Challenges and Issues.
Unpublished Paper Presented at a Symposium, St Patrick's College, Maynooth, Co
Kildare.
Khwaja, A. I. (2003). A Theory of Participation and Empowerment. Working paper,
Kennedy School of Government, Harvard University.
Kim, W. C. & Mauborgne, R. A. (2001). Implementing global strategies: The role of
procedural justice, Strategy Management Journal, Vol. 12, No. 1, 125-143.
Klein, H. J., Molloy, J. C. & Brinsfield, C. T. (2012). Reconceptualizing workplace
commitment to redress a stretched construct: Revisiting assumptions and removing
confounds, Academy of Management Review, Vol. 37, No. 1 130-151.
Klein, K. J. & Sorra, J. S. (2007). The challenge of innovation implementation. Academy of
Management Review, 21, 1055-1080.
Kleymeyer, C.D. (2009). Cultural traditions and community-based conservation. In Western,
D.; R.M. Wright & S.C. Strum (eds.), Natural Connections: Perspectives in
community-based conservation, Island Press, Washington D.C., USA. pp 323-346.

86
Korsgaard, M. A., Schweiger, D. M. & Sapienza, H. J. (2005). Building commitment,
attachment and trust in strategic decision-making teams: The role of procedural
justice, Academic Management Journal, Vol. 38, No. 1, 60-84.
Kottak, C. P. (2001). When People Don't Come First: Some Sociological Lesson From
Completed Projects, in Cernea, Michael M. (ed.), Putting People First: Sociological
Variables in Rural Development, New York: Oxford University Press.
Lewis, R. & Hinton, L. (2008). Citizen and staff involvement in health service decision-
making: have National Health Service foundation trusts in England given
stakeholders a louder voice? Health Services and Policy, 13: 19-25.
Liffman, M. (2002). Rapid Assessment: A Technique for Rural Tourism Development in
Louisiana. Louisiana State University. National Extension Tourism Conference
Proceedings. Retrieved 29 May 2016 from
www.ncrcrd.iastate.edu/net2002/sessions/d2-liffmann.htm
Lotz-Sisitka H. & O’Donoghue, J. (2008). Participation, situated culture and practice reason.
In A. Reid et al (Eds.), Participation and Learning: Perspectives on Education and
the Environment, Health and Sustainability, 111 (Netherlands: Springer, 2008).
MacGilchrist, B. & Mortimore, P. (2007). The Impact of school development plans in
primary schools. School Effectiveness and School Improvement. An International
Journal of Research, Policy and Practice, 8(2), 198-218.
Mantere, S. & Vaara, E. (2008). On the problem of participation in strategy: A critical
discourse perspective, Organizational Science, Vol. 19, No. 2, 241-358.
Mohammad, S. N. (2010). People‘s Participation in Development Projects at Grass-root
Level: A Case Study of Alampur and Jagannathpur Union Parishad. Master’s Thesis,
North South University, Bangladesh, Retrieved on August 12, 2013, from
Bangladesh North South University Digital Thesis.

87
Morgan, L. M. (2003). Community participation in health: the politics of primary care in
Costa Rica, Cambridge University Press, New York, NY.
Mugenda, O. M., & Mugenda, A. G. (1999). Research methods qualitative and quantitative
approaches. Nairobi: African Centre.
Mugenyi, C. (2015). An examination of teachers’ perceptions of stakeholders’ involvement
in school improvement planning: The Case of Uganda. International Journal for
Cross-Disciplinary Subjects in Education (IJCDSE), Vol. 6, Issue 3, 2265-2274.
Mushemeza, D. E. (2003). Financial Management of Education in a Decentralized Setting:
The Case of Uganda. A paper prepared for CODESRIA - Working Group on Finance
and Education (WGFE).
National Planning Authority (2005). Pre-primary and Primary Education in Uganda:
Access, Cost, Quality and Relevance. Retrieved August 2016 from http://npa.ug/wp-
content/uploads/NDPF5-Paper-3172015.pdf
Parry, G., Moyser, G. & Day, N. (2002). Political Participation and Democracy in Britain.
Cambridge: Cambridge University Press.
Pauline, R. (2003). Communities, Gender and Education: Evidence from Sub-Saharan
Africa. Background paper for 2003 UNESCO Global Monitoring Report. Centre for
International Education, University of Sussex.
Plummer, J. (2000). Municipalities and Community Participation: A Sourcebook for
Capacity Building. GHK international: New York
Ribot, J. (2007) Participation Without representation. Cultural Survival Quarterly, 20(3), 40-
44.
Rosenstone, S. & Hansen, M. (2002). Mobilization, Participation, and Democracy in
America. New York: Macmillan.
Senge, P. M. (2000). The leader’s new work: building learning organizations, Sloan
Management Review, Vol. 32 No. 1, pp. 7-23.

88
Serban, S. (2002). Community Involvement In Public Service Delivery, a challenge For Both
Local Authorities And Citizens - Romanian Experience. Retrieved 28 February 2018
http://unpan1.un.org/intradoc/groups/public/documents/NISPAcee/UNPAN004339.p
df.
SHAFOCS (2011). SHAFOCS Resource Mobilization Manual. Hawassa, Ethiopia
Simonovic, S. P. & Akter, T. (2006). Participatory Floodplain Management in the Red River
Basin, Canada. 30 Annual Reviews in Control. p183,189.
Simon-Vandenbergen, A. M. (2007). Lay and expert voices in public participation
programmes: A case of generic heterogeneity. Journal of Pragmatics, 1420-1429.
Smith, B. (2003). Public Policy and Public Participation: Engaging Citizens and
Community in the Development of Public Policy. Canada: Population and Public
Health Branch, Health Canada.
Stalk, G., Evans, P. & Schulman, L. E. (2002). Competing on capabilities: The new rules of
corporate strategy. Harvard Business Review, Vol. 70, No. 2, pp. 57-69.
Strömblad, P. & Bengtsson, B. (2015). Collective Political Action as Civic Voluntarism:
Analysing Ethnic Associations as Political Participants by Translating Individual
Level Theory to the Organizational Level. Linnaeus University Centre for Labour
Market and Discrimination Studies.
Tekman, Ebru Deniz et al, (2012). A Participatory Development Training Manual. UNDP
UNEP (2006). Resource Mobilization is Comprehensive Process Involving Strategic
Planning for Program Project Funding. UNEP
USAID (2004). Corrective action is a change that’s implemented to address a weakness
identified. USAID
Verba, S., Schlozman, K. L. & Brady, H. E. (2005). Voice and Equality: Civic Voluntarism
in American Politics. Cambridge MA: Harvard University Press.

89
Welsh, T. & McGinn, N. (2009). Decentralization of Education: What and How? Paris:
IIEP.
White, E. E. (2006). Grassroots Involvement in Rural Development. In. Olisa, M.S.O. and
Obiukwu, J. I. (Ed.). Rural Development in Nigeria: Dynamics and Strategies.
Akwa: Mekslink.
Wight, A. & Grindle M. (2008). Participation, Ownership, and Sustainable Development.
Getting Good Government: Capacity Building in the Public Sectors of Developing
Countries. Harvard College: Harvard Institute for International Development.
Wilcox, G. H. (2010). Community participation is a necessity for project success: A case
study of rural water supply project in Jeppes Reefs, South Africa. African Journal of
Agricultural Research, Vol. 5(10), pp. 970-979, 18 May, 2010.
Winkler, D. R. Gershberg, A. I. (2003). Education Decentralization in Africa: A Review of
Recent Policy and Practice. Retrieved 25 July 2016 from
http://www1.worldbank.org/
publicsector/decentralization/March2004Course/Winkle.doc.
Word Bank (2011). Participatory planning can be defined as a tool for identifying the needs
of all individuals within a community, a way of building consensus, and a means of
empowering disadvantaged or disenfranchised groups. Word Bank.
World Bank (2007). Participation, for Some, it is A Matter of Principle; For Others,
Practice; For Still Others, An End In Itself. Word Bank.
Yong, J. K. (2000). A Multidimensional and Hierarchical Model of Service Quality in The
Participant Sport Industry. Unpublished doctoral dissertation, The Ohio State
University.
Zeithaml, V. A., Parasuraman, A. & Berry, L. L. (2000). Delivering Quality Service. The
Free Press, New York, N.Y.
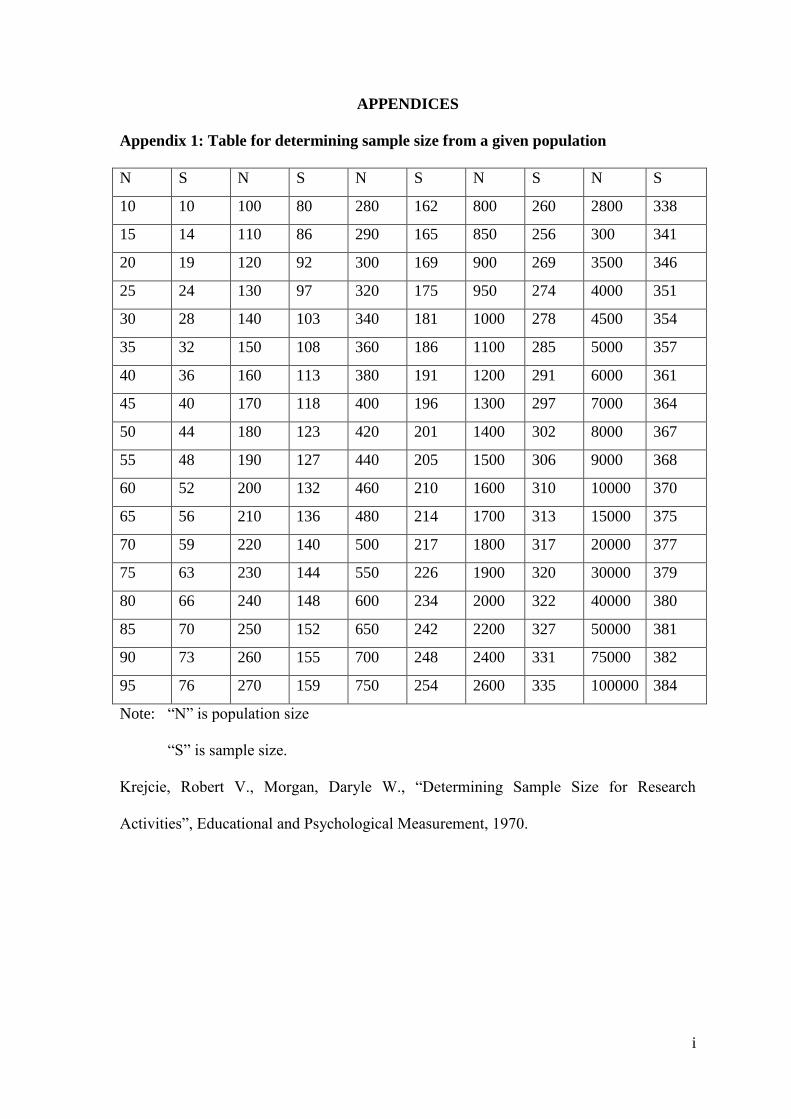
i
APPENDICES
Appendix 1: Table for determining sample size from a given population
N S N S N S N S N S
10 10 100 80 280 162 800 260 2800 338
15 14 110 86 290 165 850 256 300 341
20 19 120 92 300 169 900 269 3500 346
25 24 130 97 320 175 950 274 4000 351
30 28 140 103 340 181 1000 278 4500 354
35 32 150 108 360 186 1100 285 5000 357
40 36 160 113 380 191 1200 291 6000 361
45 40 170 118 400 196 1300 297 7000 364
50 44 180 123 420 201 1400 302 8000 367
55 48 190 127 440 205 1500 306 9000 368
60 52 200 132 460 210 1600 310 10000 370
65 56 210 136 480 214 1700 313 15000 375
70 59 220 140 500 217 1800 317 20000 377
75 63 230 144 550 226 1900 320 30000 379
80 66 240 148 600 234 2000 322 40000 380
85 70 250 152 650 242 2200 327 50000 381
90 73 260 155 700 248 2400 331 75000 382
95 76 270 159 750 254 2600 335 100000 384
Note: “N” is population size
“S” is sample size.
Krejcie, Robert V., Morgan, Daryle W., “Determining Sample Size for Research
Activities”, Educational and Psychological Measurement, 1970.

ii
Appendix 2: Questionnaire for headteachers, teachers and school community
members
Dear respondent, I am Aminah Bykenya conducting research on public participation and
primary education service delivery in Bugambe Sub County, Hoima District. The purpose
of the study is partial fulfillments of the requirement of the Degree of a Masters of Arts in
Management Studies (Public Administration and Management) of Uganda Management
Institute (UMI), Kampala. I therefore request for your cooperation in answering the
following questions. All information provided will be treated with utmost confidentiality
thank you very much.
Section A: Background Information
1. Gender :
Male Female (Please tick)
2. Highest education level
Primary O level A level Institution University Other
(specify)
3. Years working with the organisation
Less than 1 year 1-2years 3-5 years 5-10 years Above10 years
4. Age
20-30 31-39 40-49 above 50
Section B: Public participation in program planning
In the following section, please indicate the extent to which you agree or disagree with
statements about public participation in program planning. Circle or tick the appropriate
response based on the likert scale. In case you are not sure about an item, circle or tick the
number under Not Sure. Please do not omit any item.
SD=Strongly Disagree D=Disagree NS=Not Sure A= Agree SA: Strongly Agree
Items about participation in decision making SD D NS A SA
1. The community participates in the decision-making of
schools
1 2 3 4 5
2. The community work together with officials to make
decisions of schools
1 2 3 4 5
3. The community of schools is involved from the beginning
rather after decisions are made
1 2 3 4 5
4. The community of schools has a clear idea of making
decisions for the school program
1 2 3 4 5
5. The community of schools generates ideas for the school
program
1 2 3 4 5
6. The community of schools participates in organizing ideas 1 2 3 4 5

iii
into goals for the of the school program
Items about participation in problem identification
7. The community of schools is informed about the problems of
the school program
1 2 3 4 5
8. The community of schools is consulted about problems of the
school program
1 2 3 4 5
9. The community of schools involved in identifying problems
of the school program
1 2 3 4 5
10. The community of schools is empowered to identify
problems of school
Items about participation in education needs assessment SD D NS A SA
11. The community of schools is informed about the education
needs assessment of school activities
1 2 3 4 5
12. The community of schools is consulted about the education
needs assessment of school activities
1 2 3 4 5
13. The community of schools is involved in actual education
needs assessment of school activities
1 2 3 4 5
14. The community of schools is empowered to conduct
education needs assessment of school activities
1 2 3 4 5
Section C: Public participation in program implementation
In the following section, please indicate the extent to which you agree or disagree with
statements about public participation in program implementation. Circle or tick the
appropriate response based on the likert scale. In case you are not sure about an item,
circle or tick the number under Not Sure. Please do not omit any item.
SD=Strongly Disagree D=Disagree NS=Not Sure A= Agree, SA: Strongly Agree
Items about participation in resource mobilization 1 2 3 4 5
1. The community of schools is informed about the resource
mobilization for the school activities
1 2 3 4 5
2. The community of schools is consulted about the resource
mobilization for the school activities
1 2 3 4 5
3. The community of schools is involved in actual resource
mobilization for the school activities
1 2 3 4 5
4. The community of schools is empowered in the resource
mobilization for the school activities
1 2 3 4 5
Items about community implementation commitment SD D NS A SA
5. School community members have been committed to
contributing financially to school activities
1 2 3 4 5
6. School community members have been committed to
contributing materially to school activities
7. School community members have been committed to
contributing morally to school activities
1 2 3 4 5
8. School community members have been committed to help 1 2 3 4 5

iv
their children with school requirement

v
Section D: Public participation in program monitoring & evaluation
In the following section, please indicate the extent to which you agree or disagree with
statements about public participation in program monitoring and evaluation. Circle or tick
the appropriate response based on the likert scale. In case you are not sure about an item,
circle or tick the number under Not Sure. Please do not omit any item.
SD=Strongly Disagree D=Disagree NS=Not Sure A= Agree, SA: Strongly Agree
Items about participation in quality assurance SD D NS A SA
1. The community of schools is informed about the quality
assurance of the school activities
1 2 3 4 5
2. The community of schools is consulted about the quality
assurance of the school activities
1 2 3 4 5
3. The community of schools is involved in actual quality
assurance of the school activities
1 2 3 4 5
4. The community of schools is empowered in the quality
assurance of the school activities
1 2 3 4 5
Items about participation in taking corrective action
5. The community of schools is informed about the corrective
action to be taken for the school activities
1 2 3 4 5
6. The community of schools is consulted about the corrective
action to be taken for the school activities
1 2 3 4 5
7. The community of schools is involved in actual corrective
action for the school activities
1 2 3 4 5
8. The community of schools is empowered in taking the
corrective action for the school activities
1 2 3 4 5
Section E: Service delivery
In the following section, please indicate the extent to which you agree or disagree with
statements about service delivery. Circle or tick the appropriate response based on the
likert scale. In case you are not sure about an item, circle or tick the number under Not
Sure. Please do not omit any item.
SD=Strongly Disagree D=Disagree NS=Not Sure A= Agree SA: Strongly Agree

vi
Items about participation in program monitoring &
evaluation
SD D NS A SA
1. The school has enough classrooms for the pupils 1 2 3 4 5
2. The number of pupils per teacher is low 1 2 3 4 5
3. The school provides enough reading materials such as
textbooks to pupils
1 2 3 4 5
4. Teachers are always in class to teach pupils 1 2 3 4 5
5. School’s education services are easily accessed 1 2 3 4 5
6. The school provides adequate time for children to learn 1 2 3 4 5
7. The school provide clean water to pupils 1 2 3 4 5
8. The school provide food to pupils 1 2 3 4 5
9. The school provide a good classrooms for better learning
environment to pupils
1 2 3 4 5
10. The school have good toilets/latrines for pupils 1 2 3 4 5
Thank you for your cooperation

vii
Appendix 3: Interview guide
Dear Respondent,
Dear respondent, I am Aminah Bykenya conducting research on public participation and
primary education service delivery in Bugambe Sub County, Hoima District. The purpose
of the study is partial fulfillments of the requirement of the Degree of a Masters of Arts in
Management Studies (Public Administration and Management) of Uganda Management
Institute (UMI), Kampala. I therefore request for your cooperation in answering the
following questions. All information provided will be treated with utmost confidentiality
thank you very much.
1. Are you satisfied with the public participation in program planning of school
activities? If yes, briefly explain your satisfaction? If no, why aren’t you satisfied?
2. To what extent has the community participated in implementation of school
activities? Briefly explain your response.
3. Does community participate in monitoring and evaluation of school activities? If no
why? If yes are satisfied with how the community participates in monitoring and
evaluation of issues? Please briefly explain your answer.
4. How would rate school’s service delivery? Please briefly explain your answer.
5. How has public participation in program planning of school activities affected the
service delivery?
6. How has public participation in program implementation of school activities affected
the service delivery?
7. How has community participate in monitoring and evaluation of school activities
affected the service delivery?
Thank you for your cooperation

viii
Appendix 4: Work Plan
Date Activity
August-September 2016 Proposal writing and submission
October 2016 Data collection
October 2016 Data processing, analyzing of the processed
data
November 2016 Report writing
November 2016 Submission of the report
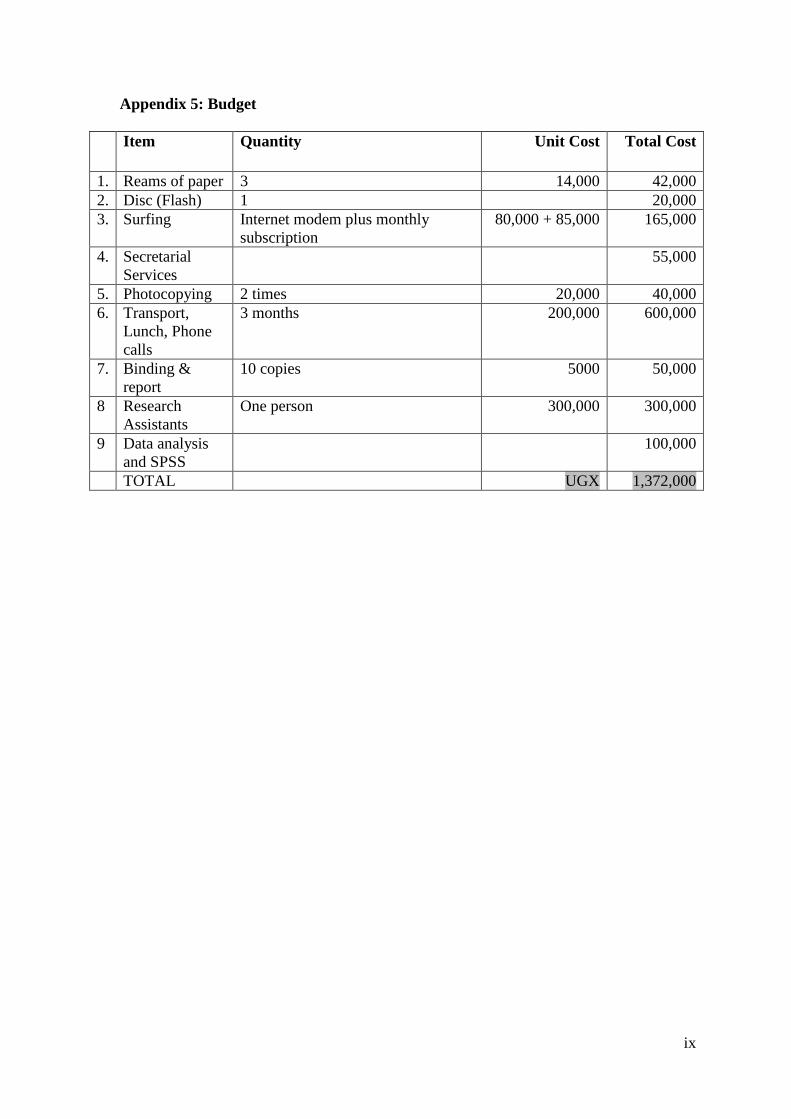
ix
Appendix 5: Budget
Item Quantity Unit Cost Total Cost
1. Reams of paper 3 14,000 42,000
2. Disc (Flash) 1 20,000
3. Surfing Internet modem plus monthly
subscription
80,000 + 85,000 165,000
4. Secretarial
Services
55,000
5. Photocopying 2 times 20,000 40,000
6. Transport,
Lunch, Phone
calls
3 months 200,000 600,000
7. Binding &
report
10 copies 5000 50,000
8 Research
Assistants
One person 300,000 300,000
9 Data analysis
and SPSS
100,000
TOTAL UGX 1,372,000