DEVELOPMENT - Eesti Koostöö Kogu
220
ESTONIAN HUMAN DEVELOPMENT REPORT 2012/2013 Estonia in the World
-
Upload
khangminh22 -
Category
Documents
-
view
1 -
download
0
Transcript of DEVELOPMENT - Eesti Koostöö Kogu

ESTONIAN HUMANDEVELOPMENTREPORT 2012/2013
Estonia in the World
ESTONIAN HUMANDEVELOPMENT REPORT 2012/2013
Estonia in the WorldESTO
NIA
N H
UM
AN
DEV
ELOPM
ENT R
EPO
RT | 2012/2013 | ESTON
IA IN
THE W
OR
LD


Tallinn 2013
EESTI INIMARENGUARUANNE 2012/2013
Eesti maailmas
EESTI KOOSTÖÖ KOGUTallinn 2013
ESTONIAN HUMANDE V E LOPM E N TREPORT 2012/2013Estonia in the World

2 Estonian Human Development Report 2012/2013
Table of Contents
1 Human Capital / Mati Heidmets, Editor 7
Introduction / Mati Heidmets 7
1.1 UN Human Development Index / Aado Keskpaik 8
1.2 Population / Allan Puur, Luule Sakkeus, Tiit Tammaru 14
1.3 Education /Anu Toots, Triin Lauri 30
1.4 Health / Raul-Allan Kiivet 41
1.5 Values/ Anu Realo 48
Summary / Mati Heidmets 59
2 People and Society / Marju Lauristin, Editor 61
Introduction / Marju Lauristin 61
2.1 General success of the development: Bertelsmann Transition Index / Peeter Vihalemm 62
2.2 Freedom and democracy / Martin Mölder, Vello Pettai 67
2.3 Civil society and social capital / Juhan Kivirähk, Marju Lauristin 74
2.4 The information environment and freedom of the media / Peeter Vihalemm 78
2.5 Corruption / Jüri Saar 83
2.6 Crime and the population’s sense of security / Jüri Saar 86
2.7 Children’s safety in the new media environment /Veronika Kalmus. 92
2.8 Public assessments of the state’s development and trust in government institutions / Juhan Kivirähk, Marju Lauristin 95
2.9 Estonia’s peacefulness and security in an unstable world / Marju Lauristin, Juhan Kivirähk 100
Summary / Marju Lauristin 103
3 Welfare and the Quality of Life / Anu Toots, Editor 105
Introduction / Anu Toots 105
3.1 The Concepts of welfare / Kaie Kerem, Kaire Põder 106

3Estonian Human Development Report 2012/2013
3.2 Income inequality and equality / Triin Roosalu 114
3.3 Subjective well-being / Mati Heidmets 122
3.4 Quality of life / Anu Toots 129
3.5 Environment dimension of well-being / Mari Jüssi 139
Summary: Paradoxes of the Estonian quality of life / Anu Toots 146
4 The Economy / Jüri Sepp, Editor 149
Introduction / Jüri Sepp 149
4.1 Economic environment / Jüri Sepp, Clemens Buchen, Helje Kaldaru 150
4.2 The wealth and growth potential of nations / Alari Purju 158
4.3 Labour market / Reelika Leetmaa, Andres Võrk 165
4.4 Productivity and the economic structure / Uku Varblane, Urmas Varblane 173
4.5 Innovation / Erik Terk, Katrin Männik, Silja Lassur 181
Summary / Jüri Sepp 190
5 Globalisation and Policy Patterns / Erik Terk, Editor 193
Introduction / Erik Terk 193
5.1 Globalisation and Estonia /Erik Terk, Marju Lauristin 194
5.2 The impacts of globalisation and possible strategies in a globalising world / Silja Lassur, Erik Terk 197
5.3 Development policies / Erik Terk, Silja Lassur 201
5.4 Future perspectives / Erik Terk, Silja Lassur 204
Summary / Erik Terk 207
6 The Next Step / Mati Heidmets 209
EHDR 2012/2013 Authors 212

4 Estonian Human Development Report 2012/2013
Dear ReaderSince the moment when Estonia restored its independence 22 years ago, we have almost always been on our way. On our way back to the West. To Europe. To the world. Back to the company of states that are free, wealthy and determine their own fates.
On this road, we have used the aquis communitaire, that is, the chapters of the European Union’s acces-sion plan, to measure our capability. We occupied an important place on the roadmap established by NATO; years later, we adjusted ourselves to the Maastricht criteria, which determined if we were mature enough for the euro area. Through it all, we have been interested in knowing who is ahead of us and who lags behind.
Now these countless interim finishes and accessions are starting to fade from memory. That’s the way it should be, because we have arrived in the West, in Europe and in the world, and are among the most developed states in the world.
We regard the fact that we belong to all the organisations that are important to us with calm pre-sumption. The desire to measure and compare is part of human nature. This is also true in Estonia, where most of us have participated directly in the impressive progress of the state and the society.
I have nothing against rankings, if they remain within the limits of science and common sense. After all, without making comparisons, we cannot find out what we have done well and where we need to make an extra effort. All the more because many of the charts are also tracked by those whose attention and favourable predisposition we require. For example, the Index of Economic Freedom says more to companies that are planning foreign investments than a glossy ad, paid for by the state, in a business newspaper with a global circulation.
The best rankings are those which are comprised of a great number of fundamental components. In the developed world, the assessment of a population’s level of education has not been based on the rate of literacy for a long time, but rather on lifelong learning and tertiary education. Continued instability in the euro area and elsewhere has prompted a critical assessment of debt levels, the percentage of social costs and GDP ratios. Thus, it has turned out that some states that were considered to be fairly wealthy based on previous calculations are actually lagging behind, because their high rankings were the result of borrowed wealth, rather than sustainable policies.
In order to adequately discern Estonia’s position in a comparison with the other nations of the world, we must look behind the scenes of the international rating industry. In this way we can deter-mine which is wheat and which is chaff. This is the topic that this Estonian Human Development Report dissects, familiarising us with the backgrounds of the rankings that, based on their methodologies, are most reliable, and therefore, also worth taking seriously. Estonia’s position in this international comparison allows each one of us to come to objective conclusions about the road we have taken to date and the choices that await us.
Kadriorg, 22 April 2013
Toomas Hendrik IlvesPresident of the Republic of Estonia

5Estonian Human Development Report 2012/2013
Foreword
Mati HeidmetsEditor-in-Chief
Estonia has been part of the open world for two decades. This means it is dependent on global trends, and also has the opportunity to shape these trends. The 2013 Estonian Human Development Report asks the following questions: What does Estonia look like against the global background? How well have we coped with the matters, ideas and policies that should be dealt with in the global marketplace? The view of Estonia provided in this report is based on a traditional UN human development approach, as well as on many other yardsticks and bases of comparison.
The first UN Human Development Report, which was issued in 1990, was a trailblazer. Under the aegis of the global organisation, the states and peoples of the world started to be compared and ranked. Everyone was provided with a glimpse of how they appear against a global background. The evaluation was based on something new at the time – on human development. The idea was to combine various mea-sures of a life worthy of human dignity. Health- and education-related indicators were added to the already standard gross domestic product (GDP). The authors of the first report justified their approach as follows:
“The central message of this Human Development Report is that while growth in national production (GDP) is absolutely necessary to meet all essential human objectives, what is important is to study how this growth translates – or fails to translate – into human development in various societies.”
The UN initiative to compare the development of peoples, from various points of view, with the help of combined yardsticks, fell on fertile ground. The development paradigm had clearly assumed the domi-nant position in the Western world. This is a viewpoint that values movement and change, gives direction to change, and tries to measure the efficiency of movement. Indeed, here and now we are also establishing developmental goals, creating development plans and founding development funds; we support developing countries and provide development assistance. Development is good. The inability to develop is bad. Things that are good and important should be measured.
Actually, the measurement of both human development and society’s progress is a difficult and contradictory undertaking. The UN rankings have also been criticised. Doubts continue to be voiced about whether the three yardsticks (health, education, wealth) are so universally human and applicable that it is appropriate to compare Americans to Hindus, or Estonians to Ethiopians, based thereon, and to draw conclusions about someone’s developmental success or backwardness. Despite the criticism, the desire to be compared to others, and to organise the comparisons into rankings, has triumphed. Hundreds of new measures and yardsticks have developed alongside the Human Development Index. States and peoples are compared, based on their level of democracy and corruption, freedom and peacefulness, innovation and digitalisation, equality and happiness, and dozens and dozens of other criteria. The majority of these measurements make authors speak about development – directly or indirectly, intentionally or uninten-tionally. A high level of corruption, or low level of innovation, indicates that a state or people must make greater efforts in its development.
The international assessment of development has become a separate field of activity. The classifica-tions and rankings created for it have become important opinion makers and policy influencers. There are various yardsticks used to evaluate development. Some are based on respectable theoretical baggage (such as population processes, or examinations of economic development). In the case of others, the approach is still taking shape (for instance, the evaluation of “peacefulness”). Despite the complaints that the compar-isons are superficial and ignore cultural differences, etc., the industry of producing development-related comparisons has spread to all spheres of life. The media eagerly informs us whether Estonia’s position has risen or fallen in one or other global ranking. And we have to accommodate this knowledge into our conceptual space.
The 2013 Estonian Human Development Report examines the measures for development around the world, and asks what this complicated and diverse flow of messages tells us about Estonia’s position in the world. Where do we seem to be very capable? Where are we in danger of falling behind? Chapters 1 to 4 of the report deal with various fields of development (human development, social organisation, well-being and quality of life, economics and competitiveness). Chapter 5 looks into the future, by examining the attitudes and preferences of Estonia’s elite groups in shaping future developments.
So, enjoy thinking along with us!


7Estonian Human Development Report 2012/2013
1 HUMAN CAPITALESToNIAN HUMAN DEVELoPMENT REPoRT 2012/2013
Compared to the early 1990s, the approach of the UN Human Development Report (HDR) has become sig-nificantly broader today. In the 2010 UN HDR, human development is defined as follows: “Human development is the expansion of people’s freedoms to live long, healthy and creative lives; to advance other goals they have reason to value; and to engage actively in shaping development equita-bly and sustainably on a shared planet.”
In addition to the three traditional yardsticks (health, education, and wealth), new focuses have been added – peo-ple’s choices and creativity, and the sustainability of society. However, the central focus of the approach to development remains – people, with their own unique goals and the freedom to choose the means of realising them. The most spirited debates in Estonia revolve around human capital. How much capital did we have in the past? How much do we have now and will have in the future? How healthy and happy do we feel? What determines the choices and life plans of the people in Estonia? The first chapter of the 2012/2013 EHDR examines Estonia’s developments from the viewpoint of human capital. Attention is paid to population development, health and education, as well as values.
The focus of this report is Estonia in the global context. We are attempting to position Estonia’s development against the background of the rest of the world, by combining various yardsticks and approaches. In addi-tion to the global view, we feature a separate group of “reference countries.” These are countries that, in a rela-tively short time, have made significant progress in both the human development rankings and other indicators related to development. It seems that comparison with these countries, which have made rapid and substantive progress, could be interesting and instructive for Esto-nia. The countries that have been chosen as reference countries are relatively small ones from various regions of the world: Slovakia, the Czech Republic, Hungary, and Slovenia in Central and Eastern Europe; Austria, Ireland, Switzerland, the Netherlands, Denmark and Finland, representing Western and Northern Europe; and also New Zealand, South Korea, Singapore, Chile, Uruguay and Costa Rica. The reference countries are not used as absolute comparison partners throughout the report; they are used only where the appropriate data exists, or the comparison is suitable.
IntroductionMati Heidmets

8 Estonian Human Development Report 2012/2013
To date, the Human Development Index (HDI) has functioned as a comparative measure of the world’s countries for over 20 years. It was implemented in the first Human Development Report commissioned by the United Nations Development Programme (UNDP) in 1990, and since then has developed into the principal gauge for regularly monitoring human development. The global table of HDI values has developed into a tradi-tional component of the UNDP Human Development Report, being, perhaps, even the most anticipated com-ponent. It attracts the attention of the public, the media and politicians, and is used in appropriate research, as well as a tool in political debates. In connection with the 20th anniversary of the Human Development Index in 2010, the Human Development Report Office undertook a thorough methodological analysis of both the Index and the criticism based thereon, and made significant changes in the calculation methods (Klugman, Rodri-guez, Hyung-Jin 2011). For the better comprehension of the following, it should be mentioned that in the new method, the HDI is calculated as the geometric mean of three sub-indices – health, education and income. The health sub-index is calculated on the basis of life expectancy at birth. The education sub-index is calcu-lated as the average of two indicators – the mean years of schooling and the expected years of schooling. The income sub-index is calculated on the basis of the gross national income per capita. However, the methodological questions related to the HDI have yet to be discussed in Estonia, and it would definitely be useful to turn our attention to this before starting to interpret, assess and draw any conclusions about Estonia’s position and the shifts thereof.
1.1.1. What is the Human Development Index?Mahbub ul Haq, a Pakistani economist, is considered to be the initiator of the development of the Human Development Index. The Index was created because of dissatisfaction with income level being used as the principal measure of human development. The concep-tual content of the index is based, to a great degree, on the capabilities approach to measuring well-being
implemented by Amartya Sen, the Nobel Prize-winning economist from India. According to this approach, well-being and the quality of life is expressed by people’s capabilities – their ability and freedom to choose between the various lifestyles (functionings) that are ensured by the resources at their disposal, which they can realise according to their values and wishes1. In this approach, the most important thing about human development is not the abstract freedoms that have been recorded, but the people’s capability to utilise these freedoms.
Right from the beginning, the HDI has been a synthesized compilation comprised of three dimen-sions of human development – education, health and income. It must be remembered that from the viewpoint of the capabilities-based approach, an attempt is made to directly calculate, using the HDI, only two of these extremely important human capabilities – the ability to acquire an education, as well as to live healthily and for a long time. The calculation of the third dimension of the Index – the income – on an equal basis with the aforementioned is not theoretically correct within the framework of a capabilities-based approach, because income should play a strictly instrumental role. But, including the income as the third dimension of the Index is justified by the fact that it is used as an approx-imation of all other measures of human development2. It seems that including the standard of living measure in the HDI has been inconvenient, but unavoidable. If the composite index were limited to only the measures of education and health, the content would be too meagre. On the other hand, the addition of the income, as the indirect representative of the aggregate of unspecified capabilities, clearly limits the analytical potential of the Index. The importance of the connection between income and human development has not been deter-mined and, therefore, it is difficult to draw any socio- political conclusions from it.
From the start, the structuring and utilisation of the HDI has been limited by the shortage of reliable statistics that can be compared on a global basis. Partially, this is what has determined the small number of dimensions, and the indicators characterising them that are taken into consideration by the HDI. However, the enhancement of
1.1.UN Human Development Index Aado Keskpaik
1 The approach explored sees individual advantage not merely as opulence or utility, but primarily in terms of the lives people manage to live and the freedom they have to choose the kind of life they have reason to value. The basic idea here is to pay attention to the actual “capabilities” that people end up having. The capabilities depend both on our physical and mental characteristics as well as on social opportunities and influences (and can thus serve as the basis not only of assessment of personal advantage but also of efficiency and equity of social policies). (Sen, 1998 http://www.nobelprize.org/nobel_prizes/economics/laureates/1998/sen-autobio.html)
2 „Longevity and education are clearly valuable as aspects of the good life, and also valued as constituents of the capability to do other things…the income component of the HDI has been used as an indirect indicator of some capabilities not well reflected, directly or indirectly, in the measures of longevity and education.” (Anand, Sen, 2000, p. 86, emphasis in original).

9Estonian Human Development Report 2012/2013
the HDI’s content has also been hindered by other addi-tional factors. For instance, the HDI does not measure the capabilities related to political freedoms, human rights, environmental sustainability and the pursuit of happiness.
Attempts to include politically sensitive measures in the Human Development Reports have caused the countries which feel that they are affected to voice their objections to the UN, and have resulted in discussions at the General Assembly. In 1992, an attempt to construct an index of political freedoms even resulted in the con-tinuity of the Human Development Report’s publication being put at risk. On the other hand, for example, the construction of an environmental friendliness indicator has been obstructed by the great conceptual differences of opinion among the theoreticians (Klugman, Rodriguez, Hyung-Jin 2011).
At this point, putting aside the disputes about the reasoning behind the choice of indicators and the calcu-lation methodology employed in computing the HDI, we can, based even on the aforementioned, agree with the assessment by the spiritual father of the HDI, Amartya Sen (Sen 2003), that the HDI is an imperfect measure of capabilities. The concept of capability itself has such a broad meaning, being rich and abstract, that no matter what summarised measure is used to compare a large number of countries, it will be accompanied by much generalising and simplifying approximating (Klugman, Rodriguez, Hyung-Jin 2011).
According to the same authors, (Klugman, Rodri-guez, Hyung-Jin 2011), who are involved in using the indices in the Human Development Reports, the mea-surement of capabilities based on the HDI clearly differs from the measurement of well-being. Unlike the function of measuring well-being, the capability index supposedly does not require maximisation, i.e. the need to necessar-ily aggrandise. Since the HDI, as an index of capabilities, describes an aggregate of freedoms that people are able to use in the execution of their highly-valued life plans, then the expansion of these freedoms is one of the goals of society, but this does not have to be the only goal (Klug-man, Rodriguez, Hyung-Jin 2011).
Yet, regardless of its creators’ continued attempts to focus on capabilities and the concepts of freedom of choice related thereto, it seems that the HDI has started to live its own life, which is not very firmly linked to the initial theoretical reasoning. The ranking and the grouping of countries based on the level of development in the Human Development Reports, the calculation of the average annual growth rates of the Human Develop-ment Index and its sub-indices, and the analyses of the advancements in the country rankings testify to the fact that the maximisation of the Human Development Index is actually considered to be important.
In practice, the Human Development Index is treated as a simplified, and therefore significant, indicator that has been freed of any political appendages, and is thereby acceptable to countries with all types of regimes. But, well-being, as a reflection of the satisfying of human needs, in the context of the concept that is widely in use in the social sciences, consisting of health, learnedness, as well as income, traditionally has a value of its own, and the aforementioned are, in regards to well-being,
1990
2000
2005
2006
2007
2008
2009
2010
2011
2012
24 37 30 28 28 30 30 33 33 33
Table 1.1.1Estonia’s position in the Human Development Index, based on the 2010 calculation method, 1990-2012
Source: based on UNDP 2013
Rank
Country Life
exp
ecta
ncy
at
birt
h (y
ears
)
Mea
n ye
ars
of
scho
olin
g
Expe
cted
yea
rs o
f sc
hool
ing
(yea
rs)
Gros
s nat
iona
l inc
ome
(GNI
) per
cap
ita(2
005
PPP
US d
olla
rs)
Hum
an d
evel
opm
ent
inde
x
Very
hig
h hu
man
dev
elop
men
t 1 Norway 81.3 12.6 17.5 48,688 0.955
2 Australia 82.0 12.0 19.6 34,340 0.938
3 United States 78.7 13.3 16.8 43,480 0.937
4 Netherlands 80.8 11.6 16.9 37,282 0.921
5 Germany 80.6 12.2 16.4 35,431 0.920
6 New Zealand 80.8 12.5 19.7 24,358 0.919
7 Ireland 80.7 11.6 18.3 28,671 0.916
8 Sweden 81.6 11.7 16.0 36,143 0.916
9 Switzerland 82.5 11.0 15.7 40,527 0.913
10 Japan 83.6 11.6 15.3 32,545 0.912...
12 South Korea 80.7 11.6 17.2 28,231 0.909...
15 Denmark 79.0 11.4 16.8 33,518 0.901...
21 Finland 80.1 10.3 16.9 32,510 0.892
22 Slovenia 79.5 11.7 16.9 23,999 0.892...
28 Czech Republic 77.8 12.3 15.3 22,067 0.873...
33 Estonia 75.0 12.0 15.8 17,402 0.846
35 Slovakia 75.6 11.6 14.7 19,696 0.840...
37 Hungary 74.6 11.7 15.3 16,088 0.831...
40 Chile 79.3 9.7 14.7 14,987 0.819
41 Lithuania 72.5 10.9 15.7 16,858 0.818...
44 Latvia 73.6 11.5 14.8 14,724 0.814
High
hum
an d
evel
opm
ent ...
51 Uruguay 77.2 8.5 15.5 13,333 0.792...
55 Russia 69.1 11.7 14.3 14,461 0.788...
62 Costa Rica 79.4 8.4 13.7 10,863 0.773...
Table 1.1.2Human Development Index and his basic indicators in selected countries, 2012
Source: UNDP 2013
XVIDEOS Pale Teen Gets Her Assfucked free

10 Estonian Human Development Report 2012/2013
equal dimensions (see, for example, the OECD’s Better Life Index: http://www.oecdbetterlifeindex.org/). In addi-tion to its ideological suitability, the HDI’s popularity and authority are increased by the fact that an authoritative UN sub-organisation (UNDP) is in charge of the constant updating of the indicators. Thus, the UN Human Devel-opment Index has become an estimable instrument of policymaking.
1.1.2. Two decades in the mirror of human developmentThe Human Development Index has also become a means of introspection for Estonia. Twenty years is a long enough period of time for drawing conclusions about Estonia’s human development in the global context. Table 1.1.1 shows the change in Estonia’ rankings based on the HDI values that have been recalculated based on the changes in methodology made in 2010.
Estonia’s 24th position in 1990 may not be very comparable with the others due to the nature of the economy at the time and the quality of the statistical data reflecting it. We can also state that in the early 2000s we underwent strong development, and thereafter, have remained around 30th in the world. Our position has been shifted backward in the last few years primarily because Singapore, as well as Liechtenstein and Andorra, were recently (2009 and 2010, respectively) added the coun-tries monitored by the UNDP, and they are ranked ahead of us in the HDI.
Estonia’s HDI value for 2012 is 0.846, which places us 33rd position, along with Andorra, compared to 187 countries and territories (Table 1.1.2).
Table 1.1.3 shows that in the period between 1990 and 2012, Estonia has made noteworthy progress in all the indicators that form the basis for calculating the HDI according to the current method, as well as in regard to the HDI values. Estonia’s life expectancy at birth has increased 5.6 years, the means years of schooling 2.7 years and the gross national income per capita by 71%.
1.1.3. Trends and prospectsThe UN Human Development Index time-series data, encompassing, by now, more than 20 years, allows countries to be compared on the basis of the dynamics of human development indicators. The HDI’s change curves in time express the speed and uniformity of the achievement of success and the impact of sporadic set-backs. If, in the promotion of human development, we wish to learn from the achievements of other countries, it makes sense to look for countries that are, more or less, similar to us, and have demonstrated relatively rapid human development. Firstly, in this way, we can place ourselves in yet another system of references, and assess our success among those similar to us. Secondly, it would be worthwhile to choose countries whose eco-nomic and social policies we could analyse and assess more closely from the aspect of possibly adapting certain elements of their system of functioning.
Below, the dynamics of Estonia’s human development has first been compared to the averages of the group of countries that have, according to the HDI, very high and high human development levels, and thereafter, with selected reference countries. This group of so-called “reference countries” consists of successful small coun-tries from various regions of the world, whose cultural background and level of development generally do not differ greatly from ours. These are:
• from Central and Eastern Europe – Slovakia, the Czech Republic, Hungary and Slovenia;
• from Western and Northern Europe – Ireland, Swit-zerland, the Netherlands, Denmark and Finland;
• from the rest of the world – New Zealand, South Korea, Chile, Uruguay and Costa Rica.
Based on the database of the 2013 global Human Devel-opment Report, graphs have been compiled that show the Estonian trends in comparison to the given countries, based on the HDI and its three sub-indices. In order to make the diagrams easier to read, a limited selection of the reference countries is included on each diagram.
Between 1990 and 2012, Estonia, in the HDI com-parison with countries with a very high as well as with a high level of human development, has increased faster than the average, and has therefore approached the aver-age of countries with a very high level of development (Figure 1.1.1).
In Figure 1.1.2, the development of Estonia’s human development index is compared to the fastest developers in the groups of reference countries. Compared to the reference countries in Central and Eastern Europe, the speed of Estonia’s development was comparable to that of Slovenia, the leader of the group. In comparison to the Western and Northern European countries, the pace of Estonia’s development has been comparable to that of Ire-land, the leader of this group of countries. However, hav-
Life
exp
ecta
ncy
at
birt
h (y
ears
)
Mea
n ye
ars
of
scho
olin
g (y
ears
)
Expe
cted
yea
rs o
f sc
hool
ing
(yea
rs)
Gros
s na
tiona
l inc
ome
(GNI
) per
cap
ita
(200
5 PP
P US
dol
lars
)
Hum
an
deve
lopm
ent i
ndex
1990 69.4 9.3 12.8 10,181 0.728
2000 70.2 11.7 15.0 11,137 0.786
2005 72.7 11.9 16.1 15,920 0.830
2010 74.6 12.0 15.8 15,788 0.839
2011 74.8 12.0 15.8 16,980 0.844
2012 75.0 12.0 15.8 17,402 0.846
Table 1.1.3Changes in Estonia’s human development index and its basic indicators, 1990-2012
Source: UNDP 2013

11Estonian Human Development Report 2012/2013
0.90
0.85
0.80
0.75
0.70
0.65
1990
2000
2005
2006
2007
2008
2009
2011
EstoniaCountries with high human developmentCountries with very high human development
hum
an d
evel
opm
ent i
ndex
1990
2000
2005
2006
2007
2008
2009
2011
0.90
0.85
0.80
0.75
0.70
0.65
Ireland South Korea SloveniaEstonia Chile
hum
an d
evel
opm
ent i
ndex
1990
2000
2005
2006
2007
2008
2009
2011
2010
Countries with very high human development EstoniaCountries with high human development
0.90
0.85
0.80
0.75
0.70
0.65
0.60
0.55educ
atio
n su
b-in
dex
Figure 1.1.1The human development index: Estonia compared to the group of countries with very high and high human development levels, 1990–2012
Figure 1.1.2The human development index: Estonia in comparison to the reference countries, 1990–2012
Figure 1.1.3The education sub-index: Estonia compared to the groups of countries with very high and high human development levels, 1990–2012
Figure 1.1.4The education sub-index: Estonia in comparison to the reference countries, 1990–2012
Source: UNDP 2013 Source: UNDP 2013
ing started, in 1990, from a considerably lower HDI level, our gap with the given reference countries has definitely decreased in 20 years, but we are a long way from catch-ing up. In 2011, Estonia was at the HDI level where, for instance, the Netherlands and Switzerland were already 20, Ireland 15 and Finland 10 years ago.
Compared to successful small countries elsewhere in the world, the speed of Estonia’s development is nothing to be ashamed of. The only country we are clearly lagging behind is South Korea, which is a clear exception in this group – in only twenty years, starting
Source: UNDP 2013 Source: UNDP 2013
from a level only slightly better than ours it was able to become one of the top countries in the world. In 20 years, Latin America’s successful countries, headed up by Chile, which is the most successful according to the HDI, have not come close to our level of human development, while we ourselves have come closer to the reference countries that have had the highest levels of human development for a long time, for instance, New Zealand.
It is generally known that in the sub-indices of the HDI, Estonia has room for development in both
1990
2000
2005
2006
2007
2008
2009
2010
2011
0.95
1.0
0.90
0.85
0.80
0.75
0.70
New Zealand Ireland South KoreaEstonia Slovenia
hum
an d
evel
opm
ent i
ndex

12 Estonian Human Development Report 2012/2013
the health and income indices, while in the education index, i.e. the number of years devoted to the acquisi-tion of education, we have, at least in the context of the HDI’s sub-index, exceeded the average of the countries with very high human development (Figure 1.1.3). However, at the same time, we have made no further development in this index since 2004. Is this a prob-lem? Probably not, since it appears that for most coun-tries the saturation point, related to years of education, is arrived at around the sub-index value 0.9, the point which Estonia has already reached (see Figure 1.1.4). New Zealand and Ireland, the countries with the highest values in the education sub-index, stand out – their saturation point was just arrived at a slightly higher level. It seems that from that point on, the suitability of the current sub-index for differentiat-ing the educational levels of various countries ends. There is no point in extending the duration of educa-tion, and development will proceed on to substantive measurements.
In the health sub-index, which calculates life expectancy at birth, Estonia is at a more modest posi-tion. Figure 1.1.5 shows that in the 1990s, during an economically and socially difficult transition period, Estonia’s development in this area was halted, and compared to the countries that continued to develop, a relative setback occurred. However, since the turn of the century, we have succeeded in somewhat closing the gap with the average of the countries with very high human development. But, to date, we have not been able to achieve the average achieved by the refer-ence countries 20 years ago.
At the same time, the increase in average life expec-tancy in Estonia, since the beginning of the new century, has been faster than that of any of the Central and East-ern European countries included in the comparison; we
1990
2000
2005
2006
2007
2008
2009
2011
0.95
0.90
0.85
0.80
0.75
0.70heal
th su
b-in
dex
Countries with very high human development EstoniaCountries with high human development
1990
2000
2005
2006
2007
2008
2009
2011
Ireland Chile Slovenia UruguaySouth Korea Estonia
heal
th su
b-in
dex
0.95
0.90
0.85
0.80
0.75
Figure 1.1.5The health sub-index: Estonia compared to the groups of countries with very high and high human development levels, 1990-2012
have already surpassed Hungary and are catching up with Slovakia, which can be considered to be a good achieve-ment (Figure 1.1.6).
In the comparison with Western and Northern European countries, during the last decade, the pace of our improvement in the health sub-index has been rapid, compared to the successfully rising Ireland. Yet, closing the gap with Ireland, or even Finland, may take another twenty years.
Against the background of the rest of the world, during the last decade, Estonia has made relatively rapid progress. The speed of our development is roughly equiv-alent to that of the “miracle country” – South Korea. On the other hand, in regard to the health sub-index (average life expectancy), we unfortunately lag significantly behind all of the reference countries, and in the near future, we will probably only begin to catch up with Uruguay.
Due to rapid economic fluctuations, the develop-ment in the income sub-index has been more sporadic than in the other indicators. The 1990s, due to the tran-sition crisis, was a time when the relative gap increased, if we compare Estonia to the general trend in the coun-tries with a very high level of human development (Figure 1.1.7). The short boom period after the turn of the century improved the wealth indicator significantly, but after the last economic crisis, the restoration of the convergence with the average achieved by countries with a very high level of human development, which occurred during the boom period, is not very probable.
The economic crisis has reduced the gross national income (GNI) of all the Central and Eastern European countries included in the comparison. Our closest com-petitors in the economic growth sphere continue to be Slovakia and Hungary, with whom we have very similar wealth levels, but, for instance, in comparison to Slove-nia, no significant progress has been made in closing the gap (Figure 1.1.7).
Source: UNDP 2013
Source: UNDP 2013
Figure 1.1.6The health sub-index: Estonia in comparison to the reference countries, 1990-2012

13Estonian Human Development Report 2012/2013
In the comparison with Western and Northern European countries, it can be noted that in summarizing the period between 1990 and 2007, the average pace of Estonia’s growth in the income index was only slightly slower than that of the Celtic Tiger, Ireland, despite the serious tran-sition crisis in the early 1990s.
In comparison to the small countries elsewhere in the world, the growth of Estonia’s income index in the years from 1990 to 2007 also seems to be rapid. True, it lagged behind that of South Korea, but was approxi-mately the same as that of the Latin American reference countries.
The HDI’s and its sub-indices’ comparison of the temporal dynamics of the various countries allows us to draw some general conclusions about Estonia’s human development.
• The average speed of Estonia’s human development during the last two decades has been one of the fastest among the chosen reference countries, being close to the relevant indicators of the well-known success stories, Ireland and Slovenia, and only lag-ging behind the speed of development experienced by South Korea, which has been exceptionally suc-cessful in the global context.
• Estonia’s perceptible gap with the countries with the world’s highest development levels is caused less by our slow development than by our low point of departure and the transition crisis of the 1990s. Today, despite the problems experienced, our health and wealth sub-indices are at a level achieved by the most developed reference countries 10 to 20 years ago.
• The political choices made after the restoration of Estonia’s independence have generally promoted successful human development in the society as a whole. Whereas, this success was achieved predom-inantly before Estonia’s accession to the European Union and, at first, without any assistance from EU Structural Funds, which we did not start to receive until 2005. Based on the development of the reference countries, it can be claimed that it would have been unrealistic to hope for more rapid development.
• In order for Estonia to close the gap with the coun-tries that have the world’s best human development indicators, it is most important to increase people’s wealth and to promote healthy behaviour. In this regard, we can utilise the noteworthy experiences of several reference countries.
References1. AnAnd, S. & Sen, A. (2000). “The Income Component of the Human
Development Index,” Journal of Human Development 1(1), 83–106.
2. KlugmAn, J., RodRíguez , F., Hyung-Jin CHoi. (2011). The HDI 2010: New Controversies, Old Critiques. Human Development Research Papers, 2011/01, Human Development Report Office, United Nations Development Programme.
3. Sen, AmARtyA. (1998). Autobiography. http://www.nobelprize.org/nobel_prizes/economics/laureates/1998/sen-autobio.html
4. Sen, AmARtyA. (2003). “Foreword,” Readings in Human Devel-opment, Concepts, Measures and Policies for a Development Paradigm. S. Fukuda-Parr and A. K. Shiva Kumar (Eds). Oxford University Press, New York.
5. undP (2013). International Human Development Indicators http://hdrstats.undp.org/en/tables/
1990
2000
2005
2006
2007
2008
2009
2010
2011
Countries with very high human development EstoniaCountries with high human development
inco
me s
ub-in
dex
0.80
0.85
0.75
0.70
0.65
0.60
1990
2000
2005
2006
2007
2008
2009
2010
2011
Ireland Slovenia South KoreaEstonia Chile
0.85
0.80
0.75
0.70
0.65
0.60inco
me s
ub-in
dex
Source: UNDP 2013
Source: UNDP 2013
Figure 1.1.7The income sub-index: Estonia compared to the groups of countries with very high and high human develop-ment levels, 1990-2012
Figure 1.1.8The income sub-index: Estonia in comparison to the reference countries, 1990-2012

14 Estonian Human Development Report 2012/2013
The concept of development became the focus of popu-lation research with the formulation of the demographic transition theory in the middle of the 20th century. By generalising the changes that had appeared in popu-lation processes, Adolphe Landry (1934) and Frank Notestein (1945) arrived at the understanding that an upheaval was occurring in Europe and the overseas countries settled by Europeans, which, in a few gen-erations, would cause a systemic change in the demo-graphic regime that had existed previously. In the course of this upheaval, the traditional pattern of population replacement, which was characterised by short life expectancy and high fertility, would be replaced by a modern pattern, the main attributes of which are long life expectancy and low fertility.
In retrospect, this course of developments proba-bly seems obvious but at the time that the demographic transition theory was formulated, it was far from clear whether the events that involved such a small group of countries would really spread throughout the world, regardless of the political and economic structure, cul-tures, religious beliefs, etc. of the various societies. In the decades following World War II, these doubts were dissipated, and thereafter, the idea of development, according to which the population system will undergo universal and largely similar evolutionary changes, has prevailed in demographic thinking (Lee, Reher 2011). This concept is also the cornerstone for comparing the population development of various countries. There-fore, we are also starting this chapter with Estonia’s position related to this major transformation in the demographic regime.
1.2.1 From the demographic past to the presentTable 1.2.1 presents the estimated onset of the demo-graphic transition based on fertility measures. These results were compiled by the Princeton European Fertility Project (1962–1984), which is the most comprehensive investigation of the demographic modernisation of Europe to date (Coale, Watkins 1986). This study also covered the European part of the Russian Empire, which included Estonia before it achieved its independence. Within the framework of the Princeton Project, a special set of demo-graphic measures was developed for dealing with the transition. Its point of reference was the natural fertility of the Hutterites (a religious sect in the U.S. and Canada, similar to the Amish, practicing no birth control) in the 1920s and 1930s (Coale 1973). It should be noted that the start of the demographic transition, presented in the Table 1.2.1 does not refer to estimated beginning of the transition, but rather to the moment when marital fe rtility
has declined by 10% from the pre-transition plateau. Regardless of the specific level of the pre-transition fer-tility – in populations with traditional, uncontrolled fertility, the fertility has varied to a marked extent, ranging from an average of three to four children, up to an average of seven to eight children – passing the 10% threshold signalled the irreversibility of the change in the model that would result in a lower fertility rate.
1.2PopulationAllan Puur, Luule Sakkeus, Tiit Tammaru
Country Year
France 1827
Belgium 1881
Switzerland 1887
Estonia 1888
Germany 1888
Latvia 1892
Sweden 1892
England and Wales 1892
Lithuania 1895
The Netherlands 1897
Denmark 1898
Norway 1903
Austria 1907
Hungary 1910
Uruguay 1910
Bulgaria 1912
Finland 1912
Greece 1913
Italy 1913
Ukraine 1916
Portugal 1916
Spain 1920
Ireland 1922
Russia (European part) 1922
Moldova 1927
Belarus 1930
Singapore 1959
South Korea 1962
Costa Rica 1965
Chile 1966
Table 1.2.1The onset of the demographic transition based on fertil-ity measures. Estonia and selected countries.
Source: Coale, Watkins (1986); Coale (1992); Caldwell (2006). The countries are ranked according to the year by which their marital fertility had declined by 10% compared to the country-specific pre-transition level.

15Estonian Human Development Report 2012/2013
The results of the Princeton Project place Estonia among the forerunners of demographic modernisation. Of all the remaining European countries – except for France, which was the only nation where the manifestations of family planning were clearly evident in the early 19th century – Estonia belongs to the next group of coun-tries, where the turn toward a modern demographic regime had gained momentum during the 1880s. The early onset of the demographic modernisation in Estonia is also confirmed by other comparative studies that are based on different methodology (Chesnais 1992; Reher 2004). Considering the fact that the actual beginning of the changes preceded the moment when the 10% threshold was exceeded, and also that, of the two major components of population replacement, the reduction in mortality was initiated first, the start of Estonia’s demo-graphic modernisation may have occurred in the 1860s (Katus 1994; 2000). This viewpoint is also supported by the time-series of the crude fertility and mortality rates that, in Estonia’s case, stretch back into the 18th century (Palli 1997).
In Estonia, the rapid and irreversible decline in mortality and fertility, which is characteristic of demo-graphic modernisation, lasted until the 1930s. Similarly to the majority of Northern and Western European countries, and also Latvia and the Czech Republic, during the decade before World War II, Estonia’s fer-tility fell below the replacement level for the first time. The corresponding moment in time is often considered to be the border that marks the entry into a modern demographic regime. In the remaining Eastern Euro-pean countries, as well as in Southern Europe, this milestone was generally not reached until the 1970s and 1980s. In the rest of the world, if we disregard the English-speaking countries with populations that origi-nated in Europe, the change in the demographic regime came at a much later period. Based on the criterion of the Princeton European Fertility Project (the reduction of the marital fertility rate by 10%), Japan appears to be the only country where we can speak about the transi-tion to controlled fertility starting before World War II. Most of the Latin America and the Asian countries did not enter the new developmental stage until the 1960s and 1970s. In Africa, the start of fertility transition was postponed until the 1970s to 1990s, making it the last region of the world where this occurred.
The timeframe and pattern of change in the demo-graphic regime remains the key to understanding the country’s demographic situation, even if the transition was completed long ago. Thus, the early timing of the transition and modest population growth during the transition, which is characteristic of most forerunners of the transition, has pre-determined a great deal of Esto-nia’s demographic development since the 1930s. Among other things, it is one of the reasons that Estonians are among the few peoples in Europe whose numbers have not reached pre-war levels.
The very different timing of the demographic modernisation is also a reason why it is not possible to draw direct parallels between the current population situations in Estonia and the Asian and South Ameri-can countries, which are included among the countries
used for the comparison in this report. The demographic regime in South Korea, Singapore, Costa Rica and Chile started to change only after World War II, and in the late 1950s and early 1960s, there were still an average of 5.5 to 7.2 births per woman in these countries. The subsequent rapid modernisation reduced fertility to below the replacement level in the South Korea and Singapore in the course of 25 to 30 years, and in Costa Rica and Chile, in the course of 40 to 50 years. In all these countries, the largest generations of all time were born in the last quarter of the 20th century, which has significantly contributed to their rapid economic and social development. In Estonia, a similar phase of devel-opment occurred in the late 19th and early 20th century; the achievements of our large generations include the establishment of statehood and success in the War of Independence.
1.2.2 Population development during the post-transition periodBesides the timeframe of its demographic moderni-sation, another significant factor has also affected Estonia’s position in the international comparison – the discontinuity of country’s social and economic development. In Estonia’s case, the beginning of the modern demographic regime coincided with the loss of statehood. The impact that the societal discontinuity and a half century of occupation had on population development appeared extensive, and this legacy is also important for understanding the trends in the period following the restoration of independence and the con-temporary situation.
In order to cast light on these influences, in the next section of this chapter, the population trends in Estonia and the four major regions of Europe – North-ern, Western, Eastern and Southern Europe -- have been compared. In addition to changes in Estonia’s position, this comparative perspective also highlights the transformations in the European populations since the early 1960s. To conserve space, statistical evidence is presented mainly in graphic form, the presentation of numerical data is limited to the most recent time period (Table 1.2.2). The publication date of the report allows us to present the results of the recent round of population censuses, and based thereon, to summarise the population changes in Estonia between 2000 and 2011. A short explanation is also provided of the con-tent of the dimensions used to characterise the popu-lation processes.
1.2.3 Fertility and family processesThe total fertility rate, which summarises fertility level for the calendar year by means of the number of children, is presented in Figure 1.2.1. The total fer-tility rate indicates the average number of births per woman, based on the assumption that the age-specific fertility patterns characteristic of the specific calendar year continue throughout the reproductive years of

16 Estonian Human Development Report 2012/2013
Country Popu
latio
n
(peo
ple)
Popu
latio
n ch
ange
(%
of t
he 2
000
popu
latio
n)
Natu
ral i
ncre
ase
(% o
f the
200
0 po
pula
tion)
Net m
igra
tion
(% o
f the
200
0 po
pula
tion)
Tota
l fer
tility
rate
(c
hild
ren
per w
oman
)
Tem
po-a
djus
ted
tota
l fer
tility
rate
(c
hild
ren
per w
oman
)
Mot
her’s
age
at fi
rst b
irth
(yea
rs)
Perc
enta
ge o
f non
-mar
ital b
irths
(%
)
Life
exp
ecta
ncy,
men
(yea
rs)
Life
exp
ecta
ncy,
wom
en(y
ears
)
Infa
nt m
orta
lity
rate
(‰
)
Perc
enta
ge o
f the
eld
erly
65+
(%)
Perc
enta
ge o
f urb
an p
opul
atio
n (%
)
2000 -2011
2000 -2011
2000 -2011 2011 2008 2008
-2010 2011 2011 2011 2011 2011 2010
Austria 8,443,018 5.5 0.3 5.2 1.42 1.67 28.2 40 78.3 83.9 3.6 17.6 67
Belgium 11,041,266 7.8 2.0 5.8 1.84 1.93 ... 49 77.6 83.0 3.3 17.1 97
Bulgaria 7,327,224 -10.5 -5.7 -4.8 1.51 1.64 25.1 56 70.7 77.8 8.5 18.5 73
Estonia 1,294,544 -5.7 -2.5 -3.2 1.52 1.93 26.4 60 71.2 81.1 2.5 17.7 69
Spain 46,196,276 15.3 2.5 12.8 1.36 1.54 29.3 34 79.4 85.4 3.2 17.1 77
The Netherlands 16,730,348 5.5 4.1 1.4 1.76 1.83 29.2 45 79.4 83.1 3.6 15.6 83
Ireland 4,582,769 21.3 11.8 9.5 2.05 2.10 ... 34 78.3 82.8 3.5 11.5 62
Iceland 319,575 14.5 11 3.5 2.02 2.41 26.4 65 80.7 84.1 0.9 12.3 94
Italy 60,820,764 6.8 -0.3 7.1 1.39 1.51 ... 26 79.4 84.6 3.7 20.3 68
Greece 11,290,935 3.6 0.3 3.3 1.43 1.66 28.5 8 78.5 83.1 3.7 19.3 61
Cyprus 862,011 24.8 6.1 18.7 1.35 1.73 27.5 17 79.3 83.1 3.1 12.7 70
Lithuania 3,007,758 -14.4 -3.2 -11.2 1.76 1.84 26.6 30 68.1 79.3 4.2 17.9 67
Latvia 2,041,763 -14.3 -5.4 -8.9 1.34 1.70 24.4 45 68.6 78.8 6.6 18.4 68
Luxembourg 524,853 21.0 4.9 16.1 1.52 2.05 29.0 34 78.5 83.6 4.3 13.9 85
Malta 416,110 9.4 2.9 6.5 1.38 1.60 ... 23 79.2 83.6 6.1 15.5 95
Moldova 3,559,541 -2.3 -1.3 -1.0 1.27 1.49 ... 23 66.9 75.0 11.0 10.0 47
Norway 4,985,870 11.3 4.4 6.9 1.88 2.08 27.7 55 79.1 83.6 2.4 15.1 79
Poland 38,538,447 0.7 0.3 0.4 1.30 1.60 25.8 21 72.6 81.1 4.7 13.5 61
Portugal 10,541,840 3.4 0.3 3.1 1.35 1.61 27.9 43 77.6 84.0 3.1 19.1 61
France 63,460,768 7.8 5.1 2.7 2.03 2.12 28.6 55 78.3 85.3 3.5 16.9 85
Sweden 9,482,855 7.0 1.6 5.4 1.90 1.97 28.9 54 79.9 83.8 2.1 18.5 85
Romania 21,355,849 -4.9 -2.2 -2.7 1.25 1.46 24.8 30 71.0 78.2 9.4 14.9 53
Germany 81,843,743 -0.4 -2.1 1.7 1.36 1.68 29.1 34 78.4 83.2 3.6 20.6 74
Slovakia 5,404,322 0.1 0.6 -0.5 1.45 1.70 26.7 34 72.3 79.8 4.9 12.6 55
Slovenia 2,055,496 3.4 0.5 2.9 1.56 1.71 28.2 57 76.8 83.3 2.9 16.5 50
Finland 5,401,267 4.4 2.1 2.3 1.83 1.91 28.2 41 77.3 83.8 2.4 17.5 84
Great Britain 62,989,550 7.2 3.2 4.0 1.97 2.12 ... 47 78.7 82.6 4.3 16.7 80
Switzerland 7,954,662 11 2.3 8.7 1.52 1.69 29.9 19 80.5 85.0 3.8 16.9 74
Denmark 5,580,516 4.7 1.9 2.8 1.75 1.98 28.4 49 77.8 81.9 3.5 16.8 87
Czech Republic 10,505,445 2.2 -0.3 2.5 1.43 1.81 27.4 42 74.8 81.1 2.7 15.6 73
Ukraine 45,453,282 -8.0 -7.2 -0.8 1.46 1.60 ... 22 66.0 76.0 9.0 15.3 69
Hungary 9,957,731 -2.6 -4.3 1.7 1.23 1.66 27.7 42 71.2 78.7 4.9 16.7 69
Belarus 9,465,150 -5.5 -4.8 -0.7 1.51 1.68 ... 19 64.7 76.9 3.8 13.8 75
Russia 143,056,383 -1.7 -5.2 3.5 1.54 1.66 24.8 25 63.0 74.8 7.3 12.8 74
Table 1.2.2Main indicators of population development. Estonia and the comparative countries
Sources: Council of Europe (2006). Recent Demographic Developments in Europe 2005. Strasbourg: Council of Europe Publishing; Eurostat (2012). Statistics database.(http://epp.eurostat.ec.europa.eu); Human Fertility Database (2012) (www.humanfertility.org); Human Mortality Database (2012) (www.mortality.org); United Nations (2011). World Population Prospects. New York: United Nations Population Division; Vienna Institute of Demography (2012). European Demographic Data Sheet 2012. Statistical offices in Estonia and elsewhere; the authors calculations.

17Estonian Human Development Report 2012/2013
the hypothetical generation. The total fertility rate is related to the concept of the replacement level, which defines the average number of children necessary for the replacement of the parental generation. Somewhat paradoxically, the replacement level does not depend on fertility but rather on mortality. In contemporary low mortality settings, the replacement levels is slightly less than 2.1 births per woman (in the developed coun-tries more than 99% of children survive to adulthood), while in pre-modern settings it took 3.5 to 6, or even more births, depending on the infant and child mor-tality, to replace the parents.
Against the background of the major regions of Europe, Estonia’s fertility development stands out with several particularities. Firstly, from the end of World War II until the second half of the 1960s, the Estonian fertility remained below the recovery level, being one of the lowest in Europe and the world in that period. This deviation was presumably caused by the forced reorganisation of the society (Klesment 2010). In the Northern and Western European countries, with the early onset of demographic modernisation that was similar to Estonia, and where, in the 1930s, the fertil-ity had also fallen below the replacement level, a baby boom occurred after the war, which brought fertility above the replacement level for 20 to 25 years (depend-ing on the country, the total fertility rate reached 2.5 to 2.9 births per woman). The fertility in Southern Europe was at the same level, but for another reason – namely the transition to a modern demographic regime was still underway. Contrary to popular conceptions about the demographic differences between East and West, Eastern Europe’s birth rate, in the 1960s, was lower than in the remaining regions.
The situation profoundly changed in the 1970s and 1980s. The Estonian fertility gradually moved its ranking upward, from among the lowest countries. The same applies to Eastern Europe as a whole. One driving force underlying this changes was the increase in fertil-ity (8%, compared to the 1960s), which raised the total fertility rate of the 1970s and 1980s to the replacement level. However, no less important role in the change was the concurrent fertility decrease in the other regions of Europe. Thus, the post-war baby boom was followed by a new wave of changes in population development. This wave, known today as the second demographic transition (SDT), brought fertility below the replacement level (van de Kaa 1987; Lesthaeghe 1995). Like the “first” demographic transition, the SDT started in Northern and Western Europe after the mid-1960s, and later spread to other regions.
Although in several Eastern European countries fertility had fallen slightly below replacement already in the 1980s, a sudden drop in fertility rates was initiated by the social changes of the 1990s. This also applies to Estonia, where, due to the relatively high fertility lev-els in the 1980s, the decline appeared greater than the average for the region. The early 1990s was a period of the most rapid decrease in fertility in Estonia, and the total fertility rate fell to its lowest level in 1998 (1.28 children). At the beginning of the 21st century, fertility started to increase. This increase in the fertility rates
EstoniaNorthern Europe
Western EuropeSouthern EuropeEastern Europe
1960
1965
1970
1975
1980
1985
1990
1995
2000
2005
2010
Age,
year
s
22
23
25
27
29
24
26
28
1960
1965
1970
1975
1980
1985
1990
1995
2000
2005
2010
1,00
1,25
1,50
1,75
2,00
2,25
2,50
2,75
TFR,
child
ren
per w
oman
Western Europe Southern EuropeEstoniaNorthern Europe Eastern Europe
Figure 1.2.1Total fertility rate. Estonia and the European regions 1960–2011
In this chapter, the breakdown of the main European regions is the following: Northern Europe — DNK, FIN, NOR, SWE; Western Europe — AUT, BEL, CHE, DEU, GBR, FRA, IRL, LUX, NLD; Eastern Europe — BGR, CZE, HUN, LTU, LVA, POL, ROM, SVK, SVN; Southern Europe — ESP, GRC, ITA, PRT. To prevent the larger countries dominating the pattern, the indicators for the regions have been computed as an unweighted arithmetical average of the country indicators.
Figure 1.2.2Mother’s age at first birth. Estonia and the European regions 1960–2011

18 Estonian Human Development Report 2012/2013
occurred in all the regions of Europe, although, as was the case with the preceding decline, it turned out to be somewhat more dynamic in Estonia. As a result, the total rate emerged from the “extremely low” fertility zone (1.3 or less children per woman), and from 2007 to 2010, reached slightly more than 1.6 children (78% to 79% of the recovery level). During the first decade of the 21st century, the fertility rate in Estonia was the highest among the eastern Member Countries of the European Union.
On the fertility map of contemporary Europe – with a fertility rate that was 10% to 15% lower than the recov-ery level in Northern and Western Europe, on one hand, and with a deficiency of 30% to 35% in relation to the average in Southern and Eastern Europe, on the other —in 2004–2008, Estonia moved toward the first group (Figure 1.2.1). Unfortunately, the most recent correction in the fertility trend, after 2008, halted this movement. Although among Estonians, the total fertility rate achieved a local maximum in the period of economic recession (1.76 children per woman in 2010), the last few years have seen a reduction in fertility. In 2011, the total fertility rate was 8% lower than in 2008 and 2012 will bring an additional decline. In a comparison with the EU’s Eastern European members, this has meant that Estonia no longer features the highest fertility rate, but has fallen to third place (table 1.2.2).
The factors shaping the contemporary fertility trends in Estonia, as well as in the other countries of Europe, are complex, and providing a comprehensive overview of them would require a more extensive a consultation of specialised literature. However, one simple, but very influential factor – the timing of child-bearing – cannot be ignored even in a cursory approach (Billari et al. 2006). In the case of the contemporary family model, with fewer children, the moment for becoming parents can vary within relatively a long age span. This is illustrated by Figure 1.2.2, which shows that, after World War II, the timing of childbearing in Europe has undergone two distinct development stages. In the regions west of the Hajnal line (see the map), the period of the Malthusian marriage model came to an end in the 1950s and 1960s. The improvement of the “availability” of marriage opened the way for earlier childbearing and for a significant reduction in child-lessness. Together, these two developments explain to a significant degree the high fertility, observed during the baby boom period in Northern and Western Europe.
In the early 1970s, the shift towards ever earlier timing of childbearing was replaced, in both mentioned regions, by a contrary trend. By the end of the 1970s, the Southern European countries arrived at a similar turning point. In the majority of the Eastern European countries, the trend towards delayed childbearing began in the early 1990s. Against the background of the uni-versal shift from fertility advancement to fertility post-ponement, Estonia stands out with a quite unique trajec-tory. Similarly to the other countries located to the west of the Hajnal line, in the sphere of influence of the Mal-thusian marriage model, a shift towards earlier marriage and childbearing prevailed in the 1950s and 1960s. In
Bulgarians
Germans
Russians
Belarusians
Ukrainians
Slovaks
Magyars
RomaniansCroats
Serbs
Albanians
Italians
Poles
Lithuanians
Latvians
Estonians
Finns
Chechs
Austrians
St. Peterburg
Trieste
Hajnal lineThe Hanjal line is one of the oldest demographic divides in Europe. In the 17th to 18th century, the so-called Mal-thusian marriage, with its relatively late age (average age of women at marriage was over 23, often 25–26 years) and high percentage of never-marrying (over 10% of the generation, often 15%–20%), emerged in the areas west of the line. To the east of the Hajnal line, the traditional early (average age at marriage 18–20 years) and universal (2%–5% never-marrying) marriage persisted. The emer-gence of the Malthusian marriage pattern was driven by the reduction in mortality and accelerating population growth, which started in the areas west of the Hanjal Line. The Malthusian marriage can be seen as response of the demographic system to amounting pressures of over-pop-ulation, mediated by the neo-local family formation that had prevailed in these areas (neo-local family formation assumed that the married couple would establish a sep-arate household). Because of the described causal chain, which started from the reduction in mortality, the devel-opment of the Malthusian marriage has sometimes been considered as the onset of the demographic transition in Europe. Although the Malthusian marriage, as well as the Hajnal line, ceased to exist after World War II, its long-term legacy is still visible in contemporary demographic patterns (Puur et al. 2012).
Sources: Hajnal (1965); Plakans, Wetherell (2005).

19Estonian Human Development Report 2012/2013
that period, fertility timing in Estonia was quite similar to Western Europe. However, during the next decades, this similarity disappeared, and by the 1980s, Estonia had completely switched to the characteristic of Eastern Europe. This pattern of early childbearing was preva-lent in Estonia until a new, sudden change in the 1990s, which reflects the removal of the mechanisms that had stimulated early childbearing during the state socialism (Katus, et al. 2007).
Compared to the early 1990s, the mean age of childbearing has increased by almost four years (26.4 years in 2011). The extensive postponement of childbearing has introduced a systematic downward bias into all the standard measures of fertility level, including the total fertility rate (Bongaarts, Sobotka 2012). To illustrate the effect of fertility postponement, Table 1.2.2 compares the usual (observed) and the tem-po-adjusted fertility rates. According to the calculations performed by the Vienna Institute of Demography, the tempo-adjusted total fertility rate in Estonia exceeded the observed measure by 18%, and reached 1.9 chil-dren (2008). This adjusted fertility rate reflects Esto-nia’s fertility level on the eve of the economic reces-sion, in the absence of the reducing effect of fertility postponement. The reliability of the given estimate is confirmed by the results of cohort analysis. Based on the latter, the women born in the first half of the 1970s – these are the first generations whose reproductive period occurred mostly under the new societal con-ditions – will have, on average, 1.80 to 1.85 children
per woman, for the total population, and slightly more among the Estonians (Puur, Rahnu 2011). The ultimate confirmation of the validity of these estimates is pro-vided by the 2011 census. However, unfortunately, the census data on cohort fertility will not be published until after this report has already appeared.
While the aspects of fertility that have been dealt with are essential for the sustainability of population development, in international comparisons, Estonia also attracts attention for the high proportion of children that are born outside of registered marriage (Table 1.2.2). During the last years, this measure has stabilised at close to 60% for the total population (65% to 66% for Estonians). In Europe, Estonia ranks second only to Iceland (65%). Since the overwhelming majority of chil-dren born out of wedlock are not born to single parents, but rather to cohabiting couples, the high percentage of out-of-wedlock births suggests that the family model based on cohabitation is popular and widely accepted in Estonian society. According to the theory of the second demographic transition, the observed disconnection of childbearing from registered marriage is a universal trend in modern societies. It does not necessarily har-binger the disappearance of family values, but is just indicative of another new stage in the long-term evolu-tion of family institutions (Kertzer, Barbagli 2003; Nazio 2008). In Europe, the Nordic countries have progressed furthest along on this path, and in the light of the evi-dence discussed above, Estonia can be included among the trendsetters.
1960
1965
1970
1975
1980
1985
1990
1995
2000
2005
2010
1960
1965
1970
1975
1980
1985
1990
1995
2000
2005
2010
Men Women
60
62
64
66
68
70
72
74
76
78
80
82
84
60
62
64
66
68
70
72
74
76
78
80
82
84
EstoniaNorthern Europe Western EuropeSouthern Europe Eastern Europe
Age,
year
s
Age,
year
s
Figure 1.2.3Life expectancy. Estonia and the European regions 1960–2011

20 Estonian Human Development Report 2012/2013
1.2.4 MortalityIn regard to the second major component of population replacement – mortality – the period since 1960 can also be divided into several distinctive stages. However, compared to fertility, Estonia’s position on the popula-tion map of Europe has changed to a lesser extent during this period. Figure 1.2.3 presents the mortality trends by means of life expectancy at birth, which, similarly to the number of expected children (the total fertility rate), condenses the characteristics of the process into a single measure that summarises the mortality pattern for each calendar year.
By the late 1950s, Estonia had recovered from a crisis that, in the mid-1940s, temporarily shot the mortality rates back to the post-World War I level (Mer-telsmann 2011). By 1960, life expectancy for men had reached 64.7, and 73 years for women, which ensured a fairly good position for Estonia in international com-parisons. The life expectancy of Estonian women was comparable to the Western European average at the time, while for the men, who had suffered greatly in the course of the war and the repressions, life expectancy lagged three to five years behind Northern and West-ern Europe. Unfortunately, life expectancy in Estonia only increased in the short term. After the middle of the 1960s, life expectancy stagnated throughout East-ern Europe. This can be seen as evidence of the limited developmental potential of the social model and health care systems in the state socialist countries (Coleman 2006). As revealed by Figure 1.2.3, , stagnation in life expectancy was somewhat more pronounced in Estonia than in the Eastern Europe on average.
In the 1970s, a new stage in the increase of life expectancy arrived in the countries behind the Iron Curtain, which was primarily driven by the retreat of cardiovascular mortality (Vallin, Meslé 2005). As a result of divergent trends, by the end of the 1980s, in Europe, an extensive health gap had developed between the East and the West, which takes several decades to reduce. Unlike the fertility trends, which were generally similar across Eastern Europe in the 1990s, mortality trends diverged after the change of societal regime. In Poland, Slovakia, Slovenia and the Czech Republic, soon after the social changes, life expectancy started to increase, but in the former republics of the Soviet Union, the eco-nomic and social upheaval was first accompanied by a noticeable decrease in life expectancy. In some countries (e.g. Bulgaria and Hungary), the situation in the early 1990s was characterised by a continued stagnation in life expectancy.
In this period, Estonia stands out with its large fluctuations in the mortality indicators. The life expec-tancy decreased markedly, and by 1994, it had fallen to 60.5 years for men, and 72.7 years for women. Against the background of the Central European transition countries, such an extensive reduction attests to both the tempo of the social and economic changes, and the difficulty of adapting to new realities; this especially affected working-age men. However, after the initial crisis, since the second half of the 1990s, life expec-
tancy has increased vigorously, and in 2011, reached 71.2 years for men, and 81.8 for women (for Estonians 72.4 and 81.8 respectively). The main engines for this positive development have been the reduction in mortality due to cardiovascular diseases, and exter-nal causes (accidents, homicides, and suicides). The research results suggest that the observed change is not merely quantitative, but signals the entry into a new stage marked by a systematic reduction of deaths due to cardiovascular and anthropogenic causes (Jasilionis, et. al. 2011).
As a result of the trends since the middle of the 1990s, the improvement in the position of Estonian women in international comparisons has been particu-larly visible. Among the EU’s eastern Member Countries, only in Slovenia is the average life expectancy for women longer than in Estonia, and the life expectancy of Esto-nian women only lags two years behind the average for women in Northern and Western Europe. Although, since the middle of the 1990s, the life expectancy for Estonian men have increased even more, the Estonian men had not yet caught up the average for Eastern Europe in 2011. The continued large, 6- to 7-year gap with other regions of Europe alludes to fact that the reduction male mortality constitutes a major reserve that would enable Estonia to considerably improve its position in international human development.
1960
1965
1970
1975
1980
1985
1990
1995
2000
2005
2010
0
2
4
6
8
-2
-4
-6
-8
-10
-12
-14
-16Net m
igra
tion,
per
thou
sand
EstoniaNorthern Europe
Western EuropeSouthern Europe
Eastern Europe
Joonis 1.2.4Net migration. Estonia and the European regions 1960–2011

21Estonian Human Development Report 2012/2013
Table 1.2.2 also presents the most recent infant mor-tality rates (i.e. the percentage of new-born children who die during the first year of life). In international comparisons, this is the second most widely used mor-tality indicator after life expectancy. Infant mortality is among the few demographic measures that provides a reading (2.5% in 2011) from which it is no longer possible to discern the lack of continuity in Estonia’s development in the 20th century. In fact this is not sur-prising because, unlike older generations, the health of the new-born children does not bear the mark of the past.
1.2.5 Migration and urbanisationAfter World War II, about 200,000 Estonians lived out-side the borders of Estonia, of them 110,000 in Russia, and 90,000 in the West (Tammaru, Kumer-Haukanõmm, Anniste 2010). The Estonian settlement in Russia had developed as a result of out-migration in the period of demographic transition. The Estonian settlement in the West primarily resulted from the great flight in 1944. The urbanisation level in pre-war Estonia was low, like in many East European countries, and towards the end of the independence period approximately one in three Estonians lived in urban settlements.
Estonia’s incorporation into the Soviet Union affected migration more directly than the other popula-tion processes: it resulted in a large-scale immigration from Russia and other areas of the Soviet Union that lasted for several decades. Initially, the immigration to Estonia was largely organised by the Soviet authorities and all-Union enterprises, and therefore, many of those who had arrived in Estonia did not settle here perma-nently, but left after some time. In total, it is estimated that during the Soviet period, 1,600,000 people arrived in Estonia, and 1,260,000 left. This yields a positive net migration of 340,000 people (Sakkeus 1991). The return migration of Estonians from Russia also played a part in the immigration; in the post-war period, a total of 52 to 54 thousand Estonians returned (Kulu 1997). Until the 1960s, the intensive migration from Russia to other parts of the Soviet Union was supported by rapid population growth characteristic of the demo-graphic transition in Russia in that period (Rõbakovskii 1987). Thereafter, Russia’s net migration to most Soviet Republics became negative. Only in Estonia, Latvia and Lithuania did the positive net migration sustain until the end of the 1980s. However, during the 1970s and 1980s, the net migration in Estonia and the other Baltic countries was significantly less than at the beginning of the Soviet era.
Against the background of Europe’s major regions, Estonia is distinguished by a high level of net migration until the restoration of independence (Figure 1.2.4). In Western and Northern Europe, the net migration was also positive in that period, but smaller than in Estonia. Due to the closed-off state borders during the period of state socialism, the international migration in the Eastern European countries was close to nil, and their populations were affected neither by immigration nor
by emigrations. The greatest changes in migration flows during this period took place in Southern Europe. Until the 1970s, Southern Europe was an emigration region, with intra-European migration being highly significant for this region. At that time, flows from Southern Europe to Western Europe were prevailing in the intra-European migration (Castles, Miller 2008), compared to the flows from Eastern Europe to Western Europe today. Starting in the 1970s, Southern Europe gradually became a region of immigration.
When Estonia’s independence was restored in 1991, the proportion of foreign-born population was among the highest in Europe: every fourth resident had been born outside of Estonia. For instance, at the same time, the percentage in Germany was 13%, 14% in Sweden, and only 4% in Finland. Among the Euro-pean countries, only Luxembourg featured a higher percentage of foreign-born residents (30%) than Estonia or Latvia, and the percentage in Switzerland (21%) was largely comparable to ours. In 1945, Estonians com-prised approximately 97% of Estonia’s population. The changes that took place, between 1960 and 2011, in the proportion of the native and foreign-origin population (immigrants and their children born in the receiving country) are approximated quite precisely by different ethnic groups in Figure 1.2.5.
The majority of the immigrants settled in the urban areas, where the proportion of Estonians dropped, by the end of the 1980s, to an average of 51%, and to an even lower level in Tallinn and the cities of Ida-Viru
Popu
latio
n, th
ousa
nds
1960
1965
1970
1975
1980
1985
1990
1995
2000
2005
2010
0
200
400
600
800
1000
1200
1400
1600
Estonians Other ethnic groups
Joonis 1.2.5Population, number of Estonians and other ethnic groups. Estonia 1960–2011
22 Estonian Human Development Report 2012/2013
County. From the viewpoint of the settlement system, the immigration resulted in the rapid growth of the urban population, despite modest intra-Estonian rural-to-urban migration. In the period of state socialism, the rural-to-urban migration was relatively small in most other Eastern European countries as well. This reflected the shortage of housing in urban areas, and the inefficient agricultural sector that required a lot of manpower. As a result, a system-specific phenomenon – under-urban-isation – occurred in the settlement system of Eastern European countries (Szelenyi 1996). The legacy of this phenomenon can also be discerned in contemporary international comparisons (Table 1.2.2).
In the 1970s and 1980s, the changes in the ethnic composition of the urban population, the shortage of dwellings and apartment queues, the elitism of higher education and the increased importance of the agricul-tural sector, which was caused by problems with food supplies in the Soviet Union, attached the Estonians living in the countryside to their habitat, and attracted Estonians living in the cities to move to rural areas (Marksoo 2005). This resulted in a turnaround in rural-to-urban migration, and the first manifestations of suburbanisation, which got their start in the early 1970s in migration flows between Tallinn and Harju County (several wealthy agricultural enterprises were located around the capital). In the early 1980s, the turnaround in rural-to-urban migration expanded and became characteristic of Estonia as a whole. A simi-lar shift in internal migration had also taken place in Western Europe in the 1970s, but within a different social setting (Champion 1989). In Eastern Europe, the turnaround in rural-to-urban migration never became widespread, besides Estonia it was also observed in Hungary (Brown, Schafft 2002). The described shift in migration flows resulted in the relatively dispersed settlement of Estonians across the country, on the one hand, and the strong spatial concentration of the immi-grants into the urban areas in Northern Estonia, on the other hand.
The restoration of Estonia’s independence was accompanied by yet more extensive changes in migra-tion processes. Since the 1990s, the internal migration has mostly been in two directions: the long-distance migration into the larger cities for education and work, and suburbanisation caused by families in urban areas seeking a better living environment (Tammaru et al. 2009). The growth in education migration was stim-ulated, to a significant degree, by the replacement of elitist higher education by mass higher education. Edu-cation is the main reason why young people move to cities today. The concentration of the population in the cities and their suburbs was also promoted by the rapid growth of efficiency in agricultural production, and the disappearance of Soviet-era agricultural employment in collective farms, together with the increase in the ser-vice economy. In general, the changes that have taken place in internal migration in Estonia and elsewhere in Eastern Europe can be treated as lagged urbanisation, which is making up for the previous under-urbanisation, and bringing the settlement systems in the entire region closer to the Western countries.
In international migration, the restoration of Estonia’s independence resulted in an extensive wave of return migration, primarily to Russia, in the early 1990s. The application of the balance method, reveals that the size of the population belonging to ethnic minorities decreased by more than 140,000, between 1989 and 2000, while the negative net migration of Estonians did not exceed 10,000. In relative terms, the return migration of other nationalities from Estonia (24% of the respective groups in 1989) was 50% less than the decline in ethnic minority populations projected for the former Soviet Republics in the early 1990s (Cole, Filatotchev 1992). Between the 2000 and 2011 censuses, the decrease in the size of the population belonging to ethnic minorities due to the negative net migration (more than 28,000) was significantly smaller than in the 1990s, and that of the Estonians was somewhat larger (more than 16,000). Considering the fact that Estonians comprise 70% of the total population, this means that the emigration of the ethnic minorities was more than three times as intensive as that of the Estonians.
If we leave aside the return migration of Russians and other ethnic minority groups to their countries of origin, departures to other European countries have dominated the out-migration. In the last two decades, two major waves can be distinguished in the out- migration from Estonia. The first wave occurred in the early 1990s, and formed a part of the east-to-west ethnic migration in Europe that followed the fall of the Iron Curtain. During this period, extensive migration from Estonia to Finland took place for the first time in history (in 1991, there were very few Estonians living in Finland). Many of those who departed in the early 1990s were Ingrian Finns, who were treated by Finland as ethnic return migrants. The second and larger wave of migration began when Estonia joined the European Union, and accelerated during the economic crisis that broke out in 2008 (Anniste at al. 2012).
The current scale of emigration from Estonia reflects the combined effect of several factors. Firstly, in the 2000s, the relatively large generations born in the 1980s reached the prime age of migration. The large generations born in the 1980s are characteristic not only of Estonia, but Eastern Europe in general; these generations carry a significant migration potential in the countries of this region which drives the east-west migration in today’s Europe. Secondly, in addition to the noticeable gap in the standard of living, which was a legacy of the Soviet era, a new factor was added in the late 2000s. This was the impact of the economic crisis, which struck Estonia considerably harder than it did Finland or the other countries in Northern and Western Europe. Emigration was also fostered by the opening up of the labour mar-kets of the old EU Member Countries (the last countries opened up their labour markets to Estonia in 2011), which gave Estonian residents the right to work freely in the EU countries. As a result of these developments, in the 2000s, Finland became the most important desti-nation for out-migration from Estonia; almost every other migrant in this decade has left for Finland. What’s more, in a relatively short time, Finland has replaced Russia as the foreign country with the largest Estonian community.

23Estonian Human Development Report 2012/2013
The new trends that are appearing in migration are not limited to work migration. A new type of migration that is growing rapidly is related to education. Saar Poll’s recent survey among the 2012 graduates of upper sec-ondary schools shows that, especially the graduates of Russian-language schools do not view higher education in Estonia attractive, and prefer to continue their studies elsewhere in Europe. As far as the direction of migration is concerned, during the last few years, return migration has increased, in parallel with emigration. It is worth not-ing that return migration into Estonia is, currently, larger than emigration from Estonia was in the early 2000s.
Based on the consideration of the aforementioned factors, some assumptions can be made about the future course of migration processes. First, although emigration from Estonia still continues to increase, the potential for emigration will presumably start to decrease in the next few years, as the small generations born in the 1990s arrive at the prime age of migration. Secondly, alongside, or instead of, permanent migration, a rapid increase is occurring in the other forms of spatial mobility, the ten-dency, which has been termed the new mobility revolu-tion (Scheller, Urry 2006). Therefore, one can assume that ever more people, in the future, will live transnational lives, with one part connected to Estonia, and another part to some other country.
In an integrating Europe, working, studying, or seeking new experiences abroad for a longer or shorter period will become increasingly common. The evi-dence from the European Social Survey shows that among Estonians the percentage of people who have experience working abroad is one of the highest in Europe (Mustrik 2011). This suggests that Estonia is on the forefront of these new developments. Thus, in summary, one can probably only agree with those authors who speak about the arrival of a new era — the migration era — in contemporary population devel-opment (Castles, Miller 2008) and a new mobility paradigm (Scheller, Urry 2006). All countries have to adjust to these new realities, and take into account the fact that today ever more frequently a person’s life crosses state borders, the same way it once started to cross the borders of birthplace and local community. When assessing the consequences of these changes, the rapid development of modern means of communication must not be overlooked – these new means have made cross-border communicating much simpler and less expensive, and enable to maintain daily contacts with one’s country of origin from any distance.
1.2.6 Population ageingAlthough population ageing is not included among the basic demographic processes, it is often regarded as major challenge for contemporary European societies (EC 2005). Despite the concerns that usually accompany any discussion of this phenomenon, population ageing must be considered to be a legitimate outcome of demo-graphic modernisation. The cause for population ageing is the major change in the demographic regime men-tioned at the beginning of the chapter, which, in time,
transforms the shape of the age structure from pyramid to pillar (Martin, Preston 1994). This relationship, along with the variation in the onset of the demographic modernisation, generally determines the results of the international comparisons of ageing. In this chapter, the percentage of the elderly (65+) in the population has been used as a measure of ageing.
Ref lecting the early demographic modernisa-tion, the proportion of the elderly in Estonia started to increase already in the last quarter of the 19th cen-tury (Katus et al. 2003). Before World War II, people aged 65 and older comprised 10% of the population, whereby Estonia was among the four to five “oldest” nations in Europe. Although post-war immigration tem-porarily halted the ageing process, and even reversed it, the degree of population ageing in the 1960s was still comparable to the Northern and Western Europe (Figure 1.2.6). In the 1970s, the similarity to the latter regions comes to an end and the proportion of elderly in Estonia started to resemble that observed in the coun-
1960
1965
1970
1975
1980
1985
1990
1995
2000
2005
2010
Prop
ortio
n, %
6
8
10
12
14
16
18
7
9
11
13
15
17
19
Estonia Northern Europe Western EuropeSouthern Europe Eastern Europe
Joonis 1.2.6Proportion of elderly (65+). Estonia and the European regions 1960–2011

24 Estonian Human Development Report 2012/2013
tries of Eastern Europe. In the 1980s, Estonia experi-enced a temporary reversal of the ageing trend, which was caused by the small generation born during World War I and the War Independence entering old age. Due to the repeated disruptions in the process, the propor-tion of elderly in Estonia at the end of the 1980s was only 0.7 percentage points higher than at the beginning of the 1940s. The median age of the population was even lower than a half century earlier. Among European countries, Estonia and Latvia share the record for halt-ing demographic ageing for the longest period, by means of immigration.
The end of large-scale immigration and the simul-taneous transformation of several demographic processes resulted in a marked acceleration of population ageing in Estonia in the 1990s. In that period, the post-war immi-grants who had settled in Estonia in the 1940s and 1950s, started to reach old age, adding momentum to the ageing process. As a result, the proportion of elderly doubled among the foreign-origin population, and reached par-ity with the native population (Puur, Põldma 2010). The combined effect of these factors increased the proportion of the elderly from 11.6% to 17.4% (based on the census data, the ratio has been adjusted to 17.7%) in Estonia between 1990 and 2011. In that period, the tempo of
1960
1965
1970
1975
1980
1985
1990
1995
2000
2005
2010
Mig
ratio
n, p
er th
ousa
nd
0
4
8
12
-4
-8
-12
-16
Natural increaseNet migrationPopulation change
Figure 1.2.7Natural increase, net migration and total population increase. Estonia 1960–2011
population ageing in Estonia has been exceeded by only a few European nations. The rapid pace of ageing is also revealed by the comparison with the main regions of Europe (Figure 1.2.6).
Against the background of the trends since 1990, it may seem surprising that the proportion of elderly in Estonia has not increased during the last four years. Like the disruption in the ageing trend in the 1980s, the reason relates again to the aftermath of the erratic 20th century, or, more precisely, to the small size of the gen-eration born in Estonia toward the end of World War II and immediately after the war (1943–1946). However, as the following sections of the chapter reveal, this is only a temporary cessation of demographic ageing.
1.2.7 Population changeIn this chapter, so far, the demographic processes have been dealt with separately, whereas now, the different perspectives will be integrated by focusing on popula-tion change. In the period perspective, change in the number of population reflects a combined outcome of fertility, mortality, immigration and emigration). Indirectly, an even broader spectrum of demographic processes is reflected (e.g. family formation and dissolu-tion, and health-related behaviour), as are the outcomes of past demographic trends that are stored in the age structure of the population. For the better understanding of population change, the contribution made by its two components – natural increase and net migration – are shown below.
Considering the dynamics of the demographic pro-cesses discussed in the earlier sections, it is, of course, not surprising that based on population change the period since 1960 is divided into very different parts in Estonia (Figure 1.2.7). Although population growth decelerated – by the late 1980s, the rate of growth had almost halved compared to the 1960s – until the restoration of indepen-dence it was still unusually large for a population that had modernised early on. Estonia’s population increased 30% in the period between 1960 and 1989 (among Esto-nians, the growth was 7.7%, among other ethnic groups it amounted to 95%). This exceeded the population growth in the Northern and Western European countries, in the same period, 1.7 to 2.1 times, and was also considerably larger than the growth observed for Southern Europe. Likewise, the population grew faster than in Estonia in 1960–1989 in only a few European countries. Without exception, these were countries in which the demo-graphic transition had ended several decades later. The main reason for Estonia’s unprecedentedly rapid popu-lation growth was, of course, the persistent large-scale immigration from other parts of the former Soviet Union -- until the mid-1970s, more than half, and in the 1980s, approximately half of the total population growth was due to positive net migration. In the same period, in Western and Northern Europe, the contribution of net migration averaged 24% and 13%, respectively. In Eastern Europe, the role of migration was even smaller, and in Southern Europe, due to the dominance of emigration, the net migration made a negative contribution until the 1970s.

25Estonian Human Development Report 2012/2013
In fact, until the end of the 1980s, the role of migration, as a source of population growth, was actually even larger in Estonia than the percentages in the previous paragraph suggest. This is due to the indirect effect of immigration: positive natural increase supported by the youthful age structure of the population. To illustrate the total impact of migration, Figure 1.2.8 shows the components of pop-ulation change by ethnicity. Since Estonia lost most its historical minorities in the course of World War II, the combined contribution of migration to population change is approximated by the total of net migration and the natural increase of ethnic groups other than Estonians. By employing this point of view, in the 1960s–1980s the contribution of migration amounts to about 4/5 of the total population growth in Estonia.
The transformations in the demographic processes, which had started in the late 1980s, brought both com-ponents of population change to the negative side, already on the eve of the restoration of Estonia’s independence. The net migration, which usually reacts more rapidly, became negative in 1989, and the natural increase fol-lowed in 1991. Although the growth had been replaced by decrease, migration remained the main source for the population change during the 1990s. The net migration that had become negative, due to the partial return of the post-war immigrants to their countries of origin, reduced the population by 9.7%, in the course of the decade. The negative natural increase added another 2.9%. Among the countries included in this study, Estonia featured the greatest population loss during the 1990s. In Estonia, the population decreased by 12.6% (Estonians by 3.5%, and the other ethnic groups by 27%), followed by Latvia (a reduction of 10.7%) and Bulgaria (a reduction of 6.6%). The average population decrease in Eastern Europe, in the 1990s, was limited to 2.8%. In the other regions of
thou
sand
per
sons
1960 1965 1970 1975 1980 1985 1990 1995 2000 2005 2010
0
5
10
15
-5
-10
-15
-20
-25
-30
-35
-40
-45
0
5
10
15
-5
-10
-15
-20
-25
-30
-35
-40
-45
Other ethnic groups:Estonians: Net migration Natural increaseNet migration Natural increase
Figure 1.2.8Components of population change by Estonians and other ethnic groups. Estonia 1960–2011
Europe, the populations increased on average by 3.3% to 6.0%, with 50% to 88% of the observed increase directly attributable to immigration.
The first decade of this century was characterised by the gradual improvement in demographic measures, but this still did not halt the population decrease. The recent census showed that, in the period from 2000 to 2011, Estonia’s population decreased by 5.7% (the reduction in the number of Estonians was 3.0%, for other ethnic groups 11.3%). Of the components of population change, the largest contribution continued to be made by negative net migration, but unlike in the 1990s, its predominance over the contribution of natural increase was no longer as excessive (-3.2% and -2.5% respectively). With regard to natural increase, the excess in the number of deaths over the number of births gradually diminished, and this tendency culminated in the marginally positive natural increase in 2010 (+35 people). This tendency was some-what more pronounced among Estonians and, in 2008 to 2011, resulted in a positive natural increase; due to the latter, in the course of four years, the number of Estonians increased by 4,000. In the period from 2000 to 2011, the population loss of Estonians, caused by a negative natu-ral increase, was limited to 1.2%. However, the decrease, resulting from negative net migration, reached 1.9% in the same period. These figures indicate a change in the role of the two components compared to the 1990s, when the primary factor, reducing the number of Estonians was a negative natural increase.
In a comparative perspective, the developments of the last decade have meant a certain improvement in the position of Estonia, with regard to population change. Although the population loss, in the 2000s, continued to be larger in Estonia than the average in any major region of Europe, the previously wide gap with average

26 Estonian Human Development Report 2012/2013
for Eastern Europe was replaced by a more modest differ-ence. During the recent four to five years, Estonia’s total population growth no longer markedly differed, in the negative sense, from the average of the region. Of the two components of population change, this direction has been supported, primarily, by the reduction in the negative natu ral increase in population.
The other areas of Europe featured rapid pop-ulation growth in the first decade of the 21st century: between 2000 and 2011, the population of Northern Europe increased by 6.9%, Western Europe by 9.6%, and Southern Europe by 7.3%. In the context of a mod-ern demographic regime, such growth rates can only be achieved with the support of large-scale immigration. This is confirmed by an increase in the role of net migration in all three regions, compared to the 1990s. In 2000–2011, the direct contribution of migration varied from 64% to 90% of the total growth in these regions. The indirect impact of migration must be added to the aforementioned figures, in order to gauge the full contribution of immigration. The comparative data, on Figure 1.2.9, also highlight the essential role of economic conditions in the receiving countries in sustaining the migration-based growth. The impact of relinquishing this precondition is reflected in the trends for Southern Europe during recent years. The data on population change, natural increase and net migration by individual countries is presented in Table 1.2.2.
1.2.8 SummaryIn the preceding sections, population development in Estonia was examined against the background of Europe’s four main regions. In regard to all the processes addressed, the time-span of the study, which extends back to the onset of the demographic modernisation, highlighted several stages of development that are also related to the changes in Estonia’s position on the demo-graphic map of Europe.
The longest of these stages came to an end with World War II. Its beginning can be traced back to the 17th and 18th centuries, when the countries to the west of the Hajnal line took the first significant step toward a modern demographic regime. Although this step did not involve direct change in fertility and mortality, it replaced early and universal marriage Malthusian marriage and determined Estonia’s demographic affiliation for the next two centuries. Along with Finland, Ingria, Latvia and Lithuania, Estonia formed the easternmost area for the spread of the new marriage pattern. In his research, Ans-ley Coale, the initiator of the Princeton European Fertility Project (1973; 1992), has demonstrated a close connection between the emergence of Malthusian marriage and the early onset of fertility transition, which placed Estonia among the forerunners of demographic modernisation in Europe and the world. In the countries belonging to the latter group, the transition to a modern demographic regime was largely completed by the end of the 1930s. In that period, Estonia’s demographic development bore a close similarity to that in the countries of Northern and Western Europe. 19
60
1965
1970
1975
1980
1985
1990
1995
2000
2005
2010
1960
1965
1970
1975
1980
1985
1990
1995
2000
2005
2010
0
2
4
6
8
10
12
-2
-4
-6
-8
0
2
4
6
8
10
12
-2
-4
-6
-8
0
2
4
6
8
10
12
-2
-4
-6
-8
0
2
4
6
8
10
12
-2
-4
-6
-8Per t
hous
and
Per t
hous
and
Per t
hous
and
Per t
hous
and
Natural increaseNet migrationPopulation change
Northern Europe
Southern Europe
Western Europe
Eastern Europe
Figure 1.2.9Natural increase, net migration and population change. European regions 1960–2011

27Estonian Human Development Report 2012/2013
New features were introduced into Estonia’s population development by the loss of independence in the course of the World War II. Based on evidence presented in this chapter, the departure from a long-term path of demo-graphic development could be seen as a common denom-inator thereof. Although it did not take long to inflict the demographic losses due to war and repressions, the international comparisons show that it required an entire generation to transform the demographic patterns – judg-ing from childbearing, mortality and ageing, the transfor-mation was completed by the early 1970s. At the same time,
a new wave of demographic changes had gained momentum in
Northern and Western Europe. Unlike in the past, however, the manifestations of this wave – with a few exceptions – did not appear in Estonia. Instead, the stagnation in life expectancy, the persistent shift toward ever earlier childbearing, an increase in period fertility rates based thereon, as well as the deceleration of population ageing, brought Estonia ever closer to Eastern Europe, when it came to demographic patterns. By the 1980s, the amal-gamation was virtually complete with regard to the main demographic processes.
The collapse of state socialism opened up the way for social upheaval in Eastern Europe, which also included demographic changes. In regard to most of the new demographic trends that emerged in the region in the early 1990s – population decline, sharp reduction in fertility, decrease in life expectancy, rise in emigration, and the acceleration of population ageing – among the countries of Eastern Europe, Estonia stands out for the rapid pace and large scale of the changes. This can be explained by a more radical detachment from the old societal system on the one hand, , and the situation that had developed during the period of state socialism (e.g. markedly long stagnation in life expectancy and popu-lation ageing, the large immigrant population, relatively high fertility in the 1980s, following lower levels in the 1950s and 1960s).
Although there is a stark contrast between the demographic indicators in the 1980s and 1990s, in the comparative view, it is not at all clear that a dividing line indicating the start of a new demographic era can be drawn between these two decades. If we consider the position of Estonia relative to Europe’s major regions, Estonia’s demographic affiliation with Eastern Europe, which had developed in the 1970s and 1980s, persisted in the 1990s, notwithstanding the radical transforma-tion in the demographic regime. It is interesting to pose the same question in regard to contemporary Estonia – two decades into the restored independence, is there any reason to speak about a new stage of demographic development, or does the legacy of the occupations con-tinue to determine the country’s demographic profile? A good means of finding an answer to this question is international comparison, which the present human development report focuses on.
The evidence presented in this chapter suggests that the contemporary demographic patterns reflect the influences from the past, as well as some new features that have emerged relatively recently. Considering the continuity characteristic of population development, such interweaving is to be expected. The most spectac-
ular manifestation of the influence carried forward from the past is the continued population decrease, which clearly differentiates Estonia from the Northern and Western European countries. Although the population decrease is taking place now, many of the reasons for this can be found in the earlier demographic trends. For instance, this includes the “young” family formation and childbearing of the 1970s and 1980s, the replacement of which, with a “more mature” pattern, which started in the 1990s, continues to push the observed fertility rates downward for another 10 to 15 years, and keeps the natural increase in the negative. The circumstances that caused many post-war immigrants and their descen-dants to leave Estonia in the 1990s can also be traced back to the period prior to the restoration of indepen-dence. The gaps in the standard of living and welfare systems that separate Estonia from the neighbouring countries, which have not experienced repeated societal discontinuities, are also associated with the past. This gap has, by now, been only partially closed, and instead of attracting immigrants to Estonia, promotes emigration driven by economic motives.
At the same time, international comparisons also highlight other features related to population develop-ment in Estonia. This is most clearly expressed in the diversity of family forms, which places Estonia among the forerunners of the second demographic transition (Sobotka 2008; Lesthaeghe 2010). Estonia shares several common features with the higher fertility countries of Northern and Western Europe. These include favour-able opportunities for combining work and parenthood, the availability of public childcare services, and starting from 2004, the income-related parental leave scheme with a high rate of compensation. Although a generous welfare system comparable to the Nordic countries will remain unachievable in the near future, the opportu-nities for combining work and parenthood in Estonia are considered to be among the best, when compared to the Eastern and Southern Member Countries of the European Union (Matysiak 2011). More specific analyses (Klesment, Puur 2010) have revealed a positive associa-tion between educational attainment and the progression to second birth, which is known to be one of the mecha-nisms supporting higher fertility in the Nordic countries (Kravdal 1992; Vikat 2004; Gerster et al. 2007). As more educated persons are regarded the forerunners who lead the way for other groups, then the emergence of a pos-itive relationship between education and childbearing could be considered to be a good sign for the future.
The new features that deserve attention in a com-parative perspective are not limited to family forms and fertility. In the context of population ageing, for instance, Estonia stands out for the notably high labour market attachment among older persons. Before the economic recession, from 2005 to 2009, in regard to the employ-ment rate of 55-64-year-olds Estonia ranked second or third among the EU countries, after Sweden and Den-mark. Against the background of the health status of the older population in Estonia, such a high ranking is perhaps surprising, but instils confidence in the ability to absorb the effects of demographic ageing. With regard to mortality, international comparisons corroborate Estonia’s

28 Estonian Human Development Report 2012/2013
entry into the stage of receding cardiovascular mortality, which is one of the main factors that have driven the increase life expectancy in the Western countries since the 1970s. Estonia preceded its Baltic neighbours in enter-ing this new stage, and in regard to women, has caught up with the most successful countries in Eastern Europe.
Although the views of demographers regarding the future population trends became more optimistic during the last decade (Morgan 2003; Goldstein, Sobotka, Jasili-oniene 2009; Bongaarts, Sobotka 2012), the international comparisons reveal the persistence of regional differences that developed in Europe in the 1980s and the 1990s. This contemporary regional variation primarily stems from fertility, Northern and Western Europe feature fertility rates close to the replacement whereas Southern and Eastern Europe, along with the German-speaking countries, are characterised by lower demographic zones. Thus, the long-term demographic outlook for Estonia depends to an important extent on the zone towards which Estonia will drift.
Notwithstanding the long-term course, we must be prepared, in the shorter term, for the fact that the decrease in fertility that occurred in the 1990s will increasingly affect Estonia’s contemporary demographic profile. During the current decade, the small generations born in the 1990s will reach parenting age, which will inevitably and noticeably decrease the number of births, and shift the natural increase to further to negative side. This also implies that population decrease and ageing will persist, and carefully planned efforts for the adaptation of societal institutions to demographic changes will be required. According to medium and constant fertility scenarios of the United Nations population projections, by 2050, the percentage of the elderly (65+) will increase from the current 18% to 25%-26% in Estonia (United Nations 2011). The old-age dependency ratio (ratio of the age group 65+ to age group 20-65) will increase from 28 to 47-49 during the same period.
Despite the extent of the projected changes, it would be a misconception to assume that such trends are something unique to Estonia. According to the United Nations projections, the forecasted increase in the pro-portion of elderly and the old-age dependency ratio in Estonia appear similar to those projected for the Northern European countries. In the latter region, the proportion of the elderly is projected to increase from 17% to 25%, and the old-age dependency ratio from 28 to 47 in 2050. For Western Europe, the UN predicts that the propor-
tion of the aged will reach 27%–28%, and the old-age dependency ratio 52–53. For Eastern Europe, the corre-sponding figures are 27%– 33% and 52–55 respectively. In case the demographic trends will test the limits of the adaptability of European societies, this will probably happen in the Mediterranean countries. As a combined result of high life expectancy and very low fertility during almost three decades, this region can expect the elderly to make up one-third of the population (32%-34%), and the old-age dependency ratio to reach 66–69. A similar future awaits the Asian industrial countries (e.g. South Korea, Singapore) which underwent an exceptionally rapid demographic transition in the second half of the 20th century. The UN projects that the proportion of the elderly will reach 33%–36% in the South Korea and the old-age dependency ratio 63–67 by 2050. In the three South American countries, discussed in this report, the old-age dependency ratio will reach 37-42 by 2050, while the population ageing will continue and peak in the sec-ond half of the 21st century. The small variances across project scenarios shows the accuracy of the projections, which results from the fact that those who will be the elderly in the middle of the 21st century, are all present in the contemporary populations, as do the majority of those who will provide for their maintenance after 35–40 years.
In conclusion, it should be emphasised that, although the population projections provide useful insights into the demographic trends across one or two generations, they do not determine the future. There-fore, the future course of Estonia’s demographic devel-opment is not limited to the narrow numerical intervals of the projections cited above, which in comparison to some other countries, may even instil a deceptive sense of security. As a small and open society, Estonia will remain demographically more dynamic and influence-able than larger nations. This is proven by Estonia’s position at the extreme positions, or nearby, in several international rankings. The concluding message of this chapter could be that in the contemporary demographic scene, possibilities exist for both positive and negative developments. It is definitely not impossible to take advantage of these possibilities and turn the positive into reality, but this will require trust within society, and a quest for smart solutions.
The authors thank Liili Abuladze, Asta Põldma and Jaak Valge for their valuable comments and recommendations in the course of preparing this chapter.
References1. AnniSte, K., tAmmARu, t., PungAS, e., PAAS, t. (2012). “Dynamics
of Educational Differences in Emigration from Estonia to the old EU Member States,” Trames: Journal of the Humanities and Social Sciences, 16 (1), 219–235.
2. BillARi, F., lieFBRoeR, A., PHiliPov, d. (2006). “The Postponement of Childbearing in Europe: Driving Forces and Implications,” Vienna Yearbook of Population Research, 4, 1–18.
3. BongAARtS, J., SoBotKA, t. (2012). “A Demographic Explanation for the Recent Rise in European Fertility,” Population and Devel-opment Review, 38(1), 83–120.
4. BRown, d., SCHAFFt, K. (2002). “Population Deconcentration in Hungary during the Post-Socialist Transition,” Journal of Rural Studies, 18(3), 756–793.
5. CAldwell, J.C. (2006). Demographic Transition Theory. Springer.
6. CAStleS, S., milleR, m. (2008). The Age of Migration. 4th Edition. London: Palgrave Macmillan.
7. CHAmPion, t., ed. (1989). Counterurbanisation: The Changing Pace and Nature of Population Deconcentration. London: Edward Arnold, 1–18.
8. CHeSnAiS, J.-C. (1992). Demographic Transition. Stages, Patterns and Economic Implications. Oxford: Oxford University Press.
9. CoAle, A. J. (1973). “The Demographic Transition Reconsidered,” Proceedings of the IUSSP International Population Conference, 1. Liege: Editions Ordina, 53–73.
10. CoAle, A.J. (1992). “Age of Entry into Marriage and the Date of the

29Estonian Human Development Report 2012/2013
Initiation of Voluntary Birth Control,” Demography, 29(3), 333–341.
11. Coale, A., Watkins, S., (Eds.) (1986). Fertility Decline in Europe: The revised proceedings of a conference on the Princeton Euro-pean Fertility Project. Princeton, N.J.: Princeton University Press.
12. Cole, J., FilAtotCHev, i. (1992). “Some Observations on Migration within and from the Former USSR in the 1990s,” Post-Soviet Geography, 33(7), 532–543.
13. ColemAn, d. (2006). “The European Demographic Future: Deter-minants, Dimensions and Challenges,” The Political Economy of Global Population Change 1950–2050. Demeny, P., McNicoll, G. (Eds.), Population and Development Review, Supplement to Vol. 32, 52–95.
14. euRoPeAn CommiSSion (2005). Green Paper “Confronting Demographic Change: a New Solidarity between Generations“. Brussels: Commission of the European Communities.
15. Frejka, T., Sobotka, T. 2008. “Fertility in Europe: Diverse, Delayed and Below Replacement,” Demographic Research SC7: Childbearing Trends and Policies in Europe, 19, 15–46.
16. geRSteR, m., Keiding, n., KnudSen, l.B., StRAndBeRg-lARSen, K. (2007). “Education and Second Birth Rates in Denmark 1981–1994,” Demographic Research, 17, 181–210
17. goldStein, J.R., SoBotKA, t., JASilioniene, A. (2009). “The End of ‘Lowest-Low’ Fertility?” Population and Development Review, 35(4), 663–699.
18. HAJnAl, J. (1965). “European Marriage Patterns in Perspective,” D. V. Glass, D. E. Eversley (Eds.), Population in History. Essays in Historical Demography. London: Edward Arnold, 101–143.
19. JASilioniS, d., meSlé, F., SHKolniKov, v. m., vAllin, J. (2011). Recent Life Expectancy Divergence in the Baltic Countries,� European Journal of Population, 27(4), 403–431.
20. KAtuS, K. (1994). “Fertility Transition in Estonia, Latvia and Lithuania,” Lutz, W., Scherbov, S., Volkov, A. (Eds.), Demo-graphic Trends and Patterns in the Soviet Union Before 1991. London and New York: Routledge, 89–111.
21. KAtuS, K. (2000). “Long-term Mortality Trend in the Baltic Countries,” Trames: Journal of the Humanities and Social Sci-ences, 4(3), 231–256.
22. KAtuS, K., PuuR, A., PõldmA, A., SAKKeuS, l. (2003). Population Ageing and Socio-economic Status of Older Persons in Estonia. New York and Geneva: United Nations Economic Commission for Europe.
23. KAtuS, K., PuuR, A., PõldmA, A., SAKKeuS, l. (2007). �First Union Formation in Estonia, Latvia and Lithuania: Patterns across Countries and Gender.,� Demographic Research, 17, 247–300.
24. KeRtzeR, d. i., BARBAgli, m. (2003). Family Life in the Twentieth Century. The History of the European Family, 3. New Haven and London: Yale University Press.
25. KleSment, m. (2010). Fertility Development in Estonia during the Second Half of the 20th Century: The Economic Context and its Implications. Dissertations in Social Sciences, 46. Tallinn: Tallinn University.
26. KleSment, m., PuuR, A. (2010). “Effects of Education on Second Births before and after Societal Transition: Evidence from the Estonian GGS,” Demographic Research, 22, 891–932.
27. KRAvdAl, Ø. (1992). �The Emergence of a Positive Relation between Education and Third Birth Rates in Norway with Supportive Evidence from the United States,� Population Studies, 46(3), 459–475.
28. Kulu, H. (1997). Eestlaste tagasiränne 1940–1989. Lääne-Siberist pärit eestlaste näitel. Tartu: Tartu University Press.
29. lAndRy, A. 1982 (1934). La Révolution Démographique. Études et Essais sur les Problèmes de la Population. Paris: INED.
30. lee, R.d., ReHeR, d.S., edS. (2011). “Demographic Transition and its Consequences,” Population and Development Review, Supplement to Vol. 37.
31. leStHAegHe, R. (1995). “The Second Demographic Transition in Western Countries: An Interpretation,” K. Mason and A.-M. Jensen (Eds.), Gender and Family Change in Industrialised Countries, Oxford: Clarendon Press, 17–62.
32. leStHAegHe, R. (2010). “The Unfolding Story of the Second Demographic Transition,” Population and Development Review, 36(2), 211–251.
33. mARKSoo, A. (2005). �Linnastumine nõukogude aastatel,� Kulu, H., Tammaru, T. (Eds.), Asustus ja ränne Eestis: uurimusi Ann Marksoo 75. sünnipäevaks. Tartu: Tartu University Press, 59–81.
34. mARtin, l.g., PReSton, S.H. (1994). Demography of Aging. Washington, D.C.: The National Academies Press.
35. mAtySiAK, A. (2011). Interdependencies between Fertility and Women’s Labour Supply. Springer.
36. meRtelSmAnn, o. (2011). “Keskmine oodatav eluiga stalinismi-aegses Eestis,” Ajalooline ajakiri, 1, 105–110.
37. moRgAn, P. S. (2003). “Is Low Fertility a Twenty-First-Century Demographic Crisis?” Demography, 40(4), 589–603.
38. muStRiK, K. (2011). Välismaal töötamise kogemus Euroopa riikide elanike seas. Master’s thesis University of Tartu, Depart-ment of Geography.
39. nAzio, t. (2008). Cohabitation, Family and Society. New York and London: Routledge, Taylor and Francis Group.
40. noteStein, F.w. (1945). “Population – The Long View, Schultz, T. W., (Ed.), Food for the World. Chicago: Chicago University Press, 36–57.
41. Palli, H. 1997. Eesti rahvastiku ajalugu 1712–1799. Tallinn: Estonian Academy of Sciences.
42. PlAKAnS, A., wetHeRell, C. (2005). “The Hajnal Line and Eastern Europe,” Engelen, T., Wolf, A.P. (Eds.), Marriage and the Family in Eurasia. Perspectives on the Hajnal Hypothesis. Amsterdam: Aksant, 105–126.
43. PuuR, A., PõldmA, A. (2010). �Rahvastiku vananemine demograa-filises vaates,� Sotsiaaltrendid V. Tallinn: Statistics Estonia, 16–32.
44. PuuR, A., RAHnu, l. (2011). �Teine demograafiline üleminek ja Eesti rahvastiku nüüdisareng,� Akadeemia, 23(12), 2225–2272.
45. PuuR, A., RAHnu, l., mASlAuSKAite, A., StAnKuniene, v., zAKHARov, S. (2012). “Transformation of Partnership Formation in Eastern Europe: The Legacy of the Past Demographic Divide,” Journal of Comparative Family Studies, 43(3), 389–418.
46. ReHeR, d.S. (2004). “The Demographic Transition Revisited as a Global Process,” Population, Space and Place, 10, 19–41.
47. RõBAKovSKii, l. (1987). Migratsija naselenija: prognosõ, faktorõ, politika. Moskva: Nauka.
48. SAKKeuS, l. (1991). Post-war migration trends in Estonia. RU sari B, nr.15. Tallinn: Eesti Kõrgkoolidevaheline Demouuringute Keskus.
49. SHelleR, m., uRRy, J. (2006). “The New Mobilities Paradigm,” Environment and Planning A, 38(2), 207–26.
50. Sobotka, T. 2008. “The Diverse Faces of the Second Demo-graphic Transition in Europe,” Demographic Research: SC7: Childbearing Trends and Policies in Europe, 19, 171–224.
51. Szelényi, i. (1996). �Cities under Socialism � and After,� Andrusz, G., Harloe, M., Szelényi, I., (Eds.), Cities After Socialism. Urban and Regional Change and Conflict in Post-Socialist Societies. Oxford: Blackwell Publishers, 286–317.
52. tAmmARu, t., leetmAA, K., Silm, S., AHAS, R. (2009). “Temporal and Spatial Dynamics of the New Residential Areas around Tallinn,” European Planning Studies, 17(3), 423–39.
53. tAmmARu, t., KumeR- HAuKAnõmm, K., AnniSte, K. (2010). “Eesti diasporaa kujunemise kolm lainet,” Praakli, K.,Viikberg, J. (Eds.), Eestlased ja eesti keel välismaal. Tallinn: Estonian Language Foundation, 35–55.
54. united nAtionS (2011). World Population Prospects. New York: United Nations Population Division.
55. vAn de KAA, d. (1987). “Europe’s Second Demographic Transi-tion,” Population Bulletin 42 (1).
56. vAllin, J., meSlé, F. (2005). “Convergences and Divergences: an Analytical Framework of National and Sub-national Trends in Life Expectancy. A New Approach to Health Transition,” Genus, vol. LXI, no. 1, 83–124.
57. viKAt, A. (2004). “Women’s Labour Force Attachment and Child-bearing in Finland,” Demographic Research SC3: Contemporary Research on European Fertility: Developments and Perspectives, S3, 177–212.

30 Estonian Human Development Report 2012/2013
Today, expectations have increased considerably for the contribution that education can make to the development of society. We often hear people speak about education as a cure for absolutely all our worries. In this century, the subject of education has appeared on the agendas of several international organisations that previously did not deal with education (OECD, EU, WB, and WTO). To date, education as a factor of cultural integration has been considered to be part of the domestic sphere, but the ascendancy of international organisations in educational governance1 alludes to the globalisation of education and education policy.
Generally, we can talk about two tasks that are assigned to the modern governance of education. Firstly, the economic role, according to which good education is the key to a country’s economic competitiveness and sustainability. This point of view explains why, along with the UN, international organisations that are focused on the economy, such as the Organisation for Economic Co-operation and Development (OECD), the World Bank (WB) and the World Economic Forum (WEF) have started to show interest in the measuring and (ranking) education.
Education’s second, cultural and political task is to increase social cohesion. This perspective has also become markedly more multifaceted than the initial approach of the UN, which focused on human rights. Education is, of course, part of an individual’s capital and this approach is amply stressed on the neoliberal worl-dview, but in addition to this, education is an efficient tool for promoting the understanding and a meeting of minds between people. According to several studies, edu-cated people are more tolerant, are greater supporters of democracy (Mc Mahon 2004), behave more constructively in regard to their health (Grossmann 2000), are happier (Putnam, Helliwell 1999) and cope better on the labour market. The economic and social functions of education are intertwined, because modern economies and democ-racies presuppose the existence of socially sensitive people with open mindsets, who are able to quickly adapt to new working collectives and cultures, and to intelli-gently and actively participate in public life. The attempt to reconcile the rational and social functions of education are characteristic primarily of the European Union, the educational objectives of which (ET2020) are aimed at smart economic growth, and do so through education’s social indicators (e.g. by reducing the percentage of early leaving and children with meagre basic skills).
Along with knowledge-based and global economies, population ageing also an important impact on educa-tional development, and has caused widespread tensions related to the financing of education. The ageing of pop-ulations has introduced the philosophy of lifelong learn-ing into education, according to which a person must learn from the cradle to the grave. This, in turn, has been accompanied by the measurement of educational enrolment in the context of every sphere of life. Thus, the European Union and the World Economic Forum measure the rate of adult educational enrolment, and in 2011, the OECD conducted the first comparative PIAAC survey, known as the “adult PISA”, in order to measure the adults’ knowledge and skills related to coping in the workplace.2 The EU and OECD measure the rate of edu-cational enrolment among pre-schoolers (3- to 5-year-olds); and the IEA is planning a survey to measure the knowledge and skills of children in the same age group. The emphasis of the importance of early childhood edu-cation in EU and OECD materials is motivated by the conviction that, at this stage of education, the efficiency of outcome and equity of the investments complement each other. The further in time that the investments in education are postponed, the greater the risk that the aspiration for equity will come at the expense of effi-ciency. (Cunha et al. 2005).
Along with early childhood education and lifelong learning, an important change is the expansion of higher education. Once the privilege of the few, today higher education is an opportunity for the majority, and the European Union has set a goal of having a society in which 40% of the population has a higher education. The latter has, in turn, caused tensions related to the financing of education and accelerated the debate about the nature of higher education (is it a public or private commodity) and the cross-border providers of education (export of educational services).
1.3.1 International measures of educationEducation is measured by many international compos-ite indices and rankings. This confirms the importance of educational indicators in the measurement of a soci-ety’s developmental levels and trends. Generally, we can speak about composite indices, one sub-index of which is some measure of education or the indicators that come directly from indices/rankings that measure
1.3EducationAnu Toots, Triin Lauri
1 “Governance” is a term that has recently gained popularity in academic literature and the notions of its use and meanings are quite blurred. Here governance alludes to a new type of governing, in which the state has a steering role rather than an implementative role, and in which partners from the private and non-profit sector are involved from the local to the global level.
2 Program for the International Assessment of Adult Competencies, in Estonia known under the name “Tean ja oskan”.

31Estonian Human Development Report 2012/2013
educational performance (Table 1.3.1). A separate group is comprised of the uniform education and training goals and benchmarks of the European Union’s Lisbon Strategy.
Usually, the measurement of the educational situation is based on government statistics, although some of the indices also use expert opinions on the quality of education, (Global Competitiveness Index (GCI) – expert assessments; Legatum Prosperity Index (LPI) – public opinion polls). A separate category is comprised of the large international surveys of edu-cational stakeholders, which measure both the actual performance of the students in various subjects as well as the attitudes of the teachers and students toward learning and teaching. Some surveys (PIRLS) also query the parents. The International Association for the
Evaluation of Educational Achievement (IEA) already started conducting these types of comparative surveys in 1960. Today, the IEA is known primarily as the organiser of the Trends in International Mathematics and Science Study (TIMSS) and the Progress in Inter-national Reading Literacy Study (PIRLS). Besides the IEA, the OECD, with its PISA surveys that were first conduced in 2000, has become an influential organiser of education research. Both the IEA and the OECD surveys are cyclical (repeated after 3- to 5-year inter-vals), making it possible to monitor the developmental trends in education. The number of participants in the IEA and OECD surveys has increased steadily, based primarily on the emerging economies and developing countries. If 46 countries took part in the TIMSS in 1995, the total was 77 in 2011.
Compiler of the index Name of the index and English acronym Indicators
Composite indices, which include an education sub-index
JUN (UNDP) HDI – UN Human Development Index (1/3)* Average number of years of education of adults; expected years of education for 7-year-olds
WEF GCI– Global Competitiveness Index (1/12)
Enrolment in ISCED 2nd and 3rd level education, conformity of education to economic needs, quality of teaching of the sciences, level of the schools of economics and management, training possibilities for workers
oECD BLI –Better Life Index (1/11)Percentage of people with at least a secondary education among 24- to 64-year olds; PISA 2009 score; expected years of education for 5-year-olds
Legatum Institute LPI – Legatum Prosperity Index (1/8)
Enrolment in the 1st, 2nd and 3rd levels of education; quality of education; human capital (average education level of the workforce)
The most important indices measuring the efficiency of education
oECD PISA – Programme for International Student Assessment
Knowledge of 15-year-olds in mathematics, sciences, and functional literacy
oECD PIAAC – Programme for the International Assessment of Adult Competencies
Adults’ cognitive and communicative skills for coping in the labour market
IEA TIMSS – Trends in International Mathematics and Science Study
Knowledge of 4th and 8th graders in mathematics and sciences
IEA Progress in International Reading Literacy Study Reading skills of 4th graders
IEA ICCS –International Civic and Citizenship Study Knowledge and attitudes of 8th graders related to democracy
Targets of the Education and Training 2020, the education sub-strategy of the Lisbon Strategy
EL Participation in early childhood education
at least 95%
Percentage of low achieving students
less than 15%
**percentage of early school leavers(aged 18 to 24) less than 10%
**Percentage of young people with higher educations
(aged 30 to 40)at least 40%
Adults enrolled in lifelong learning
(aged 26 to 64)at least 15%
*number of sub-indices**education targets that are included among the five headline targets for the EU’s 10-year growth strategy, Europe 2020
Table 1.3.1Best-known educational indices and their indicators

32 Estonian Human Development Report 2012/2013
1.3.2 Estonia’s position in the education indicesBelow, we analyse Estonia’s position in the most popular measures of education. First we deal with the measures of quantity, which describe the parameters and trends of the population enrolled in education. Secondly, we examine the measures of educational quality, which indicate the knowledge and skills of the students, as well as the assessments of experts in the labour market in this regard.
Educational enrolmentThe UN/UNDP tradition has been to measure the quan-tity of education based on the enrolment of a certain age cohort in the age-appropriate level of education (based on the ISCED). If on the global scale, it may be important to ensure that at least a basic education (level 1) is provided to a large part of the population, in the developed countries the enrolment in level 2 (secondary education) and level 3 (higher education) is measured. Based on the principle of lifelong learning, the enrolment of children in early childhood education is also measured (ISCED 0) as is the enrolment of adults in-service training.
Besides enrolment, the OECD and the European Union place great importance on the attainment of educational levels, thus the percentage of people with higher education in specific age groups is measured. The EU, in its Europa 2020: Europe’s growth strategy, gave two education benchmarks the special status of headline targets, since their achievement is considered to be espe-cially important for the achievement of a “smart econ-omy”. Based on these two educational headline targets, by 2020 the following should apply to all the member countries:
• at least 40% of 30- to 34-year-olds completing third level education;
• not more than 10% of the 18- to 24-year-olds have only a basic education or less (i.e. reducing school drop-out rates).
Estonia’s position in the international comparison of educational enrolment seems good, i.e. enrolment in early childhood, basic and secondary education is among the top 30 in the world. If we remove the eco-nomic wealth indicator from the UN Human Develop-ment Index, Estonia rises from 34th to 26th place in the ranking. In regard to the two European Union headline targets, Estonia exceeds the average level in the Euro-pean Union, although the goal for 2020 has yet to be achieved. The percentage of young people with a only a basic education or less has constantly decreased during the last decade, but the pace of the decrease is slower than in many other member countries (European Par-liament 2011)
In addition to the percentage share of the age cohorts enrolled in education, the education sub-index of the UN Human Development Report also measures the expected years of education for small children and
the average number of school years for adults. An Esto-nian adult attends school for an average of 12 years, which places us in 8th place in the world. However, the number of expected years of education for Estonia’s 7-year-olds leaves Estonia in 24th place. If the average forecast for New Zealand, Australia, Ireland, Iceland, Finland, South Korea, Denmark, Slovenia and the Neth-erlands is 17 to 18 years of school, for Estonia, it is only 15.7. The calculation of the expected years of education is based on two factors – enrolment by age at all level of education and the percentage of school-aged children in the population at each level of education. The decline in Estonia’s indicator for expected years of education is probably caused by population ageing processes.
However, not everything is related to population processes. The last OECD education survey brings forth the fact that the number of young people with secondary educations has decreased considerably faster than in other countries; and there has not been a similar increase in 25- to 34-year-olds who have acquired higher educations, as has happened in the South Korea, Ireland or Poland
Austria
Austria
Estonia
Estonia
Netherlands
Netherlands
Ireland
Ireland
Slovakia
Slovakia
Slovenia
Slovenia
Finland
Finland
Denmark
Denmark
Czech Rep.
Czech Rep.
Hungary
Hungary
Percentage
Percentage
AustriaEstonia
NetherlandsIreland
SlovakiaSlovenia
FinlandDenmark
Czech Rep.Hungary
Adult enrolment in lifelong learning (among 26- to 64-year-old)Acquired a secondary education (20- to 24-year-olds)Enrolment in pre-school education ET 2020
0 20 40 60 8010 30 50 70 90
0 20 40 60 8010 30 50 70 90
Source: Eurostat
Figure 1.3.1Comparison of the data for 2009 for the European reference countries based on the benchmarks that that measure educational enrolment, %

33Estonian Human Development Report 2012/2013
(OECD 2012b). Therefore a certain risk exists that Estonia is relying on its past indicators for its success and in the future will not be able to sustain its current high position.
More important than the indicators of educational enrolment as a whole is the great gender imbalance, which starts already at the basic school level and con-tinues on through vocational, secondary and higher edu-cation. Generally, many international indices consider it important to increase the enrolment of women. One of the targets of the EU education strategy titled Educa-tion and Training 2010 was to increase the percentage of women among graduates in the sciences. It probably is not surprising that Estonia placed first, exceeding the European Union average by 10%. In 2009, almost half (42%) of the graduates in the sciences were women (Euro-pean Commission, 2011).
Increasing the percentage of women in higher education is a general trend, which is characteristic of all the OECD countries and of almost all specialities. Of the cohort of 20-year-olds, 42% of the women and 30% of the men are studying at university. Starting from 2000, the percentage of women at university has steadily increased (almost 10% per year), which has resulted in there being 124 female university students for every 100 male students in the European Union. Estonia is also the leader in this measure, with 156 women for every 100 men. As expected, the percentage of women also increased among the graduates of schools of higher education. If in Europe, on average, 55% of the total students are women, and among graduates, 59% are women, in Estonia and Latvia even 70% of the graduates of schools of higher education are women, which shows that there are more men among the drop-outs from schools of higher education (European Commission 2009). The gender imbalance is also noteworthy by field of study. In six fields out of eight, women comprised half or more of the higher education school graduates. In Estonia, women comprise over 90% of the graduates in the educational and welfare services fields, which is the highest indicator in the EU.
The situation in higher education is influenced by the imbalance at the lower levels of the education system, and this, in turn, affects the subsequent gender (a)sym-metry in the workplace. The boys’ problems apparently already get their start in basic school, because, compared to girls, more boys limit themselves to only a basic edu-cation or even less. There are great differences between countries in this regard. If in Slovakia and the Czech Republic, a relatively small segment of boys and girls (ca. 5%) drop out after completing basic school, in Estonia, Poland and Slovenia, the difference is almost double, to the detriment of the boys. However, one must recognise that in the period between 2004 and 2010, the situation in Estonia has improved, since the percentage of boys that drop out has decreased from 20% to 15%; about 8% of girls still drop out.
Estonia along with Lithuania, Latvia, Hungary, Ire-land, and the United Kingdom and a few more countries belong to the group of countries where more than 60% of the young people study at general secondary schools; vocational education is less popular. The fact that there are always more females in general education (in Estonia
Percentage
Percentage
EU-27
Italy
Romania
Malta
Slovakia
Czech Rep.
Austria
Portugal
Bulgaria
Hungary
Greece
Germany
Latvia
Poland
Slovenia
Estonia
Spain
Netherlands
Denmark
Belgium
France
Lithuania
Great Britain
Cyprus
Finland
Sweden
Luxembourg
Ireland
0 1010203040 20 30 40 50
0 1010203040 20 30 40 50
Drop-outs (20- to 24-year-olds)Acquired a higher education (30- to 34-year-olds)
EU 2020 target
Index
EU-27
Slovakia
Czech Republic
Austria
Hungary
Poland
Slovenia
Estonia
Netherlands
Switzerland
Denmark
Finland
Ireland
10090 110 120 130 140 150
Figure 1.3.2The position of the EU member states related to the head-line targets for the education in Europa 2020 as of 2011.
Figure 1.3.3The number of female students for 100 male students in higher education (ISCED 5-6), 2010
Source: Eurostat 2012
Source: Eurostat 2013

34 Estonian Human Development Report 2012/2013
even more than 20% more) lays the foundation for the predominance of women in higher education. At the same time, the statistics do not confirm a connection between poor vocational education and the high drop-out rate among boys. Highly developed vocational edu-cation exists in Austria, the Netherlands and Denmark, yet boys still comprise a large portion of the young people that drop out of school, whereas in Denmark the gender gap is very big.
One’s level of education affects the ability to cope on the labour market. Generally, people with higher educations find jobs faster and earn the highest salaries. Yet, there are considerable variations by country in these aspects. In Estonia, the acquisition of education has a weaker impact on the salary level than in the OECD countries on average. In 2009, a person with a higher education in Estonia earned 36% more on average than a person with a secondary education; the OECD average for the additional educational contribution was 55%. The gender- based salary gap is even more drastic: a woman with higher education in Estonia earns only 63% of the salary of a man with a higher education, which is the larg-est gap in the OECD (OECD 2012b). It is worth stressing that the gender-based salary gap in Estonia increases along with the level of education, i.e. the salary gap between men and women with higher educations is larger than between the salaries of men and women with secondary or basic educations. Thus, a singularly paradoxical situation exists in Estonia – higher education is much more attrac-tive to women than for men, but they receive considered less material benefit from this than the men.
Acquired knowledge and skillsCompared to the quantitative indicators related to educa-tion, the international measurement of the quality of edu-cation is a less developed field of activity. It has acquired
estimable influence with the onset of globalisation, which increased the importance of education in the preparation of qualified and competitive workforces. The measure-ment and comparison of educational performance was also encouraged by the neoliberal approach to education that was popular in the 1990s, according to which results are the primary yardstick of the quality of education, and the publicly available information on these results helps to increase the public’s satisfaction with education, as well as the level of the educational system (Martens et al. 2007; Furlong, Cochran-Smith, Brennan, 2009).
Figure 1.3.4Drop-out rate by gender, %, 2010
Percentage 8 106420 12 14 16 18
Females Males
EU-27
Slovakia
Czech Republic
Austria
Hungary
Poland
Slovenia
Estonia
Netherlands
Switzerland
Denmark
Finland
Ireland
40 503020100 60 70 80 90
Females Males
Slovakia
Czech Republic
Austria
Hungary
Poland
Slovenia
Estonia
Netherlands
Switzerland
Denmark
Finland
Ireland
Percentage 40 503020100 60 70 80 90
Females, vocational secondary Males, vocational secondary
Slovakia
Czech Republic
Austria
Hungary
Poland
Slovenia
Estonia
Netherlands
Switzerland
Denmark
Finland
Ireland
Percentage
Source: Eurostat
Source: Eurostat Source: Eurostat
Figure 1.3.5The percentage of males and females studying at general education schools at the secondary school level (ISCED3) in relation to the total number of males/females. 2010, %
Figure 1.3.6The percentage of males and females studying at vocational education schools at the secondary school level (ISCED3) in relation to the total number of males/females. 2010, %

35Estonian Human Development Report 2012/2013
The reciprocal dependence of the problems faced by countries and their economies has resulted in the need to standardise the output of education and increased the hope that by benchmarking, it is pos-sible to increase the efficiency of one’s educational system (Ozga, Dahler-Larsen, Segerholm, Simola 2011). In order to satisfy these needs, policymakers are ever more frequently employing the OECD and IEA surveys for assessing educational performance. The most important of these is measurement of the level of knowledge at the second level of basic education (14- to 16-year-old), in the subjects that are consid-ered important for the economy, such as mathematics, sciences and functional literacy. The PISA performance scores are included in the OECD Better Life Index and the targets of the EU’s Education and Training 2020 framework. It is worth noting that the OECD measures the knowledge score (i.e. achievement), although the European Union measures the percentage of students with low performance levels (i.e. social cohesion). The most influential IEA surveys are the TIMSS, which is a comparative study of mathematics and the sciences and the PIRLS, which measures the reading skills of fourth graders. Unlike the PISA’s age-based sample (15-year-old students), the IEA surveys are grade- and curriculum-based (4th and 8th grades). Therefore, the IEA is supposedly a better instrument for measuring educational policies and teaching practices, and evi-dence-based intervention in planning. However, the PISA surveys provide better information on the pre-paredness of students for the workplace.
When comparing the result of the IEA and OECD PISA surveys, it seems generally that the same countries are among the top dozen, regardless of the specific sur-vey. Hong Kong is in the top five in all the surveys in seven cases out of a possible eight; and Singapore in three cases out of a possible four. South Korea and Finland are constantly in the top three, except for one unsuc-cessful performance by each. The results of most of the post-Communist countries in various surveys fluctuate, but Estonia is the exception with its stable good results. At the same time, Estonia’s participation in comparative surveys is limited, which is why fundamental generalisa-tions cannot be made.
Against the background of the educational success of Southeast Asia, little attention has been paid to the unevenness of the European countries in the PISA surveys (Figures 1.3.7; 1.3.8; 1.3.9). Coherent regions like Scandi-navia or Eastern Europe do not form a uniform group in regard to the efficiency of basic education. Thus, Finland’s performance is among the best in the world, while Swe-den’s and Denmark’s performances are middling. In East-ern Europe, Estonia is the only one to be above average in mathematics, sciences and reading, while Slovenia, the Czech Republic and Hungary is sometimes above average and sometimes below average. In the case of Estonia, the phenomenon of a “strong average” can also be noticed. This means that Estonia generally placed 10th to 15th in the rankings, but, in comparison to countries at the same level, we have few very weak students (which is Estonia’s strength) and also few very smart children (which is Esto-nia’s weakness).
PISA
200
6
PISA
200
9
TIM
SS 2
003
(mat
h)
TIM
SS 2
007
(mat
h)
TIM
SS 2
011
(mat
h)
ICCS
200
9
PIRL
S 20
06
PIRL
S 20
11
Finland 1 3 - - 8 1 - 3
Hong Kong 2 4 3 1 4 7 2 1
South Korea 11 2 2 - 1 3 - -
Singapore - 5 - 2 2 - - 4
The Netherlands 9 10 10 9 - 15 12 13
Taiwan 4 23 4 3 3 22 9
Estonia 5 13 8 - - 12 - -
Hungary 21 26 9 15 11 - 8 20
Slovenia 12 31 21 19 13 15 28 24
Russia 35 43 11 6 6 19 1 2
Table 1.3.3The education systems in the world with the highest performances (ToP10) based on the oECD and IEA sur-veys, place in the ranking is indicated.
1.3.3 The search for a successful educational modelBased on Estonia’s relatively successful international testing, some causes for concern have also appeared. Firstly, along with the high performance results, the students and teachers are troubled by discontent and doubts about their own success (HTM, PISA 2009). Sec-ondly, in international comparisons, the Estonian school system is able to mitigate the impact of background characteristics on study performance quite well, but the differences in schools is discernible in the study results of almost 20% of the students (Kitsing 2012). Estonia’s less successful schools are located in socio-economically poorer areas and the language of instruction is often Russian. Therefore, an accumulation of negative factors may occur – the positive effect from school may not compensate for to the shortcomings related to the home. Results from the current PISA surveys do not indicate such an accumulation.
Although, the students from poorer families usually have a harder time getting ahead in school, there are always those whose learning performance is significantly better than one might assume from their backgrounds (“positively capable” students). The top-performing countries are characterised by a large percentage of “positively capable” students. The schools of Hong Kong and South Korea significantly increase the percentage of the positively capable; Finland, Esto-nia, Taiwan and the Netherlands are also successful in this regard. However, Hungary and Russia are not able to increase the capability of children in disadvan-taged circumstances (OECD 2011). Based on studies by Woessmann et al. (2009), the relatively greater success of children with poor socio-economic backgrounds is related to several traits of the education system, such as the accountability systems of the schools, the in-school

36 Estonian Human Development Report 2012/2013
monitoring of teaching, the schools’ autonomy in the selection of teachers, and the determination of the study content. The referenced authors also find that national testing has a positive effect if the results are used only to compare schools, and not to group chil-dren into different tracks of study.
However, assuming that impact of socio-economic deprivation will decline, one should carefully monitor whether the current good performance of Estonia’s education system will continue in the future. Possible risks are related to the liberal approach to the principle of school choice. Although the right of the parents to choose the school for their child is prevalent in many countries, Estonia is different because mechanisms are not utilised to balance the school choice model that has a segregating effect. Thus, an analysis of the children starting school in Tallinn from 2008 to 2011 showed that admission to the popular schools in the city centre was more probable if the child had completed a paid prep-school, his or her mother had a higher education, the father had a good income and they lived in the city centre (Põder, Lauri 2013). Therefore, several segregation mechanisms are simultaneously at work – an advantage based on residence in the city centre schools, admission testing, and the autonomy of the school director in deciding whether to admit a child – which intensify each other. Thus, several problems accompany the neoliberal education agenda that promotes competition. It has been discovered that it is more harmless to promote the principle of school choice in mature countries where the following preconditions exist: uniform school networks, parents who are experienced at making selections, and the ability and desire to consider collective interests experiences (Perry 2007).
1.3.4 The educational contribution to economic developmentThe OECD and IEA surveys provide the answer to the question of which education systems are among the best in the world, but based on them, we cannot draw any direct conclusions about how education systems can satisfy economic needs. In its education sub-index, the Global Competitiveness Index, which is computed by the World Economic Forum, has focused on this topic. In order to measure the conformity of education with the needs of the economy, the experts used a scale of 1 to 7 to evaluate the conformity of the following aspects of the education system with a free market economy: the quality of the teaching of the sciences in the schools; the quality of the schools of economics and management; the utilisation of the Internet in the schools; and the training opportunities for employees in the workplace. Unlike the PISA and IEA surveys, in which the respon-dents are stakeholders in the education system (students, teachers, school administrators), the World Economic Forum’s data reflects the positions of experts outside the education systems, i.e. the consumers of the education product, the educational outcome.
Estonia is above average in all the indicators, however, it stands out for the relatively low satisfaction
with the level of the management schools and the con-formity of the education to the needs of the free market as a whole. This reflects a greater concern about the insufficient link to the economy. The World Economic Forum’s Global Competitiveness Report states that the Estonian Employers Confederation considers the inad-equate preparation of the workforce to be the main drag on Estonia’s economic development (WEF 2012). Since the given index is based on the assessments pro-vided by local experts, the critical attitude of the local experts also affects the value of the index. By compar-ing the educational indicators of global competitiveness with the PISA results, it turns out that the Estonian experts are more critical than the others when assess-ing the level of the schools in their country. Thus, the performance of the Estonian students in mathematics and the sciences is higher than that of the Swiss and Belgian students, but the Estonian economic experts give the level of teaching in our schools a much lower
20 1030405060 0 10 20 30
20 1030405060 0 10 20 30
Below the base level Top level
Percentage
Percentage
Chile (421)Romania (427)Uruguay (427)Bulgaria (428)
Israel (447)Greece (466)
Lithuania (477)Latvia (482)Spain (483)
Italy (483)Ireland (487)
Portugal (487)Luxembourg (489)
Hungary (490)Great Britain (492)
Czech Republic (493)Sweden (494)
Poland (495)Austria (496)
OECD average (496)France (497)
Slovakia (497)Slovenia (501)
Denmark (503)Estonia (512)
Germany (513)Belgium (515)
New Zealand (519)Netherlands (526)Switzerland (534)
Finland (541)Rep. of Korea (546)
Singapore (562)
Figure 1.3.7Percentage of students with low and high levels of performance (%) in mathematics and the country’s average score, PISA 2009.
Source: oECD

37Estonian Human Development Report 2012/2013
Source: oECD Source: oECD
Figure 1.3.8Percentage of students with low and high levels of performance (%) in sciences and the country’s average score, PISA 2009.
Figure 1.3.9Percentage of students with low and high levels of performance (%) in reading and the country’s average score, PISA 2009.
Below the base level Top level
Percentage
Percentage
Romania (424)Uruguay (426)Bulgaria (429)
Chile (449)Lithuania (468)
Austria (470)Luxembourg (472)
Israel (474)Slovakia (477)
Czech Republic (478)Spain (481)
Greece (483)Slovenia (483)
Latvia (484)Italy (486)
Portugal (489)OECD average (492)
Great Britain (494)Hungary (494)Denmark (495)
Ireland (496)France (496)
Sweden (497)Germany (497)
Poland (500)Estonia (501)
Switzerland (501)Belgium (506)
Netherlands (508)New Zealand (521)
Singapore (526)Finland (536)
Republic of Korea (539)
20 10304050 0 10
20 10304050 0 10
Below the base level Top level
Percentage
Percentage
Uruguay (427)Rumeenia (428)
Bulgaria (439)Chile (447)
Israel (455)Greece (470)
Luksemburg (484)Spain (488)
Italy (489)Slovakia (490)
Lithuania (491)Portugal (493)
Austria (494)Latvia (494)
Sweden (495)France (498)
Denmark (499)Czech Republic (500)
OECD average (501)Hungary (503)Belgium (507)
Ireland (508)Poland (508)
Slovenia (512)Great Britain (514)Switzerland (517)
Germany (520)Netherlands (522)
Estonia (528)New Zealand (532)
Republic of Korea (538)Singapore (542)
Finland (554)
20 1030405060 0 10 20
20 1030405060 0 10 20
assessment than the Swiss and Belgian experts do for their schools (see Table 1.3.4)
The conformity of education to the requirements of a “smart economy” is also on the agenda in the European Union’s analyses. As opposed to the view that is prevalent in Estonian public debates, i.e. that our young people are studying the “wrong specialities” (horizontal incompatibility), the European Commission points out a problem with vertical incompatibility, which means that people are working beneath the level of their acquired skills and knowledge. It’s true that vertical incompatibility is not uniquely an Estonian problem, because, in Europe, about 20% of workers with higher educations are doing work that does not correspond to their educational qualifications. How-ever, the disharmony in Estonia is one of the highest in the EU (see Figure 1.3.11).
This is a phenomenon that not been researched extensively to date; it is not yet known what causes the
incompatibility, and whether the main factors are to be found the structure of the economy or the education sys-tem. However, from the European Commission’s policy trends we can surmise that a good solution for reducing the disharmony between education and the economy is to be found in the teaching of creativity and entrepreneur-ship. The existing statistics on the teaching of creativity in schools demonstrates a contrary picture. Although great emphasis is placed on creativity and innovation in general education curricula, few teachers feel it is nec-essary. Estonia especially stands out in the comparison with other European states for the great contrast between the curriculum as a normative document and the actual teaching practices. In our basic school curriculum, the words “creativity” and “innovation” appear the most, as compared to the other countries, but only 13% of teachers who were queried considered the teaching of creativity to be necessary, which is the lowest indicator in the European Union. For instance, in Finland and

38 Estonian Human Development Report 2012/2013
Sweden, more than 60% of the teachers believed this to true, and in Italy, even 70% (European Commission 2011). A third view about creativity and entrepreneurship in today’s education system is provided by the Euroba-rometer public opinion poll. Half of the respondents from the EU states found that school had help to develop their attitudes that promote entrepreneurship and initiative; a somewhat smaller percentage (41%) agreed that they have received the necessary knowledge and skills from school to start a business. The Estonian respondents are at the European average in regard to their attitudes, but they are more critical than the average about the knowl-edge that have acquired in school for running a business (see Figure 1.3.12). When making a global comparison, it is worth noting that the people in the countries with
Top level Estonia Average
Conformity of education to the economy
Quality of the MS teaching
Level of the schools of
business and management
Access to the Internet in the schools
Availability of training services
Training of workers
12
34
56
7
Both Vertical Horizontal
Percentage 2010 30 40 500
Italy
Czech RepublicAustria
NorwayGermany
EstoniaSpain
Netherlands
France
United Kingdom
Finland
Figure 1.3.10Estonia’s place in the Global Competitiveness Index’s (GCI 2012) indicator of educational competitiveness
*MS – quality of the mathematics and natural sciences teachingOn a scale of 1 to 7, in which 1 is the lowest and 7 is the highest; expert assessments
Figure 1.3.11Vertical and horizontal incompatibility between the labour market and education, % of university graduates with up to 5 years of work experience, 2005.
Source: European Commission, 2011.
developing economies (China, Turkey) gave a consider-ably higher assessment to the contribution of schools to the development of business-related knowledge and skills than European or the respondents in the old leading countries of the world (European Commission 2012b).
1.3.5 In conclusionThrough the years, education has become an increas-ingly influential instrument for the assessment of human development. It is included in all the main composite indices, and ever new and more complicated dimensions have been added. Two factors are behind the growth of complexity. Firstly, the basic quantitative educational indicators (such as enrolment in education) have reached the level of saturation in the OECD states and the dif-ferences between countries are too small to provide any useful explanations. Secondly, from the viewpoint of the international organisations, education has greater instrumental than normative value. Therefore, a greater attempt is being made to link the indicators related to education to economic development or the social cohe-sion of the society.
The measurement of educational quality has a rela-tively short history, and therefore, one large and dominant index has yet to develop. Instead, there are many indices and rankings, and they are constructed using various types of data – national statistics, tests with large samples (PISA), public opinion polls with smaller samples (Lega-tum Prosperity Index, Gallup World Poll, Eurobarometer) and expert surveys (Global Competiveness Index ). This provides each country with the best opportunity for anal-ysis based on its needs, but also places high demands on the competency of the researchers to adequately and methodologically synthesise the various data. Among other things, attention should be paid to whether the international indices work adequately for Estonia. For instance, some of the measures (ET2010 enrolment of female students in the sciences; Legatum Index) value the higher enrolment of women in education. However, for Estonia, the problem is not the deficit of women, but of men, in education. As a whole, Estonia’s membership in the IEA, EU and OECD has considerably enriched the evidential material, based on which the position and prospects of Estonian education can be analysed.
Assessing Estonia’s place in the rankings of the international education indices, for the most part, there is reason to be positive. In most of the composite indi-ces (e.g. the UN Human Development Index, the OECD Better Life Index, and the World Economic Forum’s Global Competitiveness Index) a high score in education increases Estonia’s rating as a whole. Estonian education is also uniformly good, differences between schools are small and the number of low-achieving students is marginal. The phenomenon of a “strong average” can be considered to be Estonia’s distinctive feature. This means that the general performance level is good and there are few very low-performing students, but also few top-per-forming children. Additional research is required to determine how this educational pattern affects economic perspectives.

39Estonian Human Development Report 2012/2013
Table 1.3.4The quality of education according to the Global Competitiveness Index (GCI 2012): Estonia and the top 5 countries in the world
Measures supporting efficiencyMeasures supporting
innovation
Conformity of education to the economy
Level of mathematics and sciences teaching
Level of schools of economics and management
Availability of the Internet in schools
Availability of high-quality training services
Training and development of workers
1 Switzerland Singapore United Kingdom Iceland Switzerland Switzerland
2 Finland Finland Belgium Estonia The Netherlands Finland
3 Singapore Belgium Switzerland Finland Austria Singapore
4 Qatar Lebanon Spain The Netherlands Germany Luxembourg
5 Belgium Switzerland Canada Singapore Belgium Japan
Estonia among 144 countries 49. 19. 48. 2. 39. 46.
basic education or less, which is statistically equal to the European Union average. A drop-out rate of 10–11% means 10,000 young people aged 18 to 24 who only have a basic education, if that. Only 6% of them are employed, which means great economic losses to the society in the form of unpaid taxes and increased social costs, as well as the indirect costs for ensuring security and health (European Parliament 2011).
We should keep an eye on the changes in Esto-nia’s position in the rankings of educational indicators. For instance, Estonia’s results in the 2009 PISA tests were poorer than in 2006 (Kitsing 2011). Secondly, there is no decline in the measures of education that are based on expert opinions related to competitive-ness and the public’s assessment of the role of school in the development of entrepreneurship has improved between 2009 and 2012. Therefore, the data on the quality of education are somewhat contradictory and today there are too little of it to draw any fundamental conclusions.
International impulses have significantly shaped Estonian education policy (Heidmets et al. 2011). During the last decade, Estonia has adopted the European Union’s educational guidelines, and also actively learned from neighbouring countries. At the same time, the arguments and instruments for the adoption of polices have rapidly developed; among other things, learning from our neigh-bours, has made learning from international organisations less important (Toots 2009). One reason could be that Estonia’s accession to the European Union and the OECD came at a time when greater importance started to be placed on the measurement of the efficiency of indica-tor-based education systems.
Besides the things that are on the international agenda, topics are prevalent in Estonia’s educational pol-icy debates that do not seem to be justified by Estonia’s international position (see Table 1.3.5). This confirms that external influences have been multifaceted and are mediated based on domestic interests. Secondly, it seems that domestic policymakers have not always known how to assess Estonia’s situation based on the international reference system, and therefore, some topics have been over-amplified while others have not received sufficient attention.
Attitudes Skills-knowledge
Percentage 2010 30 40 50 60 700
Japan
Rep. of Korea
Switzerland
China
Turkey
Slovakia
Czech Republic
Austria
Hungary
Slovenia
Estonia
Netherlands
Denmark
USA
Finland
Ireland
Figure 1.3.12Assessment of the role of school in the development of entrepreneurial attitudes, as well as knowledge and skills, % of the respondents that agreed that school plays a positive role.
Source: Flash Eurobarometer 354, 2012
The following educational risks for Estonia should be mentioned: the small percentage of men among the stu-dents at all educational levels and the meagre positive effect of education on positions in the labour market. Estonians with higher education more often have jobs that do not conform to their educational qualifications, and higher education also does not have the same pos-itive effect on salary levels as it does in other countries. Keeping Estonia’s small population in mind, a serious concern is the percentage of young people with only

40 Estonian Human Development Report 2012/2013
References1. euRoPeAn CommiSSion (2012). Key Data on Education in Europe.
Brussels: Education, Audiovisual and Culture Executive Agency.
2. European Commission (2012b). Enterpreunership in the EU and beyond. Flash Eurobarometer 354. http://ec.europa.eu/public_opinion/flash/fl_354_en.pdf
3. euRoPeAn CommiSSion (2011). Progress Towards the Common European Objectives in Education and Training. Indicators and Benchmarks – 2010/2011. Luxembourg: Publication Office of the European Union.
4. euRoPeAn CommiSSion (2009). Gender Differences in Educational Outcomes: Study on the Measures Taken and the Current Situ-ation in Europe. Brussels: Education, Audiovisual and Culture Executive Agency.
5. euRoPeAn PARliAment (2011). Reducing Early School Living in the EU. Brussels.
6. CunHA, F; JAmeS J; HeCKmAn, l. l; dimitRiy v. mASteRov (2006). Interpreting the Evidence on Life Cycle Skill Formation. in: Eric A. Hanushek, Finis Welch (eds.), Handbook of the Economics of Education. Amsterdam: North-Holland. NBER Working Paper 11331, Cambridge, MA: National Bureau of Economic Research, 2005.
7. FuRlong, J; CoCHRAn-SmitH, m;BRennAn, m. (2009). Policy and Politics in Teacher Education. International Perspectives. Lon-don, New York: Routledge.
8. gRoSSmAnn, m. (2000). The Human Capital Model. In: A.J. Culyer, J.P. Newhouse (eds.), Handbook of Health Economics. Volume 1A: 347-408. Amsterdam: Elsevier.
9. HeidmetS, m; KAngRo, A; RuuS, v; mAtulioniS, A; loogmA, K; zilinKSAite, v; Autio, t. (2011) Haridus. Eesti inimarengu Aruanne 2010/2011. Inimarengu Balti rajad: muutust kaks aastakümmet. Tallinn: Eesti koostöö kogu, 96-115.
10. KitSing, m. (2012). Kõrgemate ja madalamate tulemustega koolide võrdlus. Kogumikus Eesti PISA 2009 kontekstis: tugevused ja problee- mid. Programmi Eduko uuringutoetuse kasutamise lepingu aruanne”.
11. mARtenS, K. RuSConi, A; leuze, K. (2007). New Arenas of Educa-tion Governance. The Impact of International Organizations and Markets on Educational Policy Making. Palgrave Mcmillian.
12. mARtenS, K; nAgel, A. K; windzio, m; weymAnn, A. (2010). Transformation of Education Policy. Palgrave Macmillian.
13. PõdeR, K. lAuRi, t. (2013). When Public Acts Like Private: the Failure of Estonia’s School Choice Mechanism. European Educa-tional Research Journal (ilmumas).
14. tootS, A. (2009). Brussels comes via Helsinki: The Role of Finland in Europeanisation of Estonian Education Policy. Haldus kultuur, vol 10, . 58-73.
15. oeCd (2011). Against the Odds. Disadvantaged Students who Succed in School. Paris: OECD.
16. OECD (2012a) Education at a Glance: OECD Indicators 2012.
17. OECD (2012b). Education at a Glance: OECD Indicators 2012. Estonia. Country note. http://www.oecd.org/edu/eag2012.htm (vaadatud 30.12.2012).
18. ozgA, J; dAHleR-lARSen, P; SegeRHolm, C; SimolA, H. (2011). Fabri-cating Quality in Education. Data and governance in Europe. London: Routledge.
19. PutnAm, RoBeRt d; JoHn F. Helliwell (1999). Education and Social Capital. NBER Working Paper 7121. Cambridge, MA: National Bureau of Economic Research.
20. PõdeR, K.; KeRem, K.; lAuRi, t. (2013). Efficiency and equity within European education systems and school choice policy: Bridging qualitative and quantitative approches. Journal of School Choice, 440–470.
21. weF (2012). Global Competitevness Report. http:// www.weforum.org/reports/global-competitiveness-report-2012–2013
22. woeSSmAnn, l.; SCHütz, g. (2006). Efficiency and Equity in European Education and Training Systems, Analytical Report for the European Commission, EENE.
Strengths of Estonian education based on international reports
Problems presented in domestic debates
Weaknesses of Estonian education based on international reports
Teachers’ low salaries Teachers’ low salaries
Small percentage of children with low performance High drop-out rate
Poor level and volume of vocational educa-tion; poor preparation of the graduates of all schools for vocational work
Weak connection to the labour market (i.e. many people do simpler work than one might assume from their qualifications; salary gap to the detriment of women)
Relatively small differences between schools; small impact of socio-economic background on study performance
Meaning of examination results, admission tests, “elite schools”
Children’s enrolment in pre-school educa-tion at the saturation level (almost 90%) Shortage of kindergarten places
Insufficient teaching of creativity and entrepreneurship
Extremely high dependence of financing on government resources
Small percentage of men compared to women among both students and teachers at all educational levels
Table 1.3.5Strengths and weaknesses of Estonian education based on international indicators compared to the domestic debates.
Sources: Education at a Glance 2012; Progress Towards the Common objectives in Education and Training 2010/2011; The Five Chal-lenges for Estonian Education 2012

41Estonian Human Development Report 2012/2013
Changes and developments in the population’s health can be illustrated using very different indicators, of which each is informative in its own way. The indicators that have been chosen for this chapter characterise the events in Estonia from three viewpoints, in an attempt to answer the following questions:
• How much, and based on what, is life expectancy in Estonia increasing?
• How can the illness-related behaviour of the Esto-nian population be changed, based on the example of the use of prescription drugs?
• What is the future prognosis for the health indica-tors of Estonian schoolchildren?
1.4.1 Life expectancyIn international comparisons, life expectancy, which is based on mortality data, and is one of the three compo-nents of the Human Development Index, is the indicator most often used to assess the state of the population’s health. Life expectancy shows, in years, how long a per-son of a certain age will live if the current mortality rate or the distribution of deaths based on gender and age persists. For instance, in 2010, the average life expectancy for men in Estonia was 70.6 years, i.e. a boy born in that year would live that long if the mortality rate for the given year did not change.
In the UN Human Development Reports, Estonia’s persistent characteristic is the fact that its health indica-tors lag significantly behind its general standard of living and level of education; and Estonia was ranked between 80th and 90th place in the life expectancy rankings until the beginning of the 21st century. The people in all the states wealthier than us, and also those in the 40 poorer states lived longer than the people in Estonia.
During the last decade, life expectancy in Esto-nia has increased dramatically, and, in 2010, achieved an all-time record for both men and women. Between 2004 and 2010, the average life expectancy of women increased by 3 years (from 77.8 to 80.8 years) and 4.2 years for men (from 66.4 years to 70.6 years). Life expec-tancy increased because, during this time, the accidental deaths, and deaths caused by other outside factors, of young people were reduced significantly, along with the deaths of middle-aged people from heart disease and cardiovascular diseases.
Life expectancy can be calculated for every age group, and as age increases, life expectancy, understand-ably, decreases – in 2010, for 65-year-old men it was 14.2
years and 19.4 years for women, thereby lagging behind the European average by 3.1 and 1.7 years, respectively. In other words, although, if based on the adjusted life expectancy at birth, Estonia continues to be among the last five in the European Union, the prognosis for those over 65 is as good as in the rest of Europe.
Comparing the gap between the life expectancies in various age groups, we see that two-thirds of the difference falls in the 20- to 65-year age group, and reducing deaths among the young and middle-aged con-tinues to provide the greatest reserves for lengthening life expectancy.
1.4.2 Living healthy during one’s remaining yearsLife expectancy, which is calculated on the basis of mor-tality data, does not tell us anything about the health, illnesses, or the health-related quality of life of the living. The incidence of illness and the health-related quality of life can be measured using many indicators, and this is done from various points of view. However, since we are interested in the question of whether a longer life (which is definitely a value onto itself) is a full and healthy life, the concept of living a healthy life (Aru 2012) can be of help. This concept assesses both the duration of life, as well as the health-related quality of life, and takes into account the incidence of good and bad health in people of various ages.
In this case, mortality statistics are derived from data obtained by survey research, in which people of various ages assess the state of their health, and the life expectancy is multiplied by the percentage of healthy people in the corresponding gender-age group. Since health can be measured in several ways, the definitions of a healthy life can also vary. The European Union’s offi-cial statistics use a definition that is based on every-day limitations, or the concept that living healthy means a disability-free life expectancy.
A definition like this does not reflect people’s sub-jective feelings about their health, but rather, their ability to cope on their own and manage their own affairs. The incidence of bad health in the population can be over-estimated if health-related limitations are used as an excuse in situations where coping is actually hindered by other factors, for instance socio-economic reasons. Despite the possibilities for various interpretations, this method is appropriate for compiling time-series data and international comparisons.
Compared to the data for 2004, the number of years of disability-free life for Estonian boys born in 2010 had increased by 4.1 years and by 4.4 years for
1.4HealthRaul-Allan Kiivet
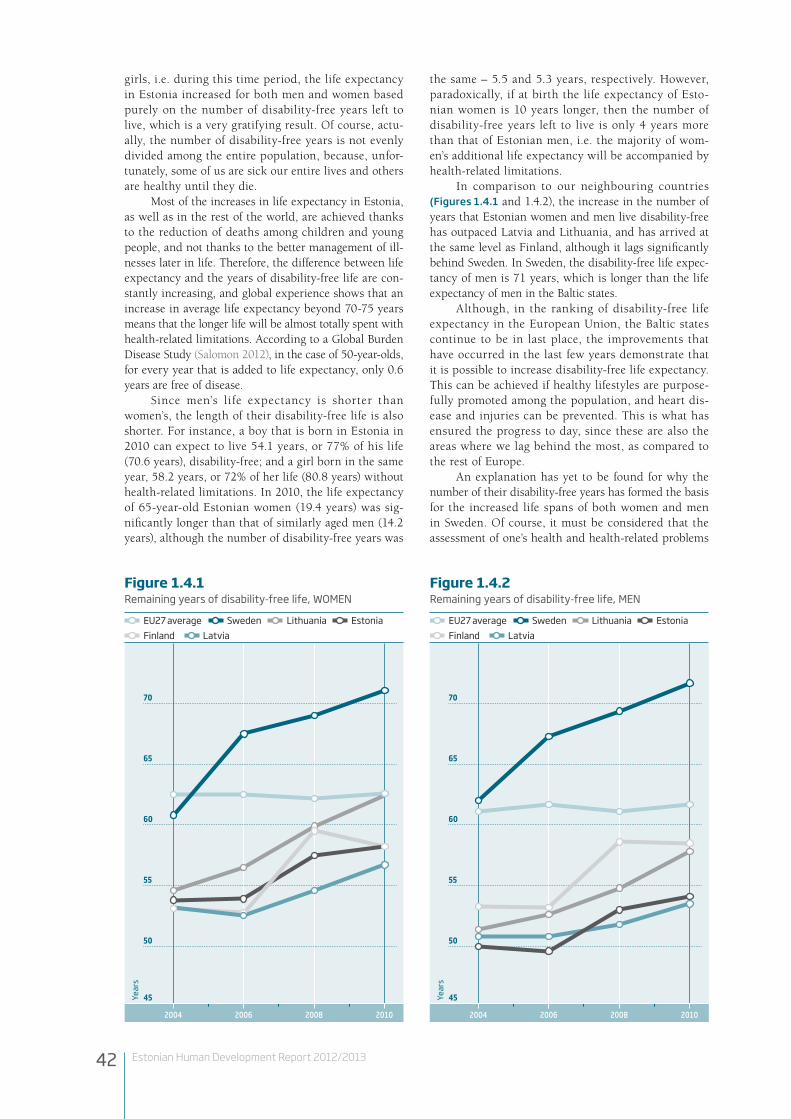
42 Estonian Human Development Report 2012/2013
girls, i.e. during this time period, the life expectancy in Estonia increased for both men and women based purely on the number of disability-free years left to live, which is a very gratifying result. Of course, actu-ally, the number of disability-free years is not evenly divided among the entire population, because, unfor-tunately, some of us are sick our entire lives and others are healthy until they die.
Most of the increases in life expectancy in Estonia, as well as in the rest of the world, are achieved thanks to the reduction of deaths among children and young people, and not thanks to the better management of ill-nesses later in life. Therefore, the difference between life expectancy and the years of disability-free life are con-stantly increasing, and global experience shows that an increase in average life expectancy beyond 70-75 years means that the longer life will be almost totally spent with health-related limitations. According to a Global Burden Disease Study (Salomon 2012), in the case of 50-year-olds, for every year that is added to life expectancy, only 0.6 years are free of disease.
Since men’s life expectancy is shorter than women’s, the length of their disability-free life is also shorter. For instance, a boy that is born in Estonia in 2010 can expect to live 54.1 years, or 77% of his life (70.6 years), disability-free; and a girl born in the same year, 58.2 years, or 72% of her life (80.8 years) without health-related limitations. In 2010, the life expectancy of 65-year-old Estonian women (19.4 years) was sig-nificantly longer than that of similarly aged men (14.2 years), although the number of disability-free years was
the same – 5.5 and 5.3 years, respectively. However, paradoxically, if at birth the life expectancy of Esto-nian women is 10 years longer, then the number of disability-free years left to live is only 4 years more than that of Estonian men, i.e. the majority of wom-en’s additional life expectancy will be accompanied by health-related limitations.
In comparison to our neighbouring countries (Figures 1.4.1 and 1.4.2), the increase in the number of years that Estonian women and men live disability-free has outpaced Latvia and Lithuania, and has arrived at the same level as Finland, although it lags significantly behind Sweden. In Sweden, the disability-free life expec-tancy of men is 71 years, which is longer than the life expectancy of men in the Baltic states.
Although, in the ranking of disability-free life expectancy in the European Union, the Baltic states continue to be in last place, the improvements that have occurred in the last few years demonstrate that it is possible to increase disability-free life expectancy. This can be achieved if healthy lifestyles are purpose-fully promoted among the population, and heart dis-ease and injuries can be prevented. This is what has ensured the progress to day, since these are also the areas where we lag behind the most, as compared to the rest of Europe.
An explanation has yet to be found for why the number of their disability-free years has formed the basis for the increased life spans of both women and men in Sweden. Of course, it must be considered that the assessment of one’s health and health-related problems
45
50
55
60
65
70
2004 2006 2008 2010
SwedenLatvia
EU27 average EstoniaLithuaniaFinland
Year
s
45
50
55
60
65
70
2004 2006 2008 2010
SwedenLatvia
EU27 average EstoniaLithuaniaFinland
Year
s
Figure 1.4.1Remaining years of disability-free life, WoMEN
Figure 1.4.2Remaining years of disability-free life, MEN

43Estonian Human Development Report 2012/2013
is affected by cultural and linguistic differences between both countries and ethnic groups. The concepts of health also change in time. However, Sweden’s experience demonstrates that the population can gain disability-free years of life in a relatively short period of time. Therefore, the eternal dream of a longer healthy life is achievable, so why not also in Estonia?
1.4.3 The treatment and medicalisation of diseaseIn everyday parlance, the opposite of health is illness – the less sick people there are, the healthier the population is. From this, we could conclude that an increase in the utilisation of medical treatments and medications demon-strates a decline in the population’s health. However, real life is more complicated. During the last few decades, it has been proven that, in the case of many illnesses, it makes sense to start treatment in the earlier and more moderate stages of the illness, and that the utilisation of more effective medications, with fewer side-effects, has also made this more acceptable to the patients.
Treatment in the early stages of an illness means that the number of people receiving treatment increases, not that the incidence of illnesses has become more fre-quent. For instance, let’s take hypertension or high blood pressure. The population’s average blood pressure indica-tors have not increased, but compared to ten years ago,
there is now a wish to start treatment earlier, when the blood pressure readings are significantly lower.
There are also other less objective reasons for the increase in the utilisation of medical treatment and the population’s demand for medical treatment. In medical sociology, this general trend is defined as medicalisa-tion. Disputes about the contents, reasons for and even the existence of this phenomenon are prevalent in the medical community. However, generally it is described as the situation in which the intervention of doctors is being requested or demanded in cases which earlier were considered to be a normal part of life or, at least, to be problems that could be solved without medical treatment. An extreme example could be pregnancy, which today is prevented with the use of hormone tablets, or vice versa, induced by in vitro fertilisation.
In this section, we use the term “medicalisation”, in its direct meaning, and monitor developments in the use of prescription drugs. In table 1.4.1, we see how the quantities of prescription drugs sold per person in Estonia have increased during the last 10 years, compared to the averages in the four Nordic countries (Norway, Sweden, Finland and Denmark). The data is directly comparable since both Estonia and the Nordic countries use the same medication classifications, in which the unit of measurement is the number of daily doses per person during 24 hours (DPD/1000/per 24 hours). This unit shows the intensity of the popula-tion’s use of medications – how many people in a thou-
ATC code Classes of medications
Estonia 2000
Estonia 2010
Change in Estonia
(2010/2000)
Average in the
Nordic countries
2000
Average in the
Nordic countries
2010
Change in the Nordic
countries (2010/2000)
Digestive tract and metabolic diseases 539 850 158% 1074 1533 143%
A incl. diabetes medications 69 114 165% 129 182 141%
A10 Heart and cardiovascular disease medications 16 45 287% 32 58 181%
C incl. ischemic heart disease medications 139 349 251% 274 440 161%
C01D incl. various blood pressure medications 17 13 76% 19 17 90%
C07-C09 incl. substances to reduce blood lipids 69 262 380% 131 273 209%
C10 Antibiotics 1 26 1804% 36 159 438%
J01 Anti-inflammation and anti-rheumatism medications 15 13 84% 17 22 128%
M01 Medications for the nervous system 55 60 109% 80 118 146%
N incl. anti-psychosis medications 46 85 185% 169 242 143%
N05A Cold medications 4 6 147% 10 15 147%
R01 Asthma medications 29 26 91% 29 42 145%
R03 Cough and cold medications 16 18 112% 58 65 112%
R05 Anti-allergy medications 14 6 42% 14 14 98%
R06 Allergiavastased ravimid 6 9 154% 25 44 175%
Table 1.4.1Usage of prescription medications in Estonia in 2000 and 2010 compared to the average of four Nordic countries (Nor-way, Sweden, Finland and Denmark).
Usage is presented in daily doses per 1,000 residents per 24 hours (DPD/1000/ööpäevas). The data originates from the medication statistics of the Estonian State Agency of Medicines (http://www.ravimiamet.ee/) and the database of the Nordic Medico-Statistical Committee (http://www.nom-nos.dk).

44 Estonian Human Development Report 2012/2013
sand use medications in normal dosages every day. The Table and the initial data in Figure 1.3.3 originate from the medication statistics of the Estonian State Agency of Medicines (http://www.ravimiamet.ee/) and the database of the Nordic Medico-Statistical Committee (http://www.nom-nos.dk).
For instance, in Estonia in 2000, the total med-ication usage for gastric and duodenal ulcers was 10 DPD/1000/per 24 hours, i.e. 10 people in a thousand (1% of the population) could be using these medications in normal doses every day throughout the year. This is a statistical average, because in real life, some people take larger doses, some do not use any medications at all, while others may be using several at the same time. Unfortunately, it is not possible to compare the data on the use of medications in Estonia with any other states in the world, besides the Nordic countries, because only in these states do representative sales statistics for medica-tions exist that cover the entire population and provide a reliable indirect assessment of the amounts of medications used by the population.
During the last 10 years, the total usage of pre-scription drugs in Estonia has increased by half and, by 2010, arrived at approximately the same level as in the Nordic countries ten years ago. However, the amount used in Estonia continues to be half of that in the Nordic countries, because the increase in abso-lute quantities (459 DPD/1000/per day) has been even greater than in Estonia (311 DPD/1000/per day). In
2000, a total of 1074 DPD/1000/per day were con-sumed, i.e. everyone (from newborns to the elderly) could be taking one ordinary dose of a prescription medication per day. In 2010, the average amount was already 1.5 ordinary doses of prescription medications per resident per day.
What can we conclude from this – are there more illnesses, or are they being treated more vigorously? Maybe the longer life spans and additional years of dis-ability-free life in the Nordic countries and Estonia are the result of the increase in medication usage? The medication manufacturers and sellers would like this explanation, but it is unlikely to be true.
Anxiety and worry, sleeplessness and depression are an increasingly significant part of modern life, while we also know how to and want to inf luence these conditions with medication. Figure 1.4.3 shows the dynamics of the use of tranquilisers, sleep aids and anti-depressants for the treatment of anxiety and mood disturbances in Estonia, Finland and Sweden. For instance, in 2008, the amount of tranquilisers and sleep aids used in Finland totalled 84 DPD/1000/per day, i.e. 8.4% of the Finnish population could be tak-ing one dose of tranquilisers every day throughout the year. But hopefully, they are not using them on a daily basis, because, as a rule, these medications lose their effect if used regularly. The impact of anti-depressants manifests itself after longer usage, and the quantities of these medications taken in Finland and Sweden
1999
2000
2001
2002
2003
2004
2005
2006
2007
2008
1999
2000
2001
2002
2003
2004
2005
2006
2007
2008
1999
2000
2001
2002
2003
2004
2005
2006
2007
2008
In d
aily
dos
es p
er 1
,000
resi
dent
s per
year
Tranquilisers and sleep aids Anti-depressants
0
10
20
30
40
50
60
70
80
90Estonia Finland Sweden
Figure 1.4.3Usage of tranquilisers and anti-depressants 1999-2008

45Estonian Human Development Report 2012/2013
HBSCaverage
Sweden
Finland
Lithuania
Latvia
Estonia
0 5 10 15 20
0 5 10 15 20
Percentage
Percentage
2002 2006 2010
HBSCaverage
Sweden
Finland
Lithuania
Latvia
Estonia
0 5 10 15 20
0 5 10 15 20
Percentage
Percentage
2002 2006 2010
allude to the fact that approximately 6% to 7% of the populations (regardless of age) could be taking anti-de-pressants every day. The great increase in the usage of anti-depressants leaves the impression that life in Finland and Sweden has become depressive for at least twice as many people.
Although, in regard to the groups of medication shown in Figure 1.4.3, the medicalisation of the Esto-nian population lags far behind that of the Nordic coun-tries, we are already at the same level, for instance, in regard to the frequency of the usage of medication for the treatment of heart disease and diabetes. In this case, what do we make of the fact that, in comparison to Fin-land and Sweden, three to four times fewer tranquilisers and anti-depressants are taken in Estonia? Is there any reason to believe that we have three times fewer cases of anxiety and mood disturbances, or are two-thirds of the sufferers in Estonia left untreated? Or, is life for the people in the Nordic countries not as free of worry and stress as we would like to think?
The increase in those receiving treatment in Estonia and the greater intensity of medication usage (Volmer 2012) means that, from the perspective of each person taking medication, the period of treat-ment increases and the years of disability-free living decreases. In Estonia too, the readiness of the medical system to treat and intervene has increased, as has the readiness of the population to be treated, and to admit that it needs help.
1.4.4 Health of schoolchildrenFigures 1.4.4 to 1.4.7 describe the interlinked parameters chosen from the health indicators for schoolchildren in Estonia and the neighbouring countries – obesity and physical activity. The initial reasons for obesity and cor-pulence are an imbalance in the assimilating and expend-ing of calories, which accompanies increasingly frequent sedentary lifestyles.
The data originates from a survey conducted every four years, titled Health Behaviour of School-aged Children (HBSC, see http://www.hbsc.org/), which Estonian joined in 1993. Today, 41 countries participate in the survey, including the U.S., Canada, Russia, Turkey and the separate areas of Great Britain, in addition to all the European Union Member States. Standard questionnaires are answered by 11-, 13- and 15-year-old schoolchildren. Obesity is calculated based on a body mass index (weight is divided by height squared), and adjusted for age and gender. The chil-dren that participate daily in at least 60 minutes of moderate or active physical activity are considered to be physically active.
The graphs present data on 13-year-olds, but the same trends are characteristic of both the 11- and 15-year-olds. Whereas, in almost all of the states, the older chil-dren are less physically active than the younger ones, and there are more overweight children among them. In all of the age groups, obesity in boys appears twice as often as in girls, although, there are twice as many physically active boys as there are girls.
Figure 1.4.4Percentage of obese girls among 13-year-old girls
Figure 1.4.5Percentage of obese boys among 13-year-old boys

46 Estonian Human Development Report 2012/2013
Based on the 2010 HBSC survey, the largest number of overweight schoolchildren is in the U.S. and Greece (about 30%), and the smallest number (6–8%) is in the Netherlands, Switzerland and Denmark. Ireland and Austria have the largest number of physically active children (more than 30%), and Italy has the least (6%). Unfortunately, during the last decade, Estonia has almost risen into the top third of the country rankings related to obesity in schoolchildren, and fallen into the bottom quarter in the rankings related to physical activity.
The spread of obesity among children and teenagers, which results in metabolic problems that create the risk of heart and joint ailments, is an increasing health problem in the entire developed world. This is accompanied by psychosocial setbacks, as well as poor self-esteem, depres-sion and a declining quality of life.
The healthy lifestyles that are practiced when one is young are carried over into adulthood and vice versa – sedentary lifestyles promote the continuance and inten-sification of unhealthy habits. As the HBSC survey shows, this is what has happened among Estonian schoolchildren – with the last decade, the time spent watching TV and sitting behind the computer has drastically increased. What is positive is the fact that the earlier trend of increased weekly smoking and alcohol consumption has been halted, although Estonian students are still in first place when it comes to the age when they have tried ciga-rettes and narcotics, and the percentage who have become drunk (Aasvee 2009).
Unfortunately, the impact of the factors that pro-mote health is decreasing faster among Estonian school-children than in other developed countries. During the last decade, the number of overweight boys and girls has increased suddenly, and just as suddenly, the number of those who are physically active every day has decreased. This dynamic is typical not only of Estonia, but of all the developed countries, which portends a significant increase in illness and the need for medical care in this generation in a few decades.
1.4.5 In conclusionGenerally the health of the Estonian population has improved during the last decade. For instance, the projected life spans for men and women in Estonia that are 65 and older is just as good as in Europe on average, and the middle-aged are quickly approaching the European level. In regard to life expectancy and the remaining years of disability-free life, Estonia has reached record levels in the 21st century, which is based on the significant reductions in the previous levels of mortality.
Compared to the data for 2004, the number of years of disability-free life for Estonian boys born in 2010 had increased by 4.1 years and by 4.4 years for girls, i.e. during this time period, the life expectancy in Estonia increased for both men and women, based purely on the number of disability-free years left to live, which is a very gratifying result. In order to have this trend continue, and to have a longer life also mean years of disability-free living, we must continue to actively
0 10 20 30 40 50
0 10 20 30 40 50
HBSCaverage
Sweden
Finland
Lithuania
Latvia
Estonia
Percentage
Percentage
2002 2006 2010
HBSCaverage
Sweden
Finland
Lithuania
Latvia
Estonia
0 10 20 30 40 50
0 10 20 30 40 50Percentage
Percentage
2002 2006 2010
Figure 1.4.6Percentage of those that are physically active every day among 13-year-old girls
Figure 1.4.7Percentage of those that are physically active every day among 13-year-old boys

47Estonian Human Development Report 2012/2013
References1. Eurostat Healthy life years statistics. http://epp.eurostat.ec.europa.
eu/statistics_explained/index.php/Healthy_life years_statistics
2. Health Behaviour of School-aged Children Study. http://www.hbsc.org/
3. Estonian State Agency of Medicines medication statistics. http://www.ravimiamet.ee/
4. Nordic Medico-Statistical Committee. http://www.nom-nos.dk
5. Aru J., Rahno J., Rannala H. “Tervena elada jäänud aastad ning nende arvutamine,” Quarterly newsletter of Statistics Estonia. 2012; 1: 45–50.
6. Salomon J. A., Wang H., Freeman M. K., Vos T., Flaxman A. D., Lopez A. D., Murray C. J. L. “Healthy life expectancy for 187 countries, 1990–2010: a systematic analysis for the Global Burden Disease Study 2010,” Lancet 2012; 380: 2144–2162.
7. Volmer D., Smirnova L., Henrikson E., Kiivet R. A. “Eesti inimeste retseptiravimite kasutamise seosed tervise enesehin-nangu ja krooniliste haiguste esinemisega 1996. ja 2006. aasta Eesti terviseuuringu andmetel,” Eesti Arst 2012; 91(6): 286–293.
8. Aasvee K., Maser M. “Ülevaade Eestis 2001/2002. ja 2005/2006. õppeaastal toimunud kooliõpilatse tervisekäitumise uuringutest teiste riikide taustal” Eesti Arst 2009; 88(6):390-401.
promote healthy lifestyles among the population, and to prevent heart disease and injuries, which has ensured the progress to date; but, at the same time, these are the reasons that the Estonian population’s health indicators to continue to lag.
Medicalisation – the increased utilisation of medi cal assistance and medications – is a phenomenon charac-teristic of developed countries, and it is also spreading in Estonia. This is evidenced by the increased readiness of the medical system to provide continual medical assis-tance for various illnesses, as well as the readiness of the population to admit that they need help. The quantity of prescription medications that is being used, which characterises medicalisation, has doubled during the last decade in both Estonia and the Nordic countries. The total number of medication users, as well as the intensity of the use, has increased, although we cannot conclude from this that we now have more people who are ill, or that the illnesses have become more serious. This phe-nomenon rather demonstrates that the population’s ill-ness-related behaviour is becoming consumer behaviour.
Unfortunately, among Estonia’s young people, the health-promoting factors are decreasing, and the ones damaging to health are increasing, and this is hap-pening faster than in the other developed countries. Among schoolchildren, the number of overweight boys and girls has suddenly increased during the last decade and, just as suddenly, the number of children who are physically active has decreased. This dynamic is typical not only of Estonia, but also the rest of the developed countries, and portends a significant increase in illness and the need for medical care in this generation, in a few decades.
The Estonian population’s health trends, during the last decade, allow us to make a very simplified summary -- the older segment of the Estonian popu-lation is living longer; the middle-aged segment is liv-ing healthier; but among the young, the impact of the factors that protect one’s health is declining. We can only hope that the health behaviour of Estonia’s young people will become more health-sustaining when they reach the next age group.

48 Estonian Human Development Report 2012/2013
The attention of many cultural researchers has been engaged, for several decades, by values that express cultural ideals and shared understandings about what is good and what is bad. Values are seen as a central theme or axis of culture around which shared beliefs, symbols, norms, and practices are centered, allowing us to compare different cultures (Hofstede 1980, 2001; Inglehart 1997, 2006; Schwartz 1994, 2004). Cultural values shape and justify individual and group beliefs, habits, goals and actions. Everyday practices and insti-tutional functioning, in turn, reflect important cultural values. The dominant value orientations in the culture develop and change when societies are faced with fundamental problems or issues that regulate human activity (Schwartz 2004).This chapter will examine the development of values in Estonia during the last twenty years. The chapter is based mostly on the value the-ory of Ronald Inglehart and his colleagues (Inglehart 1997, 2006; Inglehart & Baker 2000; Inglehart & Wel-zel 2005). Also included are the results of the World Values Survey (WVS), which is presumably the world’s largest survey of attitudes, values and beliefs (Ingle-hart & Baker 2000). In cooperation with the European Values Survey (EVS), which was started in 1981, the project involves approximately 90 countries, and uses nationally representative samples for its research. The new wave of surveys for the World Values Survey is currently underway, and data was collected in Esto-nia in the autumn of 2011. This data provides a good opportunity to analyse whether and how much Esto-nia’s position on the “cultural map of the world” has changed during the last 20 years.
1.5.1 The Inglehart and Welzel’s dimensions of cultural valuesBased on Inglehart and Welzel’s (Ing lehart 1997, 2006; Inglehart & Welzel 2005) approach, one can speak about two large value dimensions: (1) traditional versus secu-lar-rational, which contrasts the religious and traditional values typical of agrarian societies with the secular and rational values, which mainly predominate in urban-ised and industrialised societies, and (2) survival versus self-expression, which reflects the shift from an emphasis on economic and physical security to the appreciation of self-expression, subjective well-being and the quality of life. These two dimensions make it possible to describe most of the cultural differences in value preferences (see Figure 1.5.1).
The values dimension that contrasts traditional and secular-rational values reflects the “the contrast between societies in which religion is very important
and those in which it is not” (p. 25); at the same time, obedience to authority – be it God, a government leader or head of a family – are all very closely related (Inglehart & Baker 2000). In societies that stress tradi-tional values, religion plays an important role; people consider strong ties between children and parents to be important; as well as obedience to authority. In societies that stress traditional values, things that are viewed as “social anomalies,” such as divorce, abortion, suicide and euthanasia, are disapproved. In societies that emphasize secular-rational values, religion and religious authority is less important; instead, people consider their personal aspirations more important than social conformity. They have a rational belief in the progress of science and technology, and in an individual right to make important decisions regarding their own lives (incl. euthanasia, suicide, divorce and abortion) (Inglehart & Welzel 2005).
In those societies where values related to self- expression dominate, people have a better self-reported health; they also take more responsibility for their actions, are politically active, tolerant of differences, and knowledgeable and enthusiastic about issues related to nature conservation (Inglehart & Baker 2000). The peoples that stress self-expression are more sensitive about human rights issues, aware of technology-related dangers and risks, and more attentive when it comes to the discrimination of minorities. Societies where values related to survival predominate are characterised by a sense of low economic and physical security, and the prioritisation of material values. People that live in societies that stress survival do not trust each other, are not satisfied with life and do not tolerate having people who are different (e.g. foreigners, or people with differ-ent sexual orientations) around them. In these societies, people consider their own health to be relatively poor, and do not think that issues related to gender equality, nature conservation or sustainable living are important (Inglehart & Oyserman 2004).
The aforementioned dimensions of cultural values have been confirmed empirically by the research of Inglehart and his colleagues (Inglehart 1997; Inglehart & Baker 2000), which summarises the data collected in the course of the fourth wave of the World Values Survey, based on 200 samples from 78 countries. If Inglehart (1997) initially computed the factor scores for the values dimensions based on 22 items, later analyses showed that ten indicators are sufficient (see Table 1.5.1) to describe the most important cultural differences in people’s value preferences (Inglehart & Baker 2000). The two values dimensions explain a total of 71% of the crossnational variation and enable the positions of every society to be charted on a global map showing
1.5ValuesAnu Realo

49Estonian Human Development Report 2012/2013
Traditional values(Secular-rational values stress the opposite)
Self-expressive values (Values related to survival stress the opposite)
Greater respect for authority is a good thing
The respondent feels that protecting the freedom of speech and giving people more say in important government decisions are more important than fighting rising prices and maintaining order in the country b
God is very important in respondent’s life Most people can be trusted
In the family, it is more important to raise children to be religious and obedient than to be independent and determined, perseverant a The respondent is happy
The respondent has a high level of national pride Homosexuality is always justified
Abortion is never justified The respondent has signed a petition
Table 1.5.1Indicators that form the basis for Inglehart and his colleagues’ cultural value dimensions
1,5
1,0
0,5
-0,5
-1,0
-1,5
-2,0
-2,5
0
1,5
1,0
0,5
-0,5
-1,0
-1,5
-2,0
-2,5
0
Trad
ition
al V
alue
s
Survival Values Self Expression Values
Secu
lar-R
atio
nal V
alue
s
Belarus
SerbiaLatvia
GeorgiaAzerbaijan
Armenia
Poland
ZimbabweMorocco
JordanAlgeria
Uganda
Pakistan
IranSouthAfrica
Chile Argentina
NigeriaGhana
Tansaania
Croatia
Czech Republic
Belgium
GreatBritain
France
RussiaBulgaria
UkraineLithuania
Estonia1990
Estonia1996
ChinaSouth-Korea
Taiwan
Montenegro
Albania
HungaryMacedonia
Moldova
Romania
Bosnia
Slovakia
India
Turkey
Indonesia
BangladeshPhilippines
Peru
Vietnam
Portugal
Dominican Republic
Brazil
VenezuelaColumbia
Mexico
El SalvadorPuerto Rico
Ireland
North Ireland
Uruguay
Spain
IsraelItaly
Greece
Slovenia
West Germany
East Germany
Japan
Finland
Norway
Switzerland
Denmark
Netherlands
Sweden
Luxembourg
Austria
USA
AustraliaCanada
New Zealand
Iceland
Egypt
Estonia
-2,0 -1,5 -1,0 -0,5 0 0,5 1,51,0 2,0
-2,0 -1,5 -1,0 -0,5 0 0,5 1,51,0 2,0
English speaking
Protestant EuropeConfucian
Catholic Europe
South Asia
AfricaLatin America
Ex-Communist
Figure 1.5.1The World Values Survey Cultural Map of the World 1999–2004.
The figure is taken from the World Values Survey website (see www.worldvaluessurvey.org) and was originally published in a book by Ronald Inglehart and Chris Welzel (2005) titled Modernization, Cultural Change, and Democracy, published in New York by Cambridge University Press (p. 63). Estonia’s position on the values map, in 1990 and 1996, is indicated by the author of the sub-chapter, and is based on the data presented on the World Values Survey (WVS) website.
Note: The table was compiled based on Table 2.1 in Inglehart and Welzel’s (2005) book (p. 49), aAutonomy Index; b Materialism-Post-materialism Index.
50 Estonian Human Development Report 2012/2013
the cultural variations of values (see Figure 1.5.1). Sur-vival versus self-expression has been found to be very closely related to Hofstede’s (1980) individualism versus collectivism, and Shalom Schwartz’s (1994) autonomy versus conservation of cultural value dimensions as all three deal with the common dimension of cultural variation – people’s aspiration toward greater autonomy and freedom of choice (Inglehart & Oyserman, 2004; Schwartz 2004).
1.5.2 Do values change and how?The main goal of Ronald Inglehart and his colleague’s approach to values (Inglehart 1997; Inglehart & Welzel 2005) is to explain cultural value change. The theory focuses on the socio-economic development of society (the so-called “modernisation” theory), which, on the one hand, is accompanied by considerable social, politi-cal and cultural changes, and, on the other hand, allows predictions to be made regarding how and in what direction values will develop.
Socio-economic development starts from techno-logical innovations, which increase labour efficiency, and this, in turn, is accompanied by greater specialisation in the division of labour, increased incomes and levels of education, diversification of human relations, and it shifts the focus from authoritarian forms of communica-tion to market economy relations. In the long term, this development is accompanied by changes in gender roles, sexual norms, current attitudes toward the authorities, as well as the people’s increased political activism and involvement in activities related to civil society (Ingle-hart & Welzel 2005).
According to Inglehart and Welzel’s theory (2005), the socio-economic development of a society increases people’s autonomy, creativity and freedom of choice through three important mechanisms. Firstly, socio-eco-nomic development increases people’s sense of material security, through which the impact of material limita-tions on people’s choices and decisions is reduced. Sec-ondly, the increase in the educational level, the spread of the means of mass communications, and cognitively more demanding work tasks increase the people’s intel-lectual independence. Thirdly, greater specialisation in the division of labour as well as the reduction in the importance of traditional social relations and roles increase the people’s social autonomy – it is possible for people to create new social relations based on their own desires and needs, and not based on prescribed (e.g. inherent) and strictly defined roles. Therefore, it could be said that, by reducing limitations on the people’s free-dom of choice and by increasing the people’s autonomy, modernisation and socio-economic development guide societies and the changes in the predominant values in a broadly predictable direction (Inglehart 2006; Inglehart & Welzel 2005).
At the same time, Inglehart and his colleagues’ research (Inglehart 200e6; Inglehart & Baker 2000) shows that the development of values is path dependent – the dominant religious background of the society, be it Protestantism, Orthodoxy, Islam, Confucianism, etc., is clearly expressed in the development of cultural areas, which have characteristic value systems that persist even after economic development is taken into account. Therefore, although the value systems of var-ious countries are moving in the same direction under the influence of modernisation, the development of the values of these societies are influenced, to a significant degree, by their cultural, historical and religious lega-cies. Thus, Inglehart describes the development of val-ues based rather on a paradigm of multiple modernities (Eisenstadt, 2000).
In Inglehart and his colleagues’ approach, a significant cultural shift has taken place during the last thirty to forty years in the developed industrial countries, where the people’s value preferences have shifted from values that stress a sense of material and physical security toward “post-modern” values, i.e. those that stress greater self-expression and quality of life. According to Inglehart (1990), the change is based on two important hypotheses, which comple-ment each other.
• The scarcity hypothesis: almost all people appre-ciate freedom and autonomy, although under con-ditions of economic hardship, people must first pay attention to the most important activities necessary for survival in order to ensure their material and physical security. As economic well-being increases, so does the importance of post-materialist, self-ex-pressive values.
• The socialisation hypothesis: the socio-economic development of society does not cause changes in the people’s value preferences overnight. People’s values are formed during the early years of their childhood and represent the economic conditions prevalent at that time. Thus, as the society becomes wealthier, values change gradually through genera-tional turnover.
In summary, it could be said that according to Ingle-hart and his colleagues, the development of values depends to a great extent on the socio-economic and technological development of the society, but also fol-lows the historical-religious patterns that are typical of that society. However, cultural change that is caused by socio-economic development takes place in two stages: industrialisation (including the secularisation of both society and power) is accompanied by a growth in the importance of secular-rational values, while the emer-gence of values that stress self-expression and autonomy accompany post-industrialisation (Inglehart 1997; Ingle-hart & Welzel 2005).1
1 Although Inglehart’s and his colleagues approach to value dimensions and value changes has warranted great interest and recognition among social scientists, this fame has inevitably been accompanied by an increased number of researchers that view Inglehart’s ideas and methods sceptically and critically. An overview of the criticism and counter criticism related to Inglehart’s work is provided by an article by Paul Abramson (2011), which can be downloaded from http://escholarship.org/uc/item/3f72v9q4.

51Estonian Human Development Report 2012/2013
1.5.3 Estonia’s participation in the World Values SurveyEstonia participated for the first time in the World Values Survey in 1990, that is, while it was still part of the Soviet Union (see Table 1.5.2). Officially, this was the second wave of the European Values Survey, which was later replicated within the framework of the World Values Survey, in many different countries of the world. The next wave of the World Values Survey took place in Estonia five years after re-independence was declared, i.e. in the autumn of 1996. Thereafter, only three years later, in 1999, the survey was conducted again under the aegis of the European Values Survey. The fifth wave of the World Values Survey took place from 2005 to 2008, but unfortunately, Estonia did not participate in that wave of the survey. However, the next wave of data collection for the European Values Survey took place in Estonia in 2008 – since the sur-vey questionnaires for the two surveys overlap to a great degree, the results from that survey can also be included in a comparative analysis. The latest World Values Survey, i.e. the sixth wave, began in 2010 and data in Estonia were collected in the autumn of 2011. The person responsible for conducting most of the sur-veys in Estonia has been Andrus Saar from the social and market research company Saar Poll.
1.5.4 The values of the Estonian population between 1990 and 2011Estonia’s position on Inglehart and Welzel’s (1995) cultural map of the world, between 1990 and 1999, is shown in Figure 1.5.1. The vertical axis of the map contrasts traditional and secular-rational values and
the horizontal axis the values stressing survival and self-expression. The positions of the countries on the map have been derived from the results of the factor analysis conducted at the cultural level, which is based on the ten indicators shown in Table 1.5.1. The higher a country’s factor score on either the vertical or horizon-tal axis, the more the secular-rational or self-expressive values are stressed in that country, in comparison to other countries.
As can be seen from Figure 1.5.1, based on all three survey waves, Estonia is positioned in the upper left corner of the cultural map of the world, i.e. in both 1990 and 1996, as well as in 1999, compared to the other countries, people living in Estonian considered secular-rational as well as survival-related values to be important. In the comparison of the world’s countries, Estonian residents, on the one hand, stressed individ-ualistic aspirations, did not support the superiority of authority (not God, state or family), expressed com-paratively low level of nationalism and national pride, found that divorce, abortion and suicide are acceptable phenomena in society, and expressed great belief in the importance of scientific and technological progress (secular-rational values). On the other hand, the results of the surveys conducted in the 1990s show that peo-ple in Estonia have little trust in other people, a low levels of tolerance and subjective well-being, as well as meagre levels of political activism, environmental awareness and personal initiative (values that stress survival). According to Inglehart and his colleagues (Inglehart & Baker 2000; Inglehart & Welzel 2005), the strong focus on secular-rational values, but also on survival-related ones, is the direct achievement or legacy, depending on one’s viewpoint, of the 50 years of Communist rule. This argument is supported by the fact that a large number of those who shared Estonia’s fate (including our neighbours Latvia, Lithu-ania, Russia and many other former Soviet Republics) are positioned quite close to Estonia on the cultural map of the world, thereby forming a group of former Communist countries. Estonia’s position in the higher portion of the axis of secular-rational versus traditional values may also be affected by our Protestant religious legacy that has dominated in the historical perspective and, which acknowledges authority to a much smaller degree than in Catholic countries.
During the aforementioned ten years, substantial changes did not take place in the significance of secu-lar-rational values for Estonia’s population. However, a small shift toward even greater emphasis on the surviv-al-related values did take place in the period from 1990 to 1996. A similar trend took place in the other Eastern European countries, which Inglehart and Baker (2000) have interpreted as a reaction to complex economic, social and political changes that took place after the fall of the Iron Curtain and the independence of those countries in the early 1990s. In 1999, Estonia’s position on the values dimension stressing self-expression (as opposed to stressing survival) was practically the same as three years earlier.
What might Estonia’s position be on the cultural map of the world in 2011? An exact answer to this
Survey period Survey
Size of the
sampleMean age
(SD)Principal
investigator
01.06.1990–30.08.1990 EVS/WVS 1008 39.7 (14.8) Andrus Saar*
20.10.1996–23.11.1996 WVS 1021 43.6 (15.3) Mikk Titma*
01.10.1999–31.10.1999 EVS/WVS 1005 44.4 (17.6) Andrus Saar
01.07.2008–31.08.2008 EVS 1518 50.1 (18.5) Andrus Saar
18.11.2011–02.12.2011 WVS 1533 48.6 (18.5) Andrus Saar
Note: EVS – European Values Survey; WVS – World Values Survey; SD = standard deviation. The given data comes from the surveys’ websites, see www.worldvaluessurvey.org and www.europeanvaluesstudy.eu. *The survey was conducted in cooperation with Hans-Jürgen Klingemann.
Table 1.5.2Estonia’s participation in the World Values Survey and the European Values Survey

52 Estonian Human Development Report 2012/2013
question cannot be given before the completion of the ongoing, sixth wave of the survey, because the posi-tions of the countries on the map of world values are not absolute, but relative, and computed in comparison to other countries. However, based on the data from the survey conducted in Estonia in 2011, it is possible to make reasoned assumptions about whether, and to what degree, the values of the Estonian population have changed in ten years. If we proceed from Inglehart’s cul-tural change theory (Inglehart 1997; Inglehart & Welzel 2005), which was described above, for which the main thrust mechanism is the state’s socio-economic devel-opment, a certain emergence of self-expressive values could accompany an increase in the country’s national wealth. However, has Estonia’s economic development been sufficient to ensure Estonia’s population a sense of material and physical security, without which the emergence of post-materialist and self-expressive values is not possible? To find an answer to this question, the changes in values in Estonia, from 1999 to 2011, are analysed below according to the individual indicators that form the basis for Inglehart’s cultural values dimen-sions (see Table 1.5.1). In order to obtain a longer time span for the value changes, the results from the 1990 and 1996 surveys, have been added in the cases where they are available.
Intentionally, and not at all incidentally, this chapter examines the values of the entire population, without distinguishing between Estonians, Russians or members of other nationalities. Although numerous earlier surveys have shown that significant differences continue to exist in the value preferences of Estonians and non-Estonians (see Kalmus & Vihalemm 2004; Lauristin et al. 1997; Magun & Rudnev 2010; Tart 2011;
Tart, Sõmer & Lilleoja 2012), including the fact that the values of the Russian-speaking population underwent a greater change during the transition period (Kalmus & Vihalemm 2004; Lauristin, et al. 1997), this chapter is based on Estonian society as a whole, as is typical of large comparative international surveys. (Also in the data for the other countries, the respondents are not differentiated on the basis of whether they belong to a majority or minority group).
1.5.5 Secular-rational versus traditional valuesThe focus of secular-rational versus traditional values is the belief in the importance of a higher power, be this authority of God, the state or head of the family. The percentage of Estonia’s population (45%) that believes that greater respect for authority, in the near future, is a good thing has remained at the same level from 19962 to 2008, but decreased noticeably in 2011. Thus, in the last survey wave, compared to earlier ones, there has been an increase in the percentage of the Estonian population that believes that greater respect for authority tends to be a bad thing, or who have no opinion in this regard (see Figure 1.5.2).
Based on the data from the latest World Values Survey,3 in regard to the importance placed on author-ity, Estonia places fourth from last, among 32 countries – only the South Korea (27%), Sweden (23%) and Japan (5%) have a smaller percentage of people who believe that greater respect for authority is good in the near future.
The percentage of Estonia’s population that con-sidered God to be very important in their lives has increased by six percent, compared to 1999 (answers to the question could be given on a scale of 1 (“not at all important”) to 10 (“very important”). The percentage, which totalled 28% of the respondents in 2011, was computed based on those who gave answers from 7 to 10 (see Inglehart, Basanez, Diez-Medrano, Halman & Luijkx 2004). Despite the small increase for this indi-cator, Estonia places second from last in a comparison with 32 countries – only in Sweden are there even fewer people (22%) who consider God to be important in their lives.
An important component in the assessment of traditional versus secular-rational values is what qual-ities people consider to be important for children to learn at home. An emphasis on independence and determination, perseverance refer to secular-rational values, while stressing religiousness and obedience refer to traditional values. In Estonia, from 1990 to 2008,4 the importance of raising children to be deter-mined and perseverant has slowly decreased, while the percentage of people who believe that children should be raised to be religious and obedient has somewhat
2 The survey conducted in Estonia in 1990 does not include this question.
3 Here and below: this is unofficial and initial data from the 6th wave of the World Values Survey (2010-2012), which includes data from 32 countries, and which, as of January 2013, was only available to the survey’s national coordinators.
4 Due to the change in methodology, it is not possible to use the data from the 2011 survey. If in earlier surveys, eleven possible choices were provided and the respondents had to choose the five most important qualities that should be encouraged in children, in the survey conducted in Estonia in 2011, the respondents were asked to indicate whether each of the eleven qualities were important or not.
Figure 1.5.2The percentage of the Estonian population from 1996 to 2011 who are of the opinion that greater respect for autho-rity, in the near future, is “good”, “don’t mind” or “bad”.
Bad Don’t mind Good
Perc
enta
ge
0
10
20
30
40
50
60
70
80
90
1996 1999 2008 2011
Source: World Values Survey and European Values Survey

53Estonian Human Development Report 2012/2013
increased. Compared to the first half of the 1990s, the percentage of the Estonian population who consider it important to raise children to be independent has decreased almost twofold. However, compared to 1999, the changes have not been very great – also ten years later, the largest share of people in Estonia considered it important to raise children to be decisive, persever-ant (45%), followed by those whose valued obedience (28%) and independence (25%), while only 7% of the Estonia’s residents believed that children should be raised to be religious. Apparently, in the early 1990s, it seemed to people that, similarly to national indepen-dence, it was important to raise children to be inde-pendent and autonomous. However, after accession to the European Union and NATO, the independence of the Estonian state does not seem to be an important topic any longer and the residents of Estonia have also returned to more traditional values. Compared to other countries (see Figure 1.5.3), it becomes evident that Estonia is positioned among such Eastern and Western European countries, like Belarus, Armenia, Belgium and France, where neither independence nor religiousness are considered important for children to learn at home. Another distinct group is comprised of the Scandinavian countries (i.e. Norway, Iceland, and Denmark), where, similarly to Estonia, a religious upbringing is not important, but the development of a child’s independence and autonomy are considered to be very important.
In Inglehart and his colleagues’ research (2000, 2005), an important indicator of the traditional versus secular-rational value dimension has been the question of people’s national pride. In the surveys conducted in Estonia, this question has been formulated very differ-ently throughout the years. In 1990, the question was, “How proud are you of your ethnic membership?” In 1996, 1999 and 2008, the question was “How proud are you to be an Estonian citizen?” Then, in the last wave of the survey, in 2011, the question was worded as follows,
“How proud are you to be an Estonian resident?” For this reason, it is not possible to directly compare the results from the various years. Based on the data from the latest wave of the World Values Survey (2010–2012), Estonia places last, together with the South Korea, in regard to being proud of being a resident of one’s country. Only 21% of the respondents were very proud of the fact that they are residents of Estonia, while in Sweden, the cor-responding indicator was almost 40%, and 60% in the United States.
The last important attr ibute that should be spoken about in regard to traditional versus secu-lar-rational values is the people’s attitude toward the opportunity to make important decisions in one’s life, including abortion, divorce and suicide. The attitudes toward these questions have been found to be inter-related, and therefore, when computing the score for this values dimension, the only indicator that was taken into account was how acceptable is abortion in a society. The percentage of Estonia’s residents who believe that abortion is not justified under any circum-stances increased somewhat in the second half of the 1990s, and remained at the same level (21–22%) until 2008. According to the data in the latest survey wave, in 2011, only 18% of Estonia’s population believed that abortion is not justified under any conditions, and based on this indicator, we place third behind Swe-den and Japan (see Figure 1.5.4). Thus, in Estonia, the majority of the people believe that people themselves have the right to make such decisions about their lives.
Based on the analysis of the aforementioned questions, one can state in summary that Estonia’s position on the traditional versus secular-rational axis (see Figure 1.5.1) has not notably changed from 1999 to 2011. Estonia’s position in 2011, at the top end of the axis, on the pole of secular-rational values may also be caused, primarily, by the fact that, in comparison to other countries, the residents of Estonia place less importance on God, religion, authority or the role of the state in their
ReligiousIndependent
Perc
enta
ge
0
10
20
30
40
50
60
70
80
90
0
10
20
30
40
50
60
70
80
90
Ukra
ine
North
. Cyp
rus
Arm
enia
Esto
nia
Belar
usFr
ance
Belg
ium
Alba
nia
Russ
iaMa
ltaBo
snia
Serb
iaCy
prus
Portu
gal
Spain
Mont
eneg
roPo
land
Italy
Croa
tiaGr
eece
Bulg
aria
Neth
erlan
dsMo
ldov
aGr
eat B
ritain
North
. Irel
and
Koso
voFin
land
Luxe
mbo
urg
Geor
gia
Azer
baija
nRo
man
iaIre
land
Switz
erlan
dSw
eden
Czec
h Rep
.Au
stria
Latv
iaSl
ovak
iaGe
rman
ySl
oven
iaLit
huan
iaHu
ngar
yDe
nmar
kIce
land
Norw
ay
Figure 1.5.3The percentage of the population in European countries, in 2008-2010, who believe that it is important to raise chil-dren to be independent and religious.
Source: European Values Survey, 4th wave, 2008–2010.

54 Estonian Human Development Report 2012/2013
lives. At the same time, people’s freedoms, and the right to make their own decisions about their lives, are empha-sised in Estonia.
If Estonia’s position on the traditional versus secu-lar-rational values axis has remained approximately the same from 1990 to 2011, the question of what has hap-pened in the survival versus self-expression dimension is all the more interesting.
1.5.6 Self-expressive versus survival valuesOne of the most definitive components of the value dimension that stresses survival versus self-expression is the Materialism-Postmaterialism Index (Inglehart 1997), which is based on people’s preferences regarding issues
Percentage 0 10 20 30 40 50 60 70 80 90
Percentage 0 10 20 30 40 50 60 70 80 90
Sweden
Japan
Estonia
Spain
New Zealand
USA
Russia
Belarus
South Korea
Ukraine
Kazakhstan
Cyprus
Poland
Uruguay
Chile
Azerbaijan
Uzbekistan
Ecuador
Philippines
Kyrgyzstan
Armenia
Peru
Nigeria
Mexico
Turkey
Malaysia
Trinidad and T
Zimbabwe
Ghana
Qatar
Morocco
Colombia
Figure 1.5.4Percentage of the population in various countries of the world, in 2010-2012, that believe that abortion is never justified.
Source: World Values Survey, 6th wave, 2010–2012.
related to the development of the state. If people think that protecting the freedom of speech and giving people more say in government decisions are important, they endorse post-materialistic values. However, if people consider maintaining order in the country and fighting prices to be important, materialistic values prevail. Com-binations of the aforementioned variations are positioned between the two trends.
When examining the materialistic versus post- materialistic attitudes of Estonia’s population, it becomes evident that changes during the last twenty years have not been significant. The percentage of people that stress material values increased about 10% during the 1990s, thereby expressing the complicated socio-economic conditions that prevailed in Estonian society during that period (see the shift described above in the sur-vival versus self-expression axis, Inglehart and Baker (2000)), but, by 2008, it had decreased to the same level as during the initial period of the survey (32%), and has remained there until 2011. During the period under examination, the percentage of people that adhere to post-materialist values has fluctuated somewhat from 6% (1990) to 4% (2011). Based on the data from the latest World Values Survey, compared to the other world countries, Estonia continues to be positioned at the end of the ranking among the former Soviet Republics (e.g. Uzbekistan, Kazakhstan, Russia, Armenia, Belarus, etc.), where the percentage of people in the population that stress post-materialist values is 5%, or even less. In 2010, the corresponding indicator in Sweden was 32%, 18% in the United States and 8% in Poland.
When assessing the values that stress survival versus self-expression, it is important to consider how much people trust each other, which, among other things, is one of the key indicators of social capital (Allik & Realo 2004; Realo & Allik 2009). Social capital is usually defined as the collective and economic benefit derived from the cooperation of people and groups, jointly shared interests and mutual trust. The general degree of trust of Estonia’s population decreased during the first half of the 1990s, but since 1996 (22%), has steadily increased. According to the 2011 survey, 40% of the respondents thought that “most people can be trusted”, while in 2008, the corresponding indicator was 33%, and only 24% in 1999. At the same time, regardless of the considerably increase of trust that has occurred during the last decade, a majority of the pop-ulation (60%) continues to believe that one needs to be very careful in dealing with people (also see Chapter 2 of this report).
In addition to trust, the people’s feeling of happi-ness has also increased during the last decades. If, in 1990, 61% of Estonia’s population stated that, consider-ing all circumstances, they are very or rather happy, in 2008 and 2011, approximately 77% of the respondents stated that they are happy. A lengthier discussion on the Estonians’ feeling of happiness can be found in Chapter 3 of this report.
Satisfaction with life also demonstrated a power-ful upward trend (Realo 2009) among Estonia’s pop-ulation in the 2000s. In the early 2000s, the rate of satisfaction with life among Estonian residents was one

55Estonian Human Development Report 2012/2013
of the lowest in Europe. But in only five years, buoyed by general economic growth and positive political events, (Estonia’s accession to the European Union in 2004, etc.), it increased by almost 30%, reaching its peak in September 2006, when, based on the Euroba-rometer survey, 79% of the Estonian population was satisfied or very satisfied with life. Although Estonia’s economic growth continued until early 2008, the Esto-nian population’s assessments related to the level of life satisfaction slowly started to decrease, already in the spring of 2007, and stabilised at 69%, by the spring of 2012 (see Figure 1.5.5). It is interesting to note that the continued growth of Estonia’s GDP, starting in 2010, has not been accompanied by an increase of satisfac-tion among Estonia’s population. The reasons probably lie in the fact that, starting in 2007, the cost of the largest items of expenditure in Estonia, i.e. the prices for dwellings and food, has increased considerably faster than the average wages.
The self-expressive values also include the people’s greater tolerance toward minorities, be it homosexuals, or people with different ethnic or religious backgrounds. If, in 1990, more than three quarters (76%) of the respon-dents thought that homosexuality is never justified, 20 years later, the corresponding indicator is 48%. How-ever, in 2011, almost half of the Estonian population still thinks that homosexuality is not acceptable and, in the comparison with other countries, this high share of people continues to place Estonia among the Eastern European, rather than Western European, countries (see figure 1.5.6).
An important measure of self-expressive versus survival values is the people’s political, environmental and community activism. In the World Values Survey, this has been measured, among other things, with a question about whether the respondent has ever signed a petition as a political protest or, at least, plans to do
% of satisfaction
Perc
enta
ge
GDP,
bill
ions
of E
uros
GDP
0
10
20
30
40
50
60
70
80
90
0
0.5
1.0
1.5
2.0
2.5
3.0
3.5
4.0
4.5
Oct 2
003
Oct 2
004
June
2005
Oct 2
005
Apr 2
006
Sept
2006
May 2
007
Oct 2
007
Apr 2
008
Oct 2
008
June
2009
Nov 2
009
June
2010
Nov 2
010
May 2
011
Nov 2
011
May 2
012
Figure 1.5.5Percentage of the Estonian population who were “satis-fied” or “very satisfied” with their life between 2003 and 2012. As a comparison, Estonia’s GDP, in billions of Euros, during the same period, is included in the chart.
Source: Eurobarometer, Statistics Estonia
Source: World Values Survey, 6th wave, 2010–2012.
Percentage 0 10 20 30 40 50 60 70 80 90
Percentage 0 10 20 30 40 50 60 70 80 90
ArmeniaAzerbaijan
QatarMorocco
GhanaTrinidad and T
UzbekistanTurkey
ZimbabweKyrgyzstanKazakhstan
NigeriaMalaysia
RussiaBelarusUkraine
EstoniaPoland
ColombiaCyprusMexico
South KoreaEcuador
PeruPhilippines
USANew Zealand
JapanUruguay
ChileSpain
Sweden
Would never participate Might participate Have participated
Perc
enta
ge
0
10
20
30
40
50
60
70
80
90
1990 1996 1999 2008 2011
Figure 1.5.6Percentage of the populations of various countries in the world in 2010-2012 that believe that homosexuality is never justified.
Figure 1.5.7Percentage of people living in Estonia, from 1990 to 2011, who have signed a petition (as a form of political protest), might do so in the future, or would never do so under any circumstances.
Source: World Values Surveys and European Values Surveys.

56 Estonian Human Development Report 2012/2013
so in the future. Figure 1.5.7 shows that the number of people in Estonia who have never signed a petition for any reason has continually increased since 1990 (23%), and reached 57% in 2011. At the same time, the number of people who have signed a petition, or are considering doing so in the future, has decreased year-by-year.
In the comparison of the world’s countries, based on these indicators, Estonia is positioned between Tur-key and Zimbabwe, while, for instance, in New Zealand, the percentage of people who have signed a petition is 83%, and only 3% have never done it or would never do it under any circumstances (see Figure 1.5.8). However, Estonia’s position in the aforementioned ranking cannot be unequivocally interpreted, since there can be two different reasons for not participating in petitions: (a) the lack of political or civil activism or (b) the restriction of political freedoms, which reduces the likelihood of signing protests.
Summarising the changes that have occurred in the values that stress survival versus self-expression during the last 10 years, it must be said that the Esto-nian population’s general trust in others have steadily increased, as has the sense of happiness and satisfac-tion with life. To some extent, the tolerance toward minorities has also increased. All of this could provide evidence that, on the map of world values, Estonia could slowly be moving from stressing values related to survival to placing greater importance on self-ex-pressive values. At the same time, Estonia continues to be positioned in the group of the former Soviet Republics and African countries, where the percentage of people that stress post-materialistic values is 5% or even less. And this percentage has not notably changed during the last 20 years. Even more, during 20 years, the number of people in Estonia who would not sign a protest under any circumstances has doubled, reaching 57% in 2011. Based on Inglehart and Welzel’s (2005) theory of cultural change, the latter speaks for the importance of survival values.
1.5.7 Has Estonia’s position on the cultural map of the world changed?Based on existing data, and not knowing whether, and to what extent, changes have taken place in people’s values elsewhere in the world, one can cautiously argue that Estonia’s position on the map of world values has not notably changed, compared to 1999. In 2011, compared to the people of other countries, Estonia’s population still considered secular-rational values to be more important, while also placing greater empha-sis on survival rather than self-expressive values. The increase in trust, well-being and tolerance among Estonia’s residents during the last decades provides evi-dence of a small shift in the direction of self- expressive values. However, apparently, Estonia’s socio- economic development has not been sufficient, to date, to ensure the population a material and physical sense of security, and thereby, also the emergence of stronger post-materialistic values.
Would never participate Might participate Have participated
Percentage 0 10 20 30 40 50 60 70 80 90
Percentage 0 10 20 30 40 50 60 70 80 90
Azerbaijan
Kyrgyzstan
Malaysia
Morocco
Kazakhstan
Ukraine
Armenia
Ghana
Nigeria
Philippines
Russia
Ecuador
Zimbabwe
Estonia
Turkey
Chile
Uruguay
Mexico
Peru
Colombia
Cyprus
Poland
Spain
South Korea
Trinidad and T
Japan
USA
Sweden
New Zealand
1990 andlater
1980-1989
1970-1979
1960-1969
1950-1959
1940-1949
1930-1939
Perc
enta
ge
0
10
20
30
40
50
60
70
80
90
Figure 1.5.8Percentage of people living in various states of the world in2010-2012, who have signed a petition (i.e. as a form of political protest that people can participate in), might do so in the future, or would never under any circumstances do it.
Source: World Values Survey, 6th wave, 2010-2012.
Figure 1.5.9Percentage of people living in Estonia, in 2011, by various birth cohorts that believe that homosexuality is never justified.
Source: World Values Survey, 6th wave, 2011.

57Estonian Human Development Report 2012/2013
The fact that Estonia’s position on the map of world val-ues has generally remained the same does not mean that the population’s values have not changed at all during the last 20 years. There are a number of studies that have examined the value change in Estonia in the period following re-independence (see, for instance, Lauristin et al. 1997; Tart 2011) which show that a significant shift towards hedonistic as well as post-modern or Western values took place during the transition period (1991–2003; Kalmus & Vihalemm 2008; Vihalemm & Kalmus 2009). The latter is partially confirmed by the data of the World Values Survey, according to which, since the mid-1990s, the importance of so-called post-modern and self-expressive values, such as a general trust of people, a sense of well-being and tolerance has slowly increased. At the same time, regardless of the growth of these indicators, compared to the people in Scandinavia, for instance, Estonia’s residents continue to be consid-erably less trusting, less tolerant and less happy, and tend to place greater emphasis on fighting rising prices and maintaining order in the state than on the general freedom of speech and political participation.
If we think of Estonia’s economic development during the last decade (which regardless of the com-plicated situation in the world economy, has been characterised by the growth of both the GDP and exports), should we have expected a greater emphasis on self-expressive values in Estonia than current data indicates? According to Inglehart’s (1997) socialisation hypothesis, which is described above, values change steadily as the society’s wealth increases, through gen-erational turnover, whereas the basis for the value shift is the economic situation in the society during a per-son’s formative years, i.e. during childhood and youth. Therefore, a state’s socio-economic development is not accompanied by a sudden change in values. People’s val-ues are relatively conservative, and they may not exactly follow the changes in the economy and social organ-isation of life. Based on this approach, we really have no reason to expect greater changes in values during the last decade, because economic development and the growth of wealth did not start in Estonia until the mid-2000s. Consequently, as socio-economic development continues, we should expect to see a more significant emergence of self-expressive values in “Generation Z” which now consist of 10-years-olds, and those some-what older and younger. It won’t be possible to check this hypothesis until the new data collection waves of the World Values Survey are completed, which will hopefully include Estonia, in a dozen or so years.
The latest data from the autumn of 2011 indicates that every subsequent generation, with one important exception, actually supports self-expressive values more than the previous generation. The exception is the gen-eration of “free Estonia’s” children, who were born in the early 1990s, and whose values are moving back to a
greater emphasis on survival, or to less political activism, less trust and less tolerance than the two previous gene-rations (see, for instance, Figure 1.5.9). Future studies must provide the answers to the questions of whether this somewhat reactionary value shift will be permanent, and what the reasons are for this (i.e. the complicated economic and socio-political situations in Estonia in the early 1990s, etc.).
The focus and volume of this chapter does not allow for a more detailed analysis of value changes separately by Estonians and non-Estonians, but earlier research has found considerable differences in their value preferences (see, for instance, Magun & Rudnev 2010; Tart 2011). Data from the last wave of the World Values Survey (2011) shows that the values of the Esto-nian- and Russian-speaking populations differ signifi-cantly only in regard to one dimension – that of survival versus self-expression. Compared to the Estonians, the values related to survival predominate slightly more among Russian-speaking people, which, as a whole, may tilt Estonia slightly to the left on the cultural map of the world5. However, the difference in value preferences between the two language groups is not excessively large, and becomes even smaller when the Estonian and non-Estonian cohorts born in the 1980s and 1990s are compared. Therefore, the World Values Survey results confirm that the values of Estonians and non-Estonians are becoming more similar through generational turn-over (Sõmer 2011).
1.5.8 ConclusionsIn conclusion, it should be emphasised that Inglehart and his colleagues’ approach to values and the cultural map of the world (Inglehart & Welzel 2005, 2010) do not lay claim to the absolute truth, and it is only one of many theories of cultural values and cultural dimensions that have been suggested by various researchers through the years. On the one hand, the basis for the popularity of Inglehart and his colleagues’ approach is its simplicity and, at the same time, its great capacity for generalisation – only two clear and easily interpreted value dimensions make it possible to explain over two-thirds of the total crossnational variance. The second advantage of the study is that the surveys have been carried out over a period of 30 years, which makes it possible to speak about value trends and their changes over time. In addition, as men-tioned above, the reliability of the World Values Survey research is increased further by the fact that at least the survival versus self-expression value dimension has been shown to be strongly related to other well-known cultural dimensions such as individualism–collectivism (Hofstede 1980) and autonomy-conservation(Schwartz 1994), which all express people’s wishes and aspirations for greater autonomy and self-determination. Therefore, regardless
5 In the case of the five qualities that form the basis for the survival vs. self-expression value dimension, the greatest difference between the two language groups appears in their attitude toward homosexuality. If 42% of the Estonian-speaking respondents think that homosexuality is never justified, among the Russian-speaking respondents the corresponding indicator is 59%. The differences between the two language groups also continue to exist in the younger cohorts: for example, of the young people born between 1980 and 1989, 24% of the Estonian-speaking respondents think that homosexuality is never justified, while 41% of the Russian-speaking respondents take this position.

58 Estonian Human Development Report 2012/2013
References1. ABRAmSon, P. R. (2011). Critiques and Counter-critiques of the
Postmaterialism Thesis: Thirty-four years of Debate. CSD Work-ing Papers, Center for the Study of Democracy, UC Irvine. http://escholarship.org/uc/item/3f72v9q4
2. AlliK, J. & ReAlo, A. (2004). “Individualism-collectivism and Social Capital,” Journal of Cross-Cultural Psychology, 35(1), 29 –49. doi: 10.1177/0022022103260381
3. eiSenStAdt, S. n. (2000). “Multiple Modernities,” Dædalus, 129, 1–29.
4. HoFStede, g. (1980). Culture’s Consequences: International Differences in Work-related Values. Beverly Hills, CA: Sage.
5. HoFStede, g. (2001). Culture’s Consequences: Comparing Values, Behaviors, Institutions and Organizations across Nations (2 ed.). Beverly Hills, CA: Sage.
6. ingleHARt, R. (1990). Culture Shift in Advanced Industrial Societies. Princeton: Princeton University Press.
7. ingleHARt, R. (1997). Modernization and Postmodernization: Cultural, Economic and Political Change in 43 Societies. Prince-ton: Princeton University Press.
8. ingleHARt, R. (2006). “Mapping Global Values,” Comparative Sociology, 5, 115–136.
9. ingleHARt, R. & BAKeR, w. e. (2000). “Modernization, Cultural Change, and the Persistence of Traditional Values,” American Sociological Review, 65, 19–51.
10. ingleHARt, R., BASAnez, m., diez-medRAno, J., HAlmAn, l. & luiJKx, R. (2004). Human Beliefs and Values: A Cross-cultural Sourcebook Based on the 1999–2002 Values Surveys. Mexico: Siglo XXI Editores.
11. ingleHARt, R. & oySeRmAn, d. (2004). “Individualism, Autonomy, and Self-expression,” Vinken, H., Soeters, J. & Ester, P. (Eds.), Comparing Cultures: Dimensions of Culture in a Comparative Perspective. Leiden, NL: Brill, 74–96.
12. ingleHARt, R. & welzel, C. (2005). Modernization, Cultural Change, and Democracy: The Human Development Sequence. New York, NY: Cambridge University Press.
13. ingleHARt, R. & welzel, C. (2010). “Changing Mass Priorities: The Link between Modernization and Democracy,” Perspectives on Politics, 8(2), 551–567. doi: 10.1017/s1537592710001258
14. KAlmuS, v. & viHAlemm, t. (2004). “Eesti siirdekultuuri väär-
tused,” Kalmus, V., Lauristin, M. & Pruulmann-Vengerfeldt, P. (Eds.), Eesti elavik 21. sajandi algul: Ülevaade uurimuse Mina. Maailm. Meedia tulemustest . Tartu: Tartu University Press, 31–43.
15. KAlmuS, v. & viHAlemm, t. (2008). “Patterns of Continuity and Disruption: The Specificity of Young People’s Mental Structures in Three Transitional Societies,” East European Politics and Societies, 16, 251–278.
16. lAuRiStin, m., viHAlemm, P., RoSengRen, K. e. & weiBull, l. . (1997). Return to the Western world: Cultural and Political Perspectives on the Estonian Post-communist Transition. Tartu: Tartu University Press.
17. mAgun, v. & Rudnev, m. (2010). “The Life Values of the Russian Population: Similarities and Differences in Comparison with Other European Countries,” Sociological Research, 49(4), 3–57.
18. ReAlo, A. (2009). “Happiness and Satisfaction with Life,” M. Lauristin (Ed.), Estonian Human Development Report 2008. Tallinn: Estonian Cooperation Assembly, 63–67.
19. ReAlo, A. & AlliK, J. (2009). “On the Relationship between Social Capital and Individualism-Collectivism,” Social and Personality Psychology Compass, 3, 1–16.
20. SCHwARtz, S. H. (1994). “Beyond Individualism/Collectivism: New Cultural Dimensions of Values,” Kim, U., Triandis, H. C., Kagitçibasi, Ç. Choi, S. C. & Yoon, G. (Eds.), Individualism and Collectivism: Theory, Method, and Applications. Thousand Oaks, CA: Sage, 85–119.
21. SCHwARtz, S. H. (2004). “Mapping and Interpreting Cultural Differences around the World,” H. Vinken, J. Soeters & P. Ester (Eds.), Comparing Cultures: Dimensions of Culture in a Com-parative Perspective. Leiden, Boston: Brill, 43–73.
22. SõmeR, m. (2011). “Heterogeneity of the Estonian Value Space,” Tart, I. (Ed.), Basic and Human Values in Estonia and the Baltic Sea Countries. Tartu: Tartu University Press, 63–87.
23. tARt, i. (2011). Basic Human Values in Estonia and the Baltic Sea Countries Tartu: Tartu University Press.
24. tARt, i., SõmeR, m. & lilleoJA, l. (2012). “Alusväärtused Eestis teise laine perioodil,” Aarelaid, A., Tart, I (Eds.), Nullindate kultuur I: Teine tulemine. Tartu: Tartu University Press, 44–70.
25. viHAlemm, t. & KAlmuS, v. (2009). “Cultural Differentiation of the Russian Minority,” Journal of Baltic Studies, 40, 95–119.
of possible problems with the methodology of the World Values Survey, and the fact that the survey includes far from all of the values that people may consider to be important in their lives, this is probably the best attempt so far for comparing the value preferences of various peo-ples over time. Estonia’s position on the cultural map of the world – with a strong focus on secular-rational values,
but also on values related to survival – reflects, to a great extent, our position on the geopolitical map, on the cross-roads between Northern and Eastern Europe. Thus, we cannot help that Estonia’s actual position on both maps diverges somewhat from the position in which we would wish, or imagine, ourselves to be, which is closer to the Nordic ideal.

59Estonian Human Development Report 2012/2013
The global view of human development alludes to the fact that the size of the differences between countries and peoples are sometimes almost impossible to comprehend. The wealth per person, in the most advanced countries, is more than 50 times greater than in the least developed countries. In the computations of the years devoted to schooling,, the differences have stretched to being five-fold. Life expectancy in Europe is pushing forward into the eighties, while in many African countries it has yet to reach the fifties. The world continues to be split, and we are used to this. We are used to all kinds of rankings that start with Europe and North America, and end with Central Africa.
Against the background of a split world, Estonia looks good. According to the 2013 UN Human Devel-opment Report, we continue to be a country with “very high human development.” On the global scale, Estonia is far from being a poor peripheral country, which how we sometimes see ourselves – actually we are signifi-cantly smarter, wealthier and more developed than the average, and a society that has coped well in the global marketplace. A position among the “highly developed” also presumes a corresponding mentality, including the understanding that helping those who lag behind is our duty and in our interests. Slowly, alongside the mentality of being a dependant and an aid recipient, a new, more self-confident and empathetic approach to the world is actually developing in this country, which is actually a truer reflection of our position in the global cauldron.
Our rapidly changing position from being depen-dent, to being accountable, also means that a different attitude toward global matters is required. The concern about a deeply divided world is also Estonia’s concern. It is in our interest to work to mitigate these differences, be it through developmental aid; by spreading knowl-edge; or by distributing fishing hooks. Although not widely publicised in Estonia, one of the major large-scale undertakings for smoothing over these gaps was initiated in September 2000, when the UN General Assembly approved the United Nations Millennium Declaration. The nations of the world accepted the task of working to resolve the most significant development concerns. Among other things, it was agreed to reduce, by 2015, the number of people suffering from hunger twofold, compared to the beginning of the century; and to halve the proportion of the world’s people whose income is less than one dollar a day. A very important goal is to ensure that all children complete a full course of primary education. At first glance, it would seem that
these topics do not affect Estonia. Actually they do, very much so. Efforts to create a balanced and sustainable world are directly related to the efforts being made on behalf of Estonia’s future.
A global, and therefore well synthesised, view of Estonia does not always coincide with how we see and assess our life and development internally. The closer the scrutiny, the more causes for concern there are – even in those fields of activity in which the rest of the world views us as being very successful. Let’s take education, our perennial trump card in various rankings. Estonia is characterised by both very well-acquired knowledge as well as by poor personal capabilities. Estonian people have sufficient knowledge, but lack self-sufficiency and self-confidence; there is little creativity or willingness to assert our erudition. The same thing is indicated by our continued Eastern European position on the map of the World Values Survey. Many fundamental values of Western life (tolerance, readiness to participate in the affairs of the society) are becoming rooted with great difficulty. Estonians have gained individual freedom, but filling this with positive and constructive content will take more time.
Often enough, Estonia’s good average indicators hide unreasonably excessive differences within the society. A discernible split continues to exist between Estonians and the representatives of other nationalities. It seems that many non-Estonians have yet to become fully acclimated to the situation in re-independent Estonia, and continue to suffer from a kind of transition stress. This is indicated by a low natural population increase, which is signifi-cantly lower than among Estonians; by more dynamic emigration from the country; and by a lower degree of trust in the Estonian country. And the gender gap has become a dismal trademark of sorts for Estonia. We are the European Union champions not only in the sphere of sex-based salary differences, but also in the educational inequality between men and women – in Estonia, more than twice as many women as men acquire higher edu-cation. Maybe this odd distinction is the reason why so many young and educated women leave Estonia.
In twenty years, Estonia has built a well-function-ing country and energetic society. In global comparisons, we are praised for this. At the same time, it seems that a considerable segment of Estonians have not yet settled into their new environments, due to their resources, lifestyles or mentalities. Bringing a successful Estonia into the homes and souls of all those living in Estonia could be an important challenge for the next period of development.
SummaryMati Heidmets

60 Estonian Human Development Report 2012/2013

61Estonian Human Development Report 2012/2013
In this chapter, we deal with the institutional environ-ment of human development, which is related to politics, governance and media, and on which people’s freedom of choice, sense of security, knowledge and opportunities to participate as members of society directly depend.
The year 2012, in the development of Estonia’s domestic politics, was characterised by heightened civil activism, increased demands related to the honesty and trustworthiness of the politicians, increased dissatis-faction with the functioning of democratic institutions and the performance of the government. In other post- Communist states, an increasingly critical attitude has also developed regarding political developments. Looking back on the two decades of democratic development in Eastern and Central Europe, Western social scientists are asking whether we are seeing democracy fatigue, or even a reversal in the development of democracy (Rupnik and Zielonka 2013: 5). The increase in critical activism can partially be attributed to the impact of the economic crisis, but those who see the economic crisis as a cata-lyst and amplifier of public criticism, rather than as its cause, are probably right. In Estonia as well, the criti-cism is directed less at the problems of coping with the economic crisis (here our public opinion is considerably more positive than in many of the other countries gripped by the crisis), but rather, fundamental issues related to democracy and governance have been raised.
As the international indicators described below show, after the restoration of its independence, the state of Estonia has fulfilled the rules established by the interna-tional environment (European Union, NATO, IMF) in an exemplary manner, and has achieved a leading position, among the other transition countries, in moving from an authoritarian planned economy to a democratic state with a market economy. Based on these achievements, in 2010, Estonia was accepted as a member of the OECD, an asso-ciation of the world’s most developed and wealthy states. This event alludes to a significant change in the reference
IntroductionMarju Lauristin
system for assessing Estonia’s developments. Looking back on the path that has been travelled, Estonia can be proud of its leading position among post-transition coun-tries, based on several development dimensions. However, at the new stage of development, no longer as a transition country, but as a full-fledged member of the OECD, it is more accurate to assess our development based on a comparison with the social order of the highly developed wealthy states. Based on this yardstick, the heightened expectations of the public become understandable, in regard to both Estonia’s democracy, and the opportunities for self-realisation that are provided by Estonian society.
Below, the quality of the functioning of the Esto-nian state along with an objective assessment of Estonia’s institutional development level will be examined, which includes the following: the effectiveness of the democratic institutions, protection of rights and freedoms, the level of corruption, domestic and foreign security, and the avail-ability of information. The indicators that characterise the relationship between people and the institutional environ-ment, such as the trust and sense of security related to the future of one’s country, are also included. The analysis in the chapter focuses on the composite indices (Bertels-mann Transformation Index and Global Peace Index) that reflect the institutional development level of states. In addition, several more specific indices that assess the social order and quality of the state’s effectiveness will be examined, such as democracy indices, media freedom indices, a corruption index, rule of law index, etc. The individual indicators that comprise the comparisons of the institutional development levels of the world’s states as well as the relationships between people and the social environment will also be examined. In order to compare Estonia’s developments with other countries in Europe and the world, we use data from internationally rec-ognised expert organisations like Eurostat, Bertelsmann Stiftung, Freedom Forum, Transparency International, Global Economic and Peace Institute, OECD, etc.
2 PEoPLE AND SoCIETYESToNIAN HUMAN DEVELoPMENT REPoRT 2012/2013

62 Estonian Human Development Report 2012/2013
In May of 2004, the Bertelsmann Foundation in Ger-many first published the results of a project that was started in 1996, which tried, with the help of compar-ative composite indices, to measure the development of 116 transition countries/economic areas on their path to democracies based upon market economies, during the years 1998 to 2003. In autumn 2005, the second Bertelsmann Transition Index was published, which analysed development between 2001 and 2005; in Feb-ruary 2008, the third index, which included develop-ment from 2005 to 2007; in November 2009, the fourth index, which summarises development from 2007 to 2009. The fifth index (BTI 2012), published in March 2012, included developments from 2009 to 2011, and the number of states/territories that were under obser-vation had increased to 128.
The surveys do not include the states that were OECD members in 1989 – democratic states with highly developed economies that has been consolidated for a long time (Western European states, USA, Canada, Japan, Australia, New Zealand), as well as states with populations under 2 million. However, an exception was made in the case of several smaller states, which are interesting from a transformational point of view, and also includes Estonia.
The cognitive value of the Bertelsmann Transition Index is based on the multidimensional institutional model of the transformational process that forms the basis of this index, and which can be successfully employed to compare the economic and political devel-opments occurring in various parts of the world. Based on this model, transformation is defined as “a politically managed broad-based process of change, in the course of which an authoritarian system develops in the direc-tion of democracy and a market economy” (Bertelsmann 2012: 131).
With the help of a special codebook, a network of international experts, assembled by the Bertelsmann Foundation, evaluates and analyses the political and economic development of each country, by using the international statistical data available for each country. Nineteen criteria were used to compute the com posite index for comparing the states in 2004, of which, many were comprised of several indicators, for a total of 58. In both 2008 and 2012, 17 criteria and 52 indi-cators were used to compute the index (Bertelsmann 2008: 73–85; Bertelsmann 2009: 16–22; Bertelsmann 2012: 129–132). The scores based thereon comprised expert opinions on a scale of one to ten, which were often based on quantitative (statistical) indicators. Based thereon, two composite indices were compiled
– the Status Index and the Management Index – see Table 2.1.1. The Status Index assesses the political and economic development (transformation) of the coun-tries with the help of two analytical dimensions. These are, on the one hand, the movement toward democ-racy under the rule of law and, on the other hand, the movement toward a market economy anchored in prin-ciples of social justice. The Management Index assesses the quality of governance, as well as effectiveness in establishing and fulfilling goals.
Transformation – the integral reorganisation and formation of society – does not mean straight-forward or irreversible development without setbacks or missteps (Bertelsmann 2012: 131), which is clearly indicated, for instance, by Hungary’s political retrogres-sion, as well as by the great fluctuations in the success of Slovenia’s and Slovakia’s process management, etc. (see Tables 2.1.2 and 2.1.3).
Comparing the various aspects of Estonia’s develop-ment between 2009 and 2011, based on the assessments of the aforementioned criteria (Table 2.1.1), we see that the stability of the democratic institutions, organisation of the market and competition, as well as the extent of private ownership get high marks. In Estonia’s case, rela-tively low marks are given to the level of socio- economic development, as well as the growth potential and sus-tainability of the economy in the years impacted by the economic crisis.
Based on the Status Index, Estonia’s transition path has been successful – placing second, after Slovenia, in the summary for 2006; in third position, after the Czech Republic and Slovenia, in 2008; in fourth place, after the Czech Republic, Slovenia and Taiwan in 2010; and in 2012, after the Czech Republic, Taiwan, Slovenia, and Uruguay, in fifth p position. In all cases, the results were uniformly high in both political and economic develop-ment (Table 2.1.2).
In Table 2.1.2, we see that the composition of the group of highly advanced countries with market economies has been very stable. All the countries were already included in this group in the 2003 index, and the composition has remained the same, although some states, within the group, have experienced rises and falls – Uruguay underwent a strong rise from 13th position to fourth (the determining factor was a very successful political democratisation process, which put Uruguay in first place, among the transition countries, while remaining in tenth place based on the success of its economic reforms; see Table 2.1.3). Slovakia and Hungary have also undergone sudden increases and decreases: Hungary has declined from first rank, which
2.1General success of the development: Bertelsmann Transition IndexPeeter Vihalemm

63Estonian Human Development Report 2012/2013
it achieved in 2008, to 12th; and Slovakia, from second to eighth. Based on the sub-index of economic transfor-mation, Latvia fell out of the group of countries with highly advanced market economies, while a relatively high score for political transformation helped to keep it in the this group of states. Estonia stands out for its stability, although it has slipped from its initial second position to fifth; while Slovenia has demonstrated the most stability, by remaining at the top of the transition countries until 2011. The dramatic decline suffered by Slovenia, in 2012 and 2013, is not yet reflected in the Bertelsmann indices.
Based on the Political Transformation Index (2012), the transition countries were divided into five groups: democracies in consolidation (23 states), defec-tive democracies (39 states), highly defective democracies (13 states), moderate autocracies (20 states) and hard-line autocracies (33 states).
Status Index (9.28) Management Index (7.41)
Political transformation criteria Economic transformation criteria Process management criteria
Stability of democratic institutions (10.0)Political participation (9.8)Rule of law (9.8)Stateness (9.5)Political and social integration (8.8)
organisation of the market and competition (10.0)Private Property (10.0)Currency and price stability (9.5)Welfare regime (9.0)Sustainability (8.5)Level of socioeconomic development (8.0)Economic performance (8.0)
International cooperation (9.7)Steering capability (9.0)Consensus building (8.8)Resource efficiency (8.7)
Level of difficulty (1.9)
Table 2.1.1Structure of the Bertelsmann Transformation Index (criteria that are utilised). Assessments of Estonia’s development, on a scale of one to ten, in parentheses.
Source: Bertelsmann 2012
2003 2006 2008 2010 2012
Rank Score Rank Score Rank Score Rank Score Rank Score
Slovenia 1. 9.45 2. 9.49 2. 9.6 2. 9.52 3. 9.45
Estonia 2. 9.29 3. 9.42 6. 9.5 4. 9.34 5. 9.28
Czech Republic 3. 9.23 1. 9.56 2. 9.6 1. 9.65 1. 9.61
Taiwan 4. 9.18 4. 9.33 8. 9.2 3. 9.39 2. 9.54
Hungary 5. 9.16 5. 9.18 1. 9.7 8. 9.00 12. 8.48
Slovakia 6. 9.06 7. 9.14 2. 9.6 6. 9.14 8. 8.88
Lithuania 7. 9.02 6. 9.16 2. 9.6 7. 9.04 7. 9.03
South Korea 8. 8.99 10. 8.89 8. 9.2 12. 8.72 11. 8.73
Poland 9. 8.90 11. 8.76 7. 9.4 10. 8.86 6. 9.05
Chile 10. 8.85 8. 8.89 8. 9.2 9. 8.99 9. 8.87
Costa Rica 12. 8.70 12. 8.73 11. 8.9 10. 8.86 10. 8.84
Uruguay 13. 8.67 9. 8.90 13. 8.6 5. 9.25 4. 9.30
Latvia 14. 8.20 13. 8.60 12. 8.7 13. 8.51 13. 8.29
Table 2.1.2The development dynamics of the highly advanced transition countries, based on the Bertelsmann Status Index from 2003 to 2012
Source: Bertelsmann 2004, 2005, 2008, 2009, 2012
As noted above, the political transformation in Uru-guay was assessed as most effective, followed by the Czech Republic, Taiwan, Slovenia and Estonia. All the remaining new EU Member States, including Bulgaria and Romania, are included among the democracies in consolidation. Russia is classified as a highly defective democracy. Four of the CIS states are assessed as being more democratic than Russia – Moldova, Georgia, and Ukraine are classified as defective democracies, and Kyrgyzstan, together with Russia, is among the highly defective democracies. Of the states that are less demo-cratic than Russia, Armenia, Azerbaijan and Kazakhstan are rated as moderate autocracies, and Belarus, Tajiki-stan, Uzbekistan and Turkmenistan are rated as hard-line autocracies (Bertelsmann 2012: 29).
Based on the Economic Transformation Index (2012), the transition countries were divided into five groups: developed market economies (15 states), func-

64 Estonian Human Development Report 2012/2013
2012 2010 2008 2006 2004
Rank Score Rank Score Rank Score Rank Score Rank Score
Very good management (8 countries, ranks 1 to 8)
Taiwan 1. 7.72 6. 7.12 7. 7.04 5. 7.37 11. 6.9
Uruguay 2. 7.66 1. 7.52 8. 6.93 14. 6.85 6. 7.4
Estonia 3. 7.41 3. 7.33 2. 7.43 7. 7.29 1. 7.9
Brazil 4. 7.29 5. 7.18 15. 6.70 13. 6.86 14. 6.6
Chile 5. 7.15 2. 7.35 1. 7.52 2. 7.51 3. 7.6
Lithuania 5. 7.15 10. 6.91 15. 6.70 9. 7.00 2. 7.7
South Korea 7. 7.05 4. 7.24 6. 7.09 8. 7.25 8. 7.1
Botswana 8. 7.02 7. 7.11 3. 7.33 3. 7.44 4. 7.5
Good management, ranks 9 to 44, 36 countries, incl.
Costa Rica 9. 6.95 15. 6.63 15. 6.70 19. 6.63 8. 7.1
Latvia 11. 6.81 13. 6.68 10. 6.86 16. 6.78 21. 6.3
Slovakia 12. 6.80 8. 7.03 5. 7.20 6. 7.32 6. 7.4
Poland 13. 6.79 19. 6.52 53. 5.27 23. 6.36 14. 6.6
Czech Republic 18. 6.57 9. 6.95 20. 6.62 10. 6.95 12. 6.7
Slovenia 18. 6.57 18. 6.55 12. 6.83 4. 7.41 10. 7.0
Singapore 32. 5.99 32. 6.03 32. 6.03 36. 5.78 37. 5.2
Moderately successful management. Total of 43 countries, incl.
Hungary 48 5.47 20 6.51 18. 6.67 15. 6.81 12. 6.7
Table 2.1.3Development of the transition countries based on the scores in the Management Index 2003–2012 (maximum 10 points)
Source: Bertelsmann 2004, 2006, 2008, 2010, 2012
Table 2.1.4The components of the most successful transition countries in the Transformation Index in 2012.
Index of the general success of the transi-
tion (status) 2012Political transformation
result 2012Economic transforma-
tion result 2012Process management
success 2012
Rank Score Rank Score Rank Score Rank Score
Czech Republic 1. 9.61 2. 9.65 1. 9.57 18. 6.57
Taiwan 2. 9.54 2. 9.65 2. 9.43 1. 7.72
Slovenia 3. 9.45 2. 9.65 3. 9.25 18. 6.57
Uruguay 4. 9.30 1. 9.95 10. 8.64 2. 7.66
Estonia 5. 9.28 5. 9.55 5. 9.00 3. 7.41
Poland 6. 9.05 8. 9.20 6. 8.89 13. 6.79
Lithuania 7. 9.03 7. 9.35 9. 8.71 5. 7.15
Slovakia 8. 8.88 10. 9.00 7. 8.75 12. 6.80
Chile 9. 8.87 8. 9.20 12. 8.54 5. 7.15
Costa Rica 10. 8.84 6. 9.40 13. 8.29 9. 6.95
South Korea 11. 8.73 12. 8.70 7. 8.75 7. 7.05
Hungary 12. 8.48 17. 8.35 11. 8.61 48. 5.47
Latvia 13. 8.29 11. 8.80 18.* 7.82 11. 6.81
*Based on the 2012 economic transformation sub-index, Latvia dropped out of the group of highly advanced market economies.

65Estonian Human Development Report 2012/2013
tioning market economies (15 states), market economies with functional flaws (51 states), poorly functioning market economies (40 states) and rudimentary market economies (7 states). The economic transformation of the Czech Republic, Taiwan, Singapore, and Estonia were rated most highly. The majority of the new EU Mem-ber States are also in the group with developed market economies, except for Bulgaria, Latvia and Romania. Russia is classified among the states that have market economies with functional flaws, as are the majority of the other CIS states (Bertelsmann 2012: 41).
The uniform strength of the political and economic dimensions have secured top positions for the new Euro-pean Union Member States, which, by having fulfilled the requirements for membership, have already demon-strated progress in both democratisation and the tran-sition to market economies. In 2003, 2006, 2008, 2010 and 2012, there were five new EU Member States among the top ten: the Czech Republic, Slovenia, Estonia, Lith-uania and Slovakia. Based on the 2008 index, Poland had dropped out of the top ten; and based on the 2012 index, Hungary dropped out. The only one that was not among in the top ten at any time was Latvia, which is still in the group of democracies with highly advanced market economies. Of the non-European states/areas, the development that occurred in Taiwan from 2009 to 2011 has been given the highest composite score. In democratisation, Uruguay has also gotten an almost maximum score, but its economic development has been more modest. Among the highly advanced states, we also find some of the other reference state in this report – Uruguay, Chile, Costa Rica and the South Korea. All of them can be viewed as developmental leaders in their region. In regard to economic development, Singapore has also been assessed quite highly (9.57 points in 2008, 9.14 in 2010 and 9.18 in 2012), along with the Czech Republic, Taiwan and Slovenia.
Based on the Management Index (2012), the tran-sition countries were divided into five groups: with very good management (8 states); good management, but with shortcomings (36 states); moderately successful manage-ment (43 states); weak management (27 states); and failed management (14 states) – see Table 2.1.3.
According to the Management Index in 2003, 2008, as well as 2010 and 2012, Estonia was one of the most successful transition countries, placing first, second and third position, respectively, and slightly behind, in sev-enth rank, in 2006. Of the other new EU Member States, only Lithuania and Slovakia are assessed as states with very good management, but not in all the years – Slovakia only four times, and Lithuania twice. Latvia is among the states with good management, but with shortcomings, but has improved its position somewhat in recent years. Based on the 2012 index, Taiwan and Brazil have received significantly better assessments than in previous years. Of the new EU Member States, the assessment of manage-ment in Slovakia and Slovenia have decreased somewhat in recent years, and it has fluctuated quite a bit in Lithu-ania, the Czech Republic and Poland.
In the assessment of the management of gover-nance processes, Hungary and Russia have suffered the greatest decrease. In the indices for 2003 to 2010, Hun-
gary was among the countries with good management, but based on the 2012 index, they dropped out of this group, being the only new EU Member State among the moderately successful countries (declined from 12th position, in 2003, to 48th, in 2012). Russia has even declined by two country groups – from 31st, based on the 2003 index (good management, but with shortcom-ings), to 87th position in 2006 (moderately successful management), and finally, into the group of countries with weak management (98th in 2008, 107th in 2010 and 99th in 2012). According to the Status Index, in all the years between 1998 and 2011, the political and economic transformation in the Czech Republic, Slove-nia and Taiwan was consistently more successful than in Estonia. Process management has been, consistently, very successful in Chile, and during the last few years, in Taiwan and Uruguay. However, when combining both indices through the years, Estonia’s transforma-tion result has been better, and its positions in the ranking higher.
Great attention was paid to the relative level of dif-ficulty related to the specifics of each country’s develop-ment, which was calibrated by using an additional coeffi-cient to make the final determination of the Management Index score.
The calibration of the composite Management Index utilised a coefficient that can reduce the score in the final index up to 25% – if the value in the quality of manage-ment sub-index is 1.0, it was divided by a coefficient of 1.250; if the value is 1.1, the coefficient is 1.246; if the value is 1.2, the coefficient is 1.242, etc, until a coefficient of 1.0, when the level of difficulty is 10.0. Between 2009 and 2011, the highest level of management difficulty was assigned to Somalia (9.8) and Haiti (9.5). Of the states with moderately successful management, the level of difficulty was highest for the Central African Republic (8.5), Burundi (8.2), Rwanda (7.8) and Mauritania (7.8). Estonia is among the group of countries with relatively good management, with a level of difficulty, in 2012, of 1.9. The lowest level of difficulty is assigned to Slovenia (1.1) and the Czech Republic (1.2).
Based on a summary of the Status and Management Indices, based on the analysis of the transformation processes between 1998 and 2011, by the Bertelsmann Foundation, Estonia has been very successful. This is, primarily, thanks to the uniform scores and ranks of both the Status and the Management Index (see Table 2.1.4 and Figure 2.1.1).
It is important to note that the values of the process management index can also be comparatively low for successful transition countries (18th rank for the Czech Republic and Slovenia; even 48th rank for Hungary), which alludes to a poor capability to cope with crises.
In the analytical summaries made on the basis of the Bertelsmann Transformation Index (BTI) 2012, it is recognised that it no longer makes sense to view the given lead group of countries – eight EU Member States in Eastern and Central Europe, three Latin American and two Asian states (see Table 2.1.3 and Figure 2.1.1) – as transition countries in the context of a transition to democracy and market economies, since this has already occurred. Underway is the consolidation of the

66 Estonian Human Development Report 2012/2013
References1. Bertelsmann 2004 – Bertelsmann Transformation Index 2003:
Auf dem Weg zur marktwirschaftlichen Demokratie. Gütersloh: Bertelsmann Stiftung. A large part available electronically – www.bertelsmann-stiftung.de
2. Bertelsmann 2005 – Bertelsmann Transformation Index 2006: Auf dem Weg zur marktwirschaftlichen Demokratie. Gütersloh: Bertelsmann Stiftung. A large part available electronically – www.bertelsmann-stiftung.de
3. Bertelsmann 2008 – Bertelsmann Transformation Index 2008: Political Management in International Comparison. Gütersloh:
Bertelsmann Stiftung. A large part available electronically – www.bertelsmann-stiftung.de
4. Bertelsmann 2009 – Bertelsmann Transformation Index 2010: Political Management in International Comparison. Gütersloh: Bertelsmann Stiftung. S A large part available electronically – www.bertelsmann-stiftung.de
5. Bertelsmann 2012 – Transformation Index BTI 2012: Political Management in International Comparison. Gütersloh: Bertels-mann Stiftung. A large part available electronically – www.bti-project.de
0
5
10
15
20
25
30
35
40
45
0
5
10
15
20
25
30
35
40
45
LatviaHungarySouth-KoreaCosta RicaChileSlovakiaLithuaniaPolandEstoniaUruguaySloveniaTaiwanCzech Republic
Bert
elsm
ann
Tran
sfor
mat
ion
Inde
x
Status Index Political transformation result Economic transformation result Process management index
Figure 2.1.1The world’s most successful transition countries 2012 (based on the positions in the Bertelsmann Transformation Index)
political and economies systems, in order to ensure the sustainability of the achieved levels of development (Ber-telsmann 2012: 19).
Based on the Status Index, the remaining 115 states under observation are divided into four groups: devel-oped states; states with limited development: and states with severely limited development; as well as states with blocked, or failed, development. Bulgaria and Romania, the newest EU Member States, have been classified among the developed states. Based on the 2012 Status Index, Russia is a state with limited development and ranked 65th. Two years earlier, it was also in 65th position; earlier, it was in 59th and 47th. The research results have been thoroughly analysed by region, by comparing the devel-opment trends to date, and by highlighting the future risks and opportunities.
In the case of Eastern, Central and South-Eastern Europe (17 states), the greatest risk factors for future development are the narrowing of the opportunities for politicians to act, and increased restrictions placed on the freedom of choice of the member states by the EU and other international economic organisations, on the one hand; and the disenchantment and disappoint-ment of the public, related to political development, on
the other hand. In the Central and Eastern European states, innovative development may also be slowed down by an excessive dependence on foreign capital. The sustainability of democratic development may be negatively affected by the immaturity of civil society, a low level of trust in the political institutions, and large generational differences, as well as a high emi-gration rate. Along with the continued narrowing of opportunities, many of the politicians in this region waver between populist promises and the cultivation of technocratic policies.
Under these conditions, the development of educa-tion and research activities are strategically important. This field of activity provides the smallest states in the region with the best opportunities for influencing their future outlooks in the global division of labour and competition.
At the same time, the analysis related to the Bertels-mann Transformation Index shows that the majority of the states in the region are not sufficiently dedicated to developing strategic plans for the future that could ensure sustainable development (Bertelsmann 2012: 111).
Unfortunately, this conclusion totally applies to Estonia also.

67Estonian Human Development Report 2012/2013
2.2Freedom and democracyMartin Mölder and Vello Pettai
2.2.1 Measuring democracy and freedomMore indices have been compiled for the assessment of the democracy, freedom and other general social parameters than can be examined in a brief survey. The following describes and evaluates the Estonian posi-tion in four of the most popular indices, which all, in somewhat different ways, map political systems, as well as their perspectives of democracy and freedom in the broader context. These include the two indices com-piled by Freedom House – Freedom in the World and Nations in Transit. The first is one of the best known indices used to measure democracy and freedom, and is noteworthy for the number of states and the scope of the parameters it utilises for its assessments. Nations in Transit is somewhat more focused, and somewhat more important for the evaluation of Estonia’s posi-tion, since it focuses on determining the situation and development level of democracy in the states that were once behind the Iron Curtain. Another index that is monitored is the Democracy Index, which appears in The Economist, the scope of which is comparable to the first index, and which is compiled for only four peri-ods during the last six years. Also Estonia’s position in the Polity IV data series has been tracked, which is included as an index with a relatively specific focus on the democratic and autocratic traits of political sys-tems, and which includes a wide spectrum of states, and is perhaps the most reliable and authoritative index from a social sciences point of view.
The Freedom in the World1 index has been com-piled almost every year since 1973, and it currently includes 195 states and 14 disputed territories. The index reflects the political systems of the states and their broader functioning in society from the perspec-tive of liberal democracy through two dimensions – political rights and civil liberties – which are divided into seven sub-dimensions (the electoral process, political pluralism and participation, functioning of government, freedom of expression and belief, rights of assembly and association, rule of law, personal auton-omy and individual rights). These two dimensions, along with the seven sub-dimensions, are divided into ten and fifteen sub-questions, respectively, which are used to rate the states based on a five-point scale (0-4). The corresponding assessments are first compiled
based on the seven sub-dimensions and the two main dimensions, and thereafter, aggregated into uniform numerical indicators, on a scale of 1 to 7. Based on this scale, the states are, in turn, divided into the fol-lowing categories: “free” (1 – 2.5), “partially free” (3–5) and “not free” (5.5–7). Although, as the name says, the index measures freedom, it is essentially an index defining liberal democracy.
Nations in Transit2 is also an index for the assess-ment of democracy compiled by Freedom House, although its focus is somewhat narrower. The index has been compiled since the middle of the 1990s, and it concentrates on the assessment of the post-Com-munist states that developed after the end of the Cold War as a result of the collapse of the Soviet Union. The index covers 29 states and territories, starting in 1995, and focuses on the assessment of the elections, the media, civil societies, as well as local and national gov-ernments, court systems and levels of corruption, from the viewpoint of the development and consolidation of democracy. The states are rated according to the given dimensions on a scale of 1 to 7, and the corresponding assessments are aggregated into a uniform measure of democracy. Based thereon, the states are, in turn, divided into consolidated democracies (1.00–2.99), semi-consolidated democracies (3.00–3.99), hybrid regimes (4.00–4.99), semi-consolidated authoritarian regimes (5.00–5.99) and consolidated authoritarian regimes (6.00–7.00).
The Democracy Index published by The Economist3 has been compiled four times, to date – for 2006, 2008, 2010 and 2011. The index covers 167 states, and assesses the status of democracy by determining the condition of their electoral process and pluralism, the functioning of government, political participation, political culture and civil liberties. The Index relies on a total of twenty questions, and based on the answers, the states are assessed according to each dimension separately, and an average of all the dimensions is computed on a 10-point scale. Based on the results, the states are divided into full democracies (8.00–10.00), f lawed democracies (6.00–7.99), hybrid regimes (4.00–5.99) and authoritar-ian regimes (1.00–3.99).
Polity IV4 currently covers 164 states, and includes the longest period of time – from 1800 to 2010. The index, simultaneously, assesses the demo-cratic and authoritarian traits of political systems on
1 Available at: Available at: http://www.freedomhouse.org/report-types/freedom-world
2 Available at: http://www.freedomhouse.org/report-types/nations-transit
3 Last version available at: http://www.eiu.com/public/thankyou_download.aspx?activity=download&campaignid=DemocracyIndex2011
4 Available at: http://www.systemicpeace.org/polity/polity4.htm

68 Estonian Human Development Report 2012/2013
65
70
75
80
85
90
95
100
Freedom in the World Polity IV Nations in Transit Economist
1992
1993
1994
1995
1996
1997
1998
1999
2000
2001
2002
2003
2004
2005
2006
2007
2008
2009
2010
2011
65
70
75
80
85
90
95
100
Figure 2.2.1Assessments of Estonia’s democracy in the temporal perspective
a composite scale of -10 (fully institutionalized autoc-racies) to +10 (fully institutionalized democracies). In addition to democracies and autocracies, “anocracies” are evaluated on a scale of -5 to +5, as an interim cate-gory between the first two. The index is comprised of six measures, which form the basis for evaluating the execution of executive authority, constraints on exec-utive authority, and political competition. Therefore, the emphasis of this index is primarily on institutional processes and the balance between them, and less on the direct measurements of freedom.
The main categories, which the given indices focus on, are shown in the following Table 2.2.1.
2.2.2 Estonia’s position in the democracy indicesIf we convert Estonia’s position, based on the assess-ments of the indices (to achieve comparability), into percentages of the maximum possible result, we get the picture shown in Figure 2.2.1. The Freedom in the World and Polity IV indices, which cover the longest periods of time, both produce a very similar trajectory in regard to the end of Estonia’s political transition, and the consolidation of the democratic political sys-tem, during the 1990s. Currently, the values of both indices have stabilised at the best possible result. The Nations in Transit and The Economist’s index, which cover a shorter period, does not indicate the same change, and based thereon, Estonia’s political system gets a relatively stable assessment, in the covered period, from all four indices.
It would be important, at this point, to mention the differences between the indices, since they cannot always be interpreted on a one-to-one basis. Freedom in the World and Polity IV give Estonia an almost maximum result, which means that, currently, Estonia has achieved the highest level of democracy that can be determined based on these indices. In the given period, Nations in Transit gives Estonia an assessment that is between 80–85% of the index’s maximum value, and this is a very good result in the given index,
since it makes Estonia the state with almost the high-est level of democracy among the (post-Communist) states under observation. The Economist’s assessment of Estonia’s democracy has remained at a somewhat lower level, placing it between 75% and 80%. In the global context, this places Estonia in the 40s, in the category of flawed democracies. At the same time, it should be mentioned that, even in this index, Estonia’s position, at least among the post-Communist states, is good – in 2011, only the Czech Republic and Slovenia achieved a better result.
Therefore, Estonia’s result in the context of all the indices under observation is very positive, and we can conclude that, in the category of states with similar short histories, Estonia is one of the most successfully democra-tized states. The comparative data (the point scores of the indices and the percentage of possible maximum values) on Estonia’s results in the context of Central and Eastern Europe, as well as the former Soviet Union, are shown in Table 2.2.2. As far as the states in the world with a higher level of democracy is concerned, it is worth remembering that in the Freedom in the World and Polity IV indices, these states are assigned practically the maximum pos-sible value, and in The Economist’s index, values higher than 8 points.
It is possible to obtain more information about Estonia’s position from these indices if we concentrate on the indices that have a greater degree of differen-tiation. Therefore, we should set aside the Freedom in the World and maybe, at first glance, the Polity IV index, since a result that is close to the maximum gen-erally means that, based on this index, the state has fulfilled all the criteria of democracy to the maximum degree, or has come very close to doing so. This, in turn, means that the two indices do not enable one to focus on the possible shortcomings of the democracy, since the index is not sensitive to these shortcomings. Among the four indices under consideration, The Econ-omist’s index and Nations in Transit have the greatest degree of differentiation, and, by examining the sub-scores, it is possible to focus on the weaknesses of Estonia’s democracy.

69Estonian Human Development Report 2012/2013
Here only the general, summarised categories have been included. The specific indicators for the indices have been formulated signi-ficantly more precisely and to learn more about them, one must examine the information available on the websites for these indices.
Polity IV
Governance Constraints on executive authority.
Executive recruitment (elections)
Competitiveness of political participation, regulation of political participation, the openness and competiveness of the execution of executive authority.
Economist
Electoral process and pluralism Free and fair elections; transfer of power; political rights and the freedom of assembly.
Functioning of governmentPower of elected authorities; balance of powers; responsibility and transparency of the government; corruption; accountability and transparency of the government; corruption; public service capability; corresponding attitudes of the general public.
Political participation Electoral and political participation; participation of minorities; promotion of participation; corresponding attitudes of the general public.
Political culture Social cohesion; corresponding attitudes of the general public; separation of church and state.
Civil liberties Free media and freedom of expression; occupational organisations; protection of rights; court system; freedom of belief; equality before the law; private property; personal liberties.
Freedom in the World
Electoral process Election of the executive authority; election of the legislative authority; electoral system.
Political pluralism and participation Freedom of assembly, existence of an opposition, freedom of political choices; rights of minorities.
Functioning of government Actual power of elected authorities; lack of corruption; accountability and transparency of government.
Freedom of expression and belief
Free media; freedom of belief; academic freedom and educational system; open and free private discussion.
Associational and organisational rights
Freedom of assembly and demonstration; freedom for nongovernmental organisations; occupational organisations.
Rule of law Independent judiciary; prevalence of the rule of law; protection against political persecution; equal treatment.
Personal autonomy and individual rights
Freedom of travel or choice of employment; rights of property and enterprise; personal social freedoms; equal opportunity and absence of economic exploitation.
Nations in Transit
National governance Democracy of the governmental system; stability of the governmental system; oversight of the military and security services.
Electoral process Free and fair elections; political pluralism and participation; freedom of political choices.
Civil society An independent and vital civil society; lack of extremism; participation of nongovernmental organisations; trade unions; educational system.
Independent media Media freedom; responsible media; diversity of the media landscape; establishment of occupational organisations; Internet.
Local democratic governance
Existence and rights of local governments; free and fair elections; citizen participation; autonomy of local governance; resources; transparency and accountability.
Judicial framework Protection of fundamental rights; equality before the law; judicial independence; compliance with judicial decisions.
CorruptionAnti-corruption initiatives; state’s intervention in the economy; efficiency and transparency of the public sector; financial disclosure; protection for those exposing corruption; attitudes of the media and the public.
Table 2.2.1Democracy indicators

70 Estonian Human Development Report 2012/2013
Table 2.2.2Assessments of Estonia’s democracy from a comparative perspective
Source: http://www.eiu.com/public/thankyou_download.aspx?activity=download&campaignid=DemocracyIndex2011
Estonia
Central and Eastern Europe1
(average)
Former Soviet Union2
(average)
Freedom in the World 1 100% 1,86 85,7% 5,21 29,8%
Nations in Transit 1,93 84,5% 3,04 49,3% 5,99 16,8%
Economist 7,61 76,1% 6,78 67,8% 3,74 37,4%
Polity IV3 9 95% 9,17 98,5% -0,41 47,95%
Source: see the data of the given indices on the Internet
TOTA
L
Elec
tions
Gove
rnan
ce
Part
icip
atio
n
Polit
ical
cu
lture
Civi
l lib
ertie
s
Denmark 9,52 10 9,64 8,89 9,38 9,71
New Zealand 9,26 10 9,2 8,89 8,13 10
Switzerland 9,09 9,58 9,29 7,78 9,38 9,41
Finland 9,06 10 9,64 7,22 8,75 9,71
Austria 8,49 9,58 7,86 7,78 8,13 9,12
Czech Republic 8,19 9,58 7,14 6,67 8,13 9,41
Uruguay 8,17 10 8,93 4,44 7,5 10
Costa Rica 8,1 9,58 8,21 6,11 6,88 9,71
South Korea 8,06 9,17 7,86 7,22 7,5 8,53
Slovenia 7,76 9,58 7,5 6,67 6,25 8,82
Estonia 7,61 9,58 7,14 5 7,5 8,82
Chile 7,54 9,58 8,57 3,89 6,25 9,41
Taiwan 7,46 9,58 7,14 5,56 5,63 9,41
Slovakia 7,35 9,58 7,5 5,56 5 9,12
Singapore 5,89 4,33 7,5 2,78 7,5 7,35
Table 2.2.3Estonia’s position in the context of the reference coun-tries (The Economist’s index 2011)
Estonia has always received a low assessment in The Economist’s index, and has even demonstrated a slight downward trend in the years under observation. Of the four indices included here, this is the one that most clearly highlights some of the possible problems in Estonia’s democracy. Estonia’s result in 2011 was 7.61 points, which places us in 34th place among 167 states, and in the category of flawed democracies. If we examine the sub-components of the index, we see that the main reason for Estonia’s low rating is its poor result in the political participation category, in which Estonia was given a rating of only five points out of ten. The given category assesses the level of electoral participation, autonomy and involvement of minorities, percentage of women in parliament, membership in political parties and political organisations, the citi-zenry’s interest in politics, readiness to participate in demonstrations, level of adult literacy, monitoring of politics in the media, and the promotion of political participation by the authorities. Other studies, like the World Values Survey, have been used to assess many of these elements. However, it is important to note that, since The Economist does not publish the non-aggre-gated data of its index, without recreating the assess-ment process ourselves, it is impossible to surmise what the reasons are for the evaluations given to the various points. Table 2.2.3 shows the assessments for the five main dimensions of the index for Estonia, as well as the other reference states of this report.
From the comparison with the other states, we can see that some of the results put Estonia at the same level as the full democracies (a total score of more than 8 points), but in some dimensions, it lags behind significantly. In the strongest dimension – elections – Estonia gets the same amount of points as the full democracies, but this dimension does not differentiate Estonia, very much, from the other states. Almost all the reference states get approximately the same number of points (between 9.17 and 10), with the only excep-tion being Singapore (4.33 points). But elections do not
suffice for the existence of democracy. Free and fair elections must exist, as well as, for instance, a govern-ment that functions in accordance with democratic values (including transparency and the lack of corrup-tion). And the citizenry must perceive this (trust the government and the political parties). This is measured by the second yardstick in The Economist’s index. In this regard, Estonia, with 7.14 points, lags significantly behind the states under observation, and shares the lowest result with Taiwan and the Czech Republic. Therefore, it can be stated that to increase the minimal functioning of democracy, Estonia needs to improve the quality of governance and the functioning of the government.
As far as the remaining three dimensions are concerned – participation, political culture and civil liberties – Estonia’s results in the dimension of civil liberties are the only ones comparable to the full democracies, although here, as in the case of the electoral dimension, all the states under observation get relatively high marks. Therefore, Estonia does not differ, substantially, from the other states. Estonia gets significantly lower results, than the full democracies, in the participation and political culture dimensions – 5 and 7.50 points, respectively. If we compare Estonia to the reference states, from this aspect, one can say that in the democracy dimensions, in which Estonia is in the best position (i.e. elections and civil liberties), it does not differ substantially from the states that are significantly more democratic, or those that are less democratic. However, in the dimensions where Estonia
1 Albania, Bosnia ja Herzegovina, Bulgaria, Croatia, Latvia, Lithuania, Macedonia, Montenegro, Poland, Serbia, Slovakia, Slovenia, Czech Republic, Hungary. 2 Except for the Baltic sta-tes. 3 Bosnia ja Herzegovina and Montenegro are missing from the Central and Eastern European states.

71Estonian Human Development Report 2012/2013
Valu
es o
f ind
ices
0
1
2
3
4
5
6
7
8
9
10
0
1
2
3
4
5
6
7
8
9
10
1 2 3 4 5 6 7 8 9 10 11 12 13 14 15Place
Total Elections Governance Civil libertiesPolitical cultureParticipation
Figure 2.2.2The distribution of the sub-scores of The Economist’s index in comparison with the group of selected countries (Esto-nia’s score is in big circle)
5 e.g. Pettai ja Mölder 2013.
6 A more detailed explanation of the given assessment, along with the index for Estonia, is published in the following report: http://www.systemicpeace.org/polity/Estonia2010.pdf
is relatively the weakest (participation and governance), Estonia’s result is generally comparable to the states with flawed democracies. For instance, even in clearly undemocratic Singapore, the functioning of the govern-ment is assessed at a higher level, and the democratic political culture there is at the same level.
The given trend is clearly visible if we compare the distribution of the scores in the context of the given states from the highest to the lowest (Figure 2.2.2). This figure can be described, conditionally, by saying the following: the more stable and steep the decline of the line indicating one dimension, the more the levels of democracy in the given states differ from each other in this dimension. It is obvious that the level related to elections and civil liberties is high in most of the states, and only a few states have low results. At the same time, we can see that in the assessments for participa-tion, but also for political culture and governance, the difference between the states with high and low results is clearly visible, and the transition from the high-level states to the low-level states is steady. Therefore, politi-cal culture, governance and, especially, participation, are the three dimensions that differentiate the high-level democracies from the low-level democracies. The given context accentuates the importance of Estonia’s weakest dimension – participation.
The Nations in Transit index also allows for an assessment of some of the possible problems with Esto-nia’s democracy, since it (like The Economist’s index) is compiled so that a maximum result is not impossible to achieve, but it is very difficult. Therefore, possible shortcomings are more visible. For 2011, Estonia got relatively low results in the following Nations in Tran-sit sub-dimensions: governance (2.25 points on a scale
of 1 to 7, with 1 as the highest result); local governance (2.50 points); and corruption (2.25 points). Estonia’s results have remained quite stable through the years. If we consider the fact that the corruption, as well as the local and national governance dimensions, is equiva-lent to the functioning of government dimension in The Economist’s index, we see that both indices, generally, supported each other’s assessments in this field. We cannot say the same for the participation dimension, since Nations in Transit does not pay as much attention to this. However, in the case of the Nations in Transit, it should be mentioned that this is not a very trans-parent index. It is not known what the corresponding assessments are based on, and the only way to get a better understanding of the index’s results is to read the annual report about the states that is published along with the index, and which generally explains the reasons for the scores in the index.5
The Polity IV index, which gives Estonia relatively high marks, also directs attention to the problems related to participation, as does The Economist’s index 6. In the case of Estonia, it is the imperfect electoral rights of the Russian-speaking population in the parliamen-tary elections, which, in turn, affects democracy as it relates to the execution of executive authority. At the same time, the report directs attention to the fact that the corresponding discrimination is only indirect, and results from the decisions related to citizenship policies made when the state was established. Direct ethnic dis-crimination by the government was not noticed, but it is mentioned that, in the society as a whole, there is a low level of readiness for cultural integration.
But, despite the aforementioned shortcomings and weaknesses, one should still note that Estonia’s position,

72 Estonian Human Development Report 2012/2013
in relationship to the other states, is generally very good, especially considering its recent history. In its histor-ical context, it makes sense to compare Estonia to the other post-Communist states, and the easiest way to do this is with Nations in Transit. As already mentioned above, Estonia stands out for its high assessment (1.93) in Nations in Transit. A better general assessment for the 2011 results was only merited by Slovenia (1.89). At the same time, it must be admitted that the differences among the new EU Member States that are covered by the index, are relatively small – there are very small differences between the Czech Republic (2.18), Latvia (2.11), Poland (2.14), Lithuania (2.29) and Slovakia (2.50). Somewhat lower assessments in the group of states were earned by Bulgaria (3.14), Romania (3.43) and Hungary (2.86). The remaining groups of states are further behind – the average general assessment for the Balkan countries was 4.09, and 5.99 for the former Soviet republics (except for the Baltic states).
If we compare Estonia to the other post-Commu-nist states, based on the other indices, the results are generally the same – Estonia emerges mostly positively. The Freedom in the World index shows that Estonia is located at a slightly higher level than the average for Cen-tral and Eastern Europe, similarly to the Czech Republic, Lithuania, Poland, Slovakia and Slovenia, which were all given higher assessments for 2011, while the average for the given region is only a few tenths lower. Most of the other former Soviet republics and Russia are left out of the group of free states.
The Polity IV index confirms this interpretation of the situation of democracy in the given region, although, unlike Lithuania, Poland, Hungary, Slovakia and Slovenia, Estonia does not get the highest assessment, being one point short. The general trends are still the same – the post-Communist states in Central and Eastern Europe have all achieved close to the maximum result, while the remaining post-Communist states remain far behind.
Therefore, the following can be said, based on the criteria of the indices under consideration: despite the small differences, Estonia, like the majority of the one-time transition states in this region, has reached a level of democracy that is at least comparable to the level in Western Europe. At the same time, there is still a lot of room for development before maximum possible democ-racy is achieved, which is alluded to, primarily, by The Economist’s index.
It is also worth considering a comparison of Estonia with the high-level democracies in the global context. Here, it is again sensible to focus on The Economist’s index, which provides a somewhat more diverse picture and possibilities for interpretation. Based on this index, the highest assessment, in 2011, was earned by Norway, which received a general assessment of 9.80 points. The
category of full democracies is comprised of 25 states, including many Western European states, but only one post-Communist state – the Czech Republic (in 16th place in the global context). The next state to get a high rating is Slovenia, which in the democracy ranking is 30th, fol-lowed in this group by Estonia, in 34th place. Therefore, the general trend is the same – among the transition states, Estonia was one of the most successful. At the same time, if the remaining comparisons, which were less sensitive, placed Estonia at the same level as the old democracies, the potential differences with well-function-ing democracies are still so large that, instead of in the category of full democracies, Estonia is positioned among the flawed democracies.
However, when thinking about the assessments of these indices, one should keep in mind that, from a scientific perspective, these indices are not all equal in value. When compiling an index, one of the most import-ant values is the transparency of the index7 (Munck and Verkuilen 2002), which enables the reliability and validity of the index to be assessed. In this survey, Polity IV, for which all the information necessary for evaluating its reli-ability is freely available, is the only one that conforms to the requirement of transparency8. As far as the other indices are considered, the corresponding information is at least partially insufficient. If we leave aside the Polity IV index, we encounter problems, related to transparency, with all the other indices, and therefore, their reliability suffers in the eyes of the evaluator.
In regard to the democracy indices, as with all other indices, it is worth keeping in mind that these are ways of interpreting political systems, which are often accompanied by inescapable problems. The process of compiling indices is so multifaceted that practically no index fulfils the con-ditions established for it (Munck and Verkuilen 2002), and even if agreement is reached on what democracy should mean, and how it should be measured, it is not possible to draw an indisputable line between democracies and non-democracies (Bogaards 2012). Thus, compiling indi-ces is always a changing and developing process and, in summary, it would be sensible to take a look at the most recent development trends in this field of activity.
One way to eliminate these shortcomings is to further refine the collection methods for the indices, or rather for the corresponding data, by using a greater number of indicators, and thereby, making it possible to assess the concept of democracy in a more multi-faceted way. One initiative, which is now coming into use (Coppedge et al. 2011), aims to correct some of the errors in the existing indices by creating a database where reliable data, related to the various wide-ranging concepts of democracy, would be available in non- aggregated form (i.e. without being aggregated into one numerical indicator) for most of the world’s states9. This
7 Generally, this means that we must know what the criteria are that the index uses to assess the states and, for each assessed event, it must be known what assessment has been given for each sub-component and why. If the corresponding data is not available, the reliability of the index suffers considerably, regardless of how “credible” the results are or not.
8 In the case of Polity IV, in addition to the non-aggregated data, the website (see above) also includes a detailed manual for coding, or assessing, the states and separate reports for each state, which provides a brief overview of the background of the assessment. Therefore, in the case of the given index, all the interested parties have the opportunity to know exactly why and how the assessment for one or another state was earned.
9 Varieties of Democracy project: https://v-dem.net/

73Estonian Human Development Report 2012/2013
References1. Bogaards, Matthijs. 2012. “Where to Draw the Line? From
Degree to Dichotomy in Measures of Democracy,” Democratiza-tion 19 (4): 690–712.
2. Coppedge, Michael, John Gerring, David Altman, Michael Ber-nhard, Steven Fish, Allen Hicken, Matthew Kroenig, et al. 2011. “Conceptualizing and Measuring Democracy: A New Approach,” Perspectives on Politics 9 (02): 247–267.
3. Munck, Gerardo L. 2012. “Conceptualizing the Quality of Democracy: The Framing of a New Agenda for Comparative
Politics,” DISC Working Paper Series (23).
4. Munck, Gerardo L., ja Jay Verkuilen. 2002. “Conceptualizing and Measuring Democracy Evaluating Alternative Indices,” Comparative Political Studies 35 (1): 5–34.
5. Pettai, Vello and Martin Mölder. 2013. “Estonia,” Nations in Transit 2012, Democratization from Central Europe to Eurasia, Sylvana Habdank-Kolaczkowska, Katherin Machalek and Chris-topher T. Walker (eds.), New York, Freedom House, 201–217.
would be something that none of the current indices provides. Another approach, that has been suggested recently, points out that in order get a better under-standing of democracy, attention must be paid not only to procedural criteria (institutions, as well as formal rights and freedoms), but also to their socio-economic context. This may mean not only the value added to the democratic institutions that function independently of the democratic institutions, but the preconditions nec-essary for their functioning (Munck 2012).
In conclusion, it can be said about Estonia, that the assessment of our state’s freedom and democracy depends primarily on the index that you are looking at, on the states that Estonia is compared to, and what we are expecting from the concept of democracy. The posi-tion of every state, including Estonia, is determined only in comparison to other states and the more we pay atten-tion to the indices with a high level of differentiation, the more accurate this determination will be. In the case
of the Freedom in the World and Polity IV, which have a low differentiation capability, Estonia is positioned at the same level as the other decidedly democratic states. With the help of the indices with a greater differenti-ation capability – The Economist and Nations in Tran-sit – it is possible to highlight some of the weaknesses of Estonia’s democracy, which are primarily related to the execution of authority, participation and political culture. These are the areas in which the gap between Estonia and the states with a high level of democracy is most noteworthy. Therefore, in order to raise the level of its democracy, Estonian must pay attention to elim-inating the shortcomings in these dimensions. This is undoubtedly more difficult and time-consuming than the development of the main democratic institutions, since, among other things, these dimensions require changes and shifts in the attitudes and values of the authorities and the citizenry, which can only occur on a temporal scale encompassing several.

74 Estonian Human Development Report 2012/2013
The previous sub-chapter ended with the realisation that Estonia lags behind the states with developed democra-cies most noticeably when it comes to such indicators like the functioning of governance, participation and political culture. Eliminating the shortcomings in the given mea-sures is significantly more difficult and time-consuming than the development of the principal democratic institu-tions, since these measures, among other things, require changes in the attitudes and values of the authorities and the citizenry, which shifts in a temporal scale lasting many generations.
The years of 2012 and 2013 are characterised by a remarkable change in the relationship between the state authorities and the people. This has yet to bring about any visible shift in attitudes and values, but the need to change them has clearly been on the agenda, and the more thoughtful part of society has become aware of this. If this would not occur, Estonian society would have no place in the premier league of democratic states.
2.3.1 Development of civil societyThe readiness of society to be an estimable partner for the governing institutions in the execution of authority, and also to exercise social oversight, is related to the maturity of civil society. It is popular to bemoan the weakness of civil society in the post-Communist states. However, based on recent developments, we can state that the development of Estonia’s civil society has reached a level where the cit-izenry’s awareness and knowledge has increased, and the non-governmental sector is no longer willing to have their positions ignored when political decisions are being made. The relative progress made by Estonia’s civil society is also confirmed by international comparisons.
At the initiative of the U.S. Agency for International Development (USAID), a Civil Society Organisation (CSO) Sustainability Index for Central and Eastern Europe and Eurasia (the former republics of the Soviet Union) has been compiled for years (Table 2.3.1). Within the frame-work of the general sustainability of civil society, the fol-lowing components are also examined separately:
• legal environment,
• organisational capacity,
• financial viability,
• advocacy,
• service provision,
• infrastructure,
• public image.
Estonia’s position related to the maturity of its civil soci-ety and development capability has been the best among the CSOs in Central and Eastern Europe and Eurasia.
In Estonia, the most positive aspects supporting civil society are the legal environment, the developed infra-structure, and advocacy; while the weakest aspects are financial viability, organisational capacity and the provi-sion of services. In other words, as has been recognised in the case of the state of Estonia as a whole (Vetik 2012), the legal and institutional framework for the functioning of a democratic society exists, but this has yet to be filled with sufficient content.
Despite the relatively good developmental level of Estonia’s civil society, compared to the other transition countries, Estonia gets quite a middling score for polit-ical participation (see The Economist’s Democracy Index in the previous sub-chapter). Although the indicators for
2.3Civil society and social capitalJuhan Kivirähk, Marju Lauristin
Slovenia
Lithuania
Greece
Estonia
Slovakia
Hungary
Czech Rep.
Ireland
Average in Europe
Switzerland
Netherlands
Denmark
Finland
Has a preference related to a political party
Participated in the activities of some other association, organisation
Participated in the activities of a political party during the last 12 months
Percentage
Percentage 0 10 20 30 40 50 60 70
0 10 20 30 40 50 60 70
Figure 2.3.1Civic involvement of the residents of Estonia and other European countries
Source: European Social Survey 2010, author’s calculations

75Estonian Human Development Report 2012/2013
political participation are generally low in all the East-ern European countries, regardless of Estonia’s higher indicator for the sustainability of its civil society, in this field, it lags behind the Czech Republic, as well as Slo-venia and Poland.
Also, based on the European Social Survey (2010) data, Estonia is among those that lag behind when it comes to political self-determination and participation in political parties and civil society organisations, along with the other Eastern and Central European states (Figure 2.3.1).
2.3.2 Social capitalOf course, the engagement of the citizens in CSOs is not only important from the viewpoint of political par-ticipation, for the influence it has on the activities of the national and local governments, but it also plays an important role in strengthening society’s general cohesion – its social capital. Social capital is defined as „features of social life – networks, norms and trust - that enable participants to act together more effectively to pursue shared objectives.” (Putnam 1995: 664-665). Based on U.S. data, Robert Putnam’s influential work Bowling Alone (2000) pointed out the role that social capital plays in the existence of an individual’s democratic experience and involvement in political life.
The Legatum Prosperity Index (LPI) also includes indicators about the level of social capital. This input has two dimensions: firstly, societal cohesion, which is mea-sured by trust, helpfulness and communication networks, with participation in volunteer work, and support from families and community networks also being taken into consideration; secondly, personal freedom, which includes freedom of movement, expression and belief, as well as social tolerance.
The empirical studies of social capital have con-firmed that insufficient social capital is accompanied by economic hardship. Social capital can be considered a resource of economic and social wellbeing.
The positions of Estonia and the comparative states, based on the social capital component of the LPI, is shown in Table 2.3.2.
We see that the LPI social capital indicator also confirms the fact that Estonia is at the forefront of the Eastern European states when it comes to the develop-ment of its civil society, but it still lags behind Scandi-navia and the Central European states. At the same time, despite the indicators that have improved compared to 2010, participation in charity work and volunteering is still at a low level in Estonia. Forty percent of Estonians have provided help to a stranger, which is also a rela-tively low indicator.
The existence of support networks has improved – 91% say they have someone to depend on in hard times. The marriage rate is very low in Estonia, as is the partic-ipation in religious activities.
Comparing the values of the individual components of social capital in the Baltic states (Table 2.3.3), we see that the structure and general development level is quite similar. The role of one’s family and close friends is the
Table 2.3.1Sustainability of CSos 2011 (on a scale of 1 to 5, where 1 is the best rating)
Source: USAID
Orga
nisa
tiona
l cap
acit
y
Fina
ncia
l via
bilit
y
Advo
cacy
Serv
ice
prov
isio
n
Lega
l env
ironm
ent
Infr
astr
uctu
re
Publ
ic im
age
Gene
ral s
usta
inab
ility
Estonia 2.3 2.4 1.7 2.3 1.7 1.6 1.9 2
Poland 2.6 2.7 1.7 2.2 2.2 1.7 2.2 2.2
Czech Republic 3 3.2 2.1 2.4 2.8 2.8 2.4 2.7
Latvia 3 3.3 2.1 2.5 2.3 2.4 3.2 2.7
Slovakia 3 3.4 2.5 2.5 2.8 2.3 2.4 2.7
Slovenia 3.8 4.4 3.5 3.5 3.3 3.6 3.7 2.7
Lithuania 2.9 3.2 2 3.4 2.2 3 2.6 2.8
Average of the transition countries 2.9 3.2 2.2 2.7 2.5 2.5 2.6 2.7
2012 2011 2010
Denmark 2. 2. 2.
New Zealand 4. 3. 3.
Finland 5. 6. 6.
Netherlands 6. 5. 5.
Ireland 7. 10. 10.
Switzerland 11. 13. 13.
Austria 14. 16. 16.
Israel 22. 24. 24.
Taiwan 24. 29. 29.
Estonia 30. 46. 43.
Slovenia 36. 33. 33.
Singapore 39. 32. 32.
Czech Republic 45. 35. 35.
Poland 46. 22. 22.
Slovakia 47. 45. 45.
Lithuania 49. 66. 49.
South Korea 51. 52. 52.
Uruguay 55. 56. 56.
Costa Rica 66. 42. 42.
Chile 69. 62. 62.
Hungary 79. 77. 77.
Latvia 86. 96. 92.
Source: The 2012 Legatum Prosperity Index (LPI)
Table 2.3.2Rankings of the countries based on the social capital sub-index (ranks in the corresponding year)

76 Estonian Human Development Report 2012/2013
Greece
Slovenia
Slovakia
Hungary
Lithuania
Czech Rep.
All
Ireland
Estonia
Switzerland
Netherlands
Finland
Denmark
Thinks that most people can be trustedThinks that people are mostly helpfulSocialises with friends, colleagues and relatives at least once a week
Percentage
Percentage 0 10 20 30 40 50 60 70 80 90
0 10 20 30 40 50 60 70 80 90
Percentage
Percentage 0 10 20 30 40 50 60 70 80 90
0 10 20 30 40 50 60 70 80 90
Estonia
Turkey
Poland
Israel
Czech Rep.
Rep. of Korea
Hungary
Slovakia
Greece
Italy
Slovenia
Austria
Chile
Switzerland
OECDaverage
Finland
Belgium
Norway
Germany
UK
France
Sweden
Denmark
USA
Ireland
Netherlands
New Zealand
Australia
CanadaH
as d
onat
ed m
oney
to a
ch
arit
y du
ring
the
last
mon
th
Has
hel
ped
a st
rang
er
durin
g th
e la
st m
onth
Is m
arrie
d
Has
att
ende
d a
hous
e of
w
orsh
ip d
urin
g th
e la
st w
eek
Gets
sup
port
from
frie
nds
and
fam
ily in
cas
e of
diffi
culti
es
Belie
ves
that
mos
t pe
ople
can
be
trus
ted
Has
vol
unte
ered
du
ring
the
last
mon
th
Estonia 19.2 40.9 40.8 12.1 90.9 34 21.5
Latvia 34.2 39.9 49.7 19.7 83.6 13.1 11.8
Lithuania 20.6 36.8 51.6 26.9 91.1 25.5 11.1
Source: The 2012 Legatum Prosperity Index
Figure 2.3.2Social capital indicators in Estonia and some other Euro-pean countries
Figure 2.3.3Communities’ minority tolerance index in the oECD countries in 2010 (% of respondents with high tolerance indicators)
Source: oECD 2011Source: European Social Survey 2010, author’s calculations
Table 2.3.3Comparison of Estonia’s social capital indicators with the indicators for Latvia and Lithuania (percentage of positive answers among the respondents)

77Estonian Human Development Report 2012/2013
strongest, while a very small percentage of the population has done volunteer work, donated to charities, or helped someone in trouble.
An important component of social capital is trust and the willingness to help people. Based on the data of the European Social Survey, Estonia places higher than even the European average in this regard. Compared to the other young democracies, the involvement of the Esto-nian population in social communication and the positive attitude toward their fellow citizens is even better than in the post-Communist states, not to mention Greece, where not only the economy, but all the social capital indicators are at the absolute minimum (Figure 2.3.2.)
The answer to the question of whether other people can be trusted was also included in the 2009 Gallup World Poll. In Denmark, 62% stated that they trust others, 59% in Finland, 51% in New Zealand, 47% in the Netherlands, and 45% in Switzerland. With its 34%, Estonia was in 21st place in the world in regard to this indicator. The countries that have levels of trust in other people similar to Estonia’s included Taiwan (36%) and Singapore (33%), and Ireland (31%) was quite close to Estonia’s level. At the same time, the trust level in Hungary was only 13%, in Slovenia 15%, and in Slovakia 21%. The trust indicators are also low in the Latin American states (26% in Uruguay, 14% in Costa Rica and Chile).
For Estonia, an important factor in the reduction of social capital is the heterogeneity of the population and the large proportion of the migrant population. The situation of the minorities (immigrant population) is also reflected in the sub-index of the Legatum’s social capital index – the personal freedom sub-index – which measures the situation in regard to individual freedom of choice, expression, movement and belief, as well as social tolerance.
In 2012, Estonia ranked very low in this sub-index, being in only 74th place. The reason for the modest result is, primarily, the indicator for tolerance – only 55.8% find that Estonia is a good place for minorities to live.
Estonia’s results are on a comparable level with those of Latvia and Lithuania (who are in 112th and 93rd place, respectively) but clearly lagged behind most of the reference states (only Israel had a lower tolerance indicator than Estonia, and even Latvia). Estonia’s problems with tolerance are also confirmed by the corresponding OECD indicators, where Estonia is ranked last among the OECD member states in the tolerance ranking (Figure 2.3.3).
At the same time, if we look at the data contained in the European Social Survey, we see that the answers to the specific question related to tolerance, the attitudes of the Estonian population toward minorities are not the most negative at all (Figure 2.3.4).
2.3.3 In conclusionWhen comparing Estonia to the small wealthy European states, we see great differences not only in material well-being, but also in regard to the people’s level of civic activ-ism, participation in societal life, trust and willingness to help each other, as well as tolerance toward minorities. All this combined comprises social capital, and increasing it is just as important for the achievement of wellbeing as the growth of economic wealth. To achieve changes in the fields of political culture and participation, raising the functioning capability of CSOs will not suffice. Changes also have to occur in the understandings about the role of the citizenry as decision makers, thereby ensuring that the social groups that are currently not being included are involved in policymaking.
References1. European Social Survey 2010 – http://ess.nsd.uib.no/ess/round5/
2. Legatum 2012 Prosperity Index – www.prosperity.com
3. OECD 2011 – Society at a Glance 2011: OECD Social Indicators. - http://books.google.ee/books?id=3Y-GYe5H5dc-C&pg=PA26&dq=OECD+2011,+Society+at+a+glance+2011:+O-ECD+social+Indicators&hl=en&sa=X&ei=M3dAUbiDDe6Z0A-WKuYGwDw&ved=0CCcQ6AEwAA
4. PutnAm, R. (1995). “Tuning In, Tuning Out: The Strange Disap-pearance of Social Capital in America,” PS: Political Science and Politics, 28, 4, 664–683.
5. PutnAm, R. (2000). Bowling Alone: The Collapse and Revival of American Community. New York: Simon & Schuster.
6. Vetik, R. 2012. Eesti poliitika ja valitsemine 1991-2011. Ed. Raivo Vetik, Tallinn: Tallinn University Press,
Figure 2.3.4Tolerance toward specific minority groups in Estonia, and in some other European countries
Gays and lesbians should be allowed to live as they wishImmigrants enrich our country’s culture
Percentage
Percentage 0 10 20 30 40 50 60 70 80 90
0 10 20 30 40 50 60 70 80 90
Slovenia
Lithuania
Greece
Estonia
Slovakia
Hungary
Czech Rep.
Ireland
Averagaein Europe
Switzerland
Netherlands
Denmark
Finland
Source: European Social Survey 2010, author’s calculations

78 Estonian Human Development Report 2012/2013
The freedom of media is closely related to general political freedom. Through the years, this has been high, based on both the Freedom House (Freedom of the Press) and Reporters Without Borders indices (22nd and 11th in the world, in 2012 and 2013, respectively).
From the table, we see that in the majority of the countries used as reference states in this report, general developmental success is connected to great media free-dom. The exceptions are Singapore, partly also Israel, Chile and South Korea, and during the last couple of years, Hungary (Table 2.4.2).
For many years, the media in the Nordic coun-tries has been considered to be the freest. According to the Freedom House assessments, Estonia, along with Germany and the U.S., are positioned between 14 and 22, slightly ahead of the Czech Republic. The position of Lithuania and Latvia was near this in 2007, but in subsequent years, has sharply decreased. This is related to the significant withdrawal of foreign capital from the Latvian and Lithuanian media markets from 2008 to 2010, similarly to many other Eastern and Central Euro-pean countries. The new domestic owners (so-called “oligarchs”) have tried to use the media in their polit-ical and economic interests, and this has significantly restricted the freedom of the media, and has reduced the expert evaluations of it (Lauk 2012). At the media conference at Tallinn University, in May of 2012, it was affirmed that the situation of the Estonian media differs greatly from the other Eastern and Central Europe coun-tries, in that we have no oligarchs who would control the media to an ever more significant extent (Kadastik 2012; Raudsaar 2012).
The great decrease in the freedom of the media in Hungary during the last few years (Table 2.4.2) can be explained by the media law passed at the end of 2010, which promoted widespread protests by the public, as well as by the European Parliament. According to the 2012 assessment by Freedom House, Hungary is the only country in the European Union where the press is not free, but rather, only partly free.
Here, it should be added that, in Russia, the freedom of media, like political freedom generally, has undergone a reversal since 1994, especially in the last decade, during Putin’s time in power. This has resulted in Russia being given an assessment of not free, starting in 2006.
As far as Internet freedom is concerned, Estonia has placed first in the world for the second year in a row, according to Freedom House’s Freedom on the Net index (Table 2.4.3.). In the survey of this index, Estonia’s IT development and Internet services have been given a very high assessment – as far as communications technology
2.4The information environment and freedom of the mediaPeeter Vihalemm
Freedom House 2012
(197 countries)
Reporters Without Borders 2013
(179 countries)
Rank
Status Rank
Assessment of media freedom
Finland 1. Free 1. Good
Norway 1. Free 3. Good
Sweden 1. Free 10. Good
Denmark 5. Free 6. Good
Netherlands 5. Free 2. Good
Switzerland 5. Free 14. Good
Ireland 13. Free 15. Good
New Zealand 16. Free 8. Good
Estonia 22. Free 11. Good
Costa Rica 25. Free 18. Good
Czech Republic 25. Free 16. Good
Slovakia 31. Free 23. Satisfactory
Lithuania 40. Free 33. Satisfactory
Poland 47. Free 22. Satisfactory
Slovenia 47. Free 35. Satisfactory
Taiwan 47. Free 47. Satisfactory
Uruguay 51. Free 27. Satisfactory
Latvia 54. Free 39. Satisfactory
Israel 65. Free 112. Noticeable problems
Chile 67. Partly free 60. Noticeable problems
South Korea 68. Partly free 50. Satisfactory
Hungary 78. Partly free 56. Noticeable problems
Singapore 150. Not free 149. Difficult situation
Russia 172. Not free 148. Difficult situation
China 187. Not free 173. Very serious situation
Belarus 193. Not free 157. Difficult situation
North Korea 197. Not free 178. Very serious situation
Table 2.4.1Positions of various states in the freedom of media ranking 2012–2013
Source: www.freedomhouse.org; www.rsf.org

79Estonian Human Development Report 2012/2013
is concerned, Estonia is one of the most developed coun-tries in the world, and restrictions on Internet content are some of the most lenient.
However, it must be taken into consideration that the Nordic countries, and several other European states, including Latvia and Lithuania, are missing from the study (in 2011, 37 countries were included, and 47 in 2012).
A very important indicator for generally character-ising an information environment is the extent to which the Internet is available and used (Figure 2.4.1). This is closely related to the level of IT development. Based on this indicator, Estonia is slightly above the European Union average, but is losing its advantage over the other new EU Member States.
From the viewpoint of Internet use, the Nordic countries are in the leading position, but Australia and New Zealand are not far behind. The EU average is slightly lower than the U.S. average. The countries that are viewed as reference states for Estonia in this report are mostly the leading users of the Internet in their regions.
An illustrative and important indicator for under-standing the changes in the information environment is the dynamics of Internet use. Table 2.4.4 shows the corresponding data for the EU states from 2004 to 2012.
In the course of eight years, from 2004 to 2012, Internet use in Estonia has increased 1.7 times, which is slightly less than the EU average (1.9 times). This con-firms the deceleration of the pace of IT growth in Estonia during the last few years, compared to the late 1990s and early 2000s. The growth in Latvia and Lithuania (2.6 and 2.5 times, respectively) has been much faster than in Estonia. Due to their very low initial level, the tempo of growth has been even greater in Romania, Bulgaria and Greece, where Internet use in 2012 was much lower than in Estonia, but the gap has been decreasing.
As far as the use of traditional media is concerned, Estonia also places slightly above the EU average.
One of the most important traditional indicators of an information environment is newspaper distribution. The comparative indicators used here are the press runs of daily newspapers per 1,000 adults (Figure 2.4.4).
Figure 2.4.2 shows that there are similar traits between newspaper distribution and Internet use – here too, the Nordic countries, and some South-East Asian states (Japan, South Korea, and Singapore) are in the lead-ing positions. However, there are also many differences. Newspaper distribution in the U.S. and Australia is mod-erate and quite modest in the Latin American countries under observation, lagging behind India and China.
During the Soviet era, newspaper distribution in Estonia was at the same level as in the Nordic coun-tries, but circulation fell many times in the 1990s to the European average, but is still slightly higher than in Southern Europe.
It is essential to note that the decrease in news-paper circulation in Estonia is compensated, somewhat, by the large readership of web publications and portals. According to Eurostat data (BNS 18.12.2012), news was read online by 91% of the Internet users in Estonia, 92% of the users in Lithuania, and 61%, on average, in the European Union. The use of Internet banking in Estonia is also significantly higher than the EU average, with
Table 2.4.2The positions of various countries in the freedom of media rankings, from 2007 to 2012, based on the assessment by Freedom House
2007 2009 2011 2012
Finland 1. 2. 1. 1.
Norway 3. 2. 2. 1.
Sweden 3. 5. 2. 1.
Germany 16. 18. 16. 16.
Estonia 16. 14. 22. 22.
USA 16. 24. 16. 22.
Lithuania 29. 24. 32. 40.
Latvia 31. 43. 45. 54.
Hungary 39. 33. 53. 78.
Source: www.freedomhouse.org
India
Africa average
Asia average
World average
Latin Americaaverage
China
Costa Rica
Russia
Uruguay
Chile
Poland
Lithuania
Hungary
Latvia
Slovenia
Czech Republic
EU 27
Singapore
Taiwan
Ireland
Estonia
USA
Slovakia
Japan
Switzerland
South Korea
Germany
UK
New Zealand
Australia
Finland
Denmark
Sweden
Netherlands
Norway
Iceland
Percentage
Percentage 0 10 20 30 40 50 60 70 80 90
0 10 20 30 40 50 60 70 80 90
Figure 2.4.1Internet use in various countries of the world
Source: www.internetworldstats.com

80 Estonian Human Development Report 2012/2013
87% of Internet users making bank transactions online (the EU average is 54%). The use of social media in Estonia is at the same level as is the EU average (56% of Internet users, in 2012).
The results of the Eurobarometer survey provide a general overview of the daily information environ-ment, and the use of various media in the EU countries. Table 2.4.5 shows the survey data for the European refer-ence states for 2012. Figure 2.4.3 shows the ranking of EU countries based on the percentage of respondents with a high index of media use.
We see that Estonia is among the countries with a high level of media use, 9th rank based on the percentage of people in the population with a high level of media use (and even 6th rank, based on the index of people with very high media use). Like the majority of countries with high media use, Estonia is characterised by the uniformly high use of all mediums (Table 2.4.5). At the same time when, for example Latvia, lags significantly behind the EU average in regard to the monitoring of print media, but compared to the other member states, has the most active users of social media.
Based on the general level of media use, the EU is clearly divided into Northern and Southern Europe, and in the Nordic countries, there are approximately twice as many people who use media often than in Portugal and Romania.
Table 2.4.3Freedom on the Net 2011 and 2012(10 countries with the most freedom, based on expert opinions)
Table 2.4.4Internet use in the EU countries, 2004–2012 (ranking based on 2012 data, for the percentage of people who use the Internet at least once a week)
Source: Media use in the European Union. Standard Eurobarom-eter 76, Autumn 2012.
Wat
ch T
V
List
en to
th
e ra
dio
Read
the
writ
ten
pres
s
Use
the
Inte
rnet
Use
onl
ine
soci
al
netw
orks
Ever
y da
y
At le
ast o
nce
a w
eek
Ever
y da
y
At le
ast o
nce
a w
eek
Ever
y da
y
At le
ast o
nce
a w
eek
Ever
y da
y
At le
ast o
nce
a w
eek
Ever
y da
y
At le
ast o
nce
a w
eek
Sweden 84 95 69 88 76 93 82 92 35 54
Denmark 88 98 68 86 50 75 80 88 37 54
Netherlands 84 97 63 83 59 84 81 90 36 56
Ireland 91 98 80 95 43 87 51 72 19 45
Finland 79 93 55 82 73 93 63 77 31 46
Estonia 83 95 67 86 43 77 60 71 31 47
Latvia 81 95 57 80 20 69 60 73 38 55
Slovenia 81 95 65 87 38 77 53 66 26 40
Slovakia 85 98 64 86 27 73 42 62 25 43
Lithuania 82 97 53 76 30 76 50 60 25 41
Czech Republic 83 97 54 86 23 70 47 66 18 33
EU 27 86 97 51 76 36 71 48 64 20 35
Poland 83 97 52 84 15 63 43 59 17 35
Hungary 87 97 46 78 31 66 35 53 21 42
2012 2011
Score Rank Score Rank
Estonia 10 1. 10 1.
USA 12 2. 13 2.
Germany 15 3. 16 3.
Australia 18 4. 18. 4.
Hungary 19 5. - -
Italy 23. 6. 26 6.
Philippines 23 6. - -
Great Britain 25 8. 25 5.
Argentina 26 9. - -
South Africa 26 9. 26 7.
Source: Eurostat
Source: www.freedomhouse.org
Table 2.4.5Media use in various European countries, in 2012 (% of the respondents)
2004
2005
2006
2007
2008
2009
2010
2011
2012
1.–2.Sweden 75 76 80 75 83 86 88 91 91
Netherlands ? 74 76 81 83 86 88 90 91
3. Luxembourg 59 63 65 72 77 83 86 86 90
4. Denmark 70 73 78 76 80 82 86 87 89
5. Finland 63 62 71 75 78 79 83 86 88
6. Great Britain 49 54 57 65 70 76 80 81 ?
7.–9.
Germany 50 54 59 64 68 71 75 77 78
Belgium ? 53 58 63 66 70 75 78 78
France ? ? 39 55 63 67 72 74 78
10. Austria 46 49 55 61 66 67 70 76 76
11. Estonia 45 54 56 59 62 67 71 73 75
12.–13
Ireland 27 31 44 51 57 60 63 71 74
Slovakia 40 43 43 51 62 66 73 72 74
EL-27 36 43 45 51 56 61 65 68 70
14. Latvia 27 36 46 51 57 61 62 66 70
15. Hungary 21 34 42 49 56 57 61 66 69
16.–17.
Czech Republic 25 26 36 42 51 54 58 63 66
Malta ? 34 36 43 46 55 60 66 66
18.–20.
Slovenia 33 40 47 49 52 58 65 64 65
Lithuania 26 30 38 45 50 55 58 61 65
Spain 31 35 39 44 49 54 58 62 65
21. Poland 22 29 34 39 44 52 55 58 59
22. Cyprus 28 26 29 35 35 45 50 54 58
23. Portugal 25 28 31 35 38 42 47 51 56
24. Italy 26 28 31 34 37 42 48 51 53
25.–26.
Greece 17 18 23 28 33 38 41 47 50
Bulgaria 13 ? 22 28 33 40 42 46 50
27. Romania 10 ? 18 22 26 31 34 37 43

81Estonian Human Development Report 2012/2013
Uruguay
Chile
Costa Rica
Slovakia
Portugal
China
Poland
India
Hungary
Spain
Latvia
New Zealand
Czech Rep.
France
Estonia
USA
Israel
Taiwan
Lithuania
Slovenia
Ireland
Germany
Netherlands
Denmark
Singapore
South Korea
Japan
Finland
Sweden
Norway
Switzerland
Iceland
0 100 200 300 400 500
0 100 200 300 400 500
Percentage
Percentage 0 10 20 30 40 50 60 70 80 90
0 10 20 30 40 50 60 70 80 90
Portugal
Romania
Greece
Bulgaria
Cyprus
Italy
Spain
Malta
Hungary
Poland
EU-27
France
Czech Rep.
Lithuania
Belgium
Slovakia
Slovenia
Great Britain
Latvia
Estonia
Germany
Austria
Luxembourg
Finland
Ireland
Netherlands
Denmark
Sweden
27.
26.
24.-25.
24.-25.
22.-23.
22.-23.
21.
20.
19.
18.
EU 27
17.
15.-16.
15.-16.
14.
13.
11.- 12.
11.-12.
10.
9.
8.
7.
6.
5.
4.
2.-3.
2.-3.
1.
Figure 2.4.3Media use in the European Union in 2012 (ranking of countries based on the index of people with a high level of media use, %)
Figure 2.4.2Average circulation of daily newspapers per 1,000 adults, in various countries in 2009
The situation may differ if the individual mediums are considered instead of the general level of media use. For example, the volume of daily TV viewing is gene-rally greater in Southern Europe than in Northern Europe. When comparing the frequency of use of various mediums, we see that TV viewership is uniformly high in all the EU states, whereas, it is also significantly higher than the use other mediums (Table 2.4.3). TV is the must important news channel for both domestic and European events and processes. In the EU on the average, after TV, radio is the next most frequently used medium, and the print media is the most important news channel, although, in many countries, the Internet has become more popular than the other mediums.
The effectiveness of media freedom from the viewpoint of democracy development is also related to how the given state, more generally, guarantees its citizens access to public information. In this regard, Estonia’s openness is remarkably good. Based on OECD data, in Estonia, more access to the data and documents that reflect the activities of the public authorities is guaranteed by law than in any other OECD state (see Table 2.4.6). However, we must, of course, consider that in many of the “old” democra-cies, the realisation of the citizen’s democratic rights is not regulated by legislation, but, in many cases, by good governance practices; while in the new democracies, the rights guaranteed by laws may not be complied with, if good practices are lacking.
Source: Media Use in the European Union. Standard Euro baro-meter 76, Autumn 2011Source: World Press Trends 2010

82 Estonian Human Development Report 2012/2013
Source: oECD Factbook 2011
References1. BNS press release 18.12.2012. “Eesti on veebiuudiste tarbimiselt
Euroopas teisel kohal,” www.postimees.ee/1079074/print/ees-ti-on-veebiuudiste-tarbimisel-Euroopas-teisel-kohal.
2. KAdAStiK, mARt. (2012). “Enesepeksu raske töö,” Postimees, 28.05.2012.
3. lAuK, ePP (2012). “What is Happening to (Foreign) Ownership in the Baltic Media Markets?” Baltic Rim Economies, Quarterly Review, 2 (31.5.2012). www.tse.si/pei
4. Media use in the European Union. Standard Eurobarometer 76, Autumn 2011. http://ec.europa.eu/public_opinion/index_en.htm
5. OECD Factbook 2011. www.oecd-library.com
6. RAudSAAR, mARt (2012). “Heldur Tõnisson ja tema sajand,” Eesti Päevaleht, 26.06.2012.
7. World Press Trends 2010. Paris: World Association of Newspa-pers/ZenithOptimedia.
In conclusion, it can be said that Estonian society stands out for its great freedom of media and its very active information consumption. The general level of media use in Estonia is significantly higher than the EU average. The media use in all the other European reference states being compared to Estonia is also higher, except for Hungary.
Estonia is characterised by a very liberal media environment, good availability of public information and a high level of IT. In addition to the broader availability
of information technology, the maximum level of free-dom is guaranteed to the consumer, the most illustrative expression of which is Estonia’s first place in the world in Internet freedom.
The high level of media freedom, and the high level of information use by the population, along with the availability of public information, which is ensured by legislation, forms a good basis for the transparency in governance, and for fighting corruption.
Budg
et
Min
iste
rial a
nnua
l rep
orts
Audi
t res
ults
Intr
oduc
tions
of p
oliti
cian
s
Com
mer
cial
con
trac
ts
of s
tate
age
ncie
s
Nam
es a
nd s
alar
ies
of e
mpl
oyee
s
Data
base
s
Cont
ent a
nd ru
les
for t
he u
se
of d
ata
colle
cted
by
the
stat
e
Inte
rnal
pro
cedu
res
and
inst
ruct
ions
of
the
adm
inis
trat
ive
agen
cies
Desc
riptio
ns o
f the
str
uctu
re a
nd
func
tions
of g
over
nmen
t age
ncie
s
Annu
al re
port
on
the
fr
eedo
m o
f inf
orm
atio
n
Intr
oduc
tion
of th
e pr
oced
ures
for
ensu
ring
free
dom
of i
nfor
mat
ion
Disc
losu
re in
dex*
: Max
24
Estonia 24
Hungary 22
South Korea 22
Slovenia 20
Finland 18
USA 16
Russia 16
Chile 13
Czech Republic 12
Great Britain 12
New Zealand 11
Slovakia 11
Netherlands 10
Denmark 8
Ireland 8
Poland 8
Sweden 8
Switzerland 7
Austria 6
Table 2.4.6Availability of national government information in Estonia and the reference countries
* Author’s calculations: required by law – 2 points; usually disclosed – 1 point

83Estonian Human Development Report 2012/2013
In accordance with the generally accepted definition, corruption is the abuse of public power for private gain at the expense of the public interest. In the Western political culture, corruption is a central theme for the relationships between people and authority, because “power tends to corrupt, and absolute power corrupts absolutely”. Corruption, as a negative co-phenomenon of power, is considered to have an inhibitory impact on social development, and it is degrading to people. Corruption poses a danger to the state’s security by causing inequitable treatment, by damaging compe-tition and by inhibiting economic development. This phenomenon reduces the legitimacy of the political and institutional system, decreases social cohesion and undermines people’s opportunities to influence collec-tive decision-making.
Several studies (see Lipset, Lenz 1999; Arlington, Sandholtz, Taagepera 2005) have demonstrated that the level of corruption can be ascertained by using cultural characteristics. Corruption, being based on a monop-olistic freedom of decision making and on deficit of transparency and reporting obligations, (Corruption = Monopoly + Discretion – Accountability) is more toler-ated in some governing traditions than in others. The type of culture that promotes institutionalised corrup-tion, where the entire power system revolves around a patron-client relationship, is called clientelistic (Mauss 2000/1924). In the case of institutionalised corrup-tion, corrupt behaviour, in the Western sense, ensures a position in the informal structure of the collective body, without which it is not possible to procure formal power. In societies with clientelistic traditions, corrupt persons are also not unknown, but they are defined as people who are not able to draw a line or follow the rules, according to which “you do not bite the hand that feeds you.” Such an understanding of corruption does not coincide with the principles adopted in the Western cultural space, where the main efforts to pre-vent corruption are focused on the transparency of the functioning of authority, and on responsibility that is directed downward.
2.5.1 The spread of corruption in Estonia and the reference statesA large number of international surveys conducted in the last two decades provide a comparative assessment of corruption in Estonia. An incomplete list includes evaluations by GRECO (Group of States Against Cor-ruption), the World Bank, the OECD, and Freedom House. Transparency International has been compar-ing states by utilising an index that characterises the
perceptions of corruption since 1995. Direct indicators could, for example, be the number of corruption-re-lated crimes and the punishments that are imposed, the initiation of criminal proceedings, guilty verdicts, and other characteristics related to the criminal justice system. However, these are all unique to each state, and this makes it difficult to compare states on the international level.
When developing the Corruption Perceptions Index (CPI), an attempt has been made to take into account the variances in the definitions of corruption and different cultural backgrounds. The composite index ranks countries based on how corrupt a country’s public sector is perceived to be, based on at least three surveys that are carried out by independent institutions (experts). The Corruption Perceptions Index was scored on a scale of 0 to 10, with 0 being highly corrupt. In
2.5CorruptionJüri Saar
Figure 2.5.1Perception of corruption in Estonia and reference countries, 2012
index
index 0 10 20 30 40 50 60 70 80 90
0 10 20 30 40 50 60 70 80 90
1
1
1
5
6
9
20
20
25
25
32
37
37
39
45
46
48
48
54
54
62 Slovakia
Latvia
Czech Rep.
Lithuania
Costa Rica
Hungary
South-Korea
Israel
Taiwan
Slovenia
Estonia
Ireland
Austria
Uruguay
Chile
Netherlands
Switzerland
Singapore
New Zealand
Finland
Denmark
Source: 2012 Corruption Perceptions Index

84 Estonian Human Development Report 2012/2013
2012, the scale for presenting the index was changed – a total clean country now collects 100 points, while a highly corrupt country collects 0 points.
Based on the results for 2012, the European states are essentially divided into two groups (see Figure 2.5.1). On one side, there are the Eastern and Southern Euro-pean countries, like Ukraine (index value of 26), Russia (28), Belarus (31), Kosovo (34), Moldova (36), Greece (36), Serbia (39), and Bulgaria (41). As a rule, the correspond-ing index values indicate a level of corruption in these states that is very perceptible. On the other side, there are presented the Western and Northern European countries like Denmark (index value of 90), Finland (90), Sweden (88) and Norway (85). In these countries, corruption is rated as minimal.
Examining the variation of corruption within the European Union, the resent study emphasize that the states that suffered the most from the last economic crisis are the ones that have a relatively high level of corruption. These countries include Greece (index
value of 36, and 94th place) and Italy (index value of 42, 72nd place). Corruption is seen as one of the reasons for the crisis, since the use of public finances was not sufficiently transparent, and this helped to hide the debt crisis that had been intensifying for a long time (Koch 2012).
Based on the newest Corruption Perceptions Index, Estonia places 32nd in the ranking, outpacing all the former socialist Eastern European states, not to mention the former Soviet republics (Figure 2.5.1.). Slovenia has been at more-or-less the same level with Estonia for many years. Compared to the other transition countries, Estonia represents a “corruption-related success story”.
Surveys of the elites organised in many transition states, at the turn of the century, showed that corruption is a relatively smaller problem in Estonia than it in the neighbouring eastern and southern states. In 2000, 51% of the members of the Estonian elite, who were polled, considered corruption to be a very significant problem. In Latvia, the corresponding indicator was 72%; in
2011 2010 2009 2008 2006 2004 2002 2000 1998
Scor
e
Rank
Scor
e
Rank
Scor
e
Rank
Scor
e
Rank
Scor
e
Rank
Scor
e
Rank
Scor
e
Rank
Scor
e
Rank
Scor
e
Rank
New Zealand 9.5 1. 9.3 1. 9.4 1. 9.3 1. 9.6 1. 9.6 2. 9.5 2. 9.4 3. 9.4 4.
Denmark 9.4 2. 9.3 1. 9.3 2. 9.3 1. 9.5 4. 9.5 3. 9.5 2. 9.8 2. 10.0 1.
Finland 9.4 2. 9.2 4. 8.9 6. 9.0 5. 9.6 1. 9.7 1. 9.7 1. 10.0 1. 9.6 2.
Sweden 9.3 4. 9.2 4. 9.2 3. 9.3 1. 9.2 6. 9.2 6. 9.3 5. 9.4 3. 9.5 3.
Singapore 9.2 5. 9.3 1. 9.2 3. 9.2 4. 9.4 5. 9.3 5. 9.3 5. 9.1 6. 9.1 7.
Norway 9.0 6. 8.6 10. 8.6 11. 7.9 14. 8.8 8. 8.9 8. 8.5 12. 9.1 9. 9.0 8.
Netherlands 8.9 7. 8.8 7. 8.9 6. 8.9 7. 8.7 9. 8.7 10. 9.0 7. 8.8 8. 9.0 8.
Australia 8.8 8. 8.7 8. 8.7 8. 8.9 7. 8.7 9. 8.8 9. 8.6 11. 8.3 13. 8.7 11.
Switzerland 8.8 8. 8.7 8. 9.0 5. 9.0 5. 9.1 7. 9.1 7. 8.5 12. 8.6 11. 8.9 10.
Canada 8.7 10. 8.9 6. 8.7 8. 8.7 9. 8.5 14. 8.5 12. 9.0 7. 9.2 5. 9.2 6.
Estonia 6.4 29. 6.5 26. 6.6 27. 6.6 27. 6.7 24. 6.0 31. 5.6 29. 5.7 27. 5.6 26.
Slovenia 5.9 35. 6.4 27. 6.6 27. 6.7 26. 6.4 28. 6.0 31. 6.0 27. 5.5 28. ? ?
Poland 5.5 41. 5.3 41. 5.0 49. 4.6 58. 3.7 61. 3.5 67. 4.0 45. 4.1 43. 4.6 39.
Lithuania 4.8 50. 5.0 46. 4.9 52. 4.6 58. 4.8 46. 4.6 44. 4.8 36. 4.1 43. ? ?
Hungary 4.6 54. 4.7 50. 5.1 46. 5.1 47. 5.2 41. 4.8 42. 4.9 33. 5.2 32. 5.0 33.
Czech Republic 4.4 57. 4.6 53. 4.9 52. 5.2 45. 4.8 46. 4.2 51. 3.7 52. 4.3 42. 4.8 37.
Latvia 4.2 61. 4.3 59. 4.5 56. 5.0 51. 4.7 49. 4.0 57. 3.7 52. 3.4 57. 2.7 71.
Slovakia 4.0 66. 4.3 59. 4.5 56. 5.0 52. 4.7 49. 4.0 57. 3.7 52. 3.5 52. 3.9 47.
Italy 3.9 69. 3.9 67. 4.3 63. 4.8 55. 4.9 45. 4.8 42. 5.2 31. 4.6 39. 4.6 39.
Romania 3.6 76. 3.7 69. 3.8 71. 3.8 70. 3.1 84. 2.9 87. 2.6 77. 2.9 68. 3.0 61.
Greece 3.4 80. 3.5 78. 3.8 71. 4.7 57. 4.4 54. 4.3 49. 4.2 44. 4.9 35. 4.9 36.
Bulgaria 3.3 86. 3.6 73. 3.8 71. 3.6 72. 4.0 57. 4.1 54. 4.0 45. 3.5 52. 2.9 66.
Russia 2.4 143. 2.1 154. 2.2 146. 2.1 147. 2.5 121. 2.8 90. 2.7 71. 2.1 82. 2.4 76.
Table 2.5.2Assessment of the level of corruption in the less corrupt states in the world, in the post-Communist transition states, and in some Southern European states; and the change in Estonia’s position in the ranking of the states, 1998-2011 (Corruption Perceptions Index (CPI) on a ten-point scale, with 10=clean; ranking based on 2011)
Source: Global Corruption Reports 1999-2011 (www.transparency.org)

85Estonian Human Development Report 2012/2013
References1. 2012 Corruption Perceptions Index – www.transparency.org/
policy_research/surveys_indices/cpi/2012/results
2. GRECO 2012 – http://www.korruptsioon.ee/greco
3. KARKlinS, R. (2005). The System Made Me Do It: Corruption in Post-Communist Societies. Armonk, NY, London: M.E. Sharpe.
4. KoCH, A. (2012). Corruption Perceptions Index 2012 and the European Financial Crisis. http://www.transparency.org/pol-icy_research/surveys_indices/cpi/2012/results
5. liPSet, S., lenz, g. (1999). Corruption, Culture, and Markets. Manuscript, George Mason University, Arlington, VA.
6. Mauss, M. (2000/1924). The Gift: The Form and Reason for Exchange in Archaic Societies. New York: W.W. Norton.
7. Nations in Transit 2012 – www.freedomhouse.org
8. SAndHoltz, w., tAAgePeRA, R. (2005). “Corruption, Culture, and Communism,” International Review of Sociology, 15, 1, 109-131.
9. Steen, A. (2004). “How Elites View Corruption and Trust in Post-Soviet States,” Global Corruption Report 2004: Special Focus: Political Corruption. London; Sterling, VA: Pluto Press /Transparency International.
Lithuania, 61%; and in Russia, 69%. In the global cor-ruption report compiled in 2004, a clearly more positive attitude toward public authority could be seen among the Estonian elite, as compared with Lithuania, Latvia and Russia. If 39% of the Estonian elite agreed with the statement that the representatives of public authority are dealing with their personal interests, in Russia, the respective indicator was 61%, in Latvia 55% and in Lith-uania 51% (Steen 2004).
When we examine the changes in Estonia’s posi-tion based on the corruption perception for the last ten years, we see a somewhat different picture. Esto-nia’s ranking in the corruption perceptions index list has constantly deteriorated during the named period (see Table 2.5.1). Estonia’s highest position was achieved in 2006 (24th place); then, we fell by three to four places; remained there; and declined again, during the last two years. During the last six years, Estonia’s position has worsened by eight places. Based on the corruption per-ceptions indicators, Estonia has not drawn closer to the Western and Northern European countries, but rather, decreased its gap with the former socialist states. A shift in the same direction is also occurring in the attitudes of the public toward the abuse of power in Estonia. The cases of political corruption, which have regularly been disclosed recently, have increased people’s concerns about political corruption and the transparency of governance.
The last two GRECO reports dealt with political corruption in Estonia. In 2008, the report included several proposals for improving oversight over political party financing. As of the beginning of 2012, of the eight recommendations regarding the regulation of the crimi-nalisation of corruption, five had not been implemented, two were partly implemented and one has been satisfac-torily implemented. In its newest report, which deals with
the prevention of corruption among parliament members, judges and prosecutors, GRECO made seven recommen-dations for improving the work of the Estonian Parlia-ment (Riigikogu). Among other things, the report dealt with establishing rules for people who try to influence the drafting of legislation, for the establishment of codes of ethics, for subsequent job restrictions for members of parliament and for the declaration of their economic interests (GRECO 2012).
2.5.2 SummaryAs compared to the majority of the former Eastern bloc countries, the extent of the corruption in Estonia has been assessed as rather modest. Estonia’s anti-corrup-tion strategy, are primarily concerned with simpler forms of corruption, the so-called “lower level” of corruption, i.e. activities which are mainly related to the honesty and transparency in business. If foreign companies, which represented the Western-style busi-ness and management culture, played a large role in the economic reorganisation, we were left, more or less, on our own, when it came to the development of the political culture.
The international organisations have repeatedly indicated to the danger of political corruption, the negative impact of which on the Estonian development has become increasingly evident in recent years. An essential role has also been played by our inexperience and the lack of a consistent policymaking tradition. We are often not able to see the importance of stability and ethical values in institutional activities, compared to personal gain and interests. Self-criticism is inhibited by the wrong habit of hiding any shortcomings behind a shiny façade.

86 Estonian Human Development Report 2012/2013
Controlling crime should be viewed as defending the fundamental values of a society. Being focused directly on criminal behaviour, both a secure social and a certain cultural environment is reproduced, while social capital is also being created. The civilising process is expressed in both the particularities of crime, as well as in the meth-ods for controlling crime: “today we may be living in the most peaceable era in our species’ existence”(see Pinker 2011, xix). The deepening, even fundamental, opposition to violence as a means of achieving goals is one of the “landmarks” of human development over long stretches of time. Below, we examine Estonia’s situation and the trends that have been expressed on three indicators that are usually used in the international comparisons of the level and control of crime. These are the homicide rate, the prison rate, and the population’s sense of security.
2.6.1 HomicidesDespite the variations of the definitions of homicides in various jurisdictions,1 this crime category has become the indicator that is compared by country – homicides per 100,000 inhabitants. The data for intentional homi-cides are characterised by a relatively small dependency on lawmaking, a low level of statistical manipulation by the states, a low rate of registration latency, and a high clearance rate. Therefore, comparing crime in different states by using intentional homicide statistics has become the tradition in criminology. The level of homicides has become the indicator in the most general social sciences approaches, where this crime category is used to assess the criminal situation and level of security, as well as to characterise human development. In a complex way, the frequency of intentional homicides is an expression of the violence in human relations, thereby reflecting the “sym-bolic value” of human life.
The UNODC (United Nations Office on Drugs and Crime) and WHO (World Health Organization) have the longest traditions in the collection and analysis of inten-tional homicide data. The UN relies on law enforcement (crime) statistics; the WHO relies on statistics related to the victims of violent crime. In addition, several regional/international organisations collect data on intentional homicides (e.g. Eurostat, UNICEF, and Interpol). When assessing the level of intentional homicides, sometimes, various indicators are combined in order to get a more complete picture. Since the principles for compiling statistics differ, the specific numbers may vary. In some
countries, there are great differences between healthcare data and crime data related to homicides.
According to UN statistics, the number of homicide victims in the entire world was about 490,000 people in 2004, which made the average indicator 7.6 homicides per 100,000 inhabitants (Geneva Declaration 2009). The level of homicides in Europe, Asia and North America are per-sistently relatively low, based on both the health statistics and criminal justice statistics. Central and South America, the Caribbean area, and South Africa are charac terised by higher rates. The corresponding indicators in these areas exceed the ones in Western Europe by 7 to 40 times (Malby 2009).
2.6Crime and the population’s sense of securityJüri Saar
Year
Number of homicides and
attempted homicides
Per 100.000 inhabitants
Number of victims*
1991 136 8.7 170
1992 239 15.6 302
1993 327 21.9 389
1994 365 25.0 426
1995 304 21.2 328
1996 268 18.9 293
1997 247 17.6 237
1998 248 17.9 267
1999 200 14.5 227
2000 189 13.8 190
2001 137 10.8 207
2002 155 11.4 159
2003 188 13.9 148
2004 127 9.4 109
2005 156 11.6 123
2006 119 8.8 99
2007 110 8.2 95
2008 104 7.8 91
2009 95 7.0 82
2010 84 6.3 64
2011 100 7.5 65
2012 80 6.0 57
Source: Police Board, since 2003, the Ministry of Justice. Statis-tics Estonia
Table 2.6.1Number of intentional homicides and rate per 100,000 inhabitants in Estonia, 1991–2012
1 In some states, for example, “killings of honour” are treated differently than other intentional homicides; in Finland, for instance, homicides that occur in the course of fights are not considered to be intentional homicides.

87Estonian Human Development Report 2012/2013
2.6.2 Intentional homicides in Estonia, 1991–2011A clear dynamic appears in the intentional homicides committed in Estonia, during the last 20 years of inde-pendence. The number of homicides increased sharply in the early 1990s, and achieved their maximum level in 1994, when 365 homicides were committed (25.0 per 100,000 inhabitants). In the mid 1990s, intentional homicides started to decrease steadily, and this general trend has not been disrupted by the temporary increases in particular years.
The level of intentional homicides committed in Estonia, in the 1990s, attracted international atten-tion, because, based on this indicator, Estonia ended up among the states that are known for the highest levels of violence in the world. Based on the 1994 data of the UN Demographic Yearbook, the four states in the world with the highest ratios of homicide victims were Colombia (89.6), Russia (30.3), El Salvador (28.1) and Estonia (25.8). The data on homicides, from 1994, was published in the 1999 UN Human Development Report. In it, Estonia (24.4) was in seventh position from the top, and placed higher than Russia (21.8). Without exception, the countries with higher inten-tional homicide rates were exotic Third World states (e.g. Jamaica with 27.1, The Bahamas, 85.5 and Leso-tho, 70.4).
Estonia’s position in the international homicide picture has for the present constantly improved on the global scale. Based on the newest statistical data, Estonia is among the states with below average homicide rates, being significantly behind such “top countries” like Hon-duras (82.1 per 100,000 inhabitants), El Salvador (66.0), and Jamaica (52.1). Since the countries of Western and Northern Europe are among those with very low homi-cide rates, Estonia’s rank against this background is still relatively poor (Table 2.6.2)
2.6.3 Number of prisonersThe number of prisoners per 100,000 inhabitants is a recognised indicator that is used as an input in global peace indices (see sub-chapter 2.9). This reflects the criminal situation and the government’s reaction to crime in a comprehensive way. The confinement becoming the main form of punishment, instead of various previously employed punishments (corporal punishment, death sentences) marked a turning point in the relations between people and the state. Today, in the Western world, imprisonment is considered to be a manifestation of state violence, and the rate of imprisonment demonstrates the readiness and capabil-ity of the government to legitimately employ violence in order to control crime. The number of prisoners has become an indicator of the type of human development and social cohesion, which is used for comparing states in more general social analyses.
There are several problems with international comparisons of the number of prisoners. The quality Source: UNoDC 2011
Figure 2.6.1Intentional homicides per 100,000 inhabitants in Estonia, 1991–2012
Table 2.6.2Homicides in Estonia and the reference countries
0
5
10
15
20
25
1991
1994
1997
2000
2003
2006
2009
2012
Inte
ntio
nal h
omic
ides
per
100,
000
inha
bita
nts
State
Homicides per 100,000
inhabitants
Number of vic-
tims
Year the data was collected
Austria 0.5 43 2009
Singapore 0.5 25 2009
Slovenia 0.6 13 2009
Switzerland 0.7 54 2009
Denmark 0.9 47 2009
Czech Republic 0.9 92 2009
Netherlands 1.1 179 2009
Ireland 1.2 53 2010
Hungary 1.4 139 2009
Slovakia 1.5 84 2009
New Zealand 1.5 65 2009
Israel 2.1 158 2010
Finland 2.3 121 2009
South Korea 2.9 1374 2009
Taiwan 3.6 832 2009
Chile 3.7 630 2009
Latvia 4.8 108 2009
Estonia 5.2 70 2009
Uruguay 6.1 205 2010
Leedu 7.5 252 2009
Costa Rica 11.3 527 2010

88 Estonian Human Development Report 2012/2013
of the population statistics varies from state to state. The definition of a prison also varies and the dividing line between a penal institution and a “non-prison”, between imprisonment and freedom, may be ambigu-ous (e.g. the “detention centres” in China or in North Korea). The alternative measures to imprisonment that are not used instead of incapacitation, but besides to imprisonment, increase the state’s control over individuals.
In 2010, there were more than 10.1 million prison-ers in the world’s prisons. The global ratio of prisoners per 100,000 inhabitants was 146. The prison popula-tions vary considerably, between various regions of the world. High prison rates are characteristic of South America (an average of 175), and especially states of the Caribbean region (an average of 357). Western Europe is characterised by very low numbers of prisoners (an average of 96), while in the states on the border between Europe and Asia, the average is higher – 228 (Walms-ley 2010). On the global scale, Estonia has an above average number of prisoners (254 per 100,000), and is among the countries that are the greatest implementers of imprisonment in the Western world. The states with the highest number of prisoners in the world are the United States (716), Rwanda (527), Cuba (510) and Rus-sia (493). Liechtenstein (28), Monaco (34), Iceland (47), Andorra (49) and Japan (55) are characterised by the lowest prison rates.
The Estonian crime control policy is characterised by the fact that the number of prisoners has remained at the same level, and relatively unchanged, throughout the period of independence.2 Since Estonia’s population decreased at the same time, the number of prisoners, per 100,000 inhabitants, was higher, in the second half of the 1990s, than in the first half.
We can speak about a reduction in the number of prisoners starting only in 2007, when the correspond-ing indicator was below 260 prisoners per 100,000 inhabitants. For example, the total number of prison-ers, on 1 January 2008, was 3,456, of which, 2,540 were imprisoned and 916 were remand prisoners. By 2011, the number of prisoners had stabilised at 3,400. This change – a 21% decline, compared to 2006 – is related to a corresponding focused effort in this field, but the number of prisoners, compared to the other democratic states of Europe, is still very high (Walms-ley 1996).
2.6.4 International crime victims surveys and the sense of security of Estonia’s population, 1993–2011The organising of international crime victims surveys, starting in the late 1980s, was prompted by great prob-lems in comparing crime in different states based on police statistics. Secondly, there was a need for an alter-native standardised means for measuring the spread of Source: World Prison Brief 2013)
Source: Ministry of Justice; Kuritegevus Eestis, Tavares & Thomas 2009
Costa Rica
Lithuania
Latvia
Taiwan
Chile
Uruguay
Estonia
Singapore
Czech Republic
Slovakia
New Zealand
Hungary
Austria
Ireland
South Korea
Netherlands
Switzerland
Slovenia
Denmark
Finland
0 50 100 150 200 250 300
0 50 100 150 200 250 300
prisoners
prisoners
Year Number of prisonersPrisoners per
100,000 inhabitants
1992 4408 281
1997 4638 316
2002 4775 350
2004 4565 338
2006 4310 320
2007 3456 258
2008 3656 257
2009 3555 272
2010 3393 253
2011 3400 254
2012** 3371 252
Figure 2.6.2Number of prisoners per 100,000 inhabitants, in Estonia and the reference countries
Table 2.6.3Number of prisoners and prison rate in Estonia, 1992–2012
2 The number of prisoners in Estonia, during the Soviet occupation, exceeded 8,500 in the middle of the 1980s, which is more than 550 prisoners per 100,000 inhabitants. At that time, this did not include military or several other categories of detainees. See: Saar 1996. “Penal Policy: International Trends and Estonia,” Juridica International. Law Review. University of Tartu, pp. 62-68.

89Estonian Human Development Report 2012/2013
crime. And thirdly, there was a wish to promote a vic-tim-based way of thinking, throughout the world (Zwekic 1998). The International Crime Victims Survey (ICVS) data collections are organised in five waves in many states. If, in the beginning, the survey focused, primarily, on the developed industrial states (Western European countries, U.S., Canada, Japan, etc.), since the 1990s, the survey includes the majority of the Eastern European states, as well as several Central and South American, African and Asian states. In the last survey (ICVS-5), organised in 2004-2005, the residents in 30 states, and 33 large cities in these states, were surveyed (Van Dijk, van Kesteren, Smit 2008).
People’s fear of crime, their sense of security has been one of the most important topics in international victims surveys, and a phenomenon that is systematically examined (Ditton, Farral 2000). Researchers refrain from associating the level of the sense of security with the fear of falling victim to crime and see it more as an emotion that reflects a general attitude – whether people feel safe or not. People’s sense of security also reflects the trust in the state and its institutions, and whether people believe in the ability of the state to establish order, and ensure a favourable living environment, or not.
The sense of security has been studied in all the international crime victims surveys that have been organised to date, which were conducted in 1993, 1995, 2000, 2004 and 2009. The following standard question was asked to determine the respondent’s fear of crime: “How safe do you feel, walking alone, in your neighbourhood, after dark?” This standard question as tool is based on the assumption that a sense of security is more of an emotional reaction to the entire societal situation, rather than the result of a rational calcula-tion. Secondly, it was assumed that fear is experienced most intensively when walking on the street alone, at night, when the risk of falling victim to crime is rel-atively high. Thirdly, the standard question is used to get a comparative indicator, both geographically, and
for time series. Essentially, a similar indicator question is asked in the World Gallup survey, which allows the results to be extensively compared.
Based on the victims survey data for 1993, the sense of security, among Estonia’s population, was divided, approximately, in half. 49% of the respondents felt unsafe when walking alone on the street, in the dark, and 51% felt safe (Ahven, Tabur, Aromaa 2001). Since that time, the percentage of people who feel safe has increased. By 2004, 68% of the respondents felt totally or quite safe in their neighbourhoods, in the dark, and 32% felt very uncertain (Saar et al. 2005). Based on the most recent, 2011, survey, the proportion of respondents who felt safe, had increased to 72% (Kuritegevus Eestis 2011). Therefore, since the time when the first international victims survey was con-ducted, the fear of crime, among the Estonian population, has significantly and constantly decreased, and the sense of security, assessed on the basis of the aforementioned indicator, has increased (see Figure 2.6.3).
The percentage of positive answers to the question, “How safe do you feel, walking alone, in your neighbour-hood after dark?”
When comparing the indicators related to the sense of security of Estonia’s population to the other European states, we see that we are among the countries with a somewhat higher than average fear of crime. The most recent World Gallup survey, for which the results are available, places Estonia in a relatively modest position.
Figure 2.6.3Growth of the sense of security of Estonia’s population, 1993–2011.
0
10
20
30
40
50
60
70
Feel
s saf
e on
a da
rk st
reet
(%)
2011
2010
2009
2004
2000
1995
1993
Source: World Gallup 2012
Lithuania
Costa Rica
Latvia
Uruguay
Chile
South Korea
Estonia
Hungary
Czech Republic
Slovakia
Taiwan
New Zealand
Ireland
Finland
Netherlands
Denmark
Austria
Slovenia
Singapore
Percentage 0 10 20 30 40 50 60 70 80 90
Percentage 0 10 20 30 40 50 60 70 80 90
Figure 2.6.4The sense of security of population in Estonia and the reference countries

90 Estonian Human Development Report 2012/2013
The sense of security of Estonia’s population is higher than in the other Baltic states, but is lower than in the welfare states.
In the 2011 World Gallup survey, the results of which were published in August 2012, the answer options were only “yes” or “no”, and therefore, the results differ from the data of the victims survey mentioned above. However, it still enables us to compare the sense of secu-rity in Estonia with the reference states (Figure 2.6.4).
The institutional basis for the increasing of the sense of security is the existence of the strong rule of law. Based on a comparison of the world’s states, and on the develop-ment level of the rule of law, Estonia gets relatively good marks. Compared to the other post-Communist states, and the more successful transition states in Latin Amer-ica, the development level of the rule is better, and closer to the Nordic model. However, based on specific indica-tors, we still have room for improvement (Figure 2.6.5). This pattern is characterised by transparent governance, protection of the citizenry’s fundamental rights, law enforcement authorities with good reputations, a low level of corruption related to the public authority, clarity related to the limits of executive power, independent over-sight of the lawfulness of the execution of power, and the law obedience of officials and the population.
There is no automatic connection between the insti-tutional development of the rule of law and the popula-tion’s sense of security. In the case of the sense of security, an important role is played by factors related to the social and material environment, starting from family relations and the general behavioural culture, and ending with street lighting.
2.6.5 SummaryIn Estonia, the highpoint in intentional homicides occurred in the middle of the 1990s, and thereafter, the homicide rate has constantly decreased. However, the indicator still differs significantly from Western Europe
and the Nordic countries. If the current developments continue, the number of violent crimes in Estonia should continue to decrease and attain the level that is character-istic of those states.
Despite the efforts that have been made, the number of prisoners, which forms the basis for the assessments of Estonia’s crime control policy, has not declined sufficiently enough to bring Estonia into line with Western Europe and the Nordic countries. Based on prison rates, i.e. the organisation of their crime control policies, the Baltic states, including Estonia, are located between two large regions – between two socio-cultural spaces. In some sense, in this field of activity, clear and unambiguous choices have not been made between an Eastern and Western orientation – choices that have been made successfully in many other spheres of social life.
The dynamics of the sense of security in Estonia can be partly explained by the improvement in the crime situation generally, and by an increased trust in the police and other law enforcement institutions. The increase in the sense of security, and the reduc-tion in the fear of crime, reflect the growth of people’s social and economic wellbeing, which has taken place in Estonia during the last 20 years. The population’s assessments have changed in time, and have become increasingly similar to those of the old European Union states, but still differ.
Based on the organising of its legislation, and the maintenance of public order, Estonia has approached the rule of law model prevalent in the Nordic countries, and has moved further away from the model which exists in the majority of the post-Communist countries. The relatively low level of our population’s sense of security indicates that there is a need to devote more time to dealing with violence and aggression in human rela-tions, as well as with environmental security at work, in school and in public places. A separate problem is the proper assessment and prevention of the possible dangers and risks.
Finland Austria Estonia Czech Republic Hungary
Deve
lopm
ent f
acto
rs
Criminal rightsCivil rightsObedience to the law
Transparent governance
Protection of fundamental rights
Order and security
Elimination of corruption
Restrictions on the power of the government
0,0
0,2
0,4
0,6
0,8
0,1
0,3
0,5
0,7
0,9
0,0
0,2
0,4
0,6
0,8
0,1
0,3
0,5
0,7
0,9
Figure 2.6.5Development factors related to the rule of law in Estonia and some reference countries
Source: World Justice Project (WJP) Rule of Law Index 2012

91Estonian Human Development Report 2012/2013
References1. AHven, A. & tABuR, l., ARomAA, K. (2001). Victims of Crime
in Estonia. Research Report. Ministry of the Interior, Estonia, National Research Institute of Legal Policy, Finland, Research Communications 51. Tallinn–Helsinki.
2. demogRAPHiC yeARBooK oF tHe united nAtionS 1994 (1996). United Nations, New York.
3. Ditton, J., Farral, S. (eds.) (2000). The Fear of Crime. Dartmouth: Ashgate.
4. Geneva Declaration 2009. Global Burden of Armed Violence Report, Geneva Declaration Secretariat.- http://www.genevadec-laration.org/publications.html
5. ICPS World Prison Brief-Entire World – Prison Population Rates per 100,000 of the national population. http://www.prisonstudies.org/info/worldbrief/wpb_stats.php?area=all&cate-gory=wb_poprate
6. KuRitegevuS eeStiS 2011 (2012). Kriminaalpoliitka uuringud 16. Tallinn: Ministry of Justice
7. vAn diJK, J.J.m., vAn KeSteRen, J.n. & Smit, P. (2008). Criminal Victimisation in International Perspective. Key findings from the 2004–2005 ICVS and EU ICS. The Hague: Boom Legal Publishers.
8. mAlBy, S. (2009). “Homicide,” International Statistics on Crime and Justice (Ed.) Harrendorf, S., Heiskanen, M., Malby, S. HEUNI Report Series 64. Helsinki.
9. PinKeR, S. (2011). The Better Angels of Our Nature. Why Violence Has Declined. New York: Viking.
10. SAAR, J. (1996). “Penal policy: International trends and Estonia,” Juridica International: Law Review University of Tartu, 62–68.
11. SAAR, J., mARKinA, A., oole, K. & ReSetniKovA, A. (2005). “Rahvusvaheline kuriteoohvrite uuring Eestis 2004,” Kriminaal-poliitika uuringud 1. Institute of Law at the University of Tartu, Ministry of Justice, Ministry of the Interior. Tallinn.
12. tAvAReS, C. And tHomAS, g.(2009). Eurostat Statistics in Focus, 36/2009 – http://epp.eurostat.ec.europa.eu/cache/ITY_OFFPUB/KS-SF-09-036/EN/KS-SF-09-036-EN.PDF
13. UNDP Human Development Report 1999. - http://hdr.undp.org/en/reports/
14. unodC (2011). 2011 Global Study on Homicide. Trends, Con-texts, Data. http://www.unodc.org/documents/data-and-analysis/statistics/Homicide/Globa_study_on_homicide_2011_web.pdf
15. wAlmSley, R. (1996). Prison Systems in Central and Eastern Europe. Progress, Problems, and the International Standards. HEUNI, Publications Series, no 29, Helsinki.
16. wAlmSley, R. (2010). World Prison Population List (ninth edi-tion). International Centre for Prison Studies. – http://www.idcr.org.uk/wp-content/uploads/2010/09/WPPL-9-22.pdf
17. World Gallup 2012. – http://www.gallup.com/poll/156236/latin-americans-least-likely-worldwide-feel-safe.aspx
18. World Justice Project. Rule of Law Index 2012-2013. – worldjus-ticeproject.org/sites/default/files/WJP_Index_Report-2012_pdf
19. World Prison Brief 2013 - ICPS World Prison Brief-Entire World- Prison Population Rates per 100, 000 of the national population. http://www.prisonstudies.org/info/worldbrief/wpb_stats.php?area=all&category=wb_poprate
20. zweKiC, u. (1998). Criminal Victimization in Countries in Tran-sition. UNICRI Publication no. 61. Rome.

92 Estonian Human Development Report 2012/2013
The media environment and its changes are closely related to society and human development. The ability of society to broadly and quickly adopt to the newest media technologies depends on the economic development and wealth of the society, as well as on the characteristics of human capital – the general education level and openness to innovations. New media technologies, in turn, provide opportunities for the development of the economy and human capital, but present risks to the safety and wellbeing of people.
When weighing the opportunities and risks of the Internet, the policy documents and public discourses of the European Union Member States, and also of other states, focus primarily on children and young people – on a target group that eagerly uses new media technologies, but who is more vulnerable to the possible risks than adults. This sub-chapter also focuses, to a great degree, on the risk behaviour of children and young people, and the use of the opportunities provided by the new media environment, as well as on the parents concerning the ensuring of risk awareness and Internet safety. The main information comes from a representative study EU Kids Online, in the course of which, 9- to 16-year-old Internet users and one of their parents were interviewed in the autumn of 2010 in 25 European states (N=25,142) (EU Kids Online 2010). This is the largest scale and most thor-ough survey dealing with Internet use and online safety of European children, the data for which is freely avail-able through the UK Data Archive. The reports that have been compiled previously based on these same interviews (Kalmus et al. 2011; Livingstone et al. 2011) show that Estonia is, simultaneously, advanced and problematic – Estonian children rank highly in Europe for making use of online opportunities, as well as for experiencing the risks. In addition to the indicators specific to this field (percentage of daily Internet users, proportion of those who have experienced online risks, the risk awareness of parents), some general indicators of development (num-ber of expected years of education for children starting school, the Freedom of the Press Index) are also used in this sub-chapter, which enable Estonia’s position in the ranking of 25 states to be interpreted and explained.
2.7.1 Intensity of online use by children and parentsThe main measures of the adaptation to the new media environment, and the development of the information soci-ety, include the ratio of Internet users in the population and various groups, and the percentage of daily users among the Internet users. Based on these indicators, during the last few years, Estonian children have ranked very high among their European peers. For example, among the 25
Prop
ortio
n of
dai
ly u
sers
amon
g chi
ldre
n, p
erce
ntag
e
0 10 20 30 40 50 60 70 80 90
0 10 20 30 40 50 60 70 80 90
Estonia Norway
LatviaCzech FinlandNetherlands
DenmarkSweden
Austria
Belgium
IrelandGermany
Great Britain
France
SlovakiaRomania
Bulgaria
SpainItaly
Cyprus
Hungary
Poland
Portugal Greece
Turkey
0
20
40
60
80
10
30
50
70
90
Proportion of daily users among parents, percentage
2.7Children’s safety in the new media environmentVeronika Kalmus
Source: EU Kids online 2010
Figure 2.7.1Proportion of daily users among the 9- to 16-year-old Internet users and their parents in Europe (%)
Lower riskLower use: Some riskHigher use: Some risk Higher risk
Figure 2.7.2Classification of European states, based on Internet use and online risk experiences of 9- to 16-year-olds
Source: Livingstone et al. 2011: 41

93Estonian Human Development Report 2012/2013
states included in the EU Kids Online survey, Estonian children place third in daily online use, whereas, in 2010, 82% of Estonian children did not let a day go by without logging on at least once (Figure 2.7.1). Estonia, with the other new EU Member States, is in a group of countries in which the children are more active users of the Internet than their parents (upper triangle in Figure 2.7.1).
Although the generational gap in Estonia is not large, it differs significantly from all of the Nordic coun-tries, where parents are more active Internet users than their children. This creates better preconditions in those states for the parents to be aware of the online risks, and to be able to guide their children’s Internet use. However, it is still important to state that the generational gap in Estonia has decreased: if in 2005, 90% of 6- to 17-year-olds, and 83% of their parents, used the Internet (Special Eurobarometer 250); in 2008, the respective indicators were 93% and 92% (Flash Eurobarometer 248).
2.7.2 Children’s online risk behaviourIn international comparisons, Estonian children stand out for extremely risky online use. Based on the data of the EU Kids Online survey (Kalmus et al. 2011), Estonia leads the European ranking in young online bullies and excessive Internet users. Our children are the keenest to meet face-to-face with new acquaintances from cyberspace. In Estonia, there are more children whose personal information, which they have revealed online, has been misused. A quarter of our children have been bothered or upset by online expe-riences – in this regard, we lag only behind young Danes.
The EU Kids Online report (Livingstone et al. 2011) classifies European states, based on the indicators of chil-dren’s online use and risk experiences, into four groups (Figure 2.7.2). Estonia, along with three Scandinavian coun-tries and four new EU Member States, belongs to the cate-gory of higher use, higher risk. What development indicators at the macro level help to explain this grouping of states?
The multi-dimensional regression analysis used in the EU Kids Online report (Lobe et al. 2011) shows that the development of the state’s IT infrastructure does not influence the intensity of children’s online use, but, to a sig-nificant degree, is related to online risks . The level of chil-dren’s risk experiences tends to be higher in the countries where the percentage of broadband connections is larger, and where the Internet has expanded faster.1 This trend indicates that, in several European states (primarily Esto-nia, Norway, Sweden and Denmark), the development of the IT infrastructure and the intensity of children’s online use have outstripped the development of online safety.
Of the indicators of development at the macro level, an important role is played by the press freedom index2 (Figure 2.7.3). Estonia, along with the Nordic countries, Lithuania and the Czech Republic, belongs to the group of states, where the liberalism of the information environment is accompanied by a high level of online risk experiences.
Prop
ortio
n of
thos
e w
ho h
ave
expe
rienc
ed o
nlin
e ris
ksPress Freedom Index
0 5 10 15 20 25 30 35
0 5 10 15 20 25 30 35
Estonia
NorwayLithuania
Czech Republic
Finland
Netherlands
Denmark
Sweden
Austria
Belgium
Ireland
Germany
Great Britain
France
Slovakia
RomaniaBulgaria
SpainItalyCyprus
Hungary
Poland
PortugalGreece
40
60
30
50
45
65
35
55
Turkey
1 Measured in years that have passed since the moment when 50% of households had access to the Internet at home. The speed of Internet expansion, as well as the percentage of broadband connections, explain 6.2% of the variability in children’s online risk experiences at the state level (Lobe et al. 2011: 62–63).
2 The freedom of the press index explains 4.4% of the variability in children’s online risk experiences at the state level (Lobe et al. 2011: 60).
Sources: EU Kids online 2010; Reporters Without Borders 2009
Figure 2.7.3Proportion (%) of 9- to 16-year-olds in Europe who have experienced online risks by the Press Freedom Index, by country
Figure 2.7.3 shows that there are also states where a high indicator of freedom of information does not preclude safe Internet use by children. Great Britain deserves special attention – their press freedom index, development of the IT infrastructure and children’s intensity of Internet use considerably exceed the European average, but the rate of online risk experiences is lower than the average. An important role in this phenomenon is probably played by the fact that the relevant information has been distri-buted more extensively and longer and this has increased the awareness of online risks, and the skills to cope with them, among both children and parents.
2.7.3 Risk awareness of parentsIn the European context, Estonian parents stand out for their comparatively untroubled attitude toward the possi-bility of problems, including online risks, related to their children (Figure 2.7.4). Almost half (47%) of Estonian parents are not worried about any of the problems sug-gested by the aforementioned European survey; in Europe as a whole, only a quarter of the parents are unconcerned. In regard to such online threats as seeing inappropriate online content, and communicating with strangers, the percentage of risk-aware parents in Estonia is only about half of the European average.
Parents’ participation and the active mediation of their children’s Internet use are extremely important, and reduce the probability that children will experience some online risk (Dürager & Livingstone 2012). Against the background

94 Estonian Human Development Report 2012/2013
of the other states, Estonian parents are comparatively passive – similarly to several Eastern European states (for example Lithuania and Slovenia), both the supervision, and the setting of restrictions by parents is below the average for Europe. The passivity of Estonian parents is probably explainable by a low awareness of the risks and a generally liberal attitude toward their (children’s) information envi-ronment. Apparently, a role is also played by the aforemen-tioned generational difference in the intensity of Internet use, which may promote the impression that the “digital natives” do not even need the help of the older generation.
2.7.4 SummaryEstonia, along with Norway, Sweden, Denmark and several new EU Member States, belongs to the group of European states, where the development of the IT infrastructure and the intensity of children’s Internet use has outstripped the development of and policies to promote safe online behaviour. If, in the Scandinavian countries, the reason seems to be hidden in the states’ liberal information environ-ment, which apparently also reflects the domestic childrear-ing values and practices, in Estonia, and in the countries with cultures closer to ours in Eastern Europe (primarily Lithuania and the Czech Republic), other possible factors are the generational gap in Internet use and the low risk aware-ness of the parents. At a more general level, we can interpret the situation in Estonia and the other transition states as being a conflict between the super fast development of tech-nology and the media environment, and the ability of people to adapt and learn. The tensions and risks resulting from the different tempos of eco-technological and social trans-formation can be alleviated by political measures. It would be worthwhile for Estonia to observe the developments in Great Britain and Finland, as possible models, where, despite a high intensity of Internet use, and the existence of a liberal information environment, fewer children experience online risks than is the European average, or is lower than in the other Nordic countries, respectively. In the case of both states, a role is probably played by long-term and extensive publicity concerning this issue, and the importance of media education in school curricula. This sub-chapter was completed with the support of the Estonian Research Council project ETF8527 and the European Commission’s Safer Internet Plus project SIP-KEP-321803.
References1. düRAgeR, A., livingStone, S. (2012). How Can Parents Support
Children’s Internet Safety? London: LSE, EU Kids Online. http://www2.lse.ac.uk/media@lse/research/EUKidsOnline/EU%20Kids%20III/Reports/ParentalMediation.pdf
2. EU Kids Online 2010. – http://www2.lse.ac.uk/media@lse/research/EUKidsOnline/Home.aspx.
3. FlASH euRoBARometeR 248 (2008). http://ec.europa.eu/infor-mation_society/activities/sip/docs/eurobarometer/analyticalre-port_2008.pdf.
4. KAlmuS, v., KARu, K., KomP, l., Runnel, P., PRuulmAnn-vengeR-Feldt, P., SiiBAK, A., uguR, K. (2011). Riskid ja turvalisus inter-netis: Euroopa laste vaatenurk. Peamiste tulemuste eestikeelne kokkuvõte. Tartu: University of Tartu, Institute of Journalism and Communication. http://www2.lse.ac.uk/media@lse/research/EUKidsOnline/EU%20Kids%20II%20%282009-11%29/EUKidsExecSummary/EstoniaExecSum.pdf
5. livingStone, S., HAddon, l., göRzig, A., ÓlAFSSon, K. (2011). EU Kids Online Final Report. London: LSE, EU Kids Online. http://www2.lse.ac.uk/media@lse/research/EUKidsOnline/EU%20Kids%20II%20%282009-11%29/EUKidsOnlineIIReports/Final%20report.pdf
6. loBe, B., livingStone, S., ÓlAFSSon, K., vodeB, H. (2011). Cross-Na-tional Comparison of Risks and Safety on the Internet: Initial Analysis from the EU Kids Online Survey of European Children. London: LSE, EU Kids Online. http://www2.lse.ac.uk/media@lse/research/EUKidsOnline/EU%20Kids%20II%20%282009-11%29/EUKidsOnlineIIReports/D6%20Cross-national.pdf
7. Reporters Without Borders 2009 - http://en.rsf.org/press-free-dom-index—ZO09,1001.html
8. SPeCiAl euRoBARometeR 250 (2005) http://ec.europa.eu/infor-mation_society/activities/sip/docs/eurobarometer/eurobarome-ter_2005_25_ms.pdf.
Figure 2.7.4Parents of 9- to 16-year old children in Europe (%), who are concerned about the online risks related to their children (as a reference, the percentage of parents who are not worried about any problems)
Average
Lithuania
Hungary
Czech Republic
Austria
Estonia
Romania
Netherlands
Germany
Poland
Slovenia
Sweden
Denmark
Finland
Norway
Bulgaria
Belgium
Italy
Great Britain
Ireland
France
Greece
Turkey
Cyprus
Spain
Portugal
NoneHaving contact with strangers
Inappropriate online content
Percentage
Percentage 0 10 20 30 40 50 60 70
0 10 20 30 40 50 60 70
Source: EU Kids online 2010

95Estonian Human Development Report 2012/2013
The basis of representative democracy is trust. Ordinary citizens do not have to, or even wish to, deal with prob-lems related to the functioning of the state on an everyday basis – they delegate the representation of their interests to representative political bodies. Although the activities of states’ governments are assessed on the basis of various indicators (including democracy indices), one of the main components of good governance is the existence of a bond of trust with the citizens.
Of course, trust can also exist without the involve-ment of the citizens and without providing them with the opportunity to participate – this depends on the political culture of the specific country, the citizenry’s levels of education, organisation and readiness to participate in the development of the society. Today, the majority of democratic societies have reached a stage of development where information technology provides the citizens with the opportunity to stay updated on what’s going on in the country and to express their opinions. The society members’ levels of information and awareness have grown significantly; and the need and wish to participate in the state’s development has increased. If governments do not make a sufficient effort to involve the citizenry in policy-making, and do not take their opinions into consider-ation, this can lead to a protest mentality, and a declining of trust in state authority. Of course, the situation is exac-erbated by the fact that people’s socio-economic wellbeing worsens when uncertainty deepens about whether the bodies of power can cope with their assignments. If, in this situation, the bodies of power have an understanding of democracy that is limited to obtaining an authorisation of power, and feedback (reporting to, and communica-tions with, the electorate) is reduced to only regular elec-tions, political trust will start to erode.
2.8.1 Trust in state governance in Estonia and other European states The trust in state institutions among the citizens of the European Union Member States is regularly examined by the Eurobarometer.
The level of satisfaction with the state’s general devel-opmental trends is low in almost all of the EU states (slightly positive assessments can be found only Austria and Den-mark); however, in Finland, the Netherlands, Austria and Denmark, trust in the state’s leading political institutions is significantly higher than in the other states under obser-vation. It is noteworthy that the institutions that are closer to the citizenry, with which a personal contact exists (local bodies of power), are trusted more in all the states.
When comparing the old and new democracies (Figure 2.8.1.), we notice different patterns of trust, as well as various levels of trust. In the Nordic countries, with their strong democratic traditions, as well as in Austria and the Netherlands, trust in the parliament is higher than in the government, and there is no sharp difference between the trust in power at the national and local levels. At the same time, in Estonia, as in the other post-Communist countries, as a rule, trust in the local governments is much greater than in the institutions at the national level, whereas, there is more trust in the govern ment than in the parliament.
If, in Finland and Denmark, over 60% of the respon-dents trust the parliament, in Estonia, only a third of the
2.8Public assessments of the state’s development and trust in government institutionsJuhan Kivirähk, Marju Lauristin
Source: Eurobarometer 78
Government Parliament Local government
Percentage
Percentage 0 10 20 30 40 50 60 70
0 10 20 30 40 50 60 70
Czech Rep.
Slovenia
Latvia
Ireland
Lithuania
Hungary
Slovakia
Estonia
Denmark
Netherlands
Austria
Finland
Figure 2.8.1Trust in institutions, autumn 2012

96 Estonian Human Development Report 2012/2013
citizens do. In Lithuania, Latvia, Slovenia and the Czech Republic, only one in nine citizens trusts the parliament. Therefore, in Estonia, trust in both the government and the parliament is the highest of all the new EU Member States.
This picture can probably be explained by the exis-tence of different political cultures, including the under-standing of people living in the developed democracies that, regardless of the current difficulties that negatively impact the development of the state, the parliament and government are doing their best, and their actions are based on the interests of the people. However, in the Central and Eastern European states, thanks to extensive political alienation, distrust in political institutions pre-dominates.
Understandably, the trustworthiness of political insti-tutions is affected not only by the acuteness of the societal problems, but also by specific political circumstances and election cycles. It is quite usual that, after general elections, the trust in the newly elected parliament, and the govern-ment formed thereby, is high. However, during the term of office, this trust starts to decrease.
An example is the level of trust in the parliament and government, based on the monitoring of public opin-ion by the Public Opinion and National Defence Survey, between 2000 and 2012 (Figure 2.8.2). We can also see that, in addition to the election cycle, the trust ratings are also strongly impacted by the economic situation – the impact of the 2008 economic recession was revealed in the declining trust assessments. The recovery from the crisis was marked by a sharp increase in trust, which, however, turned into a steady decline, at the end of 2011.
From the graph, we can see that the rise and fall of the trust in political authority is related to the election cycles, as well as to large political crises and scandals (2001 – Laar’s picture scandal; 2004 – fall of the Res Publica government; 2007 – Bronze Night, which lead to
30
35
40
45
50
55
60
65
30
35
40
45
50
55
60
65
ParliamentGovernment
Trus
t, pe
rcen
tage
Oct 2
012
Mar 2
012
Oct 2
0 11
Sept
2010
Jan 2
010
May 2
009
Jan 2
009
Aug 2
008
Jan 2
008
Sept
2007
June
2007
Dec 2
006
Sept
2006
Oct 2
0 05
June
2005
Oct 2
004
June
2004
Oct 2
003
June
2003
Oct 2
002
June
2002
Oct 2
001
May 2
001
Oct 2
000
May 2
000
Figure 2.8.2Trust in the parliament and government, from 2000 to 2012
Source: Public opinion and National Defence poll
Source: Public opinion and National Defence poll
Oct 2
012
Mar 2
012
Oct 2
011
Aug 2
011
Sept
2010
Jan 2
010
May 2
009
Jan 2
009
Aug 2
008
Jan 2
008
June
2007
Dec 2
006
Estonians non-EstoniansEstonians non-EstoniansParliament:
Parliament:
Trus
t, pe
rcen
tage
0
5
10
15
20
25
30
35
40
45
50
55
60
65
70
75
0
5
10
15
20
25
30
35
40
45
50
55
60
65
70
75
Figure 2.8.3Trust of the Estonians and the Russian-speaking minority toward the parliament and government, from 2006 to 2012

97Estonian Human Development Report 2012/2013
a loss of trust among the Russian-speaking respondents; 2009 – impact of the economic crisis; 2012 – Reform Party financing scandal).
Estonia’s problem is the strong correlation between the trust assessments and the ethnic background of the respondents, which reflects the different attitudes of the Estonians and the Russian-speaking minority toward the Estonian state (Figure 2.8.3). It is also noteworthy that the Russian-speaking respondents demonstrated greater trust in the parliament than in the government, but the opposite is true of the Estonians, who trust the government more.
However, when comparing the changes in the trust in Estonia’s government, with that in the reference states, we see clearly that, despite the economic crisis, some governments retain the trust of the people and some do not (Figure 2.8.4). In the old democracies, the trust in the government has been declining steadily in Greece, but, in the Baltic Sea area, which is of interest to us, Denmark has turned out to be the most vulnerable. On the other hand, the ratings of the governments in Finland and the Nether-lands have turned out to be consistently high, regardless of the crisis. The trust level of Estonia’s government has remained higher than that of the other new EU Member States. Initially, the rapid recovery from the crisis raised the level of trust in the government, but in the autumn of 2011, this started to decline. It is worth observing how Slovenia and the Czech Republic, which, to date, have consistently outstripped Estonia in human and economic development, and have tried to maintain a “soft line” in their reform policies, have ended up in a serious crisis of trust, during and after the economic crisis.
Simultaneously with trust in the government (Figure 2.8.5), a change has also occurred in the trust in political parties, which has been lower than the trust in the government, and which declined, in many states, to below 10%, during the crisis. After the crisis, the trust in
political parties increased only in Finland and Denmark, and somewhat in Slovakia and Hungary, while, at the same time, the trust in the political systems of Slovenia and the Czech Republic were not able to recover, even by the end of 2012. In Estonia, the decline in the trustwor-thiness of the government, compared to 2010, has been faster and sharper than the reduction in the trustworthi-ness of the political parties, which, until 2011, remained higher than in the other Member States.
However, it can generally be stated that, regardless of the increase in public criticism, Estonia’s political system, which is based on representative democracy, has become more stable than in the majority of the other Eastern and Central European states. However, if we com-pare all the other European Union Members States with the problem child, Greece, the question develops, whether trust in the government, parliament and political parties has been decimated by the economic crisis, or is the rea-son why Greece actually cannot cope with its problems is the existence of a great deficit in social capital, and a total lack of trust.
2.8.2 Satisfaction with the functioning of democracy Trust in political institutions is an indication of how well democracy functions in the given state. Or, in other words, to what extent people perceive that the state authorities are capable of finding solutions to problems, while also considering the interests of various societal groups, in the process.
The following percentages of the citizens are sat-isfied with the functioning of democracy in their states: 90% in Denmark, 78% in Finland, 75% in the Nether-lands, and 70% in Austria. On the other hand, 76% of
2006
2007
2009
2010
2011
2012
2006
2007
2009
2010
2011
2012
2006
2007
2009
2010
2011
2012
2006
2007
2009
2010
2011
2012
2006
2007
2009
2010
2011
2012
2006
2007
2009
2010
2011
2012
2006
2007
2009
2010
2011
2012
2006
2007
2009
2010
2011
2012
2006
2007
2009
2010
2011
2012
Trus
t, pe
rcen
tage
GreeceNetherlandsDenmarkFinlandSloveniaHungarySlovakiaCzech RepublicEstonia
0
10
20
30
40
50
60
70
5
15
25
35
45
55
65
75
0
10
20
30
40
50
60
70
5
15
25
35
45
55
65
75
Figure 2.8.4Changes releated to trust in government, Estonia and the reference states, from 2006 to 2012
Source: Eurobarometer

98 Estonian Human Development Report 2012/2013
the citizenry in Lithuania, 73% in Slovenia, 70 % in the Czech Republic, Slovakia, and Hungary, 60% in Estonia and 55% in Latvia are not satisfied (Figure 2.8.6). Espe-cially noteworthy is the relatively positive assessment of the functioning of democracy in Latvia at the end of 2012, when, only a year ago, the majority of the people were deeply pessimistic when assessing the democratic development in their state, and its ability to cope with problems (see Lauristin, Vihalemm 2011). Despite their government’s drastic cutback policy, the belief of the cit-izenry in Latvia and Estonia has proven to be stronger during the crisis period than it has been in the Czech Republic and Slovenia, which have set examples for us in the democracy ratings. It can only be said that quite a large role is played therein by the freedom of the media, which allows for an honest and wide-ranging dissection of the scandals that inflame the public, and of the crit-ical problems in society, before they develop into waves of mass protest, as we have seen in Bulgaria, Hungary and also Greece.
2.8.3 Assessments of the state’s path of developmentIn Europe, there are few states, where, despite the crisis, the majority of the population is convinced that things are moving in the right direction in their country. When asked for an assessment of the current path of the state’s development, most of the opinions are critical. Only in Denmark and Austria, are there slightly fewer doubters than there are people who continue to believe that the country had chosen the correct path of development (Figure 2.8.7). The greatest doubts about the direction
2006
2007
2009
2010
2011
2012
2006
2007
2009
2010
2011
2012
2006
2007
2009
2010
2011
2012
2006
2007
2009
2010
2011
2012
2006
2007
2009
2010
2011
2012
2006
2007
2009
2010
2011
2012
2006
2007
2009
2010
2011
2012
2006
2007
2009
2010
2011
2012
2006
2007
2009
2010
2011
2012
Trus
t, p
erce
ntag
e
GreeceNetherlandsDenmarkFinlandSloveniaHungarySlovakiaCzech RepublicEstonia
0
10
20
30
40
50
60
70
5
15
25
35
45
55
65
75
0
10
20
30
40
50
60
70
5
15
25
35
45
55
65
75
Figure 2.8.5Changes related to trust in political parties in Estonia and the reference countries, from 2006 to 2012.
Source: Eurobarometer
Lithuania
Slovenia
Hungary
Slovakia
Czech Republic
Estonia
Latvia
Poland
Ireland
Austria
Netherlands
Finland
Denmark
Satis�ed Not satis�ed
Percentage 0 10 20 30 40 50 60 70 80 90
Percentage 0 10 20 30 40 50 60 70 80 90
Source: Eurobarometer 78, autumn 2012
Figure 2.8.6Satisfaction with the functioning of democracy in Esto-nia and the reference countries, 2012

99Estonian Human Development Report 2012/2013
of the state’s development are encountered in the Czech Republic, Slovenia, Hungary, Poland and Slovakia. Esto-nia’s public opinion, which, previously, differed signifi-cantly from that of Latvia and Lithuania, has now become quite similar, and public opinion, in Ireland, is similar to all three of them.
If we compare this, to the answers to the same ques-tions five years ago (2007), when the effects of the crisis were yet to be felt, we see that, at that time, the assess-ments of development were clearly optimistic. There were more supporters for the direction of development of the country, than there were doubters, in Finland, Denmark and Austria, as well as Estonia, Ireland and Slovakia. Of course, there are also exceptions like Hungary, were the assessments of the developmental path were low, for a long time; or Latvia, where, five years ago, the direction of development was assessed even more pessimistically, but now the percentage of optimists has increased slightly. Generally, it can be said that the crisis made the citizens of all the European Union states think about the possibil-ity of alternative development models.
However, the important question is whether the search for these alternatives takes place in a con-structive democratic atmosphere, where workable solutions are being sought, or the crisis mentality has deteriorated the belief in democracy, and this leads, not to new solutions, but to conflicts, which make it increasingly difficult to find solutions, and threaten the stability of the entire society.
2.8.4 SummaryIn conclusion, it can be said that trust in a state and its institutions is an important indicator, which expresses not only the reaction of the public to the events and scandals occurring in the state, but also reveals the pub-lic’s more general attitude toward democracy, and their satisfaction with the general direction of development in the state. Trust in the state’s institutions is reflected, indirectly, in society’s cohesion, and its capability to cope with conflicts and crises, Therefore, a decline in trust can be seen as a dangerous symptom of the reduc-tion in that society’s stability. In international compari-sons, we see the following clear differentiation: on the one hand, are the Nordic countries and some other old democracies, where trust in the government and politi-cal parties, and the general assessment of the function-ing of democracy, has quite definitely endured the crisis; and on the other hand, are the countries, primarily in Central and Southern Europe, where the trustworthiness of the political system has suffered a serious decline as a result of the crisis, and therefore, the stability of the society has fallen into crisis. The fragility of the trust capital of young democracies is demonstrated by the
Czech Republic
Slovenia
Hungary
Slovakia
Lithuania
Poland
Latvia
Estonia
Ireland
Netherlands
Finland
Austria
Denmark
Development progressing in the right direction:2007 2012
Development progressing in the wrong direction:2007 2012
Percentage 0 10 20 30 40 50 60 70 80 90
Percentage 0 10 20 30 40 50 60 70 80 90
Figure 2.8.7Assessment of the direction of development in Estonia and the reference countries, 2007 and 2012
Source: Eurobarometer 68 and 78
References1. Public Opinion and National Defence poll – www.kmin.ee/et/
avalik-arvamus
2. Eurobarometer 68 – Eurobarometer 68: Autumn 2007. – ec.europa.eu/public_opinion/archives/eb/eb68/eb68_en.pdf
3. Eurobarometer 78 – Standard Eurobarometer 78: Autumn 2012.
– ec.europa.eu/public_opinion/archives/eb/eb78/eb78_first_en.pdf
4. lAuRiStin, m., viHAlemm, P. (2011). “Satisfaction with the Outcomes of Baltic Transition in Spring 2011,” Estonian Human Develop-ment Report 2010/2011. Tallinn: Estonian Cooperation Assembly
trajectory of the former success stories of the Czech Republic and Slovenia, during and after the crisis, when trust in the government and political parties has been steadily declining, falling below 10% of the population. Compared to these countries, Estonia’s democratic institutions have maintained a relatively good reserve of political trust, although the decline, during the last few years, is also cause for concern in Estonia, and the assessment of the correctness of the country’s direc-tion of development has decreased, more than twofold, within the last five years.

100 Estonian Human Development Report 2012/2013
2.9.1 Components and country comparisons of the Global Peace IndexThe following factors were taken into consideration when compiling the Global Peace Index: the militarism of the countries, defensive capability, level of crime and vio-lent conflicts, access to weapons in the population and the level of the country’s armament, risk of terrorism and foreign aggression, participation in peacekeeping missions, number of casualties in foreign conflicts. The 23 statistical indicators related to militarism, the risk of conflict, and instability; which reflect the security of a state, are recalculated into a 5-point scale and a general score for the peace index is computed on a 5-point scale based thereon. As background indicators, the Global Peace Index report also includes all the most important indicators for economic, human and democracy develop-ment, which enable the security of each country to be juxtaposed with its general level of development.
Based on the general Global Peace Index (GPI) score, the countries under examination are divided into five quin-tiles. In 2012, 158 countries were examined, slightly fewer than in previous years. The top ten secure states include the following: from Europe the Nordic countries, Austria, Ireland, Switzerland and the post-Communist countries of Slovenia and the Czech Republic; and Canada, New Zea-land and Japan of the non-European countries. The states with the highest peace ratings in the index are also among the best based on the indicators for democracy, human and economic development, and they are relatively corruption free. Based on the GPI, Estonia is in 41st place; a sharp
decline occurred after 2007 (see Table 2.9.1). Estonia’s 41st rank puts us in the second quintile, at the same level with France and the South Korea. All the new EU Member States, except for Latvia and Lithuania, placed ahead of Estonia. Of the European Union Member States, Greece is in the worst position. Russia is among the least secure states in the world, along with Pakistan, India, North of Korea, Israel and Iraq.
As we can see from the table, all reference states selected for comparison in this report besides the South Korea, and Estonia itself, are in the first quintile of the peace index, whereas seven of them are in the top ten.
Of the background traits, the following are important: the free flow of information, stable and functioning rule of law, relatively successful fight against corruption, relatively favourable business environment, and high education level.
Of the background traits, Estonia’s security has been damaged the most by the following: its limited success with integration, which is interpreted as a risk of eth-nic conflict; tense relations with Russia; and the limited cohesion of the society, which is expressed by inequitable access to resources.
2.9.2 External securityThe indicators that reflect external security comprise 40% of the Global Peace Index. These include the following: the state’s level of military spending; number of armed services personnel per 100,000 inhabitants, the state’s financial appropriations for participation in peacekeep-ing missions; number of heavy weapons per 100,000 inhabitants; export of conventional weapons per 100,000 inhabitants; evaluation of the state’s military capability; number of refugees and displaced persons as percentage of population; assessment of the relations with neighbour-ing states; participation in internal and external conflicts; and the number of deaths due to external wars.
The Bonn International Centre for Conversion (BICC) regularly compiles a Global Militarisation Index. Based thereon, the world’s most militarised state is Israel, and of the Baltic states, Estonia. Based on the data col-lected by the BICC in 2011, in the Militarisation Index, is positioned at 35th place right after Iran (34th place). One of the fundamental indicators of this index is defence spending as a percentage of GDP. For instance, according to this index, Latvia places 94th in the world and Lithua-nia places 60th, after Georgia. Based on defence spending, Finland is the 27th state in the world. The top ten are com-prised of Israel, Singapore, Syria, Russia, Jordan, Cyprus, Kuwait, Azerbaijan, Bahrain and Saudi Arabia.
2.9Estonia’s peacefulness and security in an unstable worldMarju Lauristin, Juhan Kivirähk
Positively: Negatively:
lack of domestic violent conflict; lack of political terror; participation in peacekeeping missions;training;lack of illegal weapons export; lack of refugees from country; improving domestic security.
level of perceived criminality in society;number of violent deaths and homicides; number of prisoners;demonstrations that have become violent; military capability; large percentage of defence expenditures per GDP, which reflects a feeling of military threat; insecure relations with neigh-bouring states.
What affects Estonia’s position in the security ranking of the world states?

101Estonian Human Development Report 2012/2013
In some sense this approach is misleading, as are many other indicators based on GDP. Since the index reflects defence spending as a percentage of GDP, the U.S., which contributes the most in the world to this field of activity with a defence budget totalling US$698 billion, is only in 30th position in this table. China’s US$129 billion defence budget puts it in second place after the U.S., but in this index it is in 82nd place.
In the Global Peace Index ranking, Estonia’s rating is influenced positively by its participation in peacekeeping missions, the small percentage of heavy weaponry and lack of weapons export, as well as the good training of its armed forces. However, Estonia’s position is impacted negatively by a low defence capability and relations with its neighbouring states in the external security field.
As is the case in all kinds of general indices, one should view these indicators with a bit of scepticism. If we look at the assessments in the indices related to mili-tary capability, we see that Estonia, Finland and Latvia have all merited an equal 3.0 points (the best is 1.0 and the worst is 5.0). However, for those familiar with the military capability of Finland, and for example Latvia, this assessment is definitely incomprehensible. True, Fin-land’s defence spending as a percentage of GDP is lower than Estonia’s, but the capability level of its regular forces and the existence of the largest reserve in the region have always been praised by military experts.
If we assume that Estonia and Latvia rise to an equal level with Finland thanks to their NATO membership, then the recently compiled Baltic Sea Report sees large qualita-tive differences in the capabilities of Estonia and Latvia.
It is also interesting to take a look at the assessment of the states’ relations with their neighbours. Estonia, Fin-land and Latvia all have Russia as their large neighbour. If in Finland’s case, relations with Russia get the best score (1.0), in Latvia’s case the rating is 2.0 and for Estonia 3.0. This understandably involves the quality of diplomatic relations. Therefore, in the case of this parameter, it is less the risk posed by the neighbour that is being assessed, and more the skill of the state to live securely next to this dangerous neighbour.
In the 2007 index, Estonia was given an assessment of 2.0. This subsequently worsened as a result of the Bronze Night. It can be expected that the developments in upcoming years will not provide a reason to assess Estonian-Russian relations as being any worse than Latvian-Russians ones.
With the size of its defence expenditures, regular armed forces and prepared reserves, Estonia is clearly positioned in the group of Nordic countries, which have rather large reserve forces that supplement their small pro-fessional forces. Actually, when speaking about the suffi-ciency of defence capabilities, there is always the question – Sufficient for what? The expenditures and other efforts (size of the reserve, nature and quality of the weaponry, diplomatic activities related to improving relations with neighbours, etc.) depend to a significant degree on the region where the state is located, and the environment that it must cope with. It is a fact that in order to ensure external security, Estonia must do more than many other states that are located in “more secure regions”.
Compulsory military service and a strong will to defend are factors that point, on the one hand, to strong
2012 2011 2010 2009 2008 2007
Iceland 1. 1. 2. 4. 1.
Denmark 2. 4. 7. 2. 2. 3.
New Zealand 2. 2. 1. 1. 4. 2.
Canada 4. 8. 14. 8. 11. 8.
Japan 5. 3. 3. 7. 5. 5.
Austria 6. 6. 4. 5. 10. 10.
Ireland 6. 11. 6. 12. 6. 4.
Slovenia 8. 10. 11. 10. 16. 15.
Finland 9. 7. 9. 9. 8. 6.
Switzerland 10. 16. 18. 18. 12. 14.
Belgium 11. 14. 17. 15. 15. 11.
Czech Republic 13. 5. 12. 11. 17. 13.
Sweden 14. 13. 10. 6. 13. 7.
Germany 15. 15. 16. 16. 14. 12.
Portugal 16. 17. 13. 14. 7. 9.
Hungary 17. 20. 20. 27. 18. 18.
Norway 18. 9. 5. 2. 3. 1.
Singapore 23. 24. 30. 23. 29. 29.
Poland 24. 22. 29. 32. 31. 27.
Spain 25. 28. 25. 28. 30. 21.
Slovakia 26. 23. 21. 24. 20. 17.
Taiwan 27. 27. 35. 37. 44. 36.
Netherlands 28. 25. 27. 22. 22. 20.
Great Britain 29. 26. 31. 35. 49. 49.
Chile 30. 38. 28. 20. 19. 16.
Romania 32. 40. 45. 31. 24. 26.
Uruguay 33. 21. 24. 25. 21. 24.
Costa Rica 36. 31. 26. 29. 34. 31.
Italy 38. 45. 40. 36. 28. 33.
Bulgaria 39. 53. 50. 56. 57. 54.
France 40. 36. 32. 30. 36. 34.
Estonia 41. 47. 46. 38. 35. 28.
South Korea 42. 50. 43. 33. 32. 32.
Lithuania 43. 43. 42. 43. 41. 43.
Latvia 45. 46. 54. 54. 39. 47.
Greece 77. 65. 62. 57. 54. 44.
USA 88. 82. 85. 83. 97. 96.
China 89. 80. 80. 74. 67. 60.
Georgia 141. 134. 142. 134.
India 142. 135. 128. 122. 107. 109.
Pakistan 149. 146. 145. 137. 127. 115.
Israel 150. 145. 144. 141. 136. 119.
North Korea 152. 149. 139. 131. 133.
Russia 153. 147. 143. 136. 131. 118.
Iraq 155. 152. 149. 144. 140. 121.
Sudan 156. 151. 146. 140. 138. 120.
Afghanistan 157. 150. 147. 143. 137.
Table 2.9.1The positions of Estonia and other states in the ranking of the Global Peace Index, 2007–2012
Source: http://www.visionofhumanity.org/gpi-data

102 Estonian Human Development Report 2012/2013
social cohesion, and on the other, to the potential threat of an external attack. In Estonia and Finland, there is strong support for the conscription of young men. However, conscription was eliminated in Latvia in 2008 based on the lack of public support for it. In addition to providing young men with military training, conscription is also seen as important for socialisation and the acquisi-tion of skills for coping in physically difficult and critical conditions.
A secure society relies on the awareness of the people and their trust in the states. A heightened sense of danger and uncertain outlooks for the future promote conflict and increase the insecurity of the society. One of the guarantees of security is definitely the internal social balance and resilience of a society. In addition to strength-ening the internal security of the state, social cohesion and public spiritedness also ensures the preparedness of the people to defend the state in case of military attack.
2.9.3 Positive Peace IndexIn 2012, the Institute for Economics and Peace developed an index of positive peacefulness (Positive Peace Index), which leaves out all the direct risk factors. The Positive Peace Index (PPI) includes the traits that characterise the attitudes of the population and the strength of the insti-tutions, which the authors believe reflect the capabilities and readiness of the states to ensure a peaceful society. These traits are combined into eight Pillars of Peace, which the authors believe contrast the very popular “con-flict-study” approach, which is focused, not on peace, but on factors related to violence and conflicts. These eight Pillars of Peace include a sound business environment, well-functioning government, equitable distribution of resources, free flow of information, low levels of cor-ruption, acceptance of the rights of others, high levels of education, and good relations with neighbouring states. The indicators that show the stability and peacefulness of these domestic and foreign policy processes enable a prognosis to be made of how stable and peaceful the developments in the state are, and how securely the citi-zens may view their future.
2.9.4 Estonia’s potential for developing into highly peaceful and resilient societyBy juxtaposing the Global Peace Index, which deals pri-marily with the strengths of the internal and external threats, with the Positive Peace Index, which summarises the strengths of stability and functionality, the creators of the peace indices have characterised the difference between the two as the state’s unused (+) or missing (-) resources for coping with tensions and conflicts, and the potential for building and maintaining a peaceful, stable and secure society. If we compare Estonia to the reference states from this point of view, we see that Estonia is a
society with a relatively large reserve of unused oppor-tunities for security. When analysing the ranking of the reference states in the table, we see that Estonia is charac-terised by great developmental potential in comparison to the other successful small states. This is demonstrated by the large difference between the modest level of achieved security (41st place in the GPI) and the preconditions for stable and secure development (21st in the PPI 21). From the table we can see that compared to the reference states, Estonia’s strengths include the free flow of information, high levels of education and relatively well-functioning government, but when compared to more successful examples, the weaknesses are related to the equitable distribution of resources and the levels related to justice, the business environment, good neighbourliness and corruption.
In conclusion, we can state that it would be feasible for Estonia to become a state that provides one of the most secure living environments, similarly to the Nordic countries. The key issue is the need to reduce the tensions resulting from the inequity of opportunities and ethnic heterogeneity of the population, and to get past the con-stant stress that is caused by the insecurity related to our large neighbour.
Percentage
Percentage 0 1 2 3 4 5 6 7 8
0 1 2 3 4 5 6 7 8
Costa Rica
Ireland
Austria
Switzerland
Hungary
Uruguay
New Zealand
Canada
Slovakia
Czech Republic
Netherlands
Denmark
Finland
Slovenia
Estonia
Chile
Poland
Taiwan
South Korea
Singapore
Israel
Figure 2.9.1Defence expenditures of Estonia and the reference states
References1. ieP (2010). Peace, Wealth and Human Potential. Discussion
Paper 2010. Institute for Economics and Peace.2. http://economicsandpeace.org/wp-content/
uploads/2011/09/2010-GPI-Discussion-Paper.pdf
Source: The Military Balance 2012

103Estonian Human Development Report 2012/2013
In this chapter, with the help of international comparisons, we have tried to clarify, how successful has been Estonia’s national development looking from the international perspective at the quality of its institutions which should guarantee implementation of democratic rule of law, create a secure living environment for the population and the conditions for the free and active participation in public life. To make sure that the assessment is realistic, it is nec-essary to consider the achievements of the last twenty years of independence as well as the problems that still await solution. The achievements can be seen more clearly by casting a glance at the past, when, together with the other nations that were freed from the oppression of communist regimes, we started to search for a path that would lead to the establishment of a democratic and sustainable society. In comparison to the parts of the former Soviet empire that are located to the east and south of us, the new European Union Member States have all been successful as transition countries. It is gratifying that, when we compare ourselves to them based on various indices, we receive confirmation of the relatively high capability of the Estonian state to ensure democracy, security and freedom.
As a result of our analysis, we can state that Estonian society has reached a level of social development, where the institutional mechanisms necessary for democratic rule of law are sufficiently secure and function relatively well. The comparison of Estonia with the reference states clearly showed that Estonia is at the forefront in regard to many areas of life and social organisation, but qualitatively, it is still relegated to the second league, compared to the European ‘old democracies’ which had enjoyed more comprehensive development. Estonia’s strengths include the stable function-ing of democratic institutions, relatively well-functioning rule of law, and a fairly secure, non-violent and open environ-ment, which promotes individual self- realisation, as well as the functioning of businesses and civil society organisations. Estonia’s privilege is good access to public information and unrestricted freedom of expression in both traditional and new media. The signs of success in fields such as the con-tainment of corruption and crime, and an increased sense of security are gratifying. However, the same worrying signs are repeated in all the generalisations based on various indi-cators that can summarised as follows: the legal, institutional and technological infrastructure is strong and relatively well-constructed, but the content that has developed in this framework – the way these institutions function – does not correspond to people’s expectations and demands. At the same time, there is no reason to be satisfied with the level of participation in public life, the activities of civil organi-
sation, or the level of tolerance concerning minorities and their readiness to contribute to the quality of the society. Therefore, the key issue is not the lack of institutions, but their quality. Having formally exited the status of post-Com-munist transition country, there is still plenty of room for improvement in Estonia’s political culture, trustworthiness of the state’s institutions, and the will of the citizens to par-ticipate before we arrive in the leading group of the world’s democratic states.
In the course of the global economic crisis, the ability of the states to quickly and effectively find a way out of critical situations and maintain social stability became very important. The economic crisis put all the states – both large and small – to the test. Many people assumed that the new democracies, whose economies and organisation of government are still on weak legs, would suffer the most. It has now become clear that the resilience of the states was not based on the length of their traditions, their affil-iation with Western or Eastern Europe, or the formal level of wealth measured by GDP per capita. The ability of the society to endure sudden changes and adapt quickly to the requirements of a harsher environment are based on public trust, on the belief of the legitimacy of the state’s institu-tions, on acting in a way that considers the public interest, on shared values and attitudes, and on common national accountability. And there is more of this social capital in a society that is cohesive, corruption-free and secure, and takes the interests of all its members into account.
The resilience of Estonia society has stood up well to the tribulations of the economic crisis, and proven the advantages of small states to the world: greater tenacity and the ability to react quickly. However, the crisis has also shown how quickly the success stories of some coun-tries can turn into declines. The danger signs for Estonia are the downward trend related to trust in the state’s institutions, a perception of corruption and disagreement with the state’s path of development, which has occurred during the last two years.
Taking a comparative look at our neighbours in the west and north, and matching our development opportu-nities with their templates, we see that Estonia is gradually approaching the balanced development model of the Nor-dic countries. However, we lag just as far behind when it comes to the fundamental functioning of the democratic rule of law, as we do in the level of our material wellbe-ing. Still, there is reason to state that the accomplishments realised during the building of the Estonian state and the increased will of the people to participate have created rather good preconditions for reducing this gap.
SummaryMarju Lauristin
3. ieP (2011). Structures of Peace. Institute for Economics and Peace.
4. http://economicsandpeace.org/wp-content/uploads/2011/09/Structures-of-Peace.pdf
5. ieP (2012). Institute for Economics and Peace. Global Peace Index 2012. http://www.visionofhumanity.org/globalpeacein-dex/2012-gpi-findings/
6. The Military Balance 2012; Published by Routledge for The International Institute for Strategic Studies. London 2012, 504 p
7. The Global Militarization Index (GMI), Bonn International Centre for Conversion, Occasional Paper February 2011, http://www.bicc.de/publications/publicationpage/publication/the-glob-al-militarization-index-gmi-use-of-the-gmi-for-evaluating-the-de-velopment-orientation-of/

104 Estonian Human Development Report 2012/2013

105Estonian Human Development Report 2012/2013
3 WELFARE AND THE QUALITY oF LIFEESToNIAN HUMAN DEVELoPMENT REPoRT 2012/2013
This chapter is dedicated to one of the most important goals of the economic and social development of society – the analysis of people’s welfare and quality of life.
The concept of welfare is multifaceted, and the fundamental meaning and measurement techniques vary according to the time period, as well as the disciplinary background and normative viewpoint of the researchers. The history of measuring welfare starts in the middle of the 20th century, when the welfare states of Western Europe were fully developed. The obligation of welfare states to help their populations cope with the compet-itive environment related to market economies entailed a system for comparing states by the size of the expen-ditures made for social policies, as a percentage of GDP. The analytical logic of the 1970s, i.e. the golden age of welfare states, was simple – the larger the percentage of GDP devoted to social costs, the better people’s welfare needs can be assured.
In the last decade of the 20th century, this way of thinking was subjected to increasing criticism. Firstly, it became clear that the changed economic structure and ageing populations do not enable the redistribution prin-ciples of the welfare states to be continued; and thus, sus-tainability and social interests increased in importance. Secondly, the measurement of social costs at the macro level of society (as a percentage of GDP) made it impos-sible to make an assessment of how individual people, or various social groups, are able to cope. Thus, the voices of those researchers who demanded that one must look beyond GDP, and consider other parameters, besides material ones, when measuring welfare, became louder. Thus, today’s indices of welfare and quality of life are complicated, and combine traditional indicators of eco-nomic wealth with social statistics, like those related to housing and the environment, to employment parameters and to civic engagement. The larger well-being indices, like the OECD’s Better Life Index and the EU Quality of Life Index, also encompass the people’s subjective assess-ment of their satisfaction with their lives and its quality.
Since its re-independence, Estonia has proceeded from the concept of market fundamentalism, according to
which, welfare is limited by the performance of the mar-kets and economy. At times, the public has regarded this orientation critically, and at other times, optimistically, but on the whole, always loyally. This has resulted in some of the lowest public sector social expenditures in the Euro-pean Union, and the solution of many social problems (primarily housing, but also healthcare, and care giving) by private means. The assessment of Estonia’s situation is complicated by the fact that the Nordic countries, with the world’s highest quality of life, as well as the post-Com-munist states of Eastern Europe, with the lowest quality of life in Europe, are both located in our vicinity. This creates a certain equivocation in Estonia, and among the people of Estonia, about how to define an adequate quality of life. We lag far behind some of the countries, and are far ahead of others. In this sense, Estonia’s situation could be compared to a cross-country skier who is left alone on the trail. He does not have to fear those who are coming from behind, but catching up to the leaders, seems to be unrealistic. Maintaining the correct tempo can be difficult, for both the athlete and the state. This chapter analyses how Estonia, with its contradictory welfare state structure and attitudes towards it, is positioned in the international rankings of well-being and the quality of life.
The presentation logic of the chapter moves from the macro level to the micro level (from the society to the individual), and from the classic approach to new meth-ods. The first sub-chapter examines the capability of all the states to ensure well-being based on the traditional perspective of economic wealth. The second sub-chapter analyses the distribution of wealth in the society and its impact on the equality and inequality of various groups. The third part provides an international comparison of subjective well-being and happiness, which is an approach typical of psychologists. The fourth sub-chapter focuses on measuring the quality of the new approaches to the quality of life, which integrates all the aforementioned aspects. And the fifth part forms a bridge to the next chap-ter, which is devoted to the economy, by demonstrating how people’s lifestyles and economic activities impact the welfare and quality of life in the society.
IntroductionAnu Toots
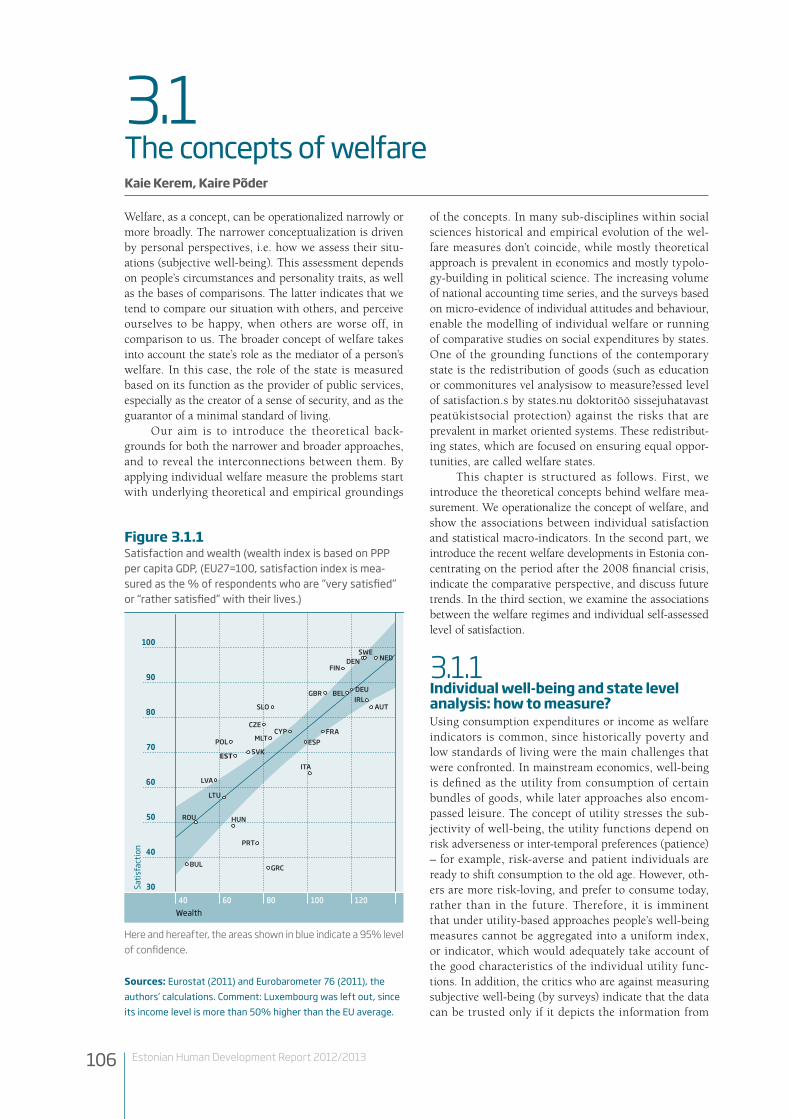
106 Estonian Human Development Report 2012/2013
Welfare, as a concept, can be operationalized narrowly or more broadly. The narrower conceptualization is driven by personal perspectives, i.e. how we assess their situ-ations (subjective well-being). This assessment depends on people’s circumstances and personality traits, as well as the bases of comparisons. The latter indicates that we tend to compare our situation with others, and perceive ourselves to be happy, when others are worse off, in comparison to us. The broader concept of welfare takes into account the state’s role as the mediator of a person’s welfare. In this case, the role of the state is measured based on its function as the provider of public services, especially as the creator of a sense of security, and as the guarantor of a minimal standard of living.
Our aim is to introduce the theoretical back-grounds for both the narrower and broader approaches, and to reveal the interconnections between them. By applying individual welfare measure the problems start with underlying theoretical and empirical groundings
of the concepts. In many sub-disciplines within social sciences historical and empirical evolution of the wel-fare measures don’t coincide, while mostly theoretical approach is prevalent in economics and mostly typolo-gy-building in political science. The increasing volume of national accounting time series, and the surveys based on micro-evidence of individual attitudes and behaviour, enable the modelling of individual welfare or running of comparative studies on social expenditures by states. One of the grounding functions of the contemporary state is the redistribution of goods (such as education or commonitures vel analysisow to measure?essed level of satisfaction.s by states.nu doktoritöö sissejuhatavast peatükistsocial protection) against the risks that are prevalent in market oriented systems. These redistribut-ing states, which are focused on ensuring equal oppor-tunities, are called welfare states.
This chapter is structured as follows. First, we introduce the theoretical concepts behind welfare mea-surement. We operationalize the concept of welfare, and show the associations between individual satisfaction and statistical macro-indicators. In the second part, we introduce the recent welfare developments in Estonia con-centrating on the period after the 2008 financial crisis, indicate the comparative perspective, and discuss future trends. In the third section, we examine the associations between the welfare regimes and individual self-assessed level of satisfaction.
3.1.1 Individual well-being and state level analysis: how to measure?Using consumption expenditures or income as welfare indicators is common, since historically poverty and low standards of living were the main challenges that were confronted. In mainstream economics, well-being is defined as the utility from consumption of certain bundles of goods, while later approaches also encom-passed leisure. The concept of utility stresses the sub-jectivity of well-being, the utility functions depend on risk adverseness or inter-temporal preferences (patience) – for example, risk-averse and patient individuals are ready to shift consumption to the old age. However, oth-ers are more risk-loving, and prefer to consume today, rather than in the future. Therefore, it is imminent that under utility-based approaches people’s well-being measures cannot be aggregated into a uniform index, or indicator, which would adequately take account of the good characteristics of the individual utility func-tions. In addition, the critics who are against measuring subjective well-being (by surveys) indicate that the data can be trusted only if it depicts the information from
3.1The concepts of welfareKaie Kerem, Kaire Põder
BEL
BUL
CZE
DEN
DEU
EST
IRL
GRC
ESPFRA
ITA
CYP
LVA
LTU
HUN
MLT
NED
AUT
POL
PRT
ROU
SLO
SVK
FIN
SWE
GBR
Satis
fact
ion
Wealth40 60 80 100 120
30
40
50
60
70
90
80
100
Sources: Eurostat (2011) and Eurobarometer 76 (2011), the authors’ calculations. Comment: Luxembourg was left out, since its income level is more than 50% higher than the EU average.
Here and hereafter, the areas shown in blue indicate a 95% level of confidence.
Figure 3.1.1Satisfaction and wealth (wealth index is based on PPP per capita GDP, (EU27=100, satisfaction index is mea-sured as the % of respondents who are “very satisfied” or “rather satisfied” with their lives.)

107Estonian Human Development Report 2012/2013
choices made, not what people say they would do. Since the concept of subjective well-being or utility lacks an explicit definition, then the design of the surveys also differs. However, the measurement of well-being based on surveys is a popular method for assessing people’s feelings, satisfaction and emotional states. In psychol-ogy, well-being is understood to be a combination of good feelings and coping (see also sub-chapter 3.3). Sociology and economics define material and spiritual coping as a precondition for well-being, rather than as a component. This measure of well-being could be treated as being satisfied with one’s life. According to some assessments, (an overview is provided by Ferrer-i-Car-bonell (2002)), the lack of a clear and unequivocal defi-nition for subjective well-being does not prevent the measurement of the same.
Figure 3.1.1 shows an association between the wealth of the state (GDP, per capita) and satisfaction with life – a unit increase in the wealth index is accompanied by a 3% increase in the satisfaction index. The wealthy Nordic countries – Finland, Sweden and Norway – are located above the regression line. The populations of these states are more satisfied than the average. Since this data dates from 2011, we see that the majority of the populations in the European states with economic difficulties (Greece, Italy and Portugal), as expected, are less satisfied, on average, than the wealth of the states would presuppose. Including these outliers, it shows that Estonia’s population, at its wealth level, is more satisfied than the average.
In 1974, Richard Easterlin wrote an article, which attracted little attention at the time, indicating that in international comparisons, the average reported level of happiness did not vary much compared to national income per person. Wealth and happiness are related (rich people tend to be happier than the average), but in the long term, the sense of well-being does not increase along with income. This observation is called the East-erlin paradox. Recently, numerous attempts have been made, in happiness studies, to disprove this paradox (e.g. Stevenson and Wolfers 2008; Deaton 2008). Using individual-based data, Di Tella et al. (2001) show that, if other conditions are equal, rich, educated, married, stu-dents, self-employed, and retired have a greater sense of well-being, as do women, and those who are really young or quite old (in the age-related dimension, the well-be-ing curve is U-shaped, where the bottom of the curve is reached when one is about 45 years old). Also the unem-ployed and divorced are unhappy, including those who live with teenagers. Therefore, there is a multiplicity of factors affecting happiness that are not related to material well-being.
Figure 3.1.2 shows the association between unem-ployment and satisfaction: one percentage point increase in the unemployment rate decreases satisfaction with life by 2.3 percentage points. In the case of Estonia, relatively high unemployment has a negative impact on life-satisfaction. Di Tella et al. (2001) indicates that, in high-unemployment countries people are unhappier than average, even when they themselves are not unemployed – apparently, the feeling of happiness is affected by the fear of becoming unemployed.
Thus, both the proponents and opponents of the East-erlin paradox may be justified, i.e. the complexity of the concept of well-being that contains not only monetary measure; freedom, a stable job, good health, etc. are also important (Granham 2010). Unfortunately, the latter are endogenous, which means that the wealthier countries have means to affect non-monetary well-being.
BEL
BUL
CZE
DEN
DEU
EST
IRL
GRC
ESPFRA
ITA
CYP
LVA
LTU
LUX
HUN
MLT
NED
AUT
POL
PRT
ROU
SLO
SVK
FINSWE
GBR
Satis
fact
ion
20
10
40
30
50
60
70
90
80
100
50 10 15 20Unemployment
BEL
BUL
CZE
DEN
DEU
EST
IRL
GRC
ESPFRA
ITA
CYP
LVA
LTU
LUX
HUN
MLT
NED
AUT
POL
PRT
ROU
SLO
SVK
FINSWE
GBR
Gini
Satis
fact
ion
25 30 3522,5 27,5 32,5
40
30
60
80
100
90
70
50
Sources: Eurostat 2011 and Eurobarometer 76 (2011), authors’ calculations
Figure 3.1.2Unemployment rate and life-satisfaction (% of the population that is satisfied with life)
Figure 3.1.3The relationship between income distribution (Gini coef-ficient) and satisfaction with life (% of the population that is satisfied with life), 2011
Source: Eurostat 2011 and Eurobarometer 76 (2011), authors’ calculations

108 Estonian Human Development Report 2012/2013
Although the Easterlin paradox has been questioned, the explanations behind it at the individual level are worth consideration. Namely, Easterlin asserts that people’s happiness does depend on their income level, but on its relative position. According to Easterlin and his propo-nents, people’s well-being depends, primarily, on how we position ourselves relative to others, or in comparison with some social norm. Justified envy can poison our sense of happiness. The latter refers to perceived injustice, i.e. when people believe that incomes vary not because of objective circumstances, like diligence, knowledge and abilities, but because someone was “at the right place at the right time” or knew the “right people”. Such justified envy generally reduces the sense of well-being. Some authors (Heliwell et al. 2012) call the opposite situation, i.e. the envy-free distribution of income, an institutional advantage, and conceptualise it as social trust.
Figure 3.1.3 shows association between income dis-tribution (Gini coefficient) and life-satisfaction in various countries. The correlation between the Gini coefficient (the closer to the 100% the greater is the income inequal-ity) and life-satisfaction is apparent. In the countries with greater income equality (e.g. Sweden, the Netherlands, and Finland), the people are more satisfied. Some of the post-Communist countries, like Slovakia and the Czech Republic, belong to the group of states with small income inequalities, but the satisfaction indicator in these coun-tries is below average (i.e. below the regression line). On the other hand, the life-satisfaction in Ireland and Great Britain is greater, despite a relatively high Gini coeffi-cient. These deviations from statistical regularity may be explained by the existence, or lack of, justified envy.
It is important to note that none of the aforemen-tioned analyses refer to a causal relationship between well-being and wealth (or unemployment), or between well-being and the income inequality (social trust). These
are correlations, or partial correlations, that do not allow us to ascertain what causes what. However, since the measurement of subjective well-being is complex, it may be reasonable to indicate well-being at the aggregate level by so called traditional measures, such as gross domestic product (GDP) and the Gini coefficient.
3.1.2 Welfare and the social protection expendituresThe extent of the state’s social protection expenditures is common for mapping aggregate welfare spending and indicating the intensity of the welfare state. Social protection expenditures (social expenditures hereinafter) include spending in following main areas of social policy: health, labour market programmes and unemployment, old age, education and the family. It is evident that a wel-fare state cannot be characterised only by the size of its social programmes.
In Europe, social spending-to-GDP ratios are 20% to 25%; in the emerging economies of Asia and South America, it is half of that. Although, in almost all of the reference states (except for Hungary), social expen-ditures, as a percentage of GDP, have increased after the recent crisis. However, the spending-to-GDP ratios do not increase only because real public expenditures (adjusted for inflation) have increased, but also because of the decline or slow growth of GDP. Estonia is a telling example of latter, while trends in GDP growth (decline)
t
Below average (5.7%)
Around average (5.7% to 14.2%)
Above average (14.2%)
Chan
ge in
real
soc
ial e
xpen
ditu
res
(201
1 co
mpa
red
to 2
007,
aver
age
0.7%
(S.D
. 8.5
%)
Above average (3.6%)
Poland, Sweden
Chile,Israel,Switzerland, South Korea
Around- average (-4.9% to 3.6%)
Austria, Denmark, Finland, Netherlands, Slovakia
New Zealand
Below average (-4.9%)
Hungary
Czech Republic, Estonia, Ireland, Slovenia
Table 3.1.1Change in real public social expenditures and the eco-nomic crisis – 2011 compared to 2007
Source: oECD, 2012
0 5 10 15 20 25 30-5
0 5 10 15 20 25 30-5
2007 2011 growth compared to 2007
Denmark
Finland
Austria
Slovenia
Netherlands
Ireland
Hungary
New Zealand
Czech Republic
Poland
Switzerland
Estonia
Slovakia
Israel
Chile
South Korea
Source: oECD, SoCX database
Figure 3.1.4The dynamics of social expenditures, from 2007 to 2011, in selected countries (% of GDP)

109Estonian Human Development Report 2012/2013
are more diverse than spending trends. Although the growth of Estonia’s social expenditures (see Figure 3.1.4) is one of the largest, in comparison to 2007 (in 2011, social expenditures were almost 19% of GDP), they are still below the OECD average (22%). Table 3.1.1 shows that the real growth of social expenditures in Estonia is about average, therefore, the increase in social expen-ditures, as a percentage of GDP, was caused primarily by a decline in GDP. Similar developments also char-acterise some of the Eastern European countries, such as the Czech Republic and Slovenia. The growth of real expenditures has been faster in Finland and Sweden, as well as in Poland and Slovakia. The Asian and South American countries, where national welfare expendi-tures have conventionally been low, also demonstrate rapid growth in both wealth and real social expendi-tures.Source: OECD, 2012
Estonia is below the OECD average in regard to almost all the social spending components (Figure 3.1.5), except for the pensions and family benefits. In terms of spending on the most vulnerable social policy area – cash benefits to older people – there is a large variation among OECD countries. Below, in the OECD average cases (e.g. U.S., Australia, and Canada), the private contributions (both mandatory and voluntary) play a relatively large role in total spending. Estonia’s gap, in regard to all the components of social spending, is especially large in comparison to the Nordic countries, while we do not differ much from the other transition countries, as well as emerging non-European welfare states.
The population structure is a key driver of social spend-ing, and thus Estonia’s future position also differs from Europe (Figure 3.1.5). Most of the European countries are rapidly ageing, (expected change in the number of elderly is more than a 50% in the next 10 years); in Estonia, the percentage of the elderly in the population is growing as well, but at a much slower rate (about 10% growth in the next 10 years) (OECD 2012). These demographic pres-sures impact not only cash in benefits, such as pensions, but also have a great effect on healthcare spending. To alleviate the ageing effects for several years the priority of Estonian social policy was to increase both voluntary and mandatory private contributions to social protection. Figure 3.1.6 indicates the lack of success in this effort – the small contribution (0.02% of GDP) made by the private sector to social expenditures is not even visible on Figure 3.1.6.
The total social expenditures (combined private and public expenditures) somewhat equalise the differences between the reference states, but worsen the positions
0 5 10 15 20 25 30
0 5 10 15 20 25 30
Pension Health Other social expenditures
Republic of Korea
Chile
Israel
Switzerland
Slovakia
Estonia
Poland
Czech Republic
New Zealand
OECD average
Hungary
Slovenia
Ireland
Finland
Austria
Netherlands
Denmark
0 5 10 15 20 25 30
0 5 10 15 20 25 30
Government Private
Denmark
Sweden
Belgium
Austria
Finland
England
Netherlands
USA
Japan
Ireland
OECD
Canada
Hungary
Slovenia
New Zealand
Poland
Czech Republic
Estonia
Slovakia
Switzerland
Israel
Chile
South Korea
Figure 3.1.5Public social spending on pensions, health and other policy areas, in percentage of GDP, in 2009
Source: oECD, SoCX database
Figure 3.1.6Total social expenditures as a percentage of GDP, com-parison of countries in 2009
Source: oECD, SoCX database

110 Estonian Human Development Report 2012/2013
of Estonia, and the other post-Communist countries. Although the low private contributions in the post-Com-munist cases have path-dependent historical consequences, it is still the lowest in Estonia (private voluntary and mandatory contributions in Estonia are 0.02%; 0.04% in Poland; 0.2% in Hungary; 0.9% in Slovakia; and 1.2% of GDP in Slovenia). As an illustration, Figure 3.1.6 also includes some liberal, or Anglo-American, welfare regimes, in order to emphasize the differences from the continental European model. In Japan, Canada, England, but especially the U.S., the private social spending comprises a large part of the total social expenditures (4%, 5%, 6% and 11% of GDP, respectively). Despite of the differences in private con-tributions Estonia and the Anglo-American countries are similar in terms of total expenditures – which stay below 20% of the GDP. Acknowledging the fact that the Esto-nian social policy simultaneously has low public and still non-existent current private contributions leads us to the conceptualising of welfare regimes typologies for realising future social policy alternatives. Although, during the last decade, social policy has been directed at increasing private share in social spending, moving toward Anglo-American social model has not been transparent and publicly recog-nized policy agenda.
3.1.3 Types of welfare states and their futureThe fundamental dilemma of a welfare state is the relationship between the market and the state. Public assistance and insurance are not the only objectives of the welfare state – it is rather the trade-off between effi-ciency and equity that is at the heart of many discussions addressing the attempts to classify welfare states. There is no single theoretical framework that gives justification to state intervention and its dimensions. . Without being exhaustive, one explanation for this is the concept of
social traps, i.e. a situation in which a group of people act to obtain short-term individual gains, which in the long run leads to a loss for the individual as well as for the group as a whole. The term “social traps” is the common generalised term for market failures. These failures are related to information traps (e.g. people underestimate the probability of becoming unemployed), externalities (e.g. the investments into the social and human capital of children, as future taxpayers, also benefit the childless) or the problem of “free riders”, where individuals lack the incentives to contribute to the provision of public goods. Since individual choices generally do not take social wel-fare into account, private spending in the markets with negative externalities is not efficient. However, these dif-ferent arguments are not sufficient for government inter-vention, it has to be confirmed that the correction itself is not going to produce even worse outcomes.
Therefore, the intervention of the state can be better justified by the social contract. It can be a Rawlsian veil of ignorance type of agreement – that relies on equality and justice as fairness principles. According to Rawls (1971), people would prefer the Difference Principle to regulate inequalities, which only permits inequalities that work to the advantage of the worst-off. Based on similar argu-ments, Dworkin’s (2000) justification for redistribution and egalitarianism is nested in the idea of an envy-free society (distribution of resources), which was briefly dis-cussed above. In both cases, the interventions are justi-fied, not only by lending a helping hand to the markets (protection of property rights, provision of law and order, correction of market failures), but also by the redistribu-
Liberal ConservativeSocial
Democratic
Com
mod
ifica
tion
High Medium Low
Stra
tifica
tion Dual:
policies targeted at supporting markets
High:opportunities depend on status
Low:policies targeted at equality
Refe
renc
e co
untr
ies USA,
Great Britain, New Zealand, Ireland
Germany, Switzerland, France, Austria
Sweden, Finland, Norway, Denmark
BELCZE
DEN
DEU
EST
IRL
GRC
ESP
FRA
ITA
LVA
LTU
HUN AUT
POL
PRT
SLO
FINSWE
GBR
USA
NOR
Social protection index (SWE=100)
Com
mod
i�ca
tion
inde
x (US
A=10
0)
4030 6050 8070 90 1000
20
10
40
50
70
90
110
30
60
80
100
Table 3.1.2Classification of welfare states
Source: Põder and Kerem 2011.
Figure 3.1.7Esping-Andersen’s typology and the post-Communist welfare states
Source: Table constructed by the authors, based on Esping-An-dersen 1990
Comments: the first two principal components have been used to compile indices from 16 different indicators that characterise wel-fare states. Pre-financial crisis data from 2000-2008, 22 countries.

111Estonian Human Development Report 2012/2013
tion agreed upon the social contract. Of course, such a social contract is only an ideal, which, in reality, is exe-cuted by the interests groups (social classes) in the polit-ical process of choice. In political economy, for instance, it has been argued that the “social contract” is more of a concession made by the ruling elite to the lower classes, in order to avoid major conflicts that could threaten the elite’s legitimate power. These concessions allow the elite to stay in power at the cost of redistribution.
There is a general consensus that welfare states pro-mote equity; but a similar consensus is lacking regard-ing economic growth and wealth. The main problem is – which parameters and criteria should be used to measure a welfare state. Starting with Esping-Andersen’s (1990) seminal typology three distinguished regimes are acknowledged which differ by the degree of decommodi-fication and the kind of stratification they produce in soci-ety. Decommodification occurs when a service is rendered as a matter of right, and when a person can maintain a livelihood without reliance on the market (Esping-An-dersen, 1990: 21-22). Stratification refers to the outcome of redistribution and the level of universality of solidar-ity that is imposed by the welfare state and it reflects inequality in society. Based upon these two dimensions Esping-Andersen distinguished between (a) liberal, (b) conservative-corporatist and (c) social-democratic welfare states (Table 3.1.2.)
Esping-Andersen believed that divergent “post-com-munist regimes” would shift towards some of the main welfare regime types after 15 years of transition (Esp-ing-Andersen 1996). This period was over for Baltics in about 2006. However, a puzzling phenomenon has emerged. Although “post-communist regimes” exhibit social expenditure well below those of the EU15, there has been no convergence (Draxler and van Vliet 2010), although the traditional social policy models in the West seem to be converging (Castles 2008; van Vliet 2010). Even if the transition period appeared to be longer than predicted due to some unanticipated path dependency, this phenomenon tends not to be present even in more recent studies (Ferge 2011, Põder and Kerem 2011, Drax-ler and van Vliet 2010, Fenger 2005).
At the same time, Aidukaite (2006) and Rys (2001) have stated that the differences among the post-Com-munist states are too great for a separate type to be conceptualised.
Our main finding (Figure 3.1.7) is that there is no convergence between the Nordic social-welfare system and the rest of the EU countries, including Estonia. According to two composite scores of “social protection” and “commodification” countries can be divided into two distinct ends: the Nordics with high ‘social protection’ and low “commodification” scores; and Liberals with the opposite characteristics. The Continentals and Mediterra-neans are positioning somewhere closer to the lower left corner, having lower “social protection” and “commodi-fication” scores than the Nordics. The Post-Communists have the lowest “social protection” scores, but at least, the Baltics have higher ‘commodification’ scores than Conti-nentals-Mediterraneans. It can be said that the Post-Com-munists have two possible development paths: the Conti-nental path or the Liberal (Anglo-American) path.
Estonia, along with Latvia and Lithuania, are in a specific position, having extremely low social protection scores and, as far as the risks related to the labour market are concerned, are more similar to such liberal welfare states like Ireland and Great Britain. Also, the literature refers to the fact that the initial historical context of the post-Com-munist states enabled them to build their welfare states based on solidarity, social dialogue and a striving towards greater equality (Hermann and Hofbauer 2007; Juhasz
BEL
BUL
CZE
DEN
DEU
EST
IRL
GRC
ESPFRA
ITA
CYP
LVA
LTU
LUX
HUN
MLT
NED
AUT
POL
PRT
ROU
SLO
SVK
FIN
SWE
GBR
40
50
70
90
30
60
80
100
Satis
fact
ion
Social expenditures15 20 25 30
BEL
CZE
DENDEU
EST
IRL
GRC
ESP FRA
ITA
HUN
AUT
POL
PRT
SLO FINSWE
GBRUSA
NOR
Pro-
soci
al b
ehav
iour
inde
x
Welfare state index
10
10
20
50
60
30
40
20 40 60 8030 50 70
Sources: Eurostat (2011) and Eurobarometer 76 (2011), author’s calculations
Figure 3.1.8Social expenditures (% of GDP) and life-satisfaction (% of the population that is satisfied with life)
Source: Põder and Kerem (2011) and oECD (2011)
Figure 3.1.9The extent of the welfare state and pro-social behaviour
112 Estonian Human Development Report 2012/2013
2006). Thus, it can be asked, are they are welfare states after all?
Comments: the first two principal components have been used to compile indices from 16 different indicators that characterise welfare states. Pre-financial crisis data from 2000-2008, 22 countries.
Figure 3.1.8 shows a positive connection between people’s subjective well-being (life-satisfaction) and social spending; the coefficient of the corresponding correlations is 0.53. However, this indicator lacks statistical signifi-cance, thus life-satisfaction is more associated with the equal division of wealth and income than previously (Figure 3.1.1. and 3.1.3.). Estonia’s position in this respect is similar to the majority of new EU Member States, which are characterised by lower social expenditures as well as lower level of satisfaction than that of old-Europe.
Thus, the generosity of the public welfare expen-ditures is not the single criteria for assessment the role and functions of the welfare state. Based thereon, we can say that the significance of a welfare state in the devel-opment of well-being is not dependent only on how gen-erously the state finances social protection. Firstly, the so-called social contract or legitimate agreement upon the ideal type of the social model or welfare regime has to be established. Secondly, the universality of benefits providing equal opportunities should be ultimate aim. It is often said that (in addition to efficiency loss) redistri-bution and a paternalistic state can crowd out incentives for individual coping and make us helpless. Testing the “crowding-out hypothesis” is problematic, thus, we ask whether individual pro-social behaviour is affected by the intensity of welfare state. We measure pro-social behaviour based on the OECD index (2011) that aver-ages the countries’ responses to three questions asked by Gallup World Poll (2010) – whether the respondent has volunteered time, donated money to a charity and helped a stranger in the last month. Figure 3.1.9 shows how pro-social behaviour is related to the extent of the welfare state, that is, with the average value of the social protection index and the de-commodification index depicted in Figure 3.1.7.
The crowding-out hypothesis – the belief that a high degree of government intervention will crowd out volun-tary activity is not supported by any empirical evidence or solid theoretical foundations (Van Oorshot and Arts 2005). We also indicate that in the comparison of at least 18 European states (see Figure 3.1.9), there is not direct association between the dimension of the welfare state and pro-social behaviour. The OECD report (OECD 2011) states that the Nordic countries, which are at the top of many social indicators in this publication, were unusu-ally ordinary performers in terms of pro-social behaviour, while the Anglo-American ones (U.S., Ireland and Great Britain) position much higher. The Mediterranean and Eastern European countries typically had low levels of pro-social behaviour that is also reflected in Figure 3.1.9. We show that the outperforming countries are divided into two groups: liberal and pro-social states plus abun-dant welfare and pro-social states. Sadly Estonian is posi-tioned at the lower end of the case countries -- with very limited welfare state and minimal pro-social behaviour. Conclusively, few illustrative facts that contradict some
theoretical frameworks allow us to allude to the country being at a crossroads. The welfare contributions by the state are not so limited that it would make people coop-eratively search for alternatives; but, these are also not enough to promote greater pro-social behaviour.
3.1.4 ConclusionsOur aim was to illustrate the associations between the indicators of subjective well-being, aggregate concepts of welfare, various economic indicators and parameters related to welfare states. However, correlation and associ-ation doesn’t imply causality. We find that the economic indicators that characterise the development of a state – GDP and growth, low unemployment and a low Gini coefficient can be associated with people’s life-satisfac-tion. The most influential of these is the Gini coefficient. The latter indicates that subjective well-being is not just efficiency and market (wealth) based concept, but rather on more complex phenomenon, which also contain broad questions about relative equality and equal opportunities. The greatest challenge, related to well-being, is the ques-tion of how to reduce the income gap, without signifi-cantly inhibiting efficiency (growth).
We also argue, that well-being and life-satisfaction indicators as aggregate indices are not replacements for GDP and the Gini coefficient, as measures of social progress. Primarily because happiness is relative. There-fore, when analysing happiness, relying on microdata is advisable and age, marital status, employment and other individual-based indicators must be controlled. It is also disputable whether all individuals perceive well-being similarly – is this rather security, personal freedom, or societal norms like equal opportunities. The standards for happiness and satisfaction may differ by culture, making international comparisons difficult.
There is no clear-cut answer to the question of whether public social spending also results in well-being. Since social expenditures are mostly endogenous (rich states can spend more) it is difficult to avoid a vicious cir-cle, in which poverty results in low social expenditures, which in turns lead to poverty. So far, political agendas have relied on one main trigger – efficiency – which leads to the economic growth. And it has been feared that the welfare state may inhibit growth. Estonia’s real social expenditures increased after the crisis, but the gap with the Nordic countries is still increasing. The question of whether to increase public social contributions, or rely on private ones instead is still open for Estonia. We believe that taking a position regarding the future is inevitable, that this firstly means agreement on the Estonian wel-fare state model. This could also help to break current vicious circle. This is a social contract. If it is decided that the Nordic model should be the goal, then increas-ing the state’s role is unavoidable, and the corresponding fiscal issues related to how to finance such a turn must be faced. If the goal is the Anglo-American vision, then the problem is not only incentivising private contributions for future provision of social services but also creating compensating schemes for disadvantaged families such as pensioners or lower-SES.

113Estonian Human Development Report 2012/2013
References1. AiduKAite, J. (2006). “The Formation of Social Insurance Insti-
tutions of the Baltic States in the Post-Socialist Era,” Journal of European Social Policy, 16 (3), 259–270.
2. Bonoli, g. (1997). “Classifying Welfare States: a Two Dimen-sional Approach,” Journal of Social Policy, 26 (3), 351–372
3. CAStleS, F.g. (2004). The Future of the Welfare States: Crisis Myths and Crisis Realities. Oxford: Oxford University Press
4. deAton, A. (2008). “Income, Health, and Well-Being around the World: Evidence from the Gallup World Poll,” Journal of Economic Perspectives, vol. 22, 53–72
5. di tellA, R., mACCulloCH, R. J.; oSwAld, A. J. (2001). “The Macroeconomics of Happiness,” Warwick Economic Research Papers, 615
6. dwoRKin, R.m. (2000). Sovereign Virtue: The Theory and Prac-tice of Equality. Cambridge, MA:Harvard University Press
7. dRAxleR, J., And vAn vliet, o.(2010). “European Social Model: No Convergence from the East,” Journal of European Integration, 32, 115–35.
8. eASteRlin, R. (1974). “Does Economic Growth Improve the Human Lot? Some Empirical Evidence,” Nations and Households in Economic Growth: Essays in Honour of Moses Abramovitz, Ed. P. David and M. Reder. Academic Press: New York and London
9. eSPing-AndeRSen, g. (1990). The Three Worlds of Welfare Capi-talism. Cambridge: Polity Press
10. eSPing-AndeRSen, g. (1996). “After the Golden Age? Welfare State Dilemmas in a Global Economy,” Welfare States in Transition. National Adaptations in Global Economies, Ed. Andersen, G. London: Sage
11. FengeR, m. (2005). Welfare Regimes in Central and Eastern Europe: Incorporating Post Communist Countries in a Welfare Regime Typology, NIG Annual Work Conference
12. FeRge, z. (2001). “Welfare and ‘Ill-fare’ Systems in Central-East-ern Europe,”, Globalization and European Welfare States: Challenges and Change, Ed. B. Sykes, B. Palier and M. Prior. Basingstoke: Palgrave
13. FeRReR-i-CARBonell, A. (2002). Subjective Questions to Measure Welfare and Well-being. Tinbergen Institute Discussion Paper. http://www.tinbergen.nl/discussionpapers/02020.pdf
14. FeRReRA, m. (1996). “The ‘Southern’ Model of Welfare in Social Europe,” Journal of European Social Policy, 6 (1), 17–37
15. FeRReRA, m. (2007). The European Welfare State. Golden Achievements, Silver Prospects. URGE Working Paper, 4
16. gRAHAm, C. (2010). Happiness Measures as a Guide to Develop-ment Policy? Promise and Potential Pitfalls. Bank-Fund ABCDE Conference, Panel on Measuring Welfare (GDP)/Happiness.Stockholm, Sweden, June.
17. Heliwell, J; lAyARd, R, SACHS, J. (2012). World Happiness Report. Earth Institute. CIFAR, 2012.http://earth.columbia.edu/sitefiles/file/Sachs%20Writing/2012/World%20Happiness%20Report.pdf
18. HeRmAnn, C., And HoFBAueR, i. (2007). The European Social Model: Between Competitive Modernisation and Neoliberal Resistance. Capital and Class: Conference Socialist Economist
19. JuHASz, g. (2006). “Exporting or Pulling Down? The European Social Model and Eastern Enlargement of the EU,” European Journal of Social Quality, 6 (1), 82–108
20. oeCd (2012). Social Spending after the Crisis, Social Expenditure (SOCX) Data Update 2012. www.oecd.org/els/social/expenditure.
21. oeCd (2011). “Pro- and Anti-social Behaviour,” Society at Glance 2011: Social Indicators, OECD Publishing
22. PõdeR, K., KeRem, K. (2011). “Social Model in a European Comparison; Convergence or Divergence,” Eastern European Economics, 49 (05), 55–74.
23. RAwlS, J. A. (1971). Theory of Justice, Harvard University Press.
24. RyS, v. (2001) “Transition Countries of Central Europe Entering the European Union: Some Social Protection Issues,” Interna-tional Social Security Review, 54 (2–3), 177–189.
25. StevenSon, B., wolFeRS, J. (2008). “Economic Growth and Subjec-tive Well-Being: Reassessing The Easterlin Paradox,” NBER Work-ing Papers 14282, National Bureau of Economic Research, Inc.
26. vAn ooRSCHot, v., ARtS, w. (2005). “The Social Capital of Euro-pean Welfare States: The Crowding Out Hypothesis Revisited,” Journal of European Social Policy, 15, 5–26.
27. vAn vliet, o. (2010). “Divergence within Convergence: Euro-peanisation of Social and Labour Market Policies,” Journal of European Integration, 32(3), 269–290.

114 Estonian Human Development Report 2012/2013
The inequality in society has as many dimensions as there are resources, differentiated into valuable and less valu-able. In principle, in the case of literally every resource, a determination can be made about who has more or less of it, and based on these distinctions, an assessment can be made as to whether the inequality is large or small. How significant an inequality currently is, is connected to the values that are predominant in the society. If a sufficient number of people believe that some resource is import-ant, the possession of this resource becomes an important dimension of inequality.
A lot of attention is still paid to economic inequality and its various dimensions. On the one hand, economic inequality can quite easily be measured in this monetary age. On the other hand, this reflects the significance of money in the present day – money is the resource that can be exchanged for other resources, by, for instance, paying for education and healthcare services. Studies have repeatedly shown that meagre economic opportunities are connected to low levels of education, limited social participation, poor health and weak social cohesion. In this chapter, we focus on the various facets of economic inequality, juxtaposing countries based on their internal inequalities.
3.2.1 The significance of inequalityDiscussions are constantly being held about the topic of inequality, by focusing on how much inequality is acceptable. Some economists assert that inequality is the motivating force in society that creates opportunities, for instance, for innovation and, over time, for a general increase in wealth. However, others find that society can-not allow great inequality because its price is even grater inequality, especially in cases where the wealth collects in the hands of a small group of people. The representatives of the last interpretation include Joseph Stiglitz, a pro-fessor at Columbia University and a winner of the Nobel Prize for Economics. He has consistently pointed out that GDP is not an adequate yardstick of social success, and has presented empirical and theoretical evidence related to the problematic nature of inequality. In his book, The Price of Inequality (Stiglitz 2011), he shows how inequal-ity has increased in the United States, but this has not resulted in greater enterprise, but rather, incomes have converged, leading, in turn, to greater inequality in fields outside of the economy. Stiglitz’s arguments have been introduced to Estonian readers by Gustav Kalm (2012), who also placed them in the Estonian context.
Economic liberalism, the systematic elimination of regulations and the decline in trade union member-ship has been accused of causing economic inequality
even before the economic crisis, and Stiglitz has not been the only one to do so. When comparing neo-lib-eral Anglo-American policies with those of continental Europe, where the role of trade unions continues to be relatively strong, it turns out that (Schmitt and Zip-perer, 2006) the U.S. model is characterised by the fol-lowing: a large percentage of the population that lacks social cohesion, which is accompanied by great income inequality, high relative and absolute rates of poverty, low and uneven educational results, poor health and large percentages of crime and imprisonment. At the same time, the flexible labour policies in the U.S. do not support social mobility, which lags behind the comparative European states.
In addition to economists, sociologists and other social scientists have also constantly studied inequality and stratification, and found proof that social inequality damages society and social cohesion. Rather recent stud-ies show that the people in states with less inequality favour democracy more than others do (De Werfhorst and Salverda 2012); inequality primarily reduces the electoral participation of less-educated people, and thereby, causes unequal political engagement (Scervini and Segatti, 2012); people in countries with greater inequality are generally less willing to undertake anything to improve the living conditions of their compatriots (Paškov and Dewilde, 2012). Therefore, it can be said that material inequality amplifies the differences in the material and emotional resources of individuals (Werfhorst and Salverda, 2012).
Thus, the problem of inequality has been signifi-cantly promulgated by economists and social scientists. This topic also occupies a significant place in influential international organisations like the UN and OECD.
When speaking of economic inequality, the UN report on economic development (United Nations, 2012) differentiates the following aspects: how great a role labour costs and incomes play in the total production of the state (compared, for instance, to capital gains); how large a proportion of total income is comprised of the highest incomes (the so-called “top 1% of income earners”); and how incomes are distributed among the population, that is, how many people’s incomes fall below the poverty level. Besides these indicators, which directly describe income equality, attention is also directed at wealth and material inequality. In this connection, other related topics are the inequality of land and capital ownership, and access to the education that enables greater incomes. The dimension of gender inequality is also dealt with separately – this indicates how external circumstances, which individuals cannot influence, affect their possibilities for earning income. Therefore, for the purposes of examining social equity, a differentiation can be made that is related, on the one
3.2Income inequality and equality Triin Roosalu

115Estonian Human Development Report 2012/2013
hand, to the “inequality of access,” or whether people have similar or differing opportunities for earning a living, and on the other hand, to the result of that inequality, which is expressed in actual differences in incomes (Plotnik, 2008).
Material and educational inequality is also explored in another chapter of this report, and therefore, the focus in this chapter is on the equality, or inequality, of the results – income inequality, the working poor, and the gender pay gap. Considering the conditions in Estonia, it would undoubtedly be important to add an ethnici-ty-based analysis to the gender-based analysis of income inequality; however, the comparative data in this regard is difficult to collect, for various reasons, and therefore, it will not be included.
The main sources for the statistical information are international organisations, primarily the Organisation for Economic Co-operation and Development (OECD), the United Nations (UN) and Eurostat. In addition, data from the Social Inequality Survey, organised by the Interna-tional Social Survey Programme (ISSP), is included (ISSP Research Group, 2013). This comparative survey, which is based on a uniform methodology, was conducted in 40 states around the world, including Estonia, and the data collection lasted from the autumn of 2008 to Jan-uary of 2012 (in most states, the survey was conducted between 2009 and 2010). In each state, a representative sample was surveyed, which means that between 900 and 3,300 people were queried in one state (in most of the states, the number of respondents was about 1,000). Attention should be paid to the fact that, despite the care-ful harmonisation of the methods and principles of data collection, the questions may mean different things to respondents in different social contexts. Therefore, in the case of surveys with such a global reach, it is especially important to try and interpret the results based on the economic and social environment of the specific state in order to better understand the background of the inter-national differences.
3.2.2 Income differences and people’s assess-ment thereofExaminations have been made of social stratification and, changes therein, in the transition states (Evans, Kelley, Kolosi, 1992; Evans, Kelley, 2004; Saar, 2010; Saar, 2011), and these reflect the different aspects of inequality and their changes in time. The analyses show that, by the end of the economic boom, Estonia had become a society with greater inequality. Although, in the dominant ideology, an attitude prevails that inequal-ity is a characteristic feature of a market economy, a large part of the population does not share this posi-tion. From the viewpoint of social justice, it can be said that the Estonian society’s sense of fairness has been offended (Plotnik, 2008).
A thorough overview of the income differences, starting at the beginning of the transition period, is included in the 2009 Estonian Human Development Report (Paškov, Kazjulja, 2010), and there is no reason to include the entire time series here. However, let us recall that the Gini coefficient, which shows income inequality, increased in the years between 1989 and 1995 from 0.277 to 0.396, and remained high for 10 years (0.358), and then decreased to 0.309, by 2007. Therefore, income inequality has demonstrated strong growth in Estonia, but started to decline somewhat once the economic boom ended. What happened during the economic crisis? In Figure 3.2.1, where the zero point is the 1989 level of inequality (0,277), we see that, since 2007, the level of inequality has started to climb sharply again, and reached 0.326 by 2011. Therefore, the level of income equality changes very rapidly.
In order to give substance to these numbers, it is useful to look at the variance of the Gini Index by state. The Gini Index value is between 0 and 1 – with 0 being a totally equal society, and 1 being a totally unequal society. The difference in Gini indicators, for the European states, remains within 0.16 points, which shows that, although various policies may be implemented in a space with similar cultural, social and political traits, generally, there is little difference in inequality. Costa Rica, Chile and Uruguay are also very similar, as are Singapore, Mexico and the U.S. The inequality in these Asian and South American coun-tries is greater than in Europe.
Income inequality is measured more exactly in two ways – income is differentiated before and after social transfers. First, the differences in market-based income are measured, which depend on whether the person works at all, on pay differences, the number of family members being supported, etc. In order to level the differences resulting from the labour market and the nature of the household, most societies pro-vide a social protection system, which also includes the payment of supports and benefits to the weaker mem-bers of society. Therefore, it is useful to measure the differences in incomes after social transfers, i.e. after deducting taxes and adding social benefits, pensions, etc. At the end of the 2000s, in the European states, Sweden had the lowest indicator for income inequality
0.275
0.285
0.295
0.305
0.315
0.325
0.335
Gini
inde
x
2005
2006
2007
2008
2009
2010
2011
Figure 3.2.1Estonia’s Gini Index, from 2005 to 2011. Source: Statis-tics Estonia (the zero point of the axis is close to 0.277, the Gini level for 1989)

116 Estonian Human Development Report 2012/2013
after the taxes and benefits in the Gini Index (0.23). The indicators for Denmark, Norway, Hungary and Slovakia were also low. Incomes were more unequal in Portugal (Gini value of 0.39), and a similar situation existed in Israel, Japan and New Zealand. Of the states being analysed, the greatest differences in income were in Chile, Mexico, Costa Rica, Singapore and Uruguay, where the Gini Index value is close to 0.5. In regard to its income inequality, Estonia tends to be among the states with greater inequality, like Spain, Italy, Greece,
France, Ireland and Poland. Compared to the other European states, Estonia is characterised by the limited effectiveness of our social system in the reduction of inequality. The social protection effect in Iceland and Switzerland, as well as in South Korea and Chile, is even smaller than Estonia’s. The situation in Japan, the U.S. and New Zealand is similar to Estonia.
Along with the inequality determined on the basis of these objective criteria, the population’s subjective sense of equality is also important. The interpretations
Gini after transfersHow much did transfer reduce inequality? % of initial Gini value
Gini index
Gini index
0 0,1 0,2 0,3 0,4 0,5
0 0,1 0,2 0,3 0,4 0,5
SwedenHungaryDenmark
NorwaySlovakia
AustriaLuxembourg
FinlandGermany
BelgiumIceland
SloveniaAustralia
NetherlandsCzech Republic
South KoreaEstonia
ItalySpain
CanadaTaiwanFranceGreece
SwitzerlandIreland
Great BritainPoland
New ZealandJapan
PortugalIsrael
TurkeyUSA
UruguaySingaporeCosta Rica
MexicoChile
Percentage
Percentage
0 10 20 30 40 50 60 70 80
0 10 20 30 40 50 60 70 80
Norway
Philippines
New Zealand
Belgium
Venezuela
Cyprus
Denmark
Australia
Great Britain
USA
Finland
Spain
Sweden
Chile
Argentina
China
Switzerland
Japan
Taiwan
West Germany
South Africa
Austria
South Korea
Iceland
Turkey
Czech Republic
Poland
Israel
Bulgaria
Latvia
Slovenia
Croatia
Portugal
Slovakia
Russia
Italy
Estonia
East Germany
France
Ukraine
Hungary
Figure 3.2.2Income inequality after social transfers (measured with the Gini coefficient) and the relative importance of the transfers in the reduction of inequality (what proportion of the initial inequality was reduced by transfers).
Figure 3.2.3The percentage of the population that agrees strongly with the statement that the differences in income in the country is too large.
Source: CIA Factsheet 2012 (CIA 2012), oECD online database Social Inequality (oECD 2012) Source: ISSP 2009 survey, author’s calculations

117Estonian Human Development Report 2012/2013
and explanations of the extent of inequality indicated by various surveys allude to the importance of subjective assessments and perceptions, and its significance for Estonia has also been shown (Lindemann 2011.
Below, we examine how the populations assess the level of inequality that exists in reality. These assessments originate from a survey (ISSP Research Group 2013) conducted between 2009 and 2010 in 40 states. The respondents were asked whether they agree with several statements, which included: “Differences in income [in our country] are too large”. The respon-dents could choose between four possible answers: 1 – strongly agree, 2 – agree, 3 – neither agree nor dis-agree, 4 – disagree, 5 – strongly disagree. The answer “can’t choose” was also possible. The following diagram includes only the data from the respondents who chose “strongly agree”. It turns out that two-thirds of Estonia’s population considered the income differences to be too large, which in the comparison of states is a remark-ably high indicator. Of the post-Communist states, an even more critical attitude than Estonia’s was found in Hungary, Ukraine, and also East Germany. (Since it was an opinion poll, it was considered important to differentiate the data for the states that had belonged to the Eastern bloc, i.e. for East Germany and West Germany separately). The dissatisfaction indicator in West Germany is considerably lower (less than 50%), which indicates how the previous social experience has affected the perception of inequality.
It should definitely be taken into consideration that the survey was conducted at the same time that the economic crisis occurred, which may have caused the assessments of the respondents to be more negative. However, in 1999, the same survey was carried out in 26 states, and based thereon, it can be said that the eco-nomic crisis was not the most important factor shaping the attitudes of the respondents. Namely, it turns out that, in some of the states, the opinions were consider-ably more negative than ten years earlier (e.g. Bulgaria, Slovakia, Czech Republic, Russia and also Norway); however, in others, it was considerably more positive (e.g. East and West Germany, Hungary, Poland, Cyprus, and France). The attitudes were stable in Iceland, Swe-den, and England. Therefore, it can be concluded that the impact of the global economic crisis is reduced by the developments in the specific state, for example, the inequality within the state.
One can surmise that, behind these negative assess-ments are people’s good opportunities for comparing themselves with other states, and they choose to compare themselves with the more successful ones. It also seems that in the states with smaller differences in income, there are few people who assess inequality to be extremely large. The exceptions are New Zealand, the U.S. and Great Britain, where the differences in income are quite large, but few people consider them to be too large. All three of these countries represent the liberal welfare model, where greater emphasis is placed on the equality of opportunities, rather than on results, and therefore, the public tolerates greater inequality.
At this point, we should ask, if the equalisation of incomes in Estonia is too slow? Sometimes, this is
-25 -20 -15 -10 -5 0 5 10 15
-25 -20 -15 -10 -5 0 5 10 15
Changes that took place during the economic crisis in the second half of the 2000sDevelopment from the 1990s to the mid-2000s
% of Gini value
% of Gini value
Poland
Estonia
Norway
Portugal
Ireland
Hungary
Turkey
Czech Republic
Belgium
Italy
Slovenia
Greece
Slovakia
Finland
Israel
Chile
Austria
New Zealand
USA
Spain
Mexico
France
Canada
Japan
South Korea
Netherlands
Germany
Great Britain
Denmark
Australia
Switzerland
Sweden
Luxembourg
Iceland
Figure 3.2.4Changes in the Gini Index during the 1990s and 2000s
Source: oECD database (oECD 2012b), author’s calculations.

118 Estonian Human Development Report 2012/2013
what causes dissatisfied attitudes in society. The next diagram provides a general picture of the direction of the changes in inequality, by state. The diagram shows (1) the changes in the Gini coefficient from the mid-1990s to the mid-2000s and (2) the changes in the Gini coefficient during the global economic crisis, in the second half of the 2000s. This data (OECD, 2012b) originates from the different states in different years, and therefore, the temporal designation is general, and differentiates between the beginning, middle and end of the decade. Therefore, at the moment of observation, all the states are, actually, not at the same distance from the end of the Communist regimes and the economic crisis(es). Yet, the diagram graphically demonstrates that the capability of the states to reduce inequality differs over time. However, it is worth considering that the smaller the initial inequality of the state, the more room there is for the inequality to grow, and vice versa. In most cases, reducing or balancing inequalities requires great changes in the society – either long-term economic growth or decline; changes in the taxation system and reorganisation of social transfers; restructuring of the labour market and economy, etc. Therefore, it is import-ant to interpret the data in these two diagrams within the context of each state.
3.2.3 The working poor in statistics and people’s assessmentsSeveral sources provide an overview of the income inequality and poverty in Estonia (Toomse, 2007; Kutsar. 2010; TAI, 2010; Nimmerfeldt, 2012), so that we will not pause here for long. Below, we focus on a special form of poverty – the working poor. Some tend to explain poverty by saying that some people just do not want to work, and if they do not contribute to the production of social benefits by paying taxes, they have no right to get support from the society. Nevertheless, there are people who have such low-paying jobs that their wages do not help them get out of poverty. These people are called the working poor. How large is the proportion of the working poor, by state, and how many people in each state feel that they are being paid less than they deserve?
Answers to the first part of the question are pro-vided by the EU-SILC pan-European income survey. The “working poor” are defined as the people who earn 60% of the state’s median income, also taking into account social transfers (pensions, benefits, etc.). It should be considered that this indicator does not measure wealth or poverty, but how low the incomes are, compared to the other residents of the state. Thus, this is a relative, not absolute, yardstick.
However, for an answer to the second half of the question – how many people in the state feel that their pay is unjustly small – we turn again to the Social Inequality IV survey (ISSP Research Group, 2013) con-ducted between 2009 and 2010. The respondents were asked, “Below please assess your pay. Would you say that you earn…” 1- much less than I deserve; 2- less than I deserve; 3- what I deserve; 4- more than I deserve;
0 5 10 15 20 25 30 35
0 5 10 15 20 25 30 35
I earn much less than I really deserve (2010)
Percentage
Percentage
Working poor (2007) Working poor (2011)
Switzerland
Norway
Belgium
Denmark
Austria
South Korea
New Zealand
West Germany
Iceland
Spain
Cyprus
China
Finland
South Africa
Taiwan
Great Britain
Australia
Sweden
USA
Slovenia
France
Israel
Portugal
Venezuela
Japan
Italy
Croatia
East Germany
Latvia
Turkey
Philippines
Slovakia
Bulgaria
Czech Republic
Estonia
Hungary
Poland
Argentina
Chile
Ukraine
Russia
Figure 3.2.5Ranking of countries based on how large a percentage of their workers find that they get less pay than they deserve, and the percentage of working poor in the European countries before the global economic crisis (2007), and during the crisis (2011).
Source: ISSP 2009 Social Inequality; Eurostat.

119Estonian Human Development Report 2012/2013
5- much more than I deserve. Some dissatisfaction with pay is not necessarily problematic; therefore, in the following analysis, we will only include those who assessed their pay to be much less than I deserve.
From the following diagram, it turns out that the percentage of people who are not saved from poverty by working is between 3% and 12%, depending on the state. This indicates quite a large difference, despite the fact that the state’s median income was used for the calculation, so that the proportion of working poor is basically similar. In the course of the economic crisis, the percentage of working poor has increased in about half the states, while in some it has remained compar-atively the same. In Switzerland, Austria and Finland, the number of working poor declined during the crisis. The situation in Estonia is illustrated by the fact that, although the proportion of working poor is quite large, it has remained practically unchanged during the eco-nomic crisis.
Although the states differ, based on the number of actual working poor, this variance is relatively small compared to the differences in the perception of justice (see Figure 3.2.5).
It is clear from the diagram that Estonia is among those at the bottom of the rankings, that is, about a quarter of the workers in Estonia feel that they defi-nitely deserve higher pay. A great proportion of people feel this way in Hungary, Poland, Ukraine and Russia, as well as in Chile and Argentina. In these states, the people feel that they are being treated unjustly, since they do not get paid what they think they deserve. The workers in Norway, Denmark, Switzerland, Belgium and Austria take the position that they receive less pay than they deserve, considerably less frequently. These states are characterised by a high standard of labour relations, which means that managers and owners have a respect-ful attitude toward the needs and expectations of their workers. On the other hand, greater dissatisfaction is also based on the state’s generally poorer quality of life and wage level, which characterises Eastern Europe and South America. Information about the wage levels and working conditions in other states is readily available, and the possibilities for the workers themselves to move, are also uncomplicated. Nevertheless, the studies assert (Magun, 2013) that the transparency of the pay system, and the merited recognition of the worker’s contribution, are of decisive importance in both the growth of the gross domestic product (GDP) and the accompanying increase in the wage level.
3.2.4 Gender inequality and the pay gapThe working poor can often have a “woman’s face”, because, in many countries in the world, women are paid less for their work. The gender pay gap is the extent to which women’s pay lags behind the average pay paid to men. Estonia’s gender pay gap is one of the largest in Europe, and due to this great gender inequality, Estonia’s position in international rankings has suffered. However, a great lag in women’s pay is not necessarily characteris-tic of the post-Communist states. For instance, Slovenia
and Poland have the smallest gender pay gaps in Europe, while the gaps in the Czech Republic and Slovakia are large, just like in Estonia. Although, a smaller gender pay gap is usually accompanied by a smaller Gini index, this is not always true.
If, on average, the gender pay gap in Europe is between 8% and 18%, in the OECD states, the pay gap is wider – from 10% to 30%. This shows that outside of Europe, in the Asian countries and South America, the gender-based income differences are larger. The largest objectively unexplained pay gaps are in Chile, South Africa and Argentina (Tijdens, Van Klaveren, 2012). Costa Rica, on the other hand, stands out for its less than 10% gender pay gap.
How to provide an explanation for women’s low wages? The first possibility is to juxtapose the pay gap
0 5 10 15 20 25
0 5 10 15 20 25
Slovenia
Poland
Italy
Malta
Luxembourg
Romania
Belgium
Portugal
Bulgaria
Ireland
Lithuania
Sweden
Latvia
France
Norway
Denmark
EU 27
Spain
Cyprus
Hungary
Netherlands
Switzerland
Great Britain
Slovakia
Finland
Greece
Germany
Austria
Czech Republic
Estonia
Percentage
Percentage
Figure 3.2.6Gender pay gap in the European countries, 2010.
Source: Eurostat

120 Estonian Human Development Report 2012/2013
indicators with those for women’s participation in the labour market. The fewer women that there are in the labour market, the more probable it is that working women’s careers will follow a manly trajectory, and that jobs and working conditions intended especially for women will not be created. Instead, it will be assumed that working women are orientated to their jobs and careers, and therefore, will receive a “man’s wages”. This rule could explain the small pay gaps in states like Italy, Malta and Belgium, where a traditional gender regime applies. On the other hand, in the countries where the majority of women are in the labour market, jobs that are intended for women have developed, along with working conditions that are appropriate for combining work and family life. Often, these areas of employment have low wage levels, and therefore, women’s wages are generally lower than men’s. This could explain why the gender pay gap in Sweden, Norway, Denmark and France is quite considerable.
If we turn our attention to the pay differences that occur within the framework of the same occupation, several factors must be considered. Wages are affected, to a great degree, by the worker’s general competitive-ness; personal suitability for the job, including (appro-priate) preparation; sufficient efforts and dedication to work. However, the working conditions offered by the employer, for the specific work and position, are also important.
In Estonia, the gender pay gap has been thoroughly researched, and although some part of the pay gap can be attributed to structural or individual factors, a large part of the pay gap cannot be explained objectively (Ans-pal et al., 2010). This provides a basis for asserting that women’s unequal pay is the result of the prevalence of old-fashioned gender roles, and the behavioural choices based thereon.
How has the recent economic crisis affected the gender pay gap? In Figure 3.2.7 we see that, although the pay gap has not increased in Estonia between 2006 and 2010, the decrease is also marginal. We see a similar sta-bility in many other states, which once again confirms that the differences in women’s and men’s wages are, to a great extent, related to non-economic factors. For example, it is evident that the states where the gender pay gap has sharply decreased, during the last decade, are Catholic and Greek Orthodox countries (Poland, Slovenia, Ireland and Cyprus). Only in Portugal is the development moving in the opposite direction. In the European states generally, the developments in gender inequality have moved in different directions, and there-fore, it is hard to indicate a general trend.
3.2.5 In conclusionBased on the Gini coefficient, income inequality in Esto-nia lags behind the best performers in Europe and is thus close to the European average, and a slight decrease in inequality is noticeable on favourable reading. A totally different situation exists in regard to the assessments of the population related to inequality, with the people in Estonia being among the most critical. Two thirds of the
-100 -60-80 -40 -20 0 20 40 60 80
Changes during the economic crisis, 2008-2010Trend in the changes before the economic crisis, 2006-2008Total change, 2006-2010
-100 -60-80 -40 -20 0 20 40 60 80
Percentage
Percentage
Slovenia
Poland
Netherlands
Slovakia
Cyprus
Great Britain
Ireland
Luxembourg
Lithuania
Spain
Denmark
Estonia
Sweden
Austria
Finland
Germany
Norway
France
Latvia
Switzerland
Bulgaria
Greece
Belgium
Czech Republic
Romania
Italy
Hungary
Malta
Portugal
Source: Eurostat, author’s calculations
Figure 3.2.7Changes in the gender pay gap in the European countries, 2006-2010.

121Estonian Human Development Report 2012/2013
people in Estonia consider the income difference in Esto-nia to be too large.
The inequality is also illustrated by the relatively high proportion of working poor, with Estonia being only at the average level for Europe, an indicator that has not been increased by the economic crisis. At the same time, very many people in Estonia find that they are being paid considerably less than what they deserve. In the percep-tion of this inequality, Estonia’s is one of the most critical in Europe.
In regard to gender inequality, an “unprecedented” gender regime prevails in Estonia. This is characterised by the clearly weaker economic position of women; this is also accompanied by progressive gender behaviour in
References1. AnSPAl, S, KRAut, l, Rõõm, t. (2010) Sooline palgalõhe Eestis.
Empiiriline analüüs. Study report. Tallinn: Praxis Centre for Policy Studies, Ministry of Social Affairs. Web. http://www.sm.ee/fileadmin/meedia/Dokumendid/Sotsiaalvaldkond/kogu-mik/2_raport.pdf
2. CiA (2012) The World Factbook 2011. Washington, DC: Central Intelligence Agency. Web. https://www.cia.gov/library/publica-tions/the-world-factbook/index.html
3. evAnS mdR, Kelley, J. And KoloSi, t. (1992) “Images of Class: Public perceptions in Hungary and Australia,” American Socio-logical Review 57(4): 461-482.
4. evAnS mdR And Kelley, J. (2004) “Subjective Social Location: Data from 21 Nations” International Journal of Public Opinion Research 16(1): 3-38.
5. iSSP ReSeARCH gRouP (2013) International Social Survey Pro-gramme: Social Inequality IV, ISSP 2009. GESIS Data Archive, Cologne. ZA5400. Data file Version 3.0.0. Web. http://www.gesis.org/issp/issp-modules-profiles/social-inequality/2009/
6. KAlm, g (2012) “Ebavõrdsuse hind. Joseph Stiglitzi sõnul kah-justab majanduslik ebavõrdsus nii majandust kui ka demokraa-tiat” Diplomaatia no. 110, October 2012
7. KutSAR, d (2010) Vaesus Eestis/Poverty in Estonia. Tallinn: Statistics Estonia. Web. http://www.stat.ee/38021
8. lindemAnn, K (2011). “The Changing Perception of Social Position,” Towards a Normal Stratification Order: Actual and Perceived Social Stratification in Post-Socialist Estonia. Ed. Ellu Saar. Frankfurt: Peter Lang, 481 – 499.
9. lindemAnn, K; SAAR, e (2010). “Social Stratification According to People’s Subjective Assessments,” Estonian Human Development Report 2009. Ed. Marju Lauristin. Tallinn: Estonian Cooperation Assembly, 75 - 78.
10. mAgun, v (2013) “Töömotivatsiooni tegurid Euroopa riikides.” Presentation at the Labour Market, Education, Stratification, Consumption, Migration Roundtable, at the European Sociology Association Research Network 36 Interim seminar on the Sociology of Transformations: East and West, in Tartu, 22-24 March 2013
11. mAteJu, P; veCeRniK, J. (1999) “The Renewal of the Middle Class and Its Political Circumstances,” Ten Years of Rebuilding Capital-ism: Czech Society after 1989. Prague: Academia, 207–227
12. nimmeRFeldt, g. (2012) “Sotsiaalne tõrjutus,” Eesti Statistika
Aastaraamat 2012. Tallinn: Statistics Estonia, 105-108. http://www.stat.ee/57659
13. OECD (2012a). Trends in Income Inequality. OECD Factbook 2011-2012: Economic, Environmental and Social Statistics. http://www.oecd-ilibrary.org/sites/factbook-2011-en/
14. OECD (2012b) “Income Distribution and Poverty: Data, Fig-ures, Methods and Concepts,” Web. www.oecd.org/els/social/inequality
15. oeCd (2011) Divided We Stand. Why Inequality Keeps Rising. OECD Publishing. http://dx.doi.org/10.1787/9789264119536-en
16. PAšKov, m, dewilde, C (2012). “Income Inequality and Solidarity in Europe,” Research in Social Stratification and Mobility. Vol-ume 30, Issue 4, December 2012: 415–432
17. Plotnik, H. (toim.) (2008) Sotsiaalse õigluse arusaamad. Tartu: Tartu University Press
18. SAAR, e. (2011). Towards A Normal Stratification Order: Actual and Perceived Social Stratification in Post-Socialist Estonia. Bern: Peter Lang Publishers
19. SAAR, e (2010) “Sotsiaalne ebavõrdsus ja põlvkondadevaheline mobiilsus,” Sotsiaaltöö, 13:6, 24-29.
20. SCHmitt, J, ziPPeReR, B (2006) “Is the U.S. a Good Model for Reducing Social Exclusion in Europe?” post-autistic economics review 40, 1 December 2006, article 1, 2-17 http://www.paecon.net/PAEReview/issue40/SchmittZipper40.htm
21. Stiglitz, J. e. (2011). The Price of Inequality: How Today’s Divided Society Endangers Our Future. New York, London: W.W. Norton and Company
22. toomSe, m (2007) Sotsiaalne ebavõrdsus/Social Inequality. Tallinn: Statistics Estonia. http://rahvatervis.ut.ee/bit-stream/1/883/1/ES2007_3.pdf
23. undP (2010). Measuring Key Disparities in Human Develop-ment: The Gender Inequality Index http://hdr.undp.org/en/reports/global/hdr2010/papers/HDRP_2010_46.pdf
24. united nAtionS (2012). UN Conference on Trade And Develop-ment, Geneva. Trade And Development Report 2012. New York and Geneva: UN. Web. http://unctad.org/en/PublicationChap-ters/tdr2012ch3_en.pdf
25. vAn de weRFHoRSt, H.g, SAlveRdA, w. (2012) “Consequences of Economic Inequality: Introduction to a Special Issue” Research in Social Stratification and Mobility, Volume 30, Issue 4, Decem-ber 2012, 377–387.
other fields of activity (family life, education), which is even comparable to the Scandinavian countries. There-fore, Europe’s largest gender pay gap is very difficult to explain. In addition to understanding this contradiction, we should make an effort to try to find possibilities for reducing gender inequality in the society, in a situation where there are no direct parallels.
It is possible that it is those aspects – general per-ceptions of inequality and unfair wages in general – that explain why the gender pay gap remains, as it is consid-ered to be of a lesser importance. On the other hand, it may indeed be this gender pay gap that is behind the large income inequality and sizeable numbers in working poor in Estonia.

122 Estonian Human Development Report 2012/2013
Besides the external and easy-to-measure indicators (life span, income, education level, etc.), researchers of development have started to focus on people’s subjective worlds, their attitudes towards themselves and their sur-roundings. It is true that the growth of wealth, or the reduction of inequality, acquire a sense and a meaning only when they are reflected in the feelings of those who acquire the wealth, or experience the (in)equality -- and this shapes their attitudes to the events. A rich, smart, but unhappy, person is definitely a more problematic mem-ber of society than one who has not acquired a higher education, whose wallet is thin, but who is still happy and enjoys life just like it is. People’s attitudes toward themselves and their lives have started to be character-ised, using the concept of subjective well-being. Accord-ing to Robert Putnam, this should be the most important variable in social sciences: “... the ultimate ‘dependent variable’ in social science should be human well-being, and in particular, well-being as defined by the individual him- or herself, or ‘subjective well-being.’” (Helliwell, Put-nam, 2004, 1435).
According to the definition offer by the most famous researcher in this field, University of Illinois professor Edward Diener, “... subjective well-being con-sists of emotional and cognitive components. Emotional well-being is reflected in frequent experiences of pleas-ant emotions and infrequent experiences of unpleas-ant emotions. The cognitive component of subjective well-being refers to a global evaluation of one’s life, often assessed as life satisfaction.” (Toy, Diener, 2008). When speaking about subjective well-being, we are speaking about the satisfaction that a person feels regarding his or her own life, as well as the proportion of positive emotions the person has about everyday life. The latter can be defined as happiness.
The European Foundation for the Improvement of Living and Working Conditions (Eurofound), which functions as a European Union agency differentiates the Europeans’ quality of life into life satisfaction, on the one hand, and happiness, on the other, and also attempts to measure them both: “... life satisfaction measures how people evaluate their life as a whole after taking all life circumstances into consideration – in a way it can be viewed as a person’s measure of their success in life. Happiness is a state of mind, incorpo-rating both the existence of positive emotions and the absence of negative emotions. … Life experiences and objective circumstances, particularly negative experi-ences, such as unemployment, deprivation, illness and family breakdown can all have a significant impact on life satisfaction, while happiness is also influenced by an existing predisposition through personality. (Euro-found, 2012, 18).
In the research on subjective well-being (SWB), of these two viewpoints, discretionary-based life sat isfact ion is used more than emotion-based happiness, and this is also true of sociology, psy-chology and development studies. Together with general satisfaction, various aspects of satisfaction are now also measured – job satisfaction, hous-ing sat isfact ion, marr iage /mar ital sat isfact ion, and consumer/client satisfaction (Spector, 1997). Studies indicate that people who are satisfied with life, and have a positive attitude, are more construc-tive, more interested in social affairs and more loyal to the authorities. Constant dissatisfaction, on the other hand, results in conflict, opposition and ignorance. Both researchers and the public had stuck positive labels on satisfaction – a satisfied citizen, worker, cli-ent, and voter is better than an unsatisfied one. Actions and objectives that help to increase satisfaction are welcomed. Based thereon, shifts in life satisfaction, as well as subjective well-being as a whole, have become an important yardstick, which helps to assess societal changes. If SWB increases, we are on the right path; if it decreases, things are going wrong.
In the international debates related to development, people’s assessments and subjective preferences are gain-ing importance. The OECD motto is: “Better policies for better lives.” The UK Office for National Statistics has started to measure national well-being. Bhutan has even established the promotion of Gross National Happiness as a national objective. In 2011, with its Resolution 65/309, the UN also issued a corresponding challenge to its Member States to work out additional measures, based on which the spread of well-being and happiness could be assessed, and to plan national policies based thereon. (The Happy ...2012, 5).
3.3.1 Measures of subjective well-beingThe reliable measuring of subjective well-being, and the comparison of the nations-states based thereon, is a complicated undertaking, since individual particu-larities and the broader cultural context come into play (Diener, 2009). The uniform yardsticks, for this field, are still developing, and in addition to satisfaction and happiness, which were already mentioned, several other viewpoints are used for subjective assessment – people’s assessment of the “goodness” of their lives is examined, along with optimism about the future, the sense of security, etc. As a rule, well-being is not treated as a black-and-white construction (satisfied or not satisfied, happy or unhappy), but as a multifaceted attitude toward oneself and one’s surroundings.
3.3Subjective well-beingMati Heidmets

123Estonian Human Development Report 2012/2013
Probably the largest measurer of subjective well-being is the U.S. research company Gallup. The Gallup World Poll has mapped the subjective attitude of the world’s peoples toward their lives for years and asks the respondents to imagine themselves being on a ladder, the top of which marks the best possible life for the person, and the bot-tom the worst. Gallup’s question is formulated as follows: “Please imagine a ladder with steps numbered from 0 at the bottom to 10 at the top. Suppose we say that the top
of the ladder represents the best possible life for you, and the bottom of the ladder represents the worst possible life for you. On which step of the ladder would you say you personally feel you stand at this time, assuming that the higher the step the better you feel about your life, and the lower the step the worse you feel about it? Which step comes closest to the way you feel?”
Table 3.3.1 shows the average assessments of the people in various states related to their position on
Ladder step above 7 (19)Ladder steps from 6 to 7 (28)
Ladder steps from 5 to 6 (48)
Ladder steps from 4 to 5 (38)
Ladder steps below 4(15)
Great Britain,Belgium 6,9
Slovakia,Peru,Poland,Malaysia,Algeria
5,9Namibia,Azerbaijan,Laos
4,9Afghanistan,Yemen,Cambodia
3,9
Argentina 6,8
Malta,Bolivia,Libya,Ecuador,Italy,Lithuania
5,8
Palestine,Nigeria,Bosnia,Zimbabwe
4,8
Haiti,Senegal,Burundi,Mali,Nepal
3,8
Germany,Trinidad,El Salvador
6,7
Paraguay,Kazakhstan,Jordan,Guatemala,Belarus
5,7
South Africa,Hungary,India,Mozambique
4,7 Chad,Benin 3,7
Norway 7,7
Uruguay,France,Venezuela,Kuwait,Qatar
6,6Kosovo,Russia,Hong Kong
5,6 Ghana,Tunisia 4,6
Botswana,Central African Republic
3,6
Sweden,Iceland 7,6
Chile,Singapore,Colombia
6,5Vietnam,Turkmenistan,Albania
5,5
Iraq,Iran,Bahrain,Tajikistan
4,5 Syria 3,3
Denmark, Netherlands,Switzerland
7,5 Saudi,Arabia 6,4
Cuba,Nicaragua,Estonia,Dominican Republic
5,4
Sudan,Cameroon,Ethiopia,Madagascar
4,4 Togo 2,8
Israel,Finland,Canada,Austria
7,4Czech Republic,Spain,Thailand
6,3
Zambia,Myanmar,Indonesia,Turkey
5,3Georgia,Kenya,Armenia
4,3
Panama,New Zealand,Costa Rica,United Arab
7,2 Jamaica,Cyprus 6,2
Romania,Lebanon,Kyrgyz Republic,Serbia
5,2
Macedonia,Liberia,Bulgaria,Angola,Uganda,Ivory Coast,Sri Lanka
4,2
Mexico,Luxembourg 7,1 Taiwan,
Slovenia 6,1
Ukraine,Latvia,Greece,Pakistan
5,1Niger,Egypt,Sierra Leone
4,1
Ireland,Brazil,USA
7,0
Uzbekistan,South Korea,Moldavia,Croatia,Japan
6.0
Bangladesh,Morocco,China,Honduras,Mongolia,Philippines,Portugal
5,0 Congo 4,0
Source: Gallup World Poll 2012, https://worldview.gallup.com/, HPI Report 2012
Table 3.3.1Experienced Well-Being 2011/12.

124 Estonian Human Development Report 2012/2013
Gallup’s “ladder of good life”. Estonia and the reference states are indicated in yellow. As expected, the citizens of the richer states position themselves on the higher steps of the ladder; but there are several states at the top of the ladder, where the income levels are significantly lower, for example, Mexico, Costa Rica, and Panama. In the ranking of the world’s states, Estonia is down in the 70s, and in the Gallup ranking, we find ourselves on the same step of the ladder with Cuba, Nicaragua and the Dominican Republic.
The life satisfaction of the European Union Member States and the candidate states, and its changes, are illus-trated by the Eurobarometer, which asks the following: „On the whole are you very satisfied, fairly satisfied, not very satisfied or not at all satisfied with the life you lead?“
Table 3.3.2 shows the percentage of those who, in May of 2012, answered positively to the Eurobarometer’s question about life satisfaction, compared to previous
years. Both the ranking and the changes in the last ten years allude to a connection between life satisfaction and the wealth of the states, as well as to the changes taking place in those states. In the countries that continue to be faced by economic worries – Portugal, Greece and Italy – the difficulties of daily life are reflected in the reduction of the percentage of people who are satisfied with their lives. In five of the EU states, the majority of the people (i.e. over 50%) were dissatisfied with their lives. In the period from 2004 to 2012, the proportion of people satisfied with their lives in Estonia held steady,
2004 2006 2008 2010 2012
Sweden 96 94 95 96 98
Denmark 97 96 96 98 97
Luxembourg 95 92 95 96 94
Finland 94 94 94 95 94
Netherlands 92 95 96 95 94
Great Britain 90 87 87 92 92
Belgium 85 85 84 85 91
Germany 84 82 82 84 89
Ireland 93 91 88 88 86
France 82 85 78 83 85
Austria 85 85 84 85 85
Slovenia 90 87 89 85 85
Malta 88 82 85 76 80
Cyprus 90 85 90 82 80
Czech Republic 77 81 82 78 79
EU 27 81 81 77 78 77
Poland 71 71 75 79 75
Spain 86 88 85 77 72
Turkey 71 70 63 65 71
Estonia 70 69 76 73 69
Croatia 70 69 69 69 67
Slovakia 59 66 69 75 67
Latvia 55 60 63 60 66
Lithuania 54 60 60 50 62
Italy 76 76 64 72 60
Romania 48 43 53 36 48
Hungary 50 55 47 50 42
Bulgaria 32 37 40 38 40
Portugal 59 55 52 44 34
Greece 66 67 65 42 31
Table 3.3.2The ranking based on the May 2012 survey, with additional data from 2010, 2008, 2006, and 2004. The proportion of people satisfied with life (proportion of respondents who are very satisfied or generally satisfied, %)
Source: Standard Eurobarometer.
Figure 3.3.1Life satisfaction and happiness in the EU countries.
Bulgaria
Hungary
Greece
Latvia
Estonia
Slovakia
Czech Republic
Lithuania
Romania
Portugal
Italy
Slovenia
Poland
EL-27
Cyprus
Germany
France
Malta
Great Britain
Belgium
Ireland
Spain
Austria
Netherlands
Luxembourg
Sweden
Finland
Denmark
Happiness Life Satisfaction
Index
Index
5,0 5,5 6,0 6,5 7,0 7,5 8,0 8,5
5,0 5,5 6,0 6,5 7,0 7,5 8,0 8,5
Source: Eurofound, 2009

125Estonian Human Development Report 2012/2013
at about 70%. In Latvia and Lithuania, the proportion of satisfied people has increased during this period; if at the beginning of the century, slightly more than half of our southern neighbours were satisfied with life, cur-rently, the percentage of satisfied people has reach about 2/3 in both states.
The European Foundation for the Improvement of Living and Working Conditions (Eurofound 2011) tries to measure life satisfaction along with happiness. The Eurofound question about happiness is formulated as follows: “Taking all things together, on a scale 1 to 10, how happy you would say you are? Here 1 means you are very unhappy and 10 means you are very happy.” The question about life satisfaction is the following: “All things concerned, how satisfied would you say you are with your life in these days? Please tell me on a scale of 1 to 10, where 1 means very dissatisfied and 10 means very satisfied.”
In Figure 3.3.1 it appears that in the case of most nations, the assessment of happiness is slightly higher than the assessment of satisfaction. And the gap between the assessments of satisfaction and happiness is greater, the lower the general life satisfaction level. Similarly to other researchers, the authors of this report also conclude that life satisfaction primarily reflects actual economic conditions and living standard; but the sense of happiness is connected to objective conditions more indirectly, and also includes a strong personal compo-nent, and is influenced by the cultural background. (Eurofound 2009).
People’s assessments of their well-being are also used in many “combined” measures, of which, one of the most ambitious is the Happy Planet Index (HPI). This is compiled by the New Economics Foundation (NEF) (see http://www.neweconomics.org/). This think tank, which has operated in Great Britain since 1986, clearly contrasts itself with the dominant economic, environmental protection and social paradigm of the Western world. Among other things, the foundation focuses on such topics like eliminating the debt burden of developing countries, ethical commerce, and social investments, and they have tried to place pressure on the G8, etc. The foundation favours the introduction of new ways of viewing development and progress, by calling this sustainable well-being. In this context, they have also created the Happy Planet Index, which com-bines subjective well-being with life expectancy and the ecological footprint (HPI = Experienced Well-being x Life Expectancy/Ecological Footprint).
The index value is increased by the number of happy years of life, but decreased by a large ecological footprint. In summary, the index value should allude to how successful the states have been in ensuring their populations good and happy lives, while also enabling the same for future generations. (The Happy ... 2012, 3).
The ranking of states, based on the HPI (see Table 3.3.3), is totally different from the one provided to us by both the more objective indicators (freedom, wealth, democracy), and the rankings based on subjec-tive well-being. According to the HPI, the world’s top countries are mostly small Central American states, where life expectancy is relatively long, people are happy, and
Top and bottom 10
1. Costa Rica 64,0
2. Vietnam 60,4
3. Colombia 59,8
4. Belize 59,3
5. El Salvador 58,9
6. Jamaica 58,5
7. Panama 57,8
8. Nicaragua 57,1
9. Venezuela 56,8
10. Guatemala 56,9
...
142. Republic of South Africa 28,2
143. Kuwait 27,1
144. Niger 26,8
145. Mongolia 26,8
146. Bahrain 26,6
147. Mali 26,0
148. Central African Republic 25,3
149. Qatar 25,2
150. Chad 24,7
151. Botswana 22,6
Table 3.3.3Ranking of the countries based on the Happy Planet Index, 2012. The 10 top and bottom countries, and the reference countries.
Source: The Happy Planet Index: 2012 Report
Reference countries
1. Costa Rica 64,0
15. Israel 55,2
19. Chile 53,9
28. New Zealand 51,6
34. Switzerland 50,3
48. Austria 47,1
63. South Korea 43,8
65. Canada 43,6
67. Netherlands 43,1
70. Finland 42,7
73. Ireland 42.4
87. Slovenia 40,2
89. Slovakia 40,1
90. Singapore 39,8
92. Czech Republic 39,4
93. Uruguay 39,3
104. Hungary 37,2
110. Denmark 36,6
117. Estonia 34,9
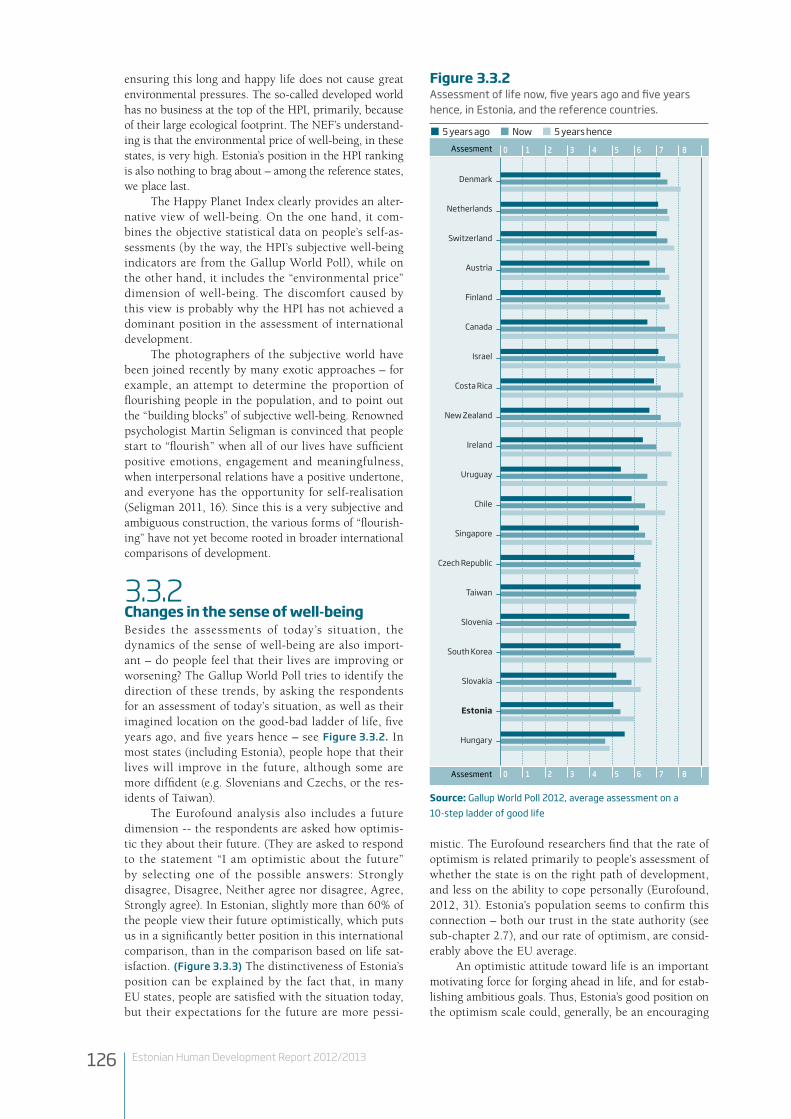
126 Estonian Human Development Report 2012/2013
ensuring this long and happy life does not cause great environmental pressures. The so-called developed world has no business at the top of the HPI, primarily, because of their large ecological footprint. The NEF’s understand-ing is that the environmental price of well-being, in these states, is very high. Estonia’s position in the HPI ranking is also nothing to brag about – among the reference states, we place last.
The Happy Planet Index clearly provides an alter-native view of well-being. On the one hand, it com-bines the objective statistical data on people’s self-as-sessments (by the way, the HPI’s subjective well-being indicators are from the Gallup World Poll), while on the other hand, it includes the “environmental price” dimension of well-being. The discomfort caused by this view is probably why the HPI has not achieved a dominant position in the assessment of international development.
The photographers of the subjective world have been joined recently by many exotic approaches – for example, an attempt to determine the proportion of flourishing people in the population, and to point out the “building blocks” of subjective well-being. Renowned psychologist Martin Seligman is convinced that people start to “flourish” when all of our lives have sufficient positive emotions, engagement and meaningfulness, when interpersonal relations have a positive undertone, and everyone has the opportunity for self-realisation (Seligman 2011, 16). Since this is a very subjective and ambiguous construction, the various forms of “flourish-ing” have not yet become rooted in broader international comparisons of development.
3.3.2 Changes in the sense of well-beingBesides the assessments of today’s situation, the dynamics of the sense of well-being are also import-ant – do people feel that their lives are improving or worsening? The Gallup World Poll tries to identify the direction of these trends, by asking the respondents for an assessment of today’s situation, as well as their imagined location on the good-bad ladder of life, five years ago, and five years hence – see Figure 3.3.2. In most states (including Estonia), people hope that their lives will improve in the future, although some are more diffident (e.g. Slovenians and Czechs, or the res-idents of Taiwan).
The Eurofound analysis also includes a future dimension -- the respondents are asked how optimis-tic they about their future. (They are asked to respond to the statement “I am optimistic about the future” by selecting one of the possible answers: Strongly disagree, Disagree, Neither agree nor disagree, Agree, Strongly agree). In Estonian, slightly more than 60% of the people view their future optimistically, which puts us in a significantly better position in this international comparison, than in the comparison based on life sat-isfaction. (Figure 3.3.3) The distinctiveness of Estonia’s position can be explained by the fact that, in many EU states, people are satisfied with the situation today, but their expectations for the future are more pessi-
mistic. The Eurofound researchers find that the rate of optimism is related primarily to people’s assessment of whether the state is on the right path of development, and less on the ability to cope personally (Eurofound, 2012, 31). Estonia’s population seems to confirm this connection – both our trust in the state authority (see sub-chapter 2.7), and our rate of optimism, are consid-erably above the EU average.
An optimistic attitude toward life is an important motivating force for forging ahead in life, and for estab-lishing ambitious goals. Thus, Estonia’s good position on the optimism scale could, generally, be an encouraging
Denmark
Netherlands
Switzerland
Austria
Finland
Canada
Israel
Costa Rica
New Zealand
Ireland
Uruguay
Chile
Singapore
Czech Republic
Taiwan
Slovenia
South Korea
Slovakia
Estonia
Hungary
0 1 2 3 4 5 6 7 8
0 1 2 3 4 5 6 7 8
Assesment
Assesment
5 years ago Now 5 years hence
Source: Gallup World Poll 2012, average assessment on a 10-step ladder of good life
Figure 3.3.2Assessment of life now, five years ago and five years hence, in Estonia, and the reference countries.

127Estonian Human Development Report 2012/2013
sign. It seems that the usual view of Estonia’s popula-tion, as being comprised of depressed pessimist, is not justified now.
3.3.3 Factors affecting subjective well-beingWhat does subjective well-being depend on? The material situation and people’s wealth are definitely important fac-tors. Generally, people in wealthier societies are more sat-isfied with their lives than those in poorer countries (see also sub-chapter 3.1.1). However, the connection between wealth and well-being is not linear, nor is it absolute, and researchers allude to the many particularities of this connection.
Firstly, the impact of wealth depends on the con-text. Internally, the connection between income and subjective well-being is usually weaker than interna-tionally. Diener’s analyses show that the correlation between income, and subjective well-being internally, by state, usually, is in the range of 0.15 – 0.20, whereas in international comparisons, the connection is signifi-cantly stronger (the average of various studies is ca. 0.60). Diener provides the following explanation for this: in the wealthier states, besides the differences in income levels, many other important factors (that are not dependent on income level) affecting satisfaction have developed, such as honouring human rights, equi-table treatment, and a better level of education. (Diener, Biswas-Diener 2002, 132).
Secondly, wealth impacts subjective well-being more strongly among the poorer classes of society, and in poorer states. There is less impact in the wealthier ones. It turns out that the higher-income people in wealthy states are only somewhat happier than their poorer compatriots. According to Diener, „for middle and upper-income people in economically developed nations, acquiring more income is not likely to strongly enhance subjective well-being“. (Diener, Biswas-Diener, 2002, 149).
Thirdly, subjective well-being is not shaped so much by the absolute income level, but rather, by the relative level. What is important is my material situation, in comparison to those close to me, to my acquaintances and to other members of the society (Easterlin 2003). An important basis for comparison also seems to be people’s “personal histories” – their previous level of well-being. If the trend is downward, it also significantly lowers subjective well-being. Although the absolute value of the Italians’ and Greeks’ incomes is significantly higher than the Estonians’, their subjective well-being indicators are rapidly moving downward (and are lower than the Estonians’ indicators today), thanks to comparisons with “how things were before.”
Wealth is not the only determinant of subjective well-being. In the Gallup ranking, Mexicans rate their lives better than Germans, although economic logic would assume the opposite. Research data points to the fact that the wealthier a society becomes, the more important the “non-material” factors affecting well-being become. These include health, work, and family life (Easterlin 2003), but also people’s involvement in social life, and interpersonal
trust (Helliwell, Putnam 2004, 1444). Education level is also a determining factor – in practically all the states, people with higher educations are happier, and more satisfied with life than those who are less educated (Edu-cation at Glance 2011, 192).
Therefore, wealth is an important factor influencing subjective well-being. However it is a principal force, pri-marily, in the societies that are at a “lower development phase”, i.e. at a time when most people are worried about satisfying their elementary needs – about making ends meet. For those who have made it out of the poverty zone (including the majority of Estonian people), the quality of life in the broader sense has a greater impact on subjective well-being.
Greece
Slovakia
Portugal
Italy
France
Hungary
Cyprus
Czech Republic
Slovenia
Belgium
Bulgaria
EL-27
Romania
Latvia
Great Britain
Spain
Malta
Luxembourg
Lithuania
Austria
Poland
Estonia
Germany
Netherlands
Ireland
Finland
Denmark
Sweden
0 10 20 30 40 50 60 70 80 90
0 10 20 30 40 50 60 70 80 90
Percentage
Percentage
Stronly agree Agree Neither agree no disagreeDisagree Strongly disagree
Figure 3.3.3optimism about the future.
Source: Eurofound, 2012, 31

128 Estonian Human Development Report 2012/2013
References1. dieneR, e. (2009). Culture and Well-Being. The Collected Works
of Ed Diener. Springer, London.
2. dieneR, e., dieneR, m., dieneR, C. (1995). “Factors Predicting the Subjective Well-being of Nations,” Journal of Personality and Social Psychology, 69/5, APA, N.Y.
3. eASteRlin, R. (2003). Do Aspirations Adjust to the Level of Achievement? A Look at the Financial and Family Domains. Pre-pared for European Science Foundation Exploratory Workshop on Income, Interactions and Subjective Well-Being, Paris, France, 25–26 September. www.delta.ens.fr/swb/EasterlinParis.pdf.
4. euRoFound (2012). Third European Quality of Life Survey - Quality of life in Europe: Impacts of the Crisis.
5. Helliwell, J., PutnAm, R. (2004). “The Social Context of Well-Be-ing,” Philosophical Transactions of the Royal Society. London, B, 359, rstb.royalsocietypublishing.org
6. oiSHi, S., dieneR, e., luCAS, R., SuH, e. (1999). “Cross-Cultural Variations in Predictors of Life Satisfaction: Perspective from Needs and Values,” Personality and Social Psychology Bulletin, 25/8, Sage.
7. oeCd (2011). Education at a Glance 2011:OECD Indicators, Paris: OECD Publishing. http://dx.doi.org/10.1787/eag-2011-en
8. SeligmAn, m. (2011). Flourish. A New Understanding of Happi-ness and Well-being. Nicholas Brealey Publishing, London.
9. SPeCtoR, P. (1997). Job Satsifaction. Application, Assessment, Cause and Consequences. Sage, London.
10. StevenSon, B., wolFeRS, J. (2008). “Economic Growth and Subjective Well-Being: Reassessing the Easterlin Paradox,” Brookings Papers on Economic Activity, pp. 1–87 Brookings Institution Press, N.Y.
11. neF (2012). The Happy Planet Index: 2012 Report. A Global index of Sustainable Well-being. London: New Economics Foundation, 2012, www.happyplanetindex.org
3.3.4 In conclusionWhen examining Estonia’s position in the rankings for subjective well-being, the importance of the particular viewpoint and the measuring instrument becomes evi-dent. The ranking of the states depends on how subjective well-being is examined – are people asked to assess the situation today, or are views of the future being consid-ered; are people asked to compare themselves based on a “ladder of good life”, or to assess their life satisfaction and feeling of happiness.
In comparative assessments, people in Estonia are the most critical. On the “ladder of good life”, we are located in the seventh tenth of the world, which is sig-nificantly lower than our position in wealth of human development rankings. We can guess that, in the case of the assessment method that asks the respondent to “com-pare yourself to the best possible life”, our assessments are affected by the fact that images of the “best possible life” are close by and right before our eyes in the form of the Nordic countries. Therefore, the bar is placed very high for us, and this also shapes our assessment of reality.
Estonia achieves a somewhat better position when, rather than a comparison, people are simply asked to assess their life satisfaction. About 2/3 of the people in Estonia are more or less satisfied with their lives. How-ever, when we place this indicator, which is quite good, into an international comparison, we, again, come out significantly below the EU average.
Estonia achieves the best positions in the assess-ments related to the future. In Estonia, about two-thirds of the population views the future positively, which is about 10% higher than the EU average. Our
better position in the optimism ranking is based on the fact that, in many EU countries, as a result of the economic crisis, the people’s visions of the future, compared to the present situation, have become more pessimistic. Also, in comparison to the reference states, Estonia stands out for a relatively low assessment of the current situation, while clearly having hopes for a better future.
Therefore, Estonia’s challenge for the future could be to encourage the one-third who are dissatisfied with life, and are pessimistic -- to help them catch up, and pro-vide them with a positive perspective. At the same time, attractive development prospects should also be provided for those who have succeeded, considering the fact that being satisfied and happy increasingly means more than just the amount of money in your bank account, and opportunities for self-realisation become more important (Oishi, Diener, Lucas, Suh 1999).
Can our position in various subjective well-being rankings tell us something about the concept, which is constantly circulating in our public space, about the anxious, negative and pessimistic mindset of the people in Estonia? In the case of the “good life” ranking, in which our subjective assessment of life is below several objective well-being indicators, one could conclude that the popular tendency here is to be more critical about oneself and one’s life, than is the case elsewhere in the world. At the same time, we cannot be reproached for a lack of optimism, at least in the context of our Euro-pean Union friends and colleagues we seem to be very efficient. On the one hand, we are, perhaps, even too critical about the “goodness” of our current life, but we are still clearly optimistic about the future – this is the reality of Estonia today.

129Estonian Human Development Report 2012/2013
3.4.1 Measuring the quality of lifeThe concept of the quality of life was introduced by Ger-man sociologist Wolfgang Zapf in the middle of the1980s (Glatzer, Zapf, 1984). It combined indicators for objective living conditions with those for subjective well-being, and reflected the dissatisfaction of the research community regarding too narrow approach to the measurement of people’s standard of living. The Easterlin Paradox already illustrated that life satisfaction is not linearly associated with increase of the wealth of society. Other studies had found that, paradoxically, people with very different standards of living can feel happy. Thus, a new construct was required that would combine both the material and non-material, personal and social aspects related thereto. The quality of life, or more simply a good life, became the wanted construct. Although material resources continue to be very important in the organisation of everyday life, peo-ple also consider social relations and the level of neighbour-hood development to be essential, along with good health, meaningful leisure time and the opportunity to have a say in policies (Noll, 2002, Phillips, 2006; Abbot, Wallace, 2012a). This, far from complete, list already alludes to how complicated the measurement of quality of life can be.
The first quality of life indices were compiled in the 1970s by commercial companies, in order to influ-ence investors, leading executives, or wealthy retirees, in choosing locations for their companies or homes. The best-known indices of this kind are the International Living’s Quality of Life Index and the Mercer’s Quality of Living index.
In the 1970s, the OECD and the United Nations experimented with measuring the quality of life, but this attempt wasstopped, since comparable and reliable international statistics were not available. In the 2000s, the measurement of life quality became again topical, and many countries started to work out their own indicators. The European Commission ordered the European Quality of Life Survey (EQLS) from the Eurofound in 2003 – an undertaking of symbolic importance. Namely, the study was based on understanding that the quality of life is com-prised both of material well-being, as well as of the qual-ity of social context. Thus, the European approach to the measurement of life quality considered such components like the sense of economic security, community involve-ment and cohesion, and the empowerment of people.
A new impetus for measuring well-being and the quality of life was provided by the expert commission convened by N. Sarkozy, which was supposed to create an improved methodology for the combined measurement of economic and social progress. The commission was headed by Joseph Stiglitz, Amartya Sen and Jean-Paul
Fitoussi, and the main message of the so-called “Stiglitz Commission” stressed the multi-dimensional nature of well-being and its altered focal point in contemporary society (Stiglitz, Sen, Fitoussi, 2009). The Stiglitz Com-mission worked as an independent think tank; however, today, its positions have been adopted by the European Commission (Eurofound 2012), and by the OECD (2011), as the basis for the measurement of the quality of life.
Thereby, the OECD, as an organisation that has, up until now, focused primarily on the economic side of well-being, sent a clear signal that the “soft”, non-material facets of human development are equally important. “Isegi majanduslikult rasketel aegadel, mil majanduskasvu taas-tamine on oluline mitmete heaoluindikaatorite (nagu hea töökoht või taskukohane eluase) saavutamiseks, peavad poliitika keskmes olema inimeste vajadused, mured ja unistused ning meie ühiskondade jätkusuutlikkus“Even during times of economic hardship, when restoring growth matters for the achievement of many well-being outcomes, such as having a good job or access to affordable housing, at the core of policy action must be the needs, concerns and aspirations of people and the sustainability of our societies(OECD:2011, 14). There is another important focal point in this quote – the OECD measures well-being and the quality of life in order to intervene, to change the sit-uation. Therefore, the chosen measures of well-being are those that can be changed by policies. The above men-tioned indices of the commercial companies regard the quality of life levels as predetermined, and the individual’s role is only to make a choice between locations with dif-ferent levels of quality (e.g. the International Living Index includes weather conditions as one of its components).
The EU was initially also an association focusing on economicdevelopment. However, “soft” social values attracted the attention of the European policymakers and analysts earlier than in the OECD. Unlike the OECD Better Life Index, the EU Quality of Life Survey places
3.4Quality of lifeAnu Toots
Quality of life Material living conditions
Health Income
Work-life balance Jobs
Community Housing
Education
Civic engagement
Environment
Safety
Life satisfaction
Table 3.4.1Main dimensions and indicators of the oECD Better Life Index (BLI) (2011)

130 Estonian Human Development Report 2012/2013
greater importance on the social cohesion and differences between social groups (in addition to the differences between countries that are important to both).
3.4.2 Indices and measures of the quality of lifeDue to the multi-faceted nature of the concept of life quality, there have not been any reliable indicators for a long time. Due to the lack of a better indicator, GDP was often used for this purpose; an approach which today has been widely criticised (Diefenbacher, Zieschank, 2009; Toots and Bachmann, 2010). In the 1970s and 1980s, per-centage of social costs of GDP has been used to rankthe welfare states. Today, the high percentage of welfare costs is no longer an adequate measure of the country’s social sustainability.Moreover, this indicator does not provide
Index compo-nents EU measures OECD measures
Income and wealth
Ability to make ends meet Material deprivation (inability to afford certain items)
Household net-adjusted disposable income Household financial wealth
Jobs and wages —
Employment rateLong-term unemployment rate Personal earningsJob security
Housing
Housing tenureQuality of dwelling Neighbourhood quality (services, safety, state of the environment)
Rooms per person Dwelling with basic facilities (% of people with WC)Housing expenditure
Health Health satisfaction; Access to health care
Life expectancy;Self-reported health
Work-life balance
Balancing work and family life;Strain-based conflict
Employees working very long hours (over 50 hours per week); Time devoted to leisure and personal care (incl. sleep)
Community
Contact with family members and friendsSatisfaction with family life and social life
Quality of support system
Education —Years in education; Student skills (average perfor-mance of students aged 15)
Civic engagement
Various forms of political and civic participation (except for elections and engagement)
Voter turnout; Consultation on rule-making
Environment Is included under housing Air pollution Water quality
Safety Safety in the neighbourhood (as a housing indicator)
Assault rateHomicide rate
Life satisfaction Subjective well-being Self-reported life satisfaction
Satisfaction with public services
By field of service —
Quality of society
Trust in people and public institutions Perceived social tensions
–
Table 3.4.2Indicators and measures of the oECD Better Life Index (2011) and the EU Quality of Life Survey (2011)
information about how well-being is distributed among the individuals or social groups. Thus, the access to healthcare, in countries with similar level of social expenditures, may differ. In sum, the GDP did not measure the quality of life adequately, and, also, it did not cover all of the content that is included today in the meaning of quality of life (Stiglitz, Sen, Fitoussi, 2009). Thus, the OECD adopted a complex framework of measures, which is based on three pillars: material living conditions, quality of life and the sustain-ability of well-being in time. Since by today the Better Life Index has been compiled only once, the sustainability dimension cannot be computed yet and– the OECD’s Better Life Index (BLI) measures well-being in two interconnected dimensions, by using eleven inidcators(Table 3.4.1). It is also important that well-being is measured at the micro- (individual) and meso- (group) levels, because the macro level (general economic situation, GDP) and an individual standard of living may diverge.
An important feature of the OECD quality of mea-surement is reliance on statistical indicators, and thorough attention to the quality (incl. comparability) of the statistics that are used. Some other indices (e.g. the Gallup World Poll, the European Quality of Life Survey) are based on opinion polls, about which the OECD has reservations (the comparison of countries may be nonreliable, the samples are too small). However, the OECD is also using some subjective data from the Gallup World Poll for measuring subjective well-being, until better data become available.
This chapter relies primarily on the OECD Better Life Index, supplementing them, with data from the European Quality of Life Survey (EQLS). Many of the indicators of these two surveys of quality of life overlap, but there are also differences (Table 3.4.2.). For example, the OECD includes labour market indicators in the Better Life Index; the EU acknowledges the importance of employment in life satisfaction, but does not measure it in connection with the quality of life. As a whole, in the European Union’s approach, greater attention to the social side of life quality can be noticed (e.g. the state of one’s neighbourhood, social tensions between groups, social and civic engagement, net-works, and perceived social alienation). Satisfaction with public services is a separate indicator of the EQLS, which can be explained by the European social model that val-uesgovernment responsibility in securingcitizens welfare. Although the OECD countries also are welfare states, the concept of the state as the provider of welfare is signifi-cantly different in Asia and the U.S. than it is in Europe (Alber and Gilbert, 2010; Alcock and Craig, 2009). There-fore, it is not possible to make meaningful comparison of the level of public services in various regions of the world.
3.4.3 Quality of life – the general pictureIt is not adequate to place countries into one absolute ranking in the case of such a multifaceted object, like a high-quality, or good, life. A country can be at the top, in regard to certain indicators, and lag behind, in oth-ers. By reducing the various indicators to one composite score, we would get an “average” result, which would not provide a adequate picture of the social success. This is also the argument used by the EQLS to explain why

131Estonian Human Development Report 2012/2013
a uniform composite indicator has not be created, and why the various dimensions of life quality are analysed separately (Eurofound 2012). It is better to make country clusters , with similar levels of life quality, , or to compare countries on the bases of specific indicators. Here, we use the final product of the OECD’s statistical calculations,-expressed in scale values between 0 and 10 points, where 10 is the highest and 0 the lowest level.
Country groupingsOf the 36 OECDcountries, the top countries (7.5–8.0 points) are Switzerland, Norway, Canada, the U.S., Sweden, Denmark, and the Netherlands. The next group (7.0–7.5 points) is primarily comprised of Western European states – Belgium, Finland, Great Britain, Iceland, Ireland, Austria, Germany, and New Zealand. The group of with a score slightly above average (6–7 points) is geographically and politically the most diverse – France, Spain, Italy, Slovenia, Japan, Poland and the Czech Republic. A common trait is the relatively short span of an open democratic society, which applies to all, except France. Estonia belongs to the next group, where the level of quality of life is below average (ca. 4.5), and which also includes Hungary, Brazil and Chile. At the same time, Russia, Mexico, and especially Turkey, lag considerably behind others.
According to the European Quality of Life Survey (EQLS), the countries with the higher quality of life are located in Northern and Western Europe, while the level in the Eastern and Southern countries is lower. Although in some base indicators differences between countries are decreasing, in general theyare still large. The Central and Eastern European countries have not caught up with the old Member States, but rather, the quality of life has weakened in some old Member States, especially in the Mediterranean countries. Since the EQLSdoes not make generalised indicators, it is compliated to speak about clusters here. More broadly, it is not typical for the Euro-pean Union to rank states, as the OECD does.
3.4.4 Country rankings in separate indicatorsBased on the individual indicators of the Better Life Index, Estonia’s position in the ranking is somewhat surprising. Estonia has similar rankings with countries that we usu-ally do not consider as being similar to us (Table 3.4.3). Estonia is most similar to Poland, but also to Slovakia, Hungary, Italy and Spain. Moreover, the similarities are not limited just to the indicators of material well-being, but also to social capital and subjective well-being.
Another unexpected finding is that the Scandina-vian countries do not comprise a uniform group. A very high level of well-being and quality of life can be found in the various regions of the world – in the heart and on the edges of Europe, in North America, Australia and Asia. It is also worth noticing that one particular country has achieved the highest score in a maximum of two indica-tors out of ten. Dispersion, not convergence seems to be the current trend in global human development.
Based on the European Quality of Life Survey, in many indicators of material well-being, Estonia is simi-lar to Hungary and Latvia, but also to Poland, the Czech
Republic and Lithuania. However, greater social involve-ment, institutional trust and optimism about the future make Estonia totally different from other Eastern Euro-pean countries. Thus, the Estonian population’s perception of life quality continues to be transitional – the prevailing thinking is “things are tough today, but the future will be better”. This optimistic attitude is not typical to other post-communist states, which makes Estonia quite unique.
3.4.5 Strengths and weaknesses of Estonian quality of lifeEstonia’s low position in the overall ranking of the OECD Better Life Index (31st position out of 36countries)rises the question, “Which indicators are the ones that significantly increase ourposition, and which decrease it?” This ques-tion is also important because, in the states with higher quality of life, the level of various indicators are relative-lysimilar, which demonstrates a balanced development. Estonia however,demonstrates uneven levelof develop-
Table 3.4.3The position of countries in the oECD Better Life Index (2011),according various inidcatora; the reference states are shown in bold
Compo-nents Measures
States similar to Estonia
State with the highest indicator
Income and wealth
Household net-adjusted disposable income Household financial wealth
Slovakia, Poland,Hungary
USA
Jobs and wages
Employment rateLong-term unemployment rate Personal earningsJob security
Slovakia, Spain Switzerland
Housing
Rooms per person Dwelling with basic facilities (% of people with WC)Housing expenditure
Hungary, Chile,Poland
USA
Health Life expectancy;Self-reported health
Korea,Turkey Switzerland
Work-life balance
Employees working very long hours (over 50 hours per week); Time devoted to leisure and personal care (incl. sleep)
Brazil,New Zealand, Canada,Great Britain
Denmark
Community Quality of support systemPoland, Brazil, Italy, Czech Republic
Iceland
EducationYears in education; Student skills (average perfor-mance of students aged 15)
Korea, New Zealand, Poland, Sweden
Finland
Civic engagement
Voter turnout; Consultation on rule-making Israel, Russia Australia
Environment Air pollution Water quality Spain, Italy Sweden
Safety Assault rateHomicide rate
Russia, Israel, Belgium Japan
Life satisfaction Self-reported life satisfaction Greece, Poland Denmark

132 Estonian Human Development Report 2012/2013
ment in various spheres. Therefore, our progress is being driven by a few factors, which may be not sufficient for sustainable development. (Aaviksoo, Kirss, Mägi, 2010). On the other hand, it gives a chance to turn the uneven-ness from a problem into opportunity – the weaker areas can be pulled along, with the help of the stronger ones.
As could be expected, Estonia’s strength is its acces-sible and efficient educational system; our position is also improved by people’s reciprocal helpfulness, as well as by the good air and water quality. Also, as could be expected, Estonia’s weakness is small household incomes, calculated on net-adjusted disposable income and household finan-cial wealth. In Estonia’s case, the low level of household financial wealth means that the real estate owned by fam-ilies has a low market value; people own few securities, and have heavy loan obligations. This explains also, why in the jobs and wages indicator, Estonia scores higher than in the income and wealth indicator.
Recently, there has been a lot of discussion about the rapid development of civil society and the spread of civic engagement. However, the corresponding indicator for Estonia in the Better Life Index (BLI) is one of the low-est, along with Israel and Russia. The reason for this dis-sonance has to be looked for in the differences in the data that form the indicator. The civic engagement component of the OECD’s BLI includes two measures – turnout in the last elections, and consultations with the public in the course of law-making. The openness and transparency of the consultation process was assessed on the basis of an expert survey, where employees in the government cabi-net have been the respondents. Thus, there is probably no reason to assume that the picture provided by the data is worse than the reality.
Does the European Quality of Life Survey (EQLS), which is based on an opinion poll, change Estonia’sposi-tion, compared to the measurements made by the OECD on bases of national statistics? Leaving aside some meth-odological differences , it has to be said that it does not. The standard of living, which the EQLS measures by a material deprivation index, places Estonia third from the bottom, after Bulgaria and Hungary. In quality of housing and health satisfaction, Estonia ranks, after Latvia, next to last . Since all the listed indictors correlate with life satisfaction, it is not surprising that in life satisfaction Estoniais in fifth position from the bottom, among the 27 EU Member States.
Political engagement, which is included into both the OECD and the EU index, is below the average. At the same time, Estonia is one of the few post-communist countries where the level of people’s apolitical social activi-ties (clubs, associations and societies) is considerably above the EU average. This highlights a characteristic feature of Estonia’s civil society -- a high level of community engage-ment, but limited access to governance and policymaking.
Estonia’s greatest strength, based on EQLS 2011, are limited tensions on the grounds of race-ethnicity and religion. This is the only measure, in the entire compli-cated system of indicators, where Estonia ranks first. Only 16% of the respondents in Estonia found that there are great tensions between ethnic groups, while the European Union average was 37%; in Belgium, the Netherlands and France it was even 48% to 50%.
Figure 3.4.2.Difficulties making ends meet, by income quartile (%)
Education(5.)
Community(25.)
Environment(27.)
Safety(33.)
Work-lifebalance
(22.)
Health(34.)
Jobs and wages(35.)
Housing(35.)
Civicengagement
(34.)
Life satisfaction(30.)
Income(32.)
2
4
6
8
Source: oECD (2011) Better Life Index http://www.oecdbetter-lifeindex.org/#/22212213212
Figure 3.4.1Estonia’s position among 36countries, and the scores by indicators, on a ten point scale , where 0 is the lowest and 10 the highest
Highest income group Middle income groupLowest income group
0 10 20 30 40 50 60 70 80 90
0 10 20 30 40 50 60 70 80 90
Greece
Hungary
Bulgaria
Romania
Latvia
Estonia
Lithuania
Slovakia
Cyprus
Ireland
Malta
Poland
Spain
Italy
France
EU 27
Czech Republic
Slovenia
Belgium
Great Britain
Portugal
Germany
Finland
Netherlands
Austria
Denmark
Luxembourg
Sweden
Percentage
Percentage
Source: EQLS 2011

133Estonian Human Development Report 2012/2013
3.4.6 The components of life qualityBelow, some of the important components of life qual-ity, not analysed in other parts of this report, will be discussed in greater detail. The data originate from the European Quality of Life Survey (EQLS) and the OECD’s Better Life Index (BLI).
3.4.7 Living standardThe economic crisis, which started in 2008, has changed many Europeans’ ability to cope. According to the European Quality of Life Survey, in 2011 and 2012, 45% of Europeans experienced larger or smaller problems coping economically (Figure 3.4.2). Yet, the differences between the countries are very large.In Austria, Sweden and Denmark less than 20% faced these problems, in Greece 86%, and in the Eastern European states, approximately 70%. In Estonia, in addition to the high percentage (68%) of people with coping prob-lems, the small difference between the lowest and highest income quintile is also striking. This means, that half of the people in the wealthiest population group had also difficul-tiesin making ends meet . This can occur, on the one hand, because people with higher incomes are living beyond their means, and have heavy loan burden, on the other hand, because of overall low wealth of Estonian society. The income level of highest income class in Eastern Europe, are close to that of the middle class in Western Europe.
The self-assessment of economic coping may depend on which standard of living is being aspired to – if the stan-dard is set too high, the self-assessment may, as a result, be
low. Therefore, to make data comparable, one should esti-mate to what extent people can afford certainitems. In the EQLS survey, these items included a warm room, a week’s holiday, the replacement of worn-out furniture, the possibil-ity to eat regular meals that included meat and fish, to buy new (not second-hand) clothes and to invite guests over.siin allpool on korrektne loetelu originaalis The six items are: 1. – keeping the home adequately warm; 2. – paying for a week’s annual holiday away from home (not staying with relatives); 3. – having a meal with meat, chicken or fish every second day; 4. – replacing worn-out furniture; 5. – buying new clothes rather than second-hand ones; 6. – inviting friends or family for a drink or meal at least once a month.
Based on the listed items, a deprivation index was created, which shows the mean number of items people could not afford. In the index, all items were given equal weight, although their monetary cost differs. There-fore, it is understandable that fewer people can afford a week-long holiday, than can afford to have friends over.However, this difference in the cost of the items does not harmcomparison of thecountries In the wealthy Western European states, most people can afford everything; while the situation is much worse in Eastern Europe. A quarter of the people in Estonia cannot afford any of the items, whereas 25% put up with a cold apartment, and 63% can-not afford a holiday away from home, or to replace their old furniture. Based on the deprivation index, Estonia is third from the bottom, above Bulgaria and Hungary.
3.4.8 Quality of housing and local neighbourhoodQuality housing adequate to one’s needs is one of the most important components of the quality of life. In the material context, this is a household’s largest expenditure, while non-materially it affects the mental development and health indicators of the children and other family members.Source: EQLS 2011
Keep
ing
hom
e
adeq
uate
ly w
arm
An a
nnua
l w
eek’
s ho
liday
Repl
acin
g w
orn-
out
furn
iture
Regu
lar m
eals
w
ith m
eat o
r fish
Buyi
ng n
ew, n
ot s
ec-
ond-
hand
, clo
thes
Invi
ting
frie
nds
or
fam
ily fo
r a d
rink/
mea
l
Mea
n nu
mbe
r of i
tem
s pe
ople
can
not a
ffor
d
Denmark 2 16 15 2 4 4 0,4
Austria 2 14 14 4 4 7 0,4
Netherlands 2 14 18 2 9 6 0,5
Finland 1 20 21 4 9 6 0,6
Slovenia 2 36 36 10 15 10 1,1
Ireland 9 39 34 4 12 18 1,2
EU 27 12 37 35 10 17 15 1,2
Czech Republic 5 36 46 17 27 19 1,5
Slovakia 11 58 56 26 32 30 2,1
Estonia 25 63 63 28 43 29 2,6
Hungary 15 65 70 41 46 39 2,8
Table 3.4.4Deprivation index and its components in the reference states, % of people who cannot afford the listed items, and the mean number of items people could not afford.
Table 3.4.5Problems with housing and the neighbourhood, %, reference countries
Shor
tage
of
spa
ce
Rot i
n
win
dow
s
Dam
p
Lack
of i
ndoo
r to
ilet
Lack
of b
ath
Lack
of s
pace
ou
tsid
e
No
gree
n sp
ace/
rest
are
a
Estonia 15 18 22 13 15 22 12
Hungary 14 16 14 4 5 12 11
EU 27 15 9 12 3 3 14 14
Slovakia 10 6 7 3 3 11 19
Finland 15 6 10 1 2 8 4
Austria 10 3 5 2 1 18 9
Ireland 13 5 10 1 1 6 9
Czech Republic 17 5 11 0 1 22 17
Slovenia 11 8 12 1 0 5 8
Denmark 13 6 10 0 0 0 2
Netherlands 13 8 12 0 0 5 13
Source: EQLS 2011

134 Estonian Human Development Report 2012/2013
The lack of rooms, or their non-conformity to the house-hold structure, has been a classic measure of the quality life. In recent years (especially in times of last economic recession), the issue of housing costs has become more acute, including housing tenure and the mortgage burden. Although high housing costs are often an issue of concern in Estonia, their percentage in the family budget is not high, compared to other OECD countries. At average of 10% of households in the OECD countries spend 40%, or more, of their budgets on housing, which is considered to be a(housing cost overburden. In Estonia the housing cost overburden rate is only 4.4%. This indicator depends, to great extent, on the country’s housing policies, housing tenure and subsidies, and therefore, one must be cautious when making cross-country comparisons. Everywhere, those who rent housing from the private sector at market prices are in the worse situation; in some countries (incl. Estonia), households that have housing loans experience the housing cost overburden more often than others. The difference in housing costs between households with mortgage, and with home ownership is especially strik-ing in countries that experienced the real estate boom in 2007 and 2008 (like Estonia, Hungary, Slovakia, Slovenia and Spain).
Yet, coping with housing costs, or even loans, is not the greatest problem in Estonia; in international comparisons, we are quite ordinary. What we do stand out for (and in a negative way) is the poor quality of the housing (lack of WC and shower, rotting windows, dampness). In most of the OECD countries, all the households have elemen-tary sanitary facilities; but in Estonia, 13% of families do not have a WC and shower. On this indicator, Estonia is similar to Turkey and Chile, and also to Latvia, Lithuania, Bulgaria and Romania.Moreover, for Estonia is typical that elderly people are twice less equipped with basic sanitary facilities than younger generations. Twenty percent of 65+ people in Estonia have only outdoor toilet, and no shower room.
Satisfaction with housing is directly correlated with the sanitary conditions and the sufficiency of space. How-ever, there is no correlation between housing costs and satisfaction, which shows that, for many households, the investment in housing has beena voluntary option, and they are ready to bear the high housing costs (OECD, 2011). Therefore, in order to provide adequate explanations, it is important to differentiate those who spend a large amount of household budget on housing voluntarily, and those, who are forced to do so due to their small income.
USA
Uus-Meremaa
Iirimaa
Šveits
Holland
Tai
Soome
Austria
Tšehhi
Slovakkia
Sloveenia
Eesti
Ungari
Korea
Ratio of the wealthiest income quintile to the poorestPoorest income quintile Wealthiest income quintile
0 10 20 30 40 50 60 70 80 90
0 0,5 1,0 1,5 2,0Ratio
Percentage
Figure 3.4.3People’s self-assessment of their health, by income group: Adults (15 years and older) who consider their health as good or very good (%) and the difference in assessments between the wealthiest and poorest income quintiles (2009)
Source: oECD 2011
0 1 2 3 4 5 6 7 8
FinlandDenmark
AustriaNetherlands
SloveniaIreland
Czech RepublicEU 27
EstoniaHungarySlovakia
AustriaFinland
NetherlandsDenmark
EU 27EstoniaSlovenia
Czech RepublicIreland
SlovakiaHungary
0 1 2 3 4 5 6 7 8
Figure 3.4.4aPerceived quality of the education system, on a ten point scale, where 0 = not satisfied at all, and 10 = very satisfied.
Source: EQLS 2011
Figure 3.4.4bPerceived quality of public transport, on a ten point scale , where 0 = not satisfied at all, and 10 = very satisfied.
Source: EQLS 2011

135Estonian Human Development Report 2012/2013
0 1 2 3 4 5 6 7 8
FinlandAustria
DenmarkNetherlands
SloveniaCzech Republic
EstoniaEU 27
IrelandSlovakiaHungary
0 1 2 3 4 5 6 7 8
AustriaDenmark
NetherlandsFinland
SloveniaCzech Republic
EU 27Ireland
EstoniaHungarySlovakia
0 1 2 3 4 5 6 7 8
AustriaDenmark
FinlandNetherlands
IrelandEU 27
EstoniaSlovenia
Czech RepublicSlovakiaHungary
0 1 2 3 4 5 6 7 8
FinlandNetherlands
DenmarkAustriaIreland
EU 27Czech Republic
SloveniaEstoniaHungarySlovakia
0 1 2 3 4 5 6 7 8
AustriaDenmark
NetherlandsFinland
Czech RepublicSlovenia
EU 27EstoniaHungary
IrelandSlovakia
Source: EQLS 2011
Figure 3.4.4cPerceived quality of social housing, on a ten point scale , where 0 = not satisfied at all, and 10 = very satisfied.
Source: EQLS 2011
Figure 3.4.4dPerceived quality of childcare services, on a ten point scale, where 0 = not satisfied at all; and 10 = very satisfied.
Source: EQLS 2011
Figure 3.4.4ePerceived quality of long-term careservices, on a ten point scale, where 0 = not satisfied at all, and 10 = very satisfied.
Figure 3.4.4gPerceived quality of the state pension system, on a ten point scale , where 0 = not satisfied at all, and 10 = very satisfied.
Figure 3.4.4fPerceived quality of the health services, on a ten point scale, where 0 = not satisfied at all, and 10 = very satisfied.
Source: EQLS 2011 Source: EQLS 2011
More broadly, the housing indicators are correlated with almost all the dimensions of well-being, because housing in an important consumtion item and investment. There-fore, increase in housing quality effectively increases the entire life quality and well-being.
3.4.9 HealthGood health is one of the most important aspects of a high quality of life, which influences people’s ability to cope financially and socially. As a rule, healthier societies also have better employment indicators and a higher level of civic engagement (OECD 2011). The measurement of health, in the human development context, has undergone a process similar to educa-tion – from simple quantitative indicators (average life span, infant mortality), it has moved to more com-plicated indices. These include both health statistics and people’s subjective assessments of their health, as well as the links between health and lifestyle. (). “Modern diseases”, such as obesity, mental problems, and chronic illnesses are often not related to the the society’s wealth, but rather to the environment status, culture and education. Also, longer life expectancy has been accompanied by the increase in chronic illnesses, despite advanced medical care and increasing health-care costs. Therefore, it is not surprising that the per-centage of people in Estonia that suffer from chronic medical problems is similar to Finland (about 40%);

136 Estonian Human Development Report 2012/2013
the obesity index in the U.S. is about 33%, 20% in Estonia, but less than 5% in China and the Republic of Korea (WHO 2008).
The objective health indicators do not reflect, one-to-one, the subjective assessment of health. For instance, in the U.S. in 2009, 90% of the people considered their health to be good or very good (the highest OECD indi-cator), but in Japan only 32% did so (OECD 2011). In the same year, 52% of the people in Estonia, considered their health to be good or very good, while two years later this proportion had dropped by almost 10%, to 44% (EQLS 2011). With these indicators, Estonia ranks at the bottom both in the OECD and the EU.
However, Estonia’s most serious problem is not the low satisfaction with their own health, but the large difference in the level of satisfaction between the low and high income groups. 74% of people in the highest income quintile consider their health to be good or very good; in the lowest income group the same indicator is to times lower, i.e. 32% (Figure 3.4.3). Although, the wealthier people assess their health status higher everywhere; in Estonia the gap is largest.It considerably exceeds even the level of countries, where the private healthcare is dominant(e.g. the U.S., Republic of Korea, and Switzerland).
The explanation is probably that, to a great extent, health depends on lifestyles not only on healthcare. Only 26% of people in Estonia report that the cost of the healthcare is for them a problem, hindering access to the healthcare. By this indicator Estonia performs above the EU average (EQLS 2011).. On the other hand, Estonia has the greatest difference in life expectancy between people with high and low levels of education. A 30-year-old man with higher education will live 17 years longer than a poorly educated man in Estonia, while this difference is only four to six years in Western Europe. Among women, life expectancy is also related to the educational level, but here the difference is more modest (9 years), but the difference between Estonia and Western Europe is still large (Eurostat, 2010). Thus, health related components of quality of life can be efficiently improved by investing more in other components of human development, pri-marily into education.
3.4.10 Public servicesAlthough life quality and satisfaction is associated to many individual factors, such as socio-economic sta-tus, values and attitudes, the government also plays an important role in t promoting the quality of life, through its public policies. Traditionally, the quality of the society has been measured through interpersonal and institu-tional trust, as well as civic engagement. The European Quality of Life Survey has elaborated this approach, by asking people how satisfied they are with the main fields of social policy.
When comparing Estonia to the reference countries, one can draw two conclusions. Firstly, in the post-com-munist states (Slovenia, Czech Republic, Slovakia and Hungary) all public services get lower assessment than in the established Western European countries. Ireland,
which underwent economic turbulence recently, is more similar to Eastern than Western Europe. Secondly, the public satisfaction with public services in Estonia is at the EU 27 average in some policy fields, but remains con-siderably belowe average in others, such as healthcare, long-term care and the pension system.In general, the people in Estonia stand out for their critical view– even the education system, which, for example, achieves a high, 5th position, in the OECD Better Life Index, gets a lower rating than is given by the people in the coun-tries where the objective education indicators are lower. (see Figure 3.4.4a).
The differences between the countries can also be caused by the different expectations that people have con-cerning public services, as well as by the way that the pol-icies actually cope with the provision of services. There-fore, in addition to comparingcountries, it is important to examine the opinions of various respondent groups. Generally, poorer people give a lower assessment to ser-vices than respondents from higher income groups, and young people give a higher assessment than the elderly. However, statistically, these differences are insignificant. Rather, the systemic difference in assessments is based on whether the respondent has used the service, or not. Those who actually use the services are as a rule more satisfied than those who have not.
3.4.11 Changes in the quality of life in Europe and EstoniaAs mentioned above, the OECD Better Life Index has only been compiled once (2011), which makes impossible to evaluate the change in the quality of life in the devel-opedcountries around the world. However, this possibility does exist for the European Union, because the European Quality of Life Survey has already been conducted three times. However, changes in the research methodology do not always allow to compare all three surveys – in 2003, 2007 and 2011.
When comparing 2003 and 2007, the Central and Eastern European countries are still poorer, and lag behind the European average in most indicators of the quality of life (Alber, Fahey, Saraceno, 2008). As a result of the economic crisis, the number of peo-ple having difficulties in making end meet increased in almost all of the EU countries. In Estonia, France, Greece, Ireland, Slovakia, Slovenia, Spain and Great Britain, there were 10% more of these people in 2011 than in 2007. The deprivation index also increased, whereas, the downward change was considerably larger in Southern and Eastern Europe than in Finland, Swe-den, Austria, Denmark or the Netherlands. Compared to the pre-crisis period, Estonia’s indicator is the worst – the deprivation index has almost doubled here (Euro-found 2012).
The economic standard of living also affected peo-ple’s satisfaction with life, although the impact differed in Eastern and Western Europe. Firstly, life quality in Eastern Europe is more clearly related to economic fac-tors (Bohnke, 2008). Secondly, the volatility of satisfaction in latest EU member states is higher and affected by the

137Estonian Human Development Report 2012/2013
financial crisis more than that in the old member states. In many Central and Eastern European countries (espe-cially in Estonia, Slovakia and Lithuania), satisfaction with the standard of living increased very rapidly between 2003 and 2007 (9%, on the average), and thereafter, decreased just as rapidly. In the Baltic States, the decline in satisfaction was directly related to the decrease in GDP, while, in France, for example, the GDP remained more or less stable, but the satisfaction with the standard of living declined considerably.
Unlike the fluctuations in material well-being, fam-ily relations seem to be more stable, and changes in the satisfaction with them were less than one percent, on the average, in 2007 - 2011. The impact of the economic crisis on close relations is not differentacross countries, but rather, across socio-economic classes. People with lower income and education level feel greater work and family stress, and their contacts with their parents have decreased. This shows that, in times of crisis, the empow-erment of the weaker members of society becomes espe-cially important, so as to help them maintain control over their lives (Abbot, Wallace, 2012).
In addition to households, the economic crisis also puts governments, and the provision of public services, in a difficult position. Have the austerity measures reduced the public satisfaction with services? Based on the European Quality of Life Survey, between 2007 and 2011, on average, this has changed very little, if at all (0.1%), in Europe. On the other hand, in Estonia, satisfaction with all public services has declined, especially with the pension system and the health care services. Since the people between 40 and 50 are the most dissatisfied with the pension system, it can be concluded that the decline in the satisfaction is not caused by the modest level of today’s pension benefits, but by the sudden changes being made in the pension system (e.g. the suspension of state payments into the second pillar of the pension scheme during the years 2009 and 2011). Similarly, satisfaction with the education system may have decreased because of the disputed secondary and higher education reform, the goals and implementation of which was not clear to the public (Aavakivi, 2012; Ader, 2012).
Figure 3.4.5Changes in the deprivation index in result of the economic crisis (2011 compared to 2007) and the mean number of items people could not afford.
0.0 0.5 1.0 1.5 2.0 2.5
0.0 0.5 1.0 1.5 2.0 2.5
2007 2011
Index
Index
Bulgaria
Hungary
Estonia
Greece
Latvia
Lithuania
Romania
Poland
Cyprus
Slovakia
Portugal
Malta
Czech Republic
Spain
EU 27
Ireland
Great Britain
Slovenia
France
Belgium
Germany
Italy
Finland
Netherlands
Austria
Denmark
Sweden
Luxembourg
Source: EQLS 2007 ja EQLS 2011
0
1
2
3
4
5
6
7
0
1
2
3
4
5
6
7
Public transportChildcare servicesEducation systemLong-term (elderly)care services
Social housingHealthcare servicesPension system
2007 2011Europe average:2007 2011Estonia:
Aver
age v
alue
s
Figure 3.4.6Change in the public satisfactionwith public services, 2007–2011; average values, on a ten point scale, where 0 = is the lowest, and 10 = the highest rating.
Source: EQLS 2007 and EQLS 2011

138 Estonian Human Development Report 2012/2013
3.4.12 In conclusionThis chapter looked at modern approaches to measur-ing the quality of life , which combine material and non-material, objective and subjectiveindicators. This multi-dimensionality of the phenomenon also questions the feasibility of creating an absolute and single ranking , since different countries can be found at the top on the different dimensions. Yet, some common features are still typical for the top performers. Switzerland, Norway, Can-ada, Denmark and Sweden – they all have a long stable democracy, and equally highly developed dimensions of the quality of life. Estonia belongs in the life quality to the lowest quarter of the OECD countries, resembling Hungary, Brazil and Chile. Estonia is exceptional in the unevenness of the various dimensions of the quality of life, and the great lag in material living conditions. Non-material components of private lifes (good family and community relations, work-life balance), in contrary, increase Estonia’s overall position and proved to be resil-ient to the economic recession.
However, Estonia is not a typical Eastern Europe-ancountry, becauseunlike the other post-communist nations, the people of Estonia are optimistic about the
References1. AAvAKivi, K. (2012). Valitsuse (governance) printsiipide rakend-
amine põhikooli- ja gümnaasiumiseaduse koostamise protsessis. Master’s thesis Tallinn: Institute of Political Science and Gover-nance, Tallinn University.
2. AAviKSoo, A., KiRSS, l., mägi, e. (2010). “Is Education as Estonia’s Current Human Development Engine Starting to Tire?” Estonian Human Development Report 2009. Ed. Lauristin, M. Tallinn: Estonian Cooperation Assembly, 17–20.
3. Abbot, P., Wallace, C. (2012b). “Rising Economic Prosperity and Social Quality: The Case of New Member States of the European Union,” Social Indicators Research. Springer Link http://link.springer.com/article/10.1007%2Fs11205-012-9992-0 ( vaadatud 14.02.2013)
4. Abbot, P., Wallace, C. (2012a). “Social Quality: A Way to Mea-sure the Quality of Society,” Social Indicators Research. 2012 August; 108(1): 153–167.
5. AdeR, S. (2012) Noorteühenduste roll hariduspoliitika kujun-damisel: Eesti kõrgharidusreformi juhtum. Master’s thesis. Tallinn: Institute of Political Science and Governance, Tallinn University.Alber, J., Gilbert,N. (eds) (2010). United in Diversity? Comparing Social Models in Europe and America. Oxford: Oxford University Press.
6. Alber, J., Fahey, T., Saraceno, C. (eds.) (2008). Handbook of Qual-ity of Life in the Enlarged European Union. London: Routledge.
7. Alcock, P., Craig,G. (eds.) (2009). International Social Policy. Welfare Regimes in the Developed World. Houndmills, Bas-ingstoke: Palgrave Macmillan.
8. BoHnKe, P. (2008). “Does Society Matter? Life Satisfaction in an Enlarged Europe,” Social Indicators Research, 87, 189–210.Glatzer, W., Zapf, W. (hrsg) (1984) Lebensqualität in der Bundesrepublik. Objektive Lebensbedingungen und subjektives Wohlbefinden . Frankurt: Campus.
9. International Living http://internationalliving.com/2010/12/quality-of-life-2011/( viewed 13.03.2013)
10. dieFenBACHeR, H., zieSCHAnK, R. (2009) Measuring Welfare in
Germany. A Suggestion for a New Welfare Index. Final Report on the Research Project. Heidelberg: Research Centre of the Evangelishen Studiengemeinschaft, Heidelberg and Research Centre for Environmental Policy, Freie Universität Berlin.
11. Stiglitz, J., Sen, A., FitouSSi, J-P. (2009). Report by the Com-mission on the Measurement of Economic and Social Progress. http://www.stiglitz-sen-fitoussi.fr/en/index.htm (viewed 21.12.2012).
12. euRoFound (2013). Third European Quality of Life Survey. Survey Mapping Tool http://www.eurofound.europa.eu/surveys/smt/3eqls/index.EF.php
13. euRoFound (2012). Third European Quality of Life Survey – Quality of Life in Europe: Impacts of the Crisis. Publications Office of the European Union: Luxembourg.
14. euRoFound (2010). Trends in Quality of Life in EU: 2003–2009. http://www.eurofound.europa.eu/publications/htmlfiles/ef1047.htm (viewed 25.12.2012)
15. euRoStAt (2010). “Highly Educated Men and Women Likely to Live Longer,” Statistics in Focus, 24.
16. meRCeR (2012). Quality of Living Ranking. http://www.mercer.com/qualityofliving (viewed 13.03.2013)
17. Noll, H.( 2002) “Towards a European System of Social Indica-tors,” Social Indicators Research 58: 47–87.
18. oeCd (2011). How’s Life? Measuring Well-Being. OECD Publishing.
19. PHilliPS, d. (2006). Quality of Life. Concept, Policy and Practice. London: Routledge
20. tootS, A., BACHmAnn, J. (2010) “Contemporary Welfare Regimes in Baltic States: Adapting Post-Communist Conditions to Post-Modern Challenges,” Studies of Transition States and Societies, Vol. 2 (2), 31–44.
21. wHo (2008). World Health Organization Global Health Obser-vatory Data Repository
22. http://apps.who.int/gho/data/ (viewed 12.02.2013).
future, trust their fellow citizens, and are socially active. This optimism and the strong community ties are in sharp contrast to satisfaction with public services. In the EU the economic recession had practically no impact on the public satisfaction with public services, in Estonia instead, the satisfaction with the pension system, healthcare and long-term care services has decreased significantly. One of the weaknesses in enhancing the quality of life quality in Estonia are the poor and uneven housing conditions. The lack of a national housing policy has resulted in many elderly and poor people lacking elementary health and sanitary conditions, while people with housing loans in Estonia have higher coping risk than those in other countries. Since satisfaction with housing is correlated with almost all other life quality indicators, increasing the satisfaction with housing would increase the total life quality and well-being. Another life quality component that would create such positive spillover is education. Based thereon, when planning public policy, broader and more complex attention must be paid to less-educated people, along with their own empowerment. Typically, the positive effect of education on material well- being and employability have been stressed. Yet, a similar effect can also be seen on health, family relations and the work-life balance.

139Estonian Human Development Report 2012/2013
This sub-chapter analyses the developments in Esto-nia during the last 10 to 15 years, using the indices and indicators related to the ecological sustainability and resource consumption of society. The Ecological Footprint, Carbon Footprint, energy intensity of the economy, and resource productivity are all examined. Estonia is part of the globalising world, where products, as well as the environmental impact of human activity, move across national borders, and therefore, the statis-tics that are usually related to the environmental impact of production do not reflect the environmental impact of imported products and services caused in foreign coun-tries. In other words – the global ecological impact that is caused by the production and consumption in Estonia has not been considered to date.
3.5.1 The Ecological Footprint – definition and measuresThe Ecological Footprint is a composite indicator, which associates the ecological impact of human activ-ities with the existing ecological reserves. In other words, the Ecological Footprint shows how many services of the Earth’s ecosystem are consumed by humanity, its countries and cities, and whether this consumption is within the limits of nature’s regener-ation capability. The size of the equivalent biologically productive area (in global hectares), which would be able to regenerate these natural resources and neu-tralise the waste, is calculated for the country’s (or some other unit’s) material and energy flows. Accord-ing to the latest Global Ecological Footprint report, compiled in 2011, the area per capita in the world necessary for this regeneration is 1.8 global hectares, i.e., this is the sustainable level of Ecological Footprint per capita, which would allow planet Earth to tolerate the resource consumption of the entire population. This can fluctuate somewhat by year, depending on the level of productivity of the Earth and the size of population. Currently, the consumption per capita is about 2.7 global hectares, or figuratively, 1.5 planets annually. This means that it takes Earth 18 months to regenerate the resources that humanity consumes, and to decompose the waste it creates, in a year. This is called ecological overshoot. This is a situation in which the consumption of resources is greater than their actual reserves, resulting in the depletion of eco-logical resources and the accumulation of waste. The resources consumed by humanity have exceeded the regeneration capability of Earth since the early 1980s; but as recently as the mid-1960s, humanity consumed half as much. (WWF et al., 2012)
3.5Environment dimension of well-beingMari Jüssi
€ per capita
Built-up area Carbon Fishing ground ForestGrazing land Cropland GDP (PPP)
0 1 2 3 54 76 8
Denmark
Belgium
Netherlands
Ireland
Finland
Sweden
Austria
Czech Republic
Slovenia
Greece
France
Spain
Estonia
Great Britain
EU 27
Slovakia
Germany
Italy
Lithuania
Portugal
Latvia
Poland
Hungary
Bulgaria
Romania
Hectare per capita
0 5 10 15 2520 3530 40
Source: Global Footprint Network 2012
Figure 3.5.1.aThe Ecological Footprint and GDP (based on PPP), per capita of the European Union Member Countries, 2008.

140 Estonian Human Development Report 2012/2013
The Ecological Footprint combines six indicators related to people’s consumption of renewable natu-ral resources and their regeneration: food and fibres produced from plants (cropland), food and products produced from animals (grazing land), fish (fishing ground), lumber and other forest products (forest), land that accumulates and stores fossil carbon dioxide (carbon sink) and land under buildings and structures (built-up land).
The strength of the Ecological Footprint as an indicator is considered to be the fact that it is possible to use it to show whether humanity (or a country, city, household) is within the regeneration limits of the eco-system. With the help of the Ecological Footprint, the impact of various consumption habits on the Earth’s ecosystem can be clearly explained. The Ecological Footprint methodology is based on the belief that the regeneration capability of the Earth will be the limiting factor for human activity, if humanity’s overconsump-tion continues.
On the other hand, the Ecological Footprint methodology is also limited, because it does not show economic relationships, or the consumption of non-re-newable natural resources. However, it is probably not possible to use only one complex indicator to describe all of the environmental impacts, so that various indicators must be analysed (Galli et al. 2012).
3.5.2 Estonia’s position in the rankings of the Ecological Footprint IndexThe Ecological Footprint of the European countries, including Estonia, is three to five times greater than that of the developing countries. Although the consumption of natural resources in Europe has not grown in the last 20 years, the import of natural resources and products from other parts of the world has increased significantly, which means that Europe has partly “exported” its environmental impact (Galli et al, 2012). The majority of Eastern European countries live within the regener-ation capability of their region, but on the global level, this rate of consumption is not sustainable (Kitzes et al., 2008). Based on a report concerning the Ecological Footprint of 150 countries in the world, which is based on 2008 data (Global Footprint Network 2012), Estonia is in 26th place, starting from the country with the larg-est Footprint, and exceeds the global sustainability level 2.5 times. If we compare the Ecological Footprints with the country’s economic levels, generally, a larger gross domestic product (GDP) is accompanied by a larger Ecological Footprint. When we compare the Ecological Footprint and GDP in the European Union Member States, Estonia stands out for its large Ecological Foot-print despite its smaller GDP (Figure 3.5.1 a, b).
Carbon Built-up area Fishing ground Forest Grazing land Cropland
7.0
6.0
1.0
2.2
3.0
4.0
5.0
7.5
6.5
5.5
0.5
1.5
2.5
3.5
4.5
0
7.0
6.0
1.0
2.2
3.0
4.0
5.0
7.5
6.5
5.5
0.5
1.5
2.5
3.5
4.5
0
1992
1993
1994
1995
1996
1997
1998
1999
2000
2001
2002
2003
2004
2005
2006
2007
2008
Figure 3.5.2Estonia’s Ecological Footprint per capita, 1992–2008 (global hectares per capita)
Source: Global Footprint Network 2012
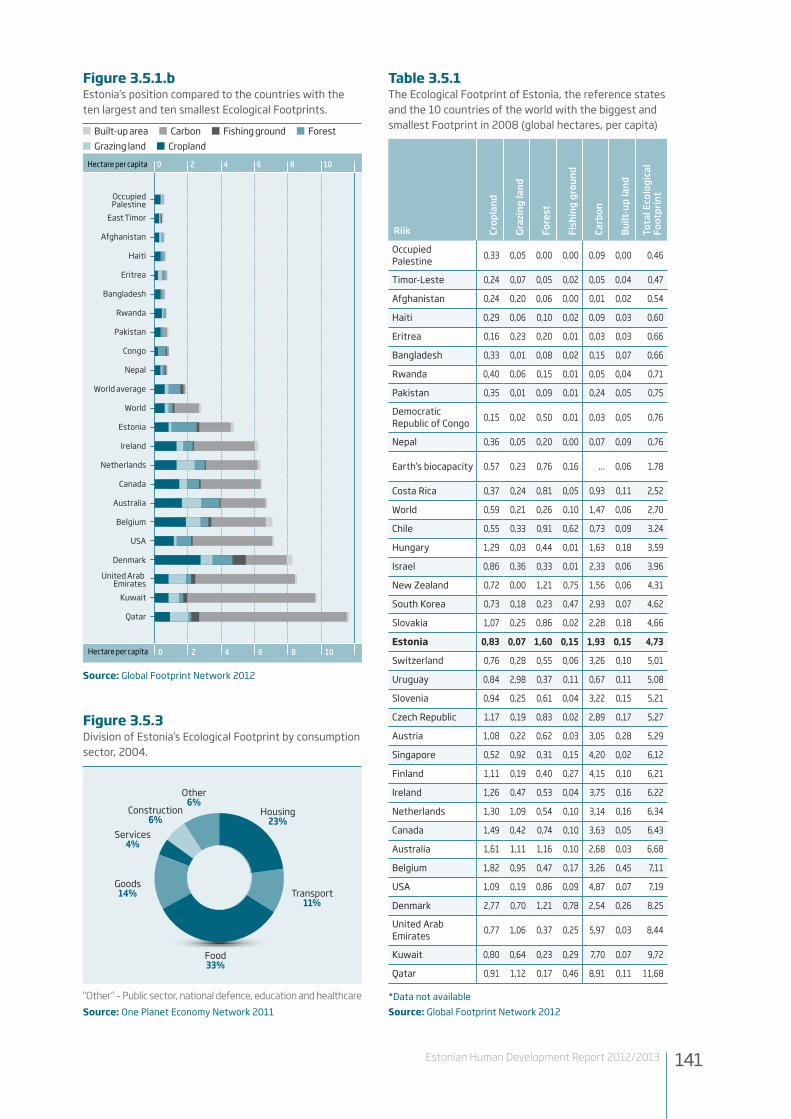
141Estonian Human Development Report 2012/2013
Source: Global Footprint Network 2012
0 2 4 6 108
0 2 4 6 108
Built-up area Carbon Fishing ground ForestGrazing land Cropland
Hectare per capita
Hectare per capita
East Timor
Afghanistan
Haiti
Eritrea
Bangladesh
Rwanda
Pakistan
Congo
Nepal
World average
World
Estonia
Ireland
Netherlands
Canada
Australia
Belgium
USA
Denmark
OccupiedPalestine
United Arab Emirates
Kuwait
Qatar
Food33%
Transport11%
Housing23%
Other6%
Construction6%
Services4%
Goods14%
Figure 3.5.1.bEstonia’s position compared to the countries with the ten largest and ten smallest Ecological Footprints.
Figure 3.5.3Division of Estonia’s Ecological Footprint by consumption sector, 2004.
“Other“ – Public sector, national defence, education and healthcareSource: one Planet Economy Network 2011
Riik Crop
land
Graz
ing
land
Fore
st
Fish
ing
grou
nd
Carb
on
Built
-up
land
Tota
l Eco
logi
cal
Foot
prin
t
occupied Palestine 0,33 0,05 0,00 0,00 0,09 0,00 0,46
Timor-Leste 0,24 0,07 0,05 0,02 0,05 0,04 0,47
Afghanistan 0,24 0,20 0,06 0,00 0,01 0,02 0,54
Haiti 0,29 0,06 0,10 0,02 0,09 0,03 0,60
Eritrea 0,16 0,23 0,20 0,01 0,03 0,03 0,66
Bangladesh 0,33 0,01 0,08 0,02 0,15 0,07 0,66
Rwanda 0,40 0,06 0,15 0,01 0,05 0,04 0,71
Pakistan 0,35 0,01 0,09 0,01 0,24 0,05 0,75
Democratic Republic of Congo 0,15 0,02 0,50 0,01 0,03 0,05 0,76
Nepal 0,36 0,05 0,20 0,00 0,07 0,09 0,76
Earth’s biocapacity 0,57 0,23 0,76 0,16 ... 0,06 1,78
Costa Rica 0,37 0,24 0,81 0,05 0,93 0,11 2,52
World 0,59 0,21 0,26 0,10 1,47 0,06 2,70
Chile 0,55 0,33 0,91 0,62 0,73 0,09 3,24
Hungary 1,29 0,03 0,44 0,01 1,63 0,18 3,59
Israel 0,86 0,36 0,33 0,01 2,33 0,06 3,96
New Zealand 0,72 0,00 1,21 0,75 1,56 0,06 4,31
South Korea 0,73 0,18 0,23 0,47 2,93 0,07 4,62
Slovakia 1,07 0,25 0,86 0,02 2,28 0,18 4,66
Estonia 0,83 0,07 1,60 0,15 1,93 0,15 4,73
Switzerland 0,76 0,28 0,55 0,06 3,26 0,10 5,01
Uruguay 0,84 2,98 0,37 0,11 0,67 0,11 5,08
Slovenia 0,94 0,25 0,61 0,04 3,22 0,15 5,21
Czech Republic 1,17 0,19 0,83 0,02 2,89 0,17 5,27
Austria 1,08 0,22 0,62 0,03 3,05 0,28 5,29
Singapore 0,52 0,92 0,31 0,15 4,20 0,02 6,12
Finland 1,11 0,19 0,40 0,27 4,15 0,10 6,21
Ireland 1,26 0,47 0,53 0,04 3,75 0,16 6,22
Netherlands 1,30 1,09 0,54 0,10 3,14 0,16 6,34
Canada 1,49 0,42 0,74 0,10 3,63 0,05 6,43
Australia 1,61 1,11 1,16 0,10 2,68 0,03 6,68
Belgium 1,82 0,95 0,47 0,17 3,26 0,45 7,11
USA 1,09 0,19 0,86 0,09 4,87 0,07 7,19
Denmark 2,77 0,70 1,21 0,78 2,54 0,26 8,25
United Arab Emirates 0,77 1,06 0,37 0,25 5,97 0,03 8,44
Kuwait 0,80 0,64 0,23 0,29 7,70 0,07 9,72
Qatar 0,91 1,12 0,17 0,46 8,91 0,11 11,68
Table 3.5.1The Ecological Footprint of Estonia, the reference states and the 10 countries of the world with the biggest and smallest Footprint in 2008 (global hectares, per capita)
*Data not availableSource: Global Footprint Network 2012

142 Estonian Human Development Report 2012/2013
Other Wastes Agriculture Industrial processes Transport Power industryManufacturing industry and construction
5,000
10,000
15,000
20,000
2,500
7,500
12,500
17,500
22,500
0
5,000
10,000
15,000
20,000
2,500
7,500
12,500
17,500
22,500
0
1995
1996
1997
1998
1999
2000
2001
2002
2003
2004
2005
2006
2007
2008
2008
2010
Figure 3.5.4Greenhouse gas emissions in Estonia, 1995–2010, 1,000 tonnes Co2 eq
Source: Eurostat/EEA
The largest part of Estonia’s Ecological Footprint is comprised of the Carbon Footprint and forestry (Figure 3.5.2). Somewhat surprising is the change in the Footprint related to forest and lumber products, between 2000 and 2005, which partially coincides with the period of the largest logging volumes and exports, but which, considering the Ecological Footprint meth-odology, should reflect final domestic consumption. Estonia’s very large Carbon Footprint is caused pri-marily by the power industry, which is based on oil shale and the large consumption of natural resources related thereto. Therefore, below, we will take a closer look at Estonia’s greenhouse gas emissions, its Carbon Footprint, the energy intensity of the economy and resource productivity. There are few surveys of the spe-cific areas of consumption that increase the Ecological Footprint, and the latest data on Estonia is for 2004, and available from the One Planet Economy Network database (2011). Based thereon, the greatest consump-tion occurs in the following sectors: food (including, especially meat, milk, fish), housing (electricity and heating), goods (forestry products, chemical products) and transport (Figure 3.5.3).
3.5.3 Greenhouse gas emissions and the Carbon FootprintAs far as greenhouse gas emissions are concerned, compared to the levels agreed upon in the Kyoto Protocol, Estonia’s greenhouse gas emissions are cur-
rently significantly smaller than in 1990 (40% less), although the main reduction took place between 1991 and 1994, immediately after the collapse of the Soviet Union and the industry and agriculture related to it. However, in 2010, Estonia was still among the 20 countries producing the most greenhouse gases per capita in the world (World Development Indica-tors 2012). As Figure 3.5.4 shows, most of Estonia’s greenhouse gas emissions are caused by the power industry, which is based on the use of oil shale, but an increasingly large part comes from transportation. According to the Säästva transpordi raport (Sustainable Transport Report), people are not widely aware of the energy conservation potential of transport, primarily related to passenger cars ( Jüssi et al., 2010).
Currently Estonian, EU and the UN databases report on the CO2 emissions emitted into the air on the country’s territory, in the last few years, attention has increasingly been directed toward the indirect “export” and “import” of CO2 emissions through international commerce. This means that, if Estonia exports some of the electricity it produces using oil shale, then the CO2 footprint that results from this power production will be recorded as the CO2 footprint of the population in the consuming countries, not as the CO2 footprint of Estonia’s population. At the same time, access to the data needed to compute an indicator that includes the global trade balance is a time-consuming process – the last available data is for 2004 and, unfortunately, there is no possibility to analyse the present trend of the changes taking place (Figures 3.5.5 and 3.5.6).
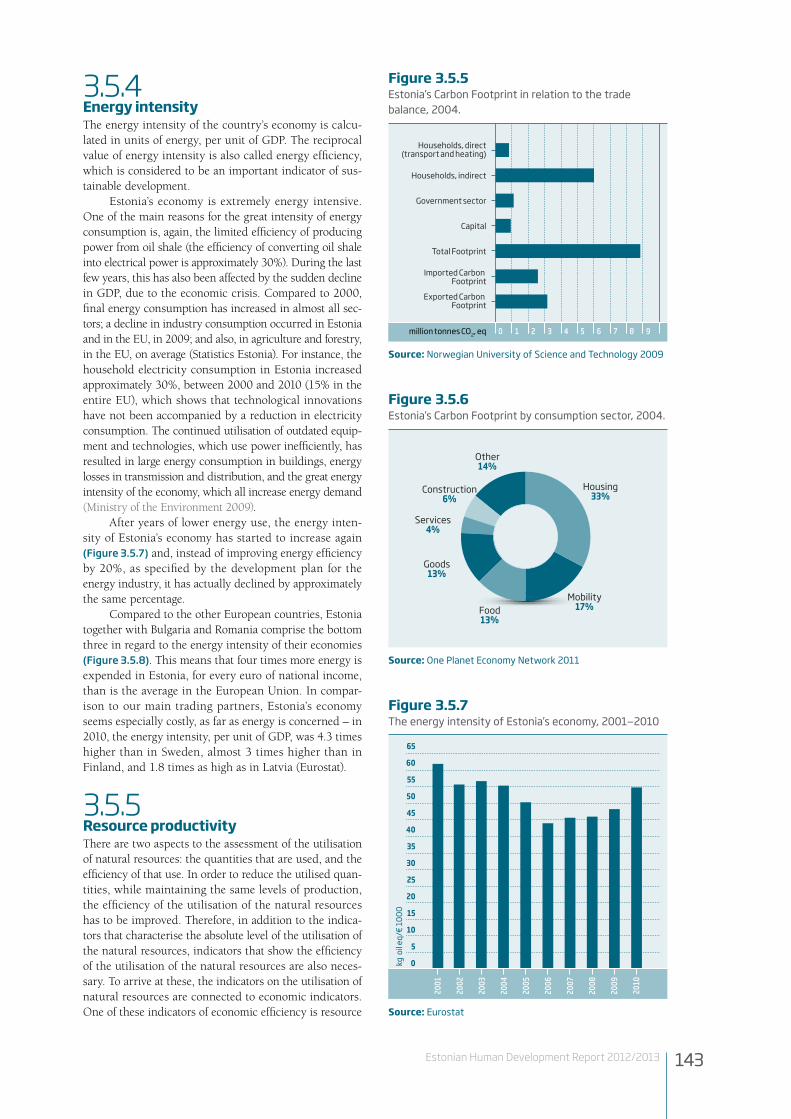
143Estonian Human Development Report 2012/2013
kg o
il eq/
€ 10
00
0
10
20
30
40
50
60
5
15
25
35
45
55
65
2001
2002
2003
2004
2005
2006
2007
2008
2009
2010
Housing33%
Mobility17%Food
13%
Goods13%
Services4%
Construction6%
Other14%
0 2 4 6 81 3 5 7 9million tonnes CO2, eq
Households, direct(transport and heating)
Households, indirect
Government sector
Capital
Total Footprint
Imported Carbon Footprint
Exported Carbon Footprint
Source: Norwegian University of Science and Technology 2009
Source: one Planet Economy Network 2011
Figure 3.5.5Estonia’s Carbon Footprint in relation to the trade balance, 2004.
Figure 3.5.6Estonia’s Carbon Footprint by consumption sector, 2004.
Source: Eurostat
Figure 3.5.7The energy intensity of Estonia’s economy, 2001–2010
3.5.4 Energy intensityThe energy intensity of the country’s economy is calcu-lated in units of energy, per unit of GDP. The reciprocal value of energy intensity is also called energy efficiency, which is considered to be an important indicator of sus-tainable development.
Estonia’s economy is extremely energy intensive. One of the main reasons for the great intensity of energy consumption is, again, the limited efficiency of producing power from oil shale (the efficiency of converting oil shale into electrical power is approximately 30%). During the last few years, this has also been affected by the sudden decline in GDP, due to the economic crisis. Compared to 2000, final energy consumption has increased in almost all sec-tors; a decline in industry consumption occurred in Estonia and in the EU, in 2009; and also, in agriculture and forestry, in the EU, on average (Statistics Estonia). For instance, the household electricity consumption in Estonia increased approximately 30%, between 2000 and 2010 (15% in the entire EU), which shows that technological innovations have not been accompanied by a reduction in electricity consumption. The continued utilisation of outdated equip-ment and technologies, which use power inefficiently, has resulted in large energy consumption in buildings, energy losses in transmission and distribution, and the great energy intensity of the economy, which all increase energy demand (Ministry of the Environment 2009).
After years of lower energy use, the energy inten-sity of Estonia’s economy has started to increase again (Figure 3.5.7) and, instead of improving energy efficiency by 20%, as specified by the development plan for the energy industry, it has actually declined by approximately the same percentage.
Compared to the other European countries, Estonia together with Bulgaria and Romania comprise the bottom three in regard to the energy intensity of their economies (Figure 3.5.8). This means that four times more energy is expended in Estonia, for every euro of national income, than is the average in the European Union. In compar-ison to our main trading partners, Estonia’s economy seems especially costly, as far as energy is concerned – in 2010, the energy intensity, per unit of GDP, was 4.3 times higher than in Sweden, almost 3 times higher than in Finland, and 1.8 times as high as in Latvia (Eurostat).
3.5.5 Resource productivityThere are two aspects to the assessment of the utilisation of natural resources: the quantities that are used, and the efficiency of that use. In order to reduce the utilised quan-tities, while maintaining the same levels of production, the efficiency of the utilisation of the natural resources has to be improved. Therefore, in addition to the indica-tors that characterise the absolute level of the utilisation of the natural resources, indicators that show the efficiency of the utilisation of the natural resources are also neces-sary. To arrive at these, the indicators on the utilisation of natural resources are connected to economic indicators. One of these indicators of economic efficiency is resource

144 Estonian Human Development Report 2012/2013
€/kg
2001 2002 2003 2004 2005 2006 2007 2008 20092000
0
0,2
0,4
0,6
0,8
1,0
1,2
1,4
1,6
0
0,2
0,4
0,6
0,8
1,0
1,2
1,4
1,6
EU 27 Estonia
€/kg
€/kg 0 0,5 1,0 1,5 2,52,0 3,53,0
0 0,5 1,0 1,5 2,52,0 3,53,0
Romania
Bulgaria
Estonia
Latvia
Poland
Turkey
Cyprus
Lithuania
Slovakia
Czech Republic
Croatia
Portugal
Hungary
Finland
Slovenia
Greece
Austria
Ireland
Spain
EU 27
Sweden
Denmark
Belgium
Germany
Italy
France
Great Britain
Malta
Luxembourg
Netherlands
kg oil eq/€ 1000
kg oil eq/€ 1000
0 200 400 600100 300 500 700
0 200 400 600100 300 500 700
Switzerland
Ireland
Denmark
Great Britain
Italy
Norway
Austria
Spain
Luxembourg
Germany
Greece
France
EU 27
Portugal
Netherlands
Sweden
Malta
Cyprus
Belgium
Finland
Croatia
Slovenia
Turkey
Hungary
Lithuania
Poland
Latvia
Slovakia
Czech Republic
Romania
Estonia
Bulgaria
Source: Eurostat
Figure 3.5.8The energy intensity of the economies of the European countries, 2010
Source: Eurostat
Figure 3.5.9The EU average and Estonia’s resource productivity, 2000–2009 (at constant 2000 prices)
Figure 3.5.10The resource productivity of the European countries and Estonia (GDP/domestic material consumption), 2009 (€/kg)
Source: Eurostat

145Estonian Human Development Report 2012/2013
productivity, which is defined as the relationship between GDP and domestic material consumption, i.e. the domes-tically produced, plus imported material, less exported material). Although in the case of this indicator, the quantities of imported and exported material are calcu-lated, this reflects only the direct trade of materials, and not the quantities of materials that have been expended, indirectly, in the course of producing these quantities of materials. (Statistics Estonia 2010)
Estonia’s resource productivity declined between 2000 and 2009 (Figure 3.5.9). If, in 2000, €0.42 worth of monetary value was added by consuming 1 kg of mate-rial, in 2009, the corresponding amount was only €0.35. At the same time, the average resource productivity in the EU has increased from €1.33 per kg, in 2000, to €1.57 per kg, in 2009. The resource productivity of Estonia’s economy is one of the lowest among the EU Member States (Figure 3.5.10). In order to explain the background of the decline in the resource productivity of Estonia’s economy, data for a longer period of time is needed, but the decline in resource productively may partly be explained by the rapid economic growth and the rela-tively high resource consumption by the construction sector that accompanied it.
By juxtaposing the indicators for the resource productivity and Ecological Footprint of the European countries, it appears that the nations with high resource productivity are also those with a large Ecological Foot-print. Therefore, the efficiency of resource productivity related to GDP does not automatically result in the lower consumption of natural resources. Thus, the indicators for resource productivity cannot be viewed separately from society’s impact upon the environment,, and especially not from the need to reduce consumption as a whole.
3.5.7 In conclusionEstonia is a country with a large Ecological Footprint and a very large Carbon Footprint, as well as with low resource productivity and energy efficiency. The last 10 to 15 years do not point to any improvement in these indicators. This is a reminder that, despite its small size, Estonia is a country of large consumption, and one that is ecologically deeply in debt. The main causes for the large footprint are
caused by energy consumption based on carbon-intensive oil shale power production; housing and means of trans-portation that consume large amounts of energy; forest utilisation; and greater consumption of meat and dairy products than the global average, the production of which, with current agricultural methods (artificial fertilizers, fos-sil fuels, etc.), are very burdensome to ecological resources.
Although the overconsumption of natural resources, and the lack of resource efficiency are matters that have been talked about for years, no specific goals or measure-able aims have been established at the European Union, or Estonian, level. As far as the quantity of greenhouse gas emissions is concerned, the European Union has established clear goals for 2020 – to reduce greenhouse gas emissions by 20%, to improve energy efficiency by 20%, and to cover 20% of energy needs using renewable energy (the “20-20-20 strategy”), as compared to the 1990 levels. At the same time, these goals do not include final consumption, or the Carbon Footprint that is calculated on the basis of trading, and the Ecological Footprint as a whole. This may be providing the wrong signal about the country and its environmental impacts, since the environ-mental impact related to production may occur outside the borders of the particular country or region of the world.
In order to reduce Estonia’s Ecological Footprint, the total consumption of fossil fuels and energy must, primar-ily, be reduced – including housing-related electricity and fuel consumption; the transportation system must become more pedestrian- and bicycle-friendly, and the use of pub-lic transportation must be increased, and the growth of motor transport curbed. In energy-intensive societies, the total replacement of fossil fuels with renewable sources of energy may not significantly reduce the Ecological Footprint. If, for instance, instead of fossil fuels, logging, or the development of grasslands occurs, the Ecological Footprint of the forests and croplands is increased, which, at the global level, is already suffering from overconsump-tion. The reserves of arable land and forests in Estonia, and in the Nordic countries are still quite large, but the sustainable use of these reserves presupposes a sharing of these resources with those regions where there is short-age of forests and croplands. According to the One Planet Network scientists (Kitzes et al., 2008), the reduction of global overconsumption can only occur through more equitable distribution of the utilisation of resources.
References1. EEA. European Environmental Agency Data Viewer. Excerpt
from database: http://www.eea.europa.eu/data-and-maps.
2. Eurostat. Excerpt from database http://epp.eurostat.ec.europa.eu.
3. euRoPeAn CommiSSion (2012). Assessment of resource efficiency indicators and targets. Final report. DG Environment, http://ec.eu-ropa.eu/environment/enveco/resource_efficiency/pdf/report.pdf.
4. gAlli, A., wiedmAnn, t., eRCin, e., KnoBlAuCH, d., ewing, B., gilJum, S. (2012). “Integrating Ecological, Carbon and Water footprint into a “Footprint Family” of Indicators: Definition and Role in Tracking Human Pressure on the Planet,” Ecological Indicators, 16, 100–112.
5. gloBAl FootPRint netwoRK (2012). National Footprint Accounts 2011. Excerpt of data concerning Estonia in a letter dated 6.11.2012 from Eli Lazarus.
6. JüSSi, m., Poltimäe, H., SARv, K., oRRu, H. (2010). Säästva trans-pordi raport 2010. Tallinn: Säästva Arengu Komisjon.
7. KeSKKonnAminiSteeRium (2009). Eesti keskkonnaseisundi näitajad 2009. Tallinn: Keskkonnaministeeriumi Info- ja Tehnokeskus.
8. KitzeS, J., wACKeRnAgel, m., loH, J., PelleR, A., goldFingeR, S. And CHeng, d. (2008). “Shrink and Share: Humanity’s Present and Future Ecological Footprint,” Philosophical Transactions of the Royal Society B-Biological Sciences. 363 (1491): 467–475.
9. noRwegiAn univeRSity oF SCienCe And teCHnology (2009). Excerpt from database: http://www.carbonfootprintofnations.com/ 21.12.2012
10. one PlAnet eConomy netwoRK (2011). Excerpt from database: https://www.eureapa.net
11. StAtiStiCS eStoniA (2010). Eesti statistika kvartalikiri 4/10. Quar-terly Bulletin of Statistics Estonia.
12. WWF/World Wide Fund for Nature, Zoological Society of London, Global Footprint Network, European Space Agency (2012). Living Planet Report 2012. Biodiversity, Biocapacity and Better Choices.

146 Estonian Human Development Report 2012/2013
In this chapter, we have focused on the level of social welfare and the quality of life. We have examined them, based on economics, psychology, sociology, political science and ecology. We have also turned to the classical indicators of well-being like GDP, the Gini index, the energy intensity of the economy; as well as innovative measures like satisfaction with public services, the quality of social relations and subjective satisfaction.
Although life in Estonia is not as good as in many other countries, Estonia and Chile are the states that the OECD points to as the ones that have made remarkable progress in the last decade. (OECD 2011: 24). It is true that our social protection budget has recovered, work and family life is better balanced than in many countries, the communities are strong and the general educational level is high. However, many aspects of Estonia’s success are very fragile. During the 2008 economic crisis, the people’s ability to cope in Estonia was hit harder than in most other EU states. During the crisis years, the deprivation index almost doubled in Estonia, the Gini index also increased, and differences in the state of health expanded across income groups. Unlike in Western Europe, difficulties in coping were experienced in Estonia also by many people in the highest income quintile. This sharp setback in the material well-being is explainable by two reasons. Firstly, the decline in well-being started from a boom, not from a normal level of development, which made the losses seem bigger. Secondly, Estonian society is poor, in an East European way. This means that the incomes of high-income people here are sim-ilar to those of the medium-income groups in West-ern Europe, and therefore, the upper classes become instantly vulnerable when economic conditions worsen.
Despite the fact that, for historical and political rea-sons, Estonia lacks the preconditions for a high level of well-being and quality of life, it would be wrong to argue that nothing can be achieved by appropriate policies. Our quality of life indicators are weak primarily in the fields where public policy is lacking (e.g. housing and spatial planning), or where the reforms have halted (e.g. health-care; tax policies). If the state does not intervene, the situ-ation is regulated by the market, and this is accompanied by the commodification that is inherent to the market situation– services can only be consumed by those who have the purchasing power. As a consequence, compared to Europe, the differences in Estonia by income groups, in the quality of housing, health and assessments of some areas of life (social welfare, healthcare) are very large. Estonia’s task, in the next few years, should be to help the weaker members of society to catch up, empowering them and providing them with a positive life perspective.
Now, after the economic crisis has crested and the markets have stabilised, we could – or even should –
ask, what direction should Estonia move in, and how? Hereafter, economic performance alone will not increase the quality of life, if the growth in GDP is not accom-panied by a reduction in income inequality, and if the GDP does not improve the coping ability of households (Abbot, Wallace, 2012). Estonia’s success, which is based on fiscal policies, must be brought to the micro level – to impact people’s everyday lives. In addition, it is worth remembering that while wealth is import-ant for well-being, it is of key importance only in the elementary phases of development, when most people are worried about making ends meet. For the societies and people that have left the poverty zone (including a large part of Estonia’s population), the quality of life, in the broader sense, becomes increasingly important. Therefore, when planning Estonia’s strategic perspectives for the future, welfare has to be viewed in the broader context, by supplementing economic indicators with social and ecological ones. When defining our future goals, we cannot ignore the contradictory phenomena of our current situation, which could be called paradoxes of Estonian quality of life.
Firstly, Estonian people have contradictory atti-tudes toward wealth and the welfare state. On the one hand, public surveys show that austerity is perceived as the normal order; the public is reconciled to the fragile welfare state and small social support, and try to manage on its own. On the other hand, many peo-ple consider the income inequality in Estonia to be too high, and believe the generous governmental welfare provisions typical of industrial societies should be the norm. Unfortunately, there are no signs in Estonia of this kind of welfare state; although, there are signs of a wasteful economy of the industrial era. Yet, it is unclear how Estonia will transit to post-modernity, so that this will be accompanied by an improvement in the quality of life, encompassing everyone.
Secondly, the level of Estonian civil society and citizens’ engagement is relatively high, though apolitical. Apolitical means that the citizenry does not participate meaningfully in lawmaking and existing consultation processes are not sufficiently open and transparent. Thus, significant know-how is left unused, as well as the possibility to enhance the legitimacy of government. The current situation can be described as standing at a crossroads. On the one hand, the Estonian people are more critical than other Europeans about the quality of public services, and about their own ability to cope. On the other hand, we differ from the other post-Communist countries by a clear optimism about the future. Meaning-ful involvement in public governance could significantly reinforce this optimism.
Thirdly, using the optimism concerning the future as an engine could be endangered by the peo-ple’s low level of self-esteem. The people of Estonia
Summary: Paradoxes of the Estonian quality of lifeAnu Toots

147Estonian Human Development Report 2012/2013
perceive themselves as worse off than statistical data indicates (e.g. the state of their health, or the confor-mity of their pay to their qualifications). This could be a reflection of a broader trend, whereby the people in wealthier countries tend to rate their own countries as above average, while those in poorer countries tend to underrate their countries (Dehley, Kohler, 2008). In order to improve the situation, we must figure out how to empower the people of Estonia, so that they feel valuable and influential.
Thus, the roots of Estonian quality of life para-doxes may be in the opportunity to compare them-selves to other countries. What is our reference group or standard? The popular position is that we do not want to be an Eastern European, but rather a Nordic country. Yet, the analyses in this chapter indicate
something different. Based on the quality of life indi-cators, Estonia is similar to countries to which we seldom compare ourselves – Slovakia, Poland, Brazil, Chile, New Zealand and the Republic of Korea. The Estonians’ low level of wealth brings us closer to East-ern Europe, while almost none of our indicators are similar to the Nordic countries. As a whole, Estonian welfare and quality of life appear to be distinctive, and they have no models or analogues. Therefore, the met-aphor of the “lonely skier” that was suggested at the beginning of the chapter turns out be more applicable than might have seemed at first. Robert Putnam (2000) made America’s civil society famous by comparing it to a lonely bowler, Estonia today has the chance to show that by being alone on the ski trail it still can develop a modern society with a sustainable quality of life.
References1. ABBot, P., wAllACe, C. (2012). “Rising Economic Prosperity and
Social Quality: The Case of New Member States of the European Union,” Social Indicators Research. Springer Link http://link.springer.com/article/10.1007%2Fs11205-012-9992-0 (viewed 14.02.2013).
2. deHley, KoHleR (2008). “Where We Stand in Europe: Citizen Perceptions of European Country Rankings and their Influence
on Subjective Well-Being,” (2008). Handbook of Quality of Life in the Enlarged European Union, Eds. Alber, J., Fahey, T., Sara-ceno, C. London: Routledge, 385–404.
3. oeCd (2011) How’s Life?: Measuring Well-Being, Paris: OECD Publishing.
4. PutnAm, R. (2000) Bowling Alone: The Collapse and Revival of American Community. New York: Simon & Schuster.

148 Estonian Human Development Report 2012/2013

149Estonian Human Development Report 2012/2013
4 THE ECoNoMYESToNIAN HUMAN DEVELoPMENT REPoRT 2012/2013
In the approach to the economy in this report, we try to focus on the future and, if possible, to differentiate the developmental level that has been achieved by the econ-omy, from the means and factors for increasing it in the future, and to find the appropriate indicators for dealing with this particular assignment. According to the con-cept of competitiveness, a country’s economic well-being (wealth, earning capacity) depends on the input (effec-tiveness) of private companies and the government. If the economy is primarily related to companies by the ability to sell, i.e. the ability to compete, internationally, in both domestic and foreign markets for goods and services, then the primary role of the government is to shape the framework, or the economic environment, in which business takes place, so as to make the given state attractive to economic agents. The first sub-chap-ter is devoted to this latter topic. The components of an economic environment are the institutions that form a social stimulation system (North 1990) on the one hand, and the infrastructure as the physical basis for economic activity, on the other hand. Of course, in the first case, along with the formal rules of the game established by the state, the informal institutions (social norms, values), which develop on an evolutionary basis, are also extremely important. Both economic efficiency, as well as the attractiveness of the state in the international rivalry of competing systems, depends on them. In the second sub-chapter, an examination is made of the possibilities for measuring the role and potential of various develop-ment factors with the help of the macroeconomic model
of the state’s wealth. In this process, it considered that, in its broader meaning, wealth is a complicated phenomenon comprised of several components, and its development involves both natural and intangible factors in addition to the produced and human capital involved. The third sub-chapter focuses separately on one essential component of the economic environment – the labour market. The reason is both its direct connection to human capital as the most important production factor, as well as the contradictory nature of the assessment given to the situation in Estonia’s labour market. The second important basis for economic success, along with the general economic environment, is the position of the state’s enterprises in global value chains and networks, the criterion of which is sophistication (in the sense of complexity, and refinement) – thus, in this essay, we speak about the sophistication of business. The organi-sational structure of the economy can be viewed as one, self-created component of the institutional framework of economic agents, which is defined as an arrangement, in order to differentiate it from the so-called external envi-ronment. On the other hand, the main direct criteria for the static and dynamic efficiency of enterprise are pro-ductivity and innovation, and the last two sub-chapters are devoted to them. Of course, a state’s attractiveness and business capability is not something insular. These are elements of one and the same socio-economic system, which are closely related and can be developed only if we take into consideration the specific historical, social and cultural context involved.
Introduction

150 Estonian Human Development Report 2012/2013
Today, two viewpoints of economic development can be identified within the framework of economics: 1) the growth theory based on production functions and factors, and 2) an institutional approach that places importance on the motivation of individuals. The first course is characterised, somewhat, by a mechanical approach to the economy (Leschke 2011, 95–96). The interests and incentives of the economic subjects are ignored. How-ever, the efficiency of using production factors may vary to a great extent under different social conditions. It is enough to allude to the relatively modest results produced by developmental aid to date, to be convinced that large investments may turn out to be a waste of money, if the social preconditions for development, in the form of pur-poseful and functional formal and informal institutions, are lacking.1 Essentially, the decisive role of institutions is demonstrated by the analysis of specific nations’ wealth in sub-chapter 4.2, where this role is determined indirectly, as a certain residual value of wealth.
In the context of this study, the intertwining of two approaches to development theory, within the frame-work of the UN human development concept, deserves special attention. In the 1996 and 2003 Human Devel-opment Reports, a qualitative model was presented to illustrate the specific connection between human capital and economic development, which also confirms the importance of institutions (HDR 1996, 68; HDR 2003, 70). Namely, the reciprocal impact of human capital and economic development can be viewed as functioning through several filters or catalysts. The inhibitors and accelerants in both directions are the private and public institutions that guide human behaviour. In some states, a relatively harmonious process of human development and economic growth becomes evident, while in others, one or the other development factor becomes an inhibi-tor (Sepp, Eerma 2011).
In the following empirical analysis we will try to focus on those institutions, which clearly have a positive impact. At the same time, we should not lose sight of the fact that various institutions may be substantively equiv-
alent, and develop complicated mutual connections and dependencies. In this study, the possibilities for making the quality of institutions measurable from the viewpoint of economic development are explored2. Methodologically and empirically, this is based on the rankings compiled by international organisations, which are regularly avail-able for forming assessments3. The best known are three generalising indicators:
• Economic competitiveness, which is expressed in the indices of both the World Economic Forum (WEF) and the International Institute for Manage-ment Development (IMD);
• Economic freedom, which is examined empirically by the Heritage Foundation (HF) in the U.S. and the Fraser Institute (FI) in Canada. Entrepreneurial freedom is measured, in detail, by the World Bank, in its series called Doing Business. In principle, the integrated index on the regulation of the commodi-ties market, compiled by the OECD, can be consid-ered to be a reverse indicator of economic freedom;4
• Quality of governance, which the World Bank measures with its Worldwide Governance Indicators (WGI), and based on which, economic and political institutions are also assessed. Assessments of tran-sition states are provided by the European Bank of Reconstruction and Development (EBRD).5
The connections of these three criteria to economic development differ. Economic freedom and the quality of governance are essentially directed to opening up the state’s institutional development potential. However, competitiveness is a construction in which the achieved level of development (the ability to earn) and its factors – the ability to sell and the ability to attract – are combined (Trabold 1995). Therefore, the general indicators of com-petitiveness are relatively endogenous (derived internally), and as such, are not very informative. However, some of the sub-indicators (components) of competitiveness pro-
4.1Economic environmentJüri Sepp, Clemens Buchen, Helje Kaldaru
1 Institutions include all the rules and standards that affect cooperation between individuals, and, based on North’s (1990) often quoted statement, are the social stimulation systems. As influencers of human behaviour, institutions may promote economic growth or inhibit it. Therefore, any growth theory that is based on production factors will be only a conditional abstraction, if it is not supplemented by an analysis of the interests and stimuli of the economic agents.
2 Therefore, the data provided by Freedom House is not included, because its main focus is on political conditions.
3 The Ifo Institute’s Institutions Climate Index, which assesses the OECD states would, actually, warrant attention, but unfortunately, its authors have not considered it necessary to include Estonia. See Eicher ja Röhn (2007) and http://www.cesifo-group.de/ifoHome/facts/DICE/Oth-er-Topics/Basic-Country-Characteristics/Institutions-Climate-Indices/ins-clim-inde-11.html. We have also not included the data available from individual researchers, the sustainability of which is questionable, i.e. Kuncic (2012).
4 Unfortunately, this is only a periodically available indicator, the last level of which characterises 2008. See Wölfl et al. (2009) and http://www.oecd.org/eco/regulatoryreformandcompetitionpolicy/indicatorsofproductmarketregulationpmr.htm
5 http://www.ebrd.com/pages/research/publications/flagships/transition.shtml

151Estonian Human Development Report 2012/2013
vide a valuable connection for making assessments of the state’s institutional quality as a developmental factor. At the same time, the endogenous nature, or dependence on economic development, of the institutional development cannot be denied. This makes the identification and exploration of causal connections extremely complicated.
4.1.1 CompetitivenessIn the case of competitiveness, the two levels of compe-tition, or “competitive classes”, must be differentiated. At the micro level, entrepreneurs compete, primarily, as providers in the sales markets. At the macro level, on the other hand, governments, at both the national and local levels, compete for mobile production factors. In the lat-ter rivalry, the role of the instruments is primarily filled by public (formal) institutions and the infrastructure. If the focus is on institutions, the term institutional sys-tem-competition among jurisdictions (or a part therefore) is preferred; however, if the focus is on infrastructure, (geographical) locational competition is referred to.6 Unfortunately, infrastructure is the factor that is strongly endogenous, being directly dependent on economic devel-opment and the financing opportunities based thereon.
Essentially, this duality of competitive subjects is also reflected in the leading empirical studies of com-petitiveness. For instance, the World Competitiveness Yearbook (WCY), which has been regularly published by the International Institute for Management Development since 1989, divides competitiveness into four fields of activity, each of which has five basic components:
• economic results: domestic economy, foreign econ-omy, foreign investments, employment, prices;
• effectiveness of governance: state finance, fiscal pol-icy, public institutions, business law, social network;
• business efficiency: productivity, labour market, finance, management practices, attitudes and values;
• infrastructure: physical, technological and scientific infrastructure, healthcare, education.
The latter are made measurable with the help of various individual indicators (a total of 329) for 59 states and the composite evaluation is given on a scale of 100. The maximum 100 points were achieved in 2012 by Hong Kong, which narrowly outpaced the U.S. Of the European states, Switzerland (3) and Sweden (5) achieved the best positions. Although, at the individual indicator level there could be some scepticism, in principle, that the economic results characterise the ability to earn, the effectiveness of governance and infrastructure, the government’s ability to compete at the macro level (the attractiveness of the state) and business efficiency, the situation at the micro level in company competition (ability to sell).
Before the crisis, Estonia’s competitiveness was rated, by the IMD, to be in 22nd place in the world (IMD
2007). By 2009, Estonia had fallen to 35th place, but in the last few years has climbed four places, and, in 2012, achieved 66.9% of the maximum level (IMD 2012). This is a better position than was achieved in the Human Devel-opment Index. An even larger difference exists in the position for the income level. Of the institutional factors, the ones on the plus side are effectiveness of governance, especially public finance and business law (Figure 4.1.1), which has positioned Estonia, during the last few years, between 20th and 24th place. On the other hand, the economic results, during the crisis, have sporadically even dropped us into the 60s.
The second well-known measure of competitive-ness originates from the World Economic Forum (WEF), which publishes the annual Global Competitiveness Report (GCR). Starting in 2006, the Global Competi-tiveness Index (GCI), compiled by Xavier Sala-i-Martin, has been included in the report, which differentiates the development factors based on three levels of development: the resource-, efficiency- and innovation-based stages.
At each stage of development, separate development factors are differentiated: four at the first stage; six at the second; and two at the third. In the general indicator, greater weight is given to those factors, for each state, that correspond to the developmental stage of the given state. Of course, the developmental stage itself is determined in quite a primitive way – based on the achieved income level. Based thereon, Estonia is positioned between the second and third stages of development. All 144 states are studied. The leading states are shown in the Annex.
Based on the Global Competitiveness Index (GCI), Estonia has the greatest potential of the transition states. Before the crisis, Estonia’s position held steady at 25 to 27; after the crises, we have had to reconcile ourselves to positions 33 to 34.
Figure 4.1.1Components of Estonia’s governance effectiveness and business efficiency 2012 (ranking: the larger it is, the worse it is)
Source: IMD
20
40
60
State �nance
Fiscal policy
Institutional network
Business law
Social networkProductivity and
e�ciency
Labour market
Financing
Management practices
Attitudes and values
6 Specifically in the Estonian context, see Wrobel (2000).

152 Estonian Human Development Report 2012/2013
Estonia’s strengths included both technological readiness and macro economy (Figure 4.1.2). Meanwhile, the cri-sis caused a great decline in the assessment results, but now a position among the top twenty has been regained. Unfortunately, we have partially lost our technological advantage. However, according to the GCR, our newest strength is labour market efficiency, which the other indi-ces do not always confirm.
Apparently, we have to reconcile ourselves to the poor position achieved due to the size of our market. However, we should be worried about the poor rating for sophistication, and also its decline. This refers, primarily, to the low developmental level of business networks and clusters in Estonia, which is accompanied by a modest role in the value chain (see chapter 4.5 for details).
As a whole, the favourable institutional base for economic development created by Estonia, and also its sufficiently good “marketing” to the international pub-
lic, was reflected in the competitiveness indicators. This may be sufficient for development in the resource- and efficiency-based phase, but would, unfortunately, not be enough to rise to the level of the world’s top countries in the innovation-based stage of development.
4.1.2 Economic freedomThe fact that the assessment of institutional development is often executed under the label of economic freedom results from the central role played by the guarantee of individual property rights and the rule of law in an effective market economy model. Without this, there is no hope of entrepreneurial activity, which presumes motivated individuals. Undoubtedly, there is a need for competences and capabilities, but without motivation, this is only (unused) potential. Without initiative and entrepreneurship, there is no innovation or development.
Economic freedom does not mean that everything is permissible, but rather, that the environment for these activities is transparent and secure. We can also speak about real freedom when the economic agents do not need to fear attacks on their person or property (Gwart-ney, Lawson 2006: 5). This is the principal condition for avoiding all kinds of dilemma structures, or rationality traps, which inhibit development (Homann, Suchanek 2012). At the same time, the risk of attack from both the state as well as private individuals must be precluded.
Economic freedom is a complex phenomenon, in which the excessive development of one component can damage the others. In any case, the goal cannot be to minimise the size (spending) of the state, which may be detrimental to other aspects of economic freedom (for example, the rule of law).7
The measurement of economic freedom does not have a long tradition. The Fraser Institute (FI) started dealing with this concept in the 1980s, and compiled its first summarised comparative analysis in 1996. This anal-ysis retrospectively assessed economic freedom back to 1975. The Heritage Foundation (HF) has been compiling summaries of economic freedom since 1995. Before that, economists tried to examine the impact of institutional frameworks indirectly, by using indicators about the spread of democracy. Unfortunately, the empirical stud-ies showed that the impact of democracy on economic development was far from unambiguous (Apolte, Peters 2009).8 On the other hand, the positive impact of eco-nomic freedom on the objective indicators of economic development – on both the level (GDP per capita) as well as the growth – has supposedly been confirmed empir-ically, including, by the author of this essay (Sepp 2006 and Sepp, Eerma 2007).
The last study by the Fraser Institute rated the econ-omic freedom of 144 states in 2010, on a scale of 1 to 10,
Figure 4.1.2Components of Estonian competitiveness 2006-2013 (ranking: the larger it is, the worse it is)
Basic institutions
Infrastructure
Macro economy
Health and primary education
Higher education and in-service training
E�ciency of the goods markets
Labour market e�ciency
Developement of �nancial markets
Technological maturity
Size of the market
Business sophistication
Innovation
0 20 40 60 80
0 20 40 60 80
2006—2007 2009—2010 2012—2013
Source: World Economic Forum
7 The descriptive factor and regression analysis conducted by us, as a background study, confirmed that the size of the state itself (if all the other conditions are equal) does not correlate with the economic development level.
8 The current discourse on this topic is significantly shaped by Acemoglu and Robinson, with their book Why Nations Fail (2012), which analyses the importance of extractive and inclusive institutions in both the economy and politics, as well as the connection between these two spheres, whereas one of the central themes is the struggle related to the distribution of well-being in society. Essentially, this approach can be considered to be an elaboration of the concept of open and limited access societies (North et al., 2006).

153Estonian Human Development Report 2012/2013
based on 42 individual indicators, in the following five basic areas:
• Size of Government: Expenditures, Taxes, and Enterprises
• Legal Structure and Security of Property Rights
• Sound Money
• Freedom to Trade with Foreigners
• Regulation of Credit, Labor, and Business
The ranking (see Annex) is led by Singapore and Hong Kong, and Switzerland in Europe. Finland was at a respectable 9th position. Estonia (Figure 4.1.3) has been given this composite evaluation since 1995, when it achieved 5.6 points, on a scale of 10, and placed 75th. By 2005, Estonia had risen to 8th place, with 8 points, and was, thus, especially mentioned in the report. The greatest improvement has appeared in the loan market, and in the “health” of money. A small backslide was noticeable in the freedom of foreign trade, which was related to the implementation of the EU’s uniform trade policy. Unlike the World Economic Forum, the Fraser Institute considers the weakest link in Estonia to be the freedom of the labour market.9 During the crisis years, Estonia’s economic freedom declined to 7.7 points, and it ranked 16th and 17th, in 2009 and 2010, respectively. The main culprit is the size of the government, which, nevertheless, achieved a level of more than 6 points. It is here that the endogenous nature of institutional quality evaluations becomes apparent, i.e. dependence on real economic development, which does not make it possible to consider these assessment results to be purely indica-tive of development potential.
Another well-known measure of economic freedom is the Heritage Foundation’s Index of Economic Freedom, which includes ten components with 50 individual indi-cators. Starting in 2006, it also uses a scale of 1 to 100. In 2012, the ten components were grouped into four main categories:
• Rule of Law (property rights, freedom from corruption);
• Limited Government (fiscal freedom, government spending);
• Regulatory Efficiency (business freedom, labor freedom, monetary freedom); and
• Open Markets (trade freedom, investment freedom, financial freedom).
The composite index is the arithmetic average of ten com-ponents. In 2012, 184 states were included in the survey, with 179 providing full sets of data.
Here too, numerous studies have confirmed that economic freedom has a significant statistically and sub-stantively positive connection to economic development – with both its level and growth. The Heritage Foun-dation itself has examined the impact of the changes in economic freedom on economic growth, and has come
0 2,00 4,00 6,00 8,00
0 2,00 4,00 6,00 8,00
2010 2005 2000 1995
Size of government
Rule of law
“Health” of money
Free trade
incl. credit market
incl. labour market
incl. business
Regulation
Kokku
Summary
Business start-up
Getting a building
permit
Getting electricity
Property registration
Getting loansInvestor protection
Paying taxes
Cross-border trading
Ful�lling contracts
Bankruptcy proceedings
020
40
60
80
Figure 4.1.3Components of economic freedom in Estonia 1995–2010, on a scale of 1 to 10 (FI)
Source: Fraser Institute
Figure 4.1.4The components of business freedom in Estonia in 2013 (ranking: the bigger it is, the worse it is)
Source: World Bank
9 Contradictory assessments, in various rankings, are one of the reasons why the labour market has warranted a separate chapter in this report.

154 Estonian Human Development Report 2012/2013
to the conclusion that differences in economic freedom cause an approximate 2% fluctuation in economic growth annually. The author of this study has also reached the same conclusion (Sepp 2006).
The Heritage Foundation rankings are led by Hong Kong and Singapore; in Europe, by Great Britain and Ire-land. Estonia’s position in the HF ranking is also good; in 2005, even culminating with 4th place in the world. In 2007, Estonia was 12th, and 16th in 2012, between Fin-land and the Netherlands; Estonia places seventh, when the ranking is limited to Europe. Starting in 2007, the impact of the economic crisis has caused a negative trend in the composite index of Estonia’s economic freedom, which on a scale of 1 to 100 fell from 78 to 73 points. The main reason is the decline in the assessment given to government spending, which fell to 38.8 points. This was lower only in 2000. Another problem is labour market freedom and freedom from corruption. The remaining components steadily score over 70 points, and there-fore are not directly affected by the economic situation (see Figure 4.1.3).
A more detailed ranking of business freedom is provided by the World Bank (see Annex). The ranking is led again by Singapore and Hong Kong, and Denmark and Norway in Europe. In the ranking of the world’s states during the last year, Estonia has dropped two places, being 21st in the world in 2013, and 14th among OECD states between Germany and Japan.
Figure 4.1.4 shows that Estonia’s weaknesses and strengths are quite graphic. If goods markets are very open, and the registration of property is simple, greater problems are related to bankruptcy proceedings and investor protection. It is noteworthy that the World Bank is no longer assessing business freedom in the context of the labour market. Earlier research gave Estonia a damning assessment in this regard. Therefore, the sit-uation in the labour market is dealt with separately, in sub-chapter 4.3.
4.1.3 Quality of governanceAnother possibility for assessing the quality of institutions is related to the concept of governance. The empirical basis for this is provided by the World Bank’s Worldwide Governance Indicators (WGI). Essentially, Kaufmann, et al. (2010) defines governance as traditions and institu-tions by which the authority in a state is exercised. There-after, it is divided into three dimensions, each of which is characterised by two indicators.
Unlike the concept of business freedom, the political institutions are also considered. The first two indicators are related to the rules for electing a government, con-trolling it and dispersing it. The first indicator, called Voice and Accountability, measures the participation of the citizenry in democratic processes, and the freedom of opinion and assembly. The second dimension character-
ises political freedom, and the extent of terror and politi-cal violence in each state, and examines the ability of the government to formulate and execute economic policy. The first indicator of this dimension measures the general effectiveness of the government, including assessments of the quality of officialdom, and of political independence. The second indicator characterises regulatory quality, based on the impact of regulations on economic develop-ment, primarily by supporting the private sector.
The third dimension of the quality of governance presumes that the citizenry and the state respect the economic and political institutions. In this connection, the rule of law is first evaluated, which is related to the protection of property rights and the enforcement of con-tracts. At the same time, corruption is also measured as a means of abusing public office for private economic gain.
Thereby a total of six indicators are assembled, behind each of which there are numerous sub-indicators, a total of 31.10 The sources include surveys of individ-uals and companies, expert opinions from officials (e.g. the World Bank, African Development Bank, U.S. State Department, etc.), information from nongovernmental organisations (e.g. Reporters Without Borders) and eco-nomic information from commercial sources (e.g. Econ-omist Intelligence Unit). In this report, when assessing the
-20 -10 0 10 20
-20 -10 0 10 20
Slovenia
Israel
Singapore
Hungary
Austria
Slovakia
Netherlands
Czech Republic
Uruguay
Switzerland
South Korea
Costa Rica
Canada
Denmark
Ireland
Finland
Estonia
Chile
New Zealand
Figure 4.1.5The development reserve of the reference states as the difference between the rankings for income and the average of the economic environment indicators.
10 Here we also conducted our own factor and regression analysis. By using the data on the reference states, two latent factors appeared, whereas the first of these is related, primarily, to economic traits, and the other, to political traits. The previously mentioned regularity was confirmed, namely, that political factors by themselves do not correlate with economic development. On the other hand, the quality of economic institu-tions (first factor) was closely connected to the achieved level of earning, and statistically significant.

155Estonian Human Development Report 2012/2013
rule of law, the sub-indicators for economic freedom and competitiveness have been examined separately.
A statistical analysis was used for the integration of the initial indicators, which is known as an unobserved component model. Greater weight is given to those indicators that are more closely correlated to the others. Thereby, six synthesised indictors are obtained in stan-dardised form (with a mean value of zero, and a standard deviation of one), which generally fall between -2.5 and +2.5, whereas the positive direction corresponds to better governance. In addition, a percentile between 0 and 100 is indicated for each state, which indicates how many (what percentage of) states are worse off. Evaluations since 1996, which encompass 215 states, are available. The leading states are shown in the Annex.
Estonia’s quality and development of governance, from 2002 to 2011, is shown in Table 4.1.1. All the indicators place Estonia among the top one-third in the world, and generally, a positive development is noticeable in the last decade.
Estonia achieves its highest marks in regulatory quality (it has reached the top 10%), which can be consid-ered to be one of the most important governance aspects, from an economic standpoint. The positive dynamics of the rule of law and government effectiveness evaluations are also achievements. At the same time, the political sta-bility assessment has decreased significantly since 2002, which is incomprehensible (the “Bronze Night” did not occur until 2007).
4.1.4 The institutional potential of economic developmentAs we monitor the economic environment, we are dealing with the observed indicators as development factors by examining their relationship with the level of economic development that has actually been achieved. We use the GNI (Gross National Income per capita), which is the economic component of the Human Devel-opment Index, to measure the latter. In Table 4.1.2, the reference states are ranked according to their positions in the wealth component of the HDI. Singapore, with its 4th position, gets the highest score. Estonia, with its 47th position, is fourth from the bottom, outpacing only Hungary, Chile and Uruguay. However, at this point, we are more interested in the comparison of the economic development indicators with other indicators, by state, the results of which are reflected in the last column of the table. Here we include the data from those indicators in which the states achieve a better position in interna-tional rankings than based on GNI. In Estonia’s case, Estonia’s position in all the other indices is higher than based on the economic development achieved to date. This can be interpreted as the existence of certain devel-opment reserves, from the viewpoint of all five observed development factors (HDI, GCI, FI, DB and WGI11). Only Denmark, New Zealand and Chile are also, still, in this
Table 4.1.1Development of Estonia’s governance 2002–2011 (per-centiles)
Source: World Bank
GNI HDI GCI FI DB WGI +
Singapore 4 26 2 2 1 25 3
Switzerland 11 11 1 4 28 7 3
The Netherlands 12 3 5 35 31 8 3
Austria 15 19 16 25 29 11 1
Canada 16 6 14 5 17 10 4
Denmark 19 16 12 15 5 4 5
Finland 22 22 3 8 11 2 4
Ireland 26 7 27 12 15 15 4
South Korea 27 15 19 33 8 55 3
Israel 31 17 26 48 38 66 1
Slovenia 32 21 56 90 35 43 1
New Zealand 35 5 23 3 3 1 5
Czech Republic 41 27 39 57 65 35 2
Slovakia 43 35 71 35 46 51 2
Estonia 47 34 34 12 21 33 5
Hungary 49 38 60 65 54 56 1
Chile 58 44 33 11 37 29 5
Uruguay 60 48 74 50 89 49 3
Costa Rica 73 69 57 44 110 64 4
Year Voic
e an
d Ac
coun
tabi
lity
Polit
ical
St
abili
ty a
nd
Abse
nce
of
Viol
ence
Gove
rnm
ent
Effec
tiven
ess
Regu
lato
ryQu
alit
y
Rule
of L
aw
Corr
uptio
n Co
ntro
l
2002 80.8 77.4 74.6 89.2 72.7 75.6
2006 82.7 67.3 84.9 88.2 84.7 80
2011 83.6 66 84.8 90.5 85.4 78.7
Table 4.1.2Rankings of the reference states based on some indica-tors of economic, human and institutional development as well as competitiveness
Source: compiled by the authors, based on the most recently available data.
GNI – indicator for the wealth component of the UN Human Development Report; HDI – UN Human Development Index; GCI – World Economic Forum’s Global Competiveness Index; FI – Fra-ser Institute’s Economic Freedom of the World index; DB – World Bank’s Doing Business ranking; WGI – World Bank’s Worldwide Governance Indicators
11 Since the World Bank does not provide summarised indicators for the quality of governance, we ranked the states by the average of the six sub-indicators.

156 Estonian Human Development Report 2012/2013
Annex. Leading states based on four indicators of the economic environment
Competitiveness GCI
Quality of governance WGI
Economic freedom FI
Business freedom DB
1 Switzerland New Zealand Hong Kong Singapore
2 Singapore Finland Singapore Hong Kong
3 Finland Sweden New Zealand New Zealand
4 Sweden Denmark Switzerland USA
5 The Netherlands Luxembourg Canada Denmark
6 Germany Norway Australia Norway
7 USA Switzerland Bahrain Great Britain
8 Great Britain The Netherlands Finland South Korea
9 Hong Kong Liechtenstein Mauritius Georgia
10 Japan Canada United Arab Emirates Australia
11 Qata Austria Chile Finland
12 Denmark Australia Estonia Malaysia
13 Taiwan Andorra Ireland Sweden
14 Canada Iceland United Kingdom Iceland
15 Norway Ireland Denmark Ireland
16 Austria Guernsey and Jersey (Channel Islands) Taiwan Taiwan
17 Belgium Anguilla USA Canada
18 Saudi Arabia Greenland Qatar Thailand
19 South Korea Germany Japan Mauritius
20 Australia Belgium Cyprus Germany
21 France Aruba Jordan Estonia
22 Luxembourg Great Britain oman Saudi Arabia
23 New Zealand Hong Kong Kuwait Macedonia
24 United Arab Emirates Barbados Norway Japan
25 Malaysia Singapore Austria Latvia
26 Israel France Peru United Arab Emirates
27 Ireland USA Sweden Lithuania
28 Brunei Bermuda Germany Switzerland
29 China Chile Lithuania Austria
30 Iceland Malta Malta Portugal
31 Puerto Rico Japan Montenegro The Netherlands
32 oman Cayman Islands Luxembourg Armenia
33 Chile Estonia South Korea Belgium
34 Estonia Cyprus Panama France
35 Bahrain Czech Republic The Netherland Slovenia
situation. At the same time, a series of reference states (Austria, Israel, Slovenia and Hungary) have achieved, by today, economic development that exceeds their posi-tion, based on as many as four indicators of institutional development. In these states, if other conditions remain the same, a slowdown of development could occur. The extent of the potential is illustrated in Figure 4.1.5, which shows the deviation in the positions of the states, based on the average of five economic development and insti-tutional development indicators. The greatest differences occur in New Zealand, Chile and Estonia – in all three, the gap between the indices indicating their potential, and the achieved economic level (GNI), is more than twentyfold. However, it cannot be precluded that some-thing objective exists, i.e. a geographic factor (distance,
smallness of the market), which does not allow the found potential to be realised. In the case of New Zealand, it could be assumed that geographic remoteness has a negative impact. On the negative side, Slovenia stands out, with an income level that is 17 times better than could be assumed, based on the average of institutional indicators. It is not very believable that this position is sustainable. In principle, in this case, there are two paths – either to reconcile oneself to a deceleration of economic development, or to deal with institutional reforms. In the case of Israel and Singapore, the large deviation is related, primarily, to problems with the political environ-ment, which reduces the results related to the quality of govern tance, which has a relatively indirect connection to economic development.
157Estonian Human Development Report 2012/2013
References1. ACemoglu, d.; RoBinSon, J. (2012) Why Nations Fail: The Origins
of Power, Prosperity and Poverty. Profile Books Ltd.
2. APolte, t.; PeteRS, H. (2009) Governance, Demokratie und wirtschaftliche Entwicklung in den ehemaligen sozialistischen Staaten. IÖB-Diskussionspapier, No. 1/09, http://hdl.handle.net/10419/39080.
3. eiCHeR, t.; RöHn, o. (2007), “Institutional Determinants of Economic Performance in OECD Countries – An Institutions Climate Index”, CESifo DICE Report 5(1), 38–49.
4. gwARtney, J., lAwSon, R. (2007) Economic Freedom of the World: 2005 Annual Report. Vancouver et al.: Fraser Institute et al.
5. Heritage Foundation (HF). Index of Economic Freedom. http://www.heritage.org/index/
6. HomAnn, K.; SuCHAneK, A. (2012). Sissejuhatus ökonoomikasse. TÜ Kirjastus. E-raamat.
7. Human Development Report (HDR). http://hdr.undp.org/en/
8. IMD. World Competitivness Yearbook. http://www.imd.org/research/publications/wcy/index.cfm
9. KunCiC, A. (2012). Institutional quality database, online statisti-cal appendix. http://sites.google.com/site/aljazkuncic/institution-al-factor-scores. [Online; accessed 01-February-2012].
10. leSCHKe, m. (2011). Ökonomik der Entwicklung – Eine Ein-führung aus institutionenökonomischen Sicht. Verlag NMP.
11. noRtH, d. (1990) Institutions, Institutional Change and Eco-nomic Performance. Cambridge: Cambridge University Press. Estonian translation: Institutsioonid, institutsiooniline muutus ja majandusedu. Tartu: Fontes Publishers, 2004.
12. noRtH, d.; wAlliS, J.; weingASt, B. (2006) Violence and Social
Orders: A Conceptual Framework for Interpreting Recorded Human History. Cambridge University Press.
13. SePP, JüRi (2006). “Effects of Institutional Factors and Human Capital on Countries’ Economic Potential and Growth,” Business Interaction in a Global Economy. Wilkes, Beijing: COPE Interna-tional, 69 –82.
14. SePP, J.; eeRmA, d. (2007). “Institutional Factors Impact on Coun-tries Economic Growth.” Economic Development, Environment, Energy and Ethics in a Global Economy. Wilkes, COPE Interna-tional, 269 – 278.
15. SePP, J.; eeRmA, d. (2011). “Why Economic Development Deviates from Human Development,” Central European Review of Eco-nomics and Finance, 1(1), 11 – 25.
16. tRABold, H. (1995) “Die internationale Wettbewerbsfähigkeit einer Volkswirtschaft,” Deutsches Institut für Wirtschaftsfor-schung, Vierteljahreshefte zur Wirtschaftsforschung, Heft 2, 64. Jg. Berlin, 169.
17. World Bank. Doing Business. http://www.doingbusiness.org/
18. World Bank. Worldwide Governance Indicators. http://info.worldbank.org/governance/wgi/index.asp
19. World Economic Forum. The Global Competitiveness Report. http://www.weforum.org/issues/global-competitiveness
20. wRoBel, R. (2000) Estland und Europa: Die Bedeutung des Systemwttbewerbs für die Evolution und Transformation von Wirtschaftssysteme. University of Tartu Press.
21. wölFl, A., i. wAnneR, t. KozluK, g. niColetti (2009), “Ten years of product market reform in OECD countries – insights from a revised PMR indicator”, OECD Economics Department Working Paper No 695, OECD, Paris.

158 Estonian Human Development Report 2012/2013
If the economic success of states is usually character-ised by gross domestic product (GDP), the UN Human Development Report, as well as the latest analyses from the World Bank, use gross national income (GNI) as the point of departure. When comparing states, it is also natural to view per capita data (see Table 4.2.1). Per capita GDP is used to measure income levels in two different ways. Nominal per capita GDP is based on the gross domestic product of the state and the population, and is a simple quotient of the two amounts. However, when evaluating the actual standard of living, the purchasing power of the corresponding income unit is important, i.e. the amount of goods or services that can be purchased in various countries for the same income unit. Generally, the price levels in the wealthier states are higher than in the poorer states, and therefore, the same income unit will, on average, buy more goods and services in the poorer states. To account for this, per capita GDP, based on purchasing power parity (PPP) is used, in which the nominal indicators are adjusted to reflect the differences in price levels in the various states. There are large differ-ences in price levels in the sectors closed to international
trading (for example, the prices of utility services or pub-lic transportation). Usually, the average aggregate of the states is used as the basis for comparison, for example, the average price level of the 27 Member States of the European Union (EU 27) is equated with 100% as a con-ditional reference basis. In 2011, Estonia’s GDP per capita adjusted for PPP was 67% of the EU 27 average, while the nominal GDP was only 38.9% (Statistics Estonia 2013).
The national income differs from the gross domestic product primarily due to the calculation of cross-border economic activities. GDP is territory-based, while national income is residence-based. In the case of the former, it includes all the income that is created on the territory of the state; in the second case, only the income of the peo-ple living in that state, regardless of where it is created, is included. National income is measured in two basic ways – as gross and net national income, which differ based on the calculation of depreciation. Net national income can be equated with gross national product (GNP).
However, when examining the success and sus-tainability of states, other aspects, besides just produc-tion results, also need to be examined. The UN Human
4.2The wealth and growth potential of nations Alari Purju
No. CountryGNI
(USD)
1 Norway 88,890
2 Qatar 80,440
3 Luxembourg 77,580
4 Switzerland 76,400
5 Denmark 60,120
6 Sweden 53,150
7 Netherlands 49,650
8 Australia 49,130
9 Kuwait 48,900
10 USA 48,620
11 Austria 48,190
12 Finland 47,770
13 Belgium 45,990
14 Canada 45,560
15 Japan 44,900
16 Germany 44,270
17 Singapore 42,930
18 France 42,420
19 United Arab Emirates 40,760
20 Ireland 39,930
No. CountryGNI
(USD)
21 Great Britain 37,840
22 Italy 35,290
23 Iceland 34,820
24 Brunei 31,800
25 Spain 30,890
26 Cyprus 29,450
27 New Zealand 29,140
28 Israel 28,930
29 Greece 24,480
30 Slovenia 23,610
31 Bahamas 21,970
32 Portugal 21,210
33 South Korea 20,870
34 oman 19,260
35 Malta 18,620
36 Czech Republic 18,620
37 Saudi Arabia 17,820
38 Puerto Rico 16,560
39 Slovakia 16,070
40 Bahrain 15,920
No. CountryGNI
(USD)
41 Trinidad and Tobago 15,840
42 Equatorial Guinea 15,670
43 Estonia 15,260
44 Croatia 13530
45 Hungary 12,730
46 Barbados 12,660
47 Saint Kitts and Nevis 12,610
48 Poland 12,480
49 Latvia 12,350
50 Libya 12,320
51 Lithuania 12,280
52 Chile 12,280
53 Antigua and Barbuda 11,940
54 Uruguay 11,860
55 Venezuela 11,820
56 Seychelles 11,130
57 Russia 10,730
58 Brazil 10,720
59 Turkey 10,410
60 Argentina 9,740
Table 4.2.1States with the largest national income per capita in 20111
Source: World Bank
World 9,511

159Estonian Human Development Report 2012/2013
Development Report employs generalising measurements of the indicators that characterise synthetic human devel-opment in various ways. However, the World Bank has undertaken the measurement of the wealth of nations, or their total wealth, and the examination of the possibilities for its sustainable preservation.
The wealth of nations, or total wealth, approach is based on the system implemented by the World Bank.2 According to this method of assessing the wealth of nations, wealth is comprised of produced capital, as well as human and institutional capital. An essential generalis-ing method for dealing with various types of capital is the relationship that is applied in the theoretical framework of economics, i.e. the value of capital is equal to the future income flow created by the capital. Also, based on this point of departure, present net savings are equal to the future changes in well-being, or more precisely, the net changes brought about by future consumption (growth or decline) (Hamilton and Hartwick, 2005).
The concept of genuine net savings has come into use, which is defined as savings from which negative external influences and the costs of creating and using the assets have been subtracted. For instance, in the case of tangible capital, the value of the capital is the sum of the additions made in time, the net value of which is calculated by adding up all the investments made during the entire period, and by subtracting the depreciation that has occurred in the various years of the period. In the case of natural resources, this means that the deple-tion of the capital, by utilising mining or other means of extraction, have been subtracted from the assets. The utilisation of natural resources reduces a society’s wealth, unless it is accompanied by investments into other capital, such as human capital. Hamilton and Clemens (1999) have shown that genuine savings, which take into consideration the depletion of natural resources, the accumulation of pollutants (representing negative savings) and the accumulation of human capital (positive savings that increase the value of the total wealth), are equivalent to the changes in social welfare measured in money. These authors have also shown that, if genuine savings are negative, the well-being provided to society, in the future, by economic activities, will be reduced.
The last fact is important in determining a long-term sustainable development path -- consumption can be maintained at the same level, and this with finite resources and pre-determined technological oppor-tunities, only if the genuine savings during every time
period are nil (i.e. do not become negative). Generally, this means that the depletion of natural resources must be compensated by traditional net savings in other fields of activity. Positive genuine savings are a precondition for the growth of consumption possibilities. These facts provide the basis, for instance, for defining sustainable development -- a development path is sustainable if the social welfare does not decrease at any point in this devel-opmental path. In this case, social welfare is defined as the beneficial present value of future utility over the time horizon. (Dasgupta 2001).
4.2.1 Value and structure of capitalThere are two methods for measuring the value of capital.
• The value of capital is derived from the sum of the additions made over time (investments from which depreciation has been subtracted);
• Capital can be valued as the net present value (NPV) of future income, i.e. the income that this capital will produce in the future.
The World Bank Report generally uses both of these methods, but various capital groups are usually assessed by using one of these two methods.
Capital is divided into tangible and intangible capital (Figure 4.2.1). Tangible capital is in turn divided between produced and natural capital; intangible capital, on the other hand, between human capital, institutions (the gov-ernance of which represents the informal side of formal and social capital) and net foreign assets (financial assets, from which the state either receives or pays interest).
In the case of produced capital, the value of the capital is derived from the value of the net investments. This means that, in the case of this capital, it is presumed that there is an average period of use, and the capital, for a definite year, is treated as the sum of the investments made during the average period of use, from which depre-ciation has been subtracted.3
Urban land, as one type of capital, is differentiated from agriculture land. Since the value of urban land varies from area to area, and also by the type of asset involved, in comparisons that include different countries, the value of urban land is assessed in a simplified way as an agreed-upon percentage of the value of the structures and equipment.4
1 The date in Table 1 is based on the indicator for the nominal total income per capita.
2 Where is the Wealth of Nations? Measuring Capital for the 21st Century, 2006, The Changing Wealth of Nations, 2011. The Mystery of Capital. Why Capitalism Triumphs in the West and Fails Everywhere Else (de Soto, 2000), which was written by Peruvian economist Hernando de Soto, and generated a lot of feedback, preceded the World Bank report. De Soto considers one of the development inhibitors on the road to capitalism to be the difficulties encountered in changing assets into capital, which were revealed in the lack of the corresponding institutions in the developing states, which, in turn, caused the lack of economic information, the lack of opportunities to use assets in economic relations without changing into capital (for instance, a residence that is not entered in the land registry cannot be used as security to obtain a bank loan, etc.). On the one hand, De Soto stressed the lack of political will, and, on the other hand, the occurrence of various possible violent regulatory incidents by the government and other economic agents, if the legal protection provided for property is lacking or defective. The World Bank’s methodical approach to the topic of the wealth of nations places itself into the same row as the analytical and comparative studies of the business environment that the World Bank has produced within the framework of its Doing Business reports (see p.3.2).
3 In the World Bank’s approach, the average period of use for assets is estimated to be 20 years, and, assuming the use of a linear depreciation method, the annual depreciation rate is 5%.
4 Kunte et al. (1998) used a constant size of 0.24, and based thereon, the value of urban land in the year t is Ut = 0,24 Kt , whereas Kt is the residual value of structures and equipment in the year t.

160 Estonian Human Development Report 2012/2013
The value of sub-soil assets is assessed during the period of use, based upon the net present value of the net profit earned during the (future) period of use.5
In the case of forest resources, the value is the present value of the resource rent for timber. In order to do the calculations, data is required about timber produc-tion, the unit price of products made from timber, and the period of use of the forest. The product value is rela-tively simple to calculate, using the average or prevalent global market prices. The assessment of the resource rents is more difficult. Theoretically, the present value of the forest should be equal to the net value of the forest own-er’s future stump fees, from which the costs of growing the forest, throughout the maturation period, have been deducted. Generally, the exact figures reflecting the reve-nues and costs of forest owners are not available in many states, and therefore, various average prices for timber products, as well as the calculated regional resource rents (price – cost/price) were used in the study.6
In the case of agriculture land, assumptions were made concerning the average revenue from resource rent for ten cultures; the invariability of the agriculture land; as well as the average growth of 0.97% of agricultural pro-duction, per year, in the developed states, and a growth
of 1.94% in the developing states. If the calculation year is t (based on the last assessment for 2005), the projected revenues for the period are t+24.7
In the case of protected areas, the best theoretical point of departure is the willingness of the consumers to pay for the existence of protected areas. The evaluation method based on the willingness to pay is implemented in the case of natural sites that do not directly produce revenues, but which are valuable for many other reasons. These sites may be unusual natural phenomena, like the Jägala Cascade, or red sandstone outcropping on the Ahja River in Taevaskoda. Since these natural wonders do not have a price, the following method is used to determine their value — people are asked how much they would be willing to pay to preserve these natural wonders. In this case, the survey depends on the sample of respondents. The same principles are applied to summarise the result as are used for determining the support for various polit-ical parties. Since the evaluation of natural wonders in this way is related primarily to individual examples, in order to apply this way of thinking more generally, and ensure comparability on an international scale, an evalu-ation method utilising quasi-alternative costs was used, which was based on the average productivity of crop land
Residual value of structures and
equipment
Residual value of structures and
equipment
Value of urban land assessed
indirectly Produced capital
Produced capital
Wealth measured
using the NPV method
Natural capital
Intangible capital
Step 1 Step 2 Step 3 Step 4 Step 5Structures and equipment Urban land Natural capital Total wealth Intangible capital
Protected areas, alternative
cost method
Forest resources, NPVLand assets, NPV
Agricultural land, NPV
Source: Where is the Wealth of Nations? Measuring Capital for the 21st Century, 22
Figure 4.2.1Assessment of the components of total wealth
5 The value Vt is calculated with the following formula: in which pi is a unit of rent income; qi the production volume; r the social discount rate and T the life span of the resource (depletion time). Although generally, assessments exist for
the various sub-soil resources and possible depletion periods, actually, the assessment of the reserves and possible future production volumes are uncertain. In the calculations, the value T=20 is used for all sub-soil assets, or in other words, it is assumed that the sub-soil assets will be depleted in 20 years.
6 To calculate the present value of forests, a timing value factor of 4%, and a time horizon of 25 years, is used. If the harvest exceeded the natural growth, the quotient of the difference between the forest reserve and the natural growth was used for the temporal assessment of the depletion of the forest reserves. If, based on this calculation, the depletion period for the forest reserves turned out to be less than 25 years, the appropriate shorter time period was used to calculate the value of the forest. When dealing with production reserves, the existence of infrastructure is also considered, which would ensure the accessibility of the timber, and the timber that is located more tan 50 km from the corresponding infrastructure is assessed as production reserves. Taking this fact into consideration means that only the forest which can be harvested and transported at a reasonable cost, due to the existence of the infrastructure, is taken into account.
7 4% was used as the timed factor (The Changing Wealth of Nations, 2011, 149). In the case of pasture land, the general assumptions were the same; the global prices for beef and lamb, as well as milk and wool, were used to calculate the rent value; and the growth tempo was assessed at 0.89% annually, in the developed states, and 2.95% in the developing states (The Changing Wealth of Nations, 2011, 149).
Vt = ∑ pi qi / (1 + r)i–tt+T–1
i=t

161Estonian Human Development Report 2012/2013
and pasture land, and this was capitalised over a 25-year period at an adjusted rate of 4%.
The value of the intangible capital is derived as the residual of the total value of wealth, which is calculated using the net present value (NPV) method. This is based on a principle that comes from the financial theory that the value of capital is equal to the income flow it creates in the future. If certain preconditions exist regarding the future income flow and discount rate, (which in the World Bank Report is used as the social rate of return on social investments) it is possible to evaluate the total value of wealth that its income flow will create.8 Since, based on direct calculations, assessments of the value of tangible capital exist, which are derived from the dif-ference between the total wealth and tangible capital, it is possible to obtain an assessment related to the value of the intangible capital. In principle, an assumption is made that the existence of various types of assets makes it possible to produce gross national income of a certain value, and from this gross value, the value of the assets is derived, which enables this national income to be produced.9 On the other hand, relatively direct figures, which are based on market evaluations, exist for tangible assets. Since national income varies more than tangible capital (the value of produced and natural capital, incl. per capita) from state to state, it is easy to conclude that, generally, it is intangible capital that is important in the
determination of a state’s standard of living. Based on the World Bank’s summary data, in the case of the low- income states, 15% of wealth was related to produced capital and urban land, 30% to natural capital, and 55% to intangible capital, whereas the average wealth per capita, in 2005, was $6,523 per capita. In middle-income states, the corresponding proportions were 20%, 20% and 60%, while the average wealth per capita was $30,662. In the high-income states, the corresponding proportions were 15%, 4% and 81%, while the average wealth per capita was $561,129 per capita (The Changing Wealth of Nations, 2011, 182-183).
In Table 4.2.2, data is presented about the set of ref-erence states. Generally, the proportions of wealth related to produced capital and urban land vary from 15% to 20%; the percentage of natural capital between 1% and 5%; and intangible capital 75% to 85%.
An exception is the states with significant sub-soil assets, like Chile, where the percentage of natural cap-ital reaches 18.5%. The relative importance of produced capital and urban land, compared to the other states, was somewhat higher in South Korea and the Czech Republic, where it reached 22.3% and 22.6%, respectively. A totally unique capital structure can be found in Singapore, where the rela tive importance of produced capital and urban land was 45.2%. In the case of this high percentage, a significant role is also played by the fact that investments made in
State
Produced capital and urban land Natural capital Intangible capital Total Wealth
Per capita (USD, thousands) %
Per capita (USD, thousands) %
Per capita (USD, thousands) %
Per capita (USD, thousands) %
Austria 104.8 18.4 9.1 1.6 456.8 80.0 570.7 100
Estonia 31.7 19.2 8.2 4.9 125.4 75.9 165.3 100
Netherlands 108.0 18.2 13.2 2.2 472.4 79.6 593.6 100
Ireland 101.9 17.0 11.2 1.9 486.0 81.1 599.1 100
Israel 43.7 13.4 4.8 1.5 278.9 85.1 327.4 100
Canada 86.8 16.1 36.9 6.9 415.0 77.0 538.7 100
South Korea 55.4 22.3 2.6 1.1 190.2 76.6 248.2 100
Lithuania 18.1 13.6 6.0 4.5 108.8 81.9 132.9 100
Latvia 19.3 15.9 7.3 6.1 94.7 78.0 121.3 100
Singapore 136.1 45.2 0.0 0.0 164.9 54.8 301.0 100
Finland 90.9 15.9 19.2 3.4 460.1 80.7 570.2 100
Denmark 132.1 17.8 19.6 2.6 591.2 79.6 742.9 100
Czech Republic 40.9 22.6 4.6 2.5 135.3 74.9 180.8 100
Chile 17.3 16.9 18.9 18.5 65.8 64.6 101.9 100
Hungary 25.7 14.9 6.0 3.4 141.3 81.7 173.0 100
Uruguay 8.9 10.3 8.3 9.6 69.5 80.2 86.7 100
Source: The Changing Wealth of Nations. Measuring Sustainable Development in the New Millennium 2011, 176–182.
Table 4.2.2Total wealth and its components in 2005.
8 In principle, the sample W(t) = ∫C(t) r(s) is used, in which W(t) is wealth in period t; C(t) is consumption in period t; r(s) is the timing coefficient. In this case, in order to eliminate volatility in the calculation of wealth in 2005, the average consumption between 2003 and 2007 was used along with a timing period of 25 years.
9 The study is based on the use of available total and net national income indicators, for which various indicators of saving have been calculated. The available gross national income is traditionally derived from the gross domestic product (GDP), which appears in such comparisons in the following manner — the GDP is added to the net income from foreign countries and the current net transfers. The available net national income is arrived at by deducting the latest depreciation from the gross national income.

162 Estonian Human Development Report 2012/2013
foreign countries are also included as part of this capital. This figure is also influenced by that fact that Singapore is a city-state, which lacks natural resources. The break-down of capital in Estonia was relatively similar to the other states, and intangible capital predominated, reaching 75.9%. The capital structure in Estonia was similar to the wealthy states, but the volume of capital was lower.10
Various capital forms the basis for future income. To a considerable degree, the capital structure, as a whole, is shaped by the structure of the economy, although, at the same time, the use of various types of assets is affected by the demand for the products that are produced with the help of these assets. For instance, a precondition for the existence of forest resources is the production of tim-ber products, but the sales volumes of timber products is influenced by the demand for them, which in turn, is dependent on people’s incomes, as well as the existence and cost of replacement goods made of other materials used for the same purpose. Therefore, in this approach, the presumed volume of timber products impacts the value of the forest resources.
4.2.2 Growth potential The concept of genuine savings is very important for assessing the possible impact of the changes, which have taken place in the production potential of the various states during some time period, on future GDP produc-tion and the standard of living. By using this concept, an attempt is made to combine the changes that have occurred in capital with the changes in other types of assets. Some are positive, for example, the education level increases as a result of the expenditures made in educa-tion. Others are primarily negative, such as the depletion of sub-soil assets. However, finding and exploiting new sub-soil assets increases natural capital.
The various components of genuine savings are computed as follows:
• total savings is the available national income, minus public and private consumption, plus international transfers (transfers to foreign countries increase total savings, and transfers from foreign countries reduce total savings);
• net savings is total savings minus depreciation;
• net savings plus current education expenditures, mi -nus investments into structures and equipment, equals net savings plus investments in human capital;
• net saving plus investments in human capital, minus the depletion of natural capital, minus damage to the environment from pollution, equals genuine savings.
In the case of natural capital, if the size of the capital remains the same, its depletion results in negative savings. The assessment of the value of natural capital is based on the volume of sub-soil assets that are extracted, the
global market price and resource rent rate. The theory recommends that the marginal cost be used to calculate the resource rent, but since data on the former is not gen-erally available, the average cost indicator is used. The same approach is used for primary energy sources like petroleum, coal and natural gas.
In the case of forests, the net saving is positive, if the natural growth exceeds the harvest, and in the opposite case, if the harvest is greater than the natural growth, the net saving is negative. In the latter case, the negative net saving is equal to the difference between the harvest and natural growth, multiplied by the price of roundwood and the resource rent product.
Carbon emissions are treated as negative savings. The determination of their extent is based on carbon dioxide emissions, the percentage of carbon in the car-bon dioxide, and a price of $20 per ton of carbon. The problem with assessing the damage caused by carbon emissions is that the cost of the permanent social damage that is caused may be significantly higher than the market or estimated price of carbon.
In the case of hazardous substances, the theory recommends that the assessment be based on the will-ingness to pay for the prevention of death and serious health damage. The practical calculations are based on the number of estimated years of life that are lost, and the value of the years, based on average wages.
State Gros
s na
tiona
l sa
ving
s
Cons
umpt
ion
of
fixe
d ca
pita
l
Net
nat
iona
l sa
ving
s
Educ
atio
n ex
pend
iture
s
Savi
ngs
rela
ted
to p
rodu
ced
capi
tal a
nd
hum
an c
apit
al
Austria 27.2 14.3 12.9 5.3 18.2
Estonia 20.1 13.5 6.6 4.6 11.2
Netherlands 10.3 13.9 -3.6 4.8 1.2
Ireland 19.7 17.1 2.5 5.2 7.7
Israel 19.8 13.5 6.3 5.9 12.2
Canada 23.4 14.0 9.4 4.8 14.2
South Korea 30.5 12.6 17.9 3.9 21.8
Lithuania 15.2 12.7 2.5 4.6 7.1
Latvia 22.3 12.6 9.6 5.6 15.2
Singapore 47.0 14.1 32.9 2.7 35.6
Slovenia 27.0 13.6 13.4 5.3 18.7
Finland 24.8 14.1 10.7 5.6 16.3
Denmark 23.6 14.2 9.4 7.4 16.8
Czech Republic 24.2 13.8 10.4 4.4 14.8
Chile 24.2 12.9 11.4 3.6 15.0
Hungary 15.9 15.1 0.8 5.3 6.1
Uruguay 18.2 11.9 6.3 2.6 8.9
Source: The Changing Wealth of Nations. Measuring Sustain-able Development in the New Millennium 2011, 186–195
Table 4.2.3Total and net savings as a percentage of national income in 2008 (%)
10 In the World Bank report, complete data on the various types of capital in Estonia existed for 2000. In 2005, several important indicators were missing, and to ensure comparability with other states in the study, many of the indicators for Estonia were derived from price and volume indices.

163Estonian Human Development Report 2012/2013
Basing the total and net savings related to produced capital on the gross national income, means that only the domestic savings have been taken into account, and the foreign savings have been left out. In Estonia, for example, during the period of rapid economic growth from 2001 to 2008, the total capital investment in fixed assets was about 30% of GDP, two-thirds of which was covered by domestic savings and one-third by foreign savings. The latter was utilised through foreign invest-ments. Only the investments that were based on domes-tic savings were taken into account as increasing the state’s capital reserve. This approach promotes the fol-lowing train of thought -- the capital of the population in the given state is only increased by the investments that are made from local savings (i.e. the proprietary income goes to the citizens of the state to whom the investments money belongs). The foreign investments based on foreign savings earn proprietary income for the foreigners. Only the portion of the capital reserve based on domestic savings, which exceeded depreciation, was increased by the investments. In addition to the savings that were realised as produced capital, education expen-ditures also increased genuine savings. The net savings related to natural capital are based on the depletion of natural capital and the emissions of various dangerous substances, and are negative in all the states under observation. Based on the relationship stipulated in the introduction, according to which, the value of capital is equal to the income flow that it creates in the future, and present net savings are equal to the future changes in well-being, it can be concluded that, in order preserve well-being at the same level at least, the negative net savings related to pollution and the depletion of sub-soil resources should be covered by the positive net savings from produced and human capital.
When assessing the 2008 indicators for the genuine saving of various states, the basic reference points should be taken into consideration. Generally, the net invest-ments (capital gains) in rich countries are smaller, since most of their production is capital-intensive, and a large portion of the investments are used to replace existing capital (Table 4.2.3). In the set of reference states, a state like this is the Netherlands, where the savings related to produced and human capital are only 1.2% of the operat-ing net national income, and adding the negative savings related to natural capital also results in negative genuine savings (Figure 4.2.2).
Ireland, Hungary, Uruguay and Lithuania also have relatively low savings rates (less than 10%) related to produced and human capital. The corresponding indi-cator in Estonia was 11.2%, and this puts Estonia sixth from the bottom, in this group of states. Singapore and South Korea, which represent the Asian market economy model in the set of states, stood out for their high savings rates. In regard to natural capital, the states where the mining of minerals was important, primarily Chile and Canada, stood out for their large negative savings rate (Table 4.2.4).
In this group of states, Estonia was ranked fifth, based on the size of the negative savings related to nat-ural capital, and was the state where the largest contri-bution to this indicator was made by carbon emissions.
Singapore and South Korea are differentiated by their high genuine savings rate (over 20%). Another group is comprised of the states in which the corresponding indicator is between 10% and 20%, and this includes seven out of the 17 states in the set. Estonia is among the next six states, which have indicators that are under 10%, but are still positive. Negative genuine savings rates can be found in the Netherlands (primarily due to the great need for replacement capital) and Chile (due to the great impact of the mining of mineral resources on the economy).
Examining some of the savings indicators based on partially available data (Figure 4.2.3), we see that that the basic proportions continue in 2010. Singapore, South Korea, and, here, also Switzerland, are the states with the highest net savings, while the only state with negative savings is Israel. Estonia’s net savings have risen above 10%, and along with the calculation of education expen-ditures, Estonia’s growth potential has even increased to fourth place among the reference states. However, this last indicator does not take into account the use (depletion) of natural capital, and measures growth potential based only on produced and human capital.
Although the points of reference for the states differ, some generalisations can be made. The capital-intensive production, in the states with high standards of living,
Source: The Changing Wealth of Nations. Measuring Sustain-able Development in the New Millennium 2011. 186–195.
Table 4.2.4Percentage of national income related to natural capital in 2008 (%)
State Ener
gy d
eple
tion
Min
eral
dep
letio
n
Net
fore
st d
eple
tion
CO2 d
amag
e
Haz
ardo
us
Tota
l sav
ings
rela
ted
to n
atur
al c
apit
al
Austria -0.2 … … -0.1 -0.1 -0.4
Estonia -1.5 0 0 -0.7 0 -2.2
Netherlands -2.0 0 0 -0.2 -0.2 -2.4
Ireland … … 0 -0.1 0 -0.1
Israel -0.2 -0.3 0 -0.3 -0.1 -0.9
Canada -5.5 -0.6 0 -0.3 -0.1 -6.1
South Korea … … 0 -0.4 -0.3 -0.7
Lithuania -0.1 0 -0.1 -0.3 -0.1 -0.6
Latvia 0 0 -0.2 -0.2 … -0.4
Singapore 0 0 0 -0.3 -0.6 -0.9
Slovenia -0.1 0 -0.2 -0.2 -0.1 -0.6
Finland 0 -0.1 0 -0.2 … -0.3
Denmark -3.0 0 … -0.1 … -3.3
Czech Republic -0.7 0 … -0.5 … -1.2
Chile -0.3 -14.3 0 -0.3 -0.4 -15.3
Hungary -0.8 … 0 -0.3 -1.1
Uruguay 0 0 -0.4 -0.2 -1.1 -1.7

164 Estonian Human Development Report 2012/2013
requires substantial capital replacement, in order to pre-serve the existing standard of living in the future. For sustainable growth, the states with extensive sub-soil assets and large mining sectors need institutions that enable the resource rents for sub-soil assets to be turned into investments into other sectors and into human cap-ital. Actually, the same problem exists for states that are dependent on foreign capital. In order to increase their standard of living, they require mechanisms that would change the profits earned by foreign capital into invest-ments into infrastructure and human capital, in the given state. Production that causes extensive emissions of haz-ardous substances needs to be compensated or replaced by other types of economic activity.
References1. dASguPtA, P. (2001). Human Well-Being and the National Envi-
ronment. Oxford, Oxford University Press.
2. de Soto, H. (2000). The Mystery of Capital. Why Capitalism Triumphs in the West and Fails Everywhere Else. Bantam Press, London and New York.
3. doing BuSineSS in 2013. (2012). The World Bank, Washington, DC.
4. StAtiStiCS eStoniA 2013. (2013). http://www.stat.ee/29957
5. HAmilton, K., m. ClemenS. (1999). “Genuine Savings Rates in Developing Countries,” World Bank Economic Review, 13 (2), 333–356.
6. HAmilton, K., m. HARtwiCK. (2005). “Investing Exhaustible Resource Rents and the Path of Consumption,” Canadian Journal of Economics, 38 (2), 615–621.
7. Kunte, A., K. HAmilton, J. dixon, m. ClemenS. (1999). Estimating National Wealth: Methodology and Results. Environment Department Paper 57, World Bank, Washington D.C.
8. Where is the Wealth of Nations? Measuring Capital for the 21th Century. (2006). World Bank, Washington, D.C.
9. tHe CHAnging weAltH oF nAtionS. meASuRing SuStAinABle develoP-ment in tHe new millennium. (2011). World Bank, Washington, D.C.
Savings related to produced and human capitalTotal genuine savings
Percentage
Percentage
-5 0 5 10 15 20 25 30 35
-5 0 5 10 15 20 25 30 35
Chile
Netherlands
Hungary
Lithuania
Uruguay
Ireland
Canada
Estonia
Israel
Denmark
CzechRepublic
Latvia
Finland
Austria
Slovenia
South Korea
Singapore
Education expendituresNet savings
Percentage
Percentage
-10 0 10 20 30
-10 0 10 20 30
Ireland
New Zealand
Finland
Canada
Uruguay
Israel
Slovakia
Denmark
Hungary
Czech Republic
Slovenia
Netherlands
Austria
Chile
Estonia
South Korea
Switzerland
Singapore
Figure 4.2.2Genuine savings related to produced and human capital as a percentage of national income in 2008 (%). Ranked according to genuine savings.
Figure 4.2.3Net savings and education expenditures as a percentage of national income in 2010 (%). Ranked according to net savings.
Estonia is representative of the pattern related to states with average income, where the volume of produced cap-ital is smaller than in the wealthier states, and therefore, the savings and investments enable the volume of capital to be partially increased due to the limited need for capi-tal replacement. As wealth increases, accompanied by an increase in the volume of capital and capital intensity, the need to replace existing capital also increases, which in turn means smaller growth of capital in the future. The increase in Estonia’s human capital provided an estimable percentage of the increase in wealth during the previous period, and this volume will be increasingly important in the future, from the standpoint of increasing the total value of capital and national income.

165Estonian Human Development Report 2012/2013
From the viewpoint of economic competitiveness and development of companies, the existence of an educated and skilled labour force is important along with the ability of the labour market to adapt to changes in the economic environment, technologies and demographics. The existence of the labour force is dependent primarily on the size of the population, its aged-based structure and the ability of the working aged population to work. A person’s resources, which are comprised of the following, are a precondition of their ability to work: good health; relevant education; sufficient know-how; physical, mental and social capabilities; values, motivation and satisfaction with work; as well as the corresponding working conditions and a work environment (see also Ilmarinen 1999). If people’s resources and working conditions create the prerequisites for their employment and for the labour market’s ability to adapt, employment and social poli-cies create the environment that affects whether, under changing conditions, people have the opportunity and motivation to provide high-quality labour, and whether it is beneficial for employers to hire people.
The ability of the labour market to adapt means that employers have the opportunity to increase and reduce the number of employees, their working hours and wages. It also assumes that the people who are in danger of los-ing their jobs have the opportunity to constantly improve their skills and knowledge and are assured sufficient income while they are unemployed. The flexibility pro-vided to the employers, and the employees’ opportunities for supplemental training, along with social guarantees, support structural changes in the economy, which are needed due to changes in the economic environment or long-term technological and demographic processes. An adaptable labour market creates the preconditions for the competitiveness of companies and countries, as well as an increase in productivity and employment and the reduction of poverty (Caballero et al. 204; Seifert, Tangian 2007; Muffels et al. 2008).
Since the flexibility of the labour market, which forms the basis of the labour market’s adaptability, has also been dealt with in previous human development reports (Eamets and Leetmaa 2009, Eamets 2011), only a concise survey of the nature of labour market flexibility is provided in this sub-chapter. The European Union’s “flex-icurity” policy stresses the importance of four institutions – flexible labour laws, efficient social protection, effective active labour market policies, and a lifelong learning sys-tem – in ensuring the adaptability of the labour market.1
Various indicators for measuring the flexibility and insti-tutions of the labour market have been created, which can be used to describe the Estonian labour market and compare it to those in other countries. However, it should be taken into account that, unlike economic competitive-ness and economic freedom, which are measured with the help of various indices (see 4.1) comprised of several sub-components, no yardsticks for measuring the com-petitiveness and flexibility of labour markets have been created. Instead, various numerical indicators are used, which may generally be divided into two groups.
The first group includes measures that provide information about the human activities in the labour market, and are based primarily on surveys. Basically, these are indicators related to processes and outputs. They describe the participation of the working age population in the labour market, their working hours and employment based on sectors and occupations, as well as unemployment, poverty, income inequality, etc. Today, the main source of information for these indi-cators is the labour studies based on the methodology of the International Labour Organisation (ILO). This group of dimensions includes, for example, the ILO’s 18 Key Indicators of the Labour Market (KILM), as well as the indicators for employment and unemploy-ment, as well as the assessments of the availability of skilled labour and competent top specialists included in the various sub-indices compiled by the Interna-tional Institute for Management Development (IMD) in Lausanne.
The second group includes dimensions that pri-marily characterise the labour market institutions in each country, such as expenditures for labour market services and unemployment benefits, as well as the strictness of the labour market regulations. These indicators are usually based on administrative statistics, on the regu-lations dealing with the labour market, or opinion polls conducted among business managers. For instance, the strictness of the legislation regulating the start and finish of the employment relationship is measured by the OECD Employment Protection Legislation Indicator (EPL), the rigidity of employment by the sub-index of the World Bank’s Doing Business Index (DB), and labour freedom by the labour market sub-index of the Heritage Founda-tion’s Index of Economic Freedom (HF labour freedom sub-index). In the comparison of states, the Strictness of Eligibility Criteria Index developed by the Danish Foreign Ministry and later supplemented by the OECD is also used (Venn 2012).
4.3Labour marketReelika Leetmaa, Andres Võrk
1 The aforementioned are also considered to be the most important institutions influencing the functioning of the labour market in labour economics, in addition, taxes on labour and the influence of labour unions are mentioned.

166 Estonian Human Development Report 2012/2013
In addition to individual indicators, the European Com-mission has worked out a detailed system of measures for monitoring the implementation of the EU’s strategies for economic growth and employment. More than 60 different monitoring and analytical indicators are used to measure the implementation of the EU Employment Strategy approved at the Luxembourg Summit in 1997 (Employment Committee 2009a, 2009b). The list also includes the indicators used to monitor the European Commission’s innovative policy initiatives (flexibility and security, i.e. flexicurity), quality of working life, taxes and gainful employment, youth employment, etc.), which are assembled into various groups. For instance, almost 30 different indicators are used to measure flexicurity, which are combinations of input, output and process indicators.
For the following analysis, the main measures that we have chosen are the ones used by the ILO, European Commission and other international organisations, which characterise both the competitiveness of a state’s economy (see also chapter 4.1) and the functioning of its labour market institutions. A comparison of the individual com-ponents with other states makes it easier to assess where Estonia lags behind the most and where it has the greatest
development potential – is it the employment rate, the working hours or the labour market regulations. This also makes it possible to look into the future and to conclude how population ageing should or can be compensated by increasing the employment rate or number of working hours. The choice of reference states is based on the states that are also used for comparisons in other chapters, as well as on the availability and comparability of the data. First, we provide an overview of Estonia’s position based on the main employment indicators, and thereafter, focus on the labour market institutions. Labour productivity is dealt with in detail in chapter 4.4.
4.3.1 The employment situation in Estonia in international comparisonsIn the comparison of the general indicators of Estonia’s labour market with other states, the following indicators were used.
• The employment index and labour market index of the International Institute for Management Development (IMD) in Lausanne. The IMD employ-ment index includes such fields as the number and percentage of employed, the structure of employ-ment by sector, the unemployment rate, incl. youth unemployment and long-term unemployment. The IMD labour market index includes the labour cost in the manufacturing sector and changes therein; the number of active people in the labour market, and the change and percentage in the population; part-time employment; working hours; percentage of women in employment; and the assessments of company mangers about the quality of the labour force (For a more thorough review and information about the methodology, see Estonian International Competitiveness, published regularly by the Estonian Institute of Economic Research).
• Employment rate, which indicates the percentage of employed persons in the population. Employed per-sons are defined as those who, based on a the cor-responding surveys, worked at least one hour and received compensation for this as salaried employ-ees, as entrepreneurs or freelancers, or worked for free in a family enterprise or on their own farm, as well as those who are temporarily not working, but have a job. Increasing the employment rate among 20- to 64-year-olds is also one of the main objec-tives of the EU’s growth strategy.
• Actual annual number of working hours per worker, which can be found either from surveys of workers or companies in different countries.
In the IMD employment and labour market indices of recent years, Estonia has placed in the 40s or 50s (out of a total of 59 states). First off, the IMD indices mention the small size of Estonia’s labour market and the high rate of unemployment (especially after the economic crisis), but it is the assessment by company managers of the availability of labour, which places Estonia near the bottom of the list.
Source: International Management Development World Com-petitiveness online; Heritage Foundation online database
Comment: The states are sorted based on the 2012 IMD emp-loyment index. The IMD index includes 59 states; the HF index includes 185 states. The HF data for 2013 is generally calculated on the basis of the data for 2012.
Table 4.3.1Rankings of the reference states in selected employ-ment and labour market sub-indices
IMD
empl
oym
ent
inde
x
IMD
labo
ur
mar
ket
inde
x
HF
labo
ur
free
dom
su
b-in
dex
2008 2012 2008 2012 2013*
Singapore 2 4 1 2 2
Switzerland 6 7 6 13 9
South Korea 15 8 32 24 140
Taiwan 22 18 8 12 125
Canada 20 20 23 22 18
Netherlands 8 21 13 14 103
Austria 19 23 16 29 16
Israel 24 28 11 19 79
Chile 37 31 10 9 46
New Zealand 14 36 25 35 6
Denmark 17 37 24 43 3
Czech Republic 25 38 26 33 12
Finland 33 40 33 32 148
Estonia 27 48 37 41 110
Slovenia 39 49 39 51 163
Hungary 48 50 31 37 74
Slovakia 52 53 34 44 52
Ireland 16 55 12 21 38

167Estonian Human Development Report 2012/2013
The problems include the very limited availability of skilled labour (58th position in 2012); lack of labour with financial knowledge (57th); the lack of competent managers (57th); risk of a brain drain (51st); and very limited attractiveness for foreign skilled labour (51st). One of the possible rea-sons for the scarcity of skilled labour is the non-conformity of the workers’ educational levels to the demands of the labour market and the insufficient training of workers, which is alluded to by the positions that Estonia achieved in the Global Competitiveness Index (Table 1.3.4 in sub-chapter 1.3, which deals with education.)
Based on the labour market indicators used for the IMD ranking, one of Estonia’s relative strengths is the high participation of women in the labour market (1st in 2011, and also in a leading position in previous years). As far as labour costs are concerned, Estonia ranks in the middle of the IMD sub-index (23rd); and also in the middle of com-pany managers’ assessment of constructive employment relationships (21st) and the employment rate (32nd.)
In the IMD indices related to employment, the Asian states rank at the top. In the employment sub-indices from 2008 to 2011, China, Thailand, Qatar and Singa-pore headed up the rankings. This reflects the size of the labour markets and high employment rates in these coun-tries. The states that appeared at the top of the labour market sub-index in various years included Singapore, Thailand, the Philippines and Hong Kong. Of the other Asian states, which were chosen as reference states for Estonia (Table 4.3.1), Taiwan, South Korea have also been ranked higher than Estonia in competitiveness; while among the European reference states, Switzerland and the Netherlands, which have higher employment rates and highly qualified labour according to the assessments of employers, are at the forefront. A more detailed compari-son of the employment indicators of the European Union and OECD states alludes to the fact that Estonia lags behind many states due to the percentage of employed persons in the population, although the ones who are employed work long hours. In 2011, Estonia’s employ-ment rate for 15- to 64-year-olds (the most commonly used age group in international comparisons) was 65.1% according to Eurostat data, while the rate was 79.3% in Switzerland, 74.1% in the Netherlands, and 74.1% in Swe-den (see Figure 4.3.1).
A large number of part-time employees are the rea-son for the high employment rates in Europe, and there-fore, the average annual number of working hours per employed person in these states is not high. If part-time employees in Estonia comprise 9.3% of all employment (2011), in Switzerland it is 33.9%, in the Netherlands, 48.5% and in Sweden, 24.7%. As a result, the number of working hours per employed person in Estonia is sig-nificantly higher than in these states. (Based on OECD data, it was even 1,924 hours in Estonia in 20112; 1,632 in Switzerland, 1,379 in the Netherlands, and 1,644 in Sweden). The combined impact of the hours worked and the employment rate gives us the number of annual working hours per working-age person, which, among the states under observation, is highest in Switzerland,
Figure 4.3.1Employment rate for 15- to 64-year olds, and the annual working hours per worker and person, 2011
Source: Eurostat, table, Employment rates by sex, age and nationality (%); oECD, oECD.StatExtracts, table “Average annual hours actually worked per worker”, last viewed on 01.02.13; the authors’ computations.
Annual working hours per workerAnnual working hours per person Employment rate
Working hours
Percentage 0 20 40 60 80
0 500 1000 1500 2000
Switzerland
New Zealand
Chile
Estonia
Canada
Sweden
Czech
Republic
Finland
Austria
OECD
Israel
Greece
Denmark
Slovenia
Slovakia
Luxembourg
Netherlands
Germany
Italy
Belgium
Spain
France
Ireland
2 At the same time, in the IMD Index, only 1,762 working hours per year are used for Estonia in 2011.
New Zealand, Chile and Estonia. In Estonia, this totalled 1,253 hours in 2011, which is significantly higher than the average for the OECD states (1,151 hours).
Therefore, based on the example of other states, Estonia does not need to increase the number of work-ing hours per person, as much as it needs to reduce the number of unemployed and inactive people, including by increasing part-time work.
The change in the age structure of the population has a long-term impact on the labour market. While, at the beginning of 2011, 62% of Estonia’s population

168 Estonian Human Development Report 2012/2013
was at the best working age (20 to 64), based on the population projections made by Eurostat in 2010, this will decline to 56% by 2030. The impact of population ageing could partially be compensated by an increase in the employment rate. In order to achieve this compen-sation, the employment rate in the 20- to 64-year age group would have to increase from the current 70% to 78%, which is comparable to the current employment rate in Sweden, Iceland and Switzerland. If, for exam-ple, Estonia’s employment rates were to achieve levels similar to Sweden, by age group, it would be possible to keep the total number of employed persons at the cur-rent level, (almost 609 thousand employed persons in 2011) for another 25 years, i.e. until 2035. In this case, the employment rate in the 15- to 74-year age group
would increase from 59% in 2011 to 66% in 2030; and from 70% to 80% in the 20- to 64-year age group. If the employment rates should remain at 2011 levels, the number of employed persons will decrease by 80,000 people, purely as a result of structural demographic changes (Figure 4.3.2).
In addition to population ageing, labour potential is affected by the persons that are working abroad as well as the permanent emigration from Estonia. Based on the data from the 2011 census, almost 25,000 per-manent residents of Estonia work abroad. In addition, the registered data for 2004 to 2011 shows that almost 38,000 people emigrated from Estonia, while almost 23,000 people immigrated. Long-term population pro-jections (e.g. Eurostat’s EUROPOP2010) assume that Estonia’s net migration will remain negative until 2030; and after that it will become positive. According to the projections, the gap between emigration and immigra-tion would achieve the maximum level in 2020, being approximately 1,000 persons annually. However, based on the experience of recent years, one can say that net migration has tended to be underestimated in the pop-ulation projections – for instance, between 2010 and 2011, the gap was 2,500 persons annually. Therefore, the assessments of the unavailability of quality labour by Estonia’s employers is further intensified by migration, which increases the need to make better use of labour potential or to increase immigration.
4.3.2 Labour market institutionsLike economic development generally, the labour market also depends on flexible institutions, i.e. the rules and standards that regulate the functioning of the labour market, and which, through the stimuli that are created, impact the supply and demand of labour.3
We have used the following indicators to compare the labour market institutions with those of other states.
• Heritage Foundation (HF) Labour Freedom sub-index, which measures the strictness of labour legislation (also see sub-chapter 4.1, for the dynam-ics of the HF Index of Economic Freedom and the Labour Freedom sub-index). The index is comprised of the following six components based on the state’s labour market regulations: ratio of minimum wage to the average value added per worker; hindrance to hiring additional workers; rigidity of hours; dif-ficulty of firing redundant employees; legally man-dated notice period; and mandatory severance pay. The index values vary from 0 to 100, whereas, the higher the number, the more freedom there is.
Source: The Eurostat 2010 population projections for Estonia; Estonia’s 2011 employment rates from the Statistics Estonia database; Sweden’s 2011 employment rates from the Eurostat database.
3 In the analysis compiled by OECD (2012), data was used about 18 OECD states from 1982 to 2007. The authors concluded, among other things, that more important than the assessment of the impact of individual institutions was to view the combined effect of the various labour market institutions in the state. For example, high unemployment benefits/the percentage of workers covered by large collective agreements increase structural unemployment in OECD states on the average, but not in those states, where effective active labour market policies/coordinated wage negotiations take place. Therefore, a balance between various institutions is most important, which is also emphasised in the aforementioned concept of flexicurity. In Estonia, the impact of labour market institutions on the general unemployment rate has not been examined to date. Detailed surveys of the yardsticks used by the EU Commission to measure labour markets, their computation methods and their suitability to the Estonian context have been compiled by Krillo and Eamets (2010); Võrk, Nurmela et al. (2010), Krillo, Nurmela et al. (2010), and Võrk, Kaarna et al (2010).
0
10
20
30
40
50
60
1995
2000
2005
2010
2015
2020
2025
2030
2035
2040
2045
2050
0
200
400
600
800
1000
1200
Maximum employment rates2011 employment ratesWorking age population (15–74)Employment in case of maximum employment ratesEmployment in case of 2011 employment rates
Perc
enta
ge
Figure 4.3.2Number of employed persons in Estonia and the develop-ment of the employment rate based on various scenarios
Comment: “Maximum employment rates and employment” means that, by 2030, Sweden’s 2011employment rates will be achieved in the gender and age groups where they fell below the 2011 levels. “2011 employment rates and employment” me-ans that the employment rates in the gender and age groups will remain at the 2011 Estonian levels.

169Estonian Human Development Report 2012/2013
• Expenditures for active labour market policies as a percentage of GDP, which indicate the relative importance of active labour market policies in the state under observation. This is one of the Euro-pean Commission’s flexicurity measures, and this indicator is used primarily in studies that analyse the impact of active labour market policies on the general unemployment rate.
• Expenditures for passive labour market policies, i.e. unemployment benefits as a percentage of GDP, indicate the relative importance of unemployment benefits in the given state. Taking the differences in the unemployment rates in the different states into account, the indicator is divided by the unemploy-ment rate and the result is multiplied by ten for better visualisation. The measure is one of the European Commission’s flexicurity indicators. In research, it is also one of the most frequently used indicators for the assessment of the impact of passive labour market policies on the general unemployment rate.
One of the problems in Estonia’s economy is strict labour legislation. Often mentioned by several indices evaluating economic freedom, it limits the employers’ opportunities for reacting flexibly to changes in the market situation by firing redundant workers or reducing wages. The HF labour market sub-indices, DB labour market sub-indi-ces, and the EPI compiled by the OECD also allude to this problem. The given indices are comprised of various components, which are usually related to the strictness of the regulations related to hiring and firing workers, the flexibility of working hours, the cost of firing redundant workers, the mandated notice period and size of the min-imum wage. The data from the DB labour market sub-in-dex is used by both the FI and HF for compiling their indices. Although the methodology for these indices does not overlap completely, they are actually quite strongly correlated (Krillo and Eamets 2010).
The labour sub-indices of the World Bank’s DB and the OECD’s EPI are the most frequently used in stud-ies related to labour markets. Since the data for the DB labour sub-index and the OECD EPI are not available or are outdated, the HF freedom of labour sub-index has been used below.4
After the enactment of the new Employment Con-tracts Act in 2009, Estonia rose from 137th position (2009) to 110th position in 2013 (see Table 4.3.1). How-ever, in regard to labour freedom, it is still part of the next-to-the-last group of “mostly not free” states. At the same time, many successful small states lag behind Esto-nia, such as Sweden (124), Taiwan (125), South Korea (140), Finland (148), and Norway (151), whereas the
states at the top of the list include Denmark (3), Switzer-land (9), Hong Kong (11) and the Czech Republic (12). It should be taken into consideration that the HF index may not consider the provisions of collective agreements between employers and employees5. Therefore, these indices may underestimate the strictness of the labour market regulations in states that have strong labour unions and where many of the working conditions are agreed upon in collective agreements. For example, based on the OECD’s 2010 data, only 8% of the workers in Estonia belong to trade unions, and, based on the data of 2009 survey of working life, the terms and conditions of collective agreement extended to 33% of the workers. On the other hand, according to the OECD’s 2010 data, almost 70% of the workers in Denmark belonged to trade unions and 80% of the workers were covered by collective agreements, whereas, in Denmark, collective agreements are also often signed at the company level (Fulton 2011). The indicators characterising Estonia’s trade union membership and the density of collective agreements are also considerably lower in comparison to other European states (OECD 2012; Fulton 2011). In other words, in our case, the working conditions of the majority of workers are determined by the Employment Contracts Act, while elsewhere, collective agreements play a large role – a fact that may not be reflected in the values of the aforementioned indices.
Another shortcoming of such indices is the fact that they do not take into account how well the laws are actually enforced. For instance, based on the aforemen-tioned indices, before the implementation of the 2009 Employment Contracts Act, Estonia was ranked as a state with one of the most rigid regulations, but an analysis of the job creation and destruction at the company level by Eamets and Masso (2005) revealed that although less jobs are created and eliminated in Estonia than in the Nordic countries, it occurred at the same rate as in the U.S., and at a considerably higher rate than in the other states of Europe. Based on the analysis, the authors concluded that Estonia’s labour market is flexible, regardless of the strict regulations. The authors believe that one reason for this is the fact that the law was being ignored. This was also indicated by the considerably larger number of labour disputes per worker than in the other European states (Bank of Estonia, 2006).
To date, the impact of the Employment Contracts Act, which entered into force in 2009, has been analysed only by Liina Malk (2012). In her research, based on data from labour force surveys, she assessed the impact of the new law on the movement of labour between labour mar-ket statuses. For instance, when analysing the movement from employment to unemployment, from unemployment to employment, and from unemployment to inactivity, the
4 Starting in 2011, the World Bank abandoned the use of the labour market sub-index in the assessment of business freedom and initiated a review of the methodology. The initial data dealing with the components of the labour market sub-index are available, but, as of 2011, the index values are not. The values of the OECD EPI are available for 2008, and for individual states, (incl. Estonia) for 2009. After the new Employment Contracts Act came into force, value in the OECD EPI for Estonia dropped from 2.4 to 1.65, and is lower than the average of the OECD states (OECD, 2010). This is caused mainly by the first component of the index, i.e. the restrictions on the requirements for working with a contract without a specified term, including the shortening of the mandated notice period and the reducing of redundancy payments.
5 Collective agreements have been taken into account that extend to more than half of the companies in the processing industry sector, and extend to companies that are not parties to the collective agreement.

170 Estonian Human Development Report 2012/2013
corresponding indicators for Lithuania were used as the control group. The results confirmed that, since the new Employment Contract Act came into force, the probabil-ity of leaving employment increased in Estonia, although the movement from unemployment to employment has not increased. At the same time, it turned out that, after the implementation of the new law, the movement from unemployment to inactivity has increased, and the move-ment between jobs has decreased. Therefore, the new law has made it simpler for workers to leave employment, but, at the same time, the prospects of the unemployed to find jobs had not improved. The author believes that the reason is the limited availability of the other flexicurity components, primarily active labour market policies and opportunities for lifelong learning (Malk 2012).
Another important labour market institution, which supports the flexibility of the labour market, is active labour market policies, i.e. labour market services, which, since 2009, have been provided in Estonia by the Unemployment Insurance Fund. Active labour market policies make it possible to support the movement of workers from less productive sectors and/or those with high unemployment rates to more productive and/or low unemployment sectors; to improve the availability of information related to available jobs and to matching jobs with job seekers, to involve disadvantaged groups in the labour market, and also to reduce the moral risk related to the payment of unemployment benefits.
Usually, labour market expenditures, as a percentage of GDP, are used as an indicator for monitoring European Union flexicurity, and as a variable in studies that anal-yse the importance of active labour market policies in labour market policies. As we can see from Figure 4.3.3, the expenditures made for active labour market policies in Estonia have increased, but they are still considerably below the average for OECD states. This is also confirmed by Eurostat data, in which Estonia is at the bottom of the rankings compared to other EU Member States in regard to both the expenditures as a percentage of GDP, and per each job seeker (which better takes into account the dif-ferences between the labour market situations in various states). In addition, in Estonia, considerably fewer people participate actively in labour market services than in the EU Member States on average: in 2010, only 3.8 people for every 100 job seekers; while the average in the EU 27 states was 30 (Eurostat).
During the last few years, a positive development that is worth highlighting is the considerable growth in the number of labour market services provided by the Estonian Unemployment Insurance Fund. Many differ-ent kinds of counselling services have been added (e.g. psychological counselling, social rehabilitation, addiction counselling, debt counselling), as well as the provision of flexible services depending on the special needs of the job seeker (individual implementation). Based on data from the Unemployment Insurance Fund, from the viewpoint of the number of participants, the most important labour market services in 2012 were labour market training (about 48,000 participants, incl. 35,000 of which partic-ipated in job-related training), career counselling (about 21,000 participants) and wage subsidies (about 6,000 participants).
The studies about the impact of labour market services in Estonia, which have been completed in the last few years, confirm that participating in services improves the prospects for people to find jobs later on. For example, Lauringson et al. (2011) concluded that the people who participated in labour market training in 2009 and 2010 had a 10% to 13% greater probability of finding a job later on than those who had not. It has been also shown that the probability of later employment is increased by the implementation of wage subsidies (Anspal et al. 2012) and participating in practical training (Estonian Unem-ployment Insurance Fund, Analysis Department 2013). Therefore it can be said that active labour market policies have been effective in Estonia, but they are implemented to such a small extent that the impact has not been appar-ent on the unemployment rate generally.
The supply of labour, and thereby also the function-ing of the labour market, is affected, among other things, by the benefits and allowances that are paid to people
Figure 4.3.3Expenditures for active labour market policies as a per-centage of GDP
Source: oECD, oECD. StatExtracts, table Public expenditure of LMP by main categories (% GDP), last viewed on 25.01.2013.
0 0,25 0,750,5 1 1,25 1,5 1,75
0 0,25 0,750,5 1 1,25 1,5 1,75
2008 2010
Percentage
Percentage
OECD average 2010
Denmark
Belgium
Netherlands
France
Sweden
Finland
Ireland
Germany
Spain
Austria
Portugal
Poland
Hungary
Italy
Slovenia
Chile
South Korea
New Zealand
Canada
Czech Republic
Slovakia
Estonia
Israel

171Estonian Human Development Report 2012/2013
minimum wage, if the other does not work, since the amount gained by working is less than the potential loss in subsistence benefits and the additional transport or kindergarten costs. It is also not profitable to take a job that pays much less (or is part-time) than the job seeker was paid before receiving unemployment insurance ben-efits, or if the household has the right to simultaneously receive several social protection benefits (e.g. old-age pension under favourable conditions, an early retirement pension, disability pension or parental benefit simulta-neously with the unemployment insurance benefits). The motivation to work is also reduced by the simultaneous payment of several social protection benefits (Leetmaa et al. 2012). Therefore, getting a job might not always be profitable, and therefore, stimuli should be increased that make working more profitable even at low wages.
Figure 4.3.4Expenditures for unemployment benefits as a percentage of GDP (divided by the unemployment rate multiplied by 10)
Source: oECD, oECD. StatExtracts, table Public expenditure of LMP by main categories (% GDP), last viewed on 25.01.2013; authors’ calculations.
0 0,5 1 1,5 2 2,5 3 3,5 4
0 0,5 1 1,5 2 2,5 3 3,5 4
2008 2010
OECD average 2010
Netherlands
Austria
Belgium
Ireland
Finland
Denmark
Italy
Spain
Norway
Portugal
Canada
Slovenia
South Korea
Sweden
New Zealand
Hungary
Czech Republic
Estonia
Slovakia
Poland
who lose their jobs. These ensure income protection in the case of social risk (e.g. unemployment, illness, age) or need. In the context of labour market flexibility, the ben-efits and allowances paid in case of unemployment, i.e. “passive labour market policies,” are the most important.
The expenditures onpassive labour market policies, as a percentage of GDP, are increasingly being employed as an indicator to assess the impact of labour market insti-tutions and to monitor the EU’s concept of flexicurity. As is clear from figure 4.3.4, the expenditures for unemploy-ment benefits in Estonia, considering the differences in the unemployment rates, are among the lowest in comparison to the other OECD states. The small size of the unemploy-ment benefits also points to the low net replacement rate of unemployment benefits6 in case of both short- and long-term unemployment (see Leetmaa et al. 2012). Low com-pensation levels are accompanied, in turn, by a high risk of poverty for the unemployed (Leetmaa et al. 2012). In addition to the small size of the benefits, only half of the registered unemployed received unemployment insurance benefits or unemployment allowances in 2011 according to the Unemployment Insurance Fund data. Therefore, Esto-nia’s unemployment benefits are generally lower, access to them is more limited and unemployment is accompanied by a higher risk of poverty. Many empirical studies have confirmed that higher unemployment benefits are usually accompanied by greater unemployment, but this link does not apply if the precondition for receiving more generous unemployment benefits is involvement in active labour market policies; if the job-seeking activities of the benefit recipients are monitored and sanctions are enacted if job searches are abandoned (OECD 2012).
Although Estonia’s unemployment benefits are small, an analysis based on Estonian data (Lauringson 2012) confirms that the receipt of unemployment insur-ance benefits lengthened the duration of the unemploy-ment period before and also during the economic crisis. At the same time, it was found that people who received unemployment insurance benefits for a longer period worked longer at the jobs that they did find. Therefore, the receipt of unemployment insurance benefits enables people to find jobs that suited them better and did not force them to accept the first jobs that they were offered. Therefore, the jobs found by the people who received unemployment benefits for a longer period were of better quality (Lauringson 2012). However, it should still be considered that the data used in the study does not allow for an assessment of how much the more efficient control of the job-seeking activities and, if necessary, implemen-tation of sanctions, would reduce the negative impact of getting unemployment benefits. During the period under examination, the control of job-seeking activities in Estonia was superficial, and sanctions were seldom implemented (Lauringson 2012).
Leetmaa et al. (2012) also recognised that, in certain cases in Estonia, it is not beneficial to get a job instead of collecting unemployment insurance benefits. For instance, it was found that in a household with two children it does not pay for one parent to work at
6 Defines how large a segment of an unemployed person’s income is in comparison to their income when employed.

172 Estonian Human Development Report 2012/2013
References1. AnSPAl S., JäRve, J., JäätS, K., KAllASte, e., mAAR, K., mägi, A.,
tootS, A. (2012), Programmi “Kvalifitseeritud tööjõu pakkumise suurendamine 2007–2013” teenuste hindamine. Palgatoetuse ja tööturuteenuste vahehindamine. Eesti Rakendusuuringute Keskus Centar, InterAct Projektid & Koolitus OÜ.
2. BAnK oF eStoniA (2006). Tööturu ülevaade.
3. CABAlleRo, R. J., CowAn, K., engel, e. m.R.A, miCCo, A. (2004). Effective Labour Regulation and Microeconomic Flexibility. Cambridge: National Bureau of Economic Research, Working Paper, 10744. http://www.nber.org/papers/w10744 (05.04.2012).
4. eAmetS, R. (2011). “Labour Market, Labour Market Flexibility and the Economic Crisis in the Baltic States,” Estonian Human Development Report 2010/2011. Baltic Way(s) of Human Development: Twenty Years On. Tallinn: Estonian Cooperation Assembly, 75–82.
5. eAmetS, R.; leetmAA, R. (2009). “Tööturg ja sellega seostuvad poliitikad,” Eesti Inimarengu Aruanne. Tallinn: Eesti Ekspress Press, 138–147.
6. eAmetS, R., mASSo, J. (2005). “Labour Market Flexibility and Employment Protection regulation in the Baltic States,” European Journal of Industrial Relations Vol. 11, No 1, 2005, 71-90.
7. Eesti rahvusvaheline konkurentsivõime 2011 aastaraamat. Eesti konkurentsivõime maailma 59 riigi ja Euroopa Liidu 24 liikmesriigi võrdluses (Leev Kuum, ed.). Enterprise Estonia, State Chancellery, Estonian Institute of Economic Research.
8. Employment Committee (EMCO) (2009a). Monitoring and Analyses of Flexicurity Policies. http://ec.europa.eu/social/main.jsp?catId=102&langId=en.
9. Employment Committee (EMCO) (2009b). Reports Issue 1. Employment Guidelines 2009. Indicators for Monitoring and Analysis in the NRPs 2009. http://ec.europa.eu/social/main.jsp?catId=89&langId=en&newsId=591&furtherNews=yes.
10. eStoniAn unemPloyment inSuRAnCe Fund, AnAlySiS dePARtment (2013). Tööpraktika mõjuanalüüs.
11. euRoPeAn CommiSSion (2003). The European Union Labour Force Survey: Methods and Definitions – 2001. Office for Official Publications of the European Communities. http://epp.eurostat.ec.europa.eu/cache/ITY_OFFPUB/KS-BF-03-002/EN/KS-BF-03-002-EN.PDF.
12. ilmARinen, J. (1999) Ageing Workers in the European Union: Status and Promotion of Work Ability, Employability and Employment. Helsinki: Finnish Institute of Occupational Health and Ministry of Social Affairs and Health.
13. KRillo, K., eAmetS, R. (2010) Kuivõrd kajastavad tööturu jäikuse indeksid tegelikke erinevusi riikide vahel? EuroCollege Centre for Applied Research, University of Tartu.
14. KRillo, K., nuRmelA, K., eAmetS, R., PHiliPS, K. (2010) Elukestva õppe roll turvalise paindlikkuse kujundamisel Eestis. EuroCol-lege Centre for Applied Research, University of Tartu.
15. lAuRingSon, A. (2012). The Impact of the Generosity of Unem-ployment Benefits on Estonian Labour Market Outcomes in a Period of Crisis. (Doctoral thesis, University of Tartu) Tartu: Tartu University Press.
16. lAuRingSon, A., villSAAR, K. tAmmiK,l., luHAvee, t. (2011). Tööturukoolituse mõjuanalüüs. Eesti Töötukassa analüüs. Tallinn, 1–97.
17. leetmAA, R., mASSo, m., võRK, A., KARu, m., veldRe, v., PAuluS, A., tuRK, P. (2012). Sotsiaalkaitsehüvitiste ja -toetuste mõju töömoti-vatsioonile. PRAXIS Center for Policy Studies. Tallinn.
18. mAlK, l. (2012). Töölepingu seaduse roll turvalise paindlikkuse kujundamisel Eestis. Master’s thesis. Tallinn University of Technology.
19. muFFelS, R., CHung, H., FouARge, d., KlAmmeR, u., luiJKx, R., mAnzoni, A., tHiel, A., wiltHAgen, t. (2008). Flexibility and Security over the Life Course. Dublin: European Foundation for the Improvement of Living and Working Conditions. http://www.lex.unict.it/eurolabor/documentazione/altridoc/Flexibil-ity_life_course_Feb_08.pdf (30.03.2012).
20. oeCd (2012). Employment Outlook 2012.
21. SeiFeRt, H., tAngiAn, A. (2007). Flexicurity: Reconciling Social Security with Flexibility – Empirical Findings for Europe. Düs-seldorf: WSI-Diskussionpapier no. 154. http://www.boeckler.de/pdf/p_wsi_diskp_154_e.pdf (10.02.2012).
22. venn, d. (2012). Eligibility Criteria for Unemployment Benefits: Quantitative Indicators for OECD and EU Countries, OECD Social, Employment and Migration Working Papers, No. 131, OECD Publishing, 62.
23. võRK, A., KAARnA, R., nuRmelA, K., oSilA, l., leetmAA, R. (2010). Aktiivse tööpoliitika roll turvalise paindlikkuse kujundamisel Eestis. PRAXIS Center for Policy Studies. Tallinn. Toimetis nr 1/2010.
24. võRK, A., nuRmelA, K., KARu, m., oSilA, l. (2010). Sotsiaalkait-sesüsteemi roll turvalise paindlikkuse kujundamisel Eestis. PRAXIS Center for Policy Studies. Tallinn. Toimetis nr 2/2010.

173Estonian Human Development Report 2012/2013
In the long term, productivity1 is the most important competitiveness factor and source of economic growth. It plays this role in both the national economy and in individual companies. The stable growth of productivity at the company level enables large profits to be earned, real wages to be increased, new investments to be made in technologies and product development, new channels to be developed for entering foreign markets, etc. All the aforementioned increase the competitiveness of business enterprises in domestic and foreign markets. A competi-tive business sector, in turn, forms a strong basis for the national economy, and thereby, the growth of productivity is directly related to the improvements in the standard of living – when the real income growth of people allows for an increase in the consumption of goods and services, investment in education etc.
The level of productivity and its speed of growth are affected, in turn, by many factors – both inside and out-side the business enterprises. The most important internal factors are the range of products, equipment, materials and energy used in production, as well as the human resources and working methods involved. The external productivity factors can be accommodated under the con-cept of the economic environment (see chapter 4.1.) and divided into institutions (e.g. infrastructure, legislation, the education system) and socio-economic factors (e.g. demographic changes, changes in the economic structure and technological progress).
Countries are constantly competing to attract capital and labour, by trying to provide more favourable business environments based on a physical and institutional infra-structure (Sinn 2002). In the same way, firms compete for their major production factors. Their success depends on how well they are able to sell goods and services and earn a profit. However, the ability to earn a profit depends to a great extent on the efficiency, or productivity, of utilising the production factors. In this way, the connection between the levels of competitiveness and productivity of both countries and companies is revealed. Paul Krugman, a Nobel laureate in economics, has stated that the concept of competitive-ness, which he believes is only a political concept, is used excessively in the assessment of the economic competitive-ness of countries. Instead, the productivity levels of the
states should be compared, which he believes form the fun-damental content of competitiveness. However the equiva-lency of productivity and competitiveness is a simplification, because competitiveness, as a phenomenon, has several levels, and the definition of the indicators that characterise and impact it, depend on the level of the analysis, whereas it is sensible to differentiate between direct and indirect factors. For example, the productivity gap between the European Union and the U.S., which has emerged since the late 1990s, is often associated with the European Union’s weak competitiveness, thereby recognising the connection between the level of productivity and competitiveness. At the same time, there is a need to go further with the analysis and to explain the deeper reasons for this gap.
4.4.1 Measures of productivityWhy do we need to measure productivity? Measuring productivity actually fulfils several important objectives.
• Assessing the standard of living. By measuring productivity, we can provide an assessment of the population’s standard of living in the given state. Empirical studies have shown a close connection between the income levels of a state’s residents and the productivity indicators.
• Assessing technological change. By measuring productivity, we can provide an assessment of the state’s technological development – whether this has resulted in shifts in various branches of the econ-omy, and whether progress is being made in the direction of best practice.
• Assessing efficiency. In this case, we can provide an assessment of whether the results have achieved a sensible utilisation of resources in the economic sense. This is also accompanied by the determina-tion of real costs savings (see OECD, 2001).
There are different possible ways of measuring productiv-ity. The choice of the indicators for measurement depends on the level of analysis, the objectives of measuring the
4.4Productivity and the economic structure Uku Varblane, Urmas Varblane
1 The concept of productivity was probably used in scientific literature for the first time by French economist F. Quesnay, in 1766. Productivity is a very broad concept, which includes several different aspects and levels. Most generally, productivity is understood as the ratio of output(s) to input(s) (Syverson 2011). In this ratio, the denominator may be comprised of one input (partial productivity); two or more combined inputs (divisor group productivity), or all the inputs (total productivity). The concepts with broader meaning that are related to productivity are profitability, which considers the impact of price changes; and performance, which is the most general concept, and includes earning capacity and other factors independent of price (quality, speed, distribution, flexibility). In Estonian, confusion has been cause by the interpretation of the closely related concepts of effectiveness and efficiency. The first means “doing the right things”, i.e. the ability to reach a desired objective. The second concept’s meaning is that “things must be done right”, and it characterises how well the existing resources are used to achieve the objectives, and whether a saving of resources was achieved or an overrun developed. Therefore, the concept of effectiveness is used when one is focused on the outputs of the production chain; and the efficiency concept is used to asses how well the production operation uses the inputs (Coelli et al., 2005).

174 Estonian Human Development Report 2012/2013
productivity, and the available data. At the state level, the most popular measures of productivity are gross domestic product (GDP) and gross national product (GNP) (OECD 2006). At the economic sector level, the value added in the corresponding economic sector is usually measured. Based on value added, productivity is calculated per worker, per hour worked, or in relation to some other resource indi-cator. At the company level, both natural units – tonnes, kilograms, etc. – and produced value added is used to mea-sure productivity. At the worker level, productivity is also measured in either natural units or based on value added.
Internationally, the most popular indicator for measur-ing productivity in the monitoring conducted by the OECD, Eurostat and World Bank is value added, which is defined as “the value added to products by every action (produc-tion, marketing, etc.) in the value-adding process, which is reflected in the price increase of the product and offsets all the costs related to the utilisation of resources in the supply chain, as well as the profit” (Mereste, 2003, 508).2
Since, when measuring productivity, the output is usually associated with a specific input (e.g. worker, capital unit, etc.); this allows the levels of productivity to be com-pared by states, companies, etc. The most popular factor in constructing productivity indicators is labour, because labour costs comprise a significant part of a product’s value; the indicators related to labour are simple to measure; the labour productivity indicators are relatively simple to interpret; and these indicators are easily comprehended by economic policymakers. For a long time, labour productiv-ity was the only possible measure of productivity, because there were no other effective methods for collecting and
presenting data related to capital (Galarneau et al. 1995, 2). At the same time, it should be remembered that productiv-ity is not only labour productivity, since considerably more inputs are involved in the production process.
Various combined indicators are also used to mea-sure productivity. One of the most important and most frequently used productivity indicators for characterising a state’s competitiveness are unit labour costs (ULC) (OECD 2007)3. To find the unit labour costs, the labour costs per worker are divided by labour productivity. On the one hand, the ratio of unit labour costs shows the amount of labour costs that are required to generate one unit of GDP, and on the other, the unit labour costs express the ratio between the labour costs and labour pro-ductivity used to generate GDP (Mertsina et al. 2012).4 The dynamics of this indicator are characterised by the ratio between the changes in labour costs and productivity.
Sometimes, the computation of unit labour costs is also reduced to the hourly level, and is calculated as the ratio of total labour costs per hour to real output per hour. Generally, the changes in labour costs and productivity should be in balance. If the increase in labour costs exceeds the growth of productivity, this creates a pressure for reducing the number of workers or for increasing productivity. If the growth of productivity exceeds the increase in labour costs, companies increase their profits, and it is possible to increase wages. It is important to note that the presumption of a unit labour costs balance is not valid only for those countries where the initial level of labour costs is very low. Compared to other countries, relatively low unit labour costs allude to the country’s strong competitive advantage. The growth of unit
Table 4.4.1Ranking of states based on hourly productivity in 2011 (GDP per working hour, USD)
2 Value added can be calculated in a simplified manner with the following formula: LV = NK – KK + TK + K ,where: LV – value added, NK – net return on realisation, KK – total costs, TK – labour costs (wage costs and social taxes), K – depreciation of fixed assets. The indicators calculated in this way are called the gross value added. An alternative definition, which is also used by the OECD, defines the gross value added as the difference between total production and intermediate consumption (OECD, 2007). Gross value added includes taxes, interest, rent, profit, depreciation as well as wages for management and workers, including social insurance. The value added indicator, which does not include the depreciation of fixed assets, is called net value added. The advantage of using value added, as an indicator of productivity, is that it eliminates the impact of the material intensity of production, which makes it easier to compare various fields of activity. Value added has also been used frequently in practice, due to its simplicity.
3 The term special labour cost is sometimes used in appropriate literature (see, for example, Tamm 2005).
4 The unit labour costs are calculated as follows:
Rank
State
Hourly produc-
tivity
1 Norway 81.50
2 Luxembourg 78.90
3 Ireland 66.40
4 U.S.A. 60.30
5 Netherlands 59.80
6 Belgium 59.20
7 France 57.70
8 Germany 55.30
9 Denmark 53.20
10 Switzerland 51.70
11 Sweden 51.60
12 Austria 51.40Ra
nk
State
Hourly produc-
tivity
13 Finland 49.10
14 Australia 48.60
15 Spain 48.10
16 Great Britain 46.90
17 Canada 46.20
18 Italy 45.60
19 Japan 39.80
20 Iceland 39.60
21 Slovenia 35.90
22 New Zealand 34.00
23 Greece 33.90
24 Israel 33.80
Rank
State
Hourly produc-
tivity
25 Slovakia 33.00
26 Portugal 32.50
27 Czech Republic 30.60
28 South Korea 28.30
29 Turkey 28.10
30 Hungary 26.80
31 Poland 26.20
32 Estonia 25.90
33 Russia 22.00
34 Chile 20.90
35 Mexico 16.70
Source: oECD iLibrary
Nominal unit labour costs =Real GDP / Total number of employed
Unemployment benefits / Number of unemployed

175Estonian Human Development Report 2012/2013
labour costs at the company level reduces profitability and causes inflationary pressure, because the company directs the increased labour costs to the consumer, i.e. increases the prices for products and services. It should also be noted that while unit labour costs only examine the connection between labour costs and productivity, other costs besides labour costs, like capital costs, are also important.
4.4.2 The general level of productivity in the Estonian business sectorThe analysis of Estonia’s productivity level starts from the viewpoint of the country as a whole. At this macro level the GDP indicator is used as the measure of productivity, which can be used both at its nominal value or adjusted for purchasing power parity. In the latter case, the dif-ferences in the prices of goods and services in various countries are taken into account, and the GDP indicator for the given state is adjusted accordingly. When calculat-ing the productivity of the entire business sector, the GDP indicator is divided by the number of people employed in the economy as a whole and the hours that they work. Thus, we get various indicators of labour productivity. Hourly productivity is a somewhat more precise measure of labour productivity, than the level of productivity per worker, because some of the people who are employed may not be working fulltime (Table 4.4.1).
Based on a summary of OECD data, Estonia ranks 32nd, i.e. the next to the last position compared to the reference states. Chile is below us and Hungary slightly above, with the Czech Republic, Slovakia, and the South Korea slightly above that. A large group of small euro area states – Austria, Finland, Denmark – along with Canada and Japan, rank significantly higher. Of the reference states, Ireland has a particularly high productivity level, which reaches 67 USD per hour, followed by Netherlands, with an hourly productivity of 60 USD.
4.4.3 Productivity in Estonia’s main economic spheresEstonia’s position related to labour productivity, in comparison to the other reference states, is shown in Table 4.4.2. The 2010 data from Eurostat and the national statistics offices related to the level of value added per worker has been used. The ten aggregated areas of activity have been differentiated in the com-parison. For the better visualisation of the results, the relative level of Estonian productivity by the branches of the economy is shown as a percentage of the level of the corresponding state.
The economic branches of activity where Estonia’s labour productivity is higher than the comparative coun-try, i.e. the ratio is over one hundred, have been shaded. In the comparison, Estonia’s productivity is, unfortunately, significantly lower than the majority of the states in most of the economic spheres. Only compared to Hungary is Estonia’s productivity level higher in most of the economic activity areas, but manufacturing industries productivity in Estonia is lower than in Hungary. At that, Hungary’s economy has been in decline during the last few years, and as a result of the financial crisis (primarily due to the impact of currency exchange fluctuations), has suffered more than the other states. Estonia’s level of productivity is higher than the corresponding indicators for the Czech Republic and Slovakia, in several fields. Compared to the Czech Republic, Estonia has higher productivity in water supply, transport, and administrative and support service activities (building management, labour leasing, etc.). Estonia’s productivity is also somewhat higher than Slovakia’s level in water supply and transportation, as well as accommodations and food service. Water supply in Estonia is also more productive than in Slovenia.
Compared to the remaining states, Estonia’s level of productivity is significantly lower. The areas that
Man
ufac
turin
g in
dust
ry
Elec
tric
ity
ener
gy, e
tc.
Wat
er s
uppl
y
Trad
e
Tran
spor
tatio
n
Acco
mm
odat
ion,
fo
od s
ervi
ce
Info
rmat
ion
and
com
mun
icat
ions
Real
est
ate
Prof
essi
onal
, sc
ient
ific
and
tech
nica
l
Adm
inis
trat
ive
and
supp
ort
serv
ice
activ
ities
Ireland 11 24 61 33 40 40 20 82 29 41
Switzerland 18 31 30 14 28 21 24 23 16 33
Denmark 22 27 26 29 27 32 35 22 23 32
Netherlands 24 26 43 34 41 42 36 20 30 64
Austria 26 43 43 34 40 31 42 18 31 34
Finland 28 29 38 32 50 27 42 15 33 45
EU 27 38 45* 45 60* 43 40 36 34 55
Slovenia 64 91 113 55 74 50 68 57 63 96
Hungary 75 78 177 124 152 146 92 120 115 135
Czech Republic 82 40 148 83 125* 90 66 63 74 110
Slovakia 93 66 164 84 138 108 71 69 88 94
Table 4.4.2Productivity by aggregated areas of activity (as a percentage of the level in the reference states in 2010)
Source: Eurostat *2009 data. EU27 – European Union average.

176 Estonian Human Development Report 2012/2013
are weakest include Estonia’s manufacturing industry, professional, scientific and technical activities (research and development, engineering activities, legal activities, etc.) and activities related to real estate, where our labour productivity level is only one third of the levels of most of the reference states. At the same time, manufacturing industry is considered to be the core of an economy that also creates demand in other fields of activity. And the experience of states with high income levels shows that states cannot reach very high income levels without pass-ing through a stage in which manufacturing is a sector with very high productivity.
4.4.4 Level and dynamics of Estonia’s manu-facturing industryBased on the Eurostat database, the productivity of man-ufacturing industry is characterised in Table 4.4.3, where the states are compared based on value added per worker. In addition, the table shows the growth of productivity, between 2000 and 2010, as a percentage, and in Euros per worker.
In 2010, the value added per worker, produced in Estonia’s industry, was €19,900, which is the lowest among the reference states. For instance, the produc-tivity of Estonia’ manufacturing industry was 4.5 times lower than in Denmark and 3.6 times lower than in Fin-land. However, the level in Slovakia surpassed Estonia by only 8% and the level in the Czech Republic by 23%. As a positive aspect, Estonia was a state where labour productivity increased 1.76 times, in the period from
2000 to 2010, which was the second best result after Slovakia. Especially noteworthy was the comparison with Finland, where productivity increased by only 1.3% in the same period.
As a result of this large increase in productivity, Estonia’s relative productivity gap has decreased some-what, but the pace of the productivity growth is still insufficient to significantly reduce the gap during the next few decades. This is very clearly demonstrated by the productivity growth from 2000 to 2010. In the absolute terms, the produced value added growth per worker in Estonia during this time period totalled €12,700. Based on Estonia’s very low initial position, the absolute growth of productivity lagged behind Ireland (growth in the same period of €46,800), Denmark (€38,600), the Netherlands (€20,400), and surprisingly, also Hungary (€14,300), the Czech Republic (€13,700) and Slovakia (€14,100). Therefore, a general conclusion can be drawn that the productivity of manufacturing is still very low in Estonia, and with this pace of growth, it will not be able to catch up with the average in the European Union within the next few decades. If Estonia continues to maintain this level of absolute growth, we will be able to catch up to Finland after forty years; catching up to the calculated EU average would take a century; and we would not be able to catch up to many states in even a hundred years, if they continue their current rate of growth (Ireland, Denmark, Netherlands).
A more precise idea of the productivity of the sub-branches of Estonia’s manufacturing industry is provided by Table 4.4.4, in which Estonia’s indicators are compared to some other small countries, and the EU average. In the interest of providing a better overview, the productiv-ity data has been modified so that, for all the countries involved in the comparison, the level of Estonia’s produc-tivity was calculated as a percentage of the corresponding country’s productivity in the given branch of the industry. All the branches of industry in the comparative states, in which Estonia’s productivity percentage is higher, or over 100%, have been shaded in the table. The table shows that, in many branches of manufacturing industry, the productivity of Estonia exceeds the levels in Slovakia and Hungary, and also in a few fields of activity in the Czech Republic and even Slovenia. Of the various areas of activity, Estonia’s level of productivity is highest in the wood industry, where productivity is 74% of the Euro-pean Union average, followed by the paper industry 58%, publishing 57% and building materials 52%.
However, comparisons with the remaining states provide to the productivity levels of Estonia’s branches of manufacturing industry a very critical assessment. For example, in comparisons with Ireland’s productivity levels, the branches of Estonia’s manufacturing get indica-tors from 4% (pharmaceuticals) to 62% (paper industry). Compared to the Netherlands, Denmark and Finland, the productivity levels of various branches of industry in Estonia also fall between 15% and 50%. Estonia has come closest to achieving the productivity levels of the old European Union Member States in the wood, paper and building materials industries. In these branches of industry, Estonia has already achieved 66% or 50% of the level of the old EU Member States.
Comment: years of origin for the data * 2003–2010 ** 2001 *** 2001–2010 **** 2002 ***** 2002–2010
Country 2000 2005 2010
Productivity growth 2000–2010
Thousands of € %
Ireland 132.2 157.2 179.0 46.8 35.4
Switzerland a.p. a.p. 111.0
Denmark 50.4 62.7 89.0 38.6 76.6
Netherlands 62.2 75.1 82.6 20.4 32.8
Austria 56.6 67.1 75.5 18.9 33.4
Finland 70.6 74.0 71.5 0.9 1.3
EU 27 47.1 52.8 9.6* 22.2*
Slovenia 17.4**** 24.9 31.3 13.9***** 79.9****
Hungary 12.4 21.1 26.7 14.3 115.3
Czech Republic 10.7** 16.8 24.4 13.7*** 128***
Slovakia 7.4 14.5 21.5 14.1 190.5
Estonia 7.2 12.2 19.9 12.7 176.4
Table 4.4.3Productivity in manufacturing industry from 2000 to 2010 (value added per worker in thousands of Euros), and its absolute and relative increase
Source: Eurostat

177Estonian Human Development Report 2012/2013
4.4.5 Productivity of the branches of Estonia’s service sectorBelow, the productivity of the branches of Estonia’s service sector are analysed in more detail. Productivity is again measured as value added per worker, and the branches of Estonia’s service sector have been compared to some other small EU states and the average of the 27 EU states. In the interests of providing a better overview, the productivity data has been modified so that for all the states involved in the comparison, the level of Estonia’s productivity was calculated as a percentage of the corre-sponding state’s productivity in the given branch of the service sector. Table 4.4.5 shows that the productivity of the branches of Estonia’s service sector in several areas of activity exceed the levels in the Czech Republic, Hungary and Slovakia, and in regard to the labour leasing, also the level in Netherlands. Of the service branches, Estonia’s level of productivity has the best position in warehous-ing, where productivity is 69% of the average EU level, followed by 63% for the leasing and brokering of labour, 59% of leasing and operational leasing, and 47% for legal activities and programming.
4.4.6 Unit labour costsBelow, based on OECD data, the dynamics of the unit labour costs in the reference states have been explained from 2000 to 2011. The base year for the analysis is 2005,
or the unit labour costs ratio for the given year equals 100, and the change is calculated in relation to this year. In Table 4.4.6, the reference states are ranked on the basis of the total change in the unit labour costs. Of the refer-ence states, the unit labour costs have increased the most in Estonia. Although, the growth of Estonia’s productiv-ity had been very rapid, and exceeded the indicators of most of the reference states (Figure 4.4.1), the unit labour costs have increased at an ever faster pace. In Estonia, the period from 2005 to 2008 is clearly differentiated, during which the unit labour cost increased by nearly 50%, i.e. the gap between the growth of productivity and the increase in labour costs was very wide. In the next period, from 2008 to 2011, the ratio of unit labour costs decreased somewhat. On the one hand, in connection with the economic recession, the pressure to increase wages disappeared, and on the other hand, the compa-nies reorganised their work processes and were able to increase productivity.
From 2000 to 2011, the unit labour costs changed the least in Ireland. Although, in the period from 2000 to 2004, a significant increase occurred in the value of the ratio, starting in 2009, the unit labour costs decreased. The reason for this is the unemployment and reduction in wages that were caused by the financial crisis. Therefore, productivity has increased somewhat between 2008 and 2001, but wages declined during the same period. The increase in unit labour costs has been relatively small, only 4.9%, in the South Korea, where the distinctive char-acteristic is the relatively rapid increase in the unit labour costs, which also exceeded the increase in productivity
Branches of industry Irela
nd
Swit
zer-
land
Denm
ark
Net
her-
land
s
Finl
and
Aust
ria
EU 2
7
Slov
enia
Czec
h Re
publ
ic
Hun
gary
Slov
akia
Food 11 20 23 23 30 34 41 65 89 101 106
Textiles 27 20 20 23 29 25 46 56 74 128 89
Clothing 38 15 12 24 25 23 45 62 100 113 123
Leather 14 17 15 17 22 17 34 59 91 94 74
Wood 49 34 37 43 48 37 74 118 156 216 153
Paper 62 43 50 46 29 38 58 116 128 136 97
Publishing 29 31 36 44 45 31 57 88 116 164 142
Chemical 34 26 23 18 29 26 35 67 83 77 134
Pharmaceutical 4 10 17 28 18 25 21 33 76 46 73
Rubber, plastic 36 20 19 25 29 27 39 55 62 79 82
other non-metallic mineral products 42 26 35 37 44 35 52 82 88 105 109
Basic metal 33 23 29 24 24 21 34 60 92 76 55
Metalworking 41 25 30 31 39 30 47 75 102 124 120
Electronics, Equipment 10 16 20 16 23 22 30 65 101 82 48
Electrical equipment 42 25 28 32 29 25 40 67 103 112 126
Machine building 27 22 26 23 28 27 34 69 85 46 90
Motor vehicles 57 36 36 32 51 29 40 69 70 59 83
other transport equipment 29 23 44 28 72 22 38 85 88 146
Furniture 17 18 29 32 32 45 79 93 130 89
Table 4.4.4Comparison of the productivity levels of the branches of Estonia’s manufacturing industry with other states in 2010. (%)
Source: Eurostat

178 Estonian Human Development Report 2012/2013
between 2000 and 2004. Starting in 2005, the increase in productivity has also significantly accelerated. The growth of the unit labour costs has also been low, only 7.6%, in the European Union as a whole. This alludes to a well-developed and stable economic system where big changes do not occur.
In the states that have backgrounds similar to Estonia, like the Czech Republic, Slovakia and Hungary, the growth of unit labour costs have been significantly slower than in Estonia. During the entire period under observation, it has been between 10% and 17% in all these states. This again
Branches of the service sector Irela
nd
Swit
zer-
land
Denm
ark
Net
her-
land
s
Finl
and
Aust
ria
EU 2
7
Slov
enia
Czec
h Re
publ
ic
Hun
gary
Slov
akia
Water transport 15 7 23 31 41 16 50 187 254 79
Warehousing, ancillary transport activities 68 53 42 49 86 48 79 62 145 150 348
Book and periodical publishing 22 17 30 18 24 21 26 50 66 72 93
Audio recording and music publishing 30 15 29 28 24 34 19 46 69 83 95
Programming, consultations and other similar activities 26 25 29 38 39 44 41 75 72 122 85
Programming 39 32 44 52 47 88 141 117
Information-related activities 17 32 20 21 25 44 38 83 47
Legal activities 32 24 28 40 33 46 47 88 95 136 111
Research and development activities 28 11 46 32 38 48 43 63 83 141 110
Advertising and market research 32 26 30 37 35 39 40 62 71 91 67
Designers’ activities 34 18 28 39 42 31 94 89 218 94
Leasing and operational leasing 70 57 56 47 63 28 59 216 124 93 159
Temporary employment agency activities 49 28 41 107 54 43 63 93 145 181 133
Table 4.4.5The productivity level of Estonia’s service branches (value added per worker), in comparison to other states in 2010 (% of the corresponding state’s level)
Source: Eurostat
reflects the singularity of Estonia’s situation between 2005 and 2008, and the risk to the competitiveness of Estonia’s economy that developed during this period.
The computation of the unit labour costs ratio is illustrated by its division into components – into the change in labour costs and the change in productiv-ity. The average annual pace of growth for unit labour costs and productivity from 2000 to 2011 is shown in Figure 4.4.1.
From the diagram, we can see that, in Finland, for example, the average growth of unit labour costs also exceeded the increase in productivity, but this occurred at a significantly slower pace. Therefore, if we leave out the period from 2005 to 2008, the increase in Estonia’s labour costs has been comparable to the other states, and compatible with the model of a rapidly developing econ-omy, because it was also accompanied by an increase in productivity.
4.4.7 How to increase the productivity of Estonia’s economy?What causes the low level of our labour productivity? This cannot be explained simply by the low work perfor-mance of Estonian workers. Also important is the kind of work they do; how complicated the produced goods and services are; and what price they can be sold for. The management of the production operations is also import-ant along with the structure of the organisation and the position of our business enterprises in the global value chain. Since the company level is most important when it comes to increasing productivity, the following example is informative. If a subsidiary of a Danish furniture com-pany, located in Estonia, produces furniture parts that are
2000 2004 2009 2010 2011
Ireland 82.1 95.6 110.6 103.4 100.1
South Korea 86.0 97.7 103.8 102.3 104.9
EU 27 93.8 98.6 105.9 106.7 107.6
Czech Republic 85.2 100.8 108.9 108.9 110.1
Slovakia 84.3 96.2 112.8 111.8 111.4
Netherlands 88.8 100.4 110.9 110.1 111.5
Austria 96.7 98.8 111.3 111.3 112.3
Hungary 73.3 97.3 116.3 115.3 117.3
Finland 93.0 97.9 117.3 115.4 117.5
Denmark 88.4 97.8 120.3 118.9 118.9
Slovenia 78.9 98.6 119.7 120.1 119.4
Estonia 80.5 96.3 148.7 139.6 137.6
New Zealand 84.2 95.7 118.6 ... ...
Switzerland 94.3 98.9 109.9 107.7 ...
Table 4.4.6Nominal unit labour costs in the reference countries (2005=100)
Source: Eurostat

179Estonian Human Development Report 2012/2013
sent to Denmark, where they are assembled and sold on the global market, the value added produced in Estonia is limited to the wages earned for the time spent producing the product, and the small residual income for the local division. However, when the Danish company sells the product on the global market, the price of the end prod-uct includes the cost of the brand, the product develop-ment and design costs, marketing costs, etc. This creates a situation where the value added created by the Danish manufacturer in the corresponding branch of industry is several times greater than in Estonia. In this example, the Estonian company fulfilled the simplest production stage in the value chain (see Figure 4.4.2). Several studies have shown that within the value chain (from product devel-opment to sales to the end user) the least value added is earned in the production stage (Dhanani, Scholtès 2002). To improve the situation and increase productivity, the company has at least three strategic development paths.
The first path is to continue their current production activities, but to try and implement different operational innovations and improve the functioning of the organi-
Figure 4.4.1Annual average increase in the unit labour costs and labour productivity (%) in the reference states from 2000 to 2011.
Source: oECD Factbook 2013
Unit labour costs Labour productivity
-4 -2 0 2 4-3 -1 1 3 5
-4 -2 0 2 4-3 -1 1 3 5
Japan
Israel
Austria
Switzerland
Sweden
South Korea
OECD
Belgium
USA
EU 27
Netherlands
Czech Republic
Finland
Canada
Ireland
Denmark
Slovakia
New Zealand
Slovenia
Hungary
Estonia
Brands
Distribution channels
Logistics centre
Production centre
Develop-ment
centre
Design centre
R&D
Serv
ices
Desi
gn
Engi
neer
ing
Prod
ucti
on
Mar
keti
ng
Sale
s
Bran
ds
Value added
Figure 4.4.2Various possibilities for increasing labour productivity by moving the company’s position in the global value chain
sation by reducing production costs and increasing the produced value added. This development path is illus-trated in Figure 4.4.2 as the movement to the next level of the value chain, or an upward shift. Then production is profitable again, but now more complicated things are being produced, and the workers’ skills and knowledge cannot be easily copied by foreign competitors.
The second path is for the company to move for-ward in the value chain. This means the development of new or updated products; the creation of new engineering solutions and their connection to production. Now, the workers in the production stage can be paid more and the entire value added created by the company increases (the arrow to the left of production in Figure 4.4.2).
The third option is to move the production toward the consumer, or combine production with sales, in order to arrive at selling your own brand, in which case, it would be good to combine the offered product with appropriate and necessary services (the arrow to the right of production in Figure 4.4.2). In this case, the total value added produced by the company also increases, so that it is also possible to pay the people employed, in the pro-duction process, more.
There are definitely fields of activity where one must think more broadly, more globally – this means a deci-sion to move the production stage, which produces the least value added, out of Estonia, and to, instead, develop new products, new technological solutions and services to accompany the products, and to develop one’s own brands. The innovation capability of Estonia’s economy is dealt with in chapter 4.5.

180 Estonian Human Development Report 2012/2013
References1. Coelli, t. J., PRASAdA RAo, d. S., o’donnell, C. J., BAtteSe, g. e.
(2005) An Introduction to Efficiency and Productivity Analysis. New York: Springer Science, 349.
2. dHAnAni, S., SCHoltèS, P. (2002) Thailand’s Manufacturing Com-petitiveness: Promoting Technology, Productivity and Linkages. UNIDO SME Technical Working Paper Series 8, 94.
3. Directorate-General of the Commission, Eurostat. [http://epp.eurostat.ec. europa.eu/portal/page/portal/eurostat/home/]. 28.12.2012.
4. gAlARneAu, d., mAynARd, J.-P. (1995) “Measuring Productivity,” Statistics Canada, Catalogue 75-001E, 26–32.
5. KRugmAn, P. (1994) “Competitiveness: A Dangerous Obsession,” Foreign Affairs, March/April.
6. meReSte, u. (2003) Majandusleksikon. 2. osa. Tallinn: Estonian Encyclopaedia Publishers Ltd.
7. meRtSinA, t., JäneS, t. (2012). “Tööjõu ühikukulu majanduse konkurentsivõime näitajana,” Statistics Estonian Quarterly Newsletter, 4/12, 43–47
8. oeCd (2001) “Measuring Productivity,” OECD Manual. Paris: OECD Publishing.
9. oeCd (2007) Glossary of Statistical Terms. OECD Publishing.
10. oeCd (2013) OECD Factbook 2013: Economic, Environmental and Social Statistics. OECD Publishing.
11. oeCd (2006) OECD Compendium of Productivity Indicators. Paris: OECD Publishing
12. QueSnAy, F. (1766) “Analyse de la formule arithme´tique du tableau e conomique de la distribution des de´penses annuelles d’une nation agricole,” Journal de l’Agriculture, du Commerce & des Finances, 11–41.
13. Sinn, H.w.(2002) “The New Systems Competition,” NBER Work-ing Papers 8747, National Bureau of Economic Research, Inc.
14. SyveRSon, C. (2011) “What Determines Productivity?” Journal of Economic Literature Vol. 49, No.2, 326–365.
15. tAmm, d. (2005). Tööjõu erikulu seos Eesti töötleva tööstuse ekspordivõimega. Eesti ettevõtluse perspektiivid Euroopa Liidus: III teadus- ja koolituskonverents; Pärnu, Eesti; 28-29. January 2005. Tallinn, Pärnu: Mattimar, 2005, 211 - 223.
16. tAngen, P. (2005) International Journal of Productivity and Performance Management, Vol. 54, No. 1, 34–46

181Estonian Human Development Report 2012/2013
The innovation capability of economies, societies and states, and the realisation of this capability become extremely important, especially at certain stages of development. Literature has traditionally dealt, primarily, with how the enterprises in a par¬ticular country are able to update their products and technologies, to move up in the value chain thereby enabling them to demand higher prices and how countries succeed in establishing new cutting-edge indus-trial sectors. However, in addition to product and technol-ogy innovations, attention has recently increasingly been directed at innovations in marketing, organisation, compa-nies’ foreign contacts and other non-technological innova-tions. In the broader context, innovations in governance, lifestyles, i.e. social innovation in general, has become a special topic for research. All these aspects of innovation are interconnected, and together they form a complicated innovation pattern in a specific country. In order to support innovation, states develop innovation policies and improve national systems for innovation. The latter is understood to mean the networks of public and private sector organ-isations that initiate, import, adapt and disseminate new technologies and other innovative solutions. Attention is focused on the knowledge, technology and information flows between companies and other organisations (uni-versities, research institutions, etc.), but also between the companies themselves (Freeman 1995; Rothwell 2002). It is the quality of the functioning of complex cooperation networks that creates the bases for the rising innovative-ness of the country.
We observe the necessary preconditions for inno-vation process, how the innovation potential emerging in the country due to the preconditions raises the country’s competitiveness, which in its turn will be realised in economic growth and other development indicators. We shall describe how different countries attempt to make the aforementioned chain function properly by using innovation and economic policy measures.
Firstly, we examine the innovation-related rankings of states and ascertain the positions of Estonia and its reference states. We describe the specifics of innovation potential in the states, the situation related to the indi-vidual elements, and generalise these results at the level of regional groups of countries. This allows us to better understand the context in which innovation capability develops and is realised. We compare Estonia’s “innova-tion pattern” with the innovation patterns of the other Central and Eastern European (CEE) countries, as well as states in other regions of the world, and ascertain how innovation capability is linked to a state’s competiveness. Thereafter, we examine the most important changes in the states’ innovation policies during the last few years, as well as describe and generalise them, and try to draw some conclusions for Estonia.
4.5.1 The innovation rankings of statesMeasuring innovation potential of the country or results of innovation is quite complicated. Different methods have been developed for this, and their results diverge somewhat. In the current case, we rely primarily on two methodologies; the first was developed by the World Eco-nomic Forum (WEF), and is used to measure the general competiveness of states. The second, the methodology of the European Innovation Scoreboard, is used by the European Commission. Unfortunately, the latter has been used in non-EU countries only in rare cases.
The European Commission’s (EC) use more than 40 parameters to measure the state of innovation. The parameters are not limited to ones related to innovation potential (the scientific potential of the country, invest-ments in research and development [hereinafter R&D], in-house research in companies, access to venture capi-tal, etc.), but also reflect the use of innovation potential and the achieved results. The number of different types of innovations implemented by the companies in the period under observation is measured; the percentage of the population working in knowledge-based fields of activity, etc. Labour’s education-related indicators are also dealt with as a precondition for innovation. The World Economic Forum’s (WEF’s) index of innovation is com-prised of seven relevant yardsticks of innovation, which are directed at the measurement of innovation potential. However, the index deals with it in a relatively restricted manner, by focusing primarily on the technological and financing aspects of innovation, and the relations of companies with universities and research organisations. However, since the WEF method examines innovation in the context of competitiveness as a whole (see sub-chap-ter 4.1), this method enables the innovation index and its components to be compared to other, closely related indicators of competitiveness. Often, the innovation indi-cators obtained by using the WEF’s method are examined together with the indicators for business sophistication.
In the ranking of innovation capacity, based on the WEF’s methodology, Estonia, along with the more capa-ble Central and Eastern European states, is positioned at the beginning of the 40s in the World. According to this assessment, we are ranked somewhat ahead of Slovenia and the Czech Republic. But closer analysis shows that the difference is marginal, and is probably based on the technical nuances of the methodology. The gap between Estonia and the top ten in the World is relatively large.
In the following comparison of the innovation- related rankings of the EU Member States, based on the two afore-mentioned methods, no great differences can be found in regard to Estonia or most of the other states. The exception
4.5InnovationErik Terk, Katrin Männik, Silja Lassur

182 Estonian Human Development Report 2012/2013
is Denmark, which, thanks to the high innovation activity and networking level of its small enterprises, is better posi-tioned in the ranking based on the European Commission’s method than in the innovation index based on the WEF’s method, which focuses more on the measurement of the preconditions for the technological innovation.
4.5.2 Innovation capacity in various country groupsBelow, we examine the development and implementation of the state’s innovation potential in Estonia and the ref-erence states used in this report, adding to them Israel and Canada. We divided the countries under observation into four groups, which differ as to their economic devel-opment and geographical location. The need and oppor-tunities for innovation arise from the level of existing economic development of the country; on the other hand, the success in realisation of innovation potential is one of the main factors that ensures that the state’s economic level will increase in the future.
The first group of the comparison could be called the countries with developed economies. This group is comprised of Finland, Denmark, Netherlands, Switzer-land, Austria and Ireland, as well as New Zealand and Canada, of the states located outside of Europe. As a whole, this group could be called the group of old rich countries, in which Ireland, and sometimes also Finland, are considered to be the ones that started their rise most recently, with upward trajectories starting roughly in the 1960s. Except for New Zealand, the GDP per capita of this group of countries is about twice as high as that of Estonia. The pace of GDP growth during the last 15 years
Table 4.5.1Ranking of the innovation capability of states based on the WEF methodology
Rank Country
1. Switzerland
2. Finland
3. Israel
4. Sweden
5. Japan
6. USA
7. Germany
8. Singapore
9. Netherlands
10. Great Britain
12. Denmark
13. Austria
14. Taiwan
16. South Korea
21. Republic of Ireland
22. Canada
Rank Country
24. New Zealand
30. Estonia
32. Slovenia
33. China
34. Czech Republic
37. Hungary
38. Costa Rica
41. India
43. Lithuania
44. Chile
51. Russia
63. Poland
64. Latvia
69. Uruguay
89. Slovakia
Source: K. Schwab (ed.). The Global Competitiveness Report 2012-2013, Geneva 2012
has been significantly lower than in Estonia, or generally, in the best of the CEE countries, which is quite natural, when starting from a higher level. In this context, the pace of growth in Ireland and Finland must be considered as truly exceptional for developed economies.
Despite strong competition from the countries of East Asia, based on the competitiveness ranking, the countries that belong to this group can still be regarded as the world’s “elite.” Only New Zealand is left out of the top 20, and just barely. Switzerland and Finland are the best in the world, when it comes to competitiveness.
In this group of states with developed economies, their position in the innovation capacity ranking is nearly in all cases practically the same as in the competitiveness ranking. It is only slightly worse for Austria. It seems that innovation is so important for very highly developed economies that a position at the top of the competitive-ness ranking cannot be maintained without it. It is also apparent that the so-called old wealthy states in our sam-ple have made great investments into their innovation potential, and do not intend to concede their excellent positions among the developmental leaders. However, since the innovation capacity ranking is not significantly higher in these countries than the competitiveness rank-ing, we cannot presume that the conversion of the for-mer into the latter would result in a great leap in their economic development in the upcoming period (which could be possible in some East Asian countries).
In practically all the states in the given group, the innovation pattern is uniformly good, without any special weak elements. The engine is usually a combination of four factors: the level of the universities and research institutions, existence of scientists and engineers, col-laboration between universities and companies, and the ability to create new technologies, not just adopt them. Somewhat less frequently, high R&D investments by com-panies and their patents are included among the stronger elements of the innovation pattern. The Netherlands and Switzerland stand out, primarily, for their strong univer-sities, along with Denmark, Canada and New Zealand. Finland is somewhat concerned about the level of its uni-versities. A strong element in the innovation pictures of Finland, Ireland and Canada is the existence of scientists and engineers, while at the same time, in the Netherlands, Austria, New Zealand and also Denmark, they are more concerned about the dearth of scientists and engineers than about any other elements of innovation potential.
The collaboration between companies and univer-sities is very good in Finland, Switzerland, Denmark, Ireland, Canada and New Zealand. This element is not among the weakest innovation potential elements in any of the states of this group. In the same group, patents are among the strongest elements of innovation potential only in Austria (however, this indicator is also very good in Switzerland); the R&D investments of companies are stron-gest in Austria and Switzerland; but these indicators are not markedly weak in any of the countries in this group. It can be said about the innovation pattern of the countries in the developed economies group that although, as rule, we are dealing with strong and often international companies; the innovation potential of these countries depends, to a great extent, on the collaboration between the private and pub-

183Estonian Human Development Report 2012/2013
lic sectors. It seems that the existence of strong (even very strong) universities is a key element here. The countries in this group are not only implementers of new technologies, but also the creators of new technologies.
During the last 15 years, rapid economic growth has been typical of the Central and Eastern European (CEE) countries; whereas Slovenia and the Czech Republic are somewhat wealthier than Estonia and the others. In the general index of innovation capability, the countries in this group lag behind all the countries in the previous group. The innovation picture in these countries is also uneven, and as a rule, includes some weak elements. Against an international background, the innovation indices of the Czech Republic and Slovenia are still suffi-ciently good, and upon closer analysis, one can state that they are structurally better than the corresponding index for Estonia. Slovakia’s innovation index is considerably worse than the indices of the other group members, and is more similar to those of the South and Central Amer-ican states. An analysis of the innovation picture of the countries in the CEE group shows that in all of them, besides Slovakia, the quality of their universities and other research institutions is relatively good, but not out-standing (none of the top universities of the CEE states in our selection are among the 200 strongest universities in the world). In these countries, this component is usually among the strongest. The synthetic innovation indices in the states of this group are either worse than the higher education and training indicators or more or less on the same level (Czech Republic). Collaboration between uni-versities and companies is one of the strongest compo-nents of innovation potential only in the case of Estonia.
Can we speak about the countries in this group as creators of new technologies, not only as the adopters of
these technologies? In this regard, positive assessments have been given in the case of Slovenia and the Czech Republic. As far as the companies’ R&D investments, one can speak positively only about Slovenia, and as far as patents are concerned, about Slovenia and Hungary.
In the Czech Republic and Estonia, compared to the other innovation components, the sufficiency of scientists and engineers is in a weaker position; as are patents in Estonia. The government procurement of advanced tech-nology is not among the stronger elements in any of the given countries.
The Czech Republic is better positioned in the ranking of innovation capacity than in the ranking of general competitiveness; in the other states in the group the situation is reversed. From this we can conclude that there is a danger that, following the rise in the cost of the economy and the exhaustion of less sophisticated devel-opment reserves, insufficient innovation capability may become an obstacle, for the majority of countries in this group, in achieving an economic growth similar to that of previous periods.
As a whole, it can be said that, during the 2000s, the economic development in the reference states of South and Central America (three countries) lagged behind the leaders of Central and Eastern Europe. If, in the late 1990s, these three countries, with their per capita GDP of approximately US$10,000, were at, approximately, the same level as the previous group (except for Slovenia), during the decade before the last economic crisis they, nevertheless, did not achieve strong economic growth. If the CEE leaders at least doubled the size of their econ-omies during this period, the GDP in the countries in the Americas under observation increased only 1.3 to 1.7 times. And currently, the GDP per capita is clearly lower than in the top CEE countries.
Costa Rica’s and Chile’s innovation capability indices, and most of the component indicators, are both at a strong middling level, and lag only slightly behind Estonia. Based on these indicators, Uruguay is clearly in a weaker position. The innovation capability rankings of all the South and Central American states under observation are worse than their positions based on higher education and training. The picture is about the same as for the CEE countries. However, what stands out about the American reference states is that the majority deal only with the adoption of technology, and not its creation.
Although Costa Rica and Chile seem to be relatively similar, based on the traits examined above, the general competitiveness of Chile’s economy was significantly better than its innovation capability. This means that problems may develop when the economy arrives at the next, so-called innovation-based, stage of development. It is just the opposite in the case of Costa Rica – a relatively high innovation potential is underutilised because of inadequate economic policies, or for some other reasons.
All of the four reference states in Asia are wealth-ier than Estonia, based on GDP per capita – Singapore very substantially, and the remainder (Israel, Taiwan and South Korea) by approximately one-third. It can be said that these all are economies, which have been suc-cessfully created during the last half century under very difficult circumstances. If we start to examine economic
Table 4.5.2Comparison of innovation rankings of EU Member States based on two methodologies
Innovation ranking of EU Member States based on the EC Scoreboard (2011 data)
Ranking of the innovation capacity of the EU Member States based on WEF methodology (2011 data)
Sweden 1 Finland 1
Denmark 2 Sweden 2
Germany 3 Germany 3
Finland 4 Netherlands 4
Belgium 5 Great Britain 5
Great Britain 6 Belgium 6
Netherlands 7 Denmark 7
Austria 8 Austria 8
Luxembourg 9 France 9
Ireland 10 Luxembourg 10
France 11 Ireland 11
Slovenia 12 Estonia 12
Estonia 14 Slovenia 14
Czech Republic 17 Czech Republic 15
Hungary 19 Hungary 18
Slovakia 22 Slovakia 25

184 Estonian Human Development Report 2012/2013
growth starting in the later 1990s, it turns out that, as far as the growth of GDP is concerned only South Korea had a faster pace of growth than Estonia. Singapore was already quite a wealthy country in the mid-1990s when economic growth in the CEE countries was just gaining momentum. This group of countries has also moved up in the human development indices, and place higher than Estonia. However, the differences with Estonia are smaller than if only strictly economic indicators are considered. The innovation indices of this group of countries are also significantly better than the corresponding index for Esto-nia. In this regard, all four of these countries belong to the highest class – the world’s premier dozen.
It is clear that playing in the “premier league” of innovation is not possible without strong research institutions and universities. At the same time, a closer analysis of the innovation picture shows that the Asian countries’ strongest components are not only high-level universities, and the collaboration between universities and companies, as it is in many of the countries in the first group of reference states. It is very specifically – and this in all four states – patents. It is true, that in the case of Israel, the quality of their research insti-tutions is also rated very highly, while Singapore’s is distinguished by the great importance of government procurement of advanced technology. The rating given to the sufficiency of scientists and engineers is not low in any of the Asian countries, but compared to the other, very strong components in the innovation pic-ture, it tends to be weaker. It seems that there tends to be a shortage of this resource in high-level and rapidly developing economies.
In the innovation capability ranking, Israel, Taiwan and South Korea place higher than they do in the general competitiveness index. (In Singapore’s case, the position in the competitiveness index is slightly better than in the innovation ranking.) As a whole, one can state that by developing their innovation potential, the Asian states under observation have created good preconditions for their future economic growth.
4.5.3 The position of companies in international business networks Recently, more attention has started to be paid to the dependency of innovation-related activities on the posi-tioning by the country’s companies in international business networks (value chains) and the strategic func-tions (for example, product development, marketing or financial management) they have been able to occupy for themselves in these networks. In the WEF’s com-petitiveness methodology, the indicators measuring this phenomenon have been assembled under the concept of business sophistication, and compiled into a business sophistication index (BSI)
This is a relatively heterogeneous composite indica-tor comprised of nine components, of which the majority reflect various aspects of inter-company relations, while some deal with in-house production and management. The index reflects such issues as the control exercised by domestic companies over marketing channels, the existence of local suppliers (their quantity and quality), the existence of mature business clusters, the value chain breadth (i.e. how wide a section of the value chain the exporting companies of the country are capable of occupying), as well as the nature of their competitive advantage (whether only users of new technologies or also developers) control over distribution channels, and the sophistication of the production processes.
In the case of the group of states with developed economies as a whole, the indicators for business sophis-tication are usually conspicuously high. For Ireland, New Zealand and also Canada, they are still lower than for the other developed countries under observation. The exis-tence of mature business clusters is typical of Finland, Switzerland, and also Canada and Denmark. Austria’s BSI indicators are surprisingly high.
Of the group of CEE states, the Czech Republic, with high-quality local suppliers and wide value chain breadth, stands out most for its business sophistication. Slovenia also has rather good indicators (production complexity, control of the distribution network, etc.). Its weakness is an insufficient number of local suppliers.
Unfortunately, when we compare Estonia to the other CEE state in the aggregate, based on its BSI and its components, we do not stand out for anything positive. Estonia’s position, based on the BSI, is sig-nificantly weaker than in the ranking for innovation capability, and our dynamic in the BSI is also negative. We are quite capable when it comes to the quality of the local suppliers (only the Czech Republic places higher in our group) and the willingness to delegate authority (this is also a BSI component). The quantity of local suppliers is small, which may partially be due to the small size of the country. The role of clusters is weak, and most businesses are based on functions that produce limited value. Sophisticated marketing techniques are not used, and no control is exercised over international marketing channels.
In the South and Central American group, Costa Rica and Chile are in relatively good positions in the BSI, while the same cannot be said for Uruguay. The compa-
Table 4.5.3Comparison of the innovation capacity and competitive-ness indices
Innovation capability
Innovation capacity better than competitive-ness
Competitive-ness better than innova-tion capacity
Both almost equal
HighTaiwanIsraelSouth Korea
Singapore
Switzerland FinlandDenmarkCanada
Austria
Middle
IrelandCzech RepublicSloveniaHungaryCosta Rica
EstoniaChile
Low Uruguay Slovakia

185Estonian Human Development Report 2012/2013
nies in Costa Rica are able to make use of their interna-tional competitive advantage, which is apparently their relatively inexpensive production location, which is close to the U.S. markets; the utilisation of top tech nology is also rated as being quite good. Chile stands out primarily for its good marketing skills and the existence of clusters.
In all the Asian states in the sample, their posi-tions are better in the innovation index than in the BSI, but as a rule, their business sophistication indicators are high. Singapore lags behind the others as far as the quantity of local suppliers (caused by the small size of the state) and the strong role of foreign participation in the state’s economy. South Korea has very good indica-tors related to the position of its companies in the value chain and control of distribution channels. However, the WEF methodology does not want to accept South Korea’s closed cooperative system of monopoly conglom-erates (chaebols), and punishes it with low marks for the state’s decentralisation capability, which reduces South Korea’s general BSI rating. As a whole, the business enterprises in the selected Asian countries, except for the companies in Taiwan, have relatively strong control over the entire value chain, and they all use the world’s top technology. In this group of states, the development of clusters is especially essential in Taiwan and Singa-pore. It would be beneficial for Estonia to investigate this concrete business development.
In Table 4.5.4, we see that the majority of the states in our sample get a better assessment in the innovation index, than in the BSI. It can be assumed that the reason for this is the singularity of our sample – the sample is dominated by small states. In large states, like the U.S., Japan and Germany, there are definitely better opportu-nities for controlling the value chain and for using local suppliers. One can also assume that developing business networks takes more time than the development of inno-vation potential, and that government policies have less of an impact on them.
In Table 4.5.4, we can see that the business sophis-tication index is positively impacted by a country’s geo-graphical/logistical position. The geographical location of the Netherlands, Austria or the Czech Republic is defi-
nitely more favourable for appropriating key positions in the value chain, than are the locations of Estonia or New Zealand. But this cannot be changed. Insofar that it is clear that poor positioning in business networks limits the possibilities for making one’s economy more innova-tive, Estonia must look for answers for how to compensate for this shortcoming.
The first possibility is to have Estonia’s companies appropriate positions in servicing and processing the goods and raw materials flows that, for rational logisti-cal reasons, tend to cross the territory of our state – for instance the transport and processing of goods and raw materials related to Finland and Russia. However, this presupposes the establishment of appropriate transport channels (for example, Rail Baltic) and the development of a business-friendly climate in foreign policy. The second possibility would be a more purposeful national policy for cluster creation. And the third possibility, a policy for attracting foreign high tech firms to the coun-try, which would encompass the development of collab-oration networks that involve domestic companies, right from the start.
4.5.4 Foreign versus domestic capital The reference states can be generally divided into two groups: the ones whose economic development has occurred based primarily on domestic capital, and those that have developed with the help of foreign invest-ments. The most conspicuous examples of countries in the first group are Austria and Switzerland; the most sig-nificant representatives of the second group are Slovakia, the Czech Republic and Hungary.
Most of the countries with highly developed econ-omies belong to the first group. The exception is Ireland, where the strong development is based on foreign invest-ments. Canada and New Zealand comprise an interim group, since the control of their distribution channels tends to be in the hands of foreigners, to a fairly large extent. Of the CEE countries, only Slovenia belongs to the first group, all the other countries in the sample belong to the second group, some even in an extreme manner. Of the comparative group of Latin American countries, Chile belongs to the first group, while Costa Rica and Uruguay are, rather, in the second group. However, none of these classifications are of an extreme nature. Of the Asian countries in the comparative group, Singapore, quite clearly, belongs to the second group. The other Asian countries in the sample belong to first group.
A weakness of the development that is based on foreign investments is the risk that foreign-owned com-panies tend to bring less sophisticated and cheaper func-tions to the destination state, while the functions at the top of the value chain, as well as the more complex and expensive production, tends to remain in the country of origin. Based on our sample, we will examine whether this risk is actually realised, by using the indicators for value chain breadth and the complexity of the produc-tion processes to find the answer. Since the correlation between these indicators is quite high, we arrive at the following three classifications:
Table 4.5.4Comparison of the indices of innovation capacity and business sophistication
Innovation capacity
Innovation capacity better than business sophistication
Business sophistication better than innovation capacity
Both almost equal
High
FinlandTaiwanIsraelSingaporeSouth KoreaCanada
NetherlandsAustria
Switzerland Denmark
Middle
New ZealandEstoniaHungaryCosta Rica
ChileIrelandCzech RepublicSlovenia
Low Uruguay Slovakia

186 Estonian Human Development Report 2012/2013
• The high relative importance of foreign capital, along with a good position in the value chain, and the appropriation of complex production functions – Singapore and Ireland. It’s true that, in the case of Ireland, the state has a sufficiently attractive environment and resources for business activities throughout the entire value chain, but these activ-ities are controlled, to a great extent, by foreign companies that have not been especially willing to involve local suppliers in their activities.
• The high relative importance of foreign capital, with middling success in regard to positioning in the value chain, and the appropriation of complex pro-duction processes – the Czech Republic and Costa Rica. In some sense, the Czech Republic can be compared to Ireland, whereas in the Czech Repub-lic, the cooperation between the foreign enterprises and locals seems to be stronger; and the quantity and quality of the local suppliers is assessed to be good as a development factor.
• The high relative importance of foreign capital, with little success related to positioning in the value chain, and the appropriation of complex production processes – Hungary, Estonia, and Uruguay.
It is difficult to place Slovakia in this classification, since its position in the value chain is poor, while it has been able to appropriate production that is quite complex.
The conclusion is -- even with an economic policy that is strongly supported by foreign investments, it is pos-sible to achieve quite a good position in the international value chains. To achieve this, well-considered and selective policies are required for attracting foreign investors and dealing with them. Singapore and Ireland have been able to follow this path. While Estonia has invested in the gen-eral economic environment, it has not been able to create the levers for getting foreign-owned companies not only to utilise the local economic environment, but also to help the Estonian economy to rise to a higher qualitative level.
4.5.5 The dynamic of recent yearsThe above has described the current situation of the indi-cators for innovation and the closely connected business sophistication in various groups of countries. Undoubt-edly, the dynamics of these indicators is also of interest. Unfortunately, it is difficult to find the corresponding comparative indicators for states outside of Europe for a longer time period. Based on WEF materials, it is possible to compare the indicators and positions of the states that interest us, from 2005 to 2007, and for 2012. This time period is quite short, but some generalisations can be made nevertheless.
During the period under observation, as a whole, the group with developed economies, in Europe, or with European backgrounds, tended to strengthen its position in the indicators for both innovation and busi-ness sophistication. The indicators for the Netherlands underwent a great improvement during this period, and
the positions of Switzerland, Austria and Finland also increased somewhat, in the corresponding rankings.
The Asian countries had already secured high places in the rankings prior to 2005. Taiwan, which, during the last period, dealt mostly with transferring its high tech production to mainland China, declined in the rankings. Singapore improved somewhat, and the remain-der maintained their positions.
The group of Latin American countries, with not very enviable positions in the rankings for innovation and business sophistication, did not worsen or improve their rankings, during the period under observation.
Unfortunately, we have to recognise that the rel-evant positions of the CEE countries did not improve between 2005 and 2012, but rather worsened. The greatest reversal was suffered by Slovakia. Estonia maintained, approximately, the same position in the innovation ranking, but the positions of all the other CEE countries declined. In the business sophistication ranking, between 2005 and 2012, the positions of all the CEE countries, including Estonia, declined. The extent to which the impact of the international economic crisis was at play here, and to what extent, some other factors were involved needs to be clarified by a more detailed analysis. In any case, the worsening of one’s position in international business networks is a very serious nega-tive trend, and impairs the movement toward innovation in the future, especially in regard to high tech innova-tion (see Reid, Varblane et al. 2011, p. 96).
4.5.6 New focal points in innovation policyThe innovation policies of the various states have devel-oped over a long period of time, and are, generally, quite stable. Currently, the catalogues of policy measures in use by various states tend to overlap to a great degree. It is also clear that the focal points based thereon are depen-dent on each state’s level of development, its specific sta-tus as well as traditions. The emphasis, in each case, may depend on whether having the state actively intervene in the economy and the modernisation of business is accept-able; on the various efforts that are made to utilise the potential of universities and research institutions for inno-vation; but also on whether the emphasis is on making the most out of the strengths of the innovation system, or rather, on trying to reduce its weaknesses. The situation was changed considerably by the recent international eco-nomic crisis and its aftermath, which, on the one hand, made it more difficult for states to find resources for R&D investments, and on the other hand, increased the moti-vation to make innovation policies more effective, and to direct them at the rapid achievement of clear economic and employment-related results (Funding... 2010–2012; Innovation policy 2012, p. 1). How this was achieved depends on the specific state (see the country overviews). Generalising the developments, the following changes in course can be highlighted:
• Attempts to improve the R&D planning and financ-ing in the state, incl. rationalising the provision of research grants from the public sector to companies

187Estonian Human Development Report 2012/2013
in order to make the R&D potential correspond bet-ter to the needs of the economy. The crisis has accel-erated changes in this area, making standing water move. This focal point can also be combined with attempts to help better commercialise the knowledge that has accumulated in the research institutions of the public sector. The latter can occur through both domestic and foreign companies.
• Various measures to assist innovative domestic small and medium enterprises (SME), especially technol-ogy-centred SMEs, i.e. simplifying their establish-ment, supplying them with venture capital, con-necting them more effectively to the state’s existing research base, helping SMEs enter foreign markets, etc. This course is not limited to high tech start-ups at the state’s universities and research institutions. It seems that this type of activity has been especially topical recently (e.g. in Austria, New Zealand, etc.).
• Measures for attracting innovative foreign-owned companies, especially high-tech ones, to the state, and developing cooperation with them, including, by increasing the connections between these companies and companies based on domestic capital (knowl-edge transfer). This course can be associated with large multinationals as well as domestic start-ups.
• Innovation-based cooperation between the state and leader firms based on domestic capital. If in large states, like France, Germany or the U.S., this is a very important course, in our sample, which is com-prised of smaller states, it is more clearly apparent only in South Korea, and earlier also in Finland (in cooperation with Nokia). It seems that in the case of smaller states, there are simply few domestic tech-based leader firms, even Switzerland’s pharma-ceutical firms are dealt with more as international firms than domestic ones.
• Supporting various enterprise clustering and net-working initiatives related to innovation. At this point, it should be stressed that, in the case of most cluster promotion programmes, innovation-related cooperation is only one type of cooperation that the corresponding programmes aspired to. In the case of innovation-related cooperation, cross-border clusters are the ones that tend to be actualised.
• Supporting foreign cooperation and foreign expansion related to R&D and innovation (e.g. in the direction of China or India). This activity includes involving one’s own technology-based companies – making it possible for them to plug into promising projects in foreign countries – as well as, for instance, attracting foreign firms to one’s technology incubators.
• Searching for new areas for innovative development and growth; launching (experimental) activities in these areas (the state together with the business community). In many states, the conclusion was reached that previous policy measures were too uni-
versal and vague, and based thereon, the aspiration developed to strengthen a sector-specific approach in innovation policy and, to a greater extent, to direct measures to new growth areas.
A series of changes are related to (higher) education, for example, the improvement of the higher education system (the improvements may differ from state to state), addi-tional investments in education, etc.
4.5.7 New trends in innovation polices by countriesFinland’s innovation policy is famous for its achievements in combining the efforts of businesses and universities, as well as research institutions, and the development of its national cluster policy. A very important engine in the innovation policy was Nokia, for which very many SMEs worked. Today, as a result of the economic crisis (the R&D allocations in the national budget have been decreased somewhat) and Nokia’s worsened situation, the focal points of the innovation policies have started to change. Greater importance is now being placed on searches for new fields of growth, and also, if necessary, on changing the innovation policy to be more sector-based. More atten-tion is also being paid to attracting foreign investors in a deliberate manner. It seems that the policy of defining pri-ority clusters, at the national level, has been discontinued. It is being stressed that clusters are, by nature, a regional phenomena, and therefore, clusters programmes should be worked out “locally”, at the level of Finland’s largest cities, and naturally, together with entrepreneurial circles. The more promising programmes that develop, in this way, will then get some degree of support from the state.
Characteristic of Denmark, are a highly developed knowledge base (universities, higher technical schools), on the one hand, and a business sphere that is mostly based on small and medium enterprises. An oft-heard slogan in Denmark’s innovation policy is that Danish companies must be among the most innovative in the world, and considering the state’s distinctive nature, this slogan applies primarily to Denmark’s SMEs. The cen-tral concepts of the innovation policy are collaboration between companies and universities, as well as various development networks. Several dozen state-supported development networks joining universities and compa-nies operate in Denmark, which combine measures as the establishment of research and technology consortiums, other cooperation programmes involving companies and universities as well as voucher-based assistance to compa-nies. Research parks and business incubators play a sig-nificant role. The idea of networks is also being developed at subnational (regional economic growth forums) and supernational levels (within the framework of Denmark’s globalisation strategy, help is provided to companies for their foreign expansion endeavours).
It has been said about Austria that, despite the state’s high innovation indicators, the efficiency of converting the existing knowledge base into economic results is too low. Of the policy shifts that occurred during the recent cri-sis, the most important has been the sharpened focus on

188 Estonian Human Development Report 2012/2013
SMEs, and especially, on supporting their marketing activ-ities. These measures include supporting market analyses, patent searches, packaging-related solutions, the develop-ment of marketing concepts and providing of grants for entry into new markets. The corresponding grants for small companies are approximately €10,000 per company.
Several top technological universities and leader firms, operating in the forefront of technological progress (especially in the pharmaceutical industry), are located in Switzerland. A large part of the economy and employ-ment is high-tech. Although the public sector investments in innovation are not small, the lion’s share of R&D investments is made by large (primarily international) technology-based companies. The role of the state is seen in the financing of general scientific research. The long-term and carefully-thought-out collaboration between business enterprises and the public sector (incl. the uni-versities) is often mentioned in the case of Switzerland. (For example, private companies are often represented on the boards of universities that finance R&D, etc.). At the same time, criticism is increasing that the state is not able to utilise its extremely strong knowledge potential and convert it into economic output. However, as a whole, the innovation system is considered to be well-functioning, and no great changes are planned. The possibilities for improvement include the following: improving the con-nections between SMEs and the existing knowledge sys-tem; creating a suitable venture capital system for SMEs; and improving the higher education system, in order to produce more high-tech specialists and entrepreneurs. It is interesting that in Finland we can see a withdrawal from the idea of regional universities, but in Switzerland, a course has been set to establish new (technological uni-versities) in the cantons, in order to better utilise regional human potential. At the junction between enterprise and innovation policy, there are various measures for start-up enterprises, especially for helping technology-based com-panies. In Switzerland, the reaction to the international economic crisis was an “anti-cyclical” financial policy, which also affected R&D&I expenditures that were increased, rather than reduced, during the crisis.
Foreign investors play a dominant role in Ireland’s economy. The question of progress of local businesses and their ties with foreign companies has shifted to the background and the situation has worsened. Unfortunately, clusters have not achieved conspicuous strength. Such an economy is very vulnerable to the changes in foreign markets. Currently, Ireland has directed all of its resources to increasing the added value and volume of exports, of which 85% is generated by foreign-owned companies. The objectives of the policy are explicit. Ireland’s strategy, which is called Trading and Investing in a Smart Economy: A Strategy and Action Plan for Irish Trade, Tourism and Invest-ment to 2015, is directed primarily at the creation of new jobs in exporting companies (150,000 new jobs in five years), and direct investments (780 projects), primarily in new and nascent economies. A “personal” approach to multinational enterprises is employed – beneficial “per-sonalised” packages (IDA Ireland) are prepared for them. Irish hopes are primarily associated with two sectors of the economy: ICT and medical technologies. Nine of the 10 top pharmaceutical companies (e.g. GSK, Merck, Pfizer) are
represented in Ireland, as are eight of the 10 IT compa-nies. Having entered the market as manufacturers, today, important R&D centres have been established in collabo-ration with local universities. Since the budgetary situation was strained, starting in 2010, the R&D expenditures made by the state have been reduced somewhat. Currently, more emphasis is being placed on “close-to-market” research, as well as on collaboration between research and business. Recently, fourteen research areas were chosen to be pri-oritised over the next few years (National Research Priori-tisation Exercise). The last few years have seen a reduction in investments in R&D human resources, which are con-nected to institutions of higher education. The money has been proportionally redirected to R&D resources that are more directly connected to the market, by supporting the creation of high-end jobs, etc.
Strong universities and high-quality local suppliers are characteristic of New Zealand. Moreover, the collabo-ration between companies and universities is quite close. At the same time, considering the generally good level of the state, the export structure is a bit primitive; companies are not in key positions in the international value chain; and clustering is weak. The companies have few engi-neers; the volume of high-tech products that are exported is small; and the skills for entering international markets with complex products are poor. Therefore, in the last few years, great emphasis, in the innovation policy, has been placed on increasing the commercialisation of innovations, and the capability to enter international markets (expan-sion capability). In 2011, The Kiwi Innovation Network was established, which is a consortium of universities and state research institutions, with the aim of combining forces, experiences and resources related to the develop-ment of commercialisation. Also, a few dozen high-tech companies, with great potential, were selected, which are being provided with support for growth and expansion, in order to make them truly global. Support is being pro-vided to improve the companies’ skills, so as to enable them to enter foreign markets with more complex prod-ucts, and to find the necessary capital to expand. Some organisational changes have also been made to increase the state’s capability to manage the R&D&I policy.
Against the background of the other CEE countries, the Czech Republic is characterised by the great relative importance of high technology, high-level exact sciences, and strong technical universities, etc. Sectors like machine building and the chemical industry have traditionally been strong. As a whole, the companies’ level of innova-tion is quite high, although it tends to be characterised by less radical innovations. The R&D investments are also quite high, and the connection between science and industry functions. However, upon closer examination, it turns out that two different systems are behind these gen-erally middling indicators. The large foreign firms develop in-house research in their branches that are located in the Czech Republic, but this is mostly based on the research strategies that come from their headquarters, whereas the Czech universities and institutions have little to do with this. The latter do communicate with Czech SMEs, but their volume of production knowledge is quite modest. One of the main goals of the state’s innovation policy is to overcome this contradiction.

189Estonian Human Development Report 2012/2013
It is characteristic of the South Korea, that research and development activities and innovation policy (R&D&I policy) are connected, to a great extent, to the state’s large companies – the former monopolies known as chaebols. Two-thirds of the state’s R&D expenditures come from the large companies, and they also make a noteworthy con-tribution to financing higher education. Six courses are established in the science and tech nology policy, which form the basis for the future economic growth of the state. These include information and communications technol-ogy (ICT), life sciences and medical technology, nanotech-nology, energy technology and aerospace technology. The state has also announced a “green growth” strategy.
Singapore is characterised by a very strong and focused state R&D and innovation policy, with a strat-egy that extends to 2015. A large portion of the research financing moves through state programmes, not univer-sity programmes. Three broad R&D courses have been chosen: environmental and water technologies, biomed-ical sciences and the interactive and digital media. Start-ing in the 2000s, and especially in the second half of the decade, the state has vigorously invested in improving the level of the universities and the quality of the research institutions. As a result, they have top-level laboratories and research work, as well as patents. This policy has most likely been the reason that foreign investors con-tinue to be interested in Singapore, which is characterised by a high participation of foreign capital; along with a good position in the value chain, and the appropriation of complex production functions. The principle is to import the top brains, because there are not enough of them in Singapore, in any case. The last few years have added another focus to the innovation policy – in 2011, the National Innovation Challenge programme was initi-ated, in which energy will be the focus for the next five years: energy efficiency, reduction of CO2 emissions, and the diversification of energy sources.
Israel is characterised by the very high relative importance of R&D&I expenditures, this primarily in regard to public funds. The state is famous for its high technology, especially ICT, start-up support to high-tech and venture capital. Another distinctive feature of the innovation policy is the conversion of ideas and solutions coming from the military sphere into civilian production (the take-off base of many high-tech companies is related to the service of young students and engineers in the high-tech Israeli Army), as well as the brains that have immigrated to Israel from abroad, especially from the former Soviet Union. It was for the latter that Israel estab-lished high-tech incubators at one time. The financial support provided for innovative business ideas is strongly based on the profit motive, whereas it is assumed that the turnover and resulting profits will come mostly from global markets. To cover the R&D costs, discount credits are provided, which must be repaid if success is achieved. Similarly to Estonia, mechanisms based on technology and development centres (the creation of consortiums of research institutions and companies) are also employed. However, the state covers a much higher percentage of the costs than in Estonia. Officially, there are no preferential areas of innovation, but in reality, they exist (especially ICT, but also high technologies for agriculture).
Costa Rica has been quite successful in attracting indus-trial production based on foreign companies. It has been said that, in this regard, the state has repeated the eco-nomic policy that was successful for the Republic of Ire-land in the past. The branches of industry that dominate are also similar to those in Ireland – production of elec-tronics and medical instruments. As a result, the relative importance of the export of high-tech products is higher than in many developed industrial states. However, the success is not based on high productivity, but simply on the availability of labour and other production factors. As wages increase, the sustainability of a model of this kind is questionable. Competition from the Asian states is also feared. There is reason to believe that, if the foreign firms start to import innovation to maintain their competitive-ness, it will probably reduce the number of jobs in Costa Rica. The impact of the foreign firms on the local SMEs was minimal. Therefore, a course was taken, in the new research, technology and innovation strategy for 2011-2014, to support innovation at the company level. A goal was established to take the country on a path to an inno-vation-based and knowledge-based economy. However, many analysts are sceptical of the possibility of achieving this goal during a realistic period, because, although the relative importance of higher education and the level of the universities is normal, compared to the average in the other Latin American countries, it is significantly lower than in Ireland (even in Ireland a few decades ago). Study-ing engineering is not popular. A number of measures, that are familiar from Estonia, have been planned for the realisation of the strategy, such as the establishment of research parks and enterprise incubators, innovation grants for SMEs, and the development of their collabora-tion with universities. Middle-level technical schools have been established, as well as a university of technology as a joint project with the national universities.
Both weaknesses and strengths have been pointed out in Chile’s innovation policy. The weaknesses include the low level of R&D investments, and the convergence of knowledge potential in the capital of Santiago, while many of the key branches of industry (mining, fisheries) are located in other parts of the state. As a whole, one of the problems in the state is economic diversification, and the reducing of dependence on an industry requiring sup-plies and upon agriculture. In search of a consensus, long consultations with interest groups have been held regard-ing the question of whether innovation policy should be the fundamental path for developing the state’s economy, and who should finance it and how. A significant step forward was the establishment of a fund, in 2006, to deal with the reorganisation of the state’s economy, which was financed by the profits from copper production. In 2007, eight promising economic clusters were selected to be prioritised. These were based on both old (copper production, agriculture) as well as new sectors (e.g. inter-national financial services). The official rhetoric states that the principle involved is not the selecting of winners, but the backing of winners. A good example is the start up of effective fish farming (salmon farming) in Chile as a new field of activity. Although some companies had started to deal with this sphere of activity earlier, the state played quite an important role in launching this new branch of

190 Estonian Human Development Report 2012/2013
the economy. Lead by Fundacion Chile, the state assumed many functions related to the development of technology and sanitary regulations. Currently, Japanese money and know-how has been invested in the fish farming. In the specialised literature, this cooperation is considered to be an example of experiment-based structural policy. It seems that the consensus regarding the need for an innovation policy in the state, is working, and that the
References1. FReemAn, CHR. (1995). “The ‘National System of Innovation’ in
Historical Perspective,” Cambridge Journal of Economics, 19, 5–24.
2. Funding Research and Innovation in the EU and Beyond: Trends during 2010–2012. Technopolis Group, Brussels & Tallinn
3. INNO Policy TrendChart with ERAWATCH (2011-2012)
4. innovAtion PoliCy in timeS oF AuSteRity (2012). INNO Policy Trendchart. Brussels.
5. innovAtion union SCoReBoARd (2011). EC DG Enterprise and Industry. Brussels
6. Reid A., vARBlAne u. et Al. (2011) Innovaatiline tegevus ettevõtetes aastatel 2006–2008. Tallinn: Enterprise Estonia.
7. RotHwell, R. (2002). “Towards the Fifth-Generation Innovation Process,” Henry, J., Mayle, D. (eds.). Managing Innovation and Change. London: The Open University & SAGE Publications.
8. Schwab, K. (ed.) (2012). The Global Competitiveness Report 2012–2013. World Economic Forum. Geneva.
investments in innovation have increased, despite the period of economic crisis. One of the courses for moving forward is the establishment of regional innovation and growth centres. An interesting example of how start-up high-tech firms were invited to join a Chilean research park that is under development – the Chileans adopted the slogan: “If you can’t make it in California, come to us. We care about your ideas!”
Despite a transition that has lasted for 15 years, as well as Estonia’s accession to the EU, the actual development level of the economy is one of the lowest in Europe. Based on the latest data, income per capita, even when adjusted for purchasing power parity, is in 47th place in the world. At the same time, the international indicators for develop-ment potential, as well as the economic growth to date, point to Estonia’s possibilities for convergence with the developed states. The composite indicators for human development and competitiveness, which synthesise all the developmental preconditions, give Estonia a posi-tion in the 40s. The general indicators for the quality of governance put Estonia in the 30s, in the ranking of the same states. The situation is even better when based on the indices for economic freedom that focus on economic institutions, where Estonia is even positioned in the 20s.
In regard to the labour market, one can say that Estonia is in a poor position in comparison to the others, due to low marks for the availability of skilled labour. On the one hand, this is a result of the small size of the labour market, but based on various international com-parisons, the problem is also the fact the workers’ edu-cation levels do not correspond to the demands of the economy. Another reason is the modest level of active labour policies. Population ageing and a reduction in the working age population, which is amplified by negative net migration, is having a long-term impact on the labour market. However, it is good that Estonia’s labour market institutions have not caused a rigidity of the labour mar-ket. Rather, the problem is the small role played by active labour policies in the education of skilled labour, and the high risk of poverty that accompanies unemployment.
In summary, the rules of the game for Estonia’s econ-omy can be seen to foster competitiveness and economic growth. However, this is only true in the current stage of development. In order to reach the top, the great lag in business sophistication and the productivity gap that has developed as result, must be overcome.
Above all, it is necessary to arrive at a situation where the economy gets firm support from industry, which is not very large based on total employment, but is very productive. Unfortunately, the productivity of Esto-nia’s manufacturing industry continues to be low, and its growth will not enable Estonia’s level of productivity to catch up to the European Union average within the next few decades. For example, if Estonia maintains the current level of absolute growth, we will catch up with Finland in about forty years. It would take about a hun-dred years to reach the EU average.
At the same time, productive growth cannot be achieved by simple means. The interaction of a large num-ber of factors is required, and both business enterprises and the state, with its economic policies, must make a contribution.
The latter must definitely consider the existing ref-erence system. The capital-based production of the states with high standards of living requires significant capital replacement, in order to maintain the current standard of living in the future. For sustainable growth, states with extensive mineral deposits and large mining sectors need institutions, among other things, that enable resource rents to be converted into investments in other sectors and in human capital. The same problem is faced by the states that are dependent on foreign capital, which require
SummaryJüri Sepp
191Estonian Human Development Report 2012/2013
mechanisms for increasing their standard of living that would convert the profits earned from foreign capital into investments into the state’s infrastructure and human capital. Production that causes extensive emissions of pollutants requires compensation, and should be replaced by other types of economic activity.
Today, Estonia’s development is between the effi-ciency- and innovation-based stages, and therefore, the success factors for both of these stages must be con-sidered, if we want to take advantage of all the develop-ment opportunities. Although Estonia’s productivity has increased at a very fast pace, to date, the labour costs have increased at an even faster rate. In Estonia’s case, the most problematic period is 2005 to 2008, when the unit labour costs increased by almost 50%, i.e. the gap between the growth in productivity and the increase in unit labour costs was alarmingly large. The efficiency-based com-petitiveness of Estonia’s economy was seriously endan-gered. In the subsequent period, from 2008 to 2011, Estonia succeeded in returning to a sustainable path of development.
However, to ensure and increase Estonia’ compet-itiveness in the innovation-based stage, efforts must be made not only to work better, but to do better work – to produce goods and services with have greater added value. In addition to investments in research and devel-opment activities, this also presupposes the ability to implement the technologies, management methods and production organisation used in the rest of the world in local enterprises. By no means should innovation be viewed narrowly as just new product development. First, it obviously assumes that changes need to occur in the thinking of company managers, and lifelong learning must become the norm.
In summary, the key to the growth of productivity in Estonia is its people – the development of their knowl-edge and skills. The economy is not just an aggregate of structures and technologies, but the people functioning therein and their knowledge. If the economic environ-ment provides sufficient motivation, the development of people’s capabilities will initiate the changes that will later be reflected in the financial indicators of the business enterprises. Considering the fact that more than a third of our working age population (aged 15 to 64) is out of the labour market – is unemployed or not active – our first task is to focus on supporting the return of these groups to employment. This primarily affects those people who want to work, but have not found suitable jobs, and those who cannot take jobs because of their caregiver burdens or poor health. Here, the state can help, for instance, by ensuring that part-time work is profitable, that the neces-sary care services are available, and that possibilities exist for self-improvement, as well as retraining, if necessary.
Coming back to the state’s tasks in the innova-tion-based stage of development, first, we see that around the world, state are searching for ways to fund solutions for enterprise policies that would cope with these new conditions and accelerate development. In this connec-tion, attempts are being made not to come into conflict with the market signals, and to take the advantages and strengths of their states’ into account. Some states are continuing to invest in strategically pre-defined preferred
areas of activity in developing their research policies and prioritised business sectors. The search for new areas of growth has also intensified (the movement of innovation policy in the direction of selectivity, which was out of fashion for awhile). At the same time, there are states that are continuing their horizontal (broad-based) innovation policies. Some states have reduced their R&D invest-ments, some have not. There is a common aspiration to increase the effectiveness of policies by encouraging cooperation between the public and private sector, and by directing resources to produce the greatest return.
What does Estonia look like against this back-ground? Actually, our position in the world’s rankings is not so bad. R&D&I investments have increased, in both the public sector (EU funding) and in business enterprises. There are also some impressive indicators of success in the ICT field. We have introduced many standard measures of innovation policy that are used in other states; most recently, the provision of risk cap-ital (Development Fund), cluster grants, and innovation shares provided to companies. At the same time, Estonia’s position in the innovation rankings is only relatively good – in comparison to the CEE countries, or countries that are located on the periphery of international economic development. The gap with the real innovation leaders is very big, and a reduction is not in sight. If we assume that prices will go up in the future, i.e. wage levels will increase; Estonia will have to be competitive in the league of innovation-based economies, where the demands are much more rigorous.
Examining our development potential for the future, we must recognise that the quality of our univer-sities and research institutions is not sufficiently high for innovation-based development. There is little high-tech production. There are few sectors in our economic struc-ture where the possibilities for increasing innovation and productivity are outstanding. Our position in the inter-national business networks is poor, and it is worsening. We have few leader firms, especially technology-based leader firms. The work that is done to attract foreign investments is unsystematic. The funding of research in universities is weakly connected to the perspective needs of the economy. The preferential fields of research are the same as in most other developed states. It is unclear where our relative advantage lies. It seems that we are more oriented to developing, implementing and maintaining the measures of innovation policy, which are actually sensible, than we are to finding and realising courses of action to achieve fundamental breakthroughs. It is also clear that a strategy that can help the state get to a higher level of innovation-related activity cannot be limited to the implementation of innovation policy measures, in the strictest sense, but must be related to the concretisation of the focus of socioeconomic development, in the broadest sense. This must encompass connections to the policies related to enterprise, education and research, the organ-isation of governance, and to structural policies, which is a category not often discussed in Estonia. At the same time, in the case of the latter, we must not, of course, come into conflict with the EU’s competition policies, especially regarding the rules for state aid. Greater light will be cast upon these issues in the last chapter of this publication.

192 Estonian Human Development Report 2012/2013

193Estonian Human Development Report 2012/2013
GLoBALISATIoN AND PoLICY PATTERNSESToNIAN HUMAN DEVELoPMENT REPoRT 2012/20135
This chapter will begin with a discussion of the impor-tance of globalisation as the context of the development of countries, then we examine the ways for measur-ing the levels of globalisation, as well as the progress made by Estonia and the reference states. Based on the results of a survey conducted in early 2013, an overview will be provided of how Estonia’s decision- makers (i.e. the elite) in the fields of economics, politics and culture, as well as scientists who have recently
defended doctoral theses, assess the impact of global-isation on Estonia. We examine which strategies they recommend for coping with the negative consequences of this process, and for making the best use of the opportunities which open. We take a look at which policies and policy changes would be appropriate for a small state operating under the conditions of global-isation, and what the future developments in Estonia might be against this background.
IntroductionErik Terk

194 Estonian Human Development Report 2012/2013
5.1.1 Globalisation as a context of developmentGlobalisation is a process of pivotal importance, which increasingly affects the conditions for development in the majority of countries. This term is used to characterise the intensification of connections and dependencies between economies and of the communication between various countries’ residents, which started in the 1980s and has been explosively increasing ever since.
There have also been earlier periods of intense inter-national relations and therefore, many authors prefer to call the process, which started in the 1980s’ economic- centred globalisation, rather than simply globalisation, stressing that, currently, it is the economic intertwin-ing that serves as the engine for the integration of the other spheres of life. The globalisation of economy has occurred, at least initially, at a much faster pace than the integration between lifestyles and cultures, the develop-ment of supranational governance structures, etc., but it is also pulling these processes along. Globalisation is inter-preted as the highest stage of internationalisation, which is accompanied by qualitative changes in practically all spheres of life. This is not just a number of various simul-taneous developments, such as cross-border interpersonal communication, international relations between compa-nies, the increased importance of international financial markets, etc., but rather a complex integral process, which involves societies, companies and people in various coun-tries. Globalisation is both geographic and functional inte-gration, whereas the latter aspect is even more important than the former (Dicken, 1998; Terk, 2012). Globalisation is closely related to other significant processes in today’s world – namely deregulation, both internationally and domestically.
The beginning of the globalisation phase in the world has been associated with the reduction of customs tariffs between states, which made the unhindered move-ment of goods possible, as well as with the collapse of the Soviet Union and the socialist bloc that it controlled: It allowed a large number of countries, whose partici-pation in the integrated global economy had previously been limited, to become involved in it. These factors are significant, but do not reveal the fundamental content of the process. Researchers almost unanimously agree that there are three engines for the current globalisation, which reciprocally amplify each other. Firstly, the accel-erated movement of capital across state borders (mostly the movement of financial capital, since foreign direct investments, i.e. the investment of money in companies’ buildings and equipment are significantly more selective and conservative). Secondly, the revolutionary develop-ment of information and communications technology.
Thirdly, the intensification and cheapening of inter-national airline connections, which promotes frequent travel between different countries. For the countries that are plugged into it, globalisation can provide an opportu-nity for accelerated economic growth, as well as various developmental impetuses, starting with the transfer of know-how, and ending with intercultural enrichment. At the same time, globalisation in its present form is being justifiably criticized because the entire complexity of globality is being dominated by economic and business processes. This makes both the globalisation process and its results quite contradictory (Beck, 2002). Thereby, the pattern of the social relations formed over long periods, guarantees secured by workers, existing welfare systems, and uniqueness of national cultures, etc. may suffer. As the latest international economic crisis demonstrated, an additional danger is the possible setbacks that can result from the volatility of the international markets. The crit-ics of globalisation find that the process as a whole (if we ignore a few exceptions, primarily China) increases, rather than reduces, the development gaps between the countries of the world. The optimists, on the other hand, find that the plusses of globalisation greatly outweigh the minuses, even for the less-developed countries, while the “humanising” of globalisation would only require some agreements and limitations (e.g. ecological ones), maybe with a slower, more gradual opening of economies and societies in some cases (Bhagwati, 2004). The opinions of the more critically-minded authors vary broadly, from demands to halt globalisation, to calls for making its ideology more social, initiating common efforts by the states to gain greater control over international capital, and strengthening supranational institutions and inter-national legislation, which should help to reduce the negative consequences of globalisation, etc. At the state level, a significant dilemma is the relationship between protective mechanisms, and the creation of the precondi-tions necessary for success in a globalised economy.
Some authors assert that globalisation is just a new way of reproducing the previous relationship based on the domination of the centre over the periphery, i.e. the continued ruling position of the so-called “triad” (the U.S., the European Union and Japan) (Amoroso, 1998). However, reality bears witness to the fact that more complicated dependency relations are developing. Of the geo-economic shifts during the last ten to fifteen years, the most important one has been the rise of the East-Asian countries, especially China. The bilateral relation-ship between the U.S. and China is so pivotal that the future progress of the world’s economy depends on it. In this context, Russia, as one of the former principal power centres, along with Eastern Europe, has been demoted to a lower plane.
5.1.Globalisation and EstoniaErik Terk, Marju Lauristin

195Estonian Human Development Report 2012/2013
When Estonia regained its independence in 1991, it was faced with a world that was already globalising. Regard-less of the fact that the reestablishment of independence took place under slogans calling for the restoration of the nation-state, there was no alternative to the opening up of the economy, and to going along with globalisa-tion – an isolationist policy would have led Estonia into a dead end. International openness paved the way for many more contacts, for information and capital to flow in from the developed countries (assuming the ability to ensure the elementary functioning of the business environment), and also access to markets (assuming the capability of reaching these markets, which, regarding the end consumer, can be quite difficult). An important role in the shaping of the social affairs of re-indepen-dent Estonia was played by United Nations organisa-tions: the WHO, along with the World Bank, helped to reorganise the healthcare system; the ILO helped with labour policies and the UNDP with the creating of the foundations for family and integration policies. In the period right after the restoration of independence, an important role was also played by the International Monetary Fund, which put Estonia’s finances and the public sector on track. George Soros’s international Open Society Foundation established the basis for the development of civil society. These global organisations earned good reputations in Estonia, unlike in many other developing countries and post-Communist states, especially Russia; and cooperating with them comprised an efficient globalisation school for the officials, various professional specialists and civil society activists, who had had little international experience. A few years later, this all proved to be very helpful when relations with the European Union started to develop.
There has been little research and generalisation related to the impact of globalisation on Estonia, since it is difficult to differentiate the effect of globalisation from the impact of Estonia’s accession to the European Union. The EU accession can be addressed as one of the subsidiary processes of globalisation – as noted by Dehesa, nation-states must give way to regional inte-gration, and, to a certain extent, subordinate their own activities to transnational institutions (Dehesa, 2006). However, the EU accession cannot be considered to be ordinary globalisation. The support from the European Union expedited the convergence of living standards with those in the wealthier countries, while this support was dependent on the accelerated adoption of the EU institu-tional framework. This also means that economic inte-gration is accompanied by a political dimension related to national sovereignty. The significance of this aspect will probably increase in the future – issues related to the continued intensification of integration, and a movement toward the “federalist” model of the European Union will become more topical. Discussing globalisation predomi-nantly within the context of internal EU integration, as has been done to date, ignores many important aspects of globalisation, such as the opportunities of the Asian market; coping with the competitive pressure caused by Asian goods; participation in the international coopera-tion and security organisations, which transcend Europe; participation in educational cooperation and labour
exchange with countries outside the EU. Technological development, the functioning of global information net-works and the internationalisation of culture are far from European-centred phenomena.
5.1.2 How globalised is Estonia?Various indicators are used internationally to measure globalisation and openness. These are relatively multifac-eted and complicated to measure phenomena; therefore indicators reflecting individual aspects of openness, rather than overall globalisation of a country have been more popular so far. Used most frequently are yardsticks of economic openness based on the share of foreign trade in GDP, assessments based on foreign investment statistics, and various indicators related to the intensity of foreign relations and international interpersonal contacts. Yet there have been some attempts to compile synthetic indi-ces that measure the overall level of globalisation.
The best-known indicator of a country’s economic openness is to divide foreign trade volume (exports plus imports) by that of GDP (hereinafter, the EO indicator). In small states with open economies the total of the exports and imports often exceeds GDP, and therefore, the ratio may be more than 100%. Based on this indicator Estonia usually ranks in the top ten. However, when interpreting this fact, one should understand that there are huge dif-ferences between large and small states in regard to this indicator. The top ten countries in the world according to the EO indicator are primarily small states, for instance, the city-state of Singapore, Luxembourg and island states like the Seychelles and the Maldives, while the U.S. with its large domestic market is at the bottom of the ranking.
In the majority of the successful small- and medi-um-sized states, including the reference states in this report, the foreign trade-to-GDP ratio is between 80% and 150%. Of the states within our sphere of interest, the ones with a high EO indicator include Singapore, Taiwan, Estonia (with a ratio of over 120%), as well as Slovakia and Ireland. The EO indicators of the Czech Republic and Hungary are also relatively high, although lower than the aforementioned states. The economies of New Zealand and Uruguay are, according to this yardstick, significantly less open.
A large foreign trade-to-GDP ratio may offer great opportunities for growth and development, but also con-tains a major risk component. In international economic crises, countries with high EO indicators usually suffer large declines. In countries with large domestic markets, where most companies have partners that are located in the same country, the impact is less drastic. In order to avoid serious consequences, the states with high levels of economic openness, like Estonia, should have geographi-cally diverse lists of partner countries (even during inter-national economic crises, there are regions of the world where economic growth continues), or be able to establish strong financial buffers for the times when their export markets decline.
Another indicator for comparing the economic glo-balisation levels of various states is foreign direct invest-ment (hereinafter, FDI) stock as a percentage of GDP. This ratio fluctuates less than the EO indicator based on

196 Estonian Human Development Report 2012/2013
foreign trade. In our chosen reference states, this indicator usually falls between 35% and 70%, exceeding this level in Singapore, Ireland, Switzerland and Estonia (75.4% in Estonia, based on 2011 statistics), and remaining under 35% in South Korea, Slovenia, Uruguay and, based on the statistics for the last few years, also in Finland. In the case of South Korea and Slovenia, we can say that this is the result of economic policies that favour domestic capital.
Of course, it must be recognised that the stage of globalisation is reflected not only by the inflow of FDI, but also by the outward FDI made by a country’s compa-nies . While in the former socialist states the volume of inward FDI is much higher that outward FDI, then, in the Netherlands, Denmark, Finland, Switzerland, Austria as well as Ireland the outward volume is notably larger than the inward volume.
The indicators based on both trade and investments have one shortcoming when it comes to measuring the stage of globalisation – they do not differentiate the econ-omic connections with large rising markets (the majority of which are far from Europe) from the economic relations with neighbouring markets, which may be wealthy, but have a low growth potential. In the case of Estonia, both the foreign trade and foreign investment statistics indicate that its economic relations are primarily with neighbour-ing countries, especially in the Baltic Sea Region.
The best-known synthetic indicator of globalisation is probably the KOF Index of Globalisation compiled by the researchers at the Swiss Federal Institute of Technology (ETH) in Zurich and is comprised of three components (economic, social and political). In addition to indicators for foreign trade and foreign investments (both FDI and portfolio investments), the economic globalisation section also includes the levels of direct and indirect barriers to for-eign partners. Social globalisation is computed on the basis of such indicators as foreign residents’ share of the total population, the movement of people across state borders, and personal contact and information flows (international Internet and telephone traffic, access to global TV channels, and the availability of international newspapers), as well as the presence of iconic international chains (McDonald’s restaurants and Ikea home furnishings stores). The politi-cal globalisation indicators include the number of foreign embassies in the country, the number of international trea-ties, membership in various international organisations, and participation in various, especially U.N.-initiated, forms of international cooperation.
It appears that all ex-socialist countries with the exeption of Slovenia are lower in the synthetic globalisa-tion ranking than in the economic globalisation ranking. It can be argued, of course, whethter all indicators used for measuring the level of social and political globalisation are best suited for it; e.g. the popularity of McDonalds or
Ikea out of all brands or international book trade rather than TV formats or popular music.
Estonia is in second place in the world for the open-ness of its global information flows, which is also included in this index, and the indicators for the movement of peo-ple (international tourism and the percentage of foreign residents) are quite high. Based on the latest general global-isation level calculated by ETH, we just barely miss being included among the 24 world’s most globalised states. The majority of the EU Member States are more globalised than Estonia, but it must be kept in mind that the European Union is one of the world’s most globalised regions. Only a few countries outside of Europe (Singapore, Canada, and Australia) outpace Estonia in regard to the general globali-sation level, according to the ETH methodology.
Positions in the economic globalisation ranking
Positions in the synthesised (economic, social and politi-cal) globalisation ranking
1. Singapore 1. Belgium
2. Luxembourg 2. Ireland
3. Ireland 3. Netherlands
4. Malta 4. Austria
5. Netherlands 5. Singapore
6. Belgium 6. Denmark
7. Hungary 7. Sweden
8. Estonia 8. Portugal
9. Bahrain 9. Hungary
10. Sweden 10. Switzerland
12. Denmark 13. Canada
14. Czech Republic
15. Finland 15. Czech Republic
16. Austria 16. Finland
17. Slovakia
19. Chile 19. Slovakia
22. New Zealand 25. Estonia
24. Israel 28. New Zealand
27. Switzerland 29. Israel
30. Slovenia
33. Slovenia 35. Chile
34. Canada 52. Uruguay
62. Uruguay 63. Costa Rica
72. Costa Rica
Table 5.1.1.Globalisation rankings based on the calculations of the Swiss Federal Institute of Technology (ETH) (2013)
References1. diCKen, P. (1998) Global Shift. London: Paul Chapman Publishing.
2. teRK, e. (2012) “Globaliseerumine, jah, aga milline?,” Eestist ja ettepoole. Terk, E. Tallinn: Tallinna Ülikool, Eesti Tuleviku-uu-ringute Instituut (first published 2002).
3. BeCK, u. (2002) What is Globalization? Cambridge (UK): Polity Press.
4. BHAgwAti, J. (2004) In Defence of Globalization. Oxford (UK) & New York: Oxford University Press.
5. AmoRoSo, B. (1998) On Globalization. Capitalism in the 21st Century. Basingstoke (UK) & New York: Palgrave,.
6. deHeSA, g. (2006) Winners and Losers in Globalization. Malden MA (USA) & Oxford (UK): Blackwell Publishing.
7. KoF (2013) KOF Index of Globalization. Detailed Index Infor-mation. www.globalization.kof.ethz.ch
Assessment, data from 2010-2013

197Estonian Human Development Report 2012/2013
In order to ascertain the attitude of the different elite groups of Estonia about globalisation, the Turu-uuringute AS con-ducted an expert survey in early 2013, which included 177 experts – 43 politicians, 55 people active in the economic field and 35 in the cultural field, as well as 44 scholars who have defended their doctoral theses during the last three years. The politicians’ sample included both opposition as well as coalition members from the Riigikogu and represen-tatives of bigger municipalities, as well as people working for the larger political parties. The group of economic deci-sion-makers included 42 economic policymakers (the Min-istries of Economic Affairs and Finance, the Bank of Estonia and the Estonian Development Fund, members of the Riigi-kogu’s committees on economics and finance, leaders of the national business associations, and economists who have actually participated in economic policymaking) as well as 13 representatives of companies and commercial banks, who have been active in the sectoral business associations, or who have spoken out about Estonia’s economic situation and economic policy. For brevity, the latter are referred to, hereinafter, as entrepreneurs. The sample of cultural figures also encompassed those, including journalists, who have participated in public discussions on the Estonian culture and issues related to Estonia’s general development. Since the sample included people who are in important positions and actively participate in making key decisions related to Estonia’s politics, economy and cultural life, this survey can be described hereinafter as an “elite survey”.
5.2.1 How are the results of globalisation being perceived?The survey shows that the assessments of the results of globalisation in Estonia are relatively positive, especially considering the impact of the international economic recession that hit Estonia recently. On a scale of one to five, 85% of the entrepreneurs, 88% of the economic policymakers, 65% of the politicians, 69% of the cultural figures and 73% of the newly graduated PhDs chose the option “globalisation has predominantly provided devel-opment opportunities” or “has provided more opportuni-ties than risks for development.”
In order to ascertain in detail which consequences the respondents were more satisfied with, and which less, they were given a list of nine potential results of globalisation, and were asked to assess them separately (see Table 5.2.1).
We see that, as a rule, the most positive assessments were given by the representatives of the economic elite. The fact that the economic circles strongly support glo-balisation is not surprising. It was not the first time – a
survey conducted among Estonian economic policymak-ers in 2000 showed that over 90% of them were positive about globalisation. It was less obvious that the politicians that had unanimously conducted pro-globalisation policies over a long period of time, and in various governments, were more critical about some social results of globalisa-tion than the respondents from the cultural sphere. The entrepreneurs are not as unanimously positive about the increase of competition and about Estonia opening up to foreign labour as are the economic policymakers. It should be remembered that in the assessment of some influences different respondents may base their assessments on dif-
5.2The impacts of globalisation and possible strategies in a globalising worldSilja Lassur, Erik Terk
Entr
epre
neur
s
Econ
omic
pol
icym
aker
s
Polit
icia
ns
Cultu
ral fi
gure
s
PhDs
Rank
ing
of th
e sa
mpl
e as
a w
hole
Improvement of export opportunities for Estonian companies
4.9 4.8 4.6 4.3 4.3 1
Increased diversity of life-styles and areas of activity 4.6 4.4 3.9 4.3 4.1 2
Inflowing foreign investments for Estonian companies 4.6 4.4 4.2 4.1 4.0 3
Access to international financial capital 4.6 4.1 3.9 3.9 4.0 4
opportunity for Estonians to work abroad 4.2 4.1 3.7 4.1 3.9 5
Increasing movement of people across state borders 4.2 3.9 3.7 4.0 3.6 6
Increased competition in various spheres of life 3.8 4.1 3.5 3.9 3.6 7
opening of Estonia to foreign labour 3.2 3.6 3.4 3.5 3.4 8
International crime related to globalisation 2.6 2.6 2.7 2.5 2.7 9
Table 5.2.1Assessments of the potential impacts of opening up Estonia to the world
Average value on a scale, where 1 = impact has been very ne-gative; 5 = impact has been very positiveFor the last option in the table (international crime related to globalisation) it is difficult to expect the answer to be “the impact is positive”. However, almost 60% of the respondents found that this impact is difficult to assess, and 31% felt that the impact of globalisation is negative.

198 Estonian Human Development Report 2012/2013
ferent viewpoints. For instance, when the entrepreneurs are critical about opening Estonia to foreign labour, the reason for the critical attitude may be the fact that the labour market has not been opened up sufficiently. At the same time the cultural figures and some politicians may be critical for exactly the opposite reasons.
The cultural figures are characterised by their slightly cooler attitude to the opportunities for utilising financial markets and for exporting, although even they consider foreign investments in Estonian companies to be very important.
If a positive attitude to the impacts of most factors included here, can be considered to be self-evident, in many countries both the majority of the people, as well as the elites are relatively critical about such factors like increased competition, people’s opportunities to work abroad and the strong role played by foreign investors in the economy. Based on this survey, it seems that this is not true of Estonia’s elite.
In the questionnaire, we also asked our experts for their assessment of various aspects of Estonia’s affairs – whether the situation in one or another sphere has improved or deteriorated during the last decade, without specifying whether the respondent interprets the shift to be the result of globalisation or not (Figure 5.2.1).
The critical assessments were predominantly related to only three spheres out of a total of fifteen: the demographic situation, economic equality/inequality and trust in the state authorities. Therefore, it can be stated that the assessments of the changes, which can be considered to be indirect con-sequences of globalisation, are also mostly positive.
It is interesting to compare the above to the predic-tions made in 2000 by economic policymakers concern-ing the possible negative effects of globalisation. The list of fears was at that time topped by the departure of highly qualified labour from Estonia, by setbacks in the financial markets (primarily in the case of high-risk speculative investments), by increased differences in wealth, as well as by problems related to international crime. Damage to the natural en viron ment was not expected to be great, and the departure of less-qualified labour was not thought to be likely. The possible weakening of cultural identity was toward the bottom of the list of possible problematic shifts. Some of the fears from that time have been real-ised, but some, for instance the increase in international crime, luckily, have not. Actually, the departure of labour has already moved beyond just highly skilled labour. It is noteworthy that, despite the generally positive attitude toward globalisation, there is now more concern about cultural identity than there was in 2000.
5.2.2 Response patternsWhat would be the best measures for supporting Estonia’s ability to cope with the impacts of globalisation? We gave the respondents a list of possible measures to evaluate.1 Table 5.2.2 shows how the answers were distributed.
Figure 5.2.1Has the situation in the given sphere improved or deteri-orated during the last ten years? (% of respondents)
Total PhDs Cultural �guresPoliticians Economic policymakers Entrepreneurs
1.5 2.0 2.5 3.0 3.5 4.0
1.5 2.0 2.5 3.0 3.5 4.0
E-governance development
Extent of innovative mindset in the economy and society
Personal freedoms
Competitiveness of the economy
Perception of security by the people
Ecological situation
People’s income level
State of the people’s health
Ethnic relations in Estonia
Corruption
Development of democracy
Education
People’s life satisfaction
Trust in the state authorities
Economic equality/inequality
Estonia’s demo-graphic situation
Average on a scale of 1 to 5, where 1 = the situation has gotten a lot worse; and 5 = the situation has gotten a lot better
1 The list of means was developed in 2000 for examining the globalisation-related economic policies (authors M. Didõk and E. Terk). At that time, the situation related to banking was quite severe, and this explains why the list includes many measures that are related to the improvement of the financial sector. We decided to use the list of measures for this study in a relatively unchanged form.

199Estonian Human Development Report 2012/2013
If we compare the measures preferred by economic pol-icymakers in 2000 with those in 2013, we see that the ones related to the financial sphere (overcoming banking problems) and fighting crime are not as topical any more. However, the importance of developing labour quality, and to a certain extent, also the development of industrial and technology policies, and the social protection system, as well as the preservation of cultural identity has increased.
In the subsequent interpretation of measures, we have distributed the individual measures into three groups: 1) protectionist measures – measures to protect jobs, farmers’ subsidies, immigration barriers, also the possible reintroduction of the national currency and departure from the euro area; 2) measures to consoli-date the economic environment; 3) measures related to development activities and international cooperation (see Table 5.2.3). We did not include the preservation of cultural identity and the strengthening of the social pro-tection system as more universal aspirations in this clas-sification; therefore in the following table, the columns showing the percentages of the supported measures do not add up to 100 percent.
We see that support for the protectionist mea-sures was quite limited, as was also true in the 2000 survey. The measures related to economic development and international cooperation were mentioned most frequently by all the expert groups, whereas especially noteworthy was the strong support to these from the economic policymakers. Compared to the 2000 survey, the importance of consolidating the economic environ-ment has decreased somewhat, in the opinion of the economic policymakers.
Above, we placed each of the individual measures in one of three groups, based on what its main contri-bution seemed to be from the survey compilers’ view-points. However, in reality, the respondents’ views may differ somewhat from this grouping. In order to under-stand the perception of the measures and their connec-tion by respondents we used cluster analysis2. Based on data clustering the measures were concentrated in clusters as to their “proximity” or “remoteness”. In the case of each cluster, we can speak about a “cluster form-ing measures”, around which the others converge. It is also possible to determine, which measures selected by
Total sample,
2013
Economic policymakers,
2013
Economic policymakers,
2000
International cooperation for fighting crime 4 – 5 2 – 3 1 – 2
Stricter rules to ensure the transparency of financial institutions 7 6 1 – 2
Stronger supervision of the financial sector by the Bank of Estonia and the Financial Supervision Authority 8 7 – 8 3 – 5
Stronger industrial and technological policies 3 2 – 3 3 – 5
Rising labour quality for coping in international competition 1 1 3 – 5
International cooperation related to environmental protection 6 5 6
International cooperation to prevent money laundering and banking-related crime 10 9 – 10 7
Measures against abusing off-shore zones 12 11 8 – 9
Maintaining of Estonia’s cultural identity 2 4 8 – 9
Strengthening and better financing of the social protection system (helping people to cope with a crises) 4 – 5 7 – 8 10
Subsidising/supporting agriculture 9 12 11
Protective measures to preserve jobs in Estonia 13 – 14 13 12
Barriers to prevent unwanted immigration 13 - 14 14 *
International cooperation to fight against diseases and epidemics 11 9 – 10 *
Table 5.2.2Support of the different respondent groups for the measures that are necessary for coping with the impacts of globali-sation (the position of the measure in the ranking is based on the percentage of supporters)
*Measures indicated with a * were not included in the 2000 survey.
2 In the analysis, we used k-means cluster analysis.
Entr
epre
neur
s
Econ
omic
pol
icym
aker
s
Polit
icia
ns
Cultu
ral fi
gure
s
PhDs
Econ
omic
pol
icym
aker
s,
2000
Protectionist measures 10 4 14 11 18 5
Measures to consolidate the economic environment 24 27 22 24 21 42
Development activities and international cooperation 48 52 44 42 40 47
Table 5.2.3The support of the elite groups for the different types of measures (support for the measures of the correspond-ing group among all the measures supported by the given elite group (%))

200 Estonian Human Development Report 2012/2013
which groups of respondents dominated in the forma-tion of one or another cluster.
As a result of the analysis, three clusters were formed:
• 1. This cluster formed around measures such as the strengthening of the social system, the strengthen-ing of cultural identity, labour development and the promotion of industrial and technological policies. We called this the human capital-focused response pattern cluster.
• 2. This cluster formed around measures such as the preservation of jobs, agricultural subsidies, barriers to prevent immigration as well as the strengthening of cultural identity and fighting crime. We called this the defensive-national-centred response pattern cluster.
• 3. This cluster was the most diverse. On the one hand, it includes the main measures from the first cluster – the development of labour as well as industrial and technological policies. However, a number of other measures are also included, such as consolidation of the financial sphere; manage-ment of various non-economic risks; international cooperation for the prevention of crime and disease; and environmental conservation. We called this the cluster focused on institutional solutions for development and risk prevention. This cluster is characterised by a high percentage of measures related to international cooperation.
Three measures play a formative role in two clusters simultaneously. These measures are the preservation of Estonia’s cultural identity, labour quality improvement as well as the development of industrial and technological policies. Emphases on national identity is connected to the first cluster with the means for strengthening Esto-nia’s potential in the international economy; in the second cluster, the same value is positioned in a protectionist context. It is understandable that the content and con-sequences of this aspiration may be different for different respondents. For some people, valuing the national iden-tity may be connected to a desire to close Estonia off to external influences and dangers; while for others, it may be connected to the aspiration of having Estonia create its own high-tech industry.
The fact that the majority of the economic pol-icymakers, based on their preferences, are classified as belonging to the third cluster, is quite understandable, because their own activities are (or at least have been to date) quite focused on institutions and regulations (here, Estonia’s EU membership also probably plays a role). The breakdown of the entrepreneurs between clusters differs from that of the economic policymakers – most of them are positioned in the first cluster, which is focused on human capital. Although one of the factors forming the first cluster is the strengthening of social policies, and the majority of entrepreneurs are not among its supporters, the affiliation of the majority of entrepreneurs with the first cluster is determined by their support for labour development, and the promotion of industrial and tech-nological policies. In the case of the entrepreneurs a cer-tain underestimation of the importance of international
cooperation measures can be observed (see Table 5.2.4.).Unlike the economic policymakers, the human capital and social issues (along with international cooperation) are significant on the mental maps of the politicians, judging by their large percentage in the first cluster. The breakdown of the cultural figures is broadly similar to that of the general sample. The fact that defensive atti-tudes dominate in a relatively large portion of the recently graduated PhDs may be partly caused by the fact that there are more women among them than in the other clusters. It is assumed that protective attitudes are more typical of women than men.
There are differences between opinions of people broken down in different clusters as to how well Estonia has succeeded, or has not, as do their attitudes toward the European Union. As for the assessment of the dynamics in Estonia’s affairs (see Fig. 5.2.1.) it turns out that the respondents, whose answers mainly relate to the defen-sive-national-centred cluster, display a noticeably more negative assessment of the dynamics of Estonia’s demo-graphic situation, as well as the dynamics of security developments and the widening income gap . They have a more negative image of the European Union than the others, and most of them do not agree with the opinion that Estonia’s membership in the EU has mitigated the negative impacts of globalisation.
In most cases, those affiliated by their prefer-ences with the third cluster look at the developments in Estonia, through glasses that are much rosier than the others’. This does not only apply to topics like the competitiveness of the state, or the impact of foreign investments on Estonia, but also, for instance, to health, the sense of security, wealth inequality, and even demographic trends. At this point it could be speculated that, due to the nature of their professional activities, the representatives of this cluster may be less down-to-earth, especially when it comes to their perception of social problems.
Judged by their degree of criticism, the respondents affiliated with the human capital-focused cluster are gen-erally located between the two other clusters. At the same time, they are more critical than the others about the dynamic of Estonia’s economic competitiveness.
Cluster types Entr
epre
neur
s
Econ
omic
po
licym
aker
s
Polit
icia
ns
Cultu
ral fi
gure
s
PhDs
Tota
l
Human capital-focused response pattern 54 26 49 34 32 37
Defensive-national- centred response pattern 15 12 16 26 36 22
Response pattern focused on institutional solutions for development and risk prevention
31 62 35 40 38 41
Table 5.2.4Breakdown of the different elite groups as to their response patterns, % of the group.

201Estonian Human Development Report 2012/2013
The level of institutional development in Estonia has improved consistently and is among the best in Central and Eastern Europe. At the same time, criticism, about some aspects of the current governance practices in Estonia, has started to increase. It has been asserted that governance, in Estonia, is characterised by a shift towards a universalistic and standard governance culture and procedures. Estonia’s governance practices are quite proper, but have certain shortcomings – its administrative and reactive nature, and a tendency towards autonomous operation of individual spheres of governance, rather than their cooperation and the involvement of various social groups in policymaking. Such a governance system tends to consider all activities to be equally important, and, in this framework, it is difficult to shape and focus on developmental preferences. A more focused and pro-active form of state governance is needed (Eesti 2010, b). This kind of criticism can also be found in the international surveys of Estonia’s institutional development, which are otherwise quite positively inclined (OECD 2011).
5.3.1 Policy priorities and the stateThe issue of focusing also applies to economic development and economic policies . Estonia has been praised for its success in maintaining macroeconomic stability, and this under very difficult external conditions. At the same time, it can be asserted that none of the conspicuously successful states in Europe or Asia have been able to develop their
global competitive advantages based only on a macroeco-nomic stability and a favourable business environment (Chang, 2001). In this connection, the issue of “exper-iment-based economic policies” has been raised – of the need for the state to enact measures for the creation of new growth areas in the economy1 (Kuusk, 2012). In Estonia, discussions about new growth areas and smart specialisa-tion have gained momentum (especially at the initiative of the Estonian Development Fund), but this has not changed the dominant governance culture, or the economic policy dogma. Actual shifts related to the discovery and imple-mentation of new growth areas have yet to be noticed.
The elite groups, who participated in the survey, were quite unanimous regarding the focusing of policies. The prevailing position was that Estonia needs more focused policies and clearer priorities – this was the answer given by 80% of the respondents. The entrepre-neurs and economic policymakers were the most reso-lute concerning this topic. Focuses and priorities do not necessarily have to come from the “top”; they can also develop as the result of the collaborative processes of peo-ple representing different social groups. However, the pro-cess of priority setting requires coordination on the level of the society as a whole. Therefore, we cannot ignore the necessary role of the state institutions in this process. We asked the representatives of Estonia’s elite groups to choose policy spheres from a pre-determined list, which required the strengthening of national policies, in the near future. The results are shown in Figure 5.3.1.
1 Total growth areas are not considered to be traditional economic sectors, but narrower fields of activity which frequently overlapping different traditional sectors.
5.3Development policiesErik Terk, Silja Lassur
Figure 5.3.1Support for increasing the state’s role in various policy areas, %
90
80
60
70
40
50
20
10
30
0
90
80
60
70
40
50
20
10
30
0
Total PhDs Cultural �gures Politicians Economic policymakers
Perc
enta
ge
Ensu
ring r
egio
nal
deve
lopm
ent
Impr
ovin
gso
cial s
ecur
ity,
supp
ortin
gpe
ople
in n
eed
Orga
nisin
ged
ucat
ion
Prom
otio
nof
rese
arch
Shap
ing b
usin
ess-
and i
nves
tmen
ts-
frie
ndly
econ
omic
envi
ronm
ent
Heal
th
insu
ranc
e and
pr
omot
ion o
f hea
lth
Prom
otio
n of
inno
vatio
n
Man
agem
ent o
f m
igra
tion p
roce
sses
Shap
ing E
ston
ia’s
econ
omic
stru
ctur
e
Impr
ovem
ent o
f na
tura
l env
ironm
ent
Man
agem
ent o
f et
hnic
rela
tions
in Es
toni
a
Prom
otio
n of
cultu
re

202 Estonian Human Development Report 2012/2013
If the respondents’ understanding of the need for greater focus in state policies was almost unanimous, a clearly prevailing support for the strengthening of the state’s role was achieved only in regard to regional policies, social insurance and the organisation of education. Much-dis-cussed areas, like the promotion of healthcare, or innova-tion policy, were clearly “under the radar”. Increasing the role of the state in structural policy also did not receive great support, although, as we see from sub-chapter 5.2, industrial and technological policies were considered to be one of the most sensible opportunities for responding to the challenge of globalisation. The different elite groups suggested different areas where they thought the state could take the initiative – for example, the entrepreneurs suggest education, healthcare and the improvement of the economic environment; the PhDs suggest education; the cultural figures suggest research and innovation (even more than the PhDs), etc. The last two elite groups are the greatest supporters of state intervention, while those working in the field of economy seem to be more distrust-ful of the state, or rely on it less.
The positions of the representatives of the elite groups overlapped more when it comes to the growth areas in economy (Table 5.3.1). This was primarily expressed in the unanimous preference for ICT as the most important area. Tourism, leisure industry, and new technologies in energy production, were favoured by close to 50% of the respondents; and the green economy, tran-sit and logistics followed close behind. Therefore, there was no clear answer to the question of what, besides ICT, should be a priority for Estonia’s economic development. It is noteworthy that neither creative industries, nor inter-national financial services were supported by the groups that were queried (at least not now).
5.3.2 Attitudes of the elite groupsBelow, we attempt to underline some of the generalised atti-tudes of the respondents and the interconnections between these attitudes. One important indicator is the attitude to the possibilities for openness, keeping pace with the chang-ing world. This applies to global processes as well as the EU level. We constructed an index to measure openness, based on the positive answers given to 4 questions about globalisation and the EU. A second index was created based on the assessments given to the trends in various spheres during the last 10 years.
Figure 5.3.2 shows how these two composite indi-cators relate – firstly, to the idea of reduction of income differences as a precondition for successfully coping with globalisation, and secondly, to the respondent’s wishes to strengthen the role of the state, in various spheres of activity.
Do the correlations of Figure 5.3.2 confirm the cli-ché about the contradiction between the people who are rejecting global trends, disappointed in market economy developments to date and supportive of an increased role for the state; and, on the other hand, the people with open views, who are satisfied with the market economy reforms and supportive of the strengthening of the state’s role? Actually, they do not. Based on Figure 5.3.2 we can conclude that the desire to strengthen the role of the state is
associated with a critical attitude toward the development that has taken place, as well as an inclination to consider the reduction of income differences to be important; but the openness index has no statistical connection to the idea of strengthening of the state’s role (nor with the desire for more focused policies).
Considering significance of the aspiration for open-ness and the equalisation of incomes as broader indica-tors, let us take a closer look at the connection between the two attitudes. When combining these two indicators, the respondents were divided into four groups:
• A – the “globalists” (support Estonia’s continued integration into the global economy and the EU) who support the reducing of the income gap – 37% of the respondents;
• B – the “globalists” who reject the need for reduc-ing of the income gap – 33% of the respondents;
Econ
omic
po
licym
aker
s
Polit
icia
ns
Cultu
ral fi
gure
s
PhDs
Tota
l
Information and communications technology (ICT) 76 70 74 68 72
New technologies in power production 51 63 40 43 50
Tourism and the leisure industry 45 56 46 52 50
Green economy 45 42 51 45 46
Transit and logistics 42 51 46 41 45
Creative industries 27 30 57 25 33
Agriculture 18 28 26 27 24
International financial services 25 21 17 18 21
Table 5.3.1Priority areas for Estonia’s economic policy, percentage of support by group
Openness toward
the world
Level of criticism towards
past changes
Need to strengthen the role of the state
Need to reduce income
di�erences
0.40
-0.33
-0.18*
0.38
0.39
Figure 5.3.2Correlations between the various attitudes
Correlation is significant at the p=0.01 level; *Correlation is significant at the p=0.05 level.

203Estonian Human Development Report 2012/2013
• C –the “Estonia-centred” supporters of income gap reduction. They are critical of integration with the world and the EU, as well as support the reduc-tion of income differences – 23% of the respondents;
• D – the “Estonia-centred” rejecters of income gap reduction. They are not happy about the policies that promote globalisation or income equality – 11% of the respondents.
The globalists favouring the income gap reduction include an above average share of PhDs and below average share of politicians, while the group of globalists that rejects income equalisations has a greater representation of economic elite and, especially, entrepreneurs. We find a large number of cultural figures, but also politicians, among this Esto-nia-centred group, which favours income equalisation. Yet, of both cultural figures and politicians, a minority (less than a third) belong to the above group. Among the economic elite this combination of attitudes is clearly unpopular.
Groups A and C tend to favour increasing the role of the state, more than the others do. Both of these groups very strongly support increasing the role of the state in regional policies, and the promotion of educational activities. Group C, characteristically, places greater emphasis on the role of the state in social security, in the organisation of ethnic relations and in healthcare policies, but also in the develop-ment of economic structures. For this part of globalists who favour equalisation, the corresponding spheres of activity
are the promotion of innovation, management of migration, and the improvement of the environment. The globalists that reject income equalisation also indicate less than aver-age support for increasing the role of the state in the spheres of activity under observation. However, more than 50% of them still support the strengthening of the state’s role in regional development and the organisation of education.
5.3.3 Cooperation and development networks in the shaping of policyIn addition to the content of policies, an important issue is the matter of the mechanisms used to create and real-ise these policies. Some theoreticians believe that at least five or six variants can be differentiated, depending on the level of state domination, starting from total statism, where the state is not interested in any kind of involve-ment or feedback, and ending with the “Dutch” approach to procedures, in which policies are actually developed by the concerned parties, and the state controls the process from a distance and indirectly (Peters &Pierre, 2006). In this study, we differentiated three methods:
• Civil servants authorised by the politicians are the developers and the organisers of the realisation pro-cess. The goal is speed and efficiency, and if neces-sary, experts are invited to participate in the process of policymaking. Consulting with interest groups is not considered important –if it is done, it tends to be a formality.
• In the course of creation (and if possible, in the imple-mentation) of the policies, meaningful cooperation takes place with the umbrella organisations of societal institutions (e.g. employers, employees, organisations representing the rural population, professional asso-ciations, etc.). However, narrower interest groups or individuals are not allowed access to the process.
• Network-type cooperation, in which all the inter-ested parties, including individuals, are allowed to participate and to express their opinions.
We got the following results when we asked the respon-dents to indicate which form of policymaking they pre-ferred (Table 5.3.2). If we exclude PhDs the network-based option for policymaking was favoured overwhelmingly. The question is, to what extent does this result reflect strong democratic aspirations, and to what extent a lim-ited trust in the state, or the weakness of the representa-tive organisations in Estonia. The most favoured option may be very promising, and if it succeeds, it could open up important opportunities for the social mobilisation of the population in economy-related matters; but in prac-tice, this is far from easy to implement.
Entr
epre
neur
s
Econ
omic
po
licym
aker
s
Polit
icia
ns
Cultu
ral fi
gure
s
PhDs
Tota
l
Establishing objectives and developing solutions is pri-marily the task of politicians and state officials
15 2 5 3 11 6
When establishing objectives and developing solutions, the state should organise cooperation with the umbrella organisations of the important social partners (corporativist option)
31 24 33 23 50 33
The establishment of objec-tives and development of solutions must be organised so that it is possible for all the interest groups and individuals to participate (network-based option)
54 74 63 74 39 61
Table 5.3.2Support for various organisational forms in policymaking, %
References 1. CHAng, H.-J. (2001) Kicking Away the Ladder. Development
Strategy in Historical Perspective. Anthem.
2. KuuSK, K. (2012). Eksperimenteeriv majanduspoliitika. Tallinn: Estonian Development Fund.
3. oeCd (2011). OECD Public Governance Reviews. Estonia. Paris.
4. PeteRS, B.g., & PieRRe, J. (2006) Governance, Government and the State, The State. Theories and Issues. Ed by C. Hay & D. Marsh. Basingstoke (UK) and New York: Palgrave Macmillan.
5. Võtmevaldkond: Riigivalitsemine. Ekspertrühma raport. Esto-nian Development Fund 2010.

204 Estonian Human Development Report 2012/2013
The survey also examined the Estonian elite’s view of Estonia’s future perspectives. We start with the signifi-cant shifts forecast for the next ten years. The respondents were asked to select important positive changes, which would impact the general situation in Estonia and which they expect/presume to take place. The top of the ranking of these shifts is shown in Table 5.4.1.
Considering the level of the change expectation within the group (majority or minority of representa-tives expect the change), the differences of opinions between the groups and making some hypotheses about the connections between the shifts (which shifts could serve as premises for others), we obtained the following series of somewhat contradictory perspectives of the future. (When compiling the descriptions, we also used the assessments for the spheres where only individual groups expected changes and which were therefore omitted from the table)
The cultural figures’ vision of the future -- one of the focal shifts changing the future will be the develop-ment of democracy (at the same time they were pessi-mistic about increased personal freedoms). They assumed that the education level and innovativeness in Estonia will increase, but in regard to these expectations the cultural figures were not as unanimous as the representatives of the other groups. The cultural figures have a somewhat greater belief than the other groups that the population’s trust of the state will increase somewhat and that econ-omic inequality will decrease. The majority of them do not predict that an increase in the competitiveness of the economy will be one of the main shifts, which will change the situation in Estonia – they either do not believe it will increase, or do not consider it to be of pri-mary importance.
Economic policymakers’ vision of the future – the competitiveness of the economy will increase; this will, apparently, be helped along by improvements in educa-tion, and to a lesser extent, by an increase of innovative thinking. They do not believe/assume that incomes will be equalised to a greater extent. Neither do they assume that trust in the state will increase.
Economic practitioners’ (entrepreneurs’) vision of the future -- there is a unanimous belief in the increase of the competitiveness of the economy; this primarily due to the growth of innovativeness, and to a lesser extent, due to an increased level of education. They do not believe in the reduction of income gap; and they believe less in a significant increase occurring in the population’s income, than the other groups do. They believe in the strengthen-ing of the e-governance, but not in the strengthening of democracy. The entrepreneurs have even less faith than the others in the people’s trust in the state increasing.
Recent PhD’s vision of the future – they are more sceptical than the average about the prospects of inno-vation. However, the majority believes in the growth of the competitiveness of the Estonian economy, but not as unanimously as the other elite groups. They believe in the increase of the educational level; in increased incomes; and in a reduction of income differences. Compared to the other groups, they are somewhat more optimistic about the reduction of corruption.
Politicians’ vision of the future -- they believe in the growth of the economy’s competitiveness; in the increase in people’s incomes; and, for some reason, also, in an improvement in the demographic situation. The majority of this group’s representatives think that the given shifts will increase people’s satisfaction with their lives. Com-pared to the average of the respondents, the politicians
5.4Future perspectivesErik Terk, Silja Lassur
EntrepreneursEconomic
policymakers PoliticiansCultural figures PhDs Total
Competitiveness of the economy 77 64 67 46 57 61
Education 69 60 51 54 64 58
Extent of innovative thinking 85 67 56 54 41 57
Level of people’s income 46 50 56 51 59 54
Demographic situation 54 48 56 51 36 48
State of people’s health 46 52 40 31 52 45
People’s satisfaction with life 54 40 53 34 43 44
Development of democracy 15 33 30 57 36 37
People’s perception of security 38 26 42 37 32 35
Economic equality/inequality 23 24 35 37 45 35
Table 5.4.1The spheres in which the respondents expect major progress during the next 10 years, % of respondents, who chose the corresponding sphere among their choices (maximum of six).

205Estonian Human Development Report 2012/2013
are more reserved in their belief in an improvement of education, and in the expansion of innovation as primary shifts; only slightly more than 50% of the politicians include the given spheres among the six main shifts. They do not believe much in the e-governance perspectives and, similarly to the other groups, do not believe that the reduction of corruption could be an influential change. The level of their expectations related to the significant equalisation of incomes falls between those of the entre-preneurs and the cultural and educational figures..
Viewing the sample a whole levels off the differ-ences between the groups, producing a much more econ-omy-deterministic picture. The main assumption, which is shared by the largest number of respondents, is that the economy will become more competitive (apparently thanks to improved education and the spread of innova-tive thinking) and this will result in increased incomes. The respondents, generally, do not assume that income differences will decrease, that ethnic relations will improve, or that positive shifts will take place in the parameters of the political environment (development of democracy, reduction of corruption, etc.). The prevailing majority also does not believe that the state of the natural environment will improve, nor in the success of the e-governance that became Estonia’s trademark during the previous period. A certain uncertainty develops about whether in such an environment it is logical to assume that Estonia’s economic success will continue. Will the improvements related to education and innovation provide sufficient means for this? And what will be the factors that promote the improvement of education and the growth of innovation?
One can ask whether it can be assumed that in the next developmental period, the factors that brought success in the last period will continue, or whether the impact of the significant negative trends can be reversed, and the situation related thereto improved. When comparing the current assessments with the visions of the future, one tends to assume the former. The period of last 10-15 years was generally characterised by a well-developing economy, a relatively innovative entrepreneurial atmosphere, improving education, the growth of people’s incomes and an improve-ment in health. Success in all these areas is also predicted for the next period. As described in sub-chapter 5.2. some
negative trends have been developing: widening income gap, declining confidence in the state authority, and dete-riorating demographic situation. Nothing good is predicted for the first two in the next period either; and demographics is the only sphere in which improvement is foreseen (the survey methodology cannot determine the reasons for that belief). During the last period, a modest improvement was discerned in the parameters of the political environment – in regard to democracy, corruption and ethnic relations. However in the next period, the respondents do not see important positive shifts occurring in these spheres. If it turns out that the possibility of prolonging the impact of the previous success factors is overrated, and new positive developments in critical areas (trend breakes), do not occur, the end result may be far from enviable.
As a separate question, we examined the attitudes toward the European Union, as Estonia’s most relevant economic and cooperation space – starting from assess-ments of the EU and its role in relation to Estonia. A high level of agreement was evident -- 76% of the respondents stated that, for them, the European Union’s image was very positive, or generally positive, and there were no great differences between the elite groups about that. 69% found that membership in the EU has significantly, or somewhat, mitigated the negative impact of globalisation. The economic elite were more convinced of this than the other groups. As a rule, the decision-makers, who have a positive assessment of globalisation, also have a positive assessment of integration with the EU, and vice versa.
The recent Eurobaromater survey (Public… 2012) showed that more people in Estonia find that the EU has helped to better cope with the difficulties caused by globalisation, than those who deny its role as a buffer. However, the Estonian general public is not as positive as the Estonian elite in regard to this question.
As far as the future of the EU is concerned, 72% of the queried decision-makers were optimistic and, here too, their level of optimism was higher than among Esto-nia’s population as a whole. The economic elite are the most optimistic; the politicians are slightly more critical.
The answers to the question about which possible EU development path should be supported by Estonia are reflected in Figure 5.4.1.
60
40
50
20
10
30
0
60
40
50
20
10
30
0
Total PhDs Cultural �gures Politicians Economic elite
Perc
enta
ge
Collapse or dissolution of the EU
Regionalisation of the EU, the development of
a “Europe of regions”
The EU remaining as it is now
The EU remaining an association of nation-states together with
supplemental functions being assigned to the EU
Strengthening of the role of nation-states
in the European Union
Movement of the EU toward
becoming a federal state
Figure 5.4.1Support for the possible EU development options, %

206 Estonian Human Development Report 2012/2013
As can be seen, the Estonian elite as a whole supports the more centralised options for the future development of the EU, whereas the positions of the political elite and economic elite differ somewhat. The economic elite were unanimous in their support for the option, in which, regardless of the centralisation of supplementary func-tions, the EU would still remain a union of nation-states. Among the political elite, this option is also the most popular, although, one third of them still supports the movement toward a federal state.
The upward trend in the attitudes that favour the strengthening of the EU’s authority are corroborated by the results of the last Eurobarometer, which show a shift in the attitudes of Estonia’s general public in the same direction (Public… 2013). However, if we compare the results of the elite survey, which is used here, to the sur-vey of the European political and economic elites con-ducted between 2007 and 2009, we see that there is a considerable shift. In the European Elite Survey, Estonia stood out for its quite rigid opposition to the centralisa-tion trends inside the European Union (Best et al., 2012), by taking the most critical position among the states under observation along with the United Kingdom.
Which states/regions are the ones on which Estonia’s trade policy should focus more in the next 10 years than previously? We gave the respondents a list of states and regions, and asked them to choose the most important ones. The answers are shown in Table 5.4.2.
From the results, it can be seen that there is a desire to strengthen the traditional economic relations, as well as to expand the geography of economic relations. The assessments of the various elite groups differ only a little, from each other.
Estonia’s neighbouring market – the Baltic Sea Region – was named as the area requiring the most attention (three-quarters of the respondents considered it necessary to concentrate more on economic ties with the states in this region; a quarter of the respondents did not consider this necessary, and therefore thought the focus of economic policy should be shifted to other regions). The rest of the European Union placed second – about 60% of the respondents thought it important to focus on the other EU states. This is logical, because the other EU states, besides the ones in the Baltic Sea Region, are
clearly underrepresented in the geography of Estonia’s foreign trade relations. Slightly more than 50% of the respondents thought it necessary to invest in economic relations with Russia.
China came in fourth in the list of partners with whom cooperation should be accelerated (mentioned by 42% of the respondents). However, if we combine China, as a target of economic policy, with India and the coun-tries in South-East Asia, East and South Asia move up in the ranking of the focal points for Estonia’s trade policies, outpacing both Russia and the entire CIS region (in addi-tion to Russia, other large states like Ukraine and Kazakh-stan). East Asia moving ahead of the CIS region as a pri-ority area for Estonia’s economic policy is definitely a very significant shift. However, what calls for caution, is the fact that the economic elite, as well as the entrepreneurs and economic policymakers, express less support for the development of relations with China, than the sample as a whole. There is hardly any basis to assume that economic relations with China will start to develop rapidly, if the Estonian economic elite do not invest in them.
Relatively weak interest is shown towards the states and regions in the CIS outside of Russia, and to the U.S., which is our top geo-political partner. Both lagged behind South-East Asia. It should carefully considered why the U.S. – despite its powerful and high-tech economy – is not seen as being sufficiently attractive (or accessible?) as a partner for Estonian economic policy, to warrant an investment in the intensification of economic ties. Politicians are often thought to be the factor hindering the development of relations with Russia, but the politicians’ answers, in our survey, show that they placed greater value on improved economic relations with Russia than the sample did on average.
Based on the answers to the questions about Esto-nia’s geo-economical perspectives, it can be stated that, on the whole, the future Estonia requires a multidirectional and carefully considered economic policy. Some steps have already been taken in this direction, such as concre-tising the economic aspirations related to China, and Asia generally. Unfortunately, Estonia’s current foreign policy functions, on the whole, as a “general” foreign policy with a strong defence policy dominant. There is still a lot of work to be done in connection with directing our foreign policy toward the fulfilment of economic policy goals.
EntrepreneursEconomic
policymakers PoliticiansCultural figures PhDs Total
Baltic Sea Region 77 79 81 66 70 75
EU 69 59 65 51 66 62
USA 38 17 30 17 25 24
Russia 31 52 60 54 41 50
other CIS countries 38 24 23 26 14 23
China 31 33 44 49 45 42
Table 5.4.2Important cooperation regions for Estonia, % of respondents by group
References1. Best, E. et al. (eds.) (2012) The Europe of Elites. A Study of the
Europeanness of Europe’s Political and Economic Elites. Oxford & New York: Oxford University Press.
2. Public Opinion in the European Union. Tables of Results. Nov. 2012.

207Estonian Human Development Report 2012/2013
Estonia is part of the world’s most globalised region – the European Union – and is also quite globalised as a state, especially in regard to the economy. A strong dependencev an international economic environment contains great opportunities for economic gowth, but also significant risks. In order to make use of the oppor-tunities provided by globalisation and to reduce the risks involved, more consistent efforts and proactive behaviour are required on the part of our economic policy, incl. for-eign trade policy.
The Estonian elite clearly stand out for their globali-sation-minded and pro-EU attitudes. The latest economic crisis has not weakened these attitudes. The attitudes of the various elite groups do no differ significantly when it comes to these issues. In principle, the attitudes of Esto-nia’s general public are also the same.
There is a clear expectation among the Estonian elite about the need to move towards more focused policies along with an understanding that the role of the state, as the initiator, should be stronger in several spheres of activity.
Despite similar expectations related to the need to continue economic openness, and to improve the focus of our policies, the positions of the various elite groups are quite diffused when it comes to what should be focused on, what should be prioritised and in which spheres of activity the role of the state should be strengthened. One could wonder whether the elite’s basic preferences and expectations related to development, are sufficiently reinforced by measures necessary for their realisation. For instance, an increase of economic competitiveness is almost unanimously expected, while the same cannot be said about the increase of innovativeness or improvements in human capital, which should serve as basis for greater competitiveness. This alludes to the need to develop forms of activity that will provide a framework for enabling the
various elite groups (politicians, top officials, economic elite, scholars and others) to horizontally discuss and resolve their positions. A good example are the SITRA seminars in Finland that have been organised for com-plex groups for a long time, enabling the participants to learn from the best foreign development experience, and to discuss how to implement them in Finland. Although we too have searched (especially under the leadership of the Estonian Development Fund) for ways to best help new growth areas to develop in the economy, no clear common positions on these issues have been formulated, and the corresponding changes in economic policy have not been undertaken.
One central issue is likely to concern, in the tough competition of the globalising economy, the combining of the striving for efficiency with the need for sustainable use of social resources while maintaining the cohesion of the society, which is particularly important for a small country (income policy, social security, regional policy etc). It seems, that the political discussion concerning these issues will intensify in near future. The elite survey showed that, fortunately, the attitudes valuing economic openness do not rigidly oppose the social attitudes that perceive income differentiations as a problem. This creates the preconditions for overcoming the conflicts caused by the differences related to economic and social policies.
Foreign policy is faced with the task of helping to develop and implement a multi-directional foreign trade policy (incl. neighbouring EU regions, more distant EU regions, Russia, China and South-East Asia). Also, con-sidering the attitudes of the decision-makers that partic-ipated in the survey, there is very strong support for the implementation of mechanisms for more open and dem-ocratic policymaking. This process will not be easy, but it may provide the opportunity to find new development impetuses and opportunities.
SummaryErik Terk


209Estonian Human Development Report 2012/2013
6 SUMMARYESToNIAN HUMAN DEVELoPMENT REPoRT 2012/2013
The Estonia Human Development Report for 2012–2013 introduced the reader to dozens of measures and hun-dreds of rankings, which the authors believe should provide a good description of today’s world and its people. Inevitably the question arises: what is this – the truth about life, a manipulation by interest groups, or a good business project? There is no sense in searching for the complete truth or an unambiguous message in these rankings, or numerical indicators characterising the countries. After all, the only thing a comparison can provide is hints about how things are going – nothing more. Everyone must obtain the complete picture through their own interpretation. At the same time, global com-parisons definitely provide a more trustworthy basis for these interpretations than purely personal attitudes and common (pre)conceptions. The rating industry provides a way for the globalising world to perceive and describe itself. If organisations like the UN, OECD and Eurostat are behind the offering, one can be sure that an attempt is being made to use yardsticks that are assembled using the best available knowledge and carefully controlled proce-dures. Yet, it is still pertinent to point out some distinctive features of the rating industry.
If we know the author, both the content and mean-ing of the comparison become clearer. Thus, in some cases the procedures and the result acquire the face of the initiator. If the UN is compiling the comparison, it will probably be related to global concerns; if the OECD
is involved, an important motive will be to find instru-ments for stimulating economic development. In the case of Gallup, their American-centric approach in formulating the questions and interpreting the results is inevitable. Knowing the author allows us to better understand the idea and implications of the undertaking.
It also pays to pay attention to the sources of the data. These can vary to a great extent; some sources are more reliable and trustworthy, like national censuses or government statistics, although, even in these cases there are certain margins of error. The yardsticks with greater degrees of fluctuation and more possibilities for interpre-tation are the ones based on surveys or expert assess-ments. Especially the latter are significantly affected by the composition of the expert group, and also the broader cultural context.
The numerical values of the indicators character-ising countries and peoples, most of which are presented as so-called “averages”, have caused some confusion. An average does not mean that this is characteristic of the majority. If the average life satisfaction value on the Gal-lup “ladder” is 5.4, this does not mean that the majority of Estonians have positioned their level of satisfaction between the fifth and sixth “steps of the ladder”. An average becomes meaningful when complemented by knowledge about the extent to which the given indicator varies in society. Actually, there is no such thing as an average Estonian – there are different groups, interests and
The Next StepMati Heidmets

210 Estonian Human Development Report 2012/2013
behavioural patterns. Therefore, it is pertinent to take a look behind the averages and find out how wealth, satis-faction or the use of the Internet is actually distributed by age groups, regions, etc.
The situation in which several different groups of authors or organisations come to similar conclusions by examining the same phenomenon adds credibility to the results. An example is the information being received from several sources about the increasing differences between men and women in Estonia related their life expectancy, wages conditions and educational levels. So, it must be true that gender-related matters are out of order and the time is ripe for conducting a broader analysis and taking some practical steps.
Friendly scepticism about the information received from the rating industry is definitely appropriate, but this should be accompanied by the realisation that there is often nothing more precise or reliable to replace it.
6.1.1 The ideal worldMost measures of development are constructed as rank-ings. Those at the top of ranking get plusses and are defined as better and more developed; ending up toward bottom gives to a minus – defines you as being sec-ond-rate. Either explicitly or covertly, rankings indicate a desired direction of movement – toward the things that are expected in today’s world, be it longer life expectancy, greater competitiveness or a more perfect democracy. Could collecting plus points from various rankings allude to some more general ideal, to a model of a dream society toward which the globalising world is moving – a move-ment that is esteemed by others?
No attempt has been made to construct this ideal world, which would be based on the measures of devel-opment, and this is probably not a good idea. The sample of measures is very changeable; they are often born and disappear along with their authors, and their interpreta-tion is contradictory. At the same time, it cannot be denied that many of the paths that get plus points have validated themselves globally and serious efforts are being made to try and achieve them. Some have even become globally or nationally accepted developmental objectives, including the United Nations Millennium Development Goals, the European Union’s smart growth or Estonia’s Smart and Active People programmes. Using the Gallup ladder metaphor, one can say the following: there are dozens and dozens of devel-opmental ladders in use around the world and not only are they being eagerly climbed, but the climbers of these ladders are being zealously assessed and compared. So what if the tops of the ladders are hidden in the fog and a clearly defined objective for making the climb is not visible.
Comparing and ranking the climbers on the developmental ladders adds momentum to their climbs. Getting a step ahead of one’s neighbour is exciting and provides self-confidence; clearly lagging behind causes concern and forces one to try harder. This is true regard-less of the critics for whom all this is just a useless rat race or the increasingly thorough satisfying of ever more pointless needs. The more serious critics offer their own alterna-tives. A good example is the New Economics Foundation
The following are higher than the EU average in Estonia
Media freedom
Internet freedom
Economic freedom
Intensity of media use
Schoolchildren’s level of knowledge
Trust in the European Union
Optimism about the future
The following correspond to the EU average in Estonia
The following are lower than the EU average in Estonia
Democracy
Competitiveness of the economy
Innovation capability
Corruption
Trust in government institutions
Percentage of people with higher education
Ecological Footprint
Life expectancy
Years of healthy life
Productivity of work
Wealth, wage level
Life satisfaction
Tolerance
Gender equality
Figure 6.1.1Estonia and European Union

211Estonian Human Development Report 2012/2013
that repudiates the GDP-centric mindset and has created a Happy Planet Index, which is rapidly gaining popularity.
From Estonia’s point of view, most of these ladders seem reasonable and pertinent: even the anti-globalists and euro-sceptics want to live healthy lives with some banknotes in their pockets, and none of them want to fall victim to criminals or end up in the grasp of corrupt superiors. Regardless of the criticism and the qualms, the development ladders we see circulating in the world rep-resent the current understanding of what is important and significant in life. Climbing them will not lead to an ideal world, but it will make life more worthy of human dignity.
6.1.2 The next stepIt has taken Estonia two decades to settle into the open world and the global marketplace. In this report, we com-pare the length of our steps both globally and in respect to selected reference states. Figure 6.1.1 provides a gener-alised comparison with our immediate environment – the European Union. The spheres of life where Estonia is an achiever in the EU context are included, as are the areas where we lag behind.
When examining Estonia’s position in the world, as well as in Europe, a unique contradiction becomes evident – the indicators of our potential are often better than our actual results. Estonia has been able to create a favour-able environment, without any significant restrictions, for people, companies, and civil society organisations to act. We follow the rules; our procedures are simple and technology-friendly, even outdoing the countries of “old” Europe. The Estonian taxpayers have to spend relatively little to service the state debt. We have built an environ-ment that supports development, but, at the same time, have not succeeded in adequately converting this into benefits for the local people. Our health, wallets and life satisfaction continue to among the poorest in Europe. The development environment is good, but the development itself does not meet expectations. Thus, our next challenge is to transform Estonia’s potential into actual life quality. The following are some observations based on this report, which could support the steps that we will need to take.
Firstly – the broader view. Today, there are great fluctuations in the assessments of Estonia: the external view consists mostly of a wonderful success story; the internal view is indecisive and critical, and sometimes downright dramatic. The dramatic internal view is often supported by a narrow base of comparison, which usu-ally starts with the statement, “But in Finland, they ….” Broader comparative circumstances would benefit the Estonians’ mindset. By examining the broader context, we would find out that ideal worlds do not exist, and on the global arena, we have actually coped very well – we are one of the few societies with a population of about one million which has established itself in the world. A broader comparison would also help to increase the people’s self-confidence in Estonia and cure them of the need to cling to past concerns. It would help to shift their attitude from someone who is endangered and waiting for help toward someone who is responsible and makes a con-tribution. Because our actual position in the world tells us
outright – we have to tend not only to our own business, but also to the business of Europe and the world.
Secondly – the obstinate view. In the course of twenty years, the Estonian state and people have been good learners, adopting the things that already existed – be it the European Union’s rules, NATO’s standards or the correct wording of human rights issues. Unfortu-nately, imitation can only produce a middling result, not the best one. Becoming one of the best requires stepping outside the well-worn path, having the courage to risk, taking a critical of view oneself, but also having the ability to compromise. In this regard, we lag behind the most capable players – be it enterprise in the economic sphere, leadership in the social sphere, or clearly argued involve-ment in politics. Our conservative self-interest needs to be purposefully complemented by a more constructive and creative attitude toward life.
Thirdly – the comprehensive view. The report points out that some unreasonably large differences in the society are hidden behind Estonia’s excellent average indicators – be it regional differentiations, gender gaps or differences between Estonians and other ethnic groups. A small society cannot allow itself the luxury of being splintered or of wasting its human capital – those who lag behind have to be brought up to speed. Experience teaches us that the successful small states of the world do not rec-reate America at home, but rather strive to create Nordic countries, in the belief that the price of vitality is internal harmony. The attitudes of the elite who are focused on the social sphere, which were described in chapter five of this report, point to the fact that things are changing.
Fourthly – the direct view. The next step requires that we also face some inconvenient truths, which capa-ble Estonia has preferred to ignore – whether the topic is our title of European HIV-positive champion, the hot potato of immigration, the Russian complex that consis-tently impedes us, and forces us to write preambles, fight against gas pipelines and be ashamed of Yeltsin bas-re-liefs. Instead, we must look at the Estonian-Russians with a clear gaze and recognise their contribution to the improvements in our life, supported by the knowledge that those who ignore problems can achieve mediocrity but not excellence.
The global marketplace is a harsh world, where sur-vival is not guaranteed for anyone. It is a kind of miracle that, after surviving the meat grinder of the twentieth century, Estonia has been able to establish itself and cope in this marketplace. Unfortunately, the rules of the mar-ketplace do not allow for any let-up. A great step has been taken and the next one is just ahead. Estonia’s skeleton – its judicial area, economic environment and democracy – works but it requires some fine tuning. Now the focus must shift to the content – smarter enterprise, better-paid work, transparency in politics, flexibility in education, and uniform development. This requires a fresh viewpoint and leadership, but we must also rid ourselves of any impedi-ments. Estonia has been remarkably capable at removing external limitations, now we have to come to grips with the internal ones. A broader, more obstinate, more comprehen-sive and more honest view of ourselves and the world will hopefully help us to join those who are the best, not only in potential, but also in the context of actual life quality.

212 Estonian Human Development Report 2012/2013
Clemens Buchen (PhD)
is a post-doctoral fellow at the Univer-sity of Tartu, within the framework of the ERMoS project titled “The Institu-tional Bases of Innovation of Foreign Investments”. The topic of his doctoral thesis is the emerging economic sys-tems in Central and Eastern Europe.
Aado Keskpaik (PhD) is project manager at The Estonian Institute for Futures Studies at Tallinn University. His main field of research is the regional development of Estonia. He has long-term experience as an expert in drawing up regional development strategies, national spatial planning documents and operational programmes for the EU Structural Funds.
Raul-Allan Kiivetis Professor of Health Care Manage-ment at the University of Tartu, and Head of the University’s Department of Public Health. During the last few decades, his research activities have been focused on the evaluation of the outcome and effectiveness of the healthcare services, clinical pharma-cology and health economics.
Kaie Kerem is Professor of Economic Theory at the Economics Department of the Tallinn University of Technology, and Director of the Institute of Economic Theory. Her main area of research is related to social models and convergence. Five doctoral candidates have defended their theses under her supervision. She is also the author of several text-books on economic theory.
Helje Kaldaruis Candidate in Economics, Associate Professor of Microeconomics at the University of Tartu; her research work is focused on the regularity of economic development, the develop-ment of social and human capital, and connections between the institutional social organisation and economic development.
Mari Jüssihas worked as Senior Expert at the Estonian Institute for Sustainable Development since 1998. Her main fields of interest include the analysis of environmental policy and assess-ment of the impacts of transportation, mobility and urban planning. She is involved in developing many envi-ronmental strategies and plans for Estonia. Interested in environmental awareness and living environments, she is a coordinator of a project to promote the use of bicycles in Tallinn.
Mati Heidmetsis Professor of Psychology at Tallinn University and Candidate of Psychol-ogy. His fields of research include environmental psychology, educa-tional policy and quality planning in education. He was the editor-in-chief of the Estonian Human Development Report in 2006 and 2007.
Veronika Kalmus (PhD) is Professor of Media Studies at the Institute of Journalism and Commu-nication of the University of Tartu. Her research interests are related to children’s and young people’s media use, online risks and opportunities, socialisation, as well as intergenera-tional relations and values.
EDR 2012/2013 authors

213Estonian Human Development Report 2012/2013
Silja Lassur is a PhD candidate and project man-ager at Tallinn University’s Estonian Institute of Future Studies. Her fields of research include innovation and the international comparison of inno-vation policies, as well as the creative economy.
Triin Lauri is a PhD candidate at Tallinn University’s Institute of Political Science and Gov-ernance and lecturer in economic and social policy. Her research interests are focused primarily to school selection, and the related questions of efficiency and equity in education. Her interest in the topic of school selection has also added the following to Triin’s research interests: the problems of educational administration; and issues concerning the modification public policies and the public sphere more broadly, incl. meth-od-related challenges in the solution of complicated public problems.
Juhan Kivirähk is Senior Researcher Fellow at the International Centre for Defence Stud-ies. He has conducted public opinion polls and market research for almost 30 years, working in various research companies (Emor; Turu-uuringute AS; Faktum Research Centre). During the last six years, he has concentrated on sociological research related to national defence.
Marju Lauristin is Professor of Social Communications at the University of Tartu, and Candi-date of Philology. Her main fields of research are social changes in transi-tional Estonia, problems related to the knowledge and information society, and the Russian minority in Estonia. From 2008 to 2011, she was the edi-tor-in-chief of the Estonian Human Development Report.
Reelika Leetmaa is the Programme Director of Labour and Social Policy and Member of the Executive Board at the Praxis Center for Policy Studies. Since 2003, she has advised the European Commission on topics related to labour market policies, by participating in the work of the Euro-pean Employment observatory. Her fields of research include the impact of labour policy on the functioning of the labour market; and she is the author of many applied research studies.
Martin Mölder is a PhD candidate in political science at Central European University. In his work, he has focused on examining the political similarities of political parties in the context of the party sys-tems and coalition governments of the European countries. During the last few years, he and Vello Pettai have been the co-authors of the Estonian survey for Freedom House’s Nations in Transit study.
Katrin Männik (PhD) is the senior consultant at Technop-olis Group, an international research and consulting firm. Her main fields of research are policies for the sup-port of entrepreneurship in various countries, their development and the assessment of their effectiveness.
Vello Pettai (PhD) is Professor of Comparative Politics at the University of Tartu, and Director of the Institute of Political Science and Governance. His fields of research include democratisation and electoral studies. Since 2009, he, together with Martin Mölder, has compiled the annual survey of Estonian politics for Freedom House’s Nations in Transit study.

214 Estonian Human Development Report 2012/2013
Kaire Põder (PhD) is Senior Research Scientist in the Chair of Theoretical Economics of the Department of Finance and Economics at the Tallinn University of Technology. Her main field of research is political and institutional economics with an emphasis on the analysis of the attri-butes of social traps and distribution mechanisms. In addition, she is the responsible executor for the research topic, Estonian School Selection Mech-anisms.
Jüri Saar is Professor of Criminology in the Insti-tute of Public Law at the University of Tartu. His main fields of research are criminal careers, the various forms of criminal activity (incl. corruption, human trafficking and homicides) and crime control in a globalising world.
Luule Sakkeus (PhD) is Director and Senior Researcher at Tallinn University’s Estonian Institute for Population Studies. Her main field of expertise is demographic develop-ment in Estonia; her current research is mainly focused on population ageing and health. Since 2010, she has coordi-nated the international SHARE survey in Estonia, and also actively involved in the development of the national statistical system.
Alari Purju is Professor of Public Economy at the Tallinn University of Technology. His field of research is the economy and taxation of the public sector. He has also published articles on the mutual impact of foreign trade and regional economic activity, as well as the recip-rocal impact of regulations, and the policies of the European Union.
Allan Puur (PhD) is Leading Researcher at Tallinn Uni-versity’s Estonian Institute for Popu-lation Studies. His area of research is demographic development in Estonia. In recent years, his research work has focused on fertility and family formation (the Second Demographic Transition, changes in the timing of parenthood and its effects, long-term continuities in demographic patterns). He also involved with the development of infrastructure and data sources for population research in Estonia.
Anu Realo (PhD) is Estonian Academy of Sciences Research Professor in the Depart-ment of Psychology at the University of Tartu. Her research is focused on personality norms, personality genet-ics, emotions, subjective well-being, social capital and stereotypes of national character. Since 2012, she has also been the responsible researcher in Estonia for the World Values Survey.
Jüri Sepp is Professor of Economic Policy at the University of Tartu, and Candi-date of Economics. His research work is related to the institutional and structural factors of the economic development of states, including the organisation of the governance of the infrastructural sector. He is also the author and translator of several general works on economic theory and economic policy.
Triin Roosalu (PhD) is a researcher at Tallinn University’s Institute of International and Social Studies. As a sociologist, her research interests include social stratification, pre- and post-socialist states and com-parative institutional analysis, which are related primarily to work, lifelong learning and the combining of jobs and life, as well as gender regimes more broadly. From 2004 to 2011, she par-ticipated in the international research project titled Towards a Lifelong Learn-ing Society in Europe: The Contribution of the Education System; and since 2012, she has represented Estonia on the lead committee of the International Social Studies Programme (ISSP).
EDR 2012/2013 authors

215Estonian Human Development Report 2012/2013
Tiit Tammaru (PhD) is Professor of Urban and Population Geography at the University of Tartu. His main fields of research are popula-tion migration and sub-topics related thereto: migration and the changes in the Estonian diaspora in time and space; urbanisation, suburbanisation and counter-urbanisation; housing conditions, changing neighbourhoods and segregation. He has also exam-ined the mutual connections between the spatial location of ethnic groups and integration.
Uku Varblane (MA) is an analyst in the Centre for Applied Research at the University of Tartu and a PhD candidate in the Depart-ment of Economics at the University of Tartu. His fields of research are concerned primarily with topics related to productivity, innovation and direct foreign investments.
Peeter Vihalemm is a Senior Researcher of Media Studies at the University of Tartu, Professor Emeritus, and Candidate of Psychology. His main fields of research include soci-etal changes in transitional Estonia, the media system and media use in Estonia, and the international social space in the Baltic Sea Region.
Anu Toots is Professor of Comparative Public Policy at Tallinn University’s Institute of Political Science and Governance. Her research interests are related to the contemporary problems of welfare states, including the concept of the welfare state as a state comprised of social investments. Within the framework of educational policy, she is involved with the IEA’s international studies of educational achievement and coordinated the IEA Civic and Citizenship Education Study between 1999 and 2009.
Erik Terk (PhD) is Director of Tallinn University’s Institute for Future Studies, and Pro-fessor of Future Studies and Strategic Management at the same university’s Institute of Political Science and Gov-ernance. His fields of research include the compilation of development sce-narios for states and regions, and developments in Estonia viewed in a geo-economic context.
Urmas Varblane is an academician, Professor at the University of Tartu, Head of the Chair of International Business and Inno-vation, and Candidate of Economics. The main directions of his research include the following: the interna-tionalisation of Estonia businesses, the role of direct foreign investments in the economy, the state’s innovation system and innovation policy, produc-tivity and competitive of the branches of the economy.
Andres Võrk is Lecturer of Econometrics in the Department of Economics at the University of Tartu and Analyst of Labour and Social Policy at the Praxis Center for Policy Studies. His fields of research include the impact of Esto-nian labour and social policies on the labour market and the sustainability of social security. He is the author of sev-eral applied research studies dealing with the Estonian labour market and social policies.

Editor-in-Chief: Mati Heidmets
Production coordinator and Estonian language editor: Piret Mäeniit
Translation: Juta Ristsoo
Design: Disainkorp
Front cover photo: Meeli Küttim
Publisher: Estonian Cooperation Assembly
Printer: ILOPRINT
ISSN 1406-5401
The expert survey conducted for this report on the impact of globalisation on Estonia and the future prospects of the European Union were financed by the European Commission (order no. EE/2012/10.02.05.02.02).


ESTONIAN HUMANDEVELOPMENTREPORT 2012/2013
Estonia in the World
ESTONIAN HUMANDEVELOPMENT REPORT 2012/2013
Estonia in the World
ESTON
IAN
HU
MA
N D
EVELO
PMEN
T REP
ORT | 2012/2013 | ESTO
NIA
IN TH
E WO
RLD