Determination of Selectivity and Efficacy of Fatty Acid Synthesis Inhibitors
43
1 Determination of Selectivity and Efficacy of Fatty Acid Synthesis Inhibitors Srinivas Kodali 1 , Andrew Galgoci 1 , Katherine Young, Ronald Painter, Lynn L. Silver 2 , Kithsiri B. Herath, Sheo B. Singh, Doris Cully, John F. Barrett, Dennis Schmatz and Jun Wang* Department of Human and Animal Infectious Disease, Merck Research Laboratories, Rahway, New Jersey 07065 *Corresponding author: Jun Wang Merck & Co., Inc.; P.O. Box 2000 R80Y-205; Rahway, NJ 07065 Telephone: 732-594-2776; Fax: 732-594-1399 E-mail: [email protected] Footnote: 1 S. K. and A. G. contributed equally to this work 2 Current address: LL Silver Consulting, 3403 Park Place, Springfield, NJ KEY WORDS: FASII, High throughput assay, efflux, permeability, cerulenin, bischloroanthrabenzoxocinone (BABX), thiolactomycin, triclosan RUNNING TITLE: Type II Fatty Acid Synthesis --------------------------------------------------------------------------------------------------------------- Abbreviations: BABX: bischloroanthrabenzoxocinone; βME: β-mercaptoethanol; DTT: dithiothreitol; ACP: acyl carrier protein; CoA: coenzyme A; NAC: N-acetyl-cysteamine; cerulenin: (2S)(3R)2,3-epoxy-4-oxo-7,10-dodecadienoylamide; thiolactomycin: (4S)(2E,5E)-2,4,6 trimethyl-3-hydroxy-2,5,7-octatriene-4-thiolide; triclosan: 2,4,4’- trichloro-2’-hydroxydiphenylether; MIC: minimal inhibitory concentration. JBC Papers in Press. Published on November 1, 2004 as Manuscript M406848200 Copyright 2004 by The American Society for Biochemistry and Molecular Biology, Inc. by guest on September 3, 2016 http://www.jbc.org/ Downloaded from by guest on September 3, 2016 http://www.jbc.org/ Downloaded from by guest on September 3, 2016 http://www.jbc.org/ Downloaded from by guest on September 3, 2016 http://www.jbc.org/ Downloaded from
-
Upload
efluniversity -
Category
Documents
-
view
0 -
download
0
Transcript of Determination of Selectivity and Efficacy of Fatty Acid Synthesis Inhibitors

1
Determination of Selectivity and Efficacy of Fatty Acid Synthesis
Inhibitors
Srinivas Kodali1, Andrew Galgoci1, Katherine Young, Ronald Painter, Lynn L. Silver2, Kithsiri
B. Herath, Sheo B. Singh, Doris Cully, John F. Barrett, Dennis Schmatz and Jun Wang*
Department of Human and Animal Infectious Disease, Merck Research Laboratories,
Rahway, New Jersey 07065
*Corresponding author: Jun Wang Merck & Co., Inc.; P.O. Box 2000 R80Y-205; Rahway, NJ 07065 Telephone: 732-594-2776; Fax: 732-594-1399 E-mail: [email protected]
Footnote: 1 S. K. and A. G. contributed equally to this work 2 Current address: LL Silver Consulting, 3403 Park Place, Springfield, NJ
KEY WORDS: FASII, High throughput assay, efflux, permeability, cerulenin,
bischloroanthrabenzoxocinone (BABX), thiolactomycin, triclosan
RUNNING TITLE: Type II Fatty Acid Synthesis
--------------------------------------------------------------------------------------------------------------- Abbreviations: BABX: bischloroanthrabenzoxocinone; βME: β-mercaptoethanol; DTT: dithiothreitol; ACP: acyl carrier protein; CoA: coenzyme A; NAC: N-acetyl-cysteamine; cerulenin: (2S)(3R)2,3-epoxy-4-oxo-7,10-dodecadienoylamide; thiolactomycin: (4S)(2E,5E)-2,4,6 trimethyl-3-hydroxy-2,5,7-octatriene-4-thiolide; triclosan: 2,4,4'-trichloro-2'-hydroxydiphenylether; MIC: minimal inhibitory concentration.
JBC Papers in Press. Published on November 1, 2004 as Manuscript M406848200
Copyright 2004 by The American Society for Biochemistry and Molecular Biology, Inc.
by guest on September 3, 2016
http://ww
w.jbc.org/
Dow
nloaded from
by guest on September 3, 2016
http://ww
w.jbc.org/
Dow
nloaded from
by guest on September 3, 2016
http://ww
w.jbc.org/
Dow
nloaded from
by guest on September 3, 2016
http://ww
w.jbc.org/
Dow
nloaded from

Srinivas Kodali Type II Fatty Acid Synthesis 2
Summary
Type II fatty acid synthesis (FASII) is essential to bacterial cell viability and is a
promising target for the development of novel antibiotics. In the past decade, a few
inhibitors have been identified for this pathway, but none of them lend themselves to
drug development. In order to find better inhibitors that are potential drug candidates, we
developed a high throughput assay that identifies inhibitors simultaneously against
multiple targets within the FASII pathway of most bacterial pathogens. We demonstrated
that the inverse t1/2 of the FASII enzymes-catalyzed reaction gives a measure of FASII
activity. The Km values of octanoyl CoA and lauroyl CoA were determined to be
1.1±0.3 and 10±2.7 µM in Staphylococcus aureus and Bacillus subtilis, respectively. The
effects of free metals and reducing agents on enzyme activity showed an inhibition
hierarchy of Zn2+>Ca2+>Mn2+>Mg2+; no inhibition was found with β-mercaptoethanol or
dithiothreitol. We used this assay to screen the natural product libraries and isolated an
inhibitor, bischloroanthrabenzoxocinone (BABX) with a new structure. BABX showed
IC50 values of 11.4 and 35.3 µg/ml in the S. aureus and E. coli FASII assays,
respectively, and good antibacterial activities against S. aureus and permeable E coli
strains with MICs ranging from 0.2 to 0.4µg/ml. Furthermore, the effectiveness,
selectivity and the in vitro and in vivo correlations of BABX as well as other fatty acid
inhibitors were elucidated, which will aid in future drug discovery.
by guest on September 3, 2016
http://ww
w.jbc.org/
Dow
nloaded from

Srinivas Kodali Type II Fatty Acid Synthesis 3
Introduction
Infectious disease is a global problem and the development of drug resistance is a major
issue for all classes of antibiotics. Therefore, development of new high throughput assays
for simultaneous screening of multiple targets in order to rapidly identify novel
antibiotics is crucial. Fatty acids are essential for viability. The significant organizational
and structural differences between the fatty acid synthesis of bacteria and humans make
this system an attractive target for antibacterial drug discovery. The human fatty-acid
synthase (FASI) is a multifunctional single polypeptide composed of distinct enzyme
domains. In contrast, bacterial fatty acid synthesis (FASII) is carried out by a series of
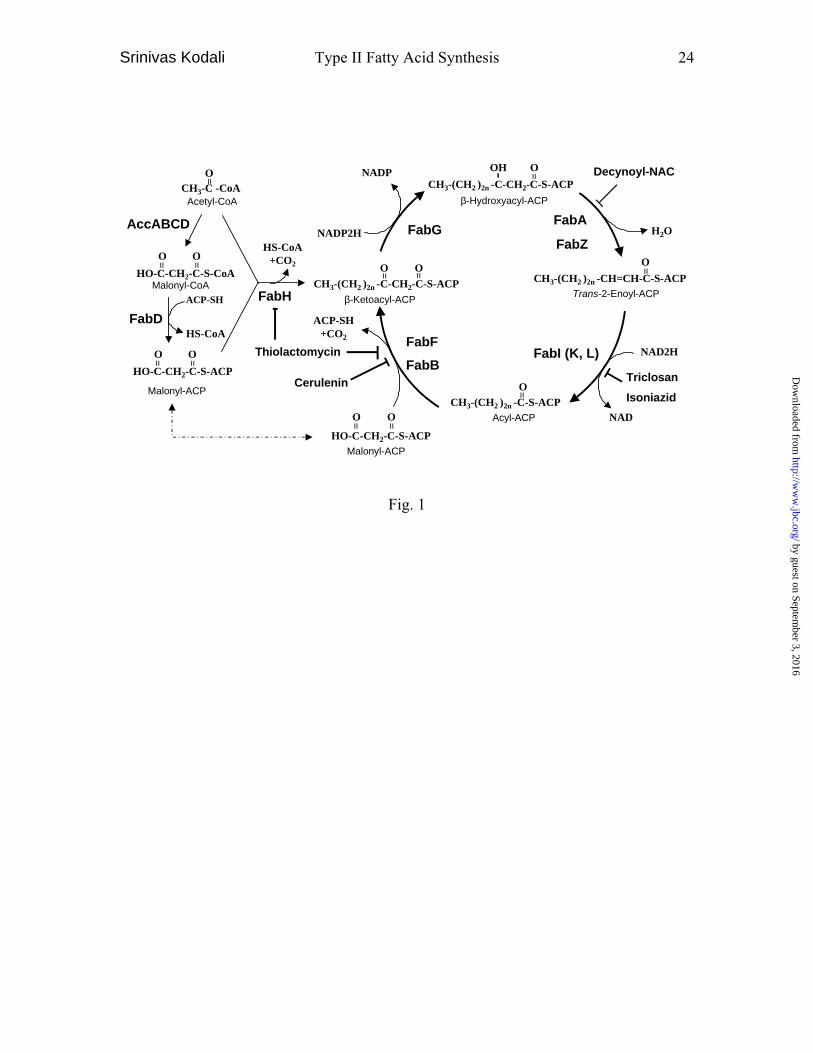
individual enzymes, which has been extensively reviewed (1,2) and is schematically
described in Fig.1. Initially, acetyl CoA is carboxylated by AccABCD (3) to form
malonyl CoA, which is, in turn, transferred to ACP (4) by FabD (5). Fatty acid synthesis
is initiated by FabH (6) supplying substrates (acetoacetyl-ACP) to the fatty acid
elongation cycle which includes FabG (7), FabA/Z (8,9), FabI (L/K) (10-12) and FabF/B
(13,14) enzymes. In the cycle, the keto group of β-ketoacyl-ACP is reduced to a hydroxyl
group by NADPH-dependent reductase FabG. β-Hydroxyacyl-ACP is dehydrated by
dehydratase FabA or FabZ. The double bond of trans-2-enoyl-ACP is reduced by NADH-
dependent reductase FabI(K/L) feeding the substrate back to FabF/B which adds an
additional acetate unit (two carbons) and the cycle iterates.
Two marketed antibacterial agents, triclosan (antiseptic) and isoniazid (anti-TB), target
the FabI enzyme of fatty acid synthesis (15,16). Two natural products, cerulenin (4) and
by guest on September 3, 2016
http://ww
w.jbc.org/
Dow
nloaded from

Srinivas Kodali Type II Fatty Acid Synthesis 4
thiolactomycin (17) inhibit the condensation enzymes FabH and FabF/B, with cerulenin
showing selectivity for FabF/B while thiolactomycin and its analogs (18,19) inhibit FabH
and FabF/B. Thiolactomycin mimics malonyl-ACP in its binding site whereas cerulenin
forms a covalent bond with the active site cysteine in FabF/B with its tail occupying a
long hydrophobic cavity, which normally contains the growing acyl chain of the natural
substrate (20,21). Lately, inhibition of FabH has drawn significant attention in drug
discovery efforts (22,23).
In this study, we developed and validated a reliable high throughput fatty acid synthesis
pathway assay that can simultaneously identify inhibitors of multiple targets including
FabD, FabF/B, FabG, FabA/Z and FabI. We screened natural product extract libraries,
identified and characterized bischloroanthrabenzoxocinone (BABX) as a new inhibitor of
fatty acid synthesis. We also investigated the kinetics of pathway enzymes, the selectivity
of fatty acid synthesis inhibitors as well as the relationship of biochemical activities and
antibacterial activity.
Experimental Procedures
Reagents-All reagents were obtained from Sigma-Aldrich Chemical Co. unless otherwise
indicated. DTT was from Fisher (BP172-5); perchloric acid (70%) was from FLUKA
CHEMIKA (77230); β-mercaptoethanol (βME) was from Bio-Rad (161-0710). [14C]-
malonyl CoA (60 mCi/mmol, NEC612), [3H]-acetyl CoA (NET290250UC), Phospholipid
by guest on September 3, 2016
http://ww
w.jbc.org/
Dow
nloaded from

Srinivas Kodali Type II Fatty Acid Synthesis 5
96-well Flashplates (SMP108) and other radio-labeled chemicals used in this study were
from Perkin Elmer (NEN) Life Sciences. ACP (Sigma-Aldrich Chemical Co., A7303)
was pretreated with 3 mM DTT on ice for 20 minutes, aliquoted and stored at -80 oC
Preparation of Type II Fatty Acid Synthesis (FASII) enzymes-The procedure described
previously (24) was used with some modification. Briefly, K12-derivative E. coli strains,
S. aureus or B. subtilis were grown to stationary phase in 6 liters of LB medium. The
cultures were centrifuged at 8000 rpm for 10 minutes using a Beckman JA-10 rotor. The
pellets were washed twice with ice cold buffer A (0.1 M sodium phosphate, pH=7, 1 mM
EDTA and 5 mM βME) and resuspended in 500 ml of the same buffer. The cells were
lysed in a cold microfluidizer (Microfluidics Corp., M-110EH) at 18,000 lbs per square
inch and centrifuged at 20,000 rpm for 15 min at 4 oC using a Beckman JA-20 rotor. The
supernatant was collected and its volume was precisely measured. Ammonium sulfate
(129 g) was added to each 500 ml of the supernatant in small quantities with low speed
stirring at 4 oC to reach 45% ammonium sulfate saturation. The mixture was centrifuged
at 10,000 rpm for 5 min and the supernatant was collected. Ammonium sulfate (113 g)
was then added to each 500 ml of the supernatant to reach 80% ammonium sulfate
saturation. The mixture was centrifuged again and the supernatant was then discarded.
The 45-80% ammonium sulfate saturated protein fraction pellet, containing all necessary
fatty acid synthesis (FASII) enzymes, was dissolved in 20 ml buffer A, dialyzed at 4 oC
against four changes of buffer A using 10 kd molecular weight cutoff dialysis tubing
(Invitrogen, 15961-022) and then concentrated. The protein concentration was
by guest on September 3, 2016
http://ww
w.jbc.org/
Dow
nloaded from
Srinivas Kodali Type II Fatty Acid Synthesis 6
determined using the standard Bio-Rad protocol. The protein was aliquoted, flash frozen
using liquid nitrogen and stored at -80 oC.
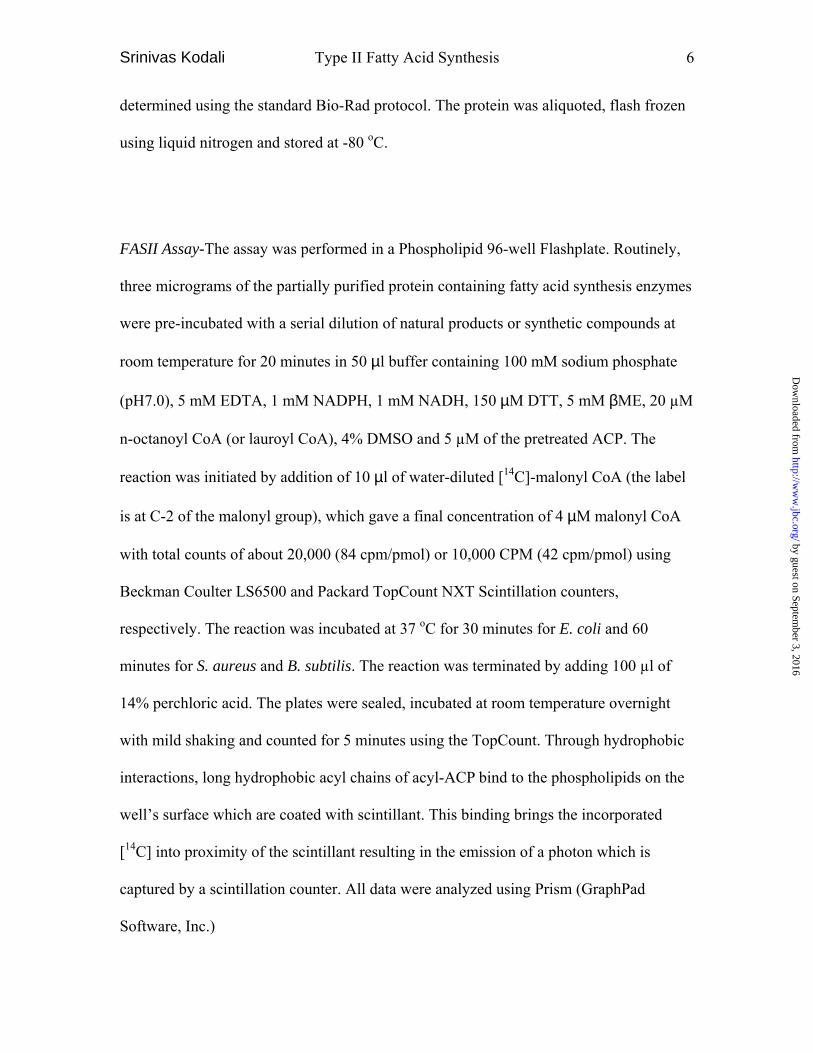
FASII Assay-The assay was performed in a Phospholipid 96-well Flashplate. Routinely,
three micrograms of the partially purified protein containing fatty acid synthesis enzymes
were pre-incubated with a serial dilution of natural products or synthetic compounds at
room temperature for 20 minutes in 50 µl buffer containing 100 mM sodium phosphate
(pH7.0), 5 mM EDTA, 1 mM NADPH, 1 mM NADH, 150 µM DTT, 5 mM βME, 20 µM
n-octanoyl CoA (or lauroyl CoA), 4% DMSO and 5 µM of the pretreated ACP. The
reaction was initiated by addition of 10 µl of water-diluted [14C]-malonyl CoA (the label
is at C-2 of the malonyl group), which gave a final concentration of 4 µM malonyl CoA
with total counts of about 20,000 (84 cpm/pmol) or 10,000 CPM (42 cpm/pmol) using
Beckman Coulter LS6500 and Packard TopCount NXT Scintillation counters,
respectively. The reaction was incubated at 37 oC for 30 minutes for E. coli and 60
minutes for S. aureus and B. subtilis. The reaction was terminated by adding 100 µl of
14% perchloric acid. The plates were sealed, incubated at room temperature overnight
with mild shaking and counted for 5 minutes using the TopCount. Through hydrophobic
interactions, long hydrophobic acyl chains of acyl-ACP bind to the phospholipids on the
well�s surface which are coated with scintillant. This binding brings the incorporated
[14C] into proximity of the scintillant resulting in the emission of a photon which is
captured by a scintillation counter. All data were analyzed using Prism (GraphPad
Software, Inc.)
by guest on September 3, 2016
http://ww
w.jbc.org/
Dow
nloaded from
Srinivas Kodali Type II Fatty Acid Synthesis 7
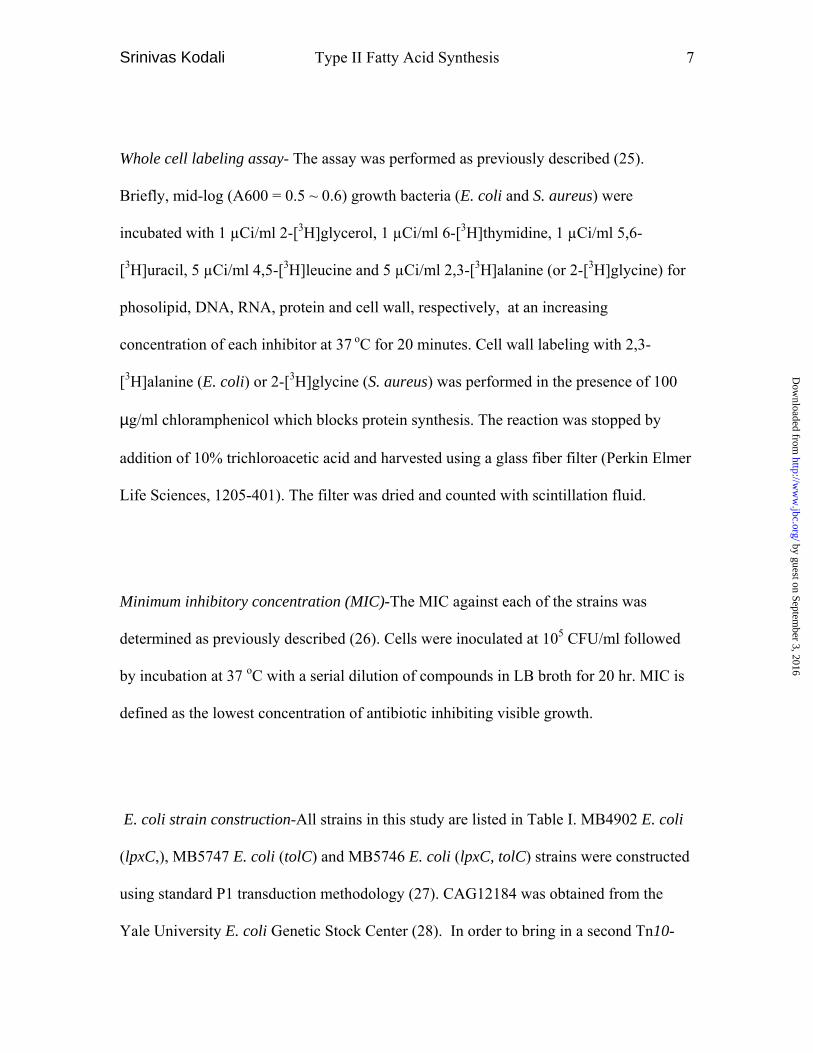
Whole cell labeling assay- The assay was performed as previously described (25).
Briefly, mid-log (A600 = 0.5 ~ 0.6) growth bacteria (E. coli and S. aureus) were
incubated with 1 µCi/ml 2-[3H]glycerol, 1 µCi/ml 6-[3H]thymidine, 1 µCi/ml 5,6-
[3H]uracil, 5 µCi/ml 4,5-[3H]leucine and 5 µCi/ml 2,3-[3H]alanine (or 2-[3H]glycine) for
phosolipid, DNA, RNA, protein and cell wall, respectively, at an increasing
concentration of each inhibitor at 37 oC for 20 minutes. Cell wall labeling with 2,3-
[3H]alanine (E. coli) or 2-[3H]glycine (S. aureus) was performed in the presence of 100
µg/ml chloramphenicol which blocks protein synthesis. The reaction was stopped by
addition of 10% trichloroacetic acid and harvested using a glass fiber filter (Perkin Elmer
Life Sciences, 1205-401). The filter was dried and counted with scintillation fluid.
Minimum inhibitory concentration (MIC)-The MIC against each of the strains was
determined as previously described (26). Cells were inoculated at 105 CFU/ml followed
by incubation at 37 oC with a serial dilution of compounds in LB broth for 20 hr. MIC is
defined as the lowest concentration of antibiotic inhibiting visible growth.
E. coli strain construction-All strains in this study are listed in Table I. MB4902 E. coli
(lpxC,), MB5747 E. coli (tolC) and MB5746 E. coli (lpxC, tolC) strains were constructed
using standard P1 transduction methodology (27). CAG12184 was obtained from the
Yale University E. coli Genetic Stock Center (28). In order to bring in a second Tn10-
by guest on September 3, 2016
http://ww
w.jbc.org/
Dow
nloaded from

Srinivas Kodali Type II Fatty Acid Synthesis 8
linked mutation (tolC) via P1 transduction, the MB5008 strain was made by curing
MB4902 of tetracycline resistance using a variation of the technique described (29).
Concentrations of quinaldic acid and chlortetracycline were adjusted due to the increased
sensitivity of the lpxC mutant.
Results
Development of high throughput assay for type II fatty acid synthesis (FASII Assay)-The
conventional type II fatty acid synthesis pathway assay uses acetyl CoA and malonyl
CoA as substrates (30). However, the FASII assay that we developed uses long chain
acyl CoA (octanoyl CoA or lauroyl CoA) instead of acetyl CoA. Therefore, our FASII
assay measures the cumulative activities of enzymes involved in the fatty acid elongation
cycle only, avoiding the complexity of the chain initiation reaction steps catalyzed by
acetyl CoA carboxylase (AccABCD), FabD and FabH. To determine enzyme activity and
set up proper conditions for the assay, we titrated the FASII enzyme mixture from E. coli
(S. aureus and B. subtilis, data not shown) in a time course study (Fig. 2A) at 37 oC. The
t1/2 values are 3.2±0.3, 6.7±1.0, 12.4±1.0, 26.9±2.3 minutes respectively for 1.5, 3, 6 and
12 µg of the FASII enzyme mixture added per assay. The plot of t1/2 values against each
concentration of the enzyme mixture results in a linear correlation (Fig. 2B), indicating
that t1/2 (or apparent rate constant) gives a measure of the activity of the FASII enzymes
(31).
by guest on September 3, 2016
http://ww
w.jbc.org/
Dow
nloaded from

Srinivas Kodali Type II Fatty Acid Synthesis 9
Determination of enzyme kinetics-The assay was performed under standard conditions
and the apparent Km (Kmapp) and Vmax of the FASII enzymes were determined. The
Kmapp and Vmax of S. aureus FASII enzymes for octanoyl CoA were 1.1±0.3 µM and
88.9±4.5 pmol/min/mg, respectively (Fig. 3A). The Kmapp and Vmax of B. subtilis FASII
enzymes were 10.0±2.7 µM and 516±31 pmol/min/mg, respectively, for lauroyl CoA
(Fig. 3B). Similar results were obtained by interchanging octanoyl CoA and lauroyl CoA
(data not shown). The experiments were repeated at least twice with duplicates.
The effect of metals and reducing agents on FASII- In order to ascertain the robustness of
the assay for use with natural product extracts which may contain metals and chelators,
the effect of divalent cations and EDTA on FASII activity was examined (Fig. 4).
Without the addition of EDTA , inhibition of FASII activity by Mg2+, Ca2+, Zn2+ and
Mn2+ exhibited IC50 values of 81±17, 9.1±6.2, 5.6±3 and 19.4±7.6 mM, respectively.
With the addition of 5 mM EDTA, the inhibition of FASII activity by these metals was
reduced, resulting in IC50 values of 76±16, 4.0±0.9, 0.3±0.09 and 14±4.5 mM for Mg2+,
Ca2+, Zn2+ and Mn2+, respectively. Neither potassium nor sodium demonstrated any
inhibitory effects on FASII activity until the concentration reached 300 mM (data not
shown). These experiments were repeated at least three times in duplicate.
Efficacy and selectivity of FASII inhibitors across multiple bacterial species-Assays were
performed with three FASII inhibitors in three different bacterial species. In the E. coli
by guest on September 3, 2016
http://ww
w.jbc.org/
Dow
nloaded from
Srinivas Kodali Type II Fatty Acid Synthesis 10
FASII enzyme assay, cerulenin, thiolactomycin and triclosan showed IC50 values of
1.0±0.3, 17.3±3.2, and 0.06±0.02 µg/ml, respectively (Fig 5A). Using B. subtilis FASII
enzymes, IC50 values of 0.10±0.03, 110±35 and 0.8±0.4 µg/ml were obtained for
cerulenin, thiolactomycin and triclosan respectively (Fig. 5B). S. aureus enzymes
revealed IC50 values of 1.5±0.4 for cerulenin, 13.0±3.9 for thiolactomycin and
0.0079±0.002 µg/ml for triclosan (Fig. 5C). Experiments were performed in duplicate or
triplicate at least three times.
Screening, isolation and characterization of new inhibitors-Using FASII assay, we
screened both natural product extracts and a collection of synthetic compounds (not
shown). The assay performed adequately to identify inhibitors of fatty acid synthesis for
enzymes involved in chain elongation. The hit rate was 0.13 % and the Z� factor (32) was
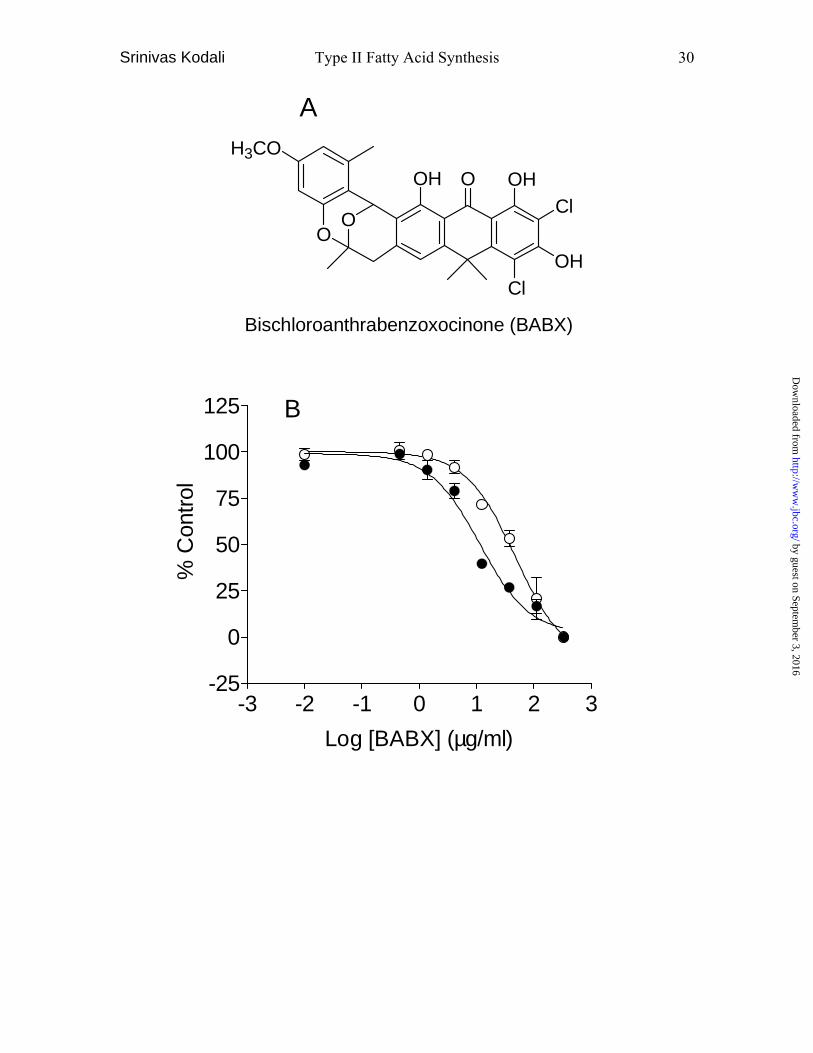
0.73. From Actinomycete active broth S18 (Fig. 6), we isolated a new compound, BABX
(Fig. 7A), which accounted for the FASII inhibitory activity of the extract. The details of
isolation and structure elucidation will be published elsewhere. BABX inhibited fatty
acid synthesis, giving IC50 values of 11.4 and 35.3 µg/ml in the S. aureus and E. coli
FASII assays, respectively (Fig. 7B). BABX exhibited good antibacterial activities
against S. aureus (MIC = 0.2 µg/ml) and poor antibacterial activities against wild type E.
coli (MIC >250 µg/ml). To determine the reason for the failure of this compound to reach
its intracellular target in E. coli, we generated permeable E. coli (lpxC) and/or efflux
negative E. coli (tolC) strains (Table 1). This compound was tested against these strains
and MIC�s were determined. It showed MIC values of 0.24, >250, and 0.39 µg/ml against
by guest on September 3, 2016
http://ww
w.jbc.org/
Dow
nloaded from
Srinivas Kodali Type II Fatty Acid Synthesis 11
E. coli (lpxC), E. coli (tolC) and E. coli (lpxC, tolC), respectively (Table 2). Similar
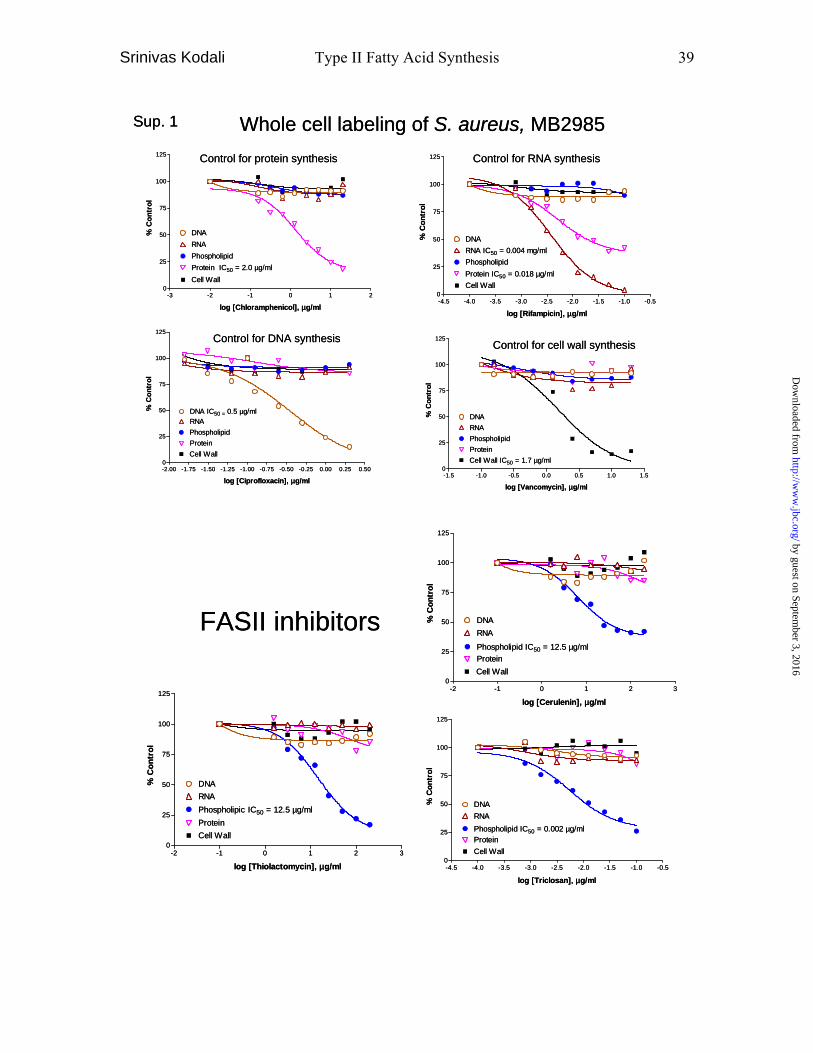
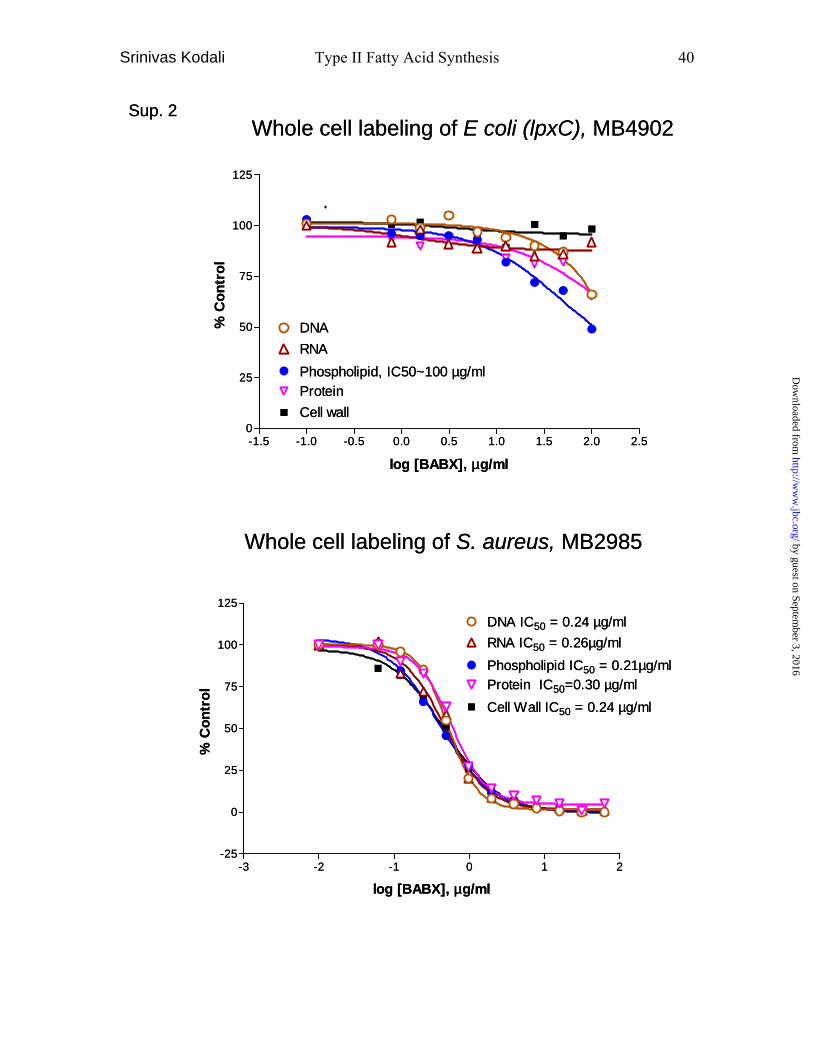
results were also observed in the Kirby-Bauer assay (Fig 7D). In the whole cell labeling
assay, BABX inhibited S. aureus phospholipid synthesis with an IC50 value of 0.21
µg/ml. However, it also inhibited DNA synthesis with a similar IC50 value of 0.24 µg/ml.
Due to the lack of penetration of BABX in E. coli, the whole cell labeling assay was
carried out using E. coli (lpxC), showing 51%, 35%, 34%, 8% and no inhibition of
phospholipids synthesis, DNA synthesis, protein synthesis, RNA synthesis and cell wall
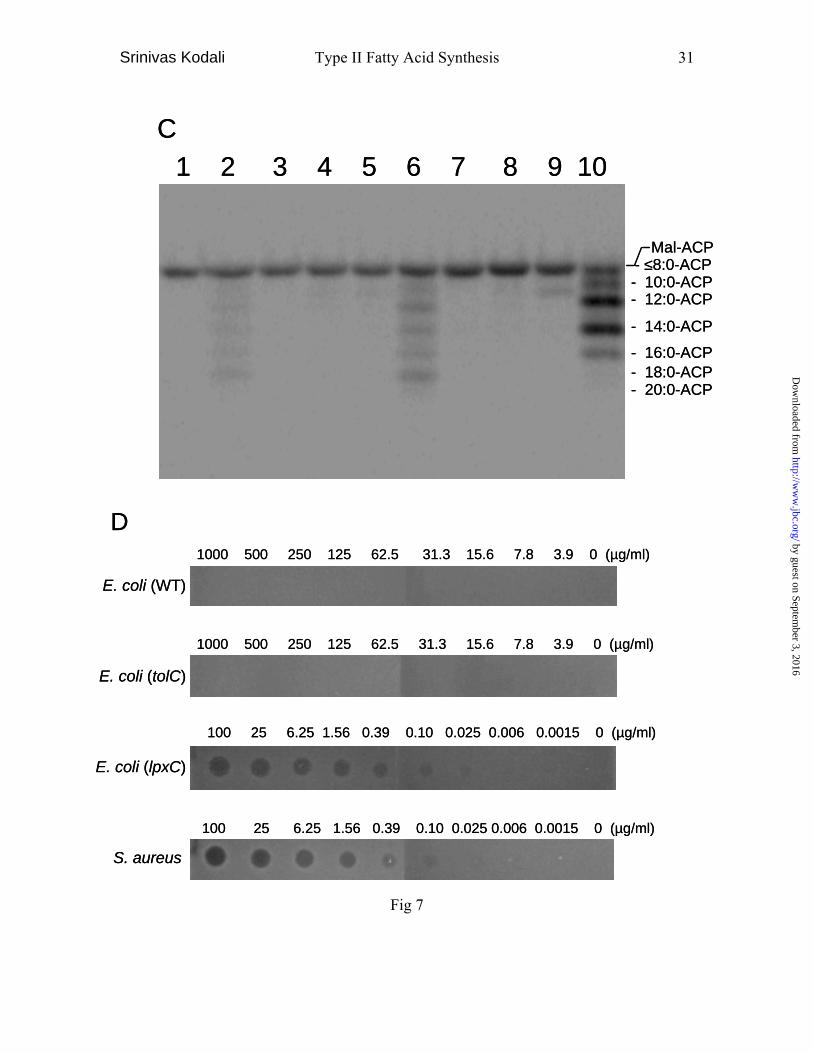
synthesis at 100 µg/ml, respectively (Table 2). To determine the possible target of
BABX, the FASII elongation assay was performed. When acetyl CoA, a natural
substrate, was used it produced longer chains of acyl-ACP but weaker signals in S.
aureus compared to E. coli (Fig 7, lanes 2, 10). However, when we used n-octanoyl CoA,
a substrate used in the FASII assay, as a substrate it produced better signals compared to
acetyl CoA in S. aureus (Fig 7, lanes 2, 7). As a result it afforded a better signal to
background window, which helped in the screening of natural product extracts against S.
aureus enzymes. At 200 µg/ml, BABX completely blocked fatty acid elongation (Fig. 7,
lanes 4, 8) similar to that of cerulenin unlike triclosan where an extra band can be seen
(Fig. 7, Lane 9), BABX did not inhibit the FabD reaction which catalyze malonyl CoA
and holo-ACP to malonyl-ACP (Fig. 7C, lanes 1, 4 and 8).
Effects of cell permeability and efflux on fatty acid inhibitors- In the process of discovery
and optimization of new antibacterials, it is evident that whole-cell activity may vary
independently of enzyme inhibition. Thus it is important to track their accumulation in
by guest on September 3, 2016
http://ww
w.jbc.org/
Dow
nloaded from
Srinivas Kodali Type II Fatty Acid Synthesis 12
cells by measuring their ability to specifically inhibit the target pathway (phospholipid
synthesis, in this case) and cell growth as well as their enzyme inhibitory activity. The
effects of cerulenin, thiolactomycin and triclosan on macromolecular synthesis and MIC
were examined as described in Experimental Procedures. All three compounds
selectively inhibited phospholipid synthesis. The IC50 values of whole cell labeling for
RNA, protein and cell wall syntheses (data not shown) were similar to those of DNA
synthesis. The results of MICs, whole cell labeling and IC50s in the FASII assay against
E. coli (wild type), E. coli (lpxC), E. coli (tolC), E. coli (lpxC, tolC) and S. aureus are
summarized in Table II. Rifampicin is a typical positive control against permeable gram-
negative bacteria. Novobiocin is a positive control substrate of the AcrA/B TolC efflux
pump of E. coli. Erythromycin is subject to both the outer membrane barrier and efflux.
The MIC results against the E. coli strains indicated that efflux played the primary role in
modulating accumulation of the three compounds. In contrast, BABX had permeability
characteristics similar to rifampicin, where TolC mediated efflux did not play a role.
Discussion
Acetyl CoA and malonyl CoA have been used as substrates for the in vitro fatty acid
synthesis assay for decades. Acetyl CoA and malonyl-ACP are condensed by FabH to
make acetoacetyl-ACP, which initiates the fatty acid elongation cycle. However, E. coli
and S. aureus FabH can utilize short (up to six carbons) fatty acid chains as a substrate
(22,33), which complicates the quantification of product formation. For example,
cerulenin is a selective FabF/B inhibitor with an IC50 range of 0.1-2 µg/ml. However, the
by guest on September 3, 2016
http://ww
w.jbc.org/
Dow
nloaded from

Srinivas Kodali Type II Fatty Acid Synthesis 13
IC50 of cerulenin for FabH is ~150 µg/ml (21) (data not shown). As such, a concentration
of cerulenin which is sufficient to completely inhibit FabF activity may still allow FabH
to continue the elongation of fatty acid chains to a maximum length of eight carbons.
Unless mass spectrometry is used, the eight carbon fatty acids can not be separated from
long chain fatty acids using ether extraction (data not shown). Using assay conditions
described in Experimental Procedures, with the substitution of acetyl CoA for octanoyl
CoA or lauroyl CoA , chain elongation inhibitors could be distinguished from fatty acid
chain initiation inhibitors (Fig. 7C, data not shown).
As previously described (34), long chain fatty acids can be converted to acyl-ACP by
acyl-acyl carrier protein synthase (Aas) in vitro. However, using long chain fatty acids as
substrates for a high throughput assay is not easy due to their poor solubility.
Conveniently, when water soluble octanoyl CoA or lauroyl CoA and [14C]-malonyl CoA
were used as substrates, the assay worked very well. To confirm that the assay is truly
using either octanoyl CoA or lauroyl CoA as a substrate, we titrated these substrates
using the extracts of FASII enzymes from S. aureus or B. subtilis (Fig. 3). As the
concentration of octanoyl CoA or lauroyl CoA increased, the [14C]-malonyl CoA
incorporation into long chain fatty acid increased in a concentration dependent manner.
The supporting data is visualized in Fig. 7C (lane 6). The affinity of S. aureus FASII
enzymes for the substrates octanoyl CoA or lauroyl CoA was 10-fold higher than that of
B. subtilis, while the Vmax of B. subtilis FASII enzymes for octanoyl CoA or lauroyl
CoA was 5.8-fold higher than that of S. aureus. The S. aureus enzyme that catalyzes
by guest on September 3, 2016
http://ww
w.jbc.org/
Dow
nloaded from
Srinivas Kodali Type II Fatty Acid Synthesis 14
octanoyl CoA or lauroyl CoA to their ACP counterpart, which can be utilized by the
enzymes for the fatty acid chain elongation, is unknown. While it has been reported (35)
that E. coli can carry out this reaction using condensing enzymes and that B. subtilis
FabH1 can utilize octanoyl CoA as a substrate, albeit poorly (36), there is no reported
evidence that identifies which S. aureus enzyme converts long chain (>6C) acyl CoA to
acyl-ACP. Further investigation could lead to a better understanding of fatty acid
metabolism. It was not obvious that the FASII system of the important gram-positive
pathogen S. aureus would work under these conditions as we have been unable to carry
out the reaction with enzymes from Streptococcus pneumoniae and Streptococcus
pyogenes.
Enzyme activities are often regulated by divalent cations. This high throughput assay has
been developed for use in screening natural product extracts, as shown in Fig 3. These
extracts may contain metal ions, including divalent metals which modulate many enzyme
activities, as well as chelators. To understand the effect of metals on FASII enzyme
activity, we titrated Mg++, Ca++, Zn++, Mn++ (Fig 4). The FASII enzyme activity was
inhibited by all divalent cations tested in the order Zn2+>Ca2+>Mn2+>Mg2+. The addition
of EDTA reduces free divalent metal concentrations, which can be calculated using the
following formulas:
[Total]=[Free]+fi[EDTA] fi=[Free]/([Free]+Kd)
by guest on September 3, 2016
http://ww
w.jbc.org/
Dow
nloaded from
Srinivas Kodali Type II Fatty Acid Synthesis 15
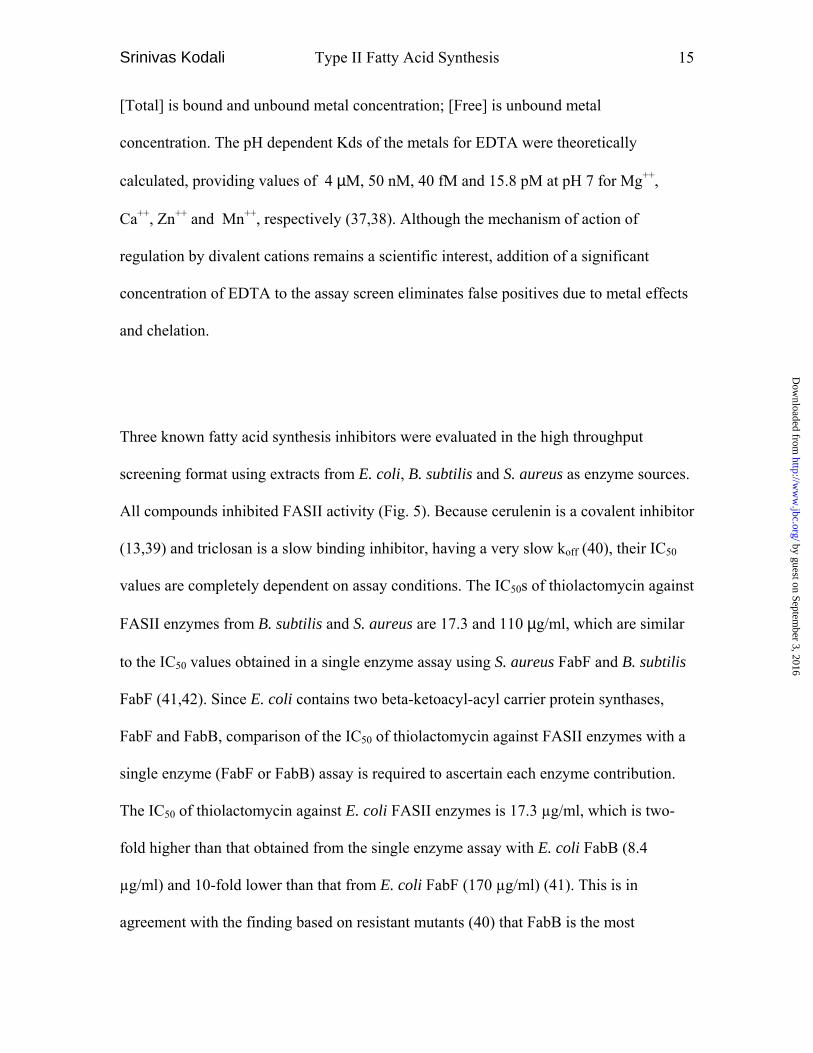
[Total] is bound and unbound metal concentration; [Free] is unbound metal
concentration. The pH dependent Kds of the metals for EDTA were theoretically
calculated, providing values of 4 µM, 50 nM, 40 fM and 15.8 pM at pH 7 for Mg++,
Ca++, Zn++ and Mn++, respectively (37,38). Although the mechanism of action of
regulation by divalent cations remains a scientific interest, addition of a significant
concentration of EDTA to the assay screen eliminates false positives due to metal effects
and chelation.
Three known fatty acid synthesis inhibitors were evaluated in the high throughput
screening format using extracts from E. coli, B. subtilis and S. aureus as enzyme sources.
All compounds inhibited FASII activity (Fig. 5). Because cerulenin is a covalent inhibitor
(13,39) and triclosan is a slow binding inhibitor, having a very slow koff (40), their IC50
values are completely dependent on assay conditions. The IC50s of thiolactomycin against
FASII enzymes from B. subtilis and S. aureus are 17.3 and 110 µg/ml, which are similar
to the IC50 values obtained in a single enzyme assay using S. aureus FabF and B. subtilis
FabF (41,42). Since E. coli contains two beta-ketoacyl-acyl carrier protein synthases,
FabF and FabB, comparison of the IC50 of thiolactomycin against FASII enzymes with a
single enzyme (FabF or FabB) assay is required to ascertain each enzyme contribution.
The IC50 of thiolactomycin against E. coli FASII enzymes is 17.3 µg/ml, which is two-
fold higher than that obtained from the single enzyme assay with E. coli FabB (8.4
µg/ml) and 10-fold lower than that from E. coli FabF (170 µg/ml) (41). This is in
agreement with the finding based on resistant mutants (40) that FabB is the most
by guest on September 3, 2016
http://ww
w.jbc.org/
Dow
nloaded from
Srinivas Kodali Type II Fatty Acid Synthesis 16
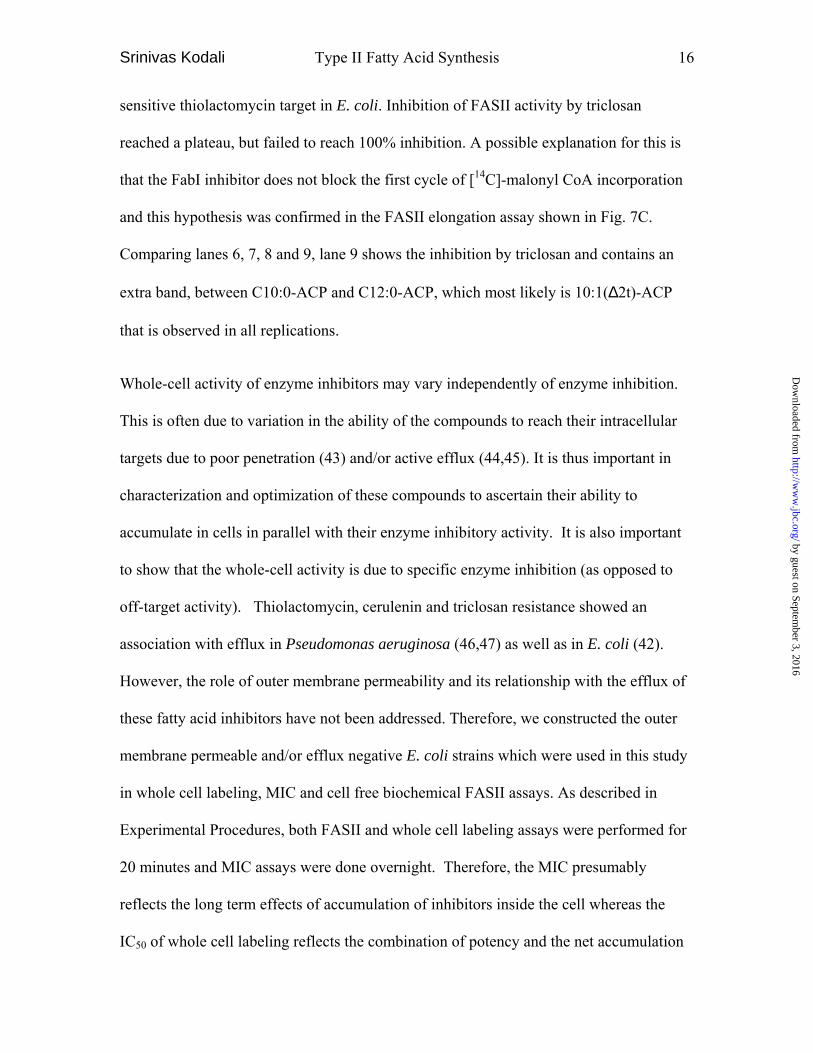
sensitive thiolactomycin target in E. coli. Inhibition of FASII activity by triclosan
reached a plateau, but failed to reach 100% inhibition. A possible explanation for this is
that the FabI inhibitor does not block the first cycle of [14C]-malonyl CoA incorporation
and this hypothesis was confirmed in the FASII elongation assay shown in Fig. 7C.
Comparing lanes 6, 7, 8 and 9, lane 9 shows the inhibition by triclosan and contains an
extra band, between C10:0-ACP and C12:0-ACP, which most likely is 10:1(∆2t)-ACP
that is observed in all replications.
Whole-cell activity of enzyme inhibitors may vary independently of enzyme inhibition.
This is often due to variation in the ability of the compounds to reach their intracellular
targets due to poor penetration (43) and/or active efflux (44,45). It is thus important in
characterization and optimization of these compounds to ascertain their ability to
accumulate in cells in parallel with their enzyme inhibitory activity. It is also important
to show that the whole-cell activity is due to specific enzyme inhibition (as opposed to
off-target activity). Thiolactomycin, cerulenin and triclosan resistance showed an
association with efflux in Pseudomonas aeruginosa (46,47) as well as in E. coli (42).
However, the role of outer membrane permeability and its relationship with the efflux of
these fatty acid inhibitors have not been addressed. Therefore, we constructed the outer
membrane permeable and/or efflux negative E. coli strains which were used in this study
in whole cell labeling, MIC and cell free biochemical FASII assays. As described in
Experimental Procedures, both FASII and whole cell labeling assays were performed for
20 minutes and MIC assays were done overnight. Therefore, the MIC presumably
reflects the long term effects of accumulation of inhibitors inside the cell whereas the
IC50 of whole cell labeling reflects the combination of potency and the net accumulation
by guest on September 3, 2016
http://ww
w.jbc.org/
Dow
nloaded from

Srinivas Kodali Type II Fatty Acid Synthesis 17
of inhibitors in a limited time. Direct comparison of FASII IC50 values with those of PL
labeling gives a measure of the effects of permeability and/or efflux. Comparison of IC50
of PL labeling with MIC is more complex since multiple factors, such as rate of
penetration versus efflux, mode of entry, nature of binding, feedback regulation, etc.,
play a role.
In this study, we provide both in vitro and in vivo evidence that the three fatty acid
inhibitors are not only pumped out by efflux in a short period of time but are also subject
to outer membrane permeability barriers. As expected, the IC50 values of the cell free
biochemical FASII assay for each of the fatty acid synthesis inhibitors showed similar
results with FASII enzymes from the four E. coli strains. MICs of the three inhibitors
decreased (antibacterial activity increased) two-fold against the outer membrane
permeable E. coli (lpxC) strain compared to its wild type parent strain. In contrast, MICs
decreased 32-, >64- and 125-fold against the efflux negative E. coli (tolC) strain for
cerulenin, thiolactomycin and triclosan, respectively, indicating that efflux plays a critical
role for their antibacterial activities. While it is possible that outer membrane permeable
(lpxC) E. coli may lack efflux mechanisms in addition to those requiring TolC, and
hence also reflect efflux rather than a simple barrier to entry, our findings indicate that
the MICs of the compounds are not strongly affected by the lpxC mutation, as would be
expected if the lpxC effect were exerted via efflux. In the whole cell labeling assay,
however, IC50s of phospholipid (PL) labeling showed a 4.4-fold decrease for cerulenin, a
50-fold decrease for thiolactomycin and a 267-fold decrease for triclosan with the
by guest on September 3, 2016
http://ww
w.jbc.org/
Dow
nloaded from
Srinivas Kodali Type II Fatty Acid Synthesis 18
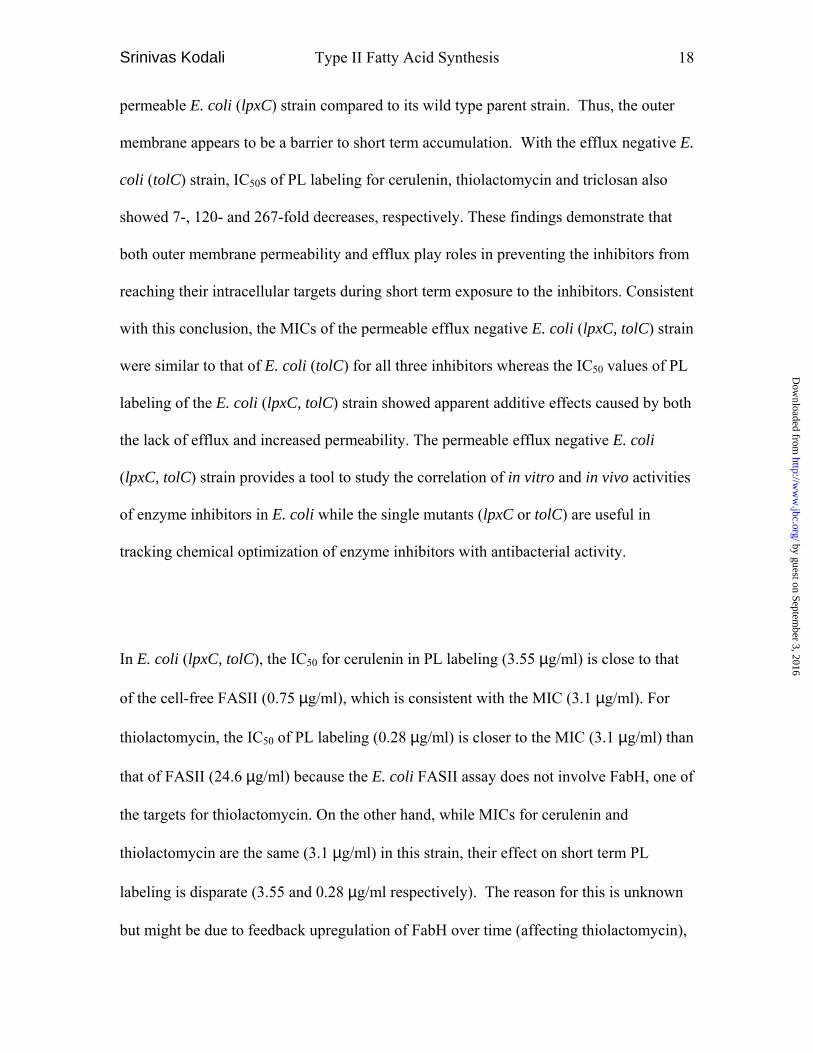
permeable E. coli (lpxC) strain compared to its wild type parent strain. Thus, the outer
membrane appears to be a barrier to short term accumulation. With the efflux negative E.
coli (tolC) strain, IC50s of PL labeling for cerulenin, thiolactomycin and triclosan also
showed 7-, 120- and 267-fold decreases, respectively. These findings demonstrate that
both outer membrane permeability and efflux play roles in preventing the inhibitors from
reaching their intracellular targets during short term exposure to the inhibitors. Consistent
with this conclusion, the MICs of the permeable efflux negative E. coli (lpxC, tolC) strain
were similar to that of E. coli (tolC) for all three inhibitors whereas the IC50 values of PL
labeling of the E. coli (lpxC, tolC) strain showed apparent additive effects caused by both
the lack of efflux and increased permeability. The permeable efflux negative E. coli
(lpxC, tolC) strain provides a tool to study the correlation of in vitro and in vivo activities
of enzyme inhibitors in E. coli while the single mutants (lpxC or tolC) are useful in
tracking chemical optimization of enzyme inhibitors with antibacterial activity.
In E. coli (lpxC, tolC), the IC50 for cerulenin in PL labeling (3.55 µg/ml) is close to that
of the cell-free FASII (0.75 µg/ml), which is consistent with the MIC (3.1 µg/ml). For
thiolactomycin, the IC50 of PL labeling (0.28 µg/ml) is closer to the MIC (3.1 µg/ml) than
that of FASII (24.6 µg/ml) because the E. coli FASII assay does not involve FabH, one of
the targets for thiolactomycin. On the other hand, while MICs for cerulenin and
thiolactomycin are the same (3.1 µg/ml) in this strain, their effect on short term PL
labeling is disparate (3.55 and 0.28 µg/ml respectively). The reason for this is unknown
but might be due to feedback upregulation of FabH over time (affecting thiolactomycin),
by guest on September 3, 2016
http://ww
w.jbc.org/
Dow
nloaded from

Srinivas Kodali Type II Fatty Acid Synthesis 19
differential effects of covalent (cerulenin) versus non-covalent (thiolactomycin) binding,
or off-target activities of cerulenin. The IC50 of triclosan for PL labeling (0.0002 µg/ml)
is similar to its MIC (0.0004 µg/ml). However, it is more potent than that for FASII
(0.05 µg/ml), suggesting the possible involvement of other unknown targets for triclosan
activity in whole cells.
Interestingly, both IC50 values of PL labeling (12.5 µg/ml) and MICs (64 µg/ml) are
identical for cerulenin and thiolactomycin against S. aureus. However, the IC50 values of
FASII are 9-fold apart (1.5 and 13 µg/ml, respectively), which likely reflects the fact that
FabH does not play a role in the S. aureus FASII assay, although differential effects of
permeability/efflux cannot be ruled out. The IC50 of triclosan for PL labeling and its MIC
against S. aureus are identical (0.002 µg/ml), which is 4-fold better than the IC50 for
FASII (0.008 µg/ml). Since little information about efflux and permeability on the fatty
acid synthesis inhibitors for gram-positive bacteria has been documented to date, the
correlation of potency between in vitro and in vivo activities against S. aureus could not
be determined. Further investigation of permeability and efflux would help to understand
the mechanism of action of fatty acid synthesis inhibitors and resistance emergence on
gram-positive bacteria.
When we screened the natural product extract libraries with the FASII assay, we used an
assay for inhibition of FtsZ polymerization as a counter screen (26). The S18 broth (Fig.
by guest on September 3, 2016
http://ww
w.jbc.org/
Dow
nloaded from

Srinivas Kodali Type II Fatty Acid Synthesis 20
6) showed selective inhibition in FASII assay, leading to the discovery of a new
compound, BABX, as an inhibitor of fatty acid synthesis. This compound showed in vitro
enzyme inhibitory activity with IC50 values of 11.4 and 35.3 µg/ml in the S. aureus and
E. coli FASII assays, respectively. BABX also showed potent antibacterial activities
against S. aureus and permeable E. coli strains with MICs ranging from 0.2 to 0.4 µg/ml.
When evaluated in the whole cell labeling assay, BABX inhibited E. coli (lpxC)
phospholipid synthesis (51%) with some selectivity compared to cell wall (no inhibition),
RNA (8%), protein (34%) and DNA (35%) syntheses at 100ug/ml. BABX inhibited S.
aureus phospholipid synthesis with an IC50 of 0.2 µg/ml, which supported the MIC and
Kirby-Bauer assay results. However, the compound also inhibited DNA synthesis at
similar concentrations (IC50 = 0.2 µg/ml). This indicates that inhibition of fatty acid
synthesis is only one of the possible mechanisms for growth inhibition and illustrates the
importance of evaluating the whole cell activity of inhibitors discovered in biochemical
assays. In the E. coli case, the MIC in the lpxC strain was much lower than the IC50s for
whole cell labeling of all macromolecular synthesis (phospholipid, DNA, protein, RNA
and cell wall) tested. Thus the primary target may be another system or growth inhibition
may occur over a longer term than the labeling period.
Which fatty acid synthesis enzyme is a possible target for BABX? As we discussed
earlier, any fatty acid synthesis inhibitor that inhibits elongation enzymes, other than
condensation reactions, in the FASII assay initiated with octanoyl CoA cannot stop the
addition of first two carbons to form 10 carbons of ß-ketoacyl-ACP, ß-hydroxyacyl-ACP
by guest on September 3, 2016
http://ww
w.jbc.org/
Dow
nloaded from

Srinivas Kodali Type II Fatty Acid Synthesis 21
or trans-2-enoyl-ACP (Fig. 1). From FASII assay (Fig. 7B) and FASII elongation assay
(Fig. 7C), BABX did not inhibit FabD but fully inhibited acyl-ACP elongation, which is
similar to that of cerulenin but different with that of triclosan, suggesting BABX is an
inhibitor of the condensation enzyme in the elongation cycle. Further screening or
potential chemical modification of BABX may lead to a better inhibitor of fatty acid
synthesis and a more selective antibacterial agent.
Acknowledgments
We are grateful to Drs. Zhiqiang An and Lorraine Hernandez for the critical reading of the manuscript. We thank Dr. Mike Goetz for the purification of thiolactomycin. We also thank Dr. Yaping Tu for the discussion of the calculation of free metals.
by guest on September 3, 2016
http://ww
w.jbc.org/
Dow
nloaded from

Srinivas Kodali Type II Fatty Acid Synthesis 22
Table I. Properties of the E. coli strains Strain Relevant Markers Other Markers Reference
CAG12184 tolC::Tn10 rph-1 (28) MB4827 wt1 leu thr lac (thi) galK (43) MB49022 lpxC::Tn10 leu thr lac (thi) galK (43) MB5008 lpxC, cured of Tn10 leu thr lac (thi) galK this study MB5747 tolC::Tn10 same as MB4827 but Tn10-linked tolC
transductant (CAG12184 donor) this study
MB5746 lpxC, tolC::Tn10 same as MB5008 but Tn10-linked tolC transductant (CAG12184 donor)
this study
1 wild-type for outer membrane permeability and efflux, also known as C600galK. 2 also known as LS583; the envA allele described in (41) has been renamed lpxC.
by guest on September 3, 2016
http://ww
w.jbc.org/
Dow
nloaded from
Srinivas Kodali Type II Fatty Acid Synthesis 23
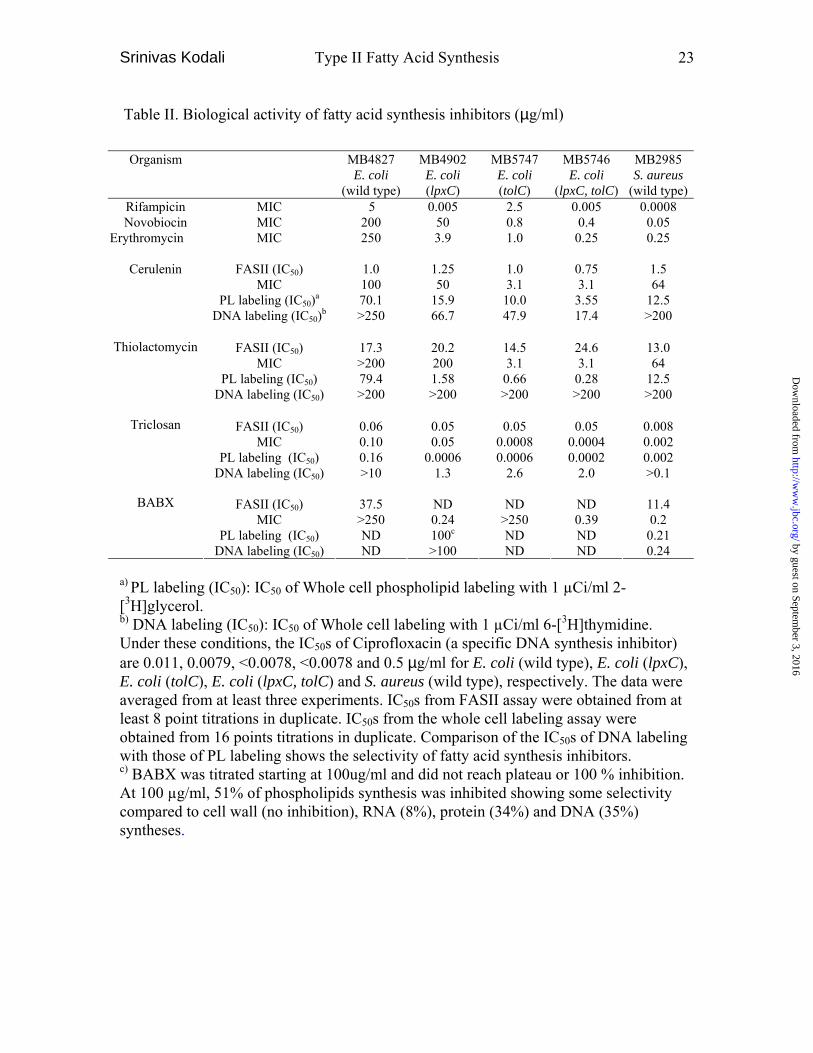
Table II. Biological activity of fatty acid synthesis inhibitors (µg/ml)
Organism MB4827 E. coli
(wild type)
MB4902 E. coli (lpxC)
MB5747 E. coli (tolC)
MB5746 E. coli
(lpxC, tolC)
MB2985 S. aureus
(wild type)MIC MIC MIC
FASII (IC50)
MIC
PL labeling (IC50)a DNA labeling (IC50)b
5 200 250
1.0 100 70.1 >250
0.005 50 3.9
1.25 50
15.9 66.7
2.5 0.8 1.0
1.0 3.1
10.0 47.9
0.005 0.4
0.25
0.75 3.1
3.55 17.4
0.0008 0.05 0.25
1.5 64
12.5 >200
FASII (IC50)
MIC
PL labeling (IC50) DNA labeling (IC50)
17.3 >200 79.4 >200
20.2 200 1.58 >200
14.5 3.1
0.66 >200
24.6 3.1
0.28 >200
13.0 64
12.5 >200
Rifampicin Novobiocin
Erythromycin
Cerulenin
Thiolactomycin
Triclosan
BABX
FASII (IC50) MIC
PL labeling (IC50) DNA labeling (IC50)
FASII (IC50)
MIC
PL labeling (IC50) DNA labeling (IC50)
0.06 0.10 0.16 >10
37.5 >250 ND ND
0.05 0.05
0.0006 1.3
ND 0.24 100c >100
0.05 0.0008 0.0006
2.6
ND >250 ND ND
0.05 0.0004 0.0002
2.0
ND 0.39 ND ND
0.008 0.002 0.002 >0.1
11.4 0.2
0.21 0.24
a) PL labeling (IC50): IC50 of Whole cell phospholipid labeling with 1 µCi/ml 2-[3H]glycerol. b) DNA labeling (IC50): IC50 of Whole cell labeling with 1 µCi/ml 6-[3H]thymidine. Under these conditions, the IC50s of Ciprofloxacin (a specific DNA synthesis inhibitor) are 0.011, 0.0079, <0.0078, <0.0078 and 0.5 µg/ml for E. coli (wild type), E. coli (lpxC), E. coli (tolC), E. coli (lpxC, tolC) and S. aureus (wild type), respectively. The data were averaged from at least three experiments. IC50s from FASII assay were obtained from at least 8 point titrations in duplicate. IC50s from the whole cell labeling assay were obtained from 16 points titrations in duplicate. Comparison of the IC50s of DNA labeling with those of PL labeling shows the selectivity of fatty acid synthesis inhibitors. c) BABX was titrated starting at 100ug/ml and did not reach plateau or 100 % inhibition. At 100 µg/ml, 51% of phospholipids synthesis was inhibited showing some selectivity compared to cell wall (no inhibition), RNA (8%), protein (34%) and DNA (35%) syntheses.
by guest on September 3, 2016
http://ww
w.jbc.org/
Dow
nloaded from
Srinivas Kodali Type II Fatty Acid Synthesis 24
HS-CoA
ACP-SH
FabD
HO-C-CH2-C-S-CoA
== OO
Malonyl-CoA
CH3-C -CoA
=O
AccABCD
FabH
Acetyl-CoA
HO-C-CH2-C-S-ACP
== OO
Malonyl-ACP
HS-CoA+CO2
Cerulenin
Thiolactomycin
β-Ketoacyl-ACPCH3-(CH2 )2n -C-CH2-C-S-ACP
=O=O
HO-C-CH2-C-S-ACP== OO
ACP-SH+CO2
CH3-(CH2 )2n -C-S-ACP
=
O
CH3-(CH2 )2n -C-CH2-C-S-ACP
=-OH O=
CH3-(CH2 )2n -CH=CH-C-S-ACPO
NADP2H
NADP
H2O
NAD
NAD2H
FabAFabG
FabF
FabBTriclosanIsoniazid
FabZ
FabI (K, L)
β-Hydroxyacyl-ACP
Trans-2-Enoyl-ACP
Acyl-ACP
Malonyl-ACP
Decynoyl-NAC
Fig. 1
by guest on September 3, 2016
http://ww
w.jbc.org/
Dow
nloaded from

Srinivas Kodali Type II Fatty Acid Synthesis 25
0 20 40 60 80 100 120 1400
1000
2000
3000
4000
5000
6000
7000
12 µg6 µg3 µg1.5 µg
Time, min
CP
M
0 2 4 6 8 10 12 140.0
0.1
0.2
0.3
0.4
FASII enzymes (µg)
FASI
I act
ivity
(t 1/2
-1,m
in-1
)
A
B
Fig. 2
by guest on September 3, 2016
http://ww
w.jbc.org/
Dow
nloaded from

Srinivas Kodali Type II Fatty Acid Synthesis 26
0 10 20 30 40 50 600
25
50
75
100
[Octanoyl CoA], µM
FASI
I Act
ivity
(pm
ol/m
in/m
g)
0 20 40 600.00
0.25
0.50
0.75
[Octanoyl CoA], µM[S
]/V
0 25 50 75 100 125 150 1750
100
200
300
400
500
600
[Lauroyl CoA], µM
FASI
I Act
ivity
(pm
ol/m
in/m
g)
0 50 100 1500.00.10.20.30.4
[Lauroyl CoA], µM
[S]/V
A
B
Fig. 3
by guest on September 3, 2016
http://ww
w.jbc.org/
Dow
nloaded from

Srinivas Kodali Type II Fatty Acid Synthesis 27
-3 -2 -1 0 1 2 3-20
0
20
40
60
80
100
120
5 mM EDTA IC50 = 81 mM
log [Total Mg2+], mM
No EDTA IC50 = 76 mM
% C
ontro
l
-3 -2 -1 0 1 2 3-20
0
20
40
60
80
100
120
5 mM EDTA IC50 = 9.1 mM
log [Total Ca2+], mM
No EDTA IC50 = 4.0 mM
% C
ontro
l
-4 -3 -2 -1 0 1 2 3-20
0
20
40
60
80
100
120
5 mM EDTA IC50 = 5.6 mM
log [Total Zn2+], mM
No EDTA IC50 = 0.3 mM
% C
ontro
l
-3 -2 -1 0 1 2 3-20
0
20
40
60
80
100
120
5 mM EDTA IC50 = 19.4 mM
log [Total Mn2+], mM
No EDTA IC50 = 14.0 mM
% C
ontro
l
Fig. 4
by guest on September 3, 2016
http://ww
w.jbc.org/
Dow
nloaded from

Srinivas Kodali Type II Fatty Acid Synthesis 28
-5 -4 -3 -2 -1 0 1 2 3-25
0
25
50
75
100
125
% C
ontro
l
-5 -4 -3 -2 -1 0 1 2 3-25
0
25
50
75
100
125
% C
ontro
l
-5 -4 -3 -2 -1 0 1 2 3-25
0
25
50
75
100
125
Log [Inhibitor], µg/ml
% C
ontro
l
A
C
B
Fig. 5
by guest on September 3, 2016
http://ww
w.jbc.org/
Dow
nloaded from

Srinivas Kodali Type II Fatty Acid Synthesis 29
S01
S02
S03
S04
S05
S06
S07
S08
S09
S10
S11
S12
S13
S14
S15
S16
S17
S18
S19
S20
S21
S22
S23
S24
S23
S26
S27
S28
S29
S30
S31
S32
S33
S34
S35
S36
S37
S38
S39
S40 5.
82.
91.
50.
70.
40.
20.
10.
0-200
20406080
100
[Natural Products], 200µg/mlCerulenin (µg/ml)IC50=1.6 µg/ml
% In
hibi
tion
Fig. 6
by guest on September 3, 2016
http://ww
w.jbc.org/
Dow
nloaded from
Srinivas Kodali Type II Fatty Acid Synthesis 30
H3CO
OO
OH O
ClOH
ClOH
A
Bischloroanthrabenzoxocinone (BABX)
-3 -2 -1 0 1 2 3-25
0
25
50
75
100
125 B
Log [BABX] (µg/ml)
% C
ontro
l
by guest on September 3, 2016
http://ww
w.jbc.org/
Dow
nloaded from
Srinivas Kodali Type II Fatty Acid Synthesis 31
1 2 3 4 5 6 7 8 9 10C
- 14:0-ACP
- 16:0-ACP- 18:0-ACP
- 10:0-ACP
- 20:0-ACP
Mal-ACP
- 12:0-ACP
- ≤8:0-ACP
1 2 3 4 5 6 7 8 9 10C
- 14:0-ACP
- 16:0-ACP- 18:0-ACP
- 10:0-ACP
- 20:0-ACP
Mal-ACP
- 12:0-ACP
- ≤8:0-ACP
E. coli (WT)
E. coli (tolC)
E. coli (lpxC)
S. aureus
1000 500 250 125 62.5 31.3 15.6 7.8 3.9 0 (µg/ml)
100 25 6.25 1.56 0.39 0.10 0.025 0.006 0.0015 0 (µg/ml)
100 25 6.25 1.56 0.39 0.10 0.025 0.006 0.0015 0 (µg/ml)
1000 500 250 125 62.5 31.3 15.6 7.8 3.9 0 (µg/ml)
D
E. coli (WT)
E. coli (tolC)
E. coli (lpxC)
S. aureus
1000 500 250 125 62.5 31.3 15.6 7.8 3.9 0 (µg/ml)
100 25 6.25 1.56 0.39 0.10 0.025 0.006 0.0015 0 (µg/ml)
100 25 6.25 1.56 0.39 0.10 0.025 0.006 0.0015 0 (µg/ml)
1000 500 250 125 62.5 31.3 15.6 7.8 3.9 0 (µg/ml)
D
Fig 7
by guest on September 3, 2016
http://ww
w.jbc.org/
Dow
nloaded from
Srinivas Kodali Type II Fatty Acid Synthesis 32
Legends
Fig. 1. Type II Fatty acid synthesis pathway in bacteria.
Fig. 2. Determination of FASII activity. A, the assay was performed at 37 °C as
described in Experimental Procedures with increasing amounts of the partially purified
FASII enzymes from E. coli ( , 1.5 µg; , 3 µg; , 6 µg ; •, 12 µg). The fatty acid was
slowly captured by phospholipids on the flash plate surface and the elongated fatty acid
was determined by measuring the incorporation of [14C] malonyl CoA at different times
shown on the abscissa. Data are normalized to the background at zero time (202 cpm)
determined by adding 100 µl of 14% perchloric acid before the assay was initiated. B,
FASII activity, presented as an inverse of each t1/2 which was obtained from each data set
of B, was plotted against the amount of FASII enzymes added. The goodness-of-fit of
liner regression (r2) is 0.9994. Data are means (±S.D.) of duplicate determinations and
similar results were obtained from repeated experiments. The specific activity of [14C]
malonyl CoA was 56.9 cpm/pmol using Packard TopCount NXT as described in
Experimental Procedures. The maximum counts obtained from this experiment,
however, were 6417 cpm, which implies the efficiency of flash plate vs. liquid
scintillation is 67.7 %, giving 38.5 cpm/pmol.
Fig 3. Determination of steady state kinetic constants. A, 3 µg of the FASII enzymes
from S. aureus were assayed as described in Experimental Procedures at increasing
by guest on September 3, 2016
http://ww
w.jbc.org/
Dow
nloaded from

Srinivas Kodali Type II Fatty Acid Synthesis 33
concentrations of n-octanoyl CoA shown on the abscissa. Data (in duplicate) were fit to
the Michaelis-Menten equation as well as to a Hanes-Wolff plot (inset). The Kmapp is
1.1±0.3 µM and Vmax is 88.9±4.5 pmol/min/mg. B, an identical experiment was done as
in A except using lauroyl CoA as substrate and the protein from B. subtilis providing
Kmapp =10.0±2.7 µM and Vmax is 516±31 pmol/min/mg.
Fig 4. The effect of divalent cat ions on FASII activity. The assay was performed as
described in Experimental Procedures using increasing concentrations of metals with (•)
or without ( ) addition of 5mM EDTA. Without addition of EDTA the total metal
concentrations equal free metal concentrations. The IC50 of free Mg++ (A) is 90 mM,
free-Mn++ (B) is 9mM, free Ca++ (C) is 6mM and free Zn++ (D) is 0.2 mM. Data was
duplicated. Similar results were obtained from three other experiments with addition of
varying concentrations of EDTA (0.8 - 5 mM, not shown). With addition of EDTA, the
free metal calculation was described in the discussion.
Fig. 5. Efficacy and selectivity of FASII inhibitors on the enzymes from different species
The assay was performed as described in Experimental Procedures with addition of a
serial dilution of inhibitors, cerulenin (•), thiolactomycin ( ) or triclosan ( ). A, the
enzymes from E. coli showed IC50s of 1.0±0.3 (cerulenin), 17.3±3.2 (thiolactomycin) and
0.06±0.02 µg/ml (triclosan). B, the enzyme from B. subtilis displayed IC50s of 0.10±0.03
(cerulenin), 110±35 (thiolactomycin) and 0.8±0.4 µg/ml (triclosan). C, the enzyme from
by guest on September 3, 2016
http://ww
w.jbc.org/
Dow
nloaded from

Srinivas Kodali Type II Fatty Acid Synthesis 34
S. aureus had IC50s of 1.5±0.4 (cerulenin), 13.0±3.9 (thiolactomycin) and 0.0079±0.002
µg/ml (triclosan). Experiments were done at least three times in duplicates.
Fig 6. Screening of natural product extracts. An example of performance of FASII assay
in 96 well plates. S18 shows inhibition greater than 50%. The background noise is below
30 % inhibition. Cerulenin was used as a positive control in each plate. Data are means
(±S.D.) of duplicate determinations. The percent inhibition was calculated using the
following equation %INH=100-100*(data-BG)/(MAX-BG). Background (BG) is
determined using 1 mM of cerulenin and Maximum Enzyme activity (MAX) is obtained
by using 3.3 % DMSO.
Fig. 7. Identification and characterization of a new inhibitor,
bischloroanthrabenzoxocinone (BABX). A, structure of BABX isolated from S18 (Fig.
6). B, FASII assay with a serial dilutions of BABX (333-0.01 µg/ml final concentration)
using S. aureus (•) and E. coli (○) FASII enzymes, providing IC50 values of 11.4 µg/ml
(95% CI: 7.3-18.0) and 35.3 µg/ml (95% CI: 17.2-72.4), respectively. The graph shows
the results of an average of two duplicate experiments. C, FASII elongation assay was
done in identical conditions as the FASII assay with some exceptions. The reaction was
performed with S. aurues FASII enzymes (lanes 2-9) and E. coli FASII enzymes (lane
10) using 4 µM of [14C]-malonyl CoA (60 mCi/mmol) as one substrate in polypropylene
tubes. The second substrate in the assay was either 20 µM acetyl CoA (lanes 2-5, 10) or
by guest on September 3, 2016
http://ww
w.jbc.org/
Dow
nloaded from

Srinivas Kodali Type II Fatty Acid Synthesis 35
20 µM of n-octanoyl CoA (lanes 6-9). After the reaction, 10 µl of each sample was
directly applied to and resolved by a l6% polyacrylamide gel containing 4 M urea. The
gel was blotted to a PVDF membrane and visualized by PhosphIimager. lane 1: a control
of malonyl-ACP; lanes 2, 6, 10: without inhibitors; lanes 3, 7: 200 µg/ml cerulenin; lanes
4, 8: 200 µg/ml BABX; lanes 5, 9: 10µg/ml triclosan. The same samples were also
resolved on l6% polyacrylamide gel containing between 0.5, 2 and 3.7 M urea (data not
shown), which was used for confirming the results. Similar experiments were repeated 4
times with reproducible results. D, Kirby-Bauer assay with minor modifications. Briefly,
20 ml of melted LB agar was maintained at 44°C, seeded with 0.75 ml (A600=0.3) of
overnight culture and plated into an omni plate (NUNC-Nalgene). After agar solidified
and dried for 15 minutes, 10 µg/ml of serial dilutions of BABX in LB containing 20%
DMSO were placed on the seeded agar plate and incubated at 37°C for 20 hours. Zone
sizes represent antibacterial activity. The results were confirmed by repeating three times.
by guest on September 3, 2016
http://ww
w.jbc.org/
Dow
nloaded from
Srinivas Kodali Type II Fatty Acid Synthesis 36
References
1. Campbell, J. W., and Cronan, J. E. (2001) Annual Review of Microbiology 55, 305-332
2. Heath, R., White, S., and Rock, C. (2001) Prog Lipid Res. 40, 467-497
3. Fall, R. R., and Vagelos, P. R. (1972) J. Biol. Chem. 247, 8005-8015
4. Matsumae, A., Nomura, S., and Hata, T. (1964) J Antibiot (Tokyo). 17, 1-7
5. Joshi, V. C., and Wakil, S. J. (1971) Archives Of Biochemistry And Biophysics 143, 493-505
6. Tsay, J., Oh, W., Larson, T., Jackowski, S., and Rock, C. (1992) J. Biol. Chem. 267, 6807-6814
7. Rawlings, M., and Cronan, J., Jr. (1992) J. Biol. Chem. 267, 5751-5754
8. Cronan, J., Jr, Li, W., Coleman, R., Narasimhan, M., de Mendoza, D., and Schwab, J. (1988) J. Biol. Chem. 263, 4641-4646
9. Mohan, S., Kelly, T., Eveland, S., Raetz, C., and Anderson, M. (1994) J. Biol. Chem. 269, 32896-32903
10. Heath, R. J., and Rock, C. O. (1995) J. Biol. Chem. 270, 26538-26542
11. Heath, R. J., and Rock, C. O. (2000) Nature 406, 145-146
12. Heath, R. J., Su, N., Murphy, C. K., and Rock, C. O. (2000) J. Biol. Chem. 275, 40128-40133
13. Kauppinen, S., Siggaard-Andersen, M., and von Wettstein-Knowles, P. (1988) Carlsberg Research Communications 53, 357-370
14. Siggaard-Andersen, M., Wissenbach, M., Chuck, J.-A., Svendsen, I., Olsen, J. G., and Von Wettstein-Knowles, P. (1994) Proceedings of the National Academy of Sciences of the United States of America 91, 11027-11031
15. Heath, R. J., Yu, Y.-T., Shapiro, M. A., Olson, E., and Rock, C. O. (1998) J. Biol. Chem. 273, 30316-30320
16. Banerjee, A., Dubnau, E., Quemard, A., Balasubramanian, V., Um, K., Wilson, T., Collins, D., de Lisle, G., and Jacobs, W. J. (1994) Science 263, 227-230
17. Noto, T., Miyakawa, S., Oishi, H., Endo, H., and Okazaki, H. (1982) J Antibiot (Tokyo) 35, 401-410
18. Dolak, L., Castle, T., Truesdell, S., and Sebek, O. (1986) J Antibiot (Tokyo) 39, 26-31
19. Omura, S., Y, I., Nakagawa, A., Iwata, R., Takahashi, Y., Shimizu, H., and Tanaka, H. (1983) J Antibiot (Tokyo) 36, 109-114
20. Kauppinen, S., Siggaard-Anderson, M., and van Wettstein-Knowles, P. (1988) Carlsburg. Res. Commun 53, 357-370
by guest on September 3, 2016
http://ww
w.jbc.org/
Dow
nloaded from
Srinivas Kodali Type II Fatty Acid Synthesis 37
21. Price, A. C., Choi, K.-H., Heath, R. J., Li, Z., White, S. W., and Rock, C. O. (2001) J. Biol. Chem. 276, 6551-6559
22. He, X., and Reynolds, K. A. (2002) Antimicrob. Agents Chemother. 46, 1310-1318
23. Daines, R. A., Pendrak, I., Sham, K., Van Aller, G. S., Konstantinidis, A. K., Lonsdale, J. T., Janson, C. A., Qiu, X., Brandt, M., Khandekar, S. S., Silverman, C., and S., H. M. (2003) J Med Chem. 46, 5-8
24. Tsay, J., Rock, C., and Jackowski, S. (1992) J Bacteriol 174, 508-513
25. Onishi, H. R., Pelak, B. A., Gerckens, L. S., Silver, L. L., Kahan, F. M., Chen, M.-H., Patchett, A. A., Galloway, S. M., Hyland, S. A., Anderson, M. S., and Raetz, C. R. H. (1996) Science 274, 980-982
26. Wang, J., Galgoci, A., Kodali, S., Herath, K. B., Jayasuriya, H., Dorso, K., Vicente, F., Gonzalez, A., Cully, D., Bramhill, D., and Singh, S. (2003) J. Biol. Chem. 278, 44424-44428
27. Miller, J. H. (1972) in Experiments in Molecular Genetics, pp. 201-205, Cold Spring Harbor Laboratory, Cold Spring Harbor, NY
28. Singer, M., Baker, T. A., Schnitzler, G., Deische, S. M., Goel, M., Dove , W., Jaacks, K. J., Grossman, A. D. E., J. W., and Gross, C. A. (1989) Microbiol Rev. 53, 1-24
29. Bochner, B. R., Huang, H. C., Schieven, G. L., and Ames, B. N. (1980) J Bacteriol. 143, 926-933
30. Lynen, F. (1962) in Methods in Enzymology (Colowick, S., and Kaplan, N., eds) Vol. 5, pp. 443-451, Academic Press, New York and London
31. Wang, J., Tu, Y., Mukhopadhyay, S., Chidiac, P., Biddlecome, G. H., and Ross, E. M. (1999) in G Proteins: Techniques of Analysis (Manning, D. R., ed), pp. 123-151, CRC Press, Boca Raton
32. Zhang, J.-H., Chung, T. D. Y., and Oldenburg, K. R. (1999) Journal of Biomolecular Screening 4, 67-73
33. Jackowski, S., and Rock, C. (1987) J. Biol. Chem. 262, 7927-7931
34. Rock, C. O., and Cronan, J. E., Jr. (1979) J. Biol. Chem. 254, 7116-7122
35. Alberts, A., Bell, R., and Vagelos, P. (1972) J. Biol. Chem. 247, 3190-3198
36. Choi, K.-H., Heath, R. J., and Rock, C. O. (2000) J. Bacteriol. 182, 365-370
37. Perrin, D. D., and Dempsey, B. (1974) (Hall, C. a., ed), New York
38. Wang, J., Tu, Y., Woodson, J., Song, X., and Ross, E. M. (1997) J. Biol. Chem. 272, 5732-5740
39. Kawaguchi, A., Tomoda, H., Nozoe, S., Omura, S., and Okuda, S. (1982) J Biochem (Tokyo) 92, 7-12
by guest on September 3, 2016
http://ww
w.jbc.org/
Dow
nloaded from

Srinivas Kodali Type II Fatty Acid Synthesis 38
40. Ward, W., Holdgate, G., Rowsell, S., McLean, E., Pauptit, R., Clayton, E., Nichols, W., Colls, J., Minshull, C., Jude, D., Mistry, A., Timms, D., Camble, R., Hales, N., Britton, C., and Taylor, I. (1999) Biochemistry 38, 12514-12525
41. Schujman, G. E., Choi, K.-H., Altabe, S., Rock, C. O., and de Mendoza, D. (2001) J. Bacteriol. 183, 3032-3040
42. Jackowski, S., Zhang, Y.-M., Price, A. C., White, S. W., and Rock, C. O. (2002) Antimicrob. Agents Chemother. 46, 1246-1252
43. Young, K., and Silver, L. (1991) J Bacteriol 173, 3609-3614
44. Poole, K. (2001) Current Opinion in Microbiology 4, 500-508
45. Markham, P. N., and Neyfakh, A. A. (2001) Current Opinion in Microbiology 4, 509-514
46. Schweizer, H. P. (1998) Antimicrob. Agents Chemother. 42, 394-398
47. Chuanchuen, R., Beinlich, K., Hoang, T. T., Becher, A., Karkhoff-Schweizer, R. R., and Schweizer, H. P. (2001) Antimicrob. Agents Chemother. 45, 428-432
by guest on September 3, 2016
http://ww
w.jbc.org/
Dow
nloaded from
Srinivas Kodali Type II Fatty Acid Synthesis 39
-2 -1 0 1 2 30
25
50
75
100
125
DNARNA
Phospholipid IC50 = 12.5 µg/mlProteinCell Wall
log [Cerulenin], µg/ml
% C
ontr
ol
-3 -2 -1 0 1 20
25
50
75
100
125
DNARNAPhospholipidProtein IC50 = 2.0 µg/mlCell Wall
log [Chloramphenicol], µg/ml
% C
ontr
ol
-2 -1 0 1 2 30
25
50
75
100
125
DNARNAPhospholipic IC50 = 12.5 µg/mlProteinCell Wall
log [Thiolactomycin], µg/ml
% C
ontr
ol
-4.5 -4.0 -3.5 -3.0 -2.5 -2.0 -1.5 -1.0 -0.50
25
50
75
100
125
DNARNA IC50 = 0.004 mg/mlPhospholipidProtein IC50 = 0.018 µg/mlCell Wall
log [Rifampicin], µg/ml
% C
ontr
ol
-1.5 -1.0 -0.5 0.0 0.5 1.0 1.50
25
50
75
100
125
DNARNAPhospholipidProteinCell Wall IC50 = 1.7 µg/ml
log [Vancomycin], µg/ml
% C
ontr
ol
-2.00 -1.75 -1.50 -1.25 -1.00 -0.75 -0.50 -0.25 0.00 0.25 0.500
25
50
75
100
125
DNA IC50 = 0.5 µg/mlRNAPhospholipidProteinCell Wall
log [Ciprofloxacin], µg/ml
% C
ontr
ol
-4.5 -4.0 -3.5 -3.0 -2.5 -2.0 -1.5 -1.0 -0.50
25
50
75
100
125
DNARNA
Cell Wall
Phospholipid IC50 = 0.002 µg/mlProtein
log [Triclosan], µg/ml
% C
ontr
ol
Whole cell labeling of S. aureus, MB2985Control for protein synthesis Control for RNA synthesis
Control for DNA synthesis Control for cell wall synthesis
FASII inhibitors
Sup. 1
-2 -1 0 1 2 30
25
50
75
100
125
DNARNA
Phospholipid IC50 = 12.5 µg/mlProteinCell Wall
log [Cerulenin], µg/ml
% C
ontr
ol
-3 -2 -1 0 1 20
25
50
75
100
125
DNARNAPhospholipidProtein IC50 = 2.0 µg/mlCell Wall
log [Chloramphenicol], µg/ml
% C
ontr
ol
-2 -1 0 1 2 30
25
50
75
100
125
DNARNAPhospholipic IC50 = 12.5 µg/mlProteinCell Wall
log [Thiolactomycin], µg/ml
% C
ontr
ol
-4.5 -4.0 -3.5 -3.0 -2.5 -2.0 -1.5 -1.0 -0.50
25
50
75
100
125
DNARNA IC50 = 0.004 mg/mlPhospholipidProtein IC50 = 0.018 µg/mlCell Wall
log [Rifampicin], µg/ml
% C
ontr
ol
-1.5 -1.0 -0.5 0.0 0.5 1.0 1.50
25
50
75
100
125
DNARNAPhospholipidProteinCell Wall IC50 = 1.7 µg/ml
log [Vancomycin], µg/ml
% C
ontr
ol
-2.00 -1.75 -1.50 -1.25 -1.00 -0.75 -0.50 -0.25 0.00 0.25 0.500
25
50
75
100
125
DNA IC50 = 0.5 µg/mlRNAPhospholipidProteinCell Wall
log [Ciprofloxacin], µg/ml
% C
ontr
ol
-4.5 -4.0 -3.5 -3.0 -2.5 -2.0 -1.5 -1.0 -0.50
25
50
75
100
125
DNARNA
Cell Wall
Phospholipid IC50 = 0.002 µg/mlProtein
log [Triclosan], µg/ml
% C
ontr
ol
Whole cell labeling of S. aureus, MB2985Control for protein synthesis Control for RNA synthesis
Control for DNA synthesis Control for cell wall synthesis
FASII inhibitors
Sup. 1
by guest on September 3, 2016
http://ww
w.jbc.org/
Dow
nloaded from
Srinivas Kodali Type II Fatty Acid Synthesis 40
Sup. 2Sup. 2Whole cell labeling of E coli (lpxC), MB4902
-1.5 -1.0 -0.5 0.0 0.5 1.0 1.5 2.0 2.50
25
50
75
100
125
RNADNA
Phospholipid, IC50~100 µg/mlProteinCell wall
log [BABX], µg/ml
% C
ontr
ol
-3 -2 -1 0 1 2-25
0
25
50
75
100
125
Protein IC50=0.30 µg/ml
DNA IC50 = 0.24 µg/mlRNA IC50 = 0.26µg/mlPhospholipid IC50 = 0.21µg/ml
Cell Wall IC50 = 0.24 µg/ml
log [BABX], µg/ml
% C
ontr
ol
Whole cell labeling of S. aureus, MB2985
Whole cell labeling of E coli (lpxC), MB4902
-1.5 -1.0 -0.5 0.0 0.5 1.0 1.5 2.0 2.50
25
50
75
100
125
RNADNA
Phospholipid, IC50~100 µg/mlProteinCell wall
log [BABX], µg/ml
% C
ontr
ol
-3 -2 -1 0 1 2-25
0
25
50
75
100
125
Protein IC50=0.30 µg/ml
DNA IC50 = 0.24 µg/mlRNA IC50 = 0.26µg/mlPhospholipid IC50 = 0.21µg/ml
Cell Wall IC50 = 0.24 µg/ml
log [BABX], µg/ml
% C
ontr
ol
Whole cell labeling of S. aureus, MB2985 by guest on September 3, 2016
http://ww
w.jbc.org/
Dow
nloaded from

Srinivas Kodali
-2 -1 0 1 2 30
25
50
75
100
125
DNA
RNA
Phospholipid IC50 = 12.5 µg/mlProtein
Cell Wall
log [Cerulenin], µg/ml
% C
ont
rol
-3 -2 -1 0 1 20
25
50
75
100
125
DNA
RNA
Phospholipid
Protein IC50 = 2.0 µg/ml
Cell Wall
log [Chloramphenicol], µg/ml
% C
on
tro
l
-2 -1 0 1 2 30
25
50
75
100
125
DNA
RNA
Phospholipic IC50 = 12.5 µg/ml
Protein
Cell Wall
log [Thiolactomycin], µg/ml
% C
on
tro
l
-4.5 -4.0 -3.5 -3.0 -2.5 -2.0 -1.5 -1.0 -0.50
25
50
75
100
125
DNA
RNA IC50 = 0.004 mg/ml
Phospholipid
Protein IC50 = 0.018 µg/ml
Cell Wall
log [Rifampicin], µg/ml
% C
ont
rol
-1.5 -1.0 -0.5 0.0 0.5 1.0 1.50
25
50
75
100
125
DNA
RNA
Phospholipid
Protein
Cell Wall IC50 = 1.7 µg/ml
log [Vancomycin], µg/ml
% C
ont
rol
-2.00 -1.75 -1.50 -1.25 -1.00 -0.75 -0.50 -0.25 0.00 0.25 0.500
25
50
75
100
125
DNA IC50 = 0.5 µg/mlRNA
Phospholipid
Protein
Cell Wall
log [Ciprofloxacin], µg/ml
% C
ont
rol
-4.5 -4.0 -3.5 -3.0 -2.5 -2.0 -1.5 -1.0 -0.50
25
50
75
100
125
DNA
RNA
Cell Wall
Phospholipid IC50 = 0.002 µg/mlProtein
log [Triclosan], µg/ml
% C
on
trol
Whole cell labeling of S. aureus, MB2985
Control for protein synthesis Control for RNA synthesis
Control for DNA synthesisControl for cell wall synthesis
FASII inhibitors
Sup. 1
-2 -1 0 1 2 30
25
50
75
100
125
DNA
RNA
Phospholipid IC50 = 12.5 µg/mlProtein
Cell Wall
log [Cerulenin], µg/ml
% C
ont
rol
-3 -2 -1 0 1 20
25
50
75
100
125
DNA
RNA
Phospholipid
Protein IC50 = 2.0 µg/ml
Cell Wall
log [Chloramphenicol], µg/ml
% C
on
tro
l
-2 -1 0 1 2 30
25
50
75
100
125
DNA
RNA
Phospholipic IC50 = 12.5 µg/ml
Protein
Cell Wall
log [Thiolactomycin], µg/ml
% C
on
tro
l
-4.5 -4.0 -3.5 -3.0 -2.5 -2.0 -1.5 -1.0 -0.50
25
50
75
100
125
DNA
RNA IC50 = 0.004 mg/ml
Phospholipid
Protein IC50 = 0.018 µg/ml
Cell Wall
log [Rifampicin], µg/ml
% C
ont
rol
-1.5 -1.0 -0.5 0.0 0.5 1.0 1.50
25
50
75
100
125
DNA
RNA
Phospholipid
Protein
Cell Wall IC50 = 1.7 µg/ml
log [Vancomycin], µg/ml
% C
ont
rol
-2.00 -1.75 -1.50 -1.25 -1.00 -0.75 -0.50 -0.25 0.00 0.25 0.500
25
50
75
100
125
DNA IC50 = 0.5 µg/mlRNA
Phospholipid
Protein
Cell Wall
log [Ciprofloxacin], µg/ml
% C
ont
rol
-4.5 -4.0 -3.5 -3.0 -2.5 -2.0 -1.5 -1.0 -0.50
25
50
75
100
125
DNA
RNA
Cell Wall
Phospholipid IC50 = 0.002 µg/mlProtein
log [Triclosan], µg/ml
% C
on
trol
Whole cell labeling of S. aureus, MB2985
Control for protein synthesis Control for RNA synthesis
Control for DNA synthesisControl for cell wall synthesis
FASII inhibitors
Sup. 1

Srinivas Kodali
Sup. 2Sup. 2Whole cell labeling of E coli (lpxC), MB4902
-1.5 -1.0 -0.5 0.0 0.5 1.0 1.5 2.0 2.50
25
50
75
100
125
RNA
DNA
Phospholipid, IC50~100 µg/mlProtein
Cell wall
log [BABX], µg/ml
% C
on
tro
l
-3 -2 -1 0 1 2-25
0
25
50
75
100
125
Protein IC50=0.30 µg/ml
DNA IC50 = 0.24 µg/ml
RNA IC50 = 0.26µg/ml
Phospholipid IC50 = 0.21µg/ml
Cell Wall IC50 = 0.24 µg/ml
log [BABX], µg/ml
% C
on
tro
l
Whole cell labeling of S. aureus, MB2985
Whole cell labeling of E coli (lpxC), MB4902
-1.5 -1.0 -0.5 0.0 0.5 1.0 1.5 2.0 2.50
25
50
75
100
125
RNA
DNA
Phospholipid, IC50~100 µg/mlProtein
Cell wall
log [BABX], µg/ml
% C
on
tro
l
-3 -2 -1 0 1 2-25
0
25
50
75
100
125
Protein IC50=0.30 µg/ml
DNA IC50 = 0.24 µg/ml
RNA IC50 = 0.26µg/ml
Phospholipid IC50 = 0.21µg/ml
Cell Wall IC50 = 0.24 µg/ml
log [BABX], µg/ml
% C
on
tro
l
Whole cell labeling of S. aureus, MB2985
WangKithsiri B. Herath, Sheo B. Singh, Doris Cully, John F. Barrett, Dennis Schmatz and Jun
Srinivas Kodali, Andrew Galgoci, Katherine Young, Ronald Painter, Lynn L. Silver,Determination of selectivity and efficacy of fatty acid synthesis inhibitors
published online October 29, 2004 originally published online October 29, 2004J. Biol. Chem.
10.1074/jbc.M406848200Access the most updated version of this article at doi:
Alerts:
When a correction for this article is posted•
When this article is cited•
to choose from all of JBC's e-mail alertsClick here
Supplemental material:
http://www.jbc.org/content/suppl/2004/11/01/M406848200.DC1.html
http://www.jbc.org/content/early/2004/11/01/jbc.M406848200.citation.full.html#ref-list-1
This article cites 0 references, 0 of which can be accessed free at
by guest on September 3, 2016
http://ww
w.jbc.org/
Dow
nloaded from