chiral induced spin selectivity effect: fundamental studies and
180
CHIRAL INDUCED SPIN SELECTIVITY EFFECT: FUNDAMENTAL STUDIES AND APPLICATIONS by Supriya Ghosh B.Sc., University of Calcutta, 2010 M.Sc., IIT Bombay, 2012 M.Sc., University of Alberta, 2015 Submitted to the Graduate Faculty of the Dietrich School of Arts and Sciences in partial fulfillment of the requirements for the degree of Doctor of Philosophy University of Pittsburgh 2021
-
Upload
khangminh22 -
Category
Documents
-
view
0 -
download
0
Transcript of chiral induced spin selectivity effect: fundamental studies and

TITLE PAGE
CHIRAL INDUCED SPIN SELECTIVITY EFFECT: FUNDAMENTAL STUDIES AND
APPLICATIONS
by
Supriya Ghosh
B.Sc., University of Calcutta, 2010
M.Sc., IIT Bombay, 2012
M.Sc., University of Alberta, 2015
Submitted to the Graduate Faculty of the
Dietrich School of Arts and Sciences in partial fulfillment
of the requirements for the degree of
Doctor of Philosophy
University of Pittsburgh
2021

ii
COMMITTE E PAGE
UNIVERSITY OF PITTSBURGH
DIETRICH SCHOOL OF ARTS AND SCIENCES
This dissertation was presented
by
Supriya Ghosh
It was defended on
April 5, 2021
and approved by
Dr. Haitao Liu, Professor, Department of Chemistry
Dr. Sean Garrett-Roe, Associate Professor, Department of Chemistry
Dr. Andrew Gellman, Professor, Chemical Engineering, Carnegie Mellon University
Dissertation Advisor: Dr. David Waldeck, Professor, Department of Chemistry

iii
Copyright © by Supriya Ghosh
2021

iv
ABST RACT
CHIRAL INDUCED SPIN SELECTIVITY EFFECT: FUNDAMENTAL STUDIES AND
APPLICATIONS
Supriya Ghosh, PhD
University of Pittsburgh, 2021
Since the discovery, chiral induced spin selectivity effect or CISS effect, which refers to
the preferential transmission of electron of one spin over another through a chiral
molecule/material, has generated significant interest due to its versatile application in different
branches of science. Over the years, a large number of theoretical and experimental studies have
been performed to understand the mechanism for the CISS effect and also to utilize the effect in
different fields of science; such as memory devices, electrocatalytic experiments, chiral
separations etc. In this dissertation, fundamental studies of chiral molecules at ferromagnetic
interfaces are investigated through surface potential and magnetic measurements. Experiments are
also done to study the spin filtering properties of chiral thin films and explore their electrocatalytic
activity. In the first study chiral molecule induced magnetization of the superparamagnetic
particles was shown. This experiment shows a novel method to create a ferromagnetic domain of
10 nm size from superparamagnetic particles using CISS. In the second study, spin dependent
charge penetration into chiral molecules from a ferromagnetic substrate is presented by measuring
surface potential using Kelvin probe method. In the third study, spin dependent electron
transmission through chiral cobalt oxide thin films was performed by using magnetic conductive
AFM and magnetoresistance measurements. In the fourth study the electrocatalytic efficiency for
water splitting was studied using chiral and magnetic thin cobalt oxide film. The finding of these
v
studies serve to advance the CISS field and may help in developing new CISS based spintronics
device and electrocatalysts.

vi
TABLE OF CONTENTS
PREFACE ................................................................................................................................. xxvi
1.0 INTRODUCTION................................................................................................................... 1
1.1 CHIRAL INDUCED SPIN SELECTIVITY EFFECT (CISS EFFECT) ................... 1
1.2 BASIC PRINCIPLE AND UNDERSTANDING OF CISS EFFECT ......................... 2
1.2.1 Measurements Methods and Detection Thereof ..................................................4
1.2.1.1 Photoemission Study ................................................................................. 4
1.2.1.2 Magnetic Conductive Probe AFM ........................................................... 5
1.2.1.3 Magnetoresistance Measurements .......................................................... 6
1.2.1.4 Electrochemistry ....................................................................................... 7
1.2.1.5 Hall Device ................................................................................................. 8
1.2.2 Timeline of Initial Experiments and Findings .....................................................9
1.2.3 Spin Polarization Through Different Chiral Material ......................................11
1.3 MAGNETIC AND THE CHIRAL INDUCED SPIN SELECTIVITY EFFECT .... 13
1.3.1 Size Dependent Magnetic Properties ..................................................................13
1.3.1.1 Magnetic Measurement .......................................................................... 18
1.3.2 Magnetism Induced by Proximity of Chiral Molecules ....................................20
1.3.3 CISS Based Memory Devices ..............................................................................21
1.4 IMPORTANCE OF SPIN IN CHEMICAL REACTION ......................................... 24
1.4.1 Basic Principles and Some Examples .................................................................25
1.4.2 Spin Control Using the CISS Effect ....................................................................26
1.4.3 OER and Mechanism ...........................................................................................27

vii
1.4.3.1 Basic of Oxygen Evolution Reaction ..................................................... 27
1.4.3.2 Oxygen Evolution Reactions Mechanisms ............................................ 28
1.4.4 Spin Control in Water Splitting ..........................................................................30
1.4.4.1 Control Spin with Magnetic Field ......................................................... 30
1.4.4.2 Control Spin with Chirality ................................................................... 31
1.5 DISSERTATION OUTLINE ........................................................................................ 33
1.6 REFERENCES .............................................................................................................. 34
2.0 SINGLE DOMAIN 10 nm FERROMAGNETISM IMPRINTED ON
SUPERPARAMAGNETIC NANOPARTICLES USING CHIRAL
MOLECULES ................................................................................................................... 41
2.1 INTRODUCTION ......................................................................................................... 42
2.2 RESULTS AND DISCUSSION .................................................................................... 45
2.2.1 Sample Preparation ..............................................................................................45
2.2.2 SQUID Measurement ...........................................................................................47
2.2.3 Magnetic Force Microscopy (M-AFM) Measurement ......................................49
2.2.4 Mechanism of Magnetization Imprinting ..........................................................51
2.3 SUMMARY .................................................................................................................... 53
2.4 REFERENCES .............................................................................................................. 54
3.0 EFFECT OF CHIRAL MOLECULES ON THE ELECTRON’S SPIN
WAVEFUNCTION AT INTERFACES .......................................................................... 56
3.1 INTRODUCTION ......................................................................................................... 57
3.2 RESULTS ....................................................................................................................... 60
3.3 A MODEL ...................................................................................................................... 66

viii
3.4 SUMMARY .................................................................................................................... 70
3.5 REFERENCES .............................................................................................................. 71
4.0 SPIN POLARIZATION STUDY OF PURE AND DOPED CHIRAL OXIDE
THIN FILM FOR SPINTRONICS BASED DEVICES WITHOUT A
PERMANENT FERROMAGNET .................................................................................. 75
4.1 INTRODUCTION ......................................................................................................... 75
4.2 RESULTS ....................................................................................................................... 78
4.2.1 Cobalt Oxide Thin Film and Chirality ...............................................................78
4.2.2 Magnetic Conductive Atomic Force Microscopy ..............................................79
4.2.3 Spin Valve Based Magnetoresistance Device .....................................................82
4.2.4 Spin Polarization with Mn Doped Cobalt Oxide Film ......................................83
4.3 CONCLUSION .............................................................................................................. 85
4.4 EXPERIMENTAL METHODS ................................................................................... 86
4.4.1 Thin Chiral Cobalt Oxide Thin Film Deposition ...............................................86
4.4.2 Magnetic Conductive AFM .................................................................................87
4.4.3 Magnetoresistance Device ....................................................................................88
4.5 REFERENCES .............................................................................................................. 88
5.0 INCREASING THE EFFICIENCY OF WATER SPLITTING THROUGH SPIN
POLARIZATION USING COBALT OXIDE THIN FILM CATALYSTS ................ 92
5.1 INTRODUCTION ......................................................................................................... 93
5.2 RESULTS AND DISCUSSION .................................................................................... 96
5.2.1 Film Preparation and Characterization .............................................................96
5.2.2 Water Splitting Study ...........................................................................................99

ix
5.2.3 A Mechanistic Scheme for OER at Different pH ............................................103
5.2.4 Magnetic Field Dependent Water Splitting .....................................................105
5.3 CONCLUSION ............................................................................................................ 108
5.4 CAVEAT ...................................................................................................................... 108
5.5 EXPERIMENTAL METHODS ................................................................................. 109
5.5.1 Formation of Cobalt Oxide Thin Film ..............................................................109
5.5.2 Circular Dichroism .............................................................................................110
5.5.3 Oxygen Evolution Studies ..................................................................................110
5.5.4 Hydrogen Peroxide Formation ..........................................................................110
5.5.5 Hoffman Apparatus............................................................................................111
5.5.6 Magnetic Field Effects on the Oxygen Evolution Reaction ............................111
5.5.7 Electrochemical Surface Area Calculation (ECSA) ........................................112
5.5.8 X-Ray Photoelectron Spectroscopy (XPS) .......................................................112
5.5.9 X-Ray Diffraction (XRD) ...................................................................................113
5.5.10 SEM Study ........................................................................................................113
5.5.11 Atomic Force Microscopy Measurement .......................................................113
5.6 REFERENCES ............................................................................................................ 114
6.0 CONCLUDING REMARKS ............................................................................................. 118
APPENDIX A ............................................................................................................................ 122
A.1 SUPERPARAMAGNETIC IRON OXIDE NANOPARTICLE
(SPION)PREPARATION ................................................................................................. 122
A.2 SAMPLE PREPARATION FOR MAGNETIC MEASUREMENTS ................... 123
A.3 MEASUREMENT SYSTEMS ................................................................................... 125
x
A.4 ADDITIONAL RESULTS ......................................................................................... 127
A.5 REFERENCES............................................................................................................ 130
APPENDIX B ............................................................................................................................ 132
B.1 SAMPLE PREPARATION ........................................................................................ 132
B.2 KPFM MEASUREMENT .......................................................................................... 134
B.3 PEPTIDE SAM PREPARATION ............................................................................. 135
B.4 PEPTIDE MACROSCOPIC CPD MEASUREMENT ........................................... 135
APPENDIX C ............................................................................................................................ 138
C.1 X-ray DIFFRACTION (XRD) ................................................................................... 138
C.2 X-ray PHOTOELECTRON SPECTROSCOPY ..................................................... 139
APPENDIX D ............................................................................................................................ 140
D.1 THICKNESS DETERMINATION ........................................................................... 140
D.2 XPS CHARACTERIZATION ................................................................................... 140
D.3 ELECTROCHEMICAL SURFACE AREA ............................................................ 144
D.4 ATOMIC FORCE MICROSCOPY .......................................................................... 145
D.5 TAFEL ANALYSIS .................................................................................................... 146
D.6 OER WITH D-CoOx ................................................................................................... 147
D.7 CHARACTERIZATION OF MAGNETIZED ELECTRODE .............................. 148
D.8 REFERENCES............................................................................................................ 150
APPENDIX E LIST OF PUBLICATIONS ............................................................................ 151

xi
LIST OF TABLES
Table 1.1 Estimated critical diameter for single domain magnetic nanoparticles.39Table is
taken from reference 39.................................................................................................. 16
Table 5.1 Average ratios of hydrogen-to-oxygen production measured using a Hoffman
apparatus for multiple L- amd meso-CoOx catalysts in sodium
carbonate/bicarbonate pH 10 buffer solutions at a 5.0 mA/cm2 current density and
pH 13 (0.1 M KOH) solutions at 10 mA/cm2 current densities. ................................ 103
Table D.1 Fitting parameters for the XPS spectra shown in Figure D.4. The peak positions
were contrained to have the same binding energy in L-CoOx and meso-CoOx whereas
for the treated sample only the orange and purple peaks could be constrained to give
a quality fit. .................................................................................................................... 143
Table D.2 Comparison of OER at 5 mA/cm2 for L-CoOx, D-CoOx and meso CoOx films
......................................................................................................................................... 148
xii
LIST OF FIGURES
Figure 1.1 Shows an energy scheme of the momentum-spin states |momentum, spin > for a
electron traveling in a helical potential.2 This figure is taken from reference 2. ....... 3
Figure 1.2 Shows the experimental set up for the spin-resolved photoemission
experiment.17This figure is taken from reference 17. .................................................... 5
Figure 1.3 Shows schematic for the magnetic conductive AFM where a ferromagnetic layer
act as a source for spin current a) or a magnetic probe is used as a spin current source
b). ........................................................................................................................................ 6
Figure 1.4 Shows a cross section geometry of a spin valve type magnetoresistance device.22
Here B is the applied magnetic field. This figure is taken from reference 22. ............ 7
Figure 1.5 Shows a schematic for a electrochemical setup for CISS measurement.23 Here the
Ni is the working electrode and the Pt and saturated calomel electrodes are the
counter and reference electrode respectively. The molecules are adsorbed on the Ni
surface which is magnetized with a external magnetic field (H). This figure is taken
from reference 23. ............................................................................................................. 8
Figure 1.6 Shows a schematic of a Hall effect based device for spin polarization measurement
24. This figure is taken from reference 24. ...................................................................... 9
Figure 1.7 Shows schematic of the monolayer of ds-DNA as a spin filter for the photoemission
experiment. In this case, linear polarized light ejects unpolarized electrons from the
gold surface, which then get spin polarized after transmitting through DNA.21 This
figure is taken from reference 21. .................................................................................. 10
Figure 1.8 Magnetization curve of ferromagnetic material. ................................................... 15

xiii
Figure 1.9 The diagram on the left shows the generic dependence of a magnetic material’s
coercivity Hc on its physical size: multidomain (green), single domain (blue) and
superparamagnetism (red). The diagram on right shows magnetization hysteresis
loops for the different domain size behaviors............................................................... 17
Figure 1.10 a) The schematic diagram illustrates a magnetic force microscopy (MFM)
measurement. MFM uses a combination of tapping mode and lift mode (or interleave
mode). b) The diagram on the right shows the magnetic phase signal of a magnetic
test sample that was measured with our instrument. Dark and bright lines show
different domains in the sample..................................................................................... 18
Figure 1.11 a) Schematic diagram shows a DC SQUID where two Josephson junction are
connected in parallel. b) The plot shows the output voltage signal with magnetic flux.
As can be seen from the diagram a small flux signal produces a corresponding voltage
swing across the SQUID. ................................................................................................ 19
Figure 1.12 Panel a and b show the topography images of the SAM of AHPA-L (a) and
AHPA-D (b) adsorbed onto a lithographically patterned ferromagnetic layer. Panel c
and d show their corresponding magnetic phase signal. As can be seen from the
diagram, the L and D chiral molecules show opposite magnetic field directions.44 This
figure is taken from reference 44. .................................................................................. 21
Figure 1.13 The above diagram (a) illustrates the spin dependence of conductance in
spintronics based memory devices. Diagram b) shows a schematic of the density of
electronic states for the corresponding parallel and antiparallel configuration (E is
the energy, EF is the Fermi level energy, NE is the density of states). ........................ 23

xiv
Figure 1.14 The above diagram shows a schematic of a CISS based spintronics memory
device. a) Shows top view of the device. b) Shows side view of the device. The FMNPs
have a random magnetization without the magnetic field. A right handed helix will
transport spin down electrons preferentially to the FMNP (c). Now if the FMNP is
magnetized upward, the resistance will be low. For the same configuration the
resistance will be higher when the FMNP is magnetized downward (d). 16 This figure
is taken from reference 16. ............................................................................................. 24
Figure 1.15 The OER mechanisms for basic (red) and acid (blue) medium. ........................ 29
Figure 1.16 Energy diagram showing different products from the combination of OH
intermediates during OER.17 This figure is taken from reference 17. ....................... 32
Figure 2.1 Panel (a) shows the generic dependence of a magnetic material (FM in the bulk)
on the reduction physical size: multidomain (green), single domain (blue) and super
paramagnetism (red). Panel (b) shows magnetization hysteresis loops for the different
domain size behaviors. Panel (c) illustrates the CISS effect in which a right-handed
chiral molecule has preference for spin up to move upward and for spin down to move
downward. ....................................................................................................................... 44
Figure 2.2 a) Transmission electron microscope image of the ≈10 nm SPIONs. b) Illustration
of the M-AFM samples patterning of the AHPA-SAM on a 100 nm Ag (gray layer)
evaporated on 4 × 4 mm2 Si chip (blue layer). 1-the resist pattern. 2-AHPA-SAM
(purple helical molecules) formation. 3-Resist lift-off, AHPA-SAM was left only
where there was no resist. 4-iron oxide nanoparticle (red spheres) adsorption. c)
Scanning electron microscope image on the border between an area with AHPA-SAM
(left side) and an area without (right side). The iron oxide density is much higher on

xv
the AHPA-SAM because of the carboxylic terminal group of the AHPA molecule
which binds to iron oxide. .............................................................................................. 45
Figure 2.3 Illustration of the sample for the SQUID measurements: 100 nm Ag (gray layer)
evaporated on 4 × 4 mm2 Si chip (blue layer). SAM of AHPA chiral molecules (purple
helical molecules) was adsorbed on the Ag layer and iron oxide nanoparticles (red
spheres) were adsorbed on top of the AHPA-SAM. b) SQUID measurements of the
magnetization hysteresis loop. The sample of L-AHPA with iron oxide nanoparticles
(purple line) showsCIFIONs with a hysteresis loop exhibiting ferromagnetic behavior
with an average coercive field of ≈80 Oe. The hysteresis loop is not symmetric around
zero and shows a preference to magnetize the CIFIONs in the upward direction.
Three reference samples were measured. The first of L-AHPA X2 with chiral
molecules adsorbed on both sides of the iron oxide nanoparticles (orange line) display
no measurable response. The second of only L-AHPA (without nanoparticles, green
line) shows weak magnetic order and no hysteresis is measured. In this case, the
adsorption of chiral molecules from one side also seem to generate some small
substrate magnetic ordering. The third reference sample of only iron oxide
nanoparticles (without AHPA, blue line) presents no measurable response. ............ 47
Figure 2.4 Panels (a-c) show topography images that were taken and interleaved with the
magnetic interaction images (tip distance of 130 nm) in panels (d–f). Topography and
phase color scales are on the respective right sides of the images. The M-AFM tip was
magnetized down (red arrow), or up (blue arrows). In panels (d) and (e) an L-AHPA-
SAM (right-handed), the substrate, is patterned with lines and shows that the iron
oxide nanoparticles are magnetized upward. The tip experiences repulsive

xvi
interactions for downward tip magnetization and attractive interactions for upward
tip magnetization, as indicated by the bright and dark colors. In panel (f), D-AHPA-
SAM (left handed) has a square patterned surface (red squares) and the darker color
shows that the iron oxide nanoparticles are magnetized downward due to attractive
magnetic interactions with a downward magnetized M-AFM tip. The insets in panels
(b) and (c) show topographic cross sections. ................................................................ 48
Figure 2.5 a) Illustration of the SPIONs with no chiral molecule reference sample. b,c)
Magnetic interaction measurements of SPIONs on Ag without chiral molecules.
There is no measurable signal for both M-AFM tip magnetizations (upward and
downward) although there are SPIONs as can be seen in the topography images
(insets). d) Illustration of SPION covered, from all directions, with left-handed
chirality tartaric acid. e,f) Magnetic interaction measurements of tartaric acid
covered SPIONs on a mica substrate. For both tip magnetization (upward and
downward), there is a repulsive magnetic interaction, which correlates to the SPIONs
seen in the topography images (insets). ......................................................................... 50
Figure 2.6 Panels (a) and (b) show right-handed and left-handed chiral molecules,
respectively, linked only to the bottom side of the iron oxide nanoparticle. Because of
the CISS effect, spin up (down) electrons are preferentially going into the
nanoparticle, while spin down (up) electrons are preferentially going out of the
nanoparticle creating majority spin up (down) electrons in the nanoparticle. This
process creates a net magnetization of the nanoparticle with a defined upward
(downward) orientation. Panel (c) shows a right-handed chiral molecule linked to the
iron oxide nanoparticle from all directions. In this case, spin up (down) electrons are

xvii
going into the nanoparticle from the bottom (top) chiral molecule and going out of the
nanoparticle from the top (bottom) molecule, resulting in unstable magnetization. 52
Figure 3.1 Schematic diagrams illustrating the principle of the Kelvin probe measurement.
In the macroscopic measurement (panel A), the distance of an Au electrode from the
chiral-SAM / ferromagnetic sample is varied sinusoidally. In the microscopy version
of the Kelvin probe measurement (panel B), an AFM conducting tip is used as the
counter-electrode and its lateral position is scanned to image the substrate’s potential
distribution. The diagrams illustrate how a static magnet is placed under the sample
in order to saturate the magnetization of the ferromagnetic layer. Measured CPD
distributions are shown for the D-AL5 peptide (panel C), L-AL5 peptide (panel E),
and an achiral SAM (Panel D) coated ferromagnetic substrate under two different
magnetizations. The blue color represents the potential distribution for a
magnetization pointing to the South, and red corresponds to a North direction. These
two directions are defined to be along the axis perpendicular to the surface. The zero
voltage is set by the averaged contact potential difference found in the two
measurements. ................................................................................................................. 58
Figure 3.2 Change in the CPD as a function of the Au layer thickness for the opposite Co
magnetization directions with adsorbed L-AL5 SAMs. The top diagram shows the
distribution of a potential in different regions of the magnetic sample along the Au
wedge. The color of each plot corresponds to the region indicated on the gradient bar
by the same shade. The zero voltage is set by the measurement at the region of the
highest Au thickness of 10 nm. The maxima of the potential distribution curves versus
the thickness of the gold layer are plotted at the bottom of the Figure. As shown in

xviii
panel (A) the CPD becomes more negative as the gold thickness decreases for a
magnetization pointing up. In contrast, in panel (B) where the magnetization vector
points down, the CPD becomes positive and its value increases with decreasing gold
layer thickness. To estimate the error in the measurements see the FWHM of the
histograms. ....................................................................................................................... 61
Figure 3.3 Coercivity dependent changes in the CPD. The Co thickness is changed from 1.5
to 3 nm and the coercive field decreases as the Co layer thickness increases. The color
of each plot corresponds to the region indicated on the gradient bar by the same
shade. The bottom diagram plots the maxima of the potential distribution curve for
the substrate with adsorbed L-AL5 SAMs vs the thickness of the Co layer. The CPD
measured in the presence of a constant magnetic field well above the coercive field
(panel A) shows a weak dependence on the Co thickness. In contrast, a strong Co
layer thickness dependence is measured in the absence of constant magnetic field
(panel B). Here, the external magnetic field has been applied to orient a magnetization
in a given direction and then removed prior to the measurement. ............................ 62
Figure 3.4 Panels A and B show a change in CPD for molecules of different length; (A) double
stranded DNA and (B) ALn oligopeptides on a magnetized Ni/Au electrode. The red
lines are fits of the data by a quadratic dependence in panel (A) and by a linear fit in
panel (B). See SI for details on the SAM compositions. Panel C shows the number of
Au NPs that electrostatically bind to an L-polyalanine monolayer in 2 seconds, for
North (red) and South (blue) magnetization directions. The experiments were
repeated 5 times and measured at several different areas to reduce fluctuations. ... 64

xix
Figure 3.5 Paneles A shows I-V curves from magnetic conductive probe atomic force
microscopy measurements in the presence of a magnetic field pointing South (blue)
and magnet pointing North (red) for an AL7 oligopeptide. The inset is a log plot in
which the dashed lines illustrate the changeover from off-state to on-state voltages.
Panel B shows a corresponding cartoon depicting the interaction of the ferromagnetic
substrate with the chiral SAM to create a “spin blockade”. The red and blue
semicircles indicate a splitting of the spin sub bands. ................................................. 69
Figure 4.1 Panel a) shows a topography image of the L-CoOx surface. Panel b) shows the
absorbance of L/D cobalt oxides that were prepared on a quartz/5 nm Ti/ 10 nm Au
substrate. Panel c) shows circular dichroism of the corresponding films. The
absorbance spectra are subtracted with the blank substrate of quartz 5nm Ti/ 10 nm
Au. The cobalt oxides are 130-150 nm thick................................................................. 79
Figure 4.2 Panel a) shows a schematic diagram for the setup for the magnetic conductive
AFM measurement. Panels b) and d) show the average i-V cruves for the L and D
cobalt oxide respectively, with a north (red) or south (black) magnetized tip. Panel c)
plots the spin polarization of the current, as a percentage, versus the applied voltage
for L- (black) or D-(red) cobalt oxide thin films. ......................................................... 80
Figure 4.3 Panel a) shows a schematic illustration for the setup used in making the four probe
magnetoregistance(MR) measurements; the bottom electrode is a gold film of 2μm
thickness and the top electrode is ferromagnetic Ni. The inset shows different layers
in the device. Panels b and c) show the magnetoregistance curves for L-CoOx and D-
CoOx respectively. .......................................................................................................... 83

xx
Figure 4.4 Panel a) shows circular dichroism spectra of pure and 5% Mn doped cobalt oxide
films. Panel b) shows i-V curves for the 5% Mn doped CoOx for different
magnetizations. Panel c) plots the spin polarization, as a percentage, versus applied
voltage for pure (black) and 5% Mn doped cobalt oxide. ........................................... 85
Figure 5.1 (a) XPS spectra of L- (black) and meso-CoOx (blue) thin films deposited on FTO.
(b) Zoomed in view in the satellite spectral region from (a). (c) XRD spectra for L-
(black, bottom) and meso-CoOx (top, blue) thin films. The peaks arising from the
substrate and CoOx are labeled. (d) Corresponding top-down SEM images of L-
(black border, left) and meso-CoOx (blue border, right) thin films. .......................... 98
Figure 5.2 (a,b) Absorbance and circular dichroism spectra, respectively, of L- (black), D-
(red), and meso-CoOx (blue) thin films electrodeposited on 10 nm thick gold coated
quartz. The absorbance data are offset by 0.5 absorbance units for clarity. ............ 99
Figure 5.3 (a) Linear sweep voltammograms for the OER using L-CoOx (black), meso-CoOx
(blue), and a bare FTO substrates (green) in 0.1M KOH. (b) Linear sweep
voltammograms of the OER using L-CoOx (black) and meso-CoOx (blue) in
Na2CO3/NaHCO3 (pH 10). (c) UV-Vis absorption spectra of hydrogen peroxide using
L-CoOx (black) and meso-CoOx (blue) catalysts. Following electrolysis the solutions
are titrated with o-tolidine indicator. The integrated peak area reflects the amount of
hydrogen peroxide present, see text for additional details. ....................................... 101
Figure 5.4 Representative Hoffman apparatus measurements for hydrogen production (left)
and oxygen production (right) with L- (black) and meso-CoOx (blue) catalysts. The
water splitting was performed at a 5.0 mA / cm2 current density in a sodium carbonate
/ bicarbonate pH 10 buffer solution. ........................................................................... 102

xxi
Figure 5.5 Proposed, mechanistic scheme explaining the role of spin polarization during
water splitting. (a) model lattice where the color of the ball represents the spin of the
radical absorbate (shown here as hydroxyl) at the catalyst side; blue indicates down
spin and red indicates up spin. For chiral catalysts (left), because of the CISS effect,
the electrons at adjacent sites tend to be spin aligned; and hence the formation of
triplet oxygen will be favored. Conversely, for achiral catalysts more spin disorder
exists at adjacent sites necessitating either a change in spin state or reaction on a
singlet reaction pathway with a higher activation barrier to form triplet oxygen. (b)
Mechanism of product formation at different pH valuess. For chiral catalysts, the
formation of triplet oxygen is favored at high pH, when the reactant is radical oxygen
(1), and at lower pH in which hydroxyl radical intermediates can also occur (2). For
achiral catalysts at higher pH (3) the formation of triplet oxygen can proceed, but is
slowed by the spin disorder, and at lower pH, (4), the production of H2O2 can compete
with the more sluggish triplet oxygen. The dotted line between the atoms indicates the
intermediate state, the solid line represents a chemical bond, and +E indicates a
higher activation barrier. ............................................................................................. 104
Figure 5.6 Current-time response of CoOx films before ( a) and after ( b) treating the film at
1.2 V vs NHE in 0.1 M KOH for 30 min. The light pink region indicates applications
of a 0.4 T external magnetic field. (c) change in magnetoresponse (jm) for L-CoOx thin
films as a function of the potential used to treat the film. ......................................... 107
Figure A.1 (a) SEM images (Zeiss Sigma500 VP) of oleylamine/oleic acid coated SPION. (b)
UV-Vis spectra of SPIONS. Note that the spectra are shifted upward by an arbitrary
amount so that they can be distinguished from one another .................................... 122

xxii
Figure A.2 Illustration of the preparation of the L- AHPA + SPIONs (achieved at stage 3)
and the L- AHPA X2 + SPIONs reference sample (achieved at stage 4); 1- preparation
of clean 4mm X 4mm Ag substrate, 2- formation of the AHPA-SAM (purple helical
molecules), 3- adsorption of SPIONs (red spheres), 4- deposition of a top layer of
AHPA molecules............................................................................................................ 124
Figure A.3 Diamagnetism baseline measurement of clean Ag which was subtracted from all
other magnetization hysteresis loop measurements................................................... 127
Figure A.4 Magnetic Interaction measurements of individual SPIONs on L-AHPA. Panel (a)
shows repulsive interaction for downward magnetization of the M-AFM tip (red
arrow) and Panel (b) shows attractive interaction for upward magnetization of the
M-AFM tip. .................................................................................................................... 128
Figure A.5 Panels a) and b) are the enlarged topography images of the sample of only
SPIONs on Ag substrate presented in Figure 5 b&c repectively. Cross sections were
taken on each of the images to show that the objects on the substrate are of ~10 nm
averaged height which correspond to the size of the SPIONs. ................................. 128
Figure A.6 Panels a) and b) show the magnetic phase shift signal per unit volume against the
diameter of the nanoparticle for L-tartaric acid coated iron oxide (a) and D-tartaric
acid coated iron oxide nanoparticles (b). N and S represent north and south pole
magnetization of the AFM tip, respectively. Panel c) and d) show a corresponding
histogram of the phase shift signal per unit volume for L- and D-tartaric acid coated
iron oxide nanoparticless respectively. ....................................................................... 130
xxiii
Figure B.1 Coercivity dependence on the thickness of the cobalt layer for epitaxial Au/Co/Au
substrates. Co was deposited as a wedge using a computer controlled movable shutter.
......................................................................................................................................... 133
Figure B.2 The left panel shows a representative topographic image corresponding to an L-
Ala5 coated ferromagnetic Ni substrate. The right panel image shows an electrostatic
potential map corresponding to the image in the left panel ...................................... 134
Figure C.1 XRD specta of L- (black, top) and D-(red, bottom) chiral cobalt oxide thin films.
......................................................................................................................................... 138
Figure C.2 XPS spectra of L-(black) and meso-CoOx (blue)................................................ 139
Figure C.3 XPS PS spectra of 5 % Mn doped L-CoOx thin film in the in the Co2p3/2 region
(Panel a) and in the Mn2p3/2 region (panel b). .......................................................... 139
Figure D.1 Calibration plot showing the change in thickness of L-CoOx thin films measured
using a profilometer to a change in absorbance. The change in thickness was achieved
by changing the duration of the electrodeposition. .................................................... 140
Figure D.2 Panel a) shows thin film XPS data of L-CoOx (black), Meso-CoOx (blue), and L-
CoOx after the application of 1.2 V vs NHE in 0.1M KOH for 30 min (orange). Panel
b) shows difference spectra in the satellite region between L-CoOx and Meso-CoOx
(blue) and L-CoOx and the same film after the application of 1.2 V vs NHE in 0.1M
KOH for 30 min (orange). The data were normalized to the Co2p3/2 peak. ............ 141
Figure D.3 shows XPS spectra of L-CoOx (A), meso-CoOx (B), and L-CoOx after treating the
film at 1.2 V vs NHE in 0.1 M KOH for 30 min (Mag-CoOx). Each spectrum was fit
to a sum of 5 peaks and the envelope is plotted as a blue-dashed line. .................... 142

xxiv
Figure D.4 O1s XPS spectra of an L-CoOx catalyst. The blue and orange peaks are consistent
with reports (see reference 3) indicating cobalt-oxide and cobalt-hydroxide
contributions, respectively. .......................................................................................... 143
Figure D.5 XPS spectra of L-CoOx before (black) and after (green) electrolysis at 5 mA / cm2
for 210 min. .................................................................................................................... 144
Figure D.6 Double layer capacitance measurements. Panel a) and b) show voltammograms
of L-CoOx and meso-CoOx, respectively. Experiments were performed at different
scan rates (0.05- 3.2 V) in 1 M NaOH. Panel c) shows the change in current (at -0.4
V) as a function of scan rate for L-CoOx(black) and meso-CoOx(blue). The slope of
the line is proportional to CDL. ..................................................................................... 145
Figure D.7 Surface topography of a) L-CoOx film and b) meso CoOx film. Corresponding
roughness of the films were also shown by drawing a line on the topography images
(below image). ................................................................................................................ 146
Figure D.8 Tafel plots of L- (black) and meso-CoOx (blue) thin film catatalysts measured in
0.1 M KOH solutions. The dashed red line is a linear fit to the data. ...................... 147
Figure D.9 shows linear sweep voltammograms for the OER using D-CoOx (red) and meso-
CoOx (blue) in 0.1M KOH ............................................................................................ 148
Figure D.10 Absorbance (a) and circular dichroism spectra (b) of L-CoOx thin films before
(black) and after (orange) treatment of 1.2 V vs NHE in 0.1M KOH for 30 min. .. 149
Figure D.11 Linear sweep voltammograms of treated CoOx thin film with applied external
magnetic field pointing north (red) and south (blue dash). ...................................... 149

xxv
LIST OF EQUATIONS
Equation 1.1 ................................................................................................................................... 2
Equation 1.2 ................................................................................................................................... 3
Equation 1.3 ................................................................................................................................... 3
Equation 1.4 ................................................................................................................................... 5
Equation 1.5 ................................................................................................................................. 17
Equation 1.6 ................................................................................................................................. 28
Equation 1.7 ................................................................................................................................. 28
Equation 3.1 ................................................................................................................................. 67
Equation 4.1 ................................................................................................................................. 81
Equation 4.2 ................................................................................................................................. 82

xxvi
PREFACE
I am fortunate enough to receive a lot of help and support from so many people in the past
few years that has made my dream come to fruition.
First of all, I would like to thank my academic advisor Dr. David Waldeck. He is a brilliant
scientist and an exceptional human being. Dr. Waldeck has always supported me and helped me
become a better scientist. He has given me the much needed freedom so that I can conduct my
research thoroughly. Every time I faced any kind of problem related to my research, he was always
there to give me advice. His patience with me has instilled a sense of calmness in my mind that
has helped me in a lot of ways during my most vulnerable moments. I am so grateful to have Dr.
Waldeck as my advisor. I can’t thank him enough for his invaluable presence in my life.
I would also like to thank my committee members Prof. Haitao Liu, Prof. Sean Garrett-
Roe, Prof. Andrew Gellman for their valuable time and suggestions. I was fortunate enough to
collaborate with some great people during my research including Prof. Ron Naaman (Weizmann
Institute of Science), Prof. Yossi Paltiel (The Hebrew University of Jerusalem), Dr. Suryakant
Mishra (Argonne National lab). Their insight and support has made my endeavors successful.
I have also had the opportunity to have so many great people as my lab mates, including
Dr. Brian Bloom, Jenny Georgieva, Caleb Clever, Yiyang Lu, Simon Wei, Dr. Gouranga
Debhnath, Mary Molitoris. Brian has been like a big brother to me from the very beginning. He
has encouraged me in so many ways during the past 5 years. I have bothered him so much, called
him at late hours, during weekends, even during holidays – but he never once showed me any
reluctance or disdain, and welcomed my overzealous and unrelenting queries with open heart. I
am forever grateful to Brian for all his support. Jenny is like a breath of fresh air in my journey.
xxvii
She is a great friend and always fun to hang around. Dr. Brittney Graff, who has helped me in so
many ways when I first joined. Dan has been a good friend and taught me a lot of things, for which
I am forever grateful.
It is hard to find selfless people in the world today. But I have been fortunate in that front.
I made some great friends during my college back in India. Dr. Manas Sajjan, who is literally the
most selfless, helpful, honest and grounded person I have ever met – I am honored to have him as
one of my best friends. He has always inspired me, motivated me when I felt lost; our long talks
about science during weekends or late nights, even when we were going on vacations has been
superbly insightful. Dr. Prakash Shee, who is one of the most fun and energetic people I have ever
met. His positive attitude towards life has always uplifted my mood, his counsels has been really
helpful during the past years. Dr. Kalyan Santra, who has been a good friend of mine from the very
beginning. In Pittsburgh, Anirban, who was my roommate and like a brother to me for the past 5
years; Zack, Ellen, Paul – three of my closest friends in Pittsburgh; Shilpa, Srijani – two of the
sweetest friends I have ever had; and Dr. Pravat Mondal and Munmun di – every one of them are
like family to me. The love, loyalty and support I got from these friends of mine is nothing less
than a blessing.
Words would not be enough to describe what a fortunate person I am for having the family
that I have. My father, Mr. Monoranjan Ghosh, has been the greatest support of my life. He made
sure to provide me the tools to pursue my dreams and goals. He guided me through thick and thin,
disciplined me whenever needed and supported my ambitions whole heartedly. He made sure that
I take every ambitious step without any hesitation, walk my path with my head held high. My
mother, Mrs. Jayanti Ghosh, her selfless and cautious nature has made me a pragmatic person. She
has taught me that even if we soar high, we should never forget where we came from and never to

xxviii
forget our roots. My elder sister Manasi and my younger brother Sudip the two constant pillars of
my life. I learned a lot of life lessons from my elder sister and my younger brother has shown me
how to unwaveringly support a person throughout, as he has been supporting my choices his entire
life. My brother-in-law Dibakar da is one of the most supportive people in my life. His help and
support is nothing short of a blessing to me. I would also mention Babu kaku, my childhood tutor.
He is truly an inspiring person. His passion for knowledge had me moved and I can proudly say
that I owe him a great gratitude for making my science lessons that much interesting that I chose
this path and walked so far. Last but not the least, I would like to thank my wife for being by my
side throughout these years. She has loved me unconditionally and has always supported me every
step in the way. Thank you so much Srijeeta, for tolerating me throughout and being by my side
with all the love, care and faith. Having all this people as my family is truly a blessing. Their
support, affection and faith upon me has given me the strength to pursue my dreams and goals. I
am proud to have them as my family and I hope to make them proud of me as well.

1
1.0 INTRODUCTION
1.1 CHIRAL INDUCED SPIN SELECTIVITY EFFECT (CISS EFFECT)
In 1999, an important discovery was made that connects electron spin transport and
chirality. In this experiment spin polarized photoelectrons were used to study the transmission of
electrons through a chiral film comprised of L or D chiral amino acids.1 It was found that the
quantum yield of the photoelectrons depends on both the chirality of the film and the polarization
of the light. This phenomenon of spin polarized transmittance of electrons through chiral
molecules is called the Chirality Induced Spin Selectivity effect, or CISS effect.2, 3
Since the discovery of CISS, a large number of theoretical and experimental studies have
been performed in different systems, and using different techniques, to study the effect.2-11 The
CISS effect has been shown to have important implications in all branches of science from biology
to chemistry and physics. Over the last few years, CISS has generated significant research interest
due to the potential that it has, in different avenues, such as chiral recognition/ separation12, 13,
spintronics devices,3, 14-16 and spin controlled chemical reaction etc.17-19 Recent progress in this
field has focused on fundamental studies to understand the mechanisms of CISS, as well as,
developing new methods and utilizing CISS for important applications. In this chapter, the basic
concept of CISS, some important experiments and methods that were used throughout the years,
and some applications of CISS, are discussed.
2
1.2 BASIC PRINCIPLE AND UNDERSTANDING OF CISS EFFECT
To explain the CISS effect a model has been proposed. A chiral molecule creates a helical
potential for the electron inside it and this helical potential is responsible for the CISS effect.2, 3
As an electron moves through a molecule, it experiences the electrostatic potential of the molecule.
For a chiral molecule, the moving electron experiences a chiral or a helical potential and its
movement produces a magnetic field in the rest frame of the electron. The strength of this magnetic
field depends on the coupling between the electron momentum and its spin, the spin orbit coupling
(SOC). Because an electron has a magnetic dipole associated with its spin, the degeneracy of the
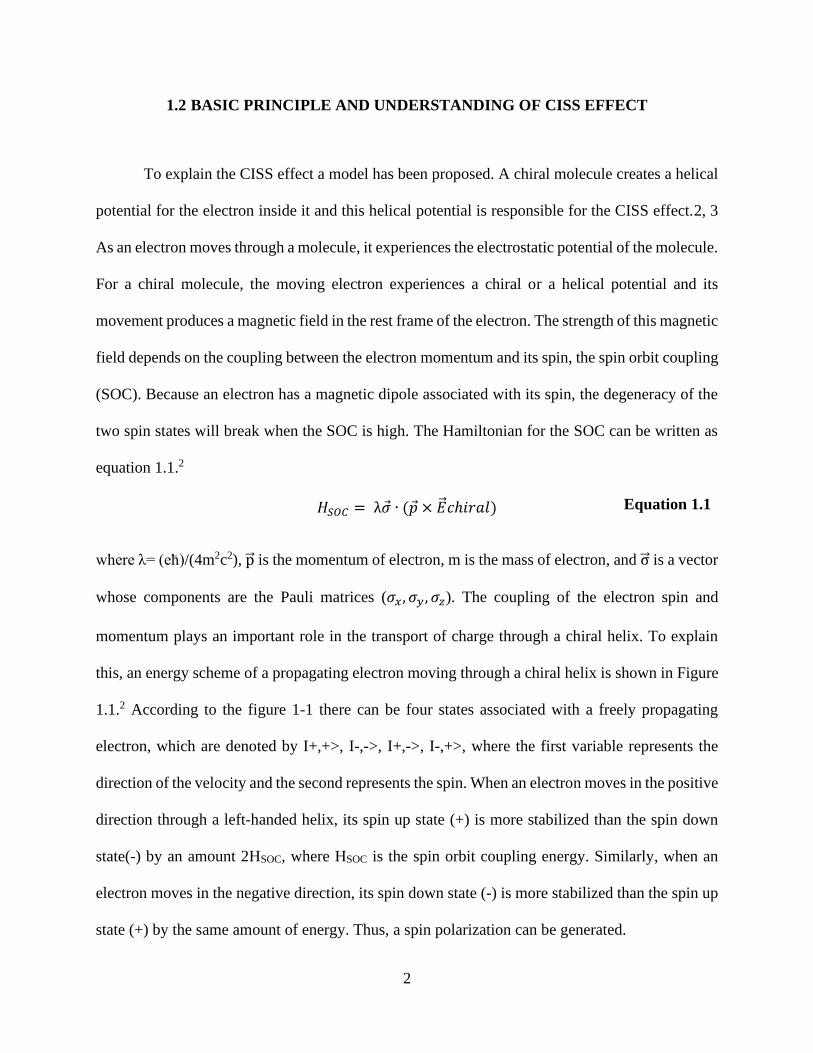
two spin states will break when the SOC is high. The Hamiltonian for the SOC can be written as
equation 1.1.2
𝐻𝑆𝑂𝐶 = λ�� ∙ (�� × ��𝑐ℎ𝑖𝑟𝑎𝑙) Equation 1.1
where λ= (eћ)/(4m2c2), p is the momentum of electron, m is the mass of electron, and σ is a vector
whose components are the Pauli matrices (𝜎𝑥, 𝜎𝑦 , 𝜎𝑧). The coupling of the electron spin and
momentum plays an important role in the transport of charge through a chiral helix. To explain
this, an energy scheme of a propagating electron moving through a chiral helix is shown in Figure
1.1.2 According to the figure 1-1 there can be four states associated with a freely propagating
electron, which are denoted by I+,+>, I-,->, I+,->, I-,+>, where the first variable represents the
direction of the velocity and the second represents the spin. When an electron moves in the positive
direction through a left-handed helix, its spin up state (+) is more stabilized than the spin down
state(-) by an amount 2HSOC, where HSOC is the spin orbit coupling energy. Similarly, when an
electron moves in the negative direction, its spin down state (-) is more stabilized than the spin up
state (+) by the same amount of energy. Thus, a spin polarization can be generated.

3
Figure 1.1 Shows an energy scheme of the momentum-spin states |momentum, spin > for a electron traveling in a
helical potential.2 This figure is taken from reference 2.
From the above discussion, it is clear that the efficiency of the spin polarization depends
on the strength of the magnetic field that is generated due to the propagation of electrons through
the chiral electric field or more specifically on the strength of the SOC.3 The magnetic field
strength inside the helix can be roughly calculated by considering that the force must be large
enough to keep the electron inside the helix. This is similar to a cyclotron motion; the effective
magnetic field can be written as equation 1.2.3
|𝐵𝑒𝑓𝑓| =
𝑚𝑉
𝑞𝑟
Equation 1.2
where m is the mass, v is the velocity, q is the charge of the electron, and r is the radius of the
helix. One can calculate HSOC by using the formula given by equation 1.3.3
𝐻𝑆𝑂𝐶 =𝑔
2𝜇𝐵|𝐵𝑒𝑓𝑓| =
𝑔𝜇𝐵𝑚𝑣
2𝑞𝑟 Equation 1.3
where g is the g-factor of the electron and μB is the Bohr magneton. If one considers an electron
with kinetic energy 1 eV (v= 6×10⁵ m/s) and uses a radius for the helix of 0.5 nm the HSOC will be

4
equal to 360 meV. Thus, the energy splitting between the states, which is double HSOC, is large
enough to explain the CISS effect. A number of theoretical studies has been proposed to explain
the CISS effect. Previously, Mujica et al. proposed a constructive interference from multiple
scattering can be the reason for enhanced spin-filtering in helices.9 Recently, Michaeli and Naaman
has proposed the spin polarization for the tunneling processes through a barrier can be increased
due to the electric field applied on a molecule.8 Although, other theoretical studies present in the
literature qualitatively explains the experimental spin polarization, there is still a lack in a concrete
theoretical model which can explain the experimental results more quantitively.4, 20
1.2.1 Measurements Methods and Detection Thereof
Over the years, many different techniques and methods have been used to study the CISS
effect. Some of those techniques are more direct and measure the spin of the transmitted electrons
from the chiral materials; such as photoemission study using Mott polarimeter,21 and others are
indirect where conductance or resistance are measured through chiral material with spin polarized
electrons. Some of the important methods that are often used are discussed below.
1.2.1.1 Photoemission Study
In this method, the spin of the ejected electrons from the surface of the chiral
molecule/material is directly measured by using a Mott polarimeter.21 Figure 1.2 shows the
experimental set up of a Mott Polarimeter. This kind of experiment is done in an ultrahigh vacuum
at a pressure of ~ 10-9 mbar. An ultraviolet (UV) laser pulse of a couple of hundreds of picoseconds
pulse duration is impinged normal to the sample which results in ejection of photoelectrons from

5
the chiral surface. The resulting spin polarized photoelectrons are then guided by an electrostatic
90o bender. As a result, the longitudinally polarized photoelectrons are converted into a transverse
polarized one, which is then detected by the Mott detector. The spin polarization is then calculated
by the equation 1.4, where N+ and N- are the scattering count rate in the upper and lower counter
of the Mott polarimeter.
𝑃 =
(𝑁+ − 𝑁−)
𝑁+ + 𝑁−
Equation 1.4
Figure 1.2 Shows the experimental set up for the spin-resolved photoemission experiment.17This figure is taken from
reference 17.
1.2.1.2 Magnetic Conductive Probe AFM
Magnetic conductive probe AFM (MCP-AFM) is an important technique that is
extensively used to study the spin-dependent transport of electrons through chiral
molecules/materials. MCP-AFM is similar to conductive AFM, except in this case the substrate is
made of a ferromagnetic layer, which is magnetized during the measurement. In this case, a voltage
is applied to the substrate containing the chiral molecule/material and the current is measured
through the ferromagnetic substrate (Ni) to the chiral molecule/material to the Pt tip of the AFM.

6
A ultrathin gold layer is often used as a protective layer as nickel is susceptible to oxidation. The
measurements are done with two opposite magnetic poles (north and south) pointing toward the
nickel substrate. Upon applying a magnetic field, the spin of the Ni layer will be either parallel or
antiparallel to the direction of the current. Now because of the CISS effect the conduction of spin
current will be favorable for one spin over the other when transiting through the chiral material.
As a result, an asymmetry in the current-voltage (I-V) curve is observed for two opposite
magnetizations, from which a spin polarization can be obtained. A schematic of the MCP-AFM
setup is shown in Figure 1.3 a. Alternatively, MCP-AFM is also done where instead of a
ferromagnetic layer a magnetic AFM tip is used as a source of spin polarized electrons (figure 1-
3b)
Figure 1.3 Shows schematic for the magnetic conductive AFM where a ferromagnetic layer act as a source for spin
current a) or a magnetic probe is used as a spin current source b).
1.2.1.3 Magnetoresistance Measurements
This kind of measurement uses a device which has the same structure as a giant
magnetoresistance (GMR) based spin valve, except the ferromagnetic reference layer and the
insulating barrier is replaced with a chiral tunneling barrier. Generally, a thin film of an achiral
insulating barrier such as MgO is used to block the leakage current. The magnetoresistance
measurements are performed in a four-probe configuration inside a cryogenic cryostat equipped
Magnet
NiAu
Pt
V
A
Au
Co/Cr
V
A
7
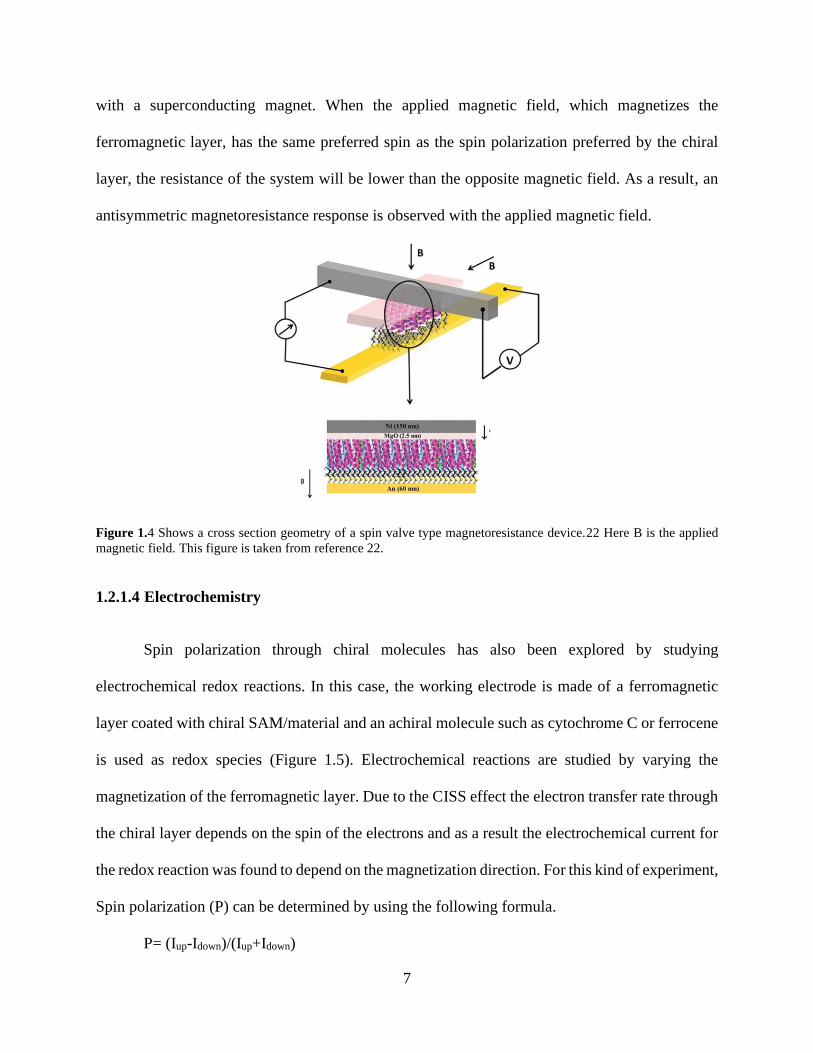
with a superconducting magnet. When the applied magnetic field, which magnetizes the
ferromagnetic layer, has the same preferred spin as the spin polarization preferred by the chiral
layer, the resistance of the system will be lower than the opposite magnetic field. As a result, an
antisymmetric magnetoresistance response is observed with the applied magnetic field.
Figure 1.4 Shows a cross section geometry of a spin valve type magnetoresistance device.22 Here B is the applied
magnetic field. This figure is taken from reference 22.
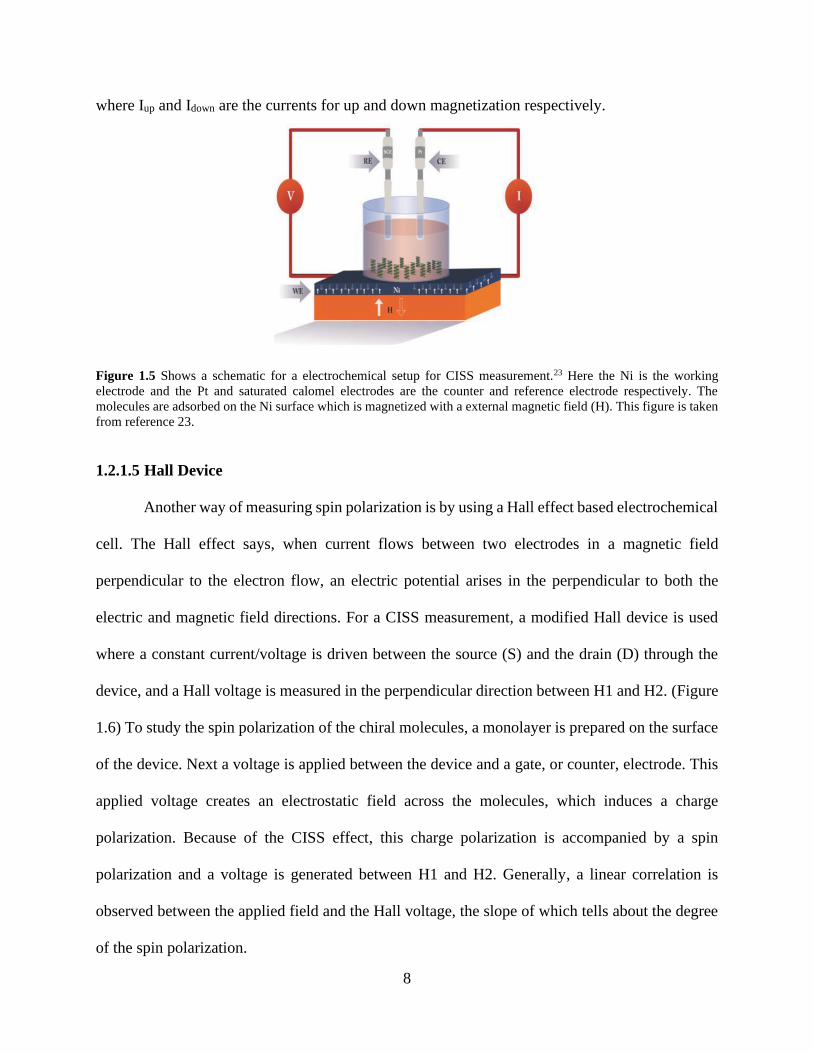
1.2.1.4 Electrochemistry
Spin polarization through chiral molecules has also been explored by studying
electrochemical redox reactions. In this case, the working electrode is made of a ferromagnetic
layer coated with chiral SAM/material and an achiral molecule such as cytochrome C or ferrocene
is used as redox species (Figure 1.5). Electrochemical reactions are studied by varying the
magnetization of the ferromagnetic layer. Due to the CISS effect the electron transfer rate through
the chiral layer depends on the spin of the electrons and as a result the electrochemical current for
the redox reaction was found to depend on the magnetization direction. For this kind of experiment,
Spin polarization (P) can be determined by using the following formula.
P= (Iup-Idown)/(Iup+Idown)
8
where Iup and Idown are the currents for up and down magnetization respectively.
Figure 1.5 Shows a schematic for a electrochemical setup for CISS measurement.23 Here the Ni is the working
electrode and the Pt and saturated calomel electrodes are the counter and reference electrode respectively. The
molecules are adsorbed on the Ni surface which is magnetized with a external magnetic field (H). This figure is taken
from reference 23.
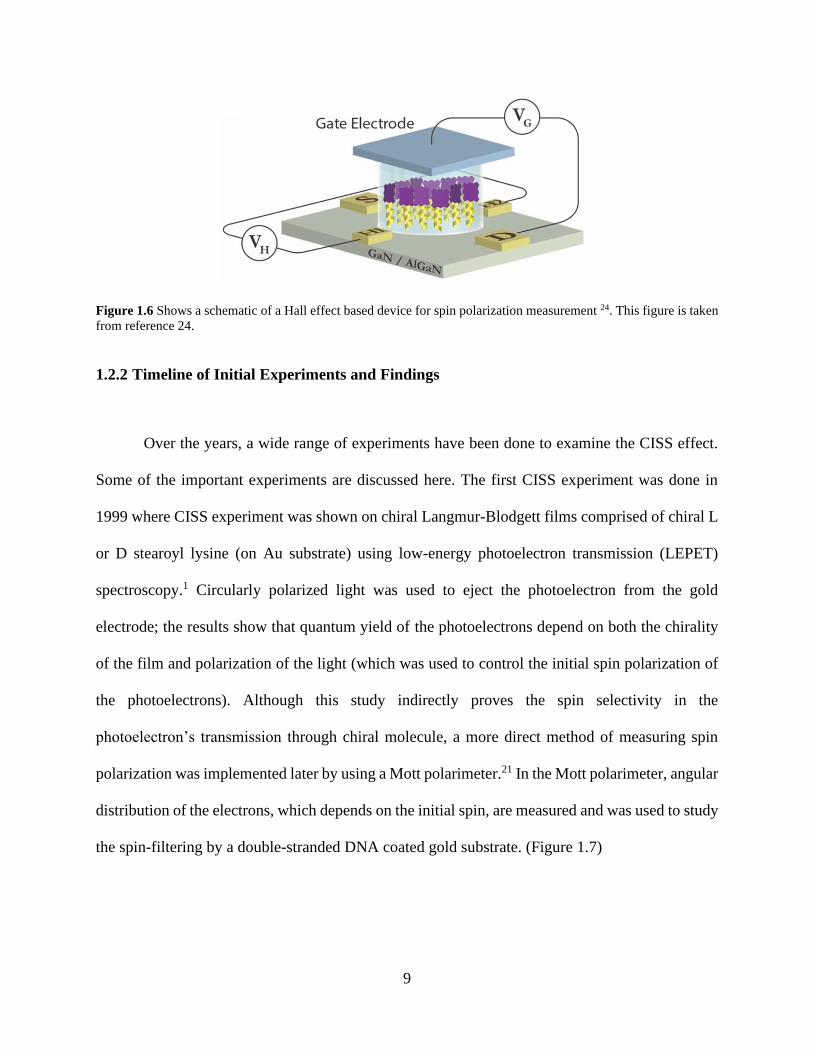
1.2.1.5 Hall Device
Another way of measuring spin polarization is by using a Hall effect based electrochemical
cell. The Hall effect says, when current flows between two electrodes in a magnetic field
perpendicular to the electron flow, an electric potential arises in the perpendicular to both the
electric and magnetic field directions. For a CISS measurement, a modified Hall device is used
where a constant current/voltage is driven between the source (S) and the drain (D) through the
device, and a Hall voltage is measured in the perpendicular direction between H1 and H2. (Figure
1.6) To study the spin polarization of the chiral molecules, a monolayer is prepared on the surface
of the device. Next a voltage is applied between the device and a gate, or counter, electrode. This
applied voltage creates an electrostatic field across the molecules, which induces a charge
polarization. Because of the CISS effect, this charge polarization is accompanied by a spin
polarization and a voltage is generated between H1 and H2. Generally, a linear correlation is
observed between the applied field and the Hall voltage, the slope of which tells about the degree
of the spin polarization.
9
Figure 1.6 Shows a schematic of a Hall effect based device for spin polarization measurement 24. This figure is taken
from reference 24.
1.2.2 Timeline of Initial Experiments and Findings
Over the years, a wide range of experiments have been done to examine the CISS effect.
Some of the important experiments are discussed here. The first CISS experiment was done in
1999 where CISS experiment was shown on chiral Langmur-Blodgett films comprised of chiral L
or D stearoyl lysine (on Au substrate) using low-energy photoelectron transmission (LEPET)
spectroscopy.1 Circularly polarized light was used to eject the photoelectron from the gold
electrode; the results show that quantum yield of the photoelectrons depend on both the chirality
of the film and polarization of the light (which was used to control the initial spin polarization of
the photoelectrons). Although this study indirectly proves the spin selectivity in the
photoelectron’s transmission through chiral molecule, a more direct method of measuring spin
polarization was implemented later by using a Mott polarimeter.21 In the Mott polarimeter, angular
distribution of the electrons, which depends on the initial spin, are measured and was used to study
the spin-filtering by a double-stranded DNA coated gold substrate. (Figure 1.7)

10
Figure 1.7 Shows schematic of the monolayer of ds-DNA as a spin filter for the photoemission experiment. In this
case, linear polarized light ejects unpolarized electrons from the gold surface, which then get spin polarized after
transmitting through DNA.21 This figure is taken from reference 21.
The CISS effect has also been shown in electron transport and electron transfer processes.
Electron transport in the tunneling regime was studied by measuring single molecule conductance
of double-standard DNA by using magnetic conductive-AFM technique. In this study, spin
polarized electrons from the nickel are injected from either parallel or antiparallel to the helical
axis and the results show that the conduction of electrons through the DNA is spin selective.25 The
importance of the CISS effect was also shown in electron transfer processes. In one of the recent
studies, it was shown that the electron transfer from photoexcited nanoparticles through a chiral
system was more efficient than transfer through an achiral system.26 For this study, CdSe
nanoparticles are attached to the chiral and achiral SAM coated on a gold substrate. Upon
excitation of the NP, there will be a charge transfer between the NP and the gold surface, which
resulted in formation of a dipole in the surface. By measuring the contact potential difference using
a Kelvin probe method,26 the difference in the work function between the probe surface and gold
surface was examined. In another study, a photoelectrochemical measurement was done, in which
a porphyrin chromophore was attached to chiral SAM coated on a gold substrate. In this case,
circularly polarized light was used to photo-excite the chromophore and the dependence of the

11
photocurrent was examined with the polarization of the light and the chirality of the SAM. An
asymmetry in photocurrent was observed with different circularly polarized light, which changes
with molecular chirality.27 CISS based electron transfer has also been studied by different methods,
such as magnetoresistance,28 spin dependent electrochemistry,29 and by capacitance
measurements.30 All of these experiments show the importance of the CISS effect on electron
transfer processes in the tunneling regime.
Very recently, another important experiment was done by Kumar et. al who used Hall
measurements to show that within a chiral molecule a charge polarization accompanies spin
polarization and that it happens without any external electron transfer and charge flow.13 These
results show that spin polarization can happen within the chiral molecules, even without any net
electron transfer or electron transport. Some other important experiments on CISS can be found in
the recent CISS based review papers.3, 11
1.2.3 Spin Polarization Through Different Chiral Material
Earlier studies on CISS effect were mostly done on either chiral peptides or DNAs in gold
substrate. In 2013, spin polarization studies examined purple membranes containing
bacteriorhodospin deposited on gold, aluminium/aluminum oxide, and nickel substrates. Although
the spin polarization obtained from that system is only 15 %, it shows that the CISS effect
originates from the chiral system itself irrespective of the substrate.29 Since CISS effect tells that
chiral molecules or chiral materials can act as a spin filter, it is important to study spin polarization
through different chiral materials for future applications in a spintronics device. Recently, spin
polarization efficiency was studied with different chiral materials. In 2015 Prakash et al. studied
spin selective electron transport through a chiral polymer (poly{[methyl N -(tert-butoxycarbonyl)-
12
S-3-thienyl- L - cysteinate]-cothiophene) and observed spin polarizations as high as 50%.23 Spin
filtering properties were also studied with molecules without a stereogenic carbon center but
possessing a dissymmetric secondary structure; namely with helicenes as done by Kiran et. al.31
They have also shown the importance of molecular orientation of the film for efficient spin
polarization, where they were able to increase the spin polarization from 4 % to ~ 50 % by making
a uniform film. Other bioorganic molecules such as multiheme cytochromes and ethylene-bridged
(porphinato) zinc structures were also shown to act as efficient spin filters.24, 32 Recently, spin
polarization through chiral π-conjugated fibers33, 34 show a high spin polarization (close to 85 %)
for conducting polyaniline of micron size fiber and show that spin selectivity can be observed even
in micron distances.
While most work has examined spin polarization through organic molecules, workers have
also done experiments with chiral hybrid inorganic/organic material. Bloom et. al. have shown
spin selective electron transfers through chiral CdSe quantum dots coated with cysteine
molecules.35 Other organic/inorganic material such as 2D perovskite has also shown very high spin
polarization (86%) for electron transport.36 Spin polarization study was also done by chiral CuO
thin film using photoemission experiment. A very weak spin polarization (5 %) was obtained with
the film.17 Recently, chiral induced spin transport was also studied through pure inorganic
monoaxial chiral dichalcogenide CrNb3S6.37 By measuring the spin phenomenon as inverse spin
Hall signal, they were able to show the spin signal can be observed in a micrometer length scale,
which is important since spin generally depolarizes within nanometer distance.
13
1.3 MAGNETIC AND THE CHIRAL INDUCED SPIN SELECTIVITY EFFECT
Chiral induced spin selectivity tells that chiral molecules can be used as a source of spin
polarized electrons; similar to a ferromagnetic material. This property of chiral molecules can be
utilized for different applications in memory devices. For example, in traditional spin based
memory devices, spin current is used to magnetize the magnetic storage domains utilizing the spin-
transfer torque (STT) effect. Two main problems of using STT effect to make a spintronic device
are that 1) it requires complicated device structure and 2) it requires a high current density to
operate. Another problem of using ferromagnetic material in a spin-based memory device is the
limitation in miniaturization of the device. Use of ferromagnets limits the size reduction that is
possible due to the magnetic property of ferromagnets, which depend on the size of the material.
We and others have showed how CISS can be used to circumvent these issues. In this section,
details about magnetic properties of materials, magnetism induced by CISS and also some CISS
based memory devices are discussed.
1.3.1 Size Dependent Magnetic Properties
Magnetic nanoparticles exhibit magnetic properties that depend on their size and shape, as
well as their composition.38 Before discussing about the size dependent magnetic properties let us
consider different kinds of magnetic properties. Depending upon its response to a magnetic field,
a material can be divided mainly into four types: diamagnetic, paramagnetic, ferromagnetic, and
superparamagnetic. These material types differ by their different magnetization, their magnetic
susceptibility, and their magnetic permeability. The magnetization (M) of a sample is defined as
∑ ��
V , where �� is magnetic moment of each atom and V is the volume. The magnetic susceptibility

14
(χ) quantifies a material’s response to an applied magnetic field and the magnetization it generates.
It is defined as χ = (M/H), where H is the applied magnetic field. The permeability (μ) of a
substance is a response function that reports on how the magnetic induction B changes with the
applied magnetic field H i.e., μ = B/H. The relative permeability (μr) is the ratio of the permeability
of any material to the permeability of vacuum (μ0) i.e., μr = μ/ μ0. The susceptibility and the
permeability are related through the formula, μ= μ0 (1+ χ).
Diamagnetism: A diamagnetic substance has a very weak interaction with an external
magnetic field due to an absence of unpaired electrons. For such materials the relative permeability
μr ≤ 1 and the magnetic susceptibility is very small (10-6–10-3).
Paramagnetism: Paramagnetic substances have a net magnetic moment due to the presence
of unpaired electrons. Like diamagnetic substances, the magnetization is also zero for
paramagnetic substances in the absence of a magnetic field. For these materials the relative
permeability is μr ≥ 1 and the susceptibility is very small (10-3–10-5).
Ferromagnetism: Unlike paramagnetic or diamagnetic materials, ferromagnetic substances
exhibit strong magnetization even in the absence of an external magnetic field. Most ferromagnets
have multiple magnetic domains that are separated by domain walls. In magnetism, domain walls
are interfacial regions between volumes of a ferromagnetic material that have different magnetic
moments. In a particular domain all the magnetic dipoles align in the same direction. The
magnetization of a ferromagnetic substance with an external magnetic field gives a hysteresis
curve as shown in Figure 1.8. When the magnetic field strength is increased in the positive
direction, the magnetization of a ferromagnetic substrate increases until it reaches the saturation
point (Ms). If the magnetic field strength is then decreased, the magnetization does not follow the
same trajectory; instead, it falls down more slowly. In fact, when the magnetic field strength is
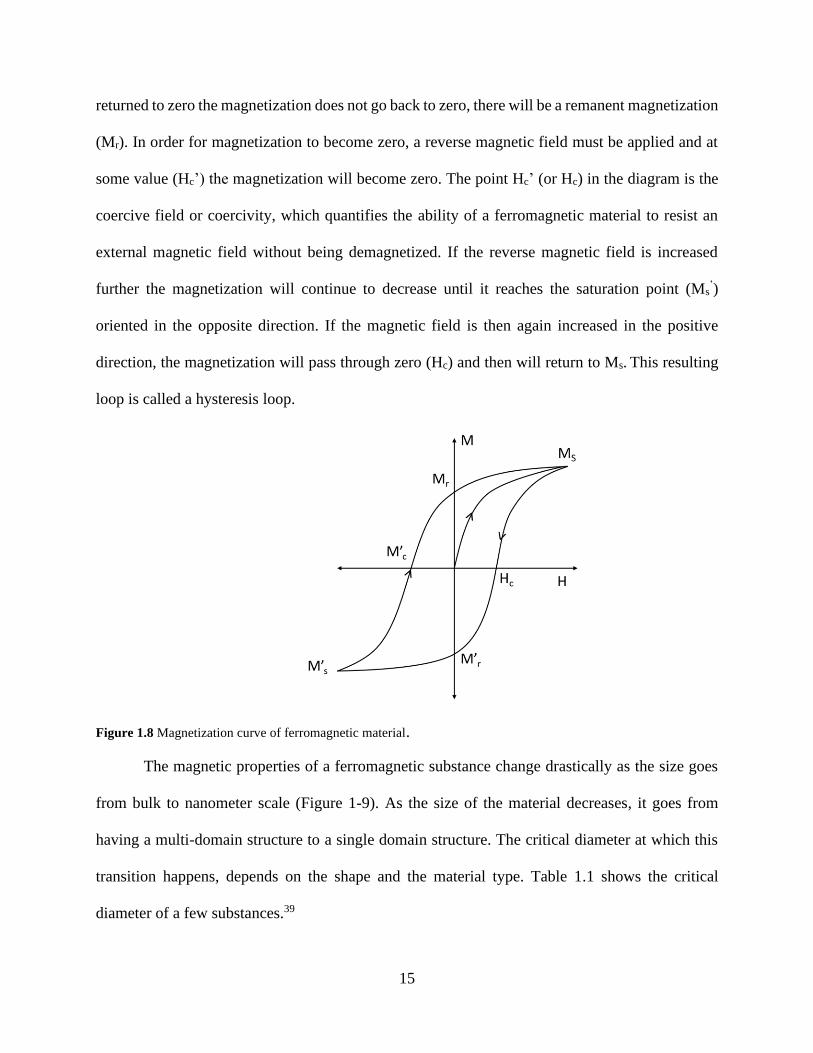
15
returned to zero the magnetization does not go back to zero, there will be a remanent magnetization
(Mr). In order for magnetization to become zero, a reverse magnetic field must be applied and at
some value (Hc’) the magnetization will become zero. The point Hc’ (or Hc) in the diagram is the
coercive field or coercivity, which quantifies the ability of a ferromagnetic material to resist an
external magnetic field without being demagnetized. If the reverse magnetic field is increased
further the magnetization will continue to decrease until it reaches the saturation point (Ms’)
oriented in the opposite direction. If the magnetic field is then again increased in the positive
direction, the magnetization will pass through zero (Hc) and then will return to Ms. This resulting
loop is called a hysteresis loop.
Figure 1.8 Magnetization curve of ferromagnetic material.
The magnetic properties of a ferromagnetic substance change drastically as the size goes
from bulk to nanometer scale (Figure 1-9). As the size of the material decreases, it goes from
having a multi-domain structure to a single domain structure. The critical diameter at which this
transition happens, depends on the shape and the material type. Table 1.1 shows the critical
diameter of a few substances.39

16
Table 1.1 Estimated critical diameter for single domain magnetic nanoparticles.39Table is taken from reference 39
The reversal in magnetization of a multidomain material happens by the movement of the
domain wall, whereas the magnetization reversal for a single domain structure can only be realized
by rotating the magnetic moments of the particle. Because the latter is energetically more
demanding, the single domain structure often has a higher coercivity as shown by the blue line of
the Figure 1.9 (right).
17
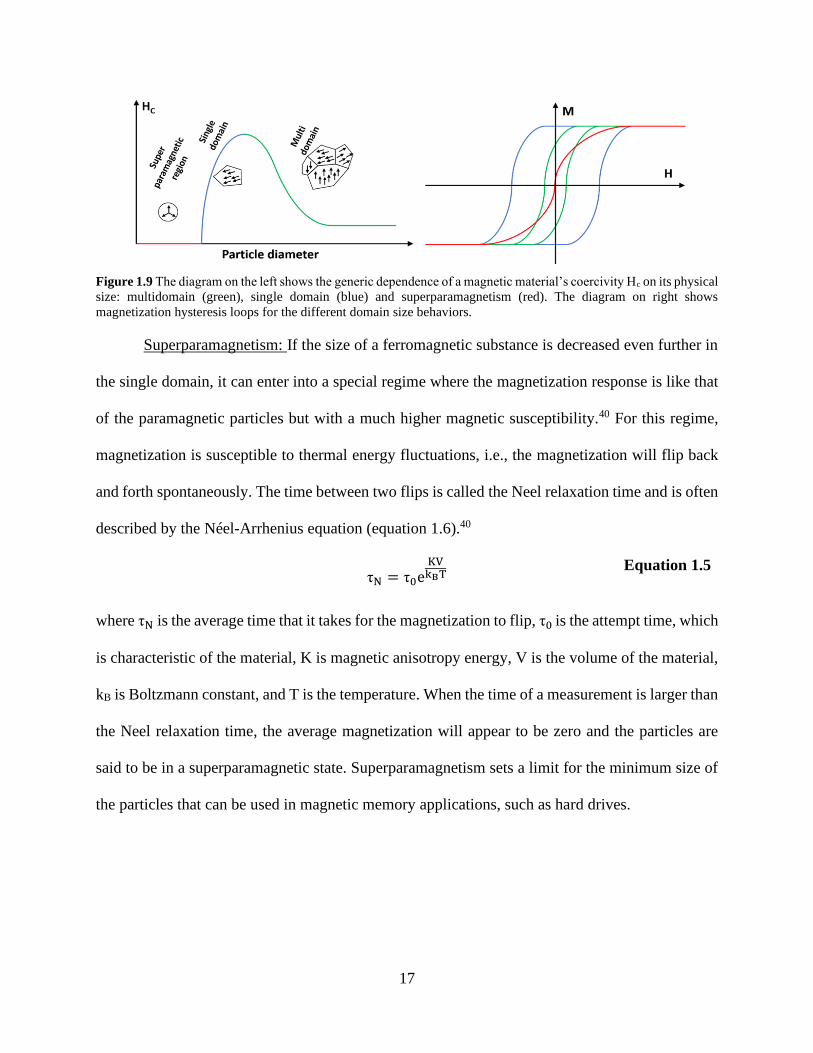
Figure 1.9 The diagram on the left shows the generic dependence of a magnetic material’s coercivity Hc on its physical
size: multidomain (green), single domain (blue) and superparamagnetism (red). The diagram on right shows
magnetization hysteresis loops for the different domain size behaviors.
Superparamagnetism: If the size of a ferromagnetic substance is decreased even further in
the single domain, it can enter into a special regime where the magnetization response is like that
of the paramagnetic particles but with a much higher magnetic susceptibility.40 For this regime,
magnetization is susceptible to thermal energy fluctuations, i.e., the magnetization will flip back
and forth spontaneously. The time between two flips is called the Neel relaxation time and is often
described by the Néel-Arrhenius equation (equation 1.6).40
τN = τ0e
KVkBT
Equation 1.5
where τN is the average time that it takes for the magnetization to flip, τ0 is the attempt time, which
is characteristic of the material, K is magnetic anisotropy energy, V is the volume of the material,
kB is Boltzmann constant, and T is the temperature. When the time of a measurement is larger than
the Neel relaxation time, the average magnetization will appear to be zero and the particles are
said to be in a superparamagnetic state. Superparamagnetism sets a limit for the minimum size of
the particles that can be used in magnetic memory applications, such as hard drives.

18
1.3.1.1 Magnetic Measurement
Magnetic Force Microscopy: Magnetic force microscopy (MFM) technique is a variant of
atomic force microscopy where the scanning tip is coated with a magnetic material that allows for
the imaging of the spatial distribution of the magnetic fields of magnetic substances. For films of
magnetic material, there will be a magnetic interaction between the magnetic tip and the material
in addition to the mechanical and electrostatic interactions between the tip and the surface. To
minimize the mechanical forces, MFM measurements are done at a large tip-to-sample distance.
In general, MFM measurements are done using an “interleave” scan mode, in which two scans are
performed on the surface. In the first scan, the tip scans the surface in non-contact mode to obtain
the topography of the surface, and for the second scan the tip-sample distance is increased to a
particular value and scans are performed along the topography line to maintain a constant height
between tip and the sample (Figure 1.10).
Figure 1.10 a) The schematic diagram illustrates a magnetic force microscopy (MFM) measurement. MFM uses a
combination of tapping mode and lift mode (or interleave mode). b) The diagram on the right shows the magnetic
phase signal of a magnetic test sample that was measured with our instrument. Dark and bright lines show different
domains in the sample.
During the second scan, the tip will be affected by the magnetic force; the magnetic force
shifts the cantilever oscillation, and this change is measured as a phase shift (shown in Figure
1.10).
Phase shift
Lift height
Magnetic forces causes phase shift
Magnetic probe
a) b)

19
SQUID Magnetometer: A superconducting quantum interference device, or SQUID, is a
very sensitive magnetometer, based on superconducting loops with Josephson junctions; and it can
be used to measure very small magnetic fields. This device is based on two principles: Josephson
effect at a superconductor- insulator- superconducting junction and magnetic flux quantization on
a superconducting loop. The Josephson effect is the flow of a constant current between two
superconductors even if they are separated by a tunneling barrier. A SQUID incorporates
Josephson junctions in a ring structure (Figure 1.11). An important property of a superconductor
ring is magnetic flux quantization, i.e., a superconducting ring allows only certain magnetic flux
values which are an integer multiple of the flux quantum Ф0. In a SQUID the current flow through
the Josephson junction is very sensitive to the magnetic field in the ring. Because of the quantum
nature of the flux, the current (hence the voltage of the whole SQUID) varies periodically with the
magnetic field applied to the ring. The period of this oscillation is related to the flux quantum Ф0.
Thus, by measuring this variation it can be determined how many Ф0 flow through the rings.
Figure 1.11 a) Schematic diagram shows a DC SQUID where two Josephson junction are connected in parallel. b)
The plot shows the output voltage signal with magnetic flux. As can be seen from the diagram a small flux signal
produces a corresponding voltage swing across the SQUID.
Voltage
Magnetic fieldJosephson junction
One flux quantum
Voltage change
Flux
Vo
ltag
e
Current flux signal
a) b)

20
1.3.2 Magnetism Induced by Proximity of Chiral Molecules
The formation of a self-assembled monolayer (SAM) of chiral molecules on a gold surface
can magnetize the surface.41-43 This effect is called magnetism induced by proximity of adsorbed
chiral molecules, or MIPAC effect. It originates from SAM formation and the CISS effect. When
a SAM of chiral molecules with large dipole moments is adsorbed on a metal surface, charge
transfer occurs to equalize the electrochemical potential between the adsorbed layer and the metal
surface. Because of the CISS effect, the charge transfer through the chiral molecules is spin
selective. Thus, spin polarized electrons are produced on the metal surface, and magnetize it.
Alternatively, one can view the phenomenon as arising from the excess electron density on the Au
surface which becomes spin polarized because the wavefunction penetration into the chiral
molecule is spin dependent. This leads to an imbalance in spin-up and spin-down populations on
the metal and magnetizes it.
Recently Dor, et al showed this effect for the adsorption of chiral polyalanine (AHPA) on
Au-coated ferromagnetic (FM) films. They showed that the FM substrate film could be magnetized
by polyalanine adsorption and that the switching of the magnetization direction can be controlled
by the handedness of the chiral molecules.44

21
Figure 1.12 Panel a and b show the topography images of the SAM of AHPA-L (a) and AHPA-D (b) adsorbed onto
a lithographically patterned ferromagnetic layer. Panel c and d show their corresponding magnetic phase signal. As
can be seen from the diagram, the L and D chiral molecules show opposite magnetic field directions.44 This figure is
taken from reference 44.
Figure 1.12 shows the topography images and magnetic phase signals of a patterned
substrate covered with either L-polyalanine (left) or D- polyalanine (right) monolayers. In this
image the bright region in the magnetic phase indicates a repulsive interaction and the dark region
indicates an attractive interaction. As can be seen from the figure, even though topography signals
are the same for both AHPA enantiomers; the magnetic phase signals are opposite.
1.3.3 CISS Based Memory Devices
Spintronics based memory devices are important because of their increased data processing
speed and decreased electric power consumption compared to conventional semiconductor
devices.45 Conventional semiconductor devices use the charge properties of the electrons, whereas

22
spintronics devices use the spin properties of electrons.3, 45 In general spintronics based magnetic
memory devices are made of two magnetic layers; one permanent magnetic layer and another
ferromagnetic layer called a “free layer” (Figure 1.13).15 Most of these devices are based on a spin
filter concept in which the free layer is magnetized either by a current loop or by transferring spin
alignment to it. In this kind of system, spin polarized current is produced by passing it through the
permanent magnet layer. When the ferromagnetic layer and the permanent magnet are aligned, the
electrical resistance will be low (top image in figure 1.13a) and when they are antiparallel to each
other the electrical resistance will be high (bottom image figure 1.13a). As can be seen from the
diagram for the case of the parallel configuration, the majority spin (up) electrons and minority
spin (down) electrons from the permanent magnetic layer can easily transfer to the second
ferromagnetic layer and fill majority spin (up) and minority spin (down) electronic states
respectively and will result in a large conductance or low resistance state. Whereas in the case of
the anti-parallel state, the majority spin (up) electrons and minority spin (down) electrons from the
first ferromagnetic layer fill the minority (up) and majority (down) states in the second
ferromagnetic layer, respectively. This will result in a lower conductance or higher resistive state.
Thus, 0 and 1 state can be controlled by changing the direction of the “free” layer magnetization.
Although spintronics devices are already in use, their reliance on a permanent magnet restricts the
device size and imposes structural requirements.
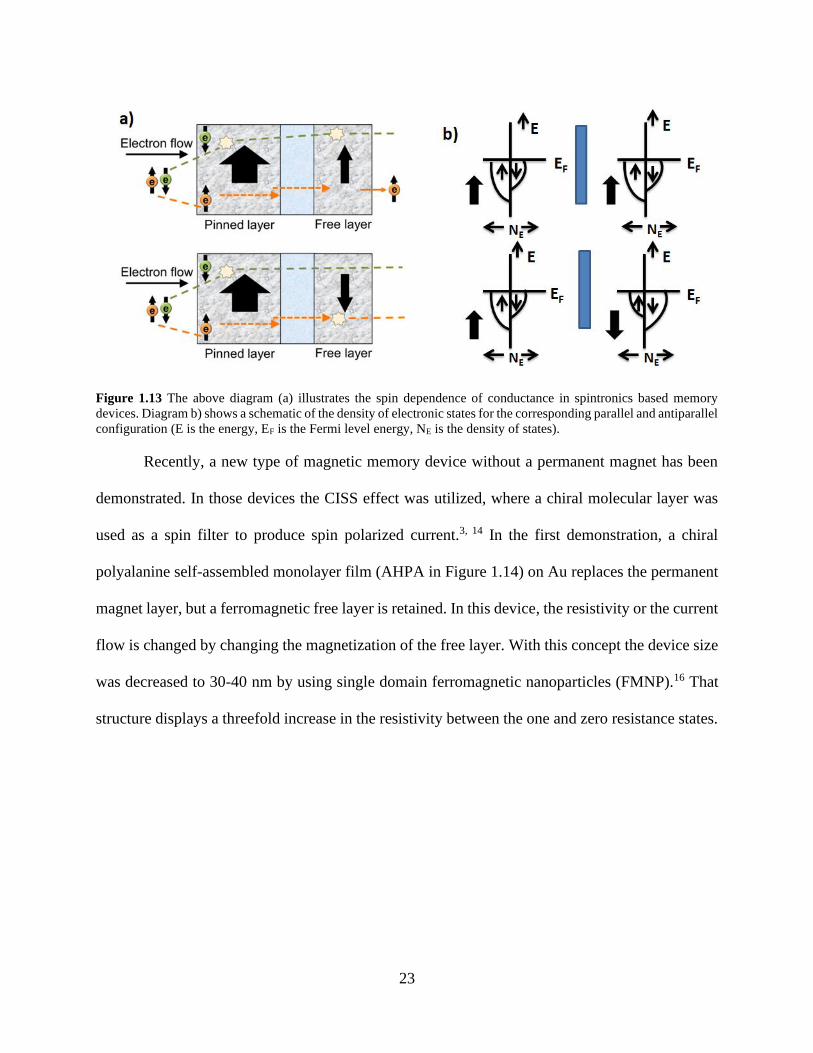
23
Figure 1.13 The above diagram (a) illustrates the spin dependence of conductance in spintronics based memory
devices. Diagram b) shows a schematic of the density of electronic states for the corresponding parallel and antiparallel
configuration (E is the energy, EF is the Fermi level energy, NE is the density of states).
Recently, a new type of magnetic memory device without a permanent magnet has been
demonstrated. In those devices the CISS effect was utilized, where a chiral molecular layer was
used as a spin filter to produce spin polarized current.3, 14 In the first demonstration, a chiral
polyalanine self-assembled monolayer film (AHPA in Figure 1.14) on Au replaces the permanent
magnet layer, but a ferromagnetic free layer is retained. In this device, the resistivity or the current
flow is changed by changing the magnetization of the free layer. With this concept the device size
was decreased to 30-40 nm by using single domain ferromagnetic nanoparticles (FMNP).16 That
structure displays a threefold increase in the resistivity between the one and zero resistance states.

24
Figure 1.14 The above diagram shows a schematic of a CISS based spintronics memory device. a) Shows top view
of the device. b) Shows side view of the device. The FMNPs have a random magnetization without the magnetic field.
A right handed helix will transport spin down electrons preferentially to the FMNP (c). Now if the FMNP is
magnetized upward, the resistance will be low. For the same configuration the resistance will be higher when the
FMNP is magnetized downward (d). 16 This figure is taken from reference 16.
1.4 IMPORTANCE OF SPIN IN CHEMICAL REACTION
Controlling chemical reactivity by spin manipulation has been one of the most significant
researches of the last decade that has shown a great promise to control the rate and selectivity for
the product formation.46-48 Spin effect on chemical reaction is amusing since the spin interaction
energy in general is orders of magnitude smaller than the thermal energy kBT. The importance of
spin chemistry has been shown to have applications in different areas of science, which includes
solar energy conversion in photosynthetic systems,49 magnetic direction sensing by migratory
birds,50 NMR sensitivity enhancement,51, 52 quantum computing, and magneto-
electroluminescence in organic semiconductors.53 Although a number of studies have shown spin
control on chemical processes, most of the early experiments are limited to organic radical pairs.
Recent experiments on spin control, based on the CISS effect, have shown a great promise for
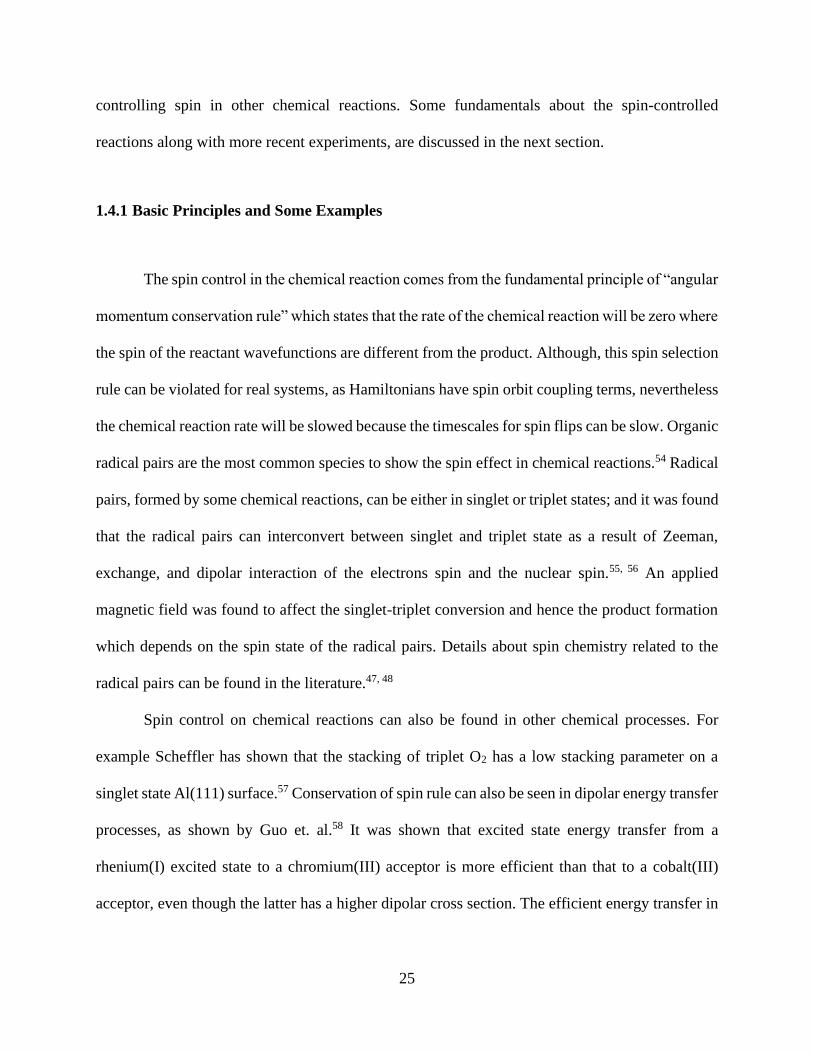
25
controlling spin in other chemical reactions. Some fundamentals about the spin-controlled
reactions along with more recent experiments, are discussed in the next section.
1.4.1 Basic Principles and Some Examples
The spin control in the chemical reaction comes from the fundamental principle of “angular
momentum conservation rule” which states that the rate of the chemical reaction will be zero where
the spin of the reactant wavefunctions are different from the product. Although, this spin selection
rule can be violated for real systems, as Hamiltonians have spin orbit coupling terms, nevertheless
the chemical reaction rate will be slowed because the timescales for spin flips can be slow. Organic
radical pairs are the most common species to show the spin effect in chemical reactions.54 Radical
pairs, formed by some chemical reactions, can be either in singlet or triplet states; and it was found
that the radical pairs can interconvert between singlet and triplet state as a result of Zeeman,
exchange, and dipolar interaction of the electrons spin and the nuclear spin.55, 56 An applied
magnetic field was found to affect the singlet-triplet conversion and hence the product formation
which depends on the spin state of the radical pairs. Details about spin chemistry related to the
radical pairs can be found in the literature.47, 48
Spin control on chemical reactions can also be found in other chemical processes. For
example Scheffler has shown that the stacking of triplet O2 has a low stacking parameter on a
singlet state Al(111) surface.57 Conservation of spin rule can also be seen in dipolar energy transfer
processes, as shown by Guo et. al.58 It was shown that excited state energy transfer from a
rhenium(I) excited state to a chromium(III) acceptor is more efficient than that to a cobalt(III)
acceptor, even though the latter has a higher dipolar cross section. The efficient energy transfer in

26
the former case was attributed to the same spin state of the donor and acceptor which results in a
spin allowed process.
1.4.2 Spin Control Using the CISS Effect
Although spin is an important parameter for a molecule’s electronics structure and essential
for bonding formation, spin control in chemical reaction has not been explored vastly. Part of the
reason might be due to the weak coupling between electron spin and a molecule’s nuclear
geometry. Because of the weak coupling, it is hard to control the relative orientation of the
intermediate radical species with respect to the reaction coordinate(s). Recent discovery of CISS
effect has shown chiral molecules are different,10 and electron transfer and electron rearrangement
in a chiral molecule is affected by the spin. Generally, for a closed shell molecule charge
reorganization or polarization creates a dipole moment across the molecule, and in chiral molecule
this electron displacement creates a spin polarization. That is, for a chiral molecule opposite spin
accumulation occurs at the opposite electric poles and this can cause the molecule to act as a
“singlet biradical”. This property of chiral molecules may contribute to the enantioselectivity in
the interaction of the chiral molecules, and it opens up new ways to control the spin in chemical
reactions.10, 13 Recently, several important applications based on this effect has been shown; such
as separation of enantiomers with a ferromagnetic surface,12 enantiospecific electrochemistry,59
and water splitting with chiral materials.17, 19, 60, 61 Details about these specific projects can be found
in the literature.

27
1.4.3 OER and Mechanism
Electrolysis of water to produce hydrogen is considered one of the promising avenues
which can fulfill the clean energy demand. Several studies have been done to make stable, efficient,
cost effective catalysts that are required to make water splitting a viable energy technology. But
higher overpotential, often found in the water splitting experiment, limits the use of catalyst to
make it an economically viable process. Previous experiments have shown that the spin of the
intermediate species during water splitting experiments play a crucial role in determining the
efficiency of the catalyst.
1.4.3.1 Basic of Oxygen Evolution Reaction
The water splitting reaction can be divided into two half reactions: The hydrogen evolution
reaction, or HER, and the oxygen evolution reaction, or OER.
4𝐻2𝑂 + 4𝑒− → 2 𝐻2 + 4 𝑂𝐻− HER
4𝑂𝐻− → 2 𝐻2𝑂 + 𝑂2 + 4 𝑒− OER
Among the two reactions, the oxygen evolution reaction is considered to be the more
challenging since it occurs through a complicated four electron process, which leads to formation
of an O-O bond. The OER reaction is kinetically sluggish and generally a higher overpotential is
required for this reaction to occur at a useful rate. For electrochemical reactions, the overpotential
of a reaction is the extra potential that one needs to apply in order for product formation as
compared to the thermodynamically required value. The thermodynamic potential for the OER can
be calculated as follows; for the reaction below,

28
2𝐻2𝑂 → 𝑂2 + 4𝐻+ + 4𝑒− 𝐸0 = +1.23
This potential will shift depending on the pH value and the modified potential can be calculated
using Nernst equation as shown below:
𝐸𝑛𝑒𝑤 → 𝐸0 + 4
𝑅𝑇
𝑛𝐹𝑙𝑛[𝐻+]
Equation 1.6
Because n = 4 in this case,
𝐸𝑛𝑒𝑤 → 𝐸0 + 0.059 𝑙𝑛[𝐻+] Equation 1.7
For pH 13, Enew = 1.23 – 0.059*13 = 0.46 V. Thus, the overpotential will be η = Vapp - 0.46
V, where η is the overpotential, Vapp is the applied potential, and 0.46 V is the theoretical onset
potential of OER (vs SHE)
In the past few decades, extensive studies were performed to design stable and efficient
catalysts that have lower overpotential. To date RuO2 and IrO2 have been considered to be the
benchmark for the OER with an overpotential of 300 mV in the alkaline medium.62 Even though
significant studies on these oxides are reported in literature, large scale production is hindered as
both of them are made of precious metals. Transition metal oxides, on the other hand, have shown
comparable electrocatalytic activity, whereas they are both cheap and can be synthesized easily.63,
64
1.4.3.2 Oxygen Evolution Reactions Mechanisms
Understanding the reaction mechanism of OER is key to improving water splitting
catalysis.65 Some electrocatalytic parameters such as the Tafel slopes, which relate the rates of an
electrochemical reaction to the overpotential, provide valuable information about the mechanism
of the OER. Details about the analysis of the Tafel slope for a multistep process and the mechanism

29
are available in the literature.66 Over the years, many scientists have proposed possible
mechanisms for OER with a metal (M) based catalyst in either basic or acidic conditions. Most of
the proposed mechanisms include similar intermediates such as MO, MOH, MOOH, whereas the
major difference is found in the last step; i.e. the formation of O2 step. An example of a step-by-
step mechanism for the OER is shown for a basic medium (red curve) and an acidic medium (blue
curve) in Figure 1.15. The active site of the OER is shown by M. At the first step a hydroxyl radical
is adsorbed on the active site to form M-OH; which then undergoes a coupled proton and electron
transfer to form M-O. From the M-O intermediate there are two different pathways which can form
the molecular oxygen. One is a more direct route through the combination of two M-O moieties to
produce O2; whereas the other one involves the formation of another intermediate M-OOH before
it decomposes to O2. The diagram shown is a typical blueprint for the general OER mechanism.
In addition to these steps, some papers also show a parallel step where 2M-OH goes by a slow
dissociation to form hydrogen peroxide. Formation of H2O2 is found to be more stable at acidic
pH, however, it eventually decomposes to molecular oxygen.
Figure 1.15 The OER mechanisms for basic (red) and acid (blue) medium.
O2
+H2O
M
M-OOH
M-O
M-OH
½ O2
O2+H+
+H2OH++e-
H+
H2O +OH-
H+ +H2O
+OH-
e-
+OH-
e-
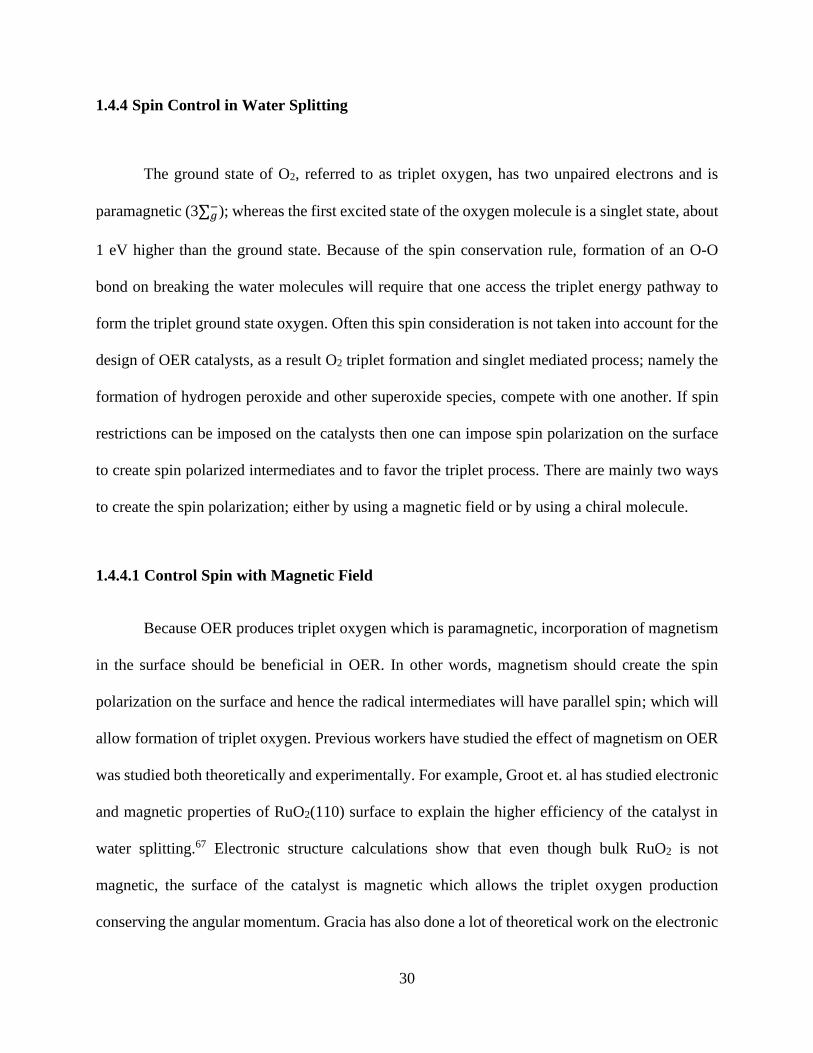
30
1.4.4 Spin Control in Water Splitting
The ground state of O2, referred to as triplet oxygen, has two unpaired electrons and is
paramagnetic (3∑𝑔−); whereas the first excited state of the oxygen molecule is a singlet state, about
1 eV higher than the ground state. Because of the spin conservation rule, formation of an O-O
bond on breaking the water molecules will require that one access the triplet energy pathway to
form the triplet ground state oxygen. Often this spin consideration is not taken into account for the
design of OER catalysts, as a result O2 triplet formation and singlet mediated process; namely the
formation of hydrogen peroxide and other superoxide species, compete with one another. If spin
restrictions can be imposed on the catalysts then one can impose spin polarization on the surface
to create spin polarized intermediates and to favor the triplet process. There are mainly two ways
to create the spin polarization; either by using a magnetic field or by using a chiral molecule.
1.4.4.1 Control Spin with Magnetic Field
Because OER produces triplet oxygen which is paramagnetic, incorporation of magnetism
in the surface should be beneficial in OER. In other words, magnetism should create the spin
polarization on the surface and hence the radical intermediates will have parallel spin; which will
allow formation of triplet oxygen. Previous workers have studied the effect of magnetism on OER
was studied both theoretically and experimentally. For example, Groot et. al has studied electronic
and magnetic properties of RuO2(110) surface to explain the higher efficiency of the catalyst in
water splitting.67 Electronic structure calculations show that even though bulk RuO2 is not
magnetic, the surface of the catalyst is magnetic which allows the triplet oxygen production
conserving the angular momentum. Gracia has also done a lot of theoretical work on the electronic
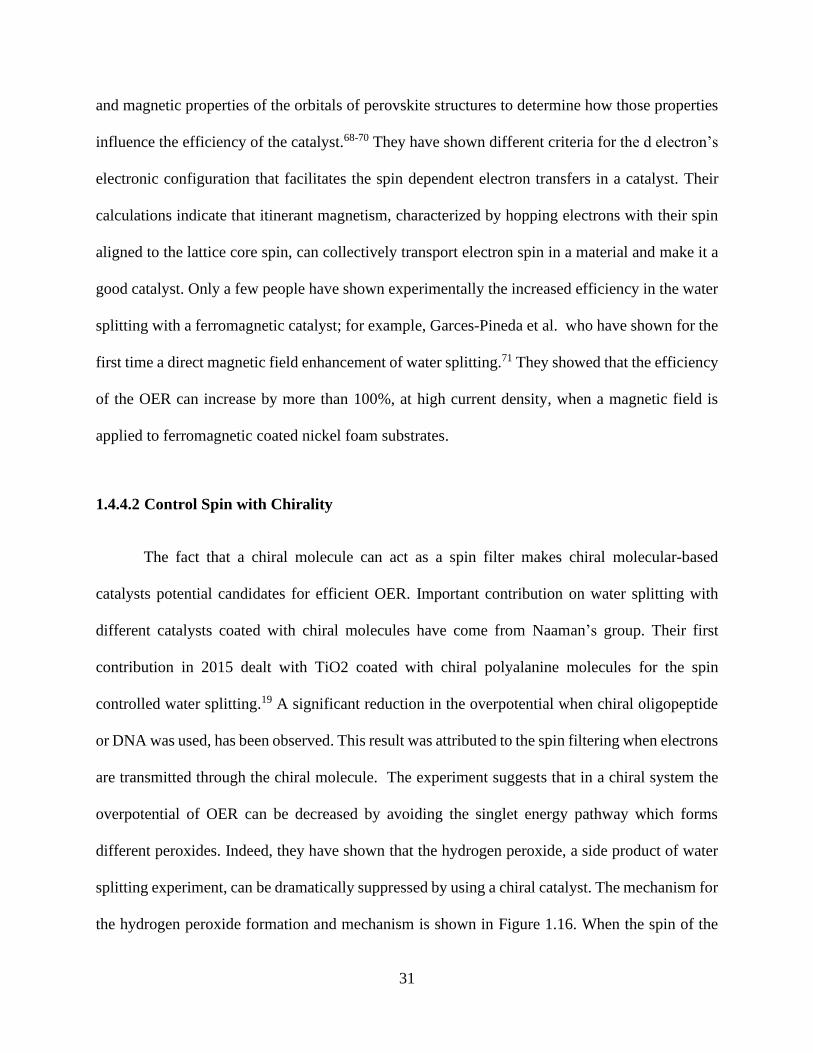
31
and magnetic properties of the orbitals of perovskite structures to determine how those properties
influence the efficiency of the catalyst.68-70 They have shown different criteria for the d electron’s
electronic configuration that facilitates the spin dependent electron transfers in a catalyst. Their
calculations indicate that itinerant magnetism, characterized by hopping electrons with their spin
aligned to the lattice core spin, can collectively transport electron spin in a material and make it a
good catalyst. Only a few people have shown experimentally the increased efficiency in the water
splitting with a ferromagnetic catalyst; for example, Garces-Pineda et al. who have shown for the
first time a direct magnetic field enhancement of water splitting.71 They showed that the efficiency
of the OER can increase by more than 100%, at high current density, when a magnetic field is
applied to ferromagnetic coated nickel foam substrates.
1.4.4.2 Control Spin with Chirality
The fact that a chiral molecule can act as a spin filter makes chiral molecular-based
catalysts potential candidates for efficient OER. Important contribution on water splitting with
different catalysts coated with chiral molecules have come from Naaman’s group. Their first
contribution in 2015 dealt with TiO2 coated with chiral polyalanine molecules for the spin
controlled water splitting.19 A significant reduction in the overpotential when chiral oligopeptide
or DNA was used, has been observed. This result was attributed to the spin filtering when electrons
are transmitted through the chiral molecule. The experiment suggests that in a chiral system the
overpotential of OER can be decreased by avoiding the singlet energy pathway which forms
different peroxides. Indeed, they have shown that the hydrogen peroxide, a side product of water
splitting experiment, can be dramatically suppressed by using a chiral catalyst. The mechanism for
the hydrogen peroxide formation and mechanism is shown in Figure 1.16. When the spin of the

32
OH radicals are antiparallel to each other, they combine to form hydrogen peroxide or singlet
oxygen; however, if the spin of the radicals are parallel to each other they form ground state triplet
oxygen. Due to the CISS effect, in the chiral case the spin polarization in the surface enhances
triplet product as compared to singlet product such as hydrogen peroxide and singlet oxygen.
While some other chiral catalysts have demonstrated this effect and have shown spin polarized
enhancements in OER efficiency, the chirality was imprinted using long organic molecules or
chiral materials which are not good water splitting catalysts. Thus, for practical applications,
further studies are required on efficient electrocatalysts at different pH regimes to fully explore
CISS mediated OER.
Figure 1.16 Energy diagram showing different products from the combination of OH intermediates during OER.17
This figure is taken from reference 17.

33
1.5 DISSERTATION OUTLINE
The CISS effect has already shown great potential in different branches of science. Current
studies on CISS effect are mainly focused in three different avenues. Firstly, fundamental
understanding of the CISS effect, i.e, why this effect is so robust. Secondly, finding new chiral
systems with better spin filtering properties that can be synthesized and fabricated easily for
different applications. Thirdly, explore different areas of sciences, where CISS is utilized or can
be utilized. The work presented in this dissertation has addresses these by studying spin dependent
properties of chiral molecules at the ferromagnetic interface and by exploring spin filtering
efficiencies through chiral metal oxide thin films that can be used in electrocatalytic experiments.
Chapter 2 reports our work on chirality induced magnetization of superparamagnetic
particles. Asymmetric attachment of chiral molecules on a superparamagnetic iron oxide particle
changes the magnetic properties of the particles from superparamagnetic to ferromagnetic. It was
also found that magnetization direction of the particles depends on the handedness of the chiral
molecules. Importance of symmetry breaking for magnetization was also explored by studying
different systems using magnetic force microscopy. This study shows a potential to build memory
devices of less than 10 nm size.
Chapter 3 reports the study of spin exchange interaction at chiral molecule ferromagnetic
interface. Here Kelvin-probe measurements were used to measure the surface charge of
magnetized ferromagnetic thin films coated with self-assembled monolayers (SAM) of chiral
molecules. The findings reveal that the electron penetration from the metal electrode into the chiral
molecules depends on the magnetization of the ferromagnet and the chirality of the molecule. This
study is very important for molecular based spintronics devices.
34
Chapter 4 demonstrates spin filtering ability of chiral cobalt oxide thin film. Spin
polarization study was performed by using magnetic conducting AFM and results show that
conduction of electrons depends on the chirality and the magnetization of the tip. A spin-valve
based magnetoresistance device was also made using chiral cobalt oxide thin film. The effect of
dopant on the spin polarization, where chiral cobalt oxide is doped with Mn ions, also studied.
Interestingly, Mn dopant improves the spin polarization. This study shows that chiral metal oxide
thin film act as an efficient spin filter and can replace the permanent magnetic layer in the
spintronics devices.
Chapter 5 reports our work on electrocatalytic activity with chiral cobalt oxide thin film
for water splitting reaction. Chiral catalyst shows much higher efficiency for water splitting than
achiral catalyst where a reduction of 65mV at 10 mA/cm2 in the reaction overpotential was
observed with the chiral catalyst. Experiments are also done at different pH and the product
formation was evaluated. Effect of magnetic field on the catalytic activity were also studied with
a modified paramagnetic catalyst. The importance of spin polarization through the materials that
favors the formation of spin-favorable intermediates which facilitates the water splitting
efficiency, has been shown.
1.6 REFERENCES
1.Ray, K.; Ananthavel, S. P.; Waldeck, D. H.; Naaman, R., Asymmetric Scattering of Polarized
Electrons by Organized Organic Films of Chiral Molecules. Science 1999, 283 (5403), 814.
2.Naaman, R.; Waldeck, D. H., Chiral-Induced Spin Selectivity Effect. The Journal of Physical
Chemistry Letters 2012, 3 (16), 2178-2187.
35
3.Naaman, R.; Waldeck, D. H., Spintronics and Chirality: Spin Selectivity in Electron Transport
Through Chiral Molecules. Annual Review of Physical Chemistry 2015, 66 (1), 263-281.
4.Dalum, S.; Hedegård, P., Theory of Chiral Induced Spin Selectivity. Nano Letters 2019, 19 (8),
5253-5259.
5.Guo, A.-M.; Sun, Q.-f., Spin-Selective Transport of Electrons in DNA Double Helix. Physical
Review Letters 2012, 108 (21), 218102.
6.Gutierrez, R.; Díaz, E.; Gaul, C.; Brumme, T.; Domínguez-Adame, F.; Cuniberti, G., Modeling
Spin Transport in Helical Fields: Derivation of an Effective Low-Dimensional Hamiltonian. The
Journal of Physical Chemistry C 2013, 117 (43), 22276-22284.
7.Gutierrez, R.; Díaz, E.; Naaman, R.; Cuniberti, G., Spin-selective transport through helical
molecular systems. Physical Review B 2012, 85 (8), 081404.
8.Michaeli, K.; Naaman, R., Origin of Spin-Dependent Tunneling Through Chiral Molecules. The
Journal of Physical Chemistry C 2019, 123 (27), 17043-17048.
9.Yeganeh, S.; Ratner, M. A.; Medina, E.; Mujica, V., Chiral electron transport: Scattering
through helical potentials. The Journal of Chemical Physics 2009, 131 (1), 014707.
10.Naaman, R.; Paltiel, Y.; Waldeck, D. H., Chiral Induced Spin Selectivity Gives a New Twist
on Spin-Control in Chemistry. Accounts of Chemical Research 2020, 53 (11), 2659-2667.
11.Naaman, R.; Paltiel, Y.; Waldeck, D. H., Chiral Molecules and the Spin Selectivity Effect. The
Journal of Physical Chemistry Letters 2020, 11 (9), 3660-3666.
12.Banerjee-Ghosh, K.; Ben Dor, O.; Tassinari, F.; Capua, E.; Yochelis, S.; Capua, A.; Yang,
S.-H.; Parkin, S. S. P.; Sarkar, S.; Kronik, L.; Baczewski, L. T.; Naaman, R.; Paltiel, Y.,
Separation of enantiomers by their enantiospecific interaction with achiral magnetic substrates.
Science 2018, 360 (6395), 1331.
13.Kumar, A.; Capua, E.; Kesharwani, M. K.; Martin, J. M. L.; Sitbon, E.; Waldeck, D. H.;
Naaman, R., Chirality-induced spin polarization places symmetry constraints on biomolecular
interactions. Proceedings of the National Academy of Sciences 2017, 114 (10), 2474.
14.Ben Dor, O.; Morali, N.; Yochelis, S.; Baczewski, L. T.; Paltiel, Y., Local Light-Induced
Magnetization Using Nanodots and Chiral Molecules. Nano Letters 2014, 14 (11), 6042-6049.
15.Dor, O. B.; Yochelis, S.; Mathew, S. P.; Naaman, R.; Paltiel, Y., A chiral-based magnetic
memory device without a permanent magnet. Nature Communications 2013, 4 (1), 2256.
16.Koplovitz, G.; Primc, D.; Ben Dor, O.; Yochelis, S.; Rotem, D.; Porath, D.; Paltiel, Y.,
Magnetic Nanoplatelet-Based Spin Memory Device Operating at Ambient Temperatures.
Advanced Materials 2017, 29 (17), 1606748.

36
17.Ghosh, K. B.; Zhang, W.; Tassinari, F.; Mastai, Y.; Lidor-Shalev, O.; Naaman, R.; Möllers,
P.; Nürenberg, D.; Zacharias, H.; Wei, J.; Wierzbinski, E.; Waldeck, D. H., Controlling Chemical
Selectivity in Electrocatalysis with Chiral CuO-Coated Electrodes. The Journal of Physical
Chemistry C 2019, 123 (5), 3024-3031.
18.Naaman, R.; Paltiel, Y.; Waldeck, D. H., Chiral Induced Spin Selectivity Gives a New Twist
on Spin-Control in Chemistry. Accounts of Chemical Research 2020.
19.Mtangi, W.; Kiran, V.; Fontanesi, C.; Naaman, R., Role of the Electron Spin Polarization in
Water Splitting. The Journal of Physical Chemistry Letters 2015, 6 (24), 4916-4922.
20.Ghazaryan, A.; Paltiel, Y.; Lemeshko, M., Analytic Model of Chiral-Induced Spin Selectivity.
The Journal of Physical Chemistry C 2020, 124 (21), 11716-11721.
21.Göhler, B.; Hamelbeck, V.; Markus, T. Z.; Kettner, M.; Hanne, G. F.; Vager, Z.; Naaman,
R.; Zacharias, H., Spin Selectivity in Electron Transmission Through Self-Assembled Monolayers
of Double-Stranded DNA. Science 2011, 331 (6019), 894.
22.Varade, V.; Markus, T.; Vankayala, K.; Friedman, N.; Sheves, M.; Waldeck, D. H.; Naaman,
R., Bacteriorhodopsin based non-magnetic spin filters for biomolecular spintronics. Physical
Chemistry Chemical Physics 2018, 20 (2), 1091-1097.
23.Mondal, P. C.; Kantor-Uriel, N.; Mathew, S. P.; Tassinari, F.; Fontanesi, C.; Naaman, R.,
Chiral Conductive Polymers as Spin Filters. Advanced Materials 2015, 27 (11), 1924-1927.
24.Bullard, G.; Tassinari, F.; Ko, C.-H.; Mondal, A. K.; Wang, R.; Mishra, S.; Naaman, R.;
Therien, M. J., Low-Resistance Molecular Wires Propagate Spin-Polarized Currents. Journal of
the American Chemical Society 2019, 141 (37), 14707-14711.
25.Xie, Z.; Markus, T. Z.; Cohen, S. R.; Vager, Z.; Gutierrez, R.; Naaman, R., Spin Specific
Electron Conduction through DNA Oligomers. Nano Letters 2011, 11 (11), 4652-4655.
26.Michaeli, K.; Kantor-Uriel, N.; Naaman, R.; Waldeck, D. H., The electron's spin and
molecular chirality – how are they related and how do they affect life processes? Chemical Society
Reviews 2016, 45 (23), 6478-6487.
27.Wei, J. J.; Schafmeister, C.; Bird, G.; Paul, A.; Naaman, R.; Waldeck, D. H., Molecular
Chirality and Charge Transfer through Self-Assembled Scaffold Monolayers. The Journal of
Physical Chemistry B 2006, 110 (3), 1301-1308.
28.Ravi, S.; Sowmiya, P.; Karthikeyan, A., MAGNETORESISTANCE AND SPIN-FILTERING
EFFICIENCY OF DNA-SANDWICHED FERROMAGNETIC NANOSTRUCTURES. SPIN
2013, 03 (01), 1350003.
29.Mishra, D.; Markus, T. Z.; Naaman, R.; Kettner, M.; Göhler, B.; Zacharias, H.; Friedman,
N.; Sheves, M.; Fontanesi, C., Spin-dependent electron transmission through bacteriorhodopsin
embedded in purple membrane. Proceedings of the National Academy of Sciences 2013, 110 (37),
14872.

37
30.Senthil Kumar, K.; Kantor-Uriel, N.; Mathew, S. P.; Guliamov, R.; Naaman, R., A device for
measuring spin selectivity in electron transfer. Physical Chemistry Chemical Physics 2013, 15
(42), 18357-18362.
31.Kiran, V.; Mathew, S. P.; Cohen, S. R.; Hernández Delgado, I.; Lacour, J.; Naaman, R.,
Helicenes—A New Class of Organic Spin Filter. Advanced Materials 2016, 28 (10), 1957-1962.
32.Mishra, S.; Pirbadian, S.; Mondal, A. K.; El-Naggar, M. Y.; Naaman, R., Spin-Dependent
Electron Transport through Bacterial Cell Surface Multiheme Electron Conduits. Journal of the
American Chemical Society 2019, 141 (49), 19198-19202.
33.Jia, L.; Wang, C.; Zhang, Y.; Yang, L.; Yan, Y., Efficient Spin Selectivity in Self-Assembled
Superhelical Conducting Polymer Microfibers. ACS Nano 2020, 14 (6), 6607-6615.
34.Kulkarni, C.; Mondal, A. K.; Das, T. K.; Grinbom, G.; Tassinari, F.; Mabesoone, M. F. J.;
Meijer, E. W.; Naaman, R., Highly Efficient and Tunable Filtering of Electrons' Spin by
Supramolecular Chirality of Nanofiber-Based Materials. Advanced Materials 2020, 32 (7),
1904965.
35.Bloom, B. P.; Kiran, V.; Varade, V.; Naaman, R.; Waldeck, D. H., Spin Selective Charge
Transport through Cysteine Capped CdSe Quantum Dots. Nano Letters 2016, 16 (7), 4583-4589.
36.Lu, H.; Wang, J.; Xiao, C.; Pan, X.; Chen, X.; Brunecky, R.; Berry, J. J.; Zhu, K.; Beard,
M. C.; Vardeny, Z. V., Spin-dependent charge transport through 2D chiral hybrid lead-iodide
perovskites. Science Advances 2019, 5 (12), eaay0571.
37.Inui, A.; Aoki, R.; Nishiue, Y.; Shiota, K.; Kousaka, Y.; Shishido, H.; Hirobe, D.; Suda,
M.; Ohe, J.-i.; Kishine, J.-i.; Yamamoto, H. M.; Togawa, Y., Chirality-Induced Spin-Polarized
State of a Chiral Crystal ${\mathrm{CrNb}}_{3}{\mathrm{S}}_{6}$. Physical Review Letters
2020, 124 (16), 166602.
38.Chatterjee, J.; Haik, Y.; Chen, C.-J., Size dependent magnetic properties of iron oxide
nanoparticles. Journal of Magnetism and Magnetic Materials 2003, 257 (1), 113-118.
39.Leslie-Pelecky, D. L.; Rieke, R. D., Magnetic Properties of Nanostructured Materials.
Chemistry of Materials 1996, 8 (8), 1770-1783.
40.Bean, C. P.; Livingston, J. D., Superparamagnetism. Journal of Applied Physics 1959, 30 (4),
S120-S129.
41.Carmeli, I.; Leitus, G.; Naaman, R.; Reich, S.; Vager, Z., Magnetism induced by the
organization of self-assembled monolayers. The Journal of Chemical Physics 2003, 118 (23),
10372-10375.
42.Crespo, P.; Litrán, R.; Rojas, T. C.; Multigner, M.; de la Fuente, J. M.; Sánchez-López, J.
C.; García, M. A.; Hernando, A.; Penadés, S.; Fernández, A., Permanent Magnetism, Magnetic
Anisotropy, and Hysteresis of Thiol-Capped Gold Nanoparticles. Physical Review Letters 2004,
93 (8), 087204.

38
43.Yamamoto, Y.; Miura, T.; Suzuki, M.; Kawamura, N.; Miyagawa, H.; Nakamura, T.;
Kobayashi, K.; Teranishi, T.; Hori, H., Direct Observation of Ferromagnetic Spin Polarization in
Gold Nanoparticles. Physical Review Letters 2004, 93 (11), 116801.
44.Ben Dor, O.; Yochelis, S.; Radko, A.; Vankayala, K.; Capua, E.; Capua, A.; Yang, S.-H.;
Baczewski, L. T.; Parkin, S. S. P.; Naaman, R.; Paltiel, Y., Magnetization switching in
ferromagnets by adsorbed chiral molecules without current or external magnetic field. Nature
Communications 2017, 8 (1), 14567.
45.Bhatti, S.; Sbiaa, R.; Hirohata, A.; Ohno, H.; Fukami, S.; Piramanayagam, S. N., Spintronics
based random access memory: a review. Materials Today 2017, 20 (9), 530-548.
46.Buchachenko, A., Recent advances in spin chemistry. Pure and Applied Chemistry 2000, 72,
2243 - 2258.
47.Buchachenko, A. L.; Berdinsky, V. L., Spin Catalysis of Chemical Reactions. The Journal of
Physical Chemistry 1996, 100 (47), 18292-18299.
48.Hore, P. J.; Ivanov, K. L.; Wasielewski, M. R., Spin chemistry. The Journal of Chemical
Physics 2020, 152 (12), 120401.
49.Colvin, M. T.; Ricks, A. B.; Scott, A. M.; Smeigh, A. L.; Carmieli, R.; Miura, T.;
Wasielewski, M. R., Magnetic Field-Induced Switching of the Radical-Pair Intersystem Crossing
Mechanism in a Donor−Bridge−Acceptor Molecule for Artificial Photosynthesis. Journal of the
American Chemical Society 2011, 133 (5), 1240-1243.
50.Hore, P. J.; Mouritsen, H., The Radical-Pair Mechanism of Magnetoreception. Annual Review
of Biophysics 2016, 45 (1), 299-344.
51.Lee, J. H.; Okuno, Y.; Cavagnero, S., Sensitivity enhancement in solution NMR: Emerging
ideas and new frontiers. Journal of Magnetic Resonance 2014, 241, 18-31.
52.Levitt, M. H., Singlet Nuclear Magnetic Resonance. Annual Review of Physical Chemistry
2012, 63 (1), 89-105.
53.Wohlgenannt, M., Organic magnetoresistance and spin diffusion in organic semiconductor thin
film devices. physica status solidi (RRL) – Rapid Research Letters 2012, 6 (6), 229-242.
54.Steiner, U. E.; Ulrich, T., Magnetic field effects in chemical kinetics and related phenomena.
Chemical Reviews 1989, 89 (1), 51-147.
55.Evans, E. W.; Dodson, C. A.; Maeda, K.; Biskup, T.; Wedge, C. J.; Timmel, C. R., Magnetic
field effects in flavoproteins and related systems. Interface Focus 2013, 3 (5), 20130037.
56.Jones, A. R., Magnetic field effects in proteins. Molecular Physics 2016, 114 (11), 1691-1702.
39
57.Chrétien, S.; Metiu, H., O2 evolution on a clean partially reduced rutile TiO2(110) surface and
on the same surface precovered with Au1 and Au2: The importance of spin conservation. The
Journal of Chemical Physics 2008, 129 (7), 074705.
58.Guo, D.; Knight, T. E.; McCusker, J. K., Angular Momentum Conservation in Dipolar Energy
Transfer. Science 2011, 334 (6063), 1684.
59.Metzger, T. S.; Mishra, S.; Bloom, B. P.; Goren, N.; Neubauer, A.; Shmul, G.; Wei, J.;
Yochelis, S.; Tassinari, F.; Fontanesi, C.; Waldeck, D. H.; Paltiel, Y.; Naaman, R., The Electron
Spin as a Chiral Reagent. Angewandte Chemie International Edition 2020, 59 (4), 1653-1658.
60.Mtangi, W.; Tassinari, F.; Vankayala, K.; Vargas Jentzsch, A.; Adelizzi, B.; Palmans, A. R.
A.; Fontanesi, C.; Meijer, E. W.; Naaman, R., Control of Electrons’ Spin Eliminates Hydrogen
Peroxide Formation During Water Splitting. Journal of the American Chemical Society 2017, 139
(7), 2794-2798.
61.Zhang, W.; Banerjee-Ghosh, K.; Tassinari, F.; Naaman, R., Enhanced Electrochemical Water
Splitting with Chiral Molecule-Coated Fe3O4 Nanoparticles. ACS Energy Letters 2018, 3 (10),
2308-2313.
62.Lee, Y.; Suntivich, J.; May, K. J.; Perry, E. E.; Shao-Horn, Y., Synthesis and Activities of
Rutile IrO2 and RuO2 Nanoparticles for Oxygen Evolution in Acid and Alkaline Solutions. The
Journal of Physical Chemistry Letters 2012, 3 (3), 399-404.
63.Song, F.; Bai, L.; Moysiadou, A.; Lee, S.; Hu, C.; Liardet, L.; Hu, X., Transition Metal
Oxides as Electrocatalysts for the Oxygen Evolution Reaction in Alkaline Solutions: An
Application-Inspired Renaissance. Journal of the American Chemical Society 2018, 140 (25),
7748-7759.
64.Deng, X.; Tüysüz, H., Cobalt-Oxide-Based Materials as Water Oxidation Catalyst: Recent
Progress and Challenges. ACS Catalysis 2014, 4 (10), 3701-3714.
65.Dau, H.; Limberg, C.; Reier, T.; Risch, M.; Roggan, S.; Strasser, P., The Mechanism of
Water Oxidation: From Electrolysis via Homogeneous to Biological Catalysis. ChemCatChem
2010, 2 (7), 724-761.
66.Suen, N.-T.; Hung, S.-F.; Quan, Q.; Zhang, N.; Xu, Y.-J.; Chen, H. M., Electrocatalysis for
the oxygen evolution reaction: recent development and future perspectives. Chemical Society
Reviews 2017, 46 (2), 337-365.
67.Torun, E.; Fang, C. M.; de Wijs, G. A.; de Groot, R. A., Role of Magnetism in Catalysis:
RuO2 (110) Surface. The Journal of Physical Chemistry C 2013, 117 (12), 6353-6357.
68.Gracia, J., Spin dependent interactions catalyse the oxygen electrochemistry. Physical
Chemistry Chemical Physics 2017, 19 (31), 20451-20456.

40
69.Sharpe, R.; Lim, T.; Jiao, Y.; Niemantsverdriet, J. W.; Gracia, J., Oxygen Evolution Reaction
on Perovskite Electrocatalysts with Localized Spins and Orbital Rotation Symmetry.
ChemCatChem 2016, 8 (24), 3762-3768.
70.Sharpe, R.; Munarriz, J.; Lim, T.; Jiao, Y.; Niemantsverdriet, J. W.; Polo, V.; Gracia, J.,
Orbital Physics of Perovskites for the Oxygen Evolution Reaction. Topics in Catalysis 2018, 61
(3), 267-275.
71.Garcés-Pineda, F. A.; Blasco-Ahicart, M.; Nieto-Castro, D.; López, N.; Galán-Mascarós, J.
R., Direct magnetic enhancement of electrocatalytic water oxidation in alkaline media. Nature
Energy 2019, 4 (6), 519-525.

41
2.0 SINGLE DOMAIN 10 nm FERROMAGNETISM IMPRINTED ON
SUPERPARAMAGNETIC NANOPARTICLES USING CHIRAL MOLECULES
This work was published as Koplovitz, E.; Leitus, G.; Ghosh, S.; Bloom, B. P.; Yochelis,
S.; Rotem, D.; Vischio, F.; Striccoli, M.; Elisabetta, F.; Naaman, R.; Waldeck, D. H.; Porath, D.;
Paltiel, Y. Small 2019, 15, 1804557. The author of the dissertation performed the nanoparticle
synthesis, the design of the experiments, the magnetic force microscopy measurement, and
participated in writing the manuscript. The supporting information for this chapter can be found in
Appendix A.
The rapid growth in demand for data and the emerging applications of Big Data requires
the increase of memory capacity. Magnetic memory devices are among the leading technologies
for meeting this demand; however, they rely on the use of ferromagnets that creates size reduction
limitations and poses complex materials requirements. Usually, magnetic memory sizes are limited
to 30-50 nm. Reducing the size even further, to the ~10-20 nm scale, destabilizes the magnetization
and its magnetic orientation becomes susceptible to thermal fluctuations and stray magnetic fields.
In the present work it is shown that 10 nm single domain ferromagnetism can be achieved. Using
asymmetric adsorption of chiral molecules superparamagnetic iron oxide nanoparticles become
ferromagnetic with an average coercive field of ~ 80 Oe. The asymmetric absorption of molecules
stabilizes the magnetization direction at room temperature and the orientation is found to depend
on the handedness of the chiral molecules. These studies point to a novel method for the
miniaturization of ferromagnets (down to ~10 nm) using established synthetic protocols.

42
2.1 INTRODUCTION
The rapid growth in demand for data (such as videos, pictures and audio) and the emerging
applications of Big Data require the increase of memory capacity, as well as faster and more energy
efficient non-volatile memory devices. Spintronic based magnetic memory devices are among the
leading technologies for meeting this demand.1-3 Spintronics technology is already industrialized
and widely used in devices such as hard disk drives and magnetic random access memory.4 All
spintronic devices require the use of magnetic materials as the memory storage medium and for
generating spin polarized currents. The use of ferromagnets for producing the spin current creates
size reduction limitations and poses complex materials requirements.3, 4
The size reduction limitation arises from the physicochemical nature of the materials,
specifically ferromagnets (FM), whose magnetic properties are comprised from their magnetic
domains at smaller sizes. Typically, magnetic domains in a ferromagnet are a micron in size, so
that reducing the size to ~50 nm scale creates a single magnetic domain with high coercivity. The
exact location of the transition from multiple domain to single domain of Fe3O4 depends on both
size and shape. For example, in cuboidal particles the critical diameter for forming a multi-domain
structure has been theoretically and experimentally determined to be 76 nm5 and for spherical
Fe3O4 nanoparticles the theoretical critical diameter was found to be 128 nm.6 Reducing the size
of the material even further destabilizes the magnetization and its magnetic orientation becomes
susceptible to thermal fluctuations and weak stray magnetic fields. At small enough sizes, the
material enters the superparamagnetic regime, ~10-20 nm scale, with zero coercivity and no
magnetic remanence (Figure 2.1a ,b).7 Thus, the reduction in size of magnetic memory devices
and magnetic reading heads is usually limited to a 30-50 nm size regime.8

43
In recent works it was shown that simple spintronic devices without magnetic layers could
be realized using the Chiral Induced Spin Selectivity (CISS) effect.9, 10 The CISS effect provides
an easy and efficient way to generate a spin polarized current that is either parallel or anti-parallel
to the electrons’ velocity; in addition, it correlates with the handedness of the chiral molecules.
Using the CISS effect, new types of simple spintronic memory devices and a nanoscale memristor
have been demonstrated.11-14
The adsorption of chiral molecules on a metal surface has been shown to change the metal’s
magnetic properties15-18 and also switch the magnetization direction of a soft FM in a way that
depends on the handedness of the chiral molecules.19 This effect was named the magnetism
induced by proximity of adsorbed chiral molecules (MIPAC). The MIPAC effect arises from the
CISS effect, i.e., the spin-dependent electron fluctuations in chiral molecules. For right-handed
(left-handed) chiral molecules electrons with a preferred spin up (down) move upward through the
molecule and electrons with a preferred spin down (up) move downward through the molecule
(Figure 2.1 c). In a semiclassical picture, placing chiral molecules with these charge oscillations
in contact with a metal induces a magnetic moment in the metal by spin torque transfer.20-22 In a
more quantum picture, the proximity induced wavefunction delocalization of surface states occurs
upon surface modification,23, 24 and the wavefunction penetration into the chiral molecules is spin
dependent because of the CISS effect. This phenomenon induces a non-symmetric density of states
in the material, which is equivalent to magnetization of a ferromagnetic. Note that these works
show that chiral molecules can reorder magnetization or induce paramagnetism. However no
reports claimed that superparamagnetism can be changed to ferromagnetism.

44
Figure 2.1 Panel (a) shows the generic dependence of a magnetic material (FM in the bulk) on the reduction physical
size: multidomain (green), single domain (blue) and super paramagnetism (red). Panel (b) shows magnetization
hysteresis loops for the different domain size behaviors. Panel (c) illustrates the CISS effect in which a right-handed
chiral molecule has preference for spin up to move upward and for spin down to move downward.
In the present work we show that chiral molecules can change the magnetic properties of 10 nm
iron oxide nanoparticles from superparamagnetic to ferromagnetic, thus realizing 10 nm chiral
induced ferromagnetic iron oxide nanoparticles (CIFIONs). These CIFIONs present ferromagnetic
properties even at 10nm size. The anisotropic placement of the chiral molecules stabilize the
nanoparticles magnetization direction at room temperature and the orientation depends on the
handedness of the chiral molecules. These studies point to a novel method for the miniaturization
of well-defined ferromagnets (~10 nm) using established synthetic protocols for
superparamagnetic iron oxide nanoparticles (SPIONs).
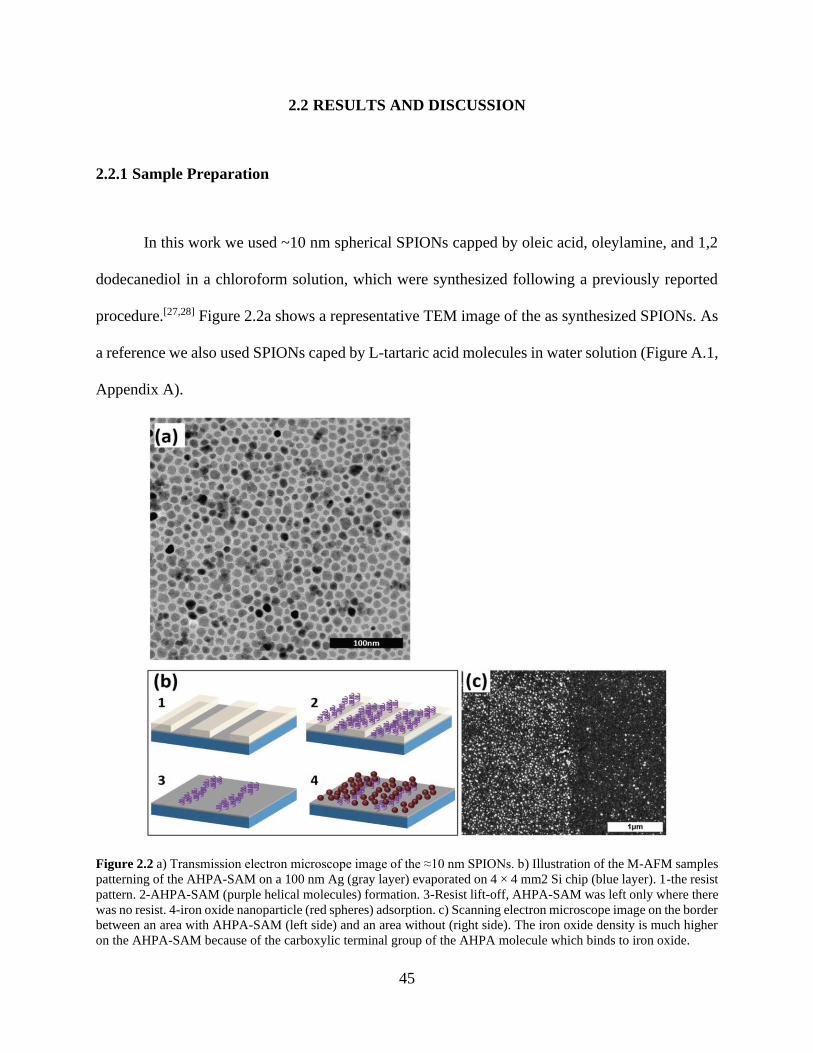
45
2.2 RESULTS AND DISCUSSION
2.2.1 Sample Preparation
In this work we used ~10 nm spherical SPIONs capped by oleic acid, oleylamine, and 1,2
dodecanediol in a chloroform solution, which were synthesized following a previously reported
procedure.[27,28] Figure 2.2a shows a representative TEM image of the as synthesized SPIONs. As
a reference we also used SPIONs caped by L-tartaric acid molecules in water solution (Figure A.1,
Appendix A).
Figure 2.2 a) Transmission electron microscope image of the ≈10 nm SPIONs. b) Illustration of the M-AFM samples
patterning of the AHPA-SAM on a 100 nm Ag (gray layer) evaporated on 4 × 4 mm2 Si chip (blue layer). 1-the resist
pattern. 2-AHPA-SAM (purple helical molecules) formation. 3-Resist lift-off, AHPA-SAM was left only where there
was no resist. 4-iron oxide nanoparticle (red spheres) adsorption. c) Scanning electron microscope image on the border
between an area with AHPA-SAM (left side) and an area without (right side). The iron oxide density is much higher
on the AHPA-SAM because of the carboxylic terminal group of the AHPA molecule which binds to iron oxide.

46
Right-handed (L) and left-handed (D) α-helix polyalanine (AHPA) were used as the chiral
molecules to imprint a magnetization on the iron oxide nanoparticles. The chiral molecules were
purchased from Sigma Aldrich Co. LLC, with a sequence of 36 amino acids of [H]-
CAAAAKAAAAKAAAAKAAAAKAAAAKAAAAKAAAAK-[OH] where C, A, and K are
cysteine, alanine, and lysine amino acids respectively. The AHPA molecules are terminated with
a thiol group from the cysteine amino acid and a carboxylic terminal group through the last lysine
residue. The thiol is used to covalently bind the AHPA molecules to metal surfaces such as gold
and silver and the carboxylic group was used to bind and immobilize the SPIONs.
Measurement of the magnetization imprinting effect on the SPIONs by the AHPA
molecules were performed with a superconducting quantum interference device (SQUID) and by
using magnetic atomic force microscopy (M-AFM). For both types of measurements, the sample
consisted of a monolayer film of SPIONs supported by a self-assembled monolayer (SAM) of L-
or D- AHPA, on a 100 nm Ag film. For the M-AFM measurement, additional lithography was
performed to pattern AHPA-SAM areas with lift-off assisted selective adsorption (Figure 2.2b
outlines this procedure) in order to compare SPIONs with and without chiral molecules in the same
M-AFM image. M-AFM measurements were obtained by taking interleaved topography and
magnetic interaction images using a cobalt alloy coated tip (coercive field of ~300 Oe, K~2.8 N/m,
F~75 KHz) which was magnetized either normal (up) or anti-normal (down) to the substrate with
a 5000 Oe magnetic field. Scanning electron microscopy images taken at the border between an
AHPA-SAM (left side) and bare silver (right side) show that a higher particle density is present
on the AHPA-SAM areas (Figure 2.2c). The higher SPION density is attributed to the carboxylic
terminal group of the AHPA molecule.

47
For the M-AFM measurements, two additional reference samples were prepared. The first
reference sample had only SPIONs on Ag (without AHPA). The second reference sample used
SPIONs that were coated from all directions with L-tartrate (or D-tartrate) ligands and placed on
a mica substrate, to check the importance of symmetry breaking.
Preparation and measurements details of all samples are available in the Appendix. A
section.
2.2.2 SQUID Measurement
Magnetic moment measurements of SPIONs adsorbed on L- AHPA molecules (Figure
2.3a) were performed using a SQUID, and the magnetization hysteresis loop was obtained (Figure
2.3b) by subtracting the response of a clean Ag substrate (Figure A.3 in the Appendix A).
Figure 2.3 Illustration of the sample for the SQUID measurements: 100 nm Ag (gray layer) evaporated on 4 × 4 mm2
Si chip (blue layer). SAM of AHPA chiral molecules (purple helical molecules) was adsorbed on the Ag layer and
iron oxide nanoparticles (red spheres) were adsorbed on top of the AHPA-SAM. b) SQUID measurements of the
magnetization hysteresis loop. The sample of L-AHPA with iron oxide nanoparticles (purple line) showsCIFIONs
with a hysteresis loop exhibiting ferromagnetic behavior with an average coercive field of ≈80 Oe. The hysteresis loop
is not symmetric around zero and shows a preference to magnetize the CIFIONs in the upward direction. Three
reference samples were measured. The first of L-AHPA X2 with chiral molecules adsorbed on both sides of the iron
oxide nanoparticles (orange line) display no measurable response. The second of only L-AHPA (without
nanoparticles, green line) shows weak magnetic order and no hysteresis is measured. In this case, the adsorption of
chiral molecules from one side also seem to generate some small substrate magnetic ordering. The third reference
sample of only iron oxide nanoparticles (without AHPA, blue line) presents no measurable response.

48
The SPIONs by themselves do not show significant magnetization when deposited on an
Ag substrate (blue). The adsorption of chiral molecules on the Ag substrate generates a weak
additional magnetism (green), which may arise from chiral imprinting.21
Figure 2.4 Panels (a-c) show topography images that were taken and interleaved with the magnetic interaction images
(tip distance of 130 nm) in panels (d–f). Topography and phase color scales are on the respective right sides of the
images. The M-AFM tip was magnetized down (red arrow), or up (blue arrows). In panels (d) and (e) an L-AHPA-
SAM (right-handed), the substrate, is patterned with lines and shows that the iron oxide nanoparticles are magnetized
upward. The tip experiences repulsive interactions for downward tip magnetization and attractive interactions for
upward tip magnetization, as indicated by the bright and dark colors. In panel (f), D-AHPA-SAM (left handed) has a
square patterned surface (red squares) and the darker color shows that the iron oxide nanoparticles are magnetized
downward due to attractive magnetic interactions with a downward magnetized M-AFM tip. The insets in panels (b)
and (c) show topographic cross sections.
Interestingly, when the SPIONs are deposited on the L-AHPA-SAM the hysteresis loop
inverts and a stronger magnetization is recorded (purple). Despite the intrinsic property of SPIONs
to be superparamagnetic, i.e., zero coercivity and no remanence field, upon their adsorption on
chiral molecules, they transform into CIFIONs with a ferromagnetic hysteresis loop and average
coercive field of ~80 Oe. The hysteresis loop is not symmetric around zero and shows a preference
to magnetize the CIFIONs in the upward direction. All measurements were repeated on three
samples.
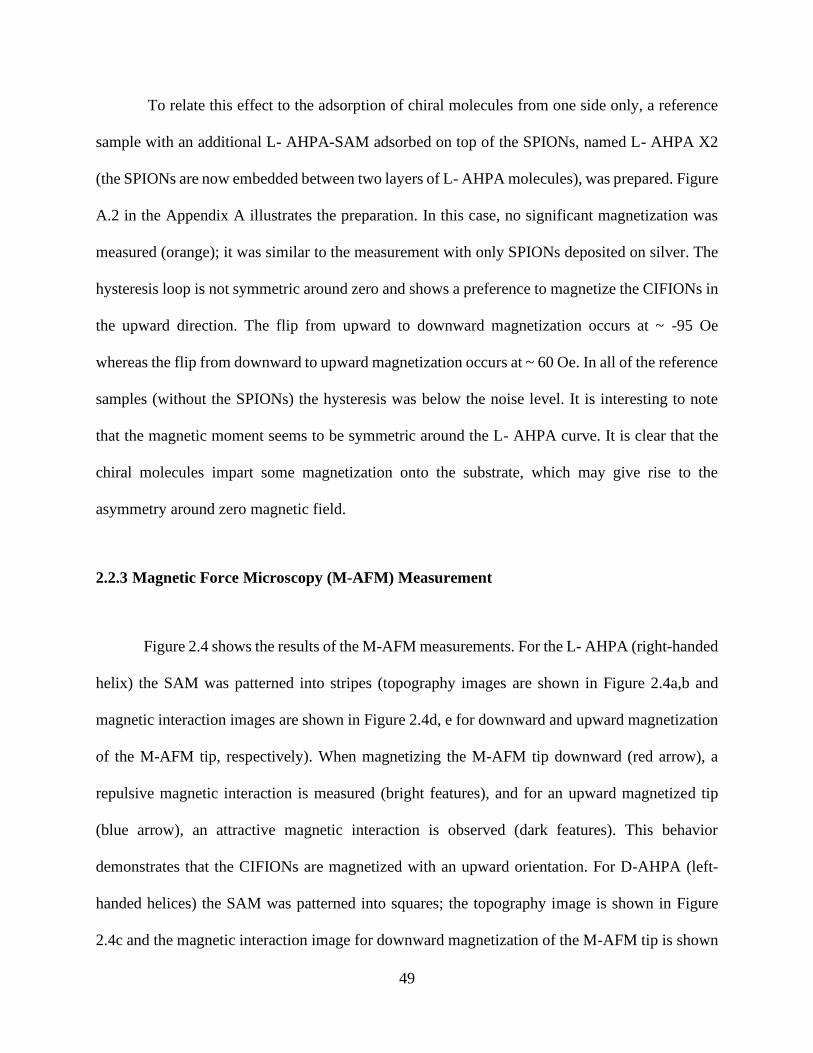
49
To relate this effect to the adsorption of chiral molecules from one side only, a reference
sample with an additional L- AHPA-SAM adsorbed on top of the SPIONs, named L- AHPA X2
(the SPIONs are now embedded between two layers of L- AHPA molecules), was prepared. Figure
A.2 in the Appendix A illustrates the preparation. In this case, no significant magnetization was
measured (orange); it was similar to the measurement with only SPIONs deposited on silver. The
hysteresis loop is not symmetric around zero and shows a preference to magnetize the CIFIONs in
the upward direction. The flip from upward to downward magnetization occurs at ~ -95 Oe
whereas the flip from downward to upward magnetization occurs at ~ 60 Oe. In all of the reference
samples (without the SPIONs) the hysteresis was below the noise level. It is interesting to note
that the magnetic moment seems to be symmetric around the L- AHPA curve. It is clear that the
chiral molecules impart some magnetization onto the substrate, which may give rise to the
asymmetry around zero magnetic field.
2.2.3 Magnetic Force Microscopy (M-AFM) Measurement
Figure 2.4 shows the results of the M-AFM measurements. For the L- AHPA (right-handed
helix) the SAM was patterned into stripes (topography images are shown in Figure 2.4a,b and
magnetic interaction images are shown in Figure 2.4d, e for downward and upward magnetization
of the M-AFM tip, respectively). When magnetizing the M-AFM tip downward (red arrow), a
repulsive magnetic interaction is measured (bright features), and for an upward magnetized tip
(blue arrow), an attractive magnetic interaction is observed (dark features). This behavior
demonstrates that the CIFIONs are magnetized with an upward orientation. For D-AHPA (left-
handed helices) the SAM was patterned into squares; the topography image is shown in Figure
2.4c and the magnetic interaction image for downward magnetization of the M-AFM tip is shown
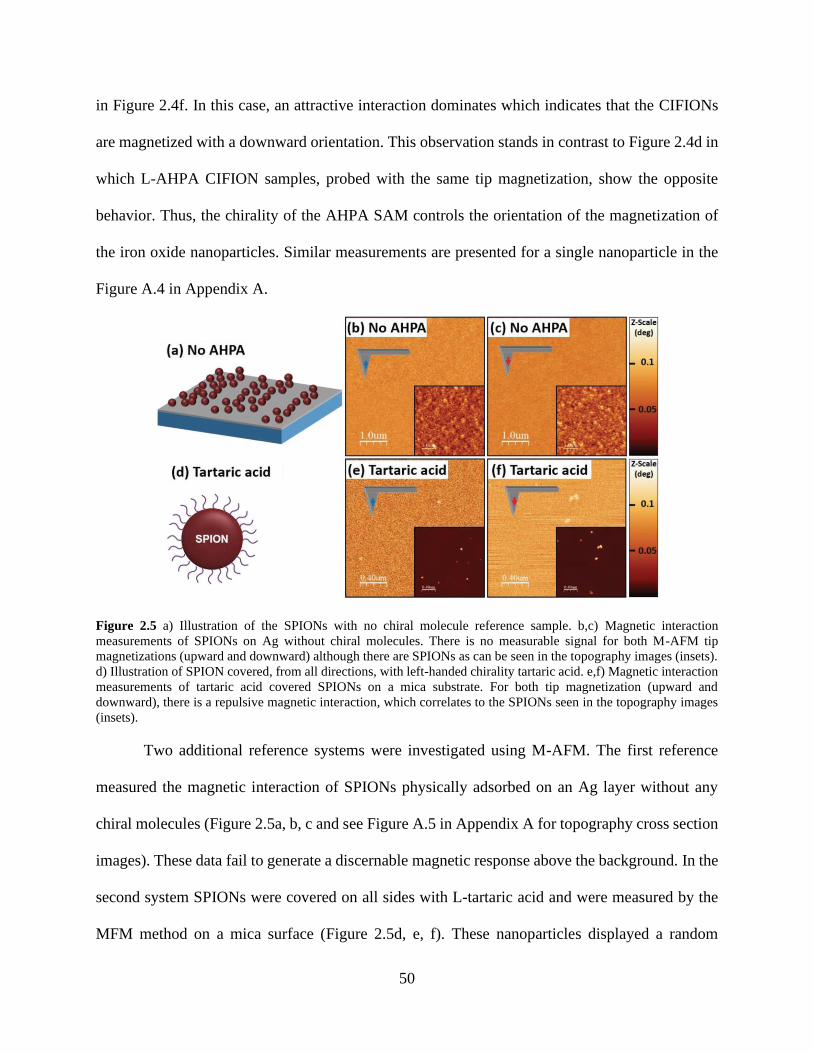
50
in Figure 2.4f. In this case, an attractive interaction dominates which indicates that the CIFIONs
are magnetized with a downward orientation. This observation stands in contrast to Figure 2.4d in
which L-AHPA CIFION samples, probed with the same tip magnetization, show the opposite
behavior. Thus, the chirality of the AHPA SAM controls the orientation of the magnetization of
the iron oxide nanoparticles. Similar measurements are presented for a single nanoparticle in the
Figure A.4 in Appendix A.
Figure 2.5 a) Illustration of the SPIONs with no chiral molecule reference sample. b,c) Magnetic interaction
measurements of SPIONs on Ag without chiral molecules. There is no measurable signal for both M-AFM tip
magnetizations (upward and downward) although there are SPIONs as can be seen in the topography images (insets).
d) Illustration of SPION covered, from all directions, with left-handed chirality tartaric acid. e,f) Magnetic interaction
measurements of tartaric acid covered SPIONs on a mica substrate. For both tip magnetization (upward and
downward), there is a repulsive magnetic interaction, which correlates to the SPIONs seen in the topography images
(insets).
Two additional reference systems were investigated using M-AFM. The first reference
measured the magnetic interaction of SPIONs physically adsorbed on an Ag layer without any
chiral molecules (Figure 2.5a, b, c and see Figure A.5 in Appendix A for topography cross section
images). These data fail to generate a discernable magnetic response above the background. In the
second system SPIONs were covered on all sides with L-tartaric acid and were measured by the
MFM method on a mica surface (Figure 2.5d, e, f). These nanoparticles displayed a random

51
magnetization direction. Additional images for L- and D-tartaric acid SPIONs on SiO2 and
statistical analysis thereof are shown in Figure A.6 in Appendix A.
The experimental results indicate that the chiral molecules change the magnetic properties
of SPIONs from superparamagnetic, which has zero coercive field and no remanence, to
ferromagnetic CIFIONs, which have a nonzero coercive field and display remanence. The SQUID
measurements exhibit a significant ferromagnetic hysteresis loop for CIFIONs on an AHPA-SAM
with an average coercive field of ~80 Oe, while the reference measurements of only SPIONs or
only AHPA-SAMs show no hysteresis loops and much weaker magnetic signals (Figure 2.3b).
The hysteresis loop is also not symmetric around zero magnetic field, which indicates that
magnetization of the CIFIONs in the upward direction requires a lower absolute magnetic field
than in the downward direction for the right-handed helical molecules (L- AHPA).
The M-AFM measurements show that the CIFIONs on an L-AHPA SAM have attractive
or repulsive magnetic interactions with the M-AFM tip when the tip is magnetized in the down
and up orientations, respectively. This dependence is reversed for CIFIONs on a D-AHPA SAM
(Figure 2.4f). These results corroborate the SQUID measurements by showing that the
functionalized iron oxide nanoparticles exhibit a stable magnetization, which is robust to thermal
fluctuations and displays a significant coercive field and remanence (in contrast to a nanoparticle
with superparamagnetic behavior). The measurements also show that the orientation of the
CIFION magnetization is controlled by the chirality of the SAM molecules.
2.2.4 Mechanism of Magnetization Imprinting
We ascribe the chiral based magnetization imprinting on the SPIONs to chiral induced spin
selectivity at the chiral molecule-iron oxide interface. An electron exchange current flows between

52
the iron oxide nanoparticles and the Ag substrate by way of the chiral molecules, and the forward
and reverse current are spin filtered by the chiral molecules. The spin preference is determined by
the helicity of the chiral molecule; for right-handed (left-handed) chiral molecules spin up (down)
electrons will be preferentially transmitted to the molecule while spin down (up) electrons will be
preferentially transferred down the molecule. This process results in a majority spin up population
in the nanoparticle and stabilizes the magnetization in the upward direction (Figure 2.6a). The
opposite magnetization of the iron oxide nanoparticle is observed when the chirality of helical
molecules is reversed (Figure 2.6b). In the case of a SPION covered by chiral molecules from all
directions or embedded between two SAMs of the same handedness, the symmetry plane is not
broken and no net stable magnetization is observed; an electron with one type of spin will transfer
into the SPION from the bottom interface with chiral molecules, while the interface at the top of
the SPION will transfer electrons of the opposite spin type (Figure 2.6c).
Figure 2.6 Panels (a) and (b) show right-handed and left-handed chiral molecules, respectively, linked only to the
bottom side of the iron oxide nanoparticle. Because of the CISS effect, spin up (down) electrons are preferentially
going into the nanoparticle, while spin down (up) electrons are preferentially going out of the nanoparticle creating
majority spin up (down) electrons in the nanoparticle. This process creates a net magnetization of the nanoparticle
with a defined upward (downward) orientation. Panel (c) shows a right-handed chiral molecule linked to the iron oxide
nanoparticle from all directions. In this case, spin up (down) electrons are going into the nanoparticle from the bottom
(top) chiral molecule and going out of the nanoparticle from the top (bottom) molecule, resulting in unstable
magnetization.

53
Measurements (both SQUID and M-AFM) of the reference samples of SPIONs without
chiral molecules do not show magnetization and substantiate the role of chiral induced spin
selective transport for the magnetization imprinting. The magnetic interaction measurements on
chiral tartaric acid coated SPIONs indicate that achieving strong magnetization imprinting requires
anisotropic coverage e.g. a defined orientation for spin flow.
2.3 SUMMARY
Using SQUID and M-AFM measurements, we have shown how ferromagnetic properties
can be imprinted on 10 nm SPIONs. This size reduction should enable the scale down of magnetic
memory area by an order of magnitude and may prove to be important to magnetic force
microscopy as well. These magnetic chiral iron oxide nanoparticles manifest remanence and an
average coercive field of ~80 Oe at room temperature. In addition, the preferred magnetization
direction is determined by the chirality of the molecules and their nonsymmetrical placement
around the nanoparticle. We propose a mechanism for the chiral imprinting that is based on the
well-established CISS effect; namely, magnetism induced by proximity of adsorbed chiral
molecules. This explanation suggests that the ferromagnetic properties are imprinted when the
chiral molecules are bound on one side of the SPIONs and should disappear when the SPIONs are
covered with chiral molecules from two opposite faces, or from all directions. Measurements of
SPIONs covered with chiral molecules from two or all directions indeed showed no remanence
and zero coercive field. The results indicate that magnetic based devices (especially spintronic
devices) can be further miniaturized using chiral-based magnetization imprinting and that

54
magnetic nanomaterials could be magnetized using chemical adsorption, without an external
magnetic field and without applying spin-polarized current.
2.4 REFERENCES
1.Guth, M.; Schmerber, G.; Dinia, A., Magnetic tunnel junctions for magnetic random access
memory applications. Materials Science and Engineering: C 2002, 19 (1), 129-133.
2.Bhatti, S.; Sbiaa, R.; Hirohata, A.; Ohno, H.; Fukami, S.; Piramanayagam, S. N., Spintronics
based random access memory: a review. Materials Today 2017, 20 (9), 530-548.
3.Hwang, C. S., Prospective of Semiconductor Memory Devices: from Memory System to
Materials. Advanced Electronic Materials 2015, 1 (6), 1400056.
4.Kawahara, T.; Ito, K.; Takemura, R.; Ohno, H., Spin-transfer torque RAM technology: Review
and prospect. Microelectronics Reliability 2012, 52 (4), 613-627.
5.Li, Q.; Kartikowati, C. W.; Horie, S.; Ogi, T.; Iwaki, T.; Okuyama, K., Correlation between
particle size/domain structure and magnetic properties of highly crystalline Fe3O4 nanoparticles.
Scientific Reports 2017, 7 (1), 9894.
6.Leslie-Pelecky, D. L.; Rieke, R. D., Magnetic Properties of Nanostructured Materials. Chemistry
of Materials 1996, 8 (8), 1770-1783.
7.Teja, A. S.; Koh, P.-Y., Synthesis, properties, and applications of magnetic iron oxide
nanoparticles. Progress in Crystal Growth and Characterization of Materials 2009, 55 (1), 22-45.
8.Hirohata, A.; Takanashi, K., Future perspectives for spintronic devices. Journal of Physics D:
Applied Physics 2014, 47 (19), 193001.
9.Naaman, R.; Waldeck, D. H., Chiral-Induced Spin Selectivity Effect. The Journal of Physical
Chemistry Letters 2012, 3 (16), 2178-2187.
10.Naaman, R.; Waldeck, D. H., Spintronics and Chirality: Spin Selectivity in Electron Transport
Through Chiral Molecules. Annual Review of Physical Chemistry 2015, 66 (1), 263-281.
11.Ben Dor, O.; Yochelis, S.; Radko, A.; Vankayala, K.; Capua, E.; Capua, A.; Yang, S.-H.;
Baczewski, L. T.; Parkin, S. S. P.; Naaman, R.; Paltiel, Y., Magnetization switching in
ferromagnets by adsorbed chiral molecules without current or external magnetic field. Nature
Communications 2017, 8 (1), 14567.

55
12.Dor, O. B.; Yochelis, S.; Mathew, S. P.; Naaman, R.; Paltiel, Y., A chiral-based magnetic
memory device without a permanent magnet. Nature Communications 2013, 4 (1), 2256.
13.Koplovitz, G.; Primc, D.; Ben Dor, O.; Yochelis, S.; Rotem, D.; Porath, D.; Paltiel, Y.,
Magnetic Nanoplatelet-Based Spin Memory Device Operating at Ambient Temperatures.
Advanced Materials 2017, 29 (17), 1606748.
14.Al-Bustami, H.; Koplovitz, G.; Primc, D.; Yochelis, S.; Capua, E.; Porath, D.; Naaman, R.;
Paltiel, Y., Single Nanoparticle Magnetic Spin Memristor. Small 2018, 14 (30), 1801249.
15.Carmeli, I.; Leitus, G.; Naaman, R.; Reich, S.; Vager, Z., Magnetism induced by the
organization of self-assembled monolayers. The Journal of Chemical Physics 2003, 118 (23),
10372-10375.
16.Crespo, P.; Litrán, R.; Rojas, T. C.; Multigner, M.; de la Fuente, J. M.; Sánchez-López, J.
C.; García, M. A.; Hernando, A.; Penadés, S.; Fernández, A., Permanent Magnetism, Magnetic
Anisotropy, and Hysteresis of Thiol-Capped Gold Nanoparticles. Physical Review Letters 2004,
93 (8), 087204.
17.Hernando, A.; Crespo, P.; García, M. A., Origin of Orbital Ferromagnetism and Giant
Magnetic Anisotropy at the Nanoscale. Physical Review Letters 2006, 96 (5), 057206.
18.Yamamoto, Y.; Miura, T.; Suzuki, M.; Kawamura, N.; Miyagawa, H.; Nakamura, T.;
Kobayashi, K.; Teranishi, T.; Hori, H., Direct Observation of Ferromagnetic Spin Polarization in
Gold Nanoparticles. Physical Review Letters 2004, 93 (11), 116801.
19.Ben Dor, O.; Morali, N.; Yochelis, S.; Baczewski, L. T.; Paltiel, Y., Local Light-Induced
Magnetization Using Nanodots and Chiral Molecules. Nano Letters 2014, 14 (11), 6042-6049.
20.Berger, L., Emission of spin waves by a magnetic multilayer traversed by a current. Physical
Review B 1996, 54 (13), 9353-9358.
21.Ralph, D. C.; Stiles, M. D., Spin transfer torques. Journal of Magnetism and Magnetic
Materials 2008, 320 (7), 1190-1216.
22.Slonczewski, J. C., Current-driven excitation of magnetic multilayers. Journal of Magnetism
and Magnetic Materials 1996, 159 (1), L1-L7.
23.Kisielewski, M.; Maziewski, A.; Kurant, Z.; Tekielak, M.; Wawro, A.; Baczewski, L. T.,
Magnetic ordering in ultrathin cobalt film covered by an overlayer of noble metals. Journal of
Applied Physics 2003, 93 (10), 7628-7630.
24.Kisielewski, M.; Maziewski, A.; Tekielak, M.; Wawro, A.; Baczewski, L. T., New
Possibilities for Tuning Ultrathin Cobalt Film Magnetic Properties by a Noble Metal Overlayer.
Physical Review Letters 2002, 89 (8), 087203.

56
3.0 EFFECT OF CHIRAL MOLECULES ON THE ELECTRON’S SPIN
WAVEFUNCTION AT INTERFACES
This work was published as Ghosh, S.; Mishra, S.; Avigad, E.; Bloom, B. P.; Baczewski,
L. T.; Yochelis, S.; Paltiel, Y.; Naaman, R.; Waldeck, D. H. J. Phys. Chem. Lett, 2020, 11(4),
1550-1557. The author of the dissertation performed the Kelvin probe measurements, the design
of the experiments, and participated in writing the manuscript. The supporting information for this
chapter can be found in Appendix B.
Kelvin probe measurements on ferromagnetic thin film electrodes coated with self-
assembled monolayers of chiral molecules reveal that the electron penetration from the metal
electrode into the chiral molecules depends on the ferromagnet’s magnetization direction and the
molecules’ chirality. Electrostatic potential differences as large as 100 mV are observed. These
changes arise from the applied oscillating electric field which drives spin dependent charge
penetration from the ferromagnetic substrate to the chiral molecules. The enantiospecificity of the
response is studied as a function of the magnetization strength, the magnetization direction, and
the handedness and length of the chiral molecules. These new phenomena are rationalized in terms
of the chiral-induced spin selectivity (CISS) effect in which one spin orientation of electrons from
the ferromagnet penetrates more easily into a chiral molecule than does the other orientation. The
large potential changes (> kT at room temperature) manifested here imply that this phenomenon
is important for spin transport in chiral spintronic devices and for magneto-electrochemistry of
chiral molecules.

57
3.1 INTRODUCTION
The control and detection of electron spin dynamics is essential for the realization of
spintronic1 and quantum information technologies. Recent developments in molecular spintronics
have pointed to the “spinterface” (ferromagnet surface/ molecular semiconductor interface) as
playing an important role in determining device behavior.2 This work demonstrates the use of
chiral molecules to control the electron spin density at an interface and its effect on the electrostatic
potential. Thus, it suggests that chiral molecules and the constraints they impose on the interface
through the chiral induced spin selectivity (CISS) effect provide a new approach to controlling the
“spinterface”. This work also provides new insight into the mechanism of the chiral induced spin
selectivity (CISS) effect discovered more than a decade ago3 and for which a full quantitative
theory has not yet been provided.
A number of different experiments have shown that chiral organic molecules exhibit
strongly spin-dependent electron transport at room temperature. For example, one experimental
method has examined the spin distribution of photoelectrons that transit from a metal substrate
through a layer of chiral molecules and are detected with a Mott polarimeter.4-6 In another method
the effect was established by measuring the spin polarization of electron tunneling currents through
individual chiral molecules adsorbed on a magnetized substrate.7-9 The effect was also observed
via the magnetization generated by chiral films10, 11 and by the dissymmetry in electron transfer
rates of chiral molecules12, 13 and chiral quantum dots,14-17 among others.18-26 In addition, CISS has
been shown by the enantiospecific adsorption rate of chiral molecules on magnetized
ferromagnetic films.27, 28 Abendroth et al29 used photoemission spectroscopy to reveal
workfunction shifts of ferromagnet/chiral molecule interfaces that depend on the magnetization

58
direction. The current work explores the interfacial effects of chiral molecules assembled on a
ferromagnetic substrate.
Figure 3.1 Schematic diagrams illustrating the principle of the Kelvin probe measurement. In the macroscopic
measurement (panel A), the distance of an Au electrode from the chiral-SAM / ferromagnetic sample is varied
sinusoidally. In the microscopy version of the Kelvin probe measurement (panel B), an AFM conducting tip is used
as the counter-electrode and its lateral position is scanned to image the substrate’s potential distribution. The diagrams
illustrate how a static magnet is placed under the sample in order to saturate the magnetization of the ferromagnetic
layer. Measured CPD distributions are shown for the D-AL5 peptide (panel C), L-AL5 peptide (panel E), and an
achiral SAM (Panel D) coated ferromagnetic substrate under two different magnetizations. The blue color represents
the potential distribution for a magnetization pointing to the South, and red corresponds to a North direction. These
two directions are defined to be along the axis perpendicular to the surface. The zero voltage is set by the averaged
contact potential difference found in the two measurements.
This study uses Kelvin probe force microscopy (KPFM)30 and macroscopic Kelvin probe31
measurements to investigate the spin-dependent resistance at metal-chiral molecule interfaces.
Self-assembled monolayers (SAMs) of chiral organic molecules were adsorbed on ferromagnetic
substrates, which were magnetized either parallel or antiparallel to the surface normal. Using the
Kelvin probe, we investigated the effect of an oscillating electric field on charge injection from
N
S
AC/DC
Ferromagnetic Substrate
Au coating
N
S
Ferromagnetic Substrate
Au Coating
AC/DC
-40 -20 0 20 40
No
rma
lise
d D
en
sity
-40 -20 0 20 40
No
rma
lise
d D
en
sity
-40 -20 0 20 40
No
rma
lise
d D
en
sity
D-SAM L-SAMAchiral-SAM
Relative Potential(mV) Relative Potential(mV) Relative Potential(mV)
A) B)
C) D) E)
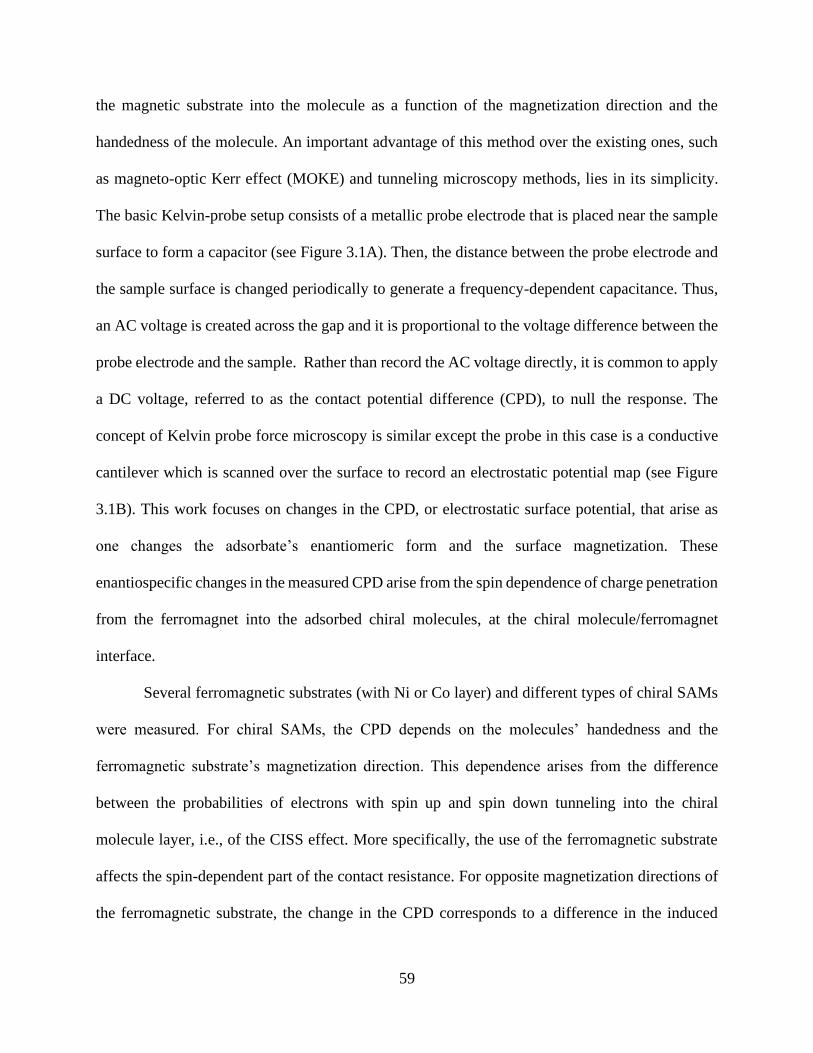
59
the magnetic substrate into the molecule as a function of the magnetization direction and the
handedness of the molecule. An important advantage of this method over the existing ones, such
as magneto-optic Kerr effect (MOKE) and tunneling microscopy methods, lies in its simplicity.
The basic Kelvin-probe setup consists of a metallic probe electrode that is placed near the sample
surface to form a capacitor (see Figure 3.1A). Then, the distance between the probe electrode and
the sample surface is changed periodically to generate a frequency-dependent capacitance. Thus,
an AC voltage is created across the gap and it is proportional to the voltage difference between the
probe electrode and the sample. Rather than record the AC voltage directly, it is common to apply
a DC voltage, referred to as the contact potential difference (CPD), to null the response. The
concept of Kelvin probe force microscopy is similar except the probe in this case is a conductive
cantilever which is scanned over the surface to record an electrostatic potential map (see Figure
3.1B). This work focuses on changes in the CPD, or electrostatic surface potential, that arise as
one changes the adsorbate’s enantiomeric form and the surface magnetization. These
enantiospecific changes in the measured CPD arise from the spin dependence of charge penetration
from the ferromagnet into the adsorbed chiral molecules, at the chiral molecule/ferromagnet
interface.
Several ferromagnetic substrates (with Ni or Co layer) and different types of chiral SAMs
were measured. For chiral SAMs, the CPD depends on the molecules’ handedness and the
ferromagnetic substrate’s magnetization direction. This dependence arises from the difference
between the probabilities of electrons with spin up and spin down tunneling into the chiral
molecule layer, i.e., of the CISS effect. More specifically, the use of the ferromagnetic substrate
affects the spin-dependent part of the contact resistance. For opposite magnetization directions of
the ferromagnetic substrate, the change in the CPD corresponds to a difference in the induced

60
dipole moments in the chiral SAM; it implies a strong penetration of the spin wavefunction through
the molecular layer for one chirality, and a weaker penetration for the opposite chirality.
3.2 RESULTS
Panels C, D, and E of Figure 3.1 show histograms of the CPD, which were measured using
the KPFM method (see Appendix B for more details), as a function of the magnetization direction
for three self-assembled monolayer (SAM) systems: a D-AL5 peptide (-S-CH2-CH2-(Ala-Aib)5-
COOH) denoted as D-SAM, an L-AL5 peptide (-S-CH2-CH2-(Ala-Aib)5-COOH) denoted as L-
SAM, and an achiral-SAM composed of mercaptoalkylcarboxylates (-S-(CH2)15-COOH). The
ferromagnetic substrates consist of a 10 nm thick layer of Ni with a 10 nm capping layer of Au.
For the D-SAM, the CPD was found to be 30-40 mV higher under North (red) magnetization than
under South (blue) magnetization (the two directions are along the axis perpendicular to the
surface), whereas the opposite was found for the L-SAM. In a control experiment with achiral
SAMs, the CPD does not show any dependence on the applied magnetization direction. These data
show that for a magnetization direction which ‘matches’ the SAM chirality, the charge density
extends farther into the chiral SAM.
To confirm that the observations originate from the preferential tunneling of one electron
spin over the other (i.e. the CISS effect), the dependence of the CPD on the Au layer thickness
(wedge shape layer) which covers the ferromagnetic cobalt thin film exhibiting a perpendicular
anisotropy (see Figure 3.2) was measured. As the thickness of the Au layer increases, the spin-
polarized electron density emanating from the ferromagnetic layer will depolarize more prior to
entering the chiral molecules.13 Thus, as the Au capping layer becomes thinner, the measured

61
dependence of the potential difference on the magnetization direction should become stronger.
Figure 3.2 shows KPFM results from measurements with L-AL5 SAMs adsorbed on a magnetic
substrate comprising a 1.8 nm thick Co film that is covered with an Au wedge layer whose
thickness is varied uniformly from 2 nm to 10 nm over a lateral distance of 10 mm (represented
by the wedge shape at the top of Figure 3.2). The CPD was measured along the thickness gradient
of the Au layer for two different film magnetization vertical orientations, North and South.
Figure 3.2 Change in the CPD as a function of the Au layer thickness for the opposite Co magnetization directions
with adsorbed L-AL5 SAMs. The top diagram shows the distribution of a potential in different regions of the magnetic
sample along the Au wedge. The color of each plot corresponds to the region indicated on the gradient bar by the same
shade. The zero voltage is set by the measurement at the region of the highest Au thickness of 10 nm. The maxima of
the potential distribution curves versus the thickness of the gold layer are plotted at the bottom of the Figure. As shown
in panel (A) the CPD becomes more negative as the gold thickness decreases for a magnetization pointing up. In
contrast, in panel (B) where the magnetization vector points down, the CPD becomes positive and its value increases
with decreasing gold layer thickness. To estimate the error in the measurements see the FWHM of the histograms.
Under application of a North magnetic field (Figure 3.2A), the CPD becomes more
negative as the gold thicknesses decreases from 10 nm to 2 nm (light to dark red). The lower panel
-60 -50 -40 -30 -20 -10 0 10
No
rmalise
d Inte
nsity
Relative Potential (mV)
-20 0 20 40 60 80 100
No
malise
d Inte
nsity
Relative Potential (mV)
North South
2 3 4 5 6 7 8 9-80
-60
-40
-20
0
Po
tential M
axim
a (
mV
)
Gold Thickness (nm)
A) B)
9 8 7 6 5 4 3 2
0
20
40
60
80
Po
ten
tia
l M
axim
a (
mV
)
Gold Thickness (nm)
Au thicknessAu thickness

62
shows a plot of the most probable CPD value (peak of the distribution) measured at different gold
thicknesses. Conversely, for South magnetization direction (Figure 3.2B) the CPD becomes more
positive as the gold thickness decreases (light to dark blue color). In both cases changing the Au
capping thickness from 10 nm to 2 nm results in a 60-80 mV shift in the CPD. These data indicate
that the spin polarization persists through more than 10 nm of Au, but that it is strongly attenuated.
Figure 3.3 Coercivity dependent changes in the CPD. The Co thickness is changed from 1.5 to 3 nm and the coercive
field decreases as the Co layer thickness increases. The color of each plot corresponds to the region indicated on the
gradient bar by the same shade. The bottom diagram plots the maxima of the potential distribution curve for the
substrate with adsorbed L-AL5 SAMs vs the thickness of the Co layer. The CPD measured in the presence of a constant
magnetic field well above the coercive field (panel A) shows a weak dependence on the Co thickness. In contrast, a
strong Co layer thickness dependence is measured in the absence of constant magnetic field (panel B). Here, the
external magnetic field has been applied to orient a magnetization in a given direction and then removed prior to the
measurement.
1.8 2.0 2.2 2.4 2.6 2.8 3.0-100
-50
0
50
100
Po
tential M
axim
a (
mV
)
Cobalt thickness (nm)
-120 -80 -40 0 40 80
Norm
alis
ed Inte
nsity
Potential (mV)
1.8 2.0 2.2 2.4 2.6 2.8 3.0-100
-50
0
50
100
Po
tential M
axim
a (
mV
)
Cobalt thickness(nm)
A) B)
Co thickness
Co thickness
-120 -80 -40 0 40 80
Norm
alis
ed Inte
nsity
Potential (mV)
Co thickness

63
More importantly, these findings support the claim that spin delocalization from the chiral
molecule into the magnetized substrate is responsible for the observed changes in CPD. Note that
the MBE grown ferromagnetic Co layer in this sample, has a higher saturation magnetization than
the polycrystalline Ni layer used for the measurements in Figure 3.1 and that in Au/Co/Au
configuration such nanostructures feature a perpendicular anisotropy;32 i.e. the easy axis points
directly out-of-plane. This feature results in a larger difference in the CPD for the Co ferromagnetic
substrates than for the Ni ferromagnetic substrates.
Previous work on the interaction of chiral molecules with ferromagnetic thin film surfaces
showed that the enantiospecificity arose from the projection of the magnetic moment on the
direction perpendicular to the film surface.33 To examine this feature, measurements on the L-AL5
SAMs were conducted using Au/Co/Au ferromagnetic substrates, in which the cobalt-layer
thickness was varied from 1.6 to 3 nm and the Au capping layer thickness was fixed at 2 nm. The
coercivity and easy-axis direction of the magnetic layer (Co) changes with thickness; below 2 nm
the easy axis of the Co is mainly out of plane while for Co layer thicknesses above 2 nm a spin
reorientation transition takes place and the magnetization easy axis rotates to an in-plane direction
(See Appendix B for more details on the ferromagnetic sample coercivity)32, 34
Figure 3.3A shows the CPD measured along the Co thickness gradient under North
magnetization for substrates with the L-AL5 SAM. Note, the magnet was placed underneath the
substrate during the measurements, i.e. the Co layer magnetization was oriented perpendicular to
the sample normal, even for Co thicknesses above the spin reorientation transition, along the
applied magnetic field direction. In this configuration, a large negative shift of CPD was observed,
however the CPD distributions vary only weakly with the Co thickness. Figure 3.3B shows
experimental results for the same sample as in Figure 3.3A, but upon removal of the permanent

64
magnet. When the magnetic field is removed, the magnetization of the Co layer (for thicknesses
of Co layer above 2 nm) is no longer oriented normal to the surface and instead rotates toward the
‘easy’ axis as a function of thickness. When the easy axis is not aligned with the electron injection
direction into the SAM the electron density injected into the SAM is lower and the CPD becomes
more positive. These results imply that the tilt angle of chiral molecules adsorbed on the substrate
surface, in an ordered chiral monolayer, could be probed by changing the magnetization direction.
Figure 3.4 Panels A and B show a change in CPD for molecules of different length; (A) double stranded DNA and
(B) ALn oligopeptides on a magnetized Ni/Au electrode. The red lines are fits of the data by a quadratic dependence
in panel (A) and by a linear fit in panel (B). See SI for details on the SAM compositions. Panel C shows the number
of Au NPs that electrostatically bind to an L-polyalanine monolayer in 2 seconds, for North (red) and South (blue)
magnetization directions. The experiments were repeated 5 times and measured at several different areas to reduce
fluctuations.
0
1
2
3
4
5
6
7
8
South
NP
s x
10
8 / c
m2
North
4 5 6 7 8 9 10 11 12 13
10
20
30
40
50
60
70
80
C
PD
(m
v)
Length (nm)
1.5 2.0 2.5 3.0-20
-15
-10
-5
0
5
10
C
PD
(m
V)
Length (nm)
A) B)
C)
1.5 2.0 2.5 3.0-20
-15
-10
-5
0
5
10
C
PD
(m
V)
Length (nm)

65
Lastly, the dependence of the CPD’s asymmetry on the substrate magnetization, was
studied as a function of the chiral molecule length (𝐿); see Figure 3.4. The CPD of the SAM coated
substrate electrode arises from the potential drop across the SAM and thus should be proportional
to the dipole moment of the molecules, 𝐷 ∝ 𝐿𝑄, in the SAM; where 𝑄 is the amount of charge
transferred between the metal surface and the monolayer and 𝐿 is the effective distance between
this charge and the surface. As the molecules become longer, the injected charge can delocalize
farther from the metal substrate and a larger potential drop is expected. If the delocalization length
changes with the chiral molecule length, then the asymmetry in the contact potential difference,
∆CPD = 𝐶𝑃𝐷(North) − 𝐶𝑃𝐷(South), should change with length. Figure 3.4A shows the ∆CPD
for North and South magnetized films with chiral DNA, and Figure 3.4B shows the case for
oligopeptides (ALn with n=3-7) SAMs. See the Appendix B for molecular sequences of the DNA
and oligopeptides. Interestingly, a different length dependence was observed for the two types of
molecules: ∆CPD ∝ 𝐿2 for the DNA and ∆CPD ∝ 𝐿 for the oligopeptides.
Given that the ∆CPD of the SAM-coated electrodes is proportional to the dipole moment
of the molecules 𝐷 ∝ 𝐿𝑄, a linear dependence on L implies that the amount of charge displacement
in the SAM layer is independent of molecular length; whereas, a supralinear dependence on L
implies that the amount of charge displacement in the SAM increases with the molecular length.
In DNA, the molecule’s polarizability has been shown to scale linearly with the molecule’s
length,35 and this could account for the quadratic growth in the dipole moment with the length,
𝐷 ∝ 𝐿2. The data suggest that the polarizability in the oligopeptides does not change significantly
over the short lengths studied (1.5 to 3 nm) and therefore the dipole moment appears to change
linearly with the molecular length. While the ∆CPD signal has a different sign for DNA and
oligopeptides, these data are consistent with previous reports; conductive AFM measurements

66
showed a higher tunneling barrier for DNA under North magnetization7 than South magnetization
and the opposite for oligopeptides.8
Large changes in the surface potential can affect surface chemical processes. Figure 3.4C
illustrates this fact by demonstrating how the change in surface charge of an L-polyalanine SAM
on a magnetized Ni/Au substrate can be used to control the electrostatic adsorption of achiral gold
NPs. The substrate was immersed for 2 seconds and the number of particles was normalized to a
1 cm2 substrate area. The gold NPs were counted using SEM images. The experiment was repeated
five times. By simply changing the magnetization direction applied to the substrate, a two-fold
change in the absorption rate was found.
3.3 A MODEL
Here we sketch a model that rationalizes the observations and is consistent with the many
other CISS effect observations for electron transmission through chiral molecules. First we
describe the time-dependence of the response, which results from the oscillating electric
polarization in the molecule, and second we discuss the large magnitude of the effect. In the Kelvin
probe experiment, a time-dependent response of the chiral SAM/ferromagnet sample is measured.
Namely, charge flows between the ferromagnetic substrate and the SAM in response to the
oscillating electric field that is applied by the Kelvin probe. As is known, the Kelvin probe
measurement can be modeled by an AC electrical circuit comprising a capacitance for the probe
and the interface. The situation studied here (metal with an insulating monolayer film) requires an
effective capacitance comprising the capacitance of the SAM/Kelvin probe junction, Cmol−p, in
series with a resistance and capacitance for the ferromagnet/chiral-SAM interface, R and Cfm−mol.
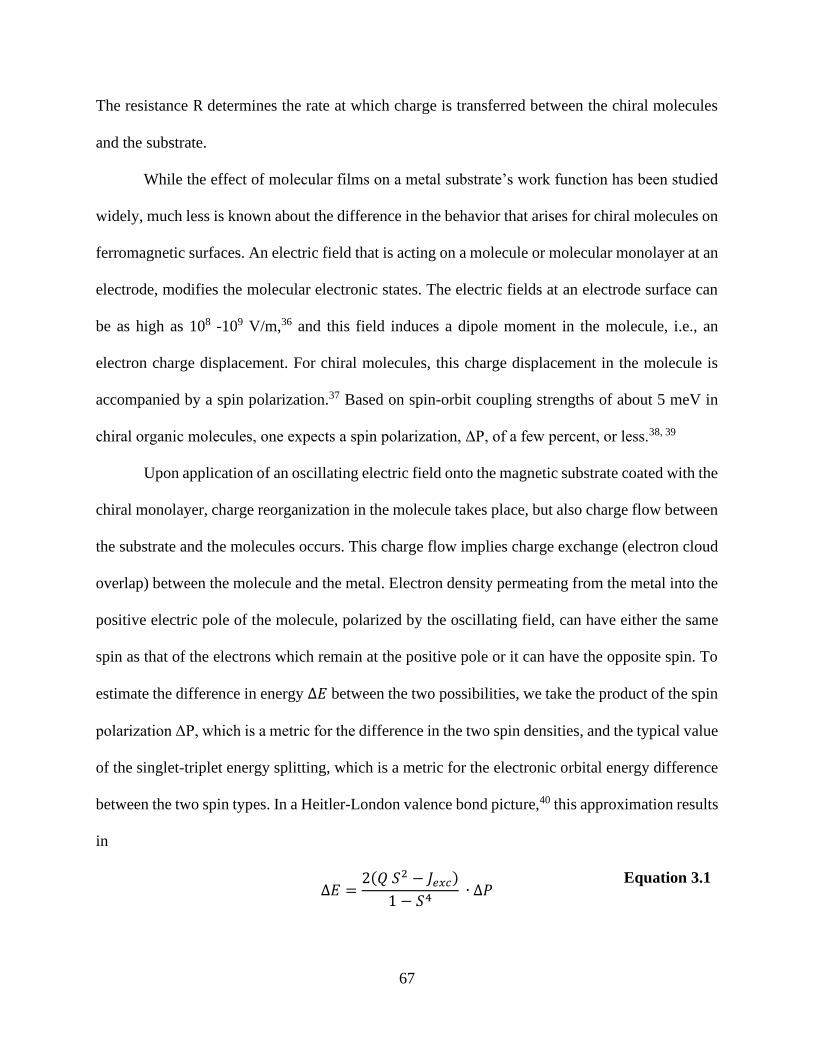
67
The resistance R determines the rate at which charge is transferred between the chiral molecules
and the substrate.
While the effect of molecular films on a metal substrate’s work function has been studied
widely, much less is known about the difference in the behavior that arises for chiral molecules on
ferromagnetic surfaces. An electric field that is acting on a molecule or molecular monolayer at an
electrode, modifies the molecular electronic states. The electric fields at an electrode surface can
be as high as 108 -109 V/m,36 and this field induces a dipole moment in the molecule, i.e., an
electron charge displacement. For chiral molecules, this charge displacement in the molecule is
accompanied by a spin polarization.37 Based on spin-orbit coupling strengths of about 5 meV in
chiral organic molecules, one expects a spin polarization, ΔP, of a few percent, or less.38, 39
Upon application of an oscillating electric field onto the magnetic substrate coated with the
chiral monolayer, charge reorganization in the molecule takes place, but also charge flow between
the substrate and the molecules occurs. This charge flow implies charge exchange (electron cloud
overlap) between the molecule and the metal. Electron density permeating from the metal into the
positive electric pole of the molecule, polarized by the oscillating field, can have either the same
spin as that of the electrons which remain at the positive pole or it can have the opposite spin. To
estimate the difference in energy ∆𝐸 between the two possibilities, we take the product of the spin
polarization ΔP, which is a metric for the difference in the two spin densities, and the typical value
of the singlet-triplet energy splitting, which is a metric for the electronic orbital energy difference
between the two spin types. In a Heitler-London valence bond picture,40 this approximation results
in
∆𝐸 =
2(𝑄 𝑆2 − 𝐽𝑒𝑥𝑐)
1 − 𝑆4 ∙ ∆𝑃
Equation 3.1
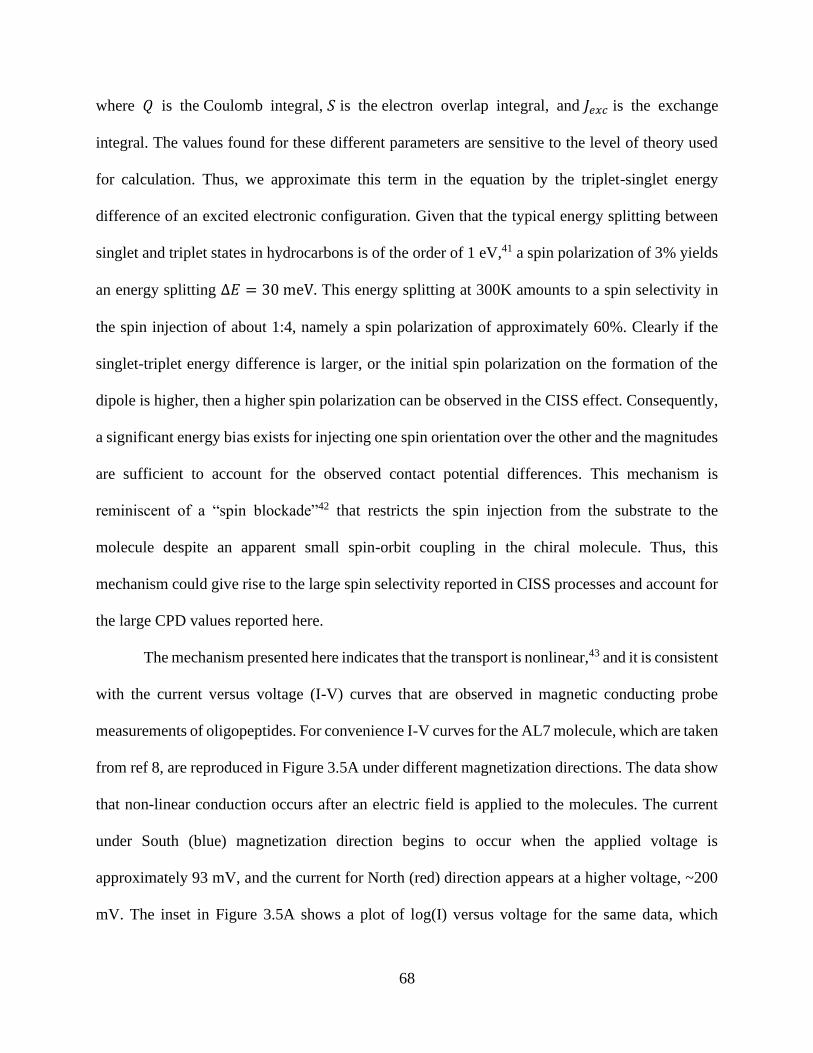
68
where 𝑄 is the Coulomb integral, 𝑆 is the electron overlap integral, and 𝐽𝑒𝑥𝑐 is the exchange
integral. The values found for these different parameters are sensitive to the level of theory used
for calculation. Thus, we approximate this term in the equation by the triplet-singlet energy
difference of an excited electronic configuration. Given that the typical energy splitting between
singlet and triplet states in hydrocarbons is of the order of 1 eV,41 a spin polarization of 3% yields
an energy splitting ∆𝐸 = 30 meV. This energy splitting at 300K amounts to a spin selectivity in
the spin injection of about 1:4, namely a spin polarization of approximately 60%. Clearly if the
singlet-triplet energy difference is larger, or the initial spin polarization on the formation of the
dipole is higher, then a higher spin polarization can be observed in the CISS effect. Consequently,
a significant energy bias exists for injecting one spin orientation over the other and the magnitudes
are sufficient to account for the observed contact potential differences. This mechanism is
reminiscent of a “spin blockade”42 that restricts the spin injection from the substrate to the
molecule despite an apparent small spin-orbit coupling in the chiral molecule. Thus, this
mechanism could give rise to the large spin selectivity reported in CISS processes and account for
the large CPD values reported here.
The mechanism presented here indicates that the transport is nonlinear,43 and it is consistent
with the current versus voltage (I-V) curves that are observed in magnetic conducting probe
measurements of oligopeptides. For convenience I-V curves for the AL7 molecule, which are taken
from ref 8, are reproduced in Figure 3.5A under different magnetization directions. The data show
that non-linear conduction occurs after an electric field is applied to the molecules. The current
under South (blue) magnetization direction begins to occur when the applied voltage is
approximately 93 mV, and the current for North (red) direction appears at a higher voltage, ~200
mV. The inset in Figure 3.5A shows a plot of log(I) versus voltage for the same data, which

69
illustrates more clearly the difference in the voltage (difference in on-state and off-state voltage
slopes) for the two curves. According to the suggested model vide supra, the difference of 100 mV
between the voltage of the two spin currents is associated with a “spin blockade”42. Note, in this
experiment the tip is ferromagnetic, as opposed to the experiments in Figures 3.1 –3.4 where the
tip was conductive, hence the geometry of the experiment is inverted and the effect on the
magnetization is reversed; panel B illustrates this difference. The sub-band splittings of the AFM
tip, blue and red semicircles, are controlled by the applied magnetization, whereas the spin
injection from the substrate into the chiral molecule, blue and red semicircles, is determined by
the helicity of the molecule.
Figure 3.5 Paneles A shows I-V curves from magnetic conductive probe atomic force microscopy measurements in
the presence of a magnetic field pointing South (blue) and magnet pointing North (red) for an AL7 oligopeptide. The
inset is a log plot in which the dashed lines illustrate the changeover from off-state to on-state voltages. Panel B shows
a corresponding cartoon depicting the interaction of the ferromagnetic substrate with the chiral SAM to create a “spin
blockade”. The red and blue semicircles indicate a splitting of the spin sub bands.
Based on the presented model, the difference in the resistance of the chiral molecules can
be rationalized by the spin dependence of the electron penetration into the molecular layer. Figure
3.3B provides further evidence corroborating the suggested model. Here, the contact potential
difference of the same sample is measured, but in regions with two different thickness ranges.
When Co is 1.8 nm thick the easy axis is pointing out-of-plane and the potential shift is much
70
larger than that found for a 2.5 nm thick cobalt region in which the easy axis is in-plane. For the
1.8 nm thick Co both spin-orbit coupling and spin exchange interactions should be considered;
whereas for the 2.5 nm thick Co, the spin-orbit coupling term may dominate.
3.4 SUMMARY
It was shown that coating a ferromagnetic film electrode with a self-assembled monolayer
of chiral molecules leads to contact potential differences (measured via the Kelvin probe method)
that depend on the magnetization direction of the ferromagnetic film with respect to the SAM’s
chirality. The data show that the asymmetry in the potential difference can be as large as 100 mV
and is controlled by the magnetization direction of the ferromagnetic film electrode. The use of
Kelvin probe measurements for extracting spin dynamics inside chiral organic monolayer films
demonstrates a new way to probe spin penetration in ultrathin films without the need for external
contacts. The phenomena were interpreted using the CISS effect and AC transient charge
redistribution, and the magnitude of the effect is explained by the non-linearity of the spin
exchange interactions. These observations rationalize how large spin polarizations can be
generated in the experiments despite the apparent small spin-orbit coupling in the chiral
hydrocarbons and should thus motivate more detailed calculations on the interaction of chiral
molecules with ferromagnetic substrates in the future.
71
3.5 REFERENCES
.
1.Varignon, J.; Vila, L.; Barthélémy, A.; Bibes, M., A new spin for oxide interfaces. Nat. Phys.
2018, 14, 322.
2.Cinchetti, M.; Dediu, V. A.; Hueso, L. E., Activating the molecular spinterface. Nat. Mater.
2017, 16, 507.
3.Naaman, R.; Paltiel, Y.; Waldeck, D. H., Chiral molecules and the electron’s spin. Nat. Rev.
Chem. 2019, 3, 250.
4.Göhler, B.; Hamelbeck, V.; Markus, T. Z.; Kettner, M.; Hanne, G. F.; Vager, Z.; Naaman,
R.; Zacharias, H., Spin Selectivity in Electron Transmission Through Self-Assembled Monolayers
of dsDNA. Science 2011, 331, 894.
5.Kettner, M.; Göhler, B.; Zacharias, H.; Mishra, D.; Kiran, V.; Naaman, R.; Fontanesi, C.;
Waldeck, D. H.; Sęk, S.; Pawłowski, J., Spin Filtering in Electron Transport Through Chiral
Oligopeptides. J. Phys. Chem. C 2015, 119, 14542.
6.Kettner, M.; Maslyuk, V. V.; Nürenberg, D.; Seibel, J.; Gutierrez, R.; Cuniberti, G.; Ernst,
K. H.; Zacharias, H., Chirality-Dependent Electron Spin Filtering by Molecular Monolayers of
Helicenes. J. Phys. Chem. Lett. 2018, 9, 2025.
7.Xie, Z.; Markus, T. Z.; Cohen, S. R.; Vager, Z.; Gutierrez, R.; Naaman, R., Spin specific
electron conduction through DNA oligomers. Nano Lett. 2011, 11, 4652.
8.Kiran, V.; Cohen, S. R.; Naaman, R., Structure Dependent Spin Selectivity in Electron Transport
through Oligopeptides. J. Chem. Phys. 2017, 146, 092302.
9.Aragonès, A. C.; Medina, E.; Ferrer-Huerta, M.; Gimeno, N.; Teixidó, M.; Palma, J. L.; Tao,
N.; Ugalde, J. M.; Giralt, E.; Díez-Pérez, I., Measuring the Spin-Polarization Power of a Single
Chiral Molecule. Small 2017, 13, 1602519.
10.Ben Dor, O.; Yochelis, S.; Radko, A.; Vankayala, K.; Capua, E.; Capua, A.; Yang, S. H.;
Baczewski, L. T.; Parkin, S. S. P.; Naaman, R., Magnetization switching in ferromagnets by
adsorbed chiral molecules without current or external magnetic field. Nat. Commun. 2017, 8,
14567.
11.Smolinsky, E. Z. B.; Neubauer, A.; Kumar, A.; Yochelis, S.; Capua, E.; Carmieli, R.; Paltiel,
Y.; Naaman, R.; Michaeli, K., Electric field controlled magnetization in GaAs/AlGaAs
heterostructures-chiral organic molecules hybrids. J. Phys. Chem. Lett. 2019, 10, 1139.
12.Mondal, P. C.; Fontanesi, C.; Waldeck, D. H.; Naaman, R., Spin-dependent Transport through
Chiral Molecules Studied by Spin-dependent Electrochemistry. Acc. Chem. Res. 2016, 49, 2560.

72
13.Mondal, P. C.; Fontanesi, C.; Waldeck, D. H.; Naaman, R., Magnetic Field and Chirality
Effects on Electrochemical Charge Transfer Rates: Spin Dependent Electrochemistry. ACS Nano
2015, 9, 3377.
14.Ben Dor, O.; Morali, N.; Yochelis, S.; Baczewski, L. T.; Paltiel, Y., Local Light-Induced
Magnetization Using Nanodots and Chiral Molecules. Nano Lett. 2014, 14, 6042.
15.Bloom, B. P.; Kiran, V.; Varade, V.; Naaman, R.; Waldeck, D. H., Spin Selective Charge
Transport through Cysteine Capped CdSe Quantum Dots. Nano Lett. 2016, 16, 4583.
16.Bloom, B. P.; Graff, B. M.; Ghosh, S.; Beratan, D. N.; Waldeck, D. H., Chirality Control of
Electron Transfer in Quantum Dot Assemblies. J. Am. Chem. Soc. 2017, 139, 9038.
17.Bloom, B. P.; Liu, R.; Zhang, P.; Ghosh, S.; Naaman, R.; Beratan, D.; Waldeck, D. H.,
Directing Charge Transfer in Quantum Dot Assemblies. Acc. Chem. Res. 2018, 51, 2565.
18.Carmeli, I.; Skakalova, V.; Naaman, R.; Vager, Z., Magnetization of Chiral Monolayers of
Polypeptide-A Possible Source of Magnetism in Some Biological Membranes. Angew. Chem., Int.
Ed. 2002, 41, 761.
19.Zwang, T. J.; Hürlimann, S.; Hill, M. G.; Barton, J. K., Helix-Dependent Spin Filtering
through the DNA Duplex. J. Am. Chem. Soc. 2016, 138, 15551.
20.Eckshtain-Levi, M.; Capua, E.; Refaely-Abramson, S.; Sarkar, S.; Gavrilov, Y.; Mathew, S.
P.; Paltiel, Y.; Levy, Y.; Kronik, L.; Naaman, R., Cold denaturation induces inversion of dipole
and spin transfer in chiral peptide monolayers. Nat. Commun. 2016, 7, 10744.
21.Suda, M.; Thathong, Y.; Promarak, V.; Kojima, H.; Nakamura, M.; Shiraogawa, T.; Ehara,
M.; Yamamoto, H. M., Light-driven molecular switch for reconfigurable spin filters. Nat.
Commun. 2019, 10, 2455.
22.Dor, O. B.; Yochelis, S.; Ohldag, H.; Paltiel, Y., Optical Chiral Induced Spin Selectivity
XMCD Study. Chimia 2018, 72, 379.
23.Santos, J. I.; Rivilla, I.; Cossío, F. P.; Matxain, J. M.; Grzelczak, M.; Mazinani, S. K. S.;
Ugalde, J. M.; Mujica, V., Chirality-Induced Electron Spin Polarization and Enantiospecific
Response in Solid-State Cross-Polarization Nuclear Magnetic Resonance. ACS Nano 2018, 12,
11426.
24.He, X.; Zhou, Y.; Wen, X.; Shpilman, A. A.; Ren, Q., Effect of Spin Polarization on the
Exclusion Zone of Water. J. Phys. Chem. B 2018, 122, 8493.
25.Abendroth, J. M.; Nakatsuka, N.; Ye, M.; Kim, D.; Fullerton, E. E.; Andrews, A. M.; Weiss,
P. S., Analyzing Spin Selectivity in DNA-Mediated Charge Transfer via Fluorescence
Microscopy. ACS Nano 2017, 11, 7516.
26.Ravi, S.; Sowmiya, P.; Karthikeyan, A., Magnetoresistance and Spin-filtering Efficiency of
DNA-Sandwiched Ferromagnetic Nanostructures. SPIN 2013, 03, 1350003.

73
27.Banerjee-Ghosh, K.; Ben Dor, O.; Tassinari, F.; Capua, E.; Yochelis, S.; Capua, A.; Yang,
S. H.; Parkin, S. S. P.; Sarkar, S.; Kronik, L., Separation of enantiomers by their enantiospecific
interaction with achiral magnetic substrates. Science 2018, 360, 1331.
28.Tassinari, F.; Steidel, J.; Paltiel, S.; Fontanesi, C.; Lahav, M.; Paltiel, Y.; Naaman, R.,
Enantioseparation by crystallization using magnetic substrates. Chem. Sci. 2019, 10, 5246.
29.Abendroth, J. M.; Cheung, K. M.; Stemer, D. M.; El Hadri, M. S.; Zhao, C.; Fullerton, E.
E.; Weiss, P. S., Spin-Dependent Ionization of Chiral Molecular Films. J. Am. Chem. Soc. 2019,
141, 3863.
30.Nonnenmacher, M.; O’Boyle, M. P.; Wickramasinghe, H. K., Kelvin probe force microscopy.
Appl. Phys. Lett. 1991, 58, 2921.
31.Melitz, W.; Shen, J.; Kummel, A. C.; Lee, S., Kelvin probe force microscopy and its
application. Surf. Sci. Rep. 2011, 66, 1.
32.Kisielewski, M.; Maziewski, A.; Tekielak, M.; Wawro, A.; Baczewski, L. T., New
possibilities for tuning ultrathin cobalt film magnetic properties by a noble metal overlayer. Phys.
Rev. Lett. 2002, 89, 087203.
33.Koplovitz, G.; Leitus, G.; Ghosh, S.; Bloom, B. P.; Yochelis, S.; Rotem, D.; Vischio, F.;
Striccoli, M.; Fanizza, E.; Naaman, R., Single Domain 10 nm Ferromagnetism Imprinted on
Superparamagnetic Nanoparticles Using Chiral Molecules. Small 2019, 15, 1804557.
34.Kisielewski, M.; Maziewski, A.; Kurant, Z.; Tekielak, M.; Wawro, A.; Baczewski, L. T.,
Magnetic ordering in ultrathin cobalt film covered by an overlayer of noble metals. J. Appl. Phys.
2003, 93, 7628.
35.Ying, L.; White, S. S.; Bruckbauer, A.; Meadows, L.; Korchev, Y. E.; Klenerman, D.,
Frequency and Voltage Dependence of the Dielectrophoretic Trapping of Short Lengths of DNA
and dCTP in a Nanopipette. Biophys. J. 2004, 86, 1018.
36.Zangwill, A., Physics at Surfaces. 1988.
37.Kumar, A.; Capua, E.; Kesharwani, M. K.; Martin, J. M. L.; Sitbon, E.; Waldeck, D. H.;
Naaman, R., Spin Polarization Accompanies Charge Polarization in Chiral Molecules- Implication
for Enantio-selectivity and Bio-recognition. Proc. Natl. Acad. Sci. U. S. A. 2017, 114, 2474.
38.Yeganeh, S.; Ratner, M. A.; Medina, E.; Mujica, V., Chiral electron transport: Scattering
through helical potentials. J. Chem. Phys. 2009, 131, 014707.
39.Michaeli, K.; Naaman, R., Origin of Spin Dependent Tunneling Through Chiral Molecules. J.
Phys. Chem. C 2019, 123, 17043.
40.Shaik, S. S.; Phillipe, C. H., A Chemist’s Guide to Valence Bond Theory. 2007.
74
41.Köhler, A.; Beljonne, D., The singlet-triplet exchange energy in conjugated polymers. Adv.
Funct. Mater. 2004, 14, 11.
42.de Bruijckere, J.; Gehring, P.; Palacios-Corella, M.; Clemente-Leon, M.; Coronado, E.;
Paaske, J.; Hedegard, P.; van der Zant, H. S. J., Ground-State Spin Blockade in a Single-Molecule
Junction. Phys. Rev. Lett. 2019, 122, 197701.
43.Matityahu, S.; Utsumi, Y.; Aharony, A.; Entin-Wohlman, O.; Balseiro, C. A., Spin-dependent
transport through a chiral molecule in the presence of spin-orbit interaction and nonunitary effects.
Phys. Rev. B: Condens. Matter Mater. Phys. 2016, 93, 075407.

75
4.0 SPIN POLARIZATION STUDY OF PURE AND DOPED CHIRAL OXIDE THIN
FILM FOR SPINTRONICS BASED DEVICES WITHOUT A PERMANENT
FERROMAGNET
This work shows that the transmission of electrons through chiral cobalt oxide (CoOx) thin
films is spin selective. The spin filtering is revealed through two complementary studies: magnetic
conducting probe-atomic force microscopy (mcp-AFM) measurement of current-voltage curves
and magnetoresistance measurements in a thin film device. The data show that the conduction of
electrons depends on the chirality of the CoOx films. The mcp-AFM data and the
magnetoresistance data display an antisymmetric response with the direction of the applied
magnetic field, a signature that is indicative of the chiral induced spin selectivity (CISS) effect. In
addition to the data on pure CoOx films, mcp-AFM studies of Mn doped oxide films are also
reported and show that the Mn doping improves the spin polarization.
4.1 INTRODUCTION
Conventional electronics use electronic charge, whereas spintronics devices use the
electron spin for data storage, data transfer, and other operations.1 Spintronics devices are
attractive as they require less energy to manipulate the spin than charging a capacitor. All the
spintronics devices are based on the concept of transferring a spin-polarized electron to another
ferromagnetic layer through a nonmagnetic layer. For example a spin valve based on the giant
magnetoresistance (GMR) or tunneling magnetoresistance (TMR) effects consist of two
76
ferromagnetic layers separated by a thin nonmagnetic layer; the first ferromagnetic layer is a fixed
layer and the second layer acts as an analyzer which changes the magnetization direction with an
external magnetic field.2, 3 Although spin valve based devices are very attractive and are already
being used in read heads and hard disks that are based on GMR or TMR effect, they suffer from
drawbacks which limit their use for future application.4, 5 The first one being the problem with
miniaturization. The use of a permanent magnet limits the minimum sizes of material that can be
used in the device since below that size the material becomes superparamagnetic. The second
challenge is the need for the permanent ferromagnetic layer close to the free ferromagnetic layer.
To solve the later problem other layers are being incorporated, which not only complicates the
structure but also makes the devices more expensive. Additionally, it was found that the injection
of spin current into the nonmagnetic layer often suffers from impedance mismatch between the
metals and high-resistivity materials.5-7
The chiral induced spin selectivity effect (CISS effect), which describes chiral molecules
as a spin filter, has been exploited to create devices in which spin current is injected without any
need of permanent ferromagnetic layer. The CISS effect happens of the coupling between an
electron’s spin and its angular momentum in a chiral electrostatic potential. Because of this
coupling, the transmission of one spin direction is preferred over the other in chiral molecules. A
number of chiral biomolecules such as oligopeptides,8 DNA,9-12 bacteriorhodopsin(bR),13
helicenes,14 chiral conductive polymers15 and other organic molecules16 have been shown to
display efficient spin filtering properties. Other inorganic-organic materials such as quantum
dots,17 perovskites,18 metal organic frameworks or MOFs,19 chiral metal organic crystals20 have
also shown great promise as a candidate for CISS based spintronics application. Although
molecular based spintronics have shown some great promise, their implementation poses

77
significant engineering challenges. For example, using chiral molecule assemblies in devices has
not proved to be robust to high temperatures and other operating conditions. Moreover, the
fabrication of reliable molecule metal junctions is not only a cumbersome process but also suffers
from device shorting. A promising alternative would be to use pure chiral inorganic material as a
source for spin polarized electrons.
Previously some pure inorganic material has shown to have efficient spin polarization. For
example Inui et al. have studied spin transport through monoaxial chiral dichalcogenide CrNb3S6.21
Their results show that a spin signal persists even over micrometer distances, which was attributed
to spin-momentum locking due to the antisymmetric spin orbit interaction (SOI) under monoaxial
chiral symmetry. Although the chiral crystal shows efficient spin transfer, the material consists of
mixed chiral domains; as a result, different domains in the material will polarize different spin,
which inhibits the materials use for making a spintronics device. Recently our group has shown
another chiral metal oxide film, i.e chiral copper oxide which shows spin polarization at room
temperature.22 But the material shows only a very weak (5%) spin polarization which makes it
difficult to make a device with a reasonable efficiency. So, to make spintronics devices with a
nonmagnetic material as a spin source, it is necessary to use a material which can be prepared
easily and also exhibit efficient spin polarization.
In this work spin dependent electron transport was studied through chiral cobalt oxide thin
films that were prepared by the electrodeposition method. Two different experimental setups were
used to study the spin polarization. In the first method, a magnetic conductive probe AFM
technique was used, and electron conduction was measured with opposite magnetization. Results
show higher conduction of one electron spin over the other with a chiral film. In the second method
a spin-valve based magnetoresistance device was prepared and resistance of the device was

78
measured for opposite spins. An antisymmetric magnetoresistance behavior was observed with the
applied magnetic field. In both the cases the preferred spin was found to be opposite for L and D
chiral film. Finally, the effect of doping on the spin polarization of the chiral cobalt oxide film was
also studied and results show an improvement in the spin polarization upon doping the material
with Mn ions.
4.2 RESULTS
4.2.1 Cobalt Oxide Thin Film and Chirality
Chiral cobalt oxide thin films were prepared by using a previously reported procedure.23
Briefly electrodeposition is performed at a constant potential of 0.7 V vs Ag/AgCl in an aqueous
solution of cobalt-tartrate complex at pH 9.6 (see experimental section for details). The thickness
of the films are controlled by depositing for different amounts of time. Previous results showed
that during the electrodepostion Co(II) in the solution oxidizes to generate Co(III)/Co(IV) species
in the film. Figure 4.1a shows the surface topography of an L- cobalt oxide film.24 As can be seen
the surface has a roughness of ± 2 nm. To study the chirality, L and D cobalt oxide thin films were
electrodeposited on an ultrathin metal electrode, comprising a quartz substrate that was coated with
a 5nm Ti/10 nm Au gold overlayer, and the chirality was measured using circular dichroism
spectroscopy. Figure 4.1b and 4.1c show the absorbance and circular dichroism spectra of the L/D
chiral cobalt oxide films. In the absorbance spectra the feature at 325 -450 nm and at higher energy
is associated with a Co-O ligand to metal charge transfer transition.25 The opposite CD signal for
the L and D cobalt oxides (figure 4.1c) indicates control over the chirality of the films by

79
manipulation of the tartrate chirality. XRD (Figure C.1 in Appendix C) and XPS (Figure C.2 in
Appendix C) characterization of the films were also performed, and they reveal no significant
differences between the physical and morphological features of the films. Note that the cobalt
oxide film which is prepared under these conditions is not magnetic.23
Figure 4.1 Panel a) shows a topography image of the L-CoOx surface. Panel b) shows the absorbance of L/D cobalt
oxides that were prepared on a quartz/5 nm Ti/ 10 nm Au substrate. Panel c) shows circular dichroism of the
corresponding films. The absorbance spectra are subtracted with the blank substrate of quartz 5nm Ti/ 10 nm Au. The
cobalt oxides are 130-150 nm thick
4.2.2 Magnetic Conductive Atomic Force Microscopy
Spin dependent charge transport through the chiral cobalt oxide thin film was studied using
magnetic conductive probe AFM (mcp-AFM) with a Co/Cr coated ferromagnetic tip. The sample
for the mcp-AFM was prepared by electrodepositing a 25 nm thin film of CoOx on a 10 Ti/ 80 nm
Au electrode. The ferromagnetic Co/Cr tip was magnetized by placing it on a permanent magnet,
and the tip (magnetized either up or down) was then used to perform the conductance

80
measurement; see Figure 4.2a. A potential bias is applied between the tip (held at ground) and the
gold substrate, and the current flows between the gold substrate and the tip through the chiral metal
oxide thin film. More than 40 current vs potential (i-V) curves were collected for each
magnetization and an average of these curves are reported in Figure 4.2. The details about the
experiments are given in section 4.4. Because conductive-AFM is very sensitive to different
parameters such as the tip, contact resistance variation over the sample surface, the applied force,
sample preparation etc., it is very important to do the measurements consistently between two
opposite magnetizations. To avoid systematic biasing of the measurements, current-voltage curves
were sampled on different regions of the surface with the same tip and the same force being used;
the data in the figure are a statistical average of these different curves. During a typical experiment,
an area of 20𝜇m by 20 𝜇m was first scanned to select flat and defect free regions for collecting the
I-V measurements.
Figure 4.2 Panel a) shows a schematic diagram for the setup for the magnetic conductive AFM measurement. Panels
b) and d) show the average i-V cruves for the L and D cobalt oxide respectively, with a north (red) or south (black)

81
magnetized tip. Panel c) plots the spin polarization of the current, as a percentage, versus the applied voltage for L-
(black) or D-(red) cobalt oxide thin films.
Figure 4.2 summarizes the mcp-AFM data collected for the L and D chiral cobalt oxide
films. Panel 4.2b) shows the current versus voltage (i-V) curves for L-CoOx and panel 4.2d) shows
the i-V curves for the D-CoOx. Note that a nonlinear and asymmetric i-V behavior is obtained for
the applied bias. The asymmetry of the individual i-V curves with voltage is attributed to the
Schottky barriers in the AFM tip/CoOx/Au circuit element and is qualitatively consistent with that
shown by others for metal-semiconductor-metal (M-S-M) structures.26, 27 For L-CoOx, the current
is consistently higher for the down magnetization than it is for the up magnetization. These data
imply that under positive bias the spins polarized anti-parallel to the electron velocity (along the
surface normal in the lab frame) transmit through the L-cobalt oxide more readily than the spins
polarized parallel to the electron velocity (down in the lab frame). Under negative bias, the
preferred spin orientation is also anti-parallel with the electron velocity, however the current
direction has changed, and the preferred spins are oriented anti-parallel to the surface normal in
the lab frame. This behavior manifests for spin filtering which occurs from the CISS effect.
From what is known about the CISS effect, the opposite chiral film should favor the
opposite spin. Indeed, an opposite effect is observed with the D-cobalt oxide film where the up
spin (spin parallel to electron velocity) shows a higher current than the spin down electrons
(antiparallel to the electron velocity) under positive bias. The degree of spin polarization, P, can
be calculated from the i-V data by using the equation.
𝑃 =
𝑖𝑢𝑝 − 𝑖𝑑𝑜𝑤𝑛
𝑖𝑢𝑝 + 𝑖𝑑𝑜𝑤𝑛 × 100%
Equation 4.1

82
where 𝑖𝑢𝑝 and 𝑖𝑑𝑜𝑤𝑛 are the current measured with up or down magnetized tip respectively. From
the figure 4.2c it can be seen that the spin polarization is close to 25-35 % between L and D cobalt
oxide.
4.2.3 Spin Valve Based Magnetoresistance Device
Given the significant spin filtering (circa 25%) by the chiral CoOx film, a spin valve device
that operates based on magnetoresistance was fabricated. A shematic diagram of the spin valve
device is shown in Figure 4.3a. See section 4.4 for device specifications. In this device a crossbar
geometry was employed. In the measurement, 1 mA of current flows from the bottom gold
electrode through the CoOx film to the top electrode. During the experiment an external magnetic
field is varied from 0 to 0.6 Tesla, then from 0.6 Tesla to -0.6 Tesla, and finally back to 0 Tesla.
The data (pink dots in Figure 4.3b and Figure 4.3c) are collected at 0.05 Tesla intervals. The
voltage difference was measured through the other two electrode contacts, and the resistance was
computed using Ohm’s law. The magnetoresistance is defined as
𝑀𝑅(%) =
𝑅(𝐻) − 𝑅(0)
𝑅(𝐻) + 𝑅(0)× 100
Equation 4.2
where R(0) is the resistance at zero magnetic field and R(H) is the resistance measured under the
field. As can be seen from figure 4.3b), the magnetoresistance curve is antisymmetric with the
field direction. Under a positive applied magnetic field, the nickel layer is magnetized along the
surface normal and a larger resistance (by ~ 1 %) is observed for current flow through the L-CoOx
layer than for the case of zero field. Under a negative applied magnetic field, the opposite behavior
is observed; that is, the resistance to current flow by the chiral film is lower than it is under zero
field (by ~ 1 %). This antisymmetric response is a common feature of spin current flowing through

83
a chiral medium in contact with a ferromagnetic electrode.28 It occurs because the spin filtering by
the chiral film does not change with magnetic field direction but that of the Ni layer does; the Ni
film can be considered as an analyzer polarizer for the spin current. Figure 4.3c shows the MR
response for a D-CoOx film and it has an anitsymmetric MR response that is opposite to that of the
L-CoOx , as expected for spin filtering by the CISS effect.
Figure 4.3 Panel a) shows a schematic illustration for the setup used in making the four probe magnetoregistance(MR)
measurements; the bottom electrode is a gold film of 2μm thickness and the top electrode is ferromagnetic Ni. The
inset shows different layers in the device. Panels b and c) show the magnetoregistance curves for L-CoOx and D-
CoOx respectively.
The magnitude of the magnetoresistance difference is about 2%, between up an down. This
experiment shows that non magnetic chiral thin films of CoOx can act as a spin filter in a device
structure is about 2%, between up an down. Although the magnetoresistance difference in this
system is low compare to other giant magnetoresistance device,29 this experiment shows that non
magnetic chiral thin films of CoOx can be used replacing the permanent ferromagnetic layer.
4.2.4 Spin Polarization with Mn Doped Cobalt Oxide Film
Thin film composition and order likely have a significant impact on spin filtering
performance. For example, a recent study reported that chiral crystalline metal organic frameworks
made of lanthanide show almost 100 % spin polarization, which is attributed to large spin-orbit

84
coupling from paramagnetic Dy(III) species.19 Figure 4.4 shows mcp-AFM data and spin
polarizations for cobalt oxide doped with 5% Mn dopant. See the experimental section for details
on the preparation of the doped L-CoOx films. To determine the stoichiometry between CoOx and
the Mn dopant, X-ray photoelectron spectroscopy was employed; Figure C.3 shows the measured
Co2p and Mn2p spectra. To determine the atomic percent ratio the 2p3/2 peaks were integrated,
and the resulting area was scaled to account for the differences in photoelectron cross section.
Figure 4.4a compares the CD spectra of the doped and undoped L-CoOx films and it shows no
significant differences between the two films.
The magnetic conducting probe AFM data for the Mn doped L-CoOx films were collected
for both up and down magnetic fields, and the averaged current vs potential profiles are plotted in
figure 4.4b. The current with down magnetization shows a higher current than do the data for the
up magnetization. Note that the chirality of the pure and the doped L-CoOx films have the same
sense (as defined by the circular dichroism spectra) and thus they are expected to select for the
same spin polarizion of the electrons(figure 4.4a).30 The spin polarization was computed for these
doped films and it is plotted along with that computed for the undoped L-CoOx films in Figure
4.4c. Interestingly the polarization with the doped film shows a larger spin polarization (red curve)
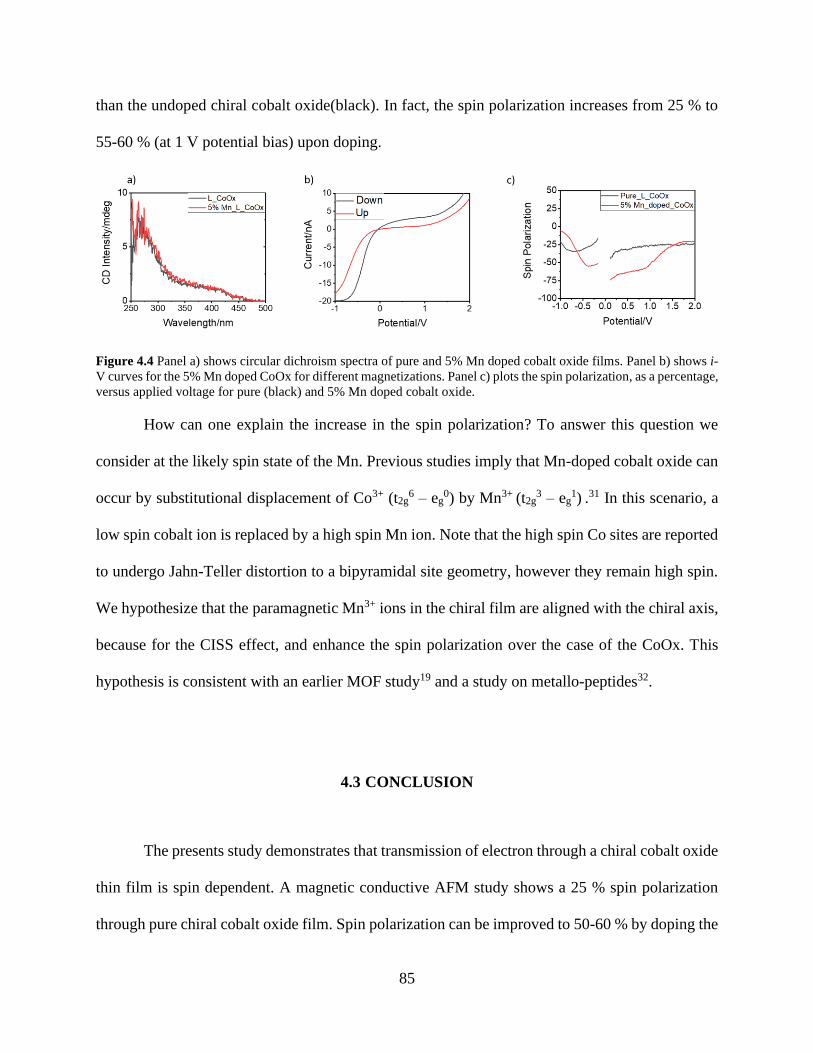
85
than the undoped chiral cobalt oxide(black). In fact, the spin polarization increases from 25 % to
55-60 % (at 1 V potential bias) upon doping.
Figure 4.4 Panel a) shows circular dichroism spectra of pure and 5% Mn doped cobalt oxide films. Panel b) shows i-
V curves for the 5% Mn doped CoOx for different magnetizations. Panel c) plots the spin polarization, as a percentage,
versus applied voltage for pure (black) and 5% Mn doped cobalt oxide.
How can one explain the increase in the spin polarization? To answer this question we
consider at the likely spin state of the Mn. Previous studies imply that Mn-doped cobalt oxide can
occur by substitutional displacement of Co3+ (t2g6 – eg
0) by Mn3+ (t2g3 – eg
1) .31 In this scenario, a
low spin cobalt ion is replaced by a high spin Mn ion. Note that the high spin Co sites are reported
to undergo Jahn-Teller distortion to a bipyramidal site geometry, however they remain high spin.
We hypothesize that the paramagnetic Mn3+ ions in the chiral film are aligned with the chiral axis,
because for the CISS effect, and enhance the spin polarization over the case of the CoOx. This
hypothesis is consistent with an earlier MOF study19 and a study on metallo-peptides32.
4.3 CONCLUSION
The presents study demonstrates that transmission of electron through a chiral cobalt oxide
thin film is spin dependent. A magnetic conductive AFM study shows a 25 % spin polarization
through pure chiral cobalt oxide film. Spin polarization can be improved to 50-60 % by doping the

86
material with 5% Mn. The paramagnetic nature of the Mn species with empty d orbitals ensures
that spin transport is intact throughout the materials. Finally using the chiral cobalt oxide thin film
we have prepared a spin valve based on magnetoresistance of the device. This study shows how a
simple electrodeposition of chiral film can be used as a alternative to the magnetic layer for spin
electron source in spintronics devices. This work demonstrates that chiral metal oxide films can
displayspin filtering properties that may prove useful as a source of spin polarized electrons in
spintronics device. This will not only simplify the spintronics device structure but also make this
a economically viable process.
4.4 EXPERIMENTAL METHODS
4.4.1 Thin Chiral Cobalt Oxide Thin Film Deposition
Chiral cobalt oxide thin films wereprepared by using an electrodeposition method
following a previous procedure.23 Briefly L/D tartaric acid( 0.8 mmol), CoCl2.6H2O (0.08 mmol)
were added to 10 ml of water to make a Co-tartrate complex. Next, sodium carbonate (2 mmol)
was added to the solution and the total volume was increased to 20 ml. A three-electrode system
was employed where the working electrode is made of glass and coated with 10 nm Ti and 80 nm
Au which is deposited by e-beam evaporation. A Pt sheet and Ag/AgCl were used as counter and
reference electrode, respectively. The electrodeposition was done 0.7 V constant potential for 300
sec to deposit a 25 nm thin film. For preparing the Mn doped cobalt oxide films, the deposition
was performed under the same conditions except that MnCl2 was also added in the electrolyte
solution. The ratio of metal salts that is needed to prepare a 5% Mn-doped cobalt oxide was found

87
to be 95:5 for CoCl2: MnCl2. Prior to the electrodeposition, the substrate was cleaned with boiling
acetone and ethanol for 10 min each, and after the deposition the film was rinsed with water and
dried before use.
4.4.2 Magnetic Conductive AFM
Magnetic conductive probe AFM (mcp-AFM) was performed using a chiral metal oxide
coated/gold substrate. The substrate was prepared by depositing 10 nm Ti followed by a 80 nm Au
layer on a glass substrate. Prior to the electrodeposition the substrate was cleaned with boiling
acetone and ethanol for 10 min each. A 25-30 nm chiral L/D CoOx thin film was deposited on the
one half of the substrate. After the deposition was complete the substrate was rinsed with water
and left in the vacuum to dry before the conducting probe measurements. The mcp-AFM was
performed using an Asylum instrument with a Cr/Co magnetic tip (ASYMFMHM-R2, Asylum
Research) of coercivity 550 Oe. Before the conductance measurement the tip was magnetized with
a permanent magnet for 10 min with either up or down magnetic field. For each magnetization,
40-50 i-V curves were measured at different positions. To avoid damage of the tip by lateral
motion, the tip was retracted in between the measurements. Before the conductance measurement
on the cobalt oxide film, experiments were performed on a bare gold surface to confirm the
conductive signal from the gold surface. Note that the tip that was used for this experiment has
higher coercivity and it retains its magnetization for many hours, > 5 hrs. The i-V curves were
measured in a contact mode with a force of 25 nN that was applied between tip and the substrates
during the experiment. Applying a lower force results in inconsistent signals. Measurements for
opposite magnetization were done in the same location for a fair comparison.

88
4.4.3 Magnetoresistance Device
Magnetoresistance experiments were done in a crossbar geometry using a four probe
method. The device was prepared on SiO2 wafer, where the bottom electrode (2um) was made of
10 nm Ti layer followed by 40 nm gold (Au) layer, and was prepared by using optical lithography.
On the top of that a thin film (20-25 nm) of chiral cobalt oxide was deposited using
electrodeposition (described above). A buffer layer of thickness 1.5 nm of MgO was deposited on
the top using e-beam evaporation. Finally, a 50 μm top electrode made of 40 nm Ni and 10 nm Au
were deposited in a cross-bar geometry using a shadow mask. The gold layer on the top was used
to protect the ferromagnetic (Ni) layer from oxidation. The conductance measurements were
carried out within a SQUIDMPMS3 made by Quantum Design. A magnetic field between ± 0.6
Tesla is applied in out of the plane mode of the device and the resistance of the devices was
measured using a standard 4 probe method by applying a constant 1 mA current to the opposite
electrode. The magnetic field was varied cyclically from 0 to 0.6 T and then -0.6 T back to 0T.
The 1 mA current was passed from the bottom gold electrode to the top ferromagnetic electrode
and the potential was measured for each 0.05 T change in the magnetic field.
4.5 REFERENCES
1.Žutić, I.; Fabian, J.; Das Sarma, S., Spintronics: Fundamentals and applications. Reviews of
Modern Physics 2004, 76 (2), 323-410.
2.Tsymbal, E. Y.; Pettifor, D. G., Perspectives of giant magnetoresistance. In Solid State Physics,
Ehrenreich, H.; Spaepen, F., Eds. Academic Press: 2001; Vol. 56, pp 113-237.

89
3.Lee, Y. M.; Hayakawa, J.; Ikeda, S.; Matsukura, F.; Ohno, H., Effect of electrode composition
on the tunnel magnetoresistance of pseudo-spin-valve magnetic tunnel junction with a MgO tunnel
barrier. Applied Physics Letters 2007, 90 (21), 212507.
4.Dolui, K.; Narayan, A.; Rungger, I.; Sanvito, S., Efficient Spin Injection and Giant
Magnetoresistance in Fe/MoS2/Fe Junctions. Physical Review B 2014, 90 (4), 041401.
5.Schmidt, G.; Ferrand, D.; Molenkamp, L. W.; Filip, A. T.; van Wees, B. J., Fundamental
obstacle for electrical spin injection from a ferromagnetic metal into a diffusive semiconductor.
Physical Review B 2000, 62 (8), R4790-R4793.
6.Rashba, E. I., Theory of electrical spin injection: Tunnel contacts as a solution of the conductivity
mismatch problem. Physical Review B 2000, 62 (24), R16267-R16270.
7.Mathew, S. P.; Mondal, P. C.; Moshe, H.; Mastai, Y.; Naaman, R., Non-magnetic
organic/inorganic spin injector at room temperature. Applied Physics Letters 2014, 105 (24),
242408.
8.Aragonès, A. C.; Medina, E.; Ferrer-Huerta, M.; Gimeno, N.; Teixidó, M.; Palma, J. L.; Tao,
N.; Ugalde, J. M.; Giralt, E.; Díez-Pérez, I.; Mujica, V., Measuring the Spin-Polarization Power
of a Single Chiral Molecule. Small 2017, 13, 1602519.
9.Abendroth, J. M.; Nakatsuka, N.; Ye, M.; Kim, D.; Fullerton, E. E.; Andrews, A. M.; Weiss,
P. S., Analyzing Spin Selectivity in DNA-Mediated Charge Transfer via Fluorescence
Microscopy. ACS Nano 2017, 11, 7516.
10.Göhler, B.; Hamelbeck, V.; Markus, T. Z.; Kettner, M.; Hanne, G. F.; Vager, Z.; Naaman,
R.; Zacharias, H., Spin Selectivity in Electron Transmission Through Self-Assembled Monolayers
of Double-Stranded DNA. Science 2011, 331, 894.
11.Xie, Z.; Markus, T. Z.; Cohen, S. R.; Vager, Z.; Gutierrez, R.; Naaman, R., Spin Specific
Electron Conduction through DNA Oligomers. Nano Lett. 2011, 11, 4652.
12.Zwang, T. J.; Hürlimann, S.; Hill, M. G.; Barton, J. K., Helix-Dependent Spin Filtering
through the DNA Duplex. J. Am. Chem. Soc. 2016, 138, 15551.
13.Varade, V.; Markus, T.; Vankayala, K.; Friedman, N.; Sheves, M.; Waldeck, D. H.; Naaman,
R., Bacteriorhodopsin based non-magnetic spin filters for biomolecular spintronics. Physical
Chemistry Chemical Physics 2018, 20 (2), 1091-1097.
14.Kiran, V.; Mathew, S. P.; Cohen, S. R.; Hernández Delgado, I.; Lacour, J.; Naaman, R.,
Helicenes—A New Class of Organic Spin Filter. Advanced Materials 2016, 28 (10), 1957-1962.
15.Mondal, P. C.; Kantor-Uriel, N.; Mathew, S. P.; Tassinari, F.; Fontanesi, C.; Naaman, R.,
Chiral Conductive Polymers as Spin Filters. Advanced Materials 2015, 27 (11), 1924-1927.

90
16.Mishra, S.; Pirbadian, S.; Mondal, A. K.; El-Naggar, M. Y.; Naaman, R., Spin-Dependent
Electron Transport through Bacterial Cell Surface Multiheme Electron Conduits. Journal of the
American Chemical Society 2019, 141 (49), 19198-19202.
17.Bloom, B. P.; Kiran, V.; Varade, V.; Naaman, R.; Waldeck, D. H., Spin Selective Charge
Transport through Cysteine Capped CdSe Quantum Dots. Nano Letters 2016, 16 (7), 4583-4589.
18.Lu, H.; Wang, J.; Xiao, C.; Pan, X.; Chen, X.; Brunecky, R.; Berry, J. J.; Zhu, K.; Beard,
M. C.; Vardeny, Z. V., Spin-dependent charge transport through 2D chiral hybrid lead-iodide
perovskites. Science Advances 2019, 5 (12), eaay0571.
19.Huizi-Rayo, U.; Gutierrez, J.; Seco, J. M.; Mujica, V.; Diez-Perez, I.; Ugalde, J. M.; Tercjak,
A.; Cepeda, J.; San Sebastian, E., An Ideal Spin Filter: Long-Range, High-Spin Selectivity in
Chiral Helicoidal 3-Dimensional Metal Organic Frameworks. Nano Letters 2020, 20 (12), 8476-
8482.
20.Mondal, A. K.; Brown, N.; Mishra, S.; Makam, P.; Wing, D.; Gilead, S.; Wiesenfeld, Y.;
Leitus, G.; Shimon, L. J. W.; Carmieli, R.; Ehre, D.; Kamieniarz, G.; Fransson, J.; Hod, O.;
Kronik, L.; Gazit, E.; Naaman, R., Long-Range Spin-Selective Transport in Chiral Metal–Organic
Crystals with Temperature-Activated Magnetization. ACS Nano 2020, 14 (12), 16624-16633.
21.Inui, A.; Aoki, R.; Nishiue, Y.; Shiota, K.; Kousaka, Y.; Shishido, H.; Hirobe, D.; Suda,
M.; Ohe, J.-i.; Kishine, J.-i.; Yamamoto, H. M.; Togawa, Y., Chirality-Induced Spin-Polarized
State of a Chiral Crystal ${\mathrm{CrNb}}_{3}{\mathrm{S}}_{6}$. Physical Review Letters
2020, 124 (16), 166602.
22.Ghosh, K. B.; Zhang, W.; Tassinari, F.; Mastai, Y.; Lidor-Shalev, O.; Naaman, R.; Möllers,
P.; Nürenberg, D.; Zacharias, H.; Wei, J.; Wierzbinski, E.; Waldeck, D. H., Controlling Chemical
Selectivity in Electrocatalysis with Chiral CuO-Coated Electrodes. The Journal of Physical
Chemistry C 2019, 123 (5), 3024-3031.
23.Ghosh, S.; Bloom, B. P.; Lu, Y.; Lamont, D.; Waldeck, D. H., Increasing the Efficiency of
Water Splitting through Spin Polarization Using Cobalt Oxide Thin Film Catalysts. The Journal
of Physical Chemistry C 2020, 124 (41), 22610-22618.
24.Casella, I. G., Electrodeposition of cobalt oxide films from carbonate solutions containing
Co(II)–tartrate complexes. Journal of Electroanalytical Chemistry 2002, 520 (1), 119-125.
25.Barreca, D.; Massignan, C.; Daolio, S.; Fabrizio, M.; Piccirillo, C.; Armelao, L.; Tondello,
E., Composition and Microstructure of Cobalt Oxide Thin Films Obtained from a Novel Cobalt(II)
Precursor by Chemical Vapor Deposition. Chemistry of Materials 2001, 13 (2), 588-593.
26.Wang, S.; Cheng, G.; Cheng, K.; Jiang, X.; Du, Z., The current image of single SnO2 nanobelt
nanodevice studied by conductive atomic force microscopy. Nanoscale Research Letters 2011, 6
(1), 541.
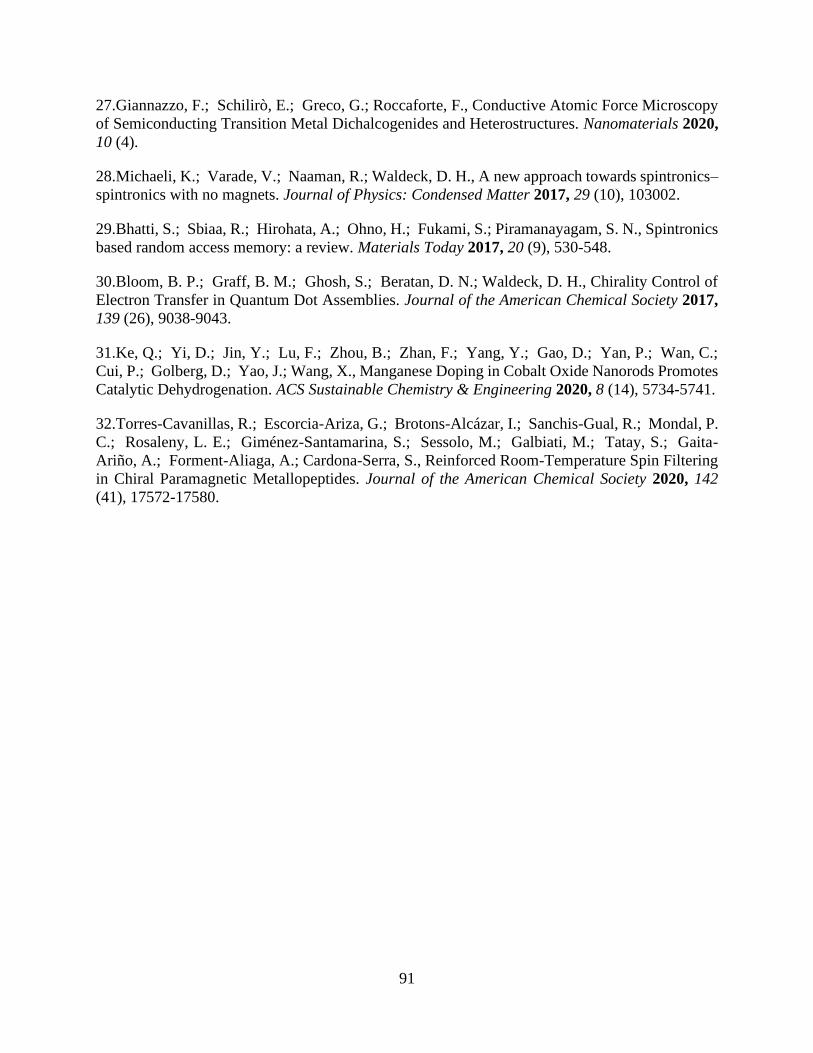
91
27.Giannazzo, F.; Schilirò, E.; Greco, G.; Roccaforte, F., Conductive Atomic Force Microscopy
of Semiconducting Transition Metal Dichalcogenides and Heterostructures. Nanomaterials 2020,
10 (4).
28.Michaeli, K.; Varade, V.; Naaman, R.; Waldeck, D. H., A new approach towards spintronics–
spintronics with no magnets. Journal of Physics: Condensed Matter 2017, 29 (10), 103002.
29.Bhatti, S.; Sbiaa, R.; Hirohata, A.; Ohno, H.; Fukami, S.; Piramanayagam, S. N., Spintronics
based random access memory: a review. Materials Today 2017, 20 (9), 530-548.
30.Bloom, B. P.; Graff, B. M.; Ghosh, S.; Beratan, D. N.; Waldeck, D. H., Chirality Control of
Electron Transfer in Quantum Dot Assemblies. Journal of the American Chemical Society 2017,
139 (26), 9038-9043.
31.Ke, Q.; Yi, D.; Jin, Y.; Lu, F.; Zhou, B.; Zhan, F.; Yang, Y.; Gao, D.; Yan, P.; Wan, C.;
Cui, P.; Golberg, D.; Yao, J.; Wang, X., Manganese Doping in Cobalt Oxide Nanorods Promotes
Catalytic Dehydrogenation. ACS Sustainable Chemistry & Engineering 2020, 8 (14), 5734-5741.
32.Torres-Cavanillas, R.; Escorcia-Ariza, G.; Brotons-Alcázar, I.; Sanchis-Gual, R.; Mondal, P.
C.; Rosaleny, L. E.; Giménez-Santamarina, S.; Sessolo, M.; Galbiati, M.; Tatay, S.; Gaita-
Ariño, A.; Forment-Aliaga, A.; Cardona-Serra, S., Reinforced Room-Temperature Spin Filtering
in Chiral Paramagnetic Metallopeptides. Journal of the American Chemical Society 2020, 142
(41), 17572-17580.
92
5.0 INCREASING THE EFFICIENCY OF WATER SPLITTING THROUGH SPIN
POLARIZATION USING COBALT OXIDE THIN FILM CATALYSTS
This chapter is taken from Ghosh, S.; Bloom, B. P.; Lu, Y.; Lamont, D.; Waldeck, D. H.
J. Phys. Chem. C 2020, 124(41), 22610-22618. The author of the dissertation performed the
electrochemistry, the design of the experiments, the thin film deposition, and the water splitting
measurements, as well as participated in writing the manuscript. The supporting information for
this chapter can be found in Appendix D.
This work explores the use of chiral cobalt oxide thin film electrocatalysts for the oxygen
evolution reaction and examines how their spin polarization properties might be used to control
electrochemically generated intermediates at different pH values. These studies demonstrate that
chiral cobalt oxide electrocatalysts reduce the reaction overpotential by 65 mV at 10 mA cm-2,
increase the oxygen yield by 1.4-fold at a fixed current density at pH 10, and decrease the
production of hydrogen peroxide by 4.0-fold as compared to the corresponding meso-CoOx
analogs. Additional studies in which the electrocatalyst is modified to make it paramagnetic exhibit
a similar enhancement with an applied external magnetic field. The findings from these studies are
described using a proposed mechanistic model which unifies the favorable effects of chirality and
magnetization. The results are attributed to the advantage of spin polarized intermediates in
facilitating the oxygen evolution reaction.

93
5.1 INTRODUCTION
The emergence of a hydrogen economy is largely predicated upon the development of cost-
effective and low carbon footprint methods for producing hydrogen. While gasification and steam
reforming are established cost-effective routes to hydrogen generation, their carbon content is
significant.1 The electrolysis of water is one promising avenue for storing the electricity generated
from renewable and carbon free technologies as hydrogen fuel.2-4 Because of their excellent
prolonged stability and potential for high turnover efficiency, metal oxide catalysts have been
studied extensively for water splitting reactions.5, 6 First row transition metal oxide and hydroxides
are particularly interesting candidates for next-generation electrocatalysts because of their
relatively cheap cost and ease in fabrication, however more improvement is required to compete
with existing state-of-the-art electrolysis technologies.7
During the water splitting process, hydrogen is formed at the cathode, and oxygen is
formed at the anode through a process involving the net transfer of four electrons. The anodic
process, or oxygen evolution reaction (OER), has previously been identified as greatly affecting
the overpotential for the water splitting reaction and can be the bottleneck for the entire process.8
Because ground state oxygen exists in a triplet state, O2 (3∑𝑔
−), we and others have hypothesized
that its ‘sluggishness’ arises from spin constraints that exist in the elementary reaction steps for its
formation.9, 10 Often, spin constraints are not explicitly included in the design of water splitting
architectures, so that O2 (3∑𝑔
−) formation competes with singlet mediated processes such as, the
formation of hydrogen peroxide and other superoxide species. At high pH, these undesired
pathways are less favorable because of the stability of the products, however the spin restrictions
in the formation of O2 (3∑𝑔
−) can still limit the Faradaic efficiency of the reaction. At neutral pH,

94
however, peroxide and superoxide species are more stable11, 12 so that preventing their formation
becomes increasingly important. The formation of hydrogen peroxide and superoxides can also
decrease the stability of the anode13 which degrades the catalyst’s performance. Thus, a catalyst’s
ability to minimize side reactions while improving the efficiency of O2 (3∑𝑔−) formation is
paramount for increasing the stability of the catalyst and the overall efficiency of the reaction.
Several groups have investigated the importance of spin considerations during O2 (3∑𝑔
−)
generation.9, 14-19 For instance, de Groot et al. has shown theoretically that the good catalytic
performance in OER for RuO2(110) may arise from the material’s magnetic moment on the surface
which helps to align adjacent spins.14 Other groups have illustrated the importance of the number
of unpaired electron’s in the catalyst’s active center15, 16 which have since been shown theoretically
to allow for ferromagnetic-like exchange interactions between the oxygen radical intermediates
and the catalyst.20, 21 These theoretical studies are corroborated by experiments on ferromagnetic
catalysts for which the magnetization state was shown to affect the OER efficiency.22, 23 The utility
of spin-alignment for enhancing OER efficiency was demonstrated convincingly by Garces-Pineda
and coworkers who showed that an external magnetic field caused a two-fold increase in current
densities (above 100 mA cm-2) at high applied bias voltage.24
Recent research suggests that electrocatalysts coated with chiral molecules25-27 and
intrinsically chiral CuO,10 can be used to align the electron’s spin orientation and enhance the
OER. By a comparison of chiral catalysts with their achiral analogues, these studies showed a
reduction in the overpotential for the OER. The enhanced efficiency for O2 (3∑𝑔
−) production was
attributed to the formation of spin-polarized radical intermediates on the electrocatalyst’s surface
because of the chiral induced spin selectivity (CISS) effect.28-31 The CISS effect says that electrons
(or holes) moving through a chiral electrocatalyst become spin-polarized; that is, there is a

95
preference to have the spin aligned either parallel or antiparallel to the electron’s velocity. Thus,
as reactants (such as water or hydroxide) become oxidized on a chiral anode they inject,
preferentially, electrons of one spin type. For singlet state reactants (such as hydroxide), the radical
intermediates that are generated on the chiral anode surface have their electron spins polarized
preferentially whereas those formed on an achiral anode surface are not necessarily polarized. Prior
to this study with CoOx, chiral electrocatalysts comprised long organic molecules as the spin-
filtering agent or used chiral CuO which is not a very efficient water splitting catalyst (relatively
high overpotentials). Moreover, earlier work with chiral catalysts have not discussed how pH
dependent changes in mechanism may affect the role of spin-polarized reaction intermediates.
This study explores the OER reaction with an efficient CoOx chiral electrocatalyst over a range of
alkaline pHs.
Previous studies on mixed cobalt oxide and cobalt oxide hydroxide catalysts have shown
that they are some of the best electrocatalysts for the OER, with overpotentials ranging from 0.238
V to 0.290 V.32 In this work, we show how to fabricate chiral cobalt oxide/oxyhydroxide (CoOx)
anodes, through the electrodeposition from solutions of CoCl2 and tartaric acid. Because the
reaction overpotential for water splitting is sensitive to choices about the pH, electrolyte, mass
loading, and the active catalytic area11, 33 this work focuses on how chirality affects the catalyst
performance, rather than more general comparisons to the state-of-the-art in the literature. The
findings of this study demonstrate that chiral CoOx thin films enhance the catalytic efficiency for
water splitting, compared to its achiral analogue, over a pH range from pH 13 to pH 6.5. In
addition, we show that the electrochemical conversion of these CoOx films to a paramagnetic phase
causes them to display a dependence of their OER efficiency on an external magnetic field. Lastly,

96
we propose a mechanistic picture that describes the role of spin polarization in electrochemically
generated radical intermediates over the pH range.
5.2 RESULTS AND DISCUSSION
5.2.1 Film Preparation and Characterization
Chiral cobalt oxide thin films were prepared by modifying previously developed
protocols.34 Briefly, the electrodeposition was performed at a constant potential of 0.9 V vs. NHE
in an aqueous solution containing 4 mM of CoCl2·4H2O, 0.1 M Na2CO3, and 40 mM of L-, D-, or
meso-tartaric acid. Previous studies indicate that the electrodeposition process involves a redox
transition from Co(II) in solution to Co(III)/Co(IV) species, such as Co3O4, CoOOH, or Co2O3, in
the electrodeposited films.30 The thickness of the film was controlled by the deposition time and it
was quantified using profilometry. For practical purposes, instead of measuring the thickness for
each film a calibration curve of thickness vs absorbance was used (See Figure D.1 and Appendix
D for more details).
To ensure a valid comparison of catalytic efficiency between L- and meso-CoOx thin films,
the physical and morphological features of the films were characterized. Figure 5.1a shows X-ray
photoelectron spectroscopy (XPS) data (normalized to the Co 2p3/2 maxima) for L- (black, bottom)
and meso-CoOx (blue, top) in which the satellite structure between 784 and794 eV (see zoomed in
view in Figure 5.1b), indicates that the oxide / hydroxide content is remarkably similar. A more
detailed analysis and discussion of the XPS spectra on the composition and properties of the CoOx
catalysts are provided in the Appendix D. Figure 5.1c shows X-ray diffraction (XRD) patterns for

97
L- (black, bottom) and meso-CoOx (blue, top) thin films on FTO which corroborate the XPS data.
The peaks arising from CoOx and FTO are labeled in accordance with previous literature
assignments35 and both spectra show similar peak 2θ positions and peak intensity ratios. Although
it is difficult to determine the exact composition of the materials, because of the large number of
possible oxide / oxyhydroxide states overlapping in the spectral region, the similarity between the
L-CoOx and meso-CoOx in the XPS and XRD imply that the catalysts are the same with the
exception of film’s overall chirality. Figure 5.1d shows top-down SEM images of L- (black border,
left) and meso-CoOx (blue border, right) thin films. Both images show similar morphological
structure. Although the geometrical area of the substrates that are used for these studies is 1 cm2,
the electrochemical surface area can change between films because of changes in the surface
roughness. To ensure this was not the case, the electrochemical surface area was measured using
the double layer capacitance method,36 and it was found to be very similar for L- and meso-CoOx;
see Appendix D and Figure D.6 for details. The surface structure was further probed by AFM
topography measurements which indicate that the L-CoOx and meso-CoOx exhibit comparable
surface roughness; See Figure D.7
98
Figure 5.1 (a) XPS spectra of L- (black) and meso-CoOx (blue) thin films deposited on FTO. (b) Zoomed in view in
the satellite spectral region from (a). (c) XRD spectra for L- (black, bottom) and meso-CoOx (top, blue) thin films.
The peaks arising from the substrate and CoOx are labeled. (d) Corresponding top-down SEM images of L- (black
border, left) and meso-CoOx (blue border, right) thin films.
To study the optical properties of the CoOx films, the substrate was changed to gold coated
quartz which allows for better transmittance in the UV spectral region. Figure 5.2 shows
absorbance (a) and circular dichroism (b) measurements on CoOx thin-films that were deposited
from solutions containing complexes of Co2+ with L-tartaric acid (black), D-tartaric acid (red), and
meso-tartaric acid (blue). The feature at 325-450 nm is associated with a Co–O ligand-to-metal
charge transfer transition.37 A higher energy transition, occurring to the blue, is also observed and
is consistent with reports on other cobalt oxides.38 Similarity in the UV-Vis spectra along with the
aforementioned characterization methods between L-, D-, and meso-CoOx samples confirms that
the composition, morphology, and thickness of the films are comparable. The mirror image Cotton
effects in the circular dichroism spectra in L- and D-CoOx indicate the chirality of the thin films.
20 30 40 50 60 70
No
rma
lize
d C
ounts
2θ (Degrees)
FTO
FTO
FTO
FTO
FTO
FTO
FTO
FTO
FTO
Co
Co
Co
Co
Co
Co
FTO
a) b) c)
5μm
L-CoOx meso-CoOxd)
810 800 790 7800
10
1
I/I m
ax
Binding Energy(eV)
5μm
L-CoOx
5μm
meso-CoOx
794 792 790 788 786 7840.0
0.1
0.2
I/I m
ax
Binding Energy(eV)

99
Figure 5.2 (a,b) Absorbance and circular dichroism spectra, respectively, of L- (black), D- (red), and meso-CoOx
(blue) thin films electrodeposited on 10 nm thick gold coated quartz. The absorbance data are offset by 0.5 absorbance
units for clarity.
More importantly, the opposite signal arising at the Co - O charge transfer transition
indicates that the chirality is imprinted onto the electronic structure of the catalyst. The chirality is
thought to arise in an analogous manner to that reported for CuO, in which tartaric acid can direct
the deposition of the material so that high index (chiral) planes of the crystallites in these
polycrystalline films are preferentially presented on the surface.10, 39 During the electrodeposition
the L- and D-tartrate ligands act to select these index planes enantiospecifically which gives rise
to the approximate mirror symmetry. In contrast, the meso-tartrate with its two opposite chirality
centers has no such bias and a null CD response is obtained.
5.2.2 Water Splitting Study
Figure 5.3A shows linear sweep voltammograms for the chiral L-CoOx (black) and meso-
CoOx (blue) thin film electrodes in 0.1 M KOH. A large increase in current is evident for both
CoOx films as compared to a bare FTO substrate (green), indicating their electrocatalytic activity.
a) b)
250 300 350 400 450 500 5500.0
0.5
1.0
1.5
2.0
2.5A
bso
rba
nce
(a
.u.)
Wavelength (nm)
250 300 350 400 450 500 550-8
-4
0
4
8
CD
In
ten
sity (
md
eg
)
Wavelength (nm)
100
The reaction overpotential, defined as the voltage needed to maintain a current density of 10
mA/cm2, is found to be 64 mV lower (13%) for the L-CoOx than for the meso-CoOx. The difference
in applied potential needed to generate a given current density increases between the chiral and
meso electrocatalysts at larger current densities; 105 mV at 20 mA/cm2 (20%) and 159 mV (28%)
at 40 mA/cm2. Figure 5.3b shows voltammograms of chiral L-CoOx (black) and meso-CoOx (blue)
thin films at pH 10 in sodium carbonate / bicarbonate buffer solution. A similar difference in
overpotential is observed at 3 mA/cm2 between the measurements at pH 10 and pH 13; ~25mV.
The surface area of the two catalysts was found to be the same by using a double layer capacitive
current method; note that the surface area of the meso-CoOx would need to be ~3 time higher to
match the overpotential of L-CoOx at 30 mA/cm2 current density. Tafel analysis of L- and meso-
CoOx films is presented in the Appendix D, see Figure D.8. The Tafel slope, which indicates the
amount of overpotential required to increase the reaction rate by a factor of 10, is approximately
~1.3-fold lower for L-CoOx (101 mV/dec) than for meso-CoOx (133 mV/dec) at pH 13. The
improvement in the current-voltage behavior for the L-CoOx is similar in magnitude to other chiral
electrocatalysts,26 however the CoOx catalysts in this study are operating at much higher current
densities and lower overpotentials. While the emphasis of these studies is on the comparison
between L- and meso-CoOx it is important to note that previous studies on OER of chiral materials
show that D and L enantiomers exhibit similar behavior.10, 26 To verify this, linear sweep
voltammograms comparing D-CoOx and meso-CoOx were collected and are shown in Figure D.9
and table D.2. A notable improvement is again observed using the chiral catalyst, D-CoOx,
compared to the meso-CoOx

101
Figure 5.3 (a) Linear sweep voltammograms for the OER using L-CoOx (black), meso-CoOx (blue), and a bare FTO
substrates (green) in 0.1M KOH. (b) Linear sweep voltammograms of the OER using L-CoOx (black) and meso-CoOx
(blue) in Na2CO3/NaHCO3 (pH 10). (c) UV-Vis absorption spectra of hydrogen peroxide using L-CoOx (black) and
meso-CoOx (blue) catalysts. Following electrolysis the solutions are titrated with o-tolidine indicator. The integrated
peak area reflects the amount of hydrogen peroxide present, see text for additional details.
A competing pathway for the oxygen evolution reaction at neutral pH is the formation of
hydrogen peroxide. To study the role of chirality, more specifically the chirality-induced spin
alignment of radical intermediates, for inhibiting hydrogen peroxide formation, electrochemical
experiments were performed in which 1.5 V vs. NHE was applied to a CoOx thin film for 45 min
in a 0.1 M Na2SO4 solution at pH=6.5. Following the reaction, a spectrophotometric redox
indicator, o-tolidine, was added to the solution and the absorbance was measured. Figure 5.3c
shows the change in absorption of o-tolidine, and hence the amount of hydrogen peroxide
production, when the water splitting reaction is performed using L-CoOx (black) and meso-CoOx
(blue) as the electrocatalyst. Integrating the absorbance peaks of these data indicate that the meso-
CoOx produces 4-times more hydrogen peroxide than is produced for the L-CoOx, despite the
lower current density of meso-CoOx at the applied potential. Thus, the chiral electrocatalyst is
more selective against peroxide generation, than is the meso-catalyst
a) b)
300 350 400 450 500 550 6000.0
0.5
1.0
Absorb
ance (
a.u
.)
Wavelength (nm)
c)
0.6 0.8 1.0 1.20
10
20
30
40
50
60
Potential vs NHE (V)
Curr
ent
Density (
mA
/cm
2)
0.8 1.0 1.20
1
2
3
4
Curr
ent
Density (
mA
/cm
2)
Potential vs NHE (V)

102
Figure 5.4 Representative Hoffman apparatus measurements for hydrogen production (left) and oxygen production
(right) with L- (black) and meso-CoOx (blue) catalysts. The water splitting was performed at a 5.0 mA / cm2 current
density in a sodium carbonate / bicarbonate pH 10 buffer solution.
This phenomenon was investigated further by quantitatively measuring the hydrogen and
oxygen yield using a Hoffman apparatus, Figure 5.4. Experiments with Pt as both the anode and
cathode were used to standardize the apparatus to the expected 2:1 hydrogen-to-oxygen ratio and
account for any instrumental deviations. Measurements were performed using a pH 10 sodium
carbonate / bicarbonate buffer solution at a current density of 5.0 mA / cm2. The hydrogen
production (panel a) was similar for the L-CoOx (blue) and meso-CoOx (black) catalysts, however
more oxygen (panel b) was produced for the chiral catalyst. Table 5.1 shows the average ratio of
H2 to O2 production across multiple experiments at pH 10 and pH 13 (0.1 M KOH). Because the
formation of hydrogen peroxide is unfavorable at high pH, pKa1 of 11.7, the H2:O2 ratio for the
chiral and meso catalysts are nearly the same; ~2.1:1.0. Thus, the difference in overpotential,
arising from the more favorable pathway for O2 (3∑𝑔−) formation in the chiral catalyst, is
compensated for by operating at a fixed current density (higher bias voltage). Conversely, at a
lower pH where hydrogen peroxide formation is favorable, the chiral catalyst creates more oxygen
(2.4:1.0) than the meso catalyst (3.7:1.0) further corroborating the findings in Figure 5.3c. By
0 50 100 150 200 250
0.0
0.5
1.0
1.5
2.0
2.5
3.0H
ydro
ge
n (
mL
)
Time (min)
0 50 100 150 200 250
0.0
0.2
0.4
0.6
0.8
1.0
1.2
1.4
1.6
Oxyg
en
(m
L)
Time (min)
a) b)

103
fitting the data for oxygen production and averaging across multiple electrodes we find that the
oxygen evolution rate for chiral catalysts is ~1.4 times larger than that for meso catalysts.
Table 5.1 Average ratios of hydrogen-to-oxygen production measured using a Hoffman apparatus for multiple L- amd
meso-CoOx catalysts in sodium carbonate/bicarbonate pH 10 buffer solutions at a 5.0 mA/cm2 current density and pH
13 (0.1 M KOH) solutions at 10 mA/cm2 current densities.
H2:O2 L-CoOx meso-CoOx
pH 10 2.4:1.0 3.7:1.0
pH 13 2.2:1.0 2.1:1.0
5.2.3 A Mechanistic Scheme for OER at Different pH
From our experimental studies at different pH values, we propose a mechanistic scheme
that can explain the observed effects (Figure 5.5). Figure 5.5a shows a model lattice representing
the polarization of the electron spin of radical intermediates (down, blue ball and up, red ball) on
a chiral (left) and achiral catalyst surface (right). For chiral catalysts, the spin at adjacent sites on
the lattice of intermediates are mostly aligned, because of the CISS effect. This model is consistent
with spin polarization measurements made on other chiral metal oxides.10 For achiral catalysts,
however, CISS does not operate and alignment of the spin at adjacent sites does not occur. When
the pH is high (pH 13) the electrochemical intermediates are mostly dominated by radical oxygen
formation.40, 41 For the chiral catalysts at high pH (1), the spins at adjacent reaction sites are aligned
parallel (↑O∙∙∙O↑) and thus favor the formation of triplet oxygen (↑O-O↑). Conversely, for achiral
catalysts at high pH (3) the spins at adjacent sites on the catalyst are mixed; both parallel (↑O∙∙∙O↑)
and antiparallel (↑O∙∙∙O↓) configurations exist. Because the ground state of oxygen is a triplet,

104
formation of oxygen from the antiparallel alignment is spin forbidden which decreases the rate
constant because of differences in the activation energy and/or the need for transitioning between
the triplet and singlet reaction pathways. For example, Chrétien and Metiu9 calculated more than
a 0.5 eV activation barrier difference for the singlet and triplet pathways of O2 on TiO2/Au catalytic
surfaces. Such differences could account for the change in overpotential between L- and meso-
CoOx, as shown in Figure 5.3 and explain why the ratio of H2/O2 is the same at high pH when the
same current density is applied (higher bias voltage); see Table 5.1.
Figure 5.5 Proposed, mechanistic scheme explaining the role of spin polarization during water splitting. (a) model
lattice where the color of the ball represents the spin of the radical absorbate (shown here as hydroxyl) at the catalyst
side; blue indicates down spin and red indicates up spin. For chiral catalysts (left), because of the CISS effect, the
electrons at adjacent sites tend to be spin aligned; and hence the formation of triplet oxygen will be favored.
Conversely, for achiral catalysts more spin disorder exists at adjacent sites necessitating either a change in spin state
or reaction on a singlet reaction pathway with a higher activation barrier to form triplet oxygen. (b) Mechanism of
product formation at different pH valuess. For chiral catalysts, the formation of triplet oxygen is favored at high pH,
when the reactant is radical oxygen (1), and at lower pH in which hydroxyl radical intermediates can also occur (2).
For achiral catalysts at higher pH (3) the formation of triplet oxygen can proceed, but is slowed by the spin disorder,
and at lower pH, (4), the production of H2O2 can compete with the more sluggish triplet oxygen. The dotted line
between the atoms indicates the intermediate state, the solid line represents a chemical bond, and +E indicates a higher
activation barrier.
High pH
Low pH
Achiral
Chiral
b)
a)OH OH OH OH
HO .... OH2 O O + 2H2OTriplet product
O .... O O OTriplet product
+EO .... O O .... O O O
Triplet productHigh pH
Low pH
Spin aligned Random spin
(1)
HO .... OH
HO .... OH+E O OTriplet product
Singlet product
+ 2H2O
2
2
HO OH2
(3)
(2)
(4)

105
As the pH decreases (pH 10) both radical oxygen and hydroxyl radicals will contribute
significantly to the population of intermediates, and the general mechanistic picture changes
because the H2O2 reaction pathway becomes more competitive. For chiral catalysts with hydroxyl
intermediates (2); spin alignment (↑HO∙∙∙OH↑) favors the formation of triplet oxygen (↑O-O↑).
Whereas for achiral catalysts a new pathway emerges, (4), and competes with the formation of
triplet oxygen; the thermodynamically favored pathway for the parallel (↑HO∙∙∙OH↑) spin
alignment is (↑O-O↑) and the thermodynamically favored process for antiparallel (↑HO∙∙∙OH↓)
alignment is (↑HO-OH↓). This new pathway emerges at lower pH because of the stability of the
H2O2 product and manifests as a difference in oxygen yield, presented in Table 5.1 at pH 10 and
the amount of H2O2 produced at pH 6.5 in Figure 5.3c. This proposed mechanism is supported by
previous studies showing that the reaction leading to molecular intermediates from a separated
atom configuration (O∙∙∙O) at a higher pH is thermodynamically more stable in the case of triplet
species compared to singlet species.9
5.2.4 Magnetic Field Dependent Water Splitting
An alternative means for controlling the spin alignment of the radical intermediates is
through the use of a magnetized electrocatalyst surface. Figure 5.6a shows current versus time
curves of an L-CoOx thin film electrode (conditions are 0.9 V vs. NHE at pH 13) with no applied
magnetic field (white) and with the application of an external 0.4 T field (pink). The as synthesized
CoOx thin film exhibits very weak, nearly negligible, changes in current density with an external
magnetic field. This is because the film comprises mostly Co(III) species which are diamagnetic
and therefore no net magnetic moment is generated.42 Figure 5.6b shows current-time data for a
film that was biased at 1.2 V vs NHE for 30 min in 0.1 M KOH, which converts the average

106
oxidation state of the CoOx catalyst from Co(III) to Co(IV) and forms a paramagnetic material.43
This change in magnetic properties upon treatment is consistent with the Pourbaix diagram, which
indicates the formation of Co(IV) (a paramagnetic species) at higher applied potentials,44, 45 and
with EPR measurements.11, 46 As Figure 5.6b shows, these films display an apparent increase in
the current upon application of a magnetic field. Note that the data sets in Figure 5.6 were obtained
sequentially, first the data in Figure 5.6a were collected; and after the electrochemical treatment,
the data in Figure 5.6b were collected. The absorbance spectra, circular dichroism, and XPS
spectra, which support the change in the film composition, are presented in the Appendix D (Figure
D.2, and Figure D.10).
The fact that a magnetic field dependence is observed after the applied voltage treatment,
and not before, implies that the magnetic field enhancement of the OER arises from spin
polarization properties of the electrocatalyst surface, rather than transport effects, such as diffusion
of reagents and gas bubbles because of Lorentz forces acting on the solution - as shown by others.47
Given that the primary difference in the CoOx films in Figure 5.6a,b is the Co oxidation state, the
emergence of a magnetic field effect must be rooted in the spin alignment of the active sites/species
during the reaction. That is, the external magnetic field aligns (spin polarizes) the radical
intermediates on the paramagnetic CoOx, similar to the effect of chirality, and favors the O2 (3∑𝑔
−)
pathway. These results are consistent with the study of Garces-Pineda24 for ferromagnetic
electrodes and the theoretical work of Gracia who has identified that spin dependent interactions
can improve the OER in perovskite electrocatalysts.22
Figure 5.6c shows the magnetocurrent (jm) as a function of the potential used to treat the
film. In this study the film is treated with a particular potential for 20 min and the magneto-
response was measured. Then, the sample was treated again with a higher potential and followed
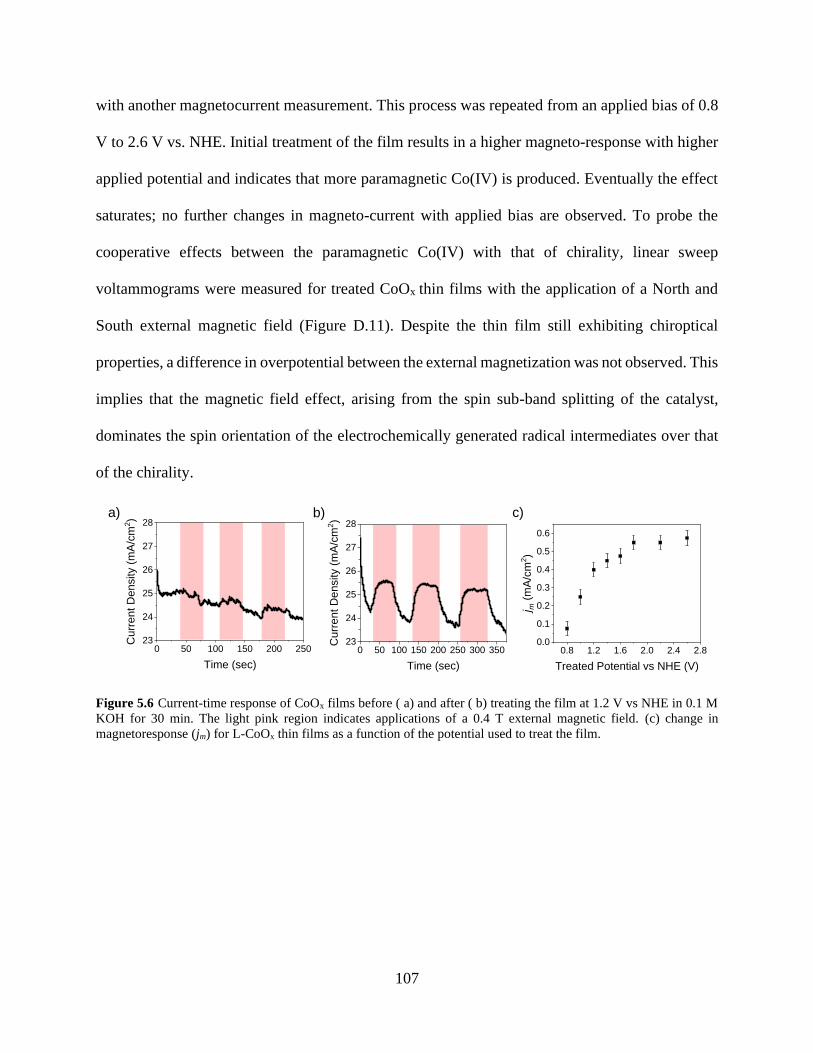
107
with another magnetocurrent measurement. This process was repeated from an applied bias of 0.8
V to 2.6 V vs. NHE. Initial treatment of the film results in a higher magneto-response with higher
applied potential and indicates that more paramagnetic Co(IV) is produced. Eventually the effect
saturates; no further changes in magneto-current with applied bias are observed. To probe the
cooperative effects between the paramagnetic Co(IV) with that of chirality, linear sweep
voltammograms were measured for treated CoOx thin films with the application of a North and
South external magnetic field (Figure D.11). Despite the thin film still exhibiting chiroptical
properties, a difference in overpotential between the external magnetization was not observed. This
implies that the magnetic field effect, arising from the spin sub-band splitting of the catalyst,
dominates the spin orientation of the electrochemically generated radical intermediates over that
of the chirality.
Figure 5.6 Current-time response of CoOx films before ( a) and after ( b) treating the film at 1.2 V vs NHE in 0.1 M
KOH for 30 min. The light pink region indicates applications of a 0.4 T external magnetic field. (c) change in
magnetoresponse (jm) for L-CoOx thin films as a function of the potential used to treat the film.
a) b) c)
0 50 100 150 200 25023
24
25
26
27
28
Cu
rre
nt
De
nsity (
mA
/cm
2)
Time (sec)
0 50 100 150 200 250 300 35023
24
25
26
27
28
Cu
rre
nt
De
nsity (
mA
/cm
2)
Time (sec)
0.8 1.2 1.6 2.0 2.4 2.80.0
0.1
0.2
0.3
0.4
0.5
0.6j m
(m
A/c
m2)
Treated Potential vs NHE (V)

108
5.3 CONCLUSION
By creating chiral CoOx electrocatalysts that can support high current densities, this work
substantiates and extends earlier claims that controlling the spin polarization of radical
intermediates is an important strategy for improving the OER efficiency. Efficiency improvements
were demonstrated by using chiral cobalt oxide thin films, which impart a spin polarization through
the CISS effect, and by creating paramagnetic CoOx films which can be spin polarized with an
external magnetic field. The improvement in water splitting manifests in two ways. First, the
reaction overpotential decreases by 65 mV at a benchmark current density of 10 mA/cm2. Second,
the oxygen yield increased by 1.4 times at pH=10 by reducing the formation of the H2O2 side-
product. This difference becomes increasingly important at pH=6.5 where a 4-fold decrease in
H2O2 was observed. These studies are outlined within a proposed mechanistic model that describes
how the spin-filtering of electron injection can enhance reaction selectivity and points to a strategy
for improving water electrolysis at neutral pH.
5.4 CAVEAT
The experiments shown in this project demonstrate that the catalytic activity of the cobalt
oxide made from chiral tartaric acid outperforms the catalysts that are made from meso tartaric
acid. Although, the CD spectroscopy confirms the chirality of the film as a whole, the active center
of the catalysts might still be achiral. The difference in the catalytic activity between meso and L-
catalysts might come from other properties of the active center or because of the different numbers
of the active sites in the catalysts. It is certain that the spin plays an important role in the water

109
splitting as shown by the magnetic field dependent OER study with the paramagnetic catalysts.
But in order to unequivocally prove that the spins role in the chemical reaction is linked to the
chiral nature of the catalyst will require more extensive studies focused on the chirality of the
active centers.
5.5 EXPERIMENTAL METHODS
5.5.1 Formation of Cobalt Oxide Thin Film
Cobalt oxide films were prepared using an electrochemical deposition method. For the
electrodeposition, 0.8 mmol of L-, D-, or meso-tartaric acid and 0.08 mmol of CoCl2·6H2O was
added to 10 ml of water. Next, 2 mmol of Na2CO3 was added to the solution and the total volume
was increased to 20 mL. A three electrode electrochemical cell was employed for the deposition
in which a fluorine-doped tin oxide (FTO) coated glass substrate, or a 10 nm gold coated quartz
substrate, was used as the working electrode. A Pt sheet and Ag│AgCl were used as the counter
and reference electrodes, respectively. For the deposition, a constant potential of 0.7 V was applied
using a CH Instruments 430a potentiostat, and the thickness of the film was controlled by the
deposition time. Following electrodeposition, the film was washed with copious amounts of water
and dried under a stream of argon.
110
5.5.2 Circular Dichroism
Circular dichroism measurements were performed using an Olis DSM 17 CD spectrometer
with an integration time of 3 sec and a bandwidth of 1 nm. Measurements were made on gold
coated quartz substrates which allow for higher transmission in the UV than FTO.
5.5.3 Oxygen Evolution Studies
Electrochemical measurements for the OER were performed in 0.1 M KOH or pH 10
sodium carbonate / bicarbonate buffer. A three electrode electrochemical cell was used for the
electrochemical measurement. An FTO substrate deposited with L-, D-, or meso-CoOx thin films
was used as the working electrode, Ag│AgCl was used as the reference electrode, and a Pt sheet
was used as the counter electrode. The electrochemical measurement was performed by using
linear sweep voltammetry from 0.5V to 1.2 V vs Ag│AgCl with a scan rate of 20 mV/s
5.5.4 Hydrogen Peroxide Formation
Hydrogen peroxide formation was detected by the addition of a redox indicator o-tolidine.
In the presence of hydrogen peroxide o-tolidine forms a yellow colored solution which has an
absorption peak at 436 nm. For the hydrogen peroxide formation experiment, L- and meso-CoOx
were deposited on FTO coated glass substrates. Electrochemical experiments were performed in
0.1 M Na2SO4 (pH 6.5) solution at a constant potential of 1 V for 45 mins. Following the
experiment, 3 ml of the electrolyte solution from the electrochemical cell was mixed with 1 ml of

111
an o-tolidine indicator solution and the absorption was measured using a Model 8453 Agilent UV-
Vis spectrometer.
5.5.5 Hoffman Apparatus
A modified Hoffman apparatus was used to measure the hydrogen and oxygen yield during
water splitting. An additional port, adjacent to the working electrode was milled into the glass to
allow for the presence of an Ag│AgCl reference electrode. First, a linear sweep voltammogram
was measured to determine the potential at which a current density of 10 mA/cm2 (for 0.1M KOH
solutions) or 5 mA/cm2 (for sodium carbonate/bicarbonate solutions) is achieved. Then, a fixed
potential was applied and the volume displaced in the Hoffman apparatus was recorded every 10
min for KOH solutions and 30 min for sodium carbonate/bicarbonate solutions. The volume
resolution of the instrument is 0.1 mL. To account for any imperfections in the apparatus, the
hydrogen to oxygen ratio was standardized using Pt as both the anode and cathode. Deviations
from a 2:1 ratio are expected to occur from poor oxygen saturation, and thus the measured volume
of the oxygen for electrolysis with CoOx electrodes was modified to reflect the H2:O2 ratio found
in the Pt-Pt measurement.
5.5.6 Magnetic Field Effects on the Oxygen Evolution Reaction
Prior to the magnetic field dependent study, the film was first treated with a constant
potential of 1.0 V vs Ag│AgCl for 1000 s in 0.1M KOH. Using the treated substrates, the effect
of a magnetic field on the current was investigated. A constant potential of 1.2 V was used during
the experiment and an external magnet was applied and then removed from the back of the
112
substrate. The magnetic field acting on the surface of the electrode was measured with a
gaussmeter to be 350- 400 mT.
5.5.7 Electrochemical Surface Area Calculation (ECSA)
ECSA was calculated using a double layer capacitance (CDL) method following previously
published protocols.6 Briefly,
ECSA = CDL/Cs
where Cs is the specific capacitance of the sample or the capacitance of an atomically smooth
planar surface of the material under identical electrolyte conditions, and CDL is measured using
cyclic voltammetry at a potential region where no Faradaic processes occur. Here, cyclic
voltammograms were measured at different scan rates (0.05- 3.2 V/s) in 1 M NaOH solutions
within a potential range of -0.3 - 0.5V vs Ag/AgCl. The double layer charging current is the product
of CDL and the scan rate such that a plot of current vs scan rate gives a slope of CDL.
5.5.8 X-Ray Photoelectron Spectroscopy (XPS)
XPS data were collected on an ESCALAB 250XI instrument. The data were referenced to an
adventitious carbon peak of 284.8 eV and measured before and after a soft ion sputter cleaning (1000
eV for 10 seconds) to ensure that the treatment was not changing the oxidation state of the metal oxide.
The data were collected while using a flood gun to compensate for surface charging. Each spectrum
represents the average of 20 scans.
113
5.5.9 X-Ray Diffraction (XRD)
Powder XRD patterns were collected using a Bruker AXS D8 Discover XRD (NanoScale
Fabrication and Characterization Facility, Petersen Institute of NanoScience and Engineering,
Pittsburgh, PA) equipped with a Cu Kα (λ α = 1.5406 Å) X-ray source operating at 40 kV and 40
mA. The diffracted beam was detected using a Bruker AXS Lynxeye (silicon strip) detector.
PXRD patterns were collected using a continuous lock-coupled scan with a scan speed of 0.25
Sec/Step from 15.00o to 95.00o with a step size of 0.025o.
5.5.10 SEM Study
Imaging was performed using an FEI Scios focused ion beam (FIB) / scanning electron
microscope (SEM) dual-beam system (Nanoscale Fabrication and Characterization Facility,
Petersen Institute of NanoScience and Engineering, Pittsburgh, PA).
5.5.11 Atomic Force Microscopy Measurement
Atomic force microscopy measurements were performed using an Asylum Research MFP-
3D atomic force microscope. The meso- and L-CoOx samples were prepared on FTO substrates
and the surface topography was measured in non-contact mode.

114
5.6 REFERENCES
1.El-Shafie, M.; Kambara, S.; Hayakawa, Y., Hydrogen Production Technologies Overview. J.
Power Energy Eng. 2019, 07, 107.
2.Turner, J. A., Sustainable Hydrogen Production. Science 2004, 305, 972.
3.Lewis, N. S., Toward Cost-Effective Solar Energy Use. Science 2007, 315, 798.
4.McKone, J. R.; Lewis, N. S.; Gray, H. B., Will Solar-Driven Water-Splitting Devices See the
Light of Day? Chem. Mater. 2014, 26, 407.
5.McCrory, C. C.; Jung, S.; Peters, J. C.; Jaramillo, T. F., Benchmarking Heterogeneous
Electrocatalysts for the Oxygen Evolution Reaction. J. Am. Chem. Soc. 2013, 135, 16977.
6.McCrory, C. C. L.; Jung, S.; Ferrer, I. M.; Chatman, S. M.; Peters, J. C.; Jaramillo, T. F.,
Benchmarking Hydrogen Evolving Reaction and Oxygen Evolving Reaction Electrocatalysts for
Solar Water Splitting Devices. J. Am. Chem. Soc. 2015, 137, 4347.
7.Lin, Y.; Tian, Z.; Zhang, L.; Ma, J.; Jiang, Z.; Deibert, B. J.; Ge, R.; Chen, L., Chromium-
Ruthenium Oxide Solid Solution Electrocatalyst for Highly Efficient Oxygen Evolution Reaction
in Acidic Media. Nat. Commun. 2019, 10, 162.
8.Song, F.; Bai, L.; Moysiadou, A.; Lee, S.; Hu, C.; Liardet, L.; Hu, X., Transition Metal Oxides
as Electrocatalysts for the Oxygen Evolution Reaction in Alkaline Solutions: An Application-
Inspired Renaissance. J. Am. Chem. Soc. 2018, 140, 7748.
9.Chrétien, S.; Metiu, H., O2 Evolution on a Clean Partially Reduced Rutile TiO2 (110) Surface
and on the Same Surface Precovered with Au1 and Au2: The Importance of Spin Conservation. J.
Chem. Phys. 2008, 129, 074705.
10.Ghosh, K. B.; Zhang, W.; Tassinari, F.; Mastai, Y.; Lidor-Shalev, O.; Naaman, R.; Mollers,
P.; Nurenberg, D.; Zacharias, H.; Wei, J.; Wierzbinski, E.; Waldeck, D. H., Controlling Chemical
Selectivity in Electrocatalysis with Chiral CuO Coated Electrodes. J. Phys. Chem. C 2019, 123,
3024.
11.Gerken, J. B.; McAlpin, J. G.; Chen, J. Y. C.; Rigsby, M. L.; Casey, W. H.; Britt, R. D.;
Stahl, S. S., Electrochemical Water Oxidation with Cobalt-Based Electrocatalysts from pH 0-14:
The Thermodynamic Basis for Catalyst Structure, Stability, and Activity. J. Am. Chem. Soc. 2011,
133, 14431.
12.Smith, A. F.; Nicoll, W. D., Stability of Stability of Dilute Alkaline Solutions of Hydrogen
Peroxide. Ind. Eng. Chem. 1955, 47, 2548.

115
13.Seabold, J. A.; Choi, K. S., Effect of a Cobalt-Based Oxygen Evolution Catalyst on the Stability
and the Selectivity of Photo-Oxidation Reactions of a WO3 Photoanode. Chem. Mater. 2011, 23,
1105.
14.Torun, E.; Fang, C. M.; de Wijs, G. A.; de Groot, R. A., Role of Magnetism in catalysis: RuO2
(110) surface. J. Phys. Chem. C 2013, 117, 6353.
15.Suntivich, J.; Gasteiger, H. A.; Yabuuchi, N.; Nakanishi, H.; Goodenough, J. B.; Shao-Horn,
Y., Design Principles for Oxygen-Reduction Activity on Perovskite Oxide Catalysts for Fuel Cells
and Metal–Air Batteries. Nat. Chem. 2011, 3, 546.
16.Suntivich, J.; May, K. J.; Gasteiger, H. A.; Goodenough, J. B.; Shao-Horn, Y., A Perovskite
Oxide A Perovskite Oxide Optimized for Oxygen Evolution Catalysis from Molecular Orbital
Principles. Science 2011, 334, 1383.
17.Zhou, S.; Miao, X.; Zhao, X.; Qiu, Y.; Hu, Z.; Zhao, J.; Shi, L.; Zeng, J., Engineering
Electrocatalytic Activity in Nanosized Perovskite Cobaltite through Surface Spin-State Transition.
Nat. Commun. 2016, 7, 11510.
18.Chen, S.; Kang, Z.; Hu, X.; Zhang, X.; Wang, H.; Xie, J.; Zheng, X.; Yan, W.; Pan, B.;
Xie, Y., Delocalized Spin States in 2D Atomic Layers Realizing Enhanced Electrocatalytic
Oxygen Evolution. Adv. Mater. 2017, 29, 1701687.
19.Pan, L.; Ai, M.; Huang, C.; Yin, L.; Liu, X.; Zhang, R.; Wang, S.; Jiang, Z.; Zhang, X.;
Zou, J.; Mi, W., Manipulating Spin polarization of Titanium Dioxide for Efficient Photocatalysis.
Nat. Commun. 2020, 11, 418.
20.Sharpe, R.; Munarriz, J.; Lim, T.; Jiao, Y.; Niemantsverdriet, J. W.; Polo, V.; Gracia, J.,
Orbital Physics of Perovskites for the Oxygen Evolution Reaction. Top. Catal. 2018, 61, 267.
21.Gracia, J., Spin Dependent Interactions Catalyse the Oxygen Electrochemistry. Phys. Chem.
Chem. Phys. 2017, 19, 20451.
22.Liang, X.; Yang, Z., Self-Magnetic-Attracted NixFe(1–x)@NixFe(1–x)O Nanoparticles on
Nickel Foam as Highly Active and Stable Electrocatalysts towards Alkaline Oxygen Evolution
Reaction. Nano Res. 2020, 13, 461.
23.Davodi, F.; Muhlhausen, E.; Tavakkoli, M.; Sainio, J.; Jiang, H.; Gokce, B.; Marzun, G.;
Kallio, T., Catalyst Support Effect on the Activity and Durability of Magnetic Nanoparticles:
toward Design of Advanced Electrocatalyst for Full Water Splitting. ACS Appl. Mater. Interfaces
2018, 10, 31300.
24.Garcés-Pineda, F. A.; Blaco-Ahicart, M.; Nieto-Castro, D.; Lopez, N.; Galán-Mascarós, J. R.,
Direct Magnetic Enhancement of Electrocatalytic Water Oxidation In Alkaline Media. Nat. Energy
2019, 4, 519.
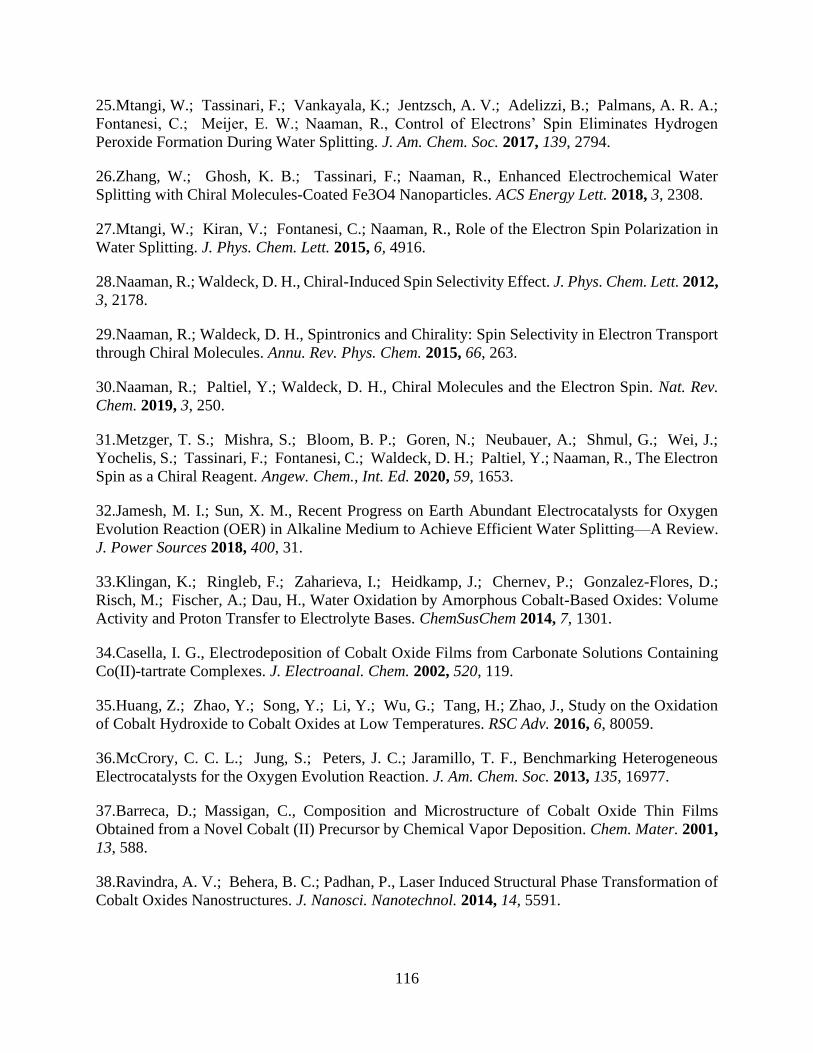
116
25.Mtangi, W.; Tassinari, F.; Vankayala, K.; Jentzsch, A. V.; Adelizzi, B.; Palmans, A. R. A.;
Fontanesi, C.; Meijer, E. W.; Naaman, R., Control of Electrons’ Spin Eliminates Hydrogen
Peroxide Formation During Water Splitting. J. Am. Chem. Soc. 2017, 139, 2794.
26.Zhang, W.; Ghosh, K. B.; Tassinari, F.; Naaman, R., Enhanced Electrochemical Water
Splitting with Chiral Molecules-Coated Fe3O4 Nanoparticles. ACS Energy Lett. 2018, 3, 2308.
27.Mtangi, W.; Kiran, V.; Fontanesi, C.; Naaman, R., Role of the Electron Spin Polarization in
Water Splitting. J. Phys. Chem. Lett. 2015, 6, 4916.
28.Naaman, R.; Waldeck, D. H., Chiral-Induced Spin Selectivity Effect. J. Phys. Chem. Lett. 2012,
3, 2178.
29.Naaman, R.; Waldeck, D. H., Spintronics and Chirality: Spin Selectivity in Electron Transport
through Chiral Molecules. Annu. Rev. Phys. Chem. 2015, 66, 263.
30.Naaman, R.; Paltiel, Y.; Waldeck, D. H., Chiral Molecules and the Electron Spin. Nat. Rev.
Chem. 2019, 3, 250.
31.Metzger, T. S.; Mishra, S.; Bloom, B. P.; Goren, N.; Neubauer, A.; Shmul, G.; Wei, J.;
Yochelis, S.; Tassinari, F.; Fontanesi, C.; Waldeck, D. H.; Paltiel, Y.; Naaman, R., The Electron
Spin as a Chiral Reagent. Angew. Chem., Int. Ed. 2020, 59, 1653.
32.Jamesh, M. I.; Sun, X. M., Recent Progress on Earth Abundant Electrocatalysts for Oxygen
Evolution Reaction (OER) in Alkaline Medium to Achieve Efficient Water Splitting—A Review.
J. Power Sources 2018, 400, 31.
33.Klingan, K.; Ringleb, F.; Zaharieva, I.; Heidkamp, J.; Chernev, P.; Gonzalez-Flores, D.;
Risch, M.; Fischer, A.; Dau, H., Water Oxidation by Amorphous Cobalt-Based Oxides: Volume
Activity and Proton Transfer to Electrolyte Bases. ChemSusChem 2014, 7, 1301.
34.Casella, I. G., Electrodeposition of Cobalt Oxide Films from Carbonate Solutions Containing
Co(II)-tartrate Complexes. J. Electroanal. Chem. 2002, 520, 119.
35.Huang, Z.; Zhao, Y.; Song, Y.; Li, Y.; Wu, G.; Tang, H.; Zhao, J., Study on the Oxidation
of Cobalt Hydroxide to Cobalt Oxides at Low Temperatures. RSC Adv. 2016, 6, 80059.
36.McCrory, C. C. L.; Jung, S.; Peters, J. C.; Jaramillo, T. F., Benchmarking Heterogeneous
Electrocatalysts for the Oxygen Evolution Reaction. J. Am. Chem. Soc. 2013, 135, 16977.
37.Barreca, D.; Massigan, C., Composition and Microstructure of Cobalt Oxide Thin Films
Obtained from a Novel Cobalt (II) Precursor by Chemical Vapor Deposition. Chem. Mater. 2001,
13, 588.
38.Ravindra, A. V.; Behera, B. C.; Padhan, P., Laser Induced Structural Phase Transformation of
Cobalt Oxides Nanostructures. J. Nanosci. Nanotechnol. 2014, 14, 5591.
117
39.Kothari, H. M.; Kulp, E. A.; boonsalee, S.; Nikiforov, M. P.; Bohannan, E. W.; Roizot, P.;
Nakanishi, S.; Switzer, J. A., Enantiospecific Electrodeposition of Chiral CuO Films from
Copper(II) Complexes of Tartaric and Amino Acids on Single-Crystal Au(001). Chem. Mater.
2004, 16, 4232.
40.Nakabayashi, Y.; Nosaka, Y., The pH Sependence of OH Radical Formation in Photo-
Electrochemical Water Oxidation with Rutile TiO2 Single Crystals. Phys. Chem. Chem. Phys.
2015, 17, 30570.
41.von Sonntag, C., Free-Radical-Induced DNA Damage and Its Repair. 2006.
42.Casella, I. G.; Guascito, M. R., Anodic Electrodeposition of Conducting Cobalt Oxyhydroxide
Films on a Gold Surface. XPS Study and Electrochemical behavior in Neutral and Alkaline
Solution. J. Electroanal. Chem. 1999, 476, 54.
43.Casella, I. G.; Guascito, M. R., Study of the Electrochemical Deposition and Properties of
Cobalt Oxide Species in Citrate Alkaline Solutions. J. Electroanal. Chem. 2002, 534, 31.
44.Motohashi, T.; Katsumata, Y.; Ono, T.; Kanno, R.; Karppinen, M.; Yamauchi, H., Synthesis
and Properties of CoO2, the x= 0 End Member of the LixCoO2 and NaxCoO2 Systems. Chem.
Mater. 2007, 19, 5063.
45.Huang, L. F.; Rondinelli, J. M., Reliable Electrochemical Phase Diagrams of Magnetic
Transition Metals and Related Compounds from High-Throughput ab initio Calculations. npj
Mater. Degrad. 2019, 3, 26.
46.Kutin, Y.; CoX, N.; Lubitz, W.; Schnegg, A.; Rudiger, O., In Situ EPR Characterization of a
Cobalt Oxide Water Oxidation Catalyst at Neutral pH. Catalysts 2019, 9, 926.
47.Elias, L.; Hegde, C., Effect of Magnetic Field on HER of Water Electrolysis on Ni-W Alloy.
Electrocatalysis 2017, 8, 375.

118
6.0 CONCLUDING REMARKS
The work shown in the dissertation has explored fundamental aspects and applications of
the chiral induced spin selectivity effect. Advancement of the CISS field depends on the
understanding the mechanism and factors that influence the effect, as well as exploring different
chiral systems to study various CISS mediated processes. The projects discussed here have
explored some very important role of chiral molecules at the ferromagnetic interface that can
unravel the mechanism of CISS effect and also investigated spin filtering properties of new types
of chiral materials that can have application in memory devices or in electrocatalysis.
Chapter 2 shows a technique to induce magnetism using chiral molecules that occurs via
spin exchange interaction between chiral molecules and a metallic surface. The results show that
the asymmetric adsorption of chiral molecules onto the surface of superparamagnetic nanoparticles
can induce ferromagnetism in those particles and that the magnetization direction depends on the
handedness of the chiral molecules. Using this strategy, a stable ferromagnetic domain of 10 nm
size, comprising the chiral molecule/nanoparticle, was created. This method promises to be very
important for creating magnetic devices of nm size, which is otherwise difficult because of the
superparamagnetic nature of materials at smaller sizes. The results introduce a new paradigm to
chiral molecules where charge polarization induces spin polarization; a consequence of the CISS
effect.
Chapter 3 of this dissertation presents a very important property of chiral molecules at the
spinterface (ferromagnetic and chiral molecule interface.). In this project spin dependent charge
penetration was studied at the ferromagnetic-chiral molecule interface. Surface potential
microscopy measurements show that electron penetration from metal electrode into the chiral

119
molecule depends on the chirality and magnetization direction. This work demonstrates that chiral
molecules can control the electron density at the ferromagnetic interface spin dependent charge
penetration was also studied with different magnetization strength, thickness of gold overcoat, and
the length of the chiral material. Previous results on molecular based spintronics devices show that
organic molecules at the ferromagnetic interface can influence the spin polarization and hence
controls the device properties. This study show spin polarization at the chiral molecule and
ferromagnetic interface can occur even without an external bias. These results might explain why
organic spintronics devices sometimes show anomalous behavior.
Chapter 4 has demonstrated the spin filtering efficiency of a chiral cobalt oxide thin film.
In this project spin dependent charge transfer through the chiral cobalt oxide thin film was studied
using magnetic conductive AFM. It was found that conduction of electrons (or the current) depends
on both the chirality and the spin orientation of the transmitted electrons. For L- cobalt oxide the
spin down electron was found to be conducted more readily than the spin up electrons, and an
opposite behavior was observed with D-Cobalt oxide film. Additional results show that doping the
cobalt oxide with paramagnetic species (Mn3+) increases the spin polarization. Efficient spin
filtering through this material suggests that thin film chiral material can be used for spintronics
type applications. Indeed, a spin valve based magnetoresistance device was also prepared and
results show the resistance of the device depends on chirality and the magnetization direction. For
future directions, the role of dopant interaction, crystal structure and composition of the film on
spin polarization study will be important. The results indicate that paramagnetic species (or
dopants) in the film might improve the device spin polarization.
Chapter 5 has demonstrated how controlling of electron spin via the CISS effect, during
the oxygen evolution reaction, affects the reaction rate and product formation. The water splitting

120
efficiency and the product formation for chiral and achiral catalysts were studied. Results on the
electrocatalytic experiments on the oxygen evolution reaction in water splitting study show that
the chiral material acts as a better catalyst than the achiral catalyst. Because the reaction involves
hydroxyl radical intermediates, spin polarization (arising from CISS effect) enhances the triplet
oxygen and suppresses the singlet mediated process. It was also shown magnetic field can also
improve the water splitting efficiency with paramagnetic catalysts by controlling the spin of the
surface site. A mechanistic picture of the effect of spin polarization for different product formation
at different pH was also discussed. These results show that spin polarization of chiral or magnetic
material improves the water splitting efficiencies thereby introducing newer avenues for future
researchers to design novel chiral electrocatalysts based on spin polarization. This work suggests
that the design principle for enhancing the water splitting activity of metal oxides is to improve
their chiral ordered structured for maximum activity, which can be further improved by increasing
the paramagnetic species concentration in the catalyst.
The work presented in this dissertation has explored some very important spin dependent
properties at the interface between a ferromagnetic surface and chiral molecule. Controlling spin
electron density or magnetization by the chiral molecules, as shown in Chapters 2 and 3, not only
unveils some important aspects of the CISS effect but also reveals new strategies for creating
spintronics devices based on the CISS effect. While these studies certainly help understand the
mechanism behind efficient spin polarization of the chiral system, a unifying model is still needed
to explain the results more quantitively. Exploring chiral molecules with modulations in the helical
pitch and/or diameter along with variations in functional groups remains an open area for further
studies. A correlation between the spin polarization and these parameters should unravel some
details about the effect and help build a unified model. Another area of interest is utilizing CISS

121
effect to control spin during chemical reactions. Chapters 4 and 5 show how spin dependent charge
transport through a chiral thin film facilitates spin dependent chemical reactions. Although proof
of principle experiments have been underlined herein, an overall improvement in the chirality of
the system under consideration and the effect of paramagnetic ions can further help validate the
claims. This dissertation lays a solid groundwork enabling future advancements of the CISS effect
and related phenomena.
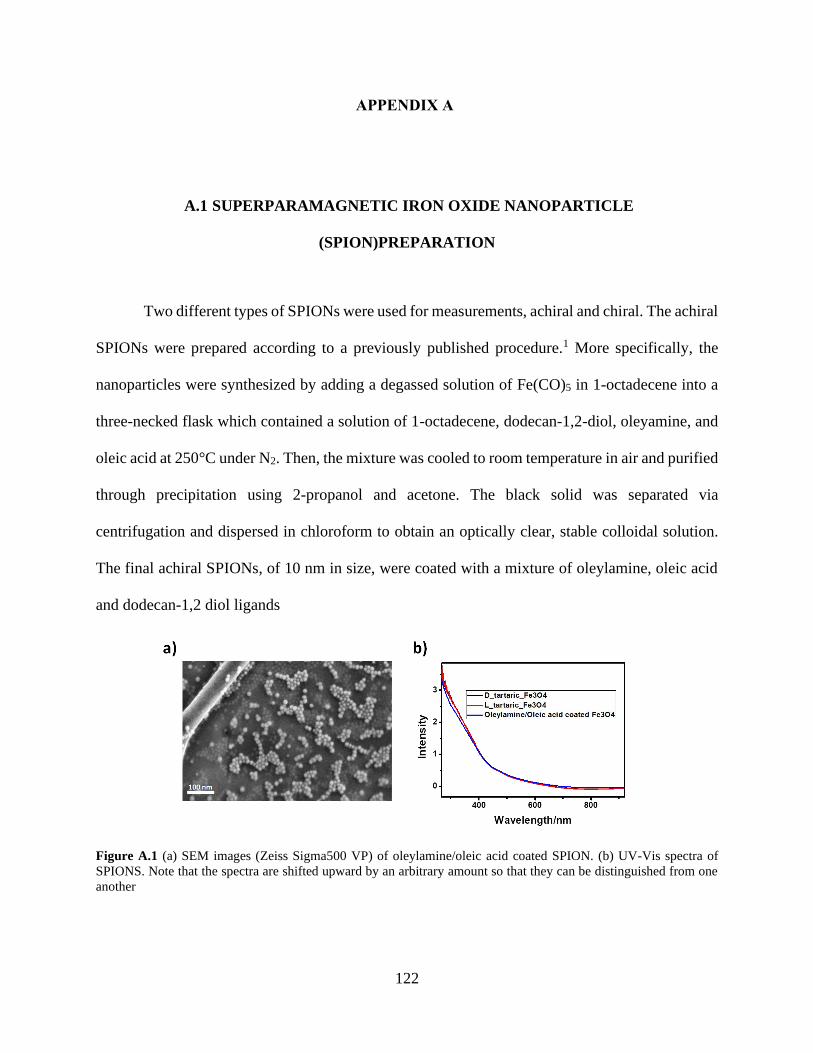
122
APPENDIX A
A.1 SUPERPARAMAGNETIC IRON OXIDE NANOPARTICLE
(SPION)PREPARATION
Two different types of SPIONs were used for measurements, achiral and chiral. The achiral
SPIONs were prepared according to a previously published procedure.1 More specifically, the
nanoparticles were synthesized by adding a degassed solution of Fe(CO)5 in 1-octadecene into a
three-necked flask which contained a solution of 1-octadecene, dodecan-1,2-diol, oleyamine, and
oleic acid at 250°C under N2. Then, the mixture was cooled to room temperature in air and purified
through precipitation using 2-propanol and acetone. The black solid was separated via
centrifugation and dispersed in chloroform to obtain an optically clear, stable colloidal solution.
The final achiral SPIONs, of 10 nm in size, were coated with a mixture of oleylamine, oleic acid
and dodecan-1,2 diol ligands
Figure A.1 (a) SEM images (Zeiss Sigma500 VP) of oleylamine/oleic acid coated SPION. (b) UV-Vis spectra of
SPIONS. Note that the spectra are shifted upward by an arbitrary amount so that they can be distinguished from one
another
123
Reference measurements were made using SPIONs coated in all directions with left- or
right-handed chiral tartaric acid molecules. The chiral SPIONS were prepared by post synthesis
ligand exchange of oleylamine/oleic acid coated iron oxide with tartaric acid. For the synthesis of
the reference nanoparticles a previously published protocol was followed, based on the thermal
decomposition of iron oleate in the presence of oleic acid and oleylamine(1:3).2 The mixture was
heated under argon at 200°C for 2 hours and then the temperature was increased to 300°C for 2
additional hours. The nanoparticles were purified through precipitation with ethanol and washed
with hexane and ethanol (1:1 ratio). Figure A.1 shows an SEM image and the absorbance spectrum
(Figure A.1b, blue line) of the synthesized particles. For the ligand exchange reaction, 5 mg of
synthesized oleylamine/oleic acid iron oxide was dissolved in toluene and 20-30 mg of tartaric
acid (dissolved in DMSO) was added. The mixture was vigorously stirred for 48 hours resulting
in the formation of a precipitate which was washed with ethanol multiple times to remove excess
ligands. Finally, the tartaric acid coated iron oxide nanoparticles were dispersed in pH 9 water.3 A
similar absorbance spectrum before (blue) and after (black, red) ligand exchange indicates that the
integrity of the nanoparticles persists (Figure A.1b).
A.2 SAMPLE PREPARATION FOR MAGNETIC MEASUREMENTS
Two types of magnetic measurement techniques were used: SQUID and M-AFM.
Preparation of the samples for both systems started by depositing 10 nm of Ti (adhesion layer),
followed by 100 nm of Ag onto a Si wafer by evaporation. The Ag coated wafers were then diced
into 4 mm x 4 mm chips.

124
Sample Preparation for SQUID: Samples were prepared under an inert (nitrogen)
atmosphere. The chips were immersed in 11.25 M HCl solution (50% v/v) for 10 seconds to
remove any native oxide layer formed on the Ag surface. Afterward, the samples were washed
with distilled water and then dried with an N2 gas flow. Additional cleaning was done by soaking
the chips in absolute ethanol for 20 minutes and then drying with N2 gas. For the formation of
AHPA-SAMs, the samples were placed in a 1 mM L- (or D-) AHPA solution in ethanol and
incubated for 3 hours. After adsorption, the samples were immediately washed in absolute ethanol
to remove excess unbound AHPA molecules and dried with N2. Lastly, a dilute 5 µL SPION
chloroform solution was drop cast onto the sample surface and dried with an N2 gas flow. The
preparation of the L- AHPA X2 in which an additional L- AHPA-SAM was formed on top of the
SPIONs layer included one additional step. In this case the sample was placed again in the 1 mM
L- AHPA solution for 3 hours followed by washing with ethanol and drying with N2 gas flow.
Figure A.2 illustrates the main preparation stages of these samples.
Figure A.2 Illustration of the preparation of the L- AHPA + SPIONs (achieved at stage 3) and the L- AHPA X2 +
SPIONs reference sample (achieved at stage 4); 1- preparation of clean 4mm X 4mm Ag substrate, 2- formation of
the AHPA-SAM (purple helical molecules), 3- adsorption of SPIONs (red spheres), 4- deposition of a top layer of
AHPA molecules.
Sample Preparation for M-AFM: An additional lithography process was performed to
pattern areas of the substrate with the AHPA SAM. Following the Ag layer evaporation, an

125
optically active resist (AR-P 7400.23) was spin coated onto the sample. Line and square patterns
were written in the resist using a Laser writer (LW405-A) and then developed. The adsorption
procedure of the AHPA-SAM was carried out in the same fashion as the SQUID samples. After
the formation of the AHPA-SAM, the resist was removed by immersing in acetone for 1 minute.
Thus, the regions in which resist was present resulted in bare substrate with no SAM formation.
Despite the lift-off process, some AHPA molecules re-adsorbed outside the AHPA-SAM areas,
but with a much lower density. The SPIONs were then drop cast onto the chips (Figure A.2b
outlines the steps in this procedure).
Additional reference samples of SPIONs covered with L- or D-tartaric acid were carried
out in an analogous manner on a mica or plasma cleaned SiO2 substrates. The mica substrate was
cleaved three times to achieve a clean surface before drop casting a 5 µL solution of tartaric acid
coated SPIONs and drying with a N2 gas flow.
A.3 MEASUREMENT SYSTEMS
Superconductive quantum interference device (SQUID) measurements were done using
MPMS3 LOT Quantum Design Inc. in vibrating sample magnetometry (VSM) mode to
characterize the magnetization hysteresis loop of the SPIONs on the AHPA-SAM. The samples
were mounted such that their surface was perpendicular to the direction of the magnetic field. The
magnetic field was applied between -500 Oe to +500 Oe on a logarithmic scale to obtain higher
resolution near zero field. The baseline was taken using a sample with only the Ag layer (no AHPA
molecules or SPIONs). This substrate baseline was subtracted from all other measurements (Figure
A.3).

126
M-AFM measurements were made using an AIST-NT SmartSPMTM 1000 Scanning probe
Microscope under ambient conditions with a cobalt alloy coated M-AFM tip (BudgetSensor
MagneticMulti75-G, coercive field of ~300 Oe, K~2.8 N/m, F~75 KHz). A 5000 Oe magnetic
field was applied with a home-made electromagnet to magnetize the tip either normal (up) or anti-
normal (down) to the substrate. Interleaved topography and magnetic interaction images were
taken. The topography was measured in tapping mode at an average tip distance of ~30 nm from
the sample, while the magnetic interaction was measured at an additional height of 100 nm (a total
distance of ~130 nm) to avoid Van der Waals interactions that can influence the measurements.
The magnetic interaction image measures the relative phase of the oscillating tip; a positive phase
(brighter spots) indicates a repulsive interaction between the tip and the surface and a negative
phase (darker spots) indicates an attractive interaction. Additional measurements on the all covered
SPIONs were also conducted on an Agilent 5500 scanning probe microscope with a Co-Cr
magnetic tip (coercive field of ~400 Oe, K~3 N/m, F~75 KHz). The magnetic phase signal is
measured in a interleave scan mode with a interleave pull away distance of 100 nm.
Transmission electron microscopy investigation of the achiral SPIONs was accomplished
by a Joel Jem-1011 microscope operating at an accelerating voltage of 100 kV and equipped with
a W source and a Quemesa Olympus CCD 11 Mp Camera for the image acquisition. The SPIONs
dispersion was deposited on a 300 mesh amorphous carbon coated Cu grid by dipping. Freeware
imageJ analysis program was used to determine the size of the nanoparticles.
For the achiral SPIONs on patterned AHPA-SAM, SEM images (Figure 2.2) were taken
on a MagellanTM 400L XHR-SEM instrument under 2.0 kV accelerating voltage, 13 pA current,
at a 1.9 mm working distance and using a TLD detector in secondary electrons mode.
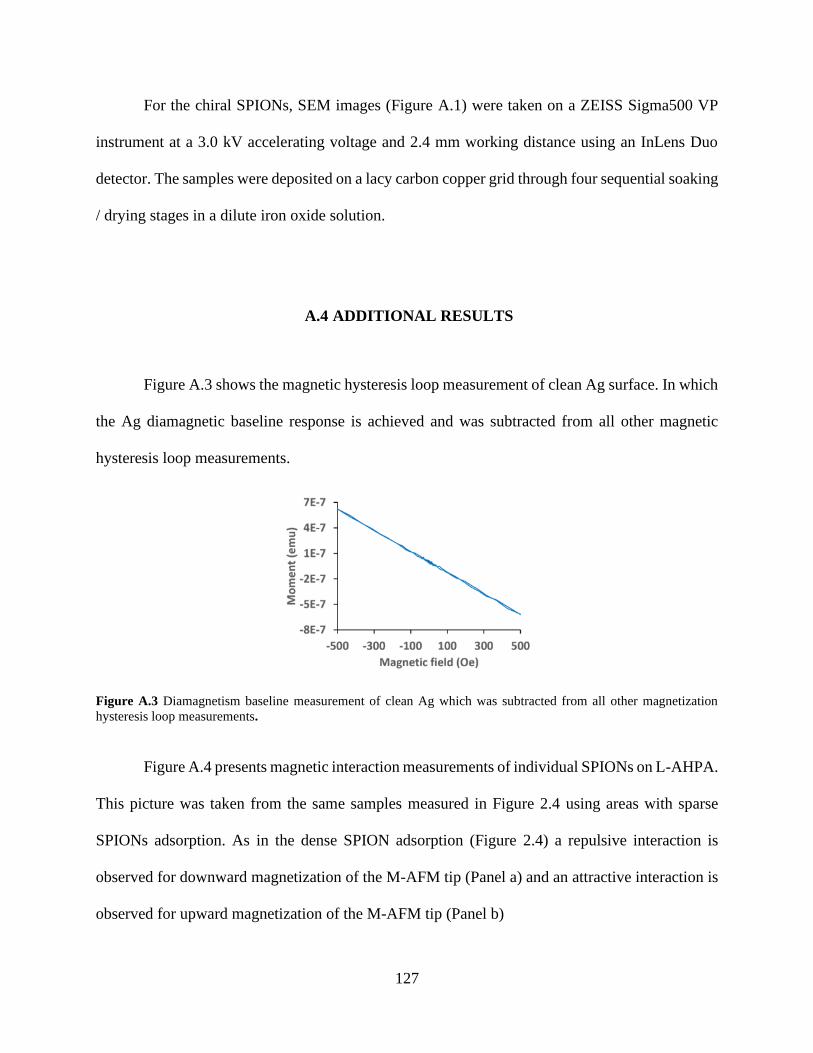
127
For the chiral SPIONs, SEM images (Figure A.1) were taken on a ZEISS Sigma500 VP
instrument at a 3.0 kV accelerating voltage and 2.4 mm working distance using an InLens Duo
detector. The samples were deposited on a lacy carbon copper grid through four sequential soaking
/ drying stages in a dilute iron oxide solution.
A.4 ADDITIONAL RESULTS
Figure A.3 shows the magnetic hysteresis loop measurement of clean Ag surface. In which
the Ag diamagnetic baseline response is achieved and was subtracted from all other magnetic
hysteresis loop measurements.
Figure A.3 Diamagnetism baseline measurement of clean Ag which was subtracted from all other magnetization
hysteresis loop measurements.
Figure A.4 presents magnetic interaction measurements of individual SPIONs on L-AHPA.
This picture was taken from the same samples measured in Figure 2.4 using areas with sparse
SPIONs adsorption. As in the dense SPION adsorption (Figure 2.4) a repulsive interaction is
observed for downward magnetization of the M-AFM tip (Panel a) and an attractive interaction is
observed for upward magnetization of the M-AFM tip (Panel b)

128
Figure A.4 Magnetic Interaction measurements of individual SPIONs on L-AHPA. Panel (a) shows repulsive
interaction for downward magnetization of the M-AFM tip (red arrow) and Panel (b) shows attractive interaction for
upward magnetization of the M-AFM tip.
Figure A.5 panels a) and b) shows an enlargement of the topography images and cross
sections of only SPIONs on Ag sample presented in the insets of figure 5 panels b) and c)
respectively. The cross sections show that the nano objects on the surface are of ~10 nm average
height, in agreement with the size of the SPIONs measured by TEM, indicating the presence of
monolayers of SPIONs on the surface.
Figure A.5 Panels a) and b) are the enlarged topography images of the sample of only SPIONs on Ag substrate
presented in Figure 5 b&c repectively. Cross sections were taken on each of the images to show that the objects on
the substrate are of ~10 nm averaged height which correspond to the size of the SPIONs.

129
Figure A.6 shows the magnetic phase shift of the L- and D-tartaric acid coated iron oxide
nanoparticles. The coating is covering the nanoparticles from all directions. The magnetic phase
shift value was taken from M-AFM measurements on single nanoparticles. A distribution of
magnetic phase shift per unit volume against the size of the nanoparticles is plotted in Figure A.5
panels a) and b). The black symbols are for measurements in which the tip was magnetized in the
north direction (N) and the red symbols are for measurements in which the tip was magnetized in
the south direction (S). Histograms of the magnetic phase shift are presented for both chiralities
and magnetizations in Figure A.5 panels c) and d). The overlapping distribution of the phase shift
for north and south pole tip magnetization indicates that no clear MIPAC effect is evident. This
behavior is attributed to a frustrated magnetic dipole in the iron oxide nanoparticles, as are the
SPIONS in the L- AHPA X2 + SPIONs sample (Figure 2.3b). While the majority of the data
indicates random orientations, the tail of the histograms indicates that some asymmetry exists. The
origin of this effect may arise from asymmetric surface coverage of the nanoparticles, which
creates a principal axis to stabilize the frustrated magnetic dipole.

130
Figure A.6 Panels a) and b) show the magnetic phase shift signal per unit volume against the diameter of the
nanoparticle for L-tartaric acid coated iron oxide (a) and D-tartaric acid coated iron oxide nanoparticles (b). N and S
represent north and south pole magnetization of the AFM tip, respectively. Panel c) and d) show a corresponding
histogram of the phase shift signal per unit volume for L- and D-tartaric acid coated iron oxide nanoparticless
respectively.
A.5 REFERENCES
1.Depalo, N.; Carrieri, P.; Comparelli, R.; Striccoli, M.; Agostiano, A.; Bertinetti, L.; Innocenti,
C.; Sangregorio, C.; Curri, M. L., Biofunctionalization of Anisotropic Nanocrystalline
Semiconductor–Magnetic Heterostructures. Langmuir 2011, 27 (11), 6962-6970.
2.Xu, Z.; Hou, Y.; Sun, S., Magnetic Core/Shell Fe3O4/Au and Fe3O4/Au/Ag Nanoparticles with
Tunable Plasmonic Properties. Journal of the American Chemical Society 2007, 129 (28), 8698-
8699.
3.Calero, M.; Gutiérrez, L.; Salas, G.; Luengo, Y.; Lázaro, A.; Acedo, P.; Morales, M. P.;
Miranda, R.; Villanueva, A., Efficient and safe internalization of magnetic iron oxide
131
nanoparticles: Two fundamental requirements for biomedical applications. Nanomedicine:
Nanotechnology, Biology and Medicine 2014, 10 (4), 733-743.

132
APPENDIX B
B.1 SAMPLE PREPARATION
Different types of magnetic samples were used for the KPFM measurements; however, all
of the experiments showed similar magnetization trends. For the experiment illustrated in Figure
3.1 in the main text ITO substrate were coated with 3 nm of Ti buffer layer, followed by 10 nm of
polycrystalline Ni, and 10 nm of Au using a Plassys evaporator. For the experiments describe in
Figure 3.4 e-beam evaporation of Ti/Ni/Au-10nm/120nm/10nm on Si-100 was used as the
substrate
Epitaxial thin films with cobalt ferromagnetic layer were used in all figures 3.2 and 3.3.
The films were grown using PREVAC molecular beam epitaxy method (MBE) with base pressure
10 -10 Torr, according to the following configuration Al2O3 (0001)/Pt (5 nm)/Au (20 nm)/Co
(1.5nm)/Au (5 nm). A Pt buffer layer was deposited at 650 °C to ensure an atomically flat buffer
layer surface allowing the epitaxial growth of consecutive layers. Sharp streaks were visible in
the in-situ obtained RHEED images for each growth step. The crystallographic orientation of the
epitaxially grown layers was as follows: Pt(111), Au(111), Co(0001), and Au(111). The Pt buffer
and Co layers were deposited using an electron gun; Au layers were deposited from high
temperature effusion cells. Sample with the flat uniform Co thickness of 1.5 nm has a
perpendicular anisotropy, featured rectangular hysteresis loop for a magnetic field direction
perpendicular to the plane, which is characteristic of the out-of-plane easy axis. Wedge type
samples were also studied and they were deposited using a movable shutter controlled by a step
motor. Two types of wedge samples were also grown - Au wedge and Co wedge.
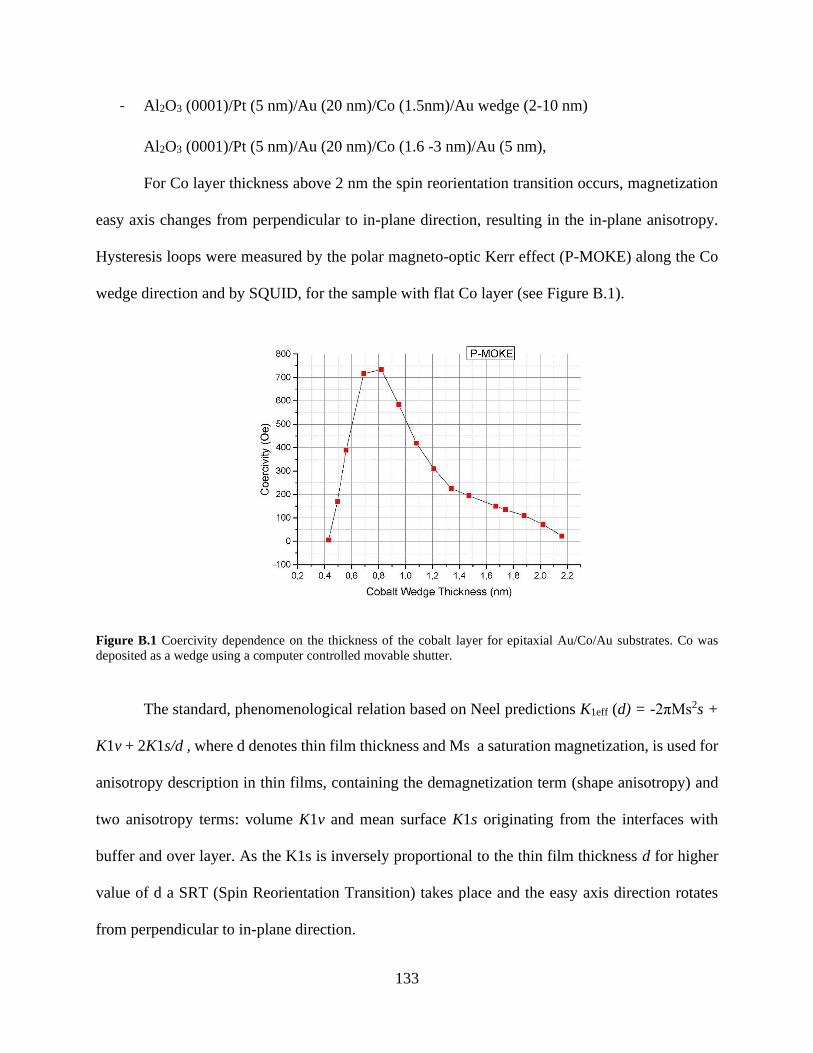
133
- Al2O3 (0001)/Pt (5 nm)/Au (20 nm)/Co (1.5nm)/Au wedge (2-10 nm)
Al2O3 (0001)/Pt (5 nm)/Au (20 nm)/Co (1.6 -3 nm)/Au (5 nm),
For Co layer thickness above 2 nm the spin reorientation transition occurs, magnetization
easy axis changes from perpendicular to in-plane direction, resulting in the in-plane anisotropy.
Hysteresis loops were measured by the polar magneto-optic Kerr effect (P-MOKE) along the Co
wedge direction and by SQUID, for the sample with flat Co layer (see Figure B.1).
Figure B.1 Coercivity dependence on the thickness of the cobalt layer for epitaxial Au/Co/Au substrates. Co was
deposited as a wedge using a computer controlled movable shutter.
The standard, phenomenological relation based on Neel predictions K1eff (d) = -2πMs2s +
K1v + 2K1s/d , where d denotes thin film thickness and Ms a saturation magnetization, is used for
anisotropy description in thin films, containing the demagnetization term (shape anisotropy) and
two anisotropy terms: volume K1v and mean surface K1s originating from the interfaces with
buffer and over layer. As the K1s is inversely proportional to the thin film thickness d for higher
value of d a SRT (Spin Reorientation Transition) takes place and the easy axis direction rotates
from perpendicular to in-plane direction.
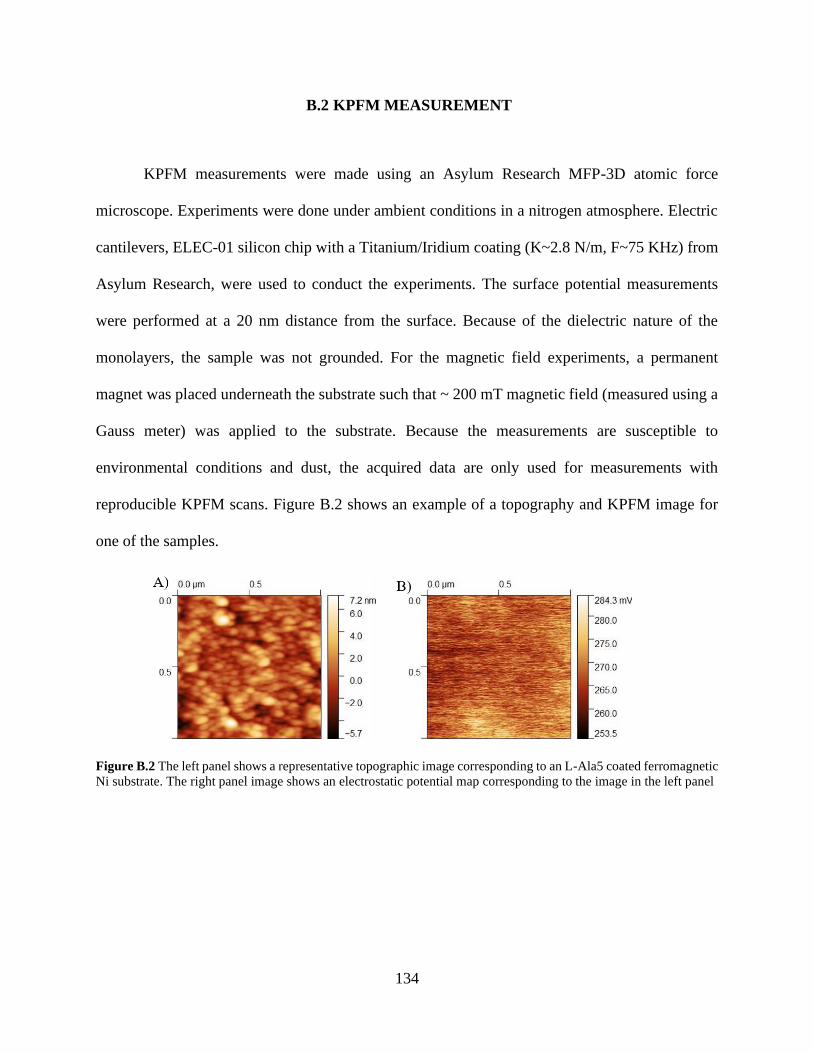
134
B.2 KPFM MEASUREMENT
KPFM measurements were made using an Asylum Research MFP-3D atomic force
microscope. Experiments were done under ambient conditions in a nitrogen atmosphere. Electric
cantilevers, ELEC-01 silicon chip with a Titanium/Iridium coating (K~2.8 N/m, F~75 KHz) from
Asylum Research, were used to conduct the experiments. The surface potential measurements
were performed at a 20 nm distance from the surface. Because of the dielectric nature of the
monolayers, the sample was not grounded. For the magnetic field experiments, a permanent
magnet was placed underneath the substrate such that ~ 200 mT magnetic field (measured using a
Gauss meter) was applied to the substrate. Because the measurements are susceptible to
environmental conditions and dust, the acquired data are only used for measurements with
reproducible KPFM scans. Figure B.2 shows an example of a topography and KPFM image for
one of the samples.
Figure B.2 The left panel shows a representative topographic image corresponding to an L-Ala5 coated ferromagnetic
Ni substrate. The right panel image shows an electrostatic potential map corresponding to the image in the left panel

135
B.3 PEPTIDE SAM PREPARATION
Measurements were performed on two different peptides (D and L-HS-CH2-CH2-(Ala-
Aib)5-COOH) and an achiral molecule (HS-(CH2)15-COOH). The D- and L-peptides were
synthesized by Genemed Synthesis, Inc. and the achiral molecules were purchased from Sigma
Aldrich.
To prepare the SAM, the substrates were first cleaned by immersing them in absolute
ethanol for 10 minutes and then drying them under a stream of argon gas. The substrates were then
incubated in a 1mM peptide / achiral molecule ethanoic solution for 48 hours. After adsorption,
the samples were washed in absolute ethanol to remove excess unbound molecules and dried with
argon. All of the substrates were stored under vacuum prior to KPFM measurements.
B.4 PEPTIDE MACROSCOPIC CPD MEASUREMENT
The CPD of the surfaces was determined using a commercial Kelvin probe instrument
(Delta Phi Besocke, Julich, Germany) within a Faraday cage at atmospheric pressure. The
reference probe consisted of a gold grid. The CPD signal was allowed to stabilize before recording,
where ∆𝐶𝑃𝐷 is the difference in the direction of magnetic field.
Substrate Preparation and Cleaning: Substrates used for the CPD measurement are grown
by e-beam (ODEM evaporator) where Si-100 wafer used as a substrate to grow Ti/Ni/Au- 10
nm/120 nm/10 nm with 0.5 Ǻ/sec deposition rate at 10-8 Torr pressure The surfaces were cleaned
by first boiling in acetone and then boiling in ethanol for 10 minute each. The surfaces then
underwent UV-Ozone treatment for 10 minutes and then subsequently immersed in ethanol for 30

136
minutes. Immediately afterwards, the substrates were dried with a nitrogen stream and then used
for monolayer deposition.
DNA SAM Preparation: The self-assembled monolayers (SAM) of DNA were prepared
using DNA oligomers 3’- functionalized with thiol groups on one strand. DNA duplexes were used
for monolayer preparation and spin polarization studies in the following way: First, a 100 µM
stock solution of DNA was prepared in deionized water. Before monolayer preparation, the stock
solution was mixed with 0.8 M PBS (K2HPO4/KH2PO4) buffer (pH = 7.2) in equal quantity – thus
making a 50 µM DNA solution in 0.4 M PBS buffer. The solution was then mixed with the same
quantity of 10 mM Tris(2-carboxyethyl)phosphine hydrochloride (TCEP, purchased from Sigma
Aldrich) in 0.4 M PBS buffer (pH 7.2). The solution was left in Tris buffer for 2 hours, then was
purified by filtering through a Micro Bio-Spin P-30 column (purchased from Bio Rad). The final
concentrations of all DNA were measured with UV-vis spectroscopy using a Nanodrop
spectrometer and was found to be between 20-30 µM. This DNA solution was drop cast onto the
substrate The sample was left for 20 to 24 hours in humid environment and then rinsed twice with
0.4 M PBS and twice in deionized water.
DNA Sequence:
20bp dsDNA:
5’-CGC TTC GCT TCG CTT CGC TT/3ThioMC3-D/-3’
5’-AAG CGA AGC GAA GCG AAG CG-3’
30bp dsDNA:
5’-CGC TTC GCT TCG CTT CGC TTC GCT TCG CTT/3ThioMC3-D/-3’
5’-AAG CGA AGC GAA GCG AAG CGA AGC GAA GCG-3’
40bp dsDNA:
5’-CGC TTC GCT TCG CTT CGC TTC GCT TCG CTT CGC TTC GCT T/3ThioMC3-
D/-3’
5’-AAG CGA AGC GAA GCG AAG CGA AGC GAA GCG AAG CGA AGC G-3’
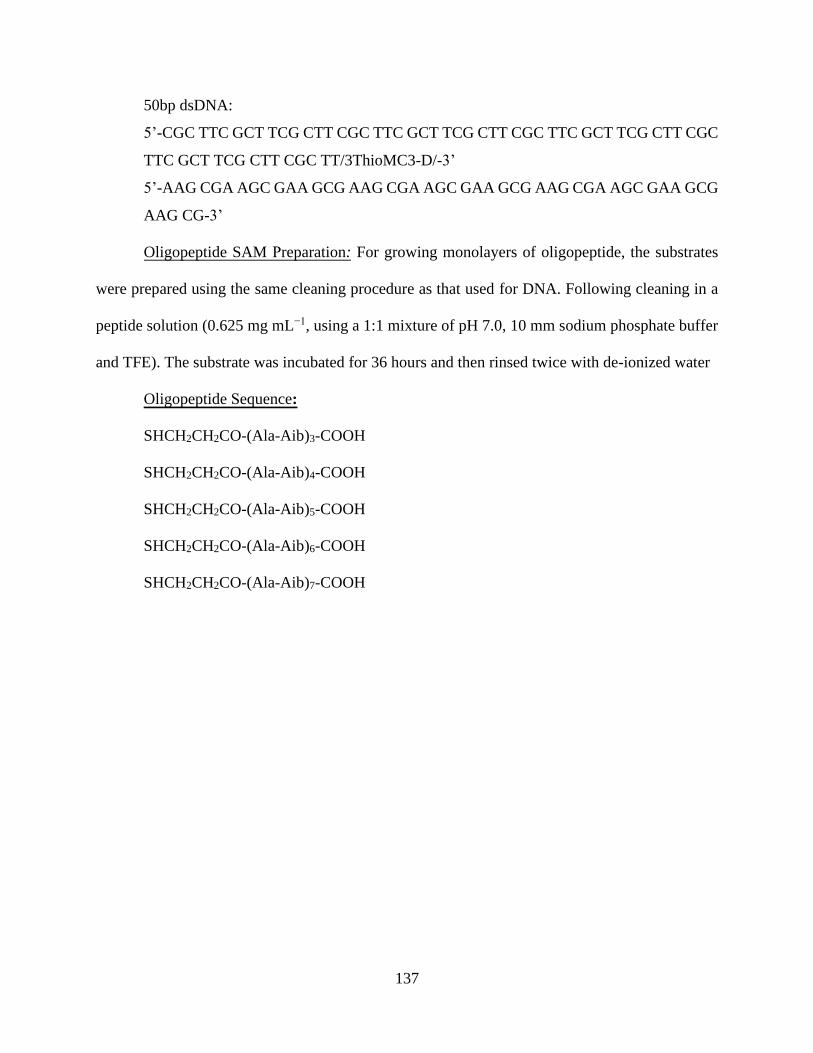
137
50bp dsDNA:
5’-CGC TTC GCT TCG CTT CGC TTC GCT TCG CTT CGC TTC GCT TCG CTT CGC
TTC GCT TCG CTT CGC TT/3ThioMC3-D/-3’
5’-AAG CGA AGC GAA GCG AAG CGA AGC GAA GCG AAG CGA AGC GAA GCG
AAG CG-3’
Oligopeptide SAM Preparation: For growing monolayers of oligopeptide, the substrates
were prepared using the same cleaning procedure as that used for DNA. Following cleaning in a
peptide solution (0.625 mg mL−1, using a 1:1 mixture of pH 7.0, 10 mm sodium phosphate buffer
and TFE). The substrate was incubated for 36 hours and then rinsed twice with de-ionized water
Oligopeptide Sequence:
SHCH2CH2CO-(Ala-Aib)3-COOH
SHCH2CH2CO-(Ala-Aib)4-COOH
SHCH2CH2CO-(Ala-Aib)5-COOH
SHCH2CH2CO-(Ala-Aib)6-COOH
SHCH2CH2CO-(Ala-Aib)7-COOH
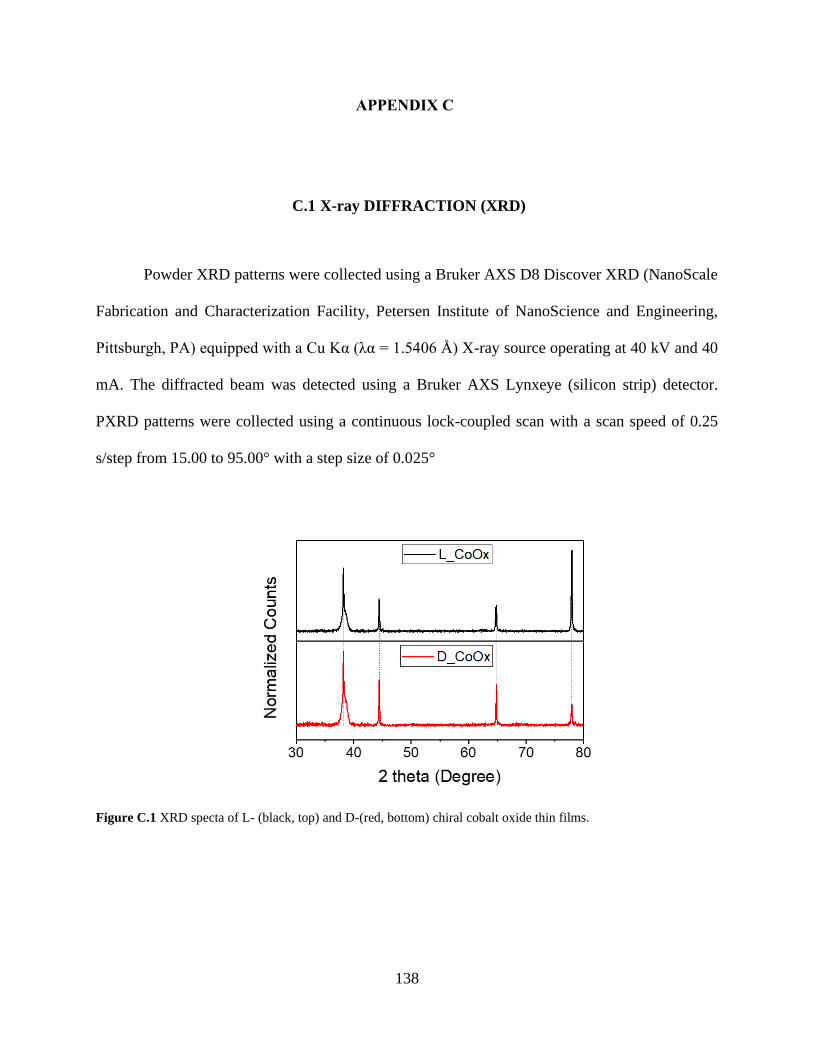
138
APPENDIX C
C.1 X-ray DIFFRACTION (XRD)
Powder XRD patterns were collected using a Bruker AXS D8 Discover XRD (NanoScale
Fabrication and Characterization Facility, Petersen Institute of NanoScience and Engineering,
Pittsburgh, PA) equipped with a Cu Kα (λα = 1.5406 Å) X-ray source operating at 40 kV and 40
mA. The diffracted beam was detected using a Bruker AXS Lynxeye (silicon strip) detector.
PXRD patterns were collected using a continuous lock-coupled scan with a scan speed of 0.25
s/step from 15.00 to 95.00° with a step size of 0.025°
Figure C.1 XRD specta of L- (black, top) and D-(red, bottom) chiral cobalt oxide thin films.

139
C.2 X-ray PHOTOELECTRON SPECTROSCOPY
XPS data were collected on an ESCALAB 250XI instrument. The data were referenced to
an adventitious carbon peak of 284.8 eV and measured before and after a soft ion sputter cleaning
(1000 eV for 10 s) to ensure that the treatment was not changing the oxidation state of the metal
oxide. The data were collected while using a flood gun to compensate for surface charging. Each
spectrum represents the average of 20 scans.
Figure C.2 XPS spectra of L-(black) and meso-CoOx (blue)
Figure C.3 XPS PS spectra of 5 % Mn doped L-CoOx thin film in the in the Co2p3/2 region (Panel a) and in the
Mn2p3/2 region (panel b).
20 30 40 50 60 70
Norm
aliz
ed C
ounts
2θ (Degrees)
FTO
FTO
FTO
FTO
FTO
FTO
FTO
FTO
FTO
Co
Co
Co
Co
Co
Co
FTO
a) b) c)
5μm
L-CoOx meso-CoOxd)
810 800 790 7800
10
1
I/I m
ax
Binding Energy(eV)
5μm
L-CoOx
5μm
meso-CoOx
794 792 790 788 786 7840.0
0.1
0.2
I/I m
ax
Binding Energy(eV)

140
APPENDIX D
D.1 THICKNESS DETERMINATION
Figure D.1 shows a thickness calibration plot of L-CoOx thin films using profilometry and
UV-Vis spectroscopy. The thickness of the film was modified through the deposition time. The
relationship between thickness and absorptivity at 368 nm was fit to an exponential function (red
line). The same thickness dependence with deposition time was observed for meso-CoOx.
Figure D.1 Calibration plot showing the change in thickness of L-CoOx thin films measured using a profilometer to
a change in absorbance. The change in thickness was achieved by changing the duration of the electrodeposition.
D.2 XPS CHARACTERIZATION
Figure D.2 shows X-ray photoelectron spectra (panel a) and difference spectra (panel b) in
the Co2p3/2 region for L-CoOx (black), meso-(CoOx) (blue), and L-CoOx after treatment at 1.2 V
vs NHE (orange). The data in panel a) are offset for clarity. For the difference spectra the data
0.0 0.4 0.8 1.2 1.6 2.0
0
100
200
300
400
500
600
Thic
kness (
nm
)
Absorbance (a.u.)

141
were first normalized to the Co2p3/2 peak before subtraction. The satellite structure plotted between
782 -794 eV is reflective of the valence state of the cobalt in the catalysts.
Figure D.2 Panel a) shows thin film XPS data of L-CoOx (black), Meso-CoOx (blue), and L-CoOx after the application
of 1.2 V vs NHE in 0.1M KOH for 30 min (orange). Panel b) shows difference spectra in the satellite region between
L-CoOx and Meso-CoOx (blue) and L-CoOx and the same film after the application of 1.2 V vs NHE in 0.1M KOH
for 30 min (orange). The data were normalized to the Co2p3/2 peak.
Figure D.3 shows XPS spectra and corresponding fitting of L-CoOx (A), meso-CoOx (B),
and L-CoOx after treating the film at 1.2 V vs NHE in 0.1 M KOH for 30 min (Mag-CoOx). The
Co 2p3/2 and 2p1/2 peak maximum splitting is ~15 eV in all three samples and is consistent with
the presence of Co3O4.1 Conversely, the O1s spectrum is fit to a sum of 4 peaks and is consistent
with reports indicating that cobalt is bound to both oxides (blue peak) and hydroxides (orange
peak); see Figure D 4.2 This may indicate that one, or both, of Co(OH)2 and CoOOH are present.
Because of the overlapping behavior of the different cobalt oxide/hydroxide peaks, stoichiometric
quantification of these catalyst components is not possible. Instead, the cobalt XPS data is fit to a
sum of five peaks and only the differences between the catalyst peak intensity, specifically in the
sattelite region, are considered. The fitting parameters are shown in Table D.1.While the peak
position can change with the type of oxide/hydroxide, the majority of the peak contribution for the
satellite structures at ~786 eV and ~790 eV are attributed to Co(II) and Co(III), respectively.1, 2
794 792 790 788 786 784 782-0.04
-0.02
0.00
0.02
0.04
I
nte
nsity
Binding Energy (eV)
810 805 800 795 790 785 780 775
Norm
aliz
ed
CP
S
Binding Energy (eV)
L
M
Mag
a) b)
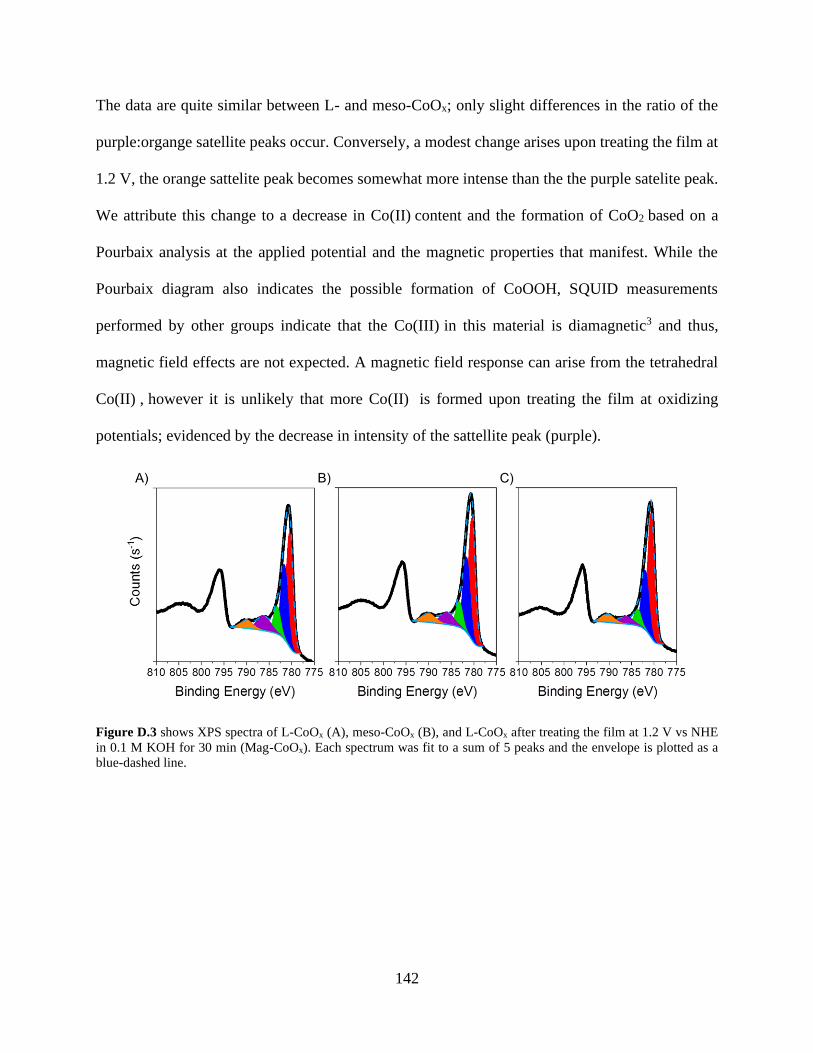
142
The data are quite similar between L- and meso-CoOx; only slight differences in the ratio of the
purple:organge satellite peaks occur. Conversely, a modest change arises upon treating the film at
1.2 V, the orange sattelite peak becomes somewhat more intense than the the purple satelite peak.
We attribute this change to a decrease in Co(II) content and the formation of CoO2 based on a
Pourbaix analysis at the applied potential and the magnetic properties that manifest. While the
Pourbaix diagram also indicates the possible formation of CoOOH, SQUID measurements
performed by other groups indicate that the Co(III) in this material is diamagnetic3 and thus,
magnetic field effects are not expected. A magnetic field response can arise from the tetrahedral
Co(II) , however it is unlikely that more Co(II) is formed upon treating the film at oxidizing
potentials; evidenced by the decrease in intensity of the sattellite peak (purple).
Figure D.3 shows XPS spectra of L-CoOx (A), meso-CoOx (B), and L-CoOx after treating the film at 1.2 V vs NHE
in 0.1 M KOH for 30 min (Mag-CoOx). Each spectrum was fit to a sum of 5 peaks and the envelope is plotted as a
blue-dashed line.

143
Figure D.4 O1s XPS spectra of an L-CoOx catalyst. The blue and orange peaks are consistent with reports (see
reference 3) indicating cobalt-oxide and cobalt-hydroxide contributions, respectively.
Table D.1 Fitting parameters for the XPS spectra shown in Figure D.4. The peak positions were contrained to have
the same binding energy in L-CoOx and meso-CoOx whereas for the treated sample only the orange and purple peaks
could be constrained to give a quality fit.
L-CoOx meso-CoOx Treated
BE (eV) AP (%) BE (eV) AP (%) BE (eV) AP (%)
Red 780.41 43.92 780.41 46.34 780.65 55.16
Blue 781.62 28.71 781.62 28.43 782.02 25.46
Green 783.25 10.45 783.25 9.95 783.74 7.33
Purple 786.15 11.35 786.15 9.02 786.15 5.03
Orange 789.96 5.58 789.96 6.27 789.96 7.01
The change in composition of the L-CoOx catalyst after 210 min of water splitting at 5 mA
/ cm2 is shown by Figure D.5 (before (black) and after (green)). The loss of the satellite feature at
~786 eV, presumably from oxidation, is consistent with a decrease in Co(II) content. Conversion
of the catalyst during electrolysis for CoOx is common,4 however the implication for chiral effects
536 534 532 530 528 526
Cou
nts
(s
-1)
Binding Energy (eV)
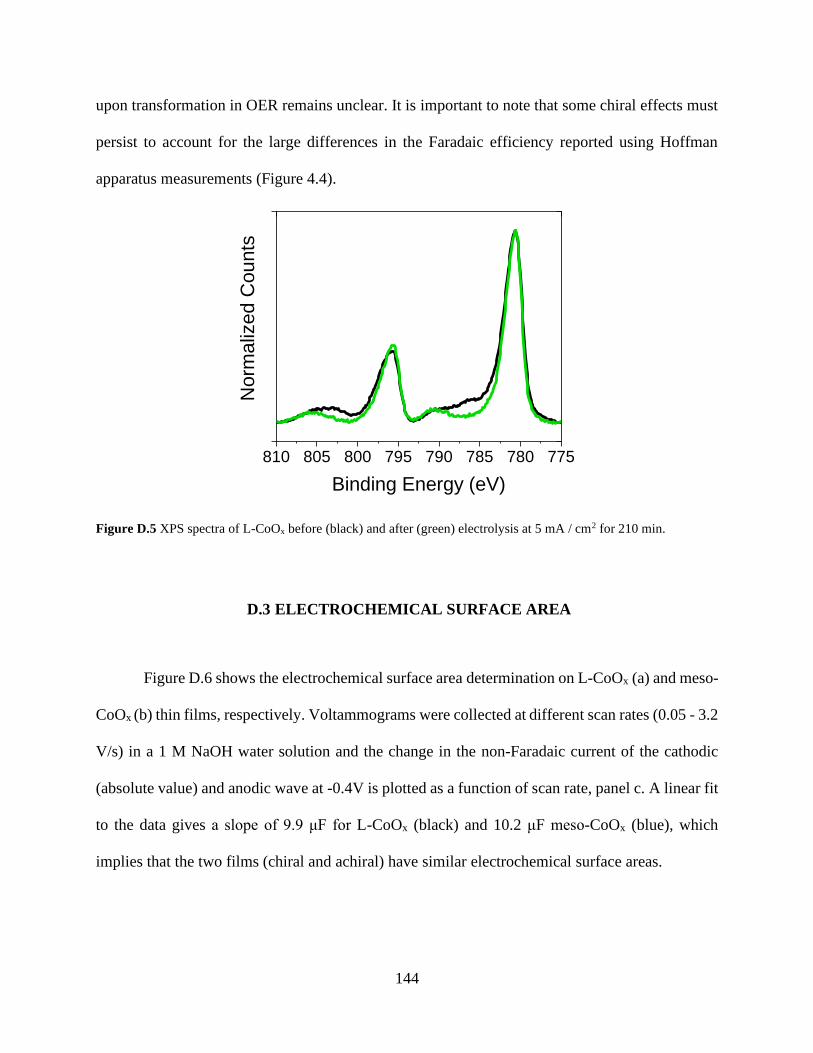
144
upon transformation in OER remains unclear. It is important to note that some chiral effects must
persist to account for the large differences in the Faradaic efficiency reported using Hoffman
apparatus measurements (Figure 4.4).
Figure D.5 XPS spectra of L-CoOx before (black) and after (green) electrolysis at 5 mA / cm2 for 210 min.
D.3 ELECTROCHEMICAL SURFACE AREA
Figure D.6 shows the electrochemical surface area determination on L-CoOx (a) and meso-
CoOx (b) thin films, respectively. Voltammograms were collected at different scan rates (0.05 - 3.2
V/s) in a 1 M NaOH water solution and the change in the non-Faradaic current of the cathodic
(absolute value) and anodic wave at -0.4V is plotted as a function of scan rate, panel c. A linear fit
to the data gives a slope of 9.9 μF for L-CoOx (black) and 10.2 μF meso-CoOx (blue), which
implies that the two films (chiral and achiral) have similar electrochemical surface areas.
810 805 800 795 790 785 780 775
Norm
aliz
ed C
ounts
Binding Energy (eV)
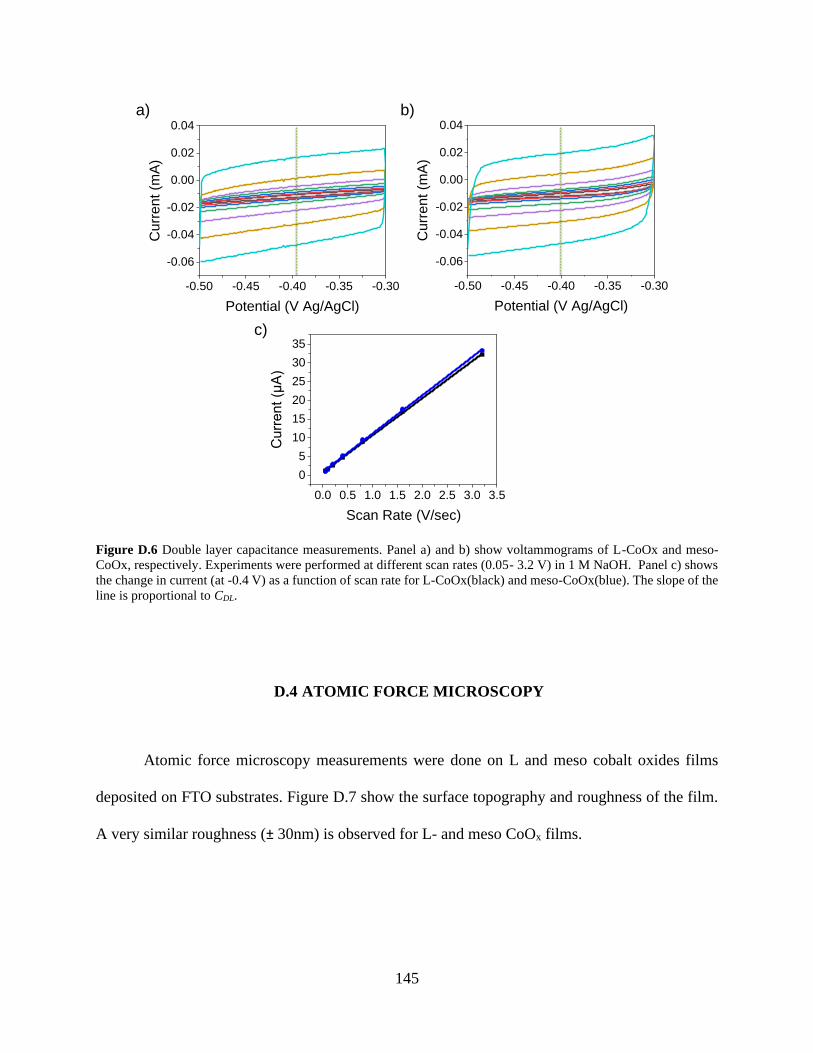
145
Figure D.6 Double layer capacitance measurements. Panel a) and b) show voltammograms of L-CoOx and meso-
CoOx, respectively. Experiments were performed at different scan rates (0.05- 3.2 V) in 1 M NaOH. Panel c) shows
the change in current (at -0.4 V) as a function of scan rate for L-CoOx(black) and meso-CoOx(blue). The slope of the
line is proportional to CDL.
D.4 ATOMIC FORCE MICROSCOPY
Atomic force microscopy measurements were done on L and meso cobalt oxides films
deposited on FTO substrates. Figure D.7 show the surface topography and roughness of the film.
A very similar roughness (± 30nm) is observed for L- and meso CoOx films.
-0.50 -0.45 -0.40 -0.35 -0.30
-0.06
-0.04
-0.02
0.00
0.02
0.04
Cu
rre
nt
(mA
)
Potential (V Ag/AgCl)
-0.50 -0.45 -0.40 -0.35 -0.30
-0.06
-0.04
-0.02
0.00
0.02
0.04
Cu
rre
nt
(mA
)
Potential (V Ag/AgCl)
0.0 0.5 1.0 1.5 2.0 2.5 3.0 3.5
0
5
10
15
20
25
30
35
Cu
rre
nt
(μA
)
Scan Rate (V/sec)
a) b)
c)

146
Figure D.7 Surface topography of a) L-CoOx film and b) meso CoOx film. Corresponding roughness of the films
were also shown by drawing a line on the topography images (below image).
D.5 TAFEL ANALYSIS
Figure D.8 shows Tafel plots for L- (black) and meso-CoOx (blue) measured in 0.1M KOH
solutions. A linear fit to the data are represented by a red dashed line. The Tafel plot relates the
amount of overpotential required to increase the current density by a factor of 10.
a) b)

147
Figure D.8 Tafel plots of L- (black) and meso-CoOx (blue) thin film catatalysts measured in 0.1 M KOH solutions.
The dashed red line is a linear fit to the data.
D.6 OER WITH D-CoOx
Figure D.9 show the linear sweep voltammograms of thin film D-CoOx(red) along with
meso-CoOx (blue) catatalysts measured in 0.1 M KOH solutions. The D-CoOx film was prepared
using the same condition as L-CoOx (see methods). The enhancement in OER is for D-CoOx over
meso-CoOx is consistent with that shown for L-CoOx.
-3.0 -2.8 -2.6 -2.4 -2.2 -2.00.2
0.3
0.4
0.5
0.6
Overp
ote
ntial(V
)
log i(A/cm2)
101 mV/dec
133 mV/dec
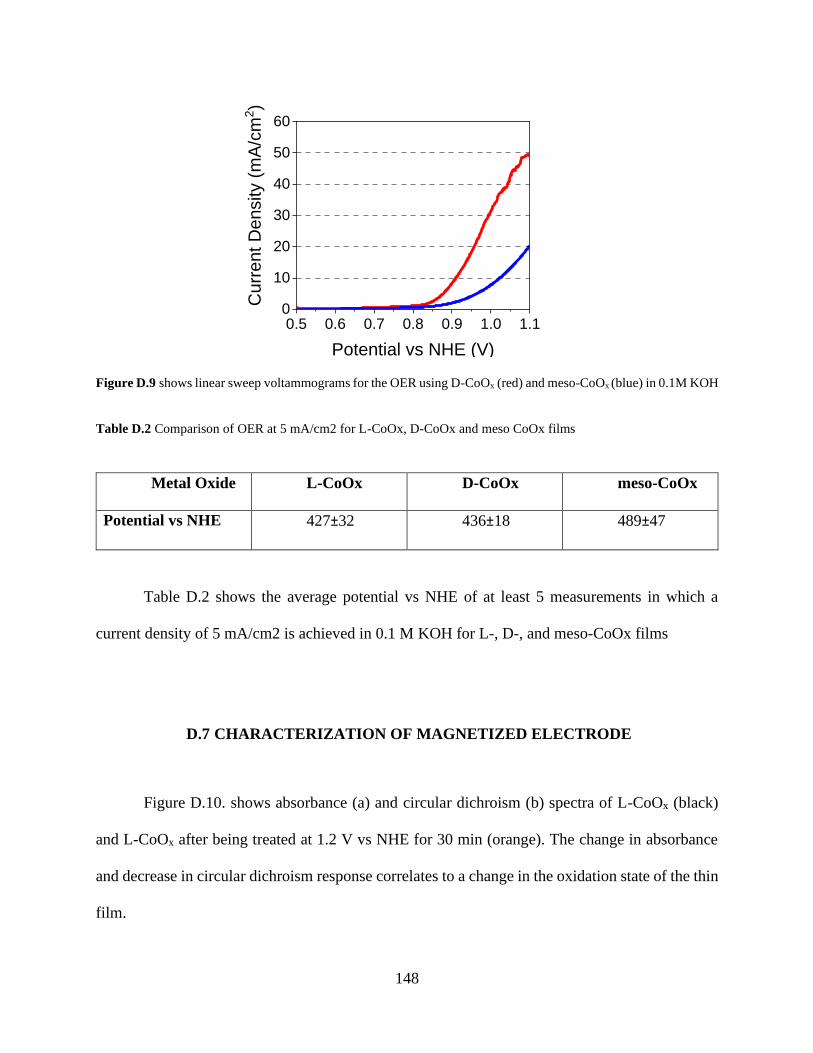
148
Figure D.9 shows linear sweep voltammograms for the OER using D-CoOx (red) and meso-CoOx (blue) in 0.1M KOH
Table D.2 Comparison of OER at 5 mA/cm2 for L-CoOx, D-CoOx and meso CoOx films
Metal Oxide L-CoOx D-CoOx meso-CoOx
Potential vs NHE 427±32 436±18 489±47
Table D.2 shows the average potential vs NHE of at least 5 measurements in which a
current density of 5 mA/cm2 is achieved in 0.1 M KOH for L-, D-, and meso-CoOx films
D.7 CHARACTERIZATION OF MAGNETIZED ELECTRODE
Figure D.10. shows absorbance (a) and circular dichroism (b) spectra of L-CoOx (black)
and L-CoOx after being treated at 1.2 V vs NHE for 30 min (orange). The change in absorbance
and decrease in circular dichroism response correlates to a change in the oxidation state of the thin
film.
0.5 0.6 0.7 0.8 0.9 1.0 1.10
10
20
30
40
50
60
Potential vs NHE (V)
Cu
rre
nt
De
nsity (
mA
/cm
2)

149
Figure D.10 Absorbance (a) and circular dichroism spectra (b) of L-CoOx thin films before (black) and after (orange)
treatment of 1.2 V vs NHE in 0.1M KOH for 30 min.
Figure D.11. shows linear sweep voltammograms for a treated CoOx thin film with
application of a North (red, dashed-line) and South (blue, solid-line) external magnetic field.
Despite the thin film still exhibiting chiroptical properties, a difference in overpotential between
the external magnetization was not observed.
Figure D.11 Linear sweep voltammograms of treated CoOx thin film with applied external magnetic field pointing
north (red) and south (blue dash).
250 300 350 400 450
Ab
so
rba
nce
(a
.u.)
Wavelength (nm)
a) b)
250 300 350 400 450-2
0
2
4
CD
In
ten
sity (
md
eg
)
Wavelength (nm)
0.8 0.9 1.00.00
0.01
0.02
0.03
0.04
Cu
rre
nt
De
nsity (
mA
/cm
2)
Potential vs NHE (V)

150
D.8 REFERENCES
1.Biesinger, M. C.; Payne, B. P.; Grosvenor, A. P.; Lau, L. W. M.; Gerson, A. R.; Smart, R. S.
C., Resolving surface chemical states in XPS analysis of first row transition metals, oxides and
hydroxides: Cr, Mn, Fe, Co and Ni. Applied Surface Science 2011, 257 (7), 2717-2730.
2.Yang, J.; Liu, H.; Martens, W. N.; Frost, R. L., Synthesis and Characterization of Cobalt
Hydroxide, Cobalt Oxyhydroxide, and Cobalt Oxide Nanodiscs. The Journal of Physical
Chemistry C 2010, 114 (1), 111-119.
3.Kudielka, A.; Bette, S.; Dinnebier, R. E.; Abeykoon, M.; Pietzonka, C.; Harbrecht, B.,
Variability of composition and structural disorder of nanocrystalline CoOOH materials. Journal
of Materials Chemistry C 2017, 5 (11), 2899-2909.
4.Bergmann, A.; Jones, T. E.; Martinez Moreno, E.; Teschner, D.; Chernev, P.; Gliech, M.;
Reier, T.; Dau, H.; Strasser, P., Unified structural motifs of the catalytically active state of
Co(oxyhydr)oxides during the electrochemical oxygen evolution reaction. Nature Catalysis 2018,
1 (9), 711-719.

151
APPENDIX E LIST OF PUBLICATIONS
At University of Pittsburgh
1. Ghosh, S.; Bloom, B. P.; Lu, Y.; Lamont, D.; Waldeck, D. H., Increasing the Efficiency
of Water Splitting through Spin Polarization Using Cobalt Oxide Thin Film Catalysts. The Journal
of Physical Chemistry C 2020, 124 (41), 22610-22618.
2. Sun, M.; Gottlieb, E.; Yuan, R.; Ghosh, S.; Wang, H.; Selhorst, R.; Huggett, A.; Du,
X.; Yin, R.; Waldeck, D. H.; Matyjaszewski, K.; Kowalewski, T., Polyene-Free Photoluminescent
Polymers via Hydrothermal Hydrolysis of Polyacrylonitrile in Neutral Water. ACS Macro Letters
2020, 9 (9), 1403-1408.
3. Ghosh, S.; Mishra, S.; Avigad, E.; Bloom, B. P.; Baczewski, L. T.; Yochelis, S.;
Paltiel, Y.; Naaman, R.; Waldeck, D. H., Effect of Chiral Molecules on the Electron’s Spin
Wavefunction at Interfaces. The Journal of Physical Chemistry Letters 2020, 11 (4), 1550-1557.
4. Koplovitz, G.; Leitus, G.; Ghosh, S.; Bloom, B. P.; Yochelis, S.; Rotem, D.; Vischio,
F.; Striccoli, M.; Fanizza, E.; Naaman, R.; Waldeck, D. H.; Porath, D.; Paltiel, Y., Single
Domain 10 nm Ferromagnetism Imprinted on Superparamagnetic Nanoparticles Using Chiral
Molecules. Small 2019, 15 (1), 1804557.
5. Bloom, B. P.; Liu, R.; Zhang, P.; Ghosh, S.; Naaman, R.; Beratan, D. N.; Waldeck,
D. H., Directing Charge Transfer in Quantum Dot Assemblies. Accounts of Chemical Research
2018, 51 (10), 2565-2573.
6. Georgieva, Z. N.; Bloom, B. P.; Ghosh, S.; Waldeck, D. H., Imprinting Chirality onto
the Electronic States of Colloidal Perovskite Nanoplatelets. Advanced Materials 2018, 30 (23),
1800097.

152
7. Bloom, B. P.; Graff, B. M.; Ghosh, S.; Beratan, D. N.; Waldeck, D. H., Chirality
Control of Electron Transfer in Quantum Dot Assemblies. Journal of the American Chemical
Society 2017, 139 (26), 9038-9043.
Before University of Pittsburgh
8. Schnitzler, E. G.; Seifert, N. A.; Ghosh, S.; Thomas, J.; Xu, Y.; Jäger, W., Hydration
of the simplest α-keto acid: a rotational spectroscopic and ab initio study of the pyruvic acid–water
complex. Physical Chemistry Chemical Physics 2017, 19 (6), 4440-4446.
9. Ghosh, S.; Thomas, J.; Huang, W.; Xu, Y.; Jäger, W., Rotational Spectra of Two
Hydrogen-Bonded Methyl Salicylate Monohydrates: Relative Stability and Tunneling Motions.
The Journal of Physical Chemistry Letters 2015, 6 (16), 3126-3131.
10. Ghosh, S.; Dixit, M. K.; Bhattacharyya, S. P.; Tembe, B. L., Franck–Condon Factors
for Diatomics: Insights and Analysis Using the Fourier Grid Hamiltonian Method. Journal of
Chemical Education 2013, 90 (11), 1463-1471