DETECTION OF CARDIAC CYCLE FROM INTRACORONARY ULTRASOUND
15
Ultrasound in Medicine and Biology Copy of e-mail Notification z2y7626 RUSH: Ultrasound in Medicine and Biology article for proofing (# 7626) ===== Dear Author, The proof of your article, to be published by Elsevier in Ultrasound in Medicine and Biology, is available as a "PDF" file at the following URL: http://rapidproof.cadmus.com/RapidProof/retrieval/index.jsp Login: your e-mail address Password: ---- The site contains 1 file. You will need to have Adobe Acrobat Reader software to read these files. This is free software and is available for user download at: http://www.adobe.com/products/acrobat/readstep.html After accessing the PDF file, please: 1) Carefully proofread the entire article, including any tables, equations, figure legends and references. 2) Ensure that your affiliations and address are correct and complete. 3) Check that any Greek letter, especially "mu", has translated correctly; 4) Verify all scientific notations, drug dosages, and names and locations of manufacturers; 5) Be sure permission has been procured for any reprinted material. 6) Answer all author queries completely. They are listed on the last page of the proof; You may choose to list the corrections (including the replies to any queries) in an e-mail and return to me using the "reply" button. Using this option, please refer to the line numbers on the proof. If, for any reason, this is not possible, mark the corrections and any other comments (including replies to questions) on a printout of the PDF file and fax this to Lorraine Bernazzani (fax #: 845-883-5682), or mail to the address given below. If you submitted usable colour figures with your article they will appear in colour on the web, at no extra charge, as you can see in the attached PDF proof of your article. In the printed issue, colour reproduction depends on journal policy and whether or not you agree to bear any costs. Do not attempt to edit the PDF file (including adding post-it type notes). Within 48 hours, please return the following to the address given below: 1) Corrected PDF set of page proofs 2) Print quality hard copy figures for corrections if necessary (we CANNOT accept figures on disk at this stage). If your article contains color illustrations and you would like to receive proofs of these illustrations, please contact us within 48 hours. If you have any problems or questions, please contact me. PLEASE ALWAYS INCLUDE YOUR ARTICLE NUMBER (7626) WITH ALL CORRESPONDENCE. Sincerely, Lorraine Bernazzani Issue Manager, UMB 236 Patura Road Modena, NY 12548 Tel: 845-883-5681 Fax: 845-883-5682 Email: [email protected]
-
Upload
independent -
Category
Documents
-
view
2 -
download
0
Transcript of DETECTION OF CARDIAC CYCLE FROM INTRACORONARY ULTRASOUND

Ultrasound in Medicine and BiologyCopy of e-mail Notification z2y7626
RUSH: Ultrasound in Medicine and Biology article for proofing (# 7626)=====Dear Author,
The proof of your article, to be published by Elsevier in Ultrasound in Medicine and Biology, is available as a "PDF" file at the following URL:http://rapidproof.cadmus.com/RapidProof/retrieval/index.jsp
Login: your e-mail addressPassword: ----
The site contains 1 file. You will need to have Adobe Acrobat Reader software to read these files. This is free software and is available for user download at: http://www.adobe.com/products/acrobat/readstep.html
After accessing the PDF file, please:1) Carefully proofread the entire article, including any tables, equations, figure legends and references.2) Ensure that your affiliations and address are correct and complete.3) Check that any Greek letter, especially "mu", has translated correctly;4) Verify all scientific notations, drug dosages, and names and locations of manufacturers;5) Be sure permission has been procured for any reprinted material.6) Answer all author queries completely. They are listed on the last page of the proof;
You may choose to list the corrections (including the replies to any queries) in an e-mail and return to me using the "reply" button. Using this option, please refer to the line numbers on the proof. If, for any reason, this is not possible, mark the corrections and any other comments (including replies to questions) on a printout of the PDF file and fax this to Lorraine Bernazzani (fax #: 845-883-5682), or mail to the address given below.
If you submitted usable colour figures with your article they will appear in colour on the web, at no extra charge, as you can see in the attached PDF proof of your article. In the printed issue, colour reproduction depends on journal policy and whether or not you agree to bear any costs.
Do not attempt to edit the PDF file (including adding post-it type notes).
Within 48 hours, please return the following to the address given below:1) Corrected PDF set of page proofs2) Print quality hard copy figures for corrections if necessary (we CANNOT accept figures on disk at this stage). If your article contains color illustrations and you would like to receive proofs of these illustrations, please contact us within 48 hours.
If you have any problems or questions, please contact me. PLEASE ALWAYS INCLUDE YOUR ARTICLE NUMBER (7626) WITH ALL CORRESPONDENCE.
Sincerely,Lorraine BernazzaniIssue Manager, UMB236 Patura RoadModena, NY 12548Tel: 845-883-5681Fax: 845-883-5682Email: [email protected]

Ultrasound in Medicine and BiologyCopy of e-mail Notification z2y7626

62636465666768697071727374757677787980818283
12345678910111213141516171819202122232425262728293031323334353637383940414243444546474849505152535455565758596061
Ultrasound in Med. & Biol., Vol. xx, No. x, pp. xxx, 2006Copyright © 2006 World Federation for Ultrasound in Medicine & Biology
Printed in the USA. All rights reserved0301-5629/06/$–see front matter
tapraid3/z2y-umb/z2y-umb/z2y00306/z2y7626d06z xppws S�1 1/27/06 17:47 Art: 7626 DTD5.0
PRO
OF
doi:10.1016/j.ultrasmedbio.2005.12.011
DETECTION OF CARDIAC CYCLE FROM INTRACORONARYULTRASOUND
DONGBAI GUO* and PETER RICHARDSON†
*Oracle USA, Nashua, NH; and †Engineering Division, Brown University, Providence, RI, USA
(Received 11 January 2005, revised 1 December 2005, in final form 9 December 2005)
Abstract—In this paper, we describe a method automatically to determine the phase of a cardiac cycle for eachvideo frame of an intravascular ultrasound (IVUS) video recorded in vivo. We first review the principle of IVUSvideo and demonstrate the general applicability of our method. We show that the pulsating heart leads to phasicchanges in image content of an IVUS video. With an image processing method, we can reverse this process andreliably extract the heart-beat phase directly from IVUS video. With the phase information, we demonstrate thatwe can build 3-D (3D) time-variant shapes and measure lumen volume changes within a cardiac cycle. We mayalso measure the changes of IVUS imaging probe off-center vector within a cardiac cycle, which serves as anindicator of vessel center-line curvature. The cardiac cycle extraction algorithm requires one scan of the IVUSvideo frames and takes O(n) time to complete, n being the total number of the video frames. The advantage ofthis method is that it requires no user interaction and no hardware set-up and can be applied to coronary scansof live beating hearts. The extracted heart-beat rate, compared with clinical recordings, has less than 1% error.(E-mail: [email protected]) © 2006 World Federation for Ultrasound in Medicine & Biology.
Key Words: Intracoronary ultrasound, Image processing, Cardiac cycle detection, Shape reconstruction, Mea-surement.
84858687888990919293949596979899
100101102103104105106107108109
CTD
UNCORRE
INTRODUCTION
Intracoronary ultrasoundHeart and coronary artery diseases are the largest
cause of death in western societies (Phibbs et al. 1971).Intravascular ultrasound (IVUS) is one of the most im-portant imaging modalities for diagnosing coronary vas-cular deceases. Typically, the spatial and temporal reso-lution of IVUS is much higher than those of other im-aging modalities, allowing it to image the shape,composition, and movement of the blood vessel wall.
IVUS has widespread clinical uses. Examples in-clude the assessment of luminal and plaque morphology(Escaned et al. 1996), assessment of atherosclerosis (Ho-nye et al. 1992), interventional guidance (Kimura et al.1992; Nissen et al. 1991; Rosenfield et al. 1992; Fitzger-ald and Yock 1993), and tissue classification (Tobis et al.1991; Lee et al. 1992; Fitzgerald et al. 1992). It is alsoimportant for mathematical modeling of blood vesselmechanics, for example, using IVUS-based vessel mod-els to explain/predict plaque rupture (Richardson et al.1989; Loree et al. 1992; Lee et al. 1992; Cheng et al.1993) and collapse of stenotic arteries (Aoki and Ku1993).
Address correspondence to: Dongbai Guo, OracleUSA, NEDC,Nashua, NH 03062, USA. E-mail: [email protected]
1
EMotivations for cardiac cycle detectionIn this paper, we introduce a method to derive the
phase in the cardiac cycle from IVUS video alone. Al-though many IVUS-based applications have been devel-oped, most of them concentrate on extracting the mor-phologic features of a blood vessel, not its dynamics.IVUS has the advantage of recording the motion of ablood vessel in response to arterial pressure change.
Because vessel mechanical properties are deter-mined by the tissue composition, discovering the dynam-ics of a blood vessel, in addition to its morphologicfeature, will significantly improve diagnostic benefits ofIVUS. A critical step in studying the dynamics is todetermine the phase in the cardiac cycle for each frameof an IVUS video. With phase information through asuccession of heart-beats, we may reconstruct the shapeof a blood vessel for a particular phase in the cardiaccycle. From these reconstructions of the response of avessel segment to the arterial pressure change, one mayestimate its mechanical properties (Lee et al. 1992).
Knowing the phase in the cardiac cycle for eachvideo frame also enables the removal of the jitteringmotion of cardiac ultrasound, thus benefiting IVUS ap-plications (Nadkarni et al. 2003) such as tissue classifi-cation (Zhang et al. 1998), 3-D modeling (Klingensmithet al. 2003, 2000; Olszewski et al. 2000), and tissuemechanical property estimation (Cespedes et al. 2000;
110111112113114115116117118119120121122
Cheng et al. 1993).

6263646566676869707172737475767778798081828384858687888990919293949596979899
100101102103104105106107108109
12345678910111213141516171819202122232425262728293031323334353637383940414243444546474849505152535455565758596061
CT
2 Ultrasound in Medicine and Biology Volume xx, Number x, 2006
tapraid3/z2y-umb/z2y-umb/z2y00306/z2y7626d06z xppws S�1 1/27/06 17:47 Art: 7626 DTD5.0
UNCORRE
Previous workExisting methods for determining the phase in the
cardiac cycle are either to analyze the electrocardiogram(ECG) signal overlaid on top of IVUS images (Zhang etal. 1998) or to use ECG-gated IVUS video capturing(von Birgelen et al. 1997; Terashima et al. 1997; Klin-gensmith et al. 2000). The latter is automated and itsprocess is the following (von Birgelen et al. 1997). Acomputer is connected to a custom-built step motor, anECG device and a frame grabber receiving video feedfrom the IVUS imaging station. The computer may sendtriggering signals to either the step motor or the framegrabber. The triggering signals drive the step motor thatpulls the IVUS imaging catheter forward. To capture anIVUS field at a new location, the computer monitors theECG input until it positively detects the second peak ofan R-wave. At this moment, it sends a second signal tothe frame grabber to capture an IVUS image. The pro-cess continues to the next capturing position and so on.When the vessel curvature is ignored, one may assembleall the images and create a shape corresponding to thepeak of the R-wave.
Our approachIn this paper, we present a method to determine the
cardiac cycle of a video frame automatically from anIVUS video. To accomplish this, we first study themotion of the IVUS imaging probe and the coronaryartery, and conclude that the motion as observed by anIVUS imaging probe is dominated by the transient mo-tion driven by the heart-beat. This leads to phasic vari-ation in image content of an IVUS video, and this changehas the same frequency as the heart-beat. With imageprocessing techniques, we can extract the cardiac cycledirectly from IVUS video. The method described in thispaper is based on the first author’s PhD thesis (Guo,2000).
Because our method can be directly applied to invivo IVUS recordings and reconstructs time-variantshape series, we are not limited to static dimensionmeasurement and can make important quantitative mea-surements of the dynamics of the vessel wall. Suchmeasurements make possible important studies such astissue mechanical responses (de Korte et al. 1998) andthus take the full advantage of IVUS imaging.
When compared with the ECG-gated method (vonBirgelen et al. 1997; Terashima et al. 1997; Klingen-smith et al. 2000), this method has the advantage ofdirectly building 3-D models solely from IVUS. There isno need for any set-up process or custom-built hardwareand thus it is easier to use in a clinical environment. Itcan be applied to archival videos as well. Second, ourmethod operates in a continuous fashion. We can extractpulsatile shapes instead of a single shape for each IVUS
ED P
ROO
F
run, thus making phase-correlated measurement feasible.Next, our capture process does not have the step-pulse-capture style of motion; therefore, it has less than half thecapture time of the ECG-gated method for the same axialresolution of a 3-D reconstruction. Finally, both externalECG gating and overlaid display of ECG signal withultrasound can suffer from systematic errors. A recentstudy (Walker et al. 2002) shows that as much as a 90-ms(equivalent to three IVUS video frames) delay can existbetween IVUS and the ECG signal. Our work, however,uses the intrinsic motion to recover the cardiac cycle andtherefore does not have this type of system error. We arein the process of studying such error for ECG-gatedIVUS video capture.
Another related image-based method (de Winter etal. 2004) uses a user-selected heart rate to derive a seriesof end-systolic images from an IVUS video. Our workdiffers from this method in that we compute a time-variant heart rate from an IVUS video, rather than takinga constant input value.
A limitation of our method is that we ignore vis-coelastic effects in the coronary artery wall and assumethat the maximum lumen area occurs at peak systolicpressure. This is, however, a common assumption madein computational studies because of the lack of data forartery viscoelastic properties (Cheng et al. 1993).
Organization of this paperIn the protocol section below, we discuss the exper-
imental set-up and preprocessing of an IVUS video. Inthe analysis section, we study the principle of IVUSvideo and describe the general applicability of ourmethod. We then describe our algorithm for the auto-matic extraction of the heart cycle from IVUS videoframes. In the application section, we show some appli-cations of our method, for 3-D time-variant shape recon-struction, phase-correlated volume, and motion measure-ments.
IVUS VIDEO CAPTURING ANDPREPROCESSING
All the procedures were performed according to theguidelines of Dartmouth College Animal Research Com-mittee and the National Institutes of Health. In an epi-cardial IVUS operation, an imaging catheter is inserted,over a guide wire, to an artery on the surface of the heart.At the tip of the imaging catheter is the imaging probe,an ultrasound transducer, which can emit and receiveultrasound waves in a pulse-echo mode. The acousticresponse of the surrounding tissues is converted intoradio-frequency (RF) signals by the transducer. TheIVUS imaging station digitizes the RF signals and scan-converts them into video frames. Typically, an imaging
110111112113114115116117118119120121122
6263646566676869707172737475767778798081828384858687888990919293949596979899
100101102103104105106107108109
12345678910111213141516171819202122232425262728293031323334353637383940414243444546474849505152535455565758596061
CT
Detection of cardiac cycle from IVUS ● D. GUO AND P. RICHARDSON 3
F1
AQ: 1
tapraid3/z2y-umb/z2y-umb/z2y00306/z2y7626d06z xppws S�1 1/27/06 17:47 Art: 7626 DTD5.0
UNCORRE
probe is pulled back from its initial position at the distalend of a coronary artery. As the probe moves along theaxial line of an artery, it records the acoustic response ofthin slices of the surrounding volume perpendicular tothe probe axis. The resulting images are concatenatedtogether into a digital or an analog video.
IVUS videos used in this paper were produced fromlive animal subjects (pigs) according to the followingimaging protocol. An IVUS imaging catheter was intro-duced through a femoral artery and was advanced to thedistal end of the left anterior descending artery (LAD).The imaging probe was slowly pulled back by a mechan-ical pullback device at a constant speed of 0.5 mm persecond. The pullback terminated at the tip of the guidewire, which was adjusted to be at the junction of the leftmain artery and the LAD. All the videos were generatedby 30-MHz mechanical transducers (Boston Scientific™).The withdrawal process was recorded on a videotape inS-VHS format. The video was digitized with video cap-turing software (Media100™) into Quicktime® Cinepakcompressed digital video, with a compression ratio of10:1. The video is compressed to save disk space. IVUSvideo frames were exported to TIFF format with losslesscompression with the Moviemaker utilities on SGITM.The IVUS imaging stations produced videos in NTSCformat. The stations record videos at 30 frames persecond. Each frame is then deinterlaced (an up-samplingprocess) into two fields of size 640 � 480. We use“median 9” filter (Juhola et al. 1989) to deinterlace IVUSvideo frames. This method performs both spatial andtemporal interpolation to fill the missing scan lines.
In this paper, we represent an IVUS video by itsfield sequence. We denote an IVUS image (a field) by Ii,where the subscript i refers to the field ID. I1 is the firstfield of an IVUS video and so on.
Certain artifacts must be removed to avoid interfer-ence with image distance measurement.
Corrupted fields, because of the deinterlacing arti-fact and block shift, are automatically detected and re-jected with basic image processing techniques. The dein-terlacing artifact is introduced during the digitizationprocess. Part of, or an entire, field will contain horizontallines of alternating brightness. This artifact can be de-tected by thresholding the ratio of the absolute value ofthe image Y-direction (vertical) difference to the X-di-rection (horizontal) difference. The block shift artifactmight be introduced during the scan conversion phase. Ablock-shifted field contains sharp discontinuity betweentwo adjacent scan lines. It can be detected by convertinga field into scan lines (R-� plot), then searching foroutliers of the angular projection. Typically, for a draw-back sequence of 2 minutes (totally, 7200 fields), wereject no more than 20 fields. Fiduciary markers, screentext, probe shadow, and ring-down artifact in each image
ED P
ROO
F
lead to false local minima in image distance measure-ment. We automatically detect them with image process-ing techniques. They can either be replaced by the me-dian of the surrounding pixels (if the area is small) ormarked “invalid” by a binary mask accompanying eachfield. To remove probe shadow, we locate the center ofan IVUS field (i.e., the center of its binary mask) andmark all pixels within a fixed radius to be probe shadow(to be invalid pixels in the binary mask). To removering-down artifact, we detect all bright (pixel valueabove a given threshold) concentric rings, whose originsare within one pixel distance of the probe shadow origin,and mark these pixels as “invalid” in the binary maskaccompanying each IVUS field. Figure 1 shows a sampleIVUS field after preprocessing.
ANALYSIS OF INTRACORONARYULTRASOUND VIDEO
In this section, we study the pulsatile motion re-corded by an IVUS imaging station. The purpose of thisanalysis is to show that the general applicability of ouralgorithm to IVUS video is not limited to the specificcases we demonstrate in this paper.
We can think of an IVUS imaging probe as a tinycamera spinning in the space and exploring its immediatesurroundings. At every spatial location, this camera cap-tures a disk-shaped imaging volume and displays it as a2-D image.
Fig. 1. A sample IVUS field after preprocessing. This image isdeinterlaced from a digitized video frame. The fiduciary mark-ers, screen text, probe shadow, and ring-down artifact are
removed.
110111112113114115116117118119120121122
6263646566676869707172737475767778798081828384858687888990919293949596979899
100101102103104105106107108109
12345678910111213141516171819202122232425262728293031323334353637383940414243444546474849505152535455565758596061
CT
4 Ultrasound in Medicine and Biology Volume xx, Number x, 2006
AQ: 2
tapraid3/z2y-umb/z2y-umb/z2y00306/z2y7626d06z xppws S�1 1/27/06 17:47 Art: 7626 DTD5.0
UNCORRE
In an in vivo IVUS study, both the imaging target(coronary artery) and the camera (IVUS imaging probe)move constantly with respect to the imaging platform.The artery motion consists of two parts, the first beingthe overall change of the vessel center-line and the sec-ond being the local vessel wall deformation. The IVUSimaging probe motion also consists of two parts, thesteady pullback and the rhythmic throb (due to the myo-cardial contraction). The latter is because the imagingcatheter is moved continuously by the heart wall. Boththe guide wire and the imaging catheter are elastic;therefore, the throb of the imaging probe is smootherthan that of the artery and it includes both translationaland rotational motion.
Because the imaging catheter has a small curvature,the dominant rotational motion of the imaging probewith respect to the patient body is the rotation around theprobe’s longitudinal axis. For translational motion, theaxial shift is larger than the in-plane swing in general, butthey are of the same order of magnitude. Note that theexistence of large axial motion has the effect of “shuf-fling” the IVUS fields: the volume swept by an imagingprobe during one heart-beat covers a much larger rangethan the volume swept by the steady pullback if therewere no throbbing. In other words, two fields that aretemporally close in recording may not be spatially closeto each other, a fact sometimes ignored in previous 3-Dshape reconstruction work.
The motion captured by IVUS is a combination ofboth that of the blood vessel and the imaging probe. Itconsists of both the rigid motion, i.e., the translation andthe rotation of a vessel segment, and the deformablemotion of the vessel wall. In the next section, we esti-mate the relative magnitude of these motions.
Probe motion and image contentThe observed motion in IVUS is the combined
result of the steady pullback of the imaging probe, thepropagation of the blood pressure wave, and the contrac-tion of the myocardium. We assume that there is nosystematic drift in imaging probe location and orienta-tion: if not pulled back, the imaging probe returns to thesame position and orientation after a heart-beat.
The mechanical pullback contributes to the probeaxial translation relative to the arterial wall. The speed ofmechanical pullback is 0.5 mm/s and can be consideredto be constant.
The blood pressure fluctuates at the same frequencyas the heart-beat and deforms the vessel wall. The prop-agation of the pressure wave affects the observation ofthis deformable motion, due to the Doppler effect. Manyfactors, such as the subject’s age, exercise, and measure-ment site affect the speed of the pressure wave in a bloodvessel (Nichols and O’Rourke 1998). However, its aver-
ED P
ROO
F
age range is 5 to 9 m/s, much larger than the imagingprobe speed (observer speed), which is in the order of 1to 10 mm/s (Guo 2000). The shift l in wavelength � dueto the motion of the observer can be described by theDoppler equation: �⁄�0 � �c�v⁄c�v, where c is thespeed of the pressure wave and v is the speed of theobserver. In this case, v��c; therefore, we can safelyignore the Doppler effect.
The contraction of the myocardium leads to therigid rotation and translation of the imaging probe withrespect to the vessel wall. The instantaneous velocity ofthe imaging probe is very hard to measure. We have notfound any statistics from the literature. We propose amethod to estimate it from an IVUS video with the helpof anatomical landmarks such as a vein crossing or avessel branch. Note that many factors, such as the localheart-wall motion, the location of the probe, and the localcurvature, affect the actual value. Our measurements(Guo 2000) show that the speed of probe translationalmotion is in the order of 1 to 10 mm/s. However, sincethe probe speed is an order of magnitude larger than thepullback speed, we can conclude that the velocity of theimaging probe with respect to the vessel wall is deter-mined by the pulsatile motion of the heart and, thereforethat they fluctuate at the same frequency.
Very often, we may easily observe the pulsatilemotion in an IVUS video playback and directly count thenumber of heart-beats, because:
1. The imaging volumes of two consecutive fields over-lap.
2. The imaging volumes of two fields separate by a fullcardiac cycle (minimal phase difference) overlap.
3. The imaging volumes of two fields separate by half acardiac cycle (maximal phase difference) do notoverlap.
The above statements can be verified (Guo 2000)with a little arithmetic and the typical IVUS imagingparameters (Teo 2003).
Because a speckle image is formed by the echoesfrom all scatterers within an imaging volume, the moreoverlap two imaging volumes have, the higher the imagesimilarity (or the lower image distance). In other words,the first statement is a continuity condition and guaran-tees the visual coherence of the scene. The second andthird statements together give a repeatability conditionand guarantee the pulsatile variation of the scene.
The above analysis may be verified quantitatively,as demonstrated in the application section.
Cardiac cycle detectionFrom the analysis in the above section, we learn that
changes in image content reflect the pulsatile probe mo-
110111112113114115116117118119120121122
tion, which is the result of the heart-wall motion; there-

6263646566676869707172737475767778798081828384858687888990919293949596979899
100101102103104105106107108109
12345678910111213141516171819202122232425262728293031323334353637383940414243444546474849505152535455565758596061
CT
Detection of cardiac cycle from IVUS ● D. GUO AND P. RICHARDSON 5
F2
F3
tapraid3/z2y-umb/z2y-umb/z2y00306/z2y7626d06z xppws S�1 1/27/06 17:47 Art: 7626 DTD5.0
UNCORRE
fore, we may extract cardiac cycle from the changes inimage content, which has the same frequency as the heartpulsatile motion.
There are two aspects to cardiac motion. First, themotion is cyclic (i.e., the blood vessel and heart-wallmotion repeat themselves after a complete heart-beat).Second, the motion varies within a cardiac cycle (i.e., thepressure wave is characterized by a quick rise in systoleand a slower fall in diastole [Nichols and O’Rourke1998]). In this section, we show that one may extract theheart cycle based on either aspect. However, we showthat the latter allows faster (linear-time) extraction of thecardiac cycle.
In the next few subsections, we describe the imagedistance which we use to compare image content be-tween a pair of IVUS fields. We show the strong cyclicpattern in image distance in an IVUS video and describeour method to extract heart-beat rate from image distancevector computed from an IVUS video. We then describea linear time solution to heart rate recovery from IVUS.Finally, we show the result of our method.
Multiresolution image distance measurementChange in image content can be measured with an
image distance metric. Many image distance metricshave been proposed for conventional video processing(Ahanger and Little 1996; Yeung et al. 1998). From ourexperiment, a simple image distance metric, mean abso-lute difference, is fast to compute and works well inpractice. This distance metric is not rotation invariant.However, this is not a problem because two adjacentfields, or two fields with minimal phase difference, arelikely to be similar in image content and small in rota-tional motion, and vice versa.
Image distance needs to be computed for a largenumber of images. To speed up this process, we use thedyadic wavelet transform to convert images into mul-tiresolution representations. Givenk images (or fields),we can compute the image distance between any pair ofthem. We denote this distance Da,b
s , where a,b is the IDof the image pair and the superscript s is the resolutionused to compute this distance:
Da,bs
��i�1..n.j�1..m �Ia
s(i, j) � Ibs(i � rs, j � cs)�va
s(i � rs, j � cs)
�i�1..n.j�1..m vas(i, j)vb
s(i � rs, j � cs)
(1)
where m, n is the image size at resolution s. rs and cs arethe row and column shift of image b with respect toimage a. Vs
ais the valid image area mask for image a atresolution s. Vb is the valid image area mask for image b.
sED P
ROO
F
The masks are computed in the preprocessing stage, asdescribed in the protocol section.
The image distances measured at different resolu-tions are not the same. The low-resolution image dis-tance is less noisy and smaller than the high-resolutionimage distance; therefore, the scale for image distancedecreases with resolution. However, the pattern, or therelative value, remains the same.
With multiresolution measurement, we start withthe lowest resolution. Find the minima from the lowestresolution, then explore its neighborhood of the nexthigher resolution to find the minimal and so on. Becauseof the speckle noise, higher resolution does not alwaysmean higher accuracy (Adam et al. 1987). Lower-reso-lution images can suppress speckle noise and its imagedistance is faster to compute. In our implementation, weuse resolution level three, which is the original imagescaled down four times in each dimension, to computeimage distance.
This choice is based on the response of the corre-lation measure that we used to detect the heart rate. Fromnow on, we drop the superscript s for resolution for thesake of readability.
Image distance measurement, phasic behaviorIn this section, we extract the cardiac cycle from a
sliding window of an image distance vector that mea-sures the cyclic motion of the heart.
At any discrete time k (measured by the field ID) fora sequence of fields {Ii}, we may compute the imagedistance between the field k and its neighbors (w fields ineither direction).
The resulting local image distance vector Dk�j�� Dkj, where j� � w, � w � 1,. . ..,w, is then a slidingwindow of 2w � 1 fields centered at k. We plot a seriesof the local image distance vectors in Figure 2. Eachhorizontal line is a distance vector Dk(w � 45) measuredat time k. The vertical direction is the time axis k, whichhas 1200 vectors and corresponds to about 10 s. Eachrectangular pixel in the image is an image distance mea-sure Dk�j�. The distance is color-coded: blue indicatessmall image distance and red indicates large image dis-tance. The window size (91) was chosen such that, at aheart rate of 60 beats per second or higher, it can stillcover more than a full heart-beat to ensure the accuracyof heart rate detection. At any given time (a horizontalline), the repeating color pattern (low-high-low in imagedistance) indicates that the optimal matching appears at aregular time lag. In this case, because of the short dura-tion, the heart rate is almost constant, as indicated by thenear-straight blue vertical band.
We can vertically project an image such as Figure 2to illustrate the cyclic image distance measurement. InFigure 3, both curves show the vertical projection of D
110111112113114115116117118119120121122

6263646566676869707172737475767778798081828384858687888990919293949596979899
100101102103104105106107108109
12345678910111213141516171819202122232425262728293031323334353637383940414243444546474849505152535455565758596061
CT
6 Ultrasound in Medicine and Biology Volume xx, Number x, 2006
COLOR
tapraid3/z2y-umb/z2y-umb/z2y00306/z2y7626d06z xppws S�1 1/27/06 17:47 Art: 7626 DTD5.0
UNCORRE
vectors over 1000 consecutive fields. The difference isthat the thicker gray curve is derived from a videosequence of a stationary imaging probe, whereas thethinner black curve is derived from a steady pullback.
With steady pullback, the imaging volume gradu-ally shifts with the progress of time; therefore, the longerthe duration between two fields (at the same phase in thecardiac cycle), the larger is the image distance. Thevalleys of the curves correspond to the instant that theprobe returns to roughly the same position and orienta-tion after a full cardiac cycle. The peaks of the curvesmark the time of the maximum phase difference. Thisfigure shows that a field matches optimally at a regularspacing and that the stationary curve (gray), whose peaksand valleys remain constant, does not have the driftshowing in the pullback curve (black).
This figure also shows the importance of the imag-ing volume conditions defined above. The temporal co-herence requirement (the first statement) guarantees thecontinuity of the distance curve D and therefore, thestability of the algorithm. The phase coherence (thesecond statement) and difference (the third statement)requirements guarantee the variation in image distance,on which we rely for cardiac cycle extraction.
Heart rate recoveryThe cyclic nature of the image distance behavior
may be used to recover the heart rate as an average overa finite interval of time. Here, we use the autocorrelationmethod to recover the optimal matching distance. An-other commonly used method to recover the heart rate is
Fig. 2. Image distance measured from a sequence of IVUSfields. The vertical direction is the time axis (field ID). Eachhorizontal line represents the distance measurement of a fieldwith respect to its neighbors (a window of 91 fields). Each pixelis color-coded by its image distance. We can clearly observethe cyclic behavior of the distance measurement (repeating
dark bluish vertical stripe).
EDPRO
OF
the discrete Fourier transform (DFT) (Spiegl et al. 1998;Patwardhan et al. 1998). We chose the autocorrelationover DFT because we use only a very small window size.It is known that, when applied to small gate lengths, DFTexhibits a considerable loss of frequency spectrum reso-lution (Wear et al. 1994).
To remove image noise, we smooth the local dis-tance vector D by temporal averaging:
D� k(j) �Dk�1(j) � Dk�1(j) � Dk(j)
3(2)
where D�k is the smoothed distance vector. In addition, we
normalize D�k so that its mean is zero and denote this
value by D̂k. We then use autocorrelation to look for theheart cycle:
rk(T) � mean� 2D̂k(t)D̂k(t � T)
D̂k(t)D̂k(t) � D̂k(t � T)D̂k(t � T)� (3)
where 1 � t � 2w � 1 � T and rk�T� is the response ofthe autocorrelation for cycle period T. We may computerk for a large range of T values and locate the cycle T thatleads to the largest response. The first positive peak ofrk(T1) is the correlation value of the basic period T1.
A peak value of one indicates optimal correlation.For half of the basic period, the correlation value is
generally less than zero, since the input vector D̂ isnormalized. An rk value of —1 at this position indicates
Fig. 3. Cyclic behavior of image distance measures from IVUS.The two curves compare the projected image distance of twodifferent IVUS video segments. The thicker gray curve iscomputed from an IVUS video recorded by a stationary probeand the thinner black curve is computed from an IVUS pull-back sequence. The black curve shows increase of image dis-tance with respect to time lag due to the change of the averageprobe location, whereas the gray curve shows little decay in
image distance with respect to time lag.
110111112113114115116117118119120121122
6263646566676869707172737475767778798081828384858687888990919293949596979899
100101102103104105106107108109
12345678910111213141516171819202122232425262728293031323334353637383940414243444546474849505152535455565758596061
CT
Detection of cardiac cycle from IVUS ● D. GUO AND P. RICHARDSON 7
F4
AQ: 3
F5
tapraid3/z2y-umb/z2y-umb/z2y00306/z2y7626d06z xppws S�1 1/27/06 17:47 Art: 7626 DTD5.0
UNCORRE
optimal correlation as well. The correlation vector rk isalso cyclic for a periodic input. However, because thedistance vector has a wide frequency spectrum, the cor-relation value generally decays with increasing T.
Figure 4 shows the result T for a typical distancevector. As we can see, the correlation value is very high(�0. 9), which indicates the regularity of the cyclicmotion. This correlation response is used to select theoptimal image resolution.
The above equation defines the correlation responseonly at integer coordinates. In practice, the actual heartcycle will not be a multiple of the field interval. We usespline interpolation to detect noninteger peak loca-tions. The first such peak is very easy to locate auto-matically and reliably. The frequency of the heartcycle extracted by this method, when compared with aclinical recording, has �1% error for a total of 15pullbacks. Note that these IVUS videos are capturedfrom fully anaesthetized pigs in which extra systolicbeats were not observed.
The running time of this algorithm is bounded bythe number of image pairs examined when measuring thedistance. This number is (2w � 1)n, where n is thenumber of fields which we tried to evaluate for the imagedistance and w is the window size and w is determined bythe heart rate and cannot be decreased. So this methodhas a running time of O(wn). In the next section, wedescribe an improvement to this method that allows us toextract heart rate with linear time O(n).
Fig. 4. Autocorrelation of a distance vector. The horizonaxis is the correlation value. The correlation is interpolat
(blac
ED P
ROO
F
Cardiac cycle extraction, a faster solutionAs we mentioned in the beginning of this section,
the instantaneous probe speed varies within a cardiaccycle, because of the systole-diastole variation. When theduration of the systole is shorter, the pressure risessharply and the heart wall suddenly contracts. When theduration of the diastole is longer, the pressure dropsgradually and the heart wall slowly relaxes. Higher in-stantaneous probe speed leads to larger changes in im-aging volume and, therefore, to larger changes in imagedistance between two adjacent fields. As a result, pair-wise image distances between adjacent fields also havepeaks and valleys that match the systolic and diastolicmotion variations. With this analysis, we can constructan algorithm that takes linear time to compute.
The advantage of this algorithm is that it onlyrequires a single scan of the image sequence and com-putes image distances only for adjacent pairs of an imagesequence; therefore, it greatly reduces the computationalcost. Currently, on a personal computer with 256 MB ofmemory, running Windows® XP (Microsoft, Redmond,WA) and Matlab 6.5, it takes an average of 0.72 s/field tocompute the heart rate of a field sequence.
To compute the systole-diastole image distance vari-ation, we define a new image distance measurement D:
D(i) � Di(i � 1) � Di,i�1. (4)
Figure 5 shows an example of such as vector measuredfrom an actual in vivo IVUS run. We can observe large
is the delay, measured in number of fields. The verticalpline interpolation (gray circles) from the original value
les).
tal axised by sk circ
110111112113114115116117118119120121122

6263646566676869707172737475767778798081828384858687888990919293949596979899
100101102103104105106107108109
12345678910111213141516171819202122232425262728293031323334353637383940414243444546474849505152535455565758596061
CT
8 Ultrasound in Medicine and Biology Volume xx, Number x, 2006
F6
tapraid3/z2y-umb/z2y-umb/z2y00306/z2y7626d06z xppws S�1 1/27/06 17:47 Art: 7626 DTD5.0
UNCORRE
values of D during systole and smaller values of Dduring diastole.
Similarly, we may compute the autocorrelation ofthis new vector D:
r(T) � mean� 2D(t)D(t � T)
D(t)D(t) � D(t � T)D(t � T)� (5)
where i � w � 1 � t � i � w � 1 � T.
RESULTS
The heart rate that we have recovered is not aconstant but, rather, a function of time. We denote theheart cycle time series T(t). Figure 6 shows an example
Fig. 5. Adjacent distance vector for an image sequence. In bothfigures, the horizontal axis is the field ID (time) and the verticalaxis is the distance measure of the corresponding field from itsimmediate neighbor. The bottom figure is a local magnifiedview of the top figure. The pulsatile change of the imaging
volume leads to cyclic variations in image distance.
Fig. 6. Heart cycles measured from an IVUS image sequefrom the IVUS video. The horizontal axis is the time m
in number of beats
ED P
ROO
F
of T(t) extracted from a typical image sequence with thelinear-time method.
SAMPLE APPLICATIONSIn this section, we show some sample applications
of phase extraction from IVUS video; more examplescan be found in the thesis (Guo 2000).
Application 1: 3-D phase-correlated shape reconstruc-tion
One may use the reconstructed phase information toproduce a 3-D moving model of the blood vessel. Thereconstruction method is similar to an early one (vonBirgelen et al. 1997), except that we now have a series ofvolumes rather than just one. To our knowledge, this isthe first work to produce time-dependent models directlyfrom IVUS video. The disadvantage of our reconstruc-tion, in comparison with the fusion of angiogram andIVUS (Evans et al. 1996; Prause et al. 1997; Slager et al.1998; Wahle et al. 1998), is that we do not providecurvature information. However, 3-D reconstructioneven without curvature information has been demon-strated to be useful in many studies, for example, inclinical trials (Coy et al. 1992; von Birgelen et al. 1995,1996) and surgical planning (Prati et al. 1996). Ourmethod has the advantage of being an automated soft-ware solution, requiring only IVUS video input.
To assemble fields into a volume, we first locatelocal maxima/minima of the Dd vector, which corre-sponds to maximal/minimal instantaneous probe speedduring systole/diastole. Second, we use the local maximato segment the field sequences into cardiac cycles anduse the local minima to provide subpartitions and extraverifications. We then linearly interpolate to determinethe phase of the rest of the fields within a cardiac cycle.Finally, we assemble fields at the same phase in thecardiac cycle into a volume.
is plot shows the heart rate variability measured directlyin frame number and the vertical axis is the heart rate
nce. Theasured
110111112113114115116117118119120121122
per minute.
6263646566676869707172737475767778798081828384858687888990919293949596979899
100101102103104105106107108109
12345678910111213141516171819202122232425262728293031323334353637383940414243444546474849505152535455565758596061
CT
Detection of cardiac cycle from IVUS ● D. GUO AND P. RICHARDSON 9
F7
F8
F9
tapraid3/z2y-umb/z2y-umb/z2y00306/z2y7626d06z xppws S�1 1/27/06 17:47 Art: 7626 DTD5.0
UNCORRE
The spacing of two adjacent fields in a shape isdetermined by the in-plane resolution of the fields andthe pullback speed. We set the spacing such that thesampling grid is the same size in the axial direction as inthe cross-sectional plane; thus, the shape is not distortedwhen displayed. The choice of the actual resolution isbounded by the rendering capability of the hardware. Forour current implementation, if we choose a 640 � 480window for displaying shapes, the maximum resolutionwhich we use is 128 � 128 � 512. At this size, renderingof a single frame takes about 40 s on a Sun™ Ultra-sparc20™ with 3-D hardware acceleration.
Figure 7 compares the sagittal view of the LADcomputed using our method with one computed with atraditional reconstruction method. Both views are de-rived from the same IVUS video recorded in vivo. Thetop one is computed by assuming a constant heart rate,like some previous methods did. The heart rate usedwhen computing the top view is measured when theimaging catheter is at the proximal end (left side). Noticethat the sagittal reconstruction is very smooth near theproximal end, but begins to show jagged lumen boundarytoward the distal end (right side) due to the irregularheart-beat during the IVUS video recording. This dis-continuity is typical of a volume assembly without theproper cardiac gating (Klingensmith et al. 2003).
The bottom view is computed using the methoddescribed in this paper, taking heart rate variability intoaccount. Notice that the smoothness of the shape is a
Fig. 7. Sagittal views computed from the reconstructed 3-Dshapes. The above two sagittal views are computed from thesame IVUS video recorded in vivo. The top one is computed byassuming a constant heart rate, like some previous methods did.The heart rate is measured when the imaging catheter is at theproximal end (left side). The top reconstruction shows jaggedlumen boundary from the middle section to the distal end (rightside) due to irregular heart-beat during the IVUS video record-ing. The bottom view is computed using the method describedin this paper, taking heart rate variability into account. Ourmethod leads to a smooth shape, with details of the vessel wall
clearly visible.
ED P
ROO
Fresult of the correct assembly of an instantaneous volumethat corresponds to a particular phase in the cardiaccycle.
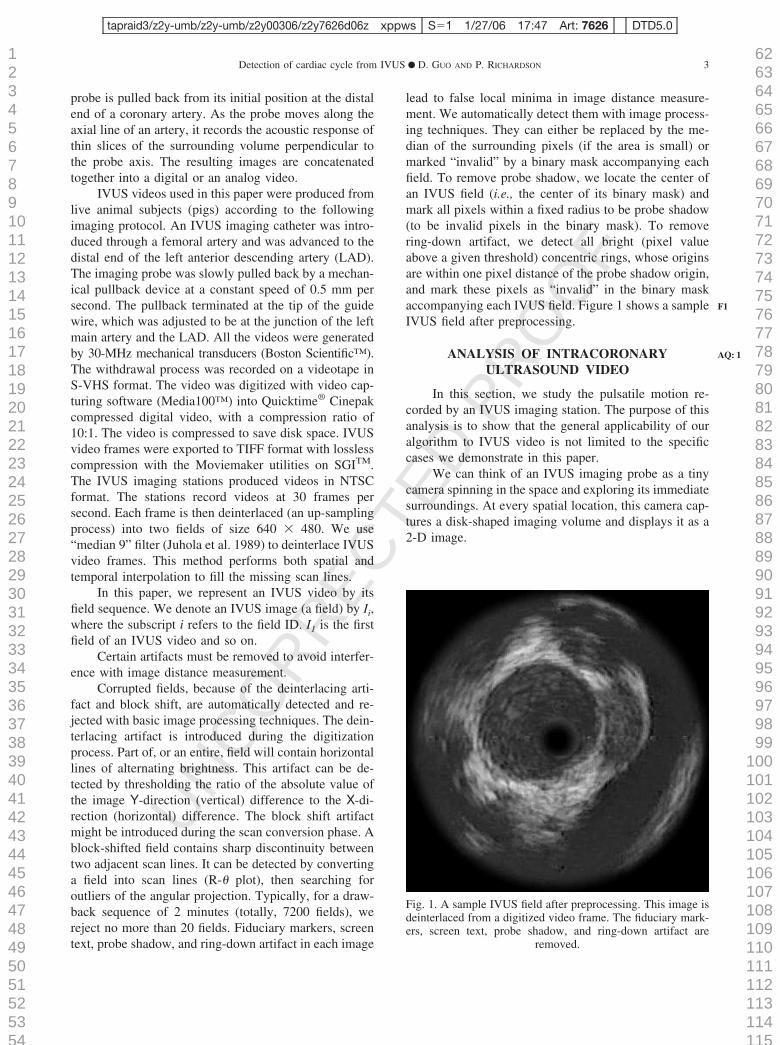
Figure 8 shows a series of volumes constructedfrom an in vivo IVUS. This series shows the phasicchanges of the vessel wall shapes and overall vesseldimension. When these images are shown as videos, thepulsatile motion of the vessel wall is much clearer than ina sequence of static captures. In addition, our programalso allows manipulation of volume for viewing at dif-ferent viewpoints and arbitrary cross-sections.
Application 2: 3-D phase-correlated volume measure-ment
The 3-D phase-correlated shape reconstruction al-lows us to measure the volume change within a cardiaccycle, showing the dynamics of the artery wall. As wealready know, coronary arteries are elastic arteries: theirmotion is passive and is driven by the blood-pressurewave. If we could make real-time pressure measurementsat the tip of an IVUS probe, we could then compare ourphasic volume measurement with the correspondingpressure wave. Unfortunately, we do not have such de-vices available for our experiment. However, pressuremeasurements are widely available in the literature. Fig-ure 9 compares a pressure wave measured at the ascend-ing aorta (human) and our phase-correlated volume mea-
Fig. 8. Phasic 3-D shapes constructed from an IVUS video. Allimages are rendered with the same set of rendering parameters.
110111112113114115116117118119120121122

6263646566676869707172737475767778798081828384858687888990919293949596979899
100101102103104105106107108109
12345678910111213141516171819202122232425262728293031323334353637383940414243444546474849505152535455565758596061
CT
10 Ultrasound in Medicine and Biology Volume xx, Number x, 2006
F10
tapraid3/z2y-umb/z2y-umb/z2y00306/z2y7626d06z xppws S�1 1/27/06 17:47 Art: 7626 DTD5.0
UNCORRE
surement (pig) for the LAD. The pressure wave measure-ment is obtained from the textbook by McDonald et al.(Nichols and O’Rourke 1998).
Although the shape of pressure wave varies withlocation, the waveform is typical. One possible futuredirection is to combine the blood pressure and shapevariation measurements to find the stress distributioninside the blood vessel. However, the present study doesnot address viscoelastic response of a vessel wall.
Application 3: Probe motion extraction from IVUS videoInformation on vessel curvature and its local varia-
tion during the cardiac cycle could be important in re-fining stress calculations through the wall.
Although the exact curvature cannot be recovereddirectly from IVUS, we can estimate the local curvaturefrom the probe off-center vector (Wahle et al. 1999).This estimate may serve as a warning of high-curvatureregions where the volume measurement may not beaccurate.
Other uses of the probe off-center vector includeimage intensity adjustment (Thompson and Wilson1996) and blood-flow measurement adjustment (Lupottiet al. 2003).
The probe off-center vector is defined as the vectorfrom probe center to lumen center. The probe center canbe extracted during the preprocessing stage described inthe protocol section.
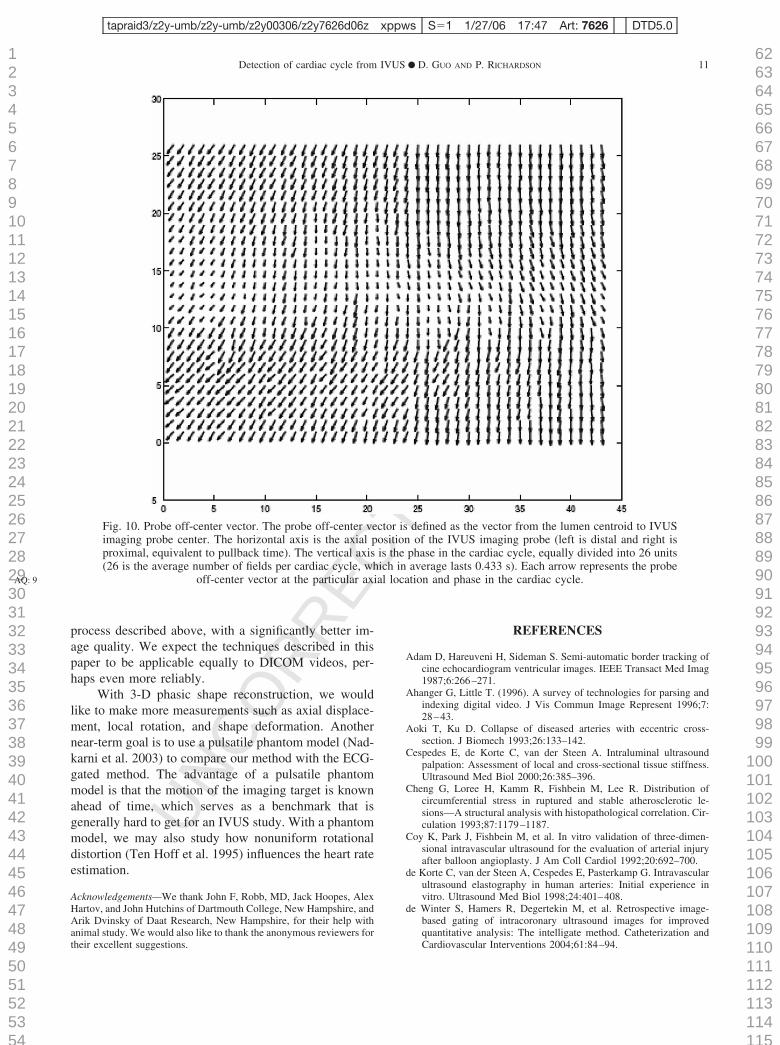
The lumen center can be extracted by segmentinglumen area from an IVUS image automatically (Guo2000). Figure 10 shows a series of probe off-centervectors measured by this method; the horizontal axis isthe axial location and the vertical axis is the cardiac cyclephase.
The length of this vessel segment is 1 cm. Even overthis short distance, we can still observe axial changes inthe behavior of the probe off-center vector: toward theproximal (left) end, the probe tends to stay at the side for
Fig. 9. A comparison of blood-pressure wave (right) and phase-correlated volume change (left). The above pressure wave ismeasured in the ascending aorta. The volume measurement isobtained for the LAD from a digitized IVUS video recorded in
vivo.
the entire heart cycle, while at the distal end the probe
ED P
ROO
F
swings from the side to the center of the lumen, thenback to the side, within a heart cycle. Roughly speaking,there are two horizontal blocks of different mean vectordirection for each location, and over the heart-beat, oneblock (systolic, at the top and the bottom of the figure)occupying more of the cardiac cycle than the other (di-astolic, in the middle). One possible direction for futurestudy is to understand how the probe off-center vectorchanges with axial location of the imaging probe andhow it influences heart rate computation.
It is not proposed that the information embedded inthese variations can be used to reconstruct a local vesselcurvature from which a 3-D image of the vessel aroundthe beating ventricles can be constructed. However, itmay assist in the fitting of the IVUS data and vesselreconstructions around a 3-D mapping such as may beobtained from dynamic biplane angiography. The factthat digital primary recording of angiography is becom-ing more widespread should simplify the fusion of themodalities.
SUMMARY AND FUTURE DEVELOPMENTWe have shown in this paper that, by using some
image analysis techniques tailored for the specific task, itis possible to extract the timing of the cardiac cycle,including its normal short-term variability, from process-ing of IVUS video taken under regular IVUS catheterpull-back conditions. Further, we have demonstratedfrom actual recordings that this permits smooth phase-correlated longitudinal reconstructions of sections of in-terest of an imaged vessel (Figs. 7 and 8). It is importantto note that the lumen has not been extracted withsmoothing of the sort often used for lumen area estima-tion, so features of luminal surface topography, up to theresolution of IVUS, are preserved and displayed. Varia-tions of lumenal surface topography with location and,perhaps, with a change of mean arterial pressure, mightbe useful indicators of tissue mechanical property vari-ations associated with advanced atherosclerosis. There isalso information obtained on the probe off-center vector(Fig. 10), which is related to local curvature of the vesseland which demonstrates its phasic variation, seen fordifferent locations along a vessel in the variations in eachvertical column in Figure 10.
The reliability of our program depends on the qual-ity of IVUS video captured. If there are significantamounts of noise (for example, due to occlusion) or mostof a lumen is outside of view (for example, when imag-ing catheter is at the proximal end), the program may failto extract the heart rate from an IVUS video. Currentstate-of-the-art IVUS machines use higher-frequencyIVUS catheters and produce digital video in digital im-aging and communication in medicine (DICOM) format,
110111112113114115116117118119120121122
thus eliminating the digital-analog-digital conversion
6263646566676869707172737475767778798081828384858687888990919293949596979899
100101102103104105106107108109
12345678910111213141516171819202122232425262728293031323334353637383940414243444546474849505152535455565758596061
Detection of cardiac cycle from IVUS ● D. GUO AND P. RICHARDSON 11
AQ: 9
tapraid3/z2y-umb/z2y-umb/z2y00306/z2y7626d06z xppws S�1 1/27/06 17:47 Art: 7626 DTD5.0
UNCORRE
process described above, with a significantly better im-age quality. We expect the techniques described in thispaper to be applicable equally to DICOM videos, per-haps even more reliably.
With 3-D phasic shape reconstruction, we wouldlike to make more measurements such as axial displace-ment, local rotation, and shape deformation. Anothernear-term goal is to use a pulsatile phantom model (Nad-karni et al. 2003) to compare our method with the ECG-gated method. The advantage of a pulsatile phantommodel is that the motion of the imaging target is knownahead of time, which serves as a benchmark that isgenerally hard to get for an IVUS study. With a phantommodel, we may also study how nonuniform rotationaldistortion (Ten Hoff et al. 1995) influences the heart rateestimation.
Acknowledgements—We thank John F, Robb, MD, Jack Hoopes, AlexHartov, and John Hutchins of Dartmouth College, New Hampshire, andArik Dvinsky of Daat Research, New Hampshire, for their help withanimal study. We would also like to thank the anonymous reviewers fortheir excellent suggestions.
Fig. 10. Probe off-center vector. The probe off-center veimaging probe center. The horizontal axis is the axial pproximal, equivalent to pullback time). The vertical axis(26 is the average number of fields per cardiac cycle, wh
off-center vector at the particular ax
ED P
ROO
FREFERENCES
Adam D, Hareuveni H, Sideman S. Semi-automatic border tracking ofcine echocardiogram ventricular images. IEEE Transact Med Imag1987;6:266–271.
Ahanger G, Little T. (1996). A survey of technologies for parsing andindexing digital video. J Vis Commun Image Represent 1996;7:28–43.
Aoki T, Ku D. Collapse of diseased arteries with eccentric cross-section. J Biomech 1993;26:133–142.
Cespedes E, de Korte C, van der Steen A. Intraluminal ultrasoundpalpation: Assessment of local and cross-sectional tissue stiffness.Ultrasound Med Biol 2000;26:385–396.
Cheng G, Loree H, Kamm R, Fishbein M, Lee R. Distribution ofcircumferential stress in ruptured and stable atherosclerotic le-sions—A structural analysis with histopathological correlation. Cir-culation 1993;87:1179–1187.
Coy K, Park J, Fishbein M, et al. In vitro validation of three-dimen-sional intravascular ultrasound for the evaluation of arterial injuryafter balloon angioplasty. J Am Coll Cardiol 1992;20:692–700.
de Korte C, van der Steen A, Cespedes E, Pasterkamp G. Intravascularultrasound elastography in human arteries: Initial experience invitro. Ultrasound Med Biol 1998;24:401–408.
de Winter S, Hamers R, Degertekin M, et al. Retrospective image-based gating of intracoronary ultrasound images for improvedquantitative analysis: The intelligate method. Catheterization andCardiovascular Interventions 2004;61:84–94.
defined as the vector from the lumen centroid to IVUSof the IVUS imaging probe (left is distal and right is
phase in the cardiac cycle, equally divided into 26 unitsaverage lasts 0.433 s). Each arrow represents the probetion and phase in the cardiac cycle.
CTctor isositionis theich in
ial loca
110111112113114115116117118119120121122

6263646566676869707172737475767778798081828384858687888990919293949596979899
100101102103104105
12345678910111213141516171819202122232425262728293031323334353637383940414243444546474849505152535455565758596061
CT
12 Ultrasound in Medicine and Biology Volume xx, Number x, 2006
AQ: 4
AQ: 5
AQ: 6
AQ: 7
AQ: 8
tapraid3/z2y-umb/z2y-umb/z2y00306/z2y7626d06z xppws S�1 1/27/06 17:48 Art: 7626 DTD5.0
UNCORRE
Escaned J, Baptista J, DiMario C, et al. Significance of automatedstenosis detection during quantitative angiography—Insightsgained from intracoronary ultrasound imaging. Circulation 1996;94:996–972.
Evans J, Ng K, Wiet S, et al. Accurate three-dimensional reconstructionof intravascular ultrasound data—spatially correct three-dimen-sional reconstruction, Circulation 1996;93:567–576.
Fitzgerald P, Ports T, Yock P. Contribution of localized calciumdeposits to dissection after angioplasty—An observational studyusing intravascular ultrasound. Circulation 1992;86:64–70.
Fitzgerald P, Yock P. Mechanisms and outcomes of angioplasty andatherectomy assessed by intravascular ultrasound imaging. J ClinUltrasound 1993;21:579–588.
Guo D. Intravascular ultrasound video analysis [PhD thesis], BrownUniversity, 2000.
Honye J, Mahon D, Jain A, et al. Morphological effects of coronaryballoon angioplasty in vivo assessed by intravascular ultrasoundimaging. Circulation 1992;85:1012–1025.
Juhola J, Nieminen A, Salo J, Neuvo Y. Scan rate conversion usingweighted median filtering. IEEE International Symposium on Cir-cuits and Systems, 1989, pp. 433–436.
Kimura B, Fitzgerald P, Sudhir K, Amidon T, Strunk B, Yock P.Guidance of directed coronary atherectomy by intracoronary ultra-sound imaging. Am Heart J 1992;124:1365–1369.
Klingensmith J, Schoenhagen P, Tajaddini A, et al. Automated three-dimensional assessment of coronary artery anatomy with intravas-cular ultrasound scanning. Am Heart J 2003;145:795–805.
Klingensmith J, Shekhar R, Vince G. Evaluation of three-dimensionalsegmentation algorithms for the identification of luminal and me-dial-adventitial borders in intravascular ultrasound images. IEEETransact Med Imaging 2000;19:996–1011.
Lee R, Richardson S, Loree H, et al. Prediction of mechanical prop-erties of human atherosclerotic tissue by highfrequency intravascu-lar ultrasound imaging—An in vitro study. Arterioscl Thromb1992;12:1–5.
Loree H, Kamm R, Stringfellow R, Lee R. Effects of fibrous capthickness on peak circumferential stress in model atheroscleroticvessels. Circ Res 1992;71:850–858.
Lupotti F, Mastik F, Carlier S, et al. Quantitative IVUS blood flow:Validation in vitro, in animal and in patient. Ultrasound Med Biol2003;29.
Nadkarni S, Austin H, Mills G, Boughner D, Fenster A. A pulsatingcoronary vessel phantom for two- and three- dimensional intravas-cular ultrasound studies. Ultrasound Med Biol 2003;29.
Nichols W, O’Rourke M. McDonald’s blood flow in arteries: Theoret-ical, experimental and clinical principles, 4th ed. London: Arnold,1998.
Nissen S, Gurley J, Grines C, et al. Intravascular ultrasound assessmentof lumen size and wall morphology in normal subjects and patientswith coronary-artery disease. Circulation 1991;84:1087–1099.
Olszewski M, Long RM, Mitchell S, Wahle A, Sonka M. Quantitativemeasurements in geometrically correct representations of coronaryvessels in 3-d and 4-d, 4th IEEE Southwest Symposium on Imageanalysis and Interpretation, 2000, pp. 259.263.
Patwardhan A, Vallurupalli S, Evans J, Knapp C, Bruce E. Use ofamplitude-modulated breathing for assessment of cardiorespiratoryfrequency response within subrespiratory frequencies. IEEE Trans-actions on Biomedical Engineering 1998;45:268–273.
Phibbs B, Craddockm L, Griffith G, Patrick R, Walker C. The humanheart: A guide to heart disease. St Louis: C.V. Mosby Co, 1971.
Prati F, DiMario C, Gil R, et al. Usefulness of on-line three-dimen-sional reconstruction of intracoronary ultrasound for guidance ofstent deployment. Am J Cardiol 1996;77:455–461.
Prause G, de Jong S, McKay C, Sonka M. Towards a geometrically
correct 3D reconstruction of tortuous coronary arteries based onED P
ROO
F
biplane angiography and intravascular ultrasound. Int J CardiacImaging 1997;13:451–462.
Richardson P, Davies M, Born G. Influence of plaque configuration andstress distribution on fissuring of coronary atherosclerotic plaques.Lancet 1989;ii:941,–944.
Rosenfield K, Kaufman J, Pieczek A, Langevin R, Razvi S, Isner J.Realtime three-dimensional reconstruction of intravascular ultra-sound images of iliac arteries. Am J Cardiol 1992;70:412–415.
Slager C, Wentzel J, Oomen J, et al. True reconstruction of vesselgeometry from combined X-ray angiographic and intracoronaryultrasound data. Semin Intervent Cardiol 1998;2:43–47.
Spiegl A, Steinbigler P, Schmucking I, Knez A, Haberl R. Analysis ofbeat-to-beat variability of frequency contents in the electrocardio-gram using two-dimensional Fourier transforms. IEEE Transac-tions on Biomedical Engineering, 1998.
Ten Hoff H, Gussenhoven E, Korbijn A, Mastik F, LancJe C, N B.Mechanical scanning in intravascular ultrasound imaging: Artifactsand driving mechanisms. Eur J Ultrasound 1995.
Teo T. High frequency IVUS. In: Sajio Y, van der Steen AFW, eds.Vascular ultrasound. New York: Springer-Verlag, 2003.
Terashima M, Hayakawa M, Awano K, et al. Three-dimensional re-construction of intravascular ultrasound images of coronary stentsusing an ECG-gated pull-back device. Heart Vessels 1997;12:188–190.
Thompson R, Wilson L. The effect of variations in transducer positionand sound speed in intravascular ultrasound: A theoretical study.Ultrasound Med Biol 1996;22:719–734.
Tobis J, Mallery J, Mahon D, et al. Intravascular ultrasound imaging ofhuman coronary arteries in vivo—Analysis of tissue characteriza-tions with comparison to in vitro histological specimens. Circula-tion 1991;83:913–926.
von Birgelen C, de Vrey E, Mintz G, et al. ECG-gated three-dimen-sional intravascular ultrasound—Feasibility and reproducibility ofthe automated analysis of coronary lumen and atheroscleroticplaque dimensions in humans. Circulation 1997;96:2944–2952.
von Birgelen C, DiMario C, Li W, et al. Morphometric analysis inthree-dimensional intracoronary ultrasound: An in vitro and in vivostudy performed with a novel system for the contour detection oflumen and plaque. Am Heart J 1996;132:516–527.
von Birgelen C, Slager C, DiMario C, de Feyter P, Serruys P. Volu-metric intracoronary ultrasound: A new maximum confidence ap-proach for the quantitative assessment of progression-regression ofatherosclerosis? Atherosclerosis 1995;118:S103–S113.
Wahle A, Prause G, de Jong S, Sonka M. Determination of the absoluteaxial orientation of intracoronary ultrasound images in fusion withbiplane angiography. IEEE Proceedings of Computers in Cardiol-ogy 1998;25:153–156.
Wahle A, Prause G, de Jong S, Sonka M. Geometrically correct 3Dreconstruction of intravascular ultrasound images by fusion withbiplane angiography ¨ C methods and validation. IEEE Transac-tions on Medical Imaging 1999;18:686–699.
Walker A, Olsson E, Wranne B, I R, P A. Time delays in ultrasoundsystems can result in fallacious measurements. Ultrasound MedBiol 2002;28:259–263.
Wear K, Wagner R, Garra B. High resolution ultrasonic backscattercoefficient estimation based on autoregressive spectral estimationusing Burg’s algorithm. IEEE Transactions on Medical Imaging1994;13:500–507.
Yeung M, Yeo B, Liu B. Segmentation of video by clustering andgraph analysis. Comput Vis Image Understanding 1998;71:94–109.
Zhang X, McKay CR, Sonka M. Tissue characterization in intravas-cular ultrasound images. IEEE Transact Med Imaging 1998;17:
106107108109110111112113114115116117118119120121122
889–899.

JOBNAME: AUTHOR QUERIES PAGE: 1 SESS: 2 OUTPUT: Fri Jan 27 17:50:46 2006/tapraid3/z2y�umb/z2y�umb/z2y00306/z2y7626d06z
AQ9— Please check all equations and symbols carefully.
AQ1— Should this be change to Intravascular?
AQ2— Should there be a word after “exercise”? Maybe “capacity”?
AQ3— Please provide manufacturer and location (city, state) of Matlab 6.5.
AQ4— Please provide page number(s) for Lupotti et al.
AQ5— Please provide page number(s) for Nadkarni et al.
AQ6— Please provide last name and first initial(s) for last author of Ten Hoff et al, plus volumeand page number(s).
AQ7— Please provide relevant page number(s) for Teo reference.
AQ8— Please provide last names and first initials of last two authors in Walker et al 2002.
AUTHOR QUERIES
AUTHOR PLEASE ANSWER ALL QUERIES 1