Despite hydropower surplus, most Ugandans report lack of ...
10
Copyright ©Afrobarometer 2021 1 Dispatch No. 441 | 14 April 2021 Despite hydropower surplus, most Ugandans report lack of electricity Afrobarometer Dispatch No. 441 | Ronald Makanga Kakumba Summary Electricity is a major determinant of a country’s economic prosperity. Lack of access to electricity has an enormous impact on the use of emerging technologies, modern economic activities, public service delivery, and standards of living (Blimpo & Cosgrove, 2019). About 15 years ago, Uganda experienced a power crisis, with electricity demand exceeding the available supply by a 2-to-1 ratio due to delayed capacity additions and low water levels in Lake Victoria (RMI, 2020). Today the country generates a surplus of electricity. Production capacity of 1,254 megawatts as of 2019 (Electricity Regulatory Authority, 2019) is expected to reach 1,800 megawatts if Karuma Dam is commissioned later this year. Yet Ugandans can only consume about 600 megawatts at peak (Global Press Journal, 2020), in large part because the limited national electric grid doesn’t reach most households. In an attempt to address this supply-demand gap, the government put in place National Development Plans I & II and the Rural Electrification Strategy and Plan between 2010 and 2015, aiming not only to expand the national electric grid but also to accelerate the pace of gains in electricity access and service penetration (Ministry of Energy and Mineral Development, 2018). In 2018, the government launched the Electricity Connection Policy giving customers an electricity connection for just UGX 20,000 (about U.S. $5.50), aiming to ensure access for 60% of households by 2027 (Nile Post, 2021; Rural Electrification Agency, 2018). Despite these efforts, the most recent official statistics show that only 26.7% of households have access to electricity, including just 18% in rural areas (Uganda Bureau of Statistics, 2016). In addition to the limited grid, barriers include high electricity tariffs and connection charges (Nabukeera, 2020; Blimpo, McRae, & Steinbuks, 2018). Moreover, funding shortages have slowed the implementation of existing policies, including suspension of the Electricity Connection Policy in late 2020 (NTV News, 2020). A recent Afrobarometer survey provides an on-the-ground look at electricity access in the country. Findings show that only about half of Ugandans live in zones served by the electric grid, and only a quarter live in households that are connected to the grid. More households use solar energy than electricity from the national grid. Lack of access and connection to the national electric grid is especially common for the poorest citizens, rural residents, and those in the Northern and Western regions. Even so, citizens’ ratings of the government’s performance on providing reliable electricity have improved significantly. These findings suggest that the government’s plans, policies, and programs, while appreciated by citizens, require accelerated implementation to achieve widespread access and lower electricity costs.
-
Upload
khangminh22 -
Category
Documents
-
view
2 -
download
0
Transcript of Despite hydropower surplus, most Ugandans report lack of ...

Copyright ©Afrobarometer 2021 1
Dispatch No. 441 | 14 April 2021
Despite hydropower surplus, most Ugandans
report lack of electricity
Afrobarometer Dispatch No. 441 | Ronald Makanga Kakumba
Summary
Electricity is a major determinant of a country’s economic prosperity. Lack of access to
electricity has an enormous impact on the use of emerging technologies, modern economic
activities, public service delivery, and standards of living (Blimpo & Cosgrove, 2019).
About 15 years ago, Uganda experienced a power crisis, with electricity demand exceeding
the available supply by a 2-to-1 ratio due to delayed capacity additions and low water
levels in Lake Victoria (RMI, 2020). Today the country generates a surplus of electricity.
Production capacity of 1,254 megawatts as of 2019 (Electricity Regulatory Authority, 2019) is
expected to reach 1,800 megawatts if Karuma Dam is commissioned later this year.
Yet Ugandans can only consume about 600 megawatts at peak (Global Press Journal, 2020),
in large part because the limited national electric grid doesn’t reach most households.
In an attempt to address this supply-demand gap, the government put in place National
Development Plans I & II and the Rural Electrification Strategy and Plan between 2010 and
2015, aiming not only to expand the national electric grid but also to accelerate the pace of
gains in electricity access and service penetration (Ministry of Energy and Mineral
Development, 2018).
In 2018, the government launched the Electricity Connection Policy giving customers an
electricity connection for just UGX 20,000 (about U.S. $5.50), aiming to ensure access for 60%
of households by 2027 (Nile Post, 2021; Rural Electrification Agency, 2018).
Despite these efforts, the most recent official statistics show that only 26.7% of households
have access to electricity, including just 18% in rural areas (Uganda Bureau of Statistics, 2016).
In addition to the limited grid, barriers include high electricity tariffs and connection charges
(Nabukeera, 2020; Blimpo, McRae, & Steinbuks, 2018). Moreover, funding shortages have
slowed the implementation of existing policies, including suspension of the Electricity
Connection Policy in late 2020 (NTV News, 2020).
A recent Afrobarometer survey provides an on-the-ground look at electricity access in the
country. Findings show that only about half of Ugandans live in zones served by the electric
grid, and only a quarter live in households that are connected to the grid. More households
use solar energy than electricity from the national grid. Lack of access and connection to
the national electric grid is especially common for the poorest citizens, rural residents, and
those in the Northern and Western regions. Even so, citizens’ ratings of the government’s
performance on providing reliable electricity have improved significantly.
These findings suggest that the government’s plans, policies, and programs, while
appreciated by citizens, require accelerated implementation to achieve widespread access
and lower electricity costs.
Copyright ©Afrobarometer 2021 2
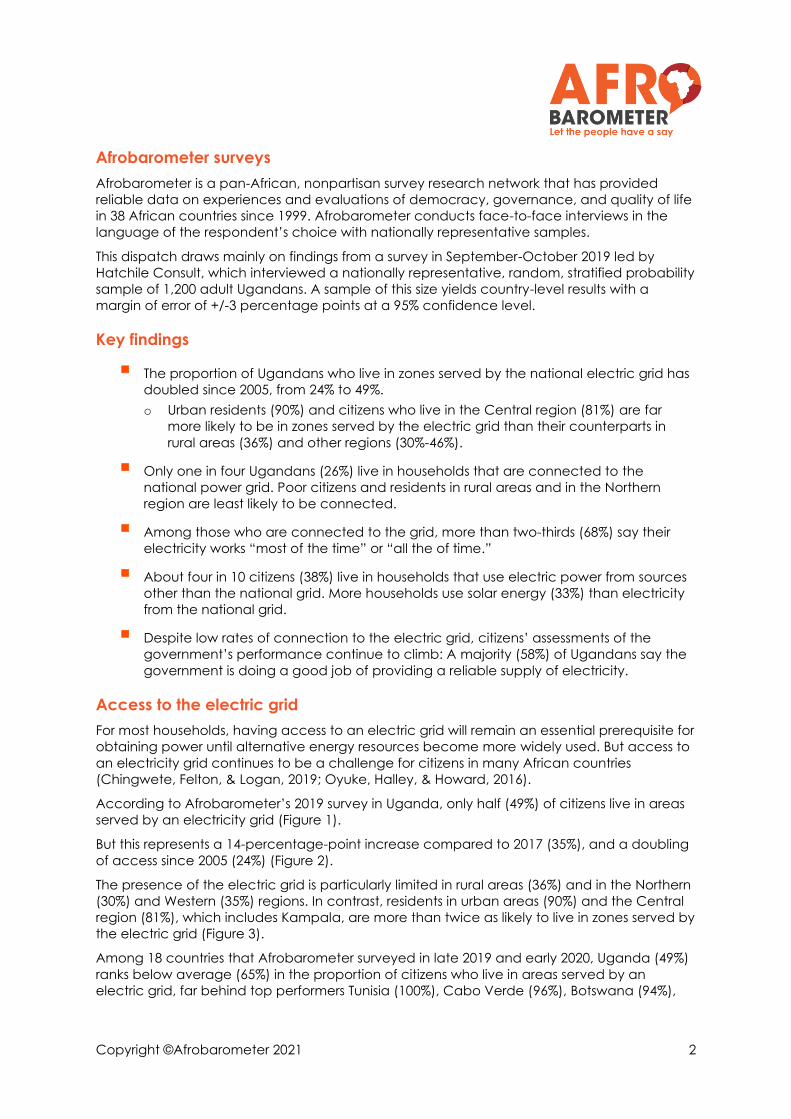
Afrobarometer surveys
Afrobarometer is a pan-African, nonpartisan survey research network that has provided
reliable data on experiences and evaluations of democracy, governance, and quality of life
in 38 African countries since 1999. Afrobarometer conducts face-to-face interviews in the
language of the respondent’s choice with nationally representative samples.
This dispatch draws mainly on findings from a survey in September-October 2019 led by
Hatchile Consult, which interviewed a nationally representative, random, stratified probability
sample of 1,200 adult Ugandans. A sample of this size yields country-level results with a
margin of error of +/-3 percentage points at a 95% confidence level.
Key findings
▪ The proportion of Ugandans who live in zones served by the national electric grid has
doubled since 2005, from 24% to 49%.
o Urban residents (90%) and citizens who live in the Central region (81%) are far
more likely to be in zones served by the electric grid than their counterparts in
rural areas (36%) and other regions (30%-46%).
▪ Only one in four Ugandans (26%) live in households that are connected to the
national power grid. Poor citizens and residents in rural areas and in the Northern
region are least likely to be connected.
▪ Among those who are connected to the grid, more than two-thirds (68%) say their
electricity works “most of the time” or “all the of time.”
▪ About four in 10 citizens (38%) live in households that use electric power from sources
other than the national grid. More households use solar energy (33%) than electricity
from the national grid.
▪ Despite low rates of connection to the electric grid, citizens’ assessments of the
government’s performance continue to climb: A majority (58%) of Ugandans say the
government is doing a good job of providing a reliable supply of electricity.
Access to the electric grid
For most households, having access to an electric grid will remain an essential prerequisite for
obtaining power until alternative energy resources become more widely used. But access to
an electricity grid continues to be a challenge for citizens in many African countries
(Chingwete, Felton, & Logan, 2019; Oyuke, Halley, & Howard, 2016).
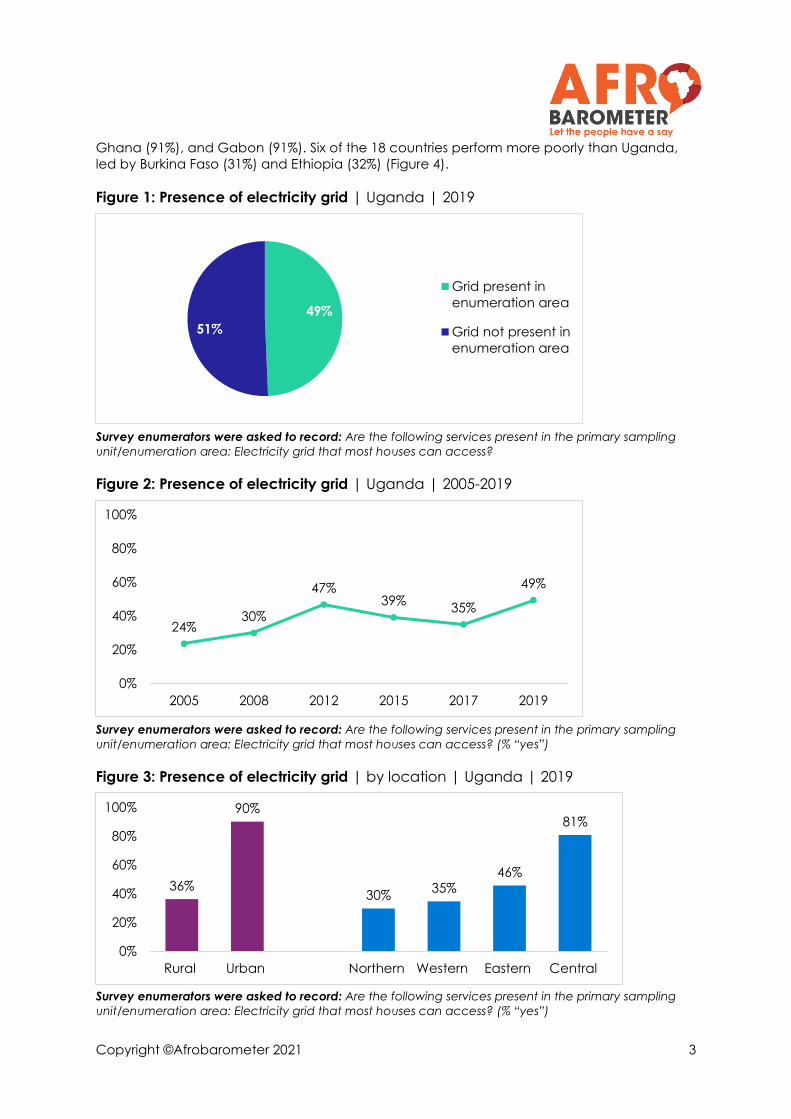
According to Afrobarometer’s 2019 survey in Uganda, only half (49%) of citizens live in areas
served by an electricity grid (Figure 1).
But this represents a 14-percentage-point increase compared to 2017 (35%), and a doubling
of access since 2005 (24%) (Figure 2).
The presence of the electric grid is particularly limited in rural areas (36%) and in the Northern
(30%) and Western (35%) regions. In contrast, residents in urban areas (90%) and the Central
region (81%), which includes Kampala, are more than twice as likely to live in zones served by
the electric grid (Figure 3).
Among 18 countries that Afrobarometer surveyed in late 2019 and early 2020, Uganda (49%)
ranks below average (65%) in the proportion of citizens who live in areas served by an
electric grid, far behind top performers Tunisia (100%), Cabo Verde (96%), Botswana (94%),
Copyright ©Afrobarometer 2021 3
Ghana (91%), and Gabon (91%). Six of the 18 countries perform more poorly than Uganda,
led by Burkina Faso (31%) and Ethiopia (32%) (Figure 4).
Figure 1: Presence of electricity grid | Uganda | 2019
Survey enumerators were asked to record: Are the following services present in the primary sampling
unit/enumeration area: Electricity grid that most houses can access?
Figure 2: Presence of electricity grid | Uganda | 2005-2019
Survey enumerators were asked to record: Are the following services present in the primary sampling
unit/enumeration area: Electricity grid that most houses can access? (% “yes”)
Figure 3: Presence of electricity grid | by location | Uganda | 2019
Survey enumerators were asked to record: Are the following services present in the primary sampling
unit/enumeration area: Electricity grid that most houses can access? (% “yes”)
49%
51%
Grid present in
enumeration area
Grid not present in
enumeration area
24%30%
47%39%
35%
49%
0%
20%
40%
60%
80%
100%
2005 2008 2012 2015 2017 2019
36%
90%
30%35%
46%
81%
0%
20%
40%
60%
80%
100%
Rural Urban Northern Western Eastern Central

Copyright ©Afrobarometer 2021 4
Figure 4: Presence of electricity grid | 18 African countries | 2019/2020
Survey enumerators were asked to record: Are the following services present in the primary sampling
unit/enumeration area: Electricity grid that most houses can access? (% “yes”)
Connection to the electric grid
Living in zones served by an electric grid does not guarantee a supply of electricity. Costs
associated with service from the power grid – including fees for inspection, house wiring, and
connection – may present prohibitive hurdles for many citizens.
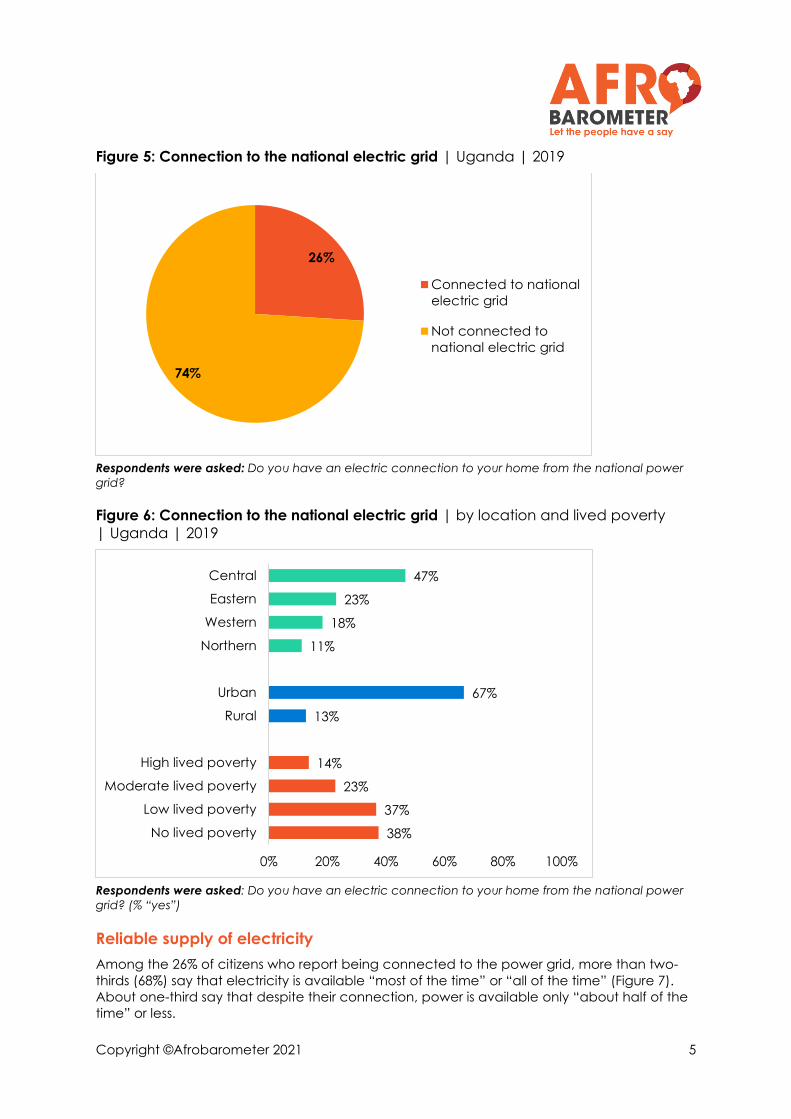
Only one in four Ugandans (26%) live in households that are actually connected to the
electric grid (Figure 5).
Urban residents (67%) are five times as likely to have an electricity connection as their rural
counterparts (13%) (Figure 6). Almost half (47%) of residents of the Central region have
electricity, compared to fewer than one-fourth of residents of the Eastern (23%), Western
(18%), and Northern (11%) regions.
As might be expected, the poorest1 citizens (14%) are far less likely to be connected to the
power grid than those experiencing no or low lived poverty (37%-38%).
1 Afrobarometer’s Lived Poverty Index (LPI) measures respondents’ levels of material deprivation by asking how often they or their families went without basic necessities (enough food, enough water, medical care, enough cooking fuel, and a cash income) during the preceding year. For more on lived poverty, see Mattes (2020).
31%
32%
37%
40%
41%
47%
49%
62%
63%
65%
66%
66%
78%
80%
91%
91%
94%
96%
100%
0% 20% 40% 60% 80% 100%
Burkina Faso
Ethiopia
Sierra Leone
Guinea
Mali
Malawi
Uganda
Angola
Namibia
Average
Lesotho
Nigeria
Côte d'Ivoire
Kenya
Gabon
Ghana
Botswana
Cabo Verde
Tunisia
Copyright ©Afrobarometer 2021 5
Figure 5: Connection to the national electric grid | Uganda | 2019
Respondents were asked: Do you have an electric connection to your home from the national power
grid?
Figure 6: Connection to the national electric grid | by location and lived poverty
| Uganda | 2019
Respondents were asked: Do you have an electric connection to your home from the national power
grid? (% “yes”)
Reliable supply of electricity
Among the 26% of citizens who report being connected to the power grid, more than two-
thirds (68%) say that electricity is available “most of the time” or “all of the time” (Figure 7).
About one-third say that despite their connection, power is available only “about half of the
time” or less.
26%
74%
Connected to national
electric grid
Not connected to
national electric grid
38%
37%
23%
14%
13%
67%
11%
18%
23%
47%
0% 20% 40% 60% 80% 100%
No lived poverty
Low lived poverty
Moderate lived poverty
High lived poverty
Rural
Urban
Northern
Western
Eastern
Central
Copyright ©Afrobarometer 2021 6
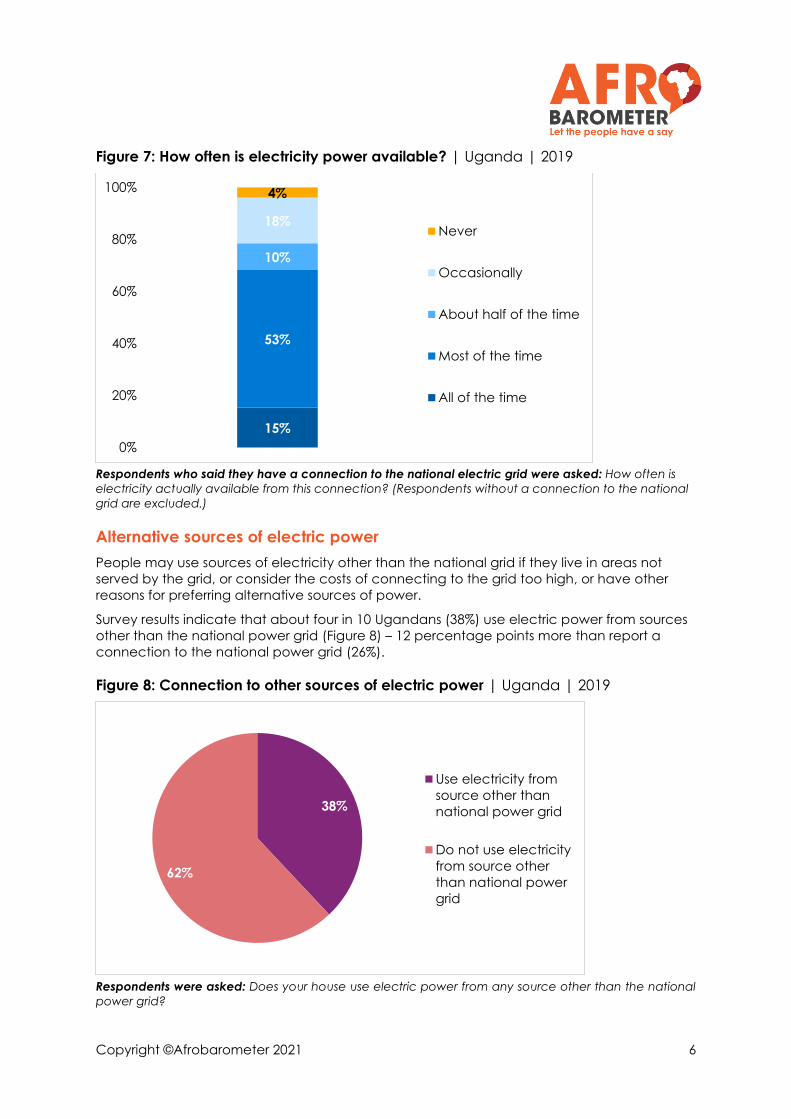
Figure 7: How often is electricity power available? | Uganda | 2019
Respondents who said they have a connection to the national electric grid were asked: How often is
electricity actually available from this connection? (Respondents without a connection to the national
grid are excluded.)
Alternative sources of electric power
People may use sources of electricity other than the national grid if they live in areas not
served by the grid, or consider the costs of connecting to the grid too high, or have other
reasons for preferring alternative sources of power.
Survey results indicate that about four in 10 Ugandans (38%) use electric power from sources
other than the national power grid (Figure 8) – 12 percentage points more than report a
connection to the national power grid (26%).
Figure 8: Connection to other sources of electric power | Uganda | 2019
Respondents were asked: Does your house use electric power from any source other than the national
power grid?
15%
53%
10%
18%
4%
0%
20%
40%
60%
80%
100%
Never
Occasionally
About half of the time
Most of the time
All of the time
38%
62%
Use electricity from
source other than
national power grid
Do not use electricity
from source other
than national power
grid

Copyright ©Afrobarometer 2021 7
In rural areas, where access to the electric grid is especially low, residents are more likely
than their urban counterparts to use power from other sources (42% vs. 26%) (Figure 9). The
use of alternative sources of electricity is also higher in the Western (53%) and Central (37%)
regions than in the Eastern (29%) and Northern (31%) regions.
But while poor citizens are less likely to be connected to the national grid, they are also less
likely than their better-off counterparts to use other sources of power.
Figure 9: Connection to other sources of electric power | by location and lived
poverty | Uganda | 2019
Respondents were asked: Does your house use electric power from any source other than the national
power grid? (% “yes”)
Among those who get electricity from sources other than the national power grid, the
overwhelming majority use solar energy, making the sun a power source for fully one-third
(33%) of the Ugandan population – 7 percentage points more than report a connection to
the national power grid. Far smaller proportions use hydro power and batteries or power
banks (2% each of the whole sample) (Figure 10).
Figure 10: Other sources of electricity used | Uganda | 2019
Respondents were asked: Does your house use electric power from any source other than the national
power grid? [If yes:] What is the source of the electricity for this connection?
47%
43%
35%
34%
26%
42%
29%
31%
37%
53%
0% 20% 40% 60% 80% 100%
No lived poverty
Low lived poverty
Moderate lived poverty
High lived poverty
Urban
Rural
Eastern
Northern
Central
Western
33%
2% 2% 1%
62%
0%
20%
40%
60%
80%
100%
Solar panel Batteries or
power bank
Hydro power Other/ Multiple
sources
Do not use
other sources

Copyright ©Afrobarometer 2021 8
Government performance on electricity supply
Even though only one-fourth of Ugandans say they get electricity from the national grid, a
majority (58%) say the government is performing “fairly well” or “very well” on the provision of
a reliable electricity supply. Ratings of the government performance on electricity have
been improving steadily over the past decade, with approval more than doubling since 2012
(27%) (Figure 11).
These increasingly positive evaluations may reflect awareness of government policies and
programs designed to increase electricity-generation capacity, extend the electric grid, and
improve household access to power, even if they haven’t yet made electric power a reality
for many Ugandans.
Figure 11: Government performance in provision of reliable electricity supply
| Uganda | 2008-2019
Respondents were asked: How well or badly would you say the current government is handling
providing a reliable supply of electricity, or haven’t you heard enough to say?
Conclusion
Despite Uganda’s surplus in electricity generation, most citizens lack access and connection
to the national power grid. Poor people and residents of rural areas and the Northern and
Western regions are particularly disadvantaged.
Nonetheless, the government receives increasingly positive ratings of its performance on
providing reliable electricity, probably attributable to its policies and programs designed to
improve access to electricity.
These findings point to the need to address implementation challenges of existing electricity-
access plans and policies in order to accelerate the pace of gains in access, bridge the
supply-demand gap, and lower the unit cost of electricity.
35%27%
32%
40%
58%62%
68% 67%
55%
40%
0%
20%
40%
60%
80%
100%
2008 2012 2015 2017 2019
Fairly well/
Very well
Fairly badly/
Very badly
Do your own analysis of Afrobarometer data – on any question, for any country and survey round. It’s easy and free at
www.afrobarometer.org/online-data-analysis.

Copyright ©Afrobarometer 2021 9
References
Blimpo, M. P., McRae, S. D., & Steinbuks, J. (2018. Why are connection charges so high? Analysis of the electricity sector in sub-Saharan Africa. World Bank Policy Research Working Paper No. 8407.
Blimpo, M. P., & Cosgrove-Davies, M. (2019). Electricity access in sub-Saharan Africa: Uptake and reliability and complementary factors for economic impact. World Bank Group.
Chingwete, A., Felton, J., & Logan, C. (2019). Prerequisite for progress: Accessible, reliable power still in short supply across Africa. Afrobarometer Dispatch No. 334.
Electricity Regulatory Authority. (2019). Electricity supply industry performance report.
Global Press Journal. (2020). Power puzzle in Uganda: Lots of electricity but not enough legal users. 5 July.
Mattes, R. (2020). Lived poverty on the rise: Decade of living-standard gains ends in Africa. Afrobarometer Policy Paper No. 62.
Ministry of Energy and Mineral Development. (2018) Electricity connections policy report: Financing and implementation for connections.
Nabukeera, M. (2020). The performance of the free electricity connection policy in Uganda. Islamic University Multidisciplinary Journal, 7(3), 163-177.
Nile Post. (2021). Government resumes free electricity connection policy. 3 March.
NTV News. (2020). Lack of funds delays free Electricity Connections Policy. 4 November.
Oyuke, A., Halley, P., & Howard, B. (2016). Off-grid or ‘off-on’: Lack of access, unreliable electricity supply still plague majority of Africans. Afrobarometer Dispatch No. 75.
RMI. (2020). Achievements and challenges of Uganda’s power sector. 9 January.
Rural Electrification Agency. (2018). The electricity connections policy.
Uganda Bureau of Statistics. (2016). 2016 statistical abstract.

Copyright ©Afrobarometer 2021 10
Ronald Makanga Kakumba is a research associate for Hatchile Consult Ltd. in Kampala,
Uganda. Email: [email protected].
Afrobarometer, a non-profit corporation with headquarters in Ghana, is a pan-African, non-
partisan research network. Regional coordination of national partners in about 35 countries is
provided by the Ghana Center for Democratic Development (CDD-Ghana), the Institute for
Justice and Reconciliation (IJR) in South Africa, and the Institute for Development Studies
(IDS) at the University of Nairobi in Kenya. Michigan State University (MSU) and the University
of Cape Town (UCT) provide technical support to the network.
Financial support for Afrobarometer Round 8 has been provided by Sweden via the Swedish
International Development Cooperation Agency, the Mo Ibrahim Foundation, the Open
Society Foundations, the William and Flora Hewlett Foundation, the U.S. Agency for
International Development (USAID) via the U.S. Institute of Peace, the National Endowment
for Democracy, the European Union Delegation to the African Union, Freedom House, the
Embassy of the Kingdom of the Netherlands in Uganda, GIZ, and Humanity United.
Donations help the Afrobarometer Project give voice to African citizens. Please consider
making a contribution (at www.afrobarometer.org) or contact Bruno van Dyk
([email protected]) to discuss institutional funding.
Follow our releases on #VoicesAfrica.
/Afrobarometer @Afrobarometer
Afrobarometer Dispatch No. 441| 14 April 2021