Comparative study of brine management technologies for desalination plants
This article was published in the above mentioned Springer issue.The material, including all portions thereof, is protected by copyright;all rights are held exclusively by Springer Science + Business Media.
The material is for personal use only;commercial use is not permitted.
Unauthorized reproduction, transfer and/or usemay be a violation of criminal as well as civil law.
ISSN 1866-6280, Volume 59, Number 5
ORIGINAL ARTICLE
Desalination of a sedimentary rock aquifer system invadedby Pleistocene Champlain Sea water and processes controllinggroundwater geochemistry
Vincent Cloutier Æ Rene Lefebvre ÆMartine M. Savard Æ Rene Therrien
Received: 9 May 2008 / Accepted: 3 February 2009 / Published online: 20 February 2009
� Springer-Verlag 2009
Abstract The objective of this study was to identify
geochemical processes and Quaternary geological events
responsible for the variations in groundwater geochemistry
observed in a sedimentary rock aquifer system, including
brackish to saline groundwater. Inorganic constituents and
environmental isotopes were analyzed for 146 groundwater
samples. Dissolution of carbonates dominates in recharge
areas, resulting in Ca-, Mg-HCO3 groundwater. Further
along flow paths, under confined conditions, Ca2?–Na? ion
exchange causes groundwater evolution to Na-HCO3 type.
Na-Cl groundwater is also found and it falls on a seawater
mixing line. Using conservative tracers, Cl- and Br-, the
original Champlain Sea water is shown to have been, in the
region, a mixture of about 34% seawater and 66% fresh-
water, a composition still retained by some groundwater.
Na-Cl groundwater thus results from mixing with former
Champlain Sea water and also from solute diffusion from
overlying marine clay. The system is thus found to be at
different stages of desalinization, from the original
Champlain Sea water still present in hydraulically stagnant
areas of the aquifer to fully flushed conditions in parts,
where more flow occurs, especially in recharge zones. The
geochemical processes are integrated within the hydro-
geological context to produce a conceptual geochemical
evolution model for groundwater of the aquifer system.
Keywords Hydrogeochemistry � Salinity �Groundwater � Champlain Sea � Canada
Introduction
The Basses–Laurentides aquifer system is located on the
north shore of the St. Lawrence River, northwest of Mon-
treal in Canada (Fig. 1). It covers approximately 1,500 km2
in the physiographic region of the St. Lawrence Lowlands.
The study area is within the limits of the postglacial
Champlain Sea (Fig. 1). Groundwater hydrogeochemistry
of this sedimentary rock aquifer system was studied as part
of a regional hydrogeological assessment. Nastev et al.
(2004, 2005, 2006) investigated the hydraulic properties of
the rock aquifer, developed a numerical groundwater flow
model for this aquifer and determined the conditions
required for its sustainable exploitation. Ross et al. (2004,
2005) developed a 3D geological model of the overlying
Quaternary units and assessed the rock aquifer vulnerability
on the basis of downward advective time.
The Basses–Laurentides aquifer system has complex
flow patterns, with a widely varying groundwater geo-
chemistry including brackish to saline groundwater. The
regional rock aquifer system contains buried valleys cov-
ered by a thick layer of marine clays that create confined
V. Cloutier (&) � R. Lefebvre
Institut national de la recherche scientifique, INRS-Eau,
Terre et Environnement, Universite du Quebec,
490 rue de la Couronne, Quebec, QC G1K 9A9, Canada
e-mail: [email protected]
Present Address:V. Cloutier
Department of Applied Sciences,
Universite du Quebec en Abitibi-Temiscamingue,
Campus d’Amos, 341 rue Principale Nord,
Amos, QC, J9T 2L8, Canada
M. M. Savard
Geological Survey of Canada, Natural Resources Canada,
490 rue de la Couronne, Quebec, QC G1K 9A9, Canada
R. Therrien
Department of Geology and Geological Engineering,
Universite Laval, Quebec, QC G1K 7P4, Canada
123
Environ Earth Sci (2010) 59:977–994
DOI 10.1007/s12665-009-0091-8 Author's personal copy
conditions, as well as ridges overlain by thin reworked
glacial tills that allow preferential groundwater recharge
under unconfined conditions (Nastev et al. 2005). Cloutier
et al. (2006) characterized the regional groundwater hy-
drogeochemistry and established the relationship between
groundwater types and hydrogeological settings, with the
specific objective of identifying the origin of groundwater
in the study area. Cloutier et al. (2008) used multivariate
statistics to analyze the geochemical data to better identify
the processes controlling the geochemical evolution of
groundwater in the aquifer system. A very interesting
aspect of the work of Cloutier et al. (2006) is the identi-
fication, in the aquifer system under confined conditions, of
brackish to saline water of Na-Cl groundwater type. The
occurrence of groundwater with high salinity in the study
area was also identified in previous studies (Simard 1978;
Soucy 1998). For local municipalities that rely on
groundwater for their water supply, groundwater with high
salinity poses a problem for the provision of potable water.
The objective pursued in this paper is to identify the on-
going geochemical processes as well as Quaternary
geological events that have influenced groundwater
geochemistry in this aquifer system. The understanding of
geochemical processes controlling current groundwater
geochemistry is required for the sound management of
groundwater resources in the region. Emphasis is on
explaining the presence of brackish to saline groundwater
and this paper presents a first quantitative explanation for
the occurrence of Na-Cl groundwater in the aquifer system
using the conservative elements Cl- and Br-, as well as
d18O. Although the study focuses on a relatively local
system, it provides an example of general interest for the
potentially long-term effect of a major perturbation on the
geochemical evolution of an aquifer system. The study also
shows the interrelation between steady state hydraulic
conditions and transient geochemical conditions that are
still evolving after a major perturbation.
Description of the study area
Geological and hydrogeological setting
The area has generally a flat topography, with the excep-
tion of the Monteregian Oka and St. Andre Hills related to
Cretaceous alkaline intrusions (Fig. 2a). The Laurentian
Highlands, part of the Grenville Province of the Canadian
Shield, border the study area to the north. The study area is
bounded to the southwest, south, and southeast by the
Outaouais River, the Deux Montagnes Lake, and the Mille
Iles River, respectively. The watershed of the Mascouche
River forms the eastern limit of the study area.
The Basses–Laurentides aquifer system is part of the
geological Province of the St. Lawrence Platform and
consists of nearly horizontal Cambrian–Ordovician sedi-
mentary formations lying unconformably on the crystalline
basement of the Precambrian Grenville Province (Fig. 2a).
Precambrian rocks, such as quartzite, crystallized lime-
stone, gneiss, and anorthosite, form a window through the
Paleozoic sequence with the Cretaceous intrusions (Gold
1972; Lewis 1971).
The geological map shows the Cambrian–Ordovician
sedimentary sequence covering most of the study area
(Fig. 2a). The Cambrian Potsdam Group comprises the
Covey Hill Formation (a reddish feldspathic sandstone,
locally conglomeratic and poorly cemented) and the
Cairnside Formation (a well-cemented, pure, quartz arenite
sandstone) (Globensky 1987). The Ordovician Beekman-
town Group includes the Theresa Formation (dolomitic
sandstone and sandy dolostone), the Beauharnois Forma-
tion (sandy to pure, massive, dolostone) and the Carillon
Formation (pure dolostone with limestone near its summit)
(Salad Hersi et al. 2003). The Chazy Group (sandstone,
limestone and shale), Black River Group (dolostone, shale
and limestone) and Trenton Group (limestone and shale)
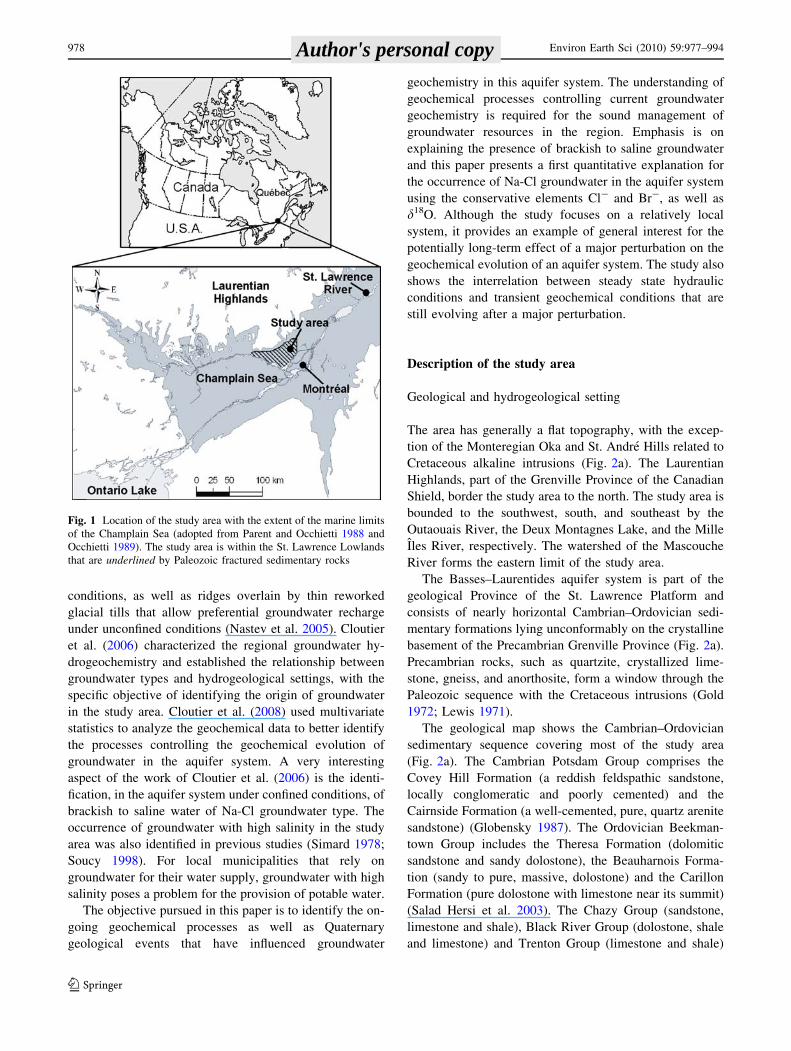
Fig. 1 Location of the study area with the extent of the marine limits
of the Champlain Sea (adopted from Parent and Occhietti 1988 and
Occhietti 1989). The study area is within the St. Lawrence Lowlands
that are underlined by Paleozoic fractured sedimentary rocks
978 Environ Earth Sci (2010) 59:977–994
123
Author's personal copy
complete the sequence (Globensky 1987). More details on
the lithology and mineralogy of the sedimentary formations
are provided by Cloutier (2004).
The last Quaternary glaciation covered the rock units
with Upper Wisconsinan sediments, such as glacial till and
glacio-fluvial sand and gravel (Bolduc and Ross 2001).
During deglaciation, the Laurentide Ice Sheet was retreated
from the St. Lawrence Valley. The combined depression of
the continent, due to the glaciation, and the retreat of the
Laurentide Ice Sheet led to marine invasion from the St.
Lawrence Gulf, which created the Champlain Sea (Fig. 1).
The main basin of the Champlain Sea was established
around 12,000 BP (Parent and Occhietti 1988) and sub-
merged the study area for about 2,000 years (Levesque
1982). The Champlain Sea water was a mixture of conti-
nental waters, including meltwater from the Laurentide Ice
Sheet and local precipitation, and salt water from the St.
Lawrence Gulf (Hillaire-Marcel 1988). The Champlain Sea
episode led to the deposition of marine sediments, mainly
clayey-silts to silty-clays that can reach a thickness of more
than 80 m in the study area (Bolduc and Ross 2001).
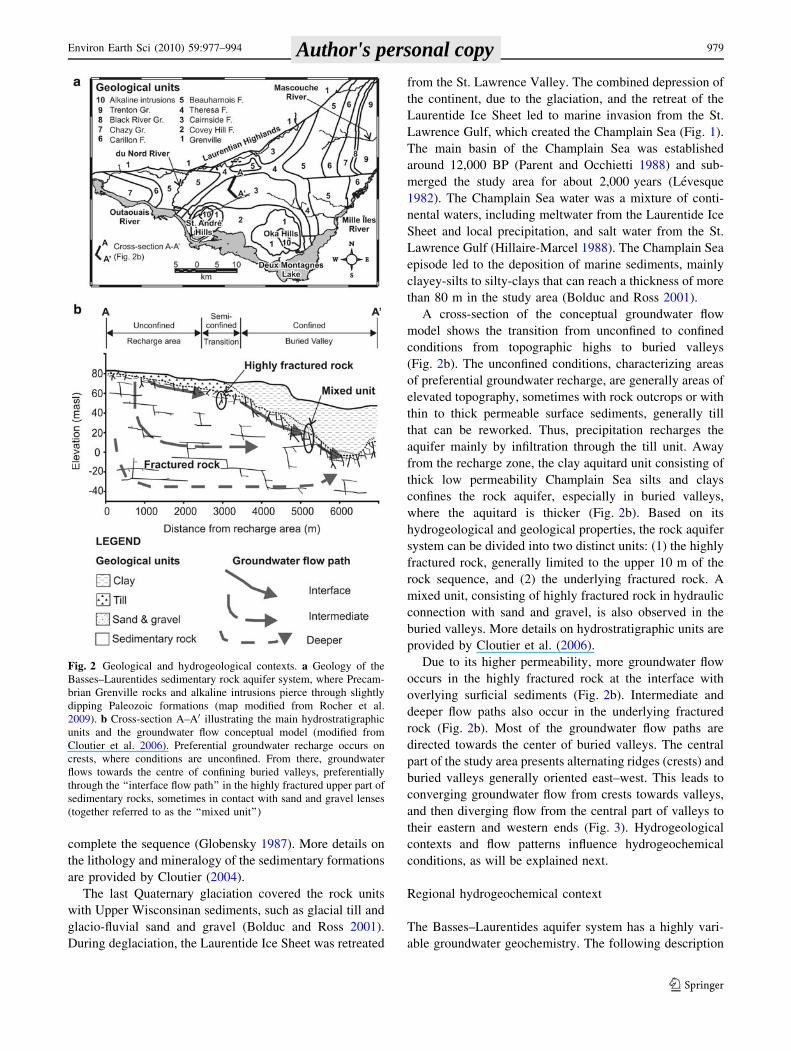
A cross-section of the conceptual groundwater flow
model shows the transition from unconfined to confined
conditions from topographic highs to buried valleys
(Fig. 2b). The unconfined conditions, characterizing areas
of preferential groundwater recharge, are generally areas of
elevated topography, sometimes with rock outcrops or with
thin to thick permeable surface sediments, generally till
that can be reworked. Thus, precipitation recharges the
aquifer mainly by infiltration through the till unit. Away
from the recharge zone, the clay aquitard unit consisting of
thick low permeability Champlain Sea silts and clays
confines the rock aquifer, especially in buried valleys,
where the aquitard is thicker (Fig. 2b). Based on its
hydrogeological and geological properties, the rock aquifer
system can be divided into two distinct units: (1) the highly
fractured rock, generally limited to the upper 10 m of the
rock sequence, and (2) the underlying fractured rock. A
mixed unit, consisting of highly fractured rock in hydraulic
connection with sand and gravel, is also observed in the
buried valleys. More details on hydrostratigraphic units are
provided by Cloutier et al. (2006).
Due to its higher permeability, more groundwater flow
occurs in the highly fractured rock at the interface with
overlying surficial sediments (Fig. 2b). Intermediate and
deeper flow paths also occur in the underlying fractured
rock (Fig. 2b). Most of the groundwater flow paths are
directed towards the center of buried valleys. The central
part of the study area presents alternating ridges (crests) and
buried valleys generally oriented east–west. This leads to
converging groundwater flow from crests towards valleys,
and then diverging flow from the central part of valleys to
their eastern and western ends (Fig. 3). Hydrogeological
contexts and flow patterns influence hydrogeochemical
conditions, as will be explained next.
Regional hydrogeochemical context
The Basses–Laurentides aquifer system has a highly vari-
able groundwater geochemistry. The following description
Fig. 2 Geological and hydrogeological contexts. a Geology of the
Basses–Laurentides sedimentary rock aquifer system, where Precam-
brian Grenville rocks and alkaline intrusions pierce through slightly
dipping Paleozoic formations (map modified from Rocher et al.
2009). b Cross-section A–A0 illustrating the main hydrostratigraphic
units and the groundwater flow conceptual model (modified from
Cloutier et al. 2006). Preferential groundwater recharge occurs on
crests, where conditions are unconfined. From there, groundwater
flows towards the centre of confining buried valleys, preferentially
through the ‘‘interface flow path’’ in the highly fractured upper part of
sedimentary rocks, sometimes in contact with sand and gravel lenses
(together referred to as the ‘‘mixed unit’’)
Environ Earth Sci (2010) 59:977–994 979
123
Author's personal copy
of the regional hydrogeochemical context uses the
groundwater classification approach of dominant and
mixed groundwater types presented by Cloutier (2004).
This approach, based on major ions concentrations, clas-
sifies the Basses–Laurentides groundwater samples into six
dominant and four mixed groundwater types (Table 1).
Cloutier et al. (2006) classified these ten groundwater types
into four main groundwater groups, Ca-, Mg-HCO3 (G1),
Na-HCO3 (G2), Na-Cl (G3) as well as Ca-SO4 and Na-SO4
(G4).
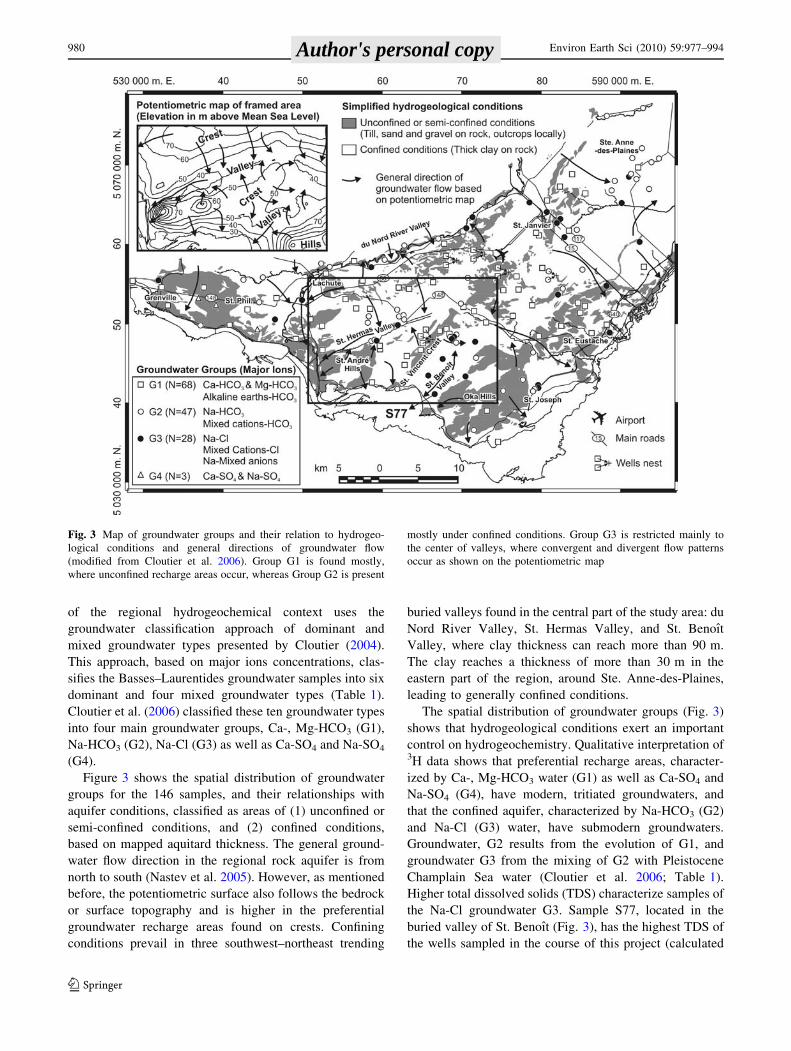
Figure 3 shows the spatial distribution of groundwater
groups for the 146 samples, and their relationships with
aquifer conditions, classified as areas of (1) unconfined or
semi-confined conditions, and (2) confined conditions,
based on mapped aquitard thickness. The general ground-
water flow direction in the regional rock aquifer is from
north to south (Nastev et al. 2005). However, as mentioned
before, the potentiometric surface also follows the bedrock
or surface topography and is higher in the preferential
groundwater recharge areas found on crests. Confining
conditions prevail in three southwest–northeast trending
buried valleys found in the central part of the study area: du
Nord River Valley, St. Hermas Valley, and St. Benoıt
Valley, where clay thickness can reach more than 90 m.
The clay reaches a thickness of more than 30 m in the
eastern part of the region, around Ste. Anne-des-Plaines,
leading to generally confined conditions.
The spatial distribution of groundwater groups (Fig. 3)
shows that hydrogeological conditions exert an important
control on hydrogeochemistry. Qualitative interpretation of3H data shows that preferential recharge areas, character-
ized by Ca-, Mg-HCO3 water (G1) as well as Ca-SO4 and
Na-SO4 (G4), have modern, tritiated groundwaters, and
that the confined aquifer, characterized by Na-HCO3 (G2)
and Na-Cl (G3) water, have submodern groundwaters.
Groundwater, G2 results from the evolution of G1, and
groundwater G3 from the mixing of G2 with Pleistocene
Champlain Sea water (Cloutier et al. 2006; Table 1).
Higher total dissolved solids (TDS) characterize samples of
the Na-Cl groundwater G3. Sample S77, located in the
buried valley of St. Benoıt (Fig. 3), has the highest TDS of
the wells sampled in the course of this project (calculated
Fig. 3 Map of groundwater groups and their relation to hydrogeo-
logical conditions and general directions of groundwater flow
(modified from Cloutier et al. 2006). Group G1 is found mostly,
where unconfined recharge areas occur, whereas Group G2 is present
mostly under confined conditions. Group G3 is restricted mainly to
the center of valleys, where convergent and divergent flow patterns
occur as shown on the potentiometric map
980 Environ Earth Sci (2010) 59:977–994
123
Author's personal copy
TDS = 11,337 mg/L). Although they are located in, or
close to, unconfined areas, some samples collected along
the main highways 15 and 117, particularly around St.
Janvier, have Na-Cl groundwater (Fig. 3). For these sam-
ples, it was shown that groundwater is contaminated by de-
icing road salts, which gives its Na-Cl characteristics,
without the high Br- found in marine water (Cloutier et al.
2006).
Methods of investigation
The approach used for this study was to determine the
hydrogeochemistry of groundwater for all hydrogeologic
units of the Basses–Laurentides aquifer system, starting
from the groundwater recharge areas along the regional
flow direction. The study also characterized the hydrog-
eochemistry of all sources that could influence the
composition of groundwater, such as rain and snow in
recharge zones, and clay pore water in the buried valleys.
The regional characterization of groundwater hydrogeo-
chemistry, performed in 1999 and 2000, consisted of
groundwater sampling of private, municipal and observa-
tion wells. Regional groundwater samples were collected at
153 sites, to a maximum depth of about 140 m. Sampling
sites are evenly distributed over the region and cover the
following permeable hydrostratigraphic units: surface
sediments, such as till, sediments under clay deposits, the
mixed unit consisting of highly fractured rock and sedi-
ments under clay deposits, and fractured rock units.
In situ field measurements were made on water samples
for temperature, pH, electrical conductivity, dissolved
oxygen, and redox potential. Groundwater samples were
analyzed for major, minor and trace inorganic constituents
for a total of 36 parameters, stable isotopes d2H, d18O and
d13C of dissolved inorganic carbon (DIC), and some
samples were analyzed for 3H and 14C of DIC. The sam-
pling and analytical protocols, as well as the complete
hydrogeochemical dataset, are presented in Cloutier et al.
(2006). For the 153 groundwater samples, 134 samples
have an electro-neutrality below 5%, 12 between 5 and 8%,
and 7 above 10%. Samples with an electro-neutrality above
10% were rejected, as their analyses were generally miss-
ing major ions. The remaining 146 groundwater samples
with electro-neutrality below 8% are retained for the fol-
lowing interpretation of the main geochemical processes.
Results and interpretation of main
geochemical processes
This section documents the interpretation of the main
geochemical processes that are controlling the evolution of
groundwater in the aquifer system. The description starts
from the process found to be dominant in recharge areas,
carbonate dissolution, to processes prevalent under con-
fined conditions, being ion exchange and groundwater
mixing.
Dissolution of carbonates
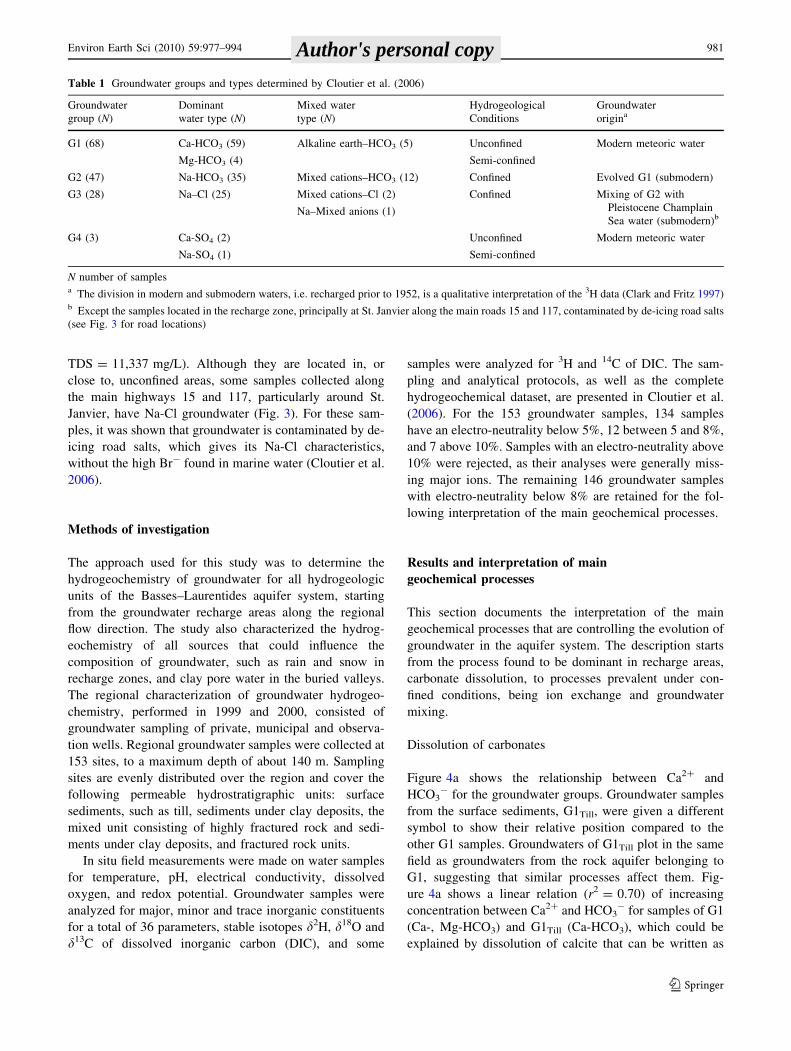
Figure 4a shows the relationship between Ca2? and
HCO3- for the groundwater groups. Groundwater samples
from the surface sediments, G1Till, were given a different
symbol to show their relative position compared to the
other G1 samples. Groundwaters of G1Till plot in the same
field as groundwaters from the rock aquifer belonging to
G1, suggesting that similar processes affect them. Fig-
ure 4a shows a linear relation (r2 = 0.70) of increasing
concentration between Ca2? and HCO3- for samples of G1
(Ca-, Mg-HCO3) and G1Till (Ca-HCO3), which could be
explained by dissolution of calcite that can be written as
Table 1 Groundwater groups and types determined by Cloutier et al. (2006)
Groundwater
group (N)
Dominant
water type (N)
Mixed water
type (N)
Hydrogeological
Conditions
Groundwater
origina
G1 (68) Ca-HCO3 (59) Alkaline earth–HCO3 (5) Unconfined Modern meteoric water
Mg-HCO3 (4) Semi-confined
G2 (47) Na-HCO3 (35) Mixed cations–HCO3 (12) Confined Evolved G1 (submodern)
G3 (28) Na–Cl (25) Mixed cations–Cl (2) Confined Mixing of G2 with
Pleistocene Champlain
Sea water (submodern)bNa–Mixed anions (1)
G4 (3) Ca-SO4 (2) Unconfined Modern meteoric water
Na-SO4 (1) Semi-confined
N number of samplesa The division in modern and submodern waters, i.e. recharged prior to 1952, is a qualitative interpretation of the 3H data (Clark and Fritz 1997)b Except the samples located in the recharge zone, principally at St. Janvier along the main roads 15 and 117, contaminated by de-icing road salts
(see Fig. 3 for road locations)
Environ Earth Sci (2010) 59:977–994 981
123
Author's personal copy
CaCO3 ? CO2 ? H2O $ Ca2? ? 2HCO3- (Appelo and
Postma 2005). Samples of G2 (Na-HCO3) and G3 (Na-Cl)
show more spread on the diagram. For HCO3- above
7 mmol/L, Ca2? concentrations for both groups G2 and G3
decrease to values lower than 0.5 mmol/L (Fig. 4a).
A clear trend of increasing Mg/Ca with increasing pH is
observed, from precipitation to groundwaters of G1 and G4
in preferential recharge areas, to groundwaters of G2 and G3
under confined conditions (Fig. 4b). Again, groundwaters
from the surface sediments, G1Till, plot in the same field as
groundwaters from the rock aquifer belonging to G1. The
majority of Ca-, Mg-HCO3 (G1) samples have a pH between
6.8 and 8.0, and a Mg/Ca ratio between 0.6 and 0.9. These
Mg/Ca ratios for G1 are close to the expected value of 0.8 for
groundwater in equilibrium with calcite (CaCO3) and
dolomite [CaMg(CO3)2] (Appelo and Postma 2005). Thus,
the relationship between Ca2? and HCO3- and that between
the Mg/Ca ratio and pH indicate dissolution of calcite during
infiltration, as well as dissolution of dolomite that can be
written as CaMg(CO3)2$ Ca2? ? Mg2? ? 2CO32- (Ap-
pelo and Postma 2005). Occurrence of marine carbonate
dissolution has been shown by Cloutier et al. (2006) from
stable carbon isotopes on DIC in the till groundwater, and is
consistent with the presence of calcite and dolomite in the till
matrix as described in previous work (Levesque 1982).
Groundwaters of G2 and G3 dominate at elevated pH and at
Fig. 4 Evidences of carbonates
dissolution. a The relationship
between Ca2? and HCO3-
concentrations for Group G1
samples could be explained by
dissolution of calcite. b There is
a relation between Mg/Ca and
pH and the Mg/Ca ratio for G1
is typical of groundwater in
equilibrium with calcite and
dolomite (precipitation
calculated by averaging
monthly data from the
Department of the Environment,
Quebec, 1994–1996)
982 Environ Earth Sci (2010) 59:977–994
123
Author's personal copy
Mg/Ca above 1 (Fig. 4b), and other processes that contribute
to the increase in pH, as well as Mg/Ca ratios, must affect
these two groups.
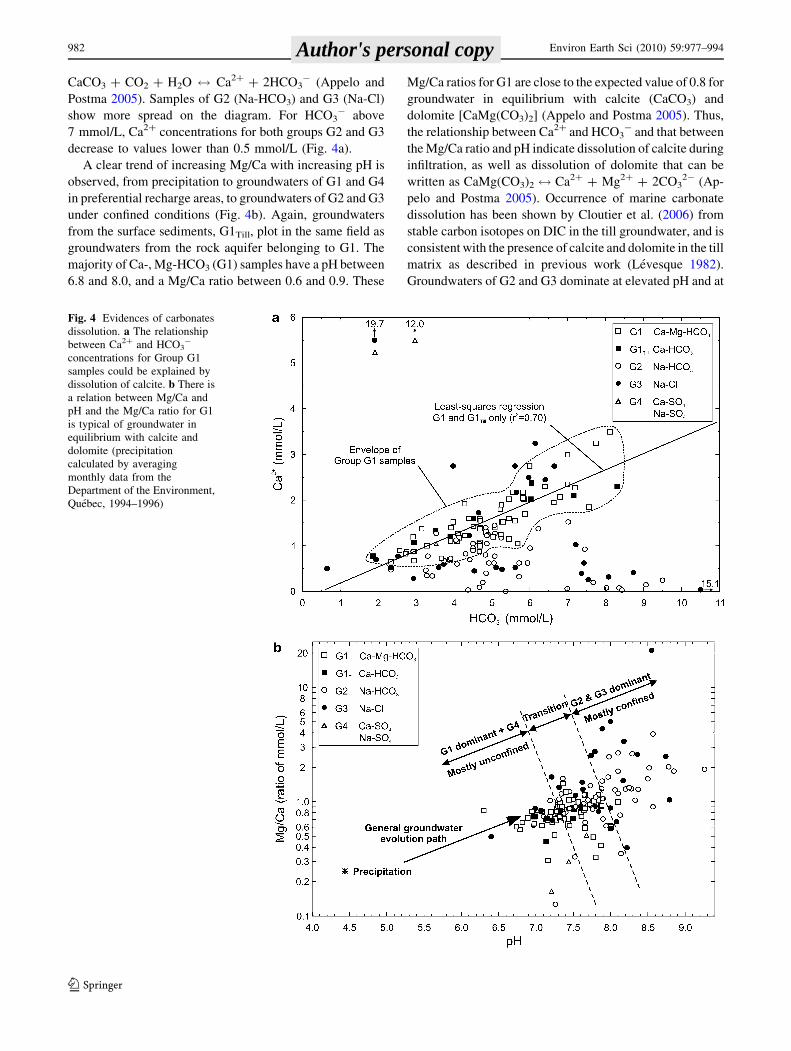
Carbonate dissolution is caused partly by processes
occurring in surface soils. Respiration and decay of organic
matter increase CO2 partial pressure (pCO2) in soil gases
relative to the atmosphere, which has a pCO2 of 10-3.5 atm
(Drever 1988). Appelo and Postma (2005) mention that
pCO2 values of 10-1.5–10-2.5 atm are commonly found in
soils. This elevated pCO2 for soil water has a major impact
on the interaction with carbonate minerals present in sur-
face sediments. Geochemical modeling was performed
with PHREEQC 2.6 (Parkhurst and Appelo 1999) to
evaluate the likelihood of carbonate dissolution during
infiltration through soil and surface sediments. Figure 5a
indicates that the majority of samples from G1 (Ca-, Mg-
HCO3), including G1Till, and G4 (Ca-SO4, Na-SO4), have a
pCO2 of 10-1.5–10-2.5 atm, and a calcite saturation index
(SI) undersaturated or near equilibrium, with an uncertainty
of ±0.1 units (Langmuir 1971). Samples from G2 (Na-
HCO3) and G3 (Na-Cl), under confined conditions, are
showing a trend of lower pCO2, with a calcite SI evolving
from undersaturated to near equilibrium and supersatu-
rated. These results indicate that samples in preferential
groundwater recharge areas (G1 and G4) are dissolving
calcite in an open system with respect to CO2. As calcite
Fig. 5 Evidences of carbonates
dissolution. a For Groups G1
and G4 samples under
unconfined conditions, ranges of
log pCO2 and calcite saturation
index (SI) are indicative of
dissolving calcite in an open
system with respect to CO2.
b Dolomite SI versus calcite SIfor the groundwater groups
indicate that conditions in
recharge areas could allow the
dissolution of both dolomite and
calcite
Environ Earth Sci (2010) 59:977–994 983
123
Author's personal copy
dissolution consumes H?, pH buffering must be observed
in the infiltrated water. The pH of precipitations is low,
with a monthly average of 4.4, but it is buffered to a
median pH of 7.3 in surface sediments (Fig. 4b).
A linear relation exists between dolomite and calcite SI
(Fig. 5b). As for calcite, the majority of samples from G1,
including G1Till, and G4, have a dolomite SI undersaturated
or near equilibrium, with an uncertainty of ±0.5 units
(Plummer et al. 1990). Samples from G2 and G3, under
confined conditions, have a dolomite SI evolving from
undersaturated to near equilibrium and supersaturated.
Therefore, samples in groundwater recharge areas have the
potential to dissolve dolomite as well as calcite. The
increase of Ca2?, Mg2?, and HCO3- concentrations in
surface sediments is the main characteristic of all ground-
water samples from G1 (Ca-, Mg-HCO3). The dissolution
of carbonates, initiated in surface sediments, is active in the
sedimentary rock aquifer system as well, and is mainly the
result of water–rock interaction with the dolostone and
limestone formations.
Ion exchange
Hydrogeochemical data suggest that Ca2?–Na? ion
exchange, where Ca2þwater exchanges with Naþmineral; could be
the main geochemical process involved in the evolution of
groundwater from Ca-, Mg-HCO3 (G1) to Na-HCO3 (G2)
water types (Cloutier et al. 2006). The ion exchange
reaction is written as 1/2 Ca2? ? Na-X ? 1/2 Ca-
X2 ? Na?, where X indicates the mineral exchanger
(Appelo and Postma 2005). Conditions required in the
aquifer system for ionic exchange to operate are a
recharged groundwater with elevated Ca2? concentrations,
and the presence of minerals with both high cation
exchange capacities (CEC) and Na? on their exchange
sites.
The first condition was demonstrated in the previous
section on carbonate dissolution, which showed that
recharged water dissolves carbonates in the till, and thus
increases its Ca2? concentration. The limestone has clay
minerals, and shale beds, that could act as mineral
exchangers (Globensky 1987). Globensky (1987) indicates
that the dolostones have some clay minerals and iron
oxides that could act as mineral exchangers, but it is
unknown if they are abundant enough to account for the
amount of Ca2?–Na? exchange. This is also the case in
St. Hermas Valley, where the pure quartz sandstone has
some traces of micas and iron oxides. When clay minerals
and iron oxides are not present in sufficient quantity to
account for ion exchange, other sources for the exchange
must be found. A possible source in the sandstone of the
Potsdam Group are the minerals of the ultramafic sills
observed in the rock cores retrieved from a well in St.
Hermas Valley, which are associated to the intrusions
emplacement (Lewis 1971). A second possible source is
the ionic exchange with minerals in the till and in the clay
aquitard unit above the highly fractured rock unit. This
possibility could be the case in Ste. Anne-des-Plaines,
where most of the wells have a relatively short opening in
the highly fractured rock unit, just below the clay, as well
as in St. Hermas Valley, where the majority of the wells
are installed in the sediments under the clay unit, or in the
mixed unit, in contact with the clay aquitard. Thus, as
water flows in the confined aquifer, Ca2þwater could
exchange with Naþmineral of the confining aquitard, pro-
ducing the Na-HCO3 water type of G2. As mentioned, the
mineral exchangers must have Na? adsorbed on their
exchange sites for the exchange reaction to happen. This
issue, related to the origin of salinity in the Basses–Lau-
rentides aquifer system, is discussed in the next section on
groundwater mixing and salinity origin.
Figure 6a shows that groundwaters of G1 (Ca-, Mg-
HCO3) have low Na? concentrations and pH values
ranging from 6.3 to 8.1, characteristic of unconfined
conditions. From the recharge areas, groundwater flows
through the aquifer system under confined conditions.
Samples of G2 (Na-HCO3) and G3 (Na-Cl), characteristic
of these confined conditions, form separate fields on the
diagram. Relative to G1, samples of G2 show increasing
pH values with increasing Na? concentrations, which is
consistent with ion exchange operating from G1 to G2
(Fig. 6a). Groundwaters from G3 show a trend of
increasing Na? concentrations relative to G2 samples,
indicating that a second Na? source is involved in the
evolution from G2 to G3 groundwaters. The increase in
Na? concentrations for groundwaters of G2 is coupled to
a sharp decrease in Ca2? concentrations, confirming the
importance of Ca2?–Na? ion exchange (Fig. 6b). As
illustrated in Fig. 6a, samples from G3 are characterized
by an increase in Na? concentration compared to G2
(Fig. 6b). This Na? concentration increase is towards the
clay pore water sample C85-14 and sample S77, which
has the highest TDS of the wells sampled in the study
area. Seven samples of G3, located in recharge areas, are
labelled as anthropogenic contamination (Fig. 6b). These
are the samples identified by Cloutier et al. (2006), being
contaminated by de-icing road salts. Their position on the
diagram indicates that their geochemistry results from the
addition of Na? to G1 waters.
The increase in Na? concentration for groundwaters of
G2 (Na-HCO3) is not really coupled to a Cl- increase,
which constitutes another argument in favor of Ca2?–Na?
ion exchange for the evolution of G2 (Fig. 6c). On the
other hand, G3 (Na-Cl) samples show a linear increase
between Na? and Cl-. In addition, groundwaters from G3
plot near, or slightly above, the seawater dilution line.
984 Environ Earth Sci (2010) 59:977–994
123
Author's personal copy
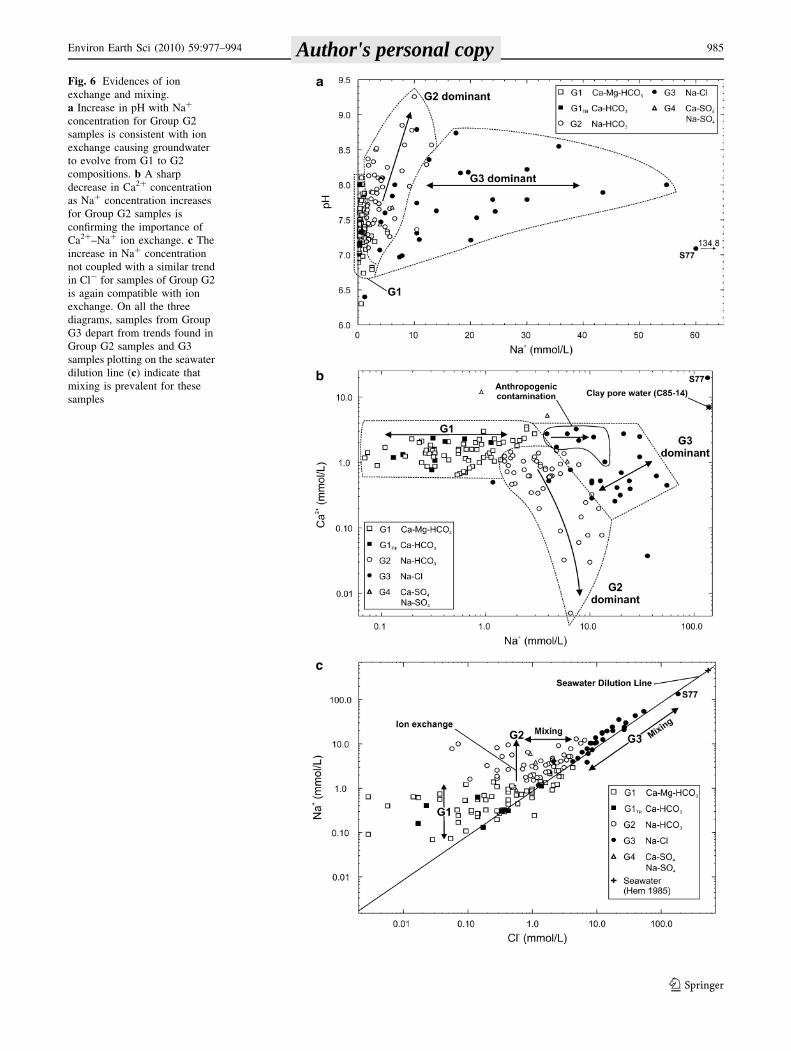
Fig. 6 Evidences of ion
exchange and mixing.
a Increase in pH with Na?
concentration for Group G2
samples is consistent with ion
exchange causing groundwater
to evolve from G1 to G2
compositions. b A sharp
decrease in Ca2? concentration
as Na? concentration increases
for Group G2 samples is
confirming the importance of
Ca2?–Na? ion exchange. c The
increase in Na? concentration
not coupled with a similar trend
in Cl- for samples of Group G2
is again compatible with ion
exchange. On all the three
diagrams, samples from Group
G3 depart from trends found in
Group G2 samples and G3
samples plotting on the seawater
dilution line (c) indicate that
mixing is prevalent for these
samples
Environ Earth Sci (2010) 59:977–994 985
123
Author's personal copy
Groundwaters from G2 plot above the seawater dilution
line, having a Na? surplus relative to Cl-.
Figure 6a to c indicate that Ca2?–Na? ion exchange is
the main geochemical process affecting groundwater
belonging to G2. The distribution of G2 also indicates the
possibility of mixing with groundwater of G3, increasing
its Cl- concentrations relative to Na? (Fig. 6c). Ground-
waters from G3, which are affected by mixing with G2,
must originate from another process to explain their ele-
vated Na? as well as Cl- concentrations. The trend of G3
groundwaters towards seawater suggests that groundwater
mixing, with an end-member having a seawater compo-
nent, is characteristic of G3 groundwaters evolution. This
is further discussed next.
Origin of groundwater salinity
Most of the samples of G3 can be categorized as brackish
water defined by a TDS between 1,000 and 10,000 mg/L
(Freeze and Cherry 1979). These samples exceed the
Canadian drinking water quality guideline for Cl- of
250 mg/L (aesthetic objective of Health Canada 2007).
With a calculated TDS of 11,337 mg/L, sample S77 from
St. Benoıt Valley is the only sample in the saline water
class.
Increasing salinity in groundwater may result from dif-
ferent processes, such as water–rock interaction along the
flow path, dissolution of evaporite rocks, old or current
seawater intrusion, mixing with formation water, solute
diffusion from aquitard containing saline pore water, and
anthropogenic contamination, such as de-icing road salts or
agricultural input (Hem 1985; Appelo and Postma 2005;
Richter and Kreitler 1993). In the Basses–Laurentides
aquifer system, the increase in salinity is associated with an
increase in Na? and Cl- (Fig. 6c). In the geological con-
text of the region, it is unlikely that water–rock interaction
could produce the Na-Cl water type of G3 in the upper
portion of the sedimentary rock aquifer system. As there
are no evaporite formations in the aquifer, and this is not a
coastal aquifer, other sources must be examined to explain
the origin of salinity. Contamination by de-icing road salts
explains the salinity found in some samples in the recharge
areas, but not in the valleys, where thick clay deposits
provide a good protection to the aquifer system. The geo-
logical background of the area gives a limited number of
possibilities for the presence of brackish to saline water in
the upper portion of the aquifer system.
Since the Cambrian–Ordovician sedimentary formations
of the St. Lawrence Lowlands represent a complete cycle
of marine transgression–regression (Globensky 1987), it is
expected that brine formation waters could still be present
in those geological units. In fact, Globensky (1972) men-
tioned that salt water is found in the Trenton and Potsdam
groups, generally in wells deeper than about 150 m, thus,
below the studied portion of the aquifer system. The salt
water is often associated with presence of oil and natural
gas (Globensky 1972). In most recent geological times, a
series of glaciations during the Quaternary may have
affected the geochemistry of the groundwater, by flushing
the upper portion of the aquifer system with glacial melt-
water. The last major geological event to affect the study
area is the marine invasion from the St. Lawrence Gulf
during the last deglaciation. As the Champlain Sea occu-
pied the study area during late Pleistocene, a seawater
component could be the source of salinity in the upper
portion of the aquifer system. The already shown linear
relationship between Cl- and Na? for samples of G3 (Na-
Cl) and their location near the seawater dilution line pro-
vide initial indications for a marine water source of salinity
(Fig. 6c). The Champlain Sea clays, deposited during the
marine episode, could also contribute to the salinity of the
aquifer system through solute diffusion of its saline pore
water.
Cloutier et al. (2006) have shown that sample S77, the
most saline of G3 (Na-Cl) groundwater samples found
under confined condition in St. Benoıt Valley (Fig. 3), has
a geochemistry very similar to the pore water in marine
clay (sample C85-14). The clay pore water was extracted
by squeezing Champlain Sea clay samples from a clay core
retrieved at a site in St. Hermas Valley, where the clay has
a thickness of 46 m. Sample C85-14, from a depth of
14.1 m, has the highest Cl- concentration in this profile
(6,900 mg/L). Similarities between groundwater sample,
S77 and clay pore water were observed for Cl- and Br-,
two conservative ions that can be used as tracers to identify
the origin of groundwater salinity (Richter and Kreitler
1993; Andreasen and Fleck 1997; Vengosh et al. 2002), as
well as in d18O values (-10.9% for the clay pore water
C85-14 and -11.0% for the groundwater S77).
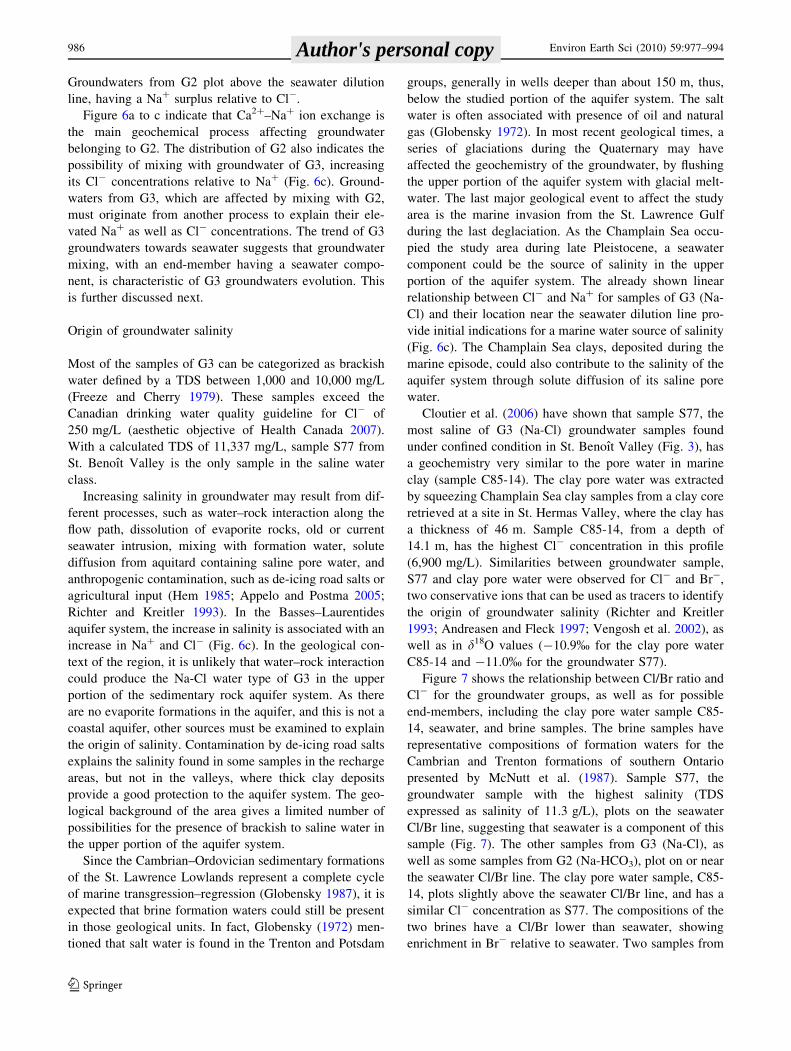
Figure 7 shows the relationship between Cl/Br ratio and
Cl- for the groundwater groups, as well as for possible
end-members, including the clay pore water sample C85-
14, seawater, and brine samples. The brine samples have
representative compositions of formation waters for the
Cambrian and Trenton formations of southern Ontario
presented by McNutt et al. (1987). Sample S77, the
groundwater sample with the highest salinity (TDS
expressed as salinity of 11.3 g/L), plots on the seawater
Cl/Br line, suggesting that seawater is a component of this
sample (Fig. 7). The other samples from G3 (Na-Cl), as
well as some samples from G2 (Na-HCO3), plot on or near
the seawater Cl/Br line. The clay pore water sample, C85-
14, plots slightly above the seawater Cl/Br line, and has a
similar Cl- concentration as S77. The compositions of the
two brines have a Cl/Br lower than seawater, showing
enrichment in Br- relative to seawater. Two samples from
986 Environ Earth Sci (2010) 59:977–994
123
Author's personal copy
the limestone in the eastern area of St. Anne-des-Plaines
have a Cl/Br lower than seawater that could result from
solute diffusion from the shale beds of the Chazy and
Trenton groups (Globensky 1987). Figure 7 is also helpful
in distinguishing the samples from G3 that are affected by
anthropogenic contamination. The samples plot above the
seawater Cl/Br line, indicating that the Cl- increase is not
coupled to a Br- increase. This group of groundwater
includes the samples in the preferential recharge areas
along main highways 15 and 117 (Fig. 3). High Cl/Br ratio
may be produced by dissolution of de-icing road salts or
agricultural chemicals, such as fertilizers (Davis et al.
2001). The trend in the samples from G1 characterizes
groundwater in unconfined conditions affected by an
increase in Cl- concentrations, when Br- concentrations
are still at low background level (Fig. 7). Andreasen and
Fleck (1997) used a similar trend to show the effect of Cl-
contamination from an anthropogenic source that does not
contain Br-. In the Basses–Laurentides, the Cl- concen-
trations for the G1 samples that are part of the trend are
low, generally below 1 mmol/L. The sources of this rela-
tively slight contamination, when compared to samples
from G3 affected by anthropogenic contamination, could
be many and include de-icing road salts or fertilizers.
Since the clay was deposited in the Champlain Sea
environment, Cloutier et al. (2006) assumed that the clay
pore water sample C85-14, the most saline sample at that
site, represents the original Pleistocene Champlain Sea
water for the Basses–Laurentides aquifer system. As
mentioned previously, the Champlain Sea did not have a
typical seawater composition. It was diluted seawater
resulting from the mixture between continental waters,
including meltwater from the Laurentide Ice Sheet and
local precipitation, and salt water from the St. Lawrence
Gulf (Hillaire-Marcel 1988). The similarity between the
clay pore water and the groundwater S77, in their conser-
vative ions ratio and concentrations, as well as in their
d18O, suggests that both samples have the same water
origin. Thus, it could be assumed that the groundwater
from S77 is close to the original saline end-member of the
area. Conservative tracers Cl- and Br- can be used to
determine the percentage of seawater present in the original
Champlain Sea water. Table 2 compares concentrations of
Cl- and Br-, in mmol/L, for groundwater S77 and sea-
water. For that sample, the ratios to seawater for both
conservative ions are 0.34. Thus, the original Champlain
Sea water in the Basses–Laurentides was likely a mixture
of about 34% ‘‘normal’’ seawater and 66% freshwater. In a
study of Champlain Sea clay near Varennes, northeast of
Montreal, Desaulniers and Cherry (1989) calculated a very
similar mixture of 33% seawater and 67% freshwater at a
depth of 27 m in the clay deposit.
Groundwater mixing model
Figure 8 uses Br- and Cl- diagrams to explain the model
proposed for the origin of salinity in the area. Step 1
Fig. 7 Evidence of mixing.
Diagram of Cl/Br versus Cl- for
the groundwater groups and
possible end-member samples.
Most samples from Group G3
fall on the seawater Cl/Br ratio
line, indicating the importance
of mixing. G3 samples with
large Cl/Br ratios are related to
contamination by de-icing salt
Table 2 Comparison of Cl- and Br- (mmol/L) between the
groundwater sample S77 and seawater
Ions S77 Seawatera S77/Seawater
Cl- 183.34 535.92 0.34
Br- 0.2878 0.8385 0.34
a Hem (1985)
Environ Earth Sci (2010) 59:977–994 987
123
Author's personal copy
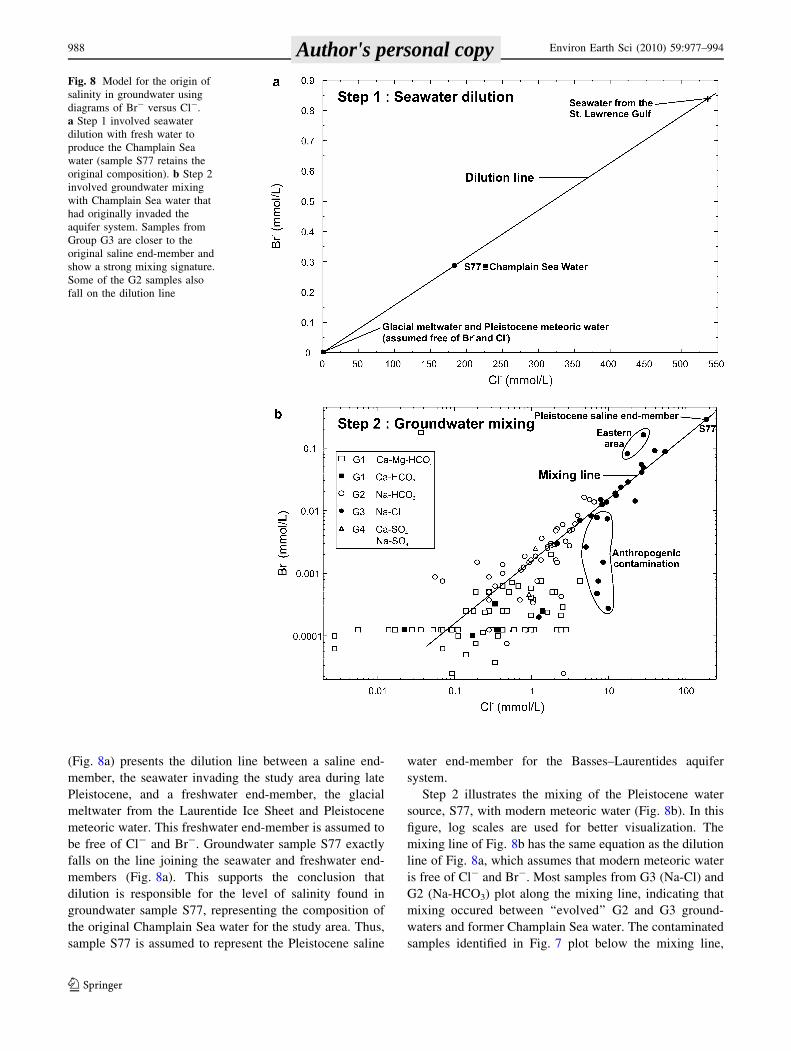
(Fig. 8a) presents the dilution line between a saline end-
member, the seawater invading the study area during late
Pleistocene, and a freshwater end-member, the glacial
meltwater from the Laurentide Ice Sheet and Pleistocene
meteoric water. This freshwater end-member is assumed to
be free of Cl- and Br-. Groundwater sample S77 exactly
falls on the line joining the seawater and freshwater end-
members (Fig. 8a). This supports the conclusion that
dilution is responsible for the level of salinity found in
groundwater sample S77, representing the composition of
the original Champlain Sea water for the study area. Thus,
sample S77 is assumed to represent the Pleistocene saline
water end-member for the Basses–Laurentides aquifer
system.
Step 2 illustrates the mixing of the Pleistocene water
source, S77, with modern meteoric water (Fig. 8b). In this
figure, log scales are used for better visualization. The
mixing line of Fig. 8b has the same equation as the dilution
line of Fig. 8a, which assumes that modern meteoric water
is free of Cl- and Br-. Most samples from G3 (Na-Cl) and
G2 (Na-HCO3) plot along the mixing line, indicating that
mixing occured between ‘‘evolved’’ G2 and G3 ground-
waters and former Champlain Sea water. The contaminated
samples identified in Fig. 7 plot below the mixing line,
Fig. 8 Model for the origin of
salinity in groundwater using
diagrams of Br- versus Cl-.
a Step 1 involved seawater
dilution with fresh water to
produce the Champlain Sea
water (sample S77 retains the
original composition). b Step 2
involved groundwater mixing
with Champlain Sea water that
had originally invaded the
aquifer system. Samples from
Group G3 are closer to the
original saline end-member and
show a strong mixing signature.
Some of the G2 samples also
fall on the dilution line
988 Environ Earth Sci (2010) 59:977–994
123
Author's personal copy
confirming the different origin for their salinity (de-icing
road salts).
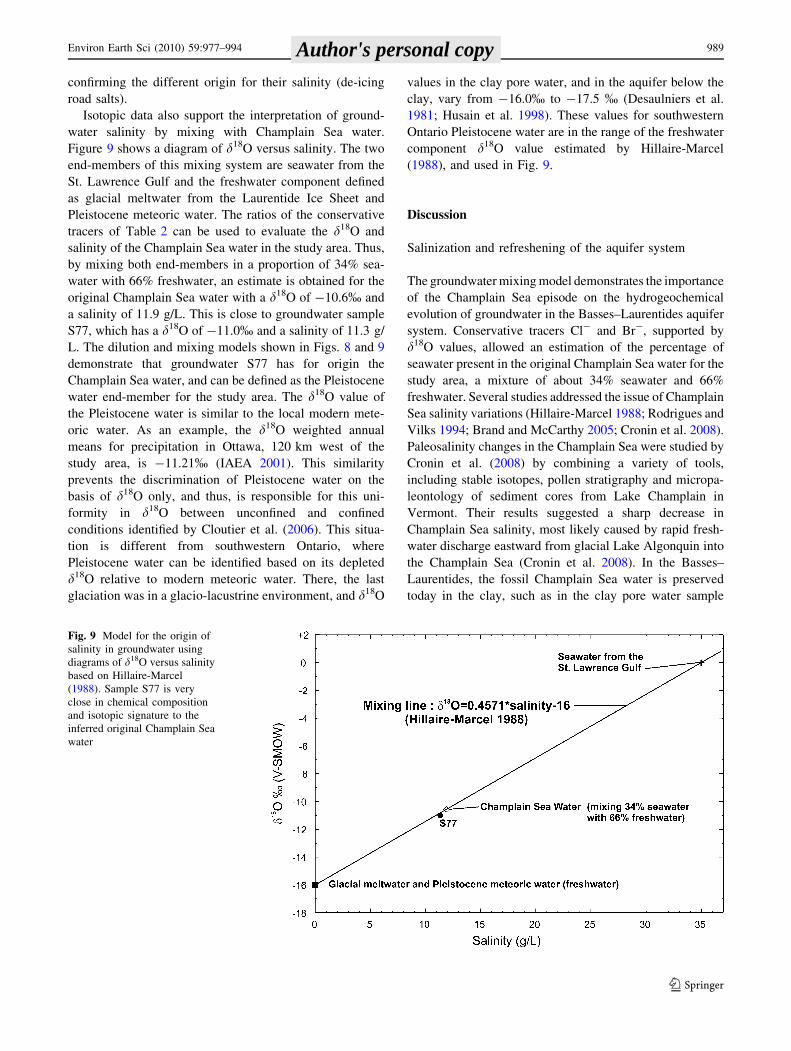
Isotopic data also support the interpretation of ground-
water salinity by mixing with Champlain Sea water.
Figure 9 shows a diagram of d18O versus salinity. The two
end-members of this mixing system are seawater from the
St. Lawrence Gulf and the freshwater component defined
as glacial meltwater from the Laurentide Ice Sheet and
Pleistocene meteoric water. The ratios of the conservative
tracers of Table 2 can be used to evaluate the d18O and
salinity of the Champlain Sea water in the study area. Thus,
by mixing both end-members in a proportion of 34% sea-
water with 66% freshwater, an estimate is obtained for the
original Champlain Sea water with a d18O of -10.6% and
a salinity of 11.9 g/L. This is close to groundwater sample
S77, which has a d18O of -11.0% and a salinity of 11.3 g/
L. The dilution and mixing models shown in Figs. 8 and 9
demonstrate that groundwater S77 has for origin the
Champlain Sea water, and can be defined as the Pleistocene
water end-member for the study area. The d18O value of
the Pleistocene water is similar to the local modern mete-
oric water. As an example, the d18O weighted annual
means for precipitation in Ottawa, 120 km west of the
study area, is -11.21% (IAEA 2001). This similarity
prevents the discrimination of Pleistocene water on the
basis of d18O only, and thus, is responsible for this uni-
formity in d18O between unconfined and confined
conditions identified by Cloutier et al. (2006). This situa-
tion is different from southwestern Ontario, where
Pleistocene water can be identified based on its depleted
d18O relative to modern meteoric water. There, the last
glaciation was in a glacio-lacustrine environment, and d18O
values in the clay pore water, and in the aquifer below the
clay, vary from -16.0% to -17.5 % (Desaulniers et al.
1981; Husain et al. 1998). These values for southwestern
Ontario Pleistocene water are in the range of the freshwater
component d18O value estimated by Hillaire-Marcel
(1988), and used in Fig. 9.
Discussion
Salinization and refreshening of the aquifer system
The groundwater mixing model demonstrates the importance
of the Champlain Sea episode on the hydrogeochemical
evolution of groundwater in the Basses–Laurentides aquifer
system. Conservative tracers Cl- and Br-, supported by
d18O values, allowed an estimation of the percentage of
seawater present in the original Champlain Sea water for the
study area, a mixture of about 34% seawater and 66%
freshwater. Several studies addressed the issue of Champlain
Sea salinity variations (Hillaire-Marcel 1988; Rodrigues and
Vilks 1994; Brand and McCarthy 2005; Cronin et al. 2008).
Paleosalinity changes in the Champlain Sea were studied by
Cronin et al. (2008) by combining a variety of tools,
including stable isotopes, pollen stratigraphy and micropa-
leontology of sediment cores from Lake Champlain in
Vermont. Their results suggested a sharp decrease in
Champlain Sea salinity, most likely caused by rapid fresh-
water discharge eastward from glacial Lake Algonquin into
the Champlain Sea (Cronin et al. 2008). In the Basses–
Laurentides, the fossil Champlain Sea water is preserved
today in the clay, such as in the clay pore water sample
Fig. 9 Model for the origin of
salinity in groundwater using
diagrams of d18O versus salinity
based on Hillaire-Marcel
(1988). Sample S77 is very
close in chemical composition
and isotopic signature to the
inferred original Champlain Sea
water
Environ Earth Sci (2010) 59:977–994 989
123
Author's personal copy
C85-14, and locally in the rock aquifer, such as site S77 in the
buried valley of St. Benoıt. The Champlain Sea water con-
tributed to the salinization of at least the studied upper
portion of the aquifer system (above 140 m depth).
This salinization event is similar to a seawater intrusion
process, with the intruding saline water exchanging Naþwater
with Ca2þmineral present in the geological formations, and can
be written as Na? ? 1/2 Ca-X2 ? Na-X ? 1/2 Ca2?
(Appelo and Postma 2005). The retreat of the Champlain
Sea allowed the start of the desalinization process, or the
refreshening of the aquifer as described by Appelo and
Postma (2005). Flushing of the aquifer system by fresh
groundwater recharge leads to Ca2?–Na? ion exchange and
to the mixing of the recharged water with the Pleistocene
saline water end-member. The spatially variable intensity
of flushing (equivalent number of pore volumes circu-
lated) and the presence of preferential flow paths and
stagnant zones are largely responsible for the present-day
geochemistry of groundwater in the rock aquifer system.
Thus, the Basses–Laurentides aquifer system can be
viewed as being at different stages of desalinization fol-
lowing the Pleistocene invasion of Champlain Sea water
in the system.
Groundwater flow patterns are thought to have played a
major role in preserving the former Champlain Sea water
signature in the aquifer system. Major occurrences of
Group G3 Na-Cl groundwater are found at the center of
valleys: du Nord River, St. Hermas and especially St.
Benoıt (Fig. 3). As noted before, groundwater is recharged
on the crests found north and south of these valleys and
then flows towards the buried valley centers, where flow
then diverges towards their eastern and western ends (see
potentiometric contours and flow paths in the inset map of
Fig. 3). These converging–diverging flow patterns do not
lead to important groundwater flow in the central part of
these valleys. Considering the physiography of the area, it
is likely that these groundwater flow patterns were estab-
lished soon after the Champlain Sea retreat. Limited
groundwater flow at the center of these valleys has likely
thus prevented the originally present Champlain Sea water
in the rock aquifer from being ‘‘flushed’’. These flow pat-
terns contribute to preserving the fossil saline groundwater
signature and allow mixing to occur with more recent
groundwater, especially Group G2 groundwater. In the
otherwise quite similar aquifer system found in the Cha-
teauguay River watershed, south across the St. Lawrence
River from the study area, brackish to saline water occur-
rence is much more limited. Even though there are traces of
the former presence of Champlain Sea water that covered
the watershed, steady and continuous groundwater flow
paths from a large main recharge area has allowed the
almost total desalination of the Chateauguay aquifer sys-
tem (Blanchette et al. 2005).
In the St. Benoıt Valley, most groundwater samples
have Group G3 Na-Cl water and sample S77 has a com-
position close to the original Champlain Sea water. This
valley is at the least advanced stage of the desalinization
process. This poorly flushed area could be considered a
relatively stagnant part of the aquifer system, where the
converging–diverging groundwater flow pattern has lead to
a stable ‘‘singularity’’ at the valley center, where little flow
occurs (Fig. 3). The other two buried valleys in the study
area, St. Hermas and du Nord River, as well as the Ste.
Anne-des-Plaines area, are in a more advanced stage of
desalinization. The sites with Na-Cl groundwater types in
these two valleys could be local, stagnant water, or solutes
diffusing downward from the clay aquitard. In the two
valleys, there is a limited but present flow path in the valley
centers as well as local contacts with overlying rivers that
could account for some saline water flushing. In the Ste.
Anne-des-Plaines area, the flow pattern is relatively linear
towards the south, but there is a restricted recharge area to
the north that may not provide sufficient groundwater entry
to allow efficient desalinization. Still, in these last three
areas, a good part of the Cl- has already been flushed, with
Na2? lagging behind on exchange sites. Cationic exchange
of Ca2þwater with Naþmineral gives the Na-HCO3 groundwater
type that dominates in these areas.
Finally, the recharge areas are completely flushed of the
Champlain Sea water component. It was demonstrated that
the Na-Cl water types in these areas result from anthro-
pogenic de-icing salt contamination.
Hydrogeochemical conceptual model
Groundwater groups and water sources are represented in
Fig. 10 to show their relative position within the ground-
water flow conceptual model to produce a conceptual
geochemical model of groundwater evolution. Present-day
precipitation infiltrates the soils and the permeable surface
sediments, generally till, in the groundwater recharge areas.
The starting point for the geochemical evolution of
groundwater consists of carbonate dissolution in surface
sediments following water infiltration in the soil zone. The
linear relation between Ca2? and HCO3-, the Mg/Ca ratios
between 0.6 and 0.9, the pH increase relative to precipi-
tation, as well as the undersaturated to near equilibrium
calcite and dolomite SI, have been presented as evidence of
carbonate dissolution operating in the surface sediments.
Carbonate dissolution is responsible for the geochemical
characteristics of G1Till (Ca-HCO3) and is consistent with
both the d13CDIC of the till groundwater (Cloutier et al.
2006) and the availability of calcite and dolomite in the till
matrix. The geochemistry of G1Till is very important, as it
controls to a large extent that of G1 (Ca-, Mg-HCO3).
Groundwater, G1 is the recharged groundwater in the
990 Environ Earth Sci (2010) 59:977–994
123
Author's personal copy
sedimentary rock aquifer system, following its infiltration
through the till. Samples that belong to this group are
located in unconfined to semi-confined conditions near
recharge areas. Water–rock interaction, as carbonate dis-
solution, is also active in the sedimentary rock particularly
in the dolostone and limestone formations.
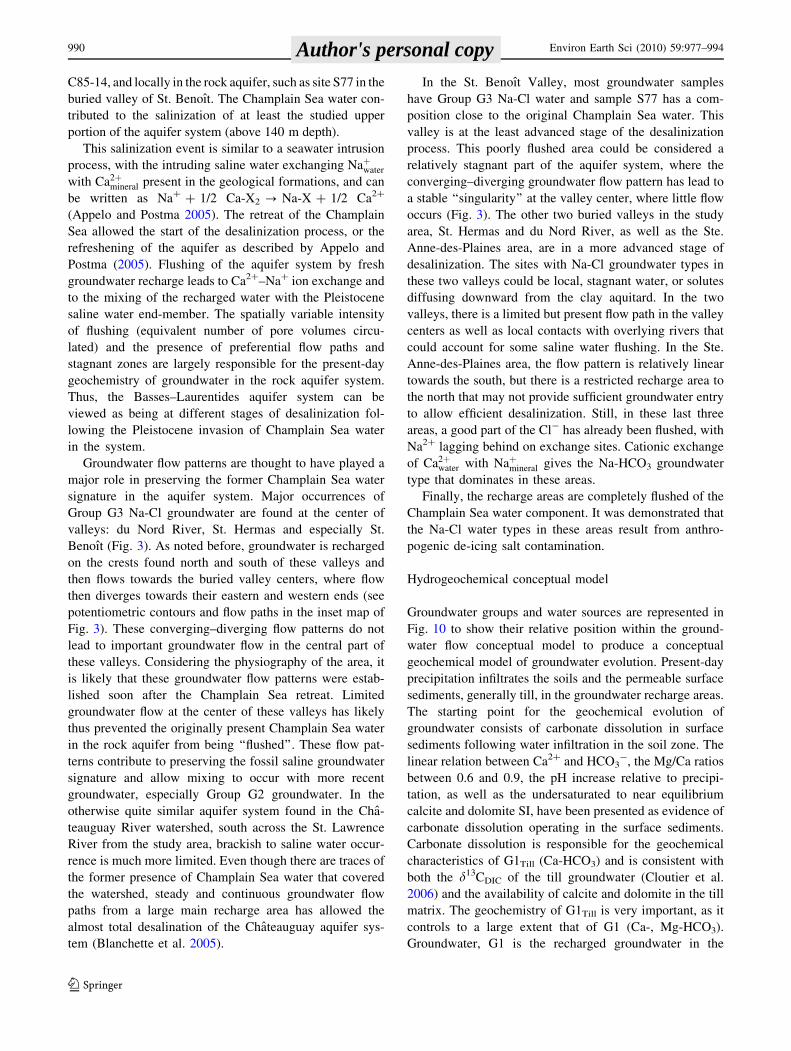
From recharge areas, groundwater flows through the
active aquifer system under confined conditions, resulting
in a geochemical evolution to G2 (Na-HCO3). This
groundwater flow occurs as interface preferential ground-
water flow in the highly fractured rock or mixed unit, as
well as intermediate to deeper groundwater flow in the
fractured sedimentary rock (Fig. 10). Active post Champ-
lain Sea groundwater flow is responsible for the on-going
desalinization of the confined aquifer system. The
approximate transition front from G1 (Ca-, Mg-HCO3) to
G2 (Na-HCO3) is more advanced in the interface zone due
to faster groundwater flow (Fig. 10). Being confined by the
clay aquitard, the geochemistry of G2 groundwaters is not
affected by direct recharge but by the geochemical
processes occurring along the flow path, from the recharge
areas to the sampling site. Due to the diversified geological
and hydrogeological contexts of the Basses–Laurentides,
the geochemical evolution paths and the resulting water
types vary accordingly to the sedimentary formations, the
depth of groundwater flow, as well as the geographical
area. In buried valleys, interface flow occurs below the
Champlain Sea clay aquitard that has a Na-Cl pore water
geochemistry. The contact with the clays leads to Ca2þwater �
Naþmineral ion exchange that results in G2 (Na-HCO3)
groundwater in the confined aquifer system. Evidence of
Ca2?–Na? ion exchange occurring along the groundwater
flow path includes an increasing trend between pH and Na?
concentrations coupled to a decrease in Ca2? concentra-
tions, as well as an increase in Na? concentrations not
strongly coupled to a Cl- increase. The active intermediate
and deeper groundwater flow in the sandstone and dolo-
stone of the buried valleys is also impacted by ion
exchange with mineral exchangers of the rock formations,
also resulting in G2 groundwaters.
Fig. 10 Conceptual
hydrogeochemical model of
groundwater evolution within
the Basses–Laurentides
sedimentary rock aquifer
system. Recharge preferentially
occurs in unconfined areas,
where carbonate dissolution
leads to the initial Group G1
groundwater composition.
Further flow away from
recharge zones into confined
conditions leads to Group G2
composition due to ion
exchange. The aquifer is still
undergoing an active
desalination process by flowing
groundwater that mixes with
remnants of the original
Champlain Sea water that had
invaded the aquifer system.
Groundwaters of Group G3
retain a clear signature of that
original saline water in
relatively low flow zones
Environ Earth Sci (2010) 59:977–994 991
123
Author's personal copy
Former Pleistocene Champlain Sea water is still pres-
ent in the aquifer system, either as the most concentrated
stagnant groundwater, in poorly flushed zones of the
aquifer system, such as site S77 in St. Benoıt Valley, and
as pore water of the Champlain Sea marine clay aquitard.
Locally, stagnant brackish to saline groundwater mixes
with G2 groundwaters to produce areas of G3 (Na-Cl)
groundwaters. Conservative tracers Cl- and Br-, as well
as d18O, confirmed that these brackish to saline ground-
waters originate from the Champlain Sea water. This
mixing is observed at a larger scale for the St. Benoıt
Valley, where the Pleistocene Champlain Sea water was
sampled (site S77), but can be present sporadically in the
St. Hermas and the du Nord River valleys as well.
Locally, in stagnant parts of the system, downward dif-
fusion of Cl- and Na? from the aquitard could result in
groundwater with G3 characteristics. Due to this down-
ward diffusive transfer of solutes, the brackish to saline
pore water of the aquitard has major impacts on the
geochemistry of groundwater from the interface zone,
increasing groundwater salinity in more isolated sections
of the aquifer system. Groundwater, G3 is also observed
locally in preferential recharge areas, and results in there
from a contamination by de-icing road salts. The Cl-
concentrations of these de-icing road salts impacted
groundwater is not coupled to a Br- increase as it is for
the samples of G3 located under confined condition, thus
confirming their different origin.
Relationships between hydraulic
and geochemical conditions
Although focused on a local aquifer system, the data and
interpretation from this study provide a generally mean-
ingful illustration of the relationships between hydraulic
and geochemical conditions. Confined or unconfined con-
ditions as well as flow patterns were shown to have an
important role in the geochemical evolution of groundwa-
ter. Such coupling has been observed by numerous
previous studies and general conceptual models have
integrated the generally expected geochemical evolution of
groundwater under ‘‘natural equilibrium’’ (Toth 1999). An
original aspect of the present study is that it illustrates the
geochemical evolution of an aquifer system following a
major perturbation, namely Champlain Sea water intrusion
in the aquifer. Different parts of the aquifer were shown to
still be at various stages of a desalinization process. So,
although hydraulic conditions are likely to have reached
somewhat steady state relatively shortly after the Champ-
lain Sea retreat, still evolving and transient geochemical
conditions are prevailing to this day, 10,000 years after the
perturbation. The study area thus shows that long-term
geochemical recovery may be required by some aquifer
systems after major perturbations, and that locally pre-
vailing hydraulic conditions affect the rate of this recovery.
Summary and conclusions
This paper aimed to identify the main active geochemical
processes as well as the Quaternary geological events that
have influenced groundwater geochemistry in the Basses–
Laurentides. The aquifer system of the Basses–Laurentides
consists of Cambrian–Ordovician sedimentary formations
(sandstone, dolostone, and limestone) lying on Pre-
cambrian crystalline basement. Unconfined conditions
characterize the areas of preferential groundwater recharge,
where precipitation infiltrates soils and till. The marine
clay aquitard confines the rock aquifer, for example in
buried valleys. From the recharge areas, groundwater flows
through the highly fractured rock and mixed unit at the
interface with the overlying clay aquitard, as well as
intermediate to deeper groundwater flow in the fractured
sedimentary rock unit.
The interpretation of the main geochemical processes
presented in this paper relies on the classification of
groundwater groups determined by Cloutier et al. (2006).
The main geochemical processes that are affecting the
evolution of groundwater groups were presented with
respect to their relative position in the groundwater system,
starting from the recharge and along groundwater flow
paths. Dissolution of carbonates, calcite and dolomite,
dominates in the preferential recharge areas resulting in
Ca-, Mg-HCO3 (G1) groundwater. Ca2?–Na? ion
exchange, groundwater mixing with Pleistocene Champ-
lain Sea water as well as solute diffusion from the marine
clay aquitard are the main processes under the confined
conditions resulting in a Na-HCO3 (G2) and Na-Cl (G3)
groundwater. This interpretation of groundwater groups
within the hydrogeological contexts defined the main
geochemical processes, thus providing the meaning of
these groups in terms of groundwater evolution in the
Basses–Laurentides sedimentary rock aquifer system
The last major geological event to affect the study area
is the marine invasion from the St. Lawrence Gulf during
the last deglaciation. This paper has further confirmed that
the resulting Champlain Sea was a mixture of continental
fresh water and seawater from the Gulf. The analysis has
also shown that fossil Champlain Sea water is still found in
stagnant parts of the aquifer system and in the pore water of
thick marine clays left by the Champlain Sea episode. It
was demonstrated that the marine invasion that resulted in
the Champlain Sea is the cause of the salinization of the
aquifer system. Conservative tracers Cl- and Br-, sup-
ported by d18O values, allowed an estimation of the
percentage of seawater present in the original Champlain
992 Environ Earth Sci (2010) 59:977–994
123
Author's personal copy
Sea water for the Basses–Laurentides, a mixture of about
34% seawater and 66% freshwater. The present geochem-
istry of groundwater indicates that the aquifer system is at
different stages of desalinization, from the fossil Champ-
lain Sea water in stagnant parts to fully flushed sections of
the aquifer system in preferential recharge areas. A modern
salinity source, de-icing road salts, was identified in
recharge areas and could be distinguished by its Cl/Br
ratio. This knowledge of the main geochemical processes
that are affecting the evolution of groundwater, particularly
the distribution and origin of groundwater salinity, is
important for the municipalities of the region in their
planning and managing of the groundwater resource.
Acknowledgments The project was carried out by the Geological
Survey of Canada (GSC), in collaboration with INRS-Eau, Terre &
Environnement (INRS-ETE), Universite Laval and Environment
Canada. Funding and support for the study came from the GSC,
Economic Development Canada, Regional County Municipalities
(RCM) of Argenteuil, Mirabel, Deux-Montagnes and Therese-de-
Blainville, Quebec Environment Ministry, Conseil Regional de
Developpement-Laurentides, and Association des Professionnels de
Developpement Economique des Laurentides. Financial support for
V. Cloutier was provided by the Natural Sciences and Engineering
Research Council (NSERC) of Canada, Fonds quebecois de la
recherche sur la nature et les technologies, and INRS-ETE as post-
graduate scholarships. NSERC also supported R. Lefebvre and R.
Therrien through operating grants. We acknowledge the Quebec
Environment Ministry for providing the analyses of inorganic con-
stituents in groundwater. The drilling was partly supported by the
Quebec Ministry of Transportation. The authors thank Marc Luzin-
court (Delta-Lab, GSC-Quebec) for stable isotopes analyses and
Magalie Roy (UQAT) for illustrations. We also thank Dr. Stephen
Grasby, Dr. Ken Howard and Dr. Alfonso Rivera, who provided
valuable comments on an early manuscript as members of Cloutier’s
thesis committee. Finally, the authors wish to thank Dr. Jan
Schwarzbauer (Associate editor) and an anonymous reviewer who
have provided constructive comments, which helped improve the
original manuscript. The work of all students involved in the project
as field assistants, and the collaboration of the population of the RCM
giving site access are greatly appreciated.
References
Andreasen DC, Fleck WB (1997) Use of bromide: chloride ratios to
differentiate potential sources of chloride in a shallow, uncon-
fined aquifer affected by brackish-water intrusion. Hydrogeol J
5:17–26
Appelo CAJ, Postma D (2005) Geochemistry, groundwater and
pollution, 2nd edn. A.A. Balkema Publishers, Leiden (3rd
corrected reprint 2007)
Blanchette D, Lefebvre R, Nastev M, Lamontagne C, Croteau A,
Lavigne MA, Roy N, Cloutier V (2005) Hydrochemical
assessment of groundwater in the Chateauguay River watershed,
Quebec. Paper presented at the 58th Canadian Geotechnical
Conference and 6th Joint CGS/IAH Conference, Saskatoon,
Canada, October 2005, Session 4E, Paper 555, p 8
Bolduc AM, Ross M (2001) Surficial geology, Lachute-Oka, Quebec.
Geol Surv Can, Open File 3520
Brand U, McCarthy FMG (2005) The AllerØd–Younger Dryas–
Holocene sequence in the west-central Champlain Sea, eastern
Ontario: a record of glacial, oceanographic and climatic changes.
Quat Sci Rev 24:1463–1478
Health Canada (2007) Guidelines for Canadian drinking water
quality: summary table. Federal–Provincial–Territorial Commit-
tee on Drinking Water, March 2007. http://www.hc-sc.gc.ca/
ewh-semt/water-eau/drink-potab/guide/index-eng.php
Clark I, Fritz P (1997) Environmental isotopes in hydrogeology.
Lewis Publishers, New York
Cloutier V (2004) Origin and geochemical evolution of groundwater
in the Paleozoic Basses-Laurentides sedimentary rock aquifer
system, St. Lawrence Lowlands, Quebec, Canada. PhD Thesis,
INRS-Eau, Terre & Environnement, Quebec, Canada (in French
and English)
Cloutier V, Lefebvre R, Savard MM, Bourque E, Therrien R (2006)
Hydrogeochemistry and groundwater origin of the Basses–
Laurentides sedimentary rock aquifer system, St. Lawrence
Lowlands, Quebec, Canada. Hydrogeol J 14:573–590
Cloutier V, Lefebvre R, Therrien R, Savard MM (2008) Multivariate
statistical analysis of geochemical data as indicative of the
hydrogeochemical evolution of groundwater in a sedimentary
rock aquifer system. J Hydrol 353:294–313
Cronin TM, Manley PL, Brachfeld S, Manley TO, Willard DA,
Guilbault JP, Rayburn JA, Thunell R, Berke M (2008) Impacts
of post-glacial lake drainage events and revised chronology of
the Champlain Sea episode 13–9 ka. Palaeogeogr Palaeoclimatol
Palaeoecol 262:46–60
Davis SN, Cecil LD, Zreda M, Moysey S (2001) Chlorine-36,
bromide, and the origin of spring water. Chem Geol 179:3–16
Desaulniers DE, Cherry JA (1989) Origin and movement of
groundwater and major ions in a thick deposit of Champlain
Sea clay near Montreal. Can Geotech J 26:80–89
Desaulniers DE, Cherry JA, Fritz P (1981) Origin, age and movement
of pore waters in argillaceous Quaternary deposits at four sites in
southwestern Ontario. J Hydrol 50:231–257
Drever JI (1988) The geochemistry of natural waters. Prentice-Hall,
Englewood Cliffs
Freeze RA, Cherry JA (1979) Groundwater. Prentice-Hall, Engle-
wood Cliffs
Globensky Y (1972) Gas–oil–salt water in wells drilled in Quebec
between 1860 and 1970. Department of Natural Resources,
General Direction of Mines, Mineral Deposits Service, Quebec,
Report S-127AF
Globensky Y (1987) Geologie des Basses-Terres du St-Laurent
(Geology of the St. Lawrence Lowlands). Ministry of Energy
and Resources, General Direction for geologic and mineral
exploration, Quebec, Report MM 85-02
Gold DP (1972) The Monteregian Hills: ultra-alkaline rocks and the
Oka carbonatite complex. 24th International Geological Con-
gress, Montreal, Canada, Guidebook B-11
Hem JD (1985) Study and interpretation of the chemical character-
istics of natural water. US Geol Surv Water-Supply Paper 2254,
3rd edition
Hillaire-Marcel C (1988) Isotopic composition (18O, 13C, 14C) of
biogenic carbonates in Champlain Sea Sediments. In: Gadd NR
(ed) The late Quaternary development of the Champlain Sea
Basin. Geol Assoc Can Spec Pap 35:177–194
Husain MM, Cherry JA, Fidler S, Frape SK (1998) On the long-term
hydraulic gradient in the thick clayey aquitard in the Sarnia
region, Ontario. Can Geotech J 35:986–1003
IAEA (2001) GNIP maps and animations. International Atomic
Energy Agency, Vienna. http://www-naweb.iaea.org/napc/
ih/GNIP/userupdate/Waterloo/index.html http://isohis.iaea.org.
Cited September 2002
Langmuir D (1971) The geochemistry of some carbonate ground
waters in central Pennsylvania. Geochim Cosmochim Acta
35:1023–1045
Environ Earth Sci (2010) 59:977–994 993
123
Author's personal copy
Levesque G (1982) Geology of Quaternary deposits of the Oka-St.
Scholastique region, Quebec. M.Sc. Thesis, Universite du
Quebec a Montreal, Quebec, Canada (in French)
Lewis DW (1971) Qualitative petrographic interpretation of Potsdam
Sandstone (Cambrian), Southwestern Quebec. Can J Earth Sci
8:853–882
McNutt RH, Frape SK, Dollar P (1987) A strontium, oxygen and
hydrogen isotopic composition of brines, Michigan and Appa-
lachian Basins, Ontario and Michigan. Appl Geochem 2:495–
505
Nastev M, Savard MM, Lapcevic P, Lefebvre R, Martel R (2004)
Hydraulic properties and scale effects investigation in regional
rock aquifers, south-western Quebec, Canada. Hydrogeol J
12:257–269
Nastev M, Rivera A, Lefebvre R, Martel R, Savard M (2005)
Numerical simulation of groundwater flow in regional rock
aquifers, southwestern Quebec, Canada. Hydrogeol J 13:835–
848
Nastev M, Lefebvre R, Rivera A, Martel R (2006) Quantitative
assessment of regional rock aquifers, south-western Quebec,
Canada. Water Resour Manage 20:1–18
Occhietti S (1989) Quaternary geology of St.Lawrence Valley and
adjacent Appalachian subregion. In: RJ Fulton (ed) Chapter 4 of
Quaternary Geology of Canada and Greenland, Geological
Survey of Canada, Geology of Canada, no. 1
Parent M, Occhietti S (1988) Late Wisconsinian deglaciation and
Champlain Sea invasion in the St. Lawrence Valley, Quebec.
Geographie physique et Quaternaire 42:215–246
Parkhurst DL, Appelo CAJ (1999) User’s guide to PHREEQC
(version 2)—a computer program for speciation, batch-reaction,
one-dimensional transport, and inverse geochemical calcula-
tions. US Geol Surv, Water Resour Invest, Report 99-4259
Plummer LN, Busby JF, Lee RW, Hanshaw BB (1990) Geochemical
modeling of the Madison aquifer in part of Montana, Wyoming,
and South Dakota. Water Resour Res 26:1981–2014
Richter BC, Kreitler BE (1993) Geochemical techniques for identi-
fying sources of ground-water salinization. C.K. Smoley, Boca
Raton
Rocher M, Salad-Hersi O, Castonguay S (2009) Geologic map of St.
Lawrence Lowlands—sector west of Montreal (update). In:
Regional hydrogeologic characterization of the fractured aquifer
system in south-western Quebec: part I. Geol Surv Can, Bull.
587 (in press)
Rodrigues CG, Vilks G (1994) The impact of glacial lake runoff on
the Goldthwait and Champlain Seas: the relationship between
Glacial Lake Agassiz runoff and the Younger Dryas. Quat Sci
Rev 13:923–944
Ross M, Martel R, Lefebvre R, Parent M, Savard MM (2004)
Assessing rock aquifer vulnerability using downward advective
times from a 3D model of surficial geology: a case study from
the St. Lawrence Lowlands, Canada. In: Rodriguez R, Civita M,
de Maio M (eds), Geof Int 43:591–602
Ross M, Parent M, Lefebvre R (2005) 3D geologic framework models
for regional hydrogeology and land-use management: a case
study from a Quaternary basin of southwestern Quebec, Canada.
Hydrogeol J 13:690–707
Salad Hersi O, Lavoie D, Nowlan GS (2003) Reappraisal of the
Beekmantown Group sedimentology and stratigraphy, Montreal
area, southwestern Quebec: implication for understanding the
depositional evolution of the lower–middle Ordovician Lauren-
tian passive margin of eastern Canada. Can J Earth Sci 40:149–
176
Simard G (1978) Hydrogeologie de la region de Mirabel (Hydroge-
ology of the Mirabel Region). Department of Natural Resources,
Groundwater Service, Quebec, Report H.G.-11
Soucy D (1998) Cartographie des indicateurs de qualite des eaux
souterraines a l’echelle regionale. Memoire de maıtrise, INRS-
Eau, Quebec, Canada (in French)
Toth J (1999) Groundwater as a geologic agent: an overview of the
causes, processes, and manifestations. Hydrogeol J 7:1–14
Vengosh A, Gill J, Davisson ML, Hudson GB (2002) A multi-isotope
(B, Sr, O, H, and C) and age dating (3H–3He and 14C) study of
groundwater from Salinas Valley, California: hydrogeochemist-
ry, dynamics, and contamination processes. Water Resour Res
38:9.1–9.17
994 Environ Earth Sci (2010) 59:977–994
123
Author's personal copy
Copyright © 2022 FDOKUMEN