Deliverable 3.4 - Universiteit Utrecht
170
Project Acronym: IRIS Project Full Name: Integrated and Replicable Solutions for Co-Creation in Sustainable Cities Grant Agreement: No 774199 Project Duration: 5 years (starting 1 October 2017) Deliverable 3.4 Smart City User Innovation and Business Incubation Program Handbook for Implementation in IRIS cities and beyond Work Package: WP3: Development of Bankable Business Models and Exploitation Activities Task: T3.2: User Innovation in business model incubation and development and Intellectual Assessment Management Lead Beneficiary: UU Due Date: 30 September 2021 (M48) Submission Date: 21 October 2021 (M49) Deliverable Status: Final Deliverable Style: R Dissemination Level: PU File Name: IRIS_Deliverable_3.4_August2021 This project has received funding from the European Union’s Horizon 2020 research and innovation program under grant agreement No 774199
-
Upload
khangminh22 -
Category
Documents
-
view
4 -
download
0
Transcript of Deliverable 3.4 - Universiteit Utrecht

Project Acronym: IRIS
Project Full Name: Integrated and Replicable Solutions for Co-Creation in Sustainable Cities
Grant Agreement: No 774199
Project Duration: 5 years (starting 1 October 2017)
Deliverable 3.4
Smart City User Innovation and Business Incubation Program Handbook for Implementation in IRIS cities and beyond
Work Package: WP3: Development of Bankable Business Models and Exploitation Activities
Task: T3.2: User Innovation in business model incubation and development and
Intellectual Assessment Management
Lead Beneficiary: UU
Due Date: 30 September 2021 (M48)
Submission Date: 21 October 2021 (M49)
Deliverable Status: Final
Deliverable Style: R
Dissemination Level: PU
File Name: IRIS_Deliverable_3.4_August2021
This project has received funding from the European Union’s Horizon 2020 research and
innovation program under grant agreement No 774199

GA #774199
D 3.4 Dissemination Level: Public/Confidential Page 2 of 170
Authors
Surname First Name Beneficiary e-mail address
Sanders Mark UU [email protected]
Zanders Loek UU [email protected]
Polzin Friedemann UU [email protected]
Reviewers
Surname First Name Beneficiary e-mail address
Kiseleva Anastasiya VUB [email protected]
Norrman Jonas IMCG [email protected]
Version History
Version Date Modifications made by
0.1 30-08-2021 First Draft
0.2 18-09-2021 Loek Zanders
0.3 22-09-2021 Mark Sanders
0.4 07-10-2021 Mark Sanders
1.0 21-10-2021 Final version to be released to the EC

GA #774199
D 3.4 Dissemination Level: Public/Confidential Page 3 of 170
Executive Summary The aim of this deliverable is to report on the activities undertaken in Task 3.2: Developing and testing of
new business models. More specifically, we have analysed the problem of developing new smart city
business models and based on this research, have concluded early on that developing a dedicated
incubation program is not the most fitting approach. Instead, our efforts were aimed at adjusting the
business incubation programs at UtrechtInc to serve a more diverse inflow of new business models and
feed that program with a series of dedicated smart city ideation tools. The combination of clearly focused
ideation with a broad, high quality incubation program is, according to our research and pilot project, an
effective way to support new business model creation in smart cities.
The report consists of three parts. First, we present the more academic research based on which we have
developed our practical approach. Next is a description of the reforms in the UtrechtInc incubation
programs. We conclude with a ‘cookbook’ type description of recipes for the smart city ideation activities
we have (co)organised. Readers who are interested in developing more effective smart city incubation
programs are advised to jump ahead to Part II, whereas readers interested in directly replicable smart city
ideation activities can jump directly to the recipes in Part III.
Based on extensive academic literature reviews, we develop and propose two indices that can be used to
identify smart city and user projects based on short descriptions. Our Smart City Index (SCI) and User
Innovation Index (UII) can be used to identify ex-ante but also monitor the impact of interventions ex-
post.
Our recommendation to academic readers is to use these tools to study user and smart city innovation in
different contexts. It that way our tools can be tested and validated in other contexts and build a
knowledge base on a comparable, literature based empirical definition of smart city and user innovations.
For smart city planners, developers, and policy makers our report has more practical recommendations.
From the research in Part I we conclude that the most effective way to support smart city business model
development is to NOT create or support smart city specific incubation programs. Our research (and the
literature) shows that business incubation programs do have a positive impact on performance criteria
such as firm survival, investability, growth, or turnover. Smart city start-ups and projects, however, do not
differ significantly on these criteria, so the data does not justify a dedicated, exclusive smart city
incubation program. Instead, incubators should try to open their programs for a broader group of
incubates in different stages of development.
The focus on users or incumbents as alternative sources of incubatable ideas has also proven to be
ineffective. The reason is that incumbent ideas, so-called spinout innovations, are very hard to identify
and track in practice. Ideas in incumbent firms are either too premature to incubate or too advanced and
already under development in the incumbent firms themselves. User innovations face other challenges.
We have found they are underrepresented in incubation programs, but the reason is that it is very difficult
to compensate in incubation for the lack of a motivated team. User innovators not only lack the resources
and expertise but importantly also the incentives to develop their idea into a business.
In Part II we show that the pivot in the incubation programs of UtrechtInc has been successful in attracting
a broader range of business ideas from a broader set of sources and in a wider range of stages of

GA #774199
D 3.4 Dissemination Level: Public/Confidential Page 4 of 170
development. Our main recommendation from this pilot is to aim to broaden the inflow, especially on the
dimension of accepting ideas from different sources and in different stages of development and
structuring the program to support these.
The recipes presented in Part III show that different recipes have had different levels of success. Across
all recipes, we conclude that business ideation can be focused on smart city development by creating clear
challenges and provide clear information to participants. The key take-away from our different recipes is
that the number and level of development of the ideas harvested, depends on the combination of
specificity of the challenge and size of the prize. People are willing to brainstorm and generate many very
immature ideas for relatively low incentives, but generating more developed ideas by more motivated
teams that can flow into an incubation program, requires more specific challenges and higher incentives.
However, such more specific events also generate fewer benefits in terms of citizen engagement,
awareness building, and communication.
When IRIS lighthouse and follower cities take our recommendations to heart, a vibrant entrepreneurial
ecosystem around smart city challenges can be developed. Of course, these ecosystems will be unique in
every specific context and will focus on different subsets of problems and challenges. The program and
recipes described in this report, however, can easily be adapted to local pre-conditions. Of course, it is
much easier to implement a smart city business incubation program in places that already have business
incubation programs and incubators in place. Also, the presence of universities and higher education
institutions can provide a high-quality knowledge infrastructure that can support such programs and
supply potential incubates. Access to networks of potential problem solvers is essential for the success of
business ideation activities. Therefore, it pays for smart city planners and policy makers to invest in
building up and maintaining communication channels to such networks.
The report has received valuable input from the other tasks in work package 3, notably tasks 3.1 and 3.3
and provides input for tasks 3.3, 3.4 and 3.5. Moreover, the presented recipes for smart city business
ideation will be disseminated for replication in IRIS follower cities and beyond, serving as an input to the
replication tasks in work package 8. The proposed reforms in the UtrechtINC incubation programs are
directly relevant for the incubators PACA-Est in Nice and Chalmers’ Ventures, in Goteborg, as well as for
any other incubator interested in widening their scope. The work presented in Part I has relevance in the
IRIS project but also contributes to the broader academic literature on smart city development and
business incubation.

GA #774199
D 3.4 Dissemination Level: Public/Confidential Page 5 of 170
Table of Contents Executive Summary ....................................................................................................................................... 3
Table of Contents .......................................................................................................................................... 5
List of Figures ............................................................................................................................................ 8
List of Tables ............................................................................................................................................. 8
List of Equations ........................................................................................................................................ 9
List of Abbreviations and Acronyms ......................................................................................................... 9
1. Introduction ........................................................................................................................................ 10
Scope, objectives and expected impact ...................................................................................... 12
Contributions of partners ........................................................................................................... 13
Relation to other activities .......................................................................................................... 13
Structure of the deliverable and reading guide .......................................................................... 14
2. General overview of literatures on Business Incubation, Smart Cities, Spinouts and User Innovations
15
Business Incubation .................................................................................................................... 16
Smart Cities ................................................................................................................................. 19
Spinout Innovations .................................................................................................................... 20
2.3.1. Business Incubation ............................................................................................................ 22
2.3.2. Corporate Entrepreneurship ............................................................................................... 22
2.3.3. The Common Process Model .............................................................................................. 23
User Innovations ......................................................................................................................... 25
Summary and Conclusions .......................................................................................................... 26
3. The Scope for Spinout Innovation in the Smart City Context ............................................................. 27
Research context ......................................................................................................................... 28
Interviewed organisations .......................................................................................................... 29
Trends and Scenarios for Transition Tracks ................................................................................ 30
Barriers to smart-city business model development .................................................................. 32
Conclusions and next steps ......................................................................................................... 37
4. Classifying Start-ups as Smart City and User Innovations ................................................................... 42
The User Innovation (UI-)Index ................................................................................................... 42
The Smart City Innovation (SCI-)Index ........................................................................................ 52

GA #774199
D 3.4 Dissemination Level: Public/Confidential Page 6 of 170
Summary and conclusions .......................................................................................................... 55
5. Smart City Business Incubation in Utrecht, Gothenburg and Nice ..................................................... 56
Characteristics of a Venture and the Impact of Business Incubation ......................................... 56
User Innovation Based Business Incubation in Utrecht .............................................................. 59
User Innovation Based Business Incubation in Nice ................................................................... 63
Smart City Innovation Based Business Incubation in Utrecht, Gothenburg and Nice ................ 65
Summary and Conclusions .......................................................................................................... 74
6. A Business Incubation Program to Support Smart City Development: The UtrechtInc Business
Incubation Programs ................................................................................................................................... 76
The incubation methods ............................................................................................................. 77
The old incubation method ......................................................................................................... 78
The pivot: old versus new program ............................................................................................ 80
New program .............................................................................................................................. 80
COVID-19 and digitalization ........................................................................................................ 85
Additional conclusions for smart city start-ups .......................................................................... 85
7. Taking stock of ideation tools available from the literature and selecting the right recipe. .............. 88
Interviews and Findings .............................................................................................................. 88
Innovation Crowdsourcing .......................................................................................................... 91
Civic Hackathons ......................................................................................................................... 95
Civic Crowdfunding ..................................................................................................................... 99
Discussion, implications and conclusions ................................................................................. 102
8. Ideation Cookbook with Recipes and Step-by-Step Guide ............................................................... 105
Start-up in Residence Utrecht ................................................................................................... 105
Smart Lighting Challenge .......................................................................................................... 109
Energy Poverty Challenge ......................................................................................................... 114
Utrecht Mobility Challenge ....................................................................................................... 117
ChangeU Student Hackathon .................................................................................................... 120
Citizen Innovation Challenge .................................................................................................... 124
Gothenburg Smart City Challenge ............................................................................................ 127
FIWARE (Digital) hackathon ...................................................................................................... 131
Summary and Conclusions ........................................................................................................ 135
9. Conclusions and Forward and Backward Linkages in WP3 and IRIS ................................................. 136
9.1 Conclusions and Recommendations ......................................................................................... 136
9.2 Explicit linking of the work to T3.1 on ecosystems ................................................................... 137

GA #774199
D 3.4 Dissemination Level: Public/Confidential Page 7 of 170
9.3 Explicit linking of the work to T3.3 on business model development ...................................... 137
9.4 Explicitly linking the work to T3.4-3.5 and the other WP. ........................................................ 137
9.5 Explicitly linking the work to the other work packages ............................................................ 138
References ................................................................................................................................................ 139
Annex ........................................................................................................................................................ 148

GA #774199
D 3.4 Dissemination Level: Public/Confidential Page 8 of 170
List of Figures Figure 1: Schematic Overview of Business Incubation Process .................................................................. 15
Figure 2: reproduced from Valkova (2020) - Common Framework for Business Incubation and Corporate
Entrepreneurship ........................................................................................................................................ 24
Figure 3: User Innovation Index .................................................................................................................. 51
Figure 4: Categorical Representation of User Innovation Variable (in percentages) reproduced from
Eckinger and Sanders (2019) Figure 2 ......................................................................................................... 62
Figure 5: Incubation Programmes at UtrechtInc - old vs new .................................................................... 81
Figure 6: Design Thinking Process ............................................................................................................. 110
Figure 7: Narrative sheets ......................................................................................................................... 111
List of Tables Table 1: Table 1 reproduced from Valkova (2020) ..................................................................................... 21 Table 2: Interviewed organizations ............................................................................................................. 29 Table 3: Trends and scenarios for Transition Tracks ................................................................................... 31 Table 4: Categories, barriers, and corresponding transition track ............................................................. 34 Table 5: Novel Business Models identified from Baseline Reports Lighthouse Cities ................................ 41 Table 6: User innovation characteristics and their numerical appearance ................................................ 50 Table 7: Categorical grouping of user innovation characteristics ............................................................... 50 Table 8: Value assignment to user innovation characteristics ................................................................... 51 Table 9: Smart City Innovation characteristics and their appearance ........................................................ 53 Table 10: The SCI-Index ............................................................................................................................... 53 Table 11: Empirical Results Eveleens 2019 Table 9: Regression models testing the interaction effect of
diversity and originality ............................................................................................................................... 58 Table 12: Results Eckinger and Sanders (2019) Table 8: Regression models testing hypotheses 2&3 ...... 62 Table 13: Descriptives for Incubators ......................................................................................................... 65 Table 14: Descriptives for Dutch Cities ....................................................................................................... 66 Table 15: Regression results reproduced from Nijland (2020) Table 6 ...................................................... 68 Table 16: Marginal effects reproduced from Nijland (2020) Table 7 ......................................................... 68 Table 17: Descriptives PACA-Est, reproduced from Picari (2020) Table 7 .................................................. 69 Table 18: Regression results reproduced from Picari (2020) Table 19 ....................................................... 71 Table 19: Descriptive Statistics reproduced from Kolassa (2021) Table 2 .................................................. 71 Table 20: Regression results reproduced from Kolassa (2021) Tables 7 and 8 .......................................... 72 Table 21: Starting Points for Designing the New Incubation Program(s) ................................................... 77 Table 22: Overview of New UtrechtInc Programs ...................................................................................... 82 Table 23: Descriptives reproduced from Eveleens (2019) Table 6 ............................................................. 86 Table 24: Descriptives reproduced from Kolassa (2021) Table 2 ............................................................... 86 Table 25: Interviewees reproduced from Meraza-Farfan (2018) Table B1 ................................................ 89 Table 26: Summary of the results on non-financial benefits ...................................................................... 90 Table 27: Summary of the results on knowledge produced ....................................................................... 91 Table 28: Guide for selecting Ideation Tools reproduced from Meraza-Farfan (2018) Table 5 ............... 103 Table 29: Ideation Concepts ..................................................................................................................... 112

GA #774199
D 3.4 Dissemination Level: Public/Confidential Page 9 of 170
List of Equations Equation 1: UI-Index 45
Equation 2: SCI-Index 47
List of Abbreviations and Acronyms Abbreviation Definition
EU European Union
HKU Hogeschool voor de Kunsten Utrecht
LH Lighthouse
SCI Smart City Index
SCUIBI Smart City User Innovation Business Incubation
TT Transition Track
UI User Innovation
UU Utrecht University
WP Work Package

GA #774199
D 3.4 Dissemination Level: Public/Confidential Page 10 of 170
1. Introduction The purpose of the lighthouse projects in general and IRIS specifically among them is to promote smart
city innovation in European Cities. The underlying idea in work package 3 (WP3) is that to do so, we need
to not only develop and demonstrate the technical feasibility of integrated solutions, but also work on
developing and diffusing the corresponding business models. New technologies have impact and change
urban living, only if they are adopted and taken up by users. Developing viable and profitable business
based on these new technologies and integrated solutions is an effective, efficient, and sustainable way
of doing so. The WP is divided into six tasks (T), in which nine deliverables (D) are developed. All tasks and
deliverables in the WP build on each other.
Important to mention here is that the work in WP3 starts from the assumption that innovation and new
business development does not take place in a vacuum. The WP is structured in such a way that the
different tasks address this context along the stages one can identify in the typical journey from rough
first idea to validated and bankable business models. To position the work presented in this report, it is
useful to briefly describe the other tasks in WP3.
Task 3.1 zooms in on the characteristics of the local, regional, and national ecosystem or technology
innovation system in which new business models, including the novel, integrated solutions that IRIS
demonstrates and develops. In that task, deliverable D3.2 zooms in on strengths and weaknesses in the
technical innovation systems of our lighthouse and follower cities, while D3.3 puts this analysis in a
broader context and develops an evidence based diagnostic toolkit for the ability of regional ecosystems
to promote innovation and business development in general and smart city innovations on IRIS’ five
transition tracks specifically.
Task 3.2 focuses on development and testing of new business models, to come up with and strengthen
viable IRIS solutions at district scale. To be comprehensive, T3.2 contains activities devoted to different
stages of business model development. More specifically T3.2 aims to bring user innovation and design
thinking to the stage of business incubation; to take existing emergent business models in LH-city Utrecht
to the next level of business incubation; and to match business model developers to the resources they
need. Lessons learned are delivered in this well-documented step-by-step guide/cookbook, through
which IRIS lighthouse and follower cities can implement a Smart City User Innovation Business Incubation
(SCUIBI)-program. The proposed SCUIBI-program can best be described as a set of activities and facilities
specifically designed to develop and validate ideas, generated by users, and turn them into new, scalable
business models addressing smart city challenges.
In this report (D3.4) we therefore zoom in on the role of incubators and incubation techniques in smart
city development. But over the course of the project intermediate results and experiences drove us to
pivot and change the originally envisioned approach. Our original idea was to develop a dedicated
incubation program for smart city user innovations in the three lighthouse cities’ incubators. This Smart
City User Innovation Business Incubation (SCUIBI)-program was supposed to have been designed and
piloted in year one in Utrecht and then improved in two iterations in Nice and Goteborg before being
disseminated to the follower cities and beyond. Our first analyses, however, presented below in detail in
Part 1 (Chapters 2 to 5), quickly revealed that business incubation programs need not be targeted on
smart city innovation to be effective and typically will not attract a lot of user innovations and/or spinouts

GA #774199
D 3.4 Dissemination Level: Public/Confidential Page 11 of 170
from incumbents. Analysis of the historical records of UtrechtInc, later confirmed also in PACA-Est in Nice
and Chalmers Ventures in Goteborg, revealed that both spinout innovation and user innovations are rare
animals in incubators and the same incubation programs and techniques promote smart city innovation
as well as they promote other innovation and business development. Consequently, the way to promote
smart city (user) innovation in a regional ecosystem is not to target incubation programs, but rather
ensure that incubation programs are optimally organized, and smart city (user) innovation ideas are being
generated and find their way into the generic programs that already exist. It is not in the stages of
incubation and scale-up that smart city (user) innovations are different and need special attention and
there is no need for a SCUIBI-program. So, we advised the incubators in Utrecht, Nice and Goteborg not
to develop a specific smart city (user) incubation program, but instead optimize their existing programs
to receive smart city (user) innovations. UtrechtInc in lighthouse city Utrecht has reformed its incubation
program to broaden the scope of ideas and teams flowing into the incubation programs, tailoring these
programs to the specific needs of academics, students and entrepreneurs while extending its scale-up
program. We describe the antecedents and preliminary experiences with this new program set-up in Part
2 (Chapter 6). This pivot in the business incubation program can be interpreted as our recipe for creating
a supportive business incubation program for smart city innovation. The COVID pandemic was an
unexpected natural experiment in the incubation program, as all activities had to be moved online. We
also reflect on the impact of this natural experiment on the inflow and effectiveness of business
incubation for smart city development.
Then we shift our attention to the stage of ideation in Part 3 (Chapter 7 and 8). We shifted focus and
resources to investigating a range of ideation tools that were either already being used or could be (co-)
organized and guided by the WP3 team to ensure that the IRIS transition tracks would be in focus. We
first investigated what ideation tools would be available and suitable in what conditions to obtain what
goals and report on this in Chapter 7. We then describe a range of actual experiments, some more
successful than others, that we undertook to test what ideation tools would work successfully towards
developing incubateable new ventures. Chapter 8 therefore takes the form of a list of step-by-step recipes
for (smart city) ideation tools that in themselves have been written in such a way that they can be
replicated in follower and other cities. The key ingredients for a successful venture, smart city or
otherwise, is a team and an idea. To find that golden combination is a rare event, and one typically needs
many failed attempts and dedicated coaching before a successful venture emerges. Our gross list of
recipes identifies what business incubation methods worked better under what circumstances. The
ideation activities we (co)organised and monitored for this, resulted in several start-ups and we describe
the case of a single start-up venture that has moved from one of our ideation events to the UtrechtInc
incubation program.
Task 3.3 then brings the work in T3.1 and T3.2 together. It shows how the lighthouse, follower and
potential replication cities could assess and strengthen their local ecosystems, while it also presents tools
and techniques adapted from business incubation that have been helpful for the innovators in the IRIS
project (the smart city business model canvass), seeking to fit their integrated replicable solutions to new
local, regional, and national contexts. Tasks 3.4 and 3.5 then present how this work can be extended
beyond IRIS in time and space. Together, the tasks in WP3 thus present research and develop toolkits and
strategies that both innovators and ecosystem managers in lighthouse cities, follower cities and urban
developers inside and outside of Europe can apply to accelerate smart city development, whether they

GA #774199
D 3.4 Dissemination Level: Public/Confidential Page 12 of 170
seek to adopt and replicate the integrated IRIS solutions of our project or develop new smart city business
altogether.
Scope, objectives and expected impact This deliverable aims to provide an overview of the activities organized in the IRIS project, specifically
lighthouse city Utrecht, around business incubation and ideation to support smart city development. The
importance of new business models in smart city development cannot be overstated. But it is far from
clear how new business formation can be supported in this context.
In this deliverable, we aim to find out what is the best way to test and develop new and innovative
business models in a smart city context. The main objective resulting from this quest, is to develop a guide
which especially policy makers, but also other stakeholders, can use in their respective cities to stimulate
innovation and business development in the process of becoming a smart city. Next to policy makers, the
target audience of this deliverable are different stakeholders in the business incubation process, who we
identify as investors, (aspiring) entrepreneurs, incubators, and researchers on topics related to
entrepreneurship and smart city development.
Our first objective is to figure out what type of innovation or business development can be qualified as
relevant in the smart city context. Then, we need to find out to what extent business incubation programs
are beneficial to develop ideas into validated and investable businesses. And what happens when we
combine the two? Do business incubation programs have a different – more positive or negative – impacts
on smart city ideas? At the start of the project, there was little academic research or information that we
could build upon, so we set out to research these questions ourselves. Using the knowledge thus acquired,
we proceed to our next step: describing the ideal business incubation program for smart city ideas.
However, while drafting such a program, we also realised that participants in an incubation program do
not magically appear and asked ourselves, which activities do we need to organize to stimulate ideation
and business development in the first place? In this report we thus move from more academic research-
based analysis of the problem at hand towards more practical approaches to shaping a more vibrant smart
city business development ecosystem.
Different parts of the deliverable are therefore also expected to have a different impact on different
stakeholders. An explanation of the concepts (Chapters 2 to 4) is relevant to policy makers and
researchers, whereas the analyses of the impacts and effectiveness of incubation programs on (smart city)
start-ups (Chapter 5) may also be relevant for the stakeholders in the business incubation process. An
overview of ideation tools, ideation activities, and the business incubation program (Chapters 6 to 8) we
propose and describe is certainly more directly relevant to incubators and smart city developers
interested in building up an ecosystem in their own context.
Both the lessons from the business incubation program pivot and the ideation events can be useful for
replication (after adaptation) in follower cities in IRIS as well as cities aiming for smart city development
beyond IRIS. We advise readers interested in the justification and motivation for choosing this approach
to creating a smart city business incubation program (in deviation from the originally envisioned SCUIBI-
program) to also read Part I of the report. Parts II and III are more relevant for more practically oriented
incubator managers, wanting to learn how to pivot their programs to broaden the inflow of ideas (Part II),

GA #774199
D 3.4 Dissemination Level: Public/Confidential Page 13 of 170
and smart city developers and policy makers interested in generating more business ideation on smart
city challenges (Part III).
Contributions of partners The work underlying this report has been done by a broad range of partners, both inside and outside of
the IRIS-consortium. Of course, especially in the work discussed this deliverable we have worked
intensively with our academic IRIS partners at Chalmers University of Technology and University of Nice
Sophia Antipolis as well as our incubator IRIS third party beneficiary, UtrechtInc, and the incubation
programs Chalmers’ Ventures in Goteborg, Sweden and PACA-EST in Nice, France, providing data and
access to experts in the respective incubation programs. For the first part, we thank Aleksander Tase,
Daniel van Hemert, Elsa Weiszflog, Simon Rombouts, Fernanda Ardiles Morgado, Inge Scholman, Thomas
Achtereeke and Elisa de Weerd for excellent research assistance at UU. Carolin Eckinger, David Mooij,
Estela Meraza Farfan, Imke Nijland, Maaike Hermse, Katherina Valkova, Martina Picari, Romain Morin,
lenne Omlo, Maurits Vogels, Britt Kuipers, and Kaj Steenhouwer for contributing their Bachelor and
Master Thesis research at UU, Eva Werkman, Francine Burema, Guolle Quintana, Niek Takken, Urbanus
Kiio, Boris Lumumba, Georgia Zafeiri, Nestory Makendi and Wieger de Vries for their participation in the
Lean Startup Research Project IRIS challenges and Leendert de Bell for supervising these projects and
giving us valuable feedback, Alexander Boisseau, Ibrahim Nijad, and Sjoerd Piersma for doing IRIS related
qualitative research under the supervision of Friedemann Polzin and Max Schmal, Lu Ting An, Gloria Carta,
Anik Metzger, and Felina Lapp at the UtrechtInc Students Board for their support in the student challenges
we describe in part 3. Furthermore, we are grateful for contributions from HKU, Rianne Bakker and the
team for WP5 in Utrecht, Labyrinth Research who contributed much more that what they were contracted
for and a host of partners in the various events and activities described below, especially in part 3 of this
report. We thank them all for their kind cooperation in executing and granting interviews, collecting,
cleaning, and analyzing data, giving feedback, and providing context and background information. All
possible remaining errors are of course ours alone.
Relation to other activities This deliverable and the activities underlying it is naturally closely related to the work done in Tasks 3.1
and Task 3.3. The first task aims to analyse and map out the innovation ecosystem of partner cities and
developed tools and methods to do so. The new business development in a city is of course a vital and
fundamental part of this ecosystem and as such Task 3.2 zooms in on that aspect of the entrepreneurial
ecosystem and technology innovation system that is represented by the incubation programs in the three
lighthouse cities. In part 1 of this report, we present and discuss the strengths and weaknesses of these
respective incubation environments in generating smart city (user) innovation for new business model
creation. The work on business incubation also inspired some of the work that was done for and presented
in Task 3.3, D3.6. That is, in this report we already present results on a comparison between new business
incubation and innovation in incumbent firms and in (Giourka et al., 2019) we have taken this one step
further in developing the smart city business model canvass as a tool to assess business model viability
for developing bankable business models in the smart city context.

GA #774199
D 3.4 Dissemination Level: Public/Confidential Page 14 of 170
Structure of the deliverable and reading guide The remainder of this report is structured as follows: In part one (Chapters 2 to 5) we describe the research
done to investigate the potential of spinout- and user innovation for incubation, using a mix of qualitative
and quantitative research methods and using the data collected from incubators in the three lighthouse
cities. In part two (Chapter 6) we describe how UtrechtInc implemented a reorganization of its programs
to better accommodate (smart city user) business incubation. In part three (Chapters 7 and 8), we describe
the importance of ideation for promoting smart city innovation specifically, list a range of recipes for
supporting the creation and development of ideas into viable business propositions and describe a case
of a start-up that is currently enrolled in the UtrechtInc incubation program as a direct result of IRIS
business ideation activity. Part four (Chapter 9) explains how the deliverables in Tasks 3.3, 3.4 and 3.5
follow up on this work by providing a framework for assessing and improving such business propositions
and matching the resulting business models to different local conditions and/or identify how such
conditions might be altered to increase the chances of successful replication within and beyond IRIS and
Europe.
We advise those readers interested in the more academic background and research that motivates our
choice to not develop a smart city (user) innovation specific incubation program, to read Part I entirely.
There we outline the most relevant concepts: business incubation, smart cities, spinouts, and user
innovations from the academic literature in chapter 2. In chapter 3 we present the results of our research
showing that the potential for spinout innovations as a source of ideas for business incubation was limited
in the Utrecht context. We also concluded from our survey of the relevant literatures, that very practical
methods for classifying start-ups as smart city (user) innovators are lacking and propose methods to fill
that gap in chapter 4. Chapter 5 then presents the results of our empirical analyses of the impact of
business incubation on (smart city user) innovations, showing why it does not make sense to develop a
very targeted smart city (user) innovation business incubation program, but rather split this into targeted
ideation activities combined with a more open, but generic business incubation program.
More practically oriented readers, who are willing to accept the above conclusion without having seen
the evidence and arguments, are advised to skip directly to Parts II and III where chapter 6 describes the
pivot in the UtrechtInc incubation programs, chapter 7 offers guidance on selecting the fitting type of
ideation event and chapter 8 offers a list of “recipes” for business ideation activities that can be geared
towards specific smart city challenges and local contexts.

GA #774199
D 3.4 Dissemination Level: Public/Confidential Page 15 of 170
2. General overview of literatures on Business Incubation, Smart Cities, Spinouts and User Innovations
The purpose in WP3, T3.2 is to identify and help develop new, bankable business models that support the
transition tracks that have been identified in the IRIS project. Utrecht University, in close collaboration
with UtrechtInc, is responsible for setting up a business incubation program in which we aim to develop
such new business models. An incubation program is a process. By matching resources and coaching to a
team with an idea, it aims to develop these ideas into bankable business models (Fout! Verwijzingsbron
niet gevonden.).
Figure 1: Schematic Overview of Business Incubation Process
Strictly speaking a “start-up” is a new organisation that may emerge towards the end of the incubation
process to exploit the developed business model, but for the purposes of this report we will use this term
lightly to refer to a team that has organised itself around developing a new idea into a venture (Cockayne,
2019). Generating and collecting ideas, with capable teams to implement and develop them into a viable
business, is the key challenge in any business incubation program (Hansen et al., 2000). In IRIS this
challenge is even larger as we want to focus our efforts on business models in the five predefined
transition tracks and search for teams and firms in the three lighthouse cities primarily.
From the literature we can derive that there are broadly speaking three sources of new business ideas
that we can look at (see e.g. Alexy et al., 2012; Coyne et al., 2007; Dahlander & Piezunka, 2014): New
business models can come from existing companies, active in the transition tracks already; from new
entrants that look for new application of technologies and solutions they have available; and finally from

GA #774199
D 3.4 Dissemination Level: Public/Confidential Page 16 of 170
citizens and users that experience problems along the way, for which solutions may have been developed
non-commercially representing viable new business ideas.
All three sources have their specific incubation challenges. With spinouts from incumbents the team is
often strong and capable, but the new business may not be in the strategic interest of the incumbent and
the new venture competes with ongoing business concerns for attention, energy, and resources. For new
entrants there is little strategic disagreement, but resource constraints are often much tighter and novel
ideas are often technology driven, supply push and market demand is doubtful. Whereas for user
innovators, the demand is obviously there, but the team is often weak or even absent, resource
constraints are tight and often incentives are misaligned (Riggs & Von Hippel, 1994; Henkel & Von Hippel,
2004). The numbers in Figure 1 are there to give an idea of the rate of attrition between the typical stages
of business incubation. In order to develop a single successful (Smart City) start-up, one needs a
development funnel of approximately 100 ideas, resulting from e.g. Spinouts, Start-up Challenges and
User Innovation. These might result in 25 matched teams to ideas. During a careful selection process, 5 to
10 ideas might have right qualities to join a Business Incubation program. And in the end, after a few
months or years, it is possible that one of these can survive and grow into a thriving business venture. A
well-designed incubation program might alleviate the bottlenecks and thereby promote smart city
business development by attracting (more) ideas from spinout and user innovation specifically. The work
in task 3.2 thus centres around four key concepts: Business Incubation, Smart Cities, Spinouts and User
Innovation. To set the stage and provide the background for the report, this chapter first surveys and
summarizes the academic literature on these concepts.
Business Incubation1 Business incubation has been studied quite intensively by academics, interested in innovation dynamics
and entrepreneurship and a rather extensive literature has developed. Since the earliest accounts of
incubators in 1959 in the Batavia Industrial Centre in New York (Leblebici & Shah, 2004), the phenomenon
has become widespread.2 Also in lighthouse cities Utrecht, Goteborg and Nice, several incubators and
incubation programs are active. There have been different generations and types of business incubators
(Bruneel et al., 2012; Dee et al., 2015; Grimaldi & Grandi, 2005; Leblebici & Shah, 2004). Most of the
variety of incubation models, in more conceptual terms, lies in three dimensions. First, incubation models
vary in terms of their intervention system, resources, and services provided (Bruneel et al., 2012; Grimaldi
& Grandi, 2005; van Weele et al., 2018; von Zedtwitz & Grimaldi, 2006). Second, incubators focus on
different stages of the start-up development (Dee et al., 2015; Madaleno et al., 2018; Mian et al., 2016).
Third, incubators vary in terms of their funding or sponsorship (Baraldi & Ingemansson Havenvid, 2016;
Bergek & Norrman, 2008). Despite this variety, the common thread has always been to support innovative
1 This chapter is based on work published earlier as Eveleens (2019). Large parts of this paragraph are (sometimes verbatim) quotes from earlier publications of IRIS work. 2 As of November 2018, the website 6fs listed no less than 8.591 accelerators/programs worldwide

GA #774199
D 3.4 Dissemination Level: Public/Confidential Page 17 of 170
entrepreneurship. What unites the different models is the underlying logic that it is possible, desirable,
and effective to interfere with the development of start-ups.
Academic research on the topic has focused on such questions as how incubation performs and what
distinguishes successful from less successful incubators and incubation practices. As is common in
academic research, the first papers in the field relied more on qualitative research methods (small-n case
studies and interviews) and focused on scoping out the emerging field. But these efforts were quickly
followed by more quantitative assessments of incubator impacts and incubates’ performance (Albort-
Morant & Ribeiro-Soriano, 2016; Mian et al., 2016). The publication of a systematic review by Hackett and
Dilts (2004a) and a special issue in the Journal of Business Venturing (Phan et al., 2005) directed research
along three main lines of inquiry. The first concentrates on the definition, configuration, and taxonomies
of business incubators; in other words: what is incubation? The second focusses on the evaluation of the
performance and impact of incubators, in other words: are they helping? The third area of inquiry
concerns the theoretical mechanisms which explain how incubators influence start-up performance; in
other words, how and why would they work?
The first question can be debated at length, but for our purposes here a simple definition can suffice. A
business incubator can be defined as “an organisational entity which performs a set of activities or services
for incubated firms, such as facility renting, coaching, training, and networking” (Baraldi & Ingemansson
Havenvid, 2016, p. 53). The precise services and resources depend on the goals of the incubator (Bergek
& Norrman, 2008), but they are provided through interactions between start-ups, mentors, coaches,
investors, etc, accentuating a network-based understanding of incubation (Hansen et al., 2000; McAdam
& Marlow, 2008).
For our purposes the second line of inquiry is most relevant. This line of research was based on data
collection efforts and more quantitative analyses (e.g. Aernoudt, 2004; AMEZCUA et al., 2013; Barbero et
al., 2012; Colombo & Delmastro, 2002; Ensley & Hmieleski, 2005; Lindelöf & Löfsten, 2003; Van Rijnsoever,
Frank J. et al., 2017; Vásquez-Urriago et al., 2016; S. Yu, 2020).
A methodological challenge in this literature has always been to handle the strong selection biases in the
population of incubated firms. Incubators have a stake in the success of their incubates. Sometimes very
directly when they take an ownership share in the incubated companies, but more often indirectly in
terms of reputation and reporting to their funders and supporters and attracting investors and coaches
for their incubates. They therefore select among the already self-selected applicants, such that those
start-ups that eventually end up being incubated, are not a random draw from the universe of start-ups.
Consequently, it is hard to separate the effect of the pre-conditions they self-select and are selected on
from the effects of incubation on the observable outcomes (J. Yu & Nijkamp, 2009). Comparing incubated
and non-incubated firms on outcomes is simply insufficient and one must try and control for the factors
that drove selection and potentially affected the outcomes. A suitable control group is simply missing
(Hallen et al., 2016). The location of the incubator also influences its impact, and this further complicates
arriving at generalisable results from impact assessment (AMEZCUA et al., 2013; Chakma et al., 2010) on
a range of relevant outcome variables (Dvouletý et al., 2018). Finally, the type and aim of the incubator
also affects the impact (AMEZCUA, 2010; Barbero et al., 2012).

GA #774199
D 3.4 Dissemination Level: Public/Confidential Page 18 of 170
Consequently, earlier generations of incubator studies were not always able to show positive impact
(Lukeš et al., 2019; Schwartz, 2013; Udell, 1990). More recent studies, based on better data and methods,
but also studying more mature incubators, generally do show a significant and positive effect on the most
common dependent variables such as survival, investments raised, and start-up growth in turnover or
employment (Hallen et al., 2016; Stokan et al., 2015; Van Rijnsoever, Frank J. et al., 2017). For our
purposes, the relevant conclusion from this literature is that there are ways to identify the impact of
business incubation and the evidence now suggest that such effects are generally positive even if they
remain highly context dependent. If we dig a little deeper into the nature of business incubation, this
should not come as a big surprise.
Business incubation itself is not a one-size-fit-all treatment that is implemented in the same way in all
incubators for all incubates. In fact, every incubator has its own practices and methods, typically linking
coaches with always a unique set of experiences, networks, and skills to incubates in response to their
individual needs. In other words, business incubation is very much tailored to the needs of the incubate
at the time of incubation. This makes incubation (success) highly context dependent, even if it is limited
to some extent by the skills and resources of the incubator. This limits the usefulness of statistical analysis,
as that assumes a degree of generalizability that is simply absent. But even though the match between
incubate and incubator is always unique, the literature suggests that the contemporary incubation model
increases the employment (Madaleno et al., 2018; Stokan et al., 2015), growth (Hallen et al., 2016; Stokan
et al., 2015), investments (Hallen et al., 2016; Madaleno et al., 2018; Smith & Hannigan, 2015), and exits
(Smith & Hannigan, 2015; S. Yu, 2020) of start-ups that are drawn to incubation. From these studies, it
also has become clear that the effect of incubation depends on the characteristics of incubation. Namely,
the more experienced, assertive, and high-pressured incubators contribute more to start-up performance
(Lukeš et al., 2019; Madaleno et al., 2018; van Weele et al., 2018). As a result, while previous research
emphasised the broad variety of incubation approaches (Aernoudt, 2004; Hackett & Dilts, 2004a), the
accelerator model begins to emerge as a dominant model of incubation (S. L. Cohen et al., 2019; Madaleno
et al., 2018) Nonetheless, Eveleens (2019) concludes, based on his elaborate survey of the literature, that
five problems remain:
4. There is a paucity of studies that systematically review, organize, and analyze the extant
incubation literature. This leads to fragmentation instead of consolidation of the field of research.
5. There is a lack of incubation impact studies in north-western Europe to complement the
prevalence of studies in the American context. This hampers generalizability.
6. It remains unclear if some start-ups are more suitable for incubation than others. This could
account for unexplained variance in the impact of incubation.
7. There is a need for more convincing explanatory mechanisms that relate incubation services and
activities to start-up performance.
8. There is a lack of studies that explicitly compare cases of incubation with non-incubation. This has
led to research that is susceptible to an overly positive view of incubation. Source: Eveleens (2019) Table 1.
For our purposes in IRIS, question 3 proved particularly relevant as we need to know how business
incubation (programs) would have to be tweaked to support smart city and user innovations specifically.
Unfortunately, the literature could give us only limited guidance on that. To date, the question of whether

GA #774199
D 3.4 Dissemination Level: Public/Confidential Page 19 of 170
the positive effects of incubation depend on the characteristics of the start-ups is largely ignored in the
literature. Because incubation was originally targeted at a quite specific group of start-ups in the ICT
domain (S. Cohen, 2013), their characteristics were rather similar. Today incubation also targets other
types of start-ups, including clean tech (Malek et al., 2014), life sciences (Van Rijnsoever, Frank J. et al.,
2017), sustainability (Bank et al., 2017) and media (Schwartz & Hornych, 2008). Before we can consider
building a program that will target and support smart city and user innovations specifically, we need to
establish how the standard accelerator model performs in attracting and affecting start-ups in this
domain. With the methods and approaches developed in the literature surveyed above, we can do so.
The literature above gives us guidance in selecting the relevant outcome and performance variables and
the methods by which we may hope to tackle the important selection bias issues. But to be able to identify
the impact of incubation programs on smart city and user innovation-based start-ups specifically, we also
need an empirically workable definition of what constitutes such a start-up. We turn to those challenges
in Chapters 4 and 5, but first survey the academic literature on Smart City Innovation in general.
Smart Cities3 Smart city development is high on the policy agenda of urban planners around the world (de Lima et al.,
2020). Research has shown that smart cities are part of a new and rapidly changing reality that will affect
the efficiency, equity, sustainability, and quality of life in cities (Batty et al., 2012). Consequently, the
concept is increasingly being researched, also in the academic literature (e.g. Adiyarta et al., 2020;
Fietkiewicz et al., 2017; Ismagilova et al., 2019; Sproull & Patterson, 2004; Sun & Poole, 2010; Sussman,
2001; Tan, 1999). However, the literature is currently developing without a clear and unambiguous
definition of the concept.
In some research, modern cities are referred to as for example intelligent city, digital city, innovative city,
or knowledge city (Adiyarta et al., 2020; Fietkiewicz et al., 2017; Ismagilova et al., 2019; Sproull &
Patterson, 2004; Sun & Poole, 2010; Sussman, 2001; Tan, 1999).These studies all provide building blocks
for our understanding of the phenomenon. But when authors collect data, often for a limited number of
case-studies, based on their own definitions, this limits the comparability across studies, generalisability
of results and the usefulness of these definitions for empirical research. Moreover, “smart cities”
represent something more than these more limited concepts (Samarakkody et al., 2019; Yigitcanlar et al.,
2018). Definitions of “smart cities”, however, also emphasise different themes, elements, or dimensions
(e.g. Giffinger et al., 2007; Silva et al., 2018; Winkowska et al., 2019).
A highly cited definition of smart city that incorporates many of these elements is “a city is smart when
investments in human and social capital and traditional (transport) and modern (ICT) communication
infrastructure fuel sustainable economic growth and high quality of life, with a wise management of
natural resources, through participatory governance” (Caragliu et al., 2011, p. 70). However, other
definitions emphasize other dimensions. For example, according to Zhuhadar et al. (2017, p. 274) “smart
cities are those cities that have the greatest quality of life and economic wellbeing for their citizens”. This
3 This section was published as Hermse et al. (2020)

GA #774199
D 3.4 Dissemination Level: Public/Confidential Page 20 of 170
definition emphasizes the citizens in a city and their quality of life. Whereas e.g. Neirotti et al. (2014, p.
25) focus on the Information and Communication Technologies (ICT) aspect of smart cities, stating: “smart
cities are characterized by the pervasive use of ICT, which, in various urban domains, help cities make
better use of their resources”. Governance and institutional components are also often emphasized in
definitions. According to for example Nam & Pardo (2011, p. 284) “smart cities are an organic connection
among technological, human and institutional components. The usage of ‘smart’ captures innovative and
transformative changes driven by new technologies”. Most scholars emphasize the quality of life, citizen
wellbeing, technology, or governance. But other topics are also frequently incorporated, such as
innovation, collaboration, and infrastructures. None of the definitions incorporates all the themes
identified in the definitions of smart city.
What all definitions do seem to have in common is the idea that a smart city challenges the old way of
doing things in the urban environment. This puts entrepreneurs and start-ups in focus as they are
considered the agents of change (Lombardi et al., 2012). However, as there is no readily available
definition of smart city, it is even harder to define a smart city start-up. The empirical literature on smart
city start-ups is therefore limited to date. Building on the definitions that have been proposed in the
literature, in chapter 3, we propose a definition and develop a coding scheme for smart city start-ups to
help researchers collect data and do empirical research on smart city development.
Spinout Innovations4 Many of today’s largest firms are spinouts from parents we often do not even remember. The literature
on these spinouts was initiated by Garvin (1983) and pushed by the late Steve Klepper and co-authors
(Klepper, 2009; Klepper & Sleeper, 2005; Thompson & Klepper, 2005). Several researchers have analysed
the factors that lead to spinoffs and spinouts. A common theme in many prior studies is that of strategic
disagreement, or even conflict, between the parent firm and the employee. For example, large firms can
be bureaucratic and inert, developing inflexible but valuable internal organisational ‘routines’ which
discourage radical change and intrapreneurship (R. Henderson, 1993; R. M. Henderson & Clark, 1990;
Winter, 1984). Employees who discover radical new opportunities within these firms are not permitted to
develop them intrapreneurially or through assisted spinouts because that would disrupt the firm’s
routines (Freeman & Engel, 2007). On other occasions, a new business idea might fall so far outside the
firm’s core line of business that the firm does best by sticking to its core competencies. Employees,
prevented from seeing their ideas developed, can thus become frustrated and come into conflict with
their employer (Garvin, 1983; Klepper, 2007). Research has shown that this commercialization route is of
particular importance in the early stages of new industries, when dominant designs have not yet been
established and a lot of experimentation characterizes the dynamics in the sector. Under those
circumstances, there is a lot of potential strategic conflicts that may cause spinouts. Ultimately, employees
might have to leave and start up on their own if they are ever to commercialise their ideas. This logic can
4 The literature uses the terms spinout and spinoff interchangeably. We will refer to spinouts in the remainder of the report. Parts of this section have been published earlier as an IRIS report in Zanders, Polzin and Sanders (2019) and Valkova (2020).

GA #774199
D 3.4 Dissemination Level: Public/Confidential Page 21 of 170
explain why, even though large bureaucratic firms generate plentiful ideas, they can also be associated
with numerous independent breakaways (Klepper & Sleeper, 2005). Sometimes these are accompanied
by vigorous litigation by the firm alleging breach of trade secrets (Jackson, 1998; Agarwal et al., 2009).
Organisational limitations are not the only reason why employees sometimes leave firms to develop new
innovations. Another is asymmetric information. For example, Klepper (2007) develops a theory in which
an incumbent firm’s managers agree about the firm’s current course until one manager comes into
possession of a new piece of information about a valuable opportunity for the firm. This manager tries to
persuade the other managers of the value of pursuing the opportunity. If this effort fails and the managers
disagree, and if the opportunity’s expected value exceeds the cost of starting a new firm, then the well-
informed manager quits and starts his own venture. The same outcome also arises from several models
based on agency theory. When property rights are weak, and firms cannot credibly commit to reward
employees for co-operating on product development in a joint venture, employees are likely to leave the
firm and start up an independent venture (Anton and Yao, 1995; Wiggins, 1995).
For the purposes of the IRIS-project, we need not delve deeper into the theoretical and largely US based
empirical literatures here. The relevance of the spinout literature for our purposes is that smart city
development also presents a dynamic and fluid environment in which employees in existing firms may
have ideas that are not being developed in the firms in which they are employed.
In Valkova (2020) we have therefore developed a more elaborate comparison of the literatures and
models that have been developed to describe the processes of business incubation and corporate
entrepreneurship. The extant literature does not offer a common framework that encompasses both
these forms of innovation. Valkova (2020) provides a literature review of existing process models (her
Table 1, reproduced below) and she ends with a synthesis and comparison of the existing models that
served as guideline for her qualitative, empirical analysis.
Process Authors Outcome
Business
Incubation
(Campbell et al., 1985) A process model of business incubation
(Smilor, 1987) A process model of business incubation; Success factors
(Hackett & Dilts,
2004a)
A real options driven theory of business incubation
(Phan et al., 2005) Science parks and incubators; Observations, Synthesis
and
(Ayatse et al., 2017) The business incubation process and firm performance
Corporate
Entrepreneurship
(Burgelman, 1983a) A process model of internal corporate venturing in
diversified large firm
(Edison et al., 2018) Conceptual framework of lean startup; Lean internal
startups for software product innovation
(Fecher et al., 2020) Innovation labs from a participant’s perspective
(Heikkinen et al., 2018) Managing radical innovations in established companies
Table 1: Table 1 reproduced from Valkova (2020)

GA #774199
D 3.4 Dissemination Level: Public/Confidential Page 22 of 170
2.3.1. Business Incubation
Valkova (2020), like Eveleens (2019), emphasise the idiosyncrasies of the various forms of business
incubation and related terms, such as incubators, accelerators, science parks, technology parks,
innovation centers etc., when considering them in their geographic, economic, cultural, political and social
contexts (Phan et al., 2005). Still, across these very different contexts, at a higher abstraction level, the
business incubation process can be described as a process with distinct stages. An early process model for
business incubation was introduced by Campbell et al. (1985). This model includes four basic “services”
(value addition activities) by which an incubator might contribute to the performance of incubated start-
ups: diagnosis of needs, selection and monitoring, capital investment, and access to expert networks.
Ayatse, Kwahar, & Iyortsuun (2017) pointed out limitations to this framework: the model does not account
for entrepreneurial capability, the strengths and shortcomings of the ecosystem, and the adopted
selection criteria. A model by Smilor (1987) was built on the framework proposed by Campbell et al. (1985)
and was extended by putting more emphasis on the external environment (incubator affiliation and
support systems) relative to the internal activities of an incubator. This framework describes the process
as a combination of internal support services and external networks that allow for the formation of new
ventures to reach higher objectives of technology development. Nevertheless, unlike Campbell et al.'s
(1985) framework, this model merely describes the internal support systems, failing to address the actual
processes occurring within the incubator.
More complete process models were defined by Hackett and Dilts (2004a, 2004b) based on their
systematic review of business incubation research. Drawing on the Campbell et al.'s (1985) focus on value
adding activities, their models acknowledge the same elements of the incubation process: new venture
selection, monitoring and assistance, and resource infusion but add a ‘black box’ principle for describing
the internal process of business incubation.
2.3.2. Corporate Entrepreneurship
Like business incubation, the process of corporate entrepreneurship has been studied intensively in recent
decades. Arguably, there are subcategories of corporate entrepreneurship to be studied as individual
processes (Sharma & Chrisman, 1999), however, as will be shown below, these approaches exhibit similar
steps when it comes to process modelling and often fail to account for specific resources and practitioners’
methodologies. According to a study of internal corporate venturing in diversified major firms (Burgelman,
1983a), there are two core processes of internal corporate venturing: definition (articulation of the
technical-economic aspects) and impetus (attaining and preserving support in the organization).
Burgelman (1983a) emphasized that internal venturing takes shape in the strategic and structural contexts
within the corporation. In other words, the new venture is influenced by various organizational and
administrative mechanisms that support the current corporate strategy on the operational and middle
managerial level. The current corporate strategy often needs to be extended or adjusted to accommodate
the new business activities of an internal venture that has fallen outside its scope.
The model accounts for different stages of the process, from a process of linking solutions with problems
and needs, to project championing, and to the impetus process which is composed of strategic forcing
and strategic building. However, there has been a shift in the approach to corporate innovation over the

GA #774199
D 3.4 Dissemination Level: Public/Confidential Page 23 of 170
last few decades. In the recent years, the Lean Startup methodology by Ries (2011) has become popular
not only in the start-up scene, but also in the corporate innovation context. In its essence, it is a
hypothesis-driven approach that aims at achieving a product-market fit.
Edison (2015) proposed a conceptual framework for the lean internal start-up and tested it empirically
(Edison et al., 2018). His framework uncovered three main phases: envisioning, steering, and accelerating.
In the first stage, a vision of the future venture is created using necessary support systems from the
corporate management – authorization and coaching. In the steering process, otherwise also called
impetus process, the idea is (in)validated in an iterative process based on the build-measure-learn cycle
(Ries, 2011). The corporate management monitors the progress of the innovation team during each cycle.
In the last stage, steering, the intrapreneurs aim to scale their project to a viable product or service, while
aligning their goals with the corporate strategy. Sometimes the intrapreneurs must convince the
corporate management to change their strategy to accommodate the new business. Incumbents often
use similar procedures without linking them very explicitly to The Lean Startup methodology. An example
of this is presented in a study of the innovation process in established companies by Heikkinen et
al.(2018). There, the process is described as a sequence of idea generation, proposal preparation and idea
verification with an optional trial at the end. This “Product/market fit means being in a good market with
a product that can satisfy that market” (Andreesen, 2007) approach is like the above-mentioned
framework in many ways, although it does not mention the iterative process when validating an idea.
Innovation labs are a recent popular phenomenon in the corporate innovation area. However, the current
literature does not provide a process model for this novel concept. A study by Fecher et al. (2020), while
not providing a process model to follow, does propose three distinct phases: a pre-lab phase (1), in which
organizations make decisions on time, talent, and tasks, a lab phase (2), where research, ideation, and
prototyping take place, and a post-lab phase (3), where the innovative project is abandoned or prepared
for transfer reintegration to the business line. According to Memon & Meyer (2017), an innovation lab,
not much unlike an incubator, commonly comprises three components: a physical space, resources, and
facilitation.
2.3.3. The Common Process Model
A synthesis of the existing models suggests that there are many similarities between the two processes in
terms of their chronological phases. This suggests that a comparative study can be performed when it
comes to resources and methodologies used by practitioners. Both the corporate entrepreneurship and
business incubation processes begin with a form of envisioning, when a new innovative idea is born
through processes such as linking a solution to a need or problem and keeping an idea backlog. For
business incubation, envisioning is present in an independent venture or carried out by an entrepreneur.
In corporate settings, it is usually the presence of entrepreneurial orientation that fosters intrapreneurial
behaviour. In some cases, the external environment of an incumbent firm (market, governmental policy
or similar) requires a new corporate strategy that leads to a top-down decision to innovate (Blank, 2013;
Burgelman, 1983b; Edison, 2015; Edison et al., 2018; Lumpkin & Dess, 1996; Ries, 2011).
Next, product championing takes place. This involves pitching the idea to either the incubator
representatives or to the corporate management or in the case of top-down innovation, selecting and

GA #774199
D 3.4 Dissemination Level: Public/Confidential Page 24 of 170
appointing the project manager (Burgelman, 1983a, 1983b; Campbell et al., 1985; Edison et al., 2018;
Hackett & Dilts, 2004a; Heikkinen et al., 2018). After delivering a successful pitch, the idea is transformed
into a project or new venture and the steering process of new business development begins. Here, the
independent venture enters the incubation program, and the nascent corporate innovation unit begins
the so-called impetus process. In both cases, the embryotic business unit is monitored, gains access to
coaching, external network and other non-financial and financial resources (Burgelman, 1983a; Campbell
et al., 1985; Edison et al., 2018; Hackett & Dilts, 2004a). The steering phase is over once the new venture
starts concentrating on growing and scaling, as well as attracting venture capital. For the independent
venture, this stage usually begins after exiting the business incubation program. Some start-ups then enter
an acceleration program which guides them in their growth phase and connects them to investors. In a
corporation, the innovative project becomes a multifunctional business unit that is part of the overall
corporate strategy (Burgelman, 1983a; Campbell et al., 1985; Edison, 2015; Edison et al., 2018; Smilor,
1987).
Figure 2:
Figure 2: reproduced from Valkova (2020) - Common Framework for Business Incubation and Corporate Entrepreneurship
As demonstrated in Figure 3, both processes follow similar steps that can be described as four phases:
envisioning, product championing, steering, and accelerating. In Valkova (2020) we found and described
the differences between the two processes, using the four phases as common guiding criteria for the
comparison. For this chapter we can suffice to say that the similarities in business incubation and
corporate entrepreneurship were sufficient reason to consider spinoffs and corporate entrepreneurship
a relevant channel for business incubators to tap into if the aim is to develop bankable smart city business
models. The quality of the ideas developed inside existing organisations is typically high, as the ideas come
from people engaged intensively with the new technologies and challenges that the smart city transition
entails. Moreover, although it may be beyond the resources or strategic interests of the incumbent firm
to develop these ideas, they might be willing to allow their employees to develop them outside the firm,

GA #774199
D 3.4 Dissemination Level: Public/Confidential Page 25 of 170
as these ideas may well be complementary to the firms’ own strategic interests. In chapter 2 we therefore
explore this channel and its potential for business incubation in the context of the IRIS project.
User Innovations5 Users can also be an important source of innovation (Urban & Von Hippel, 1988). User innovations are
developed for personal use and as such satisfy needs not yet detected by manufacturers. The innovations
developed can thus be used to detect latent consumer demand (von Hippel et al. 2011). Additionally, user
innovations help to resolve inefficiencies in the market such as reducing information asymmetry, reducing
business stealing and filling high-need niche markets (Henkel & Von Hippel, 2004). We find successful user
innovations in form of modifications or improvements of equipment for kayaking, mountain biking, kite
surfing or canoeing (Franke et al., 2006; Franke & Shah, 2003; Hienerth, 2006; Lüthje et al., 2002). Other
examples are found in open software development (i.e. Linux), scientific instruments, improvements to
librarian information systems or computer assistance systems (Morrison et al., 2000; Urban & Von Hippel,
1988). Eventually incumbent manufacturing firms pick up many of these innovations, but several modern
household names like Dyson and Dropbox can indeed be traced to user innovations. User innovations
sometimes linger in obscurity for quite some time. Only a few user innovators built successful firms and
became famous with their innovations. Many more user innovators can simply not be traced. These
inventors lacked the skill, capacities, or incentives to develop their innovations into a business themselves
and others have picked up on their ideas.
While researchers and industrialists are starting to recognize the importance of user innovation, users as
a source of innovation are still being underestimated by policy makers (Bradonjic et al., 2019). The cases
described in the literature all show that user innovations justify further attention and could be promoted
more openly to encourage users to innovate and increase the number of user innovations. Incumbent
firms are increasingly interested in mining this hidden treasure (e.g. Kraft, 2012) and developed design
thinking and open innovation to tap into the user resource for their own benefit. But these processes are
designed to promote the interests of the company, not society at large. Therefore, truly transformative
ideas that could disrupt, cannibalize, or creatively destroy exiting activities, will receive insufficient
support from incumbent firms and in fact may be actively discouraged. The same market failures that
justify public support for new ventures can therefore also justify the support for the disclosure and
incubation of user innovations. Business incubation programs could thus play an important role as
providers of skills, facilities, and finance, as they are for would-be entrepreneurs. Especially in the Smart
City context, user innovations have the marked advantage of an automatic alignment between user-need
and innovator solution. As an important element in the definition of a Smart City is the role of citizen
engagement and involvement in the selection and implementation of solutions, this makes User
innovation an interesting concept for Smart City (business) developers.
To target public support for user innovation, however, it is essential that decision makers can identify
them unambiguously and early on. The academic literature on user innovations to date is very case-based
5 Parts of this section have been published as part of Eckinger and Sanders (2019)

GA #774199
D 3.4 Dissemination Level: Public/Confidential Page 26 of 170
and academics and innovation managers still use their own definitions. There is some theory
development, but rigorous empirical testing, especially in the context of the effectiveness of business
incubation programs for Smart City User Innovations is absent, limited by a lack of data and an established,
unambiguous definition of the concepts that are essential to investigate this. We return to this in Chapter
3 where we develop workable definitions and classification schemes.
Summary and Conclusions In this chapter we present the academic literature related to the key concepts in his report. Of course, the
review of these different literatures is necessarily incomplete and leaves many open questions. The most
important conclusion from this review is that there is still a gap in the literature when it comes to assessing
the impact of business incubation programs on different types of start-ups and innovative firms.
Specifically, the potential for smart city spinout and user innovation-based projects is not clear. Designing
a program to support smart city innovation requires that we scope the potential for spinout innovations
and develop clear and empirically operationalizable definitions of “smart city” and “user” innovations.
Then we can proceed to investigate how the incubators in the Light House cities perform in supporting
such ventures in the past and present. Such an analysis can identify what elements in these programs that
are most relevant to smart city and spinout and user innovations and could be strengthened as part of an
urban transition strategy.

GA #774199
D 3.4 Dissemination Level: Public/Confidential Page 27 of 170
3. The Scope for Spinout Innovation in the Smart City Context
Our first step in scoping the potential for spinout innovation in smart city incubation was to scan the
existing local ecosystem in Utrecht for opportunities and ideas. As this exercise also generates relevant
information for other parties in the consortium, we published this chapter also as an intermediate report
(Zanders et al., 2019). In this chapter, we present the results of interviews that were held in the period
November 2017-April 2018 in Utrecht. We contacted 37 and interviewed 17 businesses in and around
Utrecht to generate data and collect information into the inner workings of their innovation processes
(Taylor Buck & While, 2017). The targeted interviewees were found in the consortium and local
entrepreneurial ecosystem and were selected to be active in the five transition tracks targeted in IRIS: 1)
Smart renewables and closed loop energy positive districts, 2) Smart energy management solutions, 3)
Smart e-mobility, 4) City Innovation Platforms and 5) Citizen engagement and co-creation. As there are
no commercial firms active in the latter transition track and our user innovation focus in chapters 3 and
10 will cover citizen engagement, the latter transition track was left out of scope. The following questions
were discussed with innovation managers, business developers or strategy representatives in these firms.
1. How does your company act in the IRIS transition pathways?
2. What kind of problems do the clients of your company face in these areas?
3. What would be potential solutions, and could they be commercially exploited?
4. Is your company actively pursuing these ideas (for example through the creation of spin-offs
or through or forms of ‘start-up support’)?
5. Which barriers prevent the commercialization of (your) smart city ideas?
Not all firms were able or willing to provide detailed answers to all these questions and our interviews did
not uncover any readily incubatable ideas. Responses on questions 3 and 4 were thus usually limited. This
was perhaps to be expected. We managed to interview 17 people in as many firms, and it would indeed
be a rare coincidence if one of these people would have detailed information about a potential business
idea in the exact right stage for it to enter incubation. Still our interviews, together and individually, do
give a good overview of the current state of things in the Utrecht ecosystem and we thought it useful to
report on our findings. The structure of our interview guide implies we carefully mapped the current
business models on a well-established business model canvas and the discussions with our interviewees
were revealing on opportunities and barriers they perceive in the Utrecht ecosystem for Smart City
innovation as defined in the IRIS transition tracks. In addition to the results of our interviews, we also draw
conclusions on our own process and discuss how we have pivoted the incubation program to address the
challenge of identifying viable business models in the future.
The remainder of this report first briefly presents the research context and methodology in section 3.1.
Then section 3.2 discusses the data we have collected and describes the business models that our
interviewees currently operate in the different IRIS-transition tracks. Our interviewees, short of offering
detailed future business models they want to develop, did give us a lot of information on the trends and
opportunities they see in their respective markets. Section 3.3 presents the results on these outlooks for
the IRIS transition paths. Section 3.4 then presents the major barriers our interviewees identified for their

GA #774199
D 3.4 Dissemination Level: Public/Confidential Page 28 of 170
firms to address challenges and engage with new opportunities. Section 3.5 concludes and reflects on the
results as well as the next iteration of the IRIS-incubation program for Utrecht.
Research context In this research, a qualitative research approach (M. Q. Patton, 2002) was used. A team of research
assistants6 contacted businesses of various sizes and asked to discuss business ideas with innovation
managers, business developers or strategy representatives (see e.g. Alexy et al., 2012). To build a relevant
database of interviewees, our research assistants conducted several interviews with multiplier parties.
We kept doing multiplier interviews until saturation was achieved. That is, new multipliers would not
mention new target interviewees. We started by contacting the IRIS Project partners, and then continued
to contact other companies using snowball sampling, the multiplier interviews and the researchers’
professional networks (Bryman, 2016). In total, 37 organisations were identified as relevant and
approached for an interview. Out of these organisations, 17 organisations (46%) agreed to have an
interview representing typical cases from a Smart City eco-system.
The interview guide is reproduced in the Annex. To allow for a comprehensive assessment of new business
ideas we mainly based our questions on the established business model canvas that is used in the lean
start-up method process (Osterwalder et al., 2005). After a brief introduction of the research process,
interviewees were asked to elicit their current and prospective involvement in the Smart City ecosystem.
The interviewers then turned towards (most promising) business ideas as well as its origin (one of the
contributions of this research). The remainder of the interview revolved around properties of this
potential new idea, including the customer value proposition, key resources and process to implement
that idea (value delivery) and the profit formula (value capture) (see also Bocken et al., 2014). In a final
part we discussed future developments of the business models (with respect to the transition track) as
well as barriers with the company representatives.
The interviews were conducted in the period November 2017 to April 2018. The interviews had an average
length of 41 minutes, the shortest lasting 23 minutes, and the longest lasting 78 minutes. During the
interviews, the interview guide ensured our research assistants consistently asked about the way the
organisation acts in the IRIS transition pathways, what problems companies face in these areas, and what
potential solutions they think would be feasible and could potentially be commercially exploited. There
was a strong focus on (potential) new business models. The coding strategy started from a top-down
analysis by using the business model canvas (Johnson et al., 2008). In addition, during the coding process,
codes that arose from the interview data were added (M. Q. Patton, 2002; Yin, 2014). All interviews were
coded independently by at least two researchers and the senior researcher checked consistency in blind
samples.
6 We are grateful to Elisa de Weerd, Inge Scholman, Fernanda Ardiles Morgado, Thomas Achtereekte and Aleksander Tase for their excellent research assistance.

GA #774199
D 3.4 Dissemination Level: Public/Confidential Page 29 of 170
Interviewed organisations The interviewed organisations consist of partners of the IRIS consortium (Utrecht) such as Bo-Ex, Civity,
LomboXnet, Qbuzz as well as other parties active in the smart-city ecosystem of Utrecht. Further
companies that took part in the study were Solease, Suez, Elaad, Wocozon, van Scherpenzeel, Viriciti,
Senfal, Qwiksense, Sundata, Veolia, Strukton and Antea Group as well as intermediary organisations
(TNO). An overview about the consulted organisations can be found in Table 2.
Name of the company Sectoral focus IRIS consortium Transition Track
Antea Group Engineering & Consultancy No 3 Bo-Ex Housing corporation Yes 1, 5 Civity Data management Yes 4 Elaad (Smart) charging infrastructure No 3 LomboXnet (Smart) charging infrastructure Yes 2, 3 Qbuzz Public transportation No 2, 3 QwikSense7 Energy data management No 2 Senfal Energy data management No 2 Solease Solar energy No 1 Strukton Rail infrastructure No 3 Suez Waste processing No 1 Sundata Solar energy No 1 TNO Research institute No 1, 2, 3 van Scherpenzeel Waste processing No 1 Veolia Resource management Yes 2, 3 ViriCiti (Smart) charging infrastructure No 3 Wocozon Solar energy No 1
Table 2: Interviewed organizations
Bo-Ex, Solease, Suez, Sundata, TNO and van Scherpenzeel are all active in transition track 1, Smart
renewables and closed loop energy positive districts. Both Suez and van Scherpenzeel are trying to turn
waste into energy, closing the loop. Bo-Ex, as a housing corporation, is looking to make their portfolio
energy neutral. Both Wocozon and Solease are providers of renewable energy, marketing solar panels as
a service, targeting renters and private homeowners respectively. TNO is a research institute working on
research questions in this transition track, as well as transition tracks 2 and 3.
In transition track 2, Smart energy management and solutions, active organizations are LomboXnet,
Qbuzz, Qwiksense, Senfal, TNO and Veolia. IRIS-partner Qbuzz puts the organization of storage of energy
at the core of their business model development activities. They aim at storage and sell electricity with
their busses and provide enhanced load-management to the grid operator. LomboXnet also targets
storage and control, by providing solutions to storage in cars but also stationary storage. Qwiksense uses
data to improve the indoor climate in i.e. schools and offices. Senfal uses artificial intelligence to manage
energy use and production. Veolia is a French transnational company with activities in four main service
7 QwikSense was declared bankrupt in February 2018 and has since continued activities as Unicornify Labs.

GA #774199
D 3.4 Dissemination Level: Public/Confidential Page 30 of 170
and utility areas traditionally managed by public authorities – water management, waste management,
transport and energy services, extending its activities to both transition tracks 2 and 3.
Antea Group, Elaad, LomboXnet, Qbuzz, Strukton, TNO, Veolia and Viriciti are active in transition track 3,
Smart e-mobility. Antea Group is an internationally active engineering and consultancy agency,
specialized in the infrastructure of (e-) mobility, a specialization they share with construction company
Strukton. LomboXnet and Qbuzz both work on mobility solutions (vehicle to grid) including cars solutions,
as well as electric busses. Elaad is a knowledge centre for electric mobility and ViriCiti provides monitoring
systems for electric trucks and busses.
Civity is a main provider of City Innovation Platforms, transition track 4, whereas Bo-Ex’ core business is
social renting of houses, putting citizen engagement – transition track 5 – very close to their core business,
because Dutch law and regulations largely protect renters from changes to their housing situation and
prior consultation and consent is usually required.
Trends and Scenarios for Transition Tracks During the interviews, interviewees were asked to reflect on the most relevant trends for the future.
These outlooks can be clustered according to the transition tracks identified above and give us an
overview of the future the active players in each transition path are currently planning on. Taking the
most common elements from these outlooks together we can build scenarios that organisations active in
these tracks feel they are likely to face when it comes to developments in Smart City innovation.
Transition Tracks (TT) Likely scenarios
TT1: Smart renewables and
closed loop energy positive
districts
• Data protocols will be put in place, so available data can be
easily linked
• Increase in need for connecting organisations (i.e. municipality,
incubators, etc.), who link smaller organisations together to
generate co-created ideas and business models
• The B2B and B2C markets will change from a purchasing market
to a service market, changing underlying business models.
Where currently as much products as possible need to be sold
to make profit, future products need to last to make a profit;
• Product production will become increasingly circular, more
often using recycled raw materials;
TT2: Smart energy
management and solutions
• Housing and offices will become energy-neutral and use of
renewable energy will be substantial
• Consumers will increasingly enter the energy market as
producers;
• Innovation will become increasingly data-driven, as historic
data can be used to predict future developments;
• A clear link will emerge and develop between smart mobility
and smart energy, in terms of generation and storage of energy

GA #774199
D 3.4 Dissemination Level: Public/Confidential Page 31 of 170
TT3: Smart e-mobility • An increase in number of smaller organisations with very
specific knowledge (data, expertise, etc.)
• An increase in size of object printing possibilities is expected,
making it possible to print i.e. houses, bridges, etc.
• Time-to-market of innovations exponentially decreases;
• Increase in drones as a means of transport (people, packaging)
• Decline in (ownership of) cars
• Self-driving cars and public transport (buses, trains, etc.)
• Increase in use of public transport
• Transport will become electric
TT4: City Innovations
Platforms
No future scenarios are mentioned in the interviews with organizations
active in Transition Track 4. This is not necessarily strange, since this
track is horizontal overlapping Transition Tracks 1 to 3, largely covering
the same activities.
TT5: Citizen engagement and
co-creation
No future scenarios are mentioned in the interviews with organizations
active in Transition Track 5. This is not necessarily strange, since this
track is horizontal overlapping Transition Tracks 1 to 3, largely covering
the same activities.
Table 3: Trends and scenarios for Transition Tracks
Taking the most common elements from these outlooks, we conclude from Table 3 that the interviewees
in Transition Track 1 foresee a need for so-called orchestrators. A lot of activity is happening concerning
smart city developments, increasing the need for connecting existing organizations and streams of data,
to bundle resources in moving towards these future scenarios. This expected scenario is shared by
organizations active in Transition Track 3. Interviewees for example said:
“We're now constructing a part of the puzzle that touches upon other parts of the
puzzle. I think the biggest opportunity is how to, in a smart and efficient way,
combine all these pieces of the puzzle together. [..] the role of the incubator can also
be the role of an integrator of all these different pieces of the puzzle.” - Renewable
energy producer
“One of the main challenges is going to be linking all available data. Gathering all the
data from public transport companies, car and bike sharing businesses, et cetera, and
putting them in one place.” - Mobility consultant
In terms of business modelling, we can conclude that players in the energy service market see the trend
where the need for more sustainable products represents a clear opportunity for business, as a shift from

GA #774199
D 3.4 Dissemination Level: Public/Confidential Page 32 of 170
a product to a service-market is expected. If businesses have the incentive to sell as many goods as
possible, the sustainability level of the respective goods will not be optimal.
“When making long-lasting sustainable products - which do not easily break down,
that are easy to repair, and in the end of the life cycle are easy to recycle - you'll only
have the financial benefit of the product in a service business model.” - Renewable
energy producer
In terms of smart energy management (TT2), interviewees expect a large impact from the transition from
fossil fuels to renewable energy when it comes to production and consumption of energy, increasing the
need for balanced grid-use. Finding this balance requires an increasing need for energy storage and large
quantities of data to predict flows of energy.
“We have had the situation in Germany, where during a very sunny day, there was
not enough demand for energy. This resulted in a negative price for energy
(consumers received money for using energy, red.). Now it must be possible to switch
off solar parks, which is absurd.” - Mobility infrastructure producer
“Using data, we can predict and look at historic patterns.” - Energy manager
A conclusion we can derive from interviews with organizations active in smart e-mobility (TT3), the
transition to electric cars and busses, accompanied with the transition from product to a service market,
will largely impact (inner) cities. Decreasing ownership of cars and more frequent and efficient use of
public transport will also change the use of public space. Or as an interviewee put it:
“Public transport use will increase, and we will see more use of car services instead of
ownership. [..] You’re going to need less parking spots, opening up the possibilities of
rethinking public space.” - Mobility consultant
No future scenarios are mentioned in the interviews with organizations active in Transition Tracks 4 and
5. This is not necessarily strange, since both tracks are horizontal tracks overlapping Transition Tracks 1 to
3, largely covering the same activities.
Barriers to smart-city business model development Throughout the research several barriers to business model development and implementation were
mentioned. In the process of open coding, we coded these into commercial, communication and

GA #774199
D 3.4 Dissemination Level: Public/Confidential Page 33 of 170
partnership, legal/taxation, societal and technical barriers. In the axial coding phase we linked these to
existing literature (Bocken et al., 2014; Ceschin, 2013; Rauter et al., 2017). Technical, commercial and
communication barriers mainly link to the customer value proposition, value delivery and value capture
part of the business model (Bocken et al., 2014). Legal, tax barriers and partnership barriers as well as
societal barriers more explicitly are part of the wider socio-technical environment that influences the
development and implementation of business models (Ceschin, 2013; Rauter et al., 2017).
Our coding scheme is thus not exhaustive perhaps, but it allows us to discuss the barriers identified in
rather general terms. For an overview see Table 4. We will refer to “an interviewee” if only one mentioned
it, “some interviewees” if it were at least two and “all interviewees” when in a transition track all
interviewees mentioned and described similar barriers (see also Polzin et al., 2018).
Barrier Type Experienced Barrier Transition
Track
Commercial Knowledge at customer’s organization 2
Commercial Long term planning (electrical cables, grits, etc.) make short term
innovation hard
3
Commercial New product innovations (much) more expensive than current
products (electrical cars)
3
Commercial Small financial margin in energy market 2
Commercial Tax regulation doesn’t promote enough the use energy during non-
peak hours
2
Commercial High storage costs 1
Commercial Intelligent products often a lot more expensive than non-intelligent
versions, not possible to earn difference back
2
Commercial Finding developers 1
Commercial Cost of infrastructure is very high 2, 3
Communication Lack of skilled workforce within organization 3
Communication Decision-making in organizations very cumbersome 3
Communication Education level in city neighborhoods very different, need for
different ways to communicate
5
Communication Innovation also means educating customers 3
Legal and tax Concerns about use of data in terms of privacy legislation 4
Legal and tax Flying drones within 25 meters of the road is not allowed 3
Legal and tax Need for more favorable regulations concerning energy (use of
batteries, nudge people to use electricity in non-peak hours)
2
Legal and tax Energy neutral buildings mean wind and sun energy collection in the
neighborhood, not necessarily an energy neutral building itself
3
Legal and tax Paying taxes when charging and using a battery, double 3
Legal and tax Subsidies for fossil fuels doesn’t help the development of renewable
energy
3
Legal and tax No regulation for taxes on the ocean 3

GA #774199
D 3.4 Dissemination Level: Public/Confidential Page 34 of 170
Legal and tax Currently not possible to be an incidental heath supplier 1
Legal and tax Rental laws don’t help housing corporations to make homes more
sustainable, because the individual renter doesn’t always have the
same interest as the collective
5
Limited Time Lack of innovation capacity within the organization 3
Limited Time Processes with governments take a lot of time, some which
innovative small organizations (i.e. startups) don’t have
1, 2, 3
Partnership Governments should act as examples, for example regarding their
procurement policies
1
Partnership Organizations keep data to themselves, while seeming useless data
could be useful for other organizations
3
Partnership Bigger organizations often afraid to work with startups 1
Societal Lack of people/organizations taking responsibility for tackling
climate problems
3
Societal High percentage of unemployment and crime in some city
neighborhoods
5
Societal Change of mindset needed for people when to use energy, cars, etc. 5
Societal Sustainable alternative needs big upfront investment, with ROI in 30
years – no individual consumer thinks this far ahead
1
Societal Hard to get people involved in societal challenges 1, 2, 3
Technical Really hard to get the right data, and quality data, especially since
it’s almost impossible to get historical data
4
Technical Problems for grid operators can be very, very local 2
Technical Too few batteries, too few electrical cars, not enough capacity to
store energy
2
Table 4: Categories, barriers, and corresponding transition track
Commercial barriers mainly referred to customer value proposition, value delivery and value capture
(costs and revenues) of the business model and relate to transition tracks 1-3 which concern the main
markets (energy production, energy efficiency and mobility). Some interviewees highlighted limited
knowledge of wishes of potential customers and the challenge of creating (additional) value in the existing
energy market. In addition, the long-term planning (electrical cables, grids, etc.) makes short term
innovation hard for the companies in our sample. A second set of obstacles relate to the value delivery.
Limited budget allocated to innovation per year and for finding technical developers on the job market
makes it hard to commercialize new smart city ideas as value delivery is jeopardized. Overly long processes
involving governments prove especially hindering for innovative small organizations (i.e. start-ups) that
do not possess the endurance.
The biggest part of the perceived issues revolves around profitability of new business models (value
capture). General commercial barriers such as small financial margins in energy market and the fact that
new (smart) product innovations are (much) more expensive than current products (electrical cars) imply
that

GA #774199
D 3.4 Dissemination Level: Public/Confidential Page 35 of 170
“It is hard or impossible to earn investments back” - Mobility consultant
In specific smart city innovations such commercial barriers, such as high cost of energy storage and
infrastructure as well as high switching costs (for example for individuals to change heat system), make it
hard or impossible to recover investments. Companies also emphasize the fact that tax regulation doesn’t
promote enough the use energy during non-peak hours, which
“Makes it hard to create a business case for technologies that help people manage
their energy use” - Energy manager
Communication and partnership barriers indirectly relate to the individual business model as it mainly
affects the ability of companies to integrate into a present and future (smart) city ecosystem. We found
links to transition tracks 1, 3 and 5 that focus on the energy on the district level, integrated mobility
systems and citizen engagement.
“The energy transition only works if all organizations change at the same time.” -
Research consultant
Governments should act as examples, for example regarding their procurement policies. Interviewees
referred to internal struggles in the organisations such as a lack of skilled workforce and distributed
knowledge which makes decision making and entering a partnership difficult. Larger and more mature
organizations often refrain from working with start-ups. Interestingly organisations keep most of the data
they produce to themselves although seemingly useless data could be useful for other organizations.
Furthermore, the education level in city neighbourhoods is very different, which necessitates educating
customers and governments as well as businesses communicating the challenges in different ways. Both
activities do not happen to a sufficient degree according to the interviewees.
A large cluster of barriers revolves around legal and taxation aspects of new business models based on
ICT technologies for smart cities that can be found in all the transition tracks as they touch upon a variety
of boundary conditions. The interviewees feel that
“The regulatory environment is not ready for digital / smart society and city.” -
Several interviewees

GA #774199
D 3.4 Dissemination Level: Public/Confidential Page 36 of 170
This concerns use of data in terms of privacy legislation and the use of new technologies such as drones.
However, they also realize that future-proofing laws and regulation takes a lot of time in comparison to
developing innovative business models.
The energy sector is one of the most regulated business environments. The interview participants stress
the need for more favourable regulations concerning energy (use of batteries, nudge people to use
electricity in non-peak hours). Also, the concept of energy neutral buildings means that wind and sun
energy collection in the neighbourhood, not necessarily an energy neutral building itself. However:
“Rental laws don’t help housing corporations to make homes more sustainable,
because the individual renter doesn’t always have the same interest as the
collective.” - Housing manager
In the energy literature this is referred to as ‘split incentives’ (Sorrell, 2015). On a more general note,
subsidies for fossil fuels do not help the development of renewable energy.
In a deep transition, such as the current Smart City and sustainability transition, societal barriers play an
important role. We mainly see overlap with ‘system-focused’ transition tracks 1, 3 and 5 (district energy,
mobility and citizen engagement). The interviewees mention the struggle to involve people in addressing
societal challenges, reflected in the fact that few people and organisations take responsibility for tackling
climate problems. Most potential customers are preoccupied with a high percentage of unemployment
and crime in some city neighbourhoods and think about their role in a Smart City as a secondary problem.
“It requires a change of mindset when to use energy, cars, etc.” - Research consultant
On the business side that means a change from product market to service market. In the current transition
towards a Smart City people willing to move first in energy transition are not rewarded or advantaged
hence there is no incentive to use new products or services. In addition, they require large upfront
investments.
“With an ROI in 30 years – no individual consumer thinks this far ahead”. - Renewable
energy producer
Challenges that are mentioned in relation to technical barriers are the quality and suitability of data and
missing technical infrastructure and equipment e.g. on the side of the grid operator or properties of
technology. These understandably link to the more ‘technology-oriented’ transition tracks 2 and 4 (energy
management and city innovation platform).
GA #774199
D 3.4 Dissemination Level: Public/Confidential Page 37 of 170
Conclusions and next steps In this chapter, we have described the findings derived from interviews with employees of seventeen
organizations active in five different transition tracks. The interviewees have described different scenarios
they foresee regarding these transition tracks. According to the interviewees on transition track 1, the
main changes and developments will occur in business modelling – shifting from a product market to a
service market. Also, a clear need for orchestrators of activities in this transition track is described.
Interviewees in transition track 2, smart energy management, expect many more players on the market
and therefor emphasize the need of a balanced energy-grid and the need for large quantities of data to
for prediction purposes. The third track, smart e-mobility, expects mobility will become more of a service,
compared to the current ownership of vehicles, foreseeing changes in demand of public transport and use
of public spaces.
In terms of barriers, a few exist for multiple transition tracks. Friction is mentioned between long-term
planning of infrastructure and wishes for short- and medium-term innovation. Both commercially and
regarding communication, organizations highlight the lack of knowledge inside and outside their
organization. Regarding legal and tax barriers, interviewees promote more favourable regulations for
smart city innovations and stress the need for clarity on privacy regulation. Looking at limited time barrier,
we can conclude the lengthy processes in the smart city domain do not benefit start-ups with short-term
horizons. The main conclusion we can derive looking at the partnership barrier, is that to reach the in
section 4 described futures, organisations need to be more open and collaborate more with other
organizations in the same domain. In a deep transition, such as the current smart city and sustainability
transition, societal barriers play an important role. The interviewees mention the struggle to involve
people in addressing societal challenges, reflected in the fact that few people and organisations take
responsibility for tackling climate problems. The quality and suitability of data is a technological barrier
which organizations currently face.
Regarding the first iteration of our smart city incubation program, we can conclude that the approach we
have designed and implemented to track and find incubatable ideas in the Utrecht ecosystem did not
deliver the readily incubatable ideas for active incubation. We have deployed resources to interview
incumbents (project partners) to look for incubatable spinout ideas and snowballed through the Utrecht
ecosystem to identify incubatable spinouts and spin-out ideas. These efforts have resulted in interesting
data and information that is useful also in the ecosystem assessment, but it did not yield ideas in the right
stage of development or teams willing to develop them. Still, our search for needles in the haystack did
deliver some relevant information that may be useful for other partners working in the IRIS-project.
Moreover, we identified several barriers to innovation for incumbents. It is not to be expected that
incumbents have solutions to these barriers readily available but not yet implemented. These barriers are
opportunities for new business development, but it is not clear what teams would work on what ideas to
overcome them. We conclude that, although spinout innovation can sometimes be revealed (ex post), it
is near impossible to track these ideas (ex ante) in a stage and with a team that would make them benefit
from enrolment in a business incubation program. Therefore, we have decided to abandon the search for
spin-out incubates and pivot our approach for the second iteration of the incubation program in Utrecht
in the following way:

GA #774199
D 3.4 Dissemination Level: Public/Confidential Page 38 of 170
1. UtrechtInc developed a program to engage students and academics (see Chapter 6 of this report)
more intensively. To attract smart city innovations more effectively into these programs we need to
approach them with clear challenges, for which we have designed and field-tested several recipes
(see Part III of this report).
2. Information gathered in the interviews has been disseminated and can be used as blueprint for similar
analysis and to take stock of the development of the business ecosystem in other cities. The
forecasted scenarios have been used in the search for related ideas and guiding incubatable ideas.
3. The research team committed to keeping close track of the demonstration projects being developed
in IRIS with a special focus on potentially incubatable business models.
The main lesson we must draw from our first iteration of the SCUIBI-project is that the chosen strategies
of interviewing existing firms and gatekeepers in the ecosystem yields very few useful leads and ideas for
incubation. Ideas are either in a very early stage and not yet ready for incubation or have already been
implemented and are currently in development, beyond the stage of incubation. There simply are not that
many ideas around in the right stage of maturity, let alone ideas with motivated and capable teams. This,
however, is a general problem for incubators worldwide and there is no easy solution.
Later in the project, as IRIS demonstrator projects and solutions were implemented, we have scanned the
baseline reports of the three lighthouse cities for spinout and spinoff business models. That is, we have
listed the 18 novel business models we identified could benefit from business incubation methods to
validate them. Table 5 below lists these products and services.
Product /
Service
Company Short Description Location Transition
Track
Solar Panels Bo-Ex A business model will be set up for each of the 644
households, with their own set of PV-panels (collectively
placed on the building roofs by Bo-Ex), to exchange solar
power. This business model has been set up by Bo-Ex.
Utrecht TT1
Overcome Split
Incentive
Bo-Ex The housing cooperation Bo-Ex will develop a novel business
model to overcome the split incentive for the additional
investment required to deliver nearly zero energy buildings.
Split incentives occur when those responsible for paying
energy bills (the tenants) are not the same entity as those
making the capital investment decisions (the building owner).
In this model, the benefits associated with the resulting
energy savings accrue to the tenant.
Utrecht TT1
Second-Life
Batteries
Stedin The project will develop business models whereby second-life
(former automotive) batteries may profitably be used for
static energy storage in a building or district. The project will
also examine depreciation against longevity of these specific
batteries and potential extended use of stationary battery
storage.
Utrecht TT2

GA #774199
D 3.4 Dissemination Level: Public/Confidential Page 39 of 170
TOON Smart
Meter
Eneco Usually the Eneco Toon is sold to users through purchase
channels. With these earnings, the costs for developing and
producing the Eneco Toon are covered. IRIS sponsors the
purchase of the Toon including installation works which is
worth about € 325 per household. Besides, the (optional)
subscriptions from clients and relevant information obtained
from the users to develop (new) products and improve
existing products e.g. Warmtewinner, compatible software
applications and/or other concepts Eneco wants to develop
in the future.
Utrecht TT1
Innovative
home EMS
(Energy
Management
System)
Stedin The project will investigate business models whereby
stationary batteries may profitably be used for static energy
storage in a building or district. Such business models will be
coupled to the exploitation of the smart grid and Smart
RenewableV2G Charging systems. Extra sources of flexibility
emerge from the static storage, the V2G cars, from smart
charging of these cars and from the PV-panels and hybrid heat
pumps.
Utrecht TT2
V2G e-cars We Drive
Solar
MaaS
At this point, the business model of the shared e-cars is in a
demonstration phase. Participants in the sharing scheme pay
a fixed amount per month for the possibility to use a car for a
certain number of days per month; there are several tiers. On
top of that fixed amount, an amount is charged per km driven,
which includes charging costs.
Utrecht TT3
Smart
Renewable V2G
Charging
Stedin &
Gemeente
Utrecht
By using the EV Batteries in the energy system an extra
business model may be added to the cars, in the form of price
bonuses compared to classic EV charging tariffs. At this
moment, this business model is in its pilot phase; several
aspects are under investigation.
Utrecht TT3
City Innovation
Platform
Civity The CIP brings together city data in a structure that facilitates
development of services of all sorts, like services improving
the city mobility system.
Utrecht TT4
Virtual reality
platform
Bo-Ex A virtual reality platform, extending existing Oculus Rift® VR
experiences for apartment buildings to other new buildings
so households can experience their future ‘new’ home,
including infotainment and interactive training about the new
smart energy and mobility services they may expect.
Utrecht TT5
Optimization of
heating load
curve
COFELY As part of the renovation of existing buildings, the aim [..] is
to integrate a smart control system within the district heating
distribution, giving the possibility to adjust heat supply to the
individual demand in each apartment according to their
sun/wind exposures but also considering accurate indoor
temperature.
Nice TT1
Local Energy
Management
Dashboard
EDF The dashboard will provide real time or near to real time
information of the energy and environmental performance of
the system to the community by mapping energy fluxes
related to the district. Thanks to IRIS, the dashboard will be
enhanced in its functionalities concerning its capabilities of
monitoring the energy fluxes, potentially integrate
forecasting services for optimal demand-supply balance and
Nice TT1

GA #774199
D 3.4 Dissemination Level: Public/Confidential Page 40 of 170
the information quality made accessible to the end user or
provided via push notifications.
EC2B Trivector EC2B offers customers an attractive alternative to owning
their own car, allowing easy access to a variety of transport
modes in connection to where customers live or work and
make their everyday choices for transport. The EC2B service
integrates several different mobility solutions within one app.
To start with, the following are included: e-cars, e-bikes
(normal bikes as well as cargo bikes), light e-vehicles and
public transport. Further on, taxi, rental cars and municipal
bike sharing might be added.
Gothenbu
rg
TT3
Energy Cloud SME
Metry
Partner SME Metry will develop and implement an “Energy
Cloud” on the Chalmers Campus. Near real-time data from
energy (electricity, heat, water) consumption will be
collected, integrated and made available for further analysis,
thereby opening up for new applications to optimise energy
supply and management on campus.
Gothenbu
rg
TT4
Fighting Energy
Poverty
Bo-Ex &
Gemeente
Utrecht
Early warning to Housing Corporation when households’
energy costs are rising: the CIP brings together data of
housing corporations, the Municipality, and energy grid
operators on energy consumption of citizens. The housing
corporation wants to use this data as an early warning system
in case their tenants have an extremely high or irregular
energy consumption pattern.
Utrecht TT4
Free floating
scheme
The added value of these innovative mobility services, lies on
the consideration of the impact of the technological
evolutions on users’ daily practices on a territory, by
examining what are the links between technical aspects
(number of charging stations, level of connectivity,
improvement of online offering, increasing of EV’s
autonomy…) and behaviors?. In return, what are the
practice’s impacts on technological evolutions (including EV’s
geographical distribution, energy management, dynamic
pricing…).
Nice TT3
Smart Lighting Gemeente
Utrecht /
HKU
"Slimme straatverlichting benutten: bewoners denken mee
over invulling en apps om de wijk te verbeteren"
Utrecht TT5
“Model a Better
City”
The main activity will be the organisation of a spatial planning
design contest using the Minecraft® city model aimed at
young people (“Model a Better City"). In the creation of
forthcoming electrified bus stops, with related services for
passengers, security aspects and availability issues, students
for a Greenhack will be involved. Individuals, classes and
several schools will build the new attractive society which will
Gothenbu
rg
TT5

GA #774199
D 3.4 Dissemination Level: Public/Confidential Page 41 of 170
eventually be expanded in the building game Minecraft, with
2021 as the target.
Table 5: Novel Business Models identified from Baseline Reports Lighthouse Cities
Several of these have then been evaluated using the smart city business model canvas that was developed
in Giourka et al. (2019) for the purpose of Task 3.3 and published these as Omlo (2020) and Kuiper (2020)
on the IRIS website. Results of that exercise are reported there.

GA #774199
D 3.4 Dissemination Level: Public/Confidential Page 42 of 170
4. Classifying Start-ups as Smart City and User Innovations
In this chapter we develop empirically workable definitions for the key concepts in our report. For both
User innovations and Smart City Innovations we have developed an index, following the same literature-
based methodology to get to such an index. This chapter explains how these indices have been
constructed. In chapter 4 we then present the research these indices allowed us to do. The sections in this
chapter have been published in two working papers as Eckinger and Sanders (2019) and Hermse et al.
(2021) (and are sometimes reproduced verbatim here).
The User Innovation (UI-)Index Eric von Hippel is one of the pioneers in researching user innovation and has defined user innovation as
‘firms or individual consumers that benefit from using a product or a service they develop’ (Von Hippel,
1988; von Hippel, 2005). Key elements in this early definition are therefore: (1) firms or individual
consumers, (2) development of a service or product, (3) personal usage, and a (4) received benefit. This
definition has been used (papers cited 1459 and 9228 times respectively) and extended by many other
researchers. For instance, Baldwin et al. (2006) further specified the type of user innovators into single
user innovators as either a single firm or individual, or collaborative user innovations. Collaborative user
innovations or communities of users have been additionally identified by Baldwin et al. (2006) by
introducing a model that illustrates the transformation of a user innovation through a user community
into a commercialized product. This concept was validated in case studies of the rodeo and kayak industry
(Hienerth, 2006). Hence, ‘user community’ can be added as an element to the user innovation definition.
A user innovation is first and foremost, an innovation. That is, it is classified as a ‘modification’ or ‘new
creation’. This criterion can be especially found in empirical research, identifying user innovations within
broad samples. De Jong and von Hippel (2008) distinguished ‘user creation’ and ‘user modification’ and
defined firm user creation ‘as developing an entirely new technique, equipment or software’ whereas firm
user modifications are ‘any modification the firm may do to an existing technique, software or
equipment’. Other empirical studies have applied the same criteria to identify firm user innovators within
samples of UK firms, high-tech SME’s in the Netherlands and Canadian manufacturing plants (De Jong &
von Hippel, 2009; Flowers et al., 2010; Gault & Von Hippel, 2009).
Next to firm user innovations, the elements ‘user creation’ and ‘user modification’ have also been applied
to distinguish among consumer innovators. For instance, Flowers et al. (2010) adjusted the definition of
these two elements for individual consumers to ‘modification or creation from scratch of an existing
product or service’ and used these as selection criteria within a sample of UK consumers.
A final element of user innovation is the development of an innovation for ‘personal use’ by individual
consumers or ‘in-house use’ by firms. De Jong and von Hippel (2009) added this element to their criteria
of user innovations in a sample of Dutch high-tech SME’s, as did Flowers et al. (2010) in their sample of

GA #774199
D 3.4 Dissemination Level: Public/Confidential Page 43 of 170
firms and consumers based in the UK and De Jong et al. (2015) in a random sample of the Finnish
population.
This gives us three elements of user innovations identified within the literature build the key
characteristics of a user innovation: (1) firm user, individual consumer user or user community, (2)
modification or new creation of products, processes, techniques, or software, and (3) development for
personal or in-house use.
Other elements were mentioned rather briefly or only mentioned by a limited number of researchers.
Nevertheless, these elements still need to be taken into consideration to create a specific understanding
of innovations that qualify as a user innovation. As Von Hippel stated in his first papers, user innovations
create a benefit for the user (Von Hippel, 1988; von Hippel, 2005). This realization has been supported by
other researchers as well (e.g. Franke et al., 2006; Henkel & Von Hippel, 2004; Morrison et al., 2000).
Further characteristics identified are (1) new to market and novelty, (2) satisfaction and better suit of own
needs, and the (3) development of tailor-made and customized innovations (e.g. Baldwin et al., 2006,
2006; Gault & Von Hippel, 2009; Morrison et al., 2000).
We will not use characteristics such as “high product-related knowledge” and “high-use experience”
(Lüthje, 2004; Lüthje et al., 2002; von Hippel, 2005), “low production cost” (Lüthje et al., 2002; Morrison
et al., 2000) and “low market demand for the innovation” (Henkel & Von Hippel, 2004) in our definition
as they do not appear consistently in the literature. Table 6 provides an overview of all user innovation
characteristics identified in the literature base (see Interview Guide Spinout Innovations Chapter 3
• Introduction
• Introduction of the researchers
• Explanation of the IRIS project and SCUIBI (the business incubation process)
• Assurance of confidentiality!
• Company’s engagement in smart city innovation / background
• How does your company act in these five transition pathways (mobility, energy, …)?
• Person of the entrepreneur/team/business: experience, motivation, etc.
• Where does your company see NEW (business) opportunities/ideas regarding the transition
tracks?
• The business idea (focus on most promising business idea?)
• (What’s the name of the business idea?)
• Please describe the product/service (as it currently stands)
• (Can you give a brief description/summary (‘30 second pitch’) about the idea?)
• Has it been tried out already (pilot), or is it a wild guess? Or is it emerging?
• Origin of the idea

GA #774199
D 3.4 Dissemination Level: Public/Confidential Page 44 of 170
• Where does the idea originate: Incumbent/spin-off interview, challenge, user-source, other?
• Can you please explain the origin of the idea?
• Customer value proposition/value proposition canvas (required!)
• What kind of customer demand do you see arising in the future?
• What core value would you deliver to the customer? Which customer needs would you satisfy?
• What kind of problems do the clients of your company face in these areas and how do they solve
these problems today?
• What would be potential solutions and could they be commercially exploited?
• What kind of customers do you intend to serve? Who is your most important customer?
• What bundles of products and services are we offering to each Customer Segment?
• Key resources (optional)
• What key resources does your value proposition require?
• What resources are important the most in distribution channels, customer relationships,
revenue stream…?
• Who are your key partners/suppliers? What are the motivations for the partnerships?
• Which Key Resources are we acquiring from partners?
• Key processes (optional)
• What key activities does your value proposition require?
• What activities are important the most in distribution channels?
• And in customer relationships?
• And in production/manufacturing?
• Which Key Activities do partners perform?
• Profit formula (optional)
• How will you make money with this idea?
• What kind of revenue model do you foresee?
• What does the cost structure look like?

GA #774199
D 3.4 Dissemination Level: Public/Confidential Page 45 of 170
• Business idea development
• Is your company actively pursuing these ideas (for example through the creation of spin-offs or
through or forms of ‘start-up support’)?
• Which barriers prevent the commercialisation of (your) smart city ideas?
• End of the interview
• Any comments, remarks, feedback from the interviewee?
• Can be contacted for clarifications/additional information?
• Who else would you suggest we could speak to with these questions? (You can always email it to
us)

GA #774199
D 3.4 Dissemination Level: Public/Confidential Page 46 of 170
Potential follow-up questions for individual business model elements
Questions for developing new products
(if there are insufficient ideas coming from the interviewee)
De-average buyers and users
Which customers use or purchase our product in the most unusual way?
Do any customers need vastly more or less sales and service attention than most?
For which customers are the support costs (order entry, tracking, customerspecific design) either
unusually high or unusually low?
Could we still meet the needs of a significant subset of customers if we stripped 25% of the hard or soft
costs out of our product?
Who spends at least 50% of what our product costs to adapt it to their specific needs?
Examine binding constraints
What is the biggest hassle of purchasing or using our product?
What are some examples of ad hoc modifications that customers have made to our product?
For which current customers is our product least suited?
For what particular usage occasions is our product least suited?
Which customers does the industry prefer not to serve, and why?
Which customers could be major users, if only we could remove one specific barrier we’ve never
previously considered?
Explore unexpected successes
Who uses our product in ways we never expected or intended?
Who uses our product in surprisingly large quantities?
Imagine perfection
How would we do things differently if we had perfect information about our buyers, usage, distribution
channels, and so on?
How would our product change if it were tailored for every customer?
Look beyond the boundaries of our business
Who else is dealing with the same generic problem as we are but for an entirely different reason? How
have they addressed it?
What major breakthroughs in efficiency or effectiveness have we made in our business that could be
applied in another industry?

GA #774199
D 3.4 Dissemination Level: Public/Confidential Page 47 of 170
What information about customers and product use is created as a by-product of our business that could
be the key to radically improving the economics of another business?
Revisit the premises underlying our processes and products
Which technologies embedded in our product have changed the most since the product was last
redesigned?
Which technologies underlying our production processes have changed the most since we last rebuilt our
manufacturing and distribution systems?
Which customers’ needs are shifting most rapidly? What will they be in five years?
Explanations
Value Proposition
Describes the bundle of products and services that create value for a specific Customer Segment.
The Value Proposition is the reason why customers turn to one company over another. It solves a
customer problem or satisfies a customer need. Each Value Proposition consists of a selected bundle of
products and/or services that caters to the requirements of a specific Customer Segment. In this sense,
the Value Proposition is an aggregation, or bundle, of benefits that a company offers customers. Some
Value Propositions may be innovative and represent a new or disruptive offer. Others may be similar to
existing market offers, but with added features and attributes.
Customer Segments
Defines the different groups of people or organizations an enterprise aims to reach and serve.
Customers comprise the heart of any business model. Without (profitable) customers, no company can
survive for long.
In order to better satisfy customers, a company may group them into distinct segments with common
needs, common behaviors, or other attributes. A business model may define one or several large or small
Customer Segments. An organization must make a conscious decision about which segments to serve and
which segments to ignore. Once this decision is made, a business model can be carefully designed around
a strong understanding of specific customer needs.
Customer groups represent separate segments if:
• Their needs require and justify a distinct offer
• They are reached through different Distribution Channels
• They require different types of relationships
• They have substantially different profitabilities
• They are willing to pay for different aspects of the offer
Channels

GA #774199
D 3.4 Dissemination Level: Public/Confidential Page 48 of 170
Describes how a company communicates with and reaches its Customer Segments to deliver a Value
Proposition.
Communication, distribution, and sales Channels comprise a company's interface with customers.
Channels are customer touch points that play an important role in the customer experience.
Channels serve several functions, including:
• Raising awareness among customers about a company’s
• products and services
• Helping customers evaluate a company’s Value Proposition
• Allowing customers to purchase specific products and services
• Delivering a Value Proposition to customers
• Providing post-purchase customer support
Customer Relationships
Describes the types of relationships a company establishes with specific Customer Segments.
A company should clarify the type of relationship it wants to establish with each Customer Segment.
Relationships can range from personal to automated.
Customer relationships may be driven by the following motivations:
• Customer acquisition
• Customer retention
Boosting sales (upselling)
Key Resources
Describes the most important assets required to make a business model work.
Every business model requires Key Resources. These resources allow an enterprise to create and offer a
Value Proposition, reach markets, maintain relationships with Customer Segments, and earn revenues.
Different Key Resources are needed depending on the type of business model. A microchip manufacturer
requires capital-intensive production facilities, whereas a microchip designer focuses more on human
resources. Key resources can be physical, financial, intellectual, or human. Key resources can be owned
or leased by the company or acquired from key partners.
Key Activities
Describes the most important things a company must do to make its business model work.
Every business model calls for a number of Key Activities. These are the most important actions a company
must take to operate successfully. Like Key Resources, they are required to create and offer a Value
Proposition, reach markets, maintain Customer Relationships, and earn revenues. And like Key Resources,

GA #774199
D 3.4 Dissemination Level: Public/Confidential Page 49 of 170
Key Activities differ depending on business model type. For software maker Microsoft, Key Activities
include software development. For PC manufacturer Dell, Key Activities include supply chain
management. For consultancy McKinsey, Key Activities include problem solving.
Key Partnerships
Describes the network of suppliers and partners that make the business model work.
Companies forge partnerships for many reasons, and partnerships are becoming a cornerstone of many
business models. Companies create alliances to optimize their business models, reduce risk, or acquire
resources.
We can distinguish between four different types of partnerships:
• Strategic alliances between non-competitors
• Competition: strategic partnerships between competitors
Joint ventures to develop new businesses
Cost Structure
Describes all costs incurred to operate a business model.
This building block describes the most important costs incurred while operating under a particular
business model. Creating and delivering value, maintaining Customer Relationships, and generating
revenue all incur costs. Such costs can be calculated relatively easily after defining Key Resources, Key
Activities, and Key Partnerships. Some business models, though, are more cost-driven than others. So-
called “no frills” airlines, for instance, have built business models entirely around low Cost Structures.
Revenue Streams
Represents the cash a company generates from each Customer Segment (costs must be subtracted from
revenues to create earnings).
If customers comprise the heart of a business model, Revenue Streams are its arteries. A company must
ask itself, For what value is each Customer Segment truly willing to pay? Successfully answering that
question allows the firm to generate one or more Revenue Streams from each Customer Segment. Each
Revenue Stream may have different pricing mechanisms, such as fixed list prices, bargaining, auctioning,
market dependent, volume dependent, or yield management.
A business model can involve two different types of Revenue Streams:
• Transaction revenues resulting from one-time customer payments
• Recurring revenues resulting from ongoing payments to either deliver a Value Proposition to
customers or provide post-purchase customer support
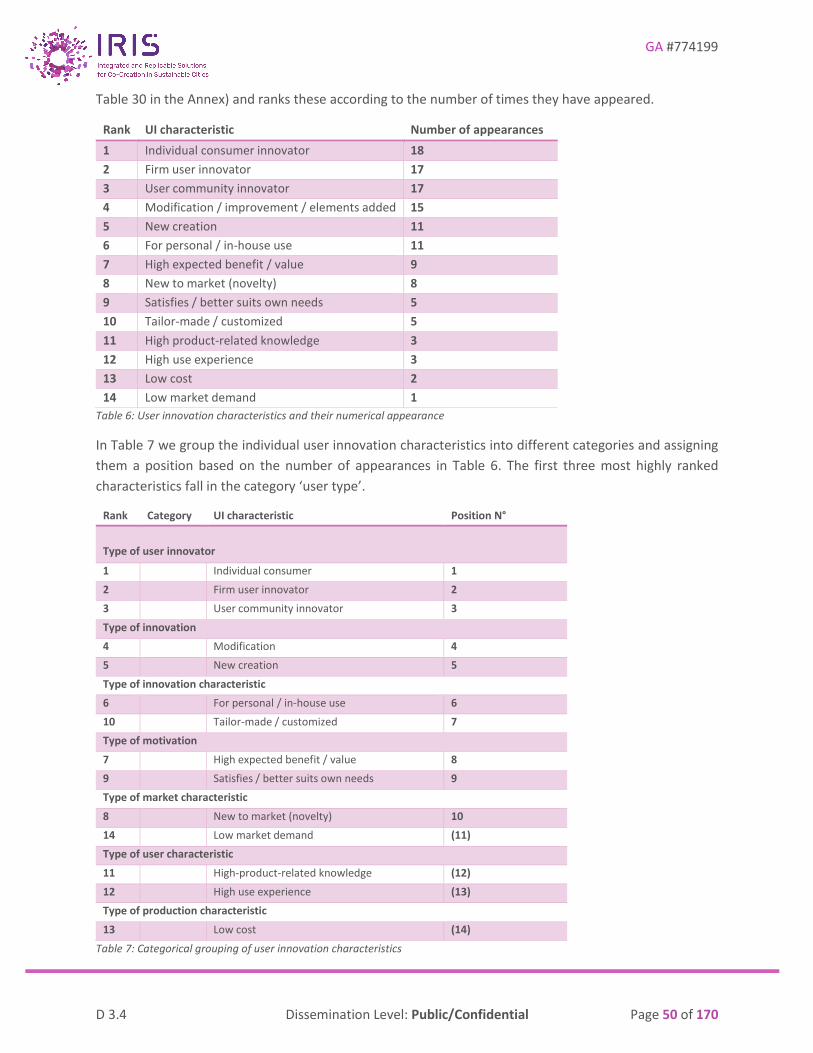
GA #774199
D 3.4 Dissemination Level: Public/Confidential Page 50 of 170
Table 30 in the Annex) and ranks these according to the number of times they have appeared.
Rank UI characteristic Number of appearances
1 Individual consumer innovator 18
2 Firm user innovator 17
3 User community innovator 17
4 Modification / improvement / elements added 15
5 New creation 11
6 For personal / in-house use 11
7 High expected benefit / value 9
8 New to market (novelty) 8
9 Satisfies / better suits own needs 5
10 Tailor-made / customized 5
11 High product-related knowledge 3
12 High use experience 3
13 Low cost 2
14 Low market demand 1
Table 6: User innovation characteristics and their numerical appearance
In Table 7 we group the individual user innovation characteristics into different categories and assigning
them a position based on the number of appearances in Table 6. The first three most highly ranked
characteristics fall in the category ‘user type’.
Rank Category UI characteristic Position N°
Type of user innovator
1 Individual consumer 1
2 Firm user innovator 2
3 User community innovator 3
Type of innovation
4 Modification 4
5 New creation 5
Type of innovation characteristic
6 For personal / in-house use 6
10 Tailor-made / customized 7
Type of motivation
7 High expected benefit / value 8
9 Satisfies / better suits own needs 9
Type of market characteristic
8 New to market (novelty) 10
14 Low market demand (11)
Type of user characteristic
11 High-product-related knowledge (12)
12 High use experience (13)
Type of production characteristic
13 Low cost (14)
Table 7: Categorical grouping of user innovation characteristics

GA #774199
D 3.4 Dissemination Level: Public/Confidential Page 51 of 170
Additional categories are innovation type, innovation characteristic, type of motivation, market
characteristic, user characteristic, and production characteristic. We now construct our own definition by
using the most relevant characteristics with a minimum numerical appearance of 5 (see Table 6) and
limited the number of characteristics to be included in the measure to 10.
It is of course possible to score actual ventures, firms, innovations, and ideas on the criteria identified
above. Each characteristic (item) can then take on a value of zero (false) or one (true). But for a meaningful
and consistent measure of the degree to which a specific activity classifies as a user innovation, we need
to develop an index. The index we are looking for must exclude those activities that are not innovations
and those that do not come from users, while it should give higher values to activities that tick more of
the boxes. We, admittedly somewhat arbitrarily, used the innovation characteristics with position number
1 to 10 (see Table 6). The first three characteristics (with position number 1 to 3 and a numerical
appearance higher than 10) were used as “user innovation identifying” characteristics. The remaining four
characteristics were added as “supplementary criteria”, that intensify an identified user innovation. The
results are shown in Table 8.
Item Symbol Value
User innovation identification
4. Individual consumer/firm/community user innovator I 0|1
5. Modification/ new creation M 0|1
6. For personal/in house use P 0|1
User innovation intensification
a. Tailor-made/customized TM 0|1
b. High expected benefit/value BE 0|1
c. Satisfies/ better suits personal needs SA 0|1
d. New to market/ novelty NE 0|1
Table 8: Value assignment to user innovation characteristics
Note: 0 = false | 1 = true
We then apply equation (1) to calculate an ordinal index measure ranging from 1 to 5 that captures the
degree to which a venture conforms with the criteria used most often in the literature:
UI-Index = (I*M*P) (1 + TM + BE + SA+ NE) (1)
If the first three items of the user innovation identification outlined in Table 8 are not satisfied and, hence,
take on a value of zero, the outcome of the formula will be zero and the innovation is not a user
innovation. If the value is 1 for the first three criteria, the user innovation can be classified as a very weak
(1) up to a very strong (5) user innovation based on its index number (see Figure 3).
0 1 2 3 4 5
Non-UI Very weak Weak Moderate Strong Very strong
Figure 3: User Innovation Index
With this index in hand, we can investigate the effect of business incubation on User Innovations that end
up in business incubation programs.

GA #774199
D 3.4 Dissemination Level: Public/Confidential Page 52 of 170
The Smart City Innovation (SCI-)Index The aim of this section is to develop a clear classification scheme to identify “smart city” projects and
start-ups. To do so, we follow the method proposed above (Eckinger & Sanders, 2019), using a variety of
definitions found in the existing literature. Based on these definitions, we develop our index using on the
one hand necessary conditions for “smart city”, and on the other hand, some non-necessary variables to
measure the intensity. We call this the Smart City Index (SCI).
First, we systematically collected papers regarding smart cities and their definitions in the literature via
Google Scholar. The search terms used were “smart city”, “smart-city”, “smart city” AND “literature
review”, “smart city” AND “definition”, and “definition smart city”. In total, we came up with 165 articles,
including multiples of the same reference and twenty literature review articles from which we took
articles and definitions to supplement our reference list. After deleting the recurring papers, we were left
with a list of 92 unique peer-reviewed papers, including 20 literature reviews (see Table 31 in the Annex).
These references were collected in an Excel file with a column for the author, publication date, title, and
journal (Table 32 in the Annex). Next, these articles were ranked by the number of citations per paper.
We took citations in Google Scholar on the 1st of April 2020 and added this to the spreadsheet in a
separate column. To be more accurate, two extra columns were added; one with citations per year, thus
taking the total citations per article and dividing it by the years the article had been in circulation, and
another for the rounded-up number of these citations per year. We deleted articles below 3 citations per
year, however keeping the articles of 2019 and 2020 regardless, plus the definitions of(Manville et al.,
2014). Finally, we ended up with 78 different references.
Next, we divided the 78 articles amongst ourselves (excluding the literature reviews) and looked in each
one for a definition using “smart city”, “define” and/or “definition”, later adding this to the Excel file in a
new column. Some definitions were quoted multiple times by different authors. These were deleted, after
which we ended up with a total of 73 unique definitions of a smart city in our Excel sheet (see Table 32 in
the Annex). We then listed the main keywords per definition. To come to an idea on what keywords
appeared most, we did an initial search of the recurrence per word. Based on this, we were able to code
the most recurring keywords and chose the following themes, coded 0 if the definition did not include the
theme, coded 1 if it did. The themes were “technology”, “ICT”, “quality of life”, “city”, “sustainability”,
“innovation”, “collaboration”, “citizen”, “integration”, “economic”, “human capital”, “social capital”,
“business”, “resource management”, “infrastructure”, “efficiency”, “safety/security”, “transportation”,
“network”, “energy”, “growth”, and “creativity”. Next, we calculated the percentage of appearances in
the 73 definitions by making a sum of all the codes and ordered them in descending order.
# Themes % of appearances in total
number of definitions
1. Technology (data, sensors, activators, internet, ICT, IT, database, algorithm,
grid, digital, solar panels, smart meters, WIFI, software, hardware, smart
devices)
80.9%
2. City/ urban challenges (territory, place, geographical area) 75.6%
3. Sustainability (green, environmental, ecological) 50.2%
4. ICT (if 1, also add 1 to technology) 49.6%

GA #774199
D 3.4 Dissemination Level: Public/Confidential Page 53 of 170
5. Social capital (social, social wealth, inclusion, community) 48.4%
6. Economic (economy) 38.6%
7. Quality of life (liveability, prosperity, habitable, well-being) 38.1%
8. Human capital (intelligence, skilled workers/ jobs, (high) education,
knowledge)
35.4%
9. Resource management 34.8%
10. Infrastructure 32.2%
11. Citizen (inhabitants, people) 29.2%
12. Transportation (mobility, transport) 23.4%
13. Innovation 17.8%
14. Growth 17.5%
15. Efficiency (efficient) 14.3%
16. Safety (security) 14.1%
17. Energy 10.9%
18. Business (entrepreneurship) 10.5%
19. Integration 10.5%
20. Collaboration (participation, partnership, relational capital, coordination,
stakeholder)
9.5%
21. Network (interconnected) 8.6%
22. Creativity 5.8%
Table 9: Smart City Innovation characteristics and their appearance
Additionally, we also calculated the percentage of appearances based on the total amount of citations per
year (see Table 33 in the Annex). Based on these percentages, we identified the themes and keywords in
Table 9. In this table, we present the keywords that are included in the theme.
Conditions Themes Symbol Keywords included
Necessary
conditions
Technology T Technology, data, sensors, activators, internet, ICT, IT, database, algorithm, grid,
digital, solar panels, smart meters, WIFI, software, hardware, smart devices)
City C City, urban, urban challenges, territory, place, geographical area
Intensity
conditions
ICT IC ICT
Citizen CI Citizen, inhabitants, people
Environmental
Sustainability
ES Sustainability, green, environmental, ecological
Quality of Life QL Quality of life, liveability, prosperity, habitable, well-being
Social Capital SC Social capital, social, social wealth, inclusion, community
Economic EC Economic
Human Capital HC Human capital, intelligence, skilled workers/jobs, (high) education, knowledge
Table 10: The SCI-Index
There are two criteria that clearly stand out as most important – Technology and City. As we think it is
also rather fundamental that smart city projects address urban problems and do so with smart, new

GA #774199
D 3.4 Dissemination Level: Public/Confidential Page 54 of 170
technology, we labelled these the two necessary conditions and dubbed the next seven – ICT (IC), citizen
(CI), environmental sustainability (ES), quality of life (QL), social capital (SC), economic (EC) and human
capital (HC) - intensity conditions. The overall SCI-index is then defined analogous to the UI-index defined
above in equation (1):
SCI-Index = (T*C) (1 + IC + CI + ES + QL + SC + EC + HC) (2)
To test our coding scheme, we coded several datasets independently and iterated the coding scheme
accordingly. We applied the above coding scheme to a dataset of start-ups that have applied for
incubation at UtrechtInc between 2014 and 2017. For each start-up, we coded all start-ups, with three
people independently, using the descriptions of the start-ups provided by Eveleens et al. (2019). These
rather elaborate descriptions were composed from information collected online, using LinkedIn and the
incubator files (see Eveleens et al. (2019) for details on the data collection). In the discussion of individual
results, small irregularities were found. We therefore decided to make a few minor adjustments.
After making these adjustments, we tested our adapted coding scheme in a second dataset. This time, we
used a dataset of start-ups in Gothenburg. These start-ups are incubated at Chalmers Ventures between
2015 and 2020. Three authors coded ten companies independently. Again, we coded them on seven
variables - two necessary conditions and five intensity conditions. The descriptions of the companies on
the Chalmers Ventures website, however, are short and basic. This made the coding of the start-ups more
challenging, but we managed to get quite similar results. In our discussion, we decided to code the variable
“quality of life” 1 only when the start-up has a direct effect on the quality of life of people. Incorporating
the indirect effects on the quality of life in this variable would introduce a lot of ambiguity and subjectivity,
which would make it hard for others to replicate the coding. Additionally, it became clear in the discussion
that the definition of “technology” should be considered a lot broader than some may have in mind.
Therefore, before coding, it is important that one has a good and common understanding of what
“technology” entails. This allows for a more accurate replication when using the algorithm. We then coded
a second set of start-ups in Gothenburg. We used twelve start-ups to check our adapted coding scheme.
The results we individually obtained were very similar, with only a few discrepancies. This meant that the
coding scheme is replicable, and the definitions were no longer ambiguous. When discussing the results,
we agreed that to be able to code the variable “technology” as 1, new academic knowledge or R&D should
be put into practice by the start-up. We acknowledge that this makes technology time dependent, which
may introduce some ambiguity. However, we feel it is the most reliable way of coding technology since it
is closest to the definition. It also proved challenging to code the variable ICT. We agreed that a start-up
should be able to collect, store, use and send or share data electronically to be coded 1 on this variable.
After having coded another 12 start-ups independently on “economy”, we also agreed that “economics”
should entail both the direct effect on the start-up itself, for example cost reduction, but also the indirect
effects on the customers of the start-up. These customers can be businesses or consumers, so it is valid
for both B2B and B2C start-ups. In contrast, we decided to code the variable “quality of life” as 1 only
when the effect of the start-up on the quality of life is direct. The indirect effect on the quality of life is
more prone to interpretation, which would limit the replicability of our coding scheme. Finally, we agreed
that the variable “citizens” should be coded a 1 when we could code the variable “city” as 1 also, as these

GA #774199
D 3.4 Dissemination Level: Public/Confidential Page 55 of 170
two variables are connected to each other (the “citizens” referred to in the definitions, live in a city by
definition).
With these iterations, we were able to proceed and code the full datasets for the Netherlands (a further
194 start-ups various Dutch cities; see Hermse (2020) for details on the data) in Gothenburg (157 start-
ups in Chalmers Ventures; see Nijland (2020) for details on the data) and Nice (295 start-ups in incubator
PACA-EST; see Morin (2019) and Picari (2020) for details on the data). The results of our coding are
presented and described in the next chapter.
Summary and conclusions In this chapter we presented the two indices we have developed in the IRIS project to classify projects,
start-ups and incubates on the degree to which they match the rather diffuse definition of these concepts
as can be found in the academic literature. Both indices were constructed based on an elaborate text
analysis of definitions proposed in the academic literature. We cannot claim to have been exhaustive in
our approach, but we do believe our indices capture the most salient features of these definitions and
probably overlap to a large extent with definitions used in papers we have missed. Moreover, should
future research reveal additional dimensions, than these can easily be added to our indices. For now, we
conclude that these indices capture the state of the art in both literatures. Moreover, by distinguishing
between necessary conditions and intensifying aspects, we have built indices that not only classify a
venture, project or innovation as User Innovation or Smart City Innovation in a 1/0 form but give a value
that refers to how much overlap there is between the venture and aspects of the concept as deemed
important in the academic literature. Both indices were tested for consistency across coders by coding
datasets of start-ups that contain a short description of the start-up’s main activities, products, and
services. The indices and definitions of the component parts have been discussed until convergence was
achieved and thus, we have ensured consistent coding of the data we had available for the project. We
turn to the resulting data, coding and first results in the next chapter.
Both policy makers and researchers can use our indices to identify and distinguish between activities
focussing on providing solutions for rapid changes in the (smart) city. A clear and unambiguous way to
identify smart city and user innovations is an important tool in targeting policies as well as monitoring
their impact. Using a Business Incubation program, as will be described in Chapter 6, can help these
projects or companies in becoming successful quicker or more often.

GA #774199
D 3.4 Dissemination Level: Public/Confidential Page 56 of 170
5. Smart City Business Incubation in Utrecht, Gothenburg and Nice
In Chapter 3 we have already established that spinout innovations is not a very likely source of incubatable
ideas in smart city development in Utrecht. The ideas that (people in) incumbent firms might be either
too green or too developed and it is hard to near impossible to speak to the right people at the right time
to hope to generate significant numbers of spinout incubates. In Chapter 4 we developed our methods
for identifying the remaining projects as smart city and user innovations, where we, importantly,
developed an index that allows us to also differentiate between projects that are only marginally and very
much aligned with the definitions of these concepts in the academic literatures. In this chapter we present
the results of our data collection efforts in the IRIS project. To analyse what business incubation practices
and programs are most congenial to smart city and user innovations, we collected data on incubated start-
ups in incubators in the three lighthouse cities in the IRIS project, Utrecht, Gothenburg and Nice. We
collected historical and contemporary data (before and during the IRIS project) to track the incidence of
smart city and user innovation-based start-ups in these incubators prior to and during the IRIS project. In
a first study, based on data from Utrecht, we investigate if the knowledge base underlying a venture
influences the impact of business incubation. Using by now standard techniques we then analyse also how
specifically smart city and user innovation-based start-ups fare relative to their non- or less-smart city and
non- or less-user innovation-based colleagues in the incubators. Unfortunately, data on start-up
performance is not easy to come by. Incubators do not systematically keep track of this data and
reconstructing it from public sources is very labour intensive. In this chapter we describe the data
collection process and present the results for Utrecht, Gothenburg and Nice, respectively.
Characteristics of a Venture and the Impact of Business Incubation8
Before we can propose an effective business incubation program to support user innovations in a smart
city context, we would need to establish that the underlying characteristics of the venture have an impact
on the effectiveness of business incubation practices. If business incubation programs already cater to the
needs of smart city and non-smart city or user and non-user innovations alike, then there would be no
need to adapt the programs and/or target these ventures specifically. More generally, it is relevant to
investigate what underlying mechanism would drive such differential impacts. The work of Eveleens
(2019) proves highly relevant here. Eveleens (2019) views start-ups as bundles of knowledge with which
they exploit an entrepreneurial opportunity to achieve their growth ambitions (Fleming & Sorenson, 2001;
Grant, 1996). Eveleens (2019) distinguishes two rather generic characteristics of the start-up. The
originality and diversity of the knowledge base underlying the venture. If these characteristics can be
8 This chapter is based on work published earlier as Eveleens (2019). Large parts of this paragraph are (sometimes verbatim) quotes from earlier publications of IRIS work.

GA #774199
D 3.4 Dissemination Level: Public/Confidential Page 57 of 170
shown to affect the outcomes of business incubation, it is likely that characteristics of incubates in general
should be considered when designing targeted incubation programs.
The originality of the knowledge base refers to the extent to which the knowledge base is different from
the knowledge base of other start-ups (Amason et al., 2006; Koellinger, 2008). While a high level of
originality can result in the introduction of important and radical innovations, sometimes even sparking
completely new industries (Hannan & Freeman, 1989), it is also associated with low survival rates of
businesses (Hyytinen et al., 2015). Business incubation has been proposed as a tool to overcome this low
survival rate by creating a support network around these startups that may otherwise remain
misunderstood, undervalued, or even actively opposed (AMEZCUA et al., 2013; Bøllingtoft & Ulhøi, 2005;
Hallen et al., 2016). This embedding in a network may be particularly helpful for the start-ups with the
most original knowledge base.
The diversity of their knowledge base refers to how they combine different types of knowledge
(Aharonson & Schilling, 2016; W. M. Cohen & Levinthal, 1990). Due to their limited size, start-ups often
have a quite narrow knowledge base (Freeman et al., 1983; van Weele et al., 2018), which limits their
ability to search, identify, and integrate new knowledge (Macpherson & Holt, 2007; Zahra & George,
2002). Incubation has been suggested to complement the knowledge base of start-ups and thus increase
their absorptive capacity (D. Patton, 2014). This would imply that incubation is especially helpful for start-
ups that have a low level of knowledge base diversity.
Together, the increased variety of start-ups could mean that the dominant model of incubation is more
suitable for some start-ups than others. Indeed, this would provide support to the idea that incubation
becomes more standardised, and that one size does not fit all (S. L. Cohen et al., 2019). Unveiling this
would have important practical implications for the incubator selection process (Aerts et al., 2007) or for
the design of incubation programs (S. L. Cohen et al., 2019), specifically also for the design of smart city
incubation programs.
Eveleens (2019) focused on start-ups that apply to incubators, because this is the relevant population to
study the effect of incubation. The conceptualisation of start-ups as a unique mix of knowledge types
enables us to measure them as a multidimensional vector representing their knowledge base. This
knowledge base determines their location in a knowledge space (Fleming & Sorenson, 2001; Frenken et
al., 2007; Krafft & Quatraro, 2011). We determine this location of the start-up using elaborate text
descriptions of the start-ups which we assessed using a topic modelling algorithm (Blei et al., 2003). From
their location in the knowledge space, we derive proxies for originality (Jaffe, 1986) and diversity (Rafols
& Meyer, 2010). Drawing on the incubation literature and using a knowledge-based perspective, Eveleens
(2019) first hypothesises that because incubation helps the start-up to navigate the knowledge space
more efficiently, incubation experience leads to higher start-up performance. Second, he hypothesises a
moderating effect of the originality and diversity of the start-up’s knowledge base on the impact of
incubation. Eveleens (2019) then tested these hypotheses on an original dataset of 269 start-ups that
applied for two publicly sponsored incubation programmes in Utrecht, the Netherlands, of which 158
were accepted. See Eveleens (2019) for a more detailed description of the theoretical background, data
collection process and data. Importantly, Eveleens (2019) used the pre-incubation quality and analysis of
sub-samples to control for non-random selection by the incubator.

GA #774199
D 3.4 Dissemination Level: Public/Confidential Page 58 of 170
The main results of the analysis are presented in Eveleens (2019) Table 9, reproduced in Table 11:
Dependent Var Method
Survival Logistic
Size Zero inflated count data
Growth Ordinary Least Squares
Investments Logistic
(1) (2) (3) (4) (5) (6) (7) (8) (9) (10) (11) (12)
INCUB 1.422*** 2.460* 1.946† 0.636** -0.318 0.405 3.048*** 1030 0.745 1.568** -0.098 0.083
(0.316) (1.131) (1067) (0.206) (0.910) (0.673) (0.728) (2.610) (2.514) (0.587) (1.907) (2.020)
DIVERSITY 1.115†
-0.555
-0.477
-0.814
(0.659)
(0.562)
(1.442)
(1.268)
INCUB*DIVERSITY -0.684
0.627
1.395
1.284
(0.734)
(0.557)
(1.716)
(1.234)
ORIGIN
0.584
-0.141
-1.062
-0.858
(0.729)
(0.488)
(1.753)
(1.714)
INCUB*ORIGIN
-0.452
0.256
2.281
1.421
(0.915)
(0.556)
(2.171)
(1.830)
QUALITY -0.034 -0.026 -0.040 0.023 -0.027 -0.029 0.078 0.081 0.071 -0.159 -0.162 -0.253
(0.163) (0.164) (0.162) (0.100) (0.102) (0.098) (0.376) (0.378) (0.366) (0.302) (0.299) (0.241)
AGE AT APPL 0.705*** 0.719*** 0.692*** -0.023 -0.033 -0.028 0.093 0.126 0.105 0.071 0.084 0.077
(0.177) (0.178) (0.176) (0.054) (0.055) (0.054) (0.239) (0.241) (0.240) (0.150) (0.151) (0.150)
YEARS SINCE -0.249 -0.253 -0.248 0.147 0.132 0.129 0.292 0.346 0.303 0.415† 0.429† 0.425†
(0.155) (0.157) (0.155) (0.095) (0.099) (0.099) (0.360) (0.364) (0.361) (0.234) (0.236) (0.235)
MARKET B2C -0.508† -0.524 -0.511† -0.174 -0.180 -0.114 -0.579 -0.921 -0.618 0.083 0.097 0.093
(0.298) (0.317) (0.302) (0.192) (0.197) (0.182) (0.695) (0.753) (0.697) (0.444) (0.441) (0.440)
HARDWARE -0.713* -0.356 -0.657† -0.197 -0.239 -0.176 -1.655* -1.101 -1.435† -0.227 -0.318 -0.192
(0.326) (0.411) (0.341) (0.181) (0.236) (0.209) (0.755) (0.926) (0.803) (0.453) (0.554) (0.468)
Constant 0.803 -1.284 0.134 0.742 1.297 1.082 -1.001 -0.249 0.066 -4.26** -2.197 -3.058
(0.826) (1.285) (1.143) (0.488) (1.103) (0.795) (1.879) (2.974) (2.681) (1.397) (2.011) (2.200)
Observations 269 269 269 269 269 269 269 269 269 269 269 269
McFadden R2 0.169 0.178 0.170 0.054 0.058 0.054 0.014 0.014 0.015 0.085 0.091 0.090
Log Likelihood -145.7 -144.0 -145.6 -601.7 -599.1 -601.4 -840.1 -839.7 -839.5 -80.2 -79.7 -79.8
LR-test
1.577 0.352
-0.243 -0.162
-0.243 -0.162
0.397 0.298
Note †P<0.10; *p<0.05; **p<0.01; ***p<0.001; Z = zero data, CD = count data, INCUB = incubation, ORIGIN = originality
Table 11: Empirical Results Eveleens (2019) Table 9: Regression models testing the interaction effect of diversity and originality
Eveleens (2019) finds that while incubation positively affects all measures of performance, the originality
and diversity of the start-up do not moderate this effect. In other words, such characteristics of a start-up
do not significantly affect the impact of incubation on start-up performance.

GA #774199
D 3.4 Dissemination Level: Public/Confidential Page 59 of 170
With this insight, we can draw two important conclusions. First, we find a positive effect of incubation on
start-up performance.9 Second, we show that start-ups with knowledge of varying originality and
diversity similarly benefit from incubation.
These results suggest that, regardless of their location in the knowledge space, start-ups benefit from
incubation equally. Of course, this suggests there is no need to tailor the incubation program to target
incubates’ knowledge base, including that specific to smart city and user innovations. But before we turn
to these implications, we need to confirm this using the indices we developed and that allow us to go into
more detail on the (potentially differential) effect of business incubation on smart city and user
innovations.
User Innovation Based Business Incubation in Utrecht10 The main role of business incubators is to support innovative and entrepreneurial start-ups and new
ventures with services geared towards their performance and success. Adegbite (2001) has created an
overview of these services which include incubator space, professional management, strict admission and
exit rules. Furthermore, common services such as counselling, training, secretarial support, start- up
financing, as well as assistance with product development and marketing, support ventures in their
growth process (Adegbite, 2001, p. 157). In broader terms, services of business incubators address needs
regarding the overall infrastructure of the start-up, coaching and networking (Peters et al., 2004, p. 86).
Entrepreneurs and starting enterprises benefit from incubation programs since these often lack these
specific success factors. Limited access to funding is one of the main challenges start-ups face due to high-
risk evaluations by financial institutions based on their failure rate (Kirsty, 2010, p. 3). Additionally, start-
ups are lacking skills regarding market opportunity recognition and industry expertise, have limited access
to technologies needed and have only limited social and business network connections for further
expansion (Kirsty, 2010, pp. 3–5). Due to these limitations, start-ups are motivated to apply to business
incubation programs which provide the services required to grow and succeed (Lose & Tengeh, 2016). The
performance of start-ups can be observed by certain indicators such as survival, growth, or increased R&D
activity (Barbero et al., 2012). A lot of empirical research has tested the effect of incubation on start-up
performance which has led to the identification of a positive relationship between incubation programs
and the success rate of start-ups and their innovations (Arlotto et al., 2011; Eveleens, 2019; D. Patton,
2014; Sedita et al., 2017). To validate our data, we will retest this effect and compare our findings to the
positive relationship found in the literature. Based on this we formulate a first hypothesis:
H1: BUSINESS INCUBATION POSITIVELY INFLUENCES THE PERFORMANCE OF START-UPS.
If we can support hypothesis 1, we can show that incubation positively affects the performance of start-
ups, implying that start-ups benefit from incubation. If the effect is positive and significant, we have found
9 Confirming earlier findings in for example Hallen et al. (2016); Madaleno et al. (2018); Van Rijnsoever et al. (2017)
10 Parts of this section have been published as part of Eckinger and Sanders (2019)

GA #774199
D 3.4 Dissemination Level: Public/Confidential Page 60 of 170
the same outcome as previous research and can use this as a validation of our data to test our hypotheses
specific to user-innovations.
Start-ups and new ventures develop innovations for different reasons. These can be profit-related, aimed
at increasing social welfare or developed for the own personal benefit. If the latter applies, the innovation
developed could classify as a user innovation. User innovations differ from non-user innovations, also
called producer or manufacturing innovations, in the sense that the latter are developed to create a
financial profit from selling it (De Jong & von Hippel, 2009; Gambardella et al., 2017; von Hippel, 2005).
This stands in contrast to user innovations. Another distinguishing feature is that producer innovations
are specifically developed to satisfy consumer needs and to attract a large share of the market (Henkel &
Von Hippel, 2004) instead of being developed for personal use or value (Gambardella et al., 2017). But
even though differences regarding the motivation of the innovations’ development exist, similarities can
still be observed. Firstly, some user innovations are developed due to recognition of new market
opportunities as well (Baldwin et al., 2006; Franke & Shah, 2003), though not necessarily for a large share
of the market. Secondly, both lead to a benefit for the developer, either in terms of financial profitability
or personal use, though regarding user innovation this is not the initial motivation. Third, user innovations
as well as non-user innovations imply the development of new products or addition to existing products
or services (Gault & Von Hippel, 2009; Hienerth, 2006), though new product development derives from
an individual need, looking at user innovations. Since both innovation types show underlying similarities
and since business incubators can be considered profitable for start-ups by providing the necessary skills,
we hypothesize that business incubators will be beneficial also for user innovations:
H2: BUSINESS INCUBATION POSITIVELY INFLUENCES THE PERFORMANCE OF USER INNOVATION -
BASED STARTUPS.
If we can support hypothesis 2, we can show that incubation positively affects the performance of user
innovations, implying that user innovations benefit from incubation as well. Regarding the acquisition
process of start-ups, business incubators use specific selection criteria to evaluate start-ups and estimate
their incubation success. Common screening factors include characteristics of the management team,
financial ratios, and market factors (Aerts et al., 2007). Since the success of an incubator depends on the
performance of the start-up that has been accepted to the program, incubators try to select only the most
suitable candidates with lowest potential failure rates (Aerts et al., 2007). As a result, strict screening
practices are applied by the business incubators. We hypothesized that business incubators can be
beneficial for the performance of user innovations. However, when it comes to the selection of suitable
start-ups for the incubation program, user innovations might have a disadvantage compared to other
candidates. Since user innovations are developed for personal use due to the detection of a problem or
need, the founding team of user innovations usually consists of the user himself (Shah & Tripsas, 2007)
and therefore, tends to be small. Even a user innovation community or group doesn’t match the selection
criteria because most user innovators are specialized in their field and have strong experience with the
product or service they develop (Lüthje, 2004; Lüthje et al., 2002), hence the overall diversity as well as
technical, management, financial and marketing skills of the innovation team (Aerts et al., 2007) being
rather low. In terms of their financial strength user innovations might also experience barriers regarding
their selection to incubation programs. Most user innovations are developed at low cost and therefore do

GA #774199
D 3.4 Dissemination Level: Public/Confidential Page 61 of 170
not require much capital and investment from the user side (Lüthje et al., 2002; Morrison et al., 2000).
Taking this into consideration, financial ratios regarding the start-up’s liquidity, profitability or debt are
likely to have a negative effect on the selection of the user innovations to incubation programs (Aerts et
al., 2007). From this, we hypothesize that a selection bias of business incubator selection criteria against
user innovations exists, meaning that incubators are not likely to select many user innovations to their
programs based on the selection criteria applied.
Moreover, user innovations are not primarily developed to achieve financial profitability and to become
commercially successful, but rather to satisfy the users own personal needs (Shah & Tripsas, 2007). We
therefore further hypothesize that user innovations show a negative self-selection bias towards business
incubators themselves. This would imply that not many user innovations are attracted by incubation
programs nor apply for their support in the first place. But despite these selection biases, incubation
programs could strongly benefit user innovations because of their small size and lack of financial
profitability. Therefore, we would like to test whether the benefit of incubation, if hypothesis 2 can be
supported, differs for user innovations and non-user innovations. By looking for a moderation effect of
user innovations on incubation in comparison to other start-ups, we can formulate our third hypothesis:
H3: USER INNOVATION POSITIVELY MODERATES THE INFLUENCE OF INCUBATION ON
PERFORMANCE.
If we find support for hypothesis 3, we can show that incubation indeed influences the performance of
user innovations more positively compared to non-user innovations. To study these hypotheses, we used
the same data as Eveleens (2019) above, amended with our indicator for user innovations described
above. For a more detailed description of the data selection and collection, we refer to the original reports
Eckinger and Sanders (2019) and Eveleens (2019). In these reports, the reader can also find more
elaborate positioning in the academic literature. For the purposes of this report, we fast forward to the
results. First, we found that only 7% of all 269 start-ups in the Utrecht incubators’ dataset were coded as
user innovations. Compared to percentages of user innovations in broader datasets (e.g., De Jong, von
Hippel, Gault, Kuusisto and Raasch (2015) find 176 verified user innovations out of 624 innovations (28%)
reported by of 2048 respondents in Finland), we therefore find an indication for a negative self-selection
bias of user innovations towards incubation programs. Only 6 out of the 19 user innovations, so about
32%, were eventually admitted to the incubation programs. This is 58% in the total dataset and the
relatively low acceptance rate for user innovations could indicate a further selection bias of business
incubators against user innovations.

GA #774199
D 3.4 Dissemination Level: Public/Confidential Page 62 of 170
Figure 4, reproduced from Eckinger and Sanders (2019), shows that of the user innovations we did find,
most (5.1 percent point) could be classified as moderately user innovation, whereas we did not find a
single user innovation that would tick all the boxes in our dataset. We conclude from these results that
user innovations, like spinout innovations, are a rare animal in our data and unlikely to be attracted to
and admitted in existing incubator programs. The results on the hypotheses follow from the reproduced
Table 8 from Eckinger and Sanders (2019) in Table 12:
Dependent Var Method
SURVIVAL Logistic
GROWTH Ordinary Least Squares
INVESTMENT Logistic
Model: (1) (2) (3) (4) (5) (6) (7) (8) (9)
INC 1.132*** 1.093*** 0.990** 2.981*** 2.663*** 2.623*** 1.891** 1.718** 1.567* (0.381) (0.388) (0.399) (0.852) (0.845) (0.897) (0.803) (0.806) (0.817) UI -0.317 -1.165 -1.675 -1.969 0.280 -12.993
(0.739) (1.207) (0.990) (1.160) (1.205) (1501.427) INC*UI 1.700 0.577 13.644 (1.715) (1.590) (1501.428)
QUAL -0.047 -0.069 -0.071 -0.056 0.050 0.051 -0.364 -0.223 -0.225 (0.181) (0.185) (0.186) (0.341) (0.335) (0.335) (0.305) (0.316) (0.323)
SAA -0.106 -0.083 -0.070 -0.903*** -0.824*** -0.819*** -0.255 -0.210 -0.195 (0.130) (0.132) (0.133) (0.227) (0.226) (0.229) (0.213) (0.209) (0.209) AAA 0.629*** 0.653*** 0.643*** 0.082 0.073 0.070 0.156 0.162 0.152
(0.199) (0.204) (0.203) (0.160) (0.160) (0.161) (0.177) (0.177) (0.177) YSA -0.159 -0.164 -0.126 0.326 0.415 0.425 0.601* 0.567* 0.595* (0.194) (0.197) (0.202) (0.523) (0.523) (0.528) (0.311) (0.317) (0.323)
EXP -0.159 -0.220 -0.233 -0.081 -0.195 -0.198 0.460 0.291 0.280 (0.215) (0.220) (0.220) (0.522) (0.523) (0.524) (0.315) (0.332) (0.332)
B2C -0.596* -0.674* -0.694* -0.939 -0.933 -0.939 0.148 0.099 0.058 (0.352) (0.363) (0.364) (0.906) (0.957) (0.959) (0.543) (0.578) (0.585) HDW -0.653* -0.677* -0.705* -1.520* -1.577* -1.577* -0.207 -0.154 -0.163
(0.388) (0.395) (0.400) (1.159) (1.172) (1.175) (0.539) (0.569) (0.570) Const. 1.355 1.529 1.488 1.841 1.435 1.424 -4.697*** -4.866*** -4.816*** (1.097) (1.123) (1.128) (1.819) (1.782) (1.789) (1.777) (1.866) (1.768)
Obs 186 180 180 186 180 180 186 180 180 Pseudo R-squared
0.137 0.146 0.151 0.110 0.110 0.110 0.130 0.110 0.130
Note: Robust standard errors and normal R-squared for Growth *** p<0.01, ** p<0.05, * p<0.1
Table 12: Results Eckinger and Sanders (2019) Table 8: Regression models testing hypotheses 2&3
Figure 4: Categorical Representation of User Innovation Variable (in percentages) reproduced from Eckinger and Sanders (2019) Figure 2

GA #774199
D 3.4 Dissemination Level: Public/Confidential Page 63 of 170
Models 1, 4 and 7 include incubation experience and all control variables and provide the results on
hypothesis 1. These confirm earlier findings, amongst others by Eveleens (2019), that incubation positively
impacts the outcome variables under consideration. Models 2, 5 and 8 add user innovation as an
independent variable to the incubation model. Finally, models 3, 6 and 9 add the interaction term
between UI and INC to the model. We can observe that adding UI as well as adding the interaction term
between INC and UI does not impact the significance of the results of the incubation model. The estimates
stay almost the same within all three models for each performance measure. Only the estimates of INC
with SURV and INV are reduced in their confidence percentage when adding the interaction term.
However, we cannot find any significant or positive estimates of user innovation when adding the UI
variable to our incubation model. From this, we can conclude that the performance of user innovations
in terms of survival, growth and investments is not affected by the user innovation being incubated or
not.
Of course, we must be cautious in interpreting these results. We have identified only a small number of
incubates that classify as user innovation and the number of observations is too small to even attempt to
estimate the effect of scoring more on the user-innovation index. The power in our statistical analysis is
weak, potentially explaining the absence of significant results that might still be there and could be
revealed in larger datasets. Nevertheless, the results as presented here, give us no reason to change
incubation practices for the benefit of user innovations specifically. The absence of significant coefficients
for the user innovation dummy in our regressions, implies that user innovations, to the extent that they
self-select and are accepted into incubation programs, benefit from the incubation program in the same,
positive, way as non-user innovations. The implication of this analysis is that we should rather focus on
getting more user innovations to apply for incubation and perhaps make incubators more sensitive to the
specific strengths and weaknesses of such innovations. Business incubation is, to date, very much geared
towards the specific needs of the incubates, such that user innovations, even if they enter with somewhat
weaker teams and financial resources, benefit from incubation in strengthening these weaknesses and
leveraging their strengths.
User Innovation Based Business Incubation in Nice11 We also replicated the analysis that was conducted by Eveleens et al. (2019) and Eckinger and Sanders
(2019) for Utrecht in a French dataset on 308 incubates in the incubator PACA-Est in Nice. Exact replication
is unfortunately not possible, as very little data was collected for non-incubated firms. In fact, for the
latter, we only have survival up to 2019 and some information from the application. However, to assess
the impact of incubation itself, we would need information on quality for a significant number of non-
incubated firms in the sample. Therefore, the study on PACA-Est, published earlier as Morin (2019),
investigated the impact of incubation on the survival expectancy of start-ups by using survival analysis
with a Cox proportional hazard model. This analysis is followed by the study of three different types of
resources and their impact on incubated firm’s success indicators with a multilinear regression model.
11 Parts of this section have been published as part of Morin (2019)

GA #774199
D 3.4 Dissemination Level: Public/Confidential Page 64 of 170
The extensive data collected over eighteen years enabled Morin (2019) to contribute to the assessment
of incubation impact and the role of knowledge capital, human capital, and financial resources in the
success of start-ups. Moreover, we focused on specific dimensions such as user innovation, using the
above UI-index and smart-city transition tracks.12
In his thesis, Morin (2019) first explores the existing theoretical framework of incubation and start-up
growth. Particularly, the study conducted by Hausberg & Korreck (2018) offers a comprehensive literature
review about incubators. Second, Morin (2019) detailed the data collection process. His data section also
contains a precise description of all variables used in the analysis. We refer to the full report in Morin
(2019) for a detailed presentation of the theoretical background, data collection and methods applied in
the analysis. For this report, we skip right to the results and their interpretation considering our main
purpose here.
First, Morin (2019) found, as Eckinger and Sanders (2019) did for Utrecht, a low number of user
innovations in the PACA-Est incubator. This should not come as a surprise. The criteria for application in
the PACA-Est incubator include a requirement to involve a scientist from the university, such that the
incubator targets academic start-ups primarily. This reduces the scope for user innovations, especially in
the smart city domain, significantly. Consequently, it did not come as a surprise that only 9 out of 308
incubated firms could be classified as user innovations. These rare user innovations did score very high on
our index (4.3 out of 5), but the number is simply too small to make any statistically relevant conclusions
on the impact of business incubation on user innovations, specifically.
Morin (2019) then investigated the role of resources that the Resource-Based View of the firm would
predict an incubator can effectively mobilize for start-ups. He concluded that having a diverse team,
specifically, having non-academics on a relatively highly educated team, significantly increases survival
and performance. He also finds that incubation of hardware producers (as opposed to software and
service providers) tends to increase growth but decrease survival probabilities, whereas a match on the
IRIS transition tracks as identified in the project has no significant impact on survival (neither positive nor
negative) but does show a positive and significant effect on growth (in employment). As Morin (2019)
could not yet benefit from the work published in Hermse et al. (2020), the matching on transition tracks
was done by first scoring a subset of incubates and then verifying these classifications with transition track
coordinators in the project (in Utrecht). The results gave us a first indication that perhaps smart city
innovations would fare differently in incubation programs and therefore, one might design an incubation
program specifically for smart city innovation. However, the results for user innovations in Morin (2019)
confirmed that that type of innovation rarely applies for and/or gets selected into incubation programs.
More importantly, the results also suggested that those that do, benefit in the same way from business
incubation as non-user innovation-based start-ups. Therefore, redesigning incubation programs
specifically for these types of innovations did not seem to be needed or effective. To develop more user
12 Note, this is not using the smart city index described above that was developed later in time, but rather classified the start-ups on the IRIS-specific transition tracks. A venture was therefore only classified as Smart City if it fitted the IRIS transition tracks. We developed the SCI later because we felt this was a too restrictive definition.

GA #774199
D 3.4 Dissemination Level: Public/Confidential Page 65 of 170
innovations in an incubator, one would instead have to look at the factors that drive the (self)-selection
of such innovators in the incubation program. We now turn our attention to first classifying and then
researching if smart city innovation-based start-ups benefit from incubation differently and require a
different approach.
Smart City Innovation Based Business Incubation in Utrecht, Gothenburg and Nice13
Table 133 and Table 14 shows the descriptive statistics for our coded data for the samples from incubators
(UtrechtInc, Climate-KIC, Chalmers Ventures, and PACA-Est) and Dutch cities, respectively. The samples
show that smart city innovation is not uncommon in our datasets.
City Technology Quality of Life
Citizen Sustainability ICT Economic #Smart city
Average SCORE
Obs.
UtrechtInc, Utrecht, NL
6 (13.33%)
43 (95.56%)
8 (17.78%)
4 (8.89%)
7 (15.56%)
38 (84.44%)
20 (44.44%)
6 (13.33%)
3.67 45
Climate-KIC, Utrecht, NL
19 (27.94%)
68 (100%)
20 (29.41%)
9 (13.24%)
60 (88.24%)
19 (27.94%)
55 (80.88%)
19 (27.94%)
3.84 68
Chalmers Ventures, Gothenburg, SE
14 (8.92%)
149 (94.90%)
34 (21.66%)
5 (3.18%)
33 (21.02%)
97 (61.78%)
41 (26.11%)
14 (8.92%)
3.29 157
PACA-Est, Nice, FR
29 (9.8%)
294 (99.6%)
68 (23.1%)
10 (3.4%)
86 (29.2%)
103 (34.9%)
74 (25.1%)
28 (9.4%)
3.21 295
Total 68 (12.0%)
554 (98.0%) 130 (23.0%)
28 (4.9%)
186 (32.9%)
257 (45.5%)
190 (33.6%)
67 (11.8%)
3.34 565
Table 13: Descriptives for Incubators
Over all incubators, the percentage of start-ups that we could classify as “smart city” is 11.8%, ranging
between some 9% in Gothenburg and 27% in Climate KIC, an incubator dedicated to sustainable
innovation. It should also be noted that the most restrictive necessary condition is “city”, not
“technology”, as the latter scores 1 for over 90% in all samples. That is, incubators tend to be focused on
tech start-ups. That tech start-ups in incubators address urban challenges is rarer. Of the “intensity”
factors, the scores on “citizen” are clearly lowest at on average 5%. In comparison, the use of ICT
13 Parts of this section have been published earlier as parts of Nijland (2020), Picari (2020), Hermse et al. (2020) and Kolassa (2021).

GA #774199
D 3.4 Dissemination Level: Public/Confidential Page 66 of 170
technology is common to some 50% of the sample. All this makes sense intuitively and corresponds with
what we would expect, given the profiles and nature of the incubators.
City Technology Quality
of Life
Citizen Sustainability ICT Economic #Smart
city
Observations
Amsterdam 10
(9.2%)
109
(100%)
10
(9.2%)
5
(5.0%)
16
(14.7%)
99
(90.8%)
38
(34.9%)
10
(9.2%)
109
(56.2%)
Rotterdam 6
(20.0%)
30
(100%)
8
(26.7%)
12
(40%)
6
(20%)
21
(70.0%)
9
(30.0%)
6
(20.0%)
30
(15.5%)
Den Haag 0
(0.0%)
13
(100%)
0
(0.0%)
0
(0.0%)
2
(15.4%)
10
(76.9%)
1
(7.7%)
0
(0.0%)
13
(6.7%)
Utrecht 3
(45.8%)
19
(100%)
3
(15.8%)
1
(5.5%)
4
(21.1%)
17
(89.5%)
4
(21.1%)
3
(15.8%)
19
(9.8%)
Eindhoven 2
(33.3%)
6
(100%)
1
(16.7%)
1
(16.7%)
1
(16.7%)
3
(50.0%)
2
(33.3%)
2
(33.3%)
6
(3.1%)
Delft 2
(11.8%)
17
(100%)
4
(23.5%)
2
(11.8%)
6
(35.3%)
12
(70.6%)
6
(35.3%)
2
(11.8%)
17
(8.8%)
Total 23
(11.9%)
194
(100%)
26
(13.4%)
21
(10.8%)
35
(18.0%)
162
(83.5%)
60
(30.9%)
23
(11.9%)
194
(100%)
Table 14: Descriptives for Dutch Cities
In Table 13, we observe that the patterns are quite similar in a sample of start-ups in different Dutch cities.
Some 11% of the start-ups are classified as “smart city” and once more technology is not a very
discriminating factor. For this smaller sample it is remarkable that the start-ups coded “1” on citizen do
seem to be more common (at about 10% on average with rates as high as 40% in Rotterdam), but the
sample sizes differ quite a bit across the cities, with most start-ups concentrated in Amsterdam. For
Amsterdam, the pattern is roughly comparable to the sample in UtrechtInc. As that incubator has rather
general programs for business incubation, this suggests the smart city index works reasonably well in and
outside incubators and that incubators attract and select a representative sample of start-ups on the
smart city index dimensions. To promote smart city development, incubators should thus aim to increase
the share of smart city innovations that apply to their programs. But before we can conclude this might
be a good idea, we should first establish that smart city innovations benefit at least as much from business
incubation services as the non-smart city (tech) start-ups.
To investigate this question, we ran similar analyses on survival, growth as presented above. In Nijland
(2020) we presented the results for a comparison between the combined UtrechtInc-Climate KIC dataset
collected by Eveleens (2019) and data collected from Chalmers’ Ventures in Gothenburg, Sweden. The
dataset for this analysis consisted of 157 start-ups from Chalmers Ventures, 45 of UtrechtInc and 68 of
Climate-KIC. The descriptive statistics for the full sample are presented in Table 13.
The total sample size consists of 270 start-ups. One of the most significant differences between the data
of Utrecht and Gothenburg is the mean of “investment”. This is a binary variable indicating if the start-up
had received an external investment up to the date of data collection (spring of 2019). The mean of

GA #774199
D 3.4 Dissemination Level: Public/Confidential Page 67 of 170
investment is 0.757 for Gothenburg, whereas it was only 0.133 for Utrecht. This could be because
Chalmers Ventures itself, also provides funding for some of the start-ups that they are incubating.
For the analysis, Nijland (2020) presents a set of general linear regression models. As we have three
performance measures, we follow Eveleens (2019) and estimate three different models. A logistic
regression model is estimated for the performance measures of investments and survival. The
performance measure of employment growth is estimated with a negative binomial regression. This
model was applicable since the variable consists of a count variable. Additionally, Nijland (2020) tested
for overdispersion by looking at the histogram of the employment growth, and the goodness of fit of the
Poisson model. Also, the variance was larger than the mean of the employment growth. Based on these
tests, it was clear that there was overdispersion, and the negative binomial regression is most applicable
(Lawless, 1987). Additionally, Nijland (2020) performed a likelihood-ratio test (LR-test). This test shows
whether adding the independent variable, “smart city score”, enhances the model fit. The appropriate
assumptions of each of the analyses are verified (see Nijland (2020), Appendix C). Nijland (2020) tested
for multicollinearity using Spearman’s correlations and variational inflation factors (VIF). All the VIF scores
were below 2, implying there is no issue with multicollinearity in the model (Field et al., 2012).
Additionally, based on the scatterplots, Nijland (2020) removed three outliers from the model. We
reproduce Nijland’s (2020) results in her tables 6 and 7 below in Table 15:
Dependent Var Method
SURVIVAL Logistic
INVESTMENTS Logistic
EMPLOYMENT GROWTH Negative Binomial
Model: (1) (2) (3) (4) (5) (6) (7) (8) (9)
Smart City
0.288 0.972
0.028 0.083
0.093* 0.356*
(0.206) (0.743)
(0.157) (0.584)
(0.055) (0.208)
UtrechtInc 2.907*** 2.958*** 2.955*** -3.367*** -3.366*** -3364 0.321 0.326 0.330
(1.053) (1.060) (1.069) (0.680) (0.680) (0.680) (0.207) (0.206) (0.206)
Climate-KIC 1.167** 1.065* 1.082* -2.782*** -2.796*** -2792 -0.117 -0.172 -0.165
(0.551) (0.562) (0.560) (0.473) (0.480) (0.478) (0.188) (0.190) (0.189)
Founding team size -0.115 -0.172 -0.170 0.418* 0.416* 0.416 0.170* 0.164* 0.161*
(0.251) (0.254) (-0.254) (0.242) (0.242) (0.242) (0.094) (0.093) (0.093)
Percentage males 5.048* 5.520* 5.538* -2.012 -2.026 -2.018 1.518 1.456 1.502
(2.770) (2.843) (2.837) (3.115) (3.113) (3.113) (1.330) (1.322) (1.321)
Percentage males squared -3381 -3.884 -3.893 2.289 2.291 2.284 -0.849 -0.835 -0.880
(2.477) (2.562) (2.555) (2.686) (2.681) (2.682) (1.099) (1.092) (1.092)
Age startup 0.437*** 0.454*** 0.450*** 0.057 0.057 0.057 -0.019 -0.019 -0.019
(0.105) (0.108) (0.108) (0.056) (0.056) (0.056) (0.023) (0.023) (0.023)
Market type B2C -0.176 -0.286 -0.253 -0.490 -0.498 -0.492 -0.008 -0.061 -0.043
(0.439) (0.448) (0.445) (0.480) (0.481) (0.479) (0.178) (0.179) (0.178)
Constant -2.062** -2.064** -2.071** -0.014 -0.010 -0.011 -0.457 -0.435 -0.443
(0.813) (0.814) (0.814) (0.897) (0.900) (0.897) (0.397) (0.394) (0.394)
Obs. 222 222 222 182 182 182 211 211 211
Log Likelihood -77.240 -76.090 -76.275 -83.533 -83.518 -83.524 -351.110 -349.700 -349.652

GA #774199
D 3.4 Dissemination Level: Public/Confidential Page 68 of 170
Chi2 60.88*** 63.18*** 62.81*** 84.45*** 84.48*** 84.47*** 13.41* 16.23** 16.33**
McFadden R2 0.283 0.293 0.292 0.336 0.336 0.336 0.019 0.023 0.023
LR-test
2.30 1.93
0.03 0.02
2.82* 2.92*
Note: *p<0.10, **p<0.05: ***p<0.01;
Table 15: Regression results reproduced from Nijland (2020) Table 6
The models (1), (4), and (7) in Nijland’s (2020) Table 15 only contain control variables. Model (2), (5), and
(8) contain the independent variable of smart-city, whereas model (3), (6), and (9) contain the
independent variable of smart-city as a binary variable. All the models created are found to be significant
(1%, 5% and 10% levels). However, the McFadden R2 are low for the negative binomial regressions. In the
marginal effects of the logistic regressions are shown in Table 16. Nijland’s (2020) Tables 6 and 7 show
some interesting significant estimators.
Dependent Variable SURVIVAL INVESTMENT
Model: (1) (2) (3) (4) (5) (6)
Smart City
0.021 0.056*
0.007 0.020 (0.015) (0.033)
(0.039) (0.145)
UtrechtInc 0.121*** 0.115*** 0.116*** -0.545*** -0.545*** -0.545*** (0.034) (0.033) (0.033) (0.058) (0.058) (0.058)
Climate-KIC 0.074** 0.065* 0.066** -0.540*** -0.542*** -0.542*** (0.034) (0.033) (0.034) (0.066) (0.067) (0.067)
Founding team size -0.009 -0.013 -0.013 0.103* 0.102* 0.102* (0.020) (0.019) (0.019) (0.060) (0.060) (0.060)
Percentage males 0.400* 0.411* 0.417* -0.495 -0.499 -0.497 (0.226) (0.217) (0.219) (0.766) (0.766) (0.766)
Percentage males squared
-0.268 -0.289 -0.293 0.563 0.564 0.562
(0.198) (0.192) (0.193) (0.661) (0.660) (0.660)
Age start-up 0.035*** 0.033*** 0.034*** 0.014 0.014 0.014 (0.007) (0.007) (0.007) (0.014) (0.014) (0.014)
Market type B2C -0.014 -0.023 -0.020 -0.118 -0.120 -0.118 (0.037) (0.037) (0.037) (0.112) (0.112) (0.111)
Table 16: Marginal effects reproduced from Nijland (2020) Table 7
On Average chances of survival increase when a start-up is incubated at UtrechtInc in comparison to
Chalmers Ventures, which is significant at a 1% level. This is also true for Climate-KIC, even though the
difference is small. Moreover, chances of survival increase when the age of the start-up increases, which
is significant at a 1% level. This is in line with previous research (Soetanto & Jack, 2013).
Additionally, for the dependent variable investment, results are somewhat different. On average changes
of investment decrease when the start-up was incubated at UtrechtInc or Climate-KIC in comparison to
Chalmers Ventures. These relationships are significant at a 1% level. But this may simply reflect the fact
that Chalmers Ventures also offers funding for some of their incubated start-ups. A larger founding team
also significantly (10% level) increases chances of receiving investment for the start-up.

GA #774199
D 3.4 Dissemination Level: Public/Confidential Page 69 of 170
For the negative binomial model with a dependent variable of employment growth, a bigger founding
team also significantly increases employment growth (10% level). Therefore, the results are in line with
previous studies (Klepper, 2001; Leonard & Sensiper, 1998; Soetanto & Jack, 2013).
In addition to the significant effects of the control variables, Nijland (2020) also finds a positive association
between the SCI score and the dependent variables. This relationship is significant for the negative
binomial models for the normal smart city and the binary smart city scores. This means that being a “smart
city start-up” increases the employment growth significantly (10% level). Based on the LR-test, Nijland
(2020) concludes that adding smart city as an independent variable for these two models substantially
improves the model fit (10% level). The relationship between the binary smart city score variable and the
dependent variable survival is also significant (10% level). This means that when the start-up is defined as
a “smart city start-up” chances of survival increase.
In a parallel study, Picari (2020) coded the data we collected on the incubator PACA-Est in Nice discussed
above and in Morin (2019) on the SCI-index in Hermse et al. (2021). In a similar exercise as Nijland (2020)
did for Chalmers’ ventures, she then compared outcomes for smart city and non-smart city incubates
between Utrecht and Nice. The descriptive statistics of the chosen control variables for the PACA-EST
incubator are shown in Table 17.
Variable Obs Mean Std. Dev. Min Max
Age start-up 160 7.95625 4.653188 1 18 Male percentage
269 0.8608028 0.2518105 0 1
Male percentage^2
269 0 .8041543 0.3194621 0 1
Experience 212 1.613208 0.7977546 0 3 Exited 297 0.5858586 0.4934045 0 1 Incubated 297 0.0707071 0.2567675 0 1 hw 297 0.4309764 0.4960486 0 1 Turnover 243 0.7201646 0.4498448 0 1 Founders team 291 2.766323 1.571415 1 10 Smart City 297 0.0942761 0.2927056 0 1
Table 17: Descriptives PACA-Est, reproduced from Picari (2020) Table 7
The smart city index is here a binary variable that corresponds to the interaction between the
characteristics of a start-up to be defined as “smart city”. Picari’s (2020) Table 19, reproduced in Table 18,
shows the results adopting the Logistic and the Negative Binomial procedures. Unlike Nijland (2020), Picari
(2020) ran the regression models separately for the Utrecht and Nice data. Regressions 1, 2, 5, 6, 7 and 8
refer to the Nice dataset, while regressions 3, 4, 9, 10, 11 and 12 to the Utrecht dataset. As before, her
dependent variables are survival and growth.
For the first model, Picari (2020) developed two regressions for each dataset to analyse the difference
between smart city and non-smart city start-ups. The same procedure was followed for the second set of
negative binomial models on growth, including incidence rate ratios (irr) regressions (models 6, 8, 10 and
12). Model 1 and 2 are statistically insignificant. Models 3 and 4, where Picari (2020) added the dummy

GA #774199
D 3.4 Dissemination Level: Public/Confidential Page 70 of 170
for market type, in contrast, are significant. Results on the Smart City index remain insignificant, also when
we look at employment growth. This contrast to the results in Nijland (2020) can be explained when we
consider the effect of running the regression models for the two datasets separately. In that case the
number of observations and degrees of freedom drops significantly. And with it the estimation of not so
clear and strong effects becomes imprecise. The results for Utrecht in Picari (2020) show that Nijland
(2020) needs the variation across Utrecht and Gothenburg to identify the effect, whereas in Picari (2020)
no such significant impacts can be found. In addition, it should be noted that the number of smart city
incubees in the French incubator was low (only 28 observations or 9%) to begin with. This probably has a
lot to do with the way the incubator attracts and selects incubates for its programs. PACA-Est is an
incubator that is much more affiliated with the University and requires the involvement of academics in
the incubates. Moreover, it seems to be specialized in incubating firms that offer digital security and
encryption solutions. Such firms will occasionally offer relevant solutions for smart city development,
especially in the data management sphere, but they can rarely be exclusively and unambiguously classified
as smart city innovations.
Dependent Variable Method
SURVIVAL Logit
GROWTH Negative Binomial
Model: (1) (2) (3) (4) (5) (6-irr) (7) (8-irr) (9) (10-irr) (11) (12-irr)
Smart City -0.593
-0.147
0.113 1.120
0.149 1.161
(0.536)
(0.374)
(0.362) (0.406)
(0.282) (0.327)
Founders team 0.078 0.093 0.107 0.114
(0.128) (0.128) (0.113) (0.111)
Male Percentage 0.182 0.269 0.626 0.046 6.728** 835.499**
6.719** 828.422**
-0.208 0.811 0.494 1.638
(3.618) (3.589) (2.420) (2.345) (3.375) (2820.62
1) (3.373) (2794.4) (2.169) (0.118) (1.996) (3.271)
Male Percentage Squared
-0.583 -0.623 -0.001 0.457 -4.418** 0.012** -4.395** 0.012** 0.353 1.424 -0.181 0.834
(2.751) (2.729) (2.094) (2.045) (2.285) (0.027) (2.283) (0.028) (1.796) (2.559) (1.662) (1.138)
Age start-up
0.016 1.016 0.015 1.015 -0.130 0.878 -0.188* 0.828*
(0.028) (0.029) (0.028) (0.028) (0.134) (0.118) (0.123) (0.102)
Market Type B2C
0.519* 0.515*
0.116 1.123 0.125 1.133
(0.365) (0.357)
(0.302) (0.339) (0.288) (0.326)
Entrepreneurial Experience
-0.154 -0.158 -0.164 -0.120 -0.379** 0.684** -0.378** 0.685** 0.063 1.065 0.033 1.033
(0.231) (0.230) (0.200) (0.196) (0.171) (0.117) (0.171) (0.117) (0.141) (0.151) (0.134) (0.139)
Hardware -0.161 -0.133 -0.708** -0.679** -0.241 0.785 -0.250 0.778 -0.362* 0.695* -0.273 0.760
(0.374) (0.371) (0.336) (0.329) (0.233) (0.183) (0.231) (0.180) (0.277) (0.192) (0.258) (0.196)
Incubated 0.406 0.308 0.920*** 1.034*** 0.132 1.141 0.127 1.135 0.893*** 2.443*** 0.924*** 2.519***
(0.675) (0.662) (0.325) (0.318) (0.420) (0.480) (0.420) (0.477) (0.249) (0.610) (0.237) (0.597)
Constant 1.874* 1.715* -0.152 -0.216 -1.768* 0.170* -1.75* 0.172* 0.275 1.317 0.332 1.394
(1.202) (1.179) (0.727) (0.720) (1.220) (0.208) (1.219) (0.210) (0.690) (0.909) (0.660) (0.920)
Obs. 190 190 206 206 147 147 147 147 142 142 150 150
Log-Likelihood -92.047 -92.623 -177.926 -122.533 -201.904 -201.904 -201.95 -201.95 -262.40 -262.40 -279.95 -279.95
Chi2 3.25 2.10 19.44 20.83 10.88 10.88 10.78 10.78 15.97 15.97 18.51 18.51

GA #774199
D 3.4 Dissemination Level: Public/Confidential Page 71 of 170
Prob > chi2 0.860 0.910 0.012 0.004 0.144 0.144 0.09 0.09 0.042 0.042 0.009 0.009
Note: standard errors in parentheses, * p<0.1, **p<0.05, ***p<0.001
Table 18: Regression results reproduced from Picari (2020) Table 19
This interpretation of the Picari (2020) results was confirmed in a follow-up study by Kolassa (2021) on
incubates in UtrechtInc since the start of the IRIS project in 2017. The data collected in Kolassa (2021) has
information about start-up survival, their smart-city categorization, and the number of employees.
Financial information such as revenue or investments has proven difficult to obtain. The data was
complemented with more information gathered by web search (browsing, LinkedIn), but is necessarily
less complete than the data that was collected in Eveleens (2019) and from the historical archives at
Chalmers Ventures. The companies and mostly the founders, the founding year and if the start-up
survived, were found up on LinkedIn. Furthermore, LinkedIn displayed a specific year the start-up stopped
operating. Information about the number of employees was gathered via LinkedIn as well as the
company’s websites. Lastly, Kolassa (2021) reached out to the ventures via their official e-mail address
and asked about the number of employees they are employing at the time of data collection.
The sample contains 168 start-ups and depicts applications from the beginning of 2017 till September
2020. This dataset covers both approved and unselected start-ups for the incubation program. Kolassa
(2021) looked at incubated start-ups only. The descriptive statistics for this sample are reproduced in
Kolassa’s (2021) Table 2 in Table 19:
Variable Obs Mean Std. Dev. Min Max
Survival 168 0.554 0.497 0 1
Size 168 1.875 3.163 0 15
Smart city start-up 168 0.214 0.411 0 1
Smart city score 168 1.000 1.741 0 6
Online/Offline 168 0.512 0.501 0 1
Entrepreneurial experience
168 0.208 0.407 0 1
Founding team 168 1.827 0.841 1 5
Gender 167 0.835 0.313 0 1
Market type 157 0.325 0.470 0 1
Age start-up 168 19.351 28.791 0 216 Table 19: Descriptive Statistics reproduced from Kolassa (2021) Table 2
Survival shows that 93 out of 168 start-ups survived, which results in a survival rate of 55.4%. The second
variable size indicates that the average number of employees within our data sheet is 4 people. Out of the
168 coded start-ups, Kolassa (2021) concluded that about a quarter of them can be categorized as smart
city start-ups. This is significantly more than the 13.3% reported for the dataset collected by Eveleens
(2019) and used in all previously discussed studies. From Table 19, it can also be seen that the average
score on the index has dropped to 1.7 from 3.6. This suggests that more of the UtrechtInc incubates
address urban challenges in recent years, but this higher number on average scores lower on the intensity
factors in the SCI.

GA #774199
D 3.4 Dissemination Level: Public/Confidential Page 72 of 170
The outbreak of COVID-19 and the ensuing lockdowns imply that this sample can be split between
ventures incubated on site and those incubated online. We see that here the split is about 50-50, and
although we will use this variable as a control variable below, it should be noted that it confounds the
effects of being incubated online with those of being incubated during rather exceptional economic
circumstances. This dummy variable correlates perfectly with COVID-19 restrictions in the Netherlands.
Although the impact of these restrictions on employment growth and firm survival is likely to be
important, we do not see any strong reasons for these effects to impact smart city start-ups differently.
Dependent Variable Method
SURVIVAL Logistic
SIZE Negative Binomial
SURVIVAL Penalized
ML 1 2 3 4 5 6 7
SC (1/0)
Omitted
1.119***
4.057***
(0.286)
(1.454)
SC(score)
1.142***
0.292***
(0.358)
(0.078)
Online/Offline 0.792* 0.510 0.335 0.172 0.021 -0.145 0.455
(0.417) (0.463) (0.476) (0.281) (0.268) (0.279) (0.444)
Entrepreneurial Experience
1.420** 1.268* 1.302* 0.311 0.392 0.297 1.140
(0.694) (0.736) (0.754) (0.331) (0.312) (0.314) (0.689)
Founding Team -0.137 -0.156 -0.134 0.209 0.236 0.218 -0.134
(0.230) (0.258) (0.261) (0.186) (0.183) (0.184) (0.246)
Gender -0.827 -1.179* -1.190 -0.307 -0.514 -0.546 -1.082
(0.646) (0.710) (0.724) (0.444) (0.421) (0.425) (0.676)
Market 0.010 -0.381 -0.388 -0.238 -0.436 -0.456 -0.349
(0.418) (0.491) (0.505) (0.295) (0.286) (0.290) (0.470)
Age 0.065* 0.052***
0.045***
0.037*** 0.032*** 0.032*** 0.0474***
(0.015) (0.016) (0.016) (0.009) (0.008) (0.008) (0.015)
Constant -0.264 0.063 0.073 -0.534 -0.581 -0.473 0.036
(0.881) (0.0975) (0.994) (0.651) (0.612) (0.612) (0.929)
Obs. 156 120 156 156 156 156 156
Log Likelihood -79.282 -64.469 -64.297 -268.326 -260.291 -260.676 -55.838
Chi2 51.89***
37.12***
81.86***
31.14*** 47.21*** 46.44*** 26.23***
McFadden R2 0.2466 0.2235 0.3890 0.055 0.083 0.082
LR-test
29.97***
238.66***
210.61***
216.29***
Table 20: Regression results reproduced from Kolassa (2021) Tables 7 and 8

GA #774199
D 3.4 Dissemination Level: Public/Confidential Page 73 of 170
The results of the analysis in Kolassa (2021) are reproduced in
Dependent Variable
Method SURVIVAL
Logistic SIZE
Negative Binomial SURVIVAL Penalized
ML 1 2 3 4 5 6 7
SC (1/0)
Omitted
1.119***
4.057***
(0.286)
(1.454)
SC(score)
1.142***
0.292***
(0.358)
(0.078)
Online/Offline 0.792* 0.510 0.335 0.172 0.021 -0.145 0.455
(0.417) (0.463) (0.476) (0.281) (0.268) (0.279) (0.444)
Entrepreneurial Experience
1.420** 1.268* 1.302* 0.311 0.392 0.297 1.140
(0.694) (0.736) (0.754) (0.331) (0.312) (0.314) (0.689)
Founding Team -0.137 -0.156 -0.134 0.209 0.236 0.218 -0.134
(0.230) (0.258) (0.261) (0.186) (0.183) (0.184) (0.246)
Gender -0.827 -1.179* -1.190 -0.307 -0.514 -0.546 -1.082
(0.646) (0.710) (0.724) (0.444) (0.421) (0.425) (0.676)
Market 0.010 -0.381 -0.388 -0.238 -0.436 -0.456 -0.349
(0.418) (0.491) (0.505) (0.295) (0.286) (0.290) (0.470)
Age 0.065* 0.052***
0.045***
0.037*** 0.032*** 0.032*** 0.0474***
(0.015) (0.016) (0.016) (0.009) (0.008) (0.008) (0.015)
Constant -0.264 0.063 0.073 -0.534 -0.581 -0.473 0.036
(0.881) (0.0975) (0.994) (0.651) (0.612) (0.612) (0.929)
Obs. 156 120 156 156 156 156 156
Log Likelihood -79.282 -64.469 -64.297 -268.326 -260.291 -260.676 -55.838
Chi2 51.89***
37.12***
81.86***
31.14*** 47.21*** 46.44*** 26.23***
McFadden R2 0.2466 0.2235 0.3890 0.055 0.083 0.082
LR-test
29.97***
238.66***
210.61***
216.29***
Table 20. Models (1) and (4) are only including control variables. Instead, models (2) and (5) have been
run with the independent variable smart city start-up, and models (3) and (6) with the second independent
variable smart city score. The LR-test indicates that adding “smart city score” as an independent variable
to the model, is substantially improving the model fit (1% level).
The first interesting finding in the logistic regressions is the control variable entrepreneurial experience,
which was significant at all three models (5% and 10% level). More entrepreneurial experienced founders
survive longer. With a 10% level of significance, gender harms the survival within the full binary model of

GA #774199
D 3.4 Dissemination Level: Public/Confidential Page 74 of 170
the logistic regression. And we need to control for age in our regression (1% and 5% level) as predicted by
previous research by Soetanto and Jack (2013). The highest McFadden R2 value for survival has been
obtained by the model (3), pointing to the model's best fit with the independent variable smart city score.
Nonetheless, all models have a McFadden value between 0.2 and 0.4 and thus constitute a good model
fit (McFadden, 1973).
The independent variable of the model (2) is perfectly correlating with the dependent variable survival,
which is why it is omitted in the second model. Because determining the coefficient and standard error
for such a covariate in a regular logistic regression is theoretically impossible, the covariate is omitted,
along with the perfectly correlated observations (36) from the model. Kolassa (2021) proposed a solution
to overcome this (quasi) “complete” separation in our logistic regression model. To decrease bias in
generalized linear models, Firth (1993) proposed modifying the score equations. In logistic regression,
Heinze and Schemper (2002) proposed utilizing Firth's technique to address the problem of "separation",
a situation in which maximum likelihood estimates trend to infinity (become inestimable). Kolassa (2021)
was then able to include the SCI as an independent variable into the regression and obtained statistically
significant results for the whole model (1 % level) and the variables smart city start-up (1% level) and age
(1 % level) using all observations (156) in model (7) in Table 20.
The binary variable smart city start-up and the control variable age were thus found to affect the survival
rate of a start-up positively. All models of the negative binomial regression regarding the size of the start-
ups were statistically significant (1% level). The LR-test indicates that the first model has the best fit, which
was only run with control variables (4). In these regressions, Kolassa (2021) also obtained some significant
results for our coefficients. The independent variable smart city start-up is significant at a 1% level. Smart
city start-ups compared to “regular” start-ups are expected to have a 1.119 times greater number of
employees, while holding the other variables constant in the model. The same applies to the smart city
score, which is likewise statistically significant at a 1% level and positively impacts the size of start-ups.
Summary and Conclusions Using the indicators we developed for identifying smart city (user) innovations empirically, in this chapter
we have reported on the various studies that have been conducted with these indices to establish if and
in what way business incubation programs need to be adapted to facilitate and promote smart city (user)
innovations. Eveleens (2019) has first shown that business incubation has a positive impact on incubates
survival rates, investment, and employment growth and that such performance enhancement is NOT
related to the knowledge base a venture is founded upon. This is good news for developing a smart city
user innovation program, as it implies that we need not redesign the business incubation program from
the ground up to serve this purpose. However, the results in Morin (2019) and Eckinger and Sanders
(2019) show that business incubation programs attract only very few user innovations and indeed seem
to discriminate against them in their selection procedures. On the other hand, these studies also showed
that user innovations, like any other venture, do benefit from incubation programs. Hence, the challenge
will be to attract and select more user innovations into incubator programs, but there seems to be no
need to change these programs themselves. Studies by Picari (2020), Nijland (2020) and Kolassa (2021)
showed that smart city innovations benefit from business incubation. In Picari (2020) the effect was

GA #774199
D 3.4 Dissemination Level: Public/Confidential Page 75 of 170
insignificant in Nice, implying smart city innovations do not survive or grow more or less than non-smart
city incubates in incubation programs, while Nijland (2020) and Kolassa (2021) show positive and
significant effects for Utrecht and Goteborg.
Interestingly, Kolassa (2021) also showed that smart city business incubation has become more prevalent
over the past years at UtrechtInc, even if the smart city incubation seems to tick fewer boxes in our SCI-
index. We can conclude from these results that business incubation benefits smart city innovation, even
if it does not always benefit it more than non-smart city incubates. This implies that our program can
remain generic and open to non-smart city innovations. To promote smart city development through
business incubation, not the incubation program but the ideation stage of business creation needs to be
targeted. We return to this in Part 3. Part 2 will now describe how UtrechtInc used our early results to
improve the structure of their incubation program to support smart city incubates.

GA #774199
D 3.4 Dissemination Level: Public/Confidential Page 76 of 170
6. A Business Incubation Program to Support Smart City Development: The UtrechtInc Business Incubation Programs
UtrechtInc is a start-up incubator located in Utrecht, with a focus on start-ups with tech aspects. Currently,
UtrechtInc runs a new program, in which around 40 start-ups participate yearly, with an inflow moment
twice a year. Before IRIS and up to 2018, UtrechtInc had had three programs: one validation, one
acceleration, and one scaleup program. The validation program was focused on turning an idea into a
product. The acceleration program focused on finding the right market for the product and generating
initial revenue. The scaleup program focused on growing the revenue of the young venture. After a careful
internal review, and partly because of IRIS, UtrechtInc drastically overhauled its programs to facilitate
(user) smart-city innovation. From our analyses above, however, it was clear that smart city (user)
innovations do not really need targeted incubation programs. Therefore, the reforms were not geared
towards changing the contents of the programs but rather to better fit them to the different target groups
for recruiting (user smart city) business ideas. Specifically, the scaleup program was discontinued, the
acceleration program overhauled, and the validation program has been split into three different
programs, focusing on academics-based, students-based, and tech-focused teams, respectively. What was
the basis for this change? Did it succeed? This chapter presents some evidence from a series of in-depth
interviews, briefly explaining the design of their old and new programs, and UtrechtInc’s justification for
the pivot. We then identify the most significant benefits and pitfalls of the new programs.
Furthermore, we explore how the characteristics of the program are related to smart city start-ups. We
already concluded above that smart city start-ups have become more prevalent in the UtrechtInc
population of incubates. It is too early and rather complicated to link this directly and exclusively to the
changes made to the program, but we can conclude that the implemented pivot has not hurt UtrechtInc’s
ability to support smart city innovation. The lessons drawn from the above research and discussions with
the executives at UtrechtInc and their stakeholders resulted in a list of starting points for the pivot in the
UtrechtInc program that are summarised in Table 21.
On the design of an Incubator On Incubators and smart city start-ups
Team needs (with regards to training) are dependent on the team skill-set, not the product
Partitioning on the team skill-set/background seems productive
Validation programs need to focus on very early stages of product development
Smart city start-ups require similar incubation programs to normal start-ups.
Demands may vary, but not significant enough to warrant a separate program

GA #774199
D 3.4 Dissemination Level: Public/Confidential Page 77 of 170
The informal community and network created plays a very significant role in the success of an incubator
Current programs can produce and have produced a plethora of successful smart city start-ups
Spinout and user innovation are not very promising sources for incubateable smart city innovations
Table 21: Starting Points for Designing the New Incubation Program(s)
The incubation methods Globally, over 7,000 incubation programs aim to aid startups and ideas into full-fletched businesses
(Mulolli et al., 2017). UtrechtInc is one of these incubators, based in Utrecht. To participate, ideas of
potential startups require a tech-aspect; non-tech startups are not considered for participation. Originally
founded in 2009, UtrechtInc is and has been the starting ground for over 200 businesses, of which 64%
remains active today. The original founding partners of UtrechtInc are Utrecht University, University
Medical Center Utrecht, Utrecht University of Applied Sciences, the municipality of Utrecht, the Province
of Utrecht, and Rabobank. Being linked to major educational institutes of Utrecht, UtrechtInc focuses on
helping startups originating from academics and students and local tech practitioners. Overall, UtrechtInc
is a reputable incubator, spawning successful businesses such as FAQRA, GitLab, and SnappCar. Originally,
UtrechtInc aligned its incubation program to the stages identified in business incubation process models
and ran an incubation, validation, and acceleration program. Over the course of 2018, they worked on a
pivot towards three different incubation programs and a single validation program. These programs were
executed over the course of 2019 for the first time – with influx moments at the start of the year as well
as over summer. In total, 98 startups applied, out of which 38 eventually were accepted into the programs.
As UtrechtInc specialises in incubating tech-based start-ups and has an additional focus on smart-city
solutions, the weaknesses and strengths of their old and new programs and their motivations for
adaptation provide valuable lessons.
In general, incubators require a significant amount of time before major payoffs can be expected. Most
incubators adopt a business model in which they foster ideas with great potential, and the success of only
one or a few of these ideas can fund the incubator, at times generating a profit. UtrechtInc, in contrast to
many incubators, has a business model that requires incubates to pay minor fees for participation (as
commitment) and renting office space (albeit below market price). UtrechtInc, has a participation fee of
€1,500 for the tech and science-based programs, and €750 for the student-based programs. Prices for
office spaces differ but start with desk space costing €150 per month. Additionally, upon breaking
€150,000 turnover after 3, 4, or 5 years after completion of the program, start-ups must pay a set fee
between €3,600 and €18,000, depending on how high their turnover is. UtrechtInc is – by design – making
a loss, and local governments and sponsors partially fund the gap. This choice is made from the belief that
this model provides more breathing space for start-ups, as providing a suitable infrastructure is deemed
more important than making a profit.
In contrast, there are many different common practices for other incubators. These often either a) require
a stake (e.g. 5%) in the start-up, b) charge program fee’s, c) charge percentages of future financing rounds,
and/or d) charge royalties over future turnover for a set period of time.

GA #774199
D 3.4 Dissemination Level: Public/Confidential Page 78 of 170
In a smart city development context, it seems appropriate that the incubator does not charge the
incubates for full costs of the incubation. Subsidies and sponsoring can be justified by the fact that smart
city innovation typically generates positive spillovers and external effects that are hard for the startups to
monetize. Non-smart city incubates also generate such positive externalities and as the incubation activity
is similar both on the costs, risks, and benefits side, it is not advisable to try and distinguish between
incubates. Furthermore, making such distinctions might interfere with the community building and
knowledge exchanges that are sometimes of crucial importance in an incubator. Our research presented
in Part I, as well as, these more practical and operational considerations led to the conclusion that
incubation programs should not differentiate between smart city and non-smart city incubates in the
selection into or the contents of the programs. Instead, promoting smart city innovation requires targeted
activities in the ideation stage that precedes incubation and to which we return in Part 3.
The old incubation method Before 2019, UtrechtInc organized three yearly incubation programs: validation, acceleration, and scale-
up. To apply to such a program, a team would contact UtrechtInc with a one-paged idea description,
mainly focusing on the idea at hand and how the team expects this to be both a valid and scalable idea in
the future. The incubator thus assumes that both the team and idea have been formed before the
incubation process can start. If the one-pager is both of sufficient quality and meaningfully developed, the
team is invited for a pitch. In this pitch, the feasibility of the idea and the motivation, quality, diversity,
and versatility of the team are assessed. This assessment is done by employees of UtrechtInc and an
industry expert (often one of the current start-ups) and contains no set checklist of criteria. This jury is
asked to assess the quality of the idea presented and the quality of the team in rather general terms. The
final decision to incubate a start-up is up to this jury – after which a start-up can join the incubation
program (or not).
“Yes, we operated under the assumption that we would bring the incubates to the
next stage. In fact, that is what we still do, but we have redefined what that next
stage is. In the past, we selected incubates at the door and looked for startups that
had a product to develop into a successful start-up. But we have found that the main
problem for the market, our customers, the potential startups, is in the validation
stage. So, one step before the incubation stage. So, the researching of an idea. An
entrepreneur with an idea or a scientist with an idea. Not yet a team with an idea,
but people that say: “I have to develop this”, “I want to develop this” and: “Give me
tools to make it work”.” – Jorg Kop, General Manager at UtrechtInc
Upon entering the program, the teams behind the start-ups can rent a workplace (ranging from simple
desks to small offices), join workshops given by former participants or industry experts aiming to help the
business advance, and join informal events. This has the final aim of the start-up outgrowing the
incubation program, after which it can join first the validation then the acceleration program. After the
acceleration program, which primarily focuses on scale-up, the start-up should have grown into a full-
fletched business and thus have completed all programs.

GA #774199
D 3.4 Dissemination Level: Public/Confidential Page 79 of 170
The pre-IRIS incubation program lasted around 4 months, with regards to the work-shops participants
were asked to attend. On average, participation took 3 to 4 workdays a week for the first two weeks and
half a workday per 2 weeks after that: next to the management of the start-up itself.
Specifically, the 4-month programs aimed to:
• Learn about entrepreneurship
• Develop your entrepreneurial skills
• Create a blueprint for your (academic) start-up
• Validate to a successful business model
• Explore the market potential for your venture
• Work on a founder team
• Develop a road map for the next months
• Find the right follow-up (network, finance) Offering the following activities in the incubator:
• 2 day lean start-up training
• Business model canvas
• Masterclass Customer Discovery
• Legal Basics
• Masterclass: Team setup/composition/skills
• Masterclass: Design thinking
• Masterclass: Accounting & Financials
• Masterclass: Funding (Subsidies & Investors)
• Masterclass: Pitching
• biweekly progress session with an expert (entrepreneur) en UtrechtInc. An important part of this session is giving and receiving peer feedback from other start-ups in the program
• Mentor sessions during the program
• Access to monthly consultation hours with experts (legal/financial etc.)
A start-up was deemed to have completed the program when it generated (significant) turnover.
Participants came mainly from academia (both students and scientists) and practitioners aiming to build
their own idea into a company – which is also represented in the pivot. The number of applications ranged
between 30 and 40 per round, with around half of that number in accepted participants.
But UtrechtInc realized, as we did in the research presented above, that a program is vulnerable if it
focuses very specifically on start-ups and ideas that are exactly at the start of their incubation stage.
“There are simply too few start-ups in that stage, too few quality start-ups in that
stage.” – Jorg Kop, General Manager at UtrechtInc

GA #774199
D 3.4 Dissemination Level: Public/Confidential Page 80 of 170
The pivot in UtrechtInc aimed to broaden the inflow of participants by widening the funnel of ideas to
include less developed business ideas in earlier stages of development. As the pivot brings incubation
programs closer to the ideation stage, smart city ideation can easily feed into the programs.
The pivot: old versus new program After an extensive process of critical reflection, the team concluded that a new program was required.
“We have listened to our customers and what they wanted. It turned out that that
has changed gradually over the past few years and drifted away from what we
thought at the start of UI. And by listening to what your customer wants, you come to
programs that differ from each other.” – Jorg Kop, General Manager at UtrechtInc
First, the old program worked well in many aspects, which thus could be the same; with regards to
application, for example, little changed. The same goes for the fostering of informal support and
interaction between the participating start-ups. This has been recognized as one of the most important
factors to success – and will thus be more of a focus – but the system will remain relatively similar. On
other aspects, it was noted that improvements were needed.
Second, UtrechtInc noted that, upon entering, most start-ups were in a less advanced stage than initially
expected. Additionally, they found that their focus on the complete route from validation to scale-up
required a too diverse set of skills and resources. Third, they found that the workshops provided were not
always as helpful as hoped. This was not a quality issue, but different start-ups seemed to have vastly
different support needs because of the difference in the stage. Differences in needs seemed to be mostly
decided by the type of team supporting the product and said phase, rather than the type of product. Last,
as noted before, the positive informal atmosphere seemed to play a large role in the success of start-ups
and thus became a larger priority.
And although this pivot was broader and had more antecedents than the IRIS program, there was a clear
link between the need to develop more smart city innovation in the incubator and the pivot of 2019.
“I think IRIS has also contributed to the changes that we have now made. We have
spent a lot of time and energy in trying to promote start-ups in the IRIS transition
tracks but had to conclude that this was more difficult than originally envisioned.
Then you have to look if there are perhaps other ways to achieve the same
objectives.” – Jorg Kop, General Manager at UtrechtInc
New program The new system builds on the observations mentioned above. The first decisions were to discontinue the
scale-up program and to shift focus within the validation programs. The validation programs currently

GA #774199
D 3.4 Dissemination Level: Public/Confidential Page 81 of 170
focus on an earlier stage of product development. Just as before, UtrechtInc aims to guide start-ups from
their first nascent phase to the next phase, but in a sense, both phases have been redefined. Then, to
overcome the vastly different needs of start-ups, they split their validation programs into three programs:
science-based start-ups, student start-ups, and tech-focused start-ups. Last, to improve further positive
spillovers between start-ups, UtrechtInc increased the number of informal events.
Figure 5: Incubation Programmes at UtrechtInc - old vs new
The new incubation programs lasts 3 months for student-based start-ups, 10 months for science-based
start-ups, and 3 months for tech-based start-ups. They take up 8-24 hours per week for both the student-
and science-based programs and over 32 for the tech-based programs. These programs are all pre-
revenue, and a start-up is a successful participant if they reach the revenue phase, at which point they
can continue in the acceleration program.
Program Validation for Student startups
Validation for Science startups
Validation for Tech startups
Acceleration
Focus Interviews & experiments
Business development
Interviews & experiments
Introductions, investors & customers
How? Workshops & coaching
Workshops & coaching
Workshops & coaching
Masterclasses & mentoring
Commitment Parttime (8 – 24 hpw) Parttime (8 – 24 hpw) Fulltime (> 32 hpw) Fulltime (> 40 hpw)
Duration 4 months 10 months 3 months 4 months
Iterations per year 2x 1x 3x 2x
Stage Pre revenue Pre revenue Pre revenue Post revenue
Customer UU, UMCU or HU students
UU or UMCU scientists
UU, UMCU, HU alumni and others
All
Trainers Internal & graduates Internal & external & graduates
Internal & external & graduates
External & graduates

GA #774199
D 3.4 Dissemination Level: Public/Confidential Page 82 of 170
Progress sessions & coaching
Bi-weekly Monthly Bi-weekly Bi-weekly
Coaches Internal External External External
Mentor No Yes Yes Yes (at least 2)
No Yes Yes Yes (at least 2)
Expert consults monthly
No Yes (legal, accounting, etc.)
Yes (legal, accounting, etc.)
Yes (legal, accounting, etc.)
Online startup library Yes Yes Yes Yes
Rabo Pre Seed Fund No Yes, 18K after completion
Yes, 18K after completion
Yes, 50K during or after completion
Price Commitment fee (249 Euro)
Commitment fee (399 Euro)
899 Euro 1.499 Euro
Success fee Double Normal Normal Half
Max / ideal # per batch
20/10 10 / 5 20 / 10 10 / 5
Topics 1. Lean startup methodology
1. Business development
1. Lean startup methodology
1. Funding (early stage & VC)
2. Customer discovery
2. Customer discovery
2. Customer discovery
2. Grow the team
3. Experiments & MVP
3. MVP & IP 3. Experiments & MVP
3. Marketing
4. BMC 4. BMC 4. BMC 4. Sales
5. Pitching 5. Pitching 5. Pitching 5. Networking
6. Funding (basics) 6. Funding (basics) &
Grants 6. Funding (basics) 6. Media & PR
7. Founding team 7. Founding team 7. Founding team
8. Sales (basics)
Hours of online self study
33 33 35 33
Hours with U.I. graduates
3 4 3 4
Hours with trainers 23 31 33 34
Hours with coaches 7 7 3 6
Table 22: Overview of New UtrechtInc Programs
The student program requires a participation fee of €249 (with an increased fee upon success). Training
and coaching sessions are bi-weekly and provided by graduates and internal experts, focusing on the
basics such as pitching and funding. The Science program has a fee of €399. It consists of monthly
workshops, additionally provided by external experts, who also offer individual consultation focusing on
more complex matters such as legal or accounting aid. Topics additionally include slightly more complex
topics such as sales. Finally, the tech program is like the science program, albeit a bit more intense. The
fee is €899, and the workshops are bi-weekly. The maximum numbers of participants are 20, 10, and 20,
respectively, with the ideal number being at half capacity for each.
This three-way split represents three different types of teams; the student start-up program aims to
bridge the gap from the classroom to practice. Being aimed towards students means it is the cheapest
program for the participants and focuses much on practicality. The science-based program aims to
facilitate researchers in bridging the gap from academic and theoretical work to practical applications.
The tech program allows current (tech) practitioners to develop their own start-up, being a shorter
program and focusing more on the details. In this manner, UtrechtInc can now better target the individual

GA #774199
D 3.4 Dissemination Level: Public/Confidential Page 83 of 170
needs of teams. Long masterclasses on how to file taxes, for example, may not be relevant to experienced
academics or practitioners but may be highly valuable to students. Alternatively, masterclasses that focus
mainly on steering theory into practical solutions may help academics but are hardly relevant for those
already working as practitioners.
To engage the participants more and tailor the sessions to their needs, the didactical approach was also
adjusted. The workshops and sessions are more interactive, more engaging, and more focused on skills
than knowledge. The newly hired program and event coordinator:
“I give the example of the workshop on funding. In the old program that was a two-
hour session of lecture and knowledge transfer on that topic by one of our trainers
who knows a lot about that topic. Now we start with a 30-minute session in which
the participants meet and greet a graduate. They explain who they are, and then
questions and discussion emerge from the group that is there. After that, there is a 2-
hour interactive workshop or masterclass in which the trainer has given some
homework and material to be prepared in advance, so the participants are already up
to speed on the basics. The start-ups do this homework conscientiously and in the
session, the group can go into the details very fast. In special cases, we then add
several one-on-one consultation hours if needed. So, where this was first a one-size-
fits-all session to transfer knowledge, it is now a half-day filled with content around a
specific theme. That is a big difference, and they get a very diverse offer on different
themes, meeting various people.” – Robin Lechner, Program and Event Coordinator at
UtrechtInc
This approach also implies that the participants must take a bit more responsibility but get a lot more out
of the sessions, as they can tailor the contents to their individual needs. Such, more open validation and
incubation programs are more fitting for start-ups in a broader range of developmental stages and,
importantly, can accommodate ideas on a wider range between initial first ideas and a fully developed
business model. This implies the incubator can make the same resources available to more incubates and,
by playing this numbers game, incubate more and more successful start-ups with the given resources. The
approach to let start-ups take more responsibility in shaping their own incubation program allowed the
incubator to provide more tailored support and was consistently implemented.
“What we did well is that we stimulated the start-ups at the right time to go into
action themselves. Mentoring Day for example, we have shaped very differently. In
the old program, we were trying to match the mentors and the start-ups. Now we
organized an evening in which the start-ups pitched their ideas to the mentors and
then had informal drinks. The start-ups did get the mentors' profiles in advance but
had to pitch and approach them themselves. That worked very well.” – Robin
Lechner, Program and Event Coordinator at UtrechtInc

GA #774199
D 3.4 Dissemination Level: Public/Confidential Page 84 of 170
Note that there no differences in the program are introduced based on the sector or product of the start-
up. As mentioned before, all start-ups at UtrechtInc must have a tech-based concept, but the needs per
concept do not differ significantly enough to separate programs on the bases of product-type or sector.
Indeed, not every workshop is always equally relevant, but separation by stage and background of the
team seems much more suitable than doing so by sector or technology. Although to truly measure
outcomes quite some time is needed as start-ups require time to grow, the staff and participants already
indicate they are much more satisfied with the new programs.
“Yes, I feel good about this. I have recently executed the program evaluation and in it
the program participants indicated they are very satisfied. We get a lot of good
feedback and when someone misses something, or a workshop missed depth, then
we can offer it again. So, it was pretty easy to keep the participants happy as we can
target our resources on what the start-ups need at that moment. They also very
much appreciate the community here. That is something that we have worked hard
to achieve. To make sure that the community grows larger and closer and really
works for the start-ups.” – Robin Lechner, Program and Event Coordinator at
UtrechtInc
Furthermore, this is reflected in the significant growth of applications that UtrechtInc has seen over the
past year, illustrating that the programs have been attracting more attention due to word-to-mouth
communication.
The UtrechtInc team notes that some improvements may still be possible – though typically trade-offs are
involved. At times, the usefulness of masterclasses could be improved – not every masterclass is yet
relevant for everyone, and some topics which may be relevant for a few could currently be missed. Yet,
this is a trade-off between masterclass quality and costs. More classes would mean higher costs, and at
this point the gains seem insufficient to warrant making the program less affordable. The program and
events coordinator:
“Absolutely. I have several trainers I would like to engage but who are too expensive.
I could also make the program much nicer if there would be more financial resources,
also when it comes to coaching. But we need to make trade-offs between what we
would like, how we can optimize our program and how we can remain responsible
towards our sponsors and financial partners. I do not know exactly how things are
organized, but the money comes from somewhere and we cannot throw it around to
make the program perfect. With more financial resources we can push the program
from an 8 to a 10. But that is about it. I would not change the fundamental approach
or the themes. I would expand on the coaching and try to motivate the start-ups to
work even more in the incubator to build the community.” – Robin Lechner, Program
and Event Coordinator at UtrechtInc

GA #774199
D 3.4 Dissemination Level: Public/Confidential Page 85 of 170
Alternatively, more online integration of the program could also prove convenient for participating start-
ups. UtrechtInc is a founding partner in StartupMe, an online platform for start-ups in the Netherlands
and was active in online business incubation before the COVID-19 lockdowns. That forced UtrechtInc to
fully develop online incubation programs. But although online can complement the offline incubation
program, going 100% online may reduce the benefits from informal contacts with other start-ups, an
intangible factor of which the benefits are very often highlighted and cannot be underestimated.
In general, many different choices on program design, business model, and program partitioning are
possible. Most important, however seems to be an affordable program that caters sufficiently to the
individual team’s needs. That is best “organised” by putting the star-ups in the driver seat and stimulating
them to take the initiative and shape their own incubation program while continuously fostering informal
community forming. The participants appreciated the combination of feeling autonomy and support in
the first waves of the new program, even if it is too early to tell if the new program is more successful
than the old on the more traditional measures of incubation success and failure.
COVID-19 and digitalization Besides the previously mentioned programs, UtrechtInc has been in the process of rolling out a digital
program. This allows participants from all geographic regions and is less time consuming than the original
programs. In addition, there are communal workshops and meetings. Part of this process has been
implemented on the traditional program as well, due to COVID-19. COVID-19 made physical meetings in
larger groups impossible, and UtrechtInc was forced to move parts of its program online entirely.
UtrechtInc identifies its digital program as an opportunity to share knowledge more efficiently with a
broader audience. This may be useful to start-ups inconveniently located or those having a hard time
attending physical meetings. Whilst participants are generally satisfied, the team does note one crucial
difference; a digital environment does not allow for a similar community creation as the physical program
– while this is identified as one of the most beneficial aspects to participants. This is partially overcome
by providing similar informal events digitally. Those events have been more successful than previously
imagined, but the difference in community building still is noticeable, and something UtrechtInc aims to
improve upon.
Additional conclusions for smart city start-ups All start-ups in the programs of UtrechtInc have a technological aspect at their core. Many of these start-
ups could also be classified as providing smart city solutions (see Kolassa, 2021). As we have reported
above, the new programs attracted some 40 incubates of which about half were accepted over the various
waves since the pivot in 2019. To tentatively compare the results of the new versus the old programs at
UtrechtInc, we can compare the descriptive statistics for Kolassa’s (2021) 168 incubates in the period
2017-2020, that includes the new program (reproduced from Table 2 in Kolassa (2021) below) to the 259
start-ups that enrolled in the programs studied by Eveleens (2019) between 2014 and 2017 (reproduced
from Table 6 in Eveleens (2019), below). In both samples, about half survived for a year after the last

GA #774199
D 3.4 Dissemination Level: Public/Confidential Page 86 of 170
program.14 Also, on size, measured as employment at the data collection date, the averages for the
Eveleens’ data are higher and feature a very high standard deviation, implying the difference is not likely
to be significant. As Kolassa (2021) could not obtain data on investments and growth, the comparison on
these incubation outcome measures is not yet possible.
Moreover, these numbers cannot be compared in any meaningful way with similar statistics on the old
program as especially the years 2020 and 2021 were exceptional because of the COVID lockdowns. We
therefore tentatively conclude that inflow of start-ups at UtrechtInc has unambiguously increased, the
prevalence of smart city start-ups in their programs has increased (cf. the descriptive statistics in Nijland
(2020), Picari (2020) and Hermse et al. (2020) who coded the Utrecht data collected by Eveleens (2019)
using the SCI) and their survival and size have not suffered visibly and significantly despite the COVID-19
restrictions put on the new program in the last iterations. Without further data collection and analysis, it
is impossible to say anything about whether these effects are caused by the pivots in the program. It is
possible that these changes would have occurred also under the old programs. To conclude causality, we
would need to compare to a representative control group that has not been given access to the new
program. Such a design, however, was not feasible and outside the scope of the IRIS project.
Variable Obs Mean Std. Dev. Min Max
Survival 269 0.654 0.476 0 1
Size 269 3.734 5.755 0 38
Growth 269 1.054 5.732 -8 36
Investments 269 0.100 0.301 0 1
Table 23: Descriptives reproduced from Eveleens (2019) Table 6
Variable Obs Mean Std. Dev. Min Max
Survival 168 0.554 0.497 0 1 Size 168 1.875 3.163 0 15 Smart City (1/0) 168 0.214 0.411 0 1 SCI-score 168 1.000 1.741 0 6
Table 24: Descriptives reproduced from Kolassa (2021) Table 2
Therefore, the above is not a formal quantitative evaluation of the differential impact the new incubation
program at UtrechtInc had on smart city business model development in Lighthouse City Utrecht. But the
data do give a first indication. In Part 1 of this report, our research concluded that smart city business
incubation was unlikely to require different incubation programs and approaches. This is not surprising
when we consider that business incubation, in general, is very much tailored to the needs of the incubate
and the fact that many smart city innovations find themselves facing the same challenges other (tech)
start-ups typically face. We also found that, despite our efforts, innovative (employees at) incumbent
firms and users, for different reasons, are hard to draw into business incubation programs. This has led
UtrechtInc to decide against more drastic interventions, like for example, providing a validation program
14 It should be noted that in the Eveleens’ (2019) dataset this can be survival up to 4 years, whereas in Kolassa (2021) it was restricted to 1 year. Also, the Kolassa (2021) dataset contains all start-ups that were incubated online, due to COVID-19 lockdowns.

GA #774199
D 3.4 Dissemination Level: Public/Confidential Page 87 of 170
specifically aimed at smart-city start-ups or user innovations. The benefits of being able to cater better to
their specific needs would be trumped by the loss of important economies of scale and access to common
networks and communities for the start-ups. Instead, we shifted our focus to organising events that would
help feed more smart city (user) innovations into the incubator. The pivoted program could then help
these innovations to the next stage in their development exactly because they could network them with
start-ups and support infrastructures that also non-smart city innovators benefit from and help shape.
Therefore, we concluded with UtrechtInc that the needs of teams should be the focus of the program
reform and the same infrastructure supporting tech start-ups, in general, will allow smart city start-ups to
flourish. Having more inclusive incubators that are able to tailor their services and support to the needs
of the incubates will thus benefit smart city development and innovation alike.
“We have chosen for an approach which is certainly also applicable to smart city
[start-ups]’’ – Jorg Kop, General Manager at UtrechtInc
What smart city managers (and incubators) can do to promote more smart city (user) innovation in their
respective cities specifically, is organise events and activities that challenge would-be entrepreneurs to
think about and formulate solutions for smart city challenges. We believe smart city developers can team
up with incubators to promote new business model development during this pre-incubation stage of
ideation. To stay faithful to our original task of providing tools and recipes to promote smart city business
model development, we report on the ideation activities we have (co)organised and monitored. We
believe, even if this caused us to deviate from the originally planned activities under Task 3.4 that using
the results of scientific research to make improvements to, in this case, incubation practices is a more
fruitful and cost-effective way to spend our resources.

GA #774199
D 3.4 Dissemination Level: Public/Confidential Page 88 of 170
7. Taking stock of ideation tools available from the literature and selecting the right recipe.15
In smart city development, as in IRIS, city planners and business developers alike face the challenge to
involve citizens. The most interesting and useful stage for citizens to be involved in is when their
involvement can still significantly impact the outcomes. Therefore, before we go into ideation for smart
city development, we want to discuss the use of citizen engagement in these ideation tools first. Different
ideation tools have been implemented throughout European smart city projects, but to date this has
attracted little academic attention, especially for the non-financial benefits that can be obtained through
different ideation tools. This chapter is based on a research project that contributed to filling this gap by
contrasting civic hackathons, innovation crowdsourcing and civic crowdfunding in terms of the potential
benefits obtained and type of knowledge produced. To examine this topic, 8 interviews with ideation
event initiators and platforms were conducted and coded. The findings indicate that smart city planners
should select the most suitable ideation tools depending on which potential non-financial benefit they
wish to pursue: community building, citizen-oriented decision-making, continuous citizen involvement or
image improvement. In our research, we analysed and contrasted three ideation tools increasingly used
in different European Smart City projects: civic hackathons, innovation crowdsourcing, and civic
crowdfunding. These three tools were selected based on the frequency of use and will be explained in the
following sections. We then conducted interviews with the organisers of such activities to hear their
experiences. Data collected through these interviews were analysed using a three-cycle coding method
focusing on a better understanding of the benefits obtained through civic ideation initiatives.
Interviews and Findings Eight interviews were conducted with people who have experienced a civic ideation tool's planning and
implementation phases. Table 1, reproduced from (Meraza Farfan, 2018), briefly describes the
interviewees.
Interviewee Civic Ideation Tool EU City Country Initiative/Organisation Role Specific role Date Duration Channel
1 Civic Hackathon Utrecht NL UtrechtInc Platform Organisation Leader 16/05/2018 01:24 F2F
2 Civic Hackathon Utrecht NL Avicenna hackathon Initiator Board executive 29/05/2018 01:16 F2F
3 Innovation Crowdsourcing Amsterdam NL Agru Platform Founder 02/05/2018 01:31 F2F
4 Innovation Crowdsourcing Brussels BE Citizen Lab Platform Founder 30/04/2018 00:36 TEL
5 Innovation Crowdsourcing Rotterdam NL City Lab 010 Initiator Municipality Leader 07/05/2018 00:32 TEL
15 This chapter is a reworked version of the MSc. thesis published as (Meraza Farfan, 2018) and contains (verbatim) quotes from that source.

GA #774199
D 3.4 Dissemination Level: Public/Confidential Page 89 of 170
6 Civic Crowdfunding London UK Crowdfunding London Initiator Municipality Leader 30/04/2018 00:41 TEL
7 Civic Crowdfunding Utrecht NL Voor je buurt Platform Manager 07/05/2018 00:38 TEL
8 Civic Crowdfunding North-Holland NL 1% Club Initiator Municipality Leader 02/05/2018 01:40 F2F
Table 25: Interviewees reproduced from Meraza-Farfan (2018) Table B1
Of course, the number of interviews limits the generalisability of our results. As there is very little data
and research out there to answer our specific research questions, our results can be considered a first
attempt at systematically collecting evidence on what ideation tools might create what type of benefits
for smart city development. To be able to at least cross-validate the information from the interviews
somewhat, at least two interviews per civic ideation tool were conducted. Interview transcripts were then
analysed, organised, and compared. For the analysis of this research, a three-cycle coding process was
applied. During the first cycle, two interview transcripts were coded in themes based on literature.
Afterwards, the rest of the transcripts were coded in the second cycle, taking the first cycle codes as a
basis. However, since first cycle themes were insufficient, other themes were added to ensure that no
critical information was lost. Finally, the third cycle consisted in finding patterns and relationships
regarding the research question and sub-questions.
After several iterations of revising and reorder codes, the final themes were defined. Themes were
contrasted to avoid redundancy on references and concepts. The code hierarchy was analysed with special
attention to making a comparison between the three civic ideation tools. According to the three sub-
questions of this chapter, the tools were compared on three aspects: non-financial benefits, knowledge
produced, and challenges faced. Finally, we compared between the literature and our empirical results.
Tables 25 and 26 below summarize the results on non-financial benefits and knowledge produced
respectively:
Coded Quotes and
Sample Quotes Innovation
Crowdsourcing Civic
hackathon Civic
crowdfunding Total
Coded Quotes
No
n-f
inan
cial
ben
efit
s
Community building
67 (31,9%) [25,8%] “[…] It really helps to build your [Smart City] platform using this viral effect “
62 (29,5%) [40,5%] “[…] the goal was to make people [citizens] enthusiastic about meeting others.”
81 (38,6%) [56,6%] “These were people [citizens] that never worked together before toward a common goal.”
210 (100%) [37,8%]
Continuous citizen involvement
105 (61,7%) [40,4%] ¨ […] give feedback and also enough possibility for citizens to give you input more than once.”
46 (27,0%) [30,3%] “We [initiators] kept track of the people who won the prices via email and LinkedIn […]”
19 (11,1%) [13,3%] “ […] apart from posting results, they can post an update of the impact the projects are having.”
170 (100%) [30,6%]
Image improvement
32 (34,4%) [12,3%]
35 (37,6%) [22,9%]
26 (27,9%) [18,2%]
93 (100%) [16,7%]

GA #774199
D 3.4 Dissemination Level: Public/Confidential Page 90 of 170
“So only through the acquisition of participant you [municipalities] get a lot of exposure […]”
“the benefit is more about the impact, the visibility, the story telling they can do with those projects [...]”
Citizen oriented decision-making
56 (67,5%) [21,5%] “The interface designed dashboard of the discussion is valid and useful as a report of the discussion […]”
10 (12,0%) [6,5%]
17 (20,5%) [11,9%]
83 (100%) [14,9%]
Total Coded Quotes
260 (46,8%) [100%]
153 (27,5%) [100%]
143 (25,7%) [100%]
556 (100%) [100%]
Table 26: Summary of the results on non-financial benefits
Considering the “non-financial benefits”, four main themes were coded. The most frequently mentioned
was community building (37,8%), which refers to the ability to create and nurture relationships between
initiator, citizens, and other stakeholders. The next most relevant theme relates to the facility for initiators
to go back to citizens and ideas as needed over time, which we will refer to as “continuous citizen
involvement” (30,6%). The third theme found is referred to as “citizen-oriented decision making” (14,9%),
which points out the increased attention to citizens from their municipality. The fourth and last main
theme identified the “image improvement” (16,7%) of the city in becoming smarter and more citizen-
oriented.
Coded Quotes and Sample Quotes
Innovation Crowdsourcing
Civic hackathon
Civic crowdfunding
Total Coded Quotes
Kn
ow
led
ge p
rod
uce
d
Early stage ideas
8 (47,0%) [57,1%] “[...] promotes civic discussions and solution-oriented discussions.”
5 (29,4%) [25,0%]
4 (23,5%) [25,0%]
17 (100%) [34,0%]
Prototype 1 (6,7%) [7,1%]
11 (73,3%) [55,0%] “It could either be an app, prototype […]”
3 (20,0%) [18,8%]
15 (100%) [30,0%]
Ready-to- implement
5 (27,7%) [35,7%]
4 (22,2%) [20,0%]
9 (50,0%) [56,3%] “[…] project proofs if they get to achieve the initial promise.”
18 (100%) [36,0%]
Total Coded Quotes
14 (28,0%) [100%]
20 (40,0%) [100%]
16 (32,0%) [100%]
50 (100%) [100%]

GA #774199
D 3.4 Dissemination Level: Public/Confidential Page 91 of 170
Ch
alle
nge
s Relevant problem
Resources for continuity Marketing strategy
Coaches & experts Resources: promotion Data access Outcome ownership
Skepticism Inclusiveness
Li
tera
ture
Theme related solution Structure process Continuity
Validates prototype On-going communication Innovative branding
Transparent process Community support Project strategic planning
Table 27: Summary of the results on knowledge produced
A lot less was commented on the “knowledge produced” aspect of ideation activities (50 versus 556 on
non-financial benefits), possibly reflecting that the initiators and platform providers we interviewed were
less interested in the outcomes than the process. Still, we can identify three main themes reflecting how
readily useable the input collected from the ideation tools was. The first theme indicates that more
conceptual input is generated by citizens, which is referred to as “early-stage ideas” (34%). The next theme
considers “prototypes” as the knowledge produced (30%), which indicates a more developed and
validated solution. Finally, the theme of “ready-to-use solutions” (36%) emerged from the input that is
closer to an implementation phase.
The challenges mentioned in our interviews, as well as the strengths and weaknesses mentioned in the
literature, obviously differ by ideation activity. In addition, there are some remarkable differences across
the three ideation tools we have covered. We discuss these tools in a bit more detail below.
Innovation Crowdsourcing Innovation crowdsourcing taps into the wisdom of the crowd to develop innovative ideas on how to
address a well-specified challenge. Continuous citizen involvement seems to be the most significant
aspect for innovation crowdsourcing (105 quotes out of 260). Innovation crowdsourcing can take place in
a digital or physical environment depending on the strategy developed by the initiator. To implement this
ideation tool, initiators can either use an existing platform or build their own from scratch. According to
our interviews, the initiators preferred to join an existing platform as a tailor-made solution that gave
them a defined process with clear steps to follow. Moreover, the existing platform gave the initiator
access to the best practices of smart city development applied in previous ideation initiatives. Relying on
platform expertise on effective civic ideation processes is perceived as an important benefit that our
interviewees repeatedly mentioned:
“we [platform] developed a methodology to help cities on different ideation
processes. We provide them with all support. For the cities [innovation
crowdsourcing] is still very new, so we help them design each process depending on
their purpose” (Interviewee 3)

GA #774199
D 3.4 Dissemination Level: Public/Confidential Page 92 of 170
Both innovation crowdsourcing platforms studied developed their own methodology to achieve citizens
participation. The continuity of the ideation initiative is a key element for innovation crowdsourcing
success due to the difficulty of keeping track of citizens’ ideas. Therefore, it is relevant to achieve the
purpose of continuous citizen participation in public initiatives (Schuurman et al., 2012). When citizens
participate in a crowdsourcing initiative, they are interested in receiving follow-up regarding the ideation
process. Therefore, founders from both platforms always recommend initiators to give constant feedback
to idea contributors during and after the ideation process.
“[…] is important to give continuity, what I mean by that is that you [initiator] need to
make sure you give feedback and also enough possibility for citizens to give you input
more than once.” (Interviewee 4)
In addition to scoring high on continuous citizen involvement (61,7%), innovation crowdsourcing
initiatives also received the most references to citizen-oriented decision making (67,5%). Most of the
respondents from this civic ideation tool considered that getting information facilitates their decision-
making process within the municipality. Gathering information from citizens through digital platforms
enables initiators to translate this information into discussion material for internal meetings.
“The interface designed dashboard of the discussion is valid and useful as a report of
the discussion. So, it provides an overview of the problem, the solutions and the pros
and cons [comments]. And of course, how many people voted [in favor of] each of
them.” (Interviewee 3)
Through innovation crowdsourcing, initiators get both quantitative and qualitative data. In most cases,
respondents 3 and 4 identified a tendency of initiators to rely more on the quantitative data, such as the
number of votes or arguments against the ideas. This can help them make faster decisions. However, the
drawback is leaving out the interesting arguments and thoughts presented by citizens as qualitative data.
As interviewee 3 mentioned, the quantitative approach might be a natural preference for municipalities
due to its similarity to a democratic decision, in which most votes are what matters.
“[…] all that time I was really hoping to for this government to look at the arguments,
look at the discussion. […] And the question is how municipalities deal with this kind
of input and I am afraid that they overly rely on like the processes input. And they
focus more on the quantitative input, and I think qualitative input is way more
valuable.” (Interviewee 3)

GA #774199
D 3.4 Dissemination Level: Public/Confidential Page 93 of 170
Finally, citizen-oriented decision-making is possible after a crowdsourcing initiative due to understanding
citizen priorities and interests. Understanding their real needs is considered by interviewees the first step
to achieve the desired orientation in decision-making:
“For instance, our policymakers are mainly concern about bike lanes in their cities,
while most of the people [citizens] are more concerned about not having enough
parking space to go the butcher.” (Interviewee 4)
Community building is essential across all three types of ideation activity. As expected from the literature,
smart city planners seek to build or improve a relationship with citizens and identify or develop new
communities that enhance the implementation of initiatives (Certoma et al., 2015). For our interview
respondents, community building plays a vital role during the planning phase of the ideation. Respondents
from crowdsourcing initiatives acknowledge the community-building benefits between the initiator and
participants. In the three initiatives we discussed, an open dialogue was created within the ideation
process, where the initiator takes an active role in communication and feedback. Interviewees repeatedly
mentioned Co-creation as a practice to strengthen the relationship between municipality and citizens:
“Also, the idea of co-creating enables citizens and the city to work together and
achieve something new. This is also a new way of government”. (Interviewee 5)
Co-creation leads to a better acceptance of public decisions and gain support from citizens (Schaffers et
al., 2011). This element is considered in the ideation process planning when initiators decide how to
interact with participants during the smart city development. In innovation crowdsourcing challenges, co-
creation is a crucial element where citizens interact directly with initiators. This personal approach was
considered by respondents a strong benefit for building a community with citizens due to the support
element and face-to-face interaction on top of the digital communication. For crowdsourcing initiatives,
the co-creation element needs to be planned to make sure municipality staff and citizens have an
interaction element throughout the process.
Also, citizens should not encounter barriers to share their ideas on a platform. The aim is to get as many
participants as possible to gain more knowledge, better solutions, and bigger communities. Thus,
respondents emphasized the need to avoid complicated and unnecessary steps to access the forums.
Moreover, municipalities should select problems that are both relevant and clear for citizens. Since the
description of the problem or task asked by the initiator might pose a barrier for the crowd to participate
(Brabham, 2008), initiators should prevent such barriers for citizens to get involved.
According to respondents, problems presented should focus on specific and local problems easy to relate
to for citizens. Furthermore, citizens should understand what is expected of them, not only in terms of
the ideas provided but also in the interaction that crowdsourcing requires. For instance, it should be

GA #774199
D 3.4 Dissemination Level: Public/Confidential Page 94 of 170
communicated from the beginning that it is important to interact with municipality staff, comment on
others’ ideas or vote for an idea different than their own.
Finally, community building among citizens emerged as important during the interviews. As mentioned
before, open call platforms focus in seeking for local solutions to specific problems pinpointed by the
municipality. Consequently, most of the citizens are motivated to participate due to the direct impact that
this solution will make in their neighbourhood. This implies that citizens living in the same area are going
to be participating in the same platform by posting their ideas and commenting on each other´s proposals.
This creates the possibility for offline interaction that may emerge, allowing citizens from the same
neighbourhood to communicate directly and co-create. In addition, outside the platform, citizens´
communities can be built and strengthened because of the crowdsourcing initiative:
“And when people [citizens] started to post ideas, they started to activate friends and
family through Facebook or through their social networks. That also helped for the
sake of discussion. That is really a big interaction that causes a lot of additional users
[citizens]. It really helps to build your [Smart City] platform using this viral effect.”
(Interviewee 3)
Innovation crowdsourcing as an ideation tool produces a variety of ideas depending on factors such as
problem specification, type of participation and rewards. Problem specification refers to the extent in
which initiators present the call for ideas to citizens in terms of specific requirements. For all the initiatives,
this characteristic is key to determine the level of detail and development of the ideas obtained from the
ideation tool. Interviewee respondents consider that the more specific the problem is, more readily
implementable the solutions obtained are. Nonetheless, through crowdsourcing platforms, knowledge
produced is usually an early-stage idea. Therefore, problem specification in an innovation contest is a
priority for initiators. Establishing themes or topics is consequently helpful for initiators to narrow the
scope of knowledge produced. This strategy was implemented in CityLab 010 and incentivized with the
possibility to get funds from the municipality budget. According to interviewee 5, if this incentive would
not exist the knowledge produced would not be feasible for implementation.
“If you [municipality] are looking for ideas and you really want them [citizens] to put
effort and time into creating a great idea, make sure that there is a reward”
(Interviewee 3)
In short, the innovation crowdsourcing initiatives and platforms we discussed were quite strong in
generating continued citizen involvement and citizen-oriented decision making. In contrast, the events
scored comparably to the other ideation tools on community building and image improvement. An
innovation crowdsourcing campaign, however, does put significant strains on the smart city planners. The
contest needs to be incentivized and quite a bit of time, effort and energy needs to be spent on identifying,

GA #774199
D 3.4 Dissemination Level: Public/Confidential Page 95 of 170
developing, and clearly communicating the challenges. Nevertheless, the innovation crowdfunding tool
should be part of smart city planners' standard toolkit that cares about citizen engagement and is willing
to involve citizens in the early stages of smart city planning.
Civic Hackathons Civic hackathons are comparable to innovation crowdsourcing but typically smaller scale and more
focused in scope and time. Where a crowdsourcing campaign can run online, for large groups and over
extended periods of time, the hackathon is typically more focused on a specific problem and takes place
on-site in a short period of time. The civic hackathons initiatives studied in this chapter took place in the
Netherlands, where according to our respondents, these events are gaining attention from companies
and citizens. Citizen participation was higher than expected in most of the hackathons organized by
interviewees. There typically is a marketing strategy behind this ideation tool to acquire participants. This,
perhaps, explains their relatively high score on community building and image improvement.
Depending on the nature and topic of the hackathon, promotion can make use of different channels.
Partnerships with organizations in the field and the business sector are highly relevant to get a higher
spread and scope. For instance, in a hackathon related to e-health solutions, partnerships with health
research institutes, universities and pharmaceutical companies will make a big difference in terms of
quantity and quality of participants. This also implies that one typically applies more selective criteria for
participants in this civic ideation tool.
Because of the marketing strategy to acquire the right participants, the branding and image of the initiator
are enhanced (if it is done well). Interview respondents underlined the image effect associated with
hackathons:
“So only through the acquisition of participant you [municipalities] get a lot of
exposure, and also during the event you also have a press release after the final. It is
a new, positive, innovative news. A lot of media channels or partners are willing to
share that kind of news. It also involves like the Netherlands as a society, with a
message of innovation can be for everyone.” (Interviewee 1)
The development of smart cities is strongly related to the technological element as an enabler to improve
services for citizens. Therefore, using an ideation tool that has an innovation and technology concept
closely interrelated helps build a consistent image in the eyes of citizens.
By initiating a hackathon, the municipality can brand itself as innovative and technologically inclined,
which fits the smart city concept and therefore generate benefits beyond the hackathon itself in recruiting
and mobilizing citizens for smart city developments in other ways. The benefits of this branding are also
observed in the number of applications to participate:

GA #774199
D 3.4 Dissemination Level: Public/Confidential Page 96 of 170
“[awareness] is something that is easily achieved, because you [municipality] are
building a website, logo, get out there and if you get 80 participants then we have
120 applications, and you reach out through a lot of channels. There is big marketing
strategy behind it, it is a big campaign.” (Interviewee 1)
Civic hackathons also enable people to work together in a multi-disciplinary approach. Participants have
different backgrounds and expertise that complement each other in building a solution for the challenge
set by the initiator. Early on, hackathons were mainly receiving applicants from IT backgrounds who were
experienced and interested in programming skills. However, current hackathons are looking to attract
people from all sorts of backgrounds to motivate more innovative solutions that consider different
perspectives in addition to the digital and technical ones. Thus, jury members in hackathons are no longer
technology experts exclusively. Instead, juries are formed by business, social and science experts related
to the hackathon theme. This approach makes the hackathon a strong tool in community building:
“[…] the goal was to make people [citizens] enthusiastic about meeting others who
see the same problem and come with ideas.” (Interviewee 2)
Citizen’s networking benefits the initiator due to its contribution in achieving citizens interested in smart
city challenges. Access to specialized talent is also part of the non-financial benefit gained by the initiator:
“One of the main goals is to get in touch with talented people within IT
or programmer sector who are in high demand. They [initiators] really want this, it is
also very important for the initiator to have enough people and connect with
participants. We have coaches in the hackathons. There is a lot of networking going
on.” (Interviewee 1)
Respondents also emphasized the importance of the concept is to facilitate an informal, fun and
interactive environment for participants to come with innovative solutions and allow a better integration
among teams. Due to the complementary activities during the event such as ping-pong matches,
workshops, and dinners, the community building is encouraged.
Typically, more than half of the participants do not register together with a team. Thus, teams are formed
between people who did not know each other beforehand. Interview respondents consider a strong
characteristic of hackathons that the team formation usually occurs at the event's beginning. Although
not all teams continue with implementing their idea together, interviewees mentioned that participants
started a new active network after the civic hackathon that extends the impact of the initiative.

GA #774199
D 3.4 Dissemination Level: Public/Confidential Page 97 of 170
Civic hackathons create an open environment in which participants are open to sharing their ideas with
initiator staff. Based on the experience of the respondents, this learning process also motivates an
innovative organizational culture within the municipality:
“The third goal is the internal culture to change internally, they [initiators] want to
inspire their own employees or management to get them more in an innovative
mindset and stimulate them to come out of their comfort zone so they think more out
of the box.” (Interviewee 1)
Civic hackathons typically last between 24 and 48 hours. Due to this limited time to develop solutions
worth pitching in front of the jury, the fast-paced progress experienced by the teams is characteristic of
this ideation tool. However, after this fast experience, it is challenging to generate continuity and build a
relationship with participants. Only by taking special action is how initiators can get continuous citizen
involvement. Normally, a follow-up is not given to all participants from hackathons initiatives because
there is a natural focus on the winners. And since the participant team is typically the owner of the solution
created, the implementation is completely its responsibility. Due to the uncertain results at the beginning
of the planning phase, initiators have difficulty managing expectations and partnering with (winning)
teams. After the hackathon, some teams will look for expert advice from the initiator or a validation from
a customer perspective. That provides a valuable way to build the relationship, but not all initiators are
interested.
“After the hackathon, some initiators got involved, some others didn't. Sometimes
they were involved more as a validation for the solution.” (Interviewee 2)
In case that initiators look for solutions to invest in, they prefer to count on an intermediary to manage
the progress and communication between them and the team. For instance, interviewee 2 indicated one
way to keep a continuous citizen involvement was to give winners a business model consultancy program
as their prize:
“The key factor to follow up with the solutions was to give the prizes in which the
company and the team get involved, as consultancy sessions.” (Interviewee 2)
Civic hackathons organizers/platforms act as a middleman between initiators and participants throughout
the process. After a civic hackathon is finished, they may connect them again to allow for continuity. But
this needs to be planned carefully in advance if continuous citizen involvement is desired. Offering the
winning teams of a hackathon a place in a business incubator like UtrechtInc can be an effective way to
keep (citizen) engagement high and at the same time ensure a higher inflow of viable smart city

GA #774199
D 3.4 Dissemination Level: Public/Confidential Page 98 of 170
innovations into the incubator program. Our respondents highlighted, however, that initiators typically
do not invest resources in this last phase. Hence, they do not take an active role to follow-up with teams
with the best solutions. Normally, a lack of resources in terms of people and time prevents initiators from
either incorporating the solution into their organisation or taking the investor role. In IRIS, we have tried
to organise a hackathon (ChangeU, see Chapter 8.5.) to see if we could overcome this problem.
The knowledge produced during a civic hackathon is entirely developed during the hackathon, meaning
they have a very limited time to create a product further than a prototype that, in most cases, is validated
with potential customers. To achieve this level of knowledge production, workshops on problem-oriented
perspective, lean start-up and customer validation are given to participants. Some tools to build
prototypes that are not digital applications are available for teams to use, such as building materials and
3D printers. These characteristics and facilities allow hackathons to produce prototypes as the most
common knowledge produced.
Since the knowledge produced is not limited to digital applications, teams can create different types of
knowledge. They are expected to give a pitch in front of a jury that will decide. The development of the
solutions is expected to be further than an early-stage idea.
“[knowledge produced] It could either be an app, prototype or also, for example, one
team did something with paperwork, and it was a good solution. In the end, we got
more apps, as the most common solution. But you [participant] can also build a smart
device.” (Interviewee 2)
An essential requirement for the knowledge produced in hackathons is to give a clear idea to the jury of
how it works and what potential customers would see when using it. Furthermore, teams should present
how did they validated the prototype they presented. Most of the teams use their own network to validate
their prototype through surveys or quick remote interviews. In some cases, teams validate their idea
either with other teams or staff from initiators present in the event. This makes the knowledge produced
more focused on feasibility than an open call innovation crowdsourcing, for instance.
The knowledge produced depends on determining criteria for teams to win the prize. Criteria may include
technical feasibility, the progress in validation and data used to motivate the relevance of the solution.
Regarding the technical results, teams are expected to be more focused on programming and hacking
activities to end up with a functional application.
“[…] in tech hackathons, they [participants] did use the data and technology so they
usually build some code to proof how something would work. The products are
developed, usually apps or tools. Is more difficult, cost more time if you do a tech
hackathon. And you [initiator] need to provide enough hacking time to build this.”
(Interviewee 1)

GA #774199
D 3.4 Dissemination Level: Public/Confidential Page 99 of 170
In this type of hackathons, initiators need to take into consideration that more resources will be needed.
This is when the criteria of data available also take relevance due to its relationship with the development
of the product. Based on the data available, teams can validate their idea and at the same time build a
solution closely related to reality. According to respondents, data is not always offered by the initiators,
which impacts the quality of the results. In some cases, teams bring their own data to work with. During
the Avicenna hackathons, for example, the winning team had data that let them run some tests to prove
the functionality and build a more advanced prototype:
“We [initiators] also have a team of tech guys and they were very good, but hey were
missing a company to embrace them. They also won the gold price because they
design this app able to analyze a biopsy without a microscope, using a picture and
then the app tells you what kind of cells. They did that within the 48 hours.”
(Interviewee 2)
In this example, the team had data of biopsies and cell patterns to try their solution on. Besides the
outstanding solution this represents for the theme of e-health of Avicenna hackathon, the team excels on
the pitch due to the strong validation presented. Based on this example, one can infer that data gives
teams more tools to present prototypes or even ready-to-use solutions. One or more partners can
facilitate the data and the municipality can complement it with public data available. In fact, respondents
mentioned that hackathons usually rely on different partners to achieve a better knowledge production.
In this regard, it is also important to consider the availability of human resources at the event to give
support for teams in case of difficulties in understanding the data. This makes hackathons, in contrast to
innovation crowdsourcing, rather intensive. In a shorter period, more needs to be organised and be
available. This makes civil hackathons more complex logistically even if parts of the event can be organised
online and organising them well takes more time, resources, and energy. But in terms of helpful
knowledge produced, they can be more targeted and more successful at achieving more readily
implementable ideas and solutions. The main challenge in a civic hackathon, as in innovation
crowdsourcing, is to reach out to the right target audience of potential participants. In business ideation,
there is strength in numbers and diversity. A more extensive and more diverse pool of participants will
yield more and higher quality knowledge while generating more of non-financial benefits.
Civic Crowdfunding Civic crowdfunding is more oriented on the financial commitment of participants. It, therefore typically
starts with more developed solutions and serves more as a validation tool and selection device for a given
set of alternative solutions than to generate new ideas and creative solutions. Civic crowdfunding aims to
bring meaningful and bottom-up involvement in the development of smart cities. Therefore, community
building is the most significant benefit obtained in civic crowdfunding and is the ideation tool that stands
out with most references related to this benefit (56%). This ideation tool enables citizens to build their
own communities around projects they relate to and consider impactful. An important challenge is to get

GA #774199
D 3.4 Dissemination Level: Public/Confidential Page 100 of 170
a diversity of people involved in the same project, not necessarily as leaders or participants but also as
(financial) backers of projects.
In our research, there were three initiatives that we could analyse. All three used a digital platform to
implement the civic crowdfunding as their main channel to achieve the ideation process. However,
interviewee 8 highlighted that important community-building results were obtained in the physical
environment also. In the context of smart cities, civic crowdfunding opens possibilities to get people to
know each other through the digital platform and then participate in physical meetings to support
projects. For instance, a market was started by citizens where local products could reach more people to
test new products. The participants were very active in raising awareness of their civic crowdfunding
campaign among their community. It took three months of both digital and physical promotion to get the
community engaged and back this project. Through these promotion activities, the initiators were able to
mobilize more people from their local areas. The initiators managed to then also involve these citizens in
implementing this marketplace in the area.
“Crowdfunding can really make a difference between three people with a great idea,
and three people and involved community around them that gives support, do coach,
use the network and coming to help out.” (Interviewee 7)
The constant communication that participants need to maintain with their backers also nurtures a long-
term relationship between citizens. In smart cities, initiators frequently experience the challenge to
involve as many citizens as possible. An additional challenge is to engage groups long-term with public
issues. Most of the respondents believe that through civic crowdfunding this can be achieved, especially
with younger members of communities:
“[…] because the way it works and the fact that it is normal platform we help
to younger generation that typically you [municipality] don´t see contributing to the
public-sector initiative.” (Interviewee 6)
Civic crowdfunding can also be used to build communities offline. An exciting example took place at a
mental disease day-care where the goal was to build a greenhouse as part of the treatment activities for
their patients. During the event organized for the civic crowdfunding initiative, the community around the
day-care center attended to back the project. During the event, citizens, businesses, and the municipality
funded the project with a monetary pledge and resources such as soil and tools to build the greenhouse.
Therefore, this project reached community building in different levels: citizens to citizens, citizens to
municipality and business to citizens:

GA #774199
D 3.4 Dissemination Level: Public/Confidential Page 101 of 170
“Citizens from the village came, and they started to chat with people from
the daycare, not realizing that those people were the ones living there. So, they
became aware that those people are just people who you can talk to and are not
strange at all.” (Interviewee 8)
There are dedicated civic crowdfunding platforms, such as “Voor je Buurt”, that help smart cities reach
citizens’ ideas related to specific purpose. In one case in The Netherlands, a municipality aimed to increase
awareness on the preservation of biodiversity among citizens. To achieve this, they opted for a civic
crowdfunding initiative in which citizens could back their favourite ideas on how to accomplish this goal
in their region:
“For the province, the main benefit is that now they have almost twenty showcases,
with a story, which they can use to show that not just something that they make a
policy about, but they really make a difference in reaching their goal.” (Interviewee 7)
The civic crowdfunding initiative gave the municipality the content to raise awareness in biodiversity while
at the same time promoting collaboration with citizens in doing so. Creating relevant content for citizens
that enhances the municipality's image can thus be part of the purpose pursued. Therefore, civic
crowdfunding can be used to “build the brand and own name for municipalities” (Interviewee 7) as part
of the awareness of the smart city development.
Besides the benefit of an innovative image and increased interaction, engaging with civic crowdfunding
regularly would create a consistent storytelling to connect with citizens and get them onboard public
issues and policymaking:
“I think the benefit is more about the impact, the visibility, the storytelling they can
do with those projects. Because my neighbourhood garden is sexier than just a new
policy around on how do we treat the borders around the province.” (Interviewee 7)
Strongly related to building a community and a citizen-oriented brand is the continuous citizen
involvement in civic crowdfunding campaigns. This is achieved by having the municipality fund or subsidize
the selected projects and inform the backers on their progress. This does not end after the crowdfunding
campaign has ended. After backers and the municipality fund the projects, citizens are expected to
nurture a relationship with them and maintain communication. Continuity also happens within the
community built during the crowdfunding campaign. Civic crowdfunding thus empowers citizens to take
part of the smart city development in an active way, first by providing a platform to share ideas as a
solution, second to create a community of backers and third by receiving economic support from either
the municipality or other citizens.

GA #774199
D 3.4 Dissemination Level: Public/Confidential Page 102 of 170
In civic crowdfunding campaigns the ideas from citizens must enter the contest in a more developed stage
than crowdsourcing and hackathons. Normally, the knowledge produced by citizens needs to be in the
ready-to-use stage to attract backers. Typically, the proposed ideas will be implemented as proposed to
maintain trust among the backers. In fact, the community built with backers and municipality generates
a commitment from participants to deliver on the promises made in the crowdfunding campaign.
Moreover, after getting the support from their communities, initiators often connect with volunteers
willing to implement the proposed idea together. In an ideation process using civic crowdfunding smart
city planners should therefore look at the knowledge produced differently:
“I would advise you [municipalities] to not only collect ideas but also collect
initiatives. People need to have the ambition to go for it, start the project themselves
and together with local municipalities. Collecting ideas can work, but citizens tend to
say to governments like “do this or that, but I don’t have any responsibilities”.
I believe that for city projects success people should get involved and feel
responsible.” (Interviewee 7)
As interviewees 7 and 8 repeatedly mentioned, participants are committed to making their ideas a reality.
The sense of responsibility developed after the campaign is strong towards their project, the community,
and the municipality as backers. Through civic crowdfunding, citizens get empowered to build by
themselves solutions that are relevant for both, themselves and smart city development.
Discussion, implications and conclusions From the above, we can draw several conclusions. First, from the earlier parts in this report, we concluded
that smart city (user) innovation-specific incubation programs are unnecessary or useful. Instead, smart
city business model development would benefit most from designing smart city ideation activities, such
that the flow of new ideas into incubation programs would result in more smart city business models. In
this chapter, we presented an overview, based on literature review and interviews, of three broad
categories of such ideation activities: innovation crowdsourcing, civic hackathons, and civic crowdfunding
campaigns. These three were selected to represent a range of activities that could help identify and select
smart city solutions. We evaluated these three types of events on their effectiveness in generating
relevant smart city (user) innovations (knowledge production) but also on their ability to create non-
financial benefits, mostly in the form of enhanced community building and engagement. As our smart city
definition of chapter 2 and the set-up of the IRIS project already indicate, citizen engagement is an integral
part of smart city development and in addition to generating feasible and working solutions to smart city
challenges, the events described in this chapter all contribute to engaging (interested) citizens in smart
city development as a natural corollary to the activities.
Specifically, on citizen engagement, we identified benefits in community building, continuous citizen
involvement, image and branding benefits and citizen-oriented decision making and concluded from both
the literature and the empirical data that the three types of events differ in their emphasis and

GA #774199
D 3.4 Dissemination Level: Public/Confidential Page 103 of 170
effectiveness in achieving these benefits. On knowledge production, we also found that both literature
and our interviews suggest that the events discussed each has a specific focus on the technological
readiness of ideas and solutions generated. In order of technological readiness of the ideas generated in
the events, we tentatively conclude that an innovation crowdsourcing yields the least mature, a civic
hackathon a more mature, and the civic crowdfunding campaigns yield the most mature solutions.
Based on the analysis of both the literature and our interviews, Table 27 below shows the strengths and
weaknesses of the different types of ideation activities. Smart city planners, who should act as initiators
to implement these civic ideation tools, can use these results to better select the appropriate event for
their specific purposes. The proficiency of each ideation tool in achieving non-financial benefits and
produce specific knowledge is indicated by the number of plus symbols. The more plus symbols the table
shows, the more suitable the civic ideation tool is in the indicated outcome. Is important to highlight that
the number of plus symbols represents the contest version of this tool for innovation crowdsourcing.
Innovation
Crowdsourcing
Civic
hackathon
Civic
crowdfunding
Non-
financial
benefits
Community building ++ + +++
Continuous citizen involvement +++ + ++
Citizen oriented decision-making +++ + ++
Image improvement + +++ ++
Knowledge
produced
Early stage ideas +++ + +
Prototype ++* +++ ++
Ready-to- implement +* ++ +++
Table 28: Guide for selecting Ideation Tools reproduced from Meraza-Farfan (2018) Table 5
Finally, a general recommendation that emerged from the data analysis is to combine these
methodologies to build on their benefits and complement each other. In any case, thorough planning is
needed to contemplate all factors presented in the results section regarding challenges and key learnings.
These findings are also relevant to make an informed selection of tools to generate the outcomes desired
and expected by initiators.
In conclusion, we would encourage smart city developers to consider ideation as an integral part of both
their citizen engagement strategy and their smart city business model development strategy. For the
former, this chapter has shown that ideation tolls can be helpful in achieving engagement objectives as a
natural corollary to the main aim of the activities, which is to generate new ideas in various stages of
technological readiness that can then be fed into well-designed business incubation programs. The
analysis in this chapter was kept limited to only three types of ideation events to keep the analysis
manageable. In the chapter that concludes this report, we will present a list of ideation activities that have
been co-organised and/or monitored by the IRIS project team. These are written up as recipes, such that

GA #774199
D 3.4 Dissemination Level: Public/Confidential Page 104 of 170
interested smart city developers in IRIS and beyond can easily follow these to organise their own ideation
events.

GA #774199
D 3.4 Dissemination Level: Public/Confidential Page 105 of 170
8. Ideation Cookbook with Recipes and Step-by-Step Guide
In this chapter we have collected “recipes” for ideation activities that might be replicated in other
lighthouse cities, follower cities or cities beyond and after the IRIS project. These recipes have also been
published separately on the IRIS website and are reproduced here verbatim. These activities aim to
generate, identify, and mobilize resources to push smart city solutions to their next stage. As was clear
from Chapter 7, these types of events can also serve a secondary purpose of engaging citizens in smart
city development.
The collected recipes here represent the events we were able to track during the IRIS project (2017-2021).
For practical reasons, the emphasis has been on events in and around Utrecht, but we have tried to make
explicit the resources and preconditions that were vital to the events’ success, such that one can check in
other contexts if similar activities might be replicated. Our data collection method for this chapter has
been extremely pragmatic. We have scanned our networks, social media, and the internet for events we
thought would fit our rather broad definition of an ideation tool and then contacted the organisers to
obtain the information we needed. In all events, a level of collaboration with IRIS partners was present.
In four out of the presented eight recipes (Energy Poverty Challenge, Citizen Innovation Challenge, Smart
Lightning Challenge and ChangeU), the event was initiated and organised by IRIS (partners). This has
resulted in a “cookbook” that now contains 8 recipes, of which six were organised with a clear focus on
Utrecht, one was international, and one in and focused on Goteborg.
Start-up in Residence Utrecht Start-up in Residence is a concept that originates from the United States of America and is being carried
out by several Dutch municipalities, provinces, and ministries (https://startupinresidence.com/). Start-up
in Residence challenges’ entrepreneurs to come up with innovative solutions to social issues in the
respective region. The municipality of Utrecht ran a Startup in Residence challenge in 2017, at the start of
the IRIS project. The result was a range of concrete products and services, which were pitched to the
municipality of Utrecht. For every posed challenge, the best solution was chosen from the entries. The
selected start-ups then worked on the solution in an incubation program, guided by incubation experts
and relevant civil servants. The municipality then decided whether to purchase the developed product or
service. The program was started to pay more attention to starting entrepreneurs in the municipalities’
procurement procedures.
Dish: challenge | 0.4 FTE | 3M preparation + 3M execution + 3M incubation | €300.000
Recipe for: 76 ideas | 6 start-ups
Ingredient List:
• Budget
o €95.000-120.000 organization costs

GA #774199
D 3.4 Dissemination Level: Public/Confidential Page 106 of 170
o €20.000 procurement budget per challenge
• Time
o Preparation (12 weeks):
▪ Finding and finalizing challenges
▪ Tender for incubation program
o Challenge (13 weeks):
▪ Challenge open for entries: 6 weeks
▪ First evaluation round: 10 days
▪ Pitch preparation for selected entries: 3 weeks
▪ Pitches and final evaluation: 1 week
o Incubation (12 weeks)
▪ Program: 12 weeks, 1 day per week activities
• Resources
o Types of organizations involved
▪ Departments of the Municipality
• Economics (organization)
• Public Services, Health, Education, Public Spaces, Mobility (challengers)
▪ Incubation by Graduate Space
▪ Recruitment of start-ups by StartHubs’ subsidiary Battle of Concepts
o Types of roles involved (mentors, organizing team, experts, etc.)
▪ Organizing team
▪ Judges for selection of ideas
▪ Experts for guiding during incubation program
o Location(s)
▪ Registration and selection via www.startupinresidence.com/utrecht
▪ Location for pitches
▪ Location for meetings in incubation program
o Terms and conditions
Planning
Preparation
First, the organizing team of Startup in Residence decided on the goals and deliverables for the program.
The to be realized goals were:
1. Encouraging and facilitating starting entrepreneurs
2. Solving social issues (challenges) of the municipality of Utrecht in an innovative and creative way
3. Strengthening innovative thinking and working within the municipality of Utrecht
Deliverables to reach these goals:
1. Recruitment of 5 to 10 challenges within the municipality of Utrecht
2. At least 25 entries from start-ups to the challenges of the municipality of Utrecht

GA #774199
D 3.4 Dissemination Level: Public/Confidential Page 107 of 170
During the planning phase, the organizing team of Startup in Residence had two main tasks: first, find an
organization to support during the incubation phase. Second, and more importantly, find enough
departments of the municipality of Utrecht ready to join the program and pose a suitable challenge.
Ultimately, five departments joined the program, posing the following nine societal issues (challenges):
• How do we get people to eat something healthy in the sports canteen?
• How do we encourage more visits to the current leisure facilities and events in Leidsche Rijn?
• How do we ensure that all residents take sustainable energy measures via the regional energy
desk?
• Developing means to reach pupils and their parents early on in intermediate vocational education
and encourage them to make an occupational choice with a labour market perspective.
• How can we make flexible working in the hospitality industry more attractive to intermediate
vocational education students?
• What can the municipality of Utrecht do to improve its business climate for start-ups and scale-
ups and how can you (the start-up participating in this challenge) contribute to this?
• How can we reduce the number of service and construction buses in the city centre of Utrecht?
• How do we monitor the number of solar panels on Utrecht roofs and the amount of power they
generate?
• Make getting married in Utrecht a 'piece of cake'!
• Wildcard
All challenges were presented in a fixed format, that consisted of the following topics: 1) the challenge, 2)
some context, facts & figures, 3) solution conditions, and 4) exclusion criteria. The first phase was
concluded by a positive decision of the alderman for Economic Affairs to continue to the next phase.
Event
Startup in Residence Utrecht publicly launched at November 1, 2017. With help of Battle of Concepts – a
company specialized in communication aimed at innovators, students, creative (young) professionals, and
innovative start-ups – the ten preselected challenges were distributed through the StartHubs platform
and Startups in Residence Utrecht website. A costly, but vital success factor to be able to reach out to
thousands of potential applicants. The deadline for entries was set at December 11, 2017. While the
challenges were ‘open’, potential participants had the opportunity to visit an information meeting on
November 16, 2017 and ask questions through the StartHubs platform until November 23, 2017. All
questions and answers were publicly published on November 29, 2017.
Startup in Residence Utrecht received a total of 76 entries. Between December 11 and December 20,
2017, all entries were checked by the organizing team based on the challenge requirements. Next, a more
in-depth review was undertaken by the organizing team and representatives of incubator Graduate Space.
32 entries were selected for the following round, which was a live pitch between 8 and 11 January 2018.
The pitches were judged by the challengers of the municipality of Utrecht, based on 8 criteria: 1) problem
description, 2) substantiation of problem description, 3) quality of design criteria, 4) fit between problem
description and proposed solution, 5) quality of solution (innovation, desirability, and technique), 6) level
of ambition, 7) team quality (competent, eager), and 8) sustainable business model.

GA #774199
D 3.4 Dissemination Level: Public/Confidential Page 108 of 170
7 start-ups were selected to join the incubation program, led by Graduate Space. Three of ten initial
challenges failed to find a suitable solution. Of the 25 entries that were not selected for the incubation
program, 13 entries did join a feedback session organized by Graduate Space.
The incubation program, led by Graduate Space, consisted of Design Thinking sessions for one full day per
week over the course of 3 months, starting at February 1, 2018. The focus of the incubation program was
both the development of the product or service, and the newly formed company itself. Valuable co-
creation sessions were organized with the respective departments of the municipality of Utrecht and
start-ups were encouraged to challenge and coach each other. Furthermore, each start-up was coached
by an experienced entrepreneur and additional experts were invited for deep dives on specific topics.
On May 1, 2018, all seven start-ups were invited to pitch their final solution to the departments of the
municipality of Utrecht who posed the initial challenges. Of the seven start-ups, six were eventually
awarded with a ‘launching customer’ contract by the municipality of Utrecht (one €40.000 contract and
five €20.000 contracts).
Evaluation
After Startup in Residence Utrecht concluded, the program was thoroughly reviewed. Main feedback by
the organizing team, and participating entrepreneurs and civil servants included:
• A key success factor is the reaching out to thousands of potential applicants. The difficulty of
getting access to a network that is relevant cannot be underestimated. It is also a very costly
ingredient.
• Both entrepreneurs and civil servants experienced the co-creation sessions as very valuable,
inspiring, and refreshing.
• The seven developed products or services were positively received by the municipality of Utrecht,
leading to six ‘launching customer’ contracts.
• Entrepreneurs value the incubation program, especially coaching and challenging each other.
Time needs to be allocated to customization of the program, as the entrepreneurs’ needs differ
based on experience and problem-definition.
• Societal organizations relating to the respective municipality departments need to be included in
the process early on, during the challenge formulation and reviewing of entries.
• While the wildcard is positively received by entrepreneurs, the entries mainly consist of existing
products and there is a lack of ownership of the challenge within the municipality.
Reflection IRIS
It was too late for IRIS to get involved in Startup in Residence 2017. We have worked with the responsible
team in 2018-2019 to try and get the municipality of Utrecht to run another iteration of Startup in
Residence, but political priorities shifted, and it proved impossible to get a second round organised. The
set-up of Startup in Residence is very suitable for smart city developers. The initiative needs to come from
a large, central player in smart city planning, such that a diverse set of challenges can be collected, and
resources can be made available to plan the event. It is advisable to link with partners that have a large
network they can mobilize on the challenge and partners that can provide expertise on the incubation of

GA #774199
D 3.4 Dissemination Level: Public/Confidential Page 109 of 170
the winning solutions. The success rate of Startup in Residence (7 viable businesses out of 76 ideas
submitted 10%) is impressive, but also has a lot to do with very clear challenges and relatively high stakes.
Smart Lighting Challenge In the Smart Lighting Challenge Design Thinking was used to engage citizens in the implementation of
smart lighting. This technique aims to lead to solutions that solve the problem in a manner that complies
with citizens’ needs and desires. Design Thinking consists of two phases: discovering the problem and the
creative process. In three sessions, various residents of the Kanaleneiland-Zuid neighbourhood and
experts participated, to co-create designs in which smart lampposts were used to create a safer
neighbourhood. The highest rated idea was submitted to the traffic specialists of the municipality of
Utrecht, to further develop the solution into a detailed plan.
Dish: co-creation | 0.8 FTE | 3M preparation + 2W execution | €3.000
Recipe for: 5 ideas
The Ingredient List
• Budget
o €3.000 out-of-pocket costs
• Time
o Preparation (12 weeks)
▪ Problem definition
▪ Understanding the neighbourhood
▪ Selecting and briefing of sessions’ participants
o Event (2 weeks)
▪ Three Design Thinking sessions: 1 evening per session
• Resources
o Types of organizations involved
▪ Organization by Municipality of Utrecht (4 x 0.2 FTE)
▪ Design Thinking process guidance by HKU
o Types of roles involved
▪ Organizing team
▪ Design Thinking experts
▪ Neighbourhood residents
▪ Entrepreneurs in the neighbourhood
o Location(s)
▪ Location for Design Thinking sessions
The Preparation Method
Planning

GA #774199
D 3.4 Dissemination Level: Public/Confidential Page 110 of 170
In the Smart Lighting Challenge, the technique Design Thinking was used by a team of trainees of the
municipality of Utrecht to involve citizens in the design process of finding one or more solution(s) to
perceived problems in their neighbourhood. This technique is a six-step process, divided into two phases,
and aims to generate solutions that solve the perceived problem and comply with the neighbourhood’s
needs and desires.
The first phase is all about finding the right problem that needs to be solved. During this phase, it is
required to collect and analyse as much information as possible regarding the problem. This involved
talking to experts and engaging with the problem holders. After all the information and observations are
carefully analysed, a design problem can be defined.
The design problem sets the stage for the second phase: finding the right solution. During this phase,
participants ideate about possible ideas to solve the design problem. Next, a few ideas are chosen and
turned into prototypes – inexpensive, minimalistic versions of a product or service which can be tested
within the team, or with the problem holders. The last two steps are iterative: results of the testing phase
can be used to improve the prototype, which can than again be tested. Alterations and refinements can
be made until the final product or service is ready for deployment.
Figure 6: Design Thinking Process
Although the Smart Lighting Challenge indeed performed the six steps of the Design Thinking process, in
terms of sequence of steps, the execution was not aligned with the sequence that this method proposes.
The main factor being that the design question (Define) was already formulated before having executed
the Understand and Empathize-phases.
During the preparation of the Smart Lighting Challenge, before executing the six steps of Design Thinking,
a design question was formulated by the owner of the problem, the municipality of Utrecht: ‘How can we
create smart lampposts that contribute to a better/healthier/safer/finer neighbourhood for residents and
entrepreneurs in Kanaleneiland-Zuid?’. As this design question already assumes a solution (smart
lampposts), assumes that the municipality is the problem owner (and not the residents), and leaves the
problem undefined, potentially, a problematic foundation for the Design Thinking process was laid.
After determining the design question, the neighbourhood was visited. The representatives of the
municipality of Utrecht reached out to various central residents in the neighbourhood, to invite them and
their network to the Ideation-phase of the Smart Lighting Challenge. They carefully selected people they

GA #774199
D 3.4 Dissemination Level: Public/Confidential Page 111 of 170
wanted to approach, so the final group would be a representation of the neighbourhood’s residents.
Unfortunately, it was particularly hard to involve the young and residents with a migration background.
Next, the organizing team decided to prepare and organize three three-hour sessions, which all focused
on different parts of the Design Thinking process. For every session, a goal and desired output were
determined. To allow the three sessions to go well, facilitating roles were divided among the organizing
team. This was crucial for efficiently organizing a process with no clear output.
The desired output of the first session was to collect wishes, needs, and dreams of residents and
entrepreneurs in the neighbourhood. The goal of the second session was to have participants co-create
new concepts that fit the needs of Kanaleneiland-Zuid’s residents. In the third session, concepts of the
second session and collected wishes and needs of the first session were matched.
Event
Realistically, the dish that was served during the Smart Lighting Challenge, consisted of steps Understand
(first step), Empathize (second step), Ideate (fourth step), and in part Test (sixth step). During the Smart
Lighting Challenge, the design question (third step) was already formulated during the Understanding-
phase. As the residents could only give their input after the design question was defined, this poses the
risk of residents feeling unheard. Also, prototyping and testing (fifth and sixth step) were done in the
months after the event.
Session 1: Collecting (Understand, Empathize)
At the beginning of the process, attention was paid to managing expectations of all participants. During
this session the organizing team talked with residents, professionals, and entrepreneurs from the
neighbourhood. They processed this information in real time into so-called narrative sheets. To get the
discussion going and to stimulate the thought process of the participants, thirty photos of the
neighbourhood were shown. These pictures were on the table and functioned as the session’s
conversation starter. Also, participants were asked about their dream for Kanaleneiland – information
that could later be used in the
process. Next, participants
wrote down quotes,
anecdotes, and interesting
details about the
neighbourhood that formed
the basis for the ‘narrative’
that was developed.
The result of the session was a
filled out narrative sheet, that
formed the basis for the second session. The narrative sheets did include a design question by residents;
however, they did not align with the design question already posed by the municipality of Utrecht.
Figure 7: Narrative sheets

GA #774199
D 3.4 Dissemination Level: Public/Confidential Page 112 of 170
Session 2: Design (Ideate)
The information gathered in the collection session formed the basis for the design session. In the design
session, a multidisciplinary group of content experts, designers, creatives, and civil servants joined
together. New ideas and concepts were worked on in three groups according to the Crazy Eight
methodology. This is a brainstorm methodology in which eight ideas are drawn in 30-second instalments
on an A3 sheet. The ideas were potential solutions for problems that were collected in the collecting
session. Of the Crazy Eight designs, each group picked the best ideas for further development and a pitch.
No tangible prototypes were designed.
Concept Explanation Implementation for use Residents
Theme
Free wi-fi Making specific locations attractive for loitering teenagers by introducing wi-fi
Pleasant living + Free wi-fi
Sound sensor for signalling unsafe situations Better security in the neighborhood due to brightly lighted areas
Giving teenagers a place to hang out
+ Social Interaction
Sound and light: Bring your own music, music lights to the beat signalling unsafe situations
Lights that adjust to the music Pleasant living and amusement
- Security
App interface with a lamppost for various applications, attractive to youths
Controlling a post with a telephone Pleasant living and amusement
- Social Interaction
Speakers for playing music Playing music with the lamppost Pleasant living and amusement
- Social Interaction
Tinder light app: matchmaking Finding and meeting each other by the lights colors
Pleasant living and amusement
+ Social Interaction
Mood lighting: dim your lights Pleasant or unpleasant ambience for teenagers to hang out in
Pleasant living + Security
LEDs for showing the way Bringing the social functions to the attention of the residents
Promotes social interaction and physical activity
- Social Interaction
App for planning routes Plotting your route and following it by the LEDs in the lampposts
Pleasant living and amusement
- Convenience
Telephone/communication function Creates social interaction in the neighborhood
Reduces social isolation - Social Interaction
Lighting configuration for projecting a zebra crossing
Practical solution for avoiding unsafe traffic situations
Unsafe traffic situations ++ Security
Table 29: Ideation Concepts
Session 3: Pitch (Test)
Testing the concepts put together in the design session is the last step of the first iteration of the Design
Thinking process. The ideas can be found in the table above. By testing the ideas, the outcomes are
validated with the end user. A Dragons’ Den session was organized for this. During this last session the
designers presented their ideas from the design session to the neighbourhood experts from the first
session. Each design group presented two concepts in 3 minutes. In the session, the end users were
allowed to ask questions. After the presentation the audience could ‘invest’ in ideas: end-users were given
fictitious money to determine the value of the ideas. This, however, resulted in a heated discussion
between residents about the usefulness and necessity of smart lighting, and its relation to the societal
issues they had posed during Session 1. Whereas the project team was surprised by this, in hindsight, it
GA #774199
D 3.4 Dissemination Level: Public/Confidential Page 113 of 170
could have been expected since the design question was defined before understanding and empathizing
with the residents.
Execution
The idea that received the highest ‘investment’ was a lamp post with a special lighting configuration for
crosswalks, lighting up when someone wants to cross the street, to prevent unsafe traffic situations. This
idea was then submitted to the traffic specialists of the municipality of Utrecht, to further develop the
solution into a detailed plan. They made three visual prototypes of the original idea, which were presented
to the residents of the Kanaleneiland-Zuid neighbourhood, who could then choose the final design.
Evaluation
• As the design question, the third step of the process, was done first, this resulted in a mismatch
of expectations between the municipality and residents. Also, it should have been made clearer
that the events during the Smart Lighting Challenge would only focus on Understanding,
Empathizing, and Ideation, as Prototyping and Testing would happen in the months after the
event.
• Take preconditions and limitations into consideration and manage expectations of participants
regarding these preconditions and limitations. In the IRIS project, goals are set regarding
sustainability, (technological) innovation and meeting the residents’ needs, whereas sustainability
isn’t always a priority for residents.
• A good location is essential for the creative process. For the design sessions its best to choose a
creative location with lots of space.
• It is important to involve residents that are representative for the residents in the neighbourhood.
It is particularly hard to reach youth and people with a non-western background.
Reflection IRIS
The IRIS team was intensively involved in the set-up and execution of this ideation event. But in hindsight,
we can conclude that perhaps a better integration of the various expertises in the Utrecht team would
have helped. The design thinking method can be very helpful in generating viable ideas and solutions as
well as engaging citizens. It is, however, essential to follow the steps in the correct order. If steps are
missed or have been pre-structured, as was the case here, then it poses a risk. Residents have their own
priorities, worries and concerns and it is risky to assume they will share the problem analysis or see the
benefits of technological solutions the way experts and city planners do. If choices have already been
made, setting up design thinking processes is complicated and may well create misaligned expectations
and frustration. The ideas generated in the event were of high quality and implementable but perhaps
less suitable for follow-up business model incubation. The value proposition of the proposed solutions
typically had a strong public goods character, such that the municipality was the most likely and single
client for the proposed solutions. In this case, business model development was therefore not foreseen,
and the proposed solutions were developed further in-house.

GA #774199
D 3.4 Dissemination Level: Public/Confidential Page 114 of 170
Energy Poverty Challenge The Energy Poverty Challenge is an initiative rooted in two developments that were part of the WP5
demonstration in Utrecht. The first development is a pressing social issue that is increasingly becoming an
important challenge for multiple stakeholders in Utrecht: energy poverty. The second development is the
municipality of Utrecht working on the realization of a City Innovation Platform (CIP), as part of the WP5
demonstration. The aim of CIP is to support the data economy, by matching supply and demand of data.
Housing corporation Bo-Ex, the municipality of Utrecht, and Utrecht University joined hands to launch the
Energy Poverty Challenge. A budget of €20.000 was allocated by the IRIS project to help the winning
solution develop the product or service. The result is a concrete product or service, which is pitched to
the municipality of Utrecht and Bo-Ex. The best solution is chosen from the entries.
Dish: challenge | 0,2 FTE | 3M preparation + 2M execution + 3M incubation | €20.000
Recipe for: 5 ideas | 1 startup
The Ingredient List
• Budget
o €20.000 award money
• Time
o Preparation (12 weeks):
▪ Supporting base and budget: 2 weeks
▪ Preliminary research: 8 weeks
▪ Stakeholder workshop: 2 weeks
o Challenge (8 weeks):
▪ Challenge open for entries: 5 weeks
▪ First evaluation round: 1 week
▪ Pitch preparation for selected entries: 1 week
▪ Pitches and final evaluation: 1 week
o Incubation (12 weeks):
▪ Program: 12 weeks, 1 day per week activities
• Resources
o Types of organizations involved
▪ Housing corporation Bo-Ex (challenger)
▪ Municipality of Utrecht (challenge organization)
▪ Utrecht University (research & business development)
▪ UtrechtInc (incubation)
o Types of roles involved (mentors, organizing team, experts, etc.)
▪ Organizing team
▪ Judges for selection of ideas
▪ Experts for guiding during incubation program
o Location(s)
▪ Registration and selection via www.iris-utrecht.nl/challenge

GA #774199
D 3.4 Dissemination Level: Public/Confidential Page 115 of 170
▪ Location for pitches
▪ Location for meetings in incubation program
The Preparation Method
Planning
The Energy Poverty Challenge addressed a pressing social issue that is increasingly becoming an important
challenge for multiple stakeholders in Utrecht: energy poverty. Energy poverty is a situation in which a
household spends more than ten percent of the disposable income on energy cost. When people start
getting difficulties paying the energy bill, they start building up payment arrears for both energy and rent.
This can lead to being disconnected from the energy grid altogether or, in the worst-case scenario, to
eviction. At the same time the municipality of Utrecht is working on the realization of a City Innovation
Platform (CIP), as part of the WP5 demonstration. The aim of CIP is to support the data economy, by
matching supply and demand of data through an open data platform with relevant local data. CIP offers
an open ICT system and open application program interfaces (APIs) that encourage data sharing.
The first step in the preparation of the challenge was to have a clear supporting base within the IRIS-
project. Housing corporation Bo-Ex (responsible for TT1, Energy Positive Districts & TT2, Flexible Energy
Management and Storage), the municipality of Utrecht (WP5, Utrecht Demonstration & TT4, City
Innovation Platform), and Utrecht University (WP3, Business Modelling) joined hands to launch the Energy
Poverty Challenge. A budget of €20.000 was allocated by the IRIS project to help the winning solution
develop the product or service.
Master students of the Utrecht University program Business Development & Entrepreneurship were
asked to do a preliminary study into the scope of the local problem and its local target group, and develop
and test a Minimum Viable Product (MVP). Recommendations by the students, combined with various
national studies into the scope of the problem of energy poverty and the services already available, led to
a workshop in which the challenge was ultimately designed. Participants of the workshop included
stakeholders involved in the IRIS projects and experts from the municipality of Utrecht working with the
target group.
Prerequisites for the solution to the challenge were
1. to include a data service for tenants of housing corporation Bo-Ex, which gives the tenants control
over and/or better understanding of their energy bills, resulting in reduced energy bills and an
increase in the disposable income of tenants;
2. An additional requirement for market parties was to make use of data-sets available through the
City Innovation Platform in their proposed solution.
The challenge was finally presented on the website of the WP5 Utrecht demonstration. The challenge was
presented in a format, that consisted of the following topics: 1) the challenge, 2) solution conditions, 3)
context, facts & figures, and 4) next steps.
Event

GA #774199
D 3.4 Dissemination Level: Public/Confidential Page 116 of 170
The Energy Poverty Challenge publicly launched on May 21, 2019. The challenge was locally and nationally
communicated through and by the Utrecht-based stakeholders in IRIS, including a press release to local
media. The deadline for entries was set on June 28, 2019. While the challenge was ‘open’, potential
participants had the opportunity to ask questions to the organizing team through a contact form.
Participation in the challenges was free of charge, and teams were allowed to send in multiple entries.
Entries were allowed to be a maximum of five pages and should include topics like: 1) company or team
description, 2) solution, 3) value proposition, 4) clients and/or end users, and 5) usage of data.
The Energy Poverty Challenge received a total of 5 entries. 2 entries were excluded from the challenge, as
they did not meet the prerequisites of the challenge. Mainly, they missed an idea for a business model. 3
entries were invited to pitch their solution to a jury on July 9, 2019. The pitches were judged by 11
representatives: from Bo-Ex (1 representative), Utrecht University (2), incubator UtrechtInc (1),
municipality of Utrecht (4), CIP-developer Civity (1), and two representatives from TT5, Citizen
Engagement. The entries were scored on 15 criteria, divided into three themes: Market Potential (35%
weight), Sustainability (25%), and Market Readiness (40%).
The judges unanimously concluded to select no entry to join the incubator program, led by UtrechtInc.
Evaluation
After the Energy Poverty Challenge concluded prematurely, the program was thoroughly reviewed. Main
feedback by the organizing team and stakeholders included:
• The challenge formulation was clear. Possibly, in the preparation phase, more research could have
been done with regards to wishes and needs of end users of the product or service.
• Communicating about the challenge in the right networks is a challenge. Many local outlets have
been used and website-traffic shows a clear increase. It is not clear, however, if the right people
and organizations have been reached. In addition to current efforts, communication towards
incubators and/or start-up networks can be improved.
• The challenge focused on ‘ready’ ideas, whereas the award money was appropriate for the
development of an idea: it was not balanced. Development of a prototype can cost up to €20.000,
whereas the development of a functioning product can cost as much as €200.000. Therefore, the
appropriate parties might not have been interested in participation.
Reflection IRIS
As this challenge was organised entirely by IRIS partners, the evaluation described above covers most of
our lessons and reflections. The problem/challenge of reaching out to the correct networks and of
matching the incentives to the desired output of the activity, are important lessons learned. In addition,
it can be noted that an event is not a failed event if it does not deliver the ideas that were hoped for.
Ideation is inherently an uncertain process with many factors and sometimes such events simply fail to
deliver the quality of ideas one hopes for. It is then important to carefully evaluate and draw lessons from
the event.

GA #774199
D 3.4 Dissemination Level: Public/Confidential Page 117 of 170
Utrecht Mobility Challenge A challenge is a short-term and intensive innovation process in which participants are put into (diverse)
teams, informed about a certain topic and/or problem question, and asked to come up with a suitable
solution. In this case, the participants were students from Utrecht University (UU), the Utrecht University
of Applied Sciences Utrecht (HU), and the ROC Utrecht (vocational education). The challenge was
organized by an ‘alliance’ of Utrecht-based organizations: municipality of Utrecht, Economic Board
Utrecht (EBU), and the before mentioned educational institutions. During the challenge the teams were
guided by practitioners and experts to ensure relevance. In this case, the topic was mobility in the city of
Utrecht. As the city becomes more congested, especially during commute-hours, teams were asked to
think about new and smart solutions. As a conclusion to the process, teams pitched their ideas to a jury,
who could choose multiple winners. Winning teams got the opportunity to work with relevant
stakeholders and companies to put their idea into practice. In some cases, students also received study
credits for their participation.
Dish: challenge | 6M preparation + 4D event
Recipe for: 7 ideas | 7 teams
The Ingredient List
• Time
o Preparation (6 months):
o Challenge (4 days):
▪ Problem sketch (1 day - 14 November)
▪ Official team-work days (3 days – 15, 21, 22, November)
▪ Presentation and announcement winner (1 day – 22 November)
• Resources
o Types of organizations involved
▪ Stakeholders (judges, feedback, data, problem statement)
• Municipality of Utrecht
• Utrecht Province
• Educational institutions (UU, HU, ROC)
• Rijkswaterstaat
• Practitioners (Sweco, Ideate, Fundamentals, INFO)
▪ Funders
• Educational institutions (UU, HU, ROC)
• Municipality of Utrecht
• Economic board Utrecht
• Relevant companies
o Types of roles involved (mentors, organizing team, experts, etc.)
▪ Organizing team
▪ Judges for selection of ideas
▪ Mentors for guiding the teams

GA #774199
D 3.4 Dissemination Level: Public/Confidential Page 118 of 170
▪ Experts and practitioners for lectures
o Location(s)
▪ Locations for lectures and training (preferably at relevant stakeholder)
▪ Location for team meetings
▪ Location for final
The Preparation Method
Planning
The Utrecht Challenge Alliance (UCA) is a partnership between the municipality of Utrecht, EBU, Utrecht
University, the Utrecht University of Applied Sciences, and ROC Utrecht. It aims to facilitate finding
innovative local solutions to societal problems, by combining the knowledge of students, professionals,
and citizens. UCA’s main focus is the organization of challenges. Furthermore, it is linked to IRIS through
the participation of both Utrecht University and the municipality of Utrecht.
The UCA team specializes in organizing said challenges. The head of organization has in total been in
charge of 8 similar challenges. First, the team is in contact with possible interested (local) companies and
stakeholders; organizations with a problem they want a fresh outlook on. In this case, a salient topic was
decided to be mobility in Utrecht. This phase usually starts round half a year before the eventual challenge
takes place.
Compared to the eventual date of the challenge, preparation started even earlier on this occasion. On the
original dates a mobility convention was taking place, making it incredibly difficult to find a jury and
lecturers – thus the challenge was moved to a later date.
Upon deciding a subject, the 6 months are first filled with finding interested stakeholders and shaping the
challenge. After publicly announcing the challenge, the next few weeks were spent on gathering
participants as well as a lot of work behind the screens – but as noted, work already started beforehand.
Participants are recruited through a multitude of manners – mainly through word-by-mouth promotion
from knowledgeable teachers to students which are perceived as potentially interested. In some cases
(ROC) students receive ECTS for their participation. Other channels of promotion are social media and
their website – but their main method of recruiting participants is the word-to-mouth from participating
or interested academics to their students.
Most of the organization is then put into the actual workdays. These require lectures, locations, and
mentors to guide the teams. In this case the problem statement was the congested infrastructure of
Utrecht; teams were asked to come up with new and creative solutions for this problem. The problem
statement is formalized but not as strict as in other recipes; the team is urged to think out-of-the-box.
Event
There were 35 applicants, in the end forming 7 teams. The teams are formed by balancing the diversity of
the participants, to optimize their output. Students were diverse in their educational backgrounds, both
in level and direction. Some examples of studies represented are data driven design, smart sustainable
cities, social geography, and civil engineering. Diversity is promoted as more theoretically versed (e.g.

GA #774199
D 3.4 Dissemination Level: Public/Confidential Page 119 of 170
university) students often have great theoretical knowledge, but fail to identify practical obstacles. More
practically versed (e.g. ROC) students may be well-equipped to understand what works, but could use
theoretical guidance. Different fields may similarly provide different insights. Thus, groups are formed
such that students’ skills are complementary.
For the mobility challenge, the challenge spanned four full workdays, once including work until after
dinner (the third day). The first day consisted of a problem introduction, team formation and introduction,
and an initial brainstorm. The second day started with a keynote lecture on the future of mobility, further
providing information on the problem at hand. Teams were then asked to draft a few preliminary solutions
they found promising, after which a meeting with experts followed (providing them feedback). A
multitude of locations for these days was provided by Rijkswaterstaat, in their Utrecht office.
Then, after a break of six days, the challenge continued with the third day This day consisted out of
another lecture providing insights on how to incite behavioural change. The rest of the day, until the
evening, was used by the teams to pick one concept, after which they fully develop and test it. At the end
of the workday their final draft was pitched to experts and mentors, after which they spent the evening
finalizing their concept. The last day consisted out of a final test with feedback, the preparation of a pitch,
after which it concluded with the pitches and the announcement of the winners.
In this case, expert lectures were provided by Sweco and Ideate. The 6 jury members were announced on
the fourth day, consisting out of employees of relevant stakeholders, in this case being employees from
the municipality of Utrecht, EBU, Rijkswaterstaat, Sweco, Vodafone, Ziggo, and Ideate. The judgement
procedure is relatively informal. Jury members are a part of the stakeholders providing the original
problem statement. As such, they are not given strict guidelines, but were urged to pick a winner: the
team with the most feasible solution. In this case, the jury considered three different ideas equally feasible
resulting in three winners.
Making sure there is sufficient follow up with the ideas is often difficult. As such, UCA provided winners
with a second meeting, with a set-up like the TV-show Dragons’ Den. In this session, the teams are urged
to further develop their idea and pitch it once more to the stakeholders, who then can decide to take on
the project if they deem it sufficiently relevant and feasible.
Evaluation
Together with UCA we have evaluated the Challenge. Furthermore, we drew lessons from their extensive
review of previous challenges:
• Diversity in approaches helps create very refreshing ideas;
• Short-term and intensive approach helps maximize cooperation and generating new ideas;
• Out-of-the-box is a double-edged sword; it can give very refreshing ideas but similarly draw
solutions which are not considered for a reason;
• Practitioners and stakeholders are very willing to get involved with the organization of a
challenge;
• Ensuring the ideas are further worked with is difficult, but a set follow-up may help;

GA #774199
D 3.4 Dissemination Level: Public/Confidential Page 120 of 170
• The organization of an ideal challenge (with relevant locations and lectures) is logistically
demanding, especially if the expertise is not in-house;
• Allowing all students to apply at times caused a language barrier: in this manner both
international (non-Dutch speaking) students and Dutch students who less often require English
could apply, making it at times difficult for either group to follow the other language or
communicate amongst each other.
Reflection IRIS
Again, as IRIS researchers were involved in co-organising this challenge, the reflections of the organisation
above coincide with our own. In this challenge the access to participants and their willingness to
participate in all stages of the challenge, was much facilitated by the fact that participants were students
that gained credits for their education with their participation. Of course, these student-oriented
challenges can only be replicated in cities that have a significant student population. Student challenges,
in collaboration with educators, can mobilize a lot of participants and students are typically enthusiastic,
creative, and energetic. A downside of having only or mostly students as participants, is that they typically
lack some real-world experience and are hard to motivate in the longer run and for follow-up activities.
ChangeU Student Hackathon The ChangeU Student Hackathon is an initiative rooted in two developments in the WP5 demonstration
in Utrecht. First, in the early stages of the IRIS project, inhabitants expressed their concern that smart
energy and smart mobility weren’t the pressing issues in their district (see also the recipe on the smart
street lighting challenge). Second, the municipality of Utrecht is working on the realization of a City
Innovation Platform (CIP), as part of the WP5 demonstration. The aim of the ChangeU Student Hackathon
is to develop and incubate ideas that provide solutions to issues in the Kanaleneiland district, while using
(open) data. A budget of €3000 was allocated to UtrechtInc Students, who organized a 16-day virtual
activity, during which 16 teams of students worked on developing solutions.
Dish: hackathon | 0.5 FTE | 4M preparation + 2.5W execution + 10W incubation | €3.000
Recipe for: 13 ideas | 1 startup
The Ingredient List
• Budget
o €2.500 award money
o €500 out-of-pocket costs (workshops, representation)
• Time
o Preparation (12 weeks):
▪ Challenge definition
▪ Program outline
▪ Participant recruitment
o Hackathon (2.5 weeks):
▪ Kick-off

GA #774199
D 3.4 Dissemination Level: Public/Confidential Page 121 of 170
▪ Workshops
▪ Final
o Incubation (10 weeks):
▪ Program: 12 weeks, 1 day per week activities
• Resources
o Types of organizations involved
▪ UtrechtInc Students (hackathon organization)
▪ Utrecht University (support & business development)
▪ Municipality of Utrecht (challenger)
▪ UtrechtInc (incubation)
o Types of roles involved (mentors, organizing team, experts, etc.)
▪ Organizing team
▪ Judges for selection of ideas
▪ Kanaleneiland residents for validating ideas
▪ Experts for workshops with participants
▪ Experts for guiding during incubation program
o Location(s)
▪ Registration and selection via www.changeu.nl
▪ Virtual meeting room (Zoom) for all program activities
The Preparation Method
Planning
The ChangeU Student Hackathon is an initiative rooted in two developments in the WP5 demonstration
in Utrecht. First, an underlying contextual factor, is that during an earlier project focusing on Smart
Lighting (in TT4 City Innovation Platform), inhabitants expressed their concern that smart energy and
smart mobility weren’t the pressing issues in their district. ChangeU therefore uses the pressing issues as
starting point for the hackathon. Second, the municipality of Utrecht is working on the realization of a City
Innovation Platform (CIP), as part of the WP5 demonstration. The aim of CIP is to support the data
economy, by matching supply and demand of data through an open data platform with relevant local
data. CIP offers an open ICT system and open application program interfaces (APIs) that encourage data
sharing. The aim of the ChangeU Student Hackathon is to develop and incubate ideas that provide
solutions to issues in the Kanaleneiland district, while using (open) data.
The first step in the preparation of the activity was to attract a local partner with a great network of
creative and open-minded ‘problem solvers’. UtrechtInc Students (UIS), the student branch of the
UtrechtInc incubator, hosted the hackathon, as they have a large local network of students from different
study backgrounds. A representative of Utrecht University consulted the students during the organization
of the activity and the Municipality of Utrecht joined as a challenger, providing both knowledge and
budget for the award structure.
First, UIS simultaneously worked on three critical resources for the ChangeU Student Hackathon: (1)
insights in Kanaleneiland district issues; (2) overview of available open data at local, national, and

GA #774199
D 3.4 Dissemination Level: Public/Confidential Page 122 of 170
European level; (3) program to inspire and engage students to develop ideas. To get insights in the local
issues, UIS had several conversations with district stakeholders, both from the perspective of the resident
and the municipality of Utrecht. Together, five topics were determined: Inclusive Labour Market;
Community Health; Shared Space; Smart Mobility; Local Energy Transition. Next, in collaboration with a
representative of Civity, the organization responsible for building CIP, an overview was created of
available data. Lastly, the hackathon program was design in cooperation with UtrechtInc, to make sure
that resulting ideas would fit the incubation program.
To attract as many participants as possible and get the participants to finish all stages of the program, the
program was designed as a ‘funnel’: to get students to sign up, a lot of effort was put into designing a
program that would also benefit the participant in terms of personal and professional development; to
get teams to submit a solution, a compelling award structure was put in place. Also, students were given
the option to either sign up as an individual or as a group of 3 to 5 participants. Individual sign-ups would
then later be joined together in teams or added to existing teams of 3 or 4.
The activity details were presented on a website specifically designed for the ChangeU Student
Hackathon. On the website, the following topics were explained: (1) general introduction; (2) sign up form;
(3) explanation of local issues; (4) judges and judging criteria; (5) overview of frequently asked questions
and answers; (6) a contact form; (7) terms and conditions of the activity.
Event
The ChangeU Student Hackathon publicly launched on January 15, 2021. The details of the activity were
distributed via (student) organizations related to the three Utrecht-based higher educational institutions.
The deadline to sign up was on February 10, 2021. 72 students signed up for the activity – 32 individually,
40 as a team. In total, 16 teams joined the ChangeU Student Hackathon.
Before the official kick-off of the hackathon, all participants received a participant guide – detailing the
activity’s program, participating teams, helpful resources, submission guidelines, and judging criteria. On
February 12, an icebreaker was organized for individuals to get to know their team.
On February 15, 2021, ChangeU had its official kick-off. During the kick-off, all teams were introduced in
the program of the hackathon and the challenges. The kick-off was followed by five workshops:
• Open Data 101 on February 16, 2021, during which Civity introduced participants in the world of
open data.
• Ideation Crash Course on February 17, 2021, hosted by UIS to help bridge the gap between having
an idea and making the first steps towards a business model.
• Ideating with Data Workshop on February 19, 2021, hosted by the Digital Society School, during
which data and ideation were combined.
• Business Model Canvas Workshop on February 23, 2021, during which UtrechtInc explained
everything about turning an idea into a business.
• Pitching Workshop on February 25, 2021, hosted by the Pitch Academy, to help participants
convince a jury of their ideas.

GA #774199
D 3.4 Dissemination Level: Public/Confidential Page 123 of 170
Before the Grand Finale could take place on March 3, 2021, all participating teams had to submit a one-
pager (deadline February 28) and 2-minute video pitch (deadline March 2). In the one-pager, teams were
asked to answer 8 questions on their idea in up to 500 words. A template was provided for this purpose.
13 teams, consisting of in total 55 students, submitted an idea that was assessed. The one-pagers and
video pitches were judged by 6 entrepreneurship/innovation/data experts and 5 Kanaleneiland residents.
The one-pagers were scored on 5 criteria (comprehensibility, realizability, innovativeness, scalability, and
benefit for society); the video pitch was scored on 2 criteria (convincingness and clarity). During the Grand
Finale at March 3, the jury announced an Overall Winner (highest overall score on all criteria) and Most
Convincing Pitch (highest score on the pitching criteria). The Kanaleneiland residents announced their
favourite. Next, all submissions were published for an one-week audience vote. The Audience Favourite
was announced at March 10.
Following the Grand Finale, all participants were encouraged to join the UtrechtInc incubation program.
As UtrechtInc indicated most ideas were a not perfect fit for the program – quality and intrinsic motivation
of the team would be a determining factor for the teams to succeed and grow into a business with a
sustainable business model.
Evaluation
After the ChangeU Student Hackathon concluded, the program was thoroughly reviewed. Main feedback
by the organizing team and stakeholders included:
• The 16-day program possibly was too short to get students to deliver a detailed plan on the
business idea. In general, ‘comprehensibility’ and ‘benefit to society’ scored above average. The
criteria of ‘realizability’, ‘innovativeness’, and ‘scalability’ were scored below average. An
improvement can be to provide participants with feedback halfway during the activity, the better
guide them into a solution direction.
• If the ideas need to be of better quality for the teams to join the incubation program, a ‘bridging
program’ is required to bridge the quality gap between the event and the start of the program.
However, this might contradict the 16-day effort that is requested of participants. Therefore,
potentially, the event organizers can investigate (intrinsic) motivation of students as a way of
selecting participants, instead of accepting all students who sign up.
• Due to Covid-19, the event had to be organized virtually. This might have had an impact on
teamwork and team dynamics, especially if a team consisted of individuals who did not know each
other until right before the event. During a next edition of the event, more focus could be put on
the matchmaking of teams, to make sure there is a (better) fit between participants.
• Both in terms of chance of the team making an entry (100% versus 66%), as well as quality of the
entry (6.19 versus 5.49 on a 10-point scale), teams consisting of individual sign-ups performed
better compared to teams who signed up as a group. A possible explanation for this is that groups
of individuals can and will continue if one team member drops out, whereas for teams who signed
up as a group, losing one team member can result in the full team dropping out. In terms of
quality, teams of individuals have different educational backgrounds. Teams who signed up as a
group often stem from the same studies, resulting in a less diverse perspective.

GA #774199
D 3.4 Dissemination Level: Public/Confidential Page 124 of 170
• Thirteen teams are too many teams for the final event. Potentially organize a semi-final and select
teams for the final.
• Program quality and award structure were named as most important factors for students to
participate.
Reflection IRIS
As the event was co-organised and supported intensively by IRIS-Utrecht partners, the reflections of the
IRIS team largely coincide with the above evaluation of the event. We might add that the winning team
applied and was admitted into the next wave of the UtrechtInc validation program and is currently going
through the program. This shows that indeed ideation events organised with a smart city focus, can help
to generate, mobilize, and identify teams and ideas for smart city innovation. At the date of publishing
this report it remains to be seen if the resulting venture can successfully complete the stages of business
model creation and overcome the many challenges that entails.
Citizen Innovation Challenge The aim of the Citizen Innovation Challenge was to find and incubate specifically user innovations in the
district Kanaleneiland in Utrecht. The challenge intended to engage with ordinary citizens in a structured
way to elicit problems they face and collect coping strategies that exist. Subsequently, it is assessed
whether (some of) these coping strategies contain the starting point of a social impact venture that can
be incubated, scaled-up and/or replicated to areas with comparable characteristics. The project was
initiated by Utrecht University (UU) and Hogeschool voor de Kunsten Utrecht (HKU), with support of
Labyrinth Research Agency. Labyrinth Research Agency is a local network partner that was able to reach
out and effectively engage with citizens in Kanaleneiland, Utrecht. Labyrinth conducted a survey and
organized focus groups to collect information on problems the inhabitants of Kanaleneiland are facing in
their daily life. Using these insights, Utrecht University formulated topics on which citizens could send in
their innovative coping strategies. The most innovative idea that also could be incubated in Utrecht could
win a cash prize of €2.500.
Dish: challenge | 0,4 FTE | 3M preparation + 1M execution | €13.500
The Ingredient List
• Budget
o €11.000 organization cost of local field partner
o €2.500 award money
• Time
o Preparation (12 weeks):
▪ Street interviews: 10 weeks
▪ Focus groups: 2 weeks
o Challenge (5 weeks):
▪ Challenge open for entries: 4 weeks
▪ Final evaluation: 1 week

GA #774199
D 3.4 Dissemination Level: Public/Confidential Page 125 of 170
• Resources
o Types of organizations involved
▪ Hogeschool voor de Kunsten Utrecht (citizen engagement)
▪ Utrecht University (research & business development)
▪ Labyrinth Research Agency (local research and network partner)
o Types of roles involved (mentors, organizing team, experts, etc.)
▪ Organizing team
▪ Judges for selection of ideas
▪ Experts with district knowledge and network
o Location(s)
▪ Registration and selection via prijsvraagkanaleneiland.nl
▪ Location for pitches
The Preparation Method
Planning
The Citizen Innovation Challenge is an initiative that stems from several activities in the IRIS project, both
in WP5 Utrecht Demonstration and WP3 Business Modelling. At its core is TT5 Citizen Engagement. The
main aim of TT5 is to actively engage and intrinsically motivate the inhabitants of the district
Kanaleneiland Zuid to save energy, match the moment energy use to the supply of renewable energy, and
to use electric means of transport. The project was initiated by Utrecht University (UU) and the
Hogeschool voor de Kunsten Utrecht (HKU), with support of Labyrinth Research Agency.
The diversity in stakeholders and the crucial role of citizens as enablers of the energy transition, especially
in the low-income and multicultural district Kanaleneiland Zuid, require co-creation and attractive and
inclusive services that support them in their own objectives to engage, express ownership, and behaviour
change.
During an earlier project focusing on Smart Lighting (in TT4 City Innovation Platform), inhabitants
expressed their concern that energy and mobility weren’t the pressing issues in their district. Therefore,
the Citizen Innovation Challenge took another course and intended to engage with ordinary citizens in a
structured way to elicit problems they face and collect existing coping strategies. The aim of the Citizen
Innovation Challenge is to find and incubate user innovations in the district Kanaleneiland Zuid.
The first step in the preparation of the challenge was to attract a local network partner, deeply rooted in
the local civic network. Labyrinth Research Agency helped implement the challenge, as they have a broad
network in the district and have extensive experience with doing research amongst groups that are
difficult to reach.
First, Labyrinth set-up, distributed, and collected a survey among inhabitants of Kanaleneiland Zuid. A
team of interviewers visited different places in the neighbourhood to approach a wide range of people.
The questionnaire consisted of several questions regarding several topics, i.e.: nuisance, neighbourhood,
housing, public space, traffic, health, transport, income, work, youth, elderly, and cultural differences.
Depending on the available time of respondents, 1 up to 12 topics were covered during the interview and

GA #774199
D 3.4 Dissemination Level: Public/Confidential Page 126 of 170
each topic was randomly chosen by the software system. Between July and September 2019, 126
respondents were interviewed, covering 205 topics.
After completing the street interviews, Labyrinth organized several focus groups with residents of
Kanaleneiland. The aim of these focus groups was first to retrieve new ideas on how people cope with
daily problems. The information and insights gathered during the street interviews were used to prepare
for the focus groups.
The results of both the street interviews and focus groups was disappointing. On October 1, 2019, it was
concluded to not continue the efforts on the challenge. UU analysed the efforts to date together with
Labyrinth and concluded that:
• The target group does not feel it has the influence and/or ability to change the social issues in the
district;
• There is a low degree of organization among residents. The critical mass is often limited to one
person;
• Kanaleneiland Zuid is a former ‘krachtwijk’ (= neighbourhood where several social and societal
problems occur simultaneously, i.e. unemployment, crime and addiction problems). Over the past
years, the district was continuously monitored and received outside help. As these organizations
tend to come and go, no organizations have been responsible for the district for a long time. This
limits the amount of confidence inhabitants tend to have in outside organizations.
These three conclusions combined led to the overarching feeling that the challenge would not get enough
inhabitants engaged and/or would not attract the desired types of user innovated ideas.
Labyrinth and UU then decided to collaborate on a different activity, less focused on ideation and more
on informing and engaging citizens in an event around sustainable energy in the neighbourhood under
the name of EnergieKanaleneiland, which contains the Dutch word “Energiek”, meaning energetic. The
event was planned for the spring of 2019 and then postponed in the first COVID-19 lockdown. The
organisation of the event had progressed up to the preparation of marketing materials and the
confirmation of participants and sponsors for the event in the fall of 2020 but once more had to be
postponed because of the second COVID-19 wave in the Netherlands. At the time of writing this report,
the event has yet to take place.
Event
Although the challenge was cancelled, the Citizen Innovation Challenge was supposed to launch on
October 1, 2019, through prijsvraagkanaleneiland.nl. Inhabitants of Kanaleneiland Zuid could enter their
ideas for the problems in the neighbourhood until October 27, 2019. Entries would be judged on two
criteria: 1) readiness of the idea, and 2) does it improve the life of inhabitants of Kanaleneiland Zuid.
Dissemination of the challenge focused on channels being used in the district. These included online
channels (Facebook groups and pages, Instagram, websites of social organizations active in the district),
offline channels (flyers and posters in frequented spots), and local and district media. Especially
multilanguage offline promotion was important, considering that the residents have below average access

GA #774199
D 3.4 Dissemination Level: Public/Confidential Page 127 of 170
to internet and not all residents have a sufficient level of Dutch. Considered languages were Dutch (B1-
level), Arabic, Turkish and English.
The winner or winners were supposed to be announced on November 3, 2019. The total award money
was budgeted at €2.500 that could be shared amongst the winning ideas or through a winner-takes-all
principle. Students at the Utrecht University would than take on the ideas and further develop them using
the Smart City Business Model Canvas developed by Giourka et al. (2019) in Task 3.3 of the IRIS project.
Evaluation
• It is critical to have a partner organization who has an engaged network of residents and business
owners in the neighbourhood.
• The challenge needs to be more specific. It is too easy to submit ideas that are circulating already
on the internet, when a very open challenge is formulated.
• Rewarding participants for submitting already existing coping strategies can also invite fraudulent
submissions, where people try to win the prize money with other people’s ideas. Having to check
for this is rather time consuming and creates a negative atmosphere.
• The initial idea to try and elicit user innovations in a challenge had to be abandoned. From the
literature we know that user innovations exist and can be important drivers of change, but true
user innovations are too rare to expect a lot of submissions in challenges that are either very
specific on the problems formulated or restricted in the audience they reach.
• Many of the problems people indicate as important in their daily lives are of the kind that make
it hard for individuals to develop solutions. This is logical as most of the problems for which
individuals can come up with solutions, have already been solved and are not perceived as
relevant anymore.
• In complicated socio-economic environments, user-innovativeness is likely to be limited. The
reason for this, apart from perhaps the lack of skills, resources and networks to make the
innovations work, seems to be that people quickly get used to expecting solutions for problems
from outside.
Reflection IRIS
As this challenge was set up by the IRIS team, the reflections above overlap completely. The Citizen
Innovation Challenge may work as a recipe in more pro-active and assertive populations. In more
challenging socio-economic environments it was decided that taking a few steps back and first engaging
citizens with information and creating awareness would be advised.
Gothenburg Smart City Challenge The Gothenburg Smart City Challenge is part of the Leading in a Digital World course lectured at Chalmers
University of Technology in Gothenburg, Sweden. To help the City of Gothenburg fulfil its vision towards
a Smart City, student teams developed a digital innovation and accompanying business model. In total,
100 Chalmers students, who are finalizing the third year at the Industrial Economics program, worked in
18 different teams to develop and present ideas over a timespan of eight weeks. Submitted ideas included

GA #774199
D 3.4 Dissemination Level: Public/Confidential Page 128 of 170
everything from reducing food waste, improved mobility and air quality, water use management, a
student accommodation platform, waste sorting and even connected urban farming.
Dish: challenge | 1.0 FTE | 8W preparation + 8W execution | €1.000
Recipe for: 18 ideas
The Ingredient List
• Budget
o Out-of-pocket printing costs for exhibition
• Time
o Preparation (8 weeks):
▪ Course outline
▪ Preparing materials
o Challenge (6 weeks):
▪ Kick-off
▪ Workshops
o Showroom (9 weeks)
• Resources
o Types of organizations involved
▪ Chalmers University of Technology (organizing team)
▪ City of Gothenburg, multiple departments (challenger)
o Types of roles involved (mentors, organizing team, experts, etc.)
▪ Organizing team
▪ Judges for selection of ideas
▪ Residents for validating ideas
o Location(s)
▪ Classrooms at University
▪ Virtual Exhibition Area via stadsutveckling.goteborg.se/smart-city-challenge/
▪ Exhibition Area
The Preparation Method
Planning
The Gothenburg Smart City Challenge is part of the Leading in a Digital World course lectured at Chalmers
University of Technology in Gothenburg, Sweden. The purpose of the course is to expand the knowledge
of leadership and strategic thinking in a global and digital world for the participants. The focus in this
challenge is therefore educational. Still, the resulting ideas are of interest and could be fed into an
incubation program as part of the smart city development strategy. The course enabled students to
develop an understanding and skills through applying the appropriate frameworks, concepts, and
methods in groups in a Live Case project for the City of Gothenburg. In self-assigned teams of maximum
six people, students are to conceive of and pitch a digital innovation to help the City of Gothenburg pursue
its vision of becoming a smart city as well as a circular and sustainable one.

GA #774199
D 3.4 Dissemination Level: Public/Confidential Page 129 of 170
Before the City of Gothenburg was invited to co-host the challenge, four lecturers worked on the course
outline and framework of the activity. However, city officials already indicated their interest in joining
beforehand. In the preparation, multiple departments of the City of Gothenburg were involved (i.e. urban
planning, citizen wellbeing).
To help the City of Gothenburg fulfil its vision towards becoming a smart city, with a particular focus on
open data and citizen engagement, student teams developed a digital innovation and accompanying
business model to convince the City of Gothenburg’s jury, the citizens of Gothenburg, the faculty, and the
rest of the class that the innovation is a great innovation for the City of Gothenburg. The innovation was
to be based on the following guidelines: novelty, digital, smart and circular measurable impact, user-
focused, self-financing and self-sustaining, and idea quality.
To create an initial idea, teams were provided with an Initial Idea Worksheet, based on Babson’s
Entrepreneurial Thought & Action and IDEO’s design methodology. The worksheet focusses on potential
resources, pain that an idea can solve, which stakeholders are involved, and which challenges and/or
opportunities are addressed. During the challenge, teams had to collect market information to develop
the innovation, as well as test assumptions. To be valid entries, in the innovation, teams must use at least
one digital tool and one dataset made available by the City of Gothenburg. Teams were also encouraged
to use the electronic datasets available at Chalmers University of Technology.
Event
In total, 100 Chalmers students, who are finalizing the third year at the Industrial Economics program,
worked in 18 different teams to develop and present ideas. Teams were self-assigned and consisted of
maximum six people. Students were requested to aim for a diversity of backgrounds and skills in the team.
Also, a request was made to strive for gender and background balance in the team’s presentations. Each
team had to select an innovation focus area and geographical location (one of the boroughs of
Gothenburg), to make sure the challenge would result in wide range of different ideas. There was a limit
of one team per innovation focus area and two teams per geographical area. Selection was on a first come,
first serve basis.
As a final submission, teams were to prepare a one-page A0-sized poster in either Swedish or English
pitching the team’s innovation. Also, all teams needed to prepare a max. 3-minute video pitch. For two
months the public was invited to vote for their favourite. Meanwhile, a jury including members from the
city's various administrations and the teacher of the course, assessed the proposals.
The Leading in a Digital World course – containing the Gothenburg Smart City Challenge – started on
January 22 2020 with a kick-off lecture. The challenge details were explained, which were simultaneously
also made available via the course syllabus. The kick-off was followed by several activities and
deliverables:
• Innovation Area on January 28, 2020, during which teams were to select an innovation area and
geographic location;
• Handing in Initial Idea Worksheet on February 17, 2020;
• Pitch Workshop on February 26 & 27, 2020;

GA #774199
D 3.4 Dissemination Level: Public/Confidential Page 130 of 170
• Draft Pitch and Peer Feedback on March 4 & 5, 2020;
• Handing in Final Pitch Poster & Video on March 12, 2020;
From March 16 to May 31, 2020, the Innovation Pitch Videos were displayed online and the Innovation
Pitch Posters were displayed at an exhibition area in the City of Gothenburg. The City of Gothenburg has
created a jury to evaluate the innovations and selected the winners of the Gothenburg Smart City
Challenge on May 31, 2020, together with citizens of Gothenburg.
Submitted ideas included everything from reducing food waste, improved mobility and air quality, water
use management, a student accommodation platform, waste sorting and even connected urban farming.
The proposal Matvinn, which simultaneously solves two issues, impressed both the public and the jury
when voting for the winner of the Gothenburg Smart City Challenge. By saving food waste from school
kitchens and allowing students' parents to bring food boxes home, the climate impact of food waste can
be reduced while the everyday lives of families are made easier. The app has not been fully developed
during the semester, but the team has been in contact with a school in Angered, Sweden, that has shown
interest in the project.
All teams have been encouraged to keep working on their respective idea, as further development would
be needed to qualify for an incubation program. A limited number of teams have indeed done so.
Evaluation
After the Gothenburg Smart City Challenge concluded, the program was thoroughly reviewed. Main
feedback by the organizing team and stakeholders included:
• Although participation was mandatory, students were very engaged to join in such an activity, as
it is concerning their own surroundings.
• The quality of the submissions did not meet the expected or hoped quality. Students would often
use technologies in their idea without understanding them. Students need to be more critical
about feasibility, especially in terms of technology used, privacy of users, and cost versus benefit.
• Teams were not really diverse, as all students have a similar background and are doing the same
studies. It could also be that students have collaborated in other projects. To diversify teams. It
might be interesting to randomize group composition and see how this affects the submission
quality.
• The challenges the students needed to work on were formulated based on a combination of topics
and neighbourhoods. This helped in diversifying the challenges students were working on.
However, students found the goals of the City of Gothenburg not concrete enough, they could
have been more specific.
• Students were encouraged to use the city’s open data as this is one of the City of Gothenburg’s
goals, however, the open data portal was difficult to navigate. It would have been good to include
a mandatory requirement for students to use at least one open data source and/or provide
training to students on how to use the portal.
Reflection IRIS
GA #774199
D 3.4 Dissemination Level: Public/Confidential Page 131 of 170
Although this challenge was not part of the IRIS project in lighthouse city Goteborg, it was identified as a
relevant recipe for smart city ideation tools and included in the cookbook. Of course, the preconditions
for organising a student challenge as an integral part of an educational program, implies many very
specific preconditions need to be met. But if these preconditions are met, the recipe can deliver important
ideas that can be shifted into an incubation program relatively easily. These preconditions are present in
Utrecht, Goteborg and Nice as the lighthouse cities in the IRIS project and in many cities beyond the IRIS
project around Europe and the world. Importantly, an enthusiastic and skilful teacher/coordinator for the
course is essential. Smart city planners are advised to reach out to such a person before considering
setting up a challenge along these lines. As in the case of the student challenges organised and co-
organised in Utrecht, this challenge generated novel and creative ideas and with proper support and
guidance, these can be validated and tested to be made ready for more serious incubation efforts.
FIWARE (Digital) hackathon A hackathon is an idea-creating event originating from the cybersecurity sector, where companies would
ask hackers to expose security leaks for payment. A hackathon is a short and intensive session, which
usually lasts 24-hours, during which teams are explained a problem and using some tools like data or basic
training, are expected to pitch a solution or idea at the end of the session. Sometimes, parts of the
problem, data, or introductory masterclasses are already provided beforehand. In the fall of 2019,
FIWARE, a European consortium build around an open access big data platform, organized a digital
hackathon. Such a hackathon differs from a physical one as information is spread online, and submissions
are digitally received. Furthermore, it differs as the time-constraint for 24-hours can be relaxed. In the
case of the FIWARE hackathon, both were true; participants received online information and were given
several weeks to come up with a solution. The winner of the hackathon was announced at the FIWARE
Global Summit in Berlin.
In the hackathon the goal was to use the open source FIWARE technologies, which are open-source tools
which aim to aid developers in developing smart solutions. Their technologies could be used for four
different aims: 1) the development and long-term sustainability of (but not limited to) European cities, 2)
the implementation of innovative systems applied to the Smart Manufacturing sector, 3) the reuse of
Open Data in the context of all the vertical domains of the hackathon, and 4) unleashing the innovation
potential for the digital transformation of the European Agrifood Sector using FIWARE open source
technologies. Participants could win €2.500,- per aim, with the possibility of multiple ideas winning for a
single aim and the possibility of an idea winning multiple prizes (if it covered multiple aims). In addition,
winners received fully paid attendance to the Smart City Expo World Congress in Barcelona, and a year of
free FIWARE technical services as well as a year of free social media promotion through FIWARE’s
channels.
Dish: hackathon | 12W preparation + 14W execution | €10.000
The Ingredient List
• Budget
o €10.000 prize (flexible)

GA #774199
D 3.4 Dissemination Level: Public/Confidential Page 132 of 170
• Time
o Preparation (minimum of 12 weeks):
o Challenge (14 weeks):
▪ Hackathon launch (29 July)
▪ First masterclass: week 7
▪ Challenge open for entries: week 8, for 6 weeks
▪ Pitches: week 11, 3 days
▪ Announcement winner: week 14, 1 day
• Network
o Promotion/distribution partners (to disseminate the call)
o Reputation (to motivate participants)
• Resources
o Types of organizations involved
▪ Organization with problem question (FIWARE)
▪ Event announcement winner (if chosen)
• Location
• Local governance
▪ Judge providers
• Practitioners, experts
o Types of roles involved (mentors, organizing team, experts, etc.)
▪ Organizing team
• Promotional team
▪ Judges for selection of ideas
▪ Experts for providing webinars
o Location(s)
▪ Registration and selection via https://www.fiware.org/summit-berlin/startup-
day/hackathon/
▪ Location for final (if chosen)
o Terms and conditions
The Preparation Method
Planning
FIWARE is a foundation with a twofold of major roles. First, they provide ‘a framework of open-source
platform components to accelerate the development of smart solutions’. These components should add
to FIWARE’s mission: ‘to build an open sustainable ecosystem around public, royalty-free and
implementation-driven software platform standards that will ease the development of new Smart
Applications in multiple sectors’. In other words, they develop open-source development tools for new
smart solutions. Their public API’s can for example be used to allow objects to connect to the IoT. Second,
the foundation supports a variety of start-up fostering initiatives. The foundation for example hosts a
start-up accelerator and provides guidance to many incubators and other accelerator programs.

GA #774199
D 3.4 Dissemination Level: Public/Confidential Page 133 of 170
The FIWARE team has an employee specialized in organizing similar events. So far, they have organized
around 8 events. Originating from the EU Future Internet Public Private Partnership (FI-PPP), FIWARE is
in essence a European organization. Their network is spread all over Europe. As such, the hackathons are
not focused on a specific locale and accept international submissions.
First, the team identified four clear aims for applications in the Smart Cities, Smart Manufacturing, Open
Data, and Smart Agrifood topics. The aims of the hackathon were:
1. The development and long-term sustainability of (but not limited to) European cities;
2. The implementation of innovative systems applied to the Smart Manufacturing sector;
3. The reuse of Open Data in the context of all the vertical domains of the hackathon.
4. Unleashing the innovation potential for the digital transformation of the European Agrifood
Sector using FIWARE open source technologies.
For this hackathon, the team set three clear themes – which are provide more structured guidance to
participants. In essence, the aims serve a grander strategy, the themes are specific concepts which may
help completing the aims. Participants needed to use the open FIWARE data to:
1. Enhance public administration efficiency;
2. Provide user-centred services;
3. Reduce the digital divide.
At times, aims are shaped towards the needs of cooperating stakeholders. Otherwise, they are geared
towards specific needs of cities identified by the organization.
Participants then need to provide a new idea which uses the FIWARE data and platform which adheres to
one or multiple of these goals. Furthermore, the ideas needed to be relevant for the aims in the four
specified sectors. Teams registered using an online form. The final deadline for the proposal was on the
same date as the first pitches.
Event
On July 29, 2019, FIWARE launched the FIWARE Hackathon, complete with the timeline. Besides
monitoring submissions, organizing webinars, and promoting the Hackathon, there is little mid-period
organisation required.
The jury was announced on the same date as the challenge. The jury is often regarded as one of the most
important factors for a Hackathon, as they provide both expertise and legitimacy. For this Hackathon, the
jury consisted out of a member of the EC, a project lead manager at EIT Digital, a senior researcher from
ATB-Bremen, and the COO of FIWARE.
The deadline for submissions was 15 October 2019 (10:00 CET) – elevator pitches followed between the
15th and the 17th. Pitches were given a maximum of 10 points in total. These 10 points are made up out of
a maximum of two points within the following 5 categories: the use of technology, extent of problem
solving, quality of the pitch, marketability, and realism. The original registration required a short abstract
of the idea and the problem which the idea aims to tackle, an architecture of the solution, a

GA #774199
D 3.4 Dissemination Level: Public/Confidential Page 134 of 170
demo/prototype, further plans for final development, and some basic market analysis. The final winner
was decided by the jury based on elevator pitches which followed the registration deadline.
Winning ideas were then announced during FIWARE’s start-up day in Berlin, on the October 24, 2019. In
total, winners were decided by category, with a total prize pool of €10.000,-. In other words, the best
Open Data, Smart Manufacturing, Smart City, and Smart Agrifood ideas could win €2.500,-. As ideas could
cover multiple topics, it is also possible to win multiple prizes. If one category had a multitude of good
proposals, multiple winners are also possible. This happened during this Hackathon; 3 ideas won €2.500,-
. Next to the financial incentive, winners receive fully paid attendance to the FIWARE world summit in
Barcelona, a year of free technical services on the FIWARE platform, and a year of free social media
promotion through the FIWARE channels.
Lastly, much of the organizational work was put into two additional factors. First, FIWARE organizes a
weekly webinar series at the start, during which experts provide lectures on certain specific topic. These
webinars delve both into conceptualizations and coding options. Second, much time was spent on
promotion. The event was promoted though official press releases, Eventbrite, social media accounts, and
members of the FIWARE community. Next to contacting personal contact Eventbrite was identified as the
most time/cost-efficient promotion technique.
Evaluation
• There is significant flexibility in the online form of a Hackathon, especially with regards to costs
(next to an incentive, most of the costs are optional);
• Promotion is key and works significantly better if there is a decent reputation and network;
• The webinars aid teams by making sure their proposals better suit what is expected;
• Hackathons become increasingly easy to organize (and promote) as the organization becomes
more experienced, making them suitable for repetition (e.g. annual);
• (Digital) Hackathons are not very dependent on third parties and may function well in logistically
constrained situations;
• In the current set-up, a digital Hackathon is similar (but more hands-off) than a challenge;
• Guiding the idea to become more than just an idea is difficult, even when this is considered by
the organizer.
Reflection IRIS
It proved beyond the scope and capabilities of IRIS to organize our own (online) hackathon for smart city
ideation. Fortunately, the FIWARE hackathon had a smart city connection, and the organisation was willing
to share information with us on how the hackathon was organized. This experience has taught us that it
would make sense for smart city planners and developers to look around and reach out to organizers of
hackathons. These organisations are looking for good themes and access to networks of experts and
technology that smart city developers might be able to provide. In co-creating these events, the ideation
can be targeted more on the challenges in a specific smart city context while one can benefit from the
often-large networks and outreach of the hackathon organisers. To organise a successful smart city
hackathon, several key resources, that are not often found in a single organisation, need to come

GA #774199
D 3.4 Dissemination Level: Public/Confidential Page 135 of 170
together. We would suggest that smart city planners interested in generating high quality smart city
innovations and business models consider teaming up with organisations like FIWARE who have the
capabilities and network to organise successful hackathons.
Summary and Conclusions Across these events we can draw some relevant conclusions for smart city developers considering
organising ideation events in the future:
Due to lack of data, we cannot make any conclusion on the effect of team diversity (cultural, gender,
educational) on the quality of submissions. However, in one of the activities, there was a clear difference
in the chance of the team making a submission, as well as quality of the entry, when comparing teams of
individual sign-ups to teams who signed up as a group. A possible explanation for this is that groups of
individuals can and will continue if one team member drops out, whereas for teams who signed up as a
group, losing one team member can result in the full team dropping out. In terms of quality, teams of
individuals have different educational backgrounds. Teams who signed up as a group often stem from the
same studies, resulting in a less diverse perspective.
To ‘attract’ the desired ideas, it is crucial to develop an open challenge question and very clear
prerequisites. The challenge question can best be framed as a ‘How Might We …’ question (IDEO Design
Kit - https://www.designkit.org/methods/3). Do not add a potential solution to the challenge question.
The prerequisites should be as specific as possible: not ‘use data in your innovation’, but ‘use one or more
of datasets x, y and z in your solution’.
Teams need to have some basic entrepreneurial skills (ideation, collaboration, creativity) in order
successfully complete an activity. If the skills cannot be assumed for the participants at the start of the
activity, workshops on these skills should be part of the activity. Activities often result in high quality ideas,
but, however, need mentoring to turn into bankable ideas. This ‘skill’ or knowledge – business
development and scalability – is often lacking. Most organizations who organized such an activity to find
new business ideas, hosted a follow-up mentoring and/or incubation program shortly after the activity to
guide teams with this next step. It is smart to plan this soon after, not to lose momentum.
Depending on the format/incentives, take note that not all people who sign up will join, and not all people
who join submit an idea. Losses can be significant at every stage of the ‘activity funnel’. It is important to
think about all the steps in the funnel and have incentives for participants to move to the next phase. Only
when directly linked to a course in participants’ education, you will get close to 100% pass rates. When
the challenge is fully open, there will be no information at all on how many people consider participating.
This makes planning difficult. Consider asking people who are interested to join to sign up to get detailed
information about the activity.
Incentive (award structure) is often mentioned as an important factor to join an activity. However, the
award needs to be proportionate to the expected effort: €1.000-2.000 for a winning idea submission;
€10.000-20.000 when is expected to develop the idea into a business. The latter should be clear upfront
and can be arranged via a non-exclusive launching customer contract.

GA #774199
D 3.4 Dissemination Level: Public/Confidential Page 136 of 170
9. Conclusions and Forward and Backward Linkages in WP3 and IRIS
9.1 Conclusions and Recommendations The work presented in this deliverable aimed to promote new business model development in smart
cities. We concluded from our research that smart city business incubation does not require a specific but
rather a broad and open business incubation program, combined with specific and targeted smart city
ideation activities. In that way, many new ideas can be mobilized and quickly selected on feasibility and
viability. Accordingly, we describe how UtrechtInc has broadened its incubation programs and, as far as
we can establish, has done so successfully. Moreover, a series of ideation events has generated, with more
and less success, a flow of new ideas to make our lighthouse cities smarter and more sustainable. Based
on the work described in this deliverable, we can now write out the steps a city planner or smart city
developer would take to promote new business model incubation in their smart cities. These steps are:
1. Identify key players in the entrepreneurial ecosystem, notably business incubators and
accelerators in your city.
2. Engage with them to try and “open” their programs for a broad range of incubates, especially
from different target groups (students, scientists, entrepreneurs, employees at incumbents etc.
etc.) and over a broad range of stages of development (first idea to validated business model)
using the proposed reforms in chapter 6.
3. Select the appropriate type of events following the checklist developed in chapter 7.
4. Select the appropriate (set of) recipe(s) from the cookbook in chapter 8.
5. Evaluate and learn, then start again at 2.
Of course, if smart city developers set up and organize their own challenges and bring the participants
and winners of these challenges into incubation programs, there is no need to really measure their degree
of “smart city-ness”. A good challenge, by design, will only yield business models that would qualify as
smart-city innovations. But it is possible that compromises must be made. It is better to organize a broader
challenge and open the incubation programs also for non-smart city business models, if in doing so one
gains access to important networks or essential resources. The measures we have developed in chapter
4, however, have proven useful in assessing the performance of already existing programs and broader
business incubation challenges. The Smart City Index can be used to “score” innovations in any stage of
development, based on a short description of the business model. This SCI can then help researchers
identify the factors that support smart city innovation in urban technology innovation systems and
entrepreneurial ecosystems. The indices we have developed can also be used for projects, investments
and activities that are not in their early stages of development. The smart city business model canvass
(Giourka et al. 2019), for example, is a tool to systematically develop and improve the business model of

GA #774199
D 3.4 Dissemination Level: Public/Confidential Page 137 of 170
smart city projects. This also holds for the tools developed in the business model toolkit in Task 3.3. To be
able to apply these tools usefully, identifying and scoring smart city projects in a consistent and systematic
way, would be useful.
9.2 Explicit linking of the work to T3.1 on ecosystems Task 3.1 zooms in on the characteristics of the local, regional, and national ecosystem or technology
innovation system that surrounds the new, integrated solutions that IRIS demonstrates and develops.
D3.2 zooms in on strengths and weaknesses in the technical innovation systems of our lighthouse and
follower cities, while D3.3 puts this analysis in a broader context and develops an evidence based
diagnostic toolkit for the ability of regional ecosystems to promote innovation and business development
in general and smart city innovations on IRIS’ five transition tracks specifically. The SCI presented in this
report and published earlier as Hermse et al. (2020) can be helpful in generalizing the evidence based
diagnostic tools to smart cities beyond the rather specific IRIS transition tracks. This will help make these
tools suitable for application also beyond IRIS. By evaluating the performance of local, regional, and
national ecosystems on bringing forth smart city innovations, the general applicability of out innovation
system assessment tools can be extended in future work. Our work on the business incubation landscape
in Utrecht, Gothenburg and Nice has informed a range of activities to improve the functioning of these
ecosystems in the project.
9.3 Explicit linking of the work to T3.3 on business model development
Task 3.3 brings the work in T3.1 and T3.2 together. It shows how the lighthouse, follower and potential
replication cities could assess and strengthen their local ecosystems, while it also presents tools and
techniques adapted from business incubation that have been helpful for the innovators in the IRIS project
(the smart city business model canvass), seeking to fit their integrated replicable solutions to new local,
regional, and national contexts. The early work presented in chapters 2-3 of this report informed the
9.4 Explicitly linking the work to T3.4-3.5 and the other WP. Tasks 3.4 and 3.5 present how this work can be extended beyond IRIS in time and space. To make our
tools and approaches applicable beyond IRIS, we extended and generalized our definition of smart city
innovation and investigated how business incubation programs can contribute to the development of
smart city projects that were not part of the IRIS demonstration projects. The recipes for ideation activities
and challenges are all replicable in other cities and for other smart city challenges. The tools developed to
help smart city developers pick the right recipe for their specific challenges are also useful beyond IRIS.
Together, the tasks in WP3 thus present research and develop toolkits and strategies that both innovators
and ecosystem managers in lighthouse cities, follower cities and urban developers inside and outside of
Europe can apply to accelerate smart city development, whether they seek to adopt and replicate the
integrated IRIS solutions of our project or develop new smart city business altogether.

GA #774199
D 3.4 Dissemination Level: Public/Confidential Page 138 of 170
9.5 Explicitly linking the work to the other work packages Our ideation recipes (Startup in Residence, Smart Lighting Challenge, Energy Poverty Challenge, Utrecht
Mobility Challenge, ChangeU Student Hackathon and Citizen Innovation Challenge, Gothenburg Smart City
Challenge) were part of the demonstration work packages (WP5, Utrecht and WP7, Gothenburg). The
challenges were organized and developed in close collaboration with IRIS partners in these work packages,
and resulting ideas and projects are still contributing to the demonstration and pilot projects in IRIS. The
description of the Business Incubation program in chapter 6 and Ideation activities in chapter 8 are aimed
to be replication activities (WP8)

GA #774199
D 3.4 Dissemination Level: Public/Confidential Page 139 of 170
References Adegbite, O. (2001). Business Incubators and Small Enterprise Development: The Nigerian Experience.
Small Business Economics, 17(3), 157–166. https://doi.org/10.1023/A:1011801018398 Adiyarta, K., Napitupulu, D., Syafrullah, M., Mahdiana, D., & Rusdah, R. (2020). Analysis of smart city
indicators based on prisma: Systematic review. IOP Conference Series: Materials Science and Engineering, 725, 012113. https://doi.org/10.1088/1757-899X/725/1/012113
Aernoudt, R. (2004). Incubators: Tool for Entrepreneurship? Small Business Economics, 23(2), 127–135. https://doi.org/10.1023/B:SBEJ.0000027665.54173.23
Aerts, K., Matthyssens, P., & Vandenbempt, K. (2007). Critical role and screening practices of European business incubators. Technovation, 27(5), 254–267. https://doi.org/10.1016/j.technovation.2006.12.002
Aharonson, B. S., & Schilling, M. A. (2016). Mapping the technological landscape: Measuring technology distance, technological footprints, and technology evolution. Research Policy, 45(1), 81–96. https://doi.org/10.1016/j.respol.2015.08.001
Albort-Morant, G., & Ribeiro-Soriano, D. (2016). A bibliometric analysis of international impact of business incubators. Journal of Business Research, 69(5), 1775–1779. https://doi.org/10.1016/j.jbusres.2015.10.054
Alexy, O., Criscuolo, P., & Salter, A. (2012). Managing Unsolicited Ideas for R&D. California Management Review, 54(3), 116–139. https://doi.org/10.1525/cmr.2012.54.3.116
Amason, A. C., Shrader, R. C., & Tompson, G. H. (2006). Newness and novelty: Relating top management team composition to new venture performance. Journal of Business Venturing, 21(1), 125–148. https://doi.org/10.1016/j.jbusvent.2005.04.008
AMEZCUA, A. S. (2010). Performance analysis of entrepreneurship policy: Which business incubators nerate the highest levels of economic performance?ge . Frontiers of Entrepreneurship Research,.
https://scholar-google-nl/citations?view_op=view_citation&hl=en&user=w2TBYv4AAAAJ&citation_for_view=w2TBYv4AAAAJ:d1gkVwhDpl0C
AMEZCUA, A. S., GRIMES, M. G., BRADLEY, S. W., & WIKLUND, J. (2013). Organizational Sponsorship and Founding Environments: A Contingency View on the Survival of Business-Incubated Firms, 1994-2007. The Academy of Management Journal, 56(6), 1628–1654.
Andreesen, M. (2007). Product/market fit. Business Management For Electrical. Arlotto, J., Sahut, J.-M., & Teulon, F. (2011). What is the performance of incubators? The point of view of
coached entrepreneurs. International Journal of Business, 16(4), 341–352. Ayatse, F. A., Kwahar, N., & Iyortsuun, A. S. (2017). Business incubation process and firm performance: An
empirical review. Journal of Global Entrepreneurship Research, 7(1), 1–17. Baldwin, C., Hienerth, C., & von Hippel, E. (2006). How user innovations become commercial products: A
theoretical investigation and case study. Research Policy, 35(9), 1291–1313. https://doi.org/10.1016/j.respol.2006.04.012
Bank, N., Fichter, K., & Klofsten, M. (2017). Sustainability-profiled incubators and securing the inflow of tenants – The case of Green Garage Berlin. Journal of Cleaner Production, 157, 76–83. https://doi.org/10.1016/j.jclepro.2017.04.123
Baraldi, E., & Ingemansson Havenvid, M. (2016). Identifying new dimensions of business incubation: A multi-level analysis of Karolinska Institute’s incubation system. Technovation, 50–51, 53–68. https://doi.org/10.1016/j.technovation.2015.08.003

GA #774199
D 3.4 Dissemination Level: Public/Confidential Page 140 of 170
Barbero, J. L., Casillas, J. C., Ramos, A., & Guitar, S. (2012). Revisiting incubation performance: How incubator typology affects results. Technological Forecasting and Social Change, 79(5), 888–902. https://doi.org/10.1016/j.techfore.2011.12.003
Batty, M., Axhausen, K. W., Giannotti, F., Pozdnoukhov, A., Bazzani, A., Wachowicz, M., Ouzounis, G., & Portugali, Y. (2012). Smart cities of the future. The European Physical Journal Special Topics, 214(1), 481–518. https://doi.org/10.1140/epjst/e2012-01703-3
Bergek, A., & Norrman, C. (2008). Incubator best practice: A framework. Technovation, 28(1), 20–28. https://doi.org/10.1016/j.technovation.2007.07.008
Blank, S. (2013). Why the lean start-up changes everything. Harvard Business Review, 91(5), 63–72. Blei, D. M., Ng, A. Y., & Jordan, M. I. (2003). Latent dirichlet allocation. The Journal of Machine Learning
Research, 3, 993–1022. Bocken, N. M. P., Short, S. W., Rana, P., & Evans, S. (2014). A literature and practice review to develop
sustainable business model archetypes. Journal of Cleaner Production, 65, 42–56. https://doi.org/10.1016/j.jclepro.2013.11.039
Bøllingtoft, A., & Ulhøi, J. P. (2005). The networked business incubator—Leveraging entrepreneurial agency? Journal of Business Venturing, 20(2), 265–290. https://doi.org/10.1016/j.jbusvent.2003.12.005
Brabham, D. C. (2008). Crowdsourcing as a Model for Problem Solving: An Introduction and Cases. Convergence, 14(1), 75–90. https://doi.org/10.1177/1354856507084420
Bradonjic, P., Franke, N., & Lüthje, C. (2019). Decision-makers’ underestimation of user innovation. Research Policy, 48(6), 1354–1361. https://doi.org/10.1016/j.respol.2019.01.020
Bruneel, J., Ratinho, T., Clarysse, B., & Groen, A. (2012). The Evolution of Business Incubators: Comparing demand and supply of business incubation services across different incubator generations. Technovation, 32(2), 110–121. https://doi.org/10.1016/j.technovation.2011.11.003
Bryman, A. (2016). Social research methods (5th edition). Oxford university press. Burgelman, R. A. (1983a). A process model of internal corporate venturing in the diversified major firm.
Administrative Science Quarterly, 223–244. Burgelman, R. A. (1983b). Corporate Entrepreneurship and Strategic Management: Insights from a Process
Study. Management Science, 29(12), 1349–1364. https://doi.org/10.1287/mnsc.29.12.1349 Campbell, C., Kendrick, R. C., & Samuelson, D. S. (1985). Stalking the latent entrepreneur: Business
incubators and economic development. Economic Development Review, 3(2), 43–49. Caragliu, A., Del Bo, C., & Nijkamp, P. (2011). Smart Cities in Europe. Journal of Urban Technology, 18(2),
65–82. https://doi.org/10.1080/10630732.2011.601117 Certoma, C., Corsini, F., & Rizzi, F. (2015). Crowdsourcing urban sustainability. Data, people and
technologies in participatory governance. Futures, 74, 93–106. Ceschin, F. (2013). Critical factors for implementing and diffusing sustainable product-Service systems:
Insights from innovation studies and companies’ experiences. Journal of Cleaner Production, 45, 74–88. https://doi.org/10.1016/j.jclepro.2012.05.034
Chakma, J., Masum, H., & Singer, P. A. (2010). Can incubators work in Africa? Acorn Technologies and the entrepreneur-centric model. BMC International Health and Human Rights, 10(1), S7. https://doi.org/10.1186/1472-698X-10-S1-S7
Cockayne, D. (2019). What is a startup firm? A methodological and epistemological investigation into research objects in economic geography. Geoforum, 107, 77–87.
Cohen, S. (2013). What do accelerators do? Insights from incubators and angels. Innovations: Technology, Governance, Globalization, 8(3–4), 19–25.
Cohen, S. L., Bingham, C. B., & Hallen, B. L. (2019). The role of accelerator designs in mitigating bounded rationality in new ventures. Administrative Science Quarterly, 64(4), 810–854.

GA #774199
D 3.4 Dissemination Level: Public/Confidential Page 141 of 170
Cohen, W. M., & Levinthal, D. A. (1990). Absorptive capacity: A new perspective on learning and innovation. Administrative Science Quarterly, 128–152.
Colombo, M. G., & Delmastro, M. (2002). How effective are technology incubators?: Evidence from Italy. Research Policy, 31(7), 1103–1122. https://doi.org/10.1016/S0048-7333(01)00178-0
Coyne, K. P., Clifford, P. G., & Dye, R. (2007). Breakthrough thinking from inside the box. Harvard Business Review, 85(12), 70–78.
Dahlander, L., & Piezunka, H. (2014). Open to suggestions: How organizations elicit suggestions through proactive and reactive attention. Research Policy, 43(5), 812–827. https://doi.org/10.1016/j.respol.2013.06.006
de Jong, J. P. J., von Hippel, E., Gault, F., Kuusisto, J., & Raasch, C. (2015). Market failure in the diffusion of consumer-developed innovations: Patterns in Finland. Research Policy, 44(10), 1856–1865. https://doi.org/10.1016/j.respol.2015.06.015
De Jong, J. P., & von Hippel, E. (2008). User innovation in SMEs: Incidence and transfer to producers. EIM’s Research Program on SMEs and Entrepreneurship Research Reports, H200814.
De Jong, J. P., & von Hippel, E. (2009). Transfers of user process innovations to process equipment producers: A study of Dutch high-tech firms. Research Policy, 38(7), 1181–1191.
Dee, N., Gill, D., Weinberg, C., & McTavish, S. (2015). Startup support programmes: What’s the difference. NESTA, London. ME SD, 1(2), 3.
Dvouletý, O., Longo, M. C., Blažková, I., Lukeš, M., & Andera, M. (2018). Are publicly funded Czech incubators effective? The comparison of performance of supported and non-supported firms. European Journal of Innovation Management, 21(4), 543–563. https://doi.org/10.1108/EJIM-02-2018-0043
Eckinger, C., & Sanders, M. (2019). User Innovation and Business Incubation. USE Working Paper Series, 19(16).
Edison, H. (2015). A Conceptual Framework of Lean Startup Enabled Internal Corporate Venture. Product-Focused Software Process Improvement, 607–613. https://doi.org/10.1007/978-3-319-26844-6_46
Edison, H., Smørsgård, N. M., Wang, X., & Abrahamsson, P. (2018). Lean internal startups for software product innovation in large companies: Enablers and inhibitors. Journal of Systems and Software, 135, 69–87.
Ensley, M. D., & Hmieleski, K. M. (2005). A comparative study of new venture top management team composition, dynamics and performance between university-based and independent start-ups. Research Policy, 34(7), 1091–1105. https://doi.org/10.1016/j.respol.2005.05.008
Eveleens, C. P. (2019). Interfering with innovative entrepreneurship: How business incubation impacts the performance of start-ups [PhD Thesis]. Universiteit Utrecht.
Fecher, F., Winding, J., Hutter, K., & Füller, J. (2020). Innovation labs from a participants’ perspective. Journal of Business Research, 110, 567–576. https://doi.org/10.1016/j.jbusres.2018.05.039
Field, A., Miles, J., & Field, Z. (2012). Discovering statistics using R. Sage publications. Fietkiewicz, K. J., Mainka, A., & Stock, W. G. (2017). eGovernment in cities of the knowledge society. An
empirical investigation of Smart Cities’ governmental websites. Government Information Quarterly, 34(1), 75–83. https://doi.org/10.1016/j.giq.2016.08.003
Firth, D. (1993). Bias reduction of maximum likelihood estimates. Biometrika, 80(1), 27–38. Fleming, L., & Sorenson, O. (2001). Technology as a complex adaptive system: Evidence from patent data.
Research Policy, 30(7), 1019–1039. https://doi.org/10.1016/S0048-7333(00)00135-9 Flowers, S., von Hippel, E., de Jong, J., & Sinozic, T. (2010). Measuring user innovation in the UK: The
importance of product creation by users.

GA #774199
D 3.4 Dissemination Level: Public/Confidential Page 142 of 170
Franke, N., & Shah, S. (2003). How communities support innovative activities: An exploration of assistance and sharing among end-users. Research Policy, 32(1), 157–178. https://doi.org/10.1016/S0048-7333(02)00006-9
Franke, N., Von Hippel, E., & Schreier, M. (2006). Finding commercially attractive user innovations: A test of lead-user theory. Journal of Product Innovation Management, 23(4), 301–315.
Freeman, J., Carroll, G. R., & Hannan, M. T. (1983). The liability of newness: Age dependence in organizational death rates. American Sociological Review, 692–710.
Freeman, J., & Engel, J. S. (2007). Models of innovation: Startups and mature corporations. California Management Review, 50(1), 94–119.
Frenken, K., Van Oort, F., & Verburg, T. (2007). Related Variety, Unrelated Variety and Regional Economic Growth. Regional Studies, 41(5), 685–697. https://doi.org/10.1080/00343400601120296
Gambardella, A., Raasch, C., & von Hippel, E. (2017). The user innovation paradigm: Impacts on markets and welfare. Management Science, 63(5), 1450–1468.
Garvin, D. A. (1983). Spin-offs and the new firm formation process. California Management Review, 25(2), 3–20.
Gault, F., & Von Hippel, E. (2009). The prevalence of user innovation and free innovation transfers: Implications for statistical indicators and innovation policy.
Giffinger, R., Fertner, C., Kramar, H., & Meijers, E. (2007). City-ranking of European medium-sized cities. Cent. Reg. Sci. Vienna UT, 1–12.
Giourka, P., Sanders, M. W., Angelakoglou, K., Pramangioulis, D., Nikolopoulos, N., Rakopoulos, D., Tryferidis, A., & Tzovaras, D. (2019). The smart city business model canvas—A smart city business modeling framework and practical tool. Energies, 12(24), 4798.
Grant, R. M. (1996). Toward a knowledge-based theory of the firm. Strategic Management Journal, 17(S2), 109–122. https://doi.org/10.1002/smj.4250171110
Grimaldi, R., & Grandi, A. (2005). Business incubators and new venture creation: An assessment of incubating models. Technovation, 25(2), 111–121. https://doi.org/10.1016/S0166-4972(03)00076-2
Hackett, S. M., & Dilts, D. M. (2004a). A real options-driven theory of business incubation. The Journal of Technology Transfer, 29(1), 41–54.
Hackett, S. M., & Dilts, D. M. (2004b). A Systematic Review of Business Incubation Research. The Journal of Technology Transfer, 29(1), 55–82. https://doi.org/10.1023/B:JOTT.0000011181.11952.0f
Hallen, B. L., Bingham, C. B., & Cohen, S. (2016). Do accelerators accelerate? The role of indirect learning in new venture development. The Role of Indirect Learning in New Venture Development (January, 19, 2016.
Hannan, M. T., & Freeman, J. (1989). Organizational ecology. Harvard university press. Hansen, M. T., Chesbrough, H. W., Nohria, N., & Sull, D. N. (2000). Networked incubators. Harvard Business
Review, 78(5), 74–84. Hausberg, J. P., & Korreck, S. (2018). Business incubators and accelerators: A co-citation analysis-based,
systematic literature review. Journal of Technology Transfer, 1–26. https://doi.org/10.1007/s10961-018-9651-y
Heikkinen, T., Belt, P., Mottonen, M., Harkonen, J., & Haapasalo, H. (2018). Managing radical innovations in established companies. International Journal of Management Practice, 11(4), 422–447.
Heinze, G., & Schemper, M. (2002). A solution to the problem of separation in logistic regression. Statistics in Medicine, 21(16), 2409–2419. https://doi.org/10.1002/sim.1047
Henderson, R. (1993). Underinvestment and Incompetence as Responses to Radical Innovation: Evidence from the Photolithographic Alignment Equipment Industry. The RAND Journal of Economics, 24(2), 248–270. https://doi.org/10.2307/2555761

GA #774199
D 3.4 Dissemination Level: Public/Confidential Page 143 of 170
Henderson, R. M., & Clark, K. B. (1990). Architectural Innovation: The Reconfiguration of Existing Product Technologies and the Failure of Established Firms. Administrative Science Quarterly, 35(1), 9–30. https://doi.org/10.2307/2393549
Henkel, J., & Von Hippel, E. (2004). Welfare implications of user innovation. The Journal of Technology Transfer, 30(1–2), 73–87.
Hermse, M., Nijland, I., & Picari, M. (2020). Classification of Smart City Startups: Smart City Index. Working Paper.
Hienerth, C. (2006). The commercialization of user innovations: The development of the rodeo kayak industry. R&D Management, 36(3), 273–294. https://doi.org/10.1111/j.1467-9310.2006.00430.x
Hyytinen, A., Pajarinen, M., & Rouvinen, P. (2015). Does innovativeness reduce startup survival rates? Journal of Business Venturing, 30(4), 564–581. https://doi.org/10.1016/j.jbusvent.2014.10.001
Ismagilova, E., Hughes, L., Dwivedi, Y. K., & Raman, K. R. (2019). Smart cities: Advances in research—An information systems perspective. International Journal of Information Management, 47, 88–100. https://doi.org/10.1016/j.ijinfomgt.2019.01.004
Johnson, M. W., Christensen, C. M., & Kagermann, H. (2008). Reinventing Your Business Model. Harvard Business Review. https://hbr.org/2008/12/reinventing-your-business-model
Kirsty, D. (2010). The state of entrepreneurship in South Africa. Mount Nelson Hotel. White Paper Deliberation and Key Findings.
Klepper, S. (2001). Employee startups in high-tech industries. Industrial and Corporate Change, 10(3), 639–674.
Klepper, S. (2007). Disagreements, Spinoffs, and the Evolution of Detroit as the Capital of the U.S. Automobile Industry. Management Science, 53(4), 616–631. https://doi.org/10.1287/mnsc.1060.0683
Klepper, S. (2009). Spinoffs: A review and synthesis. European Management Review, 6(3), 159–171. https://doi.org/10.1057/emr.2009.18
Klepper, S., & Sleeper, S. (2005). Entry by spinoffs. Management Science, 51(8), 1291–1306. Koellinger, P. (2008). Why are some entrepreneurs more innovative than others? Small Business
Economics, 31(1), 21. Kolassa, J. (2021). Smart-city entrepreneurship – the role of business incubation for kick-starting the urban
transition [Master’s Thesis]. Utrecht University. Krafft, J., & Quatraro, F. (2011). The dynamics of technological knowledge: From linearity to
recombination. In Handbook on the economic complexity of technological change. Edward Elgar Publishing.
Kraft, C. (2012). User experience innovation: User centered design that works. Apress. Lawless, J. F. (1987). Negative Binomial and Mixed Poisson Regression. The Canadian Journal of Statistics
/ La Revue Canadienne de Statistique, 15(3), 209–225. https://doi.org/10.2307/3314912 Leblebici, H., & Shah, N. (2004). The Birth, Transformation and Regeneration of Business Incubators as
New Organisational Forms: Understanding the Interplay between Organisational History and Organisational Theory. Business History, 46(3), 353–380. https://doi.org/10.1080/0007679042000219175a
Leonard, D., & Sensiper, S. (1998). The role of tacit knowledge in group innovation. California Management Review, 40(3), 112–132.
Lindelöf, P., & Löfsten, H. (2003). Science Park Location and New Technology-Based Firms in Sweden – Implications for Strategy and Performance. Small Business Economics, 20(3), 245–258. https://doi.org/10.1023/A:1022861823493
Lombardi, P., Giordano, S., Farouh, H., & Yousef, W. (2012). Modelling the smart city performance. Innovation: The European Journal of Social Science Research, 25(2), 137–149. https://doi.org/10.1080/13511610.2012.660325

GA #774199
D 3.4 Dissemination Level: Public/Confidential Page 144 of 170
Lose, T., & Tengeh, R. K. (2016). An evaluation of the effectiveness of business incubation programs: A user satisfaction approach. Investment Management and Financial Innovations, 13, Iss. 2 (contin. 2), 370–378.
Lukeš, M., Longo, M. C., & Zouhar, J. (2019). Do business incubators really enhance entrepreneurial growth? Evidence from a large sample of innovative Italian start-ups. Technovation, 82–83, 25–34. https://doi.org/10.1016/j.technovation.2018.07.008
Lumpkin, G. T., & Dess, G. G. (1996). Clarifying the Entrepreneurial Orientation Construct and Linking It To Performance. Academy of Management Review, 21(1), 135–172. https://doi.org/10.5465/amr.1996.9602161568
Lüthje, C. (2004). Characteristics of innovating users in a consumer goods field: An empirical study of sport-related product consumers. Technovation, 24(9), 683–695.
Lüthje, C., Herstatt, C., & von Hippel, E. A. (2002). The Dominant Role of (SSRN Scholarly Paper ID 322800). Social Science Research Network. https://doi.org/10.2139/ssrn.322800
Macpherson, A., & Holt, R. (2007). Knowledge, learning and small firm growth: A systematic review of the evidence. Research Policy, 36(2), 172–192. https://doi.org/10.1016/j.respol.2006.10.001
Madaleno, M., Nathan, M., Overman, H. G., & Waights, S. (2018). Incubators, Accelerators and Regional Economic Development (SSRN Scholarly Paper ID 3261715). Social Science Research Network. https://papers.ssrn.com/abstract=3261715
Malek, K., Maine, E., & McCarthy, I. P. (2014). A typology of clean technology commercialization accelerators. Journal of Engineering and Technology Management, 32, 26–39. https://doi.org/10.1016/j.jengtecman.2013.10.006
Manville, C., Cochrane, G., Cave, J., Millard, J., Pederson, J. K., Thaarup, R. K., Liebe, A., Wissner, M., Massink, R. A., & Kotterink, B. (2014). Mapping smart cities in the EU.
McAdam, M., & Marlow, S. (2008). A preliminary investigation into networking activities within the university incubator. International Journal of Entrepreneurial Behavior & Research, 14(4), 219–241. https://doi.org/10.1108/13552550810887390
McFadden, D. (1973). Conditional logit analysis of qualitative choice behavior. Memon, A. B., & Meyer, K. (2017). Why we need dedicated web-based collaboration platforms for inter-
organizational connectivity? A research synthesis. International Journal of Information Technology and Computer Science, 9(11), 1–11.
Meraza Farfan, E. (2018). Developing Smart Cities with citizens: Involving citizens in idea generation for Smart City development. Utrecht University.
Mian, S., Lamine, W., & Fayolle, A. (2016). Technology Business Incubation: An overview of the state of knowledge. Technovation, 50–51, 1–12. https://doi.org/10.1016/j.technovation.2016.02.005
Morin, R. P. D. (2019). Incubation performances and impact of start-up’s resources. Study-case of a research-based incubator in Nice. [Master’s Thesis].
Morrison, P. D., Roberts, J. H., & Von Hippel, E. (2000). Determinants of user innovation and innovation sharing in a local market. Management Science, 46(12), 1513–1527.
Mulolli, E., Islami, X., & Skenderi, N. (2017). Business Incubators as a Factor for the Development of SMEs in Kosovo. Mulolli, E., Islami, X., & Skenderi, 2017, 659–666.
Nam, T., & Pardo, T. A. (2011). Conceptualizing smart city with dimensions of technology, people, and institutions. Proceedings of the 12th Annual International Digital Government Research Conference: Digital Government Innovation in Challenging Times, 282–291.
Neirotti, P., De Marco, A., Cagliano, A. C., Mangano, G., & Scorrano, F. (2014). Current trends in Smart City initiatives: Some stylised facts. Cities, 38, 25–36. https://doi.org/10.1016/j.cities.2013.12.010
Nijland, I. (2020). Effects of Business Incubation on the Performance of Smart City Start-ups in Utrecht and Gothenburg [Master’s Thesis]. Utrecht University.

GA #774199
D 3.4 Dissemination Level: Public/Confidential Page 145 of 170
Osterwalder, A., Pigneur, Y., & Tucci, C. (2005). Clarifying Business Models: Origins, Present, and Future of the Concept. Communications of the Association for Information Systems, Volume 16(1). http://aisel.aisnet.org/cgi/viewcontent.cgi?article=3016&context=cais
Patton, D. (2014). Realising potential: The impact of business incubation on the absorptive capacity of new technology-based firms. International Small Business Journal, 32(8), 897–917. https://doi.org/10.1177/0266242613482134
Patton, M. Q. (2002). Qualitative research and evaluation methods. SAGE. Peters, L., Rice, M., & Sundararajan, M. (2004). The Role of Incubators in the Entrepreneurial Process. The
Journal of Technology Transfer, 29(1), 83–91. https://doi.org/10.1023/B:JOTT.0000011182.82350.df
Phan, P. H., Siegel, D. S., & Wright, M. (2005). Science parks and incubators: Observations, synthesis and future research. Journal of Business Venturing, 20(2), 165–182. https://doi.org/10.1016/j.jbusvent.2003.12.001
Picari, M. (2020). Smart City start-ups; A Comparative Analysis between Utrecht and Nice [Master’s Thesis]. Utrecht University.
Polzin, F., Sanders, M., & Stavlöt, U. (2018). Do investors and entrepreneurs match? – Evidence from The Netherlands and Sweden. Technological Forecasting and Social Change, 127, 112–126. https://doi.org/10.1016/j.techfore.2017.07.016
Rafols, I., & Meyer, M. (2010). Diversity and network coherence as indicators of interdisciplinarity: Case studies in bionanoscience. Scientometrics, 82(2), 263–287.
Rauter, R., Jonker, J., & Baumgartner, R. J. (2017). Going one’s own way: Drivers in developing business models for sustainability. Journal of Cleaner Production. https://doi.org/10.1016/j.jclepro.2015.04.104
Ries, E. (2011). The lean startup: How today’s entrepreneurs use continuous innovation to create radically successful businesses. Currency.
Riggs, W., & Von Hippel, E. (1994). Incentives to innovate and the sources of innovation: The case of scientific instruments. Research Policy, 23(4), 459–469.
Samarakkody, A. L., Kulatunga, U., & Bandara, H. (2019). What differentiates a smart city? A comparison with a basic city. https://doi.org/10.31705/WCS.2019.61
Schaffers, H., Komninos, N., Pallot, M., Trousse, B., Nilsson, M., & Oliveira, A. (2011). Smart cities and the future internet: Towards cooperation frameworks for open innovation. The Future Internet Assembly, 431–446.
Schuurman, D., Baccarne, B., De Marez, L., & Mechant, P. (2012). Smart Ideas for Smart Cities: Investigating Crowdsourcing for Generating and Selecting Ideas for ICT Innovation in a City Context. Journal of Theoretical and Applied Electronic Commerce Research, 7(3), 49–62. https://doi.org/10.4067/S0718-18762012000300006
Schwartz, M. (2013). A control group study of incubators’ impact to promote firm survival. The Journal of Technology Transfer, 38(3), 302–331. https://doi.org/10.1007/s10961-012-9254-y
Schwartz, M., & Hornych, C. (2008). Specialization as strategy for business incubators: An assessment of the Central German Multimedia Center. Technovation, 28(7), 436–449. https://doi.org/10.1016/j.technovation.2008.02.003
Sedita, S. R., Apa, R., Bassetti, T., & Grandinetti, R. (2017). Measuring the effect of business incubators on the innovation performance of start-ups. Academy of Management Proceedings, 2017(1), 10677.
Shah, S. K., & Tripsas, M. (2007). The accidental entrepreneur: The emergent and collective process of user entrepreneurship. Strategic Entrepreneurship Journal, 1(1–2), 123–140. https://doi.org/10.1002/sej.15

GA #774199
D 3.4 Dissemination Level: Public/Confidential Page 146 of 170
Silva, B. N., Khan, M., & Han, K. (2018). Towards sustainable smart cities: A review of trends, architectures, components, and open challenges in smart cities. Sustainable Cities and Society, 38, 697–713. https://doi.org/10.1016/j.scs.2018.01.053
Smilor, R. W. (1987). Managing the incubator system: Critical success factors to accelerate new company development. IEEE Transactions on Engineering Management, 3, 146–155.
Smith, S. W., & Hannigan, T. J. (2015). Swinging for the fences: How do top accelerators impact the trajectories of new ventures. Druid, 15, 15–17.
Soetanto, D. P., & Jack, S. L. (2013). Business incubators and the networks of technology-based firms. The Journal of Technology Transfer, 38(4), 432–453. https://doi.org/10.1007/s10961-011-9237-4
Sorrell, S. (2015). Reducing energy demand: A review of issues, challenges and approaches. Renewable and Sustainable Energy Reviews, 47, 74–82. https://doi.org/10.1016/j.rser.2015.03.002
Sproull, L., & Patterson, J. F. (2004). Making information cities livable. Communications of the ACM. https://dl.acm.org/doi/abs/10.1145/966389.966412
Stokan, E., Thompson, L., & Mahu, R. J. (2015). Testing the Differential Effect of Business Incubators on Firm Growth. Economic Development Quarterly, 29(4), 317–327. https://doi.org/10.1177/0891242415597065
Sun, J., & Poole, M. S. (2010). Beyond connection: Situated wireless communities. Communications of the ACM, 53(6). https://dl.acm.org/doi/abs/10.1145/1743546.1743579
Sussman, F. S., Gerald. (2001). Telecommunications and Transnationalism: The Polarization of Social Space. The Information Society, 17(1), 49–62. https://doi.org/10.1080/019722401750067423
Tan, M. (1999). Creating the Digital Economy: Strategies and Perspectives from Singapore. International Journal of Electronic Commerce, 3(3), 105–122. https://doi.org/10.1080/10864415.1999.11518344
Taylor Buck, N., & While, A. (2017). Competitive urbanism and the limits to smart city innovation: The UK Future Cities initiative. Urban Studies, 54(2), 501–519. https://doi.org/10.1177/0042098015597162
Thompson, P., & Klepper, S. (2005). Spinoff entry in high-tech industries: Motives and consequences. Udell, G. G. (1990). Are business incubators really creating new jobs by creating new business and new
products. Journal of Product Innovation Management, 7(2), 108–122. https://doi.org/10.1016/0737-6782(90)90053-H
Urban, G. L., & Von Hippel, E. (1988). Lead user analyses for the development of new industrial products. Management Science, 34(5), 569–582.
Válková, K. (2020). A Comparative Study of the Business Incubation and Corporate Entrepreneurship Processes in the Context of Smart City Innovation. Utrecht University.
Van Rijnsoever, Frank J., Van Weele, Marijn A., & Eveleens, Chris P. (2017). Network brokers or hit makers? Analyzing the influence of incubation on start-up investments. International Entrepreneurship and Management Journal, 13(2), 605null. https://doi.org/10.1007/s11365-016-0416-5
van Weele, M., van Rijnsoever, F. J., Eveleens, C. P., Steinz, H., van Stijn, N., & Groen, M. (2018). Start-EU-up! Lessons from international incubation practices to address the challenges faced by Western European start-ups. The Journal of Technology Transfer, 43(5), 1161–1189. https://doi.org/10.1007/s10961-016-9538-8
Vásquez-Urriago, Á. R., Barge-Gil, A., & Modrego Rico, A. (2016). Science and Technology Parks and cooperation for innovation: Empirical evidence from Spain. Research Policy, 45(1), 137–147. https://doi.org/10.1016/j.respol.2015.07.006
Von Hippel, E. (1988). The sources of innovation. Oxford University Press. von Hippel, E. (2005). Democratizing innovation: The evolving phenomenon of user innovation. Journal
Für Betriebswirtschaft, 55(1), 63–78. https://doi.org/10.1007/s11301-004-0002-8

GA #774199
D 3.4 Dissemination Level: Public/Confidential Page 147 of 170
von Zedtwitz, M., & Grimaldi, R. (2006). Are Service Profiles Incubator-Specific? Results from an Empirical Investigation in Italy*. The Journal of Technology Transfer, 31(4), 459–468. https://doi.org/10.1007/s10961-006-0007-7
Winkowska, J., Szpilko, D., & Pejić, S. (2019). Smart city concept in the light of the literature review. Engineering Management in Production and Services, Vol. 11(2). https://doi.org/10.2478/emj-2019-0012
Winter, S. G. (1984). Schumpeterian competition in alternative technological regimes. Journal of Economic Behavior & Organization, 5(3), 287–320. https://doi.org/10.1016/0167-2681(84)90004-0
Yigitcanlar, T., Kamruzzaman, Md., Buys, L., Ioppolo, G., Sabatini-Marques, J., da Costa, E. M., & Yun, J. J. (2018). Understanding ‘smart cities’: Intertwining development drivers with desired outcomes in a multidimensional framework. Cities, 81, 145–160. https://doi.org/10.1016/j.cities.2018.04.003
Yin, R. K. (2014). Case Study Research: Design and Methods (5th ed.). SAGE Publications, Inc. Yu, J., & Nijkamp, P. (2009). Methodological challenges and institutional barriers in the use of
Experimental Method for the evaluation of business incubators: Lessons from the US, EU and China. 2009 Atlanta Conference on Science and Innovation Policy, 1–9. https://doi.org/10.1109/ACSIP.2009.5367841
Yu, S. (2020). How Do Accelerators Impact the Performance of High-Technology Ventures? Management Science, 66(2), 530–552. https://doi.org/10.1287/mnsc.2018.3256
Zahra, S. A., & George, G. (2002). Absorptive capacity: A review, reconceptualization, and extension. Academy of Management Review, 27(2), 185–203.
Zanders, L., Polzin, F., & Sanders, M. (2019). Smart city business model incubation: Development and barriers in the city of Utrecht. Utrecht University.
Zhuhadar, L., Thrasher, E., Marklin, S., & de Pablos, P. O. (2017). The next wave of innovation—Review of smart cities intelligent operation systems. Computers in Human Behavior, 66, 273–281. https://doi.org/10.1016/j.chb.2016.09.030

GA #774199
D 3.4 Dissemination Level: Public/Confidential Page 148 of 170
Annex Interview Guide Spinout Innovations Chapter 3
• Introduction
• Introduction of the researchers
• Explanation of the IRIS project and SCUIBI (the business incubation process)
• Assurance of confidentiality!
• Company’s engagement in smart city innovation / background
• How does your company act in these five transition pathways (mobility, energy, …)?
• Person of the entrepreneur/team/business: experience, motivation, etc.
• Where does your company see NEW (business) opportunities/ideas regarding the transition
tracks?
• The business idea (focus on most promising business idea?)
• (What’s the name of the business idea?)
• Please describe the product/service (as it currently stands)
• (Can you give a brief description/summary (‘30 second pitch’) about the idea?)
• Has it been tried out already (pilot), or is it a wild guess? Or is it emerging?
• Origin of the idea
• Where does the idea originate: Incumbent/spin-off interview, challenge, user-source, other?
• Can you please explain the origin of the idea?
• Customer value proposition/value proposition canvas (required!)
• What kind of customer demand do you see arising in the future?
• What core value would you deliver to the customer? Which customer needs would you satisfy?
• What kind of problems do the clients of your company face in these areas and how do they solve
these problems today?
• What would be potential solutions and could they be commercially exploited?
• What kind of customers do you intend to serve? Who is your most important customer?
• What bundles of products and services are we offering to each Customer Segment?

GA #774199
D 3.4 Dissemination Level: Public/Confidential Page 149 of 170
• Key resources (optional)
• What key resources does your value proposition require?
• What resources are important the most in distribution channels, customer relationships,
revenue stream…?
• Who are your key partners/suppliers? What are the motivations for the partnerships?
• Which Key Resources are we acquiring from partners?
• Key processes (optional)
• What key activities does your value proposition require?
• What activities are important the most in distribution channels?
• And in customer relationships?
• And in production/manufacturing?
• Which Key Activities do partners perform?
• Profit formula (optional)
• How will you make money with this idea?
• What kind of revenue model do you foresee?
• What does the cost structure look like?
• Business idea development
• Is your company actively pursuing these ideas (for example through the creation of spin-offs or
through or forms of ‘start-up support’)?
• Which barriers prevent the commercialisation of (your) smart city ideas?
• End of the interview
• Any comments, remarks, feedback from the interviewee?
• Can be contacted for clarifications/additional information?
• Who else would you suggest we could speak to with these questions? (You can always email it to
us)

GA #774199
D 3.4 Dissemination Level: Public/Confidential Page 150 of 170
Potential follow-up questions for individual business model elements
Questions for developing new products
(if there are insufficient ideas coming from the interviewee)
De-average buyers and users
Which customers use or purchase our product in the most unusual way?
Do any customers need vastly more or less sales and service attention than most?
For which customers are the support costs (order entry, tracking, customerspecific design) either
unusually high or unusually low?
Could we still meet the needs of a significant subset of customers if we stripped 25% of the hard or soft
costs out of our product?
Who spends at least 50% of what our product costs to adapt it to their specific needs?
Examine binding constraints
What is the biggest hassle of purchasing or using our product?
What are some examples of ad hoc modifications that customers have made to our product?
For which current customers is our product least suited?
For what particular usage occasions is our product least suited?
Which customers does the industry prefer not to serve, and why?
Which customers could be major users, if only we could remove one specific barrier we’ve never
previously considered?
Explore unexpected successes
Who uses our product in ways we never expected or intended?
Who uses our product in surprisingly large quantities?
Imagine perfection
How would we do things differently if we had perfect information about our buyers, usage, distribution
channels, and so on?
How would our product change if it were tailored for every customer?
Look beyond the boundaries of our business
Who else is dealing with the same generic problem as we are but for an entirely different reason? How
have they addressed it?
What major breakthroughs in efficiency or effectiveness have we made in our business that could be
applied in another industry?

GA #774199
D 3.4 Dissemination Level: Public/Confidential Page 151 of 170
What information about customers and product use is created as a by-product of our business that could
be the key to radically improving the economics of another business?
Revisit the premises underlying our processes and products
Which technologies embedded in our product have changed the most since the product was last
redesigned?
Which technologies underlying our production processes have changed the most since we last rebuilt our
manufacturing and distribution systems?
Which customers’ needs are shifting most rapidly? What will they be in five years?
Explanations
Value Proposition
Describes the bundle of products and services that create value for a specific Customer Segment.
The Value Proposition is the reason why customers turn to one company over another. It solves a
customer problem or satisfies a customer need. Each Value Proposition consists of a selected bundle of
products and/or services that caters to the requirements of a specific Customer Segment. In this sense,
the Value Proposition is an aggregation, or bundle, of benefits that a company offers customers. Some
Value Propositions may be innovative and represent a new or disruptive offer. Others may be similar to
existing market offers, but with added features and attributes.
Customer Segments
Defines the different groups of people or organizations an enterprise aims to reach and serve.
Customers comprise the heart of any business model. Without (profitable) customers, no company can
survive for long.
In order to better satisfy customers, a company may group them into distinct segments with common
needs, common behaviors, or other attributes. A business model may define one or several large or small
Customer Segments. An organization must make a conscious decision about which segments to serve and
which segments to ignore. Once this decision is made, a business model can be carefully designed around
a strong understanding of specific customer needs.
Customer groups represent separate segments if:
• Their needs require and justify a distinct offer
• They are reached through different Distribution Channels
• They require different types of relationships
• They have substantially different profitabilities
• They are willing to pay for different aspects of the offer
Channels

GA #774199
D 3.4 Dissemination Level: Public/Confidential Page 152 of 170
Describes how a company communicates with and reaches its Customer Segments to deliver a Value
Proposition.
Communication, distribution, and sales Channels comprise a company's interface with customers.
Channels are customer touch points that play an important role in the customer experience.
Channels serve several functions, including:
• Raising awareness among customers about a company’s
• products and services
• Helping customers evaluate a company’s Value Proposition
• Allowing customers to purchase specific products and services
• Delivering a Value Proposition to customers
• Providing post-purchase customer support
Customer Relationships
Describes the types of relationships a company establishes with specific Customer Segments.
A company should clarify the type of relationship it wants to establish with each Customer Segment.
Relationships can range from personal to automated.
Customer relationships may be driven by the following motivations:
• Customer acquisition
• Customer retention
Boosting sales (upselling)
Key Resources
Describes the most important assets required to make a business model work.
Every business model requires Key Resources. These resources allow an enterprise to create and offer a
Value Proposition, reach markets, maintain relationships with Customer Segments, and earn revenues.
Different Key Resources are needed depending on the type of business model. A microchip manufacturer
requires capital-intensive production facilities, whereas a microchip designer focuses more on human
resources. Key resources can be physical, financial, intellectual, or human. Key resources can be owned
or leased by the company or acquired from key partners.
Key Activities
Describes the most important things a company must do to make its business model work.
Every business model calls for a number of Key Activities. These are the most important actions a company
must take to operate successfully. Like Key Resources, they are required to create and offer a Value
Proposition, reach markets, maintain Customer Relationships, and earn revenues. And like Key Resources,

GA #774199
D 3.4 Dissemination Level: Public/Confidential Page 153 of 170
Key Activities differ depending on business model type. For software maker Microsoft, Key Activities
include software development. For PC manufacturer Dell, Key Activities include supply chain
management. For consultancy McKinsey, Key Activities include problem solving.
Key Partnerships
Describes the network of suppliers and partners that make the business model work.
Companies forge partnerships for many reasons, and partnerships are becoming a cornerstone of many
business models. Companies create alliances to optimize their business models, reduce risk, or acquire
resources.
We can distinguish between four different types of partnerships:
• Strategic alliances between non-competitors
• Competition: strategic partnerships between competitors
Joint ventures to develop new businesses
Cost Structure
Describes all costs incurred to operate a business model.
This building block describes the most important costs incurred while operating under a particular
business model. Creating and delivering value, maintaining Customer Relationships, and generating
revenue all incur costs. Such costs can be calculated relatively easily after defining Key Resources, Key
Activities, and Key Partnerships. Some business models, though, are more cost-driven than others. So-
called “no frills” airlines, for instance, have built business models entirely around low Cost Structures.
Revenue Streams
Represents the cash a company generates from each Customer Segment (costs must be subtracted from
revenues to create earnings).
If customers comprise the heart of a business model, Revenue Streams are its arteries. A company must
ask itself, For what value is each Customer Segment truly willing to pay? Successfully answering that
question allows the firm to generate one or more Revenue Streams from each Customer Segment. Each
Revenue Stream may have different pricing mechanisms, such as fixed list prices, bargaining, auctioning,
market dependent, volume dependent, or yield management.
A business model can involve two different types of Revenue Streams:
• Transaction revenues resulting from one-time customer payments
• Recurring revenues resulting from ongoing payments to either deliver a Value Proposition to
customers or provide post-purchase customer support

GA #774199
D 3.4 Dissemination Level: Public/Confidential Page 154 of 170
Table 30: Complete Literature Base for User Innovation Index
Study Research Title Description UI Variable UI definition UI operationalisation Methodology Sample
Baldwin, von Hippel (2011)
Theoretical Modelling a paradigm shift: From producer innovation to user and open collaborative innovation
Assessment of the economic viability of innovation by producers relative to two increasingly important alternative models: innovations by single user individuals or firms, and open collaborative innovation.
Single user innovator
- Single user innovator is a single firm or individual that creates an innovation in order to use it. Examples are a single firm creating a process machine in order to use it, a surgeon creating a new medical device in order to use it, and an individual consumer creating a new piece of sporting equipment in order to use it {p. 9} - Individual user innovators depend only on their own in-house use of their design to recoup their innovation-related investments {p. 2}
Implicitly stated: - Investment in a design whose value to her is vs (includes all aspects of the innovation that the user values (i.e. improved performance, lower cost, lower environmental impact, greater flexibility, and/or enhanced capabilities) {p. 13} - Effort of innovation is worthwhile (for this innovator and this design) if this value is greater than the user’s design cost: ds < vs {p. 13} - To attract users who can innovate on their own, the producer’s price must be less than the user’s design cost, which by definition is less than the user’s value: p<ds <vs {p. 26}
Statistical analysis; development of theoretical model
Not given
Firm user Not explicitly stated
- Process innovations developed by user firms, reduce the process user’s costs (production, transactions, communication, design) without changing consumers’ willingness to pay for the product {p. 14}
Collaborative inovation
Not explicitly stated
pen collaborative innovation: - User innovators will choose to participate in an open collaborative innovation project if the increased communication cost each incurs by joining
the project is more than offset by the value of designs obtained from others {p. 17}
De Jong & von Hippel (2008)
Empirical User innovation in SMEs: incidence and transfer to producers
Measure of the incidence of user innovation in a broad sample of firms and assessment if current innovation surveys adequately capture user innovation.
User Innovation
- User innovation refers to innovations developed by end users, rather than by producers. Users can be either firms or individual consumers, they are distinguished from producers by the fact that they expect to benefit from using a product or a service (von Hippel, 2005) {p. 6} - Users primarily innovate to satisfy their process-related needs which
producers are (initially) unable or unwilling to solve. User innovators tend to be found at the early stages of the life-cycles of products, technologies and industries (von Hippel, 2005) {p. 6}
- User creation: developing entirely new techniques, equipment or software for your own use, because there is no appropriate market supply {p. 12} - User modification: any modification your firm may do to existing techniques, equipment or software to improve their usefulness to your business. This does NOT include modifications of your own products for customers {p. 13}
Survey 2,416 SMEs in NL Technology based small firms in NL
Baldwin, Hienerth, & von Hippel (2008)
Empirical How user innovations become commercial products: A theoretical investigation and case study
Modelling of the pathways commonly traversed as user innovations are transformed into commercial products.
User innovators
- User innovators seek to develop new designs for their own personal use or (in the case of user firms) internal corporate
Implicitly stated: - Users develop innovations in order to satisfy their own needs - Users identify new market opportunities - User innovation platforms are built on
Case study; statistical analysis
Case study – Kayak industry

GA #774199
D 3.4 Dissemination Level: Public/Confidential Page 155 of 170
benefit They do not anticipate
selling goods or services based on their innovations, although they may later go into business as user-manufacturers. Designing for use and testing by use are the essential characteristics of user-innovators: they may subcontract production and parts supply, but they cannot subcontract the innovation’s design or testing and be user-innovators under our definition {p. 7} - Our theory views user-innovators as economic actors
who perceive their time and effort to be valuable and respond rationally to changing incentives {p. 12}
easily modifiable innovations
- User innovations are tailor-made products - Design searches by user-innovators are motivated by the users’ own desires for a better product {p. 8} - Modification of existing /mass products - User innovators innovate if there is a high probability that the new design will be better than the old design - Users create new designs as long as the expected value is higher than the opportunity cost
De Jong & von Hippel (2009)
Empirical Measuring user innovation in Dutch high-tech SMEs: Frequency, nature & transfer to producer
Detailed survey of 498 “high tech” SMEs in the Netherlands shows process innovation by user firms to be common practice.
User innovators
We define user-innovators as firms or individual consumers that benefit from using a product or a service they develop {p. 4}
Explicitly stated {p. 11} - Had the respondent developed new processes equipment or software for his own use within the last 3 years - Had the respondent modified existing process equipment or software for his own use - User developed process innovations - Even for new developments, innovating actors adapt and incorporate the components of existing machines and software into their new designs
(von Hippel, 1988, 2005) {p. 16}
Survey 498 high tech SMEs (NL) spanning a broad range of industries
Producer innovators (Non-UI)
Producer-innovators are firms or individuals that benefit from selling a product or a service they develop {p. 4}
Gault & von Hippel, (2009)
Empirical The prevalence of user innovation and free innovation transfers: Implications for statistical indicators and innovation policy
Report upon a pilot project in which a novel set of statistical indicators were deployed in a 2007 survey of 1,219 Canadian manufacturing plants. Responses to the survey showed that data on both user innovation and the transfers of these innovations could be reliably collected, and that novel findings important to policymaking would result.
Producer innovators (Non-UI)
Producer-innovators are firms or individuals that benefit from selling a product or a service they develop (von Hippel, 1988, 2005) (p. 3)
Explicitly stated in survey question - Significantly modified one or more AMT process equipment types to better suit their production needs {p. 13} - Whether they had developed entirely new equipment within one of the 26 AMT categories within the last 3 years {p. 13} - Development of new technologies for in-house use {p. 13}
Survey Statistics Canada (2007) 1,219 Canadian manufacturing plants
End-users Not explicitly stated
End-users/consumers: working individually or in groups, are the actual developers of many consumer products later commercialized and sold to the general marketplace by producers {p. 3}
User innovators
We define user-innovators as firms or individual consumers that benefit from using a product or a service they develop (von Hippel, 1988, 2005) (p. 3)
Not given

GA #774199
D 3.4 Dissemination Level: Public/Confidential Page 156 of 170
Flowers, von Hippel, de
Jong, & Sinozic (2010)
Empirical Measuring user-innovation in the
UK - the importance of product creation by users
This report sets out to address
this gap in the understanding of the role of users – including individual consumers and business firms – in processes of innovation across a range of sectors.
Consumer-level
innovation
Widespread creation and
modification of consumer products by consumers themselves independent of producer involvement {p. 5} > Creating or modifying products or software they use in their daily lives with the goal of better addressing their own personal needs {p. 14-15}
- Content Production - User modification
(software/product) - User creation from scratch (software/product) - User innovation (combining user modification, user creation, software & product) {p. 37}
Research report; closed questionnaire survey
Firm survey: 1,004 UK
firms with 10-250 employees Initial Consumer survey: 2,109 UK consumers aged 15 and over Consumer follow-up survey: 344 UK consumers aged 15 and over
Firm-level innovation
Flowers, von Hippel, de Jong,, & Sinozic (2010)
- User modification (software, physical products) - User creation from scratch (software, physical products) - User innovation (combination of ‘user modification’ and ‘user
creation’) { p. 35}
Non-UI Not explicitly stated
- Developed as part of their jobs - Had been developed for commercial – rather than user – purposes - Simply homemade replicas of products already available on the marketplace - Modifications and improvements that manufacturers had anticipated users would undertake and had made provisions for – such as software upgrades {p. 14}
Morrison, Roberts, & von Hippel (2000)
Empirical Determinants of user innovation and innovation sharing in a local market
Exploring the characteristics of innovation, innovators, and innovation shar ing by library users of OPAC information search systems in Australia.
Lead users Lead users of a novel or enhanced product, process, or service are defined as those who display two characteristics with respect to it: -Lead users face needs that will be general in a marketplace-but face them months or years before the bulk of that marketplace encounters them, and -Lead users are positioned to benefit significantly by obtaining a solution to those need {p. 569}
Not given Questionnaires,;personal interviews
464 Australian libraries selected using stratified random sampling
User innovations
Not explicitly stated
Implicitly stated: - OPAC modifications/additional improvements by employees - Customization of OPACs according to owns novel ideas and local settings {p. 6} - Easily modifiable - Low cost
Urban, & von Hippel (1988)
Empirical Lead user analysis for the development of new industrial products
Integration of market research within this lead user methodology and reporting of a test of it in the rapidly evolving field of computer-aided systems for the design of printed circuit boards (PC-CAD).
Lead users Lead users of a novel or enhanced product, process, or service are defined as those who display two characteristics with respect to it: -Lead users face needs that will be general in a marketplace-but face them months or years before the bulk of that marketplace encounters them, and -Lead users are positioned to benefit
Not given Case study with focus on n computer aided design (CAD) systems which used to design the printed circuit boards used in electronic products, PC-CAD
market of over 40 competing firms

GA #774199
D 3.4 Dissemination Level: Public/Confidential Page 157 of 170
significantly by obtaining a
solution to those need {p. 569}
User innovations
Not explicitly stated
Explicit criteria to extract user innovation from sample - High expected benefit from solving a need - Evidence of user product development or product modification - User dissatisfaction with existing products (services or processes)
Von Hippel (2005)
Theoretical Democratizing innovation: the evolving phenomenon of user innovation
Provide an overview of what the international research community now understands about user-centred innovation.
User innovators
Can develop exactly what they want, rather than relying on manufacturers to act as their (often very imperfect) agents {p. 2} > Do not have to develop everything they need on their own: they can benefit from innovations developed and freely shared by others {p. 2}
Explicitly stated: - Developed for in-house/own use {p. 3} - Development of improvement {p. 4} - Developed because of strong need {p. 5} - Developing or modifying product {p. 5} - Drivers: Agency costs & Enjoyment (individual) {p. 9} - Functional novelty {p. 11} - Require user-need information & use context information {p. 11} - Low cost {p. 11} - Types: new functional capability, sensitivity, resolution or accuracy improvement, convenience or reliability improvement
Not given Not given
Manufacturer innovators (Non-UI)
Manufacturer-centric model, in which products and services are developed by manufacturers in a closed way, with the manufacturers using patents, copyrights, and other protections to prevent imitators from free riding on their innovation investments {p. 2}
Not given
Franke, von Hippel, & Schreier (2006)
Empirical Finding commercially attractive user innovations: A test of lead‐user theory
The present study empirically tests and confirms the basic tenets of lead-user theory. It also uncovers some new refinements and related practical applications.
Lead users Lead users are defined as members of a user population who (1) anticipate obtaining relatively high benefits from obtaining a solution to their needs and so may innovate and (2) are at the leading edge of important trends in a marketplace under study and so are currently experiencing needs that will later be experienced by many users in that marketplace (von Hippel, 1986) (p. 302)
Not given Survey; attractiveness evaluation by 6 external experts
Memberships of several important European kite-surfing communities via a multisampling method 15 samples of kite surfers
User innovations
Not explicitly stated
Implicitly stated: - User innovation: - User perceive high-expected benefit from innovation - Innovation-related resources are provided - Improvements - Innovations are meaningful - More attractive innovations & high expected benefit (diagram, p. 311)
De Jong,, von Hippel, Gault, Kuusisto, & Raasch (2015)
Empirical Market failure in the diffusion of consumer-developed innovations:
Utilization of a broad sample of consumers in Finland to explore the extent to which innovations
Consumer innovation
Consumers as user innovators are motivated to create innovations to serve their own
- Creation/modification of products or applications for personal use in the past three years during leisure time {1858}
Survey Random sample of Finland's population

GA #774199
D 3.4 Dissemination Level: Public/Confidential Page 158 of 170
Patterns in Finland
developed by individual users
are deemed of potential value to others, and the extent to which they diffuse as a function of perceived general value.
needs, not those of others, and
consumer needs have shown to be heterogeneous {1857}
- Innovations that produce some level of
functionality (development of customized versions of existing products that are not available on the market & that provide important value for the developer {p. 1858}
Non-UI Not explicitly stated
- If developed as part of the respondent's job or whether the respondent knew of an equivalent product available on the market that he could have bought {p. 1858} - Purely aesthetic improvements {p. 1858}
Henkel, & von Hippel (2005)
Theoretical Welfare implications of user innovation
In this paper we explore the implications of adding innovation by users to existing models of social welfare that currently assume innovation by manufacturers only.
User innovators
- Users tend to develop innovations that only they or a few may want, and that create a high consumer surplus for themselves { p. 73} - Users tend to develop new functionality which they require {p. 74}
Explicitly stated: - Users tend to develop innovations that only they or a few may want, and that create a high consumer surplus for themselves {p. 74} - Users will tend to develop products having (so far) relatively small marketplace demand—because manufacturer products are not likely to be present there—and for which the user itself has high and inelastic demand (very precise requirements) { p. 78} - Costs (product development) are fully covered by the benefit the user innovator derives from in-house use of the innovation {p. 79} - Users are the generators of information regarding their needs {p. 80} - Innovative products fill small niches of high need {p. 82}
Analysis Not given
Manufacturer innovators (Non-UI)
Manufacturers tend to develop products that many will want, and where they see a chance to capture a large share of the surplus the innovations will create {p. 73}
- Manufacturers tend to develop products that many will want, and where they see a chance to capture a large share of the surplus the innovations will create - Manufacturers can study these early user innovations to gain information about both emerging market needs and possible solutions that would be difficult to obtain otherwise
Franke, & Shah (2002)
Empirical How communities support innovative activities: an exploration of assistance and sharing among end-users
This study is the first to explicitly examine how user-innovators gather the information and assistance they need to develop their ideas and how they share and diffuse the resulting innovations.
User innovators
- Research has shown that many important industrial product and process innovations are developed within firms where the product is used, rather than by firms who manufacturer the product for sale to others (von Hippel, 1988) {p.
157} - User-innovators expect to benefit by direct use (Enos, 1962; Knight, 1963; Freeman, 1968; Shaw, 1985; von Hippel, 1988) {p. 158}
Explicit characteristics identified in sample (UI): - Newness, Urgency, Market Potential, Commercialisation {p. 163}
Interviews with questionnaires
Sample of communities engaged in innovative activity (sailplaning, kayoing, boarder cross, handicapped cycling)
Hienerth (2006)
Empirical The commercialization of user innovations: the development of the rodeo kayak industry
In this study, we analyse the commercialization process of user innovations in open communities.
User innovators
- User innovators generate new applications, products and problem solutions (in different development stages) themselves, often based on existing
Explicit sample criteria: {p. 279} - Type of innovation: radical innovation - Innovation motive: individual needs, fun - Competition (technical/economical): no competition - Industry life-cycle:
Case study analysis Sample of 410 registered starters and staff members in the rodeo kayak industry

GA #774199
D 3.4 Dissemination Level: Public/Confidential Page 159 of 170
products from manufacturers,
developing new uses and techniques or completely new products and solutions - User innovators have a direct personal need but usually no commercial interest. Thus, no manufacturer is involved in their innovative activities; users themselves test and retest their innovations (von Hippel, 1988; von Hippel and Tyre, 1995; Thomke and von Hippel, 2002) {p. 275}
pre-industry stage Implicitly stated:
- Innovated, designed and shaped new products and materials according to their personal needs {p. 280} - Modification of existing products {p. 280} - Want to create something new for own use {p. 281}
Bogers, Afuah, & Bastian (2010)
Theoretical Users as Innovators: A Review, Critique, and Future
Research Directions
In this article, the authors review this growing literature, critique
it, and develop some of the research questions that could be explored to contribute to this literature and to the theoretical perspectives that underpin the literature.
Intermediate user as innovator
Intermediate users are users such as firms that use equipment
and components from producers to produce goods and services. Intermediate users also include, for example, scientists, librarians, webmasters, and surgeons {p. 859}
Explicitly stated: Users innovate because their knowledge is sticky and they expect
to benefit significantly from using the innovation {p. 861}
Review & critique Not given
Consumer user as innovator
Consumer users- users of consumer goods are typically individual end customers or a community of end users {p. 859}
Users innovate because they draw on sticky and local knowledge, and they expect to benefit from using and possibly selling the innovation and from enjoying the innovation process {p. 861}
Luthje, Herstatt, & von Hippel (2002)
Empirical The dominant role of 'local' information in user innovation: the case of mountain biking
In this paper we examine the specificity with which innovations developed by user-innovators address their in-house needs.
User innovators
- User innovators do tend to develop innovations to serve precisely their own needs. - They do not do this out of ignorance of the market: user-innovators in our sample have an accurate understanding of the breadth of potential marketplace demand for the innovations that they have developed (p. 2)
Explicitly stated characteristics: - Newness, technical sophistication, personal benefit, market potential Findings: - User-innovators do not stray significantly from attempting to solve their own in-house needs {p. 2} - User-innovators tend to use only their own pre-existing stocks of solution-related knowledge to develop their innovations {p. 2} - Users operate in a “low-cost innovation zone” when they develop innovations precisely responsive to problems they encounter in the normal course of their activities, and that they address by using solution information already in hand {p. 3} Reported that they gained a high personal benefit from using their innovations in their own mountain biking activities {p. 16} The higher the amount and “extreme nature” of use experience, the more probable that a user has ideas and concepts for new or improved products {p. 19}
Survey 2 samples of Mountain bikers (255 members of MTB clubs, 1,209 members of MTB online forums)
Luthje (2004)
Empirical Innovating consumers
The author reports on a survey of the innovation activities and characteristics of 153 users of outdoor-related consumer products.
Innovating consumers
Not explicitly stated
Explicit findings: - Expectation of innovation related benefits {p. 5} - Level of user expertise - Use expertise: frequent use of products {p. 6} - Product related knowledge: know-how
Survey 153 users of outdoor-related consumer product

GA #774199
D 3.4 Dissemination Level: Public/Confidential Page 160 of 170
about the product architecture and the
used materials and technologies of the existing products in the market {p. 6} - Modifications of existing product parts as well as the addition of new elements to existing goods {p. 9-10} - Significant: commitment to product & innovation related core benefit {p. 14} - Not-significant: expected financial reward {p. 14}
Gambardella, Raasch, & von Hippel (2016)
Theoretical The User Innovation Paradigm: Impacts on Markets and Welfare
We build a microeconomic model of a market that incorporates demand side innovation and competition.
Single user innovator
- Single firm or individual that creates an innovation in order to use it - Examples: single firm creating a process machine in order to use it, a surgeon creating
a new medical device in order to use it, and an individual consumer creating a new piece of sporting equipment in order to use it (von Hippel 2005) {p. 1452} - Innovating users find it viable to develop and self-provide innovative designs related to the producer
Explicit criteria & implicit through model: - User activities with no producers involved {p. 1452} - Users developing new products/services to serve their own in-house needs {p. 1453} - Users possess sticky information regarding
their needs and context of use (von Hippel 2005) {p. 1453} - Innovations produced for own use but many users have similar interests {p. 1453} - Users derive utility from using the innovation they have created & from the innovating process (fun, learning) {p. 1456} - Maximise utility {p. 1456}
Logical analysis; theoretical model
Not given
Producer innovator (non UI)
- Single firm or individual anticipating profiting from their designs by selling design information or products based on that “recipe” to others: by definition, they obtain no direct use-value from them. - Examples: firm or individual that patents an invention and licenses it to others and a firm that develops a new product or service to sell to its customers (von Hippel 2005, Baldwin & von Hippel 2011). {p.1452} Non-innovating users do not have a viable option of innovating. - Their costs may be too high, for example, because they lack needed skills or access to tools
{p. 1455}
Not given
De Jong (2016)
Theoretical The empirical scope of user innovation
This chapter summarizes and discusses the empirical work concerned with the scope of user innovation in broader samples.
User innovators
- User innovation refers to innovations developed by end users, rather than by producers {p. 3} - User-innovators can be either firms or individual consumers. They are distinguished from producer-innovators by the fact that they expect to benefit from their innovation efforts by using a
Explicitly stated: - To qualify as a process innovator it is sufficient to adopt a piece of technique, equipment or software, while user innovation excludes adoption, and requires some kind of development effort and functional novelty {p. 5} > Consumers may innovate in their leisure time by creating and/or modifying everyday items for their own benefit {p. 7} - Respondents knew of equivalent products
Summary of other work Not given
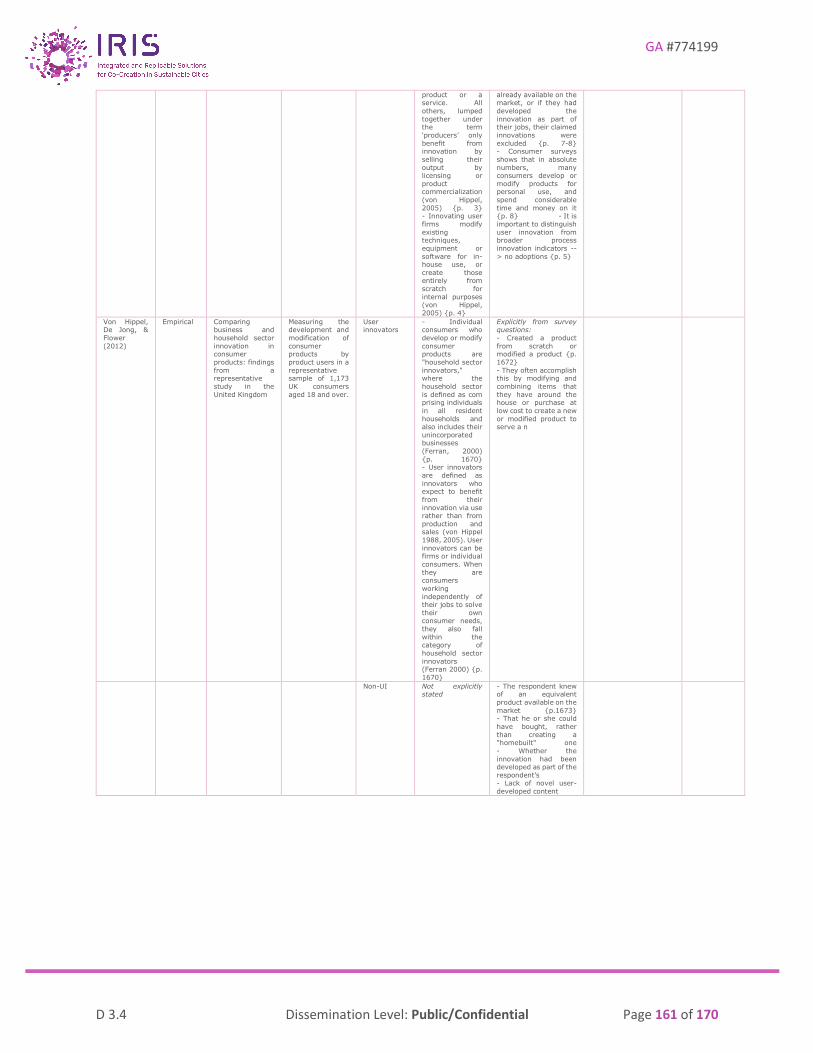
GA #774199
D 3.4 Dissemination Level: Public/Confidential Page 161 of 170
product or a service. All
others, lumped together under the term ‘producers’ only benefit from innovation by selling their output by licensing or product commercialization (von Hippel, 2005) {p. 3} - Innovating user firms modify existing techniques, equipment or software for in-house use, or create those entirely from scratch for internal purposes (von Hippel, 2005) {p. 4}
already available on the market, or if they had
developed the innovation as part of their jobs, their claimed innovations were excluded {p. 7-8} - Consumer surveys shows that in absolute numbers, many consumers develop or modify products for personal use, and spend considerable time and money on it {p. 8} - It is important to distinguish user innovation from broader process innovation indicators --> no adoptions {p. 5}
Von Hippel, De Jong, &
Flower (2012)
Empirical Comparing business and
household sector innovation in consumer products: findings from a representative study in the United Kingdom
Measuring the development and
modification of consumer products by product users in a representative sample of 1,173 UK consumers aged 18 and over.
User innovators
- Individual consumers who
develop or modify consumer products are "household sector innovators," where the household sector is defined as com prising individuals in all resident households and also includes their unincorporated businesses (Ferran, 2000) {p. 1670} - User innovators are defined as innovators who expect to benefit from their innovation via use rather than from production and sales (von Hippel 1988, 2005). User innovators can be firms or individual
consumers. When they are consumers working independently of their jobs to solve their own consumer needs, they also fall within the category of household sector innovators (Ferran 2000) {p. 1670}
Explicitly from survey questions:
- Created a product from scratch or modified a product {p. 1672} - They often accomplish this by modifying and combining items that they have around the house or purchase at low cost to create a new or modified product to serve a n
Non-UI Not explicitly stated
- The respondent knew of an equivalent product available on the market {p.1673} - That he or she could have bought, rather than creating a "homebuilt" one - Whether the innovation had been developed as part of the respondent's - Lack of novel user-
developed content

GA #774199
D 3.4 Dissemination Level: Public/Confidential Page 162 of 170
Table 31: Literature Reviews on Smart City Development

GA #774199
D 3.4 Dissemination Level: Public/Confidential Page 163 of 170
Table 32: Complete Literature Base for Smart City Index
Author(s)
Year
of
Publication
Times
cited (total)
Times
cited
(per year)
Title Journal/ Other Definition of smart city Keywords in definition
Caragliu, Del Bo, & Nijkamp (2011)
2011 3325 332.50 Smart Cities in Europe
Journal of Urban Technology
A city is smart when investments in human and social capital and traditional (transport) and modern (ICT) communication infrastructure fuel sustainable economic growth and a high quality of life, with a wise management of natural resources, through participatory governance
Human capital, social capital, investment, modern, ICT, sustainable, economic, growth, quality of life, resource management, governance, city, transport
Townsend (2013)
2013 1617 202.13 Smart cities—big data, civic hackers and the quest for a New Utopia
Book Smart cities are places where information technology is combined with infrastructure, architecture, everyday objects, and even our own bodies to address social, economic and environmental problems
IT, infrastructure, social wealth, place, social, economic, environmental
Neirotti et al. (2014)
2014 1381 197.29 Current trends in smart city initiatives–some stylised
facts
Cities Smart cities are characterized by a pervasive use of Information and Communication Technologies (ICT), which, in various urban domains, help cities make better
use of their resources
ICT, urban, resource management
Hollands (2008) 2008 2439 187.62 Will the real smart city please stand up?
City: analysis of urban trends, culture, theory, policy, action
Smart city as (1) a celebratory label, (2) a marketing hype rather than a practical engine for infrastructural change, and (3) a loaded term carrying an uncritical, pro-development stance. For the author serious smart city projects consider human capital as the most important component.
City, monitoring, integration, optimization, resource management, maintenance, security, citizen, services, infrastructure, energy
Backici et al. (2012)
2012 727 80.78 A Smart City initiative: The Case of Barcelona
Journal of the Knowledge Economy
Smart city as a high-tech intensive and advanced city that connects people, information and city elements using new technologies in order to create a sustainable, greener city, competitive and innovative commerce, and an increased life quality.
Technology, social, city, information, sustainable, green, innovation, competition, quality of life, business
Harrison et al. (2010)
2010 861 78.27 Foundations for Smarter Cities
IBM Journal of Research and Development
A city connecting the physical infrastructure, the IT infrastructure, the social infrastructure, and the business infrastructure to leverage the collective intelligence of the city
City, IT, social, infrastructure, intelligence, business
Lombardi et al. (2012)
2012 650 72.22 Modelling the Smart City Performance
Innovation: The European Journal of Social Science Research
The application of information and communications technology (ICT) with their effects on human capital/education, social and relational capital, and environmental issues is often indicated by the notion of smart city.
ICT, education, human capital, social capital, relational capital, environmental
Lee, Hancock, & Hu (2014)
2014 500 71.43 Towards an effective framework for building smart cities: Lessons from Seoul and San Francisco
Technological Forecasting and Social Change
A smart city aims to resolve various urban problems (public service unavailability or shortages, traffic, over-development, pressure on land, environmental or sanitation shortcomings and other forms of inequality) through ICT-based technology connected up as an urban infrastructure. The ultimate goal is to revitalize some of the city's structural (environmental and social) imbalances through the efficient redirection of information. Smart cities are envisioned as creating a better, more sustainable city, in which people's quality of life is higher, their environment more liveable and their economic prospects stronger.
Solutions, environmental, inequality, ICT, infrastructure, efficiency, sustainable, city, quality of life, livability, economic, social, information
Washburn & Sindhu (2010)
2010 683 62.09 Helping CIOs Understand "smart City" Initiatives:
Defining the Smart City, Its Drivers, and the Role of the CIO
Cambridge, MA: Forrester Research, Inc.
The use of smart computing technologies to make the critical infrastructure components and services of a city- which include city
administration, education, healthcare, public safety, real estate, transportation, and utilities - more intelligent, interconnected and efficient
Technology, infrastructure, services (administration, education, healthcare, public safety, real estate,
transportation, utilities), intelligence, interconnected, efficiency
Gretzel et al. (2015, p. 559)
2015 343 57.17 Conceptual foundations for understanding smart tourism ecosystems
Computers in Human Behavior
A smart city is a city that uses advanced ICT to optimize resource production and consumption
ICT, resource management
Zygiaris (2013) 2013 451 56.38 Smart City Reference Model: Assisting Planners to Conceptualize the Building of Smart City
Journal of the Knowledge Economy
The term “smart city” is understood as a certain intellectual ability that addresses several innovative socio-technical and socio-economic aspects of growth. These aspects lead to smart city conceptions as “green” referring to urban infrastructure for environment protection and reduction of CO2
Intelligence, innovation, technology, economic, growth, green, infrastructure, environment, interconnected, intelligence, information, data, sensors, activators, knowledge, creative, human capital, city

GA #774199
D 3.4 Dissemination Level: Public/Confidential Page 164 of 170
Innovation Ecosystems
emission, “interconnected” related to revolution of broadband
economy, “intelligent” declaring the capacity to produce added value information from the processing of city’s real-time data from sensors and activators, whereas the terms “innovating”, “knowledge” cities interchangeably refer to the city’s ability to raise innovation based on knowledgeable and creative human capital
Lazaroiu & Roscia (2012)
2012 462 51.33 Definition Methodology for the Smart Cities Model
Energy A community of average technology size, interconnected and sustainable, comfortable, attractive and secure.
Community, technology, sustainable, interconnected, comfortable, attractive, security
Antopoulos et al. (2019)
2019 101 50.50 A Unified Smart City Model (USCM) for smart city conceptualization and benchmarking
Smart Cities and Smart Spaces: Concepts, Methodologies, Tools, and Applications
All means of innovations in the urban atmosphere (ICT-based, yet not necessarily) that purpose to improve the city dimensions including economy, people, government, mobility, environment and living
Innovation, urban, ICT, economy, people, government, mobility, environment, quality of life
Dameri (2013) 2013 360 45.00 Searching for smart city definition: A comprehensive proposal
International Journal of Computer Technology
A Smart City is a well-defined geographical area, in which high technologies such as ICT, logistic, energy production, and so on, cooperate to create benefits for
citizens in terms of well-being, inclusion and participation, environmental quality, intelligent development; it is governed by a well-defined pool of subjects, able to state the rules and policy for the city government and development”
Geographical area, technology, energy, well-being, citizen, inclusion, participation, environmental, intelligence, development,
rules, policy, governance, ICT, logistics
Marsal-Llacuna et al. (2015)
2015 258 43.00 Lessons in urban monitoring taken from sustainable and livable cities to better address the Smart City initiative
Technological Forecasting and Social Change
Smart Cities initiatives try to improve urban performance by using data, information and information technologies (IT) to provide more efficient services to citizens, to monitor and optimize existing infrastructure, to increase collaboration among different economic actors, and to encourage innovative business models in both the private and public sectors.
Urban, data, services, citizens, efficient, innovation, IT, monitoring, optimization, infrastructure, collaboration, economic, governance, performance, information
Piro et al. (2014, p. 169)
2014 291 41.57 Information centric services in smart cities
Journal of Systems and Software
A smart city is intended as an urban environment which, supported by pervasive ICT systems, is able to offer advanced and innovative services to citizens in order to improve the overall quality of their life.
ICT, innovation, social, quality of life, urban, citizens, services
Hernandez-Munoz et al. (2011)
2011 409 40.90 Smart cities at the forefront of the future internet
The future internet assembly
A city that represents an extraordinary rich ecosystem to promote the generation of massive deployments of city-scale applications and services for a large number of activity sectors
City, ecosystem, services
Khatoun & Zeadally (2016, p. 46)
2016 202 40.40 Smart cities: Concepts, architectures, research opportunities
Communications of the ACM
A smart city is an ultra-modern urban area that addresses the needs of businesses, institutions and especially citizens
Urban, business, institutions, citizens, modern
van Zoonen (2016, p. 472)
2016 164 32.80 Privacy concerns in smart cities
Government Information Quarterly
In a smart city, ICT-infused infrastructures enable the extensive monitoring and steering of city maintenance, mobility, air and water quality, energy usage, visitor movements, neighbourhood sentiment, and so on.
ICT, monitoring, resource management, transportation, city, mobility, energy, maintenance, community
Winters (2011) 2011 310 31.00 Why are smart cities growing? Who moves and who stays
Journal of Regional Science
I consider “smart cities” to be metropolitan areas with a large share of the adult population with a college degree
Urban, citizens, high education
Gil-Garcia, Zhang, & Puron-Cid (2016)
2016 153 30.60 Conceptualizing smartness in government: An integrative and multi-dimensional view
Government Information Quarterly
A city is smart when there are actions taken towards innovation in management, technology, and policy, all of which entail risks and opportunities
Innovation, management, technology, policy, opportunities, risks, city
Toppeta (2010) 2010 318 28.91 How innovation and ict can build smart, “livable”, sustainable cities
Innovation Knowledge Foundation
A city “combining ICT and Web 2.0 technology with other organizational, design and planning efforts to dematerialize and speed up bureaucratic processes and help to identify new, innovative solutions to city management complexity, in order to improve sustainability and livability
ICT, technology, design, planning, governance, innovation, solutions, sustainability, livability, efficiency, management, city, organization
Schuurman et al. (2012, p. 51)
2012 243 27.00 Smart ideas for smart cities: Investigating crowdsourcing for generating and selecting ideas for ICT innovation in a city context
Journal of Theoretical and Applied Electronic Commerce Research
In smart cities collaborative digital environments facilitate the development of innovative applications, starting form the human capital of the city, rather than believing that the digitalization in se can transform can improve cities.
Innovation, improvement, development, collaboration, human capital, city, digital

GA #774199
D 3.4 Dissemination Level: Public/Confidential Page 165 of 170
Kourtit et al. (2012)
2012 240 26.67 Smart Cities in Perspective
- a Comparative European Study by Means of Self-organizing Maps
Innovation: The European Journal of
Social Science Research
Smart cities have high productivity as they have a relatively high share
of highly educated people, knowledge-intensive jobs, output-oriented planning systems, creative activities and sustainability-oriented initiatives.
Productivity, education, (skilled) job, creativity,
sustainability, planning, systems, activities
Huovila et al. (2019)
2019 51 25.50 Comparative analysis of standardized indicators for Smart sustainable cities: What indicators and standards to use and when?
Cities An innovative city that uses information and communication technologies (ICTs) and other means to improve quality of life, efficiency of urban operation and services, and competitiveness, while ensuring that it meets the needs of present and future generations with respect to economic, social, environmental as well as cultural aspects
Innovation, city, ICT, quality of life, efficiency, services, competition, economic, social, environmental, cultural, sustainable
Hall et al. (2000) 2000 533 25.38 The vision of a smart city
2nd International Life Extension Technology Workshop (Paris)
An urban centre of the future, made safe, secure environmentally green, and efficient because all structures–whether for power, water, transportation, etc. are designed, constructed, and maintained making use of advanced, integrated materials, sensors, electronics, and networks which are interfaced with computerized systems comprised of databases, tracking, and decision-making algorithms
Urban, green, efficiency, integration, interface, ICT, algorithms, safety, security, transportation, energy, water, design, sensors, networks, technology, database
Lee & Lee (2014, p. 93)
2014 175 25.00 Developing and Validating a citizen-centric typology for smart city services
Government Information Quarterly
A city which develops and manages a variety of innovative services that provide information to all citizens about all aspects of city life via interactive and internet-based applications
City, innovation, information, services, ICT, technology, citizens, internet, livability
Belissent (2010) 2010 266 24.18 Getting clever about smart cities: New opportunities require new business models
Cambridge: Forrester A city that uses ICTs to make the critical infrastructure components and services of a city–administration, education, healthcare, public safety, real estate, transportation, and utilities–more aware, interactive, and efficient
ICT, infrastructure, services (administration, education, healthcare, public safety, real estate, transportation, utilities), interaction, efficiency
Pereira et al. (2017, p. 528)
2017 88 22.00 Delivering public value through open government data initiatives in a smart city context.
Information Systems Frontiers
A smart city encompass an efficient, technologically advanced, sustainable and socially inclusive city
Efficient, technology, sustainable, social, inclusion, city
Zhuhadar et al. (2017, p. 274)
2017 86 21.50 The next wave of innovation- Review of smart cities intelligent operation systems.
Computers in Human Behavior
Those cities that have the greatest quality of life and economic wellbeing for their citizens
Quality of life, economic, well-being, citizens, city
Paskaleva (2009)
2009 257 21.42 Enabling the smart city: The progress of city e-governance in Europe
International Journal of Innovation and Regional Development
A city that takes advantages of the opportunities offered by ICT in increasing local prosperity and competitiveness–an approach that implies integrated urban development involving multi-actor, multi-sector and multi-level perspectives
ICT, development, competition, opportunities, collaboration, city, prosperity
Komninos (2011)
2011 214 21.40 Intelligent Cities: Variable Geometries of Spatial Intelligence
Intelligent Buildings International
(Smart) cities as territories with high capacity for learning and innovation, which is built-in the creativity of their population, their institutions of knowledge creation, and their digital infrastructure for communication and knowledge management.
Territories, learning, innovation, creativity, knowledge, digital, citizens, ICT
Kourtit & Nijkamp (2012)
2012 187 20.78 Smart Cities in the Innovation Age
Innovation: The European Journal of Social Science Research
Smart cities are the result of knowledge-intensive and creative strategies aiming at enhancing the socio-economic, ecological, logistic and competitive performance of
cities. Such smart cities are based on a promising mix of human capital (e.g. skilled labor force), infrastructural capital (e.g. high-tech communication facilities), social capital (e.g. intense and open network linkages) and entrepreneurial capital (e.g. creative and risk-taking business activities).
City, economic, ecological, logistic and competitive performance, human capital, social capital, entrepreneurship, creativity,
knowledge, infrastructure, business
Odendaal (2003) 2003 366 20.33 Information and communication technology and local governance: understanding the difference between cities in developed
Computers, Environment and Urban Systems
A city that capitalises on the opportunities presented by ICTs in promoting its prosperity and influence.
City, opportunities, ICT, capitalization, prosperity

GA #774199
D 3.4 Dissemination Level: Public/Confidential Page 166 of 170
and emerging economies
Xie et al. (2019) 2019 37 18.50 A Survey of Blockchain Technology Applies to Smart Cities: Research Issues and Challenges
IEEE Communications Surveys and Tutorials
Upgraded quality of life, sustainable urban environment, use of advanced ICT, public government openness, encouraged community participation, effective management of traffic and public transport, intelligent device control, optimum resource utilization, improved environmental protection, and improved public services
Quality of life, sustainable, urban, ICT, governance, community, participation, efficiency, transport, resource management, environmental, public services
Lara et al. (2016)
2016 92 18.40 Smartness that matters: Towards a comprehensive and human-centred characterisation of smart cities
Journal of Open Innovation: Technology, Market, and Complexity
A community that systematically promotes the overall wellbeing for all of its members, and flexible enough to proactively and sustainably become an increasingly better place to live, work and play
Community, well-being, livability, sustainability, proactive, citizens, flexibility, quality of life
Yeh (2017, p. 556)
2017 72 18.00 The effects of successful ICT-based smart city services: From citizens' perspectives
Government Information Quarterly
A general definition involves the implementation and deployment of information and communication technology (ICT) infrastructures to support social and urban growth through improving the economy, citizens' involvement and
government efficiency
ICT, social, growth, urban, economy, efficiency, citizen (involvement), government
Hussain et al. (2015, p. 253)
2015 107 17.83 Health and emergency-care platform for the elderly and disabled people in the smart city
Journal of Systems and Software
The smart cities are using digital technologies to enhance the quality and performance of urban services
Digital, technology, quality, performance, urban, services
Ygitcanlar (2015)
2015 100 16.67 Smart cities: an effective urban development and management model?
Australian Planner A city in which the traditional services and networks based on digital technologies are made more efficient for the benefit of its businesses, services, and inhabitants
City, technology, digital, efficiency, businesses, services, networks, inhabitants
Gascó-Hernandez (2018, p. 50)
2018 45 15.00 Building a smart city: lessons from Barcelona
Communications of the ACM
A smart city is an umbrella term of how information and communication technology can help improve the efficiency of a city's operations and its citizens' quality of life while also promoting the local economy
ICT, efficiency, improvement of operations, quality of life, citizens, city
Barrionuevo, Berrone, & Ricart (2012)
2012 134 14.89 Smart Cities, Sustainable Progress
IESE Insight Being a smart city means using all available technology and resources in an intelligent and coordinated manner to develop urban centers that are at once integrated, habitable, and sustainable.
Technology, resource management, intelligence, coordination, urban, integration, sustainable, habitable
Ygitcanlar (2016)
2016 73 14.60 Technology and the city: Systems, applications and implications
New York: Routledge An ideal form to build the sustainable cities of the 21st century, in the case that a balanced and sustainable view on economic, societal, environmental and institutional development is realised.
City, sustainable, economic, societal, environmental, institutional, development
Mahizhnan (1999)
1999 313 14.23 Smart cities: The Singapore case
Cities Information technologies represent the key concept. The vision of an intelligent city is not confined to economic excellence that can be led by information technologies, but an integral part of this vision is its concern for the quality of life for the ordinary citizen.
IT, quality of life, economic, citizen, city
Chatterjee, Kar, & Gupta (2018)
2018 38 12.67 Success of IoT in Smart Cities of 2018 Journal India: An empirical analysis
Government Information Quarterly
Smart Cities where the citizens are expected to use Information and Communication Technology with the help of internet.
ICT, citizen, internet
Rana et al. (2018, p. 1)
2018 37 12.33 Barriers to the development of smart cities in Indian context
Information Systems Frontiers
Smart cities can be defined as a technologically advanced and modernised territory with a certain intellectual ability that deals with various social, technical, economic aspects of growth based on smart computing techniques to develop superior infrastructure constituents and services
Technological, intelligence, social, technical, economic, infrastructure, modern, services, growth, territory
Komninos et al. (2015)
2015 72 12.00 Smart city ontologies: Improving the effectiveness of smart city applications
URENIO Research Smart cities are created by a convergence of top-down and bottom-up processes, wherein market forces and strategic planning come together to build broadband networks, urban operational systems, embedded systems, and software, all of which change the functioning and life in cities.
Top-down, bottom-up, planning, network, operational, systems, software, quality of life, city
Giffinger et al. (2007)
2007 148 10.57 Smart cities: ranking of European medium-sized cities
Vienna: Centre of Regional Science - Vienna UT
A city well performing in a forward-looking way in economy, people, governance, mobility, environment, and living, built on the smart combination of endowments and activities of self-decisive, independent and aware citizens
Economy, people, governance, mobility, environment, livability, awareness, citizens, activities, self-decisive, city

GA #774199
D 3.4 Dissemination Level: Public/Confidential Page 167 of 170
Thite (2011) 2011 105 10.50 Smart Cities: Implications
of Urban Planning for Human Resource Development
Human Resource Development
International
Creative or smart city experiments [ . . . ] aimed at nurturing a
creative economy through investment in quality of life which in turn attracts knowledge workers to live and work in smart cities. The nexus of competitive advantage has [ . . . ] shifted to those regions that can generate, retain, and attract the best talent.
Creativity, economic, quality of life, livability, competitive
advantage, talent acquirement, knowledge
Cretu (2012) 2012 84 9.33 Smart Cities Design Using Event-driven Paradigm and Semantic Web
Informatica Economica A smart city has well designed ICT infrastructure, transforms real time data into meaningful information, a smart city allows inhabitants to predefine automated actions in response to events
ICT, data, information, inhabitants, automation, events
Eger (2009) 2009 110 9.17 Smart growth, smart cities, and the crisis at the pump a worldwide phenomenon
The Journal of E-Government Policy and Regulation
A particular idea of local community, one where city governments, enterprises and residents use ICTs to reinvent and reinforce the community's role in the new service economy, create jobs locally and improve the quality of community life
Community, governance, technology, livability, productivity, ICT, quality of life, city, businesses, inhabitant, economy
Bartoli et al. (2011)
2011 85 8.50 Security and privacy in your smart city
Proceedings of the Barcelona smart cities congress
The main topics are SCs are related to of their smart inhabitants, quality of social interaction, educational degree, integration with public life, as well as openness
to the wider world.
Inhabitants, social, education, integration, openness
Peng, Nunes & Zheng (2017)
2017 32 8.00 Impacts of low citizen awareness and usage in smart city services: the case of London's smart parking system
Information Systems and e-Business Management
Smart cities are essentially built by utilising a set of advanced information and communication technologies (ICT), including smart hardware devices (e.g. wireless sensors, smart meters, smart vehicles, and smartphones), mobile networks (e.g. WIF, 3G/4G/5G network), data storage technologies (e.g. data warehouse, cloud platform), and software applications (e.g. back-office control systems, mobile apps, big data analytical tools)
ICT, data, network, technology, software, hardware, devices
Chen (2010) 2010 88 8.00 Smart Grids, Smart Cities Need Better Networks
IEEE Network Smart cities will take advantage of communications and sensor capabilities sewn into the cities’ infrastructures to optimize electrical, transportation, and other logistical operations supporting daily life, thereby improving the quality of life for everyone
Communications, sensors, infrastructure, optimization, electricity, transportation, logistics, quality of life
Corbett and Mellouli (2017, p. 428)
2017 31 7.75 Winning the SDG battle in cities: How an integrated information ecosystem can contribute to the achievement of the 2030 sustainable development goals
Information Systems Journal
Smart cities seek to leverage advanced communication technologies and IS (information systems) in order to improve all areas of city administration, enhance citizens' quality of life, engage citizens and provide more sustainable and resilient public services
ICT, city, administration, quality of life, citizen (engagement), sustainable, services
Thuzar (2011) 2011 77 7.70 Urbanization in SouthEast Asia: developing smart cities for the future?
Regional Outlook Smart cities of the future will need sustainable urban development policies where all residents, including the poor, can live well and the attraction of the towns and cities is preserved. […] Smart cities are […] cities that have a high quality of life; those that pursue sustainable economic development through investments in human and social capital, and traditional and modern communications infrastructure (transport and information communication technology); and manage natural resources through participatory policies. Smart cities should also be sustainable, converging economic, social, and environmental goals
Development, city, quality of life, policy, inhabitants, human capital, social capital, ICT, resource management, sustainable, economic, environmental, infrastructure, transport, modern
Schiavonea, Paolonec, & Mancinia (2019)
2019 15 7.50 Business model innovation for 2019 urban smartization
Technological Forecasting & Social Change
Smart cities are the result of a combination of investments made in resources (human, social, creative, infrastructural, technological and business capital) that encourage sustainable economic growth under the conditions of a strong management and governance system (Caragliu et al., 2011)
Investments, resources, sustainable, economic, growth, governance, human capital, social capital, creativity, infrastructure, business capital, technology
Schaffers et al. (2012, p. 2)
2012 66 7.33 Special issue on smart applications for smart cities - new approaches to innovation: Guest editors' introduction
Journal of Theoretical and Applied Electronic Commerce Research
The smart city is an urban innovation ecosystem, a living laboratory acting as agent of change
Urban, innovation, ecosystem, laboratory

GA #774199
D 3.4 Dissemination Level: Public/Confidential Page 168 of 170
Zhao (2011) 2011 70 7.00 Towards sustainable
cities in China: Analysis and assessment of some Chinese cities in 2008
Berlin: Springer A city that improves the quality of life, including ecological, cultural,
political, institutional, social, and economic components without leaving a burden on future generations.
City, quality of life, ecological, cultural, political,
institutional, social, economic, sustainable
Heaton & Parkilad (2019)
2019 14 7.00 A conceptual framework for the alignment of infrastructure assets to citizen requirements within a Smart Cities Framework
Cities The concept of Smart City engages with cities' stakeholders and encompasses all of the built and natural environment
City, stakeholders, environment
Rios (2012) 2012 62 6.89 Creating the smart city
Thesis A city that gives inspiration, shares culture, knowledge, and life, a city that motivates its inhabitants to create and flourish in their own lives—it is an admired city, a vessel to intelligence, but ultimately an incubator of empowered spaces
City, culture, knowledge, life, intelligence, inhabitants, incubator
El-Haddadeh et al. (2018, p. 1)
2018 20 6.67 Examining citizens' perceived
value of internet of things technologies in facilitating public sector services engagement
Government Information Quarterly
Smart cities are all about networks of sensors, smart devices, real-time data, and ICT integration in
every aspect of human life
Network (of sensors, smart devices, real-time data), ICT, citizen
Qian et al. (2019)
2019 13 6.50 The Internet of Things for Smart Cities: Technologies and Applications (Guest editorial)
IEEE Network Human and societal capital investments, modern-day communication, infrastructure, sustainable economic growth, participatory governance, natural resources management, and advanced infrastructure (physical, modern ICT, social, and business) integration to sustain the city's collective intelligence
ICT, communication, sustainable, economic, growth, governance, resource management, human capital, social capital, investment, physical infrastructure, business, integration, intelligence
Outlook (2014) 2014 43 6.14 Early Release Overview
US Energy Information Administration
A city that uses ICT to be more interactive, efficient, and making citizens more aware of what is happening in the city.
City, ICT, interaction, efficiency, awareness, citizens
Calderoni, Maio, & Palmieri (2012, p. 74)
2012 55 6.11 Location-aware mobile services for a smart city: Design, implementation, and deployment
Journal of Theoretical and Applied Electronic Commerce Research
A smart city is high-performance urban context, where citizens are more aware of, and more integrated into the city life, thanks to an intelligent city information system
Performance, urban, citizen, awareness, integration, IT
Partridge (2004) 2004 96 5.65 Developing a human perspective to the digital divide in the smart city
ALIA 2004 Biennial Conference: Challenging ideas, Gold Coast, Australia
A city that actively embraces new technologies seeking to be a more open society where technology makes easier for people to have their say, gain access to services and to stay in touch with what is happening around them, simply and cheaply
City, technology, quality of life, services, openness
Alkandari, Alnasheet, & Alshaikhli (2012)
2012 48 5.33 Smart cities: a survey
Journal of Advanced Computer science and Technology Research
A city that uses a smart system characterised by the interaction between infrastructure, capital, behaviours and cultures, achieved through their integration
Systems, interaction, integration, infrastructure, capital, behaviour, city, culture
Heo et al. (2014) 2014 35 5.00 Escaping from ancient Rome! Applications and challenges for designing smart cities
Transactions on Emerging Telecommunications Technologies
An urban environment which able to improve the quality of citizens’ life by using ICT systems
Urban, quality of life, citizens, ICT
Chong et al. (2018, p. 10)
2018 14 4.67 Dynamic capabilities of a smart city: An innovative approach to
discovering urban problems and solutions
Government Information Quaterly
Smart city is an integration of infastructures and technology-mediated services, social learning for strengthening human infrastructure, and governance for
institutional improvement and citizen engagement
Integration, infrastructure, technology, services, social learning, human, governance, instiutional, improvement, citizen
(engagement)
Guan (2012) 2012 41 4.56 Smart Steps To A Battery City
Government News A city that is prepared to provide conditions for a healthy and happy community under the challenging conditions that global, environmental, economic and social trends may bring.
City, community, challenges, environment, economic, social, quality of life, global
Shafiullah et al. (2010)
2010 44 4.00 Potential challenges: integrating renewable energy with the smart grid
20th Australasian Universities Power Engineering Conference
Smart cities are characterized by the pervasive use of ICT to smartness application in natural resources and energy, transportation and mobility, buildings, living, government, economy, and people.
ICT, energy, transportation, mobility, buildings, living, government, economy, people, resource management
Chang et al. (september, 2019)
2019 5 2.50 Multivariate relationships between campus
Applied Energy The main features of the smart city are smart economy, smart mobility, smart environment,
Economy, mobility, environment, people, living, governance

GA #774199
D 3.4 Dissemination Level: Public/Confidential Page 169 of 170
design parameters
and energy performance using reinforcement learning and parametric modeling
smart people, smart living, and smart governance.
Mandeville et al. (2014)
2014 17 2.43 Mapping smart cities in the EU
Economic and scientific policy
A city seeking to address public issues via ICT-based solutions on the basis of a multi-stakeholder, municipally based partnership
City, ICT, solutions, issues, partnerships, municipality
David & Koch (2019)
2019 3 1.50 “Smart Is Not Smart Enough!” Anticipating Critical Raw Material Use in Smart City Concepts: The Example of Smart Grids
Urban Transformations Towards Sustainability
A city that tries to make resource production and allocation in urban areas more efficient, and thus more sustainable through new sociotechnical innovations such as smart grids, smart meters, or solar panels.
City, resource management, efficiency, sustainable, innovation, technology (solar panels, smart meters, smart grids), urban

GA #774199
D 3.4 Dissemination Level: Public/Confidential Page 170 of 170
Table 33: Appearances of keywords in definitions
.
# Themes
% of appearances
in total number of definitions
1. Technology (data, sensors, activators, internet, ICT, IT, database, algorithm, grid, digital, solar panels, smart meters, WIFI, software, hardware, smart devices)
80.9%
2. City/ urban challenges (territory, place, geographical area)
75.6%
3. Sustainability (green, environmental, ecological) 50.2%
4. ICT (if 1, also add 1 to technology) 49.6%
5. Social capital (social, social wealth, inclusion, community)
48.4%
6. Economic (economy) 38.6%
7. Quality of life (liveability, prosperity, habitable, well-being)
38.1%
8. Human capital (intelligence, skilled workers/ jobs, (high) education, knowledge)
35.4%
9. Resource management 34.8%
10. Infrastructure 32.2%
11. Citizen (inhabitants, people) 29.2%
12. Transportation (mobility, transport) 23.4%
13. Innovation 17.8%
14. Growth 17.5%
15. Efficiency (efficient) 14.3%
16. Safety (security) 14.1%
17. Energy 10.9%
18. Business (entrepreneurship) 10.5%
19. Integration 10.5%
20.. Collaboration (participation, partnership, relational capital, coordination, stakeholder)
9.5%
21. Network (interconnected) 8.6%
22. Creativity 5.8%