Deliverable - Level-Up
115
D1.2 – LEVEL-UP SoA analysis LEVEL-UP Protocols and Strategies for extending the useful Life of major capital investments and Large Industrial Equipment Deliverable D1.2 LEVEL-UP SoA analysis Deliverable Lead: Atlantis Engineering SA (ATLA) Deliverable due date: 31/03/2020 Actual submission date: 31/03/2020 Dissemination level: PU Version: 1.0 This project receives funding in the European Commission’s Horizon 2020 Research Programme under Grant Agreement Number 869991. The information contained in this report is subject to change without notice and should not be construed as a commitment by any members of the LEVEL-UP Consortium. The information is provided without any warranty of any kind. This document may not be copied, reproduced, or modified in whole or in part for any purpose without written permission from the LEVEL-UP Consortium. In addition to such written permission to copy, acknowledgement of the authors of the document and all applicable portions of the copyright notice must be clearly referenced. © COPYRIGHT 2020 LEVEL-UP Consortium. All rights reserved.
-
Upload
khangminh22 -
Category
Documents
-
view
1 -
download
0
Transcript of Deliverable - Level-Up

D1.2 – LEVEL-UP SoA analysis
LEVEL-UP
Protocols and Strategies for extending the useful Life of major
capital investments and Large Industrial Equipment
Deliverable
D1.2 LEVEL-UP SoA analysis
Deliverable Lead: Atlantis Engineering SA (ATLA)
Deliverable due date: 31/03/2020
Actual submission date: 31/03/2020
Dissemination level: PU
Version: 1.0
This project receives funding in the European Commission’s Horizon 2020 Research Programme under
Grant Agreement Number 869991.
The information contained in this report is subject to change without notice and should not be construed as a commitment
by any members of the LEVEL-UP Consortium. The information is provided without any warranty of any kind.
This document may not be copied, reproduced, or modified in whole or in part for any purpose without written permission
from the LEVEL-UP Consortium. In addition to such written permission to copy, acknowledgement of the authors of the
document and all applicable portions of the copyright notice must be clearly referenced.
© COPYRIGHT 2020 LEVEL-UP Consortium.
All rights reserved.

D1.2 – LEVEL-UP SoA analysis
LEVEL-UP | GA n. 869991 Pag. 1 | 115
Revision history
Version Author(s) Changes Date
0.1 ATLA Document creation 16/12/2019
0.4 ATLA, LEVEL-UP Partners Consolidation of partners’ inputs
14/01/2020
0.6 ATLA, LEVEL-UP Partners Consolidation of partners’ inputs
17/02/2020
0.7 ATLA, LEVEL-UP Partners Consolidation of partners’ inputs
10/03/2020
0.8 ATLA Release for Review 13/03/2020
0.9 ATLA Reviewed deliverable to Coordinator
17/03/2020
0.91 ATLA Release for Consortium Review 24/03/2020
1.0 ATLA Final version, Release for EC Portal
27/03/2020
D1.2 – LEVEL-UP SoA analysis
LEVEL-UP | GA n. 869991 Pag. 1 | 115
EXECUTIVE SUMMARY / ABSTRACT
Abstract This deliverable describes how a timely positioning of the developments is ensured by benchmarking against advances of the field and emergence of new applications.
Keywords State of the Art, Advances, Projects, Products, Technologies, Machine learning, Crack healing, IoT, Digital twin, Data aggregation
Europe is still lacking an efficient approach for a complete, cost-effective, integrated and circular application for the digital uplifting of existing factories to an Industry4.0 level. There are capital investments that were done more than 15-20 years ago, large equipment of critical importance to production process that work in non-optimal ways, lines that are not sensorised or connected enough. The need to avoid a two-speed digital transformation across industries in different sectors and enterprises of different sizes is prominent.
The LEVEL-UP project proposes specific goals and actions in four directions: i) digital uplifting/CPSisation of equipment with an orientation towards openness and continuity, ii) use of advanced manufacturing technologies and circular economy to serve and support digital automation, iii) evidence-based predictive and prescriptive extension of assets’ useful life, iv) analysis of costs and benefits for informed decisions.
In order to meet them, LEVEL-UP will make use of various technologies, which will be demonstrated at 7 different pilot partners. Not all pilots require to make use of all technologies, but in each case a bouquet of those solutions will be employed. Hence, it was important to document the aspects that are of interest to the LEVEL-UP not only for the research community in general, but also for the end users and the complete consortium. An overview of the current state-of-the-art, focused on what is relevant for project is presented for:
• Internet of Things
• Operating Systems
• Operating Platforms (SIEM)
• Connection in the physical layer
• Data aggregation
• Knowledge representation and Ontologies
• Machine Learning
• Risk assessment (FMECA, KRI models)
• Decision Support System
• Cost Benefit Analysis
• CAD/CAM/CAPP extraction
• Digital Twins on the edge and cloud
• Digital twin operation on the edge
• Updating virtual twins
• Virtual commissioning
• Repairing approaches
• Crack Healing
• Virtual refurbishment
• Recyclability
Taking into account that the aforementioned technologies have been put in use for other scopes in new, existing and past projects, the partners have reviewed several of them, highlighting which points are of interest for the LEVEL-UP project. Each one is accompanied with an identity card, as a quick overview, which might prove to be a helpful tool for other members of the R&D community with similar interests. Additionally, new, existing and past related initiatives and products have been reviewed, which provide more insights in the applications of these technologies at different levels of readiness and from different stakeholders of the digital transformation of European industry and enterprises. The report is completed with a preliminary assessment of possible opportunities and potential threats from the use of these technologies in the project. Partners will continue to update this analysis, as part of their knowledge management and technology watch activities.

D1.2 – LEVEL-UP SoA analysis
LEVEL-UP | GA n. 869991 Pag. 2 | 115
TABLE OF CONTENTS
TABLE OF CONTENTS ..................................................................................................................................2
Abbreviations ......................................................................................................................................................5
1 Introduction ................................................................................................................................................8
2 State Of The Art of LEVEL-UP Technologies ...........................................................................................8
2.1 Internet of Things ...............................................................................................................................8
2.2 Operating Systems for digital factories............................................................................................... 10
2.2.1 Reference Architectures ................................................................................................................ 11
2.2.2 Factory Operating systems ............................................................................................................. 12
2.3 Operating Platforms .......................................................................................................................... 15
2.3.1 Operating Platforms on-site ........................................................................................................... 15
2.3.2 Cloud operating platform .............................................................................................................. 16
2.3.3 Cloud operating platform with Edge computing ............................................................................ 18
2.4 Connection in the physical layer ........................................................................................................ 19
2.4.1 Physical Thing ............................................................................................................................... 20
2.4.2 Digitalization ................................................................................................................................. 21
2.4.3 Data and Communication ............................................................................................................. 22
2.5 Data aggregation ................................................................................................................................ 24
2.5.1 Closing the gap among existing architectures ................................................................................. 24
2.5.2 Going a step forward: build a governance for data usage ............................................................... 26
2.6 Knowledge representation and Ontologies ........................................................................................ 28
2.7 Machine Learning ............................................................................................................................. 29
2.7.1 State-of-the-Art in Machine State Forecasting ................................................................................ 30
2.7.2 Predictive models for zero unexpected breakdowns and increased operating life, Models for
detecting/predicting defects ....................................................................................................................... 30
2.8 Risk assessment (FMECA, KRI models) ........................................................................................... 31
2.9 DSS ................................................................................................................................................... 33
2.9.1 Multi attribute methods ................................................................................................................. 33
2.9.2 DSS Mitigation Adviser – Risk Management ................................................................................ 34
2.9.3 Multiple Criteria Decision Analysis ............................................................................................... 35
2.10 Cost Benefit Analysis ........................................................................................................................ 36
2.10.1 Cost benefit analysis .................................................................................................................. 36
2.10.2 Sensitivity analysis ...................................................................................................................... 37
2.10.3 Return on assets (ROA) ............................................................................................................ 37
2.11 CAD/CAM/CAPP extraction ............................................................................................................ 39
2.11.1 CAD – Computer Aided Design ............................................................................................... 39
2.11.2 CAE – Computer Aided Engineering ....................................................................................... 39
2.11.3 CAM – Computer Aided Manufacturing .................................................................................. 40
2.11.4 CAPP – Computer Aided Process Planning ............................................................................. 40
2.11.5 Interoperability Standards ......................................................................................................... 40
2.12 Digital Twins on the edge and cloud ................................................................................................. 43
2.12.1 Digital twin operation on the edge ............................................................................................. 48
2.12.2 Updating virtual twins ................................................................................................................ 51
2.12.3 Virtual commissioning ............................................................................................................... 60

D1.2 – LEVEL-UP SoA analysis
LEVEL-UP | GA n. 869991 Pag. 3 | 115
2.13 Repairing approaches ........................................................................................................................ 61
2.13.1 Necessity for part repair ............................................................................................................ 61
2.13.2 Remanufacturing techniques ..................................................................................................... 61
2.14 Virtual refurbishment (ESI) ............................................................................................................... 70
2.15 Recyclability ...................................................................................................................................... 71
2.15.1 Analysis of Materials and Recycling options .............................................................................. 71
2.15.2 European Approaches to Recycling .......................................................................................... 73
2.15.3 Life Cycle Assessment Methodology ......................................................................................... 73
3 New, Existing and Past Related Projects .................................................................................................... 74
3.1 BOOST4.0 ....................................................................................................................................... 74
3.2 QU4LITY ......................................................................................................................................... 75
3.3 Z-BRE4K .......................................................................................................................................... 75
3.4 iQonic ............................................................................................................................................... 75
3.5 BEinCPPS......................................................................................................................................... 76
3.6 HUMAN .......................................................................................................................................... 76
3.7 NIMBLE .......................................................................................................................................... 77
3.8 OpenHybrid ..................................................................................................................................... 77
3.9 Uptime .............................................................................................................................................. 78
3.10 FITMAN .......................................................................................................................................... 78
3.11 FALCON .......................................................................................................................................... 78
3.12 MovAiD ............................................................................................................................................ 79
3.13 iMain ................................................................................................................................................. 79
3.14 Sharework ......................................................................................................................................... 80
3.15 Precom .............................................................................................................................................. 80
3.16 Programs ........................................................................................................................................... 80
3.17 SafetyValu€ ....................................................................................................................................... 81
3.18 SERENA ........................................................................................................................................... 81
3.19 Factory of the Future ......................................................................................................................... 81
3.20 INCUBIS .......................................................................................................................................... 82
3.21 MAESTRI ........................................................................................................................................ 82
3.22 MODULASE ................................................................................................................................... 83
3.23 INTEGRADDE ............................................................................................................................... 83
3.24 MAShES ........................................................................................................................................... 84
3.25 Far-Edge ............................................................................................................................................ 84
3.26 Prophesy ........................................................................................................................................... 85
3.27 Applications - Call III ........................................................................................................................ 86
3.28 CK SVT ............................................................................................................................................ 86
4 New, Existing and Past Related Initiatives and Products ........................................................................... 88
4.1 FOCUS ............................................................................................................................................. 88

D1.2 – LEVEL-UP SoA analysis
LEVEL-UP | GA n. 869991 Pag. 4 | 115
4.2 TPSVT.............................................................................................................................................. 88
4.3 INDUSTRY CLUSTER 4.0 ............................................................................................................. 89
4.4 Early Detection and Prediction Engine ............................................................................................. 89
4.5 EIT Manufacturing ........................................................................................................................... 89
4.6 Intelligent Manufacturing Ecosystem ................................................................................................. 90
4.7 MAIN-FoF ........................................................................................................................................ 90
4.8 MindSphere ...................................................................................................................................... 91
4.9 iLIke Machines ................................................................................................................................. 91
4.10 DFX .................................................................................................................................................. 91
4.11 DDD Simulator ................................................................................................................................ 92
4.12 DANOBAT Data System ................................................................................................................. 92
4.13 Risk Management Studio .................................................................................................................. 93
4.14 SimaPro ............................................................................................................................................ 93
4.15 Semantic Mediator Front- end Backend ........................................................................................... 93
4.16 ITK product ...................................................................................................................................... 94
4.17 Virtual Manufacturing Solutions ........................................................................................................ 95
4.18 Simulation X ..................................................................................................................................... 95
4.19 Engineering Data Analytics ............................................................................................................... 95
5 Potential Opportunities and Threats ......................................................................................................... 96
6 Conclusions and Next Steps .................................................................................................................... 100
7 List of Figures .......................................................................................................................................... 101
8 List of Tables .......................................................................................................................................... 103
9 References ............................................................................................................................................... 103

D1.2 – LEVEL-UP SoA analysis
LEVEL-UP | GA n. 869991 Pag. 5 | 115
Abbreviations
Abbreviation Meaning
ABC Activity-Based Costing
ALDP Automated Laser Powder Deposition
AM Additive Manufacturing
BFO Basic Formal Ontology
BoC Bill of Characteristics
CA Criticality Analysis
CAD Computer Aided Design
CAE Computer Aided Engineering
CAI Computer Assisted Inspection
CAM Computer Aided Manufacturing
CAPP Computer Aided Process Planning
CATIA Computer Aided Three-dimensional Interactive Application
CBA Cost – Benefit Analysis
CEP Complex-event processing
CNC Computer Numerical Control
CO2 Carbon Dioxide
CoAP Constrained Application Protocol
CPPS Cyber-Physical Production System
CPSoS Cyber Physical Systems of Systems
DBN Deep Belief Network
DDS Data Distribution Services
DED Direct Energy Deposition
DIH Digital Innovation Hubs
DLF Direct Light Fabrication
DMSC Digital Metrology Standards Consortium
DOLCE Descriptive Ontology for Linguistic or Cognitive Engineering
DSS Decision Support System
DT Digital Twin
DWG Drawing (CAD programs filename extension)
EBW Electron Beam Welding
EDT Experientable Digital Twins
EPT Electropulsing treatment
EU European Union
FEA Finite Element Analysis
FEM Finite Element Method
FM Failure Mode
FMEA Failure mode and effects analysis
FMECA Failure Mode Effect and Criticality Analysis
FoF Factories of the Future
GD&T Geometric Dimensioning and Tolerancing
GOS Global Operational State
HAZ Heat-Affected Zones
HIL Hardware-in-the-loop
HTTP Hypertext Transfer Protocol
HVOF High-Velocity Oxyfuel
ICT Information and communications technology
IDS Industrial Data Space
IEC International Electrotechnical Commission
D1.2 – LEVEL-UP SoA analysis
LEVEL-UP | GA n. 869991 Pag. 6 | 115
IGES Initial Graphics Exchange Specification
IIoT Industrial Internet of Things
IIRA Industrial Internet Reference Architecture
IoS Internet of Services
IoT Internet of Things
IP Internet Protocol
ISO International Organization for Standardization
IVI (Japanese) Industrial Value chain Initiative
JSON JavaScript Object Notation
KPI Key Performance Indicator
KRI Key Risk Indicator
LAMSM Laser Additive Manufacture
LCA Life-cycle assessment
LDC Laser Direct Casting
LENS Laser Engineered Net Shaping
LMF Laser Powder Fusion
LPD Laser Powder Deposition
LRP Laser Rapid Forming
LSTM Long-Short Term Memory
LUCON Logic-based Usage Control
M2M Machine-to-Machine
MADM Multi – Attribute Decision – Making
MBD Model-Based Definition
MBS Multi Body Simulation
MCDA Multiple Criteria Decision Analysis
MES Manufacturing Execution System
MIDIH Manufacturing Industry Digital Innovation Hubs
MLP Multi-Layer Perceptron
MQTT MQ Telemetry Transport
Nd-YAG Neodymium-doped Yttrium Aluminium Garnet
OPS Object Linking and Embedding for Process Control
OSH Occupational Safety and Health
PBF Powder Bed Fusion
PC Personal Computer
PdM Predictive Maintenance
PDP Policy Decision Point
PEP Policy Enforcement Point
PLC Programmable Logic Controllers
PMI Product Manufacturing Information
PoliMi Polytechnic of Milan
PTAW Plasma-Transferred Arc Welding
QIF Quality Information Framework
QIF Quicken Interchange Format
QoS Quality of Service
R&D Research and Development
RA Reference Architecture
ROA Return on Assets
RPN Risk Priority Number
SAE Stacked Auto-Encoder
SAT Site Acceptance Test
SCADA Supervisory Control and Data Acquisition
SIL Software-in-the-loop
SLR Systematic Literature Review
SMU Smart Manufacturing Units
SoA State of the Art

D1.2 – LEVEL-UP SoA analysis
LEVEL-UP | GA n. 869991 Pag. 7 | 115
SVM Support Vector Machine
TCP/IP Transmission Control Protocol/Internet Protocol
TIG Tungsten Inert Gas
UA Unified Architecture
UDP Universal Datagram Protocol
URI Uniform Resource Identifier
UUID Universally Unique Identifier
VC Virtual Commissioning
VRML Virtual Reality Markup Language
XML Extensible Markup Language

D1.2 – LEVEL-UP SoA analysis
LEVEL-UP | GA n. 869991 Pag. 8 | 115
1 Introduction
The LEVEL-UP project is an ambitious one, with multiple technologies being put to the test in the different pilots, in the effort to extend the useful life of major capital investments and large industrial equipment. In this deliverable, a general overview of the technologies relevant to the project is presented. It contains useful references and summaries about technological topics related to the digital transformation of European industry and enterprises.
This report focuses on the State of the Art (Chapter 2), examining also how the selected technologies have been used in past projects and how they are being used in currently ongoing projects (Chapter 3). Moreover, new, existing and past related initiatives and products are being highlighted in Chapter 4.
For each project, initiative and product in Chapters 3 and 4, relevant information is provided, such as a brief summary, budget, time frame and relation to LEVEL-UP. In Chapter 5, possible opportunities and potential threats are presented in a concise manner. The deliverable outtakes are summarised in the Conclusions.
2 State Of The Art of LEVEL-UP Technologies
The State of the Art (SoA) technologies related to LEVEL-UP project are analysed in this section. For each technology, the State of the Art field may be broad, with applications in multiple disciplines and market verticals. Hence, it was important to focus on use and advancements of technologies relevant to those that will be required for the successful implementation of the project. Moreover, the SoA review is presented in a concise manner, highlighting multiple approaches that can be adopted, where possible. References to scientific publications and other means of verifications are to be provided, so that the deliverable is of more value not only to the consortium, but to the scientific and industrial community that the consortium reaches out to. It is noted that advancements in SoA will be monitored throughout the project, to take advantage of new advancements and solutions in the respective fields.
2.1 Internet of Things
The Internet of Things (IoT) represents a paradigm based on Internet that leverages many interconnected wireless technologies (sensor, actor networks, actuators, RFID, mobile devices, etc.) in order to allow information exchange between more agents such as applications, devices, etc. in which computing and communication systems are seamlessly embedded. Interconnection allows the objects to share various data, to interact, and to act autonomously on behalf of their users (machines, human, software applications, etc.). It is expected that by the year 2021, there will be more or less 28 billion connected devices [1].
The current needs for better control, monitoring and management in many industrial areas, and the ongoing research in this field, have originated the appearance and creation of multiple systems promoting the concept of the so-called Smart Factory. In this view, Industrial IoT (IIoT) is a subset of IoT and covers the domains related to the machine-to-machine (M2M) and industrial communication technologies with automation applications. IIoT provides the base for better understanding of the manufacturing process, enabling efficient, sustainable and agile production. Flexibility and scalability required by IoT communications are typically addressed using wireless links, lightweight protocols and standards purposely designed and released for the industry. IIoT applications typically require relatively small throughput per node and the capacity is not a main concern. Instead, the need for connecting a very large number of devices to the Internet at low cost, with limited hardware capabilities and energy resources (e.g., small batteries) makes latency, energy efficiency, cost, reliability, and security/privacy more desired features [2].

D1.2 – LEVEL-UP SoA analysis
LEVEL-UP | GA n. 869991 Pag. 9 | 115
In the industrial world, we are looking at the growing of the digital and smart manufacturing, which aims at integrating operational technology with information technology (IT) domains [3]. The IIoT (i.e. a pillar of digital manufacturing) is about connecting all the industrial assets, including machinery, equipment and control systems, with the information systems and the business processes. Therefore, the large amount of data collected can feed analytics solutions and lead to optimal industrial operations and management. On the other hand, smart manufacturing obviously focuses on the manufacturing stage of smart product life cycle, with the goal of rapid and dynamically responding to demand changes. Therefore, the IIoT affects all the industrial value chain and is a requirement for smart manufacturing.
Communication in IIoT is basically machine-oriented, and can range across a large variety of different industrial market sectors and activities. The IIoT scenarios include legacy monitoring applications (e.g. process monitoring in manufacturing plants and factories) and innovative approaches for self-organizing systems (e.g., autonomic industrial plant that requires possible human interventions and actions). Most general communication requirements of IoT and IIoT are similar and mainly related to the support for the Internet ecosystem using low-cost, resource-constrained devices and network scalability. Many communication requirements are specific to each domain and can be very different, e.g., quality of service (QoS), in terms of determinism, latency, throughput, etc., availability and reliability, security and privacy. IoT focuses more on the design of new communication standards which can connect novel devices into the Internet ecosystem in a flexible and user-friendly way. On the other side, the current design of IIoT emphasizes on possible integration and interconnection of once isolated plants and working islands, work cells or machines, offering more efficient production and new services [4] For this reason, IIoT can be considered more an evolution of IoT rather than a complete revolution. Regarding the connectivity and criticality, IIoT typically employs fixed and infrastructure-based network solutions that are designed and set to match communication and coexistence requirements. Communications are in the form of M2M links that have to satisfy stringent requirements in terms of timeliness and reliability. Addressing the process automation domain, while monitoring/supervision applications are less sensitive to packet loss and jitter (tolerating transmission delay of about 1 seconds), closed-loop control applications require bounded delay at millisecond level and a high reliability of transmission. Taking into account the data volume, IIoT currently targets at analytics (e.g., for predictive maintenance, machine/component refurbishing, addressed into LEVEL-UP project) implying a very large amount of data exchanged.
Many foundational aspects about IIoT are related architecture and connectivity.
A reference architecture consists of a higher level of abstraction description that is useful to identify aspects and challenges for the application scenarios. The design of an IIoT architecture requires to highlight extensibility, scalability, modularity, and interoperability among heterogeneous devices using various technologies. Several reference architecture frameworks originated in the past in different application contexts for both IoT and IIoT [5]. A typically adopted approach is represented by a multilayer description, which is organized around the services offered at each level and is function of technologies, business needs and technical requirements. Jia et al [6] suggests the identification of three major layers for IoT (perception/sensing layer, network layer, and service/application layer), instead the Reference Architectural Model Industrie (RAMI 4.0) [7] focuses on next generation industrial manufacturing systems and identifies a three-dimensional model considering product life cycle, value stream and IT component functionality hierarchy. The Industrial Internet Consortium published the “Reference Architecture” document [8] defining different viewpoints and related models, i.e. business, usage, functional, and implementation views: it provides not only the description of the IIoT system architecture (distribution of components and their relations/interconnections), but also a description of the selected protocols. Other common architectural patterns pave the way to business models and services in multiple tier arrangement, dictated by the heterogeneous devices and networks. In the widely accepted three-tier pattern [9] edge, platform, and enterprise tiers are connected by service and access networks. The edge defines the domain in which IIoT components interact with each other and consists of sensors, devices and actuators interconnected to a gateway, which in turn connects to larger networks of the platform tier.
IIoT connectivity depends on which the combination of backbone and edge architecture is useful in a given situation, and which combination of wired/wireless technologies is selected. A key goal is to avoid isolated systems based on proprietary solutions and enable data sharing and interoperability within and across
D1.2 – LEVEL-UP SoA analysis
LEVEL-UP | GA n. 869991 Pag. 10 | 115
industries (inside and outside the factory). IIoT requires communication protocols that are able to support efficient, timely, and ubiquitous information aggregation and availability. Lower levels of the stack must respond to scalability and flexibility requirements. Upper levels must allow smart devices (offering both computation and communication capabilities) to transport smart data, not limited to the information of interest but also providing awareness of the users and all the possible semantic rules to be correctly understood and interpreted. The three macro layers which can be identified are networking (dealing with frames and packets), connectivity (dealing with messages), and information (dealing with end-user data structures).
2.2 Operating Systems for digital factories
The third industrial revolution was centred on automating production by advancing on electronics and IT systems, with the introduction of programmable logic controllers (PLCs) as key for the deployment of automated production. On the other hand, Industry 4.0 links connected sensors to powerful computing capabilities, promoting transformation from machine dominant manufacturing to digital manufacturing, bringing intelligence, connectivity and much broader computerization to manufacturing.
While factories belonging to the third industrial revolution are structured in a hierarchical manner with very limited interoperability, smart factories in I4.0 aim to work with a higher level of automatization achieving a higher level of operational productivity and efficiency [10][11] , connecting the physical to the virtual world [12][13]. Hence, smart factories bring computerization and inter-connection into the traditional industry.
Since current automation concepts and architectures for production systems do not provide the required flexibility, new approaches are being developed. Architectures that use software agents to implement the interconnection of CPPS in a factor. Due to the high amount of digitalization and the integration of cooperating, self-aware subsystems (CPPS) connected units, reference architectures (RA) [14] are needed to integrate these heterogeneous subsystems from different manufacturers [15].
The general purpose of a system architecture is the connection of devices, tools and services, which together fulfil an integrated factory. In this context, the term reference architecture is defined as the connection of systems that enables sharing of data and services [16].
Since the Reference Architecture (RA) of a smart factory is understood as the connection of all systems in the factory that enables sharing of data and service, the RA requires to depict a high degree of interoperability taking into account that data is the oil for Industry 4.0. A horizontally driven RA poses data at the centre of the implementation and the “application” running around them, deriving in the need for a factory operating system that can connect the hardware and discrete software present on the different levels of a factory.
We need to bear in mind that usually there is no direct connection among the field devices. Field buses, Ethernet based protocols or application profiles use, can give an impression of a standard solution but there are numerous of such real or company standards.
Figure 1 highlights the diversity of interfaces between the different levels and tools, as well as data models and standards used, which may even be distributed across the life cycle of a production system. This heterogenicity in each of the different factories requires a flexible factory operating system that will be able to incorporate some of the key elements discussed in the context of Industry 4.0:
• Ensuring interoperability among vendors, factories and countries
• Decentralization. This goal implies emphasizing greater autonomy and putting intelligence at the lowest practical level. Coordination must be ensured, but a rigid, top-down organization is seen as undesirable.
• Do it in Real Time. The latest technology should allow for massive data collection and analysis on the fly. The focus on real time is a natural corollary of decentralization.
• Virtualization. A virtual copy of the Smart Factory which is created by linking sensor data (from monitoring physical processes) with virtual plant models and simulation models is envisaged.

D1.2 – LEVEL-UP SoA analysis
LEVEL-UP | GA n. 869991 Pag. 11 | 115
• Modularity and Flexibility. To this self-explanatory goal should be added a desire for access to flexible services (such as software applications), all of which should enhance agility.
Figure 1: Connectivity breaks through production hierarchies.
All in all, an open factory operating system is required in order to reflect all key elements. Implementation of such a complex operating system demands a RA in line with those requirements that will help provide a common vocabulary with which to discuss developments and implementations, often with the aim to stress commonality that could be reused in different scenarios. A RA allows for a reduction of the development costs of the factory operating system through the reuse of common assets; improvement of the communication inside the organization because stakeholders share the same architectural mindset; and, influencing the learning curve of developers due to the need of learning its features.
2.2.1 Reference Architectures
Reference architectures can be defined at different levels of abstraction. A highly abstract one might show different pieces of equipment on a communications network, each providing different functions. A lower level one might demonstrate the interactions of procedures (or methods) within a computer program defined to perform a very specific task.
Adopting a reference architecture for the implementation of Industry 4.0 accelerates delivery through the re-use of an effective solution and provides a basis for governance to ensure the consistency and applicability of technology use within the digitalisation transformation.
A factory operating system reference architecture describes an operating system´s fundamental organization, embodied in its modules and their interrelationships. It helps achieve understanding of specific domains and provides consistency of technology implementation for solving domain- specific applications.
Reference architectures for factory operating systems are built on technology and manufacturing standards. Ras describe the engineering and operations functions involved in producing discrete products, and the general nature of information flows among them. The function elements provide a frame of reference for product-and facility-specific functions in a production system, and thus for specifications for manufacturing software/hardware systems components (i.e. factory operating system). The information flow elements also provide a frame of reference for specifying the information involved in those interactions and in the corresponding component interfaces. In short, these models are part of a framework for specifying

D1.2 – LEVEL-UP SoA analysis
LEVEL-UP | GA n. 869991 Pag. 12 | 115
production systems architectures, and the related architectures for the operating systems that support production systems engineering.
The development of the Reference Architectural Model for Industrie 4.0 (RAMI 4.0) [17] was focused on industrial production as the primary area of application, including discrete manufacturing to process industries. Industry 4.0 concepts are being applied to process industries to achieve a holistic integration of automation, business information, and manufacturing execution function to improve all aspects of production and commerce across process industry value chains for greater efficiency.
The RAMI 4.0 Reference Architectural Model and the Industry 4.0 components give companies a framework for developing future products and business models. RAMI 4.0 is a three-dimensional map showing how to approach the deployment of Industry 4.0 in a structured manner. A major goal of RAMI 4.0 is to make sure that all participants involved in Industry 4.0 discussions and activities have a common framework to understand each other. The RAMI 4.0 framework is intended to enable standards to be identified to determine whether there is any need for additions and amendments.
Figure 2: RAMI 4.0 Reference Architecture.
RAMI 4.0 consists of a three-dimensional coordinate system that describes all crucial aspects of Industry 4.0. In this way, complex interrelations are broken down into smaller and simpler clusters, ensuring that all participants involved in Industry 4.0 discussions understand each other based on a common language and interpretation of concepts. Figure 2 shows the 3D schematic viw of RAMI 4.0 Therefore, the RAMI 4.0 framework goal is to define how I4.0 com-ponents communicate and interact with each other and how they can becoordinated to achieve the objectives set by the manufacturing companies.
Moreover, The ICT reference architecture underlying the platform is a data-oriented interpretation of the Industrial Internet Consortium Reference Architecture [18], which is now perfectly aligned with the RAMI 4.0 of Platform Industrie 4.0 through the recent Architecture Alignment and Interoperability white paper [19].
2.2.2 Factory Operating systems
During the last 20 years, the standardization and research efforts related to control software for industrial automation was focused on improving quality and reliability while reducing development time. Furthermore, much work has been done since as early as 2006 in relation to defining a holistic RA for the implementation of Industry 4.0 concepts in real factories including the concept of distributed automation. For example, cutting edge research projects such as SOCRADES [20] (2006) and IMC-AESOP [21] (2010) can be seen as very early attempts to defining reference architectures to be used manufacturing applications and a new information-driven interaction among the different layers and systems respectively.

D1.2 – LEVEL-UP SoA analysis
LEVEL-UP | GA n. 869991 Pag. 13 | 115
Beyond research approaches, when dealing with the factory realities, it becomes obvious that existing machinery and systems cannot be disregarded when transitioning to a smart factory. Hence, the need to enable existing plants to be part of the smart factory operating system, as it is proposed by LEVEL-UP with the CPSization of the closed legacy systems. The integration of the existing plants becomes the current automation paradigm, whereby current PLCs, following IEC 61131-3 standard, are not suitable for distributed systems.
This device-centric and monolithic engineering approach resulted from the third industrial revolution, is not designed for regular changes of the executed control applications. According to the requirements, each of the production components as well as the IT systems involved must be equipped with an interface for communicating the contents. This includes the ability to initiate communication as well as data and communication management. This adaptation needs to be standardised even when the majority of vendors implements specific extensions or only partial support of IEC 61131-3 [22].
Some attempts have been carried out in standardising the retrofitting of brownfield assets, to help installing a plug-and-produce (PnP) type of approach [23], whereby a middleware layer consisting of different software modules with PnP interfaces for common devices types is proposed to be developed beforehand in order to enable automated interchanging of devices in a production line. Technologies such as OPC-UA or MTConnect are suggested to be used to connect the devices to the middleware.
Virtual models or virtual representations have also been used to migrate existing facilities to Industry 4.0 [24], encapsulating the relevant information at the resources, acting as elements of a distributed system using internet-based communication.
A further existing approach has been presented by AUTOWARE [25] project, a recently finished H2020 reference research project. AUTOWARE objective was to set the path for fast product-process planning or proactive production control. AUTOWARE vision towards this objective was:
• Modular automation and control software services that can be trusty deployed, reliably run and flexibly orchestrated at will anywhere, anytime and on any platform.
• Data shared across digital manufacturing platforms and factories with full usage control meeting production demands and
• Factory reconfiguration, flexible human-robot collaboration and easy task programming.
Figure 3 shows the RA defined within the AUTOWARE project. As can be seen this RA allows to move from the old-fashioned automation pyramid where communication was only possible within each of the factory´s levels, to the required horizontal communication among all levels. The AUTOWARE RA also represents the two data domains that the architecture anticipates, namely the data in motion and data and rest domains. The model also represents the layers of the RA where such services could be executed with the support of the fog/cloud computing and persistence services.

D1.2 – LEVEL-UP SoA analysis
LEVEL-UP | GA n. 869991 Pag. 14 | 115
Figure 3: AUTOWARE´s Reference Architecture.
Smart factories require integration across multiple disciplines. In fact, openness and interoperability need to be facilitated across in a harmonized manner to ensure smart factory extendibility. For this purpose, AUTOWARE provides three main components. These AUTOWARE components (technologies, usability services and V&V services) provide a collection of enablers that facilitates the interaction with the system on different levels.
There have been several international projects to promote the creation of new open source enablers with the same objective as AUTOWARE and compliant with the RA that have been integrated as part of the operating system. The most interesting enablers have come from FIWARE Smart Industry [26], I4MS [27] and IDS communities [28].
Specifically, the following elements developed at FIWARE and IDSA communities have been adopted by AUTOWARE operating system with the aim to achieving an open source factory operating system:
• Backend Device Management – IDSA: For the translation from IoT-specific protocols to the NGSI context information protocol considered by FIWARE enablers.
• Orion Context Broker: It produces, gathers, publishes and consumes context information. This is the main context information communication system throughout the AUTOWARE architecture. It facilitates the exchange of context information between Context Information Producers and Consumers through a Publish/Subscribe methodology. This permits a high decentralized and large-scale context information management and high interoperability between the different components due to the use of a common NGSI protocol. The IDSA architecture and connectors permit the use of such a powerful communication tool, making the use of IDSA an extension of the AUTOWARE RA through FIWARE support to IDSA reference architecture.
• Backend Device Management – IDSA: For the translation from IoT-specific protocols to the NGSI context information protocol considered by FIWARE enablers.
• Cosmos: For an easier Big Data analysis over context integrated information with most popular Big Data platforms and cloud storage.
Furthermore, initiatives such as MIDIH [29] or Boost 4.0 [30] are working to pave the way for the implementation of data-driven smart-connected factories. On the other hand, more cross-domain initiatives for smart Internet services (FIWARE), data-sharing sovereignty (IDSA) or Industrial IoT (IIC) are both providing

D1.2 – LEVEL-UP SoA analysis
LEVEL-UP | GA n. 869991 Pag. 15 | 115
critical general software foundations for the development of vertical solutions (FIWARE Smart Industry, Boost 4.0 or MIDIH) and ensuring that interoperability across domains is properly developed as part of the digital transformation supporting the breakup of inter-domain information silos. Along this line is also worth noting the recent efforts from large industrial software companies to provide commercial solutions with open APIs to respond to the challenge of leveraging digital infrastructures and smart dataplatforms to support the next generation of digital services. In this area are very relevant initiatives such as Mindsphere by SIEMENS [31], Leonardoby SAP [32], Bosch IoT suite [33] or 3DExperience by DassaultSystems [34].
2.3 Operating Platforms
Digitalization and Industry 4.0 cover many different use cases and methods to make machines smarter and increase their efficiency. Every use case has its own characteristics and we need different Layers to get the best results out of every idea with as little investment of effort, space and money as possible. Digitalization is not a new thing, for example there are MES and ERP systems existing for a long time and already delivering data between machines and having control over production processes. Using these systems, we are mostly talking about local on-premises solutions, specifically configured for the customer with high efforts and a low flexibility in comparison.
Using modern technologies, the whole thing can be lifted to the next level of flexibility and connectivity in context of Industry 4.0.
To achieve this, it´s necessary to have an idea of the structure of typical on-site networks and which layers and connectivity options between every operating platform we can use.
2.3.1 Operating Platforms on-site
Looking at the hardware environments on site, one can see highly heterogeneous infrastructures. This is one of the key-challenges of Industry 4.0. It is necessary to make sure to have the opportunity to connect every single device out there in some way and pull the same relevant data to analyse it with standardized tools expecting standardized inputs. In most cases separated networks for field-IT and for corporate IT are seen.
Looking at machining tools, a structure like this (simplified example) can be usually found:
Figure 4: Operating Platforms on-site machine tools

D1.2 – LEVEL-UP SoA analysis
LEVEL-UP | GA n. 869991 Pag. 16 | 115
Looking at production machines a structure like this (simplified example) can be usually found:
Figure 5: Operating Platforms on-site production systems
As seen in the figures, there is mostly a server between the users from the management layer (corporate network) and the field layer. Because of standardized communication protocols a lot of different machines can be connected, also from different brands supporting these standard protocols. The local approach already gives the opportunity to work with and analyse data from the machines, but there is always a struggle with low flexibility. If it is needed to change or add data displayed and analysed in the corporate layer, care must be taken of the process control system or it is necessary to insert separate gateways to get the interesting data out of the field IT. If there is a need to access and compare data from other production locations, it is required to develop custom solutions, which is again not easy to manage.
The solution for the downsides of the local solution is the cloud-based approach.
2.3.2 Cloud operating platform
These days there are a lot of cloud-providers and cloud-service-providers where everybody can host applications and services. Most of these providers also offer lots of already included functions, so that developers can easily integrate other services in their applications. Using one of these providers may give the highest flexibility in development and everything will be possible, but it won´t be standardized and everybody would have to struggle updating their applications over their whole lifecycle. Securely connecting machines to these cloud applications requires development and maintenance of hard- and software for connectivity-agents.
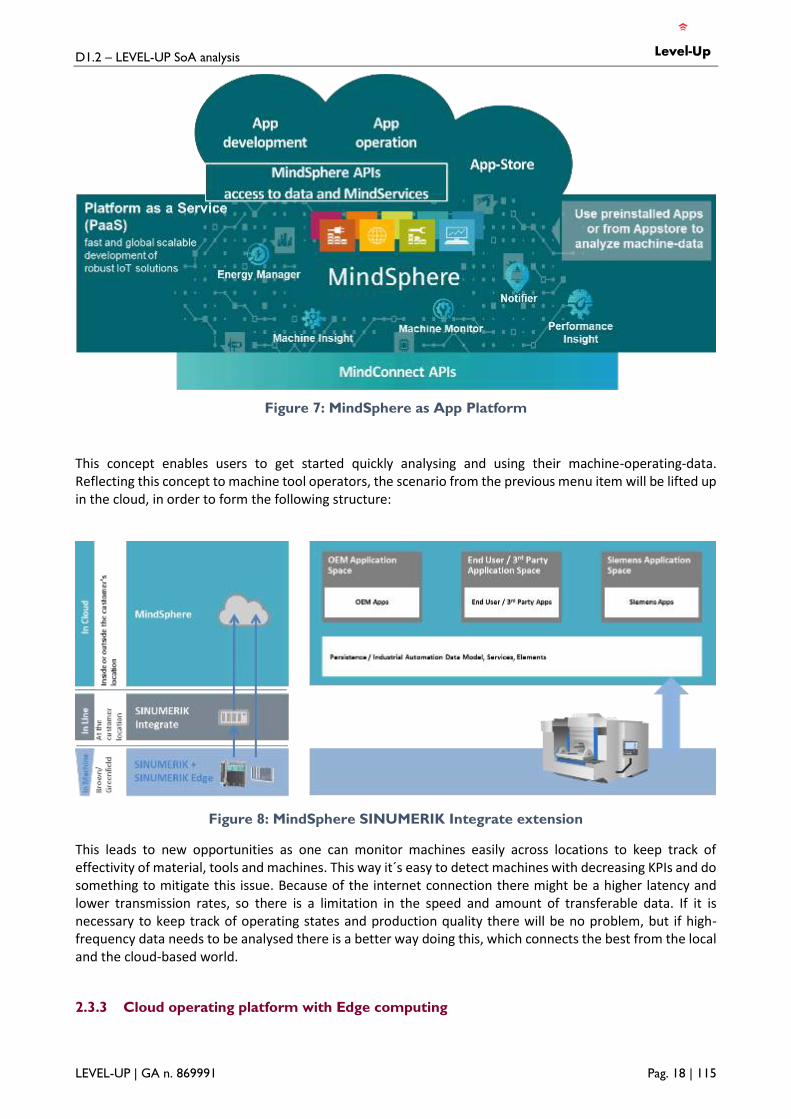
Siemens, who is also a member of the LEVEL-UP consortium, already offers the solution for these downsides as platform as a service (PaaS), together with well-maintained connectivity elements and a lot of ready-usable cloud-services (software as a service – SaaS). MindSphere is a cloud-based ecosystem for connecting a large variety of different machines with a lot of connectivity options, so nearly every data-source out in the fields can be connected.

D1.2 – LEVEL-UP SoA analysis
LEVEL-UP | GA n. 869991 Pag. 17 | 115
Figure 6: MindSphere connectivity
The Edge platform will be described in detail under the next menu item. The Edge-API offers endpoints for Data-Exchange between the Edge-Boxes and also Edge-Management, which contains Edge-Boxmanagement, Edge-Appmanagement, Updatemanagement and Diagnostic features.
Mindconnect API offers various connectivity options for standard clients maintained by Siemens, including combined Hard- and Software (Mindconnect Nano/IoT2040) and custom agents based on the supplied library for self-developed applications or on the Open Edge Device Kit for easy implementation of agent-functionality to custom devices.
IoT extension supports connecting devices via open IoT connection standards like MQTT and Rest API via Cumulocity, which is supported by many IoT devices and gateways on the market.
Using the APIs for cloud Integration it`s possible to connect already existing cloud-based and on-premises solutions to MindSphere (e.g. from Amazon AWS, SAP, SAP HANA, Microsoft Azure, etc.)
For the data from the machines to be analysed, it needs to be processed by an application. MindSphere already offers some basic apps to do some analysis of operating-data. If not, there is an app-store, or there is the opportunity to develop own apps. MindSphere acts as a platform here. Everyone can develop apps, supply them by an operator and offer them in the App-Store.
D1.2 – LEVEL-UP SoA analysis
LEVEL-UP | GA n. 869991 Pag. 18 | 115
Figure 7: MindSphere as App Platform
This concept enables users to get started quickly analysing and using their machine-operating-data. Reflecting this concept to machine tool operators, the scenario from the previous menu item will be lifted up in the cloud, in order to form the following structure:
Figure 8: MindSphere SINUMERIK Integrate extension
This leads to new opportunities as one can monitor machines easily across locations to keep track of effectivity of material, tools and machines. This way it´s easy to detect machines with decreasing KPIs and do something to mitigate this issue. Because of the internet connection there might be a higher latency and lower transmission rates, so there is a limitation in the speed and amount of transferable data. If it is necessary to keep track of operating states and production quality there will be no problem, but if high-frequency data needs to be analysed there is a better way doing this, which connects the best from the local and the cloud-based world.
2.3.3 Cloud operating platform with Edge computing

D1.2 – LEVEL-UP SoA analysis
LEVEL-UP | GA n. 869991 Pag. 19 | 115
Edge computing puts a part of intelligence back from the cloud to the field, mainly because of advantages regarding data capturing speed. The Edge computing device will still be connected to the cloud, so the benefits of the cloud infrastructure can still be used.
Figure 9: MindSphere Edge overview
The figure shows the connectivity-structure of an edge scenario.
In 1 – Edge Management: The Edge Boxes can be registered and managed. This mainly means, Firmware Updates can be deployed, Edge Applications as well as Application-updates can be registered and deployed to the Edge boxes and users can look at diagnostic information of the boxes.
In 2 – Edge Device: The direct connection between Edge-device and machines can be seen. This allows high-frequency data-capturing from devices up into the kHz-section. With this data it´s possible to do predictive maintenance, anomaly detection, frequency response analytics and many other use cases requiring fast time-series data.
In 3 – Edge App to Device: The usage of edge-applications is shown schematically. These Apps are managed from the Edge Management and can access the high-frequency data from the connections to the machines. Edge Apps are running inside Containers on top of the operating system of the edge device, so there are less compatibility issues between different hardware-platforms and developers can focus on their application. Depending on what´s needed, it´s also possible to use results of app-calculations on the field- or factory level to visualize them, but it´s also possible to upload them up to the cloud to manage the results for all machines and locations in one interface with access to everything.
2.4 Connection in the physical layer
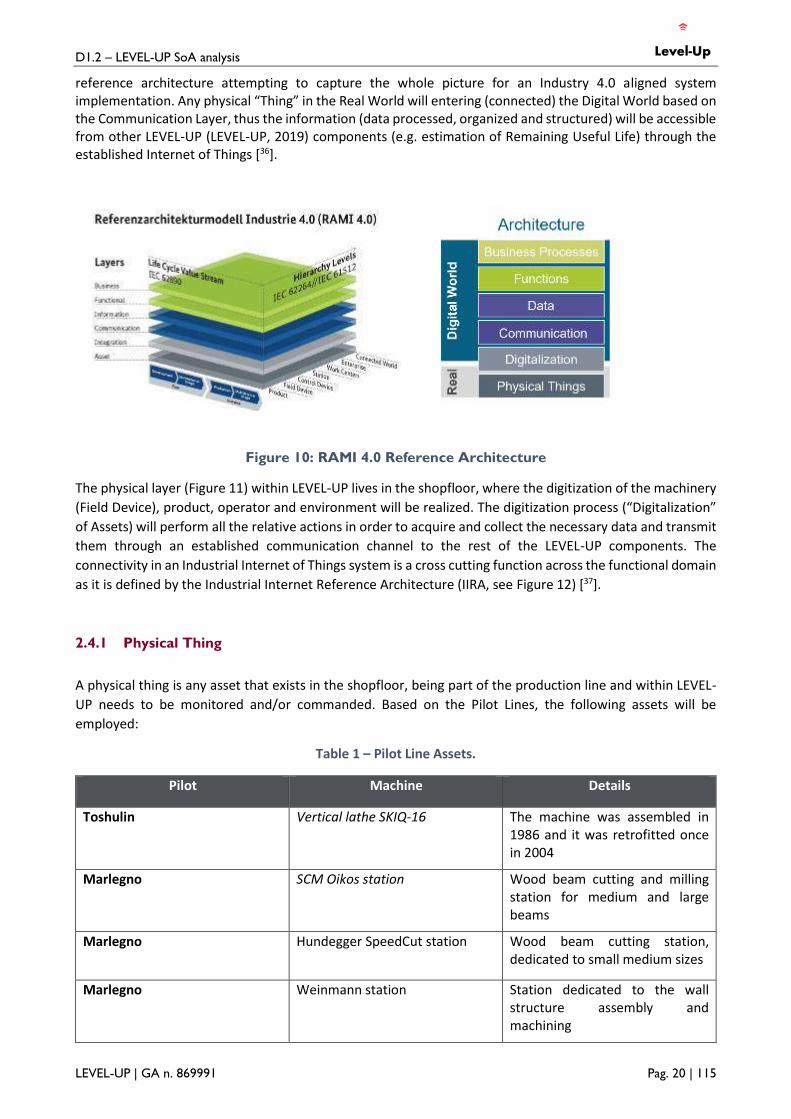
In Industry 4.0 epoch technologies and sciences as Artificial Intelligence, Big Data, Analytics, Machine Learning algorithms, Digital Twins etc., are gaining attention and space within industry. The advance of the computing power (higher process power-Lower cost), the communication and infrastructure technologies (OPC-UA, MQTT, LoRA, Cloud/Fog/Edge, etc) are establishing the prerequisite field for these technologies to be applied and developed further. In this context, the connection in the physical layer (Asset Layer according RAMI 4.0 reference Architecture [35], (Figure 10) is the first layer of any suggested or already defined
D1.2 – LEVEL-UP SoA analysis
LEVEL-UP | GA n. 869991 Pag. 20 | 115
reference architecture attempting to capture the whole picture for an Industry 4.0 aligned system implementation. Any physical “Thing” in the Real World will entering (connected) the Digital World based on the Communication Layer, thus the information (data processed, organized and structured) will be accessible from other LEVEL-UP (LEVEL-UP, 2019) components (e.g. estimation of Remaining Useful Life) through the established Internet of Things [36].
Figure 10: RAMI 4.0 Reference Architecture
The physical layer (Figure 11) within LEVEL-UP lives in the shopfloor, where the digitization of the machinery
(Field Device), product, operator and environment will be realized. The digitization process (“Digitalization”
of Assets) will perform all the relative actions in order to acquire and collect the necessary data and transmit
them through an established communication channel to the rest of the LEVEL-UP components. The
connectivity in an Industrial Internet of Things system is a cross cutting function across the functional domain
as it is defined by the Industrial Internet Reference Architecture (IIRA, see Figure 12) [37].
2.4.1 Physical Thing
A physical thing is any asset that exists in the shopfloor, being part of the production line and within LEVEL-
UP needs to be monitored and/or commanded. Based on the Pilot Lines, the following assets will be
employed:
Table 1 – Pilot Line Assets.
Pilot Machine Details
Toshulin Vertical lathe SKIQ-16 The machine was assembled in 1986 and it was retrofitted once in 2004
Marlegno SCM Oikos station Wood beam cutting and milling station for medium and large beams
Marlegno Hundegger SpeedCut station
Wood beam cutting station, dedicated to small medium sizes
Marlegno Weinmann station Station dedicated to the wall structure assembly and machining

D1.2 – LEVEL-UP SoA analysis
LEVEL-UP | GA n. 869991 Pag. 21 | 115
Koplast Extrusion machine 25 years old, working 24 hours/day and 5 days/week
Estampaciones Mayo Transfer press machines Manufactured by Fagor Arrasate
Lucchini Grinding machine DANOBAT HG-72-3000
Trimek CNC machining centre Ibarmia THR16
CRF IPC Pultrusion Machinery Rear crash beam for Jeep Renegade
Figure 11: Physical Layer Conceptual Diagram.
Figure 12: Connectivity is a crosscutting function in the Industrial Internet Reference
Architecture.
2.4.2 Digitalization
As one could define it, as the transformation of anything that can be digitized, into a digital representation.
In industry and in socioeconomics it would be the creation of value out of the production and business
processes through their transformation with the aid of digital technology. In LEVEL-UP, large machinery will

D1.2 – LEVEL-UP SoA analysis
LEVEL-UP | GA n. 869991 Pag. 22 | 115
be digitized by installing sensors for sensing and acquire measurements relative to each use case targets. In
addition, gateways and edge infrastructure will be deployed close to the machinery acquiring existent and
new data, connecting the machinery, operators and products will establish a digital network. This
transformation will allow the machine and environment monitoring, will relate the product quality to the
machine performance and several other KPI’s and it will be the foundation for the eight LEVEL-UP strategies
execution.
In the following sections, the most relative technologies within LEVEL-UP that are enabling the connection
on the physical layer will be described.
2.4.3 Data and Communication
As we proceed higher (vertically, see in Figure 12), in the digital world the connectivity will allow data exchange among partners within a functional domain, across domains within a system and across systems. These data include sensors updates, alarms, events, commands, status and configuration updates. The role of the connectivity layers is summarized in ¡Error! No se encuentra el origen de la referencia. [38]. This connectivity should support several architectural qualities, namely:
• Performance, which its spectrum spans over sub-millisecond control loop to low frequencies such as days, weeks or even monthly analysis rate. The main characteristics of the performance in metrology are latency, jitter and throughput.
• Scalability, meaning the ability for horizontal scaling to accommodate an increasing number of connected devices (end-points).
• Reliability, strict order of data delivery and data loss rates
• Resilience, the connectivity should be available even in a temporarily physical failure. The data exchange should be automatically restored and update the consumer with the latest data and the relevant missed ones.
• Security, using standards for securing the data access and transmission.
Table 2 – Role and scope of the Connectivity function layers.
IIoT Connectivity Stack Model
Correspondence to OSI Model (ISO/IEC 7498)
Correspondence to Internet Model (RFC
1122)
Correspondence to Levels of Conceptual Interoperability
Framework Layer 7. Application 6. Presentation 5. Session
Application Layer Syntactic Interoperability: Structured data types shared between endpoints. Introduces a common structure to share data; i.e., a common data structure is shared. On this level, a common protocol is used to exchange data; the structure of the data exchanged is unambiguously defined.
Transport Layer 4. Transport Transport Layer Technical Interoperability: Bits and Bytes shared between endpoints, using an unambiguously defined communication protocol.
Network 3. Network Internet Layer Packets shared between endpoints that may not be on the same physical link. Packets are routed between physical links by a “network router”.
Link 2. Data Link Link Layer
Digital Frames shared between endpoints on a shared substratum (link).

D1.2 – LEVEL-UP SoA analysis
LEVEL-UP | GA n. 869991 Pag. 23 | 115
Physical 1. Physical Analog signal modulation between endpoints on a shared substratum
A brief description of connectivity frameworks:
• Data Distribution Services (DDS) [39]
It enables network interoperability for connected machines, enterprise systems and mobile devices. It provides scalability, performance, and Quality of Service required to support IoT applications. DDS can be deployed in platforms ranging from low-footprint devices to the Cloud and supports efficient bandwidth usage as well as agile orchestration of system components. It provides a global data space for analytics and enables flexible real-time system integration. It is suitable for both the Industrial Internet of Things (IIoT) and large-scale Consumer IoT applications. DDS specifically targets the IIoT application domains, including transportation, energy, healthcare, industrial automation, simulation & test, smart cities, military and aerospace.
• Web Services over HTTP
are generally used in the application domain. Data is represented in textual form (either as JSON or XML), and embedded in a hypermedia (HTML) context. A Uniform Resource Identifier (URI) represents a data object on a server. A client (app) sends a request to a web server, specifying a data object URI, an operation and a payload. The server replies with failure or success and a response payload. The communication is text-based and designed for human speeds. It is not efficient for device-to-device communications and not suitable for real-time communications.
• OPC-UA [40]
OPC-UA is an industrial communication architecture for platform independent, high performance, secure, reliable, and semantic interoperability between sensors, field devices, controllers, and applications at the shop-floor level in real-time as well as between the shop-floor and the enterprise IT cloud. It is suitable for Automation for manufacturing, buildings, process control, energy.
• oneM2M [41]
permit applications that are hosted on connected machines and devices, enterprise systems and mobile devices to communicate with each other in an efficient, secure manner. The oneM2M horizontal platform is scalable as the Common Service Elements are able to be deployed on hosts, at the proximal network edge or within the enterprise cloud. It is suitable for both the Industrial Internet of Things (IIoT) and large-scale Consumer IoT applications. oneM2M specifically targets the IIoT application domains, including telematics and intelligent transportation, home automation, utilities, healthcare, smart cities, industrial automation.
and transport standards
• TCP and UDP over IP o UDP, Universal Datagram Protocol is a connectionless transport that provides best-effort
delivery quality of service. A message is not resent if it is lost in the transmission. Messages may be received out-of-order. Messages are sent as quickly as possible, and so it is suitable for low latency real-time communications. A message shall be less than 64KB long.
o TCP, Transmission Control Protocol is a connection-oriented transport that provides reliable and ordered delivery quality of service. A message is resent if it is lost in transmission. Messages are delivered in order. This can lead to head-of-line blocking—high priority, time-critical messages may be blocked behind low priority, non-critical messages. Retries hold up all messages in the channel. Thus, message latencies can vary greatly, leading to large jitter, especially when messages are lost in transmission. The connection sequence can be expensive in time and resources. There is no inherent limit on the message size.
• Constrained Application Protocol (CoAP)42
D1.2 – LEVEL-UP SoA analysis
LEVEL-UP | GA n. 869991 Pag. 24 | 115
The Constrained Application Protocol (CoAP) is a specialized web transfer protocol for use with constrained nodes and constrained networks in IoT. The protocol is designed for machine-to-machine (M2M) applications such as smart energy and building automation. IoT scenarios where devices are very constrained (in memory or CPU or both). Scenarios that require interoperability between web technologies and the general Internet with the IoT device domain.
• MQ Telemetry Transport (MQTT)43
MQTT is a connectivity transport for lightweight machine-to-machine (M2M) messaging. MQTT uses a centralized broker and supports publish-subscribe communications pattern running on top of TCP/IP. Telemetry. Connecting remote sensors to the cloud. IoT scenarios where small code footprint is required and/or network bandwidth is at a premium.
• Fieldbus Technologies44
Fieldbus ecosystems are well developed and extensively deployed in many industries. Most originated with special-purpose hardware and protocols. Well-known fieldbuses include Profibus (Profinet), EtherNet/IP, Modbus & Modbus/TCP, HART & HART wireless, and the Foundation Fieldbus family. Each has developed extensive ecosystems of vendors and customers.
Interoperability between fieldbus variants is, in general, poor. Many of these have been adopting IP-based networking models and Ethernet transports. This is improving technical interoperability. Syntactic or higher levels of interoperability are only available with special point solutions.
Based on the diversity of the pilot lines employed in LEVEL-UP, in terms of technology, an analysis on each use case requirements along with the overall LEVEL-UP system architecture and the components (software and Hardware) of the technology providers will lead to the blend of the technologies that will implement the connection among “Things” in the physical layer.
2.5 Data aggregation
Digital industrial platforms integrate different digital technologies and real-world applications, processes, products, and services. European industry needs to come to agreements on functions and interfaces for those platforms, reference architectures and interaction protocols that have the potential to create markets and market opportunities leading to ecosystems and standards.
IDS defines a reference architecture, which supports sovereign exchange and sharing of data between partner independent from their size and financial power. Based on strong data ethics principles the IDS Reference Architecture Model puts the user in its centre to ensure trustworthiness in ecosystems and sovereignty over data in the digital age as its key value proposition. Thus, it can meet the needs of both large and small and medium enterprises (SMEs) and give them enough leverage (sovereignty) to talk with large(er) companies. Digital responsibility is evolving from a hygiene factor to key differentiator and source of competitive advantage. For these reasons IDSA is putting all its efforts to i) close the gap between existing architectures, platforms and solutions but also to ii) build a governance for data usage.
2.5.1 Closing the gap among existing architectures
The importance of mapping and solving gaps between existing frameworks is especially true for the manufacturing industry. At European level, the Digitising European Industry Initiative of the European Commission is a key element of the Digital Single Market strategy. The interim report of this program published in March 2018 underlines three “Promising digital industrial platforms building on European strengths”:
• RAMI 4.0 (Reference Architecture Model Industrie 4.0)
• Industrial Data Space (now named International Data Spaces)
D1.2 – LEVEL-UP SoA analysis
LEVEL-UP | GA n. 869991 Pag. 25 | 115
• FIWARE
IDS has conducted important efforts to stay aligned with these 2 other essentials industrial platforms in the European landscape. The Platform Industrie 4.0 is focussing on the digital vertical integration of the manufacturing industry whereas the International Data Spaces Association is focussing on the management of data across different verticals. As the FIWARE Foundation is focussing on Context Information also across different verticals both are sharing the same vision although there are different focus areas which are enhancing each other.
Alignment with FIWARE
The adoption of NGSI-LD as a common standard for European data marketplaces based on various technologies and platforms in combination with Usage Policies and trust-enabling mechanism like the IDS Dynamic Trust Management build a strong foundation for the industrial data exchange with the perspective for the consumer market as well. A current aligned development of IDSA and FIWARE is strengthening this approach45. First examples are to be found as results of the BOOST project and first aligned FIWARE IDSA connector will be released in 2020.
Alignment with RAMI
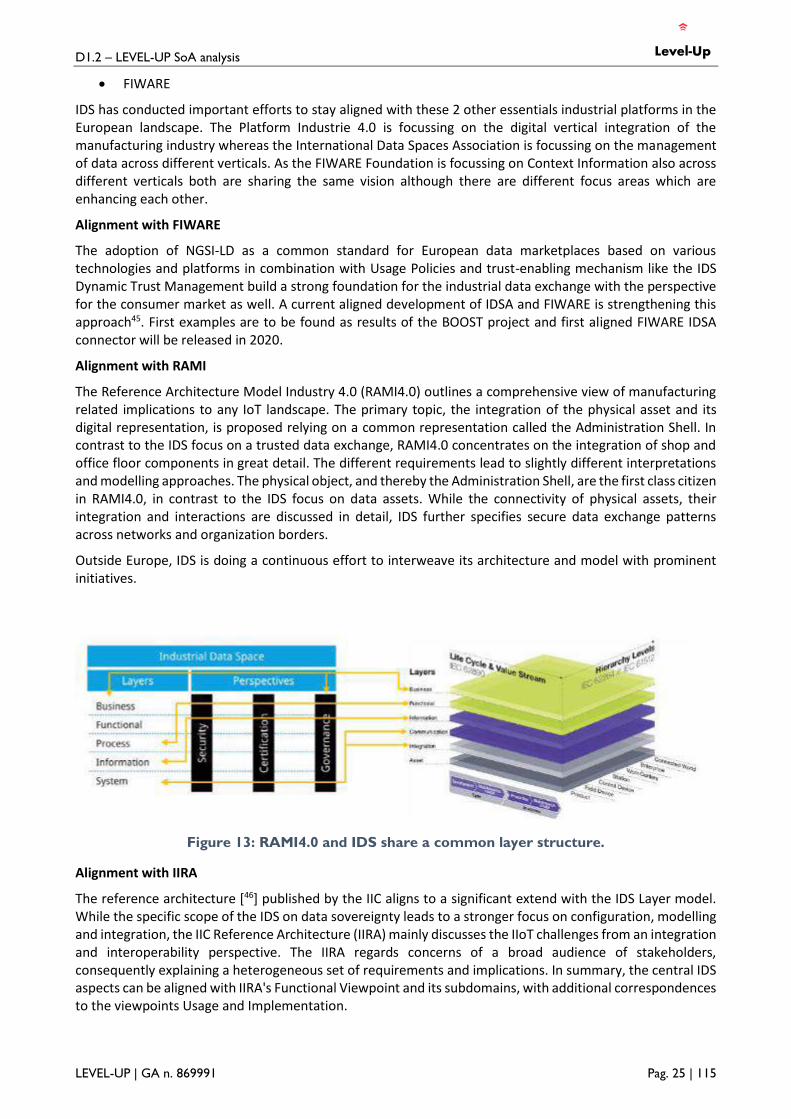
The Reference Architecture Model Industry 4.0 (RAMI4.0) outlines a comprehensive view of manufacturing related implications to any IoT landscape. The primary topic, the integration of the physical asset and its digital representation, is proposed relying on a common representation called the Administration Shell. In contrast to the IDS focus on a trusted data exchange, RAMI4.0 concentrates on the integration of shop and office floor components in great detail. The different requirements lead to slightly different interpretations and modelling approaches. The physical object, and thereby the Administration Shell, are the first class citizen in RAMI4.0, in contrast to the IDS focus on data assets. While the connectivity of physical assets, their integration and interactions are discussed in detail, IDS further specifies secure data exchange patterns across networks and organization borders.
Outside Europe, IDS is doing a continuous effort to interweave its architecture and model with prominent initiatives.
Figure 13: RAMI4.0 and IDS share a common layer structure.
Alignment with IIRA
The reference architecture [46] published by the IIC aligns to a significant extend with the IDS Layer model. While the specific scope of the IDS on data sovereignty leads to a stronger focus on configuration, modelling and integration, the IIC Reference Architecture (IIRA) mainly discusses the IIoT challenges from an integration and interoperability perspective. The IIRA regards concerns of a broad audience of stakeholders, consequently explaining a heterogeneous set of requirements and implications. In summary, the central IDS aspects can be aligned with IIRA's Functional Viewpoint and its subdomains, with additional correspondences to the viewpoints Usage and Implementation.

D1.2 – LEVEL-UP SoA analysis
LEVEL-UP | GA n. 869991 Pag. 26 | 115
Figure 14: Correspondent categorizations of IDS and IIRA.
Alignment with IVI
The Japanese Industrial Value Chain Initiative (IVI) proposes an additional architecture [47] outlining industrial data sharing between Smart Manufacturing Units (SMU). Each SMU acts as an independent organizational entity, capable to connect and exchange data with other SMUs. While the definition of an SMU matches the IDS definition of an organization hosting an IDS connector, the regarded attributes are less technical specifications but rather generalized organizational considerations. The respective IVI guidelines are less detailed than the ones provided by IDS, resulting in descriptions of business processes between SMUs rather than defining technical handshakes and interaction patterns as targeted by the IDS Reference Architecture Model. Nevertheless, the strong focus of IVI on the manufacturing organization as its first class citizen complements the IDS views especially regarding the different business roles and commercial interactions. At the same time, the in-depth analysis of data privacy and security elements by the IDS enables the business-related considerations proposed by IVI.
2.5.2 Going a step forward: build a governance for data usage
Beyond data interoperability, IDSA is developing a model for data usage enabling any data endpoint willing to share data to strengthen its control over its data, respecting its sovereignty. While other initiatives are focusing on interoperability and integration between various systems, IDS model adds a new layer enhancing interoperability capability of an ecosystem with a more refined (hence sovereign) dimension using usage policy constraints. In the age of Industry 4.0, data exchange between different organizations is an essential prerequisite to add more value to data and to develop modern business models. However, several challenges have to be solved to facilitate a secure and trustworthy data exchange between different organizations. Data sovereignty is a key success factor for data-driven business models. Industrial Data Space model provide solutions to realize a secure and trustworthy data exchange as well as data sovereignty.
D1.2 – LEVEL-UP SoA analysis
LEVEL-UP | GA n. 869991 Pag. 27 | 115
Figure 15: From data provisioning to data usage.
Definition of Usage control
Usage control is an extension to traditional access control. It is about the specification and enforcement of restrictions regulating what must (not) happen to data. Thus, usage control is concerned with requirements that pertain to data processing (obligations), rather than data access (provisions). Usage control is relevant in the context of intellectual property protection, compliance with regulations, and digital rights management.
Figure 16: Usage Control consists of provisions and obligations.
In contrast to access control, where access to specific resources (e.g., a service or a file) is restricted, the IDS architecture additionally supports data-centric usage control. In general, the overall goal is to enforce usage restrictions for data after access has been granted. Therefore, the purpose of usage control is to bind policies to data being exchanged and to continuously control the way how messages may be processed, aggregated, or forwarded to other endpoints. This data-centric perspective allows the user to continuously control data flows, rather than accesses to services. At configuration time, these policies support developers and administrators in setting up correct data flows.
At runtime, the usage control enforcement prevents IDS connectors from treating data in an undesired way, for example by forwarding personal data to public endpoints. Thus, usage control is both a tool for system integrators to ensure they are not building an architecture that violates security requirements, and an audit mechanism, which creates evidence of a compliant data usage.

D1.2 – LEVEL-UP SoA analysis
LEVEL-UP | GA n. 869991 Pag. 28 | 115
Specific security requirements cannot be achieved using traditional access control, but rather require data-centric usage control:
• Secrecy: classified data must not be forwarded to certain nodes
• Integrity: critical data must not be modified by untrusted nodes
• Time to live: certain data must be deleted from storage after a given period of time
• Anonymization by aggregation: personal data must only be used as aggregates by untrusted parties
• Anonymization by replacement: data allowing a personal identification must be replaced by an adequate substitute
• Separation of duty: two data sets from competitive entities must never be aggregated or processed by the same service
• Usage scope: certain data may never leave the connector to an external endpoint
Enforcement of Usage Control
For enforcing usage restrictions, data flows need to be monitored and potentially intercepted by control points (i.e., Policy Enforcement Point - PEPs). These intercepted data flows are given to the decision engine (i.e., the Policy Decision Point - PDP) for requesting permission or denial of the data flow. In addition to just allowing or denying the data flow, the decision can also require a modification of data. A PEP component encapsulates the enforcement.
Regarding our accompanying scenario, OEM and supplier demand the deletion of data after a certain time or that only a limited audience can access the sensitive data. Hence, we have to intercept the data flow and check which audience (i.e., processing system) is using the data. For example, the supplier demands the OEM that only the supplier management system can use the data.
Figure 17: Illustration of a PEP intercepting data with decision making (PDP).
Different technical solutions to enforce usage restrictions are already available such as MYDATA Control Technologies, (MYDATA), the Logic-based Usage Control (LUCON) and Degree (D°) [48].
2.6 Knowledge representation and Ontologies
The term knowledge is the usage of information in a well-defined context. In addition, the knowledge can be represented in a wide range of data formats offering also a wide range of formalisation grade. Examples of knowledge representation are unstructured text in a WIKI as well as a 3D model of a CAD figure including design guidelines. With respect to the intended usage of knowledge in the scope of LEVEL-UP, the knowledge
D1.2 – LEVEL-UP SoA analysis
LEVEL-UP | GA n. 869991 Pag. 29 | 115
representation in a formal manner is in the scope. The key challenge is to store/exchange information and not only data any longer to prevent the false interpretation of the data between the stakeholders. A stakeholder is in this case a human as well as an analysis method. Bellinger [49] defines information as “…data that has been given meaning by way of relational connection…”. In this article the information according to expected behaviour of a product should be represented as exchangeable unambiguous information within the PLM of a product.
The unambiguity interpretation of the transferred information can be achieved on different levels. Oren et al. [50] defined different levels of understanding, which are:
• Lexical understanding
• Syntactical understanding
• Morphological understanding
• Semantic understanding
• Pragmatic understanding
link the different domain the lexical, syntactical and morphological understanding enables the recognition of the structure of the information and the grouping of relevant entities together, but the meaning is still unclear. The semantic understanding is the key to understand the meaning of the data and close the gap from a data view to an information view. A common approach to model the semantic understanding are ontologies. Ontologies, as discussed in Artificial Intelligence, are formal, partial specifications of an agreement over the description of a domain [51] The vision of an ontology capturing all different kinds of information is called a monolithic ontology and is not convincing either under many respects [52]. Ontologies exist on different levels while each level has a specific aim. There are aims to cover basic concepts and properties in so called foundation/upper ontologies. Mascardi mentioned that “Upper ontologies are quickly becoming a key technology for integrating heterogeneous knowledge coming from different sources” [53]. Common foundation ontologies are e.g. Basic Formal Ontology, BORO, CIDOC Conceptual Reference Model, and Descriptive Ontology for Linguistic or Cognitive Engineering (DOLCE). Each foundation ontology has its own modelling focus which results in different concepts and properties. One of the common foundation ontologies which defines the term ‘information’ is DOLCE [54]. DOLCE defines the term information as an information-object which includes both a nonphysical endurant and a social object. Sub concepts of an information-object are diagrammatic-object, formal-expression, iconic-object and linguistic-object. All three sub concepts are not disjoined which means that an individual of an information-object could be specialized through one or more mentioned sub concepts. In consequence, an information object could take more than one specialization. Apart of the taxonomy, each information-object contains the object property part which could link information-objects transitively together. Therefore, DOLCE or similar upper ontologies like BFO could be used to model the overall knowledge sharing frame and to link the specific domain specific domain ontologies and other types of formalized knowledge among each other.
2.7 Machine Learning
The LEVEL-UP Machine State Forecasting component will be a novel machine learning architecture capable to predict the machine states. The methodology will be easily transferrable across the use-cases by respecting the verticality of each use-case while the approach on the predictive analysis will be horizontal across all demonstrators, i.e. no need for redesign apart from minor adaptations. The proposed novel machine learning architecture will combine different types of neurons and layers for different stages of the analysis, i.e. for the training set. The information flow will begin from the sensor data collection level. Through a series of data pre-processing and transformations, new encoded features will be derived that will enable the forecasting of the machine performance into the future. The machine states after maintenance will be considered as the ideal states and every other divergent pattern will be considered as an anomaly. An ensemble classifier will be used to classify states of malfunction and will provide interpretable information on the conditions that lead to its occurrence. This information will be used by the developed system to predict future occurrences and deterioration propagation. Summarizing, the final product will provide (i) identification about the current

D1.2 – LEVEL-UP SoA analysis
LEVEL-UP | GA n. 869991 Pag. 30 | 115
operation, (ii) prediction for future states and (iii) will also monitor and predict the significant variables/features that affect the occurrence of malfunctions.
2.7.1 State-of-the-Art in Machine State Forecasting
There are many AI algorithms for machine health monitoring, detection of anomalies and other machine tool applications, where the most important ones are described in the following sections:
A condition monitoring of a metal-working manufacturing system is realized by [55]. The developed deep learning algorithm is based on recurrent networks and simultaneously incorporates healthy machine data and the data to be analysed. This special architecture helped to capture time dependencies within the time series data. An alternative approach for anomaly state prediction is presented by [56]. They develop a Long-Short Term Memory (LSTM) based network combined with a Support Vector Machine (SVM) algorithm. The LSTM is applied to pre-process the data sequences and the SVM to identify anomalies. The overall approach showed decent results when coping with time series data but were not able to tackle dimension reduction problems.
An anomaly detection approach based on LSTM networks is presented in [57][58]. The network contains recurrent structures and is capable of learning long term dependencies with sparse representation. The Gaussian distribution is applied as anomaly detection metric. Their approach showed decent results on four existing public data sets from different applications. However, large amounts of industrial process sensory data and a reduction of features dimension was not part of their investigation.
Other similar artificial intelligence/machine learning approaches which have been proved to be powerful in anomaly detection include: one-class Support Vector Machines [59], Stacked Auto-Encoder (SAE) network [60] and [61]. A survey of various deep learning architectures proposed for machine health monitoring, based on Restricted Boltzmann Machines, Recurrent and Convolutional Neural Networks can be found in [43].
A hybrid model of manufacturing machines to estimate operational state based on machine functionality, dynamics, and interactions is presented by [62]. Their approach is based on the identification of a Global Operational State (GOS) to help partition, provide context to signals, and monitor the time of sub-tasks in a manufacturing process. Partitioning a signal based on GOS can improve anomaly detection and diagnosis. Monitoring duration of sub-tasks in the process can provide a detailed insight of cycle time and improve productivity analysis. The proposed approach was demonstrated in an automotive assembly plant to detect backlash and parts slipping in a conveyor system by monitoring energy signature and machine state variables.
A multi-objective Deep Belief Network (DBN) ensemble approach has been proposed by [63]. The proposed approach combines a multi-objective evolutionary ensemble learning framework with the DBN training process. The combined DBNs are optimized through differential evolution where the average training error is the single objective. The proposed approach outperformed several traditional machine learning algorithms, such as SVM and Multi-layer Perceptron (MLP).
2.7.2 Predictive models for zero unexpected breakdowns and increased operating life, Models
for detecting/predicting defects
Data-driven techniques, where the data refer to past events, commonly in the form of log entries, are widely used in Predictive Maintenance (PdM) [64] is a key representative of the state-of-the-art. Another event-based approach is presented in [65], where historical and service data from a ticketing system are combined with domain knowledge to train a binary classifier for the prediction of a failure. As in the previous work, a feature selection [66] and an event amplification technique is used to enhance the effectiveness of the SVM-based classifier. Event-based analysis, based on event and failure logs, is also performed in [67], where it is assumed that the system is capable of generating exceptions and error log entries that are inherently relevant to significant failures. The proposal in [51] relies on pattern extraction and similarity between patterns preceding a failure, while emphasis is posed on feature selection. We differ in that we place emphasis on

D1.2 – LEVEL-UP SoA analysis
LEVEL-UP | GA n. 869991 Pag. 31 | 115
artificial event generation from time-series data. After that, our approach bears many similarities with the approach in [48], but we differ in the details of the pre-processing steps.
The work in [68] proposes a correlation-driven approach between different sensor signals and fault events to guide the PdM process. This approach tries to identify correlations between detected anomalies in different sensor signals, which are mapped to specific faults. In our proposal, we focus on event processing, where events are generated from the sensors artificially.
Data-driven PdM is also related to online frequent episodes mining; research works [69] and [70] propose techniques in this topic. The key strength of [53] is that it can apply to an online (i.e. streaming) scenario. [54] further improves upon it through providing solutions for the case where the event types are unbounded. Complex-event processing (CEP) [71] is also a technology that enables PdM enforcement after warning sequential patterns have been extracted. A good overview of the data-driven PdM is presented in [72], where the authors list techniques for data pre-processing, feature selection, data storing, model building and validation, fault detection and prediction and estimation of remaining useful life. However, each application comes with its unique characteristics that affect the corresponding design [48]; in our application, we need to account for artificial event generation, rare target events and large and sparse feature space with the vast majority of features being irrelevant.
Motif-detection in time-series can also be used in prediction scenarios. The authors in [73] propose a tool that is able to predict outcomes based on weakly labelled time-series of millions of data points. time-series motifs of predefined length are computed using a matrix profile algorithm [74]. Fine-tuned thresholds of the detected motifs are computed and used to form a dictionary providing a little of “lead-time” to predict upcoming events. Finally, outlier detection is a vivid research field that has developed broad and multifaceted algorithmic solutions. The comparative study [75] presents a wide range of distance-based outlier detection algorithms and suggests that the MCOD algorithm, which is employed in this work, is considered as a state-of-the-art solution in the streaming data processing for distance-based outlier detection.
2.8 Risk assessment (FMECA, KRI models)
The FMECA is composed of two separate analyses, the Failure Mode and Effects Analysis (FMEA) and the Criticality Analysis (CA). The FMEA analyses different failure modes and their effects on the system while the CA classifies or prioritizes their degree of importance based on failure probability and the severity of the failure’s effect. The ranking process of the CA can be accomplished by utilizing existing failure data or by a subjective ranking procedure conducted by a team of people with a certain degree of expertise on matters concerning the system.
Therefore, while Failure mode and effects analysis (FMEA) is a risk assessment tool that mitigates potential failures in systems, processes, designs or services and has been used in a wide range of industries [76], FMECA takes this process one step further, by declaring a severity level for each failure mode. The FMECA system will not only identify but also investigate potential failure modes as well as their causes. In comparison to FMEA, this method looks at potential problems in more detail and yields more accurate results.
C. Spreafico et al [77] presents the following classification of recommendations for improvement of FMECA, as they have been proposed by academia and industry.

D1.2 – LEVEL-UP SoA analysis
LEVEL-UP | GA n. 869991 Pag. 32 | 115
Figure 18: Proposed classification of the problems (Spreafico et al.).
Both inductive (for single failure cases) and deductive (for generalization) reasoning must be utilized for comprehending failure mechanisms as well as their respective impact at an early level. To accurately assess risk probability as well as severity, Criticality Analysis (CA) of each failure will be used complementarily. Key Risk Indicators (KRIs) are to be provided to asses failure prone factors (such as inputs, parameters, ambient conditions, operating cycles) which will be evaluated and prioritized appropriately by virtual simulators. Metrics will be defined to measure each KRI in each pilot (with secondary and tertiary-level risk factors, related to different Severity and Detection factors), having multiple KRIs being associated to a single or multiple risk.
By understanding failure mechanisms and analysing their causes and effects, the aim is to reduce severity to “impossible to occur”, as well as to reduce the risk by structuring respective mitigations based on either the failure effect severity or the probability of failure or both. For each KRI max/min tolerance thresholds will be defined based on levels of risk appetite and tolerance specified in each project pilot use case. The inspection will be correlated with the FMECA results to provide suggestions to the Multi-DSS for remedial actions.
Traditionally, criticality or risk assessment in FMECA is carried out by developing a Risk Priority Number (RPN). Providing a review of academic works attempting to improve the efficiency of the traditional RPN method in real-world cases, the authors of [78] have, under the scope of several different disciplines, gathered several suggestions, including several MCDM approaches [79][80][81][82], such as priority-cost FMECA which introduces the concept of profitability [83]. One such approach recommends the application of FTOPSIS and AHP MCDM methods for prioritizing the failure modes, including a real-world test application study.
Another approach with which it is attempted to improve existing RPN FMECA methods is by utilizing certain mathematical programming methods [84][85][86][87], such as fuzzy risk priority numbers (FRPNs) for prioritization of failure modes [88], and a benchmark adjustment search algorithm, rather than the linear programming approach, to determine the weighted fuzzy geometrical means of a level sets to compute the FRPNs [89]. One approach [90] recommends the Dempster-Shafer Theory (DST) of evidence as a proper mathematical framework to tackle the epistemic ambiguity that often affects risk parameters input evaluations.
Apart from the mathematical methods described above, there are also recommendations of several Artificial Intelligence (AI) methods [91], such as an ELECTRE-TRI approach for declaring failure modes [92] or several new introductory variations of fuzzy FMEA models [93][94] with which it is sought to solve known weaknesses in the aforementioned FMECA methods.

D1.2 – LEVEL-UP SoA analysis
LEVEL-UP | GA n. 869991 Pag. 33 | 115
Several integrated/hybrid models [95][96][97][98], which deploy a fusion of the disciplines mentioned above, have also been recommended in the attempt to ameliorate FMECA methods. One such method [99] uses fuzzy linguistic variables for occurrence, severity and non-detection and then proceeds to use an if-then rule base to interconnect these variables in order to reach fuzzy RPN, whereas in another study [100], safety analysis was conducted in a real life manufacturing context to identify possible accidental occurrences, by combining FMECA with hazard and operability analysis (HAZOP) methods. FMEA has also been used [101] and performed within the context of a knowledge-based approach on flexible vehicle components, including also a certain Criticality Analysis. The integrated/hybrid methods again focus primarily on certain introductory fuzzy FMEA models as well as new additions and variations of such existing models and methods [102].
Within the context of the industrial use of FMECA, the author of [103] introduces a systematic methodology to perform FMECA of computer numerical control (CNC) lathe machine tool in order to implement predictive maintenance. In order to determine the risk associated with each component and subsystems of CNC lathe to estimate the risk priority number (RPN), industrial field failure data and expert elicitation are used. A recent paper [104] aims to understand the link between the assessment of machine criticality and the prioritization of maintenance in industrial practice, as well as the potential for improvement.
In the project, KRIs in each of the project pilot cases will be analysed, defining specific KRI models and applicable risk assessment approaches. To this end, metrics to measure each KRI will be defined in each pilot (with secondary and tertiary-level risk factors, related to different Severity and Detection factors), with multiple KRIs being associated to a single or multiple risk. Reducing the risk by structuring the respective mitigations on the basis of either the severity of the failure effect, or the likelihood of failure, or both, is a primary objective.
2.9 DSS
A Decision Support System (DSS) is an application that supports the decision-making process and suggests suitable courses of action in an organisation or a business. The DSS analyses the incoming data and uses it to reveal information to solve problems based and aid decision–makers in implementing different solutions. Typical DSS can be used in the manufacture, health care, prevention of destructions etc. The main difference to other ordinary application that simply collect data, is that DSS analyses them for gaining knowledge. The system can be fully automated or operated by humans, although it usually is a combination of both. The most important goal of a DSS is to allow humans to make more informed decisions during real–time data [105]. There are several DSS domains that scientific research focuses and they are examined in the following sections.
2.9.1 Multi attribute methods
Multi attribute methods in the decision–making process are used mainly in building and construction. Large structures are built based on the analysis of many parameters which usually are vague, imprecise and uncertain. DSS allows an extensive analysis which leads to better decisions in known ill–structured construction problems and their reformulation to structured problems. Multi–attribute decision–making (MADM) is very efficient to deal [106].
MADM features a decision matrix with m criteria and n alternatives. The matrix contains the criteria and the alternatives, and each row belongs to a criterion while each column to the performance of an alternative. The score is the performance of the alternative against the criterion. Higher scores mean better performances and are preferable in the decision [107].

D1.2 – LEVEL-UP SoA analysis
LEVEL-UP | GA n. 869991 Pag. 34 | 115
Figure 19: Weighted Decision Matrix (Geoghegan, 2019).
A multi attribute DSS will improve maintainability and performance of the large assets on the project’s pilots, while it will also ameliorate the identified shortcomings during operations and implement the MANAGE strategy.
2.9.2 DSS Mitigation Adviser – Risk Management
Risk management is very crucial in manufacturing procedures as well as in domains such as agriculture and prevention of crop destruction due to weather conditions, droughts or fires. Also, risk management is essential in the health care sector, where doctors and personnel should be able to take informed and analysed decision. DSS helps in these applications by implemented a risk mitigation adviser. The system suggests actions or courses which lead to the better risk mitigation.
A DSS mitigation adviser takes into consideration all legal and technological requirements in order to provide a suggestion to the decision-makers. This approach adds an overhead of legislation, technical and business constraints to the system, although the provided suggestions are valuable to the users and the overhead is tolerated. In order a mitigation adviser to work in a DSS, the system should comply with the following criteria:
• Meet the intent and rigor of the original risk and make it a requirement [108]
• Provide similar level of defence against the risk in the DSS
• Set sufficient limits for the risk
• Defend the suggestion against the limits of the risk.
Risks of the monitored should be documented, reviewed and validated by the DSS operators. The process allows the implementation of risk management strategies in different sectors and help to reduce risks in the organisation or business. The automation, offered by a DSS mitigation adviser, helps to improve the overhead of the risk management process and the operators to receive better suggestions. The criteria implemented in DSS mitigation advisers implement ISO standards.
Risk management is divided in risk assessment and risk control [109], as shown in Figure 20, which contain several sub-processes. Risk assessment includes Identification, Analysis and Prioritisation. Risk Control includes Planning, Resolution and Monitoring. The model identifies a risk, then analyses it and sets its priorities in the for planning and resolution. Afterwards, the planning process identify the risk factors using strategies: avoidance, tolerance and acceptance. Two decisions should be taken by the system. Risk prioritisation and discovery or the appropriate risk response strategy.
A DSS based on the Risk Management process supports in the decision–making process for risk assessment and the selection of the best strategy, based on a decision model. The system has a scheduler, which asks the appropriate questions and accordingly readapts the system’s environment. The questions assess the different risk factors and select the best strategy [110]. This functionality is enabled through a set of rules in the DSS. The DSS implements Systematic Literature Review (SLR) in the rule engine and extracts the suggestions. The DSS model is shown, below in Figure 21.

D1.2 – LEVEL-UP SoA analysis
LEVEL-UP | GA n. 869991 Pag. 35 | 115
Figure 20: Risk Management (Boehm, 1989).
In the project the DSS mitigation adviser will have inputs from other system components, such as: FMECA, KRIs models and CBA. It will be deployed to implement the described model and response the strategies and finally will implement the criteria to advise recommended risk mitigations.
Figure 21: DSS Mitigation Adviser Model (Aslam, et al., 2017).
2.9.3 Multiple Criteria Decision Analysis
A Multiple Criteria Decision Analysis (MCDA) is often discussed in literature for the decision – making process. Its appeal is based on the fact that one process is able to incorporate many parameters and each parameter to be analysed against multiple criteria. MCDA models perfectly the real world, where problems in different sectors have many solutions when they are measured against different criteria. A DSS which include MCDA is able to model many problems in different domains.
MCDA has proposed many approaches in order to be included in a DSS over the years. The most common ones are outranking method and multi attribute utility theory. There are also, more modern approaches such as the multi-objective Mathematical Programming which models the problem in a mathematical way and includes multiple objectives, variables and parameters [111]. This approach is suitable in large scale DSS, used in construction etc, where decision – makers should be provided with suggestion in problems such as: defining the angle on the vertical surfaces of a building or the weather prediction. MCDA also implements stochastic dominance concepts, for pairwise comparisons of alternatives, use of surrogate risk measures as additional decision criteria, as well as integration of scenario planning in MCDA.

D1.2 – LEVEL-UP SoA analysis
LEVEL-UP | GA n. 869991 Pag. 36 | 115
Figure 22: Simulation model of a DSS implementing MCDA112.
MCDA has also a fuzzy set approach included in the analysis. Fuzzy set approach can be implemented in complex environments with conflicting systems of logic, high uncertainty levels, vague and not accurate system knowledge. Fuzzy set approach requires specific tools, techniques and concepts that allow the information to be represented with the appropriate granularity. Fuzzy set approach is set for choice, ranking and sorting the real world problems. The problems are reviewed by fuzzy evaluations and sorting procedures for assignment of alternatives. The alternatives are graded in classes where available information is given by interacting point of view and a subset of prototype alternatives. The prototype alternatives are defined beforehand. TOMASO, a dedicated software is necessary for the analysis and the good or bad suggestions of the DSS are described based on the dominant and absorbent kernels in the graph that corresponds to an ordinal valued outranking relation.
The project’s DSS will implement MCDA to build a payoff or impact matrix to rank all options and estimate the recommended ones. It will also rank the results of the recommended decisions and will deploy the most advantageous ones. There will be simulations on system models and dynamic analysis of the manufacturing scenarios, measuring the performance on the site. Finally, the analysis will include Key Performance Indicators (KPI), user requirement data, and data from sensors and models.
2.10 Cost Benefit Analysis
The number one target for any business is to maximize the value generated to its shareholders and to do this in a way that is sustainable in a long term. In other words, this goal can be stated as profitability and measured with financial indicators such as Return on Assets (ROA). Even if in some cases it is not presented in such clear terms, profitability is the prerequisite of long-term existence for any business which makes it the most important business motive.
2.10.1 Cost benefit analysis
The basic idea of cost benefit analysis is very simple. If we have to decide whether to do (A) or not, the rule is: Do (A) if the benefits exceed those of the next best alternative course of action, and not otherwise. If we apply this rule to all possible choices, we shall generate the largest possible benefits, given the constraints within which we live [113].
Both quantitative and qualitative factors for analysis is taken into account. Benefits to costs ratio and other indicators are used to conduct such analyses.

D1.2 – LEVEL-UP SoA analysis
LEVEL-UP | GA n. 869991 Pag. 37 | 115
2.10.2 Sensitivity analysis
Sensitivity analysis is used to estimate the effects of different variables on investment returns. The benefit of using sensitivity analysis for investment decisions would be to assess risks and potential error. Perhaps the most common investment application of sensitivity analysis involves adjusting the discount rate of cash flows.
To perform sensitivity analysis:
1. Identify a set of criteria by which to evaluate the investments' success. For example, return on asset (ROA).
2. Define a set of input values that are important in generating ROA. These can include for example discount rates and sales volume.
3. Determine the range over which these values can move. Longer-term investments have larger ranges than shorter-term investments.
4. Identify the minimum and maximum values that your input variables can take while the investment model remains profitable.
5. Analyse the results of moving factors [114].
Ghezzi & Manzini (2012) [115] made sensitivity analysis in their research. The full range for the asset price was from the lower bound of 44,572 € to the upper bound of 135,656 €. This quite large difference between the possible valuations for the asset, is realized just by changing a few variables by 10% to 20%. This is a good example for the cumulative effects of valuation parameters to the final valuation.
2.10.3 Return on assets (ROA)
There are different types of ROI methods that use techniques of monetization and the expression of such a value as a ratio of benefits for investments. The strength of the ROI model, originated in the business sector, appears to lie in its simplicity, allowing decision-makers to simulate various investment packages by testing different policy options. This project introduces the proven ROA methodology to identify major drivers and aid in decision-making. ROA is an effectiveness indicator that compares net income relative to total assets in financial terms. Net income consists of outputs minus inputs that are required to earn the outputs.
𝑅𝑂𝐴 =𝑁𝑒𝑡 𝑖𝑛𝑐𝑜𝑚𝑒
𝑇𝑜𝑡𝑎𝑙 𝑎𝑠𝑠𝑒𝑡𝑠
Typically, investors use ROA to measure the profitability of companies. In this project, companies that allocate resources to investment are interested in ROA. The project uses ROA for economic evaluation of technical interventions (modernization). These interventions generate value (or outputs) for organizations. The project converts also qualitative values into monetary terms. However, the challenges rely on highly personal valuations.
ROA is one of the most widely used profitability indicators because it is simple and flexible. Flexibility means that a ROA user is free to choose inputs and outputs to be considered in the valuation. Inputs cover costs as well as capital. The coverage of costs and capital is wide.
ROA is an indicator of how profitable a company is relative to its total assets. ROA gives an analyst an idea as to how efficient a company's management is at using its assets to generate earnings. Return on assets is displayed as a percentage.
The evaluation of most of the assets and their combinations is a situational process. Therefore, the valuation begins with defining the related factors that affect the valuation. Chiesa et al. (2007) [116] found in their research that there are generally five types of factors affecting the valuation of technology-based assets: asset, firm, context, risk and transaction related factors.

D1.2 – LEVEL-UP SoA analysis
LEVEL-UP | GA n. 869991 Pag. 38 | 115
• Asset related factors consists of the technological features, its purpose and its relevance and uniqueness.
• Firm related factors consist of capabilities to utilize the asset and the reasons for the acquisition. In addition to these, [117] and [118] argue that the company maturity, size and growth rate have also an effect on the value of the technology.
• Context related factors affecting the valuation consist of the industry the technology is used in and the socioeconomic trends at the time of the transaction. For example, a technology asset usually means very different things in the pharmaceutical industry, where R&D expenditures can be one of the largest expenditures for a company and let’s say in the traditional pulp industry [94][119].
• Risk related factors are one of the most central factors in the valuation process for new technologies, due to the uncertainty about the useful life and the utilization potential of the technology [120][121].
• Transaction related factors consist of different types of transactions such as: business acquisition, joint-ventures and licensing agreements. The main difference between the different business transactions is the separation of transfer of ownership and the transfer of the right to use.
In this project the most important factors are asset related and context related factors.
Any cost data that may be required for this project will be defined by Activity-Based Costing (ABC). Activity-based costing (ABC) is mostly used in the manufacturing industry since it enhances the reliability of cost data, hence better classifying the costs incurred by the company during its production process.
D1.2 – LEVEL-UP SoA analysis
LEVEL-UP | GA n. 869991 Pag. 39 | 115
2.11 CAD/CAM/CAPP extraction
The Manufacturing metrology roadmap has long ago identified the need to integrate measurement technology into production. The challenge of this integration continues to be present specially when transitioning to Industry 4.0 and zero-defect manufacturing as inspection has taken the role of capturing and generating feedback information to be used in close loop manufacturing [122][123]. Among the challenges, measurement speed is one of the key challenges as inline measuring demands real time measurements. In addition to speed, the need to adapt to individual tasks basically demands for greater flexibility of the measurement systems and processes.
However, the decisive role for the technical implementation of and information technology integration of dimensional metrology is the interfaces and their standardisation. This means not only mechanical and electrical interfaces but also information technology interfaces.
In a standard dimensional metrology system different levels of interfaces are used in order to link the dimensional metrology with its environment. For example, at sensor level, interfaces are used to integrate a number of sensors into the measurement system which communicates with the higher interaction level. At this interaction level, the measurement system also communicates with the end-user. Other than the sensor information, information in the form of data about inspection characteristics (Product Manufacturing Information - PMI) and information about product shape (CAD) and the metrology results interface at this level. This different interaction levels can be defined as the CAD, CAE and CAPP layers.
2.11.1 CAD – Computer Aided Design
It represents the set of computer applications that allow a designer to define the product to be manufactured. It allows the designer to create images of parts, integrated circuits, assemblies and models of practically everything that comes to mind in a graphic station connected to a computer. These images become the basis of a new design, or the modification of a previously existing one. The possibilities of the CAD system are enormous, being able to perform a wide range of tasks, among which we can highlight:
• display on screen any model in three dimensions and in perspective
• use different colours for each surface
• automatically remove hidden lines and surfaces
• rotate or move the piece
• get any type of sections, drawing plants and elevations automatically
• calculate the volume, surface, gravity control, inertia etc, of each piece, almost instantly.
2.11.2 CAE – Computer Aided Engineering
This system encompasses the set of computer tools that allow analysing and simulating the behaviour of the designed product. It is the technology that analyses a design and simulates its operation to determine its compliance to the design conditions and its capabilities.
Mechanical CAE, includes a finite element analysis (FEA) to evaluate the structural characteristics of a part and advanced kinematics programs to study the complex movements of some mechanisms.
The electronic CAE also allows you to verify the designs before manufacturing them, simulate their use and other technical analyses to avoid wasting time and money. It aims, basically, to provide a series of tools that allow to manufacture the designed part.

D1.2 – LEVEL-UP SoA analysis
LEVEL-UP | GA n. 869991 Pag. 40 | 115
Main CAE applications:
• calculation of physical properties: volume, mass, centre of gravity, inertia, etc.
• lineal and non-linear tensional analysis and mechanical and structural calculation
• Vibration analysis
• mold injection process simulation: dynamic and thermal analysis of the injected fluid (virtual injection)
• manufacturing process simulation: machining, sheet metal forming, welding, fixation analysis (virtual manufacturing)
• graphic simulation of the system operation: interface calculation, aerodynamic, acoustic, ergonomic studies, etc. (virtual prototyping).
2.11.3 CAM – Computer Aided Manufacturing
This system groups the applications responsible for translating design specifications to production specifications. Among CAM applications we can find:
• numerical control program generation
• strategy and trajectories simulation for machining the designed product (based on a CAD model)
• programming of welding and robotic assemblies
• CAI – Computer Assisted Inspection
• CAT – Computer Assisted Testing
All these possibilities, provided by CAM technology, considerably shorten market time, avoiding having to make subsequent corrections in the basic design features.
2.11.4 CAPP – Computer Aided Process Planning
It is an expert system that captures the capabilities of a specific manufacturing environment and engineering manufacturing principles, in order to create a plan for the physical manufacturing of a previously designed part. This plan specifies the machinery that will be used in the production of the piece, the sequence of steps to be carried out, the tools, cutting and advances speeds, and any other data necessary to produce the finished product.
CAPP is the link between CAD and CAM in that provides for the planning of the process to be used in producing the designed part. The introduction of AI technologies in CAPP entitles these systems as knowledge-base or expert systems.
2.11.5 Interoperability Standards
Product and Manufacturing Information (PMI) is paramount for a manufacturing company, being essential along the whole product lifecycle for the integrity of the produced products. Data translation is one of the major sources of data loss, i.e. when transferring data form CAD to CAM or to CAPP, data loss occurs due to the different standards used by different program suppliers, especially when geometric information and other crucial data such as 3D annotations and Geometric dimensioning and tolerancing (GD&T) must maintain integrity.
As seen previously, the measurement process is composed of four major phases: definition of dimensional and geometric specifications (CAD), unfolding of a measurement plane -CAE, measurement execution (CAM) and analysis (CAPP)-, and interoperability barriers are found between each phase.

D1.2 – LEVEL-UP SoA analysis
LEVEL-UP | GA n. 869991 Pag. 41 | 115
Figure 23 - Interoperability barriers of measurement systems [124]
Figure 23 shows the main interoperability barriers, which is produced by the lack of homogeneous data relating the generated information at each phase of the process [125]. Historically each vendor would promote their own native CAD file format promoting the lack of integration it exists nowadays. In fact, each vendor has supported a number of native and neutral formats [126], as can be seen in Table 3.
Table 3 – CAD file types formats & vendors
Major CAD Software Developer Major Import/ Export CAD
Files
CATIA Dassault Systemes 3D XML, CATIA V5, CATIA V4, CATIA V3, DXF, IGES, STEP, and VRML
NX Siemens ACIS, CATIA V5, CATIA V4, DXF/DWG, IGES, STEP, STL
Creo PTC ACIS, DXF/DWG, IGES, JT, NX (import only), Parasolid, PDF, SolidEdge (import only), SolidWorks (import only), and STEP.
SolidWorks Dassault Systemes ACIS, CATIA V5, DXF/DWG, IGES, Parasolid, PDF (export only), STEP, and STL.
Inventor Autodesk ACIS, CATIA V5, DWG, IGES, JT, Parasolid, STEP.
However, efforts to implementing neutral CAD file formats have been in place since as early as 1980, always aiming at interoperability among CAD software. Among the neutral file formats, we can find:

D1.2 – LEVEL-UP SoA analysis
LEVEL-UP | GA n. 869991 Pag. 42 | 115
IGES (File Extension: .IGS, .IGES) - IGES files were the first bid towards neutral CAD files and ANSIS standard. They were introduced in the market on 1980 and were last updated on 1996. This format is only worth mentioning as the first neutral format, since it only supports surface geometry. Despite being somehow obsolete it is still being used (as it´s been around for a very long time), but always in conjunction with STEP and QIF formats that will be described later on in this section.
Stereolithography Files (File extension: .STL) - This is a widely supported file format (not standard), especially popular for 3D printing. It was introduced on 1987 and has since never been updated. This format focuses on surfaces geometry and shapes providing a very simple data model with no support colour, surface grouping, or even user-friendly attributes.
ACIS (File extension: .SAT) - ACIS was first introduced on 1989 and has been last updated on 2016. It is not a standard, but the internal modelling language is used by many of the downstream software, since it is a geometric modelling kernel compiled in C++ and used in CAD, CAM, CAE and CMM. Besides not being a standard, it doesn´t support semantic PMI.
PARASOLID (File extension: .X_T) – it was also introduced on 1989 and last updated on 2016. Although not a standard, these files are used by the geometric modelling kernel currently owned by Siemens and used in CAD, CAM, CAE, and product visualisation. Not a completely neutral format, but can be a good option for Solidworks and NX.
3D PDF (File extension: .PDF) – This ISO 32000 and ISO14739 standard was introduced in 2004 and has been last updated on 2017. It is a ubiquitous format, easily viewed in any device and it is especially convenient for users who do not own CAD systems or views. However, even when PDF files can be containers for STEP or QIF type of files, the 3D ergonomics are not the best and the Adobe environment limits their use.
STEP (File extension: .STEP, .STP) – This ISO 10303 standard was introduced in 1994 and is continuously updated. STEP files have been the most widely used and accepted neutral CAD format until today. Nowadays most CAD software supports STEP files for importing and exporting, making it interoperable among the CAx systems that make up the lifecycle of a product.
MTConnect - The MTConnect standard (ANSI/MTC1.4-2018) was first released in December 2008, offers a semantic vocabulary for manufacturing equipment to provide structured, contextualized data with no proprietary format. With uniform data, developers and integrators can focus on useful, productive manufacturing applications rather than translation. Data sources include: machine tools; production equipment; sensors and sensor controllers, and other factory hardware. Applications that consume MTConnect data provide more efficient operations, improved production optimization, and increased productivity.
QIF (File extension: .QIF) – This ANSI, and ISO DIS (2020) standard was first introduced on 2013 and it is being updated continuously. Quality Information Files (QIF) have been envisaged for digital transformation and optimising of semantic PMI which allows for human and machine-readable CAD, ensuring interoperability and traceability.
Significant progress in terms of standardisation has been made in the last decade [3][127][128] to facilitate the use of information across the different phases of the manufacturing process to allow for PMI that controls the full lifecycle. Some standards such as STEP, QIF and MTConnect have been adopting these standards which in collaboration with a number of projects and studies have demonstrated the importance of using standards with product definition-based Model-based definition (MBD) [129] for a holistic PMI, since PMI is required in design, manufacturing and inspection to examine product conformity to design specifications.
In terms of suitability of STEP, MTConnect and QIF as neutral protocols to achieve an interoperable and federated PMI (e.g. using 2 or more proprietary data formats from different brands or models), the fact that PMI is mostly interested on Geometric Dimensioning and Tolerancing (GD&T) standards, surface finish, material properties, welding information, and 3D annotations needs to be taken into account since each standard use different technologies.

D1.2 – LEVEL-UP SoA analysis
LEVEL-UP | GA n. 869991 Pag. 43 | 115
STEP is an ISO standard for product model data - good at long-term archiving, and at compatibility with complex data translators. MTConnect is an C standard for process monitoring focused on real time communication. However, QIF is an ISO and ANSI standard for quality planning and results reporting with a rich XML data format.
With this in mind, and having the objective of integrating the quality data into the digital thread QIF is being presented as neutral, standardized, and interoperable data structure that covers all phases of the inspection process and facilitates the feedback of results within a closed-loop manufacturing. QIF allows to cover all phases of the inspection process using a neutral data structure that manages to homogenize information both semantically and syntactically to integrate the measurement results with manufacturing data. This is achieved by:
• Model-Based Definition
• Feature-Based Tolerancing
• Characteristic-Centred
• Quality Planning with Bill of Characteristics (BoC)
• Robust Measurement Results with Persistent IDs
• Modern Software Development Techniques
Overall, QIF is a standard developed and maintained by the Digital Metrology Standards Consortium (DMSC) to be used as an enabler for a quality digital thread, see Figure 24.
Figure 24 - QIF as an enabler of a Quality Digital Thread (by Curtis W. Brown, DMSC)
QIF is been defined and developed based on 3 main pillars:
1. Feature-based characteristics- centres ontology of manufacturing quality data 2. XML technology: simple implementation with built-in code validation 3. Information semantically linked to MDB for full data traceability via persistent Ids (QPId/UUID)
2.12 Digital Twins on the edge and cloud

D1.2 – LEVEL-UP SoA analysis
LEVEL-UP | GA n. 869991 Pag. 44 | 115
There are many definitions for a digital twin (DT). The definitions evolve with evolving technologies (e.g. machine learning, wireless computation, cloud computing). DT was defined in term of pure simulations that can reproduce the behaviour of real object under real loads. Afterwards, DT was defined as multi-physics, multi-scale, probabilistic simulation using best physical model, sensor updates, history and so forth, to mirror the life of the real object. Nowadays, DT can be understood as [130]: “a broader concept that refers to a virtual representation of manufacturing elements such as personnel, products, assets and process definitions, a living model that continuously updates and changes as the physical counterpart changes to represent status, working conditions, product geometries and resource states in a synchronous manner. The digital representation provides both the elements and the dynamics of how a physical ‘thing’ operates and lives throughout its life cycle”. Another Definition is given in [131]: “The DT consists of a virtual representation of a production system that is able to run on different simulation disciplines that is characterized by the synchronization between the virtual and real system, thanks to sensed data and connected smart devices, mathematical models and real time data elaboration. The topical role within Industry 4.0 manufacturing systems is to exploit these features to forecast and optimize the behaviour of the production system at each life cycle phase in real time.”
The DT and the corresponding real-world counterpart are building a Cyber Physical System (CPS) because the actions of the DT are based on real data coming from the real world counterpart in order to take an influence on the real world. While simulation is based on what could happen in the real world, DTs are based on what is currently happening. Internet of things (IoT) describes the infrastructure (internet like) connecting physical assets in the physical world [98]. This relationship between DT, CPS and IoT is shown in Figure 25.
Figure 25: The relationship between Digital Twin, CPS and IoT.
DTs in the field of manufacturing plays a pivot role in the vision of smart manufacturing. It enables the shift from analysing the past to predicting the future [98]. For this purpose, there are many scopes of applications like digital twin for manufacturing assets [132][133], for parts being manufactured [134][135], for people [136], for factories, for production networks and evenly for collaboration between humans and robots [137]. DTs for parts being manufactured can provide a lot of additional value. The DT must describe characteristic parameters of the real-world part (e.g. mass, material and size). In the design phase, different product concepts can be generated and optimized to resist and display the effects of manufacturing variation. In the pre-production phase, the DT is the basis for all the inspection preparation. The data provided by the DT is useful for programming coordinate machines and scanners, defining inspection points and planning measure paths to prevent collision. In the production phase the virtual model is used in combination with inspection data to supervise the manufacturing process, and to expose and revise errors [103].

D1.2 – LEVEL-UP SoA analysis
LEVEL-UP | GA n. 869991 Pag. 45 | 115
DTs for manufacturing assets can deliver information about the real performance and operating conditions of an asset and facilitate proactive optimal operating decisions [98]. For this purpose, data is collected in the machine. The control system of the machine gains manufacturing data included in the NC-Code (e.g. feed rate, cutting velocity, tool path). Moreover, the control system can deliver real data related to the NC-axes (e.g. the real position, electrical current in servo drives), the spindle (e.g. revolution) and auxiliary aggregates (e.g. pressure, filling level, volume flow rate). Beside the control system, the real data can be gathered with additionally sensors (e.g. accelerometers, force transducers, acoustic emissions). A portion of these data can be employed as the input for computing and the other portion for updating the DT in order to reflect the real states and properties of the counterpart in the real world [102][103]. It is possible to make a DT only for a component of the asset. There can be more component DTs being connected to each other in order to model just a part of the asset or a type of the behaviour (e.g. deformations).
DTs for factories make a replica of a live factory environment. Digital Twin and data-driven production operations can allow the establishment of a self-organizing factory environment with complete operational visibility and flexibility. Connectivity and data tracking throughout the complete manufacturing process enable factory operations to be transformed into data-driven evidence-based practices, offering the capabilities of tracing product fault sources, analysing production efficient bottlenecks and predicting future resource requirements.
DTs for production networks aims at connecting manufacturing assets, people and service in order to virtually represent every aspect of business. Connecting distributed Digital Twins between companies will allow companies to build virtually connected production networks. Leveraging Big Data capabilities, this strategy provides unprecedented visibility into operation performance and creates the possibility of predicting future needs in a network of Digital Twins [98].
A reference model for a DT can be very simple defined as shown in Figure 26 [98]. In principle, there is a physical object, which has to be reproduced in the cyber world, and the DT. The connection between the real and cyber world is done by the communication.
The communication is one of the crucial factors in the realization of a DT. The communication should ensure a synchronization between the states of the physical object and the DT. This implies bi-directional and real-time communication. For this purpose, industrial communication protocols are often employed. An overview can be shown in [98].
An information model contains an abstraction of the physical object and accompanies a data model in order to use and interprets the data in a consistent way. There can be many information models for various purposes (e.g. STEP, G-Code, OPC-UA).
The data processing is a very important part of a DT covering data polishing, noise filtering, data storage, data fusion [100], statistical processing and transformation. The aim of the data processing is to generate information whit that the digital twin can
efficiently work, e.g. to perform a computation.
A possible structure of a DT for a machine tool as an example of a manufacturing asset is shown in Figure 21. This structure is realised on the reference model from Figure 27. In this figure, two levels namely cloud and edge can be seen. The DT in the edge level conducts computation with real time data. The real time data after data processing represent the inputs for the computation. The output of the computation can be fed back to the machine for an action influencing the manufacturing process (e.g. setting optimized process and/or machine parameters). The outputs can be locally transferred through a gateway into intranet and/or locally used in SCADA as well as in MES (e.g. for maintenance and manufacturing planning) as well. Furthermore, the outputs can be also transferred through another gateway in the cloud, from where the
Figure 26: Α reference model of a digital
twin.

D1.2 – LEVEL-UP SoA analysis
LEVEL-UP | GA n. 869991 Pag. 46 | 115
outputs are accessible via mobile devices and/or desktop PCs [100]. The cloud also provides a big benefit for a DT consisting in availability of data from other data sources (e.g. other DTs, other assets, maintenance, quality management, knowledge data base), which can contain information appropriate for establishing data driven models enabling advanced computing (e.g. predictions) [138]. The data driven models are able to enhance the model on the edge by an additionally correction / adjustment in order to increase the computing accuracy. The drawback of the DT in the cloud (i.e. computing with the data driven models) consists in the relatively low data rate between the cloud and the edge level [139]. Thus, models in the cloud should not be designed for inputs requesting a high volume of real time data. Moreover, data in the cloud are associated with relatively high costs. This implies that data with reasonable contain will be sent into the cloud rather than a high-volume data.
Figure 27: Possible structure of a DT for a machine tool.
In general, the computation model on the edge should reproduce the physics and the control system of the counterpart in the real world. In the praxis, it is not meaningful to build such a model. Instead of that, models for a certain purpose can be more effectively. When a model for DT is built, a few aspects has to be kept in mind concerning the information value resulting from the computation, the computational effort and the adaptability of the model in order to consider the time variance of the counterpart. A model always represents a certain abstraction of the real world. Therefore, the results are affected by inaccuracies due to impropriate consideration of the surroundings, impropriate interpretation of the physics, insufficiently estimated model parameters [140] and errors of the computing methods. The computational effort is a next limiting factor for the use of the model in a DT. The ideal case would be represented by a computation in real time. In fact, physical models (i.e. modelling with differential equations) often require much more computational time. This implies that a buffer is needed for temporary saving incoming data from the machine. In order to keep the buffer size in acceptable limits, the difference between the computational time and real time should be as low as possible and/or there has to exist adequate time phase in that the computation will be finished without new incoming data (e.g. waiting time, downtime of the machine). Another approach for reducing the computational time consists in parametric model reduction [141], in employing model updating [142] or in generating input-output model (i.e. black-box-model) by using transfer functions, regression analysis or machine learning technics. In such cases, the information about the physics get lost or is strongly limited. If there is still a need for keeping such information (e.g. monitoring task, optimization task), the model can be subdivided into submodels. Some of the submodels can be simplified in

D1.2 – LEVEL-UP SoA analysis
LEVEL-UP | GA n. 869991 Pag. 47 | 115
manner of the black-box and the others remain physical models. Such modelling leads to so-called grey-box model.
In general, every technical system, in particular its properties and therefore its behaviour, is changing with time. In order to ensure the validity of DT outputs, the DT should reflect the current state and condition of the physical object. This implies that DT has to change with time as well, i.e. it has to consider the time variance. The time variance can be caused by the states [98] (e.g. behaviour as a function of the position of nc axes), by degradation processes [99] (e.g. wear in bearings) or by intervention [100] (e.g. refurbishment, upgrading as shown in Figure 28). The first kind of the time variance is covered through using the states for inputs, the second one can be considered by the model updating and the last one by a certain evolution of the DT. The model updating is a technic for adjustment of model parameters by using experimental results [143]. In general, when performing model updating, a difference between computed and measured quantities is minimized by varying the model parameters. Such optimization task can be solved with various methods for various measured quantities. In the context of considering the time variance, the model updating can be continuously/automatically performed with sensor data that are not appropriate for the computation but contain measured quantities being suitable for the model updating (e.g. by using the stochastic subspace identification [144]. Alternatively, the model updating can be performed with extra measured quantities gained with a special purpose experimental setup (e.g. for geometric accuracy with laser tracer [145] or double ball bar [146], modal analysis [147]) or the desired measured quantities are gained in a semi-automatically way where special planed machine movement/processes are conducted (e.g. operational modal analysis [148], machine integrated circular test). These last two alternatives of model updating are also appropriate for considering the third kind of the time variance, i.e. evolution. However, the evolution of the physical object and the linked DT cannot be captured by the automatically model updating, i.e. by sensors. In order to reflect the evolution of the physical object in DT consequently, the computing model must be prepared in such manner that model parameters or/and whole submodels enable appropriate modification. Figure 28 shows some possibilities for considering the evolution of the physical object in DT, which are going to be subject of investigation within Level-Up.
Figure 28: Example for considering the evolution of the physical object in DT within
Level-Up.
At this point it is of interest to examine some specific cases of uses of Digital Twins, namely: Digital twin operation on the edge, Update of Virtual Twins and Virtual Commissioning.

D1.2 – LEVEL-UP SoA analysis
LEVEL-UP | GA n. 869991 Pag. 48 | 115
2.12.1 Digital twin operation on the edge
Current Digital Twins provide the basis for operations, analytics, and planning for CPS-based production systems, where sensors, distributed throughout the physical process, collectively capture diverse data, from behavioural characteristics of the manufacturing activities to environmental conditions, to support the creation of a near-real-time digital representation.
As identified in MAYA (H2020) The possibility to operate digital twins, capable to capture the behaviour of the devices, on edge infrastructures, next or nearby the equipment strongly depends on the availability of solutions capable to address two main topics: the synchronization between real and digital world and the data continuity along the machines whole lifecycle.
Figure 29: MAYA European research project reference approach.
2.12.1.1 Synchronisation of physical and digital worlds and data flows.
Synchronisation is the convergence of physical and digital worlds, where the latter must closely mirror the first, and where the former generates an unprecedented volume of data.
Currently, the data silo-effect has not effectively been relieved; information silos occur whenever a data system is incompatible or not integrated with other data systems, and thus hinder the effective data sharing required by the Digital Twin implementation and synchronisation. The causes are numerous: inconsistency of systems being used, different data formats, lack of technology integration, and mostly legacy technology barriers.
In terms of tools for the synchronisation of physical and digital worlds, some plant simulation tools (e.g. Visual Components16 and SIEMENS Tecnomatix Plant Simulation) provide extensions to directly perform I/O operations with proprietary abstraction layers from buses or with the OPC (Object Linking and Embedding for Process Control) architecture.
An interesting emerging standard for communications, that is still not part of major commercial simulation applications, is MTConnect (https://www.mtconnect.org/). MTConnect is a lightweight, open, and extensible protocol designed to exchange data between shop floor equipment and software applications.
2.12.1.2 Data continuity and lifecycle.
The ability to maintain the digital information available all along the CPSoS (Cyber Physical Systems of Systems) lifecycle is a key element in Digital Twin instantiation. The current landscape sees many overlapping standards and vendor-specific platforms that make interconnections and data flows laborious [149].

D1.2 – LEVEL-UP SoA analysis
LEVEL-UP | GA n. 869991 Pag. 49 | 115
Standards are key enablers for manufacturing, providing data definitions, detailed models of the information relationships, and interface protocols for product and process lifecycles. The optimisation of products’ lifecycle and the generation of Product Service Systems demand that data concerning different product lifecycle phases can seamlessly flow within the single organisation and along the entire value network.
The most widely used tools currently that enforce continuity include DELMIA by Dassault Systems (https://www.3ds.com/products-services/delmia) and SIEMENS Tecnomatix Plant Simulation (plus several minor but flexible player such as Flexsim - https://www.flexim.com/en or Visual Components). Although there are software tools that can represent data in XML format, the issue is still unsolved since these approaches feature bulky data models whose contents are dependent on each provider (Shariatzadeh, Navid, Gunilla Sivard, and Danfang Chen).
It is worth noting that the AutomationML group has already started creating an ecosystem of programs around COLLADA, and recently, many robotics libraries like ROS, Open-RAVE, OpenHRP3, OpenGRASP, and EusLisp developed a common set of robotics extensions and can import and export robots in COLLADA 23.
2.12.1.3 Case studies of real-digital synchronization on the edge
Some interesting results in the field of the implementation of digital twins for manufacturing equipment have been generated by two cluster projects MIDHI and BeInCPPS, where two different reference architectures have been deployed to perform real-to-digital synchronization near to the machine.
In particular, machine simulation models have been combined into a higher-level plant model and linked to the FIWARE (Orion Context Broker) and Arrowhead infrastructures to gather information from the controlling hardware to improve the adherence of the simulation model result to the plant reality.
The following paragraphs report two use cases, developed as experiments of MIDHI and BeINCPPS that come dealing with totally different scenarios, a packaging line terminal cell and a I4.0 Laboratory, showing how the real-to-digital synchronization approach executed near to the machine (on the edge level) improves the forecasting results of the models.
2.12.1.4 SIMInCPPS experiment of BeInCPPS
SIMinCPPS experiment aimed at implementing simulation methodologies and tools for the design, engineering and management of CPS-based plants, in order to support production-related activities during all the phases of the factory life-cycle, from the integrated design of the production system, through the test and validation, till the maintenance phase. SIMinCPPS developed a complete architecture to manage the simulated digital twin of terminal cells of packaging plants, that has been applied to improve three main business processes: the design and negotiation of a new packaging cell, the test and validation of the real cell before Site Acceptance Test (SAT) and, the remote maintenance to an existing cell. The latter point is of particular interest for Level-up because it showed how the digital twin could be leveraged to reproduce the breakage conditions and to speed up the maintenance phase, reducing the time needed to identify the root causes of the problem.
The implementation has been based on TTSN s.r.l. simulation tools, further evolved encompassing H2020-MAYA project’s result, and integrated into the BEinCPPS architecture (mainly the FIWARE Orion Context Broker and the IDSA OPC Agent) thanks to newly development adaptation software components. The picture below reports the architecture, where it is possible to identify the usage of OPC-UA + FIWARE for middleware implementation.
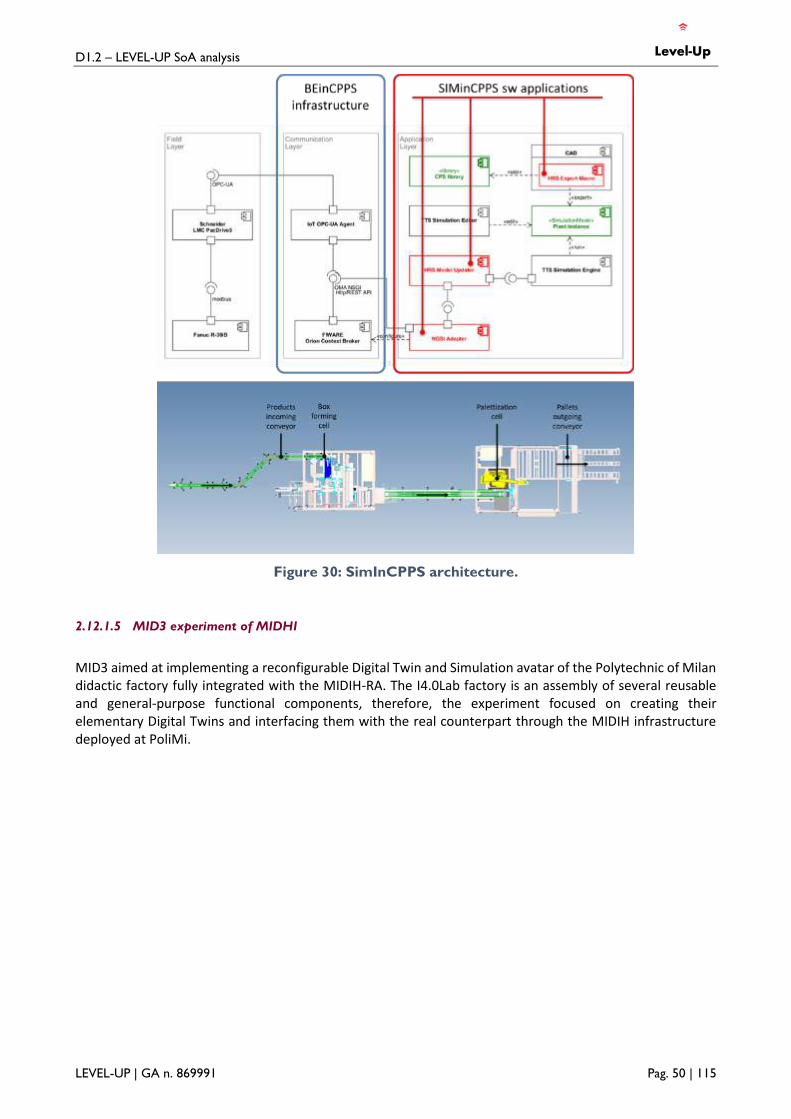
D1.2 – LEVEL-UP SoA analysis
LEVEL-UP | GA n. 869991 Pag. 50 | 115
Figure 30: SimInCPPS architecture.
2.12.1.5 MID3 experiment of MIDHI
MID3 aimed at implementing a reconfigurable Digital Twin and Simulation avatar of the Polytechnic of Milan didactic factory fully integrated with the MIDIH-RA. The I4.0Lab factory is an assembly of several reusable and general-purpose functional components, therefore, the experiment focused on creating their elementary Digital Twins and interfacing them with the real counterpart through the MIDIH infrastructure deployed at PoliMi.

D1.2 – LEVEL-UP SoA analysis
LEVEL-UP | GA n. 869991 Pag. 51 | 115
Figure 31: MID3 Architecture.
The MID3 experiment leveraged on the concept of local cloud of Arrowhead, that corresponds to an edge deployment of full system supporting the real to digital synchronization. The adoption of Arrowhead as middleware provides similar benefits to the FIWARE framework used in SimInCPPS, producing good results in terms of capability of forecasting the production lead times even under constantly changing operation conditions.
Figure 32: MID3 Arrowhead deployment.
The outcomes of MIDIH experiments represent an interesting reference for the development of evolving digital twins in Level-up use cases, because they show that the aggregation of modular (small) low-level machine digital models can be exploited to optimize the overall plant operation integrating evolving maintenance plans.
2.12.2 Updating virtual twins
Updating of virtual twins can be understood as a gradual process, which began with the transition of engineers from the drawing board, on which they created abstract twins of machines in the form of technical drawings, to the first CAD modelers (eg. AUTOCAD, Pro/E, IDEAS), that have allowed them to create the first 3D models of the machines being developed. With the development of computer technology, these 3D models began to be used for various advanced simulations (eg. CAM - Computer Aided Manufacturing, FEM - Finite Element Method, MBS - Multi Body Simulation).

D1.2 – LEVEL-UP SoA analysis
LEVEL-UP | GA n. 869991 Pag. 52 | 115
2.12.2.1 Basic terminology in evolution of virtual twins
The development of computer graphics, higher performance and processor speed have later enabled the development of software supporting virtual environment technology. This, together with the development of sensor technology able to capture and track human movements, enabled creation of a new technology called virtual reality in the 1990s. In mechanical engineering, engineers were given a new opportunity to verify the created machine 3D models in an immersive 3D virtual environment before producing a physical prototype.
This progress has made it possible to create the first virtual twins of real products, allowing to assess not only their dimensions and structure, but also their suitability for assembly or their ergonomic parameters (accessibility of the controls, light reflections, operator's working space, location of displays, etc.). However, the capacities of virtual twins were limited only to the visualization of various defined states, where the possibilities of interacting with the visualized object and gaining feedback (e.g. force, sound, touch, etc.) were limited.
Further development of computer technology has enabled the speed of data transfer and data processing to increase to such a level that the speed of computer simulations could be significantly shortened at the turn of the millennium, which increased the usability of the various computational models and their mutual interconnection in such a way, that the outputs from them could be visualized in a virtual twin of real product. Such an improved virtual twin of a real product is referred to as a digital twin and allows modelling of various real operating situations, simulating the real behaviour of the 3D model under assessment [150]. It also allows to visualize the results of these simulations in a 3D virtual environment (if beneficial) or in remote visualization devices (smartphone, tablet, computer, etc.) that can be paired with a real product through augmented or mixed reality.
Further acceleration of computing power together with faster data collection and transfer has made it possible to reduce the time needed to perform the necessary mathematical operations to such a level, that they could be performed in real time. Another developmental stage of the improvement of virtual twins, which is very topical today, is the connection of the digital twin with the real product by means of the sensory and possibly also of the actuation subsystem. This level of virtual twin is already called the Cyber-Physical-System [151], and together with Big Data and High-Speed Internet, is becoming an important element of the manufacturing industry future, which is nowadays being referred to as the fourth industrial revolution - Industry 4.0 - that is heading towards the factories of the future. This process is well evident from the figure below.
Figure 33: Updating virtual twins in context of Industry 4.0 (source: internal documentation
of the Institute of Production Machines, Systems and Robotics, BUT).

D1.2 – LEVEL-UP SoA analysis
LEVEL-UP | GA n. 869991 Pag. 53 | 115
The updating process of virtual twins described above is also better explained by the use of following terminology:
• 3D Model – is a digital file of a three-dimensional (3D) object that was created using 3D CAD software or through 3D scanning. It is generally displayed as a two-dimensional image using 3D rendering or visualization on two-dimensional screen.
• Virtual Environment – is a 3D space in which a physical object is represented by a 3D Model through information and communication technology tools (ICT tools).
• Virtual Reality - the use of 3D Models, motion tracking technology and sensory feedback to create immersive and engaging learning experiences in a virtual environment. Virtual reality technology creates a far greater sense of immersion in the virtual world than two-dimensional screen experiences.
• Augmented Reality – is a technology that allows us to see the real environment directly in front of us with implemented 3D Virtual Models or other digital information (such as audio, video, graphics or haptic inputs).
• Mixed Reality - is a technology that combines virtual reality and augmented reality to project virtual visualizations into the real world. In this environment, real-time interactions with virtual or physical objects can be performed.
• Virtual Twin – is the perfect representation of a real physical product using a fully representative 3D model in virtual reality environment that is almost indistinguishable from its physical counterpart. In a virtual twin, you can view the actual parameters of the counterpart, such as dimensions, ranges of motion, temperature, or vibration values of the monitored sites, or information that can help the operator to properly handle the physical product.
• Virtual Person - is a 3D model of a human body (also called Avatar or Manikin) which can be used for example in various ergonomics studies focused on physical interaction of a person with a real product and its environment with the help of a virtual twin (full virtual approach). This allows for example a quantitative or qualitative assessment of accessibility and visibility of operator controls and other displays on a real product with the use of its virtual twin.
• Virtual Testing – is a test that takes place in a virtual environment. Refers to the virtual twin by which a certain aspect of a real product is simulated in a virtual environment in such a way that the participants can (using a virtual person or their own body) explore it and perform various tests on that aspect similarly as it would be explored in the real world.
• Modelling and Simulation – are computational operations that can be considered a substitute for an experiment on a physical product. The modelling describes mathematically the behaviour of the real product under the influence of the surrounding environment and all significant parameters of the real product are included in the created mathematical model. In simulations, computers are used to calculate the behaviour of the real product affected by changes of surrounding environment. In this calculation, the parameters of many variables in the mathematical model are changed.
• Digital Twin – is a fully functional virtual copy of the actual product. It combines various computational models and data sets, ranging from design data (e.g. 3D CAD Model) to off-line data describing the expected behaviour of the environment acting on a real product (long-term data collection from the sensory system). Digital twin mathematical models allow real-time simulation of real object behaviour exactly as it would work under real world conditions. The development of the Digital Twins leads to the Cyber Physical Systems.
• Cyber-Physical Systems (CPS) – are systems of collaborative computing software (e.g. ANSYS, MATLAB, ADAMS, NX) that are connected on-line to the surrounding physical world and/or physical product and respond in real time to changes of its parameters. At the same time, CPS may provide and use data access and data processing services available on the Internet (CLOUD).

D1.2 – LEVEL-UP SoA analysis
LEVEL-UP | GA n. 869991 Pag. 54 | 115
Figure 34: Implementation of digital twin (global virtual model) into CPS (Kovar, et al., 2016).
• Cloud – is a term used to describe a global network of servers that are accessed over the Internet, and the software and databases that run on those servers. It is especially the on-demand availability of data storage capacities and computing power, without direct active management by the user.
• Internet of Things (IoT) – is a system of interrelated computing devices, real and digital machines, various objects, environments or people that are provided with unique identifiers and the ability to transfer data over a network without requiring direct human-to-human or human-to-computer interaction.
• Internet of Services (IoS) – various services provided through functional software accessible via the Internet and connected via a defined interface to the customer on his device.
• Artificial Intelligence (AI) – is an expanding human intelligence by means of computers, computational models, modelling and real-time simulations so that controlled machines can think like humans and solve the occurring problems in a rational way.
• Smart Machine – is a device that can learn itself how to do things. This functionality is sometimes called “machine learning” and is a subset of artificial intelligence.
• Virtual Learning (e-learning) – is a learning or training methodology that uses computer software, the Internet, or both to provide instruction. In a rapidly developing technology world, virtual reality technologies and the use of virtual twins are becoming a suitable innovative tool for increasing the efficiency of the educational process and increasing the enthusiasm for learning by the learners. The principle of e-learning in virtual reality is to transmit, practice and verify user knowledge using interactive scenarios and environments that reflect real-world situations. With the use of 3D models, VR and machine visualization using digital twins as a part of the training methodology for future machine operators, it is possible to make them familiar with different states of machine without creating hazardous situations.
2.12.2.2 Possible implementation of Virtual twins, Digital twins and Cyber-Physical Systems
In order to accomplish the vision of “smart factories” that would realize “smart planning” of production tasks and “smart control” of production, it is necessary to begin with development of digitized machines based on employment of a virtual copy of their kinematic-dynamic model (the so-called virtual twin or digital twin

D1.2 – LEVEL-UP SoA analysis
LEVEL-UP | GA n. 869991 Pag. 55 | 115
depend of the level of virtualisation). Virtual twin aims to influence the expected implications in manufacturing when introducing INDUSTRY 4.0 elements published by the European Parliamentary Research Service [152].
• Increased flexibility due to automation, data system management.
• Bulk customization will allow for economically efficient production of small series, even individual pieces, thanks to the ability to quickly reconfigure the machines and add-on production.
• Production speed increases due to digital models and simulations, data managed supply chains will accelerate the production process by 120 % by shortening the time after receipt of the order to the start of production, and by 70 % by shortening the time from finishing the production to delivery to the customer.
• High potential is identified in the increase in quality by reducing the error rate due to built-in sensors and machines that gain intelligence by accessing a large amount of data. The EU estimates savings of 160 billion euros in total for the hundreds of the most important European producers.
• Productivity increases due to a number of INDUSTRY 4.0 elements. For example, productivity growth after predictive maintenance integration is defined by 20% due to a 50% reduction in downtime. Another type of productivity gain is optimizing the number and utilization of employees.
• The concept also involves a higher level of customer engagement in the product development process, thanks to the process of return of European production from low-income countries.
• Variation in business models with the aim to diverge them from a purely cost-based competition to cost-competitiveness, including, apart from costs, also the innovation speed, flexibility in customization, quality.
The most important component of a smart machine designed to fully use the potential of INDUSTRY 4.0 is its knowledge system. It can be either in the form of a simple database using statistical data processing, visualisation of actual state of the machine and setting of limit values (virtual twin), or in the form of an advanced system based on calculation models of the machine for prediction of its behaviour and decision-making algorithms for proposals of preventive measures (Digital twin, CPS, smart machine) [153].
In order to achieve higher productivity of production, improved dimensional and geometric accuracy of a workpiece or higher safety and reliability of the machinery, it is necessary to analyse the risks of the digitized production, with its significant part being the identification of the relevant hazards. The diagram below shows a typical structure of smart machine tools. In this structure, the following eleven areas have been identified that are exposed to various hazards that need to be considered when implementing virtual twins (or digital twins or CPS) [101].

D1.2 – LEVEL-UP SoA analysis
LEVEL-UP | GA n. 869991 Pag. 56 | 115
PRODUCT
MACHINE TOOL
CONTROL SYSTEMMACHINE
OPERATORMEASURING
SYSTEM
MONITORING SYSTEM
ASISTANCE SYSTEM
COMPUTATIONAL MACHINE MODEL
KNOWLEDGE SYSTEM
DECISION ALGORITHMS
ENVIRONMENT
CLOUDCLOUD
CYBERNETIC SECURITY
CYBERNETIC SECURITY
Occ
up
atio
nal
Saf
ety
and
Hea
lth
(O
SH)
Figure 35: Smart machine tool structure (Blecha, Durakbasa, & Holub, 2019).
1) The ambient environment may have a negative influence on the behaviour of the machine in the sense of geometric accuracy (quasi-static error). Changes in the ambient temperature affect the length dilatation of the workpieces. Furthermore, the vibrations generated by the neighbouring machinery also change the quality of the workpiece surface. Last, but not least, the changes of temperature, pressure and humidity may lead to increased uncertainty of the measurement by the multisensory systems implemented in the construction of the machine and of the sensors employed in workpiece check-ups. Besides, the operator´s concentration may be disturbed by increased level of noise, temperature or vibrations.
2) A product must meet the requirements of customers expressed as the required dimensional and geometric accuracy of the product. Accuracy of the machine should correspond to the requirements put on the product portfolio. The product itself may have a negative effect on the accuracy of production as its weight may cause elastic deformations of the machine and thus decrease its geometric accuracy. In thin-walled workpieces, it is necessary to pay attention to the fact that incorrect clamping may lead to deformation of the semi-product and thus to deformation of the machined surfaces once the workpiece is released. Such a workpiece may be deformed also by the cutting process itself due to incorrect setting of the cutting conditions.
3) A machine tool is a man-made dynamic system used for transformations of a workpiece with the required dimensional and shape accuracy. It is directly linked to the ambient environment and the workpiece, which affects its final properties. If the production engineer would not consider the characteristics of the machine and the tool, it could lead to production of a not good part. Such characteristics are, for example, chatter of the machine and durability of the tool. Similarly, the designer who would neglect the conditions for the employment of the machine, could negatively affect its properties such as static and dynamic compliance or thermal deformations. This would result in a deviation of the real tool trajectory against the workpiece from the ideal one.
4) Control system of a machine may have an effect on the final production accuracy of the machine and thus also on the quality of the workpiece. Modern systems allow us to monitor the stability of the machining, temperature drifts of TCP, application of volumetric accuracy, to compensate the effects of workpiece imbalances and to warn the operator that the machining process has been incorrectly prepared. However, these functions are usually available only in the machines with integrated sensor

D1.2 – LEVEL-UP SoA analysis
LEVEL-UP | GA n. 869991 Pag. 57 | 115
system. On the other hand, incorrect setting of the limit values may have a negative effect on the production process. Unsuitable selection of the measuring system and its position may affect the final position of the workpiece and the tool.
5) Operator of the machine is nowadays usually an integral part of the production process. His / her behaviour may cause either intentional or unintentional violation of the expected technological process. Such violation can be in the form of incorrect adjustment of the tool, use of excess clamping force, poorly cleaned surface of the clamping area or unsuitable positioning of the workpiece on the machine. The operator may also neglect the maintenance of the machine and thus cause its unplanned standoff. Insufficient attention of the operator may lead to selection of a wrong production program, collision of the tool with the clamping elements or with the workpiece itself.
6) Measuring system serves as a support for evaluation of the momentary state of a monitored parameter and it can be used as an information for the operator and for the control system of the machine; it can also be used for further processing with the aim to control the work process. A measuring system may be oriented at monitoring of the workpieces, tools or other characteristics such as the temperature at the bearings or the load of the table surface. A correctly chosen measuring system with adequate uncertainty of the measurement is able to provide the monitoring or the control system with relevant data indicating the level of interference from the ambient environment as well as from the operator of the machine.
7) Monitoring system of a smart machine serves for collection and preparation of the data before their further processing. The total amount of the raw data provided by the individual sensors may cause system overload or slow down. For this reason, it is necessary to process such Big Data in a suitable way and to use only that information that are needed as input values into the relevant calculation models, the so-called virtual twins.
8) Computational model of a smart machine requires selection of a suitable mathematical model of the monitored process (static and dynamic) and determination of the physical parameters within this model. Their determination usually requires performance of time-demanding experiments in every single smart machine. An efficient way of solving the demanding applications is a combination of a numeric and experimental approach. From the long-term perspective it represents collection of data from the monitoring system, their storage and processing within the creation of the knowledge module. Use of cloud services comes with the risk of cybernetic attacks, alteration or staling of the computational model.
9) Knowledge base gathers the experiences with the interactions between the causes (i.e. machine behaviour) and their consequences (i.e. product accuracy). Based on the obtained knowledge it is then possible to adjust the calculation model of a smart machine and to visualize the processed data from the calculation model as a support for decision-making of the machine´s operator or other competent persons. The knowledge base may include the limit values of the monitored parameters that would guarantee continuous production within the required tolerances. The character and the nature of the stored data as well as the access to the internet pose the hazard of targeted cybernetic attacks with the aim to alter or steal the data from the knowledge database. Such attack could be performed from the outside as well as inside the company.
10) Decision-making algorithms of the smart machines are able to perform autonomous decisions regarding the setting of the machine constants of the machine in order to ensure the required accuracy of the production. In general, it is the consideration of the effects of the ambient environment on the machine and of the dead-weight of the workpiece clamped at the machine. Another task of the decision-making algorithm is planning of the maintenance in order to prevent unplanned stand offs due to failures of some of its components. Such decisions would require high amount of knowledge as well as experience of the machine´s operators. The missing knowledge of the designers on the ways of use of the individual machines in various customers could lead to proposal of unsuitable preventive measures. This is the reason for employment of artificial intelligence that would continuously improve its algorithms and, based on the possible damage associated with application of incorrect decision, it would choose the most suitable form of reaction

D1.2 – LEVEL-UP SoA analysis
LEVEL-UP | GA n. 869991 Pag. 58 | 115
to the unfavourable development of the monitored parameters (autonomous interference, warning to the operator, recommendations for operators, error messages). Due to the necessity of a great amount of experimental data and case studies there is a presumption of development of the decision-making algorithms on the part of the machine´s producer and providing of this know-how in the form of “Internet of services”. However, here is also the possibility of cybernetic attacks.
11) Occupational Safety and Health (OSH) during the work with a machine is associated both with the safe design of the machine and with the suitable design and application of the safety parts of its control system. Safe design of a machine can be supported by the information on the real work load of the machine during the production process in various industrial areas and safe operation of the machine by attention to the expected durability of its safety components (e.g. number of activation cycles of the individual components). A cybernetic attack aimed at a smart machine could interfere with the machine constants or even safety-related elements of software, which could finally result in an injury of the operator. However, the potential of digitization offers other possibilities how to monitor the operator´s behaviour to identify the dangerous procedures within the machine´s operation in time [101].
2.12.2.3 Case Study of Digitization of the Production Cell at BUT
The case study is focused on a modernized production cell in the context of Industry 4.0 with a view to increasing production accuracy and data visualization quality. The following part of the study is divided into the description of the production cell, the creation of the workplace virtual model, the structure of the production cell digitization, monitoring of geometric accuracy of machine tools and workplace safety.
The case study is described on a modernized production cell (production cell at BUT), which is constantly being extended according to the Industry 4.0 concept. This testbed is designed to run various testing regimes in the areas of control, metrology, production planning, safety, data management, predictive maintenance, self-calibration of machines. These areas are oriented on the research of zero-defect manufacturing, safety, precision manufacturing, digital twin and robotics. The original production cell consists of two CNC machine tools (three-axis vertical CNC milling centre, turning centre) of the industrial robot on the track motion.
Based on the requirements, the production cell was extended according to today's standards with safety elements and the elements supporting a full workplace automation, upgrade of control systems for mutual communication via a standardized OPC UA interface. The following figure shows the condition of the production cell after being extended with Industry 4.0 elements (Safety systems from ABB, Siemens Mindsphere, Siemens Sinumerik Integrate, external device for temperature monitoring on the machine and its environment).
Figure 36: Production cell, Communication layout of production cell [154].
In the case study were solved tasks related to the issue:
• Creating a virtual model

D1.2 – LEVEL-UP SoA analysis
LEVEL-UP | GA n. 869991 Pag. 59 | 115
Virtual reality visualization is supposed to provide maximum workplace credibility, including production process information. The resulting model is intended to immerse the production cell operator as much as possible in the production process without the necessity of the operator to be close to the workplace. In such set-up processes, a highly qualified person can operate multiple production sites from one location. This results in the requirements for creation of virtual reality models for production sites.
In this case, an object was created that is static and placed in the production hall under relatively constant conditions. The model will be used as a basis for creating a virtual twin and visualizing the real operation. We require a realistic model, i.e. including surface textures. To create a digital model, a machine shutdown is also needed and no intervention in the machine structure is possible.
Figure 37: Production cell model w/o correction, final production cell model [102].
• Structure of digitalization
In this case, a combination of Physics based model and data-driven model approaches was used to benefit from their main advantages. The "stability" of digital representation of a real machine is obtained using a suitable model in Matlab / Simulink, "adaptability", in turn, using a data-driven approach, where the input-output relationship is refined using machine learning methods over the entire use of the model. The software structure is described in following figure. Measured data from the machine and its ambient environment are stored in a database solution after standard processing.
Figure 38: Structure of digitalization [103].
• Geometric accuracy of machine tool
Production accuracy monitoring is developed as part of the operation of the MCV three-axis milling centre (Part of production cell at BUT). There are monitored and evaluated, for example, the dependence of machine geometric errors, volumetric errors and their mutual combination on the resulting dimensional and shape accuracy of the workpiece. Instruments such as Laser interferometer, Ballbar, LaserTRACER, Spindle error analyser and digital inclinometer are tested for monitoring and implementing of compensations.

D1.2 – LEVEL-UP SoA analysis
LEVEL-UP | GA n. 869991 Pag. 60 | 115
Figure 39: Detail of workplace in the regime of milling machine monitoring, detailed view of
axial temperature source [102].
• Risk and Safety Analysis, Functional safety assessment
The safety of automated production cells enabling human-machine collaboration needs to be seen both from the point of view of fulfilling the requirements for new machinery by their manufacturer and from the point of view of ensuring health and safety at work and the possibility of maintaining the level of safety by the user.
The presented solution offers an option of very effective communication in solving undesirable conditions in production with highly qualified staff. These employees can simultaneously operate multiple workplaces from a remote workplace, always with the online data necessary to evaluate the respective situation. It is precisely the credibility of the operation and the availability of the information that form the basis for the proposal of an appropriate measure to eliminate undesirable conditions during production process [102].
2.12.3 Virtual commissioning
Big players and their digital twins: Siemens has already adopted the term “digital twin” though the term has been in popular use generally and earlier, too. Siemens is providing the Comos platform that enables application life-cycle management. MindSphere brings IoT platform as a commercial solution. GE has similar products and initiatives.
There are multiple digital platforms of this kind that are focused on a digital single market. Commercial providers are becoming dominant in the market, whereas, research solutions provide only practical examples and proof-of-concept studies.
Hardware-and software in-the-Loop: Hardware and software-in-the-loop (HIL & SIL) simulations are rapidly evolving from a control prototyping tool to a system modelling, simulation, combining many advantages of both physical and virtual prototyping. More focus needs to be put on its metamorphosis from a control validation tool into a system development paradigm.
Digital Twin for machine tool Virtual Commissioning: The aim with VC is to shorten the lead time from when the machine is requested to when it is delivered. It is important to construct the digital model before building the physical one, because the digital model would allow to see if designs (mechanical, electrical, programs) will interact properly with each other. This results in saving time and capital. To perform a Virtual Commissioning, a connection between several design tools and disciplines must be done from the early stages of the design phase.
Experientable Digital twins and hybrid complex simulation models: The creation of Digital Twins of machine tools, cells and production lines, lead to a new kind of “Experientable Digital Twins” breaking new ground in the discrete event simulation of complex manufacturing systems. “Experientable Digital Twins” can act as the very core of simulation-based development processes streamlining the development process, enabling detailed simulations at more complex manufacturing system level.
The application of simulation techniques brings digital twins to life and makes them experientable digital twins (EDTs). Complete digital representations of the real assets and their behaviours can be created and simulated. The networking of EDTs with real assets leads to hybrid application scenarios in which EDTs are

D1.2 – LEVEL-UP SoA analysis
LEVEL-UP | GA n. 869991 Pag. 61 | 115
used in combination with real hardware, thus realizing complex control algorithms, or innovative user interfaces.
Scheduling and control: Current state of the art technologies focusses on simulation and optimization at planning stage where capacities, product portfolio and mix as well as shift plans, operator qualifications, tool uptimes, preventive maintenance plans, etc. are taken for granted.
2.13 Repairing approaches
During the life of a component, it may be subject to local impacts, thermal cycles and/or stresses or other testing conditions liable to create local defects and cracks. It is reported that several high-performance and high-volume parts are discarded as scrap after failure and so, several studies have been conducted to increase the lifetime of the components mainly by reducing level of failure due to fatigue and stress cracks.
2.13.1 Necessity for part repair
As technology advances, non-destructive methods such as ultrasonic and x-ray computed tomography techniques have been established to detect defects in components at the initial stages to prevent failure during working period, making room for repairing procedures rather than replacement.
Remanufacturing or repair is the process of restoring worn out or damaged products to a workable condition. Repair and refurbishment practices have become more popular in industry as they seek to maximize unit lifetime, availability and profitability. There are significant environmental benefits to repair rather than replacement like saving new material, reduction of waste and avoidance of energy consumption of a new manufacturing process. In addition, in some cases, repaired components can behave better than manufactured ones [155][156][51].
2.13.2 Remanufacturing techniques
There are several repairing processes. Historically, welding processes have been widely used as remanufacturing processes with techniques such as TIG (Tungsten inert gas), PTAW (plasma-transferred arc welding) and EBW (electron beam welding). This approach produces high quality results however at a cost of high residual stresses in the parts and, consequently, distortion in the components. High-velocity oxyfuel (HVOF) thermal spray emerged as an alternative technology producing less distortion in repaired part and enabling coting thin and porosity-free layers. However, it requires extensive secondary machining which limits its application. Electro-spark deposition consists in the application of a thin tungsten carbide coating to increase parts’ resistance to wear, heat and corrosion. This technique can be used for either repairing or prevention of dies by extending its lifetime. Laser based technologies such as DED (Direct energy deposition) play also an important role in remanufacturing state of the art. Although there is not much literature on such processes as remanufacturing technology it has significant benefits such as lower residual stresses, higher repeatability and precision compared to conventional methods. Table 4 sumps up different repair and remanufacturing processes [157][104][158][159][160].
Table 4 – Comparison between different repair and remanufacturing processes [108][109].
Process Post-Processing Advantages Disadvantages
Welding processes (GTAW, TIG, EBW) [161]
• Post heating stress relief
• Intricate repairs can be done
• Produces high quality results
• Imperfections in the tooling
• Repair shows up as defect in the end product

D1.2 – LEVEL-UP SoA analysis
LEVEL-UP | GA n. 869991 Pag. 62 | 115
• Surface finishing (grinding & polishing)
• Limited electrode wear
• Limited intolerance to changes in electrode gap
• Complexity and cost of apparatus
PTAW [162] • Surface finishing
• Lower energy input
• High deposition rate
• Excellent metallurgical bonding
• High precision
• Suitability for the fabrication of small and/or thin parts
• Complexity in the number of process parameters
Electro spark [163] • Dimensional stability evaluation
• Surface finishing
• Prevention of liquid metal erosion and Burr formation
• Improved bonding of Mold Spray
• No automated applications
• Liquid metal resistant electrodes need to be developed
HVOF [164] • Stress relieving
• Surface finishing
• Coating porosity free layers
• Extensive secondary machining
• Expensive instrumentation
• Low dimensional accuracy
Laser-based processes, such as DED [107][165]
• Stress relieving
• Lower heat input
• Less warpage and distortion
• Lower dilution rate
• Excellent metallurgical performance
• High precision of resulting geometry
• Suitability for full automation
• Complexity in the number of process parameters
• Low dimensional accuracy Requires a more complex and advanced control system to get the best results
Two main remanufacturing techniques are explored, specifically Direct Energy Deposition and Crack Healing.
2.13.2.1 Direct energy deposition
Direct Energy Deposition (DED) is an additive manufacturing (AM) technology in the subclass of powder/wire systems. [166] Unlike Powder Bed Fusion (PBF) systems in which powder is spread across the building platform area and then selectively sintered by an energy source (electron beam or laser), in DED systems the material is delivered directly in a melt pool that is generated by a heat source on a substrate or on previously deposited layers. The material is delivered through a nozzle and it is fused to substrate using a laser beam which ensures metallurgical bonding between deposited layer and substrate (Figure 40) [167][104] . As with other AM technologies, the components are built layer-by-layer and different kinematic systems can be implemented. From two- or three axis systems to six axis or above kinematic systems can be used to allow freedom of movement and complex toolpath [168].

D1.2 – LEVEL-UP SoA analysis
LEVEL-UP | GA n. 869991 Pag. 63 | 115
DED systems are generally unable to deliver high precision and detailed parts compared to PBF techniques. This is due to higher material deposition rates and bigger melt pool and layer height of DED, which makes it suitable for larger bulkier components. Due to the nature of the technique, a flat starting surface is not necessarily required which makes it extremely well suited to add new material to existing parts and component repair [119].
Figure 40: Powder-based direct energy deposition process schematics (Saboori et al., 2019).
The metal feedstock can be a wire-fed system, where the wire is fed from a spool and pushed toward the nozzle in a controlled manor or a power-fed system in which a stream of a carrier inert gas is needed to control the flow of powder through the nozzle. Although wire feed systems have proved benefits such as material efficiency, repeatability and cost, difficulties in delivering the wire through complex geometries and higher surface roughness limit its applications. For these reasons, powder-fed systems are the most common form of material used in the DED process. Spherical particles in the range of 50-200 µm have the best feeding properties [169][104] [119] .
Regarding heating source, different types of laser can be used, depending on laser beam spot size, thickness of deposition and complexity of the part. For instance, CO2 lasers are suitable for deposition of thick layers whereas diode laser beam or Nd-YAG (neodymium-doped yttrium aluminium garnet) lasers can be used to deposit thin layers with higher precision. The concept of energy density is crucial for this process. It is proportional to laser power and inverse to scanning speed and beam diameter. A low energy density results in limited melting of provided material, while too high energy density leads to excessive melting of the substrate and eventually evaporation of alloying elements. Therefore, care should be taken to define optimal process parameters [104][170] .
Due to its highly diversified applications, many names can be given to describe DED technology. It can also be referred as Laser Cladding (LC), “Laser Engineered Net Shaping” (LENS®), Laser Direct Casting (LDC), laser consolidation, Laser Powder Fusion (LMF), Direct Light Fabrication (DLF), Laser Powder Deposition (LPD), Automated Laser Powder Deposition (ALDP), Solid Free-form fabrication, Shape-Deposition, Laser Rapid Forming (LRP) or Laser Additive Manufacture (LAMSM). Despite the variety of names, they share several common features that define the technology: deposition of thin layers of powder particles melted by a laser heat source on a substrate [107] [104] .
Applications As an additive manufacturing technology, DED has broad field of applications that include coatings, parts repair, refurbishment, rapid prototyping and even final parts production. It has great potential to produce

D1.2 – LEVEL-UP SoA analysis
LEVEL-UP | GA n. 869991 Pag. 64 | 115
functionally graded parts and even multi-material solutions to produce components with optimal proprieties that perfectly match their application [107] [104].
The most common applications of DED is in the repair and refurbishment of high-value components such as tools, turbine blades and military components [107].
Regarding remanufacturing processes using DED technology, there are already some systems developed by high technology manufacturing companies, which offer technology-intensive products. Table 5 sums up some applications of DED systems dedicated for repairing and correspondent parameters.
Table 5 – Comparison of various dedicated DED repair systems [104] [109].
Type of Repair Repairing Corroded Steam Generator
[114]
High-Value Al Parts that Underwent
Wear
Steel Molds that
Underwent Wear
Corroded Gas Turbine
Blade [121]
Laser 1000 W, CO2 1000 W, YAG CO2 N/A
Material N/A Al alloy Tool steel IN 738
Gas He Ar or He Ar or He Ar
Control Operated through an umbilical cord from a trailer by an operator using commands to a computer, which calculates the angles and position of each axis of the arm
A six-axis assembly robot, which had special end-of-arm robotic tooling, containing the laser lens, powder tube, inert gas tube and fume elimination system as a single unit
N/A N/A
System arrangement A 6-axis robotic arm ROSA is used along with cameras for position detection and non-destructive examination sensors.
A special fixture table was designed for fixing and rotating shells
N/A 3D digitizing system was used to create a 3D model of the components
The literature regarding DED application in repairing and remanufacturing of damaged components have increased due to its advantages such as good precision, narrow melting and heat-affected zones (HAZ), that result in low part distortion. Critical concerns in this field focus on the type of repair, the microstructure of components, repaired part and their interface, mechanical properties of the repaired parts in comparison with the as-built ones and conventionally processed parts, the microstructure and mechanical performance of HAZ, and the feasibility of using different materials to repair the components and improve its performance [171][172][173][104] [174][175][176].
There are also reported applications of the implementation of DED at industry level. Table 6 resumes some industrial applications of DED to repair various components.
Table 6 – Repairing examples of different components using DED technology (Saboori et al.,
2019).
Component Material
Mold, Die, Tools [129] Steel

D1.2 – LEVEL-UP SoA analysis
LEVEL-UP | GA n. 869991 Pag. 65 | 115
Rails [177] Steel
Vessels [178] Steel
Crankshaft [179] Steel
Driveshaft Steel
Marine piston Steel
Gas turbine compressor seal Ni-based superalloy
Low-pressure turbine blades [180] Ni-based superalloy
Turbine airfoils [181] Ni-based superalloy
High-pressure single-crystal turbine blades [182] Ni-based superalloy
Thin-curved compressor blade [183] Ni-based superalloy
A common application of DED in industry is for restoration of molds and dies. Their lifetime is usually shortened due to unpredictable defects and the application of DED with a right choice of materials can have a positive effect [184][104].
In railway applications, rails are subject to extreme wear and rolling contact fatigue. The resistance to these conditions can be improved via surface treatments like case hardening, peening or surface coating, which are suitable to be applied with DED technology [185].
There is also reported examples of DED process to repair cracks in stainless steel vessels that withstand internal water pressure up to 2 bar. In this work, a successful repair was made in underwater conditions with a high powder efficiency [135].
Engine components are good examples of mechanical components that undergo extreme wear and require high precision production process and fine servicing requirements. Their repairing via conventional technologies faced some challenges like bending stiffness and are also very expensive. The use of DED technology allows better repairing results due to good interfacial bonding and dilution between deposited layer and base metal which leads to better metallurgical and mechanical bonding. There are examples of repair of diesel engine crankshaft, drive shaft and pistons. Some studies compared the application of conventional techniques and DED and the latter showed overall better results, namely in surface hardness, corrosion and erosion resistance and microstructure. This is of particular interest, since some of studied parts were subject to marine environment which proves the efficiency of DED for extreme conditions and even from an economic pint of view [186][187][188][104].
Similar conclusions can be drawn from the application of DED in repairs for aerospace industry, where parts are subject to extreme wear. Some studies were carried for repair of gas turbines, high-pressure turbine blades, turbine airfoils and compressor blades. This process produced good results from an economic point of view, with significant savings in costs when compared to manufacturing of new components. There is also reported a general increase in parts performance and mechanical properties and its ability to remanufacture a wide range of defects. Some of these studies took advantage of new computer-aided technologies and repairing was complemented with 3D-scanning procedure to free-form surface reconstruction and optimal toolpath generation. This approach is very promising and enables the development of new overhaul methodologies allowing time and raw material optimization [189][147][139].
“Laser Cladding Corp.” has also remarkable results in the field of component repair at industrial level. There are several examples of repairs such as stainless-steel stems by the application of cobalt based hardfacing, repair of casting defects in big dimension face flange, repair of seal areas of pump parts and also degraded marine diesel engine components (cylinder heads, connecting rods, cylinder liners, valve bodies, pistons and piston crowns. “Laser Cladding Corp” have also reported works in hardfacing of bearing sleeves with cobalt in order to extend service life and application of tungsten carbides in recycling industry wear parts [143].

D1.2 – LEVEL-UP SoA analysis
LEVEL-UP | GA n. 869991 Pag. 66 | 115
Conclusions DED is a maturing AM technology that offers new approaches to repair complex geometry and extensive parts for various industries, from automotive to aerospace ones. In comparison with traditional methods, the main advantages of DED is its flexibility according to a CAD model, lower heat input, and consequently small HAZ, dilution zones and lower residual stresses, can be applied to virtually all metal materials, and final product integrity and accuracy. All the research studies on this topic reported that this process is cost-effective and time-saving, which unveils its potential for sustainability matters [104][109].
The free formability of DED process may also bring significant changes to existing manufacturing processes by the concept of adding special features and improve performance of previously manufactured parts.
Apart from scientific and lab-scale investigation, the repair approach based on DED is successfully being used in industry with various successful applications. Nonetheless, since this technology is rather new, the qualification phase is quite long before the final approval of components and there is the need to define standard procedures for repairing and remanufacturing processes [104].
2.13.2.2 Crack Healing
As early as 1960s, scientists and engineers have started to study the effect of applying electric current pulse to metallic materials on their structures and properties caused by electromigration [190] and electroplasticity phenomena [191][192]. The mechanical properties of metallic materials can be influenced by the application of electric current as a result of : (1) Joule heating; (2) the generation of compressive stress due to temperature gradient; (3) the induction of electromagnetic forces; (4) plastic yielding; (5) phase change and (6) recrystallization.
In recent years, the application of electric current has been extended to the studies of crack healing in metals based on the aforementioned effects. Table 7 presents a summary of the experiments found in the literature.
Table 7 – Experimental studies on high density EPT crack healing.
Authors Alloy type Crack type
Crack width
Current Intensity
Pulse duration
Healing results
(Zhou, Zeng, He, & Zhou, 2001) [193]
1045 steel
quench cracks
various jm =5.3 GA/mm2 200 µs partly healed,
longest healed length =100 µm
(Hosoi, Nagahama, & Ju, 2012) [194]
316 stainless
fatigue cracks
5.51; 4.07 mm
Im =5560; 970A 0.5 ms healed around the crack tips, bridge formed between crack
surfaces
(Zhou, Guo, Gao, & He, 2004) [195]
carbon steel
artificial precracks
2 mm jm =2.4 kA/mm2 800 µs healed length ≈350 µm, close to
the crack tip
(Yu, Deng, Wang, &
Zhang, 2016) [196]
304 stainless
artificial precracks
6.12 mm
jm =4.1 kA/mm2 800 µs healed around both sides of the
crack: right =1347.1 µm; left =1287.4 µm
(Hosoi, Kishi, & Ju, 2013)
[197]
316 stainless
fatigue cracks
3-8 mm
Im =6.0 −9.0 kA 2.0 ms 79-89% crack closure achieved
(Tang, Hosoi, Morita, & Ju,
2013) [198]
316 stainless
fatigue cracks
micro Im =3.0 kA 0.5 ms healing of fatigue damage
observed
(Song, Wang, He, & Duan, 2017) [199]
TC4 titanium
large stretching
micro Im =26.0 kA 400 µs successfully healed
(Ren, Wang, Fang, Song, & Duan, 2020)
[200]
TC4 titanium
large stretching
micro jm =5.09 kA/mm2 400 µs crack no. reduced from 2336 to 252; Max. crack length reduced
from 23 to 12 µm

D1.2 – LEVEL-UP SoA analysis
LEVEL-UP | GA n. 869991 Pag. 67 | 115
(Lu, et al., 2017) [201]
Al3Ti fracture cracks
micro jm =90.5 A/mm2 60 µs locally healed at the narrow
regions of the crack middle, tips not healed completely
(Yang, Yang, Zhang, &
Zhang, 2018) [202]
steel large
tensile tests
micro Im =3.0 kA 400 ns Cracks with a width < 5 µm are
completely healed
Electropulsing Treatment Process Electropulsing treatment (EPT) process mainly involves the application of high current density pulses to the damaged specimens. A typical current pulse of 60-800 µs duration and 2-5 kA/mm2 is generated using a capacitor bank circuit with a discharge voltage of up to 3 kV that is connected in series through two electrodes that are directly bolted to the specimen. The magnitude of the current density and pulse period for successful crack healing are dependent on the characteristics of cracks, geometry and composition of the metal components. Figure 41 schematically depicts a general EPT set–up used [203] in which microcracks were generated by subjecting the specimen to a uniaxial tensile test with 10% deformation, then treated with pulse current with a current density of 5.09 kA/mm2 and period of 110 µs.
Figure 41: Schematic EPT set-up.
Crack Healing Mechanism Although the complete crack healing mechanism during the EPT process is not yet fully determined, it is believed that Joule heating due to the high-density electric current plays an imperative role. Figure 41 illustrates the principal steps involved in the crack healing during the EPT process. As the electric current is being applied, the internal crack acts as a cavity of infinite resistance to the current flow, causes localised current concentration, leading to stronger Joule heating around the crack tip (Figure 42-a).
The localised Joule heating generates non–uniform temperature distribution around a crack and extremely high temperature gradient around the crack tip (Figure 42-b). The thermal expansion of the hotter area is restricted by its cooler surrounding area. This induces a compressive stress flow around the crack with the largest thermal compressive stress experienced at the tip (Figure 42-c).
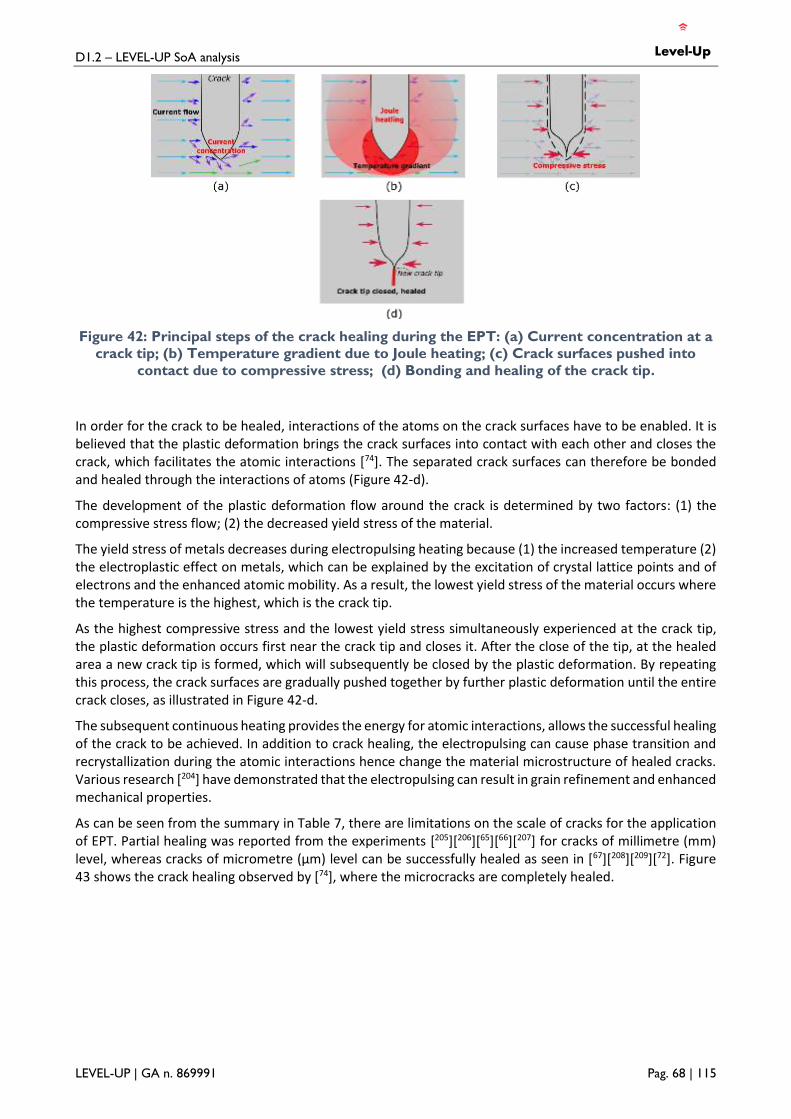
D1.2 – LEVEL-UP SoA analysis
LEVEL-UP | GA n. 869991 Pag. 68 | 115
Figure 42: Principal steps of the crack healing during the EPT: (a) Current concentration at a
crack tip; (b) Temperature gradient due to Joule heating; (c) Crack surfaces pushed into
contact due to compressive stress; (d) Bonding and healing of the crack tip.
In order for the crack to be healed, interactions of the atoms on the crack surfaces have to be enabled. It is believed that the plastic deformation brings the crack surfaces into contact with each other and closes the crack, which facilitates the atomic interactions [74]. The separated crack surfaces can therefore be bonded and healed through the interactions of atoms (Figure 42-d).
The development of the plastic deformation flow around the crack is determined by two factors: (1) the compressive stress flow; (2) the decreased yield stress of the material.
The yield stress of metals decreases during electropulsing heating because (1) the increased temperature (2) the electroplastic effect on metals, which can be explained by the excitation of crystal lattice points and of electrons and the enhanced atomic mobility. As a result, the lowest yield stress of the material occurs where the temperature is the highest, which is the crack tip.
As the highest compressive stress and the lowest yield stress simultaneously experienced at the crack tip, the plastic deformation occurs first near the crack tip and closes it. After the close of the tip, at the healed area a new crack tip is formed, which will subsequently be closed by the plastic deformation. By repeating this process, the crack surfaces are gradually pushed together by further plastic deformation until the entire crack closes, as illustrated in Figure 42-d.
The subsequent continuous heating provides the energy for atomic interactions, allows the successful healing of the crack to be achieved. In addition to crack healing, the electropulsing can cause phase transition and recrystallization during the atomic interactions hence change the material microstructure of healed cracks. Various research [204] have demonstrated that the electropulsing can result in grain refinement and enhanced mechanical properties.
As can be seen from the summary in Table 7, there are limitations on the scale of cracks for the application of EPT. Partial healing was reported from the experiments [205][206][65][66][207] for cracks of millimetre (mm) level, whereas cracks of micrometre (µm) level can be successfully healed as seen in [67][208][209][72]. Figure 43 shows the crack healing observed by [74], where the microcracks are completely healed.

D1.2 – LEVEL-UP SoA analysis
LEVEL-UP | GA n. 869991 Pag. 69 | 115
Figure 43: SEM morphology of a microcrack in titanium alloy sheet (a) before and (b) after
electropulsing. Reproduced from [210].
It is noted that complete crack healing could not occur if the maximum current density is lower than a certain threshold, however overly high current density can cause local melting area around crack tips, generating a hole at the tip. Figure 44 shows a hole was formed in the melting area at the crack tip, as observed by [65]. The formation of the hole can arrest crack propagation hence enhance the fatigue life [211][212], but it cannot close cracks completely, therefore should be avoided during the EPT process.
Figure 44: The hole generated by local melting.
Technology Advantages Compared to the conventional heat treatment, EPT can be performed in situ on existing structures, conducts on a short time scale, consumes less energy, hence has a lower environmental impact. It can be applied to a work hardened operational material and requires limited or no alterations to existing infrastructure or material manufacturing methods. The electric current finds and responds to the cracks automatically, bypassing the issues of detecting crack sites.
(a) (b)

D1.2 – LEVEL-UP SoA analysis
LEVEL-UP | GA n. 869991 Pag. 70 | 115
Industrial Applications EPT induced crack healing has been reported in a number of lab experiments. However, no engineering application of this technology has been reported. Technology Readiness levels (TRL), as shown in Table 8, are designed to access the maturity of a new technology towards full economic operation. TRLs are often used by governments and other funding bodies to define eligibility criteria. As we have seen in the literature, the majority research on crack healing using EPT is based at the laboratory scale. It’s believed that the technology of EPT induced crack healing is around TRL 1-2.
Table 8 – Technology Readiness Level (TRL), EU Horizon 2020.
TRL Description
TRL 1 Basic principle
TRL 2 Technology concept formulated
TRL 3 Experimental proof of concept
TRL 4 Technology validated in lab
TRL 5 Technology validated in relevant environment (industrially relevant
environment in the case of key enabling technologies)
TRL 6 Technology demonstrated in relevant environment (industrially relevant
environment in the case of key enabling technologies)
TRL 7 System prototype demonstration in operational environment
TRL 8 System complete and qualified
TRL 9 Actual system proven in operational environment (competitive manufacturing
in the case of key enabling technologies; or in space)
Conclusions The effectiveness of the EPT on healing internal cracks in metallic materials have been demonstrated throughout the literature review. Fully successful healing has been mostly observed for microcracks, indicating the EPT can be utilised to heal material damages due to fatigue and fracture.
The theory of thermal and electroplastic effects on metals seems to be a robust crack healing mechanism theory available in the literature to date, as it also explains well the plastic deformation flow development around the crack during the healing process.
Further research is required to better understand, clarify and optimise the quantitative and qualitative effects of the processing parameters, namely the current density, pulse duration and the number of current applications. Research is also needed to clarify the varying mechanical property changes due to the EPT.
In order for the EPT technology to be exploited to real life scenarios at an industrial scale, its applicability to defective/cracked metallic components in large equipment/ machinery has to be investigated. For this purpose, large scale simulation of the crack healing process in real components has been proposed for this study.
2.14 Virtual refurbishment (ESI)
ESI Group is a leading innovator in Virtual Prototyping software and services. Specialist in material physics, ESI has developed a unique proficiency in helping industrial manufacturers replace physical prototypes by virtual prototypes, allowing them to virtually manufacture, assemble, test and pre-certify their future products. Coupled with the latest technologies, Virtual Prototyping is now anchored in the wider concept of the Product Performance Lifecycle™, which addresses the operational performance of a product during its entire lifecycle, from launch to disposal. The creation of a Hybrid Twin™, leveraging simulation, physics and data analytics, enables manufacturers to deliver smarter and connected products, to predict product performance and to anticipate maintenance needs.
Manufacturing tools require access to accurate material models that describe the material behaviour during processing. Manufacturing processes addressed within Level-Up include machine refurbishment via additive manufacturing repair of deficient metallic components. The models consider the feed stock delivery and melt

D1.2 – LEVEL-UP SoA analysis
LEVEL-UP | GA n. 869991 Pag. 71 | 115
pool characteristics to capture the micro scale behaviour of the material. The characteristics of the melt pool and the local thermal history are results of relevance for path planning and assessment of macroscopic component behaviour such as distortion. The tools are incorporated in a multiphysics multiscale modelling suite.
Figure 45: multiphysics multiscale modelling suite.
ESI PAM-COMPOSITES is a unique Finite Element simulation chain for the modelling of the manufacturing process of composites structural components. It is used for validation, optimization or correction of a process with the objective of minimizing manufacturing defects.
Figure 46: PAM-COMPOSITES fluid-mechanics coupling functionality.
Data analytics are used to analyse parameter studies performed using physics-based tools described above as well as analysis of monitoring and characterization data acquired during and after the manufacturing process. Data analytics is the means of analysing the digital twin data. Physics-based models deliver results as captured by the theory and our understanding of the physical phenomena taking place. The digital twin captures reality without explaining the origin or the interdependencies between parameters. The difference between physical and digital twins are the unknowns and variations that cannot be captured in idealized theories. The combination provides a hybrid twin providing the explanations and the deviation to reality.
2.15 Recyclability
To address the concept of recyclability, it is important to consider the types of materials that can be recycled, the available approaches to be used and the Life Cycle assessment method(s) possible for adoption.
2.15.1 Analysis of Materials and Recycling options
Heavy equipment is made mainly of 5 material which are carbon alloys, aluminium, stainless steel, brass and plastic.
1. Carbon Alloys

D1.2 – LEVEL-UP SoA analysis
LEVEL-UP | GA n. 869991 Pag. 72 | 115
Carbon alloys are beneficial to use when creating machinery parts due to its corrosion resistance and extreme temperature stability. The carbon content in our alloys is below 5% by weight, meaning the steel can achieve a greater weldability and formability but still maintain the strength of steel. Carbon alloys are commonly used for parts that require corrosion resistance, strength and wear resistant properties.
2. Aluminium
On the other hand, aluminium can be used for parts that don’t require much strength. Due to the lack of density in aluminium, the energy output for machining is fairly low compared to machining other materials. If your machine has weight restrictions, using aluminium parts may prove to be beneficial due to its low density and light weight. Aluminium also has excellent corrosion resistance, and is easy to work with heavy machinery due to its thermal and electrical conductivity. Because of its lightweight and general availability, aluminium is fairly inexpensive compared to other metals.
3. Brass
Along with having great strength and being resistant to corrosion, brass is often used for heavy machinery that is visible to others due to its favourable appearance and colour. Brass is also very resistant to rust, making it a favourable material for machines that will be operating near water or in high humidity atmospheres. Brass is known as being extremely malleable, so it can be easily transformed into any part that you may need. Although regularly more expensive than other materials, it may be easier to work with depending on the part you need for your heavy machining product.
4. Stainless Steel
One of the most widely used metals for machining purposes today is stainless steel. Although it’s very popular, it may be hard to machine due to its intense strength and hardness. However, because of its hardness, it is a great material for heavy machinery that will be used outdoors, as it has a low corrosive property as well. Stainless steel also has a high resistance to heat, allowing it to retain strength at high temperatures.
5. Plastics
Plastic can be used for a variety of different purposes, including creating parts for heavy machinery. Although plastic isn’t very heat resistant due to its low melting temperature, its light weight and high versatility makes it an easy-to-use material for majority of machine parts. Because plastic is generally lower is strength, it would be beneficial to use it for a machine that requires light weight material.
Plastic is currently mainly used in incineration plant (41,4%), recycled (31,1%) and ends in landfills (27,3%). This low rate of recycling has different reasons among them we have its low value and the high diversity of plastic than make it more difficult to collect and valorised. The ISO 15270:2008 « plastics - Guidelines for the recovery and recycling of plastics waste » provides guidelines for the recovery and recycling of plastics waste. It also establishes the quality requirements that should be considered in all steps of the recovery process including recycling.
As they are valuable, metal have much higher recycling rate than plastic. Moreover, metal scraps represent a high fraction used in the production of new metal and alloys as they keep their properties even after multiple cycle of recycling. Looking at their average prices we have stainless steel, brass and aluminium which are around 2,000 €/t and carbon alloys around 500 €/t. Metal scraps follow the same recycling cycle other wastes. The mains steps are collection, sorting, processing, shredding, melting, purification, transportation. It is a bit more complicated to recycled alloys since their composition is not always known. For instance, when brass scraps are recycled it can be readjusted by addition of copper or zinc.
In summary, metals recycling rate is quite high, for instance more than 50% for aluminium [213] and the channels are in place. This is explained by the ease to reintroduce the scraps in the cycle of production with raw materials and the high values of the scraps. The recycling of plastic on the other side is pushed by the legislation since its value is too low and required more process to be valorised.
In sectors using heavy equipment, the 50 percent rule states that replacement is not necessary until the cost of repairing the machine exceeds more than half the cost of the desired replacement machine [214]. There

D1.2 – LEVEL-UP SoA analysis
LEVEL-UP | GA n. 869991 Pag. 73 | 115
are many strong arguments for the 50-50 rule, but many repair/rebuild/replace decisions involving heavy equipment will require an even more complex analysis and the Life Cycle Analysis is one tool that will give a better overall vision to make a wise choice.
2.15.2 European Approaches to Recycling
EU has clear objectives regarding the waste in line with this the 7th Environment Action Programme that sets the following priority objectives :
• To reduce the amount of waste generated;
• To maximise recycling and re-use;
• To limit incineration to non-recyclable materials;
• To phase out landfilling to non-recyclable and non-recoverable waste;
• To ensure full implementation of the waste policy targets in all Member States.
Waste prevention and recycling is also on the 7 strategies adopted by EU as described in his publication: "EU Waste Policy – The Story behind the Strategy" [215]. The vision is first to prevent the production of waste then to promote the re-use then the recycling prior to incineration or landfilling [216]. More recently with the publication of the EU Green Deal and the update of the Circular Economy Action Plan, more focus is expected on diverting material from landfill and promoting refurbishment/remanufacturing and recycling.
The Directive 2008/98/E C establishes the legal framework for the treatment of waste in the EU. As described by the EU a waste is "[…] any substance or object which the holder discards or intends or is required to discard" [217]. In this perspective it is interesting to note the importance attached to the qualification of a material as a resource or waste. For instance, in the scope of metal scraps the interest to qualify a scrap has been treated in a council regulation establishing criteria determining when certain types of scrap metal cease to be waste and become a resource [218]. This council regulation is in line with the EU aim to consider waste as resources.
The revised directive (EU) 2018/851 targets high recycling rate for example 50 % for plastic, 70 % for ferrous metals and 50 % for aluminium in 2025.
2.15.3 Life Cycle Assessment Methodology
Life-cycle assessment, or LCA, is an environmental accounting and management approach that considers all the aspects of resource use and emissions to the environment associated with an industrial system from cradle to grave. It gives a holistic view of a system and prevents shifting burden from one stage of the lifecycle to another, or from one impact from another. ISO standards 14040 and 14044 specify requirements and provide guidelines for life cycle assessment.
LCA is an environmental management tool that informs decision makers and support business strategies. An LCA study consists of four stages:
Stage 1 – Goal and scope definition: this steps aims to define how big a part of product life cycle will be taken in assessment and to what end will assessment be serving.
Stage 2 – Inventory analysis: the environmental inputs and outputs associated with a product or service, such as the use of raw materials and energy, the emission of pollutants and the waste streams are collected and reviewed.
Stage 3 – impact assessment: in this step, outputs are translated into environmental themes such as global warming or human health.

D1.2 – LEVEL-UP SoA analysis
LEVEL-UP | GA n. 869991 Pag. 74 | 115
Stage 4 – Interpretation: the results from the inventory analysis and impact assessment are summarized during the interpretation phase to draw conclusions and recommendations.
Figure 47: Life Cycle Assessment framework.
During the project particular attention will be given to the definition of the goal and scope definition for each use-case in order to maximise the accuracy of the results and the conclusions drawn.
3 New, Existing and Past Related Projects
This section analyses new, existing and past projects relevant to LEVEL-UP. For each one basic information is provided, together with the project’s goal and its relation to the current project, i.e. short description on why the specific project is of interest to LEVEL-UP.
3.1 BOOST4.0
BOOST4.0 Big Data value spaces for competitiveness of European connected smart factories 4.0
Start: 01-01-2018 End: 31-12-2020 Budget/Funding: 18,8M€ / 15M€
Coordinator: Associacion de Empresas Tecnologicas Innovalia (ES), Spain
No. of Partners: 50
Webpage: https://boost40.eu/
Keywords: Big data, Industrial data spaces, real-time
Goals: BOOST4.0 is the biggest European initiative in Big Data for Industry 4.0. It will lead the construction of the European Industrial Data Space to improve the competitiveness of Industry 4.0 and will guide the European manufacturing industry in the introduction of Big Data in the factory, providing the industrial sector with the necessary tools to obtain the maximum benefit of Big Data.

D1.2 – LEVEL-UP SoA analysis
LEVEL-UP | GA n. 869991 Pag. 75 | 115
The project will show demonstrations in 10 pilots and 3 replication factories covering the automotive, equipment manufacturing, white goods, textile, and ceramics sectors.
LEVEL-UP interest:
• AUTOWARE framework,
• IDS Connectors,
• Models for prediction of defects.
3.2 QU4LITY
QU4LITY Digital Reality in Zero Defect Manufacturing
Start: 01-01-2019 End: 31-03-2022 Budget/Funding: 19.5M€ / 16M€
Coordinator: ATOS SPAIN SA (Spain) No. of Partners: 45
Webpage: https://qu4lity-project.eu/
Keywords: Zero Defects Manufacturing; Digital Platforms; Excellence in Manufacturing; Quality Control
Goals: QU4LITY will demonstrate, in a realistic, measurable, and replicable way an open, certifiable and highly standardised, SME-friendly and transformative shared data-driven ZDM product and service model for Factory 4.0
LEVEL-UP interest:
• AUTOWARE framework,
• IDS Connectors,
• Models for prediction of defects
3.3 Z-BRE4K
Z-BRE4K Z-BRE4K (H2020-FOF, 2017-2021) - Strategies and Predictive Maintenance Models wrapped around Physical Systems for Zero-unexpected-Breakdowns and Increased Operating Life of Factories
Start: 01-10-2017 End: 31-03-2021 Budget/Funding: 7M€ / 6M€
Coordinator: Asociacion De Investigacion Metalurgica Del Noroeste (AIMEN) (Spain)
No. of Partners: 17
Webpage: https://www.z-bre4k.eu/
Keywords: Prediction, Data, Maintenance
Goals: Z-BRE4K is offering a novel predictive maintenance platform to eliminate unexpected-breakdowns and extend the life of production systems in order to deal with the ever-rising complexity of modern production systems and their requirements in terms of high reactivity, agility and adaptability.
LEVEL-UP interest:
• Prediction Algorithms
• Data Analytics
• Business development expertise
3.4 iQonic

D1.2 – LEVEL-UP SoA analysis
LEVEL-UP | GA n. 869991 Pag. 76 | 115
iQonic iQonic (H2020-FOF, 2018-2022) - Innovative Strategies, Sensing and Process Chains for Increased Quality, Reconfigurability and Recyclability of Manufacturing Optoelectronics
Start: 01-10-2018 End: 31-03-2022 Budget/Funding: 8M€ / 8M€
Coordinator: Fraunhofer (Germany) No. of Partners: 17
Webpage: http://www.iqonic-h2020.eu/
Keywords: zero defect manufacturing, optoelectronics, recycling, process chain
Goals: iQonic is offering a scalable zero-defect manufacturing platform covering the overall process chain of optoelectrical parts, facing the challenge of dealing with the evolution of the equipment, instrumentation and manufacturing processes they support.
LEVEL-UP interest:
• Deep Learning Algorithms for Prediction/Detection
• Exploitation and Commercialisation activities of project results
3.5 BEinCPPS
BEinCPPS Business Experiments in Cyber Physical Production Systems
Start: 01-11-2015 End: 31-10-2018 Budget/Funding: 7999485,75 € / 9517642,50 €
Coordinator: Politecnico di Milano (Italy) No. of Partners: 23
Webpage: http://www.beincpps.eu/
Keywords: Platform, Marketplace, DIH
Goals: • Integrate and experiment a CPS-oriented Future Internet-based machine-factory-cloud service platform firstly intensively in five selected Smart Specialization Strategy Vanguard regions
• Improve the adoption of CPPSs all over Europe by means of the creation, nurturing and flourishing of CPS-driven regional innovation ecosystems
LEVEL-UP interest:
• Cyber Physical Production System
• machine-factory-cloud
• IoT
3.6 HUMAN
HUMAN Human Manufacturing
Start: 01-10-2016 End: 30-09-2019 Budget/Funding: 361512,50 € / 361512,50 €
Coordinator: SINTEF (Norway) No. of Partners: 13
Webpage: http://humanmanufacturing.eu/
Keywords: Artificial Intelligence, IoT, Cognitive Manufacturing, Wearable devices
Goals: • Develop human-centred automation incorporating the physical and cognitive characteristics of the workers
D1.2 – LEVEL-UP SoA analysis
LEVEL-UP | GA n. 869991 Pag. 77 | 115
• Enhancing the monitoring and wellbeing of human automation co-operation
• Stimulating human-automation interaction for optimal performance
LEVEL-UP interest::
• IoT stack and monitoring
• Middleware, data and application interoperability
• Sensing layer and Sensor device
3.7 NIMBLE
NIMBLE collaboration Network for Industry, Manufacturing, Business and Logistics in Europe
Start: 01-10-2016 End: 31-03-2020 Budget/Funding: 7994750 € / 7994750 €
Coordinator: SRFG (Austria) No. of Partners: 18
Webpage: https://www.nimble-project.org/
Keywords: Platform, Marketplace, IoT, Federation
Goals: • Create a federated interoperable eco-system of medium-sized platforms that provide B2B connectivity for the European businesses that are SMEs and would profit from Internet platforms.
• Develop a federated, multi-sided and cloud services-based business ecosystem
LEVEL-UP interest:
• IoT stack
• Middleware, data and application interoperability
• Data channel
3.8 OpenHybrid
OpenHybrid Title
Start: 01.10.2016 End: 30.09.2019 Budget/Funding: XM€ / YM€
Coordinator: MTC (UK) No. of Partners: 13
Webpage: http://www.openhybrid.eu/
Keywords: Additive, subtractive manufacturing
Hybrid manufacturing
Repair
Goals: By creating new hybrid machines, equipped with both subtractive and additive manufacturing technologies, OpenHybrid is a game changer for faster creation of new opportunities and applications for Additive Manufacturing (AM). This new solution increases the level of robustness and repeatability of industrial processes, optimises the performance of production lines in terms of productivity and cost-effectiveness and. Sustainability, functionality and performance of the produced new materials are assessed. Beyond new parts production, this new manufacturing method allows for a very effective repair technique.
LEVEL-UP interest:
Application of repair simulations refurbishment of metallic components.

D1.2 – LEVEL-UP SoA analysis
LEVEL-UP | GA n. 869991 Pag. 78 | 115
3.9 Uptime
Uptime Unified Predictive Maintenance System
Start: 01.09.2017 End: 31.08.2020 Budget/Funding: 6 248 367,50€ / 4 847 836,25€
Coordinator: BIBA - BREMER INSTITUT FUER PRODUKTION UND LOGISTIK GMBH (Germany)
No. of Partners: 11
Webpage: https://www.uptime-h2020.eu/
Keywords: Predictive Maintenance Framework, Data-Driven FMECA
Goals: UPTIME aims to design a unified predictive maintenance framework and an associated unified information system in order to enable the predictive maintenance strategy implementation in manufacturing industries.
LEVEL-UP interest:
Experiences for the integration of sensor data into predictive maintenance methods while applying AI methods
3.10 FITMAN
FITMAN Future Internet Technologies for Manufacturing
Start: 01-04-2013 End: 30-09-2015 Budget/Funding: 18483329 € / 12890000 €
Coordinator: TXT Solution SpA (Italy) No. of Partners: 40
Webpage: https://cordis.europa.eu/project/id/604674/it
Keywords: Use Case scenarios, Early trials
Goals: • Provide the FI PPP with a set of industry-led use case trials in the Smart, Digital and Virtual Factories of the Future domains, in order to test and assess the suitability, openness and flexibility of FI-WARE Generic Enablers
LEVEL-UP interest:
• Smart digital virtual factory
• Business and Technical indicators
3.11 FALCON
FALCON Feedback mechanisms across the lifecycle for customer-driven optimization of innovative product-service design
Start: 01-01-2015 End: 31-12-2017 Budget/Funding: 5098268,00 € / 4594973,00 €
Coordinator: BIBA (Germany) No. of Partners: 13
Webpage: http://www.falcon-h2020.eu/
Keywords: User experience, social media
Goals: • Develop a Virtual Open Platform to seamlessly connect product-service usage information to design and development processes
D1.2 – LEVEL-UP SoA analysis
LEVEL-UP | GA n. 869991 Pag. 79 | 115
• Addressing product-service information collection through Collaborative Intelligence and Product Embedded Information Devices
• Enabling product-service knowledge representation, exploitation, openness and diffusion
• Strengthening collaborative new product-service development processes through new feedback and feedforward mechanisms
LEVEL-UP interest:
• IoT
• Semantics and Ontologies
3.12 MovAiD
MovAiD MovAiD - Movement Assisting Devices: Manufacturing of personalized Kineto-Dynamics parts and products for workers, elderly and children
Grant agreement ID: 680754
Start: 01-Sep-2015 End: 31-Aug-2018 Budget/Funding: 5.95M€ / 5.14M€
Coordinator: CHAS A BLATCHFORD AND SONS LIMITED (UK) No. of Partners: 12
Webpage: http://www.movaid.eu/
Keywords: movement assistive device, kineto-dynamic equipment
Goals: MovAiD was a cross-disciplinary project that aimed at developing technologies assisting manufacturing of intelligent, “passive” and highly personalised kineto-dynamic equipment (Movement Assistive Devices) to enhance or compensate human movements, aiding the disabled, elderly and workers.
LEVEL-UP interest:
- Real time sensor data collection & interpretation - Additive manufacturing product & process planning
3.13 iMain
iMain iMain
Start: 1 September 2012
End: 31 August 2015 Budget/Funding: 4.871.256€ / 3.433.448€
Coordinator: Fraunhofer (Germany) No. of Partners: 11
Webpage: https://cordis.europa.eu/project/id/314304
Keywords: predictive maintenance, Energy Monitoring, Virtual Sensors, e-Maintenance
Goals: The iMain project from 2012 to 2015 under coordination of Fraunhofer Institute of Machine Tools and Forming Technology (FRAU) with 8 partners from 4 European countries was supported by the EU under the FP7 with 3.4m Euro funding (No. 314304). The objective was to develop a novel and advanced concept with a practically verified solution for an information-based predictive maintenance system. Specifically, an embedded and nearly autonomously operating system for condition & energy monitoring was constructed, which multiplies the information that is obtained from real sensors by using theoretical models of the machine tools resulting in a number of virtual sensors. On this basis, a smart service-life prediction system and a novel e-maintenance strategy using cloud e-maintenance were developed.

D1.2 – LEVEL-UP SoA analysis
LEVEL-UP | GA n. 869991 Pag. 80 | 115
LEVEL-UP interest:
- Information-based predictive maintenance system - Artificial Intelligence Techniques
3.14 Sharework
Sharework Sharework
Start: 1 November 2018
End: 31 October 2022
Budget/Funding: 7.351.467,50€
Coordinator: Fundacio Eurecat (Spain) No. of Partners: 14
Webpage: https://sharework-project.eu/
Keywords: Human Robot Collaboration (HRC), modular hardware, software, knowledge base (KB)
Goals: Fraunhofer IWU (FRAU) is also partner in the project Sharework, which is funded by the EU under the Horizon 2020 Programme (No. 820807). During the project Digital Twins as well as different software and hardware modules are used to develop a European-wide smart modular solution that allows robots to physically interact with humans within a collaborative production environment without the need for physical protection barriers. The project, which is running from 2018 to 2022, will boost process productivity and will improve the ergonomics of workstations.
LEVEL-UP interest:
- Human Robot Collaboration - Knowledge base developement
3.15 Precom
Precom Predictive Cognitive Maintenance Decision Support System
Start: 01-11-2017 End: 31-10-2020 Budget/Funding: 6.146.402,50€ / 7.263.332,50 €
Coordinator: Linnaeus University (LNU) No. of Partners: 17
Webpage: https://www.precom-project.eu/
Keywords: Preventive, Predictive, cognitive, maintenance, Decision support system
Goals: The project will deploy and test a predictive cognitive maintenance decision-support system able to identify and localize damage, to assess damage severity, to predict damage evolution, to assess remaining asset life, to reduce the probability of false alarms, to provide more accurate failure detection, to issue notices to conduct preventive maintenance actions, and ultimately to increase in-service efficiency of machines.
LEVEL-UP interest:
PreCoM aims to deploy and test a predictive cognitive maintenance decision-support system to improve preventive maintenance and ultimately increase in-service efficiency of machines. It will be demonstrated in three different use cases with low volume, high volume and continuous manufacturing.
3.16 Programs
Programs PROGnostics based Reliability Analysis for Maintenance Scheduling
Start: 01-10-2017 End: 30-09-2020 Budget/Funding: 4.847.697,50 € /
D1.2 – LEVEL-UP SoA analysis
LEVEL-UP | GA n. 869991 Pag. 81 | 115
5.995.272,50 €
Coordinator: FIDIA S.p.A. (Italy) No. of Partners: 13
Webpage: https://www.programs-project.eu/
Keywords: Prognosis, reliability, FMECA, PRM, maintenance scheduling
Goals: The main objectives of this project are to develop a model-based prognostics method integrating the FMECA and PRM approaches for the smart prediction of equipment condition, a novel MDSS tool for smart industries maintenance strategy determination and resource management integrating ERP support, and the introduction of an MSP tool to share information between involved personnel.
LEVEL-UP interest::
Continuously monitoring the criticality of system components by performing/updating the FMECA analysis at first implementation or whenever a variation in the system design or composition occurs. Determining an optimal strategy for the maintenance activities. Creating a new schedule for the production activities that will optimize the overall system performance through a Smart Scheduling tool ensuring collaboration among the MDSS, the ERP and the RUL Estimation tool.
3.17 SafetyValu€
SafetyValu€ Safety Valu€ aims to promote economic measurement and indicators of safety Start: 1.9.2011 End: 31.12.2013 Budget/Funding: 3M€ / 2M€ Coordinator: Technical Research Centre of Finland No. of Partners: 14 Webpage: NA Keywords: Safety, measurement, profitability Goals: Aims to promote economic measurement and indicators for safety LEVEL-UP interest: Profitability measurement of safety issues
3.18 SERENA
SERENA Title Versatile Plug-and play Platform enabling remote predictive maintenance
Start: 01-10-2017 End: 30-09-2020 Budget/Funding: 6.95M€ / 5.5M€
Coordinator: COMAU SPA (Italy) No. of Partners: 14
Webpage: https://serena-project.eu/
Keywords: Remote predictive maintenance, cloud, data analytics, edge computing, plug-and-play architecture, monitoring, versatility, HMIs, AR
Goals: SERENA´s main goal is to introduce a powerful platform to aid manufactures in simplifying their maintenance burdens, by reducing costs, time and improving the productivity of their production process
LEVEL-UP interest:
• artificial intelligence methods for predictive maintenance
• advanced IoT system and smart devices for data collection
3.19 Factory of the Future

D1.2 – LEVEL-UP SoA analysis
LEVEL-UP | GA n. 869991 Pag. 82 | 115
Factory of the Future
Usine du futur 4.0
Start: 01.11.16 End: 31.12.22 Budget/Funding: 130 k€
Coordinator: Frederic Sandal (France) No. of Partners: 2
Webpage: https://www.opeo-conseil.fr/industrie-du-futur-se-pense-maintenant-en-region/
Keywords: Audit, SME, production technologies, digitalization
Goals: To finance 100% of the individual pre-diagnosis of the value chain of 600 industrial companies (SME/ETI) between 2014 and 2022 in order to identify areas for progress in terms of 1. industrial organization and management, 2. production technologies in the digital age, and 3. sustainable factories.
LEVEL-UP interest:
Development of a methodology for the quick diagnostic and support of European SME in decision making regarding production efficiency and digitalization
3.20 INCUBIS
INCUBIS An Incubator of Energy Symbiosis Facilitators
Start: 01.01.2020 End: 31.12.22 Budget/Funding: 130 k€
Coordinator: Iris Innovation (Spain) No. of Partners: 8
Webpage: N/A
Keywords: Energy, circular economy, symbiosis, production technologies, digitalization
Goals: The overall objective of the project named INCUBIS is: To help decarbonise European industry by 2050 by unlocking the market potential of energy symbiosis through developing and deploying Energy Symbiosis Incubators across Europe thus enabling the utilization of waste energy from Energy Intensive Industries.
LEVEL-UP interest:
Incubators to test methodologies and outcomes from increased environmental performance, energy symbiosis and increased in production efficiency to support decision making.
3.21 MAESTRI
MAESTRI MAESTRI project aims to advance the sustainability of European manufacturing and process industries.
Start: Sept 2015 End: Aug 2019 Budget/Funding: 5600 K€
Coordinator: ISQ (Portugal) No. of Partners: 15
Webpage: https://maestri-spire.eu/project/
Keywords: Resource Efficiency of Materials and Energy; IoT Platform; Industrial Symbiosis; Management Systems; Lean Manufacturing
Goals: The Total Efficiency Framework will be based on four main pillars to overcome the current barriers and promote sustainable improvements: a) an effective management system targeted at process and continuous improvement; b) efficiency assessment tools to define improvement and optimisation strategies

D1.2 – LEVEL-UP SoA analysis
LEVEL-UP | GA n. 869991 Pag. 83 | 115
and support decisionmaking processes; c) integration with a toolkit for Industrial Symbiosis focusing on material and energy exchange; d) d) a software Platform, based on the Internet of Things (IoT), to simplify the concept implementation and ensure an integrated control of improvement process.
LEVEL-UP interest:
- efficiency assessment tools to define improvement and optimisation strategies and support decision-making processes
- effective management system targeted at process & continuous improvement
- integration with a toolkit for Industrial Symbiosis focusing on material and energy exchange
- software platform based on the Internet of Things (IoT)
3.22 MODULASE
MODULASE Development and Pilot Line Validation of a Modular re-configurable Laser Process Head
Start: 01-09-2016 End: 29-02-2020 Budget/Funding: € 2.397.010/ € 2.184.565
Coordinator: TWI Limited (UK) No. of Partners: 8 Webpage: http://www.modulase.eu/ Keywords: Laser process head; Cladding; Welding; Cutting; Flexibility; Beam Forming Unit;
Modularity; End-effects; Materials; Geometry; Process control; Quality Assurance Goals: To develop a re-configurable highly flexible processing head system, which will be
capable of covering welding, cladding and cutting. The ModuLase process head system will:
• Be capable of welding, cladding and cutting, through the use of three modular end-effectors. • Include intelligent sensor technologies for in-process monitoring. • Be linked to an intelligent system, in order to achieve adaptive process control, quality assurance, and semi-automated process parameter configuration.
LEVEL-UP interest: • Repair in-situ laser welding, cladding and hardening. • Prototype parts manufacturing or special additions with CAD/CAM assistance.
3.23 INTEGRADDE
INTEGRADDE Intelligent data-driven pipeline for the manufacturing of certified metal parts through Direct Energy Deposition processes
Start: 01-10-2018 End: 30-09-2022 Budget/Funding: 12.716.173,00 € 12.716.173,00 €
Coordinator: ASOCIACION DE INVESTIGACION METALURGICA DEL NOROESTE (Spain)
No. of Partners: 26
Webpage: http://www.integraddeproject.eu/ Keywords: Industrial sectoral change, Automation and control systems, Directed Energy
Deposition, Additive Manufacturing, Integrated Automation, End-to-End Digital Manufacturing, Cybersecured data-driven pipeline, Bidirectional dataflow, Certified metal components.
Goals: The industrialisation of Additive Manufacturing (AM) requires a holistic data management and integrated automation. INTEGRADDE aims to develop an end-to-end Digital Manufacturing solution, enabling a cybersecured bidirectional

D1.2 – LEVEL-UP SoA analysis
LEVEL-UP | GA n. 869991 Pag. 84 | 115
dataflow for a seamless integration across the entire AM chain. The goal is to develop a new manufacturing methodology capable of ensuring the manufacturability, reliability and quality of a target metal component from initial product design via Direct Energy Deposition (DED) technologies, implementing a zero-defect manufacturing approach ensuring robustness, stability and repeatability of the process. To achieve this aim, INTEGRADDE addresses following key innovations:
• Development of an intelligent data-driven AM pipeline. • Combination of automatic topology optimisation algorithms for design, multi-scale process modelling, automated hardware-independent process planning, online control and distributed NDT for the manufacturing of certified metal parts. • A self-adaptive control is adopted focused on the implementation of non-propagation of defects strategy. Moreover, Data Analytics will provide a continuous refinement by acquiring process knowledge to assist in the manufacturing of new metal components, improving right-first-time production by adopting a mass customization approach. • Cybersecurity ensures data integrity along the AM workflow, providing a novel manufacturing methodology for the certification of metal AM parts.
INTEGRADDE implements a twofold deployment approach for the pilot lines: both in application-driven at five industrial end-users (steel, tooling, aeronautics, and construction) and open-pilot networks at RTOs already owning AM infrastructure (AIMEN, IREPA, CEA, WEST). This will allow a continuous validation and deployment of specific developments towards industrialization, boosting definitive uptake of AM in EU metalworking sector.
LEVEL-UP interest: • Additive manufacturing (L-DED) • NDT inspection • Modelling and simulation system assisting in product design • CAx technologies supporting production planning for AM • Early detection of defects • Cognitive system • Digital Thread • Physical to digital product transformation
3.24 MAShES
MAShES Multimodal Spectral Control of Laser Processing with cognitive abilities Start: 01-12-2014 End: 30-11-2017 Budget/Funding: 3 673 157€ € Coordinator: ASOCIACION DE INVESTIGACION METALURGICA
DEL NOROESTE (Spain) No. of Partners: 11
Webpage: http://www.mashesproject.eu/ Keywords: Laser process head; Cladding; Welding; Materials; Process control; Repair; Die; Goals: • Real time control in laser processing to avoid defects in highly dynamic laser
processes. • Develop a compact and cost-effective multispectral imaging device. • Fast measurement of temperature with absolute accuracy.
LEVEL-UP interest: • LMD cladding repair of dies for sheet metal forming for automotive and aerospace industry.
3.25 Far-Edge

D1.2 – LEVEL-UP SoA analysis
LEVEL-UP | GA n. 869991 Pag. 85 | 115
Far-Edge Factory Automation Edge Computing Operating System Reference Implementation
Start: 01-10-2016 End: 01-10-2019 Budget/Funding: 3,992,631.25 €
Coordinator: ENGINEERING INGEGNERIA INFORMATICA SPA- ENG (Italy)
No. of Partners: 12
Webpage: http://www.faredge.eu/
Keywords: Cyber-physical systems, Cloud Computing models, Internet of Things, Industrial Automation and Robotics, mechatronics, IoT, CPS, Edge Computing, Industrial Automation, Mass-Customization, Reshoring, Industry 4.0, RAMI 4.0
Goals: The FAR-EDGE Platform will be leveraged by solution providers and system integrators to deliver new generation solutions to the manufacturing industry. The Platform will decentralise monitoring, control and analysis of production processes, moving some key services down to the Edge level and thus helping the virtualization of the conventional automation pyramid. At the same time, the Platform will enable flexible integration of new technologies and devices, as well as fast reconfiguration of production. FAR-EDGE will establish a set of services, which will facilitate manufacturers and integrators of factory automation solutions to take advantage of edge computing architectures towards building scalable, secure and cost-effective solutions. This ecosystem will be a vertical IoT/CPS ecosystem on manufacturing, which aspires to become the world’s most prominent ecosystem on decentralized factory automation solutions based on future internet technologies.
LEVEL-UP interest:
• FAR-EDGE Platform architecture
• Decentralise monitoring, control and analysis of production processes
• Edge computing architectures
3.26 Prophesy
Prophesy Platform for rapid deployment of self-configuring and optimized predictive maintenance services
Start: 01-10-2017 End: 01-10-2020 Budget/Funding: 5,528,318.51 €
Coordinator: INTRASOFT INTERNATIONAL SA (Belgium) No. of Partners: 14
Webpage: https://prophesy.eu/
Keywords: Industrial design, CPS Manufacturing, Industrie 4.0, Predictive Maintenance, Augmented Reality, Automatic Data Collection, Visualization, Knowledge Sharing, PROPHESY-CPS, PROPHESY-AR, PROPHESYSOE
Goals: PROPHESY will deliver, validate and evaluate in operational conditions a PdM services platform (PROPHESY-PDM), which will alleviate several of the issues that prevent manufacturers from deploying PdM services, including the issues of data fragmentation, the lack of data interoperability and the limited deployment of advanced analytics, while at the same time enabling manufacturers to close the loop from PdM activities to production processes. PROPHESY-PDM will be built around the following main and complementary innovations for predictive maintenance in future factories: • A CPS platform optimized for PdM activities (PROPHESY-CPS) • Machine Learning, Data Mining and Statistical techniques for Adaptive Self-
Configuring PdM programmes (PROPHESY-ML) • A PdM service optimization engine (PROPHESY-SOE)

D1.2 – LEVEL-UP SoA analysis
LEVEL-UP | GA n. 869991 Pag. 86 | 115
The main objectives of PROPHESY include: • PROPHESY-CPS: CPS Platform for PdM Excellence • Alleviate Data Fragmentation and Facilitate Data Sharing and
Interoperability • PROPHESY-ML: Predictive Data Analytics Toolbox for Self Configuring and
Self-Adaptive PdM) • Framework for Secure and Trustworthy PROPHESY-PDM • (Remote Visualization & PROPHESY-AR) – Development and Integration of
Visualization and Augmented Reality Services for Remotely Supported maintenance
• PROPHESY-SOE: Methodologies, Platform and Tools for Dynamic and Optimal PdM Solutions
• Pilot Validation and Evaluation through Complex Demonstrators
LEVEL-UP interest:
• Prophesy architecture • CPS platform optimization
3.27 Applications - Call III
Applications - Call III
Application of research results focusing on the introduction of new technologies and processes in production large workpieces
Start: 20-01-2017 End: 31-12-2019 Budget/Funding: 1,41M€ / 0,92M€
Coordinator: SLOVACKE STROJIRNY, A.S. (Czech Republic) No. of Partners: 2
Webpage: http://www.sub.cz/spolecnost/projekty-eu.aspx
Keywords: Large workpieces, machining, monitoring, virtual reality, precision
Goals: The project is aimed at achieving a higher quality production process in the production of large workpieces at the applicant. Production of such workpieces is not a common engineering production in the Czech Republic or in the world, there are few companies that are able to handle this type of production. These include the introduction of virtual reality to monitor the production process, the introduction of advanced fixtures to improve machine efficiency and increase production accuracy for workpieces of up to 100 tons. (Project ID: CZ.01.1.02/0.0/0.0/16_084/0008839)
LEVEL-UP interest:
• Sensorics
• Volumetric accuracy
• Big data
• Prediction models
3.28 CK SVT
CK SVT Competence Center - Manufacturing Technology
Start: 01-04-2012 End: 31-12-2019 Budget/Funding: 12,61M€ / 8,75M€
Coordinator: Czech Technical University in Prague (Czech Republic)
No. of Partners: 10
Webpage: https://starfos.tacr.cz/en/project/TE01020075#project-main

D1.2 – LEVEL-UP SoA analysis
LEVEL-UP | GA n. 869991 Pag. 87 | 115
Keywords: Machine tool, Manufacturing technology, Cutting, Forming, Accuracy, Performance, Simulation, Optimization, Virtual reality, Lifecycle, New materials, Composites, Energy efficiency, Damping, Thermal error, Control, Safety, Measurement, Compensation
Goals: The MT sector develops machine tools, forming machines and new technologies for all other manufacturing sectors. The main project aim is R&D of technical means, solutions and technologies to increase main functional characteristics of machine tools (accuracy, quality, production performance, reliability, cost-efficiency and environmental performance) and to support technical excellence of the Czech MT sector. (Project ID: TE01020075)
LEVEL-UP interest:
• Virtual reality
• Simulation
• Safety
• Compensation

D1.2 – LEVEL-UP SoA analysis
LEVEL-UP | GA n. 869991 Pag. 88 | 115
4 New, Existing and Past Related Initiatives and Products
This section analyses new, existing and past initiatives related to LEVEL-UP project. It also reports on the introduction into the market of products related to the objectives of the project.
4.1 FOCUS
FOCUS FOCUS
Start: 1 January 2015 End: 31 December 2016 Budget/Funding: 324.794€
Coordinator: NTNU (Norway) No. of Partners: 11
Webpage: https://www.focusonfof.eu/
Keywords: Zero Defect Manufacturing, Robotics, Clean factory, Precision Micro Production Technologies
Goals: In the FOCUS project that was supported by the EU under the Horizon 2020 Programme (No. 637090) from 2013 to 2016 11 partners from five European “Factories of the Future” (FoF) project clusters shared experiences and best-practice to stimulate the take-up of project results and investigate how to best exploit synergies. The clusters within FOCUS were zero defect manufacturing, clean factories, robotics, high precision manufacturing and maintenance & support. Fraunhofer IWU led the cluster Maintenance and Support.
LEVEL-UP interest:
- FOCUS model for clustering and industrial exploitation known at relevant stakeholders
- Methodology for clustering - Methodology for industrial exploitation & take-up
4.2 TPSVT
TPSVT Technology Platform of Engineering Production Technology
Start: 01-01-2008 End: continues Budget/Funding: private
Coordinator: Association of Engineering Technology (Czech republic)
No. of Partners: 31
Webpage: https://www.tpsvt.cz/en/
Keywords: Cooperation, Strategic Research Agenda, Machine Tools, Technological foresight
Goals: The Technology Platform of Engineering Production Technology (TPSVT) was founded in 2008 as a group of subjects in the field of machining and forming machines. The platform consists of manufacturing companies, research institute and association that have long been operating in the "Machine tools" field in the Czech Republic. The main objectives of the Technology Platform for the period up to 2030 are: Objective No.1.: to maintain and strengthen the competitiveness of industrial production in the European and world scale through research, development and innovation;

D1.2 – LEVEL-UP SoA analysis
LEVEL-UP | GA n. 869991 Pag. 89 | 115
Objective No.2.: increasing the intensity of joint research, development and innovation activities between industry companies and research organizations that lead to a new successful production.
LEVEL-UP interest:
Technological foresight focused on a more detailed analysis of the machine tools users' needs, as well as an analysis of the needs and requirements for final consumer products.
4.3 INDUSTRY CLUSTER 4.0
IC40 Industry Cluster 4.0
Start: 15-02-2016 End: continues Budget/Funding: private
Coordinator: Brno Regional Chamber of Commerce (Czech Republic)
No. of Partners: 23
Webpage: https://ic40.cz/en/
Keywords: Industry 4.0, Digitization, Automation, Manufacturing Processes
Goals: INDUSTRY CLUSTER 4.0 is an important association of engineering and IT companies from the South Moravian Region, united to enhance their competitiveness and innovative activities, mainly through the implementation of the "Industry 4.0" concept. The cluster activities can be divided into three areas: 1. Digitization and automation of manufacturing processes (Industry 4.0) 2. Preparation of human resources in technical fields 3. Improving the export capabilities of members
LEVEL-UP interest:
Industry 4.0
4.4 Early Detection and Prediction Engine
Early Detection and Prediction Engine
Start: 01-10-2017 End: 31-03-2021 Budget/Funding: 7M€ / 6M€
Coordinator: Asociacion De Investigacion Metalurgica Del Noroeste (AIMEN) (Spain)
No. of Partners: 17
Webpage: https://www.z-bre4k.eu/
Keywords: Predictive maintenance,
Description: It is a novel predictive maintenance platform based on machine learning intelligence to eliminate unexpected-breakdowns and extend the life of production systems.
LEVEL-UP interest:
• Prediction
• Machine state analytics
4.5 EIT Manufacturing
EIT Manufacturing

D1.2 – LEVEL-UP SoA analysis
LEVEL-UP | GA n. 869991 Pag. 90 | 115
Start: 07/11/2019 End: 31/12/2026 Budget/Funding: XM€ / YM€
Coordinator: Heinrich Flegel (Daimler AG) No. of Partners: 50
Webpage: https://eitmanufacturing.eu/
Keywords: Advance manufacturing, business, education and research, innovation community
Goals: EIT Manufacturing’s mission is to bring European manufacturing actors together in innovation ecosystems that add unique value to European products, processes, services – and inspire the creation of globally competitive and sustainable manufacturing.
EIT Manufacturing will establish an innovation community and build a network of ecosystems where people can acquire skills and find opportunities; and where innovators are able to attract investors and accede venture capital.
For that purpose, EIT Manufacturing brings together 50 European leading partners from business, education and research, from 17 countries.
LEVEL-UP interest:
Take advantage of innovations and projects launched from EIT Manufacturing.
4.6 Intelligent Manufacturing Ecosystem
Intelligent Manufacturing Ecosystem (IME)
Start: 1/9/2018 End: 31/8/2020 Budget/Funding1,5 m€
XM€ / YM€
Coordinator: Tampere University (Finland) No. of Partners: 12
Webpage: https://tutcris.tut.fi/portal/en/projects/alykas-valmistus-ekosysteemissa(85a3b33d-92f3-4539-b036-9ab9bbdc4d3c).html
Keywords: New material and manufacturing technology, artificial intelligence and profitability management
Goals: The main project-level goals are in-depth material and manufacturing technology research, which is actively supported by profitability management research and artificial intelligence. The aim is also to increase the attractiveness of research and teaching in those selected technology areas.
LEVEL-UP interest:
New technology from the profitability management perspective.
4.7 MAIN-FoF
MAIN-FoF: Maintenance in Factories of the Future
Company Fraunhofer IWU
Webpage https://main-fof.jimdofree.com/
Keywords Maintenance, Digitisation, Factories of the Future, Condition Monitoring, Condition Based Maintenance

D1.2 – LEVEL-UP SoA analysis
LEVEL-UP | GA n. 869991 Pag. 91 | 115
Description The Maintenance & Support Cluster consists of eight Factory of the Future (FoF) projects: iMAIN, Power-OM, SUPREME, EASE-R, T-REX, SelSus, ReBorn and white-R. Of these, iMAIN, Power-OM, and SUPREME form the core of the cluster, involving 25 partners from eight European countries. Through these projects, the cluster will deliver the basis of an advanced modular condition monitoring and maintenance system for forming machines and other highly stressed systems. These new smart and agile maintenance approaches should increase the lifetime and energy efficiency of production equipment while reducing maintenance costs.
4.8 MindSphere
MindSphere
Company: Siemens (Germany)
Webpage: https://siemens.mindsphere.io/en
Keywords: Open IoT, Operating System, Cloud-based, Ready-to-use API
Description: Cloud-based ecosystem for connecting different machines with a lot of connectivity options. It is possible to connect existing cloud-based and on-premises solutions to MindSphere by the use of APIs for cloud Integration. MindSphere already offers basic apps to do some analysis of operating-data. Moreover, there is an app-store and the possibility to develop one’s own apps and then MindSphere acts as a platform.
4.9 iLIke Machines
iLike Machines
Company: Holonix (Country)
Webpage: https://www.holonix.it/en/i-like-machines/
Keywords: Machinery Management, Software, Sensor Data Gathering
Description: iLike Machines offers services for machinery management for both machine producers and machine owners. Producer side: geo-localization of their products, reception of (near) real-time alarms and warnings on anomalies and unexpected behaviours, possibility of providing improved diagnostic and maintenance, data collection to (re-)designs their products. Owner side: monitoring the machines, reception of alarms, plans for maintenance activities, acquisition and collection of hundreds of data from sensors, gateways and machine systems.
4.10 DFX
Lean DfX - Lean Design for eXcellence
Company INEGI
Webpage http://www.inegi.up.pt/
https://www.sciencedirect.com/science/article/pii/S2212827117309356

D1.2 – LEVEL-UP SoA analysis
LEVEL-UP | GA n. 869991 Pag. 92 | 115
Keywords Lean Design-for-Excellence; LeanDfX; LDfX; Multi-Dimensional Product Design Assessment; Product Life Cycle Management
Description Lean Design-for-X (LeanDfX) was developed by INEGI and embraces the principles of Lean Product Development and Modular Design, for a systematic applicability by design engineers and product managers, assessing the effectiveness and efficiency of a given product design. A LeanDfX index metric, ranging between 0-100%, and original scorecard were created for consistent decision support for the comparison of different design concepts or products, integrating different “X” domains. The approach was already applied in different projects and real case studies (Capital Goods, machine-tool design; Aeronautics, Assembly System Design; Automotive; urban bus body design assessment; etc.). The framework is also available in the form of a software tool, that can be used in SaaS mode.
4.11 DDD Simulator
DDD Simulator
Company: Technology Transfer System S.r.l. (Italy)
Webpage: https://www.ttsnetwork.net/en/simulator/
Keywords: 3D Simulation, Kinematics simulation software
Description: DDD Simulator is a hybrid 3D kinematics and discrete events simulation software based on a strong modular approach that supports both quasi real time and batch simulations of large complex manufacturing plants. The possibility to run simulations in accelerated mode is the key feature that enables the optimization of the operation of single machines and full plants. The logic of the simulation modules is completely programmable in a dedicated IDE that allows the user to test and debug the developed models, while a simplified Layout Builder application enables the composition of scenarios starting from libraries of simulation bricks.
4.12 DANOBAT Data System
DANOBAT Data System
Company: DANOBATGROUP
Webpage: https://www.danobat.com
Keywords: IoT gateways, data cloud,
Description: The DANOBAT Smart Box is part of the DANOBAT Data Systems platform. The IoT layer of the platform is implemented by DANOBAT Smart Box, a Plug&Work device able to connect to multiple sources such as the main machine tool CNCs/PLCs (Heindenhain, Siemens, Fanuc, Omron), and a complete set of sensors. The DANOBAT smart box is responsible of data gathering and transmission in a secure way. By default, the DANOBAT Smart Box is configured to make data persistent in the DANOBAT Industrial Cloud but can even be stored in the premises of the customer activating a local database that can be run in the DANOBAT Box.
D1.2 – LEVEL-UP SoA analysis
LEVEL-UP | GA n. 869991 Pag. 93 | 115
All the device libraries and mechanisms are integrated into the same platform using
a connectivity infrastructure developed for industrial heterogeneous ecosystem,
allowing the access to different devices used in manufacturing industry.
4.13 Risk Management Studio
Risk Management Studio
Company: Klappir (Iceland)
Webpage: https://www.riskmanagementstudio.com/#
Keywords: Risk management, software,
Description: Risk Management Studio is an Integrated Risk Management Framework for companies It provides a toolkit of solutions for the implementation of risk management policies, processes and procedures. Steps are: a) Identification and organization of the: scope, laws, regulations, risks, controls, and stakeholders required to successfully meet the business objectives, b) Fortification of the ISMS by strengthening the company’s cybersecurity defence in a centralized solution, c) Verification and validation of aspects important for proof of reliability and consistency in the desired results.
4.14 SimaPro
SimaPro
Company: Pre (Netherlands)
Webpage: https://simapro.com/
Keywords: Life cycle assessment, software, environmental assessment
Description: SimaPro allows for sustainability efforts to be measured, embedding sustainability into daily operations, and turning sustainability initiatives into a competitive advantage.
SimaPro provides a high level of transparency needed to make fully-conscious choices and achieve accurate results. SimaPro helps empower company-wide collaboration and can display LCA results in a way that helps stakeholders understand the impact of their decisions.
4.15 Semantic Mediator Front- end Backend
Company: BIBA - Bremer Institut für Produktion und Logistik GmbH
Webpage: http://www.fiware4industry.com/?portfolio=semantic-mediator-semed
Keywords: semantic interoperability, PLM support through O-MI/O-DF interface, robust query interface
Description: The FITMAN Semantic Mediator Front- end Backend (SEMed) is a mature middleware layer for semantic, virtual interoperability and integration specifically of item-level product lifecycle data. It facilitates a standards-based

D1.2 – LEVEL-UP SoA analysis
LEVEL-UP | GA n. 869991 Pag. 94 | 115
4.16 ITK product
ITK-Daedalus CPS
Company: Sensap Swiss AG (Switzerland)
Webpage: www.sensap.ch
Keywords: IIoT Edge Device, Data Acquisition
Description: ITK Daedalus CPS system transforms mainly legacy but also newer machinery to a Cyber-physical system with the benefits of the industry 4.0. Through its modular design, Daedalus besides its core functionality of data acquisition and signal processing, it has a variety of modules related to machinery production, as in-Line vision inspection modules for product quality and defect detection and “smart” Tag module for traceability and automate machine recipe loading.
Daedalus integrates with the most popular EIS systems (i.e. ERP, WMS, MRP) providing automatic and reliable synchronization of warehouse and shop-floor resources (i.e. labour, equipment, tools, and materials) with standing managerial data, while enabling real-time, remote visibility of operations performance through WEB-based customizable dashboards.
Key Features:
❖ Measurement Extraction ➢ Sensors installed to the machinery
▪ values continuously updated ➢ Machinery inter-Connection ➢ Extract measures from Signals
❖ KPI Calculation Process ➢ Calculate KPIs such as OEE, Downtime, Up time, Idle time
❖ Visualization module ➢ Visualize measures, KPIs and production order details
❖ Receive order details ➢ Gets input from barcode scanner (vision, optical)/RFID tags ➢ Request and Gets the order details from Edge Server/ERP/MES systems
❖ Send measures ➢ Send measures and KPIs to the Edge Server/ERP/MES systems
❖ Vision Inspection ➢ Defect detection
❖ Printing Server ➢ Producing Batch/Lot Labels
❖ “smart” Tag ➢ Reading/Writing RFID tag with data related to product state
access to PLM data, for example through its support for the Open Group QLM Standard Open Messaging Interface (O-MI) and Open Data Format (O-DF). At the same time, it provides semantic interoperability for different kinds of common data sources like databases and file based repositories. It introduces a layer of semantics on top of existing syntactic data structure descriptions to avoid semantic integration conflicts and allows a scalable, efficient and comfortable interoperability of product data across all of the stakeholders and IT systems involved in digital factories.

D1.2 – LEVEL-UP SoA analysis
LEVEL-UP | GA n. 869991 Pag. 95 | 115
4.17 Virtual Manufacturing Solutions
Company: ESI Group (F + D)
Webpage: https://www.esi-group.com/software-solutions/virtual-manufacturing
Keywords: Casting, Composites, Sheet Metal Forming, Welding & Assembly, Additive Manufacturing, Plastic
Description: A Virtual Manufacturing system provides unique design flexibility for process development teams. Through virtual simulation software, engineers can anticipate and solve process related issues before ever building processes. This gives the manufacturer the ability to cut costs by creating components, via simulation, for testing and quality assurance purposes. With all of these benefits, there has never been a better time to become of virtual manufacturer. The scope applied to Level-up will include Additive Manufacturing and possible composites solutions.
4.18 Simulation X
Company: ESI ITI (D)
Webpage: https://www.esi-group.com/software-solutions/system-modeling/simulationx
Keywords: System Modelling
Description: Beginners and experts alike know ESI’s SimulationX to be one of the most popular software brands in the field of multiphysics system simulation for modelling, simulating, and analysing complex dynamic systems. By assessing the consequences of technical decisions, eliminating errors and reducing the number of physical prototypes, e.g. through virtual testing, you will find that this tool can help you early on in the development process when the impact is still minor. This saves you time and money. With system simulation, you are always one step ahead – from the initial idea and decision-making to the development and sales process to virtual commissioning, operation and training.
4.19 Engineering Data Analytics
Company: ESI Group (F + D)
Webpage: https://www.esi-group.com/software-solutions/engineering-data-analytics
Keywords: Data analytics, machine learning
Description: ESI’s Data Analytics solution platform INENDI is a specialized set of solutions that combines state of the art Engineering Data Analytics and management approaches, intuitive visualization and efficient investigation methodologies to allow for a fast discovery of the unknown in large high-dimensional datasets.
With INENDI, ESI brings its long-standing innovative capability and its expertise in designing solutions tailored for professionals who need to solve difficult high-value problems into the Cyber Security market.
With INENDI, ESI also helps its customers face the Big Data challenges induced by the ever-increasing size and complexity of simulation data. Considering the total cost of ownership of such simulation data, and all of the efforts needed to produce

D1.2 – LEVEL-UP SoA analysis
LEVEL-UP | GA n. 869991 Pag. 96 | 115
high-quality simulations, the Data Analytics solutions brought by ESI improve the ROI and leverage the benefits of critical knowledge captured by engineers.
5 Potential Opportunities and Threats
This section completes the analysis on the subject of exploiting possible future opportunities as well as handling and avoiding possible threats, in relation to the use of the specific technologies, in the context of the LEVEL-UP project.
TECHNOLOGY OPPORTUNITY THREAT
IoT, Knowledge representation and Ontologies
The goal is the achievement of the interoperability of LEVEL-UP protocols independently from the data sources like sensors or complex data. Changing heterogenous data sources shouldn't have an impact on the higher level data driven analysis and application of protocols. It is an opportunity to take advantage of the semantic mediator can
Consolidating inputs from multiple data sources and with different protocols may require more time to implement. Consolidating inputs especially from equipment of different OEMs and vendors poses a challenge.
Operating systems for digital factories
Some of the key features to consider when deploying a factory operating system are interoperability, real time communications and data security. However, factory operating systems are rapidly advancing thanks to the latest technologies in communication, and specially with the development of IDSA connectors major steps can be achieved towards data sovereignty and interoperability.
Major threat to the implementation of factory operating systems when working with brownfield factories is the proprietary systems of the different equipment which could limit the interoperability within the factory slowing down the transition into a smart factory.
Operating platforms 1 - connect various existing platforms with standardized communications to the cloud, so that you can program apps with standard data-interfaces that can make use of the same data from different sources.
2 – polling data from various devices is easy to manage, without knowing much about the controller hardware.
3 – Hard and Software managed and provided with updates regarding features and security.
1 – need to make sure it´s possible to get the needed data for the application out of every single device (different programmers take different approaches handling data).
2 – need to make sure the process is not affected by the additional communication load, especially when polling high frequency data or high amounts of datapoints – analysis required before.
3 – tied to (long) support cycles, e.g. from Siemens, so if support ends you are forced to change the devices if you need reliable
D1.2 – LEVEL-UP SoA analysis
LEVEL-UP | GA n. 869991 Pag. 97 | 115
operation and replacement part availability.
iLike Machines Possible opportunities are related to the bringing of the approach to the next steps, introducing new features and enabling the system to support both owners and producers to plan for Lifetime Extension of large industrial equipment interacting with ad hoc DSS and knowledge extraction algorithms, able to automatize the cycles that currently still requires human intervention.
Possible threats are related to:
- constraints and need which will arise according to the designed LEVELUP architecture, to the interaction with other IT components and to the field requirements (pilots),
- availability of sensory data from pilot plants.
Connection in the physical layer
Innovative blend of communication technologies (Framework/transport) standards to support the digital transformation of the pilot lines shop floor to a “smart shop floor”
Current edge technologies with a dynamic status.
A holistic approach for all Use Cases may not be possible to be identified.
Data aggregation Connecting with other data ecosystems
“The international data spaces (IDS) is a virtual data space leveraging existing standards and technologies, as well as governance models well-accepted in the data economy, to facilitate secure and standardized data exchange and data linkage in a trusted business ecosystem. It thereby provides a basis for creating smart-service scenarios and facilitating innovative cross-company business processes, while at the same time guaranteeing data sovereignty for data owners [219].” Taken from the foreword of the reference architecture model of the IDSA, the idea of cross-sectorial exchanges is at the basis of the association’s model. If the data aggregation and exploitation for a company might present promising opportunities, the possibilities to connect whole value chains together are unprecedented. For that reason, Level-Up project can imagine a step in the exploitation phase where connections will be made outside the initial ecosystem to access additional data and services.
Letting a non-European based values standard impose its rules for data sharing
The specification of the IDS Association forms the basis for data ecosystems and marketplaces based on European values, i.e. data privacy and security, equal opportunities through a federated design, and ensuring data sovereignty for the creator of the data and trust among participants. Non interoperable platforms, services and data endpoints take the risk to be overcome by a de facto standard powerful enough to remove their once strong hold on a specific area or/sector/value chain. These scattered efforts to lock the value might prove to be counterproductive and pave the way for standards that don’t respect European values. This is the role of economic leaders and existing data sharing initiatives encouraged by European governments to agree upon the rules that will prevail in this new economy. IDS Association can see its action in this direction offering a platform for companies to define the rules but also

D1.2 – LEVEL-UP SoA analysis
LEVEL-UP | GA n. 869991 Pag. 98 | 115
interviewing its architecture with major initiatives [220].
Machine Learning New opportunities for advancing Predictive Maintenance solutions by offering Machine State Forecasting for large industrial machines.
The threat for the Machine Learning solutions is that historical data is not available from pilots’ plants, the need for retrofitting of sensors (CPSisation) and ramp up periods to be able to collect sensory data.
FMECA The analysis and modelling of failure modes for each pilot case will ensure the precision of the risk assessment of FMECA, which will in turn boost the performance of the DSS in improving maintenance performance.
Difficulty of pilot companies to provide reliable data, especially failure mode logs. Need to transfer knowledge from the experts on the shopfloor into LEVEL-UP systems.
DSS Achievement of interoperability of LEVEL-UP technologies (FMECA & KRI models) to improve maintainability and performance of large assets at the pilots by ameliorating precisely identified issues and shortcomings.
Difficulty in the incorporation and integration of other systems whose data DSS is intended to consume as input (i.e FMECA), as well as not having acquired the appropriate data to support and ensure the system’s reliable function.
CBA The introduction of new technology is largely technology driven. However, business development should be customer and demand driven. Profitability reviews are one step towards customer driven development work.
The threat is that not enough reliable data are made available from the pilot companies of the project.
CAD/CAM/CAPP extraction
International standards such as QIF which contain semantic data information bring the opportunity to have a complete traceable product chain, from design to manufacturing and quality control in both the virtual and physical world. This kind of standards will allow to build digital twins not only from the CAD designs, but also by feeding back metrology information into the virtual world. Ultimately, facilitating a more dynamic and reliable product chain.
QIF is a relatively new standard (7 years old) still being developed that has encounter harmonization challenges with ISO geometrical product specification. The threat for QIF is that the CAD/CAE/CAPP vendors will not support QIF in an attempt to maintain their status quo.
Digital/Virtual twins/ commissioning/refurbishment
Industry 4.0 and the associated digitisation of products, machines, production processes as well as of the whole factories bears a great potential for increase of production efficiency and thus also for better competitiveness of the companies.
The changes of temperature, pressure and humidity may lead to increased uncertainty of the measurement by the multisensory systems implemented in the construction of the machine and of the sensors employed in workpiece check-

D1.2 – LEVEL-UP SoA analysis
LEVEL-UP | GA n. 869991 Pag. 99 | 115
ups. Appearance of new threats that may stop or significantly slow down the production (incorrect setting of the limit values may have a negative effect on the production process). In further development of industry digitization, it will be necessary to pay adequate attention mainly to cybernetic safety of the smart machines. All these parameters need to be taken into account in the Digital/Virtual twins.
Repairing approaches The remanufacturing stage represents both striking opportunities and consequential risks. The opportunities lie in the possibilities of extending the life cycle of equipment through repairing, 3D welding techniques, and using the same technologies, surface functionalization.
Threats mostly rely on the difficulty to perform the tasks in situ, depending mostly on external factors such as size, geometry and accessibility of the zone to be refurbished. The powder/wire feedstock cost also needs to be considered as a threat, as the availability is not always guaranteed.
Crack Healing Currently at TRL1/2, EPT induced crack healing poses promising market potentials as it offers an effective, economical, and sustainable in-site structural repair solution. The analytical, experimental and modelling studies, in conjunction with the demonstrations in the operational/ industrial application environment will prove the critical functionality of the crack healing technology, provide a quantitative characterisation of prospective applications of this new technology, facilitating its advancement to TRL4.
The threat arises from (1) the lack of accurate analytical and computer models to simulate the crack healing behaviour as a function of processing conditions and crack characteristics due to the complex nature of multiscale and multiphysics phenomena, and (b) the crack dimensions are beyond that limit of in-situ repair using EPT technology.
Recyclability Environmental impacts are currently untracked for many machinery related replacement s and therefore this will allow for a greater understanding into the various options open to manufacturers. Additionally, this provides an option to create a framework for internal decision making combining environmental and economic factors. An additional opportunity to create a circular link by reuse of recycled material into the manufacture of machinery and thus reduce the cost of the machinery parts.
By mis-calibrating the priority and importance of environmental vs pecuniary factors, outputs could be misleading and negatively affect the performance of the system. Additionally, by not sufficiently considering external impacts to the system, such as delays in delivery or supply for components, the results could be ambiguous and less concrete in the recommendations.

D1.2 – LEVEL-UP SoA analysis
LEVEL-UP | GA n. 869991 Pag. 100 | 115
6 Conclusions and Next Steps
In the present deliverable, an extensive analysis on the State of the Art of the technologies that are being examined for their suitability to be used in the LEVEL-UP project has been presented. It is evident that a plethora of technologies is being considered, as the needs from the multiple pilots differ. The partners are defining the requirements of each use case and technology, which results in a mapping among them. Moreover, past and existing projects, initiatives and products related with LEVEL-UP have been taken into account. Their connection with the scope of the present project and the experience that partners may have carried out as a result have been the key drivers for their identification. In the corresponding tables, there is information concerning each project, such as the budget, the timeframe, a brief description and the relevance with LEVEL-UP.
In the State of the Art analysis, the following technologies have been presented:
• Internet of Things
• Operating Systems
• Operating Platforms (SIEM)
• Connection in the physical layer
• Data aggregation
• Knowledge representation and Ontologies
• Machine Learning
• Risk assessment (FMECA, KRI models)
• Decision Support System
• Cost Benefit Analysis
• CAD/CAM/CAPP extraction
• Digital Twins on the edge and cloud
• Digital twin operation on the edge
• Updating virtual twins
• Virtual commissioning
• Repairing approaches
• Crack Healing
• Virtual refurbishment
• Recyclability
All the aforementioned technologies are all going to be utilized in the LEVEL-UP project, aiming to surpass the current State of the Art and achieve new goals. Finally, there is a brief analysis focusing on opportunities and possible threats stemming from the use of these technologies in the project. This is done keeping in mind that their use may come with restrictions and advantages.
While this deliverable marks the completion of “Task 1.2 Analysis of SoA, existing and past projects/initiatives”, the partners will revisit the issue of knowledge management and technology watch with respect also to advancements in the State of the Art, within “Task 8.5 Knowledge Management, Data Management Plan & IPR Protection”, which runs throughout the complete duration of the project.

D1.2 – LEVEL-UP SoA analysis
LEVEL-UP | GA n. 869991 Pag. 101 | 115
7 List of Figures
Figure 1: Connectivity breaks through production hierarchies. ......................................................................... 11
Figure 2: RAMI 4.0 Reference Architecture. .................................................................................................... 12
Figure 3: AUTOWARE´s Reference Architecture. ......................................................................................... 14
Figure 4: Operating Platforms on-site machine tools ......................................................................................... 15
Figure 5: Operating Platforms on-site production systems ................................................................................ 16
Figure 6: MindSphere connectivity.................................................................................................................... 17
Figure 7: MindSphere as App Platform ............................................................................................................ 18
Figure 8: MindSphere SINUMERIK Integrate extension ................................................................................. 18
Figure 9: MindSphere Edge overview ............................................................................................................... 19
Figure 10: RAMI 4.0 Reference Architecture ................................................................................................... 20
Figure 11: Physical Layer Conceptual Diagram. ................................................................................................ 21
Figure 12: Connectivity is a crosscutting function in the Industrial Internet Reference Architecture. ................ 21
Figure 13: RAMI4.0 and IDS share a common layer structure. ........................................................................ 25
Figure 14: Correspondent categorizations of IDS and IIRA. ............................................................................ 26
Figure 15: From data provisioning to data usage. .............................................................................................. 27
Figure 16: Usage Control consists of provisions and obligations. ...................................................................... 27
Figure 17: Illustration of a PEP intercepting data with decision making (PDP). ................................................ 28
Figure 18: Proposed classification of the problems (Spreafico et al.). ................................................................ 32
Figure 19: Weighted Decision Matrix (Geoghegan, 2019). ............................................................................... 34
Figure 20: Risk Management (Boehm, 1989). ................................................................................................... 35
Figure 21: DSS Mitigation Adviser Model (Aslam, et al., 2017). ....................................................................... 35
Figure 22: Simulation model of a DSS implementing MCDA. ......................................................................... 36
Figure 23 - Interoperability barriers of measurement systems [] ........................................................................ 41
Figure 24 - QIF as an enabler of a Quality Digital Thread (by Curtis W. Brown, DMSC) ............................... 43
Figure 25: The relationship between Digital Twin, CPS and IoT. .................................................................... 44
Figure 26: Α reference model of a digital twin. .................................................................................................. 45
Figure 27: Possible structure of a DT for a machine tool. ................................................................................. 46
Figure 28: Example for considering the evolution of the physical object in DT within Level-Up. ..................... 47
Figure 29: MAYA European research project reference approach. .................................................................. 48
Figure 30: SimInCPPS architecture................................................................................................................... 50
Figure 31: MID3 Architecture. ......................................................................................................................... 51
Figure 32: MID3 Arrowhead deployment. ........................................................................................................ 51
Figure 33: Updating virtual twins in context of Industry 4.0 (source: internal documentation of the Institute of
Production Machines, Systems and Robotics, BUT). ....................................................................................... 52
Figure 34: Implementation of digital twin (global virtual model) into CPS (Kovar, et al., 2016). ....................... 54
Figure 35: Smart machine tool structure (Blecha, Durakbasa, & Holub, 2019). ............................................... 56
Figure 36: Production cell, Communication layout of production cell []. .......................................................... 58
Figure 37: Production cell model w/o correction, final production cell model [102
]. ........................................... 59
Figure 38: Structure of digitalization [103
]. ........................................................................................................... 59
Figure 39: Detail of workplace in the regime of milling machine monitoring, detailed view of axial temperature
source [102
]. ......................................................................................................................................................... 60
Figure 40: Powder-based direct energy deposition process schematics (Saboori et al., 2019). ........................... 63
Figure 41: Schematic EPT set-up. ..................................................................................................................... 67
Figure 42: Principal steps of the crack healing during the EPT: (a) Current concentration at a crack tip; (b)
Temperature gradient due to Joule heating; (c) Crack surfaces pushed into contact due to compressive stress;
(d) Bonding and healing of the crack tip. .......................................................................................................... 68
Figure 43: SEM morphology of a microcrack in titanium alloy sheet (a) before and (b) after electropulsing.
Reproduced from []. ......................................................................................................................................... 69
Figure 44: The hole generated by local melting. ................................................................................................ 69
Figure 45: multiphysics multiscale modelling suite. ........................................................................................... 71
Figure 46: PAM-COMPOSITES fluid-mechanics coupling functionality. ........................................................ 71
Figure 47: Life Cycle Assessment framework. ................................................................................................... 74

D1.2 – LEVEL-UP SoA analysis
LEVEL-UP | GA n. 869991 Pag. 102 | 115

D1.2 – LEVEL-UP SoA analysis
LEVEL-UP | GA n. 869991 Pag. 103 | 115
8 List of Tables
Table 1 – Pilot Line Assets. .............................................................................................................................. 20
Table 2 – Role and scope of the Connectivity function layers. .......................................................................... 22
Table 3 – CAD file types formats & vendors .................................................................................................... 41
Table 4 – Comparison between different repair and remanufacturing processes [108][109]............................. 61
Table 5 – Comparison of various dedicated DED repair systems [104] [109]. ................................................. 64
Table 6 – Repairing examples of different components using DED technology (Saboori et al., 2019). ............ 64
Table 7 – Experimental studies on high density EPT crack healing. ................................................................. 66
Table 8 – Technology Readiness Level (TRL), EU Horizon 2020. .................................................................. 70
9 References
1
Atzori, L., Iera, A., Morabito, G.: The internet of things: A survey. Computer Networks (May 2010) 2787{2805
2
J. Akerberg, M.Gidlund, and M.Bjorkman, “Future research challenges in wireless sensor and actuator
networks targeting industrial automation,” in Proc. 9th IEEE Int. Conf. Ind. Inform., 2011, pp. 410–415.
3
J. Akerberg, M.Gidlund, and M.Bjorkman, “Future research challenges in wireless sensor and actuator
networks targeting industrial automation,” in Proc. 9th IEEE Int. Conf. Ind. Inform., 2011, pp. 410–415.
4
L. D. Xu, W. He, and S. Li, “Internet of things in industries: A survey,” IEEE Trans. Ind. Inform., vol. 10, no.
4, pp. 2233–2243, Nov. 2014.
5
M. Weyrich and C. Ebert, “Reference architectures for the internet of things,” IEEE Softw., vol. 33, no. 1, pp.
112–116, Jan./Feb. 2016.
6
X. Jia, Q.Feng, T.Fan, and Q.Lei, “RFID technology and its applications in internet of things (IoT),” in Proc.
2nd Int. Conf. Consum. Electron., Commun. Netw., 2012, pp. 1282–1285.
7
H. Flatt, S. Schriegel, J. Jasperneite, H. Trsek, and H. Adamczyk, “Analysis of the cyber-security of industry
4.0 technologies based on RAMI 4.0 and identification of requirements,” in Proc. IEEE 21st Int. Conf. Emerg.
Tech. Factory Autom., 2016,
8
Industrial Internet Consortium. Industrial internet reference architecture. [Online]. Available:
http://www.iiconsortium.org/IIRA.htm
9
International Electrotechnical Commission (IEC), IoT 2020: Smart and Secure IoT Platform. IEC, Switzerland,
2016.
10
Y. Lu, Industry 4.0: A survey on technologies, applications and open research issues, J. Ind. Information Integr.
6 (2017) 1–10. 10.1016/j.jii.2017.04.005.
11
S. Weyer, M. Schmitt, M. Ohmer, D. Gorecky, Towards Industry 4.0 – Standardization as the crucial challenge
for highly modular, multi-vendor production systems, IFAC-PapersOnLine 48 (3) (2015) 579-584
12
C. Leyh, S. Martin, T. Schäffer, Industry 4.0 and Lean Production – A Matching
Relationship? An analysis of selected Industry 4.0 models, 2017 Federal Conference on Computer Science and
Informatics Systems (FedCSIS) Prague 11 (2017) 989-993,
13
F. Baena, A. Guarin, J. Mora, J. Sauza, S. Retat, Learning Factory: The Path to Industry 4.0, Procedia
Manufacturing 9 (2017) 73–80
14
Leitão P, Colombo AW, Karnouskos S (2016) Industrial auto-mation based on cyber-physical systems
technologies: prototype implementations and challenges. Comput Ind 81:11–25
15
Vogel-Heuser B, Diedrich C, Pantforder D, Göhner P (2014) Cou-pling heterogeneous production systems by
a multi-agent based cyber-physical production system. In: 12th IEEE INDIN, IEEE, pp 713–719
16
A. W. Colombo, T. Bangemann and S. Karnouskos, "A system of systems view on collaborative industrial
automation," 2013 IEEE International Conference on Industrial Technology (ICIT), Cape Town, 2013, pp.
1968-1975.

D1.2 – LEVEL-UP SoA analysis
LEVEL-UP | GA n. 869991 Pag. 104 | 115
17
https://www.zvei.org/en/subjects/industry
18
http://www.iiconsortium.org/IIRA.htm
19
https://www.iiconsortium.org/pdf/JTG2_Whitepaper_final_20171205.pdf
20
http://www.socrades.net/
21
https://cordis.europa.eu/project/id/258682/fr
22
The Digital Shopfloor: Industrial Automation in the Industry 4.0 Era, doi: https://doi.org/10.13052/rp-
9788770220408
23
Ehrlich, Marco & Wisniewski, Lukasz & Jasperneite, Juergen. (2015). Usage of Retrofitting for Migration of
Industrial Production Lines to Industry 4.0.
24
Bader, S.R., Wolff, C., Voessing, M., Schmidt, J.-P., 2018. Towards enabling cyber-physical systems in
brownfield environments. In: in: Exploring Service Science:9th International Conference, IESS 2018, Karlsruhe,
Germany, September 19-21,2018, Proceedings, Vol. 331, Springer, p. 165.
25
Bader, S.R., Wolff, C., Voessing, M., Schmidt, J.-P., 2018. Towards enabling cyber-physical systems in
brownfield environments. In: in: Exploring Service Science:9th International Conference, IESS 2018, Karlsruhe,
Germany, September 19-21,2018, Proceedings, Vol. 331, Springer, p. 165.
26
https://www.fiware.org/community/smart-industry/
27
https://i4ms.eu/
28
https://www.internationaldataspaces.org/
29
http://www.midih.eu/
30
https://boost40.eu/
31
https://siemens.mindsphere.io/en
32
https://www.sap.com/products/leonardo.html
33
https://www.bosch-iot-suite.com/
34
https://www.3ds.com/products-services/3dexperience/?wockw=3dexperience%20platform
35
Adolphs, Peter. "RAMI 4.0: An Architectural Model for Industrie 4.0." Platform Industrie 4 (2015).
36
Tzafestas, Spyros G. "The Internet of Things: A Conceptual Guided Tour." European Journal of Advances in Engineering and Technology 5.10 (2018): 745-767.
37
Lin, Shi-Wan, et al. "The industrial internet of things volume G1: reference architecture." Industrial Internet
Consortium (2017): 10-46.
38
Joshi, R., Didier, P., Jimenez, J., & Carey, T. (2017). The industrial internet of things volume G5: connectivity
framework. Industrial Internet Consortium Report.
39
DDS Foundation - https://www.dds-foundation.org/
40
OPC UA - https://opcfoundation.org/about/opc-technologies/opc-ua/
41
oneM2M - http://www.onem2m.org/
42
CoAP - https://coap.technology/
43
MQTT - http://mqtt.org/
44
Fieldbus Foundation - http://www.fieldbus.org/index.html
45
https://www.ncbi.nlm.nih.gov/pmc/articles/PMC6068996/
46
Industrial Internet Reference Architecture V1.8, 2018
47
https://iv-i.org/docs/doc_171127_IVRA-Next-en.pdf
48
Usage Control In The International Data Spaces, chapter 4.
49
Bellinger, G., Castro, D., & Mills, A. Data, information, knowledge, and wisdom; 2004

D1.2 – LEVEL-UP SoA analysis
LEVEL-UP | GA n. 869991 Pag. 105 | 115
50
Understanding as a Basis for Software Agents with Understanding Abilities. Proceedings 2007 Spring
Simulation Multiconference, IEEE Press
51
Guarino, N.: Formal Ontology in Information Systems. In Guarino, N., ed.: Pro-ceedings of the International
Conference on Formal Ontology in Information Sys-tems (FOIS’98), Trento, Italy, IOS Press, Amsterdam
(1998) 3–15
52
Masolo, C., Borgo, S., Gangemi, A., Guarino, N., Oltramari, A., Schneider, L.:The WonderWeb Library of
Foundational Ontologies. WonderWeb Deliverable 17(2002)
53
MASCARDI, Viviana; CORDÌ, Valentina; ROSSO, Paolo. A Comparison of Upper Ontologies. In: WOA.
2007. S. 55-64
54
Masolo, C., Borgo, S., Gangemi, A., Guarino, N., Oltramari , A.: WonderWeb Deliverable D18. Wonder
Web Deliverable 18(2003), http://www.loa.istc.cnr.it/old/Papers/D18.pdf
55
Kuo, C. J., Ting, K.-C., Chen, Y.-C. 2017. State of product detection method applicable to Industry 4.0
manufacturing models with small quantities and great variety: An example with springs. In: IEEE Applied System
Innovation, pp. 1650-1653.
56
Ergen, T., Mirza, A., Kozat, S. 2017. Unsupervised and semi-supervised anomaly detection with LSTM neural
networks, arXiv:1710.09207, Cornell University.
57
Malhotra, P., Vig, L., Shroff, G., Agarwall, P. (2015): Long-Short Term Memory Networks for Anomaly
Detection in Time Series. ESANN 2015 proceedings, European Symposium on Artificial Neural Networks,
Computational Intelligence and Machine Learning. Bruges, Belgium.
58
Malhotra, P., Ramakrishnan, A., Anand, G., Vig, L., Agarwal, P., and Shroff, G. (2016). LSTM-based encoder-
decoder for multi-sensor anomaly detection. arXiv preprint:1607.00148.
59
Erfani, S.M., Rajasegarar, S., Karunasekera, S., Leckie, C. 2016. High-dimensional and large-scale anomaly
detection using a linear one class SVM with deep learning, Pattern Recognition, vol. 58, pp. 121–134.
60
M. Sakurada and T. Yairi. 2014. Anomaly detection using autoencoders with nonlinear dimensionality
reduction. In Proc. MLSDA, 2nd Workshop on Machine Learning for Sensory Data Analysis (MLSDA’14).
pp. 4–11.
60
Zhao, R., Yan, R., Chen, Z., Mao, K., Wang, P., and Gao, R. X. 2019. Deep learning and its applications to
machine health monitoring. Mechanical Systems and Signal Processing, vol. 115, pp. 213-237.
61
Liu, J., Guo, J., Orlik, P.V., Shibata, M., Nakahara, D., Mii, S., & Takác, M. (2018). Anomaly Detection in
Manufacturing Systems Using Structured Neural Networks. 2018 13th World Congress on Intelligent Control
and Automation (WCICA), 175-180.
62
Saez, M., Maturana, F., Barton, K., & Tilbury, D. (2017). Anomaly detection and productivity analysis for
cyber-physical systems in manufacturing. In13th IEEE Conference on Automation Science and Engineering, pp.
23-29.
63
Zhang, C., Lim, P., Qin,A.K., Tan, K.C. 2017. Multiobjective deep belief networks ensemble for remaining
useful life estimation in prognostics. IEEE Trans Neural Networks Learning Systems, 28 (10), pp. 2306-2318.
64
Korvesis, P., Besseau, S., Vazirgiannis, M.: Predictive maintenance in aviation: Failure prediction from post
flight reports. In: IEEE Int. Conf. on Data Engineering (ICDE), pp. 1414–1422 (2018)
65
Sipos, R., Fradkin, D., Moerchen, F., Wang, Z.: Log-based predictive maintenance. In: Proceedings of the
20th ACM SIGKDD international conference on knowledge discovery and data mining, pp. 1867–1876. ACM
(2014)
66
Bach, F.R.: Bolasso: model consistent lasso estimation through the bootstrap. In: Proc. of the 25th Int. Conf.
on Machine learning, pp. 33–40. ACM (2008)
67
Wang, J., Li, C., Han, S., Sarkar, S., Zhou, X.: Predictive maintenance based on event-log analysis: A case
study. IBM Journal of Research and Development 61(1), 11–121 (2017)
68
Zhu, M., Liu, C.: A correlation driven approach with edge services for predictive industrial maintenance.
Sensors (Basel, Switzerland) 18(6) (2018)

D1.2 – LEVEL-UP SoA analysis
LEVEL-UP | GA n. 869991 Pag. 106 | 115
69
Ao, X., Luo, P., Li, C., Zhuang, F., He, Q.: Online frequent episode mining. In: IEEE 31st Int. Conf. on Data
Engineering (ICDE), pp. 891–902 (2015)
70
Li, H., Peng, S., Li, J., Li, J., Cui, J., Ma, J.: Once and once+: Counting the frequency of time-constrained serial
episodes in a streaming sequence. arXiv preprint arXiv:1801.09639 (2018)
71
Kolchinsky, I., Schuster, A.: Efficient adaptive detection of complex event patterns. PVLDB 11(11), 1346–
1359 (2018)
72
Kovalev, D., Shanin, I., Stupnikov, S., Zakharov, V.: Data mining methods and techniques for fault detection
and predictive maintenance in housing and utility infrastructure. In: 2018 International Conference on
Engineering Technologies and Computer Science (EnT), pp. 47–52 (2018)
73
Yeh, C.C.M., Kavantzas, N., Keogh, E.: Matrix profile IV: using weakly labeled time series to predict outcomes.
Proceedings of the VLDB Endowment 10(12), 1802–1812 (2017)
74
Zhu, Y., Zimmerman, Z., Senobari, N.S., Yeh, C.C.M., Funning, G., Mueen, A., Brisk, P., Keogh, E.: Matrix
profile II: Exploiting a novel algorithm and gpus to break the one hundred million barrier for time series motifs
and joins. In: ICDM, pp. 739–748. IEEE (2016)
75 Tran, L., Fan, L., Shahabi, C.: Distance-based outlier detection in data streams. Proceedings of the VLDB
Endowment 9(12), 1089–1100 (2016)
76
Liu, H.-C., Liu, L., & Liu, N. (2013). Risk evaluation approaches in failure mode and effects analysis: A
literature review. Expert Systems with Applications, 40(2), 828–838. doi:10.1016/j.eswa.2012.08.010
77
C. Spreafico, et al., A state-of-the-art review of FMEA/FMECA including patents, computer science review
(2017), http://dx.doi.org/10.1016/j.cosrev.2017.05.002.
78
Liu, H.-C., Liu, L., & Liu, N. (2013). Risk evaluation approaches in failure mode and effects analysis: A
literature review. Expert Systems with Applications, 40(2), 828–838. doi:10.1016/j.eswa.2012.08.010
79
Hu, A. H., Hsu, C. W., Kuo, T. C., & Wu, W. C. (2009). Risk evaluation of green components to hazardous
substance using FMEA and FAHP. Expert Systems with Applications, 36, 7142–7147.
80
Yang, J., Huang, H. Z., He, L. P., Zhu, S. P., & Wen, D. (2011). Risk evaluation in failure mode and effects
analysis of aircraft turbine rotor blades using Dempster– Shafer evidence theory under uncertainty. Engineering
Failure Analysis, 18, 2084–2092.
81
Zammori, F., & Gabbrielli, R. (2011). ANP/RPN: A multi criteria evaluation of the risk priority number.
Quality and Reliability Engineering International, 28, 85–104
82
Chang, K. H., Cheng, C. H., & Chang, Y. C. (2010). Reprioritization of failures in a silane supply system using
an intuitionistic fuzzy set ranking technique. Soft Computing, 14, 285–298.
83
Carmignani, G. (2009). An integrated structural framework to cost-based FMECA: The priority-cost FMECA.
Reliability Engineering and Systems Safety, 94, 861–871
84
Xu, Z. S., & Da, Q. L. (2003). An overview of operators for aggregating information. International Journal of
Intelligent Systems, 18, 953–969.
85
Lertworasirikul, S., Fang, S. C., Joines, A. J., & Lw Nuttle, H. (2003). Fuzzy data envelopment analysis (DEA):
A possibility approach. Fuzzy Sets and Systems, 139, 379–394.
86
Chang, D. S., & Sun, K. L. P. (2009). Applying DEA to enhance assessment capability of FMEA. International
Journal of Quality & Reliability Management, 26, 629–643.
87
Garcia, P. A. A., Schirru, R., & Frutuoso Emelo, P. F. (2005). A fuzzy data envelopment analysis approach for
FMEA. Progress in Nuclear Energy, 46, 359–373.
88
Chin, K. S., Wang, Y. M., Poon, G. K. K., & Yang, J. B. (2009a). Failure mode and effects analysis by data
envelopment analysis. Decision Support Systems, 48, 246–256.
89
Gargama, H., & Chaturvedi, S. K. (2011). Criticality assessment models for failure mode effects and criticality
analysis using fuzzy logic. IEEE Transactions on Reliability, 60, 102–110.
90
Certa A, Hopps F, Inghilleri R, La Fata CM. A Dempster Shafer Theory-based approach to the Failure Mode,
Effects and Criticality Analysis (FMECA) under epistemic uncertainty: application to the propulsion system of a
fishing vessel. Reliability Engineering & System Safety 2017;159:69-79.

D1.2 – LEVEL-UP SoA analysis
LEVEL-UP | GA n. 869991 Pag. 107 | 115
91
Sant’Anna, A. P. (2012). Probabilistic priority numbers for failure modes and effects analysis. International
Journal of Quality & Reliability Management, 29, 349–362.
92
Certa A, Enea M, Galante GM, La Fata CM. ELECTRE TRI-based approach to the failure modes classification
on the basis of risk parameters: An alternative to the risk priority number, Computers & Industrial Engineering
2017;108:100–110
93
Yang, Z., Bonsall, S., & Wang, J. (2008). Fuzzy rule-based Bayesian reasoning approach for prioritization of
failures in FMEA. IEEE Transactions on Reliability, 57, 517–528.
94
Tay, K. M., & Lim, C. P. (2010). Enhancing the failure mode and effect analysis methodology with fuzzy
inference techniques. Journal of Intelligent & Fuzzy Systems, 21, 135–146.
95
Chang, K. H., & Wen, T. C. (2010). A novel efficient approach for DFMEA combining 2-tuple and the OWA
operator. Expert Systems with Applications, 37, 2362–2370.
96
Kutlu, A. C., & Ekmekçiog˘lu, M. (2012). Fuzzy failure modes and effects analysis by using fuzzy TOPSIS-
based fuzzy AHP. Expert Systems with Applications, 39, 61–67.
97
Zhang, Z. F., & Chu, X. N. (2011). Risk prioritization in failure mode and effects analysis under uncertainty.
Expert Systems with Applications, 38, 206–214.
98
Abdelgawad, M., & Fayek, A. R. (2010). Risk management in the construction industry using combined fuzzy
FMEA and fuzzy AHP. Journal of Construction Engineering and Management, 136, 1028–1036.
99
Renjith, V. R., Jose kalathil, M., Kumar, P. H., & Madhavan, D. (2018). Fuzzy FMECA (failure mode effect
and criticality analysis) of LNG storage facility. Journal of Loss Prevention in the Process
Industries. doi:10.1016/j.jlp.2018.01.002
100
Giardina, M., & Morale, M. (2015). Safety study of an LNG regasification plant using an FMECA and HAZOP
integrated methodology. Journal of Loss Prevention in the Process Industries, 35, 35–
45. doi:10.1016/j.jlp.2015.03.013
101
Renu, R., Visotsky, D., Knackstedt, S., Mocko, G., Summers, J. D., & Schulte, J. (2016). A Knowledge Based
FMEA to Support Identification and Management of Vehicle Flexible Component Issues. Procedia CIRP, 44,
157–162. doi:10.1016/j.procir.2016.02.112
102
Gupta, G., & Mishra, R. P. (2016). A Failure Mode Effect and Criticality Analysis of Conventional Milling
Machine Using Fuzzy Logic: Case Study of RCM. Quality and Reliability Engineering International, 33(2), 347–
356. doi:10.1002/qre.2011
103
Thoppil, N. M., Vasu, V., & Rao, C. S. P. (2019). Failure Mode Identification and Prioritization Using
FMECA: A Study on Computer Numerical Control Lathe for Predictive Maintenance. Journal of Failure
Analysis and Prevention. doi:10.1007/s11668-019-00717-8
104
Gopalakrishnan, M., & Skoogh, A. (2018). Machine criticality based maintenance prioritization: Identifying
productivity improvement potential. International Journal of Productivity and Performance Management, 67(4),
654-672.
105
Segal, T. (6. August 2019). Decision Support System - DSS. Hentet fra Investopedia:
https://www.investopedia.com/terms/d/decision-support-system.asp
106
Rashidi, M., Ghodrat, M., Samali, B., & Mohammadi, M. (2017). Decision Support Systems. I M. Rashidi,
M. Ghodrat, B. Samali, & M. Mohammadi, Management of Information Systems (s. 19 - 38).
IntechOpen.
107
Geoghegan, D. (20. December 2019). Decision Matrix Analysis. Hentet fra Expert Program Management:
https://expertprogrammanagement.com/2017/09/decision-matrix-analysis/
108
Team, R. S. (20. December 2019). PCI DSS Mitigation Controls for Risk Managemt. Hentet fra RMStudio:
https://www.riskmanagementstudio.com/pci-dss-mitigating-controls-for-risk-management/
109
Boehm, B. W. (1989). Software Risk Management. Piscataway, NJ: IEEE Press.
110
Aslam, A., Ahmad, N., Saba, T., Almazyad, A. S., Rehman, A., Anjum, A., & Khan, A. (2017). Decision
Support System for Risk Assessment and Management Strategies in Distributed Software Development. IEEE Access - Special Section on Software Standards and their Impact in Reducing Software Failures.

D1.2 – LEVEL-UP SoA analysis
LEVEL-UP | GA n. 869991 Pag. 108 | 115
111
Figueira, J., Greco, S., & Ehrgott, M. (2005). Multiple Criteria Decision Analysis: State of the Art Surveys.
Boston/Dordrect/London: Kluwer Academic Publishers.
112
dos Santos Silva, R. C., Capovilla Trevisan, E. F., Botter, R. C., & Brito, T. B. (2011). Discrete Event
Simulation Combined with Multiple Criteria Decision Analysis as a Decision Support Methodology in Complex
Logistics Systems. I T. B. Brito, R. C. dos Santos Silva, E. F. Capobilla Trevisan, & R. C. Botter, Discrete Event Simulations - Development and Applications (s. 105 - 132). Intech Open.
113
Layard, R; Glaister, S, 1994. Cost-benefit analysis. Cambridge University Press, pp. 1-56.
114
Ross, Sean, 2015. Investopedia. How can I apply sensitivity analysis to my investment decisions? Updated May
13, 2015 https://www.investopedia.com/ask/answers/051315/how-can-i-apply-sensitivity-analysis-my-investment-
decisions.asp
115
Ghezzi, L., Manzini, R. (2012). On the financial evaluation of some intangible assets. Liuc Papers n. 255, Serie
Tecnologia 22, ottobre 2012.
116
Chiesa, V., Frattini, F., Gilardoni, E., Manzi, R., Pizzurno, E. (2007). Searching for factors influencing
technological asset value. European Journal of Innovation Management. 10. 467-488.
10.1108/14601060710828781.
117
Choi WW, Kwon SS, Lobo GJ. (2000). Market valuation of intangible assets. Journal of Business Research.
2000;49(1):35-45. doi: //doi.org/10.1016/S01482963(98)00121-0.
118
Xu, B. Magnan, M. & André, P. (2007). The Stock Market Valuation of R&D Information in Biotech Firms.
Contemporary Accounting Research. 24. 10.1506/car.24.4.10.
119
Dugi, A. & Torluccio, G. (2010). Can R&D Expenditures Affect Firm Market Value? An Empirical Analysis
of a Panel of European Listed Firms. SSRN Electronic Journal. 10.2139/ssrn.1609791.
120
Wirtz, H. (2012). Valuation of Intellectual Property: A Review of Approaches and Methods. International
Journal of Business and Management. Vol. 7, No. 9; May 2012. doi:10.5539/ijbm.v7n9p40
121
Del Bo, C. (2016). The rate of return to investment in R&D: The case of research infrastructures.
Technological Forecasting and Social Change. 2016;112:26-37.
122
H. Lasi, P. Fettke, H.-G. Kemper, T. Feld, M. Hoffmann, Industry 4.0, Business & Information Systems
Engineering 6 (4) (2014) 239–242.
123
S. R. Ray, A. T. Jones, Manufacturing interoperability, Journal of Intelligent Manufacturing 17 (6) (2006) 681–
688.
124
Cristhian I. Rian˜o Jaimes et al. , Procedia Manufacturing 38 (2019) 1205–1212
125
ISO/DIS 10303-1 Industrial automation systems and integration — Product data representation and exchange
— Part 1: Overview and fundamental principles
126
J. Nguyen, Exporting the right format, Capvidia 2020, https://www.capvidia.com/blog/cad-translation-
importing-exporting-the-right-format
127
ISO 10303-242:2014 Industrial automation systems and integration — Product data representation and
exchange — Part 242: Application protocol: Managed model-based 3D engineering
128
ISO 10303-238:2007 Industrial automation systems and integration — Product data representation and
exchange — Part 238: Application protocol: Application interpreted model for computerized numerical
controllers
129
S. P. Ruemler, K. E. Zimmerman, N. W. Hartman, T. Hedberg, A. B. Feeny, Promoting model-based
definition to establish a complete product definition, Journal of manufacturing science and engineering 139 (5)
(2017) 051008.
130
Lu, Y., Liu, C., Wang, K.I.-K., Huang, H., Xu, X., 2020. Digital Twin-driven smart manufacturing:
Connotation, reference model, applications and research issues. Robotics and Computer-Integrated
Manufacturing 61, 101837.
131
Werner Kritzinger, Matthias Karner, Georg Traar, Jan Henjes, Wilfried Sihn. Digital Twin in manufacturing:
A categorical literature review and classification.

D1.2 – LEVEL-UP SoA analysis
LEVEL-UP | GA n. 869991 Pag. 109 | 115
132
Cai, Y., Starly, B., Cohen, P., Lee, Y.-S., 2017. Sensor Data and Information Fusion to Construct Digital-
twins Virtual Machine Tools for Cyber-physical Manufacturing. Procedia Manufacturing 10, 1031–1042.
133
Wang, J., Ye, L., Gao, R.X., Li, C., Zhang, L., 2019. Digital Twin for rotating machinery fault diagnosis in
smart manufacturing. International Journal of Production Research 57 (12), 3920–3934.
134
Schleich, B., Anwer, N., Mathieu, L., Wartzack, S., 2017. Shaping the digital twin for design and production
engineering. CIRP Annals 66 (1), 141–144.
135
Söderberg, R., Wärmefjord, K., Carlson, J.S., Lindkvist, L., 2017. Toward a Digital Twin for real-time
geometry assurance in individualized production. CIRP Annals 66 (1), 137–140.
136
Baskaran, S., Niaki, F.A., Tomaszewski, M., Gill, J.S., Chen, Y., Jia, Y., Mears, L., Krovi, V., 2019. Digital
Human and Robot Simulation in Automotive Assembly using Siemens Process Simulate: A Feasibility Study.
Procedia Manufacturing 34, 986–994.
137
Malik, A.A., Bilberg, A., 2018. Digital twins of human robot collaboration in a production setting. Procedia
Manufacturing 17, 278–285.
138
Solomatine, D., See, L.M., Abrahart, R.J., 2008. Data-Driven Modelling: Concepts, Approaches and
Experiences, in: Abrahart, R.J., See, L.M., Solomatine, D.P. (Eds.), Practical Hydroinformatics, vol. 68.
Springer Berlin Heidelberg, Berlin, Heidelberg, pp. 17–30.
139
Hu, L., Nguyen, N.-T., Tao, W., Leu, M.C., Liu, X.F., Shahriar, M.R., Al Sunny, S.M.N., 2018. Modeling of
Cloud-Based Digital Twins for Smart Manufacturing with MT Connect. Procedia Manufacturing 26, 1193–1203.
140
Altintas, Y., Brecher, C., Weck, M., Witt, S., 2005. Virtual Machine Tool. CIRP Annals 54 (2), 115–138.
141
Fischer, M., Eberhard, P., 2014. Simulation of Moving Loads in Elastic Multibody Systems With Parametric
Model Reduction Techniques. Archive of Mechanical Engineering 61 (2), 209–226.
142
Kolouch, M., 2013. Simulation des Einflusses der Gelenke auf das statische und dynamische Verhalten von
parallelkinematischen Werkzeugmaschinen. Zugl.: Chemnitz, Techn. Univ., Diss., 2012. Verl. Wiss. Scripten,
Auerbach/V., 245 pp.
143
[14] J.E. Mottershead, M.F. Model udpating in structural dynamics: a survey. Journal of Sound and
Virbration 1993 (167), 347-375.
144
van Overschee, P., Moor, B. de, 1996. Subspace Identification for Linear Systems. Springer US, Boston, MA,
269 pp.
145
Holub, M., Blecha, P., Bradac, F., Kana, R., 2015. VOLUMETRIC COMPENSATION OF THREEAXIS
VERTICAL MACHINING CENTRE. MM SJ 2015 (03), 677–681.
146
Kakino, Y., Ihara, Y., Shinohara, A. (Eds.), 1993. Accuracy inspection of NC machine tools by double ball
bar method. Hanser; Hanser-Gardner, Munich, Cincinnati, 190 pp.
147
Ewins, D.J., 2000. Modal testing: Theory, practice and application, 2. ed. ed. Research Studies Press, Baldock,
562 pp.
148
Brincker, R., Ventura, C.E.H., 2015. Introduction to operational modal analysis. John Wiley and Sons Inc,
Chichester, West Sussex, 360 pp.
149
Lu, Yan, Katherine C. Morris, and Simon Frechette. "Current standards landscape for smart manufacturing
systems." National Institute of Standards and Technology, NISTIR 8107 (2016): 39.
150
Grieves, M. (01. 01 2018). Whitepaper: Manufacturing. Hentet fra Transforming Industries, Markets and
Customer Experiences: https://www.3ds.com/fileadmin/PRODUCTS-
SERVICES/DELMIA/PDF/Whitepaper/DELMIA-APRISO-Digital-Twin-Whitepaper.pdf
151
Badkilayay, S. K., & Bhat, H. P. (2020). The Need for a System to Benefit the Implementation of Digital
Twin, by Helping Visualize the Virtual Dynamics Remotely. In: Auer M., Ram B. K. (eds) Cyber-physical Systems and Digital Twins. REV2019 2019. Lecture Notes in Networks and Systems, vol 80. pp 38-50, Available
on: https://link.springer.com/chapter/10.1007/978-3-030-23162-0_4: Springer, Cham.
152
Davies, R. (09 2015). Industry 4.0 Digitalisation for productivity and growth. Briefing - September 2015 (European Parliament). Available on:

D1.2 – LEVEL-UP SoA analysis
LEVEL-UP | GA n. 869991 Pag. 110 | 115
https://www.europarl.europa.eu/RegData/etudes/BRIE/2015/568337/EPRS_BRI(2015)568337_EN.pdf: EPRS
| European Parliamentary Research Service.
153
Blecha, P., Durakbasa, N., & Holub, M. (2019). Digitized Production – Its Potentials and Hazards. In: Durakbasa N., Gencyilmaz M. (eds) Proceedings of the International Symposium for Production Research 2018. ISPR 2018. pp 402-411. Springer, Cham.
154
Holub, M., Tuma, Z., Kroupa, J., Kovar, J., & Blecha, P. (2019). Case Study of Digitization of the Production
Cell. In: Durakbasa N. Gencylmaz M. (eds) Proceedings of the International Symposium for Production Research 2019. ISPR 2019. pp. 253 - 262, ISBN 978-3-030-31342-5: Springer International Publishing.
155
Saboori, A., Aversa, A., Marchese, G., Biamino, S., Lombardi, M., & Fino, P. (2019). Application of directed
energy deposition-based additive manufacturing in repair. Applied Sciences (Switzerland), 9(16).
https://doi.org/10.3390/app9163316
156
W. Wang, A. J. Pinkerton, L. M. W. and L. L. (2007). Component Repair Using Laser Direct Metal
Deposition. In S. Hinduja & Kuang-Chao Fan (Eds.), Proceedings of the 35th International MATADOR
Conference.
157
Ehsan Toyserkani, A. K. and S. C. (2005). Laser Cladding. In CRC Press.
https://doi.org/10.1017/CBO9781107415324.004
158
Shoju Aoshima. (n.d.). Electro-Spark Process for Repair and Maintenance of Die-Casting Dies.
https://wenku.baidu.com/view/98f1f8c76137ee06eff918fa.html
159
Tan, J. ., Looney, L., & Hashmi, M. S. . (1999). Component repair using HVOF thermal spraying. Journal of
Materials Processing Technology, 92–93, 203–208. https://doi.org/10.1016/S0924-0136(99)00113-2
160
Wang, J., Prakash, S., Joshi, Y., & Liou, F. (2002). Laser Aided Part Repair-A Review. 13th Annual Solid
Freeform Fabrication Symposium, 57–64. https://doi.org/10.1.1.463.3399
161
Bi, G., & Gasser, A. (2011). Restoration of Nickel-Base Turbine Blade Knife-Edges with Controlled Laser
Aided Additive Manufacturing. Physics Procedia, 12, 402–409. https://doi.org/10.1016/J.PHPRO.2011.03.051
162
Alberti, E. A., Bueno, B. M. P., & D’Oliveira, A. S. C. M. (2016). Additive manufacturing using plasma
transferred arc. International Journal of Advanced Manufacturing Technology, 83(9–12), 1861–1871.
https://doi.org/10.1007/s00170-015-7697-7
163
Shoju Aoshima. (n.d.). Electro-Spark Process for Repair and Maintenance of Die-Casting Dies.
https://wenku.baidu.com/view/98f1f8c76137ee06eff918fa.html
164
Tan, J. ., Looney, L., & Hashmi, M. S. . (1999). Component repair using HVOF thermal spraying. Journal of
Materials Processing Technology, 92–93, 203–208. https://doi.org/10.1016/S0924-0136(99)00113-2
165
Roy, T., Abrahams, R., Paradowska, A., Lai, Q., Mutton, P., Soodi, M., Fasihi, P., & Yan, W. (2019).
Evaluation of the mechanical properties of laser cladded hypereutectoid steel rails. Wear, 432–433, 202930.
https://doi.org/10.1016/J.WEAR.2019.202930
166
Abdollah Saboori, Federico Bosio, Erica Librera, Michele De Chirico, Mariangela Lombardi, P. F. (2018).
Accelerated Process Parameter Optimization for Directed Energy Deposition of 316L Stainless Steel.
Proceedings EURO PM2018, December 2019, 1–6. https://doi.org/https://iris.polito.it/handle/11583/2715550
167
Mazzucato, F., Tusacciu, S., Lai, M., Biamino, S., Lombardi, M., & Valente, A. (2017). Monitoring Approach
to Evaluate the Performances of a New Deposition Nozzle Solution for DED Systems. Technologies, 5(2), 29.
https://doi.org/10.3390/technologies5020029
168
Zenou, M., & Grainger, L. (2018). Additive manufacturing of metallic materials. Additive Manufacturing, 53–
103. https://doi.org/10.1016/B978-0-12-812155-9.00003-7
169
Baufeld, B., Brandl, E., & van der Biest, O. (2011). Wire based additive layer manufacturing: Comparison of
microstructure and mechanical properties of Ti–6Al–4V components fabricated by laser-beam deposition and
shaped metal deposition. Journal of Materials Processing Technology, 211(6), 1146–1158.
https://doi.org/10.1016/J.JMATPROTEC.2011.01.018
170
Zhang, Y., Wu, L., Guo, X., Kane, S., Deng, Y., Jung, Y. G., Lee, J. H., & Zhang, J. (2018). Additive
Manufacturing of Metallic Materials: A Review. Journal of Materials Engineering and Performance, 27(1).
https://doi.org/10.1007/s11665-017-2747-y

D1.2 – LEVEL-UP SoA analysis
LEVEL-UP | GA n. 869991 Pag. 111 | 115
171
Díaz, E., Amado, J. M., Montero, J., Tobar, M. J., & Yáñez, A. (2012). Comparative Study of Co-based Alloys
in Repairing Low Cr-Mo steel Components by Laser Cladding. Physics Procedia, 39, 368–375.
https://doi.org/10.1016/J.PHPRO.2012.10.050
172
Kattire, P., Paul, S., Singh, R., & Yan, W. (2015). Experimental characterization of laser cladding of CPM 9V
on H13 tool steel for die repair applications. Journal of Manufacturing Processes, 20, 492–499.
https://doi.org/10.1016/J.JMAPRO.2015.06.018
173
Onuike, B., & Bandyopadhyay, A. (2019). Additive manufacturing in repair: Influence of processing
parameters on properties of Inconel 718. Materials Letters, 252, 256–259.
https://doi.org/10.1016/J.MATLET.2019.05.114
174
Sun, S. Da, Liu, Q., Brandt, M., Janardhana, M., & Clark, G. (2012). Microstructure and mechanical
properties of laser cladding repair of AISI 4340 steel. 28th Congress of the International Council of the
Aeronautical Sciences 2012, ICAS 2012, 6(i), 5127–5135.
175
Tan, J. ., Looney, L., & Hashmi, M. S. . (1999). Component repair using HVOF thermal spraying. Journal of
Materials Processing Technology, 92–93, 203–208. https://doi.org/10.1016/S0924-0136(99)00113-2
176
W. Wang, A. J. Pinkerton, L. M. W. and L. L. (2007). Component Repair Using Laser Direct Metal
Deposition. In S. Hinduja & Kuang-Chao Fan (Eds.), Proceedings of the 35th International MATADOR
Conference.
177
Mironovs, V., Stankevich, P., & Eiduks, J. (2019). Tendencies in the field of application of metal-powder
materials for repair and maintenance of railway equipment. Procedia Computer Science, 149, 344–348.
https://doi.org/10.1016/J.PROCS.2019.01.146
178
Rooyen, C. Van, Burger, H., Theron, M., & Doubell, P. (n.d.). In-situ Crack Repair by Laser Cladding. 1–5.
179
Koehler, H., Partes, K., & Seefeld, T. (2010). Laser reconditioning of crankshafts: From lab to application.
Physics Procedia, 5, 387–397. https://doi.org/10.1016/J.PHPRO.2010.08.160
180
Bendeich, P., Alam, N., Brandt, M., Carr, D., Short, K., Blevins, R., Curfs, C., Kirstein, O., Atkinson, G.,
Holden, T., & Rogge, R. (2006). Residual stress measurements in laser clad repaired low pressure turbine blades
for the power industry. Materials Science and Engineering: A, 437(1), 70–74.
https://doi.org/10.1016/J.MSEA.2006.04.065
181
Wilson, J. M., Piya, C., Shin, Y. C., Zhao, F., & Ramani, K. (2014). Remanufacturing of turbine blades by
laser direct deposition with its energy and environmental impact analysis. Journal of Cleaner Production, 80,
170–178. https://doi.org/10.1016/J.JCLEPRO.2014.05.084
182
Rottwinkel, B., Nölke, C., Kaierle, S., & Wesling, V. (2014). Crack Repair of Single Crystal Turbine Blades
Using Laser Cladding Technology. Procedia CIRP, 22, 263–267.
https://doi.org/10.1016/J.PROCIR.2014.06.151
183
Yilmaz, O., Gindy, N., & Gao, J. (2010). A repair and overhaul methodology for aeroengine components.
Robotics and Computer-Integrated Manufacturing, 26(2), 190–201.
https://doi.org/10.1016/J.RCIM.2009.07.001
184
Kattire, P., Paul, S., Singh, R., & Yan, W. (2015). Experimental characterization of laser cladding of CPM 9V
on H13 tool steel for die repair applications. Journal of Manufacturing Processes, 20, 492–499.
https://doi.org/10.1016/J.JMAPRO.2015.06.018
185
Mironovs, V., Stankevich, P., & Eiduks, J. (2019). Tendencies in the field of application of metal-powder
materials for repair and maintenance of railway equipment. Procedia Computer Science, 149, 344–348.
https://doi.org/10.1016/J.PROCS.2019.01.146
186
Corp., L. C. (2019). Laser Cladding Corp. - Applications. https://lasercladdingcorp.com/
187
Koehler, H., Partes, K., & Seefeld, T. (2010). Laser reconditioning of crankshafts: From lab to application.
Physics Procedia, 5, 387–397. https://doi.org/10.1016/J.PHPRO.2010.08.160
188
Mudge, R. P., & Wald, N. R. (2007). Laser engineered net shaping advances additive manufacturing and
repair. Welding Journal (Miami, Fla), 86(1), 44–48.
189
Bendeich, P., Alam, N., Brandt, M., Carr, D., Short, K., Blevins, R., Curfs, C., Kirstein, O., Atkinson, G.,
Holden, T., & Rogge, R. (2006). Residual stress measurements in laser clad repaired low pressure turbine blades
D1.2 – LEVEL-UP SoA analysis
LEVEL-UP | GA n. 869991 Pag. 112 | 115
for the power industry. Materials Science and Engineering: A, 437(1), 70–74.
https://doi.org/10.1016/J.MSEA.2006.04.065
190
Ho, P. S., & Kwok, T. (1989). Electromigration in metals. Reports on Progress in Physics, 301–348.
191
Troitskii, O. A. (1969). Electromechanical Effect in Metals. ZhETF Pisma Redaktsiiu, 10:18-22.
192
Troitskii, O. A. (2000). Electroplastic deformation of metal. Strength of Materials, 8(12):1466-1471.
193
Zhou, Y., Zeng, Y., He, G., & Zhou, B. (2001). The healing of quenched crack in 1045 steel under
electropulsing. Journal of Materials Research, 16(1):17–19.
194
Hosoi, A., Nagahama, T., & Ju, Y. (2012). Fatigue crack healing by a controlled high density electric current
field. Materials Science and Engineering: A, 533:38 – 42.
195
Zhou, Y., Guo, J., Gao, M., & He, G. (2004). Crack healing in a steel by using electropulsing technique.
Materials Letters, 58(11):1732 – 1736.
196
Yu, T., Deng, D., Wang, G., & Zhang, H. (2016). Crack healing in sus 304 stainless steel by electropulsing
treatment. Journal of Cleaner Production, 113:989 – 994.
197
Hosoi, A., Kishi, T., & Ju, Y. (2013). Healing of fatigue crack by high-density electropulsing in austenitic
stainless steel treated with the surface-activated pre-coating. Materials (Basel), 6:4213–4225.
198
Tang, Y., Hosoi, A., Morita, Y., & Ju, Y. (2013). Restoration of fatigue damage in stainless steel by high-density
electric current. International Journal of Fatigue, 56:69 – 74.
199
Song, H., Wang, Z.-j., He, X.-d., & Duan, J. (2017). Self-healing of damage inside metals triggered by
electropulsing stimuli. Scientific Reports, 7-12.
200
Ren, X., Wang, Z., Fang, X., Song, H., & Duan, J. (2020). The plastic flow model in the healing process of
internal microcracks in pre-deformed tc4 sheet by pulse current. Materials & Design, 188:108428.
201
Lu, Z., Guo, C., Li, P., Wang, Z., Chang, Y., Tang, G., & Jiang, F. (2017). Effect of electropulsing treatment
on microstructure and mechanical properties of intermetallic al3ti alloy. Journal of Alloys and Compounds, 708:834 – 843.
202
Yang, C., Yang, H., Zhang, Z., & Zhang, Z. (2018). Recovery of tensile properties of twinning- induced plasticity
steel via electropulsing induced void healing. Scripta Materialia, 147:88− 92.
203
Ren, X., Wang, Z., Fang, X., Song, H., & Duan, J. (2020). The plastic flow model in the healing process of
internal microcracks in pre-deformed tc4 sheet by pulse current. Materials & Design, 188:108428.
204
Song, H., Wang, Z.-j., He, X.-d., & Duan, J. (2017). Self-healing of damage inside metals triggered by
electropulsing stimuli. Scientific Reports, 7-12.
205
Zhou, Y., Zeng, Y., He, G., & Zhou, B. (2001). The healing of quenched crack in 1045 steel under
electropulsing. Journal of Materials Research, 16(1):17–19
206
Hosoi, A., Nagahama, T., & Ju, Y. (2012). Fatigue crack healing by a controlled high density electric current
field. Materials Science and Engineering: A, 533:38 – 42.
207
Hosoi, A., Kishi, T., & Ju, Y. (2013). Healing of fatigue crack by high-density electropulsing in austenitic
stainless steel treated with the surface-activated pre-coating. Materials (Basel), 6:4213–4225.
208
Song, H., Wang, Z.-j., He, X.-d., & Duan, J. (2017). Self-healing of damage inside metals triggered by
electropulsing stimuli. Scientific Reports, 7-12.
209
Ren, X., Wang, Z., Fang, X., Song, H., & Duan, J. (2020). The plastic flow model in the healing process of
internal microcracks in pre-deformed tc4 sheet by pulse current. Materials & Design, 188:108428.
210
Song, H., Wang, Z.-j., He, X.-d., & Duan, J. (2017). Self-healing of damage inside metals triggered by
electropulsing stimuli. Scientific Reports, 7-12.
211
Lin, H., Zhao, Y., Gao, Z., & Han, L. (2008). Effects of pulse current stimulation on the thermal fatigue crack
propagation behavior of chwd steel. Materials Science and Engineering: A, 478(1):93-100.
212
Yin, Y., Chen, H., Morita, Y., Toku, Y., & Ju, Y. (2018). Effect of electropulsing treatment on the fatigue crack
growth behavior of copper. Materials, 11(11).

D1.2 – LEVEL-UP SoA analysis
LEVEL-UP | GA n. 869991 Pag. 113 | 115
213
Recycling Rates of Metals, A status report, UNEP 2011
214
https://www.macallister.com/is-it-better-to-repair-rebuild-or-replace-heavy-equipment/
215
https://ec.europa.eu/environment/waste/pdf/story_book.pdf
216
Being wise with waste: the EU’s approach to waste management, 2010,European Union
217
https://www.municipalwasteeurope.eu/definitions
218
218 https://eur-lex.europa.eu/legal-content/EN/TXT/HTML/?uri=CELEX:32011R0333&from=FR
219
https://www.internationaldataspaces.org/wp-content/uploads/2019/03/IDS-Reference-Architecture-Model-
3.0.pdf
220
https://www.internationaldataspaces.org/wp-content/uploads/2019/07/IDSA-Position-paper-2018.pdf