ALL.7.3 Piani operativi: risultati - Portale della Performance
Upload
khangminh22Category
view
1download
0
1
su
2
Work Package 7:
This is a result of Tasks 7.3. This deliverable will include the agendas, the list of
participants, and the workshops outputs including the decisions taken.
Deliverable 7.3.
Workshop Report – Results and methods applied
Island Focal Points (IFPs):
Azores FCIENCIAS.ID Ricardo Coelho; Tiago Capela Lourenço; Hugo P. Costa; Andreia Sousa
Balearic Islands
UIB Gabriel Jordà, Xavier Garcias
Canary Islands
ULPGC Ainhoa Bilbao Altés; Carmelo J. León; Carmen Garcia Galindo; Yen Lam González
Corsica Ramboll Ghislain Dubois; Adeline Cauchy; Elodie Briche; Yoelma Rodriguez-Dartois
Crete KRITI Eleni Hatziyanni; Maria Kalatzak; Lina Anezaki
Cyprus INTERFUSION Constantinos Stylianou; Yiannis Konnaris
Fenman BEF Germany Philipp Siegel; Damian Arikas; Matthias Grätz
Madeira AREAM Filipe Oliveira; Hugo Vasconcelos; Elizabeth Olival
Malta ABT Kyra Hoevenaars; Lena Schenke
Sardinia ANCI Alessandro Mancosu; Laura Foddis; Daniela Sitzia; Manuela Tatti
Sicilia OTIE Patrizia Calò; Giacoma Brancato; Giovanni Ruggieri;
West Indies UA Jean Raphaël Gros Desormeaux; Justin Daniel
Coordinated by FCIENCIAS.ID
August 2021
PU: Public Usage. No restrictions on access (in secured PDF format).
3
REVISION HISTORY
This document presents the results of the SOCLIMPACT Adaptation Pathways consultation process
for each of the Islands and the description of the used methods and materials which were adjusted and
created for this task. This process is included in SOCLIMPACT Task 7.3 - Engage islands’ stakeholders
in the design of alternative pathways. In accordance with the project Description of Action these
workshops used the background material prepared in Task 7.2/D7.2, which includes the main results
from previous WPs for each Island.
This report includes in its annexes the Regional Workshops Reports for each island which gather the
key outputs of the online workshop materials, namely: (1) decisions taken; (2) agendas and (3) list of
participants.
This version includes new information to respond to reviewer comments with the reference Ares (2021)
4639426 dated from July 18th, 2021.
Version Date Author r
Notes
D7.3_Workshop_Report_
ISLAND_template_3s
16/10/2020 FC.ID 1st draft for IFP
v0 D7.3 Workshops Report AZORES
15/11/2020 FC.ID 2nd draft reviewed by IFP
D7.3 Workshops Reports_QR11122020
05/12/2020 FC.ID & IFP
1st draft of document prepared by IFP and FC.ID.
Review by AREAS, ULPGC and CYI.
Version for Quality Review
D7.3 Workshops
reports_211120
21/12/2020 FC.ID & IFP
2nd draft of document prepared by IFP and FC.ID.
Review by AREAS and ULPGC and CYI.
D7.3 Workshops report_
FINAL
28/12/2020 FC.ID & IFP
Version ready for approval by the Project Officer
D7.3 Workshops report_
Results&method
25/08/2021 FC.ID & IFP
Version to include reviewer comments: o An introductory synthesis of the main
findings of the workshops o The ranking concept has been more
clearly described. o A detailed description on the proposed
adaptation options and the alignment with EU Adaptation Strategy context has been added
The presentation and structure of the document was
improved to be easily understandable for people not
involved in the Project: there is a main document with
general results and methods applied and 11 different
Reports one for each Island.
4
Contents
1 EXECUTIVE SUMMARY ....................................................................................................... 6
2 WORKSHOPS DEVELOPMENT CONTEXT ........................................................................... 14 2.1 Covid-19 Contingent Plan ...................................................................................................................... 14 2.2 Impact Chains Approach ........................................................................................................................ 15 2.3 Workshops step-by-step ........................................................................................................................ 16 2.4 FAQ from the Islands ............................................................................................................................. 20
3 ADAPTATION PATHWAYS TRAJECTORIES ......................................................................... 23 3.1 Classes of adaptation ............................................................................................................................. 24 3.2 Adaptation Pathways Trajectories Narratives ....................................................................................... 26
4 DEVELOPMENT AND CHARACTERIZATION OF THE ADAPTATION OPTIONS ...................... 30 4.1 Portfolio of Adaptation Options ............................................................................................................ 30 4.2 Adaptation Options Characterization .................................................................................................... 30
5 DESIGNING AND RANKING ADAPTATION PATHWAYS ...................................................... 33 5.1 Online Survey Tool Structure and Use ................................................................................................... 36 5.2 Online Survey Tool Files......................................................................................................................... 39
6 ISLANDS ADAPTATION PATHWAYS................................................................................... 40 6.1 Azores ............................................................................................................................................ 41
6.1.1 Tourism ............................................................................................................................................. 41 6.1.2 Maritime Transport ........................................................................................................................... 45 6.1.3 Energy ............................................................................................................................................... 48
6.2 Balearic Islands .............................................................................................................................. 51 6.2.1 Tourism ............................................................................................................................................. 51 6.2.2 Maritime Transport ........................................................................................................................... 55 6.2.3 Energy ............................................................................................................................................... 59
6.3 Canary Islands ................................................................................................................................ 62 6.3.1 Tourism ............................................................................................................................................. 62 6.3.2 Maritime Transport ........................................................................................................................... 66 6.3.3 Energy ............................................................................................................................................... 69 6.3.4 Aquaculture ....................................................................................................................................... 73
6.4 Corsica ........................................................................................................................................... 77 6.4.1 Tourism ............................................................................................................................................. 77 6.4.2 Aquaculture ....................................................................................................................................... 80
6.5 Crete .............................................................................................................................................. 83 6.5.1 Tourism ............................................................................................................................................. 83 6.5.2 Maritime Transport ........................................................................................................................... 86
6.6 Cyprus ............................................................................................................................................ 88 6.6.1 Tourism ............................................................................................................................................. 88 6.6.2 Energy ............................................................................................................................................... 92
6.7 Fehmarn ......................................................................................................................................... 98 6.7.1 Tourism ............................................................................................................................................. 98 6.7.2 Further comments .......................................................................................................................... 103
6.8 Guadalupe & Martinica .................................................................................................................104 6.9 Madeira ........................................................................................................................................105
6.9.1 Aquaculture ..................................................................................................................................... 105 6.9.2 Energy ............................................................................................................................................. 109 6.9.3 Maritime Transport ......................................................................................................................... 113 6.9.4 Tourism ........................................................................................................................................... 117 6.9.5 Further comments .......................................................................................................................... 120
6.10 Malta ............................................................................................................................................122 6.10.1 Aquaculture ................................................................................................................................ 122
5
6.11 Sardinia .........................................................................................................................................126 6.11.1 Tourism ....................................................................................................................................... 126 6.11.2 Maritime Transport..................................................................................................................... 129 6.11.3 Energy ......................................................................................................................................... 131 6.11.4 Aquaculture ................................................................................................................................ 133
6.12 Sicily ..............................................................................................................................................135 6.12.1 Tourism ....................................................................................................................................... 135 6.12.2 Maritime Transport..................................................................................................................... 138 6.12.3 Energy ......................................................................................................................................... 141 6.12.4 Aquaculture ................................................................................................................................ 144
7 ADAPTATION PATHWAYS FOR BLUE ECONOMY SECTORS IN EU ISLANDS ...................... 147 7.1 Aquaculture ......................................................................................................................................... 148 7.2 Energy .................................................................................................................................................. 151 7.3 Maritime Transport ............................................................................................................................. 154 7.4 Tourism ................................................................................................................................................ 157 7.5 Most Selected Adaptation Options ..................................................................................................... 160
8 CONCLUSIONS AND DISCUSSION ................................................................................... 162 8.1 Challenges of implementation for the Methodological Framework ................................................... 162 8.2 Methodological Framework overview ................................................................................................. 162
9 REFERENCES .................................................................................................................. 164
ANNEXES ............................................................................................................................... 165
ANNEX 1 – ADAPTATION OPTIONS LIST ................................................................................. 166 1.1 Portfolio of Adaptation Options .......................................................................................................... 166 1.2 Local knowledge .................................................................................................................................. 184
ANNEX 2- REGIONAL WORKSHOPS REPORTS ........................................................................ 194
6
1 Executive Summary
This deliverable aims to present methods employed, tools used, results, and presents conclusions of the
whole process developed under T7.3 which was first proposed in D7.1. The annex addresses the
deliverable requirements set in the third amendment1 which include: the agendas, the list of participants,
and the workshops reports including the decisions taken.
A framework was set for a presential consultation method but with the arrival of the COVID-19 pandemic
context major adjustments had to be made to what was originally proposed. This report explains the
proposed framework of the Online Workshops implementation which contains the necessary steps,
frames the addressed sectors of the blue economy (Aquaculture, Energy, Maritime Transport and
Tourism) and their stakeholders, and presents the Impact Chains approach (a concept framed in D7.1,
developed under WP3 and operationalised under WP4 and WP5). The Adaptation pathways rational and
concept is presented explaining how the sector adaptation pathways were designed, how the proposed
Adaptation Options were assembled in classes of adaptation and how Adaptation Policy Trajectories
(APTs) were used as context to develop alternative adaptation pathways. The development and
characterization of those Adaptation Options is explained, putting forward how these policy options were
gathered at European level and then transduced and characterized to the island level. The results for the
Adaptation Pathways are then explained and exemplified and a Frequent Asked Questions (FAQ) is
presented.
The Online Survey Tool is a major part of the adjustments which had to be adapted for the pandemic
context (first proposed in D7.1). It brings together the background material prepared by the project (D7.2
and communication material developed by WP8) to the stakeholder choice process, under four different
future policy contexts (the APTs). With this tool the different stakeholders were able to choose from a
set of Adaptation Options developed and characterized earlier in the process. Their decision was in
practice the act of choosing one out of two Adaptation Options in each timeframe (short-term (up to
2030), mid-century (2030-2050) and end-century (2050-2100)) but this could be no easy task. Stakeholders
had to consider the risks given by climate (WP4) and socioeconomic (WP5 and WP6) indicators presented
in the background material and make the appropriate choice according with each APT context. Besides
the translation to the local language, some IFPs made useful simplifications to it that facilitated a full
implementation of the proposed framework.
Results indicate that Local Working Groups (LWGs, which are the stakeholders and the IFPs combined)
did use the APT contexts to some extent, despite the concept being a novelty. There is also an indication
the whole process was useful for the islands and for their adaptation processes under the context of
decarbonization. Results also indicate that the process of choice between one out of two Adaptation
Options was necessary to construct the pathways, considering this was and online and individual
consultation process. In this context, participation process was developed under decarbonization
perspective while dealing with uncertainty.
Azores
Overall, the adaptation pathways for the Blue Economic Sectors in Azores are characterized by a
significant heterogeneity in Tourism and Maritime Transport and across adaptation objectives a
homogenous selection across the four adaptation policy trajectories (APTs) in Energy sector and across
adaptation objectives.
1 AMENDMENT Reference No AMD-776661-21
7
For Tourism sector, pathways developed were focused on the preservation and promotion of the natural
attractiveness of the region and reflect the relevance of this issue for the Azorean tourism sector, in the
four pathways. All pathways reflect the need of conservation of the natural areas to continuous address
multiple risks. This approach promotes water resource availability without hard and irreversible
infrastructures. The vector borne diseases were not considered urgent for this sector. Like the options
agroforestry related options sector does not have direct control on the health policy. The performance of
the four ATP scenarios for tourism sector are similar for the three timeframes considered.
The pathways in Maritime Transport sector are focus on coastline protection and reflect the relevance
of this issue for the Azorean maritime transport sector, in the four pathways. All pathways reflect the need
for continuous maintenance of infrastructures, while coastal monitoring systems are centred around the
short and long term. The performance of the ATP scenarios in Maritime Transport reveals that the
pathway with the highest investment and policy change levels and underperforms the other pathways.
For Energy sector the vulnerability reduction relies on green jobs and energy storage. Green jobs can
support Azores reliance on adaptation energy issues while serving as a form of economic diversification.
In contrast, public information on climate action is not part of the pathways since it is assumed that there
is and will be a sufficient level public information in the island for it to pursue climate action. All four
pathways in the Energy sector have a similar evaluation across all timeframes. The analysis showed no
differences in the scoring of criteria as a reflection of the different ATP narratives.
Balearic Islands
In the consultation process of the Balearic Islands, 5 in-depth interviews were conducted to high level
representatives, experts, and decision makers of three blue economy sectors (Tourism, Maritime
Transport, and Energy). It is important to note that both Spanish archipelagos of the project worked
together, and several thematic tables were organised, in which stakeholders from both regions had the
opportunity to exchange ideas, and the main potentialities and challenges that differentiate both islands.
For this reason, the stakeholders of the Canary Islands also provided valuable contributions to the outputs
of Balearics. Aquaculture activity was not included in the consultation process as the industry is almost
irrelevant in the Balearic's economy.
The Balearics was the first region in Spain that approved and is already ruling a strategy to fight against
climate change through an effective action in mitigation and adaptation. On top of that effort is the law
for the conservation of the Posidonia oceanica¸2018, that plays a key role as a CO2 reservoir. The Balearics
hold the largest reef of Posidonia all over the Mediterranean Sea, which makes its conservation a key stone
in fighting against climate change. In this regard, stakeholders in the island proposed to establish the goal
of Zero sewage discharge to the sea in the short term, due to the impact it has on the entire marine
ecosystem.
Besides, as the problem of extreme temperatures and water scarcity throughout the archipelago can be
clearly seen, stakeholders proposed Drought and water conservation plans and new investments in
reducing losses along the water distribution system as urgent local adaptation measures. The huge energy
consumption of the tourism sector is also an important consequence of the above-mentioned problem,
thus leading to the necessity of promoting Distributed electric grids powered by renewables, Domestic
and small-scale photovoltaic solar energy, and financial support for the energy rehabilitation of buildings.
The importance of prevention rather than action to extinguish forest fires was also remarked. With waste
being a major problem on the islands, interviewees' concerns also pivoted around the proper management
of organic waste.
8
Canary Islands
In the consultation process of the Canary Islands, 20 interviews were conducted to high level
representatives, experts, and decision makers of the four blue economy sectors. Overall, results indicate
that there are five priority work areas to be reinforced in the archipelago in the next decades, according
to the stakeholders views and opinions:
a strategy and action plan to power energy transition to renewables;
a law for biodiversity protection, that updates the current regulation by first time linking species survival to climate change control under not dangerous levels;
the strategy for a circular economy, that includes specific guidelines on sustainable management of residual organic matter along different stages: sewage sludge, big generators and households’ generation.
modifications on the current land management law, to promote actions in the wildlife sanctuaries to improve their GHG absorption balance and in the ecological restoration associated with private initiatives.
and a climate change law, which is the bow clef of the whole regulation system, containing the regulations and incentives that should promote behavioural changes of social agents towards a decarbonised society, by at least accomplishing the European Green Deal, and facilitate the adoption of adaptation measures by the most exposed socioeconomic agents and governmental departments.
For the tourism sector, the problem of sewage discharge to the sea was considered the most urgent adaptation option, followed by the need to promote Distributed electric grids powered by renewables. In particular, reducing Residual organic matter composting to reduce methane emissions has been highlighted as a priority axe for the short and medium term. It is important to note that the tourism sector depicts a very heterogeneous picture of opinions, which may limit the process for building consensus.
According to stakeholders, the Maritime transport sector is still in a very early stage of the process of adaptation policy definition. For this reason, the Social dialogue for training is considered a priority measure. Other measures related to infrastructure protection were frequently chosen, reflecting how having safe and operational ports is of paramount importance for the Canarian stakeholders. The diversification in the territorial waters is also considered fundamental for stakeho, which propose to plan the expansion of the port to areas not exposed to risks, and accommodate new and more activity related to the opportunities offered by the special regimes of the Canary Islands (RUP, ZEC, Registry of ships -REBECA). Lastly, strengthening and improving bunkering facilities was considered necessary, since the bunkering activity is one of the most important activities of the Canarian ports, in order to favour the transition to the use of new fuels and the electrical connection to the ships. This initiative would include cutting edge solutions in the adoption of bunkering facilities to power renewable energy-based technologies.
Promote Energy efficiency in urban water management, cogeneration and Micro smart grids are categorized as urgent measures according to the stakeholders of the Energy sector. Since the Canaries are already immersed in the E1, energy efficiency certificates are required for all buildings. In this regard, the financial support to the digitalisation of buildings (intelligent buildings) is still a pending issue and a necessity, according to stakeholders.
For the aquaculture sector, reformulate the POEM and REF incentives were selected as the most urgent measures, as they compensate the industry from insularity. The Review and streamline of administrative processes was also considered a priority, since improving governance is key to addressing the impact of climate change on production. Finally, to promote local consumption on the islands would reduce emissions, enhance the zero km concept, and contribute to the development of food sovereignty with high quality protein, and strengthen social cohesion.
9
Corsica
Two sectors were chosen regarding Corsica: tourism and aquaculture. Regarding adaptation option in
tourism, few solutions linked to water (T6 River restoration, T16: Desalination, T18 Drought
management) are chosen, since water scarcity is not a real problem in Corsica. On the short term, actions
like awareness raising campaign (T12 or T10) are chosen, while on the longer term, actions that require
more investment (T9) are chosen.
In general, actions that are less resource intensive (for example awareness raising campaign) are more
often chosen for short term (APTA). Regarding adaptation policy trajectory B, actions that are based on
economic instruments are preferred over incentives to relocate activities. Also, diversification of tourism
is chosen earlier and more often than awareness raising (from APTA to APTD). Concerning, adaptation
policy trajectory C, circular economy is preferred than tourist awareness.
Regarding sustainability performance, the performance of the four ATP scenarios for tourism sector are
considerably similar during the three timeframes considered. In general, scenarios show a high level of
social acceptability and technical applicability and a medium cost efficiency and environmental protection
with a low performance in mitigation win-wins and trade-offs. However, some differences across
pathways exist:
- For APTA, minimal intervention led to higher acceptability (APTA) - For ATPD (system restructuring) contributes more to environmental protection, which is also understandable, since this is a very voluntarist scenario. - APT C (system efficiency) has a better score for mitigation.
In Aquaculture, we can see in the results that there is a clear hierarchy of stakeholders’ preference, the
Multitrophic integrated aquaculture is often chosen, as well as local consumption, species selection, disease
prevention, while short cycle aquaculture or fish food production are more rarely chosen.
When choices and APT are considered, we see that:
- Local consumption of aquaculture products (A12) is preferred to Local environmental concerns (A11). - Integrated multitrophic aquaculture (A13) is preferred by far too short cycle aquaculture (A14) - Submersible cages (A16) are preferred to indoor aquaculture (A15) - Species selection (A4) is preferred to fish food improvement (A3) Regarding sustainability performance, some differences across pathways exist:
- APTA (minimal intervention) tends to have a higher social acceptability (since little action is taken) and cost efficiency, at short and medium term. - APTD (system restructuring) never performs the best, for none of the criteria. - APT B (Economic Capacity Expansion) seems very efficient on the medium term, and APT C Efficiency enhancement) on the long term.
Crete
The two regional workshops held in Crete helped determine the most appropriate options to be included
in several adaptation pathways for the tourism and maritime transport sectors based on the degree of
commitment to policy change and level of investment across three timeframes: the short-term (until 2030),
the mid-term (until 2050), and the long-term (until 2100).
For the tourism sector, stakeholders selected Water restrictions, consumption cuts and grey-water
recycling as one of the most important measures to be included in the adaptation pathways despite being
available only for APT C and APT D. Mainstreaming Disaster Risk Management (DRM) it is an option
only available in APT C, but it is considered as a priority. Activity and product diversification and

10
Monitoring, modelling, and forecasting systems are both selected for all timeframes regardless of the
adaptation pathway.
For the maritime transport sector prepare for service delays or cancellations was selected by stakeholders
as an important option to be included in APT A in all timeframes as it was considered a sensible action
to take. The Climate proof ports and port activities, is available in all APTs and was included for all
timeframes of APT A, and the short term of APT B, APT C and APT D. Coastal protection structures
and Marine life friendly coastal protection structures were both included in short and medium time frames.
Cyprus
For the Tourism sector of Cyprus, vulnerability reduction can be achieved by implementing programmes
to raise public awareness in the short-term and the diversification of tourist activities and products in the
mid- and long-term to combat the issue of seasonality that is heavily observed on the island. Measures for
disaster risk reduction involve drought and water conservation plans as it is considered a more feasible
and cost-efficient option for managing long-term risk, especially since Cyprus will face an increase in
temperature in the distant future. The construction of coastal protection structures was also recommended
as a short-term measure in scenarios with mid-high investment, mainly because the SLR and wind wave
projections indicate extensive beach reduction at coastal areas, which in turn would decrease the
attractiveness of the island as a tourist destination. Finally, for satisfying the social-ecological resilience
objective, stakeholders mostly opted for monitoring, modelling, and forecasting systems given that reliable
and timely climate information and the ability to assess climate hazard impacts would be more suitable for
mitigating GHG emissions, as well as a more technically applicable and socially acceptable measure.
For the Energy sector of Cyprus, vulnerability reduction can be attained by promoting green jobs and
businesses because this can provide multiple benefits regarding sustainable development. Also, in the
short-term, the provision of a public information service on climate action is also recommended as it
could yield immediate results for supporting residential, hotel and commercial buildings to adapt to
Climate Change. Measures for disaster risk reduction include the review of building codes of the energy
infrastructure, which is an ongoing process that is necessary for protecting the environment and mitigating
GHG emissions. In addition, upgrading the evaporative cooling systems is also considered necessary until
the end of the century given that water scarcity and heat waves are hazards that will severely impact the
island. Hence, the technology to deal with this will need continuous improving over time. With respect to
social-ecological resilience, energy efficiency of urban water management needs to be addressed in the
immediate future, whereas the inclusion of underground tubes and piping in urban planning needs to be
addressed in the distant future.
The four APTs perform similarly to a large degree in all three timeframes with respect to the evaluation
of the five criteria. Overall, it can be observed that the four APT scenarios have a low-to-average level of
mitigation (GHG emissions) win-wins and trade-offs. In addition, they exhibit an average-to-high
performance with regards to cost efficiency, technical applicability, and social acceptability. Finally, the
scenarios have a high level of environmental protection. Given that APT A is characterized by low
investment and low commitment it is expected that the measures included in this scenario are not ranked
highly with respect to their ability to mitigate emissions and protect the environment. APT D, on the
other hand, consists of measures that are rated highly with respect to environmental protection, which is
in line with the high commitment and high investment assumed in this pathway trajectory.
Fehmarn
The activities were conducted in cooperation with stakeholders from Fehmarn Island to create Adaptation
Policy Pathways that lay out a trajectory of adaptation options that could be utilised on Fehmarn to prepare
for an uncertain climate future. Overall, the process was considered a valuable activity by the participating
11
stakeholders. The resulting adaptation pathways for different scenario form a useful basis for discussing
adaptation measures and can be used to compare differences and similarities between stakeholder
preferences among the participating SOCLIMPACT islands.
Within the project a workshop was held with stakeholders from Fehmarn to evaluate potential climate
adaptation pathways, mainly for the island`s tourism industry. The stakeholders were asked to choose
their preferences for different short-, medium- and long-term Adaption Options (AOs) while taking four
different Adaptation Policy Trajectories (APTs) into account.
The following AOs have been chosen the most:
Activity and product diversification: 75% - During the evaluation it became clear that this AO was
considered a very broad term, potentially explaining why it was so popular. In the discussion the
prolongation of the season, more winter activities as well as more alternatives to beach tourism where
mentioned.
Local circular economy: 73% - It was chosen always when the option was available which was the case in
APT C. The stakeholders imagine local circularity with a focus on small-scale activities. One stakeholder
suggested utilizing seagrass as biomaterial, for example to build housing insulations. The Stakeholders did
not have concrete ideas on how a truly circular economy would look like on Fehmarn.
Dune restoration and rehabilitation - This AO got chosen across all time frames. Dunes are important for
natural coastal protection and as a touristic attraction.
Sustainability Performance of the AOs:
The created pathways differ in their impacts regarding different aspects:
Environmental protection reached low scores. In general, measures in APT C would cause the greatest
environmental protection.
Technical applicability was rated high, as Germany is a technically advanced country, and many proposed
technologies are theoretically available.
Measures with the highest Social Acceptability (S.A.) are found in APT A scenario, the ones with the
lowest S.A. in APT D, especially long term. This indicates that when measures are getting more extreme
the S.A. for them declines.
The cost-efficiency of the measures was rather high. Highest cost-efficiency occurred in APT A.
Surprisingly, APT D had the second-highest cost-efficiency for AOs chosen for long term.
Madeira
The European Union outermost regions, particularly Atlantic Ocean archipelagos, have small and
fragmented territories located on the margins of the European Union climate models, making it difficult
to have reliable climate change projections they also face greater uncertainty and error in weather forecasts
and projections due to less coverage of weather observation networks. The SOCLIMPACT project
highlighted the lack of systematic data collection that is important to enable downscaling of climate models
and assess climate change impacts on natural ecosystems and infrastructures, and socio-economic
activities. This exercise also shown the need for a specific adaptation approach to each island within
Madeira archipelago, as they have specificities that will determine different vulnerabilities to climate
change
For the aquaculture sector there is a clear intention to invest in submersible cages, disease prevention
methods and recovery post-disaster plans as adaptation measures to climate change. For the energy sector,
12
the measures more selected by the stakeholders are educational garden plots, energy efficiency in urban
water management and energy storage systems. For the maritime transport the measures more selected
were backup routes and infrastructures during extreme weather and integrate ports in urban tissue. For
the tourism sector the stakeholders want to promote local circular economy, Mainstreaming Disaster Risk
Management (DRM) and adaptive management of natural habitats.
Malta
Climate change adaption options in Malta were developed and ranked for the Blue Economy Sector of
aquaculture. The selected pathways were based on the choices made by 5 expert island stakeholders who
participated in the local workshop. The adaption options with the highest ranking and therefore preference
in Malta are: Best management practices, efficient feed management and species selection.
The option of best management practices was ranked as the best adaption option. In this case it describes
methods that are determined to be effective and practicable means of reducing risks of climate change
impacts on the aquaculture sector in Malta. These practices have on the long-term a high sustainable
performance because they take into account financial viability, as well as environmental and social
objectives of certain methods to be used in the aquaculture sector when facing climate change. This option
was selected particularly for the APT B Economic Capacity Expansion and APT C Efficiency
Enhancement. Efficient feed management was ranked as the second-best adaption option. The growing
pressure on marine aquaculture systems due to climate change impacts demands an adaptation of fish feed
to maintain or increase its cost-effectiveness in a changing environment. Species selection is as well a
particularly important adaption option within the marine aquaculture sector, as environmental factors such
as sea surface temperature have a strong impact on the growth performance and stock health of different
farmed species. An adequate selection of species taking into account climate change impacts on these
Maltese aquaculture systems is an important step when it comes to the adaption of aquaculture to climate
change in Maltese waters. Both, efficient feed management and species selection are essential options to
be considered in all different APTs with A minimum intervention, B economic capacity expansion, C
efficiency enhancement and D system restructuring.
Sicily
The first three options selected for the Tourism sector are “Adaptive management of natural habitats”
(72% - Social-Ecological Resilience), “Pre-disaster early recovery planning” and “Health care delivery
systems” (67% - Risk Reduction), and “River rehabilitation and restoration” (64% - Social-Ecological
Resilience). The performances of the four ATP scenarios are quite similar for the mid and long
timeframes. In general, scenarios show a high level of social acceptability and technical applicability and a
medium performance for the other variables.
A certain combination of investment and commitment, then a certain level of concrete involvement
emerge for Maritime Transport sector. The favourite options are “Integrate ports in urban tissue” (83% -
Social-Ecological Resilience), “Intelligent Transport Systems” (Risk Reduction) and “Refrigeration,
cooling and ventilation systems” (Vulnerability Reduction) both 75%, finally “Diversification of trade
using climate resilient commodities” and “Social dialogue for training in the port sector” (67% -
Vulnerability Reduction). All four adaptation pathways reveal a similar structure in terms of sustainability
performance, especially from 2050 up to 2100. These pathways include measures with a relatively high
social and technical acceptability, medium level for mitigation objectives and cost-efficiency. But they will
not perform in terms of future environmental protection.
The Energy Sector is characterized by heterogeneity concerning the selection of adaptation options in all
adaptation policy trajectories (APTs). Results highlight a wide awareness about the need to do something
concretely improving the medium and long-term scenarios. The first three options selected are “Energy
storage systems” (78%), “Green jobs and businesses” (69%) both Vulnerability Reduction, and “Heated
pools with waste heat from power plants” (Social-Ecological Resilience) and “Grid reliability” (Risk
13
Reduction) both 67%. Considering the Sustainability Performance, social acceptability shows the higher
results in all the APTs and all the timeframes.
The most selected options for Aquaculture are “Recirculation Aquaculture Systems” (75% - Vulnerability
Reduction), “Integrated multi-trophic aquaculture” (71%- Vulnerability Reduction), and “Promote
aquaculture cuisine” and “Best Management Practices” (both 67% - Social-Ecological Resilience). All the
pathways have a similar evaluation across all timeframes. The dimension with the best results are the social
and technical ones, especially in mid-long time.
Sardinia
Sardinian stakeholders in the tourism sector chose adaptation options that mainly fall into the two
categories of risk reduction and vulnerability reduction, namely Economic Policy Instruments (EPIs)
(83%), Mainstreaming disaster risk management (MDRM) (80%) and drought and water conservation
plans (75%).
Sardinian stakeholders in the maritime transport sector prioritised measures that would reduce
vulnerability and once again reduce disaster risk by selecting increase operational speed and flexibility in
ports (94%), intelligent transport systems (94%) and climate resilient economy and jobs (83%).
Sardinian stakeholders in the energy sector opted again for adaptation options in the category of
vulnerability reduction and disaster risk reduction by favouring financial support for buildings with low
energy needs (71%), study and develop energy grid connections (71%) and Green jobs and businesses
(69%) vulnerability reduction.
Finally, Sardinian stakeholders in the aquaculture sector confirmed the tendency and voted for options
that reduce vulnerability and disaster risk. They selected integrated multitrophic aquaculture (89%),
environmental monitoring and early warning systems (EWS) 89% and Addressing consumer and
environmental concerns at the local level (72%).
General trends considering the Sustainability Performance of the options (considering the different APTs)
for Sardinia was very clear with stakeholders preferring by far in the short-, medium- and long-term
adaptation options that reduce vulnerability and the risk of disasters. In particular, the tourism
stakeholders want measures that are socially accepted and cost efficient. The maritime transport
stakeholders favour options that protect the environment and show a marked tilt towards mitigation win-
win and trade-offs. The energy stakeholders also prefer mitigation win-win and trade-offs options and
environmental protection. Finally, the aquaculture stakeholders support socially accepted measures and
addressing consumer and environmental concerns locally.
14
2 Workshops Development Context
The methods and materials used are part of a stakeholders’ consultation process to design a downscaled
participative and evidence-based adaptation policy. For the consultation process, the following objectives
were set:
1. Identify and present the characterized packages of adaptation and risk management
options available for each archipelago/island.
2. Develop detailed archipelago/island integrated adaptation pathways, in three timeframes:
Short term (up to 2030), Mid-century (up to 2050) and End-century (up to 2100).
3. Evaluate and rank pathways for Blue Economy sectors.
To achieve these objectives a set of four milestones (or steps) were developed (before the Covid-19
pandemic context) to engage stakeholders in a workshop. These milestones were developed for and
communicated to the IFPs (Island Focal Points) who would later explore these methods and materials
(both developed by Task 7.3) in a workshop with the LWG (Local Working Groups), as follows:
1. Contextualisation: Major current and projected climate hazards and sector-associated climate
vulnerabilities and risks were presented and discussed from the archipelago/islands perspective.
Likewise, a predefined set of sector-specific adaptation options/measures were presented and
discussed.
2. Adaptation Pathways design method: The design of the pathways is based on the concept of
Adaptation Policy Trajectories (APTs). Individual scenario narratives for the archipelago/island,
as well as the materials and the general process of pathway design were to be introduced and
explained to the participants.
3. Developing Sector Adaptation Pathways: Participants were to be given the opportunity to
contribute to the design of their island pathways working on break out groups (one per sector)
with the assistance of a sector moderator and the IPF team.
4. Enriching analysis of Sector Adaptation Pathways: Using a plenary session, each sector (by
the moderator or designated participant) was to present its pathway. The pathways were to be
collectively discussed to identify cross-sector win-win situations (i.e., actions that would yield
positive adaptation across some or all the sectors) and, when possible, a their decarbonization
performance (i.e., assess how each pathway will measure to address decarbonisation targets for
the region).
The profile of stakeholders invited are highly dependent on the interests and choices made by the IFPs.
However, a wide variety of stakeholders were involved in the process to properly capture different
perspectives, knowledge, and stakes. The profile of the individuals invited to answer involved policy and
decision-makers, practitioners, non-governmental and civil society organisations, science experts, private
sector, business operators and sector regulators.
Adjustments were made on how these milestones are to be met because of the Covid-19 pandemic
context which was tackled by T7.3 using the contingency plan developed below.
2.1 Covid-19 Contingent Plan
With the health and travel limitations due to Covid-19 pandemic, changes had to made to the original
plan. Partners decided to develop two shorter online webinars mixed with an intermediate online survey
stage and results processing. The consultation process was therefore split into two online two-hour
webinars instead of the original plan of holding one presential full day workshop in each archipelago.
15
The rationale was to make it as easier as possible for both IFPs and LWGs (stakeholders) to carry out
the proposed work, without compromising the scientific quality of the projects’ outcomes. Overall,
considering the new state of confinement and future uncertainty, a set of robust, approachable, and
pragmatic solutions were put in place. Such was the case with the development of the online survey
tool based on an Excel file containing links to the findings section of the SOCLIMPACT website for the
background material.
A set of 24 adaptation options per sector (96 in total) were developed for each of the 12 classes of
adaptation. Furthermore, up to six additional adaptation options per island and per sector could be added
by the LWG (class of adaptation “Local Knowledge”). All option were characterized for each of the
Islands using the five Sustainability criteria.
The stakeholder’s involvement process was based in the “Online SOCLIMPACT Regional
Workshops: co-developing Sector Adaptation Pathways” guidance which was shared and validated by
the IFP partners during the preparatory procedure restarted in June 2020. Nevertheless, each webinar
considered the specific requirements of each archipelago/island and the resources available to each IFP
partners. Therefore, the framework described hereafter was shaped for each Islands context (Islands
Reports) to serve specific interests and needs of their archipelago/island stakeholders and sectors.
The whale watching case study followed the defined methodological framework and the COVID-19
contingency plan proposed for the remaining sectors in the project. However, due to the specificity of the
case study, the stakeholders involved, and the tailor-made background material developed for the
Macaronesia region results will be presented and discussed in a dedicated workshop. In this workshop,
planned for March 2021, the development of adaptation pathways will be carried out.
2.2 Impact Chains Approach
The Impact Chains (ICs) method was used to base the creation of indicators that relate the interactions
between climate, environment, and human factors and that can lead to impacts or disasters, within a given
system boundary under study. Furthermore, the risk is a result of an assessment structure which was
implemented in this governance framework: Hazards + Exposure + Vulnerability (Sensibility + Adaptive
Capacity) = Risk.
The results of the application of this approach were incorporated in the background materials used in
workshops and the OST. It was based the concept of “climate risk”, which aims to merge the conceptual
and terminology gaps between disaster risk and adaptation communities and following the root-causes of
the climate impacts: (1) Climate pathway; (2) environmental and physical context; and (3) socioeconomic
pathway.
The creation of ICs emphasizes the need to consider the specificity of each region in the approach to risk
perception on climate change and adaptation (Taylor, Dessai, & Bruine de Bruin, 2014). The integration
of multiple scales in adaptation was proposed in SOCLIMPACT by developing a conceptual background
to measure climate change risks. Beyond the climate hazards, the approach used for the risk assessment
was useful to conceptualize and define the scope of adaptation and disaster risk reduction in the
environmental, economic, and social impacts components.
This was developed from the outcomes of relevant literature (e.g., IPCC, 2014; GIZ et al., 2017), that
describes a methodological approach which has been defined in three steps:
1. Definition of boundaries (for sector and system under consideration)
2. Selecting indicators (for hazard, vulnerability, and exposure)
16
3. Check indicator’s specificity (for later IC operationalization with data from the Island).
When completed, this approach aims to potentialize the study of the impacts related with multiple hazards
and their mechanisms simultaneously. The first step of defining the boundaries of analysis (D3.1), is of
the most importance as it defines what portion of a given sector and its interactions will be addressed by
each sectors IC2 (thus what will be addressed in this common framework). In the second step a flowchart
diagram is made containing the causal links between the different components of climate risks (which are
connected) (D3.2) and quantified via informative indicators (D3.3). A unified definition of ICs with
specific boundaries and indicators should be made at the European level as to allow for comparability of
results across all islands (following the example of what was made in SOCLIMPACT). In the third step
of the ICs, a check review of the indicators’ specificity and availability (D3.4) is made at the local level (for
each per island and IC).
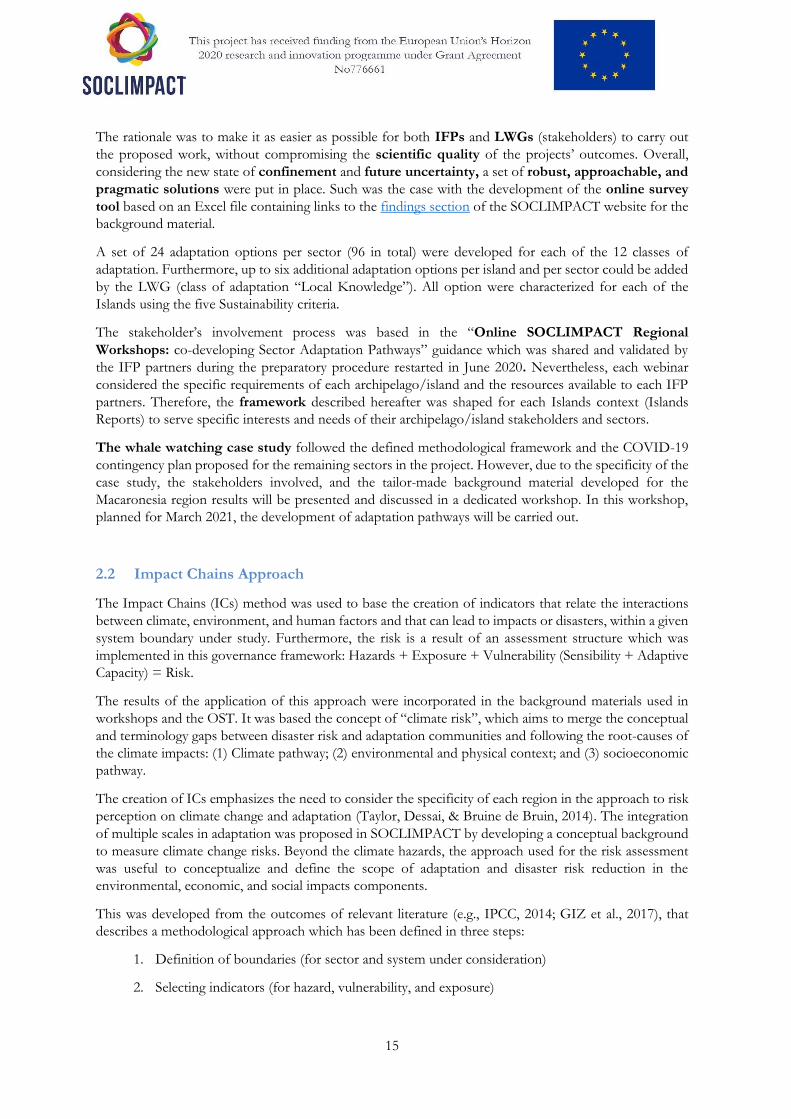
The Impact Chains approach recommends developing adaptation pathways throughout a systemic
vulnerability assessment (based on standardized indicators) to organize and prioritize factors that jointly
determine the nature and magnitude of risk (see Figure 4).
Figure 1 - Loss of attractiveness due to increased danger of forest fire in touristic areas (source: D3.2)
2.3 Workshops step-by-step
The framework applied for the interaction with SOCLIMPACT stakeholders reflects the Blue Economy
sectors considered in SOCLIMPACT. All four sectors of SOCLIMPACT (Aquaculture, Tourism, Energy
and Marine Transport) can be covered in the webinars for the stakeholder’s engagement process in all the
Islands case studies. However, during the process and following the recommended number of
stakeholders per sector (between 6 and 8), the inclusion of the sectors was adjusted accordingly.
Nevertheless, IFPs had the option to include sectors with less stakeholders available although considering
2 For instance, in SOCLIMPACT project the Aquaculture sector in only relates with Sea Aquaculture and the Energy sector only relates with electricity energy form
17
that a decrease in robustness of results could occur. Also, the sector relevancy and strategic importance
across the regions was considered as a criterion for the inclusion of sectors.
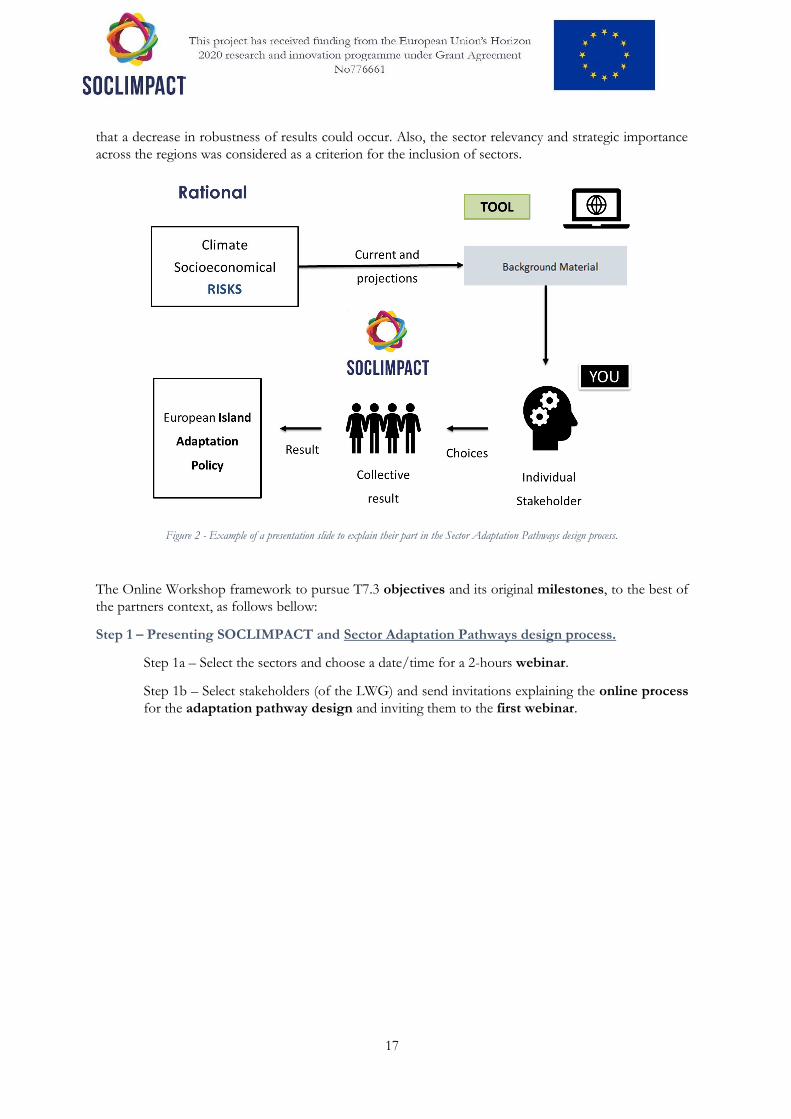
Figure 2 - Example of a presentation slide to explain their part in the Sector Adaptation Pathways design process.
The Online Workshop framework to pursue T7.3 objectives and its original milestones, to the best of
the partners context, as follows bellow:
Step 1 – Presenting SOCLIMPACT and Sector Adaptation Pathways design process.
Step 1a – Select the sectors and choose a date/time for a 2-hours webinar.
Step 1b – Select stakeholders (of the LWG) and send invitations explaining the online process
for the adaptation pathway design and inviting them to the first webinar.
18
Step 1c – Preparing the ‘Sector Adaptation Pathways - Online Survey Tool’:
Before the first webinar, as a standard procedure, complete the Adaptation Options sheet
for each selected sector, by providing local knowledge measures/options (six additional
measures that IFPs can include per island) and making the characterization of all measures
(giving criteria points that range from one to four.
Before the first webinar, as an alternative procedure, there is the option to include
stakeholders in the completion of the Adaptation Options sheet. This is an alternate step
managed by each IFP. This means stakeholders will be engaged by IFPs to provide their input
regarding local knowledge measures and the evaluation of all sector measures using the
characterization criteria (in the adaptation options tab). In this alternative, this step should
also happen before the first webinar. This guarantees that the contribution of a given
stakeholder is available to all other stakeholders when they are choosing the adaptation
pathways in the next step.
Due to time restrictions, we advise for the standard procedure as it is safer and easier to
manage by IFPs. However, some IFPs may prefer to use the alternative procedure specially
if they have resources available, a reduced number of stakeholders or they want to enrich
stakeholder input.
IFPs should also check the background material which was prepared for their island by WP8
and the links to projects website.
Having this in hand IFP can proceed to the first webinar with stakeholders, which is the
next Step.
Step 1d – Host a 2-hours webinar (using an online tool selected by IFP) with the following agenda:
Welcome and housekeeping.
Introduction to SOCLIMPACT project and their importance for the design of Sector
Adaptation Pathways, both at the local level and for the outcome of the project defining a
European Adaptation Policy for the islands
Overview of key climate change risks to the Blue Economy of the archipelago/island
presenting: (1) What is included in the background material that derived from D7.2 See
example in Figure 1; (2) Other sources that IFPs consider relevant for stakeholders to have.
Introduction to the general process for the online design of Sector Adaptation Pathways
and associated timeline
Explain to stakeholders how they will individually use the Online Survey Tool for the Sector
Adaptation Pathways
Q&A session
Next steps and closing
19
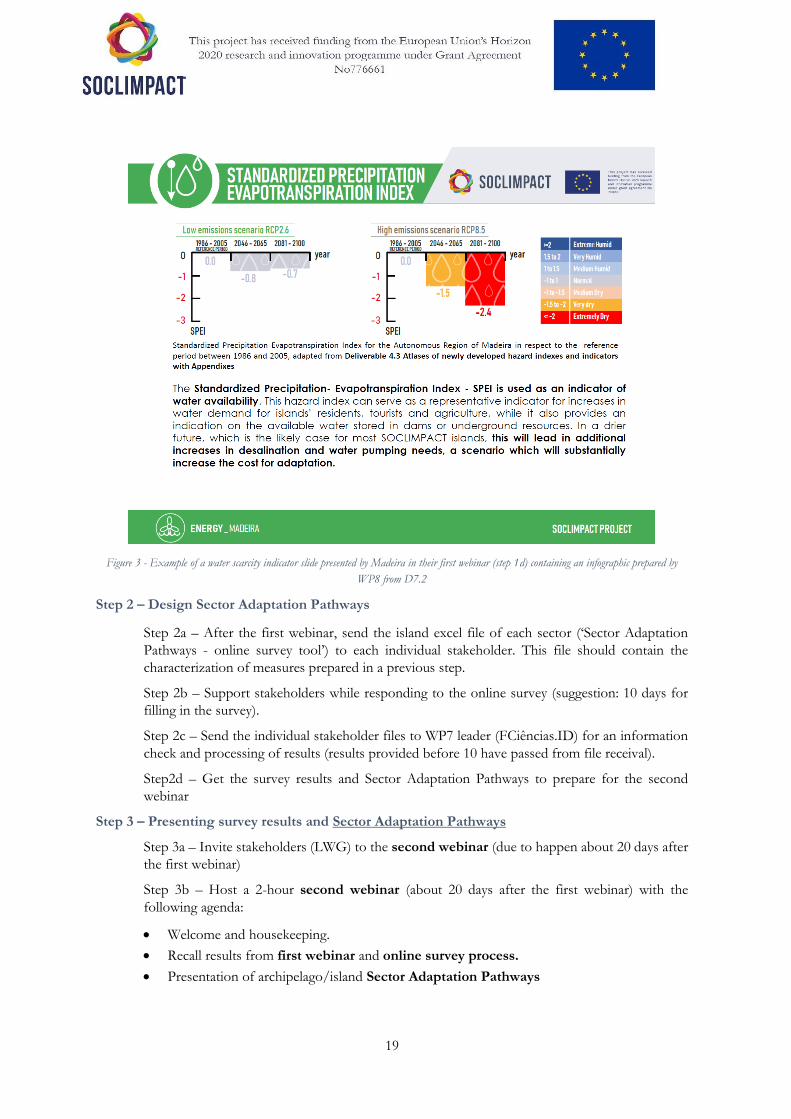
Figure 3 - Example of a water scarcity indicator slide presented by Madeira in their first webinar (step 1d) containing an infographic prepared by
WP8 from D7.2
Step 2 – Design Sector Adaptation Pathways
Step 2a – After the first webinar, send the island excel file of each sector (‘Sector Adaptation
Pathways - online survey tool’) to each individual stakeholder. This file should contain the
characterization of measures prepared in a previous step.
Step 2b – Support stakeholders while responding to the online survey (suggestion: 10 days for
filling in the survey).
Step 2c – Send the individual stakeholder files to WP7 leader (FCiências.ID) for an information
check and processing of results (results provided before 10 have passed from file receival).
Step2d – Get the survey results and Sector Adaptation Pathways to prepare for the second
webinar
Step 3 – Presenting survey results and Sector Adaptation Pathways
Step 3a – Invite stakeholders (LWG) to the second webinar (due to happen about 20 days after
the first webinar)
Step 3b – Host a 2-hour second webinar (about 20 days after the first webinar) with the
following agenda:
Welcome and housekeeping.
Recall results from first webinar and online survey process.
Presentation of archipelago/island Sector Adaptation Pathways
20
Cross-sectoral discussion on pathways and (when possible) with a decarbonization
performance and a Covid-19 discussion 3
Next steps and closing
Step 4 – Analysing data, compiling results, and sending final feedback to stakeholders.
Step 4a – Evaluate and rank final Sector Adaptation Pathways for each archipelago/island and
for European Islands as a whole, considering the results of the online survey and the second
webinar.
Step 4b – Write the Workshop Island Report for the two webinars, the evaluation, and the
pathway ranking.
Step 4c - Send back the report to stakeholders along with a process evaluation.
2.4 FAQ from the Islands
During the participation process FAQ were developed together with the IFP:
1. How to reach the stakeholders and what is expected from IFP?
The standard flow of information is: the interaction will be made through the OST with IFPs in
excel format.
The standard option is for the IFP: first complete the Adaptation Options sheet for each sector, by
providing local knowledge measures/options and the characterization of measures (points from one to
four). Having this in hand IFP can proceed to the first meeting with stakeholders. There the task will be
explained to stakeholders who will individually fill the Adaptation Pathways sheet. After all stakeholders
finish the information will be sent to FCiencias.ID by IFPs and we will produce results for discussion in
the second meeting with stakeholders. IFPs will moderate the first and the second meeting. There is the
option to include stakeholders in the Adaptation Options sheet, but this has to be managed by each IFP.
This means they will provide each one with their take on the local knowledge measures and the evaluation
of measures using the criteria. This task should happen before the first webinar so that the contribution
of a given stakeholders is available to other stakeholders when they are making the adaptation pathways.
We do not advise for this option due to time restrictions.
2. Measures to include are filled by stakeholders or IFPs?
There are standard options that come from the project and that will not be changed in the process. The
local knowledge measures for each island are the responsibility of each IFPs (see previous issue). IFPs can
choose to include stakeholders in this task but we advise them no to do so due to time restrictions.
Whatever the case, we ask IFPs to add something in the references so that everyone knows were the idea
came from and where to find more information to implement those measures. We advise that the sources
to be provided are preferably from adaptation knowledge databases or scientific references. These sources
which can be easily recognizable from both inside and outside the project and enrich the work that was
already made. News, opinion articles or commercial brochures are possible, but they do not provide such
robust sources. Also, IFPs (like AREAM) can refer themselves if they are engaged in local plans.
3. Measures proposed by us (IFPs) or stakeholders? (Adaptation Options sheet)
3 Only presented in the Regional Workshop Reports for some Islands
21
Adding (extra) local knowledge options is an IFP task and responsibility. As explained before (issue 5 and
6) there are two alternative ways to proceed: you either consult the stakeholders or you do it just by
yourself. Again, due to time restrictions, we advise that the stakeholders only define the Adaptation
Pathways (the final sheet) and are not involved in the Adaptation Options. Nevertheless, having extra
measures is not mandatory, it is only expected that you might need to include other measures which were
not included in this state-of-the-art review.
4. Definition of adaptation measures should use thresholds instead of short- or long-term time
frames. Why not proceed this way and define measures according to thresholds?
That approach cannot be applied for all the islands as there are information constrains in the project. For
instance, those thresholds are not readily available at this stage and some islands will not have the same
information. The timing and the available time to pursue this task advise us to proceed using this approach.
We suggest that IFPs who have that background information can relate those thresholds with the time
periods by consulting the available background material.
5. Deadline to fill in the sheet.
The Adaptation Options should be filled before the first webinar with stakeholders. In the first webinar
the Adaptation Pathways sheet will be presented to stakeholders who will be filling the sheet individually.
Results will be processed, and the second webinar will discuss those results. Nevertheless, IFPs should
start filling the sheet now so that we can provide the necessary assistance beforehand.
6. What happens if the measures are changed by stakeholders?
The measures were prepared for IFP to work with them. New ones can be added in the Local Knowledge
area. (issues 5, 6 and 7). Once this is done the measures cannot be changed in the Adaptation Pathways
stage. In the previous stage IFPs can include stakeholders in this process (as we explained before).
Afterwards the first webinar happens, stakeholders will choose the options according with what was
defined in the previous stage (issue 5). Therefore, at this stage the measures will not change.
7. If you make a new measure will it appear on the ATPs automatically?
Yes, they will be available on each ATP under Local Knowledge. The rest of the measures appear
according to their own class of adaptation (each ATP has a set of different adaptation classes in them).
8. Why must you choose only one measure?
The exercise is to select one measure for each timeframe and ATP. If you have both as a third option,
there will be no choice in the end. The result will be just a list of measures. The act of choice is relevant.
In total for the four different APTs, there are 29 choices to be made in each sector, times three time
periods give 116 different choices to be made. If for instance if a stakeholder is involved in all four sectors
this will add to a total of 464 choices. What is apparently seems to be a limitation (to choose from one of
two measures and not both) is in fact quite rich for just one person. If the APTs are used correctly the
result is even richer. Also keep in mind that, measures which are not present in one APT can be included
in another one.
9. Some islands will have many stakeholders and thus more combinations of these options, but
some IFP may have a limited number of stakeholders to answer this.
The overall number of stakeholders in all islands will provide a rich information about these choices for
the project. Per island, even one stakeholder may have up to 464 choices (see previous issue) and the
overall quality of this work can be further enhanced with a deeper understanding of APTs. Also, if there
is a limited number of stakeholders it is easier to engage them to participate also in the Adaptation Options
sheet as well. This was something we advised not to do due to time restrictions but if there are only a few
22
stakeholders it will be easier to manage. This will also enrich the final result. Having no choice (with an
option of having both) will diminish the quality of the work (see previous issue).
10. About the balance between having simplifications in the process and its usefulness. If you have
such a simple task to perform, choosing just one out of two options per adaptation class, will the
results be useful?
Choosing from two options means making a discrete choice. Individual choices will be summed together
to simulate what would happen in a live workshop discussion. This task is simple enough to guarantee
success in an online and social distancing reality (COVID-19) but still useful and rich, due to high number
of choices and input possibilities (please refer to issues 12 and 13). How much can be extracted from the
stakeholders depends on the choices that IFPs about how far they will involve them in the process.
Also, in a presential workshop context more options could be added by stakeholders, but they could
discuss each one before including them. This would act as a filter for excess measures or repetitions. For
the online context, the extra local adaptations options (Local Knowledge) can fill in specific gaps in each
island. Each island has a total 96 adaptation options already available for the four sectors, plus 24 potential
extra local options, adding to a total of 110 adaptation options. This total amount concerns only 4 sectors
so there are great in number. All these can make their way into the pathways and the choice is made by
stakeholders. This will make the pathways very rich due to their many possibilities, yet respecting an
accessible, adaptable, and untestable structure for different IFPs.
23
3 Adaptation Pathways Trajectories
The Adaptation Pathways methodology applied in SOCLIMPACT was based in the framework
developed by Suckall et al. (2018) and considered the three main objectives for climate resilience:
(1) vulnerability reduction - Five capitals of Sustainable Livelihoods Approach (SLA); (2) Disaster
Risk Reduction – developed throughout Hyogo and Sendai Frameworks; (3) Social-Ecological
Resilience – that emerge from the Millennium Ecosystem Assessment (MEA) and Common
International Classification of Ecosystem Services (CICES).
Adaptation Pathways Trajectories (APTs) were delineated as distinct visions (scenarios) of future
policy adaptation choices (Kebede et al., 2018). In this context, alternative directions for adaptation policy
and actions were define considering: (1) the level of investment on adaptation, and the extent to which
commitment to a significant policy change is required (Suckall et al., 2018).
Therefore, adapting to climate change may range from minimal to high cost, and from requiring a small
or incremental change to a significant change from the status quo (Suckall et al., 2018).
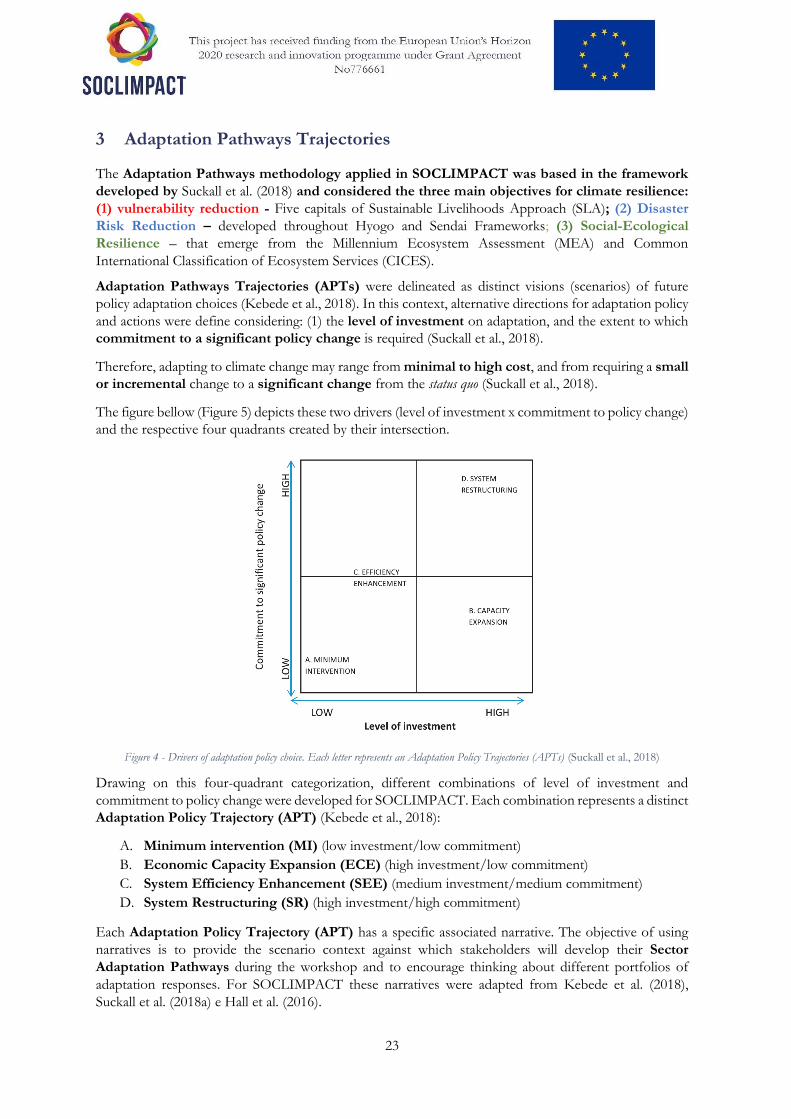
The figure bellow (Figure 5) depicts these two drivers (level of investment x commitment to policy change)
and the respective four quadrants created by their intersection.
Figure 4 - Drivers of adaptation policy choice. Each letter represents an Adaptation Policy Trajectories (APTs) (Suckall et al., 2018)
Drawing on this four-quadrant categorization, different combinations of level of investment and
commitment to policy change were developed for SOCLIMPACT. Each combination represents a distinct
Adaptation Policy Trajectory (APT) (Kebede et al., 2018):
A. Minimum intervention (MI) (low investment/low commitment)
B. Economic Capacity Expansion (ECE) (high investment/low commitment)
C. System Efficiency Enhancement (SEE) (medium investment/medium commitment)
D. System Restructuring (SR) (high investment/high commitment)
Each Adaptation Policy Trajectory (APT) has a specific associated narrative. The objective of using
narratives is to provide the scenario context against which stakeholders will develop their Sector
Adaptation Pathways during the workshop and to encourage thinking about different portfolios of
adaptation responses. For SOCLIMPACT these narratives were adapted from Kebede et al. (2018),
Suckall et al. (2018a) e Hall et al. (2016).
24
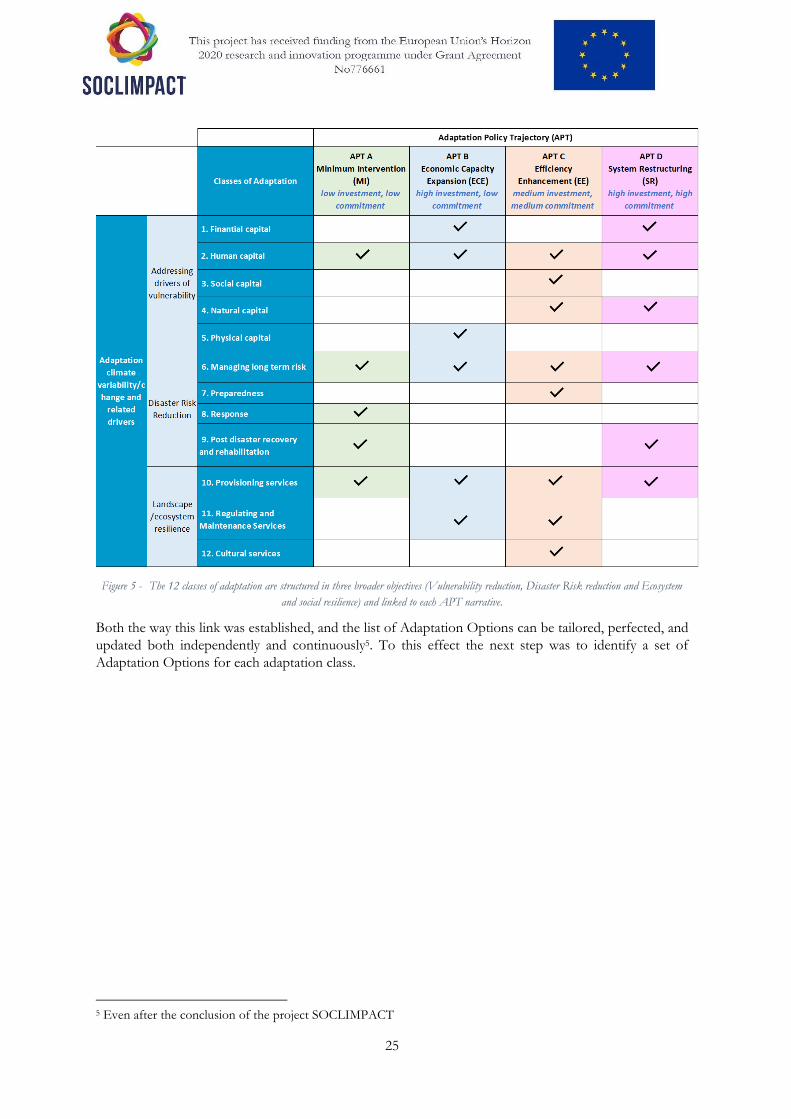
3.1 Classes of adaptation
A set of adaptation classes each one had two options/measures to choose from. Each individual
stakeholder choice (made in each class) contributed to create a policy pathway together with the choices
made by different stakeholders independently. If the majority of the stakeholders of a given island sector
chose one option instead of the other, then that measure was incorporated in the island adaptation
pathway for that specific APT context.
The method proposed presents a structure for categorising adaptation into 12 different classes, under
which the participants decide which are the most relevant options for the Region/Island under
consultation. The adaptation classes were used to define future directions for adaptation policy which
were expressed in Adaptation Policy Trajectories (APTs).
For vulnerability reduction five classes were considered: (1) Financial capital; (2) Human capital; (3)
Social capital; (4) Natural capital; and (5) Physical capital. For Disaster Risk Reduction four classes were
considered: (6) managing long term risk; (7) preparedness; (8) response; (9) post disaster recovery and
rehabilitation. For Social-Ecological Resilience three classes were considered: (10) Post disaster
recovery and rehabilitation; (11) Provisioning services; and (12) Regulating and Maintenance Services
(Figure 6). In SOCLIMPACT the Common International Classification of Ecosystem Services (CICES)
was used to Regulating and Habitat (originally called Support or Maintenance) have been merged into
Regulating and Maintenance Services (biotic and abiotic). The focus of these 12 classes has been slightly
revised from the original method to be in line with the sectors and geographical context under study (see
table in the project website
Having defined the classes of adaptation and the APT narratives, we can now establish a link for them.
To achieve this, we first4 link the APT narratives to each class of adaptation (Figure 6) and then develop
the Adaptation Options for each Blue Economy sector (chapter 2.5). This means that this first result
preludes the final purpose of allocating a set of planned policy-led option/measures into each future
direction. Having this, stakeholders will be able to more clearly choose options/measures which have a
link to each APT narrative.
We consider that this link exists when the weight that is given to each class of adaptation in each policy
direction (Suckall et al., 2018) is greater than one. Although the original method does admit limitations
and subjectivity (to the weights themselves) the link criterion we chose (our implementation solution) is
both simple and coherent. It deals at the same with the challenges within the contingency plan (Covid-19)
and the need to maintain scientific coherence.
4 In the original method (Suckall et al., 2018), first the classes of adaptation were identified, then the current or planned policy-led adaptations were identified and then the weights of each class of adaptation were assigned to each policy direction.
25
Figure 5 - The 12 classes of adaptation are structured in three broader objectives (Vulnerability reduction, Disaster Risk reduction and Ecosystem
and social resilience) and linked to each APT narrative.
Both the way this link was established, and the list of Adaptation Options can be tailored, perfected, and
updated both independently and continuously5. To this effect the next step was to identify a set of
Adaptation Options for each adaptation class.
5 Even after the conclusion of the project SOCLIMPACT
26
3.2 Adaptation Pathways Trajectories Narratives
The four APT narratives considered in the workshop are described in the following pages:
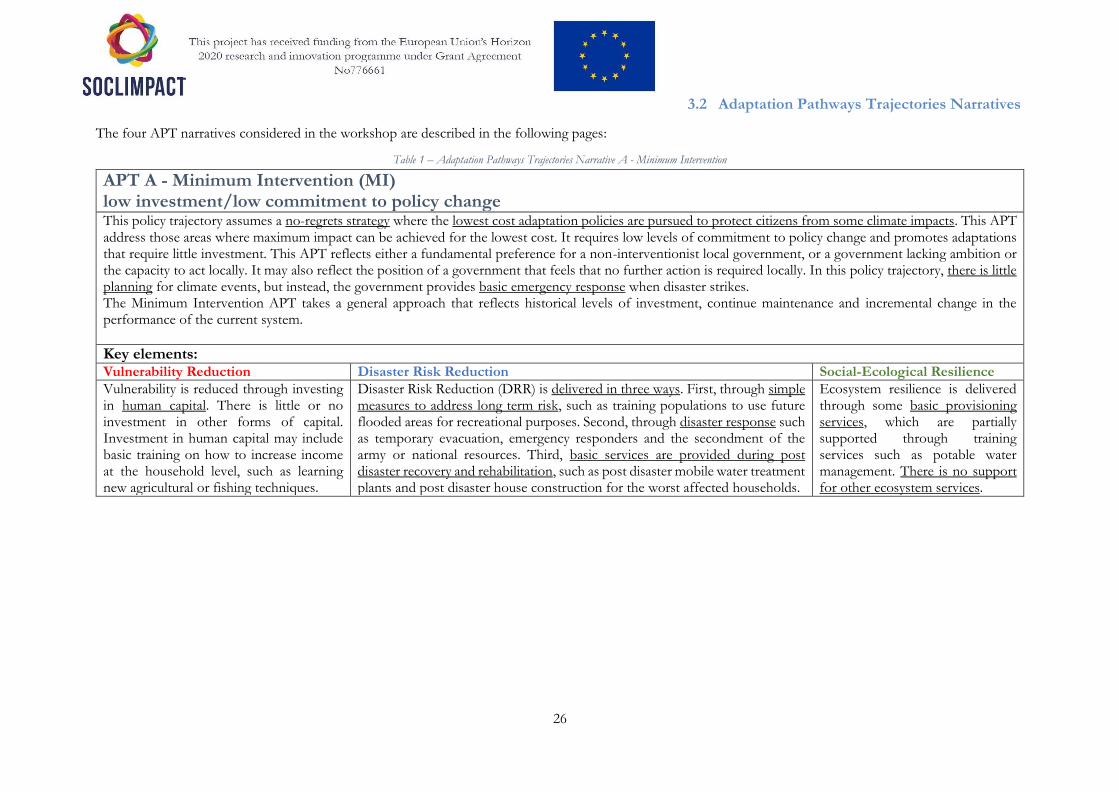
Table 1 – Adaptation Pathways Trajectories Narrative A - Minimum Intervention
APT A - Minimum Intervention (MI) low investment/low commitment to policy change This policy trajectory assumes a no-regrets strategy where the lowest cost adaptation policies are pursued to protect citizens from some climate impacts. This APT address those areas where maximum impact can be achieved for the lowest cost. It requires low levels of commitment to policy change and promotes adaptations that require little investment. This APT reflects either a fundamental preference for a non-interventionist local government, or a government lacking ambition or the capacity to act locally. It may also reflect the position of a government that feels that no further action is required locally. In this policy trajectory, there is little planning for climate events, but instead, the government provides basic emergency response when disaster strikes. The Minimum Intervention APT takes a general approach that reflects historical levels of investment, continue maintenance and incremental change in the performance of the current system.
Key elements: Vulnerability Reduction Disaster Risk Reduction Social-Ecological Resilience
Vulnerability is reduced through investing in human capital. There is little or no investment in other forms of capital. Investment in human capital may include basic training on how to increase income at the household level, such as learning new agricultural or fishing techniques.
Disaster Risk Reduction (DRR) is delivered in three ways. First, through simple measures to address long term risk, such as training populations to use future flooded areas for recreational purposes. Second, through disaster response such as temporary evacuation, emergency responders and the secondment of the army or national resources. Third, basic services are provided during post disaster recovery and rehabilitation, such as post disaster mobile water treatment plants and post disaster house construction for the worst affected households.
Ecosystem resilience is delivered through some basic provisioning services, which are partially supported through training services such as potable water management. There is no support for other ecosystem services.
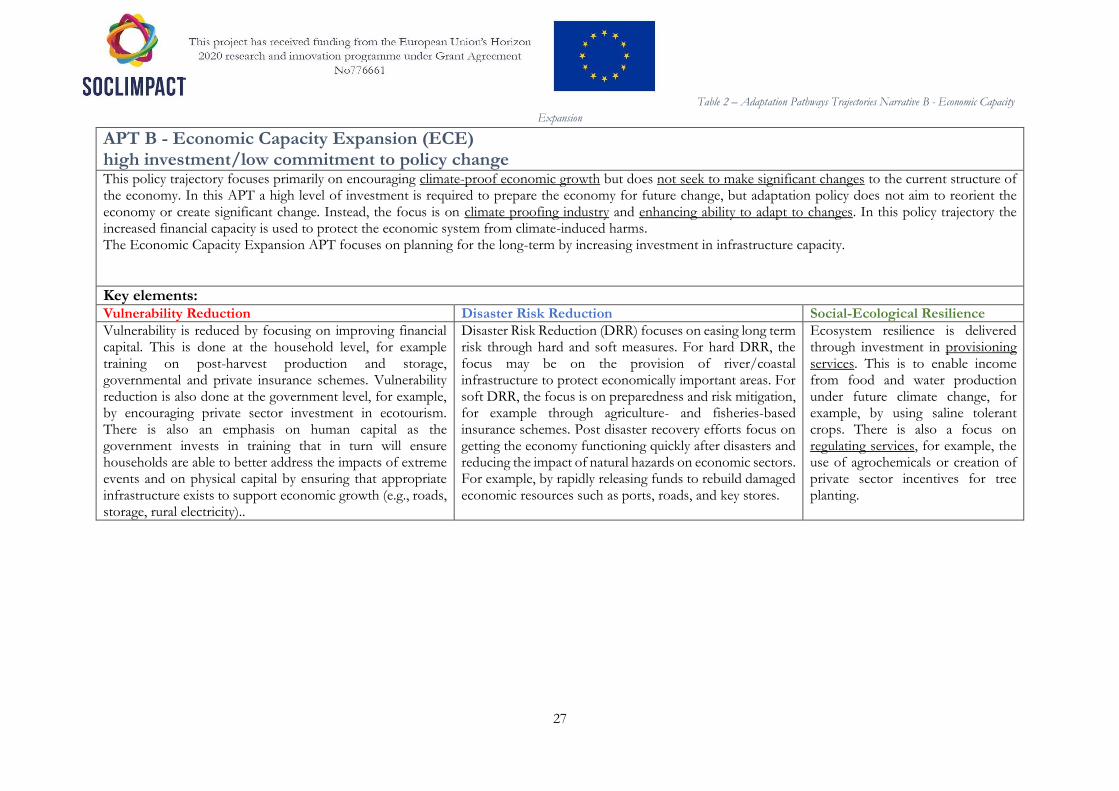
27
Table 2 – Adaptation Pathways Trajectories Narrative B - Economic Capacity
Expansion
APT B - Economic Capacity Expansion (ECE) high investment/low commitment to policy change This policy trajectory focuses primarily on encouraging climate-proof economic growth but does not seek to make significant changes to the current structure of the economy. In this APT a high level of investment is required to prepare the economy for future change, but adaptation policy does not aim to reorient the economy or create significant change. Instead, the focus is on climate proofing industry and enhancing ability to adapt to changes. In this policy trajectory the increased financial capacity is used to protect the economic system from climate-induced harms. The Economic Capacity Expansion APT focuses on planning for the long-term by increasing investment in infrastructure capacity.
Key elements: Vulnerability Reduction Disaster Risk Reduction Social-Ecological Resilience
Vulnerability is reduced by focusing on improving financial capital. This is done at the household level, for example training on post-harvest production and storage, governmental and private insurance schemes. Vulnerability reduction is also done at the government level, for example, by encouraging private sector investment in ecotourism. There is also an emphasis on human capital as the government invests in training that in turn will ensure households are able to better address the impacts of extreme events and on physical capital by ensuring that appropriate infrastructure exists to support economic growth (e.g., roads, storage, rural electricity)..
Disaster Risk Reduction (DRR) focuses on easing long term risk through hard and soft measures. For hard DRR, the focus may be on the provision of river/coastal infrastructure to protect economically important areas. For soft DRR, the focus is on preparedness and risk mitigation, for example through agriculture- and fisheries-based insurance schemes. Post disaster recovery efforts focus on getting the economy functioning quickly after disasters and reducing the impact of natural hazards on economic sectors. For example, by rapidly releasing funds to rebuild damaged economic resources such as ports, roads, and key stores.
Ecosystem resilience is delivered through investment in provisioning services. This is to enable income from food and water production under future climate change, for example, by using saline tolerant crops. There is also a focus on regulating services, for example, the use of agrochemicals or creation of private sector incentives for tree planting.
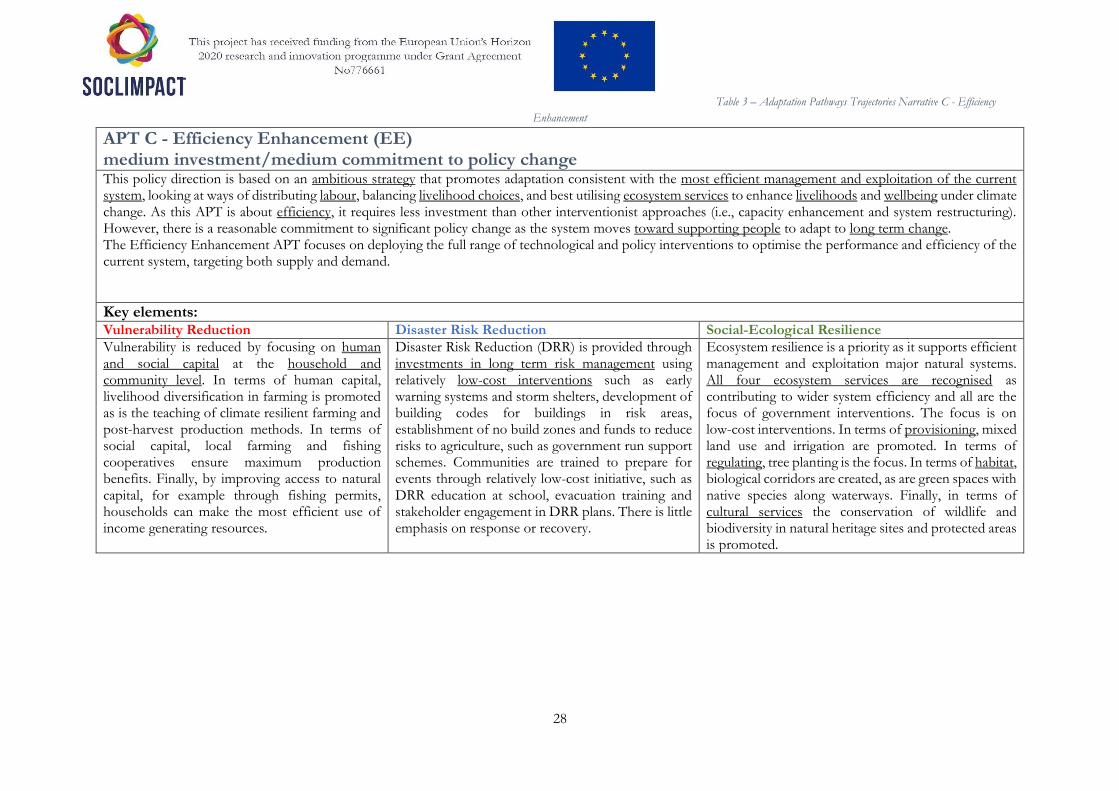
28
Table 3 – Adaptation Pathways Trajectories Narrative C - Efficiency
Enhancement
APT C - Efficiency Enhancement (EE) medium investment/medium commitment to policy change This policy direction is based on an ambitious strategy that promotes adaptation consistent with the most efficient management and exploitation of the current system, looking at ways of distributing labour, balancing livelihood choices, and best utilising ecosystem services to enhance livelihoods and wellbeing under climate change. As this APT is about efficiency, it requires less investment than other interventionist approaches (i.e., capacity enhancement and system restructuring). However, there is a reasonable commitment to significant policy change as the system moves toward supporting people to adapt to long term change. The Efficiency Enhancement APT focuses on deploying the full range of technological and policy interventions to optimise the performance and efficiency of the current system, targeting both supply and demand.
Key elements: Vulnerability Reduction Disaster Risk Reduction Social-Ecological Resilience
Vulnerability is reduced by focusing on human and social capital at the household and community level. In terms of human capital, livelihood diversification in farming is promoted as is the teaching of climate resilient farming and post-harvest production methods. In terms of social capital, local farming and fishing cooperatives ensure maximum production benefits. Finally, by improving access to natural capital, for example through fishing permits, households can make the most efficient use of income generating resources.
Disaster Risk Reduction (DRR) is provided through investments in long term risk management using relatively low-cost interventions such as early warning systems and storm shelters, development of building codes for buildings in risk areas, establishment of no build zones and funds to reduce risks to agriculture, such as government run support schemes. Communities are trained to prepare for events through relatively low-cost initiative, such as DRR education at school, evacuation training and stakeholder engagement in DRR plans. There is little emphasis on response or recovery.
Ecosystem resilience is a priority as it supports efficient management and exploitation major natural systems. All four ecosystem services are recognised as contributing to wider system efficiency and all are the focus of government interventions. The focus is on low-cost interventions. In terms of provisioning, mixed land use and irrigation are promoted. In terms of regulating, tree planting is the focus. In terms of habitat, biological corridors are created, as are green spaces with native species along waterways. Finally, in terms of cultural services the conservation of wildlife and biodiversity in natural heritage sites and protected areas is promoted.
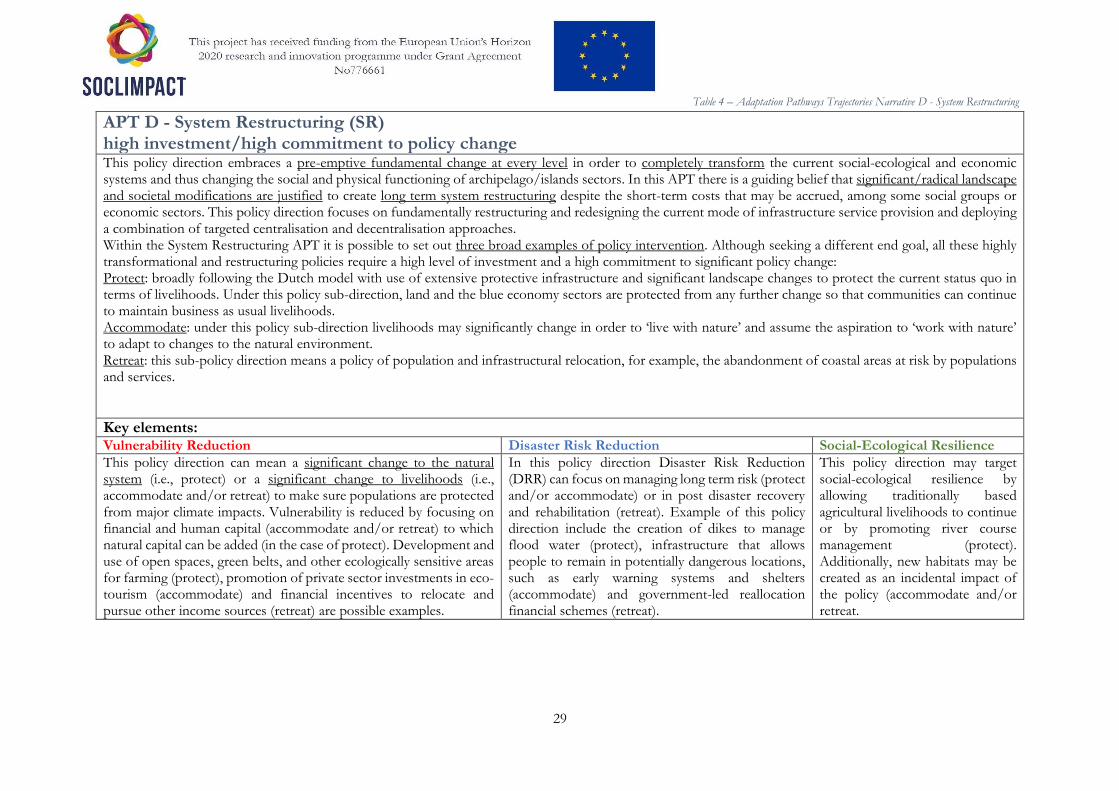
29
Table 4 – Adaptation Pathways Trajectories Narrative D - System Restructuring
APT D - System Restructuring (SR) high investment/high commitment to policy change This policy direction embraces a pre-emptive fundamental change at every level in order to completely transform the current social-ecological and economic systems and thus changing the social and physical functioning of archipelago/islands sectors. In this APT there is a guiding belief that significant/radical landscape and societal modifications are justified to create long term system restructuring despite the short-term costs that may be accrued, among some social groups or economic sectors. This policy direction focuses on fundamentally restructuring and redesigning the current mode of infrastructure service provision and deploying a combination of targeted centralisation and decentralisation approaches. Within the System Restructuring APT it is possible to set out three broad examples of policy intervention. Although seeking a different end goal, all these highly transformational and restructuring policies require a high level of investment and a high commitment to significant policy change: Protect: broadly following the Dutch model with use of extensive protective infrastructure and significant landscape changes to protect the current status quo in terms of livelihoods. Under this policy sub-direction, land and the blue economy sectors are protected from any further change so that communities can continue to maintain business as usual livelihoods. Accommodate: under this policy sub-direction livelihoods may significantly change in order to ‘live with nature’ and assume the aspiration to ‘work with nature’ to adapt to changes to the natural environment. Retreat: this sub-policy direction means a policy of population and infrastructural relocation, for example, the abandonment of coastal areas at risk by populations and services.
Key elements: Vulnerability Reduction Disaster Risk Reduction Social-Ecological Resilience
This policy direction can mean a significant change to the natural system (i.e., protect) or a significant change to livelihoods (i.e., accommodate and/or retreat) to make sure populations are protected from major climate impacts. Vulnerability is reduced by focusing on financial and human capital (accommodate and/or retreat) to which natural capital can be added (in the case of protect). Development and use of open spaces, green belts, and other ecologically sensitive areas for farming (protect), promotion of private sector investments in eco-tourism (accommodate) and financial incentives to relocate and pursue other income sources (retreat) are possible examples.
In this policy direction Disaster Risk Reduction (DRR) can focus on managing long term risk (protect and/or accommodate) or in post disaster recovery and rehabilitation (retreat). Example of this policy direction include the creation of dikes to manage flood water (protect), infrastructure that allows people to remain in potentially dangerous locations, such as early warning systems and shelters (accommodate) and government-led reallocation financial schemes (retreat).
This policy direction may target social-ecological resilience by allowing traditionally based agricultural livelihoods to continue or by promoting river course management (protect). Additionally, new habitats may be created as an incidental impact of the policy (accommodate and/or retreat.
30
4 Development and Characterization of the Adaptation Options
4.1 Portfolio of Adaptation Options
Following the objectives in WP7, packages of adaptation and risk management options were developed
and characterized which represent the current or planned state of policy-led adaptation, according with
step 4.1 of D7.1. For each sector, 24 options were developed considering the classes of the adaptation
(two different options per class). Those options were improved for the sectors and island context under
development in SOCLIMPACT from EU level, most of the option were based on Climate-ADAPT6 and
sector specific literature, in line with EU Adaptation Strategy 2013 (Priority 2 -Better informed decision-
making in Action 5) (European Commission, 2013).
Accordingly, the compilation starts with a revision of adaptation options available on Climate-Adapt for
the blue economy sectors, according with Step 4.2 of D7.1. A list of adaptation options was prepared to
address the identified risks/challenges for each sector. Next, this list of options was complemented by
filling the gaps in some classes of adaptation of each sector. All the adaptation options are present in
annex with references in the Excel files of the Online Survey Tool.
Furthermore, up to six additional adaptation options per island and per sector could be added by the
LWG (class of adaptation “Local Knowledge”).
To develop the options for adaptation in the islands and to create a rational from the mainstream of the
Blue Economy sectors, a review of concepts and references for each sector was made in D7.1. The starting
point of the adaptation options was the definitions, scope and boundaries of sectors that can be found in
D3.1 and D3.2.
This database of adaptations options was used by LWG to explore with the hazards and impacts in each
sector, which was at that time developed in other project WPs for their island. The adaptation options
screened at Island level fit in the concept of shared policy assumptions (SPA) presented in D7.1. The SPA
definition used follows Kriegler et al. 2014 and captures key elements of climate policies considering their
geographical application and time dependency. Also, policies that are different from the global tendencies
and that strongly influence local vulnerability and climate-related risks were considered.
The specification of the adaptation options used in adaptation pathways can be consulted in Annexe 0 or
in D7.5.
4.2 Adaptation Options Characterization
The final adaptation set of options for each sector was presented to stakeholders’ which selected the suited alternative adaptation pathways. The adaptation options were characterized considering 5 different criteria (Cost Efficiency; Environmental protection; Mitigation win-wins and trade-offs; Technical applicability; Social acceptability), in other to support the selection of adaptation options by local stakeholders. Concerning the criteria “mitigation trade-offs and win-wins” the scores translate an option of contribution to GHG emissions (positive, negative, or neutral) which allowed, in the sustainability pathways performance analyses stage, to compare pathways mitigation performance. This mitigation evaluation is an important step to assess islands local contribution to their mitigation goals and to the climate-neutral objective of the EU for 2050 – an economy with net-zero greenhouse gas emissions. This is the core objective of the European Green Deal, in line with the EU’s commitment to global climate action under the Paris Agreement.
The adaptation options were characterized in each respective archipelago/island according to the local
particularities and benefits. This evaluation was later used by stakeholders in the islands in the Online
6 https://climate-adapt.eea.europa.eu/
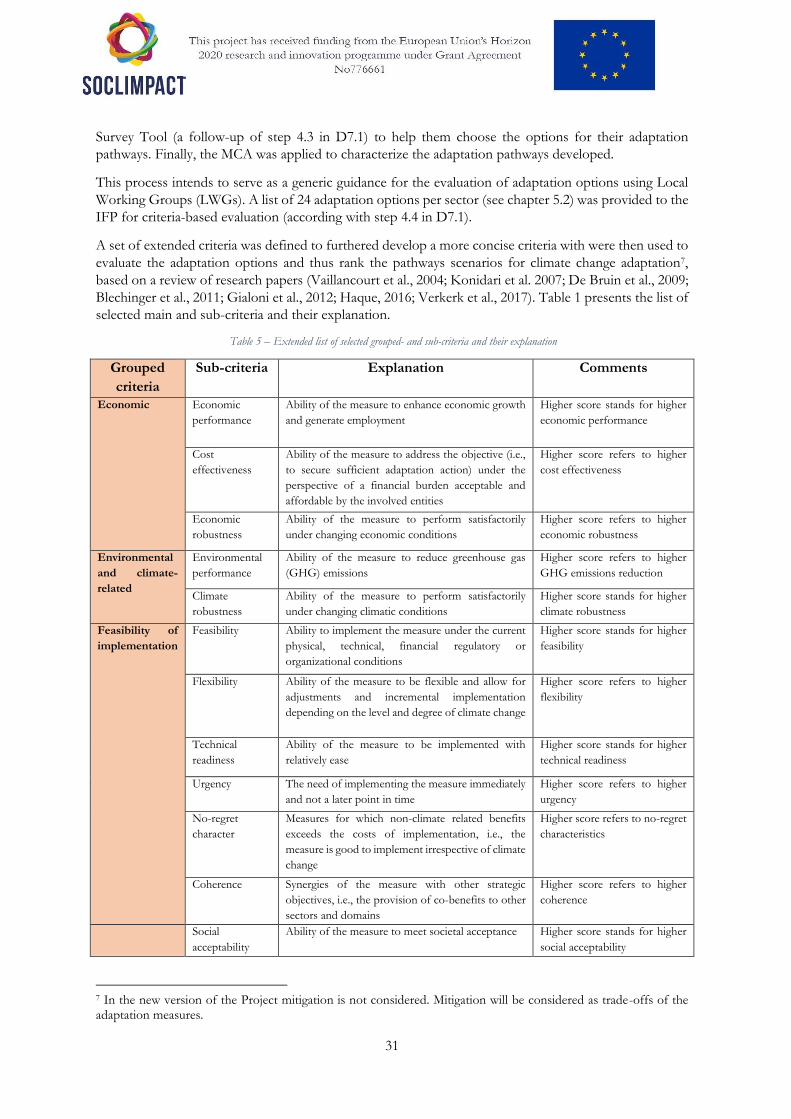
31
Survey Tool (a follow-up of step 4.3 in D7.1) to help them choose the options for their adaptation
pathways. Finally, the MCA was applied to characterize the adaptation pathways developed.
This process intends to serve as a generic guidance for the evaluation of adaptation options using Local
Working Groups (LWGs). A list of 24 adaptation options per sector (see chapter 5.2) was provided to the
IFP for criteria-based evaluation (according with step 4.4 in D7.1).
A set of extended criteria was defined to furthered develop a more concise criteria with were then used to
evaluate the adaptation options and thus rank the pathways scenarios for climate change adaptation7,
based on a review of research papers (Vaillancourt et al., 2004; Konidari et al. 2007; De Bruin et al., 2009;
Blechinger et al., 2011; Gialoni et al., 2012; Haque, 2016; Verkerk et al., 2017). Table 1 presents the list of
selected main and sub-criteria and their explanation.
Table 5 – Extended list of selected grouped- and sub-criteria and their explanation
Grouped
criteria
Sub-criteria Explanation Comments
Economic Economic
performance
Ability of the measure to enhance economic growth
and generate employment
Higher score stands for higher
economic performance
Cost
effectiveness
Ability of the measure to address the objective (i.e.,
to secure sufficient adaptation action) under the
perspective of a financial burden acceptable and
affordable by the involved entities
Higher score refers to higher
cost effectiveness
Economic
robustness
Ability of the measure to perform satisfactorily
under changing economic conditions
Higher score refers to higher
economic robustness
Environmental
and climate-
related
Environmental
performance
Ability of the measure to reduce greenhouse gas
(GHG) emissions
Higher score refers to higher
GHG emissions reduction
Climate
robustness
Ability of the measure to perform satisfactorily
under changing climatic conditions
Higher score stands for higher
climate robustness
Feasibility of
implementation
Feasibility Ability to implement the measure under the current
physical, technical, financial regulatory or
organizational conditions
Higher score stands for higher
feasibility
Flexibility Ability of the measure to be flexible and allow for
adjustments and incremental implementation
depending on the level and degree of climate change
Higher score refers to higher
flexibility
Technical
readiness
Ability of the measure to be implemented with
relatively ease
Higher score stands for higher
technical readiness
Urgency The need of implementing the measure immediately
and not a later point in time
Higher score refers to higher
urgency
No-regret
character
Measures for which non-climate related benefits
exceeds the costs of implementation, i.e., the
measure is good to implement irrespective of climate
change
Higher score refers to no-regret
characteristics
Coherence Synergies of the measure with other strategic
objectives, i.e., the provision of co-benefits to other
sectors and domains
Higher score refers to higher
coherence
Social
acceptability
Ability of the measure to meet societal acceptance Higher score stands for higher
social acceptability
7 In the new version of the Project mitigation is not considered. Mitigation will be considered as trade-offs of the adaptation measures.
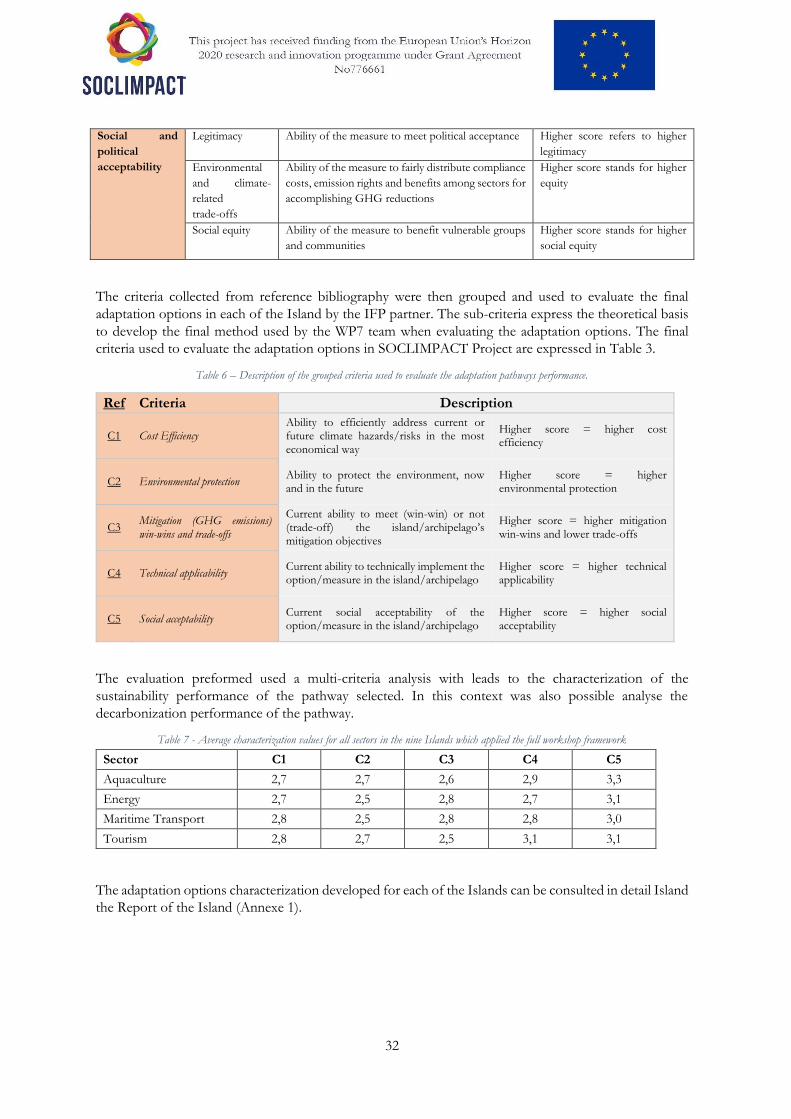
32
Social and
political
acceptability
Legitimacy Ability of the measure to meet political acceptance Higher score refers to higher
legitimacy
Environmental
and climate-
related
trade-offs
Ability of the measure to fairly distribute compliance
costs, emission rights and benefits among sectors for
accomplishing GHG reductions
Higher score stands for higher
equity
Social equity Ability of the measure to benefit vulnerable groups
and communities
Higher score stands for higher
social equity
The criteria collected from reference bibliography were then grouped and used to evaluate the final
adaptation options in each of the Island by the IFP partner. The sub-criteria express the theoretical basis
to develop the final method used by the WP7 team when evaluating the adaptation options. The final
criteria used to evaluate the adaptation options in SOCLIMPACT Project are expressed in Table 3.
Table 6 – Description of the grouped criteria used to evaluate the adaptation pathways performance.
Ref Criteria Description
C1 Cost Efficiency Ability to efficiently address current or future climate hazards/risks in the most economical way
Higher score = higher cost efficiency
C2 Environmental protection Ability to protect the environment, now and in the future
Higher score = higher environmental protection
C3 Mitigation (GHG emissions) win-wins and trade-offs
Current ability to meet (win-win) or not (trade-off) the island/archipelago’s mitigation objectives
Higher score = higher mitigation win-wins and lower trade-offs
C4 Technical applicability Current ability to technically implement the option/measure in the island/archipelago
Higher score = higher technical applicability
C5 Social acceptability Current social acceptability of the option/measure in the island/archipelago
Higher score = higher social acceptability
The evaluation preformed used a multi-criteria analysis with leads to the characterization of the
sustainability performance of the pathway selected. In this context was also possible analyse the
decarbonization performance of the pathway.
Table 7 - Average characterization values for all sectors in the nine Islands which applied the full workshop framework
Sector C1 C2 C3 C4 C5
Aquaculture 2,7 2,7 2,6 2,9 3,3
Energy 2,7 2,5 2,8 2,7 3,1
Maritime Transport 2,8 2,5 2,8 2,8 3,0
Tourism 2,8 2,7 2,5 3,1 3,1
The adaptation options characterization developed for each of the Islands can be consulted in detail Island
the Report of the Island (Annexe 1).

33
5 Designing and Ranking Adaptation Pathways
The Adaptation Pathways describe a sequence of policy actions or investments in institutions and
infrastructure over time to achieve a set of pre-specified objectives under uncertain changing conditions.
Adaptation pathways provide insight into policy options, the sequencing of actions over time, potential
lock-ins effects, and path dependencies. These pathways provide an analytical approach for exploring and
sequencing a set of possible actions based on alternative external developments over time (Haasnoot,
Kwakkel, Walker, & ter Maat, 2013).
The policy Adaptation Pathways developed, and its Sustainability Performance characteristics were used
to rank the Adaptation Pathways giving insight of how different Islands in different APT contexts gave
way to different performances. The pathways sustainability performance outputs aim to evaluate each
sector pathway using the averaged value of the chosen characterization AOs in each APT context.
The Online Survey Tool was where the stakeholders took the choice between options. The result of the
series of choices in the three timeframes among the stakeholders involved defines the pathway. Therefore,
the options were included in the pathway when they were selected more than or the same as 50% in each
time frame, within each APT and in each sector. This percentage is called Ratio of choice and it’s given
by the division between the total amount of stakeholder choices divided by the total number of possible
choices. Local Knowledge measures (an additional class of measures in all APTs) were included in the
pathways if they were chosen by at least a minimum proportion of times which is given by the inverse
number of available measures (for example, if there were 4 different Local knowledge measures available
then that minimum proportion was set at 25%). If there was a tie between two options, then they were
both included and became part of the adaptation pathway in each time frame.
The Adaptation Pathways were design through the answers given on the Online Survey Tool, which is an
essential part of the Online Workshop framework. It was developed within the Covid-19 contingency
plan to allow for the fulfilment of the “Online SOCLIMPACT Regional Workshops: co-developing Sector
Adaptation Pathways”. It is based on an Excel file containing links to the findings section of the
SOCLIMPACT website for the background material based on D7.2. This was done in this format so that
the project partners, namely WPs leaders and IFPs, could have a simple and robust tool that would be
readily available, controllable, and straightforward to use. Other solutions were considered but this
solution allowed IFPs and other partners to manipulate the tool8 according to their needs and making
their inputs.
Pursuing the framework objectives within the Covid-19 contingency plan the tools main purpose is to
allow for individual stakeholder inputs to co-develop the SOCLIMPACT Adaptation Pathways using
the following time periods (coherent with the SOCLIMPACT framework): Short term (up to 2030), Mid-
century (up to 2050) and End-century (up to 2100).
8 Within limits that don’t impair the use of analysis tools to be used later on
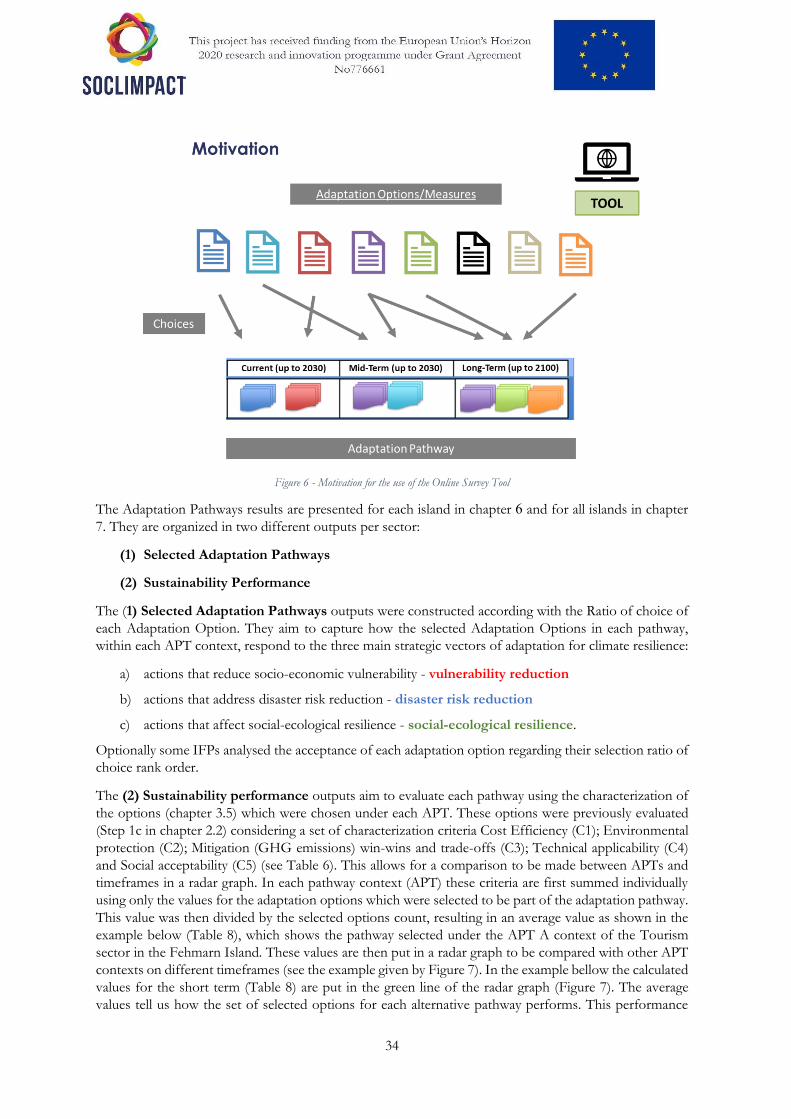
34
Figure 6 - Motivation for the use of the Online Survey Tool
The Adaptation Pathways results are presented for each island in chapter 6 and for all islands in chapter
7. They are organized in two different outputs per sector:
(1) Selected Adaptation Pathways
(2) Sustainability Performance
The (1) Selected Adaptation Pathways outputs were constructed according with the Ratio of choice of
each Adaptation Option. They aim to capture how the selected Adaptation Options in each pathway,
within each APT context, respond to the three main strategic vectors of adaptation for climate resilience:
a) actions that reduce socio-economic vulnerability - vulnerability reduction
b) actions that address disaster risk reduction - disaster risk reduction
c) actions that affect social-ecological resilience - social-ecological resilience.
Optionally some IFPs analysed the acceptance of each adaptation option regarding their selection ratio of
choice rank order.
The (2) Sustainability performance outputs aim to evaluate each pathway using the characterization of
the options (chapter 3.5) which were chosen under each APT. These options were previously evaluated
(Step 1c in chapter 2.2) considering a set of characterization criteria Cost Efficiency (C1); Environmental
protection (C2); Mitigation (GHG emissions) win-wins and trade-offs (C3); Technical applicability (C4)
and Social acceptability (C5) (see Table 6). This allows for a comparison to be made between APTs and
timeframes in a radar graph. In each pathway context (APT) these criteria are first summed individually
using only the values for the adaptation options which were selected to be part of the adaptation pathway.
This value was then divided by the selected options count, resulting in an average value as shown in the
example below (Table 8), which shows the pathway selected under the APT A context of the Tourism
sector in the Fehmarn Island. These values are then put in a radar graph to be compared with other APT
contexts on different timeframes (see the example given by Figure 7). In the example bellow the calculated
values for the short term (Table 8) are put in the green line of the radar graph (Figure 7). The average
values tell us how the set of selected options for each alternative pathway performs. This performance
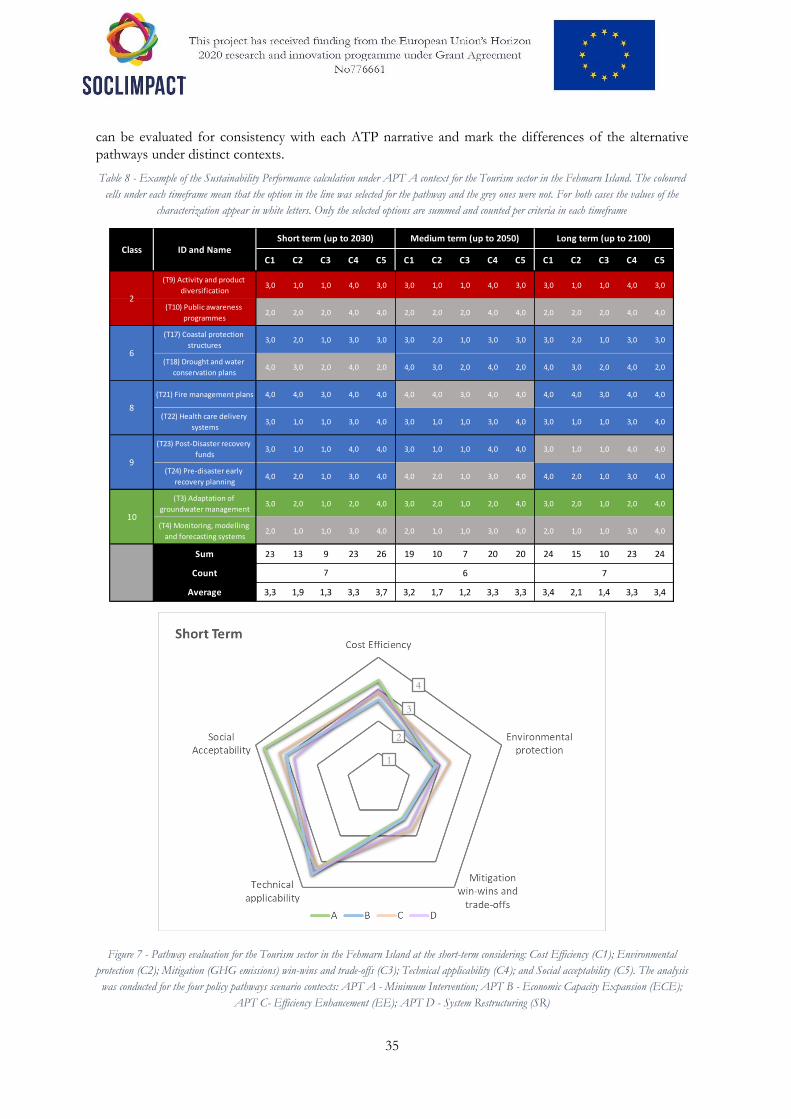
35
can be evaluated for consistency with each ATP narrative and mark the differences of the alternative
pathways under distinct contexts.
Table 8 - Example of the Sustainability Performance calculation under APT A context for the Tourism sector in the Fehmarn Island. The coloured
cells under each timeframe mean that the option in the line was selected for the pathway and the grey ones were not. For both cases the values of the
characterization appear in white letters. Only the selected options are summed and counted per criteria in each timeframe
Figure 7 - Pathway evaluation for the Tourism sector in the Fehmarn Island at the short-term considering: Cost Efficiency (C1); Environmental
protection (C2); Mitigation (GHG emissions) win-wins and trade-offs (C3); Technical applicability (C4); and Social acceptability (C5). The analysis
was conducted for the four policy pathways scenario contexts: APT A - Minimum Intervention; APT B - Economic Capacity Expansion (ECE);
APT C- Efficiency Enhancement (EE); APT D - System Restructuring (SR)
C1 C2 C3 C4 C5 C1 C2 C3 C4 C5 C1 C2 C3 C4 C5
(T9) Activity and product
diversification3,0 1,0 1,0 4,0 3,0 3,0 1,0 1,0 4,0 3,0 3,0 1,0 1,0 4,0 3,0
(T10) Public awareness
programmes2,0 2,0 2,0 4,0 4,0 2,0 2,0 2,0 4,0 4,0 2,0 2,0 2,0 4,0 4,0
(T17) Coastal protection
structures3,0 2,0 1,0 3,0 3,0 3,0 2,0 1,0 3,0 3,0 3,0 2,0 1,0 3,0 3,0
(T18) Drought and water
conservation plans4,0 3,0 2,0 4,0 2,0 4,0 3,0 2,0 4,0 2,0 4,0 3,0 2,0 4,0 2,0
(T21) Fire management plans 4,0 4,0 3,0 4,0 4,0 4,0 4,0 3,0 4,0 4,0 4,0 4,0 3,0 4,0 4,0
(T22) Health care delivery
systems3,0 1,0 1,0 3,0 4,0 3,0 1,0 1,0 3,0 4,0 3,0 1,0 1,0 3,0 4,0
(T23) Post-Disaster recovery
funds3,0 1,0 1,0 4,0 4,0 3,0 1,0 1,0 4,0 4,0 3,0 1,0 1,0 4,0 4,0
(T24) Pre-disaster early
recovery planning 4,0 2,0 1,0 3,0 4,0 4,0 2,0 1,0 3,0 4,0 4,0 2,0 1,0 3,0 4,0
(T3) Adaptation of
groundwater management 3,0 2,0 1,0 2,0 4,0 3,0 2,0 1,0 2,0 4,0 3,0 2,0 1,0 2,0 4,0
(T4) Monitoring, modelling
and forecasting systems2,0 1,0 1,0 3,0 4,0 2,0 1,0 1,0 3,0 4,0 2,0 1,0 1,0 3,0 4,0
Sum 23 13 9 23 26 19 10 7 20 20 24 15 10 23 24
Count
Average 3,3 1,9 1,3 3,3 3,7 3,2 1,7 1,2 3,3 3,3 3,4 2,1 1,4 3,3 3,4
ID and NameClass
7 6 7
10
9
8
6
Short term (up to 2030) Medium term (up to 2050) Long term (up to 2100)
2
1
2
3
4
36
5.1 Online Survey Tool Structure and Use
The tool9 is made per sector, customized per island, and consists in a set of six different parts (9 excel
tabs) which are used by the IPFs (in steps 1c and step 2 of the Online workshop framework) and LWGs
(in step 2b) as follows:
1. Read me.
2. Background material
3. APT narratives
4. Classes of adaptation
5. Adaptation options
6. Pathways section:
i. APT A
ii. APT B
iii. APT C
iv. APT D
The Read Me tab includes the identification of the island, sector, and stakeholder, as well as a short
description of the tool and some references on how to use it, namely the definition of the criteria to be
used in the measure characterization (step 1c).
The Background material is an important tab that provides customized information to the island
sector stakeholder regarding the projected risks accessed by project SOCLIMPACT. The WP8 prepared
a series of icons that directed the user to the projects findings section where the results from D7.2 where
summarized (in some cases using interactive PDFs). This allowed stakeholders to review the sector and
island risks10 when choosing between measures of the same class and within each APT context narrative.
The APT narratives tab as co-developed with WP8 and contains a summarized version as well as links
to the projects findings section where a fully detailed version designed by WP8 could be consulted.
9 An example of the tool for each sector can be found in the Annex 10 IFPs have presented in their island reports screenshots containing this background material tab as well as other sources of information they may have used to inform the stakeholders of the climate related risks
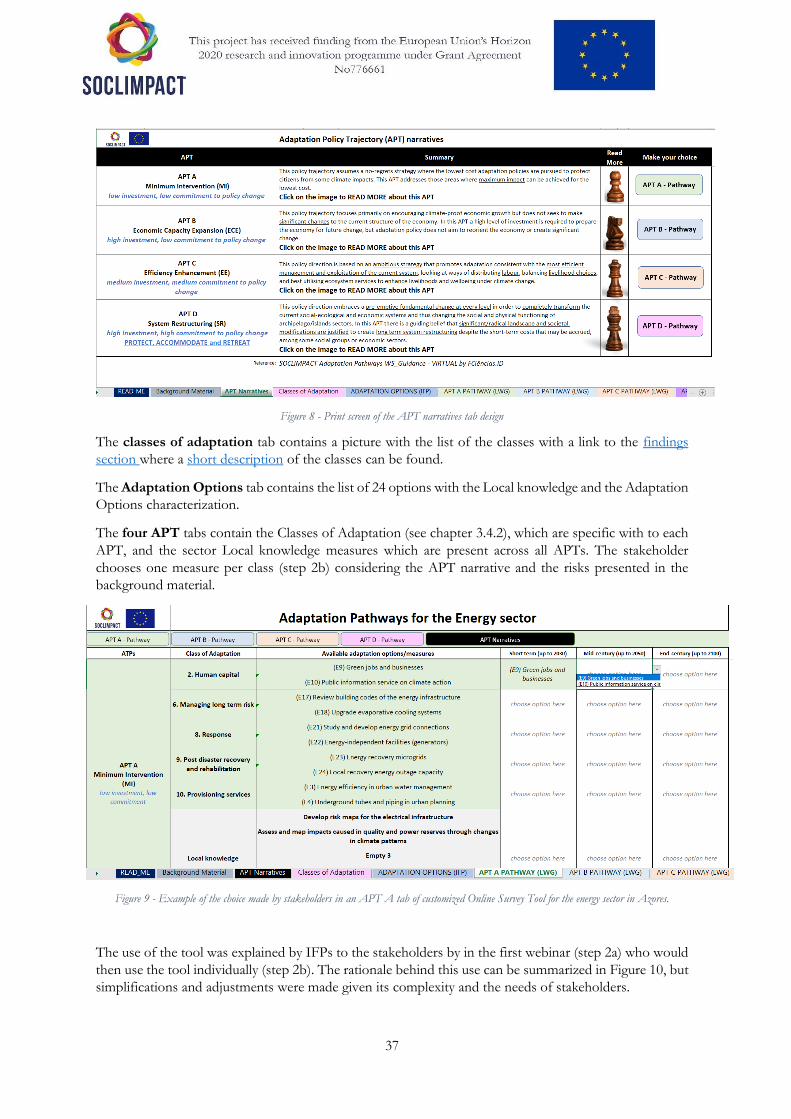
37
Figure 8 - Print screen of the APT narratives tab design
The classes of adaptation tab contains a picture with the list of the classes with a link to the findings
section where a short description of the classes can be found.
The Adaptation Options tab contains the list of 24 options with the Local knowledge and the Adaptation
Options characterization.
The four APT tabs contain the Classes of Adaptation (see chapter 3.4.2), which are specific with to each
APT, and the sector Local knowledge measures which are present across all APTs. The stakeholder
chooses one measure per class (step 2b) considering the APT narrative and the risks presented in the
background material.
Figure 9 - Example of the choice made by stakeholders in an APT A tab of customized Online Survey Tool for the energy sector in Azores.
The use of the tool was explained by IFPs to the stakeholders by in the first webinar (step 2a) who would
then use the tool individually (step 2b). The rationale behind this use can be summarized in Figure 10, but
simplifications and adjustments were made given its complexity and the needs of stakeholders.
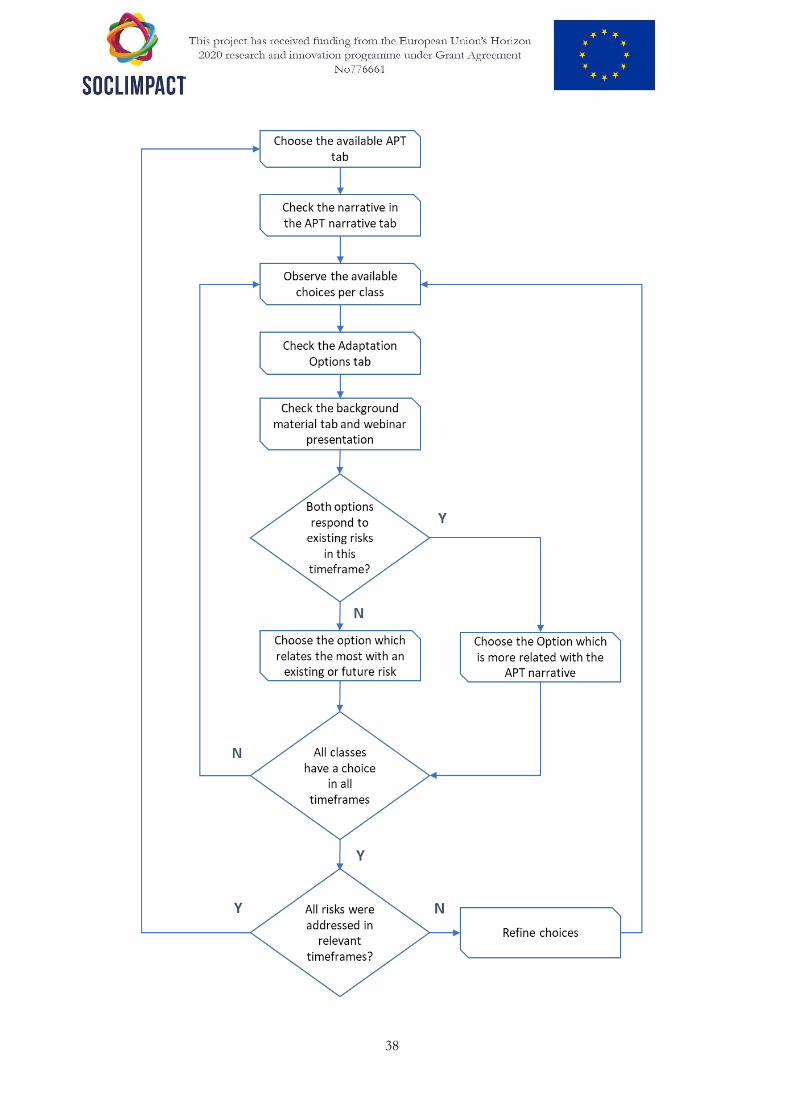
38
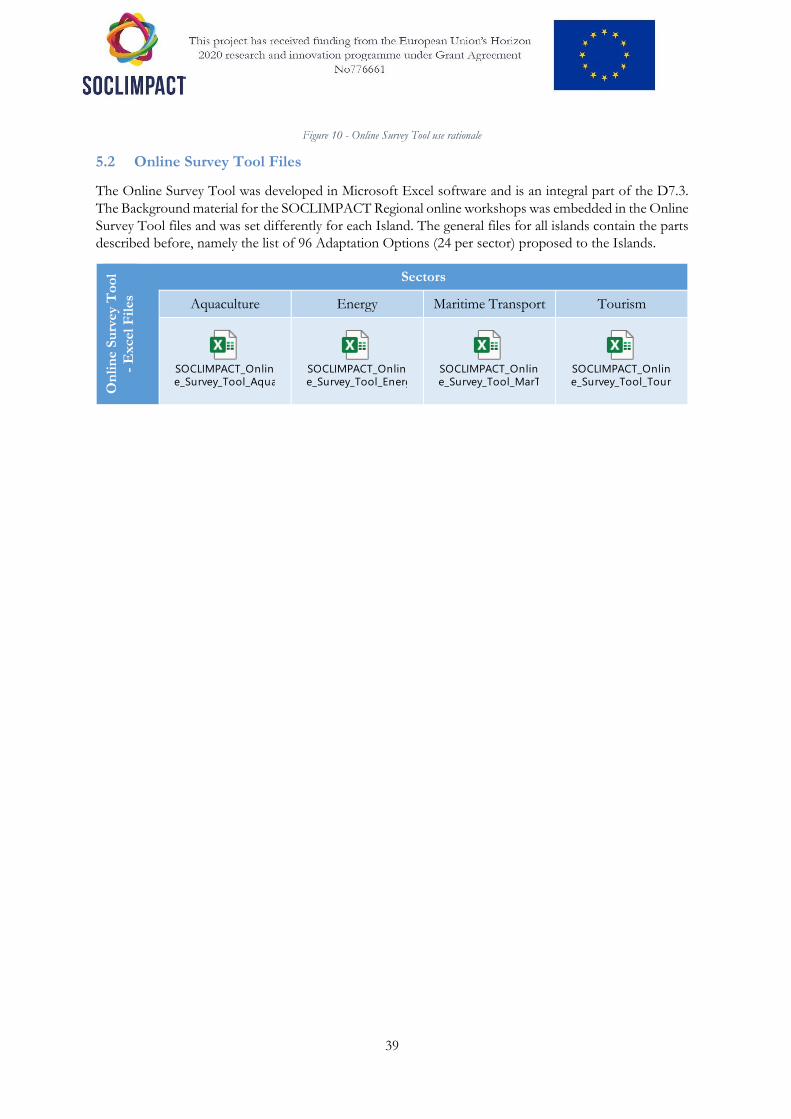
39
Figure 10 - Online Survey Tool use rationale
5.2 Online Survey Tool Files
The Online Survey Tool was developed in Microsoft Excel software and is an integral part of the D7.3.
The Background material for the SOCLIMPACT Regional online workshops was embedded in the Online
Survey Tool files and was set differently for each Island. The general files for all islands contain the parts
described before, namely the list of 96 Adaptation Options (24 per sector) proposed to the Islands.
On
lin
e S
urv
ey T
oo
l
- E
xcel F
iles
Sectors
Aquaculture Energy Maritime Transport Tourism
SOCLIMPACT_Onlin
e_Survey_Tool_Aquaculture.xlsx
SOCLIMPACT_Onlin
e_Survey_Tool_Energy.xlsx
SOCLIMPACT_Onlin
e_Survey_Tool_MarTransport.xlsx
SOCLIMPACT_Onlin
e_Survey_Tool_Tourism.xlsx
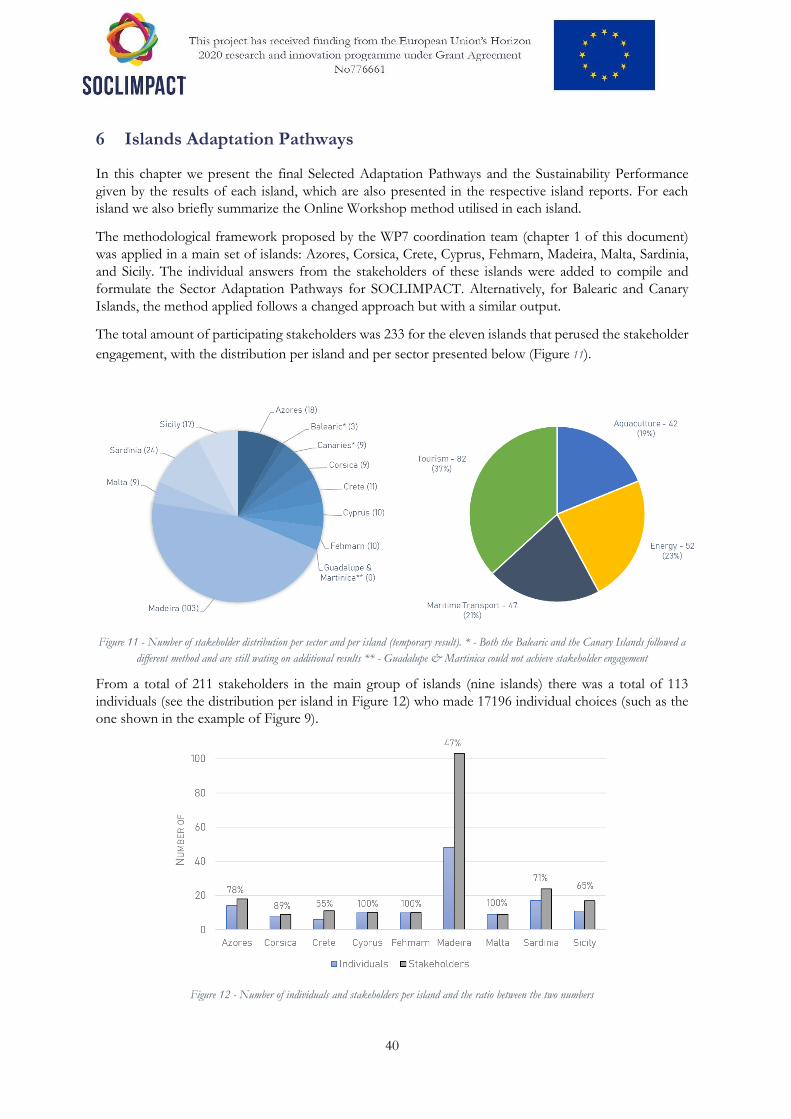
40
6 Islands Adaptation Pathways
In this chapter we present the final Selected Adaptation Pathways and the Sustainability Performance
given by the results of each island, which are also presented in the respective island reports. For each
island we also briefly summarize the Online Workshop method utilised in each island.
The methodological framework proposed by the WP7 coordination team (chapter 1 of this document)
was applied in a main set of islands: Azores, Corsica, Crete, Cyprus, Fehmarn, Madeira, Malta, Sardinia,
and Sicily. The individual answers from the stakeholders of these islands were added to compile and
formulate the Sector Adaptation Pathways for SOCLIMPACT. Alternatively, for Balearic and Canary
Islands, the method applied follows a changed approach but with a similar output.
The total amount of participating stakeholders was 233 for the eleven islands that perused the stakeholder
engagement, with the distribution per island and per sector presented below (Figure 11).
Figure 11 - Number of stakeholder distribution per sector and per island (temporary result). * - Both the Balearic and the Canary Islands followed a
different method and are still wating on additional results ** - Guadalupe & Martinica could not achieve stakeholder engagement
From a total of 211 stakeholders in the main group of islands (nine islands) there was a total of 113
individuals (see the distribution per island in Figure 12) who made 17196 individual choices (such as the
one shown in the example of Figure 9).
Figure 12 - Number of individuals and stakeholders per island and the ratio between the two numbers
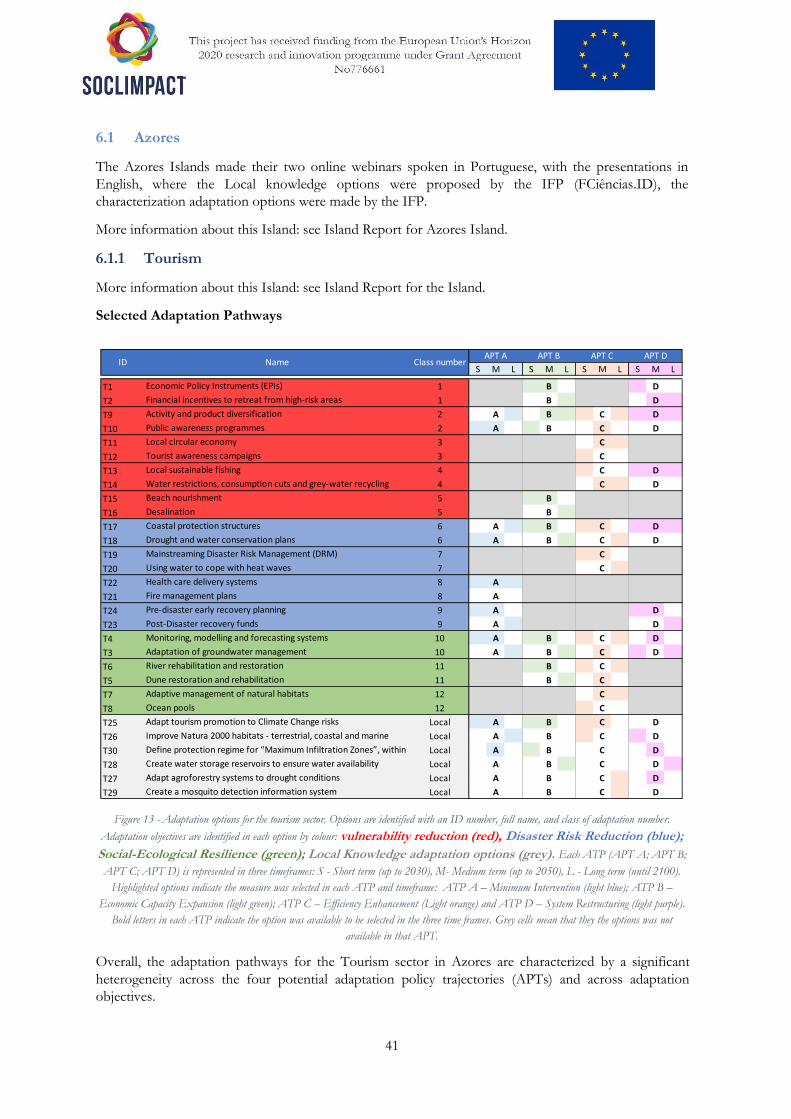
41
6.1 Azores
The Azores Islands made their two online webinars spoken in Portuguese, with the presentations in
English, where the Local knowledge options were proposed by the IFP (FCiências.ID), the
characterization adaptation options were made by the IFP.
More information about this Island: see Island Report for Azores Island.
6.1.1 Tourism
More information about this Island: see Island Report for the Island.
Selected Adaptation Pathways
Figure 13 - Adaptation options for the tourism sector. Options are identified with an ID number, full name, and class of adaptation number.
Adaptation objectives are identified in each option by colour: vulnerability reduction (red), Disaster Risk Reduction (blue);
Social-Ecological Resilience (green); Local Knowledge adaptation options (grey). Each ATP (APT A; APT B;
APT C; APT D) is represented in three timeframes: S - Short term (up to 2030), M- Medium term (up to 2050), L - Long term (until 2100).
Highlighted options indicate the measure was selected in each ATP and timeframe: ATP A – Minimum Intervention (light blue); ATP B –
Economic Capacity Expansion (light green); ATP C – Efficiency Enhancement (Light orange) and ATP D – System Restructuring (light purple).
Bold letters in each ATP indicate the option was available to be selected in the three time frames. Grey cells mean that they the options was not
available in that APT.
Overall, the adaptation pathways for the Tourism sector in Azores are characterized by a significant
heterogeneity across the four potential adaptation policy trajectories (APTs) and across adaptation
objectives.
S M L S M L S M L S M L
T1 Economic Policy Instruments (EPIs) 1 A B C D
T2 Financial incentives to retreat from high-risk areas 1 A B C D
T9 Activity and product diversification 2 A B C D
T10 Public awareness programmes 2 A B C D
T11 Local circular economy 3 A B C D
T12 Tourist awareness campaigns 3 A B C D
T13 Local sustainable fishing 4 A B C D
T14 Water restrictions, consumption cuts and grey-water recycling 4 A B C D
T15 Beach nourishment 5 A B C D
T16 Desalination 5 A B C D
T17 Coastal protection structures 6 A B C D
T18 Drought and water conservation plans 6 A B C D
T19 Mainstreaming Disaster Risk Management (DRM) 7 A B C D
T20 Using water to cope with heat waves 7 A B C D
T22 Health care delivery systems 8 A B C D
T21 Fire management plans 8 A B C D
T24 Pre-disaster early recovery planning 9 A B C D
T23 Post-Disaster recovery funds 9 A B C D
T4 Monitoring, modelling and forecasting systems 10 A B C D
T3 Adaptation of groundwater management 10 A B C D
T6 River rehabilitation and restoration 11 A B C D
T5 Dune restoration and rehabilitation 11 A B C D
T7 Adaptive management of natural habitats 12 A B C D
T8 Ocean pools 12 A B C D
T25 Adapt tourism promotion to Climate Change risks Local A B C D
T26 Improve Natura 2000 habitats - terrestrial, coastal and marine
habitats.
Local A B C D
T30 Define protection regime for “Maximum Infiltration Zones”, within
the scope of the current and climate change risks.
Local A B C D
T28 Create water storage reservoirs to ensure water availability
without overloading natural resources in times of scarcity.
Local A B C D
T27 Adapt agroforestry systems to drought conditions Local A B C D
T29 Create a mosquito detection information system Local A B C D
ID Name Class numberAPT A APT B APT C APT D
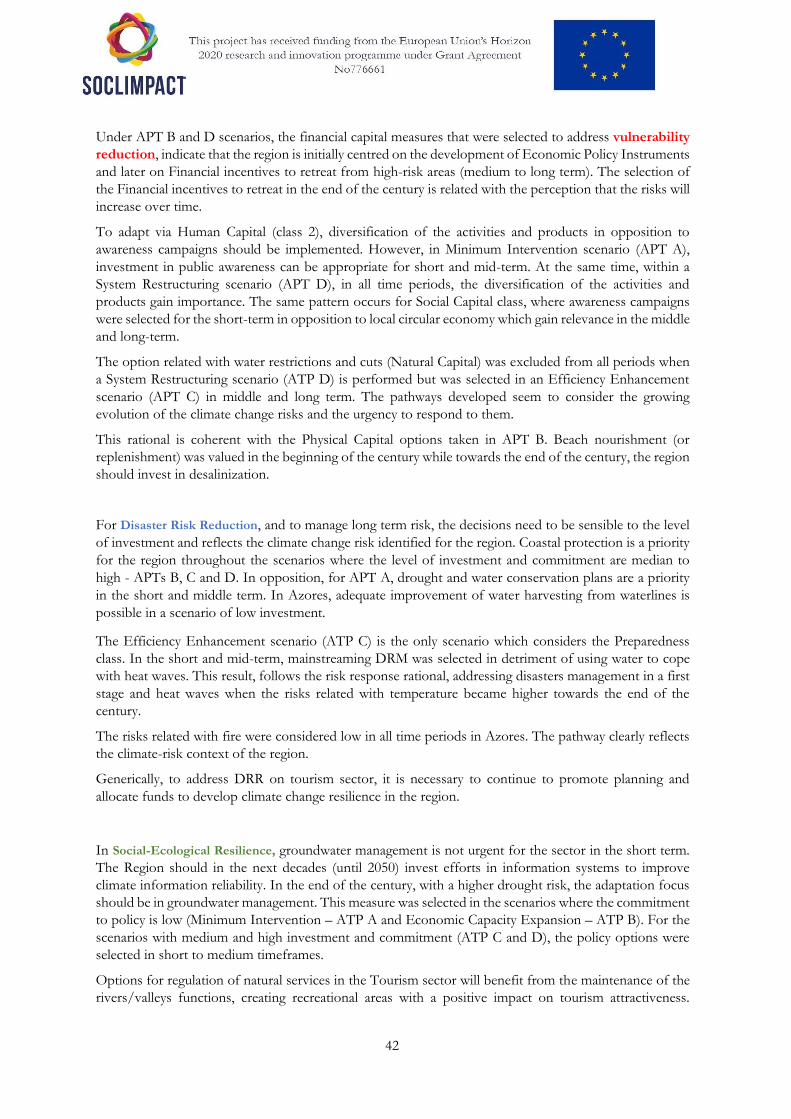
42
Under APT B and D scenarios, the financial capital measures that were selected to address vulnerability
reduction, indicate that the region is initially centred on the development of Economic Policy Instruments
and later on Financial incentives to retreat from high-risk areas (medium to long term). The selection of
the Financial incentives to retreat in the end of the century is related with the perception that the risks will
increase over time.
To adapt via Human Capital (class 2), diversification of the activities and products in opposition to
awareness campaigns should be implemented. However, in Minimum Intervention scenario (APT A),
investment in public awareness can be appropriate for short and mid-term. At the same time, within a
System Restructuring scenario (APT D), in all time periods, the diversification of the activities and
products gain importance. The same pattern occurs for Social Capital class, where awareness campaigns
were selected for the short-term in opposition to local circular economy which gain relevance in the middle
and long-term.
The option related with water restrictions and cuts (Natural Capital) was excluded from all periods when
a System Restructuring scenario (ATP D) is performed but was selected in an Efficiency Enhancement
scenario (APT C) in middle and long term. The pathways developed seem to consider the growing
evolution of the climate change risks and the urgency to respond to them.
This rational is coherent with the Physical Capital options taken in APT B. Beach nourishment (or
replenishment) was valued in the beginning of the century while towards the end of the century, the region
should invest in desalinization.
For Disaster Risk Reduction, and to manage long term risk, the decisions need to be sensible to the level
of investment and reflects the climate change risk identified for the region. Coastal protection is a priority
for the region throughout the scenarios where the level of investment and commitment are median to
high - APTs B, C and D. In opposition, for APT A, drought and water conservation plans are a priority
in the short and middle term. In Azores, adequate improvement of water harvesting from waterlines is
possible in a scenario of low investment.
The Efficiency Enhancement scenario (ATP C) is the only scenario which considers the Preparedness
class. In the short and mid-term, mainstreaming DRM was selected in detriment of using water to cope
with heat waves. This result, follows the risk response rational, addressing disasters management in a first
stage and heat waves when the risks related with temperature became higher towards the end of the
century.
The risks related with fire were considered low in all time periods in Azores. The pathway clearly reflects
the climate-risk context of the region.
Generically, to address DRR on tourism sector, it is necessary to continue to promote planning and
allocate funds to develop climate change resilience in the region.
In Social-Ecological Resilience, groundwater management is not urgent for the sector in the short term.
The Region should in the next decades (until 2050) invest efforts in information systems to improve
climate information reliability. In the end of the century, with a higher drought risk, the adaptation focus
should be in groundwater management. This measure was selected in the scenarios where the commitment
to policy is low (Minimum Intervention – ATP A and Economic Capacity Expansion – ATP B). For the
scenarios with medium and high investment and commitment (ATP C and D), the policy options were
selected in short to medium timeframes.
Options for regulation of natural services in the Tourism sector will benefit from the maintenance of the
rivers/valleys functions, creating recreational areas with a positive impact on tourism attractiveness.
43
Regulating and Maintenance Services, is only defined within medium and low commitment to policy
change. In this context, coastal restoration should only happen when coastal risks increase in the end of
the century.
Since 2008 some islands have been under relevant meteorological droughts. For example, two years ago
(2018) Azores faced a drought which originated indirect costs for the sector. During this period, it was
necessary to implement measures such as water drilling or additional water treatment. Additionally, it was
identified that some of the periods of drought have relevant implications in the crop yields and
consequentially impacts on the milk sector. However, droughts have been worsened by the agricultural
activity specially because of animal husbandry (mainly by free grazing livestock that has a relevant
freshwater input). There are specific areas in each island where the problem is worse, namely where soils
are poorer and in low laying areas.
The potential impacts of a reduction in precipitation on the landscape and its indirect impact on tourism
attractivity were highlighted. Significant changes in landscape can be challenging for the tourism sector
considering visitor’s expectations and the promotion of the islands’ natural resources. In this context,
adapting tourism promotion was identified as a priority option.
In medium investment and medium commitment to policy change scenario (APT C - Efficiency
Enhancement) cultural services are relevant. In this case, the region considered to dedicate efforts to
preserve and minimize the impacts on biodiversity and ecosystems, while also preserving the attractiveness
of the region.
Local knowledge options were focused on the preservation and promotion of the natural attractiveness
of the region and reflect the relevance of this issue for the Azorean tourism sector, in the four pathways.
All pathways reflect the need of conservation of the natural areas to continuous address multiple risk. This
approach is also aimed to promoting water resource availability without hard and irreversible
infrastructures. The vector borne diseases were not considered urgent for this sector. Like the options
agroforestry related options sector does not have direct control on the health policy.

44
Sustainability Performance
Figure 14 - Pathways evaluation for the tourism sector considering: Cost Efficiency; Environmental protection; Mitigation (GHG emissions) win-wins
and trade-offs; Technical applicability; Social acceptability. The policy pathways scenarios: APT A - Minimum Intervention; APT B - Economic
Capacity Expansion (ECE); APT C- Efficiency Enhancement (EE); APT D - System Restructuring (SR), for different timeframes: S - Short
term (up to 2030), M- Medium term (up to 2050), L - Long term (until 2100)
The performance of the four ATP scenarios for tourism sector are considerably similar during the three
timeframes considered. In general, scenarios show a high level of social acceptability and technical
applicability and a medium cost efficiency and environmental protection with a low performance in
mitigation win-wins and trade-offs.
Additionally, for all pathway scenarios the performance level decreased with time, specially from middle
to long term.
The minimum intervention scenario (APT A) tends to have socially acceptable options and adaptation
solutions with technical applicability. However, in this scenario the pathway has a low performance on
mitigation and environmental protection which agrees with the level of investment and commitment
characterized by in ATP A, which ultimately expresses the results on mitigation and environmental
protection. The efficiency enhancement scenario (ATP C) defines a pathway with a high level of
environmental protection and mitigation.
In general, the pathway defined in APT D (System Restructuring scenario), has the lower performance
when considering all timeframes.

45
6.1.2 Maritime Transport
Maritime transport pathways are based on choices made by 3 expert island stakeholders.
Selected Adaptation Pathways
Figure 15 - Adaptation options for the Maritime Transport sector. Options are identified with an ID number, full name, and class of adaptation
number. Adaptation objectives are identified in each option by colour: vulnerability reduction (red), Disaster Risk Reduction
(blue); Social-Ecological Resilience (green); Local Knowledge adaptation options (grey). Each ATP (APT A;
APT B; APT C; APT D) is represented in three timeframes: S - Short term (up to 2030), M- Medium term (up to 2050), L - Long term (until
2100). Highlighted options indicate the measure was selected in each ATP and timeframe: ATP A – Minimum Intervention (light blue); ATP B –
Economic Capacity Expansion (light green); ATP C – Efficiency Enhancement (Light orange) and ATP D – System Restructuring (light purple).
Bold letters in each ATP indicate the option was available to be selected in the three time frames. Grey cells mean that they the options was not
available in that APT.
The Azorean maritime transport sector adaptation pathways are characterized by a significant
heterogeneity across the four potential adaptation policy trajectories (APTs) which they built upon.
In the Minimum Intervention (APT A) scenario which favours limited investment costs and the use of
no-regret strategies, the Azorean maritime transportation sector follows a pathway of interventions that
seek to sustain sector activities during and after the occurrence of extreme events. Reducing vulnerabilities
in a policy scenario were changes in current policy commitment is less likely to occur, investment in
human capital takes the form of social dialogue targeting workforce training up to 2050. After that
period, reinvestment in information and behavioural change will be necessary to respond to increasing
climate related threats. Disaster risk reduction focuses on managing long term risks via climate proofing
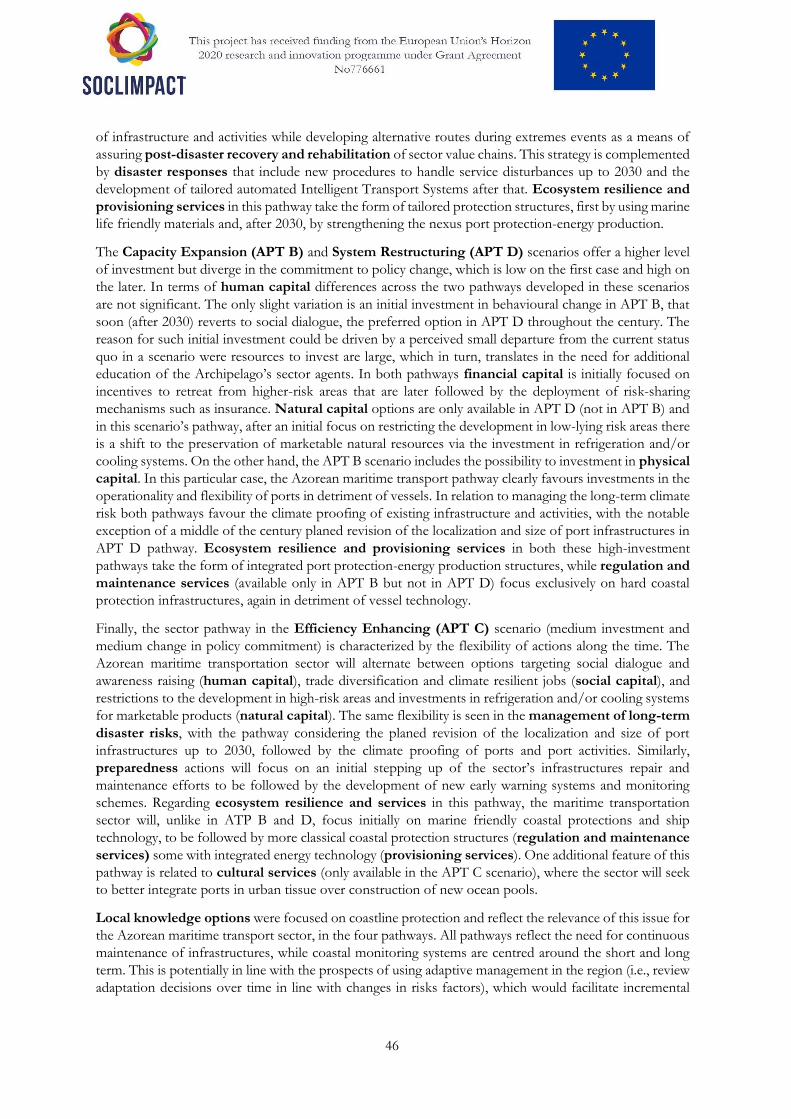
46
of infrastructure and activities while developing alternative routes during extremes events as a means of
assuring post-disaster recovery and rehabilitation of sector value chains. This strategy is complemented
by disaster responses that include new procedures to handle service disturbances up to 2030 and the
development of tailored automated Intelligent Transport Systems after that. Ecosystem resilience and
provisioning services in this pathway take the form of tailored protection structures, first by using marine
life friendly materials and, after 2030, by strengthening the nexus port protection-energy production.
The Capacity Expansion (APT B) and System Restructuring (APT D) scenarios offer a higher level
of investment but diverge in the commitment to policy change, which is low on the first case and high on
the later. In terms of human capital differences across the two pathways developed in these scenarios
are not significant. The only slight variation is an initial investment in behavioural change in APT B, that
soon (after 2030) reverts to social dialogue, the preferred option in APT D throughout the century. The
reason for such initial investment could be driven by a perceived small departure from the current status
quo in a scenario were resources to invest are large, which in turn, translates in the need for additional
education of the Archipelago’s sector agents. In both pathways financial capital is initially focused on
incentives to retreat from higher-risk areas that are later followed by the deployment of risk-sharing
mechanisms such as insurance. Natural capital options are only available in APT D (not in APT B) and
in this scenario’s pathway, after an initial focus on restricting the development in low-lying risk areas there
is a shift to the preservation of marketable natural resources via the investment in refrigeration and/or
cooling systems. On the other hand, the APT B scenario includes the possibility to investment in physical
capital. In this particular case, the Azorean maritime transport pathway clearly favours investments in the
operationality and flexibility of ports in detriment of vessels. In relation to managing the long-term climate
risk both pathways favour the climate proofing of existing infrastructure and activities, with the notable
exception of a middle of the century planed revision of the localization and size of port infrastructures in
APT D pathway. Ecosystem resilience and provisioning services in both these high-investment
pathways take the form of integrated port protection-energy production structures, while regulation and
maintenance services (available only in APT B but not in APT D) focus exclusively on hard coastal
protection infrastructures, again in detriment of vessel technology.
Finally, the sector pathway in the Efficiency Enhancing (APT C) scenario (medium investment and
medium change in policy commitment) is characterized by the flexibility of actions along the time. The
Azorean maritime transportation sector will alternate between options targeting social dialogue and
awareness raising (human capital), trade diversification and climate resilient jobs (social capital), and
restrictions to the development in high-risk areas and investments in refrigeration and/or cooling systems
for marketable products (natural capital). The same flexibility is seen in the management of long-term
disaster risks, with the pathway considering the planed revision of the localization and size of port
infrastructures up to 2030, followed by the climate proofing of ports and port activities. Similarly,
preparedness actions will focus on an initial stepping up of the sector’s infrastructures repair and
maintenance efforts to be followed by the development of new early warning systems and monitoring
schemes. Regarding ecosystem resilience and services in this pathway, the maritime transportation
sector will, unlike in ATP B and D, focus initially on marine friendly coastal protections and ship
technology, to be followed by more classical coastal protection structures (regulation and maintenance
services) some with integrated energy technology (provisioning services). One additional feature of this
pathway is related to cultural services (only available in the APT C scenario), where the sector will seek
to better integrate ports in urban tissue over construction of new ocean pools.
Local knowledge options were focused on coastline protection and reflect the relevance of this issue for
the Azorean maritime transport sector, in the four pathways. All pathways reflect the need for continuous
maintenance of infrastructures, while coastal monitoring systems are centred around the short and long
term. This is potentially in line with the prospects of using adaptive management in the region (i.e., review
adaptation decisions over time in line with changes in risks factors), which would facilitate incremental
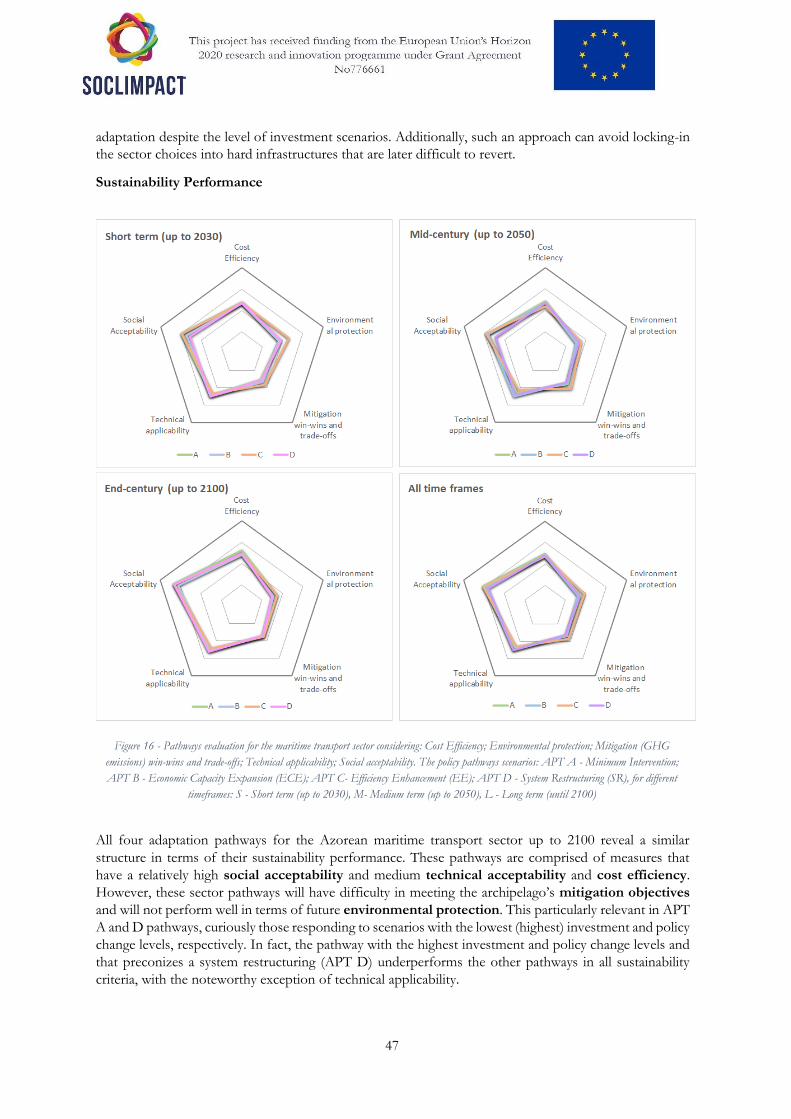
47
adaptation despite the level of investment scenarios. Additionally, such an approach can avoid locking-in
the sector choices into hard infrastructures that are later difficult to revert.
Sustainability Performance
Figure 16 - Pathways evaluation for the maritime transport sector considering: Cost Efficiency; Environmental protection; Mitigation (GHG
emissions) win-wins and trade-offs; Technical applicability; Social acceptability. The policy pathways scenarios: APT A - Minimum Intervention;
APT B - Economic Capacity Expansion (ECE); APT C- Efficiency Enhancement (EE); APT D - System Restructuring (SR), for different
timeframes: S - Short term (up to 2030), M- Medium term (up to 2050), L - Long term (until 2100)
All four adaptation pathways for the Azorean maritime transport sector up to 2100 reveal a similar
structure in terms of their sustainability performance. These pathways are comprised of measures that
have a relatively high social acceptability and medium technical acceptability and cost efficiency.
However, these sector pathways will have difficulty in meeting the archipelago’s mitigation objectives
and will not perform well in terms of future environmental protection. This particularly relevant in APT
A and D pathways, curiously those responding to scenarios with the lowest (highest) investment and policy
change levels, respectively. In fact, the pathway with the highest investment and policy change levels and
that preconizes a system restructuring (APT D) underperforms the other pathways in all sustainability
criteria, with the noteworthy exception of technical applicability.
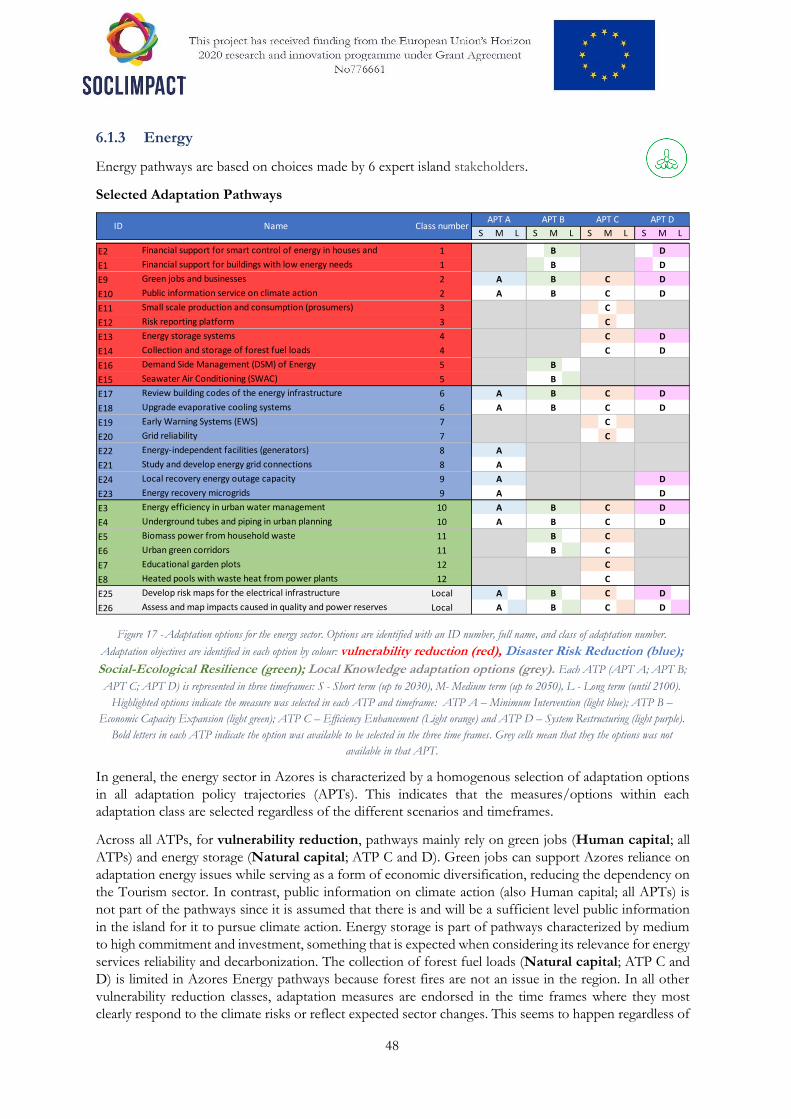
48
6.1.3 Energy
Energy pathways are based on choices made by 6 expert island stakeholders.
Selected Adaptation Pathways
Figure 17 - Adaptation options for the energy sector. Options are identified with an ID number, full name, and class of adaptation number.
Adaptation objectives are identified in each option by colour: vulnerability reduction (red), Disaster Risk Reduction (blue);
Social-Ecological Resilience (green); Local Knowledge adaptation options (grey). Each ATP (APT A; APT B;
APT C; APT D) is represented in three timeframes: S - Short term (up to 2030), M- Medium term (up to 2050), L - Long term (until 2100).
Highlighted options indicate the measure was selected in each ATP and timeframe: ATP A – Minimum Intervention (light blue); ATP B –
Economic Capacity Expansion (light green); ATP C – Efficiency Enhancement (Light orange) and ATP D – System Restructuring (light purple).
Bold letters in each ATP indicate the option was available to be selected in the three time frames. Grey cells mean that they the options was not
available in that APT.
In general, the energy sector in Azores is characterized by a homogenous selection of adaptation options
in all adaptation policy trajectories (APTs). This indicates that the measures/options within each
adaptation class are selected regardless of the different scenarios and timeframes.
Across all ATPs, for vulnerability reduction, pathways mainly rely on green jobs (Human capital; all
ATPs) and energy storage (Natural capital; ATP C and D). Green jobs can support Azores reliance on
adaptation energy issues while serving as a form of economic diversification, reducing the dependency on
the Tourism sector. In contrast, public information on climate action (also Human capital; all APTs) is
not part of the pathways since it is assumed that there is and will be a sufficient level public information
in the island for it to pursue climate action. Energy storage is part of pathways characterized by medium
to high commitment and investment, something that is expected when considering its relevance for energy
services reliability and decarbonization. The collection of forest fuel loads (Natural capital; ATP C and
D) is limited in Azores Energy pathways because forest fires are not an issue in the region. In all other
vulnerability reduction classes, adaptation measures are endorsed in the time frames where they most
clearly respond to the climate risks or reflect expected sector changes. This seems to happen regardless of
S M L S M L S M L S M L
E2 Financial support for smart control of energy in houses and
buildings
1 A B C D
E1 Financial support for buildings with low energy needs 1 A B C D
E9 Green jobs and businesses 2 A B C D
E10 Public information service on climate action 2 A B C D
E11 Small scale production and consumption (prosumers) 3 A B C D
E12 Risk reporting platform 3 A B C D
E13 Energy storage systems 4 A B C D
E14 Collection and storage of forest fuel loads 4 A B C D
E16 Demand Side Management (DSM) of Energy 5 A B C D
E15 Seawater Air Conditioning (SWAC) 5 A B C D
E17 Review building codes of the energy infrastructure 6 A B C D
E18 Upgrade evaporative cooling systems 6 A B C D
E19 Early Warning Systems (EWS) 7 A B C D
E20 Grid reliability 7 A B C D
E22 Energy-independent facilities (generators) 8 A B C D
E21 Study and develop energy grid connections 8 A B C D
E24 Local recovery energy outage capacity 9 A B C D
E23 Energy recovery microgrids 9 A B C D
E3 Energy efficiency in urban water management 10 A B C D
E4 Underground tubes and piping in urban planning 10 A B C D
E5 Biomass power from household waste 11 A B C D
E6 Urban green corridors 11 A B C D
E7 Educational garden plots 12 A B C D
E8 Heated pools with waste heat from power plants 12 A B C D
E25 Develop risk maps for the electrical infrastructure Local A B C D
E26 Assess and map impacts caused in quality and power reserves
through changes in climate patterns
Local A B C D
ID Name Class numberAPT A APT B APT C APT D
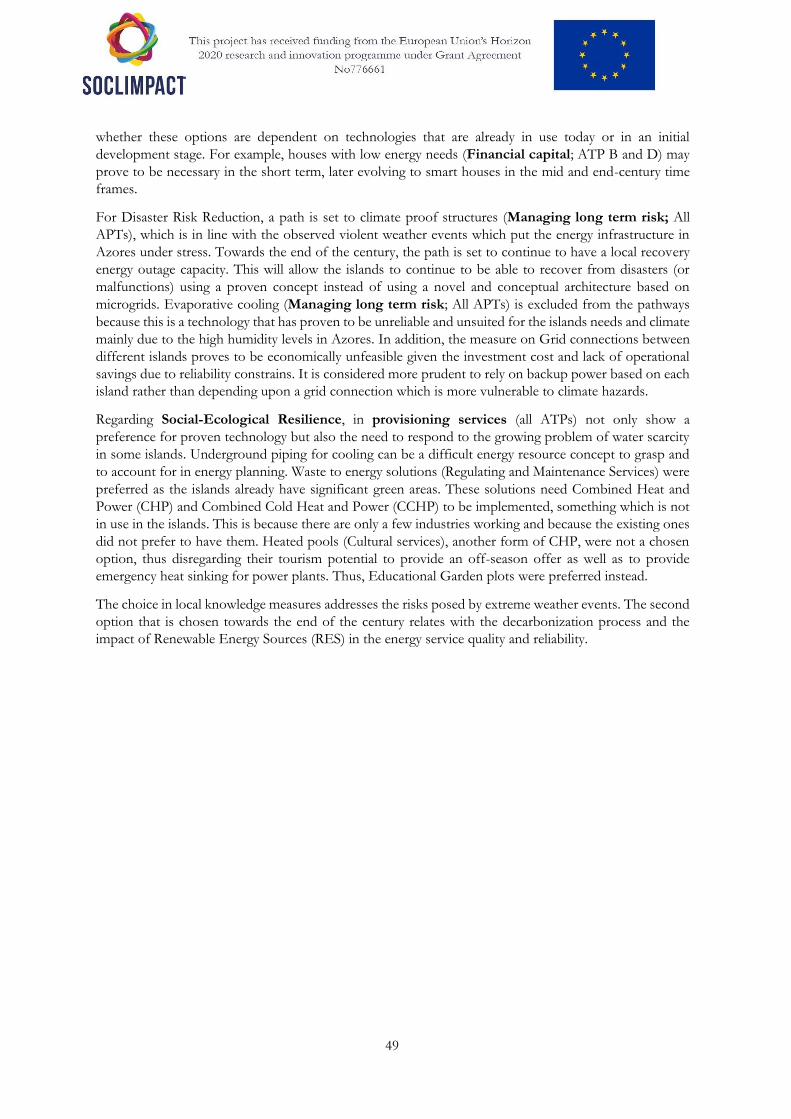
49
whether these options are dependent on technologies that are already in use today or in an initial
development stage. For example, houses with low energy needs (Financial capital; ATP B and D) may
prove to be necessary in the short term, later evolving to smart houses in the mid and end-century time
frames.
For Disaster Risk Reduction, a path is set to climate proof structures (Managing long term risk; All
APTs), which is in line with the observed violent weather events which put the energy infrastructure in
Azores under stress. Towards the end of the century, the path is set to continue to have a local recovery
energy outage capacity. This will allow the islands to continue to be able to recover from disasters (or
malfunctions) using a proven concept instead of using a novel and conceptual architecture based on
microgrids. Evaporative cooling (Managing long term risk; All APTs) is excluded from the pathways
because this is a technology that has proven to be unreliable and unsuited for the islands needs and climate
mainly due to the high humidity levels in Azores. In addition, the measure on Grid connections between
different islands proves to be economically unfeasible given the investment cost and lack of operational
savings due to reliability constrains. It is considered more prudent to rely on backup power based on each
island rather than depending upon a grid connection which is more vulnerable to climate hazards.
Regarding Social-Ecological Resilience, in provisioning services (all ATPs) not only show a
preference for proven technology but also the need to respond to the growing problem of water scarcity
in some islands. Underground piping for cooling can be a difficult energy resource concept to grasp and
to account for in energy planning. Waste to energy solutions (Regulating and Maintenance Services) were
preferred as the islands already have significant green areas. These solutions need Combined Heat and
Power (CHP) and Combined Cold Heat and Power (CCHP) to be implemented, something which is not
in use in the islands. This is because there are only a few industries working and because the existing ones
did not prefer to have them. Heated pools (Cultural services), another form of CHP, were not a chosen
option, thus disregarding their tourism potential to provide an off-season offer as well as to provide
emergency heat sinking for power plants. Thus, Educational Garden plots were preferred instead.
The choice in local knowledge measures addresses the risks posed by extreme weather events. The second
option that is chosen towards the end of the century relates with the decarbonization process and the
impact of Renewable Energy Sources (RES) in the energy service quality and reliability.
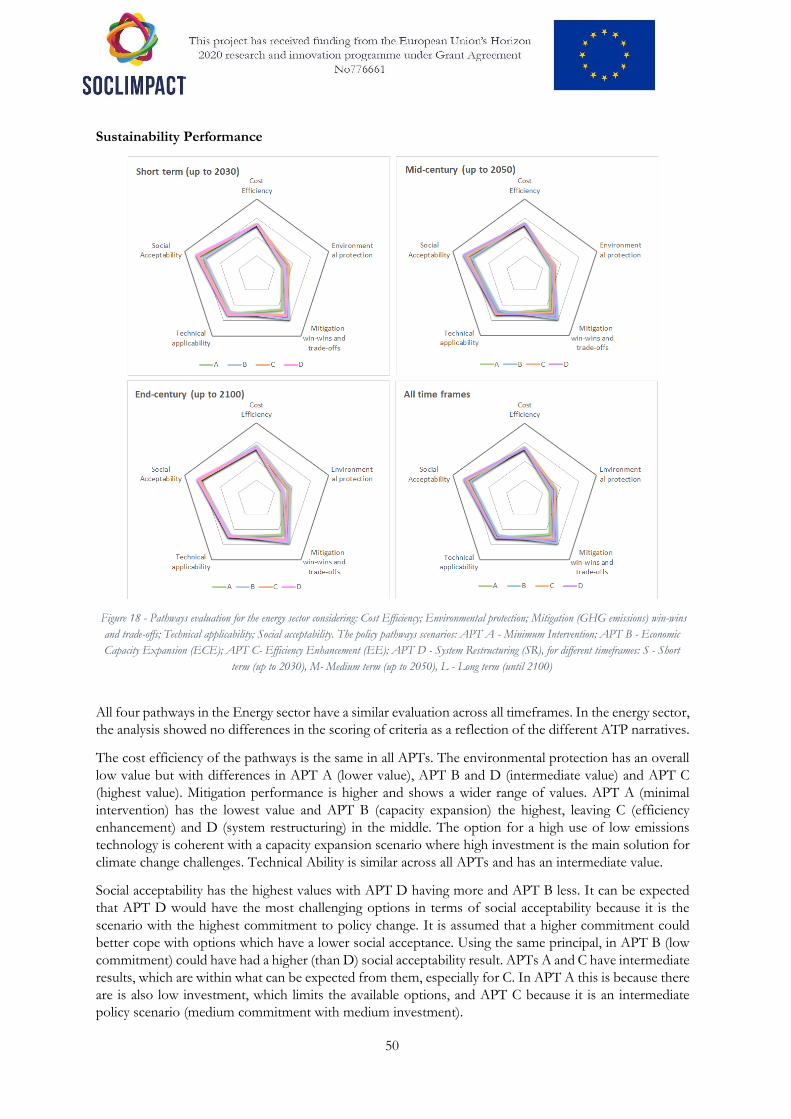
50
Sustainability Performance
Figure 18 - Pathways evaluation for the energy sector considering: Cost Efficiency; Environmental protection; Mitigation (GHG emissions) win-wins
and trade-offs; Technical applicability; Social acceptability. The policy pathways scenarios: APT A - Minimum Intervention; APT B - Economic
Capacity Expansion (ECE); APT C- Efficiency Enhancement (EE); APT D - System Restructuring (SR), for different timeframes: S - Short
term (up to 2030), M- Medium term (up to 2050), L - Long term (until 2100)
All four pathways in the Energy sector have a similar evaluation across all timeframes. In the energy sector,
the analysis showed no differences in the scoring of criteria as a reflection of the different ATP narratives.
The cost efficiency of the pathways is the same in all APTs. The environmental protection has an overall
low value but with differences in APT A (lower value), APT B and D (intermediate value) and APT C
(highest value). Mitigation performance is higher and shows a wider range of values. APT A (minimal
intervention) has the lowest value and APT B (capacity expansion) the highest, leaving C (efficiency
enhancement) and D (system restructuring) in the middle. The option for a high use of low emissions
technology is coherent with a capacity expansion scenario where high investment is the main solution for
climate change challenges. Technical Ability is similar across all APTs and has an intermediate value.
Social acceptability has the highest values with APT D having more and APT B less. It can be expected
that APT D would have the most challenging options in terms of social acceptability because it is the
scenario with the highest commitment to policy change. It is assumed that a higher commitment could
better cope with options which have a lower social acceptance. Using the same principal, in APT B (low
commitment) could have had a higher (than D) social acceptability result. APTs A and C have intermediate
results, which are within what can be expected from them, especially for C. In APT A this is because there
are is also low investment, which limits the available options, and APT C because it is an intermediate
policy scenario (medium commitment with medium investment).
51
6.2 Balearic Islands
For these Islands, a different methodology was used and explained in the island report made by the IFP
(UIB). The reasons present for not being possible to follow the proposed methodological framework are
summarized in the following points:
• The personal interview approach was considered to be the most appropriate to obtain the views of
the most representative stakeholders for three addressed sectors of the blue economy.
• This approach made it possible to understand the reasoning behind each choice and, at the same
time, to clarify any doubts or misinterpretations that the questions may have caused during the
exercise, in order to better qualify the information collected.
• Each interviewee was asked to choose different time frames between two adaptation options for a
total of 24 options, and then to prioritize between 6 specific options from local knowledge.
• Each interviewee only responded according to their own point of view, placing themselves in a
different APT than what they believed, the responses might be biased and not reflect reality.
• Consequently, in some sectors there will be empty columns, due to the fact that we did not find
interviewees who fit all the profiles.
• For the Balearic Islands the process was similar to the one in the Canary Islands but based in a
lesser number of stakeholders
The results presented below are just indicative of an approximation made to the standard Online
Workshop framework.
More information about this Island: see Island Report for the Island.
6.2.1 Tourism
Tourism pathways are based on choices made by 2 expert island stakeholders.
Selected Adaptation Pathways
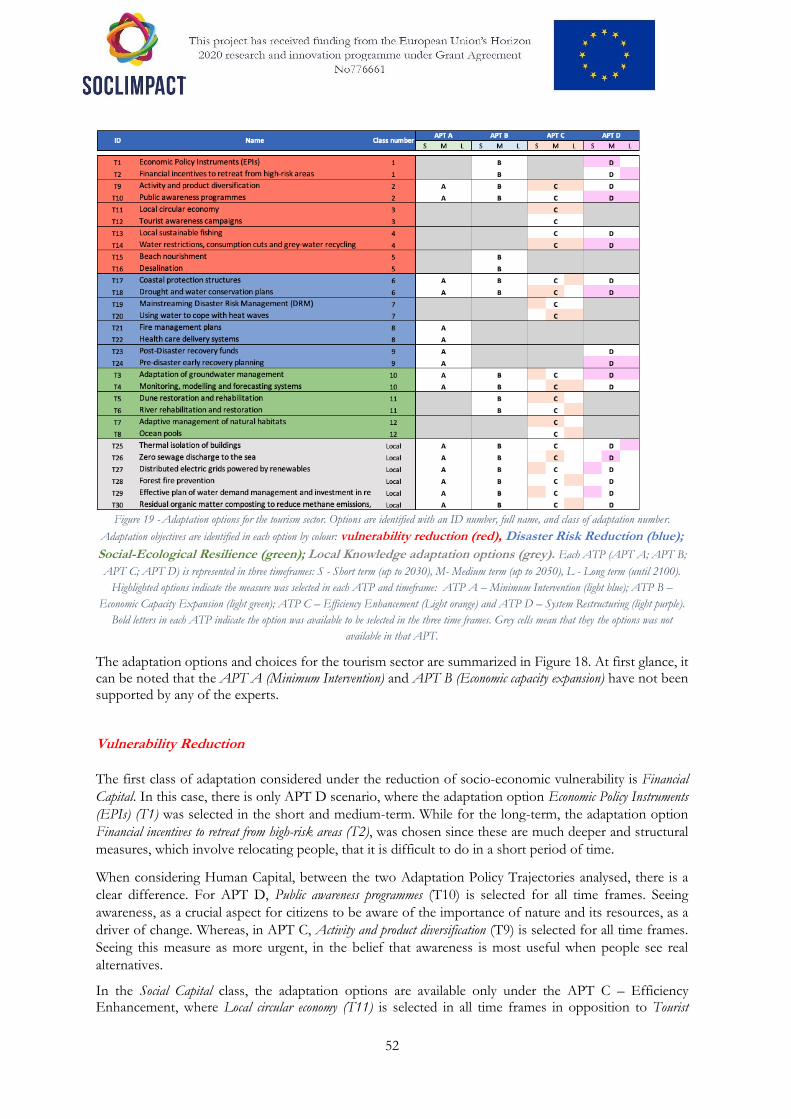
52
Figure 19 - Adaptation options for the tourism sector. Options are identified with an ID number, full name, and class of adaptation number.
Adaptation objectives are identified in each option by colour: vulnerability reduction (red), Disaster Risk Reduction (blue);
Social-Ecological Resilience (green); Local Knowledge adaptation options (grey). Each ATP (APT A; APT B;
APT C; APT D) is represented in three timeframes: S - Short term (up to 2030), M- Medium term (up to 2050), L - Long term (until 2100).
Highlighted options indicate the measure was selected in each ATP and timeframe: ATP A – Minimum Intervention (light blue); ATP B –
Economic Capacity Expansion (light green); ATP C – Efficiency Enhancement (Light orange) and ATP D – System Restructuring (light purple).
Bold letters in each ATP indicate the option was available to be selected in the three time frames. Grey cells mean that they the options was not
available in that APT.
The adaptation options and choices for the tourism sector are summarized in Figure 18. At first glance, it can be noted that the APT A (Minimum Intervention) and APT B (Economic capacity expansion) have not been supported by any of the experts. Vulnerability Reduction The first class of adaptation considered under the reduction of socio-economic vulnerability is Financial
Capital. In this case, there is only APT D scenario, where the adaptation option Economic Policy Instruments
(EPIs) (T1) was selected in the short and medium-term. While for the long-term, the adaptation option
Financial incentives to retreat from high-risk areas (T2), was chosen since these are much deeper and structural
measures, which involve relocating people, that it is difficult to do in a short period of time.
When considering Human Capital, between the two Adaptation Policy Trajectories analysed, there is a
clear difference. For APT D, Public awareness programmes (T10) is selected for all time frames. Seeing
awareness, as a crucial aspect for citizens to be aware of the importance of nature and its resources, as a
driver of change. Whereas, in APT C, Activity and product diversification (T9) is selected for all time frames.
Seeing this measure as more urgent, in the belief that awareness is most useful when people see real
alternatives.
In the Social Capital class, the adaptation options are available only under the APT C – Efficiency Enhancement, where Local circular economy (T11) is selected in all time frames in opposition to Tourist
53
awareness campaigns (T12). With the idea that we have to start now, since there is little time. Being too late to start raising awareness among tourist if we want to achieve changes in the short-term.
Regarding the fourth class, Natural Capital, the APTs considered are C and D. From the two options available, Local sustainable fishing (T13) and Water restrictions, consumption cuts and grey-water recycling (T14), the chosen one under both APTs and in all timeframes is the latter. The pathways developed consider the growing evolution of the climate change risks in particular for the Balearic Islands: the urgency to respond to water scarcity, one of the biggest issues in the archipelago. Water must be managed correctly, as there is a great shortage of water, with many tourists, swimming pools, etc. Action must be taken, regulating it more efficiently in order to achieve a responsible management of water. However, T13 is also seen as important for the archipelago.
Disaster Risk Reduction For Disaster Risk Reduction, and to manage long term risk, the decisions need to be sensible to the level of
investment and reflect the climate change risk identified for the region. Drought and water conservation plans
(T18) is the most important measure for the region throughout the scenarios. However, APT C includes
Managing long term risk and Coastal protection (T17) on the long-term, clearly showing, once again, the issue
of water scarcity.
The Efficiency Enhancement scenario (ATP C) is the only scenario which considers the Preparedness class. Mainstreaming DRM (T19) was selected in the short-term because it is something that needs to be developed immediately. While Using water to cope with heat waves (T20) has been selected for medium and long-term.
In Post disaster recovery, to address DRR on the tourism sector, in APT D, the Pre-disaster early recovery planning
(T24) was selected for all time frames over Post-disaster recovery funds (T23). Even if T23 is also important,
many future problems could be solved with T24, while there is still a lot to do in this sense.
Social-Ecological Resilience For Provisioning services. Adaptation of groundwater management (T3) is urgent for APT D in all time frames, due
to the importance of a healthy ecosystem; if we protect ourselves, there is no need for a monitoring system.
However, incorporating Monitoring, modelling, and forecasting systems (T4) for APT C is important in the
medium and longer term, because the most severe impacts of climate change will occur in the upcoming
years.
Regulating and maintenance services, is considered only in scenario C. Where the priority for Dune restoration
and rehabilitation (T5) is shown since beaches are already suffering. Then for the long-term, River rehabilitation
and restoration (T6) is selected, because right now they are not so affected, but they will be in the future.
However, it should be noted that both are seen as important.
Cultural services are only considered for the APT C - Efficiency Enhancement (medium investment and
medium commitment to policy change scenario). In this case, the region considered to dedicate efforts in
the short and medium-term to preserve and minimize the impacts on biodiversity and ecosystems, while
also preserving the attractiveness of the region (Adaptive management of natural habitats - T7). As opposed to
Ocean pools (T8), in the long-term.
Local Knowledge adaptation options The specific adaptation options for the tourism sector include solutions of various kinds. Where the
problem of water scarcity throughout the archipelago can be clearly seen, being Effective plan of water demand
management and investment in reducing losses along the water distribution system (T29) the most urgent adaptation
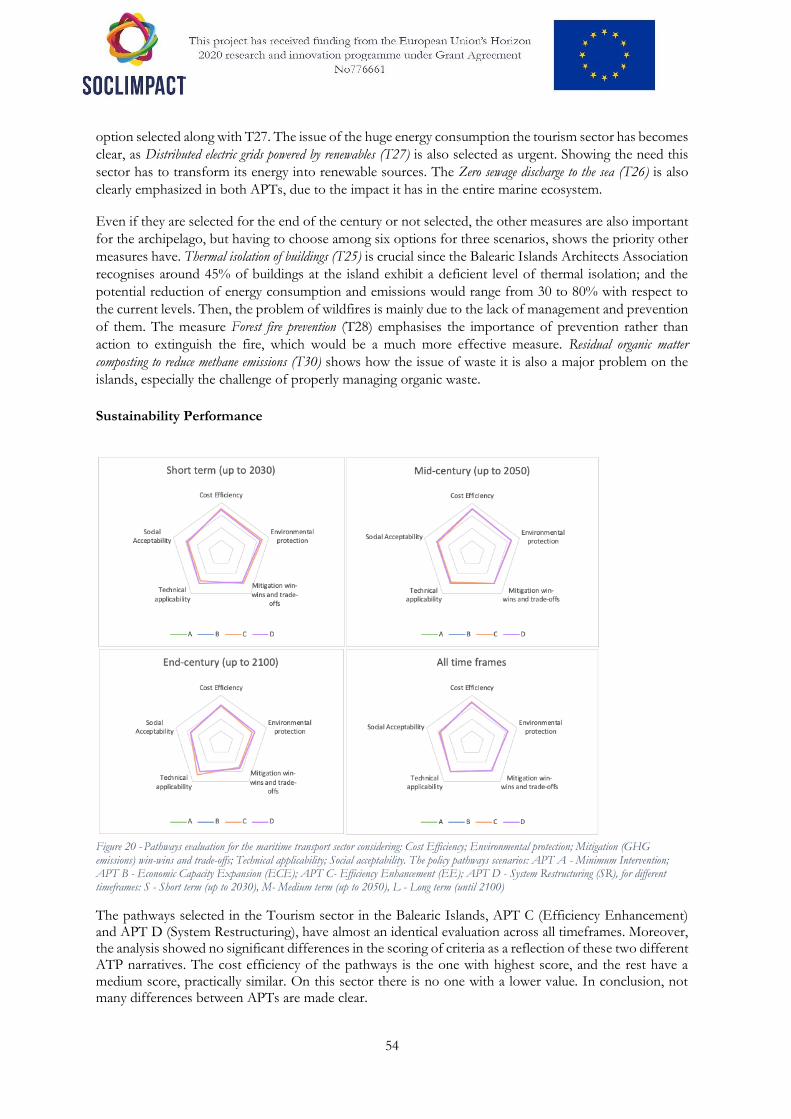
54
option selected along with T27. The issue of the huge energy consumption the tourism sector has becomes
clear, as Distributed electric grids powered by renewables (T27) is also selected as urgent. Showing the need this
sector has to transform its energy into renewable sources. The Zero sewage discharge to the sea (T26) is also
clearly emphasized in both APTs, due to the impact it has in the entire marine ecosystem.
Even if they are selected for the end of the century or not selected, the other measures are also important
for the archipelago, but having to choose among six options for three scenarios, shows the priority other
measures have. Thermal isolation of buildings (T25) is crucial since the Balearic Islands Architects Association
recognises around 45% of buildings at the island exhibit a deficient level of thermal isolation; and the
potential reduction of energy consumption and emissions would range from 30 to 80% with respect to
the current levels. Then, the problem of wildfires is mainly due to the lack of management and prevention
of them. The measure Forest fire prevention (T28) emphasises the importance of prevention rather than
action to extinguish the fire, which would be a much more effective measure. Residual organic matter
composting to reduce methane emissions (T30) shows how the issue of waste it is also a major problem on the
islands, especially the challenge of properly managing organic waste.
Sustainability Performance
Figure 20 - Pathways evaluation for the maritime transport sector considering: Cost Efficiency; Environmental protection; Mitigation (GHG emissions) win-wins and trade-offs; Technical applicability; Social acceptability. The policy pathways scenarios: APT A - Minimum Intervention; APT B - Economic Capacity Expansion (ECE); APT C- Efficiency Enhancement (EE); APT D - System Restructuring (SR), for different timeframes: S - Short term (up to 2030), M- Medium term (up to 2050), L - Long term (until 2100)
The pathways selected in the Tourism sector in the Balearic Islands, APT C (Efficiency Enhancement) and APT D (System Restructuring), have almost an identical evaluation across all timeframes. Moreover, the analysis showed no significant differences in the scoring of criteria as a reflection of these two different ATP narratives. The cost efficiency of the pathways is the one with highest score, and the rest have a medium score, practically similar. On this sector there is no one with a lower value. In conclusion, not many differences between APTs are made clear.
55
6.2.2 Maritime Transport
As all islands, the Balearic exhibit high dependency from imports and exports and, as a consequence, from the maritime transport and port operations. Additionally, to the extent in which the Balearic also show an extreme economic dependence from tourism, it exacerbates the necessity of a wide range of intermediate and final goods import, and also encourages the development of an extensive sector of recreational navigation. Nowadays, the Balearic holds around 24.200 boat mooring points, 5% of the whole Mediterranean Sea and 17% of those held by the Spanish coasts. As a result, the economy of the Balearic Islands is highly exposed to the climate change hazards that affect the marine conditions for navigability and keeping port operations on. To date, relevant stakeholders from port activity have not scheduled time to participate providing information either through questionnaires or through in-depth interviews. Yet, their participation over the next few weeks is still open so this absence could be reversed before SOCLIMPACT ends and their opinions would be included in further versions of the present Deliverable. In any case, opinions from the best adaptation options for this sector of activity have been collected from SOCLIMPACT researchers belonging to local research institutions, who besides having a vast knowledge of the effects of climate change in the Mediterranean and especially in the Balearic Islands, are familiar with port infrastructures, after having participated in some working sessions on the expected impacts of climate change on the Balearic economy and society. In those sessions, they had the opportunity to meet high representatives of the Archipelago ports sector and exchange relevant information about the challenges Balearic ports will face due to climate change impacts. Complementarily, we have resorted to indirect sources of information about plans and policies related to climate change mitigation and adaptation in the field of maritime transport and ports at the Balearic Islands. In a recent Report by the Economic and Social Council of the Balearic Government 2019 (file:///D:/descargas/CES-UIB%20H2030%20SEPARATA.pdf), it was informed that the authority is starting to study the vulnerability factors for the maritime infrastructures, a priori appointing to the relevance of the sea level rise, as it exacerbates the potential damages from high waves and storm surges (pg.36). For that purpose, the regional Government, which co-manage together with the Spanish central port authority the whole regional port system, hired the services of the Maritime Engineering laboratory of the Universitat Politècnica de Catalunya (LIM / UPC) to develop a detailed plan of climate plan adaptation assisted by complex numeric modelling. In addition, in June 2020 a General Plan for Ports of the Balearic Islands was launched planning to concentrate main efforts to ameliorate and strengthen the current port infrastructures to better face climate change and adapt to the future challenges of the maritime transport, refusing to build new ports or enlarge those which are currently operative. This information, also in the hands of the key informants, will be useful to contextualise the answers provided, together with the research outcomes delivered from SOCLIMPACT Project in previous phases, as well as from other research projects. Regarding this, it is relevant to underline that extreme wind and waves and storm surges height are not expected to increase around the Balearic Islands over the present century in any of the studied emissions scenarios. As a consequence, sea level rise and the frequency of extreme heat are the main hazards that will threaten the operability of the Balearic Islands ports over the levels already mentioned above. Knowing what is currently being undertaken and what is already planned to prepare ports and the maritime transport for climate change impacts, allowed consulted experts to provide an accurate opinion of what really needs to be done and over what time horizon in the Balearic Islands. The following section displays the tables containing the experts’ opinions gathered from questionnaires and in-depth interviews. Selected Adaptation Pathways
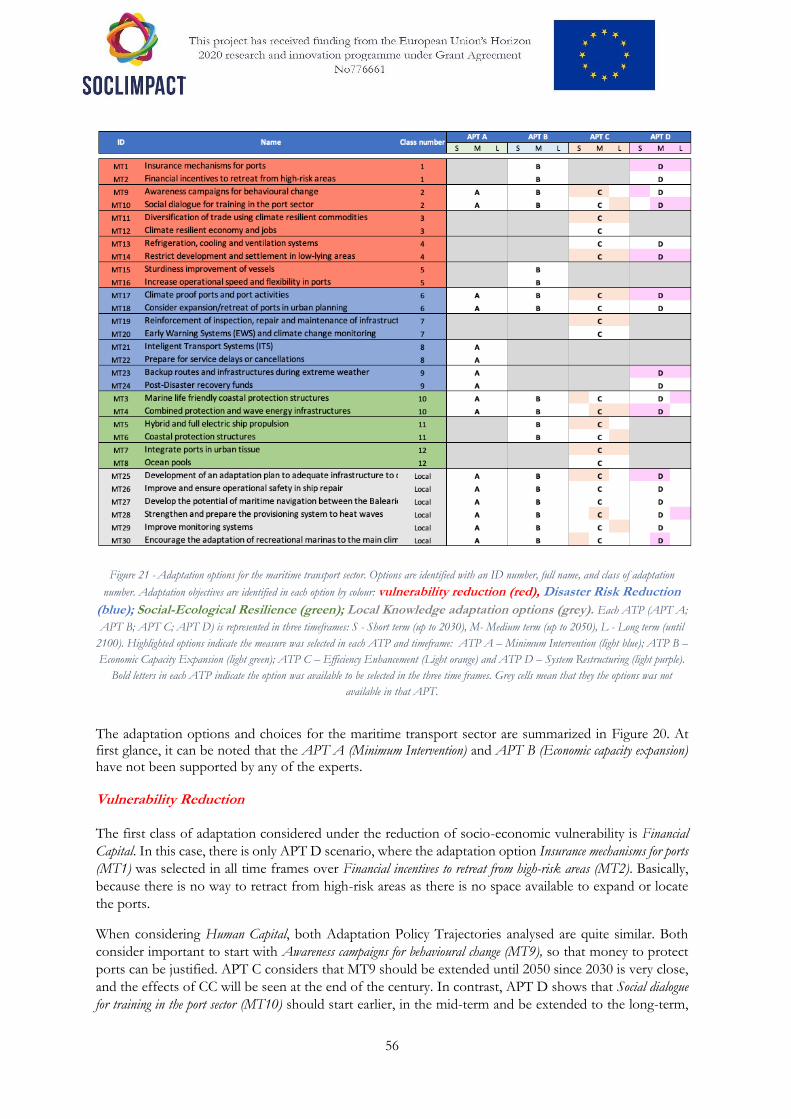
56
Figure 21 - Adaptation options for the maritime transport sector. Options are identified with an ID number, full name, and class of adaptation
number. Adaptation objectives are identified in each option by colour: vulnerability reduction (red), Disaster Risk Reduction
(blue); Social-Ecological Resilience (green); Local Knowledge adaptation options (grey). Each ATP (APT A;
APT B; APT C; APT D) is represented in three timeframes: S - Short term (up to 2030), M- Medium term (up to 2050), L - Long term (until
2100). Highlighted options indicate the measure was selected in each ATP and timeframe: ATP A – Minimum Intervention (light blue); ATP B –
Economic Capacity Expansion (light green); ATP C – Efficiency Enhancement (Light orange) and ATP D – System Restructuring (light purple).
Bold letters in each ATP indicate the option was available to be selected in the three time frames. Grey cells mean that they the options was not
available in that APT.
The adaptation options and choices for the maritime transport sector are summarized in Figure 20. At first glance, it can be noted that the APT A (Minimum Intervention) and APT B (Economic capacity expansion) have not been supported by any of the experts. Vulnerability Reduction The first class of adaptation considered under the reduction of socio-economic vulnerability is Financial
Capital. In this case, there is only APT D scenario, where the adaptation option Insurance mechanisms for ports
(MT1) was selected in all time frames over Financial incentives to retreat from high-risk areas (MT2). Basically,
because there is no way to retract from high-risk areas as there is no space available to expand or locate
the ports.
When considering Human Capital, both Adaptation Policy Trajectories analysed are quite similar. Both
consider important to start with Awareness campaigns for behavioural change (MT9), so that money to protect
ports can be justified. APT C considers that MT9 should be extended until 2050 since 2030 is very close,
and the effects of CC will be seen at the end of the century. In contrast, APT D shows that Social dialogue
for training in the port sector (MT10) should start earlier, in the mid-term and be extended to the long-term,

57
since MT9 would be already implemented for that time, and the port sector should be trained on how to
act, giving security.
In the Social Capital class, the adaptation options are available only under the APT C – Efficiency Enhancement, where Diversification of trade using climate resilient commodities (MT11) is preferred over Climate resilient economy and jobs (MT12).
Regarding the fourth class, Natural Capital, the APTs considered are C and D. From the two options available, Refrigeration, cooling, and ventilation systems (MT13) and Restrict development and settlement in low-lying areas (MT14), the chosen one under both APTs and in all timeframes is the latter; since it makes more sense than the MT13, with little chance of improving the thermal conditions of the stevedores.
Disaster Risk Reduction For Disaster Risk Reduction, and to manage long term risk, the decisions need to be sensible to the level of
investment and reflect the climate change risk identified for the region. Climate proof ports and port activities
(MT17) is clearly seen as the priority. Climate change risks have to be analysed, to better adapt and prepare
for those impacts. All investments must take climate change into account before moving forward with
them. Consider expansion/retreat of ports in urban planning (MT18) does not make sense for this archipelago,
since there is no possible location for relocating the ports.
The Efficiency Enhancement scenario (ATP C) is the only scenario which considers the Preparedness class. Reinforcement of inspection, repair, and maintenance of infrastructure (T19) was selected in all time frames over Early Warning Systems (EWS) and climate change monitoring (MT20). Since the latter, despite being crucial, is already in place. The monitoring of the ports, on the other hand, is something local that they have to do.
In Post disaster recovery, to address DRR on the tourism sector, in APT D, Backup routes and infrastructures
during extreme weather (MT23) was selected for all time frames over Post-Disaster recovery funds (MT24).
Social-Ecological Resilience For Provisioning services. Marine life friendly coastal protection structures (MT3) is urgent for APT C in the short-
term, due to the importance of protecting marine life. As it is currently a process that is already underway,
for the medium and long-term Combined protection and wave energy infrastructures (MT4) is selected; being
important to ensure that this infrastructure can be made productive from the investments that are made.
In contrast, for APT D it is just the opposite, selecting MT4 for the short and medium-term, and MT4 in
the long term.
Regulating and maintenance services, is considered only in scenario C. Where the priority for Hybrid and full
electric ship propulsion (MT5) is shown, because to lessen the fuel used by ships is crucial, since vessels pollute
the marine environment. Then for the long-term, Coastal protection structures (MT6) is selected, because is
when the greatest rise in the sea level will occur, and when the structure can be affected.
In regard to Cultural services, the sector will seek to better Integrate ports in urban tissue (MT7) over construction of new Ocean pools (MT8) as the latter is not seen as a relevant aspect for this sector. Local Knowledge adaptation options Local knowledge options are mainly focused on coastline and infrastructure protection, reflecting how having safe and operational ports is of paramount importance for the Balearic maritime transport sector: Development of an adaptation plan to adequate infrastructure to climate threats (MT25) and Encourage the adaptation of

58
recreational marinas to the main climate change hazards (MT30). MT25 focuses on adapting mooring structures, increase of dikes and the free board in old docks, particularly to the rise in sea level, so as to enable the Balearic Islands to maintain and improve their position in international recreational boating and recreational cruise traffic. Also highlighting the importance of freight traffic. And MT30, to stimulate and encourage the adaptation of recreational marinas to the main climate change hazards, in order to guarantee the operation and future expansion of recreational sailing. Nautical activities are of special importance for the Balearic Islands tourism since tourism accounts for about 45% of the GDP. Linked to climate hazards, to Improve monitoring systems (MT29), since they still can be improved, Identifying operational working windows in case of extreme events. Then, Improve and ensure operational safety in ship repair (MT26) to improve and guarantee the operational safety of large ship repair activity against climatic events, the Balearic Islands being very specialized in recreational boating and mega-yachts. Also, transfer knowledge and capacities for the adaptation to climate change to the Spanish peninsula and the Mediterranean region, which will guarantee their future connectivity with the Balearic Islands and the development of the potential of maritime navigation between the Balearic Islands and the Mediterranean region: Develop the potential of maritime navigation between the Balearic Islands and the Mediterranean region (MT27). Lastly, Strengthen and prepare the provisioning system to heat waves (MT28), to reinforce and improve, in the face of possible climatic events, in particular to heat waves, the storage areas. Sustainability Performance
Figure 22 - Pathways evaluation for the maritime transport sector considering: Cost Efficiency; Environmental protection; Mitigation (GHG emissions) win-wins and trade-offs; Technical applicability; Social acceptability. The policy pathways scenarios: APT A - Minimum Intervention; APT B - Economic Capacity Expansion (ECE); APT C- Efficiency Enhancement (EE); APT D - System Restructuring (SR), for different timeframes: S - Short term (up to 2030), M- Medium term (up to 2050), L - Long term (until 2100)
The pathways selected in the Maritime Transport sector in the Balearic Islands, APT C (Efficiency Enhancement) and APT D (System Restructuring), all four adaptation pathways reveal a similar structure during the three timeframes considered, according to the answers obtained. Social acceptability shows the highest score along with technical applicability. While the other three; cost efficiency, environmental protection and mitigation win-wins and trade-offs show medium score. The only time frame that shows a clearer variation is the third one (end-century), where environmental protection scores the lowest for APT C.

59
6.2.3 Energy
Energy pathways are based on choices made by 1 expert island stakeholders.
Selected Adaptation Pathways
Figure 23 - Adaptation options for the energy sector. Options are identified with an ID number, full name, and class of adaptation number.
Adaptation objectives are identified in each option by colour: vulnerability reduction (red), Disaster Risk Reduction (blue);
Social-Ecological Resilience (green); Local Knowledge adaptation options (grey). Each ATP (APT A; APT B;
APT C; APT D) is represented in three timeframes: S - Short term (up to 2030), M- Medium term (up to 2050), L - Long term (until 2100).
Highlighted options indicate the measure was selected in each ATP and timeframe: ATP A – Minimum Intervention (light blue); ATP B –
Economic Capacity Expansion (light green); ATP C – Efficiency Enhancement (Light orange) and ATP D – System Restructuring (light purple).
Bold letters in each ATP indicate the option was available to be selected in the three time frames. Grey cells mean that they the options was not
available in that APT.
The adaptation options and choices for the energy sector are summarized in Figure 22. Being APT D (System restructuring) the only one supported. Vulnerability Reduction The first class of adaptation considered under the reduction of socio-economic vulnerability is Financial
Capital. In this case, the adaptation option Financial support for buildings with low energy needs (E1) is necessary
in the short and medium-term. While Financial support for smart control for energy in houses and buildings (E2) has
been selected for the long-term, showing the need of evolving to smart houses in the end-century.

60
When considering Human Capital, for the only Adaptation Policy Trajectories analysed (APT D), sees as
urgent need for Green jobs and businesses (E9), where a radical change is needed. These being able to support
the Balearic Islands reliance on adaptation energy issues while serving as a form of economic
diversification, reducing the dependency on the Tourism sector. Then, Public information service on climate
action (E10) being selected for the medium and long-term.
Regarding the fourth class, Natural Capital, APT D selected Collection and storage of forest fuel loads (E14) as a required for the short-term, since it is something they are already suffering from. Followed by Energy storage systems (E13) for the medium and long-term, since in the short-term they will not be so necessary, as they are not so developed yet. It is expected to have a surplus of renewable energy and this will be required. Energy storage is crucial for energy services reliability and decarbonization objectives since it will be key to the development and penetration of renewable energy.
Disaster Risk Reduction For Disaster Risk Reduction, and to Manage long term risk, the decisions need to be sensible to the level of
investment and reflect the climate change risk identified for the region. APT D considers Review building
codes of the energy infrastructure (E17) a priority in the short and medium term since many things need to be
changed in order to adapt to climate change. Then, upgrade evaporative cooling systems (E18) for the long term
in case the technology already exists for the end of the century.
In Post disaster recovery, to address DRR on the energy sector, in APT D, the Local recovery energy outage capacity
(E24) was selected for the shorter term, whereas Energy recovery microgrids (E23) for the medium and longer
term, in order to make them more autonomous.
Social-Ecological Resilience For Provisioning services. Energy efficiency in urban water management (E3) is urgent for the sector in all time
frames. Showing again, the need to respond to the growing problem of water scarcity in the archipelago.
E3 was selected over Underground tubes and piping in urban planning (E4) since it can be a difficult energy
resource concept to grasp and to account for in energy planning.
Local Knowledge adaptation options The specific adaptation options for the energy sector include solutions of various kinds. Taking APT D,
Promotion of domestic and small-scale photovoltaic solar energy (E25) and Financial support for the energy rehabilitation
of buildings (E26) are categorized as urgent. It is urgent to encourage the massive development of
photovoltaic energy sources (the one with most potential on the islands) on rooftops, instead of creating
photovoltaic parks that occupy territory that could be used for other uses. These incentives would allow
citizens to install solar panels, thus socialising electricity production. Then, E25 will allow improvements
in old buildings with terrible energy efficiency. Usually, owners cannot afford to insulate the house, in
order to make it passive building. In addition, it could give many people an alternative job.
Then the Mass development of the public transport network powered by renewable energies (E27) it is also of vital
importance. Improving the public transport network will reduce the GHG emissions, making it much
more effective and useful for citizens, in order to encourage its use. In particular, developing the railway
network (tramway networks), taking advantage of the existing infrastructure of the old railway network.
GHG emissions cannot be reduced if this following measure is not applied: Encourage electric individual
transport and car-sharing (E28). This measure is focused on individual mobility, promoting the use of
hydrogen-powered vehicles. Additionally, encouraging the use of vehicle sharing, in order to avoid the

61
need to acquire a vehicle to move around the islands. The concept of sharing includes cars, motorbikes,
and bicycles.
Then, to condition housing, Training development in installation and thermal insulation of buildings (E29) would
be necessary, which consist in training initiatives in installation and thermal insulation of buildings. Lastly,
with the aim of solving or diminishing surplus problems, the idea of Promoting storage systems for renewable
energy installations (E30). Being key, since besides being the most mature technology and the one that has
the most potential in the islands, photovoltaic energy is the one that everyone can adopt.
Sustainability Performance
Figure 24 - Pathways evaluation for the maritime transport sector considering: Cost Efficiency; Environmental protection; Mitigation (GHG emissions) win-wins and trade-offs; Technical applicability; Social acceptability. The policy pathways scenarios: APT A - Minimum Intervention; APT B - Economic Capacity Expansion (ECE); APT C- Efficiency Enhancement (EE); APT D - System Restructuring (SR), for different timeframes: S - Short term (up to 2030), M- Medium term (up to 2050), L - Long term (until 2100)
The only pathway selected in the Energy sector in the Balearic Islands is APT D (System Restructuring), All four adaptation pathways reveal a similar structure during the three timeframes considered: scoring high in four criteria (cost efficiency, social acceptability, technical applicability and mitigation wins-wins and trade-offs) except for the short-term scenario, where environmental protection criterion also scores high. In this scenario, the five criteria score practically the same. Whereas in the other two scenarios, environmental protection scores the lowest by a considerable difference.

62
6.3 Canary Islands
For these Islands, a different methodology was used and explained in the island report made by the IFP
(ULPGC). The reasons present for not being possible to follow the proposed methodological framework
are summarized in the following points:
• The personal interview approach was considered to be the most appropriate to obtain the views of the most representative stakeholders for three addressed sectors of the blue economy.
• This approach made it possible to understand the reasoning behind each choice and, at the same time, to clarify any doubts or misinterpretations that the questions may have caused during the exercise, in order to better qualify the information collected.
The results presented below are just indicative of an approximation made to the standard Online
Workshop framework.
More information about this Island: see Island Report for the Island.
6.3.1 Tourism
Tourism pathways are based on choices made by 4 expert island stakeholders. As a total of 12 interviews
were conducted, more information will be generated from these.
Selected Adaptation Pathways
Figure 25 - Adaptation options for the tourism sector. Options are identified with an ID number, full name, and class of adaptation number.
Adaptation objectives are identified in each option by colour: vulnerability reduction (red), Disaster Risk Reduction (blue);
Social-Ecological Resilience (green); Local Knowledge adaptation options (grey). Each ATP (APT A; APT B;
APT C; APT D) is represented in three timeframes: S - Short term (up to 2030), M- Medium term (up to 2050), L - Long term (until 2100).
Highlighted options indicate the measure was selected in each ATP and timeframe: ATP A – Minimum Intervention (light blue); ATP B –
Economic Capacity Expansion (light green); ATP C – Efficiency Enhancement (Light orange) and ATP D – System Restructuring (light purple).

63
Bold letters in each ATP indicate the option was available to be selected in the three time frames. Grey cells mean that they the options was not
available in that APT.
Vulnerability Reduction
The first class of adaptation considered under the reduction of socio-economic vulnerability is Financial
Capital. In this case, the adaptation option Financial incentives to retreat from high-risk areas (T2) has only been
selected under APT B in the medium- and long-term. Conversely, the adaptation option Economic Policy
Instruments (EPIs) (T1) has been chosen under APT B in the short-term (up to 2030), and under APT D
in all timeframes: under the believe that the adaptation option T2 does not solve the problem. This is
explained by the difference in vision in each APT: since APT B, which instead of reorienting the economy
and making it more resilient (as APT D), focuses more on large investment to prepare the economy for
future changes.
When considering Human Capital, all the Adaptation Policy Trajectories are analysed, and two adaptation
measures are possible: Activity and product diversification (T9) and Public awareness programmes (T10). Here there
is also a clear difference between the different APTs. For APT C and D, investment in public awareness
can be appropriate for the short-term since these awareness programmes also diversify, but then the
importance of activities and products diversification gain importance in the mid and long-term. Whereas,
for APT A and B it is just the opposite, where it is believed that there will be no diversification without
awareness. Diversification will be brought about by the training of human capital.
The same pattern occurs for Social Capital class, where Tourist awareness campaigns (T12) were selected for
the short-term in opposition to Local circular economy (T11) which gain relevance in the middle and long-
term. On this one, the adaptation options are available only under the APT C – Efficiency Enhancement.
Showing the importance of awareness, as the beginning of many things. But also, how awareness is also
the result of other kinds of actions.
Regarding the fourth class, Natural Capital, the APTs considered are C and D. From the two options
available, Local sustainable fishing (T13) and Water restrictions, consumption cuts and grey-water recycling (T14), the
chosen one under both APTs and in all timeframes is the latter. The pathways developed consider the
growing evolution of the climate change risks in particular for the Canary Islands: the urgency to respond
to water scarcity, one of the biggest issues in the archipelago.
The final class included actions to reduce socio-economic vulnerability is Physical Capital. In this case, only
the APT B – Economic Capacity Expansion is considered. While Desalination (T16) is selected in the short-
and medium-term, Beach nourishment (T15) is the preferred option for the timeframe up to 2100 (long-
term). Again, the issue of water scarcity is made clear here, whereas by the middle of the century progress
will have been made in this area, and beaches will have to be nourished at the end of the century due to
the impacts of climate change and rising sea levels.
Disaster Risk Reduction
For Disaster Risk Reduction, and to manage long term risk, the decisions need to be sensible to the level of
investment and reflect the climate change risk identified for the region. In Managing long term risk, Coastal
protection (T17) is the most important for the region throughout the scenarios. However, for APT D,
Drought, and water conservation plans (T18) are vital and a priority in the short term; although, it has to be
mentioned that both measures are seen as equally important on this APT. In contrast to ATP A and B,
include T18 on the long term.
The Efficiency Enhancement scenario (ATP C) is the only scenario which considers the Preparedness class.
In all the time frames, Mainstreaming DRM (T19) was selected in detriment of Using water to cope with heat
waves (T20). Being a more global and generic measure, and therefore more important.

64
For the Disaster response class, the risks related with fire – Fire management plans (T21) - were considered high
in all time periods in the Canary Islands, in contrast to Health care delivery systems (T22). The pathway clearly
reflects the climate-risk context of the region.
In Post disaster recovery, to address DRR on the tourism sector, in both APTs (A and D), the Pre-disaster early
recovery planning (T24) was selected for all time frames, since many future problems could be solved this
way and there is still a lot to do in this sense. Except for APT A where in the short-term Post-disaster recovery
funds (T23) was selected, mainly due to the low probability of T24 effectiveness in the short term. Being
necessary to continue to promote planning and allocate funds to develop climate change resilience in the
region.
Social-Ecological Resilience
For Provisioning services. Adaptation of groundwater management (T3) is urgent for the sector in the short-term,
however, incorporating Monitoring, modelling, and forecasting systems (T4) for the medium and longer term it is
important, since there is still a lot to do in this field. This does not mean that adaptation option T3 is not
important, but this is because even if groundwater management is done badly, it is being done; in contrast
to the other measure (T4), where there is still more to be done.
Regulating and maintenance services, is considered only for APT B and C scenarios, where the priority for Dune
restoration and rehabilitation (T5) is shown. The tourism sector will benefit from the maintenance of dunes
as this has a positive impact on tourism, since one of the biggest attractions of the destination are its
beaches. However, for APT B, River rehabilitation and restoration (T6) is selected for mid and long term,
showing again the importance of water for this region.
Cultural services are only considered for the APT C - Efficiency Enhancement (medium investment and
medium commitment to policy change scenario). In this case, the region considered to dedicate efforts in
all time frames to preserve and minimize the impacts on biodiversity and ecosystems, while also preserving
the attractiveness of the region (Adaptive management of natural habitats - T7). As opposed to Ocean pools (T8),
since T7 is more general, which includes the latter.
Local Knowledge adaptation options
The specific adaptation options for the tourism sector include solutions of various kinds. Where the
problem of sewage throughout the archipelago can be clearly seen, being Zero sewage discharge to the sea (T26)
the most urgent adaptation option selected in all APTs. Then if we take APT C and D, the issue of the
huge energy consumption the tourism sector has becomes clear, as Distributed electric grids powered by
renewables (T27) is also selected as urgent. Showing the need this sector has to transform its energy into
renewable sources. The problem of wildfires is mainly due to the lack of management and prevention of
them. The measure Forest fire prevention (T28) emphasises the importance of prevention rather than action
to extinguish the fire, which would be a much more effective measure. This one is clearly emphasized in
all APTs. Then, Bottom-up managed marine protected micro-areas (T29) appear to be important, due to the value
the coastal resources have for the islands both, for their inhabitants and for the attractiveness to tourists.
Even if it has been selected for the long term, the issue of waste is also a major problem on the islands,
especially the challenge of properly managing organic waste. In particular, in APT A and B, Residual organic
matter composting to reduce methane emissions (T30) has been highlighted for the short and medium term.
Ultimately, even if Passive, low carbon adaptation of tourist buildings (T25) has not been selected in any scenario,
it does not mean it is not important, but having to choose among six options for three scenarios, shows
the priority other measures have.

65
Sustainability Performance
Figure 26 - Pathways evaluation for the tourism sector considering: Cost Efficiency; Environmental protection; Mitigation (GHG emissions) win-wins and trade-offs; Technical applicability; Social acceptability. The policy pathways scenarios: APT A - Minimum Intervention; APT B - Economic Capacity Expansion (ECE); APT C- Efficiency Enhancement (EE); APT D - System Restructuring (SR), for different timeframes: S - Short term (up to 2030), M- Medium term (up to 2050), L - Long term (until 2100)
The performance of the four ATP scenarios for tourism sector are the ones that vary more between them
(compared to the other sectors) during the three timeframes considered, even if they still keep some sort
of similarity. In general, scenarios show a high level of cost efficiency, environmental protection and
technical applicability, and medium mitigation win-wins and trade-off. While social acceptability has the
lowest performance and varies most among the different APTs.
For middle term, pathway scenarios perform quite similar. However, for short-term and end of the century
differences are more visible. In the short-term, the minimum intervention scenario (APT A) and the
economic capacity expansion scenario (APT B) tend to have socially acceptable options and adaptation
solutions with technical applicability, and lower mitigation win-wins and trade-offs. However, the
efficiency enhancement scenario (APT C) and the system restructuring scenario (APT D) tend to have
higher cost-efficiency, higher environmental protection and higher mitigation win-wins and trade-offs. In
the case of the mid-century (up to 2050), the structure of the spider diagram is similar, but the difference
between ATPs decreases. Finally, at the end of the century, the APT A has higher scores on social
acceptability, environmental protection and mitigation win-wins and trade-offs than the rest of APTs.
APT B scores lowest in all criteria used to evaluate the adaptation pathways performance, while APT D
scores highest in technical applicability.

66
6.3.2 Maritime Transport
Maritime transport pathways are based on choices made by 1 expert island stakeholders.
Selected Adaptation Pathways
Figure 27 - Adaptation options for the maritime transport sector. Options are identified with an ID number, full name, and class of adaptation
number. Adaptation objectives are identified in each option by colour: vulnerability reduction (red), Disaster Risk Reduction
(blue); Social-Ecological Resilience (green); Local Knowledge adaptation options (grey). Each ATP (APT A;
APT B; APT C; APT D) is represented in three timeframes: S - Short term (up to 2030), M- Medium term (up to 2050), L - Long term (until
2100). Highlighted options indicate the measure was selected in each ATP and timeframe: ATP A – Minimum Intervention (light blue); ATP B –
Economic Capacity Expansion (light green); ATP C – Efficiency Enhancement (Light orange) and ATP D – System Restructuring (light purple).
Bold letters in each ATP indicate the option was available to be selected in the three time frames. Grey cells mean that they the options was not
available in that APT.
The adaptation options and choices for the maritime transport sector are summarized in Figure 26.
Since only one interview was conducted, and as mentioned above, each respondent only answered in
regard to their own point of view, for the maritime transport only APT C (Efficiency Enhancing) will be
analysed. This scenario (medium investment and medium change in policy commitment) is characterized
by the flexibility of actions along the time.
Vulnerability Reduction
In this case, the Canarias maritime transport sector is quite clear on its priorities, selecting most of the
measures for all time frames. When considering Social dialogue for training in the port sector (MT10) is selected,
since it is much more important for the port to train the port sector on how to act, which gives security,
rather than creating Awareness campaigns for behavioural change (MT9).

67
Regarding Social capital, the Diversification of trade using climate resilient commodities (MT11) is preferred over
Climate resilient economy and jobs (MT12),
In terms of Natural Capital, Refrigeration, cooling, and ventilation systems (MT13) are preferred over Restrict
development and settlement in low-lying areas (MT14), since keeping passengers, employees and goods in good
thermal conditions is of vital importance for the operation and good service of the port.
Disaster Risk Reduction
For Management of long-term disaster risks, Climate proof ports and port activities (MT17) is clearly seen as the
priority. Climate change risks have to be analysed, to better adapt and prepare for those impacts. All
investments must take climate change into account before moving forward with them.
In terms of Preparedness, it is of great urgency to implement Early Warning Systems (EWS) and climate change
monitoring (MT20), being one of the most important measures to be implemented. Being the most
immediate and easy thing to implement. Having that information, enables to make a decision on how to
deal with these changes and act on the different infrastructures depending on what that alert tells.
Social-Ecological Resilience
Provisioning services will focus initially on Marine life friendly coastal protection structures (MT3) and for the long-
term Combined protection and wave energy infrastructures (MT4). Protecting marine life is essential, but then it is
important to ensure that this infrastructure can be made productive from the investments that are made.
In terms of Regulating and maintenance services, it will be a combination of both options. However, Coastal
protection structures (MT6) are selected for the short term since Hybrid and full electric ship propulsion (MT5) is
not realistic in the short term. However, to lessen the fuel used by ships is crucial.
In regard to Cultural services, the sector will seek to better Integrate ports in urban tissue (MT7) over construction
of new Ocean pools (MT8) as the latter is not seen as a relevant aspect for this sector.
Local Knowledge adaptation options
Local knowledge options are mainly focused on coastline and infrastructure protection, reflecting how
having safe and operational ports is of paramount importance for the Canarias maritime transport sector:
Adapt infrastructure to climate threats (MT25) and Encourage the adaptation of recreational marinas to the main climate
change hazards (MT30). By adapting mooring structures and related services, especially the electrical
connection to ships during the stay in port (cold ironing), to climatic threats, and particularly to the rise
in sea level, so as to enable the Canary Islands to maintain and improve their position in international
recreational cruise traffic. Same for recreational marinas.
After the tourism sector (direct and indirect), only the sub-sectors that we include in the blue economy,
especially port activity and maritime transport have a significant weight in the region’s GDP (around 7%).
This means that preparing and strengthening these sectors in the face of the threat of climate change is
key for the Islands. Therefore, To plan the expansion of the port linked to the locational rent of the island in areas not
exposed to risks (MT29) is also important from the point of view of diversification of the Canarias economy,
since the actions that strengthen the competences of the Canary Islands in the territorial waters (as defined
in the new Statute) are of fundamental importance. Planning with climate security (areas not exposed to
risks) the expansion of the port area to accommodate new and more activity related to the opportunities

68
offered by the special regimes of the Canary Islands (RUP, ZEC, Registry of ships (REBECA), with special
attention to mobility and the relationship between the port and the city.
Then, Improve and ensure operational safety in ship repair (MT26) aims to improve and guarantee the operational
safety of ship repair activity against climatic events, including shipyards and workshops with deep-sea
repair capacity. Also, to transfer knowledge and capacities for the adaptation to climate change of nearby
West African ports, which will guarantee their future connectivity with the Canary Islands and the
development of the potential of maritime navigation between the Canary Islands and North West Africa:
Develop the potential of maritime navigation between the Canary Islands and North-West Africa (MT27). Lastly,
Strengthen and improve bunkering facilities (MT28), since the bunkering activity is one of the most important
activities the Canarias ports, in order to favour the transition to the use of new fuels and the electrical
connection to the ships. This initiative would include cutting edge solutions in the adoption of bunkering
facilities to power renewable energy-based technologies.
Sustainability Performance
Figure 28 - Pathways evaluation for the maritime transport sector considering: Cost Efficiency; Environmental protection; Mitigation (GHG emissions) win-wins and trade-offs; Technical applicability; Social acceptability. The policy pathways scenarios: APT A - Minimum Intervention; APT B - Economic Capacity Expansion (ECE); APT C- Efficiency Enhancement (EE); APT D - System Restructuring (SR), for different timeframes: S - Short term (up to 2030), M- Medium term (up to 2050), L - Long term (until 2100)
The only pathway selected in the Maritime Transport sector in the Canary Islands is APT C (Efficiency
Enhancement). All four adaptation pathways for the Canarias maritime transport sector reveal a similar
structure during the three timeframes considered, according to the answer obtained. Social acceptability
shows the highest score, while technical applicability and cost efficiency show medium score, and
environmental protection and mitigation win-wins and trade-offs the lowest. Moreover, except for the
cost efficiency criterion, all the criteria score equal or lower over time.
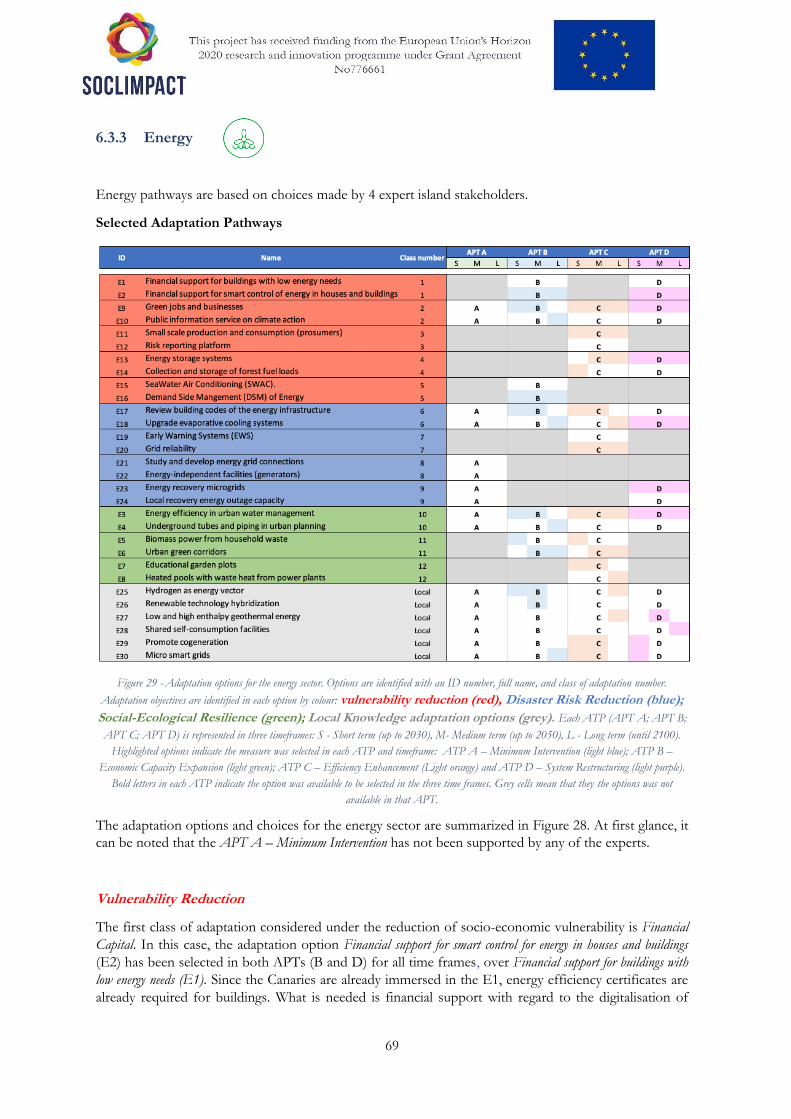
69
6.3.3 Energy
Energy pathways are based on choices made by 4 expert island stakeholders.
Selected Adaptation Pathways
Figure 29 - Adaptation options for the energy sector. Options are identified with an ID number, full name, and class of adaptation number.
Adaptation objectives are identified in each option by colour: vulnerability reduction (red), Disaster Risk Reduction (blue);
Social-Ecological Resilience (green); Local Knowledge adaptation options (grey). Each ATP (APT A; APT B;
APT C; APT D) is represented in three timeframes: S - Short term (up to 2030), M- Medium term (up to 2050), L - Long term (until 2100).
Highlighted options indicate the measure was selected in each ATP and timeframe: ATP A – Minimum Intervention (light blue); ATP B –
Economic Capacity Expansion (light green); ATP C – Efficiency Enhancement (Light orange) and ATP D – System Restructuring (light purple).
Bold letters in each ATP indicate the option was available to be selected in the three time frames. Grey cells mean that they the options was not
available in that APT.
The adaptation options and choices for the energy sector are summarized in Figure 28. At first glance, it
can be noted that the APT A – Minimum Intervention has not been supported by any of the experts.
Vulnerability Reduction
The first class of adaptation considered under the reduction of socio-economic vulnerability is Financial
Capital. In this case, the adaptation option Financial support for smart control for energy in houses and buildings
(E2) has been selected in both APTs (B and D) for all time frames, over Financial support for buildings with
low energy needs (E1). Since the Canaries are already immersed in the E1, energy efficiency certificates are
already required for buildings. What is needed is financial support with regard to the digitalisation of
70
buildings (intelligent buildings), in order to modify the structure of an existing building to lower the energy
demand.
When considering Human Capital, the three Adaptation Policy Trajectories analysed, agreeing on the
importance of Green jobs and businesses (E9). These being able to support the Canaries reliance on adaptation
energy issues while serving as a form of economic diversification, reducing the actual dependency on the
Tourism sector. In contrast, except for APT B in the long term, Public information service on climate action
(E10) is not part of the pathways since it is assumed that there is and will be a sufficient level public
information in the island for it to pursue climate action.
The same pattern occurs for Social Capital class, where Small scale production and consumption (E11) were
selected in all time frames in opposition to Risk reporting platform (E12), with the idea of empowering local
consumers before large companies, in order to be more resilient to the effects of climate change. On this
one, the adaptation options are available only under the APT C – Efficiency Enhancement.
Regarding the fourth class, Natural Capital, the APTs considered are C and D. From the two options
available, Energy storage systems (E13) was chosen over Collection and storage of forest fuel loads (E14) in all time
frames. Even if forest fires are an issue in the Canaries, the benefits of clearing forest fuel loads are still
not so clear, since plant cover has a mission, and it is also essential for the forest. However, in APT C it
is selected as urgent in the short term due to the big issue wildfires are in the archipelago. Energy storage
is crucial for energy services reliability and decarbonization objectives since it will be key to the
development and penetration of renewable energy.
The final class included actions to reduce socio-economic vulnerability is Physical Capital. In this case, only
the APT B – Economic Capacity Expansion is considered. Here again, Demand Side Management (DMS) of
Energy (E16) is the preferred option in all time frames, over Sea Water Air Conditioning (SWAC) (E15).
Energy demand management (E16) is key in the archipelago. Even if it can be used when needed, energy
storage is inefficient, since batteries often cost more than the renewable technology itself. Therefore, it is
crucial to efficiently manage the energy demand.
Disaster Risk Reduction
For Disaster Risk Reduction, and to Manage long term risk, the decisions need to be sensible to the level of
investment and reflect the climate change risk identified for the region. Except for APT D that clearly
selects Upgrade evaporative cooling systems (E18) for all time frames, both APT B and C, consider Review building
codes of the energy infrastructure (E17) as a priority in the short and medium term, and E18 for the long term.
The Efficiency Enhancement scenario (ATP C) is the only scenario which considers the Preparedness class.
In all the time frames, Grid reliability (E20) was selected in detriment of Early Warning Systems (EWS)), since
it is more important that the energy system is resilient to climate risk. However, in some way, both are
related.
In Post disaster recovery, to address DRR on the energy sector, in APT D, the Energy recovery microgrids (E23)
was selected for all time frames over Local recovery energy outage capacity (E24). Micro grids are very important
to recover power. Indeed, E23 encompasses E24.
Social-Ecological Resilience
For Provisioning services. Energy efficiency in urban water management (E3) is urgent for the sector in all time
frames, as it is more oriented to other environments where thermal consumption does exist. Showing
again, the need to respond to the growing problem of water scarcity in the archipelago. Underground
piping for cooling can be a difficult energy resource concept to grasp and to account for in energy
71
planning. However, APT B which selects Underground tubes and piping in urban planning (E4) for the longer
term, perhaps because of the future improvement of this technology.
Regulating and maintenance services, is considered only for APT B and C scenarios. Where the priority for
Biomass power from household waste (E5) is shown, with the aim of taking advantage of all that can be done
without affecting the ecosystem. Then, for the medium and long term Urban green corridors (E6) are selected,
in order to decrease energy efficiency, which cannot be done overnight, whereas the first one can.
Cultural services are only considered in APT C - Efficiency Enhancement (medium investment and medium
commitment to policy change scenario). In this case, it is considered to dedicate efforts in the short and
medium term into Educational garden plots (E7), and then in the long-term Heated pools with waste heat from
power plants (E8). Even if E7 has a more social part, and not so much the energy part, it is preferred since
the Canaries are getting rid of thermal generation, and it remains to be seen if there is another way of
generating electricity other than by thermal means.
Local Knowledge adaptation options
The specific adaptation options for the energy sector include solutions of various kinds. If we take APT
C and D, Promote cogeneration (E29) and Micro smart grids (E30) are categorized as urgent. These show the
importance of having a greater resilience, since in the event of possible power failures in the electrical
system, they will always have a guaranteed power supply. Then the Low and high enthalpy geothermal energy
(E27) which also gives stability to the electrical network. This is explained by the fact that the Canary
Islands are isolated energy systems, each island generating its own electricity. Therefore, these measures
are of the utmost importance, to prevent run out of energy.
The difference comes in APT D which aims to transform the current social-ecological and economic
system, supports Shared self-consumption facilities (E28). To encourage the shared use of facilities in order to
share costs and maximize the efficiency and management capacity of these facilities. While APT C, focuses
on Hydrogen as energy vector (E25), with the aim of using the renewable effluents for hydrogen production.
The hydrogen could then be used after storage in high-pressure tanks as vehicle fuel, especially for heavy
mobility. In contrast, APT B selects this measure (E25) as the priority. Followed by Renewable technology
hybridization (E26) to assure a balanced electrical system and guarantee quality supply. For example, if
photovoltaic technology means that energy is only available during daylight hours, other technologies such
as wind power should be used proportionally to cover what photovoltaic technology cannot. Lastly, Micro
smart grids (E30), with the aim of providing greater resilience; since in the event of possible power failures
in the electrical system, they will always have a guaranteed power supply.
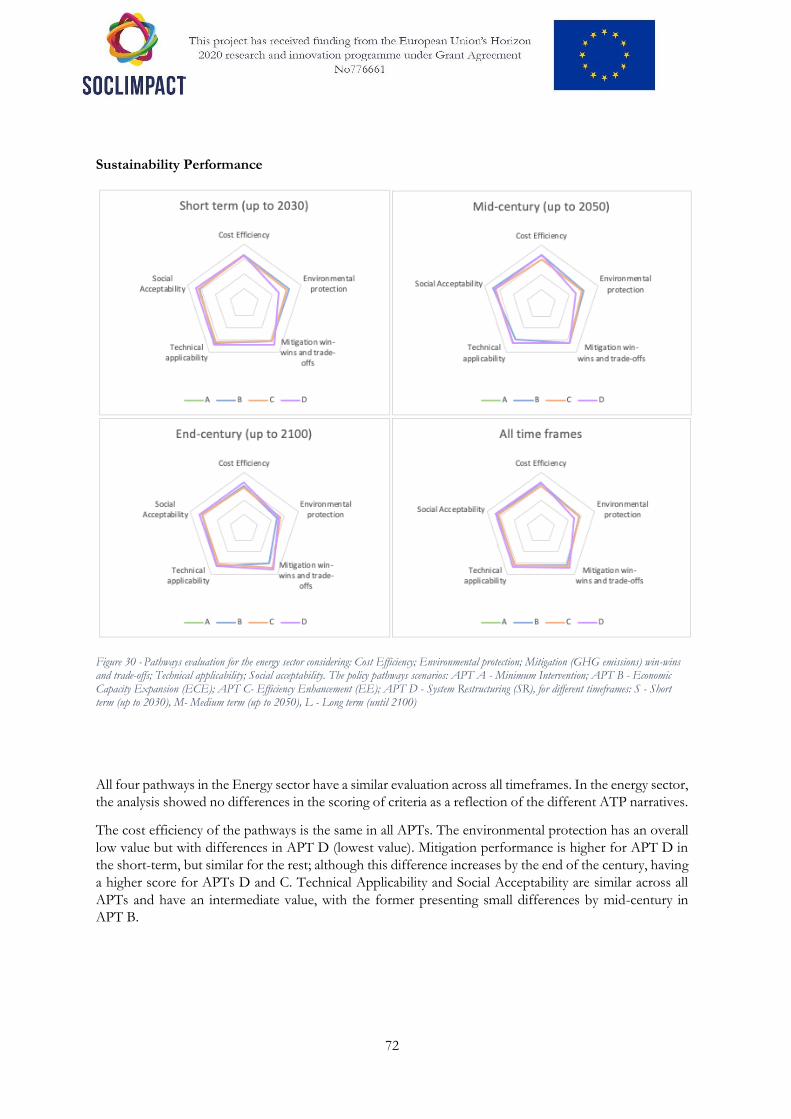
72
Sustainability Performance
Figure 30 - Pathways evaluation for the energy sector considering: Cost Efficiency; Environmental protection; Mitigation (GHG emissions) win-wins and trade-offs; Technical applicability; Social acceptability. The policy pathways scenarios: APT A - Minimum Intervention; APT B - Economic Capacity Expansion (ECE); APT C- Efficiency Enhancement (EE); APT D - System Restructuring (SR), for different timeframes: S - Short term (up to 2030), M- Medium term (up to 2050), L - Long term (until 2100)
All four pathways in the Energy sector have a similar evaluation across all timeframes. In the energy sector,
the analysis showed no differences in the scoring of criteria as a reflection of the different ATP narratives.
The cost efficiency of the pathways is the same in all APTs. The environmental protection has an overall
low value but with differences in APT D (lowest value). Mitigation performance is higher for APT D in
the short-term, but similar for the rest; although this difference increases by the end of the century, having
a higher score for APTs D and C. Technical Applicability and Social Acceptability are similar across all
APTs and have an intermediate value, with the former presenting small differences by mid-century in
APT B.

73
6.3.4 Aquaculture
Aquaculture pathways are based on choices made by 2 expert island stakeholders.
Selected Adaptation Pathways
Figure 31 - Adaptation options for the aquaculture sector. Options are identified with an ID number, full name, and class of adaptation number.
Adaptation objectives are identified in each option by colour: vulnerability reduction (red), Disaster Risk Reduction (blue);
Social-Ecological Resilience (green); Local Knowledge adaptation options (grey). Each ATP (APT A; APT B;
APT C; APT D) is represented in three timeframes: S - Short term (up to 2030), M- Medium term (up to 2050), L - Long term (until 2100).
Highlighted options indicate the measure was selected in each ATP and timeframe: ATP A – Minimum Intervention (light blue); ATP B –
Economic Capacity Expansion (light green); ATP C – Efficiency Enhancement (Light orange) and ATP D – System Restructuring (light purple).
Bold letters in each ATP indicate the option was available to be selected in the three time frames. Grey cells mean that they the options was not
available in that APT.
The adaptation options and choices for the tourism sector are summarized in Figure 30. At first glance, it
can be noted that the APT A (Minimum Intervention) and APT D (System restructuring) have not been
supported by any of the experts.
Vulnerability Reduction
The first class of adaptation considered under the reduction of socio-economic vulnerability is Financial
Capital. In this case, there is only APT B scenario, the adaptation option Tax benefits, and subsidies (A2) has
been selected in all time frames, over Financial schemes, insurance, and loans (A1), because it helps investment.

74
When companies are profitable, they need to innovate and grow. In the Canary Islands there are good tax
benefits for reinvestment. Which has brought about tremendous economic development.
When considering Human Capital, the two Adaptation Policy Trajectories analysed, agree on the
importance of Awareness campaigns for behavioural change (A9), over Efficient feed management (A10) due to the
challenge it represents. Aquaculture is based on a biased and deteriorated public perception, due to of
preconceived ideas. The industry is already immersed in a communication plan to change this perception.
The same pattern occurs for Social Capital class, where Addressing consumer and environmental concerns at the
local level (A11) was selected in all time frames in opposition to Promote cooperation to local consumption (A12),
since local consumption will not be enough due to the small population, with the idea that aquaculture
will progress with exports.
Regarding the fourth class, Natural Capital, APT C, from the two options available, Short-cycle aquaculture
(A14) was chosen over Integrated multi-trophic aquaculture (A13) in all time frames. In the private sector
efficiency is what matters, so if cycles are shortened, the sector will be more efficient and make it more
productive. In addition, A13 does not make much sense in the Canary Islands, because the carrying
capacity will never be reached, given that it is an open ocean.
The final class included actions to reduce socio-economic vulnerability is Physical Capital. In this case, only
the APT B – Economic Capacity Expansion is considered. Here again, Submergible cages (A16) is the
preferred option without any doubt in all time frames, over Recirculation Aquaculture Systems (RAS) (A15)).
Aquaculture is the future if we want to have more fish available to feed the world population.
Disaster Risk Reduction
For Disaster Risk Reduction, and to Manage long term risk, the decisions need to be sensible to the level of
investment and reflect the climate change risk identified for the region. For both APT B and C, consider
Climate proof aquaculture activities (A17) as a priority in the short-term, since it is easier to fight the open sea
and the big waves, than to be close to the land. Then Risk-based zoning and site selection (E18) for medium
and long-term; since from the point of view of risk, when we concentrate a herd of animals, it is conducive
to natural enemies. These exert a greater health risk than economic benefits; so, the more dispersion the
better.
The Efficiency Enhancement scenario (ATP C) is the only scenario which considers the Preparedness class.
In all the time frames, Disease prevention methods (A19) was selected in detriment of Environmental monitoring
and Early Warning Systems (EWS) (A20) from the private sector’s point of view. But from the public point
of view the A20 is a necessity, public institutions have to invest in it.
Social-Ecological Resilience
For Provisioning services. For APT C, Species selection (A4) is urgent for the sector in all time frames, However,
APT B which selects Feed production (A3) for the short and medium-term, since it has been found that
nutrients that fish need can be transformed, finding new alternatives. Whereas E4 for the longer term,
with the idea of replacing inefficient species.
Regulating and maintenance services, is considered only for APT B and C scenarios. Where the priority for
Selective breeding (A5) is shown. Mainly due to the fact that it contributes to development, enables to be
more efficient and more economical. This is common business practice, but it is still in its infancy and a
lot to improve. A lot will be invested in the coming decades. In contrast, APT C that selects Best management
practices (A6) as a priority in the short-term, since they are not exclusive.

75
Cultural services are only considered for the APT C - Efficiency Enhancement ( medium investment and
medium commitment to policy change scenario) - . In this case, it is considered to dedicate efforts in in
the short and medium term into Create educational visits (A7) and then in the long-term Promote aquaculture
cuisine (A8). Both measures will go hand in hand; it is very important that the A8 is known, but social
acceptance is above that (A9). Without social acceptance there is nothing to do in the Canary Islands. A8
is vital, since the public the perception is biased, but in the chefs, there is a lot of environmental awareness,
which will create awareness around consuming local products.
Local Knowledge adaptation options
The specific adaptation options for the aquaculture sector include solutions of various kinds. If we take
APT C, Reformulate the POEM (A30) is identified as the most important. With the aim to address the impact
of climate change, the criteria for determining areas to be used in the future need to be improved and
expanded: planning. Increasing depth reduces impact, improves habitats, and increases production.
Followed by Review and streamline administrative processes (A27), since improving governance is key to
addressing the impact of climate change. Reviewing and streamlining administrative procedures will help
minimize the impact on production volumes. Lastly, Favour the development of offshore aquaculture (A29), which
means introducing a cultivation system that does not exist on the islands. It improves the resistance to
catastrophic weather episodes as a result of climate change and consequently contributes to reducing the
environmental impact, favouring an increase in production.
Regarding APT B, Increase POSEI and REF incentives (A25) is selected as the most urgent, as they are
incentives that compensate for the distance and insularity. Followed by Knowledge transfer and financial support
of emerging industries (A26) and Promote tourist and non-tourist consumption (A28). On the one hand, with the aim
of enabling local production of raw materials and juveniles, and the introduction of new species more
resilient to climate change and its effects. On the other hand, to increase consumption on the islands
which will help to reduce emissions, enhance the zero km concept, contributes to the development of
food sovereignty with high quality protein, and strengthen social cohesion. Lastly, both APTs match in
the long-term measure, A29.
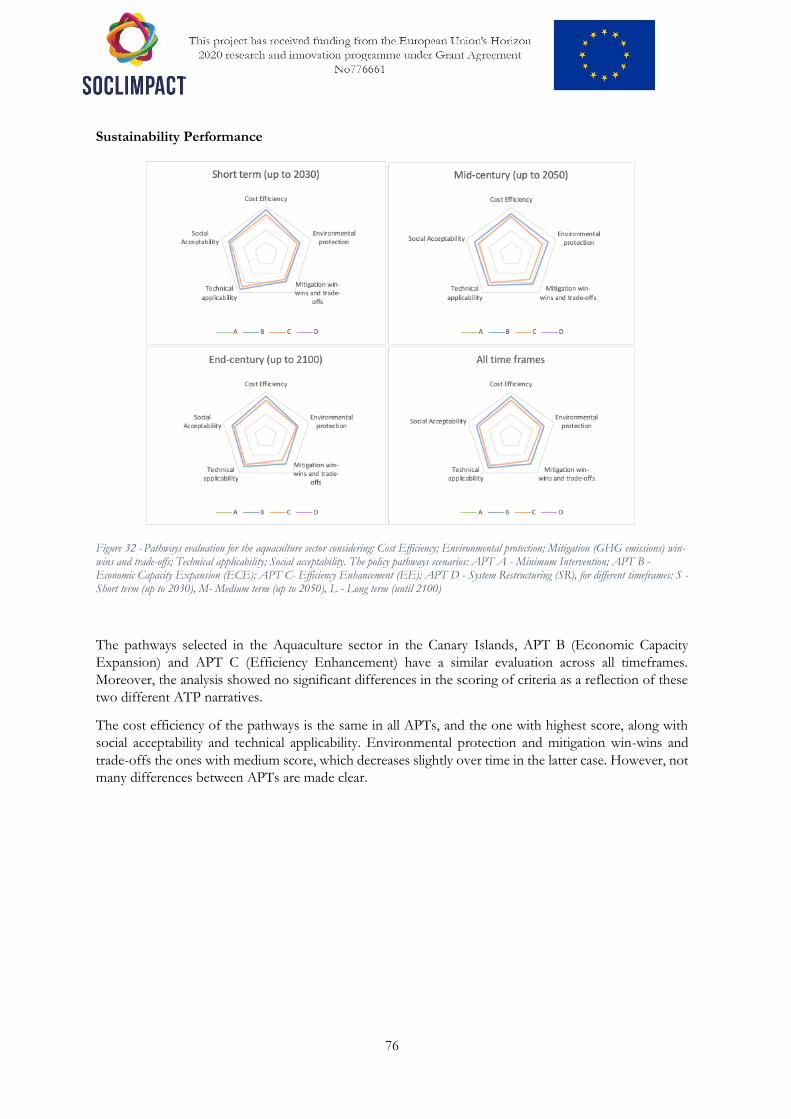
76
Sustainability Performance
Figure 32 - Pathways evaluation for the aquaculture sector considering: Cost Efficiency; Environmental protection; Mitigation (GHG emissions) win-wins and trade-offs; Technical applicability; Social acceptability. The policy pathways scenarios: APT A - Minimum Intervention; APT B - Economic Capacity Expansion (ECE); APT C- Efficiency Enhancement (EE); APT D - System Restructuring (SR), for different timeframes: S - Short term (up to 2030), M- Medium term (up to 2050), L - Long term (until 2100)
The pathways selected in the Aquaculture sector in the Canary Islands, APT B (Economic Capacity
Expansion) and APT C (Efficiency Enhancement) have a similar evaluation across all timeframes.
Moreover, the analysis showed no significant differences in the scoring of criteria as a reflection of these
two different ATP narratives.
The cost efficiency of the pathways is the same in all APTs, and the one with highest score, along with
social acceptability and technical applicability. Environmental protection and mitigation win-wins and
trade-offs the ones with medium score, which decreases slightly over time in the latter case. However, not
many differences between APTs are made clear.
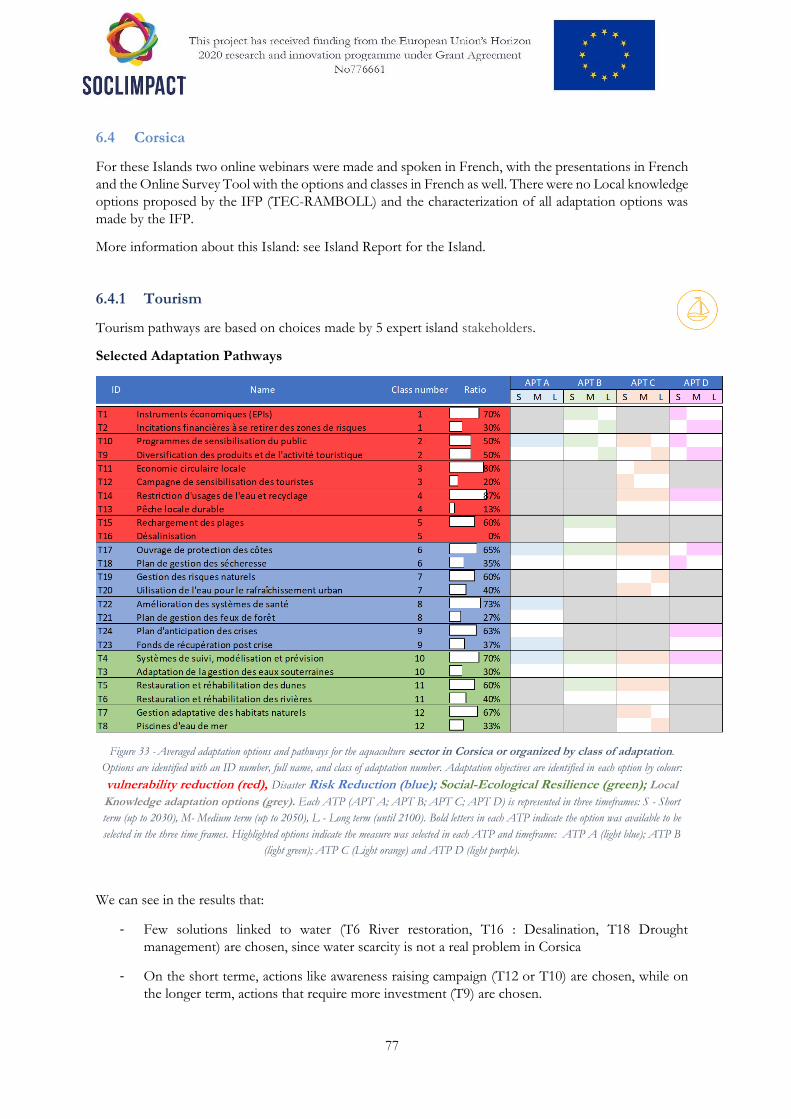
77
6.4 Corsica
For these Islands two online webinars were made and spoken in French, with the presentations in French
and the Online Survey Tool with the options and classes in French as well. There were no Local knowledge
options proposed by the IFP (TEC-RAMBOLL) and the characterization of all adaptation options was
made by the IFP.
More information about this Island: see Island Report for the Island.
6.4.1 Tourism
Tourism pathways are based on choices made by 5 expert island stakeholders.
Selected Adaptation Pathways
Figure 33 - Averaged adaptation options and pathways for the aquaculture sector in Corsica or organized by class of adaptation.
Options are identified with an ID number, full name, and class of adaptation number. Adaptation objectives are identified in each option by colour:
vulnerability reduction (red), Disaster Risk Reduction (blue); Social-Ecological Resilience (green); Local
Knowledge adaptation options (grey). Each ATP (APT A; APT B; APT C; APT D) is represented in three timeframes: S - Short
term (up to 2030), M- Medium term (up to 2050), L - Long term (until 2100). Bold letters in each ATP indicate the option was available to be
selected in the three time frames. Highlighted options indicate the measure was selected in each ATP and timeframe: ATP A (light blue); ATP B
(light green); ATP C (Light orange) and ATP D (light purple).
We can see in the results that:
- Few solutions linked to water (T6 River restoration, T16 : Desalination, T18 Drought
management) are chosen, since water scarcity is not a real problem in Corsica
- On the short terme, actions like awareness raising campaign (T12 or T10) are chosen, while on
the longer term, actions that require more investment (T9) are chosen.
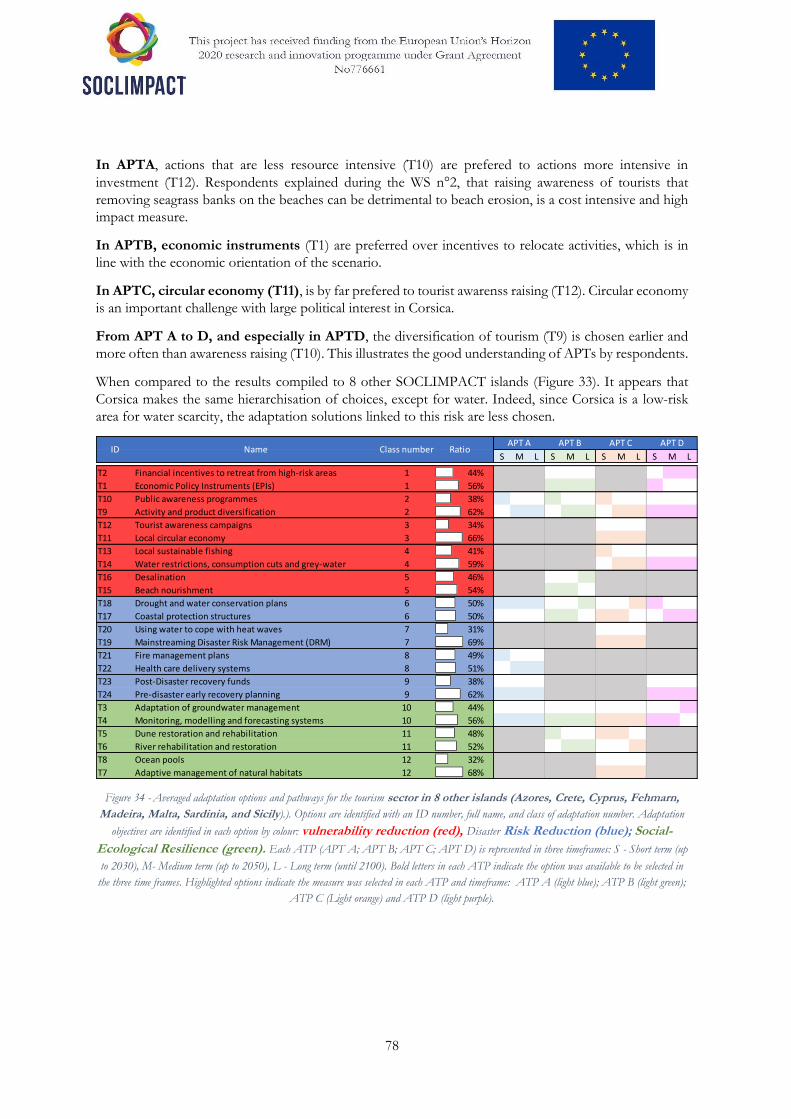
78
In APTA, actions that are less resource intensive (T10) are prefered to actions more intensive in
investment (T12). Respondents explained during the WS n°2, that raising awareness of tourists that
removing seagrass banks on the beaches can be detrimental to beach erosion, is a cost intensive and high
impact measure.
In APTB, economic instruments (T1) are preferred over incentives to relocate activities, which is in
line with the economic orientation of the scenario.
In APTC, circular economy (T11), is by far prefered to tourist awarenss raising (T12). Circular economy
is an important challenge with large political interest in Corsica.
From APT A to D, and especially in APTD, the diversification of tourism (T9) is chosen earlier and
more often than awareness raising (T10). This illustrates the good understanding of APTs by respondents.
When compared to the results compiled to 8 other SOCLIMPACT islands (Figure 33). It appears that
Corsica makes the same hierarchisation of choices, except for water. Indeed, since Corsica is a low-risk
area for water scarcity, the adaptation solutions linked to this risk are less chosen.
Figure 34 - Averaged adaptation options and pathways for the tourism sector in 8 other islands (Azores, Crete, Cyprus, Fehmarn,
Madeira, Malta, Sardinia, and Sicily).). Options are identified with an ID number, full name, and class of adaptation number. Adaptation
objectives are identified in each option by colour: vulnerability reduction (red), Disaster Risk Reduction (blue); Social-
Ecological Resilience (green). Each ATP (APT A; APT B; APT C; APT D) is represented in three timeframes: S - Short term (up
to 2030), M- Medium term (up to 2050), L - Long term (until 2100). Bold letters in each ATP indicate the option was available to be selected in
the three time frames. Highlighted options indicate the measure was selected in each ATP and timeframe: ATP A (light blue); ATP B (light green);
ATP C (Light orange) and ATP D (light purple).
S M L S M L S M L S M L
T2 Financial incentives to retreat from high-risk areas 1 44%
T1 Economic Policy Instruments (EPIs) 1 56% 1
T10 Public awareness programmes 2 38% 1
T9 Activity and product diversification 2 62% 1
T12 Tourist awareness campaigns 3 34% 0
T11 Local circular economy 3 66% 1
T13 Local sustainable fishing 4 41% 0
T14 Water restrictions, consumption cuts and grey-water 4 59% 1
T16 Desalination 5 46%
T15 Beach nourishment 5 54% 1
T18 Drought and water conservation plans 6 50% 1
T17 Coastal protection structures 6 50% 1
T20 Using water to cope with heat waves 7 31%
T19 Mainstreaming Disaster Risk Management (DRM) 7 69% 1
T21 Fire management plans 8 49% 0
T22 Health care delivery systems 8 51%
T23 Post-Disaster recovery funds 9 38%
T24 Pre-disaster early recovery planning 9 62% 0
T3 Adaptation of groundwater management 10 44% 0
T4 Monitoring, modelling and forecasting systems 10 56% 0
T5 Dune restoration and rehabilitation 11 48%
T6 River rehabilitation and restoration 11 52% 1
T8 Ocean pools 12 32% 1
T7 Adaptive management of natural habitats 12 68% 1
APT A APT B APT C APT DMax_RatioID Name Class number Ratio
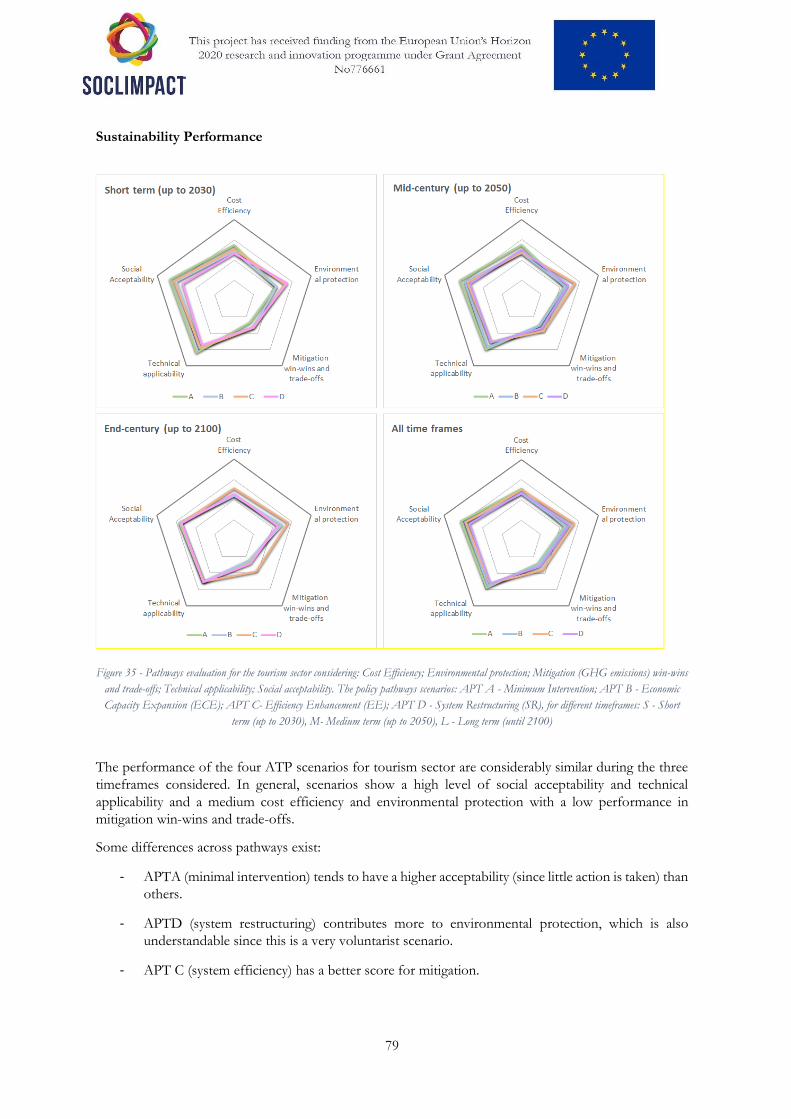
79
Sustainability Performance
Figure 35 - Pathways evaluation for the tourism sector considering: Cost Efficiency; Environmental protection; Mitigation (GHG emissions) win-wins
and trade-offs; Technical applicability; Social acceptability. The policy pathways scenarios: APT A - Minimum Intervention; APT B - Economic
Capacity Expansion (ECE); APT C- Efficiency Enhancement (EE); APT D - System Restructuring (SR), for different timeframes: S - Short
term (up to 2030), M- Medium term (up to 2050), L - Long term (until 2100)
The performance of the four ATP scenarios for tourism sector are considerably similar during the three
timeframes considered. In general, scenarios show a high level of social acceptability and technical
applicability and a medium cost efficiency and environmental protection with a low performance in
mitigation win-wins and trade-offs.
Some differences across pathways exist:
- APTA (minimal intervention) tends to have a higher acceptability (since little action is taken) than
others.
- APTD (system restructuring) contributes more to environmental protection, which is also
understandable since this is a very voluntarist scenario.
- APT C (system efficiency) has a better score for mitigation.
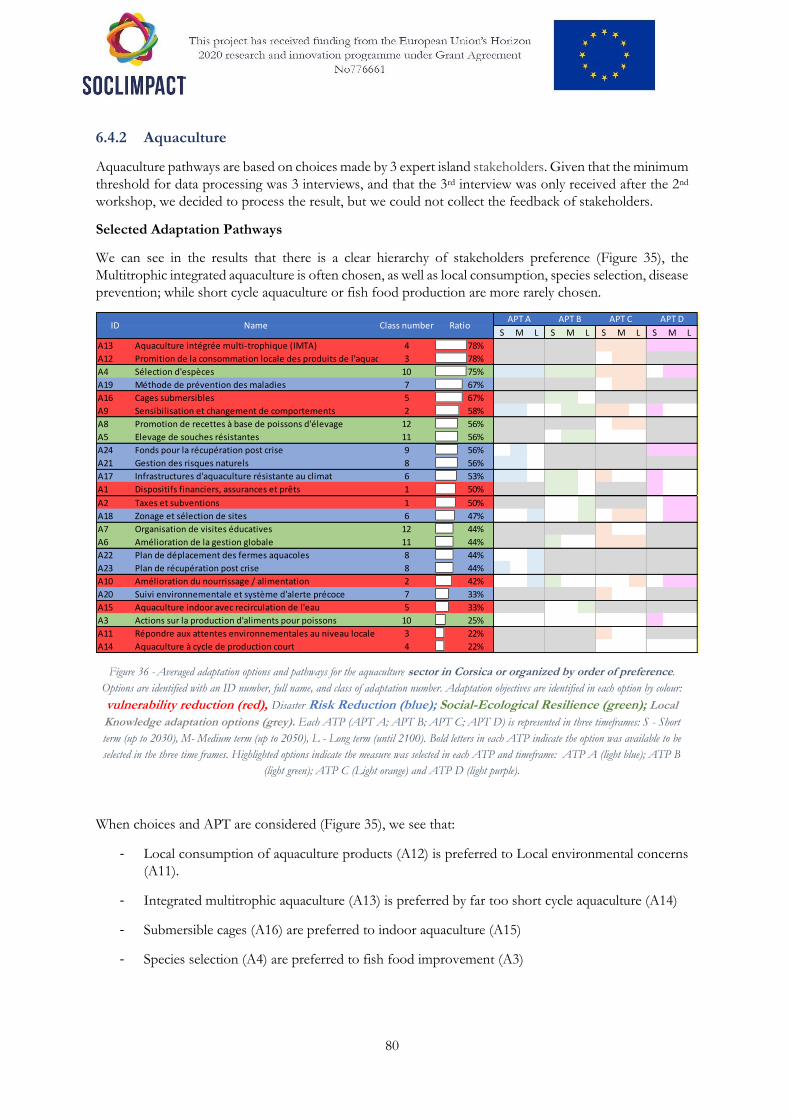
80
6.4.2 Aquaculture
Aquaculture pathways are based on choices made by 3 expert island stakeholders. Given that the minimum
threshold for data processing was 3 interviews, and that the 3rd interview was only received after the 2nd
workshop, we decided to process the result, but we could not collect the feedback of stakeholders.
Selected Adaptation Pathways
We can see in the results that there is a clear hierarchy of stakeholders preference (Figure 35), the
Multitrophic integrated aquaculture is often chosen, as well as local consumption, species selection, disease
prevention; while short cycle aquaculture or fish food production are more rarely chosen.
Figure 36 - Averaged adaptation options and pathways for the aquaculture sector in Corsica or organized by order of preference.
Options are identified with an ID number, full name, and class of adaptation number. Adaptation objectives are identified in each option by colour:
vulnerability reduction (red), Disaster Risk Reduction (blue); Social-Ecological Resilience (green); Local
Knowledge adaptation options (grey). Each ATP (APT A; APT B; APT C; APT D) is represented in three timeframes: S - Short
term (up to 2030), M- Medium term (up to 2050), L - Long term (until 2100). Bold letters in each ATP indicate the option was available to be
selected in the three time frames. Highlighted options indicate the measure was selected in each ATP and timeframe: ATP A (light blue); ATP B
(light green); ATP C (Light orange) and ATP D (light purple).
When choices and APT are considered (Figure 35), we see that:
- Local consumption of aquaculture products (A12) is preferred to Local environmental concerns
(A11).
- Integrated multitrophic aquaculture (A13) is preferred by far too short cycle aquaculture (A14)
- Submersible cages (A16) are preferred to indoor aquaculture (A15)
- Species selection (A4) are preferred to fish food improvement (A3)
S M L S M L S M L S M L
A13 Aquaculture intégrée multi-trophique (IMTA) 4 78% 1
A12 Promition de la consommation locale des produits de l'aquaculture3 78%
A4 Sélection d'espèces 10 75% 1
A19 Méthode de prévention des maladies 7 67%
A16 Cages submersibles 5 67% 1
A9 Sensibilisation et changement de comportements 2 58%
A8 Promotion de recettes à base de poissons d'élevage 12 56% 1
A5 Elevage de souches résistantes 11 56% 0
A24 Fonds pour la récupération post crise 9 56% 1
A21 Gestion des risques naturels 8 56% 1
A17 Infrastructures d'aquaculture résistante au climat 6 53% 1
A1 Dispositifs financiers, assurances et prêts 1 50% 1
A2 Taxes et subventions 1 50% 1
A18 Zonage et sélection de sites 6 47%
A7 Organisation de visites éducatives 12 44% 0
A6 Amélioration de la gestion globale 11 44% 1
A22 Plan de déplacement des fermes aquacoles 8 44% 1
A23 Plan de récupération post crise 8 44% 1
A10 Amélioration du nourrissage / alimentation 2 42% 1
A20 Suivi environnementale et système d'alerte précoce 7 33% 1
A15 Aquaculture indoor avec recirculation de l'eau 5 33% 1
A3 Actions sur la production d'aliments pour poissons 10 25%
A11 Répondre aux attentes environnementales au niveau locale 3 22%
A14 Aquaculture à cycle de production court 4 22% 1
APT DID Name Class number RatioMax_Ratio
APT A APT B APT C
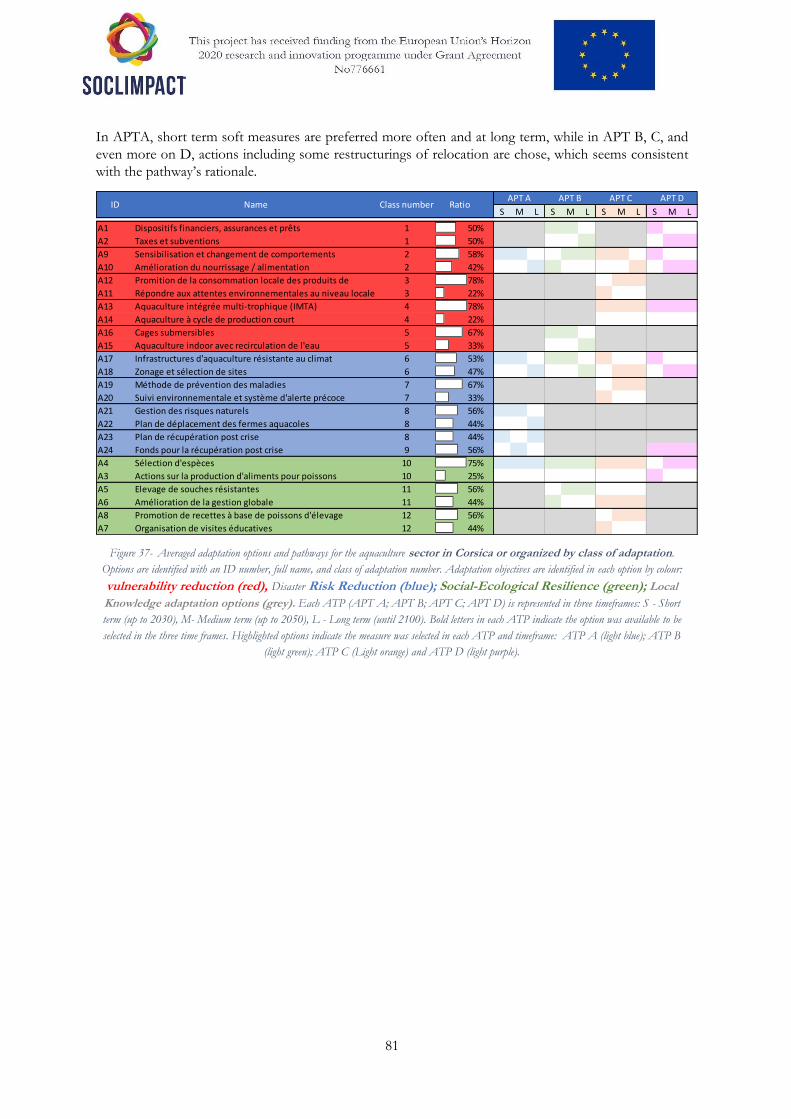
81
In APTA, short term soft measures are preferred more often and at long term, while in APT B, C, and
even more on D, actions including some restructurings of relocation are chose, which seems consistent
with the pathway’s rationale.
Figure 37- Averaged adaptation options and pathways for the aquaculture sector in Corsica or organized by class of adaptation.
Options are identified with an ID number, full name, and class of adaptation number. Adaptation objectives are identified in each option by colour:
vulnerability reduction (red), Disaster Risk Reduction (blue); Social-Ecological Resilience (green); Local
Knowledge adaptation options (grey). Each ATP (APT A; APT B; APT C; APT D) is represented in three timeframes: S - Short
term (up to 2030), M- Medium term (up to 2050), L - Long term (until 2100). Bold letters in each ATP indicate the option was available to be
selected in the three time frames. Highlighted options indicate the measure was selected in each ATP and timeframe: ATP A (light blue); ATP B
(light green); ATP C (Light orange) and ATP D (light purple).
S M L S M L S M L S M L
A1 Dispositifs financiers, assurances et prêts 1 50% 1
A2 Taxes et subventions 1 50% 1
A9 Sensibilisation et changement de comportements 2 58%
A10 Amélioration du nourrissage / alimentation 2 42% 1
A12 Promition de la consommation locale des produits de 3 78%
A11 Répondre aux attentes environnementales au niveau locale 3 22%
A13 Aquaculture intégrée multi-trophique (IMTA) 4 78% 1
A14 Aquaculture à cycle de production court 4 22% 1
A16 Cages submersibles 5 67% 1
A15 Aquaculture indoor avec recirculation de l'eau 5 33% 1
A17 Infrastructures d'aquaculture résistante au climat 6 53% 1
A18 Zonage et sélection de sites 6 47%
A19 Méthode de prévention des maladies 7 67%
A20 Suivi environnementale et système d'alerte précoce 7 33% 1
A21 Gestion des risques naturels 8 56% 1
A22 Plan de déplacement des fermes aquacoles 8 44% 1
A23 Plan de récupération post crise 8 44% 1
A24 Fonds pour la récupération post crise 9 56% 1
A4 Sélection d'espèces 10 75% 1
A3 Actions sur la production d'aliments pour poissons 10 25%
A5 Elevage de souches résistantes 11 56% 0
A6 Amélioration de la gestion globale 11 44% 1
A8 Promotion de recettes à base de poissons d'élevage 12 56% 1
A7 Organisation de visites éducatives 12 44% 0
APT A APT B APT C APT DMax_RatioID Name Class number Ratio
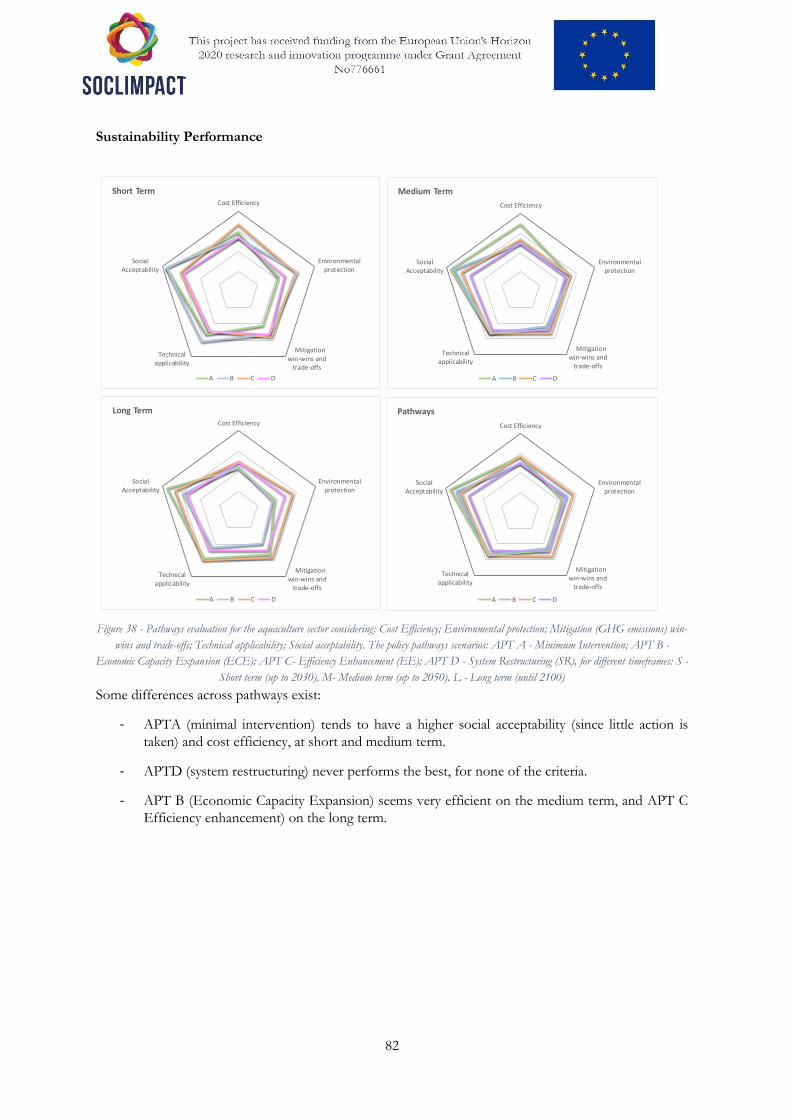
82
Sustainability Performance
Figure 38 - Pathways evaluation for the aquaculture sector considering: Cost Efficiency; Environmental protection; Mitigation (GHG emissions) win-
wins and trade-offs; Technical applicability; Social acceptability. The policy pathways scenarios: APT A - Minimum Intervention; APT B -
Economic Capacity Expansion (ECE); APT C- Efficiency Enhancement (EE); APT D - System Restructuring (SR), for different timeframes: S -
Short term (up to 2030), M- Medium term (up to 2050), L - Long term (until 2100)
Some differences across pathways exist:
- APTA (minimal intervention) tends to have a higher social acceptability (since little action is
taken) and cost efficiency, at short and medium term.
- APTD (system restructuring) never performs the best, for none of the criteria.
- APT B (Economic Capacity Expansion) seems very efficient on the medium term, and APT C
Efficiency enhancement) on the long term.
Island Corsica Sector Aquaculture Normalized (criteria) results - Used for the island report
APT Short term (2030) Mid term (2050) Long term (2100) Full pathway
APT A
APT B
APT C
APT D
APT Short term (2030) Mid term (2050) Long term (2100) Full pathway
APT A
APT B
APT C
APT D
Cost Efficiency
Environmentalprotection
Mitigationwin-wins and
trade-offs
Technicalapplicability
SocialAcceptability
Short Term
A B C D
Cost Efficiency
Environmentalprotection
Mitigationwin-wins and
trade-offs
Technicalapplicability
SocialAcceptability
Medium Term
A B C D
Cost Efficiency
Environmentalprotection
Mitigationwin-wins and
trade-offs
Technicalapplicability
SocialAcceptability
Long Term
A B C D
Cost Efficiency
Environmentalprotection
Mitigationwin-wins and
trade-offs
Technicalapplicability
SocialAcceptability
Pathways
A B C D

83
6.5 Crete
For these Islands two online webinars were made and spoken in Greek, with the presentations in Greek
and the Online Survey Tool with the options and classes in Greek as well. There were no Local knowledge
options proposed by the IFP (KRITI) and the characterization of all adaptation options was made by the
IFP.
More information about this Island: see Island Report for the Island.
6.5.1 Tourism
Selected Adaptation Pathways
Tourism pathways are based on choices made by 6 island stakeholders.
Figure 39 - Adaptation options for the tourism sector. Options are identified with an ID number, full name, and class of adaptation number.
Adaptation objectives are identified in each option by colour: vulnerability reduction (red), Disaster Risk Reduction (blue);
Social-Ecological Resilience (green). Each ATP (APT A; APT B; APT C; APT D) is represented in three timeframes: S - Short
term (up to 2030), M- Medium term (up to 2050), L - Long term (until 2100). Highlighted options indicate the measure was selected in each ATP
and timeframe: ATP A – Minimum Intervention (light blue); ATP B – Economic Capacity Expansion (light green); ATP C – Efficiency
Enhancement (Light orange) and ATP D – System Restructuring (light purple). Bold letters in each ATP indicate the option was available to be
selected in the three time frames. Grey cells mean that they the options was not available in that APT.
Under APT B and D scenarios, the financial capital measures that were selected to address vulnerability
reduction, indicate that the region of Crete is initially centred on the development of Economic Policy
Instruments and later on Financial incentives to retreat from high-risk areas.
To adapt via Human Capital (class 2), diversification of the activities and products in opposition to
awareness campaigns should be implemented. However, in Minimum Intervention scenario (APT A) and
Efficiency Enhancement scenario (APT C), investment in public awareness can be appropriate for short
term.
S M L S M L S M L S M L
T1 Economic Policy Instruments (EPIs) 1 69% 1 A B C D
T2 Financial incentives to retreat from high-risk areas 1 31% 1 A B C D
T9 Activity and product diversification 2 74% 1 A B C D
T10 Public awareness programmes 2 26% 1 A B C D
T11 Local circular economy 3 72% 1 A B C D
T12 Tourist awareness campaigns 3 28% 1 A B C D
T14 Water restrictions, consumption cuts and grey-water recycling 4 81% 1 A B C D
T13 Local sustainable fishing 4 19% 1 A B C D
T15 Beach nourishment 5 67% 1 A B C D
T16 Desalination 5 33% 1 A B C D
T17 Coastal protection structures 6 53% 1 A B C D
T18 Drought and water conservation plans 6 47% 1 A B C D
T19 Mainstreaming Disaster Risk Management (DRM) 7 78% 1 A B C D
T20 Using water to cope with heat waves 7 22% 1 A B C D
T22 Health care delivery systems 8 56% 1 A B C D
T21 Fire management plans 8 44% 1 A B C D
T24 Pre-disaster early recovery planning 9 69% 1 A B C D
T23 Post-Disaster recovery funds 9 31% 1 A B C D
T4 Monitoring, modelling and forecasting systems 10 57% 1 A B C D
T3 Adaptation of groundwater management 10 43% 1 A B C D
T6 River rehabilitation and restoration 11 56% 1 A B C D
T5 Dune restoration and rehabilitation 11 44% 1 A B C D
T7 Adaptive management of natural habitats 12 67% 1 A B C D
T8 Ocean pools 12 33% 1 A B C D
APT A APT B APT C APT DMax_RatioID Name Class number Ratio

84
For Social Capital (class 3), local circular economy gains relevance in all periods. This reflects the effort
of the Region in the development of the circular economy on the island.
The option related with water restrictions and cuts (Natural Capital) was selected for all periods in a System
Restructuring scenario (ATP D) and in an Efficiency Enhancement scenario (APT C) vs local sustainable
fishing. This obviously reflects the Region's inability to take management measures for sustainable fishing
as this depends exclusively on national and European regulations.
Beach nourishment was selected for all time periods within the Physical Capital options taken in APT B.
For Disaster Risk Reduction, and to manage long term risk, the decisions need to be sensible to the level
of investment and reflects the climate change risk identified for the region. Coastal protection is a priority
for the region throughout all the scenarios.
The Efficiency Enhancement scenario (ATP C) is the only scenario which considers the Preparedness
class. In all time periods, mainstreaming DRM was selected in detriment of using water to cope with heat
waves. This result, follows the risk response rational, addressing disasters management in a first stage.
Health care delivery systems in Minimum Intervention scenario (APT A) over comes the Fire management
plans with small difference and reflects the climate-risk context of the region with the covid-19 situation.
Generically, to address DRR on tourism sector, it is necessary to continue to promote planning and
allocate funds to develop climate change resilience in the region.
In Social-Ecological Resilience, groundwater management is not urgent for the sector in the short term.
The Region should in the next decades invest efforts in information systems to improve climate
information reliability.
Options for regulation of natural services in the Tourism sector will benefit from the maintenance of the
rivers/valleys functions, creating recreational areas with a positive impact on tourism attractiveness.
In medium investment and medium commitment to policy change scenario (APT C - Efficiency
Enhancement) the region considered to dedicate efforts to preserve and minimize the impacts on
biodiversity and ecosystems, while also preserving the attractiveness of the region.
Sustainability performance
Cost Efficiency
Environmental protection
Mitigation win-wins and
trade-offs
Technical applicability
Social Acceptability
Short Term (up to 2030)
A B C D
Cost Efficiency
Environmental protection
Mitigation win-wins and
trade-offs
Technical applicability
Social Acceptability
Medium Term (up to 2050)
A B C D

85
Figure 40 - Pathways evaluation for the tourism sector considering: Cost Efficiency; Environmental protection; Mitigation (GHG emissions) win-wins
and trade-offs; Technical applicability; Social acceptability. The policy pathways scenarios: APT A - Minimum Intervention; APT B - Economic
Capacity Expansion (ECE); APT C- Efficiency Enhancement (EE); APT D - System Restructuring (SR), for different timeframes: S - Short
term (up to 2030), M- Medium term (up to 2050), L - Long term (until 2100)
All four adaptation pathways for Crete’s tourism sector up to 2100 reveal a similar structure in terms of
their sustainability performance. These pathways are comprised of measures that have a relatively high
social acceptability and low technical acceptability and cost efficiency but performs well in terms of future
environmental protection. These sector pathways will have difficulty in meeting the archipelago’s
mitigation objectives although they perform well in terms of future environmental protection because
they have low technical applicability up to 2100. This particularly relevant in APT A and D pathways,
curiously those responding to scenarios with the lowest (highest) investment and policy change levels,
respectively. In fact, the pathway with the highest investment and policy change levels and that preconizes
a system restructuring (APT D) underperforms the other pathways in all sustainability criteria.
Cost Efficiency
Environmental protection
Mitigation win-wins and
trade-offs
Technical applicability
Social Acceptability
Long Term (up to 2100)
A B C D
Cost Efficiency
Environmental
protection
Mitigation win-wins and
trade-offs
Technical applicability
Social
Acceptability
Pathways
A B C D

86
6.5.2 Maritime Transport
Selected Adaptation Pathways
Maritime Transport pathways are based on choices made by 5 island stakeholders.
Figure 41 - Adaptation options for the maritime transport sector. Options are identified with an ID number, full name, and class of adaptation
number. Adaptation objectives are identified in each option by colour: vulnerability reduction (red), Disaster Risk Reduction
(blue); Social-Ecological Resilience (green). Each ATP (APT A; APT B; APT C; APT D) is represented in three
timeframes: S - Short term (up to 2030), M- Medium term (up to 2050), L - Long term (until 2100). Highlighted options indicate the measure was
selected in each ATP and timeframe: ATP A – Minimum Intervention (light blue); ATP B – Economic Capacity Expansion (light green); ATP
C – Efficiency Enhancement (Light orange) and ATP D – System Restructuring (light purple). Bold letters in each ATP indicate the option was
available to be selected in the three time frames. Grey cells mean that they the options was not available in that APT.
The maritime transport sector adaptation pathways are characterized by a heterogeneity across the four
potential adaptation policy trajectories (APTs) which they built upon.
Vulnerability reduction under APT B and D scenarios, Region of Crete is initially centred on Financial
incentives to retreat from high-risk areas.
To adapt via Human Capital (class 2), social dialogue for training in the port sector in opposition to
awareness campaigns should be implemented.
For Social Capital (class 3), is focus on trade diversification and climate resilient jobs.
Under the Efficiency Enhancing (APT C) scenario (medium investment and medium change in policy
commitment) and the System Restructuring (APT D) after an initial focus on the preservation of
marketable natural resources via the investment in refrigeration and/or cooling systems there is a shift to
restrictions to the development in high-risk areas (natural capital).
Crete’s maritime transport pathway favours investments in the operationality and flexibility of ports in
detriment of improvement on vessels (physical capital).
Disaster risk reduction, focused on managing risks via climate proofing of infrastructure and activities,
while developing alternative routes during extremes events as a means of assuring post-disaster recovery.
S M L S M L S M L S M L
MT2 Financial incentives to retreat from high-risk areas 1 60% 1 A B C D
MT1 Insurance mechanisms for ports 1 40% 1 A B C D
MT10 Social dialogue for training in the port sector 2 63% 1 A B C D
MT9 Awareness campaigns for behavioural change 2 37% 1 A B C D
MT12 Climate resilient economy and jobs 3 53% 1 A B C D
MT11 Diversification of trade using climate resilient commodities 3 47% 1 A B C D
MT13 Refrigeration, cooling and ventilation systems 4 50% 1 A B C D
MT14 Restrict development and settlement in low-lying areas 4 50% 1 A B C D
MT16 Increase operational speed and flexibility in ports 5 53% 1 A B C D
MT15 Sturdiness improvement of vessels 5 47% 1 A B C D
MT17 Climate proof ports and port activities 6 65% 1 A B C D
MT18 Consider expansion/retreat of ports in urban planning 6 35% 1 A B C D
MT20 Early Warning Systems (EWS) and climate change monitoring 7 60% 1 A B C D
MT19 Reinforcement of inspection, repair and maintenance of
infrastructures
7 40% 1 A B C D
MT22 Prepare for service delays or cancellations 8 80% 1 A B C D
MT21 Inteligent Transport Systems (ITS) 8 20% 1 A B C D
MT23 Backup routes and infrastructures during extreme weather 9 63% 1 A B C D
MT24 Post-Disaster recovery funds 9 37% 1 A B C D
MT3 Marine life friendly coastal protection structures 10 52% 1 A B C D
MT4 Combined protection and wave energy infrastructures 10 48% 1 A B C D
MT6 Coastal protection structures 11 60% 1 A B C D
MT5 Hybrid and full electric ship propulsion 11 40% 1 A B C D
MT7 Integrate ports in urban tissue 12 67% 1 A B C D
MT8 Ocean pools 12 33% 0 A B C D
Max_RatioID Name Class number RatioAPT A APT B APT C APT D

87
This strategy is complemented by disaster responses that include new procedures to handle service
disturbances and the development of early warning systems.
Ecosystem resilience and provisioning services take the form of tailored protection structures, first
by using marine life friendly materials and, coastal protection structures.
Sustainability performance
Figure 42 - Pathways evaluation for the maritime transport sector considering: Cost Efficiency; Environmental protection; Mitigation (GHG
emissions) win-wins and trade-offs; Technical applicability; Social acceptability. The policy pathways scenarios: APT A - Minimum Intervention;
APT B - Economic Capacity Expansion (ECE); APT C- Efficiency Enhancement (EE); APT D - System Restructuring (SR), for different
timeframes: S - Short term (up to 2030), M- Medium term (up to 2050), L - Long term (until 2100)
All four adaptation pathways for the Crete’s maritime transport sector up to 2100 reveal a similar structure
in terms of their sustainability performance. These pathways are comprised of measures that have a
relatively medium social acceptability and cost efficiency and low technical acceptability. These
sector pathways will have difficulty in performing well in terms of future environmental protection
because they have low technical applicability. This particularly relevant in APT B, C and D pathways,
responding to scenarios with the medium and high investment and policy change levels. The pathway
with the highest investment and policy change levels and that preconizes a system restructuring (APT D)
underperforms the other pathways in all sustainability criteria.
0
1
Cost Efficiency
Environmental protection
Mitigation win-wins and
trade-offs
Technical applicability
Social Acceptability
Short Term up to 2030)
A B C D
Cost Efficiency
Environmental protection
Mitigation win-wins and
trade-offs
Technical applicability
Social Acceptability
Medium Term (up to 2050)
A B C D
Cost Efficiency
Environmental protection
Mitigation win-wins and
trade-offs
Technical applicability
Social Acceptability
Long Term (up to 2100)
A B C D
Cost Efficiency
Environmental
protection
Mitigation win-wins and
trade-offs
Technical applicability
Social
Acceptability
Pathways
A B C D

88
6.6 Cyprus
For this Islands two online webinars were conducted in Greek. The presentations were in Greek and the
Online Survey Tool with the options and classes in also Greek and English as well. There were no Local
knowledge options proposed by the IFP (INTERFUSION) and the characterization of all adaptation
options was made by the stakeholders.
More information about this Island: see Island Report for the Island.
6.6.1 Tourism
The adaptation pathways for the tourism sector were developed based on the choices made by six expert
stakeholders from various organizations and SMEs, including the Cyprus Sustainable Tourism Initiative,
the Cyprus Tourism Organization, and the Cyprus Marine Environment Protection Association.
Selected Adaptation Pathways
Based on the choices of the stakeholders, the adaptation pathways for the tourism sector in Cyprus seem
to be consistent with the characteristics of the adaptation pathway trajectories (APTs).
Figure 43 - Adaptation options for the tourism sector. Options are identified with an ID number, full name, and class of adaptation number.
Adaptation objectives are identified in each option by colour: vulnerability reduction (red), Disaster Risk Reduction (blue);
Social-Ecological Resilience (green). Each ATP (APT A; APT B; APT C; APT D) is represented in three timeframes: S - Short
term (up to 2030), M- Medium term (up to 2050), L - Long term (until 2100). Highlighted options indicate the measure was selected in each ATP
and timeframe: ATP A – Minimum Intervention (light blue); ATP B – Economic Capacity Expansion (light green); ATP C – Efficiency
Enhancement (Light orange) and ATP D – System Restructuring (light purple). Bold letters in each ATP indicate the option was available to be
selected in the three time frames. Grey cells mean that they the options was not available in that APT.
For the case of APT A, vulnerability reduction is achieved via human capital and specifically, by
implementing programmes to raise public awareness in the short-term, though the diversification of
tourist activities and products are deemed necessary in the mid- and long-term to combat the issue of
S M L S M L S M L S M L
E1 Financial support for buildings with low energy needs 1 50% 1 A B C D
E2 Financial support for smart control of energy in houses and
buildings
1 50% 1 A B C D
E9 Green jobs and businesses 2 67% 1 A B C D
E10 Public information service on climate action 2 33% 1 A B C D
E11 Small scale production and consumption (prosumers) 3 67% 1 A B C D
E12 Risk reporting platform 3 33% 1 A B C D
E13 Energy storage systems 4 67% 1 A B C D
E14 Collection and storage of forest fuel loads 4 33% 1 A B C D
E16 Demand Side Mangement (DSM) of Energy 5 75% 1 A B C D
E15 SeaWater Air Conditioning (SWAC). 5 25% 1 A B C D
E18 Upgrade evaporative cooling systems 6 54% 1 A B C D
E17 Review building codes of the energy infrastructure 6 46% 1 A B C D
E20 Grid reliability 7 58% 1 A B C D
E19 Early Warning Systems (EWS) 7 42% 1 A B C D
E22 Energy-independent facilities (generators) 8 58% 1 A B C D
E21 Study and develop energy grid connections 8 42% 1 A B C D
E23 Energy recovery microgrids 9 71% 1 A B C D
E24 Local recovery energy outage capacity 9 29% 1 A B C D
E4 Underground tubes and piping in urban planning 10 58% 1 A B C D
E3 Energy efficiency in urban water management 10 42% 1 A B C D
E5 Biomass power from household waste 11 54% 1 A B C D
E6 Urban green corridors 11 46% 1 A B C D
E8 Heated pools with waste heat from power plants 12 75% 1 A B C D
E7 Educational garden plots 12 25% 1 A B C D
Max_RatioID Name Class number RatioAPT A APT B APT C APT D
89
seasonality that is heavily observed on the island. Measures for disaster risk reduction are almost identical
for all three timeframes of APT A. Specifically, drought and water conservation plans are recommended
in this APT as it is considered a more feasible and cost-efficient option for managing long term risk,
particularly as Cyprus will face an increase in temperature. Similarly, Pre-disaster early recovery planning
is preferred to deal with post-disaster recovery and rehabilitation. The reason being that proactive
measures (such as best practices and knowledge bases) rather than reactive measures will be less costly
and more environmentally protective, thus safekeeping the attractiveness of Cyprus as a tourist
destination. With regards to response adaptation, the short-term option of fire management plans is
generally beneficial for the island given the FWI projections. However, the mid-term and long-term
measure should focus on reinforcing and improving the healthcare delivery system to deal with the
possible increase in heatstroke episodes that the risk of rise in temperature will cause. Finally, for satisfying
the social-ecological resilience objective, stakeholders opted for monitoring, modelling, and forecasting
systems as the measure for provisioning services for all three timeframes. It is deemed necessary that
reliable and timely climate information and the ability to assess climate hazard impacts under this APT
(low commitment and low investment) would be more suitable for mitigating GHG emissions, as well as
a more technically applicable and socially acceptable measure.
For the case of APT B, vulnerability reduction consists of adaptation via financial capital, human capital,
and physical capital. Stakeholders recommended economic policy instruments (EPIs) as a financial capital
measure throughout the three timeframes given that high investment is a characteristic of this APT. This
is due to climate hazard projections indicating that risks will be continually increasing. Also, financial
incentives to retreat from high-risk areas is not considered to be as a socially accepted or technically
applicable measure. With respect to human capital, the implementation of public awareness programmes
is a desired measure for the short-term, whereas activity and product diversification is more suitable for
the mid- and long-term. Again, it is important to deal with the issue of seasonality but also to be in line
with commitments to the Paris Agreement and EU directives. The only class of adaptation for disaster
risk reduction involves managing long-term risk. Here, the short- and mid-term option selected for this
APT (low commitment, high investment) is the construction of coastal protection structures, mainly
because the SLR and wind wave projections indicate extensive beach reduction at coastal areas, which in
turn would decrease the attractiveness of the island as a tourist destination. For the long-term, the
development of drought and water conservation plans is the most appropriate measure, again, based on
the increase in mean daily temperature on the island. Regarding social-ecological resilience, provisioning
services and regulating and maintenance services are the two adaptation classes involved. For adaptation
via provisioning services, monitoring, modelling, and forecasting systems was chosen as the measure for
all three timeframes. For adaptation via regulating and maintenance services, the measure chosen was
dune restoration and rehabilitation for all three timeframes. In addition, for the long-term the pathway
also includes the measure for river rehabilitation and restoration given that in the future there will be both
higher temperatures and water demand. Hence this measure will increase available leisure areas for
improved thermal comfort and increase water availability.
For the case of APT C, vulnerability reduction includes human capital, social capital, and natural capital.
With respect to adaptation via human capital, this pathway includes the same choices of APT B for the
same reasons, that is, public awareness programmes for the short-term, but activity and product
diversification for the mid- and long-term. For social capital adaptation, the most suitable short-term
measure is the preparation of tourist awareness campaigns to inform tourists about Climate Change. This
measure, while not directly protecting the environment or the mitigating GHG emissions, is more relevant
in the short-term since changing visitors’ attitudes and behaviours is considered a more immediate action.
In the mid- and long-term, the creation of a local circular economy is preferred since it becomes more
vital to promote and adopt decarbonization practices through waste elimination and continual resource
utilization. As for adaptation via natural capital, stakeholders recommend the pathway water restrictions,
consumption cuts and grey-water recycling for all three timeframes. This measure will be able to tackle
the issue of increases in water demand as a result of extremely dry weather (based on SPEI projections)
90
in the future. Disaster risk reduction is achieved through managing long-term term risk and preparedness.
The most appropriate measure for managing long-term risk was chosen to be the construction of coastal
protection structures up until 2030, whereas the development of drought and water conservation plans
up were chosen as the most suitable until both 2050 and 2100. This is similar to the choices for APT B,
with the only difference being the mid-term measure. Since APT C has medium commitment and medium
investment (as opposed to high investment in APT B) the construction of coastal protection structures is
considered a more costly adaptation measure. Adaptation via preparedness contains the measure using
water to cope with heat waves for all three timeframes. Additionally, for the mid-term mainstreaming
disaster risk management is also included in this pathway. All three classes of adaptation concerning social-
ecological resilience are included in APT C. For provisioning services adaptation, similarly to APTs A and
B, all three timeframes consist of the measure for implementing monitoring, modelling, and forecasting
systems. For adaptation via regulating and maintenance services, the measure for dune restoration and
rehabilitation is chosen for all three timeframes. Moreover, the mid- and long-term also include the
measure for river rehabilitation and restoration based on the forecasts for temperature and water demand
(both increasing). Finally, for cultural services adaptation, the preferred measure is adaptive management
of natural habitats in order to deal with the impacts and pressures of human activities on the island’s
biodiversity and ecosystems that are aggravated by Climate Change. This measure is more relevant based
on the projections for hazards like fire weather index, seagrass evolution, and beach reduction.
For APT D, financial capital, human capital, and natural capital are the classes of adaptation contributing
towards vulnerability reduction. For financial capital adaptation, similarly to APT B, implementing
economic policy instruments is the most suitable measure for all three timeframes since it is technically
easier to apply and considered to be more socially acceptable. Furthermore, this specific APT assumes
high investment and high commitment, therefore the measure is also cost-effective. For adaptation via
human capital, stakeholders suggest the improving the activity and product diversification of the island
for all three timeframes. Since there will be high commitment to policy change, as well as more investment,
this measure is more suitable to deal with seasonality, infrastructure overload, and the burden on
ecosystems that the tourism industry faces. With regards natural capital adaptation, water restrictions,
consumption cuts, and grey-water recycling is a more appropriate measure for the short-term since it will
be necessary to deal with the increase in temperature and water demand. However, the mid- and long-
term will benefit from measures promoting local sustainable fishing. The restructuring of the system will
protect ecosystem services and decrease external dependency. Adaptations to deal with disaster risk
reduction concern managing long-term risks and post-disaster recovery and rehabilitation. For the former,
the construction of coastal protection structures will serve the island better in short-term, as there will be
a need to protect the coast from beach reduction. If this is taken care of, then focus can shift towards
development of drought and water conservation plans in the mid- and long-term to combat the problem
of rising temperatures and water demand in the future. For the latter, just as in APT A, post-disaster early
recovery planning is the most appropriate measure for the same reasons – maintaining Cyprus as an
attractive tourist destination. With respect to social-ecological resilience, provisioning services is the only
contributing class of adaptation. Here, for the short- and mid-term, it is preferred to invest in the
development of monitoring, modelling, and forecasting systems so that accurate climate data is obtained
as fast as possible. However, in the long-term, a measure for adaptation of groundwater management will
offer better environmental protection.
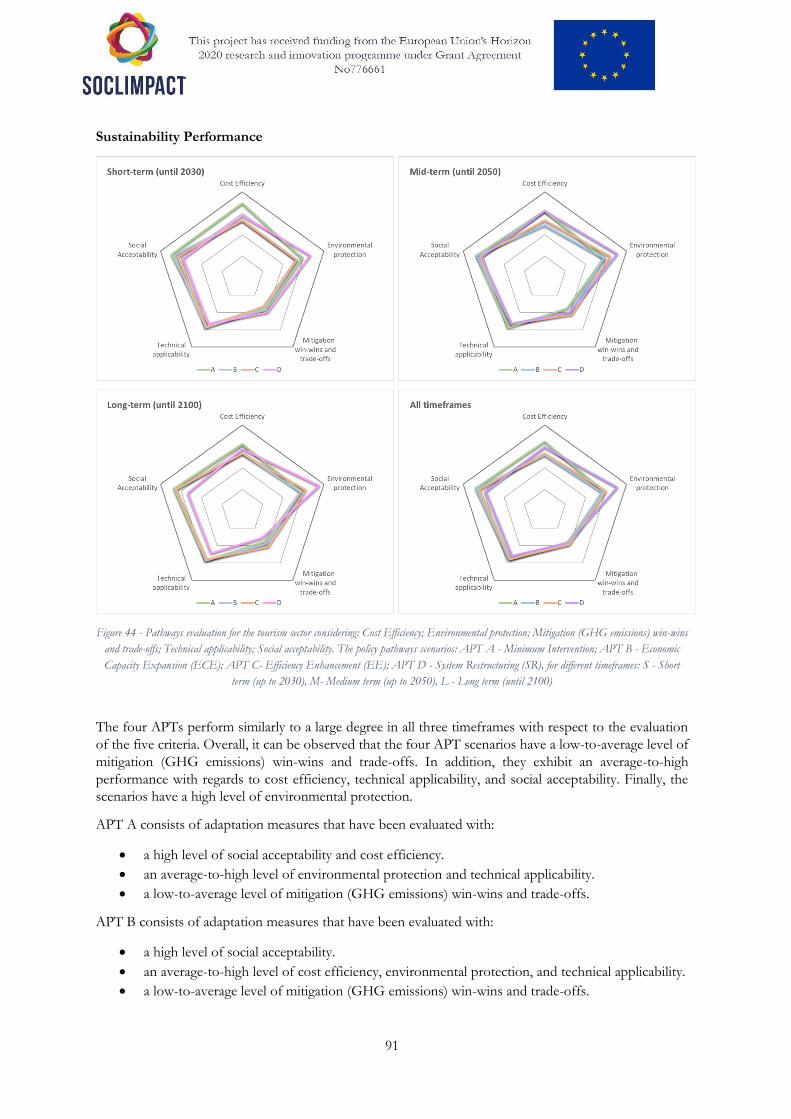
91
Sustainability Performance
Figure 44 - Pathways evaluation for the tourism sector considering: Cost Efficiency; Environmental protection; Mitigation (GHG emissions) win-wins
and trade-offs; Technical applicability; Social acceptability. The policy pathways scenarios: APT A - Minimum Intervention; APT B - Economic
Capacity Expansion (ECE); APT C- Efficiency Enhancement (EE); APT D - System Restructuring (SR), for different timeframes: S - Short
term (up to 2030), M- Medium term (up to 2050), L - Long term (until 2100)
The four APTs perform similarly to a large degree in all three timeframes with respect to the evaluation
of the five criteria. Overall, it can be observed that the four APT scenarios have a low-to-average level of
mitigation (GHG emissions) win-wins and trade-offs. In addition, they exhibit an average-to-high
performance with regards to cost efficiency, technical applicability, and social acceptability. Finally, the
scenarios have a high level of environmental protection.
APT A consists of adaptation measures that have been evaluated with:
a high level of social acceptability and cost efficiency.
an average-to-high level of environmental protection and technical applicability.
a low-to-average level of mitigation (GHG emissions) win-wins and trade-offs.
APT B consists of adaptation measures that have been evaluated with:
a high level of social acceptability.
an average-to-high level of cost efficiency, environmental protection, and technical applicability.
a low-to-average level of mitigation (GHG emissions) win-wins and trade-offs.
92
APT C consists of adaptation measures that have been evaluated with:
a high level of social acceptability.
an average-to-high level of cost efficiency, environmental protection, and technical applicability.
a low-to-average level of mitigation (GHG emissions) win-wins and trade-offs.
APT D consists of adaptation measures that have been evaluated with:
a high level of environmental protection.
an average-to-high level of cost efficiency, technical applicability, and social acceptability.
a low-to-average level of mitigation (GHG emissions) win-wins and trade-offs.
Given that APT A is characterized by low investment and low commitment it is expected that the
measures included in this scenario are not ranked highly with respect to their ability to mitigate emissions
and protect the environment. APT D, on the other hand, consists of measures that are rated highly with
respect to environmental protection, which is in line with the high commitment and high investment
assumed in this pathway trajectory.
6.6.2 Energy
The adaptation pathways for the energy sector were developed based on the choices made by four expert
stakeholders. The stakeholders involved were from research organizations and government services, such
as the Cyprus Institute and the Energy Department of the Ministry of Energy, Commerce, and Industry.
Selected Adaptation Pathways
By analysing the adaptation measures chosen by stakeholders, the adaptation pathways for the energy
sector in Cyprus are fairly heterogenous, though there are some instances where some options are chosen
irrespective of the characteristics of their adaptation pathway trajectories (APTs).
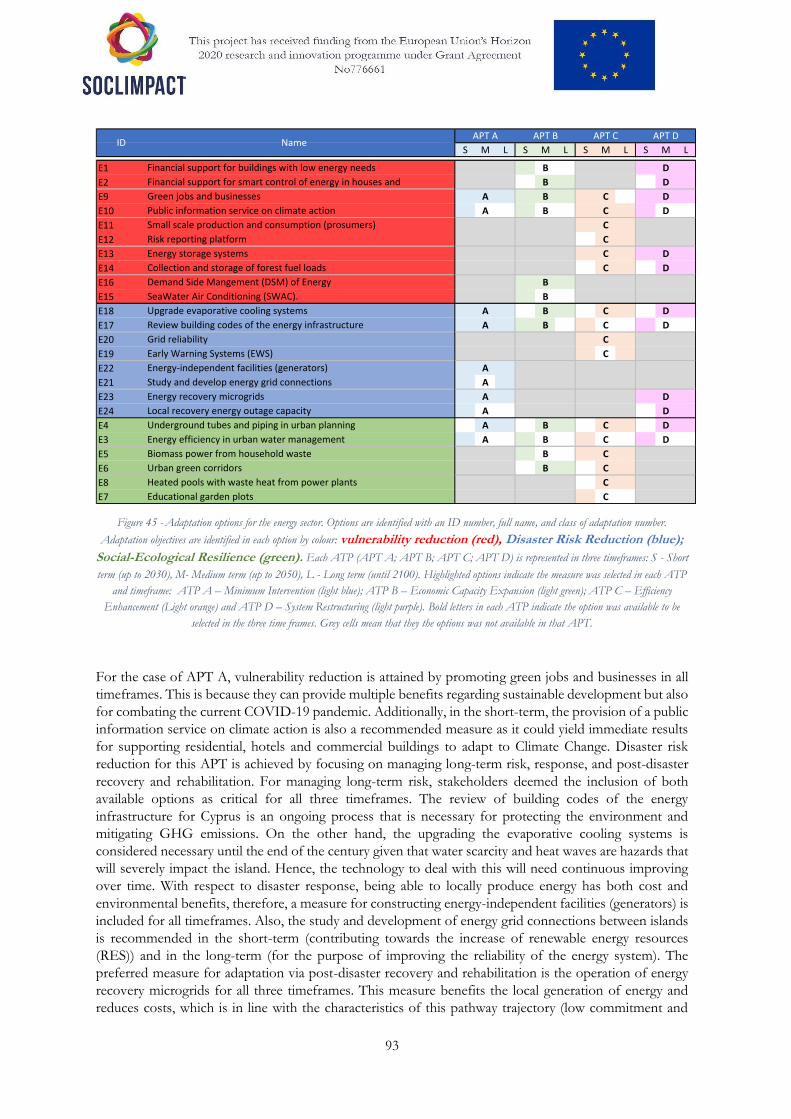
93
Figure 45 - Adaptation options for the energy sector. Options are identified with an ID number, full name, and class of adaptation number.
Adaptation objectives are identified in each option by colour: vulnerability reduction (red), Disaster Risk Reduction (blue);
Social-Ecological Resilience (green). Each ATP (APT A; APT B; APT C; APT D) is represented in three timeframes: S - Short
term (up to 2030), M- Medium term (up to 2050), L - Long term (until 2100). Highlighted options indicate the measure was selected in each ATP
and timeframe: ATP A – Minimum Intervention (light blue); ATP B – Economic Capacity Expansion (light green); ATP C – Efficiency
Enhancement (Light orange) and ATP D – System Restructuring (light purple). Bold letters in each ATP indicate the option was available to be
selected in the three time frames. Grey cells mean that they the options was not available in that APT.
For the case of APT A, vulnerability reduction is attained by promoting green jobs and businesses in all
timeframes. This is because they can provide multiple benefits regarding sustainable development but also
for combating the current COVID-19 pandemic. Additionally, in the short-term, the provision of a public
information service on climate action is also a recommended measure as it could yield immediate results
for supporting residential, hotels and commercial buildings to adapt to Climate Change. Disaster risk
reduction for this APT is achieved by focusing on managing long-term risk, response, and post-disaster
recovery and rehabilitation. For managing long-term risk, stakeholders deemed the inclusion of both
available options as critical for all three timeframes. The review of building codes of the energy
infrastructure for Cyprus is an ongoing process that is necessary for protecting the environment and
mitigating GHG emissions. On the other hand, the upgrading the evaporative cooling systems is
considered necessary until the end of the century given that water scarcity and heat waves are hazards that
will severely impact the island. Hence, the technology to deal with this will need continuous improving
over time. With respect to disaster response, being able to locally produce energy has both cost and
environmental benefits, therefore, a measure for constructing energy-independent facilities (generators) is
included for all timeframes. Also, the study and development of energy grid connections between islands
is recommended in the short-term (contributing towards the increase of renewable energy resources
(RES)) and in the long-term (for the purpose of improving the reliability of the energy system). The
preferred measure for adaptation via post-disaster recovery and rehabilitation is the operation of energy
recovery microgrids for all three timeframes. This measure benefits the local generation of energy and
reduces costs, which is in line with the characteristics of this pathway trajectory (low commitment and
S M L S M L S M L S M L
E1 Financial support for buildings with low energy needs 1 A B C D
E2 Financial support for smart control of energy in houses and
buildings
1 A B C D
E9 Green jobs and businesses 1 A B C D
E10 Public information service on climate action 1 A B C D
E11 Small scale production and consumption (prosumers) 1 A B C D
E12 Risk reporting platform 1 A B C D
E13 Energy storage systems 1 A B C D
E14 Collection and storage of forest fuel loads 1 A B C D
E16 Demand Side Mangement (DSM) of Energy 1 A B C D
E15 SeaWater Air Conditioning (SWAC). 1 A B C D
E18 Upgrade evaporative cooling systems 1 A B C D
E17 Review building codes of the energy infrastructure 1 A B C D
E20 Grid reliability 1 A B C D
E19 Early Warning Systems (EWS) 1 A B C D
E22 Energy-independent facilities (generators) 1 A B C D
E21 Study and develop energy grid connections 1 A B C D
E23 Energy recovery microgrids 1 A B C D
E24 Local recovery energy outage capacity 1 A B C D
E4 Underground tubes and piping in urban planning 1 A B C D
E3 Energy efficiency in urban water management 1 A B C D
E5 Biomass power from household waste 1 A B C D
E6 Urban green corridors 1 A B C D
E8 Heated pools with waste heat from power plants 1 A B C D
E7 Educational garden plots 1 A B C D
APT A APT B APT C APT DMax_RatioID Name
94
low investment). In the short-term, increasing and improving the capacity of the island to recover from
energy outages is also important based on the exacerbation of climate events projected. Finally,
provisioning services adaptation is the class associated with social-ecological resilience in this APT. In the
short-term, the measure selected involves bolstering the energy efficiency of urban water management
due to the projected decrease in water availability on the island. In the mid- and long-term, the focus shifts
towards the implementation of underground tubes and piping in urban planning given their Climate
Change resilience.
For the case of APT B, vulnerability reduction consists of adaptation via financial capital, human capital,
and physical capital. For financial capital, the measure suggested concerns financial support for buildings
with low energy needs for the short-term as this measure contributes towards the protection of the
environment. However, for the mid- and long-term, the measure suggested involves financial support for
smart control of energy in houses and buildings. This measure will help cut costs and mitigate GHG
emissions. Regarding human capital, the selection of measures is identical to APT A, with promoting
green jobs and businesses in all timeframes and the dissemination of public information service on climate
action as an immediate measure in the short-term. For physical capital adaptation, a short-term measure
of seawater air conditioning is included since this measure performs better in heat wave conditions.
Furthermore, for all timeframes, the implementation of demand-side management of energy as a strategy
for improving the coordination of energy producers and energy consumers is also recommended since it
is more socially acceptable, contributes more, and is a more practical solution in the long-run. Disaster
risk reduction only involves managing long-term risk in this APT. For the short- and mid-term, the option
selected here is the review of building codes of the energy infrastructure since this measure is more
technically applicable and cost-efficient in the immediate future and will help climate-proof the energy
system of the island. For the mid- and long-term, the option of upgrading evaporative cooling systems is
chosen to combat reduced water availability and increasing temperatures. With respect to social-ecological
resilience, the two classes of adaptation included in this APT are provisioning services and regulating and
maintenance services. For the former, the options selected follow the options selected in APT A.
Specifically, energy efficiency of urban water management needs to be addressed in the immediate future,
whereas the inclusion of underground tubes and piping in urban planning needs to be addressed in the
distant future. For the former, the promotion of biomass power from household waste is the short-term
measure recommended since it is a good GHG emissions mitigating alternative. In the mid- and long-
term, however, the construction of urban green corridors is the measure of choice since it will be effective
in combating the projected increase in air temperature on the island.
For the case of APT C, adaptation via human capital, social capital, and natural capital comprise the
objective for vulnerability reduction. Regarding human capital adaptation, short- and mid-term measures
consist of the promotion of green jobs and businesses, as well as of the provision of as public information
service on climate action. The fact that there is medium commitment to policy change and medium
investment makes the latter measure also viable for the long-term. Adaptation via social capital involves
a measure to promote small-scale production and consumption for all timeframes. This measure will be
able to deal with Climate Change events forecast for the island (particularly, heat waves). The transition
to local energy production will have significant benefits on multiple levels and will contribute much more
to the usage of RES, the decrease of GHG emissions, and the creation of jobs at the local level. In addition,
the mid- and long-term pathways also contain the development of a risk reporting platform as a measure.
As for adaptation via natural capital, the development of energy storage systems is recommended for all
timeframes, which is in line with the EU’s energy policy aiming for increase RES usage. Furthermore, the
collection and storage of forest fuel loads is also included for the mid- and long-term pathways, as a way
to deal with highly potential wildfire hazards that are projected for the island. The objective for disaster
risk reduction is obtained with adaptation for managing long-term term risk and preparedness. For the
former, it is suitable to have a measure for reviewing building codes of the energy infrastructure in the
short-term and a measure for upgrading evaporative cooling systems in the mid- and long-term. For the
latter, stakeholders selected for all timeframes to include a measure to ensure grid reliability since it
95
important to upgrade the grid and guarantee it is constantly stable. In the short-term, it is also important
to invest in early warning systems given the various immediate climate hazards. Furthermore, stakeholders
suggested that investment in early warning systems in the long-term will also be necessary for the purpose
of upgrading based on new knowledge. APT C includes all three classes of adaptation relating to social-
ecological resilience. For adaptation via provisioning services, the selection of measures follows APT A
and APT B, with the short-term consisting of improving energy efficiency in urban water management
and the mid- and long-term consisting of implementing underground tubes and piping in urban planning.
Regarding regulating and maintenance services adaptation, promoting the generation of biomass power
from household waste is more appropriate for all timeframes, since this APT is characterized by medium
investment and medium commitment to policy change. In addition, for the mid- and long-term, the ATP
also includes the creation of urban green corridors. Finally, for cultural services, the short-term measure
more suitable for this APT is the provision of educational garden plots, whereas the mid- and long-term
For the case of APT D, three adaptation classes are included for vulnerability reduction: financial capital,
human capital, and natural capital. Concerning financial capital adaptation, the inclusion of measures is
similar to those included in APT B, with providing financial support for smart control of energy in houses
and buildings in the mid- and long-term and providing financial support for buildings with low energy
needs in the short-term. However, because this APT has a high degree of commitment to policy change
(as opposed to a low degree of commitment in APT B), it also includes providing financial support for
buildings with low energy needs in the mid- and long-term. With respect to adaptation via human capital,
the choice of measures is the same as in APT A and APT B: providing a public information service on
climate action in the short-term and promoting green jobs and businesses for all timeframes. The measures
selected by stakeholders for natural capital adaptation is exactly as in the case of APT C for the same
reasons. The development of energy storage systems is preferred for all timeframes, whereas the collection
and storage of forest fuel loads is also selected for the mid- and long-term pathways. Disaster risk
reduction objectives are met through managing long-term risks and post-disaster recovery and
rehabilitation. For the former, again this pathway consists of measures identical to that of APT C – the
short-term involves reviewing building codes of the energy infrastructure, whereas the mid- and long-term
involve upgrading evaporative cooling systems. For the latter, the operation of energy recovery microgrids
is recommended for all three timeframes (as in APT A), however, as this APT has a high level of
investment, it is also recommended that the mid- and long-term also includes increasing and improving
the capacity of the island to recover from energy outages. Regarding social-ecological resilience objectives,
the only class of adaptation involves provisioning services, wherein, the selection of measures is the same
as the other three APTS. Specifically, the short-term measure of improving the energy efficiency of urban
water management is preferred, whereas the inclusion of underground tubes and piping in urban planning
is suggested for the mid- and long-term.
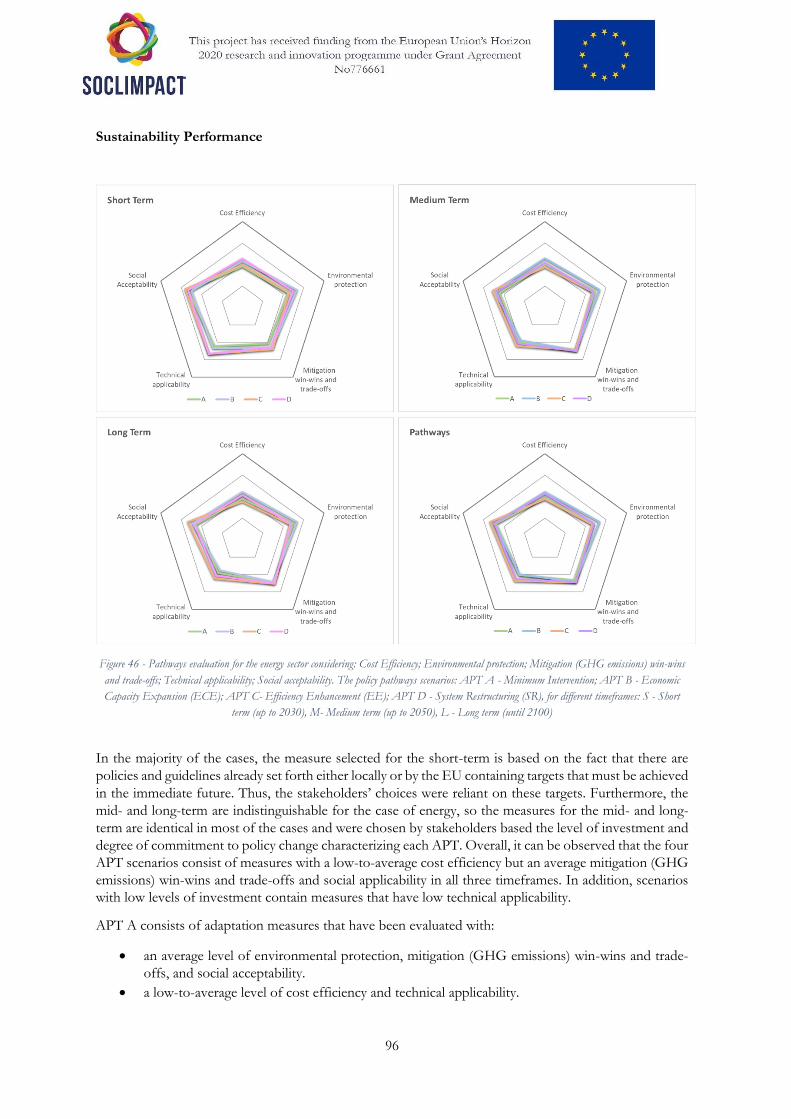
96
Sustainability Performance
Figure 46 - Pathways evaluation for the energy sector considering: Cost Efficiency; Environmental protection; Mitigation (GHG emissions) win-wins
and trade-offs; Technical applicability; Social acceptability. The policy pathways scenarios: APT A - Minimum Intervention; APT B - Economic
Capacity Expansion (ECE); APT C- Efficiency Enhancement (EE); APT D - System Restructuring (SR), for different timeframes: S - Short
term (up to 2030), M- Medium term (up to 2050), L - Long term (until 2100)
In the majority of the cases, the measure selected for the short-term is based on the fact that there are
policies and guidelines already set forth either locally or by the EU containing targets that must be achieved
in the immediate future. Thus, the stakeholders’ choices were reliant on these targets. Furthermore, the
mid- and long-term are indistinguishable for the case of energy, so the measures for the mid- and long-
term are identical in most of the cases and were chosen by stakeholders based the level of investment and
degree of commitment to policy change characterizing each APT. Overall, it can be observed that the four
APT scenarios consist of measures with a low-to-average cost efficiency but an average mitigation (GHG
emissions) win-wins and trade-offs and social applicability in all three timeframes. In addition, scenarios
with low levels of investment contain measures that have low technical applicability.
APT A consists of adaptation measures that have been evaluated with:
an average level of environmental protection, mitigation (GHG emissions) win-wins and trade-
offs, and social acceptability.
a low-to-average level of cost efficiency and technical applicability.

97
APT B consists of adaptation measures that have been evaluated with:
an average level of environmental protection, mitigation (GHG emissions) win-wins and trade-
offs, and social acceptability.
a low-to-average level of cost efficiency and technical applicability.
APT C consists of adaptation measures that have been evaluated with:
an average level of environmental protection, mitigation (GHG emissions) win-wins and trade-
offs, technical applicability, and social acceptability.
a low-to-average level of cost efficiency.
APT D consists of adaptation measures that have been evaluated with:
an average level of environmental protection, mitigation (GHG emissions) win-wins and trade-
offs, technical applicability, and social acceptability.
a low-to-average level of cost efficiency.
Analysis of the results show that the measures selected in the short-term for APT A and APT B have an
identical sustainability performance, as do the measures for APT C and APT D. Furthermore, for the
mid- and long-term all four scenarios perform similarly to a certain extent. Thus, unlike for the case of
tourism, the selection of measures seems to not consider the characteristics of the adaptation pathway to
such a large degree. Again, this is attributed to the targets set out by the EU and the Cypriot government
with respect to energy and Climate Change.
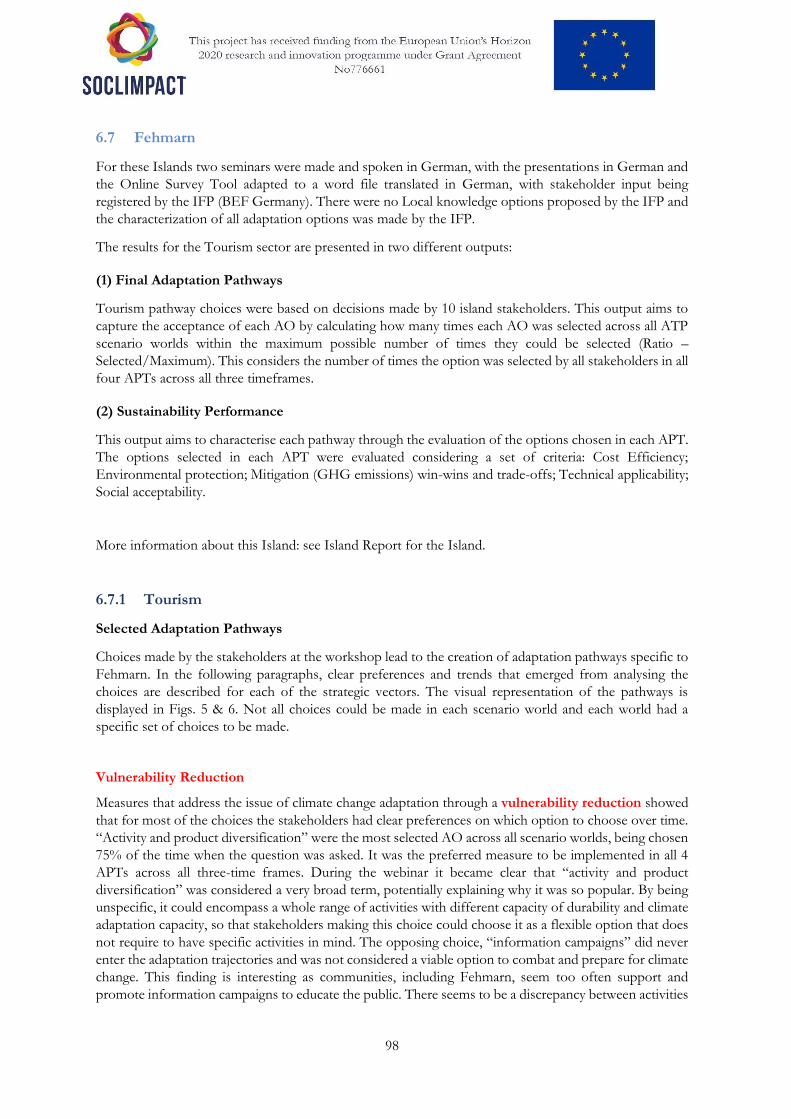
98
6.7 Fehmarn
For these Islands two seminars were made and spoken in German, with the presentations in German and
the Online Survey Tool adapted to a word file translated in German, with stakeholder input being
registered by the IFP (BEF Germany). There were no Local knowledge options proposed by the IFP and
the characterization of all adaptation options was made by the IFP.
The results for the Tourism sector are presented in two different outputs:
(1) Final Adaptation Pathways
Tourism pathway choices were based on decisions made by 10 island stakeholders. This output aims to
capture the acceptance of each AO by calculating how many times each AO was selected across all ATP
scenario worlds within the maximum possible number of times they could be selected (Ratio –
Selected/Maximum). This considers the number of times the option was selected by all stakeholders in all
four APTs across all three timeframes.
(2) Sustainability Performance
This output aims to characterise each pathway through the evaluation of the options chosen in each APT.
The options selected in each APT were evaluated considering a set of criteria: Cost Efficiency;
Environmental protection; Mitigation (GHG emissions) win-wins and trade-offs; Technical applicability;
Social acceptability.
More information about this Island: see Island Report for the Island.
6.7.1 Tourism
Selected Adaptation Pathways
Choices made by the stakeholders at the workshop lead to the creation of adaptation pathways specific to
Fehmarn. In the following paragraphs, clear preferences and trends that emerged from analysing the
choices are described for each of the strategic vectors. The visual representation of the pathways is
displayed in Figs. 5 & 6. Not all choices could be made in each scenario world and each world had a
specific set of choices to be made.
Vulnerability Reduction
Measures that address the issue of climate change adaptation through a vulnerability reduction showed
that for most of the choices the stakeholders had clear preferences on which option to choose over time.
“Activity and product diversification” were the most selected AO across all scenario worlds, being chosen
75% of the time when the question was asked. It was the preferred measure to be implemented in all 4
APTs across all three-time frames. During the webinar it became clear that “activity and product
diversification” was considered a very broad term, potentially explaining why it was so popular. By being
unspecific, it could encompass a whole range of activities with different capacity of durability and climate
adaptation capacity, so that stakeholders making this choice could choose it as a flexible option that does
not require to have specific activities in mind. The opposing choice, “information campaigns” did never
enter the adaptation trajectories and was not considered a viable option to combat and prepare for climate
change. This finding is interesting as communities, including Fehmarn, seem too often support and
promote information campaigns to educate the public. There seems to be a discrepancy between activities
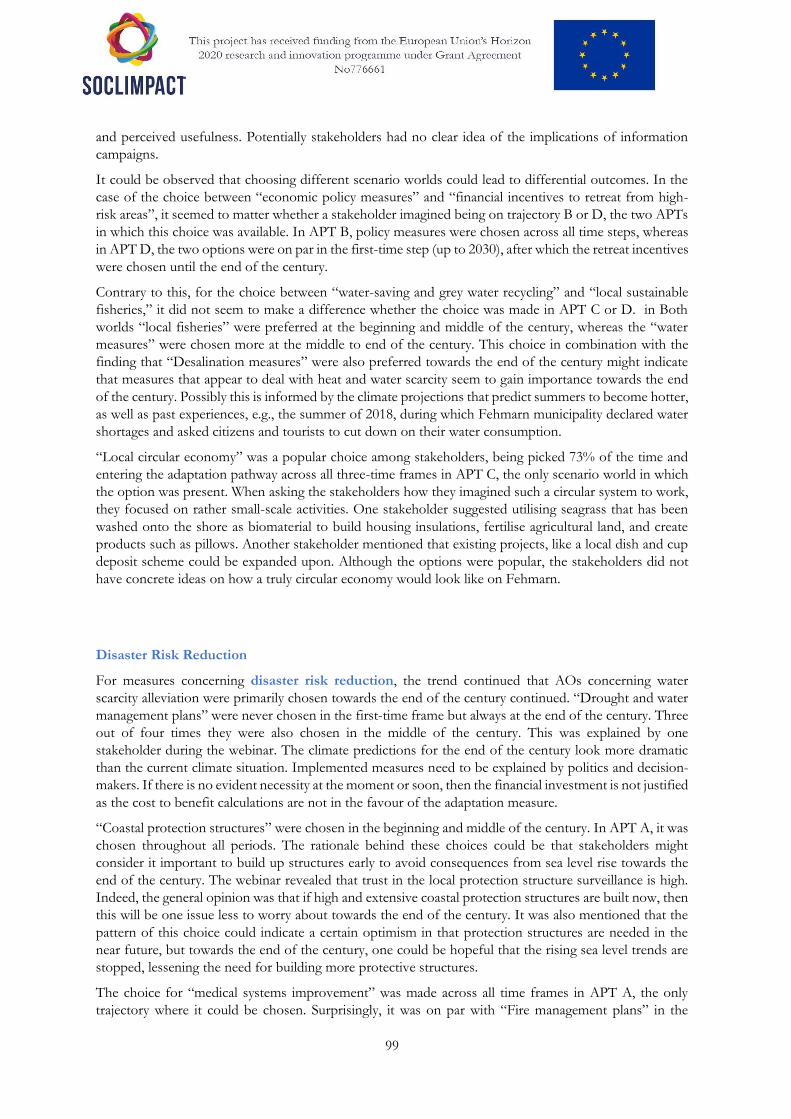
99
and perceived usefulness. Potentially stakeholders had no clear idea of the implications of information
campaigns.
It could be observed that choosing different scenario worlds could lead to differential outcomes. In the
case of the choice between “economic policy measures” and “financial incentives to retreat from high-
risk areas”, it seemed to matter whether a stakeholder imagined being on trajectory B or D, the two APTs
in which this choice was available. In APT B, policy measures were chosen across all time steps, whereas
in APT D, the two options were on par in the first-time step (up to 2030), after which the retreat incentives
were chosen until the end of the century.
Contrary to this, for the choice between “water-saving and grey water recycling” and “local sustainable
fisheries,” it did not seem to make a difference whether the choice was made in APT C or D. in Both
worlds “local fisheries” were preferred at the beginning and middle of the century, whereas the “water
measures” were chosen more at the middle to end of the century. This choice in combination with the
finding that “Desalination measures” were also preferred towards the end of the century might indicate
that measures that appear to deal with heat and water scarcity seem to gain importance towards the end
of the century. Possibly this is informed by the climate projections that predict summers to become hotter,
as well as past experiences, e.g., the summer of 2018, during which Fehmarn municipality declared water
shortages and asked citizens and tourists to cut down on their water consumption.
“Local circular economy” was a popular choice among stakeholders, being picked 73% of the time and
entering the adaptation pathway across all three-time frames in APT C, the only scenario world in which
the option was present. When asking the stakeholders how they imagined such a circular system to work,
they focused on rather small-scale activities. One stakeholder suggested utilising seagrass that has been
washed onto the shore as biomaterial to build housing insulations, fertilise agricultural land, and create
products such as pillows. Another stakeholder mentioned that existing projects, like a local dish and cup
deposit scheme could be expanded upon. Although the options were popular, the stakeholders did not
have concrete ideas on how a truly circular economy would look like on Fehmarn.
Disaster Risk Reduction
For measures concerning disaster risk reduction, the trend continued that AOs concerning water
scarcity alleviation were primarily chosen towards the end of the century continued. “Drought and water
management plans” were never chosen in the first-time frame but always at the end of the century. Three
out of four times they were also chosen in the middle of the century. This was explained by one
stakeholder during the webinar. The climate predictions for the end of the century look more dramatic
than the current climate situation. Implemented measures need to be explained by politics and decision-
makers. If there is no evident necessity at the moment or soon, then the financial investment is not justified
as the cost to benefit calculations are not in the favour of the adaptation measure.
“Coastal protection structures” were chosen in the beginning and middle of the century. In APT A, it was
chosen throughout all periods. The rationale behind these choices could be that stakeholders might
consider it important to build up structures early to avoid consequences from sea level rise towards the
end of the century. The webinar revealed that trust in the local protection structure surveillance is high.
Indeed, the general opinion was that if high and extensive coastal protection structures are built now, then
this will be one issue less to worry about towards the end of the century. It was also mentioned that the
pattern of this choice could indicate a certain optimism in that protection structures are needed in the
near future, but towards the end of the century, one could be hopeful that the rising sea level trends are
stopped, lessening the need for building more protective structures.
The choice for “medical systems improvement” was made across all time frames in APT A, the only
trajectory where it could be chosen. Surprisingly, it was on par with “Fire management plans” in the

100
beginning and end of the century, but not in the middle of the century. As those two choices entered the
trajectory to almost equal parts in all time frames, there does not seem to be a clear preference on which
AO is more important. This might indicate different perspectives, where some stakeholders might
consider the medical service to be underdeveloped, whereas others consider the fire department, which
also frequently aids in disaster management in Germany, to be not sufficiently developed. This might
depend on stakeholder’s personal experiences with past droughts and other disasters or illnesses.
“Pre-disaster management plans” vs “post-disaster financial funds” showed that stakeholders tended to
pick the financial aid for the periods in the beginning and end of the century, whereas the pre-disaster
preparation seemed more relevant at the end of the century, potentially indicating that stakeholders might
consider disaster preparation from an organised or municipal entity important, as climate risk and severity
are predicted to increase at the end of the century. Financial support might be considered adequate
towards the beginning and middle of the century to overcome the impacts of climate change or severe
weather events.
Social-Ecological Resilience
Selection choices for adaptation options that are aimed at fostering social-ecological resilience also
yielded interesting trends for Fehmarn. “Adaptation of the groundwater management system” was the
dominant choice in this category and entered the adaptation trajectories in all four APT scenarios and
across all time frames, apart from the end of the century in APT D, where “Monitoring, modelling and
forecasting systems” were chosen. Such a clear choice preference might have to do with the island’s
climate predicted to become hotter and drier in the summer. So far, the island’s freshwater is supplied via
a connection to the mainland. However, from the workshop, we identified the desire that stakeholders
would like the island to become more independent and less reliant on the mainland supply, potentially
leading to the desire to improve their groundwater management. Consultations during the second webinar
yielded that is not so much the supply of the freshwater that is considered a potential issue in the future,
but the quality of the groundwater on the island. Dry summers, as well as more industrialised activity and
over-usage of soils, are considered a threat to the groundwater on Fehmarn.
“Monitoring, modelling and forecasting systems” entered the trajectories in APTs B, C, and D at the end
of the century, although across all choices, they were only picked 37% of the time. This shows that
stakeholders might be interested in knowing specific occurrences of events when climate hazards are more
common rather than establishing these systems now and being in a continuously alerted state. During the
webinar we could find that the climate hazards of the near future are still considered to be manageable,
whereas towards the end of the century the predictions seemed more dramatic, warranting forecasting
systems.
“Dune restoration and rehabilitation measures” got chosen across all time frames when the option was
available. Dunes are playing an important role on the island, both as natural coastal protection measures,
but also from a touristic perspective. It was, therefore, a clear choice to pick, as the other option was
“River rehabilitation and restoration”, an option that was not important as there are no large rivers on the
island and only a few small canals to drain fields.
“Restoring and managing natural habitats adaptively” was chosen in the beginning and middle of the
century, whereas “establishment of ocean pools” came into play at the end of the century. This is
interesting, as Fehmarn is an island that has several larger beach lakes functioning effectively as ocean
pools. With rising sea levels, stakeholders seem to consider it important to establish more of these to have
more natural protection from stormwater surges and rising sea levels.
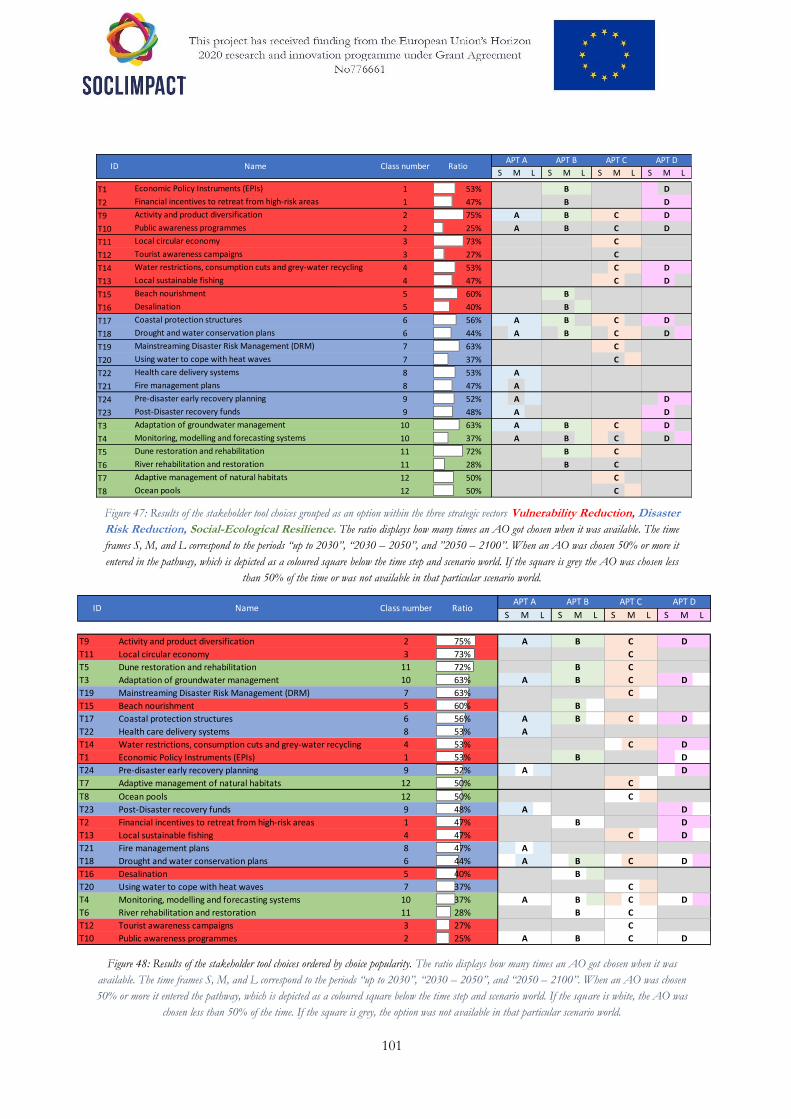
101
Figure 47: Results of the stakeholder tool choices grouped as an option within the three strategic vectors Vulnerability Reduction, Disaster
Risk Reduction, Social-Ecological Resilience. The ratio displays how many times an AO got chosen when it was available. The time
frames S, M, and L correspond to the periods “up to 2030”, “2030 – 2050”, and ”2050 – 2100”. When an AO was chosen 50% or more it
entered in the pathway, which is depicted as a coloured square below the time step and scenario world. If the square is grey the AO was chosen less
than 50% of the time or was not available in that particular scenario world.
Figure 48: Results of the stakeholder tool choices ordered by choice popularity. The ratio displays how many times an AO got chosen when it was
available. The time frames S, M, and L correspond to the periods “up to 2030”, “2030 – 2050”, and “2050 – 2100”. When an AO was chosen
50% or more it entered the pathway, which is depicted as a coloured square below the time step and scenario world. If the square is white, the AO was
chosen less than 50% of the time. If the square is grey, the option was not available in that particular scenario world.
S M L S M L S M L S M L
T1 Economic Policy Instruments (EPIs) 1 53% 1 A B C D
T2 Financial incentives to retreat from high-risk areas 1 47% 1 A B C D
T9 Activity and product diversification 2 75% 1 A B C D
T10 Public awareness programmes 2 25% 1 A B C D
T11 Local circular economy 3 73% 1 A B C D
T12 Tourist awareness campaigns 3 27% 1 A B C D
T14 Water restrictions, consumption cuts and grey-water recycling 4 53% 1 A B C D
T13 Local sustainable fishing 4 47% 1 A B C D
T15 Beach nourishment 5 60% 1 A B C D
T16 Desalination 5 40% 1 A B C D
T17 Coastal protection structures 6 56% 1 A B C D
T18 Drought and water conservation plans 6 44% 1 A B C D
T19 Mainstreaming Disaster Risk Management (DRM) 7 63% 1 A B C D
T20 Using water to cope with heat waves 7 37% 1 A B C D
T22 Health care delivery systems 8 53% 1 A B C D
T21 Fire management plans 8 47% 1 A B C D
T24 Pre-disaster early recovery planning 9 52% 1 A B C D
T23 Post-Disaster recovery funds 9 48% 1 A B C D
T3 Adaptation of groundwater management 10 63% 1 A B C D
T4 Monitoring, modelling and forecasting systems 10 37% 1 A B C D
T5 Dune restoration and rehabilitation 11 72% 1 A B C D
T6 River rehabilitation and restoration 11 28% 1 A B C D
T7 Adaptive management of natural habitats 12 50% 1 A B C D
T8 Ocean pools 12 50% 1 A B C D
APT A APT B APT C APT DMax_RatioID Name Class number Ratio
S M L S M L S M L S M L
T9 Activity and product diversification 2 75% 1 A B C D
T11 Local circular economy 3 73% 1 A B C D
T5 Dune restoration and rehabilitation 11 72% 1 A B C D
T3 Adaptation of groundwater management 10 63% 1 A B C D
T19 Mainstreaming Disaster Risk Management (DRM) 7 63% 1 A B C D
T15 Beach nourishment 5 60% 1 A B C D
T17 Coastal protection structures 6 56% 1 A B C D
T22 Health care delivery systems 8 53% 1 A B C D
T14 Water restrictions, consumption cuts and grey-water recycling 4 53% 1 A B C D
T1 Economic Policy Instruments (EPIs) 1 53% 1 A B C D
T24 Pre-disaster early recovery planning 9 52% 1 A B C D
T7 Adaptive management of natural habitats 12 50% 1 A B C D
T8 Ocean pools 12 50% 1 A B C D
T23 Post-Disaster recovery funds 9 48% 1 A B C D
T2 Financial incentives to retreat from high-risk areas 1 47% 1 A B C D
T13 Local sustainable fishing 4 47% 1 A B C D
T21 Fire management plans 8 47% 1 A B C D
T18 Drought and water conservation plans 6 44% 1 A B C D
T16 Desalination 5 40% 1 A B C D
T20 Using water to cope with heat waves 7 37% 1 A B C D
T4 Monitoring, modelling and forecasting systems 10 37% 1 A B C D
T6 River rehabilitation and restoration 11 28% 1 A B C D
T12 Tourist awareness campaigns 3 27% 1 A B C D
T10 Public awareness programmes 2 25% 1 A B C D
Max_RatioAPT A APT B APT C APT D
ID Name Class number Ratio
102
Sustainability Performance
The combined set of AOs that entered an adaptation pathway through the choices made by stakeholders
will have a certain environmental impact. This impact could be predicted as all AOs were evaluated by the
IFP coordinators from BEF Germany. The created pathways differ in their environmental impacts
regarding the 5 aspects ”Cost Efficiency”, “Environmental protection”, “Mitigation (GHG emissions)
win-wins and trade-offs”, “Technical applicability”, and “Social acceptability”. Values to assess the
impacts were discrete and could be “Low”, Medium”, and “High”. The visual representation of the results
can be found in Fig. 5. Please refer to the underlying scores in Section 6 “Additional Material” if you
would like to find out in more detail the specific sustainability performance of single AOs.
Overall, environmental protection reached low scores, indicating that measures to prepare against
catastrophe to ensure survival and comfort are rated higher than implementing measures that are beneficial
to the environment. Measures that allow mitigating effects of climate change while providing adaptation
to not worsen the possible climate hazard situation were therefore not considered important. This goes
hand in hand with the low scores that were reached for mitigation win-wins, indicating that the trade-offs
with climate adaptation would be high. Few of the proposed AOs would take care of multiple problems
at the same time and implementing one would come at the cost of another. In general, measures
implemented in the APT scenario world C would cause the greatest environmental protection (although
values would remain at a medium level), while in all other scenarios the environmental protection would
be low.
Technical applicability was rated generally high, as Germany is a developed country, and a lot of the
proposed technologies are available if the question of cost is disregarded. The question then remains
whether a solution would be feasible within its economic, social, and environmental contexts which have
to be assessed first. Some of the proposed measures could certainly be improved in their technical
development, but in general, are considered to be already at a high level and readily available if the funds
are present and willing to implement is there.
Measures with the highest Social Acceptability are found in APT A scenario, reaching high values whereas
all other scenario worlds have a medium score on the social acceptability of the implemented measures.
This appears to be logical as decision-makers in scenario world A tend to choose cost-efficient AOs that
do not do much to change the status quo. As changes are not dramatic, stakeholders should have no
reason to oppose them. Unsurprisingly, social acceptability of measures is lowest for APT D, especially
towards the end of the century. This possibly indicates that measures are getting more extreme, with social
acceptability for them declining as time progresses. Measures that are vaster and more invasive (such as
resettling whole communities), should go hand in hand with lower social acceptance.
The cost-efficiency of the chosen measures tended to be medium to high. Highest cost-efficiency occurred
in APT A; the scenario world that aims to invest as little as possible in adaptation measures. Surprisingly,
APT D had the second-highest cost-efficiency values for AOs chosen at the end of the century. This
result could appear odd in the light that one would assume that more extreme measures would be
implemented in this APT as the century progresses. However, stakeholders seem to have chosen measures
that appear to be relatively cost-efficient even though they were deciding with the mindset of a decision-
maker from scenario world D, who would have a high willingness to invest a lot of money in climate
change adaptation measures.

103
Figure 49: Pathway evaluation for the tourism sector considering: Cost Efficiency; Environmental protection; Mitigation (GHG emissions) win-wins
and trade-offs; Technical applicability; and Social acceptability. The analysis was conducted for the four policy pathways scenarios: APT A -
Minimum Intervention; APT B - Economic Capacity Expansion (ECE); APT C- Efficiency Enhancement (EE); APT D - System
Restructuring (SR), for different timeframes: S - Short term (up to 2030), M- Medium term (up to 2050), L - Long term (until 2100)
, as well as an average analysis across all timeframes. Evaluation based on the personal assessment of Fehmarn IFP Baltic Environmental Forum
Germany.
6.7.2 Further comments
General discussion on the stakeholder engagement process and climate adaptation yielded further insights
on stakeholder attitudes. It was acknowledged that climate change is coming and even mitigation measures
will not do much to reduce the impacts. By implementing island-wide measures the climatic changes
cannot be stopped in the eyes of some stakeholders. One person said that it is therefore important to
always have a plan B in case the adaptation measures will not work. It was also acknowledged that there
are limits to adaptation. Certain activities can only help so much before they cannot buffer the impacts of
climate change. Even if all preventive and absorbing measures are implemented, it will depend on the
severity of climate change to show how effective they are. There are certain events for which adaptive
measures will not help, for instance, the increased occurrence of dangerous jellyfish. In those instances,
inhabitants and tourists know that nothing can be done, and other solutions have to be found.
What was pointed out is that the island communities need to have an administrative structure that will
enable them to adapt to climatic changes. If the municipality of Fehmarn does not have the means to
coordinate and implement adequate measures, then creating adaptation plans is of no use. A negative
example for this is the planned construction of the “Fixed Fehmarn Belt” tunnel that will connect
Fehmarn and Denmark. Although the community wants to become climate neutral by 2030, the tunnel

104
and its connected infrastructure will cause lots of car traffic across the island. Fehmarn municipality and
inhabitants are against the mega-project but cannot intervene as decisions are made on a federal level.
Playing through the stakeholder tool was considered a useful activity to start thinking about climate
adaptation but working through four scenario worlds was considered a lot. One stakeholder remarked
that it was quite challenging and confusing to focus on the mindset of a specific world and make choices
based on the APT attitudes. She said that sometimes she just picked a random option to move on to the
next choice. This was potentially the case for other stakeholders as well. It was stated that focussing on
one scenario world in more detail could have potentially been more productive. Regardless of the tool’s
complexities, it was considered valuable to end up with a plan outlining the general adaptation trajectories
and a combination of measures.
6.8 Guadalupe & Martinica
Due to circumstances associated to Covid-19 context it was not possible to implement the methodology to the Island case
study, although efforts were made to contact stakeholders and attain their inputs on the adaptation options available for the
Adaptation Pathways.

105
6.9 Madeira
For these Islands two online webinars were made and spoken in Portuguese, with the presentations in
English and the Online Survey Tool with the options and classes in English as well. A support word file
with the measures were prepared. There were several Local knowledge options proposed by stakeholders
and the IFP (AREAM), and the characterization of all adaptation options was made by the IFP.
More information about this Island: see Island Report for the Island.
6.9.1 Aquaculture
The identification and description of the adaptation measures for the aquaculture sector, including the
local knowledge measures, are on the Annex AI.
Aquaculture pathways are based on choices made by 23 experts island stakeholders.
Selected Adaptation Pathways
Figure 50 - Adaptation options for the aquaculture sector. Options are identified with an ID number, full name, and class of adaptation number.
Adaptation objectives are identified in each option by colour: vulnerability reduction (red), Disaster Risk Reduction (blue);
Social-Ecological Resilience (green); Local Knowledge adaptation options (grey). Each ATP (APT A; APT B;
APT C; APT D) is represented in three timeframes: S - Short term (up to 2030), M- Medium term (up to 2050), L - Long term (until 2100).
Highlighted options indicate the measure was selected in each ATP and timeframe: ATP A – Minimum Intervention (light blue); ATP B –
Economic Capacity Expansion (light green); ATP C – Efficiency Enhancement (Light orange) and ATP D – System Restructuring (light purple).
Bold letters in each ATP indicate the option was available to be selected in the three time frames. Grey cells mean that they the options was not
available in that APT.
S M L S M L S M L S M L
A1 Financial schemes, insurance and loans 1 55% A B C D
A2 Tax benefits and subsidies 1 45% A B C D
A10 Efficient feed management 2 54% A B C D
A9 Awareness campaigns for behavioural change 2 46% A B C D
A11 Addressing consumer and environmental concerns at the local
level
3 55% A B C D
A12 Promote cooperation to local consumption 3 45% A B C D
A13 Integrated multi-trophic aquaculture (IMTA) 4 54% A B C D
A14 Short-cycle aquaculture 4 46% A B C D
A16 Submersible cages 5 75% A B C D
A15 Recirculation Aquaculture Systems (RAS) 5 25% A B C D
A17 Climate proof aquaculture activities 6 53% A B C D
A18 Risk-based zoning and site selection 6 47% A B C D
A19 Disease prevention methods 7 70% A B C D
A20 Environmental monitoring and Early Warning Systems (EWS) 7 30% A B C D
A21 Mainstreaming Disaster Risk Management (DRM) 8 61% A B C D
A22 Contingency for emergency management, early
harvest and/or relocation
8 39% A B C D
A23 Recovery Post-Disaster plans 9 65% A B C D
A24 Recovery Post-Disaster funds 9 35% A B C D
A3 Feed production 10 55% A B C D
A4 Species selection 10 45% A B C D
A6 Best Management Practices 11 55% A B C D
A5 Selective breeding 11 45% A B C D
A7 Create educational visits 12 55% A B C D
A8 Promote aquaculture cuisine 12 45% A B C D
A29 (A29) Aquaculture as an alternative to fishing Local 30% A B C D
A27 (A27) Aquaculture and circular economy Local 23% A B C D
A28 (A28) Implement measures for increasing local industry self-
sufficiency
Local 22% A B C D
A25 (A25) Long-term environmental data collection and management
at regional
Local 18% A B C D
A26 (A26) Implementation of local sanitary programs at regional scale Local 7% A B C D
ID NameClass
numberRatio
APT A APT B APT C APT D

106
The measures selected for each Adaptation Pathway for the aquaculture sector can be consulted in the
Annex BI. It is also possible to verify the percentage of stakeholders that selected each measure by
Adaptation Pathway Trajectory and time frame.
The human capital (class 2) measure considered a priority to address Vulnerability Reduction for the
APT B (capacity expansion) was “Awareness campaign and behavioural change” for all time frames, which
indicates the necessity of this measure on a scenario of low political commitment. Under APT D (system
restructuring) the considered priority was “Efficient feed management” for all time frames, which is
coherent with a scenario of high political commitment.
Under the APT B and D, both with high level of investment, the financial capital measures (class 1)
considered a priority for the short and long terms are the same. It indicates that regardless the level of
commitment, at short term the region is more focused on “Financial schemes, insurances and loans”, and
on the long term the focus is “Tax benefits and subsidies”.
In the scope of social capital (class 3) and under the APT C (efficient enhancement), “Promote
cooperation to local consumption” was consider a priority for the short term. For medium and long terms,
the priority considered was “Addressing consumer and environmental concerns at the local level”.
The measure “Short-cycle aquaculture”, physical capital (class 4), was considered a priority for all time
frames for the APT C and on short for the APT D. Currently, “Integrated multi-trophic aquaculture
(IMTA)” is not implemented in Madeira island. This measure was selected for the medium and long-time
frame for APT D, being the priority consistent with a system restructuring scenario.
In opposition to “Recirculation Aquaculture Systems (RAS)”, the measure “Submersible cages”, natural
capital (class 5), was a clear priority in all time frames of the scenario where the measure was available,
scenario of capacity expansion. The measure enables to submerge the cages according with temperature
gradient and to protect them from sea storms, being considered a good adaptation measure. Furthermore,
it decreases the cages visual impact, which, currently, is one of the main regional social constraints to the
development of this blue economy sector.
For Disaster Risk Reduction, in opposition to “Environmental monitoring and Early Warning Systems
(EWS)”, the measure “Disease prevention methods”, hazard preparedness (class 7) was considered a
priority in all time frames of the scenario where the measure was available, scenario of efficiency
enhancement.
The measure considered a priority address risk mitigation (class 6) for the APT’s B, C and D was
“Climate proof aquaculture activities” in the majority of the time frames, in opposition to the measure
“Risk-based zoning and site selection”, which was the priority for the scenario of minimum intervention
for all time frames and for the short term for the APT C and D.
In the scope of disaster response (class 8) the priority for the short term was the measure
“Mainstreaming Disaster Risk Management (DRM)” and for the medium and long term the regional
priority considered was “Contingency for emergency management, early harvest and/or relocation”, for
minimum intervention scenario.
Under the post disaster recovery (class 9), the region gave priority to the measure “Recovery Post-
Disaster plans” for all time frames in the APT A and in the short term for the APT D, in opposition with
the measure “Recovery-disaster funds”, that as priority for the medium and long terms for the APT D
(high investment/ high commitment).
In Social-Ecological Resilience adaption objective concerning provisioning services class (class 10),
the region gave considered a priority the measure “Feed production” for all time frame in the scenarios
minimum intervention (APT A) and capacity expansion (APTB), both scenarios with low commitment.
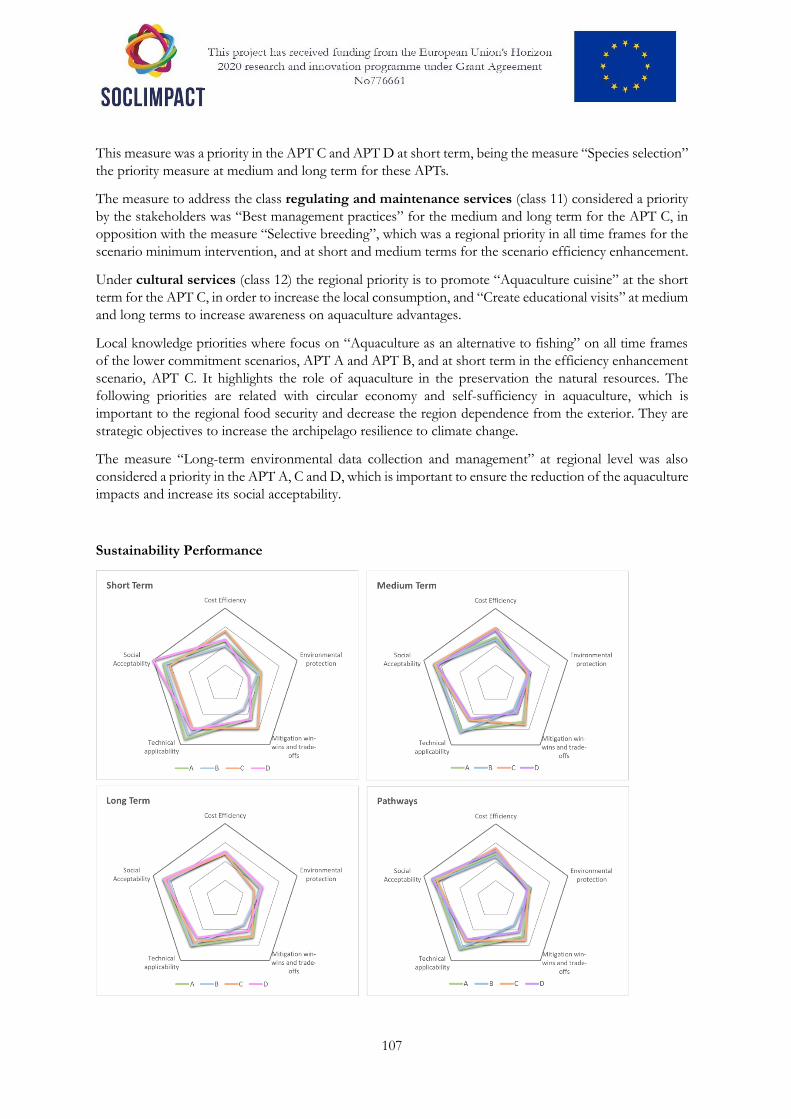
107
This measure was a priority in the APT C and APT D at short term, being the measure “Species selection”
the priority measure at medium and long term for these APTs.
The measure to address the class regulating and maintenance services (class 11) considered a priority
by the stakeholders was “Best management practices” for the medium and long term for the APT C, in
opposition with the measure “Selective breeding”, which was a regional priority in all time frames for the
scenario minimum intervention, and at short and medium terms for the scenario efficiency enhancement.
Under cultural services (class 12) the regional priority is to promote “Aquaculture cuisine” at the short
term for the APT C, in order to increase the local consumption, and “Create educational visits” at medium
and long terms to increase awareness on aquaculture advantages.
Local knowledge priorities where focus on “Aquaculture as an alternative to fishing” on all time frames
of the lower commitment scenarios, APT A and APT B, and at short term in the efficiency enhancement
scenario, APT C. It highlights the role of aquaculture in the preservation the natural resources. The
following priorities are related with circular economy and self-sufficiency in aquaculture, which is
important to the regional food security and decrease the region dependence from the exterior. They are
strategic objectives to increase the archipelago resilience to climate change.
The measure “Long-term environmental data collection and management” at regional level was also
considered a priority in the APT A, C and D, which is important to ensure the reduction of the aquaculture
impacts and increase its social acceptability.
Sustainability Performance
108
Figure 51 - Pathways evaluation for the aquaculture sector considering: Cost Efficiency; Environmental protection; Mitigation (GHG emissions) win-
wins and trade-offs; Technical applicability; Social acceptability. The policy pathways scenarios: APT A - Minimum Intervention; APT B -
Economic Capacity Expansion (ECE); APT C- Efficiency Enhancement (EE); APT D - System Restructuring (SR), for different timeframes: S -
Short term (up to 2030), M- Medium term (up to 2050), L - Long term (until 2100)
On the short term, the measures selected for the APT A have better technical applicability performance,
the measures selected for the APT D have better social acceptability performance and the measures
selected for the APT C have better cost efficiency, environmental protection, and mitigation
performances.
On the medium term, the measures selected for the APT B have better technical applicability performance,
and the measures selected for the APT C have better the cost efficiency, social acceptability, and mitigation
performances.
On the long term, all APT’s have similar performance in all criteria. However, the measures selected for
the APT B have lower mitigation performance, the measures selected for the APT C have lower
environmental protection performance and the measures selected for the APT D have lower technical
performance.
At long term, for all APTs, the technical applicability is lower, but the measures were classified for 2020
for these criteria and should be expected more maturity for this adaptation solutions after 2050.
Overall, the APT C is the one with better contribution for the regional mitigation objectives of reduce at
least 40% of GHG emissions for 2030 and achieve climate resilience and carbon neutrality (85% GHG
emissions reduction) by 2050, according the Sustainable Energy and Climate Action Plan under
development and have highest cost efficiency performance. The APT D is the scenario with better social
acceptance performance.

109
6.9.2 Energy
The identification and description of the adaptation measures for the energy sector, including the local
knowledge measures, are on the Annex AII.
Energy pathways are based on choices made by 25 expert island stakeholders.
Selected Adaptation Pathways
Figure 52 - Adaptation options for the energy sector. Options are identified with an ID number, full name, and class of adaptation number.
Adaptation objectives are identified in each option by colour: vulnerability reduction (red), Disaster Risk Reduction (blue);
Social-Ecological Resilience (green); Local Knowledge adaptation options (grey). Each ATP (APT A; APT B;
APT C; APT D) is represented in three timeframes: S - Short term (up to 2030), M- Medium term (up to 2050), L - Long term (until 2100).
Highlighted options indicate the measure was selected in each ATP and timeframe: ATP A – Minimum Intervention (light blue); ATP B –
Economic Capacity Expansion (light green); ATP C – Efficiency Enhancement (Light orange) and ATP D – System Restructuring (light purple).
Bold letters in each ATP indicate the option was available to be selected in the three time frames. Grey cells mean that they the options was not
available in that APT.
The measures selected for each Adaptation Pathway for the energy sector can be consulted in the Annex
BII. It is also possible to verify the percentage of stakeholders that selected each measure by Adaptation
Pathway Trajectory and time frame.
The financial capital (class 1) measure considered a priority to address Vulnerability Reduction for the
APT B (capacity expansion) and APT D (system restructuring) was “Financial support for buildings with
low energy needs” for the short term. At medium and long term, the regional priority was “Financial
S M L S M L S M L S M L
E2 Financial support for smart control of energy in houses and
buildings
1 55% A B C D
E1 Financial support for buildings with low energy needs 1 45% A B C D
E9 Green jobs and businesses 2 63% A B C D
E10 Public information service on climate action 2 37% A B C D
E11 Small scale production and consumption (prosumers) 3 63% A B C D
E12 Risk reporting platform 3 37% A B C D
E13 Energy storage systems 4 68% A B C D
E14 Collection and storage of forest fuel loads 4 32% A B C D
E16 Demand Side Mangement (DSM) of Energy 5 59% A B C D
E15 SeaWater Air Conditioning (SWAC). 5 41% A B C D
E17 Review building codes of the energy infrastructure 6 53% A B C D
E18 Upgrade evaporative cooling systems 6 47% A B C D
E20 Grid reliability 7 55% A B C D
E19 Early Warning Systems (EWS) 7 45% A B C D
E22 Energy-independent facilities (generators) 8 52% A B C D
E21 Study and develop energy grid connections 8 48% A B C D
E23 Energy recovery microgrids 9 57% A B C D
E24 Local recovery energy outage capacity 9 43% A B C D
E3 Energy efficiency in urban water management 10 68% A B C D
E4 Underground tubes and piping in urban planning 10 32% A B C D
E6 Urban green corridors 11 52% A B C D
E5 Biomass power from household waste 11 48% A B C D
E7 Educational garden plots 12 69% A B C D
E8 Heated pools with waste heat from power plants 12 31% A B C D
E25 (E25) Minimize islands energy dependence from imported fossil
fuels to increase resilience to climate change
Local 31% A B C D
E26 (E26) Diversification on energy supply and electricity generation Local 22% A B C D
E29 (E29) Promote electric mobility integrated in smart grids with
smart-charging and vehicle-to-grid infrastructure
Local 17% A B C D
E27 (E27) Implement electricity prices for renewable energy
generation on islands based on actual local costs to stimulate the
Local 14% A B C D
E30 (E30) Electrification of energy demand Local 10% A B C D
E28 (E28) Modelling and forecasting of supply and demand Local 6% A B C D
APT A APT B APT C APT DID Name
Class
numberRatio

110
support for smart control of energy in houses and buildings”, which reflects an expected maturity of
these solutions.
Under the human capital measures (class 2) the regional priority for the APT B and D was “Green jobs
and businesses” for all time frames. For the APT A (minimum intervention) and APT C (efficiency
enhancement), the regional priority was “Public information service on climate action” at short term and
“Green jobs and businesses” at medium term.
In the scope of social capital (class 3) and under the APT C, the regional priority was “Small scale
production and consumption (prosumers)” for all time frames.
The measure “Energy storage systems”, physical capital (class 4), was considered a priority for all time
frames of the APT C and on short for the APT D. This measure will allow Madeira to decrease its
dependency from fossil fuels, and thus increasing its resilience to climate change.
In opposition to “Seawater Air Conditioning (SWAC)”, the measure “Demand Side Management (DSM)
of Energy”, natural capital (class 5), was consider a priority in all time frames of the APT B (capacity
expansion), where the measure was available. This choice is compatible with sea water average temperature
and the island orography that difficult the sea access.
For Disaster Risk Reduction the measure considered a priority to address risk mitigation (class 6) for
the APT’s A, B, C and D was “Review building codes of the energy infrastructure” in the majority of the
time frames, in opposition to the measure “Upgrade evaporative cooling systems”, which was the priority,
at the long term, for the scenarios of capacity expansion (APT B), efficiency enhancement (APT C) and
system restructuring (APT D).
Under the class hazard preparedness (class 7), the priority at short term was “Early Warning Systems
(EWS)” and for the medium and long terms the priority was “Grid reliability” for the efficiency
enhancement scenario, where the measures were available.
In the scope of disaster response (class 8), the priority at short term was the measure “Study and develop
energy grid connections” and for the medium and long term the regional priority was “Energy-
independent facilities (generators)”, for minimum intervention scenario.
Under the post disaster recovery (class 9), the measure “Energy recovery microgrids” was considered a
priority for all time frames in the APT D and for the short and medium terms in the APT A, in opposition
to the measure “Local recovery energy outage capacity” that was consider a priority at long term for the
APT A.
In Social-Ecological Resilience adaption objective concerning provisioning services class (class 10),
the region gave clear priority to “Energy efficiency in urban water management” for all time frame in the
APT A (minimum intervention), APT B (capacity expansion), APT C (efficiency enhancement) and APT
D (system restructuring).
The measure considered a priority to address the class regulating and maintenance services (class 11)
was “Urban green corridors” for all time frames for the APT B and for the medium term for the APT C,
in opposition of the measure “Biomass power from household waste” that was consider a priority for the
short and long terms for the APT C. The local stakeholders recognize the importance of reducing the air
temperatures in the cities without increase the consumption of energy for cooling, increasing the quality
of life in open spaces.
Under cultural services (class 12), there is a clear priority to promote “Educational garden plots” for all
time frames for the APT C, which highlights the importance to reduce the food carbon footprint and
food security in islands.

111
Local knowledge priorities were focus on minimize islands energy dependence from imported fossil fuels
to increase its climate change resilience, in all time frames of the 4 scenarios. It highlights the importance
to decrease imported fossil fuels as a climate change adaptation measure. The following priority is related
with the diversification of energy supply and electricity generation (E26), which contributes the measure
“Promote electric mobility integrated in smart grids with smart-charging and vehicle-to-grid
infrastructure” and “Implement electricity prices for renewable energy generation on islands based on
actual local costs to stimulate the RES generation”.
During the results discussion, the stakeholders underlined the importance of the diversification on energy
supply and electricity generation for energy independence of islands, as the extreme weather events,
namely storms, can destroy wind farms, being important to invest in photovoltaic energy and the foreseen
precipitation reduction will affect hydropower production. Hydro energy will be affected by water scarcity
and by priority uses, human consumption and irrigation in Madeira island.
It was also underlined that downscaling the climate models for Madeira and Porto Santo islands is
important to better forecast the renewable resources and deal with the foreseen reduction of precipitation.
Currently, the available climate data and models for these Atlantic islands do not have the necessary
accuracy do support the decision-making process on RES and energy storage investments.
Sustainable Performance
Figure 53 - Pathways evaluation for the energy sector considering: Cost Efficiency; Environmental protection; Mitigation (GHG emissions) win-wins
and trade-offs; Technical applicability; Social acceptability. The policy pathways scenarios: APT A - Minimum Intervention; APT B - Economic
Capacity Expansion (ECE); APT C- Efficiency Enhancement (EE); APT D - System Restructuring (SR), for different timeframes: S - Short
term (up to 2030), M- Medium term (up to 2050), L - Long term (until 2100)

112
On the short term, the measures selected for the APT A have better social acceptability, cost efficiency
and mitigation performances, and the measures selected for the APT C have better technical applicability
and environmental protection performances.
On the medium term, the measures selected for the APT A have better cost efficiency performance, the
measures selected for the APT B have better mitigation performance, and the measures selected for the
APT C have better technical applicability, social acceptability, and environmental protection
performances.
On the long term the measures selected for the APT A have better social acceptability and environmental
protection, the measures selected for the APT B have better mitigation performance, and the measures
selected for the APT C have better technical applicability performance.
At long term, for all APTs, the technical applicability is lower, but the measures were classified for 2020
for these criteria and should be expected more maturity for this adaptation solutions after 2050.
Overall, the APT B is the one with higher contribution for the regional mitigation objectives of reduce at
least 40% of GHG emissions for 2030 and achieve climate resilience and carbon neutrality (85% GHG
emissions reduction) by 2050, according the Sustainable Energy and Climate Action Plan under
development. The APT A is the scenario with better social acceptability and cost efficiency performances,
the APT C is the scenario with better technical applicability and environmental protection performances,
and the APT D is the scenario with lower technical applicability and environmental protection
performances.

113
6.9.3 Maritime Transport
The identification and description of the adaptation measures for the maritime transport sector, including
the local knowledge measures, are on the Annex AII.
Maritime transport pathways are based on choices made by 24 expert island stakeholders.
Selected Adaptation Pathways
Figure 54 - Adaptation options for the Maritime Transport sector. Options are identified with an ID number, full name, and class of adaptation
number. Adaptation objectives are identified in each option by colour: vulnerability reduction (red), Disaster Risk Reduction
(blue); Social-Ecological Resilience (green); Local Knowledge adaptation options (grey). Each ATP (APT A;
APT B; APT C; APT D) is represented in three timeframes: S - Short term (up to 2030), M- Medium term (up to 2050), L - Long term (until
2100). Highlighted options indicate the measure was selected in each ATP and timeframe: ATP A – Minimum Intervention (light blue); ATP B –
Economic Capacity Expansion (light green); ATP C – Efficiency Enhancement (Light orange) and ATP D – System Restructuring (light purple).
Bold letters in each ATP indicate the option was available to be selected in the three time frames. Grey cells mean that they the options was not
available in that APT.
The measures selected for each Adaptation Pathway for the maritime transport sector can be consulted
in the Annex BIII. It is also possible to verify the percentage of stakeholders that selected each measure
by Adaptation Pathway Trajectory and time frame.
The financial capital (class 1) measure considered a priority to address Vulnerability Reduction for the
scenario capacity expansion (APT B) was “Insurance mechanisms for ports” for all time frames which is
coherent with the low commitment to significant policy change. For the scenario system restructuring
(APT D) the priority measure considered was “Financial incentives to retreat from high-risk areas” for all
time frames, which is coherent with a scenario of high level of investment and high commitment to
significant policy change.
S M L S M L S M L S M L
MT2 Financial incentives to retreat from high-risk areas 1 57% A B C D
MT1 Insurance mechanisms for ports 1 43% A B C D
MT10 Social dialogue for training in the port sector 2 51% A B C D
MT9 Awareness campaigns for behavioural change 2 49% A B C D
MT12 Climate resilient economy and jobs 3 61% A B C D
MT11 Diversification of trade using climate resilient commodities 3 39% A B C D
MT14 Restrict development and settlement in low-lying areas 4 61% A B C D
MT13 Refrigeration, cooling and ventilation systems 4 39% A B C D
MT16 Increase operational speed and flexibility in ports 5 58% A B C D
MT15 Sturdiness improvement of vessels 5 42% A B C D
MT17 Climate proof ports and port activities 6 53% A B C D
MT18 Consider expansion/retreat of ports in urban planning 6 47% A B C D
MT20 Early Warning Systems (EWS) and climate change monitoring 7 56% A B C D
MT19 Reinforcement of inspection, repair and maintenance of
infrastructures
7 44% A B C D
MT21 Inteligent Transport Systems (ITS) 8 57% A B C D
MT22 Prepare for service delays or cancellations 8 43% A B C D
MT23 Backup routes and infrastructures during extreme weather 9 68% A B C D
MT24 Post-Disaster recovery funds 9 32% A B C D
MT4 Combined protection and wave energy infrastructures 10 55% A B C D
MT3 Marine life friendly coastal protection structures 10 45% A B C D
MT6 Coastal protection structures 11 53% A B C D
MT5 Hybrid and full electric ship propulsion 11 47% A B C D
MT7 Integrate ports in urban tissue 12 63% A B C D
MT8 Ocean pools 12 38% A B C D
MT27 (MT27) Increase knowledge and modelling tools on climate
change for islands
Local 27% A B C D
MT28 (MT28) City ports as coastal protection infrastructures against
extreme climate events (sea level rise combined with sea storm)
Local 27% A B C D
MT25 (MT25) Specific requirements to increase climate change
resilience of maritime transports services in islands
Local 23% A B C D
MT26 (MT26) Prepare islands ports to supply alternative fuels and
electricity
Local 23% A B C D
APT A APT B APT C APT DID Name
Class
numberRatio

114
Under the human capital measures (class 2) the regional priority for the APT A, B, C and D was
“Awareness campaigns for behavioural change” for the short term. For the medium and long terms, in all
scenarios, the regional priority was “Social dialogue for training in the port sector”, underling the concerns
with the foreseen sea level rise in these time frames.
In the scope of social capital (class 3) and under the APT C, the regional priority was “Climate resilient
economy and jobs” for all time frames, which underlines the importance to reduce imported goods from
the exterior.
Under the APT C and D, in all time frames, the measure “Restrict development and settlement in low-
lying areas” physical capital (class 4), was considered a clear priority.
Under the class natural capital (class 5), the measure “Sturdiness improvement of vessels” was selected
by 50% of the stakeholders at the short term for the APT B. The measure “Increase operational speed
and flexibility in ports” was considered the priority for the medium and long term.
For Disaster Risk Reduction, the measure to address risk mitigation (class 6) “Climate proof ports and
port activities” was consider a priority for the APT A for all time frames, for the APT B for the medium
and long term, for the APT C for the medium term and for the APT D for the short and medium term,
this underlines the island dependence from the exterior and the importance of preventing the disruption
of port activities due extreme weather events.
Under the class hazard preparedness (class 7), the measure “Early Warning Systems (EWS) and climate
change monitoring” was consider a clear priority for the medium and long terms in opposition of
“Reinforcement of inspection, repair and maintenance of infrastructures”. Both measures were selected
to be included in adaptation pathway for the short term.
For the minimum intervention scenario, in the scope of disaster response (class 8) the priority at short
term, was the measure “Prepare for service delays or cancellations”. For the medium and long term,
“Intelligent Transport Systems (ITS)” was considered a regional priority, which is coherent with the
development of this technology until the end of the century.
Under the post disaster recovery (class 9), the measure “Backup routes and infrastructures during
extreme weather” was consider a clear priority for all time frames for the APT A and APT D in opposition
of “Post-Disaster recovery funds”. For the long term for the scenario system restructuring, both measures
were selected to be included in adaptation pathway.
In Social-Ecological Resilience adaption objective concerning provisioning services class (class 10), the
measure “Marine life friendly coastal protection structures” was selected for the short term for the APTs A, B, C
and D. This recognizes the potential role of coastal protection infrastructures for biodiversity preservation. For the
medium and long term, the selected measure “Combined protection and wave energy infrastructures” was selected
for the APTs B, C and D, which indicates the potential contribution of wave energy for islands energy independence.
The measure selected by the stakeholders to address the class regulating and maintenance services
(class 11) was “Coastal protection structures” for all time frames for the APT B and for the short term
for the APT C, in opposition of the measure “Hybrid and full electric ship propulsion”, that was
considered a priority for the medium and long term for the scenario efficiency enhancement.
Under cultural services (class 12), there is a priority to “Integrate ports in urban tissue” for short and
long term for the APT C. For the medium term, the measure “Ocean pools” was consider the regional
priority.
The Local Knowledge measure “Increase knowledge and modelling tools on climate change for islands”
was considered a priority for the short term for all scenarios, which highlights the importance of this

115
measure for the decision-making process. All measures were considered a priority for, at least, 3 different
scenarios, which highlights the importance of all Local Knowledge measures.
During the results discussion, the stakeholders underlined the concerns related with the sea level rise that
will require high investments in all ports and coastal protection infrastructures. Prepare island ports to
supply alternative fuels was identified as an important contribute to reduce the island energy dependence
and the emissions associated with maritime transport.
It was also underlined the importance of making available climate change projections on maximum hight
waves that combined with the sea level rise will have severe impacts in ports, marines, and other coastal
infrastructures.
Given the high dependence from maritime transport, it was highlighted by the stakeholders the
importance of backup routes and infrastructures to overcome the islands isolation during extreme weather
events which require high investment, justified by the principle of territorial continuity.
The maritime transport is very important for the transportation of goods and persons in archipelagos,
being highlighted by the stakeholders that the next concession for maritime public transport services
between islands should have requirements concerning alternative fuels and improved vessels sturdiness
to increase climate change resilience.
The regional stakeholders mention the importance to increase the regional dry docks areas in marines and
shipyards to protect recreational and maritime touristic activities boats in extreme weather events.
Sustainable performance
Figure 55 - Pathways evaluation for the maritime transport sector considering: Cost Efficiency; Environmental protection; Mitigation (GHG
emissions) win-wins and trade-offs; Technical applicability; Social acceptability. The policy pathways scenarios: APT A - Minimum Intervention;
APT B - Economic Capacity Expansion (ECE); APT C- Efficiency Enhancement (EE); APT D - System Restructuring (SR), for different
timeframes: S - Short term (up to 2030), M- Medium term (up to 2050), L - Long term (until 2100)

116
On the short term, the measures selected for the APT A have better technical applicability and
environmental protection performances, the measures selected for the APT B have better mitigation
performances, the measures selected for the APT C have better social acceptance performance, and the
APT D have better cost efficiency performance.
On the medium term, the measures selected for the APT A have better technical applicability, social
acceptability, cost efficiency and environmental protection performances, and the measures selected for
the APT C have better mitigation performance.
On the long term the measures selected for the APT A have better cost efficiency, environmental
protection and technical applicability performances, and the measures selected for the APT C have better
mitigation performance, and the measures selected for the APT D have better social acceptability
performance.
At long term, for all APTs, the technical applicability is lower, but the measures were classified for 2020
for these criteria and should be expected more maturity for this adaptation solutions after 2050.
Overall, the APT C is the one with higher contribution for the regional mitigation objectives of reduce at
least 40% of GHG emissions for 2030 and achieve climate resilience and carbon neutrality (85% GHG
emissions reduction) by 2050, according the Sustainable Energy and Climate Action Plan under
development. The APT A is the scenario with better technical applicability, environmental protection,
social acceptability, and cost efficiency performances.

117
6.9.4 Tourism
The identification and description of the adaptation measures for the tourism sector, including the local
knowledge measures, are on the Annex AIV.
Tourism pathways are based on choices made by 31 expert island stakeholders.
Selected Adaptation Pathways
Figure 56 - Adaptation options for the tourism sector. Options are identified with an ID number, full name, and class of adaptation number.
Adaptation objectives are identified in each option by colour: vulnerability reduction (red), Disaster Risk Reduction (blue);
Social-Ecological Resilience (green); Local Knowledge adaptation options (grey). Each ATP (APT A; APT B;
APT C; APT D) is represented in three timeframes: S - Short term (up to 2030), M- Medium term (up to 2050), L - Long term (until 2100).
Highlighted options indicate the measure was selected in each ATP and timeframe: ATP A – Minimum Intervention (light blue); ATP B –
Economic Capacity Expansion (light green); ATP C – Efficiency Enhancement (Light orange) and ATP D – System Restructuring (light purple).
Bold letters in each ATP indicate the option was available to be selected in the three time frames. Grey cells mean that they the options was not
available in that APT.
The measures selected for each Adaptation Pathway for the tourism sector can be consulted in the Annex
BIV. It is also possible to verify the percentage of stakeholders that selected each measure by Adaptation
Pathway Trajectory and time frame.
The financial capital (class 1), the regional priority to address Vulnerability reduction was “Financial
incentives to retreat from high-risk areas” for the APT B (capacity expansion) for the medium term and
for the APT D (system restructuring) for all time frames, in opposition to the measure Economic Policy
Instruments (EPIs) that was considered a priority for the APT B for the short and long terms.
S M L S M L S M L S M L
T2 Financial incentives to retreat from high-risk areas 1 54% A B C D
T1 Economic Policy Instruments (EPIs) 1 46% A B C D
T9 Activity and product diversification 2 58% A B C D
T10 Public awareness programmes 2 42% A B C D
T11 Local circular economy 3 68% A B C D
T12 Tourist awareness campaigns 3 32% A B C D
T14 Water restrictions, consumption cuts and grey-water recycling 4 63% A B C D
T13 Local sustainable fishing 4 37% A B C D
T16 Desalination 5 58% A B C D
T15 Beach nourishment 5 42% A B C D
T17 Coastal protection structures 6 52% A B C D
T18 Drought and water conservation plans 6 48% A B C D
T19 Mainstreaming Disaster Risk Management (DRM) 7 75% A B C D
T20 Using water to cope with heat waves 7 25% A B C D
T21 Fire management plans 8 57% A B C D
T22 Health care delivery systems 8 43% A B C D
T24 Pre-disaster early recovery planning 9 57% A B C D
T23 Post-Disaster recovery funds 9 43% A B C D
T4 Monitoring, modelling and forecasting systems 10 54% A B C D
T3 Adaptation of groundwater management 10 46% A B C D
T6 River rehabilitation and restoration 11 56% A B C D
T5 Dune restoration and rehabilitation 11 44% A B C D
T7 Adaptive management of natural habitats 12 72% A B C D
T8 Ocean pools 12 28% A B C D
T25 (T25) Rehabilitation and conservation of islands natural habitats
key assets for Islands tourism agriculture, fisheries, and food
Local 24% A B C D
T26 (T26) Diversification of economic activities to reduce the
dependence from tourism activities
Local 23% A B C D
T28 (T28) Increase knowledge and modelling tools on climate
change for islands
Local 17% A B C D
T30 (T30) Implement waste reduction and management procedures
to reduce dependence from exterior and pressures in natural
Local 17% A B C D
T29 (T29) Control measures for terrestrial and maritime tourist
activities
Local 11% A B C D
T27 (T27) Promote islands as telework tourism destinations Local 8% A B C D
ID NameClass
numberRatio
APT A APT B APT C APT D

118
Under the human capital measures (class 2), the regional priority for the APT A for all time frames
(minimum intervention) was “Public awareness programmes”. For the APT B and APT C (efficiency
enhancement) for the medium and long term, and for the APT D for all time frames the measure “Activity
and product diversification” was consider the regional priority. This result reveals the stakeholder’s
perception that it is necessary invest more money and more political commitment to diversify the tourism
economy instead of promoting awareness campaign.
In the scope of social capital (class 3) and under the APT C, the regional priority was “Local circular
economy” for all time frames. This measure will allow Madeira to decrease its waste and offers a
framework to reduce CO2 emissions from imports and exports.
In opposition to “Local fishing”, the measure “Water restrictions, consumption cuts and grey-water
recycling”, physical capital (class 4), was considered a clear priority for all time frames of the APT C and
for the APT D. This measure will allow Madeira to use hydric resource more efficiency and decrease water
waste.
For the short term, the measure “Beach nourishment”, natural capital (class 5), was consider the regional
priority. For the medium and long term, the measure “Desalination” was considered the regional priority.
This choice underlines the stakeholder concerns regarding the precipitation decrease projections and
subsequent water scarcity.
For Disaster Risk Reduction the measure considers a priority to address risk mitigation (class 6) for
the APT’s A, B, and D was “Coastal protection structures” in the majority of the time frames, in
opposition to the measure “Drought and water conservation plans”, which was the priority for the short
and medium term, for the scenario of efficiency enhancement.
Under the class hazard preparedness (class7), the clear regional priority for all time frames was
“Mainstreaming Disaster Risk Management (DRM)” for the efficiency enhancement scenario, where the
measures were available.
In the scope of disaster response (class 8), the priority at short and medium terms was the measure “Fire
management plans”, in coherence with the foreseen fire weather index that will stay in the same fire danger
class (which is high). For the long term, the regional priority was “Health care delivery systems”, for
minimum intervention scenario, in coherence with the foreseen significant increase of heat waves.
Under the post disaster recovery (class 9), the measure “Pre-disaster early recovery planning” was
selected for short and long terms in the APT A and for the short and medium terms in the APT D, in
opposition to the measure “Post-Disaster recovery funds” that was consider a priority at medium term
for the APT A, and for the long term for the APT D.
In Social-Ecological Resilience adaption objective concerning provisioning services class (class 10),
the region gave priority to “Monitoring, modelling and forecasting systems” for all scenarios for the short
term, which is coherent with the necessity to improve knowledge in these matters.
The measure considered a priority by the stakeholders to address the class regulating and maintenance
services (class 11) was “River rehabilitation and restoration” for all time frames for the APT B and APT
C, in opposition of the measure “Dune restoration and rehabilitation”. This underlines the high risk of
flash floods and its historic occurrence in Madeira island, and presence of dunes only in the small island
of Porto Santo.
Under cultural services (class 12), for all time frames for the APT C, there is a clear priority for “Adaptive
management of natural habitats”, a key asset for the archipelago’s touristic activities.

119
Local knowledge priorities where focused on habitats rehabilitation, conservation and monitoring actions,
including control of non-indigenes species, that are important to increase ecosystems resilience to climate
change, in order to preserve habitats, biodiversity and landscape, key assets for tourism, agriculture,
fisheries and food security.
The diversification of economic activities was also considered a regional priority to reduce the dependence
from tourism activities that can be disrupted by extreme weather events. Stakeholders recognise the
importance of diversify the island economy, namely by promoting the development of primary sector
activities to increase food security and reduce food carbon footprint and promote digital innovative
products and services. Also, fair trade, quality, certification, and differentiation can increase
competitiveness of islands cash crops.
Sustainable performance
Figure 57 - Pathways evaluation for the tourism sector considering: Cost Efficiency; Environmental protection; Mitigation (GHG emissions) win-wins
and trade-offs; Technical applicability; Social acceptability. The policy pathways scenarios: APT A - Minimum Intervention; APT B - Economic
Capacity Expansion (ECE); APT C- Efficiency Enhancement (EE); APT D - System Restructuring (SR), for different timeframes: S - Short
term (up to 2030), M- Medium term (up to 2050), L - Long term (until 2100)
On the short term, the measures selected for the APT A have better social acceptability performance, the
measures selected for the APT B have better technical applicability and cost efficiency performances, and
the measures selected for the APT C have better mitigation and environmental protection performance.
On the medium term, the measures selected for the APT A have better technical applicability
performance, and the measures selected for the APT C have better mitigation, social acceptability, cost
efficiency and environmental protection performances.

120
On the long term the measures selected for the APT A have better technical applicability and social
acceptability performances, the measures selected for the APT B have better environmental protection
performance, and the measures selected for the APT C have better mitigation and cost efficiency
performance.
The technical applicability for all APTs keeps almost the same for all time frames due the fact that these
measures are not as technical as the ones from the aquaculture, energy, and maritime transport sectors.
Overall, the APT C is the one with better cost efficiency and environmental protection performance, and
higher contribution for the regional mitigation objectives of reduce at least 40% of GHG emissions for
2030 and achieve climate resilience and carbon neutrality (85% GHG emissions reduction) by 2050,
according the Sustainable Energy and Climate Action Plan under development. The APT A is the scenario
with better technical applicability and social acceptability performances.
6.9.5 Further comments
The SOCLIMPACT project provided the opportunity to create a multisectoral working group, with
the participation of around 65 local and regional policy makers, public and private companies, research
institutions, associations, and local experts, that had the possibility to increase their knowledge on climate
change and adaptation. This is important to acknowledge the adaptation challenge in the daily decision-
making process and in the sectorial and holistic planning exercises, and to update the regional adaptation
strategy, foreseen for 2021.
Despite the joint discussion limitations due to the pandemic constraints, the adaptation pathways
provided insight into the concerns and priorities of regional stakeholders regarding climate change and
adaptation measures required.
Reliable climate change projections are fundamental for the decision-making process on fund allocation
for climate change adaptation. Until now, the decision-making process on climate change adaptation is
highly linked with the occurrence of extreme weather events that have severe socioeconomic and
environmental impacts. For example, the flash floods that occurred in Madeira Island in February 2010
obliged to large investments on post-disaster intervention and launched several initiatives on weather
forecast, early warning systems and other adaptation measures that contributed to disaster risk reduction.
However, the allocation of high investments on post disaster recovery, in sequence of extreme weather
events, reduces the capacity of investment on adaptation measures to increase resilience and decrease
climate change vulnerability. This fact highlights the importance of reliable downscaling climate models
for the Atlantic.
The EU outermost regions, particularly Atlantic Ocean archipelagos, have small and fragmented territories
located on the margins of EU climate models, making it difficult to have reliable climate change
projections. The participation in the project also highlighted the lack of systematic data collection that is
important to enable downscaling of climate models and assess climate change impacts on natural
ecosystems and infrastructures, and socio-economic activities.
Adaptation policies based on scientific and technical knowledge instead of reaction to extreme weather
events, allow to reduce socio-economic and environmental impacts of extreme weather events and other
climate change impacts like water scarcity and heat waves by efficiently allocating available resources to
increase resilience, decrease vulnerability and disaster risk, especially for risk mitigation, hazard
preparedness and disaster response. This scientific based approach is particularly important to support
adaptation policies to face climate change hazards never experienced before.
Even considering a scenario with increased resolution on climate change modelling and climate change
impact assessment, small and fragmented island territories such as the Archipelago of Madeira, face

121
greater uncertainty and error in weather forecasts and projections due to less coverage of weather
observation networks (there are no fixed weather stations on the ocean, some data is collected by merchant
vessels at sea).
Another conclusion of this exercise for Madeira archipelago was the evidence of the need for a specific
adaptation approach to each island within the archipelago, as they have specificities that will determine
different vulnerabilities to climate change

122
6.10 Malta
For these Islands two online webinars were made and spoken in English, with the presentations in English
and the Online Survey Tool with the options and classes in English as well. There were no Local
knowledge options proposed by the IFP (ABT) and the characterization of all adaptation options was
made by the IFP.
More information about this Island: see Island Report for the Island.
6.10.1 Aquaculture
Aquaculture pathways are based on choices made by 5 expert island stakeholders.
Selected Adaptation Pathways
Figure 58 - Adaptation options for the aquaculture sector. Options are identified with an ID number, full name, and class of adaptation number.
Adaptation objectives are identified in each option by colour: vulnerability reduction (red), Disaster Risk Reduction (blue);
Social-Ecological Resilience (green); Local Knowledge adaptation options (grey). Each ATP (APT A; APT B;
APT C; APT D) is represented in three timeframes: S - Short term (up to 2030), M- Medium term (up to 2050), L - Long term (until 2100).
Highlighted options indicate the measure was selected in each ATP and timeframe: ATP A – Minimum Intervention (light blue); ATP B –
Economic Capacity Expansion (light green); ATP C – Efficiency Enhancement (Light orange) and ATP D – System Restructuring (light purple).
Bold letters in each ATP indicate the option was available to be selected in the three time frames. Grey cells mean that they the options was not
available in that APT.
Overall, the adaptation pathways for the Aquaculture sector in Malta is characterized by a significant
heterogeneity across the four potential adaptation policy trajectories (APTs) and across adaptation
objectives.
Under APT A: Minimum intervention (low investment, low commitment to policy change) for the
human capital class, for all terms, efficient feed management was preferred over awareness campaigns for
behavioural change. To reduce disaster risk, in class 6, risk mitigation, risk bases zoning and site selection
was preferred over climate proof aquaculture (strengthening infrastructure) while in the disaster response
S M L S M L S M L S M L
A1 Financial schemes, insurance and loans 1 1 A B C D
A2 Tax benefits and subsidies 1 1 A B C D
A10 Efficient feed management 2 1 A B C D
A9 Awareness campaigns for behavioural change 2 1 A B C D
A12 Promote cooperation to local consumption 3 1 A B C D
A11 Addressing consumer and environmental concerns at the 3 1 A B C D
A13 Integrated multi-trophic aquaculture (IMTA) 4 1 A B C D
A14 Short-cycle aquaculture 4 1 A B C D
A16 Submersible cages 5 1 A B C D
A15 Recirculation Aquaculture Systems (RAS) 5 1 A B C D
A18 Risk-based zoning and site selection 6 1 A B C D
A17 Climate proof aquaculture activities 6 1 A B C D
A20 Environmental monitoring and Early Warning Systems (EWS) 7 1 A B C D
A19 Disease prevention methods 7 1 A B C D
A21 Mainstreaming Disaster Risk Management (DRM) 8 1 A B C D
A22 Contingency for emergency management, early 8 1 A B C D
A23 Recovery Post-Disaster plans 9 1 A B C D
A24 Recovery Post-Disaster funds 9 1 A B C D
A4 Species selection 10 1 A B C D
A3 Feed production 10 1 A B C D
A6 Best Management Practices 11 1 A B C D
A5 Selective breeding 11 1 A B C D
A7 Create educational visits 12 1 A B C D
A8 Promote aquaculture cuisine 12 1 A B C D
APT A APT B APT C APT DMax_RatioID Name Class numberRatio

123
class, disaster Risk management (prevention, protection, preparedness, response, recovery) was preferred
over Contingency for emergency management. In class 8, post disaster recovery, recovery plans (good
practices) were preferred over recovery funds (makes sense since this is the low investment trajectory).
Finally, to improve socio-Ecological resistance, class of provisioning services, species selection was
preferred over feed production (alternative feed ingredients). Species selection is more optimal and
efficient than the feed production.
For APT B: Economic Capacity Expansion (high investment, low commitment to policy change), in
the financial capital in vulnerability reduction for short term, tax benefits were selected over financial
schemes, insurance, and loans, while for the medium- and long-term financial schemes insurance and
loans is preferred. Classes 2 and 6 had the same results as under APT A. For natural capital, RAS was
preferred for the short term, while for mid and long-term submersible cages was selected more frequently.
To improve socio-Ecological resistance, class of provisioning services, for the short term more sustainable
feed production is preferred while for mid and long term, species selection was most selected. However,
for APT A species selection was chosen for the short term as well. This can be explained because this can
also be a strategy, to diversify species in the short-term to choose species that are most efficient for
aquaculture. Inn regulating and maintenance services, for all terms Best Management Practices was
preferred over selective breeding.
In APT C: Efficiency Enhancement (medium investment, medium commitment to policy change),
again, efficient feed management was selected for short and long term. However, we see a change of
selected measure for the mid-term where awareness campaigns were preferred. There is no clear
explanation for this. In the social capital class, for short and mid-term Promotion of local consumption
(reduce transport costs, create value addition) was preferred over promotion of economy and jobs to
address CC to address consumer and environmental concerns. For the long term it was the other way
around. For physical capital, for the short term, short cycle aquaculture (stock larger fish in cages) was
preferred over IMTA, while for the mid and long term IMTA was selected more frequently. In the risk
mitigation class, we see the same results as for APT A&B. For hazard preparedness, environmental
monitoring and Early Warning Systems were preferred for all terms over disease prevention (vaccines,
probiotics, strict hygiene procedures). Classes provisioning, and regulating and maintenance services, we
have the same results as for APT B. In the third class in social-ecological resilience, cultural services, in
the short-term promoting aquaculture cuisine was preferred while for the mid and long-term, educational
visits were selected as the most suitable adaptation measure.
APT D: System Restructuring (high investment, high commitment to policy change) has some similar
results as other APTs. For financial capital, the same results were obtained as in APT B, and for physical
capital the same as APT C. For provisioning services, the same results were found as in APT A. For the
human capital, again, efficient feed management was selected for short and mid-term. However, we see a
change of selected measure for the long term where awareness campaigns were preferred. Efficient feed
management was chosen for most the different time periods for all APTs. In the risk mitigation class, for
APT A, B, C risk-based zoning and site selection was always preferred. In APT D too for the short and
mid-terms, however for the long term, climate proof aquaculture activities (strengthening infrastructure)
was selected. Climate proof aquaculture activities was chosen for the long term in APT D because this
measure requires high investment and high commitment. On the long term, when we could run out of
other options this can be a suitable measure. In the post disaster recovery class, for the short and long
terms, plans were preferred while for the mid-term funds were selected more often.

124
Figure 59 : Ranking of adaptation measures selected by experts for aquaculture from high to low.
The 24 measures were all selected at least once. The top 3 measures selected were Best Management Practices, efficient feed management and species selection. The least preferred measures, logically from the same classes, were the use of alternative ingredients in feed production, awareness campaigns and selective breeding.
Sustainability Performance
Figure 60 - Pathways evaluation for the aquaculture sector considering: Cost Efficiency; Environmental protection; Mitigation (GHG emissions) win-
wins and trade-offs; Technical applicability; Social acceptability. The policy pathways scenarios: APT A - Minimum Intervention; APT B -
Economic Capacity Expansion (ECE); APT C- Efficiency Enhancement (EE); APT D - System Restructuring (SR), for different timeframes: S -
Short term (up to 2030), M- Medium term (up to 2050), L - Long term (until 2100)
NB-AG -

125
All four pathways in the Aquaculture sector have a similar evaluation across all timeframes. The analysis showed little differences in the scoring of criteria as a reflection of the different ATP narratives. In general, all scenarios show high levels of cost efficiency, environmental protection, mitigation trade-offs, technical applicability, and social acceptability. The cost efficiency of APT D for the long term is slightly lower. Environmental protection has an overall high value but with differences in APT D (lower value), APT C (intermediate value) and APT A and B (highest value). Mitigation performance shows a small range of values, APT D (minimal intervention) has the lowest value and APT C (capacity expansion) the highest, leaving A and B in the middle. APT A scores highest for all performance indicators apart from technical ability, which is highest in APT B for all terms. Social acceptability has the highest values with APT A having more and APT D less. It can be expected that APT D would have the most challenging options in terms of social acceptability because it is the scenario with the highest commitment to policy change. It is assumed that a higher commitment could better cope with options which have a lower social acceptance. Using the same principal, in APT A (Minimum Intervention) could have had a higher (than D) social acceptability result. APTs B and C have intermediate results, which are within what can be expected from them, especially for C. In APT B this is because there are is also low commitment, which limits the available options, and APT C because it is an intermediate policy scenario (medium commitment with medium investment).

126
6.11 Sardinia
For these Islands two online webinars were made and spoken in Italian, with the presentations in Italian
and the Online Survey Tool with the options and classes in Italian as well. There were no Local knowledge
options proposed by the IFP (ANCI) and the characterization of all adaptation options was made by the
IFP.
More information about this Island: see Island Report for the Island.
6.11.1 Tourism
Tourism pathways are based on choices made by 5 expert island stakeholders.
Selected Adaptation Pathways
In the following figures have been reported the Adaptation options for the tourism sector analysed by
class and by symmetry.
Options are identified with an ID number, full name, and class of adaptation number.
Adaptation objectives are identified in each option by colour: vulnerability reduction (red), Disaster Risk
Reduction (blue); Social-Ecological Resilience (green); Local Knowledge adaptation options (grey). Each
ATP (APT A; APT B; APT C; APT D) is represented in three timeframes: S - Short term (up to 2030),
M- Medium term (up to 2050), L - Long term (until 2100). Bold letters in each ATP indicate the option
was available to be selected in the three time frames. Highlighted options indicate the measure was selected
in each ATP and timeframe: ATP A (light blue); ATP B (light green); ATP C (Light orange) and ATP D
(light purple). Space with colour: option was selected for the timeframe: Short term, Medium term, or
Long term. Bold letter: option is available in the APT.
S M L S M L S M L S M L
T1 Economic Policy Instruments (EPIs) 1 83% 1 A B C D
T2 Financial incentives to retreat from high-risk areas 1 17% A B C D
T9 Activity and product diversification 2 55% 1 A B C D
T10 Public awareness programmes 2 45% 1 A B C D
T12 Tourist awareness campaigns 3 53% 1 A B C D
T11 Local circular economy 3 47% A B C D
T14 Water restrictions, consumption cuts and grey-water recycling 4 63% A B C D
T13 Local sustainable fishing 4 37% 1 A B C D
T15 Beach nourishment 5 53% A B C D
T16 Desalination 5 47% A B C D
T18 Drought and water conservation plans 6 75% 0 A B C D
T17 Coastal protection structures 6 25% 0 A B C D
T19 Mainstreaming Disaster Risk Management (DRM) 7 80% 0 A B C D
T20 Using water to cope with heat waves 7 20% A B C D
T21 Fire management plans 8 73% 1 A B C D
T22 Health care delivery systems 8 27% 1 A B C D
T24 Pre-disaster early recovery planning 9 67% 1 A B C D
T23 Post-Disaster recovery funds 9 33% 1 A B C D
T4 Monitoring, modelling and forecasting systems 10 72% 1 A B C D
T3 Adaptation of groundwater management 10 28% 1 A B C D
T6 River rehabilitation and restoration 11 53% 1 A B C D
T5 Dune restoration and rehabilitation 11 47% 1 A B C D
T7 Adaptive management of natural habitats 12 53% 1 A B C D
T8 Ocean pools 12 47% 1 A B C D
APT A APT B APT C APT DMax_RatioID Name Class number Ratio

127
Figure 61 - Adaptation options for the tourism sector analysed by class (top) and by symmetry in stakeholder preference (bottom). Options are
identified with an ID number, full name, and class of adaptation number. Adaptation objectives are identified in each option by colour:
vulnerability reduction (red), Disaster Risk Reduction (blue); Social-Ecological Resilience (green). Each
ATP (APT A; APT B; APT C; APT D) is represented in three timeframes: S - Short term (up to 2030), M- Medium term (up to 2050), L -
Long term (until 2100). Highlighted options indicate the measure was selected in each ATP and timeframe: ATP A – Minimum Intervention (light
blue); ATP B – Economic Capacity Expansion (light green); ATP C – Efficiency Enhancement (Light orange) and ATP D – System
Restructuring (light purple). Bold letters in each ATP indicate the option was available to be selected in the three time frames. Grey cells mean that
they the options was not available in that APT.
S M L S M L S M L S M L
T1 Economic Policy Instruments (EPIs) 1 83% 1 A B C D
T19 Mainstreaming Disaster Risk Management (DRM) 7 80% A B C D
T18 Drought and water conservation plans 6 75% A B C D
T21 Fire management plans 8 73% A B C D
T4 Monitoring, modelling and forecasting systems 10 72% 1 A B C D
T24 Pre-disaster early recovery planning 9 67% 1 A B C D
T14 Water restrictions, consumption cuts and grey-water recycling 4 63% 1 A B C D
T9 Activity and product diversification 2 55% 1 A B C D
T7 Adaptive management of natural habitats 12 53% 1 A B C D
T6 River rehabilitation and restoration 11 53% 1 A B C D
T15 Beach nourishment 5 53% A B C D
T12 Tourist awareness campaigns 3 53% 1 A B C D
T11 Local circular economy 3 47% 1 A B C D
T16 Desalination 5 47% 0 A B C D
T5 Dune restoration and rehabilitation 11 47% 1 A B C D
T8 Ocean pools 12 47% 0 A B C D
T10 Public awareness programmes 2 45% 1 A B C D
T13 Local sustainable fishing 4 37% 1 A B C D
T23 Post-Disaster recovery funds 9 33% 1 A B C D
T3 Adaptation of groundwater management 10 28% 1 A B C D
T22 Health care delivery systems 8 27% 1 A B C D
T17 Coastal protection structures 6 25% 0 A B C D
T20 Using water to cope with heat waves 7 20% A B C D
T2 Financial incentives to retreat from high-risk areas 1 17% A B C D
Max_RatioAPT A APT B APT C APT D
ID Name Class number Ratio

128
Sustainability Performance
Figure 62 - Pathways evaluation for the tourism sector considering: Cost Efficiency; Environmental protection; Mitigation (GHG emissions) win-wins
and trade-offs; Technical applicability; Social acceptability. The policy pathways scenarios: APT A - Minimum Intervention; APT B - Economic
Capacity Expansion (ECE); APT C- Efficiency Enhancement (EE); APT D - System Restructuring (SR), for different timeframes: S - Short
term (up to 2030), M- Medium term (up to 2050), L - Long term (until 2100)

129
6.11.2 Maritime Transport
Maritime transport pathways are based on choices made by 6 expert island stakeholders.
Selected Adaptation Pathways
In the following figures have been reported the Adaptation options for the Maritime Transport sector
analysed by class and by symmetry.
Options are identified with an ID number, full name, and class of adaptation number.
Adaptation objectives are identified in each option by colour: vulnerability reduction (red), Disaster Risk
Reduction (blue); Social-Ecological Resilience (green); Local Knowledge adaptation options (grey). Each
ATP (APT A; APT B; APT C; APT D) is represented in three timeframes: S - Short term (up to 2030),
M- Medium term (up to 2050), L - Long term (until 2100). Bold letters in each ATP indicate the option
was available to be selected in the three time frames. Highlighted options indicate the measure was selected
in each ATP and timeframe: ATP A (light blue); ATP B (light green); ATP C (Light orange) and ATP D
(light purple). Space with colour: option was selected for the timeframe: Short term, Medium term, or
Long term. Bold letter: option is available in the APT.
Figure 63 - Adaptation options for the Maritime Transport sector analysed by class (top) and by symmetry in stakeholder preference (bottom).
Options are identified with an ID number, full name, and class of adaptation number. Adaptation objectives are identified in each option by colour:
vulnerability reduction (red), Disaster Risk Reduction (blue); Social-Ecological Resilience (green). Each
ATP (APT A; APT B; APT C; APT D) is represented in three timeframes: S - Short term (up to 2030), M- Medium term (up to 2050), L -
Long term (until 2100). Highlighted options indicate the measure was selected in each ATP and timeframe: ATP A – Minimum Intervention (light
blue); ATP B – Economic Capacity Expansion (light green); ATP C – Efficiency Enhancement (Light orange) and ATP D – System
Restructuring (light purple). Bold letters in each ATP indicate the option was available to be selected in the three time frames. Grey cells mean that
they the options was not available in that APT.
S M L S M L S M L S M L
MT2 Financial incentives to retreat from high-risk areas 1 64% A B C D
MT1 Insurance mechanisms for ports 1 36% A B C D
MT10 Social dialogue for training in the port sector 2 64% 0 A B C D
MT9 Awareness campaigns for behavioural change 2 36% 0 A B C D
MT12 Climate resilient economy and jobs 3 83% 0 A B C D
MT11 Diversification of trade using climate resilient commodities 3 17% A B C D
MT14 Restrict development and settlement in low-lying areas 4 67% A B C D
MT13 Refrigeration, cooling and ventilation systems 4 33% 1 A B C D
MT16 Increase operational speed and flexibility in ports 5 94% 1 A B C D
MT15 Sturdiness improvement of vessels 5 6% 1 A B C D
MT17 Climate proof ports and port activities 6 61% 1 A B C D
MT18 Consider expansion/retreat of ports in urban planning 6 39% 1 A B C D
MT20 Early Warning Systems (EWS) and climate change monitoring 7 61% 1 A B C D
MT19 Reinforcement of inspection, repair and maintenance of
infrastructures
7 39% 1 A B C D
MT21 Inteligent Transport Systems (ITS) 8 94% 1 A B C D
MT22 Prepare for service delays or cancellations 8 6% 1 A B C D
MT23 Backup routes and infrastructures during extreme weather 9 69% 1 A B C D
MT24 Post-Disaster recovery funds 9 31% 1 A B C D
MT4 Combined protection and wave energy infrastructures 10 60% 1 A B C D
MT3 Marine life friendly coastal protection structures 10 40% 1 A B C D
MT6 Coastal protection structures 11 53% 1 A B C D
MT5 Hybrid and full electric ship propulsion 11 47% 1 A B C D
MT7 Integrate ports in urban tissue 12 72% 1 A B C D
MT8 Ocean pools 12 28% 0 A B C D
Max_RatioID Name Class number RatioAPT A APT B APT C APT D

130
Figure 64 - Adaptation options for the Maritime Transport sector analysed by symmetry (adaptation objectives are identified in each option by colour:
vulnerability reduction (red), Disaster Risk Reduction (blue); Social-Ecological Resilience (green); Local
Knowledge adaptation options (grey). Each ATP (APT A; APT B; APT C; APT D) is represented in three timeframes: S - Short term (up to
2030), M- Medium term (up to 2050), L - Long term (until 2100). Bold letters in each ATP indicate the option was available to be selected in the
three time frames. Highlighted options indicate the measure was selected in each ATP and timeframe: ATP A (light blue); ATP B (light green);
ATP C (Light orange) and ATP D (light purple). Space with colour: option was selected for the timeframe: Short term, Medium term, or Long
term. Bold letter: option is available in the APT.
Sustainability Performance
Figure 65 - Pathways evaluation for the maritime transport sector considering: Cost Efficiency; Environmental protection; Mitigation (GHG
emissions) win-wins and trade-offs; Technical applicability; Social acceptability. The policy pathways scenarios: APT A - Minimum Intervention;
APT B - Economic Capacity Expansion (ECE); APT C- Efficiency Enhancement (EE); APT D - System Restructuring (SR), for different
timeframes: S - Short term (up to 2030), M- Medium term (up to 2050), L - Long term (until 2100)
S M L S M L S M L S M L
MT21 Inteligent Transport Systems (ITS) 8 94% 1 A B C D
MT16 Increase operational speed and flexibility in ports 5 94% 1 A B C D
MT12 Climate resilient economy and jobs 3 83% 1 A B C D
MT7 Integrate ports in urban tissue 12 72% 1 A B C D
MT23 Backup routes and infrastructures during extreme weather 9 69% 1 A B C D
MT14 Restrict development and settlement in low-lying areas 4 67% A B C D
MT10 Social dialogue for training in the port sector 2 64% 1 A B C D
MT2 Financial incentives to retreat from high-risk areas 1 64% A B C D
MT20 Early Warning Systems (EWS) and climate change monitoring 7 61% 1 A B C D
MT17 Climate proof ports and port activities 6 61% 1 A B C D
MT4 Combined protection and wave energy infrastructures 10 60% 1 A B C D
MT6 Coastal protection structures 11 53% 1 A B C D
MT5 Hybrid and full electric ship propulsion 11 47% 1 A B C D
MT3 Marine life friendly coastal protection structures 10 40% 1 A B C D
MT18 Consider expansion/retreat of ports in urban planning 6 39% 1 A B C D
MT19
Reinforcement of inspection, repair and maintenance of
infrastructures7 39% A B C D
MT1 Insurance mechanisms for ports 1 36% 1 A B C D
MT9 Awareness campaigns for behavioural change 2 36% 1 A B C D
MT13 Refrigeration, cooling and ventilation systems 4 33% A B C D
MT24 Post-Disaster recovery funds 9 31% 1 A B C D
MT8 Ocean pools 12 28% 1 A B C D
MT11 Diversification of trade using climate resilient commodities 3 17% 1 A B C D
MT15 Sturdiness improvement of vessels 5 6% A B C D
MT22 Prepare for service delays or cancellations 8 6% 1 A B C D
Max_RatioAPT A APT B APT C APT D
ID Name Class number Ratio

131
6.11.3 Energy
Energy pathways are based on choices made by 7 expert island stakeholders.
Selected Adaptation Pathways
In the following figures have been reported the Adaptation options for the Energy analysed by class and
by symmetry.
Options are identified with an ID number, full name, and class of adaptation number.
Adaptation objectives are identified in each option by colour: vulnerability reduction (red), Disaster Risk
Reduction (blue); Social-Ecological Resilience (green); Local Knowledge adaptation options (grey). Each
ATP (APT A; APT B; APT C; APT D) is represented in three timeframes: S - Short term (up to 2030),
M- Medium term (up to 2050), L - Long term (until 2100). Bold letters in each ATP indicate the option
was available to be selected in the three time frames. Highlighted options indicate the measure was selected
in each ATP and timeframe: ATP A (light blue); ATP B (light green); ATP C (Light orange) and ATP D
(light purple). Space with colour: option was selected for the timeframe: Short term, Medium term, or
Long term. Bold letter: option is available in the APT.
S M L S M L S M L S M L
E1 Financial support for buildings with low energy needs 1 71% 0 A B C D
E2 Financial support for smart control of energy in houses and
buildings
1 29% 0 A B C D
E9 Green jobs and businesses 2 69% 1 A B C D
E10 Public information service on climate action 2 31% 1 A B C D
E11 Small scale production and consumption (prosumers) 3 62% 1 A B C D
E12 Risk reporting platform 3 38% A B C D
E13 Energy storage systems 4 64% 1 A B C D
E14 Collection and storage of forest fuel loads 4 36% 1 A B C D
E16 Demand Side Mangement (DSM) of Energy 5 67% 1 A B C D
E15 SeaWater Air Conditioning (SWAC). 5 33% 1 A B C D
E17 Review building codes of the energy infrastructure 6 51% 1 A B C D
E18 Upgrade evaporative cooling systems 6 49% 1 A B C D
E20 Grid reliability 7 67% 1 A B C D
E19 Early Warning Systems (EWS) 7 33% 1 A B C D
E21 Study and develop energy grid connections 8 71% 1 A B C D
E22 Energy-independent facilities (generators) 8 29% 1 A B C D
E23 Energy recovery microgrids 9 57% 1 A B C D
E24 Local recovery energy outage capacity 9 43% 1 A B C D
E3 Energy efficiency in urban water management 10 50% 1 A B C D
E4 Underground tubes and piping in urban planning 10 50% 1 A B C D
E6 Urban green corridors 11 55% A B C D
E5 Biomass power from household waste 11 45% 0 A B C D
E7 Educational garden plots 12 52% 1 A B C D
E8 Heated pools with waste heat from power plants 12 48% A B C D
Max_RatioID Name Class number RatioAPT A APT B APT C APT D

132
Figure 66 - Adaptation options for the energy sector analysed by class (top) and by symmetry in stakeholder preference (bottom). Options are identified
with an ID number, full name, and class of adaptation number. Adaptation objectives are identified in each option by colour: vulnerability
reduction (red), Disaster Risk Reduction (blue); Social-Ecological Resilience (green). Each ATP (APT A;
APT B; APT C; APT D) is represented in three timeframes: S - Short term (up to 2030), M- Medium term (up to 2050), L - Long term (until
2100). Highlighted options indicate the measure was selected in each ATP and timeframe: ATP A – Minimum Intervention (light blue); ATP B –
Economic Capacity Expansion (light green); ATP C – Efficiency Enhancement (Light orange) and ATP D – System Restructuring (light purple).
Bold letters in each ATP indicate the option was available to be selected in the three time frames. Grey cells mean that they the options was not
available in that APT.
Sustainability Performance
Figure 67 - Pathways evaluation for the energy sector considering: Cost Efficiency; Environmental protection; Mitigation (GHG emissions) win-wins
and trade-offs; Technical applicability; Social acceptability. The policy pathways scenarios: APT A - Minimum Intervention; APT B - Economic
Capacity Expansion (ECE); APT C- Efficiency Enhancement (EE); APT D - System Restructuring (SR), for different timeframes: S - Short
term (up to 2030), M- Medium term (up to 2050), L - Long term (until 2100)
S M L S M L S M L S M L
E21 Study and develop energy grid connections 8 71% 1 A B C D
E1 Financial support for buildings with low energy needs 1 71% A B C D
E9 Green jobs and businesses 2 69% 1 A B C D
E20 Grid reliability 7 67% 1 A B C D
E16 Demand Side Mangement (DSM) of Energy 5 67% 1 A B C D
E13 Energy storage systems 4 64% 1 A B C D
E11 Small scale production and consumption (prosumers) 3 62% A B C D
E23 Energy recovery microgrids 9 57% 1 A B C D
E6 Urban green corridors 11 55% 1 A B C D
E7 Educational garden plots 12 52% 1 A B C D
E17 Review building codes of the energy infrastructure 6 51% 1 A B C D
E3 Energy efficiency in urban water management 10 50% 1 A B C D
E4 Underground tubes and piping in urban planning 10 50% 1 A B C D
E18 Upgrade evaporative cooling systems 6 49% 1 A B C D
E8 Heated pools with waste heat from power plants 12 48% A B C D
E5 Biomass power from household waste 11 45% 1 A B C D
E24 Local recovery energy outage capacity 9 43% 1 A B C D
E12 Risk reporting platform 3 38% A B C D
E14 Collection and storage of forest fuel loads 4 36% 1 A B C D
E15 SeaWater Air Conditioning (SWAC). 5 33% 1 A B C D
E19 Early Warning Systems (EWS) 7 33% 1 A B C D
E10 Public information service on climate action 2 31% 1 A B C D
E2 Financial support for smart control of energy in houses and
buildings
1 29% 1 A B C D
E22 Energy-independent facilities (generators) 8 29% 1 A B C D
ID Name Class number Ratio Max_RatioAPT A APT B APT C APT D

133
6.11.4 Aquaculture
Aquaculture pathways are based on choices made by 6 expert island stakeholders.
Selected Adaptation Pathways
Figure 68 - Adaptation options for the aquaculture sector analysed by class (top) and by symmetry in stakeholder preference (bottom). Options are
identified with an ID number, full name, and class of adaptation number. Adaptation objectives are identified in each option by colour:
vulnerability reduction (red), Disaster Risk Reduction (blue); Social-Ecological Resilience (green). Each
S M L S M L S M L S M L
A2 Tax benefits and subsidies 1 67% 0 A B C D
A1 Financial schemes, insurance and loans 1 33% 1 A B C D
A9 Awareness campaigns for behavioural change 2 57% 1 A B C D
A10 Efficient feed management 2 43% 1 A B C D
A11 Addressing consumer and environmental concerns at the local
level
3 72% 1 A B C D
A12 Promote cooperation to local consumption 3 28% 1 A B C D
A13 Integrated multi-trophic aquaculture (IMTA) 4 89% 1 A B C D
A14 Short-cycle aquaculture 4 11% 1 A B C D
A15 Recirculation Aquaculture Systems (RAS) 5 67% 1 A B C D
A16 Submersible cages 5 33% 1 A B C D
A17 Climate proof aquaculture activities 6 51% 1 A B C D
A18 Risk-based zoning and site selection 6 49% 1 A B C D
A20 Environmental monitoring and Early Warning Systems (EWS) 7 89% 1 A B C D
A19 Disease prevention methods 7 11% 1 A B C D
A21 Mainstreaming Disaster Risk Management (DRM) 8 61% A B C D
A22 Contingency for emergency management, early
harvest and/or relocation
8 39% 1 A B C D
A23 Recovery Post-Disaster plans 9 53% A B C D
A24 Recovery Post-Disaster funds 9 47% 1 A B C D
A4 Species selection 10 65% A B C D
A3 Feed production 10 35% 0 A B C D
A6 Best Management Practices 11 75% A B C D
A5 Selective breeding 11 25% 0 A B C D
A7 Create educational visits 12 56% 1 A B C D
A8 Promote aquaculture cuisine 12 44% A B C D
APT A APT B APT C APT DMax_RatioID Name Class number Ratio
S M L S M L S M L S M L
A20 Environmental monitoring and Early Warning Systems (EWS) 7 89% 1 A B C D
A13 Integrated multi-trophic aquaculture (IMTA) 4 89% 1 A B C D
A6 Best Management Practices 11 75% 1 A B C D
A11 Addressing consumer and environmental concerns at the local
level
3 72% 1 A B C D
A15 Recirculation Aquaculture Systems (RAS) 5 67% 1 A B C D
A2 Tax benefits and subsidies 1 67% 0 A B C D
A4 Species selection 10 65% 1 A B C D
A21 Mainstreaming Disaster Risk Management (DRM) 8 61% 1 A B C D
A9 Awareness campaigns for behavioural change 2 57% 1 A B C D
A7 Create educational visits 12 56% A B C D
A23 Recovery Post-Disaster plans 9 53% A B C D
A17 Climate proof aquaculture activities 6 51% 1 A B C D
A18 Risk-based zoning and site selection 6 49% 1 A B C D
A24 Recovery Post-Disaster funds 9 47% 1 A B C D
A8 Promote aquaculture cuisine 12 44% A B C D
A10 Efficient feed management 2 43% 1 A B C D
A22 Contingency for emergency management, early
harvest and/or relocation
8 39% 1 A B C D
A3 Feed production 10 35% 1 A B C D
A1 Financial schemes, insurance and loans 1 33% 1 A B C D
A16 Submersible cages 5 33% 1 A B C D
A12 Promote cooperation to local consumption 3 28% 1 A B C D
A5 Selective breeding 11 25% 1 A B C D
A14 Short-cycle aquaculture 4 11% 1 A B C D
A19 Disease prevention methods 7 11% 1 A B C D
APT DID Name Class number Ratio Max_Ratio
APT A APT B APT C

134
ATP (APT A; APT B; APT C; APT D) is represented in three timeframes: S - Short term (up to 2030), M- Medium term (up to 2050), L -
Long term (until 2100). Highlighted options indicate the measure was selected in each ATP and timeframe: ATP A – Minimum Intervention (light
blue); ATP B – Economic Capacity Expansion (light green); ATP C – Efficiency Enhancement (Light orange) and ATP D – System
Restructuring (light purple). Bold letters in each ATP indicate the option was available to be selected in the three time frames. Grey cells mean that
they the options was not available in that APT.
Sustainability Performance
Figure 69 - Pathways evaluation for the aquaculture sector considering: Cost Efficiency; Environmental protection; Mitigation (GHG emissions)
win-wins and trade-offs; Technical applicability; Social acceptability. The policy pathways scenarios: APT A - Minimum Intervention; APT B -
Economic Capacity Expansion (ECE); APT C- Efficiency Enhancement (EE); APT D - System Restructuring (SR), for different timeframes: S -
Short term (up to 2030), M- Medium term (up to 2050), L - Long term (until 2100)

135
6.12 Sicily
For these Islands two online webinars were made and spoken in Italian, with the presentations in Italian
and the Online Survey Tool with the options and classes in Italian as well. There were no Local knowledge
options proposed by the IFP (OTIE) and the characterization of all adaptation options was made by the
IFP.
More information about this Island: see Island Report for the Island.
6.12.1 Tourism
Tourism pathways are based on choices made by 6 expert island stakeholders.
Selected Adaptation Pathways
S M L S M L S M L S M L
T1 Economic Policy Instruments (EPIs) 1 56% 1 A B C D
T2 Financial incentives to retreat from high-risk areas 1 44% 1 A B C D
T9 Activity and product diversification 2 58% 1 A B C D
T10 Public awareness programmes 2 42% 1 A B C D
T11 Local circular economy 3 61% 1 A B C D
T12 Tourist awareness campaigns 3 39% 1 A B C D
T13 Local sustainable fishing 4 58% 1 A B C D
T14 Water restrictions, consumption cuts and grey-water recycling 4 42% 1 A B C D
T15 Beach nourishment 5 61% 1 A B C D
T16 Desalination 5 39% 1 A B C D
T18 Drought and water conservation plans 6 53% 1 A B C D
T17 Coastal protection structures 6 47% 1 A B C D
T19 Mainstreaming Disaster Risk Management (DRM) 7 56% 1 A B C D
T20 Using water to cope with heat waves 7 44% 1 A B C D
T22 Health care delivery systems 8 67% 1 A B C D
T21 Fire management plans 8 33% 1 A B C D
T24 Pre-disaster early recovery planning 9 67% 1 A B C D
T23 Post-Disaster recovery funds 9 33% 1 A B C D
T4 Monitoring, modelling and forecasting systems 10 61% 1 A B C D
T3 Adaptation of groundwater management 10 39% 1 A B C D
T6 River rehabilitation and restoration 11 64% 1 A B C D
T5 Dune restoration and rehabilitation 11 36% 1 A B C D
T7 Adaptive management of natural habitats 12 72% 1 A B C D
T8 Ocean pools 12 28% 0 A B C D
ID Name Class number RatioAPT A APT B APT C APT D
Max_Ratio

136
Figure 70 - Adaptation options for the tourism sector by class (on top) and by order of stakeholder preference (bottom). Options are identified with an
ID number, full name, and class of adaptation number. Adaptation objectives are identified in each option by colour: vulnerability reduction
(red), Disaster Risk Reduction (blue); Social-Ecological Resilience (green). Each ATP (APT A; APT B; APT C;
APT D) is represented in three timeframes: S - Short term (up to 2030), M- Medium term (up to 2050), L - Long term (until 2100). Highlighted
options indicate the measure was selected in each ATP and timeframe: ATP A – Minimum Intervention (light blue); ATP B – Economic Capacity
Expansion (light green); ATP C – Efficiency Enhancement (Light orange) and ATP D – System Restructuring (light purple). Bold letters in each
ATP indicate the option was available to be selected in the three time frames. Grey cells mean that they the options was not available in that APT.
Overall, the adaptation pathways for the Tourism sector in Sicily are characterized by a significant
heterogeneity across the four potential adaptation policy trajectories (APTs) and across adaptation
objectives.
The main measures selected to address vulnerability reduction, indicate that the region is initially centred
on the development of sustainable approach both in short, medium, and long term. Indeed, especially in
APT C the goal is address a circular economy system and sustainable economic activities. But the priority
is for the Natural, Social, Physical and Human Capital rather than the Financial one. This last one is
considered residual in this class and mainly for the short and long term in APT B and D. The selection of
the Financial incentives to retreat in the end of the century is related with the perception that the risks will
continue or increase over time. To adapt via Human Capital (class 2), diversification of the activities and
products in opposition to awareness campaigns should be implemented. Products and activities
diversification are the desired option for all the time and all the APTs. It is the only option with this
consideration.
For Disaster Risk Reduction, and to manage long term risk, the decisions need to be sensible to the level
of investment and reflect the climate change risk identified for the region. Pre-disaster early recovery
planning is a priority for the region in the opposite scenarios, that is APT A and D, for the medium and
long term. In general, for this class the options are selected for the medium or long term and with a
preference for the planning tools. This result highlights a great attention towards a better management
with a long-term planning. In the other case a different combination of investment and commitment is
considered in respect of the first two options.
S M L S M L S M L S M L
T7 Adaptive management of natural habitats 12 72% 1 A B C D
T24 Pre-disaster early recovery planning 9 67% 1 A B C D
T22 Health care delivery systems 8 67% 1 A B C D
T6 River rehabilitation and restoration 11 64% 1 A B C D
T4 Monitoring, modelling and forecasting systems 10 61% 1 A B C D
T15 Beach nourishment 5 61% 1 A B C D
T11 Local circular economy 3 61% 1 A B C D
T13 Local sustainable fishing 4 58% 1 A B C D
T9 Activity and product diversification 2 58% 1 A B C D
T19 Mainstreaming Disaster Risk Management (DRM) 7 56% 1 A B C D
T1 Economic Policy Instruments (EPIs) 1 56% 1 A B C D
T18 Drought and water conservation plans 6 53% 1 A B C D
T17 Coastal protection structures 6 47% 1 A B C D
T2 Financial incentives to retreat from high-risk areas 1 44% 1 A B C D
T20 Using water to cope with heat waves 7 44% 1 A B C D
T10 Public awareness programmes 2 42% 1 A B C D
T14 Water restrictions, consumption cuts and grey-water recycling 4 42% 1 A B C D
T12 Tourist awareness campaigns 3 39% 1 A B C D
T16 Desalination 5 39% 1 A B C D
T3 Adaptation of groundwater management 10 39% 1 A B C D
T5 Dune restoration and rehabilitation 11 36% 1 A B C D
T21 Fire management plans 8 33% 1 A B C D
T23 Post-Disaster recovery funds 9 33% 1 A B C D
T8 Ocean pools 12 28% 0 A B C D
Class number RatioMax_RatioAPT A APT B APT C APT D
ID Name

137
In Social-Ecological Resilience is the most selected option, that is Adaptive management of natural
habitats, included in the Cultural Services. This measure is in APT C for all the times, then is considered
a priority, now and in the future, but only with low investments and a medium level of commitment in
this direction. All the measures of this class are mainly selected for the medium and long term and with a
certain combination of investment and commitment, then often for APT B and C. The actions concerning
the rivers represent a priority in respect of those ones on the sea and there is a special attention to the
planning and monitoring activities. This indicates that the need to prevent negative effects is considered
as urgent.
Sustainability Performance
Figure 71 - Pathways evaluation for the tourism sector considering: Cost Efficiency; Environmental protection; Mitigation (GHG emissions) win-wins
and trade-offs; Technical applicability; Social acceptability. The policy pathways scenarios: APT A - Minimum Intervention; APT B - Economic
Capacity Expansion (ECE); APT C- Efficiency Enhancement (EE); APT D - System Restructuring (SR), for different timeframes: S - Short
term (up to 2030), M- Medium term (up to 2050), L - Long term (until 2100)
The performances of the four ATP scenarios for tourism sector are quite similar for the mid and long
timeframes. In general, scenarios show a high level of social acceptability and technical applicability and a
medium performance for the other variables, that is mitigation win-wins and trade-offs, cost efficiency
and environmental protection.
In the short term, APT C has the best cost efficiency, APT D the best results in terms of environmental
protection and mitigation as well as for social acceptability and technical applicability. In the medium and
long timeframes, APT D (System Restructuring scenario) has the best combination for all the dimensions.
APT Short term (2030) Mid term (2050) Long term (2100) Full pathway
APT A
APT B
APT C
APT D
APT Short term (2030) Mid term (2050) Long term (2100) Full pathway
APT A
APT B
APT C
APT D
Cost Efficiency
Environmentalprotection
Mitigationwin-wins and
trade-offs
Technicalapplicability
SocialAcceptability
Short Term
A B C D
Cost Efficiency
Environmentalprotection
Mitigationwin-wins and
trade-offs
Technicalapplicability
SocialAcceptability
Medium Term
A B C D
Cost Efficiency
Environmentalprotection
Mitigationwin-wins and
trade-offs
Technicalapplicability
SocialAcceptability
Long Term
A B C D
Cost Efficiency
Environmentalprotection
Mitigationwin-wins and
trade-offs
Technicalapplicability
SocialAcceptability
Pathways
A B C D

138
For all the timeframes, the social acceptability and technical applicability record the best results in all the
APTs.
The minimum intervention scenario (APT A) tends to have socially acceptable options and adaptation
solutions with technical applicability. However, in this scenario the pathway has a low performance on
mitigation, environmental protection, and cost efficiency. The scenarios B and C show balanced results
for all the dimension in all the timeframes.
6.12.2 Maritime Transport
Maritime transport pathways are based on choices made by 4 expert island stakeholders.
Selected Adaptation Pathways
S M L S M L S M L S M L
MT1 Insurance mechanisms for ports 1 50% 1 A B C D
MT2 Financial incentives to retreat from high-risk areas 1 50% 1 A B C D
MT10 Social dialogue for training in the port sector 2 67% 1 A B C D
MT9 Awareness campaigns for behavioural change 2 33% 1 A B C D
MT11 Diversification of trade using climate resilient commodities 3 67% 1 A B C D
MT12 Climate resilient economy and jobs 3 33% 1 A B C D
MT13 Refrigeration, cooling and ventilation systems 4 75% 1 A B C D
MT14 Restrict development and settlement in low-lying areas 4 25% 1 A B C D
MT16 Increase operational speed and flexibility in ports 5 58% 1 A B C D
MT15 Sturdiness improvement of vessels 5 42% 1 A B C D
MT17 Climate proof ports and port activities 6 50% 1 A B C D
MT18 Consider expansion/retreat of ports in urban planning 6 50% 1 A B C D
MT20 Early Warning Systems (EWS) and climate change monitoring 7 58% 1 A B C D
MT19 Reinforcement of inspection, repair and maintenance of 7 42% 1 A B C D
MT21 Inteligent Transport Systems (ITS) 8 75% 1 A B C D
MT22 Prepare for service delays or cancellations 8 25% 1 A B C D
MT24 Post-Disaster recovery funds 9 58% 1 A B C D
MT23 Backup routes and infrastructures during extreme weather 9 42% 1 A B C D
MT4 Combined protection and wave energy infrastructures 10 56% 1 A B C D
MT3 Marine life friendly coastal protection structures 10 44% 1 A B C D
MT6 Coastal protection structures 11 54% 1 A B C D
MT5 Hybrid and full electric ship propulsion 11 46% 1 A B C D
MT7 Integrate ports in urban tissue 12 83% 1 A B C D
MT8 Ocean pools 12 17% 1 A B C D
APT A APT B APT C APT DMax_RatioID Name Class number Ratio

139
Figure 72 - Adaptation options for the maritime transport sector analysed by class (top) and by symmetry in stakeholder preference (bottom). Options
are identified with an ID number, full name, and class of adaptation number. Adaptation objectives are identified in each option by colour:
vulnerability reduction (red), Disaster Risk Reduction (blue); Social-Ecological Resilience (green). Each
ATP (APT A; APT B; APT C; APT D) is represented in three timeframes: S - Short term (up to 2030), M- Medium term (up to 2050), L -
Long term (until 2100). Highlighted options indicate the measure was selected in each ATP and timeframe: ATP A – Minimum Intervention (light
blue); ATP B – Economic Capacity Expansion (light green); ATP C – Efficiency Enhancement (Light orange) and ATP D – System
Restructuring (light purple). Bold letters in each ATP indicate the option was available to be selected in the three time frames. Grey cells mean that
they the options was not available in that APT.
The Sicilian maritime transport sector adaptation pathways are characterized by a significant heterogeneity
across the four potential adaptation policy trajectories (APTs). In general, a certain combination of
investment and commitment, then a certain level of concrete involvement emerge for this sector.
As in the Tourism sector, the most selected option for Maritime Transport is in the class of the Social-
Ecological Resilience and it is considered the best for all the timeframes and with a combination of
medium investment and commitment (APT B and C). For this class there is a certain availability in
investment for the medium and long term, mainly concerning the coastal protection, which represent a
priority also in respect of alternative and sustainable propulsions for ships. These ones are selected as
long-term option in APT B and C. Ocean pools are not considered a measure to implement in Sicily. The
orientation is toward the improvement of the infrastructures with medium long-term strategies and
investments.
In the context of Risk Reduction class of adaptation, the selection of the different measures is different
both in terms of timeframes and in terms of combination among investments and commitment. The most
selected measures concern the creation of an Intelligent Transport System but in APT A, then with low
investment and low commitment. The other options are the post disaster recovery (APT A low investment
and commitment) to react to the impacts and the prevention systems to avoid negative effects (APT C –
low investments and medium commitment). The two risk mitigation options are considered equally
desired. Prepare for service delays or cancellations, instead, is not considered as a priority and could be a
strategy only in the short time under APT C and D.
S M L S M L S M L S M L
MT7 Integrate ports in urban tissue 12 83% 1 A B C D
MT21 Inteligent Transport Systems (ITS) 8 75% 1 A B C D
MT13 Refrigeration, cooling and ventilation systems 4 75% 1 A B C D
MT11 Diversification of trade using climate resilient commodities 3 67% 1 A B C D
MT10 Social dialogue for training in the port sector 2 67% 1 A B C D
MT24 Post-Disaster recovery funds 9 58% 1 A B C D
MT20
Early Warning Systems (EWS) and climate change monitoring7 58% 1 A B C D
MT16 Increase operational speed and flexibility in ports 5 58% 1 A B C D
MT4 Combined protection and wave energy infrastructures 10 56% 1 A B C D
MT6 Coastal protection structures 11 54% 1 A B C D
MT17 Climate proof ports and port activities 6 50% 1 A B C D
MT18 Consider expansion/retreat of ports in urban planning 6 50% 1 A B C D
MT1 Insurance mechanisms for ports 1 50% 1 A B C D
MT2 Financial incentives to retreat from high-risk areas 1 50% 1 A B C D
MT5 Hybrid and full electric ship propulsion 11 46% 1 A B C D
MT3 Marine life friendly coastal protection structures 10 44% 1 A B C D
MT15 Sturdiness improvement of vessels 5 42% 1 A B C D
MT19 Reinforcement of inspection, repair and maintenance of 7 42% 1 A B C DMT23 Backup routes and infrastructures during extreme weather 9 42% 1 A B C D
MT9 Awareness campaigns for behavioural change 2 33% 1 A B C D
MT12 Climate resilient economy and jobs 3 33% 1 A B C D
MT14 Restrict development and settlement in low-lying areas 4 25% 1 A B C D
MT22 Prepare for service delays or cancellations 8 25% 1 A B C D
MT8 Ocean pools 12 17% 1 A B C D
Class number RatioMax_RatioAPT A APT B APT C APT D
ID Name

140
For the vulnerability reduction the Physical, Social and Human capital represent a priority option in the
mid-long term for APT C and D. Particularly, all these three options are considered in APT C, then with
a low level of investment and medium commitment, at least for the mid and long term. The financial
instruments are equally preferred. Specifically, the insurance mechanisms fit well in the mid and long term,
while the financial incentives are useful in the short term, in APT B and D. For almost all the measure
included in this class of adaptation, the orientation is towards a certain combination of investment and
commitment, then a certain level of involvement. Only for the Human Capital option the choice is for
APT A.
Sustainability Performance
Figure 73 - Pathways evaluation for the maritime transport sector considering: Cost Efficiency; Environmental protection; Mitigation (GHG
emissions) win-wins and trade-offs; Technical applicability; Social acceptability. The policy pathways scenarios: APT A - Minimum Intervention;
APT B - Economic Capacity Expansion (ECE); APT C- Efficiency Enhancement (EE); APT D - System Restructuring (SR), for different
timeframes: S - Short term (up to 2030), M- Medium term (up to 2050), L - Long term (until 2100)
All four adaptation pathways for the maritime transport sector reveal a similar structure in terms of their
sustainability performance, especially from 2050 up to 2100. These pathways are comprised of measures
that have a relatively high social acceptability and technical acceptability, medium level for mitigation
objectives and cost-efficiency. These sector pathways will not perform in terms of future environmental
protection.
More specifically, APT C has the best general performances in terms of cost efficiency, environmental
protection, and mitigation. APT D has the best results for social acceptability and technical applicability.
Considering the different timeframes, in the short term, APT D has the best combination except than for
the cost efficiency aspect. In the medium and long timeframes, the APT B shows the better mix for all
the dimensions.
All the pathways are characterised by a high degree of social acceptability, especially in the mid-long time.
APT Short term (2030) Mid term (2050) Long term (2100) Full pathway
APT A
APT B
APT C
APT D
APT Short term (2030) Mid term (2050) Long term (2100) Full pathway
APT A
APT B
APT C
APT D
0
1
Cost Efficiency
Environmentalprotection
Mitigationwin-wins and
trade-offs
Technicalapplicability
SocialAcceptability
Short Term
A B C D
Cost Efficiency
Environmentalprotection
Mitigationwin-wins and
trade-offs
Technicalapplicability
SocialAcceptability
Medium Term
A B C D
Cost Efficiency
Environmentalprotection
Mitigationwin-wins and
trade-offs
Technicalapplicability
SocialAcceptability
Long Term
A B C D
Cost Efficiency
Environmentalprotection
Mitigationwin-wins and
trade-offs
Technicalapplicability
SocialAcceptability
Pathways
A B C D

141
6.12.3 Energy
Energy pathways are based on choices made by 3 expert island stakeholders.
Selected Adaptation Pathways
Figure 74 - Adaptation options for the energy sector analysed by class (top) and by symmetry in stakeholder preference (bottom). Options are identified
with an ID number, full name, and class of adaptation number. Adaptation objectives are identified in each option by colour: vulnerability
reduction (red), Disaster Risk Reduction (blue); Social-Ecological Resilience (green). Each ATP (APT A;
APT B; APT C; APT D) is represented in three timeframes: S - Short term (up to 2030), M- Medium term (up to 2050), L - Long term (until
2100). Highlighted options indicate the measure was selected in each ATP and timeframe: ATP A – Minimum Intervention (light blue); ATP B –
S M L S M L S M L S M L
E2 Financial support for smart control of energy in houses and 1 56% 1 A B C D
E1 Financial support for buildings with low energy needs 1 44% 1 A B C D
E9 Green jobs and businesses 2 69% 1 A B C D
E10 Public information service on climate action 2 31% 1 A B C D
E11 Small scale production and consumption (prosumers) 3 67% 1 A B C D
E12 Risk reporting platform 3 33% 1 A B C D
E13 Energy storage systems 4 78% 1 A B C D
E14 Collection and storage of forest fuel loads 4 22% 1 A B C D
E16 Demand Side Mangement (DSM) of Energy 5 56% 1 A B C D
E15 SeaWater Air Conditioning (SWAC). 5 44% 1 A B C D
E17 Review building codes of the energy infrastructure 6 56% 1 A B C D
E18 Upgrade evaporative cooling systems 6 44% 1 A B C D
E20 Grid reliability 7 67% 1 A B C D
E19 Early Warning Systems (EWS) 7 33% 1 A B C D
E21 Study and develop energy grid connections 8 56% 1 A B C D
E22 Energy-independent facilities (generators) 8 44% 1 A B C D
E23 Energy recovery microgrids 9 56% 1 A B C D
E24 Local recovery energy outage capacity 9 44% 1 A B C D
E4 Underground tubes and piping in urban planning 10 56% 1 A B C D
E3 Energy efficiency in urban water management 10 44% 1 A B C D
E5 Biomass power from household waste 11 50% 1 A B C D
E6 Urban green corridors 11 50% 1 A B C D
E8 Heated pools with waste heat from power plants 12 67% 1 A B C D
E7 Educational garden plots 12 33% 0 A B C D
APT A APT B APT C APT DMax_RatioID Name Class number Ratio
S M L S M L S M L S M L
E13 Energy storage systems 4 78% 1 A B C D
E9 Green jobs and businesses 2 69% 1 A B C D
E8 Heated pools with waste heat from power plants 12 67% 1 A B C D
E20 Grid reliability 7 67% 1 A B C D
E11 Small scale production and consumption (prosumers) 3 67% 1 A B C D
E4 Underground tubes and piping in urban planning 10 56% 1 A B C D
E23 Energy recovery microgrids 9 56% 1 A B C D
E21 Study and develop energy grid connections 8 56% 1 A B C D
E17 Review building codes of the energy infrastructure 6 56% 1 A B C D
E16 Demand Side Mangement (DSM) of Energy 5 56% 1 A B C D
E2 Financial support for smart control of energy in houses and 1 56% 1 A B C D
E5 Biomass power from household waste 11 50% 1 A B C D
E6 Urban green corridors 11 50% 1 A B C D
E1 Financial support for buildings with low energy needs 1 44% 1 A B C D
E15 SeaWater Air Conditioning (SWAC). 5 44% 1 A B C D
E18 Upgrade evaporative cooling systems 6 44% 1 A B C D
E22 Energy-independent facilities (generators) 8 44% 1 A B C D
E24 Local recovery energy outage capacity 9 44% 1 A B C D
E3 Energy efficiency in urban water management 10 44% 1 A B C D
E12 Risk reporting platform 3 33% 1 A B C D
E19 Early Warning Systems (EWS) 7 33% 1 A B C D
E7 Educational garden plots 12 33% 1 A B C D
E10 Public information service on climate action 2 31% 1 A B C D
E14 Collection and storage of forest fuel loads 4 22% 1 A B C D
ID Name Class number Ratio Max_RatioAPT A APT B APT C APT D

142
Economic Capacity Expansion (light green); ATP C – Efficiency Enhancement (Light orange) and ATP D – System Restructuring (light purple).
Bold letters in each ATP indicate the option was available to be selected in the three time frames. Grey cells mean that they the options was not
available in that APT.
In general, the energy sector in Sicily is characterized by heterogeneity concerning the selection of
adaptation options in all adaptation policy trajectories (APTs). APT C is the prevailing combination of
investment and commitment, highlighting as there is a wide awareness about the need to do something
concretely improving the medium- and long-term scenarios.
Across all ATPs, for vulnerability reduction, pathways mainly rely on energy storage systems (Physical
capital; ATP C and D) and green jobs (Human capital; all ATPs). Both the options are considered at least
for the mid and long time. In contrast, public information on climate action (also Human capital; APT B
and C) is not a priority since it is assumed that there is and will be a sufficient level public information in
the island for it to pursue climate action. At the same way, the collection of forest fuel loads is part of
pathways D for the short term, but it relies as last option. The Natural capital and the Financial one are
considered always of equal importance in the context of vulnerability reduction. Moreover, the Financial
capital is considered necessary, almost with equal intensity, and with a certain combination of investment
and commitment, in APT B and D.
For Disaster Risk Reduction, the Grid reliability is the most selected option in APT C, for the mid and
long term. On the opposite, the Early Warning System is not a priority, chosen only in APT C as a short-
term measure. The options within the classes Risk mitigation, Disaster response and Post disaster recovery
have the same distribution of preference. Particularly, the options with the higher percentage (56%) are
valid for the short and the long term, instead the remaining ones are chosen for the medium timeframe.
Moreover, Review building codes and Generators are present in all the APTs for all the timeframes.
Regarding Social-Ecological Resilience, Heated pools with waste heat from power plants is considered
a priority in all the timeframes of APT C. Except that for underground tubes and piping in urban planning,
chosen for all the APTs, the other measures are characterized by a certain degree of investment and
commitment (APT B and C). The options in the Regulating and Maintenance Services class are considered
equally relevant and with the same degree of priority. The educational gardens are not a priority, then it
seems that there is enough awareness and knowledge about climate implication in Energy Sector.

143
Sustainability Performance
Figure 75 - Pathways evaluation for the energy sector considering: Cost Efficiency; Environmental protection; Mitigation (GHG emissions) win-wins
and trade-offs; Technical applicability; Social acceptability. The policy pathways scenarios: APT A - Minimum Intervention; APT B - Economic
Capacity Expansion (ECE); APT C- Efficiency Enhancement (EE); APT D - System Restructuring (SR), for different timeframes: S - Short
term (up to 2030), M- Medium term (up to 2050), L - Long term (until 2100)
In general, the best performance in term of cost efficiency is in APT C, while the APT D has the higher
results for the other dimensions. APT A shows the worst results in all the dimensions, especially in cost
efficiency, mitigation and environ mental protection.
In the short timeframe, APT B provides the best environmental protection, the APT C the best
combination of cost efficiency and mitigation, the APT D the best performances in terms of technical
applicability and social acceptability. In the medium time, cost efficiency has the best results in APT C,
instead APT D prevails in the other dimensions. In the long term, APT C has the best combination for
cost efficiency and technical applicability, while APT D in the other dimensions.
Also, in this case social acceptability shows the higher results in all the APTs and all the timeframes.
APT Short term (2030) Mid term (2050) Long term (2100) Full pathway
APT A
APT B
APT C
APT D
APT Short term (2030) Mid term (2050) Long term (2100) Full pathway
APT A
APT B
APT C
APT D
Cost Efficiency
Environmentalprotection
Mitigationwin-wins and
trade-offs
Technicalapplicability
SocialAcceptability
Short Term
A B C D
Cost Efficiency
Environmentalprotection
Mitigationwin-wins and
trade-offs
Technicalapplicability
SocialAcceptability
Medium Term
A B C D
Cost Efficiency
Environmentalprotection
Mitigationwin-wins and
trade-offs
Technicalapplicability
SocialAcceptability
Long Term
A B C D
Cost Efficiency
Environmentalprotection
Mitigationwin-wins and
trade-offs
Technicalapplicability
SocialAcceptability
Pathways
A B C D

144
6.12.4 Aquaculture
Aquaculture pathways are based on choices made by 4 expert island stakeholders.
Selected Adaptation Pathways
Figure 76 - Adaptation options for the aquaculture sector analysed by class (top) and by symmetry in stakeholder preference (bottom). Options are
identified with an ID number, full name, and class of adaptation number. Adaptation objectives are identified in each option by colour:
vulnerability reduction (red), Disaster Risk Reduction (blue); Social-Ecological Resilience (green). Each
ATP (APT A; APT B; APT C; APT D) is represented in three timeframes: S - Short term (up to 2030), M- Medium term (up to 2050), L -
Long term (until 2100). Highlighted options indicate the measure was selected in each ATP and timeframe: ATP A – Minimum Intervention (light
blue); ATP B – Economic Capacity Expansion (light green); ATP C – Efficiency Enhancement (Light orange) and ATP D – System
Restructuring (light purple). Bold letters in each ATP indicate the option was available to be selected in the three time frames. Grey cells mean that
they the options was not available in that APT.
S M L S M L S M L S M L
A15 Recirculation Aquaculture Systems (RAS) 5 75% 1 A B C D
A13 Integrated multi-trophic aquaculture (IMTA) 4 71% 1 A B C D
A8 Promote aquaculture cuisine 12 67% 1 A B C D
A6 Best Management Practices 11 67% 1 A B C D
A3 Feed production 10 60% 1 A B C D
A20 Environmental monitoring and Early Warning Systems (EWS) 7 58% 1 A B C D
A18 Risk-based zoning and site selection 6 58% 1 A B C D
A12 Promote cooperation to local consumption 3 58% 1 A B C D
A10 Efficient feed management 2 58% 1 A B C D
A23 Recovery Post-Disaster plans 9 54% 1 A B C D
A21 Mainstreaming Disaster Risk Management (DRM) 8 50% 1 A B C D
A22 Contingency for emergency management, early 8 50% 1 A B C D
A1 Financial schemes, insurance and loans 1 50% 1 A B C D
A2 Tax benefits and subsidies 1 50% 1 A B C D
A24 Recovery Post-Disaster funds 9 46% 1 A B C D
A19 Disease prevention methods 7 42% 1 A B C D
A17 Climate proof aquaculture activities 6 42% 1 A B C D
A11 Addressing consumer and environmental concerns at the 3 42% 1 A B C D
A9 Awareness campaigns for behavioural change 2 42% 1 A B C D
A4 Species selection 10 40% 1 A B C D
A7 Create educational visits 12 33% 1 A B C D
A5 Selective breeding 11 33% 1 A B C D
A14 Short-cycle aquaculture 4 29% 1 A B C D
A16 Submersible cages 5 25% 1 A B C D
APT DID Name Class number Ratio Max_Ratio
APT A APT B APT C
S M L S M L S M L S M L
A1 Financial schemes, insurance and loans 1 50% 1 A B C D
A2 Tax benefits and subsidies 1 50% 1 A B C D
A10 Efficient feed management 2 58% 1 A B C D
A9 Awareness campaigns for behavioural change 2 42% 1 A B C D
A12 Promote cooperation to local consumption 3 58% 1 A B C D
A11 Addressing consumer and environmental concerns at the 3 42% 1 A B C D
A13 Integrated multi-trophic aquaculture (IMTA) 4 71% 1 A B C D
A14 Short-cycle aquaculture 4 29% 1 A B C D
A15 Recirculation Aquaculture Systems (RAS) 5 75% 1 A B C D
A16 Submersible cages 5 25% 1 A B C D
A18 Risk-based zoning and site selection 6 58% 1 A B C D
A17 Climate proof aquaculture activities 6 42% 1 A B C D
A20 Environmental monitoring and Early Warning Systems (EWS) 7 58% 1 A B C D
A19 Disease prevention methods 7 42% 1 A B C D
A21 Mainstreaming Disaster Risk Management (DRM) 8 50% 1 A B C D
A22 Contingency for emergency management, early 8 50% 1 A B C D
A23 Recovery Post-Disaster plans 9 54% 1 A B C D
A24 Recovery Post-Disaster funds 9 46% 1 A B C D
A3 Feed production 10 60% 1 A B C D
A4 Species selection 10 40% 1 A B C D
A6 Best Management Practices 11 67% 1 A B C D
A5 Selective breeding 11 33% 1 A B C D
A8 Promote aquaculture cuisine 12 67% 1 A B C D
A7 Create educational visits 12 33% 1 A B C D
Max_RatioID Name Class number RatioAPT A APT B APT C APT D

145
In general, the Aquaculture sector in Sicily is characterized by a heterogeneous selection of adaptation
options in all adaptation policy trajectories (APTs). APT A prevails in Disaster Risk Reduction class of
adaptation, APT B and C are the prevalent choice in Social Ecological Resilience measures, while the
vulnerability reduction is characterized by a certain combination of APT B, C and D. This shows the
degree of commitment and investment associated to each class.
The most selected measures concern vulnerability reduction, that is Recirculation Aquaculture Systems
and Integrated multi-trophic aquaculture. These options are selected for all the timeframes respectively in
APT B for the first one and APT C and D for the other one. Since they are perceived as urgent, a priority,
there is a certain degree of investment and commitment towards them. The measures concerning Human
and Social Capital are selected for all the ATPs and different timeframes and show the same share of
preference within each class. The instruments within the Financial capital measures are considered of
equal importance, so the choice among the two options is indifferent. Short cycle aquaculture and
Submersible cages are the less selected than they do not represent a priority.
For Disaster Risk Reduction, the Disaster response measures are considered of equal relevance, then
the choice among the two options is indifferent. The monitoring and the implementation of a warning
plan are considered a priority option, showing that the prevention measures and tools are fundamental.
All the measures included in this category of class of adaptation have a certain level of relevance for local
experts, indeed they are in all the APTs and in all the timeframes.
Regarding Social-Ecological Resilience, the measures with the higher score are considered for all the
timeframes within the single ATP in which they are selected. Promote aquaculture and Best management
practices consider a different combination of investment and commitment (ATP B and C) but they are
considered valid in the short, medium, and long term. The feed production is the option universally
selected for all the ATPs and the times. In this field the need for measure addressing different aspect
emerges.

146
Sustainability Performance
Figure 77 - Pathways evaluation for the aquaculture sector considering: Cost Efficiency; Environmental protection; Mitigation (GHG emissions) win-
wins and trade-offs; Technical applicability; Social acceptability. The policy pathways scenarios: APT A - Minimum Intervention; APT B -
Economic Capacity Expansion (ECE); APT C- Efficiency Enhancement (EE); APT D - System Restructuring (SR), for different timeframes: S -
Short term (up to 2030), M- Medium term (up to 2050), L - Long term (until 2100)
All the pathways in the Energy sector have a similar evaluation across all timeframes, in general terms.
The APT B has the worst results in terms of cost efficiency, mitigation, and environmental protection.
APT D the best mix in all the dimensions except for the environmental protection for which the APT C
has a higher score.
More specifically, APT D has the best performances in the short period, the APT C in the medium and
long timeframe.
In general, the dimension with the best results are the social and technical ones, especially in mid-long
time. Environmental protection and mitigation record the worst results in all the timeframes and almost
in all the APTs.
APT Short term (2030) Mid term (2050) Long term (2100) Full pathway
APT A
APT B
APT C
APT D
Cost Efficiency
Environmentalprotection
Mitigationwin-wins and
trade-offs
Technicalapplicability
SocialAcceptability
Short Term
A B C D
Cost Efficiency
Environmentalprotection
Mitigationwin-wins and
trade-offs
Technicalapplicability
SocialAcceptability
Medium Term
A B C D
Cost Efficiency
Environmentalprotection
Mitigationwin-wins and
trade-offs
Technicalapplicability
SocialAcceptability
Long Term
A B C D
Cost Efficiency
Environmentalprotection
Mitigationwin-wins and
trade-offs
Technicalapplicability
SocialAcceptability
Pathways
A B C D

147
7 Adaptation Pathways for Blue Economy Sectors in EU Islands
These results regard a main set of islands as they do not include Canary and Baleares data, as they applied
an alternative method of stakeholder engagement, as well as Guadalupe and Martinica (West Indies) who
were not able to attain feedback from stakeholders on time and had little background information available
from the project to complete this task.
The pathways tables are presented bellow and further development on this topic will be produced in future
scientific publications These tables represent the pathways as a result of all stakeholders’ participation
throughout all the islands. This means that the results indicate the general preference of all stakeholders
as a group of islanders, but the preferred AOs may not translate site/island specific needs and preferences.

148
7.1 Aquaculture
Figure 78 - Adaptation options for the aquaculture sector in the main set of Islands. Options are identified with an ID number, full name, and class of adaptation number. Adaptation objectives are identified in each option by colour:
vulnerability reduction (red), Disaster Risk Reduction (blue); Social-Ecological Resilience (green). Each ATP (APT A; APT B; APT C; APT D) is represented in three timeframes: S - Short term
(up to 2030), M- Medium term (up to 2050), L - Long term (until 2100). Highlighted options indicate the measure was selected in each ATP and timeframe: ATP A – Minimum Intervention (light blue); ATP B – Economic Capacity
S M L S M L S M L S M L
A1 Financial schemes, insurance and loans 1 52% A B C D
A2 Tax benefits and subsidies 1 48% A B C D
A10 Efficient feed management 2 54% A B C D
A9 Awareness campaigns for behavioural change 2 46% A B C D
A11 Addressing consumer and environmental concerns at the local
level
3 52% A B C D
A12 Promote cooperation to local consumption 3 48% A B C D
A13 Integrated multi-trophic aquaculture (IMTA) 4 63% A B C D
A14 Short-cycle aquaculture 4 37% A B C D
A16 Submersible cages 5 62% A B C D
A15 Recirculation Aquaculture Systems (RAS) 5 38% A B C D
A18 Risk-based zoning and site selection 6 50% A B C D
A17 Climate proof aquaculture activities 6 50% A B C D
A19 Disease prevention methods 7 53% A B C D
A20 Environmental monitoring and Early Warning Systems (EWS) 7 47% A B C D
A21 Mainstreaming Disaster Risk Management (DRM) 8 60% A B C D
A22 Contingency for emergency management, early
harvest and/or relocation
8 40% A B C D
A23 Recovery Post-Disaster plans 9 60% A B C D
A24 Recovery Post-Disaster funds 9 40% A B C D
A4 Species selection 10 52% A B C D
A3 Feed production 10 48% A B C D
A6 Best Management Practices 11 61% A B C D
A5 Selective breeding 11 39% A B C D
A7 Create educational visits 12 52% A B C D
A8 Promote aquaculture cuisine 12 48% A B C D
APT A APT B APT C APT DMax_RatioID Name Class number Ratio

149
Expansion (light green); ATP C – Efficiency Enhancement (Light orange) and ATP D – System Restructuring (light purple). Bold letters in each ATP indicate the option was available to be selected in the three time frames. Grey cells mean that they the options was not available in that APT.
Figure 79 - Adaptation options for the aquaculture sector in the main set of Islands organised by Ratio ( Selections/possible selections). Options are identified with an ID number, full name, and class of adaptation number.
Adaptation objectives are identified in each option by colour: vulnerability reduction (red), Disaster Risk Reduction (blue); Social-Ecological Resilience (green).
Figure 80 - Pathways evaluation for the aquaculture sector considering: Cost Efficiency; Environmental protection; Mitigation (GHG emissions) win-wins and trade-offs; Technical applicability; Social acceptability. The policy pathways scenarios: APT A - Minimum Intervention; APT B - Economic Capacity Expansion (ECE); APT C- Efficiency Enhancement (EE); APT D - System Restructuring (SR), for different timeframes: S - Short term (up to 2030), M- Medium term (up to 2050), L - Long term (until 2100)
A13 Integrated multi-trophic aquaculture (IMTA) 4 63%
A16 Submersible cages 5 62%
A6 Best Management Practices 11 61%
A21 Mainstreaming Disaster Risk Management (DRM) 8 60%
A23 Recovery Post-Disaster plans 9 60%
A10 Efficient feed management 2 54%
A19 Disease prevention methods 7 53%
A11 Addressing consumer and environmental concerns at the 3 52%
A4 Species selection 10 52%
A7 Create educational visits 12 52%
A1 Financial schemes, insurance and loans 1 52%
A18 Risk-based zoning and site selection 6 50%
A17 Climate proof aquaculture activities 6 50%
A2 Tax benefits and subsidies 1 48%
A8 Promote aquaculture cuisine 12 48%
A3 Feed production 10 48%
A12 Promote cooperation to local consumption 3 48%
A20 Environmental monitoring and Early Warning Systems (EWS) 7 47%
A9 Awareness campaigns for behavioural change 2 46%
A24 Recovery Post-Disaster funds 9 40%
A22 Contingency for emergency management, early 8 40%
A5 Selective breeding 11 39%
A15 Recirculation Aquaculture Systems (RAS) 5 38%
A14 Short-cycle aquaculture 4 37%
ID Name Class number Ratio Max_Ratio
Island (All) Sector Aquaculture Normalized (criteria) results - Used for the island report
APT Short term (2030) Mid term (2050) Long term (2100) Full pathway
APT A
APT B
APT C
APT D
APT Short term (2030) Mid term (2050) Long term (2100) Full pathway
APT A
APT B
APT C
APT D
CostEfficiency
Environmental protection
Mitigationwin-wins and
trade-offs
Technicalapplicability
SocialAcceptability
Short Term
A B C D
CostEfficiency
Environmental protection
Mitigationwin-wins and
trade-offs
Technicalapplicability
SocialAcceptability
Medium Term
A B C D
CostEfficiency
Environmental protection
Mitigationwin-wins and
trade-offs
Technicalapplicability
SocialAcceptability
Long Term
A B C D
CostEfficiency
Environmental protection
Mitigationwin-wins and
trade-offs
Technicalapplicability
SocialAcceptability
Pathways
A B C D

150
Top 3 Selection of Adaptation Options for the Aquaculture Sector
Options Characterization Sources
ID Name Description
A6 Best Management Practices
Implementing Best Management Practices at farms which focus on food safety, fish health, environmental impact (including climate change) and social responsibility. These practices improve the farms capacity to participate in value chains with the aim of improving the overall resilience of the farm. For example, increasing hygiene will improve resilience of species to diseases.
Pedro B. Bueno, 2017 - Adaptation Strategies of The Aquaculture Sector to The Impacts of Climate Change
Barange, M. et al (2018). Impacts of climate change on fisheries and aquaculture: synthesis of current knowledge, adaptation, and mitigation options. FAO
A13
Integrated multi-trophic aquaculture (IMTA)
Integrated multi-trophic aquaculture (IMTA) is an ecosystem-based approach to culture species from different trophic levels (fish, shellfish, seaweeds) in an integrated farm to create balanced systems for environmental sustainability. IMTA can increase resilience due to its tolerance to wider ranges of climatic factors such as temperature and salinity.
Ahmed, N., et al (2019). Global Aquaculture Productivity, Environmental Sustainability, and Climate Change Adaptability. Environmental Management 63, 159–172.
A16 Submersible cages
Submersible cages are oceanic depth-adjustable and can be moved up and down in the sea to escape the worst effects of storms, parasite outbreaks, surface algal blooms and to keep species at an optimal temperature.
Ahmed, N., et al (2019). Global Aquaculture Productivity, Environmental Sustainability, and Climate Change Adaptability. Environmental Management 63, 159–172.
Barange, M. et al (2018). Impacts of climate change on fisheries and aquaculture: synthesis of current knowledge, adaptation, and mitigation options. FAO

151
7.2 Energy
Figure 81 - Adaptation options for the energy sector in the main set of Islands. Options are identified with an ID number, full name, and class of adaptation number. Adaptation objectives are identified in each option by colour: vulnerability reduction (red), Disaster Risk Reduction (blue); Social-Ecological Resilience (green). Each ATP (APT A; APT B; APT C; APT D) is represented in three timeframes: S - Short term (up to 2030), M-
Medium term (up to 2050), L - Long term (until 2100). Highlighted options indicate the measure was selected in each ATP and timeframe: ATP A – Minimum Intervention (light blue); ATP B – Economic Capacity Expansion (light green); ATP C – Efficiency Enhancement (Light orange) and ATP D – System Restructuring (light purple). Bold letters in each ATP indicate the option was available to be selected in the three time frames. Grey cells mean that they the options
was not available in that APT.
S M L S M L S M L S M L
E1 Financial support for buildings with low energy needs 1 47% A B C D
E2 Financial support for smart control of energy in houses and
buildings
1 53% A B C D
E10 Public information service on climate action 2 32% A B C D
E9 Green jobs and businesses 2 68% A B C D
E12 Risk reporting platform 3 36% A B C D
E11 Small scale production and consumption (prosumers) 3 64% A B C D
E14 Collection and storage of forest fuel loads 4 29% A B C D
E13 Energy storage systems 4 71% A B C D
E15 Seawater Air Conditioning (SWAC) 5 37% A B C D
E16 Demand Side Management (DSM) of Energy 5 63% A B C D
E18 Upgrade evaporative cooling systems 6 43% A B C D
E17 Review building codes of the energy infrastructure 6 57% A B C D
E19 Early Warning Systems (EWS) 7 44% A B C D
E20 Grid reliability 7 56% A B C D
E21 Study and develop energy grid connections 8 49% A B C D
E22 Energy-independent facilities (generators) 8 51% A B C D
E24 Local recovery energy outage capacity 9 47% A B C D
E23 Energy recovery microgrids 9 53% A B C D
E4 Underground tubes and piping in urban planning 10 37% A B C D
E3 Energy efficiency in urban water management 10 63% A B C D
E6 Urban green corridors 11 48% A B C D
E5 Biomass power from household waste 11 52% A B C D
E8 Heated pools with waste heat from power plants 12 39% A B C D
E7 Educational garden plots 12 61% A B C D
APT A APT B APT C APT DMax_RatioID Name Class number Ratio

152
E13 Energy storage systems 4 71%
E9 Green jobs and businesses 2 68%
E11 Small scale production and consumption (prosumers) 3 64%
E3 Energy efficiency in urban water management 10 63%
E16 Demand Side Management (DSM) of Energy 5 63%
E7 Educational garden plots 12 61%
E17 Review building codes of the energy infrastructure 6 57%
E20 Grid reliability 7 56%
E23 Energy recovery microgrids 9 53%
E2 Financial support for smart control of energy in houses and 1 53%
E5 Biomass power from household waste 11 52%
E22 Energy-independent facilities (generators) 8 51%
E21 Study and develop energy grid connections 8 49%
E6 Urban green corridors 11 48%
E1 Financial support for buildings with low energy needs 1 47%
E24 Local recovery energy outage capacity 9 47%
E19 Early Warning Systems (EWS) 7 44%
E18 Upgrade evaporative cooling systems 6 43%
E8 Heated pools with waste heat from power plants 12 39%
E15 Seawater Air Conditioning (SWAC) 5 37%
E4 Underground tubes and piping in urban planning 10 37%
E12 Risk reporting platform 3 36%
E10 Public information service on climate action 2 32%
E14 Collection and storage of forest fuel loads 4 29%
ID Name Class number Ratio Max_Ratio
Figure 82 - Adaptation options for the energy sector in the main set of Islands organised by Ratio (
Selections/possible selections). Options are identified with an ID number, full name, and class of adaptation number.
Adaptation objectives are identified in each option by colour: vulnerability reduction (red), Disaster
Risk Reduction (blue); Social-Ecological Resilience (green).
Figure 83 - Pathways evaluation for the energy sector considering: Cost Efficiency; Environmental protection; Mitigation
(GHG emissions) win-wins and trade-offs; Technical applicability; Social acceptability. The policy pathways scenarios:
APT A - Minimum Intervention; APT B - Economic Capacity Expansion (ECE); APT C- Efficiency
Enhancement (EE); APT D - System Restructuring (SR), for different timeframes: S - Short term (up to 2030), M-
Medium term (up to 2050), L - Long term (until 2100)
CostEfficiency
Environmental protection
Mitigationwin-wins and
trade-offs
Technicalapplicability
SocialAcceptability
Short Term
A B C D
CostEfficiency
Environmental protection
Mitigationwin-wins and
trade-offs
Technicalapplicability
SocialAcceptability
Medium Term
A B C D
CostEfficiency
Environmental protection
Mitigationwin-wins and
trade-offs
Technicalapplicability
SocialAcceptability
Long Term
A B C D
CostEfficiency
Environmental protection
Mitigationwin-wins and
trade-offs
Technicalapplicability
SocialAcceptability
Pathways
A B C D

153
Top 3 Selection of Adaptation Options for the Energy Sector
Options Characterization
Sources
ID Name Description
E9 Green jobs and businesses
The promotion of green jobs and businesses consists in training people and supporting green businesses to implement energy solutions across the economy, both in mitigation and adaptation. One example can be the support of research projects to help businesses deal with new technologies relevant to climate action.
Lehr, U. et al., 2012
E11
Small scale production and consumption (prosumers)
Small scale production and consumption (prosumers) aims to promote cooperation by creating economies of scale both in the production and consumption of energy. This allows for a greater use of local renewable resources and waste energy recovery which allow for a better resilience when dealing with climate change events such as heat waves.
Prosumers as New Energy Actors, Leal-Arcas et al., 2018
E13 Energy storage systems
The development of energy storage systems can provide an alternative when the main power sources fail and need time to recover. This allows for a more resilient energy grid while enabling decarbonization and peak levelling at a controlled cost. This includes not only electric batteries (like those in cars and buses), but also other forms of energy storage such as thermal tanks (heat), ice banks (cold) or water height (reversed pumping).
Gallo et.al, 2016
https://www.sciencedirect.com/science/article/pii/S0306261916305967

154
7.3 Maritime Transport
Figure 84 - Adaptation options for the maritime transport sector in the main set of Islands. Options are identified with an ID number, full name, and class of adaptation number. Adaptation objectives are identified in each option by colour:
vulnerability reduction (red), Disaster Risk Reduction (blue); Social-Ecological Resilience (green). Each ATP (APT A; APT B; APT C; APT D) is represented in three timeframes: S - Short term
(up to 2030), M- Medium term (up to 2050), L - Long term (until 2100). Highlighted options indicate the measure was selected in each ATP and timeframe: ATP A – Minimum Intervention (light blue); ATP B – Economic Capacity Expansion (light green); ATP C – Efficiency Enhancement (Light orange) and ATP D – System Restructuring (light purple). Bold letters in each ATP indicate the option was available to be selected in the three time frames. Grey cells mean
that they the options was not available in that APT.
S M L S M L S M L S M L
MT2 Financial incentives to retreat from high-risk areas 1 57% A B C D
MT1 Insurance mechanisms for ports 1 43% A B C D
MT10 Social dialogue for training in the port sector 2 57% A B C D
MT9 Awareness campaigns for behavioural change 2 43% A B C D
MT12 Climate resilient economy and jobs 3 61% A B C D
MT11 Diversification of trade using climate resilient commodities 3 39% A B C D
MT14 Restrict development and settlement in low-lying areas 4 56% A B C D
MT13 Refrigeration, cooling and ventilation systems 4 44% A B C D
MT16 Increase operational speed and flexibility in ports 5 65% A B C D
MT15 Sturdiness improvement of vessels 5 35% A B C D
MT17 Climate proof ports and port activities 6 57% A B C D
MT18 Consider expansion/retreat of ports in urban planning 6 43% A B C D
MT20 Early Warning Systems (EWS) and climate change monitoring 7 56% A B C D
MT19 Reinforcement of inspection, repair and maintenance of
infrastructures
7 44% A B C D
MT21 Intelligent Transport Systems (ITS) 8 61% A B C D
MT22 Prepare for service delays or cancellations 8 39% A B C D
MT23 Backup routes and infrastructures during extreme weather 9 65% A B C D
MT24 Post-Disaster recovery funds 9 35% A B C D
MT4 Combined protection and wave energy infrastructures 10 56% A B C D
MT3 Marine life friendly coastal protection structures 10 44% A B C D
MT6 Coastal protection structures 11 54% A B C D
MT5 Hybrid and full electric ship propulsion 11 46% A B C D
MT7 Integrate ports in urban tissue 12 67% A B C D
MT8 Ocean pools 12 33% A B C D
Max_RatioID Name Class number RatioAPT A APT B APT C APT D

155
Figure 85 - Adaptation options for the maritime transport sector in the main set of Islands organised by Ratio (
Selections/possible selections). Options are identified with an ID number, full name, and class of adaptation number.
Adaptation objectives are identified in each option by colour: vulnerability reduction (red), Disaster Risk
Reduction (blue); Social-Ecological Resilience (green).
Figure 86 - Pathways evaluation for the maritime transport sector considering: Cost Efficiency; Environmental
protection; Mitigation (GHG emissions) win-wins and trade-offs; Technical applicability; Social acceptability. The
policy pathways scenarios: APT A - Minimum Intervention; APT B - Economic Capacity Expansion (ECE);
APT C- Efficiency Enhancement (EE); APT D - System Restructuring (SR), for different timeframes: S - Short
term (up to 2030), M- Medium term (up to 2050), L - Long term (until 2100)
MT7 Integrate ports in urban tissue 12 67%
MT23 Backup routes and infrastructures during extreme weather 9 65%
MT16 Increase operational speed and flexibility in ports 5 65%
MT21 Intelligent Transport Systems (ITS) 8 61%
MT12 Climate resilient economy and jobs 3 61%
MT2 Financial incentives to retreat from high-risk areas 1 57%
MT17 Climate proof ports and port activities 6 57%
MT10 Social dialogue for training in the port sector 2 57%
MT4 Combined protection and wave energy infrastructures 10 56%
MT14 Restrict development and settlement in low-lying areas 4 56%
MT20
Early Warning Systems (EWS) and climate change monitoring7 56%
MT6 Coastal protection structures 11 54%
MT5 Hybrid and full electric ship propulsion 11 46%
MT19
Reinforcement of inspection, repair and maintenance of
infrastructures7 44%
MT13 Refrigeration, cooling and ventilation systems 4 44%
MT3 Marine life friendly coastal protection structures 10 44%
MT9 Awareness campaigns for behavioural change 2 43%
MT18 Consider expansion/retreat of ports in urban planning 6 43%
MT1 Insurance mechanisms for ports 1 43%
MT11 Diversification of trade using climate resilient commodities 3 39%
MT22 Prepare for service delays or cancellations 8 39%
MT15 Sturdiness improvement of vessels 5 35%
MT24 Post-Disaster recovery funds 9 35%
MT8 Ocean pools 12 33%
ID Name Class number RatioMax_Ratio
APT Short term (2030) Mid term (2050) Long term (2100) Full pathway
APT A
APT B
APT C
APT D
APT Short term (2030) Mid term (2050) Long term (2100) Full pathway
APT A
APT B
APT C
APT D
0
1
Cost Efficiency
Environmentalprotection
Mitigation win-wins and trade-
offs
Technicalapplicability
SocialAcceptability
Short Term
A B C D
Cost Efficiency
Environmentalprotection
Mitigationwin-wins and
trade-offs
Technicalapplicability
SocialAcceptability
Medium Term
A B C D
Cost Efficiency
Environmentalprotection
Mitigation win-wins and trade-
offs
Technicalapplicability
SocialAcceptability
Long Term
A B C D
Cost Efficiency
Environmentalprotection
Mitigationwin-wins and
trade-offs
Technicalapplicability
SocialAcceptability
Pathways
A B C D

156
Top 3 Selection of Adaptation Options for the Maritime Transport Sector
Options Characterization Sources
ID Name Description
MT5 Hybrid and full electric ship propulsion
Hybrid and full electric ship propulsion are environmentally friendly for marine life, decreases carbon emissions and can increase ship manoeuvrability which is useful in small ports and under difficult weather conditions. Low speed manoeuvring with conventional engines creates air and water pollution, noise, and fuel consumption. Electrically driven propulsion can address these issues while increasing manoeuvrability using for instance azimuth thrusters.
https://ieeexplore.ieee.org/abstract/document/4802258
Prousalidis, J. et al. (2005).Studying ship electric energy systems with shaft generator. IEEE Electric Ship Technologies Symposium.
MT9 Awareness campaigns for behavioural change
Awareness campaigns for behavioural change aim to increase individuals and organisations’ knowledge about climate change and the risk faced by the maritime transport sector. These campaigns can be targeted to regions affected by a particular climate threat, specific groups of infrastructures or the general transport sector as a whole.
Climate-Adapt metadata adaptation options-awareness campaigns for behavioural change
MT12 Climate resilient economy and jobs
Climate resilient economy and jobs aims to shift the economy and jobs towards a more climate resilient society. Perishable goods and some critical services rely heavily on the marine transport which can be affected by unpredictable extreme weather events. To address this the economy needs to adapt by shifting to products and services that depend less on Just In Time (JIT) operations, using for instance larger stocks.
Assessing the Implications of Climate Change Adaptation on Employment in the EU, European Commission, 2014

157
7.4 Tourism
Figure 87 - Adaptation options for the tourism sector in the main set of Islands. Options are identified with an ID number, full name, and class of adaptation number. Adaptation objectives are identified in each option by colour:
vulnerability reduction (red), Disaster Risk Reduction (blue); Social-Ecological Resilience (green). Each ATP (APT A; APT B; APT C; APT D) is represented in three timeframes: S - Short term
(up to 2030), M- Medium term (up to 2050), L - Long term (until 2100). Highlighted options indicate the measure was selected in each ATP and timeframe: ATP A – Minimum Intervention (light blue); ATP B – Economic Capacity Expansion (light green); ATP C – Efficiency Enhancement (Light orange) and ATP D – System Restructuring (light purple). Bold letters in each ATP indicate the option was available to be selected in the three time frames. Grey cells mean
that they the options was not available in that APT.
S M L S M L S M L S M L
T1 Economic Policy Instruments (EPIs) 1 56% A B C D
T2 Financial incentives to retreat from high-risk areas 1 44% A B C D
T9 Activity and product diversification 2 62% A B C D
T10 Public awareness programmes 2 38% A B C D
T11 Local circular economy 3 66% A B C D
T12 Tourist awareness campaigns 3 34% A B C D
T14 Water restrictions, consumption cuts and grey-water recycling 4 59% A B C D
T13 Local sustainable fishing 4 41% A B C D
T15 Beach nourishment 5 54% A B C D
T16 Desalination 5 46% A B C D
T17 Coastal protection structures 6 50% A B C D
T18 Drought and water conservation plans 6 50% A B C D
T19 Mainstreaming Disaster Risk Management (DRM) 7 69% A B C D
T20 Using water to cope with heat waves 7 31% A B C D
T22 Health care delivery systems 8 51% A B C D
T21 Fire management plans 8 49% A B C D
T24 Pre-disaster early recovery planning 9 62% A B C D
T23 Post-Disaster recovery funds 9 38% A B C D
T4 Monitoring, modelling and forecasting systems 10 56% A B C D
T3 Adaptation of groundwater management 10 44% A B C D
T6 River rehabilitation and restoration 11 52% A B C D
T5 Dune restoration and rehabilitation 11 48% A B C D
T7 Adaptive management of natural habitats 12 68% A B C D
T8 Ocean pools 12 32% A B C D
APT A APT B APT C APT DMax_RatioID Name Class number Ratio

158
Figure 88 - Adaptation options for the tourism sector in the main set of Islands organised by Ratio
(Selections/possible selections). Options are identified with an ID number, full name, and class of adaptation
number. Adaptation objectives are identified in each option by colour: vulnerability reduction (red),
Disaster Risk Reduction (blue); Social-Ecological Resilience (green).
Figure 89 - Pathways evaluation for the tourism sector considering: Cost Efficiency; Environmental protection; Mitigation
(GHG emissions) win-wins and trade-offs; Technical applicability; Social acceptability. The policy pathways scenarios:
APT A - Minimum Intervention; APT B - Economic Capacity Expansion (ECE); APT C- Efficiency Enhancement
(EE); APT D - System Restructuring (SR), for different timeframes: S - Short term (up to 2030), M- Medium term (up
to 2050), L - Long term (until 2100)
APT Short term (2030) Mid term (2050) Long term (2100) Full pathway
APT A
APT B
APT C
APT D
Cost Efficiency
Environmentalprotection
Mitigation win-wins and trade-
offs
Technicalapplicability
SocialAcceptability
Short Term
A B C D
Cost Efficiency
Environmentalprotection
Mitigationwin-wins and
trade-offs
Technicalapplicability
SocialAcceptability
Medium Term
A B C D
Cost Efficiency
Environmentalprotection
Mitigation win-wins and trade-
offs
Technicalapplicability
SocialAcceptability
Long Term
A B C D
Cost Efficiency
Environmentalprotection
Mitigationwin-wins and
trade-offs
Technicalapplicability
SocialAcceptability
Pathways
A B C D

159
Top 3 Selection of Adaptation Options for the Tourism Sector
Options Characterization Sources
ID Name Description
T3 Adaptation of groundwater management
Adaptation of groundwater management can be used to (1) conserve groundwater reservoirs, limiting water use and optimizing water reuse, and (2) restore or increase natural infiltration capacity. Both contribute to adaptation in circumstances of reduced precipitation and sea saltwater intrusion aggravated with groundwater over-exploitation. Different packages of interventions usually include freshwater injection, modifying pumping practice, delayed inflow, artificial recharge, or efficient use of freshwater.
Climate-Adapt/groundwater
T12 Tourist awareness campaigns
Tourist awareness campaigns target behavioural change of visitors and aim to increase tourists (individuals and organisations) knowledge about climate change and the risk faced by tourism destinations. These campaigns can be targeted to regions affected by a particular climate threat, specific groups of visitors or the general tourism sector as a whole.
Climate-Adapt/awareness
T19 Mainstreaming Disaster Risk Management (DRM)
Mainstreaming Disaster Risk Management (DRM) aims to plan and organize DRM along five stages including prevention, protection, preparedness, and response, recovery, and review. Examples include interventions to limit urban development in flood prone areas; identify natural hazard prone areas; develop strategies, arrangements, and procedures to address crises; and post-emergency recovery activities.
Climate-Adapt/crises and disaster

160
7.5 Most Selected Adaptation Options
In this chapter is presented a selection of the top five most selected Adaptation Options (AO) per sector,
across all APTs. These results may benefit from a data clustering involving different island groups, for
them to be more meaningful for Island Adaptation policy. These clusters may be set for Atlantic Islands,
South Mediterranean, North Mediterranean and Baltic, but further study is necessary to find out if this
such a clustering is beneficial or if another approach is necessary.
Figure 90 - Averaged adaptation options and pathways for the aquaculture sector in 5 islands (Corsica, Madeira, Malta, Sardinia, and Sicily).
Options are identified with an ID number, full name, and class of adaptation number. Adaptation objectives are identified in each option by colour:
vulnerability reduction (red), Disaster Risk Reduction (blue); Social-Ecological Resilience (green). Each ATP (APT A; APT B; APT C;
APT D) is represented in three timeframes: S - Short term (up to 2030), M- Medium term (up to 2050), L - Long term (until 2100). Bold letters
in each ATP indicate the option was available to be selected in the three time frames. Highlighted options indicate the measure was selected in each
ATP and timeframe: ATP A (light blue); ATP B (light green); ATP C (Light orange) and ATP D (light purple).
Figure 91 - Averaged adaptation options and pathways for the energy sector in 5 islands (Azores, Cyprus, Madeira, Sardinia, and Sicily).
Options are identified with an ID number, full name, and class of adaptation number. Adaptation objectives are identified in each option by colour:
vulnerability reduction (red), Disaster Risk Reduction (blue); Social-Ecological Resilience (green). Each ATP (APT A; APT B; APT C;
APT D) is represented in three timeframes: S - Short term (up to 2030), M- Medium term (up to 2050), L - Long term (until 2100). Bold letters
in each ATP indicate the option was available to be selected in the three-time frames. Highlighted options indicate the measure was selected in each
ATP and timeframe: ATP A (light blue); ATP B (light green); ATP C (Light orange) and ATP D (light purple).
Figure 92 - Averaged adaptation options and pathways for the maritime transport sector in 5 islands (Azores, Crete, Madeira, Sardinia, and
Sicily). Options are identified with an ID number, full name, and class of adaptation number. Adaptation objectives are identified in each option by
colour: vulnerability reduction (red), Disaster Risk Reduction (blue); Social-Ecological Resilience (green). Each ATP (APT A; APT B;
APT C; APT D) is represented in three timeframes: S - Short term (up to 2030), M- Medium term (up to 2050), L - Long term (until 2100).
Bold letters in each ATP indicate the option was available to be selected in the three-time frames. Highlighted options indicate the measure was selected
in each ATP and timeframe: ATP A (light blue); ATP B (light green); ATP C (Light orange) and ATP D (light purple).
S M L S M L S M L S M L
A13 Integrated multi-trophic aquaculture (IMTA) 4 63% A B C D
A16 Submersible cages 5 62% A B C D
A6 Best Management Practices 11 61% A B C D
A21 Mainstreaming Disaster Risk Management (DRM) 8 60% A B C D
A23 Recovery Post-Disaster plans 9 60% A B C D
APT DID Name Class number Ratio Max_Ratio
APT A APT B APT C
S M L S M L S M L S M L
E13 Energy storage systems 4 71% A B C D
E9 Green jobs and businesses 2 68% A B C D
E11 Small scale production and consumption (prosumers) 3 64% A B C D
E3 Energy efficiency in urban water management 10 63% A B C D
E16 Demand Side Management (DSM) of Energy 5 63% A B C D
ID Name Class number Ratio Max_RatioAPT A APT B APT C APT D
S M L S M L S M L S M L
MT7 Integrate ports in urban tissue 12 67% A B C D
MT23 Backup routes and infrastructures during extreme 9 65% A B C D
MT16 Increase operational speed and flexibility in ports 5 65% A B C D
MT21 Intelligent Transport Systems (ITS) 8 61% A B C D
MT12 Climate resilient economy and jobs 3 61% A B C D
APT A APT B APT C APT DID Name Class number Ratio Max_Ratio

161
Figure 93 - Averaged adaptation options and pathways for the tourism sector in 9 islands (Azores, Corsica, Crete, Cyprus, Fehmarn, Madeira,
Sardinia, and Sicily). Options are identified with an ID number, full name, and class of adaptation number. Adaptation objectives are identified in
each option by colour: vulnerability reduction (red), Disaster Risk Reduction (blue); Social-Ecological Resilience (green). Each ATP (APT
A; APT B; APT C; APT D) is represented in three timeframes: S - Short term (up to 2030), M- Medium term (up to 2050), L - Long term
(until 2100). Bold letters in each ATP indicate the option was available to be selected in the three-time frames. Highlighted options indicate the
measure was selected in each ATP and timeframe: ATP A (light blue); ATP B (light green); ATP C (Light orange) and ATP D (light purple).
Regarding the sustainability performance across the APT some differences can be referenced, although
they will later be revised. This performance is measured regarding the results of the five characterization
criteria of AO. For each sector there is generally a similar performance of the pathways across all APT
contexts, although for the Tourism sector there is a slightly more pronounced difference, as presented
below:
Aquaculture sector:
- Cost Efficiency in APT A and C;
- Environmental protection in APT C
- Mitigation win-wins and trade-offs in APT C;
- Technical applicability in APT A;
- Social Acceptability in APT A (performed better).
Energy sector:
- Cost Efficiency in APT A and B;
- Environmental protection in APT B
- Mitigation win-wins and trade-offs in APT B;
- Technical applicability in APT C;
- Social Acceptability in APT C and D.
Maritime sector:
- Cost Efficiency in APT A and D;
- Environmental protection in APT A and D;
- Mitigation win-wins and trade-offs in APT B;
- Technical applicability in APT A;
- Social Acceptability in APT A.
Tourism sector (here the pathways in the APT contexts performed better).:
- Cost Efficiency in APT A (in APT B the performance was worst)
- Environmental protection in APT C;
- Mitigation win-wins and trade-offs in APT B (in APT D was worst);
- Technical applicability in APT B (in APT D was worst);
- Social Acceptability in APT A (in APT D was worst);
S M L S M L S M L S M L
T19 Mainstreaming Disaster Risk Management (DRM) 7 69% A B C D
T7 Adaptive management of natural habitats 12 68% A B C D
T11 Local circular economy 3 66% A B C D
T24 Pre-disaster early recovery planning 9 62% A B C D
T9 Activity and product diversification 2 62% A B C D
Max_RatioAPT A APT B APT C APT D
ID Name Class number Ratio

162
8 Conclusions and Discussion
8.1 Challenges of implementation for the Methodological Framework
SOCLIMPACT completed a methodological framework which was presented to partners on March 11th,
but due to the Covid-19 pandemic it had to be reshaped to a non-presential format. The Covid-19
contingent Plan (chapter 3.2) was set and in three months an online format participatory process was
created throughout two webinars and using an online survey tool in between them. The proposed method
was a pragmatic compromise between simplicity and scientific relevance that proved to be demanding to
implement, because of three main challenges: 1) the APT concept was difficult to grasp, nevertheless most
of IFPs were able to explore it considering uncertainty related with climate change policy future
developments; 2a) the choice between pairs of adaptation options inside a class of adaptation proved
challenging as some options were referenced as not applicable to some Islands; 2b) the
characterization/evaluation of the adaptation options proved to raise difficulties among IFPs 3) the tool
was referenced to be challenging to explore considering the amount of factors that could be considered
for decisions.
Regarding challenge #1, the APTs were used to address uncertainty in future policy developments, which
can be driven by socio-economical changes. With the goal of better engaging stakeholders some IFPs
made their variations on the original method, giving their own insight about APTs and creating their own
revisions of the materials (changed or added support documents). From IFP experience seems to be
potential benefits in having shorter descriptions of the APTs and with real-world examples.
Regarding challenge #2, the objective to make results comparable between different islands lead to
transversal approach something which is not site (island) specific but rather a generic approach for all
islands11 (2a). This methodological approach may have had the drawback of having stakeholders choosing
options that are not completely in line with what is preconized for the island context. Evaluating
Adaptation Options (2b) per island was a necessary step to create insight regarding each island context
given by how the criteria would apply in.
Regarding challenge #3, there was a need to use a simple, flexible, and robust format for the online survey
tool, which in one package could contain sector and regionalized background information, the available
options, and the results of individual stakeholders. In practice it proved complex for some participants to
make a choice, in a given class, within a given APT, considering the climate risks in the background
information and the time frames for each measure.
8.2 Methodological Framework overview
The method proposed in WP7 was structured and designed to come across with results for each island
and for the Islands as a whole, creating a robust tool, adapted to the circumstances and which face the
pragmatic objective of producing results. In this context, we were able to reflect with local stakeholders
on the implications of adaptation policy choices for the Islands, considering the uncertainty of the future
socio-economic, climate pathways and within the risks assessed and precepted by the stakeholders in each
region.
In this context, it was created a set of adaptation options that were developed for different regions across
European or which are present in sector-specific literature, mainly in Climate-Adapt database. The
adaptation options were grouped in three main objectives: (a) actions to reduce socio-economic
vulnerability; (b) actions that address disaster risk reduction; and (c) actions that affect social-ecological
resilience. In this analysis, we do not reflect on the measures that are occurring in the Islands, for this
11 Something which in itself is a novelty

163
purpose the IFP create an additional list of options (Local Knowledge). The main questions to be address
were related with which policy direction for adaptation policy should be implemented in the future (near
future or far future) in the islands. Some stakeholder remarked that it was quite challenging and confusing
to focus on the mindset of a specific world and make choices based on the APT. It was mentioned that
focussing in one scenario world in more detail could have potentially been more productive. Regardless
of the tool’s complexities, it was considered valuable to end up with a plan outlining general adaptation
trajectory and a combination of options.
The framework implemented proved to be challenging to follow but resulted in an exercise that
stakeholders recognised as useful. For some island stakeholders addressing the subject of adaptation policy
under the context of the blue economy decarbonisation was a first, something which in itself is already
valuable. Doing this while considering adaptation policy uncertainty was in fact challenging but it may
have paved the way for future working groups that need to consider it.
We consider that this methodological framework had ambitious goals that lead to valuable results
regarding adaptation for the blue economy in the European Islands. We consider this implementation to
be a success bearing in mind that this was a first online implementation of such a decision process dealing
with uncertainty, the pandemic context, and the described challenges. The IFPs did considerable efforts
to use the proposed method and, were able to provide these results, as well as insights on the
implementation process itself.
Future developments on the adaptation options should be focus on the establishment of a list that
addresses solutions for all Islands in a more iterative and participative involvement of the local experts.
Due to limitations regarding the context of the project and time availability this objective wasn’t pursued.
The use of non-presential format and individual answers throughout an excel file was referred to have the
advantage of having an effective participation of all stakeholders. Without an active and experience
facilitation, often the round-table workshops or interviewers’ formats are dominated by individuals that
easily express publicly their opinions. When this happens, the final decisions could reflex more the
individual or part of the group perspective and less the group of people participating.
The transdisciplinary approach to understand the climate related risk in Islands captured by the framework
it was necessary to ensure the relevancy, and credibility for stakeholders. The Pathways co‐development
with stakeholders and considering climate change risk (even without as absolute structure perspective) is
key to ensure that scientific questions asked can provide useful responses. The decisions provided
throughout the framework should be considered as a focal point for future discussion between scientists,
practitioners, and citizens in EU-Islands context.

164
9 References
European Commission. Adapting infrastructure to climate change - COM(2013) 216 final (2013). Brussels. Retrieved from https://eur-lex.europa.eu/legal-content/EN/TXT/?uri=CELEX:52013SC0137
GIZ, Zebisch, M., Schneiderbauer, S., Renner, K., Below, T., Brossmann, M., … Schwan, S. (2017). Risk Supplement to the Vulnerability Sourcebook.
Haasnoot, M., Kwakkel, J. H., Walker, W. E., & ter Maat, J. (2013). Dynamic adaptive policy pathways: A method for crafting robust decisions for a deeply uncertain world. Global Environmental Change, 23(2), 485–498. https://doi.org/10.1016/j.gloenvcha.2012.12.006
Hall, J. W., Tran, M., Hickford, A. J., & Nicholls, R. J. (2016). The future of national infrastructure: A system-of-systems approach. (J. W. Hall, M. Tran, A. J. Hickford, & R. J. Nicholls, Eds.), The Future of National Infrastructure: A System-of-Systems Approach. Cambridge University Press. https://doi.org/10.1017/CBO9781107588745
IPCC. (2014). Climate Change 2014: Impacts, Adaptation, and Vulnerability. Part A: Global and Sectoral Aspects. Contribution of Working Group II to the Fifth Assessment Report of the Intergovernmental Panel on Climate Change. (C. B. Field; & V. R. B. D. J. M. D. M. Dokken;, Eds.).
Kebede, A. S., Nicholls, R. J., Allan, A., Arto, I., Cazcarro, I., Fernandes, J. A., … Whitehead, P. W. (2018). Applying the global RCP–SSP–SPA scenario framework at sub-national scale: A multi-scale and participatory scenario approach. Science of The Total Environment, 635, 659–672. https://doi.org/10.1016/J.SCITOTENV.2018.03.368
Kriegler, E., Edmonds, J., Hallegatte, S., Ebi, K. L., Kram, T., Riahi, K., … van Vuuren, D. P. (2014). A new scenario framework for climate change research: The concept of shared climate policy assumptions. Climatic Change, 122(3), 401–414. https://doi.org/10.1007/s10584-013-0971-5
Suckall, N., Tompkins, E. L., Nicholls, R. J., Kebede, A. S., Lázár, A. N., Hutton, C., … Mensah, A. (2018). A framework for identifying and selecting long term adaptation policy directions for deltas. Science of the Total Environment, 633, 946–957. https://doi.org/10.1016/j.scitotenv.2018.03.234
Taylor, A. L., Dessai, S., & Bruine de Bruin, W. (2014). Public perception of climate risk and adaptation in the UK: A review of the literature. Climate Risk Management, 4, 1–16. https://doi.org/10.1016/j.crm.2014.09.001

165
ANNEXES

166
Annex 1 – Adaptation Options List
1.1 Portfolio of Adaptation Options
Aquaculture
Portfolio of Adaptation Options for the Aquaculture Sector
Options Characterization Sources
ID Name Description
A1
Financial schemes, insurance, and loans
Financial schemes, insurance and loans are public or private risk-sharing mechanisms that aim to support farmers to respond to loss of production and infrastructures damages due to extreme weather, such as strong winds, heavy rains, floods, or tidal surges. Additionally, it can provide capital to farm relocation, infrastructure and equipment upgrade, repair or replacement required.
Barange, M. et al (2018). Impacts of climate change on fisheries and aquaculture: synthesis of current knowledge, adaptation, and mitigation options. FAO Fisheries and Aquaculture Technical Paper No. 627. Rome, FAO. 628 pp
A2 Tax benefits and subsidies
Tax benefits and subsidies consists in financial public policy instruments to promote or benefit economic or aquaculture sustainable practices and operator's overall resilience to climate change.
Barange, M. et al (2018). Impacts of climate change on fisheries and aquaculture: synthesis of current knowledge, adaptation, and mitigation options. FAO Fisheries and Aquaculture Technical Paper No. 627. Rome, FAO. 628 pp
A3 Feed production
An important indirect impact to aquaculture is the change in fisheries production due to climate change. Aquaculture of finfish is highly dependent on fisheries for feed ingredients. This already a current problem with many fisheries overexploited and will only intensify in the future. Therefore, alternative feed ingredients are being developed such as insect meal and algae.
A4 Species selection
Species selection consists of selecting species that are less sensitive to changes in the environment, less prone to diseases and less dependent on fish meal and oil. For example, choosing non-carnivorous species reduces food dependence and stocking larger hatchery fingerlings reduces the culture cycle and exposure to diseases.
Barange, M. et al (2018). Impacts of climate change on fisheries and aquaculture: synthesis of current knowledge, adaptation, and mitigation options. FAO Fisheries and Aquaculture Technical Paper No. 627. Rome, FAO. 628 pp
A5 Selective breeding
Selective breeding consists of genetic selection of species or strains with a focus on developing strains with a higher tolerance to changes in temperature, that grow faster, and which are more resilient to diseases. This is done by selecting and mating only the fish with desirable traits as broodfish. For example, choosing species with a wider temperature tolerance range may reduce the risk of future mortality.
Pedro B. Bueno, 2017 - ADAPTATION STRATEGIES OF THE AQUACULTURE SECTOR TO THE IMPACTS OF CLIMATE CHANGE
A6 Best Management Practices
Implementing Best Management Practices at farms which focus on food safety, fish health, environmental impact (including climate change) and social responsibility. These practices improve the farms capacity to participate in value chains with the aim of improving the overall resilience of the farm. For
Pedro B. Bueno, 2017 - ADAPTATION STRATEGIES OF THE AQUACULT
Barange, M. et al (2018). Impacts of climate change on fisheries and aquaculture: synthesis of current knowledge,

167
Portfolio of Adaptation Options for the Aquaculture Sector
Options Characterization Sources
ID Name Description
example, increasing hygiene will improve resilience of species to diseases.
URE SECTOR TO THE IMPACTS OF CLIMATE CHANGE
adaptation, and mitigation options. FAO Technical Paper No. 627. Rome, FAO. 628 pp
A7 Create educational visits
Students, schools, institutes, and organisations can organise visits to the fish farms to learn about aquaculture and the interactions between aquaculture and the environment. These visits can also increase knowledge on different impacts on aquaculture including man-made and climate impacts. Biosecurity should be strictly observed.
A8 Promote aquaculture cuisine
This measure promotes aquaculture via online information and uses local restaurants. Aquaculture itself can be seen as an adaptation measure to climate change as an alternative to wild fisheries, which production and yield will reduce due to climate change. Therefore, promoting aquaculture species in restaurants or setting up specific 'aquaculture' restaurants will provide both a cultural experience and promote farmed products. The online tool highlights the initiative, provides recipes, and aggregates information.
Gastronomy page example
Information page example
A9
Awareness campaigns for behavioural change
Awareness campaigns aim to increase the knowledge of individuals and organisations, it could also be relevant in a region affected by a particular climate threat, groups of stakeholders, and the general public.
Climate-Adapt - metadata adaptation options
A10
Efficient feed management
Efficient feed management practices that reduce the Food Conversion Ratio by using technology or practices to feed more efficient helps to reduce the cost of production and increase environmental standards.
Pedro B. Bueno, 2017 - ADAPTATION STRATEGIES OF THE AQUACULTURE SECTOR TO THE IMPACTS OF CLIMATE CHANGE. FAO
A11
Addressing consumer and environmental concerns at the local level
This option aims to promote economy and jobs to address the future challenges of climate change. The major challenges need to be underlined and linked to the key concerns and impacts on the aquaculture sector.
Integrating aquaculture within local communities
A12
Promote cooperation to local consumption
Cooperation to promote local consumption of aquaculture produced fish specially in tourist sector will reduce the cost of distribution and will improve the creation of add value in local products or by-products in innovative industries.
BASE on Integrating aquaculture within local communities
A13
Integrated multi-trophic aquaculture (IMTA)
Integrated multi-trophic aquaculture (IMTA) is an ecosystem-based approach to culture species from different trophic levels (fish, shellfish, seaweeds) in an integrated farm to create balanced systems for environmental sustainability. IMTA can increase
Ahmed, N., et al(2019). Global Aquaculture Productivity, Environmental Sustainability, and Climate Change Adaptability. Environmental Management 63, 159–172.

168
Portfolio of Adaptation Options for the Aquaculture Sector
Options Characterization Sources
ID Name Description
resilience due to its tolerance to wider ranges of climatic factors such as temperature and salinity.
A14 Short-cycle aquaculture
Short-cycle aquaculture shortens the farming period and the time in marine cages by stocking larger fingerlings in the nursery stage (land-based) or selecting species with a shorter culture cycle.
Pedro B. Bueno, 2017 - ADAPTATION STRATEGIES OF THE AQUACULTURE SECTOR TO THE IMPACTS OF CLIMATE CHANGE. FAO
A15
Recirculation Aquaculture Systems (RAS)
Recirculation Aquaculture Systems (RAS) are land-based indoor fish farms with closed containment rearing systems where filtration is applied to purify and regulate water parameters and remove toxic metabolic wastes of fish. Since RAS is land-based and indoor it limits the risk of infrastructure destruction due to extreme events in the ocean.
Ahmed, N., et al(2019). Global Aquaculture Productivity, Environmental Sustainability, and Climate Change Adaptability. Environmental Management 63, 159–172.
Barange, M. et al (2018). Impacts of climate change on fisheries and aquaculture: synthesis of current knowledge, adaptation, and mitigation options. FAO Technical Paper No. 627. Rome, FAO. 628 pp
A16 Submersible cages
Submersible cages are oceanic depth-adjustable and can be moved up and down in the sea to escape the worst effects of storms, parasite outbreaks, surface algal blooms and to keep species at an optimal temperature.
Ahmed, N., et al(2019). Global Aquaculture Productivity, Environmental Sustainability, and Climate Change Adaptability. Environmental Management 63, 159–172.
Barange, M. et al (2018). Impacts of climate change on fisheries and aquaculture: synthesis of current knowledge, adaptation, and mitigation options. FAO Technical Paper No. 627. Rome, FAO. 628 pp
A17
Climate proof aquaculture activities
Climate-proof activities refer to investments that consider climate change projections to manage future risks to infrastructures and improve operational safety conditions. E.g., strengthening mooring systems, cage structures and nets.
Watkiss, P., Ventura, A. and Poulain, F. 2019. Decision-making and economics of adaptation to climate change in the fisheries and aquaculture sector. FAO Fisheries and Aquaculture Technical Paper No.650. Rome, FAO.
A18
Risk-based zoning and site selection
Risk-based zoning and site selection consists of taking into consideration climate change scenarios when planning and selecting a site for a farm. For example, marine cage operations should not select a site that is (or is expected to be) exposed to high waves or strong currents, and pond farming operations should select sites with low risk of flooding. Zone management can facilitate effective sharing of space and resources with other users, taking into account the carrying capacity of the site.
Pedro B. Bueno, 2017 - ADAPTATION STRATEGIES OF THE AQUACULTURE SECTOR TO THE IMPACTS OF
Barange, M. et al (2018). Impacts of climate change on fisheries and aquaculture: synthesis of current knowledge, adaptation, and mitigation

169
Portfolio of Adaptation Options for the Aquaculture Sector
Options Characterization Sources
ID Name Description
CLIMATE CHANGE
options. FAO Technical Paper No. 627. Rome, FAO. 628 pp
A19 Disease prevention methods
Disease prevention methods are preventive health measures such as vaccines, stronger fingerlings, probiotics, ensuring optimal water quality and implementing stricter hygiene procedures with the aim of reducing the risk of diseases now and in the future.
Pedro B. Bueno, 2017 - ADAPTATION STRATEGIES OF THE AQUACULTURE SECTOR TO THE IMPACTS OF CLIMATE CHANGE. FAO
A20
Environmental monitoring and Early Warning Systems (EWS)
Environmental monitoring and Early Warning Systems (EWS) systematically collects and provides information to fish farmers with the aim of supporting climate risk management decision-making. Monitoring and early warning can facilitate adaptation actions, such as early harvesting or relocation of fish net pens from sites of intense harmful algae blooms. Dynamic vulnerability maps, remote sensing and GIS are typically applied in the development of this type of measures.
EU-funded project: EnviGuard
A21
Mainstreaming Disaster Risk Management (DRM)
This measure aims to plan and organize DRM considering climate change along five stages including prevention, protection, preparedness, and response, recovery and review in the aquaculture decision making and management frameworks. Examples include interventions to limit farm development in natural hazard areas; review safety engineering standards for farms; study the interactions of climate change in local ecosystems and appropriately develop strategies, arrangements, and procedures to address crises; and post-emergency recovery activities.
Barange, M. et al (2018). Impacts of climate change on fisheries and aquaculture: synthesis of current knowledge, adaptation, and mitigation options. FAO Fisheries and Aquaculture Technical Paper No. 627. Rome, FAO. 628 pp
A22
Contingency for emergency management, early harvest and/or relocation
These plans consist in moving produce or activities to sites with more suitable characteristics to protect them against climate hazards such as storms, high waves, temperature changes or water quality degradation. Relocation can mean moving activities within the same environment (ocean-ocean; land-land) or between environments (ocean to land). It also includes protocols emergency harvesting to reduce the stock loss.
Pedro B. Bueno, 2017 - Adaptation Strategies of The Aquaculture Sector to The Impacts Of Climate Change. FAO
A23
Recovery Post-Disaster plans
Establish early recovery good practices and objectives. This option will allow to reduce socio-economic and environmental consequences of the disaster. Examples of good practices are: Identify goods and services (support facilities like boats and docks as well as farm infrastructure) that require restoration.
Adapted From: Methodological Guide for Post-Disaster Recovery Planning Processes

170
Portfolio of Adaptation Options for the Aquaculture Sector
Options Characterization Sources
ID Name Description
A24
Recovery Post-Disaster funds
Create recovery funds and plans for Post-Disaster in Aquaculture with Initiatives to get the economy running quickly, e.g., rebuild damaged critical infrastructures such boats, docks, and farm infrastructure. This option minimizes the economic and social impacts that can occur in a post-disaster context.
International Monetary Fund (IMF)
Prevention Web (UNDRR)
Energy
Portfolio of Adaptation Options for the Energy Sector
Options Characterization Sources
ID Name Description
E1
Financial support for buildings with low energy needs
Financial schemes in the form of loans, subsidies or tax reliefs are ways to support the reduction of energy needs of new or existing buildings, making them address climate change in a more efficient manner. For example, architecture and construction materials that rely on passive thermal comfort reduce the use of energy for human comfort, so less air-conditioning is necessary in the cooling season.
European Energy Performance of Buildings Directive (EPBD, COM(2016) 765 final)
How low should be the energy required by a nearly Zero-Energy Building?
E2
Financial support for smart control of energy in houses and buildings
The support of smart control of energy in houses and buildings allows for an efficient and automated use of energy that enables savings and creates synergies with utilities. For example, such a system could coordinate the automated opening vents with the air conditioning operation, avoiding energy consumption when possible. This will allow for the adaptation of buildings at a controlled cost, while complying with mitigation goals.
European Energy Performance of Buildings Directive (EPBD, COM(2016) 765 final)
https://link.springer.com/content/pdf/10.1007/s10584-009-9576-4.pdf
E3
Energy efficiency in urban water management
Energy efficiency in urban water management is the adaptation of urban design and construction for water conservation that avoids energy use under scarcity scenarios. For instance, Water Sensitive Urban Design (WSUD) aims to plan water conservation and storm water storage with integration with elements of urban design. This both to minimises hydrological impacts on the environment and the associated energy use of water supply.
Adaptation of urban planning: water and energy (2015)
Water Sensitive Urban and building Design (WSUD) (2016)
E4
Underground tubes and piping in urban planning
Underground tubes and piping are used for space heating/cooling across the globe and are more resilient to climate change. These systems can be Earth Air Heat Exchanger (EAHE) and Ground Source Heat Pump (GSHP) types. Both systems use tubes or pipes that
Hybrid ground coupled heat exchanger systems for space heating/cooling applications: A review, Soni et.al, 2016

171
Portfolio of Adaptation Options for the Energy Sector
Options Characterization Sources
ID Name Description
usually need to be buried beyond the footprint of the building or house. The measure considers this need, and both allows and encourages the use of such space in urban planning.
E5
Biomass power from household waste
Biomass power plants burn household waste, waste from parks and public gardens and sludge generated by sewage treatment plants. Towns and cities can also realise urban production and recreational woods, which can be used for producing biomass for co-generation (Combine Heat and Power) as well as tri-generation (Combined Cold Heat and Power) plants.
urbangreenbluegrids
E6 Urban green corridors
Urban green areas decrease the air temperature in a city and thus decrease energy needs. Warm air tends to transport pollution and particulate matter to higher layers of atmosphere, causing a cloud of smog. Creating green corridors also promotes biodiversity, increases the touristic value, and decreases water run-off during storms.
urbanbluegrids/heat and smogformation
urbangreenbluegrids/reduced pave surfaced
E7 Educational garden plots
Educational garden plots are sites where people, especially children, can garden with volunteers one afternoon a week after school. The harvest can be taken home. This creates well-being while having local fresh produce reduces the energy consumption and pollution. These garden plots can be further exploring to educate people about other climate action measures, directly and indirectly related with energy such as waste to energy, composting, water retention and green corridors.
urbangreenbluegrids
E8
Heated pools with waste heat from power plants
Power plants need cooling, and their waste heat can be used in swimming pools for public use and tourism. This creates an attractive leisure activity in off-peak winter times which diversifies the touristic offer and promote community well-being. This type of heat recovery design is called Combined Heat and Power (CHP). Pools provide a heat sink for the power plants which increases efficiency and is useful during heat waves.
Lund, J. W., & Chiasson, A. (2007). Examples of combined heat and power plants using geothermal energy.
Papamarcou, M., Kalogirou, S., 2001 b) Lund, J.W., Chiasson, A., 2007
E9 Green jobs and businesses
The promotion of green jobs and businesses consists in training people and supporting green businesses to implement energy solutions across the economy, both in mitigation and adaptation. One example can be the support of research projects to help businesses deal with new technologies relevant to climate action.
Lehr, U. et al., 2012

172
Portfolio of Adaptation Options for the Energy Sector
Options Characterization Sources
ID Name Description
E10
Public information service on climate action
Public information service on climate action aims to provide the general public with information about adaptation and mitigation options available for their activities and businesses. This includes information dissemination and counselling about available solutions and the public support. This type of information is relevant, for example, to support dwellings, hotels, or commerce to adapt to climate change.
Climate Adapt
E11
Small scale production and consumption (prosumers)
Small scale production and consumption (prosumers) aims to promote cooperation by creating economies of scale both in the production and consumption of energy. This allows for a greater use of local renewable resources and waste energy recovery which allow for a better resilience when dealing with climate change events such as heat waves.
Prosumers as New Energy Actors, Leal-Arcas et al., 2018
E12 Risk reporting platform
Risk reporting platform intends to promote the communication between the general public and the administration bodies concerning the risks related with climate change. It is a platform were the general public reports directly the risks as they become aware of. These can be for example related with cliff instability, trees falling over energy lines, uncleared bushes that can be ignited by power lines or unstable structures that may fall due to strong winds.
City of Seattle (USA)
E13 Energy storage systems
The development of energy storage systems can provide an alternative when the main power sources fail and need time to recover. This allows for a more resilient energy grid while enabling decarbonization and peak levelling at a controlled cost. This includes not only electric batteries (like those in cars and buses), but also other forms of energy storage such as thermal tanks (heat), ice banks (cold) or water height (reversed pumping).
Gallo et.al, 2016
https://www.sciencedirect.com/science/article/pii/S0306261916305967
E14
Collection and storage of forest fuel loads
Collection and storage of forest fuel loads intend to promote and regulate the collection and storage of wood and combustible material to reduce wildfire hazard. Actions may include clearing of small trees out of dense areas, reduce the amount of fuel on the ground and increasing the spacing between trees. Materials collected can be used in energy to waste applications such as pellets, biogas, or other energy solutions.
Climate, Forests and Woodlands eXtension Community of Practice (CoP)
E15
Seawater Air Conditioning (SWAC)
The Seawater Air Conditioning (SWAC) measure is an alternate-energy system design that uses cold water from the deep ocean to provide more efficient, decarbonized, and reliable cooling. The sweater is piped to heat exchangers for process cooling or to provide condensation water in air conditioning systems. It replaces air cooling units or fresh water evaporative cooling towers which performances degrades in heat
Seawater Air Conditioning: A Basic Understanding (technical commercial brochure
Adoption of sea water air conditioning (SWAC) in the Caribbean: Individual vs regional

173
Portfolio of Adaptation Options for the Energy Sector
Options Characterization Sources
ID Name Description
waves. Other subsequent or parallel seawater uses can be combined, like for swimming pools or desalinisation.
effects
E16
Demand Side Management (DSM) of Energy
Demand Side Management (DSM) of energy is an operational strategy that better coordinates producers and consumers of energy. More renewable energy (like solar and wind) use is possible while ensuring the energy service reliability and controlled costs. DMS balances off-peak and peak demand using peek shaving, which is important, for example, during heat waves.
GoFLEX H2020 RESPOND H2020
E17
Review building codes of the energy infrastructure
Review energy infrastructure building codes aims to climate-proof the energy system by reviewing regulatory codes and infrastructures considering the spatial distribution of climate risks. This should include establishment of new procedures, maintenance practices, operational changes, retrofitting and the use of climate and mapping services such as those produced by the Copernicus Emergency Management Service (EMS).
K. de Bruin, 2007 - Adapting to climate change in The Netherlands: an inventory of climate adaptation options and ranking of alternatives
E18
Upgrade evaporative cooling systems
Upgrade of evaporative cooling systems that rely on a given range of air temperature and water availability is necessary given that this type of cooling systems is a technology that can be affected by climate change and become compromised due to heat waves and water scarcity.
Cuce, P. M., & Riffat, S. (2016). A state of the art review of evaporative cooling systems for building applications. Renewable and Sustainable Energy Reviews, 54, 1240-1249.
Ayoub, A., Gjorgiev, B., & Sansavini, G. (2018). Cooling towers performance in a changing climate: Techno-economic modeling and design optimization. Energy, 160, 1133-1143.
E19 Early Warning Systems (EWS)
Early Warning Systems (EWS) is an information system that assesses climate risks and provides real time information to decision makers, companies, utilities, and the general public. Climate data used to control and monitor the energy infrastructure can be relayed to the EWS. Using this data to monitor the evolution of climate related impacts in the energy sector increases the knowledge necessary to make long term climate adaptation decisions.
a) Climate Adapt b) Operational early warning systems for water-related hazards in Europe

174
Portfolio of Adaptation Options for the Energy Sector
Options Characterization Sources
ID Name Description
E20 Grid reliability
Grid reliability improvement aims to find and upgrade critical components and to enhance the energy system resilience to climate risks. This may include redundant circuitry or components that provide alternative dispatch of energy, equipment upgrades (e.g., better cooling to cope with heat waves) or power downrating (e.g., decrease power output of energy transformers so that they do not overheat during heat waves).
de Groot RJW, 2015
W. Stahlhut et al., 2008
E21
Study and develop energy grid connections
Energy grid connections aims to develop interconnections between islands and/or with the mainland allowing for the creation of economies of scale, energy system reliability improvements and more Renewable Energy Sources (RES) penetration.
G.N.Prodromidis, F.A.Coutelieris, 2010
E22
Energy-independent facilities (generators)
Energy-independent facilities (generators) make it possible for buildings to temporarily create their own energy supply. In case of an energy supply failure (power outage), essential amenities remain functional and can be optimized with Combined Heat and Power (CHP) designs and other decentralised energy generation solutions.
urbangreenbluegrids
E23
Energy recovery microgrids
Energy recovery microgrids are operational elements of the energy grids that rely on distributed generation to restore systems from power outages and to stabilize the grid. This allows for a flexible and swifter recovery from power outages caused by knock-out events (e.g., tree falls on energy lines), excess demand (e.g., during heat waves) or other causes.
Erol-Kantarci et al., 2011
Chen et.al, 2015
E24
Local recovery energy outage capacity
Local recovery energy outage capacity consists in increasing and improving the ability of the islands to recover from energy outages caused by or worsen by climate extreme events, like severe sea or windstorms that can lead to island isolation and exacerbate logistical hurdles. To facilitate a swift recovery, it's useful to have more mobile backup power, power line replacements and other grid components, logistics, supplies, and personnel.
M.M. Adibi, 1994
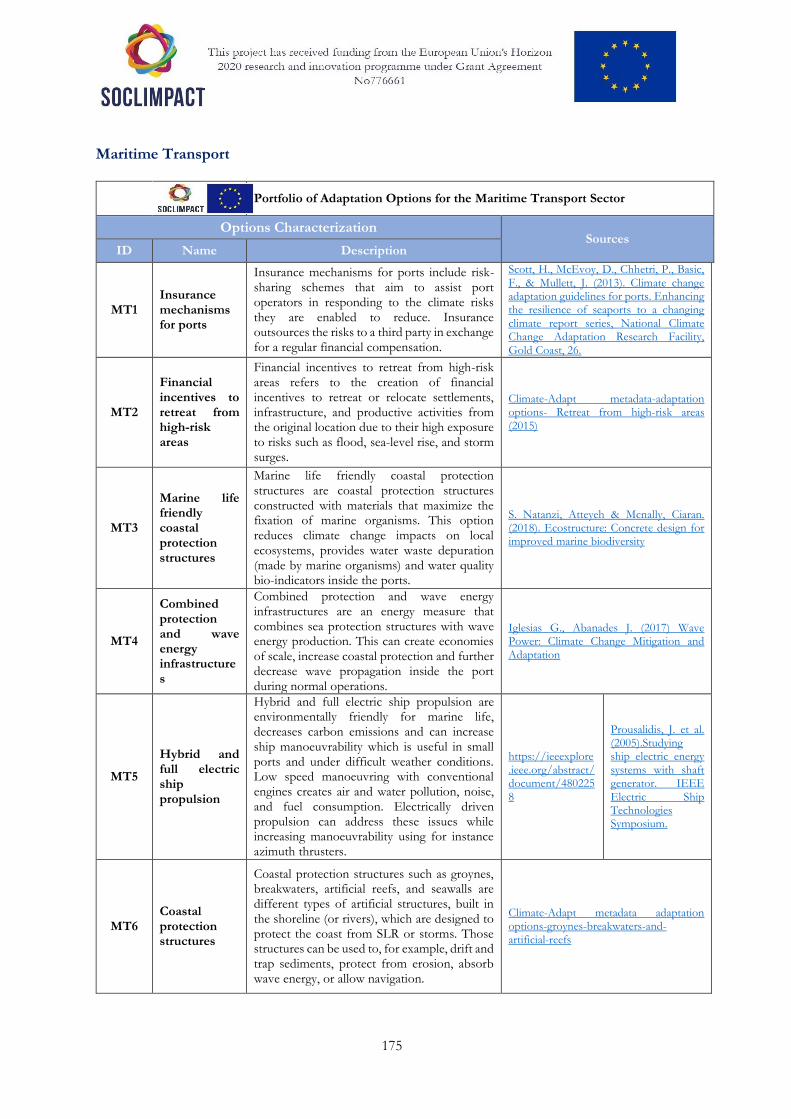
175
Maritime Transport
Portfolio of Adaptation Options for the Maritime Transport Sector
Options Characterization Sources
ID Name Description
MT1 Insurance mechanisms for ports
Insurance mechanisms for ports include risk-sharing schemes that aim to assist port operators in responding to the climate risks they are enabled to reduce. Insurance outsources the risks to a third party in exchange for a regular financial compensation.
Scott, H., McEvoy, D., Chhetri, P., Basic, F., & Mullett, J. (2013). Climate change adaptation guidelines for ports. Enhancing the resilience of seaports to a changing climate report series, National Climate Change Adaptation Research Facility, Gold Coast, 26.
MT2
Financial incentives to retreat from high-risk areas
Financial incentives to retreat from high-risk areas refers to the creation of financial incentives to retreat or relocate settlements, infrastructure, and productive activities from the original location due to their high exposure to risks such as flood, sea-level rise, and storm surges.
Climate-Adapt metadata-adaptation options- Retreat from high-risk areas (2015)
MT3
Marine life friendly coastal protection structures
Marine life friendly coastal protection structures are coastal protection structures constructed with materials that maximize the fixation of marine organisms. This option reduces climate change impacts on local ecosystems, provides water waste depuration (made by marine organisms) and water quality bio-indicators inside the ports.
S. Natanzi, Atteyeh & Mcnally, Ciaran. (2018). Ecostructure: Concrete design for improved marine biodiversity
MT4
Combined protection and wave energy infrastructures
Combined protection and wave energy infrastructures are an energy measure that combines sea protection structures with wave energy production. This can create economies of scale, increase coastal protection and further decrease wave propagation inside the port during normal operations.
Iglesias G., Abanades J. (2017) Wave Power: Climate Change Mitigation and Adaptation
MT5
Hybrid and full electric ship propulsion
Hybrid and full electric ship propulsion are environmentally friendly for marine life, decreases carbon emissions and can increase ship manoeuvrability which is useful in small ports and under difficult weather conditions. Low speed manoeuvring with conventional engines creates air and water pollution, noise, and fuel consumption. Electrically driven propulsion can address these issues while increasing manoeuvrability using for instance azimuth thrusters.
https://ieeexplore.ieee.org/abstract/document/4802258
Prousalidis, J. et al. (2005).Studying ship electric energy systems with shaft generator. IEEE Electric Ship Technologies Symposium.
MT6 Coastal protection structures
Coastal protection structures such as groynes, breakwaters, artificial reefs, and seawalls are different types of artificial structures, built in the shoreline (or rivers), which are designed to protect the coast from SLR or storms. Those structures can be used to, for example, drift and trap sediments, protect from erosion, absorb wave energy, or allow navigation.
Climate-Adapt metadata adaptation options-groynes-breakwaters-and-artificial-reefs
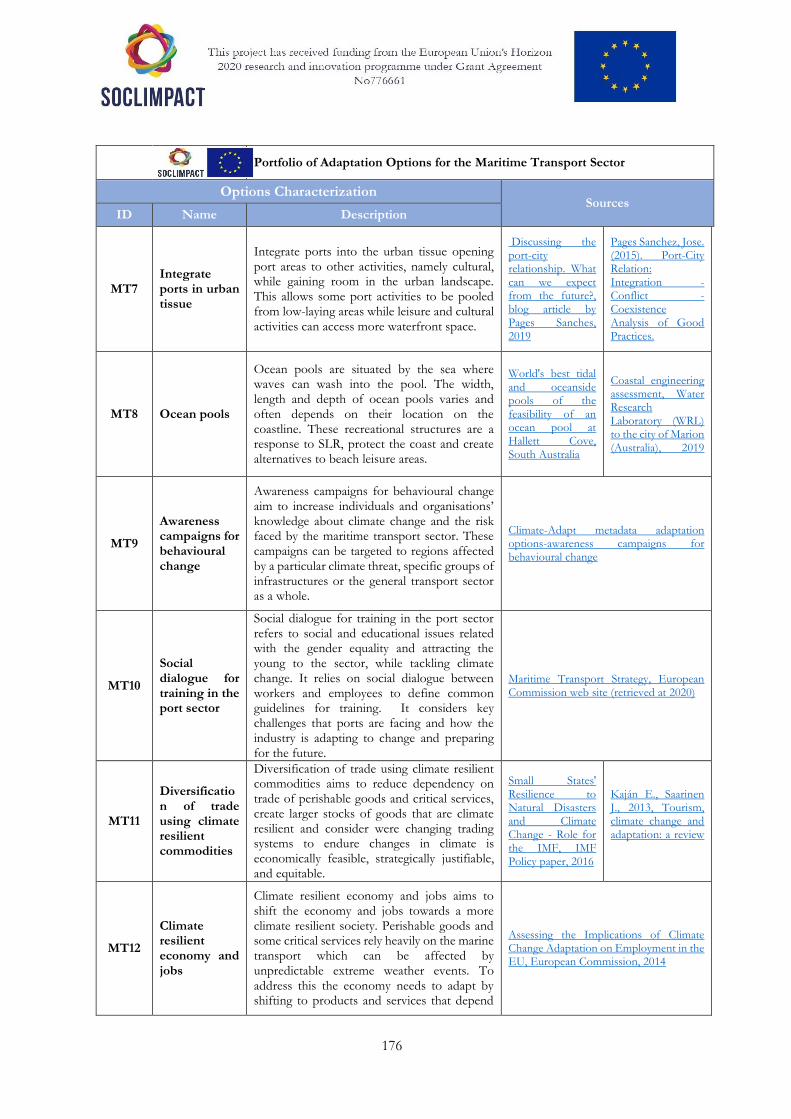
176
Portfolio of Adaptation Options for the Maritime Transport Sector
Options Characterization Sources
ID Name Description
MT7 Integrate ports in urban tissue
Integrate ports into the urban tissue opening port areas to other activities, namely cultural, while gaining room in the urban landscape. This allows some port activities to be pooled from low-laying areas while leisure and cultural activities can access more waterfront space.
Discussing the port-city relationship. What can we expect from the future?, blog article by Pages Sanches, 2019
Pages Sanchez, Jose. (2015). Port-City Relation: Integration -Conflict -Coexistence Analysis of Good Practices.
MT8 Ocean pools
Ocean pools are situated by the sea where waves can wash into the pool. The width, length and depth of ocean pools varies and often depends on their location on the coastline. These recreational structures are a response to SLR, protect the coast and create alternatives to beach leisure areas.
World's best tidal and oceanside pools of the feasibility of an ocean pool at Hallett Cove, South Australia
Coastal engineering assessment, Water Research Laboratory (WRL) to the city of Marion (Australia), 2019
MT9
Awareness campaigns for behavioural change
Awareness campaigns for behavioural change aim to increase individuals and organisations’ knowledge about climate change and the risk faced by the maritime transport sector. These campaigns can be targeted to regions affected by a particular climate threat, specific groups of infrastructures or the general transport sector as a whole.
Climate-Adapt metadata adaptation options-awareness campaigns for behavioural change
MT10
Social dialogue for training in the port sector
Social dialogue for training in the port sector refers to social and educational issues related with the gender equality and attracting the young to the sector, while tackling climate change. It relies on social dialogue between workers and employees to define common guidelines for training. It considers key challenges that ports are facing and how the industry is adapting to change and preparing for the future.
Maritime Transport Strategy, European Commission web site (retrieved at 2020)
MT11
Diversification of trade using climate resilient commodities
Diversification of trade using climate resilient commodities aims to reduce dependency on trade of perishable goods and critical services, create larger stocks of goods that are climate resilient and consider were changing trading systems to endure changes in climate is economically feasible, strategically justifiable, and equitable.
Small States' Resilience to Natural Disasters and Climate Change - Role for the IMF, IMF Policy paper, 2016
Kaján E., Saarinen J., 2013, Tourism, climate change and adaptation: a review
MT12
Climate resilient economy and jobs
Climate resilient economy and jobs aims to shift the economy and jobs towards a more climate resilient society. Perishable goods and some critical services rely heavily on the marine transport which can be affected by unpredictable extreme weather events. To address this the economy needs to adapt by shifting to products and services that depend
Assessing the Implications of Climate Change Adaptation on Employment in the EU, European Commission, 2014
177
Portfolio of Adaptation Options for the Maritime Transport Sector
Options Characterization Sources
ID Name Description
less on Just In Time (JIT) operations, using for instance larger stocks.
MT13
Refrigeration, cooling, and ventilation systems
Improve the efficiency of refrigeration, cooling, and ventilation systems in order to reduce costs in warmer weather and maintain operations during heat waves. Human thermal comfort provided by efficient ventilation and cooling is relevant to ensure the health and safety of passengers and port workers. Refrigeration is relevant for managing goods that need low temperatures.
Scott, H, et al.(2013). Climate change adaptation guidelines for ports, Enhancing the resilience of seaports to a changing climate report series
Velegrakis, A. F. (2013). Climate change impacts and adaptation for international transport networks : Expert Group Report ( 223 p.). UN (UNCTAD)
MT14
Restrict development and settlement in low-lying areas
Restrict development and settlement in low-lying areas means to assure that ports are not further developed in low-laying areas exposed to SLR. Planning must consider the long-term potential risks.
UNCTAD based on literature review - Multi-Year Expert Meeting on Transport and Trade Facilitation : Maritime Transport and the Climate Change Challenge, 16-18 February 2009, Geneva : summary of proceedings (p. 47 p. :). (2009). UN (UNCTAD)
MT15 Sturdiness improvement of vessels
Improve the strength of vessels to sea storms while decreasing the noise and increasing efficiency. Wave-induced loads on the ship structures are a major concern in hull design process. Ship owners should prefer designs that allow for more demanding wave regimes (for instance including the survivability to rouge waves).
Bitner-Gregersen E.M., et al., Climate change and safe design of ship structures, 2018
MT16
Increase operational speed and flexibility in ports
Increase operational speed and flexibility in ports aims to increase the attractiveness of ship transport in order to capture more freight and passenger movement. This can promote a modal shift towards shipping and create new opportunities including those related with exports and tourism. Faster operations also reduce the effects of heat waves on goods and people as well as decarbonise the economy.
Taneja, P. et al., 2012, Flexibility in Port Planning and Design. European Journal of Transport and Infrastructure Research
178
Portfolio of Adaptation Options for the Maritime Transport Sector
Options Characterization Sources
ID Name Description
MT17 Climate proof ports and port activities
Climate-proof ports and port activities refers to investments that consider specific climate change projections to manage future risks in port infrastructures and improve operational safety conditions. These can include retrofitting or reconfiguring breakwaters and other port structures to avoid overtops and flooding due to storm surges, heavy precipitation, extreme heat, strong winds events and extreme swell conditions. The Copernicus Emergency Management Services (EMS) services can provide regarding climate change and disaster risk reduction.
Chhetri, P. et al., 2015, Seaport resilience to climate change: mapping vulnerability to sea-level rise
Copernicus Emergency Management Service (EMS)
MT18
Consider expansion/retreat of ports in urban planning
Consider expansion/retreat of ports in urban planning means to consider the expansion or reallocation of areas for future maritime transport infrastructures due to climate change risks. The urban planning and expansion should consider the potential requirements for port expansion/retreat options.
Minutes of the Local Working Group – Azores, 1st Meeting, 28th September 2018, Ponta Delgada
SOCLIMPACT, Azores 1st Meeting Results and SSS (WP7)
MT19
Reinforcement of inspection, repair, and maintenance of infrastructures
A continuous reinforcement of inspection, repair and maintenance of infrastructures aims to adapt monitoring to a new climate context. Changes in the frequency and/or intensity of storms, SLR or temperature, for example, may have impacts in infrastructure, increasing degradation of the materials and requiring new maintenance plans.
Yi Zhang et al., 2017, Optimal sustainable life cycle maintenance strategies for port infrastructures
The Guidelines on Strategic Maintenance for Port Structures, ASEAN- Japan Transport Partnership Program, 2011
MT20
Early Warning Systems (EWS) and climate change monitoring
Early Warning Systems (EWS) is an information system with several components that assesses climate risks and relays that information to decision makers, companies’ utilities, and the general public in real time. Transport operators should integrate this tool in procedures in order to protect the safety of people and goods. The collected data can also be used to study the evolution of climate impacts as time progresses, for instance the impact of heat waves and storms in operations.
Establishment of early warning systems (2019)
Alfieri, L. et al., 2012, Operational early warning systems for water-related hazards in Europe
MT21 Intelligent Transport Systems (ITS)
Intelligent Transport Systems (ITS) are technologies that relay automated and tailored data and safety-related messages to ships, regarding climate hazards and other relevant information. ITS use communication and information standards that are uniform and widely accepted by other ports that the island is linked to.
Crainic, T.G. et al.(2009) Intelligent freight-transportation systems: Assessment and the contribution of operations research
An EU that delivers investments in smart sustainable and safe mobility for jobs and growth, 2018, European Commission
179
Portfolio of Adaptation Options for the Maritime Transport Sector
Options Characterization Sources
ID Name Description
MT22
Prepare for service delays or cancellations
Prepare for service delays or cancellations aims to promote the creation of new procedures, alternative options, and channels to sell goods and transport passengers, as well as better communication to deal with delays or cancellations. Dealing with more frequency and/or intensity of storms (which will happen in some regions) improves port reputation and customer preferences.
Multi-Year Expert Meeting on Transport and Trade Facilitation : Maritime Transport and the Climate Change Challenge, (2009). UN (UNCTAD)
Scott, H, et al., 2013, Climate change adaptation guidelines for ports, Enhancing the resilience of seaports to a changing climate report series
MT23
Backup routes and infrastructures during extreme weather
Backup routes and infrastructures during extreme weather aims to creates a post disaster response that ensures available alternatives when the main ports are damaged or inaccessible due to extreme weather events. It considers alternative ports and access roads. Alternative ports can be smaller in size, simpler and be used for other purposes, but should have a different location and orientation from the main ones.
MT24 Post-Disaster recovery funds
Post-Disaster recovery funds is the creation of recovery funds for the maritime transport sector to recover after disasters, through initiatives that get the economy up and running quickly while building-back-better (e.g., rebuild damaged critical infrastructures such as ports and roads). The aim is to minimize the economic and social impacts that can occur in a post-disaster context.
Hammett, L.M., Mixter, M., 2017, Adaptive Finance to Support Post-Disaster Recovery
Sendai Framework for Disaster Risk Reduction 2015 - 2030, 2015, United Nations Office for Disaster Risk Reduction
180
Tourism
Portfolio of Adaptation Options for the Tourism Sector
Options Characterization Sources
ID Name Description
T1
Economic Policy Instruments (EPIs)
Economic Policy Instruments (EPIs) are incentives designed and implemented with the purpose of adapting individual decisions to collectively agreed goals. Different type of instruments can be applied, like: pricing (e.g., water tariffs), environmental taxes and charges, subsidies; trading (e.g., tradable permit for pollution or water abstraction, compensation mechanisms, payments for environmental services); and voluntary agreements and risk management schemes such as insurances.
Climate-Adapt/behavioural change
T2
Financial incentives to retreat from high-risk areas
Financial incentives to retreat from high-risk areas refers to the creation of financial incentives to retreat or relocate settlements, infrastructure, and productive activities from the original location due to their high exposure to risks such as flood, sea-level rise, and storm surges.
Climate-Adapt/retreat
T3 Adaptation of groundwater management
Adaptation of groundwater management can be used to (1) conserve groundwater reservoirs, limiting water use and optimizing water reuse, and (2) restore or increase natural infiltration capacity. Both contribute to adaptation in circumstances of reduced precipitation and sea saltwater intrusion aggravated with groundwater over-exploitation. Different packages of interventions usually include freshwater injection, modifying pumping practice, delayed inflow, artificial recharge, or efficient use of freshwater.
Climate-Adapt/groundwater
T4
Monitoring, modelling, and forecasting systems
Monitoring, modelling, and forecasting systems are information system that provide timely and reliable climate information, as well as up-to-date data on the occurrence and severity of extreme events, possible impacts, and their duration. Different systems can be implemented to respond to different climate hazards, such as drought-related, water quality monitoring, water resources management and predicting and managing flood risks.
Climate-Adapt/monitoring
T5 Dune restoration and rehabilitation
Coastal (e.g., dune) restoration and rehabilitation refers to the strengthening of the flood safety and sand reservoir functions of dunes and other coastal structures. Erosion happens as a result of wind action, marine erosion, human activities, and Sea Level Rise (SLR). Possible technics examples include grass planting, thatching, and fencing.
Climate-Adapt/dunes
T6 River rehabilitation and restoration
River and valley rehabilitation and restoration are measures that emphasise the natural functions of rivers/valleys and create vegetated buffer zones alongside watercourses. This contributes to the improvement of micro-climatic conditions, reduces run-off and erosion, and increases groundwater recharge. For Tourism, this option also increases available leisure
Climate-Adapt/rivers
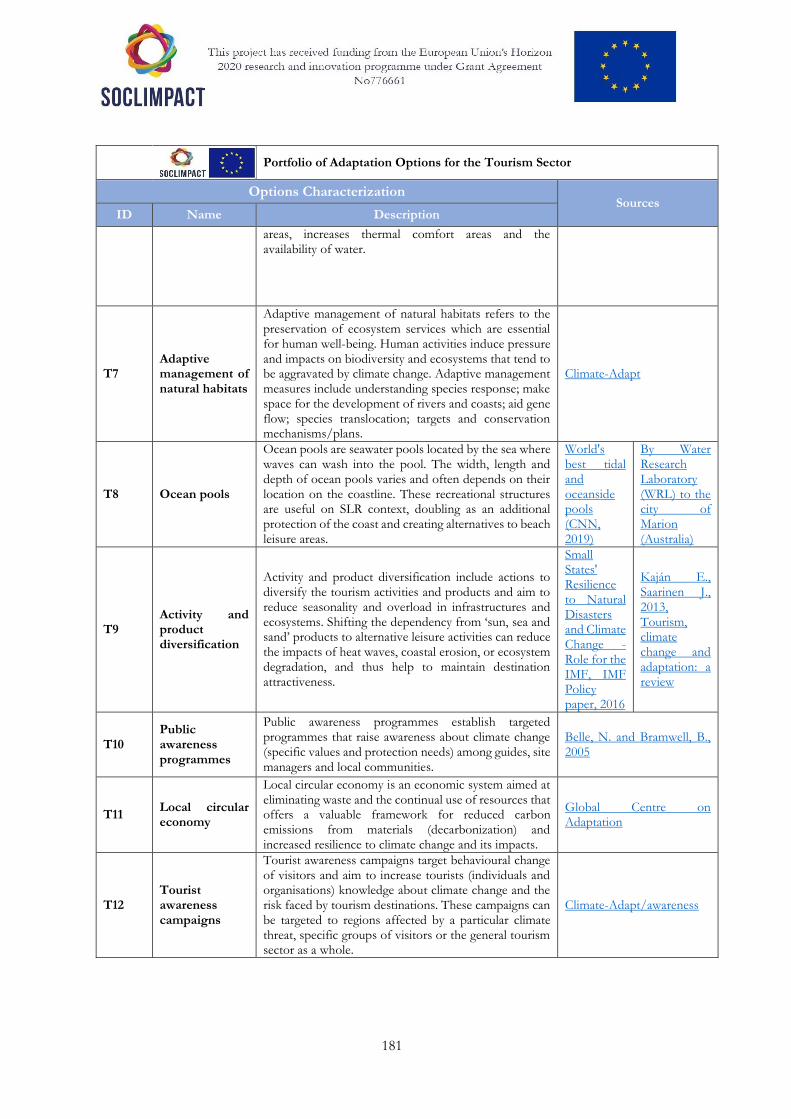
181
Portfolio of Adaptation Options for the Tourism Sector
Options Characterization Sources
ID Name Description
areas, increases thermal comfort areas and the availability of water.
T7 Adaptive management of natural habitats
Adaptive management of natural habitats refers to the preservation of ecosystem services which are essential for human well-being. Human activities induce pressure and impacts on biodiversity and ecosystems that tend to be aggravated by climate change. Adaptive management measures include understanding species response; make space for the development of rivers and coasts; aid gene flow; species translocation; targets and conservation mechanisms/plans.
Climate-Adapt
T8 Ocean pools
Ocean pools are seawater pools located by the sea where waves can wash into the pool. The width, length and depth of ocean pools varies and often depends on their location on the coastline. These recreational structures are useful on SLR context, doubling as an additional protection of the coast and creating alternatives to beach leisure areas.
World's best tidal and oceanside pools (CNN, 2019)
By Water Research Laboratory (WRL) to the city of Marion (Australia)
T9 Activity and product diversification
Activity and product diversification include actions to diversify the tourism activities and products and aim to reduce seasonality and overload in infrastructures and ecosystems. Shifting the dependency from ‘sun, sea and sand’ products to alternative leisure activities can reduce the impacts of heat waves, coastal erosion, or ecosystem degradation, and thus help to maintain destination attractiveness.
Small States' Resilience to Natural Disasters and Climate Change - Role for the IMF, IMF Policy paper, 2016
Kaján E., Saarinen J., 2013, Tourism, climate change and adaptation: a review
T10 Public awareness programmes
Public awareness programmes establish targeted programmes that raise awareness about climate change (specific values and protection needs) among guides, site managers and local communities.
Belle, N. and Bramwell, B., 2005
T11 Local circular economy
Local circular economy is an economic system aimed at eliminating waste and the continual use of resources that offers a valuable framework for reduced carbon emissions from materials (decarbonization) and increased resilience to climate change and its impacts.
Global Centre on Adaptation
T12 Tourist awareness campaigns
Tourist awareness campaigns target behavioural change of visitors and aim to increase tourists (individuals and organisations) knowledge about climate change and the risk faced by tourism destinations. These campaigns can be targeted to regions affected by a particular climate threat, specific groups of visitors or the general tourism sector as a whole.
Climate-Adapt/awareness
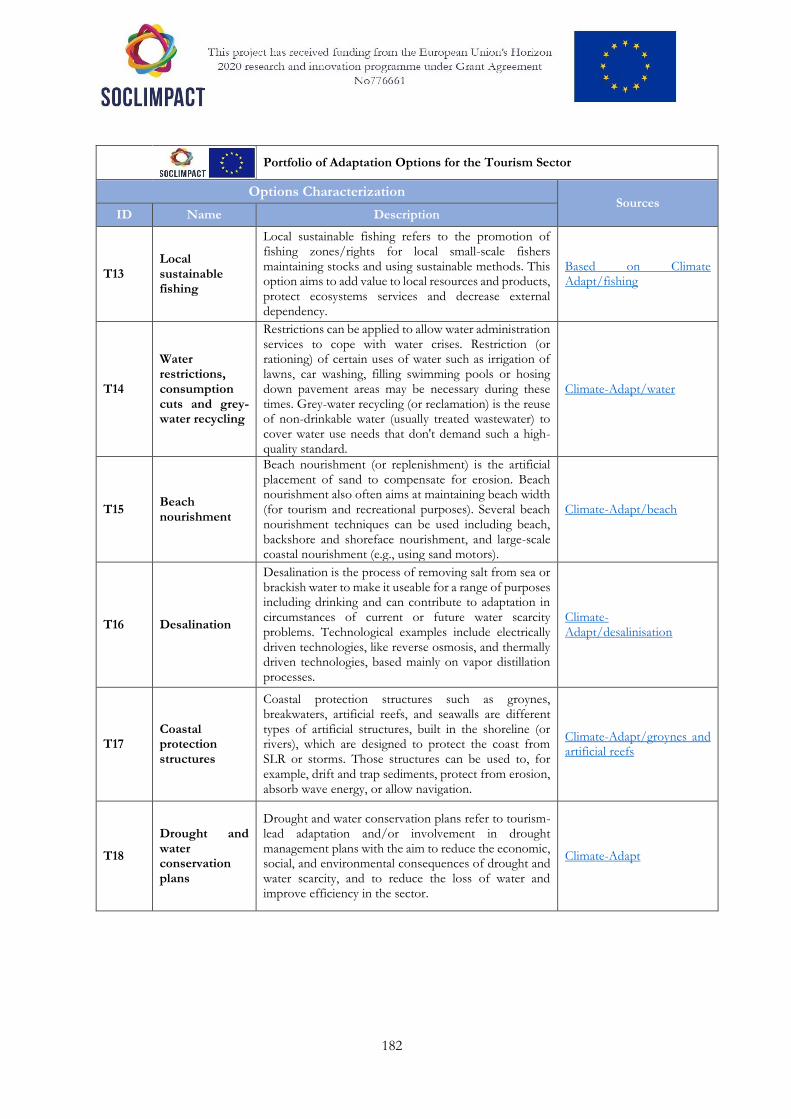
182
Portfolio of Adaptation Options for the Tourism Sector
Options Characterization Sources
ID Name Description
T13 Local sustainable fishing
Local sustainable fishing refers to the promotion of fishing zones/rights for local small-scale fishers maintaining stocks and using sustainable methods. This option aims to add value to local resources and products, protect ecosystems services and decrease external dependency.
Based on Climate Adapt/fishing
T14
Water restrictions, consumption cuts and grey-water recycling
Restrictions can be applied to allow water administration services to cope with water crises. Restriction (or rationing) of certain uses of water such as irrigation of lawns, car washing, filling swimming pools or hosing down pavement areas may be necessary during these times. Grey-water recycling (or reclamation) is the reuse of non-drinkable water (usually treated wastewater) to cover water use needs that don't demand such a high-quality standard.
Climate-Adapt/water
T15 Beach nourishment
Beach nourishment (or replenishment) is the artificial placement of sand to compensate for erosion. Beach nourishment also often aims at maintaining beach width (for tourism and recreational purposes). Several beach nourishment techniques can be used including beach, backshore and shoreface nourishment, and large-scale coastal nourishment (e.g., using sand motors).
Climate-Adapt/beach
T16 Desalination
Desalination is the process of removing salt from sea or brackish water to make it useable for a range of purposes including drinking and can contribute to adaptation in circumstances of current or future water scarcity problems. Technological examples include electrically driven technologies, like reverse osmosis, and thermally driven technologies, based mainly on vapor distillation processes.
Climate-Adapt/desalinisation
T17 Coastal protection structures
Coastal protection structures such as groynes, breakwaters, artificial reefs, and seawalls are different types of artificial structures, built in the shoreline (or rivers), which are designed to protect the coast from SLR or storms. Those structures can be used to, for example, drift and trap sediments, protect from erosion, absorb wave energy, or allow navigation.
Climate-Adapt/groynes and artificial reefs
T18
Drought and water conservation plans
Drought and water conservation plans refer to tourism-lead adaptation and/or involvement in drought management plans with the aim to reduce the economic, social, and environmental consequences of drought and water scarcity, and to reduce the loss of water and improve efficiency in the sector.
Climate-Adapt
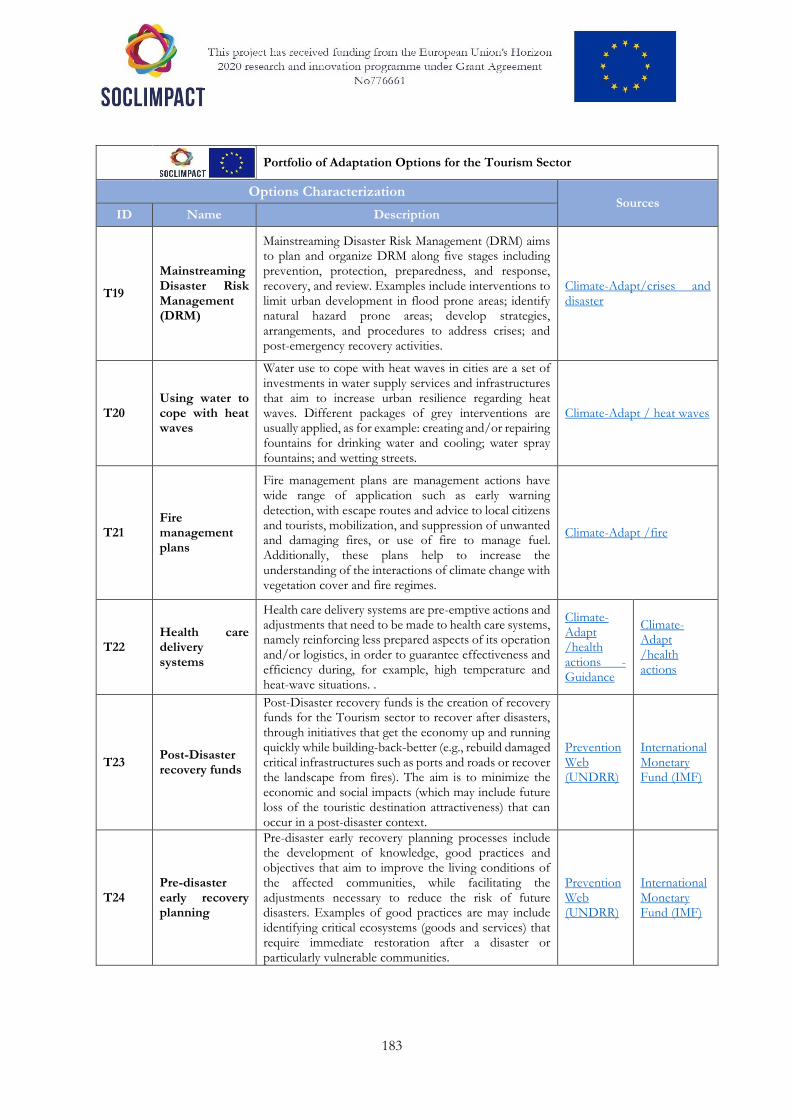
183
Portfolio of Adaptation Options for the Tourism Sector
Options Characterization Sources
ID Name Description
T19
Mainstreaming Disaster Risk Management (DRM)
Mainstreaming Disaster Risk Management (DRM) aims to plan and organize DRM along five stages including prevention, protection, preparedness, and response, recovery, and review. Examples include interventions to limit urban development in flood prone areas; identify natural hazard prone areas; develop strategies, arrangements, and procedures to address crises; and post-emergency recovery activities.
Climate-Adapt/crises and disaster
T20 Using water to cope with heat waves
Water use to cope with heat waves in cities are a set of investments in water supply services and infrastructures that aim to increase urban resilience regarding heat waves. Different packages of grey interventions are usually applied, as for example: creating and/or repairing fountains for drinking water and cooling; water spray fountains; and wetting streets.
Climate-Adapt / heat waves
T21 Fire management plans
Fire management plans are management actions have wide range of application such as early warning detection, with escape routes and advice to local citizens and tourists, mobilization, and suppression of unwanted and damaging fires, or use of fire to manage fuel. Additionally, these plans help to increase the understanding of the interactions of climate change with vegetation cover and fire regimes.
Climate-Adapt /fire
T22 Health care delivery systems
Health care delivery systems are pre-emptive actions and adjustments that need to be made to health care systems, namely reinforcing less prepared aspects of its operation and/or logistics, in order to guarantee effectiveness and efficiency during, for example, high temperature and heat-wave situations. .
Climate-Adapt /health actions - Guidance
Climate-Adapt /health actions
T23 Post-Disaster recovery funds
Post-Disaster recovery funds is the creation of recovery funds for the Tourism sector to recover after disasters, through initiatives that get the economy up and running quickly while building-back-better (e.g., rebuild damaged critical infrastructures such as ports and roads or recover the landscape from fires). The aim is to minimize the economic and social impacts (which may include future loss of the touristic destination attractiveness) that can occur in a post-disaster context.
Prevention Web (UNDRR)
International Monetary Fund (IMF)
T24 Pre-disaster early recovery planning
Pre-disaster early recovery planning processes include the development of knowledge, good practices and objectives that aim to improve the living conditions of the affected communities, while facilitating the adjustments necessary to reduce the risk of future disasters. Examples of good practices are may include identifying critical ecosystems (goods and services) that require immediate restoration after a disaster or particularly vulnerable communities.
Prevention Web (UNDRR)
International Monetary Fund (IMF)
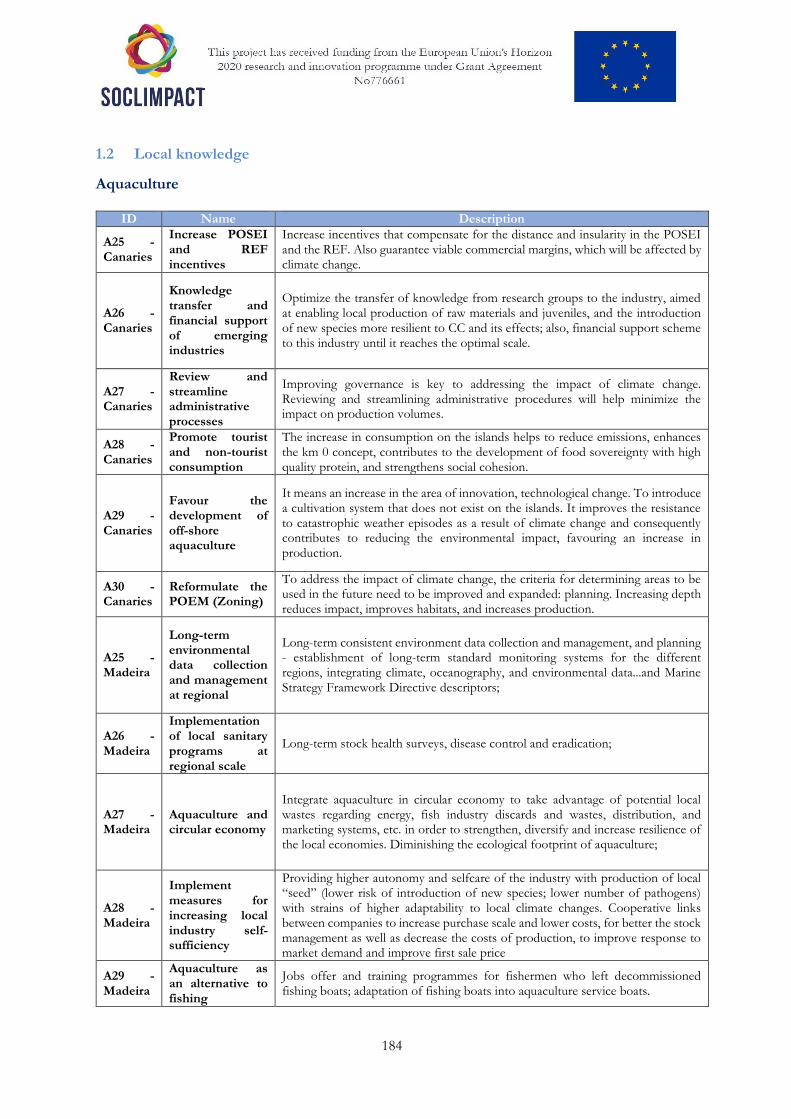
184
1.2 Local knowledge
Aquaculture
ID Name Description
A25 - Canaries
Increase POSEI and REF incentives
Increase incentives that compensate for the distance and insularity in the POSEI and the REF. Also guarantee viable commercial margins, which will be affected by climate change.
A26 - Canaries
Knowledge transfer and financial support of emerging industries
Optimize the transfer of knowledge from research groups to the industry, aimed at enabling local production of raw materials and juveniles, and the introduction of new species more resilient to CC and its effects; also, financial support scheme to this industry until it reaches the optimal scale.
A27 - Canaries
Review and streamline administrative processes
Improving governance is key to addressing the impact of climate change. Reviewing and streamlining administrative procedures will help minimize the impact on production volumes.
A28 - Canaries
Promote tourist and non-tourist consumption
The increase in consumption on the islands helps to reduce emissions, enhances the km 0 concept, contributes to the development of food sovereignty with high quality protein, and strengthens social cohesion.
A29 - Canaries
Favour the development of off-shore aquaculture
It means an increase in the area of innovation, technological change. To introduce a cultivation system that does not exist on the islands. It improves the resistance to catastrophic weather episodes as a result of climate change and consequently contributes to reducing the environmental impact, favouring an increase in production.
A30 - Canaries
Reformulate the POEM (Zoning)
To address the impact of climate change, the criteria for determining areas to be used in the future need to be improved and expanded: planning. Increasing depth reduces impact, improves habitats, and increases production.
A25 - Madeira
Long-term environmental data collection and management at regional
Long-term consistent environment data collection and management, and planning - establishment of long-term standard monitoring systems for the different regions, integrating climate, oceanography, and environmental data...and Marine Strategy Framework Directive descriptors;
A26 - Madeira
Implementation of local sanitary programs at regional scale
Long-term stock health surveys, disease control and eradication;
A27 - Madeira
Aquaculture and circular economy
Integrate aquaculture in circular economy to take advantage of potential local wastes regarding energy, fish industry discards and wastes, distribution, and marketing systems, etc. in order to strengthen, diversify and increase resilience of the local economies. Diminishing the ecological footprint of aquaculture;
A28 - Madeira
Implement measures for increasing local industry self-sufficiency
Providing higher autonomy and selfcare of the industry with production of local “seed” (lower risk of introduction of new species; lower number of pathogens) with strains of higher adaptability to local climate changes. Cooperative links between companies to increase purchase scale and lower costs, for better the stock management as well as decrease the costs of production, to improve response to market demand and improve first sale price
A29 - Madeira
Aquaculture as an alternative to fishing
Jobs offer and training programmes for fishermen who left decommissioned fishing boats; adaptation of fishing boats into aquaculture service boats.
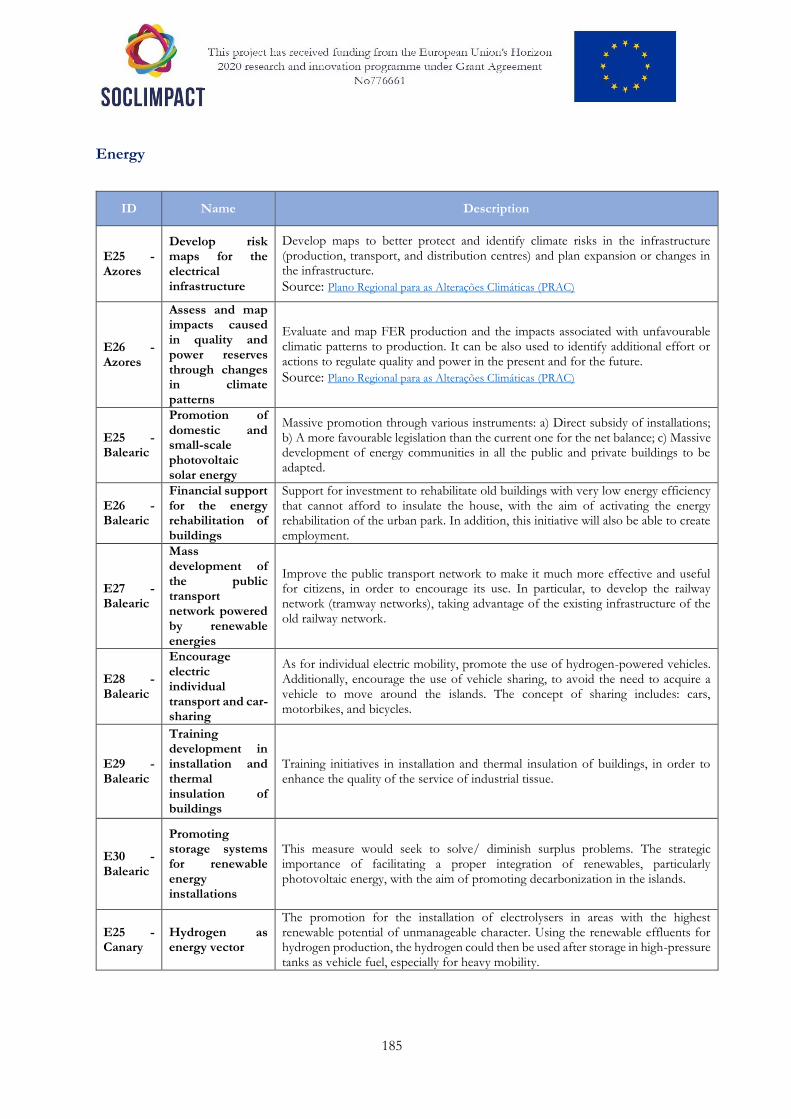
185
Energy
ID Name Description
E25 - Azores
Develop risk maps for the electrical infrastructure
Develop maps to better protect and identify climate risks in the infrastructure (production, transport, and distribution centres) and plan expansion or changes in the infrastructure. Source: Plano Regional para as Alterações Climáticas (PRAC)
E26 - Azores
Assess and map impacts caused in quality and power reserves through changes in climate patterns
Evaluate and map FER production and the impacts associated with unfavourable climatic patterns to production. It can be also used to identify additional effort or actions to regulate quality and power in the present and for the future.
Source: Plano Regional para as Alterações Climáticas (PRAC)
E25 - Balearic
Promotion of domestic and small-scale photovoltaic solar energy
Massive promotion through various instruments: a) Direct subsidy of installations; b) A more favourable legislation than the current one for the net balance; c) Massive development of energy communities in all the public and private buildings to be adapted.
E26 - Balearic
Financial support for the energy rehabilitation of buildings
Support for investment to rehabilitate old buildings with very low energy efficiency that cannot afford to insulate the house, with the aim of activating the energy rehabilitation of the urban park. In addition, this initiative will also be able to create employment.
E27 - Balearic
Mass development of the public transport network powered by renewable energies
Improve the public transport network to make it much more effective and useful for citizens, in order to encourage its use. In particular, to develop the railway network (tramway networks), taking advantage of the existing infrastructure of the old railway network.
E28 - Balearic
Encourage electric individual transport and car-sharing
As for individual electric mobility, promote the use of hydrogen-powered vehicles. Additionally, encourage the use of vehicle sharing, to avoid the need to acquire a vehicle to move around the islands. The concept of sharing includes: cars, motorbikes, and bicycles.
E29 - Balearic
Training development in installation and thermal insulation of buildings
Training initiatives in installation and thermal insulation of buildings, in order to enhance the quality of the service of industrial tissue.
E30 - Balearic
Promoting storage systems for renewable energy installations
This measure would seek to solve/ diminish surplus problems. The strategic importance of facilitating a proper integration of renewables, particularly photovoltaic energy, with the aim of promoting decarbonization in the islands.
E25 - Canary
Hydrogen as energy vector
The promotion for the installation of electrolysers in areas with the highest renewable potential of unmanageable character. Using the renewable effluents for hydrogen production, the hydrogen could then be used after storage in high-pressure tanks as vehicle fuel, especially for heavy mobility.
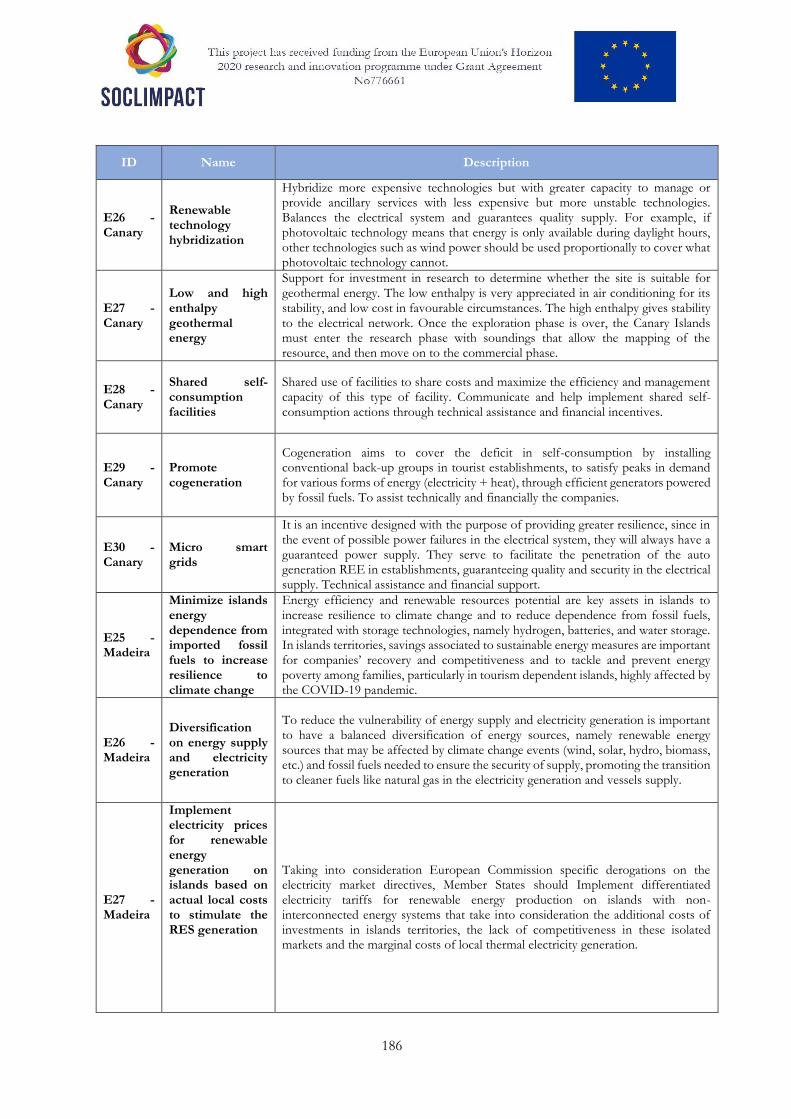
186
ID Name Description
E26 - Canary
Renewable technology hybridization
Hybridize more expensive technologies but with greater capacity to manage or provide ancillary services with less expensive but more unstable technologies. Balances the electrical system and guarantees quality supply. For example, if photovoltaic technology means that energy is only available during daylight hours, other technologies such as wind power should be used proportionally to cover what photovoltaic technology cannot.
E27 - Canary
Low and high enthalpy geothermal energy
Support for investment in research to determine whether the site is suitable for geothermal energy. The low enthalpy is very appreciated in air conditioning for its stability, and low cost in favourable circumstances. The high enthalpy gives stability to the electrical network. Once the exploration phase is over, the Canary Islands must enter the research phase with soundings that allow the mapping of the resource, and then move on to the commercial phase.
E28 - Canary
Shared self-consumption facilities
Shared use of facilities to share costs and maximize the efficiency and management capacity of this type of facility. Communicate and help implement shared self-consumption actions through technical assistance and financial incentives.
E29 - Canary
Promote cogeneration
Cogeneration aims to cover the deficit in self-consumption by installing conventional back-up groups in tourist establishments, to satisfy peaks in demand for various forms of energy (electricity + heat), through efficient generators powered by fossil fuels. To assist technically and financially the companies.
E30 - Canary
Micro smart grids
It is an incentive designed with the purpose of providing greater resilience, since in the event of possible power failures in the electrical system, they will always have a guaranteed power supply. They serve to facilitate the penetration of the auto generation REE in establishments, guaranteeing quality and security in the electrical supply. Technical assistance and financial support.
E25 - Madeira
Minimize islands energy dependence from imported fossil fuels to increase resilience to climate change
Energy efficiency and renewable resources potential are key assets in islands to increase resilience to climate change and to reduce dependence from fossil fuels, integrated with storage technologies, namely hydrogen, batteries, and water storage. In islands territories, savings associated to sustainable energy measures are important for companies’ recovery and competitiveness and to tackle and prevent energy poverty among families, particularly in tourism dependent islands, highly affected by the COVID-19 pandemic.
E26 - Madeira
Diversification on energy supply and electricity generation
To reduce the vulnerability of energy supply and electricity generation is important to have a balanced diversification of energy sources, namely renewable energy sources that may be affected by climate change events (wind, solar, hydro, biomass, etc.) and fossil fuels needed to ensure the security of supply, promoting the transition to cleaner fuels like natural gas in the electricity generation and vessels supply.
E27 - Madeira
Implement electricity prices for renewable energy generation on islands based on actual local costs to stimulate the RES generation
Taking into consideration European Commission specific derogations on the electricity market directives, Member States should Implement differentiated electricity tariffs for renewable energy production on islands with non-interconnected energy systems that take into consideration the additional costs of investments in islands territories, the lack of competitiveness in these isolated markets and the marginal costs of local thermal electricity generation.
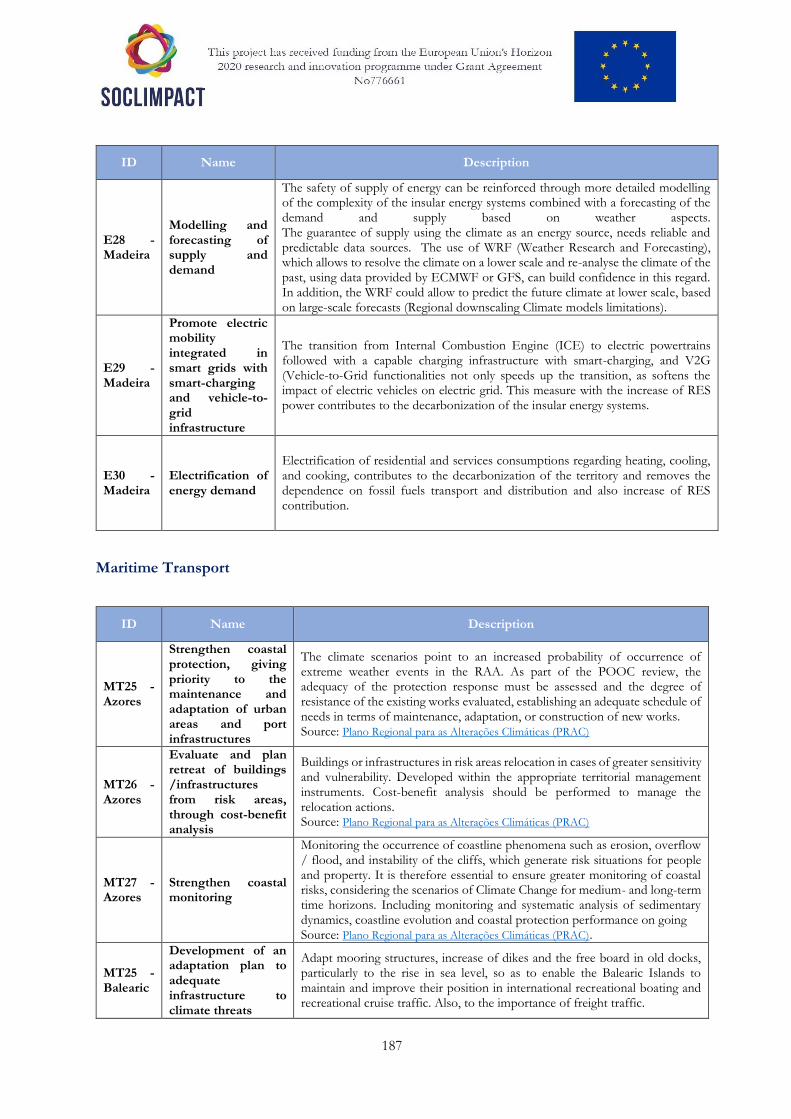
187
ID Name Description
E28 - Madeira
Modelling and forecasting of supply and demand
The safety of supply of energy can be reinforced through more detailed modelling of the complexity of the insular energy systems combined with a forecasting of the demand and supply based on weather aspects. The guarantee of supply using the climate as an energy source, needs reliable and predictable data sources. The use of WRF (Weather Research and Forecasting), which allows to resolve the climate on a lower scale and re-analyse the climate of the past, using data provided by ECMWF or GFS, can build confidence in this regard. In addition, the WRF could allow to predict the future climate at lower scale, based on large-scale forecasts (Regional downscaling Climate models limitations).
E29 - Madeira
Promote electric mobility integrated in smart grids with smart-charging and vehicle-to-grid infrastructure
The transition from Internal Combustion Engine (ICE) to electric powertrains followed with a capable charging infrastructure with smart-charging, and V2G (Vehicle-to-Grid functionalities not only speeds up the transition, as softens the impact of electric vehicles on electric grid. This measure with the increase of RES power contributes to the decarbonization of the insular energy systems.
E30 - Madeira
Electrification of energy demand
Electrification of residential and services consumptions regarding heating, cooling, and cooking, contributes to the decarbonization of the territory and removes the dependence on fossil fuels transport and distribution and also increase of RES contribution.
Maritime Transport
ID Name Description
MT25 - Azores
Strengthen coastal protection, giving priority to the maintenance and adaptation of urban areas and port infrastructures
The climate scenarios point to an increased probability of occurrence of extreme weather events in the RAA. As part of the POOC review, the adequacy of the protection response must be assessed and the degree of resistance of the existing works evaluated, establishing an adequate schedule of needs in terms of maintenance, adaptation, or construction of new works. Source: Plano Regional para as Alterações Climáticas (PRAC)
MT26 - Azores
Evaluate and plan retreat of buildings /infrastructures from risk areas, through cost-benefit analysis
Buildings or infrastructures in risk areas relocation in cases of greater sensitivity and vulnerability. Developed within the appropriate territorial management instruments. Cost-benefit analysis should be performed to manage the relocation actions. Source: Plano Regional para as Alterações Climáticas (PRAC)
MT27 - Azores
Strengthen coastal monitoring
Monitoring the occurrence of coastline phenomena such as erosion, overflow / flood, and instability of the cliffs, which generate risk situations for people and property. It is therefore essential to ensure greater monitoring of coastal risks, considering the scenarios of Climate Change for medium- and long-term time horizons. Including monitoring and systematic analysis of sedimentary dynamics, coastline evolution and coastal protection performance on going Source: Plano Regional para as Alterações Climáticas (PRAC).
MT25 - Balearic
Development of an adaptation plan to adequate infrastructure to climate threats
Adapt mooring structures, increase of dikes and the free board in old docks, particularly to the rise in sea level, so as to enable the Balearic Islands to maintain and improve their position in international recreational boating and recreational cruise traffic. Also, to the importance of freight traffic.
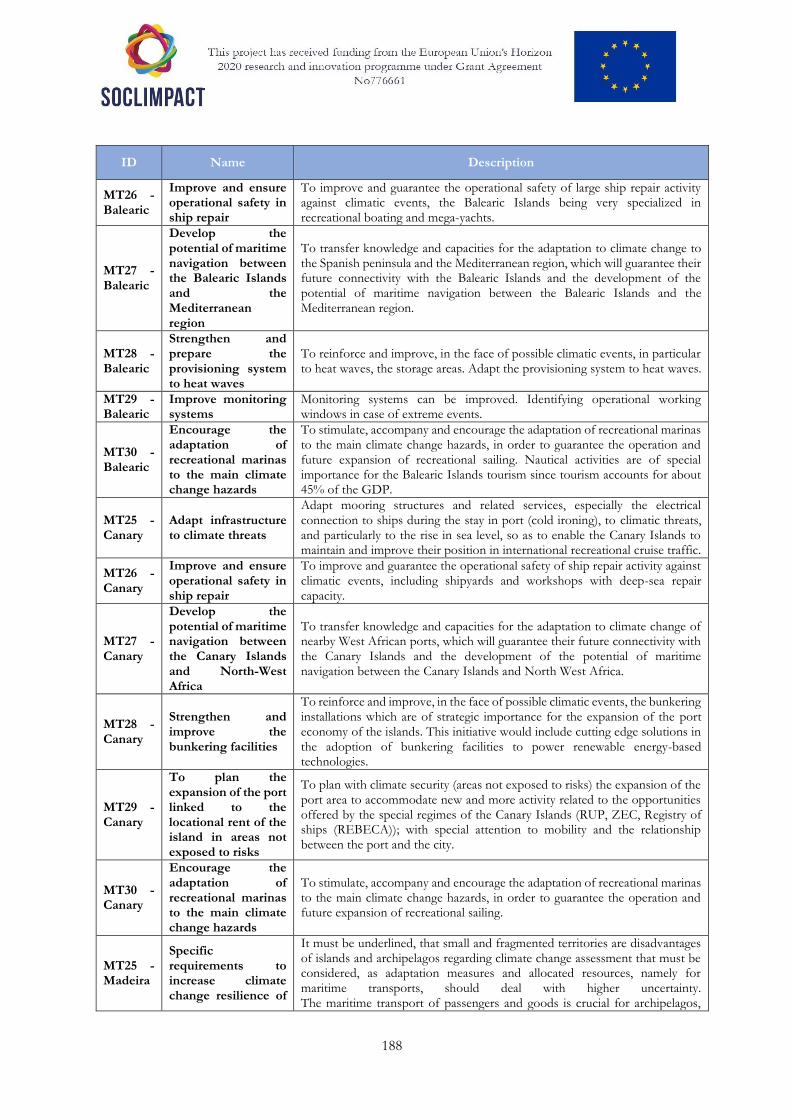
188
ID Name Description
MT26 - Balearic
Improve and ensure operational safety in ship repair
To improve and guarantee the operational safety of large ship repair activity against climatic events, the Balearic Islands being very specialized in recreational boating and mega-yachts.
MT27 - Balearic
Develop the potential of maritime navigation between the Balearic Islands and the Mediterranean region
To transfer knowledge and capacities for the adaptation to climate change to the Spanish peninsula and the Mediterranean region, which will guarantee their future connectivity with the Balearic Islands and the development of the potential of maritime navigation between the Balearic Islands and the Mediterranean region.
MT28 - Balearic
Strengthen and prepare the provisioning system to heat waves
To reinforce and improve, in the face of possible climatic events, in particular to heat waves, the storage areas. Adapt the provisioning system to heat waves.
MT29 - Balearic
Improve monitoring systems
Monitoring systems can be improved. Identifying operational working windows in case of extreme events.
MT30 - Balearic
Encourage the adaptation of recreational marinas to the main climate change hazards
To stimulate, accompany and encourage the adaptation of recreational marinas to the main climate change hazards, in order to guarantee the operation and future expansion of recreational sailing. Nautical activities are of special importance for the Balearic Islands tourism since tourism accounts for about 45% of the GDP.
MT25 - Canary
Adapt infrastructure to climate threats
Adapt mooring structures and related services, especially the electrical connection to ships during the stay in port (cold ironing), to climatic threats, and particularly to the rise in sea level, so as to enable the Canary Islands to maintain and improve their position in international recreational cruise traffic.
MT26 - Canary
Improve and ensure operational safety in ship repair
To improve and guarantee the operational safety of ship repair activity against climatic events, including shipyards and workshops with deep-sea repair capacity.
MT27 - Canary
Develop the potential of maritime navigation between the Canary Islands and North-West Africa
To transfer knowledge and capacities for the adaptation to climate change of nearby West African ports, which will guarantee their future connectivity with the Canary Islands and the development of the potential of maritime navigation between the Canary Islands and North West Africa.
MT28 - Canary
Strengthen and improve the bunkering facilities
To reinforce and improve, in the face of possible climatic events, the bunkering installations which are of strategic importance for the expansion of the port economy of the islands. This initiative would include cutting edge solutions in the adoption of bunkering facilities to power renewable energy-based technologies.
MT29 - Canary
To plan the expansion of the port linked to the locational rent of the island in areas not exposed to risks
To plan with climate security (areas not exposed to risks) the expansion of the port area to accommodate new and more activity related to the opportunities offered by the special regimes of the Canary Islands (RUP, ZEC, Registry of ships (REBECA)); with special attention to mobility and the relationship between the port and the city.
MT30 - Canary
Encourage the adaptation of recreational marinas to the main climate change hazards
To stimulate, accompany and encourage the adaptation of recreational marinas to the main climate change hazards, in order to guarantee the operation and future expansion of recreational sailing.
MT25 - Madeira
Specific requirements to increase climate change resilience of
It must be underlined, that small and fragmented territories are disadvantages of islands and archipelagos regarding climate change assessment that must be considered, as adaptation measures and allocated resources, namely for maritime transports, should deal with higher uncertainty. The maritime transport of passengers and goods is crucial for archipelagos,
189
ID Name Description
maritime transports services in islands
especially for smaller islands that are depend on main islands, aggravating their vulnerability to climate change. Additionally, to the consideration of backup routes and infrastructures, it is important to define specific requirements for this service, in order to ensure the operation of vessels with characteristics to deal with higher climate change uncertainty, and promote the use of natural gas, biogas, hydrogen and electricity, in order to decrease dependence from fossil fuels and increase manoeuvrability of vessels.
MT26 - Madeira
Prepare islands ports to supply alternative fuels and electricity
Islands ports must be prepared to supply natural gas, biogas, hydrogen, and electricity, in order to be prepared to alternative propulsion technologies and supply docked vessels with electricity from renewable sources, reducing the dependence from fossil fuels, and thus increasing the resilience of the islands energy systems to climate change, measures with high synergies with mitigation objectives.
MT27 - Madeira
Increase knowledge and modelling tools on climate change for islands
Outermost regions, namely Atlantic islands, are located in existing climate models boundaries. Support downscaling climate modelling and ensure reliable systematic climate data collection is important to face islands additional constraints and support decision making processes and resources allocation for climate change adaptation, namely on maritime infrastructures, given the high dependence of islands on maritime transports. It must be underlined, that small and fragmented territories are disadvantages of islands and archipelagos regarding climate forecast and climate change assessment that must be considered by Member states and by EU, as adaptation measures and allocated resources should deal with higher uncertainty. Specific characterization, monitorization and inspection of ports and coastal bathymetry in sensitive areas of water streams mouth and ports, should be implemented taking into consideration innovative approaches (including satellite information, geographic information systems and real-time data collection systems) to overcome knowledge gaps on climate change vulnerability and impacts on islands (especially from extreme events that combine rain, sea storms and sea level rise) and to better deal with climate change projections uncertainty. Given the high dependence from maritime transports, specific climate forecast models and climate data collection systems to ensure islands ports real-time operation must be specially promoted in other to and deal with climate change projections uncertainty and decrease islands vulnerability to climate change.
MT28 - Madeira
City ports as coastal protection infrastructures against extreme climate events (sea level rise combined with sea storm)
Future interventions in city ports should take into consideration their potential to protect turban coastal areas from sea storms combined with sea level rise.
190
Tourism
ID Name Description
T25 - Azores
Adapt tourism promotion to Climate Change risks
Adapt the promotion of tourism to Climate Change aims to maximize opportunities for tourism development. The need to adjust the promotional offer to climatic scenarios, namely at the level of the forest landscape mosaic and nautical tourism. Biodiversity conservation could be boosted together with the forestry sector to maximize the positive impacts on water regularization, carbon capture and thermal comfort. Source: Plano Regional para as Alterações Climáticas (PRAC)
T26 - Azores
Improve Natura 2000 habitats - terrestrial, coastal, and marine habitats.
Create new protected areas or ecological corridors and restore/ protect habitats considering the Climate Change risk. Source: Plano Regional para as Alterações Climáticas (PRAC)
T27 - Azores
Adapt agroforestry systems to drought conditions
Increase and improve the water supply systems to farms, considering the installation of water meters and the application of fees / tariffs. This option links up the agroforestry (landscape mosaic and products) with the tourism attractiveness. Source: Plano Regional para as Alterações Climáticas (PRAC)
T28 - Azores
Create water storage reservoirs to ensure water availability without overloading natural resources in times of scarcity
Frequency and intensity of periods of water scarcity may occur more often. Maximizing water storage capacity without increasing pressure on resources will allow greater resilience in times of scarcity without affecting water resources Source: Plano Regional para as Alterações Climáticas (PRAC)
T29 - Azores
Create a mosquito detection information system
The mosquito detection information system (a public access portal where the presence of mosquitoes is reported) is a surveillance and detection process to raise awareness on vector-borne diseases, involving the local community. Source: Plano Regional para as Alterações Climáticas (PRAC)
T30 - Azores
Define protection regime for “Maximum Infiltration Zones”, within the scope of the current and climate change risks
Define protection regime for “Maximum Infiltration Zones”, within the scope of the current and climate change risks. It is intended to adapt the regime of uses and activities to be applied to strategic areas of protection and recharge of aquifers. Source: Plano Regional para as Alterações Climáticas (PRAC)
T25 - Balearic
Thermal isolation of buildings
Funding and technical assistance for the adoption of bioclimatic architecture criteria in reformed and newly built tourist buildings; regulation forcing it should be delivered together with economic incentives, socially justified by the positive externality of contribution a more environmentally friendly image of the destination. Balearic Islands Architects Association recognises around 45% of buildings at the island exhibit a deficient level of thermal isolation and the potential reduction of energy consumption and emissions would range from 30 to 80% with respect to the current levels.
T26 - Balearic
Zero sewage discharge to the sea
This measure means to enhance sewage treatment system throughout the islands with two important, climate related purposes. First, mitigate the impact of seawater heating on the seagrass meadows, in turn crucial to sustain the entire marine ecosystems. Second, contribute to water supply with a lesser energy-demanding water source than desalination.
191
ID Name Description
T27 - Balearic
Distributed electric grids powered by renewables
Develop distributed electric grids based on renewable sources (pv, wind) to power desalination plants and tourist firms consortia, to reduce electricity cost and emissions, and increase the stability of the general electric grid while increasing renewables participation in the electric mix.
T28 - Balearic
Forest fire prevention
Incentivise forest traditional cattle-based uses to reduce forest flammability and maintenance of farming activities in the periphery of forest masses, thus performing as firewalls. Social abandoned of traditional uses and upper-land agriculture has led to recent 6ª generation, inextinguishable forest fires that destroy endemic terrestrial biodiversity and precious landscapes, and put in risk residents' and tourists' lives.
T29 - Balearic
Effective plan of water demand management and investment in reducing losses along the water distribution system
Water is one of the chief concerns at Government and societal level in the Balearic Islands when projections on climate chain impacts are made. Experts state that saving water measures have very long run before adopting the contribution of water desalination to the supply-mix. Also, sewage treatment and water reusing should be previous to water desalination.
T30 - Balearic
Residual organic matter composting to reduce methane emissions, restore degraded landscapes and enhance soil fertility
Sewage sludge, organic waste from agriculture and the organic fraction of the MSW are currently disposed in poorly managed landfills, releasing methane to the atmosphere while agricultural soil shows extreme organic poorness and exhausted quarries degrade landscapes. Composting would contribute to link tourism to decarbonization, local food options and landscapes rehabilitation.
T25 - Canary
Passive, low carbon adaptation of tourist buildings to longer extreme heat periods
Funding and technical assistance for the adoption of bioclimatic architecture criteria in reformed and newly built tourist buildings; regulation forcing it should be delivered together with economic incentives, socially justified by the positive externality of contribution a more environmentally friendly image of the destination. This option is preferred to encouraging further investment in air conditioning, which implies an increase in GHG emissions.
T26 - Canary
Zero sewage discharge to the sea
This measure means to enhance sewage treatment system throughout the islands with two important, climate related purposes. First, mitigate the impact of seawater heating on the seagrass meadows, in turn crucial to sustain the entire marine ecosystems. Second, contribute to water supply with a lesser energy-demanding water source than desalination.
T27 - Canary
Distributed electric grids powered by renewables
Develop distributed electric grids based on renewable sources (PV, wind) to power desalination plants and tourist firms consortia, to reduce electricity cost and emissions, and increase the stability of the general electric grid while increasing renewables participation in the electric mix.
T28 - Canary
Forest fire prevention
Incentivise forest traditional cattle-based uses to reduce forest flammability and maintenance of farming activities in the periphery of forest masses, thus performing as firewalls. Social abandoned of traditional uses and upper-land agriculture has led to recent 6ª generation, inextinguishable forest fires that destroy endemic terrestrial biodiversity and precious landscapes, and put in risk residents' and tourists' lives.
192
ID Name Description
T29 - Canary
Bottom-up managed marine protected micro-areas
Stakeholders-led deals to improve the management of marine areas affected by overfishing and habitat degradation to favour habitat rehabilitation and create synergies amongst sustainable fishing, eco-friendly tourist activities (diving, snorkelling, bottom-glass boating...) and land-based activities (local product-based gastronomy, ecotechnology interpretation paths, etc.).
T30 - Canary
Residual organic matter composting to reduce methane emissions, restorage degraded landscapes and enhance soil fertility
Sewage sludge, organic waste from agriculture and the organic fraction of the MSW are currently disposed in poorly managed landfills, releasing methane to the atmosphere while agricultural soil shows extreme organic poorness and exhausted quarries degrade landscapes. Composting would contribute to link tourism to decarbonization, local food options and landscapes rehabilitation.
T25 - Madeira
Rehabilitation and conservation of islands natural habitats key assets for Island’s tourism agriculture, fisheries, and food security
In islands, habitats rehabilitation, conservation and monitoring actions, including control of non-indigenes species, are important measures to increase ecosystems resilience to climate change, in order to preserve habitats, biodiversity and landscape, key assets for tourism, agriculture, fisheries and food security. Sources: Small islands. (AR4, IPCC, 2007) Small islands (AR5, IPCC, 2014)
T26 - Madeira
Diversification of economic activities to reduce the dependence from tourism activities
The climate change extreme events can cause disruption on tourism activity. For that reason, it is important to diversify the island economy to increase resilience of socioeconomic systems. Promote the development of primary sector activities taking into consideration innovative and sustainable approaches are important to increase self-sufficiency in food products and reduce its carbon footprint, contribution to increase economy diversification in islands. Fair trade, quality, certification, and differentiation can increase competitiveness of islands cash crops (and subproducts) and traditional handcrafts contributing to economy diversification from tourism. Digital innovative products and services can also be explored in islands as an economy diversification vector. Source:https://www.adaptation-undp.org/economic-diversification
T27 - Madeira
Promote islands as telework tourism destinations
The pandemic COVID-19 accelerated the adoption of video conferencing, cloud collaboration and teleworking, opening new possibilities for remote working lifestyles. Telework tourism opens new perspectives for individuals, couples, families, and groups, who are interested to combine a possibility of a new format of remote office work, and leisure in a foreign country. The territorial expansion and strength of digital infrastructures, the adaptation of traditional lodging products, and the provision of family support services are important to the promotion of islands as teleworking destinations and should be explored to ensure lodgement occupation and reduce tourism seasonality. Sources: https://vandensky.com/2020/08/03/e-tourism-long-term-work-and-leisure-fusion/ https://worldshoppingtourism.com/downloads/GJC_THE_TOURISM_INDUSTRY_AND_THE_IMPACT_OF_COVID_19.pdf
T28 - Madeira
Increase knowledge and modelling tools on
Outermost regions, namely Atlantic islands, are located in existing climate models boundaries. Support downscaling climate modelling and ensure reliable systematic climate data collection is important to face islands additional constraints and support decision making processes and resources allocation for
193
ID Name Description
climate change for islands
climate change adaptation. It must be underlined, that small and fragmented territories are disadvantages of islands and archipelagos regarding climate change assessment that must be considered by Member states and by EU, as adaptation measures and allocated resources should deal with higher uncertainty. Specific characterization, monitorization and inspection of marine and terrestrial ecosystems (natural and artificial reefs, natural inland ecosystems, forest ecosystems, agricultural ecosystems) and potentially threaten infrastructures (coastal infrastructures, roads, tunnels, bridges, airports, dams, water streams, water channels, desalination plants, energy infrastructures, health care infrastructures, communication infrastructures, etc.) should be implemented taking into consideration innovative approaches (including satellite information, geographic information systems and real-time data collection systems) to overcome knowledge gaps on climate change vulnerability and impacts on islands (sea level rise, storms, floods, flush floods, forest fires) and to better deal with climate change projections uncertainty. Given the high dependence from air transports, specific climate forecast models and climate data collection systems to ensure islands airports real-time operation must be specially promoted in other to decrease islands vulnerability to climate change.
T29 - Madeira
Control measures for terrestrial and maritime tourist activities
Climate change can originate higher pressures on natural ecosystems. For that reason, additional measures could be necessary to protect those ecosystems from some touristic activities, including regulations and normative instructions in order to ensure sustainable development of terrestrial and maritime tourism activities, such as limitations of volume visitors in fragile and restricted areas, and promote the practice of respectful wildlife watching, such as birds, marine turtles, cetaceans, and others.
T30 - Madeira
Implement waste reduction and management procedures to reduce dependence from exterior and pressures in natural ecosystems
In islands, highly dependent from goods importation, waste reduction and waste management regulations and procedures should be implemented to reduce waste production, increase waste selective collection for recycling and decrease pressure in natural habitats, that will be under stress by climate change. Given the lack of scale to make recycling viable in many insular territories, special support should be given to cover the exportation costs of these materials to be recycled in the mainland or bigger islands. Particular attention should be given to dangerous waste, as small islands do not have scale dimension to implement local adequate treatment, and maritime transport of these dangerous waste must be done in special security conditions. Organic waste valorisation (composting or bioenergy production) should be considered as there is lack of space in islands for final disposal. Incineration with energy recovery should also be studied as a solution to reduce final disposal. In archipelagos, maritime transport of waste to bigger islands should be assessed as an option for smaller islands. Specific policies to reduce overpackaging and plastic use, particularly disposable plastics, should be implemented in islands. Real-time Monitoring systems to detect and characterize marine litter, high seas pollution focus (namely by fossil fuels), coastal discharges and algae blooms should be implemented with support of innovative technologies and procedures. Dedicated awareness raising campaigns for economic actors, residents, and tourists, should be implemented to reduce waste production, increase reutilization, and promote adequate waste selective collection for recycling.
194
Annex 2- Regional Workshops Reports
(separate files)
195
Annex 3- Online Survey Tool
196
Copyright © 2022 FDOKUMEN