
Deliverable D7.4 Report on the integration of the infrastructure ...
Upload
khangminh22Category
view
0download
0
WASTE2ROAD Biofuels from WASTE TO ROAD transport
LC-SC3-RES-21-2018 (818120)
Deliverable Report
Deliverable ID D4.11 Deliverable name Open resource model available on the Internet to
potential industries Lead beneficiary BTG Contributors R.H. Venderbosch Due date Annex 3 M40 Date of final version 07-03-2022 Dissemination level PU Document approval Duncan Akporiaye 18.03.2022
This project has received funding from the European Union’s Horizon 2020 research and innovation programme under grant agreement No 818120.
PROPRIETARY RIGHTS STATEMENT
This document contains information which is proprietary to the WASTE2ROAD consortium. The document or the content of it shall not be communicated by any means to any third party except with prior written approval of the WASTE2ROAD consortium.
LC-SC3-RES-21-2018 (818120) Deliverable D4.11
Classification Confidential Page 2 of 22
Description of the deliverable content and purpose Task 4.5 Modelling (M12-M42) (BTG) Simplified and easily accessible models (next to more detailed overall models to be developed in WP5) will allow immediate exploitation of the project results by addressing potential industries also outside the consortium. In addition to mass and energy balances, specific emphasis in this modelling is on tracking the contaminant flow (ash, metals, nitrogen, oxygen) from oxygenated bio-liquid to oxygen-lean or oxygen-free product. This task will feed WP5 with performance balances for the co-FCC and co-hydrotreating experiments, also to allow tracking of the green bio-carbon. Draft models will be prepared in M24, while final models will be made available in M42. As an exploitation tools BTG will provide free accessible open resource models for case-studies available on the internet at no cost to any interested party, (CoCo Simulator). In this deliverable an open resource model for hydrotreating pyrolysis oils that is published on the Wase2Road’s website will be further detailed. The purpose of the flowsheet is to allow interested parties to investigate and validate some of the project results. Through the flowsheet, rather generic mass and energy balances are provided to consortium partners, as well as for the third parties outside the consortium. Emphasis in this modelling is on tracking the elemental flows (and mainly nitrogen and oxygen), while tracking ash and metals is yet too complicated and lack of reliable data prevails specific conclusions. These aspects are considered elsewhere (D3.11). This deliverable can be used to feed WP5 with performance balances for the value chain of going from biomass into biofuels through co-refining, either by co-FCC or by co-hydrotreating experiments. It can also be used as a first directive tool to understand the methodology to track the green bio-carbon in those co-refined streams. The latter may require substantial upgrading of the flowsheet, by implementing tools, first to understand the co-feeding reaction mechanisms and possible synergies, and then to predict the quantity and quality of the derived products It is not the intention yet to provide such a detailed model here. By definition, a model is a bad representation of the reality and is as good as the input data provided. In addition, the flowsheet provided intentionally does not provide a fully correct design as anticipated in a future exploitation activity. Parts of the anticipated design are under IPR considerations. What is presented is a tool for interested parties, from the academic and non-academic sectors, to understand some principles behind the pyrolysis oil (production and) treatments, with the main objective to provide models on basis of which better ones can be derived.

LC-SC3-RES-21-2018 (818120) Deliverable D4.11
Classification Confidential Page 3 of 22
Table of Contents 1 Introduction ..................................................................................................................................... 4
1.1 Objectives ................................................................................................................................ 4
1.2 Fast pyrolysis ........................................................................................................................... 4
2 Pyrolysis oil hydrotreatment ........................................................................................................... 8
2.1 Introduction ............................................................................................................................. 8
2.2 Background .............................................................................................................................. 8
2.3 Pyrolysis oil hydrotreatment ................................................................................................... 9
3 Pyrolysis oil stabilisation ............................................................................................................... 10
3.1 Aims ....................................................................................................................................... 10
3.2 Assumptions .......................................................................................................................... 10
3.2.1 Results ........................................................................................................................... 11
4 Hydrodeoxygenation of the SPO ................................................................................................... 13
4.1 Introduction ........................................................................................................................... 13
4.2 Results ................................................................................................................................... 14
5 Discussion ...................................................................................................................................... 17
6 Conclusion ..................................................................................................................................... 19
7 Bibliography ................................................................................................................................... 20
8 Appendix B: Hydrotreatment reactions ........................................................................................ 21
LC-SC3-RES-21-2018 (818120) Deliverable D4.11
Classification Confidential Page 4 of 22
1 Introduction
1.1 Objectives This deliverable describes the hydrotreatment of pyrolysis oil as a flow sheeting package in the freeware COCO Simulations. It actually builds further on a pyrolysis oil production model as being developed within the framework of 4REFINERY. This latter model is already publicly available on the website of CoCo.1 COCO, and its Cape Open Flowsheet Environment (COFE), is software that is especially suitable for models that require low precision. COFE offers one type of unit operator for the most important unit operations. COCO is visually strong and easily understandable. The lay-out of the flowsheet can be altered and all kinds of data and text can be displayed to explain what takes place in the model. The limited number of options that is available per unit operation, makes it easily alterable for a user unfamiliar with the process. The COCO database contains only the most basic compounds. Unavailable compounds can be defined in another Cape Open program, ChemSep, but the options for the definition of the compounds are limited. Interactions parameters have to be defined manually. Next to this, only a small number of property packages is available within COCO. This can give difficulties for obtaining realistic values from the model, especially when extreme temperatures or pressures are required. The COCO software is freely available and can be easily downloaded from the Internet, allowing BTG to freely distribute the model to interested parties, amongst other potential to customers, to get familiar with pyrolysis. This model is based on knowledge from BTG, largely implemented in the first of a kind operational unit. The first modelling approach was made by a series of students from Saxion Hogeschool Enschede and Twente University, under guidance of BTG. This section describes the checks that have been executed on the hydrotreating models, and the final steps to be able to make the model publicly available. It is obvious that the off gases can be used to deliver (part of) the hydrogen required in the previous steps, and this was and is part of ongoing work. In addition, separation steps can be included to yield finished distilled products from SDPO. These steps are not included in this flowsheet.
1.2 Fast pyrolysis Biomass is the collective name for mainly plant based materials that can be used for energy production or can be used in industrial processes. Biomass can be purposely grown but can also be rest material. Biomass is typically made up out of lignin, cellulose, and hemicellulose. The ratio of those materials differs depending on the type of biomass. Fast pyrolysis is a process performed at a temperature of roughly 500oC and atmospheric pressure. The pyrolysis takes place during a few seconds and is an irreversible reaction in which the biomass is decomposed in smaller compounds. Tar like compounds and light gases (C1-C4) are undesired products, resulting in a short but stringent process. Due to the nature of biomass the produce compounds have many oxygen atoms and are often sugary and contain aromatic rings. The model delivered before simulated the results of a commercial unit. This delivered model was carefully checked for differences with the operations to achieve a model that would resemble the
1 https://www.cocosimulator.org/index_sample.html
LC-SC3-RES-21-2018 (818120) Deliverable D4.11
Classification Confidential Page 5 of 22
commercial plant on both micro and macro scale. The flowsheet of both the delivered model and the final model can be found as an open resource flow sheeting example on the Internet.2 Shortly, wet biomass with a typical water content over 10 wt.%, is dried with dry air heated by steam. The dry biomass (still containing 5 wt.% water) is mixed with a hot sand recycle to a temperature above 500 oC, after which it undergoes pyrolysis for a very short timeframe. In CoCo, wood is a known model compound with a typical C, H and O composition. Biomass is converted to a mixture of char and vapours. The char is removed together with the sand in a cyclone. The vapours are quenched in a condenser. The reactions taking place are generated by simulating the oil generated in terms of around 20 components, and the composition is taken such that the liquids and permanent gases are resulting in the actual experimental yields, and both are, to some extent, representatives of the respective gaseous and liquid phases. The hot oil is cooled down with cooling water, after which a part of the cold oil is recycled into the condenser, quenching the incoming vapours. The incondensable gases are combusted together with the char. This produces hot off gas and heats up the sand. Both are cooled down by high pressure water streams to desired temperatures. Those water streams are transported to a steam drum, after which a part of the steam is transformed to electricity, a part used in the biomass dryer and the rest sold. A deaerator is used to degas the cold water by heating it by part of the produced steam in the pyrolysis system. 1. Compounds. COCO supports a 400+ compound database. The pyrolysis model uses many
oxygenated compounds, which are not all present in the database. Surprisingly though, the compounds ‘dry pine wood’ and ‘sand’ are as such available in CoCo database. They are solids, and data is provided only for the solid phase. Compounds that are not present in the database are simulated using the Pure Compound Data Manager (PCD Manager) in which properties can be implemented manually as well as estimated via contribution methods. The model contains a number of simulated compounds for which the group contributions were incomplete, resulting in some inaccurate properties, such as the exact enthalpy of formation. Those compounds were simulated.
2. Property package. The delivered model uses the Soave Redlich Kwong (SRK) interaction parameter. Besides some flash reactors, for example to simulate the drying of the biomass, the model only uses fixed conversions in all reactors and separators.
3. Solver method. COCO supports both the Wegstein and Newton solver. The Wegstein solver is chosen, as this solver iterates quicker, but to make the model faster in many cases the recycle streams are taken as simple as possible at this stage.
4. Redundant unit operations. A number of unit operations, especially heat exchangers, do not have a significant contribution to the model, and some of them are taken as simple as possible at this stage.
5. Other unit operations. Blowers were added to the inflow of air into the biomass dryer and the char combustor. Those are responsible for a significant part of the electricity usage of the pyrolysis process.
Some specific information on reactors is provided below: 6. Biomass dryer. The model takes the drying of the biomass into account by splitting the water from
the biomass. Air was heated to 60oC, to which the split off water was added. Both the air stream and the dried biomass stream were then heated to 60oC. This was updated to a biomass dryer in which the biomass and air are first mixed, then heated to 60oC and subsequently the vapor is split
2 https://www.cocosimulator.org/index_sample.html
LC-SC3-RES-21-2018 (818120) Deliverable D4.11
Classification Confidential Page 6 of 22
off with a flash. The amount of water that is split off is controlled by the amount of air fed to the dryer. Cyclones were added analogously.
7. Pyrolysis reactor. The pyrolysis feed heater was removed from the delivered model as in practice the feed is only heated by the recycle sand. The enthalpy type was changed to ‘EnthalpyF’ instead of ‘Enthalpy and heat of reaction’ to ensure a fixed energy balance of the whole model. Redundant reaction equations were removed and a new reaction equations for straw pyrolysis was added.
8. Char combustor. An oxygen splitter was added post the bottom char bed combustor to transport any remaining oxygen to the top combustor in which the condenser gases are combusted. Without this stream the gas combustor would sometimes have insufficient oxygen inflow, while the total oxygen feed was sufficient.
9. Pyrolysis oil condenser. The splitting of the cold oil was taken out of the condenser unit operation, to clarify that a part of the cold oil is used for quenching.
10. Steam system. The model details relevant aspects on the steam production. A steam drum connects 3 steam cycles, two of those are simple recycles with a fixed flow rate that only utilise downcomer water to cool down another stream and then return to the steam drum. A third is the produced steam, which is utilised to become low pressure liquid water.
11. Heating values. COCO provides a ‘Heat of Combustion Unit’ (HOC) which can calculate the lower heating value (LHV) and higher heating value (HHV). For the LHV the combustion enthalpy is used that is defined within the PCD file of the compound, this assumes that the combusted products are cooled down to 150 oC at 1 bar, ignoring the heat of vaporization of water. To calculate the HHV the products are further cooled to 25 oC and 1 bar, to achieve the same in and outlet conditions for the combustion. Next to the HHV’s of the biomass (BM) and the pyrolysis oil (PO) also heaters and coolers are added to some of the in- and outlets to calculate the energy deviations from a 1 bar and 25 oC situation. Those were then used to make a closed energy balance over the whole pyrolysis system.
12. Pyrolysis efficiencies. The energy requirements of the unit operations were shown directly next to those unit operations. With information streams in the background of the model an energy balance, the carbon efficiency, and the water content of important streams are calculated and shown in a clear overview. The energy balance includes Heating values, Electricity, Steam, and energy losses.
13. Text. To ensure that the pyrolysis model is understandable for anyone who opens the COCO file, text was added to the most important unit operations. Notes were added to clarify how to solve the model when altering parameters.
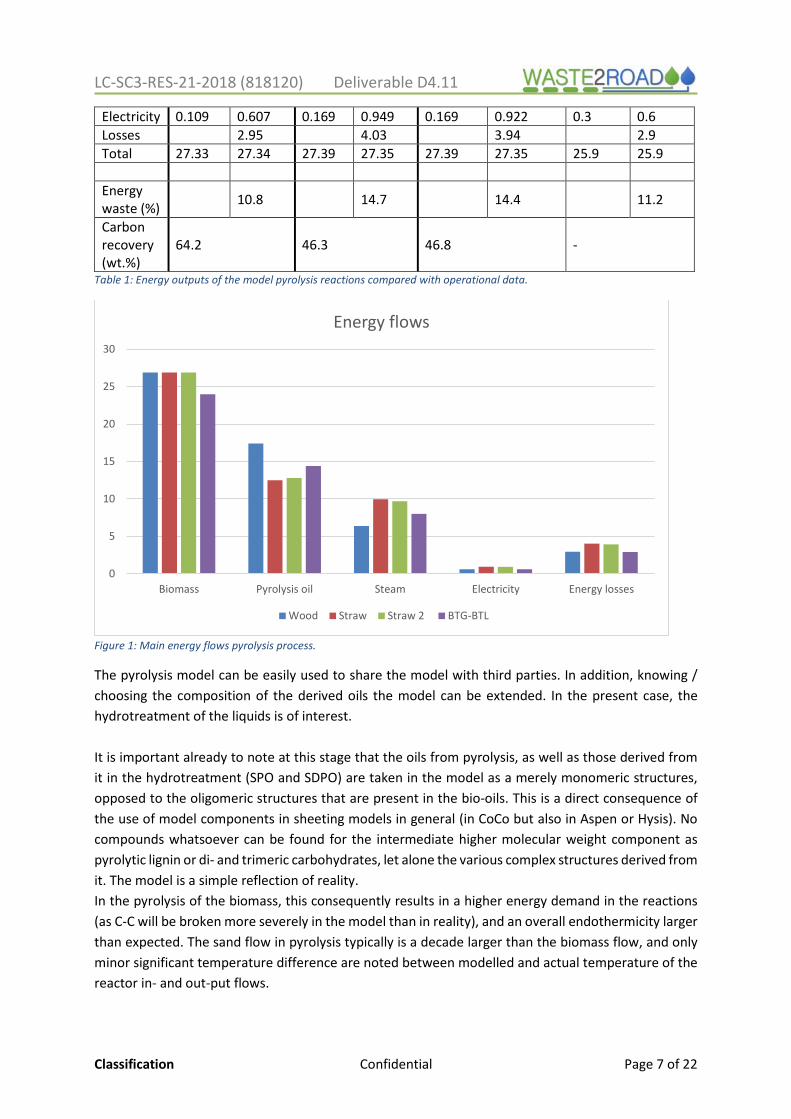
In this way a rather accurate learning model is obtained that represent the overall performance of the commercial unit. Most data were carefully checked with plant data. In this flow sheeting, the energy and carbon balances over the unit operations could be easily established. In the models, energy balance over the whole model was checked by calculating the higher heating value (HHV) of the in- and outflowing material streams combined with the energy added and subtracted by various unit operations. Typical results are listed in Table 1 and Figure 1 below. The losses in energy for the modelled pyrolysis processes is comparable with operational data. Only the electricity usage is lower than found in practice. It is also found that for all the cases only 10-15% of the energy inflow is lost.
Wood in
Wood out
Straw in
Straw out
Straw 2 in
Straw 2 out
BTG-BTL in
BTG-BTL out
HHV 26.9 17.4 26.9 12.4 26.9 12.8 24 14.4 Steam 0.325 6.38 0.325 9.97 0.325 9.69 1.6 8.0
LC-SC3-RES-21-2018 (818120) Deliverable D4.11
Classification Confidential Page 7 of 22
Electricity 0.109 0.607 0.169 0.949 0.169 0.922 0.3 0.6 Losses 2.95 4.03 3.94 2.9 Total 27.33 27.34 27.39 27.35 27.39 27.35 25.9 25.9 Energy waste (%)
10.8 14.7 14.4 11.2
Carbon recovery (wt.%)
64.2 46.3 46.8 -
Table 1: Energy outputs of the model pyrolysis reactions compared with operational data.
Figure 1: Main energy flows pyrolysis process.
The pyrolysis model can be easily used to share the model with third parties. In addition, knowing / choosing the composition of the derived oils the model can be extended. In the present case, the hydrotreatment of the liquids is of interest. It is important already to note at this stage that the oils from pyrolysis, as well as those derived from it in the hydrotreatment (SPO and SDPO) are taken in the model as a merely monomeric structures, opposed to the oligomeric structures that are present in the bio-oils. This is a direct consequence of the use of model components in sheeting models in general (in CoCo but also in Aspen or Hysis). No compounds whatsoever can be found for the intermediate higher molecular weight component as pyrolytic lignin or di- and trimeric carbohydrates, let alone the various complex structures derived from it. The model is a simple reflection of reality. In the pyrolysis of the biomass, this consequently results in a higher energy demand in the reactions (as C-C will be broken more severely in the model than in reality), and an overall endothermicity larger than expected. The sand flow in pyrolysis typically is a decade larger than the biomass flow, and only minor significant temperature difference are noted between modelled and actual temperature of the reactor in- and out-put flows.
0
5
10
15
20
25
30
Biomass Pyrolysis oil Steam Electricity Energy losses
Energy flows
Wood Straw Straw 2 BTG-BTL
LC-SC3-RES-21-2018 (818120) Deliverable D4.11
Classification Confidential Page 8 of 22
This damping effect in the hydrotreating, however, is clearly noted, while virtually no inert media are present to suppress the stronger exothermic effects. As a consequence, the temperature increase due to the exothermic hydrogenation reactions is substantially higher than deducted from the experiments. To cope with this in the flow sheeting, in the model published the reactors are taken isothermal. Duties are listed within the flow sheeting program.
2 Pyrolysis oil hydrotreatment
2.1 Introduction The Pyrolysis oil (PO) produced by the pyrolysis process is not suitable for direct use as a fuel oil. The oil contains many oxygenated compounds which are highly reactive and therefore undesired in the oil industry. The PO is therefore first hydrotreated to obtain an oil that could be used as a fuel oil. At BTG research is performed to optimise this hydrotreating process. Due to the nature of the pyrolysis process, many different compounds are present in the PO, making the research complicated. The goal of this model is to get an insight in the costs and the potential of the hydrotreatment process by obtaining a rough mass and energy balance. First a theoretical background is given for the different sections of the hydrotreatment model, to explain the process conditions and the reactions taking place. Next a per section overview is given, which includes the final flowsheet with a short summary, the aims and assumptions used, the results produced and some discussion points. Finally, the results of the whole hydrotreatment section are shown, including a carbon and hydrogen balance, together with a short discussion.
2.2 Background Pyrolysis oils obtained from biomass contains up to 30 wt.% water and high number of oxygenated compounds, giving it a polar nature. The liquid is acidic in nature, with a pH below 3, is not stable and prone to polymerization at high temperatures giving it a high viscosity. Oils as received from the pyrolysis process are as such not suitable for the fuel industry. (Yin et al., 2016) Via various hydrotreatment steps a more desirable liquid can be obtained. The oils can either be hydrotreated as a whole, or first be fractionated with water to obtain a water phase, rich in sugars, and a lignin fraction. This second option gives the potential of more specific and thus more efficient upgrading steps, but research is at an early stage. (Figueirêdo, Jotic, Deuss, Venderbosch, & Heeres, 2019). Hydrotreatment research started 30 years ago. Various research papers already showed that hydrotreated pyrolysis liquids could be co-fed into an FCC reactor with high conversion and a potential of reaching 40 – 50% carbon yield. (Yin et al., 2016) Such hydrotreatment is performed under a hydrogen pressure around 200 bar, temperatures between 80oC and 410oC in the presence of a hydrogenation catalyst.

LC-SC3-RES-21-2018 (818120) Deliverable D4.11
Classification Confidential Page 9 of 22
2.3 Pyrolysis oil hydrotreatment The hydrotreatment process following BTG’s concept is performed in 2 steps: A stabilisation and a hydrodeoxygenation step. For the hydrotreatment section the pyrolysis oil produced with wood pyrolysis, as shown in Table 1 is used as inflow. The model may include a product finishing step, and production of H2 from any by-product gases (for example via steam reforming). For simplicity this has been excluded in the present flowsheet. Stabilisation. First a stabilisation step is performed which aims to decrease the functionality of the mixture of components. Essentially, the liquids are hydrogenated, and more specifically the aim is to hydrogenate the carbonylic functions. The stabilisation is an exothermic process performed under a hydrogen pressure of 100 bar or more and starts at a temperature of 80oC up to 250oC. The stabilisation process is slow and requires a residence time of a couple of hours. Especially small aldehydes and ketones are readily converted to their corresponding alcohols via hydrogenation when using a Ni based catalyst. Also, small carboxylic compounds are converted from 80oC upwards via both decarboxylation and hydrogenation reactions. At this temperature sugars are hydrogenated to amongst others sorbitol. Anhydrosugars such as levoglucosan require a temperature of 250oC to be fully converted. (Yin et al., 2016) From BTG experience a part of the smaller lignin compounds undergoes hydrogenolysis and hydrogenation of double bonds occurs at the high temperature range. The latter two are highly dependable on the activity of the catalyst. Hydrodeoxygenation takes place to some degree. In this section only small amounts of gas, mainly CH4, CO2 and CO, are formed. Hydrodeoxygenation. The stabilised liquid, here referred to as stabilised pyrolysis oil or ‘SPO’, is typically phase separated to remove most of the water. Many oxygenated compounds are still present, resulting in a significant loss of carbon atoms to the water phase, typically 3-4% of the initial liquid carbon. The hydrodeoxygenation reactor performs at a hydrogen pressure of 100 bar with temperatures between 250oC and 410oC. In this section mainly hydrodeoxygenation of the alcohol groups takes place. This produces hydrocarbons in all shapes and sizes. From 300oC onwards hydrocracking of especially the water insoluble pyrolytic lignin fraction starts taking place. This produces mono-phenolics which are readily hydrodeoxygenated. At the highest temperature stages the organic acids, as well as dibenzofuran gain reactivity. (Yin et al., 2016) In this section a large part of the carbon, around 30 wt.% of the PO carbon, is lost via gases. This includes valuable products methane, ethane, propane and butane, each representing roughly 5 wt.% of the PL biomass. The other 10% is lost via CO2. (Venderbosch, 2019) Product finishing. The produced SDPO can be separated into a gasoline and diesel fraction via distillation. Gasoline typically contains molecules with 5-12 carbon atoms, and boiling points between 40oC and 205oC, whereas diesel contains molecules with 12-20 carbon atoms and boiling points between 250oC and 350oC. Hydrogen production. The gaseous compounds that are formed during the hydrotreatment can undergo steam reforming to obtain the hydrogen necessary for the process. In the open resource model this section is left out.
LC-SC3-RES-21-2018 (818120) Deliverable D4.11
Classification Confidential Page 10 of 22
3 Pyrolysis oil stabilisation This section first shows the flowsheet of the stabilisation of pyrolysis oil. The flowsheets of the PO stabilisation can be found in appendix C. The pyrolysis oil is pressurised to 200 bar, mixed with high pressure H2 and heated to 80oC. The liquid is treated with hydrogen and undergoes hydrogenation, hydrogenolysis, hydrolysis, decarboxylation and hydrodeoxygenation with temperatures rising to 300oC. The product is cooled down to 50oC and flashed. The H2 leaves as vapour, as well as a part of the methane and CO2 and traces of other compounds. The H2 is pressurized to 200 bar and combined with fresh H2 (produced by the steam reformer). The size of the recycle is controlled by setting the amount of H2 that will mix with the pyrolysis oils. Excess H2 is split off via a purge. The liquid leaving the flash is depressurised to 1 bar and heated to roughly 120oC to evaporate most of the water in the second flash. The evaporated water, containing traces of the oily compounds, is transported to the water treatment, the oil is pressurised to 100 bar and cooled to 80oC.
3.1 Aims First the aims of the model are defined, to have a clear goal for the stabilisation section. Most of those aims are displayed in Table 6. Next to those aims, a few other aims are kept in mind.
1. H2 recirculation. The product of the PO stabilisation contains the unconverted H2, but also contains traces of other gases. Ideally the unconverted H2 can be separated from the other products in such a way that no additional cleaning step is required to reuse this H2
2. Minimize unit operations water separation. The SPO has to be treated to remove the water fraction before undergoing hydrodeoxygenation. The amount of unit operations to achieve the desired conditions should be taken into account.
3.2 Assumptions To be able to make a model, simplifications were made. The most important, together with the assumptions, are explained below.
1. Property package. The stabilisation section contains polar streams, at high pressures. Peng Robinson (PR) is the property package that is most suitable for this situation. The flash separation of the stabilisation product was checked to validate the chosen property package. It was found that the default PR package resulted in excessive amounts of (heavy) oily vapours. The method of calculating the fugacity was changed from equation of state to Dechema, which is a simple activity coefficient model making use of the Antoine constants. A benefit of this model is that it requires no interaction parameters. With this adjustment the flash separation values were as expected, and thus this property package was used.
2. Compounds. Similar to the pyrolysis process, the stabilisation process contains many compounds that are not available in the database. The inflow compounds react to several new compounds leading to over 20 compounds in the stabilisation product.
3. Reactions. The reactions assumed to take place in the stabilisation reactor can be found in Appendix B. - Lignin hydrogenolysis of lignin A is performed in such a way that no CH4 is produced, while
for Lignin B the likelihood of the hydrogenolysis per bond is taken into account (Gómez-monedero, Ruiz, Bimbela, & Faria, 2017).
- A considerable amount of hydrogenation of double bonds within aromatics is assumed. From BTG experience the oil produced after the stabilisation step can obtain a red colour indicating the relative low presence of aromatics bonds (Andrews et al., n.d.).
- All anhydrosugars are assumed to be converted to glucose and then sorbitol.
LC-SC3-RES-21-2018 (818120) Deliverable D4.11
Classification Confidential Page 11 of 22
- The hydrodeoxygenation is performed on the alcohol groups of small compounds with easily accessible groups.
- No polymerisation takes place. Polymerisation likely happens to some degree (Yin et al., 2016), but require the use of bigger model compounds, complicating the model.
4. Solubility. The model suggests that only a part of the CH4 and CO2 exist in the vapour phase after the stabilisation reaction and that as a result H2 can be separated from those compounds with a flash. It is assumed that this situation is correct because of partial dissolving of CO2 and CH4 in the liquid phase, which is supported by BTG experiences.
5. Compound size. The compounds formed by the pyrolysis process are model compounds and are assumed to be smaller than a large portion of the actual compounds available, that can have molar masses around 1000 g/mol vs. the model lignin compounds with molar masses of 400 g/mol (Figueirêdo et al., 2019). This smaller compound size results in lower boiling curves. In the flash designed to evaporate water, this results in a relatively high fraction of oily compounds in the vapour. It is assumed that 70% of those evaporated compounds belong in the SPO instead of the water phase.
6. Water formation. The amount of water separated from the SPO is assumed to be the same amount that was present in the PO inflow. This means that any water present in the final SPO is formed in the stabilisation step.
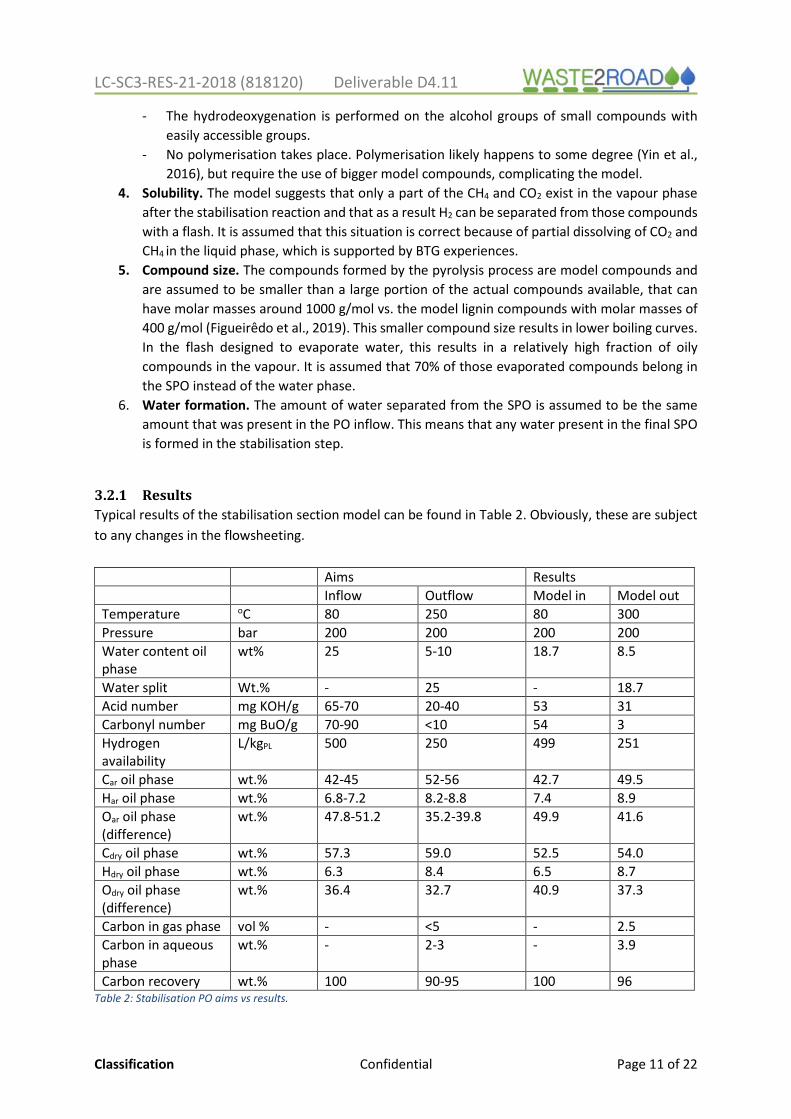
3.2.1 Results Typical results of the stabilisation section model can be found in Table 2. Obviously, these are subject to any changes in the flowsheeting.
Aims Results Inflow Outflow Model in Model out Temperature oC 80 250 80 300 Pressure bar 200 200 200 200 Water content oil phase
wt% 25 5-10 18.7 8.5
Water split Wt.% - 25 - 18.7 Acid number mg KOH/g 65-70 20-40 53 31 Carbonyl number mg BuO/g 70-90 <10 54 3 Hydrogen availability
L/kgPL 500 250 499 251
Car oil phase wt.% 42-45 52-56 42.7 49.5 Har oil phase wt.% 6.8-7.2 8.2-8.8 7.4 8.9 Oar oil phase (difference)
wt.% 47.8-51.2 35.2-39.8 49.9 41.6
Cdry oil phase wt.% 57.3 59.0 52.5 54.0 Hdry oil phase wt.% 6.3 8.4 6.5 8.7 Odry oil phase (difference)
wt.% 36.4 32.7 40.9 37.3
Carbon in gas phase vol % - <5 - 2.5 Carbon in aqueous phase
wt.% - 2-3 - 3.9
Carbon recovery wt.% 100 90-95 100 96 Table 2: Stabilisation PO aims vs results.

LC-SC3-RES-21-2018 (818120) Deliverable D4.11
Classification Confidential Page 12 of 22
Some suggestions can be made to improve the overall simplified flowsheet: 1. Pyrolysis oil composition. An imbalance between the composition of the model pyrolysis oil
and the experimental oil might cause different outcomes. To validate the obtained model data a comparison between the composition of the model pyrolysis oil and experimental pyrolysis oil might be useful.
2. Reactor design. Currently the reactor contains only conversion reactions. More precise knowledge of the reactions taking place at different temperature intervals is required to update and expand the conversion reactions or to be able to implement kinetic reactions.
3. Flash conditions H2 removal. The model presented assumes that the first flash operates at 200 bar and 50oC. The pressure should likely not be changed, as any decrease in pressure would require extra pressurising later on, and also increase the number of contaminants in the H2 recycle. The temperature could however be changed. Lower values result in lower amounts of contaminants, but higher values result in less heating required downstream.
4. Water removal. In the model the water is removed from the oil by evaporation. An option would be to not remove the water here, but after the hydrodeoxygenation reactor. Phase separation is much easier here, as little to no oxygenated compounds are present, and loss of carbon to water will be minimal. This would additionally provide an energy buffer to the exothermic hydrodeoxygenation reactions; however, this likely complicates the reactions and catalyst performances.
5. Recycle. The H2 recycle is refreshed with ‘fresh H2 feed’ but also requires a purge. As in most flowsheeting cases as in CoCo, recycling is not trivial, and can lead to delays in the solving of the overall flowsheet.
6. Heat integration. Energy in products from stabilisation can be easily used to heat the different streams. A specific exergy analysis makes sense but is not done for the present flowsheet.
LC-SC3-RES-21-2018 (818120) Deliverable D4.11
Classification Confidential Page 13 of 22
4 Hydrodeoxygenation of the SPO
4.1 Introduction This section first shows the flowsheet of the deoxygenation of pyrolysis oil. The results show values found with the model next to published and some in-house generated experimental data. In the discussion the results are discussed while in the improvement section possible alterations and improvements of the current model specific to this section are discussed. H2 is added to the SPO, and this stream is heated to 250 oC, here by heat exchange with the reactor’s outflow. H2 is added to lower the temperature increase, but in the model autothermal behaviour is assumed. The SPO undergoes HDO, and reformed hydrocarbons to obtain a final SDPO that fulfils a specific product distribution. The hot SDPO is cooled down with both the HDO inlet stream and cooling water. At a pressure of 100 bar and at 50oC the SDPO is flashed to separate the H2 that contains some carbon as CO2 and methane. This H2 stream is fed into a pressure swing adsorber (PSA) which produces a clean H2 stream and an off-gas stream. The PSA is taken as a simple splitter but may well be modelled in other units. The liquid phase of the SDPO is flashed, and a phase separation yields the final SDPO, a water stream and an off-gas stream. The SDPO is sent to a product finishing section. The water is treated in the water treatment and the off-gas streams are combined and transported to the steam reforming section. The composition and compounds of the SDPO is based on the results of Jones and can be found in Table 8. (Pathway et al., 2013) The gas phase content is based on the results of the deliverable report and can be found in Table 9. (Venderbosch, 2019) The describing text and the results do not completely match and are therefore both shown. Apart from suggestion made earlier for the SPO production, a few comments can be made specifically for the SDPO process:
1. Gasoline:diesel ratio. The desired gasoline:diesel ratio is 2:1. 2. Heavy production. A small heavy production of 5 wt.% of the SDPO is desired to be able to
model the unit operations required for the heavy conversion.
The main assumptions are provided below: 1. Property package. The selected property package is the same in section 3. 2. Compounds. Due to the reactions taking place new compounds are formed. They are defined
according to the method found in appendix B. The compounds formed in the hydrodeoxygenated SPO (SDPO) are based on Jones et al. Only compound groups that are likely to form from the compounds present in the SPO are considered. Cyclopentane and Cycloheptane are not present as building blocks in the SPO. Also, the reaction path of polycyclic groups is unclear and are therefore present to only a small extend.
3. Gasoline:diesel ratio. Octane is the light key in the gasoline. Gasoline is taken roughly C4-C10, and diesel the range of C9-C12.
4. Reactions. The main reactions assumed to take place in the hydrodeoxygenation (HDO) reactor can be found in Appendix B. - The HDO reactions take place simultaneously in the first reactor, no distinction is made
between reactant activity. - All oxygenated hydrocarbons are fully hydrodeoxygenated. - After the HDO some of the compounds are reformed to achieve a final oil composition
similar to the composition published earlier (Pathway et al., 2013) In the second and third
LC-SC3-RES-21-2018 (818120) Deliverable D4.11
Classification Confidential Page 14 of 22
reactor unification reactions take place. In the fourth and fifth reactor hexane is cracked to smaller compounds to meet the expected production of gas and water.
- From BTG experience small percentages of heavies are present in the SDPO. 5. Reactor setup. The reactor is cooled with fresh H2. For simplification purposes the cooling H2
is fed after the reactor chain. 6. H2 Separation. The H2 present in the Hydrodeoxygenated SPO (SDPO) is first removed via a
flash at 100 bar (HDO operating pressure) and 50oC. The H2 rich vapour is fed to a pressure swing adsorber (PSA) in which 90 vol.% of the H2 and 5 vol.% of the other compounds are recovered.
7. Light gas separation. The SDPO is depressurised to 1 bar and the light gases are removed by a flash operation both before and after the decanter.
8. Decanter. The decanter contains split fractions rather than solubility data. 99.5 wt.% of the water leaves via the water phase, together with half of the CO2 and small percentages of methane – butane (10 - 2).
4.2 Results Typical results can be found in the Tables 3-5 below. Obviously, these are subject to any changes in the flowsheeting.
Aims Results Inflow Outflow Model in Model out Temperature oC 250 410 250 405 Pressure bar 100 100 100 100 Acid number Mg KOH/g 20-40 0 31 0 Carbonyl number Mg BuO/g <10 0 3 0 Hydrogen availability
L/kgSPO - - 616 1560
Hydrogen uptake L/KgPL - 360 - 364 Car oil phase wt.% 54.0 85 49.5 86.9 Har oil phase wt.% 8.6 12.0 8.9 12.7 Oar oil phase (difference)
wt.% 37.4 3.0
41.6 0.4
Carbon recovery SDPO
wtSDPO/wtSPO - >60 - 65.9
Carbon in aqueous phase
wt Caq/wt CPL - <1 - 0.3
Carbon in gas phase (difference)
wt Cgas/wt CPL
- 30 - 33.8
Mass increase wtSDPO/wtSPO 100 104.7 100 105.8 Water content wt.% 8.4 31.1 8.5 37.1
Table 3: Hydrodeoxygenation SPO aims vs results. (Venderbosch, 2019)
Jones Model Compound group
Model compound Formula wt.% in upgraded oil
Model compound
Formula % wt in SDPO final
Normal paraffins
Pentane C5H12 3.88 0.9
Hexane C6H14 10.61 25.9
LC-SC3-RES-21-2018 (818120) Deliverable D4.11
Classification Confidential Page 15 of 22
Dodecane C12H26 6.11 5.6 Octadecane C18H38 - 5.6 Iso-paraffins 3-Methylhexane C7H16 3.89 - 4-methylnonane C10H22 6.15 2.9 Cyclopentanes Cyclopentane, ethyl C7H14 3.79 - 1-methyl-1-
ethylcyclopentane C8H16 5.03 -
Cyclohexanes Cyclohexane C6H12 4.86 Methyl cyclohexane
C7H14 14.1
Cylcohexane, butyl- C10H20 3.67 Cyclohexane – 2 – ethyl – 1,3 dimethyl
C10H20 2.5
1,1-Bicyclohexyl C12H22 3.37 - Cyclo C7+ 1,3-dimethyladamantane C12H20 3.44 - Aromatics o-xylene C8H10 7.90 Benzene C6H6 4.6 Toluene C7H8 2.9 propylbenzene C9H12 6.6 methylstyrene C9H10 8.1 Benzene, 1-ethenyl-4-
ethyl C10H12 3.34 Benzene – 1
ethyl – 3 propyl
C11H16 5.5
Heavies 4-methylphenanthrene C15H12 6.45 phenanthrene C14H10 1.9 Pyrene C16H10 6.24 - Diphenyl 1,2-Diphenylethane C14H14 1.08 diphenyl C12H10 0.6 Indanes and indenes
Indane C9H10 1.72 2.5
1H-Indene, 1,2,3-trimethyl-
C12H14 1.29 -
Naphthalenes 1-n-Hexyl-1,2,3,4-Tetrahydronaphthalene
C16H24 2.51 1,2,3,4 - tetrahydronaphthalene
C10H12 2.4
Naphthalene, 2,7-dimethyl
C12H12 4.31 Naphthalene C10H8 7.3
PNAs Naphthalene, 1-phenyl- C16H12 5.32 - Oxygenates 5-Methyl-2-(1-
methylethyl)phenol C10H14O 4.86 -
Nitrogen compounds
2,4,6-trimethylpyridine C8H11N 0.157 -
Sulfur compounds
Dibenzothiophene C12H8S 0.025 -
Table 4: SDPO compound and composition overview.(Pathway et al., 2013)
LC-SC3-RES-21-2018 (818120) Deliverable D4.11
Classification Confidential Page 16 of 22
Aims % (C offgas / C PO) (text)
Aims % (C offgas / C PO) (gas table)
Results % (C gas compounds HDO outlet / C SPO)
Carbon recovery >30 30 32.1 CO2 10 4.0 6.0 CH4 5 13.9 6.2 C2H6 5 5.7 6.8 C3H8 5 2.1 6.6 C4H10 5 4.3 6.5
Table 5: HDO gas phase composition overview.(Venderbosch, 2019)
LC-SC3-RES-21-2018 (818120) Deliverable D4.11
Classification Confidential Page 17 of 22
5 Discussion The HDO section produces an SDPO stream that is further separated into gasoline and diesel in a ratio of roughly 2:1 as typically seen in the tests as well. Some remarks are valid, and these generally reflect differences caused by simplicities in the flow sheeting itself (‘artefacts’) but may be part of future work to further detail the flowsheeting and make it available for reactor design purposes. Overall HDO parameters. The main results are aligned rather well with the experimental results, but some differences – due to artefacts - remain. For example, the O-content of the modelled products is significantly lower than from the tests, due to the assumption that all oxygenated compounds are hydrodeoxygenated, while in reality some oxygen content is maintained. This results in a higher water production rate, and slightly lower carbon efficiencies. SDPO composition. The composition of the SDPO does significantly differ from the actual composition. The modelled product contains relatively the ‘simple’ compounds, such as small paraffins, cyclohexanes and small aromatics. The composition suggested by Jones has more complicated compounds and on average a larger number of C-atoms per compound. Those differences are for a large extend caused by the observation of approx. 5 wt% heavies in the produced SDPO. Gas composition. Table 9 shows the gas composition produced by the model. This gas composition takes into account the alkanes C1-C4 that are present in the HDO product and is not completely the same as the gas that is separated from the final SDPO. Reactor. The cracking and unification reactions that are performed are not based on experimental and literature data. The reactions are solely there to achieve a product composition that is based on experimental results. Some suggestions on how to improve this section of the model are elaborated upon.
1. Reactor cooling. The reactor is cooled by introducing H2. This requires a large amount of H2 of which a part is lost due to contamination taking place. Different ways of cooling the reactor can be investigated with water cooling the most likely option.
2. Reactor design and activity. To understand the reactor behaviour a bit better, several reactor sections could be identified operating at different temperature regimes applying specific reactions. By definition, this requires more detailed information on which types of reactions are taking place at the different temperatures. Larger molecules need to be introduced or accounted for. In the present flowsheet, the model compounds are now already small at the entrance of the HDO sections, compared to the actual compounds, and will yield even lower weight molecules upon HDO. Unification reactions may be required to address the larger structures that are present in the pyrolysis products or produced during the hydrotreatment (either during stabilization or during HDO). The unification reactions that are performed currently are based on the groups that are present and that can be combined conveniently to larger groups. It is necessary to have more information on the formation of larger compounds, such as polycyclic aromatics. Lignin contains many aromatic groups, but no polycyclic aromatic groups. Those compounds are assumed to be present in the SDPO but are not present in the PO and are not produced by a clear pathway.
3. Diesel content. The diesel currently contains molecules up to C12, and this actually is on the low side. A larger distribution of heavy molecules would give the possibility to shift the average
LC-SC3-RES-21-2018 (818120) Deliverable D4.11
Classification Confidential Page 18 of 22
number of carbon atoms per molecules upwards, resulting in a more realistic composition of the diesel.
4. Gas separation. The gases are separated via two flashes and a decanter. This separation can potentially be achieved more efficiently.
5. Decanter. The decanter contains fixed split fractions. The split fractions should be checked with experimental data, and ideally the decanter should be modelled via solubility values.
LC-SC3-RES-21-2018 (818120) Deliverable D4.11
Classification Confidential Page 19 of 22
6 Conclusion The hydrotreatment model developed includes the reactors and other unit operators required to produce gasoline and diesel from pyrolysis oil in a stand-alone unit. The obtained results show rather good agreement with the data available at BTG, apart from any exothermal behaviour. The background here is that the oils from pyrolysis must be taken as merely monomeric structures, opposed to the oligomeric structures that will be produced in practise. Flowsheeting programs as CoCo, Aspen or Hysis cannot use compounds with high molecular weight component such as pyrolytic lignin or di- and trimeric carbohydrates, let alone the various complex structures derived from it. In the pyrolysis of biomass this inevitably leads to a miscalculation of the heat of reaction, and an endothermicity lower than expected from experiments. This additional exothermicity is compensated for in the hydrotreating section where the damping character of the endothermic cracking reactions is then neglected. To cope with this in the flow sheeting, in the model published the reactors are taken isothermal. Duties are listed within the flow sheeting program. The model solves quickly, even when large alterations are made. Only the hydrogen recycle in the stabilisation section shows solving difficulties. The carbon flow included in the model gives a clear first indication of the efficiency of the process during the different process steps. Interestingly, but part of future explorations, a subsequent model including a steam reforming of by-product gases suggests that a hydrotreatment process combined with a steam reforming section may be close to self-sustaining in hydrogen.
LC-SC3-RES-21-2018 (818120) Deliverable D4.11
Classification Confidential Page 20 of 22
7 Bibliography Andrews, R. J., Castelijns, K., Fadnes, F. H., Irvine-fortescue, J., Williams, S., Jamaluddin, A. J., Mullins,
O. C. (n.d.). Quantifying Contamination Using Color of Crude and Condensate. Barbosa Lima, D. F., Ademar, F., Kaminski, M., & Matar, P. (2012). Modeling and Simulation of Water
Gas Shift Reactor: An Industrial Case. Petrochemicals. https://doi.org/10.5772/37181 Christensen, T. S. (1996). Adiabatic prereforming of hydrocarbons - An important step in syngas
production. Applied Catalysis A: General, 138(2), 285–309. https://doi.org/10.1016/0926-860X(95)00302-9
Constantinou, L., & Gani, R. (1994). New Group Contribution Method for Estimating Properties of Pure Compounds, 40(10), 1697–1710.
Figueirêdo, M. B., Jotic, Z., Deuss, P. J., Venderbosch, R. H., & Heeres, H. J. (2019). Hydrotreatment of pyrolytic lignins to aromatics and phenolics using heterogeneous catalysts. Fuel Processing Technology, 189(January), 28–38. https://doi.org/10.1016/j.fuproc.2019.02.020
Gómez-monedero, B., Ruiz, M. P., Bimbela, F., & Faria, J. (2017). Applied Catalysis A , General Selective hydrogenolysis of α e O e 4 , β e O e 4 , 4 e O e 5 C e O bonds of lignin- model compounds and lignin-containing stillage derived from cellulosic bioethanol processing. Applied Catalysis A, General, 541(February), 60–76. https://doi.org/10.1016/j.apcata.2017.04.022
Joback, K. G., & Reid, R. C. (1987). ESTIMATION OF PURE-COMPONENT PROPERTIES FROM GROUP-CONTRIBUTIONS, 6445(May). https://doi.org/10.1080/00986448708960487
Lu, Q., Hou, Y., Laraib, S. R., Khalifa, O., Li, K., Xie, W. luan, … Yang, Y. ping. (2019). Electro-catalytic steam reforming of methane over Ni-CeO2/Γ-Al2O3-MgO catalyst. Fuel Processing Technology, 192(October 2018), 57–64. https://doi.org/10.1016/j.fuproc.2019.04.021
Manufacturers, E. A. A. (n.d.). Differences between diesel and petroleum. Retrieved September 23, 2019, from https://www.acea.be/news/article/differences-between-diesel-and-petrol
Pathway, B., Jones, S., Meyer, P., Snowden-swan, L., Tan, E., Dutta, A., … Cafferty, K. (2013). Process Design and Economics for the Conversion of Lignocellulosic Biomass to Hydrocarbon Fuels Fast Pyrolysis and Hydrotreating.
Praveen, G., Lakshmi, V., Ganesh, A., & Mahajani, S. (2015). Chemical Engineering and Processing : Process Intensi fi cation Stabilization of pyrolysis oil : Comparison of reactive distillation and reactive chromatography, 95, 327–338.
property_joback @ checalc.com. (n.d.). Retrieved from https://checalc.com/solved/property_joback.html
Sperle, T., Chen, D., Lødeng, R., & Holmen, A. (2005). Pre-reforming of natural gas on a Ni catalyst. Criteria for carbon free operation. Applied Catalysis A: General, 282(1–2), 195–204. https://doi.org/10.1016/j.apcata.2004.12.011
Sun, F., & Beekley, B. (2017). UCLA UCLA Electronic Theses and Dissertations by, 63. Venderbosch. (2019). 4 refinery deliverable. Vispute, T. P., & Huber, G. W. (2009). Production of hydrogen, alkanes and polyols by aqueous phase
processing of wood-derived pyrolysis oils. Green Chemistry, 11(9), 1433–1445. https://doi.org/10.1039/b912522c
Vogt, E. T. C., & Weckhuysen, B. M. (2015). Fluid catalytic cracking: Recent developments on the grand old lady of zeolite catalysis. Chemical Society Reviews, 44(20), 7342–7370. https://doi.org/10.1039/c5cs00376h
Yin, W., Kloekhorst, A., Venderbosch, R. H., Bykova, M. V., Khromova, S. A., Yakovlev, V. A., & Heeres, H. J. (2016). Catalytic hydrotreatment of fast pyrolysis liquids in batch and continuous set-ups using a bimetallic Ni-Cu catalyst with a high metal content. Catalysis Science and Technology, 6(15), 5899–5915. https://doi.org/10.1039/c6cy00503a
LC-SC3-RES-21-2018 (818120) Deliverable D4.11
Classification Confidential Page 21 of 22
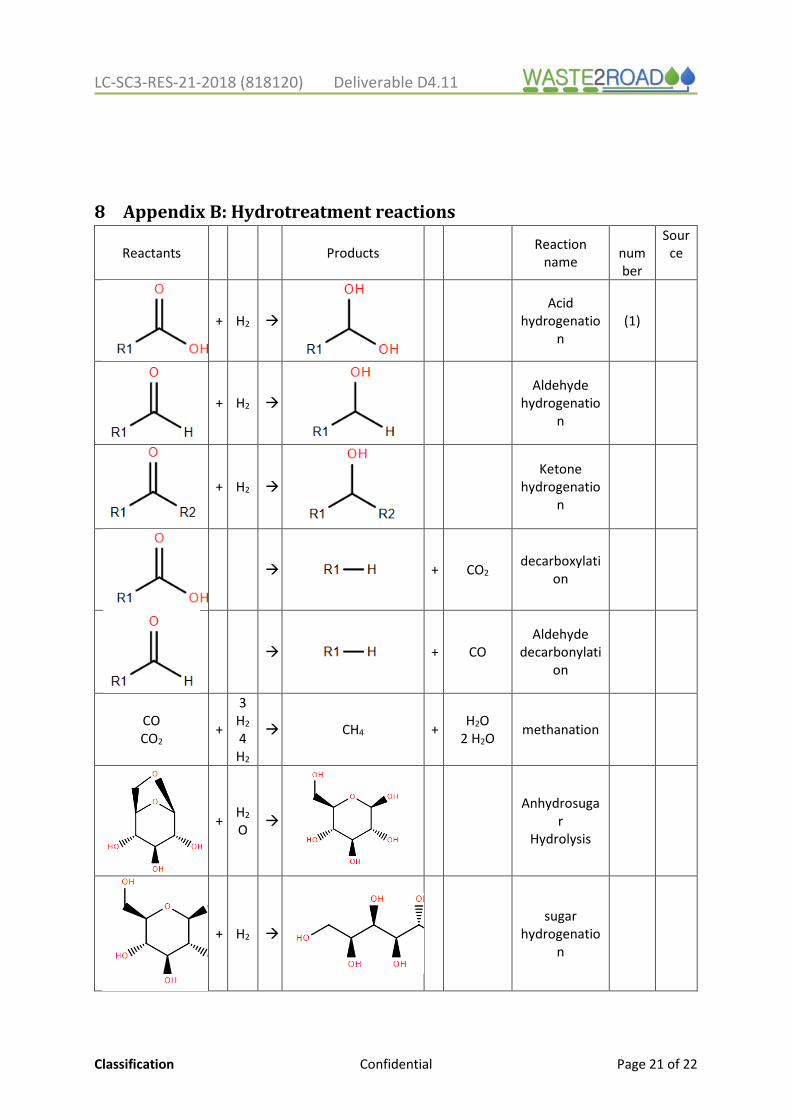
8 Appendix B: Hydrotreatment reactions
Reactants Products Reaction name
number
Source
+ H2
Acid
hydrogenation
(1)
+ H2
Aldehyde
hydrogenation
+ H2
Ketone
hydrogenation
+ CO2 decarboxylati
on
+ CO Aldehyde
decarbonylation
CO CO2
+
3H2
4H2
CH4 + H2O 2 H2O methanation
+ H2
O
Anhydrosuga
r Hydrolysis
+ H2
sugar
hydrogenation
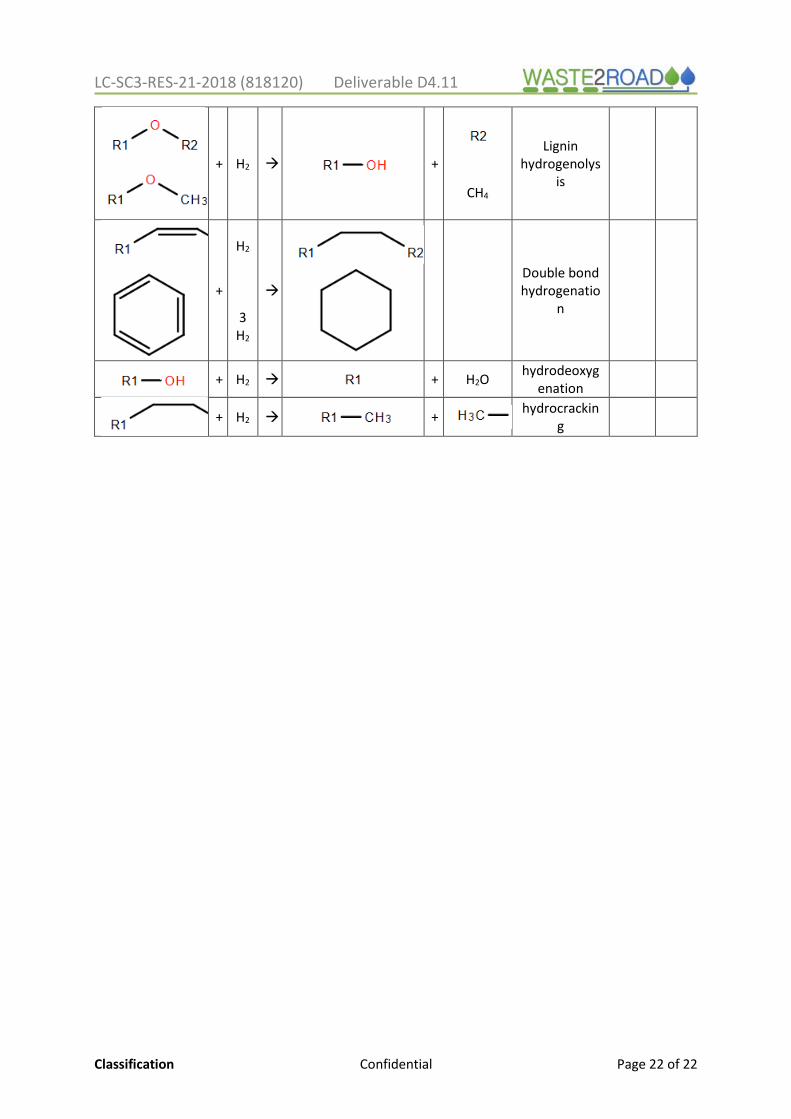
LC-SC3-RES-21-2018 (818120) Deliverable D4.11
Classification Confidential Page 22 of 22
+ H2 +
CH4
Lignin hydrogenolys
is
+
H2
3 H2
Double bond hydrogenatio
n
+ H2 + H2O hydrodeoxygenation
+ H2 +
hydrocracking
Copyright © 2022 FDOKUMEN