Untitled - Utrecht University Student Theses Repository Home
102
1
-
Upload
khangminh22 -
Category
Documents
-
view
1 -
download
0
Transcript of Untitled - Utrecht University Student Theses Repository Home
1

2
Image front cover: De Stentor (2014)
http://www.destentor.nl/algemeen/binnenland/terugblik-wateroverlast-
in-nederland-foto-s-1.4467176
Contact details
3
Research on the suitability of the KRA support tools to address the main
perceived barriers to climate change adaptation by Dutch municipalities
Student: Niels Tijhuis
Student number: 3373312
Supervisors: Dr. Carel Dieperink & Dr. Heleen Mees
2nd reader: Dr. Hens Runhaar
Utrecht University, Faculty of Geosciences
Sustainable Development: Environmental Governance
September 2015
DUTCH MUNICIPAL CLIMATE CHANGE ADAPTATION
4
Acknowledgements
This thesis was written as final part of the master program Sustainable Development:
Environmental Governance at the Faculty of Geosciences at Utrecht University. For eight months I
worked on this thesis and it proved to be the most challenging and exciting endeavor of my
entire career as a student.
Conducting this research as part of an internship at Klimaatverbond Nederland allowed me to
quickly get acquainted with the field. Through conversations with representatives of the
national government, waterboards, private actors and many municipalities I learned a lot about
the current state of climate adaptation in the Netherlands. I am thankful for the 85 interviewees
that contributed to this research and provided me with enough knowledge an insights to
develop knowledge and insights of my own. For this I would also like to thank Madeleen
Helmer, my internship supervisor, with whom I worked closely and pleasantly together during
my research.
In addition, I would like to express my gratitude and appreciation to my thesis supervisors, Dr.
Carel Dieperink and Dr. Heleen Mees, for their ongoing guidance and enthusiasm over the past 8
months. Their advice helped me a lot with overcoming challenges and setbacks, and after an
hour of drinking coffee together I always left recharged and motivated.
Last but not least I would like to thank my family, and my girlfriend Lizzy in particular, for their
patience and support during all the endless library sessions. The work is done and I am looking
forward to taking the next step in life.
Niels Tijhuis
Utrecht, The Netherlands
September 25, 2015
5
Abstract
Local risks of climate change are predicted to intensify in the Netherlands. Therefore, national
ambitions are set to become more resilient by adapting to climate change, for which
municipalities are recognized as important actors. However, many municipalities encounter
barriers that prevent them from working (further) on adaptation planning. Through the online
knowledge platform spatial adaptation (KRA), tools are offered to support municipalities in their
endeavors.
The aim of this research is to provide recommendations for improving the suitability of the KRA
support tools for addressing the main perceived barriers to Dutch municipal climate adaptation.
This is done by prioritizing the perceived barriers (84 interviews), identifying the assumptions
underlying the KRA support tools (1 interview + document analysis) and evaluating to what
extent the available support tools are suitable for addressing these main barriers. Suitability is
assessed based on two indicators: the match between the goals of the KRA support tools and the
main barriers (reconstruction of policy theory), and the use and perception of the suitability of
support tools by municipalities (interviews). The following central research question is
formulated to guide the analysis:
To what extent are KRA support tools suitable for addressing the main barriers to adaptation
planning for Dutch municipalities?
The main perceived barriers are a lack of urgency, a lack of knowledge of risks and measures,
and limited capacity. A lack of urgency is considered the most significant barrier to adaptation
planning. The goals of the KRA support tools match the main perceived barriers by
municipalities. However, the extent to which the tools can help overcome these barriers is often
limited. Tools for risk assessment are suitable for less-advanced municipalities that are taking
initial steps towards adaptation planning. These tools can help increase a sense of urgency and
develop knowledge of local risks and vulnerabilities. However, the tools are less suitable for
more advanced municipalities, as addressing their barriers requires context-specific data, and
knowledge of under-addressed risks and challenges, which the KRA support tools currently are
not able to provide.
Keywords: Climate change, adaptation planning, barriers, support tools
6
Table of contents
Acknowledgements…………………………………………………………………………...…………………………………p.4
Abstract …………………………..………………………………………………………………………………………………….p.5
Table of contents ……………..………………………………………………………………………………………………….p.6
1. Introduction ………………………………………………………………………………………………………………….p.8
1.1 Introduction ……………………………………………………………………………………………………p.8
1.2 Climate change ………………………………………………………………………………………………..p.9
1.3 Climate change in the Netherlands ……………………………………………………………………..p.9
1.4 Adaptation ………………………………………………………………………………………………….….p.11
1.5 Problem definition ………………………………………………………………………………………….p.13
1.6 Research aim and relevance ……………………………………………………………………………p.14
1.7 Research framework, questions and outline ………….. …………………………………………p.17
2. Adaptation planning, barriers and support tools in theory ………………………………………………p.20
2.1 Introduction ……………..……………………………………………………………………………………..p.20
2.2 Adaptation planning …………………………………………………………………………………………p.20
2.3 Barriers ………………………………………………………………………………………………………….p.24
2.4 Support tools ………………………………………………………………………………………………….p.28
2.5 Suitability……………… …………………………..……………………………………………………………p.30
2.6 Analytical framework…………………………………………………………………..……………………p.31
3. Methods…………………………………………………….…………………………………………………………………...p.33
3.1 Introduction……………………………………………………………………………………………………...p.33
3.2 Preliminary research…………….………………………………………………………………………...p.33
3.3 Identification of barriers and use and perception of the KRA support tools………...p.33
3.3.1 Data collection…………………………….……………………………………………………...p.33
3.3.2 Data analysis………………………….…………………………………………………………p.38
3.4 Assumptions behind the KRA support tools……...……………………………………………...p.40
3.5 Ethics………………………………………………..……………………………………………………………...p.42
3.6 Limitations……………………………………………………………………………………………………...p.42
4. Adaptation planning by Dutch municipalities……………………..………………………….………………...p.47
4.1 Introduction……………………………………………………………………………………………………...p.47
4.2 Recognized risks………………………………………………………………………….…….……………...p.47
4.3 Risk mapping……………………………………………………………………………….…………………...p.49
4.4 Adaptation planning……………………………………………………………………………….……….p.52
4.4.1 Measures……………………………………………………………………….………………….p.54
4.4.2 Governance approach……………………………………………………...………………...p.55
4.5 Conclusion…………………………………………………………………………………….………………..p.57
5. Main barriers to municipal adaptation planning……………………..…………………………………...p.58
5.1 Introduction………………………………………………….…………………………….…………………...p.58
5.2 Barriers…………………………………………………………………………………..…………..…………..p.59
7
5.3 Lack of urgency….………….………………….……………………………..………….…………………...p.60
5.4 Lack of knowledge…………………...…………………………………………….…….…………………...p.61
5.4.1 Lack of knowledge of risks…………………………………………………………………p.61
5.4.2 Lack of knowledge of measures……………………………………………………………p.63
5.5 Limited capacity………………………….………………………………………………….………………...p.64
5.6 Conclusion……………….…….……………………………………………………………….………………...p.65
6. KRA support tools…………………………………………………………………………………….…………………...p.67
6.1 Introduction………………………………………………………………………….……….………………...p.67
6.2 Social processes……………..…………………………………………………………….…………………...p.67
6.3 Final relations……………….…………………………………………………………….…………………...p.69
6.4 Causal relations……..…………………………………………………………………….…………………...p.72
6.5 Assumptions about suitability of KRA support tools for barriers………………………...p.74
6.6 Conclusion………………………………………………………………………..………….…………………...p.75
7. Suitability of the KRA support tools for addressing the main perceived barriers to
adaptation planning…………..…………………………………………………..………….…………….……...p.76
7.1 Introduction………………………………………………………………..……………….…………………...p.76
7.2 Suitability of the KRA support tools for addressing the main perceived barriers...p.78
7.2.1 Lack of urgency…………………………………………………………………...……………...p.78
7.2.2 Lack of knowledge of risks………………………………………………...……………...p.79
7.2.3 Lack of knowledge of adaptation measures………………………...……………...p.80
7.2.4 Limited capacity……………….………………………………………………...……………...p.80
7.3 Conclusion………………………………………………………………………….…………………..………...p.81
8. Recommendations and discussion.…………………………………………………………………..……………...p.84
8.1 Recommendations for improving the suitability of the KRA support tools……...…..p.84
8.2 Discussion and recommendations for future research……………………………………….p.85
References……………………………………………………………………..……………………..………………………….p.87
Appendixes………………………………………………………………………………………………..…………………….p.94
8
1. Introduction 1.1 Introduction
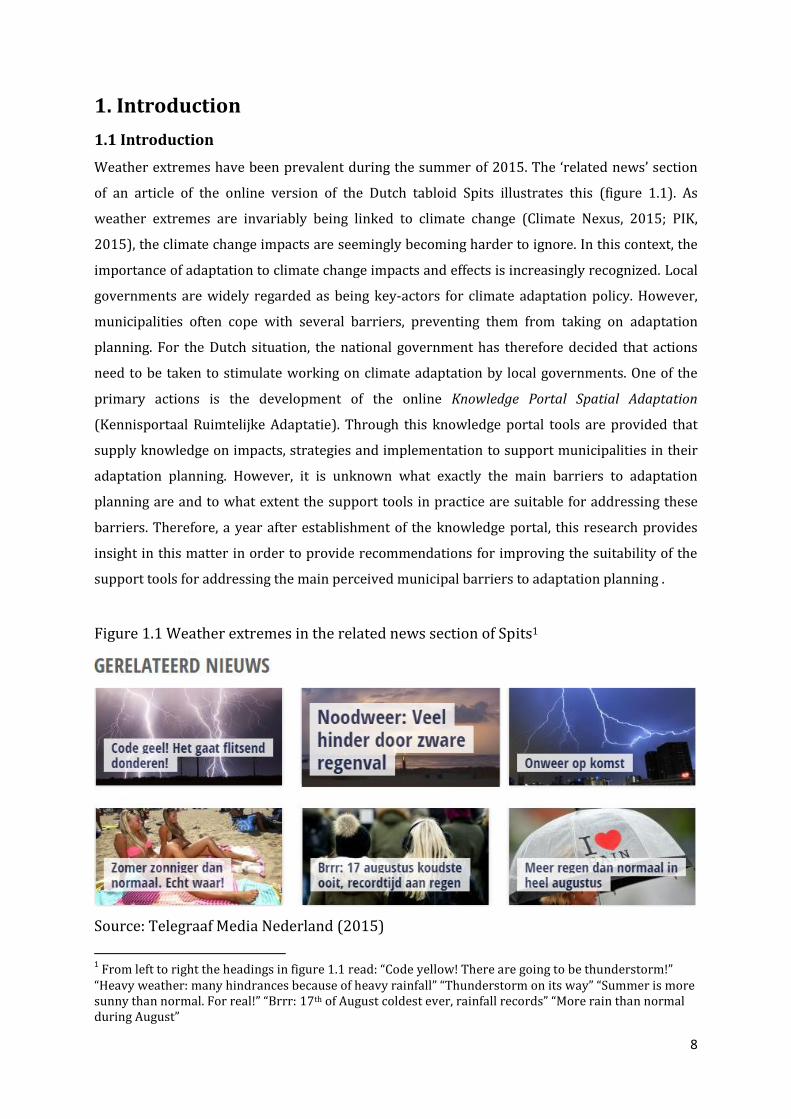
Weather extremes have been prevalent during the summer of 2015. The ‘related news’ section
of an article of the online version of the Dutch tabloid Spits illustrates this (figure 1.1). As
weather extremes are invariably being linked to climate change (Climate Nexus, 2015; PIK,
2015), the climate change impacts are seemingly becoming harder to ignore. In this context, the
importance of adaptation to climate change impacts and effects is increasingly recognized. Local
governments are widely regarded as being key-actors for climate adaptation policy. However,
municipalities often cope with several barriers, preventing them from taking on adaptation
planning. For the Dutch situation, the national government has therefore decided that actions
need to be taken to stimulate working on climate adaptation by local governments. One of the
primary actions is the development of the online Knowledge Portal Spatial Adaptation
(Kennisportaal Ruimtelijke Adaptatie). Through this knowledge portal tools are provided that
supply knowledge on impacts, strategies and implementation to support municipalities in their
adaptation planning. However, it is unknown what exactly the main barriers to adaptation
planning are and to what extent the support tools in practice are suitable for addressing these
barriers. Therefore, a year after establishment of the knowledge portal, this research provides
insight in this matter in order to provide recommendations for improving the suitability of the
support tools for addressing the main perceived municipal barriers to adaptation planning .
Figure 1.1 Weather extremes in the related news section of Spits1
Source: Telegraaf Media Nederland (2015)
1 From left to right the headings in figure 1.1 read: “Code yellow! There are going to be thunderstorm!”
“Heavy weather: many hindrances because of heavy rainfall” “Thunderstorm on its way” “Summer is more sunny than normal. For real!” “Brrr: 17th of August coldest ever, rainfall records” “More rain than normal during August”
9
1.2 Climate change
Since the pre-industrial era anthropogenic greenhouse gas emissions have been ever increasing,
resulting in present atmospheric concentrations of carbon dioxide (CO2), nitrous oxide (N2O)
and methane (CH4) that are the highest in the past 800,000 years (IPCC, 2014). Global
population growth and economic activities are seen as the most important drivers of this
increase (IPCC, 2014). It has been widely recognized that it is extremely likely that their effects
are the primary cause of the climate change observed since approximately 1950.
Since then, a wide variety of impacts from climate change has intensified, including, but not
limited to: heat waves, droughts, arctic sea ice retreat, heavy precipitation, permafrost melt,
hurricanes, flooding and wildfires (IPCC, 2014; Solomon, et al., 2008). Many of these impacts are
expected to intensify in the near future (Roders & Straub, 2015), which can also increase the
detrimental implications for ecosystems, human health and the economy (Kovats, et al., 2014;
Thomas, et al., 2004). On top of that, the physical climate changes due to past, present and future
carbon dioxide emissions are regarded to be, to a large extend, irreversible (Solomon, et al.,
2008). Overall, climate change is widely considered to be one of the main environmental
challenges of the 21st century (Roders & Straub, 2015; Carter et al., 2015).
While some climate change risks are universal, others are more relevant for specific regions. On
a global scale developing countries are generally more at risk, whereas on a national scale urban
areas are expected to be more vulnerable for drought, heat stress and flooding (IPCC, 2014;
Roders & Straub, 2015). For Europe, projections of climate change impacts mainly point to
increased temperature extremes, droughts and heavy precipitation (IPCC, 2014).
1.3 Climate change risks in the Netherlands
Climate change risks are considerably high for the Netherlands, especially water-related risks, as
the country is situated in a delta (Hof, et al., 2014). In order to assess the risks and opportunities
of climate change in the Netherlands, the Royal Netherlands Meteorological Institute (KNMI)
which is the national weather service and a research institute, has developed and published
various climate scenarios over the years.
These scenarios can serve as input for developing strategies and policies to adapt to climate
change in the Netherlands (KNMI, 2015). The most-recent climate scenario, the KNMI’14
scenario, aims to translate the global findings of the IPCC 2013 rapport to the Dutch context. By
way of observations and climate modelling, four different scenarios are distinguished that
together provide a simulation of expected climate change effects (KNMI, 2014). The main
10
climate change risks for the Netherlands are further discussed below.
The following descriptions of heat stress, heavy precipitation, coastal and river flooding, and
droughts are based on the KNMI’14 scenario’s (KNMI, 2014) unless explicitly stated otherwise.
Heat stress
The general expected trend is a continuous temperature rise, with an increase in duration and
intensity of heatwaves also known as heat stress. Although the extent of the increase in
temperature differs among the four scenarios, the common thread is that of more mild winters
and hot summers. Summers are characterized by an increase of tropical nights (with a minimum
temperature of 20 °C or higher) (KNMI, 2014). Heat stress can have various implications, such as
increased mortality, especially amongst vulnerable groups in society (e.g. elderly), electricity
outage and damage to infrastructure (PBL, 2015a).
Heavy precipitation
Heavy precipitation and rainfall in general will increase in occurrence during winters and in
intensity during summers. Furthermore, weather events including hail and thunderstorms are
expected to become more extreme (KNMI, 2014). The effects of intensified heavy precipitation
come in the form of flood flows in the built environment, potentially damaging buildings, water
overflow blocking main roads, and overflow of sanitary sewers which can have negative
environmental and health effects (RIONED, 2007).
River flooding and coastal flooding
The increase in rainfall during winters also leads to an intensified river runoff, magnifying the
risks of river flooding. Although river flooding is partially caused by heavy precipitation, it is
listed here separately. The reason for this is that river and sea flooding is also intensified by
ocean warming and melting of ice sheets and glaciers (KNMI, 2014). Therefore, regions along
river banks and coastlines are confronted with the necessity of dealing with flood control in
addition to anticipating heavy precipitation. All scenarios predict a continuous sea level rise at
an increased rate. The severity of this acceleration corresponds with the expected global
warming, which again differs per scenario.
Droughts
In between precipitation, periods of drought are likely to become more common and intense,
especially during summers. However, the confidence-level of this forecast differs substantially
among scenarios, making this a more ambiguous climate change effect compared to the other
11
effects. Still, droughts can lead to degraded water quality and salinization (with detrimental
effects for the agricultural sector) and wildfires (KNMI, 2014).
Awareness about the seriousness and the risks of climate change has grown rapidly over the
past decade (Hamin, et al., 2014), leading for example to the European Union (EU) making
combating climate change one of its key priorities (European Union, 2015a). In order to limit
climate change, substantial cuts in greenhouse gas emissions are necessary (IPCC, 2014), which
has been the primary focus of the EU as well as “encouraging other nations and regions to do
likewise” (European Union, 2015a). Limiting climate change by way of emission reduction, or
enhancing the capacity of carbon sinks, is known as ‘mitigation’. Persistent mitigation can
significantly reduce the impacts of climate change in this century (IPCC, 2014). However, despite
all mitigation efforts, emissions have continued to increase between 1970 and 2010
(approximately half of the anthropogenic CO2 concentrations since 1750 were emitted during
that time span), making climate change (although with a varying magnitude per scenario)
unavoidable (Bruin, et al., 2009; IPCC, 2014).
1.4 Adaptation
Because climate change is regarded unavoidable, adapting to climate change is increasingly
being recognized as another fundamental response for reducing climate change risks and
exploiting opportunities (Bruin, et al., 2009; Füssel, 2007; Lindgren, et al., 2009; IPCC, 2014).
Internationally, a range of adaptation finance mechanisms has been established, complimented
by various multi-lateral arrangements (Measham, et al., 2011). The European Union initiated the
development of a European Adaptation Strategy in 2009. Member States were encouraged to
develop national and regional adaptation strategies before 2013. Although, some progress has
since been made and various national adaptation strategies have been developed, or are been
developed, they generally do not contain concrete implementation- or monitoring and
evaluation- plans yet. Member States have therefore been given until 2017 to further develop
and concretize their national adaptation plans (Roders & Straub, 2015). The Dutch national
adaptation strategy is due in 2016 (PBL, 2015b).
Because of the varying intensity of the climate change risks, the EU encourages adaptation
initiatives at the national, regional and local level (European Environmental Agency, 2015). The
national adaptation strategies are also important because national institutions need to have a
coordinating role in climate adaptation, as different levels of urgency at various governance
scales need to be aligned to avoid problems (Bruin, et al., 2009). In that sense, policy-making for
12
adaptation is in general still at an early stage of development with plenty of room for
improvement for incentivizing adaptation (Roders & Straub, 2015).
Local governments are increasingly recognized as being important actors for effective
adaptation, due to their ability to scale up adaptation of local communities and managing risks,
information and financing at a local level (IPCC, 2014). Furthermore, local governments are
increasingly demanding a role in shaping policies of international climate change regimes at a
local level (Lorenzoni, et al., 2005). With the growing recognition of the importance of climate
change adaptation at higher governance levels, this could also begin to apply for adaptation
policies. In addition, municipalities are often the primarily responsible actors for managing local
climate change impacts (Measham, et al., 2011). However, in practice municipalities often tend
to take responsibility for small-scale adaptation actions that can also serve other interests
simultaneously, also known as ‘no-regret’ type actions (Runhaar, et al., 2012). Neighborhood and
municipal levels are likely the main areas of responsibility for local governments compared to
more specific areas, such as the building level for which building owners and project developers
are relevant actors (Runhaar, et al., 2012).
Climate adaptation is sometimes regarded as a somewhat ambiguous concept (Biesbroek, et al.,
2013) consisting of various forms and approaches. Understanding the various interpretations of
adaptation is however pivotal for this research.
The intergovernmental panel on climate change defines adaptation as: “Adjustment in natural or
human systems in response to actual or expected climatic stimuli or their effects, which moderates
harm or exploits beneficial opportunities” (IPCC, 2007, p.869). This definition underlines some
important elements of climate adaptation. First, it emphasized the need to intervene in our
environment, which can be translated into adapting physical planning to climate change (Ford &
Berrang-Ford, 2011). Second, this intervention can be done either reactive (after calamities) or
proactive (to prevent calamities from happening, based on risks). And third, incentives to adapt
can stem from the desire to reduce risks (potential damage), exploit beneficial opportunities, or
both.
Effective planning and ensuring adequate and timely adaptation can reduce the impacts of
climate change (Serrao-Neumann, et al., 2015). Impacts in this context often refer to ‘moderate
potential damages’ instead of extreme scenarios or catastrophes (Bruin, et al., 2009).
13
In order to effectively select and implement adaptation measures it is important to build
‘adaptive capacity’ (IPCC, 2014). Adaptive capacity constitutes the “ability of a system, region, or
community to adapt to the effects or impacts of climate change” (Bruin, et al., 2009). Adaptation
can be reactive in form, where actions are taken after impacts occurred, or proactive, where
actions are taken to limit the vulnerability to future risks. In practise this means proactive
adaptation consists of measures such as adjusting the built environment to climate change,
whereas reactive adaptation includes measures such as damage remedy of the built
environment (Runhaar, et al., 2012). Adaptation measures in practice are often still reactive in
nature (de Paula Domingos, et al., 2015). The proactive, anticipatory, form of adaptation is
generally considered to be the preferred one, as it increases the potential to prevent actual
damage, whereas reactive adaptation is in that sense more steered towards recovery (Burton, et
al., 2006). It should be noted though that adaptation, and the desired form in which it takes
place, is considered place- and context-specific (IPCC, 2014).
Adaptation and mitigation actions can work mutually reinforcing (e.g. planting of trees) as well
as contradicting (e.g. air conditioning systems) (Füssel, 2007). However, both approaches are
often seen as complementary because of their ability to reduce risks over different timescales
(Füssel, 2007; IPCC, 2014). The issue of adaptation becomes even more urgent because options
for successful adaptation will decline with increasing climate change (Lindgren, et al., 2009).
1.5 Problem definition
Despite all mitigation efforts, it is increasingly recognized that climate change, and its
consequences, are to a certain extent unavoidable (Albers, et al., 2015). Rural areas are
vulnerable to climate change because of negative impacts on nature and agriculture (PBL,
2015a; Sandt & Goosen, 2011; Tweede Kamer, 2007). Urban areas are vulnerable because of a
growing amount of people living in these areas and because cities in particular are vulnerable to
risks such as heat stress (PBL, 2015a; Tennekes, et al., 2014). As a result climate change is
gradually being recognized as an important and significant challenge to address in regional and
urban planning (Tennekes, et al., 2014; Albers, et al., 2015).
Because of their ability to address specific local risks and needs, local governments such as
municipalities are often considered to be key actors in climate change policy-making and
implementation (Storbjörk, 2007). However, the majority of Dutch municipalities are still
insufficiently considering adaptation planning and when they do, adaptation actions are rarely
addressing non-water domains such as heat stress (Hoppe, et al., 2014; Buitelaar, 2015). Many
municipalities thus still cope with barriers that prevent, stop or delay their adaptation efforts.
14
The national government is not operating in a hierarchical way, where adaptation planning is
enforced. Rather, it positions itself as facilitator and provider of support (PBL, 2015a). This
means there are no implicit rules and legislation in place to incentivize climate adaptation
(Kennisportaal Ruimtelijke Adaptatie, 2015d; Runhaar, et al., 2014). However, the national
government has recently invested in developing action plans to support adaptation efforts by
local governments. A total of 30 different actions are formulated in the manifest climate proof
cities that are designed to make the Netherlands more climate proof. One of the primary actions
was the development of an online knowledge portal: Kennisportaal Ruimtelijke Adaptatie (from
here on referred to as KRA). Through the KRA, tools are provided that need to support
municipalities in their adaptation process (H. Goosen, personal communication, April 20, 2015).
However, it is unknown to what extent these support tools in practice have been suitable for
addressing the barriers of municipalities and in-depth research on their use has remained
absent so far. Therefore, in order to improve the available support tools and, if necessary,
expand the range of tools so that the main barriers of municipalities are addressed, research is
needed.
1.6 Research aim and relevance
The aim of this research is to provide recommendations for improving the suitability of the KRA
support tools for addressing the main barriers to adaptation planning by Dutch municipalities.
This research aim is designed to have both societal and scientific relevance. Therefore, the target
audience of this research is twofold:
- the developers of the support tools are provided with; information on the suitability of the KRA
support tools and recommendations for improvement
- the research results on the main barriers to municipal adaptation planning and the suitability
of support tools to address them aim to contribute to recent debates in the scientific community
In order to substantiate the societal relevance the research aim was presented in meetings with
the KRA developers before and during the research. In these meetings, the relevance and
applicability of the research results was confirmed. “We are very interested in receiving
recommendations on how to improve the KRA. It is interesting to know how the tools are used and
perceived, and where things are still missing. Insight in what the main perceived barriers are is also
useful, as this allows us to potentially address these better.” (H. Goosen, personal communication,
April 20, 2015).
15
The scientific relevance of this research mainly consists of enriching the ‘barriers to adaptation’
research field by prioritizing barriers to adaptation planning, and by addressing the knowledge
gap on the suitability of support tools for barriers. Furthermore, the data collection approach in
this research is designed to be innovative in nature by applying largescale data collection, both
in numbers of participants (84 municipalities) and in the detail of analysis (structured in-depth
interviews) which is not common in this research field.
Furthermore, the scientific relevance of this research is substantiated by following recent
relevant debates: the Climate Alliance Working Group on Adaptation hosts a meeting on the 14th
of October in Brussels. Part of the agenda is a debate on barriers to municipal adaptation
planning and support needs (Appendix 1). In addition, the 4th international climate change
adaptation conference, held in Rotterdam 10-13 may 2016, covers ‘cross cutting issues’ in its
program on practices and solutions “that reflect prominent subjects in climate adaptation of
today and the coming decade”. One of the three cross cutting issues considers Risk assessment,
adaptation planning and evaluation. For this issue attention is o.a. given to “better methods and
tools for simulating and communicating climate risks to those who take decisions and influence
outcomes”.
Both events underline the relevance of this research and confirm barriers and support tools for
adaptation planning as a ‘hot topic’. The scientific relevancies of this research are further
substantiated by literature review and presented below.
Barriers
Initially the majority of adaptation-research focused on the identification of climate change risks
and the development of adaptation measures (Runhaar, et al., 2012). This was followed up over
the past years by extensive research on barriers to adaptation. A wide variety of barriers has
been identified and several categorizations have been proposed. However, there have been few
attempts to identify and prioritize the importance of certain barriers (Biesbroek, et al., 2013).
Therefore, this research aims to identify the main perceived barriers to adaptation planning by
municipalities. Next to assessing which barriers are most commonly experienced, this is done by
analyzing which barrier is considered the most significant. While several studies have analyzed
barriers to municipal adaptation planning, research generally focuses on an individual case or a
small number of cases (Broto & Bulkeley, 2012; Biesbroek et al., 2013). In order to provide
substantiated recommendations for improving support tools, a larger quantity of municipalities
needs to be included.
16
Support tools
The ‘barriers to adaptation’ research field would benefit from focusing more specifically on
analyzing solutions and means to deal with barriers (Biesbroek, et al., 2013; Lehmann, et al.,
2013). Therefore, this research aims to address this knowledge gap by evaluating the suitability
of a potential solution to barriers: support tools. This is a relatively new research field as still
little is known about support tools for adaptation planning at the sub-national level (de Paula
Domingos, et al., 2015). Therefore this research is rather explorative in nature.
Scope
The geographical scope of this research is set on climate adaptation by municipalities in the
Netherlands. In this section the choice for focusing on municipalities and for analyzing them in
the Netherlands is justified.
Municipalities
Municipalities are often regarded as the most relevant actors to address climate change risks, as
this is the governance level closest to the public, meaning that they are in a good position to
evaluate and address local risks and needs (Exter et al., 2014; Storbjörk, 2007). Although studies
are increasingly pointing to the importance of private actors and society for climate adaptation
(Driessen, et al., 2011; Mees, et al., 2012), governments in practice still seem to be the most
prominent actors for adaptation planning (Mees, et al., 2012). Another reason for this is that
many services in urban environments that might be affected by climate change, such as water
supply, treating waste water and preserving green space, are managed by public administrations
such as municipalities (Lehmann, et al., 2013).
The Netherlands
The need for climate adaptation is increasingly recognized in the Netherlands. However, the
uptake of climate adaptation by many municipalities is generally still low. The recent
development of potential solutions to address barriers to municipal adaptation planning, makes
the Netherlands a relevant focusing range for research on the suitability of support tools for
barriers to adaptation planning. In order to analyze the suitability of support tools in a
comparative and broad way, a large quantity of municipalities is incorporated in this research.
This way, municipalities of varying size and geographical positions are aimed to be included.
This is also in line with the vision of the Dutch National Adaptation Strategy (NAS) that aims to
address the consequences of climate change on the broadest spatial scale possible (Tweede
Kamer, 2007).
17
Some might argue that smaller, more rural, municipalities are less interesting than
municipalities in urban areas, as the latter are particularly sensitive to climate change impacts
such as exacerbated heat waves, floods and water scarcity (European Union, 2015b).
Furthermore, relatively high population density and the clustering of economic and social
functions are likely to make urban areas more vulnerable (Lehmann, et al., 2013).
However, although urban areas are indeed generally considered more vulnerable, excluding
more rural municipalities would unnecessarily narrow down the analysis for a couple of
reasons. First, most effects of climate change, such as floods, extreme rain fall and drought, will
probably occur at similar rates in rural areas compared to urban areas (with the exception of
increased heat, which is more severe in a built environment). Second, climate change is expected
to pose significant risks in rural areas to nature and agriculture (Sandt & Goosen, 2011; Tweede
Kamer, 2007), which can also indirectly pose threats to urban areas as these can be dependent
on rural areas for food and water supply (Lehmann, et al., 2013). Therefore, adaptation
measures are also necessary for rural areas in the Netherlands (Sandt & Goosen, 2011). Third,
while a large body of literature seems devoted to analyzing adaptation of frontrunner cities
(Lehmann, et al., 2013), more scientific knowledge is needed on the majority of municipalities
that are lacking behind (Carter, et al., 2013). This is especially relevant for this research, as
support tools developed to assist municipalities that are experiencing barriers to climate
adaptation are of central focus.
In conclusion, based on a literature review in the fields of ‘barriers to climate adaptation’ and
‘support tools for climate adaptation’, some knowledge gaps are identified. Recent studies have
stressed the need for future research to focus more specifically on the following questions and
content, as these are currently under exposed in literature:
- what are the main barriers to adaptation planning?
- what are potential solutions to deal with these barriers?
- can support tools stimulate adaptation planning?
- include larger quantities of cases
1.7 Research framework, questions and outline
In this section, the steps to achieve the aim of this research are presented in the research
framework. This framework provides a schematic representation of how the different phases of
the research are interconnected by subdividing it into identifiable components, with each having
their own research question (Verschuren & Doorewaard, 2010).
18
The central research question of this thesis is:
To what extent are the KRA support tools suitable for addressing the main barriers to adaptation
planning by Dutch municipalities?
By answering this research question, recommendations can be provided for improving the
support tools. In order to systematically answer the central research question, several steps in
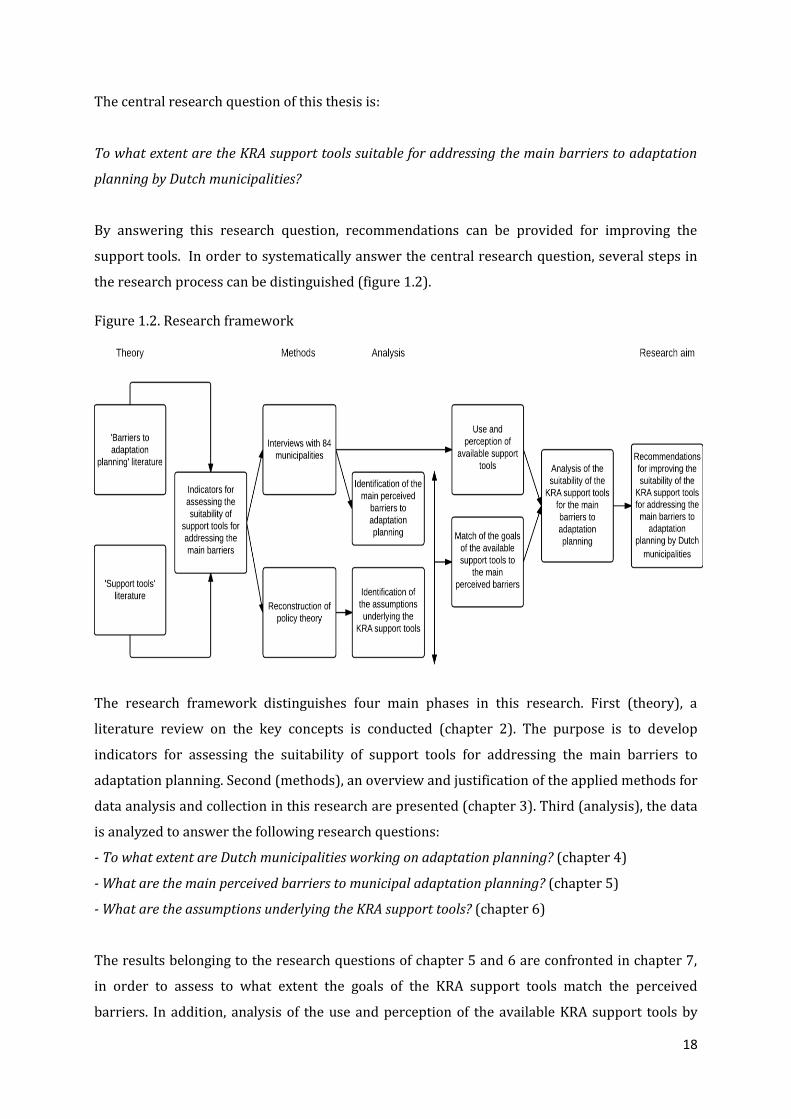
the research process can be distinguished (figure 1.2).
Figure 1.2. Research framework
The research framework distinguishes four main phases in this research. First (theory), a
literature review on the key concepts is conducted (chapter 2). The purpose is to develop
indicators for assessing the suitability of support tools for addressing the main barriers to
adaptation planning. Second (methods), an overview and justification of the applied methods for
data analysis and collection in this research are presented (chapter 3). Third (analysis), the data
is analyzed to answer the following research questions:
- To what extent are Dutch municipalities working on adaptation planning? (chapter 4)
- What are the main perceived barriers to municipal adaptation planning? (chapter 5)
- What are the assumptions underlying the KRA support tools? (chapter 6)
The results belonging to the research questions of chapter 5 and 6 are confronted in chapter 7,
in order to assess to what extent the goals of the KRA support tools match the perceived
barriers. In addition, analysis of the use and perception of the available KRA support tools by

19
municipalities is conducted in this chapter. Combining these two steps, allows for assessing the
suitability and thus answering the central research of this thesis in the conclusion of chapter 7.
Concluding, chapter 8 addressed the research aim of this thesis, which is to provide
recommendations for improving the suitability of the KRA support tools for addressing the main
perceived barriers by municipalities.
20
2. Adaptation planning, barriers and support tools in theory
2.1 Introduction
In order to provide an overview of relevant knowledge already available and position this study
in the climate adaptation research field, a literature review is conducted. By conducting a
literature review the context for this research is constructed and indicators for assessing the
suitability of support tools are developed. The literature review of this chapter is structured
according to the key-elements (with bold font) in the central research question:
To what extent are support tools suitable for addressing the main barriers to adaptation
planning for Dutch municipalities?
Adaptation planning is defined in section 2.2, the main barriers derived from theory are
identified in section 2.3 and an exploration of what is currently known of support tools to
adaptation planning is discussed is section 2.4. This chapter will conclude with defining the
concept that connects the key-elements above, namely: suitability (2.5). Two indicators are
assessed to analyze suitability, namely:
- Match between the goals of the KRA support tools and the perceived barriers by municipalities
- Use and perception of the KRA support tools by municipalities
After careful consideration the following list of key words has been composed as input for the
literature review: climate change, municipal adaptation, adaptation planning, barriers and
constraints to adaptation, support tools, planning support tools, stimuli, and support. These
keywords (used interchangeably) served as the input for the scientific search engines Google
Scholar and Scopus. Using these keywords, a selection was made both on relevance and most
cited articles. The latter approach allowed me to identify prominent researchers in the field.
2.2 Adaptation planning
The aim of this section is to determine what constitutes adaptation planning. Integrated in the
overall aim of this research is the assumption that municipalities need to conduct adaptation
planning, but there are still some conceptual unclarities about what adaptation planning actually
entails (Biesbroek, et al., 2013). The information in this section helps better understanding how
municipalities potentially can work on adaptation planning, what the different stages of
adaptation planning are, and when municipalities can be considered advanced in their
adaptation efforts.
21
Key dimensions to adaptation
In order to disentangle the complex and somewhat ambiguous concept of adaptation to climate
change, Füssel (2007) distinguishes some key dimensions of adaptation planning. First,
adaptation is relevant for all climate-sensitive domains (e.g. public health, water management,
agriculture), which makes it a broad domain involving a wide variety of actors. Second, the
predictability of impacts is subject to a varying degree of uncertainty (e.g. temperature extremes
can be predicted with a higher confidence than cyclone intensity (IPCC, 2014)). Third,
adaptation planning is dependent on various non-climatic conditions that vary across space,
such as economic and political conditions. Fourth, the planning horizon can differ from short-
term measures to long-term measures (up to several decades) (Füssel, 2007).
Lehmann, et al. (2013) define adaptation planning as “the preparation and adoption of
adaptation strategies and action plans” (Lehmann, et al., 2013, p.76). This means that
municipalities must have an explicit intention and provide some concrete examples of actions,
strategies or policies for climate adaptation.
This understanding of adaptation planning largely corresponds to what Runhaar et al. (2012)
describe as active adaptation, meaning that there is a general sense of awareness of the climate
change-induced risks, policymakers have undertaken efforts to assess and map these risks and
vulnerabilities, and adaptation strategies/policy is developed or seriously considered (Runhaar,
et al., 2012, p.781).
Measures
The possible measures for adaptation planning involve a broad range of actions, depending on
the risks they are intended for. In this research, actions are only regarded as adaptation
measures when the intention is to (also) contribute to adapting to climate change impacts. Some
examples are: improving water drainage systems, developing evacuation plans, enhancing
capacity of sluices and weirs, expanding green spaces and roofs, information campaigns,
improving air conditioning in hospitals and nursing homes, attaining sufficient open water,
replacement of vulnerable groups, conducting research on risks and vulnerabilities, and risk
spreading (Bruin et al., 2009; Runhaar et al., 2012). The actions listed address direct impacts
from climate change such as heat stress, flooding, heavy precipitation and drought, through
technical, legal, institutional, educational and behavioural measures (Füssel, 2007). However,
besides the main risks, also indirect effects of global warming for public health, such as an
increase of diseases like Lyme disease, can be addressed (Brownstein , et al., 2005; Bruin, et al.,
2009).
22
Different stages of adaptation planning
Adaptation planning serves to warrant the well-being of populations and the maintenance of
infrastructure and eco-systems. An important step towards adaptation planning is therefore to
reduce vulnerability (IPCC, 2014). Climate change assessments are needed in order to identify
and evaluate the necessity and options to adapt to climate change (Füssel, 2007). This starts
with raising awareness of the (potential) need for adaptation by assessing (potential) local
climate impacts. This is then followed up by vulnerability assessments aimed to identify the
most pressing risks and vulnerable social groups and locations. Next, policy assessment
evaluates specific measures based on criteria such as availability, cost-benefits, and effectiveness
(Füssel, 2007; Hamin, et al., 2014). It should be noted that, although risk assessment is a first
important step, adaptation is also being characterized as an iterative process, where
municipalities alternate between the different stages of adaptation, such as problem analysis
and taking measures (Kennisportaal Ruimtelijke Adaptatie, 2015c).
Governance approaches
Since other competing interests and everyday work often get priority; it can be beneficial to
embed adaptation in municipal planning frameworks to enable local adaptation (Measham, et al.,
2014). Furthermore, responsibilities, targets and tasks should be made as clear as possible
(Bruin, et al., 2009). In general three, distinctively different, governance approaches to climate
change adaptation can be distinguished, with varying degrees of political commitment.
First, municipalities can work on ‘planning’ by developing concrete strategies and plans to
prepare for the various climate scenarios, often based on vulnerability analyses (Hamin, et al.,
2014). This is from now on referred to as ‘stand-alone policy’ (to avoid confusion with the more
general concept of adaptation planning). This stand-alone policy corresponds to what
Uittenbroek et al. (2014) describe as the ‘dedicated approach’, where climate adaptation is
introduced as a new policy field (hence the stand-alone aspect). However, in practice it often
seems difficult to realize the level of commitment needed for this approach, because of the
uncertainty of (often long-term) climate change risks and the prioritization of other (short-term)
issues (Uittenbroek, et al., 2014). Second, municipalities can ‘mainstream’ climate adaptation by
integrating it into existing regulations and policy fields. In order to do this, synergies between
the two policy fields have to be established and adaptation needs to be framed in a way that
allows linking its objectives to those of the over-arching policy field (Uittenbroek, et al., 2014).
Planners in this case will make specific reference to climate change, but without conducting a
complete planning process as is the case with developing stand-alone policies (Hamin, et al.,
2014). Third, municipalities can simply choose to ‘address current hazards’. The latter form is
23
often more accessible since current hazards are politically more acceptable and pressing than
(future and uncertain) climate change risks (Hamin, et al., 2014, p. 112). In practice the division
between the definitions is obviously less clear.
There are studies that argue that mainstreaming in particular has stimulated effective and
efficient adaptation, but research to endorse this claim has remained scarce (Uittenbroek, 2014).
In this research I consider all types as valid forms of adaptation, also because of the persistent
uncertainty on which approach is best (Moser & Eksrom, 2010). However in the case of
‘addressing current hazards’ the (partial) objective of tackling climate change impacts has to be
present, as well as a sense of awareness of climate change risks (as is the case with the other two
forms). Simply upgrading the sewage system or participating in urban greening without,
amongst others, climate reasons, is not sufficient enough to be considered adaptation planning.
The reason for this is that this can all be done without awareness of the climate-induced risks,
and without much knowledge about climate change and adaptation planning in general, which
means it is likely that municipalities like these still aren’t sufficiently preparing themselves for
climate change.
There is currently no legislation for coping with all the different climate change related risks and
these risks, as well as opportunities, are likely to differ substantially geographically, reaffirming
the importance of not only addressing climate change on EU or national level, but also on a
regional and local scale (Driessen, et al., 2011). Norms and legislation relevant for climate
adaptation often do not explicitly refer to climate change or adaptation measures. This absence
means that if, and to what extent, actors organize climate adaptation responses, to a large extent
depends on their awareness of climate change risks and local vulnerabilities (Runhaar, et al.,
2014). This again reaffirms the importance of awareness of potential local climate change risks.
Assessing adaptation planning
Based on the definitions by Lehmann, et al. (2013) and Runhaar et al. (2012) and the different
governance approaches distinguished above, a few key elements of adaptation planning are
identified. Based on these elements the level of advancement of adaptation planning by
municipalities can be assessed (table 2.1).
24
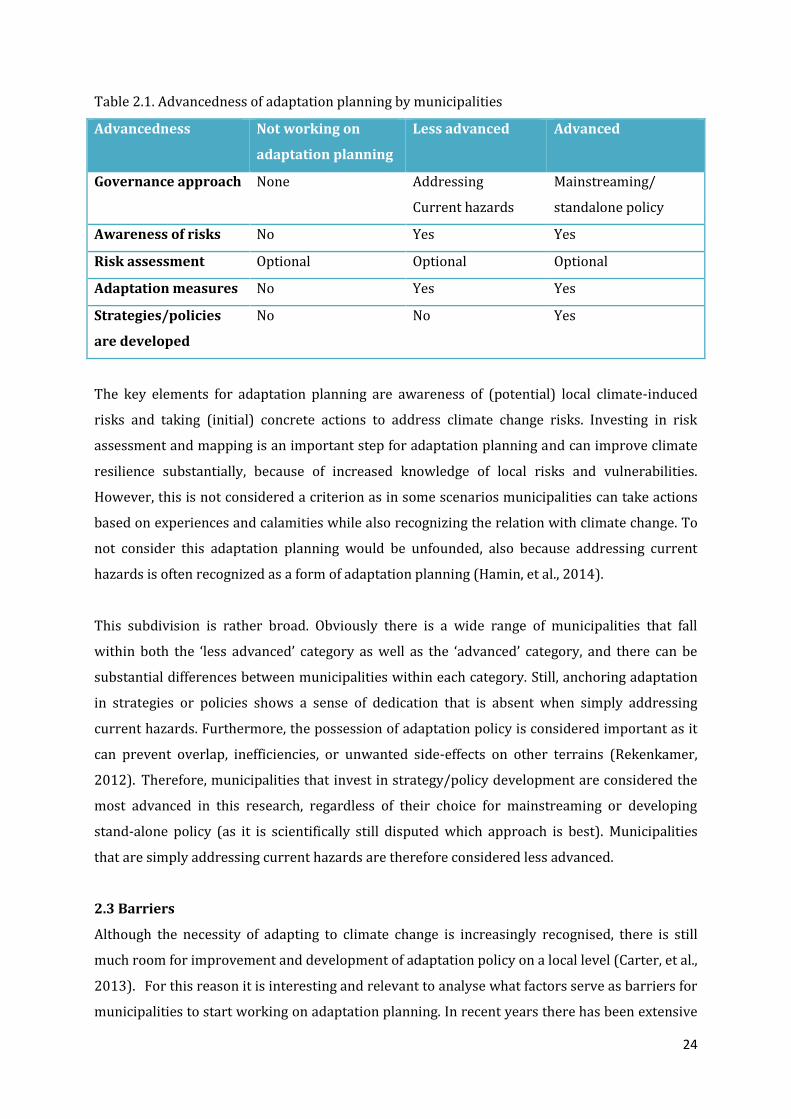
Table 2.1. Advancedness of adaptation planning by municipalities
Advancedness Not working on
adaptation planning
Less advanced Advanced
Governance approach None Addressing
Current hazards
Mainstreaming/
standalone policy
Awareness of risks No Yes Yes
Risk assessment Optional Optional Optional
Adaptation measures No Yes Yes
Strategies/policies
are developed
No No Yes
The key elements for adaptation planning are awareness of (potential) local climate-induced
risks and taking (initial) concrete actions to address climate change risks. Investing in risk
assessment and mapping is an important step for adaptation planning and can improve climate
resilience substantially, because of increased knowledge of local risks and vulnerabilities.
However, this is not considered a criterion as in some scenarios municipalities can take actions
based on experiences and calamities while also recognizing the relation with climate change. To
not consider this adaptation planning would be unfounded, also because addressing current
hazards is often recognized as a form of adaptation planning (Hamin, et al., 2014).
This subdivision is rather broad. Obviously there is a wide range of municipalities that fall
within both the ‘less advanced’ category as well as the ‘advanced’ category, and there can be
substantial differences between municipalities within each category. Still, anchoring adaptation
in strategies or policies shows a sense of dedication that is absent when simply addressing
current hazards. Furthermore, the possession of adaptation policy is considered important as it
can prevent overlap, inefficiencies, or unwanted side-effects on other terrains (Rekenkamer,
2012). Therefore, municipalities that invest in strategy/policy development are considered the
most advanced in this research, regardless of their choice for mainstreaming or developing
stand-alone policy (as it is scientifically still disputed which approach is best). Municipalities
that are simply addressing current hazards are therefore considered less advanced.
2.3 Barriers
Although the necessity of adapting to climate change is increasingly recognised, there is still
much room for improvement and development of adaptation policy on a local level (Carter, et al.,
2013). For this reason it is interesting and relevant to analyse what factors serve as barriers for
municipalities to start working on adaptation planning. In recent years there has been extensive
25
research on barriers for climate adaptation governance, and many of them have already been
identified and catalogued (Biesbroek, et al., 2014; Uittenbroek, 2014).
In this section the theoretical background necessary for understanding the research on barriers
is set out. Based on a literature review, an overview of relevant positions and trends in debates
on the barriers to climate adaptation literature is provided and the main barriers are identified.
Specific attention goes out to the phase in the adaptation process the barriers apply to, as this is
relevant for the suitability of the support tools and because this helps to concretise the broad
concept of barriers and prioritize them for this research.
The majority of studies on barriers to adaptation hardly provide clear definitions of what
barriers actually are (Biesbroek, et al., 2013). This leads to unnecessary ambiguity in the
research field which is why I aim to identify or shape a relevant and comprehensive definition
here.
Biesbroek et al. (2014) describe barriers as subjective interpretations of factors and conditions
that negatively influence the adaptation process but are manageable and can be overcome.
Moser and Ekstrom define barriers as “impediments that can stop, delay, or divert the
adaptation process” (Moser & Ekstrom, 2010, p. 22027). Both definitions seem applicable for
this research, although I prefer to add that barriers, next to “negatively influencing the
adaptation process” and “stop, delay and divert”, can also “prevent” the adaptation process from
happening. If planners are not fully aware of actual local climate change risks or possible
measures and decide to not actively work on adaptation planning, then e.g. a lack of information
and incentives can be identified as the main barriers. Therefore, in this research barriers will be
defined, largely according to the often cited definition of Moser and Ekstrom (2012) but with the
inclusion of the ‘prevent’ element, as: “the perceived impediments that can prevent, stop, delay,
or divert adaptation planning”. In this definition ‘perceived’ refers to the ‘subjective
interpretations’ (as mentioned by Biesbroek et al. (2014)) of which barriers exist according to
planners.
Barriers to adaptation planning contain a complex and wide range of institutional, informational,
technological, financial, and sociocultural factors (Hamin, et al., 2014). This includes, but is not
limited to: uncertainties about climate change risks and potential local impacts, prioritization of
other pressing issues over adaptation, lack of knowledge and expertise, limited capacity (e.g.
lack of financial means, personnel and time), unclear responsibilities, lack of political
commitment and/or leadership, lack of incentives (e.g. absence of (positive) cost-benefit ratios,
positive externalities of actions and legislative pressure), lack of guidance and stimulation for
26
local adaptation initiatives and a lack of opportunities to mainstream adaptation (Biesbroek, et
al., 2013; Glaas, et al., 2010; Hamin, et al., 2014; Lehmann, et al., 2013; Runhaar, et al., 2012;
Uittenbroek, et al., 2014). Related to, and reinforcing, some of these barriers (e.g. limited
capacity) is that cross-sector collaboration, and involvement of private actors and citizens is still
limited (Lund, et al., 2012; Mees, et al., 2012).
Biesbroek et al. (2013) analyzed 81 studies on barriers to adaptation and conclude that they all
identified unique configurations of barriers to adaptation. To some extent this can be explained
because of the context-specific nature of barriers, depending on the geographical or sectoral
scale under analysis. But many of these barriers are in some way also overlapping or inter-
related, which is why various, rather arbitrary, attempts have been made to categorize them
(Hamin, et al. 2014; Uittenbroek, et al., 2014). Examples are “distinctions between external and
internal institutional barriers (Crabbé & Robin, 2006)” and between different “temporal stages
in the planning process (Moser & Ekstrom, 2010)” (Biesbroek, et al., 2013, p. 1123).
Although the research field consists of many small-n case studies, with varying geographical and
sectoral contexts, some primary barriers to adaptation planning can be distinguished. Based on
the literature review the following factors seem to be often identified as the most significant
barriers: institutional limitations, a lack of resources (knowledge, personnel, financial means), a
lack of political leadership and ambiguity of responsibilities (Biesbroek, et al., 2013; Hamin, et
al., 2014; IPCC, 2014; Measham, et al., 2011; Runhaar, et al., 2012). According to Hamin et al.
(2014) a lack of political leadership is often the main barrier to adaptation planning, as it in turn
results in a lack of resources and failure to overcome interest conflicts, which according to
Measham et al. (2011) are serious constraints to making progress in the field of adaptation.
According to the literature review by Biesbroek et al. (2013, p.1124) only 3 out of 81 studies
made explicit reference to climate adaptation-specific barriers, which are:
- long-term impacts of climate change versus the short-term nature of politics
- dependency of planners on scientific models to identify and communicate problems and
propose solutions
- The inherent uncertainties related to climate change (risks and scenario’s)
It is however likely that these factors have been grouped under ‘overarching’ barriers, such as a
lack of knowledge, in other studies.
27
Distinction between barriers to problem recognition and adaptation measures
Because barriers are often considered place- and context-specific it makes sense to emphasize
barriers identified in adaptation-research in the Netherlands. Runhaar et al. (2012) conducted
research on barriers to municipal climate adaptation and made a valuable distinction between
barriers to problem recognition and barriers to taking concrete adaptation measures. This
distinction between, and inclusion of, both stages is relatively little applied in adaptation studies,
although it seems practical. By making the distinction between barriers to problem recognition
and barriers to adaptation measures, it is better assessable when support tools are suitable. For
example, tools that provide information on potential measures are probably more suitable for
the latter than for the former. For this reason, this distinction (together with the advancedness
of adaptation planning) is also taken into account in this research.
Barriers to problem recognition
The main barriers for this stage are a lack of awareness, lack of knowledge (expectation that
risks won’t occur plus absence of local projections), lacking sense of urgency, lack of legal
obligations for un-demarcated areas and (for ‘new’ challenges such as heat stress in particular)
the absence of a clear ‘problem owner’, meaning responsibilities were unclear to planners
(Runhaar, et al., 2012) .
Barriers to problem recognition are relevant since recognition of the risks of climate change
impacts can serve as the initial stimulus to adaptation planning. Often adaptation is still framed
as a ‘water problem’, and other risks seem to receive significantly less consideration (Hoppe, et
al., 2012). This could be because other risks are considered more new, thus increasing the
(perceived) level of uncertainty and unawareness, forming yet another barrier to problem
recognition (Runhaar, et al., 2012).
Barriers to adaptation measures
Runhaar et al. (2012) found that municipalities that were aware of the significance of climate-
induced risks, but did not actively addressed these, often coped with the following perceived
barriers: a lack of resources (limited capacity), a lack of opportunities to mainstream adaptation
and high costs.
The main difference between the barriers faced in the different stages seems to be that a lack of
incentives (limited knowledge, limited legal obligations and limited experience with impacts)
tends to result in a lack of urgency in the problem recognition stage, while the barriers to
28
adaptation measures have a more practical nature. This could have implications for selecting the
most suitable tools to address these barriers.
The following section will cover support tools to address the barriers identified in this section.
2.4 Support tools
While in the previous section the main barriers to municipal climate adaptation were identified
and discussed, this section analyzes potential ways to cope with these barriers in order to
enhance willingness and capacity for municipal adaptation planning.
In order to realize the ambition of making the Netherlands climate-proof in 2050, local
governments and waterboards are urged to have incorporated adaptation planning in their
governance by 2020 (Kennisportaal Ruimtelijke Adaptatie, 2015a) However, the uptake of
climate adaptation by Dutch municipalities has been marginal so far (Hoppe et al., 2014). The
perceived barriers to adaptation planning are abundant and most of them are context-specific,
which means well-designed policy processes and support tools are needed to overcome them
(European Comission, 2013) Therefore, it is increasingly believed local planners need more
support from all levels of government to start working on adaptation planning (Hamin, et al.,
2014).
The national government however, is also restricted by legislative limits, which is why it isn’t
able to apply instruments and policies for stimulating, or enforcing, adaptation planning at will.
(Driessen, et al., 2011). For this reason, the KRA has been set up and prioritized, as an initial
platform to support actors (primarily municipalities) in their adaptation planning efforts (H.
Goosen, personal communication, April 20, 2015). The KRA support tools theoretically allow to
further adaptation planning by municipalities by providing support rather than through focusing
on currently unattainable policy instruments (such as obliging local governments to conduct
stress tests, which is further elaborated upon in section 6.2 Social processes).
The concept of ‘tool’ is applied to a variety of planning processes, policies, analytical approaches
and software solutions that can facilitate adaptation planning (Rozum & Carr, 2013). The
understanding of what constitutes a support tool corresponds to a large extent to what Runhaar
et al. (2007) describe as planning tools. According to Runhaar et al. (2009) planning tools are
“heuristics that assist planners in accomplishing their planning tasks” (p. 418). While this
definition is somewhat broad, the examples they provide help understanding the concept better.
Planning tools can “provide guidelines or techniques for data collection, presentation or
analysis” (…) or “facilitate decision-making processes” (Runhaar et al., 2009, p. 418). The main
29
difference between these planning tools and the interpretation of support tools for this research
is that support tools (a) need to be freely available and (b) need to be available for the entire
target group (in this case municipalities). The reason for inclusion of these criteria is the
assumption that municipalities need to be supported in order to increasingly work on
adaptation planning (Hamin, et al., 2014). Hence, the conversion of the concept planning tool to
support tool.
There is still relatively little known about support tools for adaptation planning. Most studies on
tools focus on international development projects, targeting a specific issue such as disaster risk
reduction (de Paula Domingos, et al., 2015). These tools differ in purpose and scale from the
concept of support tools in this research. While de Paula Domingos et al. (2015) recognize the
lack of systematic studies on tools developed for adaptation by local decision-makers, only a
small portion of their study corresponds to the interpretation in this research of support tools.
De Paula Domingos et al. (2015) specifically evaluate measures (grey, green and soft) that
enable successful urban adaptation. The soft measures facilitate the grey and green measures,
with grey referring to physical infrastructure interventions, and green referring to measures to
make cities more resilient such as greenbelts and open spaces. The soft measures are factors
that facilitate the other measures, varying from economic incentives, land-use controls and tools
that allow for information dissemination. While de Paula Domingos, et al. (2015) include many
elements that are not particularly relevant for this research, some lessons can be learned on
which type of support tools seem useful for furthering adaptation planning:
- Standardized adaptation tools can be suitable to guide municipalities that are taking initial
steps for adaptation planning, but they can be counterproductive if they are not taking into
account the local context. For this reason, de Paula Domingos, et al. (2015) emphasize the need
for context-specific approaches. This means tools should not be too generic and need to provide
data that corresponds to the local context. While the potential counterproductive outcome is not
further explained, this could imply that e.g. municipalities are discouraged by the genericity of
tools or that less appropriate measures are taken because the local context was not sufficiently
taken into account.
- Successful adaptation plans can be developed by using qualitative data and information, based
on experiences and knowledge (de Paula Domingos, et al., 2015). This could imply that support
tools that simply provide anecdotal information or experiences on adaptation measures and
processes can still be useful to municipalities with a respective knowledge gap. According to de
Paula Domingos, et al. (2015, p. 27) this suggests that “scientific uncertainty is not necessarily a
barrier to action on adaptation planning”.
30
This suggestion seems somewhat contradicting though to the requirement for tools to be
context-specific. From this line of reasoning it seems as if tools, based on experience and
qualitative data, can still be useful if taking into account the local context, but tools based on
experiences of third parties for example might be too different from the local context.
- Participatory tools seem useful as they allow municipal planners to integrate adaptation into
community-level projects. These tools are designed to take into account local community
vulnerabilities and involving e.g. citizens with adaptation planning projects. Participatory tools
can guide planners to create ownership amongst societal actors and raise awareness on climate
change risks and the need for adaptation measures. Furthermore, it could potentially increase
knowledge and trust of citizens and increase their sense of responsibility (de Paula Domingos, et
al., 2015). Overall, it seems participatory tools might be suitable for addressing the limited
capacity barrier through creating shared-responsibility and potentially facilitate mainstreaming
with other projects more easily.
In addition to the elements above, conducting vulnerability and risk assessments are recognized
as being important initial steps to start working on adaptation planning (Rozum & Carr, 2013).
Tools for risk assessment can potentially help substantiate the need for adaptation and in this
way create awareness and urgency and enhance (political) support.
Concluding, the following elements seem important for support tools:
- standardized tools are expected to primarily be useful for less advanced municipalities that are
looking to take initial steps
- tools for vulnerability and risk assessment are important for less advanced municipalities
starting with adaptation planning
- support tools need to be context-specific for more advanced municipalities
- support tools can be qualitative in nature (for example by facilitating knowledge and
experience sharing)
- Participatory tools seem useful as they allow municipal planners to integrate adaptation into
community-level projects and to create societal awareness and involvement.
2.5 Suitability
The element in the central research question that links the concepts support tools and main
barriers is suitability:
To what extent are support tools suitable for addressing the main barriers to adaptation
planning for Dutch municipalities?
31
Two indicators are distinguished in order to assess the suitability of support tools, namely:
- the match between the goals of the KRA support tools and the perceived barriers, and
- the use and perception of the suitability of support tools by municipalities
The first step for assessing the suitability of support tools for the main barriers is to understand
the concept of suitability. The Oxford dictionary (Oxford University Press, 2015) defines
suitability as:
“Right or appropriate for a particular purpose or occasion”
Using this definition, assessing suitability in context of this research would imply determining to
what extent support tools are appropriate for addressing the main barriers to adaptation
planning. This to a large extent corresponds to what Kautto & Similä (2005) more precisely
define as relevance, which translates into analysing to what extent the objectives of a policy
instrument cover the key problems. Based on this concept, suitability is defined here as the
extent to which the goals of the support tools correspond to the perceived barriers by
municipalities. Defining suitability in this way seems appropriate as the goals of the tools need to
reflect the decision-making problems of the users in order for the tools to be suitable (Rammer,
et al., 2013).
Next to this initial assessment of suitability, the analysis is strengthened by incorporating the
perceived suitability by municipalities of the support tools for addressing the main barriers.
Inclusion of this analytical step provides insight into the suitability of the support tools in
practice, next to the already included, rather theoretical, suitability of the goals of the support
tools. Applying these two analytical steps to assess suitability enables providing
recommendations for improvement of the suitability of the KRA support tools to address the
main barriers.
2.6 Analytical framework
Based on the key concepts in this chapter an analytical framework is developed to guide the
analysis of the data in this research. This framework serves as ‘a guide for the integration of
information from multiple types of data’ (Lichtenstein, et al., 2009). Ultimately, the analytical
framework visualizes how analysis of the key concepts results in answering the central research
question.
32
Advancedness of municipalities
The advancedness of adaptation planning is assessed by looking at the following indicators (see
table 2.1):
- is there awareness of local climate change risks?
- are adaptation measures taken?
- are strategies/policies developed?
An additional characteristic that is included is whether or not risk assessment has been
conducted. However, this is an optional one for all municipalities (not working on adaptation
planning, addressing current hazards and mainstreaming/stand-alone policy). Although this one
could have been applied to further differentiate between the levels of advancedness, this goes
beyond the aim of this research. Rather, this characteristic is used to provide insight into the lack
of knowledge of the risk-barriers.
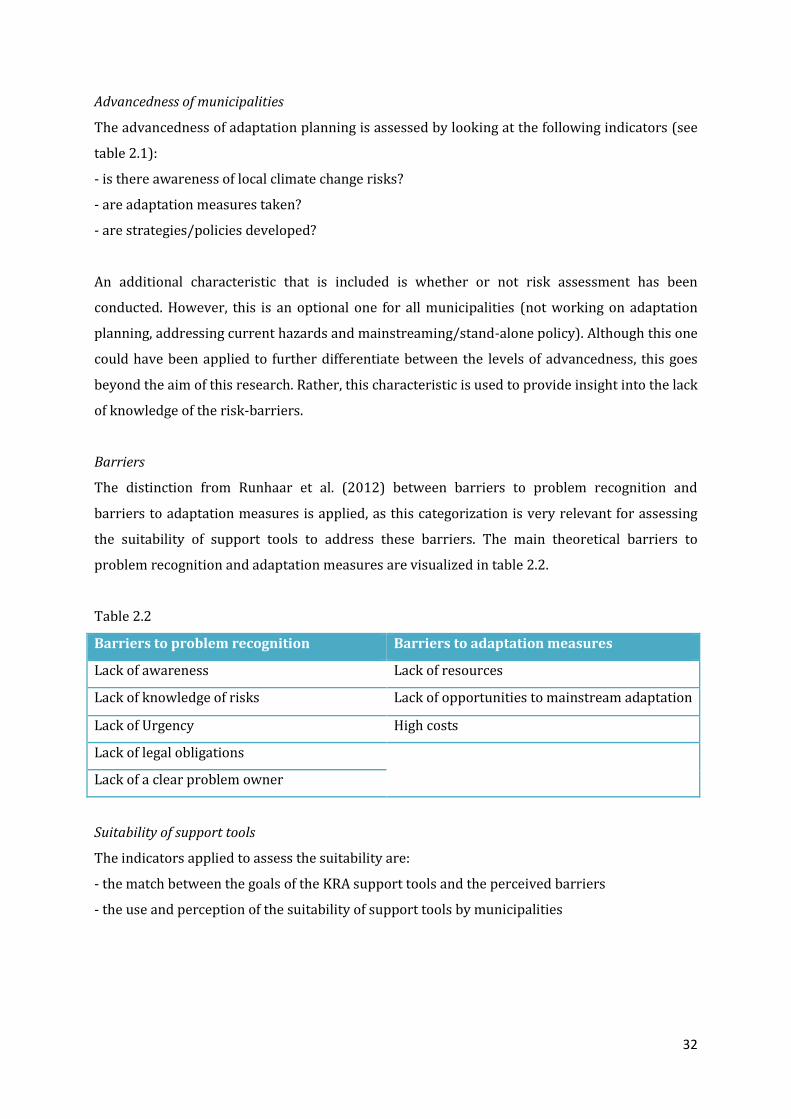
Barriers
The distinction from Runhaar et al. (2012) between barriers to problem recognition and
barriers to adaptation measures is applied, as this categorization is very relevant for assessing
the suitability of support tools to address these barriers. The main theoretical barriers to
problem recognition and adaptation measures are visualized in table 2.2.
Table 2.2
Barriers to problem recognition Barriers to adaptation measures
Lack of awareness Lack of resources
Lack of knowledge of risks Lack of opportunities to mainstream adaptation
Lack of Urgency High costs
Lack of legal obligations
Lack of a clear problem owner
Suitability of support tools
The indicators applied to assess the suitability are:
- the match between the goals of the KRA support tools and the perceived barriers
- the use and perception of the suitability of support tools by municipalities

33
3. Methods
3.1 Introduction
This chapter provides insight in, and justification for, the methods and techniques applied for
the empirical research. Since the purpose of this research is to analyse the perceived barriers to
adaptation planning and the suitability of support tools to address these, qualitative research
methods are applied that fit the interpretative nature of the analysis. Section 3.3 presents the
applied methods for data analysis and collection for the identification of barriers and use and
perception of the KRA support tools. Section 3.4 presents the method for assessing the
assumptions behind the KRA support tools. Finally, section 3.5 and 3.6 respectively present the
ethics and limitations of the research methods. The step of assessing the suitability of support
tools is not part of this chapter, as this is rather an interpretation of the preceding analytical
steps (indicators for suitability are discussed in section 2.5).
3.2 Preliminary research
In addition to the three main research methods mentioned above, observation in the research
field contributed to a better understanding of the matter in the preliminary research stage. Since
climate adaptation formed a relatively new field to me as a researcher I decided to attend
several workshops and seminars to get acquainted with the matter. While I continued attending
these gatherings throughout the entire duration of my research, these observations were
especially valuable in the early stages of this research, as I was able to achieve a general idea of
the various actors involved in the arena, the challenges currently encountered in practise and
the relevance of this research.
3.3 Identification of barriers and use and perception of the KRA support tools
In this section I explain the methods of data collection (3.3.1) and analysis (3.3.2) applied for
identifying the main perceived barriers to adaptation planning and the perception and use of the
KRA support tools. The reason that these two steps are combined here in this section is that both
these elements have been retrieved from the same interviews with municipalities.
3.3.1 Data collection
Since this research field is in need of a study encompassing a large quantity of cases, the use of a
quantitative survey would be fitting (Verschuren & Doorewaard, 2010). However, climate
adaptation is likely to be a relatively new policy field for many municipalities. Furthermore, it is
often characterized by a high degree of social complexity (Mees, et al., 2014). Therefore, making
use of a traditional survey could lead to too much ambiguity and would most likely lack the
required depth. For this reason, interviews that allow retrieving in-depth information,

34
viewpoints and experiences of participants are deemed to be more suitable (Turner, 2010).
This corresponds to a naturalistic paradigm, where knowledge is gained by interacting with the
subjects of study and context and meaning are taken into account (Krauss, 2005). It is the most
dominant paradigm in qualitative research, and it involves a standardized procedure with
structured or semi-structured interviews (Folkestad, 2008).
Semi-structured interviews include an outline of the topics to be covered, while also allowing the
researcher freedom to vary with the order of questions and bring up new ideas during the
interview. Structured interviews on the other hand have a fixed questionnaire and allow little to
no flexibility in the wording and order of questions, but the responses remain open-ended just
as with semi-structured interviews (Sewell, n.d.). Determining which interview-type is most
appropriate thus depends to a large extent on the purpose of the research (Folkestad, 2008).
For this research, structured interviews seem most appropriate for several reasons (Sewell,
n.d.). First, analysis of the data retrieved from a structured interview will be less time-
consuming, which is desirable bearing in mind time and resource constraints as well as the large
quantity of cases in this research. Open-ended interviews by nature are already difficult to code.
Some regard this as one of the primary weaknesses of open-ended interviewing, while others
point to the benefits, as open-ended questions reduce researcher biases, especially when many
participants are involved in the research (Turner, 2010). Therefore, structured open-ended
interviews seem to be the right choice for achieving an effective balance between depth of
responses and the ability to categorize them properly. Second, as an additional interviewer is
involved to support this research, bias is reduced by ensuring high comparability through
structured questionnaires (also see 3.5 limitations).
Participants
Since the ambitions and goals of this researcher were reconcilable with those of Klimaatverbond
Nederland (KVN), which is an alliance of i.a. 146 Dutch municipalities (see figure 3.1, map made
in ArcGIS 10), I chose to integrate it with an internship at KVN. This allowed me an easier and
more direct access to participants for this research. Furthermore, as became apparent while
writing the proposal for this thesis, several other adaptation-related questionnaires were (soon
going to be) send out to Dutch municipalities. Contacting potential participants and convincing
them to participate with this research was therefore more effective in behalf of KVN than it
would have been simply as a master student. Although my affiliation with KVN influenced the
sampling for this research (see 3.5 limitations), this also proved to be beneficial as I was now
able to incorporate a large quantity of cases, which was one of the aims of this research.
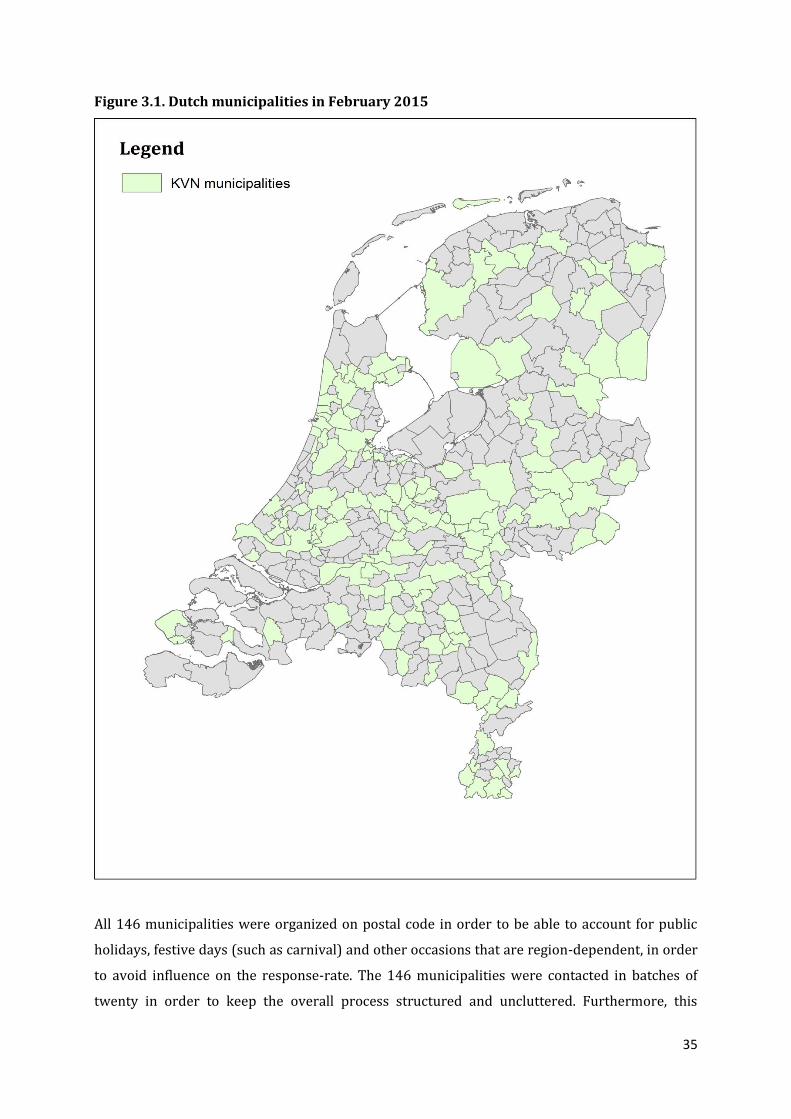
35
Figure 3.1. Dutch municipalities in February 2015
All 146 municipalities were organized on postal code in order to be able to account for public
holidays, festive days (such as carnival) and other occasions that are region-dependent, in order
to avoid influence on the response-rate. The 146 municipalities were contacted in batches of
twenty in order to keep the overall process structured and uncluttered. Furthermore, this
36
approach minimized the time between the notification email and the actual interview (thus
avoiding a gap of several months between initial contact and the follow-up). In addition, it
turned out several municipalities work together on a regional scale to address certain
adaptation-related issues. By approaching municipalities within relatively close geographical
proximity during the same time-frame, results became better comparable (e.g. if municipality A
and municipality B make similar progress on adaptation, while also working together, the
conclusion that A has made more progress simply because being interviewed 4 months later
than B, would have been flawed). The limitation of this approach was that the final batch of
municipalities were consulted during July. The reason for this was that the overall consultation
took longer than expected. It turned out it was more difficult to reach policy workers during this
month because of i.a. intensified workload and early summer holidays.
Approach
KVN has contacts (often sustainability workers) at each municipality. This is the first entry to
experts at a municipal level. This person received an email explaining the purpose and content of
this research. The questionnaire was already added to this email so that it could be forwarded to
more appropriate workers if necessary (snowball sampling). Furthermore, this also allowed the
participants to prepare and e.g. discuss the questionnaire with colleagues in order to be able to
provide more comprehensive answers.
Next, the municipal contacts were contacted by phone and asked to participate with this
research by scheduling an appointment for a telephone administered interview. This is also
when they were specifically asked to bring forward another colleague if they believed them to be
better able to answer the questionnaire. In this way I aimed to interview the most
knowledgeable person available on the topic. The interviewees spoke on behalf of their
municipality, and involved other colleagues in their preparation when appropriate and feasible.
In total, all 146 municipalities have been contacted at least once by mail, and at least three times
by phone. In the end, some municipal workers never responded and sometimes, even after eight
attempts to get into touch by phone, I failed to schedule an appointment for an interview.
In the end I got a response rate of 58%, as 84 out of 146 KVN municipalities cooperated (Figure
3.2).
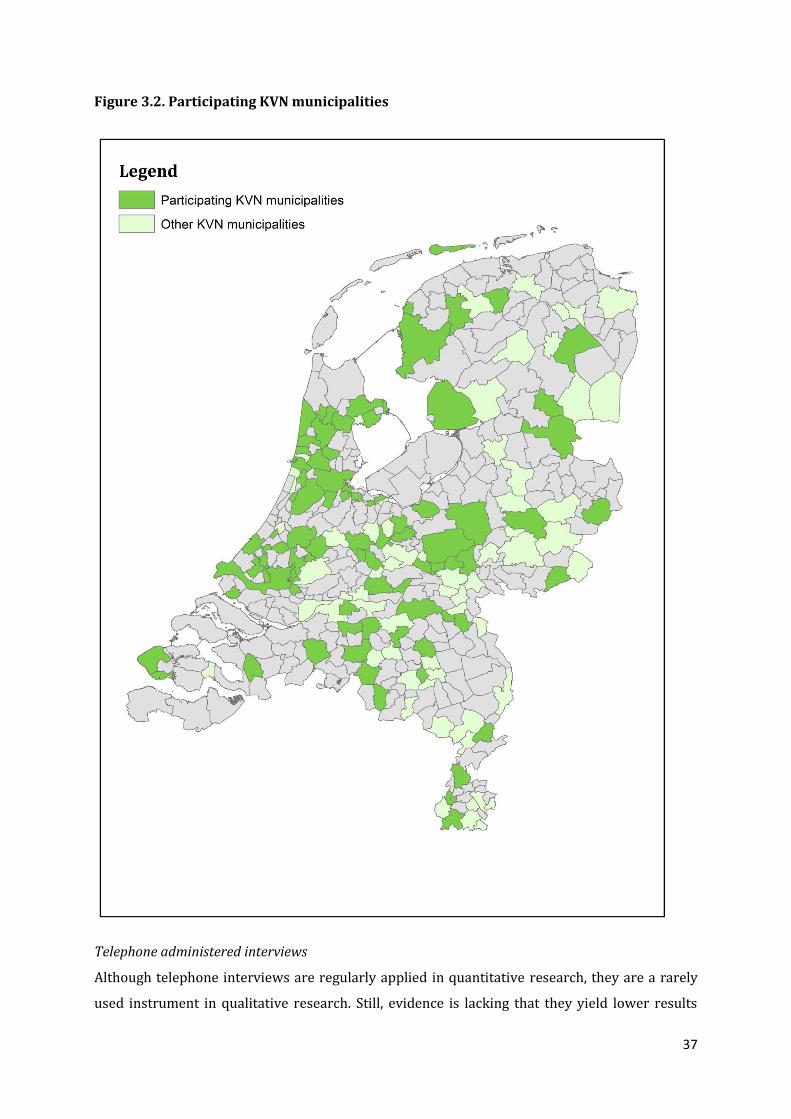
37
Figure 3.2. Participating KVN municipalities
Telephone administered interviews
Although telephone interviews are regularly applied in quantitative research, they are a rarely
used instrument in qualitative research. Still, evidence is lacking that they yield lower results
38
than face-to-face interviews (Novick, 2007). There are several pros and cons to take into account
though. Arguments against telephone interviews are that there is a loss of contextual and
nonverbal data, plus a loss or distortion of verbal data (Kassianos, 2014). While the first two
arguments aren’t very relevant for this research (for e.g. research on mental health these would
be very relevant), a loss/distortion of verbal data would definitely be concerning. However,
respondents of telephone interviews have also often been described as being relaxed, willing to
speak freely (Novick, 2007) and even to be more comfortable with sharing sensitive information
(Kassianos, 2014; Novick, 2007). On top of that, the majority of telephone-administered research
is judged as being rich, detailed and generally of high quality (Novick, 2007). Combined with the
fact that telephone interviews are lower in costs, less time-consuming, and enabling
interviewing a larger geographical spread of respondents makes it a justifiable and appropriate
methodological choice for this research.
Pilot test
Before the questionnaire was send to all municipalities a pilot test was conducted (first ten
municipalities in alphabetical order). The reason for this is that it allowed for adjusting
questions that turned out being ambiguous and making changes to the interview setup when
needed (Silverman, 2000). Furthermore, this allowed me to discover my own knowledge-gaps
and in response read-up on certain topics.
3.3.2 Data analysis
Following the data collection phase, this section will discuss the analytical process. Although
methods for qualitative data analysis are not as comprehensively formulated as quantitative
data analysis (Folkestad, 2008), there are still principles to follow when analyzing and
interpreting the data (Taylor-Powell & Renner, 2003).
Two often applied strategies are reporting results by using a category scheme, and, presenting
extensive quotation to convey the results (Basit, 2010). Both strategies are applied here (in
respective order), as they are believed to be complementary, with the former being more
structured but less illustrative and vice versa.
Because of the relatively complex and ambiguous intrinsic nature of qualitative data sets it is
important to structure the data before analysis. The transformation of the research data into
results is an essential part of research, as it makes interpretation and drawing conclusions
possible (LeCompte, 2010). Taylow-Powell and Renner (2003) provide five successive steps (get
to know your data, focus the analysis, categorize information, identify patterns and connections
within and between categories, and interpretation) to organize, analyse and interpret the data in
39
a coherent manner. Lecompte (2010) distinguishes a similar five-step approach (tidying up,
finding items, creating categories, creating patterns, and assembling structures). Together, these
approaches served as the foundation for the steps applied in this research in order to ensure a
comprehensive and systematic analysis. I structured the analytical process as followed:
Tidying up
The transcriptions of the interviews are saved in separate word-files and saved in a separate
folder. Next, the entire set of interview transcripts are composed into a large Microsoft Office
Excel 2010 sheet. In this sheet the municipal names are listed vertically and the interview
questions are listed horizontally. The answers to the questions by the interviewees are reduced
to the essence and listed in the corresponding cells. This allowed instantaneous inter-
interviewee and intra-interviewee comparisons (Basit, 2010). When necessary (e.g. when
answers turn out to be too ambiguous), additional information can easily be retrieved from the
word-files.
Finding items
Items are the main units of analysis that are coded and counted in order to answer the research
questions (LeCompte, 2010). Examples of items are the various perceived barriers named by the
interviewees. Items are analysed based on ‘frequency’ (e.g. how often is a barrier mentioned as
the main one) and ‘declaration’ (e.g. interviewees state that there is insufficient knowledge and
support available, while being unfamiliar with the KRA support tools). Verifying declaration is
important as interviewees can state certain items exist, while in reality things can be different
(LeCompte, 2010).
Categorization
The identified items must be organized in categories. The purpose is to organize items that are
similar or go together so that comparisons can be made (LeCompte, 2010). This part of the
analysis is rather descriptive as it displays the perceptions of the interviewees with regard to
climate adaptation. When categorizing data it is important to be aware of missing out on
relevant data that does not fit within certain categories (Silverman, 2000). Defining categories is
therefore a process that should be conducted very carefully. In order to reduce complexity in the
dataset and create more structure the various categories are coded (Taylow-Powell & Renner,
2003) (see appendix 4).
Creating patterns
After stable categories have been created, they are connected in ways relevant for answering the
40
research questions (LeCompte, 2010). Rather than the descriptive approach of the previous step,
this requires a more critical analytical lens (Taylow-Powell & Renner, 2003). Related categories
are connected and together form patterns. These patterns enable the construction of coherent
explanations and insights (LeCompte, 2010). Creating patterns corresponds to what Taylow-
Powell and Renner (2003) describe as connecting between categories, which can help explain
observed phenomena.
Interpretation
Interpretation is the process of attaching meaning and significance to the analysis (Taylow-
Powell & Renner, 2003). I start with listing key findings from the patterns created. These will
serve as input to answer the research questions and ultimately the central research question.
Meaningful findings that are less relevant for the research questions can serve as input for the
discussion section. In this step quotation and examples are included to convey the results in a
coherent and attractive manner.
3.4 Assumptions behind the KRA support tools
For analysis of the KRA support tools I made use of a method called reconstruction of policy
theory, which allows for reconstructing and assessing the theory behind policies, programmes
and strategies (Leeuw, 2003). A policy theory is defined by Hoogerwerf (1990) as “the total of
causal and other assumptions underlying a policy” (p.285). The concept of policy theory
corresponds to what Kautto & Similä (2005) depict as intervention theory. The principles are
largely the same: the effectiveness of a policy theory is dependent on its’ underlying
assumptions and the assumptions about relations between phenomena (Hoogerwerf, 1990).
Relations in this sense refer to:
- relations between the intended goals of a policy and the means to achieve it, or vice versa
(final relations)
- the relations between the causes of the policy problem and their effects (causal relations)
- relations between principles and concrete norms underlying a policy. The beliefs and
values of the policymakers are relevant here (normative relations)
However, as Kautto & Similä (2005) point out, retrospective evaluation of newly introduced
policy instruments is often problematic, if not unattainable. The reason for this is that the
difficulty of the evaluation is correlated with the time-span between introduction of the policy
instrument and the moment of evaluation. The longer this time-span the more information is
available (e.g. after decades the full-spectrum can be analysed from relevance and efficiency to
effectiveness and impact of the policy). However when there is only under a year between
41
introduction and evaluation, as is the case with evaluation of the KRA, there is often still little
information available and outcomes to a large extent have not yet occurred. Nevertheless, this
can be an important moment to assess the functioning of the policy instrument and provide
answers to questions such as: is the KRA on the right track or do some barriers remain
unaddressed and are adjustments needed?
The main difference with a more traditional approach to reconstruction of policy theory is thus
that the focus here is not so much on assessing the strengths and weaknesses of a policy theory
on itself, but on the extent to which the program assumptions and goals concord to the
experienced barriers. The relevant relations can therefore be narrowed down to:
relations between the intended goals (of the support tools) and the causes of the policy problem
(barriers). Therefore, the normative relations are left out of the analysis, which also makes the
diagrams depicting the relations more comprehensible for assessing the suitability of the
support tools, which is the goal of this research.
Approach
Reconstruction of policy theory is applied to identify the purpose (why was the KRA set up?) and
objectives of the KRA (which adaptation problems does it attempt to address and how?). The
core contents of the KRA support tools are assessed by way of document analysis. This approach
can be strengthened by incorporating interview data, to validate the reconstructed assumptions
(Leeuw, 2003). Therefore, a semi-structured open-ended interview is conducted with a director
of Climate Adaptation Services, which is the organization responsible for the establishment and
development of the KRA.
The following methodological steps from Hoogerwerf (1990, p. 288) are applied to guide the
analysis:
1. Collect statements from the policy designers (interview + KRA website)
2. From this statement consider which are relevant sectors of society
3. Identify final relations (ultimate goals, intermediate goals and means). Translate these
relations into (causal) hypotheses.
4. Identify causal relations. Translate these relations into (causal) hypotheses.
5. Reconstruct the total of causal hypotheses into a coherent reconstructed policy theory
The total reconstructed policy theory (chapter 6) visualizes to what extent the goals of the
support tools are assumed to address the barriers to adaptation planning according to the KRA
42
developers. This model is then confronted with the main perceived barriers (from chapter 5)
from which the suitability of the support tools to address the main perceived barriers is
determined in chapter 7.
3.5 Ethics
There is a broad consensus of what moral principles should be taken into account when doing
(qualitative) research. In general, the following elements are distinguished (Ritchie, et al., 2013,
p. 78):
A) Research should be worthwhile and not make unreasonable demands on participants
The feedback sessions with supervisors and the pilot test amongst others assured this.
B) Participation in research should be based on informed consent
This is inherent to the type of research applied for this thesis.
C) Participation should be voluntary and free from coercion or pressure
The length of the interviews depended on the available time and willingness of the interviewee.
Interviews with interested interviewees could take up to a full hour, while other interviews
lasted only fifteen minutes. This resulted in an average interview time of approximately half an
hour. Inevitably, this also led to varying depths, and level of insights, of the interviews.
D) Adverse consequences of participation should be avoided, and risks of harm known
All interviewees are provided with the final results for verification before they are analysed and
published.
E) Confidentiality and anonymity should be respected
Confidentiality of personal characteristics (except position at the municipality) is assured.
However, respondents are informed that the results of this research will be open-source (and
the purpose of this is explained as well) and all of them have approved. It is believed that
transparency on matters like these will also positively influence the honesty in respondents.
3.6 Limitations
Validity, reliability and generalizability are concepts stemming from assessing the quality of
quantitative research (Golafshani, 2003). Validity constitutes the extent to which a researcher
has been able to measure what was intended to measure. Reliability refers to the ability to
replicate the research within a different context, using similar methodology, and still yield
similar results. Generalizability refers to the ability to generalize the findings to the larger
population (Golafshani, 2003; Silverman, 2006). Over the years, researchers have tried to adapt
and translate these concepts to appropriate concepts for qualitative research. While many
alternative concepts and definitions have been proposed for qualitative research, in general
there seems to be a sense of consensus on the following translations:

43
(internal) validity corresponds to credibility, reliability corresponds to dependability and
generalizability corresponds to transferability or applicability (Golafshani, 2003; Krefting, 1990;
Shenton, 2004).
Below, measures taken to enhance the quality of this research are listed. These measures
contribute to the trustworthiness of qualitative research (Shenton, 2004, p. 73).
Credibility
- Use of appropriate and recognized research methods as highlighted in this chapter
- Development of early familiarity of the research arena by attending workshops and relevant
meetings
- Triangulation by applying different methods
- Tactics to ensure honesty in respondents (see 3.4)
- Feedback sessions between researcher and superiors
Dependability
- Conducting the research process as well as the theory selection in a transparent way. This is
done be describing and justifying the methodological choices made as well as by enabling the
database in order to allow tracing back results. Furthermore, quotes from the interviews will be
included in the data analysis in order to provide more detailed insight and clarification with
regard to the line of reasoning in the analysis. By doing this, the ability to understand and
replicate this study is enhanced.
- Triangulation by applying overlapping methods
Generalizability
Many researchers have claimed that the ability to generalize is not relevant for qualitative
research, and that qualitative researchers should merely aim to present sufficient descriptive
data to allow for comparison (Krefting, 1990). While the questionnaire is developed to provide
for sufficient descriptive contextual data, generalization in a broader sense is also of interest
since this research specifically aimed to analyze barriers to adaptation on a larger scale than has
previously been done and provide recommendations to improve support tools to address these
barriers.
However, there is a certain selection bias because the sampling of the municipalities has not
been done randomly, as it was based on the fact that they are affiliated with KVN. This affiliation
indicates that these municipalities, to a certain extent, are interested in, or have the capacity for,
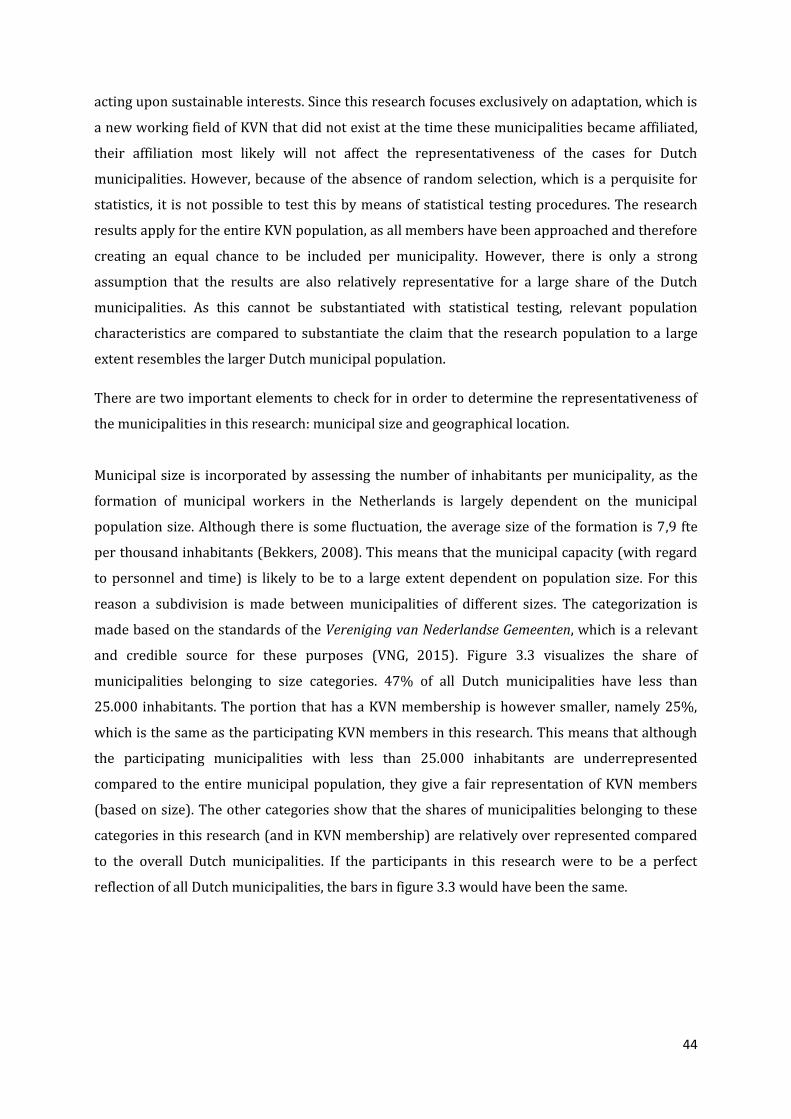
44
acting upon sustainable interests. Since this research focuses exclusively on adaptation, which is
a new working field of KVN that did not exist at the time these municipalities became affiliated,
their affiliation most likely will not affect the representativeness of the cases for Dutch
municipalities. However, because of the absence of random selection, which is a perquisite for
statistics, it is not possible to test this by means of statistical testing procedures. The research
results apply for the entire KVN population, as all members have been approached and therefore
creating an equal chance to be included per municipality. However, there is only a strong
assumption that the results are also relatively representative for a large share of the Dutch
municipalities. As this cannot be substantiated with statistical testing, relevant population
characteristics are compared to substantiate the claim that the research population to a large
extent resembles the larger Dutch municipal population.
There are two important elements to check for in order to determine the representativeness of
the municipalities in this research: municipal size and geographical location.
Municipal size is incorporated by assessing the number of inhabitants per municipality, as the
formation of municipal workers in the Netherlands is largely dependent on the municipal
population size. Although there is some fluctuation, the average size of the formation is 7,9 fte
per thousand inhabitants (Bekkers, 2008). This means that the municipal capacity (with regard
to personnel and time) is likely to be to a large extent dependent on population size. For this
reason a subdivision is made between municipalities of different sizes. The categorization is
made based on the standards of the Vereniging van Nederlandse Gemeenten, which is a relevant
and credible source for these purposes (VNG, 2015). Figure 3.3 visualizes the share of
municipalities belonging to size categories. 47% of all Dutch municipalities have less than
25.000 inhabitants. The portion that has a KVN membership is however smaller, namely 25%,
which is the same as the participating KVN members in this research. This means that although
the participating municipalities with less than 25.000 inhabitants are underrepresented
compared to the entire municipal population, they give a fair representation of KVN members
(based on size). The other categories show that the shares of municipalities belonging to these
categories in this research (and in KVN membership) are relatively over represented compared
to the overall Dutch municipalities. If the participants in this research were to be a perfect
reflection of all Dutch municipalities, the bars in figure 3.3 would have been the same.
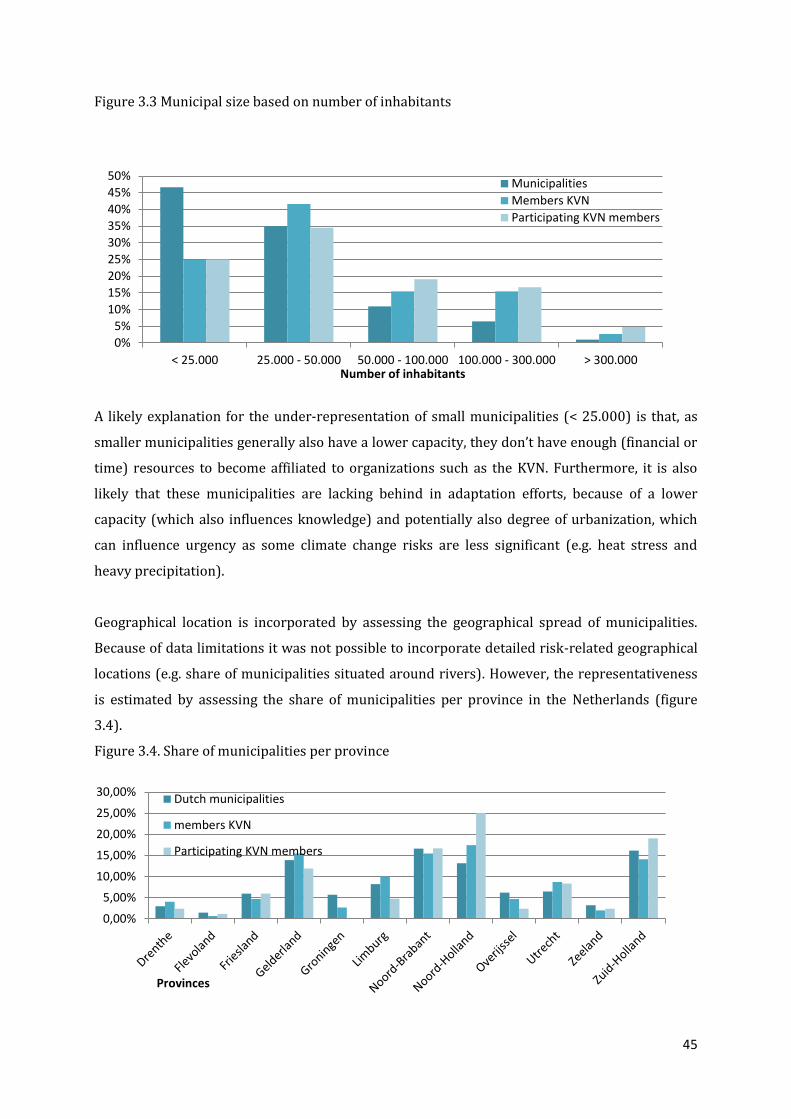
45
Figure 3.3 Municipal size based on number of inhabitants
A likely explanation for the under-representation of small municipalities (< 25.000) is that, as
smaller municipalities generally also have a lower capacity, they don’t have enough (financial or
time) resources to become affiliated to organizations such as the KVN. Furthermore, it is also
likely that these municipalities are lacking behind in adaptation efforts, because of a lower
capacity (which also influences knowledge) and potentially also degree of urbanization, which
can influence urgency as some climate change risks are less significant (e.g. heat stress and
heavy precipitation).
Geographical location is incorporated by assessing the geographical spread of municipalities.
Because of data limitations it was not possible to incorporate detailed risk-related geographical
locations (e.g. share of municipalities situated around rivers). However, the representativeness
is estimated by assessing the share of municipalities per province in the Netherlands (figure
3.4).
Figure 3.4. Share of municipalities per province
0%
5%
10%
15%
20%
25%
30%
35%
40%
45%
50%
< 25.000 25.000 - 50.000 50.000 - 100.000 100.000 - 300.000 > 300.000Number of inhabitants
Municipalities
Members KVN
Participating KVN members
0,00%
5,00%
10,00%
15,00%
20,00%
25,00%
30,00%
Provinces
Dutch municipalities
members KVN
Participating KVN members
46
Based on figure 3.4 it can be concluded that the participating municipalities seem to provide a
relatively fair share of municipalities for the provinces of: Drenthe, Flevoland, Friesland,
Gelderland, Noord-Brabant, Utrecht, Zeeland and Zuid-Holland. Groningen is the only province
that has unintentionally been completely left out of the analysis. The provinces of Limburg and
Overijssel are relatively under-represented (the latter was approached during the summer
months; June and July), while Noord-Holland is clearly over-represented.
Interviewing
I received support with data collection from my internship supervisor, as she conducted 13% of
the total interviews. This was done so she could get a better understanding of the perceptions of
participants towards this research and to get an idea of what I was actually working on during
my internship. However, the main reason was to assure reaching the largest amount of cases
possible within the given timeframe for this master thesis. Informing the proper departments of
municipalities about this research, finding and contacting the right persons for telephone-
interviews, and conducting the actual interview are very time-consuming endeavors. Having
support in this process ensured a larger, and thus more representative database, and also
allowed me to spend time, that would have otherwise been spent on data collection, on
interpretation and analysis. I remained responsible for conducting the majority (87%) of the
interviews in this research. Comparability has been ensured by using a standardized, well-
structured questionnaire. Furthermore, the interviews have been conducted in the same room.
By making sure the other person is present during the interviews, and discussing the results
together, uniformity is aspired and bias is prevented. Self-evidently, I have developed the
questionnaire for this research myself and have remained solely responsible for the
organization, interpretation, analysis, conclusions and recommendations of this research.
An effect of adding the questionnaire to the initial email explaining the purpose and content of
this research was that some (7) municipalities filled in the questionnaire by themselves and sent
it back by email. As the structured open-ended interview approach was carefully selected for
this research, and in order to aspire uniformity, these municipalities have nonetheless been
approached by phone for an interview to supplement the questionnaire. In three cases this
attempt was however unsuccessful (e.g. because of time or unavailability). Although the filled-in
questionnaires lacked the depth and elucidation of most interviews they were still considered
usable as all questions have been answered.
47
4. Adaptation planning by Dutch municipalities
4.1 Introduction
In this chapter the current state of adaptation planning by Dutch municipalities is analyzed. This
chapter is not part of the analysis of the suitability of support tools for the main barriers.
However, this chapter provides background information that allows for a more comprehensive
analysis in the next chapters. The research question that is answered is
To what extent are Dutch municipalities working on adaptation planning?
Answering this research questions gives insight in the main recognized risks. When risks are
considered not urgent, is this based on risk mapping? If not, these municipalities can benefit a lot
from risk assessment tools. Furthermore, it shows which risks are more addressed in practice. It
turns out that non-water related risks are not only recognized far less, but are relatively also
little acted upon when they are recognized. This indicates that there is a certain barrier
preventing municipalities from working on risks such as heat and drought. Explanations will be
provided in the following chapter (chapter 5. Barriers)
This chapter is structured as follows. First, the recognized risks are discussed (4.2). This
provides relevant information for the barriers to problem recognition. Then the extent to which
risks have been assessed and mapped (4.3) is analyzed. This provides relevant information for
the suitability of tools for risk assessment. Next, the extent to which municipalities work on
adaptation planning is analyzed (4.4) by assessing their measures and governance approach.
This provides insight in the level of advancedness of the municipalities in this research, which is
also relevant for the suitability of support tools. Finally, section 4.5 presents the conclusions
from this chapter.
4.2 Recognized risks
Out of 84 municipalities only 4 stated that climate change poses no significant local risk. The
assumption that climate change doesn’t pose local risks is based on minimal experience with
related calamities by municipalities. Furthermore, variance in climate variability and weather
extremes are seen as something that naturally occurs over time and therefore is little reason for
concern.
“It is possible that there are more warm or wet periods to come, which is a phenomenon that has
alternated over centuries. (…) I’m not under the impression that that is something that can or
should be acted upon”.
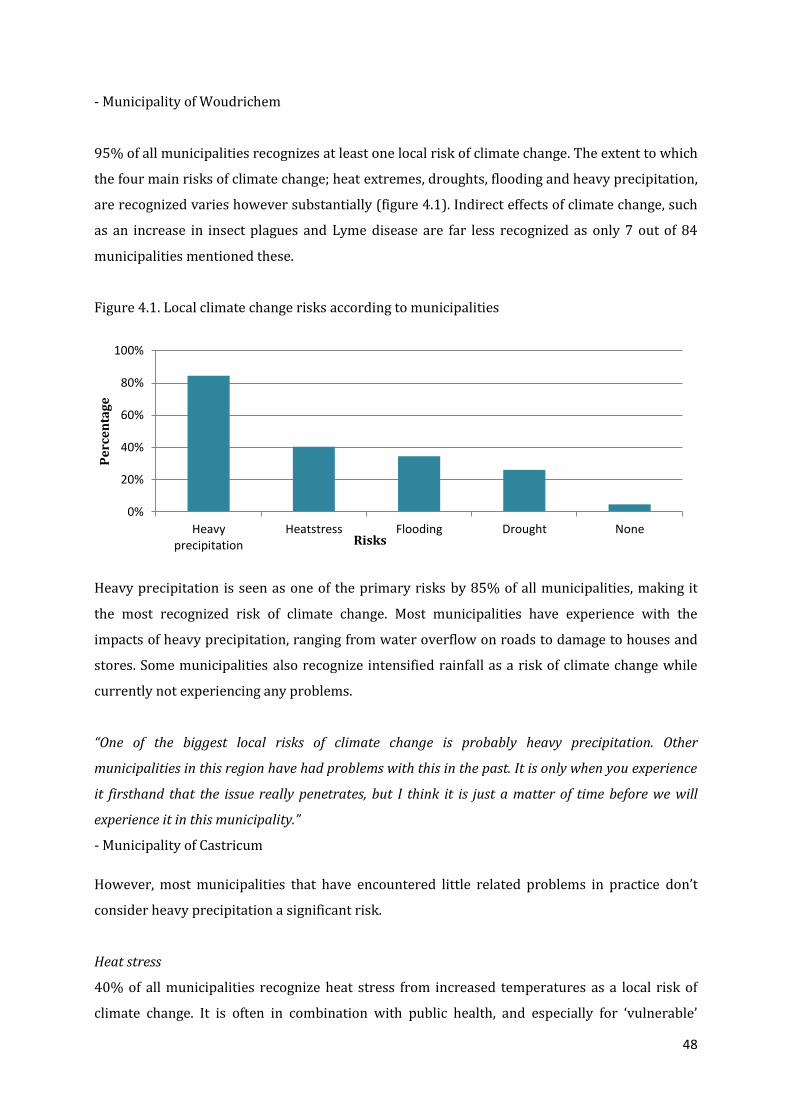
48
- Municipality of Woudrichem
95% of all municipalities recognizes at least one local risk of climate change. The extent to which
the four main risks of climate change; heat extremes, droughts, flooding and heavy precipitation,
are recognized varies however substantially (figure 4.1). Indirect effects of climate change, such
as an increase in insect plagues and Lyme disease are far less recognized as only 7 out of 84
municipalities mentioned these.
Figure 4.1. Local climate change risks according to municipalities
Heavy precipitation is seen as one of the primary risks by 85% of all municipalities, making it
the most recognized risk of climate change. Most municipalities have experience with the
impacts of heavy precipitation, ranging from water overflow on roads to damage to houses and
stores. Some municipalities also recognize intensified rainfall as a risk of climate change while
currently not experiencing any problems.
“One of the biggest local risks of climate change is probably heavy precipitation. Other
municipalities in this region have had problems with this in the past. It is only when you experience
it firsthand that the issue really penetrates, but I think it is just a matter of time before we will
experience it in this municipality.”
- Municipality of Castricum
However, most municipalities that have encountered little related problems in practice don’t
consider heavy precipitation a significant risk.
Heat stress
40% of all municipalities recognize heat stress from increased temperatures as a local risk of
climate change. It is often in combination with public health, and especially for ‘vulnerable’
0%
20%
40%
60%
80%
100%
Heavyprecipitation
Heatstress Flooding Drought None
Pe
rce
nta
ge
Risks
49
groups in society, that temperature increase is considered a risk. Municipalities that recognize
heat stress especially consider this a risk combined with developments such as the ageing of the
population and elderly living at home at an older age.
While most municipalities that recognize rising temperatures consider heat stress a significant
risk for public health, there are some exceptions.
“Elderly indeed form a vulnerable group. However, this has always been the case. If they die it won’t
be because of heat stress.”
- Municipality of Nuenen, Gerwen en Nederwetten
Municipalities that don’t consider heat stress a serious risk accredit this often to their water-rich
and rural ‘green’ environment. Municipalities that do recognize heat stress as a risk suggest that
it is primarily their urban areas that cope with this issue, making it the only risk that is
specifically tied to the level of urbanization by municipalities.
Flooding
Flooding is recognized by 35% of the municipalities as a local risk of climate change. 92 of those
municipalities are situated directly along the coast, and recognize flooding caused by a rising sea
level as one of the primary local risks of climate change. Further inland the risk of river flooding
is recognized by 20 municipalities as one of the main local risks of climate change.
Drought
Drought is recognized by 26% of the municipalities as being a local risk of climate change.
The anticipated negative effects of droughts range from wildfires on the Veluwe, which is a
forest-rich area (Apeldoorn), and rural areas and agricultural land in particular (Zaanstad).
Intensified periods of drought, e.g. resulting in salinization of freshwater systems, can lead to
harvest failures which are recognized by multiple municipalities.
4.3 Risk mapping
Next to identifying what municipalities regard as the most prominent local risks of climate
change it can create additional insights to look at how these visions have come about. Are these
perceived risks merely the perspectives of individual policy workers, stemming from
experiences and local calamities in the past, or have investments been made to map potential
2 Ameland, Bergen, Castricum, Heemskerk, Velsen, Den Haag, Sudwest Fryslan, Rotterdam, Veere,
Vlissingen.
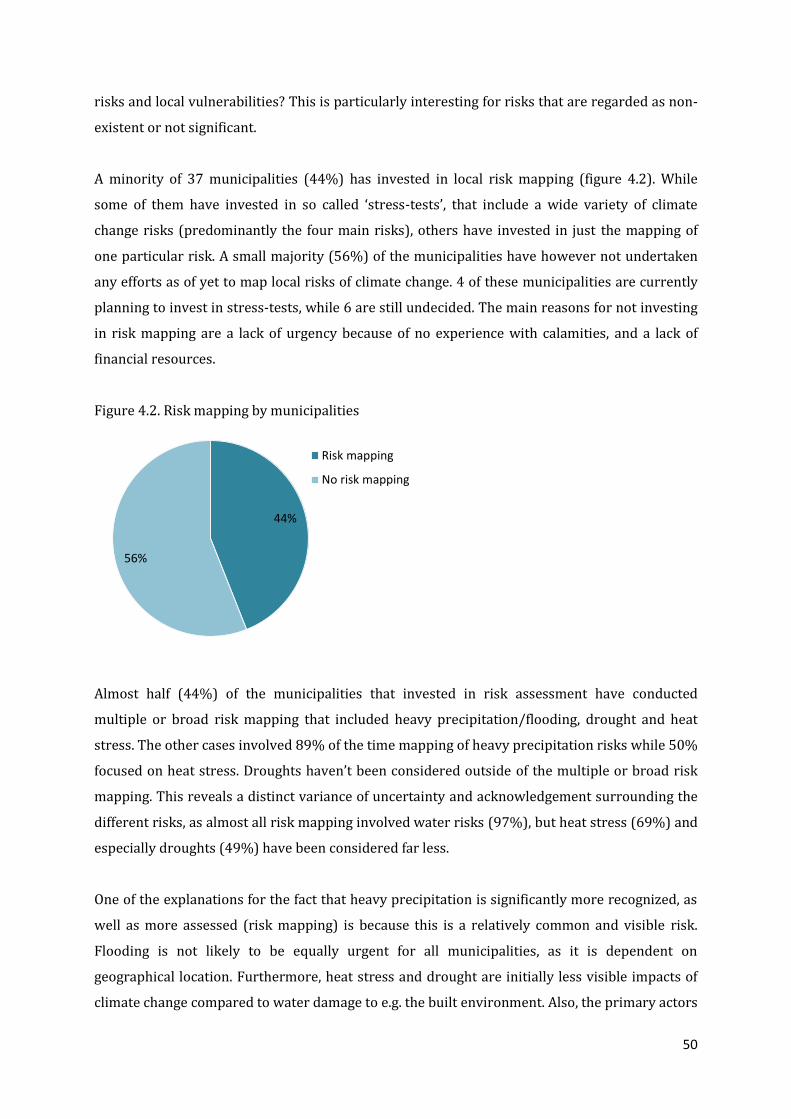
50
risks and local vulnerabilities? This is particularly interesting for risks that are regarded as non-
existent or not significant.
A minority of 37 municipalities (44%) has invested in local risk mapping (figure 4.2). While
some of them have invested in so called ‘stress-tests’, that include a wide variety of climate
change risks (predominantly the four main risks), others have invested in just the mapping of
one particular risk. A small majority (56%) of the municipalities have however not undertaken
any efforts as of yet to map local risks of climate change. 4 of these municipalities are currently
planning to invest in stress-tests, while 6 are still undecided. The main reasons for not investing
in risk mapping are a lack of urgency because of no experience with calamities, and a lack of
financial resources.
Figure 4.2. Risk mapping by municipalities
Almost half (44%) of the municipalities that invested in risk assessment have conducted
multiple or broad risk mapping that included heavy precipitation/flooding, drought and heat
stress. The other cases involved 89% of the time mapping of heavy precipitation risks while 50%
focused on heat stress. Droughts haven’t been considered outside of the multiple or broad risk
mapping. This reveals a distinct variance of uncertainty and acknowledgement surrounding the
different risks, as almost all risk mapping involved water risks (97%), but heat stress (69%) and
especially droughts (49%) have been considered far less.
One of the explanations for the fact that heavy precipitation is significantly more recognized, as
well as more assessed (risk mapping) is because this is a relatively common and visible risk.
Flooding is not likely to be equally urgent for all municipalities, as it is dependent on
geographical location. Furthermore, heat stress and drought are initially less visible impacts of
climate change compared to water damage to e.g. the built environment. Also, the primary actors
44%
56%
Risk mapping
No risk mapping

51
that municipalities cooperate with for adaptation planning are the waterboards, which most
likely contributes to water risks being more recognized and assessed (together with influences
from the Delta Program).
“We have not conducted stress tests for climate change risks. However, the local vulnerabilities of
water impacts are known through the ‘water-manage-plan’ of the regional waterboard.”
- Municipality of Vlissingen
Climate change adaptation appeared to be a relatively new working field for many
municipalities. This partly explains why the awareness of local risks, besides heavy
precipitation, is often still low. Furthermore, not all risks are going to be equally relevant for all
municipalities. It can be argued that conducting risk assessment to map local risks and
vulnerabilities would therefore be a vital step to determine if taking measures is necessary.
However, investing in risk mapping is difficult to ground when there is a low sense of urgency.
“Even though risk mapping tools are designed to highlight vulnerabilities and risks in order to try
to prevent them, we don’t feel like that would be interesting right now as we are not experiencing
any risks.”
- Municipality of AA en Hunze
This leads many municipalities to assess the necessity based on firsthand experience rather than
comprehensive mapping of risks. This approach is likely to make it difficult for the 56% of the
municipalities that did not invest in risk mapping to proactively address climate adaptation, as
in practise they are likely to only start taking actions after impacts occurred. This is further
elaborated upon in the barriers chapter (5).
Insignificant risks
Despite the high level of uncertainty, several municipalities explicitly stated (certain) climate
change risks weren’t relevant on a local scale. It is interesting to see if these claims are made
based on risk mapping or if they are solely based on personal experience, making them perhaps
less justified.
None of the 4 municipalities that claim there are no significant local risks of climate change have
conducted some form of risk mapping. This can again be explained by a low level of urgency:
“We don’t expect any calamities in the near future, which is why we don’t feel the need to map risks
and vulnerabilities. There are currently no calamities that prompt us to undertake that endeavor.”
- Municipality of Woudrichem
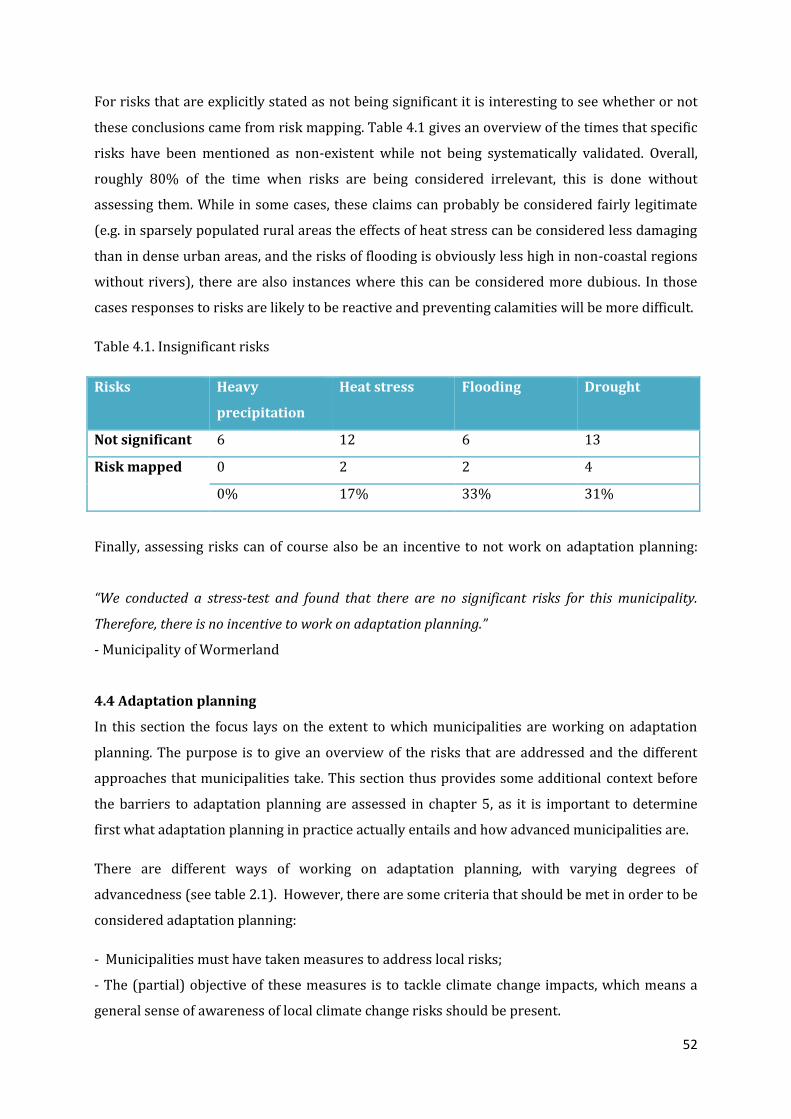
52
For risks that are explicitly stated as not being significant it is interesting to see whether or not
these conclusions came from risk mapping. Table 4.1 gives an overview of the times that specific
risks have been mentioned as non-existent while not being systematically validated. Overall,
roughly 80% of the time when risks are being considered irrelevant, this is done without
assessing them. While in some cases, these claims can probably be considered fairly legitimate
(e.g. in sparsely populated rural areas the effects of heat stress can be considered less damaging
than in dense urban areas, and the risks of flooding is obviously less high in non-coastal regions
without rivers), there are also instances where this can be considered more dubious. In those
cases responses to risks are likely to be reactive and preventing calamities will be more difficult.
Table 4.1. Insignificant risks
Risks Heavy
precipitation
Heat stress Flooding Drought
Not significant 6 12 6 13
Risk mapped 0 2 2 4
0% 17% 33% 31%
Finally, assessing risks can of course also be an incentive to not work on adaptation planning:
“We conducted a stress-test and found that there are no significant risks for this municipality.
Therefore, there is no incentive to work on adaptation planning.”
- Municipality of Wormerland
4.4 Adaptation planning
In this section the focus lays on the extent to which municipalities are working on adaptation
planning. The purpose is to give an overview of the risks that are addressed and the different
approaches that municipalities take. This section thus provides some additional context before
the barriers to adaptation planning are assessed in chapter 5, as it is important to determine
first what adaptation planning in practice actually entails and how advanced municipalities are.
There are different ways of working on adaptation planning, with varying degrees of
advancedness (see table 2.1). However, there are some criteria that should be met in order to be
considered adaptation planning:
- Municipalities must have taken measures to address local risks;
- The (partial) objective of these measures is to tackle climate change impacts, which means a
general sense of awareness of local climate change risks should be present.
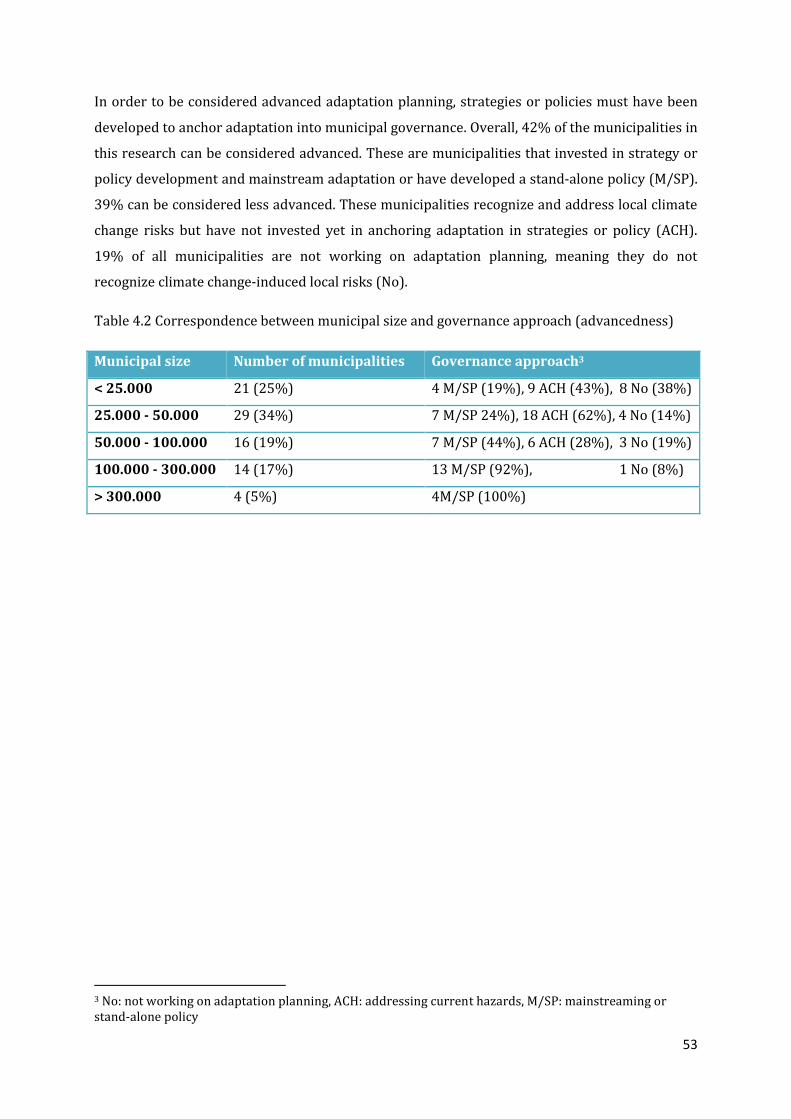
53
In order to be considered advanced adaptation planning, strategies or policies must have been
developed to anchor adaptation into municipal governance. Overall, 42% of the municipalities in
this research can be considered advanced. These are municipalities that invested in strategy or
policy development and mainstream adaptation or have developed a stand-alone policy (M/SP).
39% can be considered less advanced. These municipalities recognize and address local climate
change risks but have not invested yet in anchoring adaptation in strategies or policy (ACH).
19% of all municipalities are not working on adaptation planning, meaning they do not
recognize climate change-induced local risks (No).
Table 4.2 Correspondence between municipal size and governance approach (advancedness)
Municipal size Number of municipalities Governance approach3
< 25.000 21 (25%) 4 M/SP (19%), 9 ACH (43%), 8 No (38%)
25.000 - 50.000 29 (34%) 7 M/SP 24%), 18 ACH (62%), 4 No (14%)
50.000 - 100.000 16 (19%) 7 M/SP (44%), 6 ACH (28%), 3 No (19%)
100.000 - 300.000 14 (17%) 13 M/SP (92%), 1 No (8%)
> 300.000 4 (5%) 4M/SP (100%)
3 No: not working on adaptation planning, ACH: addressing current hazards, M/SP: mainstreaming or stand-alone policy
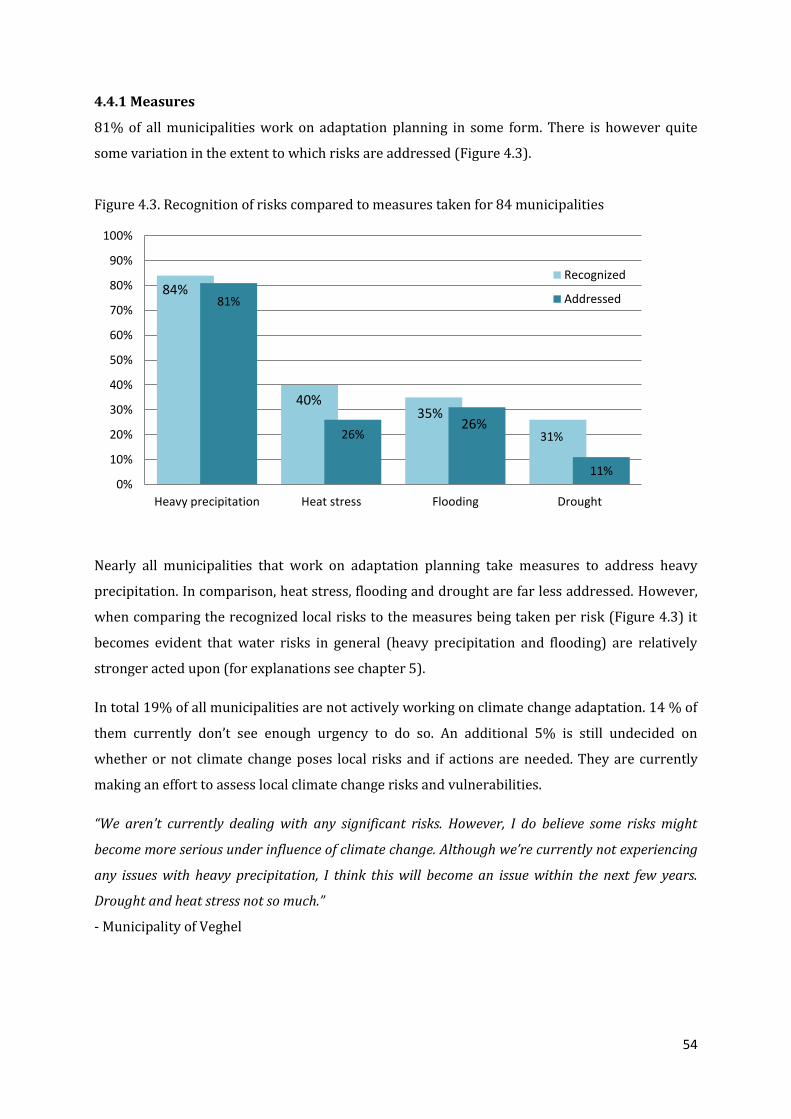
54
4.4.1 Measures
81% of all municipalities work on adaptation planning in some form. There is however quite
some variation in the extent to which risks are addressed (Figure 4.3).
Figure 4.3. Recognition of risks compared to measures taken for 84 municipalities
Nearly all municipalities that work on adaptation planning take measures to address heavy
precipitation. In comparison, heat stress, flooding and drought are far less addressed. However,
when comparing the recognized local risks to the measures being taken per risk (Figure 4.3) it
becomes evident that water risks in general (heavy precipitation and flooding) are relatively
stronger acted upon (for explanations see chapter 5).
In total 19% of all municipalities are not actively working on climate change adaptation. 14 % of
them currently don’t see enough urgency to do so. An additional 5% is still undecided on
whether or not climate change poses local risks and if actions are needed. They are currently
making an effort to assess local climate change risks and vulnerabilities.
“We aren’t currently dealing with any significant risks. However, I do believe some risks might
become more serious under influence of climate change. Although we’re currently not experiencing
any issues with heavy precipitation, I think this will become an issue within the next few years.
Drought and heat stress not so much.”
- Municipality of Veghel
81%
26% 31%
11% 0%
10%
20%
30%
40%
50%
60%
70%
80%
90%
100%
Heavy precipitation Heat stress Flooding Drought
Recognized
Addressed84%
40% 35%
26%
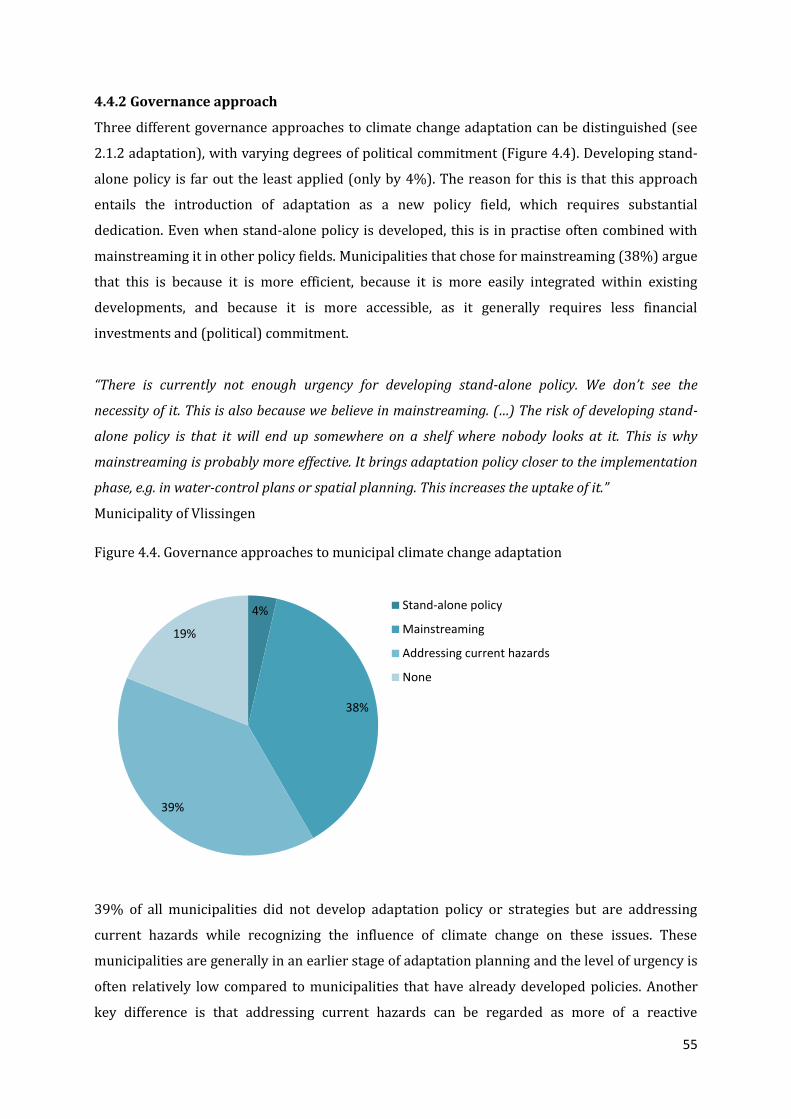
55
4.4.2 Governance approach
Three different governance approaches to climate change adaptation can be distinguished (see
2.1.2 adaptation), with varying degrees of political commitment (Figure 4.4). Developing stand-
alone policy is far out the least applied (only by 4%). The reason for this is that this approach
entails the introduction of adaptation as a new policy field, which requires substantial
dedication. Even when stand-alone policy is developed, this is in practise often combined with
mainstreaming it in other policy fields. Municipalities that chose for mainstreaming (38%) argue
that this is because it is more efficient, because it is more easily integrated within existing
developments, and because it is more accessible, as it generally requires less financial
investments and (political) commitment.
“There is currently not enough urgency for developing stand-alone policy. We don’t see the
necessity of it. This is also because we believe in mainstreaming. (…) The risk of developing stand-
alone policy is that it will end up somewhere on a shelf where nobody looks at it. This is why
mainstreaming is probably more effective. It brings adaptation policy closer to the implementation
phase, e.g. in water-control plans or spatial planning. This increases the uptake of it.”
Municipality of Vlissingen
Figure 4.4. Governance approaches to municipal climate change adaptation
39% of all municipalities did not develop adaptation policy or strategies but are addressing
current hazards while recognizing the influence of climate change on these issues. These
municipalities are generally in an earlier stage of adaptation planning and the level of urgency is
often relatively low compared to municipalities that have already developed policies. Another
key difference is that addressing current hazards can be regarded as more of a reactive
4%
38%
39%
19%
Stand-alone policy
Mainstreaming
Addressing current hazards
None
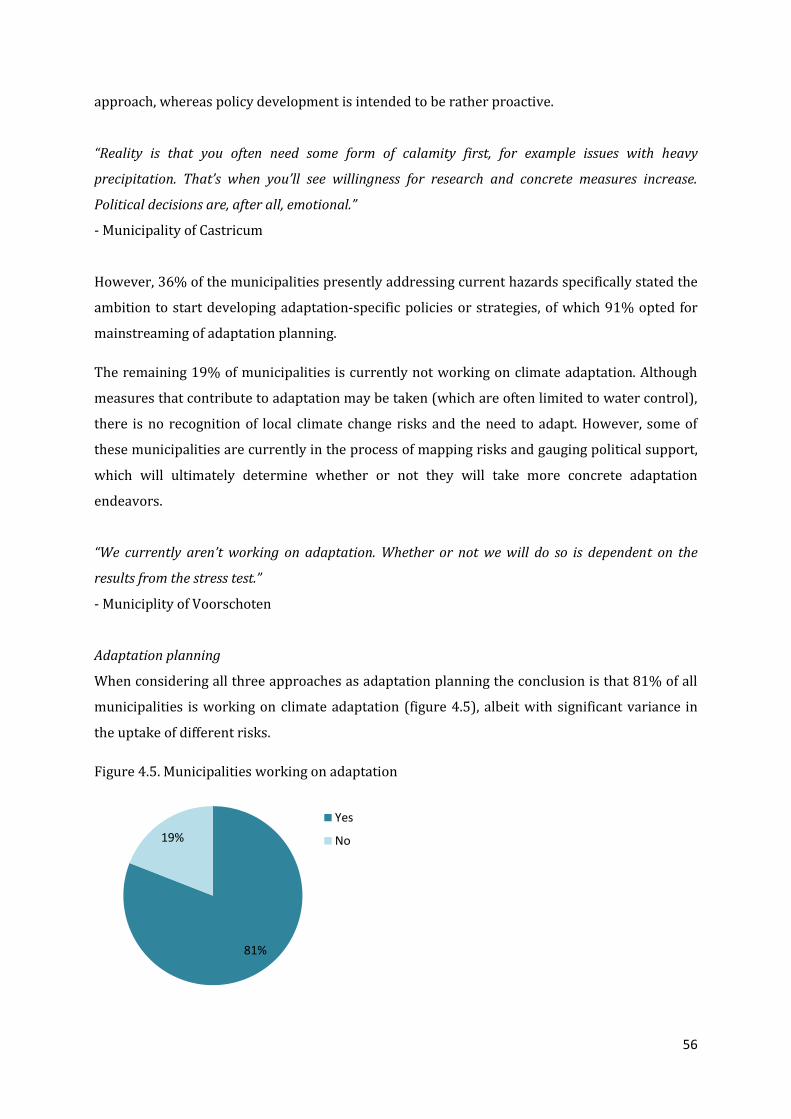
56
approach, whereas policy development is intended to be rather proactive.
“Reality is that you often need some form of calamity first, for example issues with heavy
precipitation. That’s when you’ll see willingness for research and concrete measures increase.
Political decisions are, after all, emotional.”
- Municipality of Castricum
However, 36% of the municipalities presently addressing current hazards specifically stated the
ambition to start developing adaptation-specific policies or strategies, of which 91% opted for
mainstreaming of adaptation planning.
The remaining 19% of municipalities is currently not working on climate adaptation. Although
measures that contribute to adaptation may be taken (which are often limited to water control),
there is no recognition of local climate change risks and the need to adapt. However, some of
these municipalities are currently in the process of mapping risks and gauging political support,
which will ultimately determine whether or not they will take more concrete adaptation
endeavors.
“We currently aren’t working on adaptation. Whether or not we will do so is dependent on the
results from the stress test.”
- Municiplity of Voorschoten
Adaptation planning
When considering all three approaches as adaptation planning the conclusion is that 81% of all
municipalities is working on climate adaptation (figure 4.5), albeit with significant variance in
the uptake of different risks.
Figure 4.5. Municipalities working on adaptation
81%
19%
Yes
No
57
In practise however, there can be little to no difference between municipalities that don’t work
on adaptation planning (19%) and municipalities that only work on heavy precipitation. The
reason for this is that all municipalities follow guidelines and norms set by the regional
waterboards (which has a large responsibility in local water management). This means that in
practice all municipalities undertake efforts to balance their water system. The main difference
here is thus whether or not municipalities recognize the impact of climate change on heavy
precipitation. When they do, then combined with their efforts, this is regarded as adaptation
planning, whilst if they don’t they are not perceived as working on adaptation. The justification
for this is founded in the importance of problem recognition for adaptation planning, with the
problem here being the local effects of climate change (for further explanation see 2.2
adaptation planning).
4.5 Conclusion
The aim of this chapter was to assess the current state of adaptation planning by municipalities
in the Netherlands. The information in this chapter is used as input for the analytical steps for
assessing the suitability of the support tools to address the main barriers in the next chapters (5-
7). The research question in this chapter was:
RQ: To what extent are Dutch municipalities working on adaptation planning?
Not all risks are regarded as equally relevant by all municipalities. Non-water related risks are
generally far less recognized and acted upon. This corresponds to other studies that found that
adaptation is often still framed as a ‘water problem’ (Hoppe, et al., 2012). Therefore it is likely
that the majority of barriers to problem recognition refer to risks such as heat and drought. The
majority of municipalities have not yet invested in risk assessment to substantiate the perceived
lack of urgency. This means some local risks and vulnerabilities might be overlooked and these
municipalities are not effectively preparing themselves for (future) climate change impacts.
Overall, 42% of all municipalities in this research can be considered advanced. 39% can be
considered less advanced. And 19% of all municipalities are not working on adaptation planning.
Larger municipalities, which often have a larger capacity (Bekkers, 2008) are generally the more
advanced municipalities (table 4.2).
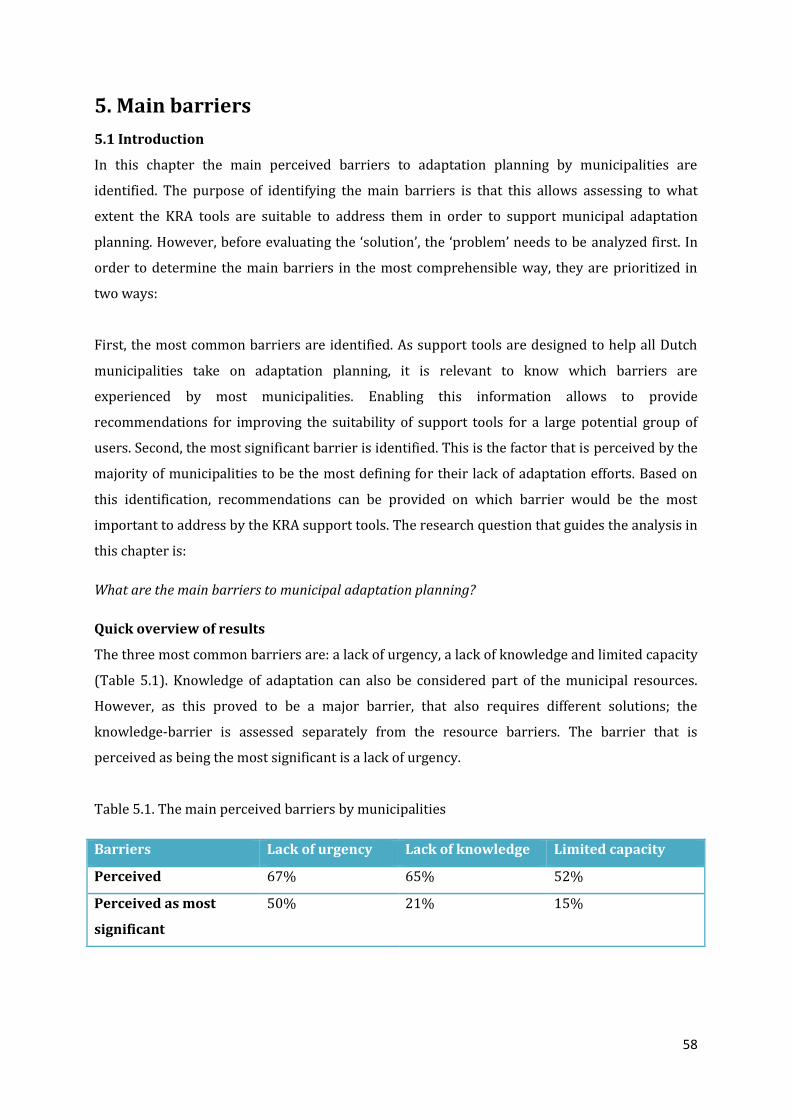
58
5. Main barriers
5.1 Introduction
In this chapter the main perceived barriers to adaptation planning by municipalities are
identified. The purpose of identifying the main barriers is that this allows assessing to what
extent the KRA tools are suitable to address them in order to support municipal adaptation
planning. However, before evaluating the ‘solution’, the ‘problem’ needs to be analyzed first. In
order to determine the main barriers in the most comprehensible way, they are prioritized in
two ways:
First, the most common barriers are identified. As support tools are designed to help all Dutch
municipalities take on adaptation planning, it is relevant to know which barriers are
experienced by most municipalities. Enabling this information allows to provide
recommendations for improving the suitability of support tools for a large potential group of
users. Second, the most significant barrier is identified. This is the factor that is perceived by the
majority of municipalities to be the most defining for their lack of adaptation efforts. Based on
this identification, recommendations can be provided on which barrier would be the most
important to address by the KRA support tools. The research question that guides the analysis in
this chapter is:
What are the main barriers to municipal adaptation planning?
Quick overview of results
The three most common barriers are: a lack of urgency, a lack of knowledge and limited capacity
(Table 5.1). Knowledge of adaptation can also be considered part of the municipal resources.
However, as this proved to be a major barrier, that also requires different solutions; the
knowledge-barrier is assessed separately from the resource barriers. The barrier that is
perceived as being the most significant is a lack of urgency.
Table 5.1. The main perceived barriers by municipalities
Barriers Lack of urgency Lack of knowledge Limited capacity
Perceived 67% 65% 52%
Perceived as most
significant
50% 21% 15%
59
This chapter is structured as follows: section 5.2 discusses the experienced barriers in general.
The main barriers to adaptation planning are discussed from section 5.3 until section 5.6. The
concluding section (5.7) provides an answer to the research question of this chapter and
compares the results to the main findings in literature.
5.2 Barriers
Roughly 7% of all municipalities aren’t currently experiencing any barriers to adaptation
planning. Although all municipalities are coping with limited financial capabilities, these
municipalities claim this isn’t necessarily hindering their adaptation efforts.
The reason for not citing any barriers to adaptation planning is largely grounded in the phase
that they are currently in. Risks have been mapped and they are (considering) taking actions to
address risks other than water challenges. Overall, they are well on their way but haven’t
reached a plateau yet.
“In this stage we are not experiencing any barriers. Our budget is sufficient, responsibilities are
clear and we have proper contacts that contribute to expanding our knowledgebase.”
- Municipality of Alkmaar
However, these municipalities do recognize that it remains very difficult to increase awareness
of climate change and adaptation on a broader level, which is an issue many municipalities
struggle with. Often when working with actors such as architects, project developers and
building engineers or when trying to have citizens take responsibility, it becomes apparent that
awareness of climate adaptation isn’t that advanced yet. The result is that it remains difficult to
involve private actors and society.
This is also when the limitations in influence and span of control of municipalities become
evident. In general, local governments can stimulate and inform but are restricted when it comes
to enforcing legislation. This means that in practise advices for climate resilient building can be
turned down because of e.g. conflicting interests.
Next to informing societal actors on local climate change impacts, and involving private
companies and citizens with local projects, municipalities are looking for solutions that serve
multiple purposes to tackle this lack of overall awareness and interest.
“Citizens are more understanding when adaptation is mainstreamed and also contributes to
enhancing the quality of the living environment for example, instead of just addressing long-term
60
climate issues.”
- Municipality of Rotterdam
Next to the broader challenge of raising awareness in society about adaptation needs, 93% of all
municipalities encounter a variety of factors that prevent, stop or delay their own adaptation
efforts. These main perceived barriers are further explained below.
5.3 Lack of urgency
Next to being the most common barrier, a lack of urgency is also considered the most significant
barrier by half of the municipalities, and to problem recognition in particular. In comparison; a
fifth of all municipalities regard the second-most significant barrier, a lack of knowledge, as the
primary one.
The reason a lack of urgency is widely considered the main barrier is because it influences all
other barriers. Municipalities struggle with a lack of knowledge, a lack of resources and an
inability to prioritize climate adaptation. But to a large extent this is because the issue is not
considered urgent enough, which is why it is often not decisively addressed.
A variety of explanations are identified as to why adaptation isn’t considered urgent. First,
outside the water-area municipalities haven’t had much experience with climate change risks,
and it is difficult to prioritize matters that are less tangible. It is in many cases only after
calamities that the level or urgency rises and taking actions is considered. Second, other matters
(mitigation efforts mostly) get priority over adaptation, as municipalities have limited resources
at their disposal. Climate adaptation is often competing with multiple issues that, contrary to
adaptation, serve short-term interests. This is why 40% of all municipalities state that there is a
prioritization issue with regard to adaptation planning. Third, smaller and more rural
municipalities claim that they believe it is probably a lot more relevant to take preventive
actions in urban areas than it is in more rural areas. However, as highlighted in section 4.3 these
municipalities have often not invested in assessing and mapping local risks to back up this claim,
which is also due to the low sense of urgency.
“Before you decide to take on adaptation planning, it first needs to be a problem. That’s when you’ll
start looking for knowledge and information on the matter in order to come up with solutions.
However, we are not nearly in that stage yet, mainly because we are not experiencing any
problems, which is why adaptation is not urgent.”
- Municipality of Nuenen, Gerwen & Nederwetten
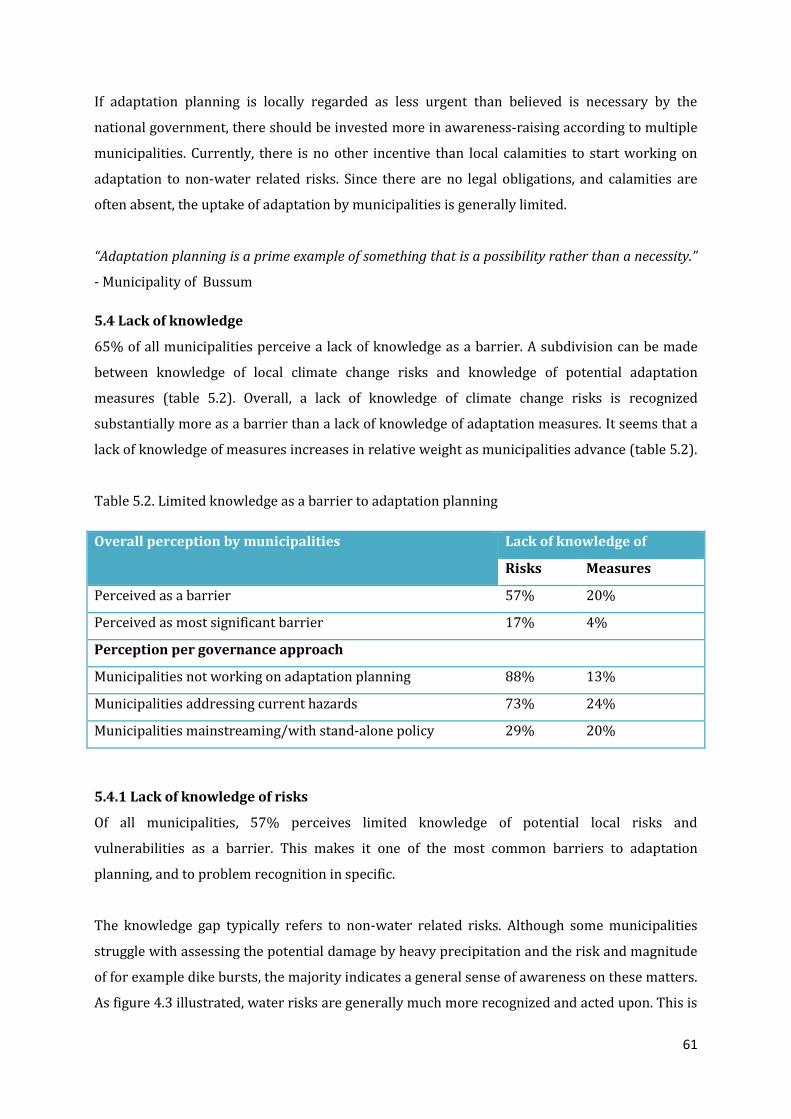
61
If adaptation planning is locally regarded as less urgent than believed is necessary by the
national government, there should be invested more in awareness-raising according to multiple
municipalities. Currently, there is no other incentive than local calamities to start working on
adaptation to non-water related risks. Since there are no legal obligations, and calamities are
often absent, the uptake of adaptation by municipalities is generally limited.
“Adaptation planning is a prime example of something that is a possibility rather than a necessity.”
- Municipality of Bussum
5.4 Lack of knowledge
65% of all municipalities perceive a lack of knowledge as a barrier. A subdivision can be made
between knowledge of local climate change risks and knowledge of potential adaptation
measures (table 5.2). Overall, a lack of knowledge of climate change risks is recognized
substantially more as a barrier than a lack of knowledge of adaptation measures. It seems that a
lack of knowledge of measures increases in relative weight as municipalities advance (table 5.2).
Table 5.2. Limited knowledge as a barrier to adaptation planning
Overall perception by municipalities Lack of knowledge of
Risks Measures
Perceived as a barrier 57% 20%
Perceived as most significant barrier 17% 4%
Perception per governance approach
Municipalities not working on adaptation planning 88% 13%
Municipalities addressing current hazards 73% 24%
Municipalities mainstreaming/with stand-alone policy 29% 20%
5.4.1 Lack of knowledge of risks
Of all municipalities, 57% perceives limited knowledge of potential local risks and
vulnerabilities as a barrier. This makes it one of the most common barriers to adaptation
planning, and to problem recognition in specific.
The knowledge gap typically refers to non-water related risks. Although some municipalities
struggle with assessing the potential damage by heavy precipitation and the risk and magnitude
of for example dike bursts, the majority indicates a general sense of awareness on these matters.
As figure 4.3 illustrated, water risks are generally much more recognized and acted upon. This is
62
not surprising as most municipalities are familiar with the Delta Program (with a strong focus on
water safety) while working in close cooperation with regional waterboards. Furthermore,
water issues are often more visible and well-known (compared to e.g. heat stress), and
municipalities are aware of their responsibility with regard to sewage systems and water
management. In contrast, responsibilities are much less clear for relatively newer issues such as
extreme temperatures and public health. 14% of all municipalities specifically indicated this is
an issue. As municipal resources are limited, defining clear responsibilities is even more
important in order to address climate change challenges collectively. Municipalities have
mentioned both the difficulties as well as the essence of involving other parties for climate
adaptation.
Many municipalities are unaware of the nature and amplitude of potential local climate change
risks. As illustrated in figure 4.2, 56% of all municipalities didn’t invest in risk mapping. When
they did conduct risk analysis, only half of the municipalities included droughts, and
approximately three quarters assessed heat stress. This comes down to respectively 22% and
30% of all municipalities in this research. This means a vast majority of municipalities has no
substantial knowledge of non-water related risks and is thus generally operating based on
assumptions.
Oftentimes there is still little experience with impacts in practise, meaning municipalities have
no strong incentive to proactively address climate change adaptation in a broad way. This makes
it difficult to prepare for climate change and become more resilient.
“There is a low level of priority and political support. This is stemming from a lack of knowledge on
local risks and its’ urgency. So far we have no experience with calamities from climate change.
When we gain more knowledge in this area, awareness will rise and developing proactive policy
becomes possible.”
- Municipality of Drechterland
In many cases a lack of knowledge on risks corresponds to a low level of awareness on climate
change impacts and adaptation. Climate change is often still a rather abstract concept and the
suggestion that climate change may have local impacts is still obscure. Although some
municipalities have experience with calamities, the connection with climate change is often
absent and needs to be confirmed in order to realize certain calamities might become more
common and intense in the (near) future.

63
Even when there is a general sense of awareness of local climate change impacts, a lack of
knowledge can still form a barrier. The following questions illustrate this: if one recognizes that
droughts can or will manifest themselves as local risks of climate change, then what does this
exactly mean? Where can local impacts be expected, what will be the severity, and whom will be
affected? Many municipalities struggle with unanswered questions like these. This is a barrier
because more knowledge on risks and local vulnerabilities is needed to substantiate the urgency
for taking action.
“I am convinced temperatures will rise and heat stress can cause problems in urban areas for
vulnerable groups. Furthermore, I also believe droughts can become an issue. However, the
problem is that it remains difficult to substantiate this in order to gain political support. There is
still too much uncertainty and ambiguity with regard to the magnitude of these risks and how to
deal with them.”
- Municipality of Renkum
5.4.2 Lack of knowledge of measures
Of all municipalities, 20% perceives limited knowledge of possible measures as a barrier. This is
significantly less than the 55% citing knowledge of risks as a barrier.
This can probably be explained by how advanced most municipalities are in their adaptation
planning. The majority has not assessed local risks and it is therefore unlikely that they are
seriously considering the next step by taking adaptation measures. Because these municipalities
are not that advanced yet, they generally also don’t perceive limited knowledge of measures to
be a barrier. However, as soon as municipalities progress it seems that a lack of knowledge of
measures increases in relative importance as a knowledge barrier. Therefore, limited knowledge
of adaptation measures is considered to be one of the main barriers to taking adaptation
measures, making it an important one to address.
As illustrated in figure 4.3, 40% recognizes heat stress while only 26% takes action. Also, 26%
recognizes droughts with only 11% taking action. This illustrates that many municipalities that
are aware of local climate change risks find it difficult to take action, especially concerning heat
and drought. A lack of knowledge of potential measures is an important explanation for this.
“Bringing knowledge and information into practise remains a challenge. This is the main barrier.
There are plenty of handbooks and examples available, but the questions remains: what do I choose
and why?”
- Municipality of Den Haag
64
The absence of clear guidelines makes it difficult to take appropriate measures, as many
municipalities are wondering what exactly is appropriate in which scenario. Information on
climate change risks and potential measures are increasingly available. However, it is translating
that knowledge into the local context that remains difficult. It seems like the complex nature of
climate change prevents generic measures and solutions to be easily applicable.
Another aspect of adaptation that municipalities are uncertain about are the costs and benefits
of taking action. In contrast to mitigation-efforts that can be cost-effective, such as increasing
energy efficiency, the benefits of adaptation measures can be more difficult to quantify. This
makes it challenging to financially substantiate actions. Therefore, more knowledge is needed on
the costs and benefits of adaptation options.
5.5 Limited capacity
Another common barrier to adaptation planning is a limited capacity. 52% of all municipalities
are struggling with a lack of time, personnel and/or finances. A limited budget is considered to
be the most significant resource-barrier, as this also influences the available time and workforce.
Furthermore, reduced budgets are also impeding knowledge development, therefore reinforcing
the knowledge-barrier with regard to risks and adaptation measures. For a large share of
municipalities this is a serious impediment. In order to determine the necessity of adaptation
planning, financial investments are needed for hiring consultancy agencies and assessing local
risks, which is often not possible because of limited financial resources. Therefore, it seems that
a lack of resources is not only a barrier to adaptation measures, but also a barrier to problem
recognition.
Because of a lack of financial capabilities municipalities need to prioritize their activities. This
means that in many cases adaptation is only invested in when responding to calamities. Applying
preventive measures is therefore less attainable, and the focus thus generally remains on
economic interests, mitigation efforts and daily tasks.
“Other projects get priority. These are often visible and uncomplicated projects such as
development of bicycle tracks and roundabouts, which are easy wins. This is due to limited resource
availability and prioritization of other projects than adaptation, which are the main barriers.”
- Municipality of Huizen
“We need to set priorities. We are currently spending a lot of effort on mitigation and developing a
sustainability-agenda, and this is still on a small scale. Therefore, I don’t see an opportunity, and
65
necessity, to work on adaptation. This is due to the fact that we are a small municipality with
limited resources (currently we have 0.4 FTE working on sustainability). There is just no capacity
to work on adaptation, and we don’t consider the risks urgent”
- Municipality of Woudrichem
Some municipalities with limited resources have found creative ways to cope with this barrier.
An example is integrating adaptation with on-going projects to optimize resource utilization, e.g.
with restructuring and new building or working on climate resilience while increasing livability.
Here again, emphasis is placed on recognizing and optimizing opportunities, rather than merely
addressing (long-term) risks.
Another example is cooperating with a multitude of stakeholders, including citizens, private
companies and other regional government organizations. By sharing resources and
responsibilities adaptation planning becomes more accessible. However, in order to do this, a
sense of awareness and urgency needs to be established first.
5.6 Conclusion
The barriers identified as the most common ones are; a lack of urgency, limited knowledge of
risks and measures, and limited capacity. The majority of municipalities consider a lack of
urgency to be the most significant barrier to adaptation planning. The reason many
municipalities don’t consider adaptation urgent is because there is a lack of incentives. There are
no legal obligations to work on adaptation planning, which means that since there is often little
experience with climate change risks in practice, municipalities have no sense of urgency to
work on adaptation planning. This is further reinforced by the limited capacity many
municipalities struggle with. With little resources available, municipalities have to prioritize;
meaning that there is little room for assessing risks and working on adaptation planning. The
main barriers thus seem to be barriers to problem recognition (low sense of urgency, lack of
knowledge of risks, and limited capacity), which corresponds to the overall picture where the
majority of municipalities are not recognizing heat and drought as local risks of climate change.
Below, the results from the empirical research are assessed in light of the main findings from the
literature review.
Runhaar et al. (2012) also identified two main barriers in this research, a low sense of urgency
and a lack of knowledge of risks, as main barriers to problem recognition. In addition, they
distinguished a lack of awareness, a lack of legal obligations and unclear responsibilities (the
absence of a clear problem owner, which they considered the main barrier) as barriers to
66
problem recognition. The latter barriers are also identified in this research, but were less often
mentioned by municipalities. Furthermore, from this research it seems that awareness tends to
follow from o.a. an increased knowledge of risks, and based on the perceived severity of risks a
sense of urgency is developed. Furthermore, a lack of legal obligations and a lack of a clear
problem owner contributed to the low sense of urgency by municipalities. However, as ‘the
problem’ was often not experienced yet in practice, municipalities regarded a lack of urgency,
primarily because of little experience with calamities and limited knowledge of local risks and
vulnerabilities, to be the main barrier.
A main barrier to adaptation measures identified is this research that is also distinguished by
Runhaar et al. (2012) is a limited capacity (lack of resources). However, rather than just being a
main barrier to adaptation measures, this barrier also prevented municipalities from investing
in local risk and vulnerability assessment. The capacity barrier is experienced by municipalities
in all stages, and by municipalities that are not working on adaptation planning in particular.
Therefore, a lack of resources is considered both a barrier to problem recognition as well as to
adaptation measures. Runhaar et al. (2012) identified two additional barriers to taking
adaptation measures; a lack of opportunities to mainstream adaptation and high costs. High
costs are primarily recognized with regard to problem recognition, as several municipalities
stated that services by consultancy firms for risk assessment are generally considered (too)
expensive. However, a lack of financial means (limited capacity) is considered a barrier for both
risk assessment and adaptation measures. From the empirical research, a lack of opportunity to
mainstream adaptation is not identified as being a main barrier to adaptation measures, which
can likely be explained by the fact that the majority of municipalities is not in this relatively
advanced stage yet.
67
6. KRA support tools
6.1 Introduction
In this chapter the policy theory behind the KRA support tools is reconstructed in order to reveal
the underlying assumptions behind the support tools. Eventually this allows for assessing the
goals behind the KRA support tools and the extent to which they match in theory with the main
perceived barriers identified in the previous chapter (in chapter 7). However, this chapter first
assesses to what extent the goals behind the support tools are believed to match with the
barriers that exist for municipalities according to the KRA. The analysis is guided by following
the steps for reconstruction of policy theory by Hoogerwerf (1990, p.288). For further
explanation of these steps please refer to 3.4 (Assumptions behind support tools).
The research question that is answered in the conclusion of this chapter is:
- What are the assumptions underlying the KRA support tools?
Quick overview of results
The first step is to identify the relevant social processes around the KRA, in order to better
understand the assumptions and intentions behind the development of the support tools. After
that, the final relations (6.3) and causal relations (6.4) are established and visualized.
Concluding, this chapter presents the assumptions underlying the KRA support tools in section
6.5 and the research question is answered in section 6.6.
6.2 Social processes
To start of the analysis the social processes in the policy field are analyzed by identifying the
relevant sectors and actors involved. The content gives context to the analysis and provides
further background information on the KRA. The section is divided into two parts - the Delta
Program and Knowledge for Climate - which together were the initiators of the KRA. All
information in section 6.2 is derived from an interview with H. Goosen (H. Goosen, personal
communication, April 20, 2015), developer of the KRA, unless stated otherwise.
Delta Program
The Delta Program, anchored in the legal framework of the Delta Act4, is a national program
designed to protect the Netherlands from river and coastal flooding (European Union, 2015c). In
2014, the Delta Decisions evolved from the program, which represent the primary national focus
for addressing water safety and freshwater supply (Delta Programme Commissioner, 2015).
4 Officially known as the Delta Act on flood safety and freshwater supply
68
Hasse Goosen:
“Amongst these Delta Decisions is the Spatial Adaptation Delta Decision. In the Spatial Adaptation
Delta Decision, the national government, provinces, municipalities and waterboards agree on
integrating water safety and climate adaptation considerations in spatial developments. The
overall ambition is to integrate climate adaptation in practice and policy by 2020, in order to
ensure the Netherlands is climate-proof by 2050.
The initial idea was to make stress-tests a legal obligation for local governments. However, this
turned out to not be attainable, which is why it was decided that stimulating adaptation planning
by local governments had to be realized in a different way. This is when the manifest climate proof
cities was established. In total 60 organizations were involved, including various government
institutions and private actors. The manifest formulated a total of 30 actions that contribute to
making the Netherlands climate proof. The KRA was among the actions receiving the highest
priority for stimulating climate adaptation.”
Knowledge for Climate
“Simultaneously, the Knowledge for Climate research program, which was focused on climate
change and adaptation in the Netherlands, was coming to an end.” The program, which was run
by a multitude of research institutes in the Netherlands and co-financed by the Ministry of
Infrastructure and the Environment, operated from 2007 till the end of 2014 (Knowledge for
Climate, 2015). “At its conclusion, there was a desire to maintain and disseminate the generated
knowledge. This is when the Knowledge for Climate together with the Delta Program strived for
development of the KRA. Climate Adaptation Services (CAS), an alliance of knowledge institutions,
was made responsible for the creation and maintenance of the KRA.”
The overall intent of the KRA is to facilitate and stimulate a wide variety of actors (including
public actors and citizens) to work on adaptation planning. The KRA published a list of actors
(and their projects) actively involved in spatial adaptation for inspiration (Kennisportaal
Ruimtelijke Adaptatie (2015b). This list exclusively consists of regional and local government
authorities like provinces, municipalities and waterboards (although in some projects citizens
and private companies are involved). In most instances, government authorities are the primary
actors involved because of their responsibilities and governance capacity. The most relevant
sector of society thus is the regional and local government sector. Although the ambition of the
KRA is to activate as many actors as possible to engage in adaptation planning, the focus with the
reconstruction of policy theory is strictly on municipalities because of the research scope5.
5 When referring to municipalities, in practice, this can be understood more generally as ‘actors’
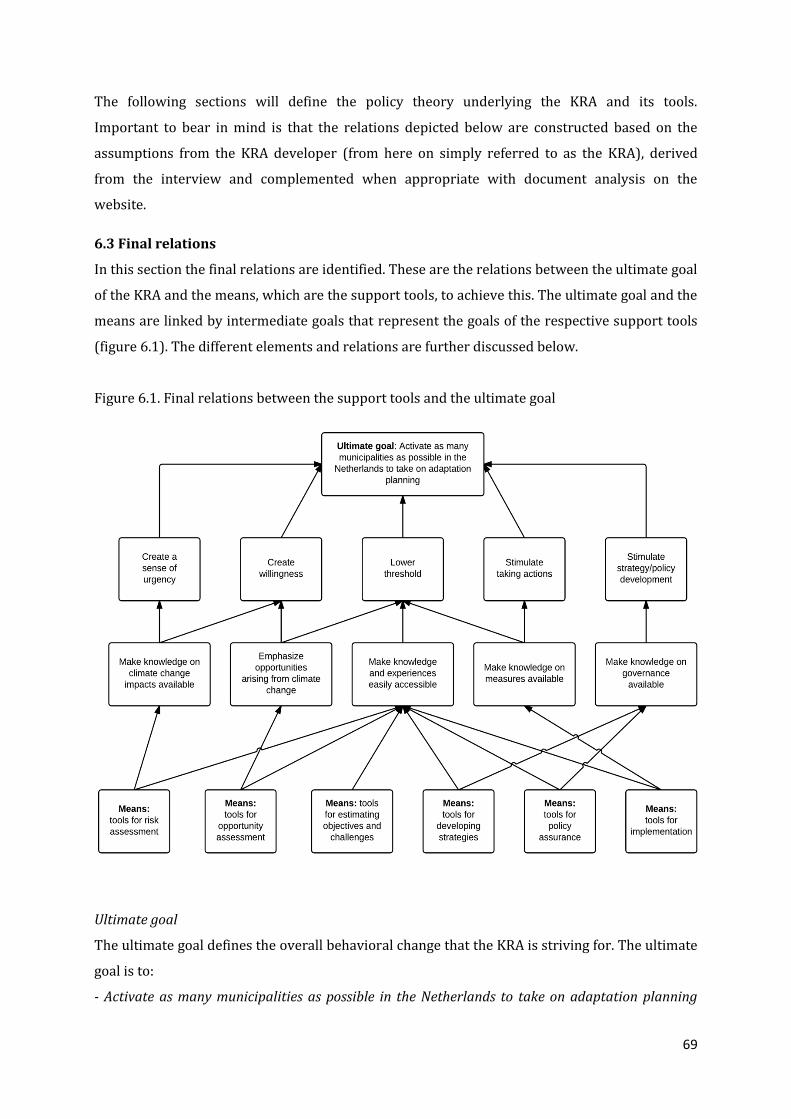
69
The following sections will define the policy theory underlying the KRA and its tools.
Important to bear in mind is that the relations depicted below are constructed based on the
assumptions from the KRA developer (from here on simply referred to as the KRA), derived
from the interview and complemented when appropriate with document analysis on the
website.
6.3 Final relations
In this section the final relations are identified. These are the relations between the ultimate goal
of the KRA and the means, which are the support tools, to achieve this. The ultimate goal and the
means are linked by intermediate goals that represent the goals of the respective support tools
(figure 6.1). The different elements and relations are further discussed below.
Figure 6.1. Final relations between the support tools and the ultimate goal
Ultimate goal
The ultimate goal defines the overall behavioral change that the KRA is striving for. The ultimate
goal is to:
- Activate as many municipalities as possible in the Netherlands to take on adaptation planning
70
Intermediate goals
In order to reach the ultimate goal, intermediate goals are defined. The accumulation of
achieving intermediate goals needs to result in achievement of the ultimate goal. The
intermediate goals are:
- Create a sense of urgency for municipalities to start working on adaptation planning by making
knowledge on climate change impacts available
- Create willingness for municipalities to take on adaptation planning by emphasizing the
opportunities that arise from climate change
- Lower the threshold for municipalities to take on adaptation planning by making relevant
knowledge and experiences easily accessible
- Stimulate municipalities in taking actions by making knowledge on potential measures available
- Stimulate strategy/policy development by municipalities by making knowledge on governance
available
Means
In order to reduce the policy problem several means (in the form of tools) are applied.
The KRA is operated by applying a subdivision of three different sections, each corresponding to
a different phase in the adaptation process, namely: analysis, ambition and action. Each section
contains tools specifically relevant for that phase. Analysis contains tools for assessing and
mapping the local risks and opportunities of climate change. Ambition contains tools for
determining the level of ambition and designing a corresponding strategy. Finally, Action
contains tools for enhancing the governance and implementation of adaptation. Below, an
overview of the tools is provided per subsection. The main features of each tool are depicted
between brackets.
Analysis
Tools for risk assessment:
Stress test guide (supportive information for conducting a stress test)
Climate adaptation atlas (maps the local effects of climate change)
Deltaportal (supplies information about the Delta Model and instruments)
List with examples of calamities (awareness raising on potential local risks)
71
Tools for opportunity assessment:
Green-blue grids (provides information on risks and examples of adaptation measures
for inspiration)
Teeb city (provides insight in value creation by adding green and blue to cities, cost-
benefits estimate)
Ambition
Tools for estimating objectives and challenges:
Omgevingswijzer (visualizes the sustainability of projects)
Tools for developing strategies:
Guiding model (provides adaptation guiding principles for 11 types of land use)
Design workshops (Manual for promoting collaboration for a climate proof city)
Action
Tools for policy assurance:
Mainstreaming guide (tool for integrating and linking adaptation with other issues)
Tools for implementation:
Mainstreaming guide (tool for integrating and linking adaptation with other issues)
Green-blue grids (provides information on risks and examples of adaptation measures
for inspiration)
Showcases (municipal map with overview of experiences with spatial adaptation)
Climate adaptation app (tool for adaptation solutions)
Huisje boompje beter (tool for creating a climate proof house and garden)
In addition to the free tools made available through the website, the KRA also provides an
overview of instruments from consultants. Although these indubitably are of value to
municipalities working on adaptation, these are left out of the analysis. The reason for this is
that hiring consultancy agents has always been an option for municipalities, and the objective
here is to analyze to what extent newly introduced support tools (as a policy instrument) are
relevant and effective for enhancing adaptation planning. Furthermore, in many cases
municipalities experience barriers that prevent them from hiring paid services from consultants,
which is why it is relevant to evaluate the free alternatives. This is also in accordance to the
criterion that support tools need to be freely available (see 2.4 support tools). The service of
providing an overview and description of the consultants and their adaptation instruments is
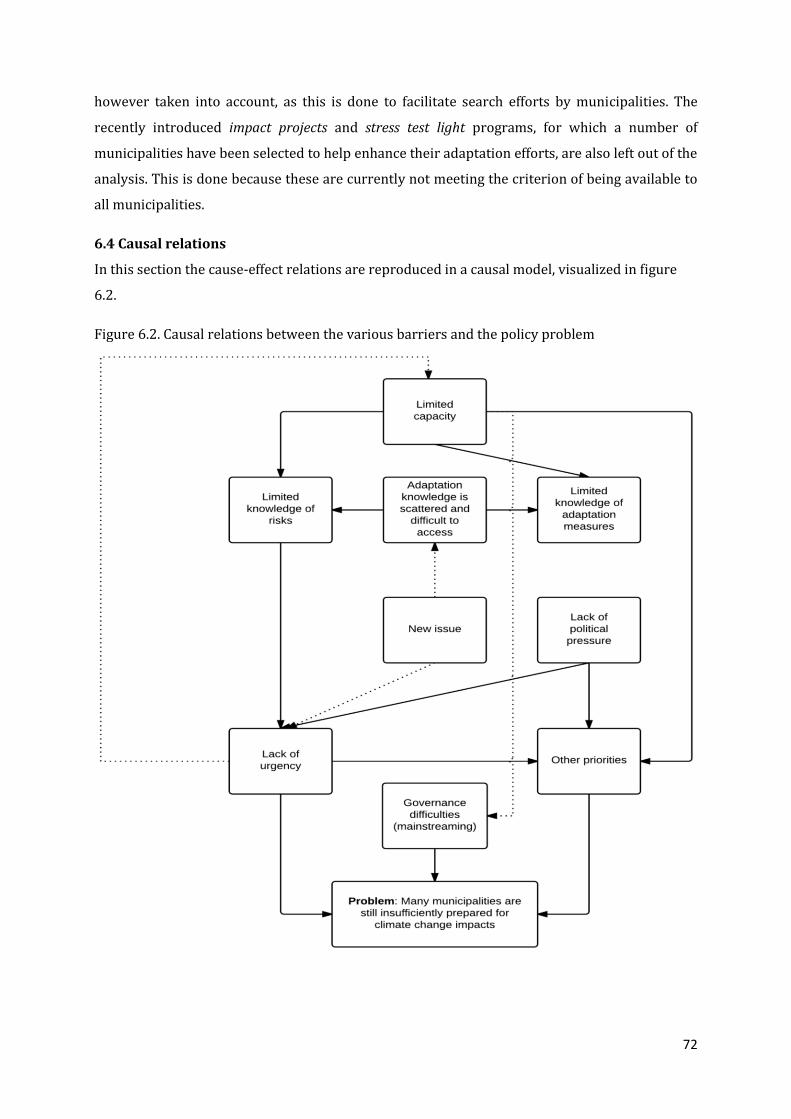
72
however taken into account, as this is done to facilitate search efforts by municipalities. The
recently introduced impact projects and stress test light programs, for which a number of
municipalities have been selected to help enhance their adaptation efforts, are also left out of the
analysis. This is done because these are currently not meeting the criterion of being available to
all municipalities.
6.4 Causal relations
In this section the cause-effect relations are reproduced in a causal model, visualized in figure
6.2.
Figure 6.2. Causal relations between the various barriers and the policy problem
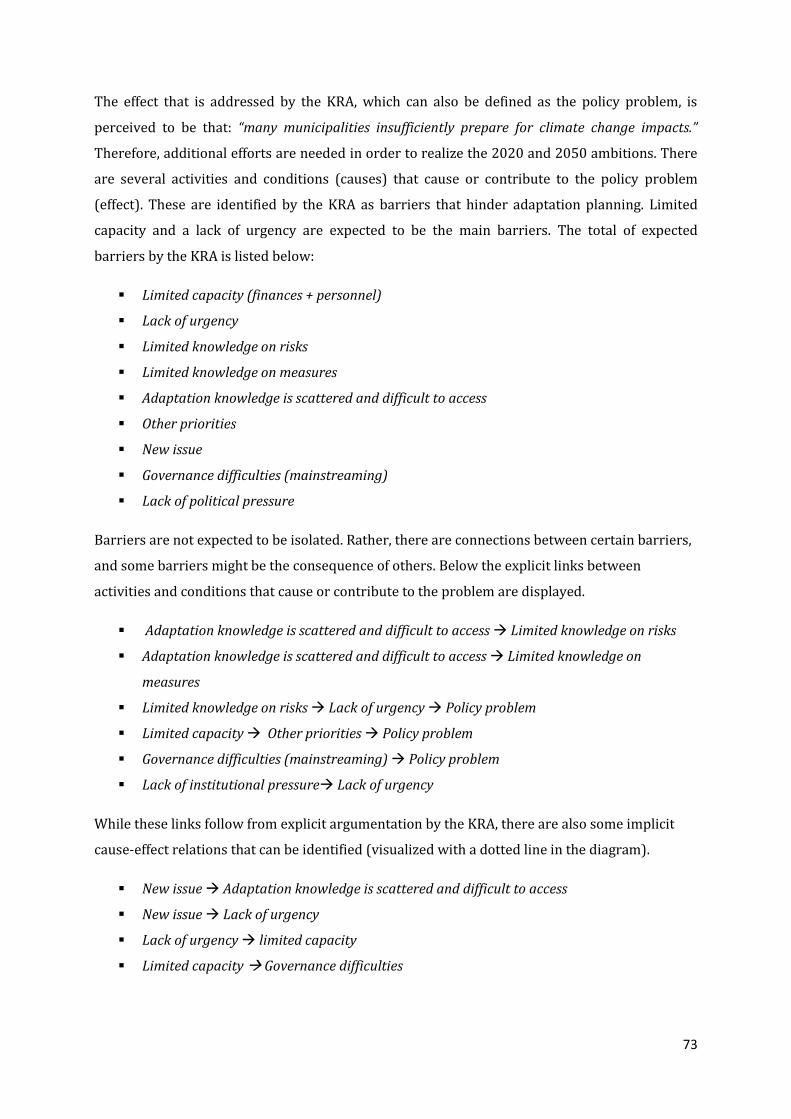
73
The effect that is addressed by the KRA, which can also be defined as the policy problem, is
perceived to be that: “many municipalities insufficiently prepare for climate change impacts.”
Therefore, additional efforts are needed in order to realize the 2020 and 2050 ambitions. There
are several activities and conditions (causes) that cause or contribute to the policy problem
(effect). These are identified by the KRA as barriers that hinder adaptation planning. Limited
capacity and a lack of urgency are expected to be the main barriers. The total of expected
barriers by the KRA is listed below:
Limited capacity (finances + personnel)
Lack of urgency
Limited knowledge on risks
Limited knowledge on measures
Adaptation knowledge is scattered and difficult to access
Other priorities
New issue
Governance difficulties (mainstreaming)
Lack of political pressure
Barriers are not expected to be isolated. Rather, there are connections between certain barriers,
and some barriers might be the consequence of others. Below the explicit links between
activities and conditions that cause or contribute to the problem are displayed.
Adaptation knowledge is scattered and difficult to access Limited knowledge on risks
Adaptation knowledge is scattered and difficult to access Limited knowledge on
measures
Limited knowledge on risks Lack of urgency Policy problem
Limited capacity Other priorities Policy problem
Governance difficulties (mainstreaming) Policy problem
Lack of institutional pressure Lack of urgency
While these links follow from explicit argumentation by the KRA, there are also some implicit
cause-effect relations that can be identified (visualized with a dotted line in the diagram).
New issue Adaptation knowledge is scattered and difficult to access
New issue Lack of urgency
Lack of urgency limited capacity
Limited capacity Governance difficulties

74
6.5 Assumptions about suitability of KRA support tools for barriers
The causal and final model are confronted and visualized into a reconstructed policy theory
(figure 6.3). This model highlights how the goals of the various tools are expected to correspond
with the expected barriers. The causal relations between the different barriers have been left out
of this model in order to warrant the intelligibility (see figure 6.2 for causal relations). Instead,
when a tool is in theory able to serve multiple purposes, links have been established between
the tool goal and all the barriers it (in) directly is able to address. For example, the tools that
enable risk assessment can increase the knowledge on local risks and this increased awareness
can also create a sense of urgency. Instead of creating links between limited knowledge on risks
and lack of urgency (as has been done in figure 6.3. final relations) there is now a direct link
between the tool goal of creating a sense of urgency and the barriers limited knowledge on risks
and lack of urgency.
Figure 6.3 Reconstructed policy theory

75
6.6 Conclusion
Overall, a vast majority of the barriers is assumed to be addressed by the tools. The fact that
adaptation is still a relatively new issue for municipalities is not a barrier in itself and also not
something that can be addressed with tools. The consequence of this unfamiliarity with climate
adaptation is that there is a lower level of urgency and that adaptation knowledge is still
scattered and therefore sometimes difficult to access (see causal model). These consequences
are targeted however, by making tools available for assessing and mapping risks (low level of
urgency) and through lowering the threshold of working on adaptation by making knowledge
and tools available in the first place (adaptation knowledge is scattered and difficult to access).
The main barriers are expected to be a lack of urgency and limited capacity. These barriers are
addressed by respectively tools for risk assessment and by the availability of free support tools
in general, as these are supposed to lower the threshold for municipalities to work on adaptation
planning.
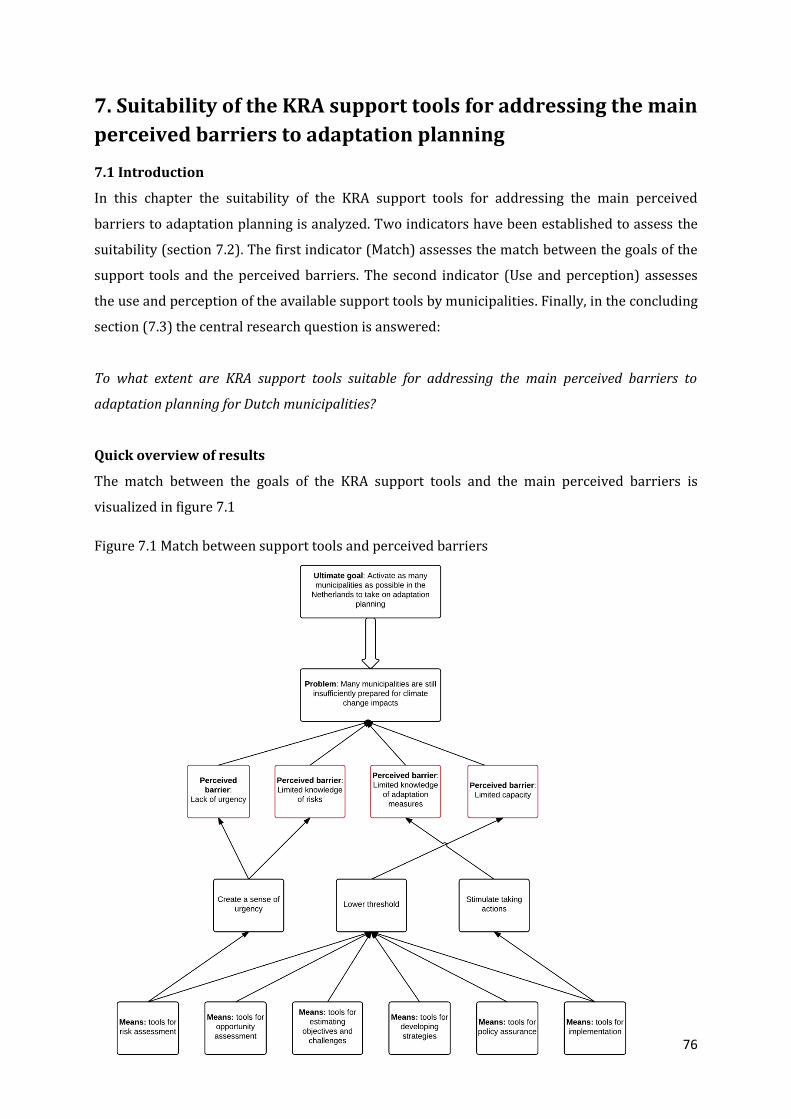
76
7. Suitability of the KRA support tools for addressing the main
perceived barriers to adaptation planning
7.1 Introduction
In this chapter the suitability of the KRA support tools for addressing the main perceived
barriers to adaptation planning is analyzed. Two indicators have been established to assess the
suitability (section 7.2). The first indicator (Match) assesses the match between the goals of the
support tools and the perceived barriers. The second indicator (Use and perception) assesses
the use and perception of the available support tools by municipalities. Finally, in the concluding
section (7.3) the central research question is answered:
To what extent are KRA support tools suitable for addressing the main perceived barriers to
adaptation planning for Dutch municipalities?
Quick overview of results
The match between the goals of the KRA support tools and the main perceived barriers is
visualized in figure 7.1
Figure 7.1 Match between support tools and perceived barriers
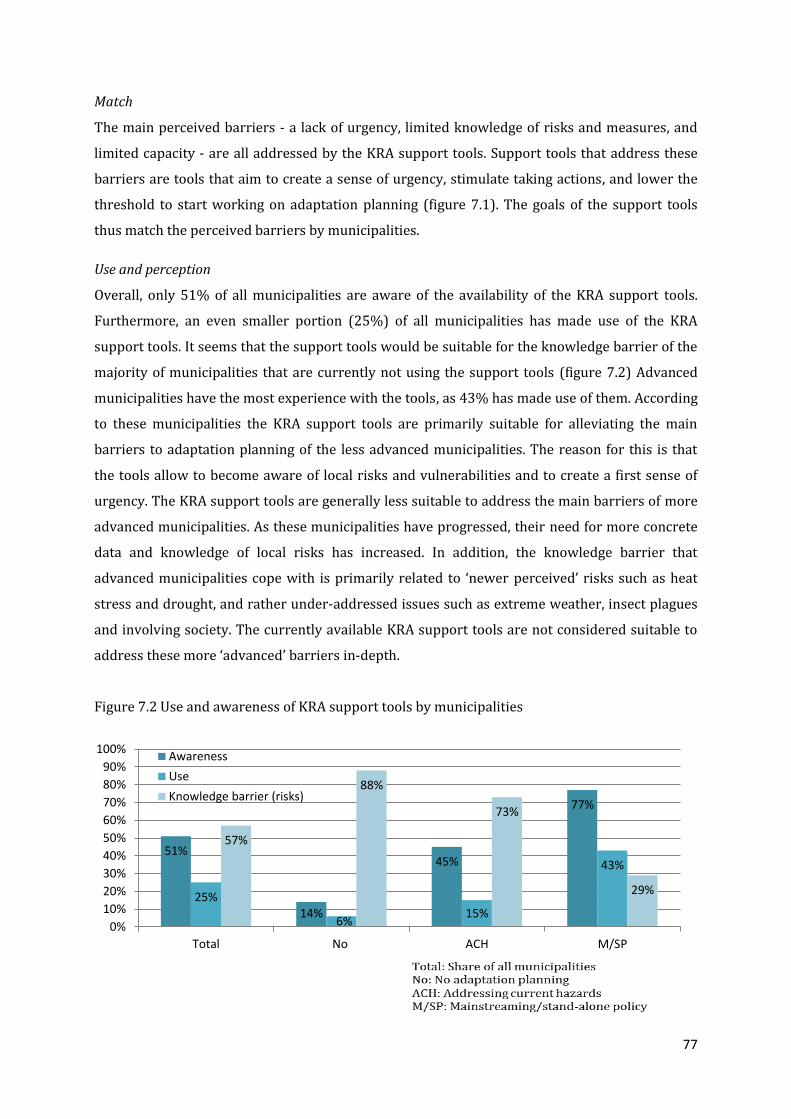
77
Match
The main perceived barriers - a lack of urgency, limited knowledge of risks and measures, and
limited capacity - are all addressed by the KRA support tools. Support tools that address these
barriers are tools that aim to create a sense of urgency, stimulate taking actions, and lower the
threshold to start working on adaptation planning (figure 7.1). The goals of the support tools
thus match the perceived barriers by municipalities.
Use and perception
Overall, only 51% of all municipalities are aware of the availability of the KRA support tools.
Furthermore, an even smaller portion (25%) of all municipalities has made use of the KRA
support tools. It seems that the support tools would be suitable for the knowledge barrier of the
majority of municipalities that are currently not using the support tools (figure 7.2) Advanced
municipalities have the most experience with the tools, as 43% has made use of them. According
to these municipalities the KRA support tools are primarily suitable for alleviating the main
barriers to adaptation planning of the less advanced municipalities. The reason for this is that
the tools allow to become aware of local risks and vulnerabilities and to create a first sense of
urgency. The KRA support tools are generally less suitable to address the main barriers of more
advanced municipalities. As these municipalities have progressed, their need for more concrete
data and knowledge of local risks has increased. In addition, the knowledge barrier that
advanced municipalities cope with is primarily related to ‘newer perceived’ risks such as heat
stress and drought, and rather under-addressed issues such as extreme weather, insect plagues
and involving society. The currently available KRA support tools are not considered suitable to
address these more ‘advanced’ barriers in-depth.
Figure 7.2 Use and awareness of KRA support tools by municipalities
51%
14%
45%
77%
25%
6% 15%
43%
57%
88%
73%
29%
0%
10%
20%
30%
40%
50%
60%
70%
80%
90%
100%
Total No ACH M/SP
Awareness
Use
Knowledge barrier (risks)
78
7.2 Suitability of the KRA support tools for addressing the main perceived barriers
This section is structured according to the main perceived barriers by municipalities (red boxes
in figure 7.1). For each main barrier the match with the corresponding support tools is analyzed,
followed by the use and perception of these support tools by municipalities.
7.2.1 Lack of urgency
Match
The most significant barrier identified in this research is a lack of urgency to work on adaptation
planning. Municipalities are often held back by a lack of urgency because they have no practical
experience with climate change risks, other than water. As problems and calamities currently
are perceived to be absent, there are very little incentives for municipalities to further take on
adaptation planning. By providing tools for risk assessment, this barrier is addressed as these
tools aim to create a sense of urgency by providing knowledge on local risks and vulnerabilities.
Therefore, the tools for risk assessment seem theoretically suitable for addressing the lack of
urgency.
Use and perception
The extent to which the tools are able to create a sense of urgency seems to be limited.
Municipalities that do not consider adaptation planning urgent at all, are often not prepared to
invest time and money in risk assessment. This is also reinforced by the capacity barrier.
However, the support tools for risk assessment are likely to be suitable for municipalities that
are taking initial steps for adaptation planning, as the tools allow to create initial insights in local
risks and vulnerabilities. As many municipalities are currently, or in the near future if awareness
of climate adaptation increases, in this stage it seems the support tools can be suitable to create
a first sense of urgency. This is also confirmed by advanced municipalities that have experience
with the risk assessment tools. However, as the tools generally do not provide data concrete
enough to assess location-specific vulnerabilities it remains difficult to significantly increase the
sense of urgency.
“The Climate adaptation atlas only contains national data. Unfortunately, this is not concrete
enough. In practice, we have already taken spatial development measures, but these are not visible
in the atlas (…) people lose interest if the data doesn’t seem correct.”
- Municipality of Breda
Because of these uncertainties the suitability of the KRA support tools to create a sense of
urgency seems limited.
79
7.2.2 Lack of knowledge of risks
Match
The KRA contains several support tools designed for risk assessment. These tools aim to create a
sense of urgency by providing municipalities several ways to explore and assess local risks and
vulnerabilities. The stress test guide for example provides supportive information for conducting
a stress test and mainly facilitates the process of acquiring knowledge of risks. For comparison, a
tool that provides more direct insight in local risks and vulnerabilities is the Climate adaptation
atlas. This tool is designed to visually map (future) risks of heavy precipitation, heat stress,
flooding and drought and comes with a manual. On a theoretical level the goals of the support
tools for risk assessment thus match the limited knowledge of risks.
Use and perception
As shown in figure 7.2 municipalities that don’t work on adaptation planning are also the least
familiar with the KRA support tools. This can be explained by the fact that they are less familiar
with climate adaptation in general. However, as 88% of these municipalities stated that limited
knowledge of local risks and vulnerabilities is a barrier for them to work on adaptation planning.
It thus seems that, although they are not aware of the KRA support tools, the available tools for
risk assessment would be able to address this barrier.
“A lack of knowledge of risks and vulnerabilities with regard to heat stress and drought forms a
barrier. Therefore we are particularly interested in receiving support for risk assessment. Freely
available tools are interesting, because this allows getting a first impression of the potential local
risks. (…) Tools for acquiring knowledge thus seem the most suitable for us.”
- Municipality of Hardenberg
Based on perceptions of advanced municipalities that are familiar with the tools for risk
assessment, they seem particularly suitable for less advanced municipalities. This is again
explained by the rather generic picture of the potential local risks and the absence of context-
specific data. Therefore, the tools lack the specificity to map risks on e.g. neighbourhood level. In
addition, the tools only consider the four main risks, whilst more advanced municipalities would
also be interested in knowledge of so far under-addressed issues such as extreme weather,
insect plagues and involving society. However, the tools for risk assessment do seem more
suitable to address the knowledge barrier, rather than the urgency barrier as there is a
substantial amount of information on risks in general available. While this information is not
likely to significantly increase the sense of urgency, the tools providing this information seem
suitable for allowing policy workers to become more knowledgeable of climate change risks. The
KRA support tools for risk assessment thus seem moderately suitable for addressing the
80
knowledge of risks barrier.
7.2.3 Lack of knowledge of adaptation measures
Match
Tools for implementation are developed to stimulate taking actions. The goal of stimulating
taking action covers the limited knowledge of measures that forms a barrier to working on
adaptation planning. The reason for this is that tools for implementation provide knowledge on
adaptation measures and information on how to integrate and link adaptation with other issues
for example. These tools are thus designed to make working on adaptation planning more
accessible and tackle the knowledge barrier by making relevant knowledge available.
Use and perception
Municipalities that are currently not working on adaptation planning often also don’t consider a
lack of knowledge of measures to be a barrier, which is explained by the state they are in. As
risks are not recognized, there is often also no interest in measures. Municipalities that address
current hazards consider a lack of knowledge of measures a barrier in 24% of the cases
(compared to 23% by advanced municipalities). Their lack of knowledge of adaptation measures
mainly applies for heat and drought risks.
The majority of advanced municipalities has assessed local risks and vulnerabilities and is taking
adaptation measures for multiple risks. However, the tools for implementation are still used
very little. This makes it difficult to assess the suitability in practice. Municipalities that have
used tools for implementation are generally positive. Especially tools that allow for sharing
experiences and providing examples of adaptation measures, such as the showcases and the
Green-blue grids are considered valuable. However, it seems that the majority of municipalities
are not aware of these tools as several have stated that they would be interested in support tools
for sharing practical experiences of similar municipalities. Municipalities that are more critical of
the tools, name a lack of technical and context-specific data, and the strong focus on spatial
adaptation as there is also a need for support (tools) on how to increase societal involvement.
This points to a need for participatory tools, as distinguished by De Paula Domingos, et al.
(2013). Overall, the tools for implementation seem suitable to address the knowledge barriers
on measures, but it should be noted that this is still a rather theoretical suitability.
7.2.4 Limited capacity
Match
A slight majority of all municipalities perceives a limited capacity to be a barrier. Municipalities
not working on adaptation planning, which are often also the relatively smaller municipalities,
81
experience this barrier the most. As the KRA support tools are made available to lower the
threshold to work on adaptation planning, by moderating search efforts for answers to
adaptation issues and because they are freely available, the available support tools theoretically
seem suitable to address the capacity barrier.
Use and perception
The most use of the KRA support tools has been made by advanced municipalities, which are
often also the relatively larger municipalities with a higher capacity. An explanation for this is
that the capacity barrier often prevents smaller municipalities from even exploring the potential
of the KRA support tools.
“The tools seem interesting. However, because of our limited capacity there is no time to consider
them.”
- Municipality of Heusden
The KRA support tools are therefore primarily suitable for municipalities that have the initial
capacity and sense of urgency to start working on adaptation planning. The tools allow these
municipalities to acquire knowledge more efficiently, and can in this sense alleviate a lack of
time. However, as the tools are not able to address the capacity barriers of municipalities for
which this barrier is the most significant, the suitability of the tools seems limited.
7.3 Conclusion
The KRA tools are provided to support municipalities in their adaptation process. However, it
was unknown to what extent these support tools are suitable for addressing the main perceived
barriers of municipalities. This research analyzed the support tools in relation to these barriers
in order to provide recommendations for improving the suitability of the KRA support. The
following central research question guided the analysis:
To what extent are KRA support tools suitable for addressing the main perceived barriers to
adaptation planning for Dutch municipalities?
Data has been collected by using two different methods; 84 in-depth interviews with
municipalities, and an expert-interview and document analysis that served as input for the
reconstruction of policy theory. The interviews resulted in an overview of the main barriers to
adaptation planning and provided insights in the use and perception of the KRA support tools.
The reconstruction of policy theory allowed identifying the assumptions underlying the KRA
82
support tools. These two steps were confronted in order to assess the suitability of support tools
for the main perceived barriers to adaptation planning based on two indicators:
81% of all municipalities work on adaptation planning to some extent. Almost all municipalities
that work on adaptation planning take measures to address heavy precipitation. In comparison,
heat stress and drought are far less addressed. Nearly all municipalities identified factors that
prevented them from furthering their adaptation planning. In most cases these were barriers to
problem recognition, as the most common and urgent barrier are respectively a lack of urgency,
followed by limited knowledge of risks. The other two main perceived barriers identified in this
research are limited knowledge of measures, which forms a barrier to taking measures, and
limited capacity which is a barrier in both stages. Regardless of the advancement of
municipalities, a lack of urgency is considered the most significant. The capacity barrier is
relatively more experienced by less advanced municipalities, which are in many cases smaller
municipalities.
All the main perceived barriers are addressed by the KRA support tools. Support tools that
match these barriers are tools that aim to create a sense of urgency, stimulate taking actions, and
lower the threshold to start working on adaptation planning.
The inherent nature of the KRA support tools is that they enable information and knowledge
sharing on adaptation. This means that these tools can assist in the initial steps of recognizing
risks and identifying appropriate ways to address them. Especially the tools for risk assessment
seem suitable, as over half of all municipalities have currently not invested in mapping local
risks and vulnerabilities, and are therefore unlikely to be prepared for climate change risks.
Most municipalities that have applied tools for risk assessment state that these tools have been
suitable for raising initial awareness and a sense of urgency for addressing local climate change
risks. This suitability corresponds to the notion by Rozum and Carr (2013), that vulnerability
and risk assessment are important initial steps for adaptation planning.
Overall, the tools seem suitable to do what they are designed for; supporting municipalities in
their adaptation endeavors. However, many municipalities with barriers for which the KRA
support tools are suitable on a theoretical level are not familiar with the tools. In addition, the
KRA support tools are not used by 75% of the municipalities in this research. This indicates that
the tools can support municipalities that are already working on adaptation planning, but are
not able to provide an incentive to municipalities currently not working on adaptation planning.
To some extent this might be improved by raising awareness of the KRA support tools and their
suitability. It is however likely that in most cases additional incentives are needed for these
83
municipalities. This is because the most significant barrier for most is a lack of urgency, caused
by a lack of incentives such as calamities or legal obligations.
Furthermore, the support tools assist in exploring the issues, raising awareness, acquiring initial
knowledge on risks and possible measures and inspire municipalities by providing insights and
examples of ways to address climate change risks. Therefore, the support tools seem most
suitable for addressing the urgency and knowledge barriers of less advanced municipalities that
are taking initial steps for adaptation planning. Advanced municipalities have a need for more
context-specific tools that allow for generating knowledge that can serve as input for taking
actual adaptation measures, e.g. addressing heat stress in particularly vulnerable
neighborhoods. This confirms the notion from de Paula Domingos, et al. (2015) that
standardized tools, that lack context-specific data, are primarily useful for less advanced
municipalities that are looking to take initial steps and that more advanced municipalities need
more context-specific support tools. Also, a lack of knowledge of less-exposed risks such as
extreme weather and insect plagues are considered a barrier by these municipalities, for which
the KRA support tools currently are not suitable.
Concluding, the KRA support tools seem suitable to support municipalities in their initial
adaptation endeavors, particularly for acquiring knowledge. However, the tools in itself are
often not suitable for incentivizing adaptation planning, and for the actual implementation of
adaptation actions. A main reason for this is that the tools are not specific enough. Therefore, the
tools seem less suitable for more advanced municipalities. Tools that are currently lesser known
which enable knowledge sharing on measures and experiences might turn out to be suitable for
a lack of knowledge of adaptation measures. This was however still difficult to assess at the time
of this research.
84
8. Recommendations and discussion
This section includes recommendations for improving the suitability of the KRA support tools
for addressing the main perceived barriers (8.1) and a critical discussion of this thesis (8.2).
8.1 Recommendations for improving the suitability of the KRA support tools
The overall aim of this research was to provide recommendations for improving the suitability
of the KRA support tools for addressing the main perceived barriers by Dutch municipalities.
This section provides recommendations on three different levels: match, use and perception.
Match
The goals of the KRA support tools match to all the perceived barriers by municipalities. In
addition, there are several tools available that can support municipalities but are not directly
addressing barriers to adaptation, such as tools for opportunity assessment and developing
strategies. The underlying assumptions behind the support tools thus seem valid based on this
research. However, on a more detailed level the tools not always match the characteristics of
every barrier. Since these insights have been gathered from the perception of support tools,
rather than from reconstruction of policy theory, these are discussed under the header
perception.
Use
A majority of municipalities is still unaware of the availability of the KRA support tools or not
using them. These are often less-advanced municipalities with knowledge barriers for which the
support tools, and especially tools for risk assessment, seem suitable. Therefore, raising
awareness of the availability and suitability of the KRA support tools could potentially increase
the uptake. It is recommended that these municipalities are targeted directly, as the majority is
unlikely to become familiar with the KRA support tools by themselves.
Perception
The tools can be made more suitable for advanced municipalities by investing in more concrete
data, which provides the tools with a level of specificity necessary to map risks on a more
detailed scale. Furthermore, by expanding the selection of available support tools to also include
under-addressed risks, such as insect plagues and extreme weather and events, and include
tools for issues such as modification of behaviour by citizens (creating responsibility), they
become more suitable for overcoming the barriers of advanced municipalities.
Overall, the KRA support tools seem suitable for providing knowledge on adaptation and to
support municipalities in their initial adaptation endeavors, particularly for acquiring
85
knowledge. The tools allow for the valorization of scientific knowledge and make relevant
insights available and applicable in practice. However, the overall goal of the KRA, which is to
activate as many municipalities as possible in the Netherlands to take on adaptation planning,
seems to not entirely fit the nature of the KRA. In other words, the support tools seem not
suitable for achieving this overall goal. The reason for this is that, based on this research, the
suitability of support tools to activate municipalities seems limited. Rather, the tools are suitable
to support and speed-up the adaptation process to some extent, once initial actions have already
been taken. Additional incentives are therefore needed to activate municipalities in taking on
adaptation planning. Projects such as Impact Projects and the Stresstest Light seem to address
this gap, by providing financial incentives and active guidance for selected municipalities to
work on adaptation planning. Still, with the policy problem being that many municipalities are
still insufficiently prepared for climate change impacts, it seems necessary that additional
pressure is necessary to active municipalities, e.g. through the National Adaptation Strategy that
is due in 2016, or through increased calamities because municipalities are insufficiently
prepared for climate change risks. Once municipalities are activated, the KRA support tools are
likely to be suitable for a much larger group of municipalities to acquire initial knowledge.
8.2 Discussion and recommendations for future research
Approach
The confrontation of support tools and barriers turned out to be a relevant and innovative
approach. The subject connects to several recent debates and provides concrete insights that are
relevant in practise. The assessment of suitability by using two indicators appeared strong in
design. By not only assessing suitability on a conceptual level, but also integrating the perceived
suitability on a large scale, the results would become more robust. Furthermore, integrating the
target group within the analysis provided more useful results for the KRA. However, this
triangulation was hampered in practice by the substantial amount of municipalities that had no
experience yet with the KRA support tools. This in itself is a research result, but not of the depth
initially desired by this researcher.
In addition, the KRA was launched in October 2014, the empirical research in this study has been
conducted from February until June. Preferably the assessment of suitability based on use and
perception by municipalities was conducted a little later. This would have generated more useful
results, as it is now likely that the current low uptake of the KRA support tools is also influenced
by their novelty. It is likely that with time municipalities will become more familiar with these
tools and this is also when the perceived suitability can be more comprehensively assessed. Still,
the differences in uptake between advanced and less-advanced municipalities are telling. It
indicates that support tools are primarily suitable to support actors that are already taking
86
actions. As an initial incentive to start working on adaptation planning, support tools are likely
less suitable, because they are less suitable to overcome the urgency barrier. For this reason, the
results of this research must be considered rather indicative with regard to the assessment of
the perceived suitability. It is hoped that this assessment can serve as an initial exploration of
the suitability of support tools to address municipal barriers to adaptation planning. Research
over a longer period of time would likely be able to add to the analysis in this research.
Furthermore, as the research field on support tools for adaptation is relatively thin, it would be
interesting to assess the suitability of support tools in different contexts.
Validity
As the smallest municipalities (< 25.000) are the only group that are relatively
underrepresented in this research (see 3.6 limitations), it is likely that the KRA support tools are
suitable for the majority of municipalities outside this research. Many of these municipalities are
likely experiencing limited capacity and the support tools seemed most suitable for
municipalities that are less advanced and are taking initial steps for climate adaptation.
However, creating awareness of the availability and suitability of the KRA support tools for these
municipalities remains a challenge. Hopefully this research can make a modest contribution by
providing insight in the suitability of the tools for many municipalities.
The main purpose of this research was to provide recommendations for improving the support
tools for adaptation planning. Assessing assumptions, intentions and perceptions were vital for
this research aim. Perception of municipal planners on climate adaptation, barriers and support
tools provided many anecdotal insights that help illustrate and understand a complex policy
problem. However, there are inherently also some limitations to this approach. When contacting
the interviewees I asked for the most knowledgeable person on the matter. As climate change
adaptation is a complex and diverse working field this often meant that they first discussed the
questionnaire with colleagues to provide me with more comprehensive answers. However, this
still does not help fully overcome the bounded rationality of the interviewees and the
interviewer. The findings from the empirical research are largely based on perceptions. Because
of time and resource constraints no external evaluation of perceptions was possible.
However, because of the systematic and comprehensive methodological approach in this
research it is expected that the internal validity of the results is still substantial. Since various
notable observations have been made (e.g. coherence between municipal size and approach),
statistical testing to validate these findings externally would be interesting. Therefore, future
research could build on some results in this research that currently appear quite indicative, in
87
order to validate them by applying statistical techniques (for a further critical reflection of the
methods I refer to section 3.6, limitations).
Conducting this research while doing an internship at KVN influenced the research results as I
targeted KVN members only. This was a prerequisite of combining my research with an
internship and has most likely allowed me to reach a much larger group of respondents than
would have been the case without the internship. The reason for this is that multiple surveys
were being conducted at the same time, and several policy workers indicated that they were not
interested in research projects by students. After explaining the relevance of the results in
practice and the affiliation with the KVN, nearly all municipalities that were initially hesitant
cooperated. By analysing relevant characteristics of the research population (size, geographical
spread) and by approaching the entirety of KRA members I attempted to counter the fact that
these municipalities were not randomly selected. The only group that seemed influenced by the
KVN boundaries are municipalities smaller than 25.000 inhabitants. In total, 47% of all Dutch
municipalities have less than 25.000 inhabitants. The portion that has a KVN membership
corresponds to 25%, which is the same as the participating KVN members in this research.
Therefore, this group of municipalities is underrepresented on a national scale. When looking at
the geographical spread, municipalities seem to provide a relatively fair representation of
municipalities for the provinces of: Drenthe, Flevoland, Friesland, Gelderland, Noord-Brabant,
Utrecht, Zeeland and Zuid-Holland. Groningen is the only province that is completely absent
from the analysis (it also has only 4 KVN members).
88
References
Albers, R.A.W., P.R. Bosch, B. Blocken, A.A.J.F. van den Dobbelsteen, L.W.A. van Hove & T.J.M. Spit (2015). Overview of challenges and achievements in the climate adaptation of cities and in the Climate Proof Cities program. Building and Environment, 83, pp.1-10 Basit, T. (2010). Manual or electronic? The role of coding in qualitative data analysis. Educational research. 45 (2), pp. 143-154 BDU Media (2015). Hoog en Laag. Nieuwsblad voor de gemeente Renkum, BDU media, jaargang 82 (31), 05-08-2015 Bekkers, H. (2008). Grote stad dik in de ambtenaren. Binnenlands Bestuur. http://www.binnenlandsbestuur.nl/bestuurenorganisatie/achtergrond/achtergrond/ grote-stad-dik-in-de-ambtenaren.100094.lynkx (cited on 30-07-2015) Biesbroek, G.R., J.E.M. Klostermann, C.J.A.M. Termeer & P. Kabat (2013). On the nature of barriers to climate change adaptation, Regional Environmental Change, 13 (5), pp. 1119-1129 Biesbroek, G.R., C.J.A.M. Termeer, J.E.M. Klostermann & P. Kabat (2014). Analytical lenses on barriers in the governance of climate change adaptation, Mitigation and Adaptation Strategies for Global Change 19, pp. 1011-1032 Broto, V.C. & H. Bulkeley (2012). A survey of urban climate change experiments in 100 cities, Global Environmental Change, 23 (1). pp.92-102 Brownstein, J.S., T.R. Holford & D. Fish (2005). Effect of climate change on Lyme disease risk in North America. EcoHealth 2005 (2). pp.38-46 Bruin, K. de, R.B. Dellink, A. Ruijs, L. Bolwidt , A. van Buuren, J. Graveland, ... E. C. van Ierland (2009). Adapting to climate change in The Netherlands: an inventory of climate adaptation options and ranking of alternatives, Climatic Change 2009. pp. 23-45 Buitelaar, S. (2015). PBL: ‘Gemeenten en provincies niet bezig met klimaat’. http://www.binnenlandsbestuur.nl/ruimte-en-milieu/nieuws/pbl-gemeenten-en- provincies-niet-bezig-met.9468074.lynkx (cited on 01-04-2015) Burton, I., E. Diringe & J. Smith (2006). Adaptation to climate change: International policy options, Advancing the international effort against climate change, PEW Center. Pp. 1-30 Carter, J.G., G. Cavan, A. Connelly, S. Guy, J. Handley & A. Kazmierczak (2015). Climate change and the city: building capacity for urban adaptation. Progress in Planning, 95, pp.1-66 Climate Nexus (2015). Climate change fuels record hot summer’s latest heat waves. http://climatenexus.org/messaging-communication/current-events/climate-change- fuels-record-hot-summer%E2%80%99s-latest-heat-waves (cited on 19-09-2015) Delta Programme Commissioner (2015). Delta Decisions. http://english.deltacommissaris.nl /delta-programme/contents/delta-decisions (cited on 03-09-2015) De Paula Domingos, N., C. Da Cunha, K. De Pyck, Y. Remvikos, & F. Germenne (2013). Typology of the tools available to policy-makers and assessment of their efficiency, D 7.2: Urban policies and governance, pp. 1-47
89
Driessen, P.P.J., A.A.J. de Gier, S.V. Meijerink, W.D. Pot, M.A. Reudink, H.F.M.W. van Rijswick, … C.J.A.M. Termeer (2011). Beleids- en rechts- wetenschappelijke aspecten van klimaatadaptatie. Klimaatbestendig Nederland. Pp.1-143 European Commission (2013). Communication from the commission to the European Parliament, the Council, the European Economic and Cocial Committee and the Committee of the Regions - An EU strategy on adaptation to climate change, Guidelines on developing adaptation strategies, Brussels 16-04-2013 European Environmental Agency (2015). Adaptation information, European Climate Adaptation Platform. http://climate-adapt.eea.europa.eu/adaptation-information/general (cited on 18-05-2015) European Union (2015a). EU action on climate. http://ec.europa.eu/clima/policies/brief/eu/ (cited on 19-05-2015) European Union (2015b). European Climate Adaptation Platform. Adaptation information. Observations and scenarios. Urban areas and human health. http://climate- adapt.eea.europa.eu/observations-and-scenarios/urban-areas-and-human-health (cited on 03-03-2015) European Union (2015c). Climate-ADAPT, European Climate Adaptation Platform, Netherlands. Policy and legal framework, http://climate-adapt.eea.europa.eu/countries/netherlands (cited on 03-09-2015) Exter, R. Den, J. Lenhart & K. Kern (2014). Governing climate change in Dutch cities: anchoring local climate strategies in organization, policy and practical implementation, Local Environment: The international journal of justice and sustainability, pp.1-19 Folkestad, B. (2008). Analysing interview data: possibilities and challenges. Working paper No 13. Unifob Global/University of Bergen Ford, J.D. & L. Berrang-Ford (2011). Climate change adaptation in developed nations: from theory to practice. Springer Science & Business Media Füssel, H.M. (2007). Adaptation planning for climate change: concepts, assessment approaches, and key lessons, Sustainability Science 2, pp. 265-275 Glaas, E., A. Jonsson, M. Hjerpe & Y. Andersson-Sköld (2010). Managing climate change vulnerabilities: formal institutions and knowledge use as determinants of adaptive capacity at the local level in Sweden. Local Environment: the International Journal of Justice and Sustainability 15 (6), pp. 525-539 Golafshani, N. (2003). Understanding reliability and validity in qualitative research. The Qualitative Report, 8 (4). University of Toronto, Canada. Pp.597-607 Hamin, E.M., N. Gurran & A.M. Emlinger (2014). Barriers to municipal climate adaptation: Examples from coastal Massachusetts’ Smaller cities and towns, Journal of the American Planning Association, Routledge. Pp. 110-122 Hof, A., P. Boot, D. van Vuuren & J. van Minnen (2014). Costs and benefits of climate change adaptation and mitigation: An assessment on different regional scales. The Hague, PBL
90
Netherlands Environmental Assessment Agency, pp.1-34 Hoogerwerf, A. (1990). Reconstructing policy theory, Evaluation and program planning, 13 (3), pp. 285‐291 Hoppe, T., M.M. van den Berg & F.H.J.M. Coenen (2014). Reflections on the uptake of climate change policies by local governments: facing the challenges of mitigation and adaptation. Energy, Sustainability and Society, 4 (8), pp. 1 -16 IPCC (2007). Climate Change 2007: Impacts, adaptation and vulnerability, Contribution of working group II to the fourth assessment report of the Intergovernmental Panel on Climate Change. M.L. Parry, O.F. Canziani, J.P. Palutikof, P.J. van der Linden and C.E. Hanson, Cambridge University Press, Cambridge, UK IPCC (2014). Climate change 2014: Synthesis Report. Contribution of working groups I, II and III to the Fifth Assessment Report of the Intergovernmental Panel on Climate Change. [Core Writing Team, R.K. Pachauri and L.A. Meyer (eds.)]. IPCC, Geneva, Switzerland Kassianos, A.P. (2014). The use of telephone interviews in qualitative psychology research: A reflective methodological exercise, The British Psychological Society, QMiP Bulletin Issue 18, pp. 23-26 Kautto, P. & J. Similä (2005). Recently introduced policy instruments and intervention theories. Evaluation, 11 (1), pp. 55-68 Kennisportaal Ruimtelijke Adaptatie (2015a). Deltabeslissing Ruimtelijke Adaptatie. http://www.ruimtelijkeadaptatie.nl/nl/deltabeslissing-ruimtelijke-adaptatie (cited on 09-06-2015) Kennisportaal Ruimtelijke Adaptatie (2015b). Praktijkvoorbeelden Ruimtelijke Adaptatie, http://www.ruimtelijkeadaptatie.nl/en/praktijkvoorbeelden-ruimtelijke-adaptatie (cited on 03-09-2015) Kennisportaal Ruimtelijke Adaptatie (2015c). Handreiking. Willen. http://www.ruimtelijkeadaptatie.nl/en/ambition (cited on 16-09-2015) Kennisportaal Ruimtelijke Adaptatie (2015d). Waar moet ik beginnen. http://www.ruimtelijkeadaptatie.nl/en/waar-moet-ik-beginnen (cited on 20-09-2015) Klimaatverbond Nederland (2015). Missie en visie. http://www.klimaatverbond.nl/klimaatverbond/missie-visie/ (cited on 17-02-2015) KNMI (2014). KNMI’14 Klimaatscenario’s voor Nederland, Leidraad voor professionals in klimaatadaptatie, KNMI, De Bilt KNMI (2015). About KNMI. http://www.knmi.nl/over-het-knmi/about (cited on 03-09-2015) Knowledge for Climate (2015). http://www.knowledgeforclimate.nl/ (cited on 03-09-2015) Kovats, R.s., R. Valentini, L.M. Bouwer, E. Georgopoulou, D. Jacob, E. Martin, … J.- F. Soussana (2014). Europe. In: Climate Change 2014: Impacts, Adaptation, and Vulnerability, Part B: Regional Aspects. Contribution of Working Group II to the Fifth Assessment Report of the Intergovernmental Panel on Climate Change [Barros, V.R., C.B. Field, D.J. Dokken, M.D. Mastrandrea, K.J. Mach, T.E. Bilir, … L.L. White. Cambridge
91
University Press, Cambridge, United Kingdom and New York, NY, USA, pp. 1267-1326. Krauss, S.E. (2005). Research paradigms and meaning making: A primer, The Qualitative report, 10 (4). Pp. 758-770 LeCompte, M.D. (2010). Analyzing qualitative data. Theory into Practice, 39 (3), pp. 146-154 Leeuw F.L. (2003). Reconstructing program theories: methods available and problems to be solved. America Journal of Evaluation. 24 (5), pp. 5-20 Lehmann, P., M. Brenck, O. Gebhardt, S. Schaller & E. Süßbauer (2013). Barriers and opportunities for urban adaptation planning: analytical framework and evidence from cities in Latin America and Germany, Mitigation and Adaptation Strategies for Global Change (2015), 20, pp.75-97 Lichtenstein, A.H., E.A. Yetley & J. Lau (2009). Application of systematic review methodology to the field of nutrition (Prepared by the Tufts Evidence-based Practice Center under Contract No. 290-020022), Rockville, MD: Agency for Healthcare Research and Quality, pp. 1-27 Lindgren, J., D. K. Jonsson & A. Carlsson-Kanyama (2009). Climate adaptation of railways: lessons from Sweden. EJTIR, 9 (2) pp. 164-181 Lorenzoni, I., N.F. Pidgeon & R.E. O’Connor (2005). Dangerous climate change: The role of risk research, Risk Analysis 25 (6), pp. 1387-1398 Lund, D.H., K. Sehested, T. Hellesen & V. Nelleman (2012). Climate change adaptation in Denmark: enhancement through collaboration and meta-governance? Local Environment: the International Journal of Justice and Sustainability, 17 (6-7), pp. 613-628 Measham, T.G., B.L. Preston, T.F. Smith, C. Brooke, R. Goddard, G. Withycombe & C. Morrison (2011). Adapting to climate change through local municipal planning: barriers and challenges. Mitigation and Adaptation Strategies: Global Change 16, pp. 889-909 Mees, H.L.P., P.P.J. Driessen & H.A.C. Runhaar (2012). Exploring the scope of public and private responsibilities for climate adaptation. Journal of Environmental Policy & Planning, 14 (3), pp. 305-330 Mees, H.L.P. (2014). Responsible climate change adaptation. Exploring, analyzing and evaluating public and private responsibilities for urban adaptation to climate change. Proefschrift, pp.1-198 Mees, H. L. P., J. Dijk, D. van Soest, P. P. J. Driessen, M. H. F. M. W. van Rijswick, & H. Runhaar ( 2014). A method for the deliberate and deliberative selection of policy instrument mixes for climate change adaptation, Ecology and Society, 19(2), pp.1-15 Moser, S.C. & J.A. Ekstrom (2010). A framework to diagnose barriers to climate change adaptation. PNAS 107 (51). Pp. 22026-22031 Novick, G. (2007). Telephone interviews is qualitative research? Yale School of Nursing, New Haven, CT, Research in Nursing & Health 2008, 41. Pp. 391-398 Oxford University Press (2015). Oxford advanced learner’s dictionary, http://www.oxforddictionaries.com/definition/learner/suitable (cited on 10-09-2015)
92
PBL (2015a). Aanpassen aan klimaatverandering - kwetsbaarheden zien, kansen grijpen. Den Haag: Planbureau voor de leefomgeving PBL (2015b). Ontwerp voor een nationale adaptatiemonitor. Een monitoring- en evaluatieraamwerk voor de Nationale Adaptatie Strategie. Den Haag: Planbureau voor de leefomgeving, pp.1-54 PIK (2015). Record-breaking heavy rainfall events increased under global warming. Potsdam Institute for Climate Impact Research. https://www.pik-potsdam.de/news/press- releases/record-breaking-heavy-rainfall-events-increased-under-global-warming (cited on 18-09-2015) Rammer, W., C. Schauflinger, H. Vacik, J.H.N. Palma, J. Garcia-Gonzalo, J.G. Borges, & M. J. Lexer (2013). A web-based toolbox approach to support adaptive forest management under climate change, Scandinavian Journal of Forest Research, 29 (1), pp. 96-107 RIONED (2007)/ Klimaatverandering, hevige buien en riolering: visie van Stichting RIONED. Ede. http://www.riool.net/c/document_library/get_file?uuid=1183bf2f-1a72-486a- 8027-a136dfade949&groupId=10180&targetExtension=pdf (cited on 18-08-2015) Ritchie, J. & J. Lewis (2003). Qualitative research practice, A guide for social science students and researchers. SAGE publications Roders, M. & A. Straub (2015). Assessment of the likelihood of implementation strategies for climate change adaptation measures in Dutch social housing, Building and Environment, 83, pp. 168-176 Rozum, J.S. & S.D. Carr (2013). Tools for Coastal Climate Adaptation Planning: a guide for selecting tools to assist with ecosystem-based climate planning, NatureServe Arlington, Va. Pp. 1-48 Runhaar, H., P.P.J. Driessen & L. Soer (2009). Sustainable urban development and the challenge of policy integration: an assessment of planning tools for integrating spatial and environmental planning in the Netherlands, Environment and Planning B: Planning and Design, 36, pp.417-431 Runhaar, H. H. Mees, A. Wardekker, J. van der Sluijs & P.P.J. Driessen (2012). Adaptation to climate change-related risks in Dutch urban areas: stimuli and barriers, Regional Environmental Change 12. Pp. 777-790 Runhaar, H., H.K. Gilissen, C. Uittenbroek, H. Mees, M. Van Rijswick & A. Gerretsen (2014). Publieke en private verantwoordelijkheden voor klimaatadaptatie - Een juridisch- bestuurlijke analyse en eerste beoordeling. Kennis voor Klimaat. Pp. 1 -156 Sandt, K. van de & H. Goosen (2011). Klimaatadaptatie in het landelijk gebied. Verkenning naar wegen voor een klimaatbestendig Nederland, Nationaal onderzoekprogramma Kennis voor Klimaat (KvK) en Klimaat voor Ruimte (KvR), pp.1-110 Serrao-Neumann, S., F. Crick, B. Harman & G. Schuch (2015). Maximizing synergies between disaster risk reduction and climate change adaptation: Potential enablers for improved planning outcomes, Environmental Science & policy, 50, Pp. 46-61
93
Sewell, M. (n.d.). The use of qualitative interviews in evaluation. The University of Arizona. http://ag.arizona.edu/sfcs/cyfernet/cyfar/Intervu5.htm (cited on 10-07-2015) Silverman, D. (2000). Doing qualitative research. A practical handbook. 4th Edition. SAGE publications Silverman, D. (2006). Interpreting qualitative data: Methods for analysing talk, text and interaction. 3rd edition. SAGE publications Solomon, S., G.-K. Plattner, R. Knutti & P. Friedlingstein (2008). Irreversible climate change due to carbon dioxide emissions, The National Academy of Sciences of the USA, Pp. 1704 - 1709 Storbjörk, S. (2007). Governing climate adaptation in the local arena: challenges of risk management and planning in Sweden. Local Environment, 12 (5), pp.457-469 Taylor-Powell, E. & M. Renner (2003). Analyzing qualitative data, Cooperative Extension Publishing operations. University of Wisconsin,pp. 1-12 Telegraaf Media Groep (2015). Binnenland. Het-weer-wordt-weer-helemaal-kt-vanmiddag. [screenshot]. http://www.spitsnieuws.nl/binnenland/2015/08/het-weer-wordt-weer- helemaal-kt-vanmiddag (Cited on 26-08-2015) Tennekes, J., P.P.J. Driessen, H.F.M.W. van Rijswick & L. Van Bree (2014). Out of the comfort zone: institutional context and the scope for legitimate climate adaptation policy, Journal of Environmental Policy and Planning, 16 (2), pp. 241-259 Thomas, C. D., A. Cameron, R.E. Green, M. Bakkenes, L. Beaumont, J. Collingham, Y. C., ... & S.E. Williams (2004). Extinction risk from climate change, Nature, 427(6970), pp. 145-148. Turner, D.W. (2010). Qualitative interview design: A practical guide for novice investigators. The Qualitative Report, 15 (3), Nova South-eastern University. pp. 754-760 Tweede Kamer (2007). Nationale Adaptatiestrategie. Vergaderjaar 2007–2008, 31 269, nr. 1 Uittenbroek, C., L.B. Janssen-Jansen & H.A.C. Runhaar (2013). Mainstreaming climate adaptation into urban planning: overcoming barriers, seizing opportunities and evaluating the results in two Dutch case studies, Regional Environmental Change, 13, pp.399-411 Uittenbroek, C.J. (2014). How mainstreaming is mainstreaming? The integration of climate adaptation into urban policy, Proefschrift, Pp.1-178 Uittenbroek, C.J., L.B. Janssen-Janssen, T.J.M. Spit, W.G.M. Salet & H.A.C. Runhaar (2014). Political commitment in organising municipal responses to climate adaptation: the dedicated approach versus the mainstreaming approach, Environmental Politics, 23 (6), pp. 1043- 1063 Verschuren, P. & H. Doorewaard (2010). Designing a research project, Eleven International Publishing, The Hague, 2nd edition VNG (2015). De staat van de gemeenten 2015. Vereniging van Nederlandse Gemeenten. Pp.1-208
94
Appendixes Appendix 1. Program Climate Alliance Working Group 2015
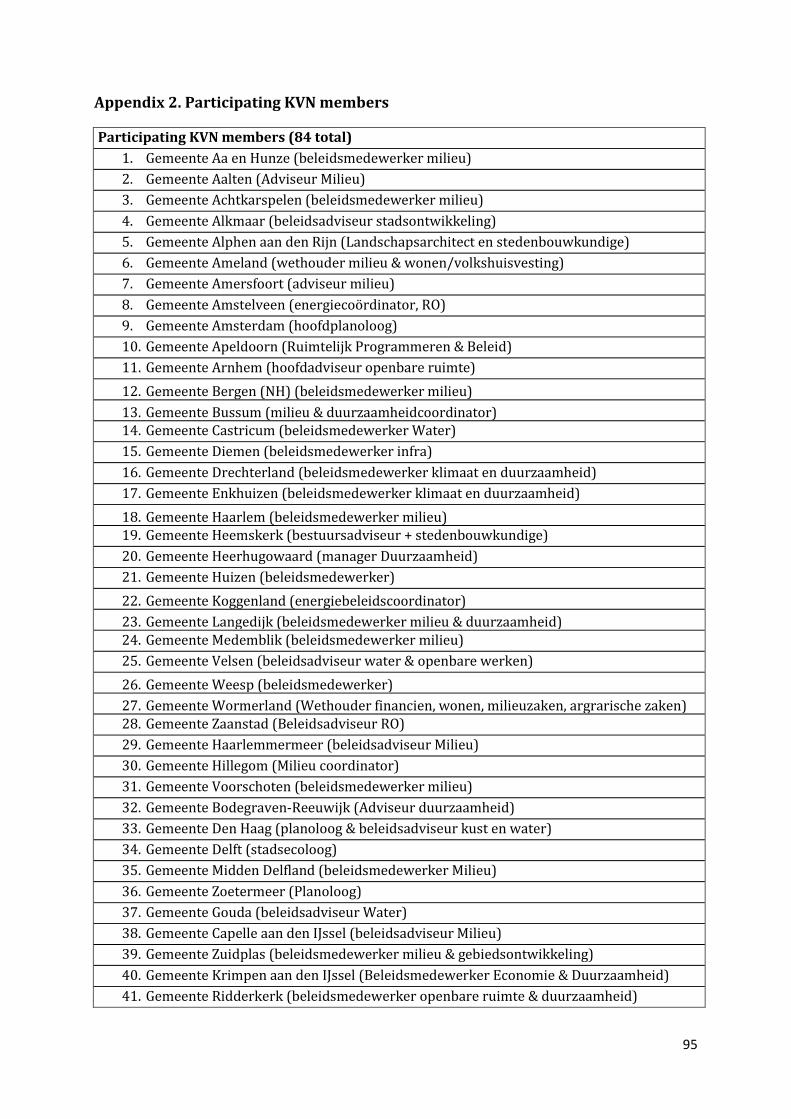
95
Appendix 2. Participating KVN members
Participating KVN members (84 total)
1. Gemeente Aa en Hunze (beleidsmedewerker milieu)
2. Gemeente Aalten (Adviseur Milieu)
3. Gemeente Achtkarspelen (beleidsmedewerker milieu)
4. Gemeente Alkmaar (beleidsadviseur stadsontwikkeling)
5. Gemeente Alphen aan den Rijn (Landschapsarchitect en stedenbouwkundige)
6. Gemeente Ameland (wethouder milieu & wonen/volkshuisvesting)
7. Gemeente Amersfoort (adviseur milieu)
8. Gemeente Amstelveen (energiecoördinator, RO)
9. Gemeente Amsterdam (hoofdplanoloog)
10. Gemeente Apeldoorn (Ruimtelijk Programmeren & Beleid)
11. Gemeente Arnhem (hoofdadviseur openbare ruimte)
12. Gemeente Bergen (NH) (beleidsmedewerker milieu)
13. Gemeente Bussum (milieu & duurzaamheidcoordinator) 14. Gemeente Castricum (beleidsmedewerker Water)
15. Gemeente Diemen (beleidsmedewerker infra)
16. Gemeente Drechterland (beleidsmedewerker klimaat en duurzaamheid)
17. Gemeente Enkhuizen (beleidsmedewerker klimaat en duurzaamheid)
18. Gemeente Haarlem (beleidsmedewerker milieu) 19. Gemeente Heemskerk (bestuursadviseur + stedenbouwkundige)
20. Gemeente Heerhugowaard (manager Duurzaamheid)
21. Gemeente Huizen (beleidsmedewerker)
22. Gemeente Koggenland (energiebeleidscoordinator)
23. Gemeente Langedijk (beleidsmedewerker milieu & duurzaamheid) 24. Gemeente Medemblik (beleidsmedewerker milieu)
25. Gemeente Velsen (beleidsadviseur water & openbare werken)
26. Gemeente Weesp (beleidsmedewerker)
27. Gemeente Wormerland (Wethouder financien, wonen, milieuzaken, argrarische zaken) 28. Gemeente Zaanstad (Beleidsadviseur RO)
29. Gemeente Haarlemmermeer (beleidsadviseur Milieu)
30. Gemeente Hillegom (Milieu coordinator)
31. Gemeente Voorschoten (beleidsmedewerker milieu)
32. Gemeente Bodegraven-Reeuwijk (Adviseur duurzaamheid)
33. Gemeente Den Haag (planoloog & beleidsadviseur kust en water)
34. Gemeente Delft (stadsecoloog)
35. Gemeente Midden Delfland (beleidsmedewerker Milieu)
36. Gemeente Zoetermeer (Planoloog)
37. Gemeente Gouda (beleidsadviseur Water)
38. Gemeente Capelle aan den IJssel (beleidsadviseur Milieu)
39. Gemeente Zuidplas (beleidsmedewerker milieu & gebiedsontwikkeling)
40. Gemeente Krimpen aan den IJssel (Beleidsmedewerker Economie & Duurzaamheid)
41. Gemeente Ridderkerk (beleidsmedewerker openbare ruimte & duurzaamheid)
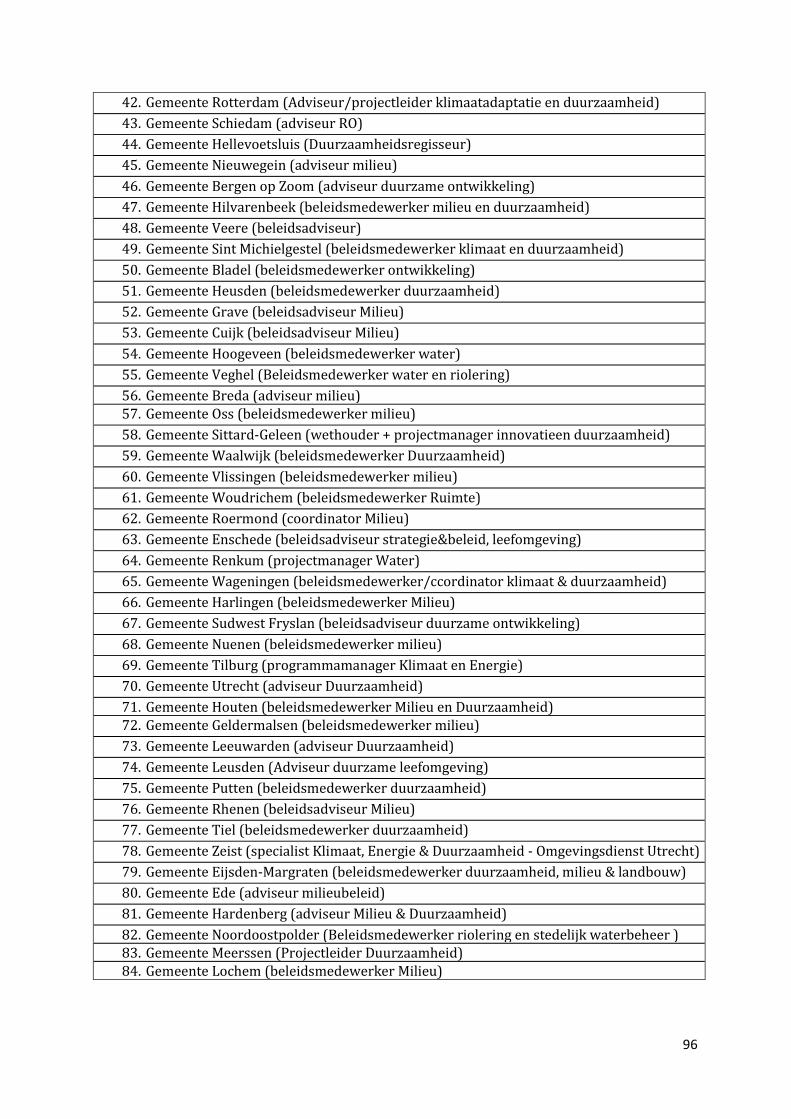
96
42. Gemeente Rotterdam (Adviseur/projectleider klimaatadaptatie en duurzaamheid)
43. Gemeente Schiedam (adviseur RO)
44. Gemeente Hellevoetsluis (Duurzaamheidsregisseur)
45. Gemeente Nieuwegein (adviseur milieu)
46. Gemeente Bergen op Zoom (adviseur duurzame ontwikkeling)
47. Gemeente Hilvarenbeek (beleidsmedewerker milieu en duurzaamheid)
48. Gemeente Veere (beleidsadviseur)
49. Gemeente Sint Michielgestel (beleidsmedewerker klimaat en duurzaamheid)
50. Gemeente Bladel (beleidsmedewerker ontwikkeling)
51. Gemeente Heusden (beleidsmedewerker duurzaamheid)
52. Gemeente Grave (beleidsadviseur Milieu)
53. Gemeente Cuijk (beleidsadviseur Milieu)
54. Gemeente Hoogeveen (beleidsmedewerker water)
55. Gemeente Veghel (Beleidsmedewerker water en riolering)
56. Gemeente Breda (adviseur milieu) 57. Gemeente Oss (beleidsmedewerker milieu)
58. Gemeente Sittard-Geleen (wethouder + projectmanager innovatieen duurzaamheid)
59. Gemeente Waalwijk (beleidsmedewerker Duurzaamheid)
60. Gemeente Vlissingen (beleidsmedewerker milieu)
61. Gemeente Woudrichem (beleidsmedewerker Ruimte)
62. Gemeente Roermond (coordinator Milieu)
63. Gemeente Enschede (beleidsadviseur strategie&beleid, leefomgeving)
64. Gemeente Renkum (projectmanager Water)
65. Gemeente Wageningen (beleidsmedewerker/ccordinator klimaat & duurzaamheid)
66. Gemeente Harlingen (beleidsmedewerker Milieu)
67. Gemeente Sudwest Fryslan (beleidsadviseur duurzame ontwikkeling)
68. Gemeente Nuenen (beleidsmedewerker milieu)
69. Gemeente Tilburg (programmamanager Klimaat en Energie)
70. Gemeente Utrecht (adviseur Duurzaamheid)
71. Gemeente Houten (beleidsmedewerker Milieu en Duurzaamheid) 72. Gemeente Geldermalsen (beleidsmedewerker milieu)
73. Gemeente Leeuwarden (adviseur Duurzaamheid)
74. Gemeente Leusden (Adviseur duurzame leefomgeving)
75. Gemeente Putten (beleidsmedewerker duurzaamheid)
76. Gemeente Rhenen (beleidsadviseur Milieu)
77. Gemeente Tiel (beleidsmedewerker duurzaamheid)
78. Gemeente Zeist (specialist Klimaat, Energie & Duurzaamheid - Omgevingsdienst Utrecht)
79. Gemeente Eijsden-Margraten (beleidsmedewerker duurzaamheid, milieu & landbouw)
80. Gemeente Ede (adviseur milieubeleid)
81. Gemeente Hardenberg (adviseur Milieu & Duurzaamheid)
82. Gemeente Noordoostpolder (Beleidsmedewerker riolering en stedelijk waterbeheer ) 83. Gemeente Meerssen (Projectleider Duurzaamheid) 84. Gemeente Lochem (beleidsmedewerker Milieu)
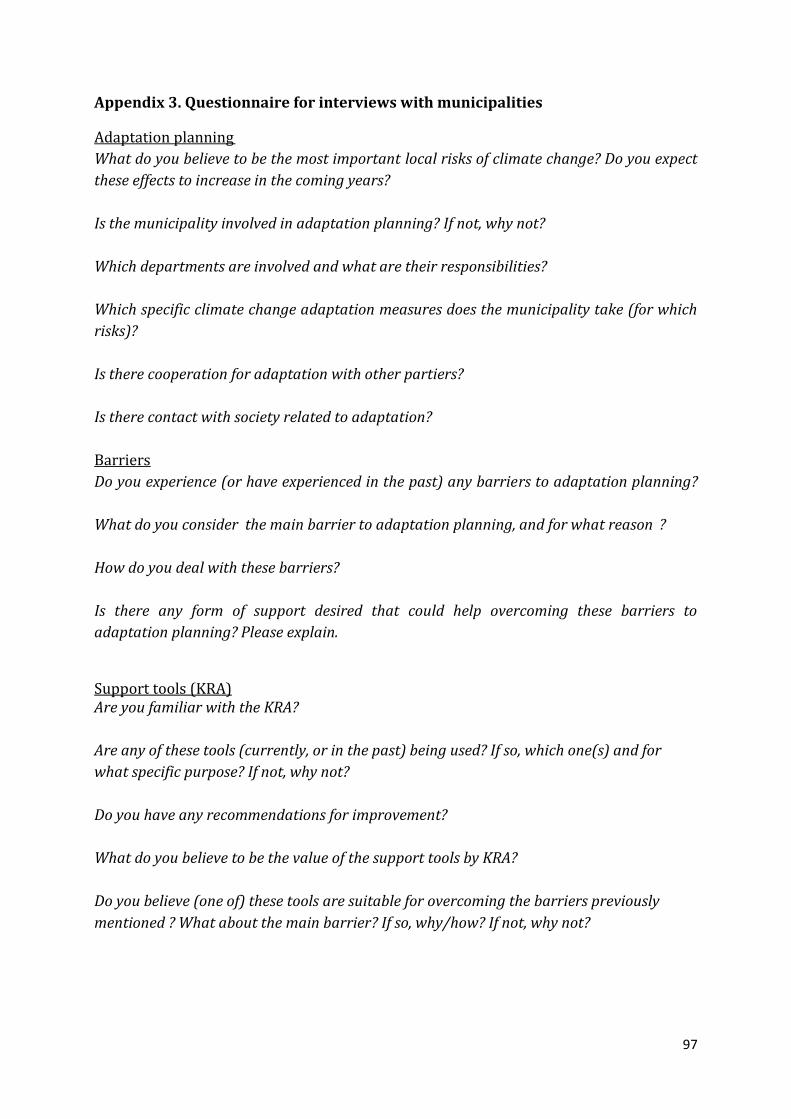
97
Appendix 3. Questionnaire for interviews with municipalities
Adaptation planning
What do you believe to be the most important local risks of climate change? Do you expect
these effects to increase in the coming years?
Is the municipality involved in adaptation planning? If not, why not?
Which departments are involved and what are their responsibilities?
Which specific climate change adaptation measures does the municipality take (for which
risks)?
Is there cooperation for adaptation with other partiers?
Is there contact with society related to adaptation?
Barriers
Do you experience (or have experienced in the past) any barriers to adaptation planning?
What do you consider the main barrier to adaptation planning, and for what reason ?
How do you deal with these barriers?
Is there any form of support desired that could help overcoming these barriers to
adaptation planning? Please explain.
Support tools (KRA) Are you familiar with the KRA?
Are any of these tools (currently, or in the past) being used? If so, which one(s) and for
what specific purpose? If not, why not?
Do you have any recommendations for improvement?
What do you believe to be the value of the support tools by KRA?
Do you believe (one of) these tools are suitable for overcoming the barriers previously
mentioned ? What about the main barrier? If so, why/how? If not, why not?
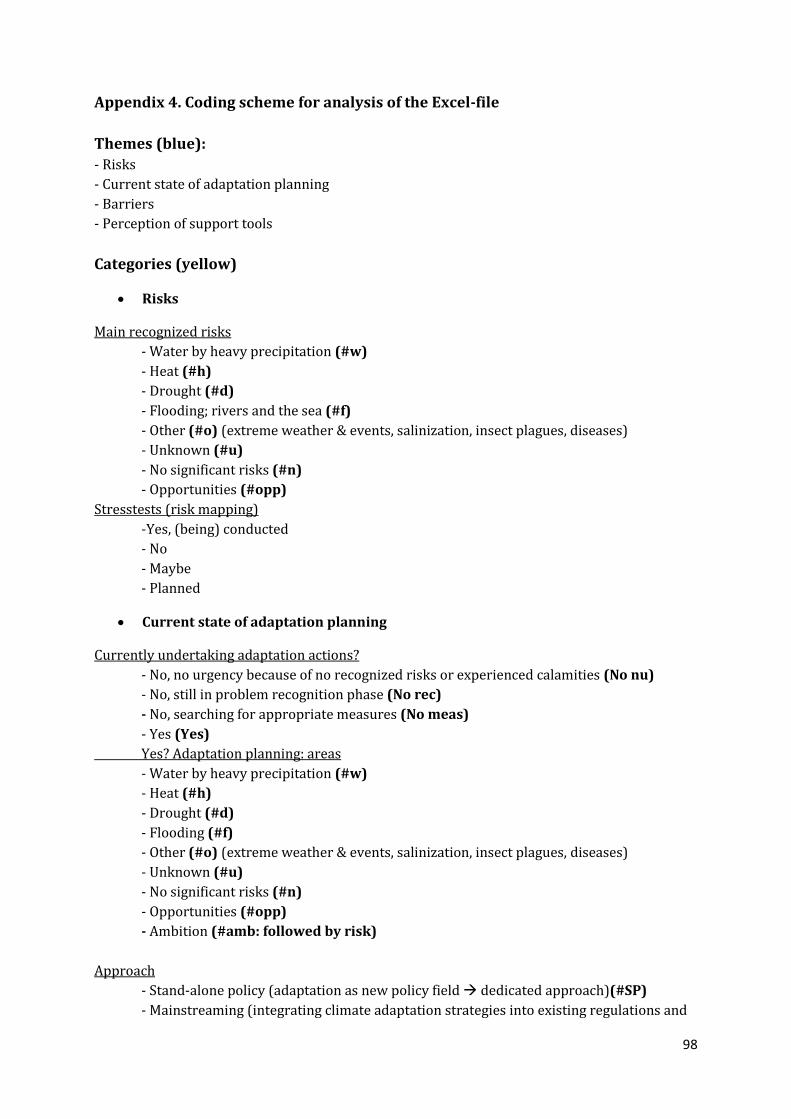
98
Appendix 4. Coding scheme for analysis of the Excel-file
Themes (blue):
- Risks
- Current state of adaptation planning
- Barriers
- Perception of support tools
Categories (yellow)
Risks
Main recognized risks
- Water by heavy precipitation (#w)
- Heat (#h)
- Drought (#d)
- Flooding; rivers and the sea (#f)
- Other (#o) (extreme weather & events, salinization, insect plagues, diseases)
- Unknown (#u)
- No significant risks (#n)
- Opportunities (#opp)
Stresstests (risk mapping)
-Yes, (being) conducted
- No
- Maybe
- Planned
Current state of adaptation planning
Currently undertaking adaptation actions?
- No, no urgency because of no recognized risks or experienced calamities (No nu)
- No, still in problem recognition phase (No rec)
- No, searching for appropriate measures (No meas)
- Yes (Yes)
Yes? Adaptation planning: areas
- Water by heavy precipitation (#w)
- Heat (#h)
- Drought (#d)
- Flooding (#f)
- Other (#o) (extreme weather & events, salinization, insect plagues, diseases)
- Unknown (#u)
- No significant risks (#n)
- Opportunities (#opp)
- Ambition (#amb: followed by risk)
Approach
- Stand-alone policy (adaptation as new policy field dedicated approach)(#SP)
- Mainstreaming (integrating climate adaptation strategies into existing regulations and
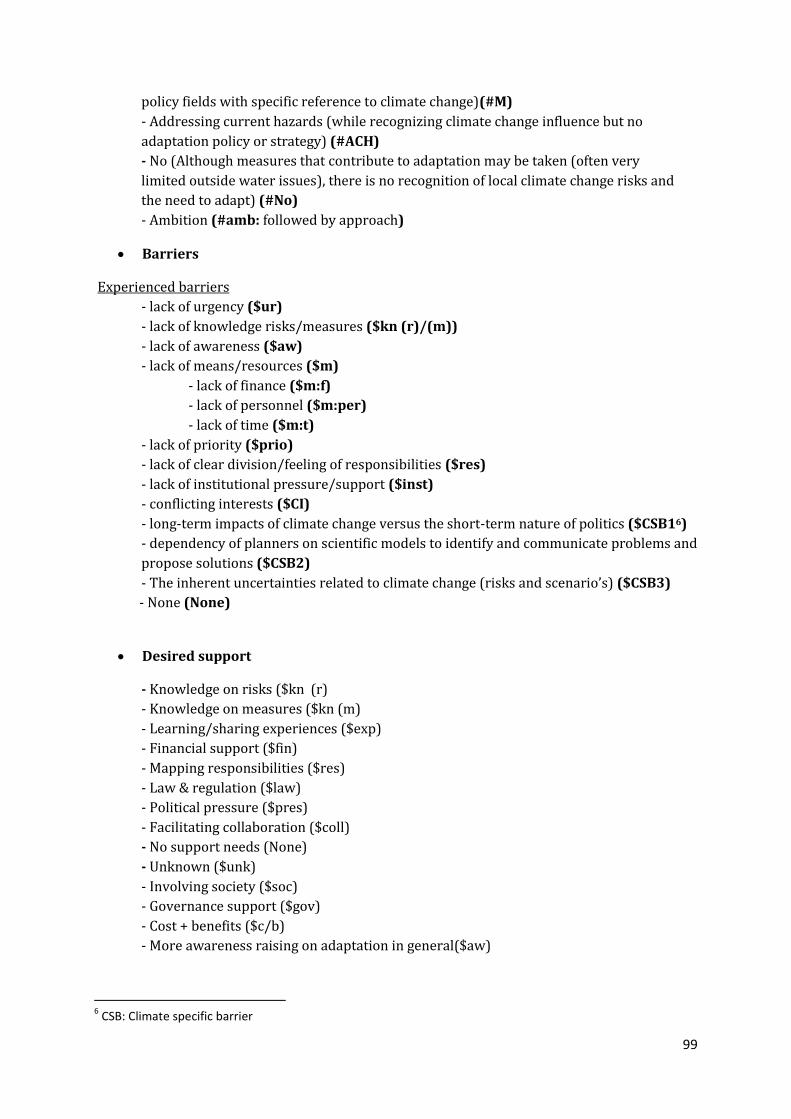
99
policy fields with specific reference to climate change)(#M)
- Addressing current hazards (while recognizing climate change influence but no
adaptation policy or strategy) (#ACH)
- No (Although measures that contribute to adaptation may be taken (often very
limited outside water issues), there is no recognition of local climate change risks and
the need to adapt) (#No)
- Ambition (#amb: followed by approach)
Barriers
Experienced barriers
- lack of urgency ($ur)
- lack of knowledge risks/measures ($kn (r)/(m))
- lack of awareness ($aw)
- lack of means/resources ($m)
- lack of finance ($m:f)
- lack of personnel ($m:per)
- lack of time ($m:t)
- lack of priority ($prio)
- lack of clear division/feeling of responsibilities ($res)
- lack of institutional pressure/support ($inst)
- conflicting interests ($CI)
- long-term impacts of climate change versus the short-term nature of politics ($CSB16)
- dependency of planners on scientific models to identify and communicate problems and
propose solutions ($CSB2)
- The inherent uncertainties related to climate change (risks and scenario’s) ($CSB3)
- None (None)
Desired support
- Knowledge on risks ($kn (r)
- Knowledge on measures ($kn (m)
- Learning/sharing experiences ($exp)
- Financial support ($fin)
- Mapping responsibilities ($res)
- Law & regulation ($law)
- Political pressure ($pres)
- Facilitating collaboration ($coll)
- No support needs (None)
- Unknown ($unk)
- Involving society ($soc)
- Governance support ($gov)
- Cost + benefits ($c/b)
- More awareness raising on adaptation in general($aw)
6 CSB: Climate specific barrier
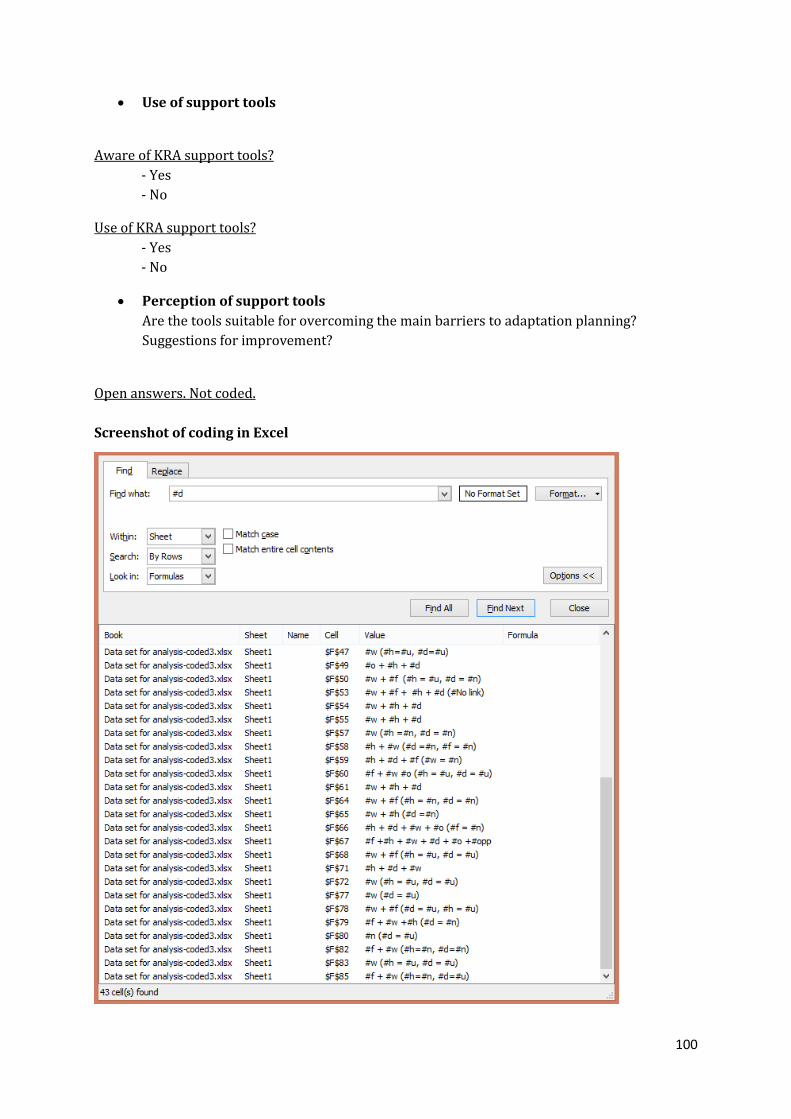
100
Use of support tools
Aware of KRA support tools?
- Yes
- No
Use of KRA support tools?
- Yes
- No
Perception of support tools
Are the tools suitable for overcoming the main barriers to adaptation planning?
Suggestions for improvement?
Open answers. Not coded.
Screenshot of coding in Excel
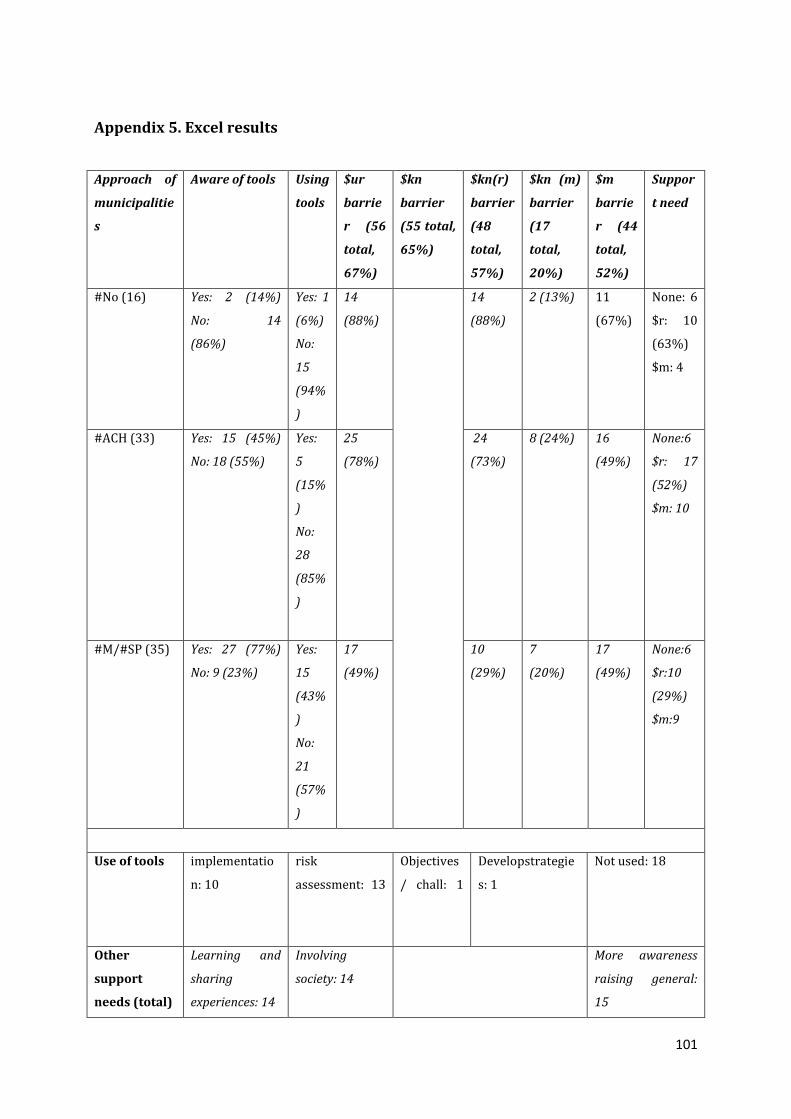
101
Appendix 5. Excel results
Approach of
municipalitie
s
Aware of tools Using
tools
$ur
barrie
r (56
total,
67%)
$kn
barrier
(55 total,
65%)
$kn(r)
barrier
(48
total,
57%)
$kn (m)
barrier
(17
total,
20%)
$m
barrie
r (44
total,
52%)
Suppor
t need
#No (16) Yes: 2 (14%)
No: 14
(86%)
Yes: 1
(6%)
No:
15
(94%
)
14
(88%)
14
(88%)
2 (13%) 11
(67%)
None: 6
$r: 10
(63%)
$m: 4
#ACH (33) Yes: 15 (45%)
No: 18 (55%)
Yes:
5
(15%
)
No:
28
(85%
)
25
(78%)
24
(73%)
8 (24%) 16
(49%)
None:6
$r: 17
(52%)
$m: 10
#M/#SP (35) Yes: 27 (77%)
No: 9 (23%)
Yes:
15
(43%
)
No:
21
(57%
)
17
(49%)
10
(29%)
7
(20%)
17
(49%)
None:6
$r:10
(29%)
$m:9
Use of tools implementatio
n: 10
risk
assessment: 13
Objectives
/ chall: 1
Developstrategie
s: 1
Not used: 18
Other
support
needs (total)
Learning and
sharing
experiences: 14
Involving
society: 14
More awareness
raising general:
15

102