examining the factors affecting student - USP Theses
153
-
Upload
khangminh22 -
Category
Documents
-
view
6 -
download
0
Transcript of examining the factors affecting student - USP Theses


18
Figure 2. 3 Diagram Showing Pascarella (1980) Attrition Theory Source:
Pascarella, 1980.
2.2.1.4 Integrated Retention Theory
Integrated Retention Theory of Cabrera, Castaneda, Nora & Hengstler (1992) is an
(1985) Student Attrition Theory. The Retention theory presents the commonalities of
the two theories. The purpose of Cabrera et al (1992) study was to examine the
convergent and discriminant validity between the two theories. The data was
gathered at several points in time using a questionnaire containing seventy-nine
items. These items were designed to measure ten constructs including (1) Intent to
Persist, (2) Family Approval, (3) Institutional Fit, (4) Courses, (5) Encouragement of
Friends, (6) Opportunity to Transfer, (7) Academic Integration, (8) Social
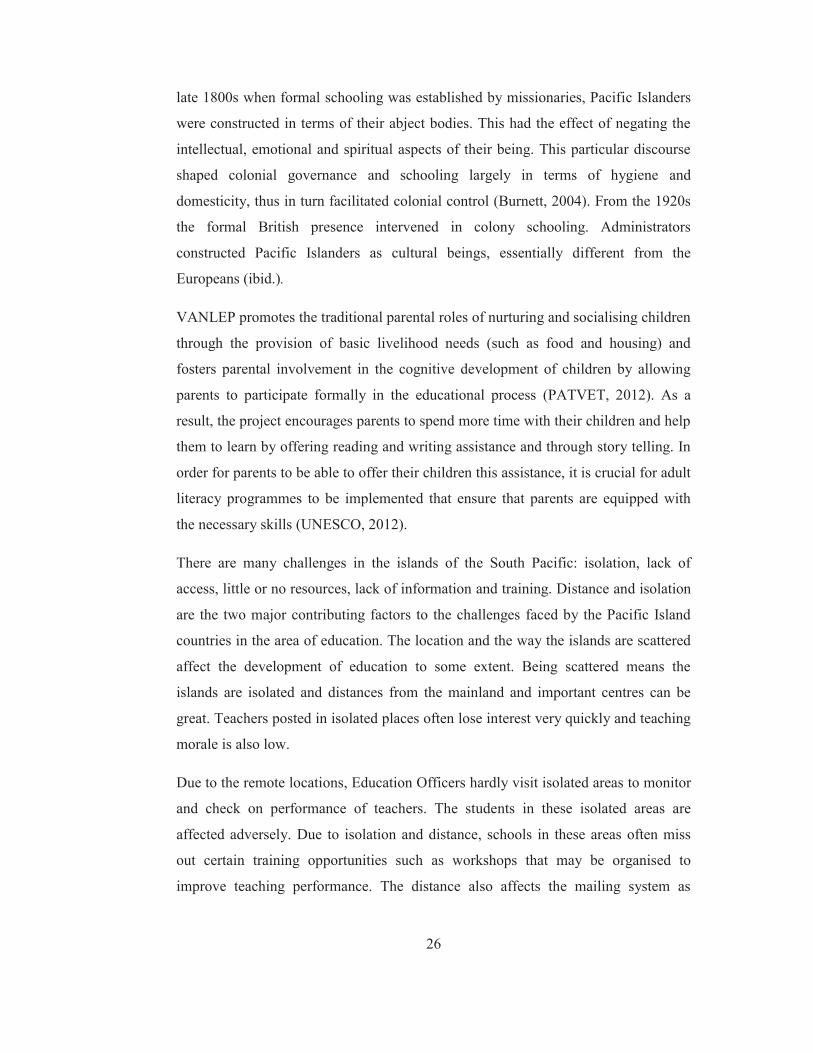
Integration, (9) Institutional Commitment, and (10) Goal Commitment.
In a follow up study, Cabrera, Nora, and Castaneda (1993) tested the Integrated
Model of Student Retention using Structural equation modelling. Their purpose was
to examine possibilities of merging two theories in order to improve understanding
of the processes of student retention. This integrated model as presented in Figure
2.4, include two independent variables and seven dependent variables. The two


78 111
142
187
234
272
0
50
100
150
200
250
300
1967 1979 1989 1999 2009 2016
No.
of P
eopl
e in
Tho
usan
d
Year


WORKSHOPS
Moodle
Soft skills
Anxiety
Depression
Stress Managem
ent
Communication


40%
49%
3% 1% 7%
Very Satisfied
Satisfied
Dissatisfied
Very Dissatisfied
No Response

31%
27%
24%
8%
4% 2% 2% 1% 1%
Prog. Content matches my interest
Prog. Leads to my intented career
Academic reputation of the University
Prog. Is well regarded by potentialemployerInfluence by family members or friends
1%
8% 4%
85%
1% 1% Looking for a Job
Full Time or Part TimeEmployment
Studying at Another Tertiary
Studying in High School
Other

39%
52%
8%
1%
0%
0% 10% 20% 30% 40% 50% 60%
Strongly agree
Agree
Not sure
Disagree
Strongly disagree


14.60%
37.30%
37.60%
10.50%
0.00% 5.00% 10.00%15.00%20.00%25.00%30.00%35.00%40.00%
Halls of Resident
Living with Parents
Renting off Campus
Own Residence
Acco
mm
odat
ion
arra
ngem
ents

80
5.3.1.3. Sources of Finance and Challenges
With reference to the st arrangement to cope with the
university expenses, Figure 5. , shows the most dominant group (45 per cent) of the
while 23 per cent took advantage of student loan scheme programmes available. 15
per cent of students received assistance fro
11 per cent funded their education expenses privately. A small number of students
received Aid donor scholarships (5 per cent). Such scholarships are highly
competitive and are awarded to high academic achievers.
Figure 5. 7 Tuition Fees Arrangements of First Year Students at USP
Source: By the Researcher, 2017.
5.3.1.4. Financial Difficulties and Implication on Retention
Despite obtaining educational scholarships, the students have other living and
running expenses, which at times may or may not be provided by scholarship donors.
These expenses range from daily life needs to educational support needs at USP. The
participants were asked whether they faced financial difficulties, a clear majority
nearly 59 per cent agreed that they face financial difficulties while 41 per cent
indicated no financial difficulties (Figure 5.8).
11%
45%5%
15%
23%1%
Personal Government Scholarship
Aid Donor Scholarship Parents Superannuation funds
Student Loan Scheme Others

59% 41% Yes
No

28%
33% 5%
29%
5% Transport
Meal
Text Book
Accommodationand BoardingMedical

0.00%10.00%20.00%30.00%40.00%50.00%60.00%70.00%
I-Taukei I-Kiribati Ni-Vanuatu Indo-Fijian
Perc
enta
ge
Transport
Meal
Textbook
Accomodation
Medical

84
Figure 5.11 Student Response of type of Financial Difficulties & Living Arrangement
Source: By the Researcher, 2017.
5.3.2. Initial Goal and Institutional Commitments
Goal commitment represents the degree to which the student is committed, or
motivated, to get a university degree in general. Students were asked about their
main educational goals when they enrolled at USP. Majority of the students
mentioned that their main educational goal was to obtain a bachelor degree. Some
students also mentioned that their educational goal was to obtain more than a
bachelor degree. Institutional commitment represents the degree to which the student
is motivated to graduate from a specific university. Students were then asked why
they choose USP. Most of the students responded that they had chosen USP because
it is one of the best universities in Fiji and the Pacific and it was close to their home.
5.3.2.1. Initial Goal and Social Support
Student goals are set by themselves and by the external parties as well such as direct
or indirect support from parents, peers and community. It is critical to understand the
dynamics of support and from where it originates. Every individual has a unique
make up of his/ her network. A Cross-tabulations test was performed to explore
relationship between various support networks and ethnicity. Figure 5.12 show that
students, irrespective of their ethnicity have indicated strongest link with their
parents. Major support to study and to continue studying comes from parents. Nearly
71 per cent Indo-Fijians, 69 per cent I-Taukei, 64 per cent Ni-Vanuatu and 49 per
0.00%
10.00%
20.00%
30.00%
40.00%
50.00%
Halls ofResident
Living withParents
Rentingoff
Campus
OwnResidence
Transport
Meal
Textbook
Accomodation
Medical

85
cent I-Kiribati students indicated that their persistence drive come from their
parents. Second most influential group that sup
friends across all ethnicities. The ratings were similar amongst all ethnicities,
however, Indo-Fijians were ranked top with 22 per cent and I-Taukei ranked the
lowest with 16 per cent.
Figure 5.12 Response of Student Social Support Network by Ethnicity
Source: By the Researcher, 2017.
Students were asked about their main educational goal when they enrolled at USP.
indicated their later goal of securing suitable employment and building better career
paths using the attained degree from USP. The two quotes from students below
withdrawing from study.
myself. I expected quality education in terms of teaching. My goal was to graduate with a good GPA from a well-recognised institute in
a good job after graduating from the programme
5.3.2.2. Institutional Commitments
Institutional commitment represents the degree to which the student is motivated to
graduate from a specific university. Students also indicated that the quality of degree
is highly recognized overseas and such qualification can be easily mobile. Together
0.00%
10.00%
20.00%
30.00%
40.00%
50.00%
60.00%
70.00%
80.00%
I-Taukei I-Kiribati Ni-Vanuatu Indo-Fijian
Parents
Friends
Community
Spouse
Relatives


87
From the preceding quotes, it appears that students have had clear initial goal
commitments and institutional commitments. Students seem to be highly aware of
programmes and its quality. Parents and friends play a critical role in
determining career goals and aspiration.
5.1.1.1. Recommendation and Continuation of Studies with Institution
Students were asked if they were going to recommend USP to their friends and
families to join. A large proportion of students answered positively. Figure 5.13
Reveals that 84 per cent of students stated that they were willing to recommend USP
to their friends and families however, 2 per cent indicated otherwise.
Figure 5.13 Student Response on Recommending USP to Friends & Family
Source: By the Researcher, 2017.
Students were also asked if they wish to continue studying at USP.
Figure 5.14 is used to show the response from the students. Around 87 per cent of
students indicated that they would continue their studies with USP while 11 per cent
of students were unsure and 2 per cent indicated that they would discontinue the
studies.

88
Figure 5.14 Student Response Regarding Continuation of Studies with USP
Source: By the Researcher, 2017.
5.1.1. Academic Integration
intellectual development (Pascarella and Terenzini, 1980). Students were asked about
the effectiveness of orientation week in helping to settle into the university. In the
very first semester, the University organises a weeklong orientation programme to
assist first year students.
5.1.1.1. USP Orientation Programme
Close to 90 per cent students indicated that the orientation programme at the
beginning of the semester had helped them in transiting to the new environment. To
that the orientation programme was beneficial, while 34 per cent of respondents
strongly agreed (Figure 5.15). The orientation programme appears to be a
knowledge-
amenities, academic and other support related programmes.
86.90%
1.60% 11.50%
Yes No Unsure

89
Source: By the Researcher, 2017.
Following are three quotes from students when asked how orientation week had
helped them settle into the new environment:
guidelines. On the first day on campus, I already knew who my programme coordinators were and whom to contact in case of
different parts and functions of the institute, to identify what all were available and as well as whom to contact should I need any assistance. With the help from mentors I met during Orientation, I was able to log in my student account and quickly learn basic
without the Campus tour. The Orientation Tour Guides helped by taking campus tour and pointing out key student support departments. Most importantly, through orientation I made lifelong
As part of the Orientation Programme, campus guided tours are crucial as it takes the
new students around the campus showing key destinations. Campus tour is one of the
key programmes at initial stage to make new students transit easily. Photograph 5.1
shows two Orientation Guides in red t-shirt leading the first year students on campus
guided tour.
0 10 20 30 40 50 60
Strongly Agreed
Agree
Disagree
Stongly Disagreed

90
27.10%
65.90%
4.10%
2.90%
Excellent
Good
Unpleasing
No Life
Photograph 5. 1. Campus Tour during Orientation Week
Source: Ronil, P. 2016.
5.1.1.2. Life on Campus
The students had indicated very affirming response when asked about their quality of
life on campus. Around 92 per cent indicated positive about their university life on
campus. However, around 6 per cent of students were not happy, indicating
unpleasant or no life. Figure 5.16 provides percentage as per the rating scale.
Source: The Researcher, 2017.
5.1.1.3. Students Support Network
Students were further asked from whom they seek assistance from when they face
difficulties in studies. Figure 5.
assistance from when they face academic challenges. A large cohort (49 per cent) of
respondents indicated that they seek assistance from their friends and peers. Tutors
and SLS staffs were ranke

15.9%
49% 1%
4.8%
28.7%
0.6%
SLS
Friends
FYE
Parents
Tutor
Others

92
0 10 20 30 40
Strongly Agree
Agree
Disagree
Strongly Disagree
occasionally visit SLS for assistance. Close to 28 per cent of students indicated that
they have never visited SLS for assistance.
Figure 5.18 Student Response for Visiting SLS for Academic Assistance
Source: By the Researcher, 2017.
5.1.1.4. Students Satisfaction
-year journey at the university, students
were asked to indicate their level of satisfaction. Figure 5.19 reveals that 64 per cent
of students indicated having a pleasant first year experience at the university and 36
per cent of students indicated not having a pleasant experience.
about their First Year Experience
Source: By the Researcher, 2017.
11.50%
25.80%
34.10%
28.70% Very Often
Occasionally
Rarely
Never

0.00%5.00%
10.00%15.00%20.00%

94
students have higher adaptability to new environment. About 14 per cent Indo-Fijian
and 11 per cent I-Taukei students indicated poor performance due to lack of time.
Figure 5.21 Reasons for Poor Academic Performance by Ethnic Group
Source: By the Researcher, 2017.
All students indicated the accent of course lecturers the major reason however,
particularly higher amongst Indo-Fijian students (12.9 per cent). Similar findings
were noted for other teaching methods used for teaching; Indo-Fijian (19 per cent)
students indicated this as a challenge that results to poor academic performance. For
reason Family Obligation, 10 per cent of the I-Kiribati respondents indicated as
major reason for poor performance. For the reasons of English language, (11%) votes
were given from Ni-Vanuatu reason. Students indicated that poor English proficiency
was also one of the primary challenges in influencing their performance. I-Kiribati
and Ni-Vanuatu students mainly experienced this while local students had lower
response regarding English proficiency as a challenge.
5.1.2.2. SLS Support for Academic Assistance
These statistics are also supported by the in-depth investigation with SLS staff on
capacity for poor ac
low English language proficiency amongst other social lifestyle issues affected
Coordinator:
he English Language, and in some cases, necessary numeracy skills sometimes result in failure. There are workshops available for many of these skills, not many students
.
0.00%
5.00%
10.00%
15.00%
20.00%
25.00%
I-Taukei I-Kiribati Ni-Vanuatu Indo-Fijian
Homesick
Lack of Time
Lecturer's Accent
Family Obligation
Social Obligation

26.40%
73.60%
Yes No

96
5.1.3. Social Integration
peer group and the faculty (Pascarella and Terenzini, 1980).
5.1.3.1. Student Interaction with Faculty Staff
The students were asked to rate how often they have social interactions with staff and
academic staff outside classroom. It appears to be that students have strong social
integration with academic staff. Close to 55 per cent students indicated that they
meet academic staff occasionally while 11 per cent of students indicated meeting
academic staff outside classroom as very often. Interesting to note that 28 per cent of
the students indicated that they rarely meet their academic staff.
Figure 5.23 Student and Academic Staff Interaction outside Classroom
Source: By the Researcher, 2017.
According to the SLS staff, student interactions with staff have been seen very
positive. The two quotes below are from interview SLS staff:
encourage them never to give up and suggest and demonstrate, plus let them try out practical ways in which they can study smarter, e.g. time management skills. I also try to follow up with students who have asked for my assistance.
available at the university, and talk about what they wish to do after their first degree. I also market the services that are provided that will assist them in their learning journey, e.g. Peer Mentoring. I also
Students were asked to describe their interactions with staff. It seems that students have open interaction with the staff and not in fear which might be in traditional
0 20 40 60
Very Often
Rarely

97
school setup. Below is a quote from a student who had maintained positive interaction with staff:
There were various mediums of communication available as well that eased the nervousness. I have also managed to stop my coordinators around the campus walk ways to ask or have a quick
5.1.3.2. Student Interaction amongst Student Peers
Figure 5.24 show that there is a high interaction between students from same course
outside their class time. Around 57 per cent of students indicated that they
occasionally meet their peers from the same course while 32 per cent of students
indicated meeting and interacting with their peers from same course very often.
Figure 5.24 Student Interaction with Peers outside Classroom
Source: By the Researcher, 2017.
5.1.4. Socio-Cultural Characteristics
As part of the main research question to investigate the socio-cultural dynamic on
socio-culture influenced their decision on formal education. Students were asked to
rate how their culture, beliefs and customs, value formal education.
Figure 5.
of respondents (74 per cent) agreed that their socio-cultural beliefs, customs and
values support formal education.
0 20 40 60
Very OftenOccasionally
RarelyNever

98
Figure 5.25 Cultural Values on Formal Education
Source: By the Researcher, 2017.
Students and staff were asked about their views of cultural influence on higher
education. The following quotes indicate that many students felt that there were
strong links between culture and education; however, the responses were unique for
every respondent. The quotes below give account of high linkage of culture through
religious practice and its endorsement of education:
religion, which serves as a guideline and we must follow it without dispute. Our culture is source that helps us live each day with
it. We wake up every morning being reminded of obedience and oneof which was making sure attaining highest level of educations. Islam actually promotes learning as one of the quotes goes -Seek
The following quotes from students shows how culture is showing change towards
accepting equity of education amongst both, a male and female child.
view for formal education. I remember how back in the days male
rtured more into domestic duties and child rearing. Now times are different, a lot seems to have changed when we hear stories from our grandparents. Now its accepted that higher
0 20 40 60 80
Very much
Little
No Importance
Cannot Say


135
13. Do you face financial difficulties while in university? Yes NoIf yes, please advice in which areas you face financial difficulties in? (You may select more than one option) Transportation cost Meal cost Accommodation and boarding cost Medical cost Others (please specify) __________________________________________________________ Section 3: Student Support Services
14. Who do you visit most for assistance if you have difficulties in your studies?
SLS Friends FYE Parents Tutor
Others (Please specify)
?________________________________________________
15. How often do you visit Student Learning Support? Very often Occasionally Rarely Never
16. Have you attended any workshops/skills training programme conducted by SLS/FYE? Yes NoSection 4: Socio-Cultural Influence
17. Who supports and encourages you to study the most? Parents Friends
Community Spouse Relatives Others
(please specify)________________ 18. How does your culture, beliefs and customs, value education? Very much
Little No Importance Cannot say 19. Does your cultural value encourage formal education? Yes No Not sure 20. Is higher formal education an essential component of your community in choosing a
leader? Very important Somewhat important Not important
Not sure
Section 5: Orientation and Transition courses
21. The faculty/USP Orientation helped me to adjust to the university environment and programme of study: Strongly agree Agree Disagree Strongly disagree
22. My first year experience was/is a pleasant and encouraging: Strongly agree Agree Disagree Strongly disagree
23. Are you a member of any student association? Yes No
24. How is your academic performance? Very Good Good Average Poor Very Poor
25. What are the reasons to your unsatisfying performance? (please tick as appropriate, you may have multiple responses): English language Accent of course lecturer Teaching methods used Lack of study environment at home Lack of time Financial difficulty Family obligations Social obligations Peer pressure Belief and customs Home sickness Inability to adjust well in university Poor support from Faculty Loneliness Not applicable Others (please specify) _______________________________________________________________________
26. How regularly do you attend your classes? Almost all classes Occasionally Rarely Never attend