
DEHUMID - CORDIS
208
COOP-CT-2005-016957 DEHUMID Novel Liquid Desiccant Dehumidification System Co-operative Research Projects Integrating and strengthening the ERA Final Activity Report (24M) Period covered: from 1 st October 2005 to 30 th September 2007 Date of preparation: 30 October 2007 Start date of project: 1 st October 2005 Duration: 24 months Project coordinator name: Maarten BONKE Project coordinator organisation name: Pro Support B.V.
-
Upload
khangminh22 -
Category
Documents
-
view
4 -
download
0
Transcript of DEHUMID - CORDIS

COOP-CT-2005-016957
DEHUMID
Novel Liquid Desiccant Dehumidification System
Co-operative Research Projects
Integrating and strengthening the ERA
Final Activity Report (24M)
Period covered: from 1st October 2005 to 30th September 2007
Date of preparation: 30 October 2007
Start date of project: 1st October 2005
Duration: 24 months
Project coordinator name: Maarten BONKE
Project coordinator organisation name: Pro Support B.V.

DEHUMID – Final Activity Report COOP-CT-2005-016957
Page 2 of 208
Table of Contents
Publishable executive summary.................................................................................................5
Project Objectives ...................................................................................................................5
Contractors involved ...............................................................................................................7
Co-ordinator contact details....................................................................................................8
Work performed ......................................................................................................................8
Impact....................................................................................................................................10
Main publishable results at T24............................................................................................11
SECTION 1 Project objectives and major achievements during the reporting period 12
1.1 Overview of general project objectives in relation to the state-of-the-art 12
1.2 Summary of recommendations from previous reviews (if any) and follow-up by the consortium..................................................................................................12
1.3 Summary of the objectives for the reporting period, work performed, contractors involved and the main achievements in the period ........................12
1.4 Problems encountered during the reporting period, including the corrective actions undertaken...............................................................................................13
SECTION 2 Work package progress during the reporting period .....................14
2.1 Introduction.....................................................................................14
2.2 Progress on Work package #1 – Functional Specifications..........29
2.2.1 Objectives.......................................................................................29
2.2.2 Progress made during the reporting period...................................29
2.3 Progress on Work package #2 – Modelling and Experimental Testing 41
2.3.1 Objectives.......................................................................................41
2.3.2 Progress made during the reporting period...................................41
2.3.3 The humidity load model of an office room ...................................42
2.3.4 Presumable dehumidification duration ..........................................44
2.3.5 LiCl solution physical proprieties functions....................................46
2.3.6 Test bed design..............................................................................49
2.4 Progress on Work package #3 – Design a Low-Cost PC System 52
2.4.1 Objectives.......................................................................................52
2.4.2 System Design ...............................................................................53

DEHUMID – Final Activity Report COOP-CT-2005-016957
Page 3 of 208
2.4.3 Special density meter.....................................................................54
2.5 Progress on Work package #4 - Design & Prototype Liquid Desiccant System 64
2.5.1 Objectives.......................................................................................64
2.5.2 Progress made during the reporting period...................................64
2.5.3 Control modules .............................................................................76
2.6 Progress on Work package #5 – System Integration & Lab Testing 84
2.6.1 Objectives.......................................................................................84
2.6.2 Progress made during the reporting period...................................84
2.7 Progress on Work package #6 - Validation & Field Testing Prototype System 116
2.7.1 Objectives.....................................................................................116
2.7.2 Progress made during the reporting period.................................116
2.8 Progress on Work package #7 - Dissemination and Exploitation 171
2.8.1 Objectives.....................................................................................171
2.8.2 Progress made during the reporting period.................................171
2.9 Deviations from the project work plan .........................................174
2.10 List of deliverables .......................................................................174
SECTION 3 Consortium management.............................................................176
3.1 Progress on Work package #9 – Consortium Management .......176
3.1.1 Objectives.....................................................................................176
3.1.2 Progress made during the reporting period.................................176
3.2 Consortium performance .............................................................176
3.2.1 General.........................................................................................176
3.2.2 Meetings and communication ......................................................176
3.3 Contractors...................................................................................190
3.3.1 Updated list of contractors ...........................................................190
3.4 Project timetable and status.........................................................191
3.4.1 Project time-line ...........................................................................191
3.5 Actual versus scheduled manpower and budget allocation........192
SECTION 4 Other issues .................................................................................193
4.1 Benefits to the SMEs....................................................................193

DEHUMID – Final Activity Report COOP-CT-2005-016957
Page 4 of 208
Annex 1 - Program source code for the control module ........................................................194
Annex 2 – Final plan for using and disseminating the knowledge ........................................195
Overview of Exploitable Knowledge.......................................................................................195
Final plan for use and dissemination of knowledge ...............................................................198
Overview of dissemination activities...................................................................................198
Publishable results .................................................................................................................199
DEHUMID Web Site............................................................................................................200
Annex 3 – Listing of recorded data ........................................................................................202
Annex 4 - References.............................................................................................................203
DEHUMID – Final Activity Report COOP-CT-2005-016957
Page 5 of 208
Publishable executive summary
Project Objectives
The goal of the DEHUMID project is to develop and test a low cost, compact, and energy efficient liquid desiccant dehumidification system that can precondition the outdoor air delivered to buildings and homes to save energy by reducing compressor size and eliminating excess chiller capacity. As an added benefit, the system will also improve indoor air quality and comfort by removing excess humidity, thus reducing the growth of mould and mildew that create “sick buildings” and destroy valuable property.
To achieve satisfactory results with respect to the identified objectives a three-stage RTD project is anticipated.
During Stage 1, research has been conducted to define the functional specifications, as well as to identify how best to improve both (1) the lithium chloride delivery and recovery system, as well as (2) the best formulation for the lithium chloride desiccant solution. Especially creating large (wetted) exchange surfaces with the very small specific solution flow provide a big technical challenge because of the problem of carrying over LiCl to the airstream. The chosen technical route to overcome this is applying the “falling film” principle.
To achieve maximum benefit from the desiccant dehumidification system and for proper sizing, understanding the variables that affect the performance has been essential. Among the variables that have a major impact on the operation and effectiveness of a desiccant dehumidification system are:
• process air moisture temperature,
• reactivation air temperature,
• velocity and moisture load of air passing through the desiccant,
• amount of desiccant presented to the reactivation and process airstreams,
• desiccant adsorption properties.
For this reason the system ahs been modelled and a small-scale test bed ahs been designed to test system principles and verify system parameters.
In Stage 2 the system and components were designed; including the mechanical liquid desiccant delivery and recovery prototype system and a PC-based control system (including environmental sensors) to provide the interface for customized process control. The system components were integrated into a working prototype.
In Stage 3 the system was validated and tested, both in laboratory tests (technically, e.g. by carrying out calibration tests and check system response to varying environmental conditions.) and in real-world applications under field conditions (environmental conditions, user-friendliness).

DEHUMID – Final Activity Report COOP-CT-2005-016957
Page 6 of 208
Conclusions
The Regenerator and absorber units of the dehumidification prototype installation used for the Quality tests (in Belleria, Italy) and Field tests (in Colores, Portugal) was fabricated by a Chinese company.The installation used the principal scheme provided by the initial work done by University of Nottingham and patented technology for the combined heat and mass exchanger from cellulose fiber.
The data analysis of the system history logs, during the short time period when the prototype was functioning properly, gave encouraging Coefficient of Performance (COP) results which averaged 2.5, with a maximum of 5.9.
When the COP results are compared with a typical COP of 3.1 for a conventional refrigerant DX dehumidification system (source: ASHRAE Journal) the DEHUMID system could be transformed into a commercial application. To get to a this objective would require further work on design modifications, as specified in other documents of this report, with subsequent field testing.
DEHUMID – Final Activity Report COOP-CT-2005-016957
Page 7 of 208
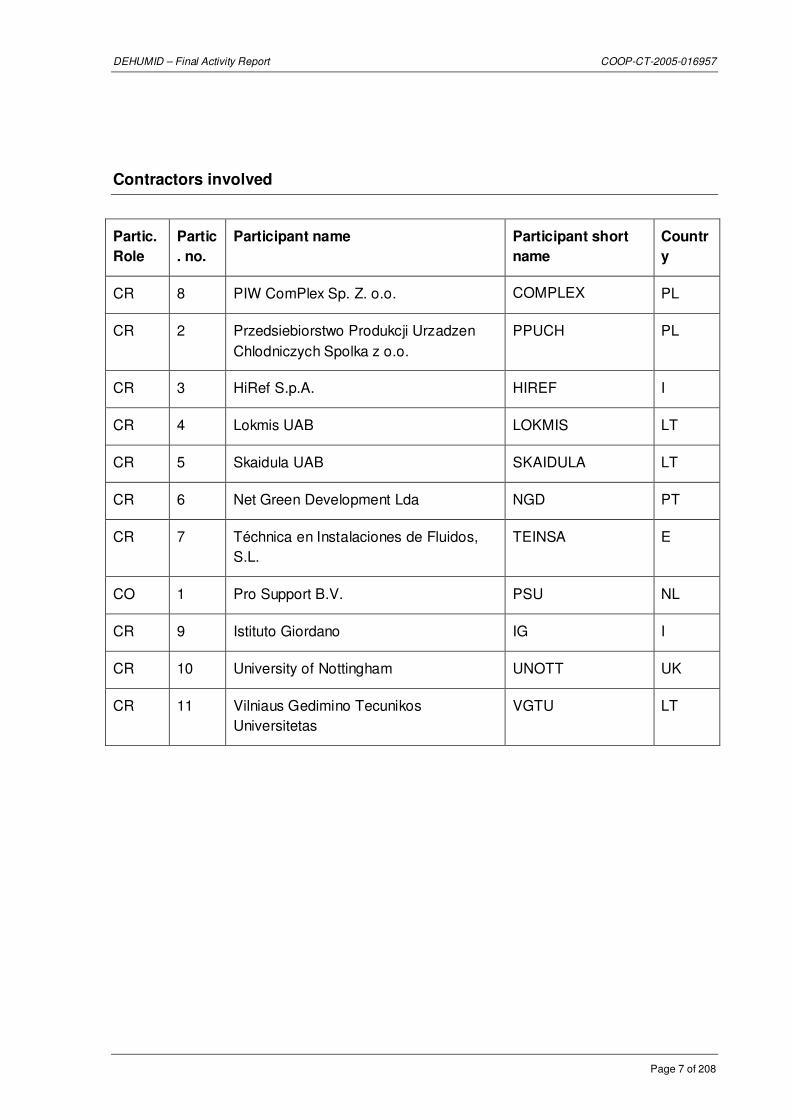
Contractors involved
Partic.
Role
Partic
. no.
Participant name Participant short
name
Countr
y
CR 8 PIW ComPlex Sp. Z. o.o. COMPLEX PL
CR 2 Przedsiebiorstwo Produkcji Urzadzen Chlodniczych Spolka z o.o.
PPUCH PL
CR 3 HiRef S.p.A. HIREF I
CR 4 Lokmis UAB LOKMIS LT
CR 5 Skaidula UAB SKAIDULA LT
CR 6 Net Green Development Lda NGD PT
CR 7 Téchnica en Instalaciones de Fluidos, S.L.
TEINSA E
CO 1 Pro Support B.V. PSU NL
CR 9 Istituto Giordano IG I
CR 10 University of Nottingham UNOTT UK
CR 11 Vilniaus Gedimino Tecunikos Universitetas
VGTU LT

DEHUMID – Final Activity Report COOP-CT-2005-016957
Page 8 of 208
Co-ordinator contact details
Pro Support B.V.
Amarilstraat 11
7554 TV Hengelo
Netherlands
tel: 0031 74 255 11 60
mob 0031 651 79 60 40
fax: 0031 74 250 81 71
Work performed
Functional Specifications
Compilation of literature about existing dehumidification technologies was carried out and analysed. Properties of dehumidification systems that are technologically and economically justified were identified.
Functional specifications of all the system components were set and a layout for the system, giving specific attention to compactness, was conducted.
The control of the system, being an important energy-reduction issue, was identified and the basic control parameters were defined so as to elaborate on the design and supply a finished product for controlling the system.
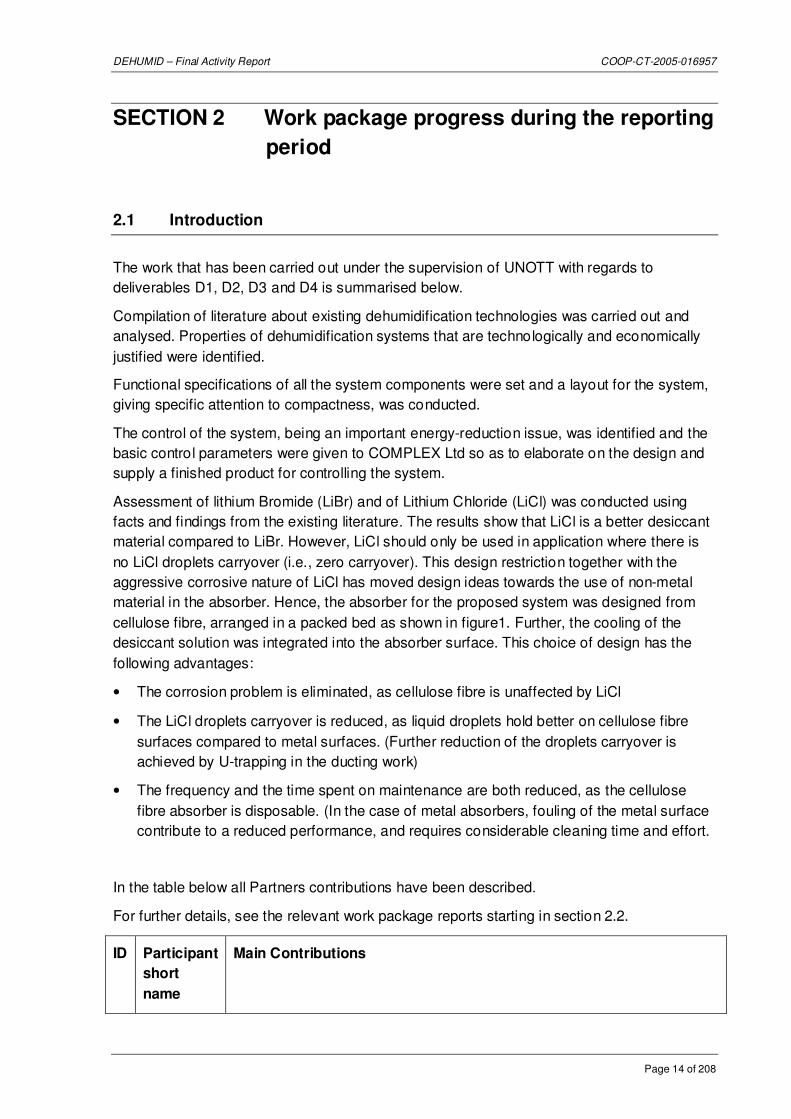
Assessment of lithium Bromide (LiBr) and of Lithium Chloride (LiCl) was conducted using facts and findings from the existing literature. The results show that LiCl is a better desiccant material compared to LiBr. However, LiCl should only be used in application where there is no LiCl droplets carryover (i.e., zero carryover). This design restriction together with the aggressive corrosive nature of LiCl has moved design ideas towards the use of non-metal material in the absorber. Hence, the absorber for the proposed system was designed from cellulose fibre, arranged in a packed bed as shown in figure1. Further, the cooling of the desiccant solution was integrated into the absorber surface. This choice of design has the following advantages:
• The corrosion problem is eliminated, as cellulose fibre is unaffected by LiCl
• The LiCl droplets carryover is reduced, as liquid droplets hold better on cellulose fibre surfaces compared to metal surfaces. (Further reduction of the droplets carryover is achieved by U-trapping in the ducting work)
• The frequency and the time spent on maintenance are both reduced, as the cellulose fibre absorber is disposable. (In the case of metal absorbers, fouling of the metal

DEHUMID – Final Activity Report COOP-CT-2005-016957
Page 9 of 208
surface contribute to a reduced performance, and requires considerable cleaning time and effort.
Specification of climatic data required for designing of air conditioning and dehumidification systems in each participating country
Searching reviewing and analysing the publications about dehumidification systems using liquid desiccants were performed. Over 30 scientific literature sources was studied and shared with other partners of consortium. The information obtained was used in formulations of the requirements of future system, in mathematical modelling of dehumidification system, prediction of performance, economical vitality and other features of future system.
Climatic data for each participant’ country was analysed and treated. The DEHUMID project participants are from 7 countries (Lithuania, United Kingdom, Netherlands, Poland, Italy, Portugal, Spain). The most extreme places for dehumidification in each country were identified. The climatic data for each country required for designing of air conditioning and dehumidification systems were collected and presented to all participants.
The humidity load model of an office room was elaborated. According to prEN 15251 the humidity load was calculated using three indoor environment categories (three comfort levels). Using available reference year data (climatic parameters of each hour of typical year) the time of possible use and average dehumidification load of future dehumidification system in three countries (Lithuania, United Kingdom, Netherlands) was calculated. The reference year data for Netherlands was obtained after treatment of 15 year’s (1991-2005) hourly climatic data.
The chart illustrating dehumidification design parameters of all participating countries and internal loads according three indoor climate parameters were prepared as well as chart of humidity ratio duration curves for three countries (Lithuania, United Kingdom, Netherlands). These curves express required annual amount of dehumidification (tons of moisture to be removed).
Desiccant solution (LiCl-H2O) physical proprieties (solubility boundary, relative vapour pressure, density, thermal capacity, differential enthalpy of dilution), available in literature sources, were programmed as custom MS Excel (MS Visual basic for applications) functions. These functions were tested and used in dehumidification system spreadsheet model. Simultaneously the proprieties of moist air were programmed as psychrometric functions to be used in same model.
Control System Design
Based on the requirements for the control modules, the design has been performed using CAD software EAGLE. The inputs have been calculated using assembled sensor data, including passive compensation of linearity for the KTY sensors.
The temperature inputs have been properly dimensioned using high accuracy resistors. In case after testing it would be required to change the ranges, the resistors (2 for each channel) must be changed.

DEHUMID – Final Activity Report COOP-CT-2005-016957
Page 10 of 208
A state-of-the-art Micro-controller (MICROCHIP) has been selected. This can be reprogrammed in the switch controls. Before the actual testing has started off, it is not exactly known which functions should be programmed.
The communication was realised using an industrial standard, RS485, 9600 Baud, half duplex. This type is highly resilient against failures. The modules were connected with the PC by a BUS (half-duplex), using master-slave communication protocols. Each module was appointed to an address which can be adjusted by DIP switches.
Data protocols were realised as simple as possible. Data processing and correcting the sensors was performed by the PC. Data security was guaranteed by using checksums.
All Parameters are registered using data logging, allowing for a detailed analysis at a later stage.
Also, an emergency programme is foreseen in case the communication should fail. The modules will fall back into an emergency mode preventing further damage or even bigger failures.
Each Module has 8 LEDs, which indicate the current status of the outputs, including failures of elements, like sensors. Critical elements are continuously watched.
A opto-isolated Interface was integrated in the control system.
Impact
Desiccant dehumidification systems can supplement conventional air conditioners, reducing the need for vapour-compression systems to operate for long cycles and at low temperatures in order to handle temperature and humidity. By working together, conventional cooling systems and desiccant dehumidification systems can tackle the temperature and humidity loads separately and more efficiently. Heating, ventilating, and air conditioning (heating and cooling) engineers can then reduce compressor size and eliminate excess chiller capacity.
Desiccants can reduce cooling loads and peak demand by as much as 50%. Typical applications are:
• Reducing peak demand for facilities paying large demand charges by their local utility
• Supplementing air conditioning systems that are undersized due to load growth or refrigerant replacement
• Reducing condensation that can breed mould and mildew in health facilities, housing and dormitories
• Cooling schools, restaurants, theatres that require a large amount of ventilation air
• Reducing frost and ice build-up in grocery stores, refrigerated warehouses and ice rinks.

DEHUMID – Final Activity Report COOP-CT-2005-016957
Page 11 of 208
Plans were drawn up to commercially exploit the DEHUMID system developed identifying possible markets, pricing and distribution.
Main publishable results at T24
Humidity ratio duration cumulative curves, generalized data about presumable time of dehumidification and average load – could be published after finishing of treatment of lacked data.
Further specific publishable results are defined and developed in the second period of the DEHUMID project.

DEHUMID – Final Activity Report COOP-CT-2005-016957
Page 12 of 208
SECTION 1 Project objectives and major achievements
during the reporting period
1.1 Overview of general project objectives in relation to the state-of-the-art
DEHUMID will result in the following main innovations.
• Zero-carryover lithium chloride system by applying a “falling film” principle.
• Low-cost PC-based control system using environmental conditions as parameters to optimize system performance.
• Compact, easy-to-maintain, energy-efficient lithium chloride system for dehumidification and cooling suitable for small spaces such as offices and residential buildings against a competitive price.
1.2 Summary of recommendations from previous reviews (if any) and
follow-up by the consortium
N/A
1.3 Summary of the objectives for the reporting period, work performed,
contractors involved and the main achievements in the period
The four SME HVAC system integrators and manufacturers PPUCH, COMOPLEX, HIREF and TEINSA have undertaken a deep analysis of system requirements and available commercial components (WP#1). The work was done in close collaboration with RTD Performer UNOTT. Also, some support from LOKMIS and SKAIDULA was provided. The results therefore cover a broad spectrum and have been taken into account in the work being carried out in WP#2, 3 and 4.
In parallel, scientific work was done by the RTD performers to investigate LicL formulations, safety requirements and climatic modelling. Moreover, laboratory tests were performed to verify the resulting chemical and mechanical properties of the materials produced with different parameters.
Specifications, including technical and processing requirements and economic constraints, that need to be fulfilled by the components manufactured have been clearly defined.
See Section 2 for all details.

DEHUMID – Final Activity Report COOP-CT-2005-016957
Page 13 of 208
1.4 Problems encountered during the reporting period, including the
corrective actions undertaken
See section 2.9 of this report.
DEHUMID – Final Activity Report COOP-CT-2005-016957
Page 14 of 208
SECTION 2 Work package progress during the reporting
period
2.1 Introduction
The work that has been carried out under the supervision of UNOTT with regards to deliverables D1, D2, D3 and D4 is summarised below.
Compilation of literature about existing dehumidification technologies was carried out and analysed. Properties of dehumidification systems that are technologically and economically justified were identified.
Functional specifications of all the system components were set and a layout for the system, giving specific attention to compactness, was conducted.
The control of the system, being an important energy-reduction issue, was identified and the basic control parameters were given to COMPLEX Ltd so as to elaborate on the design and supply a finished product for controlling the system.
Assessment of lithium Bromide (LiBr) and of Lithium Chloride (LiCl) was conducted using facts and findings from the existing literature. The results show that LiCl is a better desiccant material compared to LiBr. However, LiCl should only be used in application where there is no LiCl droplets carryover (i.e., zero carryover). This design restriction together with the aggressive corrosive nature of LiCl has moved design ideas towards the use of non-metal material in the absorber. Hence, the absorber for the proposed system was designed from cellulose fibre, arranged in a packed bed as shown in figure1. Further, the cooling of the desiccant solution was integrated into the absorber surface. This choice of design has the following advantages:
• The corrosion problem is eliminated, as cellulose fibre is unaffected by LiCl
• The LiCl droplets carryover is reduced, as liquid droplets hold better on cellulose fibre surfaces compared to metal surfaces. (Further reduction of the droplets carryover is achieved by U-trapping in the ducting work)
• The frequency and the time spent on maintenance are both reduced, as the cellulose fibre absorber is disposable. (In the case of metal absorbers, fouling of the metal surface contribute to a reduced performance, and requires considerable cleaning time and effort.
In the table below all Partners contributions have been described.
For further details, see the relevant work package reports starting in section 2.2.
ID Participant
short
name
Main Contributions

DEHUMID – Final Activity Report COOP-CT-2005-016957
Page 15 of 208
ID Participant
short
name
Main Contributions
8 COMPLEX COMPLEX contributed to all technical workpackages scheduled for the period. Chairman of the technical project management team.
WP#1: During the first three months and the first two meetings, some changes have been implemented in the work plan. COMPLEX has taken the lead in the design and manufacturing of the system controls. PPUCH will assist in this. Also, COMPLEX was responsible for the analysis and selection of the required sensors, whereby SKAIDULA and LOKMIS have helped out.
Based on the proposed installation structure of UNOTT, a hardware list for required sensors and control elements was derived.
WP#2: The testing bed was built in the next month (T13). Preparing for this, data for the various sensors have been acquired and analysed for optimisation.
WP#3: Based on the requirements for the control modules, the design has been performed using CAD software EAGLE. The inputs have been calculated using assembled sensor data, including passive compensation of linearity for the KTY sensors.
Leading the task on user interface design including graphic screens that enable operators to monitor environmental conditions and equipment performance so timely maintenance can be performed.
Co-leading with IG the task on designing, manufacturing and characterising the special density meter.
WP#4: Both modules made physically ready as a prototype ready for testing. COMPLEX have prepared studies for realising/manufacturing prototype systems and its main components like e.g. platinum elements using CAD software EAGLE.
Prototype platinum elements have been manufactured and assembled to the modules.
Several critical components have been thoroughly assessed before assembly, it was made sure that the technological risk is minimised.
WP#5:
Leading the integration of separately developed components to a system. All sub-systems have been commissioned for starting the demonstration trials (bench tests).

DEHUMID – Final Activity Report COOP-CT-2005-016957
Page 16 of 208
ID Participant
short
name
Main Contributions
~2 months reliability and life bench testing with modules have been completed.
Preparation of the test rig in Bellaria
WP#6:
Major role in in tasks on preparing field test installation, installation hardware, set up PC control, trial-runs, optimisation and fine-tuning, field test runs, repairs, improvements on installation, characterisation of performance, analysis of system performance, analysis of user friendliness.
Monitoring systems that will work in the field were designed and built.
Control software was installed on PC machine with interface to the modules.
The remote control of the system was realised by using VNCviewer software again to have full access from each place via normal internet connection.
WP#7:
Assisted in preparing publications, application notes, exploitation agreement, Final Plan for Use and Dissemination of Knowledge

DEHUMID – Final Activity Report COOP-CT-2005-016957
Page 17 of 208
ID Participant
short
name
Main Contributions
2 PPUCH PPUCH and COMPLEX have lead the tasks worked on regarding the design of the PC system (WP#3).
WP#1: PPUCh worked on definitions of the system requirements from an end user point of view, in terms of performance, user-friendliness and possible applications. HIREF defined together with HIREF and TEINSA the system layout performance requirements (dimensions and fundamental concept). Also they have assisted COMPLEX in designing the systems.
In WP#2 PPUCH has worked on the modelling and testing tasks, in close collaboration with UNOTT. In this respect they analysed together with PPUCH the functional specifications and converted these into technical specifications.
WP#3: Providing input and feedback, discussing the task on user interface design including graphic screens that enable operators to monitor environmental conditions and equipment performance so timely maintenance can be performed.
Providing input and feedback, discussing the task on designing, manufacturing and characterising the special density meter.
WP#4: PPUCH prepared together with TEINSA and HIREF the documents for the integration of the entire system and qualification testing. Additionally, several critical components have been thoroughly assessed before assembly, to ensure that the technological risk was minimised.
WP#5: Assisting in the integration of separately developed components to a system. All sub-systems have been commissioned for starting the demonstration trials (bench tests).
Assisting in preparation of the test rig in Bellaria.
WP#6: Assisting (input, feedback, trouble shooting) in tasks on preparing field test installation, installation hardware, set up PC control, trial-runs, optimisation and fine-tuning, field test runs, repairs, improvements on installation, characterisation of performance, analysis of system performance, analysis of user friendliness.
WP#7: Assisted in preparing publications, application notes, exploitation agreement, Final Plan for Use and Dissemination of Knowledge.

DEHUMID – Final Activity Report COOP-CT-2005-016957
Page 18 of 208
ID Participant
short
name
Main Contributions
3 HIREF WP#1 HIREF worked on definitions of the system requirements from an end user point of view, in terms of performance, user-friendliness and possible applications. HIREF defined together with PPUCH and TEINSA the system layout performance requirements (dimensions and fundamental concept).
WP#2 HIREF has worked on the modelling and testing tasks, in close collaboration with UNOTT. In this respect they analysed together with HIREF the functional specifications and converted these into technical specifications.
WP#3: Providing input and feedback, discussing the task on user interface design including graphic screens that enable operators to monitor environmental conditions and equipment performance so timely maintenance can be performed. Providing input and feedback, discussing the task on designing, manufacturing and characterising the special density meter.
WP#4: HIREF prepared together with TEINSA and PPUCH the documents for the integration of the entire system and qualification testing. Several critical components have been thoroughly assessed before assembly, it was made sure that the technological risk is minimised. Design documents were drawn and specified. Air treatment unit (ATU) was designed and installed at IG.
WP#5: Assisting in the integration of separately developed components to a system. All sub-systems have been commissioned for starting the demonstration trials (bench tests). Preparation of the test rig in Bellaria Assisting (input, feedback, trouble shooting) in tasks on preparing field test installation, installation hardware, set up PC control, trial-runs, optimisation and fine-tuning, field test runs, repairs, improvements on installation, characterisation of performance, analysis of system performance, analysis of user friendliness
WP#7: Assisted in preparing publications, application notes, exploitation agreement, Final Plan for Use and Dissemination of Knowledge

DEHUMID – Final Activity Report COOP-CT-2005-016957
Page 19 of 208
ID Participant
short
name
Main Contributions
4 LOKMIS LOKMIS has contributed to WPS #1, 2, 3, and 4.
Their major contribution has been the analysis and section processes for the various sensors required in the system.
Also they have assisted COMPLEX in designing the system controls from the hardware side.
WP#3: Providing input and feedback, discussing the task on user interface design including graphic screens that enable operators to monitor environmental conditions and equipment performance so timely maintenance can be performed. Providing input and feedback, discussing the task on designing, manufacturing and characterising the special density meter.
WP#4: Several critical components have been thoroughly assessed before assembly, it was made sure that the technological risk is minimised.
WP#5: Assisting in the integration of separately developed components to a system. All sub-systems have been commissioned for starting the demonstration trials (bench tests). Assisting in preparation of the test rig in Bellaria.
WP#6: Assisting (input, feedback, trouble shoooting) in tasks on preparing field test installation, installation hardware, set up PC control, trial-runs, optimisation and fine-tuning, field test runs, repairs, improvements on installation, characterisation of performance, analysis of system performance, analysis of user friendliness.
WP#7: Assisted in preparing publications, application notes, exploitation agreement, Final Plan for Use and Dissemination of Knowledge.

DEHUMID – Final Activity Report COOP-CT-2005-016957
Page 20 of 208
ID Participant
short
name
Main Contributions
5 SKAIDULA SKAIDULA has contributed to WPS #1, 2, 3, and 4; although mainly to 3,4 and 5.
Their major contribution has been the analysis and section processes for the various sensors required in the system.
Also they have assisted COMPLEX in designing the system controls from the software side.
WP#3: Providing input and feedback, discussing the task on user interface design including graphic screens that enable operators to monitor environmental conditions and equipment performance so timely maintenance can be performed. Providing input and feedback, discussing the task on designing, manufacturing and characterising the special density meter.
WP#5: Assisting in the integration of separately developed components to a system. All sub-systems have been commissioned for starting the demonstration trials (bench tests). Assisting in preparation of the test rig in Bellaria.
WP#6: Assisting (input, feedback, trouble shoooting) in tasks on preparing field test installation, installation hardware, set up PC control, trial-runs, optimisation and fine-tuning, field test runs, repairs, improvements on installation, characterisation of performance, analysis of system performance, analysis of user friendliness.
WP#7: Assisted in preparing publications, application notes, exploitation agreement, Final Plan for Use and Dissemination of Knowledge.

DEHUMID – Final Activity Report COOP-CT-2005-016957
Page 21 of 208
ID Participant
short
name
Main Contributions
6 NGD NGD has designed and developed the DEHUMID website and platform (WP#7)
Also, NGD has assisted in collecting climatological data and definition of system requirements from the end-user’s point of view being the ‘closest to the market’ of all DEHUMID partners.
WP#3: Providing input and feedback, discussing the task on user interface design including graphic screens that enable operators to monitor environmental conditions and equipment performance so timely maintenance can be performed.
WP#4: Several critical components have been thoroughly assessed before assembly, it was made sure that the technological risk is minimised
WP#5: Shipment and restarting of the unit in Colares PT
WP#6: Main leading tasks on preparing field test installation, installation hardware, set up PC control, trial-runs, optimisation and fine-tuning, field test runs, repairs, improvements on installation, characterisation of performance, analysis of system performance, analysis of user friendliness
WP#7: Assisted in preparing publications, application notes, exploitation agreement, Final Plan for Use and Dissemination of Knowledge
Prepared the project website
7 TEINSA In WP#1 they worked on definitions of the system requirements from an end user point of view, in terms of performance, user-friendliness and possible applications. HIREF defined together with PPUCH and HIREF the system layout performance requirements (dimensions and fundamental concept).
WP#2 TEINSA has worked on the modelling and testing tasks, in close collaboration with UNOTT. In this respect they analysed together with HIREF the functional specifications and converted these into technical specifications.
WP#3: Providing input and feedback, discussing the task on user interface design including graphic screens that enable operators to monitor environmental

DEHUMID – Final Activity Report COOP-CT-2005-016957
Page 22 of 208
ID Participant
short
name
Main Contributions
conditions and equipment performance so timely maintenance can be performed. Providing input and feedback, discussing the task on designing, manufacturing and characterising the special density meter.
WP#4: TEINSA prepared together with HIREF and PPUCH the documents for the integration of the entire system and qualification testing. Several critical components have been thoroughly assessed before assembly, it was made sure that the technological risk is minimised.
WP#5: Assisting in the integration of separately developed components to a system. All sub-systems have been commissioned for starting the demonstration trials (bench tests). Assisting in preparation of the test rig in Bellaria
WP#6: Assisting (input, feedback, trouble shoooting) in tasks on preparing field test installation, installation hardware, set up PC control, trial-runs, optimisation and fine-tuning, field test runs, repairs, improvements on installation, characterisation of performance, analysis of system performance, analysis of user friendliness.
WP#7: Assisted in preparing publications, application notes, exploitation agreement, Final Plan for Use and Dissemination of Knowledge

DEHUMID – Final Activity Report COOP-CT-2005-016957
Page 23 of 208
ID Participant
short
name
Main Contributions
1 PSU To ensure a smooth project management and communication among partners and between the DEHUMID consortium and the Commission, PSU acts as project co-ordinator for day-to-day project issues. They supervised the work planning and reporting, and initiate corrective actions. To this end they maintained during the entire project period, a Management Office which functions as a Project Secretariat for collation of all deliverables and milestone reports submitted to the EC and other partners, submission of all cost statements, keeping the project schedule, reviewing progress against economic, industrial and operational objectives of the project, ensuring prompt payment of financial contributions, and distribution of the minutes taken at meetings.
PSU prepared the Consortium meetings (Kick-off, 6M, 12M, 18M and final meeting) and recorded and distributed minutes from these meetings. They integrated all deliverables into one report.
PSU designed the DEHUMID project logo.
PSU also took care of the financial project management for DEHUMID.
Also, PSU chaired the activities on the deliverables D20, D21, and D22 and co-worked on deliverables D15, D16, and D17.
WP#7: Assisted in preparing publications, application notes, exploitation agreement, Final Plan for Use and Dissemination of Knowledge.

DEHUMID – Final Activity Report COOP-CT-2005-016957
Page 24 of 208
ID Participant
short
name
Main Contributions
9 IG WP#1 and #2 Participation to the kick-off meeting in Amsterdam(1 person). Participation to the technical meeting in Nottingham (2 persons). Participation to 2 technical meetings with HiRef (one in Monselice and one in Bellaria). Study of applicable European Directives. Study of applicable technical standards. Study of safety of liquid desiccants. Investigation about similar products (based on solid desiccants).
WP#3: Providing input and feedback, discussing the task on user interface design including graphic screens that enable operators to monitor environmental conditions and equipment performance so timely maintenance can be performed. Co-leading with COMPLEX the task on designing, manufacturing and characterising the special density meter.
WP#4: Several critical components have been thoroughly assessed before assembly, it was made sure that the technological risk is minimised. From the prototype from UNOTT components were detailed., the IG prototype was manufactured Design documents were drawn and specified.
WP#5: Integrating the separately developed components to a system. All sub-systems have been commissioned for starting the demonstration trials (bench tests). ~2 months reliability and life bench testing with modules have been completed. Definition of test protocol IG, test rig preparations, lab test runs. Tests and checks on “zero carry-over”, safety, performance. Shipment and restarting of the unit in Colares PT.
WP#6: Assisting (input, feedback, trouble shooting) in tasks on preparing field test installation, installation hardware, set up PC control, trial-runs, optimisation and fine-tuning, field test runs, repairs, improvements on installation, characterisation of performance, analysis of system performance, analysis of user friendliness.
WP#7: Assisted in preparing publications, application notes, Final Plan for Use and Dissemination of Knowledge.

DEHUMID – Final Activity Report COOP-CT-2005-016957
Page 25 of 208
ID Participant
short
name
Main Contributions
10
UNOTT The work carried out by UNOTT with regards to WPs # 1 and 2, leading to deliverables D1, D2, D3 and D4 is summarised below.
Compilation of literature about existing dehumidification technologies was carried out and analysed. Properties of dehumidification systems that are technologically and economically justified were identified.
Functional specifications of all the system components were set and a layout for the system, giving specific attention to compactness, was conducted.
The control of the system, being an important energy-reduction issue, was identified and the basic control parameters were given to COMPLEX Ltd so as to elaborate on the design and supply a finished product for controlling the system.
WP#3: The final system design has been made, components were detailed, the UNOTT prototype was manufactured.
LiBr and LiCl assessments were performed.
WP#4: Several critical components have been thoroughly assessed before assembly, it was made sure that the technological risk is minimised.
The final system design has been made, components were detailed., the UNOTT prototype was manufactured.
Assessment of lithium Bromide (LiBr) and of Lithium Chloride (LiCl) was conducted using facts and findings from the existing literature. The results show that LiCl is a better desiccant material compared to LiBr. However, LiCl should only be used in application where there is no LiCl droplets carryover (i.e., zero carryover). This design restriction together with the aggressive corrosive nature of LiCl has moved design ideas towards the use of non-metal material in the absorber. Hence, the absorber for the proposed system was designed from cellulose fibre, arranged in a packed bed as shown in figure1. Further, the cooling of the desiccant solution was integrated into the absorber surface.
WP#5: Definition of test protocol UNOTT, test rig preparations, lab test runs.
Integrating the separately developed components to a system. All sub-systems have been commissioned for starting the demonstration trials (bench tests).
~2 months reliability and life bench testing with modules have been

DEHUMID – Final Activity Report COOP-CT-2005-016957
Page 26 of 208
ID Participant
short
name
Main Contributions
completed.
WP#7:
Assisted in preparing publications, application notes, Final Plan for Use and Dissemination of Knowledge
11
VGTU In WP#1, RTD performer VGTU has, together with UNOTT lead activities on carrying out a compilation of literature about existing dehumidifying technologies to analyse their characteristics and have selected the most suitable ones for the project’s aims. Also climatic data for each participant’ country was analysed and treated having aim to identify the most extreme outdoor conditions for designing of dehumidification system.
In general in WPs #1 and #2: Searching reviewing and analysing the publications about dehumidification systems using liquid desiccants were performed. Over 30 scientific literature sources was studied and shared with other partners of consortium. The information obtained was used in formulations of the requirements of future system, in mathematical modelling of dehumidification system, prediction of performance, economical vitality and other features of future system.
Climatic data for each participant’ country was analysed and treated. The DEHUMID project participants are from 7 countries (Lithuania, United Kingdom, Netherlands, Poland, Italy, Portugal, Spain). The most extreme places for dehumidification in each country were identified. The climatic data for each country required for designing of air conditioning and dehumidification systems were collected and presented to all participants. The humidity load model of an office room was elaborated. According to prEN 15251 the humidity load was calculated using three indoor environment categories (three comfort levels). Using available reference year data (climatic parameters of each hour of typical year) the time of possible use and average dehumidification load of future dehumidification system in three countries (Lithuania, United Kingdom, Netherlands) was calculated. The reference year data for Netherlands was obtained after treatment of 15 year’s (1991-2005) hourly climatic data. The chart illustrating dehumidification design parameters of all participating countries and internal loads according three indoor climate parameters were prepared as well as chart of humidity ratio duration curves for three countries (Lithuania, United Kingdom, Netherlands). These curves express required annual amount of dehumidification (tons of moisture to be removed).

DEHUMID – Final Activity Report COOP-CT-2005-016957
Page 27 of 208
ID Participant
short
name
Main Contributions
Desiccant solution (LiCl-H2O) physical proprieties (solubility boundary, relative vapour pressure, density, thermal capacity, differential enthalpy of dilution), available in literature sources, were programmed as custom MS Excel (MS Visual basic for applications) functions. These functions were tested and used in dehumidification system spreadsheet model. Simultaneously the proprieties of moist air were programmed as psychrometric functions to be used in same model.
WP#5: Definition of test protocol UNOTT, test rig preparations, lab test runs
Definition of test protocol IG, test rig preparations, lab test runs
WP#6: The time of possible use and average dehumidification load of future dehumidification systems in two additional countries (Italy and Portugal) were calculated. The hourly meteorological data of Savignano (Italy) and Lisbon (Portugal) was obtained from websites of corresponding meteorological stations. The chart of humidity ratio duration curves for these two countries was updated using new data. (not presented yet in the detailed report)
The model of absorption and regeneration processes using LiCl solution was improved. The changes made on the original model, presented in literature, allows the efficiencies of absorber and regenerator to be obtained in the interval between 0 and 1. This approach is more suitable for mathematical modelling of dehumidification system, when the efficiencies are obtained from experimental test results. The improved model was tested using experimental data available from the literature.
The sensibility analysis of absorption and regeneration processes to the initial parameters was performed using experimental data available on literature. The influence of air and solution input parameters (temperature, humidity ratio, concentration, flow rate) to the air and solution output parameters and absorbed/evaporated water amount was investigated and illustrated graphically. It was found, that most important parameter for both absorption and regeneration processes is desiccant solution temperature. Variation of solution temperature invokes the greatest changes in evaporated/regenerated water flow. The influence of air flow and air humidity is also sensible, but this inf luence is rather obvious.
According to the sensibility analysis performed and the controllable parameters of dehumidification system installation the sets of the testing parameters were defined. These sets covers all range of installation’s controllable parameters (air, solution and water flows, initial solution

DEHUMID – Final Activity Report COOP-CT-2005-016957
Page 28 of 208
ID Participant
short
name
Main Contributions
concentration, solution temperature before regeneration) and wide range of indoor and outdoor climatic conditions (air temperature and humidity ratio).
The mathematical model of whole dehumidification system was elaborated. For the processes in elements of dehumidification system same principle is used as for absorption and regeneration processes. Instead of solving many differential equations the simplified method is adopted, i.e. the experimental physical efficiencies of heat and mass transfer in the system elements were used.
The mathematical model of whole dehumidification system was implemented in MS Excel™ environment. The calculation model includes 11 components (elements) of dehumidification system (absorber, regenerator, air/air, liquid/liquid and liquid/air heat and mass exchangers, solution and water basins). The output parameters of one component are used as input parameters for next component. Because of closed circulation of solution and interference of installation elements, the iterative calculation technique was used. In the calculation model the 11 iteration loops in 7 hierarchical levels are used. For calculation of air, solution and water proprieties, the psychrometric and thermophysical functions prepared earlier were used.
The mathematical model of humidity load of the small pool (e.g. in spa centre) was elaborated. However, finally this model was not used in the calculation model of the dehumidification system because of much higher humidity load in the field test installation.
The semi automatic tool for visualisation of logged parameters was elaborated in MS Excel™. This tool allows the quick visualisation and evaluation of changes in logged parameters (in form of chart of curves) as well as system „snapshot“ of selected time (principal scheme of installation with parameters, measures at selected time). This tool is an addition to the installation control system, which allows only visualisation of currently measured parameters (in real time) with no parameters curves.
The treatment of all automatically measured and logged parameters of dehumidification installation was performed (including laboratory and field tests). The total number of records is more than 470000, so first treatment was possible only with database software. The MS Access™ was used. After conditional filtration of records, the periods of different system’s performance was identified. The records with not reliable data (when some of elements or sensors of the system was working) were excluded.
The performances of components of dehumidification system installation system were determined. These performances were used in calculation

DEHUMID – Final Activity Report COOP-CT-2005-016957
Page 29 of 208
ID Participant
short
name
Main Contributions
model of the whole dehumidification system.
The calculation model was validated with experimental data. It was stated, that calculation results corresponds to experimental results rather well (this just my hope for the moment).
Using the calculation model the operation of dehumidification installation in different indoor and outdoor conditions was simulated. The theoretical possibilities of dehumidification were evaluated.
The performance of whole dehumidification system was evaluated. Different performance ratios were calculated.
WP#7: Assisted in preparing publications, application notes, Final Plan for Use and Dissemination of Knowledge
2.2 Progress on Work package #1 – Functional Specifications
2.2.1 Objectives
Ensuring correct project start-up, definition and efficiency of the project.
Definition of system requirements from an end user point of view, in terms of performance, user-friendliness and possible applications.
2.2.2 Progress made during the reporting period
Tasks worked on Contractor(s) involved
Identification of terms
Identification of main functions, etc
Function Specifications for components and system layout
Specification of QA
UNOTT Modelling work
VGTU (lead), All Partners The specification of climatic data required for designing of air conditioning and dehumidification systems in each participating country
IG (lead) Safety Studies on applicable

DEHUMID – Final Activity Report COOP-CT-2005-016957
Page 30 of 208
European Directives, technical Standards, liquid desiccants Investigation about similar products (based on solid desiccants).
COMPLEX (lead) System design
Achievements / Progress made on this task
A preliminary indication of the performance and economics required from the DEHUMID system has been formulated by all partners. They have contributed to this task by gathering and collating data. In this way main functional requirements and expected performance of the system have been established to provide all inputs necessary for the subsequent tasks. COMPLEX has developed form and structure of the required specification documents. The SME partners have defined a range of applications for which the DEHUMID technology will be developed in the framework of this CRAFT project.
VGTU and UNOTT have lead activities on carrying out a compilation of literature about existing dehumidifying technologies to analyse their characteristics and have selected the most suitable ones for the project’s aims. Functionality has been described first as an Ideal Functionality and later discussed with all partners to identify those properties which are technologically and economically justified.
Functional Specifications for the design of Mechanical & Electrical components and system layout have been put together with the aid of the SMEs, taking into account functionality, maintainability and system performance (energy efficiency). Components and properties for each component in the system have been defined.
The control system (relationships between parameters) has been defined, leading to:
• Informal system conceptual model (terms identification, main functions, use cases, including all inputs/outputs of the system, requirements for data accuracy, range of values, frequency, format etc.).
• Recommendations system runtime/testing/development environment/platforms (if any), incl. QA (quality assurance) plan and SDLC (software development life cycle).
2.2.2.1 Modelling Work
In order to design a prototype or build a test bed, modelling work is a necessary exercise for providing estimates of the operating parameters and for identifying the important parameters that are directly responsible for optimisation. In the case of dehumidification systems, one ultimately seeks the mass flow rate of water condensed from the air to the liquid desiccant during the dehumidification process. In the literature, there are numerous validated models predicting this quantity. Also available in the literature is the mass flow rate of water evaporated from the weak desiccant solution and transferred to the scavenging air stream at the regenerator. Previous theoretical and experimental work in the literature provides
DEHUMID – Final Activity Report COOP-CT-2005-016957
Page 31 of 208
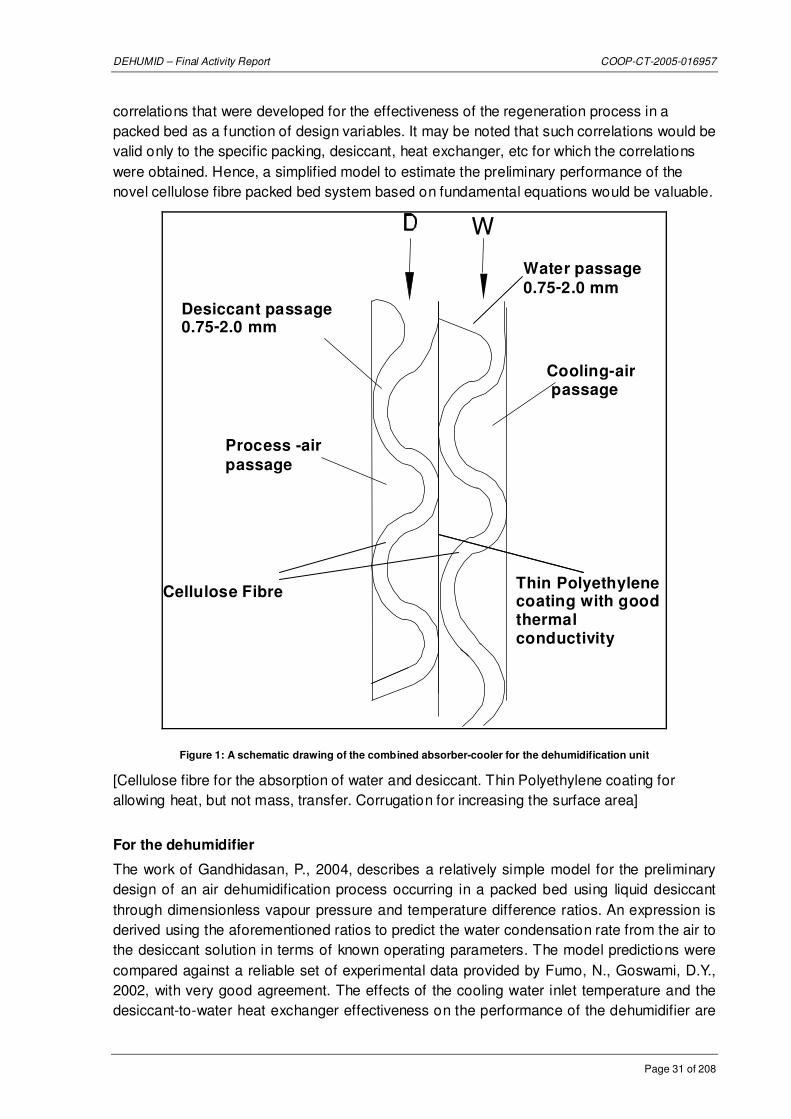
correlations that were developed for the effectiveness of the regeneration process in a packed bed as a function of design variables. It may be noted that such correlations would be valid only to the specific packing, desiccant, heat exchanger, etc for which the correlations were obtained. Hence, a simplified model to estimate the preliminary performance of the novel cellulose fibre packed bed system based on fundamental equations would be valuable.
W
Process -air passage
Thin Polyethylene coating with good thermal conductiv ity
Desiccant passage 0.75 - 2.0 mm
Cooling-air passage
Water passage
0.75 - 2.0 mm
Cellulose Fibre
Figure 1: A schematic drawing of the combined absorber-cooler for the dehumidification unit
[Cellulose fibre for the absorption of water and desiccant. Thin Polyethylene coating for allowing heat, but not mass, transfer. Corrugation for increasing the surface area]
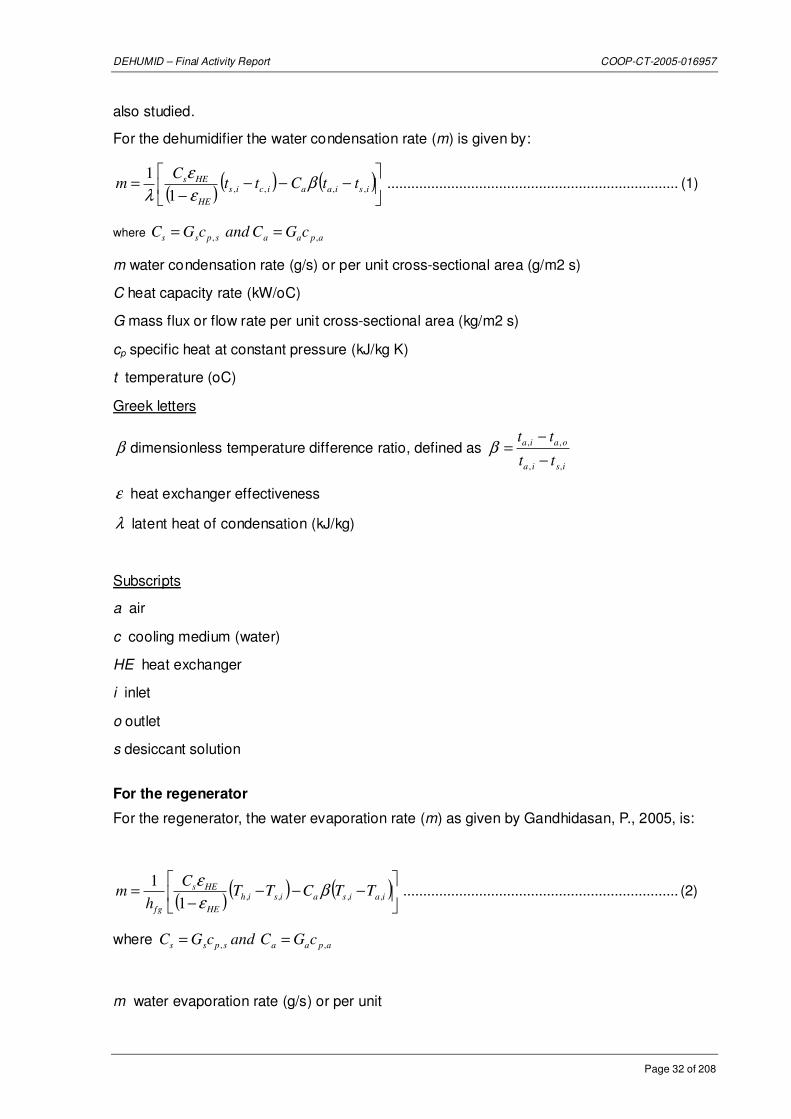
For the dehumidifier
The work of Gandhidasan, P., 2004, describes a relatively simple model for the preliminary design of an air dehumidification process occurring in a packed bed using liquid desiccant through dimensionless vapour pressure and temperature difference ratios. An expression is derived using the aforementioned ratios to predict the water condensation rate from the air to the desiccant solution in terms of known operating parameters. The model predictions were compared against a reliable set of experimental data provided by Fumo, N., Goswami, D.Y., 2002, with very good agreement. The effects of the cooling water inlet temperature and the desiccant-to-water heat exchanger effectiveness on the performance of the dehumidifier are
DEHUMID – Final Activity Report COOP-CT-2005-016957
Page 32 of 208
also studied.
For the dehumidifier the water condensation rate (m) is given by:
( )( ) ( )
−−−
−= isiaaicis
HE
HEs ttCttC
m ,,,,1
1β
ε
ε
λ......................................................................... (1)
where apaaspss cGCandcGC ,, ==
m water condensation rate (g/s) or per unit cross-sectional area (g/m2 s)
C heat capacity rate (kW/oC)
G mass flux or flow rate per unit cross-sectional area (kg/m2 s)
cp specific heat at constant pressure (kJ/kg K)
t temperature (oC)
Greek letters
β dimensionless temperature difference ratio, defined as isia
oaia
tt
tt
,,
,,
−
−=β
ε heat exchanger effectiveness
λ latent heat of condensation (kJ/kg)
Subscripts
a air
c cooling medium (water)
HE heat exchanger
i inlet
o outlet
s desiccant solution
For the regenerator
For the regenerator, the water evaporation rate (m) as given by Gandhidasan, P., 2005, is:
( )( ) ( )
−−−
−= iaisaisih
HE
HEs
fg
TTCTTC
hm ,,,,
1
1β
ε
ε..................................................................... (2)
where apaaspss cGCandcGC ,, ==
m water evaporation rate (g/s) or per unit

DEHUMID – Final Activity Report COOP-CT-2005-016957
Page 33 of 208
C heat capacity rate (kW/m2 _C)
G mass flux or flow rate per unit cross-sectional area (kg/m2 s)
cp specific heat at constant pressure (kJ/kgK)
T temperature (oC)
hfg latent heat of vaporization (kJ/kg)
Greek letters
β dimensionless temperature difference ratio, defined as iais
iaoa
TT
TT
,,
,,
−
−=β
ε heat exchanger effectiveness
Subscripts
a air
h heating fluid (water)
HE heat exchanger
i inlet
o outlet
s desiccant solution
The theoretical/analytical work of Gandhidasan, P., 2004, validated by the experimental work of Fumo, N., Goswami, D.Y., 2002, assumes the effectiveness of the heat exchanger to be 0.6.
For the case of the combined cellulose fibre absorber-cooler, there is no indication in the literature of its heat-exchange effectiveness. It is therefore not possible to reasonably model the proposed system without this value. A rough estimate for the effectiveness of the heat exchanger at the dehumidifier or the regenerator unit would produce quite inaccurate values for m.
As shown in the graphs on Figure 2, a slight increase or decrease in the value of the heat exchanger effectiveness produces a marked increase or decrease, respectively, on the value of the evaporation and condensation rates of water.

DEHUMID – Final Activity Report COOP-CT-2005-016957
Page 34 of 208
Figure 2: Influence of heat exchanger effectiveness on evaporation (left), and on condensation (right) rates – [Taken
from Gandhidasan, P., 2004]
It would therefore be more appropriate to postpone the modelling work until the test bed results have been obtained, and a representative value for the effectiveness of the integrated heat exchanger is available. Once this value is obtained experimentally, the model based on the above equations could then be utilised and refined to optimise the final design prototype.
2.2.2.2 Climatic data required for designing of air conditioning and dehumidification systems
Climatic data for each participant’ country was analysed and treated having aim to identify the most extreme outdoor conditions for designing of dehumidification systems. The DEHUMID project participants are from 7 countries (Lithuania, United Kingdom, Netherlands, Poland, Italy, Portugal, Spain). The most extreme places for dehumidification in each country were identified using ASHRAE handbook data [37]. The results for these countries are presented in Table 1.

DEHUMID – Final Activity Report COOP-CT-2005-016957
Page 35 of 208
Table 1: Cooling and dehumidification design conditions in participating countries (excerpts’ collection from [34])

DEHUMID – Final Activity Report COOP-CT-2005-016957
Page 36 of 208
Continuation of Table 1
The sets of design values in this table represent different psychrometric conditions. Design data based on dry-bulb temperature represent peak occurrences of the sensible component of ambient outdoor conditions. Design values based on wet-bulb temperature are related to the enthalpy of the outdoor air. Conditions based on dew point relate to the peaks of the humidity ratio. The designer, engineer, or other user must decide which set(s) of conditions and probability of occurrence apply to the design situation under consideration. The addition of the new psychrometric design conditions allows for several viewpoints of operational peak loads.
Cooling and Dehumidification Design Conditions. The 0.4%, 1.0%, and 2.0% dry-bulb temperatures and mean coincident wet-bulb temperatures in Column 2 of Table 1 often represent conditions on hot, mostly sunny days. These are useful for cooling applications, especially air-conditioning. Design conditions based on wet-bulb temperature in Column 3
MDB = mean coincident dry-bulb temp., °C MWS = mean coincident wind speed, m/s HR = humidity ratio, grams of moisture per kilogram of dry air
MWB = mean coincident wet-bulb temp., °C StdD = standard deviation, °C A = airport DP = dew-point temperature, °C
- station with most extreme design data for dehumidification (probably needs maximum of hours to dehumidificate)
- station with least extreme design data for dehumidification (probably needs minimum of hours to dehumidificate)
- station with available data of duration of some parameters combinations

DEHUMID – Final Activity Report COOP-CT-2005-016957
Page 37 of 208
represent extremes of the total sensible plus latent heat of outdoor air. This information is useful for cooling towers, evaporative coolers, and fresh air ventilation system design. The design conditions based on dew-point temperatures in Column 4 are directly related to extremes of humidity ratio, which represent peak moisture loads from the weather. Extreme dew-point conditions may occur on days with moderate dry-bulb temperatures resulting in high relative humidity. These values are especially useful for applications involving humidity control, such as desiccant cooling and dehumidification, cooling-based dehumidification, and fresh air ventilation systems. The values are also used as a check point when analyzing the behaviour of cooling systems at part-load conditions, particularly when such systems are used for humidity control as a secondary function. The humidity ratio values in Column 2 correspond to the combination of dew-point temperature and the mean coincident dry-bulb temperature calculated at the standard pressure at the elevation of the location.
The data for most extreme places in each country was summarised and are presented in Table 2, Table 3 and Table 4.
Table 2: Cooling design conditions in most extreme places of participating countries
Cooling DB / McWB
0,4% 1% 2% Dry Bulb Country Station
DB MC-WB
x DB MC-WB
x DB MC-WB
x AAM STD MDR Z
Lithuania Kaunas 26,9 19,2 10,9 25,2 18,2 10,4 26,6 17,1 9,7 30,0 2,0 9,2 75
UK London 27,4 18,7 10,0 25,7 17,7 9,5 24,1 17,2 9,5 31,0 2,3 9,2 24
Netherlands Beek 28,1 19,3 10,6 26,3 18,6 10,5 24,6 17,9 10,3 32,0 2,1 9,1 116
Poland Krakow 29,2 20,4 11,9 27,2 19,3 11,2 25,2 18,2 10,6 32,0 1,8 10,9 237
Italy Palermo 33,2 21,8 11,8 31,1 22,8 14,2 30,0 23,9 16,3 38,0 2,9 5,3 34
Portugal Faro 31,9 20,3 10,2 30,1 20,2 10,8 29,0 20,3 11,4 36,0 1,5 9,5 4
Spain Palma 33,0 23,1 13,8 31,4 22,9 14,7 30,2 22,9 14,7 37,0 1,8 12,4 8
Table 3: Evaporation design conditions in most extreme places of participating countries
Evaporation WB/McDB
0,4% 1% 2% Country Station WB MC-
DB x WB MC-
DB x WB MC-
DB x
Lithuania Kaunas 20,3 25,3 13,1 19,2 23,7 12,3 18,1 22,1 11,5
UK London 19,6 26,0 11,8 18,7 23,8 11,5 17,8 22,4 10,9
Netherlands Beek 20,7 26,0 13,4 19,7 24,4 12,7 18,8 23,1 12,1 Poland Krakow 21,2 27,9 13,6 20,1 26,0 12,8 19,2 24,4 12,3
Italy Palermo
26,6 29,9 21,1 26,1 28,9 20,5 25,5 28,5 19,6
Portugal Faro 22,9 27,6 15,7 22,2 26,8 15,0 21,6 26,4 14,3
Spain Palma 25,8 29,2 19,8 25,0 28,9 18,5 24,3 28,5 17,6
DEHUMID – Final Activity Report COOP-CT-2005-016957
Page 38 of 208
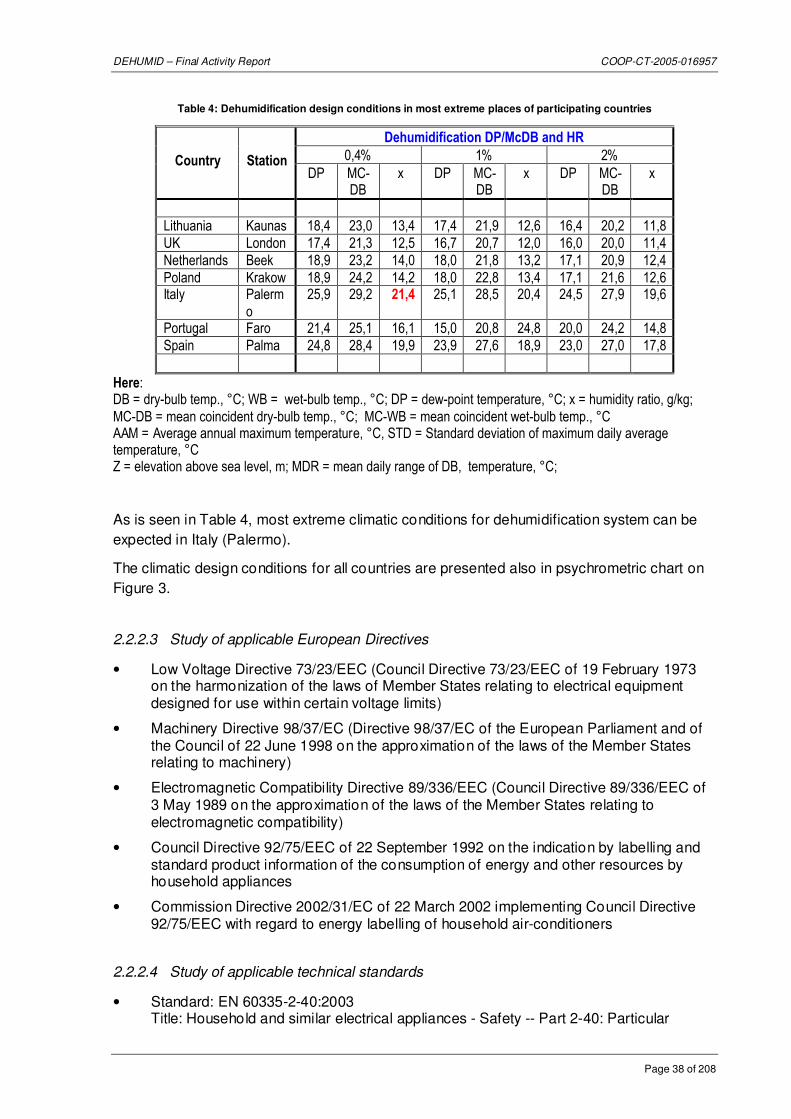
Table 4: Dehumidification design conditions in most extreme places of participating countries
Dehumidification DP/McDB and HR
0,4% 1% 2% Country Station DP MC-
DB x DP MC-
DB x DP MC-
DB x
Lithuania Kaunas 18,4 23,0 13,4 17,4 21,9 12,6 16,4 20,2 11,8
UK London 17,4 21,3 12,5 16,7 20,7 12,0 16,0 20,0 11,4
Netherlands Beek 18,9 23,2 14,0 18,0 21,8 13,2 17,1 20,9 12,4
Poland Krakow 18,9 24,2 14,2 18,0 22,8 13,4 17,1 21,6 12,6 Italy Palerm
o
25,9 29,2 21,4 25,1 28,5 20,4 24,5 27,9 19,6
Portugal Faro 21,4 25,1 16,1 15,0 20,8 24,8 20,0 24,2 14,8
Spain Palma 24,8 28,4 19,9 23,9 27,6 18,9 23,0 27,0 17,8
Here: DB = dry-bulb temp., °C; WB = wet-bulb temp., °C; DP = dew-point temperature, °C; x = humidity ratio, g/kg;
MC-DB = mean coincident dry-bulb temp., °C; MC-WB = mean coincident wet-bulb temp., °C AAM = Average annual maximum temperature, °C, STD = Standard deviation of maximum daily average temperature, °C Z = elevation above sea level, m; MDR = mean daily range of DB, temperature, °C;
As is seen in Table 4, most extreme climatic conditions for dehumidification system can be expected in Italy (Palermo).
The climatic design conditions for all countries are presented also in psychrometric chart on Figure 3.
2.2.2.3 Study of applicable European Directives
• Low Voltage Directive 73/23/EEC (Council Directive 73/23/EEC of 19 February 1973 on the harmonization of the laws of Member States relating to electrical equipment designed for use within certain voltage limits)
• Machinery Directive 98/37/EC (Directive 98/37/EC of the European Parliament and of the Council of 22 June 1998 on the approximation of the laws of the Member States relating to machinery)
• Electromagnetic Compatibility Directive 89/336/EEC (Council Directive 89/336/EEC of 3 May 1989 on the approximation of the laws of the Member States relating to electromagnetic compatibility)
• Council Directive 92/75/EEC of 22 September 1992 on the indication by labelling and standard product information of the consumption of energy and other resources by household appliances
• Commission Directive 2002/31/EC of 22 March 2002 implementing Council Directive 92/75/EEC with regard to energy labelling of household air-conditioners
2.2.2.4 Study of applicable technical standards
• Standard: EN 60335-2-40:2003 Title: Household and similar electrical appliances - Safety -- Part 2-40: Particular

DEHUMID – Final Activity Report COOP-CT-2005-016957
Page 39 of 208
requirements for electrical heat pumps, air-conditioners and dehumidifiers Scope: Deals with the safety of electric heat pumps, including sanitary hot water heat pumps, air-conditioners, and dehumidifiers incorporating sealed motor-compressors. The maximum rated voltage being not more than 250 V for single phase and 600 V for all other appliances. The referenced appliances may consist of one or more assemblies. If provided in more than one assembly, the assemblies are to used together, and the requirements are based on the use of matched assemblies. Supplementary heaters, or a provision for their separate installation, are within the scope of this standard, but only heaters which are designed as a part of the appliance package, the controls being incorporated in the appliance. Note: To be read with EN 60335-1:2002 * D126/C024: DOW postponed to 2007-03-01 (corrigendum April 2006)
• Standard: EN 60335-1:2002 Title: Household and similar electrical appliances - Safety -- Part 1: General requirements Scope: Deals with the safety of electrical appliances for household and similar purposes. It deals with the common hazards presented by appliances that are encountered by all persons in and around the home. It also covers appliances used by laymen in shops, in light industry and on farms (such as catering equipment, and industrial and commercial cleaning appliances). The rated voltage of the appliances are not more than 250 V for single-phase appliances and 480 V for other appliances.
• Standard: EN 378-1:2000 Title: Refrigerating systems and heat pumps - Safety and environmental requirements – Part 1: Basic requirements, definitions, classification and selection criteria
• Standard: EN 378-2:2000 Title: Refrigerating systems and heat pumps - Safety and environmental requirements – Part 2: Design, construction, testing, marking and documentation
• Standard: EN 378-3:2000 Title: Refrigerating systems and heat pumps - Safety and environmental requirements – Part 3: Installation site and personal protection
• Standard: EN 378-4:2000 Title: Refrigerating systems and heat pumps - Safety and environmental requirements – Part 4: Operation, maintenance, repair and recovery
2.2.2.5 Study of safety of liquid desiccants
Material Safety Data Sheets
• See MSDS_LiCl.pdf
• See MSDS-Lithium_chloride.pdf
2.2.2.6 Investigation about similar products (based on solid desiccants).
• See dri_cmp_br.pdf
• See ecodry_manual_SI.pdf
• See hrw_silicagel_brochure.pdf

DEHUMID – Final Activity Report COOP-CT-2005-016957
Page 40 of 208
2.2.2.7 System Requirements
During the first three months and the first two meetings, some changes have been implemented in the work plan.
COMPLEX will take the lead in the design and manufacturing of the system controls. PPUCH will assist in this. Also, COMPLEX was responsible for the analysis and selection of the required sensors, whereby SKAIDULA will help them out.
Based on the proposed installation structure of UNOTT, a hardware list for required sensors and control elements was derived.
Sensors:
• Regenerator : 4 x Temperature, 2 x Humidity, 1x Concentration, 1x Flow meter,
• Exchanger: 4 x Temperature, 2 x Humidity, 1x Concentration, 1x Flow meter,
• Ambient: 1 x Temperature, 1 x Humidity
Control elements:
• Regenerator : 2 Pumps, 1 Fan, 1-2 Valve
• Exchanger : 2 Pumps, 2 Fans, 1-2 Valve
More detailed Sensor data defined in the following period.
The main challenge is the application of concentration sensors. If the concentration is too high, the LiCl solution will start crystallising. This should be prevented at any time.
Various sensors have been investigated, including indirect measurement using Conductivity sensors and correlation tables.
During the first 12 months, a number of datasheets for aforementioned sensors have been assembled and analysed. The final selection was made, optimised for low-cost design.
The system can be split up into two main installations: the exchanger with air cooling, and the regenerator. Both parts could be installed at different locations, so separate control modules were added to the system.
For ambient measurements, a separate Module was developed.
The Main Control Unit for the development of the prototype, is a PC. This will improve the flexibility and ease of use during testing. Communication will take place using industrial bus systems, allowing for relatively bigger physical distances between the main PC and the control modules. This has been envisaged as ideal for testing.

DEHUMID – Final Activity Report COOP-CT-2005-016957
Page 41 of 208
2.3 Progress on Work package #2 – Modelling and Experimental Testing
2.3.1 Objectives
The system was modelled in order to be able to predict, analyse and optimize the system performance by simulations.
2.3.2 Progress made during the reporting period
Tasks worked on Contractor(s) involved
Analyse, formulate, test, and improve commercially available lithium chloride formulations
Economic modelling
Design and manufacture test bed
Perform functional tests
Analyse results
VGTU (Lead), all partners: The humidity load model of an office room was elaborated. The time of possible use and average dehumidification was calculated. Desiccant solution (LiCl-H2O) main physical proprieties were programmed as custom MS Visual basic for applications) functions.
Achievements / Progress made on these tasks
Several commercially available liquid LiCl and LiCl/Br solutions have been tested on performance, stability, corrosivity and safety risks. Falling film technology1 is used. In order to develop analytical and physical understanding of the various phenomena that could affect the heat and mass transfer in the absorber of an absorption chiller, a comprehensive property data base has been be compiled and exploratory experiments were conducted, with emphasis on methods associated with heat and mass transfer in a falling film absorber. The accomplishments include surface tension measurements for aqueous lithium bromide (LiBr) with and without additives, air solubility measurements for LiBr and lithium chloride, stability observations for a static film absorber, and preliminary tests with the falling film absorber apparatus for 60 weight/percent LiBr without surfactant additive.
An Excel spreadsheet providing a tool for economic analysis of DEHUMID was discussed for development. The spreadsheet considers investment and operating costs and judge them against measurable economic improvements (e.g. faster cooling, improved COP). This spreadsheet was used throughout the project for monitoring and evaluating the economic feasibility of the developed DEHUMID technology.
1 A falling film is a liquid layer moving down on a solid surface by the gravity. In a falling film absorber, the absorption solution is distributed to the top of a coil or a plate heat exchanger, it will flow down along the surface of the tube or wall, forming a falling film on the solid surface. In an open absorption system using the falling film, the absorption occurs on the interface between the falling film and the incoming air. The absorption heat will be transferred through the falling film and the wall into the coolant. The advantage of using falling film over using solution spray is that the air would not carry away any the solution droplets

DEHUMID – Final Activity Report COOP-CT-2005-016957
Page 42 of 208
A test bed was designed and manufactured to test the theoretical concepts; tests were run to provide experimental feed-back in order to improve the theoretical model and to verify the initial assumptions. Emphasis has been on carryover of liquid desiccant droplets to the environment.
The available test bed was extensively tested and its functionality was compared with pre-defined assumptions. Partners have tried to address key technical issues (e.g. carryover of liquid desiccant droplets) and measure important variables (e.g. process air moisture temperature, reactivation air temperature, velocity and moisture load of air passing through the desiccant, amount of desiccant presented to the reactivation and process airstreams, and desiccant adsorption properties).
Functional tests results were gathered into a database (Excel spreadsheet) and analysed. Partners will use available figures to determine the level of technical goal accomplishments. Where necessary, consortium has redefined goals if they prove to be overambitious. Analysis report are available for all partners and distributed among them via e-mails or website.
The humidity load model of an office room was elaborated. According to prEN 15251 the humidity load was calculated using three indoor environment categories (three comfort levels). Using available reference year data (climatic parameters of each hour of typical year) the time of possible use and average dehumidification load of future dehumidification system in three countries (Lithuania, United Kingdom, Netherlands) was calculated. The reference year data for Netherlands was obtained after treatment of 15 year’s (1991-2005) hourly climatic data.
The chart illustrating dehumidification design parameters of all participating countries and internal loads according three indoor climate parameters were prepared as well as chart of humidity ratio duration curves for three countries (Lithuania, United Kingdom, Netherlands). These curves express required annual amount of dehumidification (tons of moisture to be removed).
Desiccant solution (LiCl-H2O) physical proprieties (solubility boundary, relative vapour pressure, density, thermal capacity, differential enthalpy of dilution), available in literature sources, were programmed as custom MS Excel (MS Visual basic for applications) functions. These functions were tested and used in dehumidification system spreadsheet model. Simultaneously the proprieties of moist air were programmed as psychrometric functions to be used in same model.
2.3.3 The humidity load model of an office room
To specify the required capacity of future dehumidification system is not enough to know the outdoor air conditions. The internal humidity load is necessary to know as well. According to the agreement between participants reached in Technical meeting in Nottingham (Oct 2005), the target of dehumidification in this project is a typical small office, with no specific humidity loads, hence the people working inside this office are main source of internal humidity load.

DEHUMID – Final Activity Report COOP-CT-2005-016957
Page 43 of 208
The humidity load depends also on indoor comfort conditions. Indoor conditions for this model are based on prEN 15251 [38]. This standard specifies how design criteria shall be used for dimensioning of systems. It will also define how to establish and define parameters of main impact or classes to be used as input to building energy calculation methods and long term evaluation of the indoor environment. Standard specifies the three categories of indoor environment which shall be selected for a space to be conditioned. Category A corresponds to a high level of expectation (and leads to a highest percentage of satisfied occupants in respect of indoor environment), category B a medium level of expectation and category C to a moderate level of expectation. The designer may also select different levels using the same principles. A different category may be selected for thermal environment, the indoor air quality, acoustic environment and lighting for a space or a building. A different category may be selected for summer and winter. According to prEN 15251 [38], the humidity load was calculated using all three indoor environment categories (three comfort levels). Assumptions:
Office type: single office Activity: sedentary, 1,2 met Clothing: for summer wear, 0,5 clo
Table 5: Data and results:
Category of Indoor Environment Parameters
A B C Operative temperature; [r, 38] to °C 25,5 26,0 27,0 Air temperature; [a] ta °C 24,5 25,0 26,0 Relative humidity; [r, 38] RH % 50 60 70 Humidity ratio of outdoor air at 100 m above sea level; [37] x g/kg 9,8 12,1 15,0
Floor area per person; [r, 37] Afp m2/pers. 10 10 10 Volume of fresh air per m2 of floor; [r, 37] Vaf m3/m2 1,0 0,7 0,4 Mass flow of air per person per hour; [c] Map kg/h/pers. 41,8 29,2 16,7 Generation of moisture; [37] Wg g/h/person 50 50 50 Increasing of indoor; [c] ∆x g/kg 1,2 1,7 3,0 marginal humidity ratio of outdoor air above of which is necessary to dehumidificate
xm g/kg 8,6 10,4 12,0
Remarks: [number] – source (ref.No); [a] – assumed; [c] – calculated; [r] – required
The indoor and outdoor climatic design conditions and calculation results are presented in psychrometric chart on Figure 3. Most extreme dehumidification design conditions for countries participating in DEHUMID are marked as blue points. Indoor environment zones are marked as green zones. Outdoor air humidity ratio limits taking into account internal humidity loads – red lines. Dehumidification is needed when outdoor air humidity ratio is above these limits. Dehumidification need is proportional to humidity ratio difference – horizontal distance between blue point and red lines.
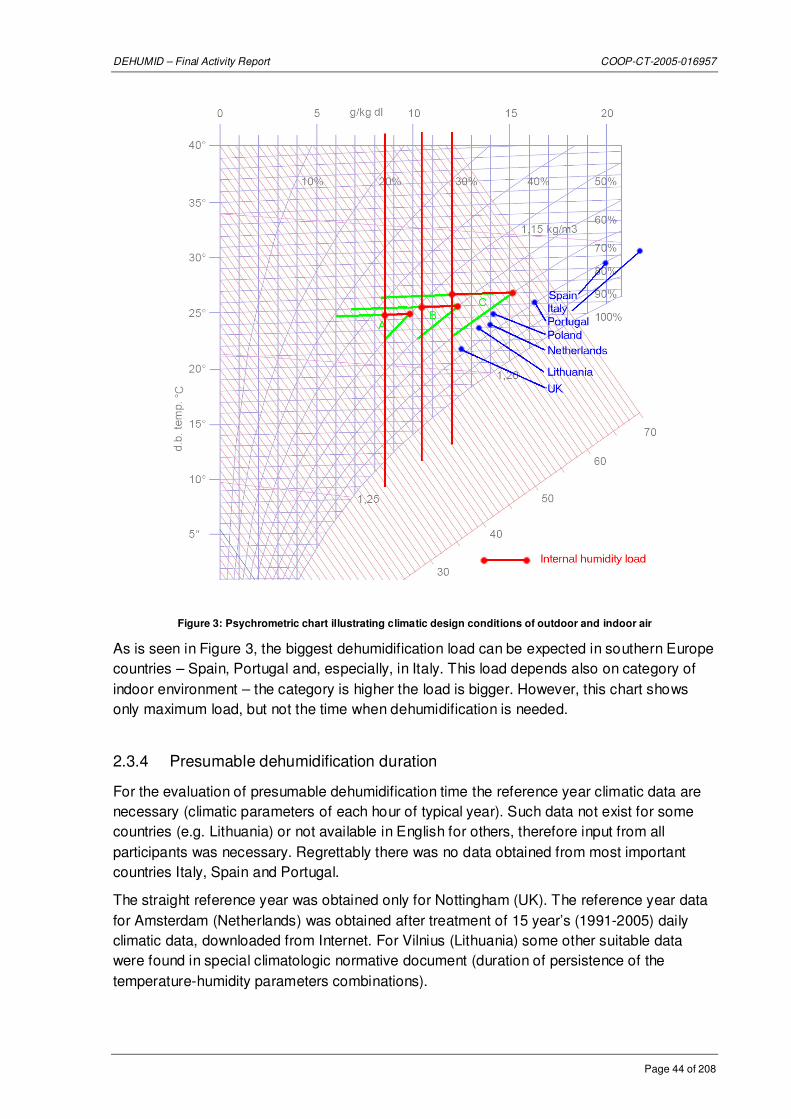
DEHUMID – Final Activity Report COOP-CT-2005-016957
Page 44 of 208
Figure 3: Psychrometric chart illustrating climatic design conditions of outdoor and indoor air
As is seen in Figure 3, the biggest dehumidification load can be expected in southern Europe countries – Spain, Portugal and, especially, in Italy. This load depends also on category of indoor environment – the category is higher the load is bigger. However, this chart shows only maximum load, but not the time when dehumidification is needed.
2.3.4 Presumable dehumidification duration
For the evaluation of presumable dehumidification time the reference year climatic data are necessary (climatic parameters of each hour of typical year). Such data not exist for some countries (e.g. Lithuania) or not available in English for others, therefore input from all participants was necessary. Regrettably there was no data obtained from most important countries Italy, Spain and Portugal.
The straight reference year was obtained only for Nottingham (UK). The reference year data for Amsterdam (Netherlands) was obtained after treatment of 15 year’s (1991-2005) daily climatic data, downloaded from Internet. For Vilnius (Lithuania) some other suitable data were found in special climatologic normative document (duration of persistence of the temperature-humidity parameters combinations).

DEHUMID – Final Activity Report COOP-CT-2005-016957
Page 45 of 208
Using available reference year data the time of possible use and average dehumidification load of future dehumidification system in three countries (Lithuania, United Kingdom, Netherlands) was calculated.
Humidity ratio duration curves
0
2
4
6
8
10
12
14
16
0 500 1000 1500 2000 2500 3000 3500 4000 4500 5000 5500 6000 6500 7000 7500 8000 8500 9000
Hours
Hu
mid
ity
ra
tio
x, g
/kg C (12 g/kg)
B (10,4 g/kg)
A (8,6 g/kg)
Nottingham
Vilnus
Amsterdam
Figure 4: Humidity ratio duration cumulative curves and marginal humidity ratio values for dehumidification
Curves in the chart on Figure 4 visually express annual requirement of dehumidification. The amount of moisture to be removed is proportional to the area delimited by cumulative curve and selected marginal humidity ratio (depending on category of indoor environment – A, B or C). Also is possible evaluate the total time, when dehumidification is necessary. This time is equal to the horizontal distance between intersection of cumulative curve with marginal humidity and total number of hours in the year (8760). In the Table 6 generalized data about time of dehumidification and average load are presented.
Table 6: Presumable time of dehumidification (when outdoor air’ humidity ratio exceed marginal humidity ratio ) and
average load
Place Category of
indoor environment
Marginal humidity
ratio
Hours, of dehumidi fication
Part of total year‘ time
Average humidity
ratio,
Humidity ratio
difference
Gram-hours
CIE xm nh xavg ∆x GH
g/kg h % g/kg g/kg gh
Nottingham A 8,6 1856 21% 10,2 1,6 2957 United Kingdom B 10,4 682 8% 11,5 1,2 791
C 12,0 178 2% 12,8 0,8 142 Vilnius A 8,6 1298 15% 11,8 3,2 1996

DEHUMID – Final Activity Report COOP-CT-2005-016957
Page 46 of 208
(Lithuania) B 10,4 456 5% 12,9 2,5 533 C 12,0 142 2% 13,8 1,8 102 Amsterdam A 8,6 3336 38% 10,6 2,0 6571 (Netherlands) B 10,4 1752 20% 11,5 1,1 1880 C 12,0 312 4% 12,2 0,2 62
Figures in Table 6 shows, that dehumidification system of typical small office was used relatively short time during the year. Especially, if indoor environment category is chosen „C“ and country is in North of Europe. In this case presumable duration of dehumidification is about 200 hours or 2% of total year time. Longer working time could be expected in coast areas. In case of indoor environment category „A“ time of dehumidification in Amsterdam can reach 3336 hours (38% year’ time). In Southern Europe cost areas this figure, probably, even higher (see Figure 3).
The total amount of humidity to be removed for different places and indoor environment categories can be compared using integrated parameter „gram-hours“ (see the last column of Table 6). This parameter is analogical to „degree-days“ used for assumption of heat amount needed for building heating. „Gram-hours“ integrate the humidity ratio difference between indoor and outdoor air and the time of such parameter persistence.
2.3.5 LiCl solution physical proprieties functions
Desiccant solution (LiCl-H2O) physical proprieties (solubility boundary, relative vapour pressure, density, thermal capacity, differential enthalpy of dilution), available in literature sources [7], were programmed as custom MS Excel (MS Visual basic for applications) functions. These functions were tested and used in dehumidification system spreadsheet model. Simultaneously the proprieties of moist air [37] were programmed as psychrometric functions to be used in same model.
Table 7: List of functions:
Returned parameter, Function name, arguments list Dimension θ = LiClSol_BoundTemp ( ξ ) °C = f ( - )
π = LiClSol_RelVapPress ( ξ , θ ) - =f( - , °C )
ρ = LiClSol_Density ( ξ , θ ) kg/m3 = f( - , °C )
c = LiClSol_ThermCap ( ξ , θ ) kJ/kg/°C =f( - , °C )
∆h = LiClSol_DiffEnthDill ( ξ , θ ) kJ/kgH2O = f( - , °C )
ρ = H2O_Density ( θ ) kg/m3 = f(°C)
c = H2O_ThermCap ( θ ) kJ/kg/°C = f(°C)
p = H2O_VapPrAboveWsurf ( θ ) Pa = f(°C)
Here:
θ [°C] - temperature ξ [-] - concentration (mass fraction) π [-] - relative water vapour pressure ρ [kg/m3] - density c [kJ/kg/°C] - specific thermal capacity

DEHUMID – Final Activity Report COOP-CT-2005-016957
Page 47 of 208
∆h[kJ/kgH2O] - differential enthalpy of dilution p [Pa] - vapour pressure
Testing charts of LiCl solution physical proprieties functions:
θ = LiClSol_BoundTemp( ξ )
-80,0
-40,0
0,0
40,0
80,0
120,0
160,0
0 0,1 0,2 0,3 0,4 0,5 0,6
ξ [-]
θ [
°C]
Figure 5: LiCl-H2O solubility boundary as function of
concentration
LiClSol_RelVapPress( ξ , θ)
-0,20
0,00
0,20
0,40
0,60
0,80
1,00
1,20
0 0,2 0,4 0,6 0,8 1 1,2
ξ [-]
π [-]
25
50
80
100
Figure 6: Relative water vapour pressure over LiCl-H2O
solution surface as function of concentration and
temperature
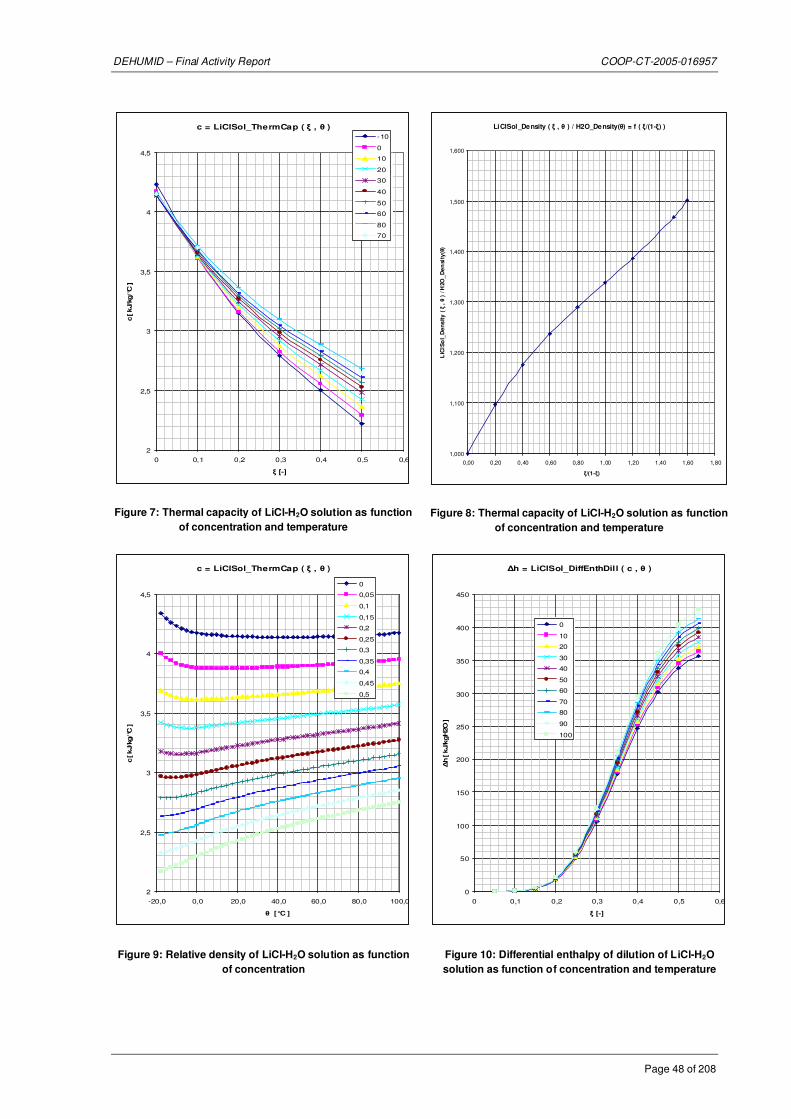
DEHUMID – Final Activity Report COOP-CT-2005-016957
Page 48 of 208
c = LiClSol_ThermCap ( ξ , θ )
2
2,5
3
3,5
4
4,5
0 0,1 0,2 0,3 0,4 0,5 0,6
ξ [-]
c [ k
J/k
g/°C
]
-10
0
10
20
30
40
50
60
80
70
Figure 7: Thermal capacity of LiCl-H2O solution as function
of concentration and temperature
LiClSol_Density ( ξ , θ ) / H2O_Density(θ) = f ( ξ/(1-ξ) )
1,000
1,100
1,200
1,300
1,400
1,500
1,600
0,00 0,20 0,40 0,60 0,80 1,00 1,20 1,40 1,60 1,80
ξ/(1-ξ)
LiC
lSo
l_D
en
sit
y (
ξ ,
θ )
/ H
2O_
De
nsi
ty(θ
)
Figure 8: Thermal capacity of LiCl-H2O solution as function
of concentration and temperature
c = LiClSol_ThermCap ( ξ , θ )
2
2,5
3
3,5
4
4,5
-20,0 0,0 20,0 40,0 60,0 80,0 100,0
θ [°C ]
c [ k
J/k
g/°C
]
0
0,05
0,1
0,15
0,2
0,25
0,3
0,35
0,4
0,45
0,5
Figure 9: Relative density of LiCl-H2O solution as function
of concentration
∆h = LiClSol_DiffEnthDill ( c , θ )
0
50
100
150
200
250
300
350
400
450
0 0,1 0,2 0,3 0,4 0,5 0,6
ξ [-]
∆h [ k
J/k
gH
2O
]
0
10
20
30
40
50
60
70
80
90
100
Figure 10: Differential enthalpy of dilution of LiCl-H2O
solution as function of concentration and temperature

DEHUMID – Final Activity Report COOP-CT-2005-016957
Page 49 of 208
2.3.6 Test bed design
The testing bed was built in T13. Preparing for this, data for the various sensors have been acquired and analysed for optimisation.
2.3.6.1 Temperature Sensors:
Sensor Type Advantages Disadvantages Typical Models
Platinum-Sensors Good accuracy Expensive, complexity measurement controls
Pt100, Pt1000
Nickel-Sensors Good accuracy Expensive, complexity measurement controls
Ni1000
Voltage Sensors Medium accuracy, good linearity
Medium complexity measurement controls, Reference voltage is required
LM35
Digital Sensors Good accuracy, good resolution
Digital interface only for small distances, expensive
DS18S20
Silicon-Sensors Medium accuracy, low cost
Linearization is required KTY81
2.3.6.2 Dehumidity Sensors:
Sensor Type Advantages Disadvantages Typical Models
Capacity Sensors Average costs Low complexity measurement controls, poor market availability for small series
808H5V5 Sencera
Resistance Sensors Low costs Complexity measurement controls, temperature compensation is required, calibration is required
SYH-2 Syhitech
H12K5 Sencera

DEHUMID – Final Activity Report COOP-CT-2005-016957
Page 50 of 208
Integrated Sensors Good accuracy, no calibration required
Very low complexity measurement controls, medium costs, calibration data are available
HIH-4000
Integrated Resistance Sensors
Good accuracy, no calibration required
Very low complexity measurement controls, medium costs, calibration data are available
SYHITECH Module
2.3.6.3 Flow meters
Standard Impulse Sensors have been selected, as UNOTT already has had very good results. Supplied by RS Electronic. Data sheet has been added to this report.
While having experienced problems during density measurements, it was revealed that conductivity measuring was required. The LiCl solution is very corrosive, only allowing for contactless sensors, which is a standard practice in the chemical industries.
2.3.6.4 Conductivity Sensors :
Sensor Type Advantages Disadvantages Typical Models
Electrode sensors Medium Costs Complexity measurement controls, temperature compensation is required, low accuracy, problems when measuring high levels of conductivity, risk for corrosion
Various Models, mostly without Interface
Contactless – induction sensors
Very high resilience, very good accuracy, simple installation
Very high costs Mettler Toledo InPro Series + Converter

DEHUMID – Final Activity Report COOP-CT-2005-016957
Page 51 of 208
2.3.6.5 Controls for Fans and Pumps:
Sensor Type Advantages Disadvantages Typical Models
Frequency-Inverter Very good regularity, real frequency inversion
Medium to high costs Various Models, e.g.. Omron J7 Series
Triac Impulse Control Very simple Controls, very low costs
Irregularity in revs, only for fans with Big Rotors, Risk for overload
Triac
Trac Phase Control Simple Controls, very low costs
Disturbance filter required, Risk for overload
Triac, Net synchronisation
The detailed data for the investigated sensors, controls (including inverter) have been added to this report.
After analysing and consulting other Partners, following sensors and controls have been selected:
• Temperature sensors – KTY81-210, simple to implement, allowing for long cables (up to ~50m), Measuring range variable on resistance,
• Humidity sensors – HIH-4000, with Calibration data
• Concentration sensor – indirect, using Conductivity measurements, still under investigation within the consortium, Universal output 0..4..20 mA in the control modules was integrated.
• Flow sensor – Impulse measurement, simple data acquisition.
• Universal output – Relay, NO or NC can be chosen, max 2 A.
• Output Optotriac with ZCD, max 1 A, for fans, valves etc.
• Output 0..10 V for Inverter.
• Interface – optoisolated RS485, half-duplex, Communication master-slave.

DEHUMID – Final Activity Report COOP-CT-2005-016957
Page 52 of 208
2.4 Progress on Work package #3 – Design a Low-Cost PC System
2.4.1 Objectives
To design system architecture including system components (software & hardware) and integration within the system. Progress made during the reporting period.
Time Period Task worked on Contractor(s) involved
1-12 System Architecture Design HIREF/UNOTT
1-12 Define System Requirements HIREF/UNOTT
1-12 Design and implementation of output HIREF/UNOTT
1-12 Design and implementation of Graphical User-Interface
HIREF/UNOTT
1-12 Develop operational protocols HIREF/UNOTT
13 User interface design including graphic screens that enable operators to monitor environmental conditions and equipment performance so timely maintenance can be performed.
COMPLEX (Lead)
PPUCH
HIREF
LOKMIS, SKAIDULA
13-14 Characterisation of the special density meter developed for the project and measurement of the density of LiCl aqueous solutions at different concentrations (30%, 35% and 40%) and for temperatures ranging from 15 to 90 °C.
IG (Lead)
COMPLEX
PPUCH
HIREF
LOKMIS, SKAIDULA
Achievements / Progress made on this task
System Architecture Design
Development/setting up of software development process related documents. System architecture design
Definition of System Requirements
Analysis of acceptable tradeoffs between competing attributes, e.g. between robustness and correctness.
Definition of PC system architecture (including memory, security, processing time, storage, system throughput, system traceability, etc.).

DEHUMID – Final Activity Report COOP-CT-2005-016957
Page 53 of 208
Environmental sensors to be included in the PC system: thermocouples, pressure transducers, humidity sensors, liquid density meters, liquid level sensors and flow rate meters. Selection criteria for the use of sensors have been: temperature range, chemical resistance, abrasion and vibration resistance, installation requirements. Calibrators have been selected to meet required accuracy specifications for the sensors.
Design and implementation of output
Centralized low-cost PC-control system development that provides the main interface for customized process control and data collection. Operates automatically and stores sensor alarms. Makes simple logical decisions such as raising/lower amount of dehumidification and/or cooling to create a healthy comfortable environment using the least amount of energy necessary.
Design and implementation of Graphical User-Interface
User interface design including graphic screens that enable operators to monitor environmental conditions and equipment performance so timely maintenance can be performed.
Develop operational protocols
Operational protocols development for regulating the variables that have a major impact on the effectiveness of a desiccant dehumidification system—required for integrating liquid desiccant dehumidification systems with heating and cooling units for the most efficient performance.
Characterisation of the special density meter
After analysis of datasheets of the conductivity measurement equipment and some tests a model for direct density measurement was developed. See Table 8 for an overview of the different density measurement methods.
2.4.2 System Design
Based on the requirements for the control modules, the design has been performed using CAD software EAGLE. The inputs have been calculated using assembled sensor data, including passive compensation of linearity for the KTY sensors.
The temperature inputs have been properly dimensioned using high accuracy resistors. In case after testing it would be required to change the ranges, the resistors (2 for each channel) must be changed.
A state-of-the-art Micro-controller (MICROCHIP) has been selected. This can be reprogrammed in the switch controls. Before the actual testing has started off, it is not exactly known which functions should be programmed.
The communication was realised using an industrial standard, RS485, 9600 Baud, half duplex. This type is highly resilient against failures. The modules were connected with the PC by a BUS (half-duplex), using master-slave communication protocols. Each module was appointed to an address which can be adjusted by DIP switches.

DEHUMID – Final Activity Report COOP-CT-2005-016957
Page 54 of 208
Data protocols were realised as simple as possible. Data processing and correcting the sensors was performed by the PC. Data security was guaranteed by using checksums.
All Parameters are registered using data logging, allowing for a detailed analysis at a later stage.
Also, an emergency programme is foreseen in case the communication should fail. The modules will fall back into an emergency mode preventing further damage or even bigger failures.
Each Module has 8 LEDs, which indicate the current status of the outputs, including failures of elements, like sensors. Critical elements are continuously watched.
A opto-isolated Interface was integrated in the control system.
2.4.3 Special density meter
Table 8: Comparison of various Density Sensors
Sensor Type Advantages Disadvantages Typical Models
Electrode sensors Medium Costs Complexity measurement controls
Temperature compensation required
Low accuracy
Problems encountered when measuring high levels of conductivity
Risk of corrosion
Various Models, mostly without Interface
Contactless – induction sensors
Very high resilience
Very good accuracy
Simple installation
Very high costs Mettler Toledo InPro Series + Converter
Differential pressure sensor
Good accuracy
Low to medium cost
Direct measurement (no data conversion)
Resistant against dirty in liquid
Easy calibration
Complex design due to air pump
Precision pressure sensor
To be developed for special use in dehumidification unit.

DEHUMID – Final Activity Report COOP-CT-2005-016957
Page 55 of 208
The indirect density measurement was not optimal because the method is temperature dependent and requires very expensive elements if aggressive liquids are utilised.
The working principle is a differential pressure measurement, using modern, very sensitive pressure sensors and an instrumentation amplifier in order to achieve minimum zero drift. A simplified working principle is shown on Figure 11.
Figure 11: Schematic of the proposed Density Meter
A model circuit was developed for testing the usability of this method, see Figure 12. The pressure sensor was connected to a high precision amplifier and to a small digital voltmeter with an LCD display. Calibration was carried out in air (0.00) and in distilled water (1.00). The measuring pipes had a length difference of 100 mm.

DEHUMID – Final Activity Report COOP-CT-2005-016957
Page 56 of 208
Figure 12: Schematic diagram of density meter model.
A basic model of the density meter was designed, to test the usability of MPX2010 sensors. The output device used was a standard 3 ½ digit voltmeter. The precision amplifier AMP04 was used for best zero drift performance. No additional drift compensation was implemented in the model circuit.
Figure 13: Density meter model. right, the air pump, left, board with electronic elements.

DEHUMID – Final Activity Report COOP-CT-2005-016957
Page 57 of 208
Figure 14: Density meter model with voltmeter module connected (right).
Figure 15: DM model with measurement glass pipes. The reading is equal to density in g/cm3.

DEHUMID – Final Activity Report COOP-CT-2005-016957
Page 58 of 208
The model was tested by IG and accepted for use in the prototype. In laboratory, the calibration of the DM was done putting the pipes in 4 different media (at 20 °C):
• air (0.00),
• distilled water (1.00),
• diethyleneglycole (1.12), and
• dichloromethane (1.33)
Successively a measurement of the density of LiCl aqueous solutions was carried out at different concentrations (30%, 35% and 40%) and for temperatures ranging from 15 to 90 °C.
1,12
1,14
1,16
1,18
1,20
1,22
1,24
1,26
1,28
0 10 20 30 40 50 60 70 80 90 100
Temperature [°C]
Den
sit
y [
g/c
m3
]
30%
35%
40%
Figure 16: Density measurements LiCl

DEHUMID – Final Activity Report COOP-CT-2005-016957
Page 59 of 208
Figure 17: Testing of the DM model in IG (1).

DEHUMID – Final Activity Report COOP-CT-2005-016957
Page 60 of 208
Figure 18: Testing of the DM model in IG (2).
As a result of tests and optimisation of the placement of the measurement pipes, the length of these pipes had to be decreased; consequently reducing the length difference to 50 mm. To improve the thermal stability of the system, an additional special compensation circuit was added. This circuit reduced the thermal drift by 3-5 times, improving the stability of the reading to within 1 mm H2O.
Prototype density meters were developed using the current interface to the control the modules because the interface in the modules was originally developed for connection to commercial density meters.
Figure 19 is the schematic diagram of the density meter circuit used in the test installation:
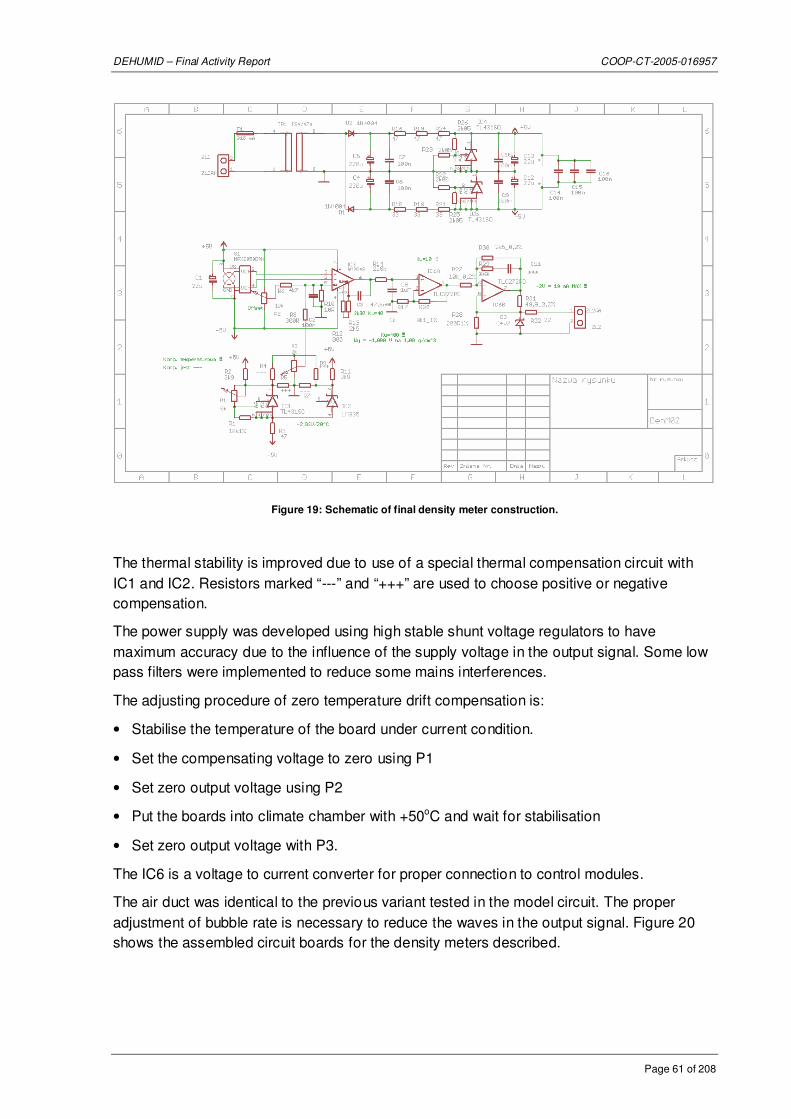
DEHUMID – Final Activity Report COOP-CT-2005-016957
Page 61 of 208
Figure 19: Schematic of final density meter construction.
The thermal stability is improved due to use of a special thermal compensation circuit with IC1 and IC2. Resistors marked “---” and “+++” are used to choose positive or negative compensation.
The power supply was developed using high stable shunt voltage regulators to have maximum accuracy due to the influence of the supply voltage in the output signal. Some low pass filters were implemented to reduce some mains interferences.
The adjusting procedure of zero temperature drift compensation is:
• Stabilise the temperature of the board under current condition.
• Set the compensating voltage to zero using P1
• Set zero output voltage using P2
• Put the boards into climate chamber with +50oC and wait for stabilisation
• Set zero output voltage with P3.
The IC6 is a voltage to current converter for proper connection to control modules.
The air duct was identical to the previous variant tested in the model circuit. The proper adjustment of bubble rate is necessary to reduce the waves in the output signal. Figure 20 shows the assembled circuit boards for the density meters described.
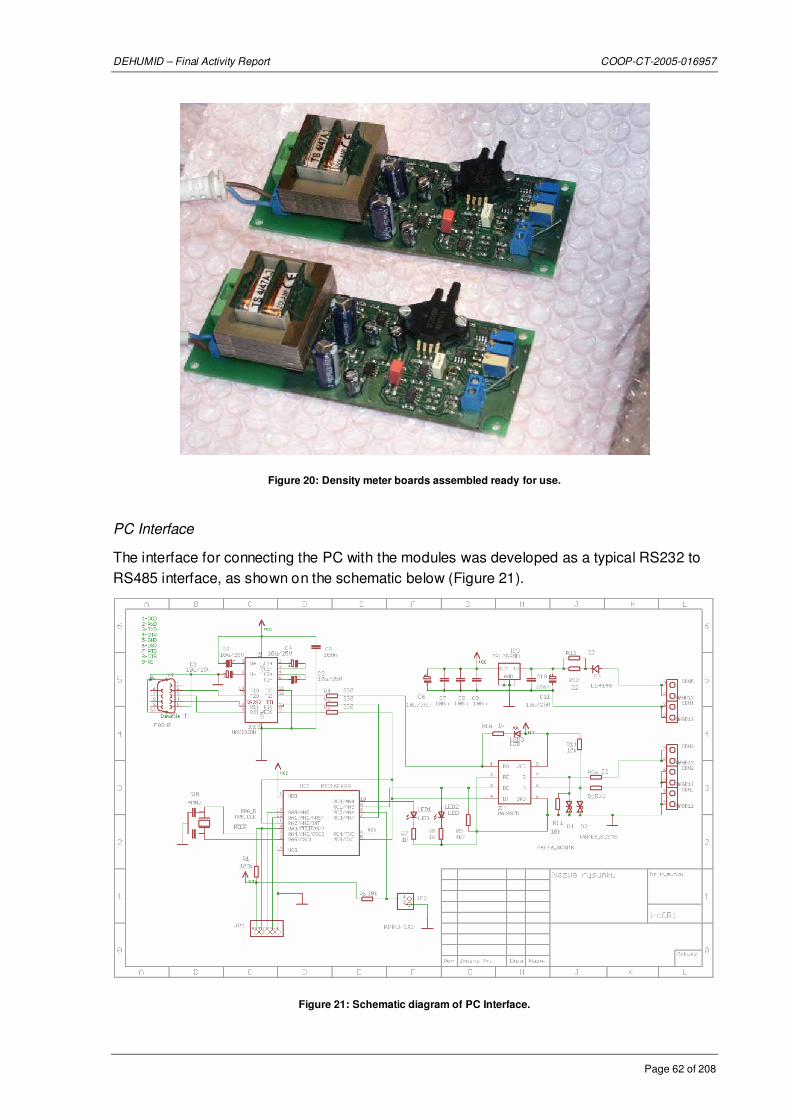
DEHUMID – Final Activity Report COOP-CT-2005-016957
Page 62 of 208
Figure 20: Density meter boards assembled ready for use.
PC Interface
The interface for connecting the PC with the modules was developed as a typical RS232 to RS485 interface, as shown on the schematic below (Figure 21).
Figure 21: Schematic diagram of PC Interface.

DEHUMID – Final Activity Report COOP-CT-2005-016957
Page 63 of 208
The microcontroller used in this interface is necessary to initiate the active sending of data to the bus and stop transmitting immediately after stopping the transmission. Unfortunately, Windows based applications are not able to resolve the information when the transmission is complete. The solution could be an additional interface with a small microcontroller which is controlling the timing!
Supply voltage is applied by an external mains supply 9 to 12V unstabilised. The interface was assembled on double sided circuit board with DB9 female connector – see (Figure 22).
Figure 22: Interface board without case.
Operational protocol development for regulating the variables that have a major impact on the effectiveness of a desiccant dehumidification system - required for integrating liquid desiccant dehumidification systems with heating and cooling units for the most efficient performance.

DEHUMID – Final Activity Report COOP-CT-2005-016957
Page 64 of 208
2.5 Progress on Work package #4 - Design & Prototype Liquid Desiccant
System
2.5.1 Objectives
To design and manufacture a compact, cost-effective dehumidification system based on liquid desiccant (LiCl.H2O) capable of meeting the specifications determined in the previous work packages.
2.5.2 Progress made during the reporting period.
Time Period Task worked on Contractor(s) involved
1-12 Design system layout
Detail components
Manufacture prototype
HIREF/UNOTT
HIREF/IG
14 Several critical components have been thoroughly assessed before assembly
COMPLEX (Lead) All SMEs, IG, UNOTT
12-15 Partners made sure that the technological risk is minimised
ALL
12-14 The final system design has been made, components were detailed., the UNOTT prototype was manufactured.
LiBr and LiCl assessments were performed.
UNOTT
13-16 From the prototype from UNOTT components were detailed., the IG prototype was manufactured Design documents were drawn and specified. HIREF’s Air treatment unit (ATU) was designed and installed at IG
IG, HIREF
Achievements / Progress made on this task
Prototypes of components were designed and manufactured, and integrated into a functional system. Components, equipment and processes were designed/constructed with the aid of CAD. The design documents and drawings have been recorded in Deliverable D09.
Several critical components were thoroughly assessed before assembly.
Prototype has been assembled based on the system layout and using components developed.

DEHUMID – Final Activity Report COOP-CT-2005-016957
Page 65 of 208
During testing of the fan speed control method we decided to use simply TRIAC control which allows speed settings between 5 and 100 % with 5% increments. This is possible due to the relatively large inertia of the fan rotors. The regulation range is sufficient for good installation control.
2.5.2.1 The Design of the System
Previous research work into dehumidification systems, carried out at the School of the Built Environment – University of Nottingham, provided basis for the design of the experimental test bed. The test bed was designed to resemble the first generation of the prototype, and represent its operating characteristics as closely as possible. This decision is envisaged to save efforts on the long run.
The Dehumidifier
As shown in Figure 23, there are two types of dehumidifier, one is of square DP/IND and MHM3C and another is of diamond DP/IND and MHM3C, the former has higher efficiency but higher air pressure drop. The latter has been selected for the experimental work, and is depicted in Figure 24 showing the temperature, humidity and desiccant-concentration sensors.
Preliminary calculations, corresponding to Figure 24, show the following results for a typical scenario:
30 oC 70% RH 18.8 g/kg 78 kJ/kg 500 m3/h 25.9 oC 58% RH 12.1 g/kg 57kJ/kg 500 m3/h 26.3 oC 33% RH 7 g/kg 44kJ/kg 500 m3/h 24 oC 50% RH 9.3 g/kg 48 kJ/kg 500 m3/h 27.9 oC 68%RH 16g/kg 69 kJ/kg 500 m3/h 27 oC 95%RH 21.5g/kg 82 kJ/kg 500 m3/h
Gross cooling: 500*1.2*(78 – 44)/3600 = 5.67kW
Net cooling: 500*1.2*(48 – 44)/3600 = 0.67 kW
Moisture removed by dehumidifier is: 500*1.2*(18.8 - 7) = 7080 g/h.
Moisture removed by DP/IND: 500*1.2*(12.1- 7) = 3060 g/h.
The Regenerator
The regenerator was designed to feature with three features in mind; namely, counter flow heat and mass transfer of air and desiccant, good wicking ability of (DP/IND) and maximum air-to-air heat recovery (A/A hex).
Preliminary calculations, corresponding to Figure 30, show the following results for a typical scenario:

DEHUMID – Final Activity Report COOP-CT-2005-016957
Page 66 of 208
30 oC 70% RH 18.8 g/kg 78 kJ/kg 100 m3/h 54 oC 20% RH 18.8 g/kg 103.4 kJ/kg 100 m3/h 70 oC 25% RH 52.9 g/kg 209.5 kJ/kg 100 m3/h 46 oC 52.9 g/kg 184.1 kJ/kg 100 m3/h
Water removed is 100*1.2*(52.9- 18.8) = 4092 g/h.
Thermal energy required is: 100*1.2*(209.5- 103.4)/ 3600 = 3.5 kW.
Figure 23: Schematic CAD drawing of two different geometries for cores of the dehumidification unit

DEHUMID – Final Activity Report COOP-CT-2005-016957
Page 67 of 208
600
DP/IND
MHM3C
EA
SA
water pumpdesiccant pump
FARA
3
6
2
5
14
fanfan
200250200150 150
250
250
100
250
25
0
t1 H1
t2 H2
t3 H3
t4 H4
t5 H5
t6 H6
ts tw Cs
1
Figure 24: A schematic drawing of the dehumidification unit
DP/IND: combined desiccant pad/indirect evaporative cooling surfaces;
MHM3C is the heat exchanger (Micro Heat & Mass Cell Cycle Core).
The basic principle is shown in Figure 24.
t is temperature, while H is humidity; so there are 8 temperature, 6 humidity sensors and 1 concentration sensor in the dehumidifier unit.
There are 2 Fans and 2 pumps.
Fresh air enters at 1 (FA1) is first dehumidified and cooled by desiccant in the MHM3C
device and exits at point 2. This air then passes the DP/IND, where it is further dehumidified,
exiting the fan at point SA3. The return air 4 (RA4) also passes the MHM3C device to get the
desiccant regenerated and become 5, and then pass the DP/IND to become humidified again
and to absorb the heat from the dehumidification process to exit the system via the fan at
EA6.

DEHUMID – Final Activity Report COOP-CT-2005-016957
Page 68 of 208
There is a desiccant basin and a water basin under the DP/IND, desiccant is cycled into one channel of the DP/IND, and water is cycled in another channel of the DP/IND.
The desiccant basin exchanges desiccant with regenerator and the water basin need to
make up water. For MHM3C device, the desiccant would get auto balance and no need to
exchange desiccant with regenerator.
MHM3C device
MHM3C device is considerably unique in comparison to conventional heat exchangers and enthalpy devices. The MHM3C employees liquid desiccant as a medium which is self-cycling; it can realize the moisture transfer, namely dehumidification and regeneration in one device.
The MHM3C is characterized with Micro Heat & Mass Cycle.
The Micro heat and mass cycle heat transfer mechanism is depicted in Figure 25.
Figure 25: The Micro heat and mass cycle heat transfer mechanism
Two streams of air are separated by a membrane, which is coated with desiccant, the heat
and mass (H&M) transfer direction is indicated in Figure 25.
The heat transfer driving force is the temperature difference, such as the heat transfer is from point 1’ to 1 as the 1’ has higher temperature.
The mass transfer driving force is the pressure difference and Micro cycle, for example, the moisture in the air at point 1’ is absorbed by desiccant D1’ as the water vapour pressure in the air is higher than that of the desiccant surface as shown in Figure 26 but the desiccant D1 is regenerated by air 1 as the water vapour pressure in the air is lower than that of the desiccant surface as shown in Figure 27. On the other hand, there is micro cycle between D1’ and D1, so that the moisture in air point 1’ via D1’, D1 and then to 1.

DEHUMID – Final Activity Report COOP-CT-2005-016957
Page 69 of 208
The so-called Micro cycle, which is driven by temperature difference and concentration difference, is shown in Figure 28.
Figure 26
Figure 27

DEHUMID – Final Activity Report COOP-CT-2005-016957
Page 70 of 208
Figure 28: The Micro cycle
DP/IND device
DP/IND device is also unique, it contains two channels, one is the water/air channel and the
another is desiccant/air channel. For each channel, there are water or desiccant channels
and an air channel, to ensure zero carry-over of liquid (water and desiccant). The scheme is
shown in Figure 29.
Figure 29: Schematic representation of the DP/IND device

DEHUMID – Final Activity Report COOP-CT-2005-016957
Page 71 of 208
(a) (b)
Figure 30: (a) a photogrpah of the desiccant regenerator (b) A schematic drawing of the desiccant regenerator
T is temperature, while H is humidity; so there are 13 temperature, 4 humidity sensors and 1 concentration sensor in the regenerator unit. There are1 Fan and 1 pump
Ts, Ts1 and Txc should read the same temperature, if the distance between them is reasonable, and therefore only one of the three could be used.
Please note that the flow meter for the desiccant could be located in either of the two sections (namely: To dehumidifier or from dehumidifier). The fact that this is an open circuit, flow from the dehumidifier must always be made equal to the flow to the dehumidifier to avoid desiccant overflow at the pans/basins.
As shown in Figure 30(b), ambient air 1 pass air to air heat exchanger to get the temperature
increased to become 2, and then pass desiccant pads (DP) to get humidified and at the
same time to get the desiccant regeneration to become 3 and then return to the heat
exchanger to release the heat and exhaust as 4.The psychrometric chart is shown in Figure
31.

DEHUMID – Final Activity Report COOP-CT-2005-016957
Page 72 of 208
Figure 31: The regenerator psychrometric chart
The regenerator is featured with high efficiency for 3 factors: the counter flow heat and mass
transfer of air and desiccant, good wick ability of desiccant pads (DP) and also for air/ air
heat recovery (A/A hex). Desiccant pads are unique pads with the combination of plastic and
special paper, the special paper enables "good wicking" and the possibilities to withstand
high temperatures. The plastic provides strength to the structure. The combination thus
provides for temperature enduring, good wicking and anti corrosion pads that can reach high
efficiency of heat and mass transfer.
The air/air heat exchanger is also uniquely made, using a high efficiency, temperature
enduring and anti corrosive plastic. Figure 32 shows the DP and A/A HEX layout and the air
flow.
Figure 32: The DP and A/A HEX layout
Liquid flow diagram
The system liquid flow diagram is shown in Figure 33

DEHUMID – Final Activity Report COOP-CT-2005-016957
Page 73 of 208
Figure 33: Schematic of the liquid circuit of the complete system (1)
Figure 34: Schematic of the Liquid circuit of the complete system (2)
SD: strong desiccant; WD: weak desiccant; HW: hot water; CW: cool water; DB: desiccant basin; WB: water basin; Ø: solenoid valve; HEX is plate heat exchanger

DEHUMID – Final Activity Report COOP-CT-2005-016957
Page 74 of 208
Control of the System
For the purpose of prototype testing, the control of the system should be manual as well as automatic; so that in the case of any control problems the logic sequence could be overridden and the system works on its components specified ratings (i.e. pumps and fans work on full capacity).
The level of LiCl on the basins/pans (at dehumidifier and regenerator) could be adjusted by means of the valves.
Automatically, the system should attain steady state conditions at optimal operation. The bottom line for optimum/ideal operation of the system is maintaining the desiccant flow rate at the right concentration (high) and at the right temperature (low), for a given flow rate of process air. This is the only way the maximum water removal rate could be achieved.
The ultimate sign of optimal operation is the value of the relative humidity of the process air H3 (figure4).
Ideally, if H3 is not down to the desired/set value then it is either that the concentration is low and/or the temperature of the desiccant solution is high.
The schematic in the following page depicts a flowchart outlining the basic layer of control for the system. Others layers containing advanced control configurations could be added as the prototype progresses and evolve.
It is assumed that wetting of pads is complete.
Values for calibration and other referencing values aiding the design of the control was provided at a later stage, as requested.

DEHUMID – Final Activity Report COOP-CT-2005-016957
Page 75 of 208
YES
Is the pump at
its max
Start the system and
allow it to attain
steady state operation
Check that the Humidity (H3)
and the temperature (t3) are
within the design/desired
Is H3
high? NO
Terminate all actions
and carry on with the
current settings.
YES
Check that the concentration (Cs1) and
the temperature of the desiccant (ts)
are within the design/desired range.
Is t3
high?
NO
Increase cooling
water flow rate
by increasing
pump rotation
YES
Is Cs1
low? NO
Increase flow of desiccant between the
regenerator and dehumidifier, by increasing
both desiccant pumps rotation and/or both
solenoid valves openings. Also increase flow
rate of scavenging air to suit the increased
desiccant flow.
NO YES
Figure 35: Basic Flow diagram for the control of the system
Advantages of the Current Design
• Compact, due to the integrated desiccant pads and indirect evaporative-cooling pads.

DEHUMID – Final Activity Report COOP-CT-2005-016957
Page 76 of 208
• Relatively lightweight, due to the novel cellulose fibre and plastic.
• Low cost, due to the novel material used.
• Cheaper maintenance, due to the readily replaceable low-cost absorber core
Figure 36: Two sizes of dehumidification units and one regenerator ready for testing
2.5.3 Control modules
Both modules have been made physically ready as a prototype ready for testing. See and below.

DEHUMID – Final Activity Report COOP-CT-2005-016957
Page 77 of 208
Figure 37: control module exchanger
Figure 38: control module regenerator

DEHUMID – Final Activity Report COOP-CT-2005-016957
Page 78 of 208
After a study on legal and normative requirements resulting from EMC-, Low Voltage and Machinery Directives, the platinum elements have been separated.
CAD software EAGLE ahs been used. The modules were mounted at typical DIN rails. All I/O’s have screw connections.
Prototype platinum elements have been manufactured and assembled to the modules.
Following the first reporting period, it was decided that future work must be performed, the following list was decided upon and tested, as this document shows.
• Manufacturing of Software for both Modules (Firmware),
• Detailed Testing of the fans with Triac-Controls,
• Implementing the conductivity-tables into the Sensors (Mettler-Toledo) or into the control software,
• Manufacturing of Control-Software for the PC based on the functions, defined by UNOTT.
• After the finishing of the test programmes, a compact Control Module was further developed with the intention of commercialisation, when the DEHUMID system is complete.
• Temp- and humidity sensors were installed into properly designed enclosures.
• Very simple control Software was developed, allowing for a wide and easy use.
• Finally, all sensors and control elements were integrated into the prototype for testing. The following paragraphs shows the methodology of these tests. Results are detailed in work package 5.
System setups and testing methods
Following the first reporting period, it was decided that experimental testing was required. This testing was carried out.
Experimental testing and monitoring of the system focussed on:
• Testing performance for various sets of temperatures and humidity conditions (scenarios)
• Finding the optimum flow rates for the interacting fluids (i.e. Air, water and lithium chloride)
• Testing the short- and long-term performance of the integrated/combined absorber-cooler pads
• The assurance of a zero-carryover LiCl.
• Seeking the effectiveness of the integrated heat exchanger (i.e., combined absorber-cooler).
• Running tests with the aim to complete, substantiate and refine the mathematical model.

DEHUMID – Final Activity Report COOP-CT-2005-016957
Page 79 of 208
To achieve maximum benefit from the desiccant dehumidification system and for proper
sizing, understanding the variables that affect the performance is essential. Variables that
have a major impact on the operation and effectiveness of a desiccant dehumidification
system include:
• Process air moisture temperature
• Reactivation air temperature
• Velocity and moisture load of air passing through the desiccant
• Amount of desiccant presented to the reactivation and process air streams
• Desiccant adsorption properties.
Assessment of lithium bromide (LiBr) and of lithium chloride (LiCl) was conducted using
information from existing literature. The results of this literature search revealed that LiCl is a
better desiccant material than LiBr, but LiCl is only suitable for applications where no LiCl
droplets carryover (i.e., zero carryover). This design restriction together with the aggressive
corrosive nature of LiCl influenced the decision to investigate the use of a non-metal material
in the absorber. Hence, the absorber in the prototype systems used cellulose fibre arranged
in a packed bed. The cooling of the desiccant solution was also integrated into the absorber
surface.
This design has the following advantages:
• The corrosion problem is eliminated, as cellulose fibre is unaffected by LiCl.
• Carryover of LiCl droplets is reduced, as liquid droplets adhere better to cellulose fibre
surfaces compared to metal surfaces. (Further reduction of droplets carryover is achieved
by U-trapping)
• Frequency and the time required for maintenance are reduced, as the cellulose fibre
absorber is disposable. In the case of metal absorbers, fouling of the metal surface
reduces performance and necessitates considerable time and effort for cleaning.
Bellaria prototype
At IG in Bellaria (Italy) a prototype was developed in parallel.
Overview
The dehumidifier was designed to work in this nominal thermodynamic points:
Summer:
• Fresh air dry bulb temperature 35°C
• Fresh air wet bulb temperature 26°C

DEHUMID – Final Activity Report COOP-CT-2005-016957
Page 80 of 208
• Return air dry bulb temperature 27°C
• Return air wet bulb temperature 19°C
Winter:
• Fresh air dry bulb temperature 7°C
• Fresh air wet bulb temperature 6°C
• Return air dry bulb temperature 20°C
• Return air wet bulb temperature 15°C
Prototypes of components used for testing
List of components used in the prototype:
• Central unit;
• Regenerating unit;
• 2x2x3 polystyrene climatic buffer room;
• 2x2x3 climatic (temperature and humidity controlled) room;
• Circulating pipes (water and air);
• Air Treatment Unit (ATU).
Figure 39: layout of the test rig

DEHUMID – Final Activity Report COOP-CT-2005-016957
Page 81 of 208
Figure 40: liquid connections between the components
Figure 41: inside view of the central unit

DEHUMID – Final Activity Report COOP-CT-2005-016957
Page 82 of 208
Figure 42: air and liquid flow in the regenerator
Figure 43: inside view of the regenerator
Figure 44: typical liquid flow between the regenerator and the central unit

DEHUMID – Final Activity Report COOP-CT-2005-016957
Page 83 of 208
Table 9: weight and dimensions of the dehumidifier
Central Unit Regenerator
Size mm L 880 300
W 810 350
H 985 1070
Weight(dry) 150 20
Figure 45: dimensional drawing of the dehumidifier

DEHUMID – Final Activity Report COOP-CT-2005-016957
Page 84 of 208
2.6 Progress on Work package #5 – System Integration & Lab Testing
2.6.1 Objectives
To integrate the several components into a functional system, and to validate/test the liquid desiccant dehumidification system in bench tests and under laboratory conditions.
2.6.2 Progress made during the reporting period
Time Period Task worked on Contractor(s) involved
13-18 Integration of separately developed components to a system. All sub-systems were commissioned so system can start demonstration trials for bench tests About 3 months reliability and life bench testing with modules were completed.
COMPLEX (Lead)
HIREF, TEINSA, SKAIDULA, LOKMIS
12-18 Definition of test protocol UNOTT, test rig preparations, lab test runs
UNOTT (Lead)
VGTU
13-18 Definition of test protocol IG IG (Lead)
VGTU
13-18 Preparation of the test rig in Bellaria IG/HIREF/COMPLEX (Lead Team)
HIREF, TEINSA, SKAIDULA, LOKMIS
13-18 Check of the “zero carry-over” IG
13-18 Safety tests IG
13-18 Performance tests IG
13-18 Shipment and restarting of the unit in Colares PT
IG
UNOTT Prototype
Control of the System
The system is Controlled manually as well as automatically, to allow any control problems in

DEHUMID – Final Activity Report COOP-CT-2005-016957
Page 85 of 208
the logic sequence to be overridden and the system to work using specific ratings of
components (i.e. pumps and fans to work at full capacity).
The level of LiCl in the basins/pans (at dehumidifier and regenerator) could be adjusted by
means of the valves.
Figure 46 to Figure 52 presents the system test point’s setup for the dehumid and the
regenerator, humidity and temperature sensor connected to data recorder were used for the
purpose of measurements during the test.
Figure 46: data taker and sensors connected to the system
Flow meters were used to adjust the desiccant flow, as this is an open circuit, flow from the
dehumidifier must always be equal to the flow to the dehumidifier to avoid desiccant over
flow at the pans/basins.
Data logger
Humidity and temperature propes

DEHUMID – Final Activity Report COOP-CT-2005-016957
Page 86 of 208
Figure 47: The desiccant flow metre
Wooden ducts added to the system to extend the fresh supply, exhaust and return air ducts.
Both desiccant meter flow rates were set to 0.55 l/m during the test.
Figure 48: The extended wooden ducts
Desiccant flow meter from dehumidifier
Desiccant flow meter to dehumidifier
Extended ducts

DEHUMID – Final Activity Report COOP-CT-2005-016957
Page 87 of 208
A 12 kW heater was added to a water tank and a temperature of 80 0C has been achieved to
supply the hot water to the desiccant regenerator. Boiler water temperature was set during
the test to 60oC and the flow rate of the boiler water was 4l/m.
Figure 49: The hot water tank
As shown in Figure 50, relative humidity and temperature was measured using humidity
sensors and thermocouples at different points of the regenerator.
Hot
water
tank
Hot water in
to regenerator
Hot water out
from regenerator
Regenerator

DEHUMID – Final Activity Report COOP-CT-2005-016957
Page 88 of 208
Figure 50: The regenerator test setup
Kettle boiling and heater were used during the test to raise the humidity and the temperature
of the fresh air entering the system as shown in Figure 51 and Figure 52.
Figure 51: Test condition
System fan speed was control using voltage controller and it was 240 V during the test.
Voltage controller

DEHUMID – Final Activity Report COOP-CT-2005-016957
Page 89 of 208
Figure 52: System test setup
Results of the Test
Experimental testing and monitoring of the system will focus on:
• Finding the optimum flow rates for the interacting fluids (i.e. air, water and lithium
chloride).
• Testing the short- and long-term performance of the integrated/combined
absorber-cooler pads.
• Ensuring zero-carryover LiCl.
• Seeking the effectiveness of the integrated heat exchanger (i.e., combined
absorber-cooler).
Air flow results:
The following table shows the air flow test results. The air flow rates of the fresh air and
return air were measured using an airflow meter.
The airflow measured at the inlet of the fresh air. (No indicates the number of measurement).
Air flow,,,,m/s
No 1 2 3 4 5 6 7 8 9 10
velocity
m/s
8.4 8.3 8.4 8.1 8.2 8.4 8.1 7.9 8.3 8.2
No 11 12 13 14 15 16 17 18 19 20 velocity
m/s
8.8 8.7 8.6 8.7 8.6 9.1 9.1 9 8.9 9.1
No 21 22 23 24 25
Velocity
m/s
8.3 8.5 8.5 8.5 8.2
Average velocity: 8.516 m/s
Cross section: S= (3.14/4)*0.15*0.15=0.0176m2 (φ150 circle)
Air flow Q=3600*V*S=3600*8.156*0.0176=516 m3/h

DEHUMID – Final Activity Report COOP-CT-2005-016957
Page 90 of 208
Desiccant (lithium chloride) and water flow rate results:
Lithium chloride solution is an excellent liquid desiccant because it has essentially zero
vapour pressure during the test therefore it can be regenerated at high temperatures with no
loss of lithium chloride and cannot evaporate into the supply air stream. Desiccant and water
flow were respectively.
Dehumidification ΔΔΔΔD cooling capacity Z Z Z Z Fresh air Return air Supply air
NO Txg ℃
Txs ℃
Dx g/kg
Hx
kj/kg
Thg ℃
Ths ℃
Dh g/kg
Hh
kj/kg
Tsg ℃
Tss ℃
Ds g/kg
Hs
kj/kg
1
35.7 28 23.7 20 31.2 21
2
36.2
28.4 24 20.3 31.3 21.2
3
35.8 28.4 24 20.3 31.2 21.7
4
35.5 28.2 24.3 20.4 31.8 21.8
5
36.2 28.5 25.2 21.1 32.1 22.1
6 36.2 28.4 24.7 20.2 31.4 21.6
7
36.1 28.3 24.3 20.1 31.3 21.4
Average 35.8 28.3
21.6 91.6
24.3 20.3
13.2 58.2
31.5 21.6
12.4 63.4

DEHUMID – Final Activity Report COOP-CT-2005-016957
Page 91 of 208
Txg: fresh air temperature, Txs: fresh air wet bulb temperature
Dx: fresh air moisture content, Hex: fresh air enthalpy
Thg: return air temperature, Ths: return air wet bulb temperature
Dh: return air moisture content, Hh: return air enthalpy
Tsg: supply air temperature, Tss: supply air wet bulb temperature
Ds: supply air moisture content, Hs: supply air enthalpy
Dehumidification: ΔD =1.2Q (Dx -Ds) /1000 (kg) =1.2*516*(21.6-12.4)/1000=5.7kg
Cooling capacity: Z=1/3 Q (Hex-Hs)/1000(kW) =1/3*516*(91.6-63.4)/1000=4.85kw
Fresh air data is measured in point “F” in Figure 53.
Supply air data is measured in point “S” in Figure 53.
Return air data is measured in point “R” in Figure 53.
Enthalpy efficiency η (%)
Fresh air Return air supply
NO Txg ℃
Txs ℃
Hx
kj/kg
Thg ℃
Ths ℃
Hh
kj/kg
Tsg ℃
Tss ℃
Hs
kj/kg
1
35.8 27.9 26 22 29 24.1
2 36.5 28.1 26.5 22.3 29.3 24.3
3
36 27.8 26.6 22.5 29.3 24.4
4
37.5 27.8
90.2
26.5 22.4
66. 2
29.3 24.4
73.7

DEHUMID – Final Activity Report COOP-CT-2005-016957
Page 92 of 208
5
35.5 28.1 26.7 22.6 29.4 24.5
6 36.4 28.1 26.5 22.5 29.4 24.5
7
36.2 27.8 26.4 22.3 29.1 24.1
Average 36.3 28 26.5 22.4
29.3 24.3
Txg: fresh air temperature, Txs: fresh air wet bulb temperature
Dx: fresh air moisture content, Hx: fresh air enthalpy
Thg: return air temperature, Ths: return air wet bulb temperature
Dh: return air moisture content, Hh: return air enthalpy
Tsg: supply air temperature, Tss: supply air wet bulb temperature
Ds: supply air moisture content, Hs: supply air enthalpy
Fresh air data is measured in point “F” in Figure 53.
Supply air data is measured in point “S” in Figure 53.
Return air data is measured in point “R” in Figure 53. η= (Hx-Hs)/ (Hx-Hh) %=( 90.2-73.7)/ (90.2-66.2) %=68.46%
Figure 53

DEHUMID – Final Activity Report COOP-CT-2005-016957
Page 93 of 208
Heat Input L
No 1 2 3 4 5 6 7 Average
Inlet water
temperature ℃
81 81 80 80 79 81 81 80.43
Outlet water
temperature ℃
75 76 75 75 75 75 76 75.29
Water flow ton/h 0.395 0.405 0.405 0.4 0.41 0.41 0.4 0.4036
∆T=Σ∆T/7=5.14 Qwater=ΣQwater/7=0.4036 ton/h
I ton = 1000 kg
L=1.16* Qwater*∆T=1.16*0.4036*5.14=2.4KW
The inlet temperature is measured at the point “hot water in” indicated in Fig 7b.
The outlet temperature is measured at the point “hot water out” indicated in Fig 7b.
Fresh and supply air Temperature and relative humidity test results:
Figure 54 and Figure 55 present the result of the temperature and relative humidity of the
fresh and supply air where about 70C and 27.6 % different have been achieved.

DEHUMID – Final Activity Report COOP-CT-2005-016957
Page 94 of 208
Variation of Fresh and supply air temperature
0
5
10
15
20
25
30
12.37 12.39 12.41 12.43 12.45 12.47 12.49 12.51 12.53 12.55 12.57 12.59 1.01 1.03 1.05 1.07
Time hh:mm
Tem
pe
ratu
re d
eg
ree C
T Fresh air T Supply air
Figure 54: Variation of Fresh and supply air temperature
Variation of fresh and supply air relative humidity
0
10
20
30
40
50
60
70
80
90
100
12.37 12.39 12.41 12.43 12.45 12.47 12.49 12.51 12.53 12.55 12.57 12.59 1.01 1.03 1.05 1.07
Time hh:mm
Re
lativ
e h
um
idity
%
RH Fresh air RH Supply air
Figure 55: Variation of Fresh and supply air relative humidity
During the test, the spray of the desiccant removed the moisture from the air and reduced
the humidity by around 30% this proves the desiccant cycle is efficient; the water removed
the heat released during the process of dehumidification. In the system the return air from
the room is dehumidified by the spray of the desiccant.
The absorbed moisture in the desiccant is removed (the desiccant is regenerated) using
thermal energy supplied by electricity.

DEHUMID – Final Activity Report COOP-CT-2005-016957
Page 95 of 208
The liquid desiccant absorbs moisture from the air depending on vapour pressure difference
between the air and the solution. The equilibrium vapour pressure of the solution depends on
the temperature and concentration of the solution. The weak solution of the absorption
process needs to be regenerated before reuse.
Conclusions
Advantages of the current design are
• The system compact, due to the integrated desiccant pads and indirect evaporative-
cooling pads.
• The system relatively lightweight, due to the novel cellulose fibre and plastic.
• Cost of the system is low, due to the novel material used.
• Cheaper maintenance, due to the readily replaceable low-cost absorber core.
• The absorber does not allow liquid desiccant to escape (i.e., zero-carryover absorber)
will bring liquid-desiccant technologies inline with market expectations.
• The system could be used in buildings where air conditioning is required and driven
by waste heat, solar power, natural gas or hybrid sources waste heat/electricity, thus
lowering the peak electric demand.
• Using the Dehumid system will serves a number of societal policy objectives such as
reducing the residential electricity demand in humid region, the environment will
obviously benefit as liquid desiccant dehumidifier saves energy, thus reducing
pollution.
• The system Operate without the use of the ozone –depletion chlorofluorocarbons
(CFCs) and hydro chlorofluorocarbons (HCFCs) and employing only environmentally
friendly refrigerant water avoiding the use of green house effect.
• Desiccant dehumidification cooling systems can substantially lower humidity levels to
reduce the growth of mould and mildew that create “thick building” by circulating
spores through air conditioning systems with high humidity levels so hospitals,
nursing homes, hotels, etc. can be safe and a healthy workplace and living
environment for residents. Desiccant dehumidification systems have substantially
reduced the cost for repair of mould and mildew damage to wallpaper, paint, carpet
and other materials caused by humidity levels- saving commercial buildings, hotels
millions annually.
Desiccant dehumidification systems are particularly cost effective for application where:
DEHUMID – Final Activity Report COOP-CT-2005-016957
Page 96 of 208
� Latent loads that are large relative to sensible loads or supply dewpoints must be
very low(supermarket, pools)
� High humidity causes significant property damage (hotels, warehouses and other
storage areas)
� High cooling demand is difficult to meet (older buildings require additional cooling,
buildings with high occupancy, but intermittent usage (church, arenas).
A criticism of the system is: the outdoor humidities in summer may be high and outdoor
temperatures not particularly different from indoor temperatures. So for a large part of the
year the system would not reduce humidity to low levels, though it should still help to get rid
of excess water vapour generated indoors.
The carryover of a corrosive desiccant out of the absorber and into the supply ductwork or
occupied space is the most important potential problem.
IG Prototype
Test Protocol
The unit was installed in a closed circle circuit and connected to a buffer room and an Air Treatment Unit (ATU) in order to achieve steady state conditions.
The idea was to reproduce the usual summer conditions in most of Mediterranean cities an test the unit at first as its maximum performances.
Performance data has been collected in accord to UNI EN 810:1999 “Dehumidifier with electrical driven compressor – Rating tests, marking, operational requirements and technical data sheets”.
The zero carry –over test was made by simply filtering the air outlet from the unit.
For other specifications please be referred to : Deliverable No D12.: Test Protocol
Preparation of the test rig in Bellaria
The unit built in Bellaria is composed by two detached body. This two parts were set in IG Thermodynamic laboratory near an existing climatic room. Another climatic room was build using a 100 mm thick polystyrene panels.

DEHUMID – Final Activity Report COOP-CT-2005-016957
Page 97 of 208
Figure 56: Regenerator case as arrived in Bellaria.

DEHUMID – Final Activity Report COOP-CT-2005-016957
Page 98 of 208
Figure 57: Central Unit case as arrived in Bellaria.
The two units were connected with flexible water and air pipes to the climatic rooms and to the ATU built by HIREF. The Hot water source was generated by a 256 kW natural gas boiler and circulated by a hot water Grundfoss pump able to achieve constant 10 L/min flow.

DEHUMID – Final Activity Report COOP-CT-2005-016957
Page 99 of 208
Figure 58: regenerator connected to hot water and central unit.

DEHUMID – Final Activity Report COOP-CT-2005-016957
Page 100 of 208
Figure 59: Central unit liquid connections.

DEHUMID – Final Activity Report COOP-CT-2005-016957
Page 101 of 208
Figure 60: Central unit air connections and polystyrene room and ATU in background.

DEHUMID – Final Activity Report COOP-CT-2005-016957
Page 102 of 208
Figure 61: ATU and air connections.

DEHUMID – Final Activity Report COOP-CT-2005-016957
Page 103 of 208
Figure 62: Connections to the existing climatic room (1).

DEHUMID – Final Activity Report COOP-CT-2005-016957
Page 104 of 208
Figure 63: Connections to the existing climatic room (2).
Zero carry-over test
To check for the presence of the LiCl in the output air we used its high hygroscopic behaviour of this component.
There was made series of two tests, one in blank conditions (i.e. filtering the air present in the laboratory not affected by LiCl) and one filtering the treated air from the dehumidifier.

DEHUMID – Final Activity Report COOP-CT-2005-016957
Page 105 of 208
The filtering was achieved using a Hoover-like water filter capable to handle 500 m3/h of air flow, which is the nominal air flow from the unit. The filter medium was deionised water.
For each test series two samples, one “blank” and one normal, were transmitted to the IG atomic adsorption unit to check the presence in the sampled water of Li+ ions.
Figure 64: Central unit with a water filter connected

DEHUMID – Final Activity Report COOP-CT-2005-016957
Page 106 of 208
Figure 65: atomic adsorption unit during the tests
For the results of this test see Deliverable No D13.: Test Report.
Safety tests
Test of safety related to LiCl presence.
The unit was tested several times to check if it’s possible or not to have desiccant overflow. The only possible overflowing causes are the following:
1. Closing of a desiccant circuit valve. In this case one of the two basins were emptied and one will overflow causing the LiCl to poor on the flow.
2. Stucking of a pump. If one of the pumps the circulate the LiCl got stucked for any reason the one of the two basins were emptied and one will overflow causing the LiCl to poor on the flow.
3. The body of both the central unit and the regenerator was mad of normal steel sheets. The bottom of the regenerator has to be rebuild in stainless steel due to the corrosion operated by drops of LiCl.

DEHUMID – Final Activity Report COOP-CT-2005-016957
Page 107 of 208
For safety reasons two big stainlees steel basins has been build to contain the two units and collect any possible leak during testing and normal operation.
Test of electrical safety
Electrical safety has been checked with a Fulltest HT Italia Mod. 2036.
Figure 66: Fulltest HT Italia Mod. 2036
Test of mechanical safety
Mechanical tests were carried out to check the compliance of the system to the requirements established by the Machinery Directive 98/37/EC and to the harmonised standards EN ISO 12100-1 and EN ISO 12100-2.
Test of power consumption
The power consumption has been checked by a digital calibrated wattmeter model Emu.k.
Test of air flow rate
The air flow was measured by a digital hot wire anemometer following the “inserire normative sulla misura del flusso d’aria”
Efficiency performance test
All elements of the installation were assembled. All sensors were additionally calibrated to have best measurement results.
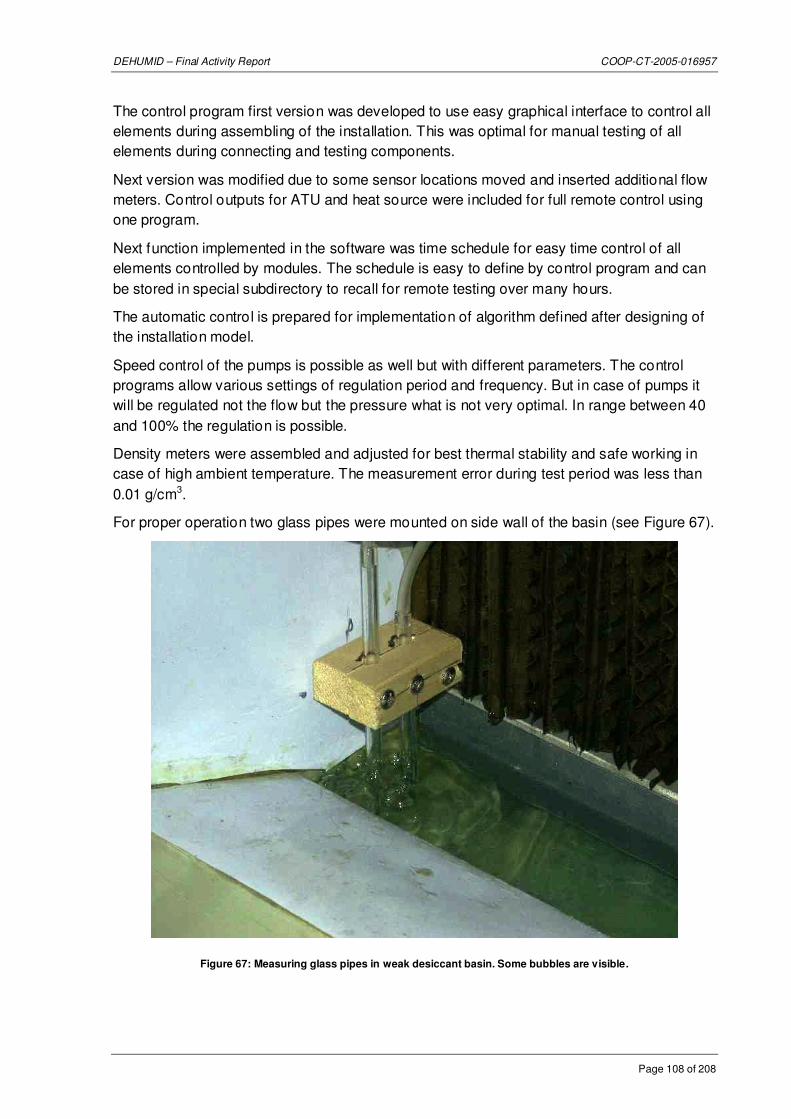
DEHUMID – Final Activity Report COOP-CT-2005-016957
Page 108 of 208
The control program first version was developed to use easy graphical interface to control all elements during assembling of the installation. This was optimal for manual testing of all elements during connecting and testing components.
Next version was modified due to some sensor locations moved and inserted additional flow meters. Control outputs for ATU and heat source were included for full remote control using one program.
Next function implemented in the software was time schedule for easy time control of all elements controlled by modules. The schedule is easy to define by control program and can be stored in special subdirectory to recall for remote testing over many hours.
The automatic control is prepared for implementation of algorithm defined after designing of the installation model.
Speed control of the pumps is possible as well but with different parameters. The control programs allow various settings of regulation period and frequency. But in case of pumps it will be regulated not the flow but the pressure what is not very optimal. In range between 40 and 100% the regulation is possible.
Density meters were assembled and adjusted for best thermal stability and safe working in case of high ambient temperature. The measurement error during test period was less than 0.01 g/cm3.
For proper operation two glass pipes were mounted on side wall of the basin (see Figure 67).
Figure 67: Measuring glass pipes in weak desiccant basin. Some bubbles are visible.

DEHUMID – Final Activity Report COOP-CT-2005-016957
Page 109 of 208
For proper measurement a calibration process was needed. For calibration, distilled water was used to set the coefficient for reading 1.00 g/cm3 – the coefficient is to be set in the control program in section module configuration.
Before calibration, it is necessary to adjust the bubble rate using the two valves inside the density meter case. The optimal bubble rate was estimated as approximately 2-3 bubbles per second.
Adjusting of zero was not necessary due to good thermal stability of the circuit.
Figure 68: Adjusting of density meter.
Prototype was assembled based on the system layout and using the developed components.
System was assembled using first version of control layout. All modules were mounted in a plastic case on the side of the dehumidification units, as indicated in Figure 69.

DEHUMID – Final Activity Report COOP-CT-2005-016957
Page 110 of 208
Figure 69: Control modules for dehumidification unit.

DEHUMID – Final Activity Report COOP-CT-2005-016957
Page 111 of 208
Figure 70: Control modules for regenerator unit.
All system elements were tested. Some minor program modifications were implemented due to the improvement of the possibility to check all system components.
Finally the control system was extended by 3 flow meters to have better control over all installation elements.
The control program has an easy to use graphical user interface. After initiation of the program, the status screen (Figure 71) is shown:

DEHUMID – Final Activity Report COOP-CT-2005-016957
Page 112 of 208
Figure 71: Status screen of control program.
Proper operation is possible in case of setting the module connections, as shown in Figure 72:

DEHUMID – Final Activity Report COOP-CT-2005-016957
Page 113 of 208
Figure 72: Module assignment screen.
The final version of control software is an easily reconfigurable program. All sensor locations and calibration data are stored in the configuration files. All possible errors are logged.
In Annex 1 of this report the source code has been listed.
All parameters of the sensors, outputs etc., are easy to define on the module configuration screen, as shown in Figure 73:

DEHUMID – Final Activity Report COOP-CT-2005-016957
Page 114 of 208
Figure 73: Module configuration screen.
The configuration screen allows the user to configure all system components including the calibration of all sensors used for measurement of air parameters.
For typical use, the process control screen was developed as a graphical representation of whole system, see Figure 74:

DEHUMID – Final Activity Report COOP-CT-2005-016957
Page 115 of 208
Figure 74: Process control screen.
Parameters to be monitored, frequency of data acquisition/logged, etc. Laboratory evaluations include:
• functional tests (cooling capacity; air flow rate; power consumption)
• efficiency performance tests (Energy Efficiency Ratio (E.E.R.) according to EN 814-1/2/3 (1997))
For safe operation, the installation has a timeout function– if the main control element (PC, including control software) is not working appropriately, the modules will switch OFF all outputs after desired time.
The software logs all data, for a predefined period. The minimum logging time is 10 seconds. The optimal logging duration is 30 seconds.
For best remote control the VNC Software was chosen. It allows full control of the remote PC including the copying of the logged data. Additionally, a webcam was installed to enable the best online control during personal absence in test laboratory.
After the initial tests, the parameters of ATU were optimised for stability of air parameters.
See Deliverables
• Commissioned system prototype
• Test Protocol
• Test Report

DEHUMID – Final Activity Report COOP-CT-2005-016957
Page 116 of 208
2.7 Progress on Work package #6 - Validation & Field Testing Prototype
System
2.7.1 Objectives
Demonstrate and test system under real life conditions.
Verify that researched concepts indeed work as expected/predicted in practice.
2.7.2 Progress made during the reporting period
Time Period Tasks worked on Contractor(s) involved
18-24 Monitoring systems that will work in the field will be designed and built.
COMPLEX
18-24 Control software was installed on PC machine with interface to the modules.
COMPLEX
18-24 The remote control of the system was realised by using VNCviewer software again to have full access from each place via normal internet connection.
COMPLEX
18-24 Searching, reviewing and analysing of publications about dehumidification systems using liquid desiccants were performed. Over 50 scientific literature sources were studied and shared with other partners of the consortium. The information obtained was used in formulations of the requirements of a future system, in mathematical modelling of dehumidification system, prediction of performance, economical vitality and other features of the future system
VGTU
12-24 Field testing:
Identify test site, prepare field test installation, installation hardware, set up PC control, trial-runs, optimisation and fine-tuning, field test runs, repairs,
Lead by NGD All SMEs
IG

DEHUMID – Final Activity Report COOP-CT-2005-016957
Page 117 of 208
Time Period Tasks worked on Contractor(s) involved
improvements on installation, characterisation of performance, analysis of system performance, analysis of user friendliness
Task 6.1- Install and commission the system on a Test site.
Identify Test Site
From the previous partner meeting, in Belleria Italy, it had been decided that the type of application would be to dehumidfy a room with humid conditions such as an internal swimming pool. Net Green Developments Lda (NGD) had the task of identifying suitable locations for the test site. A specification was drawn up identifying certain characteristics required of a potential test site such as, room with a maximum area of 40m², humid conditions above 80% relative humidity, sufficient available space and services for the prototype and a maximum radius of 20 km distance away from the NGD office. The Initially a list of 20 locations was made up of Hotels with sport/swimming pool facilities, Sports centres and Health clubs. After visits to these locations and a series of meetings with the management of these facilities it was realised that the main obstacle was the requirement of tampering with already functioning dehumidification systems,which would create the subsequent risk to the maintenance contracts these facilities had with service companies. The Test site chosen did not have a dehumidification system installed and had sufficient space external to the test room, for the prototype.
The Bombeiros Voluntários de Colares2, a voluntary local fire brigade of Colares had a large swimming pool with a changing room directly linked to the Swimming pool.
2 http://www.bvcolares.com/index.html

DEHUMID – Final Activity Report COOP-CT-2005-016957
Page 118 of 208
Figure 75: Bombeiros Voluntários de Colares – Website
The air temperature was kept high using centralised boiler plant, with the changing rooms served by a ventilation system to provide some kind of cooling/dehumidification to the space. Our prototype application was potentially advantageous for their requirements to reduce energy losses from extracting heated air directly outside.
It was agreed that we could install our protype installation with the possibility of the Bombeiros using the system after the project was completed, if the system was suitable for their requirements.

DEHUMID – Final Activity Report COOP-CT-2005-016957
Page 119 of 208
Figure 76: Test Location – Colares, Portugal
Figure 77: The Test Site – Swimming Pool, Bombeiros Colares

DEHUMID – Final Activity Report COOP-CT-2005-016957
Page 120 of 208
Figure 78: The Changing Rooms to be dehumified
After a series of site surveys to the facilities services, subsequent design drawings and concepts where submitted to the President of the Bombeiros to gain his consent to the installation.
Figure 79: Graphical proposal of the installation to the President of the Bombeiros (1)

DEHUMID – Final Activity Report COOP-CT-2005-016957
Page 121 of 208
Figure 80: Graphical proposal of the installation to the President of the Bombeiros (2)
Test Site Installation
Initially NGD was involved as a sole company when the DEHUMID project consortium was formed with a program of field testing lasting 7 months. The initial strategy of NGD’s involvement was to take on additional staff for this phase of the DEHUMID project.
Due to prototypes having reliability problems during the last 12 months of the project the field testing period was reduced down to 4 weeks, with an initial week for installation.
During the last two years another company (Net Green Solar Ltd) was formed in the UK, under the same ownership of NGD, to commercialise a sustainable heating solution developed by NGD. Due to short period of field testing the human resources of both companies were used to collaborate in the project, as it was unfeasibly to take on additional staff for such a short period, therefore it was decided to share resources therefore reduce overhead costs and risks.
The Prototype system arrived from Italy in the second week of August with boxes of accessory/spare parts.
Figure 81: Prototype packaged

DEHUMID – Final Activity Report COOP-CT-2005-016957
Page 122 of 208
The Installation was undertaken in the final week of August with personnel from NGD, with an individual from the Istituto de Giordano providing direction. The external installation was protected by a surround fence. The final connections to the hot water supply, from the central boiler plant and the Broadband network (for the Control system remote monitoring) were completed during the first week of September.

DEHUMID – Final Activity Report COOP-CT-2005-016957
Page 123 of 208
Figure 82: The DEHUMID prototype Installation at the Test Site
The Control system was installed in the swimming pool’s administration office, which gave access to the Broadband network of the Bombeiros. NGD provided a PC with all the necessary network accessories such as switches/network board.

DEHUMID – Final Activity Report COOP-CT-2005-016957
Page 124 of 208
Figure 83: The Control system graphic on the PC, located in the Admin office
Task 6.2 – Characterise performance under application at Test Site.
Test Conditions
During the field Test period two test conditions were used to provide some idea of the performance.
The first test condition, identical to the setup in Belleria, was to dehumidify outside supply air before entering into the changing room. The extract air from the changing rooms was passed through the dehumidification unit warming the supply air via the paper heat exchanger.
The climate of Colares provided day time temperatures of 25ºC with RH varying between 70 to 50%, depending on the time of day.
The second test condition was to dehumidify the air extracted from the changing room and re-entering the air after passing though the system back into the changing room. This test condition therefore recirculated air to/from the changing room. This test was undertaken last due to the high humidity levels that entered into the paper heat exchanger. At night time the cold air from the outside entering the unit would condensate the humidity before entering the desiccant dehumidification system, therefore the risk of potentially weakening the paper fabrication of the heat exchanger.

DEHUMID – Final Activity Report COOP-CT-2005-016957
Page 125 of 208
System Performance
The system during the test period had a very poor history of reliability, which would be the most significant result from the field tests.
From periods when the system was functioning well there was some data that could be analysised and provide some idea of the performance of the application.
The reliability problems were a continuous series of parts of the system breaking down or not functioning properly. These ranged from pumps stopping functioning (poor quality) and needing replacement, corroded particles of metal blocking desiccant sprayers, sensors not functioning due to the corrosive characteristics of the liquid desiccant, water valves not functioning properly, flow meters not functioning due to the corrosive characteristics of the liquid desiccant.
Parts of the control system such as the liquid desiccant density meters had to be replaced during the field tests plus two of the control modules had to be replaced due to oxidation on the electronic boards. As each part was replaced a certain amount of checking the system readings and re-calibration had to be made. This meant there was a requirement of personnel at the test site undertaking these reparations and adjustments seven days a week, 6/7 hours per day.
The reliability problems were probably due to the lack of time during the previous stages in the project to test/redesign the DEHUMID system from the results of the quality and performance testing under lab conditions.
The paper Heat Exchanger in the top of the Dehumidifying unit seamed to provide the performance required but readings of mixing of the both air flows therefore leakage was more recognizable as the field testing went on. This was probably due condensation (from the air flows of humid air) collecting on the inside of the metal lid of the dehumidifying unit, which reduced the efficiency of the adhesive of the layers of paper based cardboard that makes up the heat exchanger.
A certain amount of liquid desiccant carryover occurred from the Regenerator unit, as all the system components adjacent the Regenerator inside the fenced compound were covered by a film of desiccant by the end of the field tests. This would be a source of concern for a commercial unit due to the corrosive characteristics of the LiCl.
From the short experience of field tests there would be an opportunity to continue the project, if time was available, to redesign the Dehumidifier and Regenerator units to provide better reliability and application flexibility.
Data Collected suitable for Analysis
From all the data logs collected certain periods of data where taken for analysis only when it was recognized that the system was functioning at a full working condition. The control system was working 24 hours per day all during the field test period even when it was recognized the system was not functioning correctly. As the control system sampled the sensors every 30 seconds it has been estimated that over 75,000 logs of data had been collected during the field test period.

DEHUMID – Final Activity Report COOP-CT-2005-016957
Page 126 of 208
Task 6.3 – Analysis of system performance
Aims of the Analysis of system performance
The aim of calculating the system performance is to compare the Energy input into the DEHUMID prototype against the Energy Output to provide dehumidification using the DEHUMID prototype when used in test conditions.
During the Test conditions two applications were applied to the prototype:
1. The first test condition, identical to the setup in Belleria, was to dehumidify outside supply air before entering into the changing room.
2. The second test condition was to dehumidify the air extracted from the changing room and re-entering the air after passing though the system back into the changing room. This test condition therefore recirculated air to/from the changing room.
From calculating the COP (Coefficient of Performance) of these applications it possible to assess the efficiency of the DEHUMID system to provide dehumidification. This then can be compared with the COP’s from conventional refrigerant based A/C type systems and also conclusions can be made how to improve the DEHUMID system, which is further discussed in Deliverable D19 ‘Final plan of Use’
Definition of COP (Coefficient of Performance)
The Coefficient of Performance (COP) for a thermally driven cooling system is defined as the cooling output divided by the heat and electrical energy input.
For a liquid-desiccant air conditioner the heat input is closely tied to the amount of water that the desiccant has absorbed. It is useful to evaluate the latent COP when comparing different liquid-desiccant air conditioners, i.e., the amount of heat needed to remove water from the desiccant, rather than the overall COP.
Latent heat COP - The heat released when water vapor condenses is referred to as the latent heat of condensation. Drying air is commonly called latent cooling, while reducing the temperature of air is called sensible cooling. People are comfortable within a building only when both the sensible and latent cooling provided by the air conditioner match the building's sensible and latent loads
Task 6.4 – Analysis of user friendliness.
Discussion of Field Test usage
As already stated earlier in this report reliability of the prototype was the main problem during the short field testing period. Continuous visits on a daily basis was required to keep the system functioning, with constant re-calibration required. Obviously further work/discussion will be required to ensure system reliability as it unreasonable to expect a potential end-user of this application to use resources just to keep the system functioning.
The use of LiCl solution as a desiccant has some very corrosive characteristics therefore care in use and storage of such a material would be required in a commercial application.
DEHUMID – Final Activity Report COOP-CT-2005-016957
Page 127 of 208
The regenerator unit was found to be leaving a fine mist/deposit on its adjacent surrounding therefore further work will be required to stopping this happening, if used in a commercial application. Sourcing this type of liquid desiccant would also be problematic as it has certain regulations in terms of transport and handling plus known sources are limited.
The size of the units is a problem compared with conventional refrigeration A/C type systems. The air volume capacity of the prototype was based on 200m³/ hour which is quite a small system. As the real estate value per m² of floor are high in potential sectors for the use of this application, the financial gain from energy input reductions for dehumidification process would have to compared with the financial investment required to provide footprint area. One possibility would be to break the system into more individual components, from two units to three or four, which would provide greater flexibility in use of application and the ability to wall mount or stack the individual units.
The control system developed was purely for a prototype application. In a commercial application this could be replaced with a programmable embedded type controller which would provide remote control facilities and customer support 24/7 from programmable alarms if the system malfunctions. Additional work/discussion is required to protect certain control sensors from being effected by the proximity of LiCl desiccant solution.
Further discussion and possible solutions to the above points can be found in the Report for Deliverable D19.
Task 6.5 – Analysis acquired data and optimised system
Discussion of type of data used
During the Test conditions two applications were applied to the prototype:
• The first test condition, identical to the setup in Belleria, was to dehumidify outside supply air before entering into the changing room.
• The second test condition was to dehumidify the air extracted from the changing room and re-entering the air after passing though the system back into the changing room. This test condition therefore recirculated air to/from the changing room.
The time of possible use and average dehumidification load of future dehumidification systems in two additional countries (Italy and Portugal) were calculated. The hourly meteorological data of Savignano (Italy) and Lisbon (Portugal) was obtained from websites of corresponding meteorological stations. The chart of humidity ratio duration curves for these two countries was updated using new data. (not presented yet in the detailed report) The model of absorption and regeneration processes using LiCl solution was improved. The changes made on the original model, presented in literature, allows the efficiencies of absorber and regenerator to be obtained in the interval between 0 and 1. This approach is more suitable for mathematical modelling of dehumidification system, when the efficiencies are obtained from experimental test results. The improved model was tested using experimental data available from the literature.

DEHUMID – Final Activity Report COOP-CT-2005-016957
Page 128 of 208
The sensibility analysis of absorption and regeneration processes to the initial parameters was performed using experimental data available on literature. The influence of air and solution input parameters (temperature, humidity ratio, concentration, flow rate) to the air and solution output parameters and absorbed/evaporated water amount was investigated and illustrated graphically. It was found, that most important parameter for both absorption and regeneration processes is desiccant solution temperature. Variation of solution temperature invokes the greatest changes in evaporated/regenerated water flow. The influence of air flow and air humidity is also sensible, but this influence is rather obvious. According to the sensibility analysis performed and the controllable parameters of dehumidification system installation the sets of the testing parameters were defined. These sets covers all range of installation’s controllable parameters (air, solution and water flows, initial solution concentration, solution temperature before regeneration) and wide range of indoor and outdoor climatic conditions (air temperature and humidity ratio). The mathematical model of whole dehumidification system was elaborated. For the processes in elements of dehumidification system same principle is used as for absorption and regeneration processes. Instead of solving many differential equations the simplified method is adopted, i.e. the experimental physical efficiencies of heat and mass transfer in the system elements were used. The mathematical model of whole dehumidification system was implemented in MS Excel™ environment. The calculation model includes 11 components (elements) of dehumidification system (absorber, regenerator, air/air, liquid/liquid and liquid/air heat and mass exchangers, solution and water basins). The output parameters of one component are used as input parameters for next component. Because of closed circulation of solution and interference of installation elements, the iterative calculation technique was used. In the calculation model the 11 iteration loops in 7 hierarchical levels are used. For calculation of air, solution and water proprieties, the psychrometric and thermophysical functions prepared earlier were used. The mathematical model of humidity load of the small pool (e.g. in spa centre) was elaborated. However, finally this model was not used in the calculation model of the dehumidification system because of much higher humidity load in the field test installation. The semi automatic tool for visualisation of logged parameters was elaborated in MS Excel™. This tool allows the quick visualisation and evaluation of changes in logged parameters (in form of chart of curves) as well as system „snapshot“ of selected time (principal scheme of installation with parameters, measures at selected time). This tool is an addition to the installation control system, which allows only visualisation of currently measured parameters (in real time) with no parameters curves. The treatment of all automatically measured and logged parameters of dehumidification installation was performed (including laboratory and field tests). The total number of records is more than 470000, so first treatment was possible only with database software. The MS Access™ was used. After conditional filtration of records, the periods of different system’s performance was identified. The records with not reliable data (when some of elements or sensors of the system was working) were excluded.

DEHUMID – Final Activity Report COOP-CT-2005-016957
Page 129 of 208
The performances of components of dehumidification system installation system were determined. These performances were used in calculation model of the whole dehumidification system. The calculation model was validated with experimental data. It was stated, that calculation results corresponds to experimental results rather well (this just my hope for the moment). Using the calculation model the operation of dehumidification installation in different indoor and outdoor conditions was simulated. The theoretical possibilities of dehumidification were evaluated. The performance of whole dehumidification system was evaluated. Different performance ratios were calculated.
Mathematical model
Searching, reviewing and analysing of publications about dehumidification systems using liquid desiccants were performed. Over 50 scientific literature sources was studied and shared with other partners of the consortium. The information obtained was used in formulations of the requirements of a future system, in mathematical modelling of dehumidification system, prediction of performance, economical vitality and other features of the future system.
Absorption and regeneration calculation method
After a large amount of literature studied, the method described by Gandhidasan3 was chosen. This is a relatively simple model used for the preliminary design of an air dehumidification process occurring in a packed bed using liquid desiccant through dimensionless vapour pressure and temperature difference ratios. An expression was derived using the aforementioned ratios to predict the water condensation rate from the air to the desiccant solution, in terms of known operating parameters.
Despite of the great suitability of the aforementioned model to the DEHUMID project purposes, some improvements were made. Firstly, some inaccuracies in formulas were
fixed. Secondly, the definition dimensionless ratio β was changed (see equation (ed 29)).
The ratio used further is called "temperature efficiency" and marked as Tη . This replacement
makes the temperature difference ratio independent from air and desiccant solution temperature variation, and expresses technical characteristic of the absorber. This provides the possibility to obtain the ratio experimentally without having to carry out excess amounts of experiments.
Test calculations were made to be sure that calculation results, after the improvements were implemented, were not distorted. As reference data the experimental results of Fumo and Goswami were used. These tests were successful (see Table 10).
3 P. Gandhidasan. A simplified model for air dehumidification with liquid desiccant. Solar Energy 76 (2004) 409–416

DEHUMID – Final Activity Report COOP-CT-2005-016957
Page 130 of 208
The results obtained shows very good accuracy of the modified Gandhidasan model for both the absorption and regeneration processes. The only flow of evaporated water differs greatly. Most believable, that in the source paper this flow is divided by exchange area of the regenerator (about 21.5 m2) while in calculation method this is total flow (see the last column in the Table 10).
To identify the most important parameters for the absorption and regeneration processes, the graphical sensitivity analysis from test calculation results was made. The charts for absorption (Figure 85 – Figure 90) and for regeneration (Figure 91 – Figure 96) are presented below. In the charts all output parameters are shown as functions of one input parameter while other input parameters are constant. The most influential parameter is evaporated/regenerated water flow (in the chart marked as "m" or "Mevap").
These charts shows that the most important parameter for both absorption and regeneration processes is desiccant solution temperature Tsi (Figure 89 and Figure 95). Variation of solution temperature invokes the greatest changes in evaporated/regenerated water flow. The influence of air flow (Ga) and air humidity (Wi) is also sensitive, but this influence is rather obvious.

DEHUMID – Final Activity Report COOP-CT-2005-016957
Page 131 of 208
Table 10. Comparison of experimental data and test calculations results for LiCl aqueous solution regeneration
Experiment data - Fumo & Goswami Calculated data Accuracy
Inlet Outlet Outlet Outlet
Exp
. Ga Tai Wi Gs Tsi ξi Tao Wo Tso ξo Mev. Tao Wo Tso ξo Mev. Wo To Tso ξo Mev.
No. kg/s °C
kgwv/
kgda
kg/s °C
by
mass
°C
kgwv/
kgda
°C by
mass g/s/m2 °C
kgwv/
kgda
°C
by
mass
g/s ∆ value ∆ value
∆
value
∆
value
Mcalc/
Mexp
1 0,833 30,
4 0,0183 6,463 65,0 34,0% 58,9 0,058 58,6
34,5
% 1,55 58,9 0,058 59,09 34,17%
33,1
2 0,27% 0,00% 0,84%
-
0,94%
21,3
7
2 1,098 30,
1 0,0180 6,206 65,1 34,1% 59,3 0,053 57,8
34,8
% 1,81 59,3 0,054 57,60 34,31%
39,0
7 0,71% 0,00%
-
0,35%
-
1,39%
21,5
8
3 1,438 29,
8 0,0177 6,479 65,1 34,5% 57,5 0,049 56,6
35,2
% 2,10 57,5 0,049 56,58 34,74%
45,3
8 0,94% 0,00%
-
0,04%
-
1,30%
21,6
1
4 1,097 35,
1 0,0180 6,349 65,1 33,4% 58,5 0,055 57,4
34,1
% 1,91 58,5 0,056 57,91 33,62%
41,2
1 0,85% 0,00% 0,88%
-
1,42%
21,5
8
5 1,102 40,
0 0,0178 6,354 65,0 33,6% 58,9 0,055 57,6
34,2
% 1,91 58,9 0,055 58,07 33,82%
41,2
3 0,76% 0,00% 0,82%
-
1,12%
21,5
9
6 1,132 30,
2 0,0143 6,370 65,2 34,0% 57,6 0,051 57,2
34,7
% 1,97 57,6 0,052 57,52 34,23%
42,5
0 1,07% 0,00% 0,56%
-
1,36%
21,5
8
7 1,097 29,
4 0,0210 6,440 65,5 33,6% 58,5 0,054 58,3
34,2
% 1,70 58,5 0,055 58,61 33,79%
36,8
5 0,90% 0,00% 0,54%
-
1,19%
21,6
7
8 1,116 30,
3 0,0182 5,185 65,4 34,4% 57,6 0,051 57,0
34,9
% 1,71 57,6 0,051 56,91 34,64%
36,7
8 0,90% 0,00%
-
0,16%
-
0,73%
21,5
1
9 1,101 29,
9 0,0180 7,541 65,2 34,3% 59,0 0,056 57,9
34,9
% 1,95 59,0 0,056 58,70 34,49%
41,6
6 0,43% 0,00% 1,39%
-
1,18%
21,3
6
10 1,111 30, 0,0187 6,245 60,3 34,4% 55,8 0,045 54,2 34,8 1,36 55,8 0,045 54,44 34,56% 28,9 0,11% 0,00% 0,45% - 21,2

DEHUMID – Final Activity Report COOP-CT-2005-016957
Page 132 of 208
Experiment data - Fumo & Goswami Calculated data Accuracy
0 % 4 0,69% 8
11 1,084 29,
7 0,0184 6,315 70,0 34,5% 62,6 0,067 60,0
35,3
% 2,45 62,6 0,067 60,43 34,79%
52,9
5 0,97% 0,00% 0,71%
-
1,45%
21,6
1
12 1,099 29,
7 0,0177 6,400 64,8 32,8% 57,6 0,054 56,8
33,4
% 1,89 57,6 0,055 57,49 33,01%
40,7
8 1,12% 0,00% 1,21%
-
1,17%
21,5
8
13 1,116 30,
3 0,0182 6,428 65,0 34,9% 57,9 0,050 57,5
35,4
% 1,67 57,9 0,050 58,20 35,10%
35,9
5 0,62% 0,00% 1,22%
-
0,86%
21,5
3

DEHUMID – Final Activity Report COOP-CT-2005-016957
Page 133 of 208
0,0
10,0
20,0
30,0
40,0
50,0
60,0
70,0
80,0
1 2 3 4 5 6 7 8 9 10 11 12 13
Exp.No.
0
0,5
1
1,5
2
2,5
3
Tai
Gs
Tsi
Tao
Tso
Ga
ξi
Wo x 10
ξo
Mevap
Figure 84. Visualisation of the test calculation results for LiCl aqueous solution regeneration

DEHUMID – Final Activity Report COOP-CT-2005-016957
Page 134 of 208
Sensitivity of the output parameters to the input parameters change for the absorption
process
0,0
5,0
10,0
15,0
20,0
25,0
30,0
35,0
0,6 0,7 0,8 0,9 1,0 1,1 1,2 1,3 1,4 1,5 1,6
Ga
0,00
0,20
0,40
0,60
0,80
1,00
1,20
tao
tso
m
Wox10
ξo
ηw
ηt
ηh
Figure 85. The influence of the air flow rate for the absorption process
0,0
5,0
10,0
15,0
20,0
25,0
30,0
35,0
25,0 27,0 29,0 31,0 33,0 35,0 37,0 39,0 41,0 43,0
tai
0,00
0,10
0,20
0,30
0,40
0,50
0,60
0,70
0,80
0,90
1,00
tao
tso
m
Wox10
ξo
ηw
ηt
ηh
Figure 86. The influence of the input air temperature for the absorption process

DEHUMID – Final Activity Report COOP-CT-2005-016957
Page 135 of 208
0,0
5,0
10,0
15,0
20,0
25,0
30,0
35,0
40,0
0,010 0,012 0,014 0,016 0,018 0,020 0,022 0,024
Wi
0,00
0,10
0,20
0,30
0,40
0,50
0,60
0,70
0,80
0,90
1,00
tao
tso
m
Wox10
ξo
ηw
ηt
ηh
Figure 87. The influence of the input air humidity ratio for the absorption process
0,0
5,0
10,0
15,0
20,0
25,0
30,0
35,0
4,0 4,5 5,0 5,5 6,0 6,5 7,0 7,5 8,0
Gs
0,00
0,10
0,20
0,30
0,40
0,50
0,60
0,70
0,80
0,90
1,00
tao
tso
m
Wox10
ξo
ηw
ηt
ηh
Figure 88. The influence of the LiCl solution flow rate for the absorption process

DEHUMID – Final Activity Report COOP-CT-2005-016957
Page 136 of 208
0,0
5,0
10,0
15,0
20,0
25,0
30,0
35,0
40,0
18,0 20,0 22,0 24,0 26,0 28,0 30,0 32,0 34,0 36,0 38,0
tsi
0,00
0,20
0,40
0,60
0,80
1,00
1,20
tao
tso
m
Wox10
ξo
ηw
ηt
ηh
Poly. (ηw )
Figure 89. The influence of the LiCl solution temperature for the absorption process
0,0
5,0
10,0
15,0
20,0
25,0
30,0
35,0
32,0% 32,5% 33,0% 33,5% 34,0% 34,5% 35,0%
ξsi
0,00
0,10
0,20
0,30
0,40
0,50
0,60
0,70
0,80
0,90
1,00
tao
tso
m
Wox10
ξo
ηw
ηt
ηh
Figure 90. The influence of the LiCl solution concentration for the absorption process

DEHUMID – Final Activity Report COOP-CT-2005-016957
Page 137 of 208
Sensitivity of the output parameters to the input parameters change for the
regeneration process
0
0,5
1
1,5
2
2,5
0,4 0,6 0,8 1 1,2 1,4 1,6
Ga56,0
56,5
57,0
57,5
58,0
58,5
59,0
59,5
Wo x 10
ξo
Mevap
α
β
Tao
Tso
Figure 91. The influence of the air flow rate for the regeneration process
0
0,5
1
1,5
2
2,5
25,0 27,0 29,0 31,0 33,0 35,0 37,0 39,0 41,0
Tai57,0
57,5
58,0
58,5
59,0
59,5
Wo x 10
ξo
Mevap
α
β
Tao
Tso
Figure 92. The influence of the input air temperature for the regeneration process

DEHUMID – Final Activity Report COOP-CT-2005-016957
Page 138 of 208
0
0,5
1
1,5
2
2,5
0,0100 0,0120 0,0140 0,0160 0,0180 0,0200 0,0220
Wi
57,0
57,5
58,0
58,5
59,0
59,5
Wo x 10
ξo
Mevap
α
β
Tao
Tso
Figure 93. The influence of the input air humidity ratio for the regeneration process
0
0,5
1
1,5
2
2,5
4,000 4,500 5,000 5,500 6,000 6,500 7,000 7,500 8,000
Gs
56,5
57,0
57,5
58,0
58,5
59,0
59,5
Wo x 10
ξo
Mevap
α
β
Tao
Tso
Figure 94. The influence of the LiCl solution flow rate for the regeneration process

DEHUMID – Final Activity Report COOP-CT-2005-016957
Page 139 of 208
0
0,5
1
1,5
2
2,5
3
56,0 58,0 60,0 62,0 64,0 66,0 68,0 70,0 72,0
Tsi
53,0
54,0
55,0
56,0
57,0
58,0
59,0
60,0
61,0
62,0
63,0
64,0Wo x 10
ξo
Mevap
α
β
Tao
Tso
Figure 95. The influence of the LiCl solution temperature for the regeneration process
0
0,2
0,4
0,6
0,8
1
1,2
1,4
1,6
1,8
2
31,5% 32,0% 32,5% 33,0% 33,5% 34,0% 34,5% 35,0% 35,5%
ξi
56,5
57,0
57,5
58,0
58,5
59,0
59,5
Wo x 10
ξo
Mevap
α
β
Tao
Tso
Figure 96. The influence of the LiCl solution concentration for the regeneration process

DEHUMID – Final Activity Report COOP-CT-2005-016957
Page 140 of 208
Model of the whole dehumidification system
For the elements of the dehumidification system, the same principle is used as for absorption and regeneration. Instead of solving many differential equations, the simplified method is adopted, i.e. the experimental physical efficiencies of heat and mass transfer in the system elements were used.
The principal scheme of the elaborated prototype is presented in Figure 97. In this scheme all the elements of the dehumidification installation are presented. It is possible to change 11 elements: air, water or solution parameters (not taking into account the fans, pumps, pipes and casings of unit). These elements are placed in two separate units – absorption unit and regeneration unit. The presented scheme, with illustrative figures is taken from the model implementation in MS Excel™, therefore names of variables in the scheme differs slightly from the formulas presented below. However, the names can be easily recognised.
The calculation procedure used goes through installation elements not following the air, water or desiccant solution path. The installation is complex enough, output parameters of one element are used as input parameters for the other element, and all the elements are connected by closed or open loops. Therefore calculation procedure is iterative, and the presented model follows this calculation sequence.

DEHUMID – Periodic Activity Report (P2) COOP-CT-2005-016957
Page 141 of 208
Figure 97. The principal scheme and visualisation of results (test case) for the dehumidification system modelled

DEHUMID – Periodic Activity Report (P2)
Page 142 of 208
Nomenclature
T – temperature
D – humidity ratio
C – LiCl solution concentration (mass fraction)
H – enthalpy
P – pressure
cp – specific heat
η – efficiency , ratio
ϕ – relative humidity
ed – efficiency definition
Subscripts
a – air
s – solution or saturated
w – water
wa – water-air
sw – solution-water
aw – absorbed water
ew – ewaporated water
reg – regenerator
abs – absorber
ind – evaporative cooler
aaxa – air/air heat exchanger in the absorber unit
aaxr – air/air heat exchanger in the regenerator unit
swxa – solution/water heat exchanger in the absorber unit
swxr – solution/water heat exchanger in the regenerator unit
ssxa – solution/solution heat exchanger in the absorber unit
bar - barometric
Superscripts
‘ new value
t – transition
r – regeneration, regenerator

DEHUMID – Final Activity Report COOP-CT-2005-016957
Page 143 of 208
a – absorption, absorber
h – heating
G – flow
H – enthalpy
D – humidity ratio
T – temperature
Tc – temperature, cooling
C, c – cooling
dp – dew point
wb – wet bulb
dil – dilution
NC – no cooling
W – temperature on water side
Input parameters
Parameters with no possibility to control:
Ta1 Da1 Tw1 Ta7 Da7
T
swxrη T
aaxrη Tc
aaxrη C
aaxrη D
aaxrη D
regη T
regη T
aaxaη Tc
aaxaη
C
aaxaη D
aaxaη H
indη D
indη w
indη T
swxaη D
absη T
absη T
ssxaη
Parameters, which can be controlled:
r
aG a
aG r
sG a
sG t
sG c
wG 5wT h
wG initial
sC
Solution basin in the regeneration unit
In this basin the desiccant solution returning from the regenerator mixes with the solution returning from the absorber unit (i.e. solution/solution heat exchanger).
Calculation sequence:
1. 2. initial guess 5sT 3.
1)

DEHUMID – Final Activity Report COOP-CT-2005-016957
Page 144 of 208
4. 5. initial guess 5sC 6.
2)
7. 8. initial guess 8sT 9.
3)
10. 11. initial guess 8sC 12.
4)
13. 14. r
s
t
s
r
ss
t
ss
sGG
GTGTT
+
⋅+⋅= 85
6 15.
5)
16. 17. r
s
t
s
r
s8s
t
s5s6s
GG
GCGCC
+
⋅+⋅=
18. 6)
Solution / water heat exchanger (SWXR) in the regenerator unit
In this exchanger, solution supplied to regenerator is heated using an external heat source.
Definition of efficiency:
19.
( )
⋅−
−=η
ps
pw
6s5w
6s7sT
swxr
c
c;1minTT
TT
20. or
21.
( )
⋅
⋅⋅−
−=η
pw
ps
6s5w
6w5wT
swxr
c
c;1minTT
TT
22.
23.
24. ed 1)
25.
26.
27. ed 2)
28.
Calculation sequence:
29. 30. 6s5w
max
sw TTT −=∆ 31.
7)
32. 33. h
wpw
r
spscG
swGc
GcR
⋅
⋅=
34. 8)
T
Ts6
Tw6
Tw5
Ts7
Figure 98. Flows temperatures in SWXR

DEHUMID – Final Activity Report COOP-CT-2005-016957
Page 145 of 208
35. 36. ( )cG
sw
max
sw5w
min
6w R;1minTTT ⋅∆−= 37.
9)
38. 39. ( ) T
swxr
CG
sw
max
sw5w6w R;1minTTT η⋅⋅∆−= 40.
10)
41. 42.
⋅∆+=
CG
sw
max
sw6s
max
7sR
1;1minTTT
43. 11)
44. 45. T
swxrCG
sw
max
sw6s7sR
1;1minTTT η⋅
⋅∆+=
46. 12)
Air / air heat exchanger in the regenerator unit (AAXR)
In this exchanger, hot and humid air from the regenerator transfers heat to the outdoor air entering into the regenerator unit. If the temperature of one air stream is below that of dew point of the other air stream, condensation of water is possible.
Definition of efficiencies:
If dp
9a7a TT > and dp
7a9a TT > (case of "dry" heat exchange) there are possible 2 situations:
9a7a TT < and 7a9a TT < . For both situations:
47. 7a9a
7a8a1T
aaxrTT
TT
−
−=η
48.
49. ed 3)
50.
51. 9a7a
9a10a2T
aaxrTT
TT
−
−=η
52.
53. ed 4)
54.
55. 2
1
aaxr
T
aaxrT
aaxr
TT +=η
56.
57. ed 5)
58.
9
10
7
87
89
10
Figure 99. Scheme of air temperatures in AAXR in case of
„dry“ heat exchange

DEHUMID – Final Activity Report COOP-CT-2005-016957
Page 146 of 208
If dp
9a7a TT ≤ (condensation in exhausted air stream is possible)
59. 7a9a
7a8aTc
aaxrTT
TT
−
−=η
60.
61. ed 6)
62.
63. 79
109
aa
aaC
aaxrTT
TT
−
−=η
64.
65. ed 7)
66.
67. 7a9a
10a9aD
aaxrDD
DD
−
−=η
68.
69. ed 8)
70.
If dp
7a9a TT ≤ (condensation in entering air stream is possible)
71. 9a7a
9a10aTc
aaxrTT
TT
−
−=η
72.
73. ed 9)
74.
75. 9a7a
8a7aC
aaxrTT
TT
−
−=η
76.
77. ed 10)
78.
79. a7a
a7aD
aaxrDD
DD
−
−=η
80.
81. ed 11)
82.
8
7
9
10
7sTa7
Ta10
Ta9
Da10Da7s
Da9
Ta8
Figure 100. Scheme of air temperatures in AAXR in case of
condensation in exhausted air stream
10
9
7
8
9s Ta9
Ta8
Ta7
Da8
Da9s
Da7
Ta10
Figure 101. Scheme of air temperatures in AAXR in case of
condensation in entering air stream

DEHUMID – Final Activity Report COOP-CT-2005-016957
Page 147 of 208
Calculation sequence:
83. 84. initial guess 9aT 85.
13)
86. 87. initial guess 9aD 88.
14)
89. 90. if dp
9a7a TT ≤ 91.
15)
then:
92. 93. ( ) Tc
aaxr7a9a7a8a TTTT η⋅−+= 94.
16)
95. 96. 7a8a DD = 97.
17)
98. 99. ( ) C
aaxr7a9a9a10a TTTT η⋅−−= 100.
18)
101. 102. ( ) D
aaxrs7a9a9a10a DDDD η⋅−−= 103.
19)
else:
if dp
7a9a TT ≤
then
104. 105. ( ) Tc
aaxr9a7a9a10a TTTT η⋅−+= , 9a10a DD = 106.
20)
107. 108. ( ) C
aaxr9a7a7a8a TTTT η⋅−−= 109.
21)
110. 111. ( ) D
aaxrs9a7a7a8a DDDD η⋅−−= 112.
22)
else
113. 114. 7a8a DD = 115.
23)
116. 117. 7a10a DD =
118. 24)

DEHUMID – Final Activity Report COOP-CT-2005-016957
Page 148 of 208
119. 120. ( ) T
aaxr7a9a7a8a TTTT η⋅−+= 121.
25)
122. 123. ( ) T
aaxr9a7a9a10a TTTT η⋅−+= 124.
26)
Regenerator
In the regenerator, hot solution contacts the outdoor air preheated in the air/air heat exchanger. Water vapour pressure above the solution surface is higher than in the air therefore water evaporates from the solution to the air, therefore the solution concentration increases.
Definition of efficiencies:
125. 8a7s
8a9aD
regDD
DD
−
−=η
126. ed 12)
127. 8a7s
8a9aT
regTT
TT
−
−=η
128. ed 13)
Calculation sequence:
129. 130. ( )7s7s7s T;CfP = 131.
27)
132. 133. ( )7s7s PfD = 134.
28)
135. 136. ( )8a7s
D
reg8a9a DDDD −⋅η+=′ 137.
29)
138. 139. ( )8a7s
T
reg8a9a TTTT −⋅η+=′ 140.
30)
141. 142. 9a9a9a DDD −′=∆ 143.
31)
if 001,0D 9a >∆
RH=100%
a8
a9
s7
s8
a2Dmax
Tm
ax
C=const.
Figure 102. Air and solution parameters in
regenerator

DEHUMID – Final Activity Report COOP-CT-2005-016957
Page 149 of 208
then:
144. 145. 9a9a DD ′= ; and return to (15) 146.
32)
else:
147. 148. 9a9a9a TTT −′=∆ 149.
33)
if 1,0T 9a >∆
then:
150. 151. 9a9a TT ′= and return to (15) 152.
34)
else:
153. 154. ( )8a9a
r
a
r
ew DDGG −⋅= 155.
35)
156. 157. ( ) ( )
r
sps
r
ew
dil
s7sps
r
ew
r
s9a8a
r
a
8sGc
GHTcGGHHGT
⋅
⋅∆−⋅⋅++−⋅=′
158. 36)
159. 160.
+⋅=′
r
s
r
ew7s8s
G
G1CC
161. 37)
162. 163. 8s8s8s CCC −′=∆ 164.
38)
if 001,0C 8s >∆
then:
165. 166. 8s8s CC ′= and return to (5) 167.
39)
else:
168. 169. 8s8s8s TTT −′=∆ 170.
40)
if 1,0T 8s >∆
then:

DEHUMID – Final Activity Report COOP-CT-2005-016957
Page 150 of 208
171. 172. 8s8s TT ′= and return to (5) 173.
41)
Air / air heat exchanger in the absorber unit (AAXA)
In this exchanger, relatively dry, cold air from the room is heated by the hot outdoor air entering into the absorber unit. If the temperature of one air stream is below that of dew point of the other air stream, condensation of water occurs.
Definition of efficiencies:
If dp
4a1a TT > and dp
1a4a TT > (case of "dry" heat exchange) there are possible 2 situations:
4a1a TT < and 1a4a TT < . For both situations:
174. 1a4a
1a2a1T
aaxaTT
TT
−
−=η
175.
176. ed 14)
177.
178. 4a1a
4a5a2T
aaxaTT
TT
−
−=η
179.
180. ed 15)
181.
182. 2
TTT
aaxa
1T
aaxaT
aaxa
+=η
183.
184. ed 16)
185.
If dp
4a1a TT ≤ (condensation in air stream returned from the room is possible)
4
5
1
21
2
4
5
Figure 103. Scheme of air temperatures in AAXA in
case of „dry“ heat exchange

DEHUMID – Final Activity Report COOP-CT-2005-016957
Page 151 of 208
186. 1a4a
1a2aTc
aaxaTT
TT
−
−=η
187.
188. ed 17)
189.
190. 14
54
aa
aaC
aaxaTT
TT
−
−=η
191.
192. ed 18)
193.
194. a4a
a4aD
aaxaDD
DD
−
−=η
195.
196. ed 19)
197.
If dp
1a4a TT ≤ (condensation in air stream supplied to absorption unit is possible)
198. 4a1a
4a5aTc
aaxaTT
TT
−
−=η
199.
200. ed 20)
201.
202. 4a1a
2a1aC
aaxaTT
TT
−
−=η
203.
204. ed 21)
205.
206. 4a1a
a1aD
aaxaDD
DD
−
−=η
207.
208. ed 22)
209.
2
1
4
5
1s Ta1
Ta5
Ta4
Da5
Da1s
Da4
Ta2
Figure 104. Scheme of air temperatures in
AAXA in case of condensation in returned air
stream
5
4
1
2
4s Ta4
Ta2
Ta1
Da2Da4s
Da1
Ta5
Figure 105. Air temperatures in AAXA in case of
condensation in outdoor air stream

DEHUMID – Final Activity Report COOP-CT-2005-016957
Page 152 of 208
Calculation sequence:
210. 211. initial guess 4aT 212.
42)
213. 214. initial guess 4aD 215.
43)
216. 217. if dp
4a1a TT ≤ 218.
44)
then:
219. 220. ( ) Tc
aaxa1a4a1a2a TTTT η⋅−+= 221.
45)
222. 223. 1a2a DD = 224.
46)
225. 226. ( ) C
aaxa1a4a4a5a TTTT η⋅−−= 227.
47)
228. 229. ( ) D
aaxas1a4a4a5a DDDD η⋅−−= 230.
48)
Else:
if dp
1a4a TT ≤
then:
231. 232. ( ) Tc
aaxa4a1a4a5a TTTT η⋅−+= 233.
49)
234. 235. 4a5a DD = 236.
50)
237. 238. ( ) C
aaxa4a1a1a2a TTTT η⋅−−= 239.
51)
240. 241. ( ) D
aaxas4a1a1a2a DDDD η⋅−−= 242.
52)
else:
243. 244. 1a2a DD = 245.
53)

DEHUMID – Final Activity Report COOP-CT-2005-016957
Page 153 of 208
246. 247. 4a5a DD =
248. 54)
249. 250. ( ) T
aaxa1a4a1a2a TTTT η⋅−+= 251.
55)
252. 253. ( ) T
aaxa4a1a4a5a TTTT η⋅−+= 254.
56)
Solution basin in the absorber unit
In this basin the desiccant solution returning from the absorber mixes with solution supplying from absorber unit (i.e. solution/solution heat exchanger).
Calculation sequence:
255. 256. initial guess 4sT 257.
57)
258. 259. initial guess 4sC 260.
58)
261. 262. a
s
t
s
a
s4s
t
s1s
2sGG
GTGTT
+
⋅+⋅=
263. 59)
264. 265. a
s
t
s
a
s4s
t
s1s
2sGG
GCGCC
+
⋅+⋅=
266. 60)
Evaporative cooler (IND)
In this heat and mass exchanger, air contact with water is necessary for desiccant solution cooling. During the evaporation the temperatures of the water and air decrease but air humidity increases. Air enthalpy change depends on initial water temperature.
Definition of efficiencies:
267. 268.
( )
⋅
⋅⋅⋅−
−=η
a
a5a
c
wpw3w
5a3aw
5a6aH
ind
GH
GcT;1minHH
HH 269.
ed 23)

DEHUMID – Final Activity Report COOP-CT-2005-016957
Page 154 of 208
270. 271.
5a3aw
5a6aD
indDD
DD
−
−=η
272. ed 24)
273. 274.
( )
⋅⋅
⋅⋅−
−=η
c
wpw3w
a
a5awb
5a3w
4w3ww
ind
GcT
GH;1minTT
TT 275.
ed 25)
Daw3
Da6Da6Da5max
a5
a5wb
w4min
a6
w4
w3 Tw3
Haw3
Ha6
Ha6
Ha5
max
Figure 106. Scheme of air and water parameters in evaporative cooler
Calculation sequence:
276. 277. initial guess 3wT 278.
61)
279. 280. a
a5a
c
wpw3wHG
waGH
GcTR
⋅
⋅⋅=
281. 62)
282. 283. ( )bar3w3aw P;1;TfD = 284.
63)
285. 286. ( )bar3aw3w3aw P;D;TfH = 287.
64)
288. 289. ( ) ( )hG
wa5a3aw
max
a R;1minHHH ⋅−=∆ 290.
65)

DEHUMID – Final Activity Report COOP-CT-2005-016957
Page 155 of 208
291. 292. H
ind
max
a5a6a HHH η⋅∆+= 293.
66)
294. 295. H
ind
max
ac
wpw
a
a3w4w H
Gc
GTT η⋅∆⋅
⋅−=′
296. 67)
297. 298. 5a3aw
max
a DDD −=∆ 299.
68)
300. 301. D
ind
max
a5a6a DDD η⋅∆+= 302.
69)
303. 304. ( )bar6a6a6a P;D;HfT = 305.
70)
306. 307. ( )bar5a5a
wb
5a P;D;TfT = 308.
71)
309. 310. ( )
⋅−=∆
HG
wa
wb
5a3w
max
4wR
1;1minTTT
311. 72)
312. 313. w
ind
max
4w3w4w TTT η⋅∆−=′′ 314.
73)
315. 316. 2
TTT 4w4w
4w
′′+′=
317. 74)
Solution/ water heat exchanger in the absorber unit (SWXA)
In this exchanger, desiccant solution is cooled before supplying it to the absorber. Water is supplied from the evaporative cooler.

DEHUMID – Final Activity Report COOP-CT-2005-016957
Page 156 of 208
Definition of efficiencies:
318.
( )
⋅
⋅⋅−
−=η
ps
pw
2w2s
3s2sT
swxa
Gc
Gc;1minTT
TT
319.
320. ed 26)
321.
or
322.
( )
⋅
⋅⋅−
−′=η
pw
ps
2w2s
2w3wT
swxa
Gc
Gc;1minTT
TT
323.
324. ed 27)
325.
Calculation sequence:
326. 327. 2w2s
maxTTT −=∆
328. 75)
329. 330. C
wpw
a
spscG
swGc
GcR
⋅
⋅=
331. 76)
332. 333. ( )cG
sw
c
swxa
max
2w3w R;1minTTT ⋅η⋅∆+=′ 334.
77)
335. 336. 3w3w3w TTT −′=∆ 337.
78)
if 1,0T 3w >∆
then:
338. 339. 3w3w TT ′= , and return to (62) 340.
79)
else:
341. 342. ( )cG
sw
C
swxa
max
2s3s R;1minTTT ⋅η⋅∆−= 343.
80)
344. 345. 2s3s CC = 346.
81)
T
Tw3
Ts2
Ts3
Tw2
Figure 107. Flows temperatures in SWXR

DEHUMID – Final Activity Report COOP-CT-2005-016957
Page 157 of 208
Absorber
In the absorber, cold solution contacts the supply air, pre-cooled in the air/air heat exchanger. Water vapour pressure above the solution surface is lower than in the air, therefore water is absorbed from the air to the solution. Solution concentration decreases.
Definition of efficiencies:
347. 2a
2aD
absD
D
−
−=η
348.
349. ed 28)
350.
351. NC
3a
NC
3aT
absT
T
−
−=η
352.
353. ed 29)
354.
Calculation sequence
355. 356. ( )3s3s3s T;CfP = 357.
82)
358. 359. ( )bar3s3as P;PfD = 360.
83)
361. 362. ( )3s3s
dil
s T,CfH =∆ 363.
84)
364. 365. ( )bar2a2a2a P;D;TfH = 366.
85)
367. 368. ( ) dil
s3as2a2a
NC
3a HDDHH ∆⋅−+= 369.
86)
370. 371. ( )bar3as
NC
3a
NC
3a P;D;HfT = 372.
87)
a3
s3
a2
s4Ts3
Ta3
NC
Da3
Das3
Da2
Ta3a3NC
RH=100%
H=const.
Figure 108. Air and solution parameters in regenerator

DEHUMID – Final Activity Report COOP-CT-2005-016957
Page 158 of 208
373. 374. ( )3a2a
a
a
a
aw DDGG −⋅= 375.
88)
376. 377. ( ) ( )bar3a3abar2a2a23a P;D;TfP;D;TfH −= 378.
89)
379. 380. ( )a
aw
a
sps
ps3s
a
s23a
a
a
4sGGc
cTGHGT
+⋅
⋅⋅+∆⋅=′
381. 90)
382. 383.
a
s
aw
3s4s
G
G1
CC
+
=′ 384. 91)
385. 386. 4s4s4s CCC −′=∆ 387.
92)
if 001,0C 4s >∆
then:
388. 389. 4s4s CC ′= , and return to (59) 390.
93)
else:
391. 392. 4s4s4s TTT −′=∆ 393.
94)
if 1,0T 4s >
then:
394. 395. 4s4s TT ′= , and return to (59) 396.
95)
else:
397. 398. ( )3s
NC
3a
T
abs
NC
3a3a TTTT −⋅η−= 399.
96)
400. 401. ( )3as2a
D
abs2a3a DDDD −⋅η−= 402.
97)

DEHUMID – Final Activity Report COOP-CT-2005-016957
Page 159 of 208
Room (Pool)
Calculation sequence:
403. 404. a
apa
SH3a4a
Gc
QTT
⋅+=′
405. 98)
406.
407. ( )Pbar af, Np, Ap, Tw, Q, Da3, Ta3, Ga,fD 4a =′
(external calculation procedure using air flow, input air temperature and humidity ratio, sensible heat load, water temperature, pool surface,
number of people, pool activity factor, barometric pressure)
408. 99)
409. 410. 4a4a4a DDD −′=∆ 411. 100)
if 001,0D 4a >∆
then:
412. 413. 4a4a DD ′= , and return to (44) 414. 101)
else:
415. 416. 4a4a4a TTT −′=∆ 417. 102)
if 1,0T 4a >
then:
418. 419. 4a4a TT ′= , and return to (44) 420. 103)
else:
421. 422. ( )bar4a4a4a P;D;Tf=ϕ 423. 104)
424. 425. ( )3a4a
a
a
room
ew DDGG −⋅= 426. 105)
Solution/solution heat exchanger in the absorption unit (SSXA)
In this heat exchanger, hot solution from the regenerator transfers heat to the solution leaving the absorption unit.

DEHUMID – Final Activity Report COOP-CT-2005-016957
Page 160 of 208
Definition of efficiency:
427.
428. 2s6s
2s5s
2s6s
1s6sT
ssxaTT
TT
TT
TT
−
−=
−
−=η
429. ed 30)
T
Ts5
Ts6
Ts1
Ts2
regeneratorunit
absorberunit
Figure 109. Flows temperatures in SWXR
Calculation sequence
430. 431. ( ) T
ssxa2s6s6s1s TTTT η⋅−−= 432. 106)
433. 434. ( ) T
ssxa2s6s2s5s TTTT η⋅−+=′ 435. 107)
436. 437. 2s5s CC =′ 438. 108)
439. 440. 5s5s5s CCC −′=∆ 441. 109)
if 001,0C 5s >∆
then:
442. 443. 5s5s CC ′= and return to (5) 444. 110)
else:
445. 446. 5s5s5s TTT −′=∆ 447. 111)
if 1,0T 5s >∆
then:

DEHUMID – Final Activity Report COOP-CT-2005-016957
Page 161 of 208
448. 449. 5s5s TT ′= and return to (5) 450. 112)
Performance tests
The aim of the performance tests is to discover the marginal values of possible input parameters and the physical characteristics of the heat and mass transfer in the system components (elements). Performance tests were made for both prototype installations – at Nottingham University (UK) and at the Instituto Giordano (Bellaria, Italy). Both test installations were equipped with data acquisition systems, but only the Italian installation had the possibility to test for different climatic conditions (for the latter installation the climatic room was arranged).
Parameters sets for the performance tests
To explore marginal values of possible input parameters and physical characteristics of the heat and mass transfer in system elements the initial parameters sets were proposed.
Table 11. Parameters sets for the installation performance tests
Parameter Base values Variation sequence
Outdoor air temperature 25 °C 35 30 25 20 15 (13) Outdoor air humidity ratio 10 g/kg 18 15 13 10 8 6
Indoor air temperature 27 °C 36 33 30 27 24 21 Indoor air humidity ratio 13 g/kg 20 18 16 13 11 8
Air flow in absorption unit 100 % 100 80 60 40 20 Air flow in regeneration unit 100 % 100 80 60 40 20
Solution flow in absorption unit 100 % 100 80 60 40 20 Solution flow in regeneration unit 100 % 100 80 60 40 20
Solution temperature before absorption 25 °C 40 35 30 25 20 15 Solution concentration before absorption
35 % 41 38 35 32 29
Solution temperature before regeneration
65 °C 75 70 65 60 55
Solution concentration before regeneration
35 % 41 38 35 32 29
Water flow in evaporative cooling 100 % 100 80 60 40 20

DEHUMID – Final Activity Report COOP-CT-2005-016957
Page 162 of 208
During the test of one input parameter, all other input parameters were kept constant. The values of these parameters were kept constant and equal to the "Base values" (see Table 11)
Visualisation of the tests results
During the tests, over 40 parameters were measured constantly. The measured values were recorded to the ASCII file, at intervals of one minute (see Figure 110). To be able to make an analysis of the obtained values, a semiautomatic template was created for MS Excel™. Using this template it is possible to import new experimental data in a few, relatively simple steps. After importing the data, useful visualisation is available. In the chart (see Figure 111 and Figure 112) it is possible to choose which time interval and parameters to show.

DEHUMID – Periodic Activity Report (P2) COOP-CT-2005-016957
Page 163 of 208
Dehumid data log file.
Hour;Minute;Second;Ro1;Ro2;RH1;RH2;RH3;RH4;RH5;RH6;RH7;RH8;RH9;RH10;t1;t2; t3;t4;t5;t6;t7; t8;t9;t10; ts_d;tw;txa;txb;txc;txd;thi;tho;ts1;ts2;ts_r;FlowDehReg;FlowReg;FanDehFresh;FanDehRoom;FanReg;PumpDehWat;PumpDehDes;PumpRegDes;Valv
eDeh;ValveReg;Mode;Errors;
15;23;55;1,26;1,21;45,68;46,19;40,65;47,92;39,08;82,18;85,05;57,29;34,12;63,69;31,46;29,03;34,30;27,62;32,51;26,35;29,23;49,22;55,89;36,04;47,78;31,04;37,70;40,41;45,97;43,11;66,24;63,77;54,31;66,74;54,31;123,15;113,27;0;0;0;0;100;100;0;0;0;0;
15;24;25;1,27;1,23;45,37;45,87;40,33;47,59;39,08;82,95;86,02;56,62;34,75;62,72;31,34;29,10;34,43;27,62;32,51;26,35;29,36;49,35;55,89;36,10;47,78;31,17;37,95;40,66;46,09;43,36;66,00;63,77;54,55;66,74;54,55;125,95;113,27;0;0;0;0;100;100;0;0;0;0;
15;24;55;1,26;1,23;43,49;45,71;40,02;46,61;38,44;82,03;82,77;56,12;34,75;70,31;31,34;29,16;34,56;27,62;32,44;26,35;29,36;49,48;55,89;36,43;47,53;31,29;38,20;40,66;46,22;43,36;66,00;63,77;55,05;66,86;55,05;123,15;116,25;0;0;0;0;100;100;0;0;0;0;
15;25;25;1,27;1,23;45,37;45,40;40,02;45,30;38,76;83,71;81,47;55,62;34,75;62,89;31,27;29,16;34,62;27,75;32,51;26,35;29,49;50,00;55,95;36,49;47,78;31,29;38,20;40,78;46,34;43,48;66,00;63,77;54,92;66,74;54,92;125,95;113,27;0;0;0;0;100;100;0;0;0;0;
15;25;55;1,25;1,23;45,68;45,24;40,33;44,32;39,23;83,41;84,72;54,96;34,75;68,53;31,21;29,23;34,75;27,75;32,44;26,35;29,62;50,06;55,95;36,62;47,53;31,29;38,44;41,15;46,34;43,60;66,00;63,77;55,54;66,74;55,54;123,15;113,27;0;0;0;0;100;100;0;0;0;0;
15;26;25;1,27;1,23;45,21;44,92;40,81;44,32;39,23;83,10;81,14;54,46;34,75;65,30;31,34;29,36;34,95;27,75;32,51;26,42;29,68;50,26;56,02;36,75;48,03;31,54;38,69;41,27;46,34;43,85;66,00;63,77;55,67;66,74;55,67;125,95;116,25;0;0;0;0;100;100;0;0;0;0;
15;26;55;1,27;1,23;43,80;44,61;41,12;44,81;38,76;82,95;82,12;53,96;34,75;66,92;31,34;29,23;35,08;27,75;32,51;26,35;29,75;50,32;56,08;36,69;48,52;31,54;38,94;41,40;46,46;44,10;66,00;63,77;55,79;66,74;55,79;125,95;116,25;0;0;0;0;100;100;0;0;0;0;
15;27;25;1,26;1,23;43,33;44,45;41,28;44,32;38,44;84,17;78,86;55,96;35,38;68,21;31,21;29,29;35,21;27,75;32,51;26,48;29,88;50,78;56,15;36,75;48,77;31,54;39,18;41,64;46,59;44,10;66,24;64,02;56,04;66,99;56,04;125,95;116,25;0;0;0;0;100;100;0;0;0;0;
15;27;55;1,27;1,23;42,23;44,29;41,91;44,32;38,13;81,72;78,86;57,79;36,49;66,76;31,21;29,29;35,34;27,75;32,51;26,48;29,88;51,29;56,28;37,21;49,02;31,79;39,43;41,89;46,59;44,34;66,98;64,51;56,78;67,48;56,78;125,95;116,25;0;0;0;0;100;100;0;0;0;0;
15;28;25;1,29;1,23;42,23;44,29;42,23;44,32;38,13;81,42;81,14;60,95;37,44;67,24;31,21;29,36;35,60;27,75;32,51;26,48;29,94;51,88;56,41;37,85;49,51;31,79;39,68;42,14;46,83;44,59;67,97;65,50;57,77;68,47;57,77;125,95;116,25;0;0;0;0;100;100;0;0;0;0;
15;28;55;1,27;1,23;45,37;44,29;42,86;44,64;38,76;81,72;81,79;64,28;38,39;66,27;31,21;29,23;35,73;27,75;32,57;26,48;30,14;52,72;56,60;38,63;50,25;31,79;39,92;42,38;47,08;44,84;69,45;66,49;59,00;69,46;59,00;125,95;116,25;0;0;0;0;100;100;0;0;0;0;
15;29;25;1,26;1,23;42,86;44,29;42,86;44,97;38,13;84,17;85,37;64,62;38,86;71,60;31,21;29,16;35,99;27,75;32,57;26,48;30,27;53,37;56,66;39,67;50,75;32,03;40,05;42,76;47,58;44,96;70,44;67,35;59,99;70,32;59,99;123,15;116,25;0;0;0;0;100;100;0;0;0;0;
15;29;55;1,25;1,23;42,54;44,92;43,18;45,63;37,97;80,65;82,44;63,62;38,86;72,08;31,08;29,16;36,18;27,75;32,57;26,48;30,33;53,76;56,66;40,52;51,73;32,03;40,42;43,13;47,82;45,33;71,18;67,97;61,35;71,19;61,35;128,74;119,23;0;0;0;0;100;100;0;0;0;0;
15;30;25;1,28;1,23;42,54;43,98;43,18;45,30;37,81;80,81;88,30;64,62;38,55;80,47;31,08;29,16;36,38;27,75;32,51;26,48;30,53;54,28;56,79;41,75;52,48;32,03;40,67;43,62;48,32;45,58;71,92;68,71;61,96;71,93;61,96;125,95;116,25;0;0;0;0;100;100;0;0;0;0;
15;30;55;1,27;1,23;44,11;44,29;43,34;45,30;38,13;81,11;86,68;64,62;38,55;77,40;31,08;29,16;36,51;27,75;32,44;26,48;30,66;54,41;56,79;42,46;53,22;32,28;40,91;43,87;48,81;46,07;72,42;69,20;62,46;72,42;62,46;125,95;116,25;0;0;0;0;100;100;0;0;0;0;
15;31;25;1,30;1,23;45,68;44,29;43,66;45,63;38,44;81,72;88,79;64,28;38,55;71,92;31,08;29,16;36,77;27,75;32,57;26,48;30,92;54,67;56,79;43,31;53,96;32,28;41,16;44,36;49,30;46,44;72,91;69,70;63,08;72,92;63,08;125,95;116,25;0;0;0;0;100;100;0;0;0;0;
15;31;55;1,25;1,23;44,74;44,29;43,81;45,95;38,13;83,56;88,30;64,28;38,55;76,92;31,14;29,16;37,03;27,75;32,57;26,48;31,11;54,80;56,79;43,83;54,95;32,28;41,41;44,61;49,55;46,81;73,41;69,94;63,32;73,41;63,32;128,74;116,25;0;0;0;0;100;100;0;0;0;0;
15;32;25;1,28;1,23;44,11;44,29;44,13;46,61;38,44;82,80;87,98;62,62;37,91;78,69;31,08;29,16;37,16;27,75;32,57;26,48;31,30;54,73;56,73;44,21;55,19;32,53;41,90;45,10;50,05;47,06;73,41;70,19;63,69;73,66;63,69;128,74;119,23;0;0;0;0;100;100;0;0;0;0;
15;32;55;1,27;1,23;44,74;44,61;35,11;48,57;38,13;94,58;34,58;18,66;25,26;78,85;31,21;29,16;37,67;27,56;32,44;26,48;30,53;53,50;56,60;45,12;55,69;32,53;42,15;45,35;50,29;47,56;73,41;70,56;63,94;73,90;63,94;125,95;116,25;100;100;100;100;100;100;0
Figure 110. The fragment of the ASCII file generated by a data acquisition system of testing installation

DEHUMID – Final Activity Report COOP-CT-2005-016957
Page 164 of 208
Figure 111. Configurable data visualisation chart in MS Excel™

DEHUMID – Final Activity Report COOP-CT-2005-016957
Page 165 of 208
Figure 112. Configurable data visualisation chart in MS Excel™ (with some parameters hidden and the time interval changed)

DEHUMID - Periodic Activity Report (24M) COOP-CT-2005-016957
Page 166 of 208
Test conclusions
The regenerator and absorber units of the dehumidification installation were made in a company called IISAW, in Hangzhou, China, using the principal scheme provided by the University of Nottingham and patented technology for the combined heat and mass exchanger from cellulose fibre. The quality of this equipment was very poor and the malfunction problems were permanent during the entire test period. This caused an intolerable delay in obtaining the experimental data.
The principal scheme of installation and placement of the sensors was not comprehensive enough. For instance, there was no temperature sensor for the LiCl solution entering the absorption pads (heat and mass exchanger). This complicates evaluation of absorber efficiency and reduces the reliability of the modelling results.
The building type (destination of premises) for the field tests as well as principal scheme of installation was changed after the mathematical model was built. The building and the climatic conditions for the field tests were not representative enough to make evaluations of possible system applications and expected energy consumption/savings for the large scale.
Taking into account the intended application field (offices, small commercial buildings) and climatic conditions of countries participating in the project, it is possible to state that the investigated dehumidification system can be used in Southern Europe, where high air humidity occurs regularly and it is impossible to reduce indoor air humidity by increasing the supply air flow. Additionally, in such areas usually high solar radiation is credible, therefore it is possible to use, for example solar panels for the regeneration process and increase competitiveness of liquid desiccant system against conventional air cooling/dehumidification systems. In the continental and especially in Northern Europe, a more competitive way to reduce indoor air humidity in offices and small commercial buildings is to increase the flow of supply air.
2.7.2.1 Report on system performance
System Performance
The system during the test period had a very poor history of reliability, which would be the most significant result from the field tests.
From periods when the system was functioning well there was some data that could be analysed and provide some idea of the performance of the application.
The reliability problems were a continuous series of parts of the system breaking down or not functioning properly. These ranged from pumps stopping functioning (poor quality) and needing replacement, corroded particles of metal blocking desiccant sprayers, sensors not functioning due to the corrosive characteristics of the liquid desiccant, water valves not functioning properly, flow meters not functioning due to the corrosive characteristics of the

DEHUMID - Periodic Activity Report (24M) COOP-CT-2005-016957
Page 167 of 208
liquid desiccant.
Parts of the control system such as the liquid desiccant density meters had to be replaced during the field tests plus two of the control modules had to be replaced due to oxidation on the electronic boards. As each part was replaced a certain amount of checking the system readings and re-calibration had to be made. This meant there was a requirement of personnel at the test site undertaking these reparations and adjustments seven days a week, 6/7 hours per day.
The reliability problems were probably due to the lack of time during the previous stages in the project to test/redesign the DEHUMID system from the results of the quality and performance testing under lab conditions.
The paper Heat Exchanger in the top of the Dehumidifying unit seemed to provide the performance required but readings of mixing of the both air flows therefore leakage was more recognizable as the field testing went on. This was probably due condensation (from the air flows of humid air) collecting on the inside of the metal lid of the dehumidifying unit, which reduced the efficiency of the adhesive of the layers of paper based cardboard that makes up the heat exchanger.
A certain amount of liquid desiccant carryover occurred from the regenerator unit, as all the system components adjacent the regenerator inside the fenced compound were covered by a film of desiccant by the end of the field tests. This would be a source of concern for a commercial unit due to the corrosive characteristics of the LiCl.
From the short experience of field tests there would be an opportunity to continue the project, if time was available, to redesign the dehumidifier and regenerator units to provide better reliability and application flexibility.
Conclusions
The Regenerator and absorber units of the dehumidification prototype installation used for the Quality tests (in Belleria, Italy) and Field tests (in Colores, Portugal) was fabricated by a Chinese company.The installation used the principal scheme provided by the initial work done by University of Nottingham and patented technology for the combined heat and mass exchanger from cellulose fiber.
The quality of the fabrication and components was very poor and the reliability of the installation was a consistent problem during all the testing. This caused serious delays of obtaining reliable experimental data, which resulted in not sufficient time to optimize the running conditions of the prototype.

DEHUMID - Periodic Activity Report (24M) COOP-CT-2005-016957
Page 168 of 208
Lack of time was an issue, resulting from the problem of reliability of the system, to finalise the optimum position of the sensors to generate a model that would provide consistent performance results over different conditions.
The data analysis of the system history logs, during the short time period when the prototype was functioning properly, gave encouraging Coefficient of Performance (COP) results which averaged 2.5, with a maximum of 5.9.
When the COP results are compared with a typical COP of 3.1 for a conventional refrigerant DX dehumidification system (source: ASHRAE Journal) the DEHUMID system could be transformed into a commercial application. To get to a this objective would require further work on design modifications, as specified in other documents of this report, with subsequent field testing.
Discussion of possible areas of system modification
There are certain areas the design that should be improved before the system can be commercialised:
Material of Fabrication The prototype unit bodies were made of steel, which during the initial tests in Italy showed extensive corrosion. The deposits holding the liquid desiccant were replaced with stainless steel replacements. During the field tests the corroded metal deposits collected inside the desiccant started to block up the spray holes, which is a critical process with a requirement of a minimum flow rate. In the future the fabrication all parts adjacent to the storage/use of desiccant should be either fabricated in plastic or stainless steel.
Sensor locations Some further thought should be put to the location of the temperature and relative humidity (RH) sensors. Some of the sensors were continually changed/cleaned due to their contact directly or with the carryover of the liquid desiccant. Due to the desiccants corrosive characteristics of a salt solution different types of sensors should be used for these locations. The objective of any application would be that all the components should be maintenance free for at least 6 months. The locations fitted should also provide information required to control the system for different applications/uses, being either to dehumidify outside air or recirculating room air.
Increase the number of units from two to three or four units The system requires a large footprint in comparison with the conventional dehumidifiers plus different humid conditions during a daily cycle requires the internal components to be reconfigured to ensure that they continually function. One example component that requires different input control during a daily cycle would be the large paper air/air heat exchanger, which is located in the top half of the dehumidifier unit. This effective, economical and innovation heat exchanger slowly disintegrated during the field tests which led to air crossover between the sides of the heat exchanger. This was due to the night time outside air temperature being so low that the dew point was surpassed

DEHUMID - Periodic Activity Report (24M) COOP-CT-2005-016957
Page 169 of 208
of the air being treated, leading to condensation inside the heat exchanger. By increasing the number of main components in the system so would the flexibility of use/control of the application. The units being smaller would enable them to be wall mounted or stacked therefore reducing footprint.
Energy Input One of the main factors that decide that this system will be used for a commercial application will be to increase the COP in terms of financial cost and savings. One the main contributors to the COP calculation will be the generation of the hot water, required by the regenerator unit to evaporate the moisture gained by the liquid desiccant. The energy input of 3kW to generate the hot water compared with the 0.5kW for the rest of the electrical energy inputs, to the pumps, fans etc, is a ratio of 6:1. Therefore the COP in terms of financial costs would increase by 6 times if the hot water is generated by the of waste heat or solar collectors. Hot water could be generated by the use of efficient solar collectors, such as vacuum tubes/heat pipes, significant heat can be collected at above 80ºC in temperature during most of the year in southern European climates. Where solar energy is not so effective such as North Europe, District heating schemes are increasing in number, using and distributing waste heat from industrial applications.
Simplifying and reducing control system A PC (personal computer) was used to access/monitor/change the control system. In a commercial applications this can be done using Embedded controllers that are programmable to upload and download data between servers therefore providing remote control/monitoring plus 24/7 support to the end user. Programmes can be upgraded by uploading to the controller as the system is further studied under different applications.
2.7.2.2 Further improvements required
Density meters.
In some cases control of flow rate on both pipes between basins is not sufficient to have optimal liquid level in both units. Liquid level measurement would be nice to have better control and better safety.
After some tests we noticed the accuracy of density meters should be a bit better to have better margin for crystallisation. We found 2 ways to achieve them:
1. Use measurement pipes with bigger length difference
2. Use of self-calibrating method.
Method 2 seems to be better but more expensive. Some small air valves should be used and microcontroller to control all elements and provide self-calibration. The most important advantage of this method is possibility to measure liquid level parallel to the density so we would have full control about liquid level in all basins independent on some flow non-symmetry between both units. Exactly same amount of valves is necessary only the measuring circuit should have possibility to measure both positive and negative pressure.

DEHUMID - Periodic Activity Report (24M) COOP-CT-2005-016957
Page 170 of 208
Control modules.
After some modifications of the circuit we achieved the max allowable amount of temperature and humidity sensors but we didn’t used analog outputs and relais outputs. In the future version we can optimise the input/output structure regarding real necessity of the installation. In case of changes it should be generally analysed what additional control elements should used in the future version.
Structure of air flow system.
Prototype installation had a fixed air flow system. For example it was not possible to increase the air flow trough the cooling unit without affecting other airflow. For better configuration possibility on various climate conditions better would be to have flexible air control to change the configuration, flow rates and mix some air flows to get better performance.
Next idea is to cool the supply air by heat exchanger with air after cooling unit not only by cooling the desiccant. Combined HE with evaporating cooling unit will be interesting as well.
Cooling unit.
Using hard water with bit amount of Calcium compounds it is possible to have quickly permanent damage of the cooling unit. It would be necessary to use ionic exchanger (like in domestic applications) to avoid the problem. In such case a small bypass to empty the water with big amount of Sodium compound should be used.
Mechanical construction
Current construction is quite compact but maybe not optimal to assemble in small space. In some cases it would be nice to have some small blocks to connect all with air ducts.

DEHUMID - Periodic Activity Report (24M) COOP-CT-2005-016957
Page 171 of 208
2.8 Progress on Work package #7 - Dissemination and Exploitation
2.8.1 Objectives
To ensure that the achievements are made known to the targeted potential clients / market segments.
To prepare plans for future exploitation to ensure that the results are implemented in real-world applications.
2.8.2 Progress made during the reporting period
A policy of wide dissemination of project results has been pursued in particular focused on potential end users of the project results.
Task worked on Contractor(s) involved
Offerings for licensing
Achievements / Progress made on this task
No progress to date
Task worked on Contractor(s) involved
Set-up and maintenance of a project website
Project logo
ALL, led by NGD
NGD, Pro Support
Achievements / Progress made on this task
A website has been set-up. For details, see description in Error! Reference source not
found., Page 200.
Task worked on Contractor(s) involved
Project brochure
Achievements / Progress made on this task
No progress to date
Task worked on Contractor(s) involved

DEHUMID - Periodic Activity Report (24M) COOP-CT-2005-016957
Page 172 of 208
Other dissemination activities
Achievements / Progress made on this task
Dissemination of information to the networks and established distribution channels of the individual partners is executed on an ongoing basis.
Time Period Task worked on Contractor(s) involved
12-24 Preparing publications All SMEs and PSU
22-24 Application notes All SMEs and PSU
22-24 Exploitation agreement All SMEs and PSU
Achievements / Progress made on this task
Application notes were drawn up. See the report on deliverable D14. This document provides details of the Exploitation Agreement established with the partners of the DEHUMID consortium. Exploitation responsibilities and IPR issues were addressed in the Consortium Agreement, and possibilities further discussed throughout the project duration. An exploitation agreement was discussed and has been recorded in deliverable D20.
Time Period Task worked on Contractor(s) involved
12-24 Set-up and maintenance of a project website including a project video
Project logo
ALL, led by NGD
NGD, Pro Support
Achievements / Progress made on this task
A website has been set-up and has been refined in the 2nd project period. See report on deliverable D18. The website www.dehumid.info was created by Net Green Developments Lda (NGD) in the first year of the project. Initially it was planned to be used for a tool for project planning with the ultimate use being project information dissemination.
One of the main objectives is to develop the site to be interactive with public users to allow discussion and therefore more understanding of the potential applications of the DEHUMID technology and the subject of liquid desiccant dehumidification..
Time Period Task worked on Contractor(s) involved
N/A Project brochure N/A
Achievements / Progress made on this task

DEHUMID - Periodic Activity Report (24M) COOP-CT-2005-016957
Page 173 of 208
An official project brochure has not been developed due to a lack of money. The SMEs have decided not to invest money in this during this project.
Time Period Task worked on Contractor(s) involved
12-24 Final Plan for Use and Dissemination of Knowledge
Pro Support (Lead)
All SMEs
Achievements / Progress made on this task
See report on deliverable D19. This document provides details of the final plan for use and dissemination of knowledge.
Time Period Task worked on Contractor(s) involved
12-24 Other dissemination activities All SMEs
Achievements / Progress made on this task
Dissemination of information to the networks and established distribution channels of the individual partners was executed on an ongoing basis.
Also, a project poster was developed and shown at the field test location in Colares, Portugal.
Figure 113: Project Poster

DEHUMID - Periodic Activity Report (24M) COOP-CT-2005-016957
Page 174 of 208
2.9 Deviations from the project work plan
Problems encountered Corrective actions taken/proposed Contractor(s)
involved
D5 was postponed to T13 Test bed components and subassemblies were ordered and assembled at UNOTT and IG.
IG, UNOTT
D6 was postponed to T14 Input was received from SMEs. All
2.10 List of deliverables
Deliv. Nr Deliverable name WP# Date
due
Actual/
Forecast
delivery
date
Lead contractor
D1 System specifications 1 3 3 UNOTT
D2 Functional specification for each component (software & hardware)
1 3 3 UNOTT
D3 Report on assessment of LiCl solutions
2 10 10 UNOTT
D4 Test bed 2 10 13 UNOTT
D5 Report with experimental data 2 10 12 VGTU
D6 Spreadsheet model for economic analysis
2 10 14 VGTU
D7 Mid Term Report 3 12 12 PSU
D8 Formal specification of system configuration
3 13 13
D9 Design drawings 4 14 14

DEHUMID - Periodic Activity Report (24M) COOP-CT-2005-016957
Page 175 of 208
Deliv. Nr Deliverable name WP# Date
due
Actual/
Forecast
delivery
date
Lead contractor
D10 Prototypes of components to be used for testing
4 14 14
D11 Commissioned system prototype
5 18 18
D12 Test Protocol 5 18 18
D13 Test Report 5 18 18
D14 Report on system performance 6 24 24
D15 Website 7 24 6 NGD
D16 Application Notes 7 24 24
D17 Draft Plan for Use and Dissemination of Knowledge
7 12 12 PSU
D18 Publications and Video 7 24 24
D19 Final Plan for Use and Dissemination of Knowledge
7 24 24 PSU
D20 Exploitation Agreement 8 24 24
D21 Management Reports 8 24 24 PSU
D22 Final Report, incl. a publishable extended summary
8 24 24 PSU

DEHUMID - Periodic Activity Report (24M) COOP-CT-2005-016957
Page 176 of 208
SECTION 3 Consortium management
3.1 Progress on Work package #9 – Consortium Management
3.1.1 Objectives
To ensure a smooth project management and communication.
3.1.2 Progress made during the reporting period
The project is managed by a Project Management Team, chaired by COMPLEX. PSU is responsible for supervision of the work programme, communication with the Commission, reporting, delegation of work packages, motivation of the team, encouragement of creativity, correct problem solving procedures, and corrective actions. PSU also acts as project co-ordinator for day-to-day project issues. To this end they have set up and maintain a Management Office which functions as a Project Secretariat for the DEHUMID project.
The Project Management Team meets every 6 months to review the technical progress made by each partner, and to agree in detail the actions for the next period. In addition to the formal six-monthly meetings, the partners also set up a number of working parties to ensure delivery of specific tasks, based around the partners committed to specific tasks and objectives within the work programme.
The structure for monitoring and reporting progress consists of a series of reports and meetings.
Progress of each task is assessed quarterly to ensure that there is no - or limited - deviation from the original plan and to closely control the development activities of the partners.
3.2 Consortium performance
3.2.1 General
The management and co-ordination of the DEHUMID project activities have been implemented without major problems.
3.2.2 Meetings and communication
Discussions at the meetings have been open and constructive, enabling the direction and content of the technical work to be defined and agreed. Also outside of these meetings, communication among the consortium members has been good, mainly by e-mail/phone, enabling work packages to progress smoothly.

DEHUMID - Periodic Activity Report (24M) COOP-CT-2005-016957
Page 177 of 208
Kick-off meeting (held in Amsterdam, NL, October 10, 2005)
Attendants:
PPUCh: Jerzy WIELISIEJ Emilia ROSIAK HiRef: Federico BISCO Complex: Grzegorz ZALOT IG: Giuseppe PERSANO UNOTT: Zaffa RIFFAT VGTU: Kestutis CIUPRINSKAS PSU : Maarten BONKE
Main issues discussed/decided and agreed actions
1. Each participant gave a brief presentation about his organisation, relevant achievements in the near past and about their role in the project.
2. The Commission’s Project Officer is Ir. Nathalie LEGROS. For administrative/legal issues the responsible officer is Eva-Tatiana RODRIGUEZ CASTRO. Contact with them usually goes via Maarten BONKE.
3. Management principles agreed:
- Role of Pro Support was general assistance with administrative procedures. He will chase the participants for a timely deliverable of cost statements, hourly records and technical reports, but for all clarity:
o Participants do their own bookkeeping
o Pro Support will not be involved in any technical issues
o Pro Support will edit technical reports to the Commission (formal deliverables such as Peridoc Reports and the Plan for dissemination and use of knowledge)
- Decisions regarding project scope and major deviations from the plan (see annex to the contract) was formally made during consortium meetings, which are scheduled per 6 or 12 months. Consensus was sought on any major decision to be made regarding project’s strategy and direction. A forum may be asked for by any participant at any time. However, where differences of opinion are persistent, the team will vote and the majority was decisive. To this end, each participating organisation – incl. the RTD Performers – has ONE vote. In case of a stand-off the SME voting was decisive.
- Publications need the prior approval of the Consortium.
4. Admin Issues and Payments:

DEHUMID - Periodic Activity Report (24M) COOP-CT-2005-016957
Page 178 of 208
• As agreed in the Consortium Agreement, 40% advance payments were made. 60% is received, and the surplus 20% paid on deliverables. This is considered fair as then participants who do more the first year will get their payments earlier.
• The advance payment paid in the course of October 2005, as soon as the Form A and Consortium Agreement has been signed, and the necessary admin details (IBAN number, etc) have been received. (to be expected by the end of October)
• It is stipulated that the advance payment is the property of the Consortium. Any interests received were booked and used to cover general expenses, e.g. bank transfers, rent of meeting rooms, catering during meetings, etc. Any positive amount at the end of the project will be paid to the Consortium members pro rata the actual and accepted cost statements.
• Audited cost statements are necessary annually. It is vital to keep accurate time records from the beginning, as later memory might not be the best guide. No formal time record system needs to be installed, but to avoid problems later, it is recommended to discuss the right format with the accountant upfront.
o All time spent on the project is eligible that would not be spent when there would be no project! This accounts for travelling time, time spent on admin, reading reports, discussions on the phone, etc.
o Pro Support will provide a spreadsheet with the budgeted hours split into quarters for strict monitoring. Major deviations (if any) need to be explained.
o The RTD Performers will (have to) spend time on the project in line with efforts put in by the individual SMEs. In any case, overspending by the RTD Performers need to be avoided to ensure that SMEs will not be confronted by bills that cannot be matched by efforts.
5. IPR
• Intellectual Property Rights (patents, etc) [IPR] issues are important, however, and it must be clear who owns what after the project. Following principles have been agreed upon:
o Benefits will be in line with the business of the individual SMEs (RTD Performers are not entitled to get IPR by definition). This will among others be leading who will apply for a patent, should any patentable product emerge from the project.
o Royalties from future sales will be distributed among the SMEs pro rata the actual input in the project, taking into account also possible post-project investments

DEHUMID - Periodic Activity Report (24M) COOP-CT-2005-016957
Page 179 of 208
• Any patent resulting from the project will mention all participant names but the actual exploitation will be taken care of by an Exploitation Team, consistent with the Description of Work (see annex to the contract). It has been decided to discuss future exploitation in the next meeting.
• Pre-existing Know-how (PEKH)
o There are currently no patents that hamper DEHUMID.
6. Technical Work Issues
• A thorough project definition (WP#1) is essential to ensure the right direction of research, in particular with respect to the visualised end product because this largely affects the reflector design.
• UNOTT will send known reflector designs to the participants, reflecting the state of the art on this subject.
• See below for further technical issues as discussed at the 3M Meeting.
3M Meeting, held at UNOTT, UK, November 24-25, 2005
Attendants:
LOKMIS: Ernestas GAIDAMAUSKAS HiRef: Federico BISCO Complex: Grzegorz ZALOT IG: Giuseppe PERSANO Eugenio BERLINI UNOTT: Zaffa RIFFAT Khalid EISSA VGTU: Kestutis CIUPRINSKAS PSU : Maarten BONKE
Main issues discussed/decided and agreed actions
1. Introduction
• Our CRAFT project DEHUMID officially started October 1, 2005. In the meantime two meetings have been organised. The first meeting (kick-off meeting) was held in Amsterdam (NL) at October 10, 2005 and was attended by PPUCH, HIREF, COMPLEX, IG, UNOTT, VGTU and PSU. One of the major conclusions of this meeting was to organise a specific technical meeting in order to further detail tasks, deliverables, time schedules, etc. This two-day event was held November 24 and 25, 2005, at the University of Nottingham (UNOTT), attended by HIREF, LOKMIS, NGD, COMPLEX, IG, UNOTT, VGTU and PSU.
• This document summarises the main issues discussed during both meetings, as well as the initial decisions agreed upon. Also, Pro Support (PSU) co-ordinating DEHUMID, has added some specific information / remarks to clarify some important issues.

DEHUMID - Periodic Activity Report (24M) COOP-CT-2005-016957
Page 180 of 208
2. Communication
As for every multi-disciplinary project, communication is one of the keys for success. During the proposal preparations and the contract negotiations this could already being noticed. In the DEHUMID Distribution List all partners’ general communication details have been listed. Furthermore, following specific means of communication have been foreseen within our project:
DEHUMID Mailing Group
Grzegorz Zalot (COMPLEX) has set up and will manage a mailing group containing all email addresses of the DEHUMID partners under the name of [email protected].
Please, always use this mailing group when informing/asking all of (or at leas a majority of) the DEHUMID partners.
Phone
The most direct way of telecommunicating is by telephone. The Distribution List lists all partners’ phone numbers. Please do not hesitate to use the phone in case of important issues!
DEHUMID Website
At the Nottingham we discussed the project website which will be developed for dissemination activities during and after the project. Neil Turley (NGD) will take responsibility of setting up this website. Also, an internal part of this website will be created allowing the partners to up- and download all kinds of electronic material, including a forum application for Members.
CIRCA Website
At the CIRCA website from the European Commission an Interest Group has been created for DEHUMID. For the moment, you can find here all contract negotiation documents and the contract management files.
You can use the following link (just click on it) to login to the CIRCA website: http://etrans.fp6.cec.eu.int:80/Members/irc/rtd-dir_a-00/Home/main.
The Inlog sequence is:
User Name: zalotgrz
Password: FP6CRAFTDEHUMID
Domain: CIRCA
Click the Group 016957-DEHUMID and you will enter our Interest Group.
The use of this medium is bound to some rules and therefore a for more formal documents and final/official reporting.
3 Review
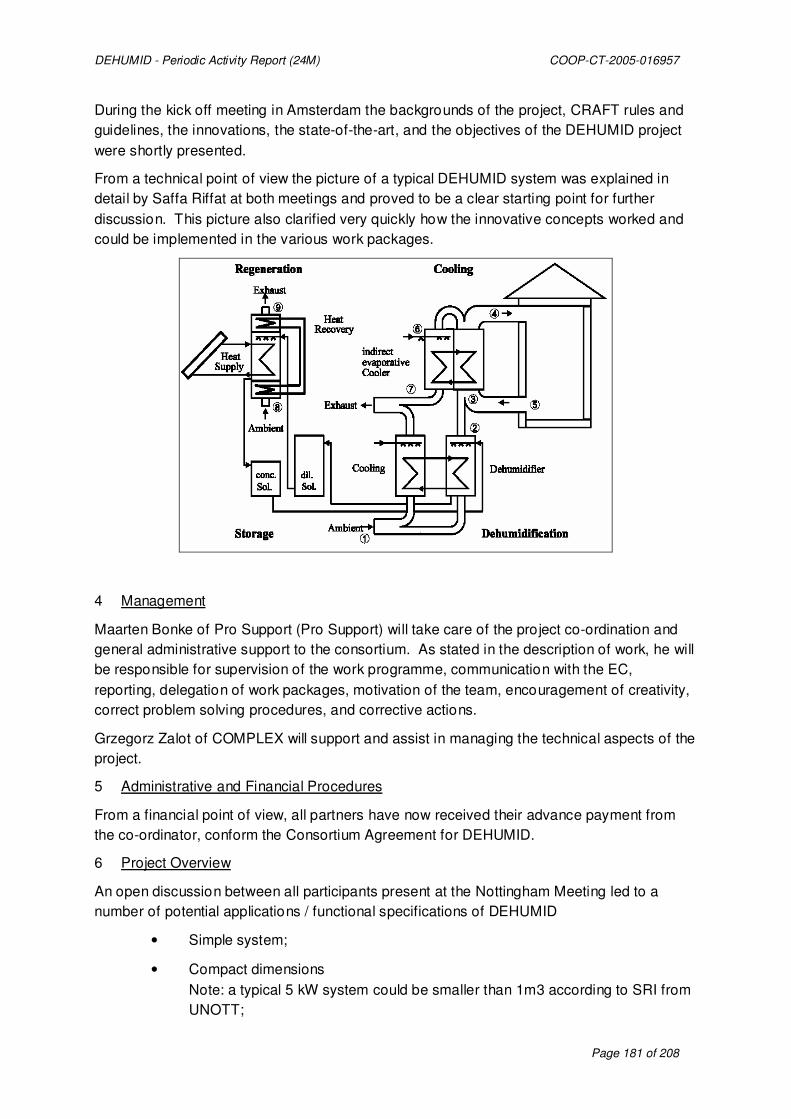
DEHUMID - Periodic Activity Report (24M) COOP-CT-2005-016957
Page 181 of 208
During the kick off meeting in Amsterdam the backgrounds of the project, CRAFT rules and guidelines, the innovations, the state-of-the-art, and the objectives of the DEHUMID project were shortly presented.
From a technical point of view the picture of a typical DEHUMID system was explained in detail by Saffa Riffat at both meetings and proved to be a clear starting point for further discussion. This picture also clarified very quickly how the innovative concepts worked and could be implemented in the various work packages.
4 Management
Maarten Bonke of Pro Support (Pro Support) will take care of the project co-ordination and general administrative support to the consortium. As stated in the description of work, he will be responsible for supervision of the work programme, communication with the EC, reporting, delegation of work packages, motivation of the team, encouragement of creativity, correct problem solving procedures, and corrective actions.
Grzegorz Zalot of COMPLEX will support and assist in managing the technical aspects of the project.
5 Administrative and Financial Procedures
From a financial point of view, all partners have now received their advance payment from the co-ordinator, conform the Consortium Agreement for DEHUMID.
6 Project Overview
An open discussion between all participants present at the Nottingham Meeting led to a number of potential applications / functional specifications of DEHUMID
• Simple system;
• Compact dimensions Note: a typical 5 kW system could be smaller than 1m3 according to SRI from UNOTT;

DEHUMID - Periodic Activity Report (24M) COOP-CT-2005-016957
Page 182 of 208
• Integrate DEHUMID system into rooftop system (also for existing systems);
• Domestic applications providing new markets for e.g. HIREF, NGD.
• Small-Commercial applications.
• Small to Medium Commercial applications
a. small offices (‘a few hundred square metres’)
b. 15-20 kW Cooling Power
c. ~5 kEuro
d. competing against $40/kW for alternative/competing systems ‘compressor types’.
Discussing the technical work to be performed within this project, the initial work plan as described in the Description of Work (DoW) will be taken as a starting point and as a reference.
However, minor changes from this work plan are allowed and will be reported to all partners and the EC.
In case of major changes, also involving a change in financial requirements, the consortium shall be informed about this change upfront and based on a majority of votes, the consortium will ask for a formal change of the contract to be discussed with the EC’s project officers.
Work Package 1: Functional Specifications
FBI from HIREF will lead / co-ordinate this WP, whereby:
• UNOTT will perform activities/tasks on performance specs;
• HIREF will take care of task on economics;
• NGD will report on applications for the DEHUMID system;
• IG leads the task on safety-related issues.
Some other important issues discussed during the Nottingham meeting related to WP1 and other related WP’s:
• UNOTT (KEI) will come up with a system layout;
• Sensors and measurements techniques by LOKMIS (EGA);
• Psychometrics VGTU (Kestutis) � Climatic data from various countries;
• Control system COMPLEX (Grzegorz), concentrate on density concentration;
• Materials, components, fluids, etcetera IG (EBE);
• SKAIDULA: Control system (data logging) � EGA of LOKMIS will contact them ASAP;
• PPUCh: Manufacturing parts of prototype � GZa will contact them ASAP;
• TEINSA: assist HiRef in analysing economics and will be Task leader Economic Modelling.

DEHUMID - Periodic Activity Report (24M) COOP-CT-2005-016957
Page 183 of 208
Work Package 2: Modelling & Experimental Testing
UNOTT will lead / co-ordinate this WP, whereby:
• Simulation (#’s 1,2 and 3 from GZA’s list ) will be co-ordinated by UNOTT;
• Functional Blocks (#4): PPUCh (development, together with GZA) and HIREF (Manufacturing aspects) Question: What could be delivered / manufactured within the project and what should be bought / subcontracted?
• Sensors (#5): LOKMIS (info from UNOTT) and then discussing with COMPLEX
• Corrosiveness of liquid (#6):
a. polyethylene (PE)
b. SS
c. Surface treated copper
• Parasitic Power (#7): Wait for simulation data;
• Zero Carry-over (#8): Membrane is certified;
• A Sub team ‘Design of absorber’ has been constituted: UNOTT, VGTU, and COMPLEX;
• Filtering (#9):
a. intake air about 5 micron;
b. Crude Filtering?
• Manufacturing of the installation elements. (#10):
a. HiRef co-ordinator;
b. Detailed plans will be discussed in May during the Meeting in Poland.
Work Package 3: Design Low-cost PC System
PPUCH and COMPLEX will lead / co-ordinate this WP, whereby
• COMPLEX will closely work together with PPUCH;
• GSM integration for data registration / downloading will be taken into account.
Work Package 4: Design & Prototype Liquid Desiccant System
HIREF will lead / co-ordinate this WP, whereby:
• HIREF optimises the System layout (originally from UNOTT);
• HIREF will manufacture/supply ‘conventional’ parts of the prototype and assemble the prototype to be lab-tested.
Work Package 5: System Integration & Laboratory Testing
IG will lead / co-ordinate this WP, whereby:

DEHUMID - Periodic Activity Report (24M) COOP-CT-2005-016957
Page 184 of 208
• UNOTT will perform the pre-testing of the prototype;
• Lab tests (functional, performance) will be performed under controlled conditions at IG.
Work Package 6: Validation & Field Testing Prototype System
NTU from NGD will lead / co-ordinate this WP, whereby:
• The prototype will be shipped to a location in Portugal;
• A suitable location in Portugal will be proposed by NTU for extended field testing.
Critical Parts in DEHUMID System:
Following critical parts/components in the DEHUMID system have been identified:
• Flow meter (can it be calibrated for LiCl?);
• Automatic shutting valves;
• Speed controller for pump(s) and fans;
• Concentration meters.
List of Actions
Following actions were agreed upon and/or will be performed. Please note that the ‘action holder’ is responsible for the end result of the action and shall receive all support he/she requires or is asking for.
Short-term Actions (STA) to be completed before the end of this year (i.e. January 1, 2006):
STA1. The minutes of both meetings will be by PSU and will be distributed to all on the distribution list � Maarten Bonke (PSU)
STA2. EC’s Financial Guidelines for FP6 will be distributed to all partners � Maarten Bonke (PSU)
STA3. Information regarding the desiccant as well as modelling of the components/systems will be sent to all partners (as agreed in Amsterdam) � Saffa Riffat/Khalid Eissa (UNOTT)
STA4. Provide details of pumps to COMPLEX � Khalid Eissa (UNOTT)
STA5. Hand over details of sensors to LOKMIS � Khalid Eissa (UNOTT)
STA6. Provide a report on sensors available/required in the DEHUMID system � Ernestas Gaidamauskas (LOKMIS).
STA7. Provide a platform for the project’s website, including a forum application � Neil Turley (NGD)
STA8. Inform SKAIDULA about project and tasks agreed upon � Ernestas Gaidamauskas (LOKMIS)

DEHUMID - Periodic Activity Report (24M) COOP-CT-2005-016957
Page 185 of 208
STA9. Inform PPUCH about project and tasks agreed upon �Grzegorz Zalot (COMPLEX)
STA10. Inform TEINSA about project and tasks agreed upon �Maarten Bonke (PSU)
Medium-term Actions (MTA) to be completed before our next meeting at 8M (i.e. May 1, 2006):
MTA1. A combined 8M / technical meeting will be organised at the premises of COMPLEX (PL), May(possibly June) 2006. All partners will be asked by Grzegorz Zalot to provide their preferred dates Grzegorz Zalot (COMPLEX)
Medium-long-term Actions (MLTA) to be completed before the project’s Midterm (i.e. October 1, 2006):
MLTA1. Patent application Grzegorz Zalot (COMPLEX)
12M Meeting, held at UNOTT, UK, October 5-6, 2006
Attendants:
PPUCH Maciej GURDZIEL NGD Neil TURLEY COMPLEX Grzegorz ZALOT IG Giuseppe PERSANO Eugenio BERLINI UNOTT Saffa RIFFAT Khalid EISSA VGTU Kestutis CIUPRINSKAS PSU Maarten BONKE
Main issues discussed/decided and agreed actions
1. Introduction
Our CRAFT project DEHUMID officially started October 1, 2005.
Now, 12 months into the project, DEMUMID is at its Mid-Term point. As agreed earlier a Mid-Term Meeting would formally be organised to discuss progress booked so far, problems encountered, and plans for the coming period. This two-day event was held October 5 and 6, 2006, at the University of Nottingham (UNOTT), attended by PPUCH, NGD, COMPLEX, IG, UNOTT, VGTU and PSU.
This document summarises the main issues discussed during the Mid-Term meeting, as well as the initial decisions agreed upon. Also, Pro Support (PSU) co-ordinating DEHUMID, has added some specific information / remarks to clarify some important issues.
2. Consortium Info
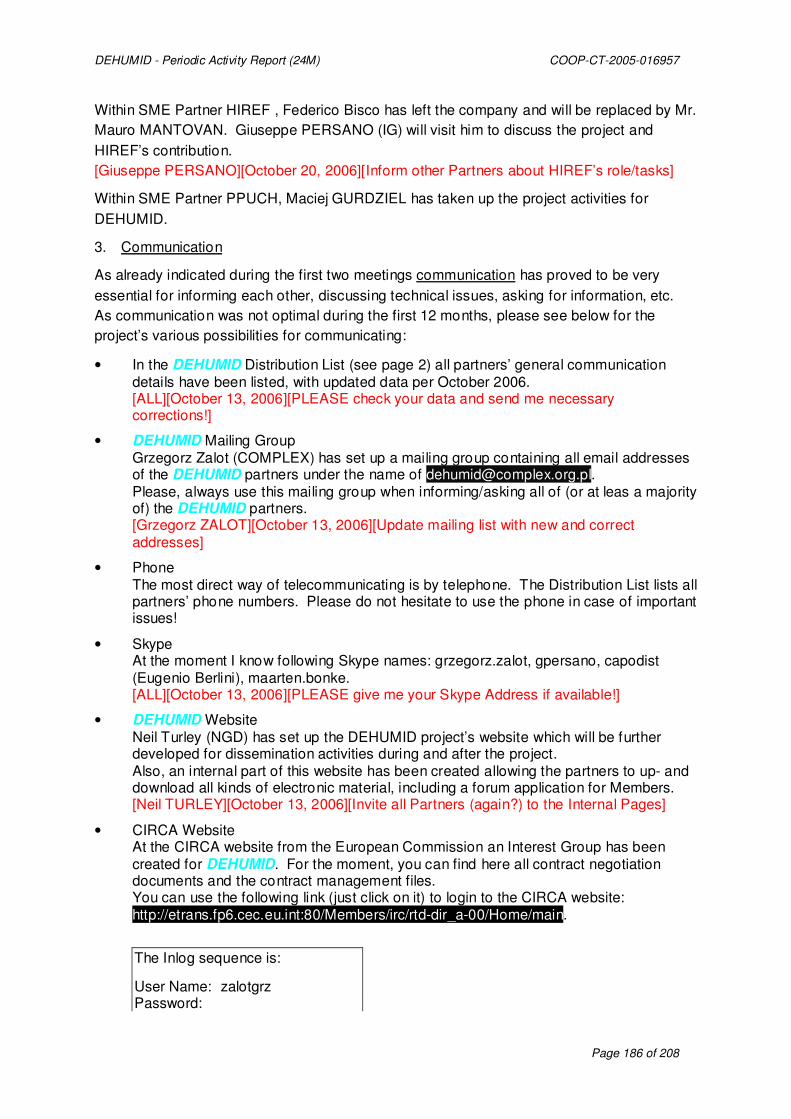
DEHUMID - Periodic Activity Report (24M) COOP-CT-2005-016957
Page 186 of 208
Within SME Partner HIREF , Federico Bisco has left the company and will be replaced by Mr. Mauro MANTOVAN. Giuseppe PERSANO (IG) will visit him to discuss the project and HIREF’s contribution. [Giuseppe PERSANO][October 20, 2006][Inform other Partners about HIREF’s role/tasks]
Within SME Partner PPUCH, Maciej GURDZIEL has taken up the project activities for DEHUMID.
3. Communication
As already indicated during the first two meetings communication has proved to be very essential for informing each other, discussing technical issues, asking for information, etc. As communication was not optimal during the first 12 months, please see below for the project’s various possibilities for communicating:
• In the DEHUMID Distribution List (see page 2) all partners’ general communication details have been listed, with updated data per October 2006. [ALL][October 13, 2006][PLEASE check your data and send me necessary corrections!]
• DEHUMID Mailing Group Grzegorz Zalot (COMPLEX) has set up a mailing group containing all email addresses of the DEHUMID partners under the name of [email protected]. Please, always use this mailing group when informing/asking all of (or at leas a majority of) the DEHUMID partners. [Grzegorz ZALOT][October 13, 2006][Update mailing list with new and correct addresses]
• Phone The most direct way of telecommunicating is by telephone. The Distribution List lists all partners’ phone numbers. Please do not hesitate to use the phone in case of important issues!
• Skype At the moment I know following Skype names: grzegorz.zalot, gpersano, capodist (Eugenio Berlini), maarten.bonke. [ALL][October 13, 2006][PLEASE give me your Skype Address if available!]
• DEHUMID Website Neil Turley (NGD) has set up the DEHUMID project’s website which will be further developed for dissemination activities during and after the project. Also, an internal part of this website has been created allowing the partners to up- and download all kinds of electronic material, including a forum application for Members. [Neil TURLEY][October 13, 2006][Invite all Partners (again?) to the Internal Pages]
• CIRCA Website At the CIRCA website from the European Commission an Interest Group has been created for DEHUMID. For the moment, you can find here all contract negotiation documents and the contract management files. You can use the following link (just click on it) to login to the CIRCA website: http://etrans.fp6.cec.eu.int:80/Members/irc/rtd-dir_a-00/Home/main.
The Inlog sequence is:
User Name: zalotgrz Password:

DEHUMID - Periodic Activity Report (24M) COOP-CT-2005-016957
Page 187 of 208
FP6CRAFTDEHUMID Domain: CIRCA
Click the Group 016957-DEHUMID and you will enter our Interest Group.
The use of this medium is bound to some rules and therefore a for more formal documents and final/official reporting.
4. Reporting
Formal procedure
At T12 we formally have to deliver following reports to the EC conform Article II.7 of the EC Contract:
• Periodic Activity Report See Word template. Including Reports on Deliverables agreed upon. [ALL][October 31, 2006][See below]
• Periodic Management Report [Pro Support][November 1, 2006][See below]
• Financial Statements See Excel template [ALL][October 31, 2006][See below]
• Financial Report [Pro Support][November 1, 2006][See below]
The deadline for submitting all reports to the EC is November 14, 2006. In order to integrate reports and give feedback, each Partner should submit all required documents to Pro Support before October 31, 2006. This cannot be negotiated and any delay will (a) harm the relationship (goodwill)! with our scientific and financial officers and (b) further delay any payments!
Templates
For the Periodic Activity Report, Report on Deliverables, and the Financial Statement, Pro Support has prepared templates in Word and Excel which have been sent out by Email to all Partners.
5. Financial Issues
Two Partners have indicated a required change of their budget:
UNOTT
In May/June 2006, UNOTT has indicated the Co-ordinator that additional funding (~ ₤11,000) was required for the manufacturing of the prototype to be lab tested at the University4.
4 Originally, UNOTT has requested following:
Manufacture of two (2 No) dehumidifiers and one (1 No) regenerator units and associated heat-exchangers, plus cost of freight. This includes spare fans and pumps. Consumables (piping, hoses, electrical switches, fittings, lithium chloride, heat energy supply unit, etc) Five (5 No) electrical inverters

DEHUMID - Periodic Activity Report (24M) COOP-CT-2005-016957
Page 188 of 208
During the Mid-Term Meeting is was unanimously decided that the required hardware was necessary for the continuation of the project. However, at the Mid-Term meeting is was also discussed that only two concentration/conductivity sensors are required. The decision was that VGTU will use €3,500 of their budget, and IG will use the remaining part allocated from their budget to buy these components/systems. For this UNOTT will further specify these items to be purchased by VGTU/IG, which will be directly shipped to UNOTT.
COMPLEX
Complex’ tasks in the project have been changed and extra tasks have been defined for them regarding the control system. A new work plan and a new budget will be defined for COMPLEX, especially the extra work for the control system. For this, some budgeted tasks from the SME partner SKAIDULA could be shifted to COMPLEX.
Payments
All partners have received in October 2005 their first advance payment from the co-ordinator, conform the Consortium Agreement, Article 5.4 for DEHUMID. This amount corresponds to 40% of the total budgeted grant for each Partner.
Depending on the received activity reports and deliverables for the first 12 months and the corresponding cost statements we will receive from all partners, we will individually check and calculate whether an extra advance payment will be required in the next month(s).
6. Project Overview
Current Status
All participants present, gave a brief presentation on their activities for the last 12 months. A short visit to UNOTT’s labs showed the current status (as-built) of the DEHUMID lab prototype, consisting of the absorber, the regenerator and the dehumidifier. Except for the required control system, including the required sensors, and pumps and fans this prototype was almost ready for testing.
Sofar, the climatological data have been analysed and prepared for modelling, the system design has been completed, the lab prototype has been designed and built (except the control system), the control system has been designed at a conceptual level, market applications have been investigated, the project website has been set up, various sensors have been analysed.
An open discussion between all participants present at the Nottingham Meeting led to a number of potential actions and decisions.
Three (3 No) concentration sensors Digital flow meters and visual flow indicators.

DEHUMID - Periodic Activity Report (24M) COOP-CT-2005-016957
Page 189 of 208
Time plan / Workplan
Neil suggested to break down the last 12 months of the project in three periods. Based on this following time plan has been scheduled:
• T12-16: Lab testing at UNOTT and IG UNOTT has planned to start the actual testing in January 2007. From this, the required extra hardware needs to be at their labs in December 2006. Also, COMPLEX will develop and install the control system at the end of November/ first period of December. At the same time, IG will build another lab prototype, based on the current design available at UNOTT. IG will perform the tests on efficiency, durability, safety, etc.
• T16-T20: Development and build of a commercial prototype PPUCH and HIREF will co-operatively (with inputs from TEINSA) develop a commercial DEHUMID prototype, based on the design of both lab prototypes. Each of them will take care of one part of the system. For example, HIREF could build the dehumidifier unit, while PPUCH will build the regenerator unit. The absorber unit could be taken from the IG prototype. At T18 an extra meeting at IG in Italy is planned for (see last page of this ).
• T20-T24: Field Testing The commercial prototype will be shipped to Portugal in May/June 2007, where Neil will by then have the testing location available.
Pro Support will together with COMPLEX revise the technical tasks for all partners’ activities and revise the time required and calculate revised budgets. [Pro Support][November 1, 2006][-]
License Agreement Absorber
Giuseppe correctly pointed out that the externally purchased absorber might impose a risk for future SME exploitation of the DEHUMID system. A license agreement with the company holding IPR on it needs to be negotiated and agreed upon. Sofar, no information on this has become available to the Consortium.
Conductivity/Concentration Sensors
Two Conductivity/Concentration Sensors are required for lab and field testing. IG will analyse where/how to get these (before the end of November 2006) in co-operation with COMPLEX. The sensors will be ordered from IG and directly shipped to COMPLEX. COMPLEX will integrate into the control module which will be installed at the lab prototype at UNOTT. [IG, COMPLEX][December 1, 2006][-]
Software
COMPLEX will study and perform design of software and hardware for controls and control modules (need a lot of extra time for software engineering), before December 2006. [COMPLEX][November 1, 2006][-]

DEHUMID - Periodic Activity Report (24M) COOP-CT-2005-016957
Page 190 of 208
LiCl
IG will provide the correlation table for T (range 10-90°C) and concentration (30%, 35%, 40%). Co-ordinate with LOKMIS, who already performed this for LiBr. [IG][December 1, 2006][-]
Task for LOKMIS: From IG, Ernestas should receive conductivity tests for LiCl, which he needs for establishing correlation table for T (range 10-90°C) and concentration (30%, 35%, 40%). [LOKMIS][January 1, 2006][-]
7. Next Meeting
Around T18 a meeting will be organised in Bellaria - Italy, hosted by IG. Exact dates have to communicated. For now April 6-7, 2007 is proposed by Pro Support. [ALL][October 20, 2006][Check your availability, or propose other dates and give feedback to Maarten]
3.3 Contractors
3.3.1 Updated list of contractors
No changes in the project partner companies have occurred during the project.
Contact Company
(shortname)
Company (full name, address)
Name Shortname
E-mail5 Phone
PSU Pro Support B.V. Amarilstraat 11 7554 TV Hengelo The Netherlands
Maarten BONKE
MBO [email protected]; +31 74 255 1160
Emilia ROSIAK
ERO [email protected]; PPUCh Przedsiebiorstwo Produkcji
Urzadzen Chlodniczych Sp. Z o.o.
05-555 Tarczyn ul. Blonska 85 Poland
Jerzy WIELISIEJ
JWI [email protected];
+48 22 727 81 61
Federico BISCO
FBI [email protected]; HiRef HiRef S.p.a.
Via Umbria 5c Monselice (Padua) Italy
Mauro MANTOVAN
MMA [email protected];
+39 0429 784683
LOKMIS JSC "Lokmis" Naugarduko g. 68b LT-03203 Vilnius Lithuania
Ernestas GAIDAMAUSKAS
EGA [email protected];
+370 5 215 18 95
5 Within DEHUMID a mailing group has been created : [email protected].

DEHUMID - Periodic Activity Report (24M) COOP-CT-2005-016957
Page 191 of 208
Contact Company
(shortname)
Company (full name, address)
Name Shortname
E-mail5 Phone
SKAIDULA Skaidula UAB
Naugarduko g. 68B LT-03203 Vilnius Lithuania
Gediminas VAITIEKUNAS
GVA [email protected]; +370 5 2397773
NGD Net Green Development Lda
av. Da Venezuela, No.1 2765-455 Monte Estoril Portugal
Neil TURLEY
NTU [email protected]; +44 7910218950
Javier CUMPLIDO
JCU [email protected]; +34 941 250033 TEINSA Technica En Instalaciones de
Fluidos S.L.
Poligono de la Portalada II C Cordornera, 2 26006 Logroño Spain
Francisco ORDONEZ
FOR [email protected];
COMPLEX Przedsiębiorstwo Innowacyjno-
Wdrożeniowe comPLex Sp. z o.o. ul. Jabłoniowa 42 40-111 Katowice Poland
Grzegorz ZALOT
GZA [email protected]; +48 32 250 5840
Giuseppe PERSANO
GPE [email protected]; +39 0541 322-232 IG Istituto Giordano S.p.a. Via Rossini 2 47814 Bellaria (RN) Italy
Eugenio BERLINI
EBE [email protected]; +39 0541 343030 (int. 233)
VGTU Vilniaus Gedimino Technikos
Universitetas Sauletekio al. 11-2513 LT-10223 Vilnius-40 Lithuania
Kestitus CIUPRINSKAS
KCI [email protected]; +370 8 5 27 44 730
Saffa RIFFAT
SRI [email protected]; +44 115 951 3158 UNOTT University of Nottingham University Park Nottingham NG7 2RD United Kingdom
Khalid EISSA
KEI [email protected]; +44 115 951 3028
Stefan WEIERS (Scientific Officer)
SWE [email protected]; +32 2 29 86 724 EC European Commission
DG Research – M.04 Office: SDME 9/22 Square de Meeûs n°8 B-1049 Brussels Belgium
Kerstin BLOME (Financial Officer)
KBL [email protected] +32 2 29 86 176
3.4 Project timetable and status
3.4.1 Project time-line
In the figure below is the original project planning (taken from the DoW). The project is pretty good on schedule, although the design and manufacturing of the prototype system will be slightly delayed. No updated planning is needed.

DEHUMID - Periodic Activity Report (24M) COOP-CT-2005-016957
Page 192 of 208
PROJECT BARCHART and STATUSAcronym: DEHUMIDContract N° COOPT-2005-016957
WP # Task Name 1 2 3 4 5 6 7 8 9 10 11 12 13 14 15 16 17 18 19 20
1
1.1 Identification of terms
1.2 Identification of main functions, etc
1.3 Funct ion Specifications for components and system layout
1.4 Specification of QA
2
2.1 Analyse, formulate, test , and improve commercially available lithium chloride formulations
2.2 Economic model ling
2.3 Design and manufacture test bed
2.4 Perform functional tests
2.5 Analyse results
3
3.1 System Architecture Design
3.2 Define System Requirements
3.3 Design and implementation of output
3.4 Design and implementation of Graphical User-Interface
3.5 Develop operational protocols
4
4.1 Design system layout
4.2 Detail components
4.3 Manufacture prototype
5
5.1 Assembly of components
5.2 Define Test Protocol
5.3 Characterise performance at start and at regular intervals
5.4 Analyse all data with focus on hardware / software functional ity
5.5 Analyse system performance
6
6.1 Install and commission systems on test-field
6.2 Characterise performance at start and at regular intervals
6.3 Analyse system performance
6.4 Analyse user-friendliness
6.5 Analyse acqui red data and optimise system
7
7.1 Preparing publicat ions
7.2 Designing websi te
7.3 Making Application Notes
7.4 Writing the Plan for using and disseminating knowledge
7.5 Making video and other disseminat ion material
8
8.1 Collation of all deliverables/reports
8.2 Submission of all cost statements
8.3 Moni toring progress; assessing results
8.4 Resolving admin or contractual issues
8.5 Distribution of information
8.6 Writing Expl. Agr., fine-tuning Cons. Agr.
Dissemination and Future Exploitation Planning
Project & Consortium Management
Year 1 Year 2
Functional Specifications
Modell ing & Experimental Testing
Design Low-cost PC System
Design & Prototype Liquid Desiccant System
System I ntegration & Laboratory Testing
Validation & Field Testing Prototype System
6 m 12 m rep 18 m rep
Figure 114: Gantt Chart
3.5 Actual versus scheduled manpower and budget allocation
The expenditures to date reflect the partners involvement and material usage. This is described in the Periodic management report. No major problems of budget allocation for completion of the project during the project are anticipated.

DEHUMID - Periodic Activity Report (24M) COOP-CT-2005-016957
Page 193 of 208
SECTION 4 Other issues
4.1 Benefits to the SMEs
In order to analyse the benefits for the SMEs from the anticipated innovation more in detail it has been decided that an Innovation Impact Assessment will be carried out. Here, the impact of the project on a number of key parameters for processing & quality, marketing & sales, human resources and purchasing will be assessed for each SME participant.
This assessment will be performeed and updated during the next 12 months.

DEHUMID - Periodic Activity Report (24M) COOP-CT-2005-016957
Page 194 of 208
Annex 1 - Program source code for the control module

DEHUMID - Periodic Activity Report (24M) COOP-CT-2005-016957
Page 195 of 208
Annex 2 – Final plan for using and disseminating the
knowledge
This document provides details of the final plan for use and dissemination of knowledge.
Overview of Exploitable Knowledge The plan for use and dissemination of knowledge describes schemes that have been put in place to disseminate the knowledge gained during the project, as well as plans for promotion of the project results, following project completion. This document has evolved over the course of the DEHIMD project, regularly updated by the project partners to give a cumulative overview of the undertaken and planned activities.
The document includes the following three sections:
Section 1 – Exploitable knowledge and its use Section 2 – Dissemination of knowledge Section 3 – Publishable results
The partners anticipate co-operation into commercial applications in the future. The scientific work carried out during the first reporting period revealed very promising results. The Falling Film Technology itself is already patented; therefore, the consortium plans to make an arrangement for use of this technology with the patent holders. However, it is possible to patent other aspects of the technology and devices utilised in the system, as highlighted in Table 12. It is the intention of the Consortium to protect any commercially significant innovations, such as the concentration sensor, and the control system, which have been developed, as well as the complete, working Liquid Desiccant Dehumidifier. Agreement concerning the protection of knowledge has been made by the consortium.
Table 12: Summary of Exploitable Knowledge/Products
Exploitable
Knowledge (description)
Exploitable
product(s) or
measure(s)
Sector(s)
of application
Timetable for commercial use
Patents or other IPR protection
Owner & Other Partner(s) involved
1. Concentration
sensor
technology
Concentration
Sensors
Physics 12 months Patent All
COMPLEX
LOKMIS
SKAIDULA
2. Complete
Control System
HVAC control
system
HVAC
Engineering.
12 months Patent All
COMPLEX
3. Liquid
Desiccant
Air
conditioning
HVAC
Electrical,
12 months Patent All

DEHUMID - Periodic Activity Report (24M) COOP-CT-2005-016957
Page 196 of 208
Exploitable
Knowledge (description)
Exploitable
product(s) or
measure(s)
Sector(s)
of application
Timetable for commercial use
Patents or other IPR protection
Owner & Other Partner(s) involved
Dehumidification
air conditioning
system mechanical
engineers and
technicians
Contractors
Consultancy Expert
knowledge of
entire HVAC
system
HVAC N/A NGD
Exploitable result:
1. Concentration sensor technology
Partners involved:
COMPLEX, LOKMIS, SKAIDULA
Role, activities planned/undertaken
The concentration sensor developed has never been used in this application before and should be patented. This task must be undertaken by the consortium partners, when the results of negotiations have been finalised.
Exploitable result:
2. Complete Control System
Partners involved:
COMPLEX
Role, activities planned/undertaken
The control system developed by COMPLEX is new control system, which can be used in the HVAC sector. To date, no patents have been found to conflict with a request for a patent for this system. Therefore, the consortium will apply for protection rights for this system. As with item 1, the task of patent application must be undertaken by the consortium partners.
Exploitable result:
3. Liquid desiccant dehumidification air conditioning
Partners involved:
ALL
Role, activities planned/undertaken

DEHUMID - Periodic Activity Report (24M) COOP-CT-2005-016957
Page 197 of 208
Upon completion, the Liquid Desiccant Dehumidification air conditioning will exploitable in the HVAC sector. It can be exploited to technicians, scientists, engineers, manufacturing companies, customers and end-users.
The precise means of exploitation must be finalised between the consortium partners.
Technical/Economic market considerations (for items 1-3):
The licensing of the patents (to be obtained) will provide economic benefits to the partners involved in the consortium. Technically this knowledge is relatively new in the usage of the technology as it is done in this application.
Potential exploitation barriers (for items 1-3)
Patent application takes time, as there are strict confidentiality issues surrounding patents, this may delay the time to market of the new HVAC, sensors and system. Although the DEHUMID project is complete, this must still be discussed and resolved between the partners.
Further additional research and development work foreseen after the project (for items
1-3)
Manufacturers should be found to mass-produce the sensor technology.
Licensing of the technology will be sold/leased.
These aspects must be addressed in the near future.
Intellectual Property Rights protection measures (for items 1-3)
It is the intention of the consortium to formulate a plan to have all technology and applications protected. To date measures taken are to keep the knowledge secret, and visitors to the departments where this work is undertaken must sign a confidentiality agreement beforehand.
Commercial activities undertaken (for items 1-3)
The website has a dedicated section to encourage interested parties to make contact to develop further the DEHUMID technology.
Exploitable result:
4. Consultancy services
Partners involved:
NGD
Role, activities planned/undertaken
Due to expert knowledge gained during this project, the partners, NGD can offer their expert service to users of the liquid desiccant dehumidifier, end product and internal components. This consultancy will available for those within the HVAC sector.
Technical/Economic market considerations (for item 4):
In providing a consultancy service, considerations must be taken as to the consultancy already available in the HVAC sector. This is to be investigated.

DEHUMID - Periodic Activity Report (24M) COOP-CT-2005-016957
Page 198 of 208
Potential exploitation barriers (for item 4)
Possible barriers may be the consultancy already available for liquid desiccant dehumidifiers; however, as the technology and control system involved in this system is different from what is already on the market, there is a need for a specialist consultant in this specific area.
Commercial activities undertaken (for item 4)
The plan is to actively seek further partners in this coming period via conferences and congresses, as well as other advertising means. The commercial activities should be increased in the coming period and will be discussed and implemented with the agreement of the whole consortium.
Final plan for use and dissemination of knowledge
Overview of dissemination activities
In Table 13, the dissemination activities are illustrated. The website has been designed and is available. Interested parties may register on the website in order to receive the DEHUMID newsletter, there is over 100 people/companies already receiving information on a regular basis. Our LOGO has been designed and will be used as a stamp of quality for the final product when it is released onto the market. It is the intention of the consortium to design and produce brochures the target audience are the contractors who may wish to utilise the dehumidifier upon release into the market. The scientific aspects of the new system are important considerations for the scientific community. Due to confidentiality issues of patented material, the publication of this information may be limited. However, the current state of the art assembly of literature may well be publishable information in a scientific peer-reviewed journal article. In order to disseminate the work of DEHUMID into the HVAC sector, it is advised that the technology is demonstrated at trade conferences, or the workshops are held in order to attract potential customers and end users. Furthermore, to attract potential partners, for example for manufacturing considerations, company visits could be arranged.
Table 13: Overview of dissemination activities
Planned
/ actual
Dates
Type
Type of
audience
Countries
addressed
Size of
audience
Partner
resp. /
involved
2007 Project web-site Scientists,
HVAC,
contractors,
engineers,
contractors
International 1500
2007 Newsletter (via Scientists,
HVAC,
International 2000

DEHUMID - Periodic Activity Report (24M) COOP-CT-2005-016957
Page 199 of 208
Planned
/ actual
Dates
Type
Type of
audience
Countries
addressed
Size of
audience
Partner
resp. /
involved
website) contractors,
engineers,
contractors
2006 LOGO International N/A
2006/
2007
Brochures Technicians,
maintenance
International 2000
2007 Scientific
conferences
Scientists,
engineers
International 1000 UNOTT
PPUCh
2007 Trade
Conferences
e.g. EXPO
Technicians,
manufacturers
Building
developers
Contractors
European –
wide/
International
+1000 IG
COMPLEX
HIREF
2007 Workshops Technicians,
Maintenance
Manufacturers
European 100 IG
COMPLEX
HIREF
2007 Company visits Manufacturers
Developers
PPUCh
HIREF
2007 Video – DVD
format
HVAC sector
Building
developers
Contractors
European-
wide
+1000
Publishable results
The results achieved by project DEHUMID will be documented in project deliverables. A list of deliverables that will be published during the project is given below (Table 14Error!
Reference source not found.). Deliverables that will be published have a dissemination level of “public” (PU). It is expected, that these deliverables contain a significant part of the project achievements and therefore dissemination activities will be largely based on the results reported in these documents.

DEHUMID - Periodic Activity Report (24M) COOP-CT-2005-016957
Page 200 of 208
Table 14: List of Public Deliverables
Deliverable
No
ID Deliverable Title Delivery
Date
Dissemination
level
D1 UNOTT plan to submit a
review article in a peer-
reviewed journal, regarding
state of the art
14 PU
D1 UNOTT and relevant
partners plan a joint
publication
14 PU
D1 VGTU Humidity Ratio
Curves
14 PU
D14 Report on system
performance
24 PU
D15 Website 24 PU
D16 Application Notes 24 PU
D17 Draft Plan for Use and
Dissemination of
Knowledge
12 PU
D18 Publications and Video 24 PU
DEHUMID Web Site
The first Dissemination task was the creation of a dedicated Web page. The DEHUMID web site www.dehumid.info was created during the first 3 months of the project to provide information related to the project. It includes a restricted area for the Consortium, which is mainly used as document repository, as well as public section to provide information to readers.

DEHUMID - Periodic Activity Report (24M) COOP-CT-2005-016957
Page 201 of 208
Information available in public section: For more detailed information, see deliverable D15.
Introduction (Figure 115) To the project, including mentioning of the funding support by the EC.
Project Synopsis Includes short project description and the main project objectives.
Partners Involved Information and links to all DEMUMID partners involved.
Photo Album A collection of relevant photographs of the DEHUMID system and project
Forum/Discussion Here member of the public may interact with each other and with the DEHUMID partners on various aspects of the technology, system, possibilities. This is a known technique for improving the knowledge of a system, as well as attracting potential clients.
Poll The poll allows DEHUMID partners to have further insight into the wishes of the public, regarding the website and the DEHUMID technology.
Contact Us Contact opportunity for organisations interested in the project.
Figure 115: DEHUMID website: Homepage
DEHUMID - Periodic Activity Report (24M) COOP-CT-2005-016957
Page 202 of 208
Annex 3 – Listing of recorded data
DEHUMID - Periodic Activity Report (24M) COOP-CT-2005-016957
Page 203 of 208
Annex 4 - References
1. Gandhidasan, P., 2004. A simplified model for air dehumidification with liquid desiccant. Solar Energy 76, 409–416.
2. Fumo, N., Goswami, D.Y., 2002. Study of an aqueous lithium chloride desiccant system: air dehumidification and desiccant regeneration. Solar Energy 72, 351–361.
3. Gandhidasan, P., 2005. Quick performance prediction of liquid desiccant regeneration in a packed bed. Solar Energy 79 (2005) 47–55.
4. Nesreen Ghaddar, Kamel Ghali, Antoine Najm. Use of desiccant dehumidification to improve energy utilization in air-conditioning systems in Beirut. International journal of energy research 2003; 27: 1317–1338 (DOI: 10.1002/er.945)
5. J. Fischer, J. Sand, A. Hallstrom, P.E. Desiccant-based preconditioning market analysis. SEMCO, Inc., The Trane Company for Oak Ridge National Laboratory. 2000
6. M. Dubois, C. Monnin, J.-P. Simonin, N. Papaiconomou. Thermodynamics of the LiCl-H2O system XVI ECROFI European Current Research On Fluid Inclusions, Porto 2001. pp. 137-138
7. Manuel R.Conde. Properties of aqueous solutions of lithium and calcium chlorides: formulations for use in air conditioning equipment design. International Journal of Thermal Sciences, Volume 43, Issue 4, April 2004, Pages 367-382.
8. R.M. Lazzarin, A. Gasparella, G.A. Longo. Chemical dehumidification by liquid desiccants: theory and Experiment. International Journal of Refrigeration 22 (1999) 334–347
9. Ren Chengqin, Jiang Yi, Tang Guangfa, Zhang Yianpin. A characteristic study of liquid desiccant dehumidification/regeneration processes. Solar Energy 79 (2005) 483–494
10. Melda Ozdinc Carpinlioglu, Murtaza Yildirim. A methodology for the performance evaluation of an experimental desiccant cooling system. International Communications in Heat and Mass Transfer 32 (2005) 1400–1410
11. P. Gandhidasan. A simplified model for air dehumidification with liquid desiccant. Solar Energy 76 (2004) 409–416
12. X.J. Zhang, Y.J. Dai, R.Z. Wang. A simulation study of heat and mass transfer in a honeycombed rotary desiccant dehumidifier. Applied Thermal Engineering 23 (2003) 989–1003
13. James R. Sand a,*, John C. Fischer Active desiccant integration with packaged rooftop HVAC equipment. Applied Thermal Engineering 25 (2005) 3138–3148
14. N. Subramanyam, M.P. Maiya, S. Srinivasa Murthy. Application of desiccant wheel to control humidity in air-conditioning systems. Applied Thermal Engineering 24 (2004) 2777–2788

DEHUMID - Periodic Activity Report (24M) COOP-CT-2005-016957
Page 204 of 208
15. R.M. Lazzarin*, A. Gasparella, G.A. Longo. Chemical dehumidification by liquid desiccants: theory and Experiment. International Journal of Refrigeration 22 (1999) 334–347
16. K. Daou, R.Z. Wang*, Z.Z. Xia. Desiccant cooling air conditioning: a review. Renewable and Sustainable Energy Reviews 10 (2006) 55–77
17. P. Mazzei *, F. Minichiello, D. Palma. Desiccant HVAC systems for commercial buildings. Applied Thermal Engineering 22 (2002) 545–560
18. Ahmed M. Hamed. Desorption characteristics of desiccant bed for solar dehumidification/humidification air conditioning systems. Renewable Energy 28 (2003) 2099–2111
19. X.H. Liu_, K.Y. Qu, Y. Jiang. Empirical correlations to predict the performance of the dehumidifier using liquid desiccant in heat and mass transfer. Renewable Energy, Volume 31, Issue 10, August 2006, Pages 1627-1639
20. G.A. Longo *, A. Gasparella. Experimental and theoretical analysis of heat and mass transfer in a packed column dehumidifier/regenerator with liquid desiccant. International Journal of Heat and Mass Transfer, Volume 48, Issues 25-26, December 2005, Pages 5240-5254
21. D. Pietruschka*, U. Eicker, M. Huber, J. Schumacher. Experimental performance analysis and modelling of liquid desiccant cooling systems for air conditioning in residential buildings. International Journal of Refrigeration, Volume 29, Issue 1, January 2006, Pages 110-124
22. Sanjeev Jaina,*, P.L. Dhara, S.C. Kaushik. Experimental studies on the dehumidi®er and regenerator of a liquid desiccant cooling system. Applied Thermal Engineering 20 (2000) 253±267
23. Pietro Mazzei, Francesco Minichiello, Daniele Palma. HVAC dehumidification systems for thermal comfort: a critical review. Applied Thermal Engineering 25 (2005) 677–707
24. Zhen Li*, Xiaohua Liu, Yi Jiang, Xiaoyang Chen. New type of fresh air processor with liquid desiccant total heat recovery. Energy and Buildings 37 (2005) 587–593
25. N. Subramanyam, M.P. Maiya, S. Srinivasa Murthy. Parametric studies on a desiccant assisted air-conditioner. Applied Thermal Engineering 24(2004 ) 2679–2688
26. Ahmed M. Hamed, A. Khalil, A.E. Kabeel, M.M. Bassuoni, A.M. Elzahaby. Performance analysis of dehumidification rotating wheel using liquid desiccant. Renewable Energy 30 (2005) 1689–1712
27. P. Gandhidasan. Prediction of pressure drop in a packed bed dehumidifier operating with liquid desiccant. Applied Thermal Engineering 22 (2002) 1117–1127
28. S.A. Abdul-Wahab, Y.H. Zurigat, M.K. Abu-Arabi. Predictions of moisture removal rate and dehumidification effectiveness for structured liquid desiccant air dehumidifier. Energy 29 (2004) 19–34

DEHUMID - Periodic Activity Report (24M) COOP-CT-2005-016957
Page 205 of 208
29. P. Gandhidasan. Quick performance prediction of liquid desiccant regeneration in a packed bed. Solar Energy 79 (2005) 47–55
30. Ren Chengqin, Jiang Yi, Zhang Yianpin. Simplified analysis of coupled heat and mass transfer processes in packed bed liquid desiccant-air contact system. Solar Energy, Volume 80, Issue 1, January 2006, Pages 121-131
31. C. S. Khalid Ahmed, P. Gandhidasan and A. A. Al-Farayedhi. Simulation of a hybrid liquid desiccant based air-conditioning system. Applied Thermal Engineering Vol. 17, No. 2, pp. 125-l 34, 1997
32. Nelson Fumo, Y. Goswami. Study of an aqueous lithium chloride desiccant system: air dehumidification and desiccant regeneration. Solar Energy Vol. 72, No. 4, pp. 351–361, 2002
33. P. Mavroudaki a, C.B. Beggs a,*, P.A. Sleigh a, S.P. Halliday. The potential for solar powered single-stage desiccant cooling in southern Europe. Applied Thermal Engineering 22 (2002) 1129–1140.
34. A, Kodama and all. The use of psychrometric charts for the optimisation of a thermal swing desiccant wheel. Applied Thermal Engineering 21 (2001) 1657–1674
35. S. Younus Ahmed, P. Gandhidasan, A. A. Al-Farayedhi. Thermodynamic analysis of liquid desiccants. Solar Energy vol. 62, No.1 (1998) pp 11–18.
36. J.R. Camargo, C.D. Ebinuma, J.L. Silveira. Thermoeconomic analysis of an evaporative desiccant air conditioning system. Applied Thermal Engineering 23 (2003) 1537–1549
37. ASRAE handbook 2001. Fundamentals.
38. prEN 15251. Criteria for the Indoor Environment including thermal, indoor air quality, light and noise. 2005
39. Löf, G., Cooling with Solar Energy, Proceedings of the Congress of Solar energy (1955), Tucson, Arizona, pp. 171-189.
40. Elsayed, M., Gari,H., Radhwan, A., "Effectiveness of heat and mass transfer in packed beds of liquid desiccant system," Renewable Energy, v 3 n 6-7, pp. 661-668, 1993
41. Stevens, D. I. Braun, J. E.; Klein, S. A., "Effectiveness model of liquid-desiccant system heat/mass exchangers," Solar Energy, v 42 n 6, pp. 449-455, 1989.
42. Meckler, M., "Desiccant outdoor air preconditioners maximize heat recovery ventilation potentials", Proceedings of the 1995 ASHRAE Annual Meeting; 24 Jun 1995-28 Jun 1995. San Diego, CA. Atlanta, GA: American Society of Heating, Refrigerating and Air-Conditioning Engineers; Vol. 101, Part 2, pp. 992-1000. 1995
43. Meckler, M., "New developments in desiccant cooling", Innovative Energy Design for the '90s. Lilburn, GA: Fairmont Press, Inc. pp. 323-348. 413 p., 1993
44. Baechler J. M.) Sick Building Syndrome, Sources Health effects, Mitigation. Noyes Date Corporation, New Jersey, 1991
45. Jain, S., “Desiccant Cooling Systems”, IIF-IIR commission's, New Delhi (1998). 46. Peng, C.S.P., Howell, J.R., “Analysis and Design of Efficient Absorbers for Low
Temperature Desiccant Air Conditioners”, Trans. of the ASME, Journal of Solar Energy Engineering, 103: 67-74, 1981.
47. Factor, M., Grossman, G., “A Packed Bed Dehumidifier/Regenerator for Solar Air Conditioning with Liquid Desiccants”, Solar Energy, 24: 541-550, 1980.

DEHUMID - Periodic Activity Report (24M) COOP-CT-2005-016957
Page 206 of 208
48. Fischer, J., Hallstrom, P.E., Sand, J., “Desiccant-Based Preconditioning Market Analysis”, Oak Ridge National Laboratory e.a., June 2000
49. Dhar, P.L.,Desiccant Based Air-conditioning System - The Emerging Alternative, IIF-IIR commission's, New Delhi (1998).
50. Dhar, P.L., Jain, S. Kaushik, S.C., “Thermodynamic Design and Analysis of a Novel Desiccant Based Cooling Cycle”, IIF-IIR commission's, New Delhi (1998).
51. Oberg, V., Goswami, D.Y., “Experimental Study of the Heat and Mass Transfer in a Packed bed liquid Desiccant Air Dehumidifier”, Journal of Solar Energy Engineering Vol 120, November 1998.
52. Shastry, D.V., Jagadish, B.S., Sharma, G.K., “Performance Studies On Adsorbents For Desiccant Cooling”, 7th International Conference on Alternative Energy Recourses, Miami University, U.S.A. DEHUMID/16957 May 25, 2005 Page 64 of 75
53. Slayzak, S.J. Pesaram, A.A., Hancock, C.E., “Experimental Evaluation of Commercial Desiccant Dehumidifier Wheels” (Source : NREL Internet website)
54. Schools Resolve IAQ/Humidity problems with desiccant preconditioning, HPAC Heating/Piping/Air-conditioning, April 1998.
55. World Market for Air Conditioning 2002, BSRIA Ltd, Feb 2002 56. ASHRAE Standard 139-1998, “Methods of Testing for Rating Desiccant
Dehumidifiers Utilizing Heat for the Regeneration Process”, American Society of Heating, Refrigerating, and Air- Conditioning Engineers, Inc., Atlanta, GA 30329, U.S.A., 1998,
57. Gas- Fired Desiccant system for Retail Super Center, ASHRAE Journal, October 1997.
58. Dehumidification Issues Of Standard 62-1989, ASHRAE Journal, March 1998 59. Pesaran, A.A., Penney, T.R., Czanderna, A.W., “Desiccant Cooling: State-of-the-Art
Assessment”, NREL Technical Report #TP-254-4147; 1992 60. Lowenstein, A., Slayzak, S., Ryan, J., Pesaran, A., “Advanced Commercial Liquid-
Desiccant Technology Development Study”, AIL Research / National Renewable Energy Laboratory, November 1998.
61. Kuijpers, L., “The Impact of the Montreal and the Kyoto Protocol on the new developments in Refrigeration and Air Conditioning”, IIF-IIR commission's, New Delhi (1998).
62. Godish, T. “Sick Buildings, Definition, Diagnosis and Mitigation”, CRC Press Florid, 1995
63. Nesreen Ghaddar, Kamel Ghali, Antoine Najm. Use of desiccant dehumidification to improve energy utilization in air-conditioning systems in Beirut. International journal of energy research 2003; 27: 1317–1338 (DOI: 10.1002/er.945)
64. M. Dubois, C. Monnin, J.-P. Simonin, N. Papaiconomou. Thermodynamics of the LiCl-H2O system XVI ECROFI European Current Research On Fluid Inclusions, Porto 2001. pp. 137-138
65. Manuel R.Conde. Properties of aqueous solutions of lithium and calcium chlorides: formulations for use in air conditioning equipment design. International Journal of Thermal Sciences, Volume 43, Issue 4, April 2004, Pages 367-382.
66. R.M. Lazzarin, A. Gasparella, G.A. Longo. Chemical dehumidification by liquid desiccants: theory and Experiment. International Journal of Refrigeration 22 (1999) 334–347
67. Ren Chengqin, Jiang Yi, Tang Guangfa, Zhang Yianpin. A characteristic study of liquid desiccant dehumidification/regeneration processes. Solar Energy 79 (2005) 483–494
68. Melda Ozdinc Carpinlioglu, Murtaza Yildirim. A methodology for the performance evaluation of an experimental desiccant cooling system. International Communications in Heat and Mass Transfer 32 (2005) 1400–1410
69. P. Gandhidasan. A simplified model for air dehumidification with liquid desiccant. Solar Energy 76 (2004) 409–416

DEHUMID - Periodic Activity Report (24M) COOP-CT-2005-016957
Page 207 of 208
70. X.J. Zhang, Y.J. Dai, R.Z. Wang. A simulation study of heat and mass transfer in a honeycombed rotary desiccant dehumidifier. Applied Thermal Engineering 23 (2003) 989–1003
71. James R. Sand a,*, John C. Fischer Active desiccant integration with packaged rooftop HVAC equipment. Applied Thermal Engineering 25 (2005) 3138–3148
72. N. Subramanyam, M.P. Maiya, S. Srinivasa Murthy. Application of desiccant wheel to control humidity in air-conditioning systems. Applied Thermal Engineering 24 (2004) 2777–2788
73. R.M. Lazzarin*, A. Gasparella, G.A. Longo. Chemical dehumidification by liquid desiccants: theory and Experiment. International Journal of Refrigeration 22 (1999) 334–347
74. K. Daou, R.Z. Wang*, Z.Z. Xia. Desiccant cooling air conditioning: a review. Renewable and Sustainable Energy Reviews 10 (2006) 55–77
75. P. Mazzei *, F. Minichiello, D. Palma. Desiccant HVAC systems for commercial buildings. Applied Thermal Engineering 22 (2002) 545–560
76. Ahmed M. Hamed. Desorption characteristics of desiccant bed for solar dehumidification/humidification air conditioning systems. Renewable Energy 28 (2003) 2099–2111
77. X.H. Liu_, K.Y. Qu, Y. Jiang. Empirical correlations to predict the performance of the dehumidifier using liquid desiccant in heat and mass transfer. Renewable Energy, Volume 31, Issue 10, August 2006, Pages 1627-1639
78. G.A. Longo *, A. Gasparella. Experimental and theoretical analysis of heat and mass transfer in a packed column dehumidifier/regenerator with liquid desiccant. International Journal of Heat and Mass Transfer, Volume 48, Issues 25-26, December 2005, Pages 5240-5254
79. D. Pietruschka*, U. Eicker, M. Huber, J. Schumacher. Experimental performance analysis and modelling of liquid desiccant cooling systems for air conditioning in residential buildings. International Journal of Refrigeration, Volume 29, Issue 1, January 2006, Pages 110-124
80. Sanjeev Jaina,*, P.L. Dhara, S.C. Kaushik. Experimental studies on the dehumidi®er and regenerator of a liquid desiccant cooling system. Applied Thermal Engineering 20 (2000) 253±267
81. Pietro Mazzei, Francesco Minichiello, Daniele Palma. HVAC dehumidification systems for thermal comfort: a critical review. Applied Thermal Engineering 25 (2005) 677–707
82. Zhen Li*, Xiaohua Liu, Yi Jiang, Xiaoyang Chen. New type of fresh air processor with liquid desiccant total heat recovery. Energy and Buildings 37 (2005) 587–593
83. N. Subramanyam, M.P. Maiya, S. Srinivasa Murthy. Parametric studies on a desiccant assisted air-conditioner. Applied Thermal Engineering 24(2004 ) 2679–2688
84. Ahmed M. Hamed, A. Khalil, A.E. Kabeel, M.M. Bassuoni, A.M. Elzahaby. Performance analysis of dehumidification rotating wheel using liquid desiccant. Renewable Energy 30 (2005) 1689–1712
85. P. Gandhidasan. Prediction of pressure drop in a packed bed dehumidifier operating with liquid desiccant. Applied Thermal Engineering 22 (2002) 1117–1127
86. S.A. Abdul-Wahab, Y.H. Zurigat, M.K. Abu-Arabi. Predictions of moisture removal rate and dehumidification effectiveness for structured liquid desiccant air dehumidifier. Energy 29 (2004) 19–34
87. P. Gandhidasan. Quick performance prediction of liquid desiccant regeneration in a packed bed. Solar Energy 79 (2005) 47–55
88. Ren Chengqin, Jiang Yi, Zhang Yianpin. Simplified analysis of coupled heat and mass transfer processes in packed bed liquid desiccant-air contact system. Solar Energy, Volume 80, Issue 1, January 2006, Pages 121-131

DEHUMID - Periodic Activity Report (24M) COOP-CT-2005-016957
Page 208 of 208
89. C. S. Khalid Ahmed, P. Gandhidasan and A. A. Al-Farayedhi. Simulation of a hybrid liquid desiccant based air-conditioning system. Applied Thermal Engineering Vol. 17, No. 2, pp. 125-l 34, 1997
90. Nelson Fumo, Y. Goswami. Study of an aqueous lithium chloride desiccant system: air dehumidification and desiccant regeneration. Solar Energy Vol. 72, No. 4, pp. 351–361, 2002
91. P. Mavroudaki a, C.B. Beggs a,*, P.A. Sleigh a, S.P. Halliday. The potential for solar powered single-stage desiccant cooling in southern Europe. Applied Thermal Engineering 22 (2002) 1129–1140.
92. A, Kodama and all. The use of psychrometric charts for the optimisation of a thermal swing desiccant wheel. Applied Thermal Engineering 21 (2001) 1657–1674
93. S. Younus Ahmed, P. Gandhidasan, A. A. Al-Farayedhi. Thermodynamic analysis of liquid desiccants. Solar Energy vol. 62, No.1 (1998) pp 11–18.
94. J.R. Camargo, C.D. Ebinuma, J.L. Silveira. Thermoeconomic analysis of an evaporative desiccant air conditioning system. Applied Thermal Engineering 23 (2003) 1537–1549
95. ASRAE handbook 2001. Fundamentals. 96. prEN 15251. Criteria for the Indoor Environment including thermal, indoor air quality,
light and noise. 2005 97. RSN 156-94. Statybinė klimatologija (Žin.,1994, Nr.24-394).