
Debt presentation - May 2022 - KBC Group
75
KBC Group Debt presentation May 2022 More infomation: www.kbc.com KBC Group - Investor Relations Office – E-mail: [email protected]
-
Upload
khangminh22 -
Category
Documents
-
view
3 -
download
0
Transcript of Debt presentation - May 2022 - KBC Group

KBC Group Debt presentation May 2022
More infomation: www.kbc.com
KBC Group - Investor Relations Office – E-mail: [email protected]

This presentation is provided for information purposes only. It does not constitute an offer to sell or the solicitation to buy any security issuedby the KBC Group.
KBC believes that this presentation is reliable, although some information is condensed and therefore incomplete. KBC cannot be held liablefor any loss or damage resulting from the use of the information.
This presentation contains non-IFRS information and forward-looking statements with respect to the strategy, earnings and capital trends ofKBC, involving numerous assumptions and uncertainties. There is a risk that these statements may not be fulfilled and that futuredevelopments differ materially. Moreover, KBC does not undertake any obligation to update the presentation in line with new developments.
By reading this presentation, each investor is deemed to represent that it possesses sufficient expertise to understand the risks involved.
Important information for investors
2

Market share (end 2021) BE CZ SK HU BG IRL
Loans and deposits
Investment funds
Life insurance
Non-life insurance
GDP growth: KBC data, April ‘22* Retail segment
9%20%19%
11% 11%11%
28% 23%
7% 12% 10%
8%13%
3% 3%
22%
9% 12%7%9% 5%
Real GDP growth BE CZ SK HU BG IRL
% of Assets
2021
2022e
2023e
4%
61%
4%25%
3%2%
3,3%6,1% 3,0% 3,8%7,1%
13,5%
3.7%2.5%2.0% 1.8%
5.0%
2.5%
IRELAND
BELGIUMCZECH REP
SLOVAKIA
HUNGARY
BULGARIA
*3.8m clients430 branches111bn EUR loans134bn EUR dep.
0.3m clients12 branches9bn EUR loans5bn EUR dep.Sale agreements
signed
4.3m clients204 branches34bn EUR loans47bn EUR dep.
0.8m clients122 branches10bn EUR loans8bn EUR dep.
1.6m clients198 branches5bn EUR loans10bn EUR dep.
1.8m clients161 branches4bn EUR loans7bn EUR dep.Belgium
Business Unit
CzechRepublicBusiness Unit
InternationalMarkets Business Unit
3.1%1.1%
3.4% 3.1% 3.0% 3.5%
3
Group Centre

KBC Group NV
KBC Bank KBC Insurance
100%100%
KBC IFIMA***
• To ensure that KBC’s HoldCo senior debt is eligible for the subordinated MREL target (i.e., to make sure that no excluded liabilities ranking pari passu or junior with HoldCo senior debt arepresent in KBC Group NV), the KBC Group ExCo decided on to make KBC Group NV a Clean HoldCo for the purpose of resolution. Ultimately from 1/1/2024, all the activities of KBC Group NVwill be transferred to a new subsidiary of KBC Group NV (with exception of the group controlling functions), the financial holding activities and issuing own funds and MREL instruments thatremain at KBC Group NV
** DISCAI (Discovering AI) is a separate fully owned subsidiary, grouping the in-house developed artificial intelligence solutions for commercialisation to third parties (as of 7 March 2022)*** All debt obligations of KBC IFIMA are unconditionally and irrevocably guaranteed by KBC Bank
AT 1 Tier 2 Senior
Covered bond No public issuance
MREL
KBC PassportGroup’s legal structure and issuer of debt instruments
Retail and Wholesale EMTN
KBC Global Services N.V.*
100%
Clean Holdco ultimately by 1/1/2024*
4
DISCAI**
100%

Latest credit ratings S&PMoody’s Fitch
Gro
upBa
nkIn
sura
nce
Senior UnsecuredTier IIAdditional Tier IShort-term P-2 A-2 F1Outlook Stable Stable Stable
Baa1 A- ABaa2 BBB BBB+Ba1 BB+ BBB-
Senior Unsecured
Short-term P-1 A-1 F1Outlook Stable Stable Stable
A2 A+ A+Tier II
Covered Bonds Aaa - AAA
-
Financial Strength RatingIssuer Credit Rating
- A -- A -
BBB
Outlook - Stable -
-
Latest updates:• 12 October 2021: Fitch revised the outlooks on KBC
Group and KBC Bank to stable. The revision of theoutlook reflects Fitch’s updated economic assumptionsfor the group’s main operating countries. This meansback to the situation pre Covid.
• 13 July 2021: Moody’s has left KBC Group’s senior debtrating unchanged but has downgraded KBC Bank’ssenior debt rating by one notch to A2 from A1. Theoutlook remains stable. The downgrade is driven byMoody’s new rating methodology related to Loss GivenFailure (LGF). However, Moody’s view of KBC’sfundamental creditworthiness remains the same. Thelong-term deposit rating of KBC Bank N.V. has beendowngraded to A1 from Aa3. The rating agency alsodowngraded the backed senior unsecured debt andMedium-Term Notes (MTN) programme ratings of KBCIFIMA S.A. to A2 from A1, and to (P)A2 from (P)A1,respectively
• 23 June 2021: S&P revised the outlook to stable fromnegative for KBC Group, KBC Insurance and KBC GroupRE given the improvement of the economic risk trendin Belgium. This means back to the situation pre Covid
5

6
Agencies ESG rating of 29th of April 2022 (previous score) Position versus industry average
A
A- (A-)
D-
Negligible RiskMedium RiskSevere Risk High Risk Low Risk
1000
AAAAABBB AB BBC
…C+CC-D+DD-
54320 1
• Top 12% • (88th percentile of 242 banks assessed)
• 3rd percentile of 189 banks assessed
• 3rd percentile of 413 diversified banks assessed• 9th of 413 diversified banks
• 1st decile rank of 299 Commercial Banks & Capital Markets assessed
• Financial services average B
13.1 (13.5)
C prime (C prime)
4.3 (4.7)
AAA (AAA)
74 (73)
• Top 4%• (96th percentile of banks assessed)
ESG ratings and indicesAhead of the curve

Contents
Roughly 40% of KBC shares are owned by a syndicate of coreshareholders, providing continuity to pursue long-term strategicgoals. Committed shareholders include the Cera/KBC AncoraGroup (co-operative investment company), the Belgian farmers’association (MRBB) and a group of industrialist families
The free float is held mainly by a large variety of international institutional investors
SHAREHOLDER STRUCTURE AT END 1Q20221. Strategy and business profile
2. Financial performance
3. Solvency, liquidity and funding
4. Covered bond programme
5. Green & Social bond framework
6. Looking forward
Appendices
7
18.6%
11.5%7.3%
59.9%
Other core
KBC Ancora
Free float
2.7%Cera
MRBB

KBC Group in a nutshell (1)We want to be among Europe’s best performing financial institutions! By achieving this, KBC wants to
be the reference in bank-insurance in its core markets• We are a leading European financial group with a focus on providing bank-insurance products and services to retail, SME and
mid-cap clients, in our core countries: Belgium, Czech Republic, Slovakia, Hungary, Bulgaria; for Ireland, sale agreements weresigned (not yet completed).
• As a result of the (potential) withdrawal from Ireland, arising M&A opportunities beyond our core markets may be assessed (forapproval of the Board of Directors) taking into account very strict strategic, financial, operational & risk criteria
Diversified and strong business performance… geographically
• Mature markets (BE, CZ, IRL) versus developing markets (SK, HU, BG)• Robust market position in all key markets & strong trends in loan and deposit growth
… and from a business point of view• An integrated bank-insurer• Strongly developed & tailored AM business• Strong value creator with good operational
results through the cycle• Unique selling proposition: in-depth
knowledge of local markets and profound relationships with clients
• Integrated model creates cost synergies and resultsin a complementary & optimised product offering
• Broadening ‘one-stop shop’ offering to our clients
Diversification Synergy
Customer Centricity
53% 52% 53% 50%
47% 48% 47% 50%
20202018 20212019
KBC Group: topline diversification 2018-2021 (in %)
Other income Net interest income
8

High profitability
FY21
Net result
2614mEUR55% 89%
C/I ratio* Combined ratio
FY20
1440mEUR57% 85%
CET1 generation (in bps) before any deployment
193
296 277 279 271 251
141
250
201820162014 20202015 2017 2019 2021
148%
NSFR
167%
LCR
146% 147%
… and robust liquidity positions
FY21 FY20
9
KBC Group in a nutshell (2)
* 11% when adjusted for the collective covid impairments** when excluding the one-off items due to the pending sales transactions in Ireland
ROE (%)14
2218 17 16 14
8
15
2014 2015 202120182016 2017 20202019
*
*
* 202bps when adjusted for the collective covid-19 impairments
Solid capital position...Fully loaded Basel 3 CET1 ratio of KBC Group (Danish Compromise)
1Q21 1H21
16.4%
9M21 FY21 1Q22
17.5%17.6%15.5% 15.3% *
11.15% Maximum Distributable Amount
* Adjusted for specific items
*** As of 1Q22, interim profit recognition (based on 50% profit accrual)

Personalised solutionsUsing data and AI to offer proactivelycompelling, relevant and personalisedfinancial solutions
Customer experienceProviding zero-hassle, no-frillscustomer experience leveraging ourunique strengths on data-securityand data-privacy
Straight-through processesThis implies re-design of processesand avoiding to digitise the currentones. Aim is E2E digital processes
TrustCapitalising on the trust customersplace in us today
Broad offerEmphasising our broad financial offerand ensuring these solutions are Bigtechproof (pro-active, convenient &personalised)
Beyond bank-insuranceStaying focused on the financial wellnessof our customers and offer services tobecome embedded in our customer’sdaily life
Differently THE NEXT LEVEL
KBC is the reference: The winning factors
10

, your digital assistant
The interaction between the customer and Kate will be triggered by data analysis (approval
granted by customer). Kate will be trained on the basis of the customer’s
profile, preferences and activities
PERSONALISED & DATA DRIVEN
Kate will only propose offers where sufficient added value is shown or when she can serve the
client in an important moment in the client's live
RELEVANT & VALUABLE OFFER
Lead journeys driven by time or location are preferably taken care of by Kate, as
notifications linked to a specific location or specifying moment in time are perceived as
highly personal
AT THE RIGHT TIME
We will offer the client a frictionless End2End digital process and in doing so
make bank/insurance simple and hassle free
DIGITAL FIRST & E2E
Kate will help the client saving time and/or money, focusing more on the convenience
factor. Kate will also serve the client regarding security and fraud
SERVING: SECURE & FRICTIONLESS
We want all our clients to meet Kate as much as possible. Kate will allow us to reach out to a
sufficient volume of clients, in terms of transactions and in terms of number of
targetable audience
VOLUME
‘No hassle, no friction, zero
delay’ Johan Thijs
Hyper personalised and trusted financial digital assistant
11

12
KATEKate4MassRetail Kate4Business
Kate Group Platform Kate4Employees
Four flavors, one
Kate is a personal virtual assistant that engages with our retail customers to save them time and money. Kate engages both in a reactive way (You2Kate) and a proactive way (Kate2You).
Kate will also engage with our SME and corporate clients with relevant and actionable insights that are
personal and proactive.
Kate will also have an impact on our employees: Kate will provide commercial steering towards our work
force, she will augment our workforce to better serve our clients, Kate will serve as a back-up for our network
and will automate certain administrative tasks.In doing so, employees can focus on providing even
more added value to our client.This will also give tools to management to better coach
employees and plan ahead.
We do not build Kate for every country individually. Kate is built once at a group level and then deployed to all core countries (Kate in a box).Technically, we have set up a shared infrastructure on the cloud that allows us to share use cases, code and IT components maximally.Furthermore, KBC strives to have a common user interface and persona, so Kate looks and feels the same everywhere.Finally, everything that can be developed at group level is governed by a specific steering committee that develops and maintains the group Kate infrastructure.
+156 000 Kate tips
processed byemployees in
CZ
‘KATE IN A BOX’
delivered to all core
countries
12 use cases live for small SMEs in BE(11 more in pipeline for
'22)
Growingnumber of USE CASES:
>240 in BE & CZ
Kate AUTONOMY
43% in BE
Already available in BE, CZ and BGTo be launched in HU (2Q22), SK (3Q22) Already available in BE and CZ
Already available in CZ and BETo be launched in HU, BG and SK (2023)
2 000 000 users
completed2 900 000
interactionswith KATE(BE+CZ+BG)

+
+
The strong basis remains
Differently THE NEXT LEVEL
13

Bank-insurance+
14
Differently: THE NEXT level
Data drivenorganisation

KBC is 3rd in customer NPS ranking
Target is to remain the reference (top-2 score on group level)
Based on weighted avg of ranking in six core countries
78% of active customers are BI customers at end 2021 (vs 2023 target of 85%) 23% of active customers are stable BI customers at end 2021 (vs 2023 target of 27%)
BI customers have at least 1 bank + 1 insurance product of our group. Stable BI customers: at least 2 bank + 2 insurance products (Belgium: 3+3)
Top-2Top-3
Top-2
2020 2021* target '23
Customer NPS ranking
77% 78% 85%
22% 23% 27%
2020 BI 2021 BI target '23 2020stable BI
2021stable
target '23
% bank-insurance (BI) clients
* Based on the latest available data.
15
Update on our 4 operational targets (1)
Differently THE NEXT LEVELTranslating strategy into non-financial targets

Update on our 4 operational targets (2)
* Based on analysis of core commercial products.
STP at 33% at end 2021 (vs 2023 target of ≥60%)
STP potential at 49% at end 2021 (vs 2023 target of ≥80%)The STP-ratio measures how many of the services that can be offered digitally are processed without any human intervention and this from the moment of interaction by a client until the final approval by KBC.
STP potential measures what the STP-ratio would be if KBC would only have the digital channel in its interaction with clients for a given process or product.
Digital sales 39% of bank sales (vs 2023 target of ≥40%) Digital sales 19% of insurance sales (vs 2023 target of ≥25%)
Based on weighed avg of selected core products
25% 33%60%
41% 49%80%
2020STP
2021STP
target '23 2020STP
potential
2021STP
potential
target '23
STP score*(straight through processing)
32%39% 40%
15% 19%25%
2020Bank
2021Bank
target'23
2020Insur.
2021Insur.
target'23
% digital sales(bank / insurance)
16
Differently THE NEXT LEVELTranslating strategy into non-financial targets

We have been a signatory to the Equator Principles (Eps) since 2004 and have integrated them in our lending policy of project finance
Signed the UNEP FI Principles for Responsible Banking &Collective Commitment to Climate Action
The first Belgian financial institution that issued a green bond
First Green Bond
Translate the 1.5°C target into concrete objectives per sector, based on scientific scenarios, by the end of 2022
“We report on our GHG emissions of
our entire loan and lease portfolios as well as our climate analysis by sector”
Johan Thijs
17
Our sustainability roadmapKBC milestones and initiatives
20042006
2016
2018 2019
20202022
Equator Principles
By signing the Collective Commitment to Climate Action, we have committed ourselves to stimulate the greening of the economy as much as possible and so limit global warming to well below 2°C, striving for 1.5°C, in line with the Paris climate agreement
KBC Asset Management signed Climate Action 100+This is an investor-led initiative to engage systemically important GHG emitters and other companies across the global economy, which have significant opportunities to drive the clean energy transition and help achieve the goals of the Paris Agreement
Signed the UNEP FI Principles for Responsible Investment (2016) and for Sustainable Insurance (2018)
Joined the UN Global compact andpublished first sustainability report over FY 2005
2011First report to society published
Continuous ESG actions…
In 2022, KBC intends to launch its first KBC Social Bond

18
Strong progress on in Environmental, Social and Governance issuesSome latest highlights
ESG ESG ESGSocialEnvironmental Governance
All remaining direct coal exposure has been phased out in line with our commitment
We calculated the GHG emissions for the entire KBC Group’s loan and lease portfolio for the first time based on the PCAF methodology
We calculated the climate-related impact of our own investments and asset management portfolio through Trucost data and methodology
Net climate-neutral regarding our direct environmental footprint
31.7bn EUR in Responsible Investing funds
10.2m EUR of outstanding loans to microfinance institutions and investments in microfinance funds, reaching 1.7m rural entrepreneurs and farmers in the South
Promoting female entrepreneurship among our start-up community
Promoting diversity and an inclusive culture and inclusion in the Bloomberg Gender-Equality Index
Top level responsibility for sustainability and climate change –anchored in our sustainability governance and remuneration
Our people as one of the main drivers in our sustainable transition
Our climate business game was further enrolled to our senior management as part of our leadership development programme
Completion of responsible behaviourawareness training by the vast majority of staff in all core countries

=
Our sustainability ambitionsWe substantially raise the bar for our climate-related ambitions
End of 2021: volume of Responsible Investing funds includes all Belgian KBC pension savings funds (adding 6bn EUR)
Responsible Investing funds ≥ 50% of annual fund production from 2021 onwards
Target set to 65% by ’30 During 2021, Project Finance Belgium concluded
7 new renewable energy transactions for a total amount of 195m EUR
Continued installation of photovoltaic panels on buildings we own and operate ourselves
Target reduction of own emissions set to 80% by ’30 A business travel ban and the switch to teleworking in 2020 and
2021 drove the strong result in terms of reduction in GHG emissions
20192018 2020 target’302021
44%61%57% 63% 65%
Volume of Responsible Investing Funds(*)(In billions of EUR)
Renewable energy loans(In % of total energy sector loan portfolio) 252
8634 36
11
202120192016 2017 2018 2020 1H21
Direct coal-related finance(In millions of EUR)
All remaining direct coal exposure has been phased out in line with our commitment
Firm commitment to exit indirect coal exposure, supporting existing clients in their transition. In order to remain eligible for any kind of financing, the related client must commit not to engage into any new coal project and must submit a coal-phase-out plan (to be achieved by 2030 at the latest)
Renewable electricity(In % of own electricity consumption)
target’302018
78%
20212019
83%
2020
87%100% 100%
Reduction own GHG emissions (incl. commuter travel)(In % compared to 2015)
56%32%
20212018
42%
20202019
71% 80%38%50%
63%76%
Full Exit
Target’30(incl. commuter travel)
Excl. commuterIncl. commuter
Full Exit
19
Achieved AchievedAbove track
Achieved Above track
= KBC achieved climate neutrality as of the end of
2021 by offsetting our residual direct emissions Three selected climate projects all complying with
the highest standards and with clear link to the SDGs and our sustainability strategy
Achieved
(*) Responsible Investing framework is a KBC in-house but well proven and externally challenged framework. KBC Asset Management is further aligning this framework to new EU regulations such as SFDR and MIFID and currently works under the assumption that all SRI funds are either article 8 or article 9 funds under the SFDR.
9 1217
32 32 30
2018 2019 target’252020 2021 1Q22Volume RI funds vs total annual fund production
30%40%
55%58%

Our environmental footprintMeasuring and reporting both our direct and indirect footprint scope
20
Measure, reduce and set clear targets on our direct footprint scope already since 2015.
- We already substantially reduced our direct footprint by -71% in 2021.
- In line with our commitment, we reached net-climate neutrality with respect to our direct footprint scope in 2021.
Measure our indirect footprint scope as a first step to identify strategies to reduce this impact and set related targets.
- In 2021, for the first time, we have calculated the Scope 3 financed emissions of KBC Group’s total loan and lease portfolio.
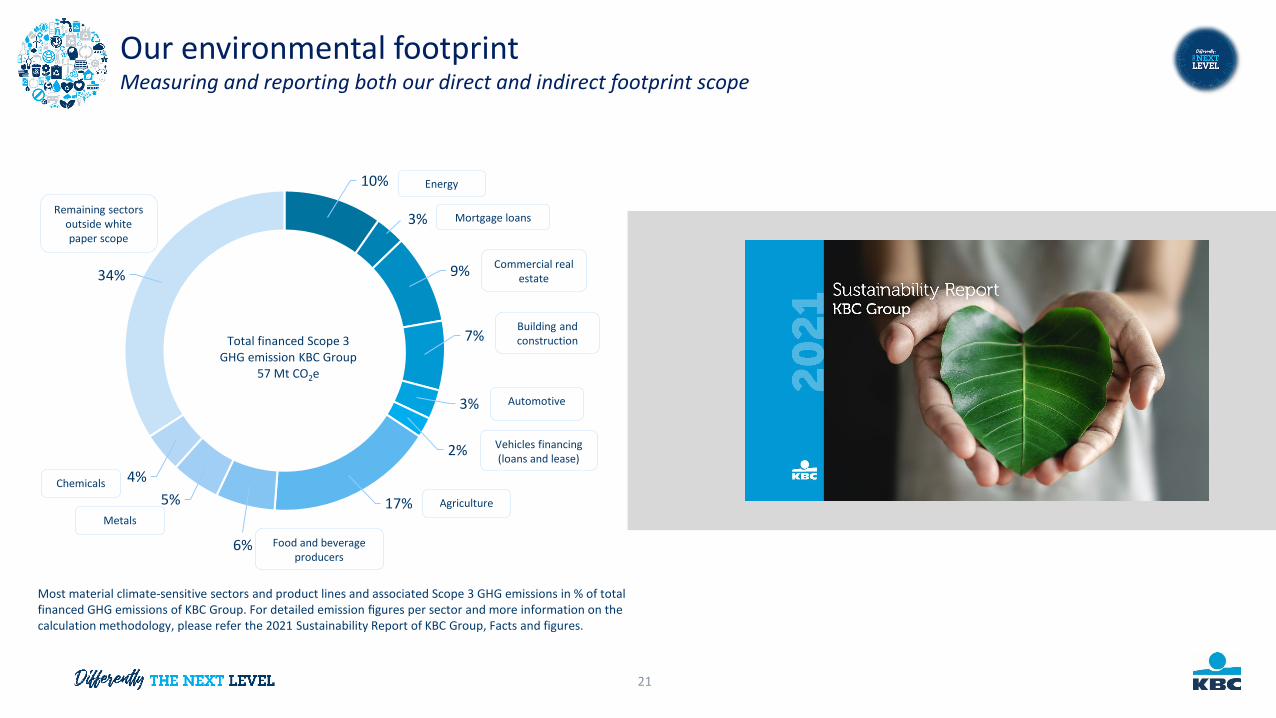
Our environmental footprintMeasuring and reporting both our direct and indirect footprint scope
21
10%
3%
9%
7%
3%
2%
17%
6%
5%4%
34%
Total financed Scope 3 GHG emission KBC Group
57 Mt CO2e
Energy
Mortgage loans
Commercial real estate
Building and construction
Automotive
Vehicles financing(loans and lease)
Agriculture
Food and beverageproducers
Metals
Chemicals
Remaining sectors outside whitepaper scope
Most material climate-sensitive sectors and product lines and associated Scope 3 GHG emissions in % of total financed GHG emissions of KBC Group. For detailed emission figures per sector and more information on the calculation methodology, please refer the 2021 Sustainability Report of KBC Group, Facts and figures.

Contents
BREAKDOWN OF ALLOCATED CAPITAL BY BUSINESS UNIT AS AT
31 March 2022
1. Strategy and business profile
2. Financial performance
3. Solvency, liquidity and funding
4. Covered bond programme
5. Green & Social bond framework
6. Looking forward
Appendices
22
62%
16%
16%
6%
Belgium
Czech Republic
International Markets
Group Centre

Commercial bank-insurance franchises in core markets performed excellently
Customer loans and customer deposits increased y-o-y in most of our core countries (on a comparable basis)
We have now realised our goal to systematically roll out Responsible Investing in all our core markets
Higher net interest income and net interest margin
Slightly higher net fee and commission income
Significant increase of net result from financial instruments at fair value
Very strong non-life insurance performance and higher sales of life insurance y-o-y
Costs in 1Q include bulk of full-year bank taxes; costs excl. bank taxes down q-o-q (notwithstanding extraordinary staff bonus1)
Net impairment release, notwithstanding creation of geopolitical & emerging risks reserve (largely offset by partial release of Covid reserves)
Solid solvency and liquidity
Excellentnet result of 458m EUR in 1Q22
ROE 14%2
Cost-income ratio excluding bank taxes 48% Combined ratio 83% Credit cost ratio -0.03% Common equity ratio 15.3% (B3, DC, fully loaded)3
Leverage ratio 5.0% (fully loaded)
NSFR 149% & LCR 162%
1Q22
Net result
1. One-off bonus for our staff for their achievements in what was a challenging and difficult year (Covid)2. When bank taxes are evenly spread throughout the year3. As of 1Q22, interim profit recognition (based on 50% profit accrual)
557
793601 663
458
2Q211Q21 4Q213Q21 1Q22
Comparisons against the previous quarter unless otherwise stated23
Amounts in m EUR
Key takeaways for KBC Group1Q22 financial performance

24
Update on the Russia/Ukraine conflict (including emerging risks) Limited impact on KBC
* See more detail on page 20
Provisions for indirect impact on credit portfolio
Provisions for direct exposure on credit portfolio
Insurance exposure
MARKETING STRATEGY
Cyber risk
55m EUR*
33m EUR*
No direct exposure
Very little exposure
Addit. preventive measures taken
Direct loan exposure to Russia, Belarus & Ukraine amounts to approx. 55m EUR, mostlycommercial exposure to Russian banks
• No direct insurance exposure in Russia/Belarus/Ukraine• War-induced claims are excluded from policies
• No targeted cyber attacks towards KBC entities detected so far. All entities remain extremelyvigilant of any suspicious events
• Exposure to Russian and Ukrainian assets amounts to only 150k EUR
Indirect credit exposure to Russia, Ukraine and Belarus:• Corporate & SME clients with a material activity in Russia, Ukraine and Belarus or a material
dependency on these markets for imports or exports• Corporate & SME clients vulnerable to oil and/or gas disruption
Asset management exposure
Economic outlook(GDP outlook for euro area) GDP 2.3% • Fears of stagflation, but KBC still assumes 2.3% GDP growth in the euro area for 2022,
revised down from 3.5% pre-war
+24m EUR • Extraordinary contribution to the Deposit Guarantee Fund in Hungary, as a result of theresolution of Sberbank HungaryIncreased Deposit Guarantee Fund contributions
Provisions for emerging risks 135m EUR*• Corporate & SME clients vulnerable to supply chain issues and increasing commodity and
energy prices• Retail clients vulnerable to higher cost of living and/or higher repayments due to higher rates

25
Net result at KBC GroupCONTRIBUTION OF BANKING ACTIVITIES
TO KBC GROUP NET RESULT*
557
793
601663
458
1Q21 1Q224Q212Q21 3Q21
NET RESULT AT KBC GROUP*
412
639
508572
345
3Q212Q211Q21 4Q21 1Q22
5681 74 60 48
10193
42 59 88
-11 -21 -21 -7 -18
2Q211Q21
147
3Q21 4Q21
96
1Q22
153
112118
CONTRIBUTION OF INSURANCE ACTIVITIES TO KBC GROUP NET RESULT*
Amounts in m EUR
Non-Life result Life result Non-technical & taxes
* Difference between the net result at KBC Group and the sum of the banking andinsurance contributions is accounted for by the holding-company/group items

26
Overview of contribution of business units to 1Q22 result
NET PROFIT – BELGIUM NET PROFIT – CZECH REPUBLIC
243 176
1,087
380227
1,207 1,168
1,617
2018 2019-86
20212020 2022
1,4501,344
1,001
1,997
1Q22 ROAC: 12%
Amounts in m EUR
171 177 88 123
207
483612
287
574
654
20192018 2020 20222021
789
375
697
1Q22 ROAC: 42%
NET PROFIT – INTERNATIONAL MARKETS
137 7074
396
309164
202135
2018 2019
88
2020
38
2022*
533
379
199127
1Q22 ROAC: 13%
2Q-4Q 1Q2Q-4Q 1Q 2Q-4Q 1Q
NET PROFIT – KBC GROUP
556 430
1,445
557458
2,014 2,059 2,057
-520202018 2019 2021 2022
2,6142,4892,570
1,440
1Q22 ROAC: 15%
2Q-4Q 1Q
*As of 1Q 2022, KBC Ireland has been shifted from Business Unit International Markets to Group Centre. No restatements have been made.

27
Higher net interest income and net interest margin
Net interest income (1 200m EUR)• NII increased by 2% q-o-q and 12% y-o-y, driven primarily by:
o organic loan volume growtho rate hikes in the Czech Republic (and to a lesser extent also in Hungary)o extensive charging of negative interest rates on more current accounts held by
corporate entities and SMEso positive forex effect (appreciation of Czech koruna against the euro)o higher netted positive impact of ALM FX swaps (mainly y-o-y)These elements more than offset :o the negative effect of lower loan margins in most marketso decreasing reinvestment yield in euro-denominated countrieso lower number of days (quarter-on-quarter)
Net interest margin (1.91%)• Increased by 6 bps q-o-q and by 13 bps y-o-y for the reasons mentioned above• despite an increase of the interest-bearing assets (denominator)
NIM **
NII
954 977 1,000 1,049 1,070
97 101 100
2Q21
215
-1
1698
1Q21
102 1 16
3Q21
261,0941,068 1,112
1
4Q21
28
1Q22
1,177 1,200
2Q21
1.80%
1Q21 3Q21 4Q21
1.91%
1Q22
1.78% 1.79%1.85%
Amounts in m EUR
NII - netted positive impact of ALM FX swaps*NII - Holding-company/group
NII - InsuranceNII - Banking
* From all ALM FX swap desks** NIM is calculated excluding the dealing room and the net positive impact of ALM FX swaps & repos
* Non-annualised ** Loans to customers, excluding reverse repos (and bonds), including Ireland (under IFRS 5) . Growth figures are excluding FX, consolidation adjustments and reclassifications.*** Customer deposits, excluding debt certificates and repos, including Ireland (under IFRS 5).
ORGANIC VOLUME TREND Total loans** o/w retail mortgages Customer deposits*** AuM Life reserves
Volume 174bn 79bn 210bn 228bn 28bn
Growth q-o-q* +2% +2% +3% -3% -2%
Growth y-o-y +7% +7% +5% +3% +0%

28
Higher net fee and commission income
Net fee and commission income (482m EUR)
• Up by 1% q-o-q and by 9% y-o-y
• Q-o-q increase was mainly the result of the following:o Net F&C income from Asset Management Services decreased by 2% q-o-q
(a drop in management fees due to lower AuM, only partially offset by higher entry fees due to strong gross sales)
o Net F&C income from banking services decreased by 1% q-o-q (a drop in payment fees only partially offset by higher credit/guarantee-related fees and securities-related fees)
o Paid distribution costs went down by 14% q-o-q(seasonally lower commissions paid linked to banking and insurance products)
• Y-o-y increase was mainly the result of the following:o Net F&C income from Asset Management Services rose by 10% y-o-y
(higher management fees, despite lower entry fees)o Net F&C income from banking services increased by 8% y-o-y
(mainly higher fees from payment services)o Paid distribution costs rose by 6% y-o-y
(mainly higher commissions paid linked to strong sales of non-life insurance products)
Assets under management (228bn EUR)• Decreased by 3% q-o-q
(extremely strong net inflows more than offset by negative price effect)• Increased by 3% y-o-y
(extremely strong net inflows and small positive price effect)
Amounts in bn EURAuM
220 228 229 236 228
3Q21 4Q211Q21 1Q222Q21
284 288 306 318 312
229 234 237 250 247
-72 -72 -77 -89 -77
2Q21 4Q211Q21 3Q21 1Q22
441467450
479 482
Asset management servicesDistribution Banking services
Amounts in m EURF&C

Insurance premium income (gross earned premiums) at 777m EUR• Non-life premium income (487m EUR) increased by 8% y-o-y• Life premium income (290m EUR) decreased by 23% q-o-q and by 1% y-o-y
Non-life combined ratio for 1Q22 amounted to an excellent 83% (78% in1Q21). This is the result of:
8% y-o-y higher earned premiums 35% y-o-y higher technical charges
(due mainly to significantly higher storm impact in BE, only partly offset by lower major claims)
Significantly higher ceded reinsurance result(up 37m EUR y-o-y, cf. storm recoveries)
29
Insurance premium income up y-o-y and excellent combined ratio
COMBINED RATIO (NON-LIFE)
PREMIUM INCOME (GROSS EARNED PREMIUMS)
83%
1Q 1H 9M
82%
FY
78%87% 89%
2021 2022
453 463 484 486 487
292 272 256375 290
745
1Q21 4Q212Q21 3Q21
735
1Q22
740861
777
Life premium incomeNon-Life premium income
Amounts in m EUR

30
Non-life and life sales significantly up y-o-y
Sales of non-life insurance products
• Up by 9% y-o-y(growth in almost all classes, but chiefly in the classes ‘Motor Comprehensive Cover’ and ‘Property’; volume and tariff increases)
Sales of life insurance products• Increased by 1% q-o-q
(higher sales of unit-linked products in Belgium partly offset by decrease of sale of guaranteed interest products (partly due to traditionally higher volumes in tax incentivised pension savings products in 4Q21)
• Increased by 16% y-o-y (strong increase of sale of unit-linked products in Belgium and Bulgaria (partly due to the consolidation of the NN Bulgaria’s life insurance activities))
• Sales of unit-linked products accounted for 54% of total life insurance sales in 1Q22
LIFE SALES
NON-LIFE SALES (GROSS WRITTEN PREMIUM)
217 272 243 211293
254223 215 330
251
2Q211Q21 3Q21
458
4Q21
541
1Q22
471 494544
Guaranteed interest products Unit-linked products
590
446 450 435
645
2Q211Q21 3Q21 4Q21 1Q22
Amounts in m EUR
Amounts in m EUR

31
Strong increase of net result from financial instruments at fair value Net other income slightly above normal run rate
The 182m EUR q-o-q increase in FIFV was attributable mainly to:• Significantly higher dealing room and other income
(higher trading and sales desks revenues due to upward shifts of IR yield curves and widening of cross-currency spreads, in combination with high volatility on the market leading to increased client activity)
• Significantly less negative change in ALM derivatives(previous quarter negatively impacted by increase in HUF interest rates, not in hedge accounting, whereas as of 1 January 2022 hedge accounting was applied on these positions to reduce volatility)
• More positive market value adjustments(uptrending yield curves and decreased KBC funding exposure, partly compensated by increased counterparty credit spreads due to geopolitical risk and decrease of equity markets)
• Slightly lower net result on equity instruments (insurance)
Net other income amounted to 54 EUR
• Slightly higher than the normal run rate of around 50m EUR per quarter• Includes some one-offs (such as a positive 7m EUR related to a legal file in
the Czech Republic)
FIFV
Amounts in m EUR
23
2526
75
44
117
-7
-105
-23
1Q21 2Q21
3512
-52
32
24 11
-3317
3Q21
201927
4Q21 1Q22
127
2928
-39
143
53
38
77
56 54
1Q21 2Q21 3Q21 4Q21 1Q22
NET OTHER INCOME
Dealing room & other income M2M ALM derivativesMVA/CVA/FVA Net result on equity instruments (overlay insurance)

32
Costs excluding bank taxes and one-off items decreased q-o-q
OPERATING EXPENSES
896 942 1,001 1,031 1,007
424514
24
3Q211Q21 2Q21
30
4Q21
47
1Q22
1,320
972 1,025 1,078
1,520
Operating expensesBank tax
* See glossary for the exact definition
Amounts in m EUR
Amounts in m EUR
TOTAL Upfront Spread out over the year
1Q22 1Q22 1Q22 2Q22 3Q22 4Q22
BE BU 354 354 0 0 0 0
CZ BU 60 60 0 1 1 1
Hungary 78 56 21 23 23 25
Slovakia 6 6 0 0 0 0
Bulgaria 12 12 0 0 0 0
Ireland & Group Centre 4 3 1 1 1 0
TOTAL 514 492 23 25 25 26
BANK TAX SPREAD IN 2022 (preliminary)
Operating expenses in 1Q22 at first sight increased by 41% q-o-q and by15% y-o-y, strongly influenced by the following:• Extraordinary staff bonus of 41m EUR in 1Q22• 1Q includes bulk of the bank taxes for the full year (514m EUR), increased by 21% y-o-y
driven by:
o an extraordinary charge of 24m EUR related to Sberbank Hungary wind down, without thisone-off the bank taxes rose 16% y-o-y
o the remainder of the increase is linked to balance sheet growth and SRF contributionpercentage increase
Operating expenses excluding bank taxes went down by 2% q-o-q andincreased by 12% y-o-y• The q-o-q decrease is due, among other things, to lower one-off charges related to the
Irish sale transactions, lower ICT, facility and marketing expenses (partly seasonaleffect) as well as lower professional fee expense, partly offset by the extraordinarystaff bonus, the impact of inflation/wage indexation, and a negative forex effect
• The y-o-y increase is due, among other things, to the above-mentioned extraordinarystaff bonus, one-off charges related to the Irish sale transactions, higher ICT expenses,inflation/wage indexation and a negative forex effect
• Operating expenses excluding bank taxes and one-offs decreased 6% q-o-q andincreased by 7% y-o-y (1Q21 very low due to Covid)
Cost/income ratio• 53% when evenly spreading the bank taxes over the year and excluding certain non-
operating items* (55% in FY21)• 48% excluding all bank taxes (51% in FY21)

33
Net loan loss impairment releases and excellent credit cost ratio
Net loan loss impairment releases
• Loan loss impairment releases of 15m EUR in 1Q22 (compared with 62m EUR in4Q21) due to:o 33m EUR loan impairment releaseso a reduction of 205m EUR of the outstanding ECL for Covido partly offset by an increase of 223m EUR due to the uncertainties surrounding
geopolitical and emerging riskso total ECL for geopolitical, emerging and Covid risks now stands at 273m EUR
(see details on next slides)
• 37m EUR impairment on ‘other’, due mainly to:o a 24m EUR impairment related to the sale agreements in Irelando a 11m EUR impairment one-off on real estate in BE
The credit cost ratio in 1Q22 amounted to:• -7 bps (9 bps in FY20) without ECL for geopolitical, emerging and Covid risks
• -3 bps (-18 bps in FY21) with ECL for geopolitical, emerging and Covid risks
The impaired loans ratio improved to 2.3% (1.2% of which over 90 dayspast due), driven by the sale of the bulk of the non-performing portfolioof Ireland in February
ASSET IMPAIRMENT
-129-50 -79
3Q21
-26 -137
-33
1Q21
6 18
-1
2Q21
-123
21
-260
19346
-45
17
4Q21
22
1Q22
-77 -16
IMPAIRED LOANS RATIO
1.8% 1.7% 1.6% 1.5% 1.2%
4Q211Q21
2.3%
2Q21 3Q21 1Q22
3.3% 3.2% 3.1% 2.9%
CREDIT COST RATIO
0.23%0.09%
-0.06% -0.04%
0.12%0.16%
0.44%
-0.27%
0.60%
FY15 FY20
-0.07%
FY17FY16 FY18 FY19
0.09%
FY21 1Q22
0.04%
-0.18%-0.03%
Impaired loans ratio of which over 90 days past due
Other impairments Impairments on financial assets at AC and FVOCI
ECL for geopolitical, emerging and Covid risks
Amounts in m EUR
CCR with ECL for geopolitical, emerging and Covid risks CCR without ECL for geopolitical, emerging and Covid risks
Negative sign is a release

Amounts in m EUR
Q-o-q change in the outstanding ECL for geopolitical, emerging and Covid risks
34
Outstanding ECL for geopolitical, emerging and Covid risksq-o-q release for Covid risk offset by geopolitical & emerging risks
289 273223-205
FY21 Write-offs (mainly Ireland)
783
FY20
-34
Covid release
Geo-political & emerging
risks
1Q22
• During 1Q 2022, we updated the impact assessment of risks that could adversely affect ourloan portfolio. As a result, the outstanding ECL for Covid was supplemented with theoutcome of the impact assessments of geopolitical and emerging risks (see next slides)
• At the end of 1Q 2022, the outstanding ECL for geopolitical, emerging and Covid risksincluded an impairment charge of 18m EUR, driven by:
• a reduction of 205m EUR in the outstanding ECL for Covid, due to the impairmentrelease in the retail portfolio and almost the entire SME & Corporate portfolio(remaining 50m EUR Covid ECL for highly vulnerable sectors - which represent just4% of the total SME & Corporate loan portfolio of KBC Group - and for the Hungarianretail and non-retail portfolio)
but offset by:• an increase in the outstanding ECL of 223m EUR, due to the uncertainties
surrounding geopolitical & emerging risks (see next slides)• a write-off of 34m EUR, mainly as a result of the completion of the sale of the Irish
NPL portfolio to CarVal (only balance sheet movement)and resulted in an outstanding ECL for geopolitical, emerging and Covid risks of 273m EUR
Q-o-q18m
Outstanding ECL by country
Eur m CovidGeopolitical &emerging risks
KBC Group 289 273 -205 223By country:
Belgium 100 122 -95 117Czech Republic 69 70 -61 64Slovakia 20 22 -17 21Hungary 37 41 0 4Bulgaria 12 12 -10 11Ireland 51 6 -22 6
Geopolitical, emerging and Covid risks
YE21 1Q22
P&L changes:

35
Update on the Russia/Ukraine conflict (including emerging risks) (1/2)Estimated impact on credit exposure
Counterparties-at-risk: (total client credit exposure on group level):Corp & SME counterparties with a material activity in/dependence towards R,B or U (i.e.,>20% of either sales, cost or profit ), either directly or indirectly through a client/supplier and Corp & SME counterparts that are directly impacted by a possible disruption in oil and gas supplies Outstanding exposure**: 2.0bn EUR Total P&L charge*: 33m EUR
KBC has no direct subsidiaries in Russia (R), Belarus (B) or Ukraine (U)No direct subsidiaries
Vulnerable clients in retail and non-retail Portfolios/(Sub)sectors impacted by newly emerging risk (energy prices/supply bottlenecks/higher cost of living and rising interest rates) Outstanding exposure**: 5.9bn EUR Total P&L charge*: 135m EUR
Direct credit exposure amounts to approx. 55m EUROf which 49m EUR transfer risk exposure on Russia, mainly concentrated in commercial exposure on Russian banks (this exposure cannot increase any further). No exposure on Russian sovereigns.
* Estimation of impairments (in C and D): it is expected that PDs of listed counterparties and portfolios/sectors at risk will change in the future even though this is not reflected in the current financials . To capture this impact (i.e., forward-looking IFRS 9), a collective stage 2 shift is accompanied by an ECL management overlay (by applying conservative stage 2 and stage 3 cover rates), taking expected PD downgrades into account. ** Aligned with the credit risk view of our loan portfolio as reported in the quarterly financial statements
A
B
C
D
+ + + = 223m EURA B C D
No direct subsidiaries
Very limited direct credit exposure
Indirect credit impact: Counterparties*
Emerging risks (Secondary Indirect credit impact): Portfolios/(Sub)sectors*
Estimated total P&L charge (on credit exposure)
36
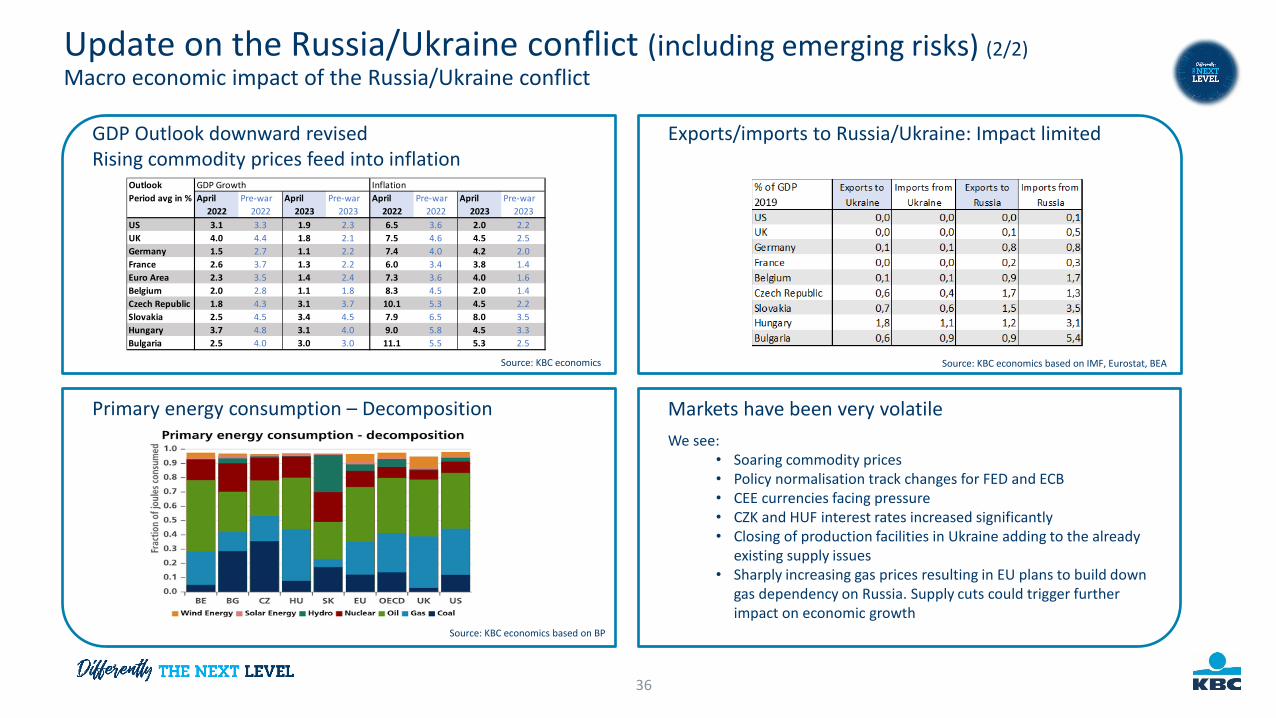
GDP Outlook downward revised Rising commodity prices feed into inflation
Exports/imports to Russia/Ukraine: Impact limited
Primary energy consumption – Decomposition Markets have been very volatile We see:
• Soaring commodity prices• Policy normalisation track changes for FED and ECB• CEE currencies facing pressure• CZK and HUF interest rates increased significantly• Closing of production facilities in Ukraine adding to the already
existing supply issues• Sharply increasing gas prices resulting in EU plans to build down
gas dependency on Russia. Supply cuts could trigger further impact on economic growth
Source: KBC economics Source: KBC economics based on IMF, Eurostat, BEA
Source: KBC economics based on BP
Update on the Russia/Ukraine conflict (including emerging risks) (2/2)Macro economic impact of the Russia/Ukraine conflict
Outlook GDP Growth InflationPeriod avg in % April Pre-war April Pre-war April Pre-war April Pre-war
2022 2022 2023 2023 2022 2022 2023 2023US 3.1 3.3 1.9 2.3 6.5 3.6 2.0 2.2UK 4.0 4.4 1.8 2.1 7.5 4.6 4.5 2.5Germany 1.5 2.7 1.1 2.2 7.4 4.0 4.2 2.0France 2.6 3.7 1.3 2.2 6.0 3.4 3.8 1.4Euro Area 2.3 3.5 1.4 2.4 7.3 3.6 4.0 1.6Belgium 2.0 2.8 1.1 1.8 8.3 4.5 2.0 1.4Czech Republic 1.8 4.3 3.1 3.7 10.1 5.3 4.5 2.2Slovakia 2.5 4.5 3.4 4.5 7.9 6.5 8.0 3.5Hungary 3.7 4.8 3.1 4.0 9.0 5.8 4.5 3.3Bulgaria 2.5 4.0 3.0 3.0 11.1 5.5 5.3 2.5

37
Loan loss experience at KBC
1Q22CREDIT COST
RATIO
FY21CREDIT COST
RATIO
FY20CREDIT COST
RATIO
FY19CREDIT COST
RATIO
FY18CREDIT COST
RATIO
FY17CREDIT COST
RATIO
AVERAGE ‘99 –’21
Belgium 0.00% -0.26% 0.57% 0.22% 0.09% 0.09% n/a
Czech Republic -0.11% -0.42% 0.67% 0.04% 0.03% 0.02% n/a
International Markets* 0.16% 0.36% 0.78% -0.07% -0.46% -0.74% n/a
Group Centre* -0.49% 0.28% -0.23% -0.88% -0.83% 0.40% n/a
Total -0.03% -0.18% 0.60% 0.12% -0.04% -0.06% 0.40%
Credit cost ratio: amount of losses incurred on troubled loans as a % of total average outstanding loan portfolio
* As of 1Q 2022, KBC Ireland has been shifted from Business Unit International Markets to Group Centre. No restatements have been made

38
Impaired loans ratios, of which over 90 days past due
INTERNATIONAL MARKETS BU*CZECH REPUBLIC BU
1.8% 1.7% 1.6% 1.5% 1.2%
2Q21
3.3%
1Q21 4Q213Q21 1Q22
2.3%
3.2% 3.1%2.9%
Impaired loans ratioOf which over 90 days past due
1.0% 0.9% 0.8% 0.8% 0.7%
3Q21
1.9%
1Q21
2.0%
2Q21
2.1%
4Q21 1Q22
2.2%
1.8%
4.0% 3.8% 3.5% 3.3%
1.4%
2Q21 4Q211Q21 3Q21 1Q22
6.3%6.7%
5.9% 5.7%
2.4%
BELGIUM BU
1.2% 1.0% 1.0% 1.0% 0.9%
2Q211Q21 1Q223Q21
2.4%
4Q21
2.5% 2.4%2.2% 2.1%
KBC GROUP
* As of 1Q 2022, KBC Ireland has been shifted from Business Unit International Markets to Group Centre. No restatements have been made

39
Cover ratios
INTERNATIONAL MARKETS BU *CZECH REPUBLIC BU
BELGIUM BUKBC GROUP
66.1%63.0%
42.9%
1Q21
69.5%
1Q222Q21
42.7%
3Q21 4Q21
64.1%
46.0%
66.9%
47.1% 48.2%
Impaired loans cover ratio
Cover ratio for loans with over 90 days past due
48.6%
1Q21 2Q21
69.8%
3Q21 4Q21 1Q22
69.3%
49.3%
70.9%
48.7%
71.7%
49.4%
72.0%
47.2%
66.9%
41.3%
1Q21 2Q21 4Q213Q21
39.4%
1Q22
67.4% 68.8%
40.3% 42.6%
66.7%
43.0%
66.9%
1Q224Q211Q21
48.0%43.4%
2Q21 3Q21
34.7% 35.7%
60.0%
49.3%44.2%
58.3% 55.7%
43.7%
* As of 1Q 2022, KBC Ireland has been shifted from Business Unit International Markets to Group Centre. No restatements have been made

Balance sheet KBC Group consolidated at the end of March 2022
124
64
165
143
Total assets (EUR 370bn)
Loan book (loans and advances to customers)
Trading assets
Investment portfolio (equity and debt securties)
Other (incl. non-current assets HFS and discontinued operations,interbank loans, reverse repos, property & equipment etc...)
Insurance investment contracts
77
2423
206
13198
Total liabilities and equity (EUR 370bn)
Deposits from customers
Equity (including AT1)
Other MREL instruments and debt certificates
Technical provisions, before reinsurance NL and L
Liabilities under insurance investment contracts
Trading liabilities
Other (incl. liabilities associated with disposal groups , interbank deposits, etc...)
Credit quality
Capital adequacy &liquidity position
40

41
Diversified loan portfolio
(1) Aligned with the credit risk view of our loan portfolio as reported in the quarterly financial statements(2) Including loan portfolio of KBC Bank Ireland, the pro-forma total loan portfolio outstanding without KBC Bank Ireland amounts to 185bn EUR(3) The ‘rest’ part includes 0.03% of the outstanding portfolio to Russia and Ukraine
Total loan portfolio outstanding by sector as a % of total Group portfolio outstanding(1)
10.1%
7.6%
7.0%
6.0%
4.5%
4.2%
3.0%
2.7%
2.3%
1.8%
1.6%
1.5%
1.4%
0.9%
0.7%
0.6%
Hotels, bars & restaurants
Agriculture, farming & fishing
Building & construction
other (< 0.5% share)
Services
Real Estate
Shipping
Distribution
Finance and insurance
Authorities
Automotive
Food producers
Electricity
Metals
Chemicals
Machinery & heavy equipment
Oil, gas & other fuels
0.6%
53.3%
18.2%
4.9%
5.6%
7.6%
Asia
Other W-Eur
Belgium
North America
3.5%Slovakia
Czech Rep.
Ireland
Hungary2.3%
Bulgaria
1.4%
0.2%
Other CEE
1.3%
1.6%Rest (3)
Total loan portfolio outstandingby geographical breakdown(1)
40.3%Mortgages3.2%Consumer Finance
Retail
SME&
Corporate
194bn EUR(2)
Total loan portfolio outstandingby segment(1)
43.5%
21.1%
35.4% Retail
SME
Corporate

Y-O-Y ORGANIC* VOLUME GROWTH
4%
* Volume growth excluding FX effects, divestments/acquisitions and reclassifications** Loans to customers, excluding reverse repos (and bonds)*** Customer deposits, excluding debt certificates and repos
Loans** Retail mortgages
Deposits***
8%7%
4%
8%
Loans** Retail mortgages
Deposits***
8%
6%
18%
Loans** Retail mortgages
Deposits***
17%
13%
8%
Retail mortgages
Loans** Deposits***
11%
-7%
15%
Loans** Retail mortgages
11%10%
Deposits***Retail
mortgages
0%
Loans** Deposits***
0%
-4%
Deposits***Loans** Retail mortgages
7%
5%
7%
Balance sheet:Loans and deposits continue to grow in most countries
CR
BE
42

Contents
1. Strategy and business profile
2. Financial performance
3. Solvency, liquidity and funding
4. Covered bond programme
5. Green & Social bond framework
6. Looking forward
Appendices
43
Fully loaded Basel 3 CET1 ratio at KBC Group (Danish Compromise)
15.26%
2.50%2.50%
1Q22
0.23%
1.50%0.55%
1.86%
11.15%
OCR
4.50%
MDA
0.55%1.50%
1.86%
4.50%
10.91%
+4.11% +4.35%
AT1 and T2 shortfallCapital conservation buffer
Pillar 2 requirementCCyBO-SII Pillar 1 Minimum requirement

* As of 1Q22, interim profit recognition (based on 50% profit accrual)
44
Strong capital position
Fully loaded Basel 3 CET1 ratio at KBC Group (Danish Compromise)
11.15% MDA
16.4%
1Q21 FY211H21 9M21
17.5%
1Q22
17.6%
15.5% 15.3%
The fully loaded common equity ratio amounted to 15.3% at the end of1Q22 based on the Danish Compromise.• The q-o-q decrease in 1Q22 is mainly related to increase of the risk weighted
assets (mainly volume driven)• The q-o-q decrease in 4Q21 was the result of the payout of a 7.6 EUR gross
dividend per share (of which 3.0 EUR final ordinary dividend per share related tothe accounting year 2021 and 4.6 EUR extraordinary dividend per share)
• This came on top of the 3.0 EUR interim dividend per share (2.0 EUR over theaccounting year 2020 and 1.0 EUR as an advance payment of the total dividendfor the accounting year 2021) already paid in November 2021. This explained theq-o-q CET1 ratio decrease in 3Q21
KBC’s CET1 ratio of 15.3% at the end of 1Q22 represents a solid capital buffer:• 4.35% capital buffer compared with the Overall Capital Requirement (OCR) of
10.91%• 4.11% capital buffer compared with the Maximum Distributable Amount (MDA)
of 11.15% (given small shortfall in AT1 and T2 bucket)
At the end of 1Q22, the transitional CET1 ratio amounted to 15.2%
10.91% OCR
*
Total distributable items (under Belgian GAAP) KBC Group 6.2bn EUR at 1Q22, of which:• available reserves: 949m• accumulated profits: 5 063m

45
Strong capital position
Fully loaded Basel 3 total capital ratio (Danish Compromise)
The fully loaded total capital ratio amounted to 18.5% at the end of 1Q22
The q-o-q decrease in 4Q21 was mainly the result of the payout of a final 7.6 EUR gross dividend per share
* As of 1Q22, interim profit recognition (based on 50% profit accrual)** As of 2Q21, the fully loaded T2 capital excludes the T2 instruments grandfathered under CRR2. These T2instruments are however included in the actual (transitional) T2 capital for the period of grandfathering, in linewith CRR2 and the COREP 3.0 reporting framework
FY21
16.4% CET1
1.4% AT1
2.1% T21.2% T2**
1.5% AT11.4% AT1
17.6% CET1 17.5% CET1
1Q21 1H21
1.9% T2**
9M21
1.6% T2**1.4% AT1
15.5% CET1
1.9% T2**1.4% AT1
20.1%
15.3% CET1
1Q22
21.2%19.7%
18.6% 18.5%*

46
Fully loaded Basel 3 leverage ratio and Solvency II ratio
1Q21 1H21 9M21
4.4%
FY21 1Q22
4.6%4.7% 5.1% 4.7%
Fully loaded Basel 3 leverage ratio at KBC BankFully loaded Basel 3 leverage ratio at KBC Group
1Q22FY211Q21 1H21 9M21
5.4%5.8% 5.5% 5.4%
5.0%
Solvency II ratio
FY21 1Q22
Solvency II ratio 201% 217%
The q-o-q delta (+16pp) in the Solvency II ratio was driven mainly by the higher interest rates
The decrease of the leverage ratio at KBC Group was mainly the result ofincreased short-term money market and repo opportunities as of 1Q21
**
* As of 1Q22, interim profit recognition (based on 50% profit accrual)

Strong and growing customer funding base with liquidity ratiosremaining very strong
67% customer
driven
* Net Stable Funding Ratio (NSFR) is based on KBC Bank’s interpretation of the proposal of CRR amendment.** Liquidity Coverage ratio (LCR) is based on the Delegated Act requirements. From EOY2017 onwards, KBC Bankdiscloses 12 months average LCR in accordance to EBA guidelines on LCR disclosure.
Ratios FY21 1Q22 Regulatory requirement
NSFR* 148% 149% ≥100%
LCR** 167% 162% ≥100%
NSFR is at 149% and LCR is at 162% by the end of 1Q22• Both ratios were well above the regulatory requirement of 100% due to a
strong growth in customer funding and the participation to TLTRO III
8%8%
4%
10%
63%
8%
7%
63%
2%
8%
6%8%
9%
67%
FY17
13%1%10%
7%
6%
1Q22
70%
6%
72%
8%8%
7%
69%
FY18
8%
7%
FY20
4%
FY19
13%11%
FY16
2%
13%
2%
1%1%
69%
FY21
6%5%
2%
7%
Interbank FundingSecured Funding
Certificates of depositDebt issues placed at institutional relationsTotal Equity Funding from Customers
KBC Bank continues to have a strong retail/mid-cap deposit base in its core markets – resulting in a stable funding mix with a significantportion of the funding attracted from core customer segments and markets;
Drop in % customer funding as growth in secured funding due to market opportunities was even outpacing growth in customer funding; KBC Bank participated to the TLTRO III for a total exposure of 24.5bn EUR which is reflected in the ‘Interbank Funding’ item below.
Government and PSE
Mid-cap
Retail and SME5%
12%
82%
143,690 155,774 163,824 176,045 192,970 200,861 211,230
FY16 FY17 FY18 FY19 FY20 FY21 3M22
Funding from customers (m EUR) of KBC Banking Group
47
1Q22

Upcoming mid-term funding maturities
48
KBC Bank has 6 solid sources of long-term funding:• Retail term deposits• Retail EMTN• Public benchmark transactions• Covered bonds• Structured notes and covered bonds using the private placement format• Senior unsecured, T1 and T2 capital instruments issued at KBC Group
level and downstreamed to KBC Bank
55%
1%8%
11%
25%
0
1000
2000
3000
4000
5000
6000
7000
2022 2023 2024 2025 2026 2027 2028 >= 2029
m E
UR
Breakdown Funding Maturity Buckets
Senior Unsecured Holdco Senior Unsecured OpCo Subordinated T1 Subordinated T2 Covered Bonds
0.7%
Total outstanding = 19bn EUR
(Including % of KBC Group’s balance sheet)
0.6%
0.9%
1.1%
0.7%
0.5%
0.2%
0.4%
Expected funding program In January 2022, KBC Group issued a senior benchmark for an amount of 750m EUR
with a 6-year maturity callable after 5Y In February 2022, KBC Group issued 700m EUR via Private Placements (i.e., 500m EUR
3NC2 and 200m EUR tap on outstanding 2031) In March 2022, KBC Group issued a senior benchmark for an amount of 750m EUR
with a 4-year maturity callable after 3Y
* Any change in regulatory requirements, RWA evolutions, MREL targets or market circumstances can modify the current disclosed range
Range2.75bn-3.5bn EUR
We aim to issue 1 green/social bond per year
Plan 2022* Plan 2023*
Range2.0bn-3.0bn EUR

KBC has strong buffers cushioning Sr. debt at all levels (1Q 2022)
KBC GroupSenior9 619
Tier 2 2 182
Additional Tier 11 500
CET1 (transitional)16 303
KBC Bank
Tier 2 1 682
Additional Tier 11 500
CET1 (transitional)15 006
KBC Insurance
Tier 2 500
Parent shareholders equity3 600
Buffer for Sr. level 27.8bn EUR
Buffer for Sr. level 20.0 bn EUR
nominal amounts in million EUR
Subordinated on loan by KBC Group9 619
49

The resolution plan for KBC is based on a Single Point of Entry (SPE) approach at KBC Group level, with bail-in as the preferred resolution tool The SRB communicated to KBC the final MREL targets (under BRRD2), expressed as a percentage of Risk Weighted Assets (RWA) and Leverage Ratio Exposure Amount (LRE) The new binding MREL targets (incl. CBR on top of the MREL target in % of RWA) are:
• 26.68% of RWA as from 01-01-2024 (including CBR of 4.55% as from 2Q2023), with an intermediate target of 25.98% as from 01-01-2022 (including CBR of 4.35% for 2022)
• 7.34% of LRE as from 01-01-2022
TLOF MCC CBR Combined Buffer Requirement = Conservation Buffer (2.5%) + O-SII buffer (1.5%) + Countercyclical Buffer (0.35% for 2022 and 0.55% as from 2Q 2023), comes on top of the MREL target
KBC complies with resolution requirementsNew MREL targets applicable as from 01-01-2024, with intermediate targets as from 01-01-2022
LAA
RCA
MCC
1.75% P2R
4.55% CBR
1.75% P2R
4.27% - 0.9375%
@10
0% R
WA
& LR
E
1.4%2.0%
9.0%
6.6%
1Q22
27.6%
HoldCo senior
T2
CET1
@94
,6%
RW
A&
LRE
8% P1
8% P1
22.13%
CBR
26.68%
MREL target
MREL + CBR
Total Liabilities and Own Funds LAA Loss Absorbing Amount RCA ReCapitalisation AmountMarket Confidence Charge = CBR (4.27% as at 2Q 2020) minus 93.75 bps; the discount will decrease in the next years to reach the BRRD2 reference level of CBR minus the Countercyclical Buffer
3% P1
3% P1
Add-on up to 8% TLOF
7.34%
15.2%
Actuals In % of RWA In % of LRE
6.6%
1Q22
9.6%
0.5%0.7%
3.1%
6.3%
AT1
Targets In % of RWA In % of LRE
1.5bn2.2bn
9.6bn
6.6%
1Q22
16.3bn
29.6bn

Available MREL as a % of RWA and LRE (BRRD2)
* No IFRS current year interim profit recognition given more stringent ECB approach ** As of 1H20, MREL ratio includes the impact of IFRS9 transitional measures
27.9%
FY20** 1Q21** 1H21** 9M21** FY21**
28.0%
1Q22**
27.4% 27.9% 27.7% 27.6%
Available MREL as a % of RWA
8.3%
1H21**1Q21**FY20** 9M21** FY21**
9.3%
1Q22**
8.1%9.7% 9.9% 9.6%
Available MREL as a % of LRE
The MREL ratio in % of RWA slightly decreased vs. 4Q21, due to increaseof the RWA; the available MREL increased: decrease in CET1 capital dueto the inclusion of 2021 profit and dividend distributions, wascompensated by issuance of 2.2bn EUR of new HoldCo instruments.
The MREL ratio in % of LRE slightly decreases compared to 4Q21, due toincrease of the Leverage Ratio Exposure (mainly driven by increase ofcash and cash balances).
(the considerable increase of the ratio in 3Q21 vs. 2Q21 - from 8.1% to 9.7% - was dueto decrease of the Leverage Ratio Exposure, mainly driven by implementation in the3Q reporting of the ECB relief measure allowing temporary exclusion of the exposureto central banks from the Leverage Ratio Exposure)
MREL requirement25.98% in 2022
MREL requirement7.34% in 2022
* * *
**
* *
51
*
*

Contents
1. Strategy and business profile
2. Financial performance
3. Solvency, liquidity and funding
4. Covered bond programme
5. Green bond framework
6. Looking forward
Appendices
52

KBC’s covered bond programmeResidential mortgage covered bond programme
Issuer: • KBC Bank NV
Main asset category: • min 105% of covered bond outstanding is covered by residential mortgage loans and collections thereon
Programme size:• 17.5bn EUR• Outstanding amount of 10.67bn EUR
Interest rate: • Fixed rate, floating rate or zero coupon
Maturity: • Soft bullet: payment of the principal amount may be deferred past the final maturity date
until the extended final maturity date if the issuer fails to pay• Extension period is 12 months for all series
Events of default:• Failure to pay any amount of principal on the extended final maturity date• A default in the payment of an amount of interest on any interest payment date
Rating agencies: • Moody’s Aaa / Fitch AAA
Moody’s Fitch
Over-collateralisation 9.5% 4%
TPI Cap Probable D-cap 4 (moderate risk)
The covered bond programme is considered as an important funding tool for the treasury department.KBC’s intentions are to be a frequent benchmark issuer if markets and funding plan permit.
53
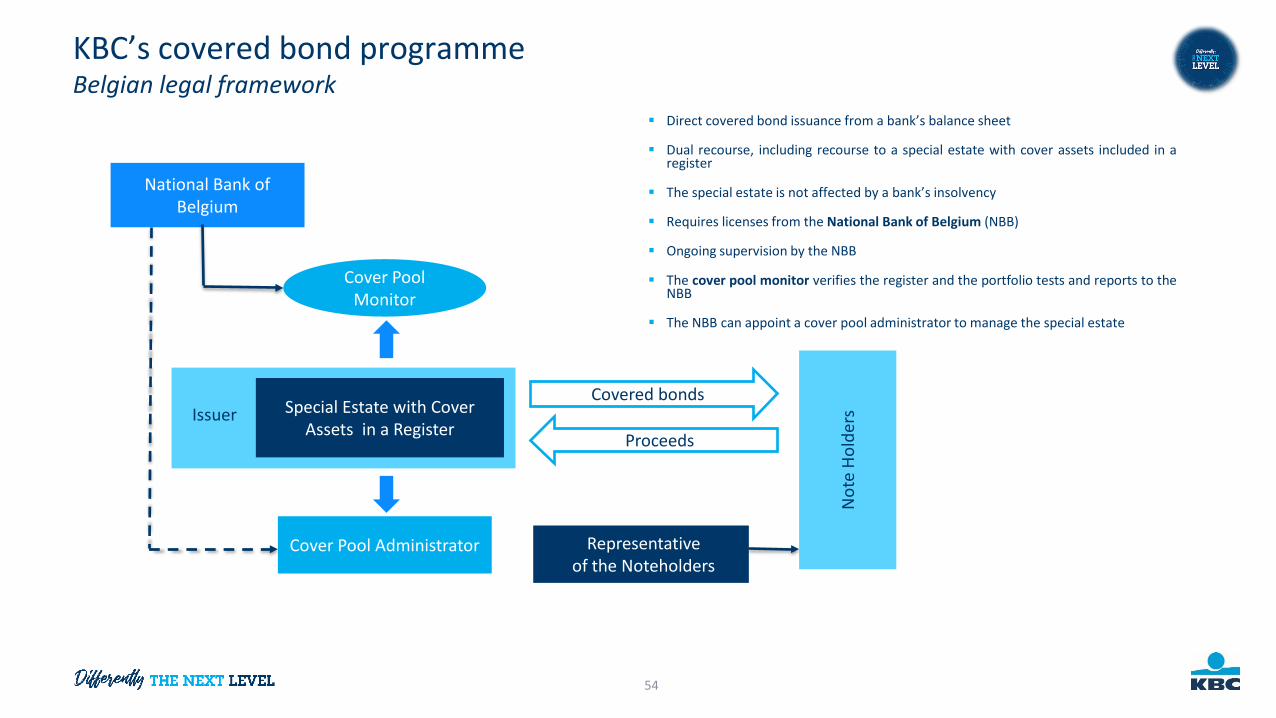
Direct covered bond issuance from a bank’s balance sheet
Dual recourse, including recourse to a special estate with cover assets included in aregister
The special estate is not affected by a bank’s insolvency
Requires licenses from the National Bank of Belgium (NBB)
Ongoing supervision by the NBB
The cover pool monitor verifies the register and the portfolio tests and reports to theNBB
The NBB can appoint a cover pool administrator to manage the special estate
National Bank of Belgium
Cover Pool Administrator
Not
e Ho
lder
s
Covered bonds
ProceedsIssuer
Cover PoolMonitor
Special Estate with Cover Assets in a Register
Representativeof the Noteholders
KBC’s covered bond programmeBelgian legal framework
54

The value of one asset category must be at least 85% of the nominal amount of covered bonds
• KBC Bank selects residential mortgage loans and commits that their value (including collections) will be at least 105%Collateral type
Over-collateralisation
Test
Cover Asset Coverage Test
Liquidity Test
Cap on Issuance
1
2
3
4
5
The value of the cover assets must at least be 105% of the covered bonds• The value of residential mortgage loans:
1) is limited to 80% LTV
2) must be fully covered by a mortgage inscription (min 60%) plus a mortgage mandate (max 40%)
3) 30 day overdue loans get a 50% haircut and 90 days (or defaulted) get zero value
The sum of interest, principal and other revenues of the cover assets must at least be the interest, principaland costs relating to the covered bonds• Interest rates are stressed by plus and minus 2% for this test
Cover assets must generate sufficient liquidity or include enough liquid assets to pay all unconditionalpayments on the covered bonds falling due the next 6 months Interest rates are stressed by plus and minus 2% for this test
Maximum 12.5% of a bank’s assets can be used for the issuance of covered bonds (temporary increase)
KBC’s covered bond programmeStrong legal protection mechanisms
55

COVER POOL: BELGIAN RESIDENTIAL MORTGAGE LOANS• Exclusively, this is selected as main asset category• Value (including collections) at least 105% of the outstanding covered bonds• Branch originated prime residential mortgages predominantly out of Flanders• Selected cover assets have low average LTV (63.3%) and high seasoning (54 months)
KBC HAS A DISCIPLINED ORIGINATION POLICY• 2009 to 2021 residential mortgage loan losses below 4 bps• Arrears in Belgium approx. stable over the past 10 years:
(i) Cultural aspects, stigma associated with arrears, importance attached to owning one’s property(ii)High home ownership also implies that the change in house prices itself has limited impact on loan
performance(iii)Well established credit bureau, surrounding legislation and positive property market
KBC’s covered bond programmeCover pool
56

Contents
1. Strategy and business profile
2. Financial performance
3. Solvency, liquidity and funding
4. Covered bond programme
5. Green & Social bond framework
6. Looking forward
Appendices
57

SustainabilityKBC Green bond framework
KBC is convinced that the financial industry has a key role to play in the transition to a low carbon economy and is willing to contribute to the development of a sustainable financial market
Green funding provides an opportunity to KBC Bank to further enhance its ability to finance the green projects of its clients and to mobilise all its stakeholders around this objective
KBC is implementing a comprehensive sustainability bond strategy to support the development of the Green Bond markets in Belgium and Europe
KBC Green Bonds can be issued under the KBC Green Bond Framework via KBC Group NV, KBC Bank NV or any of its other subsidiaries
In case of Green Bonds issued at the holding company level (KBC Group NV), KBC will allocate an equivalent amount of the proceeds to KBC Bank or its subsidiaries where the Eligible Assets are located
The KBC Green Bond Framework is intended to accommodate secured and unsecured transactions in various formats and currencies
Rationale: enhancing the KBC sustainability strategy
KBC Green Bond Framework
The KBC Green Bond Framework is in line with the Green Bond Principles (2017)
Second party opinion provided by Sustainalytics and Pre-issuance-certification by the Climate Bonds Initiative
KBC intends to align its Green Bond Framework with emerging good practices, such as a potential European Green Bond Standard or other forthcoming regulatory requirements and guidelines
For details of the KBC green bond framework, we refer to the KBC.COM website: https://www.kbc.com/en/investor-relations/debt-issuance/kbc-green-bond.html
Aligned with best practices and market developments
58

SustainabilityGreen bonds
The Climate Bonds Standard Board approved the certification of the KBC Green Bonds
Certification
Verification
One year after issuance and until maturity, a limited assurance report on the allocation of the Green Bond proceeds to Eligible Assets to be provided by an external auditor
See latest impact report as of EOY 2021 available on KBC.COM website.
KBC GREEN PORTFOLIO APPROACH
Green Bond portfolio
Green Bond funding
Inclusion of existing and new Green Assets
KBC will ensure the availability of sufficient Green Assets to match Green funding
Deletion of ineligible or amortising Green Assets
In the context of the Green Bond, KBC allocated the proceeds to three green assetcategories: renewable energy (share of 45%) and residential real-estate loans(share of 55%).
For future transactions, in cooperation with the relevant business teams, KBC aimsto capture more green assets from other categories and expand the green eligibilityto more business lines and clients.
59
Note: new impact report will be available with 1Q22 publication (incl. green bond of 2021)

SustainabilityKBC Social Bond Framework
KBC is dedicated to increase its positive social impact through its core activities by financing & insuring the (health)care & education sector. Healthcare and well-being are at the heart of KBC’s activities as a bank-insurer.
By adding the social aspect to its funding mix, KBC Bank can further enhance its ability to finance social projects and increase its positive social impact on society.
Via its Green Bond Framework and new Social Bond Framework, KBC is implementing a comprehensive sustainable bond strategy to support the development of GSS bond markets in Belgium and Europe.
KBC social bond(s) can be issued under the Social Bond Framework via KBC Group NV or KBC Bank NV. If KBC issues social bond(s) at the level of KBC Group NV, it will allocate an equivalent amount of the social bond proceeds to KBC Bank NV.
The KBC Social Bond Framework is intended to accommodate secured and unsecured (including subordinated) transactions in various formats and currencies.
Rationale: enhancing the KBC sustainability strategy
KBC Social Bond Framework
The KBC Social Bond Framework is aligned with ICMA’s Social Bond Principles (2021).
Second party opinion provided by Sustainalytics (May 2022) Information pertaining to the Social Bond Framework can be found on the
KBC.COM webpage: https://www.kbc.com/en/investor-relations/debt-issuance/kbc-social-bond.html
Aligned with best practices and market developments
60

Contents
1. Strategy and business profile
2. Financial performance
3. Solvency, liquidity and funding
4. Covered bond programme
5. Green & Social bond framework
6. Looking forward
Appendices
61

Looking forward Repercussions of the Russian invasion of Ukraine hit the global economy at a time that it had still not fully recovered from the pandemic crisis High-for-longer energy prices imply lower growth and significantly higher inflation in 2022 European economy is hit more severely than US due to its dependency on energy imports from Russia. Central European economies are most
exposed Fed expected to continue its front-loaded rate tightening cycle and to start reducing the size of its balance sheet ECB set to end net asset purchases and to make first steps towards normalising its policy rate bringing policy rates back into positive territory More dovish ECB (compared to Fed) weighs on euro/dollar exchange rate Shifting ECB policy stance leads to moderately higher intra-EMU sovereign spreads Global bond yields rising further in line with monetary tightening cycle but yields still at moderate levels. Real bond yields in the euro area will
remain negative Czech National Bank and National Bank of Hungary are already close to reaching the peak of their front-loaded rate tightening cycle Main economic risks include a further escalation of the war, more severe adverse commodity price shocks and supply chain disruptions and
remaining pandemic risks (e.g. Chinese lockdowns)
Last quarter, we provided the market with a clear FY22 guidance based upon a set of macroeconomic and business assumptions. Subsequently, the invasion of Russia in Ukraine is causing major macroeconomic and financial shocks, and very volatile markets. This is clearly going to have an impact on our financial performance. Starting from a base scenario whereby the war in Ukraine will continue for at least several months but will not escalate, we see our cost growth this year somewhat higher than previously guided, driven by the strong increase in inflation and the one-off extraordinary staff bonus for our employees*. On the other hand, however, we expect our total income (including NII) to be increasingly supported by a further improving interest rate climate and an already excellent first quarter result. Combined - under the base scenario - the jaws (income growth versus costs growth) for this year should be at least at the same level we envisaged in our earlier FY22 guidance.
Due to the creation of a provision for geopolitical and emerging risks (EUR 223 million), the credit cost ratio for 2022 is also likely to be higher than 10 bps but below 25 bps (25-30 bps = through-the-cycle CCR guidance).
We continue to monitor and analyse the situation and will provide further guidance for 2022 and long-term guidance for 2024 with the second quarter results publication.
62
Economicoutlook2022
Groupguidancefor 2022
* One-off bonus for our staff for their achievements in what was a challenging and difficult year (Covid)

Guidance as provided on February 10th
3-year and long-term financial guidance
3-year financial guidance*CAGR total income (‘21-’24) + 4.5% by 2024
CAGR OPEX excl. bank taxes (’21-’24) + 1.5% by 2024
Combined ratio ≤ 92% as of now
Surplus capital ** > 15% as of now
* Excluding Pillar 2 guidance of 100 bps** The SRB communicated the final MREL targets (under BRRD2) in % of RWA and in % of LRE to KBC. Regarding MREL as a % of RWA; (i) an intermediate MREL target of 25.98% as from
01-01-2022 and (ii) a final MREL target of 26.68% as from 01-01-2024
* IFRS17 impact is not yet taken into account given early days** Fully loaded CET1 ratio, Danish Compromise
Regulatory requirementsOverall capital requirement (OCR)* ≥ 10.91% by 2022
MREL as a % of RWA** ≥ 26.68% by 2024
MREL as a % of LRE** ≥ 7.34% by 2022
NSFR ≥ 100% as of now
LCR ≥ 100% as of now
63
=> Jaws of ± 3%=> C/I ratio excl BT ±47% in 2024}
Long-term financial guidanceCredit cost ratio 25-30 bps Through-the-cycle

Differently: the next levelDigital investment 2022-2024
OPEX excl. bank taxes
8%
92%
Other Digital first
90%
10%
CAGR (21-24) = +1.5%
Forecast Cashflow only digital first strategy2022-2024 = 1.4bn EUR
Forecast OPEX only digital first strategy2022-2024 = 1.1bn EUR
494
4552024
2023
2022
489
323
403
2022
368
2024
2023
Amounts in m EUR
2021 2024
64

Differently: the next levelDividend policy & capital distribution as of 2022
• We aim to be amongst the better capitalised financial institutions in Europe. As a consequence, the dividend policy of KBC Group istailored to that purpose. Each year, the Board of Directors will decide, at its discretion, on the total dividend based on theassessment of risks, forward looking profitability and strategic opportunities
• Payout ratio policy (i.e. dividend + AT1 coupon) of at least 50% of consolidated profit of the accounting year
• Interim dividend of 1 EUR per share in November of each accounting year as an advance on the total dividend
• On top of the payout ratio of at least 50% of consolidated profit, each year (when announcing the full year results*), the Board ofDirectors will take a decision, at its discretion, on the distribution of the capital above 15.0% fully loaded CET1 ratio, so-called surpluscapital. The distribution of this surplus capital can be in the form of a cash dividend, a share buy-back or a combination of both
• From the moment Basel IV will apply (as from 1 January 2025 at the earliest), the capital deployment plan will be updated
65
* next FY results on 9 February 2023

Appendices
1. Overview of outstanding benchmarks
2. Summary of KBC’s covered bond programme
3. Solvency: details on capital
4. Details on business unit international markets & Ireland
66

Annex 1 - Outstanding benchmarksOverview till end of April 2022
67
Senior Holdco :
Additional Tier 1 securities:
Tier 2 securities:
Issuer Currency Isin Code Issued (in mio) Coupon Re-off spread Settlement date Call date Maturity Trigger Level
KBC Group EUR BE0002592708 1,000 4.25% M/S+359,4bps 24/04/2018 24/10/2025 Perpetual Temporary write-down 5.125%KBC Group EUR BE0002638196 500 4.75% M/S+468,9bps 5/03/2019 5/03/2024 Perpetual Temporary write-down 5.125%
Issuer Currency Isin Code Issued (in mio) Coupon Re-off spread Settlement date Call date Maturity date Tenor TriggerKBC Group EUR BE0002290592 500 1.625% M/S +125bps 18/09/2017 18/09/2024 18/09/2029 12YNC7 regulatory + tax callKBC Group EUR BE0002664457 750 0.500% M/S+110bps 3/09/2019 3/12/2024 3/12/2029 10.25NC5.25 regulatory + tax callKBC Group EUR BE0002819002 750 0.625% M/S+95bps 7/09/2021 7/09/2026 7/12/2031 10.25NC5.25 regulatory + tax call
Issuer Currency Isin Code Issued (in mio) Coupon Re-off spread Settlement date Maturity date TenorKBC Group EUR BE0002266352 750 0.750% M/S +65bps 18/10/2016 18/10/2023 7yKBC Group EUR BE0002281500 750 3M Euribor +55bps 3M Euribor +55bps 24/05/2017 24/11/2022 5,5yKBC Group EUR BE0002602804 500 0.875% M/S +72bps 27/06/2018 27/06/2023 5yKBC Group EUR BE0002631126 750+250 1.125% M/S +95bps 25/01/2019 25/01/2024 5yKBC Group EUR BE0002645266 500 0.625% M/S +60bps 10/04/2019 10/04/2025 6yKBC Group EUR BE0002681626 500 0.750% M/S +65bps 24/01/2020 24/01/2030 10yKBC Group EUR BE0974365976 500 0.500% M/S +72bps 16/06/2020 16/06/2027 7NC6KBC Group EUR BE0002728096 750 0.125% M/S +60bps 3/09/2020 3/09/2026 6NC5KBC Group EUR BE0002766476 750 0.125% M/S+60bps 14/01/2021 14/01/2029 8NC7KBC Group EUR BE0002799808 500 + 200 0.750% M/S+65bps 31/05/2021 31/05/2031 10yKBC Group GBP BE0002820018 400 1.250% M/S+52bps 21/09/2021 21/09/2027 6yKBC Group EUR BE0002832138 750 0.250% M/S+47bps 1/12/2021 1/03/2027 5.25NC4.25KBC Group EUR BE0002839208 750 0.750% M/S+70bps 21/01/2022 21/01/2028 6NC5KBC Group EUR BE0002846278 750 1.500% M/S+90bps 29/03/2022 29/03/2026 4NC3

Annex 2 – KBC’s covered bond programmeKey cover pool characteristics
Investor reports, final terms and prospectus are available on www.kbc.com/covered_bonds
Portfolio data as of : 31 March 2022
Total Outstanding Principal Balance 16 580 393 895
Total value of the assets for the over-collateralisation test 15 106 303 374
No. of Loans 216 004
Average Current Loan Balance per Borrower 118 934
Maximum Loan Balance 1 000 000
Minimum Loan Balance 1 000
Number of Borrowers 139 408
Longest Maturity 359 months
Shortest Maturity 1 month
Weighted Average Seasoning 54 months
Weighted Average Remaining Maturity 185 months
Weighted Average Current Interest Rate 1.62%
Weighted Average Current LTV 63.3%
No. of Loans in Arrears (+30days) 186
Direct Debit Paying 98%
68

Annex 2 – KBC’s covered bond programmeKey cover pool characteristics
REPAYMENT TYPE (LINEAR VS. ANNUITY) GEOGRAPHICAL ALLOCATION
LOAN PURPOSE INTEREST RATE TYPE (FIXED PERIODS)
Linear1%
Annuity99%
Purchase58%
Remortgage30%
Renovation5%
Construction7%
Other0%
Brussels Hoofdstedelijk gewest6% Waals Brabant
1%
Vlaams Brabant
18%
Antwerpen28%Limburg
12%Luik2%
Namen0%
Henegouwen1%
Luxemburg0%
West-Vlaanderen
14%
Oost-Vlaanderen
18%
No review80%
1 y / 1 y7%
3 y / 3 y9%
5 y / 5 y4%
10 y / 5 y0%
15 y / 5 y0%
20 y / 5 y0%
69

Annex 2 – KBC’s covered bond programmeKey cover pool characteristics
FINAL MATURITY DATESEASONING
INTEREST RATE CURRENT LTV
0102030405060708090
2018 - 2022 2023 - 2027 2028 - 2032 > 2032
Weighted Average Remaining Maturity:
186 months
0
5
10
15
20
25
0 - 12 13 - 24 25 - 36 37 - 48 49 - 60 61 - 72 73 - 84 85 - 96 97 -108 109 -
Weighted Average Seasoning: 54 months
0102030405060708090
100
< 2,
5
2.5
< to
<=
3.0
3.0
< to
<=
3.5
3.5
< to
<=
4.0
4.0
< to
<=
4.5
4.5
< to
<=
5.0
5.0
< to
<=
5.5
5.5
< to
<=
6.0
6.0
< to
<=
6.5
6.5
< to
<=
7.0
> 7
.0
Weighted Average Current
Interest Rate: 1.62%
02468
1012141618
Weighted Average Current LTV:
63.3%
70
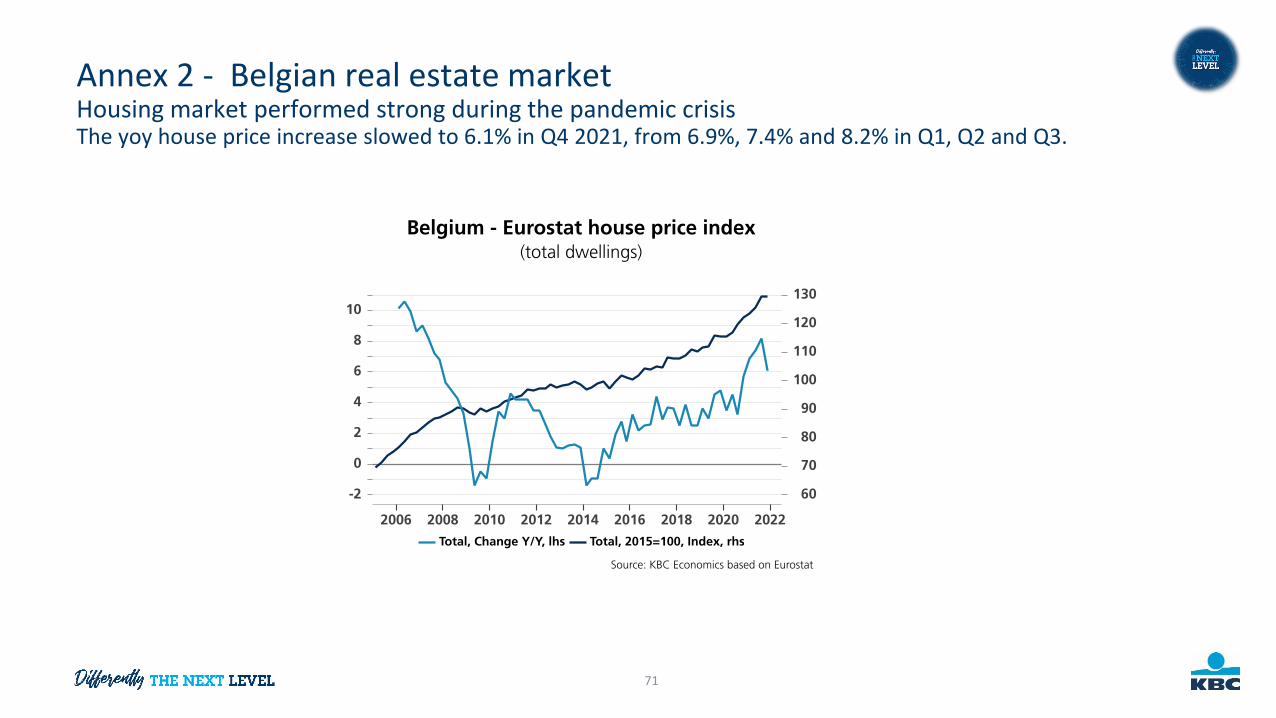
Annex 2 - Belgian real estate market Housing market performed strong during the pandemic crisisThe yoy house price increase slowed to 6.1% in Q4 2021, from 6.9%, 7.4% and 8.2% in Q1, Q2 and Q3.
71

72
Method Numerator Denominator B3 CET1 ratio
FICOD*, fully loaded 18,117 121,663 14.9%
DC**, fully loaded 16,362 107,256 15.3%
DM***, fully loaded 15,544 102,248 15.2%
* FICOD: Financial Conglomerate Directive** DC: Danish Compromise*** DM: Deduction Method
Annex 3 - Solvency detailsOverview of B3 CET1 ratios at KBC Group

73
1Q22 NET RESULT (in million euros) 227m 207m 22m 35m 17m -49m -15m
ALLOCATED CAPITAL (in billion euros) 7.8bn 2.0bn 0.7bn 0.9bn 0.5bn 0.7bn 0.5bn
LOANS (in billion euros) 111bn 34bn 10bn 5bn 4bn 9bn
BELGIUM CZECH REPUBLIC SLOVAKIA HUNGARY BULGARIA GROUP
CENTRE
DEPOSITS* (in billion euros) 134bn 47bn 8bn 10bn 7bn 5bn
Of which IRELAND
BRANCHES (end 1Q22) 430 204 122 198 161 12
Clients (end 1Q22) 3.8m 4.3m 0.8m 1.6m 1.8m 0.3m
* Customer deposits, excluding debt certificates and repos
Annex 4 – Business unit international marketsBusiness profile

B3 Basel III
CBI Central Bank of Ireland
Combined ratio (non-life insurance) [technical insurance charges, including the internal cost of settling claims / earned premiums] + [operating expenses / written premiums] (after reinsurance in each case)
Common equity ratio [common equity tier-1 capital] / [total weighted risks]
Cost/income ratio (group) [operating expenses of the group] / [total income of the group]
Cost/income ratio adjusted for specific items
The numerator and denominator are adjusted for (exceptional) items which distort the P&L during a particular period in order to provide a better insight into the underlying business trends. Adjustments include: • MtM ALM derivatives (fully excluded)• bank & insurance taxes (including contributions to European Single Resolution Fund) are included pro rata and hence spread over all quarters of the year
instead of being recognised for the most part upfront (as required by IFRIC21)• one-off items
Credit cost ratio (CCR) [net changes in individual and portfolio-based impairment for credit risks] / [average outstanding loan portfolio]. Note that, inter alia, government bonds are not included in this formula
EBA European Banking Authority
ESMA European Securities and Markets Authority
ESFR European Single Resolution Fund
FICOD Financial Conglomerates Directive
Impaired loans cover ratio [total specific impairments on the impaired loan portfolio (stage 3) ] / [part of the loan portfolio that is impaired (PD 10-11-12) ]
Impaired loans ratio [part of the loan portfolio that is impaired (PD 10-11-12)] / [total outstanding loan portfolio]
Leverage ratio[regulatory available tier-1 capital] / [total exposure measures]. The exposure measure is the total of non-risk-weighted on and off-balance sheet items, based on accounting data. The risk reducing effect of collateral, guarantees or netting is not taken into account, except for repos and derivatives. This ratio supplements the risk-based requirements (CAD) with a simple, non-risk-based backstop measure
Liquidity coverage ratio (LCR) [stock of high-quality liquid assets] / [total net cash outflow over the next 30 calendar days]
MREL Minimum requirement for own funds and eligible liabilities
Net interest margin (NIM) of the group [banking group net interest income excluding dealing room] / [banking group average interest-bearing assets excluding dealing room]
Net stable funding ratio (NSFR) [available amount of stable funding] / [required amount of stable funding]
PD Probability of default
Return on allocated capital (ROAC) for a particular business unit
[result after tax, including minority interests, of a business unit, adjusted for income on allocated capital instead of real capital] / [average capital allocated to the business unit]. The capital allocated to a business unit is based on risk-weighted assets for banking and risk-weighted asset equivalents for insurance
Return on equity [result after tax, attributable to equity holders of the parent] / [average parent shareholders’ equity, excluding the revaluation reserve for fair value through Other Comprehensive Income (OCI) assets]
TLAC Total loss-absorbing capacity
Glossary (1/2)
74

Contacts / Questions
Download the KBC IR APP
• Company website KBC
• Quarterly Report• Table of results (Excel) Quarterly Reports
• Quarterly presentation• Debt presentation Presentations
More information
Upcoming events
13 May 2022 Equity roadshow, London
19 May 2022 Equity roadshow, Asia
19 May 2022 UBS Conference, Lausanne
31 May 2022 Equity roadshow, Toronto
1 June 2022 DB Conference, New York
8 June 2022 GS Conference, Rome
21 June 2022 ESG-CSR virtual roadshow
11 August 2022 2Q2022 Publication of interim results
12 August 2022 Equity roadshow, London