
Debt Investor Update - National Grid
35
Debt Investor Update Full Year Results 2021/22 Alexandra Lewis, Group Treasurer
-
Upload
khangminh22 -
Category
Documents
-
view
0 -
download
0
Transcript of Debt Investor Update - National Grid

Debt Investor UpdateFull Year Results 2021/22
Alexandra Lewis, Group Treasurer

National Grid plc Full Year Results 2021/22 May 20222
Cautionary statementThis presentation contains certain statements that are neither reported financial results nor other historical information. These statements are forward-looking statements within the meaning of
Section 27A of the Securities Act of 1933, as amended, and Section 21E of the Securities Exchange Act of 1934, as amended. These statements include information with respect to National
Grid’s (the Company) financial condition, its results of operations and businesses, strategy, plans and objectives. Words such as ‘aims’, ‘anticipates’, ‘expects’, ‘should’, ‘intends’, ‘plans’,
‘believes’, ‘outlook’, ‘seeks’, ‘estimates’, ‘targets’, ‘may’, ‘will’, ‘continue’, ‘project’ and similar expressions, as well as statements in the future tense, identify forward-looking statements. This
presentation also references climate-related targets and climate-related risks which differ from conventional financial risks in that they are complex, novel and tend to involve projection over long
term scenarios which are subject to significant uncertainty and change. These forward-looking statements are not guarantees of National Grid’s future performance and are subject to
assumptions, risks and uncertainties that could cause actual future results to differ materially from those expressed in or implied by such forward-looking statements or targets. Many of these
assumptions, risks and uncertainties relate to factors that are beyond National Grid’s ability to control, predict or estimate precisely, such as changes in laws or regulations, including any arising
as a result of the United Kingdom’s exit from the European Union, announcements from and decisions by governmental bodies or regulators, including those relating to the RIIO-T2 and RIIO-ED2
price controls; the timing of construction and delivery by third parties of new generation projects requiring connection; breaches of, or changes in, environmental, climate change and health and
safety laws or regulations, including breaches or other incidents arising from the potentially harmful nature of its activities; network failure or interruption (including any that result in safety and/or
environmental events), the inability to carry out critical non network operations and damage to infrastructure, due to adverse weather conditions including the impact of major storms as well as the
results of climate change, due to counterparties being unable to deliver physical commodities, or due to the failure of or unauthorised access to or deliberate breaches of National Grid’s IT
systems and supporting technology; failure to adequately forecast and respond to disruptions in energy supply; performance against regulatory targets and standards and against National Grid’s
peers with the aim of delivering stakeholder expectations regarding costs and efficiency savings, as well as against targets and standards designed to deliver net zero; and customers and
counterparties (including financial institutions) failing to perform their obligations to the Company. Other factors that could cause actual results to differ materially from those described in this
presentation include fluctuations in exchange rates, interest rates and commodity price indices; restrictions and conditions (including filing requirements) in National Grid’s borrowing and debt
arrangements, funding costs and access to financing; regulatory requirements for the Company to maintain financial resources in certain parts of its business and restrictions on some
subsidiaries’ transactions such as paying dividends, lending or levying charges; the delayed timing of recoveries and payments in National Grid’s regulated businesses, including as a result of the
COVID-19 pandemic, and whether aspects of its activities are contestable; the funding requirements and performance of National Grid’s pension schemes and other post-retirement benefit
schemes; the failure to attract, develop and retain employees with the necessary competencies, including leadership and business capabilities, and any significant disputes arising with National
Grid’s employees or the breach of laws or regulations by its employees; the failure to respond to market developments, including competition for onshore transmission; the threats and
opportunities presented by emerging technology; the failure by the Company to respond to, or meet its own commitments as a leader in relation to, climate change development activities relating
to energy transition, including the integration of distributed energy resources; and the need to grow the Company’s business to deliver its strategy, as well as incorrect or unforeseen assumptions
or conclusions (including unanticipated costs and liabilities) relating to business development activity, including the integration of WPD, the sale of the Company’s Rhode Island gas and electricity
business and the announced sale of a 60% stake in its UK gas transmission and metering business. For further details regarding these and other assumptions, risks and uncertainties that may
impact National Grid, please read the Strategic Report section and the ‘Risk factors’ on pages 236 to 239 of National Grid’s most recent Annual Report and Accounts, as updated by the
Company’s unaudited half-year financial information for the six months ended 30 September 2021. In addition, new factors emerge from time to time and National Grid cannot assess the potential
impact of any such factor on its activities or the extent to which any factor, or combination of factors, may cause actual future results to differ materially from those contained in any forward-looking
statement. Except as may be required by law or regulation, the Company undertakes no obligation to update any of its forward-looking statements, which speak only as of the date of this
presentation.

National Grid plc Full Year Results 2021/22 May 20223
The Energy Transition Company
Green investment in the decarbonisation of energy systems
1. Capital expenditure considered to be aligned with the principles of the EU Taxonomy Legislation at the date of reporting, and includes most electricity
investment, including connecting clean sources of generation such as renewables and nuclear, as well as investment which reduces emissions in our gas
networks.
2. Compound annual growth rate FY2022-26. Based upon GBP/USD FX rate of 1.3; long run CPIH and RPI inflation assumptions, and scrip uptake of 25%, as
well as completion of sale of Rhode Island business and 60% majority interest in UK Gas Transmission and Metering
Investing for the
clean energy future
6-8%group asset growth CAGR
2
£30-35bncapital investment FY2022-26
c.£24bnGreen capex aligned to
EU Taxonomy1
5-7%EPS CAGR
2
Whilst maintaining a strong balance sheet and aim to
grow dividend per share growth in line with CPIH
c.£24bn1
from FY2022 - 2026
more than 70%of our 5 year framework
One of the FTSE’s biggest investors
in the deliveryof net zero

National Grid plc Full Year Results 2021/22 May 20224
Investing to decarbonise energy systems
1. Capital expenditure that meets the criteria in National Grid’s Green Financing Framework. This framework is used to issue Green Financing Instruments and further detail on the framework can be found here:
https://www.nationalgrid.com/investors/debt-investors/green-financing
2. Capital expenditure considered to be aligned with the principles of the EU Taxonomy Legislation at the date of reporting and includes most electricity investment, including connecting clean sources of generation such as renewables and
nuclear, as well as investment which reduces emissions in our gas networks.
3. Estimated investment in New England transmission excluded as it does not meet the EU Taxonomy criterion of over 67% of newly enabled generation capacity being below the 100 gCO2e/kWh threshold over a rolling five year period, on the
basis that there have been no new connections to the New England transmission network within the past five years.
4. Estimated investment in US onshore and offshore renewables joint ventures. EU Taxonomy excludes investment in joint ventures
National Grid Green Financing
Framework
EU Taxonomyaligned
Total Capital Investment
c.£13bn
c.£24bn
£30-35bn
Eligible Electricity
investment
Eligible Electricity
investment
Gas emissions
reduction investment
JVs - US renewables 4
Capital investment
FY2022-26
1
£14bnin the UK
£10bnin the US
c.£24bn2
from FY2022 - 2026
Eligible Electricity
investment
Gas emissions
reduction investment
NE Transmission 3
Ineligible gas & other
investment
2

National Grid plc Full Year Results 2021/22 May 20225
Our strategic vision
Enabling the energy transition for all
• COP26 Principal Partner
• Our strategy further underpinned by
– British Energy Security Strategy
– US Infrastructure Investment and Jobs Act
Delivering for customers efficiently
• $1.3bn in energy efficiency measures in Massachusetts over last 3 years
• Returning £200m from interconnector business to customers early
• £400m cost efficiency programme

National Grid plc Full Year Results 2021/22 May 20226
Repositioning of our portfolio
Greater visibility and certainty of long term growth
• WPD acquired and integration progressing
• UK Gas Transmission and Metering
– Sale of 60% expected to complete in Q3 FY23
– Consortium option on the remaining 40%
• Rhode Island sale expected to complete in Q1 FY23
Other transactions
• Sale of our 50% stake in St William JV
• Preparing for new Future System Operator
National Grid asset basePost-transactions1
US Regulated Networks
c.40%
NG Ventures 2
c.7%
1. Calculated as proportion of actual FY22 asset base post completion of acquisition of Western Power
Distribution, and sale of Rhode Island business and 60% majority interest in UK Gas Transmission and
Metering
2. Includes ‘Other activities’
UK Regulated Networks
c.53%
Gas
c. 30%
Electricity
c.70%

National Grid plc Full Year Results 2021/22 May 20227
Financial performance highlightsStrong delivery in 2022
Pro forma underlying 2020/21 figures include adjustments for an estimate of the underlying post-tax contribution from WPD for an equivalent 9.5 month period, as if we had owned that business in the prior year,
including estimated incremental finance costs to acquire WPD. In addition, the current year beneficial earnings impact of not depreciating our Rhode Island business has also been applied in these comparative
amounts
Underlying results from continuing operations excluding exceptional items, remeasurements, major storm costs (when greater than $100m), timing and the contribution from UK gas transmission and metering,
which are classified as a discontinued operation for accounting purposes
Capital investment includes investment in JVs and NG Partners Investments (excluding equity contributions to St William property JV)
Operating profit and capital investment calculated at constant currency
£3,992m
FY21: £3,600m
Underlying operating profit
11% 65.3p
FY21: 59.1p
Underlying EPS
10%
£6,739m
FY21: £5,680m
Capital investment
19%
11.4%
FY21: 10.6%
Return on Equity
80bps
8.7%
FY21: 5.6%
Asset growth
310 bps
Cost efficiency programme delivery
c.£140mTarget over 3 years: £400m

National Grid plc Full Year Results 2021/22 May 20228
Safety and reliability
Safety
• Another good year of safety performance
– Lost Time Injury Frequency rate: 0.13
• Slight increase in minor incidents
Reliability
• Over 99.9% availability across regulated networks
• Excellent performance despite challenging storms in UK and US

National Grid plc Full Year Results 2021/22 May 20229
Progress on operational priorities
Underlying operational delivery
• Achieved RoE 8.8%
– 99% of allowed return
• $2.6bn investment
– Rate base growth of 7.6%
– 237 miles gas pipeline replaced, reducing methane emissions
Regulatory progress
• 3-year rate plan for KEDNY / KEDLI extended by an additional year
• 3-year rate plan for Niagara Mohawk
• Progressing clean energy policy
– Co-authored Future of Heat report
New York
New York Regulatory Overview
Allowed return on
equity8.8%
CAPEX (backdated to 2020) c.$3.3bn
NIMO Gas & Electric(2021-24)
KEDNY/ KEDLI(2020-23*)
Allowed return on
equity9.0%
CAPEX c.$3.3bn

National Grid plc Full Year Results 2021/22 May 202210
Progress on operational priorities
Underlying operational delivery
• Achieved RoE 8.3%
– 80 basis points above prior year
• $2.1bn investment
– Rate base growth of 6.7%
– Replacing ageing infrastructure
Regulatory progress
• DPU 20-80 proposal filed on Future of Gas
– Clean Energy Vision sets out plan for fossil free gas and electric networks to deliver net zero
New England
New EnglandRegulatory Overview
Allowed return on
equity9.7%
CAPEX (2020/21 prices) c.$1.3bn
Massachusetts Electric(2019-24)
Massachusetts Gas(2021-26)
Allowed return on
equity9.6%
CAPEX (2019/20 prices) c.$1.5bn

National Grid plc Full Year Results 2021/22 May 202211
Progress on operational priorities
Successful start to RIIO-T2
• Achieved RoE: 7.7%
– 140bps outperformance
• £1.2bn capital investment
– Commenced LPT2 tunnel boring
– Hinkley T-pylon construction
• Provisional approval for two subsea ‘Green Link’ interconnectors between Scotland and North of England
• 16 major projects identified in ESO’s latest Network Options Assessment
UK – Electricity Transmission
.
£4.5bnto maintain the reliability of the network
0.0
0.5
1.0
1.5
2.0
2.5
T1 average
FY22 FY23 FY24 FY25 FY26
£8bn investment breakdown
Maintain Expand Connect
Sustained investment growth in Electricity Transmission
£1.5bnto connect new customers
>£2bnto expand the network to facilitate Net Zero

National Grid plc Full Year Results 2021/22 May 202212
RIIO-ED2 proposed baseline totex
Progress on operational priorities
Continuing to perform in RIIO-ED1
• Achieved RoE: 13.6%
– 400bps above allowed level
• £899m capital investment 1
ED2 business plan submission2
• Proposed totex of £6.7bn enabling connections for
– 1.5m new EV’s, 600,000 heat pumps and 2.6GW of renewables
– Supporting our most vulnerable customers
• More than £700m of embedded efficiencies
– More than 20% increase in investment
UK – Electricity Distribution
Other Non Load Network Investment and Reinforcement
Engineering Management
NetworkOperating Costs
IT &Telecoms
Vehicles, Property & Engineering
Equipment
Baseline totex
£6.7bn
1. Capital Investment for 9.5 months of WPD
2. Draft determinations expected in June and final determinations in December

National Grid plc Full Year Results 2021/22 May 202213
Progress on operational priorities
Capital expenditure: £452m
• Viking Link to complete in FY24
• Isle of Grain LNG Phase 4 construction
Interconnector progress
• IFA2 first full year of operation
• North Sea Link commissioned early
• 1GW restored to IFA, remaining 1GW by end 2022
Investment in joint ventures: £461m
• Community Offshore Wind JV seabed success
• Started operation of 200MW Prairie Wolf Solar project
NG Ventures and Joint Ventures

National Grid plc Full Year Results 2021/22 May 202214
Progress on operational priorities
Strong start to RIIO-T2
• Achieved RoE of 7.8%
– 120bps outperformance
• Capital investment of £261m
– £57m above prior year
UK – Gas Transmission & Metering

National Grid plc Full Year Results 2021/22 May 202215
Investment driving asset growth
UK Electricity Transmission
£1.2bn
UK Electricity Distribution
£0.9bn
UK Electricity System Operator
£0.1bn
New York
£2.0bn
New England
£1.6bnNGV Ventures and
Other activities
£1.0bn
£6,739mFY21: £5,680m
Capital investment1
19%
8.7%FY21: 5.6%
Asset growth2
310bps
FY21 Proforma figures displayed for comparative purposes. Includes estimate of 9.5 months of WPD capital investment
1. Capital investment from continuing operations, at constant currency, including investment in JV’s and NG Partners Investments (excluding equity contributions to St William property JV)
2. Asset growth includes UK Gas Transmission & Metering
Capital Investment1
£6.7bn

National Grid plc Full Year Results 2021/22 May 202216
• Higher impact from interest on index linked debt
• Partly offset by pension interest and a property tax refund
• 260 bps higher than prior year
• UK rate change and US state deferred tax remeasurement due to Rhode Island sale
• 65.3p/share – 10% up on prior year compared to proforma basis
Interest, tax and earnings
£1.1bn4% higher than FY213
Financecosts
24.3%Underlying tax charge: £708m
Underlying effective tax rate1
£2,350mFY213 : £2,081m
Underlying earnings 2
1. Excluding joint ventures and associates.
2. Underlying results attributable to equity shareholders.
3. Pro forma underlying 2020/21 figures include adjustments for an estimate of the underlying post-tax contribution from WPD for an equivalent 9.5 month period, as if we had owned that business in the prior year,
including estimated incremental finance costs to acquire WPD. In addition, the current year beneficial earnings impact of not depreciating our Rhode Island business has also been applied in these comparative
amounts
Underlying results, excluding timing, major storms, exceptional items and remeasurements.
National Grid plc Full Year Results 2021/22 May 202217
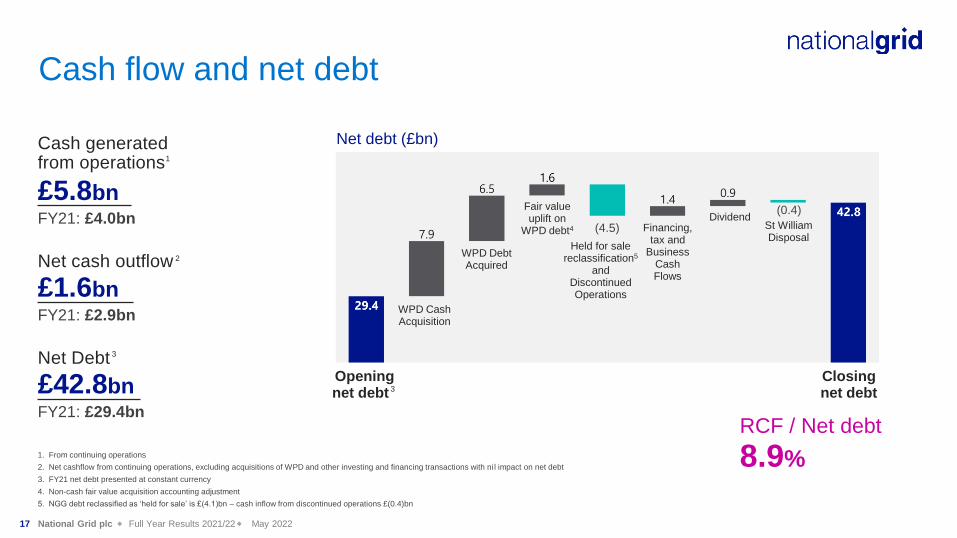
Cash flow and net debt
RCF / Net debt
8.9%
Net debt (£bn)
Openingnet debt 3
Fair value uplift on
WPD debt4
Held for sale reclassification5
and Discontinued Operations
Financing, tax and
Business Cash Flows
St William Disposal
Closing net debt
1. From continuing operations
2. Net cashflow from continuing operations, excluding acquisitions of WPD and other investing and financing transactions with ni l impact on net debt
3. FY21 net debt presented at constant currency
4. Non-cash fair value acquisition accounting adjustment
5. NGG debt reclassified as ‘held for sale’ is £(4.1)bn – cash inflow from discontinued operations £(0.4)bn
FY21: £4.0bn
Cash generated from operations1
£5.8bn
FY21: £2.9bn
Net cash outflow 2
£1.6bn
FY21: £29.4bn
Net Debt 3
£42.8bn
Dividend
WPD Cash Acquisition
WPD Debt Acquired
(4.5)
(0.4)

National Grid plc Full Year Results 2021/22 May 202218
Inflation and supply chain
• Impact on UK regulated revenues broadly offset by RPI linked debt in FY22
• Controllable costs held flat
• Similar inflation impacts expected for FY23
• Improved earnings momentum in medium term as inflation moderates
• No material impact to our supply chain to date

National Grid plc Full Year Results 2021/22 May 202219
5-year outlook and guidanceFY22-26
Capital investment £30-35bn – c.£24bn green1, aligning to EU taxonomy
c.£8bn
UK Electricity Transmission
c.£5bn
Western Power Distribution
c.£17bn
US Regulated Businesses
c.£2-3bn
NG Ventures
Group asset growth 6-8% CAGR 2
Gearing Settles slightly above 70%
Credit metrics within current rating band
EPS 5-7% CAGR 2, a strong first year
Dividend Aim to grow dividend per share in line with CPIH
FY23
• Underlying operating profit growth
• Returning c.£150m to customers
Broadly flat EPS profile
1. Aligned to EU Taxonomy
2. Compound annual growth rate FY2022-26. Based upon GBP/USD FX rate of 1.3; long run CPIH and RPI inflation assumptions, and scrip uptake of 25%,
as well as completion of sale of Rhode Island business and 60% majority interest in UK Gas Transmission and Metering

National Grid plc Full Year Results 2021/22 May 202220 National Grid plc Full Year Results 2021/22 May 202220
Delivering our vision:
• We are a leader in pioneering
smart, low carbon energy networks
• Developing resilient and efficient
transmission grids is at our core
• Completing our pivot to electricity
will bring us certainty of growth
The heart of aclean, fair and
affordable energy future

National Grid plc Full Year Results 2021/22 May 202221
Growth opportunities further underpinned
• New policies and increased clean energy targets
– British Energy Security Strategy (BESS) announced
– UK Energy Bill announced in Queen’s Speech
– US Infrastructure Investment and Jobs Act signed into law
• Coupled with pivot to electricity provide greater certainty of medium term growth

National Grid plc Full Year Results 2021/22 May 202222
UK Focus
• Continue to deliver world class network reliability
• 60% sale of UK Gas Transmission & Metering expected in 3rd quarter of FY23
• WPD integration and RIIO-ED2 process
• Progress plans to support BESS ambitions
– East Coast transmission projects
• Support development of Holistic Network Design onshore and offshore network
A critical yearto create the right regulatory and planning framework

National Grid plc Full Year Results 2021/22 May 202223
US Focus
• Infrastructure Investment and Jobs Act focused
– Grid modernization and resilience
– Electric transportation infrastructure
– Northeast Hydrogen Hub
• Massachusetts regulatory decisions
– Electric grid modernization
– Advanced metering infrastructure
– Phase 3 Electric vehicle proposal
– DPU Future of Gas proceedings
• New York Long Island transmission project bid outcome expected by end of 2022

National Grid plc Full Year Results 2021/22 May 202224
Clean Energy Vision
Utilising our existing networks to enable clean gasby 2050
4 key pillars
01 Increase energy efficiency
02 Eliminate fossil fuels by from our gas networks by 2050
03 Maximise customer benefits of pairing electric and clean gas solutions
04 Support targeted electrification of heating
Investor EventNew York
19th July 2022

National Grid plc Full Year Results 2021/22 May 202225
NG Electricity Transmission,
£731m
NG plc, £1,368mNG North
America, £873m
Niagara Mohawk Power, £304m
KeySpan Gas East (KEDLI), £304m
Boston Gas, £304m
Other loans
Debt Funding
• FY22 debt funding totalled £4.2bn across the group. Benchmark bonds issued in EUR, USD and CAD.
• NG plc issued a €850m 8yr green bond in August 2021
– Proceeds allocated to projects in NG Ventures and New England
– Majority of allocation will be for Renewable Energy and Energy Efficiency categories
– Green Financing Report to be published in June 2022 as part of the Responsible Business Report
• FY23 debt funding expected to be c.£5bn (excluding any bridge take-out)
– c.50% at HoldCo (NG plc / NGNA)
– c.25% at UK OpCo (NGET / WPD)
– c.25% at US OpCo
£4.2bn
£4.2bn is post swap amount, using $ / £ rate at 1.31
• Access to committed facilities:
– £6.0bn of general liquidity facilities
– The UK Electricity System Operator also maintains £550m of committed facilities
– WPD has £845m of committed facilities
– All undrawn as at 31 March 2022
EUR
USD
CAD
AUDGBP
£4.2bn
FY22 debt funding
National Grid plc Full Year Results 2021/22 May 202226
Summary
• Our pivot to electricity is nearly complete
• Focus on Massachusetts and RIIO-ED2 rate settlements
• Working with regulators and politicians to define 2050 clean energy roadmaps
• £24 billion1 of green investment to decarbonise energy systems in our five year framework
THE ENERGY
TRANSITIONCompany
1. Capital expenditure considered to be aligned with the principles of the EU Taxonomy Legislation at the date of reporting. and includes most electricity investment,
including connecting clean sources of generation such as renewables and nuclear, as well as investment which reduces emissions in our gas networks

National Grid plc Full Year Results 2021/22 May 202228
Appendices

National Grid plc Full Year Results 2021/22 May 202229
FY21 FY22
Net revenue
Depreciation
Controllable Costs
Other
UK Electricity Distribution
UK
£899mFY21 Proforma: £854m
Capital investment
1. Estimated rate base on acquisition (14 June 2021)
Underlying results, excluding timing, exceptional items and remeasurements.
Pro forma underlying 2020/21 figures include adjustments for an estimate of the underlying post-tax contribution from WPD for an equivalent 9.5 month period, as if we had owned that business in the prior year,
including estimated incremental finance costs to acquire WPD. In addition, the current year beneficial earnings impact of not depreciating our Rhode Island business has also been applied in these comparative
amounts
Return on equityOutperformance
Achieved return on equity
13.6%
Customer incentives
300bps
Totex performance
100bps
Underlying operating profit vs FY21 proforma (£m)
£9.3bnAt acquisition1: £8.5bn
Regulated asset value
• Greater spend on network reinforcement and connections
• Improved customer experience incentives (14)
(13)

National Grid plc Full Year Results 2021/22 May 202230
UK Electricity Transmission
UK
Net
revenue
COVID
Depreciation
Controllable
CostsOther
FY21 FY22
£54m
Underlying operating profit
Electricity System Operator
FY21: £70m
• Higher base revenues in the first year of RIIO-T2
• Partially offset by lower returns
Underlying results, excluding timing, exceptional items and remeasurements.
Return on equityOutperformance
Achieved return on equity
7.7%
Totex incentive
140bps
£1.2bnFY21: £984m
Capital investment
Underlying operating profit (£m)
£15.5bn
FY21: £14.3bn
Regulated asset value
(47)(37) (10)

National Grid plc Full Year Results 2021/22 May 202231
US Regulated – New York
• Increase in environmental reserves
• Higher depreciation
• Partially offset by rate case increases and bad debt reductions
US
Underlying results from continuing operations excluding exceptional items, remeasurements, major storm costs (when greater than $100m) and timing
Operating profit and capital investment presented at constant currency
Net revenue
COVID
Controllable Costs
Depreciation
Other
of our allowed baseline return
99%
Return on equity
Achieved return on equity
8.8%
£2.0bnFY21: £1.7bn
Capital investment
$17.0bnFY21: $15.8bn
Rate base
Underlying operating profit (£m)
FY21 FY22
Environmental Costs
(86)
(130)
(65)

National Grid plc Full Year Results 2021/22 May 202232
US Regulated – New England
• Higher rates under new rate settlement
• Resumed collection activities for outstanding receivables
US
Underlying results from continuing operations excluding exceptional items, remeasurements, major storm costs (when greater than $100m) and timing
Operating profit and capital investment presented at constant currency
1. FY21 Operating Profit has been restated on proforma basis with the current year beneficial earnings impact of not depreciating our Rhode Island business also applied in the FY21 comparative amounts
2. Other includes non COVID bad debts and property taxes
FY21: £1.4bn
Capital investment
Underlying operating profit vs FY21 proforma1 (£m)
Net revenue
COVID
Controllable Costs
Depreciation
Other2
FY21 FY22
of our allowed baseline return
85%
Return on equity
Achieved return on equity
8.3%
Environmental Reserves
$12.2bnFY21: $11.4bn
Rate base
(24)(18) (23)
43 (45)
£1.6bn

National Grid plc Full Year Results 2021/22 May 202233
NG Ventures
Operating profit and post tax share of JVs:
• First time contribution from NSL and full year from IFA2
• £200m from interconnector business to be repaid to consumers 2
• Higher development income in US Onshore renewables
NGV
1 Includes BritNed and Nemo.
2. Underlying operating profit in FY 2021/22 only includes amount earned up to regulatory cap
Operating profit, share of joint venture profit after tax and investment presented at constant exchange rates.
Underlying results, excluding timing, exceptional items and remeasurements.
FY21: £530m
Capital investment
£913m
31 March2022
Genco
Grain LNG
Interconnectors
NG Renewables
Other
Operating profit (£m)
33
113
135
11
(6)
286
31 March2021
37
104
60
(9)
(7)
185
Year ended
Interconnectors¹
Millennium
Other
91
22
9
122
26
22
8
56
Post tax share of JVs (£m)
408 241 Total NGV

National Grid plc Full Year Results 2021/22 May 202234
Other activities
Increase in operating profit:
• Fair value gains in National Grid Partners
• Release of historical unclaimed dividends
Other
Operating profit, share of joint venture profit after tax and investment presented at actual exchange rates.
Underlying results, excluding timing, exceptional items and remeasurements.
1. Capital investment includes investment in JVs (excluding equity contributions to St William property JV) and investment in NG Partners.
FY21: £66m
Capital investment1
£103m
31 March2022
Property
NG Partners
Corporate & other
Operating profit (£m)
40
66
(85)
21
31 March2021
22
1
(91)
(68)
Year ended
St William
NG Partners
11
15
26
5
5
10
Post tax share of JVs (£m)

National Grid plc Full Year Results 2021/22 May 202235
Discontinued operations1
UK Gas Transmission & Metering
Operating profit £139m higher than prior year
• Higher base revenues
• Cessation of depreciation on classification as held for sale
£261m£57m higher than prior year
Capital investment
Operating profit excluding timing, exceptional items and remeasurements
1. 100% of UK Gas Transmission & Metering to be treated as a discontinued operation until the sale of the 60% stake to the Macquarie consortium completes
FY21 FY22
Operating profit (£m)
• Achieved RoE: 7.8%
Net revenue
Controllable Costs
DepreciationOther
(3)(26)