Theoretical prediction of a peptide binding to major histocompatibility complex II

J. Exp. Med.
The Rockefeller University Press • 0022-1007/2001/04/881/12 $5.00Volume 193, Number 8, April 16, 2001 881–892http://www.jem.org/cgi/content/full/193/8/881
881
Cytokines Regulate Proteolysis in Major Histocompatibility Complex Class II–dependent Antigen Presentation by Dendritic Cells
By Edda Fiebiger,
*
§
Paul Meraner,
*
Ekkehard Weber,
i
I-Fei Fang,
*
Georg Stingl,
*
Hidde Ploegh,
§
and Dieter Maurer
*
‡
From the
*
Division of Immunology, Allergy, and Infectious Diseases, Department of Dermatology,
University of Vienna Medical School, and the
‡
Center of Molecular Medicine (CeMM) of the Austrian Academy of Sciences, A-1090 Vienna, Austria; the
§
Department of Pathology, Harvard
Medical School, Boston, Massachusetts 02115; and the
i
Department of Physiological Chemistry, Martin Luther University, 06097 Halle, Germany
Abstract
Endo/lysosomal proteases control two key events in antigen (Ag) presentation: the degradationof protein Ag and the generation of peptide-receptive major histocompatibility complex(MHC) class II molecules. Here we show that the proinflammatory cytokines tumor necrosis
factor
a
and interleukin (IL)-1
b
rapidly increase the activity of cathepsin (cat) S and catB inhuman dendritic cells (DCs). As a consequence, a wave of MHC class II sodium dodecyl sulfatestable dimer formation ensues in a catS-dependent fashion. In contrast, the antiinflammatorycytokine IL-10 renders DCs incapable of upregulating catS and catB activity and in fact, atten-uates the level of both enzymes. Suppressed catS and catB activity delays MHC class II sodiumdodecyl sulfate stable dimer formation and impairs Ag degradation. In DCs exposed to tetanustoxoid, IL-10 accordingly reduces the number of MHC class II–peptide complexes accessibleto tetanus toxoid–specific T cell receptors, as analyzed by measuring T cell receptor downreg-ulation in Ag-specific T cell clones. Thus, the control of protease activity by pro- and antiin-flammatory cytokines is an essential feature of the Ag presentation properties of DCs.
Key words: antigen-presenting cell • cathepsin • class II maturation • antigen degradation • TCR
Introduction
During their transition from an immature to a mature state,
dendritic cells (DCs)
1
acquire the unique ability to stimu-late immunologically naive T cells. Maturation of DCs is aprocess initiated by cellular activation and is manifested incells treated with proinflammatory cytokines (1–3). Uponactivation, DCs lose their ability to take up external Agsbut begin to export peptide-loaded MHC products to thecell surface. Within T cell areas of lymphoid organs, fully
mature DCs abundantly display MHC molecules loadedwith antigenic peptides together with costimulatory signals.The coordinated delivery of both signals to T cells ensuresthe induction of a productive T cell response (2, 3). At leastsome aspects of cytokine-induced DC maturation arecounteracted by antiinflammatory stimuli (4).
In the MHC class II presentation pathway, lysosomalproteases of the cathepsin (cat) family control the process-ing of Ag and the formation of peptide-receptive class IIdimers (5). The nature of these cats is a matter of debate.Specific proteases may be dedicated to the presentation ofcertain Ags: asparaginyl endopeptidase is involved in thedegradation of tetanus toxin by B lymphoblasts (6). Whilethe role of this protease in human DCs remains to be estab-lished, it is reasonable to suggest that additional proteasesare critical for Ag degradation. In fact, catB is viewed as anexopeptidase responsible for the degradation of peptides,proteins, toxins, and cell surface receptors that enter thecell via endo- or phagocytosis (7–9).
The digestion of the invariant chain (Ii) is a central step
E. Fiebiger and P. Meraner contributed equally to this work.Address correspondence to Dieter Maurer, Department of Dermatol-
ogy/CeMM, University of Vienna Medical School, Waehringer Guertel18-20, A-1090 Vienna, Austria. Phone: 43-1-40400-7769; Fax: 43-1-4031-900; E-mail: [email protected]
1
Abbreviations used in this paper:
cat, cathepsin; CLIP, class II–associatedIi-derived peptide; Cy C, cystatin C; DC, dendritic cell; HLA, histocom-
patibility leukocyte antigen; Ii, invariant chain; LHVS,
N
-morpholinurea-leucine-homophenylalanine-vinylsulfone-phenyl; LIP, leupeptin-inducedIi peptide; md, monocyte-derived; MFI, mean fluorescence intensity; OG,
oregon green; SLIP, small leupeptin-induced Ii peptide; TCC, T cellclone; TT, tetanus toxoid.

882
Cytokines Regulate Cathepsin Activity and MHC-Peptide Display
in class II–dependent Ag presentation, since it is a prerequi-site for the formation of peptide-occupied SDS stable classII
ab
dimers. The stepwise proteolytic degradation of Ii inendo/lysosomal compartments generates a heterogeneousset of
z
3-kD fragments, termed class II–associated Ii-derivedpeptides (CLIPs), which remain bound to the class IIbinding groove until exchanged for antigenic peptides in ahistocompatibility leukocyte Ag (HLA)-DM–dependentfashion (5, 10, 11). catS is the most potent catalyst of theCLIP generation in vitro and in vivo (12–15). Further po-tential candidate enzymes are catF, catB, catD, and catL,which degrade Ii in vitro (16). catF can degrade Ii in catS-deficient murine macrophages (17), whereas catD and catBunlikely are involved in the CLIP generation in murinecells (13, 16). catL is the pivotal enzyme for Ii degradationin thymic epithelial cells and, hence, is required for positiveselection of CD4
1
thymocytes (18).The expression levels of several cat family members are
upregulated by IL-4 and IFN-
g
(16, 19, 20), both of whichare potent inducers of class II expression in different celltypes. Stimuli that induce DC maturation might also regu-late the activity of proteases relevant for the generation ofexogenous Ag-derived peptides and proteases that are re-sponsible for the generation of SDS stable class II dimers.Along these lines, it has been suggested that the regulationof cystatin C (Cy C) levels in DCs controls the activity ofcatS in the course of maturation (21). The effects imposedby antiinflammatory stimuli on DC function might likewiseact by controlling the levels of intracellular proteolytic ac-tivity. IL-10 impairs class II–dependent Ag presentation in acell type–dependent fashion (4, 22–24) and is the prototypecytokine that inactivates DCs in vivo and in vitro (25).
Here we asked whether protease activity is dynamicallyregulated by physiologically relevant stimuli and, if so, whichare the enzymes affected. Cytokine-mediated regulation ofprotease activity might help us understand how pro- and an-tiinflammatory stimuli balance class II assembly and Ag pro-cessing. Therefore, we examined the nature and function ofcats involved in class II–dependent Ag presentation by hu-man DCs and analyzed the effects of pro- and antiinflamma-tory cytokines on cat activity and T cell activation.
Materials and Methods
Abs and Reagents.
CBz-Tyr-Ala-CN
2
was provided by H.Chapman (University of California at San Francisco, San Fran-cisco, CA) and iodinated. Anti-CD45 (MEM-28) and anti–HLA-DR (MEM-12) mAbs were provided by V. Horejsi (Academy ofNatural Sciences, Prague, Czech Republic). Rabbit anti–cat sera(anti-B, -L, -D, -S) were provided by E. Weber (University ofHalle-Wittenberg, Halle, Germany).
N
-morpholinurea-leucine-homophenylalanine-vinylsulfone-phenyl (LHVS; provided byJ.T. Palmer, Arris Pharmaceuticals, San Francisco, CA), FmocYACHN
2
(provided by R.W. Mason, Alfred I. duPont Hospital,Wilmington, DE; reference 26), and CA074Me (BachemFeinchemikalien AG) were dissolved at 10 mM in DMSO andstored at
2
20
8
C. Chloroquine and bafilomycin A1 were fromCalbiochem.
Cell Preparation and Culture.
B cells were prepared from PBMCsby anti-CD19 (Leu12; Becton Dickinson) immunostaining andflow sorting (FACStar
PLUS™
; Becton Dickinson). CD34
1
-derivedDCs, and CD11c
1
and CD11c
2
peripheral blood DCs wereprepared as described (27, 28). Monocyte-derived (md) DCswere prepared in the presence of 1 ng/ml TGF-
b
1 (R&D Sys-tems) in serum-free conditions (LGM3 medium; CLONTECHLaboratories, Inc.; reference 29). mdDCs were stimulated with100 ng/ml TNF-
a
and 10 ng/ml IL-1
b
(both R&D Systems; re-ferred to as “TNF/IL-1 stimulation”). When indicated, cells wereprecultured with 300 U/ml IL-10 (R&D Systems) overnight be-fore stimulation. Tetanus toxoid (TT)-specific T cell clones(TCCs) were established and characterized as described (30).
Detergent Extraction and Immunoblotting.
Cells were solubi-lized, lysates were submitted to 12% SDS-PAGE, and immuno-blotting was performed (31). mAb MEM-28 (1:5,000), rabbit anti-actin (1:5,000; Sigma-Aldrich), or rabbit anti–cat sera (1:5,000 or1:2,500) were incubated for 6 h. The binding of peroxidase-con-jugated donkey anti–rabbit IgG or sheep anti–mouse IgG F(ab
9
)
2
(both 1:20,000; Amersham Pharmacia Biotech) was detected us-ing ECLplus™ (Amersham Pharmacia Biotech).
Metabolic Labeling and Immunoprecipitation.
DCs were starvedin methionine and cysteine-free medium, pulsed for 30 min with1 mCi/ml (5–10
3
10
6
cells/ml) of InVivo Cell™ labeling mix(Amersham Pharmacia Biotech), aliquoted, and chased at 37
8
C.Protease inhibitors were added 4 h before pulse. Cells were lysedat the indicated time points as described (31). Lysates were pre-cleared with protein G beads (Sigma-Aldrich) and anti–HLA-DRimmunoprecipitation (mAb TÜ36; BD PharMingen) was per-formed for 3 h. Precipitated proteins were eluted for 20 min withnonreducing PAGE sample buffer containing 2% SDS. Non-boiled and boiled aliquots of each sample were analyzed by 12%SDS-PAGE.
Active-site Labeling of Cysteine Proteases.
0.5–1
3
10
6
DCswere stimulated with TNF/IL-1 in the presence or absence ofprotease inhibitors. Cells were washed, incubated with CBz-
125
I-Tyr-Ala-CN
2
for 30 min at 37
8
C, washed again to remove freelabel, and lysed. 12% SDS-PAGE was performed under reducingconditions. Cellular protein content per lane was defined by theuse of equal cell numbers per sample. Even loading was con-trolled by Coomassie blue staining of each gel.
Ag Degradation Assay.
DCs were incubated with 10
m
g/ml ofanti-Fc
g
RII mAbs (IV.3; Medarex) for 1 h at 4
8
C, washed, andexposed to
125
I-labeled goat anti–mouse IgG (Amersham Pharma-cia Biotech) for 1 h at 4
8
C. After extensive washes with cold PBS,aliquots of 0.5
3
10
6
cells were chased under various conditions.Then cells were lysed, lysates were mixed with nonreducing sam-ple buffer, and subjected to 10% SDS-PAGE. No signals from[
125
I]IgG were obtained without the anti-Fc
g
RII incubation step.Cellular protein content per lane was controlled as described.
Gel Densitometry.
The amount of SDS stable class II
ab
dimers and of Ii fragments was defined as follows: intensity of therespective band regions was determined from digitalized autora-diograms using the Kodak 1D v2.02 software package (EastmanKodak Co.). Values obtained from the
b
chains of boiled precip-itation aliquots were considered 100% for the calculation of theamount of the corresponding SDS stable
ab
dimers or small leu-peptin-induced Ii peptide (SLIP). Signal intensities from [
125
I]IgGwere quantified as described.
Assessment of Ag Internalization.
DCs were exposed to 10
m
g/ml biotinylated anti-Fc
g
RII or control mAbs (MOPC 21;Sigma-Aldrich) for 30 min at 4
8
C. After washing, cells were in-cubated with goat anti-mouse F(ab
9
)
2
(Molecular Probes) for an-

883
Fiebiger et al.
other 30 min at 4
8
C to cross-link receptor-bound mAbs. ExcessF(ab
9
)
2
was removed and internalization of surface-bound Abcomplexes was monitored after various culture periods at 37
8
C asfollows: DCs were harvested, chilled, and incubated with PE-labeled streptavidin (1
m
g/ml SA-PE; Becton Dickinson) for 30min at 4
8
C. PE fluorescence was analyzed using a FACScan™flow cytometer (Becton Dickinson) and expressed as the specificmean fluorescence intensity (MFI;
D
MFI, MFI of anti-Fc
g
RIImAb-stained cells minus MFI of control mAb-stained cells). Theratio of the
D
MFI of DCs cultured at 37
8
C over the
D
MFI ofDCs kept on ice multiplied by 100 gives the percentage of ligandinternalization.
Acidity of Endocytic Compartments.
DCs were exposed to anti-Fc
g
RII mAbs followed by receptor cross-linking with FITC- ororegon green (OG)–labeled goat anti–mouse F(ab
9
)
2
(MolecularProbes) at 4
8
C. Cells were washed and cultured at 37
8
C. pH-sen-sitive FITC and pH-insensitive OG fluorescence was measuredby FACS
®
. The ratio of FITC over OG fluorescence was calcu-lated for DCs cultured for the indicated time periods at 37
8
C.The FITC/OG ratio of cells kept on ice was set at 100%. Ratiosdetermined from DCs cultured for various time periods were ex-pressed as the percentage of this value. Results are given as thepercentage of specific reduction of FITC fluorescence relative tothe baseline value (0%; 0 h). Additionally, the pH of endocyticDC compartments was assessed directly using LysoSensor™ yel-low/blue conjugated to 0.25 mg/ml 10-kD dextran (MolecularProbes; reference 32). DCs were labeled overnight in the pres-ence or absence of IL-10. TNF/IL-1 was added for the indicatedtime periods, cells were washed in PBS, and the fluorescenceemission of internalized LysoSensor™ was measured within thenext 10 min using an Axiovert 100 microscope (ZEISS) equippedwith the Attofluor™ system (Atto Instruments; excitation: 365
6
12 nm; emission: 515–530 nm and 450–490 nm). The ratio ofgreen over blue emission of at least 10 randomly selected cells/microscopic field was calculated using the Attofluor™ ratio vi-sion software (Atto Instruments). Standard curve for intracellularpH measurement: calibration buffer (125 mM KCl, 20 mMNaCl, 0.5 mM CaCl
2
, 0.5 mM MgCl
2
) was titrated to pH 4 or 5with 25 mM acetic acid, pH 6 with 25 mM MES (Merck), andpH 7 with 25 mM morpholino propane sulfonic acid (Sigma-Aldrich). Cells of defined intracellular pH were generated by in-cubation with pH-adjusted calibration buffers supplemented with10
m
g/ml nigericin and 10
m
g/ml monensin (Sigma-Aldrich).Ratios of at least 10 cells/pH grade were acquired as describedabove.
Assessment of Expression and Surface Stability of HLA-DR.
DCs were analyzed in parallel for surface and total cellular HLA-DR expression by FACS
®
. For the latter analysis, cells were sub-jected to Fix&Perm™ (An der Grub Bioresearch) and stainedwith 1
m
g/ml FITC-labeled mAb L243 (Becton Dickinson). Thesurface stability of HLA-DR complexes was analyzed with bio-tinylated Fab fragments of 10
m
g/ml MEM-12. DCs were labeledfor 30 min at 4
8
C, washed, and cultured for the indicated timeperiods at 37
8
C. Biotin moieties remaining at the cell surfacewere detected with SA-PE.
TCR Downregulation Experiments.
TCR downregulation ex-periments were performed as described with minor modifications(33, 34). DCs were labeled with 20 nM CFDA-SE (MolecularProbes) in PBS for 20 min at 37
8
C, washed, and incubated for 30min with TT (Calbiochem) or TT peptides (TT
947–967
; Pichem) atthe indicated concentrations or medium only. After washing thor-oughly DCs were chased, mixed with a TT-specific TCC (DC/Tcell ratio 4:1 in RPMI 1640, 10% human AB serum; PAA Labo-
ratories), and cocultured for 4 h. TCR internalization was stoppedand DC-T cell clusters were disrupted by chilling with cold PBSand 0.5 mM EDTA. T cells were stained with PE-labeled anti-CD3 (Leu4; Becton Dickinson) or isotype control mAbs (BectonDickinson) and analyzed by FACS
®
.
D
MFI values of gated T cellswere calculated as described above and transformed to absolutenumbers of TCR/CD3 molecules per cell using the Quanti-BRITE PE™ calibration kit (Becton Dickinson). The numbers oftriggered TCRs were calculated by subtracting the TCR/CD3numbers of T cells cocultured with Ag-modified DCs from thoseof T cells exposed to nonAg-modified DCs.
Results
DCs Acquire High Levels of Mature cats during Their Differ-entiation from Precursors.
We used mdDCs as model DCs aslarge cell numbers are easily accessible at an immature stageand selected culture conditions in which mdDCs do notproduce IL-10 endogenously (29, 35). This allows a com-parison of the effects of pro- versus antiinflammatory cy-tokines on DC function. We first defined expression pat-terns of cats to see whether the proteases expressed inmdDCs were representative of human DCs.
Protease activity can be examined by at least two inde-pendent methods. First, the level of proteases themselvescan be measured by immunochemical methods. However,the assessment of the total protease content based on im-munoblotting may not yield an accurate estimate of thelevel of active enzyme. Therefore, the second approach isto measure the activity of the proteases using active site–directed, mechanism-based inhibitors. Using these twotypes of approach, we addressed the changes in proteasecontent and activity that accompany the development andthe maturation of DCs. First, cat expression in B cells,monocytes, various types of DCs, and DC precursors wasassessed by immunoblotting (Fig. 1 A). None of the pro-teases analyzed (catB, catD, catL, and catS) was detectableas the mature form in resting B cells. The only cat clearlydetected in these cells is the proform of catB, also expressedin monocytes. Low level cat expression by resting B cellscould have escaped detection by immunoblotting. It isequally possible that resting B cells have to undergo activa-tion and maturation for high level cat expression. Mono-cytes express pro-catB, pro-catL, pro- and mature catS, aswell as pro- and mature catD. During the transition fromthe monocytic precursor to the immature mdDC, maturecatB is expressed de novo and several cats (mature catS,mature catD, and pro-catL) are upregulated. Importantly,the cat expression profile of mdDCs is virtually identical toCD34
1
stem cell–derived DCs, and the cat pattern ofmonocytes, the mdDC precursors, is similar to other well-defined DC progenitors (28); peripheral blood CD11c
1
DC (DC1) precursors and CD11c
2
plasmacytoid DC(DC2) precursors express the proforms of catB and catL aswell as mature catS and catD. The levels of mature en-zymes detected are low, probably related to the relative im-maturity of DC1 and DC2. Thus, resting DCs and DCprecursors differ in the expression levels of pro versus ma-

884
Cytokines Regulate Cathepsin Activity and MHC-Peptide Display
ture proteases only. Our data allow the conclusion that, asfar as protease content is concerned, mdDCs (referred to as“DC” from now on) can be used as a representative DCpopulation for our studies.
Do stimuli that control distinctive DC functions regulate
the cat expression profile of DCs? The proinflammatory,“DC maturation–inducing” cytokines TNF-
a
and IL-1
bdo not induce significant changes in the protease levels de-tected in DCs (Fig. 1 B). Total intracellular protease con-tent was equally insensitive to treatment with the antiin-flammatory stimulus IL-10 alone. Expression of pro-catBwas not significantly altered by exposure of DCs to IL-10plus TNF/IL-1. However, stimulation of IL-10–treatedcells with TNF/IL-1 lowers the levels of other proenzymes(pro-catL, pro-catS) and downregulates the expression ofmature catB, catS, and catD within 24 h. We next analyzedthe kinetics of individual enzymatic activity levels in re-sponse to pro- and antiinflammatory stimuli.
Pro- and Antiinflammatory Cytokines Regulate Intracellular catActivity in a Reciprocal Fashion. catS, catB, and catL activitycan be monitored in intact cells with the active site–directedprobe CBz-125I-Tyr-Ala-CN2. catB and catS were consti-tutively active in resting DCs (Fig. 2 A, left). Stimulation ofDCs with TNF/IL-1 induces a rapid (within 30 min) in-crease in the activity of catS and catB (Fig. 2, A and B, left).No catL activity was observed in resting or activated DCs inmost experiments (in 2/20 experiments catL activity wasdetected after 12 h of stimulation; data not shown). Quanti-tative analysis (Fig. 2 A, right) demonstrates a sixfold increaseof catS activity accompanied by a moderate, but significant(greater than twofold) induction of catB activity upon stim-ulation with TNF/IL-1. Inclusion of 5 nM LHVS completelyblocked catS over the period of observation. Exposure ofDCs to the broad cysteine protease inhibitor leupeptin resultedin complete loss of all detected cats (Fig. 2 A, left). Al-though IL-10 alone does not decrease catS and catB activity inDCs (Fig. 2 B, 0 h), it attenuates the TNF/IL-1–mediatedupregulation of catS and catB and induces a successive loss ofboth active enzymes in TNF/IL-1–stimulated DCs (Fig. 2B). In summary, these data show that proinflammatory cy-tokines induce an immediate upregulation of enzymatic ac-tivity that can be suppressed by the antiinflammatory stim-ulus IL-10. Does such a cytokine-dependent regulation ofproteolytic activity affect class II processing?
Figure 1. Regulation of cat expression in DCs. (A) cat expression pro-file of DCs and DC precursors. NP-40 lysates of equal numbers of theindicated cell types were subjected to anti-catS, -catL, -catB, and -catDimmunoblotting. Anti-actin and -CD45 reactivity was assessed for con-trol purposes. (B) Regulation of cat expression by pro- and antiinflam-matory cytokines. mdDCs were incubated with IL-10 and/or TNF/IL-1for 24 h before immunoblotting. The positions of pro and mature (m)cats and mol wt markers (kD) are given right and left, respectively.
Figure 2. Reciprocal regulation of cat activity by cyto-kines. (A) Proinflammatory cytokines upregulate catS andcatB activity. DCs were incubated for 4 h with or withoutLHVS or leupeptin and were cultured in the presence orabsence of TNF/IL-1 for the indicated time periods. (Left)Autoradiography of an active-site labeling experiment.The positions of active catS and catB are indicated.(Right) Quantification of TNF/IL-1–induced catS andcatB activities. Data are expressed as the mean percentagecat activity (6 SEM, n = 3) in TNF/IL-1–stimulated DCsas compared with nonstimulated controls. (B) IL-10downregulates catS and catB activity. After overnight cul-ture in medium (left, upper gel) or in medium containingIL-10 (left, lower gel), DCs were exposed to TNF/IL-1and analyzed for catS and catB activity. (Left) Representa-tive autoradiography. (Right) Quantification of the IL-10–induced loss of catS and catB activity. Data are expressedas the mean percentage cat activity (6 SEM, n = 3) in IL-10–treated DCs as compared with controls.

885 Fiebiger et al.
Cytokine-induced catS Activity Mediates Rapid and EfficientSDS Stable Class II ab Dimer Formation. We examinedthe kinetics of class II maturation in TNF/IL-1–stimulatedand resting DCs by pulse-chase analysis. The metaboli-cally labeled, nonstimulated cells maintained the HLA-DRlowCD86lowCD832 phenotype of immature restingDCs and responded to TNF/IL-1 stimulation equally wellas nonlabeled DCs (data not shown). Immunoprecipita-tions were performed at the indicated time points from cellnumber–adjusted aliquots of metabolically labeled DCs us-ing the HLA-DR–specific mAb TÜ36. This mAb recog-nizes HLA-DR-ab bound to full-length Ii (splice variantsp31/33, p41, and the highly sialylated form of p41, p47), orto Ii remnants (SLIP, leupeptin-induced Ii peptide [LIP],CLIP), as well as HLA-DR-ab–peptide complexes. Fig. 3A shows the rapid formation of SDS stable class II abdimers in TNF/IL-1–activated DCs. After a 2-h chase,stimulated DCs already contained 36% of the total HLA-DR-b–bound radioactivity in SDS stable HLA-DR-abdimers (average, n = 3). This value increases to 73% after16 h (Fig. 3 B). In contrast, in resting DCs (Fig. 3 E) SDSstable class II dimers appear slowly and rather inefficiently(only 36% of HLA-DR-b incorporated radioactivity inSDS stable dimers after 16 h). Dimer formation by restingDCs is hardly affected by catS blockade (Fig. 3, E and G)and few SLIP fragments accumulate when LHVS is addedto the culture (Fig. 3 F). This finding is consistent with therather low level of catS activity of resting DCs, as detectedwith CBz-125I-Tyr-Ala-CN2 (Fig. 2 A). LHVS-mediatedinhibition of catS in activated DCs induces the accumula-tion of SLIP (Fig. 3, A and C) and a pronounced, but tem-
porary, inhibition in the generation of SDS stable class IIdimers (Fig. 3, A and B). These findings correlate well withthe activation-induced upregulation of catS activity (Fig.2). In summary, the wave of MHC class II SDS stabledimer formation induced by TNF/IL-1 (Fig. 3 D) dependson and is mediated by the immediate upregulation of catSactivity seen in response to such treatment.
IL-10 Alters Class II Processing by Modulating cat Activity.Is the observed IL-10–mediated downregulation of catactivity relevant for Ii degradation and SDS stable class IIab dimer formation? TNF/IL-1–stimulated DCs, eitherunmodified or precultured in IL-10– or LHVS-containingmedium, were metabolically labeled and subjected toHLA-DR immunoprecipitation. As expected, inhibition ofcatS by LHVS induces accumulation of SLIP (Fig. 4 A).SLIP appears in precipitates from IL-10–exposed but notfrom control DCs (Fig. 4 A). Since catS is the major en-zyme that can effectively digest SLIP in TNF/IL-1–stimu-lated DCs, it appears that IL-10 impairs catS activity suchthat it affects class II maturation. Indeed, exposure of DCsto IL-10 leads to a delay in SDS stable dimer formation(Fig. 4 B), but has no effect on the synthesis of the class IIsubunits themselves (Fig. 4 A). Thus, it appears that thetemporary accumulation of SLIP in stimulated, IL-10–treated DCs is because of the combined action of theTNF/IL-1–mediated increase in class II synthesis and theattenuated catS activity in response to IL-10.
As IL-10 suppresses not only catS but also catB activity,we assessed the relative impact of either protease on class IImaturation. For this purpose, the catB- and the catS-spe-cific inhibitors CA074Me and LHVS were used to create
Figure 3. Cytokine-induced catS activity mediates efficient SDS stable class II dimer formation. (A) Metabolically labeled DCs were chased in TNF/IL-1–containing medium in the presence or absence of LHVS and subjected to anti–HLA-DR immunoprecipitation. Nonboiled (NB) and boiled (B)precipitates were analyzed by SDS-PAGE. The positions of free HLA-DR-a (a) and b chains (b), Ii isoforms (p33, p41, p47), SDS stable HLA-DR-abdimers (ab), and LHVS-induced SLIP are indicated. (B–G) Pulse-chase immunoprecipitation experiments from TNF/IL-1–stimulated (B–D) and restingDCs (E and F) in the presence (d) or absence of LHVS (s). The radioactivity incorporated into SDS stable dimers (B and E) or into SLIP (C and F) isexpressed as the percent of the total HLA-DR-b–bound radioactivity (ordinate; mean % 6 SEM, n = 3). (D and G) catS-dependent class II dimer forma-tion expressed as the difference between the SDS stable dimers in control and LHVS-treated cells (ordinate). Abscissa shows the chase time.

886 Cytokines Regulate Cathepsin Activity and MHC-Peptide Display
catB- and/or catS-deficient cells (Fig. 4 C) for pulse-chaseanalysis. 100 nM CA074Me did not influence or only mod-erately influenced catS activity during the 16-h chase period(4-h time point in Fig. 4 C). In agreement with our earlierresults, catS but not catB mediates rapid SDS stable dimerformation in cytokine-stimulated DCs. Our conclusion thatdimers that form late during the chase period rely on catBrather than catS activity is, however, based on the assump-tion that CA074Me does not prevent the activation andmaturation of enzymes other than catB. DCs deficient forboth enzymes show reduced dimer formation during theentire time period analyzed (Fig. 4 D). This temporal reso-lution of the individual enzyme’s contributions suggests thatthey serve discrete functions in the class II pathway. Ac-cordingly, LHVS, but not CA074Me, induces the accumu-lation of Ii remnants (Figs. 2 and 4, and data not shown).
IL-10 Inhibits Ag Degradation by DCs. To further char-acterize the functional importance of catB in DCs, weasked whether pharmacological or cytokine-mediatedmodulation of catB results in impaired Ag degradation and,consequently, altered peptide display. Digestion of iodi-nated IgG internalized via FcgRII was used to investigateAg degradation by DCs. Equal numbers of Ag-loaded cellswere chased for various time periods and fragmentationpatterns of internalized IgG were analyzed. TNF/IL-1treatment increases the capacity of DCs to degrade Ag, asjudged from the accelerated disappearance of both full-length IgG and its fragments (Fig. 5 A). IL-10 treatment ofnonstimulated cells was without visible effect (data notshown). When IL-10–treated DCs were stimulated withTNF/IL-1, their Ag degradation capacity changed consid-erably (Fig. 5 B). Untreated and IL-10–treated DCs inter-nalized IgG with virtually identical kinetics and efficacy(Fig. 5 C) excluding the possibility of prolonged Ag persis-tence at the cell surface. In stimulated DCs, intact Ag has at1/2 of z1 h and degradation products are hardly discernible(Fig. 5 B). The presence of IL-10 increases the t1/2 of intactAg to .8 h and protein fragments ranging from 20 to 60kD become prominent (Fig. 5, B and D). Similar to the re-sults seen in the FcgRII targeting experiments, the degra-
Figure 4. Role of IL-10 and catB for SDS stable class II dimer forma-tion. (A and B) IL-10 delays SDS stable dimer formation. DCs cultured inthe presence or absence of LHVS for 4 h or IL-10 (overnight) were stim-ulated with TNF/IL-1 for 4 h, metabolically labeled, and chased underprelabeling culture conditions. Immunoprecipitated class II complexeswere analyzed by SDS-PAGE. (A) Representative autoradiography. (B)Quantification of SDS stable dimer formation in IL-10–treated (d) andcontrol DCs (s). The radioactivity incorporated into SDS stable dimers isexpressed as the percent of the total HLA-DR-b–bound radioactivity(ordinate; mean % 6 SEM, n = 3). Abscissa gives the chase time. (C) Se-lective elimination of catS and/or catB activity in DCs. DCs were incu-bated with or without LHVS, CA074Me, or both inhibitors for 4 h. catactivity was analyzed using CBz-125I-Tyr-Ala-CN2. The inhibition pro-file remained constant for .16 h (data not shown). (D) catB activity con-tributes to SDS stable dimer formation. DCs were exposed to LHVS (u),CA074Me (j), the combination of both (d), or medium only (s) andstimulated with TNF/IL-1 for 4 h and then subjected to pulse-chaseimmunoprecipitation as described. The radioactivity incorporated intoSDS stable dimers is expressed as the percentage of the total HLA-DR-b–bound radioactivity (ordinate; mean % 6 SEM, n = 3). Abscissa givesthe chase time.
Figure 5. IL-10 inhibits Ag degradation but not Ag uptake. (A–D)DCs were cultured in the presence or absence of IL-10 overnight. Whenindicated, DCs were stimulated with TNF/IL-1 for 4 h. Cells were ex-posed to anti-FcgRII mAbs followed by 125I-labeled goat anti–mouse IgG(A and B) or biotinylated anti-FcgRII mAbs followed by goat anti–mouse F(ab9)2 at 48C (C) and chased under prelabeling conditions. Thedegradation of iodinated IgG was followed by nonreducing 10% SDS-PAGE (A and B). Mol wt markers in kD on the left. (C) The internaliza-tion of biotinylated IgG via FcgRII was assessed by SA-PE labeling andFACS®. The percentage of Ag internalized (ordinate) by IL-10–treated(d) and control DCs (s) (mean percentage of two experiments) is de-picted as a function of the chase time (abscissa). (D) Quantification of[125I]IgG degradation by IL-10–treated (d) and control DCs (s). Thepercentage of intact IgG (ordinate) is depicted as a function of the pro-cessing time (abscissa; mean % 6 SEM, n = 3).

887 Fiebiger et al.
dation of IgG taken up via the mannose receptor pathwayof macropinocytosis (36) was inhibited by IL-10 althoughinternalization rates were not at all affected (data notshown). We conclude that IL-10 indeed inhibits the Agdegrading capacity of DCs.
IL-10 Inhibits Ag Degradation by Inhibiting catB Activity andby Modulating the pH of Endocytic DC Compartments. Dospecific cat inhibitors and IL-10 induce similar Ag frag-mentation patterns? If so, a comparison between inhibitor-and IL-10–treated cells could provide further clues as to thekey protease(s) involved. IL-10 treatment of DCs inducesthe accumulation of IgG fragments in the range from 20 to60 kD (Fig. 6 A). Although 100 nM CA047Me selectivelyinhibited catB in our experimental setting (Fig 4 C), a sin-gle mode of interference still may not be sufficient to allowdefinitive conclusions about the function of this enzy-matic activity (37). Thus, we decided to use three indepen-dent strategies to block catB, i.e., exposure of DCs to (a)CA047Me (38), (b) the catB/catL–specific inhibitor FmocYACHN2 (26), and (c) a high concentration of LHVS(0.5 mM) that eliminates catB, catL, and catS activity(12, 16, 39). Each condition produced an Ag fragmenta-tion pattern quantitatively and qualitatively similar to IL-10–exposed DCs (Fig. 6 A). Thus, these fragments areattributable to IL-10–mediated inhibition of catB. catS andcatL are not required for Ag degradation in the presence ofactive catB. catS and catL become important only in theabsence of active catB. This is seen from the accumulationof fragments ,30 kD in catL/catB– and catS/catB–doubledeficient cells to an extent similar to IL-10–exposed DCs.Data from cat B2/2 mice show only a modest shift in theefficiency of presentation of certain antigenic determinants
indicative for a minor role of this protease for Ag degrada-tion in murine splenocytes (40). Our results with humanDCs differ from this observation and underline again theimportance of studying defined populations of APCs intheir own sight. In summary, we conclude that catB is amajor Ag-degrading protease of human DCs and, further,that catB activity is negatively regulated by IL-10.
Since the pH of endo/lysosomal compartments is a criti-cal factor regulating the activity and stability of cats (16, 41),we asked whether IL-10 inhibits protease activities in DCsby elevating the pH of the endocytic pathway. DCs werelabeled with mouse mAbs to FcgRII followed by anti–mouse Abs coupled to a low pH-sensitive dye (FITC), andpH-dependent FITC quenching, which accompanies li-gand internalization, was monitored (Fig. 6 B). In thepresence of IL-10, intracellular FITC quenching was strik-ingly reduced whereas the kinetics and efficacy of ligand in-ternalization were not affected (Fig. 6 B). Using quanti-tative ratio measurements of fluorescence emission, wefurther demonstrate directly that endo/lysosomal compart-ments of IL-10–treated stimulated DCs are less acidic thanthose of control cells (Fig. 6 C). Calculations based on thestandard curve show that the average pH in endocytic com-partments changes from pH 4.5 to 5.3 (data not shown).
Do drugs that raise the pH of the endo/lysosomal systemreproduce the effects of IL-10 in DCs? DCs were exposedto the lysosomotropic drugs bafilomycin or chloroquineand monitored for their cat activity, their total intracellularprotease content, and for their Ag degradation capacity.Active-site labeling shows that catB and catS activity aremassively downregulated upon exposure of DCs to eitherof the pH-modulating drugs (Fig. 6 D). Both compounds
Figure 6. IL-10 inhibits catB-mediated Ag degradation and modulates the pH of endocytic DC compartments. (A) IL-10 inhibits Ag degradation byinhibiting catB activity. DCs were cultured in the presence or absence of IL-10 overnight or were exposed for 4 h to bafilomycin, CA074Me, LHVS (5,50, or 200 nM; indicated by the wedge), CA074Me plus LHVS (5 nM), or FmocYACHN2 in the presence of TNF/IL-1. Next DCs were labeled withanti-FcgRII/125I-goat anti–mouse IgG and allowed to process Ag for 2 h at 378C. The fragmentation pattern of [125I]IgG in the # 65-kD range is shown.(B) Internalized immune complexes experience a less acidic milieu in DCs exposed to IL-10. DCs cultured in the presence (d) or absence of IL-10 (s)were exposed to TNF/IL-1 for 4 h. Then cells were labeled with biotinylated anti-FcgRII and goat anti–mouse F(ab9)2, or with FcgRII followed byFITC- or OG-labeled goat anti–mouse F(ab9)2, and chased under prelabeling conditions for the indicated time peroids (abscissa). On the ordinate, thepercentage of the ligand internalization (broken lines; mean, n = 2) and of the pH-dependent reduction of ligand fluorescence (solid lines; mean 6 SEM,n = 3) is shown. (C) IL-10 increases the pH of endocytic DC compartments. DCs were loaded with LysoSensor™-coupled dextran in the presence orabsence of IL-10 overnight and then exposed to TNF/IL-1 for 6 h. The endosomal pH of DCs either exposed (lower) or not exposed to IL-10 (upper)was determined microscopically and is shown in a pH color code. (D) catB and S activity is downregulated by reagents that raise endosomal pH. DCswere cultured for 4 h in the presence or absence of bafilomycin, or chloroquine in TNF/IL-1–supplemented medium, and subjected to active-site label-ing. Positions of catS and catB are shown.

888 Cytokines Regulate Cathepsin Activity and MHC-Peptide Display
significantly lower the total intracellular protein levels ofmature catB and catS in DCs as assayed by immunoblotting(data not shown). Importantly, DCs exposed to bafilomy-cin were largely incapable of degrading intact Ag taken upvia FcgRII and showed accumulation of a major 50-kDIgG fragment also prominent in IL-10–treated and catB-deficient DCs (Fig. 6 A). According to the literature, IL-6acidifies endosomes in DCs (42). Our data suggest that IL-10, by raising endo/lysosomal pH, induces the opposite ef-fect. Indeed, IL-6 reverses the IL-10–induced impairmentof Ag degradation (data not shown). Thus, we concludethat regulation of endosomal pH by IL-10 contributes tothe control of proteolytic activity.
IL-10 Prevents Long-Term Delivery of a TCR Signal.TNF/IL-1–induced accumulation of HLA-DR at the cellsurface is clearly impaired by IL-10 as determined by
FACS® (Fig. 7 A). Likewise, leupeptin treatment results inreduced class II surface expression upon exposure to TNF/IL-1 (Fig. 7 A). In contrast, neither IL-10 nor leupeptinclearly affects the surface expression of HLA-DR in restingDCs (Fig. 7 A, time point 0), the TNF/IL-1–induced up-regulation of total cellular HLA-DR (Fig. 7 B), and thestimulation-induced downregulation of macropinocytoticAg uptake (data not shown). Reduced HLA-DR surfaceexpression seen in IL-10–treated DCs most likely involvesan export defect since internalization of class II from thecell surface was not enhanced by IL-10 or leupeptin (Fig. 7C, and data not shown). These results strengthen the inter-pretation that IL-10 affects class II trafficking by regulatinglysosomal protease function and not simply by preventingTNF/IL-1–induced activation of DCs.
To analyze the impact of IL-10 on the surface display ofclass II–bound peptides, we exploited internalization ofnewly engaged TCRs as a measure of specific class II–pep-tide display (43). Activated DCs were pulsed with TT orTT peptides and analyzed for their capacity to triggerTCRs of TT-specific TCCs. The kinetics of peptide-induced TCR triggering by IL-10–treated DCs is compa-rable to untreated cells (Fig. 7 D), yet the extent to whichdownregulation of the TCR occurs is markedly less. Thelower level of TCR triggering by IL-10–treated DCs mustcorrespond to their reduced display of HLA-DR loadedwith TT peptides at the cell surface. As expected, TCRdownregulation by peptide-pulsed DCs occurs instanta-
Figure 7. IL-10 inhibits export and display of class II–peptide com-plexes. (A and B) IL-10 inhibits export but not synthesis of class II. DCswere cultured overnight in the presence of IL-10 (d), leupeptin (m), ormedium only (s), and then stimulated with TNF/IL-1. Intact (A) andpermeabilized cells (B) were subjected to anti–HLA-DR immunolabeling.Specific MFI (ordinate) are plotted against the time of TNF/IL-1 stimula-tion (abscissa). (C) Internalization of class II from the cell surface is not al-tered by IL-10. DCs cultured in the presence (d) or absence of IL-10 (s)were exposed to TNF/IL-1 for 4 h. Cells were labeled with biotinylatedanti–HLA-DR Fab and chased under prelabeling culture conditions. Thepercentage of biotinylated mAb remaining at the cell surface is shown (or-dinate) as the function of time (abscissa). (D and E) IL-10 inhibits thelong-term display of full protein-derived, class II–associated peptides. DCscultured in the presence (closed symbols) or absence of IL-10 (open sym-bols) were exposed to TNF/IL-1 for 4 h. Cells were pulsed with TT (50and 5 nM; circles in D and E, respectively) or 1 nM TT peptide (TTpep;squares in D) and chased under prepulsing culture conditions. During thelast 4 h, cells were cocultured with TT-specific T cells. The absolutenumbers of triggered TCRs (ordinate) are plotted against the time of pro-cessing (abscissa). Representative experiment (n = 4).
Figure 8. Quantification of the TCR signaling deficit imposed by IL-10. (A) The numbers of triggered TCRs and the logarithm of the con-centration of pulsed Ag are correlated in a linear fashion. Short-termTNF/IL-1–stimulated DCs were pulsed with TT (j) or TT peptide (m)at the indicated concentrations (abscissa). Cells were cultured for 8 h un-der prepulsing conditions and TT-dependent TCR triggering (ordinate)was assessed. The linear regression analysis for TT and TT peptide isshown. (B) IL-10 modulates the magnitude and duration of the TCR sig-nal. DCs either exposed to IL-10 (closed symbols) or not exposed (opensymbols) were pulsed with 5 nM (circles) or 50 nM TT (squares), andchased for the indicated time periods (abscissa). The ordinate shows thedisplay of MHC class II–peptide complexes by IL-10-modified DCs(DC10; mean % 6 SEM, n = 3) relative to control DCs (DCCO). Therelative numbers of MHC class II–peptide complexes transported to thecell surface was calculated using the formula: relative class II–peptide dis-play = [e(TCRs triggered by DC10)/e(TCRs triggered by DCCO)] 1/K. K is the constantdefining the slope of the regression curve describing the correlation be-tween the concentration of pulsed Ag and the number of triggeredTCRs. K is not influenced by IL-10 (data not shown).
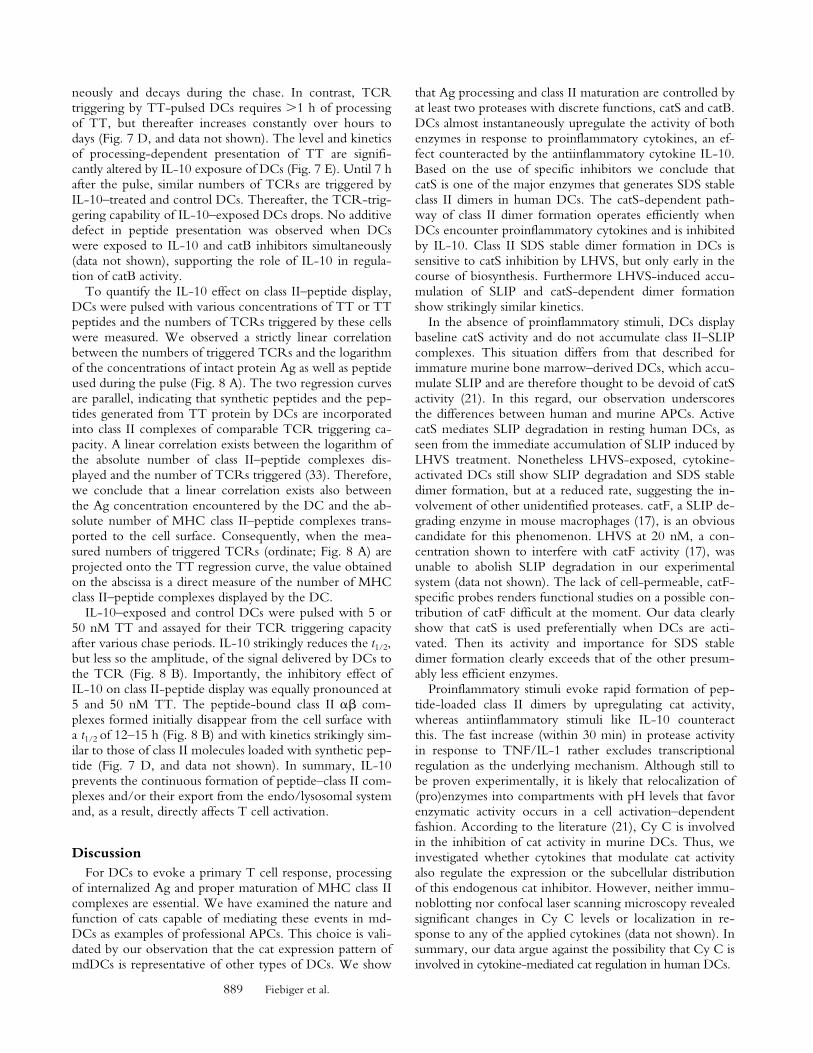
889 Fiebiger et al.
neously and decays during the chase. In contrast, TCRtriggering by TT-pulsed DCs requires .1 h of processingof TT, but thereafter increases constantly over hours todays (Fig. 7 D, and data not shown). The level and kineticsof processing-dependent presentation of TT are signifi-cantly altered by IL-10 exposure of DCs (Fig. 7 E). Until 7 hafter the pulse, similar numbers of TCRs are triggered byIL-10–treated and control DCs. Thereafter, the TCR-trig-gering capability of IL-10–exposed DCs drops. No additivedefect in peptide presentation was observed when DCswere exposed to IL-10 and catB inhibitors simultaneously(data not shown), supporting the role of IL-10 in regula-tion of catB activity.
To quantify the IL-10 effect on class II–peptide display,DCs were pulsed with various concentrations of TT or TTpeptides and the numbers of TCRs triggered by these cellswere measured. We observed a strictly linear correlationbetween the numbers of triggered TCRs and the logarithmof the concentrations of intact protein Ag as well as peptideused during the pulse (Fig. 8 A). The two regression curvesare parallel, indicating that synthetic peptides and the pep-tides generated from TT protein by DCs are incorporatedinto class II complexes of comparable TCR triggering ca-pacity. A linear correlation exists between the logarithm ofthe absolute number of class II–peptide complexes dis-played and the number of TCRs triggered (33). Therefore,we conclude that a linear correlation exists also betweenthe Ag concentration encountered by the DC and the ab-solute number of MHC class II–peptide complexes trans-ported to the cell surface. Consequently, when the mea-sured numbers of triggered TCRs (ordinate; Fig. 8 A) areprojected onto the TT regression curve, the value obtainedon the abscissa is a direct measure of the number of MHCclass II–peptide complexes displayed by the DC.
IL-10–exposed and control DCs were pulsed with 5 or50 nM TT and assayed for their TCR triggering capacityafter various chase periods. IL-10 strikingly reduces the t1/2,but less so the amplitude, of the signal delivered by DCs tothe TCR (Fig. 8 B). Importantly, the inhibitory effect ofIL-10 on class II-peptide display was equally pronounced at5 and 50 nM TT. The peptide-bound class II ab com-plexes formed initially disappear from the cell surface witha t1/2 of 12–15 h (Fig. 8 B) and with kinetics strikingly sim-ilar to those of class II molecules loaded with synthetic pep-tide (Fig. 7 D, and data not shown). In summary, IL-10prevents the continuous formation of peptide–class II com-plexes and/or their export from the endo/lysosomal systemand, as a result, directly affects T cell activation.
DiscussionFor DCs to evoke a primary T cell response, processing
of internalized Ag and proper maturation of MHC class IIcomplexes are essential. We have examined the nature andfunction of cats capable of mediating these events in md-DCs as examples of professional APCs. This choice is vali-dated by our observation that the cat expression pattern ofmdDCs is representative of other types of DCs. We show
that Ag processing and class II maturation are controlled byat least two proteases with discrete functions, catS and catB.DCs almost instantaneously upregulate the activity of bothenzymes in response to proinflammatory cytokines, an ef-fect counteracted by the antiinflammatory cytokine IL-10.Based on the use of specific inhibitors we conclude thatcatS is one of the major enzymes that generates SDS stableclass II dimers in human DCs. The catS-dependent path-way of class II dimer formation operates efficiently whenDCs encounter proinflammatory cytokines and is inhibitedby IL-10. Class II SDS stable dimer formation in DCs issensitive to catS inhibition by LHVS, but only early in thecourse of biosynthesis. Furthermore LHVS-induced accu-mulation of SLIP and catS-dependent dimer formationshow strikingly similar kinetics.
In the absence of proinflammatory stimuli, DCs displaybaseline catS activity and do not accumulate class II–SLIPcomplexes. This situation differs from that described forimmature murine bone marrow–derived DCs, which accu-mulate SLIP and are therefore thought to be devoid of catSactivity (21). In this regard, our observation underscoresthe differences between human and murine APCs. ActivecatS mediates SLIP degradation in resting human DCs, asseen from the immediate accumulation of SLIP induced byLHVS treatment. Nonetheless LHVS-exposed, cytokine-activated DCs still show SLIP degradation and SDS stabledimer formation, but at a reduced rate, suggesting the in-volvement of other unidentified proteases. catF, a SLIP de-grading enzyme in mouse macrophages (17), is an obviouscandidate for this phenomenon. LHVS at 20 nM, a con-centration shown to interfere with catF activity (17), wasunable to abolish SLIP degradation in our experimentalsystem (data not shown). The lack of cell-permeable, catF-specific probes renders functional studies on a possible con-tribution of catF difficult at the moment. Our data clearlyshow that catS is used preferentially when DCs are acti-vated. Then its activity and importance for SDS stabledimer formation clearly exceeds that of the other presum-ably less efficient enzymes.
Proinflammatory stimuli evoke rapid formation of pep-tide-loaded class II dimers by upregulating cat activity,whereas antiinflammatory stimuli like IL-10 counteractthis. The fast increase (within 30 min) in protease activityin response to TNF/IL-1 rather excludes transcriptionalregulation as the underlying mechanism. Although still tobe proven experimentally, it is likely that relocalization of(pro)enzymes into compartments with pH levels that favorenzymatic activity occurs in a cell activation–dependentfashion. According to the literature (21), Cy C is involvedin the inhibition of cat activity in murine DCs. Thus, weinvestigated whether cytokines that modulate cat activityalso regulate the expression or the subcellular distributionof this endogenous cat inhibitor. However, neither immu-noblotting nor confocal laser scanning microscopy revealedsignificant changes in Cy C levels or localization in re-sponse to any of the applied cytokines (data not shown). Insummary, our data argue against the possibility that Cy C isinvolved in cytokine-mediated cat regulation in human DCs.

890 Cytokines Regulate Cathepsin Activity and MHC-Peptide Display
The decrease in cat activity by IL-10 is physiologicallyrelevant, as demonstrated by the reduced ability of IL-10–treated DCs to activate T cells. catB’s major enzymatic tar-gets are Ags that enter DCs via macropinocytosis (mannosereceptor dependent) or via coated pits and vesicles (FcgRIImediated). IL-10 inhibits the degradation of both full-length protein Ags and Ag fragments. Pharmacologic inhi-bition of catB, but not of catS or catL activity, similarly in-hibits Ag degradation. Some Ag breakdown productsappear early after Ag loading in IL-10–treated and pharma-cologically catB-depleted DCs. Enzymes that may attackcomplex protein Ag include asparaginyl endopeptidase, aprotease implicated in TT cleavage (6, 44). Our observa-tion that full protein Ag persists while the Ag fragmentsformed initially decay in IL-10–treated DCs shows that theactivity of these proteases is attenuated by IL-10.
The alteration of the intracompartmental pH may con-tribute to the inhibition of cat activity by IL-10. IL-10 caninfluence the pH of Ag-loading compartments, as demon-strated by increased acidification of mycobacterial phago-somes in macrophages from IL-10 knockout mice and, viceversa, decreased acidification upon exposure of susceptiblecells to this cytokine (45). We show that internalized Agsexperience a less acidic milieu in DCs exposed to IL-10.Pharmacological inhibition of acidification mimics the IL-10–induced defect in Ag degradation. Whereas the expres-sion of proteases that are more stable at a pH close to neu-tral is hardly affected, IL-10 treatment downregulates themature form of those proteases that require acidic pH fortheir stability (catD, catB; reference 41). Thus, inhibitionof enzymatic activities induced by IL-10 most likely in-cludes pH-regulated maturation and activation, pH-depen-dent autocatalytic degradation, and, for some proteases, therelease into extracellular space (46). IL-10 could addition-ally affect cellular functions not yet addressed, i.e., the traf-ficking of Ags or proteases towards class II loading com-partments. Moreover, it is expected that the functionalprogram activated by exposure of DCs to IL-10 is highlycomplex. Array-based transcriptional profiling may behelpful in defining this program, and in turn, may allow amore directed cell biological analysis of IL-10’s inhibitoryeffects on Ag presentation.
We used the TCR triggering assays for a semiquantita-tive estimate of peptide display by cytokine-modified DCs.Titration and kinetics revealed that pro and antiinflamma-tory cytokines regulate the levels of surface class II peptidedisplay by DCs in a differential manner. Remarkably, asimple mathematical term describes the relationship be-tween the concentration of Ag/peptide pulsed onto theDC and the number of TCRs engaged during a cognateDC–T cell interaction. The logarithm of the Ag and pep-tide concentration and the number of triggered TCRs cor-relate in linear fashion. The number of class II–peptidecomplexes on the APC surface and the number of engagedTCRs are also correlated in semilogarithmic fashion (43).Therefore DCs convert extracellular Ag into surface-dis-posed class II peptide complexes with constant molar effi-cacy. The fact that serial triggering of TCRs is most effi-
cient when the APC expresses one or only few class IIcomplexes containing the relevant peptide renders the classII display measurement extremely sensitive. The linear re-gression calculated for the display of peptides derived fromTT intersects the abscissa at an Ag concentration of ,10210
M. Thus, on average, each DC displays one TT peptide atan Ag concentration of z10210 M. DCs internalize extra-cellular fluid equal to their own volume (z2.5 3 10213 l)in z1 h (36). Based on the assumption that the major in-ternalization mechanism for TT by DCs is fluid-phase up-take (47), we calculate that a DC pulsed with 10210 M TT(i.e., 6.023 3 1013 molecules/liter) for 30 min internalizes1.3 3 10213 liter of the solute, equivalent to z8 TT mole-cules. The internalization of this small number of intact Agmolecules suffices to trigger several hundred Ag-specificTCRs. We observed that TNF/IL-1–stimulated DCs ex-press approximately twice the amount of TT peptide–bear-ing class II complexes when compared with unstimulatedcontrols after a short Ag pulse (data not shown). The abilityof unstimulated DCs to display TT peptide in the contextof class II was described previously (1). In contrast, othersobserved that stimulated but not unstimulated murine DCscan present a peptide derived from a hen egg lysozyme (48,49). In summary, these findings support previous sugges-tions that human DCs and murine bone marrow–derivedDCs differ in terms of their Ag processing and presentationmachinery (16, 50). IL-10 causes a dramatic change in pep-tide–class II display on the surface of DCs. Whereas pep-tide–class II display is only partially reduced during the firsthours after the Ag pulse, long-term display of the com-plexes is essentially aborted in IL-10–exposed cells. Thedecay of peptide presentation by protein Ag-pulsed, IL-10–treated DCs equals peptide-pulsed DCs. The Ag presenta-tion defect imposed by IL-10 therefore results from inhibi-tion of formation or export, and not destabilization, ofpeptide–class II complexes. Thus, we, attribute limitedpeptide availability during the late phase of Ag presentationto IL-10–mediated protease inhibition.
Immunologically naive T cells require TCR stimulationat suprathreshold intensity for .30 h before they becomecommitted to proliferation and cytokine production (43,51). Our findings suggest that the suppressive action of IL-10 on T cell activation may result in premature terminationof TCR signals. Ag-specific tolerization of T cells by IL-10has been attributed mainly to suppression of costimulation.When costimulation is limited, as found in connectionwith exposure to IL-10, the magnitude and duration of sig-nals via the TCR decide whether Ag-specific T cell anergyor activation occurs (52). Thus, naive T cells that receive aTCR signal at subthreshold intensity or duration too shortto induce their functional commitment may become aner-gic. If this interpretation of the effects of IL-10 were cor-rect, then indeed manipulating protease activities could beuseful to paralyze pathogenic T cells.
B. Reininger is gratefully acknowledged for technical help.This work was supported by the Interdisciplinary Cooperation
Project, a program of the Austrian Ministry for Science and a grant

891 Fiebiger et al.
from Novartis Ltd., Basel, Switzerland. E. Fiebiger is supported byan Erwin-Schrödinger Fellowship from the Austrian Science Foun-dation.
Submitted: 25 August 2000Revised: 16 February 2001Accepted: 26 February 2001
References1. Cella, M., A. Engering, V. Pinet, J. Pieters, and A. Lanzavec-
chia. 1997. Inflammatory stimuli induce accumulation ofMHC class II complexes on dendritic cells. Nature. 388:782–787.
2. Cella, M., F. Sallusto, and A. Lanzavecchia. 1997. Origin,maturation and antigen presenting function of dendritic cells.Curr. Opin. Immunol. 9:10–16.
3. Banchereau, J., and R.M. Steinman. 1998. Dendritic cellsand the control of immunity. Nature. 392: 245–252.
4. Morel, A.S., S. Quaratino, D.C. Douek, and M. Londei.1997. Split activity of interleukin-10 on antigen capture andantigen presentation by human dendritic cells: definition of amaturative step. Eur. J. Immunol. 27:26–34.
5. Villadangos, J.A., and H.L. Ploegh. 2000. Proteolysis inMHC class II antigen presentation: who’s in charge? Immu-nity. 12:233–239.
6. Manoury, B., E.W. Hewitt, N. Morrice, P.M. Dando, A.J.Barrett, and C. Watts. 1998. An asparaginyl endopeptidaseprocesses a microbial antigen for class II MHC presentation.Nature. 396:695–699.
7. Authier, F., B.I. Posner, and J.J. Bergeron. 1996. Endosomalproteolysis of internalized proteins. FEBS Lett. 389:55–60.
8. Mort, J.S., and D.J. Buttle. 1997. Cathepsin B. Int. J. Bio-chem. Cell. Biol. 29:715–720.
9. Authier, F., M. Metioui, A.W. Bell, and J.S. Mort. 1999.Negative regulation of epidermal growth factor signaling byselective proteolytic mechanisms in the endosome mediatedby cathepsin B. J. Biol. Chem. 274:33723–33731.
10. Cresswell, P. 1994. Assembly, transport, and function ofMHC class II molecules. Annu. Rev. Immunol. 12:259–293.
11. Watts, C. 1997. Capture and processing of exogenous anti-gens for presentation on MHC molecules. Annu. Rev. Immu-nol. 15:821–850.
12. Riese, R.J., P.R. Wolf, D. Bromme, L.R. Natkin, J.A. Vil-ladangos, H.L. Ploegh, and H.A. Chapman. 1996. Essentialrole for cathepsin S in MHC class II-associated invariantchain processing and peptide loading. Immunity. 4:357–366.
13. Villadangos, J.A., R.J. Riese, C. Peters, H.A. Chapman, andH.L. Ploegh. 1997. Degradation of mouse invariant chain:roles of cathepsins S and D and the influence of major histo-compatibility complex polymorphism. J. Exp. Med. 186:549–560.
14. Shi, G.P., J.A. Villadangos, G. Dranoff, C. Small, L. Gu, K.J.Haley, R. Riese, H.L. Ploegh, and H.A. Chapman. 1999.Cathepsin S required for normal MHC class II peptide load-ing and germinal center development. Immunity. 10:197–206.
15. Nakagawa, T.Y., W.H. Brissette, P.D. Lira, R.J. Griffiths, N.Petrushova, J. Stock, J.D. McNeish, S.E. Eastman, E.D.Howard, S.R. Clarke, et al. 1999. Impaired invariant chaindegradation and antigen presentation and diminished col-lagen-induced arthritis in cathepsin S null mice. Immunity. 10:207–217.
16. Chapman, H.A. 1998. Endosomal proteolysis and MHC classII function. Curr. Opin. Immunol. 10:93–102.
17. Shi, G.P., R.A. Bryant, R. Riese, S. Verhelst, C. Driessen,Z. Li, D. Bromme, H.L. Ploegh, and H.A. Chapman. 2000.Role for cathepsin F in invariant chain processing and majorhistocompatibility complex class II peptide loading by mac-rophages. J. Exp. Med. 191:1177–1186.
18. Nakagawa, T., W. Roth, P. Wong, A. Nelson, A. Farr, J.Deussing, J.A. Villadangos, H. Ploegh, C. Peters, and A.Y.Rudensky. 1998. Cathepsin L: critical role in Ii degradationand CD4 T cell selection in the thymus. Science. 280:450–453.
19. Li, Q., and C.T. Bever, Jr. 1998. Modulation of interferon ginduced increases in cathepsin B in THP-1 cells by adrener-gic agonists and antagonists. Cell. Biol. Int. 22:13–20.
20. Sukhova, G.K., G.P. Shi, D.I. Simon, H.A. Chapman, andP. Libby. 1998. Expression of the elastolytic cathepsins S andK in human atheroma and regulation of their production insmooth muscle cells. J. Clin. Invest. 102:576–583.
21. Pierre, P., and I. Mellman. 1998. Developmental regulationof invariant chain proteolysis controls MHC class II traffick-ing in mouse dendritic cells. Cell. 93:1135–1145.
22. de Waal Malefyt, R., H. Yssel, and J.E. de Vries. 1993. Di-rect effects of IL-10 on subsets of human CD41 T cell clonesand resting T cells. Specific inhibition of IL-2 production andproliferation. J. Immunol. 150:4754–4765.
23. Willems, F., A. Marchant, J.P. Delville, C. Gerard, A. Del-vaux, T. Velu, M. de Boer, and M. Goldman. 1994. Inter-leukin-10 inhibits B7 and intercellular adhesion molecule-1expression on human monocytes. Eur. J. Immunol. 24:1007–1009.
24. Koppelman, B., J.J. Neefjes, J.E. de Vries, and R. de WaalMalefyt. 1997. Interleukin-10 down-regulates MHC class IIab peptide complexes at the plasma membrane of monocytesby affecting arrival and recycling. Immunity. 7:861–871.
25. Enk, A.H., V.L. Angeloni, M.C. Udey, and S.I. Katz. 1993.Inhibition of Langerhans cell antigen-presenting function byIL-10. A role for IL-10 in induction of tolerance. J. Immunol.151:2390–2398.
26. Xing, R., A.K. Addington, and R.W. Mason. 1998. Quanti-fication of cathepsins B and L in cells. Biochem. J. 332:499–505.
27. Charbonnier, A.S., N. Kohrgruber, E. Kriehuber, G. Stingl,A. Rot, and D. Maurer. 1999. Macrophage inflammatoryprotein 3a is involved in the constitutive trafficking of epi-dermal Langerhans cells. J. Exp. Med. 190:1755–1768.
28. Kohrgruber, N., N. Halanek, M. Gröger, D. Winter, K.Rappersberger, M. Schmitt-Egenolf, G. Stingl, and D. Mau-rer. 1999. Survival, maturation, and function of CD11c2 andCD11c1 peripheral blood dendritic cells are differentiallyregulated by cytokines. J. Immunol. 163:3250–3259.
29. Jaksits, S., E. Kriehuber, A.S. Charbonnier, K. Rappers-berger, G. Stingl, and D. Maurer. 1999. CD341 cell-derivedCD141 precursor cells develop into Langerhans cells in aTGF-b1-dependent manner. J. Immunol. 163:4869–4877.
30. Ebner, C., Z. Szepfalusi, F. Ferreira, A. Jilek, R. Valenta, P.Parronchi, E. Maggi, S. Romagnani, O. Scheiner, and D.Kraft. 1993. Identification of multiple T cell epitopes on Betv I, the major birch pollen allergen, using specific T cellclones and overlapping peptides. J. Immunol. 150:1047–1054.
31. Maurer, D., E. Fiebiger, B. Reininger, B. Wolff-Winiski,M.-H. Jouvin, O. Kilgus, J.-P. Kinet, and G. Stingl. 1994.Expression of functional high affinity IgE receptors (FceRI)

892 Cytokines Regulate Cathepsin Activity and MHC-Peptide Display
on monocytes of atopic individuals. J. Exp. Med. 179:745–750.
32. Diwu, Z., C.S. Chen, C. Zhang, D.H. Klaubert, and R.P.Haugland. 1999. A novel acidotropic pH indicator and itspotential application in labeling acidic organelles of live cells.Chem. Biol. 6:411–418.
33. Viola, A., and A. Lanzavecchia. 1996. T cell activation deter-mined by T cell receptor number and tunable thresholds. Sci-ence. 273:104–106.
34. Valitutti, S., S. Muller, M. Dessing, and A. Lanzavecchia.1996. Different responses are elicited in cytotoxic T lympho-cytes by different levels of T cell receptor occupancy. J. Exp.Med. 183:1917–1921.
35. Geissmann, F., P. Revy, A. Regnault, Y. Lepelletier, M. Dy,N. Brousse, S. Amigorena, O. Hermine, and A. Durandy.1999. TGF-b1 prevents the noncognate maturation of hu-man dendritic Langerhans cells. J. Immunol. 162:4567–4575.
36. Sallusto, F., M. Cella, C. Danieli, and A. Lanzavecchia. 1995.Dendritic cells use macropinocytosis and the mannose recep-tor to concentrate macromolecules in the major histocompat-ibility complex class II compartment: downregulation by cy-tokines and bacterial products. J. Exp. Med. 182:389–400.
37. Bogyo, M., S. Verhelst, V. Bellingard-Dubouchaud, S. Toba,and D. Greenbaum. 2000. Selective targeting of lysosomalcysteine proteases with radiolabeled electrophilic substrateanalogs. Chem. Biol. 7:27–38.
38. Buttle, D.J., M. Murata, C.G. Knight, and A.J. Barrett. 1992.CA074 methyl ester: a proinhibitor for intracellular cathepsinB. Arch. Biochem. Biophys. 299:377–380.
39. Palmer, J.T., D. Rasnick, J.L. Klaus, and D. Bromme. 1995.Vinyl sulfones as mechanism-based cysteine protease inhibi-tors. J. Med. Chem. 38:3193–3196.
40. Deussing, J., W. Roth, P. Saftig, C. Peters, H.L. Ploegh, andJ.A. Villadangos. 1998. Cathepsins B and D are dispensablefor major histocompatibility complex class II-mediated anti-gen presentation. Proc. Natl. Acad. Sci. USA. 95:4516–4521.
41. McGrath, M.E. 1999. The lysosomal cysteine proteases.Annu. Rev. Biophys. Biomol. Struct. 28:181–204.
42. Drakesmith, H., D. O’ Neil, S.C. Schneider, M. Binks, P.Medd, E. Sercarz, P. Beverley, and B. Chain. 1998. In vivo
priming of T cells against cryptic determinants by dendriticcells exposed to interleukin 6 and native antigen. Proc. Natl.Acad. Sci. USA. 95:14903–14908.
43. Lanzavecchia, A., G. Lezzi, and A. Viola. 1999. From TCRengagement to T cell activation: a kinetic view of T cell be-havior. Cell. 96:1–4.
44. Antoniou, A.N., S.L. Blackwood, D. Mazzeo, and C. Watts.2000. Control of antigen presentation by a single proteasecleavage site. Immunity. 12:391–398.
45. Via, L.E., R.A. Fratti, M. McFalone, E. Pagan-Ramos, D.Deretic, and V. Deretic. 1998. Effects of cytokines on myco-bacterial phagosome maturation. J. Cell. Sci. 111:897–905.
46. Claus, V., A. Jahraus, T. Tjelle, T. Berg, H. Kirschke, H.Faulstich, and G. Griffiths. 1998. Lysosomal enzyme traffick-ing between phagosomes, endosomes, and lysosomes in J774macrophages. Enrichment of cathepsin H in early endo-somes. J. Biol. Chem. 273:9842–9851.
47. Davidson, H.W., P.A. Reid, A. Lanzavecchia, and C. Watts.1991. Processed antigen binds to newly synthesized MHCclass II molecules in antigen-specific B lymphocytes. Cell. 67:105–116.
48. Inaba, K., S. Turley, T. Iyoda, F. Yamaide, S. Shimoyama,C. Reis e Sousa, R.N. Germain, I. Mellman, and R.M.Steinman. 2000. The formation of immunogenic major his-tocompatibility complex class II–peptide ligands in lysosomalcompartments of dendritic cells is regulated by inflammatorystimuli. J. Exp. Med. 191:927–936.
49. Turley, S.J., K. Inaba, W.S. Garrett, M. Ebersold, J. Unter-naehrer, R.M. Steinman, and I. Mellman. 2000. Transport ofpeptide-MHC class II complexes in developing dendriticcells. Science. 288:522–527.
50. Watts, C. 1997. Immunology. Inside the gearbox of the den-dritic cell. Nature. 388:724–725.
51. Iezzi, G., K. Karjalainen, and A. Lanzavecchia. 1998. Theduration of antigenic stimulation determines the fate of naiveand effector T cells. Immunity. 8:89–95.
52. Kündig, T.M., A. Shahinian, K. Kawai, H.W. Mittrucker, E.Sebzda, M.F. Bachmann, T.W. Mak, and P.S. Ohashi. 1996.Duration of TCR stimulation determines costimulatory re-quirement of T cells. Immunity. 5:41–52.
Copyright © 2022 FDOKUMEN