Elucidating coral reef predator trophodynamics across an ...
Upload
khangminh22Category
view
1download
0
Elucidating patterns of Major Histocompatibility
complex polymorphism in the Trinidadian guppy
(Poecilia reticulata) using Next Generation Sequencing
By
Jackie Lighten
Submitted in partial fulfillment of the requirements for the Degree of
Doctor of Philosophy
At
Dalhousie University
Halifax, Nova Scotia
July 2015
© Copyright by Jackie Lighten, 2015

ii
Table of Contents
List of Tables ………………………………………………………………………………………………….. vii
List of Figures ………………………………………………………………………………………………….. viii
Abstract …………………………………………………………………………………………………………. x
List of Abbreviations Used …………………………………………………………………………….. xi
Acknowledgements ………………………………………………………………………………………. xiii
Chapter 1: Introduction ..………………………………………………………………. 1
The Major Histocompatibility Complex (MHC) ……………………………………… 1
MHC copy number variation (CNV) ………………………………………………………. 3
MHC gene conversion ………………………………………………………………………….. 4
Trans-species polymorphism ……………………………………………………………….. 5
MHC supertypes ………………………………………………………………………………….. 5
Parasite and mate choice mediated natural selection …………………………. 6
The Trinidadian Guppy ……………………………………………………………………….. 7
Overview of the Thesis ……………………………………………………………………….. 9
Chapter 2: Critical review of NGS analyses for de novo genotyping multigene families …………………………………………………………………………………… 15
Abstract ………………………………………………………………………………………………………… 15
Introduction ………………………………………………………………………………………………….. 16
The downside of depth …………………………………………………………………………………. 20
The evolution of NGS MHC de novo genotyping methods ……………………………. 21
Allele validation thresholds (AVTs) ………………………………………………………… 21
Variant clustering …………………………………………………………………………………. 25
Genotype modelling based on theoretical expectations ……………………….. 28
The importance of upholding genotyping assumptions ………………………….. 31
Moving forward: Elucidating gene family CNV and the use of single molecule sequencing …………………………………………………………………………………………………… 33
Conclusion …. ……………………………………………………………………………………………….. 36

iii
Chapter 3: Ultra-deep Illumina sequencing accurately identifies MHC class IIb alleles and provides evidence for copy number variation in the guppy (Poecilia reticulata) ……………………………………… 42
Abstract ………………………………………………………………………………………………………… 42
Introduction …………………………………………………………………………………………………... 43
Methods ………………………………………………………………………………………………………… 45
Samples ………………………………………………………………………………………………………….. 45
Molecular methods ………………………………………………………………………………………… 45
Data analysis …………………………………………………………………………………………………. 47
Sequence preprocessing ………………………………………………………………………… 47
Error correction …………………………………………………………………………………….. 47
Genotype estimation …………………………………………………………………………….. 48
Validating MHC IIb genotypes ………………………………………………………………. 51
Results ………………………………………………………………………………………………………….. 52
Identifying MHC IIb alleles …………………………………………………………………………….. 52
Validating alleles …………………………………………………………………………………………… 53
Genotype estimates ………………………………………………………………………………………. 55
Sequence polymorphism ……………………………………………………………………………….. 56
Discussion …………………………………………………………………………………………………….. 57
Performance of genotyping method ………………………………………………………………. 58
Comparison to previous NGS MHC genotyping methods ………………….…………… 60
Exploring MHC CNV ……………………………………………………………………………………….. 62
Conclusion ……………………………………………………………………………………………………. 64

iv
Chapter 4: The role of MHC and parasites in the secondary sexual colouration of guppies (Poecilia reticulata) ……………………………………….. 70 Abstract …………………………………………………………………………………………………………. 70
Introduction …………………………………………………………………………………………………... 71
Methods …........................................................................................................... 74
Sampling and parasite assessment ..................................................................... 74
Molecular methods ............................................................................................. 74
Population genetic diversity ................................................................................ 75
Male guppy colouration ...................................................................................... 76
Effect of predation level, and drainage on guppy trait variation ........................ 77
Correlations between genetic diversity, colouration, and Gyrodactylus prevalence ……………………………………………………………………………. 77
Results …………………………...................................................................................... 78
Identifying MHC polymorphism ........................................................................... 78
Effect of predation level, and drainage on trait variation ………………………………… 80
Correlations between genetic diversity, colouration, and Gyrodactylus prevalence ……………………………………………………………………………. 80 Discussion ……………………………………………………………………………………………………….. 81 Is predation driving parallel evolution in guppy colour? …………………………………… 82 Parallel patterns of phenotypic and genetic variation relating to parasite driven natural selection and mate-choice driven sexual selection ………………………………………………………………………………………….. 84 Conclusion ……………………………………………………………………………………………………… 87

v
Chapter 5: Supertypes explain paradoxes and reveal cryptic processes of MHC evolutionary ecology: A new perspective ………… 98
Abstract …………………………………………………………………………………………………………… 98
Introduction ……………………………………………………………………………………………………. 99
Methods …………………………………………………………………………………………………………. 102
Sampling …………………………………………………………………………………………………………. 102
Molecular methods …………………………………………………………………………………………. 102
Population and supertype genetic diversity …………………………………………………….. 103
Results ……………………………………………………………………………………………………………. 104
MHC genotypes ……………………………………………………………………………………………… 104
Population differentiation …………………………………………………………………………….… 105
MHC supertype population characteristics …………………………………………………….. 106
Discussion …………………………………………………………………………………………………….. 108
Comparison of MHC allele and supertype diversity improves evolutionary inferences …………………………………………………………………………………………….. 108
Stabilizing selection on MHC supertypes …………….…………………………………………. 111
Conclusion ………………........................................................................................ 115

vi
Chapter 6: General Discussion and Conclusions ……………………………… 127
Redefining NGS approaches to study MHC ……………………………………………………. 128
Sample collection and laboratory protocols ……………………………………………………. 129
MHC supertypes play a role in disease susceptibility and phenotypic variability …………………………………………………………………………………………………….… 133
Supertypes are crucial in the understanding of MHC evolution ………………….… 136
The guppy is a unique model system to study MHC evolution ………………………. 139
Conclusion ……………………………………………………………………………………………………… 140
References ………………………………………………………………………………………………….. 142
Appendix 1: Supporting Information for Chapter 3 ………………………….. 161
Appendix 2: Supporting Information for Chapter 4 ………………………….. 177
Appendix 3: Supporting Information for Chapter 5 ………………………….. 186
Appendix 4: Copyright agreements .......................................…………………. 205
Appendix 5: Electronic Supplements ………………………………………… Uploaded to DalSpace
1: Excel Macro for estimating genotypes
2: Data tables for Chapter 3, Chapter 4, and Chapter 5

vii
List of Tables
Table 2.1. Common assumptions in protocols for genotyping multigene families using NGS, and how those that use AVTs treat these assumption …… 39
Table 2.2. Comparisons among aspects of the main approaches used for de novo genotyping of multigene family loci using NGS …………………………. 40
Table 2.3. Central problems associated with PCR-based analysis of
multigene families that need to be improved …………………………………………….. 41
Table 4.1. Summary metrics of MHC allelic richness (MHC-Ar),
and MHC supertype richness (MHC-STr) ……………………………………………………… 96
Table 4.2. Wilcoxon rank-sum test tests examining variation in
genetic diversity, colouration, and Gyrodactylus prevalence
between drainages, and predation levels ……………………………………………………. 97
Table 5.1. Comparisons of metrics that define east supertype across
populations of guppies ……………………………………………………………………………….. 126
ix
List of Figures
Figure 1.1. Map of Northern South America, Trinidad, and Tobago
within the natural range of the guppy (Poecilia reticulata) ………………. 12
Figure 1.2. Examples of variation in colouration observed among male
guppies (Poecilia reticulata) in natural, and aquarium populations ….. 13
Figure 2.1. The basic stages of analysis used in the current main
approaches for de novo genotyping of multigene family amplicons ... 37
Figure 2.2. Theoretical evaluation of separation of real alleles and
artefacts in amplicons through enforcing genotyping criteria …………… 38
Figure 3.1. Flowchart of analytical steps in the genotyping of
multi-template MHC amplicons …………………………………………………...….. 65
Figure 3.2. A comparison between good- and bad-quality amplicon data …… 66
Figure 3.3. Frequency distributions of Ai estimates among individual
guppies ……………………………………………………………………………………………… 67
Figure 3.4. Depth distribution of PAs and artefacts among amplicons in all
guppy samples with Ai values ranging from Ai = 1 to Ai = 6 .. ………...…… 68
Figure 3.5. Confirmation of the total number of observed unique PAs
within genotypes ……………………………………………………………………………... 69
Figure 4.1: Variation in MHC supertype richness (MHC-STr) between
high and low predation sites, and drainages ……………………………….……. 88
Figure 4.2. Variation in orange body area between high and low predation
sites, and drainages ……………………………………………………………………….…. 89
Figure 4.3. Variation in the number of fuzzy black spots between high
and low predation sites, and drainages ……………………………………………. 90
Figure 4.4. Variation in yellow body area between high and low predation
sites, and drainages …………………………………………………………………………. 91
Figure 4.5. Pearson’s correlation coefficients between Gyrodactylus
prevalence and guppy colouration …………………………………………………… 92
Figure 4.6. Pearson’s correlation coefficients between Gyrodactylus
prevalence MHC supertype frequencies …………………………………………… 93
Figure 4.7. Pearson’s correlation coefficients between guppy colouration
and MHC supertype frequencies ………………………………………………………. 94

ix
Figure 4.8. Pearson’s correlation coefficients between guppy colouration
and MHC supertype richness ……………………………………………………………. 95
Figure 5.1. The relationship between the number of alleles within an
individual (Ai) and the number of supertypes within an individual (STi)
observed among all samples ……………………………………………………………. 116
Figure 5.2. Comparisons of mean population differentiation estimates
(Dest) based on microsatellite, MHC allele, and MHC supertype
frequencies ………………………………………………………………………………………. 117
Figure 5.3. Redundancy of the protein binding region (PBR) translated from
MHC allelic nucleotide sequences in each supertype (Sr) ……………….... 118
Figure 5.4. The geographic distribution of MHC supertypes in guppy
populations across Trinidad and other oceanic islands ……………………. 119
Figure 5.5. The lack of relationship between the number of unique
alleles/PBRs and cumulative population frequency of supertype-9 ….. 122
Figure 5.6. Principle components analysis displaying the variation
among supertypes in multiple metrics ………………………………………….... 123
Figure 5.7. Scheme of the evolutionary relationship between MHC
alleles and supertypes ……………………………………………………………………… 125

x
Abstract
This thesis describes patterns of Major Histocompatibility Complex (MHC) evolution in natural
populations of the guppy (Poecilia reticulata), using Next Generation Sequencing (NGS). I have
proposed a redefinition of the molecular and bioinformatic approaches used to gather NGS
MHC sequence data, and the theoretical considerations required for accurate interpretation of
MHC diversity. The various bioinformatic approaches that are currently implemented in NGS
MHC analysis are critically reviewed to provide a clear understanding of how such data should
be analyzed. A novel molecular and bioinformatics procedure is introduced to estimate MHC
genotypes from NGS data, which performs better than previously used approaches. I also
explore the application of NGS to estimate both allelic and loci copy number variation (CNV)
among guppy populations. Results suggest that both forms of CNV are widespread among
guppies and the complex nature of CNV likely represents an important source of variation both
within and among guppy populations. In addition, I provide novel evidence to suggest complex
interactions between MHC polymorphism, parasite infection, and male colour, which are
implicit in mate choice and believed to be honest signals of immunocompetence. Comparisons
among geographic distributions of MHC supertypes and their constitutional alleles provide
support for a novel model for how MHC evolution is governed. This identifies a combination of
stabilizing selection acting on MHC supertypes (groups of functionally similar/identical MHC
alleles) and random genetic drift coupled with Red Queen processes operating on alleles within
supertypes. Patterns of population differentiation may be misinterpreted to represent high
levels of local adaptation at the allelic level if supertypes are ignored. I propose that MHC
supertypes are an important unit of selection and patterns of MHC CNV (or haplotype variation)
are likely maintained by balancing selection acting on individual loci (or groups of loci), driven
by variable parasite communities. This is summarized as the ‘stabilized supertypes – balanced
loci’ model of MHC evolution. Evidence suggests not only that guppies provide a unique system
to investigate the interplay between parasite mediated natural selection and sexual selection,
but also that the guppy is an ideal model species that can greatly improve our understanding of
MHC evolution in natural populations.

xi
List of abbreviations used
Ai Total number of MHC alleles per individual
Ap Total number of MHC alleles per population
AVT Allele validation threshold
BAC Bacterial artificial chromosome
BLAST Basic local alignment search tool
b Bases
Bp Base pairs
CNV Copy number variation of genes or alleles
DAPC Discriminant Analysis of Principle Components
DNA Deoxyribonucleic acid
dN/dS Non-synonymous/Synonymous base substitution
dNTP Deoxynucleoside triphosphates
DOC Degree of change
HLA Human Leukocyte Antigen
Li Number of loci per individual
MHC I/II/B Major Histocompatibility Complex class I/class II/beta subunit
MID Multiplex identifier
mya Million years ago
MPAF Maximum per-amplicon frequency
N. Total frequency (number)
NFDS Negative frequency dependent selection
NGS Next Generation Sequencing
PA Putative allele
PCA Principle Components Analysis
PCR Polymerase chain reaction
PBR Peptide binding region
RAD-seq Restriction site associated DNA sequencing
RPE Repeatable putative error
ROC Rate of change

xii
Sr The measure of redundancy of PBR amino acid sequences translated from MHC alleles within an MHC supertype
ST Supertype
STi Total number of MHC supertypes per individual
STp Total number of MHC supertypes per population
TSP Trans-species polymorphism
x Sequencing depth

xiii
Acknowledgements
I thank my supervisor Dr. Paul Bentzen for his patience, open-mindedness, knowledgeable
guidance, and advice throughout this project. I also thank Ian Paterson for the same reasons as
well as his invaluable expertise and effort in the lab, which generated the sequence data.
Thanks to Dr. Andrew Hendry, along with past and present members of his research group who
donated samples alongside parasite and colour data. Many thanks also to Dr. Cock van
Oosterhout and Dr. Clive Bennett for their continued enthusiasm and guidance, and to Lyndsey
Baillie for providing the microsatellite data.
Thanks to my peers within and outside of the Marine Gene Probe Laboratory, especially to
Stanley King, and my long term sounding boards Alexander S.T. Papadopulos, Chris Watson, and
Dara Mohammadi for many a fruitful discussion down the pub, excellent constructive criticism
on writings, and for putting up with me in general.
I am very appreciative of the financial support provided by research grants to Dr. Paul Bentzen,
and the Dr. Patrick Lett Fund, which allowed me to undertake this degree.
Above all I thank my unconditionally loving parents for all of the opportunities, experiences,
and support they have given me.

1
Chapter 1
Introduction
With the rapid developments of Next Generation Sequencing (NGS) and other high-throughput
assays over the last ten years, researchers are able to assess diversity at an unprecedented
scale across genomes and ecosystems, improving our understanding of the complexities of
adaptation among species (e.g. Lamichhaney et al. 2015). Notwithstanding cutting-edge NGS
genomic approaches, much of what we have learned about adaptation at the DNA level over
the past three decades has come from the study of a single set of genes - the Major
Histocompatibility Complex (MHC) immune genes. In this thesis I provide significant advances
not only in the application of NGS to the study of MHC, but also to the understanding of
patterns and processes surrounding MHC evolution in natural populations. I examine MHC
diversity across populations of the guppy (Poecilia reticulata) and make a case for how this
already valuable model species can provide further significant advances in the understanding of
MHC evolution in vertebrates. To this end I provide novel insight into the links between MHC
diversity and traits that correlate with fitness, and critically, provide evidence in support of a
new and potentially paradigm shifting theory surrounding the pattern and processes that
characterize MHC diversity.
The Major Histocompatibility Complex (MHC)
The MHC comprises a set of cell surface receptor proteins that are important in the vertebrate
immune system. A large gene family encodes these proteins, which have evolved over
hundreds of millions of years (Danchin et al. 2004), with the specific function of identifying
pathogens, and then initiating an immune response to prevent infection (Hedrick 2002). The
primary role of MHC molecules is to present antigens (small peptides derived from pathogens)
to T-cells. This acts a signaling mechanism for the immune system to make a targeted response
in eradicating pathogens (Simpson 1988; Trowsdale 1993). Proteins of the MHC that are
involved in these adaptive immunological processes are divided into MHC class I (MHC I) and
2
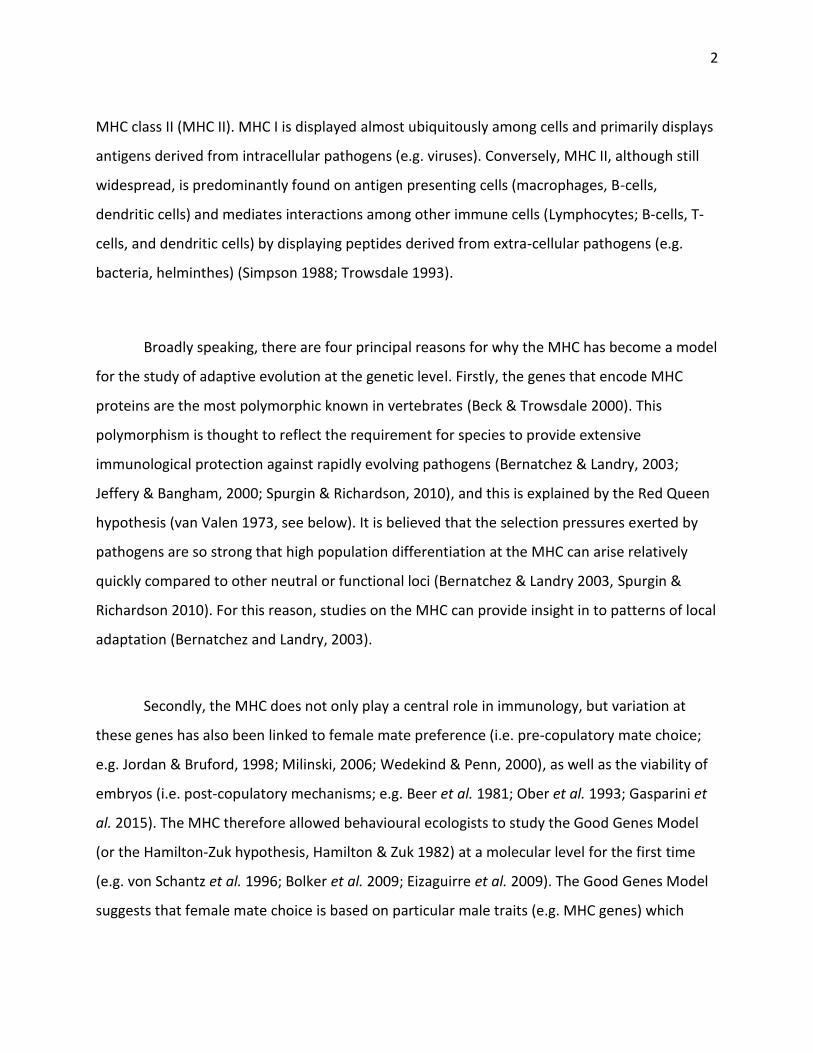
MHC class II (MHC II). MHC I is displayed almost ubiquitously among cells and primarily displays
antigens derived from intracellular pathogens (e.g. viruses). Conversely, MHC II, although still
widespread, is predominantly found on antigen presenting cells (macrophages, B-cells,
dendritic cells) and mediates interactions among other immune cells (Lymphocytes; B-cells, T-
cells, and dendritic cells) by displaying peptides derived from extra-cellular pathogens (e.g.
bacteria, helminthes) (Simpson 1988; Trowsdale 1993).
Broadly speaking, there are four principal reasons for why the MHC has become a model
for the study of adaptive evolution at the genetic level. Firstly, the genes that encode MHC
proteins are the most polymorphic known in vertebrates (Beck & Trowsdale 2000). This
polymorphism is thought to reflect the requirement for species to provide extensive
immunological protection against rapidly evolving pathogens (Bernatchez & Landry, 2003;
Jeffery & Bangham, 2000; Spurgin & Richardson, 2010), and this is explained by the Red Queen
hypothesis (van Valen 1973, see below). It is believed that the selection pressures exerted by
pathogens are so strong that high population differentiation at the MHC can arise relatively
quickly compared to other neutral or functional loci (Bernatchez & Landry 2003, Spurgin &
Richardson 2010). For this reason, studies on the MHC can provide insight in to patterns of local
adaptation (Bernatchez and Landry, 2003).
Secondly, the MHC does not only play a central role in immunology, but variation at
these genes has also been linked to female mate preference (i.e. pre-copulatory mate choice;
e.g. Jordan & Bruford, 1998; Milinski, 2006; Wedekind & Penn, 2000), as well as the viability of
embryos (i.e. post-copulatory mechanisms; e.g. Beer et al. 1981; Ober et al. 1993; Gasparini et
al. 2015). The MHC therefore allowed behavioural ecologists to study the Good Genes Model
(or the Hamilton-Zuk hypothesis, Hamilton & Zuk 1982) at a molecular level for the first time
(e.g. von Schantz et al. 1996; Bolker et al. 2009; Eizaguirre et al. 2009). The Good Genes Model
suggests that female mate choice is based on particular male traits (e.g. MHC genes) which

3
provide honest indicators of the ability to optimize reproductive success in offspring.
A third important feature of the MHC is that the functional properties of the amino
acids on which diversifying selection acts have been identified through crystallography studies
(Brown et al. 1993; Stern et al. 1994). Given that the majority of protein encoding DNA
sequence within genomes is under purifying selection (Asthana et al. 2007; Lawrie et al. 2013),
the identification of the exact amino acids, translated from DNA, that are under diversifying
selection is instrumental in evolutionary genetics studies of these genes. Notably, the relative
position of the DNA codons that translate these amino acids is highly conserved within the gene
sequences across vertebrate taxa (e.g. O’Callaghan et al. 1998; Dzuris et al. 2000). These codons
constitute the region of the MHC complex that interacts with antigens, which is known as the
peptide-binding region (PBR). Positive selection at these codons drives adaptation in efficiently
displaying unique peptides (Hughes & Nei 1988).
A fourth reason for studying MHC is that the effects of recombination-like processes
such as gene conversion and micro-recombination can be studied in detail due to the fact that
the MHC is commonly characterized by multiple gene copies. This means that the diversity can
be re-arranged between gene paralogues by gene-conversion events and micro-recombination
(see below). This can promote rapid expansion of MHC haplotype diversity and immunological
repertoires within populations, and various models have been suggested to describe this
adaptive expansion and contraction of gene copy number variation (CNV; see below) (cf. the
Accordion Model of multigene evolution, Klein et al. 1993; and the Birth and Death Model of
multigene evolution, Nei et al. 1997).
MHC copy number variation (CNV)
Gene copy number variation (CNV) is a form of genomic structural variation where regions of
DNA are either lost or duplicated. The study of CNV has gained attention in recent years as
genomic analyses increase in sophistication, revealing their importance in disease susceptibility

4
and fitness (Kondrashov 2012; Katju & Bergthorsson 2013). CNV at the MHC is commonly
observed, where ancient gene duplication events have led to an increase in the immune gene
repertoire expressed within individuals in order to combat a larger array of pathogens. Copy
number variation can be further augmented by unequal crossing over during meiosis, and
because gene duplications/deletions are largely heritable (Locke et al. 2006), sexually
reproducing populations can comprise an array of MHC CNV patterns among individuals (e.g.
Chapter 3; Lighten et al. 2014a). Consequently, genotypes may consist of different numbers of
allele copies among MHC loci (which can also vary in number), meaning that loci can be
homozygous (carrying two identical alleles), heterozygous (carrying two distinct alleles), or
hemizygous (carry just a single copy of an allele) (e.g. Chapter 3; Lighten et al. 2014a). Indeed,
because the MHC is a gene dense region containing multiple paralogous gene copies, it is often
difficult to fully characterize in non-model species that lack detailed genomic data. As such,
gene CNV is often inferred indirectly by counting the number of alleles observed within a
genotype. However, such an approach is likely to be inaccurate because it is impossible to
discriminate between hemizygous and homozygous genes. Notwithstanding these difficulties,
MHC CNV is likely an important source of variation in most vertebrate species given that the
number and diversity of alleles within an organism can affect both disease susceptibility and
mate choice (e.g. Siddle, 2010, and see below). However, the evolutionary processes operating
on MHC CNV remain unclear.
MHC gene conversion
Point mutations in the MHC generate novel sequence variation and an excess of non-
synonymous base substitutions in the PBR are a consequence of pathogen driven positive
selection (Hughes & Nei 1988). In addition, micro-recombination events can re-distribute
existing DNA variation within and among MHC loci, resulting in the formation of new
haplotypes (Chen, 2007; Ohta, 1991). Gene-conversion is believed to be an important source
for generating variation in MHC functional haplotypes (Högstrand & Böhme 1999; Martinsohn
et al. 2000; Hosomichi et al. 2008). Indeed, a recent study showed that gene conversion events

5
generated MHC haplotype variation at a rate an order of magnitude greater than point
mutations, and these were especially important in augmenting variation in genetically
depauperate populations (Spurgin et al. 2011). Despite the observation that gene conversion
can rapidly generate haplotype variation, over time it is believed to homogenize sequence
variation at paralogous loci (Ezawa et al. 2010; Takuno et al. 2010), and so the extent of gene
conversion likely varies between species and along spatial and temporal scales.
Trans-species polymorphism
Trans-species polymorphism (TSP) describes the presence of similar (but not identical) alleles in
divergent species (Arden & Klein, 1982; Klein, 1987; Klein et al. 1998; Klein et al. 2007). This
occurs though the retention of ancestral allelic genealogies (and not convergent evolution)
from ancestral species to descendent species. In the MHC, balancing selection is believed to
drive TSP, and coalescence times of genes displaying TSP are much greater (millions of years)
than those of neutrally evolving genes and pre-date speciation events (Takahata 1990;
Takahata & Nei 1990). Moreover, a recent comparison between humans and chimpanzees
showed that in addition to the MHC, over 100 genomic regions, involved in interactions with
pathogens, displayed TSP (Leffler et al. 2013). The authors conclude that balancing selection
acting on immune genes can persist for millions of years, maintaining critical functionality
despite wide-spread genomic divergence between species.
MHC supertypes
The concept of MHC supertypes (or superfamilies) originates from human studies aimed at
classifying groups of MHC alleles with similar binding properties for common motifs
(supermotifs) derived from pathogens (del Guercio et al. 1995). Such classification of
supertypes has shown to be valuable in developing vaccines targeting particular group of
antigen epitopes (Sidney et al. 1996; Sette & Sidney 1998; Sette et al. 2002). Revealing the
functional characteristics of MHC alleles is crucial in understanding their role in adaptive
immunity, but such data have generally been restricted to model organisms, where in-depth

6
experimental and theoretical research is required (Sette et al. 2002). However, bioinformatic
approaches have recently been developed which allows statistical characterization of
supertypes based on inferred shared functional properties of the amino acids, which constitute
MHC genes (Doytchinova et al. 2004; Doytchinova & Flower, 2005). In doing so, studies of non-
model organisms have been able to adopt MHC supertype analysis in order to infer MHC
functionality in studies of adaptation in natural populations (Schwensow et al. 2007; Sepil et al.
2013a; b). Despite this, the application of such analyses in studies of evolutionary ecology
remains sparse, and so the significance of supertypes and their evolution in natural populations
remains poorly characterized.
Parasite and mate choice mediated natural selection
Multiple evolutionary hypotheses have been proposed to explain the high polymorphism
observed at MHC loci. Parasites are thought to exert balancing selection on MHC polymorphism
though negative frequency-dependent selection (NFDS), heterozygote advantage
(overdominance), or fluctuating selection over time (reviewed in Edwards & Hedrick, 1998;
Spurgin & Richardson, 2010). However, disentangling the relative contributions of each of these
processes in natural populations has been difficult, and so convincing empirical evidence in
their support is sparse (but see Eizaguirre et al. 2012). Moreover, models suggest that
heterozygote advantage can explain the high polymorphism observed at MHC loci, but this
model requires that the fitness of homozygotes are nearly equal, i.e. symmetric overdominance
(De Boer et al. 2004). The model by De Boer et al. (2004) shows that under asymmetric
overdominance, the equilibrium level of polymorphism is considerably lower. Given the large
number of MHC alleles, it seems unlikely that all homozygous genotypes have a similar fitness
disadvantage (and that all heterozygous genotypes the same fitness advantage). Consequently,
overdominance is unlikely to be the only selective force to maintain MHC polymorphism and
large allelic diversity at the MHC.

7
Negative frequency-dependent selection assumes that an ongoing evolutionary arms
race between host MHC genes and evolving parasites acts to preserve polymorphism (Spurgin
& Richardson, 2010). Rare alleles in a population confer a selective advantage in parasite
resistance over more common alleles, and so increase rapidly in a population. Counter-
adaptation of parasites will then lead to a reduction in selective advantage of these alleles, and
then to an adaptive allele frequency flux as other rare alleles again increase in frequency
through novel selective advantages. However, empirical evidence in support of NFDS remains
elusive. It has also been proposed that rare-allele advantage may be augmented by mate
choice, where females choose to mate with males which carry alleles that increase fitness in
offspring (Ejsmond et al. 2014; Milinski 2006). Indeed, MHC based mate choice has been
observed across taxa (e.g. Winternitz et al. 2013), and is believed to be driven by MHC-related
odors which convey attractiveness of potential mates (Wedekind & Penn 2000). Females may
choose males that have more different MHC alleles to themselves, and so aim to increase the
allelic diversity in their offspring (Milinski 2006). Recent evidence also suggests that MHC
assortative-mate choice may facilitate local adaptation to endemic pathogens by reducing
overall diversity through the increase of crucially functioning alleles (Sin et al. 2015).
The Trinidadian Guppy
The guppy is a small freshwater fish native to Northern South America and Central America
(Figure 1.1). The contemporary species distribution outside of the neotropics represents human
mediated introductions intended to control mosquitos, however its presence on the Caribbean
Islands of Trinidad and Tobago is a consequence of natural colonization events from South
America during periods of low sea level (Magurran 2005). The ability of guppies to thrive in
fresh or brackish water, alongside a high tolerance to relatively harsh conditions, has greatly
aided colonization of new habitats (e.g. Lindholm et al. 2005). Moreover, their high propensity
for rapid evolution and adaptation (aided by relatively short generation times) has not only
made guppies a valuable model species in biological studies, but has also gained them global
popularity with aquarium hobbyists, where selective breeding has led to a myriad of ‘fancy’

8
guppy strains and phenotypes (Figure 1.2).
Much of the evolutionary and ecological research on guppies has focused on natural
populations in Trinidad. The Northern Range of Trinidad comprises many discrete and diverse
riverine ecosystems to test hypotheses of local adaptation. The many isolated populations of
guppies in these rivers, coupled with their propensity to evolve independently over relatively
small spatial scales in response to local ecological pressures (Reznick et al. 1997) has resulted in
a “natural laboratory” for studies of vertebrate ecology and evolution (Haskins et al. 1961).
Guppies show significant variation in genetics, morphology, colouration, feeding behaviour,
predator avoidance, courtship, and mating behavior among populations (Meffe 1989; Houde
1997; Magurran 2005; Willing et al. 2010; Evans et al. 2011; Baillie 2012). The value of guppies
as a model species has led to them being extensively studied both in natural populations and
under controlled experimental conditions in the lab and field (reviewed in Meffe 1989; Houde
1997; Magurran 2005; Evans et al. 2011).
Numerous studies have investigated MHC in guppies and observed reductions in
diversity through inbreeding (Sato et al. 1996; van Oosterhout et al. 2006a), inferred the
presence of both random genetic drift and balancing selection in the distribution of MHC allelic
diversity (van Oosterhout et al. 2006b; Herdegen et al. 2014), proposed extensive allelic and
loci CNV (Llaurens et al. 2012; Chapter 3; Lighten et al. 2014a), temporal variation in allele
frequencies (Fraser et al. 2010), and parasite mediated homogenizing selection (Fraser & Neff,
2010). While each of these findings are interesting in their own right, none have made a case
for the guppy to be considered as a model system in MHC studies. This is likely due to similar
findings being observed in other species (Bernatchez & Landry 2003; Piertney & Oliver 2006),
and so researchers interested in understanding MHC evolutionary ecology (rather than using
MHC to understand functional diversity in their focal species) have no impetus to focus solely
on guppies. A central aim of this thesis is to demonstrate that guppies offer a unique system for

9
the study of MHC, and can provide great insight into its evolution and function, which is
potentially absent from other study systems.
Overview of the Thesis
This thesis examines MHC evolutionary dynamics in guppy populations using NGS, and
examines the relationship between MHC polymorphism and guppy traits that correlate with
fitness (colouration, and parasite infections). This study represents the largest study of guppy
MHC to date, in terms of the number of studied samples, populations, spatial scale, and data
types (MHC and microsatellite genotypes, guppy colouration, and parasite quantification).
Chapter 2 discusses the basic concepts and issues surrounding the implication of NGS in
characterizing MHC genotypes. This chapter has been published in Molecular Ecology (2014)
23(16):3957-72, and my contributions included conception of the study, development and
execution of the analysis, interpretation of the results and writing of the paper. The various
bioinformatic approaches that are currently implemented are critically reviewed, and
commonly overlooked problems in these procedures are outlined. The aim of this chapter is to
provide a clear understanding of how NGS MHC data should be analyzed to provide accurate
genotypes in the face of potentially high bias associated with NGS data. In conclusion, I suggest
that bioinformatic approaches should adhere to strict genotyping assumptions and follow
sequencing depth modeling procedures. This can facilitate accurate separation of real
sequenced allelic variants from those that represent sequence artifacts or cross sample
contaminants. To date the only procedure that implements such a strategy is that which I
describe in the next chapter.

10
Chapter 3 introduces a novel molecular and bioinformatic procedure to estimate MHC
genotypes from NGS data, and is exemplified using individuals from multiple guppy
populations. This procedure differs greatly to those previously used and is demonstrated to
perform significantly better in reducing both Type I (erroneously including artifacts within a
genotype) and Type II (erroneously excluding true alleles from a genotype) genotyping error.
This is achieved by strictly adhering to commonly asserted genotyping assumptions (as opposed
to previous studies) and modelling the sequencing depth distribution of sequence variants
within each sample to accurately separate real alleles and sequence artifacts. Along with the
accurate identification of alleles within a genotype, I also explore the application of ultra-deep
NGS to estimate both allelic and loci CNV among guppy populations. Results suggest that both
forms of CNV are widespread among guppies and the complex nature of CNV likely represents
an important source of variation both within and among guppy populations. This chapter was
published in Molecular Ecology Resources (2014) 14(4): 753-767, and my contributions were the
same as in the previous chapter.
Chapter 4 examines the relationship between MHC polymorphism and traits related to
fitness in guppies – male coloration and parasite infection. Across populations I reveal
significant relationships between MHC population richness, particular MHC supertypes, and
changes in particular colouration (which are believed to be an honest signal of male fitness and
are implicit in mate choice) and prevalence of Gyrodactylus monogean helminthes. Crucially,
some of these relationships vary among river drainages, suggesting local adaptation. The most
conservative explanation for such patterns is that the metabolic pressure exerted by parasites
on the host immune system directly affects colouration believed to signal immunocompetence
(Houde & Torio 1992; Houde 1997; Maan et al. 2006, c.f. the 'good genes' hypothesis, and the
'indicator' hypothesis, Mays & Hill 2004). In comparisons across populations, MHC supertype
richness was positively correlated with Gyrodactylus prevalence, and negative correlated with
colour area and number of spots. These relationships are likely to be a consequence of

11
balancing selection acting on MHC supertype diversity driven by local variation in parasite
communities. In addition, I demonstrate that MHC allelic diversity is significantly correlated
with neutral microsatellite diversity; whereas, MHC supertype diversity and microsatellite
diversity are not correlated. This suggests that supertypes are less affected by demographic
processes, compared to MHC alleles, and may better represent the unit upon which selection
operates (discussed further in Chapter 5). This is the first-time such relationships have been
observed among these important fitness and mate choice related traits, and between MHC
alleles and supertypes.
Chapter 5 examines in detail the spatial distribution of MHC supertypes across guppy
populations. In doing so I describe how population structuring of MHC allelic diversity is
affected by neutral demographic processes, whereas supertype population structuring is not.
Moreover, the study of MHC supertypes in comparison with their constituent alleles reveals
detailed cryptic processes surrounding MHC evolution that cannot be inferred by the study of
MHC alleles alone, as is traditional done. I provide the first evidence to suggest that strong
stabilizing selection has operated on MHC alleles within loci specific supertypes over millions of
years in both the guppy and its relative, the swamp guppy (Poecilia picta). In concert, I suggest
that balancing selection operates directly on loci (supertypes) to produce complex patterns of
CNV both within and among populations. This helps to resolve the largely unexplained
phenomenon of MHC TSP. The spatial and temporal patterns that stabilizing selection
generates in MHC allelic diversity can be erroneously interpreted as widespread divergent
selection among populations when supertypes are not considered. This is because as MHC
allele frequencies alone may be highly differentiated among populations due to genetic drift,
and when supertypes are not considered, this is interpreted as a signature of local adaptation
(because each allele is assumed to be functionally important/unique). However, this common
interpretation fails to explain the maintenance of TSP. In conjunction with stabilizing selection I
suggest that haplotypes of MHC supertype CNV are a central unit upon which balancing
selection operates, and high levels of functional similarity among alleles within a supertype

12
render individual allele frequencies susceptible to random genetic drift. Those alleles within
supertypes which differ in fitness effects may rapidly change in frequency due to inter-
supertype Red Queen processes. This can help understand TSP and supports previous models
showing that TSP cannot be explained by balancing selection on MHC alleles (van Oosterhout,
2009b). The culmination is a description of a new paradigm in the study of MHC evolution,
which resolves multiple unexplained and commonly observed paradoxes. I purport that the
combined study of MHC alleles, supertypes, and neutral loci is required to accurately interpret
temporal and spatial patterns of MHC evolution.

13
Figure 1.1. The region of Northern Southern America, Trinidad and Tobago within the natural range of the guppy (Poecilia reticulata). Genetic evidence suggests that guppies invaded Trinidad and Tobago from ancestral population in the Orinoco River during periods of low sea level (Magurran 2005). (Used with permission from Baillie, 2012).
10
Figure 2.1: Map of a portion of the north-east coast of South America, showing the location of the islands of Trinidad and Tobago and the Orinoco River delta.

14
(a)
(b)
Figure 1.2. (a) Examples of variation in colouration observed among male guppies (Poecilia reticulata). Each group of five individuals were taken from separate natural populations in Trinidad. Photo: Andrew Hendry. (b) Selective breeding is able to produce a wide range of male phenotypic variation. These ‘fancy guppies’ are among the most popular aquarium species. Photo: unknown)

15
Chapter 2 Critical review of NGS analyses for de novo genotyping multigene families
Abstract
Genotyping of highly polymorphic multigene families across many individuals used to be a
particularly challenging task because of methodological limitations associated with traditional
approaches. Next-generation sequencing (NGS) can overcome most of these limitations, and it
is increasingly being applied in population genetic studies of multigene families. Here, I critically
review NGS bioinformatic approaches that have been used to genotype the Major
Histocompatibility Complex (MHC) immune genes, and I discuss how the significant advances
made in this field are applicable to population genetic studies of gene families. Increasingly,
approaches are introduced that apply thresholds of sequencing depth and sequence similarity
to separate alleles from methodological artefacts. I explain why these approaches are
particularly sensitive to methodological biases by violating fundamental genotyping
assumptions. An alternative strategy that utilizes ultra-deep sequencing (hundreds to
thousands of sequences per amplicon) to reconstruct genotypes and applies statistical methods
on the sequencing depth to separate alleles from artefacts appears to be more robust. The
‘degree of change’ (DOC) method avoids using arbitrary cut-off thresholds by looking for
statistical boundaries between the sequencing depth for alleles and artefacts, and hence, it is
entirely repeatable across studies. Although the advances made in generating NGS data are still
far ahead of our ability to perform reliable processing, analysis and interpretation, the
community is developing statistically rigorous protocols that will allow us to address novel
questions in evolution, ecology and genetics of multigene families. Future developments in
third-generation single molecule sequencing may potentially help overcome problems that still
persist in de novo multigene amplicon genotyping when using current second-generation
sequencing approaches.

16
Introduction
Next-generation sequencing (NGS) techniques allow researchers to provide answers to
questions in evolution, ecology and genetics that were previously unobtainable when restricted
to traditional molecular approaches (Koboldt et al. 2013). Sequence data are relatively cheap
and rapidly generated. However, with ever-decreasing costs, genetic data sets become bigger
and so do the challenges in analysing them. Ironically, some of the genes that have taught us
the most about adaptive processes in the last three decades prove to offer some of the biggest
challenges. Consider, for example, the adaptive immunity genes of the Major Histocompatibility
Complex (MHC), which are among the best-studied systems in evolutionary genetics. The MHC
is a notoriously difficult region to assemble and characterize, even when using non-targeted
‘shotgun’ sequencing approaches aimed at resolving large unknown genomic regions (Warren
et al. 2012). Approaches that target individual MHC genes in multiple individuals (i.e. in
population genetic studies) have been popular, yet bear a unique set of problems that still
hinder accurate MHC characterization (see Babik 2010, and below). Moreover, newly emerging
targeted NGS analyses raise novel complications that need to be considered when genotyping
highly polymorphic multigene families. In this chapter, I will discuss the current advances made
in this field, and although I focus on the MHC, the lessons learned from analysing these genes
can be extended and applied to other multigene families, including resistance genes (R-genes)
and self-incompatibility genes (SI-genes) in plants; the P450 superfamily and ATP-binding
cassette transporter superfamily present in all domains of life; homeobox genes in animals,
plants and fungi; the immunoglobin superfamily in vertebrates; effector and virulence genes in
pathogens; reptile toxin genes; cadherin cell adhesion genes and many more (e.g. see
www.genenames.org/genefamilies; www.genomics.msu.edu/cgi-
bin/plant_specific/family_search.cgi).
The vertebrate immune genes of the MHC are perhaps the most studied gene family
and remain one of the best systems to investigate the effects of evolutionary forces operating
at the nucleotide level (Bernatchez & Landry 2003; Piertney & Oliver 2006; Vandiedonck &

17
Knight 2009). Major Histocompatibility Complex proteins recognize, bind and present the
peptides of pathogens to the T cells of the infected host, which initiates the adaptive immune
response. The evolution of pathogens is geared towards escaping immune recognition by the
MHC, whereas natural selection in host species favours individuals with an effective immune
defense that protects against infections. This results in a series of adaptations and counter-
adaptations, which drive the co-evolutionary arms race between host and pathogens. This
process has become known as the Red Queen hypothesis (van Valen 1973; Ladle 1992) and is it
is believed to be responsible for the high levels of allelic variation that are commonly observed
at MHC genes (Piertney & Oliver 2006; Spurgin & Richardson 2010; Eizaguirre et al. 2012).
However, the particular MHC genes studied by most researchers (i.e. the MHC class I
and class II genes) are just a small part of the suite of genomic regions involved in
immunological processes. In humans, for example, the MHC (or the human leucocyte antigen
(HLA)) spans 4 × 10⁶ nucleotides and comprises over 128 expressed genes (Mehra & Kaur 2003).
In most vertebrates, the MHC in its entirety is a tightly linked, gene-dense region consisting of
tens to hundreds of immune- and non-immune-related genes (e.g. The MHC sequencing
consortium 1999; Xie et al. 2003). Because of this genomic complexity and the fact that natural
selection on the MHC interacts with other evolutionary forces (i.e. mutation, recombination,
genetic drift and gene flow), many evolutionary processes operate within this relatively small
genomic region such as epistasis, pleiotropy, linkage disequilibria, Muller's ratchet, trans-
species polymorphism, gene duplication, gene conversion, micro-recombination, transposon
accumulation and intron-mediated gene expression regulation (van Oosterhout 2009a; van
Oosterhout 2009b; Croisetière et al. 2010; Spurgin et al. 2011; Llaurens et al. 2012).
Besides being part of a complex multigene family, most MHC class I and II genes have
undergone multiple independent gene duplication events (Dawkins et al. 1999; Kulski et al.
2002). These duplications affect host adaptation by augmenting the immune defense
repertoires within individuals and populations, or increase the dosage of advantageous alleles
across loci. Individuals may contain multiple polymorphic loci at particular MHC genes as a

18
result of gene duplication, and the total number of loci can vary among individuals, populations,
and species, resulting in so-called copy number variation (CNV; i.e. individuals may comprise
different numbers of alleles due to different degrees of gene duplication; e.g. Traherne 2008;
Eimes et al. 2011; Llaurens et al. 2012; Cheng et al. 2012; Winternitz et al. 2013; Chapter 3;
Lighten et al. 2014a). The high nucleotide similarity between the duplicated gene copies may
facilitate recombinational processes such as micro-recombination (exchange of DNA sequence
fragments between alleles within or between loci), leading to gene conversion and
redistribution of nucleotide variation across MHC gene paralogues (Cullen et al. 2002; Eimes et
al. 2011). Such processes have been implicated in the rapid formation of novel MHC alleles
(Spurgin et al. 2011; Zhao et al. 2013), and recombination may be important in promoting CNV
across genomic loci (Völker et al. 2010; van Oosterhout 2013). At other non-MHC genomic loci,
multiple de novo CNVs (believed to be functional) have even been identified in progeny that
were not present in either parents (Samarakoon et al. 2011), and so CNV may act as an
important source of genomic variation in driving rapid adaptation to new or changing
environments. Moreover, the adaptive significance of CNV has recently been described in
another important immune-related multigene family – the human immunoglobin heavy-chain
multigene region (IGH), which encodes the highly variable peptides that constitute antibodies,
and is essential in adaptive immunity (Watson et al. 2013). The critical task of accurate
characterization of MHC (and IGH) diversity within populations is made challenging both by the
unknown amount of CNV as well as by the exceptionally high level of polymorphism within
individual MHC genes (and the complex gene interactions, which produce extreme diversity in
IGH peptides; Watson et al. 2013). These issues make it difficult to target individual loci and
characterize all variation, and generally with MHC, researchers use degenerate PCR primers to
conduct multi-locus genotyping (Babik 2010). Once primers have been designed that maximize
the potential to amplify alleles across loci (see e.g. Burri et al. 2014), researchers have a choice
of multiple strategies to identify unique alleles within multi-template PCR products or
amplicons. (Hereafter, I define an amplicon as a set of unique sequences that is derived from
the same PCR, and the sequences can include allelic copies as well as copies of paralogous
genes). The strategies can be grouped in two categories: (i) those that implement NGS; and (ii)
those that apply ‘traditional’ molecular approaches (e.g. PCR, cloning and Sanger sequencing,

19
single-strand conformation polymorphism, denaturing gradient gel electrophoresis; see Babik
2010 for an in depth review).
Many protocols have been developed to minimize biases associated with multi-locus
genotyping. In particular, they have aimed to identify sequence artefacts generated by sources
of methodological error, such as polymerase generated random base-mismatch errors, PCR-
associated chimeras and cloning-derived mosaic-sequences (e.g. Lenz & Becker 2008;
Cummings et al. 2009; Babik 2010). To exclude these errors, genotypes have often been based
on the validation of alleles through observing each sequence variant in at least two
independent PCR products (Babik 2010). This allele validation threshold (AVT) was set low
because of the long and expensive laboratory protocols associated with traditional approaches.
The relatively low throughput of traditional methods also means that allele dropout (the failure
to include a true allele in a genotype) may reduce genotyping accuracy, especially when PCR
bias occurs (Sommer et al. 2013). For example, disproportionately fewer clones (each specific
to a particular allele) will represent alleles that are less preferentially amplified, and so these
alleles have less chance of being sequenced when a low number of clones are screened.
In theory, NGS protocols should not be hindered by allele dropout caused by low
throughput because an amplicon can be screened hundreds to thousands of times. This
eliminates the shortcoming of being restricted to sequencing just a handful of clonally amplified
products per amplicon. Nevertheless, the rationale and thinking that has been developed over
decades using traditional approaches continues to resonate in processing NGS data. Contrary to
traditional methods, deep re-sequencing allows for the sensitive detection of alleles within an
individual even if some are less preferentially amplified (Sommer et al. 2013). However, along
with this increased resolution comes the potential for NGS to introduce new problems that may
reduce genotyping accuracy. Higher error rates and increased sequencing depth also increase
the likelihood of observing artefacts (Harismendy et al. 2009; see next section). This means that
their separation from real MHC alleles has become more challenging in NGS data than in
previous methods (discussed below). Although this problem was first emphasized alongside the
obvious benefits that NGS offers (Babik et al. 2009), it did little to tarnish the perception

20
generated in initial studies that NGS offers a relatively straightforward bioinformatic approach
to genotype MHC loci (Wegner 2009; Babik 2010; Galan et al. 2010). However, specific
problems were not fully recognized in earlier studies, and therefore, a broadly accepted and
rigorously tested theoretical or methodological approach for converting raw NGS data to MHC
genotypes is yet to emerge.
The downside of depth
The total re-sequencing depth of an amplicon required to confidently characterize the
polymorphism at diploid loci (reviewed in Nielsen et al. 2011) is easier to empirically evaluate
than the depth required in studies of multigene families. A global minimum re-sequencing
depth for accurate genotyping cannot be easily implemented because of unknown CNV. This
issue is compounded by (i) PCR amplification bias that may result in unequal amplification of
alleles (van Oosterhout et al. 2006b; Cummings et al. 2010; Sommer et al. 2013), (ii) repeatable
sequence-specific NGS base-mismatch errors (Harismendy et al. 2009; Gilles et al. 2011;
Chapter 3; Lighten et al. 2014a) and (iii) sensitive detection of low copy number DNA sequences
in amplicons when using NGS (Li & Stoneking 2012). These factors are problematic because low
copy number base-mismatch errors (generated during PCR or sequencing) and cross-sample
contamination can be common occurrences, and they can be observed at high sequencing
depths when using NGS approaches (Li & Stoneking 2012; Sommer et al. 2013; Chapter 3;
Lighten et al. 2014a). Both PCR bias and the presence of artefacts can vary among amplicons
(Sommer et al. 2013) and increase the likelihood of including artificial variants in genotypes
(Type I genotyping error) or excluding real alleles from genotypes (Type II genotyping error).
These problems are common to any NGS approach, and therefore, NGS bioinformatics used to
genotype MHC loci and other multigene families should apply much more stringent criteria
than traditional approaches in the separation of alleles and artefacts. This requires knowledge
of the error distributions specific to NGS technologies, and a shift from the genotyping rationale
of traditional sequencing.

21
The evolution of NGS MHC de novo genotyping methods
Since the first application of NGS to genotyping MHC loci (Babik et al. 2009), the approach has
gained popularity because of improved efficiency in sequence data collection. However, the
bioinformatic methods employed to transform raw sequence data into genotypes have been
quite variable. Here, I summarize the three main concepts used for NGS de novo genotyping of
MHC loci, which use (i) allele validation thresholds (AVTs); (ii) variant clustering methods; and
(iii) CNV methods (or relative sequencing depth modelling). The latter most recent approach
uses expectations derived from NGS assumptions and genetic models of CNV to facilitate
genotyping.
Allele validation thresholds (AVTs)
A key assumption in NGS studies of the MHC is that true alleles should be observed at greater
depths than artefacts (Babik et al. 2009). There are, however, also several largely unspoken
assumptions, which are likely to be violated in NGS studies. These include the supposition that
all sequencing errors are random (which they are not), that the amplification process does not
unduly bias the observed sequence depth of certain alleles (which it can), and the belief that
minute amounts of contamination will not be picked up as a signal (which most certainly will be
the case when using deep sequencing). Before evaluating the consequences of violating these
assumptions, I will discuss the rationale of AVT protocols.
The AVT protocol aims to distinguish artefacts from genuine alleles based on a
determined level of variant sequencing replication within and/or among independent PCR
amplicons. The AVT method usually comprises two separate components (summarized in
Figure 2.1): (i) a minimum required sequencing depth of a variant within and/or among
amplicons to initially be considered as a putative allele (AVT1); and (ii) a minimum within-
sample sequencing depth that is required to separate alleles from artefacts in variants that pass
the first threshold (AVT2). Babik et al. (2009) set AVT1 as the observation of a variant in at least

22
two amplicons at a depth of ≥2× in at least one, or 1× depth in at least three amplicons. Ideally,
if an AVT1 is used, it should be based on an understanding of the error distributions observed
among the products of the various stages in a genotyping workflow (e.g. PCR, sequence
coverage and specific NGS technologies), and it should not be adopted from traditional
sequencing approaches. Galan et al. (2010) went further to calculate the probability of
sufficiently filtering out artificial sequences under different AVT1 stringencies. They based their
calculation on estimating the probability of observing a single random base-mismatch
sequencing error derived from a true allele within a sample. They calculated that the
probability a sequence occurred with at least one sequencing error in the data set was
sufficiently low (P = 0.11) so that the overall probability of observing exactly the same error in
three or more sequences was negligibly small (P = 10−8). Thus, an AVT1 of 3× was implemented
and further justified by the use of similar criteria in cloning and Sanger sequencing studies (e.g.
Cummings et al. 2010). The two examples were then unified by Zagalska-Neubauer et al. (2010)
who proposed a genotyping AVT1 of 3× depth in at least two amplicons for variants to be
considered as true alleles. This particular AVT1 has been commonly applied in NGS MHC studies
with the occasional minor modification. However, in some cases, arguments for relaxed AVT1
criteria were made, evidently to maximize data retention (e.g. Nadachowska-Brzyska et al.
2012; Sepil et al. 2012), but possibly at the cost of reduced statistical rigour and genotyping
accuracy. The problem with setting an AVT1 based on random sequencing errors is that errors
may be nonrandom (Gomez-Alvarez et al. 2009; Gilles et al. 2011), which means that the
probability of detecting the same artefact multiple times will be underestimated. Furthermore,
the number of artefacts will increase both with sequence depth and the number of samples,
and hence, every study will need to calculate their own AVT1 value based on the observed error
distributions.
Commonly, to estimate AVT2, the percentage of amplicon sequencing depth attributed
to each variant that passed AVT1 is calculated, and then all unique variants observed among
amplicons are ranked in order of their maximum per-amplicon frequency (MPAF; Zagalska-
Neubauer et al. 2010). By comparing the sequence composition of variants with the lowest
MPAF (presumed to be artefacts) to those with higher MPAF (presumed to be real alleles), it is

23
possible to identify low copy number artefacts that originate from real alleles. When two
variants always co-occur among amplicons and differ by just a single base, the variant with the
lowest depth is assumed to be a base-mismatch error derived from the more highly sequenced
variant. A similar argument can be made for chimeric sequences. Artificial chimeras comprise
sequence fragments from real alleles and arise through artificial recombination during co-
amplification of multi-template amplicons (Lenz & Becker 2008). To identify potential chimeras,
both parental alleles should be present in the same sample and the chimeras are expected to
occur at a relatively low frequency. By working up from low MPAF variants towards high MPAF
variants, a depth percentage cut-off can be estimated above which only real alleles are likely to
occur. The validity of this AVT2 is then tested in the subset of amplicons and accepted if it filters
out the majority of artefacts. This AVT2 is then applied to the remaining amplicons, assuming
that it will just as reliably separate alleles and artefacts as in the subsample of assessed
amplicons.
Despite the current popularity of AVTs in NGS studies of the MHC, they are subject to
certain problems. Essentially, the use of AVTs may not only violate genotyping assumptions (see
below and Figure 2.2 and Table 2.1), but they may also be inadequate in removing artefacts,
given that most studies ignore the possibility of cross-amplicon contamination (e.g. Babik et al.
2009; Galan et al. 2010; Zagalska-Neubauer et al. 2010; Kloch et al. 2010; Sepil et al. 2012;
Nadachowska-Brzyska et al. 2012; Radwan et al. 2012; Sommer et al. 2013; Pavey et al. 2013;
Lamaze et al. 2014). Specifically, studies that have used AVTs have reported artificial chimeras
that had mimicked putative alleles in disparate amplicons (e.g. Zagalska-Neubauer et al. 2010;
Radwan et al. 2012), which in most cases were apparently identified by visual comparison of
aligned sequences within a sample. However, from the commonly observed high rate of
occurrences of these supposed ‘chimeric alleles’ among amplicons, it is more likely that they in
fact represent contamination from disparate PCR products (Chapter 3; Lighten et al. 2014a).
The identification of chimeras is a notoriously difficult task, which is reflected in the fact that
multiple programs have been designed to assess the likelihoods of chimeric sequences (e.g.
Padidam et al. 1999; Posada & Crandall 2001; Edgar et al. 2011; Martin & Wang 2011).

24
Identifying artificial chimeras is particularly difficult in MHC studies because MHC alleles
frequently undergo natural recombination (Carrington 1999). Moreover, the likelihood of
chimeras perfectly mimicking real alleles in disparate amplicons at such high frequencies seems
unrealistic.
Previous studies employing AVTs have not considered the possibility of contaminant
variants at relatively low depths, which are identical to real alleles in other samples (i.e. not
PCR-derived artefacts). Such low-depth sequences that were not observed with putative
parental alleles might be erroneously included as genuine alleles in a genotype. Adding further
to potential genotyping error, AVTs have sometimes been modified on an apparently arbitrary
basis with no justification. For example, Stiebens et al. (2013) redefined AVT2 and accepted
sequences only as genuine alleles when they achieved ≥10% of the depth of the most
sequenced allele within the sample. However, they did so without describing an empirical
evaluation, and by doing so, they risked losing non-preferentially amplified alleles or including
repeatable artifacts. Given the significant variation in amplification rate among alleles, and the
more recent realization that cross-sample contamination may be common, in retrospect, this
modification of AVT2 without thorough justification seems ill-advised irrespective of their
observed high genotype repeatability (as both alleles and artifacts can be repeatable).
Notwithstanding these problems, if AVTs are empirically assessed on a case-by-case
basis, then they may allow replicated genotype estimates if cross-sample contamination is low
and all remaining errors can be accurately identified. Accordingly, some studies have suggested
interesting patterns of MHC diversity in a variety of taxa (e.g. high number of genes per
individual, Zagalska-Neubauer et al. 2010; hybridization increasing diversity, Nadachowska-
Brzyska et al. 2012) and have demonstrated genotyping repeatability between samples when
using AVTs. As such, they have formed the basis for further development of genotyping
methods and represented an important step in the progression of NGS MHC genotyping (e.g.
Stiebens et al. 2013). However, deep sequencing exacerbates the problems that AVTs face with
contamination (Figure 2.2). With decreasing NGS costs and the advent of ultra-deep
sequencing, further developments in AVTs methods are required if they are to remain a reliable

25
genotyping approach as currently they hold no significant advantage over other available
methods (See below and Table 2.2).
Variant clustering
More recently, variant clustering approaches to MHC genotyping have been designed that aim
to separate artefacts from alleles based on the sequence similarity among variants within each
amplicon (Sommer et al. 2013; Pavey et al. 2013; Lamaze et al. 2014; summarized in Figure 2.1
and Table 2.2). Evaluating sequence variants on a per-amplicon basis is an improvement over
applying a rigid AVT across all amplicons because AVTs are usually based on sequence
observations on a sub-sample of amplicons taken from the entire data set. Therefore, the aim
of clustering approaches has been to increase genotyping accuracy by accounting for variation
in error frequencies and PCR bias among amplicons and sequencing runs. However, the attempt
to eradicate artefacts by collapsing all closely related (highly similar) sequences to a single
representative during clustering is controversial and may oversimplify patterns of diversity.
Knowledge of the actual allelic diversity is important because this can inform us about the
amount of balancing selection that is acting on the MHC (see e.g. van Oosterhout et al. 2006b).
Pavey et al. (2013) and Lamaze et al. (2014) used a complex iterative procedure in three
successive steps, which can help overcome over-reducing diversity estimates using sequence
clustering: (i) the first step generates clusters of putative allele sequences within each
individual. These clusters each describe a unique variant and the depth at which it has been
sequenced. Thresholds are set to discard clusters that fail to meet criteria of sequence similarity
and total sequencing depth within each amplicon. These criteria are based on the common
premise that artefacts should be observed at lower depths and are similar in sequence to highly
sequenced alleles. The sequences are then aligned with Sanger sequences for quality control
(e.g. for indel detection); (ii) The second step builds clusters of putative global alleles from all
individuals, and a threshold, based on the targeted length of amplicons, is used to distinguish
alleles that differ by a single nucleotide; (iii) In the third step, the global consensus alleles for all
populations constitute a BLAST database against which the original sequences within each

26
individual are compared. If a true allele is erroneously discarded from an amplicon during the
second step because it is very closely related to a more highly sequenced true allele, this third
step should reassign the allele back to that amplicon when its sequences are compared with the
BLAST database, assuming that it was correctly identified in other amplicons. Although this step
aims to reduce Type II genotyping error, careful consideration must be taken as it also increases
the potential to inflate Type I genotyping error if contamination is present. Then, for each
global consensus allele, BLAST e-value scores are plotted as a function of the number of reads.
A minimal threshold of number of sequences to accurately genotype each individual is
established based on a natural break in this relationship (as in Babik et al. 2009).
Sommer et al. (2013) followed with a similar approach that used an iterative clustering
approach of variants within each amplicon individually. They separated alleles and artefacts
based on (i) the relative frequencies of variants; (ii) variant replication among amplicons; and
(iii) nucleotide similarity among variants. Sequence variants within an amplicon are first
clustered based on sequence similarity and ranked by their percentage of amplicon sequencing
depth, removing singleton variants represented by just one sequence (i.e. 1× depth – assumed
to represent artefacts). Starting from the second highest ranked cluster (a cluster is from here
on defined as a unique variant with a particular sequencing depth) and moving down the list,
they are compared in sequence composition to more frequent ones. Chimeras are
computationally identified based on the probability that they comprise sequence fragments
from two different more frequent variants. The remaining variants are classified as either ‘1–2
base pair (bp) difference’ or ‘>2-bp difference’ from its most similar higher frequency variant.
The next stage aims to identify putative artefacts by comparing variant composition among
replicated amplicons and/or disparate amplicons. When a variant labelled as 1- to 2-bp
difference or a chimera is not present in both replicates amplicons of the same sample, it is
classified as a putative artefact. However, variants classified as >2-bp differences are identified
as putative artefacts only if they are not replicated in any sample amplicon across the entire
data set. This stage is reliant on the assumption that even if allele dropout occurs between
sample replicates, then that allele will still be identified in disparate samples. However, this

27
may fail to identify real rare alleles (present in just one individual), especially if they are less
efficiently amplified. An additional assumption is that base-mismatch errors are not repeatable
among amplicons and thus they are identified primarily by their absence in the replicate
amplicon. The final stage then defines putative alleles based on intra-amplicon comparisons of
relative depths among putative artefacts and the remaining sequences, where alleles must be
seen in both replicate amplicons at greater depth than all putative artefacts (see Sommer et al.
2013 for full details).
Interestingly, this approach also introduced measures to estimate the degree to which
the amplification of each allele was affected by PCR bias and showed that allele dropout may
occur if PCR bias is not accounted for. However, this approach to detect PCR bias (and estimate
genotypes) currently requires replicate sequencing of every sample and so reduces the total
number of unique samples that can be employed in a single sequencing run. Notwithstanding a
reduction in the total number of unique samples that can be included in a sequencing run,
currently, the repeated sequencing of a sample is the best way to validate genotypes, but is not
enough to call alleles given that artefacts are repeatable among amplicons. Also, their results
suggest a benefit of increasing amplicon sequencing depth to hundreds or thousands of
sequences, which may increase genotyping accuracy by reducing the impact of PCR bias.
Clustering sequence variants within samples has been shown to be an effective means
to filter out erroneous variants and is a popular approach to process NGS data (e.g. in RAD-seq
analysis, Catchen et al. 2013). However, because of the uncertainties surrounding the
observations of alleles and artefacts among MHC amplicons (i.e. CNV, PCR bias, error variance),
there are no a priori (and objective) parameter settings that can be used to designate clusters
and separate alleles from artefacts. Previous methods that intended to do so (e.g. Galan et al.
2010; Pavey et al. 2013) should be applied with caution because even small changes in the
arbitrary parameter settings can significantly alter the resulting allele frequencies (Oomen et al.
2013). This is particularly the case in the presence of PCR bias and contamination. The arbitrary
distance thresholds used in clustering approaches are similar to the AVT method and lack the

28
statistical rigour to theoretically validate separation of alleles and artefacts. Such statistical
approaches are important and carried out in NGS analyses in other areas of research (e.g. RAD-
seq; Catchen et al. 2013; Gagnaire et al. 2013).
Genotype modelling based on theoretical expectations
Recently, Lighten et al. (2014a) (See Chapter 3) aimed to separate alleles from artefacts based
on per-amplicon comparisons of relative sequencing depths in a data set derived from ultra-
deep sequencing, using two independent yet complementary workflows (see below, Figure 2.1
and Table 2.2). This approach takes advantage of the semi-quantitative nature of NGS and
assumes that the number of times a target region has been sequenced is approximately
proportional to its copy number in the genome (and so alleles should be sequenced at
significantly greater depths than low copy number artefacts within each amplicon). The
assumption is that PCR bias is nonexistent or negligible so that relative sequencing depths of
multi-allele MHC amplicons can be fitted to expectations derived from theoretical models of
CNV (i.e. the allele counts expected in multi-locus genotypes). While the CNV modelling
approach of Lighten et al. (2014a) (Chapter 3) may be valuable in study systems that have well-
optimized primers and few duplicated loci, the impact of higher numbers of loci (e.g. >10) and
PCR-biased allele amplification across these loci may be too great to accurately decipher
complex patterns of allele and loci CNV. Moreover, the CNV modelling approach was not tested
in a system with more than five MHC IIb loci, and the effects of PCR bias were not assessed.
Furthermore, the predicted and repeatable CNV patterns reported in the guppy remain to be
independently validated by alterative molecular methods (e.g. direct sequencing of entire MHC
region), and it would be valuable to apply the CNV modelling approach to an alternative well-
characterized genetic system and to fully test the effects of PCR bias on the accuracy of this
approach.
In taxa that are believed to harbour tens of MHC loci (e.g. passerine birds, Sepil et al.
2012), the most realistic and accurate genotype modelling approach may need to be adapted
so to focus on identifying solely the total number of alleles (Ai) if accurate and repeatable CNV
patterns cannot be verified. Lighten et al. (2014a) (Chapter 3) additionally implemented such an

29
approach, which appears to provide robust complementary estimates of Ai to those estimated
from CNV modelling. Variant depths were also evaluated (independent of CNV model
expectations) with respect to identified statistical breakpoints between alleles and artefacts.
The rationale is that alleles should occur with higher depth than artefacts so that within each
sample, there should be a noticeable drop in the number of reads between the least-amplified
allele and the most common artefact. This drop is identified by a statistically significant degree
of change (DOC) in the sequencing depth attained for alleles and artefacts (see Chapter 3;
Lighten et al. 2014a). This approach avoids the use of any a priori AVTs or parameter settings to
separate alleles from artefacts. This has the important advantage that genotyping becomes
directly comparable among studies, even if sequencing error distributions differ. Moreover, the
requirement of a statistical breakpoint between alleles and artefacts introduced an amplicon
quality control measure for reliable genotyping (Figure 2.2). Those amplicon data that could be
justified as being of poor quality were identified and removed from downstream analysis to
avoid biases in estimates of genetic diversity. Even though this method reliably separates alleles
from artefacts, a potential disadvantage of this approach is that severe PCR amplification bias
could distort estimates of CNV patterns and hinder the separation of alleles and artefacts (but
shouldn’t affect DOC genotyping, see Chapter 3; Lighten et al. 2014a). Indeed, although the
multi-locus genotypes were highly repeatable within the same sequencing run (100%), the
repeatability (the degree of concordance between the alleles observed in both replicates) was
less impressive among fully independent sequencing run data sets (83.7%; but see Chapter 5
where repeatability improves to 99.83%). Yet, this reduction is believed to be a consequence of
random effects rather than PCR bias, as the additional alleles found in the second sequencing
run were initially observed in the first data set, just at a sequencing depth which erroneously
classified them as errors. The method of Lighten et al. (2014a) (Chapter 3) also identified and
resolved problems associated with cross-amplicon contamination, which is an undesirable yet
inevitable feature of PCR-based ultra-deep sequencing methods.

30
A similar approach has been implemented using deep sequencing ratios to estimate
CNV by Hayes et al. (2013) who compared CNV estimates with sequencing depths of loci, using
both a PCR- and a non-PCR-based (sequence capture-array) approach. By including the method
applied in Sommer et al. (2013) to identify any PCR bias, the Lighten et al. (2014a) approach
would be further strengthened. Including population genetics theory and analysing the
Mendelian segregation of alleles in multi-locus genotypes could make a possible further
advance. This relies, however, on Hardy–Weinberg equilibria, an assumption that is likely to be
violated in genes such as the MHC, which are under selection. Also, the use of pedigree or
relatedness data could be a fruitful avenue to improve the scoring of multi-locus genotypes by
NGS (e.g. Huchard et al. 2012).
A point worth emphasizing is the added benefit of estimating genotypes using two
independent yet complementary approaches. Using the CNV modelling approach, Lighten et al.
(2014a) (Chapter 3) allowed for the possibility of up to five MHC IIb loci (10 alleles) based on
empirical evidence to suggest that guppies had up to three loci (six alleles). Testing the fit of the
data to a higher number of loci than expected does not affect the outcome of the best-fitting
model, and although the number of models does not constitute a genotyping threshold,
underestimating the number of loci will affect genotyping. In most cases, researchers should
have a general idea of the number of alleles present in their study species, as prior optimization
of PCR primers (whether it be though cloning and Sanger sequencing or NGS) is always
recommended. However, even if these data are lacking, the DOC criterion implemented in
Chapter 3 (Lighten et al. 2014a) is independent of CNV mathematical assumptions, and if the
number of modelled loci is underestimated in the CNV workflow, then the inflection point that
illustrates the significant increase in the DOC would fall above the number of alleles that can be
expected based on the modelled number of loci. This allows the user to adjust the number of
CNV models implemented in their analysis.

31
Finally, a common source of error that is largely overlooked in multiplexed amplicon
studies, but especially important to recognize in multigene family studies, is that of artificial
amplicon barcode (used to identify specific samples) switching during laboratory procedures.
This can lead to the formation of novel dual-barcode combinations, which were not employed
in the study design, and potentially could lead to a source of ‘contamination’ among amplicons,
where variants from one amplicon become associated with those from a disparate amplicon.
However, such variants should be relatively rare across entire data set, as the source of the
error is believed to occur when independent PCR samples are pooled together (even without
further PCR cycles) for NGS library construction when PCR products have not been thoroughly
cleaned to remove primers and primer dimers (Carlsen et al. 2012). These artefacts are easily
distinguished from real alleles when using the DOC criterion (given good quality data; Chapter
3; Lighten et al. 2014a) especially in those generated by the Illumina TruSeq protocol, as all
samples undergo just one independent PCR each. However, caution should be taken when
using protocols that perform additional PCR cycles on pooled multi-template amplicon libraries
(each of which has already undergone an initial PCR) as this could inflate the relative frequency
of all types of artefacts, potentially impeding genotyping.
The importance of upholding genotyping assumptions
Next-generation sequencing methods to genotype multigene families by PCR make the
following two assumptions: (i) different alleles should amplify approximately equally well; and
(ii) alleles should be amplified at much greater sequencing depths than low copy number
artefacts (e.g. Babik et al. 2009; Galan et al. 2010; Zagalska-Neubauer et al. 2010). Assumption
1 can be validated by the design and testing of degenerate and/or locus-specific primers that
amplify all allelic variants equally efficiently (a nontrivial task; Burri et al. 2014). Also increasing
total amplicon depths can help minimize the effect of PCR bias (Sommer et al. 2013), but in
some cases, allele dropout may be hard to eradicate. If the primers simply do not anneal
efficiently to the priming sites, no sequence depth will help to uncover these alleles. Indeed, it
is very likely that MHC studies underestimate the true allelic richness because primers are

32
designed based on the already known sequence information. Given that the MHC is highly
polymorphic, it is likely that some allelic variations will not be amplified and remain unknown.
Similarly, the use of additional sequence data can decipher unknown allelic CNV in conserved
exons (i.e. the same allele may be duplicated among different loci, and these multiple copies
will remain cryptic if the exon sequences are identical at each loci). Llaurens et al. (2012)
illustrated this point in the MHC by redesigning PCR primers in the conserved neighbouring
exon (exon 3), which were used to sequence through the adjacent intron 2. Remarkably, this
uncovered 40.9% more MHC alleles that would have been missed if they had amplified the
polymorphic exon 2 of the MHC class IIB alone, meaning that some MHC class IIB alleles were
observed in multiple copies and were only distinguishable by their associated unique intron
variation. Given that MHC class II studies tend to focus just on exon 2, it is not unlikely that
most MHC studies have significantly underestimated the ‘true’ allelic variation.
Despite the possibility that some PCR bias may be unavoidable, assumption 2 should
always be enforced; that is, there should always be a noticeable (and statistically significant)
difference between relative depths of real alleles and artefacts. This allows for the confident
separation of alleles from artefacts, and it is fully achievable using NGS (Chapter 3; Lighten et al.
2014a). Obviously, if significant PCR bias does exist, some alleles may not be observed along
with highly sequenced alleles. For this reason, primer design and the evaluation of the
amplification efficiency of primers by testing different primer combinations on a subset of
individuals is of paramount importance.

33
Moving forward: Elucidating gene family CNV and the use of single molecule sequencing
The number of duplicated loci in multigene families is usually inferred indirectly through
estimates of the total number of distinct alleles (Ai) in a genotype. (Note, however, that this
usually refers to the number of putative allelic sequences rather than the actual number of
‘true’ allele copies). Ai can vary greatly among species (e.g. Winternitz et al. 2013), and even
within species (Piertney & Oliver 2006; Chapter 3; Lighten et al. 2014a). Traditionally, variation
in Ai has been attributed to CNV in the number of MHC loci between individuals (i.e. the
number of gene paralogous), or alternatively, due to the same allele being present at multiple
loci (which might be the consequence of gene conversion). However, identifying the actual
cause of CNV is difficult. For example, if sequencing depth of an amplicon indicates that an
allele is present in two copies, it could suggest there are two alleles at a homozygous locus, but
equally, there could be two copies at two heterozygous (or hemizygous) loci. Pedigree studies
could shed further light on the genetic architecture by assessing the inheritance of alleles. To
my knowledge, few attempts have been made to quantify the frequency of either duplicated
alleles or loci at a population level, probably because estimating loci and allelic CNV using
traditional PCR-based methods is difficult. An alternative to pedigree-based approaches to
verify the structural arrangements of multigene families and the cause of CNV is to analyse
bacterial artificial chromosome (BAC) libraries. This approach can produce large DNA constructs
from cloned gene fragments spanning entire genomic regions. Although the laborious nature of
this technique means that it is not feasibly applied across many individuals, it can be used to
initially characterize CNV (assuming this variation resides on the same chromosomal region)
and then to develop CNV-specific PCR primers for population studies. Such an approach has
been applied to characterizing CNV at the human immunoglobin heavy-chain multigene region
(IGH; Watson et al. 2013) and MHC in the disease-threatened Tasmanian Devil (Siddle et al.
2010; Cheng et al. 2012).
Deep sequencing through NGS also offers a potential solution to estimate CNV
(Campbell et al. 2008; Chiang et al. 2009; Xie & Tammi 2009; Yoon et al. 2009; Oomen et al.
2013; Hayes et al. 2013) which may be more feasible on the population level. By comparing the

34
relative proportions of allelic sequences, it is possible to estimate the CNV at particular loci.
CNV estimates are commonly inferred from data collected by sequence capture or exome
sequencing approaches. Micro-arrays or targeted gene probes can be implemented to isolate
specific genomic regions of interest, which can then be sequenced. For applications in
multigene families, this approach is beneficial as it avoids potential PCR bias in designed
primers (utilizing ligation-mediated PCR) and can produce long-range haplotype data (Cao et al.
2013). The main drawbacks are that sequence capture approaches require significant a priori
genomic data for probe design and are relatively expensive compared with strictly PCR-based
approaches. Nonetheless, the information gained from extended haplotypes of multigene
families can be invaluable in elucidating the pattern and processes implicit in their important
biological functions (Pröll et al. 2011).
Inferring CNV through relative ratios of sequence product observed among variants
lacks the definitive validation of directly sequencing the primary genomic architecture of the
region suspected to contain copy number variants. Indeed, the ability to actually sequence and
genotype entire multigene family complexes efficiently on the population level rather than
count allele products at particular loci (by PCR or sequence capture) would be a major step-
change in the population genetic analysis of these genes. For example, significant fitness effects
of MHC genes are not just due to the additive effects of alleles, but also the combination of
alleles both within and between loci (i.e. overdominance and epistasis) plays a major role in the
evolutionary genetics of these genes (Gregersen et al. 2006; Oliver et al. 2009; Lippert et al.
2013). The development of methods that allow for multi-locus genotyping will significantly
advance our understanding of the evolution of multigene family function, and in the case of the
MHC, it will open up new avenues in the study of local adaptation and susceptibility to disease
in natural populations (Siddle et al. 2010; Cheng et al. 2012).
Prospective ‘third-generation sequencing’ technologies offer promise in overcoming the
hurdles in CNV characterization still present even with NGS (or ‘second-generation sequencing’,
Table 2.3), those mainly being the fact that in most cases, CNV is inferred from relative
abundance of sequence products and not direct characterization of the entire genomic region.

35
In particular, single molecule sequencing that relies on nanopore technology holds great
potential. Theoretically, this approach is not limited by sequencing read length, complex library
preparations and relative sequencing depths as with current NGS platforms, but instead can, in
theory, continuously sequence entire DNA fragments. These long reads may provide direct
characterization of entire genomic regions, which may be especially valuable in deciphering
CNV. Moreover, nanopore technology circumvents the requirement for PCR amplification,
which can further reduce the issues in describing highly polymorphic multigene families.
Because, for example, MHC and IGH regions have high gene densities (Vandiedonck & Knight
2009; Watson et al. 2013), it may be possible to characterize entire gene family regions as one
sequenced fragment, providing the opportunity for a much fuller understanding of the complex
interactions and evolution among all loci. At the moment, this approach would require the
sequence of entire genomes or individual chromosomes to locate the gene family regions if no
prior genomic targeting was undertaken. Alternatively, sequence capture approaches could be
used to initially target the region of interest (albeit in numerous fragments) prior to single
molecule sequencing. For example, sequence capture probes have recently been used to isolate
most of the MHC region in humans (HLA; e.g. Cao et al. 2013), and by avoiding the need for
short-read deep re-sequencing, as with current NGS technologies, single molecular sequencing
could dramatically reduce the cost and effort required to genotype entire HLA regions in many
individuals. This approach would allow comparatively simpler bioinformatic approaches than to
those currently being used in de novo multi-locus genotyping, and while it could be used for
more efficiently design of PCR primers (being more cost-effective and time effective than BAC
libraries), more importantly it would allow the sequencing of entire multigene family regions
across a multiplex of samples in a single sequencing run. However, future developments will
need to be made to reduce the moderate to high sequencing error rates of single molecule
sequencing technologies (Thompson & Milos 2011) and to more efficiently target whole regions
containing localized gene duplications.

36
Conclusion
A gold standard multigene family genotyping protocol based on NGS is yet to be validated and
accepted, but the development of bioinformatic approaches to separate methodological
artefacts and real alleles within amplicons continue to develop. Although approaches that have
used global, and sometimes arbitrary, a priori designated AVTs and sequence distance
thresholds have been popular, they leave genotype estimates particularly sensitive to biases.
Multiple current approaches rely on rationales adopted from traditional studies, despite stark
contrasts in characteristics between traditional MHC data and those acquired using NGS.
However, by incorporating theoretical expectations about sequencing depth, the genotyping of
multigene families can be significantly improved, and complex artefacts can be easily identified
and avoided. The future of genotyping of multigene families lies in the increase of amplicon
sequencing depth alongside with model-based approaches. This is an extension of the rationale
adopted in diploid SNP calling algorithms (reviewed in Nielsen et al. 2011). Modelling
approaches along with third-generation sequencing technologies may improve our ability to
characterize both variation in the number of duplicated loci and the degree to which alleles are
duplicated across loci. In doing so, many more widely used population genetics approaches that
rely on understanding affiliations among alleles and loci will become available to study
multigene families.

37
Figure 2.1. The basic stages of analysis used in the current main approaches for de novo genotyping of multigene family amplicons.

38
Figure 2.2. Theoretical evaluation of separation of real alleles and artefacts in amplicons through
enforcing genotyping criteria. When variants are ranked by descending sequencing depth, high-quality
amplicons are characterized by an inflection point in the cumulative depth across variants. This
inflection point illustrates a significant increase in the degree of change (DOC criterion, Chapter3;
Lighten et al. 2014a) between the sequencing depths attained for the variants on either side. Based on
the assumption that real alleles should contribute a relatively higher amplicon depth percentage than
artefacts, variants after the inflection point (which each contribute relatively little to the total amplicon
depth) are classified as artefacts if genotyping assumptions are strictly enforced (after visual validation;
see Chapter 3; Lighten et al. 2014a). If the assumption that alleles should always be observed at higher
depths than alleles is ignored, and a strict allele validation threshold (AVT) is enforced, then artefacts
can erroneously be included in genotypes, despite the potential for high-quality genotyping. Conversely,
poor-quality amplicons, which contain either high levels of contamination and/or poor-quality product,
do not demonstrate a significant inflection point. When the cumulative depth among variants is curved,
it is difficult to theoretically validate the separation of alleles and artefacts if commonly observed
contamination is present, and by enforcing genotyping assumptions, these amplicons should be
removed from further analysis. Again, if genotyping assumptions are ignored and AVTs are used, poor-
quality amplicons are not identified and can bias downstream analyses with the inclusion of poor-quality
data.

39
Assumption Expectation Justifies Applied in practice by AVTs
Genotyping assumption upheld?
Equal amplification of alleles
Approximately equal ratios of sequencing depth per allele copy in an amplicon.
Prediction of minimum total amplicon sequencing depth for accurate genotyping widely adopted from Galan et al. 2010.
Different alleles are accepted at any depth from just a few sequences (or low amplicon depth percentage) to thousands (or high amplicon depth percentage) within the same amplicon. The same allele may be accepted at a depth of just a few sequences (or low amplicon depth percentage) to thousands (or high amplicon depth percentage) within different amplicons.
No. Drastically un-uniform depth representations of the same or different alleles within and among amplicons observed using AVT directly violate assumption of equal amplification of alleles.
Alleles are sequenced at much greater depths than artefacts
A statistical breakpoint between highly sequenced alleles and low copy number artefacts.
NA Within an amplicon alleles and artefacts may be differentiated by a 1× or 0.01% sequencing depth margin.
No. AVTs stipulate a threshold that apparently separates alleles and artefacts; therefore, there is essentially no buffer zone to confirm that alleles are sequenced at much greater depths than artefacts. This provides scope for considerably inaccurate classification of variants.
NGS base-mismatch errors are randomly distributed along a sequence
There is negligible probability that multiple sequences contain the same sequencing error.
Consideration of putative alleles with very low sequencing depths within an amplicon, that is, more than a random error is expected to achieve.
AVT1 of 3× in two amplicons
No. Although random error may occur in NGS, there is also a high rate of repeatable base position-specific sequencing error. Therefore, repeatable errors can achieve high sequencing depths.
Table 2.1. Common assumptions in protocols for genotyping multigene families using NGS, and how those that use AVTs treat those assumptions.
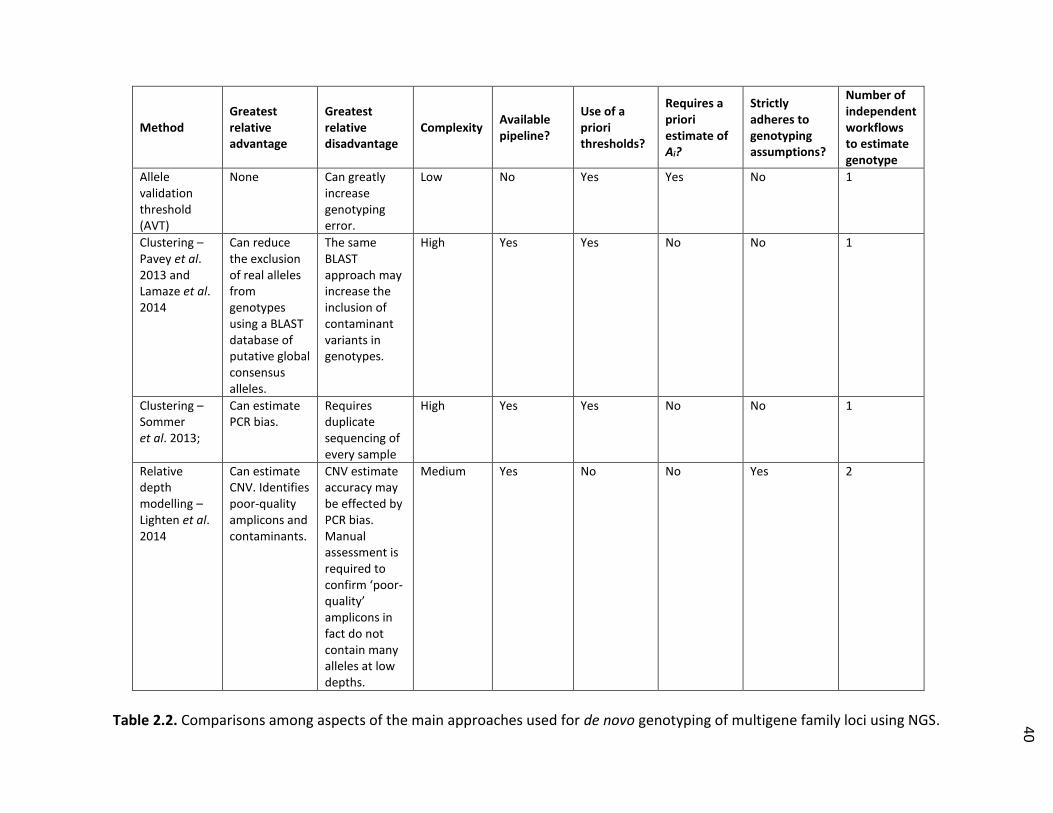
40
Method Greatest relative advantage
Greatest relative disadvantage
Complexity Available pipeline?
Use of a priori thresholds?
Requires a priori estimate of Ai?
Strictly adheres to genotyping assumptions?
Number of independent workflows to estimate genotype
Allele validation threshold (AVT)
None Can greatly increase genotyping error.
Low No Yes Yes No 1
Clustering – Pavey et al. 2013 and Lamaze et al. 2014
Can reduce the exclusion of real alleles from genotypes using a BLAST database of putative global consensus alleles.
The same BLAST approach may increase the inclusion of contaminant variants in genotypes.
High Yes Yes No No 1
Clustering – Sommer et al. 2013;
Can estimate PCR bias.
Requires duplicate sequencing of every sample
High Yes Yes No No 1
Relative depth modelling – Lighten et al. 2014
Can estimate CNV. Identifies poor-quality amplicons and contaminants.
CNV estimate accuracy may be effected by PCR bias. Manual assessment is required to confirm ‘poor-quality’ amplicons in fact do not contain many alleles at low depths.
Medium Yes No No Yes 2
Table 2.2. Comparisons among aspects of the main approaches used for de novo genotyping of multigene family loci using NGS.

41
Current problem
Impact Approach to remedy Data/analytical improvement
PCR primer amplification bias
Unequal amplification of alleles may render real alleles and artefacts difficult to differentiate based on sequencing depth.
Rigorous PCR primer design and optimization using cDNA. Third-generation sequencing can provide better baseline data to design primers (i.e. entire genomic regions), but also provide approaches to avoid PCR-based sequencing altogether.
Will enable full haplotype characterization of multigene families across loci, including CNV characterization.
Sample/PCR cross-contamination
Increase the likelihood of including artificial variants in genotypes (type I genotyping error) or excluding real alleles from genotypes (type II genotyping error).
Individually preserve samples (i.e. no batch preservation in same vial). Pre- and post-PCR laboratory conditions (as used in ancient DNA studies).
Will reduce the need for complex quality filtering of data for accurate genotype estimation. Will decrease genotyping error rates.
Difficult to estimate CNV of alleles and genes
Underestimation of allele frequencies. Restricts study of an important evolutionary aspect of genomic variation.
PCR-based deep re-sequencing of loci and identification of repeatable differential ratios of allele sequencing depth can infer CNV. Cost-effective and multiplexed third-generation sequencing may allow resolution of multigene family genomic architecture and CNV.
Accurate estimates of allele frequencies and population genetics. Reduced complexity of bioinformatics and identification of affiliations between alleles and loci.
Bias of focus on a small number of individual genes/gene families
Lack of understanding of processes governing evolution of entire gene families.
Sequence entire gene family regions. Third-generation sequencing can overcome lack of a priori knowledge required to target understudied gene families.
Will allow comparative studies among gene families and ultimately deepen our understanding of the evolution of important genomic regions.
Table 2.3. Central problems associated with PCR-based analysis of multigene families that need to be improve.

42
Chapter 3
Ultra-deep Illumina sequencing accurately identifies MHC
class IIb alleles and provides evidence for copy number
variation in the guppy (Poecilia reticulata)
Abstract
Here I address the bioinformatic issue of accurately separating amplified genes of the Major
Histocompatibility Complex (MHC) from artefacts generated during Next Generation
sequencing workflows. I fit observed ultra-deep sequencing depths (hundreds to thousands of
sequences per amplicon) of allelic variants to expectations from genetic models of copy number
variation (CNV). I provide a simple, accurate and repeatable method for genotyping multigene
families, evaluating the method via analyses of 209 b of MHC class IIb exon 2 in guppies
(Poecilia reticulata). Genotype repeatability for re-sequenced individuals (N = 49) was high
(100%) within the same sequencing run. However, repeatability dropped to 83.7% between
independent runs, either because of lower mean amplicon sequencing depth in the initial run
or random PCR effects. This highlights the importance of fully independent replicates.
Significant improvements in genotyping accuracy were made by greatly reducing Type I
genotyping error (i.e. accepting an artefact as a true allele), which may occur when using low-
depth allele validation thresholds (AVT) used by previous methods. Only a small amount (4.9%)
of Type II error (i.e. rejecting a genuine allele as an artefact) was detected through fully
independent sequencing runs. I observed 1–6 alleles per individual, and evidence of sharing of
alleles across loci. Variation in the total number of MHC class IIb loci among individuals, both
among and within populations was also observed, and some genotypes appeared to be partially
hemizygous; total allelic dosage added up to an odd number of allelic copies. Collectively,
observations provide evidence of MHC CNV and its complex basis in natural populations.

43
Introduction
The genes of the Major Histocompatibility Complex (MHC) have important links to factors
influencing individual fitness (Piertney & Oliver 2006). Not only is this region high in gene
density, but it also harbours exceptional levels of non-neutral genetic variation that are directly
linked to disease resistance, mate choice and sexual attractiveness (Edwards & Hedrick 1998;
Trowsdale 2011). Population genetic theory shows that due to its high levels of polymorphism
and epistatic gene–gene interactions, the MHC is prone to accumulate recessive deleterious
mutations and transposable elements (van Oosterhout 2009a; b), which could explain why this
region is associated with many heritable disorders (e.g. Shiina et al. 2006). Not surprisingly,
MHC genes have been important targets in the study of the genetic basis of immunology,
courtship and mating behaviour, and ecology (Bernatchez & Landry 2003; Piertney & Oliver
2006) and have also provided important insights into the interactions among evolutionary
forces (van Oosterhout 2009b). Yet, despite several decades of wide scientific interest, progress
in evolutionary and population genetic research on the MHC has been hindered by the difficulty
of accurately genotyping this highly polymorphic multigene family.
Traditionally, studies examining intraspecific MHC variation identified alleles based on
cloned PCR products and Sanger sequencing (see Bernatchez & Landry 2003). This approach is
time-consuming and relatively expensive compared to more recent Next Generation
sequencing (NGS) approaches (Babik 2010), and these factors impose important constraints on
the number of replicates (clones) sequenced per individual and the total number of individuals
genotyped. Consequently, traditional methods may underestimate the level of MHC
polymorphism at the individual, population or species level.
The advent of NGS can significantly improve the quality of MHC data and analyses.
Recently, 454 sequencing has been used to study MHC genes (e.g. Babik et al. 2009; Zagalska-
Neubauer et al. 2010); however, the separation of artefacts (generated during PCR and NGS)
from true alleles remains challenging. Previous studies have aimed to separate the two using
AVTs (e.g. Galan et al. 2010; Zagalska-Neubauer et al. 2010). A global depth threshold is

44
estimated by classifying the read depth of a subset of variants; with read depths below this
threshold assumed to represent artefacts (see Zagalska-Neubauer et al. 2010).
Unfortunately, there often is a ‘grey area’ in which the depth distinction between
putative alleles (PA; unconfirmed by RNA expression analysis) and artefacts is blurred (e.g.
Zagalska-Neubauer et al. 2010). The use of strict acceptance thresholds (e.g. 3× depth in two or
more individuals, Zagalska-Neubauer et al. 2010) can become problematic, especially when
many samples are being analysed and among which the error rates and sequence depths can
vary. The use of set thresholds may also be problematic because of reoccurring sequence-
specific errors associated with NGS (Gomez-Alvarez et al. 2009; Gilles et al. 2011), as well as low
copy number contaminants associated with large multiplexed data sets (Li & Stoneking 2012).
Base-mismatch errors and chimeric sequences generated during PCR and sequencing, and low-
level contaminants, may reach sequencing depths above the set threshold, especially in deep-
sequencing studies. These problems have been acknowledged (excluding contaminants), and it
has been recommended that genotyping protocols be adjusted on a case-by-case basis (Oomen
et al. 2013). A recent example suggests that both the inclusion of low copy number artefacts
and exclusion of less preferentially amplified alleles may be minimized when estimating MHC
genotypes using higher sequencing depths (Sommer et al. 2013).
Here, I build on previous approaches with the application of Illumina sequencing in MHC
population analysis and demonstrate a highly repeatable and accurate methodology for de
novo genotyping co-amplified multi-template amplicons. In doing so, I show that ultra-deep
NGS (hundreds to thousands of sequence reads per amplicon) can be employed in studies of
multigene families to distinguish alleles from artefacts. By avoiding the use of arbitrary and
variable global validation thresholds, it can be consistently applied across ultra-deep NGS data
sets.
My method estimates the total number of alleles observed among loci within individuals

45
(Ai) in populations exhibiting copy number variation (CNV). I compare observed sequence
depths of MHC IIb amplicon variants in guppies (Poecilia reticulata) to those expected under a
range of alternative genetic models that assume different numbers of loci. In addition to
model-based estimates of Ai, I also provide estimates of the total number of loci within
individuals (Li) and evidence in support of MHC IIb CNV that includes the occurrence of
hemizygous gene copies, that is, MHC gene copies that are present on only one homologous
chromosome. My results suggest that in combination with ultra-deep NGS and a robust
analytical pipeline, multi-locus MHC genotypes can be accurately reconstructed, which in turn
will significantly advance our understanding of the evolutionary, population genetics and fitness
consequences of MHC variation.
Methods
Samples
Guppies were collected from seven populations across Trinidad and Tobago. Two populations
were sampled from the Guanapo River (Guanapo-1: n = 32, Guanapo-2: n = 28, Caroni
drainage), one from the Quare River (Quare-1: n = 31, Oropouche drainage) and two from the
Marianne River drainage (Marianne-3: n = 28, Marianne-10: n = 29, Northern slope). Smaller
sample sets were collected from a stream at Cumana Beach, Guayamara Bay (Cumana: n = 6,
Eastern coast), and from an unnamed river along Winward Rd. in Tobago (Tobago: n = 5). A
total of 159 individuals were analysed in this study.
Molecular methods
DNA was extracted from 3 to 5 dried scales or pectoral fins using a glassmilk-binding protocol
(Elphinstone et al. 2003). A 209-base pair (bp) fragment of MHC IIb, encompassing all but three
codons predicted to comprise the peptide-binding region (PBR; Brown et al. 1993; Bondinas et
al. 2007), was amplified using the degenerate primer pair DABdegFb –
GTGTCTTTARCTCSHCTGARC – (Llaurens et al. 2012), and DABdegRei – CTCACCTGATTTAKYYAG.

46
In guppies, intron 2 of MHC IIb is less polymorphic than exon 2 (Llaurens et al. 2012), so the
reverse primer was situated spanning the boundary between exon 2 and intron 2, to reduce the
likelihood of amplification bias or null alleles. Although the possibility of null alleles or PCR bias
cannot be eliminated, PCR trials suggested that this reverse primer produced more robust
amplifications than previously used reverse primers (M. McMullan & C. van Oosterhout,
unpublished data). Each primer was uniquely modified on the 5′ end with a 10-bp multiplex
identifier (MID; Roche Diagnostics Technical Bulletin TCB No.005-2009), and samples were
amplified using a unique combination of forward and reverse MID-labeled primers, which
allowed recovery of the amplicons per individual after de-multiplexing. Because MHC IIb
appears to be a multi-locus gene family in guppies (Sato et al. 1996; van Oosterhout et al.
2006a; b), I expected some amplicons to contain more than two alleles. Polymerase chain
reactions (PCRs) contained 0.2 mm dNTPs (New England Biolabs), 0.5 μm forward primer,
0.5 μm reverse primer, 1× Phusion HF buffer, 6% DMSO, ~1–3 ng genomic DNA and 0.4 U
Phusion DNA Polymerase (Finnzymes). PCRs were performed in Mastercycler Epgradient S (96
well), or ep384 thermocyclers (Eppendorf), using the following parameters: 98 °C for 3 min; 30
cycles of 98 °C 15 s, 57 °C 40 s, 72 °C 60 s; 10 min at 72 °C, then held at 10 °C. During
optimization and testing of molecular methods, I found that no artificial chimeric sequences
were generated in amplicons when 30 PCR cycles were employed (data not shown). PCR
amplicons were pooled and prepared for 150-bp paired-end Illumina MiSeq (Illumina, Inc., San
Diego, CA, USA) sequencing using the vendor's TruSeq library protocol. Additional independent
PCRs (1–5) were sequenced for each of 49 individual samples in an independent MiSeq run to
validate the genotyping method. Some of these samples were chosen at random, but others
were chosen to verify genotypes estimated to contain the minimum, median, and maximum
number of MHC PAs. In addition, MHC IIb genotypes were characterized in PCRs using three
individual DNAs (three replicate PCRs per individual) via cloning and Sanger sequencing. Each of
the amplicons was cloned, and 32 clones per individual PCR (288 in total) were sequenced on
ABI 3730 XL sequencers (Genewiz, USA). Sanger/cloning protocols are generally limited in the
number of clones that can be feasibly sequenced and so CNV could not be estimated in the
respective replicated samples. A total of 154 independent replicate PCR products were
sequenced.

47
Data analysis
Data analysis entailed three major steps: (1) sequence preprocessing, (2) error correction and
(3) genotype estimation. The third step included two complementary approaches, the CNV
model method and the degree of change (DOC) method; the former method provided
estimates of Ai, Li and CNV pattern, whereas the latter independently estimated Ai and provided
a quality filter that allowed me to assess which amplicons were of high enough quality to yield
reliable genotypes. These steps are summarized in Figure 3.1 and described in detail below.
Sequence preprocessing
Paired-end sequencing products were assembled based on a 26-bp region of overlap, using
FLASH (Magoc & Salzberg 2011). Per-base quality scores of all sequences were assessed using
PRINSEQ (Schmieder & Edwards 2011), and I retained those with at least a mean of Q30
(99.99% base call accuracy) that were of the expected product length. Sequences were de-
multiplexed and variant depths were quantified among amplicons, along with removal of
barcodes and priming sequences in jMHC (Stuglik et al. 2011).
Error correction
I performed a multiple alignment of sequence variants (assembled contigs) observed within
each amplicon and built a neighbour-joining tree in CODONCODE aligner 3.5.7 (CodonCode,
Dedham, MA, USA) to identify repeatable base-mismatch errors, common in NGS (Gomez-
Alvarez et al. 2009; Gilles et al. 2011). Low copy number base-mismatch errors may dilute the
realized sequencing depth of the true allele from which they originate, and were identified
based on minor sequence variation (1–3 bp) from a high copy number variant (parental variant;
presumed to be a true allele). Repeatable putative errors (RPEs) were identified if they (1)
reoccurred at the same base positions or in homopolymer runs, (2) co-occurred with a parental
PA variant and (3) never occurred as a high copy number variant. RPEs, which are believed to
largely originate during sequencing, in my data acquired depths generally <2% depth of the
parental PA. The raw depth value for each RPE was added to that of the parent PA for further
analysis.

48
Genotype estimation
I made the following three assumptions for estimating MHC genotypes: (1) the relative number
of reads of an allele is proportional to its presence relative to the number of copies of other
alleles in that individual, but otherwise constant across individuals; (2) the number of reads per
allele is proportional to the number of copies of that sequence in the genome present at the
same locus and other (duplicated) loci; (3) genuine alleles amplify at considerably higher
sequencing depths than artefacts.
To estimate genotypes by the CNV model method, I first calculated the depths of up to
10 most sequenced variants in each individual, correcting the depth of each variant for RPEs as
described. A previous Sanger-based sequencing study suggested the presence of up to three
MHC class IIb loci in guppies (van Oosterhout et al. 2006b); therefore, by considering the 10
most abundant variants, I conservatively allowed for the possibility of up to five loci. I then
calculated the expected sequence depth (Eij) for each allele j of individual i and did this for each
theoretical genetic model, considering different numbers of loci and allelic copies using:
where Di is the total observed sequence depth of the 10 most sequenced variants in individual i,
E(Ai) is the expected number of allelic copies for individual i, and E(Nij) is the expected number
of copies of allele j in the multi-locus genotype of individual i (sum total of all E(Nij) = E(Ai)). For
example, if the total sequencing depth of the top 10 variants (Di) was 1000×, I calculated Eij
values in a model that assumed two unique alleles, with the first allele (i1) in homozygous state
at one locus and the second allele (i2) in hemizygous state at the second locus as:

49
and the remaining eight variants each were given Eij = 0. By calculating Eij for each of the top 10
variants, I produced expected depth ratios of allele combinations in each model of CNV and
removed the effect of many low copy number variants assumed to be artefacts (Assumption 3).
I then estimated the goodness of fit of each model across all alleles j for each individual i,
calculating the sum of squares, ∑ (Oij−Eij)2, where Oij is observed sequencing depth and Eij the
expected depth of allele j in individual i. An F-ratio test (d.f. = 1) was used to assess whether the
top two best-fitting genetic models (with the lowest sums of squares) were significantly
different from each other. When the top two models were significantly different, I used the
best-fitting model, and when there was no significant difference between models, I used the
simplest (lowest) estimate of the Li and CNV to explain the data. This provided an estimate of
Ai, Li and CNV of each individual.
I used an additional approach, the DOC method, to independently estimate Ai and to
assess the suitability of amplicons for genotype calling. In this method, Ai of each individual i
was estimated by differentiating PAs and artefacts based on the observed sequencing depths
(Oi) of the 10 most common variants n (Oin). I calculated the cumulative sequencing depth of
individual i (Ci) among the top n variants as:
I then calculated the rate of change (first derivative) in cumulative sequencing depth
(ROCin) between each variant n of individual i, which is equivalent to the raw sequence depths
of variants (e.g. ROCi1 = Ci2−Ci1). Using the ROC values of variants (ROC1 to ROC9), I calculated
the degree of change (DOC, second derivative) around each variant, which were then
transformed into percentages of the total change among all variants as:

50
The variant with the highest DOC value was deemed the last PA in the top n variants,
after which the ROC reduced considerably due to the much lower sequencing depth of artefacts
(Assumption 3; see Results). This approach using the DOC criterion is similar in some respects to
that employed by Babik et al. (2009), but differs in multiple criteria. The most important of
these is that our method relies on the conformance of variant depths to theoretical
expectations derived from my genotyping assumptions (e.g. the expectation of Assumption 3 is
that there should be an obvious reduction in sequencing depths between putative alleles and
artefacts, or an inflection point in a linear plot of cumulative sequencing depths at the point of
greatest DOC; see Results), and I discarded amplicons that violated this core assumption after
critical assessment (see below). Critically, this approach is independent of the assumptions
made in the CNV model that negligible/non-existent PCR bias exists, and that relative
sequencing depths represent allelic copy number, and only follows the assumption that alleles
should be sequenced at significantly greater depths that artefacts. By actively enforcing the
requirement that observed amplicon depths conform to the expectations of this genotyping
assumptions, I was able to theoretically assess the validity of the empirical performance of my
genotyping protocol. This allowed identification of samples of poor data quality that may bias
measures of MHC diversity. However, samples, which have an exceptionally high number of PAs
and/or have a number of poorly amplified PAs, may display a similar pattern of cumulative
variant depth to those that are of poor quality. I checked such samples for low copy number
PAs that were not observed as high copy number PAs in other amplicons. Such examples would
indicate an allele that is consistently poorly amplified by the PCR primers, whereas
contaminants would be identical to high copy number PAs in other amplicons. Similarly, it was
important to assess discarded variants in all amplicons for the likelihood that they may
represent poorly amplified PAs and not contaminants. Calculations for Ai estimates using the
CNV model fitting and the DOC criterion were performed in a custom Excel macro (Appendix 5).

51
In order to confirm that the DOC Ai estimates explained the majority of the variance in
total amplicon sequencing depth (i.e. PAs accounted for the majority of the depth; Assumption
3), I performed a principle components analysis (PCA) using FactoMineR (François Husson 2008)
in R (R Development Core Team 2011) on the mean depth values for each of the top 10 most
sequenced variants among individuals that displayed each Ai. I performed another PCA to
assess whether the maximum estimate of Ai across all samples explained most of the per-
amplicon depth variance and whether I had underestimated maximum Ai. Although our CNV
models assumed zero error, and I removed RPEs, I expected to observe low copy number
contaminants. However, these should account for an insignificant amount of variation (depth)
among variants within amplicons.
To compare my approach to previously employed methods, I also genotyped samples
using two separate AVTs. In each amplicon, all variants above (1) 3×, and (2) 10×, that could not
be explained as a base-mismatch error or a chimeric sequence of more abundant variants were
deemed PAs and included in the genotype.
Validating MHC IIb genotypes
To validate my genotyping protocol, I estimated genotyping repeatability using samples
replicated in the same sequencing run and in different sequencing runs. Repeatability was
assessed on the repeated observation of each allele within each set of replicate amplicons and
calculated using the total number of alleles that were replicated among all re-sequenced
samples.
All PAs were aligned using CODONCODE aligner 3.5.7 (CodonCode), and the reading
frame designated in guppies (van Oosterhout et al. 2006a;b) was used to check for stop codons.
PAs were compared to the NCBI nucleotide database (www.ncbi.nlm.nih.gov) using BLAST
(Altschul et al. 1990). The program OMEGAMAP (Wilson & McVean 2006) was used to identify
codons that displayed a strong signal of positive selection, and these were compared to

52
previous estimates of codons that constitute the PBR in the MHC IIb peptide (Brown et al. 1993;
Bondinas et al. 2007; Llaurens et al. 2012; McMullan 2010). The program estimates rates of
natural selection (dN/dS) in the presence of recombination using a population genetic approach
within a Bayesian framework, so may provide a more suitable measure of selection at codons
than traditional raw dN/dS ratios when examining MHC that is expected to undergo frequent
recombination (Carrington 1999). Prior distributions recommended by the program's authors
(see OMEGAMAP manual) were implemented for all modeled parameters. Two OMEGAMAP
instances were run for 600 000 interactions with a burn-in of 10 000 and combined upon
confirmation of convergence of Markov chains. I inferred codons within the PBR that displayed
>0.95 posterior probability of positive selection.
Results
Identifying MHC IIb alleles
A total of 381 677 contigs passed pre-processing and all base calls in retained sequences were
highly accurate (>Q30, 99.99% accuracy). Ultra-deep sequencing was achieved across samples
(mean: 2484× ± 1456), and 87 MHC IIb PAs were identified among 149 individuals with total
depth of at least 84× (range: 84–6611×). These 87 PAs translated into 82 unique polypeptides.
Across PAs, 63.2% of nucleotides were variable, as were 72.5% of amino acids in translated
polypeptides. Putative alleles differed by 1–76 nucleotides and 0–36 amino acids. Ten samples
(6%) that came from five populations were excluded from further analyses because PAs could
not be confidently separated from artefacts, due to violation of genotyping Assumption 3,
either because of inadequate sequencing depth or suspected PCR-carry-over contamination
combined with poor DNA quality (Figure 3.2). These samples generally contained tens of low
copy number contaminant variants identical to high copy number PAs in other amplicons.
Of the 87 PAs observed, 82 PAs were novel (GenBank: KF321642–KF321728) and only
five (Pore-DAB*103, Pore-DAB*120, Pore-DAB*130, Pore-DAB*133 and Pore-DAB*138) had
been characterized previously (Llaurens et al. 2012). Fourteen PAs were shared across at least

53
two populations, 73 were unique to single populations (private alleles), and the total number of
alleles within each population (Ap) varied between 1 and 27 (1: Cumana; 4: Marianne-3; 7:
Tobago; 14: Guanapo-1; 23: Marianne-10; 27: Guanapo-2, 27; Quare-1). Ultra-deep sequencing
provided confident identification of 36 rare PAs (subset of 82 novel PAs) that were each
observed in a single individual. Putative alleles shared 81–100% sequence identity with
previously identified MHC IIb alleles in guppies or closely related species
(www.ncbi.nlm.nih.gov).
Validating alleles
Three samples were re-sequenced using cloning plus Sanger sequencing, and 49 samples were
re-sequenced with an independent MiSeq run. The alleles inferred from the cloning/Sanger
sequencing method were identical to those determined by Illumina sequencing. In the second
MiSeq run, a total of 719 507 contigs passed preprocessing and all base calls in retained
sequences were highly accurate (>Q30, 99.99% accuracy). A mean per-amplicon sequencing
depth of 6852× ± 5433 was achieved (range: 327–24, 501×), almost three times higher than the
coverage obtained by the first run. Genotype repeatability among amplicons that were of
sufficient quality (i.e. could be genotyped using the DOC method) in the second run was 100%
(Figure S3.1a, Appendix 1), and 83.6% between runs (Figure S3.1b, Appendix 1). For eight
(16.4%) of the 49 re-sequenced samples, genotyping confirmed additional PAs in the second
sequencing run; all of these additional PAs were observed in the first run, but at insufficient
depth to be confidently deemed a PA, despite similarly high total amplicon depths in respective
replicated samples (hence, they were considered to be artificial variants).
Use of a low per-amplicon depth threshold (e.g. 3× coverage, Zagalska-Neubauer et al.
2010) would have retained these PAs, but would also have artificially inflated the Ai estimates
by 133–1600% (mean: 416 ± 359%) if applied to these replicates in the first data set,
erroneously adding 3–29 (mean: 9.62 ± 6.95) low-level contaminants per individual (Figure
S3.2a–h, Appendix 1). Furthermore, it would have produced highly disparate Ai estimates in the
remaining replicated samples, both within and between sequencing runs, resulting in 8.5%

54
repeatability between replicates within a sequencing run and 0% between runs (Table S3.2,
Appendix 5). Using 3× AVT would have resulted in a range of Ai from 2 to 64 across all
individuals in the first run, respectively (Figure S3.3, Appendix 1), and a mean Ai of 16.2 (±15.5).
Similarly, using a more conservative criterion (e.g. 10× coverage) would have resulted in a range
of Ai = 1–32 and a mean Ai of 5.7 (±7.4), erroneously inflating the Ai estimate by 16.6–800%
(mean of 124 ± 163%). Given that artefacts can occur at much higher depths than 3×, or even
10× (Figure S3.4, Appendix 1), arbitrary elevation of the depth threshold would not result in the
accurate determination of multi-locus genotypes. In particular, these low AVTs would have
performed particularly poorly in distinguishing between ‘real’ alleles (i.e. those that are part of
the true genotype of an individual) and those present in the amplicon as a result of
contamination.
In total, 36 rare alleles would have been omitted using previous protocols, but were
confirmed by the independent sequencing run. All these alleles were accepted as genuine by
the new protocol in both runs, which demonstrates that the protocol reduces the need for
replicated sequencing. Nevertheless, the new protocol does introduce a small Type II
genotyping error (rejecting the existence of 14 PA copies of 302 in total among all samples;
Type II error = 4.9%), but it also avoided a very considerable Type I genotyping error compared
to previous methods that used the 3× depth threshold criterion and which would have
accepted 602 artificial variants (Type I error = 78.6%). Furthermore, the Type II error associated
with the new protocol was completely removed in the second run, which shows that the
protocol is particularly powerful when using ultra-deep coverage. Equally important is that the
new protocol can reconstruct the most likely multi-locus genotypes, including putative
homozygotes and hemizygotes, which allows for a more complete population genetic analysis
(Table S3.1, Appendix 5).

55
Genotype estimates
One to six PAs were observed in each individual (mean: 3.15 ± 1.21), consistent with previous
estimates of up to three MHC IIb loci in guppies (van Oosterhout et al. 2006b). Among all 149
individuals, 5% had one PA, 23% two PAs, 34% three PAs, 19% four PAs, 14% five PAs and 5% six
PAs (Figure 3.3a), a distribution consistent with expectations under the optimality hypothesis
that a median Ai is maintained in high frequencies within populations through increased fitness
benefits (Nowak et al. 1992; Woelfing et al. 2009). However, the frequency distribution of Ai
also varied among populations (Figure 3.3b–h), suggesting spatial variability in processes
governing MHC diversity (Eizaguirre et al. 2011). Moreover, I observed no meaningful
relationship between total amplicon sequencing depth and Ai (Figure S3.5, Appendix 1; linear
regression: P = 0.109, r2 = 0.01), showing that the total number of alleles identified within an
amplicon is not significantly affected by increasing sequencing depth.
Individual PAs generated 5.22–97.45% (mean: 29.9 ± 17.7%) of total amplicon
sequencing depth (Figure 3.4). Overall, Ai was confidently estimated in 94% of samples using
CNV model fitting, DOC estimates and PCA validation. The latter approach showed that PAs
accounted for 100% of the variance among amplicons (Figure. S3.6, Appendix 1). Only 6% of
samples could not be genotyped due to a lack of separation between potential PAs and
artefacts.
RPEs frequently deviated from a parental PA by 1–2 bp, and individual RPEs were
observed in 1–76 amplicons. Artefacts identical in sequence to PAs in other samples, but at low
sequencing depths of 0.02–2.11% (mean: 0.7 ± 0.5%) of total per-amplicon sequencing depth,
were observed in all amplicons (Figure 3.4a). The low sequencing depths exhibited by these
sequences identical to high copy number PAs in other amplicons caused them to be considered
artefacts by my validation methods. They were likely contaminants, which are common in large
multiplexed amplicon studies (Gomez-Alvarez et al. 2009; Gilles et al. 2011). Including
contaminants would have reduced the repeatability of the Ai estimate between runs (Table

56
S3.2, Appendix 5).
The relative proportion of sequence reads attributed to PAs and artefacts varied among
amplicons containing varying numbers of PAs, but showed consistent patterns. When sequence
variants were sorted in descending order of frequency that they were observed within
individual amplicons, the mean ROC of cumulative depth was greater among PAs than among
variants judged to be artefacts (Mann–Whitney U-test: Z = 9.62, P = <0.001), affirming that I
correctly classified amplicon variants based on relative sequence depth (Figure 3.5a). There was
also a considerable increase in the mean DOC of cumulative depth at the point of transition
between sequence variants classified as PAs and those classified as artefacts (Figure 3.5).
On average, 83.9–94% of amplicon sequencing depth was attributed to PAs, and the
remainder to artefacts (Figure 3.5a). Estimates of Ai obtained using the DOC criterion showed
values of DOC ≥ 48.1% marking the boundary between PAs and artefacts (Figure 3.5b). Mean
DOC values varied depending on total Ai (mean: 61.67%, range: 48.1–86.6%). In addition, DOC
Ai estimates were corroborated using PCA, which defined PAs and artefacts based on relative
sequencing depth among amplicons (Figure S3.7a–f, Appendix 1).
In each of the 41 replicated samples that had confirmed Ai between sequencing runs, I
estimated that guppies have between 1 and 4 loci (Table S3.3, Appendix 5). CNV and Li
estimates were confirmed in 100% of these replicate PCRs (Table S3.3, Appendix 5). The
presence of odd Ai estimates, with each PA sequenced at approximately equal ratios, infers
hemizygous genotypes in progeny of parents containing different Li.
Sequence polymorphism
Positive selection was identified in 15 codons using OMEGAMAP (Figure S3.8, Appendix 1). Of
these, 14 codons matched those previously inferred to constitute the PBR in other vertebrates
based on X-ray crystallography, either alone (Brown et al. 1993) or in comparison with
sequence data (Bondinas et al. 2007), and nine codons matched those previously inferred in

57
guppies using OMEGAMAP (McMullan 2010, Figure S3.8, Appendix 1), confirming that the
correct DNA fragment had been amplified. I observed a high posterior probability of selection
for each of two additional codons predicted to reside in the guppy PBR (P = 0.89 and 0.9),
which, although below the threshold of P = 0.95, are most likely also under positive selection.
The remaining codon found to be evolving under positive selection deviated from previous
inferences of PBR designations by one codon.
Discussion
I present a method that can be used to distinguish MHC multi-locus genotypes from artefacts
generated during PCR and NGS. My approach differs from previously described methods (e.g.
Galan et al. 2010; Zagalska-Neubauer et al. 2010) in that it does not use AVTs to confirm alleles
from artefacts and provides an approach to deal with common cross-sample contamination. In
addition, it is relatively simple in comparison with more recent methods that use complex
clustering approaches (Pavey et al. 2013; Sommer et al. 2013). Instead, my approach relies on
two independent metrics. The first involves calculating the observed sequencing depths of
variants and testing their fit to expected genetic models. The second involves statistically
identifying the boundary between true alleles and artefacts using relative sequencing depths.
Overall, the application of my genotyping method and the specific assumptions it entails result
in a highly repeatable measure of alleles and genotypes per individual. I was able to accurately
separate PAs from artefacts in 94% of sufficient quality amplicons and to replicate genotypes
with 100% accuracy within a sequencing run, and 83.7% between fully independent runs. To my
knowledge, this is the first example of this level of genotyping repeatability among fully
independent data sets in a NGS MHC sequencing study.
The combined depth of erroneous and artefactual sequences (namely low copy number
contaminants) was similar across all amplicons (range: 0–22%, mean: 4.2 ± 4%), irrespective of
total number of unique artefacts, and their individual contribution to total amplicon depth.

58
Similarly, I observed consistently high proportions of amplicon sequencing depth attributed to
PAs (range: 61.8–98.6, mean: 89.18 ± 7.1%) in amplicons of varying Ai (alleles per individual),
which is in agreement with the assumption that PAs should account for considerably more
sequence depth than artefacts within amplicons.
By assessing sequencing depths of PAs and artefacts on a per-amplicon basis, I
minimized both the inclusion of artificial sequences and the exclusion of true alleles. While this
approach greatly reduces the inclusion of artificial sequences, it can also exclude PAs with low
depths. The rate of this Type II error can be estimated by fully independent re-sequencing of
samples, and the Type II error itself is largely avoided by ultra-deep sequencing. Type II error
rate between replicates sequenced both in the 1st and in the 2nd run with a mean sequencing
depth of 2424× and 6852×, respectively, equaled 4.9%, and then 0% (i.e. 100% repeatability)
between re-sequenced samples within the 2nd run.
Individuals that were not accurately genotyped either had very low sequencing depth,
or sequence depths could not be used to separate PAs from artefacts due to suspected cross-
contamination, which is common in large multiplexed amplicon studies (Li & Stoneking 2012).
These problematic samples can be easily identified using the proposed methodology, and they
are best removed from further analysis, given that they dramatically reduce genotyping
repeatability (but see below). To my knowledge such amplicon quality assessments have not
been previously implemented in NGS MHC studies, yet, such quality standards may be
important in light of the potential for common DNA/PCR-carry-over contaminants in large
multiplexed NGS data sets (Li & Stoneking 2012).
Performance of genotyping method
A significant reduction in the mean ROC at the boundary between PAs and artefacts, identified
by critical values of DOC, and separation of PAs and artefacts using PCA confirms that my
genotyping method produced estimates of Ai that conform to theoretical expectations.

59
Specifically, both findings corroborate the assumption that errors should be observed less
frequently than PAs.
Replicates of re-sequenced samples displayed identical genotypes within a sequencing
run. However, some re-sequenced individuals were observed to have up to three additional
alleles in fully independent replicates that were discarded from original genotypes due to
inadequate sequencing depth of particular variants, despite similarly high total amplicon
sequencing depths between samples replicated among data sets. This highlights the advantage
in estimating genotyping repeatability in fully independent replicates where random effects of
sample preparation and data collection may result in allele dropout. However, this also
highlights a shortcoming of classifying true PAs and contaminants based on relative sequencing
depths, where some real PAs may be erroneously discarded as contaminants, and so it is
important to critically evaluate sequences that are discarded within amplicons to reduce this.
Importantly, re-sequenced samples displayed repeatable estimates of Li and CNV despite
variation in total amplicon sequencing depth (see below).
An important step in my genotyping protocol is assessing the conformance of variant
sequencing depths, within each amplicon, to theoretical expectations derived from genotyping
Assumption 3. This acts as a quality control step to filter out samples that display deviations
from expectations (i.e. a continuum of variant depths opposed to a breakpoint between highly
sequenced alleles and minimally sequenced artefacts) and therefore cannot be reliably
genotyped. Previous work that estimated between 1 and 6 alleles per individual in guppies (van
Oosterhout et al. 2006b; Llaurens et al. 2012) was supported by my findings in all amplicons
that conformed to theoretical expectations by displaying a noticeable inflection point in
cumulative sequencing depth (highest DOC) between PAs and artefacts. Not only was the
removal of amplicons that displayed a continuum of variant depths warranted based on the
violation of genotyping Assumption 3, but the estimated PA count within these samples would
have been an order of magnitude greater than those estimated in good-quality amplicons,

60
previous studies, and test data sets (data not shown). Thus, I believe this is an important step in
improving the quality of data sets and accuracy in MHC population genetics analyses. Although
the methods allowed me to genotype guppies that acquired depths of tens or hundreds of
sequences, ultra-deep depths of thousands of sequences may be required to accurately define
a breakpoint between alleles and artefacts in species that are expected to contain tens of MHC
alleles. However, this approach does not take into consideration that some alleles may always
amplify poorly and attain sequence depths similar to those expected by low copy number
contaminants. Therefore, variants should be carefully assessed in samples that lack a clear
inflection point in cumulative depth between PAs and artefacts, where contaminants may be
distinguished from poorly amplified PAs. Of all samples in my study, 94% met the criterion for
reliable genotyping, and with further careful attention to laboratory protocols minimizing the
risk of contamination, this number would likely improve.
It is worth noting that the lack of artificial sequences that represented chimeras in this
study may have been aided by the relatively reduced number of PCR cycles (30 cycles),
compared to other studies that reported higher numbers of artefact when using more PCR
cycles (e.g. Sommer et al. 2013). A reduction in PCR cycles has been shown to effectively reduce
PCR artefacts when genotyping MHC loci and should be employed to avoid the occurrence of
problematic chimeric artefacts (Lenz & Becker 2008).
Comparison to previous NGS MHC genotyping methods
My approach differs from previous methods of MHC genotyping using NGS (Galan et al. 2010;
Zagalska-Neubauer et al. 2010) in several key ways. Although I accept a similar genotyping
assumption (Assumption 3), I strictly enforce criteria that follow from this assumption, unlike
previous methods (e.g. Zagalska-Neubauer et al. 2010), making it relatively easy to separate PA
from artefacts based on theoretical expectations. I also actively corrected the depth of PAs that
are affected by RPEs. This further reduces the number of artificial sequences within individuals
and increases accuracy in PA depth ratio estimates. Although assessments of RPE are necessary

61
to gauge data quality, they may not be crucial in data sets that contain very little cross-
contamination among samples and only aim to estimate Ai. However, I recommend their
identification to increase retention of useful data and improve genotyping accuracy. Previous
studies have eliminated suspected artefacts within amplicons by identifying variants that likely
originate as a 1 base-mismatch error from a more common parental variant (e.g. Zagalska-
Neubauer et al. 2010). However, I identified artificial variants that displayed up to two
repeatable base-mismatch errors. Therefore, detailed assessment of closely related variants
within amplicons is essential to facilitate accurate genotyping.
The method used here accounts for variation in amplicon sequencing depths. By
avoiding global AVTs, I was able to mitigate the effects of the problematic ‘grey area’ and
reduce the effect of variable error rates among individuals. This was especially important in the
case of artefacts identical to PAs in different amplicons, where low-allele acceptance thresholds
would otherwise have caused severe artificial inflation of Ai across many genotypes. These low-
depth artefacts resulted in nonreplicable Ai estimates and violated all assumptions of the
genotyping protocol and thus warranted exclusion. In addition, I identified a small number of
samples that displayed a continuum of sequencing depths across many variants. The blurring
between true PAs and artefacts may be a sign of increased contamination or poor DNA quality
in these samples, but in other cases could represent poorer amplification of real alleles.
It is worth noting that previous studies, which have employed AVTs, have in some cases
empirically defined the acceptance depth threshold (albeit based on just a subset of samples),
and also acknowledged that thresholds may not account for the removal of all artefacts. Thus,
while AVTs may have allowed for repeatable genotyping in studies that achieved less
sequencing depth per amplicon, I confirm previous evidence that they are not well suited when
ultra-deep sequencing is employed (Oomen et al. 2013). Similarly, my approach may cause
some low copy number PAs to be erroneously discarded from amplicons, and critical
62
assessment of sequence variants is always required among amplicons, especially in those that
display a continuum of sequencing depths among variants.
Recently, it was suggested that low total amplicon sequencing depths used in the
majority of 454 sequencing-based studies may be problematic as variable amplification efficacy
among PAs may cause some to be mistakenly discarded from amplicons (‘allele dropout’) if they
do not reach a set threshold (Sommer et al. 2013). Here, I show ultra-deep sequencing aided
accurate genotyping by increasing the power of quantitative appraisals of PAs and artefacts
within amplicons, which are less reliable in low-depth sequencing. This was verified by 100%
genotype repeatability within a sequencing run and only a small amount of allele dropout
between fully independent data sets. However, random PCR effects most likely caused this
dropout rather than systematic bias; thus, ultra-deep sequencing is an effective strategy to
minimize the effect of allele dropout caused by PCR bias. Admittedly, ultra-deep sequencing
and my protocol cannot fully overcome allele dropout caused by problematic PCR bias, but if
sample contamination can be reduced to negligible levels, then my approach may permit a
quantitative appraisal of the influence of amplification bias and allow simpler identification of
poorly amplified PAs. Also, my approach allowed the identification of rare PAs, which I
confirmed independently. The application of previous MHC NGS genotyping protocols, which
exclude PAs seen in just one amplicon, would have resulted in a 41% reduction in the total
number of observed PAs.
Exploring MHC CNV
Although my main focus was to provide repeatable, accurate estimates of Ai, I also observed
repeatable evidence of MHC IIb CNV within and among populations. Estimates of CNV were less
robust in studies that employed Sanger sequencing because that method offers no practical
means to quantify relative abundance of amplicon products. As such, the estimation of allele
frequencies in multigene families where the locus affiliation of alleles is unknown, and CNV may
exist, has been challenging. Consequently, estimating the number of loci has been equally

63
difficult. Despite this, traditional MHC genotyping methods have led to speculation that CNV
exists within and among populations of guppies based on the observation of odd numbers of
alleles (Llaurens et al. 2012), and my results support this. Interest in quantifying MHC CNV in
natural populations is growing, in part because of increasing evidence of its importance in
influencing patterns of susceptibility to disease (Siddle et al. 2010; Cheng et al. 2012). Recently,
studies have also suggested the presence of multiple copies of the same PA within genotypes
using relative 454 sequencing depth ratios (Oomen et al. 2013; Sommer et al. 2013), however
with very limited analysis. My detailed approach using ultra-deep sequencing supported a
range of repeatable CNV models across 149 guppies (Table S3.1 and Table S3.3, Appendix 5).
The fit of the two most probable CNV models to the observed data was significantly different in
just eleven samples (and so model 1 was used), whereas the simplest model was used in the
remainder of samples when the top two models potentially explained the data equally well
(Table S3.1, Appendix 5). Conjecturally, guppies may have between 1 and 5 loci (including
hemizygous loci), although I cannot rule out the possibility that individuals estimated to contain
1 diploid locus may actually have 1 hemizygous locus or as many as 5 loci fixed for the same
allele loci. Similarly, individuals estimated to have 2.5 loci may actually have 5 loci. Unlike the
case with Assumption 3, it is difficult to empirically evaluate Assumptions 1 and 2 of my
genotyping criteria; validation of these criteria will require further testing in guppies.
Because of the complexity of possible combinations of PA and number of loci copies in
genotypes, coupled with the semi-quantitative nature of NGS, only an estimate can be given of
the true CNV pattern exhibited. Moreover, PCR amplification bias, which is known operate
during co-amplification of MHC loci (van Oosterhout et al. 2006b; Sommer et al. 2013), may
affect sequencing depth ratios of alleles in some amplicons and so may distort quantitative
appraisals of relative depth ratios. Notwithstanding this possibility, complex yet repeatable
inferences of CNV suggest that alleles may be duplicated within individuals, in line with other
recent evidence describing MHC IIb diversity in guppies (Llaurens et al. 2012). Development of
further methods that can accurately detect PCR bias and correct sequencing depth ratios

64
accordingly will strengthen PCR-based methods to quantify CNV using sequencing depth.
Measures of Ai and Li should be less affected by minor variations in PA depth ratios and hence
should be the most robust. Nonetheless, fitting ultra-deep NGS data to theoretical models of
CNV suggests that variation in the total number of MHC IIb loci and number of PA copies exists
within and among populations. It would be interesting to apply my approach to a study system
where the genomic architecture and expression levels of the MHC are thoroughly characterized
(e.g. humans) to further validate and improve the ability to quantify CNV using PCR and ultra-
deep sequencing approaches.
Conclusion
The methods presented here improve on previous NGS protocols to genotype MHC loci by
avoiding problematic and sometimes-arbitrary AVTs, and by enforcing genotyping assumptions
to produce accurate and repeatable genotypes. My results demonstrate that substantial
improvements can be made to traditional MHC genotyping methods through the application of
NGS. In doing so, I was also able to provide repeatable comparative evidence to support CNV in
the number of MHC IIb loci and allele copies between individuals. Studies involving controlled
breeding experiments in individuals with known CNV will help further elucidate the pattern of
MHC CNV. I recommend the development of MHC genotyping protocols that strictly enforce
genotyping assumptions using ultra-deep NGS (which can be achieved using any of the current
popular NGS technologies) while compensating for PCR bias, and believe that methods aimed at
exploring CNV of MHC in natural populations may shed light on this previously understudied
aspect of MHC evolution.

65
Figure 3.1. Flowchart of analysis steps in the genotyping of multitemplate MHC amplicons.

66
Figure 3.2. A comparison between good- and bad-quality amplicon data. Shown are examples of a good (black)- and poor (grey)-quality
amplicon, each sequenced at high depth (2925× and 2498×, respectively). In the good amplicon, ultra-deep sequencing reveals a decrease in rate
of change (ROC) of the cumulative sequencing depth of the top 20 variants after n variants, marked by the hashed vertical line. This inflection
point coincides with the final estimate of Ai for this sample (Ai = 3) and clearly marks the boundary between PAs (circles) and artefacts
(triangles). The low copy number/depth of individual artefacts contribute relatively little to the total amplicon sequencing depth compared to
individually highly sequenced PAs. In contrast, in the poor-quality amplicon, which likely results from some combination of contamination and
poor template DNA quality, it is impossible to accurately identify a breakpoint between PAs and artefacts, and variants are indistinguishable
(squares). Because this distribution violates genotyping assumptions, such samples are removed from further analysis if assessment of variants
suggests the presence of low copy number contaminants derived from high copy number PAs present in disparate amplicons.

67
Figure 3.3. Frequency distributions of Ai estimates among individual guppies. (a) The frequency
distribution of Ai across all guppies conforms to expectations under the optimality hypothesis
that most individuals express an intermediate Ai, (b-h) but varies among populations. In
populations where Ai estimates across individuals were particularly skewed (e.g. M3, Cumana),
genotypes were confirmed in multiple independent replicates.

68
Figure 3.4. Depth distribution of PAs and artefacts among amplicons in all guppy samples with Ai values ranging from Ai = 1 to Ai = 6. (a) Across all amplicons, PAs were observed at between 97.4% and 5.2% of total amplicon depth. Light grey bars show the depth of every instance of PAs in each Ai category. As estimated Ai increases, the maximum depth that a PA contributes to total amplicon depth reduces. However, the distinction between PAs and contaminants (dark grey bars) is maintained even when Ai increases. We see a clear step decrease in total amplicon depth percentage between light grey and dark grey bars, shown here for sequence depths across all individuals in each Ai category, but also evident individually in each amplicon (not shown). (b–g) For clarity, the mean sequencing depth is shown for each PA that was observed among all individuals of in each Ai category (Ai = 1- Ai = 6). The number of unique PAs observed within each Ai category varied as did the mean sequencing depth for each PA.

69
Figure 3.5. Confirmation of the total number of observed unique PAs within genotypes. (a) Across
samples grouped by Ai, the mean percentage of cumulative sequencing depth decreases in ROC after n
variants – marked by the hashed vertical line. Across all samples, the mean ROC was significantly
different between PAs and artefacts (Mann–Whitney U-test: Z = 9.62, P = <0.001). In the case of each Ai
grouping, the point of decrease coincides with the final estimates of Ai for those samples. This point
marks the boundary between PAs (circle) and artefacts (triangle), where the low copy number/depth of
individual artefacts contribute relatively little to the total amplicon sequencing depth compared to
highly sequenced PAs. (b) The greatest DOC between variants characterizes this boundary between PAs
and artefacts.

70
Chapter 4
The role of MHC and parasites in the secondary sexual colouration of guppies (Poecilia reticulata)
Abstract
The guppy (Poecilia reticulata) is a model species in the study of natural and sexual selection.
The paradigm focuses on the opposing selection pressures of predators and female mate choice
on male colour. Yet this simplistic view ignores other selection pressures individuals may
experience, most notably, parasitism. Here I highlight links between colouration, parasitic
infections by Gyrodactylus, and genes of the Major Histocompatibility Complex (MHC) among
21 guppy populations in Trinidad. I show that across drainages the relative body area of
different colours decreases with increasing Gyrodactylus prevalence, and that MHC variation is
positively correlated with parasite prevalence. These associations suggest differential selection
pressure exerted by parasites may directly affect colours believed to be on honest signal of
male fitness, and relationships between MHC polymorphism and colour may be an indirect
consequence of its role in parasite infections. This supports the Hamilton-Zuk hypothesis which
states that genetic variability can be maintained by mate choice driven by preference for sexual
ornamentation that indicates parasite resistance. Indeed, some interactions between MHC,
parasite prevalence, and male colour seem to be governed by variation between host
populations in distinct river drainages. This suggests local adaptation of guppies within
drainages, and further supports the hypothesis that populations in each drainage represent
distinct evolutionary lineages. Other aspects of ecology (including parasitism) alongside
predation pressure and female mate choice may affect adaptation of guppy populations. This is
the first time such relationships have been observed in concert among MHC, pathogen
infection, and colour.
71
Introduction
Understanding how organisms adapt to their local environment can help elucidate drivers of
species diversification. In this regard, spatially varying phenotypes and genotypes may
represent local adaptation of populations, and even evidence of ecological speciation (Wang et
al. 2013; Shafer & Wolf 2013; Papadopulos et al. 2014). Conversely, similarity in ecological
conditions between localities can hinder population divergence, for example when balancing
selection and stabilizing selection slow down the rate of genetic divergence expected under
neutral evolution (e.g. allele frequency changes due to random genetic drift). Indeed, as recent
studies have shown, the rate of divergence varies across the genome (e.g. Yang 2010) and
allelic lineages in some genes (e.g. Major Histocompatibility Complex; MHC) coalesce much
further back in time than the split of the most recent common ancestor (Figueroa et al. 1988).
Even in allopatry, parallel evolutionary mechanisms (i.e. stabilizing- and balancing selection)
may lead to convergence or maintenance of particular phenotypic and genomic variants despite
long-term geographic isolation and local adaptation of other traits.
The MHC genes are used to infer patterns of vertebrate adaptation to dynamic
pathogen communities (Bernatchez & Landry 2003; Piertney & Oliver 2006), and the links
between MHC polymorphism and susceptibility to disease are well established (Trowsdale
2011; Trowsdale & Knight 2013). However, little is known about effects of this polymorphism
on phenotypic measures implicit in sexual selection, i.e. those that are believed to represent
honest signals of health. Correlations between MHC-polymorphism and parasite loads are used
as proxies for the effects of MHC on host fitness, however, other vertebrate traits, such as the
quality of secondary sexual colour displays, are believed to confer more direct signals of
individual fitness. Colouration may be a reliable indicator of an individual’s immunocompetence
because colour can be a costly trait and indicative of an honest signal (Saks et al. 2003; Kolluru
et al. 2006; Aguilera & Amat 2007; del Cerro et al. 2010; Mougeot et al. 2010). For example,
carotenoids are used as pigments in colour displays, but also have critical anti-oxidant roles in
immunological processes (Grether et al. 1999; Stahl & Sies 2003; Chew & Park 2004). The ability

72
to allocate carotenoids away from these immune processes to displays of colouration is
therefore thought to be indicative of an honest signal for high fitness and increased immune
defenses against pathogens. Similarly, melanin-based pigments in ornamentation also correlate
with parasite resistance and so may be reliable indicators of individual health (Gasparini et al.
2009; Jacquin et al. 2011). Such processes are outlined in the Hamilton-Zuk hypothesis, which
posits that specific genetic polymorphism can be maintained in a population when females
choose mates based on sexual ornamentation that indicates resistance to parasites (Hamilton &
Zuk 1982; Balenger & Zuk 2014). It follows that studying secondary sexual traits should allow
for examination of both pathogen-mediated natural selection (as traits denoting fitness will be
affected by the degree of infection), and mate choice mediated sexual selection (as females
preferentially chose mates that appeared fitter ), e.g. in guppies (Poecilia reticulata) (Houde &
Torio 1992; Grether et al. 1999; Kolluru et al. 2006). Resolving the interaction between MHC
polymorphism and the display of phenotypic traits that are associated with fitness may
elucidate complex interactions among different forms of natural selection.
The guppy is an excellent species to assess the links between MHC genes, pathogen
infection, and secondary sexual colouration. Particular MHC polymorphism in guppies may be
associated with defense against common Gyrodactylus spp. (viviparous monogenean parasites)
(Fraser & Neff 2010), and importantly, MHC can play a significant role in mate choice, where
evidence suggests that females chose male genotypes in order to optimize the immune
repertoire in their offspring (Milinski 2006). Expression of colours that are believed to be an
honest signal of immunocompetence (e.g. orange, Saks et al. 2003; Aguilera & Amat 2007; del
Cerro et al. 2010) may be affected at the individual level in guppies by both the degree of
parasite infection (e.g. intensity of orange; Houde & Torio 1992), and also past selection though
mate choice based on female preference for different male colours (Houde 1997).
The same colours that are preferred by females are also believed to be associated with
increased susceptibility to predation (Endler 1980; Houde 1997; Godin 2003) and so are
particularly suited to addressing questions focused on the interplay of various drivers of natural

73
selection. Male guppies in experimental high predation (HP) environments can evolve colour
patterns that apparently reduce conspicuousness to predators (e.g. reduction in colour spot
size), where as those in artificial low predation (LP) environments can display more carotenoid
and black colouration, driven by female mate choice (Endler 1980). The paradigm is that
predation pressure is a strong driver of parallel evolution of life history, colour, and mate choice
among genetically independent populations, despite long-term isolation (Houde 1997).
Notwithstanding this paradigm, guppy life history (Fitzpatrick et al. 2014), and colour
(Millar & Hendry 2012) can display non-parallelism among populations of similar predation
levels, and importantly there has shown to be negligible variation in the relative fitness of
brightly coloured males between HP and LP populations (Weese et al. 2010). Male colouration
in populations commonly do not conform to expectations derived from the ‘predation
paradigm’, where some LP populations display temporally stable colouration consistent with HP
environments (Gotanda et al. 2013). Moreover, guppy fitness related colours can vary
significantly among drainages, yet it is not clear what causal agent drives these differences
(Rodd & Reznick 1991). Interestingly, guppy populations within each of the three main
drainages of northern Trinidad represent distinct drainage specific lineages, which increases
evolutionary independence and facilitates testing of evolutionary hypothesis. Strictly speaking
the North Slope comprises many independent smaller watershed (as opposed to the Caroni,
and Oropouche drainages), but genetic data suggest that they represent a single lineage
(Willing et al. 2010; Baillie 2012).
Here I quantify variation in phenotypic traits and genetic polymorphisms correlated to
fitness in guppies and investigate the following questions: (1) Is colour variation in male guppies
explained solely by predation pressure; (2) do patterns of parasitism and MHC correlate with
adaptive traits (e.g. colour) in guppies, and, (3) is guppy MHC diversity influenced by
demographic processes? Defining the interactions between MHC, parasitism, and colour will
allow for a clearer understanding of how sexual selection and parasite mediated selection
define the adaptive diversity of guppies in relation to the effects of variable predation
pressures.

74
Methods
Sampling and parasite assessment
Male guppies were sampled from 21 populations across 10 rivers in northern Trinidad (Figure
S4.1, Appendix 2) in 2009 (total n = 723) and 2010 (total n = 707). Fish were isolated to prevent
parasite movement among individuals, and euthanized in 0.02 % Tricaine Methanesulfonate
(Finquel MS-222; Argent Laboratories, Redmond, WA, USA) buffered to a neutral pH with
NaHCO3. Gyrodactylus on each individual were counted using a stereomicroscope, however the
three species infecting guppies (G. turnbulli, G. poecilia, G. bullatarudis) are indistinguishable
while on the skin (Harris 1986; Cable & van Oosterhout 2007), and so as in previous studies
(Cable & van Oosterhout 2007; Fraser & Neff 2010), were not distinguished. Because I focused
on population level, and not individual level correlates among fitness related traits, infection
was quantified only as Gyrodactylus prevalence (percentage of infected fish in a population;
Bush et al. 1997).
Microsatellite and MHC data were only available for male individuals collected in 2010,
but colour and Gyrodactylus infection data were only available for individuals sampled in 2009.
However, I believe that comparisons among these data types across successive years is still
valid because: (1) MHC and microsatellite polymorphism were stable in numerous temporal
replicates across multiple populations used in this study (unpublished data, and Baillie 2012),
and so allele frequencies are not believed to be significantly different between 2009 and 2010.
(2) Gyrodactylus prevalence and coloration was stable between 2009 and 2010 in the study
populations (Gotanda et al. 2013; Gotanda & Hendry 2014).
Molecular methods
A 209 bp amplicon of the MHC IIb locus was PCR amplified, Illumina sequenced, and
subsequently genotyped in 707 guppies, as previously outlined (Chapter 2; Chapter 3; Lighten
et al. 2014a; b). All samples were additionally genotyped at 10 polymorphic microsatellite loci
using P. reticulata specific primers (Watanabe et al. 2003; Paterson et al. 2005; Shen et al.

75
2006; Baillie 2012, Table S4.1, Appendix 2). DNA was amplified via PCR in 5µl volumes
comprising 10-50ng DNA, 0.5l 10x ThermoPol PCR buffer (20 mM Tris-HCl, 10 mM KCl,
10 mM (NH4)2SO4, 0.1 % Triton X-100), 200M dNTP, 200M fluorescently labelled forward
primer, 200µM reverse primer, and 0.5U Taq DNA polymerase (New England BioLabs). PCR
amplification consisted of the following: 4 min at 95°C, 30 cycles of 30s at 95°C, 30s at locus
specific annealing temperature (Table S4.1, Appendix 2), 30s at 72°C, and 3 min at 72°C. PCRs
were carried out in Eppendorf Mastercycler ep thermal cyclers. Microsatellite PCR products
were visualized by electrophoresis on 8% denaturing polyacrylamide gels run on a LI-COR IR2
DNA analyzer at 50°C. All gels included positive control samples, redundant samples, and a
molecular weight size standard ladder. All analyses were conducted in the R statistical package
(R Development Core Team 2011) unless otherwise stated.
I classified MHC IIb alleles into functional supertypes (MHC-ST) by amino acid
polymorphism at the guppy specific peptide-binding region (PBR) (Chapter 3, Lighten et al.
2014a). The PBR is under strong directional selection and is the adaptive interface between
pathogen recognition and the host immune response. Therefore, PBR diversity should reflect
functional differences among alleles. The PBR of each allele was numerically characterized
based on the physicochemical properties of each amino acid (Sandberg et al. 1998;
Doytchinova et al. 2004; Doytchinova & Flower 2005), and were clustered using Discriminant
Analysis of Principle Components (DAPC) with the adagenet package (Jombart 2008). Supertype
classification avoided introducing missing data points into correlation analyses where the
presence of particular alleles varied greatly among populations, but the presence of MHC-STs
were more consistent (see Results).
Population genetic diversity
Locus affiliations of MHC alleles are unknown in guppies (Llaurens et al. 2012; Chapter 3;
Lighten et al. 2014a) so traditional measures of allelic richness cannot be applied. I estimated
population level MHC allelic richness (MHC-Ar) using a bootstrapping approach to account for

76
different population sample sizes. I randomly sub-sampled 10 alleles (as each guppy may have
up to five loci; see Chapter 3; Lighten et al. 2014a, and Results) from among all individuals
within a population and counted the number of unique alleles. I repeated sub-sampling with
replacement 1000 times and calculated the mean number of unique alleles sampled. This
provided unbiased relative estimates of MHC-Ar in each population. Using the same approach I
also calculated MHC-ST richness (MHC-STr) within each population.
Microsatellite genotypes were checked using Micro-Checker v.2.2.3 (van Oosterhout et
al. 2004). For each population, GENEPOP v.4.0.10 (Raymond & Rousset 1995; Rousset 2008)
was used to estimate frequency of null alleles at each locus. All 10 loci were checked for
selection using LOSITAN (Beaumont & Nichols 1996; Antao et al. 2008), which suggested that
one of the ten loci (Pret-46) did not conform to expectations under neutrality. Moreover,
inclusion of this locus resulted in inferences of population structure that were bio-
geographically implausible and contradictory to those previously reported in guppies (e.g.
Willing et al. 2010, Baillie 2012) and so was removed. Population level microsatellite richness
(Micro-Ar) was calculated in the same manner as with MHC polymorphism.
Male guppy colouration
Full details regarding collection of colour data are given in (Gotanda et al. 2013). Briefly, guppy
traits were quantified from photographs of 723 male fish sampled in 2009 only. Colour metrics
of male fish were quantified from photographs based on classification of individual colour spots
on the body and caudal fin into one of eight categories (modified from Endler 1991; Kemp et al.
2008; Millar & Hendry 2012) in Image J (Schneider et al. 2012): Black, fuzzy black, orange
(including red), yellow, blue (including purple), green, violet, blue, and silver. For each fish, the
total area of each colour was divided by the total fish area (body area + caudal fin area) to yield
relative area of a given colour. The population level mean for each colour trait (area, and
number of spots) was calculated and used in further analyses.

77
Effect of predation level, and drainage on guppy trait variation
To test whether predation level had a significant effect, I used a Wilcoxon rank-sum test for
each trait of interest (MHC-Ar, MHC-STr, Micro-Ar, MHC-ST frequencies; colour area and number
of colour spots, and Gyrodactylus prevalence), with populations separated by either high or low
predation. The same analysis was repeated, but instead populations were classified by
drainage. Despite its location in the Oropouche drainage, guppy populations from the Turure
river were classified with populations from the Caroni drainage, as they represent a relatively
recent introduction (1957, Haskins) from the Caroni drainage (Shaw et al. 1992; Suk & Neff
2009; Willing et al. 2010). Because only two true Oropouche-type guppy populations remained,
both from the Quare River, inter-drainage comparisons of trait variation were only conducted
between the North Slope and the Caroni drainage.
Correlations between genetic diversity, colouration, and Gyrodactylus prevalence
All uninfected populations were excluded from analyses of the relationships between parasites,
colour, and MHC. I also excluded one population (El Cedro-1) with low infection prevalence
from further analysis, as parasite prevalence was an order of magnitude lower than that of
other infected populations. This reduced prevalence may have been a sampling artifact, or due
to natural demographic stochasticity. All further analyses were conducted using the R package
ade4 v1.5-1 (Dray & Dufour 2007) unless otherwise stated. I assessed the variation among the
population mean for each colour trait using a principal components analysis (PCA), which
indicated co-variation among the total colour area and the number of spots of five colours
(violet, green, silver, yellow, and blue). I retained only measures of area for further analysis of
these colours. The correlation between two data matrices, which collectively contained three
types of data, was assessed by co-inertia analysis (COIN, Doledec & Chessel 1994) to test if
functional genetic diversity was correlated with traits associated with indicating fitness. Data
matrix (1) contained MHC-ST frequencies for each population, and data matrix (2) contained
colour trait means and Gyrodactylus prevalence for each population. COIN is very robust

78
against autocorrelation (Lamaze et al. 2014), compared to other similar approaches (e.g.
Mantel test), and derives from studies comparing phenotypic and environmental variables
(Doledec & Chessel 1994). A PCA was conducted on each data matrix (i.e. 1 and 2), and COIN
(COIN1) assessed the global variation among PCA axes between the PCA outputs for data matrix
1 and 2, using 1000 bootstrap replicates. Where a strong correlation was indicated between
individual traits of interest from data matrix 1 and 2 (e.g. between the frequency of a particular
supertype and a particular colour), a separate one-tailed Pearson’s correlation coefficient (PCC)
was calculated. The procedure was repeated using the data matrix (1) MHC-Ar, and MHC-STr,
and (2) male colouration and Gyrodactylus prevalence (COIN2). Where significant correlations
between metrics of genetic diversity and colouration existed in infected populations, they were
also examined in non-infected populations. Finally, I fitted separate linear models with MHC-Ar,
and MHC-STr, as dependent variables and Micro-Ar as an independent variable, across all
populations (including non-infected). Using Micro-Ar as a null model of neutral evolution, this
tested whether demographic processes affected MHC diversity, assumed to be under strong
selection (Bernatchez & Landry 2003).
Results
Identifying MHC polymorphism
A total of 1 634 085 contigs passed pre-processing (mean >Q.30; 99.99% accuracy). Of 707
samples for which genotyping was attempted, 72 (10%) were excluded from further analyses
because PAs could not be confidently separated from artifacts, leaving 635 genotyped
amplicons that had individual depths of 281x – 13,120x (mean 2391x ± 1380). Among these,
159 MHC IIb PAs were identified, which translated into 120 unique polypeptides.
Across all 158 PAs observed, 77 PAs were novel (GenBank: KR870052-KR870125) and 81
PAs had been characterized previously (Llaurens et al. 2012; Chapter 3; Lighten et al. 2014a).
Among PAs, 76 were shared across at least two populations, 82 were unique to single

79
populations (private alleles), and the total number of alleles within each population (Ap) varied
between 4 and 35 (Table S4.1, Appendix 5). I observed 87 rare PAs, each within a single
individual. One to nine PAs were observed per individual guppy (mean 2.385 ± 1.216, Figure
S4.2, Appendix 2). The range of Ai measures also varied among populations (mean=3.28, range=
1-9; Table 4.1). Genotype repeatability between sequencing runs was 95.4%.
By clustering PAs based on functional similarity of amino acids constituting the PBR, I
identified 12 MHC-STs (ST-1 to ST-12; Figure S4.3-4.4, Appendix 2, Table S4.2, Appendix 5), and
the number of alleles constituting each supertype varied (mean=13.16 ± 5, range=5-22, Figure
S4.4, Appendix 2, Table S4.2, Appendix 5). The number of MHC supertypes observed within
individuals (MHC-STi) ranged from one to six (Mean 2.81, Table S4.1, Appendix 5). In most
individuals (99.38%) each supertype was represented by a maximum of two unique MHC alleles
(Table S4.3, Appendix 5). Four samples from the same population (Aripo-2) each had three
alleles that belonged to ST-9. The number of supertypes also varied between populations (STp;
mean= 7.19 ± 1.96, range=4-10, Table S4.1, Appendix 5).
Linear models showed a significant positive relationship between MHC-Ar and Micro-Ar
across all populations (P=0.001, R2=0.41). The relationship between MHC-STr and Micro-Ar
among all populations was not significant (P= 0.289, R2=0.01) (Figure S4.5, Appendix 2). This
suggests that variation in MHC-Ar is strongly influenced by demographic processes (such as
genetic drift) whereas variation in MHC-STr is not. As such the remaining analysis used
supertypes as the metric of MHC diversity.

80
Effect of predation level, and drainage on trait variation
Across all populations (both infected and uninfected) Micro-Ar was significantly higher in HP
than the LP sites (Wilcoxon rank sum test: P=0.010, Table 4.2). Remarkably, HP and LP
populations did not differ significantly in MHC-STr but drainages did (P=<0.001, Table 4.2), with
guppy populations in the North Slope displaying lower MHC-STr than the Caroni (Figure 4.1).
Populations in the North Slope displayed significantly more orange (P=0.001) and yellow body
area (P=0.018), and more fuzzy black spots (P=0.001), which, importantly varied very little
between HP and LP sites (Table 4.1, Figure 4.2-4.4).
Gyrodactylus were observed in 14 of 21 populations (Table 4.1, Table S4.4, Appendix 5)
and one population (El Cedro-1) had a parasite incidence that was an order of magnitude lower
than the 13 remaining infected populations. Of the remaining individuals from which MHC IIb
genotypes were obtained, 167 (29.3%) were infected with Gyrodactylus. Wilcoxon rank sum
test showed that variance in Gyrodactylus prevalence among populations was significantly
correlated with predation level (P= <0.001, Table 4.2).
Correlations between genetic diversity, colouration, and Gyrodactylus prevalence
The COIN analysis between MHC-ST frequencies, male colour and Gyrodactylus prevalence
(COIN1) revealed no significant correlation between the data matrices (global co-inertia
coefficient = 0.49, P=0.167), which suggests that the strength of the relationship between
individual MHC-STs, colour traits, and parasites varied among populations (Figure S4.6,
Appendix 2). Interactions among individual MHC-ST frequencies, colour traits, and infections
were observed when co-variation among each factor was examined independently.
Gyrodactylus prevalence was negatively correlated with orange area (P=0.021, R2=0.32, Figure
4.5a), fuzzy black area (P=0.012, R2=0.38, Figure 4.5b), and yellow area (P=0.021, R2=0.32,

81
Figure 4.5c), as well as the frequency of ST2 (P=0.017, R2=0.34, Figure 4.6a), and ST11 (P=0.012,
R2=0.38, Figure 4.6b). The frequency of MHC-ST2 was positively correlated with orange area
(P=0.007, R2=0.43, Figure 4.7a), and yellow area (P=0.023, R2=0.31, Figure 4.7b). Similarly, MHC-
ST11 frequency was positively correlated with fuzzy black area (P=0.035, R2=0.27, Figure 4.7c).
In some rivers there was a similar interaction between MHC supertypes, colour and
Gyrodactylus prevalence despite predation level, (e.g. M3 (LP) and M4 (LP); Y1 (LP) and Y2 (HP);
AP1 (LP) and AP2 (HP) (Figure S4.6, Appendix 2).
Secondly, the COIN analysis between (1) MHC-Ar, MHC-STr, and (2) colouration and
Gyrodactylus prevalence (COIN2) revealed a significant correlation between the two data sets
(Global co-inertia RV coefficient = 0.37, simulated P=0.043), and important fitness correlated
traits (Figure S4.7, Appendix 2). Gyrodactylus prevalence was positively correlated with MHC-
STr (P=0.001, R2=0.59, Figure 4.8a) across infected populations. Remarkably, MHC-STr was
negatively correlated with orange body area (P=<0.001, R2=0.64, Figure 4.8b), and yellow body
area (P=0.006, R2=0.45, Figure 4.8c). Notably, the relationships between MHC-STr Gyrodactylus,
and colour, seem to be governed by variation in these traits between drainages (Figure 4.8,
Table 4.2).
Discussion
Male guppy colouration can evolve in response to female mate choice, presumably because it is
a honest indicator of individual fitness (Houde 1997). However, this effect can be counteracted
by the benefits of inconspicuous colouration when faced with increased predation (Endler
1991; Houde 1997). Freed from predation pressure, guppies in low predation (LP) sites should
consistently display more carotenoid-based colouration, but this is not always the case
(Gotanda et al. 2013; Gotanda & Hendry 2014). Here I have shown that fitness related
colouration of guppies at the population level varies more between drainages than it does
according to the classic dichotomous model of predation levels across Trinidad, and further,

82
that this variation is correlated with MHC polymorphism and parasite prevalence. Specifically,
particular MHC polymorphisms are associated both with decreased Gyrodactylus prevalence
and increases in population mean orange, yellow, and fuzzy black. Moreover, MHC supertype
richness (MHC-STr) is also related to Gyrodactylus prevalence and colour patterns. Notably,
correlations between MHC and colouration were absent in non-infected populations.
Interactions between MHC polymorphism, Gyrodactylus prevalence, and male colouration
among populations are consistent with parallel evolution related to variable selection imposed
by pathogens across drainages. Although generally not considered in studies of guppy
evolution, MHC and parasite diversity are likely important components that contribute to the
wide spread adaptation observed in this species.
Is predation driving parallel evolution in guppy colour?
Surprisingly, I found no significant differences in the population mean area and number of spots
of any colour trait between predation levels. This is contrary to expectations suggested by
previous studies that compared the effects of predation on individual level variation in
experimental mesocosms (Endler 1991), and among individuals of populations within the same
river (Weese et al. 2010; Millar & Hendry 2012; Gotanda & Hendry 2014). In particular,
variation in mean orange, and yellow body area (which are believed to indicate health, and
susceptibility to predation) was minor and non-significant between HP and LP sites, but
substantial (and significant) between drainages. Increased orange area in North Slope
populations compared to those in the Caroni has been observed previously, and speculated to
be a consequence of reduced predation pressure in this region compared to other drainages
(Rodd & Reznick 1991), but this has not been substantiated. I show that this drainage-level trait
co-varies with MHC and parasites within drainages. Moreover, the patterns of variation
between HP and LP sites in fuzzy black area (which only significantly varied between regions)
are reversed between the Caroni drainage and North Slope. The effect of predator driven
selection on colouration appears to be inconsistent among populations (and particularly
between the Caroni drainage and North Slope), and this fits with observations of non-parallel

83
evolution among guppy populations (Fitzpatrick et al. 2014; Gotanda & Hendry 2014). This
suggests that other biological/ecological factors have an impact on species-wide variation of
important colours relating to natural selection in guppies.
Similarly, MHC-STr did not vary significantly between predation levels, but did between
drainages. MHC-STr was not correlated with microsatellite allelic richness (Micro-Ar), yet MHC
allelic richness (MHC-Ar) was. The fact that MHC-STr is independent of Micro-Ar suggests that
variation in MHC supertype diversity is less susceptible to demographic processes than MHC
alleles. The significant variation in Micro-Ar (subject to drift and gene flow) between HP and LP
site is likely a consequence of the larger population sizes in downstream HP environments, and
the higher rate of gene flow from upland populations (Crispo et al. 2006; Barson et al. 2009; Suk
& Neff 2009; Willing et al. 2010). The difference in MHC-STr between drainages is likely
explained by variation in pathogen-mediated selection. The reduction in Gyrodactylus
prevalence in populations with lower MHC-STr may represent directional selection towards
more focused adaptive immunity against a smaller parasite community; however further work
is needed to test this hypothesis. Therefore, supertypes may be more important measures of
population and individual level MHC functional diversity than alleles. Signals of natural selection
purely at the MHC allelic level could potentially be confounded by demographic process across
guppy populations of different sizes (high or low predation).
Similar to Micro-Ar, Gyrodactylus prevalence was also significantly greater in HP than LP
sites. The higher prevalence of infection in HP sites is most likely a consequence of larger host
populations in the larger downstream river habitats, which receive more infected immigrants to
sustain pathogen numbers. Moreover, the anti-predation strategy of tight shoaling among
guppies in HP environments may facilitate easier transmission of parasites between individuals
(Johnson et al. 2011). Similarity in patterns of Gyrodactylus prevalence are consistent across

84
drainages and this suggests that they may exert a similar degree of selection pressure on
guppies.
Parallel patterns of phenotypic and genetic variation relating to parasite driven natural selection and mate-choice driven sexual selection
Frequencies of MHC-ST-2 and ST-11 were strongly negatively correlated with Gyrodactylus
prevalence. A previous study (Fraser & Neff 2010) also observed a negative association
between Gyrodactylus infection prevalence in Trinidadian guppies and the frequency of a
particular MHC IIb supertype (supertype ‘a’). Based on nucleotide sequences, alleles of the
‘Gyrodactylus resistance’ supertype-a (Fraser & Neff 2010) form a clade with alleles in ST-11,
which I identified as being associated with reductions in Gyrodactylus prevalence (Figure S4.4,
Appendix 2). In populations where MHC-Ar and MHC-STr were greatly reduced (e.g. Marianne-3,
and Marianne-4), all individuals had the same three alleles (Table S4.3, Appendix 5), which each
represented a unique MHC-ST. Notably, two of these alleles represented ST-2, and ST-11, and
this supports the hypothesis that a reduction in MHC population level diversity may be a
consequence of directional selection for polymorphism involved in parasite resistance
(Monzón-Argüello et al. 2013). Evidently, Gyrodactylus has a similar effect on MHC
polymorphism in all infected populations, and this corroborates the observation that this
parasite species complex may impose homogeneous selection pressures across large spatial
scales (Fraser & Neff 2010). However, the fact that guppies express multiple other MHC
supertypes among populations suggests that a fitness trade-off exists between ST-2, ST-11, and
other supertypes, which presumably function to combat other parasite species. This means that
the frequency of supertypes among populations is likely governed by the requirement for
immunological defense against variable parasite communities, where individuals are required
to express an effecting array of supertypes in relation to the number of potential parasite
species that can infect them. It is therefore somewhat surprising that given the multiple species
of Gyrodactylus, and their probable high-levels of cryptic diversity among isolated drainages
(Xavier et al. 2015), that when considered as a single complex (species or strain were not

85
differentiated in this study) significant relationships among their prevalence, colour, and MHC
polymorphism are detected. This suggests that individual MHC supertypes evolve efficient
functionality against broad but similar parasitic phenotypes.
Across all populations ST-2, and ST-11 frequencies were positively correlated with a
significant increase in the colour area of fuzzy black, orange, and yellow. This is consistent with
a previous finding that Gyrodactylus infections were negatively correlated with carotenoid
intensity in laboratory populations of guppies (Kolluru et al. 2006). Although intensity of
carotenoid pigmentation may be an honest plastic signal of male health based on nutrition
(Grether et al. 1999), the area, and number of colour spots has a genetic basis (e.g. Tripathi et
al. 2009). Because particular colour genes may confer some selective advantage through mate
choice among populations, they may possibly become linked to other important traits that
increase fitness though natural selection (Gordon et al. 2012). Indeed a recent study
demonstrated that one particular MHC-ST in baboons (Papio ursinus) was related to reduced
individual condition, and the size and shape of sexual swelling during female estrous, which
serve as secondary sexual signals (Huchard et al. 2010).
Upon visual examination of correlations among MHC diversity, colour, and Gyrodactylus
prevalence there appears to be a strong effect of drainage in governing multiple correlations.
However, drainage was not included as a factor in correlative models, as combined with the
small number of populations examined this led to over parametrization and weakening of
correlations between specific traits. However, Wilcoxon tests independently demonstrated
which of these traits varied significantly among drainages, and when compared to correlative
analyses, the effect of drainage on trait covariation can be assessed.
This study establishes a relationship among MHC-supertypes, and MHC supertype
richness, with parasite infections and secondary sexual colouration. This finding is consistent
with predictions stemming from the Hamilton-Zuk, or good genes, hypothesis, which posits that

86
genetic diversity is affected by mate choice for sexual ornamentation that signifies parasite
resistance. The fact that female guppies apparently choose mates based on visual colour cues,
and not chemosensory MHC related olfactory cues (Houde 1997; Archard et al. 2008), leads to
speculation that MHC polymorphism, which confers increases in relative fitness, is associated
with colour traits. The hypothesis that MHC and body colours are associated suggests that
sexual selection plays a large role in shaping population frequencies of MHC alleles, given the
established importance of male guppy colouration in influencing female mate choice (e.g.
Wedekind & Penn 2000; Milinski 2006). It is likely that natural selection pressures exerted by
parasites and predators both influence processes of sexual selection and this can vary among
drainages. Particular MHC polymorphisms, which confer resistance to parasites, increase in a
population because of fitness benefits. Individuals less energetically burdened by parasites are
able to spend more time devoted to courtship over foraging (Kolluru et al. 2006), and so sexual
selection could operate to increase those colours associated with female preference for
indicators of male fitness. These findings are contrary to those of a study that explicitly tested
the Hamilton-Zuk hypothesis at the individual level in natural guppy populations, and found no
association between Gyrodactylus infections and male color (Martin & Johnsen 2007). It may be
that within population variation in male color and parasite infections is so large that meaningful
relationships between colour and infections are difficult to detect. Moreover, my results
suggest that correlations in support of the Hamilton-Zuk hypothesis can be governed by
variation among drainages, and so likely result from historical effects driving local adaptation.
While disentangling the relative contributions of each type of selection will be difficult, sexual
selection is a dominant force in shaping MHC diversity across diverse taxa (Winternitz et al.
2013). In guppies, the observed patterns of MHC polymorphism and male colouration likely
result from some complex interaction among spatially varying processes of sexual selection and
natural selection driven by predators and parasites.

87
Conclusion
I show significant interactions between MHC polymorphism, parasite infection, and colour traits
related to survival and mate choice. To my knowledge this is the first-time such relationships
have been observed among these three major features related to fitness. While the difficulties
associated with correlative analyses mean that cause and effect of these relationships cannot
be definitively identified without further experimental work, they do show that variation in
colouration and genetic polymorphism are likely governed by a complex interaction of different
drivers of natural selection. The most conservative explanation for such patterns is that
immunological pressures exerted by parasites vary over space (among populations or
drainages), and this directly affects the strength of selection on colour signals. Thus the
correlation between MHC polymorphism and colour may be an indirect consequence of how
well particular polymorphism combats parasite infections, and thus MHC polymorphism that
confers high immunocompetence will lead to increases in colours that indicate increased
health. Aspects of ecology alongside predation pressure likely drive local and parallel
adaptations of guppy populations across large geographic scales, of which parasites likely play a
major role.

88
(a) (b) (c)
Figure 4.1. Variation in MHC supertype richness (MHC-STr) between (a) high and low predation sites, and (b) drainages. Variation in the Oropouche drainage (b) was not included in significance tests among drainages (Table 4.2) as it was calculated from just two populations and so should be interpreted with caution. A two way interaction plot (c) shows how mean MHC-STr varies among populations of different predation strengths among drainages, with similar caution needed regarded interpretation of Oropouche variability.

89
(a) (b) (c)
Figure 4.2. Variation in orange body area (%) between (a) high and low predation sites, and (b) drainages. Variation in the Oropouche drainage (b) was not included in significance tests among drainages (Table 4.2) as it was calculated from just two populations and so should be interpreted with caution. A two way interaction plot (c) shows how mean orange area varies among populations of different predation strengths among drainages, with similar caution needed regarded interpretation of Oropouche variability.

90
(a) (b) (c)
Figure 4.3. Variation in the number of fuzzy black spots between (a) high and low predation sites, and (b) drainages. Variation in the Oropouche drainage (b) was not included in significance tests among drainages (Table 4.2) as it was calculated from just two populations and so should be interpreted with caution. A two way interaction plot (c) shows how mean number of fuzzy black spots
varies among populations of different predation strengths among drainages, with similar caution needed regarded interpretation of Oropouche variability.

91
(a) (b) (c)
Figure 4.4. Variation in yellow body area between (a) high and low predation sites, and (b) drainages. Variation in the Oropouche drainage (b) was not included in significance tests among drainages (Table 4.2) as it was calculated from just two populations and so should be interpreted with caution. A two way interaction plot (c) shows how mean yellow area varies among populations of different predation strengths among drainages, with similar caution needed regarded interpretation of Oropouche variability.

92
(a) (b) (c)
Figure 4.5. Pearson’s correlation coefficients demonstrated significant negative association between Gyrodactylus prevalence and (a) orange area (P=0.021, R2=0.32), (b) fuzzy black area (P=0.012, R2=0.38), and (c) yellow body area (P=0.021, R2=0.32), In some cases it is evident that the variation in relationships among traits (e.g. a) varies spatially among drainages: Caroni populations (blue), North Slope populations (Red), Oropouche population (Green).

93
(a) (b)
Figure 4.6. Pearson’s correlation coefficients demonstrated significant negative association between Gyrodactylus prevalence and (a) MHC-ST2 frequency (P=0.017, R2=0.34), and (b) MHC-ST11 frequency (P=0.012, R2=0.38). Caroni populations (blue), North Slope populations (Red), Oropouche population (Green).

94
(a) (b) (c)
Figure 4.7. Pearson’s correlation coefficients demonstrated significant positive association between MHC-ST2 frequency and (a) orange area (P=0.007, R2=0.43), and (b) yellow area (P=0.023, R2=0.31). Similarly, MHC-ST11 frequency was positively associated with (c) fuzzy black area (P=0.035, R2=0.27). ), In some cases it is evident that the variation in relationships among traits (e.g. a) varies spatially among drainages: Caroni populations (blue), North Slope populations (Red), Oropouche population (Green).

95
(a) (b) (c)
Figure 4.8. Pearson’s correlation coefficients demonstrated significant positive association between Gyrodactylus prevalence and (a) MHC-STr
(P=0.001, R2=0.59). Conversely a significant negatively associated was observed between MHC-STr and (b) orange area (P=<0.001, R2=0.64), and (c) yellow body area (P=0.006, R2=0.45). The variation in relationships among traits (e.g. a) varies spatially among drainages: Caroni populations (blue), North Slope populations (Red), Oropouche population (Green).

9
6
Table 4.1. Summary metrics of MHC allelic richness (MHC-Ar), and MHC supertype richness (MHC-STr).
Predation Drainage Population Mean Ai Mean STi Range Ai Range STi
High Caroni Arima-1 3.966 3.133 2-9 1-6 Low Caroni Arima-2 3.2 3 1-6 1-6 Low Caroni Aripo-1 3.068 2.689 1-5 1-4 High Caroni Aripo-2 4.875 3.812 2-9 2-6 Low Caroni El Cedro-1 3.366 3.1 1-5 1-4 High Caroni El Cedro-1 3.843 3.187 1-7 1-5 High Caroni Guanapo-1 3.903 3.225 2-6 2-5 Low Caroni Guanapo-2 3.75 3.166 1-6 1-5 High North Slope Damier-1 3.311 2.577 1-7 1-5 Low North Slope Damier-2 2.642 2.214 1-7 1-5 Low North Slope Marianne-10 2.148 1.851 1-3 1-3 Low North Slope Marianne-16 3.032 2.741 2-6 2-5 Low North Slope Marianne-3 3.111 3.111 3-4 3-4 Low North Slope Marianne-4 2.937 2.937 2-4 2-4 Low North Slope Paria-7 3.625 3.187 2-6 2-4 Low North Slope Yarra-1 2.489 2.326 2-5 1-4 High North Slope Yarra-2 3.043 2.586 1-6 1-5 High Oropouche Quare-1 3.310 2.724 1-6 1-4 Low Oropouche Quare-2 3.117 2.588 1-6 1-5 High Oropouche (Caroni type) Turure-2 3.709 2.750 2-5 2-3 Low Oropouche (Caroni type) Turure-3 3.655 1-4 1-5 3

97
Table 4.2. Results of Wilcoxon rank-sum test tests indicate significant variation (P=0.05) of
genetic, and colour traits, and parasite prevalence between levels of predation (denoted by *).
Trait Predation Drainages
Genetic diversity W P W P Micro-Ar 88 0.010* 38 0.859 MHC- Ar 76 0.089 64 0.039* MHC-STr 67 0.301 78 <0.001* Supertype-1 51 0.961 35 0.576 Supertype-2 32.5 0.168 24 0.157 Supertype-3 53.5 0.938 45.5 0.662 Supertype-4 77.5 0.062 48.5 0.5 Supertype-5 52.5 1 59 0.112 Supertype-6 46 0.666 43.5 0.808 Supertype-7 57.5 0.666 39 0.916 Supertype-8 70 0.179 28 0.257 Supertype-9 73 0.137 54 0.250 Supertype-10 64 0.401 69 0.012 Supertype-11 34 0.204 41 1 Supertype-12 54.5 0.863 36 0.687 Colouration Black area 48 0.804 27 0.258 Fuzzy black area 40 0.413 24 0.161 Orange area 39.5 0.384 4 0.001* Yellow area 34 0.210 14 0.018* Blue area 51.5 1 23 0.133 Green area 57 0.750 60 0.093 Violet area 44 0.595 44 0.796 Silver area 77 0.075 53 0.297 Total n. spots 37 0.301 29 0.340 n. black spots 37 0.301 53 0.297 n. fuzzy spots 49 0.859 7 0.001* n. orange spots 40 0.413 34 0.596 n. yellow spots 52 1 28.5 0.309 n. blue spots 34.5 0.218 33 0.545 n. green spots 58 0.697 73 0.002 n. violet spots 62 0.500 39 0.929 n. silver spots 39.5 0.384 55 0.222 Parasite infection Gyrodactylus prevalence
97.5 <0.001* 51.5 0.344

98
Chapter 5 Supertypes explain paradoxes and reveal cryptic processes of MHC evolutionary ecology: A new perspective
Abstract
Evolution of the Major Histocompatibility Complex (MHC) is driven by immunological
adaptation to fast evolving parasites. However, it is still not fully understood why contradictory
observations among studies (i.e. directional selection and balancing selection; natural selection
and genetic drift; high allelic diversity and low allelic diversity) persist. I outline a new
perspective on MHC evolution that explains these issues, by focusing on the largely overlooked
significance of MHC supertypes (groups of similarly/identically functioning MHC alleles) in
natural populations. I describe how population structuring of MHC allelic diversity is affected by
neutral demographic processes, whereas supertype population structuring is not. The study of
MHC supertypes in comparison with their constituent alleles reveals detailed cryptic processes
of MHC evolution that cannot be inferred by the study of MHC alleles alone, as is traditional
done. I provide the first evidence to suggest that strong stabilizing selection has operated on
MHC alleles within loci specific supertypes over millions of years in both the guppy and its
relative, the swamp guppy (Poecilia picta). I also suggest that balancing selection operates
directly on loci (supertypes) to produce complex patterns of CNV both within and among
populations. The spatial and temporal patterns that stabilizing selection generates in MHC
allelic diversity can be erroneously interpreted as widespread divergent selection among
populations when supertypes are not considered. I suggest that haplotypes of MHC supertype
CNV are a central unit upon which balancing selection operates, and high levels of functional
similarity among alleles within a supertype render individual allele frequencies susceptible to
inter-supertype random genetic drift. Alleles that differ in fitness effects may rapidly change in
frequency due to inter-supertype Red Queen processes. The culmination is a description of a
new paradigm in the study of MHC evolution, which resolves multiple unexplained and
commonly observed paradoxes, and explains the enigma of MHC trans-species polymorphism.

99
Introduction
Genes of the Major Histocompatibility Complex (MHC) have contributed much of what we
know about genetic adaptation (Bernatchez and Landry 2003, Piertney and Oliver 2006). Over
the past 30 years a paradigm has emerged, which states that evolution of these highly variable
genes is driven by immunological adaptation to fast evolving parasites (reviewed in Spurgin and
Richardson 2010), as explained by the Red Queen hypothesis (van Valen 1973). This hypothesis
suggests that host and parasite co-evolve in an evolutionary arms race, where parasites
continually evolve strategies to evade the host immune system, and the host evolves more
efficient immunity against parasites. It is believed that strong extrinsic selection pressures from
pathogen infections maintain diverse MHC polymorphism over large spatial and temporal
scales, though balancing selection, in the form of negative frequency dependent selection
(NFDS), overdominance (heterozygote advantage) and fluctuating selection (Spurgin and
Richardson 2010). Variation in MHC polymorphism among populations is commonly interpreted
to represent differential selection pressures from dynamic pathogen communities, which may
fluctuate temporally, resulting in directional selection of MHC through Red Queen dynamics.
Despite NFDS and overdominance being the most popular interpretations of processes
governing MHC polymorphism, convincing empirical evidence is yet to emerge that supports
their influence on MHC genetic diversity. Moreover, this interpretation presents somewhat of
an unanswered paradox in the understanding of MHC evolution: How can balancing selection
maintain MHC allele polymorphism over large spatial and temporal scales in concert with
widespread local adaptation to different parasite communities?
Paradoxically, MHC allele frequencies can be greatly influenced by demographic
(random) processes (e.g. genetic drift or migration, Kamath & Getz 2011; Sutton et al. 2011;
Strand et al. 2012). This contradicts the central paradigm in that the MHC evolves under strong
selection. Rather, this observation suggests that MHC population genetics is affected both by
adaptive processes as well as demographic processes. Moreover, it has become apparent that
species may have greatly reduced MHC allelic diversity (e.g. Radwan et al. 2010), and this can
be caused by the effects of genetic drift (e.g. though a population bottleneck) outweighing the
100
strength of parasite mediated natural selection (Sutton et al. 2011). However, species with very
few MHC alleles among populations (traditionally presumed to be less adapted to diverse
pathogens) may appear to be just as fit as those that have many alleles (traditionally presumed
to be critically adapted to pathogen communities) (Radwan et al. 2010). It is still not fully
understood why these contradictory observations among studies (i.e. directional selection and
balancing selection; natural selection and genetic drift; high allelic diversity and low allelic
diversity) persist. Here I outline a new perspective on MHC evolutionary that explains the
persistence of these issues, by focusing on the largely overlooked significance of MHC
supertypes (groups of similarly/identically functioning MHC alleles) in natural populations.
It is the understanding of how the MHC interacts with antigens that reveals its role in
countering pathogens (e.g. Wucherpfennig 2001). This may help elucidate how MHC genes and
the proteins they encode adapt to counteract pathogens. However, these data are lacking in
non-model species, and difficult to acquire. As such very little is known about the relative
functional properties of MHC polymorphism in natural populations of most vertebrates. An
alternative approach is to classify MHC alleles into supertypes based on the level of shared
similarity in inferred functional characteristics, using bioinformatic approaches (Lund et al.
2004; Doytchinova et al. 2004; Doytchinova & Flower 2005, Chapter 4). In this approach,
functional characteristics of MHC alleles are represented by the physicochemical properties of
the amino acids that are translated from the nucleotide sequence. MHC variants are grouped
either by clustering or principal components analysis, using the properties of amino acids at
positions in the peptide binding region (PBR) that are under strong positive selection and thus
best reflect the functional differences among alleles (See Chapter 4). Correlative analysis
between the frequency of a particular MHC supertype and the degree of infection in a
population then suggests its functional significance (See Chapter 4).
Although the common philosophy of MHC population level analyses aims to uncover
patterns of local adaptation at the allelic level by simply counting alleles (implying that allelic
diversity directly reflects functional diversity; so every allele should have a distinct function),
with very limited analysis on the translated amino acid sequence (e.g. Bernatchez & Landry
101
2003; van Oosterhout et al. 2006b; Piertney & Oliver 2006; Oliver et al. 2009; Sutton et al.
2011; Eimes et al. 2011; Spurgin et al. 2011; Nadachowska-Brzyska et al. 2012; Winternitz et al.
2013), very few have adopted the premise of studying MHC evolution in the context of
supertypes comprised of alleles which have very similar or identical functions. Nonetheless, it
has recently become evident that MHC diversity represented by supertypes may reveal
patterns of selection and relative fitness benefits in relation to parasite infections (e.g.
Schwensow et al. 2007; Sepil et al. 2013a; b). The observation that demographic processes may
less affect patterns of supertype diversity, compared to allelic diversity, suggests that they may
better represent the units upon which selection operates at the MHC (Chapter 4).
Understanding the interactions among processes governing MHC supertype evolution and
those governing, more conventionally, individual alleles could provide an important new
perspective on MHC evolution.
A conceptual framework put forward by van Oosterhout (2013) described how alleles of
particular supertypes are likely to be confined to specific loci (at least in most cases), and
therefore diverse MHC functionality (different supertypes) can be maintained at disparate loci
even in instances when overall allelic diversity is degraded within loci (e.g. by inbreeding). In
Chapter 4, I compared geographic patterns of MHC supertype and allelic diversity, neutral
microsatellite diversity, and important fitness related measurements (male colouration, and
parasite infection) in natural populations of the guppy (Poecilia reticulata). I described several
key findings that fit with predictions stemming from van Oosterhout (2013): (1) In a single
genotype, each supertype was represented (largely) by a maximum of two alleles, suggesting
particular supertypes may be locus specific, as observed in other poeciliid fishes (Ellison et al.
2012), (2) MHC allelic richness was strongly correlated with microsatellite richness, but MHC
supertype richness was not, suggesting that alleles are more affected than supertypes by
demographic processes, and (3) the total number of supertypes per-individual varied within,
and among populations, suggesting spatial (and likely temporal) differences in selection
maintaining different patterns of MHC loci CNV and functional haplotypes (see Discussion).
102
Here I expand on these initial findings by comparing the geographic distribution of MHC
alleles, MHC supertypes, and microsatellite diversity in guppy populations across a large
geographic scale to investigate some important yet largely unresolved questions: What are the
relative differences in processes that operate on MHC alleles and MHC supertypes, and
importantly, can inferences of MHC evolution be unduly biased by focusing on just alleles?
Resolving these issues will allow a clearer understanding of how apparent paradoxes in MHC
diversity and evolution are observed in natural populations.
Methods
Sampling
Guppies were collected between 2008 and 2012 from 59 populations distributed among 39
rivers/lakes, across Trinidad, Tobago, Barbados, and Hawaii. Each fish was euthanized in 0.02 %
Tricaine Methanesulfonate (Finquel MS-222; Argent Laboratories, Redmond, WA, USA)
buffered to a neutral pH with NaHCO3, and then preserved in 100% ethanol. Sites were chosen
to represent a wide geographic sample of populations across Trinidad, and like the site in
Tobago, the presence of guppies here represents natural colonization from ancestral South
American populations. It is unknown if guppy populations in Barbados represent a natural
colonization from South America or a human mediated introduction, as is the case with
Hawaiian populations that were established in the early 1920’s. In addition to guppies, a small
number of individuals of the closely related swamp guppy (Poecilia picta) were sampled from
Trinidad. The last shared common ancestor between P. reticulata and P. picta was estimated at
around ~21-22 mya (Meredith et al. 2011).
Molecular methods
The methods to generate the MHC sequence data, microsatellite data, and estimate genotypes
are described in Chapter 3 and Chapter 4. However, this study sequenced samples (and
replicate PCRs) among four independent sequences runs, compared to a smaller number of
replicate PCRs among just two sequencing runs in previous chapters. Estimating MHC IIb

103
supertypes was also carried out in a similar fashion as in Chapter 4. However, use of the
diffNgroup criterion within adagenet package (Jombart 2008; Jombart & Ahmed 2011) was not
required. Because this study revealed many more alleles in a greater number of individuals (see
Results) than in Chapter 4, identification of clusters (supertypes) during the Discriminant
Analysis of Principle Components analysis (DAPC; Jombart et al. 2010) was made clearer.
Multiple instances of DAPC analysis confirmed 15 clusters. I calculated the robustness of
supertype designations by comparing the supertype grouping of the 157 alleles from Chapter 4
with the estimated groupings when combined in the current supertype analysis, which includes
many more alleles (see Results). This was calculated as the percentage of alleles within the
supertypes estimated in Chapter 4 that also group together during the current analysis.
Population and supertype genetic diversity
Because MHC loci in guppies may be duplicated, are high in diversity, and locus affiliation of
alleles in unknown, population differentiation was calculated using Dest (Jost 2008) and 1000
bootstrap replicates in the SPADE R package (Ma et al. 2014; R Core Team 2014). Differentiation
was estimated independently using MHC allele, MHC supertype, and microsatellite allele
frequencies. Pairwise values of Dest were compared among microsatellites, MHC alleles, and
MHC supertypes using a Mantel test in the ape package (Paradis et al. 2004) with 10,000
iterations, and Holm corrected P values for multiple comparisons. For each supertype, I
calculated the (1) total number of MHC alleles (hereafter defined as nucleotide variants), (2) the
number of PBR amino acid sequences, (3) the mean distance among PBR amino acid sequences
(number of differences) within a supertype, (4) the mean frequency of a supertype in
populations where it was present, (5) the mean number of alleles within each supertype per
population, and finally (6) the level of PBR redundancy among the constitutional MHC alleles
within a supertype (Sr) as,
Sr =

104
Where x is supertype 1 to 15. Co-variation among these metrics were examined using principle
components analysis (PCA) in the ade4 package (Dray & Dufour 2007) and FactoMineR
(François Husson 2008), and subsequent Pearson’s correlation coefficients were calculated.
Sequence similarity and dendrograms of MHC alleles and PBR sequences were inferred in
MEGA 5 (Tamura et al. 2011), and edited in FIGTREE (www.tree.bio.ed.ac.uk/software/figtree/).
Results
MHC genotypes
MHC genotypes were confidently estimated for 94% (1732) of the total 1839 samples
sequenced. The failure to acquire accurate genotypes in 7% of the samples was likely due to
poor DNA template, sample contamination, or random sequencing effects, and this genotyping
failure rate is similar to that observed in Chapter 3 (6%) and Chapter 4 (10%). The number of
alleles observed within an individual (Ai) ranged from 1-9 (mean Ai = 3.25 ±1.187), and mean Ai
varied among populations (range of population mean Ai = 1 – 4.76, Table S5.1, Appendix 5).
Among four sequencing runs, 233 replicate amplicons were sequenced across 103 individuals.
Genotyping repeatability among these independent runs was 99.83%, which is an improvement
over the 83.6% repeatability between just two sequencing runs previously reported using the
same genotyping protocol in guppies (Chapter 3; Lighten et al. 2014a). This improvement was
made possible by an increased number of high quality replicate samples among more
independent sequencing runs.
In total 539 MHC IIb alleles were observed. Of these 164 have been previously identified,
and 375 were novel (GenBank KT003989 - KT004363). Cluster analysis revealed that these
alleles formed 15 supertypes based on functional characteristics, which is an increase from the
12 supertypes identified in Chapter 4 using 159 alleles (Figure S5.1 and S5.2, Appendix 3). On
average (±SEM), 22% (±12) of the alleles within a supertype designated in Chapter 4 were

105
differentially grouped in the current analysis which included more alleles. In all but 16 (<1%) of
individuals, each supertype was represented by a maximum of two alleles, and the observation
of three alleles was confined to just two supertypes and a few populations; ST-9 = 1 individual
from Arima-1, 2 from El Cedro-1, 4 from Aripo 2, 1 from Shark, and 4 from San Souci; ST-3 = 1
individual from Damier-1, 1 from Paria-3, and 2 from Paria-4. This unusual observation was
concordant with other unique properties of these two particular supertypes (see below). The
number of supertypes within an individual (STi) ranged from 1 to 7 (mean = 2.79 ±0.95, Table
S5.1, Appendix 5). Among all individuals the relationship between STi and Ai was positively
associated (P=<0.001, R2=0.73). However, when individuals had the same Ai, they did not
necessarily have the same STi (Figure 5.1). For example, in all individuals with Ai =4, 8.1% had
STi = 2, 60.6% had STi =3, and 31.3% had STi = 4.
Population differentiation
Population differentiation estimates of Dest (Jost 2008) were calculated separately using MHC
allele, MHC supertype, and microsatellite allele frequencies. Microsatellite genotypes were
obtained from 50 populations of the total 59 genotyped at the MHC, and so only populations
that comprised both marker types were used in Dest comparisons. Across 50 populations the
mean Dest estimate based on microsatellites was 0.741 (± 0.007, range 0.001 - 1) (Table S5.2,
Appendix 5), 0.88 (± 0.003, range 0.027 - 1) based on MHC alleles (Table S5.3, Appendix 5), and
0.388 (± 0.014, range 0.002 - 1) based on MHC supertypes (Table S5.4, Appendix 5). Populations
were consistently highly differentiated by MHC alleles, and similarly so with microsatellites, yet
less so by with MHC supertype diversity (Figure 5.2). A Mantel test with Holm P value correction
revealed that Dest estimates of microsatellites and MHC alleles were significantly correlated
(correlation=0.10, P=0.012), yet microsatellite differentiation was not significantly correlated
with that of MHC supertypes (correlation=0.06, P=0.151). Conversely, population
differentiation estimates based on MHC alleles were highly correlated with those of MHC
supertypes (correlation=0.43, P=<0.001).
106
MHC Supertype population characteristics
The total number of alleles within a supertype ranged from 16 (ST-1) to 55 (ST9) (mean
35.93±11.79, Table 5.1). Redundancy in the PBR amino acid sequences (Sr) (i.e. the degree to
which allelic nucleotide sequences translated into the same PBR amino acid sequence) also
varied among supertypes (Table 5.1). Supertype-9 showed the highest degree of redundancy
(despite comprising the most alleles), where the 55 alleles translated into just 17 unique PBR
sequences (Figure 5.3, Table 5.1). ST-9 had an Sr of 3.23 (approximately one unique PBR
observed for every three unique nucleotide alleles), compared to an average Sr of 1.38 (range
1.18-1.65) in the remaining 14 supertypes. Remarkably, compared to all other supertypes, ST-9
also displayed more than double the mean population frequency (0.330), compared to a mean
population range of 0.017 – 0.097 in other supertypes (Figure 5.3, Table 5.1, Figure S5.3.a-o,
Appendix 3). When considering all supertypes, each was expressed on average in 17.75%
(±18.62) of individuals. However, ST-9 was observed in 79.77 % of individuals, which lies 3.33
standard deviations away from the mean, and so is significantly more common among
individuals than other supertypes (p<0.003, Figure S5.4, Appendix 3, Table S5.8, Appendix 5).
Supertype-9 alleles were absent from just 5% (3) of the sampled sites (Marianne-10,
Marianne-11, and Cumana), and these populations had particularly unusual supertype
compositions compared to other surrounding sites (Figure 5.4). Other supertypes were absent
from 14 (23.7%) to 41 (49.5%) of populations, which highlights that ST-9 is a particularly
common, almost ubiquitous, supertype. The number of ST-9 alleles within populations ranged
from 1-15 (mean 4.38). Despite variation in the number of ST-9 alleles within populations, the
presence/absence, and frequency of particular ST-9 alleles, the cumulative frequency of ST-9
alleles was remarkably similar among populations (mean = 0.330 ±0.129, range= 0.019 – 0.588,
Figure 5.4, Figure S5.3.i, Appendix 3, Table S5.5, Appendix 5). This was evident in populations
across Trinidad, Tobago, two Hawaiian Islands, and Barbados. Similar degrees of redundancy,
cumulative ST-9 frequency, and a high proportion of ST-9 alleles were also observed among
individuals of P. picta (Figure 5.4, Figure S5.2, Figure S5.3.i, Appendix 3, Table S5.6, S5.1 and
S5.7, Appendix 5). In addition, the nine unique PBR sequences from 10 alleles observed within

107
five P. picta individuals tended to be more closely related to those found in particular
supertypes of guppies (Figure S5.2), rather than describing species specific lineages. Critically,
there was no correlation between the number of unique ST-9 alleles and the total ST9
frequency within populations (P=0.303, R2=0.01), or the number of unique ST-9 PBR amino acid
sequences and the total ST9 frequency (P=0.162, R2=0.03) (Figure 5.5).
Because ST-9 population level characteristics differed from those of other supertypes, I
compared co-variation between the six supertype metrics (see Methods) in the presence, and
absence of ST-9. In the presence of ST-9 PCA axis 1 explained 60.97%, and axis 2 24.39 % of the
variation (Figure 5.6a). There was a positive association between Sr and the mean population
frequency of a supertype, and the mean number of unique alleles per supertype within a
population (additional correlation coefficient, P=<0.001, R2=0.82), yet this relationship was
mainly driven by variation in ST-9 (Figure, 5.6b; additional correlation coefficient, P=0.30,
R2=0.08). Similarly, the mean number of unique alleles per supertype within a population was
positively correlated with mean population frequency of a supertype (additional correlation
coefficient, P=<0.001, R2=0.89), yet was much weaker when ST-9 was excluded (Figure 5.6b;
additional correlation coefficient, P=0.25, R2=0.35). I observed extreme values in all of these
metrics in ST-9 (Table 5.1), and collectively these metrics characterized ST-9 as distinct from the
remainder (Figure S5.4, Appendix 3).
While ST-9 displayed the highest Sr (3.23), and the lowest level of amino acid
differentiation among PBR amino acid sequences (3.794), ST-6 displayed the highest within ST
differentiation among alleles (7.758) and lowest PBR redundancy (1.22), while still comprising a
relatively high number of unique alleles (44) (Table 5.1). Although ST-6 was observed in a range
of populations across different geographic regions, it was notably more common in southern
Trinidad, and comparatively rare in the North Slope (Figure 5.4, Figure S5.3f, Appendix 3). ST-3
was even more localized in distribution, with high frequencies (>0.20) only in North Slope
populations. In the North Slope, ST-3 was represented by just 16 alleles, with an overall Sr of
1.455, which is less than half of that observed in ST-9 (3.235) (Table 5.1). Moreover, in each
population, one or two unique alleles tended to dominate the cumulative frequency of this

108
supertype (Table S5.7, Appendix 5). When supertypes were analysed without ST-9, relationships
among metrics of the remaining supertypes were made clearer. Here, PCA axis 1 explained
53.64% of the variation, and axis 2 explained 24.34% (Figure 5.6b). A weaker signal similar to
ST-9 was observed in ST-12 and ST-4, which both showed relatively high levels of PBR
redundancy along with a high number of alleles. Conversely, ST-15, ST-13, and ST-10 all
exhibited high numbers of alleles, yet these also represented a relatively high number of unique
PBR sequences (Figure 5.6b, Table 5.1).
Discussion
Interpretations of processes governing the evolution of MHC genes have often resulted in
disparate or even contradictory inferences regarding signals of neutral processes (Sutton,
2011), parasite mediated selection (Fraser & Neff 2010; van Oosterhout et al. 2006b, Penn et al.
2002; Summers et al. 2009), and sexual selection (Winternitz et al. 2013). The common
approach has been to study MHC allelic diversity at the nucleotide level, while generally
ignoring functional significance at the level of the amino acids within the PBR that are subject to
parasite mediated selection. Here I discuss how consideration of MHC supertype diversity
(which is derived from the inferred functionality of PBR amino acid sequences) can help
elucidate complex processes of MHC evolution, and how the study of allelic diversity alone can
bias such inferences, leading to contradictory observations. Accurate interpretations of the
effects of parasite mediated selection on the MHC can only be made when simultaneously
considering allelic, and supertype diversity.
Comparison of MHC allele and supertype diversity improves evolutionary inferences
Population differentiation based on MHC allele frequencies is significantly correlated with
differentiation at neutral loci. However, I found no significant correlation between population
differentiation based on MHC supertypes and microsatellites, which shows that MHC supertype
diversity is less affected by genetic drift in this system. Despite this, there was a very strong

109
relationship between population differentiation based on MHC alleles and supertypes.
Approximately 45% of the variation in the MHC allele frequency distributions could be
explained by variation in MHC supertypes. Therefore, MHC allele frequencies (which have
typically been the focus of MHC studies in natural populations) appear to be affected by both
neutral process and changes in supertype frequency. So exactly what are the characteristics
that describe the association among alleles and supertypes?
An MHC supertype is defined as a group of alleles that share similar functional properties,
inferred from variation in amino acids within the PBR that are under strong positive selection.
The fact that the number of supertypes identified in this chapter increased by just 24% with a
357% rise in the number of alleles, compared to Chapter 4, supports the robustness of the
DAPC approach in characterizing well-defined functional clusters of alleles. Despite the addition
of many more alleles in the current analysis, there was high concordance between the
supertype groupings observed in Chapter 4 and these improved supertype estimates (mean
concordance= 76% ±21, range 42-100). Moreover, the mean number of PBR amino acid
differences among alleles increased by just 1% from those used in Chapter 4 (mean number of
differences = 9.996) compared to alleles described here (mean number of differences = 10.179).
Guppy genotypes (in 99% of cases) displayed a maximum of two MHC alleles for any
observed supertype. This supports previous studies, which infer that supertypes are (largely)
loci specific (Ellison et al. 2012; van Oosterhout 2013, Chapter 4). In addition, guppies show
extensive CNV, both within and among populations (Chapter 3; Lighten et al. 2014a), and loci
can appear either fixed or nearly fixed for particular supertypes (e.g. Marianne-3, Marianne-4,
Cumana). The inference that supertypes, and their constituent alleles, may be locus specific,
and that alleles within each supertype may be affected by demographic processes, suggests
that selection operates directly on the presence/absence of supertypes at loci (Chapter 4; see
below). Because alleles are confined to the functional space of a supertype, they are affected
by both intra-supertype selective, and demographic processes (Figure 5.7). Alleles present
within a population are influenced by the amount of intra-supertype genetic drift and this will

110
be dependent on the relative fitness that each allele confers, where alleles with
similar/identical fitness will drift more. The relative fitness of alleles within a supertype is
defined by how well each is adapted to combat parasite infection (Figure 5.7). The alleles that
occupy the functional space of a supertype will change in response to parasite evolution, which
is geared towards evading the host immune system, and changes in allele frequencies will be
driven by intra-supertype Red Queen Dynamics. As alleles within a supertype become less
efficient in defense against a parasite species, they will reduce in frequency or be lost, whereas
alleles better adapted to combat infection within a supertype will increase in frequency in a
population. This results in the optimization of supertype functionality (Figure 5.7).
The evolution of supertypes should be largely independent from each other (excluding
possible linkage and micro-recombination events) as they perform different functions, and so
each will have a reduced number of alleles (compared to the entire gene pool), which can
facilitate rapid changes in allele frequency and allelic turn-over by drift or Red Queen Dynamics.
Also, because supertypes may likely be confined to particular loci, and each is adapted to a
particular parasite(s), then it is likely that variation in parasitic community exerts balancing
selection directly on loci. Specifically, a locus is maintained in a population when a supertype
(and its constituent alleles) is advantageous in defense against the population specific parasite
fauna. This hypothesis can explain the extensive patterns of CNV observed among guppy
populations. However, CNV (and therefore supertype diversity) could likely also be affected by
extreme demographic processes (e.g. a severe population bottleneck), which could result in
either an increase or decrease of mean STi. This likely explains the extremely reduced allelic and
supertype richness observed in the Cumana population, where this population may have been
seeded by a small number of individuals from the nearby Tompire river, which shares the single
haplotype observed in the Cumana population. However, other more common demographic
processes (e.g. drift) are likely less influential on CNV and STi, which appear under selection.
The number of alleles within a supertype (or at a locus, which might harbour multiple
supertypes) is also likely to be affected by the length of time which selection has operated to
maintain its presence among populations (see below), as well as the amount of drift. Similarly,

111
populations where a supertype has remained present over long evolutionary time are also
expected to have accumulated multiple alleles of that particular supertype (some of which will
encode identical PBR amino acid sequences).
Stabilizing selection on MHC supertypes
Stabilizing selection is generally not implicated in MHC evolution as this process would result in
highly homogenized allele frequencies among populations, and observations generally support
high divergence at the MHC among populations. However, this interpretation of widespread
divergent selection is based purely on allele frequencies, while generally ignoring the PBR
amino acid functionality that each allele represents. It is now established that allele frequencies
can be significantly affected by demographic processes (e.g. Sutton et al. 2011), so even the
strength of apparent divergent selection based on alleles may be called in to question. I
propose a new argument that stabilizing selection of MHC supertypes is a strong evolutionary
force maintaining crucial functionality over millions of years. Similar processes have been
observed in histone gene supertypes (H1 multigene family; Eirín-López et al. 2004), and in allele
frequencies of the Toll-like receptor gene family (Mukherjee et al. 2014). Invoking stabilizing
selection on supertypes much better explains the observation of trans-species polymorphism
(TSP) than does the common inference of balancing selection acting strictly on alleles. Balancing
selection acting on a single gene pool cannot simultaneously explain the observation of rapid
allelic turnover (or high allelic diversity) and TSP (van Oosterhout 2009b). However, when intra-
supertype Red Queen Dynamics are invoked, rapid allelic evolution may take place within the
confines of a supertypes functional space, which is itself preserved by stabilizing selection
acting against mutant alleles with poorer peptide binding properties relative to defense against
the targeted parasite(s) (Figure 5.7). This explains the presence of TSP in terms of sharing of
allelic lineages between species, and the sharing of supertypes across species and populations,
despite significant divergence in the constituted alleles.

112
For simplicity I focus on a remarkable example of stabilizing selection observed within ST-
9. This supertype comprised 55 MHC alleles, yet these corresponded to just 17 PBR amino acid
sequence variants. This relatively reduced PBR amino acid variation was maintained over large
geographic distances among populations that have long been isolated, despite the fact that
allelic variation at the nucleotide level was quite diverse. Even more remarkable was the fact
that despite different numbers of alleles and PBR amino acid sequence variants in populations,
and long term isolation, the cumulative frequency of ST-9 alleles, and the frequency of
individuals that contained the supertype was both high and similar among populations. The
frequency of ST-9 is not significantly affected by the number of alleles or PBR amino acid
sequence variants present in the population. These observations suggest that strong stabilizing
selection is operating in concert on a diverse assemblage of alleles belonging to ST-9, despite
variation in nucleotide and PBR amino acid sequences. This is because alleles are inferred to
have similar functionality, and moreover, DAPC analysis suggests that this functionality is highly
conserved and distinct from that of other supertypes. The selective force maintaining the
functionally important ST-9 must be very strong indeed, as the characteristics of a relatively
high number of alleles, high PBR similarity/redundancy, and high/similar population frequencies
were also observed in P. picta. This maintenance of such trans-species functionality since the
last shared common ancestor between P. reticulata and P. picta ~21-22 mya suggests a very
important role for ST-9 (as well as the other shared supertypes) in poeciliid immune processes.
In Chapter 4, I described associations among numerous other MHC supertypes with
Gyrodactylus prevalence, and variation in fitness related colours. The results corroborated the
homogenizing effect of Gyrodactylus on guppy MHC supertype diversity (Fraser & Neff 2010b),
which are further explained by the model of stabilizing selection described here.
As no correlation between ST-9 and Gyrodactylus prevalence, and male colour was
previously identified, inferences of its functional relevance remain elusive. It may be that this
supertype functions to combat a common and ubiquitous parasite. This hypothesis is supported
in part by the fact that guppies from the Cumana population (which lack ST-9) appear to have
considerably higher rates of mortality and lower fecundity than guppies from Marianne-3
(which all express ST-9, and appear to have very good health) when reared in aquaria (data not

113
shown). Indeed, the fact that ST-9 is the only monophyletic supertype (based on its constituent
alleles, and PBR amino acid sequences), and is under such strong stabilizing selection, implies
that these alleles are very fastidious in function, where as other supertypes (which can be
polyphyletic or paraphyletic) may be more promiscuous in function (or target rapidly
evolving/generalist pathogens), and so recombination, and less stabilizing selection, is
characteristic of their evolution. This signal of long term stabilizing selection was only
detectable when examining the relationship among MHC supertypes and their constituent
alleles. A conventional analysis that focused purely on the geographic distribution of nucleotide
level allelic diversity would have led to an erroneous supposition that local adaptation, e.g.
though balancing NFDS must be operating to drive strong patterns of MHC allelic
differentiation.
When examining supertypes in the absence of ST-9, other interesting patterns emerge.
For example, there is no correlation between the average number of alleles within supertypes
and the average frequency of those supertypes in each population. This is consistent with
stabilizing selection also acting on these supertypes. Another important observation is that as
the number of different alleles within a supertype increases, so does the similarity among the
PBR amino acid sequences that they encode. High similarity among alleles within a supertype
(Figure S4.4, Appendix 2) supports stabilizing selection operating on the PBR amino acids of
alleles, whereas convergent evolution would increase evolutionary distance among alleles
within a supertype. The preservation of functionality among alleles within a supertype also
explains how new (rare/private) alleles can be maintained over long periods of time, as they
not as easily lost by genetic drift. If alleles were not confined to selection within the functional
boundary of a supertype, the number of alleles within supertypes would decrease as a result of
directional selection. This would prevent the wide spread observation of many rare and private
alleles that are very similar in composition to those of higher frequency.

114
Finally, weaker signals of stabilizing selection were observed in ST-12 and ST-4, which
both showed relatively high Sr values (1.520 and 1.652 respectively) along with a high number of
alleles (38 and 38 respectively). However, stabilizing selection at each of these supertypes
appears less evident than for ST-9, and was concentrated in the North Slope for ST-4, and
outside of the North Slope for ST-12. This highlights how accurate interpretation of processes
governing MHC polymorphism relies upon comparisons among populations across suitable
spatial scales.
There is growing recognition in the value of studying MHC gene evolution at the
supertype level. Previous studies have inferred functional roles of supertypes, by correlating
supertype frequency with that of parasitic infections (Schwensow et al. 2007b; Fraser & Neff
2010; Sepil et al. 2013a), which overcomes the problems of resolving MHC allele specific effects
in highly diverse study systems. Interestingly, it seems that variation in supertypes observed
among populations of a species are not just driven by their own parasitic infections, but also by
infection dynamics seen among parasite fauna in other host species at the community-level
(Pilosof et al. 2014). This places importance on evolution on shared MHC functionality among
species, either through trans-species polymorphism or convergence (Sette et al. 2012), and less
so on attempting to resolve patterns of MHC evolution strictly through patterns of allelic
diversity. Indeed, a recent study showed that supertypes can resolve patterns of selection
operating on the MHC at the population level in Hochstetter’s frog (Leiopelma hochstetteri),
which shows high diversity at the allelic level (Lillie et al. 2015). By assessing the pattern of
population differentiation at the MHC, my study gains critical insight into the interrelated
evolution of MHC alleles and supertypes. This provides the basis for a novel model of MHC
evolution, which describes a complex of processes operating on alleles and supertypes, and
importantly resolves the observation of numerous evolutionary paradoxes commonly observed
in patterns of MHC diversity. Overall I highlight that consideration of supertypes is critical in
understanding processes of MHC evolution.

115
Conclusion
This chapter examines how the consideration of supertypes can help explain the evolutionary
significance of patterns of MHC diversity in natural populations. By comparing geographic
patterns of MHC alleles, MHC supertypes, and neutral loci, previously undetected processes
governing polymorphism at MHC loci can be examined. A significant correlation between MHC
allele and microsatellite population structuring exists, however there is no significant
correlation between MHC supertype and microsatellite structuring. Moreover, a significant
correlation between MHC allele and supertype population differentiation suggests that alleles,
and not supertypes, are affected by demographic processes as well as changes in supertype
diversity. The maximum of two alleles per supertype (in >99% of genotypes), suggests that
supertypes are locus specific. In connection with these points I closely examined one particular
supertype (ST-9), and proposed that supertype functionality is maintained by strong stabilizing
selection quickly eliminating alleles that fall outside of the functional boundary (and in between
the functional boundaries of other supertypes). The frequency of alleles within a supertype that
confer a similar/identical fitness are affected by random genetic drift, albeit less so than
completely neutral loci. Frequencies of alleles that vary in relative fitness are likely affected by
intra-supertype Red Queen Dynamics. Because evolutionary processes operating on alleles are
confined within supertypes, and stabilizing selection operates on maintaining the supertype
functionality, allelic lineages within supertypes can persist over large spatial and temporal
scales, explaining TSP. This also explains the common observation of many unique rare, and
private alleles at the nucleotide level, which are functionally similar or redundant at the PBR
amino acid level. Balancing selection, driven by variable parasite communities likely operates to
maintain over all supertype diversity among populations. Therefore balancing selection may act
directly on the loci and so is complicit in driving the widespread CNV observed both within and
among guppy populations. Overall this hypothesis of ‘stabilized supertypes and balanced loci’
represents a potential paradigm shift in the study of MHC evolutionary ecology.

11
6
Figure 5.1. The relationship between the number of alleles within an individual (Ai) and the number of supertypes within an individual
(STi) observed among all samples. In general, as Ai increases, so does STi; however, there is variability in the trend, with intermediate
levels of Ai (Ai = 4-6) corresponding to more variation in STi. Individuals with a large Ai will never have a low STi, suggesting that variation
in Ai among individuals is largely due to variation in the size of the functional repertoire, which can be explained as variation in locus
specific supertypes.
1
3
5
7
0
10
20
30
40
50
60
70
80
90
100
1 2 3 4 56
78
9
Nu
mb
er
of
sup
ert
ype
s p
er
ind
ivid
ual
s (S
T i)
Fre
qu
en
cy o
f in
div
idu
als
(%)
Number of alleles per individuals (Ai)

11
7
Figure 5.2. Comparisons of mean population differentiation estimates (Dest) based on microsatellite (Blue), MHC allele (Red), and MHC supertype
(Black) frequencies. Generally guppy populations are highly differentiated based on MHC allele frequencies, as well as in microsatellite allele
frequencies and these are significantly correlated (see Results). While the majority of populations are only moderately differentiated based on
supertype frequencies, representing stabilizing selection, a few populations show higher differentiation similar to that observed in microsatellites.
This indicated that although supertype and microsatellite frequencies are not correlated across the data set (See Results), that in some cases either
supertype diversity within a population can be affected by demographic processes or local adaptation results in particular populations becoming more
differentiated in their MHC functional repertoire. Examination of MHC alleles and microsatellites alone would lead to the erroneous conclusion that
strong divergent selection is operating in concert with demographic processes driving high population differentiation in MHC alleles.
0
0.1
0.2
0.3
0.4
0.5
0.6
0.7
0.8
0.9
1
Gu
anap
o-1
Gu
anap
o-2
Ari
ma-
1
Ari
ma-
2
Ari
po
-1
Ari
po
-2
El C
edro
-1
El C
edro
-2
Turu
re-2
Turu
re-3
Die
go M
arti
n
Cu
ragu
ate
Las
Cu
eva
s
Yarr
a-1
Yarr
a-2
Dam
ier-
1
Dam
ier-
2
Mar
ian
ne
-3
Mar
ian
ne
-4
Mar
ian
ne
-10
Mar
ian
ne
-16
Par
ia-3
Par
ia-7
Par
ia-8
Par
ia-1
2
Par
ia-1
3
Mad
amas
-2
Shar
k
San
So
uci
Mis
sio
n
Tom
pir
e
Qu
are-
1
Qu
are-
2
La S
eiva
Mat
ura
Po
ole
Fae
cal D
um
p R
d.
Oro
pu
che
-So
uth
Fift
h C
om
pan
y
Gu
aygu
ayar
e
Bas
se T
err
e
Mo
nd
esir
Mo
rne
Van
ce
Pit
ch L
ake
Silv
er S
trea
m
Po
int
Fon
tin
-1
Po
int
Fon
tin
-2
Snak
e
Sto
llme
yer
Me
an s
up
ert
ype
po
pu
lati
on
dif
fere
nti
atio
n (
Des
t)
Population

11
8
Figure 5.3. Redundancy of the protein binding region (PBR) translated from the unique MHC allelic nucleotide sequences in each
supertype (Sr). Redundancy increases as the fraction of unique PBR sequences decreases among alleles within a supertype. In general, the
majority of supertypes display a similar degree of PBR redundancy, while ST-9 displays almost double the amount of PBR redundancy
compared to all other supertypes. In concert, ST-9 displays multiple other unique traits (see Results), for example this high redundancy is
coupled with the highest number of MHC alleles of any supertype. In conjunction with the near ubiquitous nature of ST-9, this suggests
that its functionality has been preserved over large temporal and spatial scales, expanding in the number of alleles through mutations
that do not deviate from the functionality that is under strong stabilizing selection.
0.0
0.5
1.0
1.5
2.0
2.5
3.0
3.5
4.0
1 2 3 4 5 6 7 8 9 10 11 12 13 14 15
PB
R r
edu
nd
ancy
(S r
)
Supertype

11
9
(a)
30k m

12
0
Figure 5.4. The geographic distribution of MHC supertypes in guppy populations across Trinidad and other oceanic islands. Rivers in the mountainous
Northern Range comprise three major regions: The North Slope (green), Caroni Drainage (light blue), and Oropouche drainage (Orange). Separate
drainages in the Northern range are shown in grey. Rivers in the relatively flat regions towards the south are shown in dark blue. Abbreviated
populations comprise; Diego Martin (DM), Curaguate (Cur), Las Cuevas (LC), Yarra 1 (Y1), Yarra (Y2), Damier 1 (D1), Damier (D2), Marianne 3, 4, 7, 10,
11, 16 (M3, M4, M7, M10, M11, M16), Paria 3, 4, 7, 8 ,12, 13 (P3, P4, P7, P8, P12, P13) Madamas (Mad), Shark (Sh), San Souci (SS), Mission (Mis),
Tompire (Tom), Cumana (Cu), Matura (Mat), Las Seiva (LS), Turure 2 (T2), Turure 3 (T3), Quare 1 (Q1), Quare 2 (Q2), Aripo 1 (Ap1), Aripo 2 (Ap2),
Guanapo 1 (G1), Guanapo 2 (G2), El Cedro 1 (EC1), El Cedro 2 (EC2), Arima 1 (Ar 1), Arima 2 (Ar2), Silver Stream (Sil), Pitch Lake (PL), Point Fortin (PF1),
Point Fortin 2 (PF2), SN (Snake), Stollmeyer (Sm), Vance (Vc), Morne (Mn), Mondesir (Mon), Fifth Company (FC), Oropouche-South (OS), Basse Terre
(BS), Poole (Po), Faecal Dump Rd. (FDR), Guayguayre (Gg). Guppies were also collected from Oahu and Maui in the Hawaiian archipelago, Windward
Rd. in Tobago, and Grahame Hall swamp In Barbados. (Cont’d)

12
1
Poecilia picta (P. picta) were collected from St. Joseph, East coast Trinidad.(A, B) Complex variation in supertype frequency distribution occurs across
populations, and for clarity those in the Marianne and Paria are shown separately. However, ST9 is obviously maintained in similar frequencies across
the majority of populations, despite wide variation in the frequencies of particular alleles that are present. Populations that are in close proximity
tend to be similar in supertype composition, which is likely a consequence of similar selection pressures and gene flow. For example, Cumana is fixed
for just one ST-allele that is found only in the neighboring Tompire River (and Pitch Lake in the South West). Populations in the Yarra, Damier,
Marianne, and Paria also appear to be largely similar. Damier populations represent a human mediated introduction from the Yarra, but the similarity
among (B) the eastern upland populations of the Marianne and those in the Paria likely represent recent colonization of the Paria from the Marianne,
and microsatellite data support this (Baillie 2012). Populations M10 and M11 lack ST9, but are unique in displaying a large expansion of ST4 alleles,
which are rare elsewhere.

12
2
Figure 5.5. The lack of relationship between the number of unique alleles (black) and cumulative population frequency of supertype-
9 (P=0.303, R2=0.01), as well as between the number of unique PBR sequences (red) within a population, and the combined
frequency of ST-9 alleles (P=0.162, R2=0.03) present in a population again supports strong stabilizing selection
0.0
0.1
0.2
0.3
0.4
0.5
0.6
0.7
0 2 4 6 8 10 12 14 16
Po
pu
lati
on
fre
qu
en
cy o
f ST
-9
Population count

123
(a)

124
(b)
Figure 5.6. Principle components analysis displaying the variation among supertypes in (1) protein
binding region (PBR) redundancy, (2) Mean population frequency (Mean freq), (3) mean number of
unique alleles within a supertype within a population (Mean N. unique alleles), (4) the number of
populations a supertype is observed (N. pops), (5) the total number of unique MHC alleles (nucleotide
sequences) in a supertype across all populations(N. alleles), (6) the number of unique PBR sequences in a
supertype (N. PBR), and (7) the mean distance among MHC PBR amino acid sequences (i.e. number of
differences) within a supertype (Within ST distance). The distance of the position of each supertype from
the center is proportional to its contribution to structuring the data set, and their position relative to the
arrow heads of each metric depict either a positive or negative association. For example, (a) ST-9 shows
the highest PBR redundancy, Mean freq, and Mean N. unique alleles, while ST-1 contains the least
number of total alleles among the fewest number of populations. Conversely, ST-6 comprises a high
mean number of unique alleles within a supertype, which are the most differentiated in nucleotide
sequences compared to other supertypes. Because ST-9 is observed in the majority of populations and
displays strong unique traits, the signal in its variation displays an overpowering contribution to the data
set. (b) When ST-9 is removed, more fine scale patterns of variation immerge in the remaining
supertypes. This reveals that ST-15, and ST-13 show a similar combination of traits that signify, although
to a lesser degree, stabilizing selection similar to ST-9.

125
12
5
Figure 5.7

126
Table 5.1. Comparisons of metrics that define each supertype across populations of guppies
Supertype N.
alleles N.
PBR
Mean PBR amino acid distance (n. differences)
N. pops
Mean population frequency
Mean frequency of individuals that have supertype (%)
Mean number of
unique alleles per population
Sr (measure of PBR
redundancy among alleles)
ST1 16 13 7.857 21 0.017 5.99 0.458 1.231
ST2 25 17 6.891 21 0.032 10.42 0.661 1.471
ST3 32 22 6.794 30 0.079 23.05 1.136 1.455
ST4 38 23 4.607 24 0.047 12.39 1.136 1.652
ST5 21 17 4.971 17 0.018 4.92 0.508 1.235
ST6 44 36 7.758 37 0.055 16.54 1.237 1.222
ST7 35 24 6.232 18 0.030 8.93 0.881 1.458
ST8 32 27 6.335 32 0.041 13.81 1.000 1.185
ST9 55 17 3.794 56 0.330 78.41 4.390 3.235
ST10 48 33 5.391 34 0.053 15.86 1.441 1.455
ST11 21 15 7.267 37 0.058 18.95 1.085 1.400
ST12 38 25 3.886 29 0.038 12.25 1.085 1.520
ST13 49 33 7.065 41 0.068 17.60 1.322 1.485
ST14 35 25 6.558 20 0.034 10.32 0.831 1.400
ST15 50 40 6.296 45 0.097 29.82 1.780 1.250

127
Chapter 6
General Discussion and Conclusions
This thesis describes the use of Next Generation Sequencing (NGS) to elucidate patterns of
Major Histocompatibility Complex (MHC) evolution in natural populations of the guppy (Poecilia
reticulata). I have proposed a redefinition of the molecular and bioinformatic approaches used
to gather NGS MHC sequence data, and the theoretical considerations required for accurate
interpretation of MHC diversity. In addition, I provide novel evidence to suggest complex
interactions between MHC polymorphism, parasite infection, and phenotypic traits believed to
be associated with survival and mate choice. Comparisons among geographic distributions of
MHC supertypes and their constituent alleles provides support of a novel model governing MHC
evolution. This identifies a combination of parasite driven stabilizing selection acting on
supertype functionality, and Red Queen Dynamics and random genetic drift acting on
functionally similar MHC alleles within supertypes. I also propose that patterns of population
differentiation may be misinterpreted to represent high levels of local adaptation at the allelic
level if supertypes are ignored. Moreover, I suggest that patterns of MHC copy number
variation (CNV) (or haplotype variation) may be maintained by balancing selection acting on
individual loci (or groups of loci), driven by variable parasite communities. The culmination is a
body of evidence to suggest not only that guppies provide a unique system to investigate the
interplay between parasite mediated natural selection and sexually mediated natural selection,
but also that the guppy is an ideal model species that can greatly improve our understanding of
MHC evolution in natural populations.

128
Redefining NGS approaches to study MHC
In Chapter 2 and Chapter 3, I presented the basis for a re-definition of NGS MHC genotyping
approaches by critically evaluating the relative merits of popular bioinformatic approaches,
which use allele validation thresholds (AVT; e.g. Radwan et al 2012) or sequence clustering (e.g.
Pavey et al. 2013). In conjunction, I introduced a novel molecular and bioinformatic procedure,
which uses ultra-deep Illumina sequencing and relative amplicon sequencing depth modeling.
This is advantageous over those that use AVTs and clustering of 454 or Ion Torrent sequencing
data as it strictly adheres to genotyping assumptions and avoids compound-PCRs (unlike
previous methods).
In these chapters, I clarified two major points of concern that had been previously
overlooked: (1) Approaches that use AVTs are inappropriate to deal with NGS artifacts, and (2)
The presence of contaminant DNA is a significant problem in NGS multigene family genotyping.
Contamination of amplicons can result from direct DNA/PCR sample contamination, or MID
barcode swapping during pooling of samples prior to sequencing. After many PCR cycles, even a
minute amount of contamination may be amplified to form a significant amount of “noise” so
that it will become increasingly difficult to distinguish it from the “true” amplicons (i.e. the
alleles present in that individual genotype). Given that NGS techniques can sequence the PCR
products with extremely high coverage, such artifacts can appear in the data read-out at
convincingly high sequencing-depth alongside the true alleles (Chapter 2; Chapter 3, Lighten et
al. 2014a; b). However, the process of dealing with contaminants and artifacts should not start
at the stage of bioinformatic data processing. Here I add to my previous advice regarding
bioinformatics, and outline important yet largely unspoken requirements for accurate
genotyping of MHC loci, during the stages of sample collections and laboratory protocols.

129
Sample collection and laboratory protocols: If attention is given during experimental design to
measures aimed at avoiding cross sample contamination, the ease of downstream analysis of
sequence data can be significantly improved. Contamination may be particularly problematic
when samples have been collected in the field, or yield small amounts of DNA. A recent
example illustrates this. Herdegen et al. (2014) used fishnets to collect a shoal of guppies, and
DNA of fish mucus could easily end up contaminating other samples. Furthermore, guppies
have to be euthanized in an overdose of anesthetic (typically MS222) before being transferred
to sample tubes with ethanol. Given that the same solution tends to be used to kill many
individuals (often simultaneously), this can lead to further contamination. This thesis also used
samples collected by batch-preserving individuals in the same vial, and I found that previously
described AVT bioinformatic protocols could not reliably remove the sequence contamination
that this process resulted in. However, contamination was significantly reduced when just a few
scales per sample were preserved individually (samples from experimental pedigrees not used
in this thesis), as opposed to preserving many whole individuals in the same vial.
This has severe implications on the validity of the AVT approach, which is founded on
the ill-conceived idea that confirmation of the authenticity of an individual’s alleles can be
based on observing that allele in other samples even when present at very low sequencing
depths. Given that sampling during fieldwork is hardly a sterile activity, low-level contamination
is a practical inevitability (as is low-level barcode swapping during pooling of PCR products prior
to sequencing), making AVTs a methodologically unsound approach. More so than ever, it is
important that researchers make every effort to minimize cross-sample contamination, and
when this is practically impossible (e.g. during fieldwork), the appropriate informatics should be
applied to curtail the problems.

130
Recently, Herdegen et al. (2014) used NGS to genotype MHC loci in guppy populations
of Northern Venezuela. They concluded that the AVT method (see Zagalska-Neubauer et al.
2010, Radwan et al. 2012) out-performs the procedure described in Chapter 3. This protocol
uses the relative ‘degree of change’ (DOC) in sequencing depth to distinguish true alleles from
artifacts (see Chapter 2; Chapter 3; Lighten et al. 2014a; b for full details). I demonstrated both
empirically and theoretically that the DOC criterion is more suitable for NGS MHC genotyping
than the various AVT approaches (Chapter 2; Chapter 3; Lighten et al. 2014a; b). However, why
did the AVT approach in Herdegen et al. (2014) appear to outperform the DOC method?
Herdegen et al. (2014) used two sequencing approaches to estimate MHC genotypes. First they
amplified MHC loci using degenerate primers and 35 PCR cycles. Once amplified, these samples
underwent an undisclosed number of additional emulsion-PCR cycles that form an integral part
of the Ion Torrent sequencing protocol (which commonly uses between 30 to 70 cycles). To
validate genotypes they also amplified independent replicate amplicons using 33 PCR cycles,
which were then pooled and underwent an additional 12 PCR cycles during the Illumina MiSeq
Nextera sequencing protocol. However, both of these approaches are ill-advised when
sequencing multi-template PCR amplicons of unknown CNV with a multitude of potential errors
(e.g. chimeras, base-mismatches etc.) and potential cross-sample contamination. I previously
outlined this issue in brief (Chapter 2; Lighten et al. 2014b) but here expand of the importance
of correct laboratory protocols, which are essential for multigene family genotyping.
Artifacts and contaminants can be relatively easily identified by the DOC method if just
one independent PCR per sample is performed because they remain at a significantly lower
sequence depth than true alleles (Chapter 2; Chapter 3; Lighten et al. 2014a; b). This is because
(1) the high-copy number template DNA (i.e. the alleles) will outcompete the low-copy number
contaminants during the first series of PCRs, and (2) the base mismatch error rates, as well as
chimeras, are still sufficiently rare to be identified as artifacts. Post-PCR, however, all artifacts
are at a significantly elevated frequency, and when introducing these artifacts into a new set of
PCRs with a fresh batch of reagents, their frequencies can increase to such extents that it

131
becomes virtually impossible to distinguish them from the true alleles (Chapter 2; Lighten et al.
2014b).
Up until now, researchers have not acknowledged that the double-PCR in Ion Torrent
and Illumina Nextera (as well as 454 sequencing) can be problematic when sequencing
multigene families with unknown CNV (and possibly also in the analysis of samples collected in
non-sterile conditions). The Illumina TruSeq protocol is in my opinion superior for these
particular purposes because it involves just a single independent PCR for each sample (see
Chapter 2; Chapter 3; Lighten et al. 2014a; b). Indeed, the DOC criterion was developed and
validated using Illumina TruSeq, which guarantees that artifacts are kept at low frequencies so
that they remain distinguishable from alleles. Moreover, because ‘double-PCR’ protocols can
produce high frequency artefacts, these become the origin of further artificial sequences. This
can produce further distortion to the depth profile of artificial variants (Chapter 2; Lighten et al.
2014b), in particular when artifacts produced during the first set of PCRs occur at much greater
depths from those generated in the second PCR. After two rounds of PCRs, the amplified
products may consist of (1) high-copy number artifacts, which are indistinguishable from high
copy number true alleles, and (2) low-copy number complex artifacts generated from high-copy
number artifacts. This makes it difficult to distinguish alleles from artifacts both using the DOC
criterion and clustering protocols (Lamaze et al. 2014, Pavey et al. 2013, Sommer et al. 2013).
An additional point worth emphasizing is the requirement for sequence error correction. In
Chapter 3 (Lighten et al. 2014a), I identified repeatable base-mismatch errors and then added
the total depth observed for these artificial variants back to the parental allele from which they
originate. Error correction becomes even more critical when using Ion Torrent or 454
sequencing because they are particularly susceptible to higher incidences of repeatable base-
mismatch and homopolymer indel errors. Critically, particular MHC alleles can be reduced in
sequencing depth by over 50% by a repeatable indel error (unpublished data). The common
practice to discard sequence variants that vary in the number of expected nucleotides (e.g.
Herdegen et al. 2014) can severely impede accurate quantification of allelic sequences in an

132
amplicon.
Finally, clarification is required regarding an important misunderstanding that seems to
have arisen about the DOC criterion, in Herdegen et al. (2014). This approach does not rely on
the assumption of equal amplification of all allelic copies. I proposed two independent (and
complementary) workflows for separating alleles from artifacts. One workflow uses the DOC
criterion and its only assumption is that alleles are amplified at significantly greater depths than
artifacts. This assumption is entirely reasonable given that it is universal to all NGS MHC
genotyping procedures, and conveniently, this approach allows for the identification of CNV,
potential PCR bias, and poor quality data. Confusion might have arisen because I also proposed
a more advanced method that aims to both estimate CNV as well as an individual’s multi-locus
genotype. The CNV method could significantly advance the field given that currently MHC
studies only score the presence of an individual’s alleles. The additional assumption made by
this method is that the relative sequencing depth of an allele is approximately proportional to
its copy number in the genome (i.e. heterozygous and hemizygous alleles are present in one
copy, alleles that are present in homozygous state in two copies, and so on). Admittedly,
variable amplification of alleles can create unequal depth profiles that can bias the calling of an
individual’s multi-locus genotype (I.e. pattern of allelic and locus CNV). However, PCR bias
should not impede actual allele identification when using the DOC criterion, given thorough
primer design, as alleles should always be observed at significantly greater depth than artifacts.
Further development and validation of the CNV method (e.g. using pedigree records and
Mendelian segregation of alleles) is required to make this a standard multi-locus genotyping
method in the future. Nevertheless, this could herald a step-change in MHC research because it
would enable many population genetic analyses that are currently impossible (e.g. locus
phasing, estimating true allele frequencies, genotypic testing of overdominance, etc.).

133
In summary, I provide new and important advice; when using NGS methods to study
multigene families with CNV and/or samples collected in non-sterile environments, I
recommend researchers should use the Illumina TruSeq protocol (or an equivalent protocol
that avoids compound PCRs). Furthermore, I strongly advise researchers to apply the
appropriate bioinformatics protocols (i.e. the DOC or novel clustering methods) to distinguish
alleles from potential artifacts and avoid AVTs.
MHC supertypes play a role in disease susceptibility and phenotypic variability
The role of MHC in disease resistance and susceptibility (both infectious and autoimmune) is
widely recognized in humans (Traherne 2008; Trowsdale 2011). Increasingly, similar
relationships between particular MHC polymorphism and parasite infections have been
observed in natural populations of non-model organisms (reviewed in Piertney & Oliver, 2006;
Spurgin & Richardson, 2010). The use of supertypes in the study of MHC and disease resistance
has several advantages over simply using assessing allelic diversity. Firstly, the presence and
absence of particular MHC alleles can vary greatly among diverse populations, where many may
be observed in just one population (private alleles). So the use of supertypes avoids including
many missing data points (alleles) among populations, which would make correlative analysis
very difficult. Secondly, supertypes allow characterization of variation in MHC functionality
among populations, which is largely ignored in most MHC population genetic studies that focus
purely on alleles.
In Chapter 4, I described two MHC supertypes (ST-2 & ST-11) that were correlated with
decreased prevalence of Gyrodactylus infections among guppy populations. The inferred role in
resistance of ST-11 appears to corroborate previous findings, where a group of alleles
(supertype ‘a’) were also associated with resistance to Gyrodactylus infections (Fraser et al.
2010). These alleles were very closely related to supertype-11. However, the pattern associated

134
with ST-2 is novel. Male guppy colouration (implicated in mate choice and predator avoidance)
was correlated with frequencies of these supertypes, as well as Gyrodactylus prevalence, and
these correlations were governed by variability across river drainages. Colours that are
important in mate choice (orange, yellow, and black) are of particular interest because they
may be honest signals of fitness, derived from individual immunocompetence (Houde 1997;
Saks et al. 2003; Aguilera & Amat 2007). Indeed, among infected populations, higher
frequencies of ST-2, and ST-11 were associated with lower Gyrodactylus prevalence, and
greater amounts of orange, yellow, and black coloration on males. The relative increase in
health, which these colours may represent, may be a direct consequence of particular MHC
supertypes providing better immunological defense against Gyrodactylus, thus reducing their
prevalence in the populations.
The fact that microsatellite allelic richness (Micro-Ar) was not associated with variation
among populations in either colouration or Gyrodactylus prevalence supports the hypothesis
that these traits may experience strong selection pressures and are largely unaffected by
demographic processes. Moreover, the associations between MHC supertype richness (MHC-
STr), colouration and Gyrodactylus prevalence indicates that these important fitness related
traits are associated with processes of natural selection operating on functional MHC diversity.
Across all populations, greater MHC-STr was associated with less orange and yellow colouration
on males. Critically, MHC-STr was not associated with Micro-Ar. This suggests that MHC-STr is
under strong selection and little affected by demographic process, while MHC-Ar is affected by
both demographic processes and changes in MHC-STr. Therefore the association between MHC-
Ar and colouration is likely a consequence of links between MHC-STr (i.e. the measure of MHC
functional diversity of MHC in a population) and fitness related traits, maintained by natural
selection (see next section for more detail on the interplay between MHC alleles and
supertypes).

135
The role of MHC diversity (or richness) in population viability is poorly understood
(Radwan et al. 2010). Such data are important both in an evolutionary and species conservation
perspective as it allows the investigation of relationships between MHC richness and pathogen
community dynamics. The current paradigm suggests that greater genomic (and MHC) diversity
within populations provides the evolutionary potential for populations to adapt to changing
environmental conditions. However, if environmental dynamics remain in equilibrium for long
periods of time, this can potentially reduce genetic (MHC) variation in populations through
critical adaptation. Thus while such populations may not be able to deal with sudden dramatic
shifts in their environments (e.g. introduction of an alien pathogen), individual fitness variability
may be less than in populations in which environmental conditions are more complex and/or
are subject to flux. Indeed, a recent study showed that MHC diversity reduced during critical
adaptation to new environments of individual rainbow trout (Oncorhynchus mykiss) that were
introduced to wild sites from aquaculture enclosures (Monzón-Argüello et al. 2013). However,
the common premise is to examine MHC-Ar in relation to population adaptation, which may be
problematic due to its susceptibility to demographic processes. Here I suggest that MHC-STr is a
more biologically relevant and robust metric to assess the role of MHC diversity in population
adaptation and viability. Notably, lower MHC-STr was strongly associated with lower
Gyrodactylus prevalence, and greater expression of colours believed to signal health, across
drainages, and so may represent critical adaptation. Importantly, MHC-STr did not significantly
vary between populations suspected of being different sizes (low-land populations in high
predation sites are generally thought to be larger than up-land low predation sites), and so is a
robust measure of functional diversity, which is maintained by strong selection pressures. This
is especially important as Gyrodactylus prevalence was observed to be significantly different
between high- and low-predation sites, yet MHC-STr varied independently of population size
and is likely implicit in changes in Gyrodactylus prevalence across drainages, driven by process
of natural selection.

136
The fact that Gyrodactylus prevalence covaried with MHC-STr suggests that the diversity
of supertypes in a population may be related to pathogen community diversity. That is, when a
pathogen community is diverse, a population requires a larger repertoire of different functional
supertypes in order to counteract diverse infection potentials. However, this reduces the
adaptive strength of that population in combating a single particular pathogen relative to a
population that is critically adapted to dealing with just one parasite species. So population
viability in the face of many parasite species may require a ‘Jack of all trades’ approach,
compared to a highly specialized approach (and so lower supertype diversity) in populations
with fewer pathogens (Pilosof et al. 2014).
Supertypes are crucial in the understanding of MHC evolution
By comparing patterns of diversity of MHC alleles, MHC supertypes, and neutral microsatellites,
I was able to uncover processes governing MHC evolution, which remain cryptic when assessing
MHC allele polymorphism alone. The often observed pattern of high allelic differentiation
among populations is traditionally interpreted as representing local adaptation of host species
to fast evolving and divergent parasite fauna (reviewed in Piertney & Oliver, 2006; Spurgin &
Richardson, 2010). However, this inference is commonly confounded by significant observed
effects of demographic processes on patterns of MHC diversity, and the common approach is to
quantify this effect by comparing MHC diversity to that of neutrally evolving microsatellite
diversity (e.g. Sutton et al. 2011; Lamaze et al. 2014). By assessing allele nucleotide sequences
and the translated PBR amino acid sequences within and among supertypes, high similarity in
inferred MHC functionality was observed. Peptide binding region amino acid sequences were
either similar or identical among alleles that appear unique at the nucleotide level. To my
knowledge this is the first time that identical PBR amino acid sequences have been observed
among divergent nucleotide alleles and populations. Such appraisals of functional comparisons
among MHC alleles are important as they allow the scale of adaptive divergence at the MHC to

137
be assessed among populations. By conducting such appraisals, I have revealed that natural
selection operates both directly on supertype functionality, and thus individual loci (supertypes
appear to be loci specific), and on individual alleles within supertypes (which can also be
significantly affected by demographic processes). Specifically, stabilizing selection operates upon
the functional space of a supertype to maintain critical functionality at particular loci. Because
alleles within a supertype have the same/similar function, they are subject to genetic drift,
although new alleles will not be lost as easily as fully neutral loci, as they convey the same/similar
fitness benefits as other high frequency alleles from which they originate. Alleles that confer
relative variation of fitness within a supertype will be subject to intra-supertype Red Queen
Dynamics. This explains the observation of many rare and private MHC alleles. The culmination of
strong stabilizing selection acting on supertype functionality, and the rapid changes of allele
frequencies within supertypes can simultaneously explain how long isolated populations can be
highly divergent in MHC allele composition, yet the sharing of particular alleles over large spatial
and temporal scales may also be maintained.
Stabilizing selection acting upon MHC alleles within supertypes is strong enough to
maintain functionality beyond speciation events. Indeed, by comparing PBR amino acid sequences
between individuals of guppies (P. reticulata) and the swamp guppy (P. picta), trans-species
polymorphism was observed in the functionally important attributes of MHC alleles. Evidence
supporting a role of stabilizing selection in maintaining MHC functionality over millions of years is
important because it resolves the inconsistencies in the traditional hypothesis that balancing
selection on MHC alleles is responsible for long term preservation of alleles. An allelic genealogy
under balancing selection is similar to those of a neutral gene genealogy, but under a different
time scale (Takahata 1990). Thus balancing selection cannot account for the topology, namely very
long terminal branches, often observed in MHC allele genealogies. Long terminal branches can
however be explained by long term stabilizing selection, and Chapter 5 outlined unique supertype
characteristics which support its operation on the MHC.

138
However, balancing selection is still likely implicit in driving MHC allelic diversity within
supertypes, as well as overall supertype diversity. Because supertypes may be MHC locus
specific, parasite mediated balancing selection should operate directly on the frequency of
particular loci among populations. This is because the unit of selection is the core functionality
at these loci (which is restricted by stabilizing selection). The fact that MHC allelic population
differentiation is strongly correlated with supertype population differentiation and neutral
differentiation, whereas supertypes differentiation is not correlated with neutral
differentiation, further supports the notion that individual loci are a unit of selection. This can
explain why female mate choice is often associated with choosing MHC heterozygous or
dissimilar males (Milinski 2006). In these cases it may be that specific allelic combination are
not the unit of choice, but rather the increased likelihood of including diverse/particular
supertypes. This goes further to explain why populations that are depauperate at the MHC
allelic level can maintain high levels of fitness (or at least do not display unusually heavy
parasite burdens; Radwan et al. 2010). Balancing selection maintains critically functioning loci
independently, while not preventing loss of allelic diversity within groups of functionally similar
supertype alleles. Indeed, a recent study of bottlenecked populations of Berthelot’s pipit
(Anthus berthelotii) revealed just 22 MHC IIb alleles among 310 individuals (Gonzalez-Quevedo
et al. 2015). However, almost all of these alleles represented a unique supertype (22 alleles - 20
supertypes). Therefore, despite large losses of allelic diversity though demographic bottlenecks,
selection for individual loci can maintain critical MHC functionality within populations. Spatially
and temporally fluctuating balancing selection at MHC loci may also explain the high variance in
MHC CNV observed in guppies, and other species. This model of ‘stabilized supertypes -
balanced loci’ could be used to experimentally deduce the biological relevance of MHC CNV in
wild populations, and to unveil a likely important and understudied unit upon which selection
operates at the MHC.

139
The guppy is a unique model system to study MHC evolution
We are now in the genomic era, which holds unparalleled power to detect signatures of
genome-wide adaptation. However, researchers in evolutionary ecology still look towards MHC
genes as a well-established system to assess local adaptation in species. Over 50 years of
empirical and theoretical analyses on these genes reflects their biological importance in fitness,
and as such, a firm basis for understanding their evolution has materialized. While biomedical
and immunology researchers focus on the MHC to better understand its critical function and
evolution in general, it seems for the most part that ecologists’ latch on to the MHC purely
though an interest in their focal species. This has revealed a complex of varying evolutionary
processes operating on the MHC among a wide range of taxa, yet often, observations in one
species may be contradicted or absent in the next. These could arise though differences in life
history, ecology, behavior, and sample/population accessibility. However, if we are to
significantly progress our understanding of MHC evolutionary ecology, researchers would do
well to focus on a model species that holds the most optimal or desirable traits, which would
augment the myriad of complex evolutionary processes in a single MHC system.
Guppies appear to be such a system for several reasons: (1) In Trinidad alone there are
hundreds, if not thousands, of isolated yet easily accessible replicate populations, (2) among
different combinations of populations, ecological conditions are either similar or dissimilar, and
so populations have been shown to demonstrate either parallel or non-parallel evolution
(Houde 1997; Magurran 2005), (3) individuals are abundant and easily sampled, (4) guppies are
among the fastest evolving vertebrates and local adaption can occur very quickly, (5) there is a
wealth of knowledge surrounding guppy physiology, ecology, life history, behavior, and natural
selection, (6) combinations of bottlenecked, and un-bottlenecked populations, (7) guppies have
been introduced globally and have colonized many different habitat types containing diverse
pathogen fauna, (8) wild individuals can easily be transported back to the lab and with simple
husbandry experimental populations can be established, (9) poeciliid species are also known to

140
hybridize allowing the experimental study of trans-species polymorphism and introgression at
the MHC, and finally (10) guppies have extraordinary MHC diversity.
The empirical data described in this thesis also demonstrate that guppies are an ideal
species to study the interaction between parasite mediated and sexually mediated natural
selection on the MHC. Moreover, they appear an elegant system in which future research could
establish the long term role of MHC CNV in fitness among populations and species. While
guppies should be recognized as a valuable resource in MHC studies, increasing caution should
be exerted in conserving population sizes, especially in those that are well studied in Trinidad.
Numerous population have experienced recent human mediated declines, and Trinidadian
authorities are aiming to protect this valuable species so that its use as an exception biological
model system can continue (Ryan Mohammed pers. comm).
Conclusion
Here I present a thesis that delineates novel approaches to both MHC sequence data collection
and genotype estimation, and in the analysis of MHC diversity among natural populations of the
guppy. Firstly, I have shown that significant improvements can be made to NGS MHC
genotyping approaches, which allows high quality and repeatable genotype estimates, while
discarding poor quality data that can severely bias downstream analysis. The overall lessons
learned are that increased diligence is required to fully eradicate artificial sequences from NGS
MHC data and that this can be accomplished by using sequence depth modelling approaches,
which strictly adhere to genotyping assumptions.
Secondly, population level MHC supertype diversity, and particular MHC supertypes are
related to changes in Gyrodactylus prevalence infecting guppy populations. By classifying alleles
based on shared functional characteristics such inferences can be made, and this is especially

141
important in species where MHC allelic diversity significantly varies among populations. In using
Gyrodactylus as a proxy for parasitism, I propose that individual parasite species exert parallel
evolutionary effects (stabilizing selection) on MHC supertypes, which maintains critical
functionality across large spatial and temporal scales. In addition, it is varying parasite
communities (number of different species or parasitic phenotypes) that exert balancing
selection on the MHC to maintain higher levels of loci specific supertype functionality.
However, further experimental work is required to confirm this.
Finally, I have uncovered cryptic evolutionary processes operating on the MHC by
comparing MHC alleles, MHC supertypes (loci specific functionality), and neutral microsatellite
population diversity. The presence of stabilizing selection acting to maintain MHC supertype
functionality, balancing selection maintaining supertype diversity, and intra-supertype
evolutionary dynamics fueling allelic turn over, forms the basis for a novel model of MHC
evolution in ‘stabilized supertypes - balanced loci’. Critically this model explains numerous
observations commonly present in MHC studies: (1) neutral processes and selective processes
both apparently operating on MHC alleles, (2) high variance in allele frequencies within and
among populations, (3) many rare and private alleles, (4) the maintenance of alleles over large
spatial and temporal scales, and so the enigma of trans-species polymorphism.

142
References
Aguilera E, Amat JA (2007) Carotenoids, immune response and the expression of sexual ornaments in male greenfinches (Carduelis chloris). Die Naturwissenschaften, 94, 895–902.
Altschul SF, Gish W, Miller W et al. (1990) Basic local alignment search tool. Journal of Molecular Biology, 215, 403–410.
Antao T, Lopes A, Lopes R et al. (2008) LOSITAN: A workbench to detect molecular adaptation based on a Fst-outlier method. BMC Bioinformatics, 9, 323.
Archard GA, Cuthill IC, Partridge JC et al. (2008) Female guppies (Poecilia reticulata) show no preference for conspecific chemosensory cues in the field or an artificial flow chamber. Behaviour, 145, 1329–1346.
Arden B, Klein J (1982) Biochemical comparison of major histocompatibility complex molecules from different subspecies of Mus musculus: evidence for trans-specific evolution of alleles. PNAS, 79, 2342–6.
Asthana S, Noble WS, Kryukov G et al. (2007) Widely distributed noncoding purifying selection in the human genome. PNAS, 104, 12410–12415.
Babik W (2010) Methods for MHC genotyping in non-model vertebrates. Molecular ecology resources, 10, 237–251.
Babik W, Taberlet P, Ejsmond MJ et al. (2009) New generation sequencers as a tool for genotyping of highly polymorphic multilocus MHC system. Molecular ecology resources, 9, 713–9.
Baillie L (2012) Genetic population structure of the Trinidadian guppy (Poecilia reticulata) across Trrinidad and Tobago. Dalhousie University.
Balenger SL, Zuk M (2014) Testing the Hamilton-Zuk hypothesis: past, present, and future. Integrative and comparative biology, 54, 601–13.
Barson NJ, Cable J, van Oosterhout C (2009) Population genetic analysis of microsatellite variation of guppies (Poecilia reticulata) in Trinidad and Tobago: Evidence for a dynamic source-sink metapopulation structure, founder events and population bottlenecks. Journal of Evolutionary Biology, 22, 485–497.
Beaumont MA, Nichols RA (1996) Evaluating Loci for Use in the Genetic Analysis of Population Structure. Proceedings of the Royal Society B: Biological Sciences, 263, 1619–1626.

143
Beck S, Trowsdale J (2000) The human major histocompatibility complex: Lessons from the DNA sequence. Annual Review of Genomics and Human Genetics, 1, 117–137.
Beer AE, Quebbeman JF, Ayers JW et al. (1981) Major histocompatibility complex antigens, maternal and paternal immune responses, and chronic habitual abortions in humans. American journal of obstetrics and gynecology, 141, 987–999.
Bernatchez L, Landry C (2003) MHC studies in nonmodel vertebrates : what have we learned about natural selection in 15 years ? Journal of evolutionary biology, 16, 363–377.
De Boer RJ, Borghans JAM, van Boven M et al. (2004) Heterozygote advantage fails to explain the high degree of polymorphism of the MHC. Immunogenetics, 55, 725–31.
Bolker BM, Brooks ME, Clark CJ et al. (2009) Generalized linear mixed models: a practical guide for ecology and evolution. Trends in Ecology & Evolution, 24, 127–135.
Bondinas GP, Moustakas AK, Papadopoulos GK (2007) The spectrum of HLA-DQ and HLA-DR alleles, 2006: a listing correlating sequence and structure with function. Immunogenetics, 59, 539–553.
Brown JH, Jardetzky TS, Gorga JC et al. (1993) Three-dimensional structure of the human class II histocompatibility antigen HLA-DR1. Nature, 364, 33–39.
Burri R, Promerová M, Goebel J et al. (2014) PCR-based isolation of multigene families: Lessons from the avian MHC class IIB. Molecular ecology resources. 14, 778-788
Bush AO, Lafferty KD, Lotz JM et al. (1997) Parasitology meets ecology on its own terms: Margolis et al. revisited. The Journal of parasitology, 83, 575–583.
Cable J, van Oosterhout C (2007) The impact of parasites on the life history evolution of guppies (Poecilia reticulata): the effects of host size on parasite virulence. International journal for parasitology, 37, 1449–1458.
Campbell PJ, Stephens PJ, Pleasance ED et al. (2008) Identification of somatically acquired rearrangements in cancer using genome-wide massively parallel paired-end sequencing. Nature genetics, 40, 722–729.
Cao H, Wu J, Wang Y et al. (2013) An integrated tool to study MHC region: accurate SNV detection and HLA genes typing in human MHC region using targeted high-throughput sequencing. PloS one, 8, e69388.
Carlsen T, Aas AB, Lindner D et al. (2012) Don’t make a mista(g)ke: Is tag switching an overlooked source of error in amplicon pyrosequencing studies? Fungal Ecology, 5, 747–749.

144
Carrington M (1999) Recombination within the human MHC. Immunological Reviews, 167, 245–256.
Catchen J, Hohenlohe PA, Bassham S et al. (2013) Stacks: an analysis tool set for population genomics. Molecular ecology, 22, 3124–40.
Del Cerro S, Merino S, Martínez-de la Puente J et al. (2010) Carotenoid-based plumage colouration is associated with blood parasite richness and stress protein levels in blue tits (Cyanistes caeruleus). Oecologia, 162, 825–835.
Chen JM, Cooper DN, Chuzhanova N et al. (2007) Gene conversion: mechanisms, evolution and human disease. Nature reviews. Genetics, 8, 762–775.
Cheng Y, Stuart A, Morris K et al. (2012) Antigen-presenting genes and genomic copy number variations in the Tasmanian devil MHC. BMC genomics, 13, 87.
Chew BP, Park JS (2004) Carotenoid Action on the Immune Response. Journal of Nutrrition, 134, 257–261.
Chiang DY, Getz G, Jaffe DB et al. (2009) High-resolution mapping of copy-number alterations with massively parallel sequencing. Nature methods, 6, 99–103.
Crispo E, Bentzen P, Reznick DN et al. (2006) The relative influence of natural selection and geography on gene flow in guppies. Molecular ecology, 15, 49–62.
Croisetière S, Bernatchez L, Belhumeur P (2010) Temperature and length-dependent modulation of the MH class IIβ gene expression in brook charr (Salvelinus fontinalis) by a cis-acting minisatellite. Molecular Immunology, 47, 1817–1829.
Cullen M, Perfetto SP, Klitz W et al. (2002) High-resolution patterns of meiotic recombination across the human major histocompatibility complex. American journal of human genetics, 71, 759–76.
Cummings SM, McMullan M, Joyce DA et al. (2009) Solutions for PCR, cloning and sequencing errors in population genetic analysis. Conservation Genetics, 11, 1095–1097.
Danchin E, Vitiello V, Vienne A et al. (2004) The major histocompatibility complex origin. Immunological Reviews, 198, 216–232.
Dawkins R, Leelayuwat C, Gaudieri S et al. (1999) Genomics of the major histocompatibility complex: haplotypes, duplication, retroviruses and disease. Immunological reviews, 167, 275–304.

145
Doledec S, Chessel D (1994) Co-inertia analysis: an alternative method for studying species-environment relationships. Freshwater Biology, 31, 277–294.
Doytchinova IA, Flower DR (2005) In silico identification of supertypes for class II MHCs. Journal of immunology, 174, 7085–95.
Doytchinova IA, Guan P, Flower DR (2004) Identifiying Human MHC Supertypes Using Bioinformatic Methods. The Journal of Immunology, 172, 4314–4323.
Dray S, Dufour AB (2007) The ade4 Package: Implementing the Duality Diagram for Ecologists. Journal of Statistical Software, 22, 1 – 20.
Dzuris JL, Sidney J, Appella E et al. (2000) Conserved MHC class I peptide binding motif between humans and rhesus macaques. Journal of immunology, 164, 283–291.
Edgar RC, Haas BJ, Clemente JC et al. (2011) UCHIME improves sensitivity and speed of chimera detection. Bioinformatics, 27, 2194–200.
Edwards SV, Hedrick PW (1998a) Evolution and ecology of MHC molecules: from genomics to sexual selection. Trends in Ecology & Evolution, 13, 305–311.
Eimes JA, Bollmer JL, Whittingham LA et al. (2011) Rapid loss of MHC class II variation in a bottlenecked population is explained by drift and loss of copy number variation. Journal of evolutionary biology, 24, 1847–1856.
Eirín-López JM, González-Tizón AM et al. (2004) Birth-and-death evolution with strong purifying selection in the histone H1 multigene family and the origin of orphon H1 genes. Molecular biology and evolution, 21, 1992–2003.
Eizaguirre C, Lenz TL, Kalbe M et al. (2012) Rapid and adaptive evolution of MHC genes under parasite selection in experimental vertebrate populations. Nature communications, 3, 621.
Eizaguirre C, Lenz TL, Sommerfeld RD et al. (2011) Parasite diversity, patterns of MHC II variation and olfactory based mate choice in diverging three-spined stickleback ecotypes. Evolutionary Ecology, 25, 605–622.
Eizaguirre C, Yeates SE, Lenz TL et al. (2009) MHC-based mate choice combines good genes and maintenance of MHC polymorphism. Molecular Ecology, 18, 3316–3329.
Ejsmond MJ, Radwan J, Wilson AB (2014) Sexual selection and the evolutionary dynamics of the major histocompatibility complex. Proceedings of the Royal Society B: Biological Sciences 281.

146
Ellison A, Allainguillaume J, Girdwood S et al. (2012) Maintaining functional major histocompatibility complex diversity under inbreeding: the case of a selfing vertebrate. Proceedings of the Royal Society B: Biological Sciences, 279, 5004–5013.
Elphinstone MS, Hinten GN, Anderson MJ, Nock CJ (2003) An inexpensive and high-throughput procedure to extract and purify total genomic DNA for population studies. Molecular Ecology Notes, 3, 317–320.
Endler J (1980) Natural selection on colour patterns in Poecillia reticulata. Evolution, 34, 76–91.
Endler JA (1991) Variation in the appearance of guppy color patterns to guppies and their predators under different visual conditions. Vision research, 31, 587–608.
Evans JP, Pilastro A, Schlupp I (Eds.) (2011) Ecology and Evolution of Poeciliid Fishes. University of Chicago Press.
Ezawa K, Ikeo K, Gojobori T et al. (2010) Evolutionary pattern of gene homogenization between primate-specific paralogs after human and macaque speciation using the 4-2-4 method. Molecular Biology and Evolution, 27, 2152–2171.
Figueroa F, Günther E, Klein J (1988) MHC polymorphism pre-dating speciation. Nature, 335, 265–267.
Figueroa F, Mayer WE, Sültmann H et al. (2000) Mhc class II B gene evolution in East African cichlid fishes. Immunogenetics, 51, 556–575.
Fitzpatrick SW, Torres-Dowdall J, Reznick DN et al. (2014) Parallelism isn’t perfect: could disease and flooding drive a life-history anomaly in Trinidadian guppies? The American naturalist, 183, 290–300.
François Husson JJ (2008) FactoMineR: An R Package for Multivariate Analysis. Journal of Statistical Software, 25, 1-18
Fraser BA, Neff BD (2010a) Parasite mediated homogenizing selection at the MHC in guppies. Genetica, 138, 273–278.
Fraser B a, Neff BD (2010b) Parasite mediated homogenizing selection at the MHC in guppies. Genetica, 138, 273–8.
Fraser BA, Ramnarine IW, Neff BD (2010) Temporal variation at the MHC class IIb in wild populations of the guppy (Poecilia reticulata). Evolution: International Journal of Organic Evolution, 64, 2086–2096.

147
Gagnaire PA, Pavey SA, Normandeau E et al. (2013) The genetic architecture of reproductive isolation during speciation-with-gene-flow in lake whitefish species pairs assessed by RAD sequencing. Evolution; international journal of organic evolution, 67, 2483–2497.
Galan M, Guivier E, Caraux G et al. (2010) A 454 multiplex sequencing method for rapid and reliable genotyping of highly polymorphic genes in large-scale studies. BMC genomics, 11, 296.
Gasparini J, Bize P, Piault R et al. (2009) Strength and cost of an induced immune response are associated with a heritable melanin-based colour trait in female tawny owls. The Journal of animal ecology, 78, 608–616.
Gasparini C, Congiu L, Pilastro A (2015) MHC-similarity and sexual selection: different doesn’t always mean attractive. Molecular ecology. In press
Gilles A, Meglécz E, Pech N et al. (2011) Accuracy and quality assessment of 454 GS-FLX Titanium pyrosequencing. BMC genomics, 12, 245.
Godin JGJ (2003) Predator preference for brightly colored males in the guppy: a viability cost for a sexually selected trait. Behavioral Ecology, 14, 194–200.
Gomez-Alvarez V, Teal TK, Schmidt TM (2009) Systematic artifacts in metagenomes from complex microbial communities. The ISME journal, 3, 1314–1317.
Gonzalez-Quevedo C, Phillips KP, Spurgin LG et al. (2015) 454 screening of individual MHC variation in an endemic island passerine. Immunogenetics, 67, 149–162.
Gordon SP, López-Sepulcre A, Reznick DN (2012) Predation-associated differences in sex linkage of wild guppy coloration. Evolution; international journal of organic evolution, 66, 912–918.
Gotanda KM, Delaire LC, Raeymaekers JAM et al. (2013) Adding parasites to the guppy-predation story: insights from field surveys. Oecologia, 172, 155–166.
Gotanda KM, Hendry AP (2014) Using adaptive traits to consider potential consequences of temporal variation in selection: male guppy colour through time and space. Biological Journal of the Linnean Society, 112, 108–122.
Gregersen JW, Kranc KR, Ke X et al. (2006) Functional epistasis on a common MHC haplotype associated with multiple sclerosis. Nature, 443, 574–577.
Grether GF, Hudon J, Millie DF (1999) Carotenoid limitation of sexual coloration along an environmental gradient in guppies. Proceedings of the Royal Society B: Biological Sciences, 266, 1317–1322.

148
Del Guercio MF, Sidney J, Hermanson G et al. (1995) Binding of a peptide antigen to multiple HLA alleles allows definition of an A2-like supertype. Journal of immunology (Baltimore, Md. : 1950), 154, 685–693.
Hamilton WD, Zuk M (1982) Heritable true fitness and bright birds: a role for parasites? Science (New York, N.Y.), 218, 384–387.
Harismendy O, Ng PC, Strausberg RL et al. (2009) Evaluation of next generation sequencing platforms for population targeted sequencing studies. Genome biology, 10, R32.
Harris PD (1986) Species of Gyrodactylus von Nordmann, 1832 (Monogenea Gyrodactylidae) from poeciliid fishes, with a description of G. turnbulli sp. nov. from the guppy, Poecilia reticulata Peters. Journal of Natural History, 20, 183–191.
Haskins CP, Haskins EF, McLaughlin JJA et al. (1961) Polymorphism and population structure in Lebistes reticulatus, an ecological study. In: Vertebrate Speciation (ed Blair WF), pp. 320–395. Austin: University of Texas Press.
Hayes JL, Tzika A, Thygesen H et al. (2013) Diagnosis of copy number variation by Illumina next generation sequencing is comparable in performance to oligonucleotide array comparative genomic hybridisation. Genomics, 102, 174–181.
Hedrick PW (2002) Pathogen resistance and genetic variation at MHC loci. Evolution; international journal of organic evolution, 56, 1902–1908.
Herdegen M, Babik W, Radwan J (2014) Selective pressures on MHC class II genes in the guppy (Poecilia reticulata) as inferred by hierarchical analysis of population structure. Journal of evolutionary biology, 27, 2347–2359.
Högstrand K, Böhme J (1999) Gene conversion can create new MHC alleles. Immunological reviews, 167, 305–317.
Hosomichi K, Miller MM, Goto RM et al. (2008) Contribution of mutation, recombination, and gene conversion to chicken MHC-B haplotype diversity. Journal of immunology, 181, 3393–3399.
Houde AE (1997a) Sex, Color, and Mate Choice in Guppies. Princeton University Press.
Houde AE (1997b) Sex, Color, and Mate Choice in Guppies. Princeton University Press.
Houde AE, Torio AJ (1992) Effect of parasitic infection on male color pattern and female choice in guppies. Behavioral Ecology, 3, 346–351.
149
Huchard E, Albrecht C, Schliehe-Diecks S et al. (2012) Large-scale MHC class II genotyping of a wild lemur population by next generation sequencing. Immunogenetics, 64, 895–913.
Huchard E, Raymond M, Benavides J et al. (2010) A female signal reflects MHC genotype in a social primate. BMC evolutionary biology, 10, 96.
Hughes AL, Nei M (1988) Pattern of nucleotide substitution at major histocompatibility complex class I loci reveals overdominant selection. Nature, 335, 167–170.
Jacquin L, Lenouvel P, Haussy C et al. (2011) Melanin-based coloration is related to parasite intensity and cellular immune response in an urban free living bird: the feral pigeon Columba livia. Journal of Avian Biology, 42, 11–15.
Jeffery KJM, Bangham CRM (2000) Do infectious diseases drive MHC diversity? Microbes and Infection, 2, 1335–1341.
Johnson MB, Lafferty KD, van Oosterhout C et al. (2011) Parasite transmission in social interacting hosts: monogenean epidemics in guppies. PloS one, 6, e22634.
Jombart T (2008) adegenet: a R package for the multivariate analysis of genetic markers. Bioinformatics (Oxford, England), 24, 1403–1405.
Jombart T, Ahmed I (2011) adegenet 1.3-1: new tools for the analysis of genome-wide SNP data. Bioinformatics (Oxford, England), 27, 3070–3071.
Jombart T, Devillard S, Balloux F (2010) Discriminant analysis of principal components: a new method for the analysis of genetically structured populations. BMC genetics, 11, 94.
Jordan WC, Bruford MW (1998) New perspectives on mate choice and the MHC. Heredity, 81, 239–245.
Jost L (2008) GST and its relatives do not measure differentiation. Molecular Ecology, 17, 4015–4026.
Kamath PL, Getz WM (2011) Adaptive molecular evolution of the Major Histocompatibility Complex genes, DRA and DQA, in the genus Equus. BMC evolutionary biology, 11, 128.
Katju V, Bergthorsson U (2013) Copy-number changes in evolution: rates, fitness effects and adaptive significance. Frontiers in genetics, 4, 273.
Kemp D, Reznick DN, Grether GF (2008) Ornamental evolution in Trinidadian guppies (Poecilia reticulata): insights from sensory processing-based analyses of entire colour patterns. Biological Journal of the Linnean Society, 95, 734–747.

150
Klein J (1987) Origin of major histocompatibility complex polymorphism: the trans-species hypothesis. Human immunology, 19, 155–162.
Klein J, Sato A, Nagl S et al. (1998) Moleculare Trans-species polymorphism. Annual Review of Ecology and Systematics, 29, 1–21.
Klein J, Sato A, Nikolaidis N (2007) MHC, TSP, and the origin of species: from immunogenetics to evolutionary genetics. Annual review of genetics, 41, 281–304.
Klein, J, Ono H, Klein D et al.(1993) The Accordian Model of MHC evolution (J Gergely, M Benczúr, A Erdei, et al., Eds,). Progress in Immunology, 8, 137-143.
Kloch A, Babik W, Bajer A et al. (2010) Effects of an MHC-DRB genotype and allele number on the load of gut parasites in the bank vole Myodes glareolus. Molecular ecology, 19, 255–265.
Koboldt DC, Steinberg KM, Larson DE et al. (2013) The next-generation sequencing revolution and its impact on genomics. Cell, 155, 27–38.
Kolluru GR, Grether GF, South SH et al. (2006) The effects of carotenoid and food availability on resistance to a naturally occurring parasite (Gyrodactylus turnbulli) in guppies (Poecilia reticulata). Biological Journal of the Linnean Society, 89, 301–309.
Kondrashov FA (2012) Gene duplication as a mechanism of genomic adaptation to a changing environment. Proceedings of the Royal Society B: Biological Sciences, 279, 5048–57.
Kulski JK, Shiina T, Anzai T et al. (2002) Comparative genomic analysis of the MHC: the evolution of class I duplication blocks, diversity and complexity from shark to man. Immunological reviews, 190, 95–122.
Ladle RJ (1992) Parasites and sex: Catching the red queen. Trends in ecology & evolution, 7, 405–408.
Lamaze FC, Pavey SA, Normandeau E et al. (2014) Neutral and selective processes shape MHC gene diversity and expression in stocked brook charr populations (Salvelinus fontinalis). Molecular ecology, 23, 1730–1748.
Lamichhaney S, Berglund J, Almén MS et al. (2015) Evolution of Darwin’s finches and their beaks revealed by genome sequencing. Nature, 518, 371-375.
Lawrie DS, Messer PW, Hershberg R et al. (2013) Strong Purifying Selection at Synonymous Sites in D. melanogaster. PLoS Genetics, 9.
151
Leffler EM, Gao Z, Pfeifer S et al. (2013) Multiple instances of ancient balancing selection shared between humans and chimpanzees. Science, 339, 1578–1582.
Lenz TL, Becker S (2008) Simple approach to reduce PCR artefact formation leads to reliable genotyping of MHC and other highly polymorphic loci — Implications for evolutionary analysis. Gene, 427, 117–123.
Li M, Stoneking M (2012) A new approach for detecting low-level mutations in next-generation sequence data. Genome Biology, 13, R34.
Lighten J, van Oosterhout C, Paterson IG et al. (2014a) Ultra-deep Illumina sequencing accurately identifies MHC class IIb alleles and provides evidence for copy number variation in the guppy (Poecilia reticulata). Molecular ecology resources, 14, 753-767.
Lighten J, van Oosterhout C, Bentzen P (2014b) Critical review of NGS analyses for de novo genotyping multigene families. Molecular ecology, 23, 3957–3972.
Lillie M, Grueber CE, Sutton JT et al. (2015) Selection on MHC class II supertypes in the New Zealand endemic Hochstetter’s frog. BMC evolutionary biology, 15, 63.
Lindholm AK, Breden F, Alexander HJ et al. (2005) Invasion success and genetic diversity of introduced populations of guppies Poecilia reticulata in Australia. Molecular Ecology, 14, 3671–3682.
Lippert C, Listgarten J, Davidson RI et al. (2013) An exhaustive epistatic SNP association analysis on expanded Wellcome Trust data. Scientific reports, 3, 1099.
Llaurens V, McMullan M, Van Oosterhout C (2012a) Cryptic MHC polymorphism revealed but not explained by selection on the class IIB peptide binding region. Molecular Biology and Evolution, 29, 1631–1644.
Llaurens V, McMullan M, van Oosterhout C (2012b) Cryptic MHC polymorphism revealed but not explained by selection on the class IIb peptide-binding region. Molecular biology and evolution, 29, 1631–44.
Locke DP, Sharp AJ, McCarroll SA et al. (2006) Linkage disequilibrium and heritability of copy-number polymorphisms within duplicated regions of the human genome. American journal of human genetics, 79, 275–290.
Lund O, Nielsen M, Kesmir C et al. (2004) Definition of supertypes for HLA molecules using clustering of specificity matrices. Immunogenetics, 55, 797–810.
Ma K., Hsieh T., Chao A (2014) spadeR: species prediction and diversity estimation in R. R package version 1.0. spadeR: species prediction and diversity estimation in R.
152
Maan ME, Van Der Spoel M, Jimenez PQ et al. (2006) Fitness correlates of male coloration in a Lake Victoria cichlid fish. Behavioral Ecology, 17, 691–699.
Magoc T, Salzberg SL (2011) FLASH: Fast Length Adjustment of Short Reads to Improve Genome Assemblies. Bioinformatics, 27, 2957–2963.
Magurran AE (2005) Evolutionary Ecology: The Trinidadian Guppy. Oxford University Press.
Martin CH, Johnsen S (2007) A field test of the Hamilton–Zuk hypothesis in the Trinidadian guppy (Poecilia reticulata). Behavioral Ecology and Sociobiology, 61, 1897–1909.
Martin JA, Wang Z (2011) Next-generation transcriptome assembly. Nature reviews. Genetics, 12, 671–682.
Martinsohn JT, Sousa AB, Guethlein LA et al. (2000) The gene conversion hypothesis of MHC evolution: A review. Immunogenetics, 50, 168-200.
Mays HL, Hill GE (2004) Choosing mates: good genes versus genes that are a good fit. Trends in ecology & evolution, 19, 554–559.
McMullan M (2010) Host-parasite co-evolution and genetic variation at the Major Histocompatibility Complex in the Trinidadian guppy (Poecilia reticulata). University of Hull.
Meffe GK (1989) Ecology and Evolution of Livebearing Fishes. Prentice Hall.
Mehra NK, Kaur G (2003) MHC-based vaccination approaches: progress and perspectives. Expert reviews in molecular medicine, 5, 1–17.
Meredith RW, Pires MN, Reznick DN et al. (2011) Molecular phylogenetic relationships and the coevolution of placentotrophy and superfetation in Poecilia (Poeciliidae: Cyprinodontiformes). Molecular Phylogenetics and Evolution, 59, 148–157.
Milinski M (2006) The Major Histocompatibility Complex, Sexual Selection, and Mate Choice. Annual Review of Ecology, Evolution, and Systematics, 37, 159–186.
Millar NP, Hendry AP (2012) Population divergence of private and non-private signals in wild guppies. Environmental Biology of Fishes, 94, 513–525.
Monzón-Argüello C, Garcia de Leaniz C, Gajardo G et al. (2013) Less can be more: loss of MHC functional diversity can reflect adaptation to novel conditions during fish invasions. Ecology and evolution, 3, 3359–3368.

153
Mougeot F, Martínez-Padilla J, Bortolotti GR et al. (2010) Physiological stress links parasites to carotenoid-based colour signals. Journal of evolutionary biology, 23, 643–650.
Mukherjee S, Ganguli D, Majumder PP (2014) Global footprints of purifying selection on Toll-like receptor genes primarily associated with response to bacterial infections in humans. Genome biology and evolution, 6, 551–558.
Nadachowska-Brzyska K, Zieliński P, Radwan J et al. (2012) Interspecific hybridization increases MHC class II diversity in two sister species of newts. Molecular ecology, 21, 887–906.
Nei M, Gu X, Sitnikova T (1997) Evolution by the birth-and-death process in multigene families of the vertebrate immune system. PNAS, 94, 7799–7806.
Nielsen R, Paul JS, Albrechtsen A et al. (2011) Genotype and SNP calling from next-generation sequencing data. Nature reviews. Genetics, 12, 443–51.
Nowak MA, Tarczy-Hornoch K, Austyn JM (1992) The optimal number of major histocompatibility complex molecules in an individual. PNAS, 89, 10896–10899.
O’Callaghan CA, Tormo J, Willcox BE et al. (1998) Structural features impose tight peptide binding specificity in the nonclassical MHC molecule HLA-E. Molecular cell, 1, 531–541.
Ober C, Steck T, Van Der Ven K et al. (1993) MHC class II compatibility in aborted fetuses and term infants of couples with recurrent spontaneous abortion. Journal of Reproductive Immunology, 25, 195–207.
Ohta T (1991) Role of diversifying selection and gene conversion in evolution of major histocompatibility complex loci. Proceedings of the National Academy of Sciences of the United States of America, 88, 6716–6720.
Oliver MK, Telfer S, Piertney SB (2009) Major histocompatibility complex (MHC) heterozygote superiority to natural multi-parasite infections in the water vole (Arvicola terrestris). Proceedings of the Royal Society B: Biological Sciences, 276, 1119–1128.
Oomen RA, Gillett RM, Kyle CJ (2013) Comparison of 454 pyrosequencing methods for characterizing the major histocompatibility complex of nonmodel species and the advantages of ultra deep coverage. Molecular ecology resources, 13, 103–116.
van Oosterhout C (2009a) Transposons in the MHC: the Yin and Yang of the vertebrate immune system. Heredity, 103, 190–191.
van Oosterhout C (2009b) A new theory of MHC evolution : beyond selection on the immune genes. Proceedings of the Royal Society, 276, 657–665.

154
van Oosterhout C (2013) Maintenance of major histocompatibility supertype variation in selfing vertebrate is no evidence for overdominant selection. Proceedings of the Royal Society B: Biological Sciences, 280, 20122501.
van Oosterhout C, Hutchinson WF, Wills DPM et al. (2004) MICRO-CHECKER: Software for identifying and correcting genotyping errors in microsatellite data. Molecular Ecology Notes, 4, 535–538.
van Oosterhout C, Joyce DA, Cummings SM (2006a) Evolution of MHC class IIB in the genome of wild and ornamental guppies, Poecilia reticulata. Heredity, 97, 111–118.
van Oosterhout C, Joyce DA, Cummings SM et al. (2006b) Balancing selection, random genetic drift, and genetic variation at the major histocompatibility complex in two wild populations of guppies (Poecilia reticulata). Evolution: International Journal of Organic Evolution, 60, 2562–2574.
Padidam M, Sawyer S, Fauquet CM (1999) Possible emergence of new geminiviruses by frequent recombination. Virology, 265, 218–25.
Papadopulos ASTP, Kaye M, Devaux C et al. (2014) Evaluation of genetic isolation within an island flora reveals unusually widespread local adaptation and supports sympatric speciation. Philosophical transactions of the Royal Society of London. Series B, Biological sciences, 369
Paradis E, Claude J, Strimmer K (2004) APE: Analyses of Phylogenetics and Evolution in R language. Bioinformatics, 20, 289–290.
Paterson IG, Crispo E, Kinninson MT et al.(2005) Characterization of tetranucleotide microsatellite markers in guppy (Poecilia reticulata). Molecular Ecology Notes, 5, 269–271.
Pavey SA, Sevellec M, Adam W et al. (2013) Nonparallelism in MHCIIβ diversity accompanies nonparallelism in pathogen infection of lake whitefish (Coregonus clupeaformis) species pairs as revealed by next-generation sequencing. Molecular ecology, 22, 3833–3849.
Piertney SB, Oliver MK (2006) The evolutionary ecology of the major histocompatibility complex. Heredity, 96, 7–21.
Pilosof S, Fortuna MA, Cosson JF et al. (2014) Host-parasite network structure is associated with community-level immunogenetic diversity. Nature communications, 5, 5172.
Posada D, Crandall KA (2001) Evaluation of methods for detecting recombination from DNA sequences: computer simulations. PNAS, 98, 13757–13762.

155
Pröll J, Danzer M, Stabentheiner S et al. (2011) Sequence capture and next generation resequencing of the MHC region highlights potential transplantation determinants in HLA identical haematopoietic stem cell transplantation. DNA research : an international journal for rapid publication of reports on genes and genomes, 18, 201–210.
R Development Core Team R (2011) R: A Language and Environment for Statistical Computing (RDC Team, Ed,). R Foundation for Statistical Computing, 1, 409.
Radwan J, Biedrzycka A, Babik W (2010) Does reduced MHC diversity decrease viability of vertebrate populations? Biological Conservation, 143, 537–544.
Radwan J, Zagalska-Neubauer M, Cichoń M et al. (2012) MHC diversity, malaria and lifetime reproductive success in collared flycatchers. Molecular ecology, 21, 2469–79.
Raymond M, Rousset F (1995) GENEPOP (version 1.2): population genetics software for exact tests and ecumenicism. Journal of Heredity, 86, 248–249.
Reznick D, Shaw F, Rodd F et al. (1997) Evaluation of the Rate of Evolution in Natural Populations of Guppies (Poecilia reticulata). Science, 275, 1934–1937.
Rodd FH, Reznick DN (1991) Life history evolution III. The impact of prawn predation on guppy life histories. Oikos, 62, 13–19.
Rousset F (2008) genepop’007: a complete re-implementation of the genepop software for Windows and Linux. Molecular ecology resources, 8, 103–6.
Saks L, Ots I, Hõrak P (2003) Carotenoid-based plumage coloration of male greenfinches reflects health and immunocompetence. Oecologia, 134, 301–307.
Samarakoon U, Gonzales JM, Patel JJ et al. (2011) The landscape of inherited and de novo copy number variants in a Plasmodium falciparum genetic cross. BMC genomics, 12, 457.
Sandberg M, Eriksson L, Jonsson J et al. (1998) New chemical descriptors relevant for the design of biologically active peptides. A multivariate characterization of 87 amino acids. Journal of medicinal chemistry, 41, 2481–2491.
Sato A, Figueroa F, O’hUigin C et al. (1996) Identification of major histocompatibility complex genes in the guppy, Poecilia reticulata. Immunogenetics, 43, 38–49.
Von Schantz T, Wittzell H, Göransson G et al. (1996) MHC genotype and male ornamentation: genetic evidence for the Hamilton-Zuk model. Proceedings of the Royal Society B: Biological Sciences, 263, 265–271.

156
Schmieder R, Edwards R (2011) Quality control and preprocessing of metagenomic datasets. Bioinformatics, 27, 863–864.
Schneider C, Rasband W, Eliceiri K (2012) NIH Image to ImageJ: 25 years of image analysis. Nature Methods, 9, 671–675.
Schwensow N, Fietz J, Dausmann KH et al. (2007) Neutral versus adaptive genetic variation in parasite resistance: importance of major histocompatibility complex supertypes in a free-ranging primate. Heredity, 99, 265–277.
Sepil I, Lachish S, Hinks AE, Sheldon BC (2013a) Mhc supertypes confer both qualitative and quantitative resistance to avian malaria infections in a wild bird population. Proceedings of the Royal Society B: Biological Sciences, 280.
Sepil I, Lachish S, Sheldon BC (2013b) Mhc-linked survival and lifetime reproductive success in a wild population of great tits. Molecular ecology, 22, 384–396.
Sepil I, Moghadam HK, Huchard E et al. (2012) Characterization and 454 pyrosequencing of major histocompatibility complex class I genes in the great tit reveal complexity in a passerine system. BMC evolutionary biology, 12, 68.
Sette A, Newman M, Livingston B et al. (2002) Optimizing vaccine design for cellular processing, MHC binding and TCR recognition. Tissue antigens, 59, 443–451.
Sette A, Sidney J (1998) HLA supertypes and supermotifs: A functional perspective on HLA polymorphism. Current Opinion in Immunology, 10, 478–482.
Sette A, Sidney J, Southwood S et al. (2012) A shared MHC supertype motif emerges by convergent evolution in macaques and mice, but is totally absent in human MHC molecules. Immunogenetics, 64, 421–434.
Shafer ABA, Wolf JBW (2013) Widespread evidence for incipient ecological speciation: a meta-analysis of isolation-by-ecology. Ecology letters, 16, 940–950.
Shaw PW, Carvalho GR, Seghers BH et al. (1992) Genetic Consequences Of an Artificial Introduction Of Guppies (Poecilia-Reticulata) In N-Trinidad. Proceedings Of the Royal Society Of London Series B-Biological Sciences, 248, 111–116.
Shen X, Yang G, Liao M (2006) Development of 51 genomic microsatellite DNA markers of guppy (Poecilia reticulata) and their application in closely related species. Molecular Ecology Notes, 7, 302–306.
157
Shiina T, Ota M, Shimizu S et al. (2006) Rapid evolution of major histocompatibility complex class I genes in primates generates new disease alleles in humans via hitchhiking diversity. Genetics, 173, 1555–1570.
Siddle H V, Marzec J, Cheng Y, Jones M, Belov K (2010) MHC gene copy number variation in Tasmanian devils: implications for the spread of a contagious cancer. Proceedings of the Royal Society B: Biological Sciences, 277, 2001–2006.
Sidney J, Grey HM, Kubo RT, Sette A (1996) Practical, biochemical and evolutionary implications of the discovery of HLA class I supermotifs. Immunology Today, 17, 261–266.
Simpson E (1988) Function of the MHC. Immunology. Supplement, 1, 27–30.
Sin YW, Annavi G, Newman C et al. (2015) MHC class II assortative mate choice in European badgers (Meles meles). Molecular ecology. In press.
Sommer S, Courtiol A, Mazzoni CJ (2013) MHC genotyping of non-model organisms using next-generation sequencing: a new methodology to deal with artefacts and allelic dropout. BMC Genomics, 14, 542.
Spurgin LG, van Oosterhout C, Illera JC et al. (2011) Gene conversion rapidly generates major histocompatibility complex diversity in recently founded bird populations. Molecular ecology, 20, 5213–5225.
Spurgin LG, Richardson DS (2010a) How pathogens drive genetic diversity: MHC, mechanisms and misunderstandings. Proceedings of the Royal Society B: Biological Sciences, 277, 979–988.
Spurgin LG, Richardson DS (2010b) How pathogens drive genetic diversity : MHC, mechanisms and misunderstandings. Proceedings of the Royal Society B: Biological Sciences, 277, 979–988.
Stahl W, Sies H (2003) Antioxidant activity of carotenoids. Molecular Aspects of Medicine, 24, 345–351.
Stern LJ, Brown JH, Jardetzky TS et al. (1994) Crystal structure of the human class II MHC protein HLA-DR1 complexed with an influenza virus peptide. Nature, 368, 215–221.
Stiebens VA, Merino SE, Chain FJJ et al. (2013) Evolution of MHC class I genes in the endangered loggerhead sea turtle (Caretta caretta) revealed by 454 amplicon sequencing. BMC evolutionary biology, 13, 95.

158
Strand TM, Segelbacher G, Quintela M et al. (2012) Can balancing selection on MHC loci counteract genetic drift in small fragmented populations of black grouse? Ecology and evolution, 2, 341–353.
Stuglik MT, Radwan J, Babik W (2011) jMHC: software assistant for multilocus genotyping of gene families using next-generation amplicon sequencing. Molecular ecology resources, 11, 739–742.
Suk HY, Neff BD (2009) Microsatellite genetic differentiation among populations of the Trinidadian guppy. Heredity, 102, 425–434.
Sutton JT, Nakagawa S, Robertson BC et al. (2011) Disentangling the roles of natural selection and genetic drift in shaping variation at MHC immunity genes. Molecular Ecology, 20, 4408–4420.
Takahata N (1990) A simple genealogical structure of strongly balanced allelic lines and trans-species evolution of polymorphism. PNAS, 87, 2419–2423.
Takahata N, Nei M (1990) Allelic genealogy under overdominant and frequency-dependent selection and polymorphism of major histocompatibility complex loci. Genetics, 124, 967–978.
Takuno S, Nishio T, Satta Y et al. (2008) Preservation of a pseudogene by gene conversion and diversifying selection. Genetics, 180, 517–531.
Tamura K, Peterson D, Peterson N et al. (2011) MEGA5: Molecular Evolutionary Genetics Analysis using Maximum Likelihood, Evolutionary Distance, and Maximum Parsimony Methods. Molecular Biology, 28, 1530–1534.
The MHC sequencing consortium (1999) Complete sequence and gene map of a human major histocompatibility complex. The MHC sequencing consortium. Nature, 401, 921–923.
Thompson JF, Milos PM (2011) The properties and applications of single-molecule DNA sequencing. Genome biology, 12, 217.
Traherne JA (2008) Human MHC architecture and evolution: Implications for disease association studies. International Journal of Immunogenetics, 35, 179–192.
Tripathi N, Hoffmann M, Willing EM et al. (2009) Genetic linkage map of the guppy, Poecilia reticulata, and quantitative trait loci analysis of male size and colour variation. Proceedings of the Royal Society B: Biological Sciences, 276, 2195–2208.
Trowsdale J (1993) Genomic structure and function in the MHC. Trends in Genetics, 9, 117–122.

159
Trowsdale J (2011) The MHC, disease and selection. Immunology letters, 137, 1–8.
Trowsdale J, Knight JC (2013) Major histocompatibility complex genomics and human disease. Annual review of genomics and human genetics, 14, 301–323.
Van Valen L (1973) A new evolutionary law. Evolutionary Theory, 1, 1–30.
Vandiedonck C, Knight JC (2009) The human Major Histocompatibility Complex as a paradigm in genomics research. Briefings in functional genomics & proteomics, 8, 379–394.
Völker M, Backström N, Skinner BM et al. (2010) Copy number variation, chromosome rearrangement, and their association with recombination during avian evolution. Genome research, 20, 503–511.
Wang IJ, Glor RE, Losos JB (2013) Quantifying the roles of ecology and geography in spatial genetic divergence. Ecology letters, 16, 175–182.
Warren RL, Choe G, Freeman DJ et al. (2012) Derivation of HLA types from shotgun sequence datasets. Genome medicine, 4, 95.
Watanabe T, Yoshida M, Nakajima M et al. (2003) Isolation and characterization of 43 microsatellite DNA markers for guppy (Poecilia reticulata). Molecular Ecology Notes, 3, 487–490.
Watson CT, Steinberg KM, Huddleston J et al. (2013) Complete haplotype sequence of the human immunoglobulin heavy-chain variable, diversity, and joining genes and characterization of allelic and copy-number variation. American Journal of Human Genetics, 92, 530–546.
Wedekind C, Penn D (2000) MHC genes, body odours, and odour preferences. Nephrology, dialysis, transplantation : official publication of the European Dialysis and Transplant Association - European Renal Association, 15, 1269–1271.
Weese DJ, Gordon SP, Hendry AP et al. (2010) Spatiotemporal variation in linear natural selection on body color in wild guppies (poecilia reticulata). Evolution, 64, 1802–1815.
Wegner KM (2009) Massive parallel MHC genotyping: titanium that shines. Molecular ecology, 18, 1818–20.
Willing EM, Bentzen P, van Oosterhout C et al. (2010) Genome-wide single nucleotide polymorphisms reveal population history and adaptive divergence in wild guppies. Molecular ecology, 19, 968–984.

160
Wilson DJ, McVean G (2006) Estimating diversifying selection and functional constraint in the presence of recombination. Genetics, 172, 1411–1425.
Winternitz JC, Minchey SG, Garamszegi LZ et al. (2013) Sexual selection explains more functional variation in the mammalian major histocompatibility complex than parasitism. Proceedings of the Royal Society B: Biological Sciences, 280, 20131605.
Woelfing B, Traulsen A, Milinski M, Boehm T (2009) Does intra-individual major histocompatibility complex diversity keep a golden mean? Philosophical transactions of the Royal Society of London. Series B, Biological sciences, 364, 117–128.
Wucherpfennig KW (2001) Insights into autoimmunity gained from structural analysis of MHC-peptide complexes. Current Opinion in Immunology, 13, 650–656.
Xavier R, Faria PJ, Paladini G et al. (2015) Evidence for cryptic speciation in directly transmitted gyrodactylid parasites of Trinidadian guppies. PloS one, 10, e0117096.
Xie T, Rowen L, Aguado B et al. (2003) Analysis of the gene-dense major histocompatibility complex class III region and its comparison to mouse. Genome research, 13, 2621–2636.
Xie C, Tammi MT (2009) CNV-seq, a new method to detect copy number variation using high-throughput sequencing. BMC bioinformatics, 10, 80.
Yang Z (2010) A likelihood ratio test of speciation with gene flow using genomic sequence data. Genome Biology and Evolution, 2, 200–211.
Yoon S, Xuan Z, Makarov V et al. (2009) Sensitive and accurate detection of copy number variants using read depth of coverage. Genome research, 19, 1586–1592.
Zagalska-Neubauer M, Babik W, Stuglik M et al. (2010) 454 sequencing reveals extreme complexity of the class II Major Histocompatibility Complex in the collared flycatcher. BMC evolutionary biology, 10, 395.
Zhao M, Wang Y, Shen H et al. (2013) Evolution by selection, recombination, and gene duplication in MHC class I genes of two Rhacophoridae species. BMC evolutionary biology, 13, 113.

16
1
Appendix 1
Supporting information for Chapter 3: Ultra-deep Illumina sequencing accurately identifies MHC class IIb
alleles and provides evidence for copy number variation in the guppy (Poecilia reticulata)
(a) (b)
Figure S3.1: Genotype repeatability between re-sequenced samples
(a) Within the same sequencing run identical Ai estimates were observed in each replicated sample with 100% genotype
replication. (b) However, when genotypes were compared between full independent replicates genotyping repeatability fell to
83.7%. This was due to some genotypes acquiring new alleles that were discarded in the original run due to low depth.
100 %
Same PAs
83.6 %
8.2 %
4.1 %4.1 %
Same PAs
1 additional PA
2 additional PAs
3 additional PAs

162
Figure S3.2
(a)
(b)
0
10
20
30
40
50
60
70
80
90
100
0 1 2 3 4 5 6 7 8 9 10 11 12 13
Cu
mu
lati
ve d
ep
th (
%)
Number of sequence variants
0
10
20
30
40
50
60
70
80
90
100
0 1 2 3 4 5 6 7 8 9 10 11
Cu
mu
lati
ve d
ep
th (
%)
Number of sequence variants

163
(c)
(d)
0
10
20
30
40
50
60
70
80
90
100
0 1 2 3 4 5 6 7 8 9 10 11 12 13 14 15 16 17 18 19 20
Cu
mu
lati
ve d
ep
th (
%)
Number of sequence variants
0
10
20
30
40
50
60
70
80
90
100
0 1 2 3 4 5 6 7 8 9 10 11 12 13 14 15 16 17 18 19 20 21 22 23 24
Cu
mu
lati
ve d
ep
th (
%)
Number of sequence variants

164
(e)
(f)
0
10
20
30
40
50
60
70
80
90
100
0 1 2 3 4 5 6 7 8 9 10 11 12 13
Cu
mu
lati
ve d
ep
th (
%)
Number of sequence variants
0
10
20
30
40
50
60
70
80
90
100
0 1 2 3 4 5 6 7 8 9 10 11 12 13 14 15 16 17 18 19 20 21 22 23 24 25 26 27 28 29 30 31 32 33 34
Cu
mu
lati
ve d
ep
th (
%)
Number of sequence variants

165
(g)
(h)
Figure S3.2: Comparison of Ai in independent replicates
For each replicated sample that produced different Ai estimates in independent sequencing runs
(G100763Q1, G100786Q1, G100970G2, G100773Q1, G100788Q1, G100979G2, G101163M10 and
G10077; a-h, respectively) the cumulative sequence depth is shown across variants (PAs: circles,
artifacts: triangles) in the original sample (black), and the replicate (blue). Squares show PAs that were
discarded in the original sample due to inadequate depth. The application of a low AVT (3x in this case)
0
10
20
30
40
50
60
70
80
90
100
0 1 2 3 4 5 6 7 8 9 10 11 12 13 14 15 16 17
Cu
mu
lati
ve d
ep
th (
%)
Number of sequence variants
0
10
20
30
40
50
60
70
80
90
100
0 1 2 3 4 5 6 7 8 9 10 11 12 13 14 15 16 17 18
Cu
mu
lati
ve d
ep
th (
%)
Number of sequence variants

166
would have retained these PAs in the original sample. However, the red-hashed lines indicate the
artificially inflated Ai estimates that would result for each sample if low copy number contaminants are
accepted under this criterion. Estimates of Ai are not replicated when a 3x depth threshold is
implemented.
Figure S3.3: Ai distribution across individuals using a low AVT When a low AVT (3x) is implemented across all samples that provided confirmed independent estimates of Ai using our method, Ai estimates range from 2 to 64 and the frequency distribution does not conform to expectation of the MHC optimality hypothesis or random segregation of alleles. This distribution reflects the error prone Ai estimates produced by using a low AVT.
0
2
4
6
8
10
12
1 3 5 7 9 11 13 15 17 19 21 23 25 27 29 31 33 35 37 39 41 43 45 47 49 51 53 55 57 59 61 63
Fre
qu
en
cy o
f in
div
idu
als
(%)
Ai
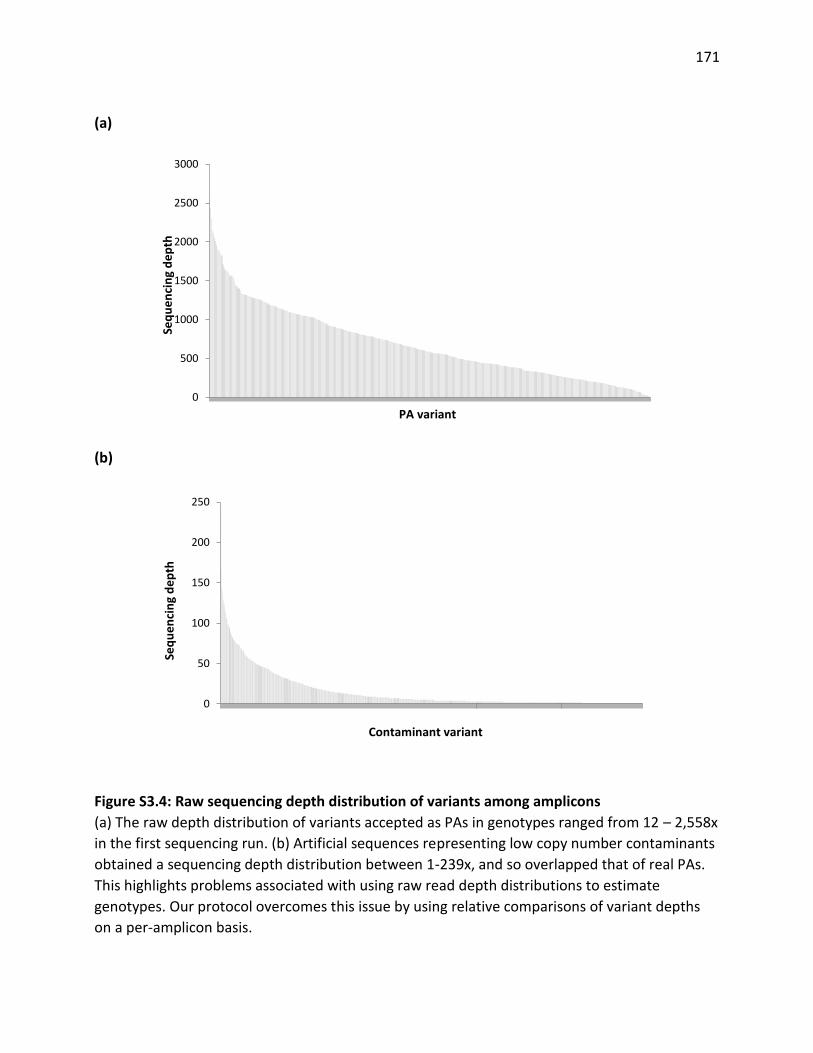
171
(a)
(b)
Figure S3.4: Raw sequencing depth distribution of variants among amplicons
(a) The raw depth distribution of variants accepted as PAs in genotypes ranged from 12 – 2,558x
in the first sequencing run. (b) Artificial sequences representing low copy number contaminants
obtained a sequencing depth distribution between 1-239x, and so overlapped that of real PAs.
This highlights problems associated with using raw read depth distributions to estimate
genotypes. Our protocol overcomes this issue by using relative comparisons of variant depths
on a per-amplicon basis.
0
500
1000
1500
2000
2500
3000Se
qu
en
cin
g d
ep
th
PA variant
0
50
100
150
200
250
Seq
ue
nci
ng
de
pth
Contaminant variant

171
Figure S3.5: Linear relationship between total amplicon sequencing depth and Ai
The lack of correlation between total amplicon depth and the number of alleles characterized
within an amplicon (Ai) (linear regression: p = 0.109, r2 = 0.01) means that estimates of Ai are not
significantly affected by sequencing depth.

172
Figure S3.6: Confirmation of maximum Ai across samples using PCA
A PCA of mean sequencing depths of the top 10 most sequenced variants across all samples
shows that 100% of the variance between variants within amplicons is attributed to PAs (PC 1 -
6). Although depth-percentages of up to 2.11% were observed for suspected contaminant
variants, they accounted for 0% of the mean variance across samples. This corroborated that a
maximum Ai of 6 explained the observed genotypes.

17
3
Figure S3.7
(a) (b)

17
4
(c) (d)

17
5
(e) (f)
Figure S3.7: Confirmation of Ai estimates among samples A PCA of mean sequencing depth of the top 10 most sequenced variants across samples within each Ai grouping (Ai =1 – Ai =6; a-f, respectively) correctly separates alleles (PA) and artifacts (A) based on mean sequencing depth. This corroborates Ai estimates illustrated in Figure 3.5 at the point of highest DOC.

17
6
Figure S3.8: Analysis of selection on MHC class IIb sequences of guppies
The plot shows an estimate of the posterior probability of positive selection based on the dN/dS ratio at each codon (sliding window of 1 codon).
Circles highlight PBR designation inferred in previous studies (black, Brown et al. 1993; grey, Bondinas et al. 2007; blue, McMullan 2011) shifted up
by one codon to account for an insertion near the amino terminus of the fish MHC class IIb molecule (Figueroa et al. 2000). Grey columns highlight
codons of the guppy MHC with a significant posterior probability (>0.95) of positive selection (codons 29, 31, 32, 38, 39, 62, 68, 71, 73, 78, 82, 86,
87, 89 and 91), where the dashed line indicates the 0.95 acceptance criteria for positive selection.

17
7
Appendix 2 Supporting information for Chapter 4: The role of MHC and parasites in the secondary sexual colouration of guppies (Poecilia reticulata)
Figure S4.1. The three main drainage systems in northern Trinidad where the bulk of guppy research has been conducted (blue, Caroni; green,
North slope; orange Oropouche) and the rivers where samples were collected. Additional river populations on the eastern and western coast
(grey) maintain high genetic relatedness to populations in their associated drainage system and together form “Caroni type”, “Oropouche type”,
and “North Slope type” genetic clades of neutral diversity (Willing et al. 2010).
20km

17
8
Figure S4.2. Frequency distribution of the percentage of individuals which had different total numbers of MHC alleles (Ai)
0
5
10
15
20
25
30
35
40
1 2 3 4 5 6 7 8 9
Freq
uen
cy o
f in
div
idu
als
(%)
Ai

17
9
Figure S4.3. Clustering of MHC polymorphism by Discriminant Analysis of Principle Components was based on the physicochemical
properties of the amino acids, which constitute the protein-binding region (PBR). Each point represents the positioning of each MHC
allele within the first two discriminant functions (axis). Circles represent the positioning of each MHC supertype, which are largely
represented by well-defined and minimally overlapping clusters.
1
2
3
4
5
6
7
8
9
10
11
12
1
2
3
4
5
6
7
8
9
10
11
12
DA eigenvalues
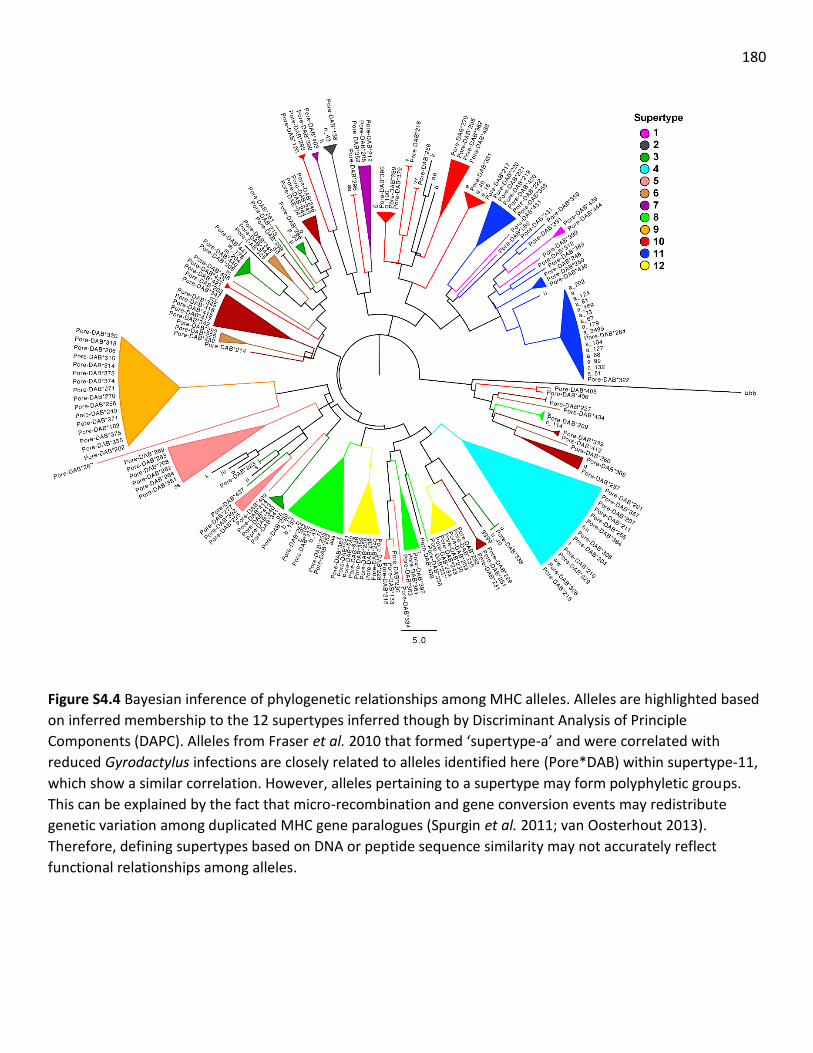
180
Figure S4.4 Bayesian inference of phylogenetic relationships among MHC alleles. Alleles are highlighted based
on inferred membership to the 12 supertypes inferred though by Discriminant Analysis of Principle
Components (DAPC). Alleles from Fraser et al. 2010 that formed ‘supertype-a’ and were correlated with
reduced Gyrodactylus infections are closely related to alleles identified here (Pore*DAB) within supertype-11,
which show a similar correlation. However, alleles pertaining to a supertype may form polyphyletic groups.
This can be explained by the fact that micro-recombination and gene conversion events may redistribute
genetic variation among duplicated MHC gene paralogues (Spurgin et al. 2011; van Oosterhout 2013).
Therefore, defining supertypes based on DNA or peptide sequence similarity may not accurately reflect
functional relationships among alleles.

181
Figure S4.5. Linear models showing the relationship between MHC population allelic richness
(MHC-Ar; black circles), supertype richness (MHC-STr; red circles), and microsatellite population
allelic richness (Micro-Ar). A strong and significant relationship is observed among all population
estimates of MHC-Ar and Micro-Ar (solid line, P=0.001, R2=0.41), and an insignificant
relationship between MHC-STr and Micro-Ar (P= 0.289, R2=0.01). Open circles denote low
predation site, and closed circles denote high predation sites.
2
3
4
5
6
7
8
9
7 7.5 8 8.5 9 9.5
MH
C p
op
ula
tio
n r
ich
ne
ss
Microsatellite population allelic richness

18
2
(a) (b)
Figure S4.6. Coinertia analysis between datasets (1) MHC supertype frequencies, and (2) colour traits and Gyrodactylus prevalence
(COIN1). (a) Vectors represent MHC supertype frequencies (ST-), whereas colour traits and Gyrodactylus prevalence are represented
by a location on the first two factoral axis (Orange area (O.a), yellow area (Y.a), black area (B.a), fuzzy black area (FB.a), green area
(G.a), blue area (Bl.a), silver area (S.a), violet area (V.a), number of orange spots (O.s), number of black spots (B.s), total number of
spots (T.s), and Gyrodactylus prevalence (Gyro). Variables are positively associated when vectors and/or axis locations are in the
same direction or close together. Variables are negatively associated when located in the opposite direction.

18
3 (a) (b)
Figure S4.7. Coinertia analysis between datasets (1) Population MHC allelic richness (MHC-Ar) and Population MHC supertype richness (MHC-
STr), and (2) colour traits and Gyrodactylus prevalence (COIN2). (a) Vectors represent MHC supertype frequencies (ST-), whereas colour traits and
Gyrodactylus prevalence are represented by a location on the first two factorial axis (Orange area (O.a), yellow area (Y.a), black area (B.a), fuzzy
black area (FB.a), green area (G.a), blue area (Bl.a), silver area (S.a), violet area (V.a), number of orange spots (O.s), number of black spots (B.s),
total number of spots (T.s), and Gyrodactylus prevalence (Gyro). Variables are positively associated when vectors and/or axis locations are in the
same direction or close together. Variables are negatively associated when located in the opposite direction. The distance of the variable from
the center of the plot represents the strength of the variation in structuring the data. (b) Populations (Aripo-1 (AP1), Aripo-2 (AP2), Arima-1
(AM1), Guanapo-1 (G1), El Cedro-2 (EC2), Damier-1 (D1), Yarra-1 (Y1), Yarra-2 (Y2), Marianne-3 (M3), Marianne-4 (M4), Paria-7 (P7), and Quare-1
(Q1)) are positioned on the first two factorial axis of COIN1 in accordance to the interaction between MHC supertype frequencies (tips of arrow)
and colouration and Gyrodactylus prevalence (dot). The translational coefficient of the population position between datasets is given by the
length and angle of the vector, where vector length is inversely correlated with the strength of the correlation between the two data sets

18
4
Locus Primer sequence (5’-3’) Repeat sequence
Optimal TA Genbank # Source Publication
Pre9 F: TTGCAAGTCAGTTGATGGTTG R: TGCCCTAGGGATGAGAAAAG
(CAGA)13 60C AY830941 Patterson et al. (2005)
Pre13 F: ACAGTACTGTCTGTCTGTCT R: TGTTTGAGACACTCATGGTGAAG
(CTGT)18 65C AY830942 Patterson et al. (2005)
Pre15 F: CTGAGGGACCAGGATGTTAAG R: CCATAAACACGCAAACCAAC
(GATG)16 65C AY830943 Patterson et al. (2005)
Pre26 F: GCTGACCCCAGAAAAGTGG R: TGGGACTTTCATGAGACTTGG
(GATG)19 60C AY830946 Patterson et al. (2005)
Pret-27 F: CACACGGGCTCTCATTTTT R: CTGTGTTTGTGTTCGGTCGTA
(GT)53 60C AB100321 Wantanabe et al. (2003)
Pret-28 F: ACATCGGCGTCCTCACCT R: GGGGGTTCAAACACATCCA
(GT)32 60C AB100322 Wantanabe et al. (2003)
Pret-38 F: AGGGAAAAGGAAAGAAAGAA R: CGAACAAGCCCAAATCTA
(GT)19 50C AB100328 Wantanabe et al. (2003)
Pret-46 F:AACCCTAATGACTCCCAACA R: CGACCCACCAGTAATCCAA
(CA)27 60C AB100334 Wantanabe et al. (2003)
Pret-80 F: GGAAGGGAGGGGAGGAT R:CACTTCAGCAGGGCAGACTA
(GT)14 (GA)11 60C AB100354 Wantanabe et al. (2003)
G145 F: TCTCCAAACCTCCCCTGTA R: GACGAGCCTCTGCTTCTTC
(GT)11 60C DQ855588 Shen et al. (2007)
Table S4.1: Details of microsatellite primers used

18
5
Table S2. Summary metrics of MHC allelic richness (MHC-Ar), and MHC supertype richness (MHC-STr).
Predation Drainage Population Mean Ai Mean STi Range Ai Range STi
High Caroni Arima-1 3.966 3.133 2-9 1-6 Low Caroni Arima-2 3.2 3 1-6 1-6 Low Caroni Aripo-1 3.068 2.689 1-5 1-4 High Caroni Aripo-2 4.875 3.812 2-9 2-6 Low Caroni El Cedro-1 3.366 3.1 1-5 1-4 High Caroni El Cedro-1 3.843 3.187 1-7 1-5 High Caroni Guanapo-1 3.903 3.225 2-6 2-5 Low Caroni Guanapo-2 3.75 3.166 1-6 1-5 High North Slope Damier-1 3.311 2.577 1-7 1-5 Low North Slope Damier-2 2.642 2.214 1-7 1-5 Low North Slope Marianne-10 2.148 1.851 1-3 1-3 Low North Slope Marianne-16 3.032 2.741 2-6 2-5 Low North Slope Marianne-3 3.111 3.111 3-4 3-4 Low North Slope Marianne-4 2.937 2.937 2-4 2-4 Low North Slope Paria-7 3.625 3.187 2-6 2-4 Low North Slope Yarra-1 2.489 2.326 2-5 1-4 High North Slope Yarra-2 3.043 2.586 1-6 1-5 High Oropouche Quare-1 3.310 2.724 1-6 1-4 Low Oropouche Quare-2 3.117 2.588 1-6 1-5
High Oropouche (Caroni
type) Turure-2 3.709 2.750 2-5 2-3
Low Oropouche (Caroni
type) Turure-3 3.655 1-4 1-5 3
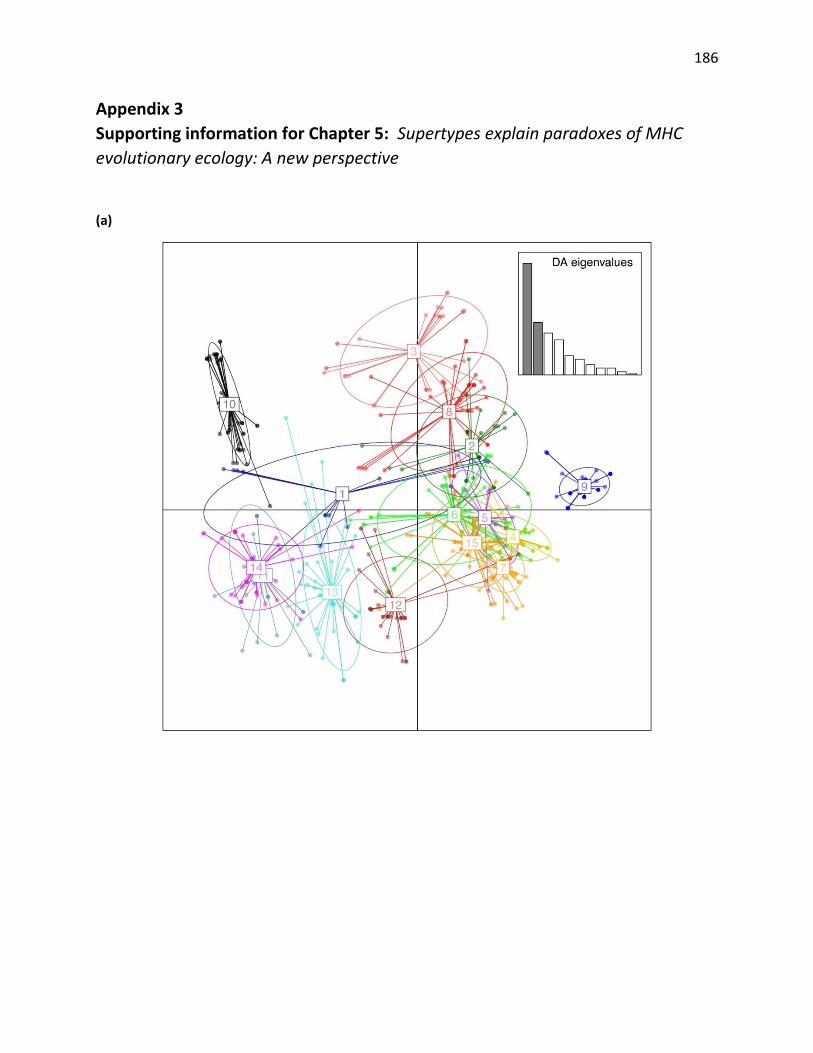
186
Appendix 3
Supporting information for Chapter 5: Supertypes explain paradoxes of MHC
evolutionary ecology: A new perspective
(a)

187
(b)
Figure S5.1. Clustering of MHC alleles by Discriminant Analysis of Principle Components (DAPC),
based on the physicochemical properties of translated amino acids inferred to comprise the
peptide binding region (PBR). DAPC inferred the presence of fifteen clusters, or supertypes,
which are visualized on (a) two, and (b) one discriminant function.

18
8
Figure S5.2. Neighbour-joining dendrogram of relationships among MHC alleles, based on the translated amino acids inferred to comprise the
peptide binding region (PBR). For clarity, allele names have been removed. Alleles are highlighted based on inferred membership to the fifteen
supertypes inferred though by Discriminant Analysis of Principle Components (DAPC). Perpendicular branch tips highlight identical PBR
sequences derived from disparate MHC alleles (nucleotide sequences). The ten alleles observed in five Poecilia picta samples are denoted by a
star symbol. Monophyly is on observed in supertype-9, and this is consistent with other unique characteristics of this supertype (See Results).

18
9
(a)
Figure S5.3. Population frequencies of (a) ST-1, (b) ST-2, (c) ST-3, (d) ST-4, (e) ST-5, (f) ST-6, (g) ST-7, (h) ST-8, (i) ST-9, (j) ST-10, (k) ST-
11, (l) ST-12, (m) ST-13, (n) ST-14, (o) ST-15
0.000
0.020
0.040
0.060
0.080
0.100
0.120
0.140
0.160
0.180
0.200
Gu
anap
o-1
Gu
anap
o-2
Ari
ma-
1A
rim
a-2
Ari
po
-1A
rip
o-2
El C
ed
ro-1
El C
ed
ro-2
Turu
re-2
Turu
re-3
Die
go M
arti
nC
ura
guat
eLa
s C
uev
asY
arra
-1Y
arra
-2D
amie
r-1
Dam
ier-
2M
aria
nn
e-3
Mar
ian
ne-
4M
aria
nn
e-7
Mar
ian
ne-
10
Mar
ian
ne-
11
Mar
ian
ne-
16
Par
ia-3
Par
ia-4
Par
ia-7
Par
ia-8
Par
ia-1
2P
aria
-13
Mad
amas
-2Sh
ark
San
So
uci
Mis
sio
nTo
mp
ire
Cu
man
aQ
uar
e-1
Qu
are
-2La
Sei
vaM
atu
raP
oo
leFa
ecal
Du
mp
Rd
.O
rop
uch
e-So
uth
Fift
h C
om
pan
yG
uay
guay
are
Bas
se T
err
eM
on
des
irM
orn
eV
ance
Pit
ch L
ake
Silv
er S
tre
amP
oin
t Fo
nti
n-1
Po
int
Fon
tin
-2Sn
ake
Sto
llme
yer
Gra
ham
e H
all s
wam
pW
ind
war
d R
dW
aih
e’e
Str
eam
Ma’
ili’il
i Str
eam
Pic
ta
Sup
erty
pe
-1 f
req
uen
cy
Population

19
0
(b)
0.000
0.050
0.100
0.150
0.200
0.250
Gu
anap
o-1
Gu
anap
o-2
Ari
ma-
1A
rim
a-2
Ari
po
-1
Ari
po
-2El
Ce
dro
-1El
Ce
dro
-2Tu
rure
-2Tu
rure
-3D
iego
Mar
tin
Cu
ragu
ate
Las
Cu
evas
Yar
ra-1
Yar
ra-2
Dam
ier-
1D
amie
r-2
Mar
ian
ne-
3
Mar
ian
ne-
4
Mar
ian
ne-
7M
aria
nn
e-1
0M
aria
nn
e-1
1M
aria
nn
e-1
6P
aria
-3P
aria
-4
Par
ia-7
Par
ia-8
Par
ia-1
2
Par
ia-1
3M
adam
as-2
Shar
k
San
So
uci
Mis
sio
n
Tom
pir
eC
um
ana
Qu
are
-1Q
uar
e-2
La S
eiva
Mat
ura
Po
ole
Faec
al D
um
p R
d.
Oro
pu
che-
Sou
th
Fift
h C
om
pan
yG
uay
guay
are
Bas
se T
err
e
Mo
nd
esir
Mo
rne
Van
ceP
itch
Lak
e
Silv
er S
tre
amP
oin
t Fo
nti
n-1
Po
int
Fon
tin
-2
Snak
eSt
ollm
eye
r
Gra
ham
e H
all s
wam
pW
ind
war
d R
dW
aih
e’e
Str
eam
Ma’
ili’il
i Str
eam
Pic
ta
Sup
erty
pe
-2 f
req
uen
cy
Population

19
1
(c)
0.000
0.050
0.100
0.150
0.200
0.250
0.300
0.350
0.400
0.450
0.500
Gu
anap
o-1
Gu
anap
o-2
Ari
ma-
1A
rim
a-2
Ari
po
-1
Ari
po
-2El
Ce
dro
-1El
Ce
dro
-2Tu
rure
-2Tu
rure
-3D
iego
Mar
tin
Cu
ragu
ate
Las
Cu
evas
Yar
ra-1
Yar
ra-2
Dam
ier-
1D
amie
r-2
Mar
ian
ne-
3
Mar
ian
ne-
4
Mar
ian
ne-
7M
aria
nn
e-1
0M
aria
nn
e-1
1M
aria
nn
e-1
6P
aria
-3P
aria
-4
Par
ia-7
Par
ia-8
Par
ia-1
2
Par
ia-1
3M
adam
as-2
Shar
k
San
So
uci
Mis
sio
n
Tom
pir
eC
um
ana
Qu
are
-1Q
uar
e-2
La S
eiva
Mat
ura
Po
ole
Faec
al D
um
p R
d.
Oro
pu
che-
Sou
th
Fift
h C
om
pan
yG
uay
guay
are
Bas
se T
err
e
Mo
nd
esir
Mo
rne
Van
ceP
itch
Lak
e
Silv
er S
tre
amP
oin
t Fo
nti
n-1
Po
int
Fon
tin
-2
Snak
eSt
ollm
eye
r
Gra
ham
e H
all s
wam
pW
ind
war
d R
dW
aih
e’e
Str
eam
Ma’
ili’il
i Str
eam
Pic
ta
Sup
erty
pe
-3 f
req
uen
cy
Population

19
2
(d)
0.000
0.100
0.200
0.300
0.400
0.500
0.600
Gu
anap
o-1
Gu
anap
o-2
Ari
ma-
1
Ari
ma-
2
Ari
po
-1
Ari
po
-2
El C
ed
ro-1
El C
ed
ro-2
Turu
re-2
Turu
re-3
Die
go M
arti
n
Cu
ragu
ate
Las
Cu
evas
Yar
ra-1
Yar
ra-2
Dam
ier-
1
Dam
ier-
2
Mar
ian
ne-
3
Mar
ian
ne-
4
Mar
ian
ne-
7
Mar
ian
ne-
10
Mar
ian
ne-
11
Mar
ian
ne-
16
Par
ia-3
Par
ia-4
Par
ia-7
Par
ia-8
Par
ia-1
2
Par
ia-1
3
Mad
amas
-2
Shar
k
San
So
uci
Mis
sio
n
Tom
pir
e
Cu
man
a
Qu
are
-1
Qu
are
-2
La S
eiva
Mat
ura
Po
ole
Faec
al D
um
p R
d.
Oro
pu
che-
Sou
th
Fift
h C
om
pan
y
Gu
aygu
ayar
e
Bas
se T
err
e
Mo
nd
esir
Mo
rne
Van
ce
Pit
ch L
ake
Silv
er S
tre
am
Po
int
Fon
tin
-1
Po
int
Fon
tin
-2
Snak
e
Sto
llme
yer
Gra
ham
e H
all s
wam
p
Win
dw
ard
Rd
Wai
he
’e S
tre
am
Ma’
ili’il
i Str
eam
Pic
ta
Sup
erty
pe
-4 f
req
uen
cy
Population

19
3
(e)
0.000
0.050
0.100
0.150
0.200
0.250
0.300
0.350
0.400
0.450
Gu
anap
o-1
Gu
anap
o-2
Ari
ma-
1
Ari
ma-
2
Ari
po
-1
Ari
po
-2
El C
ed
ro-1
El C
ed
ro-2
Turu
re-2
Turu
re-3
Die
go M
arti
n
Cu
ragu
ate
Las
Cu
evas
Yar
ra-1
Yar
ra-2
Dam
ier-
1
Dam
ier-
2
Mar
ian
ne-
3
Mar
ian
ne-
4
Mar
ian
ne-
7
Mar
ian
ne-
10
Mar
ian
ne-
11
Mar
ian
ne-
16
Par
ia-3
Par
ia-4
Par
ia-7
Par
ia-8
Par
ia-1
2
Par
ia-1
3
Mad
amas
-2
Shar
k
San
So
uci
Mis
sio
n
Tom
pir
e
Cu
man
a
Qu
are
-1
Qu
are
-2
La S
eiva
Mat
ura
Po
ole
Faec
al D
um
p R
d.
Oro
pu
che-
Sou
th
Fift
h C
om
pan
y
Gu
aygu
ayar
e
Bas
se T
err
e
Mo
nd
esir
Mo
rne
Van
ce
Pit
ch L
ake
Silv
er S
tre
am
Po
int
Fon
tin
-1
Po
int
Fon
tin
-2
Snak
e
Sto
llme
yer
Gra
ham
e H
all s
wam
p
Win
dw
ard
Rd
Wai
he
’e S
tre
am
Ma’
ili’il
i Str
eam
Pic
ta
Sup
erty
pe
-5 f
req
uen
cy
Population

19
4
(f)
0.000
0.050
0.100
0.150
0.200
0.250
0.300
0.350
Gu
anap
o-1
Gu
anap
o-2
Ari
ma-
1
Ari
ma-
2
Ari
po
-1
Ari
po
-2
El C
ed
ro-1
El C
ed
ro-2
Turu
re-2
Turu
re-3
Die
go M
arti
n
Cu
ragu
ate
Las
Cu
evas
Yar
ra-1
Yar
ra-2
Dam
ier-
1
Dam
ier-
2
Mar
ian
ne-
3
Mar
ian
ne-
4
Mar
ian
ne-
7
Mar
ian
ne-
10
Mar
ian
ne-
11
Mar
ian
ne-
16
Par
ia-3
Par
ia-4
Par
ia-7
Par
ia-8
Par
ia-1
2
Par
ia-1
3
Mad
amas
-2
Shar
k
San
So
uci
Mis
sio
n
Tom
pir
e
Cu
man
a
Qu
are
-1
Qu
are
-2
La S
eiva
Mat
ura
Po
ole
Faec
al D
um
p R
d.
Oro
pu
che-
Sou
th
Fift
h C
om
pan
y
Gu
aygu
ayar
e
Bas
se T
err
e
Mo
nd
esir
Mo
rne
Van
ce
Pit
ch L
ake
Silv
er S
tre
am
Po
int
Fon
tin
-1
Po
int
Fon
tin
-2
Snak
e
Sto
llme
yer
Gra
ham
e H
all s
wam
p
Win
dw
ard
Rd
Wai
he
’e S
tre
am
Ma’
ili’il
i Str
eam
Pic
ta
Sup
erty
pe
-6 f
req
uen
cy
Population

19
5
(g)
0.000
0.050
0.100
0.150
0.200
0.250
Gu
anap
o-1
Gu
anap
o-2
Ari
ma-
1
Ari
ma-
2
Ari
po
-1
Ari
po
-2
El C
ed
ro-1
El C
ed
ro-2
Turu
re-2
Turu
re-3
Die
go M
arti
n
Cu
ragu
ate
Las
Cu
evas
Yar
ra-1
Yar
ra-2
Dam
ier-
1
Dam
ier-
2
Mar
ian
ne-
3
Mar
ian
ne-
4
Mar
ian
ne-
7
Mar
ian
ne-
10
Mar
ian
ne-
11
Mar
ian
ne-
16
Par
ia-3
Par
ia-4
Par
ia-7
Par
ia-8
Par
ia-1
2
Par
ia-1
3
Mad
amas
-2
Shar
k
San
So
uci
Mis
sio
n
Tom
pir
e
Cu
man
aQ
uar
e-1
Qu
are
-2
La S
eiva
Mat
ura
Po
ole
Faec
al D
um
p R
d.
Oro
pu
che-
Sou
th
Fift
h C
om
pan
y
Gu
aygu
ayar
e
Bas
se T
err
e
Mo
nd
esir
Mo
rne
Van
ce
Pit
ch L
ake
Silv
er S
tre
am
Po
int
Fon
tin
-1
Po
int
Fon
tin
-2
Snak
e
Sto
llme
yer
Gra
ham
e H
all s
wam
p
Win
dw
ard
Rd
Wai
he
’e S
tre
am
Ma’
ili’il
i Str
eam
Pic
ta
Sup
erty
pe
-7 f
req
uen
cy
Population

19
6
(h)
0.000
0.050
0.100
0.150
0.200
0.250
0.300
Gu
anap
o-1
Gu
anap
o-2
Ari
ma-
1
Ari
ma-
2
Ari
po
-1
Ari
po
-2
El C
ed
ro-1
El C
ed
ro-2
Turu
re-2
Turu
re-3
Die
go M
arti
n
Cu
ragu
ate
Las
Cu
evas
Yar
ra-1
Yar
ra-2
Dam
ier-
1
Dam
ier-
2
Mar
ian
ne-
3
Mar
ian
ne-
4
Mar
ian
ne-
7
Mar
ian
ne-
10
Mar
ian
ne-
11
Mar
ian
ne-
16
Par
ia-3
Par
ia-4
Par
ia-7
Par
ia-8
Par
ia-1
2
Par
ia-1
3
Mad
amas
-2
Shar
k
San
So
uci
Mis
sio
n
Tom
pir
e
Cu
man
a
Qu
are
-1
Qu
are
-2
La S
eiva
Mat
ura
Po
ole
Faec
al D
um
p R
d.
Oro
pu
che-
Sou
th
Fift
h C
om
pan
y
Gu
aygu
ayar
e
Bas
se T
err
e
Mo
nd
esir
Mo
rne
Van
ce
Pit
ch L
ake
Silv
er S
tre
am
Po
int
Fon
tin
-1
Po
int
Fon
tin
-2
Snak
e
Sto
llme
yer
Gra
ham
e H
all s
wam
p
Win
dw
ard
Rd
Wai
he
’e S
tre
am
Ma’
ili’il
i Str
eam
Pic
ta
Sup
erty
pe
-8 f
req
uen
cy
Population

19
7
(i)
0.000
0.100
0.200
0.300
0.400
0.500
0.600
0.700
Gu
anap
o-1
Gu
anap
o-2
Ari
ma-
1
Ari
ma-
2
Ari
po
-1
Ari
po
-2
El C
ed
ro-1
El C
ed
ro-2
Turu
re-2
Turu
re-3
Die
go M
arti
n
Cu
ragu
ate
Las
Cu
evas
Yar
ra-1
Yar
ra-2
Dam
ier-
1
Dam
ier-
2
Mar
ian
ne-
3
Mar
ian
ne-
4
Mar
ian
ne-
7
Mar
ian
ne-
10
Mar
ian
ne-
11
Mar
ian
ne-
16
Par
ia-3
Par
ia-4
Par
ia-7
Par
ia-8
Par
ia-1
2
Par
ia-1
3
Mad
amas
-2
Shar
k
San
So
uci
Mis
sio
n
Tom
pir
e
Cu
man
a
Qu
are
-1
Qu
are
-2
La S
eiva
Mat
ura
Po
ole
Faec
al D
um
p R
d.
Oro
pu
che-
Sou
th
Fift
h C
om
pan
y
Gu
aygu
ayar
e
Bas
se T
err
e
Mo
nd
esir
Mo
rne
Van
ce
Pit
ch L
ake
Silv
er S
tre
am
Po
int
Fon
tin
-1
Po
int
Fon
tin
-2
Snak
e
Sto
llme
yer
Gra
ham
e H
all s
wam
p
Win
dw
ard
Rd
Wai
he
’e S
tre
am
Ma’
ili’il
i Str
eam
Pic
ta
Sup
erty
pe
-9 f
req
uen
cy
Population
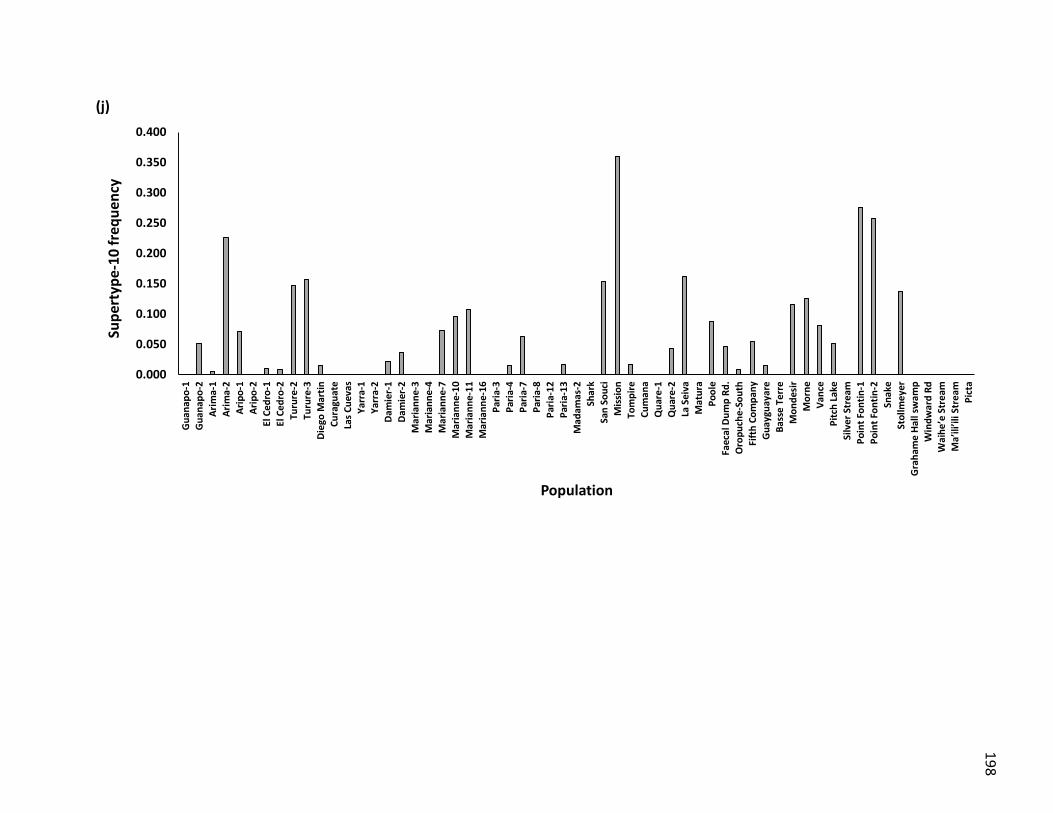
19
8
(j)
0.000
0.050
0.100
0.150
0.200
0.250
0.300
0.350
0.400
Gu
anap
o-1
Gu
anap
o-2
Ari
ma-
1
Ari
ma-
2
Ari
po
-1
Ari
po
-2
El C
ed
ro-1
El C
ed
ro-2
Turu
re-2
Turu
re-3
Die
go M
arti
n
Cu
ragu
ate
Las
Cu
evas
Yar
ra-1
Yar
ra-2
Dam
ier-
1
Dam
ier-
2
Mar
ian
ne-
3
Mar
ian
ne-
4
Mar
ian
ne-
7
Mar
ian
ne-
10
Mar
ian
ne-
11
Mar
ian
ne-
16
Par
ia-3
Par
ia-4
Par
ia-7
Par
ia-8
Par
ia-1
2
Par
ia-1
3
Mad
amas
-2
Shar
k
San
So
uci
Mis
sio
n
Tom
pir
e
Cu
man
a
Qu
are
-1
Qu
are
-2
La S
eiva
Mat
ura
Po
ole
Faec
al D
um
p R
d.
Oro
pu
che-
Sou
th
Fift
h C
om
pan
y
Gu
aygu
ayar
e
Bas
se T
err
e
Mo
nd
esir
Mo
rne
Van
ce
Pit
ch L
ake
Silv
er S
tre
am
Po
int
Fon
tin
-1
Po
int
Fon
tin
-2
Snak
e
Sto
llme
yer
Gra
ham
e H
all s
wam
p
Win
dw
ard
Rd
Wai
he
’e S
tre
am
Ma’
ili’il
i Str
eam
Pic
ta
Sup
erty
pe
-10
fre
qu
ency
Population

19
9
(k)
0.000
0.050
0.100
0.150
0.200
0.250
0.300
0.350
Gu
anap
o-1
Gu
anap
o-2
Ari
ma-
1
Ari
ma-
2
Ari
po
-1
Ari
po
-2
El C
ed
ro-1
El C
ed
ro-2
Turu
re-2
Turu
re-3
Die
go M
arti
n
Cu
ragu
ate
Las
Cu
evas
Yar
ra-1
Yar
ra-2
Dam
ier-
1
Dam
ier-
2
Mar
ian
ne-
3
Mar
ian
ne-
4
Mar
ian
ne-
7
Mar
ian
ne-
10
Mar
ian
ne-
11
Mar
ian
ne-
16
Par
ia-3
Par
ia-4
Par
ia-7
Par
ia-8
Par
ia-1
2
Par
ia-1
3
Mad
amas
-2
Shar
k
San
So
uci
Mis
sio
n
Tom
pir
e
Cu
man
a
Qu
are
-1
Qu
are
-2
La S
eiva
Mat
ura
Po
ole
Faec
al D
um
p R
d.
Oro
pu
che-
Sou
th
Fift
h C
om
pan
y
Gu
aygu
ayar
e
Bas
se T
err
e
Mo
nd
esir
Mo
rne
Van
ce
Pit
ch L
ake
Silv
er S
tre
am
Po
int
Fon
tin
-1
Po
int
Fon
tin
-2
Snak
e
Sto
llme
yer
Gra
ham
e H
all s
wam
p
Win
dw
ard
Rd
Wai
he
’e S
tre
am
Ma’
ili’il
i Str
eam
Pic
ta
Sup
erty
pe
-11
fre
qu
ency
Population

20
0
(l)
0.000
0.050
0.100
0.150
0.200
0.250
Gu
anap
o-1
Gu
anap
o-2
Ari
ma-
1A
rim
a-2
Ari
po
-1
Ari
po
-2El
Ce
dro
-1El
Ce
dro
-2Tu
rure
-2Tu
rure
-3D
iego
Mar
tin
Cu
ragu
ate
Las
Cu
evas
Yar
ra-1
Yar
ra-2
Dam
ier-
1D
amie
r-2
Mar
ian
ne-
3
Mar
ian
ne-
4
Mar
ian
ne-
7M
aria
nn
e-1
0M
aria
nn
e-1
1M
aria
nn
e-1
6P
aria
-3P
aria
-4
Par
ia-7
Par
ia-8
Par
ia-1
2
Par
ia-1
3M
adam
as-2
Shar
k
San
So
uci
Mis
sio
n
Tom
pir
eC
um
ana
Qu
are
-1Q
uar
e-2
La S
eiva
Mat
ura
Po
ole
Faec
al D
um
p R
d.
Oro
pu
che-
Sou
th
Fift
h C
om
pan
yG
uay
guay
are
Bas
se T
err
e
Mo
nd
esir
Mo
rne
Van
ceP
itch
Lak
e
Silv
er S
tre
amP
oin
t Fo
nti
n-1
Po
int
Fon
tin
-2
Snak
eSt
ollm
eye
r
Gra
ham
e H
all s
wam
pW
ind
war
d R
dW
aih
e’e
Str
eam
Ma’
ili’il
i Str
eam
Pic
ta
Sup
erty
pe
-12
fre
qu
ency
Population

20
1
(m)
0.000
0.100
0.200
0.300
0.400
0.500
0.600
0.700
0.800
0.900
Gu
anap
o-1
Gu
anap
o-2
Ari
ma-
1
Ari
ma-
2
Ari
po
-1
Ari
po
-2
El C
ed
ro-1
El C
ed
ro-2
Turu
re-2
Turu
re-3
Die
go M
arti
n
Cu
ragu
ate
Las
Cu
evas
Yar
ra-1
Yar
ra-2
Dam
ier-
1
Dam
ier-
2
Mar
ian
ne-
3
Mar
ian
ne-
4
Mar
ian
ne-
7
Mar
ian
ne-
10
Mar
ian
ne-
11
Mar
ian
ne-
16
Par
ia-3
Par
ia-4
Par
ia-7
Par
ia-8
Par
ia-1
2
Par
ia-1
3
Mad
amas
-2
Shar
k
San
So
uci
Mis
sio
n
Tom
pir
e
Cu
man
a
Qu
are
-1
Qu
are
-2
La S
eiva
Mat
ura
Po
ole
Faec
al D
um
p R
d.
Oro
pu
che-
Sou
th
Fift
h C
om
pan
y
Gu
aygu
ayar
e
Bas
se T
err
e
Mo
nd
esir
Mo
rne
Van
ce
Pit
ch L
ake
Silv
er S
tre
am
Po
int
Fon
tin
-1
Po
int
Fon
tin
-2
Snak
e
Sto
llme
yer
Gra
ham
e H
all s
wam
p
Win
dw
ard
Rd
Wai
he
’e S
tre
am
Ma’
ili’il
i Str
eam
Pic
ta
Sup
erty
pe
-13
fre
qu
ency
Population

20
2
(n)
0.000
0.050
0.100
0.150
0.200
0.250
0.300
0.350
0.400
0.450
Gu
anap
o-1
Gu
anap
o-2
Ari
ma-
1
Ari
ma-
2
Ari
po
-1
Ari
po
-2
El C
ed
ro-1
El C
ed
ro-2
Turu
re-2
Turu
re-3
Die
go M
arti
n
Cu
ragu
ate
Las
Cu
evas
Yar
ra-1
Yar
ra-2
Dam
ier-
1
Dam
ier-
2
Mar
ian
ne-
3
Mar
ian
ne-
4
Mar
ian
ne-
7
Mar
ian
ne-
10
Mar
ian
ne-
11
Mar
ian
ne-
16
Par
ia-3
Par
ia-4
Par
ia-7
Par
ia-8
Par
ia-1
2
Par
ia-1
3
Mad
amas
-2
Shar
k
San
So
uci
Mis
sio
n
Tom
pir
e
Cu
man
a
Qu
are
-1
Qu
are
-2
La S
eiva
Mat
ura
Po
ole
Faec
al D
um
p R
d.
Oro
pu
che-
Sou
th
Fift
h C
om
pan
y
Gu
aygu
ayar
e
Bas
se T
err
e
Mo
nd
esir
Mo
rne
Van
ce
Pit
ch L
ake
Silv
er S
tre
am
Po
int
Fon
tin
-1
Po
int
Fon
tin
-2
Snak
e
Sto
llme
yer
Gra
ham
e H
all s
wam
p
Win
dw
ard
Rd
Wai
he
’e S
tre
am
Ma’
ili’il
i Str
eam
Pic
ta
Sup
erty
pe
-14
fre
qu
ency
Population

20
3
(o)
0.000
0.050
0.100
0.150
0.200
0.250
0.300
0.350
0.400
0.450
Gu
anap
o-1
Gu
anap
o-2
Ari
ma-
1
Ari
ma-
2
Ari
po
-1
Ari
po
-2
El C
ed
ro-1
El C
ed
ro-2
Turu
re-2
Turu
re-3
Die
go M
arti
n
Cu
ragu
ate
Las
Cu
evas
Yar
ra-1
Yar
ra-2
Dam
ier-
1
Dam
ier-
2
Mar
ian
ne-
3
Mar
ian
ne-
4
Mar
ian
ne-
7
Mar
ian
ne-
10
Mar
ian
ne-
11
Mar
ian
ne-
16
Par
ia-3
Par
ia-4
Par
ia-7
Par
ia-8
Par
ia-1
2
Par
ia-1
3
Mad
amas
-2
Shar
k
San
So
uci
Mis
sio
n
Tom
pir
e
Cu
man
a
Qu
are
-1
Qu
are
-2
La S
eiva
Mat
ura
Po
ole
Faec
al D
um
p R
d.
Oro
pu
che-
Sou
th
Fift
h C
om
pan
y
Gu
aygu
ayar
e
Bas
se T
err
e
Mo
nd
esir
Mo
rne
Van
ce
Pit
ch L
ake
Silv
er S
tre
am
Po
int
Fon
tin
-1
Po
int
Fon
tin
-2
Snak
e
Sto
llme
yer
Gra
ham
e H
all s
wam
p
Win
dw
ard
Rd
Wai
he
’e S
tre
am
Ma’
ili’il
i Str
eam
Pic
ta
Sup
erty
pe
-15
fre
qu
ency
Population

204
Figure S5.4. Frequency distribution of the occurrence of supertypes within individuals in
populations. Supertype 9 is present in 79.77 % of individuals. The mean (and standard
deviation) of the number of supertypes per individual equals 17.55 (18.62), and supertype 9 lies
3.33 standard deviations away from the mean, which is a significant outlier with p<0.003.
0
1
2
3
4
5
6
5 10 15 20 25 30 35 40 45 50 55 60 65 70 75 80 85 90 95 100
Nu
mb
er o
f su
per
typ
es
Frequency of individuals (%)

205
Appendix 4 Copyright agreements
JOHN WILEY AND SONS LICENSE
This Agreement between Jackie Lighten ("You") and John Wiley and Sons ("John Wiley and Sons")
consists of your license details and the terms and conditions provided by John Wiley and Sons and
Copyright Clearance Center.
License Number 3601291401895
License date Apr 03, 2015
Licensed Content Publisher John Wiley and Sons
Licensed Content Publication Molecular Ecology Resources
Licensed Content Title Ultra-deep Illumina sequencing accurately identifies MHC class
IIb alleles and provides evidence for copy number variation in
the guppy (Poecilia reticulata)
Licensed Content Author Jackie Lighten, Cock van Oosterhout, Ian G. Paterson,
Mark McMullan, Paul Bentzen
Licensed Content Date Feb 5, 2014
Pages 15
Type of use Dissertation/Thesis
Requestor type Author of this Wiley article
Format Print and electronic
Portion Full article
Will you be translating? No
Title of your thesis / dissertation Elucidating patterns of Major Histocompatibility Complex
polymorphism in the Trinidadian guppy (Poecilia reticulata)
using Next Generation Sequencing
Expected completion date July 2015
Expected size (number of pages) 250
Requestor Location Jackie Lighten
Dep. of Biology, Dalhousie University
1355 Oxford Street
PO BOX 15000
Halifax, NS B3H 4R2
Canada

206
JOHN WILEY AND SONS LICENSE
This Agreement between Jackie Lighten ("You") and John Wiley and Sons ("John Wiley and Sons")
consists of your license details and the terms and conditions provided by John Wiley and Sons and
Copyright Clearance Center.
License Number 3601291401895
License date Apr 03, 2015
Licensed Content Publisher John Wiley and Sons
Licensed Content Publication Molecular Ecology Resources
Licensed Content Title Critical review of NGS analyses for de novo genotyping
multigene families
Licensed Content Author Jackie Lighten, Cock van Oosterhout, Paul Bentzen
Licensed Content Date Jul 21, 2014
Pages 16
Type of use Dissertation/Thesis
Requestor type Author of this Wiley article
Format Print and electronic
Portion Full article
Will you be translating? No
Title of your thesis / dissertation Elucidating patterns of Major Histocompatibility Complex
polymorphism in the Trinidadian guppy (Poecilia reticulata)
using Next Generation Sequencing
Expected completion date July 2015
Expected size (number of pages) 250
Requestor Location Jackie Lighten
Dep. of Biology, Dalhousie University
1355 Oxford Street
PO BOX 15000
Halifax, NS B3H 4R2
Canada
Copyright © 2022 FDOKUMEN