Elucidating the folding problem of helical peptides using empirical parameters
Upload
khangminh22Category
view
2download
0
Elucidating the olfactory pathways within and beyond the antennal
lobe in Drosophila melanogaster
Dissertation
To Fulfill the
Requirements for the Degree of
„doctor rerum naturalium“ (Dr. rer. nat.)
Submitted to the Council of the Faculty
of Biology and Pharmacy
of the Friedrich Schiller University Jena
by Dipl. Biochemikerin Amelie Erika Elfriede Baschwitz
Born on May 9th 1985 in Altenburg (Thüringen), Germany

2
Reviewers
1. Prof. Bill S. Hansson, Jena
2. Prof. Rolf G. Beutel, Jena
3. Prof. André Fiala, Göttingen
Date of public defense
July 18, 2017
3
Research is an expedition into the unknown - that´s why it is so exciting.
- The risks of playing safe -
Gottfried Schatz
(Jeff´s view on science and scientists,
Essays from FEBS Letters; 2006)

4
Table of Contents
Introduction ....................................................................................................................... 5
Olfaction in Drosophila melanogaster ........................................................................... 6
Neural circuitry in the Drosophila olfactory system ....................................................... 8
Transgenic flies and applied methods ......................................................................... 10
Aim of this thesis ......................................................................................................... 13
Overview of Manuscripts ................................................................................................. 15
Manuscript 1
Decoding Odor Quality and Intensity in the Drosophila brain ...................................... 19
Manuscript 2
Digital in vivo 3D atlas of the antennal lobe of Drosophila melanogaster ................... 51
Manuscript 3
Elucidating the neuronal architecture of olfactory glomeruli in the Drosophila antennal lobe ............................................................................................................... 67
Manuscript 4
Parallel olfactory pathways support odor valence and intensity coding in the lateral horn of Drosophila melanogaster ..................................................................... 91
General Discussion ....................................................................................................... 137
Elucidating olfactory pathways within the antennal lobe ........................................... 137
Elucidating olfactory pathways beyond the antennal lobe ......................................... 141
Future perspectives to unravel the neural circuitry governing innate behavior ......... 144
Summary ....................................................................................................................... 147
Zusammenfassung ....................................................................................................... 149
References .................................................................................................................... 151
Glossary ........................................................................................................................ 165
Declaration of independent assignment ........................................................................ 167
Acknowledgements ....................................................................................................... 168
Curriculum Vitae ........................................................................................................... 170
Introduction
5
Introduction
Every day we sense a plethora of different odors, each of those either being pleasant, really disgusting or being seemingly not recognized at all. Odorant pleasantness, or he-donic valence, influences our behavior, for example approaching a source by following an odor plume of freshly baked cake or freshly brewed coffee. This is true for humans as well as for insects, like the tiny vinegar fly Drosophila melanogaster. The preferred food sources for this fly are decaying and fermented fruits, which flies locate easily when hid-den in the abundance of unsuitable food sources in the kitchen or the orchard (Becher, 2012; Begon, 1982; Stökl et al., 2010). To fulfil this essential task they mainly rely on their sense of smell. Furthermore, they use their sense of smell for interacting socially, i.e. finding conspecifics, good mating partners and oviposition sites, as well as avoiding predators. Insects in general are very sensitive to odors and respond specifically to some odors: for example, the male silk moth Bombyx mori starts searching behavior after en-countering only a few molecules of the female pheromone bombykol (Butenandt and Hecker, 1961; Schneider et al., 1968). From the reception of an odor by olfactory senso-ry neurons (OSNs) to the elicited odor-guided behavior the relevant odor information is extracted through processing, carried out within the brain by the interplay of different neuronal populations. But how do neurons perform the processing of information from the outer world via versatile senses such as vision, audition or smell? To unravel funda-mental principles scientists have to choose simple models to test their assumptions: for example the sea hare Aplysia was – due to its large accessible cells – used to study neuron spiking properties during learning, sensitization and habituation (Kandel et al., 2014). To investigate genetic inheritance Thomas Hunt Morgan established Drosophila melanogaster as a valuable organism (Morgan, 1910). Since that time several genes and the function of their transcription products were identified in the vinegar fly (Venken et al., 2011). Furthermore, due to the insertion of exogenous genes, the improvement of genet-ic tools and the completely sequenced genome, Drosophila has become a valuable model organism to study neural systems, and especially the olfactory neural circuits (Adams et al., 2000; Luo et al., 2008; Olsen and Wilson, 2008a; Venken et al., 2011).
In the last years the odor response spectra of sensory neurons and higher-order neurons were thoroughly investigated (Bhandawat et al., 2007; de Bruyne et al., 1999; de Bruyne et al., 2001; Dweck et al., 2013; Fiala et al., 2002; Goldman et al., 2005; Hallem and Carlson, 2006; Honegger et al., 2011; Knaden et al., 2012; Kreher et al., 2005; Li et al., 2013; Ng et al., 2002; Perez-Orive et al., 2002; Schubert et al., 2014; Seki et al., 2010; Silbering and Galizia, 2007; Silbering et al., 2008; Silbering et al., 2011; Stensmyr et al., 2012; Stensmyr et al., 2003; Turner et al., 2008; Wang et al., 2003a). Moreover, the rep-resentations of odors in the primary olfactory processing center and the relay to the higher brain center involved in learning and memory have been investigated. But the
Introduction
6
olfactory neural circuitry is still not fully understood (Hansson et al., 2010; Liang and Luo, 2010; Stocker, 1994; Su et al., 2009). This is also the case for the neural circuitry under-lying innate odor-guided behavior (Li and Liberles, 2015; Schultzhaus et al., 2016). Thus, the aim of this thesis is the investigation of functional properties of second-order output neurons in the higher-brain center presumably mediating innate preference to odors by using the model organism Drosophila melanogaster. In addition, the neuropil structure in the primary olfactory processing center and the impact of neuron populations on the ar-chitecture of the neuropil substructures, the olfactory glomeruli, were examined.
Olfaction in Drosophila melanogaster
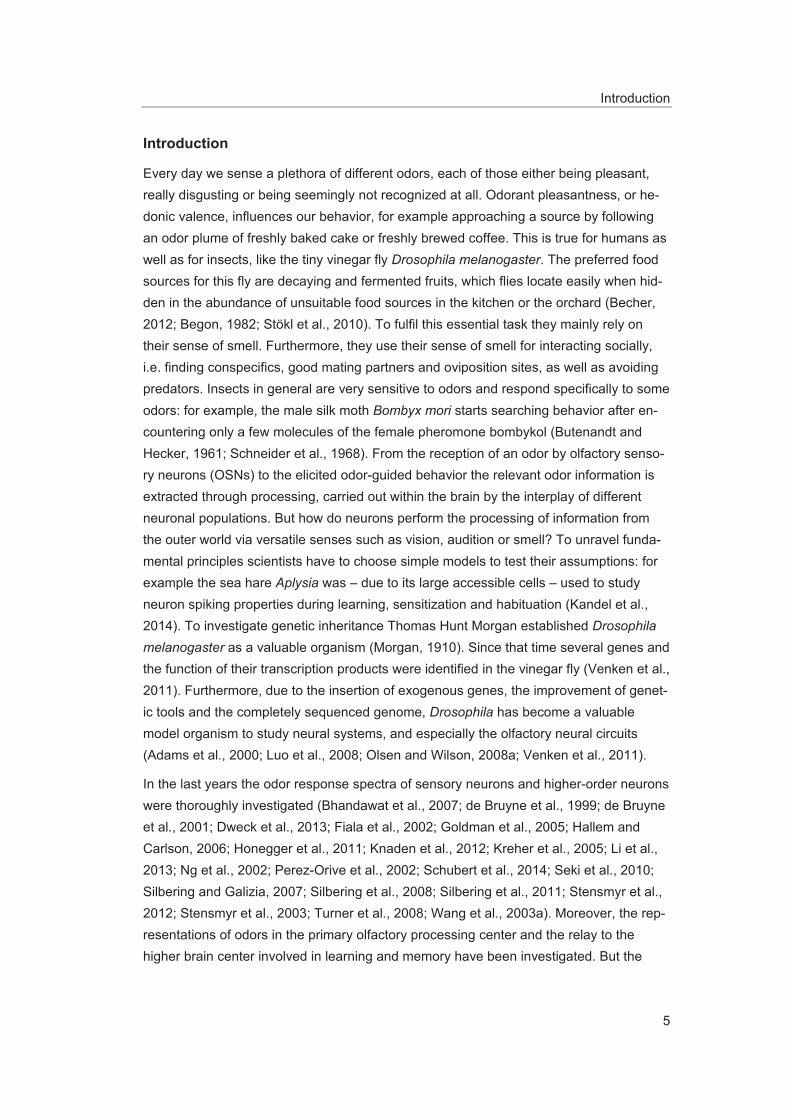
Drosophila perceives odors through two olfactory organs located on the fore-head: the maxillary palp and the antenna, more precisely the third antennal segment, the so-called funiculus (Figure 1A). The surface of the maxillary palp and the funiculus is equipped with hair-like structures, so-called sensilla. On the funiculus four different types of olfac-tory sensilla – basiconic, coeloconic, intermediate and trichoid – are stereotypically dis-tributed, whereas on the maxillary palp basiconic sensilla are intermingled with mecha-nosensitive sensilla chaetica (Figure 1B) (Stocker, 1994). Each sensillum houses up to four OSNs as well as three auxiliary cells (thecogen, tormogen, and trichogen cells). Their cell bodies lay at the sensillum base and the dendrites of OSNs lay in the sensillum shaft protected in aqueous sensillum lymph. Into this lymph auxiliary cells secrete odor-ant binding proteins (OBPs), odor degrading enzymes (ODEs) and chemosensory pro-teins (CSPs) (Leal, 2013; Pelosi et al., 2014; Shanbhag et al., 1999; Stocker, 1994; Swarup et al., 2011; Vieira and Rozas, 2011; Vogt et al., 2002; Xu et al., 2005). Through pores in the sensillum wall odor molecules enter the sensillum and bind to OBPs. This complex mediates by an unknown mechanism the activation of specific chemoreceptors integrated in the cell membrane of OSN dendrites. OSNs express either one of about 63 olfactory receptors (ORs) encoded by about 60 OR genes or one of the more ancient ionotropic receptors (IRs) encoded by 60 IR genes (Benton et al., 2009; Clyne et al., 1999; Gao and Chess, 1999; Robertson et al., 2003; Vosshall et al., 1999; Vosshall et al., 2000). But few cases of OSN types with expression of two ORs or IRs per neuron exist (Abuin et al., 2011; Couto et al., 2005; Dobritsa et al., 2003; Fishilevich and Vosshall, 2005; Goldman et al., 2005; Larsson et al., 2004; Vosshall, 2001). Exceptions are OSNs that neither express ORs nor IRs but the two gustatory receptors GR21a and GR63a, which in combination detect carbon dioxide (Jones et al., 2007; Kwon et al., 2007; Suh et al., 2004). Distinct sensilla subtypes house always an identical combination of OSNs expressing a specific chemoreceptor (Benton et al., 2009; Couto et al., 2005). OSNs housed in coeloconic sensilla mostly express IRs that detect mainly acids and amines (Abuin et al., 2011; Ai et al., 2010; Benton et al., 2009; Silbering et al., 2011; Yao et al., 2005). ORs form complexes with the ubiquitous olfactory receptor co-receptor (Or-
Introduction
7
co, formerly called OR83b) constituting a heteromeric receptor ion channel complex for the signal transduction in OSNs (Larsson et al., 2004; Neuhaus et al., 2005). This OR-Orco complex depolarizes OSNs after odor binding via ionotropic and metabotropic pathways (Sato et al., 2008; Wicher et al., 2008). Likewise, IRs form complexes with IR8a or IR25a as co-receptor (Abuin et al., 2011).
To comprehensively analyze the odor response profiles of OSNs several studies using single sensillum recordings (SSR) were performed (de Bruyne et al., 1999; de Bruyne et al., 2001; Dweck et al., 2013; Goldman et al., 2005; Hallem and Carlson, 2006; Kreher et al., 2005; Silbering et al., 2011; Stensmyr et al., 2012; Stensmyr et al., 2003; van der Goes van Naters and Carlson, 2007) (Manuscript 3). This continuously increasing knowledge on odor response profiles of almost all Drosophila olfactory chemoreceptors is available online at the DoOR data base (http://neuro.uni-konstanz.de/DoOR/2.0/) (Münch and Galizia, 2016). Furthermore, these studies revealed that the expressed chemoreceptor determines the odor response profile of OSNs, their spontaneous firing rate, the response dynamic, as well as their signaling mode – exhibiting inhibitory or ex-citatory responses (Hallem et al., 2004). Some ORs are activated by several odors, i.e. they are broadly tuned, whereas some ORs are excited by single or few odorants with a specific ecological relevance (Hallem and Carlson, 2006). To those odors belong phero-mones (Dweck et al., 2015b; Ha and Smith, 2006; Kurtovic et al., 2007), cues indicating either suitable (Dweck et al., 2013) or unsuitable oviposition sites (Ebrahim et al., 2015), the stress signal carbon dioxide (Suh et al., 2004), as well as food infested with harmful microbes (Babin et al., 2014; Stensmyr et al., 2012). The selectivity of a receptor can be described by calculating the lifetime sparseness based on the odor response profile test-ed for a large set of odors. Higher lifetime sparseness values signify a higher degree of OR specificity (Bhandawat et al., 2007; Perez-Orive et al., 2002; Vinje and Gallant, 2000) (Manuscript 3).
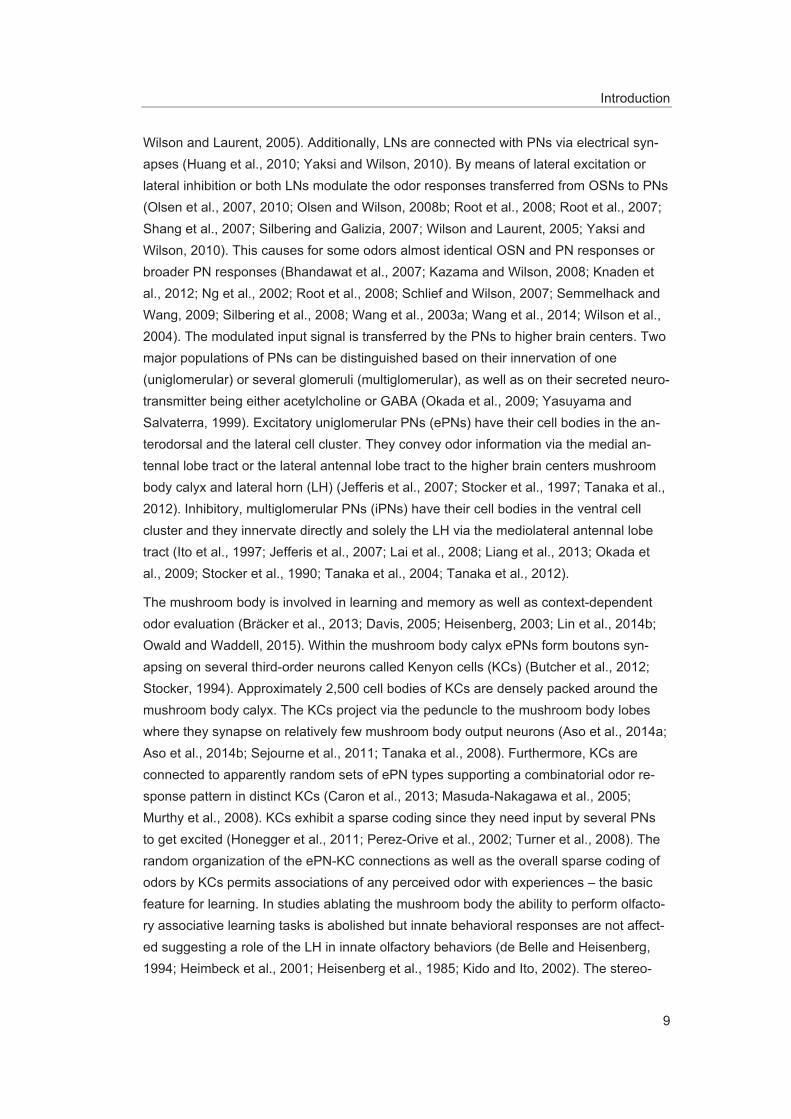
Figure 1 | Olfactory sensory organs of Drosophila melanogaster
(A) The olfactory organs, maxillary palp and the third antennal segment, the funiculus (with the mechanosensory arista), are located on the fore-head of the fly. On the surface of both olfactory appendages olfactory sensilla are distributed. (B) For each different type of sensil-lum (trichoid/ intermediate, coeloconic, antennal and palp basiconic) a representative scan-ning electron micrograph is shown (on the left) and the distribution of the sensilla by labeling of OSNs expressing a specific chemoreceptor (on the right). Scale bars equal 20 μm. Adopted from manuscript 3.
Introduction
8
Perceived odors, either being monomolecular odorants or complex mixtures, elicit stere-otypic behaviors in flies, like the approach of food sources or its avoidance. This innate odor-guided behavior of flies can be analyzed in behavioral assays such as the trap-assay, the Flywalk, the wind tunnel, the tethered flight arena or the T-maze assay (Budick and Dickinson, 2006; Frye and Dickinson, 2004; Larsson et al., 2004; Steck et al., 2012; Suh et al., 2004; Tully and Quinn, 1985). Those assays evaluate the hedonic valence, i.e. the pleasantness, of a single odor or complex mixtures as a strong or weak attractant or repellent. However, the innate odor-guided response can be modulated by the internal state of the fly, the context, or the fly´s experience (Beshel and Zhong, 2013; Bräcker et al., 2013; Heisenberg, 2015; Lin et al., 2014b; Owald and Waddell, 2015; Root et al., 2011; Su and Wang, 2014). Innate and experience-dependent odor-guided behaviors are the result of complex neural processing in different neuropils. The current knowledge about the olfactory neural circuitry is briefly reviewed in the next section.
Neural circuitry in the Drosophila olfactory system
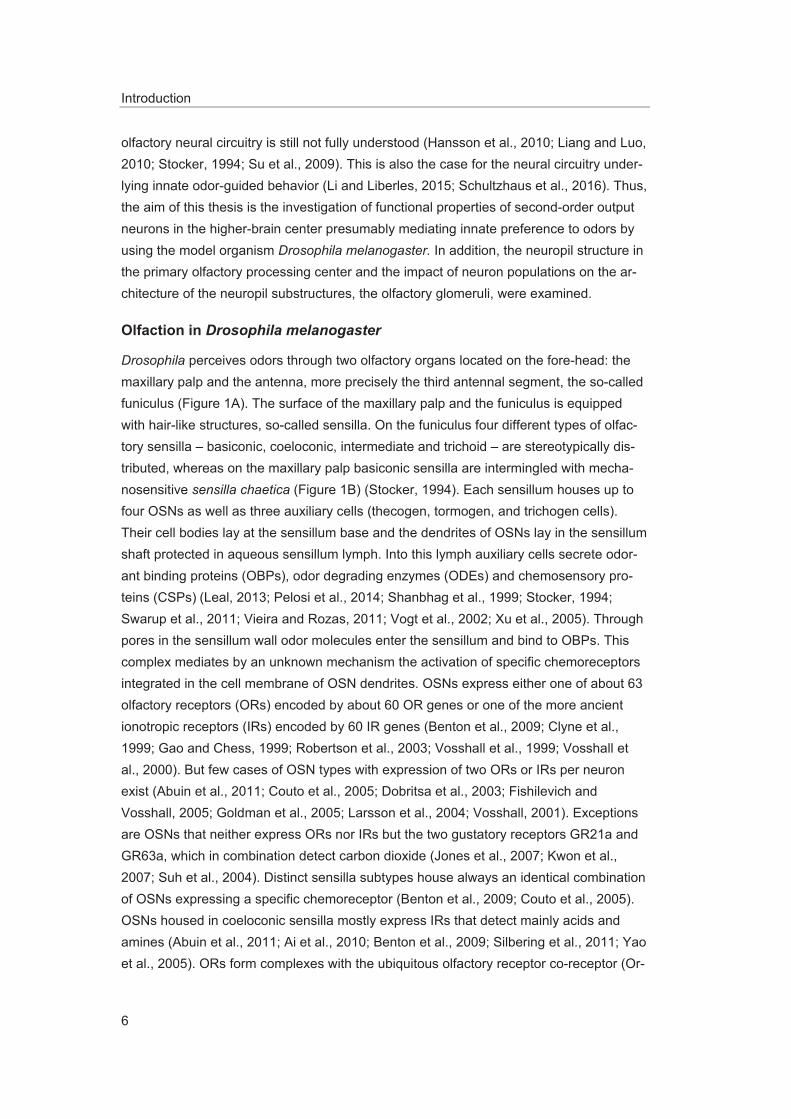
About 1,200 OSNs of the antennae converge to the antennal nerve and innervate the primary olfactory processing center, the antennal lobe (AL). About 120 OSNs of the max-illary palps converge to the labial nerve, passing through the suboesophageal ganglion, also innervate the AL (Figure 2A). Most OSNs innervate both ipsi- and contralateral ALs via an axonal commissure (Shanbhag et al., 1999, 2000; Stocker, 1994, 2001; Stocker et al., 1990). Within the AL the OSNs expressing the same chemoreceptor converge onto one (in rare cases two) spherical subunit, called glomerulus (Fishilevich and Vosshall, 2005; Gao et al., 2000; Vosshall et al., 2000). 54 glomeruli are described for Drosophila melanogaster, four of which are non-olfactory glomeruli: they are thermosensitive or hy-grosensitive (Enjin et al., 2016; Gallio et al., 2011). Position, size and shape of glomeruli are invariant across flies and thus create a topographic map (Couto et al., 2005; Fishilevich and Vosshall, 2005; Laissue et al., 1999) (Manuscript 2). In each glomerulus OSNs synapse on a specific number of second-order neurons, so-called projection neu-rons (PNs), and local interneurons (LNs) (Manuscript 3). Three cell clusters attached to the anterodorsal, lateral and ventral surface of the AL contain the cell bodies of about 150 PNs, whereas the cell bodies of about 200 LNs lie between as well as within these three cell clusters (Chou et al., 2010; Das et al., 2011; Seki et al., 2010; Stocker et al., 1990). LNs exhibit various innervation patterns in the AL either innervating all glomeruli, most glomeruli, glomeruli in specific clusters, discontinuous regions or only a few glo-meruli. Furthermore, LNs display a diverse neurotransmitter repertoire releasing the neu-rotransmitters acetylcholine, gamma-aminobutyric acid (GABA), glutamate, or neuropep-tides as well as combinations of neurotransmitters and neuropeptides, which elicit excita-tory and inhibitory effects on the postsynaptic targets (Chou et al., 2010; Das et al., 2011; Ignell et al., 2009; Liu and Wilson, 2013; Seki et al., 2010; Shang et al., 2007;
Introduction
9
Wilson and Laurent, 2005). Additionally, LNs are connected with PNs via electrical syn-apses (Huang et al., 2010; Yaksi and Wilson, 2010). By means of lateral excitation or lateral inhibition or both LNs modulate the odor responses transferred from OSNs to PNs (Olsen et al., 2007, 2010; Olsen and Wilson, 2008b; Root et al., 2008; Root et al., 2007; Shang et al., 2007; Silbering and Galizia, 2007; Wilson and Laurent, 2005; Yaksi and Wilson, 2010). This causes for some odors almost identical OSN and PN responses or broader PN responses (Bhandawat et al., 2007; Kazama and Wilson, 2008; Knaden et al., 2012; Ng et al., 2002; Root et al., 2008; Schlief and Wilson, 2007; Semmelhack and Wang, 2009; Silbering et al., 2008; Wang et al., 2003a; Wang et al., 2014; Wilson et al., 2004). The modulated input signal is transferred by the PNs to higher brain centers. Two major populations of PNs can be distinguished based on their innervation of one (uniglomerular) or several glomeruli (multiglomerular), as well as on their secreted neuro-transmitter being either acetylcholine or GABA (Okada et al., 2009; Yasuyama and Salvaterra, 1999). Excitatory uniglomerular PNs (ePNs) have their cell bodies in the an-terodorsal and the lateral cell cluster. They convey odor information via the medial an-tennal lobe tract or the lateral antennal lobe tract to the higher brain centers mushroom body calyx and lateral horn (LH) (Jefferis et al., 2007; Stocker et al., 1997; Tanaka et al., 2012). Inhibitory, multiglomerular PNs (iPNs) have their cell bodies in the ventral cell cluster and they innervate directly and solely the LH via the mediolateral antennal lobe tract (Ito et al., 1997; Jefferis et al., 2007; Lai et al., 2008; Liang et al., 2013; Okada et al., 2009; Stocker et al., 1990; Tanaka et al., 2004; Tanaka et al., 2012).
The mushroom body is involved in learning and memory as well as context-dependent odor evaluation (Bräcker et al., 2013; Davis, 2005; Heisenberg, 2003; Lin et al., 2014b; Owald and Waddell, 2015). Within the mushroom body calyx ePNs form boutons syn-apsing on several third-order neurons called Kenyon cells (KCs) (Butcher et al., 2012; Stocker, 1994). Approximately 2,500 cell bodies of KCs are densely packed around the mushroom body calyx. The KCs project via the peduncle to the mushroom body lobes where they synapse on relatively few mushroom body output neurons (Aso et al., 2014a; Aso et al., 2014b; Sejourne et al., 2011; Tanaka et al., 2008). Furthermore, KCs are connected to apparently random sets of ePN types supporting a combinatorial odor re-sponse pattern in distinct KCs (Caron et al., 2013; Masuda-Nakagawa et al., 2005; Murthy et al., 2008). KCs exhibit a sparse coding since they need input by several PNs to get excited (Honegger et al., 2011; Perez-Orive et al., 2002; Turner et al., 2008). The random organization of the ePN-KC connections as well as the overall sparse coding of odors by KCs permits associations of any perceived odor with experiences – the basic feature for learning. In studies ablating the mushroom body the ability to perform olfacto-ry associative learning tasks is abolished but innate behavioral responses are not affect-ed suggesting a role of the LH in innate olfactory behaviors (de Belle and Heisenberg, 1994; Heimbeck et al., 2001; Heisenberg et al., 1985; Kido and Ito, 2002). The stereo-
Introduction
10
typed innervation patterns of ePNs in the LH as well as the stereotyped connectivity to specific third-order lateral horn neurons (LHNs) support the notion of the LH being re-sponsible for hard-wired innate odor-guided behavior (Fi ek and Wilson, 2014; Jefferis et al., 2007; Lin et al., 2007; Marin et al., 2002; Wong et al., 2002). Odor representations for either few tested or simulated odors revealed different coding strategies either of separa-tion of food and pheromone odors or aversive and attractive odors (Jefferis et al., 2007; Liang et al., 2013; Min et al., 2013). Using a set of 18 odors including acids, lactones, terpenes, aromatics, alcohols, esters, ketones and the blend balsamic vinegar we ex-panded the investigation on odor representations of ePNs and iPNs in the LH and re-vealed a spatial coding of odor valence and intensity (Manuscripts 1 and 4). This reduc-tion of odor information to ecological relevance appears to be the basic feature to elicit innate behavior.
Transgenic flies and applied methods
Using the model-organism Drosophila melanogaster provides several advantages such as short reproduction cycles, easy and cheap breeding, a huge number of isogenic sib-lings, a fully sequenced genome, and most important a plethora of genetic tools (Adams et al., 2000; Duffy, 2002; Luo et al., 2008; Venken et al., 2011). Those tools allow the
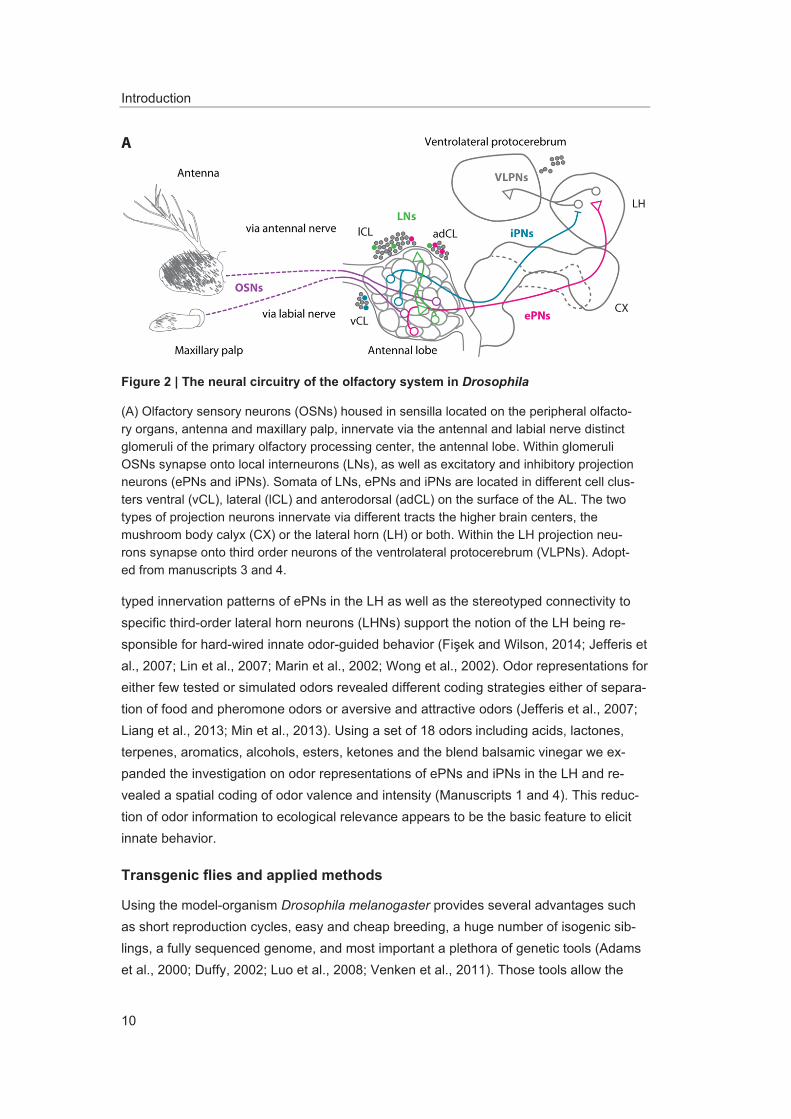
Figure 2 | The neural circuitry of the olfactory system in Drosophila
(A) Olfactory sensory neurons (OSNs) housed in sensilla located on the peripheral olfacto-ry organs, antenna and maxillary palp, innervate via the antennal and labial nerve distinct glomeruli of the primary olfactory processing center, the antennal lobe. Within glomeruli OSNs synapse onto local interneurons (LNs), as well as excitatory and inhibitory projection neurons (ePNs and iPNs). Somata of LNs, ePNs and iPNs are located in different cell clus-ters ventral (vCL), lateral (lCL) and anterodorsal (adCL) on the surface of the AL. The two types of projection neurons innervate via different tracts the higher brain centers, the mushroom body calyx (CX) or the lateral horn (LH) or both. Within the LH projection neu-rons synapse onto third order neurons of the ventrolateral protocerebrum (VLPNs). Adopt-ed from manuscripts 3 and 4.
Introduction
11
analysis of an unbelievably wide array of cellular processes of interest. Commonly used important tools are the binary transcription systems like GAL4-UAS (Brand and Perrimon, 1993), the Q-system (Potter et al., 2010) and LexA-LexAop (Lai and Lee, 2006). We chose the GAL4-UAS system in all experiments (Manuscripts 1 to 4). It is based on the brewer’s yeast its (Saccharomyces cerevisiae) transcriptional activator GAL4 integrated in the genome of a driver fly line in front of an endogenous promotor sequence and the GAL4 binding site downstream of the target sequence integrated in the genome of the responder fly line. The binding of GAL4 to its binding site, the up-stream activating sequence (UAS), initiates the transcription of the downstream gene of interest (Duffy, 2002). The binary transcription systems thus enable via crossing of dis-tinct transgenic lines a temporally and spatially selective integration and expression of reporter proteins, like fluorescent proteins, to investigate for example neuron popula-tions. One of the most frequently used fluorescent proteins is the green fluorescent pro-tein (GFP) of the jellyfish Aequorea victoria and its derivatives (van Thor, 2009). To label single neurons we expressed the photoactivatable green fluorescent protein (pa-GFP), which fluorescence signal increases 100-fold after irradiation with visible or infrared light
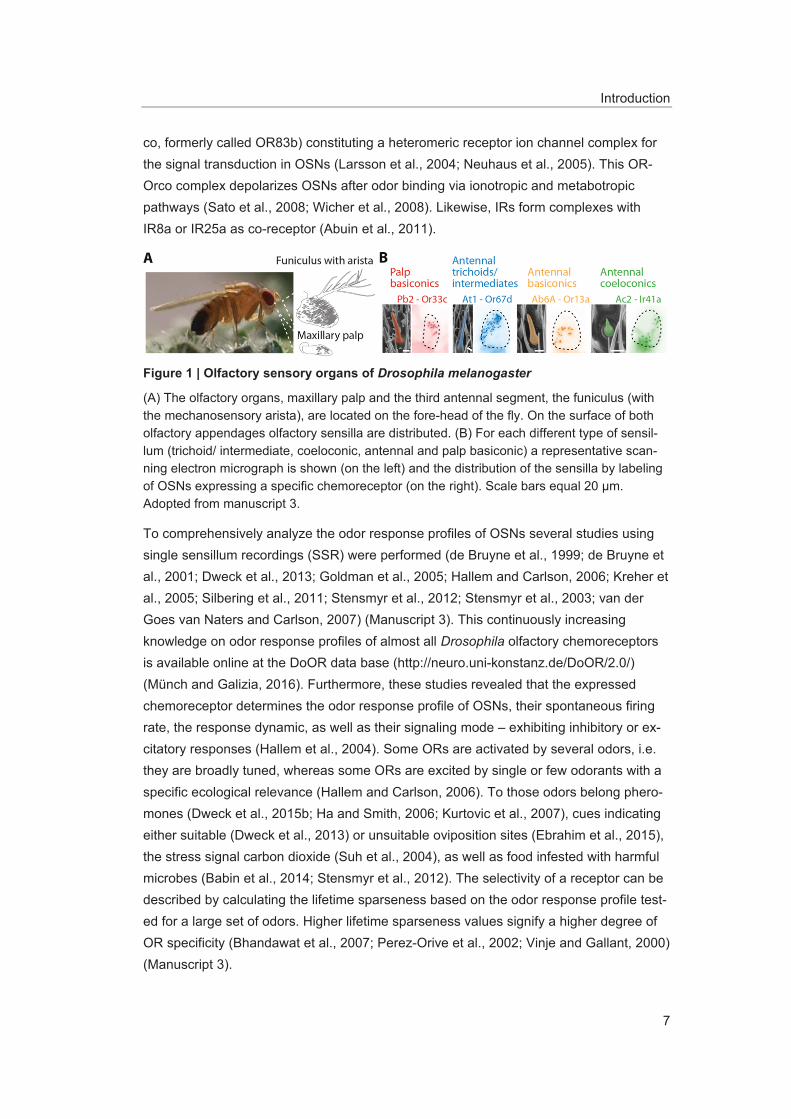
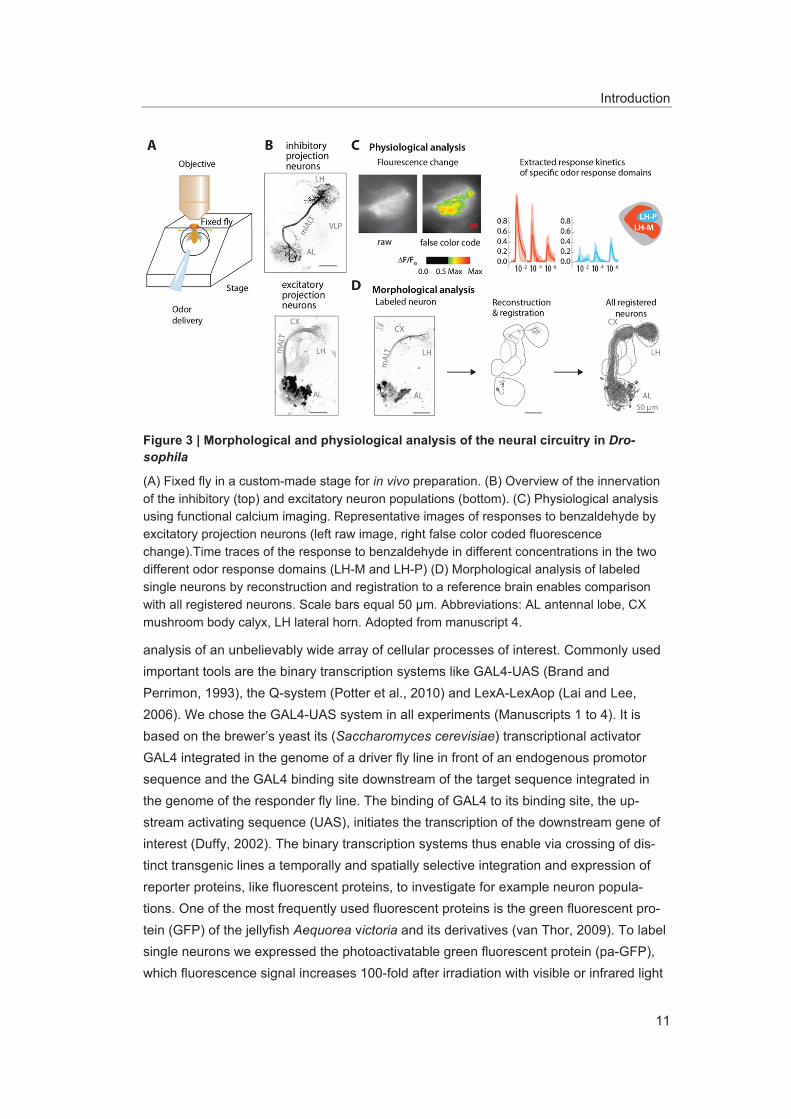
Figure 3 | Morphological and physiological analysis of the neural circuitry in Dro-sophila
(A) Fixed fly in a custom-made stage for in vivo preparation. (B) Overview of the innervation of the inhibitory (top) and excitatory neuron populations (bottom). (C) Physiological analysis using functional calcium imaging. Representative images of responses to benzaldehyde by excitatory projection neurons (left raw image, right false color coded fluorescence change).Time traces of the response to benzaldehyde in different concentrations in the two different odor response domains (LH-M and LH-P) (D) Morphological analysis of labeled single neurons by reconstruction and registration to a reference brain enables comparison with all registered neurons. Scale bars equal 50 μm. Abbreviations: AL antennal lobe, CX mushroom body calyx, LH lateral horn. Adopted from manuscript 4.
Introduction
12
(Datta et al., 2008; Patterson and Lippincott-Schwartz, 2002; Ruta et al., 2010). This permits the specific labeling of single or several neurons, as well as whole neuron popu-lations of interest, and thus allows their morphological analysis in vivo. We used this ap-proach to characterize the morphology of single neurons of the enhancer trap lines GH146-GAL4 (Stocker et al., 1997) and MZ699-GAL4 (Ito et al., 1997) that label most of the ePNs and iPNs, respectively (Figure 3B; Manuscripts 1, 3 and 4).
Another approach is the use of genetically encoded calcium (or chloride) indicators (GECIs) to monitor neuronal activity (Hires et al., 2008; Miyawaki et al., 1997; Riemensperger et al., 2012). Those indicators rely on the increased fluorescence emis-sion by the GFP fluorophore due to a conformational change after calcium binding to the calcium binding sites (Akerboom et al., 2009). The expression of calcium-sensitive pro-teins, such as GCaMP and GECO, enables the visualization of excited neurons due to the increase in cytoplasmic calcium concentration resulting in stronger emission of fluo-rescence (Chen et al., 2013; Nakai et al., 2001; Tian et al., 2009; Zhao et al., 2011). In combination with the GAL4-UAS system GECIs support the analysis of responses of defined neuron populations, whereas electrophysiological techniques are limited to re-cordings from single neurons or up to a dozen of neurons. Gained spatiotemporal activity patterns in calcium imaging experiments can be used to extract through computational analysis the time traces for the different odor responses and spatial patterns that can be clustered to odor response domains (Figure 3C). For calcium imaging in the LH we used wide-field fluorescence microscopy to record the fluorescence light emitted of neurons in a thick plane. This allows measuring the responses of the whole PN population in the LH simultaneously to get a global perspective on the odor representation (Manuscripts 1 and 4).
To analyze synaptic connections between specific neuron populations the GFP reconsti-tution across synaptic partners (GRASP) was used (Feinberg et al., 2008). In this ap-proach the GFP-protein is split in two parts and these parts are fused to synaptic pro-teins. The fused proteins are expressed in distinct neuron types accomplished by the use of different binary transcription systems. If the two parts of the GFP are located in con-nected synapses they can reconstitute and emit fluorescence. Applying this approach, we analyzed the synaptic connections of ePNs, iPNs and third-order neurons (Manu-script 4).
For anatomical analysis of single neurons obtained in our studies the spatial resolution was increased by the use of multiphoton confocal laser scanning microscopy. This ena-bles the activation of a single focal plane to reduce photobleaching and improves the signal-to-noise ratio due to the reduction of scattered photons. Moreover, multiphoton microscopy uses light of longer wavelength with lower energy to excite fluorophores, thus further reducing the photobleaching of the fluorophores and the photodamage of the

Introduction
13
tissue (Denk et al., 1990). In addition, the use of longer wavelength permits the imaging of tissues in vivo in up to 200 μm depth (Masters et al., 1997). The use of multiphoton confocal laser scanning microscopy provides higher precision for the photoactivation experiments. In contrast, for laser ablation the laser intensity was increased deliberately to damage the tissue but restricted precisely to a small region of interest (Manuscripts 1 and 4).
Investigations of neuron populations described in the manuscripts 1 and 4 aimed at con-necting morphological characterizations of single projection neurons with their physiolog-ical properties (Figure 3A). To reliably identify neuropil structures in vivo, we developed a protein construct called END1-2 that mimics the neuropil staining obtained with the anti-body nc82 (Hofbauer, 1991) (Manuscript 2). END1-2 consists of the protein ELAV (em-bryonic lethal abnormal vision), which is involved in the development of the central nerv-ous system in Drosophila melanogaster, combined with the neuronal synaptic vesicle protein n-synaptobrevin and the red fluorescent protein DsRed found in the coral Disco-soma striata (DiAntonio et al., 1993; Matz et al., 1999; Yao et al., 1993). This construct was integrated in the genome of Drosophila and thus can be combined with the GAL4-UAS system. Confocal scans of specific neurons with the neuropil staining by END1-2 facilitate subsequent 3D-reconstruction and registration of the in vivo anatomy, enabling a thorough investigation of neuropil structures and neuronal arborizations (Rybak et al., 2010) (Figure 3D; Manuscripts 1 to 4).
Aim of this thesis
This thesis aimed at investigating the relay of odor information from the primary olfactory processing center to the higher brain center, presumably mediating innate odor-guided behavior, the LH. This was accomplished by comparing the morphology of two types of projection neurons and by analyzing the characteristics of their odor representations in the higher brain to reveal the strategies of odor coding in the LH. Furthermore, the im-pact of quantitive abundance of different neuron types on the neuropil structure and on the importance of different odor processing channels was examined.
Several studies analyzed the representation of odors in the AL revealing a combinatorial map (Knaden et al., 2012; Ng et al., 2002; Root et al., 2007; Schubert et al., 2014; Wang et al., 2003a). For the mushroom body it was shown that odors are represented as a combinatorial but sparse code (Honegger et al., 2011; Ito and Awasaki, 2008; Lin et al., 2014a; Perez-Orive et al., 2002; Turner et al., 2008; Wang et al., 2004). Yet, the LH is poorly investigated regarding the representation of odors. In the LH odor responses of projection neurons were simulated or measured only for few odors (Jefferis et al., 2007; Liang et al., 2013; Parnas et al., 2013). Furthermore, a few studies analyzed the activity of subsets of third-order neurons in the LH (Fi ek and Wilson, 2014; Kohl et al., 2013;

Introduction
14
Ruta et al., 2010; Yu et al., 2010). Therefore, we analyzed the innervation patterns of ePNs and iPNs in the LH as well as their global representation of several odors. In addi-tion, the connectivity of ePNs and iPNs on a subset of third-order neurons of the VLP was investigated (Manuscripts 1 and 4).
Available atlases of the AL glomeruli are generated based on in vitro data and conse-quently suffer from fixation artefacts (Chiang et al., 2011; Couto et al., 2005; Laissue et al., 1999; Ma et al., 2008; Rein et al., 2002). However, the in vivo analysis of the glomer-ular innervation pattern of multiglomerular iPNs required the use of an atlas based on morphological in vivo data (Manuscript 1). Therefore, we generated such an in vivo atlas of the fly AL and investigated the impact of in vitro processing onto this neuropil (Manu-script 2). Furthermore, this in vivo atlas was also applied to determine the glomerulus of interest for the specific labeling of all ePNs innervating this distinct glomerulus (Manu-scripts 3 and 4).
Moreover, the characteristics of the glomerular morphology were studied as well as the impact of the neuronal composition. This enabled to correlate the glomerular neural cir-cuit with the ecological relevance of the processed odor information. Thus, we could show that the number of neurons innervating a specific glomerulus varies and that these numbers correlate with the breadth of the odor tuning profile of the glomerulus (Manu-script 3).
Overview of Manuscripts
15
Overview of Manuscripts
Manuscript 1
Decoding Odor Quality and Intensity in the Drosophila brain
Antonia Strutz, Jan Soelter, Amelie Baschwitz, Abu Farhan, Veit Grabe, Jürgen Rybak, Markus Knaden, Michael Schmuker, Bill S. Hansson, Silke Sachse
eLife 2014; 3:e04147
Published, 16 December 2014 (DOI: 10.7554/eLife.04147)
In this study we investigated the morphological, functional and behavioral properties of multiglomerular inhibitory projection neurons. Due to their segregated innervation pat-terns in the antennal lobe and lateral horn as well as due to their odor representation in the lateral horn, either coding odor valence or intensity, we describe two subpopulations of inhibitory projection neurons. Furthermore, diminishing neuronal activity in inhibitory projection neurons results in increased odor avoidance behavior as well as in dis-inhibition of third-order neurons of the ventrolateral protocerebrum. These results indi-cate the contribution to odor attraction.
Author contributions:
Built on an idea conceived by all authors.
Designed experiments: A. Strutz, S. Sachse, B. S. Hansson
Performed physiological experiments: A. Strutz, V. Grabe
Performed behavioral experiments: A. Farhan
Performed single neuron labeling and 3D-reconstruction: A. Baschwitz
Performed morphological analysis: A. Baschwitz (50%), S. Sachse
Performed bioinformatic analysis: J. Soelter, M. Schmuker
Performed physiological analysis: A. Strutz, S. Sachse
Wrote the manuscript: A. Strutz, J. Soelter, S. Sachse, B. S. Hansson

Overview of Manuscripts
16
Manuscript 2
Digital in vivo 3D atlas of the antennal lobe of Drosophila melanogaster
Veit Grabe*, Antonia Strutz*, Amelie Baschwitz, Bill S. Hansson, Silke Sachse
* These authors contributed equally
The Journal of Comparative Neurology; 523, 530-544
Published, 15 February 2015 (DOI: 10.1002/cne.23697)
Establishing a genetically encoded fluorescent neuropil staining allowed us to generate an atlas of the antennal lobe representing the in vivo situation. Furthermore, this enabled analyses of the actual impact of fixation artifacts on the flexible antennal lobe structure. Unequal volumetric differences and dislocations of the neuropil in the in vitro situation emphasized the importance of using morphological in vivo data to compare and assign with physiological studies.
Author contributions:
Built on an idea conceived by all authors.
Designed experiments: V. Grabe, A. Strutz, B. S. Hansson and S. Sachse
Performed immunohistochemistry and confocal scans: V. Grabe, A. Baschwitz (30%)
Generated fly line: A. Strutz
Analyzed the data: V. Grabe and S. Sachse
Wrote the manuscript: V. Grabe, S. Sachse and B. S. Hansson
Revised the article: all authors

Overview of Manuscripts
17
Manuscript 3
Elucidating the neuronal architecture of olfactory glomeruli in the Drosophila antennal lobe
Veit Grabe*, Amelie Baschwitz*, Hany K. M. Dweck, Sofia Lavista-Llanos, Bill S. Hans-son and Silke Sachse
* These authors contributed equally
Cell Reports 16, 3401–3413
Published, 20 September 2016 (DOI: 10.1016/j.celrep.2016.08.063)
Olfactory glomeruli in the antennal lobe exhibit stereotypic shapes and sizes. Investigat-ing the numerical proportions of sensory neurons, projection neurons, as well as local interneurons revealed varying numbers for all neuron types for the single glomeruli and the correlation of the glomerular volume to the number of sensory and projection neu-rons. Furthermore, functional consideration of all neuron types highlights a dependence of glomerular wiring to the odor tuning profile. The connection of morphological and func-tional properties emphasizes the uniqueness of each glomerulus and allows predictions of the significance of the detected odor in less characterized glomeruli.
Author contributions:
Built on an idea conceived by V. Grabe, B. S. Hansson and S. Sachse
Designed experiments: V. Grabe, A. Baschwitz (30%) and S. Sachse
Performed neuron labeling and quantification: V. Grabe, A. Baschwitz (50%)
Performed SSR: H. K. M. Dweck
Analyzed the data: V. Grabe, A. Baschwitz (25%), H. K. M. Dweck and S. Sachse
Wrote the manuscript: V. Grabe, S. Sachse and B. S. Hansson
Revised the article: all authors

Overview of Manuscripts
18
Manuscript 4
Parallel olfactory pathways support odor valence and intensity coding in the lateral horn of Drosophila melanogaster
Amelie Baschwitz*, Jan Soelter*, Natalia Marquez, Jürgen Rybak, Michael Schmuker, Bill S. Hansson, Silke Sachse
* These authors contributed equally
In preparation for eLife
In this study we analyzed the morphological and functional properties of excitatory pro-jection neurons in the lateral horn. Stereotypic innervations of excitatory projection neu-rons retain the topographic map of the antennal lobe. Moreover, odor representations in the lateral horn separate in two domains coding either aversive odors and high odor con-centration or attractive odors. Comparing these findings of ePNs with those of iPNs sup-ports a parallel but antagonizing pathway from the primary olfactory center to the sec-ond-order brain center presumably mediating innate olfactory-driven behavior.
Author contributions:
Built on an idea conceived by A. Baschwitz, J. Soelter, B. S. Hansson and S. Sachse.
Designed experiments: A. Baschwitz (60%) and S. Sachse
Performed morphological and physiological experiments: A. Baschwitz
Performed bioinformatic analysis: J. Soelter, M. Schmuker
Performed data analysis: A. Baschwitz (40%), J. Soelter, S. Sachse
Performed GRASP experiments and analysis: N. Marquez
Wrote the manuscript: A. Baschwitz (60%), B. S. Hansson and S. Sachse
Revised the article: all authors

Manuscript 1
19
Manuscript 1
Decoding Odor Quality and Intensity in the Drosophila brain
Antonia Strutz, Jan Soelter, Amelie Baschwitz, Abu Farhan, Veit Grabe, Jürgen Rybak, Markus Knaden, Michael Schmuker, Bill S. Hansson, Silke Sachse
eLife 2014; 3:e04147
Published, 16 December 2014 (DOI: 10.7554/eLife.04147)
This article is distributed under the terms of the Creative Commons Attribution License.
elifesciences.org
Strutz et al. eLife 2014;3:e04147. DOI: 10.7554/eLife.04147 1 of 21
Decoding odor quality and intensity in the Drosophila brainAntonia Strutz1, Jan Soelter2, Amelie Baschwitz1, Abu Farhan1, Veit Grabe1, Jürgen Rybak1, Markus Knaden1, Michael Schmuker2†, Bill S Hansson1, Silke Sachse1*
1Department of Evolutionary Neuroethology, Max Planck Institute for Chemical Ecology, Jena, Germany; 2Department for Biology, Pharmacy and Chemistry, Free University Berlin, Neuroinformatics and Theoretical Neuroscience, Berlin, Germany
Abstract To internally reflect the sensory environment, animals create neural maps encoding the external stimulus space. From that primary neural code relevant information has to be extracted for accurate navigation. We analyzed how different odor features such as hedonic valence and intensity are functionally integrated in the lateral horn (LH) of the vinegar fly, Drosophila melanogaster. We characterized an olfactory-processing pathway, comprised of inhibitory projection neurons (iPNs) that target the LH exclusively, at morphological, functional and behavioral levels. We demonstrate that iPNs are subdivided into two morphological groups encoding positive hedonic valence or intensity information and conveying these features into separate domains in the LH. Silencing iPNs severely diminished flies' attraction behavior. Moreover, functional imaging disclosed a LH region tuned to repulsive odors comprised exclusively of third-order neurons. We provide evidence for a feature-based map in the LH, and elucidate its role as the center for integrating behaviorally relevant olfactory information.DOI: 10.7554/eLife.04147.001
IntroductionTo navigate the environment in a way that optimizes their survival and reproduction, animals have evolved sensory systems. These have three essential tasks: First, the external world has to be trans-lated into an internal representation in the form of an accurate neural map. Second, the neural map has to be readable and interpretable, that is, the generated neural code must allow common attrib-utes to be extracted across stimuli to enable the animal to make the best decisions. Third, the animal has to be able to adapt to environmental changes and to form a sensory memory of new stimuli. Many studies have been dedicated to unraveling the primary transformation from a stimulus into an initial neural representation within various sensory systems (Manni and Petrosini, 2004; Vosshall and Stocker, 2007; Sanes and Zipursky, 2010) and to elucidating neuronal plasticity and sensory memory formation in higher-level processing centers (Heisenberg, 2003; Pasternak and Greenlee, 2005). The ability to extract features and integrate stimulus modalities have so far mainly been studied in the visual system (Livingstone and Hubel, 1988; Bausenwein et al., 1992; Nassi and Callaway, 2009). We addressed the question of how stimulus features such as odor valence and intensity are coded and integrated within the olfactory system using the model organism Drosophila melanogaster.
The olfactory system of the vinegar fly provides an excellent model system for deciphering olfac-tory processing mechanisms, since it displays remarkable similarities to the mammalian system but is less complex and highly genetically tractable. Like other sensory systems, the olfactory system employs a spatio-temporal map to translate the variables in chemosensory space into neuronal activity patterns in the brain. This map emerges when the olfactory sensory neurons (OSNs) with the same chemosen-sory receptors converge into one exclusive glomerulus in the antennal lobe (AL) which represents the
*For correspondence: [email protected]
Present address: †School of Engineering and Informatics, University of Sussex, Brighton, United Kingdom
Competing interests: See page 19
Funding: See page 19
Received: 24 July 2014Accepted: 09 November 2014Published: 16 December 2014
Reviewing editor: Mani Ramaswami, Trinity College Dublin, Ireland
Copyright Strutz et al. This article is distributed under the terms of the Creative Commons Attribution License, which permits unrestricted use and redistribution provided that the original author and source are credited.
RESEARCH ARTICLE
Manuscript 1
20
Neuroscience
Strutz et al. eLife 2014;3:e04147. DOI: 10.7554/eLife.04147 2 of 21
Research article
equivalent to the mammalian olfactory bulb (Hildebrand and Shepherd, 1997; Vosshall et al., 2000; Vosshall and Stocker, 2007). Glomeruli, the functional and morphological units of the AL, are micro-circuits comprising OSNs, multiglomerular local interneurons (LNs) and uniglomerular output neurons, so-called excitatory projection neurons (ePNs) (Wilson and Mainen, 2006; Vosshall and Stocker, 2007) that convey the olfactory information to higher brain centers, as the mushroom body calyx (MBc) and the lateral horn (LH) (Stocker et al., 1997). The stringent spatial arrangement of OSNs and ePNs in the AL generates a spatial map containing characteristic combinatorial glomerular activity pat-terns for all odorants (Fiala et al., 2002; Wang et al., 2003a; Couto et al., 2005; Fishilevich and Vosshall, 2005). The MBc is involved in olfactory memory formation (Heisenberg, 2003) and enables a contextualization of the odor space (Caron et al., 2013). By exclusion, the LH is believed to be involved in innate olfactory behavior (de Belle and Heisenberg, 1994; Jefferis et al., 2007). Excitatory PNs retain the sensory information encoded in the AL and form glomerulus-dependent, stereo-typic axonal terminal fields in the LH (Marin et al., 2002; Wong et al., 2002; Tanaka et al., 2004). Compartmentalization in the LH has been observed in form of a spatial segregation of ePNs inner-vating specific glomerular subgroups (Tanaka et al., 2004), fruit and pheromone odor information processing ePNs (Jefferis et al., 2007) as well as ammonia and amine vs carbon dioxide coding ePNs (Min et al., 2013).
Like many other sensory networks, the olfactory circuit of the fly contains spatially distinct path-ways to the higher brain, namely the inner, middle and outer antennocerebral tract (iACT, mACT and oACT) (Stocker et al., 1990). Notably, the mACT projects from the AL to the LH exclusively and con-sists of inhibitory PNs (iPNs), which exhibit also uniglomerular but mainly multiglomerular AL innerva-tions (Ito et al., 1997; Jefferis et al., 2007; Lai et al., 2008; Okada et al., 2009; Liang et al., 2013). Both PN populations have been attributed different coding properties: Although both PN popula-tions exhibit odor responses to overlapping odor ligands, iPNs seems to be broader tuned than ePNs (Wang et al., 2014). Furthermore, while ePNs encode rather odor identity (Wang et al., 2003a; Wilson et al., 2004; Silbering et al., 2008), iPNs have been shown to enhance innate discrimination of closely related odors (Parnas et al., 2013). Together, these PN populations process information on dual olfactory pathways (Liang et al., 2013; Wang et al., 2014), as do processing mechanisms in other sensory modalities (Nassi and Callaway, 2009), and most likely accomplish different olfactory behav-iors. The mainly multiglomerular AL pattern of iPNs suggests that these neurons extract characteristic stimulus features from the AL code and re-integrate this information into the LH to mediate innate odorant-guided behavior. This assumption is further supported by two recent studies showing that the
eLife digest Organisms need to sense and adapt to their environment in order to survive. Senses such as vision and smell allow an organism to absorb information about the external environment and translate it into a meaningful internal image. This internal image helps the organism to remember incidents and act accordingly when they encounter similar situations again. A typical example is when organisms are repeatedly attracted to odors that are essential for survival, such as food and pheromones, and are repulsed by odors that threaten survival.
Strutz et al. addressed how attractiveness or repulsiveness of a smell, and also the strength of a smell, are processed by a part of the olfactory system called the lateral horn in fruit flies. This involved mapping the neuronal patterns that were generated in the lateral horn when a fly was exposed to particular odors.
Strutz et al. found that a subset of neurons called inhibitory projection neurons processes information about whether the odor is attractive or repulsive, and that a second subset of these neurons process information about the intensity of the odor. Other insects, such as honey bees and hawk moths, have olfactory systems with a similar architecture and might also employ a similar spatial approach to encode information regarding the intensity and identity of odors. Locusts, on the other hand, employ a temporal approach to encoding information about odors.
The work of Strutz et al. shows that certain qualities of odors are contained in a spatial map in a specific brain region of the fly. This opens up the question of how the information in this spatial map influences decisions made by the fly.DOI: 10.7554/eLife.04147.002
Manuscript 1
21

Neuroscience
Strutz et al. eLife 2014;3:e04147. DOI: 10.7554/eLife.04147 3 of 21
Research article
inhibitory input from the AL to the LH is module-specific, that is, selective for food odors and phero-mones (Liang et al., 2013; Fisek and Wilson, 2014), while the connectivity in the MBc is rather prob-abilistic (Murthy et al., 2008; Caron et al., 2013).
However, it still remains open if and how different odor features as hedonic valence or intensity are functionally coded and integrated in the LH. In this study, we characterized and dissected the iPN olfactory processing pathway regarding the coding of odor quality and intensity at morphological, functional and behavioral levels. By linking odor-evoked activity patterns in the LH to odor-guided behavior, we provide evidence that iPNs mediate odor attraction. Furthermore, our data demonstrate a feature-based, spatially segregated activity map in the LH comprised of iPNs and third-order neu-rons and thus expand its role as a center for integrating behaviorally relevant olfactory information.
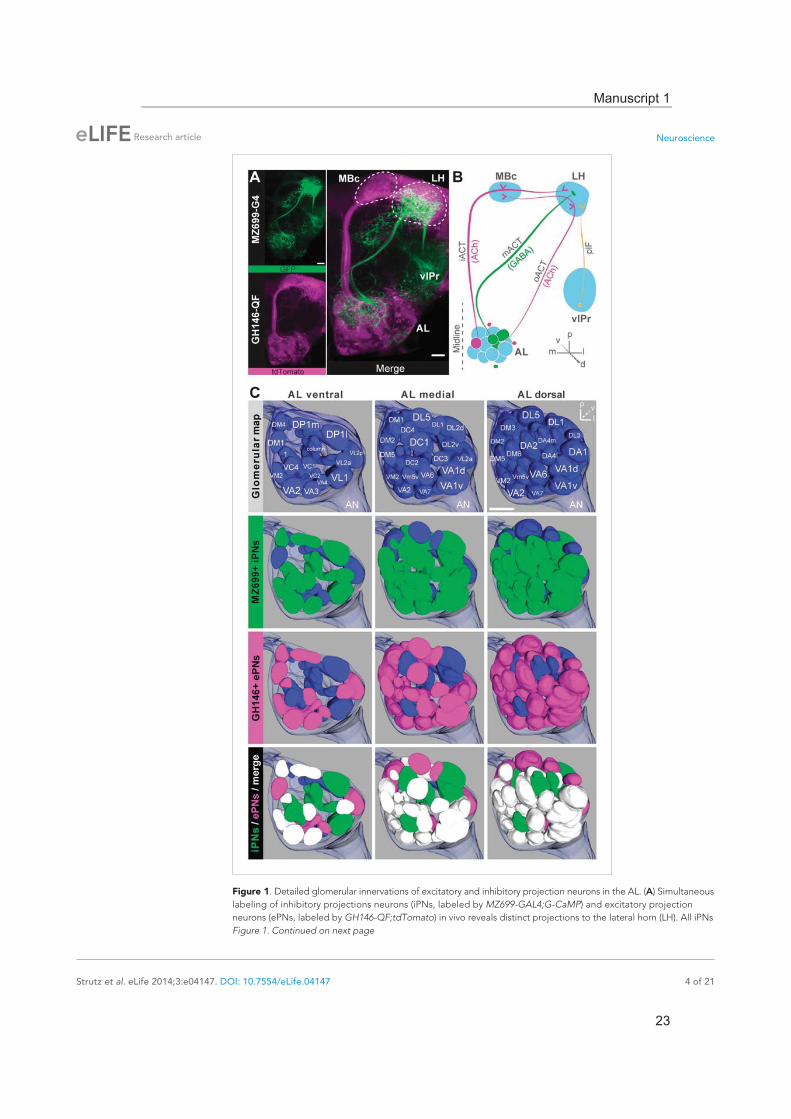
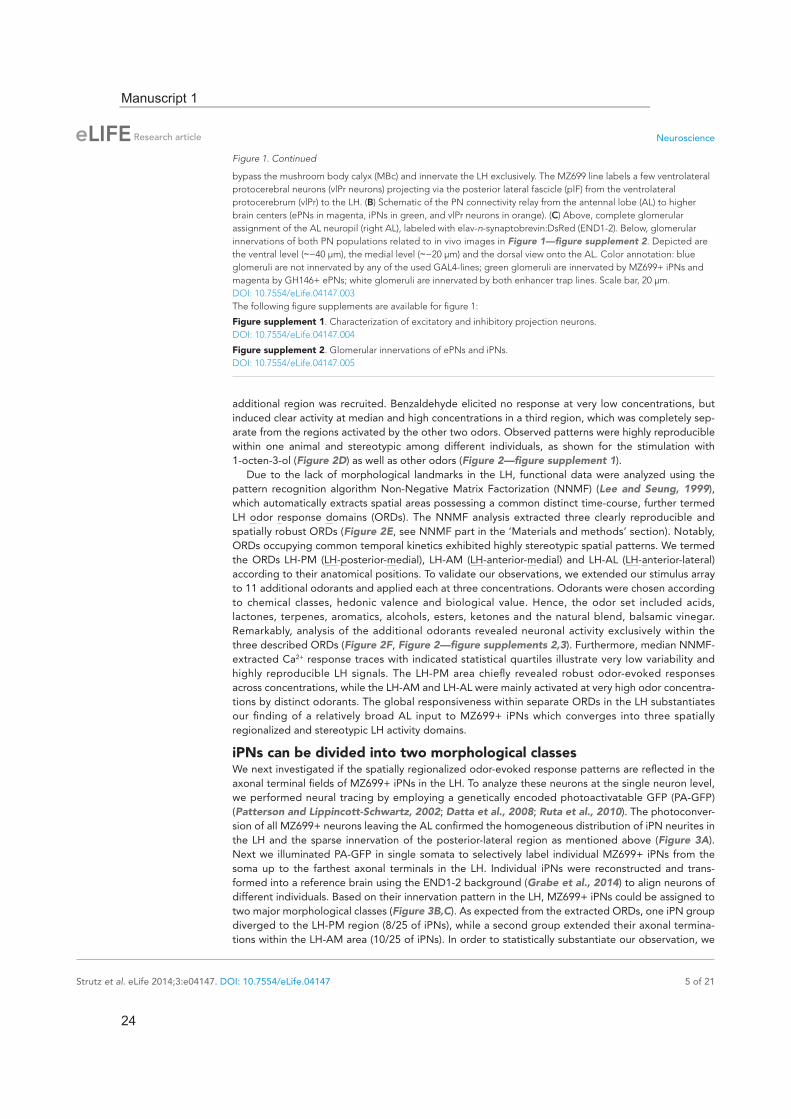
ResultsDendrites of iPNs innervate two-thirds of olfactory glomeruliCell bodies of iPNs are exclusively located in the ventral cell cluster which consists of 50 iPNs (Lai et al., 2008) that project via the mACT to the LH, thereby bypassing the MBc (Ito et al., 1997) (Figure 1A,B). In contrast, ePN somata are located anterodorsally and laterally of the AL, and their axons project through the iACT or oACT to the MBc and the LH (Stocker et al., 1997; Marin et al., 2002; Wong et al., 2002; Lai et al., 2008). To analyze the innervation patterns of iPNs and ePNs, we labeled both PN populations simultaneously in vivo using the enhancer trap lines GH146-QF and MZ699-GAL4 that label the majority of ePNs (60%) and iPNs (86%), respectively (Lai et al., 2008). Double-labeling shows that both PN types innervate overlapping regions in the AL and the LH, while a small posterior-lateral LH area is targeted only by ePNs (Figure 1A, Figure 1—figure supplement 1). In GH146-positive (GH146+) PNs, immunolabeling reveals GABA production in all 6 PNs of the ven-tral cell cluster (Wilson and Laurent, 2005), whereas ePNs of this line are exclusively cholinergic (Shang et al., 2007). For the 45 MZ699-positive (MZ699+) iPNs (Lai et al., 2008), GAD1 (glutamic acid decarboxylase) in situ hybridizations imply GABA synthesis (Okada et al., 2009), which was recently verified via immunostaining (Liang et al., 2013; Parnas et al., 2013). The polarity of both PN populations has been studied in detail, showing that both possess dendritic regions in the AL, indicating the AL as their cholinergic input site, while the LH represents their major output site (Jefferis et al., 2001; Okada et al., 2009; Liang et al., 2013; Parnas et al., 2013).
To further characterize PNs labeled by MZ699-GAL4 and GH146-GAL4, we analyzed their precise glomerular innervation to unravel how selectively they acquire information in the AL. To allow glomer-ulus identification in vivo, we employed a transgenic fly carrying elav-n-synaptobrevin:DsRed (END1-2) to express the presynaptically targeted fusion protein under the control of the neuron-specific elav promotor (Figure 1—figure supplement 2A) (Grabe et al., 2014). The reconstruction and identifica-tion of all AL glomeruli provided 53 glomeruli, of which 75% were innervated by MZ699+ iPNs (40) while 70% (37) were covered by GH146+ ePNs (Figure 1C, Figure 1—figure supplement 2B). 55% of all glomeruli were innervated by both lines. Notably, dendritic MZ699-GAL4 innervation density was not homogeneous. Certain glomeruli were densely innervated (e.g., DM2, DM4 and DM5), while others did not reveal any postsynaptic sites (e.g., DL1, DL4 and DL5). Hence MZ699+ iPNs target specific glomerular subsets selectively, which suggests that these neurons have a particular function within the olfactory network.
Calcium signals in the lateral horn spatially segregate into distinct response domainsProbabilistic synaptic density maps of GH146+ PNs predicted a regionalized neuronal activity in the LH (Jefferis et al., 2007). Do iPNs functionally segregate in a comparable way? To address this ques-tion, we expressed the Ca2+-sensitive reporter G-CaMP3.0 (Nakai et al., 2001; Tian et al., 2009) in iPNs using MZ699-GAL4 and performed functional imaging in the LH (Figure 2A–C). We initially tested three odors with potential relevance for Drosophila at different concentrations: acetoin acetate, an attractive byproduct of the yeast fermentation process, balsamic vinegar, an attractive natural odor mixture, and benzaldehyde, a well-known fly repellant (Magee and Kosaric, 1987; Keene et al., 2004; Semmelhack and Wang, 2009). We observed that odor evoked Ca2+ responses separate in certain regions of the LH in an odor-specific and concentration-dependent manner (Figure 2C). Acetoin ace-tate and balsamic vinegar evoked Ca2+ activity in spatially similar regions. At higher concentrations, an
Manuscript 1
22
Neuroscience
Strutz et al. eLife 2014;3:e04147. DOI: 10.7554/eLife.04147 4 of 21
Research article
Figure 1. Detailed glomerular innervations of excitatory and inhibitory projection neurons in the AL. (A) Simultaneous labeling of inhibitory projections neurons (iPNs, labeled by MZ699-GAL4;G-CaMP) and excitatory projection neurons (ePNs, labeled by GH146-QF;tdTomato) in vivo reveals distinct projections to the lateral horn (LH). All iPNs Figure 1. Continued on next page
Manuscript 1
23
Neuroscience
Strutz et al. eLife 2014;3:e04147. DOI: 10.7554/eLife.04147 5 of 21
Research article
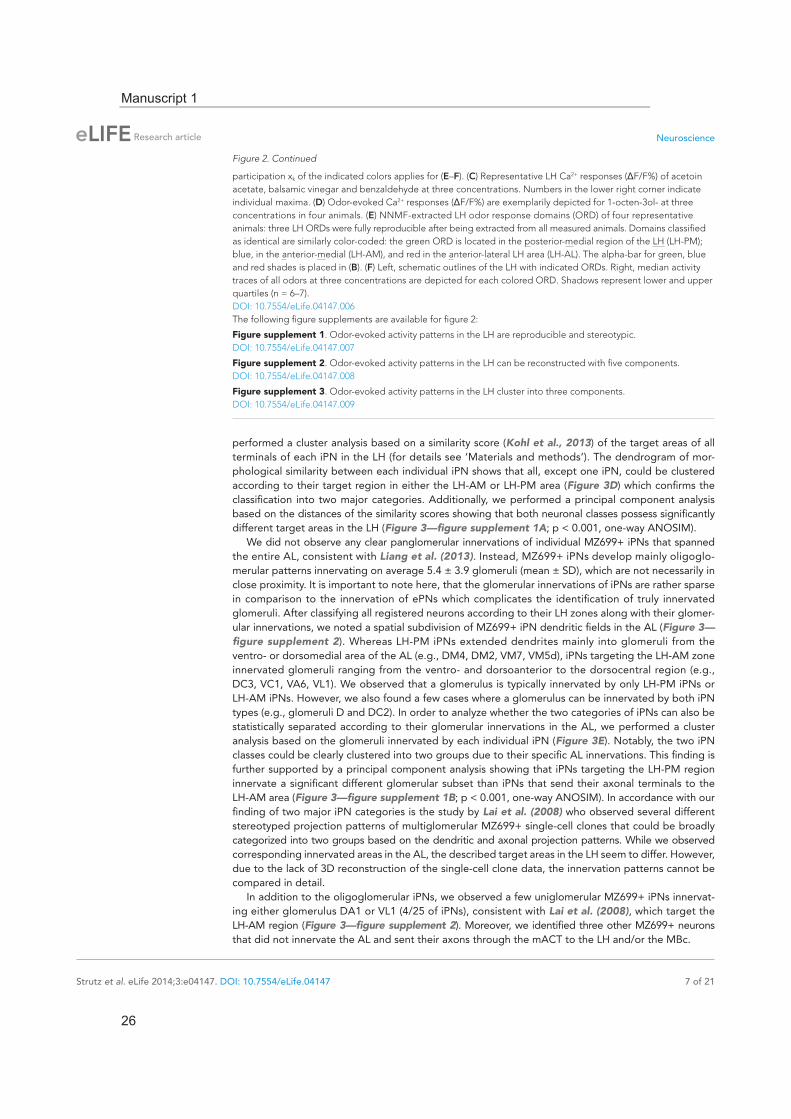
additional region was recruited. Benzaldehyde elicited no response at very low concentrations, but induced clear activity at median and high concentrations in a third region, which was completely sep-arate from the regions activated by the other two odors. Observed patterns were highly reproducible within one animal and stereotypic among different individuals, as shown for the stimulation with 1-octen-3-ol (Figure 2D) as well as other odors (Figure 2—figure supplement 1).
Due to the lack of morphological landmarks in the LH, functional data were analyzed using the pattern recognition algorithm Non-Negative Matrix Factorization (NNMF) (Lee and Seung, 1999), which automatically extracts spatial areas possessing a common distinct time-course, further termed LH odor response domains (ORDs). The NNMF analysis extracted three clearly reproducible and spatially robust ORDs (Figure 2E, see NNMF part in the ‘Materials and methods’ section). Notably, ORDs occupying common temporal kinetics exhibited highly stereotypic spatial patterns. We termed the ORDs LH-PM (LH-posterior-medial), LH-AM (LH-anterior-medial) and LH-AL (LH-anterior-lateral) according to their anatomical positions. To validate our observations, we extended our stimulus array to 11 additional odorants and applied each at three concentrations. Odorants were chosen according to chemical classes, hedonic valence and biological value. Hence, the odor set included acids, lactones, terpenes, aromatics, alcohols, esters, ketones and the natural blend, balsamic vinegar. Remarkably, analysis of the additional odorants revealed neuronal activity exclusively within the three described ORDs (Figure 2F, Figure 2—figure supplements 2,3). Furthermore, median NNMF-extracted Ca2+ response traces with indicated statistical quartiles illustrate very low variability and highly reproducible LH signals. The LH-PM area chiefly revealed robust odor-evoked responses across concentrations, while the LH-AM and LH-AL were mainly activated at very high odor concentra-tions by distinct odorants. The global responsiveness within separate ORDs in the LH substantiates our finding of a relatively broad AL input to MZ699+ iPNs which converges into three spatially regionalized and stereotypic LH activity domains.
iPNs can be divided into two morphological classesWe next investigated if the spatially regionalized odor-evoked response patterns are reflected in the axonal terminal fields of MZ699+ iPNs in the LH. To analyze these neurons at the single neuron level, we performed neural tracing by employing a genetically encoded photoactivatable GFP (PA-GFP) (Patterson and Lippincott-Schwartz, 2002; Datta et al., 2008; Ruta et al., 2010). The photoconver-sion of all MZ699+ neurons leaving the AL confirmed the homogeneous distribution of iPN neurites in the LH and the sparse innervation of the posterior-lateral region as mentioned above (Figure 3A). Next we illuminated PA-GFP in single somata to selectively label individual MZ699+ iPNs from the soma up to the farthest axonal terminals in the LH. Individual iPNs were reconstructed and trans-formed into a reference brain using the END1-2 background (Grabe et al., 2014) to align neurons of different individuals. Based on their innervation pattern in the LH, MZ699+ iPNs could be assigned to two major morphological classes (Figure 3B,C). As expected from the extracted ORDs, one iPN group diverged to the LH-PM region (8/25 of iPNs), while a second group extended their axonal termina-tions within the LH-AM area (10/25 of iPNs). In order to statistically substantiate our observation, we
bypass the mushroom body calyx (MBc) and innervate the LH exclusively. The MZ699 line labels a few ventrolateral protocerebral neurons (vlPr neurons) projecting via the posterior lateral fascicle (plF) from the ventrolateral protocerebrum (vlPr) to the LH. (B) Schematic of the PN connectivity relay from the antennal lobe (AL) to higher brain centers (ePNs in magenta, iPNs in green, and vlPr neurons in orange). (C) Above, complete glomerular assignment of the AL neuropil (right AL), labeled with elav-n-synaptobrevin:DsRed (END1-2). Below, glomerular innervations of both PN populations related to in vivo images in Figure 1—figure supplement 2. Depicted are the ventral level ( −40 μm), the medial level ( −20 μm) and the dorsal view onto the AL. Color annotation: blue glomeruli are not innervated by any of the used GAL4-lines; green glomeruli are innervated by MZ699+ iPNs and magenta by GH146+ ePNs; white glomeruli are innervated by both enhancer trap lines. Scale bar, 20 μm.DOI: 10.7554/eLife.04147.003The following figure supplements are available for figure 1:
Figure supplement 1. Characterization of excitatory and inhibitory projection neurons. DOI: 10.7554/eLife.04147.004
Figure supplement 2. Glomerular innervations of ePNs and iPNs. DOI: 10.7554/eLife.04147.005
Figure 1. Continued
Manuscript 1
24

Neuroscience
Strutz et al. eLife 2014;3:e04147. DOI: 10.7554/eLife.04147 6 of 21
Research article
Figure 2. Odors evoke specific and stereotypic calcium responses in the LH subdivided into three distinct odor response domains. (A) Schematic of the olfactory circuit with the investigated area highlighted. (B) RAW image of the LH (top picture) depicting the recorded area of figures (C–E) and the false color image (bottom picture) during the solvent application. The F/F scale bar applies for all false color-coded pictures; the alpha-bar for the pixel Figure 2. Continued on next page
Manuscript 1
25
Neuroscience
Strutz et al. eLife 2014;3:e04147. DOI: 10.7554/eLife.04147 7 of 21
Research article
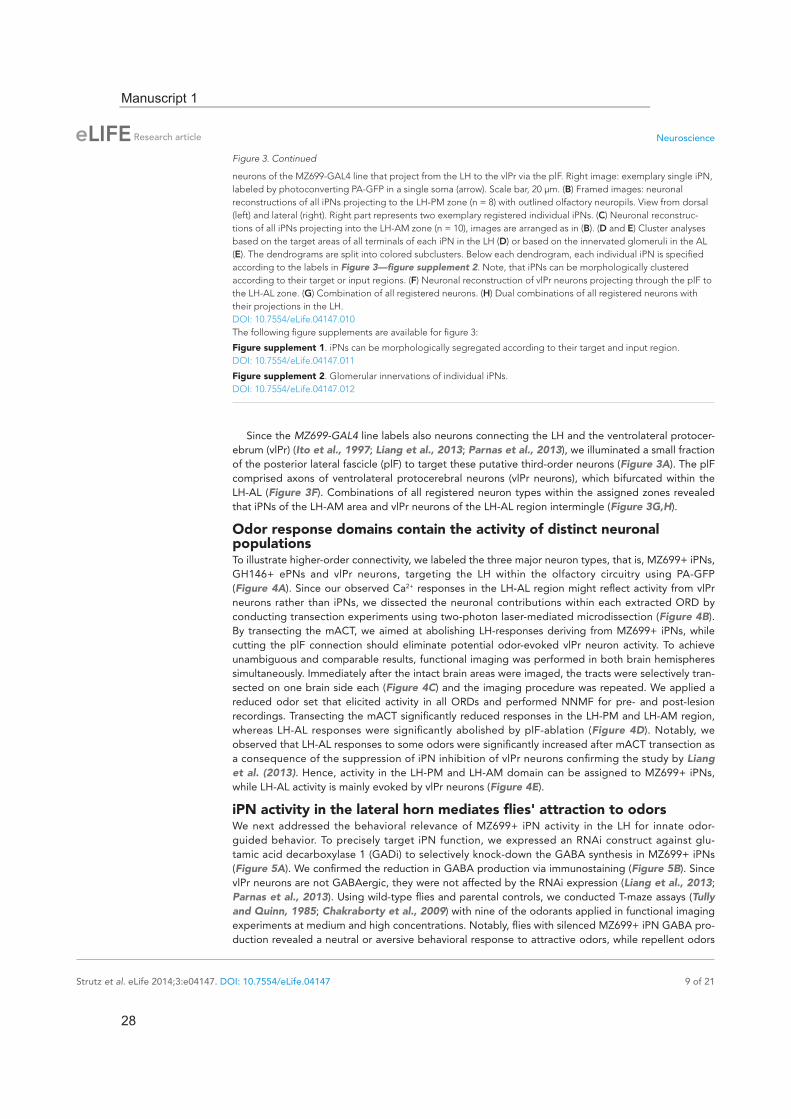
performed a cluster analysis based on a similarity score (Kohl et al., 2013) of the target areas of all terminals of each iPN in the LH (for details see ‘Materials and methods’). The dendrogram of mor-phological similarity between each individual iPN shows that all, except one iPN, could be clustered according to their target region in either the LH-AM or LH-PM area (Figure 3D) which confirms the classification into two major categories. Additionally, we performed a principal component analysis based on the distances of the similarity scores showing that both neuronal classes possess significantly different target areas in the LH (Figure 3—figure supplement 1A; p < 0.001, one-way ANOSIM).
We did not observe any clear panglomerular innervations of individual MZ699+ iPNs that spanned the entire AL, consistent with Liang et al. (2013). Instead, MZ699+ iPNs develop mainly oligoglo-merular patterns innervating on average 5.4 ± 3.9 glomeruli (mean ± SD), which are not necessarily in close proximity. It is important to note here, that the glomerular innervations of iPNs are rather sparse in comparison to the innervation of ePNs which complicates the identification of truly innervated glomeruli. After classifying all registered neurons according to their LH zones along with their glomer-ular innervations, we noted a spatial subdivision of MZ699+ iPN dendritic fields in the AL (Figure 3—figure supplement 2). Whereas LH-PM iPNs extended dendrites mainly into glomeruli from the ventro- or dorsomedial area of the AL (e.g., DM4, DM2, VM7, VM5d), iPNs targeting the LH-AM zone innervated glomeruli ranging from the ventro- and dorsoanterior to the dorsocentral region (e.g., DC3, VC1, VA6, VL1). We observed that a glomerulus is typically innervated by only LH-PM iPNs or LH-AM iPNs. However, we also found a few cases where a glomerulus can be innervated by both iPN types (e.g., glomeruli D and DC2). In order to analyze whether the two categories of iPNs can also be statistically separated according to their glomerular innervations in the AL, we performed a cluster analysis based on the glomeruli innervated by each individual iPN (Figure 3E). Notably, the two iPN classes could be clearly clustered into two groups due to their specific AL innervations. This finding is further supported by a principal component analysis showing that iPNs targeting the LH-PM region innervate a significant different glomerular subset than iPNs that send their axonal terminals to the LH-AM area (Figure 3—figure supplement 1B; p < 0.001, one-way ANOSIM). In accordance with our finding of two major iPN categories is the study by Lai et al. (2008) who observed several different stereotyped projection patterns of multiglomerular MZ699+ single-cell clones that could be broadly categorized into two groups based on the dendritic and axonal projection patterns. While we observed corresponding innervated areas in the AL, the described target areas in the LH seem to differ. However, due to the lack of 3D reconstruction of the single-cell clone data, the innervation patterns cannot be compared in detail.
In addition to the oligoglomerular iPNs, we observed a few uniglomerular MZ699+ iPNs innervat-ing either glomerulus DA1 or VL1 (4/25 of iPNs), consistent with Lai et al. (2008), which target the LH-AM region (Figure 3—figure supplement 2). Moreover, we identified three other MZ699+ neurons that did not innervate the AL and sent their axons through the mACT to the LH and/or the MBc.
participation xk of the indicated colors applies for (E–F). (C) Representative LH Ca2+ responses ( F/F%) of acetoin acetate, balsamic vinegar and benzaldehyde at three concentrations. Numbers in the lower right corner indicate individual maxima. (D) Odor-evoked Ca2+ responses ( F/F%) are exemplarily depicted for 1-octen-3ol- at three concentrations in four animals. (E) NNMF-extracted LH odor response domains (ORD) of four representative animals: three LH ORDs were fully reproducible after being extracted from all measured animals. Domains classified as identical are similarly color-coded: the green ORD is located in the posterior-medial region of the LH (LH-PM); blue, in the anterior-medial (LH-AM), and red in the anterior-lateral LH area (LH-AL). The alpha-bar for green, blue and red shades is placed in (B). (F) Left, schematic outlines of the LH with indicated ORDs. Right, median activity traces of all odors at three concentrations are depicted for each colored ORD. Shadows represent lower and upper quartiles (n = 6–7).DOI: 10.7554/eLife.04147.006The following figure supplements are available for figure 2:
Figure supplement 1. Odor-evoked activity patterns in the LH are reproducible and stereotypic. DOI: 10.7554/eLife.04147.007
Figure supplement 2. Odor-evoked activity patterns in the LH can be reconstructed with five components. DOI: 10.7554/eLife.04147.008
Figure supplement 3. Odor-evoked activity patterns in the LH cluster into three components. DOI: 10.7554/eLife.04147.009
Figure 2. Continued
Manuscript 1
26

Neuroscience
Strutz et al. eLife 2014;3:e04147. DOI: 10.7554/eLife.04147 8 of 21
Research article
Figure 3. iPNs can be classified according to their projection pattern in three distinct LH zones. (A) Complete population of MZ699+ iPNs labeled using PA-GFP (left image), the posterior-lateral LH region is encircled, arrowhead indicates the final common projection point of iPN axons. Middle image: photoactivation of all vlPr Figure 3. Continued on next page
Manuscript 1
27
Neuroscience
Strutz et al. eLife 2014;3:e04147. DOI: 10.7554/eLife.04147 9 of 21
Research article
Since the MZ699-GAL4 line labels also neurons connecting the LH and the ventrolateral protocer-ebrum (vlPr) (Ito et al., 1997; Liang et al., 2013; Parnas et al., 2013), we illuminated a small fraction of the posterior lateral fascicle (plF) to target these putative third-order neurons (Figure 3A). The plF comprised axons of ventrolateral protocerebral neurons (vlPr neurons), which bifurcated within the LH-AL (Figure 3F). Combinations of all registered neuron types within the assigned zones revealed that iPNs of the LH-AM area and vlPr neurons of the LH-AL region intermingle (Figure 3G,H).
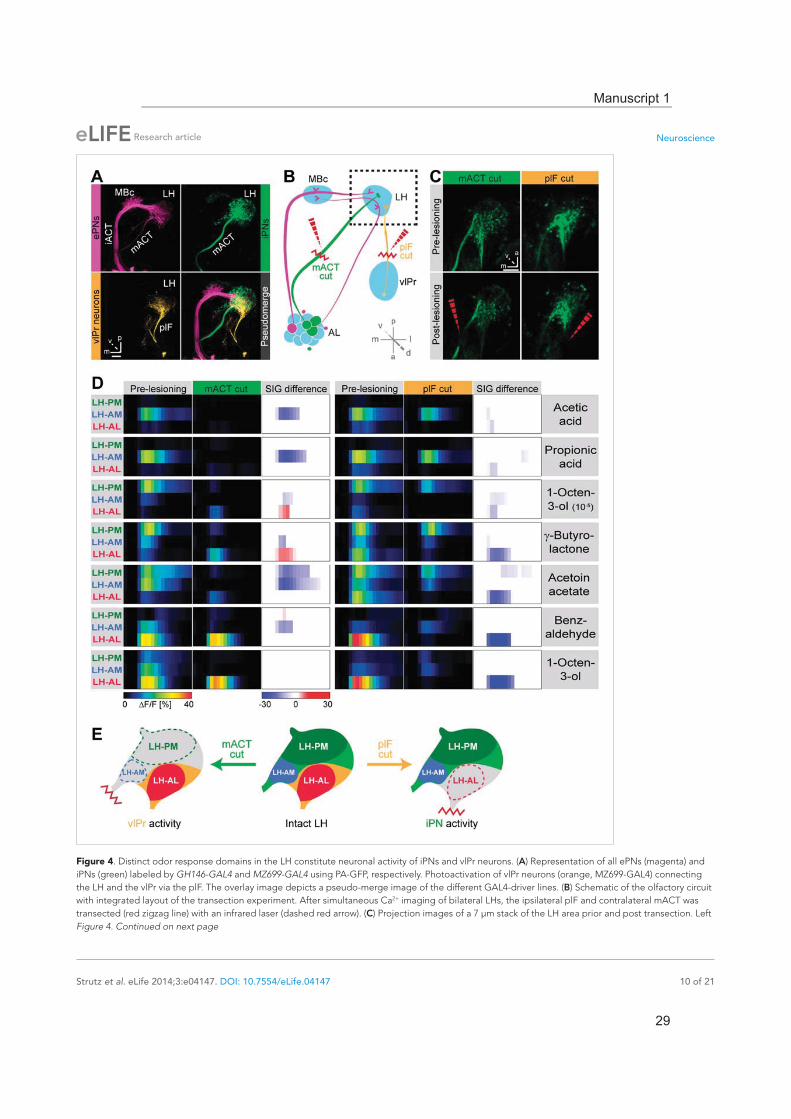
Odor response domains contain the activity of distinct neuronal populationsTo illustrate higher-order connectivity, we labeled the three major neuron types, that is, MZ699+ iPNs, GH146+ ePNs and vlPr neurons, targeting the LH within the olfactory circuitry using PA-GFP (Figure 4A). Since our observed Ca2+ responses in the LH-AL region might reflect activity from vlPr neurons rather than iPNs, we dissected the neuronal contributions within each extracted ORD by conducting transection experiments using two-photon laser-mediated microdissection (Figure 4B). By transecting the mACT, we aimed at abolishing LH-responses deriving from MZ699+ iPNs, while cutting the plF connection should eliminate potential odor-evoked vlPr neuron activity. To achieve unambiguous and comparable results, functional imaging was performed in both brain hemispheres simultaneously. Immediately after the intact brain areas were imaged, the tracts were selectively tran-sected on one brain side each (Figure 4C) and the imaging procedure was repeated. We applied a reduced odor set that elicited activity in all ORDs and performed NNMF for pre- and post-lesion recordings. Transecting the mACT significantly reduced responses in the LH-PM and LH-AM region, whereas LH-AL responses were significantly abolished by plF-ablation (Figure 4D). Notably, we observed that LH-AL responses to some odors were significantly increased after mACT transection as a consequence of the suppression of iPN inhibition of vlPr neurons confirming the study by Liang et al. (2013). Hence, activity in the LH-PM and LH-AM domain can be assigned to MZ699+ iPNs, while LH-AL activity is mainly evoked by vlPr neurons (Figure 4E).
iPN activity in the lateral horn mediates flies' attraction to odorsWe next addressed the behavioral relevance of MZ699+ iPN activity in the LH for innate odor-guided behavior. To precisely target iPN function, we expressed an RNAi construct against glu-tamic acid decarboxylase 1 (GADi) to selectively knock-down the GABA synthesis in MZ699+ iPNs (Figure 5A). We confirmed the reduction in GABA production via immunostaining (Figure 5B). Since vlPr neurons are not GABAergic, they were not affected by the RNAi expression (Liang et al., 2013; Parnas et al., 2013). Using wild-type flies and parental controls, we conducted T-maze assays (Tully and Quinn, 1985; Chakraborty et al., 2009) with nine of the odorants applied in functional imaging experiments at medium and high concentrations. Notably, flies with silenced MZ699+ iPN GABA pro-duction revealed a neutral or aversive behavioral response to attractive odors, while repellent odors
neurons of the MZ699-GAL4 line that project from the LH to the vlPr via the plF. Right image: exemplary single iPN, labeled by photoconverting PA-GFP in a single soma (arrow). Scale bar, 20 μm. (B) Framed images: neuronal reconstructions of all iPNs projecting to the LH-PM zone (n = 8) with outlined olfactory neuropils. View from dorsal (left) and lateral (right). Right part represents two exemplary registered individual iPNs. (C) Neuronal reconstruc-tions of all iPNs projecting into the LH-AM zone (n = 10), images are arranged as in (B). (D and E) Cluster analyses based on the target areas of all terminals of each iPN in the LH (D) or based on the innervated glomeruli in the AL (E). The dendrograms are split into colored subclusters. Below each dendrogram, each individual iPN is specified according to the labels in Figure 3—figure supplement 2. Note, that iPNs can be morphologically clustered according to their target or input regions. (F) Neuronal reconstruction of vlPr neurons projecting through the plF to the LH-AL zone. (G) Combination of all registered neurons. (H) Dual combinations of all registered neurons with their projections in the LH.DOI: 10.7554/eLife.04147.010The following figure supplements are available for figure 3:
Figure supplement 1. iPNs can be morphologically segregated according to their target and input region. DOI: 10.7554/eLife.04147.011
Figure supplement 2. Glomerular innervations of individual iPNs. DOI: 10.7554/eLife.04147.012
Figure 3. Continued
Manuscript 1
28
Neuroscience
Strutz et al. eLife 2014;3:e04147. DOI: 10.7554/eLife.04147 10 of 21
Research article
Figure 4. Distinct odor response domains in the LH constitute neuronal activity of iPNs and vlPr neurons. (A) Representation of all ePNs (magenta) and iPNs (green) labeled by GH146-GAL4 and MZ699-GAL4 using PA-GFP, respectively. Photoactivation of vlPr neurons (orange, MZ699-GAL4) connecting the LH and the vlPr via the plF. The overlay image depicts a pseudo-merge image of the different GAL4-driver lines. (B) Schematic of the olfactory circuit with integrated layout of the transection experiment. After simultaneous Ca2+ imaging of bilateral LHs, the ipsilateral plF and contralateral mACT was transected (red zigzag line) with an infrared laser (dashed red arrow). (C) Projection images of a 7 μm stack of the LH area prior and post transection. Left Figure 4. Continued on next page
Manuscript 1
29

Neuroscience
Strutz et al. eLife 2014;3:e04147. DOI: 10.7554/eLife.04147 11 of 21
Research article
evoked an even stronger aversion (Figure 5C). To compare the T-maze data more accurately, we cal-culated the average change of behavioral response indices (RIs) between GADi flies and parental controls (Figure 5D). Indeed, all responses changed in a negative direction, indicating MZ699+ iPNs play a crucial role in mediating attraction behavior. The sole exception involved high concentrations of the most repulsive odor, acetophenone, since this odor had already induced maximum aversion. Overall, these experiments reveal a crucial function of MZ699+ iPNs in mediating attraction behavior by releasing GABA in the LH.
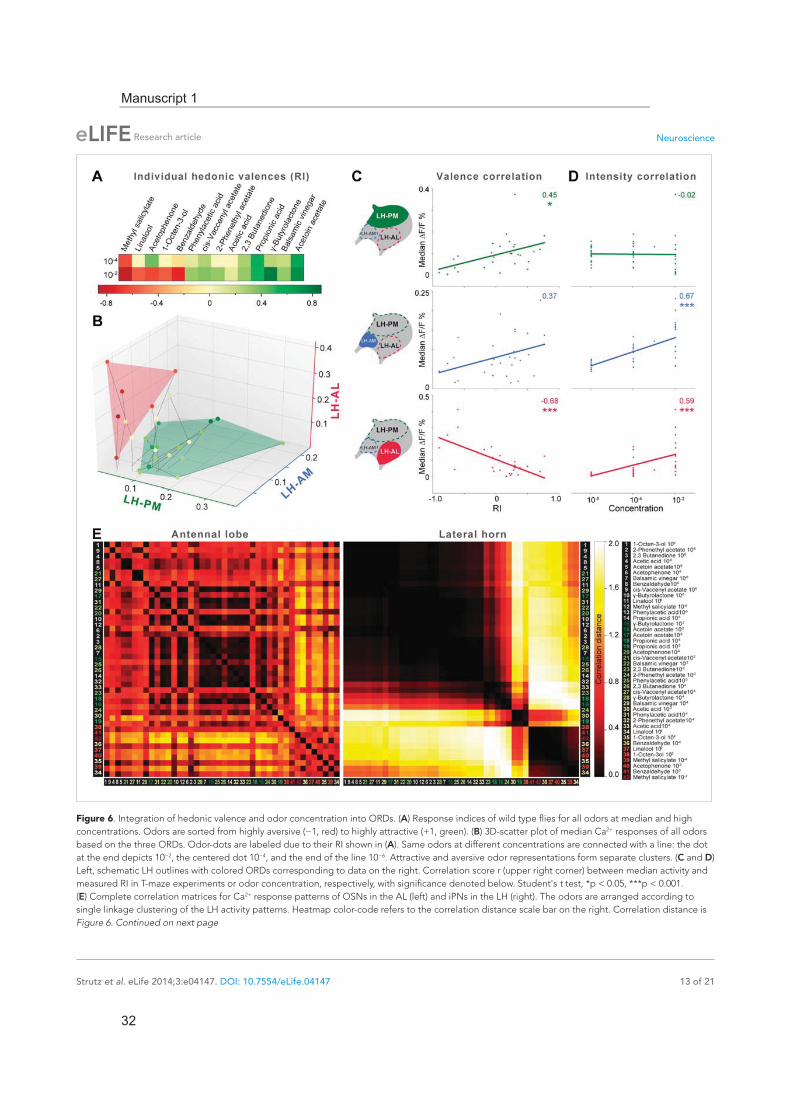
The lateral horn integrates hedonic valence and odor intensity into separate domainsThe behavioral effect of the iPN knock-down suggests that MZ699+ iPNs encode positive hedonic valences. To correlate the complete ORD pattern array with innate behavioral preferences, we assigned behavioral RIs for all odors at median and high odor concentrations using the T-maze assay as in our previous experiment (Figure 6A). Since extremely low concentrations rarely evoked any behavioral response, we excluded the 10−6 concentration in this analysis. It is important to note here, that dif-ferent behavioral assays for testing olfactory preferences in flies might lead to contradictory results. However, the majority of odors used here was also tested in two other behavioral paradigms, the trap assay (Stökl et al., 2010; Knaden et al., 2012) and the FlyWalk (Steck et al., 2012) (pers. comm. M Knaden) and yielded similar results (see Figure 6—figure supplement 1). When we plotted median odor-evoked activity in a three-dimensional space defined by the three ORDs, we saw a clear cluster-ing of responses evoked by aversive and attractive odorants (Figure 6B). The LH-AL domain, consti-tuted mainly by vlPr neurons, is coding aversive odors, while attractive odors activated only the LH-PM and LH-AM domains that derive from MZ699+ iPNs. This result is in accordance with our finding that iPNs mediate odor attraction.
We next correlated ORD activity to odor valence separately for all ORDs. This evaluation enabled us to analyze iPN and vlPr neuron coding properties apart from each other (Figure 6C). As expected, the analysis revealed a significant correlation between positive valence and the LH-PM domain, whereas Ca2+ responses in the LH-AL were strongly negatively correlated to hedonic valence. The LH-AM domain exhibited a positive but not significant correlation for odor valence. Remarkably, activity within the LH-PM was totally independent of concentration, whereas activity in both anterior domains was significantly correlated to odor intensity (Figure 6D). Hence, MZ699+ iPNs integrate odor attraction information into the LH-PM domain independent of odor intensity, confirming behav-ioral experiments. Intensity coding is in turn conducted separately by distinct iPNs within the LH-AM domain. In contrast, putative third-order vlPr neurons projecting into the LH-AL area code both nega-tive valence and odor intensity.
Finally, we wondered if this valence-specific LH representation is already reflected at the primary level of olfactory processing. The odor-evoked responses in iPNs are generally similar to those in OSNs (Wang et al., 2014), indicating a straight forward transduction of cholinergic OSN responses. We therefore performed functional imaging of odor-evoked Ca2+ dynamics at the AL input level by express-ing G-CaMP3.0 in OSNs using Orco-GAL4 (Larsson et al., 2004) (Figure 6—figure supplement 2). In order to compare the activity patterns at both processing levels, we calculated correlation distances for all pair-wise combinations of odor-evoked response patterns and plotted these with respect to maximal ORD pattern similarity in the LH (Figure 6E). As expected, odor representations in the LH clearly clustered within three separated parts of the matrix, reflecting our observed ORDs. However, this coding similarity could not predict AL activity patterns, even if the correlation matrix was sorted with respect to pattern similarity in the AL (Figure 6—figure supplement 3).
images, mACT transected; right image, plF transected. The ablated region is indicated by the dashed red arrow. Scale bar, 20 μm. (D) Median time traces displaying percental change of F/F values for indicated ORDs prior to post transection of the mACT (green, left) and the plF (orange, right) for different odorants. Significant changes of odor-evoked Ca2+ signals due to transection are shown in the column SIG difference. Differences were tested with a two-tailed paired Student's t test (p < 0.05). Color codes are indicated by the corresponding scale bar below, n = 4–5. Transecting the mACT eliminates Ca2+ signals in the LH-PM and LH-AM domain, while lesioning the plF significantly abolishes LH-AL responses. Notably, the LH-AL domain is significantly stronger activated after mACT transection following application of 1-octen-3-ol and -butyrolactone. (E) Summarized cartoon of the neuron populations contributing to ORD activity prior and post transection of axons of iPNs or vlPr neurons.DOI: 10.7554/eLife.04147.013
Figure 4. Continued
Manuscript 1
30

Neuroscience
Strutz et al. eLife 2014;3:e04147. DOI: 10.7554/eLife.04147 12 of 21
Research article
Figure 5. iPN GABA release in the LH mediates odor attraction behavior. (A) Experimental layout: iPN GABA production was selectively silenced via GADi expression in MZ699+ iPNs; ePN and vlPr neuron activity remained unaffected. (B) Immunostaining against GABA and GFP within AL somata (left) and LH neurites (right) of iPNs with intact (top) and silenced GABA production (bottom). GADi flies show GABA signals in somata of iPNs labeled by GH146-GAL4 only (arrowhead). The arrow head points to an exemplary GABA-positive bouton in the LH. Scale bar, 20 μm. (C) Averaged behavioral response indices (RIs) determined with a T-maze assay for wild-type flies (dark blue), parental controls (light blue) and experimental animals (magenta) for nine odorants at two concentrations. Empty boxes display no response (Wilcoxon signed-rank test). Dunn's Multiple Comparison Test was used for global differences in the dataset followed by a posthoc test for selected pairs (p* < 0.05; **p < 0.01; ***p < 0.001). Error bars represent SEM. (D) RI differences between GADi flies and averaged parental controls. RI differences are negative for all but one odor indicating that GADi expression shifts odor-guided behavior towards aversion. Error bars indicate SEM.DOI: 10.7554/eLife.04147.014
Manuscript 1
31
Neuroscience
Strutz et al. eLife 2014;3:e04147. DOI: 10.7554/eLife.04147 13 of 21
Research article
Figure 6. Integration of hedonic valence and odor concentration into ORDs. (A) Response indices of wild type flies for all odors at median and high concentrations. Odors are sorted from highly aversive (−1, red) to highly attractive (+1, green). (B) 3D-scatter plot of median Ca2+ responses of all odors based on the three ORDs. Odor-dots are labeled due to their RI shown in (A). Same odors at different concentrations are connected with a line: the dot at the end depicts 10−2, the centered dot 10−4, and the end of the line 10−6. Attractive and aversive odor representations form separate clusters. (C and D) Left, schematic LH outlines with colored ORDs corresponding to data on the right. Correlation score r (upper right corner) between median activity and measured RI in T-maze experiments or odor concentration, respectively, with significance denoted below. Student's t test, *p < 0.05, ***p < 0.001. (E) Complete correlation matrices for Ca2+ response patterns of OSNs in the AL (left) and iPNs in the LH (right). The odors are arranged according to single linkage clustering of the LH activity patterns. Heatmap color-code refers to the correlation distance scale bar on the right. Correlation distance is Figure 6. Continued on next page
Manuscript 1
32

Neuroscience
Strutz et al. eLife 2014;3:e04147. DOI: 10.7554/eLife.04147 14 of 21
Research article
DiscussionWe augment our present understanding of the Drosophila olfactory circuitry by elucidating the coding properties of a parallel and behaviorally relevant higher-order processing pathway to the LH. Morphological, functional and behavioral approaches provide strong evidence for a functional subdi-vision of iPNs into neurons coding either odor attraction or odor intensity. Our behavioral experiments reveal that inhibitory properties of iPNs are necessary for innate odor-guided attraction. In addition, we characterize a third neural pathway coding odor repellence.
Do MZ699+ iPNs fulfill anatomical requirements to constitute a distinct processing channel in addition to ePNs? A remarkable anatomical feature of MZ699+ iPNs is their glomerular innervation pattern in the AL. Whereas GH146+ ePNs are uniglomerular and retain the topographic code in their axonal arrangement (Marin et al., 2002; Wong et al., 2002; Jefferis et al., 2007), most MZ699+ iPNs possess oligoglomerular innervations suggesting that these neurons might not convey precise odor-identity information. In addition, MZ699+ iPNs in the AL diverge only into specific glomerular subsets, and so might be pre-determined to selectively extract common features of distinct odors. We have previously shown that the AL map at the PN level exhibits a spatial segregation of valence representa-tion (Knaden et al., 2012). Certain glomeruli, which have been classified as aversion coding at the GH146+ ePN level, are omitted by MZ699+ iPNs, whereas most glomeruli classified as attraction coding are particularly densely innervated. These results suggest that within the MZ699+ iPN popula-tion, mainly positive odor traits are extracted, whereas the odor information of negative valence is neglected. This conclusion is consistent with the recent finding that one type of LH neurons is receiving input from PNs that mainly innervate glomeruli coding fruity-smelling acetates (Fisek and Wilson, 2014) which represent attractive odor cues (Knaden et al., 2012). We furthermore demonstrate that the MZ699+ iPN population is split into two major morphological classes possessing a clear spatial segregation in the AL which is strictly maintained within the LH. It has to be kept in mind that we do not cover all iPNs by using MZ699-GAL4. Further experiments characterizing the 6 missing MZ699– iPNs, which are labeled by GH146-GAL4 (Wilson and Laurent, 2005; Lai et al., 2008), will elucidate if our assumptions apply for the whole iPN population.
So far only a handful neuroanatomical studies targeting GH146+ ePNs have dealt with the question of how olfactory information is integrated and read out by higher brain structures, in particular the LH (Marin et al., 2002; Wong et al., 2002; Tanaka et al., 2004; Jefferis et al., 2007). A recent study that traced the projection pattern of PNs coding ammonia and amines as attractive stimuli and carbon dioxide and acids as repulsive signals suggests that sensory stimuli of opposing valence are repre-sented in spatially distinct areas within the LH (Min et al., 2013). In addition the study by Liang et al. (2013) showed that MZ699+ iPNs selectively suppress the activity of vlPr neurons to food odors, while pheromone responses were not affected verifying the assumption that different odor features are processed separately. However, functional evidence for a feature-based, spatially segregated activity map in the LH was so far missing.
To unravel the coding properties of MZ699+ iPNs within the LH, we conducted Ca2+ imaging exper-iments of MZ699+ iPNs in the LH to odorants having different hedonic valences and intensities, and could classify the LH into three functional ORDs. Our neuronal tracing and transection experi-ments validated the LH segmentation into two medial domains that derive from MZ699+ iPNs, and the LH-AL domain formed by vlPr neurons. In line with our observations are morphological studies on ePNs and third-order LH neurons revealing a similarly tight constriction into three zones within the
defined as 1 − r, where r is the Pearson correlation coefficient between the response patterns of two odorants. Odor letters are color-coded according to hedonic valence; 10−6 RI values are labeled in grey (complete list right hand).DOI: 10.7554/eLife.04147.015The following figure supplements are available for figure 6:
Figure supplement 1. Odor valences determined with three different behavioral assays. DOI: 10.7554/eLife.04147.016
Figure supplement 2. Calcium responses of OSNs. DOI: 10.7554/eLife.04147.017
Figure supplement 3. Correlation matrices for odor-evoked responses in the AL and LH. DOI: 10.7554/eLife.04147.018
Figure 6. Continued
Manuscript 1
33

Neuroscience
Strutz et al. eLife 2014;3:e04147. DOI: 10.7554/eLife.04147 15 of 21
Research article
LH (Tanaka et al., 2004), while single-cell labeling combined with image registration resulted in five ePN target zones (Jefferis et al., 2007). However, the ePN terminal zones do not necessarily corre-spond to the target domains of iPNs, since it has recently been shown that MZ699+ iPNs do not inhibit odor responses of GH146+ ePNs (Liang et al., 2013) and that the presynaptic sites of iPNs are spa-tially separated from those of ePNs (Wang et al., 2014). Hence both PN populations represent parallel processing pathways that most likely accomplish distinct processing tasks analogous to the honeybee olfactory system which possesses dual olfactory pathways to the higher brain that accomplish parallel processing of similar odors (Brill et al., 2013).
Silencing MB function revealed that the LH alone is sufficient for basic olfactory behavior (de Belle and Heisenberg, 1994; Connolly et al., 1996; Heimbeck et al., 2001). Our behavioral results dem-onstrate that selectively silencing MZ699+ iPNs severely reduced the flies' odor attraction behavior. Hence our results suggest that MZ699+ iPNs are capable of extracting specific features from the com-binatorial code emerging in the AL. A behavioral study revealed that silencing MBc neurons impairs odor attraction but not repulsion (Wang et al., 2003b). The authors drew the conclusion that the LH is involved in mediating innate repulsion rather than attraction. These results are not necessarily con-tradictory to ours since some ePNs might activate the LH-AL domain exclusively (i.e., vlPr neurons). On the other hand, Wang et al. (2003b) did not include highly concentrated attractive odors. Therefore it is possible that in their experiments, the odor detection threshold was simply reduced, so that only highly concentrated odors, which induced odor aversion, could be distinguished. Our behavioral results, in contrast, revealed the constant influence of the MZ699+ iPNs in mediating attraction for odorants over a range of concentrations.
Our data suggests that odors with opposing hedonic valences are encoded by an interplay of dis-tinct processing pathways. The study by Liang et al. (2013) showed that GABA release from MZ699+ iPNs directly inhibits responses of vlPr neurons to food odors as mentioned above. This finding fits well to our observations that iPNs are activated mainly by attractive odors while vlPr neurons are not, likely due to the inhibitory input from iPNs. VlPr neurons are, on the other hand, almost solely activated by repellent odors, which do hardly activate iPNs and therefore do not induce a strong inhibition to vlPr neurons. Repellent odors most likely activate vlPr neurons via ACh release of ePNs which is supported by immunostainings with pre- and postsynaptic markers indicating that vlPr neurons receive input in the LH, while the vlPr represents their major output region (Parnas et al., 2013). The vlPr is suppos-edly also a target of visual neurons from the optic lobe (Tanaka et al., 2004) implying that a certain integration of different sensory modalities takes place at this central processing relay. Given that iPNs are inhibitory neurons, the underlying mechanism of odor attraction behavior might therefore be an inhibition of aversive neuronal circuits from the LH to the vlPr that are mainly composed of vlPr neurons. However, this assumption needs to be verified with further experiments elucidating if vlPr neurons are sufficient and necessary to mediate odor aversion.
What is known about odor coding in the LH in other insect species? Notably, in locusts it has been shown that LH neurons receiving convergent PN input appeared to encode stimulus intensity in their net firing rates and in the phases of their spikes (Gupta and Stopfer, 2012). Hence these results sup-port the idea that within the LH, general stimulus features such as odor intensity are extracted, which is well in line with our observation of the anterior LH domains whose activity is also significantly cor-related to odor intensity. Also in line with our results is a study from honeybees which shows that the representation of different pheromone types is spatially segregated in the LH (Roussel et al., 2014), indicating that odors eliciting specific behaviors are coded according to their biological values.
In conclusion, our study provides an important step in unraveling higher olfactory processing mech-anisms that are crucial for mediating innate behaviors in Drosophila. We provide functional evidence for a feature-based spatial arrangement of the LH decoding opposing hedonic valences and odor intensity. The role of the LH as a center for integrating biological values towards innate decisions by computing conveyed information of two processing pathways is thus expanded.
Materials and methodsDrosophila stocksAll fly stocks were maintained on conventional cornmeal-agar-molasses medium under L:D 12:12, RH = 70% and 25°C. For wild-type controls D. melanogaster of the Canton-S strain was used. Transgenic lines were obtained from Bloomington Stock Center (http://flystocks.bio.indiana.edu/) and Vienna
Manuscript 1
34
Neuroscience
Strutz et al. eLife 2014;3:e04147. DOI: 10.7554/eLife.04147 16 of 21
Research article
RNAi stock center (http://www.vdrc.at). Other fly stocks were kindly provided by Kei Ito (MZ699-GAL4) and Maria Luisa Vasconcelos (UAS-C3PA). The END1-2 fly line is published in Grabe et al. (2014).
ImmunohistochemistryWhole-mount immunofluorescence staining was carried out as described (Laissue et al., 1999; Vosshall et al., 2000). Initially brains were dissected in Ringer's solution (130 mM NaCl, 5 mM KCl, 2 mM MgCl2, 2 mM CaCl2, 36 mM saccharose, 5 mM HEPES, [pH 7.3]) (Estes et al., 1996) and fixed in 4% PFA in PBS-T (PBS, 0.2–1% Triton-X). After washing with PBS-T brains were blocked with PBS-T, 5% normal goat serum (NGS). Primary antibodies were diluted in blocking solution or PBS-T and incubated at 4°C for 2–3 days. Secondary antibody incubation lasted 1–2 days. Brains were mounted in VectaShield (Vector Labs, Burlingame, CA). The following primary antibodies were used: rabbit
-GABA (1:500) (Sigma), mouse -GFP (1:500) (Invitrogen). The following secondary antibodies were used: Alexa Fluor 488, goat anti-mouse (1:500); Alexa Fluor 546, goat anti-rabbit (1:500); (all IgG Invitrogen).
Functional imagingFly preparation and functional imaging of the AL was conducted as previously described (Stökl et al., 2010; Strutz et al., 2012). LH imaging was conducted similarly, except for the higher resolution achieved with a 60× water immersion objective (LUMPlanFl 60×/0.90 W Olympus). The optical plane was 30 μm below the most dorsal entrance point of the iPN tract into the LH. Binning on the CCD-camera chip resulted in a resolution of 1 pixel = 0.4 × 0.4 μm. For bilateral LH imaging during tran-section a 20× water immersion objective (NA 0.95, XLUM Plan FI, Olympus) was employed. All recordings lasted 10 s with a frame rate of 4 Hz. Odors included acids (propionic acid, acetic acid), lactones ( -butyrolactone), terpenes (linalool), aromatics (acetophenone, methyl salicylate, benzaldehyde, phenylacetic acid), alcohols (1-octen-3-ol), esters (acetoin acetate, cis-vaccenyl acetate, 2-phenethyl acetate), ketones (2,3 butanedione) and balsamic vinegar diluted in mineral oil (all from Sigma Aldrich). Odors were applied during frame 8–14 (i.e., after 2 s, lasting for 2 s). Flies were imaged for up to 1 hr, with a minimum inter-stimulus interval of one minute. We selected conventional widefield Ca2+ imaging as the method of choice, since we were able to obtain single bouton resolution with this technique.
Imaging data analysisCalcium imaging data of AL were analyzed with custom-written IDL software (ITT Visual Information Solutions) provided by Mathias Ditzen as previously described (Stökl et al., 2010; Strutz et al., 2012). Regarding the Ca2+ imaging data in the LH, we repeated recordings of each odor at each concentra-tion two to three times to ensure the reliability of the extracted domain information. To execute NNMF analysis (see below), at least 6–7 valid measurements, that is, animals with repeated identical record-ings, were collected for each odor and employed for the analysis. Individual odor measurements were aligned using ImageJ (Fiji) to correct movement artifacts. Fluorescence changes ( F/F) for each odor were calculated in relation to background fluorescence using frames 0–6 (i.e., 2–0.5 s before odor application). A Gaussian low-pass filter (ó = 1px) was applied to compensate for remaining movement artifacts and pixel noise. To reduce the computational load, the frame rate was averaged by two con-secutive frames, and recordings were spatially down-sampled by a factor of two. The resulting concat-enated time-series of the recordings is denoted as measurement matrix Y with element Yt,p being the tth observed value of pixel p.
NNMF—Non-Negative Matrix FactorizationIn contrast to the AL, which consists of highly ordered glomerular subunits, the LH comprises a mainly homogenous neuropil which does not provide spatial or functional landmarks. Therefore, we used the automatic method NNMF to extract Ca2+ signals that exhibit common spatial or temporal fea-tures. NNMF, like other matrix factorization techniques (e.g., Principal Component Analysis (PCA) and Independent Component Analysis (ICA)), decompose the measurement matrix Y into k components, Y= * +RT
k k kx a . The time-course ak of each component contains a common underlying time-courses of all pixels and each pixel participation xk declares how strongly each pixel is involved in this time-course. The residual matrix R contains the unexplained data. In order to perform NNMF, we imple-mented the HALS algorithm in Python including a spatial smoothness constraint (asm = 0.1) (Cichocki and Phan, 2009) and an additional spatial decorrelation constraint (ade = 0.1) (Chen and Cichocki, 2005).
Manuscript 1
35
Neuroscience
Strutz et al. eLife 2014;3:e04147. DOI: 10.7554/eLife.04147 17 of 21
Research article
In PCA decomposition is performed such that either timecourses ak or pixel participation xk are uncorrelated, whereas ICA aims for timecourses (temporal ICA) or pixel participation (spatial ICA) to be independent. Although spatial ICA is able to segregate signals into functional similar neuropils (Reidl et al., 2007), we chose the NNMF approach, because it is known to achieve even a better parts-based representation compared to the more holistic results of PCA or ICA (Lee and Seung, 1999). In contrast to PCA and ICA, NNMF constrains both the extracted time-courses and pixel par-ticipations to be positive. Positive pixel participation enabled us to make a straightforward physio-logical interpretation, reading the participation values as the contribution strength of an underlying physiological domain. The restriction to positive time-courses reflects the fact that we did not observe any significant decrease of fluorescence in response to an odor in the original measurement data. For each animal we performed decomposition into k = 5 components. This was sufficient to explain most of the data's variance (88% + 8%, error is standard deviation across individuals). The remaining variance in the residual matrix R contained no additional domains but rather reflected remaining movement artifacts of the measurements (Figure 2—figure supplement 2). Of the five components extracted by NNMF, three stood out prominently (Figure 2—figure supplement 3): First, they were extracted in all animals at very clearly defined anatomical positions. Second, their responses to stimuli repetitions were highly reproducible in contrast to the other two components, that is, they exhibited a significant (p < 2*10−8, t test) higher trial-to-trial correlation of 0.72 ± 0.20 in contrast to 0.52 ± 0.26 for the remaining components; third, the odorant spectra of their responses were char-acteristic across animals.
Though we cannot completely rule out that the remaining components of the factorization are ORDs of their own, there are several indications that they are not. On the one hand, they exhibit a lower trial-to-trial correlation than the three selected components. Second, those components did not consistently appear at similar anatomical position. Third, they were spatially overlapping with the selected three components. Instead of independent ORDs, these regions might convey fluores-cence changes independent of odor stimulation or an overlapping region of two of the reliable ORDs. A validation of our NNMF-based results with spatial ICA yielded very similar, but slightly worse results. Whereas the three reliable ORDs from NNMF were also extracted in spatial ICA, the two remaining components exhibited much higher variability than when obtained with NNMF. Hence, we conclude that the LH area comprising MZ699+ neurons consists of three ORDs. We labeled those three components according to the anatomical position of their pixel participation within the LH.
Statistical analysis of imaging dataTo determine the coding properties of extracted odor response domains (ORDs), we calculated the mean response of each animal within a time window of 1–4 s after stimulus onset. Hence, median responses over all animals defined the standard stimulated response o
ORDr of an ORD to an odor o. Initially, regions were evaluated individually, and correlations were calculated between standard response spectra and the behavioral response index (RI), or odor concentration, respectively, using the ‘linregress’ function of the Python scipy.stat module. To analyze the combined ORD representations of odor patterns ( )= , ,o o o
o PM AM ALp r r r we calculated for all odor pairs the pattern similarity as correlation dis-tance 1, 2 1 2=1 ( , )o o o od corr p p− . In order to visualize the correlation matrix in a comprehensible way, we then arranged odors according to the single linkage clustering of the Python scipy.cluster.hierarchy module. To compare the representation in the LH to those of the AL, we applied the same procedure to the dorsal glomerular odor activation pattern.
2-Photon photoactivation and neuronal reconstructionsFor in vivo photoactivation experiments, 1–6 day old flies (genotype: END1-2,UAS-C3PA;MZ699-GAL4) were dissected as in the imaging experiments except that tracts of the salivary glands were cut to prevent movement. Photoactivation was accomplished via continuous illumination with 760 nm for 15–25 min. After a 5-min break to permit full diffusion of the photoconverted mole-cules, 925 nm z-stacks of the whole brain were acquired and subsequently used for neuronal 3D-reconstruction. For all 3D reconstructions, the segmentation software AMIRA 4.1.1 & 5.3.3 (FEI Visualization Sciences Group, Burlington, MA) was used. Neurons of different individuals were embed-ded into the reference brain using a labelfield registration as previously described (Rybak et al., 2010). Briefly, segmented labels of brain neuropils (AL, MBc, LH) were registered onto a reference brain image using affine registration followed by elastic warping. In a second step, the calculated
Manuscript 1
36
Neuroscience
Strutz et al. eLife 2014;3:e04147. DOI: 10.7554/eLife.04147 18 of 21
Research article
transformation matrix was applied to the respective neuron morphology that was then aligned to the reference brain image.
For morphological analysis of reconstructed iPNs, we first determined all terminal points of each iPN in the LH area. For each combination of terminals we calculated a similarity score (s) in analogy to (Kohl et al., 2013) as follows:
2 21 2– ( , ) 2
1 2, = ,t ts t t e
where t is the terminal position, (t1,t2) is the Euclidean distance and is a free parameter that deter-mines how close in space terminal points must be to be considered similar; analogue to Kohl et al. (2013) we set this parameter to 3 μm. Finally we calculated the pairwise similarity score between two neurons as their average all-to-all terminal similarity scores, normalized to their self-scores as follows:
1 2 1 21 2 , 1 2 1 1 2 2, = , / , * ,t t t tS n n s t t s t t s t t
Effectively this quantifies the relative overlap of the target area of all pairs of iPNs. For clustering, the similarity scores were converted to distances (i.e., 1-S) and a hierarchical clustering was performed using UPGMA method. Principal component analysis and one-way ANOSIM was performed using the statistical software PAST 3.x (Paleontological statistics software package for education and data analysis).
2-Photon-mediated transectionTransections of either the plF tract or the mACT were conducted in one brain hemisphere, each of the same fly. The target area was monitored with 925 nm and chosen to be close to the LH but distant enough not to affect neurites ramifying in the LH neuropil. For both tracts, lesioned areas had an average size of 34 μm and were illuminated with short pulses of 710 nm every 40 ms for 250 ms in 60 (plF) to 80 (mACT) cycles in a single focal plane. After a fast z-stack with 925 nm to confirm com-plete lesion, a 5-min neuronal recovery interval followed before continuing the imaging procedure. Data were analyzed using NNMF.
Image acquisitionPhotoactivation and transection procedures as well as image acquisition following immunohisto-chemistry were accomplished with a 2-photon confocal laser scanning microscope (2PCLSM, Zeiss LSM 710 NLO) equipped with a 40× (W Plan-Apochromat 40×/1.0 DIC M27, Zeiss) or 20× (W N-Achroplan 20×/0.5 M27, Zeiss). The 2PCLSM was placed on a smart table UT2 (Newport Corporation, Irvine, CA, USA) and equipped with an infrared Chameleon Ultra diode-pumped laser (Coherent, Santa Clara, CA, USA). Z-stacks were performed with argon 488 nm and helium-neon 543 nm laser or the Chameleon Laser 925 nm (BP500-550 for G-CaMP and LP555 for DsRed/tdTomato) and had a resolution of 1024 or 512 square pixels. The maximum step size for immuno-preparations or single neuron projections was 1 μm and for AL reconstructions 2 μm.
Behavioral assayFlies carrying P[GAD1-RNAi];P[MZ699-GAL4] were crossed just before the experiment to prevent dosage compensation effects. T-maze experiments were performed as described (Stensmyr et al., 2012). WT, parental controls (P[GAD1-RNAi] or P[MZ699-GAL4]) and test flies carrying both insertions were tested separately under identical conditions. The response index (RI) was calculated as (O-C)/T, where O is the number of flies in the odor arm, C is the number of flies in the control arm, and T is the total number of flies used in the trial. Hence, the RI ranges from −1 (complete avoidance) to 1 (complete attraction). Each experiment was carried out on 30 flies and was repeated 12 times. Dunn's Multiple Comparison Test was used for global differences in the dataset. Whenever the Multiple Comparison Test was significant (i.e., p < 0.05), a posthoc test for selected pairs was performed, that is, between the GADi-flies and the other three control lines as we were not interested in differences among the different control lines. All RI were tested against 0 (no response) by using the Wilcoxon-rank-sum test.
AcknowledgementsWe thank Silke Trautheim, Regina Stieber, Linda Gummlich and Sascha Bucks for excellent technical assistance and Emily Wheeler for editorial assistance.
Manuscript 1
37
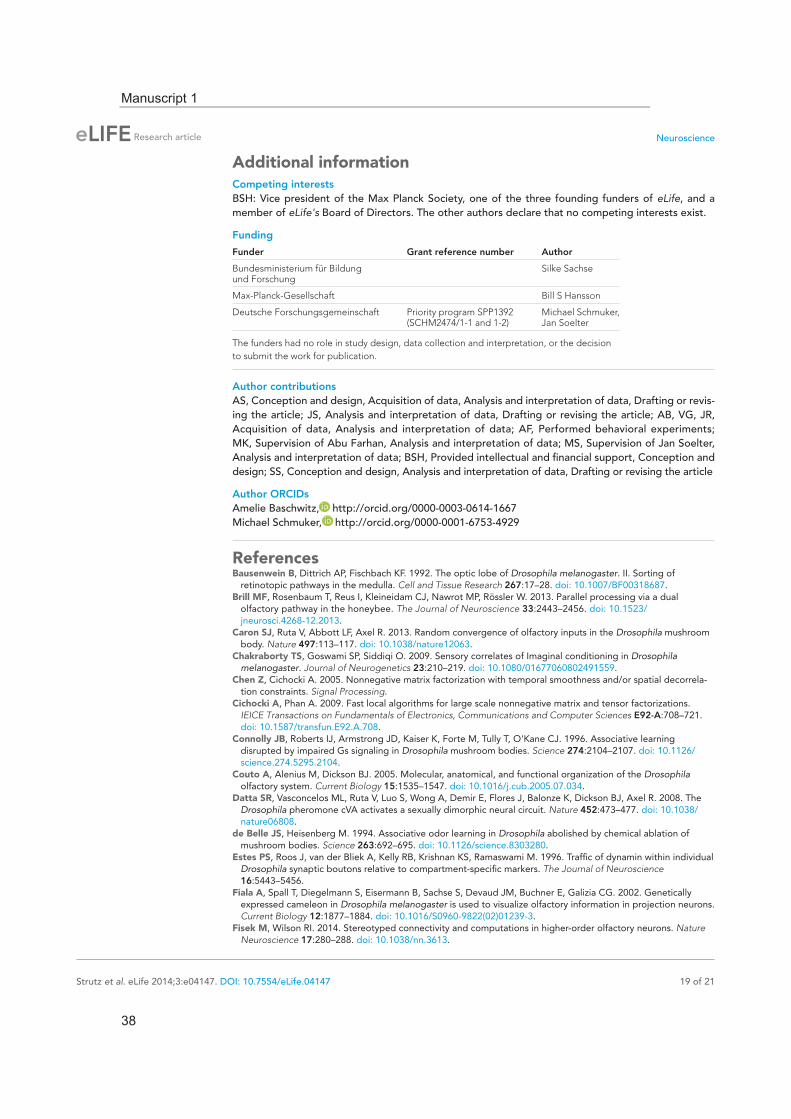
Neuroscience
Strutz et al. eLife 2014;3:e04147. DOI: 10.7554/eLife.04147 19 of 21
Research article
Additional informationCompeting interestsBSH: Vice president of the Max Planck Society, one of the three founding funders of eLife, and a member of eLife's Board of Directors. The other authors declare that no competing interests exist.
Funding
Funder Grant reference number Author
Bundesministerium für Bildung und Forschung
Silke Sachse
Max-Planck-Gesellschaft Bill S Hansson
Deutsche Forschungsgemeinschaft Priority program SPP1392 (SCHM2474/1-1 and 1-2)
Michael Schmuker, Jan Soelter
The funders had no role in study design, data collection and interpretation, or the decision to submit the work for publication.
Author contributionsAS, Conception and design, Acquisition of data, Analysis and interpretation of data, Drafting or revis-ing the article; JS, Analysis and interpretation of data, Drafting or revising the article; AB, VG, JR, Acquisition of data, Analysis and interpretation of data; AF, Performed behavioral experiments; MK, Supervision of Abu Farhan, Analysis and interpretation of data; MS, Supervision of Jan Soelter, Analysis and interpretation of data; BSH, Provided intellectual and financial support, Conception and design; SS, Conception and design, Analysis and interpretation of data, Drafting or revising the article
Author ORCIDsAmelie Baschwitz, http://orcid.org/0000-0003-0614-1667Michael Schmuker, http://orcid.org/0000-0001-6753-4929
ReferencesBausenwein B, Dittrich AP, Fischbach KF. 1992. The optic lobe of Drosophila melanogaster. II. Sorting of
retinotopic pathways in the medulla. Cell and Tissue Research 267:17–28. doi: 10.1007/BF00318687.Brill MF, Rosenbaum T, Reus I, Kleineidam CJ, Nawrot MP, Rössler W. 2013. Parallel processing via a dual
olfactory pathway in the honeybee. The Journal of Neuroscience 33:2443–2456. doi: 10.1523/jneurosci.4268-12.2013.
Caron SJ, Ruta V, Abbott LF, Axel R. 2013. Random convergence of olfactory inputs in the Drosophila mushroom body. Nature 497:113–117. doi: 10.1038/nature12063.
Chakraborty TS, Goswami SP, Siddiqi O. 2009. Sensory correlates of Imaginal conditioning in Drosophila melanogaster. Journal of Neurogenetics 23:210–219. doi: 10.1080/01677060802491559.
Chen Z, Cichocki A. 2005. Nonnegative matrix factorization with temporal smoothness and/or spatial decorrela-tion constraints. Signal Processing.
Cichocki A, Phan A. 2009. Fast local algorithms for large scale nonnegative matrix and tensor factorizations. IEICE Transactions on Fundamentals of Electronics, Communications and Computer Sciences E92-A:708–721. doi: 10.1587/transfun.E92.A.708.
Connolly JB, Roberts IJ, Armstrong JD, Kaiser K, Forte M, Tully T, O'Kane CJ. 1996. Associative learning disrupted by impaired Gs signaling in Drosophila mushroom bodies. Science 274:2104–2107. doi: 10.1126/science.274.5295.2104.
Couto A, Alenius M, Dickson BJ. 2005. Molecular, anatomical, and functional organization of the Drosophila olfactory system. Current Biology 15:1535–1547. doi: 10.1016/j.cub.2005.07.034.
Datta SR, Vasconcelos ML, Ruta V, Luo S, Wong A, Demir E, Flores J, Balonze K, Dickson BJ, Axel R. 2008. The Drosophila pheromone cVA activates a sexually dimorphic neural circuit. Nature 452:473–477. doi: 10.1038/nature06808.
de Belle JS, Heisenberg M. 1994. Associative odor learning in Drosophila abolished by chemical ablation of mushroom bodies. Science 263:692–695. doi: 10.1126/science.8303280.
Estes PS, Roos J, van der Bliek A, Kelly RB, Krishnan KS, Ramaswami M. 1996. Traffic of dynamin within individual Drosophila synaptic boutons relative to compartment-specific markers. The Journal of Neuroscience 16:5443–5456.
Fiala A, Spall T, Diegelmann S, Eisermann B, Sachse S, Devaud JM, Buchner E, Galizia CG. 2002. Genetically expressed cameleon in Drosophila melanogaster is used to visualize olfactory information in projection neurons. Current Biology 12:1877–1884. doi: 10.1016/S0960-9822(02)01239-3.
Fisek M, Wilson RI. 2014. Stereotyped connectivity and computations in higher-order olfactory neurons. Nature Neuroscience 17:280–288. doi: 10.1038/nn.3613.
Manuscript 1
38

Neuroscience
Strutz et al. eLife 2014;3:e04147. DOI: 10.7554/eLife.04147 20 of 21
Research article
Fishilevich E, Vosshall LB. 2005. Genetic and functional subdivision of the Drosophila antennal lobe. Current Biology 15:1548–1553. doi: 10.1016/j.cub.2005.07.066.
Grabe V, Strutz A, Baschwitz A, Hansson BS, Sachse S. 2014. Digital in vivo 3D atlas of the antennal lobe of Drosophila melanogaster. The Journal of Comparative Neurology doi: 10.1002/cne.23697.
Gupta N, Stopfer M. 2012. Functional analysis of a higher olfactory center, the lateral horn. The Journal of Neuroscience 32:8138–8148. doi: 10.1523/jneurosci.1066-12.2012.
Heimbeck G, Bugnon V, Gendre N, Keller A, Stocker RF. 2001. A central neural circuit for experience-independ-ent olfactory and courtship behavior in Drosophila melanogaster. Proceedings of the National Academy of Sciences of USA 98:15336–15341. doi: 10.1073/pnas.011314898.
Heisenberg M. 2003. Mushroom body memoir: from maps to models. Nature Reviews. Neuroscience 4:266–275. doi: 10.1038/nrn1074.
Hildebrand JG, Shepherd GM. 1997. Mechanisms of olfactory discrimination: Converging evidence for common principles across phyla. Annual Review of Neuroscience 20:595–631. doi: 10.1146/annurev.neuro.20.1.595.
Ito K, Sass H, Urbach J, Hofbauer A, Schneuwly S. 1997. GAL4-responsive UAS-tau as a tool for studying the anatomy and development of the Drosophila central nervous system. Cell and Tissue Research 290:1–10. doi: 10.1007/s004410050901.
Jefferis GS, Marin EC, Stocker RF, Luo L. 2001. Target neuron prespecification in the olfactory map of Drosophila. Nature 414:204–208. doi: 10.1038/35102574.
Jefferis GS, Potter CJ, Chan AM, Marin EC, Rohlfing T, Maurer CR, Maurer CR Jnr, Luo L. 2007. Comprehensive maps of Drosophila higher olfactory centers: spatially segregated fruit and pheromone representation. Cell 128:1187–1203. doi: 10.1016/j.cell.2007.01.040.
Keene AC, Stratmann M, Keller A, Perrat PN, Vosshall LB, Waddell S. 2004. Diverse odor-conditioned memories require uniquely timed dorsal paired medial neuron output. Neuron 44:521–533. doi: 10.1016/j.neuron.2004.10.006.
Knaden M, Strutz A, Ahsan J, Sachse S, Hansson BS. 2012. Spatial representation of odorant valence in an insect brain. Cell Reports 1:392–399. doi: 10.1016/j.celrep.2012.03.002.
Kohl J, Ostrovsky AD, Frechter S, Jefferis GS. 2013. A bidirectional circuit switch reroutes pheromone signals in male and female brains. Cell 155:1610–1623. doi: 10.1016/j.cell.2013.11.025.
Lai SL, Awasaki T, Ito K, Lee T. 2008. Clonal analysis of Drosophila antennal lobe neurons: diverse neuronal architectures in the lateral neuroblast lineage. Development 135:2883–2893. doi: 10.1242/dev.024380.
Laissue PP, Reiter C, Hiesinger PR, Halter S, Fischbach KF, Stocker RF. 1999. Three-dimensional reconstruction of the antennal lobe in Drosophila melanogaster. The Journal of Comparative Neurology 405:543–552. doi: 10.1002/(SICI)1096-9861(19990322)405.
Larsson MC, Domingos AI, Jones WD, Chiappe ME, Amrein H, Vosshall LB. 2004. Or83b encodes a broadly expressed odorant receptor essential for Drosophila olfaction. Neuron 43:703–714. doi: 10.1016/j.neuron.2004.08.019.
Lee DD, Seung HS. 1999. Learning the parts of objects by non-negative matrix factorization. Nature 401: 788–791. doi: 10.1038/44565.
Liang L, Li Y, Potter CJ, Yizhar O, Deisseroth K, Tsien RW, Luo L. 2013. GABAergic projection neurons route selective olfactory inputs to specific higher-order neurons. Neuron 79:917–931. doi: 10.1016/j.neuron.2013.06.014.
Livingstone M, Hubel D. 1988. Segregation of form, color, movement, and depth: anatomy, physiology, and perception. Science 240:740–749. doi: 10.1126/science.3283936.
Magee RJ, Kosaric N. 1987. The Microbial production of 2,3-butanediol. Advances in Applied Microbiology 32:89–161. doi: 10.1016/S0065-2164(08)70079-0.
Manni E, Petrosini L. 2004. A century of cerebellar somatotopy: a debated representation. Nature Reviews. Neuroscience 5:241–249. doi: 10.1038/nrn1347.
Marin EC, Jefferis GS, Komiyama T, Zhu H, Luo L. 2002. Representation of the glomerular olfactory map in the Drosophila brain. Cell 109:243–255. doi: 10.1016/S0092-8674(02)00700-6.
Min S, Ai M, Shin SA, Suh GSB. 2013. Dedicated olfactory neurons mediating attraction behavior to ammonia and amines in Drosophila. Proceedings of the National Academy of Sciences of USA 110:E1321–E1329. doi: 10.1073/pnas.1215680110.
Murthy M, Fiete I, Laurent G. 2008. Testing odor response stereotypy in the Drosophila mushroom body. Neuron 59:1009–1023. doi: 10.1016/j.neuron.2008.07.040.
Nakai J, Ohkura M, Imoto K. 2001. A high signal-to-noise Ca(2+) probe composed of a single green fluorescent protein. Nature Biotechnology 19:137–141. doi: 10.1038/84397.
Nassi JJ, Callaway EM. 2009. Parallel processing strategies of the primate visual system. Nature Reviews. Neuroscience 10:360–372. doi: 10.1038/nrn2619.
Okada R, Awasaki T, Ito K. 2009. Gamma-aminobutyric acid (GABA)-mediated neural connections in the Drosophila antennal lobe. The Journal of Comparative Neurology 514:74–91. doi: 10.1002/cne.21971.
Parnas M, Lin AC, Huetteroth W, Miesenböck G. 2013. Odor discrimination in Drosophila: from neural population codes to behavior. Neuron 79:932–944. doi: 10.1016/j.neuron.2013.08.006.
Pasternak T, Greenlee MW. 2005. Working memory in primate sensory systems. Nature Reviews. Neuroscience 6:97–107. doi: 10.1038/nrn1603.
Patterson GH, Lippincott-Schwartz J. 2002. A photoactivatable GFP for selective photolabeling of proteins and cells. Science 297:1873–1877. doi: 10.1126/science.1074952.
Reidl J, Starke J, Omer DB, Grinvald A, Spors H. 2007. Independent component analysis of high-resolution imaging data identifies distinct functional domains. Neuroimage 34:94–108. doi: 10.1016/j.neuroimage.2006.08.031.
Manuscript 1
39

Neuroscience
Strutz et al. eLife 2014;3:e04147. DOI: 10.7554/eLife.04147 21 of 21
Research article
Roussel E, Carcaud J, Combe M, Giurfa M, Sandoz JC. 2014. Olfactory coding in the honeybee lateral horn. Current Biology 24:561–567. doi: 10.1016/j.cub.2014.01.063.
Ruta V, Datta SR, Vasconcelos ML, Freeland J, Looger LL, Axel R. 2010. A dimorphic pheromone circuit in Drosophila from sensory input to descending output. Nature 468:686–690. doi: 10.1038/nature09554.
Rybak J, Kuß A, Hans L, Zachow S, Hege HC, Lienhard M, Singer J, Neubert K, Menzel R. 2010. The digital bee brain: integrating and managing neurons in a common 3D reference system. Frontiers in Systems Neuroscience 4:30. doi: 10.3389/fnsys.2010.00030.
Sanes JR, Zipursky SL. 2010. Design principles of insect and vertebrate visual systems. Neuron 66:15–36. doi: 10.1016/j.neuron.2010.01.018.
Semmelhack JL, Wang JW. 2009. Select Drosophila glomeruli mediate innate olfactory attraction and aversion. Nature 459:218–223. doi: 10.1038/nature07983.
Shang Y, Claridge-Chang A, Sjulson L, Pypaert M, Miesenböck G. 2007. Excitatory local circuits and their implications for olfactory processing in the fly antennal lobe. Cell 128:601–612. doi: 10.1016/j.cell.2006.12.034.
Silbering AF, Okada R, Ito K, Galizia CG. 2008. Olfactory information processing in the Drosophila antennal lobe: anything goes? The Journal of Neuroscience 28:13075–13087. doi: 10.1523/jneurosci.2973-08.2008.
Steck K, Veit D, Grandy R, Badia SBi, Mathews Z, Verschure P, Hansson BS, Knaden M. 2012. A high-throughput behavioral paradigm for Drosophila olfaction - the Flywalk. Scientific Reports 2:361. doi: 10.1038/srep00361.
Stensmyr MC, Dweck HK, Farhan A, Ibba I, Strutz A, Mukunda L, Linz J, Grabe V, Steck K, Lavista-Llanos S, Wicher D, Sachse S, Knaden M, Becher PG, Seki Y, Hansson BS. 2012. A conserved dedicated olfactory circuit for detecting harmful microbes in Drosophila. Cell 151:1345–1357. doi: 10.1016/j.cell.2012.09.046.
Stocker RF, Heimbeck G, Gendre N, de Belle JS. 1997. Neuroblast ablation in Drosophila P[GAL4] lines reveals origins of olfactory interneurons. Journal of Neurobiology 32:443–456. doi: 10.1002/(SICI)1097-4695(199705)32.
Stocker RF, Lienhard MC, Borst A, Fischbach KF. 1990. Neuronal architecture of the antennal lobe in Drosophila melanogaster. Cell and Tissue Research 262:9–34. doi: 10.1007/BF00327741.
Stökl J, Strutz A, Dafni A, Svatos A, Doubsky J, Knaden M, Sachse S, Hansson BS, Stensmyr MC. 2010. A deceptive pollination system targeting Drosophilids through olfactory mimicry of yeast. Current Biology 20:1846–1852. doi: 10.1016/j.cub.2010.09.033.
Strutz A, Voeller T, Riemensperger T, Fiala A, Sachse S. 2012. Calcium imaging of neural activity in the olfactory system of Drosophila. In: Martin JR, editor. Genetically encoded functional indicators. New York, USA: Springer Science+Business Media, LLC. p. 43–70. doi: 10.1007/978-1-62703-014-4_3.
Tanaka NK, Awasaki T, Shimada T, Ito K. 2004. Integration of chemosensory pathways in the Drosophila second-order olfactory centers. Current Biology 14:449–457. doi: 10.1016/j.cub.2004.03.006.
Tian L, Hires SA, Mao T, Huber D, Chiappe ME, Chalasani SH, Petreanu L, Akerboom J, McKinney SA, Schreiter ER, Bargmann CI, Jayaraman V, Svoboda K, Looger LL. 2009. Imaging neural activity in worms, flies and mice with improved GCaMP calcium indicators. Nature Methods 6:875–881. doi: 10.1038/nmeth.1398.
Tully T, Quinn WG. 1985. Classical conditioning and retention in normal and mutant Drosophila melanogaster. Journal of Comparative Physiology A, Sensory, Neural, and Behavioral Physiology 157:263–277. doi: 10.1007/BF01350033.
Vosshall LB, Stocker RF. 2007. Molecular architecture of smell and taste in Drosophila. Annual Review of Neuroscience 30:505–533. doi: 10.1146/annurev.neuro.30.051606.094306.
Vosshall LB, Wong AM, Axel R. 2000. An olfactory sensory map in the fly brain. Cell 102:147–159. doi: 10.1016/S0092-8674(00)00021-0.
Wang JW, Wong AM, Flores J, Vosshall LB, Axel R. 2003a. Two-photon calcium imaging reveals an odor-evoked map of activity in the fly brain. Cell 112:271–282. doi: 10.1016/S0092-8674(03)00004-7.
Wang K, Gong J, Wang Q, Li H, Cheng Q, Liu Y, Zeng S, Wang Z. 2014. Parallel pathways convey olfactory information with opposite polarities in Drosophila. Proceedings of the National Academy of Sciences of USA 111:3164–3169. doi: 10.1073/pnas.1317911111.
Wang Y, Chiang AS, Xia S, Kitamoto T, Tully T, Zhong Y. 2003b. Blockade of neurotransmission in Drosophila mushroom bodies impairs odor attraction, but not repulsion. Current Biology 13:1900–1904. doi: 10.1016/j.cub.2003.10.003.
Wilson RI, Laurent G. 2005. Role of GABAergic inhibition in shaping odor-evoked spatiotemporal patterns in the Drosophila antennal lobe. The Journal of Neuroscience 25:9069–9079. doi: 10.1523/JNEUROSCI.2070-05.2005.
Wilson RI, Mainen ZF. 2006. Early events in olfactory processing. Annual Review of Neuroscience 29:163–201. doi: 10.1146/annurev.neuro.29.051605.112950.
Wilson RI, Turner GC, Laurent G. 2004. Transformation of olfactory representations in the Drosophila antennal lobe. Science 303:366–370. doi: 10.1126/science.1090782.
Wong AM, Wang JW, Axel R. 2002. Spatial representation of the glomerular map in the Drosophila protocer-ebrum. Cell 109:229–241. doi: 10.1016/S0092-8674(02)00707-9.
Manuscript 1
40
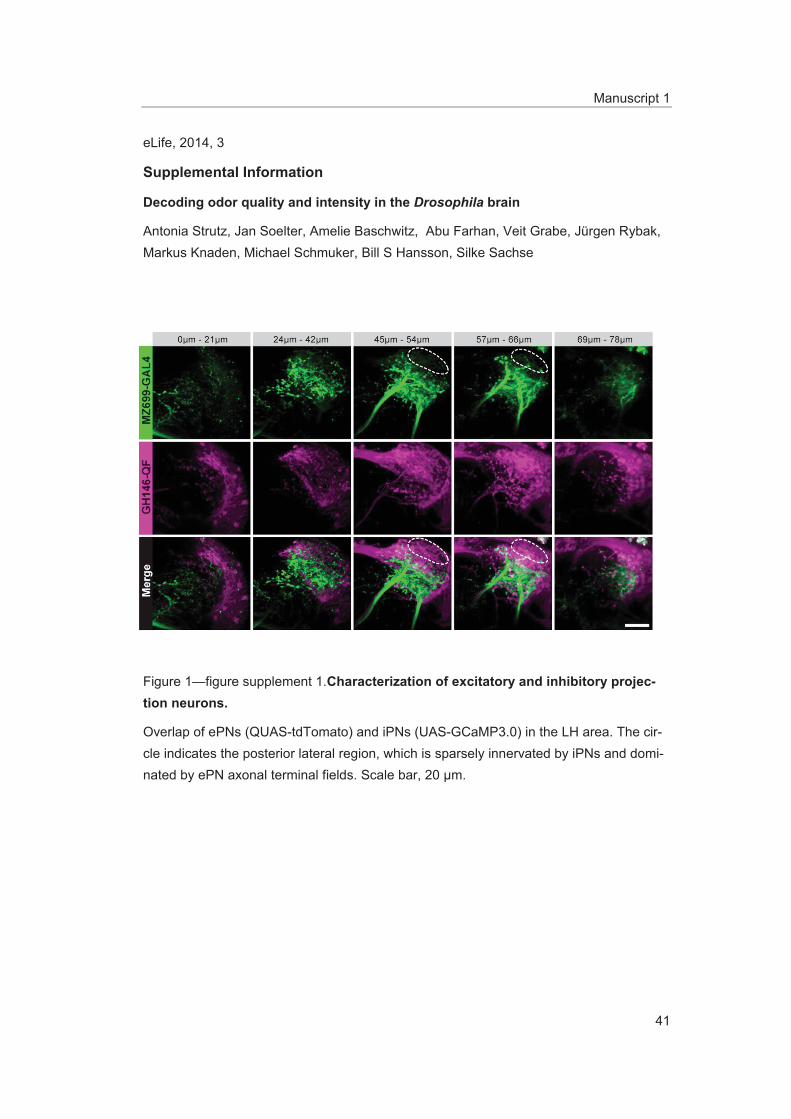
Manuscript 1
41
eLife, 2014, 3
Supplemental Information
Decoding odor quality and intensity in the Drosophila brain
Antonia Strutz, Jan Soelter, Amelie Baschwitz, Abu Farhan, Veit Grabe, Jürgen Rybak, Markus Knaden, Michael Schmuker, Bill S Hansson, Silke Sachse
Figure 1—figure supplement 1.Characterization of excitatory and inhibitory projec-tion neurons.
Overlap of ePNs (QUAS-tdTomato) and iPNs (UAS-GCaMP3.0) in the LH area. The cir-cle indicates the posterior lateral region, which is sparsely innervated by iPNs and domi-nated by ePN axonal terminal fields. Scale bar, 20 μm.
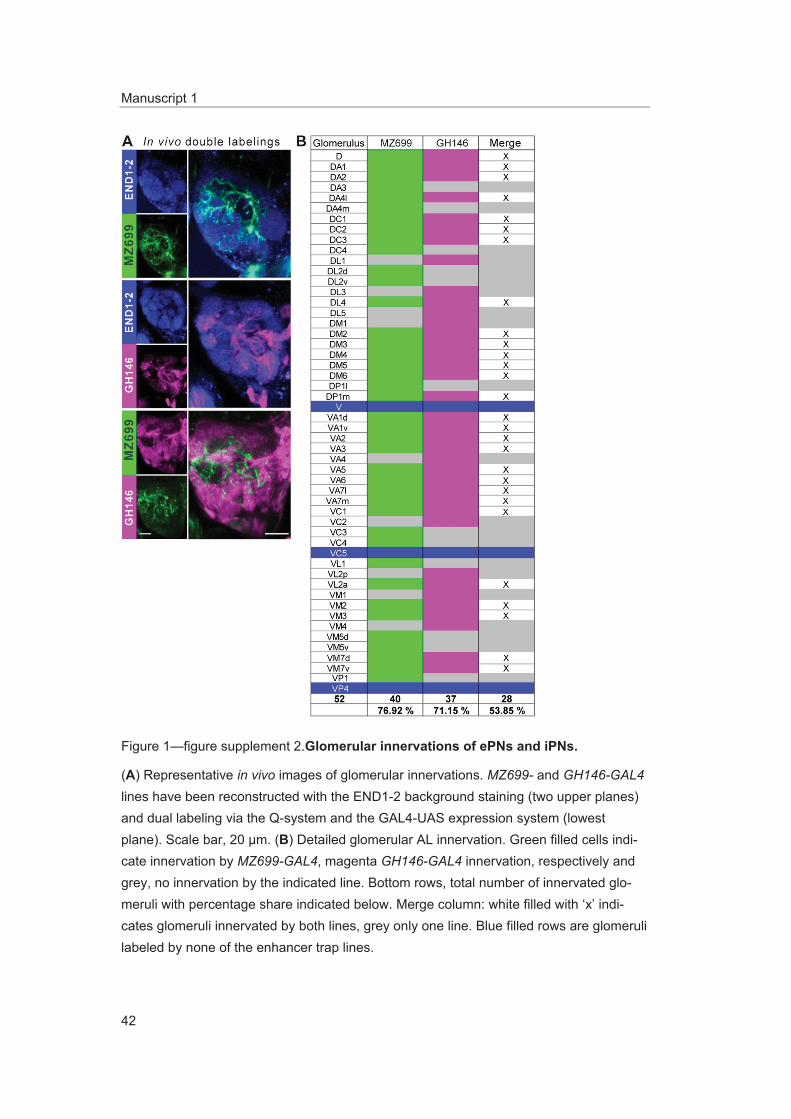
Manuscript 1
42
Figure 1—figure supplement 2.Glomerular innervations of ePNs and iPNs.
(A) Representative in vivo images of glomerular innervations. MZ699- and GH146-GAL4 lines have been reconstructed with the END1-2 background staining (two upper planes) and dual labeling via the Q-system and the GAL4-UAS expression system (lowest plane). Scale bar, 20 μm. (B) Detailed glomerular AL innervation. Green filled cells indi-cate innervation by MZ699-GAL4, magenta GH146-GAL4 innervation, respectively and grey, no innervation by the indicated line. Bottom rows, total number of innervated glo-meruli with percentage share indicated below. Merge column: white filled with ‘x’ indi-cates glomeruli innervated by both lines, grey only one line. Blue filled rows are glomeruli labeled by none of the enhancer trap lines.
Manuscript 1
43
Figure 2—figure supplement 1.Odor-evoked activity patterns in the LH are reproduc-ible and stereotypic.
Odor-evoked Ca2+ responses ( F/F%) in the LH for the three odors acetoin acetate, bal-samic vinegar and benzaldehyde in four animals are shown as false-color coded images. Two measurements in each animal are given to reveal that the activity patterns are high-ly reproducible within one animal. Comparison between the patterns among individuals shows that the activity regions are stereotypic. Numbers in the lower right corner indicate individual maxima. The F/F scale bar is shown at the bottom.
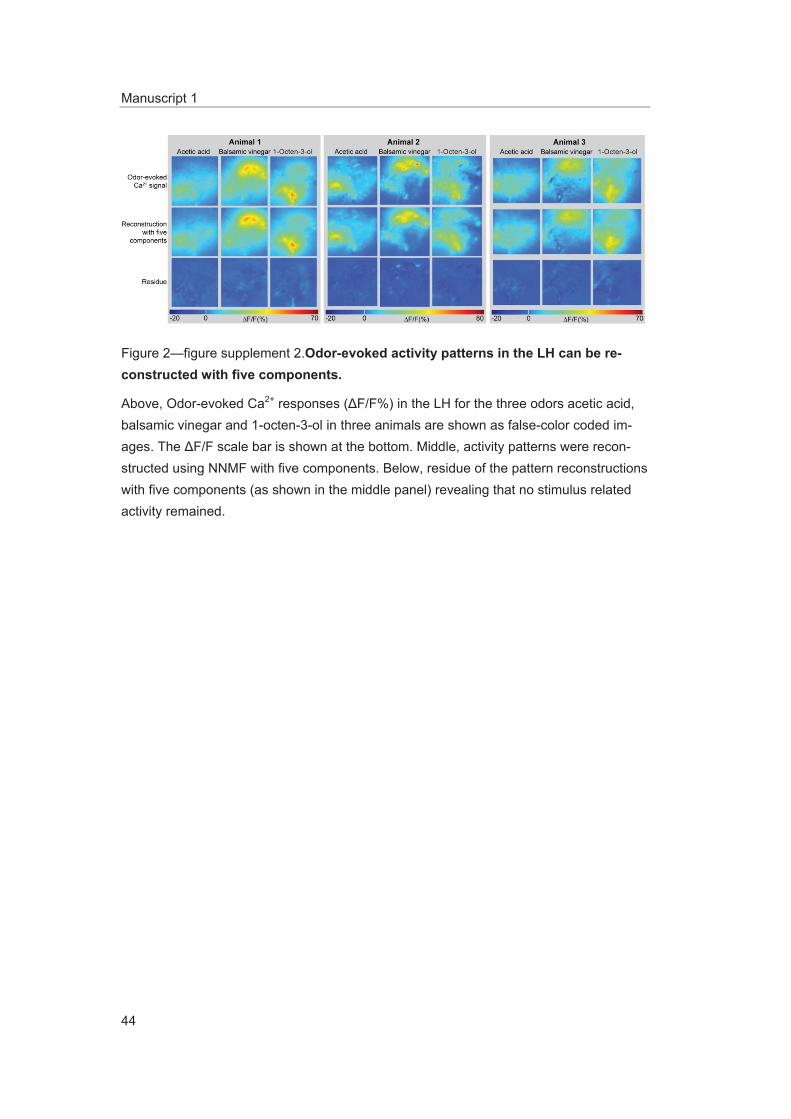
Manuscript 1
44
Figure 2—figure supplement 2.Odor-evoked activity patterns in the LH can be re-constructed with five components.
Above, Odor-evoked Ca2+ responses ( F/F%) in the LH for the three odors acetic acid, balsamic vinegar and 1-octen-3-ol in three animals are shown as false-color coded im-ages. The F/F scale bar is shown at the bottom. Middle, activity patterns were recon-structed using NNMF with five components. Below, residue of the pattern reconstructions with five components (as shown in the middle panel) revealing that no stimulus related activity remained.
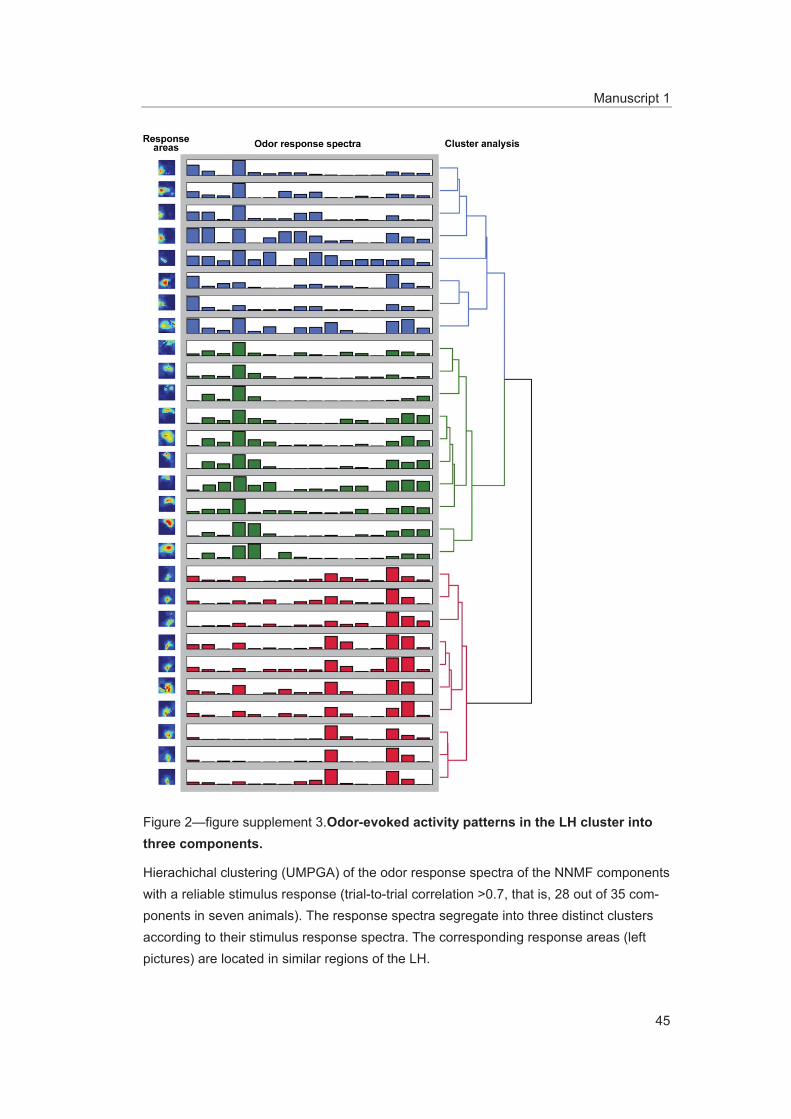
Manuscript 1
45
Figure 2—figure supplement 3.Odor-evoked activity patterns in the LH cluster into three components.
Hierachichal clustering (UMPGA) of the odor response spectra of the NNMF components with a reliable stimulus response (trial-to-trial correlation >0.7, that is, 28 out of 35 com-ponents in seven animals). The response spectra segregate into three distinct clusters according to their stimulus response spectra. The corresponding response areas (left pictures) are located in similar regions of the LH.
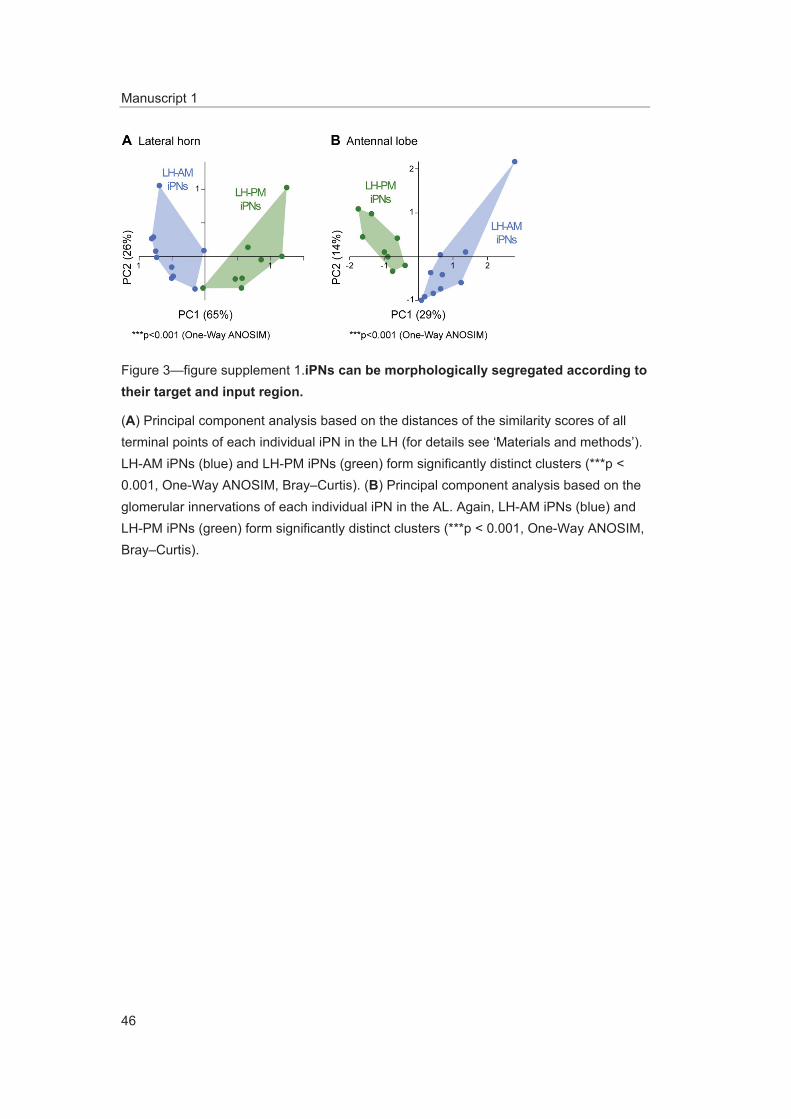
Manuscript 1
46
Figure 3—figure supplement 1.iPNs can be morphologically segregated according to their target and input region.
(A) Principal component analysis based on the distances of the similarity scores of all terminal points of each individual iPN in the LH (for details see ‘Materials and methods’). LH-AM iPNs (blue) and LH-PM iPNs (green) form significantly distinct clusters (***p < 0.001, One-Way ANOSIM, Bray–Curtis). (B) Principal component analysis based on the glomerular innervations of each individual iPN in the AL. Again, LH-AM iPNs (blue) and LH-PM iPNs (green) form significantly distinct clusters (***p < 0.001, One-Way ANOSIM, Bray–Curtis).

Manuscript 1
47
Figure 3—figure supplement 2.Glomerular innervations of individual iPNs.
Binary innervation patterns of 25 individually labeled MZ699+ iPNs using PA-GFP. Col-umns represent innervation patterns of individual neurons which have been grouped according to their innervation properties; rows represent 51 glomeruli in the AL along with the innervation in the specific odor response domains in the LH (LH-PM, LH-AM) and/or the mushroom body calyx (MBc). Glomeruli have been sorted according to their iPN innervation. Grey, innervated; white, not innervated.
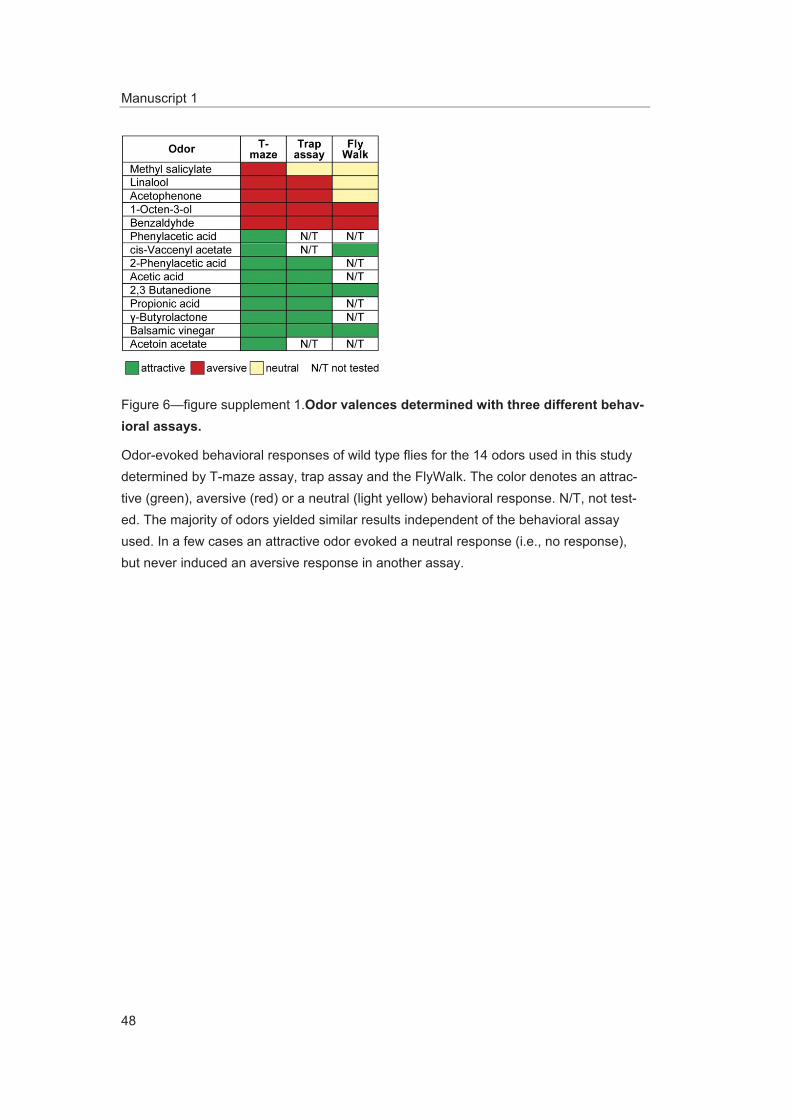
Manuscript 1
48
Figure 6—figure supplement 1.Odor valences determined with three different behav-ioral assays.
Odor-evoked behavioral responses of wild type flies for the 14 odors used in this study determined by T-maze assay, trap assay and the FlyWalk. The color denotes an attrac-tive (green), aversive (red) or a neutral (light yellow) behavioral response. N/T, not test-ed. The majority of odors yielded similar results independent of the behavioral assay used. In a few cases an attractive odor evoked a neutral response (i.e., no response), but never induced an aversive response in another assay.

Manuscript 1
49
Figure 6—figure supplement 2.Calcium responses of OSNs.
(A) Representative glomerular Ca2+-responses of OSNs in the AL for a subset of odor-ants at three concentrations. Scale bar to the right. Control (mineral oil) recordings are shown additionally as full false-color coded images. (B) Glomerular AL atlas used for glomerular identification. (C) Median Ca2+-activity traces of all glomeruli for all odorants at the three indicated concentrations. Scale bar and control measurement in the center. Odor application is indicated by the grey bar below the heatmaps (n = 6–7).

Manuscript 1
50
Figure 6—figure supplement 3.Correlation matrices for odor-evoked responses in the AL and LH.
Complete correlation matrices for calcium activity patterns of OSNs in the AL (left) and iPNs in the LH (right). The odors are arranged according to single linkage clustering of the AL activity patterns. Heatmap color-code refers to the correlation distance scale bar below each matrix. Odor letters are color-coded according to hedonic valence; 10 6 RI values are labeled in grey (complete list right hand).

Manuscript 2
51
Manuscript 2
Digital in vivo 3D atlas of the antennal lobe of Drosophila melanogaster
Veit Grabe, Antonia Strutz, Amelie Baschwitz, Bill S. Hansson, Silke Sachse
The Journal of Comparative Neurology; 523, 530-544.
Published, 15 February 2015 (DOI: 10.1002/cne.23697)
Copyright 2014 by John Wiley and Sons. Reproduced with permission of John Wiley and Sons in the format Dissertation via Copyright Clearance Center.
License Number 4160110604675
Digital In Vivo 3D Atlas of the Antennal Lobe ofDrosophila melanogaster
Veit Grabe, Antonia Strutz, Amelie Baschwitz, Bill S. Hansson, and Silke Sachse*
Department of Evolutionary Neuroethology, Max Planck Institute for Chemical Ecology, 07745 Jena, Germany
ABSTRACTAs a model for primary olfactory perception, the anten-
nal lobe (AL) of Drosophila melanogaster is among the
most thoroughly investigated and well-understood neu-
ronal structures. Most studies investigating the func-
tional properties and neuronal wiring of the AL are
conducted in vivo, although so far the AL morphology
has been mainly analyzed in vitro. Identifying the mor-
phological subunits of the AL—the olfactory glomeruli—is
usually done using in vitro AL atlases. However, the dis-
section and fixation procedure causes not only strong
volumetric but also geometrical modifications; the
result is unpredictable dislocation and a distortion of
the AL glomeruli between the in vitro and in vivo brains.
Hence, to characterize these artifacts, which are
caused by in vitro processing, and to reliably identify
glomeruli for in vivo applications, we generated a trans-
genic fly that expresses the red fluorescent protein
DsRed directly fused to the presynaptic protein n-syn-
aptobrevin, under the control of the pan-neuronal pro-
motor elav to label the neuropil in the live animal.
Using this fly line, we generated a digital 3D atlas of
the live Drosophila AL; this atlas, the first of its kind,
provides an excellent geometric match for in vivo stud-
ies. We verified the identity of 63% of AL glomeruli by
mapping the projections of 34 GAL4-lines of individual
chemosensory receptor genes. Moreover, we character-
ized the innervation patterns of the two most frequently
used GAL4-lines in olfactory research: Orco- and
GH146-GAL4. The new in vivo AL atlas will be accessi-
ble online to the neuroscience community. J. Comp.
Neurol. 000:000–000, 2014.
VC 2014 Wiley Periodicals, Inc.
INDEXING TERMS: Drosophila melanogaster; olfactory system; glomeruli; in vivo neuropil marker; in vitro artifacts
The chemical environment consists of a vast and
quickly changing array of volatile cues, each of which
has different ecological relevance. To orient itself within
this complex environment, the vinegar fly Drosophila
melanogaster possesses an elaborate olfactory system
consisting on the periphery of a set of four classes of
sensilla present in stereotypical patterns on the third
antennal segment and the maxillary palp (Vosshall and
Stocker, 2007). Each type of sensillum—antennal basi-
conic, trichoid, coeloconic, or palp basiconic—houses
from one to four olfactory sensory neurons (OSNs).
Each OSN expresses a repertoire of one or two chemo-
sensory receptors (CRs); each CR has a unique molecu-
lar receptive range (Shanbhag et al., 1999; de Bruyne
et al., 2001; Hallem and Carlson, 2006; Silbering et al.,
2011). The information gathered on volatile odorants
intercepted by the antenna is forwarded to the primary
center of the olfactory pathway, the antennal lobe (AL).
The Drosophila AL represents one of the most compre-
hensively investigated neuronal structures in nature
(Stocker et al., 1990; Masse et al., 2009; Galizia and
Sachse, 2010; Hansson et al., 2010; Wilson, 2013). It
consists of discrete neuropil subunits, called olfactory
glomeruli, which are conserved among individuals and
can be identified by their specific position and size
(Laissue et al., 1999). Each glomerulus collects OSN
axons of only one type due to the strict convergence of
OSNs expressing the same CR type (Gao et al., 2000;
Vosshall et al., 2000).
In order to study the odor-coding mechanisms of the
AL, a broad spectrum of in vivo or ex vivo techniques,
such as the photolesioning of specified tracts (Liang
et al., 2013), the photoactivation of single neurons
The first two authors contributed equally to this work.
Grant sponsor: Federal Ministry of Research and Education (BMBF);Grant sponsor: Max Planck Society (MPG).
*CORRESPONDENCE TO: Silke Sachse, Department of EvolutionaryNeuroethology, Max Planck Institute for Chemical Ecology, Hans-Kn€oll-Str. 8,07745 Jena, Germany. E-mail: [email protected]
Received September 4, 2014; Revised October 6, 2014;Accepted October 14, 2014.DOI 10.1002/cne.23697Published online Month 00, 2014 in Wiley Online Library(wileyonlinelibrary.com)VC 2014 Wiley Periodicals, Inc.
The Journal of Comparative Neurology | Research in Systems Neuroscience 00:00–00 (2014) 1
RESEARCH ARTICLE
Manuscript 2
52
(Datta et al., 2008; Ruta et al., 2010; Caron et al.,
2013), patch clamp recordings (Wilson et al., 2004;
Chou et al., 2010; Seki et al., 2010), as well as func-
tional imaging (Fiala et al., 2002; Ng et al., 2002; Wang
et al., 2003; Silbering et al., 2008; St€okl et al., 2010;
Schubert et al., 2014) has been established over the
last years. All these techniques demand an adequate
atlas for the identification of the anatomical substruc-
tures—the glomeruli—so that they can be applied in vivo.
However, all previous 3D atlases of the Drosophila AL
have derived from in vitro data (Stocker et al., 1983;
Laissue et al., 1999; Couto et al., 2005; Endo et al.,
2007; Silbering et al., 2011; Tanaka et al., 2012). Since
the dissection and fixation procedure causes not only
strong volumetric but also geometric modifications (Ma
et al., 2008), the result is the unpredictable dislocation
and distortion of the AL glomeruli between the in vitro
and in vivo brains. In order to reliably identify glomeruli
in the live fly brain, an atlas of the in vivo AL is
essential.
In this study we present the first digital 3D atlas of
the live Drosophila AL. To identify glomeruli in vivo, we
generated a transgenic fly that expresses the red fluo-
rescent protein DsRed directly fused to the presynaptic
protein n-synaptobrevin, under the control of the pan-
neuronal promotor elav (Yao et al., 1993) to selectively
label the neuropil in the live animal. In addition, we
expressed a green fluorescent protein under the control
of 34 individual chemosensory receptor genes (Couto
et al., 2005; Fishilevich and Vosshall, 2005; Silbering
et al., 2011) to confirm the correct identification of
most glomeruli by its type of OSN innervation. Once
quantified and compared to in vitro data, the new
in vivo data were used to demonstrate nontrivial and
unexpected structural deformations and distortions of
the majority of glomeruli caused by in vitro processing.
These results support the need for a digital in vivo 3D
atlas of the fly AL to find geometric matches for in vivo
studies. Furthermore, we characterized the glomerular
innervation patterns of the two most frequently used
GAL4-lines in olfactory research: Orco-GAL4 as well as
GH146-GAL4. The new in vivo 3D AL atlas will be pub-
licly accessible to the neuroscience community through
our website (www.ice.mpg.de/ext/invivoALatlas.html).
MATERIALS AND METHODS
Fly linesP[END1-2] (elav n-synaptobrevin-DsRed 1-2) was gen-
erated using a modified pCaST-elav-GAL4AD vector
(plasmid 15307, Addgene, Cambridge, MA). The GAD
domain present in the original vector was excised using
NotI and FspAI enzymes; the FspAI recognition site was
located within the DsRed coding sequence. A DNA oli-
gonucleotide containing a modified n-synaptobrevin-cod-
ing ORF (n-syb) (DiAntonio et al., 1993), upstream of a
sequence identical to the excised DsRed fragment, and
a Drosophila Kozak site (caaaATG) and recognition sites
for NotI and FspAI were synthesized and inserted into
the vector. The n-syb contains one silent mutation
(C168T) to eliminate an FspAI-recognition site within
the fragment. Excision, synthesis, and ligation were per-
formed by MWG Eurofins (Ebersberg, Germany). The
resulting plasmid was amplified in E. coli (One Shot
Top10 E. coli, Invitrogen, Eugene, OR) and purified
using a Qiagen midi-prep kit (Qiagen, Hilden, Germany).
Embryo transformation to generate transgenic lines was
performed by Aktogen (Cambridge, UK).
All fly stocks were maintained on conventional
cornmeal-agar-molasses medium under a 12-hour light:
dark cycle at 25�C. Transgenic lines used were as fol-
lows: Gr21a-GAL4 (Scott et al., 2001), Ir40a-GAL4
(RRID:BDSC_41727), Ir41a-GAL4 (RRID:BDSC_41749),
Ir75a-GAL4 (RRID:BDSC_41748 (Silbering et al., 2011)),
Ir76a-GAL4 (RRID:BDSC_41735 (Benton et al., 2009)),
Ir92a-GAL4 (RRID:BDSC_41733 (Abuin et al., 2011)),
Or10a-GAL4 (RRID:BDSC_9944), Or13a-GAL4 (RRID:
BDSC_23886), Or22a-GAL4 (RRID:BDSC_9951), Or33c-
GAL4 (RRID:BDSC_9966), Or35a-GAL4 (RRID:BDSC_
9968), Or42a-GAL4 (RRID:BDSC_9969), Or42b-GAL4
(RRID:BDSC_9972), Or43a-GAL4 (RRID:BDSC_9973),
Or43b-GAL4 (RRID:BDSC_23895), Or46aA-GAL4 (RRID:
BDSC_9979), Or47a-GAL4 (RRID:BDSC_9982), Or47b-
GAL4 (RRID:BDSC_9984), Or49a-GAL4 (RRID:BDSC_9985),
Or56a-GAL4 (RRID:BDSC_23896), Or59b-GAL4 (RRID:
BDSC_23897), Or59c-GAL4 (RRID:BDSC_23899), Or67a-
GAL4 (RRID:BDSC_23904), Or67c-GAL4 (RRID:BDSC_
24856), Or69a-GAL4 (RRID:BDSC_10000), Or71a-GAL4
(RRID:BDSC_23121), Or83c-GAL4 (RRID:BDSC_23132),
Or85a-GAL4 (RRID:BDSC_24461), Or85b-GAL4 (RRID:
BDSC_23912), Or85d-GAL4 (RRID:BDSC_24148), Or88a-
GAL4 (RRID:BDSC_23137), Or92a-GAL4 (RRID:BDSC_
23139), Or98a-GAL4 (RRID:BDSC_23141 (Vosshall et al.,
2000; Fishilevich and Vosshall, 2005)), Or67d-GAL4 (RRID:
BDSC_23906 (Kurtovic et al., 2007)), UAS-GCaMP3.0
(RRID:BDSC_32116 (Tian et al., 2009)), GH146-GAL4
(RRID:BDSC_30026 (Stocker et al., 1997)), Orco-GAL4
(RRID:BDSC_26818 (Larsson et al., 2004)).
In vivo antenna and brain preparationBetween 3 to 6 days after hatching, female flies
were anesthetized with CO2. In order to scan labeled
OSN somata on the third segment of the antenna (Fig.
1D), the whole antenna was gently severed using for-
ceps and transferred to a drop of saline with Triton-X
on an object holder. The antennae were then gathered
V. Grabe et al.
2 The Journal of Comparative Neurology |Research in Systems Neuroscience
Manuscript 2
53
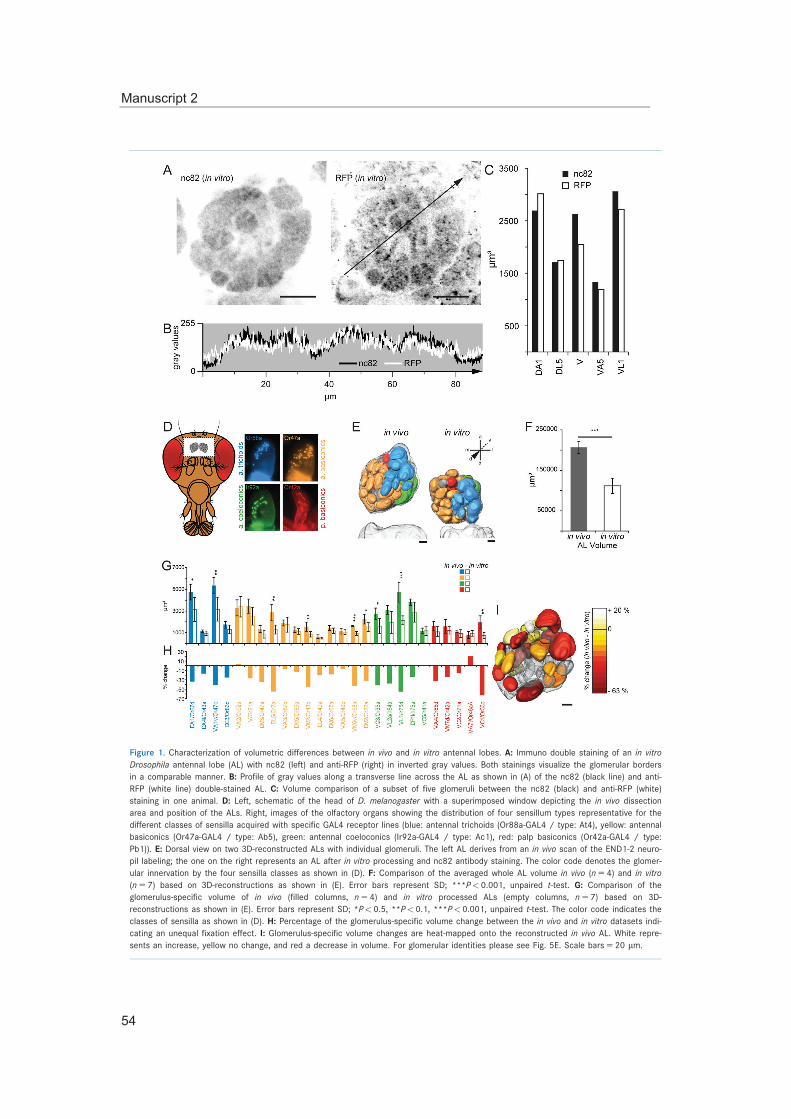
Figure 1. Characterization of volumetric differences between in vivo and in vitro antennal lobes. A: Immuno double staining of an in vitro
Drosophila antennal lobe (AL) with nc82 (left) and anti-RFP (right) in inverted gray values. Both stainings visualize the glomerular borders
in a comparable manner. B: Profile of gray values along a transverse line across the AL as shown in (A) of the nc82 (black line) and anti-
RFP (white line) double-stained AL. C: Volume comparison of a subset of five glomeruli between the nc82 (black) and anti-RFP (white)
staining in one animal. D: Left, schematic of the head of D. melanogaster with a superimposed window depicting the in vivo dissection
area and position of the ALs. Right, images of the olfactory organs showing the distribution of four sensillum types representative for the
different classes of sensilla acquired with specific GAL4 receptor lines (blue: antennal trichoids (Or88a-GAL4 / type: At4), yellow: antennal
basiconics (Or47a-GAL4 / type: Ab5), green: antennal coeloconics (Ir92a-GAL4 / type: Ac1), red: palp basiconics (Or42a-GAL4 / type:
Pb1)). E: Dorsal view on two 3D-reconstructed ALs with individual glomeruli. The left AL derives from an in vivo scan of the END1-2 neuro-
pil labeling; the one on the right represents an AL after in vitro processing and nc82 antibody staining. The color code denotes the glomer-
ular innervation by the four sensilla classes as shown in (D). F: Comparison of the averaged whole AL volume in vivo (n5 4) and in vitro
(n5 7) based on 3D-reconstructions as shown in (E). Error bars represent SD; ***P< 0.001, unpaired t-test. G: Comparison of the
glomerulus-specific volume of in vivo (filled columns, n5 4) and in vitro processed ALs (empty columns, n5 7) based on 3D-
reconstructions as shown in (E). Error bars represent SD; *P< 0.5, **P< 0.1, ***P< 0.001, unpaired t-test. The color code indicates the
classes of sensilla as shown in (D). H: Percentage of the glomerulus-specific volume change between the in vivo and in vitro datasets indi-
cating an unequal fixation effect. I: Glomerulus-specific volume changes are heat-mapped onto the reconstructed in vivo AL. White repre-
sents an increase, yellow no change, and red a decrease in volume. For glomerular identities please see Fig. 5E. Scale bars5 20 lm.
Manuscript 2
54
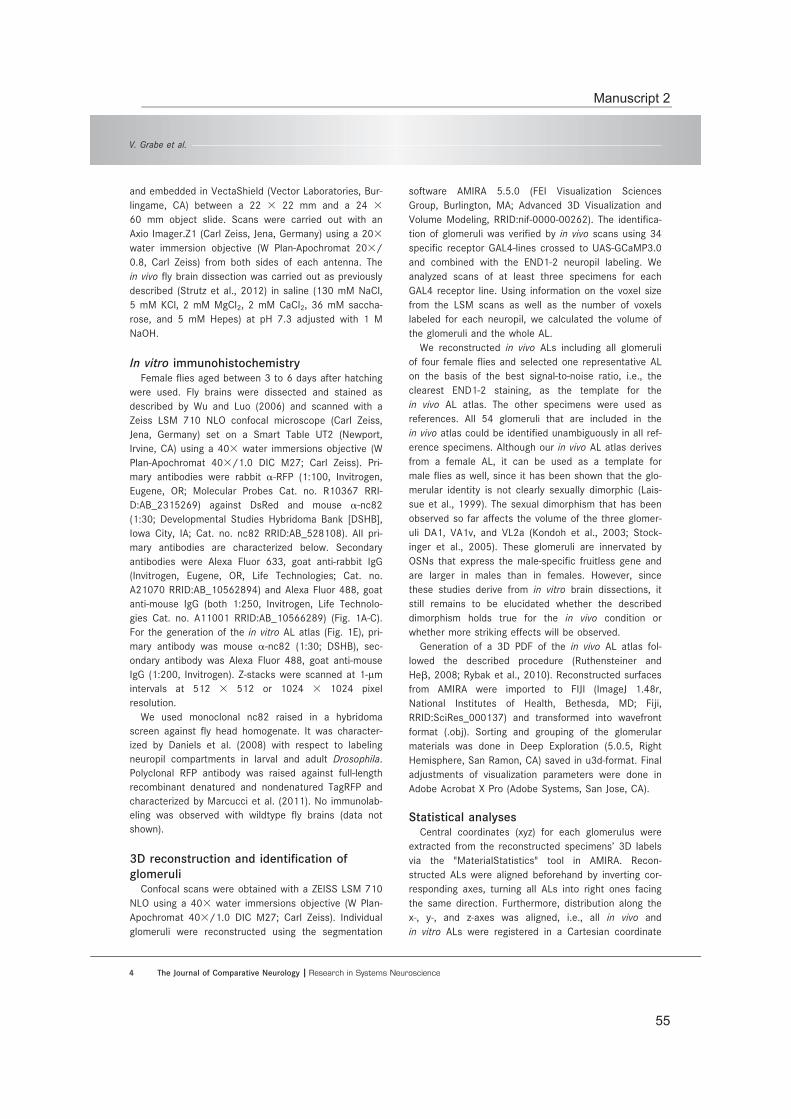
and embedded in VectaShield (Vector Laboratories, Bur-
lingame, CA) between a 22 3 22 mm and a 24 360 mm object slide. Scans were carried out with an
Axio Imager.Z1 (Carl Zeiss, Jena, Germany) using a 203
water immersion objective (W Plan-Apochromat 203/
0.8, Carl Zeiss) from both sides of each antenna. The
in vivo fly brain dissection was carried out as previously
described (Strutz et al., 2012) in saline (130 mM NaCl,
5 mM KCl, 2 mM MgCl2, 2 mM CaCl2, 36 mM saccha-
rose, and 5 mM Hepes) at pH 7.3 adjusted with 1 M
NaOH.
In vitro immunohistochemistryFemale flies aged between 3 to 6 days after hatching
were used. Fly brains were dissected and stained as
described by Wu and Luo (2006) and scanned with a
Zeiss LSM 710 NLO confocal microscope (Carl Zeiss,
Jena, Germany) set on a Smart Table UT2 (Newport,
Irvine, CA) using a 403 water immersions objective (W
Plan-Apochromat 403/1.0 DIC M27; Carl Zeiss). Pri-
mary antibodies were rabbit a-RFP (1:100, Invitrogen,
Eugene, OR; Molecular Probes Cat. no. R10367 RRI-
D:AB_2315269) against DsRed and mouse a-nc82(1:30; Developmental Studies Hybridoma Bank [DSHB],
Iowa City, IA; Cat. no. nc82 RRID:AB_528108). All pri-
mary antibodies are characterized below. Secondary
antibodies were Alexa Fluor 633, goat anti-rabbit IgG
(Invitrogen, Eugene, OR, Life Technologies; Cat. no.
A21070 RRID:AB_10562894) and Alexa Fluor 488, goat
anti-mouse IgG (both 1:250, Invitrogen, Life Technolo-
gies Cat. no. A11001 RRID:AB_10566289) (Fig. 1A-C).
For the generation of the in vitro AL atlas (Fig. 1E), pri-
mary antibody was mouse a-nc82 (1:30; DSHB), sec-
ondary antibody was Alexa Fluor 488, goat anti-mouse
IgG (1:200, Invitrogen). Z-stacks were scanned at 1-lmintervals at 512 3 512 or 1024 3 1024 pixel
resolution.
We used monoclonal nc82 raised in a hybridoma
screen against fly head homogenate. It was character-
ized by Daniels et al. (2008) with respect to labeling
neuropil compartments in larval and adult Drosophila.
Polyclonal RFP antibody was raised against full-length
recombinant denatured and nondenatured TagRFP and
characterized by Marcucci et al. (2011). No immunolab-
eling was observed with wildtype fly brains (data not
shown).
3D reconstruction and identification ofglomeruli
Confocal scans were obtained with a ZEISS LSM 710
NLO using a 403 water immersions objective (W Plan-
Apochromat 403/1.0 DIC M27; Carl Zeiss). Individual
glomeruli were reconstructed using the segmentation
software AMIRA 5.5.0 (FEI Visualization Sciences
Group, Burlington, MA; Advanced 3D Visualization and
Volume Modeling, RRID:nif-0000-00262). The identifica-
tion of glomeruli was verified by in vivo scans using 34
specific receptor GAL4-lines crossed to UAS-GCaMP3.0
and combined with the END1-2 neuropil labeling. We
analyzed scans of at least three specimens for each
GAL4 receptor line. Using information on the voxel size
from the LSM scans as well as the number of voxels
labeled for each neuropil, we calculated the volume of
the glomeruli and the whole AL.
We reconstructed in vivo ALs including all glomeruli
of four female flies and selected one representative AL
on the basis of the best signal-to-noise ratio, i.e., the
clearest END1-2 staining, as the template for the
in vivo AL atlas. The other specimens were used as
references. All 54 glomeruli that are included in the
in vivo atlas could be identified unambiguously in all ref-
erence specimens. Although our in vivo AL atlas derives
from a female AL, it can be used as a template for
male flies as well, since it has been shown that the glo-
merular identity is not clearly sexually dimorphic (Lais-
sue et al., 1999). The sexual dimorphism that has been
observed so far affects the volume of the three glomer-
uli DA1, VA1v, and VL2a (Kondoh et al., 2003; Stock-
inger et al., 2005). These glomeruli are innervated by
OSNs that express the male-specific fruitless gene and
are larger in males than in females. However, since
these studies derive from in vitro brain dissections, it
still remains to be elucidated whether the described
dimorphism holds true for the in vivo condition or
whether more striking effects will be observed.
Generation of a 3D PDF of the in vivo AL atlas fol-
lowed the described procedure (Ruthensteiner and
Heb, 2008; Rybak et al., 2010). Reconstructed surfaces
from AMIRA were imported to FIJI (ImageJ 1.48r,
National Institutes of Health, Bethesda, MD; Fiji,
RRID:SciRes_000137) and transformed into wavefront
format (.obj). Sorting and grouping of the glomerular
materials was done in Deep Exploration (5.0.5, Right
Hemisphere, San Ramon, CA) saved in u3d-format. Final
adjustments of visualization parameters were done in
Adobe Acrobat X Pro (Adobe Systems, San Jose, CA).
Statistical analysesCentral coordinates (xyz) for each glomerulus were
extracted from the reconstructed specimens’ 3D labels
via the "MaterialStatistics" tool in AMIRA. Recon-
structed ALs were aligned beforehand by inverting cor-
responding axes, turning all ALs into right ones facing
the same direction. Furthermore, distribution along the
x-, y-, and z-axes was aligned, i.e., all in vivo and
in vitro ALs were registered in a Cartesian coordinate
V. Grabe et al.
4 The Journal of Comparative Neurology |Research in Systems Neuroscience
Manuscript 2
55
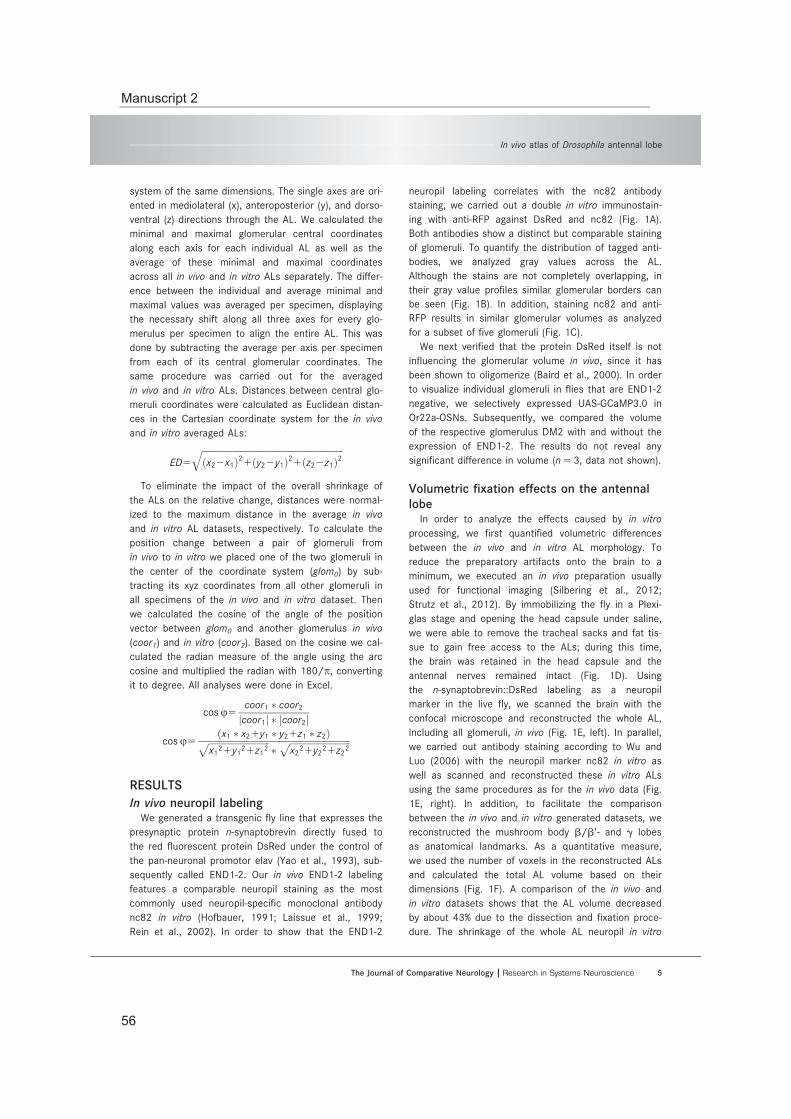
system of the same dimensions. The single axes are ori-
ented in mediolateral (x), anteroposterior (y), and dorso-
ventral (z) directions through the AL. We calculated the
minimal and maximal glomerular central coordinates
along each axis for each individual AL as well as the
average of these minimal and maximal coordinates
across all in vivo and in vitro ALs separately. The differ-
ence between the individual and average minimal and
maximal values was averaged per specimen, displaying
the necessary shift along all three axes for every glo-
merulus per specimen to align the entire AL. This was
done by subtracting the average per axis per specimen
from each of its central glomerular coordinates. The
same procedure was carried out for the averaged
in vivo and in vitro ALs. Distances between central glo-
meruli coordinates were calculated as Euclidean distan-
ces in the Cartesian coordinate system for the in vivo
and in vitro averaged ALs:
ED5ffiffiffiffiffiffiffiffiffiffiffiffiffiffiffiffiffiffiffiffiffiffiffiffiffiffiffiffiffiffiffiffiffiffiffiffiffiffiffiffiffiffiffiffiffiffiffiffiffiffiffiffiffiffiffiffiffiffiffiffiffiffix22x1ð Þ21 y22y1ð Þ21 z22z1ð Þ2
q
To eliminate the impact of the overall shrinkage of
the ALs on the relative change, distances were normal-
ized to the maximum distance in the average in vivo
and in vitro AL datasets, respectively. To calculate the
position change between a pair of glomeruli from
in vivo to in vitro we placed one of the two glomeruli in
the center of the coordinate system (glom0) by sub-
tracting its xyz coordinates from all other glomeruli in
all specimens of the in vivo and in vitro dataset. Then
we calculated the cosine of the angle of the position
vector between glom0 and another glomerulus in vivo
(coor1) and in vitro (coor2). Based on the cosine we cal-
culated the radian measure of the angle using the arc
cosine and multiplied the radian with 180/p, convertingit to degree. All analyses were done in Excel.
cosu5coor1 � coor2
jcoor1j � jcoor2jcosu5
ðx1 � x21y1 � y21z1 � z2Þffiffiffiffiffiffiffiffiffiffiffiffiffiffiffiffiffiffiffiffiffiffiffiffiffiffiffix121y121z12
p�
ffiffiffiffiffiffiffiffiffiffiffiffiffiffiffiffiffiffiffiffiffiffiffiffiffiffiffix221y221z22
p
RESULTS
In vivo neuropil labelingWe generated a transgenic fly line that expresses the
presynaptic protein n-synaptobrevin directly fused to
the red fluorescent protein DsRed under the control of
the pan-neuronal promotor elav (Yao et al., 1993), sub-
sequently called END1-2. Our in vivo END1-2 labeling
features a comparable neuropil staining as the most
commonly used neuropil-specific monoclonal antibody
nc82 in vitro (Hofbauer, 1991; Laissue et al., 1999;
Rein et al., 2002). In order to show that the END1-2
neuropil labeling correlates with the nc82 antibody
staining, we carried out a double in vitro immunostain-
ing with anti-RFP against DsRed and nc82 (Fig. 1A).
Both antibodies show a distinct but comparable staining
of glomeruli. To quantify the distribution of tagged anti-
bodies, we analyzed gray values across the AL.
Although the stains are not completely overlapping, in
their gray value profiles similar glomerular borders can
be seen (Fig. 1B). In addition, staining nc82 and anti-
RFP results in similar glomerular volumes as analyzed
for a subset of five glomeruli (Fig. 1C).
We next verified that the protein DsRed itself is not
influencing the glomerular volume in vivo, since it has
been shown to oligomerize (Baird et al., 2000). In order
to visualize individual glomeruli in flies that are END1-2
negative, we selectively expressed UAS-GCaMP3.0 in
Or22a-OSNs. Subsequently, we compared the volume
of the respective glomerulus DM2 with and without the
expression of END1-2. The results do not reveal any
significant difference in volume (n5 3, data not shown).
Volumetric fixation effects on the antennallobe
In order to analyze the effects caused by in vitro
processing, we first quantified volumetric differences
between the in vivo and in vitro AL morphology. To
reduce the preparatory artifacts onto the brain to a
minimum, we executed an in vivo preparation usually
used for functional imaging (Silbering et al., 2012;
Strutz et al., 2012). By immobilizing the fly in a Plexi-
glas stage and opening the head capsule under saline,
we were able to remove the tracheal sacks and fat tis-
sue to gain free access to the ALs; during this time,
the brain was retained in the head capsule and the
antennal nerves remained intact (Fig. 1D). Using
the n-synaptobrevin::DsRed labeling as a neuropil
marker in the live fly, we scanned the brain with the
confocal microscope and reconstructed the whole AL,
including all glomeruli, in vivo (Fig. 1E, left). In parallel,
we carried out antibody staining according to Wu and
Luo (2006) with the neuropil marker nc82 in vitro as
well as scanned and reconstructed these in vitro ALs
using the same procedures as for the in vivo data (Fig.
1E, right). In addition, to facilitate the comparison
between the in vivo and in vitro generated datasets, we
reconstructed the mushroom body b/b’- and g lobes
as anatomical landmarks. As a quantitative measure,
we used the number of voxels in the reconstructed ALs
and calculated the total AL volume based on their
dimensions (Fig. 1F). A comparison of the in vivo and
in vitro datasets shows that the AL volume decreased
by about 43% due to the dissection and fixation proce-
dure. The shrinkage of the whole AL neuropil in vitro
In vivo atlas of Drosophila antennal lobe
The Journal of Comparative Neurology | Research in Systems Neuroscience 5
Manuscript 2
56
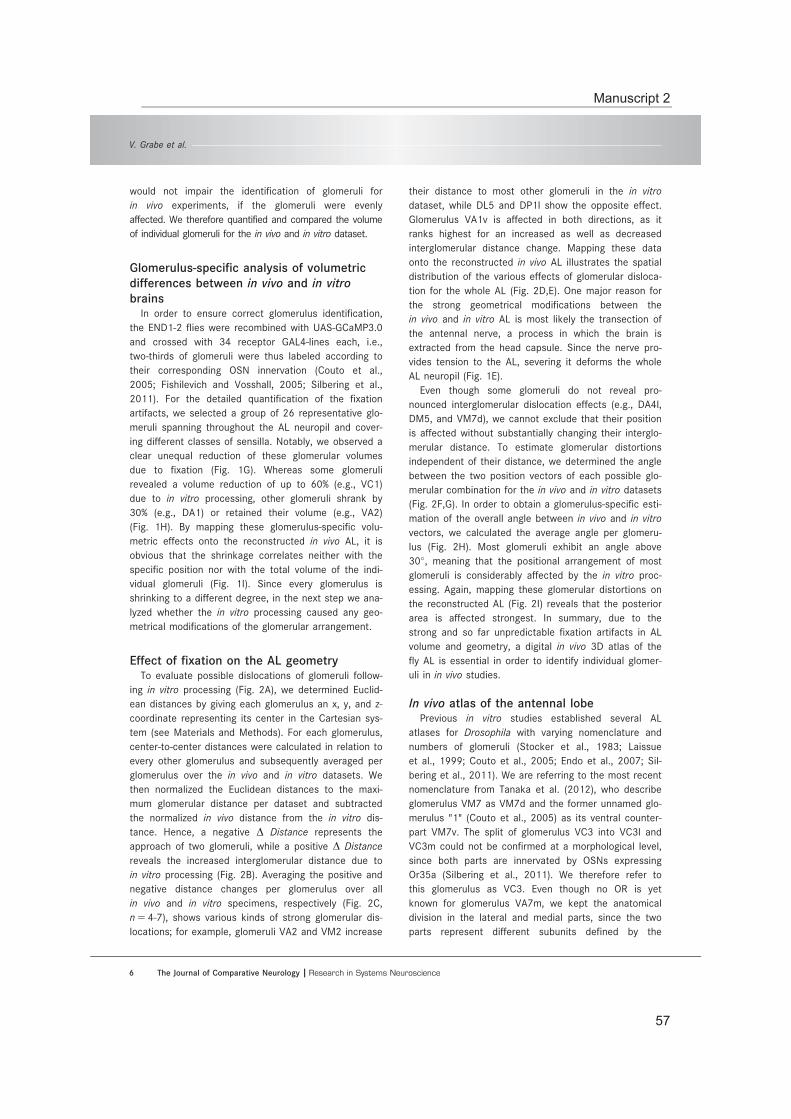
would not impair the identification of glomeruli for
in vivo experiments, if the glomeruli were evenly
affected. We therefore quantified and compared the volume
of individual glomeruli for the in vivo and in vitro dataset.
Glomerulus-specific analysis of volumetricdifferences between in vivo and in vitrobrains
In order to ensure correct glomerulus identification,
the END1-2 flies were recombined with UAS-GCaMP3.0
and crossed with 34 receptor GAL4-lines each, i.e.,
two-thirds of glomeruli were thus labeled according to
their corresponding OSN innervation (Couto et al.,
2005; Fishilevich and Vosshall, 2005; Silbering et al.,
2011). For the detailed quantification of the fixation
artifacts, we selected a group of 26 representative glo-
meruli spanning throughout the AL neuropil and cover-
ing different classes of sensilla. Notably, we observed a
clear unequal reduction of these glomerular volumes
due to fixation (Fig. 1G). Whereas some glomeruli
revealed a volume reduction of up to 60% (e.g., VC1)
due to in vitro processing, other glomeruli shrank by
30% (e.g., DA1) or retained their volume (e.g., VA2)
(Fig. 1H). By mapping these glomerulus-specific volu-
metric effects onto the reconstructed in vivo AL, it is
obvious that the shrinkage correlates neither with the
specific position nor with the total volume of the indi-
vidual glomeruli (Fig. 1I). Since every glomerulus is
shrinking to a different degree, in the next step we ana-
lyzed whether the in vitro processing caused any geo-
metrical modifications of the glomerular arrangement.
Effect of fixation on the AL geometryTo evaluate possible dislocations of glomeruli follow-
ing in vitro processing (Fig. 2A), we determined Euclid-
ean distances by giving each glomerulus an x, y, and z-
coordinate representing its center in the Cartesian sys-
tem (see Materials and Methods). For each glomerulus,
center-to-center distances were calculated in relation to
every other glomerulus and subsequently averaged per
glomerulus over the in vivo and in vitro datasets. We
then normalized the Euclidean distances to the maxi-
mum glomerular distance per dataset and subtracted
the normalized in vivo distance from the in vitro dis-
tance. Hence, a negative D Distance represents the
approach of two glomeruli, while a positive D Distance
reveals the increased interglomerular distance due to
in vitro processing (Fig. 2B). Averaging the positive and
negative distance changes per glomerulus over all
in vivo and in vitro specimens, respectively (Fig. 2C,
n5 4-7), shows various kinds of strong glomerular dis-
locations; for example, glomeruli VA2 and VM2 increase
their distance to most other glomeruli in the in vitro
dataset, while DL5 and DP1l show the opposite effect.
Glomerulus VA1v is affected in both directions, as it
ranks highest for an increased as well as decreased
interglomerular distance change. Mapping these data
onto the reconstructed in vivo AL illustrates the spatial
distribution of the various effects of glomerular disloca-
tion for the whole AL (Fig. 2D,E). One major reason for
the strong geometrical modifications between the
in vivo and in vitro AL is most likely the transection of
the antennal nerve, a process in which the brain is
extracted from the head capsule. Since the nerve pro-
vides tension to the AL, severing it deforms the whole
AL neuropil (Fig. 1E).
Even though some glomeruli do not reveal pro-
nounced interglomerular dislocation effects (e.g., DA4l,
DM5, and VM7d), we cannot exclude that their position
is affected without substantially changing their interglo-
merular distance. To estimate glomerular distortions
independent of their distance, we determined the angle
between the two position vectors of each possible glo-
merular combination for the in vivo and in vitro datasets
(Fig. 2F,G). In order to obtain a glomerulus-specific esti-
mation of the overall angle between in vivo and in vitro
vectors, we calculated the average angle per glomeru-
lus (Fig. 2H). Most glomeruli exhibit an angle above
30�, meaning that the positional arrangement of most
glomeruli is considerably affected by the in vitro proc-
essing. Again, mapping these glomerular distortions on
the reconstructed AL (Fig. 2I) reveals that the posterior
area is affected strongest. In summary, due to the
strong and so far unpredictable fixation artifacts in AL
volume and geometry, a digital in vivo 3D atlas of the
fly AL is essential in order to identify individual glomer-
uli in in vivo studies.
In vivo atlas of the antennal lobePrevious in vitro studies established several AL
atlases for Drosophila with varying nomenclature and
numbers of glomeruli (Stocker et al., 1983; Laissue
et al., 1999; Couto et al., 2005; Endo et al., 2007; Sil-
bering et al., 2011). We are referring to the most recent
nomenclature from Tanaka et al. (2012), who describe
glomerulus VM7 as VM7d and the former unnamed glo-
merulus "1" (Couto et al., 2005) as its ventral counter-
part VM7v. The split of glomerulus VC3 into VC3l and
VC3m could not be confirmed at a morphological level,
since both parts are innervated by OSNs expressing
Or35a (Silbering et al., 2011). We therefore refer to
this glomerulus as VC3. Even though no OR is yet
known for glomerulus VA7m, we kept the anatomical
division in the lateral and medial parts, since the two
parts represent different subunits defined by the
V. Grabe et al.
6 The Journal of Comparative Neurology |Research in Systems Neuroscience
Manuscript 2
57
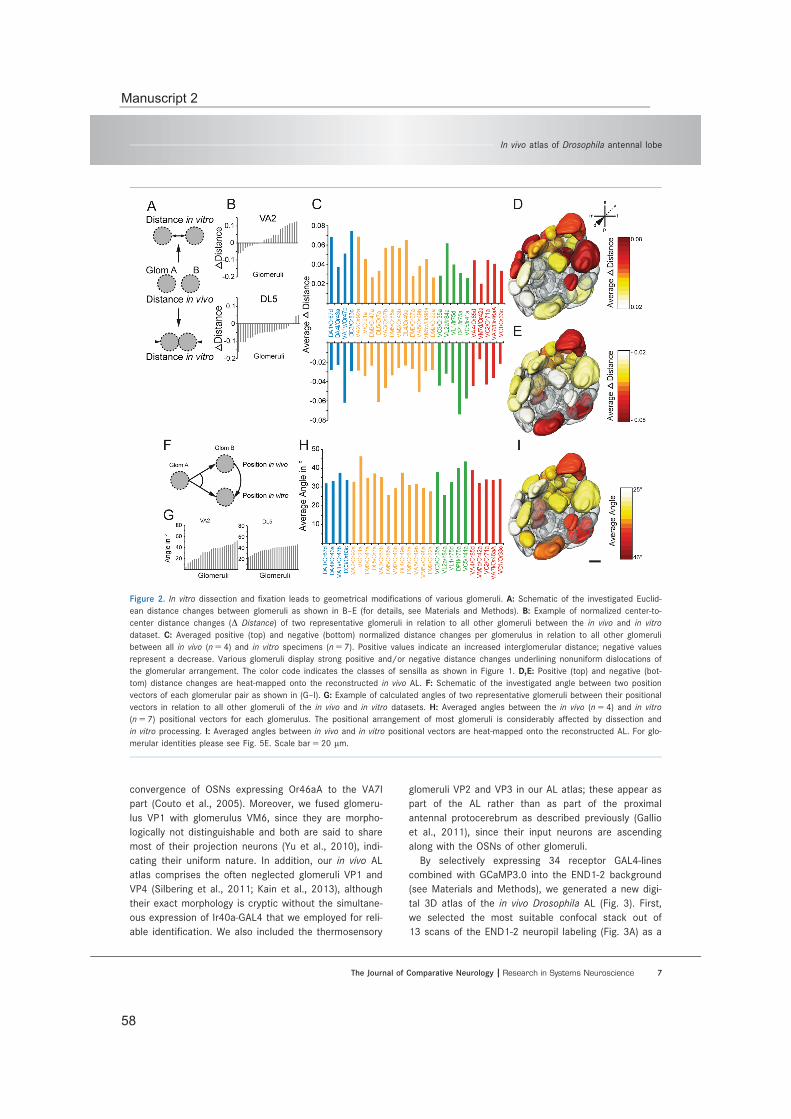
convergence of OSNs expressing Or46aA to the VA7l
part (Couto et al., 2005). Moreover, we fused glomeru-
lus VP1 with glomerulus VM6, since they are morpho-
logically not distinguishable and both are said to share
most of their projection neurons (Yu et al., 2010), indi-
cating their uniform nature. In addition, our in vivo AL
atlas comprises the often neglected glomeruli VP1 and
VP4 (Silbering et al., 2011; Kain et al., 2013), although
their exact morphology is cryptic without the simultane-
ous expression of Ir40a-GAL4 that we employed for reli-
able identification. We also included the thermosensory
glomeruli VP2 and VP3 in our AL atlas; these appear as
part of the AL rather than as part of the proximal
antennal protocerebrum as described previously (Gallio
et al., 2011), since their input neurons are ascending
along with the OSNs of other glomeruli.
By selectively expressing 34 receptor GAL4-lines
combined with GCaMP3.0 into the END1-2 background
(see Materials and Methods), we generated a new digi-
tal 3D atlas of the in vivo Drosophila AL (Fig. 3). First,
we selected the most suitable confocal stack out of
13 scans of the END1-2 neuropil labeling (Fig. 3A) as a
Figure 2. In vitro dissection and fixation leads to geometrical modifications of various glomeruli. A: Schematic of the investigated Euclid-
ean distance changes between glomeruli as shown in B–E (for details, see Materials and Methods). B: Example of normalized center-to-
center distance changes (D Distance) of two representative glomeruli in relation to all other glomeruli between the in vivo and in vitro
dataset. C: Averaged positive (top) and negative (bottom) normalized distance changes per glomerulus in relation to all other glomeruli
between all in vivo (n5 4) and in vitro specimens (n5 7). Positive values indicate an increased interglomerular distance; negative values
represent a decrease. Various glomeruli display strong positive and/or negative distance changes underlining nonuniform dislocations of
the glomerular arrangement. The color code indicates the classes of sensilla as shown in Figure 1. D,E: Positive (top) and negative (bot-
tom) distance changes are heat-mapped onto the reconstructed in vivo AL. F: Schematic of the investigated angle between two position
vectors of each glomerular pair as shown in (G–I). G: Example of calculated angles of two representative glomeruli between their positional
vectors in relation to all other glomeruli of the in vivo and in vitro datasets. H: Averaged angles between the in vivo (n5 4) and in vitro
(n5 7) positional vectors for each glomerulus. The positional arrangement of most glomeruli is considerably affected by dissection and
in vitro processing. I: Averaged angles between in vivo and in vitro positional vectors are heat-mapped onto the reconstructed AL. For glo-
merular identities please see Fig. 5E. Scale bar5 20 lm.
In vivo atlas of Drosophila antennal lobe
The Journal of Comparative Neurology | Research in Systems Neuroscience 7
Manuscript 2
58
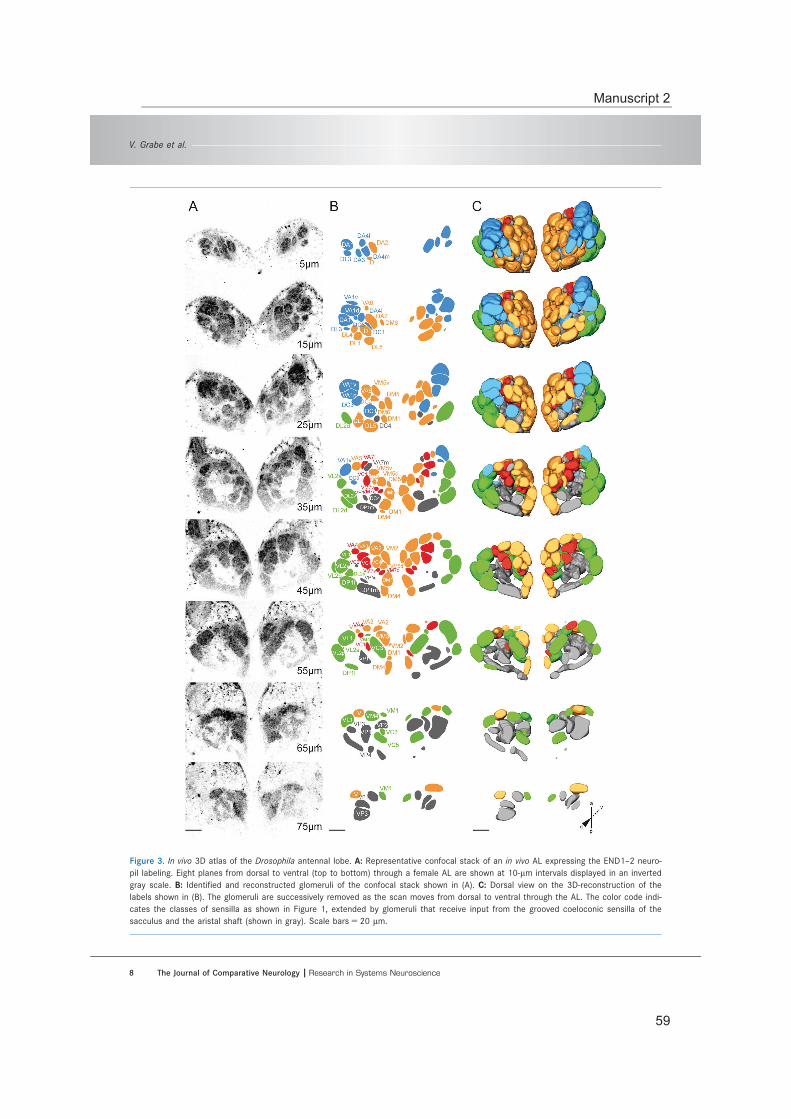
Figure 3. In vivo 3D atlas of the Drosophila antennal lobe. A: Representative confocal stack of an in vivo AL expressing the END1–2 neuro-
pil labeling. Eight planes from dorsal to ventral (top to bottom) through a female AL are shown at 10-lm intervals displayed in an inverted
gray scale. B: Identified and reconstructed glomeruli of the confocal stack shown in (A). C: Dorsal view on the 3D-reconstruction of the
labels shown in (B). The glomeruli are successively removed as the scan moves from dorsal to ventral through the AL. The color code indi-
cates the classes of sensilla as shown in Figure 1, extended by glomeruli that receive input from the grooved coeloconic sensilla of the
sacculus and the aristal shaft (shown in gray). Scale bars5 20 lm.
V. Grabe et al.
8 The Journal of Comparative Neurology |Research in Systems Neuroscience
Manuscript 2
59
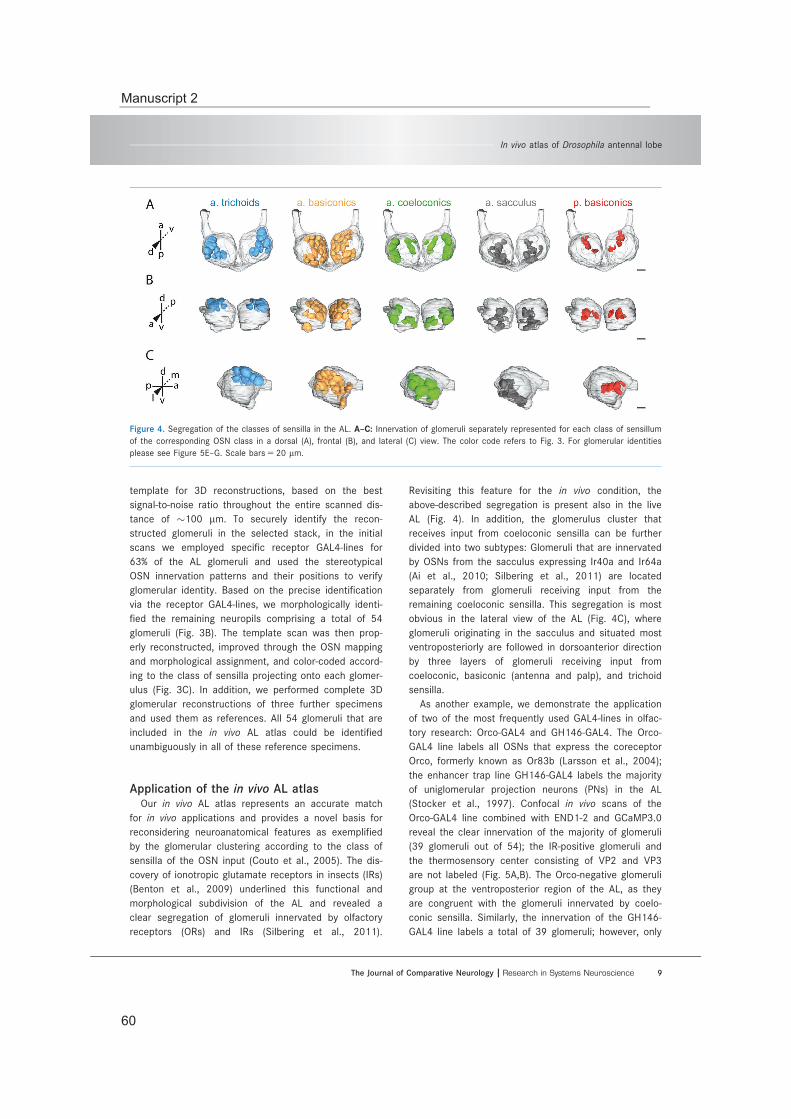
template for 3D reconstructions, based on the best
signal-to-noise ratio throughout the entire scanned dis-
tance of �100 lm. To securely identify the recon-
structed glomeruli in the selected stack, in the initial
scans we employed specific receptor GAL4-lines for
63% of the AL glomeruli and used the stereotypical
OSN innervation patterns and their positions to verify
glomerular identity. Based on the precise identification
via the receptor GAL4-lines, we morphologically identi-
fied the remaining neuropils comprising a total of 54
glomeruli (Fig. 3B). The template scan was then prop-
erly reconstructed, improved through the OSN mapping
and morphological assignment, and color-coded accord-
ing to the class of sensilla projecting onto each glomer-
ulus (Fig. 3C). In addition, we performed complete 3D
glomerular reconstructions of three further specimens
and used them as references. All 54 glomeruli that are
included in the in vivo AL atlas could be identified
unambiguously in all of these reference specimens.
Application of the in vivo AL atlasOur in vivo AL atlas represents an accurate match
for in vivo applications and provides a novel basis for
reconsidering neuroanatomical features as exemplified
by the glomerular clustering according to the class of
sensilla of the OSN input (Couto et al., 2005). The dis-
covery of ionotropic glutamate receptors in insects (IRs)
(Benton et al., 2009) underlined this functional and
morphological subdivision of the AL and revealed a
clear segregation of glomeruli innervated by olfactory
receptors (ORs) and IRs (Silbering et al., 2011).
Revisiting this feature for the in vivo condition, the
above-described segregation is present also in the live
AL (Fig. 4). In addition, the glomerulus cluster that
receives input from coeloconic sensilla can be further
divided into two subtypes: Glomeruli that are innervated
by OSNs from the sacculus expressing Ir40a and Ir64a
(Ai et al., 2010; Silbering et al., 2011) are located
separately from glomeruli receiving input from the
remaining coeloconic sensilla. This segregation is most
obvious in the lateral view of the AL (Fig. 4C), where
glomeruli originating in the sacculus and situated most
ventroposteriorly are followed in dorsoanterior direction
by three layers of glomeruli receiving input from
coeloconic, basiconic (antenna and palp), and trichoid
sensilla.
As another example, we demonstrate the application
of two of the most frequently used GAL4-lines in olfac-
tory research: Orco-GAL4 and GH146-GAL4. The Orco-
GAL4 line labels all OSNs that express the coreceptor
Orco, formerly known as Or83b (Larsson et al., 2004);
the enhancer trap line GH146-GAL4 labels the majority
of uniglomerular projection neurons (PNs) in the AL
(Stocker et al., 1997). Confocal in vivo scans of the
Orco-GAL4 line combined with END1-2 and GCaMP3.0
reveal the clear innervation of the majority of glomeruli
(39 glomeruli out of 54); the IR-positive glomeruli and
the thermosensory center consisting of VP2 and VP3
are not labeled (Fig. 5A,B). The Orco-negative glomeruli
group at the ventroposterior region of the AL, as they
are congruent with the glomeruli innervated by coelo-
conic sensilla. Similarly, the innervation of the GH146-
GAL4 line labels a total of 39 glomeruli; however, only
Figure 4. Segregation of the classes of sensilla in the AL. A–C: Innervation of glomeruli separately represented for each class of sensillum
of the corresponding OSN class in a dorsal (A), frontal (B), and lateral (C) view. The color code refers to Fig. 3. For glomerular identities
please see Figure 5E–G. Scale bars5 20 lm.
In vivo atlas of Drosophila antennal lobe
The Journal of Comparative Neurology | Research in Systems Neuroscience 9
Manuscript 2
60

32 of which overlap the innervation of Orco-GAL4 (Fig.
5C,D; for glomerular identities, see Fig. 5E-G). Hence, if
these two lines are employed simultaneously, functional
studies that compare the input and output properties of
specific glomeruli should be analyzed with caution.
Although GH146-GAL4 is said to label one ventral PN
innervating the whole AL (Marin et al., 2002), we were
not able to observe any multiglomerular innervation.
Due to the sparse glomerular innervation of multiglo-
merular PNs (Lai et al., 2008), the GCaMP3.0 expres-
sion level in this PN, which is below the detection level,
can also be ignored for imaging experiments of the
whole AL. For a detailed overview, all innervated glo-
meruli are listed for each GAL4-line in Table 1.
In summary, our in vivo AL atlas can be used to reli-
ably identify glomeruli throughout the entire neuropil in
Figure 5. Characterization of the glomerular innervation patterns of two widely used GAL4-lines. A: Representative in vivo confocal scan of
an AL expressing GCaMP3.0 under the control of the Orco promotor (green) combined with the END1–2 neuropil labeling (magenta) at 20
lm depth. The Orco-GAL4 line labels the majority of olfactory sensory neurons as depicted in the schematic on the left side. B: Glomeru-
lar innervations of the Orco-GAL4 line represented via the in vivo 3D AL atlas (green: innervated; transparent: not innervated). Depicted
are the dorsal, frontal, and lateral views onto the AL. C: Representative in vivo confocal scan of an AL expressing GCaMP3.0 under the
control of the GH146-GAL4 driver line (green) combined with the END1–2 neuropil labeling (magenta) at 30 lm depth. The GH146-GAL4
line labels the majority of projection neurons as depicted in the schematic on the left side. D: Glomerular innervations of the GH146-
GAL4 line represented via the in vivo 3D AL atlas (green: innervated; transparent: not innervated). Depicted are the dorsal, frontal, and lat-
eral views onto the AL. E–G: Complete glomerular assignment of the in vivo AL atlas from dorsal (E), frontal (F), and lateral views (G) cor-
responding to the perspectives in (B) and (D). Scale bars5 20 lm.
V. Grabe et al.
10 The Journal of Comparative Neurology | Research in Systems Neuroscience
Manuscript 2
61

the live fly brain; the atlas preserves the spatial
arrangement of individual glomeruli as well as interglo-
merular differences regarding shape and size.
DISCUSSION
In vivo atlas for enhanced applicabilityIn this study we used a newly generated transgenic
fly line, referred to as the END1-2 line, to provide
in vivo neuropil labeling of the AL; this label is compara-
ble to the nc82 immunostaining of in vitro whole mount
brains (Fig. 1A-C) (Hofbauer, 1991; Laissue et al., 1999;
Rein et al., 2002). The END1-2 line enables synaptically
dense glomerular areas to be separated from synapti-
cally sparse interglomerular areas (Boeckh et al., 1970;
Tolbert and Hildebrand, 1981) by the expression of the
presynaptic fusion protein n-synaptobrevin::DsRed in all
neurons. By obtaining confocal stacks of this line and
reconstructing individual glomeruli, we generated a 3D
map of the AL of Drosophila melanogaster that accu-
rately matches the AL in the living fly (Fig. 3). By taking
advantage of the near-complete maps of receptor gene
expression and OSN targeting (Couto et al., 2005; Fishi-
levich and Vosshall, 2005; Silbering et al., 2011), we
verified the identity of 63% of AL glomeruli using spe-
cific receptor-GAL4 lines. This assisted identification
allowed us to develop an in vivo AL atlas and a way to
label neuropils that enables the orientation within and
attribution of individual brain regions without in vitro
processing. In addition, we demonstrate two applica-
tions of the new in vivo AL atlas by revisiting the segre-
gation of glomeruli innervated by different types of
sensilla (Fig. 4) (Couto et al., 2005), as well as by char-
acterizing the glomerular innervation patterns of two of
the most crucial GAL4-lines for targeting OSNs and PNs
in the fly AL (Fig. 5).
In light of the number of glomeruli published over the
last few years, which ranges from 35 (Stocker et al.,
1990) to over 43 (Laissue et al., 1999) and up to 56 in
current nomenclature (Tanaka et al., 2012), clearly the
identification of glomeruli is not trivial. The subdividing
of glomeruli, such as DL2, DP1, VA1, VA7, VC3, VL2
(Laissue et al., 1999), DA4, VM5, and VM7 (Couto
et al., 2005) and the merging of others, such as VA1l
and VA1m, VC3l and VC3m (Couto et al., 2005) as well
as the addition of newly defined ones (e.g., VC5; Silber-
ing et al., 2011) outline the challenge of distinguishing
reliably between glomeruli. Consider glomerulus VM6,
which cannot be distinguished from glomerulus VP1 by
plain morphology. We merged the two glomeruli as VP1
since Yu et al. (2010) only observed PNs innervating
both structures together via a twin-spot MARCM study.
In addition, we were not able to assign glomerulus DL6,
TABLE 1.
Glomeruli Innervated by the Orco-GAL4 and
GH146-GAL4 Line
Glomerulus
Receptor
type
Sensillum
type
Orco-
GAL4
GH146-
GAL4
D Or69a Ab9DA1 Or67d At1DA2 Or56a Ab4DA3 Or23a At2DA4l Or43a At3DA4m Or2a At3DC1 Or19a At3DC2 Or13a Ab6DC3 Or83c At2DC4 Ir64a Sac IIIDL1 Or10a Ab1DL2d Ir75a/b/c Ac3DL2v Ir75a/b/c Ac3DL3 Or65a At4DL4 Or49a(Or85f) Ab10DL5 Or7a Ab4DM1 Or42b Ab1DM2 Or22a Ab3DM3 Or47a Ab5DM4 Or59b Ab2DM5 Or85a(Or33b) Ab2DM6 Or67a Ab10DP1l Ir75a Ac2DP1m Ir64a Sac IIIV Gr21a Ab1VA1d Or88a At4VA1v Or47b At4VA2 Or92a Ab1VA3 Or67b Ab9VA4 Or85d Pb3VA5 Or49b Ab6VA6 Or82a Ab5VA7l Or46aA Pb2VA7m ? ?VC1 Or33c Pb2VC2 Or71a Pb1VC3 Or35a Ac3VC4 Or67c Ab7VC5 Ir41a Ac2VL1 Ir75d Ac1/2/4VL2a Ir84a Ac4VL2p Ir31a Ac1VM1 Ir92a Ac1VM2 Or43b Ab8VM3 Or9a Ab8VM4 Ir76a Ac4VM5d Or85b Ab3VM5v Or98a Ab7VM7d Or42a Pb1VM7v Or59c Pb3VP1 Ir40a Sac IVP2 hot AristaVP3 cold AristaVP4 Ir40a Sac I
These two lines refer to the olfactory sensory neurons and projection
neurons, respectively. Black filled cells indicate innervation by the
indicated line; white represents no innervation. Ab, antennal basi-
conic; Ac, antennal coeloconic; At, antennal trichoid; Pb, palp basi-
conic; Sac, sacculus; Or, olfactory receptor; Ir, ionotropic receptor;
Gr, gustatory receptor.
In vivo atlas of Drosophila antennal lobe
The Journal of Comparative Neurology | Research in Systems Neuroscience 11
Manuscript 2
62
which has been mentioned in two studies (Marin et al.,
2005; Yu et al., 2010). However, its limited description
to date leads us to assume that this glomerulus has
been mislabeled and represents in fact glomerulus
DC3. Hence, the new in vivo AL atlas of the vinegar fly
consists of 54 glomeruli, of which 52 are innervated by
chemosensory and two by thermosensory neurons (Gal-
lio et al., 2011).
In vivo compared to in vitroOur idea to create an in vivo AL atlas derived from the
need to identify glomeruli in functional imaging experi-
ments. Glomerular identification has proven challenging
for in vivo data with the available in vitro atlases. More-
over, since there are not many investigations into the fix-
ation artifacts of flexible neuropils such as the AL, we
quantified the volumetric and geometrical modifications,
such as shrinkage, dislocation, and distortion following
in vitro processing. These three substantial effects of fix-
ation on the AL were distributed dissimilarly across the
AL neuropil (Figs. 1, 2). First, the heterogeneous shrink-
age of glomeruli is most likely due to the different den-
sity of intraglomerular arborizations of OSNs, PNs, or
LNs (Ignell et al., 2005), which leads to a small volumet-
ric decrease in densely packed glomeruli, while sparsely
innervated glomeruli are strongly affected.
Second, the dislocation of glomeruli during fixation
affects mainly those glomeruli located anteriorly (VA1v,
DA1, VA2) and posteriorly (DL5, DP1l), which reflects a
longitudinal distortion of the entire AL neuropil. This
global deformation is most likely based on the transec-
tion of the antennal nerve, which is required for in vitro
dissection. In addition, the transection causes general
changes in glomerular visibility: Under in vivo conditions
the anterior glomeruli of the VA cluster are invisible
when viewed from a dorsal perspective; they become
visible in the surface layer following in vitro processing.
The opposite effect happens for the posteriorly located
glomeruli of the DL and DP clusters, as they are hidden
beneath the DA glomeruli in the in vitro dissection.
Third, in addition to analyzing the dislocation of sev-
eral glomeruli, we also investigated distortions regard-
ing the relative positions of glomerular pairs. Again, we
observed distortions mainly in glomerular pairs that are
located anteriorly and posteriorly, which parallels the
dislocation effect seen in individuals; however, the pos-
terior glomeruli are more affected. These deformations
highlight the rearrangement of most glomeruli around
the ventroposterior basis, where the AL is attached to
the protocerebrum. These diverse fixation artifacts
emphasize the need for a thorough in vivo 3D AL atlas
which has an enhanced application for characterizing
GAL4 lines combined with the in vivo neuropil labeling
in single- and multiphoton imaging experiments through-
out the whole AL.
In vivo GAL4-line evaluationsAs most of the ubiquitous GAL4-lines used for func-
tional imaging studies are characterized by in vitro
whole-mount brain immunochemistry, their maps suffer
from the same issues as the initial identification of glo-
meruli described above. One can now screen any GAL4
line with the END1-2 neuropil label combined with
mCD8-GFP (Lee and Luo, 1999) by maintaining the
same conditions as in the actual in vivo experiment.
END1-2, in contrast to ENG3 (Estes et al., 2000), can
also be combined with various green fluorophores (Pat-
terson and Lippincott-Schwartz, 2002; Tian et al., 2009)
to visualize the neuropil while live measurements are
running. For the characterization of new GAL4-lines
labeling the olfactory pathway, we recommend identify-
ing a reliable set of landmark glomeruli (such as DA1,
DL5, DM2, VA2, VL1, and VM2) that is evenly spread
over the whole AL neuropil.
Advantages and limitations of the newin vivo atlas
Our new approach for in vivo morphology based on
END1-2 neuropil labeling has both advantages and limi-
tations. The new method allowed us to depict the
actual volume, distance, and angle artifacts influencing
the in vitro atlases. The in vivo AL atlas does not suffer
from those artifacts and its application in in vivo experi-
ments is thus easier, especially as it has been gener-
ated from a perspective identical to the in vivo
dissection for functional imaging experiments (Silbering
et al., 2012; Strutz et al., 2012). On the other hand,
this approach is limited by the age of flies used in the
END1-2 staining: By using flies of 3-6 days after hatch-
ing, we obtained a clearly stained neuropil. However,
stains made with older flies revealed an increasingly
indistinct distribution of the DsRed labeling, which inter-
feres with the identification of glomeruli (data not
shown). Although we are not completely sure why older
flies would have this effect, we assume that it repre-
sents a disassembly of the endocytotic recycling pro-
cess of SNARE complexes (S€udhof, 2004; Burgalossi
et al., 2010). Disassembling the whole complex could
lead to enriched levels of DsRed in the synaptic cleft.
Alternatively, the fusion of DsRed to n-synaptobrevin
might constrain vesicle recycling. Hence, to achieve the
most distinct in vivo neuropil labeling, the age depend-
ency should be kept in mind.
In summary, the new in vivo 3D digital atlas of the
Drosophila AL represented here provides an invaluable
V. Grabe et al.
12 The Journal of Comparative Neurology | Research in Systems Neuroscience
Manuscript 2
63

research tool for fly brain morphology and functional
imaging studies. Publicly available and downloadable as
a 3D PDF file, the atlas allows the AL or subgroups of
glomeruli to be visualized from any angle. In addition,
the in vivo neuropil labeling can be used to characterize
the morphology of novel driver and enhancer trap lines
in the commonly used GAL4 (Brand and Perrimon,
1993), LexA (Lai and Lee, 2006), and Q systems (Potter
et al., 2010) for broad applications in Drosophila
neuroscience.
ACKNOWLEDGMENTSWe thank Silke Trautheim and Regina Stieber for excel-
lent technical assistance, J€urgen Rybak for help with the
AMIRA software and advice on the article, Christine
Mibbach for support regarding the antennal preparations,Michael Thoma for statistical advice, Enrico Garbe and
Julia van Beesel for help with the in vitro 3D reconstruc-
tions, and Emily Wheeler for editorial assistance. Stocks
obtained from the Bloomington Drosophila Stock Center
(NIH P40OD018537) were used in this study.
CONFLICT OF INTEREST
The authors have no known or potential conflict of
interest including any financial, personal, or other rela-
tionships with other people or organizations within the
years of beginning the submitted work that could inap-
propriately influence or be perceived to influence the
work.
ROLE OF AUTHORS
All authors had full access to all the data in the
study and take responsibility for the integrity of the
data and the accuracy of the data analysis. Study con-
cept and design: Silke Sachse, Veit Grabe, Antonia
Strutz, Bill S. Hansson. Acquisition of data: Veit Grabe,
Amelie Baschwitz. Analysis and interpretation of data:
Veit Grabe, Silke Sachse. Drafting of the article: Veit
Grabe, Silke Sachse. Obtained funding: Silke Sachse,
Bill S. Hansson. Material support (generation of GAL4-
lines): Antonia Strutz. Critical revision of the article for
important intellectual content: all authors. Study super-
vision: Silke Sachse.
LITERATURE CITED
Abuin L, Bargeton B, Ulbrich MH, Isacoff EY, Kellenberger S,Benton R. 2011. Functional architecture of olfactory ion-otropic glutamate receptors. Neuron 69:44-60.
Ai M, Min S, Grosjean Y, Leblanc C, Bell R, Benton R, SuhGSB. 2010. Acid sensing by the Drosophila olfactory sys-tem. Nature 468:691-695.
Baird GS, Zacharias DA, Tsien RY. 2000. Biochemistry, muta-genesis, and oligomerization of DsRed, a red fluorescent
protein from coral. Proc Natl Acad Sci U S A 97:11984-11989.
Benton R, Vannice KS, Gomez-Diaz C, Vosshall LB. 2009. Vari-ant ionotropic glutamate receptors as chemosensoryreceptors in Drosophila. Cell 136:149-162.
Boeckh J, Sandri C, Akert K. 1970. Sensory inputs and synap-tic connections in the insect CNS. Experimental degener-ation in the antennal afferent pathway in thesupraesophageal ganglia of flies and cockroaches. Z Zell-forsch Mikrosk Anat 103:429-446.
Brand AH, Perrimon N. 1993. Targeted gene expression as ameans of altering cell fates and generating dominantphenotypes. Development 118:401-415.
Burgalossi A, Jung S, Meyer G, Jockusch WJ, Jahn O,Taschenberger H, O’Connor VM, Nishiki T-I, Takahashi M,Brose N, Rhee J-S. 2010. SNARE protein recycling byaSNAP and bSNAP supports synaptic vesicle priming.Neuron 68:473-487.
Caron SJC, Ruta V, Abbott LF, Axel R. 2013. Random conver-gence of olfactory inputs in the Drosophila mushroombody. Nature 497:113-117.
Chou Y-H, Spletter ML, Yaksi E, Leong JCS, Wilson RI, Luo L.2010. Diversity and wiring variability of olfactory localinterneurons in the Drosophila antennal lobe. Nat Neuro-sci 13:439-449.
Couto A, Alenius M, Dickson BJ. 2005. Molecular, anatomical,and functional organization of the Drosophila olfactorysystem. Curr Biol 15:1535-1547.
Daniels RW, Gelfand MV, Collins CA, DiAntonio A. 2008. Visu-alizing glutamatergic cell bodies and synapses in Dro-sophila larval and adult CNS. J Comp Neurol 508:131-152.
Datta SR, Vasconcelos ML, Ruta V, Luo S, Wong A, Demir E,Flores J, Balonze K, Dickson BJ, Axel R. 2008. The Dro-sophila pheromone cVA activates a sexually dimorphicneural circuit. Nature 452:473-477.
de Bruyne M, Foster K, Carlson JR. 2001. Odor coding in theDrosophila antenna. Neuron 30:537-552.
DiAntonio A, Burgess RW, Chin AC, Deitcher DL, Scheller RH,Schwarz TL. 1993. Identification and characterization ofDrosophila genes for synaptic vesicle proteins.J Neurosci 13:4924-4935.
Endo K, Aoki T, Yoda Y, Kimura K-i, Hama C. 2007. Notch sig-nal organizes the Drosophila olfactory circuitry by diversi-fying the sensory neuronal lineages. Nat Neurosci 10:153-160.
Fiala A, Spall T, Diegelmann S, Eisermann B, Sachse S,Devaud JM, Buchner E, Galizia CG. 2002. Geneticallyexpressed cameleon in Drosophila melanogaster is usedto visualize olfactory information in projection neurons.Curr Biol 12:1877-1884.
Fishilevich E, Vosshall LB. 2005. Genetic and functional subdi-vision of the Drosophila antennal lobe. Curr Biol 15:1548-1553.
Galizia CG, Sachse S. 2010. Odor coding in insects. In: MeniniA, editor. The neurobiology of olfaction. Boca Raton, FL:CRC Press. p 35-70.
Gallio M, Ofstad TA, Macpherson LJ, Wang JW, Zuker CS.2011. The coding of temperature in the Drosophila brain.Cell 144:614-624.
Gao Q, Yuan B, Chess A. 2000. Convergent projections ofDrosophila olfactory neurons to specific glomeruli in theantennal lobe. Nat Neurosci 3:780-785.
Hallem EA, Carlson JR. 2006. Coding of odors by a receptorrepertoire. Cell 125:143-160.
Hansson BS, Knaden M, Sachse S, Stensmyr MC, Wicher D.2010. Towards plant-odor-related olfactory neuroethologyin Drosophila. Chemoecology 20:51-61.
In vivo atlas of Drosophila antennal lobe
The Journal of Comparative Neurology | Research in Systems Neuroscience 13
Manuscript 2
64
Hofbauer A. 1991. Eine Bibliothek monoklonaler Antik€orrpergegen das Gehirn von Drosophila melanogaster [Habilita-tion thesis]. W€urzburg, Germany: University of W€urzburg.
Ignell R, Dekker T, Ghaninia M, Hansson BS. 2005. Neuronalarchitecture of the mosquito deutocerebrum. J CompNeurol 493:207-240.
Kain P, Boyle SM, Tharadra SK, Guda T, Pham C, DahanukarA, Ray A. 2013. Odour receptors and neurons for DEETand new insect repellents. Nature 502:507-512.
Kondoh Y, Kaneshiro KY, Kimura K, Yamamoto D. 2003. Evolu-tion of sexual dimorphism in the olfactory brain ofHawaiian Drosophila. Proc R Soc Lond B 270:1005-1013.
Kurtovic A, Widmer A, Dickson BJ. 2007. A single class ofolfactory neurons mediates behavioural responses to aDrosophila sex pheromone. Nature 446:542-546.
Lai S-L, Lee T. 2006. Genetic mosaic with dual binary tran-scriptional systems in Drosophila. Nat Neurosci 9:703-709.
Lai S-L, Awasaki T, Ito K, Lee T. 2008. Clonal analysis of Dro-sophila antennal lobe neurons: diverse neuronal architec-tures in the lateral neuroblast lineage. Development 135:2883-2893.
Laissue PP, Reiter C, Hiesinger PR, Halter S, Fischbach KF,Stocker RF. 1999. Three-dimensional reconstruction ofthe antennal lobe in Drosophila melanogaster. J CompNeurol 405:543-552.
Larsson MC, Domingos AI, Jones WD, Chiappe ME, Amrein H,Vosshall LB. 2004. Or83b encodes a broadly expressedodorant receptor essential for Drosophila olfaction. Neu-ron 43:703-714.
Lee T, Luo L. 1999. Mosaic analysis with a repressible cellmarker for studies of gene function in neuronal morpho-genesis. Neuron 22:451-461.
Liang L, Li Y, Potter CJ, Yizhar O, Deisseroth K, Tsien RichardW, Luo L. 2013. GABAergic projection neurons routeselective olfactory inputs to specific higher-order neu-rons. Neuron 79:917-931.
Ma Y, Smith D, Hof PR, Foerster B, Hamilton S, Blackband SJ,Yu M, Benveniste H. 2008. In vivo 3D digital atlas data-base of the adult C57BL/6J mouse brain by magneticresonance microscopy. Front Neuroanat 2:1.
Marcucci F, Maier-Balough E, Zou D-J, Firestein S. 2011. Exu-berant growth and synapse formation of olfactory sen-sory neuron axonal arborizations. J Comp Neurol 519:3713-3726.
Marin EC, Jefferis GSXE, Komiyama T, Zhu H, Luo L. 2002.Representation of the glomerular olfactory map in theDrosophila brain. Cell 109:243-255.
Marin EC, Watts RJ, Tanaka NK, Ito K, Luo L. 2005. Develop-mentally programmed remodeling of the Drosophilaolfactory circuit. Development 132:725-737.
Masse NY, Turner GC, Jefferis GSXE. 2009. Olfactoryinformation processing in Drosophila. Curr Biol 19:R700-R713.
Ng M, Roorda RD, Lima SQ, Zemelman BV, Morcillo P,Miesenbock G. 2002. Transmission of olfactory informa-tion between three populations of neurons in the anten-nal lobe of the fly. Neuron 36:463-474.
Patterson GH, Lippincott-Schwartz J. 2002. A photoactivatableGFP for selective photolabeling of proteins and cells. Sci-ence 297:1873-1877.
Potter CJ, Tasic B, Russler EV, Liang L, Luo L. 2010. The Qsystem: a repressible binary system for transgeneexpression, lineage tracing, and mosaic analysis. Cell141:536-548.
Rein K, Z€ockler M, Mader MT, Gr€ubel C, Heisenberg M. 2002.The drosophila standard brain. Curr Biol 12:227-231.
Ruta V, Datta SR, Vasconcelos ML, Freeland J, Looger LL,Axel R. 2010. A dimorphic pheromone circuit in Drosoph-ila from sensory input to descending output. Nature 468:686-690.
Ruthensteiner B, Heb M. 2008. Embedding 3D models of bio-logical specimens in PDF publications. Microsc Res Tech71:778-786.
Rybak J, Kuss A, Hans L, Zachow S, Hege H-C, Lienhard M,Singer J, Neubert K, Menzel R. 2010. The digital beebrain: integrating and managing neurons in a common3D reference system. Front Syst Neurosci 4.
Schubert M, Hansson BS, Sachse S. 2014. The banana code—natural blend processing in the olfactory circuitry of Dro-sophila melanogaster. Front Physiol 5:59.
Scott K, Brady R Jr, Cravchik A, Morozov P, Rzhetsky A, ZukerC, Axel R. 2001. A chemosensory gene family encodingcandidate gustatory and olfactory receptors in Drosoph-ila. Cell 104:661-673.
Seki Y, Rybak J, Wicher D, Sachse S, Hansson BS. 2010.Physiological and morphological characterization of localinterneurons in the Drosophila antennal lobe.J Neurophysiol 104:1007-1019.
Shanbhag SR, Muller B, Steinbrecht RA. 1999. Atlas of olfac-tory organs of Drosophila melanogaster. 1. Types, exter-nal organization, innervation and distribution of olfactorysensilla. Int J Insect Morphol Embryol 28:377-397.
Silbering AF, Okada R, Ito K, Galizia CG. 2008. Olfactory infor-mation processing in the Drosophila antennal lobe: any-thing goes? J Neurosci 28:13075-13087.
Silbering AF, Rytz R, Grosjean Y, Abuin L, Ramdya P,Jefferis GSXE, Benton R. 2011. Complementary functionand integrated wiring of the evolutionarily distinct Dro-sophila olfactory subsystems. J Neurosci 31:13357-13375.
Silbering AF, Bell R, Galizia CG, Benton R. 2012. Calciumimaging of odor-evoked responses in the Drosophilaantennal lobe. JoVE:e2976.
Stocker RF, Singh RN, Schorderet M, Siddiqi O. 1983. Projec-tion patterns of different types of antennal sensilla in theantennal glomeruli of Drosophila melanogaster. Cell Tis-sue Res 232:237-248.
Stocker RF, Lienhard MC, Borst A, Fischbach KF. 1990. Neu-ronal architecture of the antennal lobe in Drosophila mel-anogaster. Cell Tissue Res 262:9-34.
Stocker RF, Heimbeck G, Gendre N, de Belle JS. 1997. Neuro-blast ablation in Drosophila P[GAL4] lines reveals originsof olfactory interneurons. J Neurobiol 32:443-456.
Stockinger P, Kvitsiani D, Rotkopf S, Tirian L, Dickson BJ.2005. Neural circuitry that governs Drosophila malecourtship behavior. Cell 121:795-807.
St€okl J, Strutz A, Dafni A, Svatos A, Doubsky J, Knaden M,Sachse S, Hansson BS, Stensmyr MC. 2010. A deceptivepollination system targeting drosophilids through olfac-tory mimicry of yeast. Curr Biol 20:1846-1852.
Strutz A, Voeller T, Riemensperger T, Fiala A, Sachse S. 2012.Calcium imaging of neural activity in the olfactory systemof Drosophila. In: Martin J-R, editor. Genetically encodedfunctional indicators. New York: Springer Science1Busi-ness Media. p 43-70.
S€udhof TC. 2004. The synaptic vesicle cycle. Annu Rev Neuro-sci 27:509-547.
Tanaka NK, Endo K, Ito K. 2012. Organization of antennallobe-associated neurons in adult Drosophila mela-nogaster brain. J Comp Neurol 520:4067-4130.
Tian L, Hires SA, Mao T, Huber D, Chiappe ME, Chalasani SH,Petreanu L, Akerboom J, McKinney SA, Schreiter ER,Bargmann CI, Jayaraman V, Svoboda K, Looger LL. 2009.Imaging neural activity in worms, flies and mice with
V. Grabe et al.
14 The Journal of Comparative Neurology | Research in Systems Neuroscience
Manuscript 2
65
improved GCaMP calcium indicators. Nat Meth 6:875-881.
Tolbert LP, Hildebrand JG. 1981. Organization and synapticultrastructure of glomeruli in the antennal lobes of themoth Manduca sexta: a study using thin sections andfreeze-fracture. Proc R Soc Lond Ser B Biol Sci 213:279-301.
Vosshall LB, Stocker RF. 2007. Molecular architecture ofsmell and taste in Drosophila. Annu Rev Neurosci 30:505-533.
Vosshall LB, Wong AM, Axel R. 2000. An olfactory sensorymap in the fly brain. Cell 102:147-159.
Wang JW, Wong AM, Flores J, Vosshall LB, Axel R. 2003. Two-photon calcium imaging reveals an odor-evoked map ofactivity in the fly brain. Cell 112:271-282.
Wilson RI. 2013. Early olfactory processing in Drosophila: mech-anisms and principles. Annu Rev Neurosci 36:217-241.
Wilson RI, Turner GC, Laurent G. 2004. Transformation ofolfactory representations in the Drosophila antennal lobe.Science 303:366-370.
Wu JS, Luo L. 2006. A protocol for dissecting Drosophila mel-anogaster brains for live imaging or immunostaining. NatProtocols 1:2110-2115.
Yao K-M, Samson M-L, Reeves R, White K. 1993. Gene elav ofDrosophila melanogaster: a prototype for neuronal-specific RNA binding protein gene family that is con-served in flies and humans. J Neurobiol 24:723-739.
Yu H-H, Kao C-F, He Y, Ding P, Kao J-C, Lee T. 2010. A completedevelopmental sequence of a Drosophila neuronal lineageas revealed by twin-spot MARCM. PLoS Biol 8:e1000461.
In vivo atlas of Drosophila antennal lobe
The Journal of Comparative Neurology | Research in Systems Neuroscience 15
Manuscript 2
66
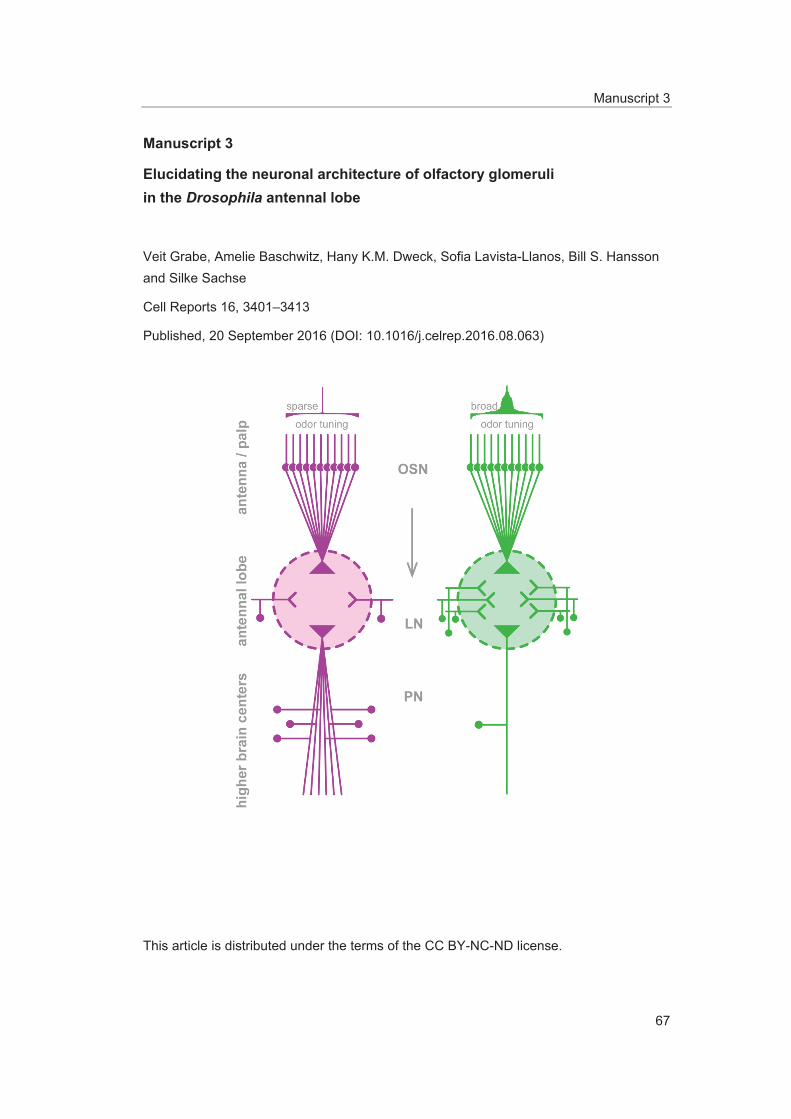
Manuscript 3
67
Manuscript 3
Elucidating the neuronal architecture of olfactory glomeruli in the Drosophila antennal lobe
Veit Grabe, Amelie Baschwitz, Hany K.M. Dweck, Sofia Lavista-Llanos, Bill S. Hansson and Silke Sachse
Cell Reports 16, 3401–3413
Published, 20 September 2016 (DOI: 10.1016/j.celrep.2016.08.063)
This article is distributed under the terms of the CC BY-NC-ND license.

Cell Reports
Resource
Elucidating the Neuronal Architectureof Olfactory Glomeruliin the Drosophila Antennal LobeVeit Grabe,1,3 Amelie Baschwitz,1,3 Hany K.M. Dweck,1,2 Sofia Lavista-Llanos,1 Bill S. Hansson,1 and Silke Sachse1,4,*1Department of Evolutionary Neuroethology, Max Planck Institute for Chemical Ecology, Hans-Knoll-Strasse 8, 07745 Jena, Germany2Present address: Department of Molecular, Cellular, and Developmental Biology, Yale University, New Haven, CT 06520, USA3Co-first author4Lead Contact
*Correspondence: [email protected]://dx.doi.org/10.1016/j.celrep.2016.08.063
SUMMARY
Olfactory glomeruli are morphologically conservedspherical compartments of the olfactory system,distinguishable solely by their chemosensory reper-toire, anatomical position, and volume. Little isknown, however, about their numerical neuronalcomposition. We therefore characterized theirneuronal architecture and correlated these anatom-ical features with their functional properties inDrosophila melanogaster. We quantitatively mappedall olfactory sensory neurons (OSNs) innervating eachglomerulus, including sexually dimorphic distribu-tions. Our data reveal the impact of OSN number onglomerular dimensions and demonstrate yet un-known sex-specific differences in several glomeruli.Moreover, we quantified uniglomerular projectionneurons for each glomerulus, which unraveled aglomerulus-specific numerical innervation. Correla-tion between morphological features and functionalspecificity showed that glomeruli innervated bynarrowly tuned OSNs seem to possess a larger num-ber of projection neurons and are involved in lesslateral processing than glomeruli targeted by broadlytuned OSNs. Our study demonstrates that theneuronal architecture of each glomerulus encodingcrucial odors is unique.
INTRODUCTION
Species of divergent animal phyla with advanced olfactory sys-
tems share an important feature: all develop olfactory glomeruli
(Strausfeld and Hildebrand, 1999). During recent decades, the
wiring properties of these spherical compartments have been
elucidated in great detail in the mammalian olfactory bulb as
well as in the insect antennal lobe (AL) (Hansson et al., 2010;
Mombaerts, 2006; Vosshall and Stocker, 2007; Wilson, 2013;
Wilson and Mainen, 2006). In spite of this, little is known about
the numerical neuronal composition of individual glomeruli.
Given that different glomeruli do not accomplish uniform tasks,
their neuronal architecture should not be homogeneous. Many
studies in Drosophila provide evidence that each glomerulus
represents a specific coding channel determined by the odor
response profile of the olfactory receptor expressed by the inner-
vating sensory neuron type (Ai et al., 2010; Dweck et al., 2015;
Ebrahim et al., 2015; Hallem and Carlson, 2006; Kreher et al.,
2008; Kurtovic et al., 2007; Ronderos et al., 2014; Silbering
et al., 2011; Stensmyr et al., 2012; Suh et al., 2004). In order
to determine whether each individual glomerulus represents
indeed a unique structural coding unit, we characterized the
complete neuronal architecture of each individual glomerulus
of the Drosophila AL. Furthermore, we correlated these anatom-
ical features with their functional properties. We used the genetic
model organism Drosophila melanogaster because the different
neuronal populations of the AL have been anatomically and func-
tionally well characterized (Stocker et al., 1990) and can be
selectively labeled and analyzed. In addition, a significant
amount of data regarding specific odor-driven behavior has
been produced lately (Dumenil et al., 2016; Ebrahim et al.,
2015; Grosjean et al., 2011; Knaden et al., 2012; Semmelhack
and Wang, 2009; Stensmyr et al., 2012).
Olfactory sensory neurons (OSNs), in Drosophila, are housed
in four different sensillum classes present on the third antennal
segmentandon themaxillarypalp (Shanbhagetal., 1999) (Figures
1A and 1A0). Each OSN expresses one, in some instances two,
specific olfactory receptors (Benton et al., 2009; Couto et al.,
2005; Fishilevich and Vosshall, 2005). OSNs expressing the
same olfactory receptor converge on one of the 52 glomeruli of
the AL (Gao et al., 2000; Grabe et al., 2015; Vosshall et al., 2000)
(Figure 1A0 0). The AL represents the first olfactory center and con-
veys odor-induced activity patterns via projection neurons (PNs)
to the protocerebrum (Vosshall and Stocker, 2007), where the
olfactory information is integrated with other sensory modalities.
OSNs synapse within each glomerulus of the AL via defined
synapse numbers (Mosca and Luo, 2014) with most of the PNs
and multiglomerular local interneurons (LNs) (Chou et al., 2010;
Rybak et al., 2016; Seki et al., 2010). Asmentioned above, several
studies have characterized themolecular receptive range ofmost
olfactory receptors and have thus provided us with a nearly com-
plete functional characterization of the odor-tuning properties of
OSNs targeting each glomerulus, which are accessible through
Cell Reports 16, 3401–3413, September 20, 2016 ª 2016 The Author(s). 3401This is an open access article under the CC BY-NC-ND license (http://creativecommons.org/licenses/by-nc-nd/4.0/).
Manuscript 3
68
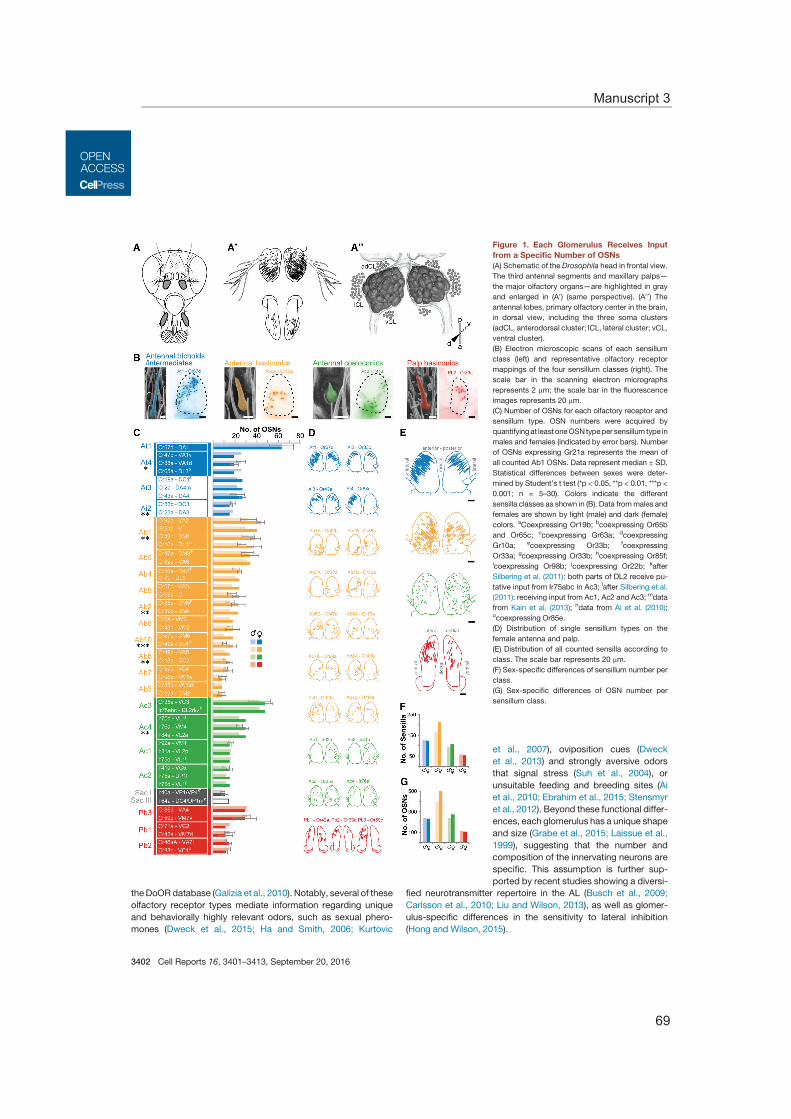
theDoORdatabase (Galizia et al., 2010). Notably, several of these
olfactory receptor types mediate information regarding unique
and behaviorally highly relevant odors, such as sexual phero-
mones (Dweck et al., 2015; Ha and Smith, 2006; Kurtovic
Figure 1. Each Glomerulus Receives Input
from a Specific Number of OSNs
(A) Schematic of the Drosophila head in frontal view.
The third antennal segments and maxillary palps—
the major olfactory organs—are highlighted in gray
and enlarged in (A0) (same perspective). (A0 0) Theantennal lobes, primary olfactory center in the brain,
in dorsal view, including the three soma clusters
(adCL, anterodorsal cluster; lCL, lateral cluster; vCL,
ventral cluster).
(B) Electron microscopic scans of each sensillum
class (left) and representative olfactory receptor
mappings of the four sensillum classes (right). The
scale bar in the scanning electron micrographs
represents 2 mm; the scale bar in the fluorescence
images represents 20 mm.
(C) Number of OSNs for each olfactory receptor and
sensillum type. OSN numbers were acquired by
quantifyingat least oneOSNtypeper sensillum type in
males and females (indicated by error bars). Number
of OSNs expressing Gr21a represents the mean of
all counted Ab1 OSNs. Data represent median ± SD.
Statistical differences between sexes were deter-
mined by Student’s t test (*p < 0.05, **p < 0.01, ***p <
0.001; n = 5–30). Colors indicate the different
sensilla classes as shown in (B). Data frommales and
females are shown by light (male) and dark (female)
colors. aCoexpressing Or19b; bcoexpressing Or65b
and Or65c; ccoexpressing Gr63a; dcoexpressing
Gr10a; ecoexpressing Or33b; fcoexpressing
Or33a; gcoexpressing Or33b; hcoexpressing Or85f;icoexpressing Or98b; jcoexpressing Or22b; kafter
Silbering et al. (2011): both parts of DL2 receive pu-
tative input from Ir75abc in Ac3; lafter Silbering et al.
(2011): receiving input from Ac1, Ac2 and Ac3; mdata
from Kain et al. (2013); ndata from Ai et al. (2010);ocoexpressing Or85e.
(D) Distribution of single sensillum types on the
female antenna and palp.
(E) Distribution of all counted sensilla according to
class. The scale bar represents 20 mm.
(F) Sex-specific differences of sensillum number per
class.
(G) Sex-specific differences of OSN number per
sensillum class.
et al., 2007), oviposition cues (Dweck
et al., 2013) and strongly aversive odors
that signal stress (Suh et al., 2004), or
unsuitable feeding and breeding sites (Ai
et al., 2010; Ebrahim et al., 2015; Stensmyr
et al., 2012). Beyond these functional differ-
ences, each glomerulus has a unique shape
and size (Grabe et al., 2015; Laissue et al.,
1999), suggesting that the number and
composition of the innervating neurons are
specific. This assumption is further sup-
ported by recent studies showing a diversi-
fied neurotransmitter repertoire in the AL (Busch et al., 2009;
Carlsson et al., 2010; Liu and Wilson, 2013), as well as glomer-
ulus-specific differences in the sensitivity to lateral inhibition
(Hong and Wilson, 2015).
3402 Cell Reports 16, 3401–3413, September 20, 2016
Manuscript 3
69

In the present study, we undertook a complete quantitative
mapping of all receptor-specific OSNs and uniglomerular PNs
that innervate each glomerulus, including sexually dimorphic
distributions and glomerular volumes. By correlating these
morphological features with functional properties, we provide
evidence for a unique neuronal architecture of glomeruli encod-
ing crucial odors.
RESULTS
Complete Quantitative Mapping of OSN InnervationAlthough it has been shown that OSNs expressing a certain
olfactory receptor occur in varying numbers, a uniform conver-
gence of about 30:1 OSNs for each glomerulus has so far been
assumed (Stocker, 2001; Vosshall and Stocker, 2007). This
is because numerical OSN data have been available for only
a limited set of olfactory receptor types (Dobritsa et al., 2003;
Gao et al., 2000; Sachse et al., 2007). In order to determine the
precise input convergence for all glomeruli in the Drosophila AL
(Figure 1A0 0), we mapped and quantified the number of OSNs
that express a certain olfactory receptor using specific ORx-/
IRx-GAL4 driver lines. In order to validate our methodological
approach, we mapped the topographical distribution of sensilla
on the antenna and the palp. To achieve this, we selected at least
one OSN type per sensillum type, which has been described to
be representative (Couto et al., 2005; Silbering et al., 2011) (Fig-
ures 1B and 1D). We observed a pattern of distribution of the
different sensillum classes that confirmed what was previously
found using single-sensillum recordings (de Bruyne et al.,
1999, 2001) as well as immunohistochemistry (Fishilevich and
Vosshall, 2005; Silbering et al., 2011). Moreover, our observed
patterns of OSN types corresponds well with in situ hybridization
data for specific OR and IR genes (Benton et al., 2009; Vosshall
et al., 2000), confirming that our approach of labeling OSN types
is reliable. Finally, our total numbers of the different sensillum
classes for the antenna and the maxillary palps (Figures 1F and
1G) match well published data as further described below (de
Bruyne et al., 2001; Shanbhag et al., 1999; Stocker, 2001).
In general, the basiconic sensilla were located almost every-
where on the third antennal segment, with higher density in the
anterior proximal region; none were present at the distal tip (Fig-
ure 1E). The trichoid sensilla were located more distally,
including the two intermediate types Ai2 and Ai3 (Dweck et al.,
2013), which we still assigned to the trichoid sensillum group
for simplicity. Coeloconic sensilla were evenly distributed with
higher density at the posterior side. The basiconic sensilla on
the maxillary palp were also evenly spread at the distal region
of this appendage.
Next, we quantified the number of OSNs expressing each ol-
factory receptor type by counting at least one type per sensillum
in males and females (Figure 1C; Table S1). For the number of
sensory neurons in the different sacculus chambers (i.e., invag-
inations in the third antennal segment), we consulted recent
studies (Ai et al., 2010; Kain et al., 2013). The remaining sensilla
represent poreless hygro- or thermosensors (Gallio et al., 2011;
Shanbhag et al., 1995) and were not included in our study. We
observed OSN numbers ranging from 10 up to 65 per functional
sensillum type; as an extreme example, Or67d, housed in the At4
sensillum, was expressed in the largest number of OSNs.
As expected, the male antenna exhibited significantly more At4
sensilla than the female, because these sensilla house fruit-
less-positive OSNs and are involved in courtship behavior
(Dweck et al., 2015; Kurtovic et al., 2007; Stockinger et al.,
2005). Several other sensillum types, all of which were fruitless
negative, were also present in sexually dimorphic numbers,
occurring significantly more frequently in females than in males
(Ab1, Ab2, Ab6, Ab10, and Ac4) or vice versa (Ai2; Figure 1C).
Regarding the number of OSNs on the maxillary palps, we did
not observe a clear sexual dimorphism, confirming previous
studies (Stocker, 2001). Finally when we determined the total
count of OSNs and sensilla on the antenna and the palp (Figures
1F and 1G), we observed that males had marginally more
trichoid sensilla than females, while basiconic and coeloconic
sensilla occured more frequently in females, as described earlier
(Stocker, 2001).
We found a total of 417 ± 89 (average ± SD) sensilla
per antenna and 57 ± 14 sensilla per palp housing 945 ± 201
and 113 ± 28 OSNs, respectively. These numbers are in line
with former studies counting approximately 440 sensilla on the
antenna and 60 on the palps, which house about 1,150 and
120 OSNs, respectively (Stocker, 2001). In order to verify
whether our quantification with specific ORx-/IRx-GAL4 lines is
comprehensive, we labeled all OSNs on themaxillary palp by ex-
pressing the nuclear marker nls-GFP using the Orco-Gal4 driver
line (Larsson et al., 2004), as well as all coeloconic sensilla on the
antenna via the Ir8a-GAL4 line (Silbering et al., 2011). We
counted 100 ± 4 (average ± SD) Orco-expressing OSNs on the
maxillary palp and 130 ± 21 Ir8a-expressing OSNs on the an-
tenna (n = 3–7 female flies). These numbers match reasonably
well our specific quantifications for female flies, which resulted
in 108 ± 19 OSNs on the palp and 107 ± 14 coeloconic sensilla
on the antenna and confirms the reliability of our quantitative
approach. Unfortunately, we could not reliably quantify the num-
ber of Orco-expressing OSNs on the antenna, becasue Orco is
heterogeneously expressed in the different sensilla classes
with high expression levels in the basiconic sensilla and low
levels in the trichoids (Benton et al., 2006; Larsson et al.,
2004). Because the maxillary palp has only basiconic sensilla,
Orco is homogeneously expressed in all OSNs on this olfactory
organ and could be used for reliable quantification.
The Number of OSNs Likely Determines GlomerularVolumeWe next analyzed whether the number of olfactory input neurons
correlates with the glomerular volume, as has been recently
shown for a subset of glomeruli in the mouse olfactory bulb
(Bressel et al., 2016). We therefore extended our previously pub-
lished volumetric data set and obtained in vivo volume measure-
ments for all glomeruli inmales and females using the in vivo neu-
ropil labeling via END1-2 (Grabe et al., 2015) (Figures 2A and 2E;
Table S1; see Experimental Procedures for details). In order to
adjust for inter-individual variability and sex-specific differences
(Figure 2B), we compared the glomerular volume relative to the
size of the summed glomerular volume per animal. We observed,
for example, that glomeruli that receive input from trichoid
sensilla account for about 20% or 25% of the complete AL
Cell Reports 16, 3401–3413, September 20, 2016 3403
Manuscript 3
70

volume in females or males, respectively (Figure 2C). This volu-
metric proportion corresponds well to the proportion of OSNs
expressing olfactory receptors housed in trichoid sensilla (23%
in females and 26% in males). Extending this comparison to
the remaining classes of sensilla, we observed a significant but
shallow correlation between glomerular volume and OSN num-
ber (Figure 2D) that was also evident when we considered
each glomerulus separately (Figure 2F). Hence, our data indicate
Figure 2. In Vivo Glomerular Volume Is Likely Determined by OSN Number
(A) Three-dimensional reconstructed ALs representing glomeruli separately for each class of sensillum of the corresponding OSN class. The scale bar represents
20 mm.
(B) Entire AL volume of males (empty column) and females (filled column). Data represent median ± SD.
(C) Percentage of AL volume of glomeruli innervated by each sensillum class separately in males and females. The colors indicate the sensillum classes as shown
in Figure 1B. Data from males and females are indicated by light (male) and dark (female) colors. Statistical differences between sexes were determined by
Student’s t test (***p < 0.001).
(D) Correlation of OSN number per sensillum class and the respective glomerular volume for males and females (*p < 0.05, two-tailed probability of the Pearson
correlation coefficient).
(E) Glomerulus-specific volumes shown as percentages of all labeled glomeruli per specimen. Data in (B), (C), and (E) represent median ± SD. Statistical dif-
ferences between sexes were determined by Student’s t test (*p < 0.05, **p < 0.01, ***p < 0.001; n = 4 for males and females each).
(F) Correlation of glomerular volume and OSN number (***p < 0.001, two-tailed probability of the Pearson correlation coefficient).
The color code refers to Figure 1B.
3404 Cell Reports 16, 3401–3413, September 20, 2016
Manuscript 3
71

that the number of OSNs plays a role in determining glomerular
volume.
Because we observed sex-specific differences for some OSN
types, we wondered whether these differences become evident
also in the volume of the target glomerulus. Sexual dimorphism in
glomerular volume has so far been studied only for glomeruli that
are involved in pheromone processing; glomeruli DA1 and VA1v,
which encode the sexual pheromones cis-vaccenyl acetate and
methyl laurate (Dweck et al., 2015; Kurtovic et al., 2007), are
significantly larger in males than in females (Kondoh et al.,
2003). Our volume measurements confirmed this finding and
extended the list by several other glomeruli. Notably, we also
observed gender-specific differences in glomeruli DA4m, VA2,
and VA6, all of which are larger in males than in females, as
well as in glomeruli DM1, DL5, DP1l, and VM5d, being larger in
females than in males (Figure 2E; Table S1). For glomeruli
VA1v and DM1, we also observed a dimorphic OSN quantity
(Figure 1C). However, a sex-specific difference in glomerular vol-
umewas not always linked to a sex-specific difference in number
of OSNs, implying that sensory input is themajor, but not the only
determinant of glomerular volume.
TheNumber of Excitatory Output Neurons Is GlomerulusSpecificHaving shown that each glomerulus is targeted by a specific
number of OSNs and that this number is correlated to the glomer-
ular volume, we next asked whether each glomerulus is also
innervated by a glomerulus-specific number of PNs. To quantify
the number of output neurons for each glomerulus, we focused
on uniglomerular, excitatory PNs by expressing photoactivatable
GFP (Patterson andLippincott-Schwartz, 2002) under the control
of the enhancer trap lineGH146-GAL4 (Stocker et al., 1997) (Fig-
ure 3A). This line is described to label about 66% of total PNs
(Stocker et al., 1997); these PNs project mainly via the medial
AL tract (Ito et al., 2014) to themushroom body calyx and farther,
to the lateral horn (LH). A small proportion projects via the lateral
AL tract to the LH and farther to the mushroom body calyx. Most
GH146-positive PNs (i.e., 94%) are cholinergic (Shang et al.,
2007). We applied repeated photoactivation of each labeled
glomerulus in a minimum of three animals to gain a reliable esti-
mate of the variability. When we quantified the excitatory output
of all glomeruli that are labeled by GH146-GAL4, we observed
two classes of glomeruli: the majority (i.e., 83%) is innervated
by on average 2 ± 1 uniglomerular PNs, while the remaining
glomeruli, which comprise glomeruli D, DA1, DA2, DC3, DL3,
and VA1v, are innervated by on average 6 ± 2 PNs (Figure 3B;
Table S1). Furthermore, we assigned each individual PN soma
to the dorsomedial, lateral, or ventral cell cluster, revealing that
a few glomeruli are innervated by PNs originating from more
than one cluster, as described previously (Marin et al., 2002)
(Table S2).
Infrequently, we also labeled onemultiglomerular PN following
photoactivation of some glomeruli. This PN belongs to the vPN
group and it is described to innervate the entire AL (Marin
et al., 2002). Possibly we do not label this vPN reliably because
of its described sparse innervation in single glomeruli. Because
we focused our study on uniglomerular PNs, we excluded this
vPN from our quantification.
Since the GH146-GAL4 line does not cover all uniglomerular
and excitatory PNs in the AL (Lai et al., 2008), we might have
underestimated the number of PNs per glomerulus. We therefore
attempted to label all AL neurons by expressing photoactivat-
able GFP under the control of the pan-neuronal driver elav. How-
ever, because the cell bodies of PNs and LNs are located in the
same cell clusters, labeled cell bodies could not be unambigu-
ously assigned to PNs (data not shown). We therefore chose a
different approach and quantified the number of all cholinergic
uniglomerular PNs per glomerulus using the ChA-GAL4 driver
line (Salvaterra and Kitamoto, 2001) (Figure S1A). For this pur-
pose, we photoactivated PNs in 28 glomeruli whichwere charac-
terized either by being sparsely or densely innervated or by being
GH146-negative (Grabe et al., 2015) (Figure S1B). Our analysis of
all cholinergic PNs confirmed that our quantification of PNs per
glomerulus was largely correct, except in six cases: we labeled
one to three more uniglomerular PNs in the anterodorsal and
lateral cell clusters in glomeruli VA1v, DA2, D, DM5, VM2, and
DM6 using the enhancer trap line GH146-GAL4 than we labeled
using the ChA-GAL4 line.
Interestingly, when we correlated glomerulus-specific PN
quantities to the glomerular volume, a weak, but significant,
correlation was visible (Figure 3C). Hence, uniglomerular PNs
do have an impact on glomerular volume, although they have
less impact than do the input neurons.
LN Innervation Is Lowest in Glomeruli Innervated byTrichoidsThe remaining major neuronal population in the AL is repre-
sented by inhibitory and excitatory LNs. In order to quantify the
glomerular innervation by LNs, we integrated a data set from
Chou et al. (2010), in which most LNs had been thoroughly
characterized with regard to their innervation frequency at the in-
dividual glomerular level, with our data. First, we analyzed the
frequency of LN innervation related to each sensillum class (Fig-
ure 4A). Glomeruli innervated by OSNs housed in basiconic
sensilla on the antenna or the palp or in coeloconic sensilla
show a high LN innervation density of on average 83%, 87%,
or 85%, respectively. Notably, glomeruli with OSN input from
trichoid sensilla display a significantly lower LN innervation
density, on average, 77% (p < 0.05, ANOVA followed by
Tukey-Kramer multiple-comparisons test). Hence, glomerular
innervation by LNs is not evenly distributed across the different
sensillum types and might reflect a functional classification.
Next, we analyzed whether the number of LNs contributes to
the glomerular volume as observed for the OSNs and PNs, but
we could not find any significant correlation (Figure 4B). Addi-
tionally, we did not observe any correlation between the LN
density and the number of OSNs per glomerulus (Figure 4C).
Instead, and interestingly, we found a significant negative corre-
lation between LN density and the number of PNs (Figure 4D),
indicating that glomeruli innervated by a high number of PNs
receive a small number of LN dendrites.
Lifetime Sparseness Allows Linking Morphology toFunctionHaving quantified the three main neuronal populations for each
glomerulus, we wondered whether the neuronal composition is
Cell Reports 16, 3401–3413, September 20, 2016 3405
Manuscript 3
72

reflected by the odor-tuning properties of each glomerulus. To
quantify the selectivity of the response profile of a certain
glomerulus, we calculated the lifetime sparseness of the olfac-
tory receptor expressed in the OSNs innervating it (Bhandawat
et al., 2007; Perez-Orive et al., 2002; Vinje and Gallant, 2000).
We used the DoOR database (Galizia et al., 2010) for olfactory
receptors that have been well characterized with an adequate
odor set. However, several olfactory receptors have so far
been tested only with a limited number of odors. In order to
obtain a precise lifetime sparseness for all olfactory receptors,
we extended the odor-tuning profile of 11 olfactory receptors
via single-sensillum recordings (SSRs) by applying an odor set
ranging from 37–474 different odors (Figure 5A; Table S3). By us-
ing our data set in addition to the odor response profiles that
have already been published, we calculated the lifetime sparse-
ness for each olfactory receptor, that is, for its corresponding
glomerulus (Figure 5B; Table S1). Next, we correlated this mea-
sure to the glomerulus-specific numbers of the three main
Figure 3. Number of Uniglomerular PNs per Glomerulus Is Specific
(A) Z projections of four different scans of brains expressing photoactivatable GFP in GH146-positive PNs after photoactivation of a specific glomerulus (DA1,
DA2, DL4, and DM2). adPN, anterodorsal PN soma cluster; lPN, lateral PN soma cluster; vPN, ventral PN soma cluster. The scale bars represent 20 mm.
(B) Number of innervating PNs per glomerulus labeled with GH146-GAL4;UAS-C3PA. Data represent median ± SD. Statistical differences between sexes were
determined by Student’s t test (*p < 0.05, **p < 0.01; n = 3–10).
(C) Correlation of glomerular volume and PN number. Empty circles represent ChA-GAL4;UAS-C3PA based data (as shown in Figure S1). *p < 0.05 (two-tailed
probability of the Pearson correlation coefficient).
The color code refers to Figure 1B.
3406 Cell Reports 16, 3401–3413, September 20, 2016
Manuscript 3
73
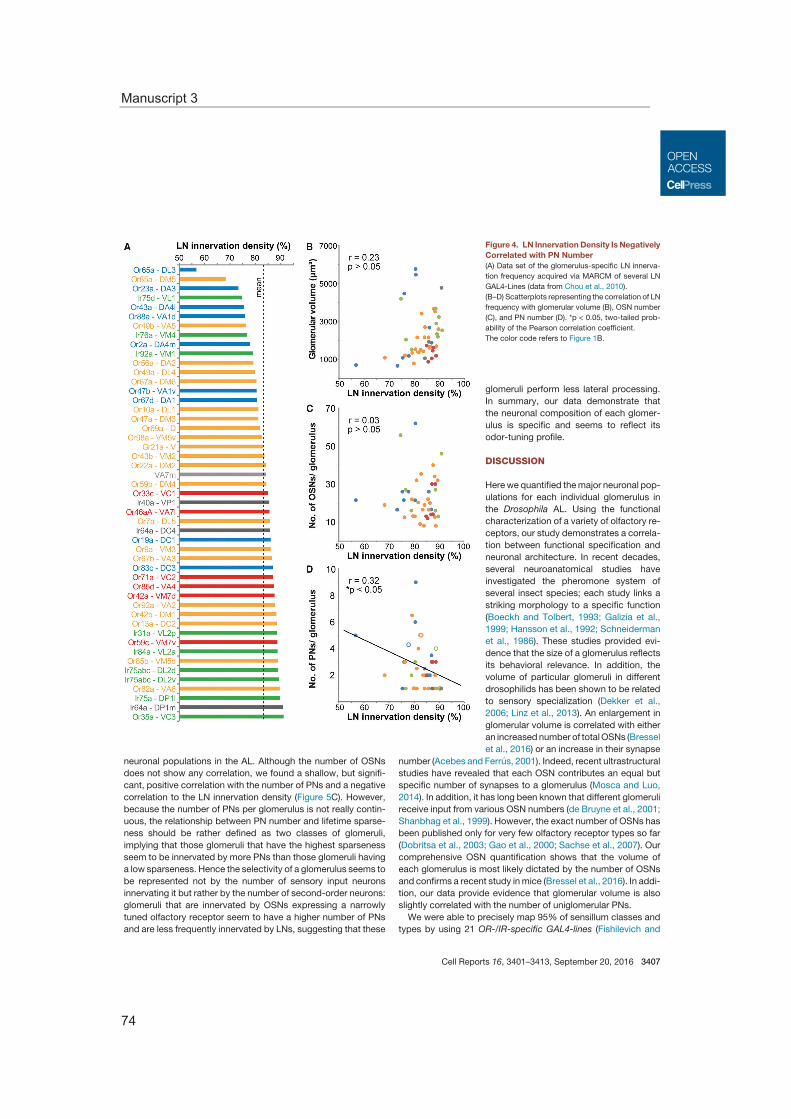
neuronal populations in the AL. Although the number of OSNs
does not show any correlation, we found a shallow, but signifi-
cant, positive correlation with the number of PNs and a negative
correlation to the LN innervation density (Figure 5C). However,
because the number of PNs per glomerulus is not really contin-
uous, the relationship between PN number and lifetime sparse-
ness should be rather defined as two classes of glomeruli,
implying that those glomeruli that have the highest sparseness
seem to be innervated by more PNs than those glomeruli having
a low sparseness. Hence the selectivity of a glomerulus seems to
be represented not by the number of sensory input neurons
innervating it but rather by the number of second-order neurons:
glomeruli that are innervated by OSNs expressing a narrowly
tuned olfactory receptor seem to have a higher number of PNs
and are less frequently innervated by LNs, suggesting that these
Figure 4. LN Innervation Density Is Negatively
Correlated with PN Number
(A) Data set of the glomerulus-specific LN innerva-
tion frequency acquired via MARCM of several LN
GAL4-Lines (data from Chou et al., 2010).
(B–D) Scatterplots representing the correlation of LN
frequency with glomerular volume (B), OSN number
(C), and PN number (D). *p < 0.05, two-tailed prob-
ability of the Pearson correlation coefficient.
The color code refers to Figure 1B.
glomeruli perform less lateral processing.
In summary, our data demonstrate that
the neuronal composition of each glomer-
ulus is specific and seems to reflect its
odor-tuning profile.
DISCUSSION
Herewe quantified themajor neuronal pop-
ulations for each individual glomerulus in
the Drosophila AL. Using the functional
characterization of a variety of olfactory re-
ceptors, our study demonstrates a correla-
tion between functional specification and
neuronal architecture. In recent decades,
several neuroanatomical studies have
investigated the pheromone system of
several insect species; each study links a
striking morphology to a specific function
(Boeckh and Tolbert, 1993; Galizia et al.,
1999; Hansson et al., 1992; Schneiderman
et al., 1986). These studies provided evi-
dence that the size of a glomerulus reflects
its behavioral relevance. In addition, the
volume of particular glomeruli in different
drosophilids has been shown to be related
to sensory specialization (Dekker et al.,
2006; Linz et al., 2013). An enlargement in
glomerular volume is correlated with either
an increasednumber of totalOSNs (Bressel
et al., 2016) or an increase in their synapse
number (Acebes and Ferrus, 2001). Indeed, recent ultrastructural
studies have revealed that each OSN contributes an equal but
specific number of synapses to a glomerulus (Mosca and Luo,
2014). In addition, it has long been known that different glomeruli
receive input from various OSN numbers (de Bruyne et al., 2001;
Shanbhag et al., 1999). However, the exact number of OSNs has
been published only for very few olfactory receptor types so far
(Dobritsa et al., 2003; Gao et al., 2000; Sachse et al., 2007). Our
comprehensive OSN quantification shows that the volume of
each glomerulus is most likely dictated by the number of OSNs
and confirms a recent study inmice (Bressel et al., 2016). In addi-
tion, our data provide evidence that glomerular volume is also
slightly correlated with the number of uniglomerular PNs.
We were able to precisely map 95% of sensillum classes and
types by using 21 OR-/IR-specific GAL4-lines (Fishilevich and
Cell Reports 16, 3401–3413, September 20, 2016 3407
Manuscript 3
74
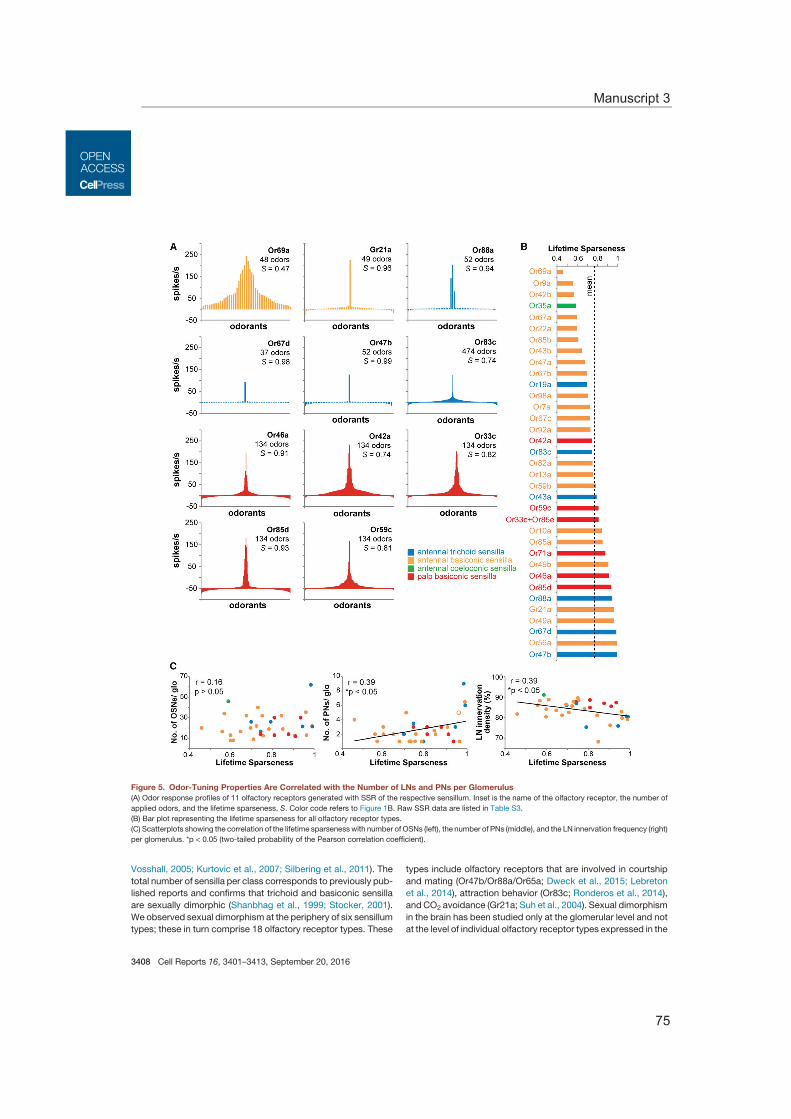
Vosshall, 2005; Kurtovic et al., 2007; Silbering et al., 2011). The
total number of sensilla per class corresponds to previously pub-
lished reports and confirms that trichoid and basiconic sensilla
are sexually dimorphic (Shanbhag et al., 1999; Stocker, 2001).
We observed sexual dimorphism at the periphery of six sensillum
types; these in turn comprise 18 olfactory receptor types. These
types include olfactory receptors that are involved in courtship
and mating (Or47b/Or88a/Or65a; Dweck et al., 2015; Lebreton
et al., 2014), attraction behavior (Or83c; Ronderos et al., 2014),
and CO2 avoidance (Gr21a; Suh et al., 2004). Sexual dimorphism
in the brain has been studied only at the glomerular level and not
at the level of individual olfactory receptor types expressed in the
Figure 5. Odor-Tuning Properties Are Correlated with the Number of LNs and PNs per Glomerulus
(A) Odor response profiles of 11 olfactory receptors generated with SSR of the respective sensillum. Inset is the name of the olfactory receptor, the number of
applied odors, and the lifetime sparseness, S. Color code refers to Figure 1B. Raw SSR data are listed in Table S3.
(B) Bar plot representing the lifetime sparseness for all olfactory receptor types.
(C) Scatterplots showing the correlation of the lifetime sparsenesswith number of OSNs (left), the number of PNs (middle), and the LN innervation frequency (right)
per glomerulus. *p < 0.05 (two-tailed probability of the Pearson correlation coefficient).
3408 Cell Reports 16, 3401–3413, September 20, 2016
Manuscript 3
75
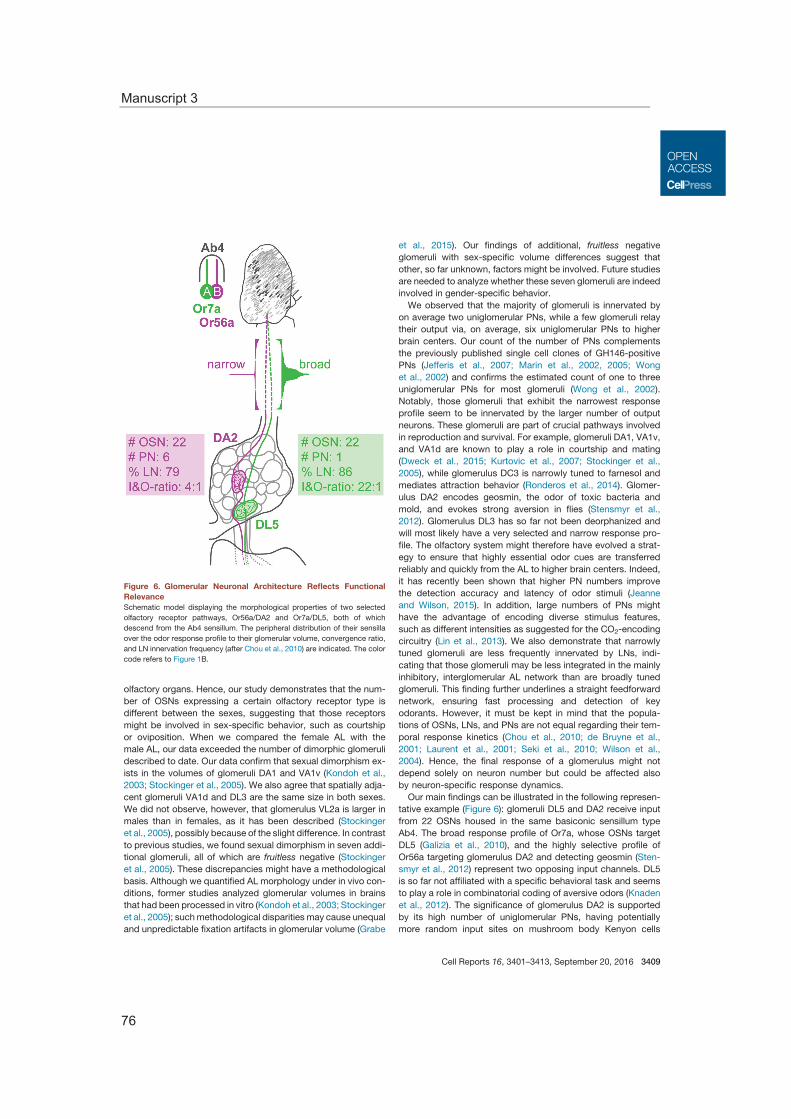
olfactory organs. Hence, our study demonstrates that the num-
ber of OSNs expressing a certain olfactory receptor type is
different between the sexes, suggesting that those receptors
might be involved in sex-specific behavior, such as courtship
or oviposition. When we compared the female AL with the
male AL, our data exceeded the number of dimorphic glomeruli
described to date. Our data confirm that sexual dimorphism ex-
ists in the volumes of glomeruli DA1 and VA1v (Kondoh et al.,
2003; Stockinger et al., 2005). We also agree that spatially adja-
cent glomeruli VA1d and DL3 are the same size in both sexes.
We did not observe, however, that glomerulus VL2a is larger in
males than in females, as it has been described (Stockinger
et al., 2005), possibly because of the slight difference. In contrast
to previous studies, we found sexual dimorphism in seven addi-
tional glomeruli, all of which are fruitless negative (Stockinger
et al., 2005). These discrepancies might have a methodological
basis. Although we quantified AL morphology under in vivo con-
ditions, former studies analyzed glomerular volumes in brains
that had been processed in vitro (Kondoh et al., 2003; Stockinger
et al., 2005); suchmethodological disparities may cause unequal
and unpredictable fixation artifacts in glomerular volume (Grabe
et al., 2015). Our findings of additional, fruitless negative
glomeruli with sex-specific volume differences suggest that
other, so far unknown, factors might be involved. Future studies
are needed to analyze whether these seven glomeruli are indeed
involved in gender-specific behavior.
We observed that the majority of glomeruli is innervated by
on average two uniglomerular PNs, while a few glomeruli relay
their output via, on average, six uniglomerular PNs to higher
brain centers. Our count of the number of PNs complements
the previously published single cell clones of GH146-positive
PNs (Jefferis et al., 2007; Marin et al., 2002, 2005; Wong
et al., 2002) and confirms the estimated count of one to three
uniglomerular PNs for most glomeruli (Wong et al., 2002).
Notably, those glomeruli that exhibit the narrowest response
profile seem to be innervated by the larger number of output
neurons. These glomeruli are part of crucial pathways involved
in reproduction and survival. For example, glomeruli DA1, VA1v,
and VA1d are known to play a role in courtship and mating
(Dweck et al., 2015; Kurtovic et al., 2007; Stockinger et al.,
2005), while glomerulus DC3 is narrowly tuned to farnesol and
mediates attraction behavior (Ronderos et al., 2014). Glomer-
ulus DA2 encodes geosmin, the odor of toxic bacteria and
mold, and evokes strong aversion in flies (Stensmyr et al.,
2012). Glomerulus DL3 has so far not been deorphanized and
will most likely have a very selected and narrow response pro-
file. The olfactory system might therefore have evolved a strat-
egy to ensure that highly essential odor cues are transferred
reliably and quickly from the AL to higher brain centers. Indeed,
it has recently been shown that higher PN numbers improve
the detection accuracy and latency of odor stimuli (Jeanne
and Wilson, 2015). In addition, large numbers of PNs might
have the advantage of encoding diverse stimulus features,
such as different intensities as suggested for the CO2-encoding
circuitry (Lin et al., 2013). We also demonstrate that narrowly
tuned glomeruli are less frequently innervated by LNs, indi-
cating that those glomeruli may be less integrated in the mainly
inhibitory, interglomerular AL network than are broadly tuned
glomeruli. This finding further underlines a straight feedforward
network, ensuring fast processing and detection of key
odorants. However, it must be kept in mind that the popula-
tions of OSNs, LNs, and PNs are not equal regarding their tem-
poral response kinetics (Chou et al., 2010; de Bruyne et al.,
2001; Laurent et al., 2001; Seki et al., 2010; Wilson et al.,
2004). Hence, the final response of a glomerulus might not
depend solely on neuron number but could be affected also
by neuron-specific response dynamics.
Our main findings can be illustrated in the following represen-
tative example (Figure 6): glomeruli DL5 and DA2 receive input
from 22 OSNs housed in the same basiconic sensillum type
Ab4. The broad response profile of Or7a, whose OSNs target
DL5 (Galizia et al., 2010), and the highly selective profile of
Or56a targeting glomerulus DA2 and detecting geosmin (Sten-
smyr et al., 2012) represent two opposing input channels. DL5
is so far not affiliated with a specific behavioral task and seems
to play a role in combinatorial coding of aversive odors (Knaden
et al., 2012). The significance of glomerulus DA2 is supported
by its high number of uniglomerular PNs, having potentially
more random input sites on mushroom body Kenyon cells
Figure 6. Glomerular Neuronal Architecture Reflects Functional
Relevance
Schematic model displaying the morphological properties of two selected
olfactory receptor pathways, Or56a/DA2 and Or7a/DL5, both of which
descend from the Ab4 sensillum. The peripheral distribution of their sensilla
over the odor response profile to their glomerular volume, convergence ratio,
and LN innervation frequency (after Chou et al., 2010) are indicated. The color
code refers to Figure 1B.
Cell Reports 16, 3401–3413, September 20, 2016 3409
Manuscript 3
76
(Caron et al., 2013; Gruntman and Turner, 2013) and on third-
order neurons in the LH, in contrast to glomerulus DL5, which
has only a single PN. The difference in output quantity is linked
to an inverse LN innervation frequency. Although glomerulus
DA2 is innervated by fewer LNs than is DL5, both glomeruli
most likely have different impacts on the AL network. These
glomeruli have different volumes, which, although the overall
OSN density per glomerulus is identical, might be due either
to the different number of innervating LNs or to a differential
density of synapses per OSN (Mosca and Luo, 2014). On the
basis of our findings of a specific and heterogeneous glomer-
ular architecture, we are in a position to speculate about the
significance of glomeruli that have remained to date poorly
characterized. Hence, we propose that glomeruli D (Or69a),
DC3 (Or83c), and DL3 (Or65a) likely encode odor information
that is as crucial as information encoded in the geosmin and
pheromone pathways.
In conclusion, our study demonstrates that each glomerulus
is a unique morphological and functional unit whose significance
regarding odor detection and odor-guided behavior can be
predicted. Future studies dedicated to elucidating the synaptic
connectivity in more detail will reveal whether ultrastructural
characteristics of individual glomeruli are also correlated with
functional properties.
EXPERIMENTAL PROCEDURES
Flies
Flies were reared at 25�C and 70% humidity on a 12 hr/12 hr day/night cycle.
We used the following fly lines ordered from the BloomingtonDrosophila stock
center (http://flystocks.bio.indiana.edu): GH146-GAL4 (Stocker et al., 1997),
UAS-GCaMP3.0 (Tian et al., 2009), UAS-nlsGFP, ChA-GAL4 (Salvaterra
and Kitamoto, 2001), Or10a-GAL4, Or13a-GAL4, Or22a-GAL4, Or33c-
GAL4, Or35a-GAL4, Or42a-GAL4, Or42b-GAL4, Or43a-GAL4, Or43b-GAL4,
Or46aA-GAL4, Or47a-GAL4, Or49a-GAL4, Or56a-GAL4, Or59c-GAL4,
Or67c-GAL4, Or69a-GAL4, Or83c-GAL4, Or85a-GAL4, Or88a-GAL4, Or92a-
GAL4, Or98a-GAL4, and Orco-GAL4 (all Fishilevich and Vosshall, 2005; Vos-
shall et al., 2000). Additional lines were kindly provided by Richard Benton
(Ir40a-GAL4; Ir41a-GAL4, Silbering et al., 2011; IR76a-GAL4, Benton et al.,
2009; Ir92a-GAL4; and Ir8a-GAL4, Abuin et al., 2011), Barry Dickson (Or67d-
GAL4, Kurtovic et al., 2007), and Bob Datta (UAS-C3PA; Ruta et al., 2010).
Scanning Electron Microscopy
Flies were anesthetized in CO2, placed in 5 ml 25% EtOH, and incubated for
12–24 hr at room temperature. In an EtOH row, the flies were further dehy-
drated in 50%, 75%, and two times 100%EtOH for 12–24 hr each at room tem-
perature. Samples were then critical point dried. After mounting the samples
with T. V. tube coat (Ted Pella) onto the SEM stubs, we sputter-coated them
with a 25-nm-thick platinum coat. Images of the sensillum types on the third
antennal segment and the maxillary palp were acquired using a LEO 1450
VP scanning electron microscope with 10 kV and 24 mm working distance
(Carl Zeiss).
OSN Quantification and Mapping
To quantify the number of OSNs innervating each glomerulus, 3- to 6-day-old
flies were anesthetized with CO2, and their antennae or palps were collected.
After the antennae or palps were covered with a solution of saline and Triton-X
(Sigma-Aldrich), they were mounted in VectaShield (Vector Laboratories) and
sealed with nail polish between a 223 22 mm and a 243 60 mm object slide,
both 1 mm thick, to allow double-sided scanning. No spacer was needed,
because the layer of nail polish provided enough space to fix the antennae
or palp but not crush it. Scans of both sides of each antenna were carried
out with an Axio Imager.Z1 (Carl Zeiss) using a 203water immersion objective
(WPlan-Apochromat 203/0.8; Carl Zeiss) in combination with aGFP filter cube
(HE 38, EX BP 470/40, BS FT 495, EM BP 525/50; Carl Zeiss). To reliably map
the sensilla, an additional transmitted light scan of each antenna was acquired.
This scan was used to register all antennae by hand, on the basis of the posi-
tion of the arista and the sacculus. The quantification of OSN cell bodies was
done in FIJI (ImageJ version 1.48r; NIH) software.
Confocal Microscopy, 3D Reconstruction, and Volume
Quantification
The dissection of fly brains was carried out as previously described (Silbering
et al., 2011; Strutz et al., 2012). Confocal scans were obtained using multiple-
photon confocal laser scanning microscopy (MPCLSM) (Zeiss laser scanning
microscopy [LSM] 710 NLO confocal microscope; Carl Zeiss) using a 403wa-
ter immersion objective (W Plan-Apochromat 40x/1.0 DIC M27; Carl Zeiss) in
combination with the internal Argon 488 (LASOS) and Helium-Neon 543 (Carl
Zeiss) laser lines. Reconstruction of whole ALs and of individual glomeruli was
done using the segmentation software AMIRA version 5.5.0 (FEI Visualization
Sciences Group). Identification of glomeruli was verified by the in vivo scans of
the specific OR-lines crossed into the END1-2 background for in vivo neuropil
labeling (Grabe et al., 2015). We analyzed scans of at least three specimens for
each GAL4 receptor line and reconstructed them in using the segmentation
software AMIRA 5.5.0 (FEI Visualization Sciences Group). Using information
on the voxel size from the laser scanningmicroscopy scans aswell as the num-
ber of voxels labeled for each neuropil in AMIRA, we calculated the volume of
the glomeruli and the whole AL.
Photoactivation of PNs
In vivo labeling of single glomeruli of 4- to 6-day-oldmale and female flies of the
genotype +;GH146-GAL4/(CyO);UAS-C3PA/(TM6B) using MPCLSM (Zeiss
LSM 710 NLO confocal microscope; Carl Zeiss) equipped with an infrared
Chameleon Ultra diode-pumped laser (Coherent). Flies were prepared as
previously described (Strutz et al., 2012). Precise regions of interest (ROIs) in
the center of each single glomerulus were continuously photoactivated for
5–15 min at a wavelength of 760 nm with a 403 water immersion objective
(W Plan-Apochromat 40x/1.0 DICM27; Carl Zeiss) with laser power of approx-
imately 1.5 mW. In detail, after obtaining a pre-photoactivation scan of
the whole AL, we identified the single target glomerulus, marked its volume
with a precise ROI, photoactivated and subsequently labeled all GH146-
positive PNs innervating it, including all corresponding somata in one of
the three cell clusters surrounding the AL (Figure 3A) as well as all axonal
projections to the mushroom body calyx and the LH. Z stacks of the pre-
and post-activation states were scanned at 925 nm with 1,024 3 1,024 pixel
resolution. The identification of glomeruli was based on the previously pub-
lished screen of GH146-GAL4/UAS-GCaMP3.0 under the same conditions
(Grabe et al., 2015).
Single-Sensillum Recordings
Adult flies were immobilized in pipette tips, and the third antennal segment or
the palps were placed in a stable position onto a glass coverslip. Sensilla were
localized under a microscope (BX51WI; Olympus) at 1003 magnification, and
the extracellular signals originating from the OSNs were measured by inserting
a tungsten wire electrode in the base of a sensillum. The reference electrode
was inserted into the eye. Signals were amplified (103; Syntech Universal
AC/DC Probe; Syntech), sampled (10,667.0 samples/s), and filtered (100–
3,000 Hz with 50/60 Hz suppression) via USB-IDAC connection to a computer
(Syntech). Action potentials were extracted using Auto Spike 32 software
(Syntech). Neuron activities were recorded for 10 s, starting 2 s before a stim-
ulation period of 0.5 s. Responses from individual neurons were calculated as
the increase (or decrease) in the action potential frequency (spikes per second)
relative to the pre-stimulus frequency.
Lifetime Sparseness, S
Acquired responses were used to quantify a receptor’s response profile
by calculating its lifetime sparseness (Bhandawat et al., 2007; Perez-Orive
et al., 2002; Vinje and Gallant, 2000). This is a non-parametric statistic
providing a measure of the likeliness of an OSN to respond. The value ranges
from 0% S% 1, where 0 means the OSN responds to every odor in the same
3410 Cell Reports 16, 3401–3413, September 20, 2016
Manuscript 3
77
way and 1 means the OSN responds exclusively to one odor in the set. Calcu-
lation was carried out with following formula:
S=ð 1
1� 1
N
Þ �
0B@1�
�PNj = 1
rjN
�2
PNj = 1
r2jN
1CA;
where S is lifetime sparseness, N is the number of tested odors, and rj is
response to a given odor j. Any values of rj < 0 were set to zero before
computing lifetime sparseness. Used data sets are taken from Dweck et al.
(2015), Ebrahim et al. (2015), and Hallem and Carlson (2006); the DoOR
database (Galizia et al., 2010), and response profiles of 11 olfactory receptors
acquired via SSR in this study (Table S3).
Statistical Methods
If not otherwise stated, data represent median ± SD. Statistical differences
between groups were determined by Student’s t test (*p < 0.05, **p < 0.01,
***p < 0.001).
Significance of the Pearson correlation coefficients were calculated using
the online tool p-Value Calculator for Correlation Coefficients (http://www.
danielsoper.com/statcalc).
SUPPLEMENTAL INFORMATION
Supplemental Information includes one figure and three tables and can be
foundwith this article online at http://dx.doi.org/10.1016/j.celrep.2016.08.063.
AUTHOR CONTRIBUTIONS
V.G. and S.S. together conceived and designed the study. V.G. planned and
carried out all experiments, with the exception of the quantification of PNs
in females (Figure 3), which was done by A.B., and the SSR experiments
(Figure 5), which were done by H.K.M.D. V.G. and S.S. analyzed and inter-
preted the results, prepared the figures, and wrote the paper. S.L.-L. helped
to generate the END1-2 fly strain and provided neurogenetic advice. B.S.H.
provided intellectual and financial support. All authors critically revised the
article.
ACKNOWLEDGMENTS
We thank Silke Trautheim for excellent technical assistance, J€urgen Rybak for
help with the AMIRA software, Christine Mißbach for support regarding the
antennal preparations, Carolin Kathner and Julia van Beesel for help with
the neuronal quantifications, and Emily Wheeler for editorial assistance.
Stocks obtained from the Bloomington Drosophila Stock Center (NIH
P40OD018537) were used in this study. We are grateful to the Hansson
Department for comments on the manuscript. This study was funded by
the Federal Ministry of Education and Research (BMBF research grant to
S.S.) and the Max Planck Society (MPG).
Received: March 26, 2016
Revised: July 15, 2016
Accepted: August 18, 2016
Published: September 20, 2016
REFERENCES
Abuin, L., Bargeton, B., Ulbrich, M.H., Isacoff, E.Y., Kellenberger, S., and Ben-
ton, R. (2011). Functional architecture of olfactory ionotropic glutamate recep-
tors. Neuron 69, 44–60.
Acebes, A., and Ferrus, A. (2001). Increasing the number of synapses modifies
olfactory perception in Drosophila. J. Neurosci. 21, 6264–6273.
Ai, M., Min, S., Grosjean, Y., Leblanc, C., Bell, R., Benton, R., and Suh,
G.S.B. (2010). Acid sensing by the Drosophila olfactory system. Nature
468, 691–695.
Benton, R., Sachse, S., Michnick, S.W., and Vosshall, L.B. (2006). Atypical
membrane topology and heteromeric function ofDrosophila odorant receptors
in vivo. PLoS Biol. 4, e20.
Benton, R., Vannice, K.S., Gomez-Diaz, C., and Vosshall, L.B. (2009). Variant
ionotropic glutamate receptors as chemosensory receptors in Drosophila. Cell
136, 149–162.
Bhandawat, V., Olsen, S.R., Gouwens, N.W., Schlief, M.L., and Wilson, R.I.
(2007). Sensory processing in the Drosophila antennal lobe increases reliability
and separability of ensemble odor representations. Nat. Neurosci. 10, 1474–
1482.
Boeckh, J., and Tolbert, L.P. (1993). Synaptic organization and development of
the antennal lobe in insects. Microsc. Res. Tech. 24, 260–280.
Bressel, O.C., Khan, M., andMombaerts, P. (2016). Linear correlation between
the number of olfactory sensory neurons expressing a given mouse odorant
receptor gene and the total volume of the corresponding glomeruli in the olfac-
tory bulb. J. Comp. Neurol. 524, 199–209.
Busch, S., Selcho, M., Ito, K., and Tanimoto, H. (2009). A map of octopaminer-
gic neurons in the Drosophila brain. J. Comp. Neurol. 513, 643–667.
Carlsson, M.A., Diesner, M., Schachtner, J., and Nassel, D.R. (2010). Multiple
neuropeptides in the Drosophila antennal lobe suggest complex modulatory
circuits. J. Comp. Neurol. 518, 3359–3380.
Caron, S.J.C., Ruta, V., Abbott, L.F., and Axel, R. (2013). Random conver-
gence of olfactory inputs in the Drosophila mushroom body. Nature 497,
113–117.
Chou, Y.-H., Spletter, M.L., Yaksi, E., Leong, J.C.S., Wilson, R.I., and Luo, L.
(2010). Diversity and wiring variability of olfactory local interneurons in the
Drosophila antennal lobe. Nat. Neurosci. 13, 439–449.
Couto, A., Alenius, M., and Dickson, B.J. (2005). Molecular, anatomical, and
functional organization of the Drosophila olfactory system. Curr. Biol. 15,
1535–1547.
de Bruyne, M., Clyne, P.J., and Carlson, J.R. (1999). Odor coding in a model
olfactory organ: the Drosophila maxillary palp. J. Neurosci. 19, 4520–4532.
de Bruyne, M., Foster, K., and Carlson, J.R. (2001). Odor coding in the
Drosophila antenna. Neuron 30, 537–552.
Dekker, T., Ibba, I., Siju, K.P., Stensmyr, M.C., and Hansson, B.S. (2006).
Olfactory shifts parallel superspecialism for toxic fruit in Drosophila mela-
nogaster sibling, D. sechellia. Curr. Biol. 16, 101–109.
Dobritsa, A.A., van der Goes van Naters, W.,Warr, C.G., Steinbrecht, R.A., and
Carlson, J.R. (2003). Integrating themolecular and cellular basis of odor coding
in the Drosophila antenna. Neuron 37, 827–841.
Dumenil, C., Woud, D., Pinto, F., Alkema, J.T., Jansen, I., Van Der Geest, A.M.,
Roessingh, S., and Billeter, J.-C. (2016). Pheromonal cues deposited bymated
females convey social information about egg-laying sites in Drosophila mela-
nogaster. J. Chem. Ecol. 42, 259–269.
Dweck, H.K., Ebrahim, S.A., Kromann, S., Bown, D., Hillbur, Y., Sachse, S.,
Hansson, B.S., and Stensmyr, M.C. (2013). Olfactory preference for egg laying
on citrus substrates in Drosophila. Curr. Biol. 23, 2472–2480.
Dweck, H.K.M., Ebrahim, S.A.M., Thoma,M., Mohamed, A.A.M., Keesey, I.W.,
Trona, F., Lavista-Llanos, S., Svato�s, A., Sachse, S., Knaden, M., and Hans-
son, B.S. (2015). Pheromones mediating copulation and attraction in
Drosophila. Proc. Natl. Acad. Sci. U S A 112, E2829–E2835.
Ebrahim, S.A.M., Dweck, H.K.M., Stokl, J., Hofferberth, J.E., Trona, F.,
Weniger, K., Rybak, J., Seki, Y., Stensmyr, M.C., Sachse, S., et al. (2015).
Drosophila avoids parasitoids by sensing their semiochemicals via a dedicated
olfactory circuit. PLoS Biol. 13, e1002318.
Fishilevich, E., and Vosshall, L.B. (2005). Genetic and functional subdivision of
the Drosophila antennal lobe. Curr. Biol. 15, 1548–1553.
Galizia, C.G., McIlwrath, S.L., and Menzel, R. (1999). A digital three-dimen-
sional atlas of the honeybee antennal lobe based on optical sections acquired
by confocal microscopy. Cell Tissue Res. 295, 383–394.
Cell Reports 16, 3401–3413, September 20, 2016 3411
Manuscript 3
78
Galizia, C.G., M€unch, D., Strauch,M., Nissler, A., andMa, S. (2010). Integrating
heterogeneous odor response data into a common response model: a DoOR
to the complete olfactome. Chem. Senses 35, 551–563.
Gallio, M., Ofstad, T.A., Macpherson, L.J., Wang, J.W., and Zuker, C.S. (2011).
The coding of temperature in the Drosophila brain. Cell 144, 614–624.
Gao, Q., Yuan, B., and Chess, A. (2000). Convergent projections of Drosophila
olfactory neurons to specific glomeruli in the antennal lobe. Nat. Neurosci. 3,
780–785.
Grabe, V., Strutz, A., Baschwitz, A., Hansson, B.S., and Sachse, S. (2015).
Digital in vivo 3D atlas of the antennal lobe of Drosophila melanogaster.
J. Comp. Neurol. 523, 530–544.
Grosjean, Y., Rytz, R., Farine, J.-P., Abuin, L., Cortot, J., Jefferis, G.S.X.E., and
Benton, R. (2011). An olfactory receptor for food-derived odours promotes
male courtship in Drosophila. Nature 478, 236–240.
Gruntman, E., and Turner, G.C. (2013). Integration of the olfactory code across
dendritic claws of single mushroom body neurons. Nat. Neurosci. 16, 1821–
1829.
Ha, T.S., and Smith, D.P. (2006). A pheromone receptor mediates 11-cis-vac-
cenyl acetate-induced responses in Drosophila. J. Neurosci. 26, 8727–8733.
Hallem, E.A., and Carlson, J.R. (2006). Coding of odors by a receptor reper-
toire. Cell 125, 143–160.
Hansson, B.S., Ljungberg, H., Hallberg, E., and Lofstedt, C. (1992). Functional
specialization of olfactory glomeruli in a moth. Science 256, 1313–1315.
Hansson, B.S., Knaden, M., Sachse, S., Stensmyr, M.C., and Wicher, D.
(2010). Towards plant-odor-related olfactory neuroethology in Drosophila.
Chemoecology 20, 51–61.
Hong, E.J., and Wilson, R.I. (2015). Simultaneous encoding of odors by chan-
nels with diverse sensitivity to inhibition. Neuron 85, 573–589.
Ito, K., Shinomiya, K., Ito, M., Armstrong, J.D., Boyan, G., Hartenstein, V.,
Harzsch, S., Heisenberg, M., Homberg, U., Jenett, A., et al.; Insect Brain
Name Working Group (2014). A systematic nomenclature for the insect brain.
Neuron 81, 755–765.
Jeanne, J.M., and Wilson, R.I. (2015). Convergence, divergence, and recon-
vergence in a feedforward network improves neural speed and accuracy.
Neuron 88, 1014–1026.
Jefferis, G.S.X.E., Potter, C.J., Chan, A.M., Marin, E.C., Rohlfing, T., Maurer,
C.R., Jr., and Luo, L. (2007). Comprehensive maps of Drosophila higher olfac-
tory centers: spatially segregated fruit and pheromone representation. Cell
128, 1187–1203.
Kain, P., Boyle, S.M., Tharadra, S.K., Guda, T., Pham, C., Dahanukar, A., and
Ray, A. (2013). Odour receptors and neurons for DEET and new insect repel-
lents. Nature 502, 507–512.
Knaden, M., Strutz, A., Ahsan, J., Sachse, S., and Hansson, B.S. (2012).
Spatial representation of odorant valence in an insect brain. Cell Rep. 1,
392–399.
Kondoh, Y., Kaneshiro, K.Y., Kimura, K., and Yamamoto, D. (2003). Evolution
of sexual dimorphism in the olfactory brain of Hawaiian Drosophila. Proc. Biol.
Sci. 270, 1005–1013.
Kreher, S.A., Mathew, D., Kim, J., and Carlson, J.R. (2008). Translation of sen-
sory input into behavioral output via an olfactory system. Neuron 59, 110–124.
Kurtovic, A., Widmer, A., and Dickson, B.J. (2007). A single class of olfactory
neurons mediates behavioural responses to a Drosophila sex pheromone.
Nature 446, 542–546.
Lai, S.-L., Awasaki, T., Ito, K., and Lee, T. (2008). Clonal analysis of Drosophila
antennal lobe neurons: diverse neuronal architectures in the lateral neuroblast
lineage. Development 135, 2883–2893.
Laissue, P.P., Reiter, C., Hiesinger, P.R., Halter, S., Fischbach, K.F., and
Stocker, R.F. (1999). Three-dimensional reconstruction of the antennal lobe
in Drosophila melanogaster. J. Comp. Neurol. 405, 543–552.
Larsson, M.C., Domingos, A.I., Jones, W.D., Chiappe, M.E., Amrein, H., and
Vosshall, L.B. (2004). Or83b encodes a broadly expressed odorant receptor
essential for Drosophila olfaction. Neuron 43, 703–714.
Laurent, G., Stopfer, M., Friedrich, R.W., Rabinovich, M.I., Volkovskii, A., and
Abarbanel, H.D.I. (2001). Odor encoding as an active, dynamical process:
experiments, computation, and theory. Annu. Rev. Neurosci. 24, 263–297.
Lebreton, S., Grabe, V., Omondi, A.B., Ignell, R., Becher, P.G., Hansson, B.S.,
Sachse, S., and Witzgall, P. (2014). Love makes smell blind: mating sup-
presses pheromone attraction in Drosophila females via Or65a olfactory neu-
rons. Sci. Rep. 4, 7119.
Lin, H.-H., Chu, L.-A., Fu, T.-F., Dickson, B.J., and Chiang, A.-S. (2013).
Parallel neural pathways mediate CO2 avoidance responses in Drosophila.
Science 340, 1338–1341.
Linz, J., Baschwitz, A., Strutz, A., Dweck, H.K.M., Sachse, S., Hansson, B.S.,
and Stensmyr, M.C. (2013). Host plant-driven sensory specialization in
Drosophila erecta. Proc. Biol. Sci. 280, 20130626.
Liu, W.W., and Wilson, R.I. (2013). Glutamate is an inhibitory neurotransmitter
in the Drosophila olfactory system. Proc. Natl. Acad. Sci. U S A 110, 10294–
10299.
Marin, E.C., Jefferis, G.S.X.E., Komiyama, T., Zhu, H., and Luo, L. (2002). Rep-
resentation of the glomerular olfactory map in the Drosophila brain. Cell 109,
243–255.
Marin, E.C., Watts, R.J., Tanaka, N.K., Ito, K., and Luo, L. (2005). Developmen-
tally programmed remodeling of the Drosophila olfactory circuit. Development
132, 725–737.
Mombaerts, P. (2006). Axonal wiring in themouse olfactory system. Annu. Rev.
Cell Dev. Biol. 22, 713–737.
Mosca, T.J., and Luo, L. (2014). Synaptic organization of the Drosophila
antennal lobe and its regulation by the Teneurins. Elife 3, e03726.
Patterson, G.H., and Lippincott-Schwartz, J. (2002). A photoactivatable GFP
for selective photolabeling of proteins and cells. Science 297, 1873–1877.
Perez-Orive, J., Mazor, O., Turner, G.C., Cassenaer, S., Wilson, R.I., and
Laurent, G. (2002). Oscillations and sparsening of odor representations in
the mushroom body. Science 297, 359–365.
Ronderos, D.S., Lin, C.-C., Potter, C.J., and Smith, D.P. (2014). Farnesol-
detecting olfactory neurons in Drosophila. J. Neurosci. 34, 3959–3968.
Ruta, V., Datta, S.R., Vasconcelos, M.L., Freeland, J., Looger, L.L., and Axel,
R. (2010). A dimorphic pheromone circuit in Drosophila from sensory input to
descending output. Nature 468, 686–690.
Rybak, J., Talarico, G., Ruiz, S., Arnold, C., Cantera, R., and Hansson, B.S.
(2016). Synaptic circuitry of identified neurons in the antennal lobe of
Drosophila melanogaster. J. Comp. Neurol. 524, 1920–1956.
Sachse, S., Rueckert, E., Keller, A., Okada, R., Tanaka, N.K., Ito, K., and Vos-
shall, L.B. (2007). Activity-dependent plasticity in an olfactory circuit. Neuron
56, 838–850.
Salvaterra, P.M., and Kitamoto, T. (2001). Drosophila cholinergic neurons and
processes visualized with Gal4/UAS-GFP. Brain Res. Gene Expr. Patterns 1,
73–82.
Schneiderman, A.M., Hildebrand, J.G., Brennan, M.M., and Tumlinson, J.H.
(1986). Trans-sexually grafted antennae alter pheromone-directed behaviour
in a moth. Nature 323, 801–803.
Seki, Y., Rybak, J., Wicher, D., Sachse, S., and Hansson, B.S. (2010).
Physiological and morphological characterization of local interneurons in the
Drosophila antennal lobe. J. Neurophysiol. 104, 1007–1019.
Semmelhack, J.L., and Wang, J.W. (2009). Select Drosophila glomeruli
mediate innate olfactory attraction and aversion. Nature 459, 218–223.
Shanbhag, S.R., Singh, K., and Singh, R.N. (1995). Fine structure and primary
sensory projections of sensilla located in the sacculus of the antenna of
Drosophila melanogaster. Cell Tissue Res. 282, 237–249.
Shanbhag, S.R., Muller, B., and Steinbrecht, R.A. (1999). Atlas of olfactory
organs of Drosophila melanogaster. 1. Types, external organization, innerva-
tion and distribution of olfactory sensilla. Int. J. Insect Morphol. Embryol. 28,
377–397.
3412 Cell Reports 16, 3401–3413, September 20, 2016
Manuscript 3
79

Shang, Y., Claridge-Chang, A., Sjulson, L., Pypaert, M., and Miesenbock, G.
(2007). Excitatory local circuits and their implications for olfactory processing
in the fly antennal lobe. Cell 128, 601–612.
Silbering, A.F., Rytz, R., Grosjean, Y., Abuin, L., Ramdya, P., Jefferis, G.S.X.E.,
and Benton, R. (2011). Complementary function and integrated wiring of the
evolutionarily distinct Drosophila olfactory subsystems. J. Neurosci. 31,
13357–13375.
Stensmyr, M.C., Dweck, H.K.M., Farhan, A., Ibba, I., Strutz, A., Mukunda, L.,
Linz, J., Grabe, V., Steck, K., Lavista-Llanos, S., et al. (2012). A conserved
dedicated olfactory circuit for detecting harmful microbes in Drosophila. Cell
151, 1345–1357.
Stocker, R.F. (2001). Drosophila as a focus in olfactory research: mapping of
olfactory sensilla by fine structure, odor specificity, odorant receptor expres-
sion, and central connectivity. Microsc. Res. Tech. 55, 284–296.
Stocker, R.F., Lienhard, M.C., Borst, A., and Fischbach, K.F. (1990). Neuronal
architecture of the antennal lobe in Drosophila melanogaster. Cell Tissue Res.
262, 9–34.
Stocker, R.F., Heimbeck, G., Gendre, N., and de Belle, J.S. (1997). Neuroblast
ablation in Drosophila P[GAL4] lines reveals origins of olfactory interneurons.
J. Neurobiol. 32, 443–456.
Stockinger, P., Kvitsiani, D., Rotkopf, S., Tirian, L., and Dickson, B.J. (2005).
Neural circuitry that governs Drosophila male courtship behavior. Cell 121,
795–807.
Strausfeld, N.J., and Hildebrand, J.G. (1999). Olfactory systems: common
design, uncommon origins? Curr. Opin. Neurobiol. 9, 634–639.
Strutz, A., Voeller, T., Riemensperger, T., Fiala, A., and Sachse, S. (2012). Cal-
cium imaging of neural activity in the olfactory system of Drosophila. In Genet-
ically Encoded Functional Indicators, J.-R. Martin, ed. (Springer Science+Bus-
iness Media), pp. 43–70.
Suh, G.S., Wong, A.M., Hergarden, A.C., Wang, J.W., Simon, A.F., Benzer, S.,
Axel, R., and Anderson, D.J. (2004). A single population of olfactory sensory
neurons mediates an innate avoidance behaviour in Drosophila. Nature 431,
854–859.
Tian, L., Hires, S.A., Mao, T., Huber, D., Chiappe, M.E., Chalasani, S.H., Pet-
reanu, L., Akerboom, J., McKinney, S.A., Schreiter, E.R., et al. (2009). Imaging
neural activity in worms, flies and mice with improved GCaMP calcium indica-
tors. Nat. Methods 6, 875–881.
Vinje, W.E., and Gallant, J.L. (2000). Sparse coding and decorrelation in pri-
mary visual cortex during natural vision. Science 287, 1273–1276.
Vosshall, L.B., and Stocker, R.F. (2007). Molecular architecture of smell and
taste in Drosophila. Annu. Rev. Neurosci. 30, 505–533.
Vosshall, L.B., Wong, A.M., and Axel, R. (2000). An olfactory sensory map in
the fly brain. Cell 102, 147–159.
Wilson, R.I. (2013). Early olfactory processing in Drosophila: mechanisms and
principles. Annu. Rev. Neurosci. 36, 217–241.
Wilson, R.I., and Mainen, Z.F. (2006). Early events in olfactory processing.
Annu. Rev. Neurosci. 29, 163–201.
Wilson, R.I., Turner, G.C., and Laurent, G. (2004). Transformation of olfactory
representations in the Drosophila antennal lobe. Science 303, 366–370.
Wong, A.M., Wang, J.W., and Axel, R. (2002). Spatial representation of the
glomerular map in the Drosophila protocerebrum. Cell 109, 229–241.
Cell Reports 16, 3401–3413, September 20, 2016 3413
Manuscript 3
80

Cell Reports, Volume 16
Supplemental Information
Elucidating the Neuronal Architecture
of Olfactory Glomeruli
in the Drosophila Antennal Lobe
Veit Grabe, Amelie Baschwitz, Hany K.M. Dweck, Sofia Lavista-Llanos, Bill S.Hansson, and Silke Sachse
Manuscript 3
81

A Pre-activation Post-activation
B
a
p
l m
d
v
GH146-GAL4
ChA-GAL4
0
2
4
6
8
10
12
DA
1
DC
1
DA
4m
DA
4l
VA
1v
VA
1d
DL3
DC
3
VA
2
V DM
1
DL1
DM
3
VA
6
DA
2
DL5
D DM
5
VM
2
DM
6
DL4
DC
2
VM
5v
DM
2
VL2
a
DP
1l
DC
4
DP
1m
GH146 +GH146
No.
of P
Ns
SUPPLEMENTAL FIGURE S1
SUPPLEMENTAL FIGURE LEGEND
Supplemental Figure S1: Comparison between number of cholinergic and GH146-positive PNs per glomerulus.(A) , Z-projection of a ChA-GAL4/UAS-C3PA scan of a left antennal lobe before photo-activation. , Z-projection of the same antennal lobe after photoactivation of glomerulusVM5v. The scale bar equals 20 m. (B) Comparison between number of PNs labeled with photoactivation using the transgenic lines GH146-GAL4 (filled bars) and ChA-GAL4 (empty bars) for 28 glomeruli. Data represent median ± SD. Statistical differences between the two lines were determined by Student’s t test, *p < 0.05, **p < 0.01, n = 3-6. The color code refers to Figure 1B.
Manuscript 3
82
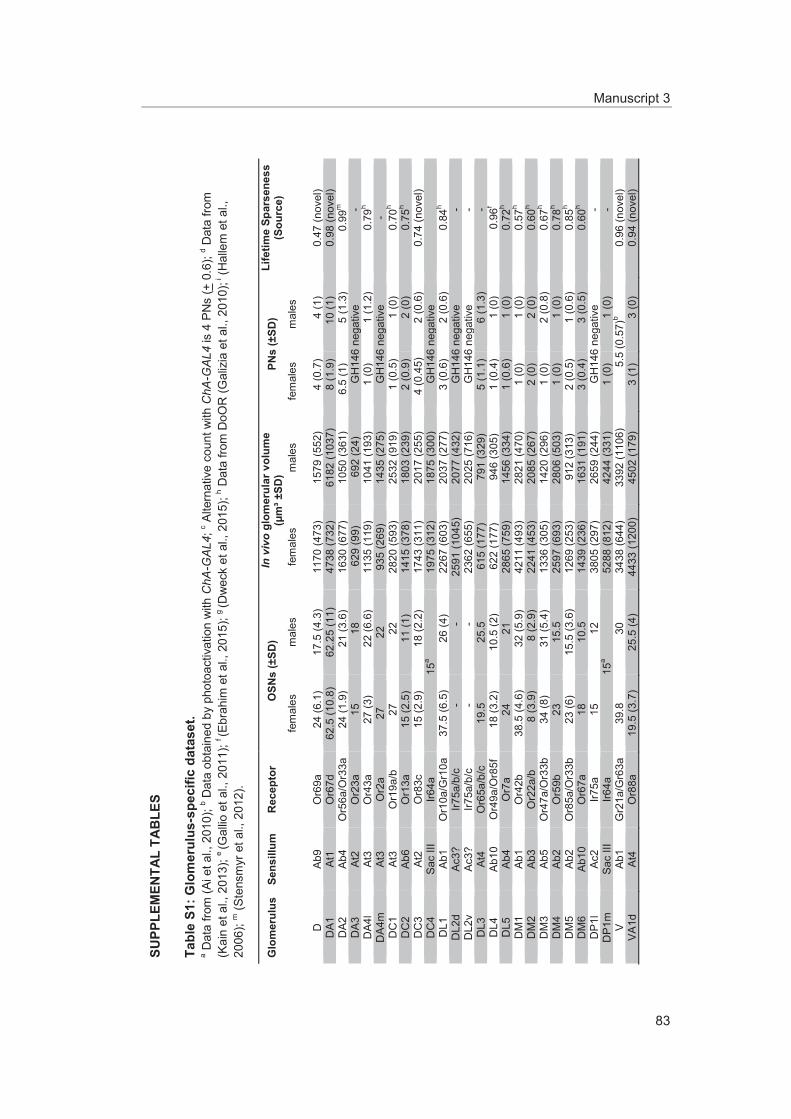
SU
PPLE
MEN
TAL
TAB
LES
Tabl
e S1
: Glo
mer
ulus
-spe
cific
dat
aset
. ChA-GAL4
ChA-GAL4
Glo
mer
ulus
Sens
illum
Rec
epto
rO
SNs
(±SD
)In
viv
ogl
omer
ular
vol
ume
(m
³ ±SD
)PN
s (±
SD)
Life
time
Spar
sene
ss
(Sou
rce)
Manuscript 3
83

all
all
all
1047
.893
4.25
1115
9310
3168
80.5
83-
Manuscript 3
84

Table S2: Quantification of PN number per cell cluster.
Glomerulus Sensillum Receptor #somata
adPN(±SD)
lPN(±SD)
vPN(±SD)
DDA1DA2DA4lDC1DC2DC3DL1DL3DL4DL5DM1DM2DM3DM4DM5DM6
DP1mVA1dVA1vVA2VA4VA5VA6VA7l
VA7mVC1VC2VL2aVL2pVM1VM2VM3VM4
VM7dVM7v
Table S3: Odorant responses of 11 olfactory receptors acquired via SSR.
Manuscript 3
85

CAS Odor Or67d Or47b Or88a Or33c Or69a Or59c Or85d Or42a Or83c Or46a Gr21a1001-45-2 6-pentadecanone -2,0010032-13-0 hexyl isovalerate -2,50100-42-5 styrene 9,00100462-58-6 (Z,Z)-7,11-heptacosadiene 0,00 -1,50 1,50100-51-6 benzyl alcohol 7,00100-52-7 benzaldehyde 1,00100-66-3 anisole 1,00 5,00 -0,50 2,00 3,00 4,00101-48-4 phenylacetaldehyde dimethyl acetal 50,50 9,20 31,60 12,67 6,00 -4,0010233-13-3 isopropyl laurate 1,00102-69-2 tripropylamine 5,00102-76-1 triacetin 2,0010281-56-8 -7,0010321-71-8 4-methyl-2-pentenoic acid -4,00103-36-6 ethyl cinnamate 0,00103-37-7 benzyl butyrate -4,00 23,20 24,00 20,00 4,00 -5,00103-45-7 phenylethyl acetate -1,00 22,00 189,75 0,00 -12,00 -0,50103-48-0 phenethyl isobutyrate 4,00103-48-0 phenyethyl isobutyrate -1,92 26,67 -2,33 155,92 0,17 -5,92 0,6710361-39-4 benzyl valerate 5,50 -2,40 -0,40 9,33 10,00 -5,50103-65-1 propyl benzene -1,00103-82-2 phenylacetic acid 1,00104410-91-5 (Z,Z)-7,11-nonacosadiene -0,40 -1,50 2,50104-50-7 gamma octalactone 17,00104-55-2 cinnamaldehyde 3,00104-61-0 gamma-nonalactone 11,00104-67-6 undecanoic -gamma-lactone 15,00104-76-7 2-ethyl-1-hexanol -6,00 200,00 1,33 -4,00 -0,67 -6,00 4,00 -2,6710482-56-1 alpha-terpineol 35,50 36,00 -6,00 125,33 -2,00 -11,50104-93-8 4-methyl anisole 2,00105-37-3 ethyl propionate 12,00105-43-1 4,00105-54-4 ethyl butyrate 6,00 3,60 6,00 74,33 6,00 0,00105-66-8 propyl butyrate 9,00105-68-0 Isoamyl propionate 12,00 24,00 2,40 25,00 3,00 11,00105-79-3 isobutyl hexanoate 0,00105-87-3 geranyl acetate 1,00106-22-9 beta-citronellol 38,00106-24-1 geraniol 22,00106-25-2 nerol 8,00 219,33 24,67 -16,00 32,67 28,00 -6,00 -5,33106-27-4 isoamyl butyrate 6,50 20,40 2,80 30,00 10,00 6,50106-32-1 ethyl octanoate 1,00106-35-4 3-heptanone -5,00106-36-5 propyl propionate 14,00106-42-3 p-xylene anhydrous -4,00106-44-5 p-cresol 17,00 10,00 12,80 22,33 3,00 92,50106-51-4 -9,00106-65-0 dimethyl succinate 0,00106-68-3 3-octanone 46,50 57,60 -14,00 52,67 6,00 15,00106-70-7 methyl hexanoate 11,00106-73-0 methyl heptanoate -7,20 1,20107-02-8 acrolein 1,00107-10-8 propylamine 9,00107-15-3 ethylenediamine 3,00107-35-7 taurine 2,001074-43-7 1,001078-61-1 3,00107-87-9 2-pentanone -1,00107-92-6 butyric acid 2,33107-98-2 1-methoxy-2-propanol 2,00108-01-0 1,00108-21-4 isopropyl acetate 5,00108-29-2 72,50 4,80 1,60 191,33 12,00 -1,50108-38-3 m-xylene 1,00108-64-5 ethyl isovalerate 0,00108-65-6 propylene glycol monomethyl ether acetate -2,00108-86-1 bromobenzene 3,00108-88-3 toluene 1,00108-93-0 cyclohexanol 19,00108-94-1 cyclohexanone -7,00 -1,20 6,40 39,33 14,00 -1,00108-95-2 phenol 1,00 6,40 -2,40 27,33 6,00 191,50109-19-3 butyl isovalerate 12,00109-21-7 butyl butyrate 19,50 42,40 0,00 28,00 5,00 -6,00109-52-4 valeric acid 1,00109-60-4 propyl acetate 0,00 -2,40 2,80 119,67 -4,00 1,00109-73-9 butylamine -10,00109-89-7 diethylamine 1,00109-94-4 ethyl formate 1,00110-13-4 2,5-hexanedione 3,00110-19-0 Isobutyl acetate 4,00110-27-0 Isopropyl myristate 1,00110-38-3 ethyl decanoate 17,00110-42-9 methyl decanoate -7,60 3,20110-43-0 2-heptanone 4,00 14,00 64,40 126,33 21,00 5,00110-54-3 hexane -2,08 14,00 2,40 2,00 13,17 1,00 -4,00 0,67110-58-7 pentylamine -5,00110-60-1 1,4-diaminobutane 1,00110-62-3 valeraldehyde 2,00110-63-4 1,4-butanediol -3,00110-73-6 10,00110-93-0 6-methyl-5-hepten-2-one 2,00111-11-5 methyl octanoate 11,00111-13-7 2-octanone 1,00111-14-8 heptanoic acid 0,00111-25-1 1-bromohexane -2,00111-26-2 hexylamine -5,00111-27-3 1-hexanol 12,00 17,20 -3,20 29,33 9,00 15,50111-66-0 1-octene 2,00111-68-2 heptylamine 1,00111-70-6 1-heptanol 11,00111-71-7 1-heptanal 5,00111-76-2 ethylene glycol butyl ether 16,00111-82-0 methyl laurate -1,20 126,00 80,00111-87-5 1-octanol 23,001120-21-4 undecane 0,00112-05-0 nonanoic acid 1,00112-12-9 2-undecanone 19,00112-14-1 octyl acetate 21,001122-62-9 2-acetylpyridine -4,50112-29-8 1-bromodecane -9,00112-30-1 2,50112-31-2 decanal -0,40 -14,00 -3,00112-39-0 methyl palmitate -0,40 0,00 202,00112-40-3 docosane 2,001124-11-4 2,3,5,6-tetramethylpyrazine -2,001124-39-6 -3,00
Manuscript 3
86

112-44-7 undecanal 11,00112-54-9 dodecyl aldehyde 13,00112-62-9 methyl oleate 6,00112-70-9 9,00112-72-1 1-tetradecanol 0,00112-80-1 oleic acid -3,00112-88-9 1-octadecene 2,00112-92-5 1-octadecanol 1,60 -0,80 2,00112-95-8 eicosane 0,40 1,50 3,001139-30-6 (-)-caryophyllene oxide 15,33 33,33 4,00 -4,00 -12,67 -1,00 -11,33 8,00115-95-7 linalyl acetate 1,00116-53-0 -6,00117-39-5 quercetin 2,00 2,40 2,50 3,00 2,50118-58-1 benzyl salicylate 7,50 4,00 -1,20 22,67 1,00 5,00118-61-6 ethyl salicylate 15,001191-16-8 prenyl acetate 5,00119-33-5 34,50 -0,40 -14,80 -2,00 4,00 -6,00119-36-8 methyl salicylate 36,00 39,20 -6,40 4,67 5,00 45,501195-79-5 fenchone 153,00 9,60 -4,80 25,67 -10,50119-64-2 -3,00120-50-3 isobutyl benzoate 9,50 96,67 0,00 0,87 7,17 12,00 -1,17 -2,67120-51-4 benzyl benzoate 9,00 1,60 2,40 11,33 0,00 37,00120-72-9 indol -0,67 47,33 2,67 -14,67 3,33 2,00 -1,33 13,33120-92-3 cyclopentanone 4,001211-29-6 methyl jasmonate 9,00121-32-4 ethyl vanillin 1,00 -2,00 1,20 4,67 4,00121-33-5 vanillin 1,00 0,80 1,50 1,00 1,50121-44-8 triethylamine 4,00122-03-2 cuminaldehyde 4,00 156,00 10,00 -11,33 0,67 3,00 -2,00 2,671222-05-5 Abbalide 0,00122-63-4 Benzyl propionate 6,00122-70-3 phenylethyl propionate 4,00 2,40 198,80 25,33 14,00 -3,00122-78-1 phenylacetaldehyde 12,00122-99-6 phenoxyethanol -3,50 0,50 0,00 -3,33 3,50122-99-6 5,00123-05-7 2-ethyl hexanal -1,00123-07-9 4-ethyl phenol 15,50 14,00 10,80 31,67 2,00 81,00123-32-0 2,5-dimethyl pyrazine 5,00123-35-3 myrcene 8,67 53,33 7,33 4,67 -3,33 8,00 5,33 -2,00123-38-6 propionaldehyde 2,00123-42-2 6,00123-51-3 isoamyl alcohol 3,50 -2,40 7,60 24,33 -3,50123-54-6 acetylacetone 1,00123-66-0 ethyl hexanoate 22,00123-72-8 butyraldehyde 0,00123-75-1 pyrrolidine 2,67 20,67 2,67 4,67 2,67 -1,00 2,00 -0,67123-86-4 butyl acetate 0,00123-92-2 isoamyl acetate 9,00 3,20 6,80 37,33 16,00 -1,00123-93-3 2,2'-thiodiacetic acid -6,00124-07-2 octanoic acid 5,00124-10-7 methyl myristate 0,40 0,00 140,00 5,00124-13-0 octanal 9,00124-19-6 nonanal 1,60 -8,50 -2,50124-38-9 carbone dioxide 220,00124-76-5 isoborneol 6,00126-90-9 7,00126-91-06 2,00127-17-3 pyruvic acid 6,00127599-39-7 (Z,Z)-7,11-pentacosadiene -0,40 1,50 1,50128-37-0 butylated hydroxytoluene -9,00 -1,20 -0,40 7,33 -7,5013327-56-5 ethyl3-(methylthio)propionate 115,00 90,40 -8,00 44,33 5,00 -3,001336-21-6 ammonium hydroxide solution 5,00134-20-3 methyl 2-aminobenzoate -3,00134-62-3 11,00135-79-5 4,00136-27-5 limonene 10,00 12,40 0,00 8,33 -6,00136-60-7 butyl benzoate 1,00 22,00 -3,60 11,33 3,00 -10,25137-32-6 6,0013877-91-3 ocimene 9,75 61,33 7,00 0,75 6,67 15,00 -2,00 0,67140-11-4 benzyl acetate 5,50 2,00 133,60 27,33 0,00 -3,00140-29-4 benzyl cyanide -3,33 88,00 216,67 -14,00 231,33 23,00 -10,00 2,6714073-97-3 (-)-menthone 0,50 -0,60 -6,65 46,83 -14,00 -2,75141-12-8 neryl acetate 1,00141-78-6 ethyl acetate 0,00 4,80 -1,60 121,33 -2,00 0,00142-62-1 hexanoic acid 7,00142-83-6 -4,00142-91-6 isopropyl palmitate 3,00142-92-7 hexyl acetate 9,00143-07-7 dodecanoic acid -1,20 0,80 5,00143-08-8 5,50143-13-5 nonyl acetate 2,00143-28-2 oleyl alcohol 0,00 2,001454-85-9 1-heptadecanol -0,80 2,001461-03-6 10,67 22,67 0,67 -4,00 -4,00 4,00 -2,67 2,00149-57-5 2-ethyl hexanoic acid 5,001502-06-3 cyclodecanone 0,001560-78-7 2-methyl tetracosane 0,00 0,50 1,001560-81-2 2-methyl docosane 1,60 1,00 1,501560-98-1 2-methyl octacosane 0,00 -4,00 2,001561-02-0 2-methyl hexacosane 0,00 -1,00 0,501569-60-4 (±)-6-methyl-5-hepten-2-ol 9,0015706-73-7 1,0015707-24-1 2,3-diethylpyrazine 3,001576-95-0 cis-2-penten-1-ol 1,001577-18-0 trans-3-hexenoic acid 1,0016423-19-1 geosmin -2,0016491-36-4 cis-3-hexenyl butyrate 38,0017283-81-7 dihydro-beta-ionone 0,001731-84-6 methyl nonanoate -1,20 3,201733-25-1 isopropyl tiglate 48,50 67,20 -6,40 32,67 0,00 0,001758-88-9 1,001775-43-5 3-hexenoic acid, (3Z)- -1,0018172-67-3 (1s)-(-)-beta-pinene 5,00 -1,3318362-97-5 isopropyl pentanoate 5,50 31,60 -12,00 19,67 0,00 2,0018368-91-7 17,42 26,00 7,53 -2,87 11,00 4,00 -8,42 -16,001839-63-0 -10,0018402-82-9 12,0019322-27-1 -1,0019870-74-7 methyl cedryl ether 6,00 22,00 0,67 -7,33 0,00 3,00 -2,00 0,002004-38-9 1-heptacosanol -5,20 2,80203719-54-4 (+)-limonene oxide 10,67 159,33 4,67 -1,33 14,00 36,00 -6,67 6,672049-96-9 1,00 2,00 5,60 5,33 5,00 -3,502050-09-1 isoamyl valerate 5,002067-33-6 5-bromovaleric acid -0,5021061-10-9 cis-8 11 14-eicosatrienoic acid methyl ester 0,00 0,402173-56-0 pentyl valerate 7,502198-61-0 isopentyl hexanoate 2,00 -0,80 1,20 20,00 2,00 0,50
Manuscript 3
87
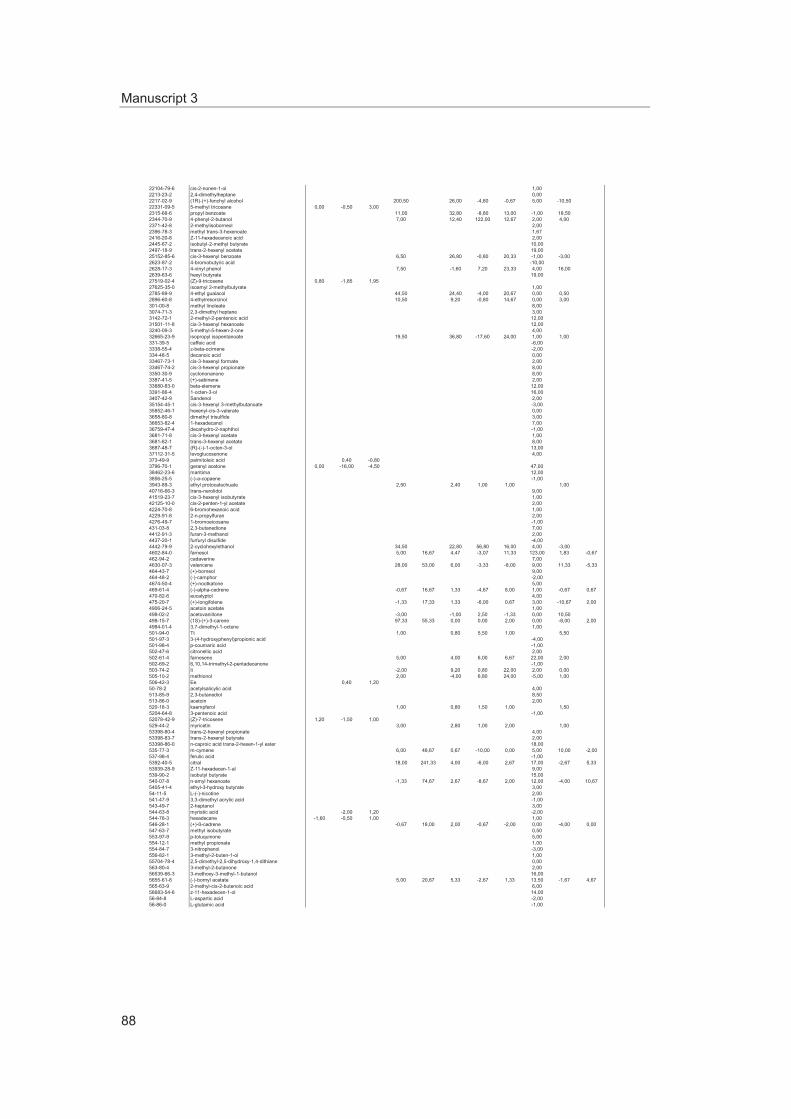
22104-79-6 cis-2-nonen-1-ol 1,002213-23-2 2,4-dimethylheptane 0,002217-02-9 200,50 26,00 -4,80 -0,67 5,00 -10,5022331-09-5 5-methyl tricosane 0,00 -0,50 3,002315-68-6 propyl benzoate 11,00 32,80 -8,80 13,00 -1,00 18,502344-70-9 7,00 12,40 122,00 12,67 2,00 4,002371-42-8 2-methylisoborneol 2,002396-78-3 1,672416-20-8 2,002445-67-2 isobutyl-2-methyl butyrate 10,002497-18-9 trans-2-hexenyl acetate 19,0025152-85-6 6,50 26,80 -0,80 20,33 -1,00 -3,002623-87-2 4-bromobutyric acid -10,002628-17-3 4-vinyl phenol 7,50 -1,60 7,20 23,33 4,00 16,002639-63-6 hexyl butyrate 19,0027519-02-4 (Z)-9-tricosene 0,80 -1,85 1,9527625-35-0 isoamyl 2-methylbutyrate 1,002785-89-9 4-ethyl guaiacol 44,50 24,40 -4,00 20,67 0,00 0,502896-60-8 10,50 9,20 -0,80 14,67 0,00 3,00301-00-8 methyl linoleate 8,003074-71-3 2,3-dimethyl heptane 3,003142-72-1 2-methyl-2-pentenoic acid 12,0031501-11-8 12,003240-09-3 5-methyl-5-hexen-2-one 4,0032665-23-9 isopropyl isopentanoate 19,50 36,80 -17,60 24,00 1,00 1,00331-39-5 caffeic acid -6,003338-55-4 -2,00334-48-5 decanoic acid 0,0033467-73-1 2,0033467-74-2 cis-3-hexenyl propionate 8,003350-30-9 cyclononanone 8,003387-41-5 2,0033880-83-0 12,003391-86-4 1-octen-3-ol 16,003407-42-9 Sandenol 2,0035154-45-1 cis-3-hexenyl 3-methylbutanoate -3,0035852-46-1 hexenyl-cis-3-valerate 0,003658-80-8 dimethyl trisulfide 3,0036653-82-4 1-hexadecanol 7,0036759-47-4 -1,003681-71-8 cis-3-hexenyl acetate 1,003681-82-1 trans-3-hexenyl acetate 8,003687-48-7 13,0037112-31-5 levoglucosenone 4,00373-49-9 palmitoleic acid 0,40 -0,803796-70-1 geranyl acetone 0,00 -16,00 -4,50 47,0038462-23-6 maritima 12,003856-25-5 (-)-a-copaene -1,003943-89-3 ethyl protocatechuate 2,50 2,40 1,00 1,00 1,0040716-66-3 9,0041519-23-7 cis-3-hexenyl isobutyrate 1,0042125-10-0 2,004224-70-8 1,004229-91-8 2,004276-49-7 -1,00431-03-8 7,004412-91-3 2,004437-20-1 furfuryl disulfide -4,004442-79-9 34,50 22,80 56,80 16,00 4,00 -3,004602-84-0 farnesol 5,00 16,67 4,47 -3,07 11,33 123,00 1,83 -0,67462-94-2 cadaverine 7,004630-07-3 valencene 28,00 53,00 6,00 -3,33 -8,00 9,00 11,33 -5,33464-43-7 9,00464-48-2 (-)-camphor -2,004674-50-4 5,00469-61-4 (-)-alpha-cedrene -0,67 16,67 1,33 -4,67 8,00 1,00 -0,67 0,67470-82-6 eucalyptol 4,00475-20-7 -1,33 17,33 1,33 -6,00 0,67 3,00 -10,67 2,004906-24-5 acetoin acetate 1,00498-02-2 acetovanillone -3,00 -1,00 2,50 -1,33 0,00 10,50498-15-7 97,33 55,33 0,00 0,00 2,00 0,00 -8,00 2,004984-01-4 3,7-dimethyl-1-octene 1,00501-94-0 Tt 1,00 0,80 5,50 1,00 5,50501-97-3 -4,00501-98-4 p-coumaric acid -1,00502-47-6 citronellic acid 2,00502-61-4 farnesene 5,00 4,00 6,00 6,67 22,00 2,00502-69-2 6,10,14-trimethyl-2-pentadecanone -1,00503-74-2 Ii -2,00 9,20 0,80 22,00 2,00 0,00505-10-2 methionol 2,00 -4,00 6,80 24,00 -5,00 1,00506-42-3 Ee 0,40 1,2050-78-2 acetylsalicylic acid 4,00513-85-9 2,3-butanediol 8,50513-86-0 acetoin 2,00520-18-3 kaempferol 1,00 0,80 1,50 1,00 1,505204-64-8 3-pentenoic acid -1,0052078-42-9 (Z)-7-tricosene 1,20 -1,50 1,00529-44-2 myricetin 3,00 2,80 1,00 2,00 1,0053398-80-4 4,0053398-83-7 trans-2-hexenyl butyrate 2,0053398-86-0 18,00535-77-3 m-cymene 6,00 48,67 0,67 -10,00 0,00 5,00 10,00 -2,00537-98-4 ferulic acid -1,005392-40-5 citral 18,00 241,33 4,00 -6,00 2,67 17,00 -2,67 5,3353939-28-9 9,00539-90-2 isobutyl butyrate 15,00540-07-8 n-amyl hexanoate -1,33 74,67 2,67 -8,67 2,00 12,00 -4,00 10,675405-41-4 ethyl-3-hydroxy butyrate 3,0054-11-5 2,00541-47-9 3,3-dimethyl acrylic acid -1,00543-49-7 3,00544-63-8 myristic acid -2,00 1,20 -2,00544-76-3 hexadecane -1,60 -0,50 1,00 1,00546-28-1 (+)-ß-cedrene -0,67 18,00 2,00 -0,67 -2,00 0,00 -4,00 0,00547-63-7 methyl isobutyrate 0,50553-97-9 p-toluquinone 5,00554-12-1 methyl propionate 1,00554-84-7 3-nitrophenol -3,00556-82-1 3-methyl-2-buten-1-ol 1,0055704-78-4 0,00563-80-4 3-methyl-2-butanone 2,0056539-66-3 3-methoxy-3-methyl-1-butanol 16,005655-61-8 (-)-bornyl acetate 5,00 20,67 5,33 -2,67 1,33 13,50 -1,67 4,67565-63-9 2-methyl-cis-2-butenoic acid 6,0056683-54-6 z-11-hexadecen-1-ol 14,0056-84-8 L-aspartic acid -2,0056-86-0 L-glutamic acid -1,00
Manuscript 3
88
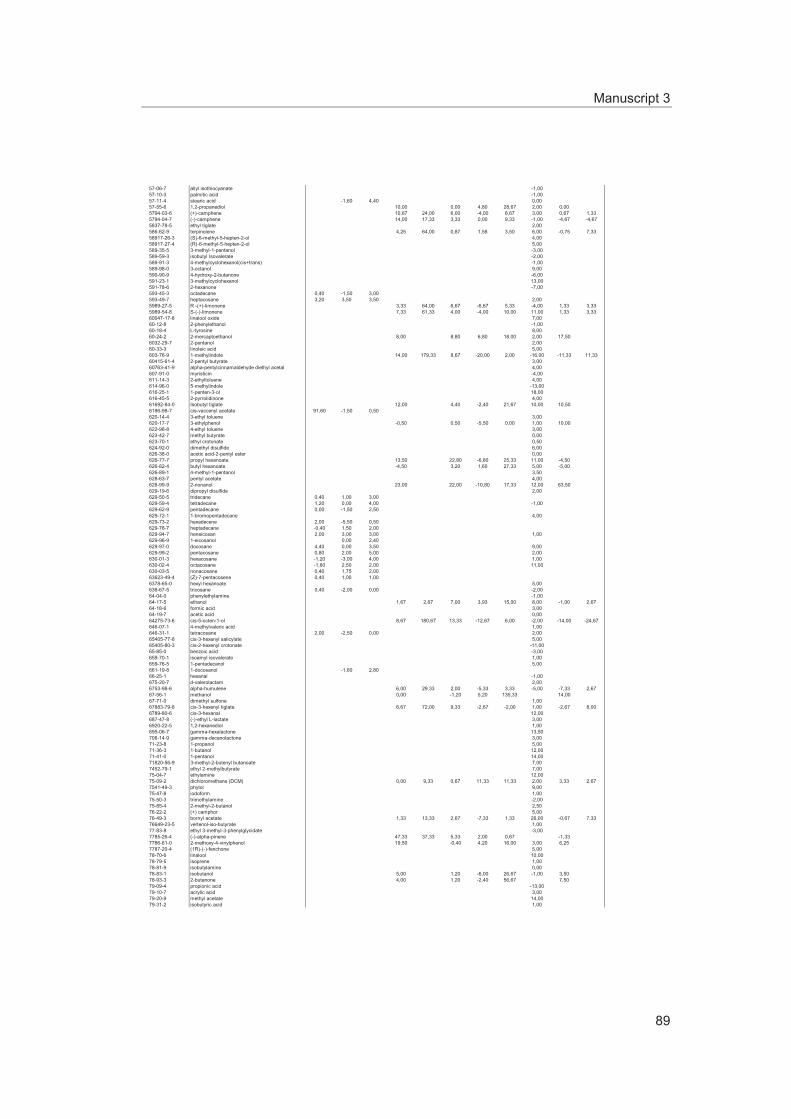
57-06-7 allyl isothiocyanate -1,0057-10-3 palmitic acid -1,0057-11-4 stearic acid -1,60 4,40 0,0057-55-6 1,2-propanediol 10,00 0,00 4,80 28,67 2,00 0,005794-03-6 (+)-camphene 10,67 24,00 6,00 -4,00 8,67 3,00 0,67 1,335794-04-7 (-)-camphene 14,00 17,33 3,33 0,00 9,33 -1,00 -4,67 -4,675837-78-5 ethyl tiglate 2,00586-62-9 terpinolene 4,25 64,00 0,87 1,58 3,50 6,00 -0,75 7,3358917-26-3 4,0058917-27-4 5,00589-35-5 3-methyl-1-pentanol -3,00589-59-3 isobutyl Isovalerate -2,00589-91-3 -1,00589-98-0 3-octanol 9,00590-90-9 4-hydroxy-2-butanone -6,00591-23-1 13,00591-78-6 2-hexanone -7,00593-45-3 octadecane 0,40 -1,50 3,00593-49-7 heptacosane 3,20 3,50 3,50 2,005989-27-5 R -(+)-limonene 3,33 64,00 6,67 -6,67 5,33 -4,00 1,33 3,335989-54-8 S-(-)-limonene 7,33 61,33 4,00 -4,00 10,00 11,00 1,33 3,3360047-17-8 linalool oxide 7,0060-12-8 2-phenylethanol -1,0060-18-4 L-tyrosine 8,0060-24-2 2-mercaptoethanol 8,00 8,80 6,80 18,00 2,00 17,506032-29-7 2-pentanol 2,0060-33-3 linoleic acid 5,00603-76-9 1-methylindole 14,00 179,33 8,67 -20,00 2,00 -16,00 -11,33 11,3360415-61-4 2-pentyl butyrate 3,0060763-41-9 4,00607-91-0 myristicin -4,00611-14-3 2-ethyltoluene 4,00614-96-0 5-methylindole -13,00616-25-1 1-penten-3-ol 18,00616-45-5 4,0061692-84-0 Isobutyl tiglate 12,00 4,40 -2,40 21,67 10,00 10,506186-98-7 cis-vaccenyl acetate 91,60 -1,50 0,50620-14-4 3-ethyl toluene 3,00620-17-7 3-ethylphenol -0,50 0,50 -5,50 0,00 1,00 10,00622-96-8 4-ethyl toluene 3,00623-42-7 methyl butyrate 0,00623-70-1 ethyl crotonate 0,50624-92-0 dimethyl disulfide 6,00626-38-0 acetic acid-2-pentyl ester 0,00626-77-7 propyl hexanoate 13,50 22,80 -6,80 25,33 11,00 -4,50626-82-4 butyl hexanoate -4,50 3,20 1,60 27,33 5,00 -5,00626-89-1 3,50628-63-7 pentyl acetate 4,00628-99-9 2-nonanol 23,00 22,00 -10,80 17,33 12,00 63,50629-19-6 dipropyl disulfide 2,00629-50-5 tridecane 0,40 1,00 3,00629-59-4 tetradecane 1,20 0,00 4,00 -1,00629-62-9 pentadecane 0,00 -1,50 2,50629-72-1 1-bromopentadecane 4,00629-73-2 hexadecene 2,00 -5,50 0,50629-78-7 heptadecane -0,40 1,50 2,00629-94-7 heneicosan 2,00 3,00 3,00 1,00629-96-9 1-eicosanol 0,00 2,40629-97-0 docosane 4,40 0,00 3,50 9,00629-99-2 pentacosane 0,80 2,00 5,00 2,00630-01-3 hexacosane -1,20 -3,00 4,00 1,00630-02-4 octacosane -1,60 2,50 2,00 11,00630-03-5 nonacosane 0,40 1,75 2,0063623-49-4 (Z)-7-pentacosene 0,40 1,00 1,006378-65-0 hexyl hexanoate 5,00638-67-5 tricosane 0,40 -2,00 0,00 -2,0064-04-0 phenylethylamine -1,0064-17-5 ethanol 1,67 2,67 7,00 3,93 15,00 8,00 -1,00 2,6764-18-6 formic acid 3,0064-19-7 acetic acid 0,0064275-73-6 cis-5-octen-1-ol 8,67 180,67 13,33 -12,67 6,00 -2,00 -14,00 -24,67646-07-1 4-methylvaleric acid 1,00646-31-1 tetracosane 2,00 -2,50 0,00 2,0065405-77-8 cis-3-hexenyl salicylate 5,0065405-80-3 -11,0065-85-0 benzoic acid -3,00659-70-1 isoamyl isovalerate 1,00659-76-5 1-pentadecanol 5,00661-19-8 1-docosanol -1,60 2,8066-25-1 hexanal -1,00675-20-7 2,006753-98-6 alpha-humulene 6,00 29,33 2,00 -5,33 3,33 -5,00 -7,33 2,6767-56-1 methanol 0,00 -1,20 5,20 135,33 14,0067-71-0 dimethyl sulfone 1,0067883-79-8 cis-3-hexenyl tiglate 6,67 72,00 9,33 -2,67 -2,00 1,00 -2,67 8,006789-80-6 cis-3-hexanal 12,00687-47-8 (-)-ethyl L-lactate 3,006920-22-5 1,2-hexanediol 1,00695-06-7 gamma-hexalactone 13,50706-14-9 gamma-decanolactone 3,0071-23-8 1-propanol 5,0071-36-3 1-butanol 12,0071-41-0 1-pentanol 14,0071820-56-9 7,007452-79-1 ethyl 2-methylbutyrate 7,0075-04-7 ethylamine 12,0075-09-2 dichloromethane (DCM) 0,00 9,33 0,67 11,33 11,33 2,00 3,33 2,677541-49-3 phytol 9,0075-47-8 iodoform 1,0075-50-3 trimethylamine -2,0075-85-4 2,5076-22-2 (+) camphor 5,0076-49-3 bornyl acetate 1,33 13,33 2,67 -7,33 1,33 26,00 -0,67 7,3376649-23-5 1,0077-83-8 -3,007785-26-4 (-)-alpha-pinene 47,33 37,33 5,33 2,00 0,67 -1,337786-61-0 19,50 -0,40 4,20 16,00 3,00 6,257787-20-4 5,0078-70-6 linalool 10,0078-79-5 isoprene 1,0078-81-9 isobutylamine 0,0078-83-1 isobutanol 5,00 1,20 -6,00 26,67 -1,00 3,5078-93-3 2-butanone 4,00 1,20 -2,40 56,67 7,5079-09-4 propionic acid -13,0079-10-7 acrylic acid 3,0079-20-9 methyl acetate 14,0079-31-2 isobutyric acid 1,00
Manuscript 3
89
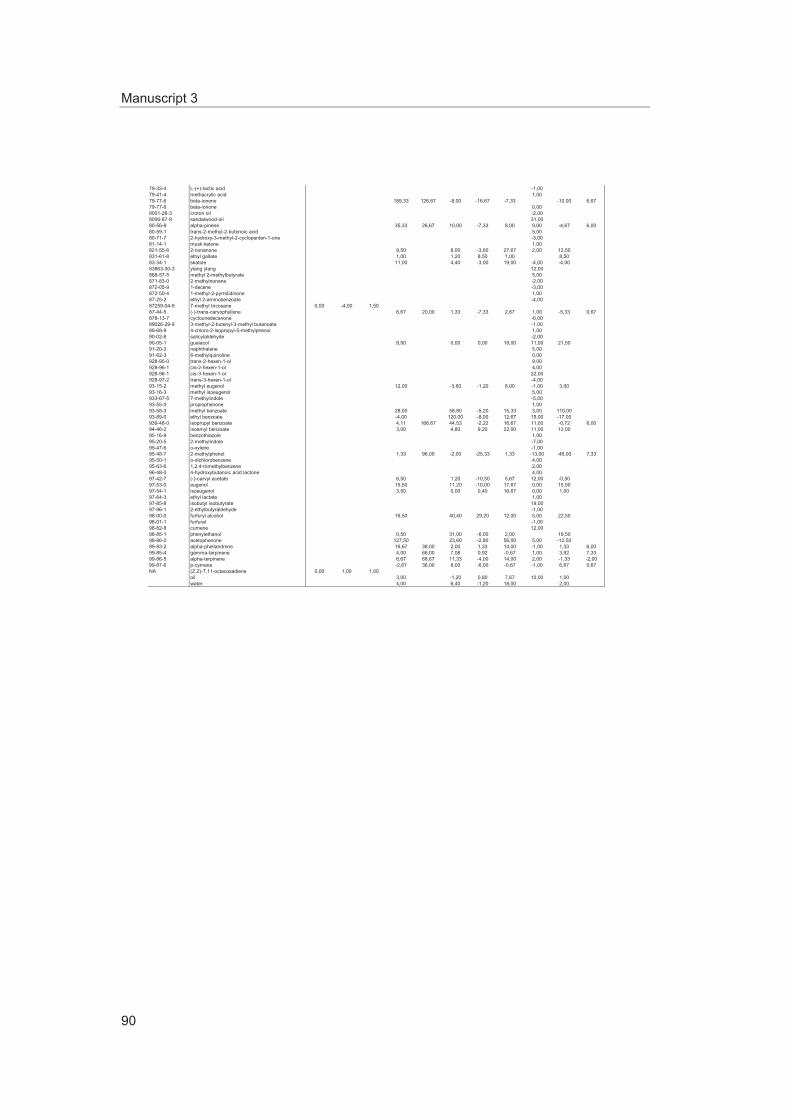
79-33-4 L-(+)-lactic acid -1,0079-41-4 methacrylic acid 1,0079-77-6 beta-ionene 189,33 126,67 -8,00 -16,67 -7,33 -10,00 6,6779-77-6 0,008001-28-3 croton oil -2,008006-87-9 31,0080-56-8 alpha-pinene 35,33 26,67 10,00 -7,33 8,00 9,00 -4,67 6,0080-59-1 trans-2-methyl-2-butenoic acid 5,0080-71-7 -3,0081-14-1 musk ketone 1,00821-55-6 2-nonanone 9,50 8,00 -3,60 27,67 2,00 12,50831-61-8 ethyl gallate 1,00 1,20 8,50 1,00 8,5083-34-1 skatole 11,00 4,40 -3,00 19,00 -4,00 -4,0083863-30-3 ylang ylang 12,00868-57-5 methyl 2-methylbutyrate 5,00871-83-0 -2,00872-05-9 1-decene -3,00872-50-4 1,0087-25-2 ethyl 2-aminobenzoate -4,0087259-04-9 7-methyl tricosane 0,00 -4,00 1,5087-44-5 6,67 20,00 1,33 -7,33 2,67 1,00 -5,33 0,67878-13-7 cyclounedecanone -6,0089026-29-9 -1,0089-68-9 1,0090-02-8 salicylaldehyde -2,0090-05-1 guaiacol 9,50 0,00 0,00 19,00 11,00 21,5091-20-3 naphthalene 5,0091-62-3 6-methylquinoline 0,00928-95-0 trans-2-hexen-1-ol 9,00928-96-1 cis-2-hexen-1-ol 4,00928-96-1 cis-3-hexen-1-ol 22,00928-97-2 -4,0093-15-2 methyl eugenol 12,00 -3,60 -1,20 8,00 -1,00 3,0093-16-3 methyl isoeugenol 5,00933-67-5 -5,0093-55-0 propiophenone 1,0093-58-3 methyl benzoate 28,00 58,80 -5,20 15,33 3,00 110,0093-89-0 ethyl benzoate -4,00 120,00 -8,00 12,67 15,00 -17,00939-48-0 isopropyl benzoate 4,11 166,67 44,53 -2,22 16,67 11,00 -0,72 6,0094-46-2 isoamyl benzoate 3,00 4,80 9,20 22,00 11,00 12,0095-16-9 benzothiazole 1,0095-20-5 2-methylindole -7,0095-47-6 o-xylene -1,0095-48-7 2-methylphenol 1,33 96,00 -2,00 -25,33 1,33 -13,00 -46,00 7,3395-50-1 o-dichlorobenzene 4,0095-63-6 1,2,4-trimethylbenzene 2,0096-48-0 4,0097-42-7 (-)-carvyl acetate 6,50 1,20 -10,50 5,67 12,00 -0,5097-53-0 eugenol 15,50 11,20 -10,00 17,67 0,00 15,5097-54-1 isoeugenol 3,50 0,00 0,40 16,67 0,00 1,0097-64-3 ethyl lactate 1,0097-85-8 isobutyl isobutyrate 19,0097-96-1 2-ethylbutyraldehyde -1,0098-00-0 furfuryl alcohol 16,50 40,40 29,20 12,00 5,00 22,5098-01-1 furfural -1,0098-82-8 cumene 12,0098-85-1 phenylethanol 0,50 31,00 -6,00 2,00 19,5098-86-2 acetophenone 127,50 23,60 -2,80 56,00 5,00 -12,5099-83-2 alpha-phellandrene 16,67 38,00 2,00 1,33 14,00 -1,00 1,33 6,0099-85-4 gamma-terpinene 4,00 66,00 7,08 0,92 -0,67 1,00 3,92 7,3399-86-5 alpha-terpinene 6,67 68,67 11,33 -4,00 14,00 2,00 -1,33 -2,0099-87-6 p-cymene -2,67 36,00 8,00 -6,00 -0,67 -1,00 6,67 0,67NA (Z,Z)-7,11-octacosadiene 0,00 1,00 1,00
oil 3,00 -1,20 0,80 7,67 10,00 1,00water 4,00 6,40 -1,20 18,00 2,00
Manuscript 3
90
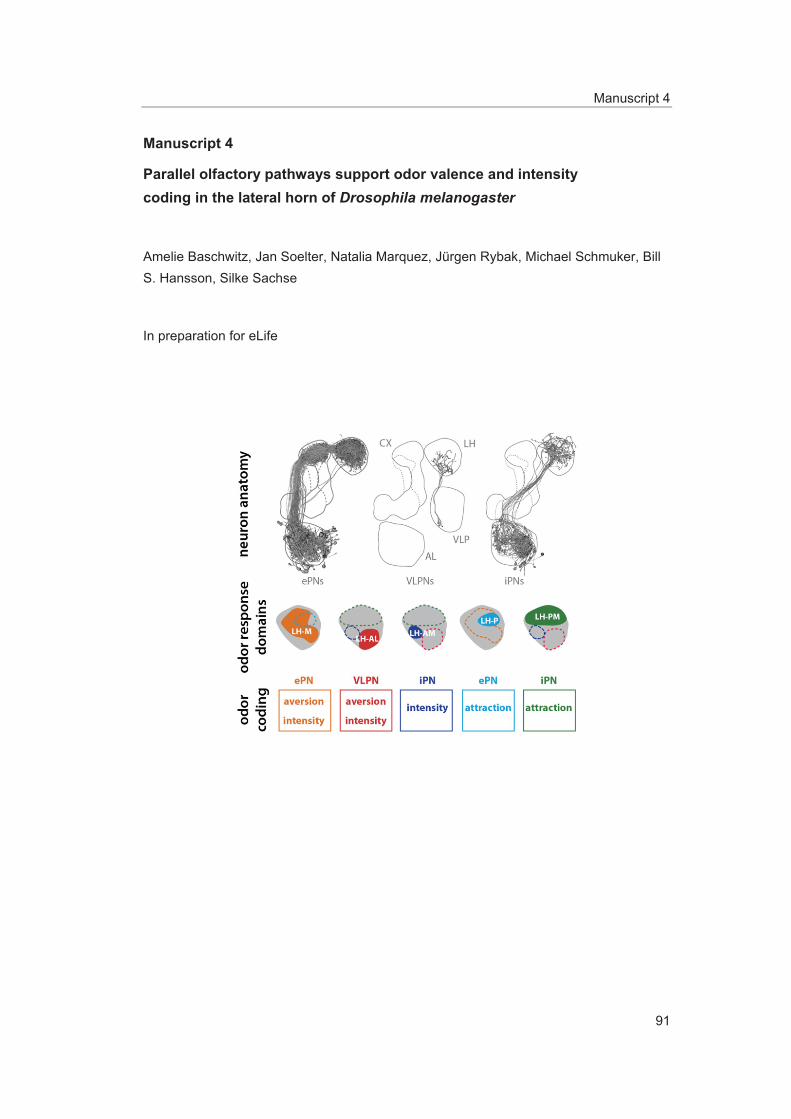
Manuscript 4
91
Manuscript 4
Parallel olfactory pathways support odor valence and intensity coding in the lateral horn of Drosophila melanogaster
Amelie Baschwitz, Jan Soelter, Natalia Marquez, Jürgen Rybak, Michael Schmuker, Bill S. Hansson, Silke Sachse
In preparation for eLife
Manuscript 4
92
Parallel olfactory pathways support odor va-lence and intensity coding in the lateral horn
of Drosophila melanogaster
Amelie Baschwitz §1, Jan Sölter §2, Natalia Marquez 1, Jürgen Rybak 1, Michael Schmuker 3, Bill S. Hansson 1, Silke Sachse *1
§ These authors contributed equally to this work.
1 Max Planck Institute for Chemical Ecology, Department of Evolutionary Neuroethology, Hans-Knöll-Str. 8, 07745 Jena, Germany
2 Free University Berlin, Neuroinformatics & Theoretical Neuroscience, Department for Biology, Pharmacy and Chemistry, Königin-Luise-Strasse 1-3, 14195 Berlin, Germany
3 University of Hertfordshire, School of Computer Science, College Lane, Hatfield, Herts AL10 9AB, United Kingdom
*Correspondence:
Dr. Silke Sachse, Department of Evolutionary Neuroethology,
Max Planck Institute for Chemical Ecology, Hans-Knöll-Str. 8, 07745 Jena, Germany.
Tel: +49-3641-571405, Fax: +49-3641-571402
Email: [email protected]
Key Words:
Drosophila melanogaster, excitatory projection neurons, odor response domains, lateral horn, odor valence, innate odor-guided behavior
Manuscript 4
93
Abstract
Vinegar flies show an innate odor-guided behavior to food, mating partners, oviposition sites, predators and harmful microbes. It is widely assumed that innate odor-guided be-havior is mediated in the lateral horn (LH), a higher brain center of the protocerebrum. Two populations of projection neurons – excitatory (ePNs) and inhibitory (iPNs) – convey the odor information to the LH. A clear morphological and physiological separation in the LH according to the representation of specific odor features, such as valence and odor intensity, was previously demonstrated for iPNs. To investigate these properties in ePNs, we analyzed in vivo the terminal fields of all ePNs of the same origin, and the odor re-sponse patterns using functional calcium imaging. Additionally, we investigated the neu-ral circuit of ePNs to third-order neurons of the ventrolateral protocerebrum that are in-hibited by iPNs. Our study reveals that ePNs, similar to iPNs, categorize odor responses due to intensity and valence in the LH in two odor response domains. Furthermore, sub-populations of ePNs and iPNs innervating the same regions in the primary olfactory pro-cessing center also innervate the same areas in the LH. Thus, via parallel pathways ePNs and iPNs convey olfactory information categorized according to ecological rele-vance distinctly to the LH. As ePNs and iPNs synapse to the same set of third-order neu-rons they modulate – in opposite manner – the neural circuitry of innate odor-guided be-havior.
Introduction
The vinegar fly Drosophila melanogaster encounters a plethora of odors while encoun-tering the environment. The approach to or escape from an odor source are subject to innate preferences depending on specific odor features, such as odor identity, valence and intensity. Those specific odor features are extracted through neural processing of odor information in the fly´s brain. In the primary olfactory processing center, the anten-nal lobe (AL), odor features are represented by odor-specific and spatially restricted neu-ronal activity. Nevertheless, little is known about the representation of odor features in the higher brain center mediating innate preference, the lateral horn (LH). Due to the genetic accessibility the vinegar fly Drosophila melanogaster is an attractive model or-ganism to examine the neural circuit in the LH.
The peripheral olfactory organs, antenna and maxillary palp, are equipped with hair-like structures called sensilla, which house olfactory sensory neurons (OSNs). OSNs ex-pressing the same chemoreceptor transfer odor information to distinct subunits in the AL, called glomeruli. Within glomeruli, OSNs, projection neurons (PNs), and local interneu-rons (inter-) connect onto each other to modulate the received odor information. Two major PN populations exist in the olfactory system of Drosophila: excitatory, uniglomeru-lar PNs (ePNs), and inhibitory, multiglomerular PNs (iPNs). Via the medial AL tract

Manuscript 4
94
(mALT; formerly inner antennocerebral tract iACT) ePNs innervate the higher brain cen-ters the mushroom body calyx and the LH. A few ePNs innervate via the lateral AL tract (lALT; formerly outer antennocerebral tract, oACT) first the LH and then the mushroom body calyx (Jefferis et al., 2007; Stocker et al., 1997; Tanaka et al., 2012). In contrast, iPNs innervate via the mediolateral AL tract (mlALT; formerly middle antennocerebral tract, mACT) directly and solely the LH (Ito et al., 1997; Jefferis et al., 2007; Lai et al., 2008; Liang et al., 2013; Okada et al., 2009; Stocker et al., 1990; Tanaka et al., 2004). Furthermore, odor information is conveyed in parallel pathways by ePNs and iPNs to the LH (Wang et al., 2014). While the mushroom body calyx is essential for learning and memory (reviewed by (Davis, 2005; Heisenberg, 2003), the LH is described to be re-sponsible for innate behavior (Heimbeck et al., 2001; Kido and Ito, 2002; Min et al., 2013; Strutz et al., 2014; Wang et al., 2003b; Xia and Tully, 2007).
So far, only few studies analyzed the morphological and physiological properties of neu-rons belonging to the neural circuit in the LH mediating innate odor-guided preference. The terminal fields of ePNs are distinct and highly stereotypic (Jefferis et al., 2007; Marin et al., 2002; Wong et al., 2002), whereas iPNs are separated in two groups due to the innervated area of the LH (Strutz et al., 2014). Depending on the innervated area sub-sets of ePNs are described to be spatially segregated either due to glomerular sub-groups (Tanaka et al., 2004), ePNs responding to food and pheromone odors (Jefferis et al., 2007; Liang et al., 2013), as well as segregated in ePNs responding to attractive amines and ammonia or aversive carbon dioxide (Min et al., 2013). While functional analysis in iPNs revealed that they code either odor valence or intensity (Strutz et al., 2014), the representation of odors in the LH was investigated in ePNs only for few odors (Liang et al., 2013; Parnas et al., 2013) or simulated for food odors (Jefferis et al., 2007). The further relay of odor information to the several described types of third-order neu-rons, i.e. LH neurons (LHNs), was analyzed only for few LHN subsets (Cachero et al., 2010; Fi ek and Wilson, 2014; Jefferis et al., 2007; Kohl et al., 2013; Lai et al., 2008; Ruta et al., 2010; Strutz et al., 2014; Tanaka et al., 2004; Yu et al., 2010). Hence, the neuronal properties of odor representations and their functional consequences are not fully understood. Therefore, we asked in this study whether ePNs can also be catego-rized morphologically and physiologically in subpopulations in the LH according to specif-ic odor features, such as odor valence and intensity as described for iPNs. Furthermore, we investigated if ePNs are connected to third-order neurons of the ventrolateral proto-cerebrum (VLP), which are inhibited by iPNs (Liang et al., 2013; Strutz et al., 2014). To investigate the neural representation of ePNs we analyzed the in vivo innervation pattern in the LH of all ePNs innervating a specific glomerulus and the odor response patterns of several odors using functional calcium imaging. We compared the innervation patterns and the odor response patterns of ePNs with the previously published data of iPNs
Manuscript 4
95
(Strutz et al., 2014). Additionally, we investigated the neural circuit of ePNs with neurons of the VLP using microlesion during functional imaging.
Our study reveals that the stereotypical innervation patterns of ePNs retain the topo-graphic map of the AL in the LH. Comparing the innervation pattern of ePNs and iPNs provides evidence that PNs that innervate overlapping regions in the AL also innervate overlapping regions in the LH. Furthermore, odor responses of ePNs in the LH can be separated due to the coding of odor valence and intensity in two odor response domains. Additionally, odor response domains coding the same odor features overlap in ePNs and iPNs. Both ePNs and iPNs responding to aversive odors connect to third-order neurons of the VLP.
We conclude that ePNs and iPNs receive odor information from the same subset of AL glomeruli and transfer this information via parallel pathways to the same regions in the LH. Via release of antagonistic neurotransmitters ePNs and iPNs modulate the odor re-sponses of third-order neurons of the VLP.
Results
LH innervation of individual excitatory PNs are similar but not identical
The lateral horn (LH) is the target region of the axons of excitatory, uniglomerular projec-tion neurons (ePNs) and of inhibitory, multiglomerular PNs (iPNs). About 90 of the esti-mated 120 ePNs are distinctly labeled by the enhancer trap line GH146-GAL4 (Heimbeck et al., 2001; Stocker et al., 1997). Notably, GH146-GAL4 labels in the ventral cell cluster around six PNs that express the inhibitory neurotransmitter gamma-aminobutyric acid (Wilson and Laurent, 2005). About 40 of the approximately 50 iPNs are distinctly labeled by MZ699-GAL4 (Ito et al., 1997; Lai et al., 2008; Okada et al., 2009). In previous studies the morphology of ePNs was obtained in vitro by labeling all GH146+ neurons (Heimbeck et al., 2001; Stocker et al., 1997) or by selectively labeling single neurons using MARCM (Mosaic Analysis with a Repressible Cell Marker) (Jefferis et al., 2007; Marin et al., 2002; Wong et al., 2002). On the other hand, iPNs were ana-lyzed in vivo using photoactivatable green fluorescent protein (pa-GFP) (Datta et al., 2008; Patterson and Lippincott-Schwartz, 2002; Ruta et al., 2010) to label single multi-glomerular MZ699+ PNs (Strutz et al., 2014). To compare the morphology of all GH146+ PNs with the in vivo data of MZ699+ PNs we labeled in vivo all PNs innervating a specif-ic glomerulus using the GAL4-UAS system to express pa-GFP under control of the GH146-GAL4 line (Brand and Perrimon, 1993; Datta et al., 2008; Patterson and Lippincott-Schwartz, 2002; Ruta et al., 2010; Stocker et al., 1997; Strutz et al., 2014). This approach enables to analyze the LH innervation considering the proportion of termi-nal fields of PNs of single glomeruli. Notably, each glomerulus is innervated by a specific but varying number of GH146+ PNs ranging from only one up to eight PNs per glomeru-

Manuscript 4
96
lus (Figure 1-figure supplement 1; see also (Grabe et al., 2016)). Our in vivo data com-prises about 185 reconstructed neurons that innervate 37 out of the total 54 glomeruli in the AL, which represents 69% of glomeruli innervated by GH146+ PNs (Grabe et al., 2015). For clarity GH146+ PNs were named by the glomerulus they innervate by apply-ing the nomenclature and glomerular innervation described in (Grabe et al., 2015). Sister PNs innervate the same glomerulus. To simplify reading we abbreviate GH146+ PNs with ePNs and MZ699+ PNs with iPNs.
Labeling all ePNs revealed a dense innervation in almost the entire lateral horn, except a small anterior part (Figure 1B). The innervation patterns in the LH of ePNs originating in the same glomerulus were distinct and stereotypic concerning the main branches as described previously (Jefferis et al., 2007; Marin et al., 2002; Wong et al., 2002). To ana-lyze the stereotypy of fine arborizations of individual ePNs, we compared the sister ePNs within one animal as well as in three different animals. Therefore, we performed 3D-reconstruction and subsequent registration to one reference brain for a subset of 21 glomeruli that were innervated by one up to three sister ePNs. Notably, while the main branches were highly stereotypic (Jefferis et al., 2007; Marin et al., 2002; Wong et al., 2002), the fine arborizations were not identical but similar (Figure 1C; Figure 1-figure supplement 1). The similarity of arborizations across three different animals was ana-lyzed using the terminal points of registered neurons to generate density maps (Jefferis et al., 2007), which represent the spatial concentration of neuron terminals. Correlating the density maps demonstrate that terminal locations of some ePNs innervating the same specific glomerulus were similar across animals (e.g. DP1m and VM3, correlation coefficient 0.8), whereas some were slightly different (e.g. DA4l and DC1, correlation coefficient 0.6) (Figure 1D, Figure 1-figure supplement 2). To compare the similarity of the ePN innervations in the LH we correlated pairwise the density maps of neurons in-nervating the same glomerulus as well as of neurons innervating different glomeruli. Terminal branches of ePNs innervating the same glomerulus were highly similar to each other (correlation coefficient 0.8), whereas, ePNs originating from different glomeruli revealed different terminal fields (correlation coefficient 0.1; Figure 1E). Generally, ana-lyzing the terminal fields of all ePNs innervating a specific glomerulus confirms the stere-otypy of the main branches described in previous in vitro studies of single neurons (Jefferis et al., 2007; Marin et al., 2002; Wong et al., 2002). But comparing sister ePNs highlights the differences of fine arborizations.
Terminal fields of ePNs overlap
Since terminal fields of ePNs were significantly different for most glomeruli we aimed at categorizing all ePNs into subgroups according to their terminal fields similar to Jefferis et al. (Jefferis et al., 2007). Having confirmed the high stereotypy of ePNs in the LH for a subset of 21 glomeruli we decided to reconstruct the ePNs of the remaining 16 glomeruli
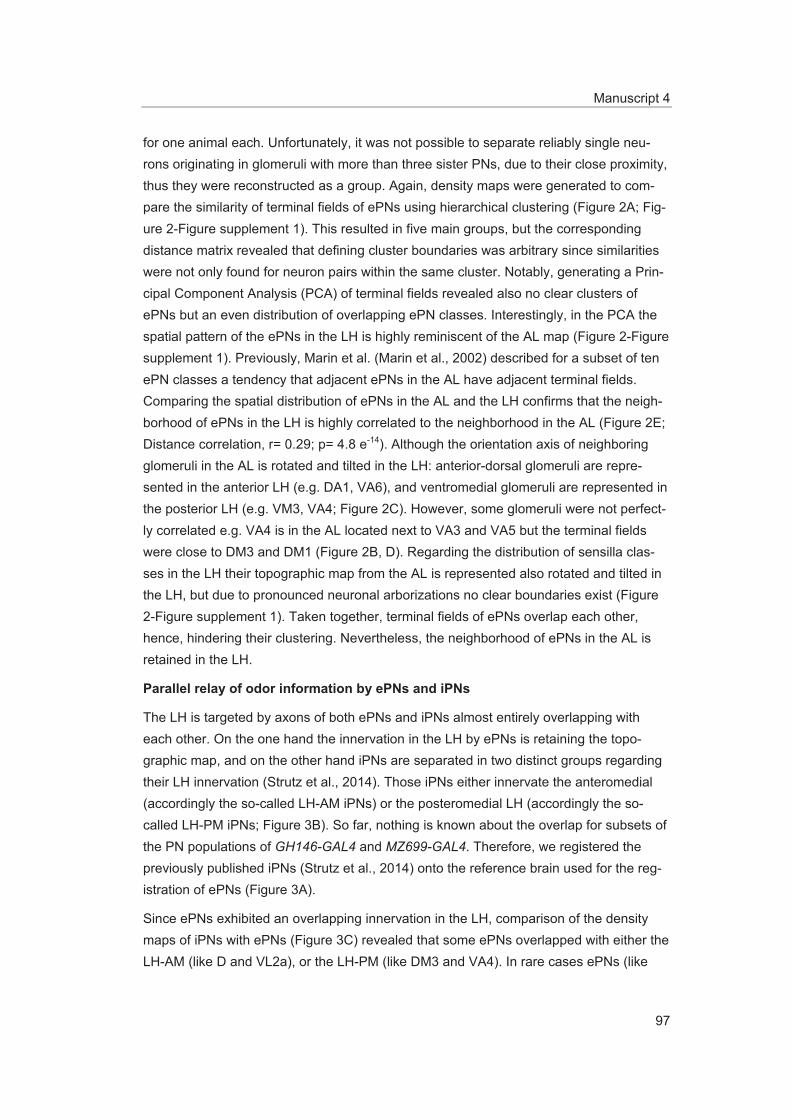
Manuscript 4
97
for one animal each. Unfortunately, it was not possible to separate reliably single neu-rons originating in glomeruli with more than three sister PNs, due to their close proximity, thus they were reconstructed as a group. Again, density maps were generated to com-pare the similarity of terminal fields of ePNs using hierarchical clustering (Figure 2A; Fig-ure 2-Figure supplement 1). This resulted in five main groups, but the corresponding distance matrix revealed that defining cluster boundaries was arbitrary since similarities were not only found for neuron pairs within the same cluster. Notably, generating a Prin-cipal Component Analysis (PCA) of terminal fields revealed also no clear clusters of ePNs but an even distribution of overlapping ePN classes. Interestingly, in the PCA the spatial pattern of the ePNs in the LH is highly reminiscent of the AL map (Figure 2-Figure supplement 1). Previously, Marin et al. (Marin et al., 2002) described for a subset of ten ePN classes a tendency that adjacent ePNs in the AL have adjacent terminal fields. Comparing the spatial distribution of ePNs in the AL and the LH confirms that the neigh-borhood of ePNs in the LH is highly correlated to the neighborhood in the AL (Figure 2E; Distance correlation, r= 0.29; p= 4.8 e-14). Although the orientation axis of neighboring glomeruli in the AL is rotated and tilted in the LH: anterior-dorsal glomeruli are repre-sented in the anterior LH (e.g. DA1, VA6), and ventromedial glomeruli are represented in the posterior LH (e.g. VM3, VA4; Figure 2C). However, some glomeruli were not perfect-ly correlated e.g. VA4 is in the AL located next to VA3 and VA5 but the terminal fields were close to DM3 and DM1 (Figure 2B, D). Regarding the distribution of sensilla clas-ses in the LH their topographic map from the AL is represented also rotated and tilted in the LH, but due to pronounced neuronal arborizations no clear boundaries exist (Figure 2-Figure supplement 1). Taken together, terminal fields of ePNs overlap each other, hence, hindering their clustering. Nevertheless, the neighborhood of ePNs in the AL is retained in the LH.
Parallel relay of odor information by ePNs and iPNs
The LH is targeted by axons of both ePNs and iPNs almost entirely overlapping with each other. On the one hand the innervation in the LH by ePNs is retaining the topo-graphic map, and on the other hand iPNs are separated in two distinct groups regarding their LH innervation (Strutz et al., 2014). Those iPNs either innervate the anteromedial (accordingly the so-called LH-AM iPNs) or the posteromedial LH (accordingly the so-called LH-PM iPNs; Figure 3B). So far, nothing is known about the overlap for subsets of the PN populations of GH146-GAL4 and MZ699-GAL4. Therefore, we registered the previously published iPNs (Strutz et al., 2014) onto the reference brain used for the reg-istration of ePNs (Figure 3A).
Since ePNs exhibited an overlapping innervation in the LH, comparison of the density maps of iPNs with ePNs (Figure 3C) revealed that some ePNs overlapped with either the LH-AM (like D and VL2a), or the LH-PM (like DM3 and VA4). In rare cases ePNs (like

Manuscript 4
98
DC1 and VA3) overlapped with both clusters of the iPNs (Figure 3D, E). Interestingly, ePNs that overlapped in the LH with LH-PM iPNs innervated in the AL glomeruli that were mainly innervated by LH-PM neurons. And likewise, ePNs overlapping in the LH with LH-AM neurons innervated in the AL glomeruli that were predominantly innervated by LH-AM neurons (Fig.3D). Correlating glomerular origin and terminal fields confirmed similarity of terminal fields for ePNs and iPNs innervating similar regions in the AL (co-sine distance 0.4). PNs innervating different regions in the AL had also different termi-nal fields (cosine distance 0.6). The innervation patterns of PNs within the same areas were significantly different to those of PNs within different areas (Mann-Whitney-U test p= 0.004; Figure 3F). In other words, excitatory uniglomerular and inhibitory multiglomer-ular PNs got their input from the same area in the AL and transferred the odor infor-mation via two parallel pathways to the same LH region.
ePN odor responses separate in two odor response domains
Having investigated the morphology of ePNs we next aimed to examine their odor coding properties in the LH. So far the odor responses of ePNs were extensively investigated only in the AL (e.g. (Knaden et al., 2012; Ng et al., 2002; Root et al., 2007; Schubert et al., 2014; Wang et al., 2003a) and the mushroom body calyx (e.g. (Fiala et al., 2002; Li et al., 2013; Wang et al., 2004). But to our knowledge the representation of odor infor-mation of ePNs in the LH was examined only for few odors in single planes using mul-tiphoton calcium imaging (Liang et al., 2013; Parnas et al., 2013). As previously revealed iPNs represent odors in the LH only according to their valence and intensity (Strutz et al., 2014). Hence, we were interested if ePNs also categorize odors only by their valence and intensity or if the odor identity is retained in the LH activity patterns. Therefore, we performed widefield-calcium imaging experiments expressing the genetically encoded calcium indicator GCaMP3 under control of the GH146-GAL4 line (Stocker et al., 1997; Tian et al., 2009). We used an odor set that is largely overlapping with the odor set used for the investigation of iPNs (Strutz et al., 2014). Our odor set contained the blend bal-samic vinegar and 18 pure odors of different ecological relevance: pheromones (11-cis-vaccenyl acetate (Ha and Smith, 2006; Kurtovic et al., 2007), methyl laurate (Dweck et al., 2015b), repellents (geosmin (Stensmyr et al., 2012), actinidin (Ebrahim et al., 2015), benzaldehyde (Semmelhack and Wang, 2009), 1-octanol (Knaden et al., 2012)), fruit odors (isoamyl acetate, acetophenone, -butyrolactone, 1-hexanol, 1-octen-3-ol), flower odor (linalool) and odors indicative for fermenting food (acetoine acetate, acetic acid (Becher, 2012), 2,3-butanedione, ethyl-4-guaiacol (Dweck et al., 2015a), propionic acid, and 2-phenethyl acetate).
Across animals the responses to different odors were very broad and seemed not to be odor specific. Only a separation in two spatial patterns for odors responses in the poste-rior part of the LH or responses in the almost entire LH was discernable. Notably, those
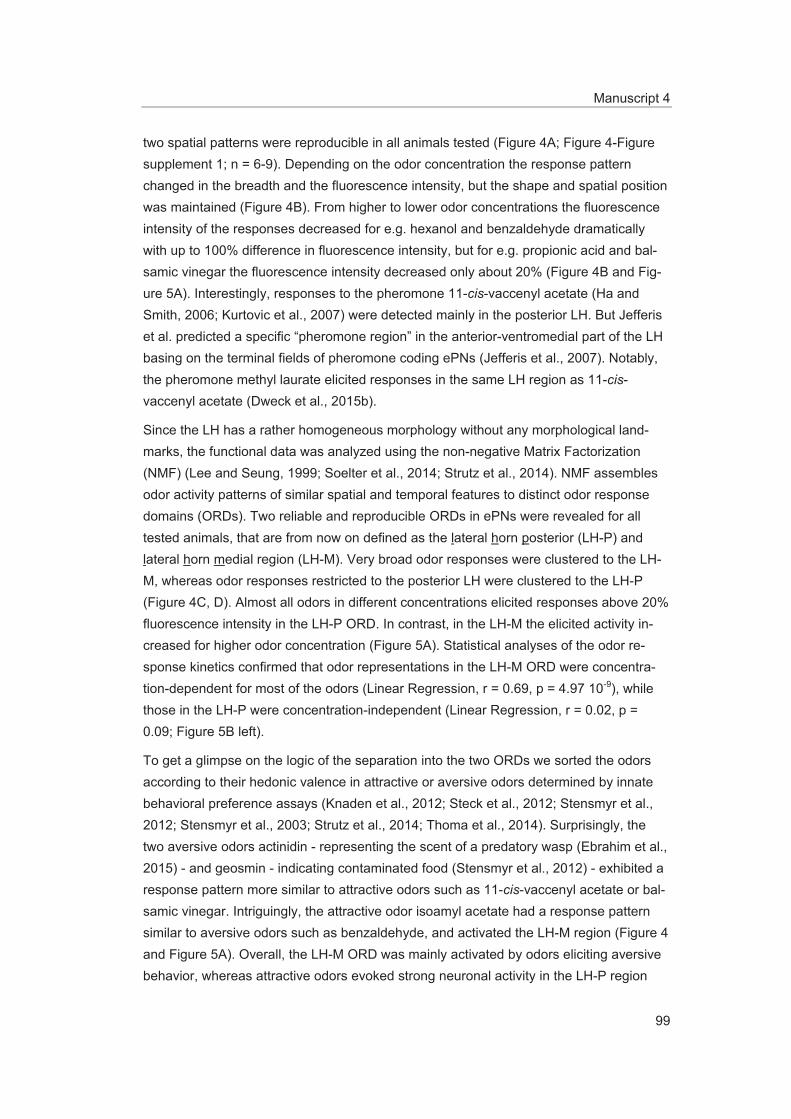
Manuscript 4
99
two spatial patterns were reproducible in all animals tested (Figure 4A; Figure 4-Figure supplement 1; n = 6-9). Depending on the odor concentration the response pattern changed in the breadth and the fluorescence intensity, but the shape and spatial position was maintained (Figure 4B). From higher to lower odor concentrations the fluorescence intensity of the responses decreased for e.g. hexanol and benzaldehyde dramatically with up to 100% difference in fluorescence intensity, but for e.g. propionic acid and bal-samic vinegar the fluorescence intensity decreased only about 20% (Figure 4B and Fig-ure 5A). Interestingly, responses to the pheromone 11-cis-vaccenyl acetate (Ha and Smith, 2006; Kurtovic et al., 2007) were detected mainly in the posterior LH. But Jefferis et al. predicted a specific “pheromone region” in the anterior-ventromedial part of the LH basing on the terminal fields of pheromone coding ePNs (Jefferis et al., 2007). Notably, the pheromone methyl laurate elicited responses in the same LH region as 11-cis-vaccenyl acetate (Dweck et al., 2015b).
Since the LH has a rather homogeneous morphology without any morphological land-marks, the functional data was analyzed using the non-negative Matrix Factorization (NMF) (Lee and Seung, 1999; Soelter et al., 2014; Strutz et al., 2014). NMF assembles odor activity patterns of similar spatial and temporal features to distinct odor response domains (ORDs). Two reliable and reproducible ORDs in ePNs were revealed for all tested animals, that are from now on defined as the lateral horn posterior (LH-P) and lateral horn medial region (LH-M). Very broad odor responses were clustered to the LH-M, whereas odor responses restricted to the posterior LH were clustered to the LH-P (Figure 4C, D). Almost all odors in different concentrations elicited responses above 20% fluorescence intensity in the LH-P ORD. In contrast, in the LH-M the elicited activity in-creased for higher odor concentration (Figure 5A). Statistical analyses of the odor re-sponse kinetics confirmed that odor representations in the LH-M ORD were concentra-tion-dependent for most of the odors (Linear Regression, r = 0.69, p = 4.97 10-9), while those in the LH-P were concentration-independent (Linear Regression, r = 0.02, p = 0.09; Figure 5B left).
To get a glimpse on the logic of the separation into the two ORDs we sorted the odors according to their hedonic valence in attractive or aversive odors determined by innate behavioral preference assays (Knaden et al., 2012; Steck et al., 2012; Stensmyr et al., 2012; Stensmyr et al., 2003; Strutz et al., 2014; Thoma et al., 2014). Surprisingly, the two aversive odors actinidin - representing the scent of a predatory wasp (Ebrahim et al., 2015) - and geosmin - indicating contaminated food (Stensmyr et al., 2012) - exhibited a response pattern more similar to attractive odors such as 11-cis-vaccenyl acetate or bal-samic vinegar. Intriguingly, the attractive odor isoamyl acetate had a response pattern similar to aversive odors such as benzaldehyde, and activated the LH-M region (Figure 4 and Figure 5A). Overall, the LH-M ORD was mainly activated by odors eliciting aversive behavior, whereas attractive odors evoked strong neuronal activity in the LH-P region

Manuscript 4
100
(Mann-Whitney-U-test, Figure 5B right). Hence, there was a tendency of the separation of the LH for responses into attractive (LH-P) and aversive odors (LH-M) for ePNs.
Unequal processing of odor information in the AL
The spatial representation of odors in the LH for ePNs separated in only two ORDs is quite puzzling since the topographic map of the AL is retained in the LH. Probably the processing of odor information in the AL or LH results in broader PN responses reflected in only two ORDs. To examine the impact of processing, we took advantage of having the morphological data of all ePNs and OSN responses for some odors used in our odor set to simulate unprocessed odor patterns in the LH. Unfortunately, no known Drosophila pheromone is included in the DoOR data base (http://neuro.uni-konstanz.de/DoOR/2.0/) (Münch and Galizia, 2016). Thus, to predict the odor pattern for the pheromone methyl laurate we estimated values for the pheromone response depending on normalized spike count (Dweck et al., 2015b).
Interestingly, the predicted odor patterns were broad and not distinct for the different odors. In fact, for most of the odors the prediction reproduced patterns that were similar to the measured odor pattern, e.g. 1-hexanol and acetophenone. Nevertheless, for some odors the predicted odor patterns appeared to be shifted, e.g. the predicted pattern for methyl laurate was slightly shifted to the anterior LH, whereas for 2,3-butanedione it was slightly shifted to the posterior LH. In the cases of 1-octen-3-ol and isoamyl acetate the measured responses were broader than the predicted patterns (Figure 6A). Notably, also the prediction exhibited no specific pattern for the pheromone methyl laurate as it would be expected to be separated from general or food odors (Jefferis et al., 2007). Correlat-ing the measured and simulated odor responses verifies that the differences are only slightly significant due to the unequal shifts of odor responses (p=0.043; Figure 6B). Consequently, the variety between simulated, unprocessed odor patterns and measured odor patterns is indicating different information processing for some odors. This confirms observations in the AL where odor information is transferred from first to second order neurons with varying degrees of processing (Bhandawat et al., 2007; Knaden et al., 2012; Ng et al., 2002; Olsen et al., 2007; Root et al., 2008; Silbering and Galizia, 2007; Wang et al., 2003a; Wang et al., 2014; Wilson et al., 2004).
ePNs synapse onto VLP neurons in the LH
Having elucidated that subsets of ePNs and iPNs innervate overlapping areas in the AL as well as in the LH, and that their odor responses can be separated due to odor valence and intensity we were curious whether they are functionally connected. Previous studies revealed that arborizations of ePNs, iPNs and VLP neurons overlap in the LH (Strutz et al., 2014). Furthermore, iPNs inhibit the third-order VLP neurons, which get their input (mainly) in the LH (Liang et al., 2013; Parnas et al., 2013; Strutz et al., 2014). Additional-

Manuscript 4
101
ly, Liang et al. (Liang et al., 2013) revealed that iPNs do not synapse onto ePNs. Yet, it is not known whether ePNs synapse onto iPNs or VLP neurons or both.
We therefore labeled synapses between the three different neuron populations using GFP reconstitution across synaptic partners (GRASP) (Feinberg et al., 2008). The sGFP1-10 was either fused to the synaptic protein neurexin (Nrx) or to the pre-synaptic protein synaptobrevin (Syb) under control of MZ699-GAL4 (Fan et al., 2013; Ito et al., 1997; Karuppudurai et al., 2014). Under control of GH146-LexA the sGFP11 was ex-pressed. Surprisingly, reconstitution of the GFP components resulted in labeling of syn-apses in the AL and the LH only for flies carrying the Nrx::sGFP1-10 construct (Figure 7A, B). [As a control for the functionality of the Syb::sGFP1-10 construct it was expressed un-der control of Orco-GAL4 (Larsson et al., 2004) in flies also carrying sGFP11 under con-trol of LN1-LexA. This combination revealed abundant labeling of synapses in the AL (data not shown).] Thus, the missing labeling of presynapses of MZ699+ neurons onto GH146+ neurons implies that ePNs receive no input from iPNs or VLP neurons. Instead, the labeling of synapses by Nrx::sGFP1-10 suggests connections from ePNs to iPNs and VLP neurons. To verify these connections we combined widefield calcium imaging for a subset of six odors in a concentration of 10-2 with microlesion of the PN-tracts mALT and mlALT. Imaging of ePNs revealed no differences in the response pattern after transec-tion of mlALT (Figure 7 D, F, E; n = 6). This confirms observation that iPNs do not syn-apse onto ePNs (Liang et al., 2013). Notably, imaging of MZ699+ neurons revealed changes of odor responses after transection of the mALT (Figure 7 I; n = 7). Again we performed NMF to separate similar spatiotemporal activity patterns (Figure 7J). In this way we can demonstrate that only responses in the LH-AL were abolished after micro-lesion. This implies a connection of ePNs onto VLP neurons, since responses in the LH-AL domain derive exclusively from VLP neurons (Strutz et al., 2014). In contrast, re-sponses in the LH-PM and LH-AM domain exhibited no changes after transection of the mALT suggesting that ePNs do not synapse onto iPNs (Figure 7 K-L).
ORDs deriving from distinct neuronal populations
In ePNs we could identify the LH-P ORD being activated by attractive odors as well as the LH-M ORD being activated by aversive odors and high odor concentrations. Neurons labeled by MZ699-GAL4 comprise three ORDs: one ORD in the anterolateral part of the LH (so-called LH-AL), one in the anteromedial part (LH-AM) and the third one in the posteromedial LH (LH-PM) (Strutz et al., 2014). While the LH-AM is intensity-dependent and valence-unspecific, the LH-PM is activated by attractive odors in a concentration-independent manner. The LH-AL represents the responses of third-order VLP neurons and encodes intensity and aversive odors. Since iPNs and VLP neurons overlap in the LH with ePNs (Strutz et al., 2014), as well as the ORDs of the three different neuron populations overlap (Figure 8A), we wondered whether the ORDs overlap regarding their
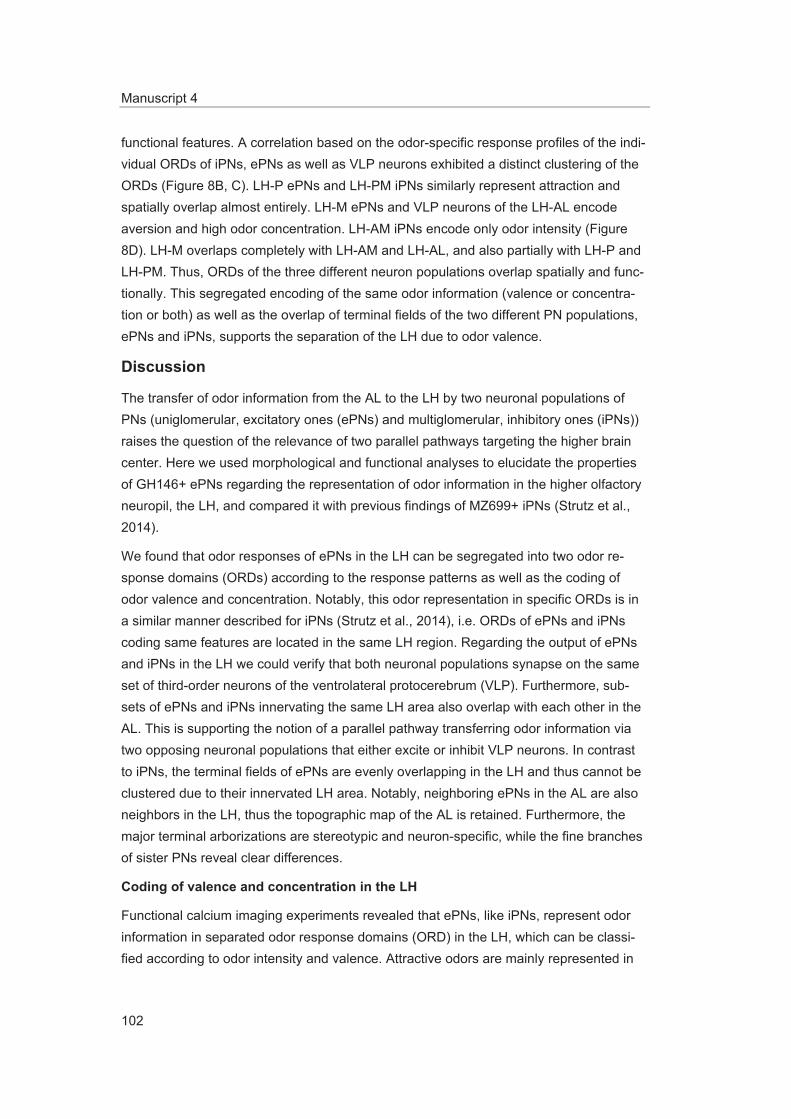
Manuscript 4
102
functional features. A correlation based on the odor-specific response profiles of the indi-vidual ORDs of iPNs, ePNs as well as VLP neurons exhibited a distinct clustering of the ORDs (Figure 8B, C). LH-P ePNs and LH-PM iPNs similarly represent attraction and spatially overlap almost entirely. LH-M ePNs and VLP neurons of the LH-AL encode aversion and high odor concentration. LH-AM iPNs encode only odor intensity (Figure 8D). LH-M overlaps completely with LH-AM and LH-AL, and also partially with LH-P and LH-PM. Thus, ORDs of the three different neuron populations overlap spatially and func-tionally. This segregated encoding of the same odor information (valence or concentra-tion or both) as well as the overlap of terminal fields of the two different PN populations, ePNs and iPNs, supports the separation of the LH due to odor valence.
Discussion
The transfer of odor information from the AL to the LH by two neuronal populations of PNs (uniglomerular, excitatory ones (ePNs) and multiglomerular, inhibitory ones (iPNs)) raises the question of the relevance of two parallel pathways targeting the higher brain center. Here we used morphological and functional analyses to elucidate the properties of GH146+ ePNs regarding the representation of odor information in the higher olfactory neuropil, the LH, and compared it with previous findings of MZ699+ iPNs (Strutz et al., 2014).
We found that odor responses of ePNs in the LH can be segregated into two odor re-sponse domains (ORDs) according to the response patterns as well as the coding of odor valence and concentration. Notably, this odor representation in specific ORDs is in a similar manner described for iPNs (Strutz et al., 2014), i.e. ORDs of ePNs and iPNs coding same features are located in the same LH region. Regarding the output of ePNs and iPNs in the LH we could verify that both neuronal populations synapse on the same set of third-order neurons of the ventrolateral protocerebrum (VLP). Furthermore, sub-sets of ePNs and iPNs innervating the same LH area also overlap with each other in the AL. This is supporting the notion of a parallel pathway transferring odor information via two opposing neuronal populations that either excite or inhibit VLP neurons. In contrast to iPNs, the terminal fields of ePNs are evenly overlapping in the LH and thus cannot be clustered due to their innervated LH area. Notably, neighboring ePNs in the AL are also neighbors in the LH, thus the topographic map of the AL is retained. Furthermore, the major terminal arborizations are stereotypic and neuron-specific, while the fine branches of sister PNs reveal clear differences.
Coding of valence and concentration in the LH
Functional calcium imaging experiments revealed that ePNs, like iPNs, represent odor information in separated odor response domains (ORD) in the LH, which can be classi-fied according to odor intensity and valence. Attractive odors are mainly represented in

Manuscript 4
103
the posterior LH region (ORD classified as LH-P ePNs or LH-PM iPNs), whereas, aver-sive odors are represented in a medial to anterior area (ORD classified as LH-M ePNs or LH-AM iPNs). Interestingly, while the region representing aversive odors is concentra-tion-dependent, the region representing attractive odors is concentration-independent. Our approach applying non-negative matrix factorization (Lee and Seung, 1999; Soelter et al., 2014) reveals two ORDs in the LH that are highly stereotypic and reproducible for all odors tested. Thus, we defined two ORDs reflecting ecological relevance, but addi-tional clusters or sub-clusters or both representing odor-specific response domains may exist. Furthermore, we used monomolecular compounds for calcium imaging except bal-samic vinegar, which exhibited a similar response pattern as single odors eliciting attrac-tion behavior. However, flies mainly encounter in their natural environment odor plumes of blends with attractive and aversive compounds. Thus, additional experiments are nec-essary to investigate the odor responses for mixtures of attractive and aversive odors to reveal if the LH processes information separately for the single compounds or if the LH rates the overall valence of the mixture.
The separation in “attractive“ and “aversive“ responses of ePNs in the LH is contradictory to predictions of separate regions for odor responses to food odors and pheromones (Jefferis et al., 2007; Liang et al., 2013). Odor responses of ePNs to pheromones are expected in the anterior LH where those pheromone-specific ePNs terminate. However, we could not assign this region being specific for pheromone responses since the pher-omones methyl laurate and 11-cis-vaccenyl acetate elicited responses in the posterior LH similar to other attractive odors such as balsamic vinegar. The similarity in odor re-sponse patterns of balsamic vinegar and 11-cis-vaccenyl acetate may be caused by ePNs relaying responses to both odors (Lebreton et al., 2015). However, if further ePNs exist that respond to methyl laurate in addition to VA1d- and VA1v-ePNs has to be veri-fied in future experiments. It is also possible that lateral excitation (Olsen et al., 2007; Root et al., 2007; Shang et al., 2007; Yaksi and Wilson, 2010) or lateral inhibition (Olsen et al., 2010; Olsen and Wilson, 2008b; Root et al., 2008) or both cause the unexpected response patterns for pheromones. Furthermore, comparison of the measured odor re-sponse patterns with our predictions basing on response data of sensory neurons (http://neuro.uni-konstanz.de/DoOR/2.0/) revealed slight shifts of some odor response patterns in the LH. These shifts also may underlie complex processing by lateral excita-tion or lateral inhibition or both (Bhandawat et al., 2007; Ng et al., 2002; Olsen and Wilson, 2008b; Root et al., 2008; Silbering and Galizia, 2007; Silbering et al., 2008; Wilson et al., 2004).
Knaden and co-workers (Knaden et al., 2012) described a separation of the AL for at-tractive odors to medial glomeruli and aversive odors to lateral glomeruli. Since the topo-graphic map is retained in the LH (see below), but rotated and tilted, the medial glomeruli are represented in the posterior-dorsal LH, and lateral glomeruli are represented in the
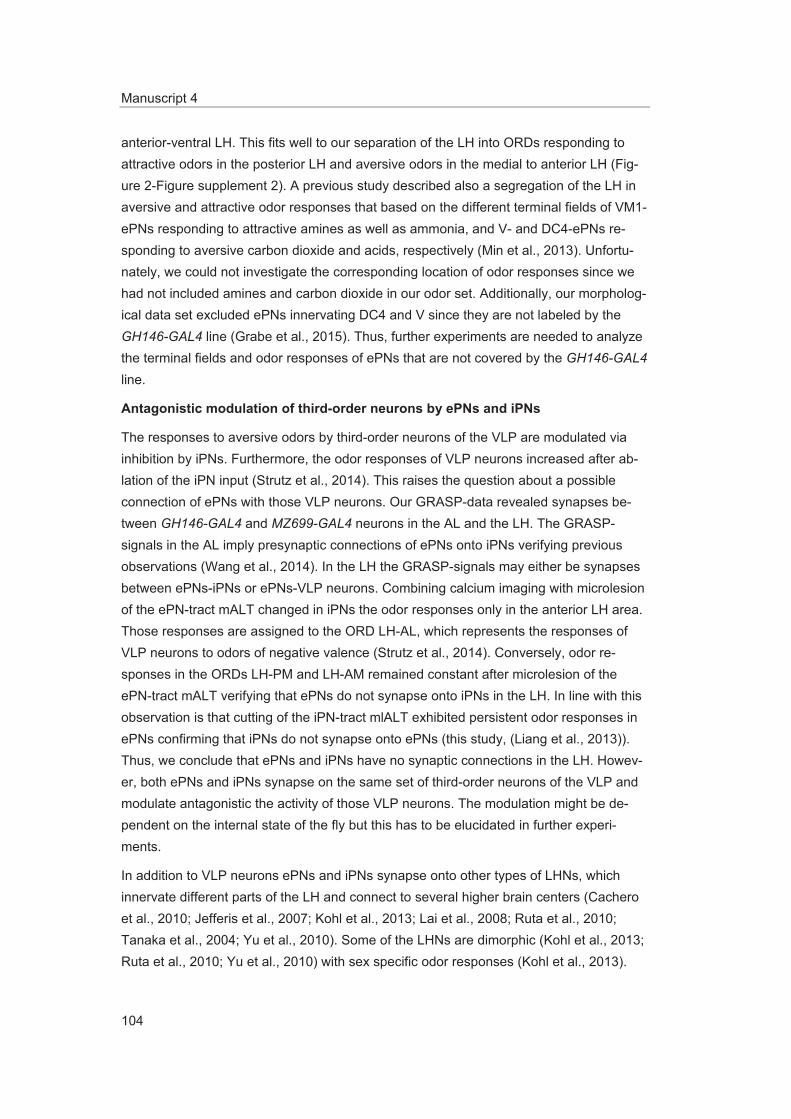
Manuscript 4
104
anterior-ventral LH. This fits well to our separation of the LH into ORDs responding to attractive odors in the posterior LH and aversive odors in the medial to anterior LH (Fig-ure 2-Figure supplement 2). A previous study described also a segregation of the LH in aversive and attractive odor responses that based on the different terminal fields of VM1-ePNs responding to attractive amines as well as ammonia, and V- and DC4-ePNs re-sponding to aversive carbon dioxide and acids, respectively (Min et al., 2013). Unfortu-nately, we could not investigate the corresponding location of odor responses since we had not included amines and carbon dioxide in our odor set. Additionally, our morpholog-ical data set excluded ePNs innervating DC4 and V since they are not labeled by the GH146-GAL4 line (Grabe et al., 2015). Thus, further experiments are needed to analyze the terminal fields and odor responses of ePNs that are not covered by the GH146-GAL4 line.
Antagonistic modulation of third-order neurons by ePNs and iPNs
The responses to aversive odors by third-order neurons of the VLP are modulated via inhibition by iPNs. Furthermore, the odor responses of VLP neurons increased after ab-lation of the iPN input (Strutz et al., 2014). This raises the question about a possible connection of ePNs with those VLP neurons. Our GRASP-data revealed synapses be-tween GH146-GAL4 and MZ699-GAL4 neurons in the AL and the LH. The GRASP-signals in the AL imply presynaptic connections of ePNs onto iPNs verifying previous observations (Wang et al., 2014). In the LH the GRASP-signals may either be synapses between ePNs-iPNs or ePNs-VLP neurons. Combining calcium imaging with microlesion of the ePN-tract mALT changed in iPNs the odor responses only in the anterior LH area. Those responses are assigned to the ORD LH-AL, which represents the responses of VLP neurons to odors of negative valence (Strutz et al., 2014). Conversely, odor re-sponses in the ORDs LH-PM and LH-AM remained constant after microlesion of the ePN-tract mALT verifying that ePNs do not synapse onto iPNs in the LH. In line with this observation is that cutting of the iPN-tract mlALT exhibited persistent odor responses in ePNs confirming that iPNs do not synapse onto ePNs (this study, (Liang et al., 2013)). Thus, we conclude that ePNs and iPNs have no synaptic connections in the LH. Howev-er, both ePNs and iPNs synapse on the same set of third-order neurons of the VLP and modulate antagonistic the activity of those VLP neurons. The modulation might be de-pendent on the internal state of the fly but this has to be elucidated in further experi-ments.
In addition to VLP neurons ePNs and iPNs synapse onto other types of LHNs, which innervate different parts of the LH and connect to several higher brain centers (Cachero et al., 2010; Jefferis et al., 2007; Kohl et al., 2013; Lai et al., 2008; Ruta et al., 2010; Tanaka et al., 2004; Yu et al., 2010). Some of the LHNs are dimorphic (Kohl et al., 2013; Ruta et al., 2010; Yu et al., 2010) with sex specific odor responses (Kohl et al., 2013).
Manuscript 4
105
For other types of LHNs either broadly or narrowly tuned responses to fruit odors are described (Fi ek and Wilson, 2014). If and how the coding of valence and intensity is relayed onto LHNs has to be investigated in further experiments.
Topographic map in the LH
Labeling in vivo all uniglomerular ePNs innervating the same glomerulus confirmed dis-tinct stereotypic branching patterns with differences in their fine arborizations (Jefferis et al., 2007; Marin et al., 2002; Wong et al., 2002). Our comparison of the terminal fields revealed an overlapping innervation in the LH and not a clustering of ePNs with distinct terminal fields (Jefferis et al., 2007). This discrepancy may result from the different gen-eration of density maps. Jefferis et al. (Jefferis et al., 2007) generated density maps inte-grating the morphology of single neurons labeled by MARCM, while we generated densi-ty maps basing on labeling of all ePNs per glomerulus (varying from one to eight; (Grabe et al., 2016)). Nevertheless, the overlapping innervation is highly correlated to the glo-merular neighborhood in the AL, confirming that the topographic map is retained in the LH (Marin et al., 2002). We speculate that the topographic map is retained to implement the representation of the outer world as odotopic map in the LH. This odotopic map will be integrated with other sensory maps, such as of olfaction and vision as described in locusts (Gupta and Stopfer, 2012), to successfully navigate in an often hostile environ-ment. In the fly the LH is linked with higher brain centers that represent e.g. the target of visual neurons, mechanosensory antennal neurons, or auditory sensory neurons. This enables a multimodal integration of several sensory types (Duistermars and Frye, 2010; Ruta et al., 2010; Tanaka et al., 2004).
Taken together, ePNs and iPNs work in a parallel pathway, however, they affect distinct aspects of olfactory information processing in the LH as described for parallel pathways in the mammalian visual system (Nassi and Callaway, 2009). While the retained topo-graphic map enables ePNs to encode odor quality read out by LHNs (Fi ek and Wilson, 2014), iPNs enhance the discrimination of odors via inhibition of postsynaptic neurons (Parnas et al., 2013). Furthermore, both ePNs and iPNs separate the LH due to odor valence and intensity and project onto third-order neurons of the VLP, which ePNs excite and iPNs inhibit. This parallel conveyance by two antagonistic PN populations may en-hance the accuracy of the representation of odor valence and intensity. Moreover, the dual representation of olfactory information restricted to ecological relevance by two an-tagonistic PN populations might be a prerequisite to elicit innate behavior. Thus, our find-ing of the separation of the LH due to odor valence and intensity by ePNs and iPNs is a step further to understanding/unravel the neural circuitry causing innate behavior.
Material and Methods
Fly lines and rearing
Manuscript 4
106
Fly lines used were obtained from the Bloomington Drosophila stock center (http://flystocks.bio.indiana.edu/): GH146-GAL4 (Stocker et al., 1997), UAS-GCaMP3.0 (Tian et al., 2009), specific Or-GAL4 lines were used to reliably identify glomeruli ( VA3, VA5, VC1, VC2, VA7l, VM7d, VM7v)Or33c-GAL4, Or42a-GAL4, Or46a-GAL4, Or49b-GAL4, Or59c-GAL4, and Or67b-GAL4, and Or 71a-GAL4 (all (Fishilevich and Vosshall, 2005; Vosshall et al., 2000)), GH146-QF,QUAS-mtdTomato (Potter et al., 2010). Addi-tional lines were kindly provided by Bob Datta for photoactivation (UAS-C3PA, (Ruta et al., 2010)) and Kei Ito (MZ699-GAL4, (Okada et al., 2009)). For calcium imaging flies of the genotypes +;GH146-GAL4/(CyO);UAS-GCaMP3.0/(TM2) were used, and +;+/UAS-GC3.0;GH146-QF,QUAS-mtdTomato/MZ699-GAL4 for microlesion experiments. Flies carrying UAS-Syb::GFP1-10 (Karuppudurai et al., 2014), UAS-Nrx::GFP1-10 and LexAop-CD4::GFP11 (Fan et al., 2013) were used for analyses on synaptic connections.
Flies were reared on standard corn meal molasses medium (1 l of fly food consists of 918 ml water, 95 g polenta, 11 g brewer’s yeast, 2.4 ml propionic acid, 3.3 ml nipagine (16%), 118 g sugar beet molasses and 4.1 g agarose) in a climate chamber with 12/12 hrs light/dark cycle, 70 % relative humidity and 23°C.
In vivo Preparation
For in vivo photoactivation as well as calcium imaging experiments 4-6 d old female flies, anesthetized for at least 15 min on ice, were fixed in a custom-made stage (one-sided beveled plastic block of 8 cm3) with a drill hole for the fly´s body. On the upper edge of the drill hole, one half of a 3.05 m thin copper grid (Athene Grids ©) with a slit of 125
m was glued. Into this slit the neck of the fly was gently pushed. A minute needle in front of the head fixed with wax onto the custom-made stage and 3-component silicon (ProtempTMII, 3M Deutschland GmbH, Neuss, Germany) coated on the back of the head prevented the fly to escape. A fine wire, fixed with wax to a trimmed plastic coverslip, was placed in the flexible ptilinal suture to stretch the antennae. The coverslip, fixed with wax to the beveled side of the stage, was bended by turning screws, which passed through the block, to tense the wire. A punched plastic plate (1 mm in diameter) was placed on the head and fixed with wax to the stage. With two-component silicone (Kwik-Sil™, WPI Inc, Sarasota, FL) the gap between head and margin of the plastic plate was sealed. Ringer solution (NaCl 7.6 g/l, KCl 0.37 g/l, MgCl2 6H2O 0.41 g/l; CaCl2 2 H2O 0.29 g/l; saccharose 12.32 g/l; HEPES 1.19 g/l; pH 7.3) was used to prevent the brain from drying out during imaging. With a stab knife (Sharpoint, Surgical Specialties Corpo-ration, Reading, PA) a window was cut in the head capsule, thus tracheae and fat bodies could be removed getting a clear view onto the brain.
Photoactivation for neuronal tracing
Photoactivation was performed with a MPCLSM 710 NLO (Zeiss, Germany) equipped with an infrared laser (Chameleon Ultra II, Coherent, Santa Clara, CA) as previously de-

Manuscript 4
107
scribed (Grabe et al., 2016). In brief, a 40x water immersions objective (W Plan-Apochromat 40x/1.0 DIC M27; Carl Zeiss, Germany) was used to continuously irradiate a glomerulus in 3 planes in succession for approx. 15-25 min with 760 nm laser wave-length. The region for activation was of similar shape as the glomerulus´ boarder but a little bit smaller. After a break of approx. 5-15 min for diffusion of the photoconverted protein through the entire neuron the brain was scanned with 925 nm in 1 μm steps (1024x1024, 8-bit). For the scanning procedure in some cases the body was removed to eliminate movement (Figure 1).
Neuronal reconstruction, registration and anatomical analyses
Confocal scans of labeled neurons were used for 3D-reconstruction with the skeleton tool of the segmentation software AMIRA 5.6.0 (FEI Company, Hillsboro, OR). The re-constructed neurons were registered onto an in vivo reference brain based on recon-structed labelfields of the different neuropils (i.e. AL, mushroom body calyx and LH (Rybak et al., 2010). For comparison MZ699-PNs (Strutz et al., 2014) were re-registered onto a reference brain basing on the GH146-GAL4 line.
The morphology of reconstructed ePNs was analyzed based on the full morphology in the LH similar to (Jefferis et al., 2007): For each ePN we used the point cloud from the neuronal reconstruction from Amira, while we used the terminal points for iPNs (accord-ing to (Strutz et al., 2014). We calculated density maps for the LH by applying a Gaussi-an kernel (size +/- 7 sigma) to this data set for each voxel in a grid of equally spaced voxels with 5 microns per side covering the space (272:353, 236:316, 50:132) in the master coordinate system. We first calculated density maps for each animal (Figure 1D) that were averaged across animals for further analyses (Figure 2, Figure 3). To quantify spatial relationships between different neuronal types we calculated the spatial overlap between the 3D density maps (map1, map2, ….) where dvox is the density per voxel as follows:
Using Principal Component Analysis (PCA) the pairwise similarity matrix of the density maps did not show any distinct and stable clustering in subgroups as assumed (Figure 2 – supplement 1). We also performed a hierarchical clustering of the similarity matrix (Figure 2 – supplement 1) that yielded four main clusters, which are similar to the clus-ters published by (Jefferis et al., 2007). However, a closer look at the full distance matrix revealed that individual clusters are not clearly spatially separated and are arbitrary at the borders of each cluster (Figure 2 – supplement 1B; e.g. glomerulus DM2 is grouped in the red cluster, but shares strong similarities with the other DM glomeruli in the green
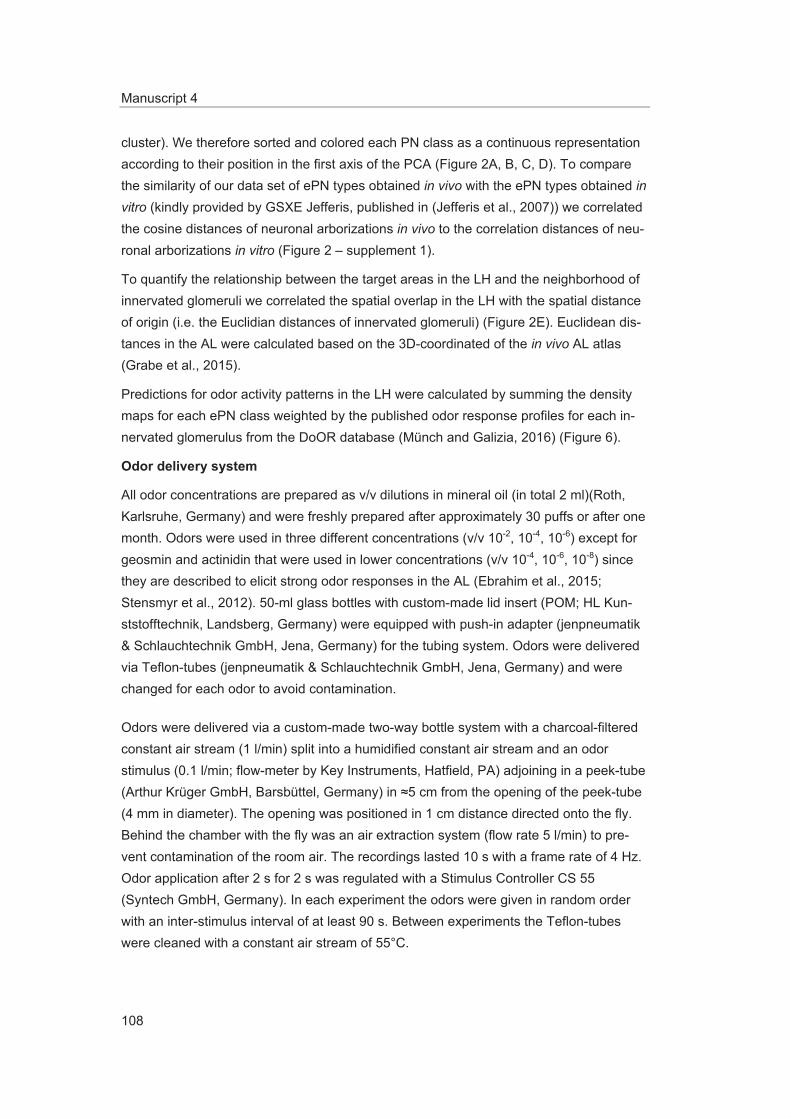
Manuscript 4
108
cluster). We therefore sorted and colored each PN class as a continuous representation according to their position in the first axis of the PCA (Figure 2A, B, C, D). To compare the similarity of our data set of ePN types obtained in vivo with the ePN types obtained in vitro (kindly provided by GSXE Jefferis, published in (Jefferis et al., 2007)) we correlated the cosine distances of neuronal arborizations in vivo to the correlation distances of neu-ronal arborizations in vitro (Figure 2 – supplement 1).
To quantify the relationship between the target areas in the LH and the neighborhood of innervated glomeruli we correlated the spatial overlap in the LH with the spatial distance of origin (i.e. the Euclidian distances of innervated glomeruli) (Figure 2E). Euclidean dis-tances in the AL were calculated based on the 3D-coordinated of the in vivo AL atlas (Grabe et al., 2015).
Predictions for odor activity patterns in the LH were calculated by summing the density maps for each ePN class weighted by the published odor response profiles for each in-nervated glomerulus from the DoOR database (Münch and Galizia, 2016) (Figure 6).
Odor delivery system
All odor concentrations are prepared as v/v dilutions in mineral oil (in total 2 ml)(Roth, Karlsruhe, Germany) and were freshly prepared after approximately 30 puffs or after one month. Odors were used in three different concentrations (v/v 10-2, 10-4, 10-6) except for geosmin and actinidin that were used in lower concentrations (v/v 10-4, 10-6, 10-8) since they are described to elicit strong odor responses in the AL (Ebrahim et al., 2015; Stensmyr et al., 2012). 50-ml glass bottles with custom-made lid insert (POM; HL Kun-ststofftechnik, Landsberg, Germany) were equipped with push-in adapter (jenpneumatik & Schlauchtechnik GmbH, Jena, Germany) for the tubing system. Odors were delivered via Teflon-tubes (jenpneumatik & Schlauchtechnik GmbH, Jena, Germany) and were changed for each odor to avoid contamination.
Odors were delivered via a custom-made two-way bottle system with a charcoal-filtered constant air stream (1 l/min) split into a humidified constant air stream and an odor stimulus (0.1 l/min; flow-meter by Key Instruments, Hatfield, PA) adjoining in a peek-tube (Arthur Krüger GmbH, Barsbüttel, Germany) in 5 cm from the opening of the peek-tube (4 mm in diameter). The opening was positioned in 1 cm distance directed onto the fly. Behind the chamber with the fly was an air extraction system (flow rate 5 l/min) to pre-vent contamination of the room air. The recordings lasted 10 s with a frame rate of 4 Hz. Odor application after 2 s for 2 s was regulated with a Stimulus Controller CS 55 (Syntech GmbH, Germany). In each experiment the odors were given in random order with an inter-stimulus interval of at least 90 s. Between experiments the Teflon-tubes were cleaned with a constant air stream of 55°C.
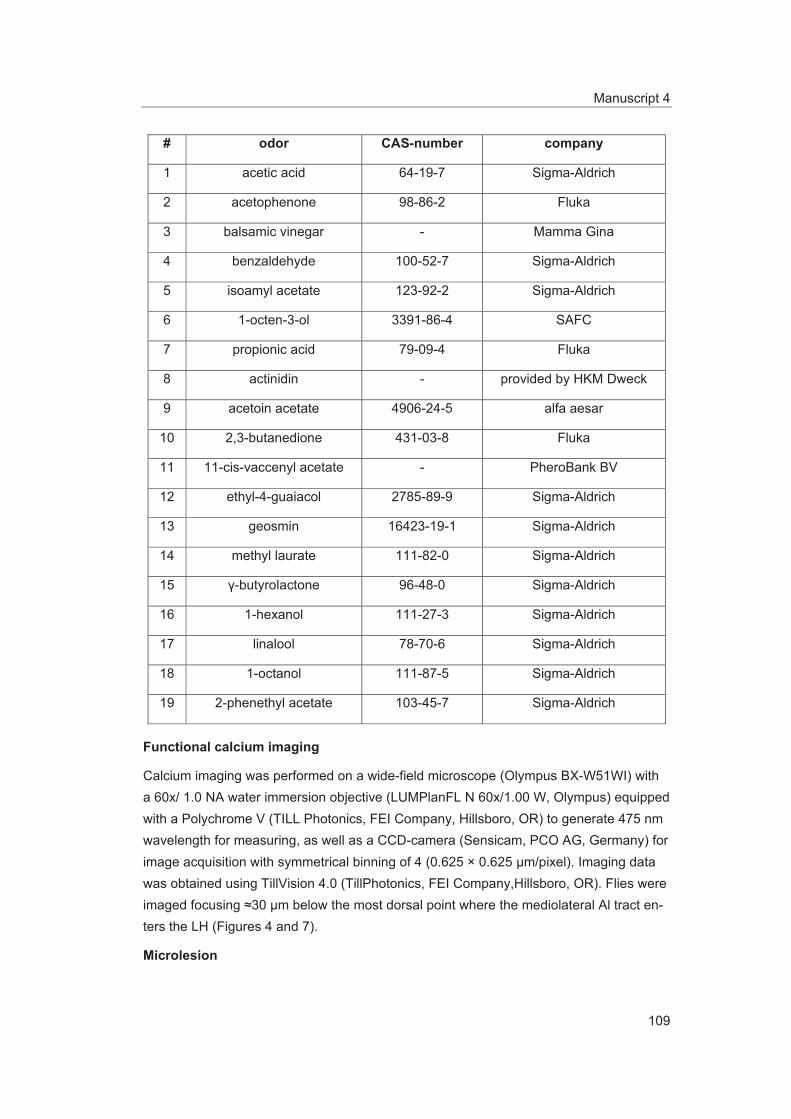
Manuscript 4
109
# odor CAS-number company
1 acetic acid 64-19-7 Sigma-Aldrich
2 acetophenone 98-86-2 Fluka
3 balsamic vinegar - Mamma Gina
4 benzaldehyde 100-52-7 Sigma-Aldrich
5 isoamyl acetate 123-92-2 Sigma-Aldrich
6 1-octen-3-ol 3391-86-4 SAFC
7 propionic acid 79-09-4 Fluka
8 actinidin - provided by HKM Dweck
9 acetoin acetate 4906-24-5 alfa aesar
10 2,3-butanedione 431-03-8 Fluka
11 11-cis-vaccenyl acetate - PheroBank BV
12 ethyl-4-guaiacol 2785-89-9 Sigma-Aldrich
13 geosmin 16423-19-1 Sigma-Aldrich
14 methyl laurate 111-82-0 Sigma-Aldrich
15 -butyrolactone 96-48-0 Sigma-Aldrich
16 1-hexanol 111-27-3 Sigma-Aldrich
17 linalool 78-70-6 Sigma-Aldrich
18 1-octanol 111-87-5 Sigma-Aldrich
19 2-phenethyl acetate 103-45-7 Sigma-Aldrich
Functional calcium imaging
Calcium imaging was performed on a wide-field microscope (Olympus BX-W51WI) with a 60x/ 1.0 NA water immersion objective (LUMPlanFL N 60x/1.00 W, Olympus) equipped with a Polychrome V (TILL Photonics, FEI Company, Hillsboro, OR) to generate 475 nm wavelength for measuring, as well as a CCD-camera (Sensicam, PCO AG, Germany) for image acquisition with symmetrical binning of 4 (0.625 × 0.625 m/pixel). Imaging data was obtained using TillVision 4.0 (TillPhotonics, FEI Company,Hillsboro, OR). Flies were imaged focusing 30 μm below the most dorsal point where the mediolateral Al tract en-ters the LH (Figures 4 and 7).
Microlesion

Manuscript 4
110
For the microlesion experiments a reduced odor set with 7 odors (11-cis-vaccenyl ace-tate, benzaldehyde, isoamyl acetate, 1-octen-3-ol, balsamic vinegar and propionic acid, all at 10-2, as well as 1-octen-3-ol at 10-6) was used for calcium imaging. Transections of either the medial antennal lobe tract (mALT) or the mediolateral antennal lobe tract (mlALT) were monitored via fast z-scans with 925 nm before and after the lesion. The elliptical regions for lesion were continuously illuminated with 800 nm for 25 s. To com-pletely cut the tracts lesion was carried out from the most dorsal to the most ventral point of the tracts by means of changes in z-position ( z = 10 μm (mlALT) and z = 20 μm (mALT)). After a recovery of 5 min the imaging procedure was continued (Figure 7).
Imaging data analysis – Non-Negative Matrix Factorization (NMF)
Image processing was done with Fiji (Version 20121127 Image J 1.49r) including move-ment correction using the plugin StackReg, the calculation of relative fluorescence changes ( F/F0; F0 is the averaged value of frames 0-8 of each measurement), false color-coded fluorescent changes in raw-data images were maximum intensity projections of frames 13-19 (Figure 4A, figure 7D, K).
For further analyses, a Gaussian low-pass filter ( = 2px) was applied to compensate for remaining movement artifacts and pixel noise. The resulting concatenated time-series of the recordings is denoted as measurement matrix Y with element Yt,p being the tth ob-served value of pixel p. Analogous to our LH study on iPNs (Strutz et al., 2014), we used the automatic method non-negative matrix factorization (NMF) to extract Ca2+ signals that exhibit common spatial or temporal features since the LH does not provide any mor-phological landmarks (Lee and Seung, 1999). NMF, like other matrix factorization tech-niques (e.g. PCA and Independent Component Analysis (ICA)), decompose the meas-
urement matrix Y into k components, . The time-course ak of each component contains a common underlying time-course of all pixels and each pixel partic-ipation xk declares how strongly each pixel is involved in this time-course. The residual matrix R contains the unexplained data. In order to perform NMF, we employed the soft-ware framework from Soelter et al. (Soelter et al., 2014) with the following parameters: �sm = 0 and �de = 10-4. For each animal, we performed decomposition into k = 2 compo-nents, which consisted each of a spatial activity pattern and the corresponding temporal odor-evoked response. The averaged response between 1 and 3 s after odor onset was
used as the component-specific response strength for each odor ( . To identify
odor-evoked patterns across animals, we clustered components according to their odor response profiles using the cosine similarity (Figure 4C) (Soucy et al., 2009):

Manuscript 4
111
For clustering we used the hierarchical clustering according to the UPGMA method. We first started to analyze the first odor set that included all odors at the highest concentra-tion (i.e. 10-2). The odor-evoked responses clearly clustered into two response patterns (orange and blue clusters in Fig. 4C) with each cluster containing exactly one component of one animal. In addition the spatial areas of the components in each cluster were highly similar between animals. The clustering was stable towards changes of included ani-mals. We defined therefore the two components as two odor response domains (ORDs). The two ORDs were highly stereotypic and could be identified in every animal measured. We performed the same analysis with an initial decomposition of k = 3 or k = 4 compo-nents, but subsequent clustering did not result into more than two distinct and reproduci-ble clusters and therefore no additional ORDs could be detected (data not shown). The two ORDs were sufficient to explain most of the data’s variance (80.4% ± 2.3%, error is standard deviation across individuals). A validation of our NMF-based results with spatial ICA yielded qualitatively similar results (data not shown). We analyzed the other three odor sets and the microlesion experiments (Figure 7) using the same approach, i.e. NMF with k = 2 and subsequent hierarchical clustering. To decompose the activity patterns of iPNs during the microlesion experiments (Figure 7F-J), we used k = 3 in line with the results of Strutz et al.(Strutz et al., 2014). To determine the coding properties of extract-ed ORDs (Figure 5B) we calculated the mean response of each animal within a time window of 1-3 s after stimulus onset. Median responses over all animals defined the standard stimulated response of an ORD to an odor o.
Immunohistochemistry for GRASP
We used flies between 5-10 days after eclosion. Brains were dissected in Ringer’s solu-tion, fixed with 4% paraformaldehyde in saline phosphate-buffer solution (PBS; pH 7.4) containing 0.3% Triton X-100 (PBST) for 30 min on ice, and washed three times for 15 min with PBST. After incubation with blocking solution containing 0.1% bovine serum albumine (BSA) and 5% normal donkey serum (NDS) or 5% normal goat serum for 1 h at room temperature (RT), brains were incubated in primary antibody for 1-2 days at 4°C. The following primary antibodies were used: mouse anti-GFP20 (Sigma, G6539) diluted 1:250; guinea pig anti-BrpN-Term ((Andlauer et al., 2014) gift from Stephan Sigrist) 1:100; rat anti N-cadherin (Developmental Studies Hybridoma Bank, DN-Ex #8) dilution 1:20. Then brains were washed three times 15 min and incubated overnight at 4°C in secondary antibody. The following secondary antibodies were used at 1:250 dilutions: donkey anti mouse Alexa Fluor 488 (Jackson ImmunoResearch Europe Ltd., 715-545-151), donkey anti guinea pig Alexa Fluor 647 (Jackson ImmunoResearch Europe Ltd., 706-605-148), goat anti mouse Alexa Fluor 488 (Invitrogen, A11001), goat anti rat Cy3 (Life technologies, A21094). Brains were mounted in Vectashield (Vector, Burlingame, CA) after washing (three times 20 to 30 min) with PBST. Whole brains were scanned
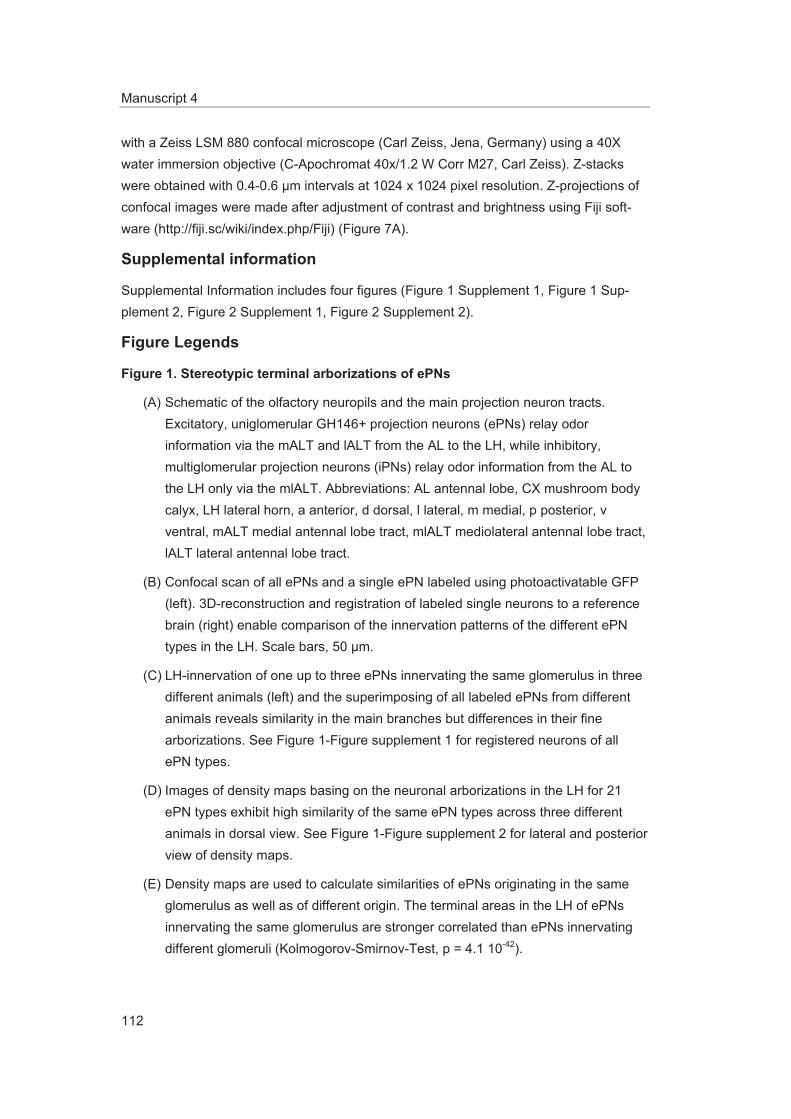
Manuscript 4
112
with a Zeiss LSM 880 confocal microscope (Carl Zeiss, Jena, Germany) using a 40X water immersion objective (C-Apochromat 40x/1.2 W Corr M27, Carl Zeiss). Z-stacks were obtained with 0.4-0.6 μm intervals at 1024 x 1024 pixel resolution. Z-projections of confocal images were made after adjustment of contrast and brightness using Fiji soft-ware (http://fiji.sc/wiki/index.php/Fiji) (Figure 7A).
Supplemental information
Supplemental Information includes four figures (Figure 1 Supplement 1, Figure 1 Sup-plement 2, Figure 2 Supplement 1, Figure 2 Supplement 2).
Figure Legends
Figure 1. Stereotypic terminal arborizations of ePNs
(A) Schematic of the olfactory neuropils and the main projection neuron tracts. Excitatory, uniglomerular GH146+ projection neurons (ePNs) relay odor information via the mALT and lALT from the AL to the LH, while inhibitory, multiglomerular projection neurons (iPNs) relay odor information from the AL to the LH only via the mlALT. Abbreviations: AL antennal lobe, CX mushroom body calyx, LH lateral horn, a anterior, d dorsal, l lateral, m medial, p posterior, v ventral, mALT medial antennal lobe tract, mlALT mediolateral antennal lobe tract, lALT lateral antennal lobe tract.
(B) Confocal scan of all ePNs and a single ePN labeled using photoactivatable GFP (left). 3D-reconstruction and registration of labeled single neurons to a reference brain (right) enable comparison of the innervation patterns of the different ePN types in the LH. Scale bars, 50 μm.
(C) LH-innervation of one up to three ePNs innervating the same glomerulus in three different animals (left) and the superimposing of all labeled ePNs from different animals reveals similarity in the main branches but differences in their fine arborizations. See Figure 1-Figure supplement 1 for registered neurons of all ePN types.
(D) Images of density maps basing on the neuronal arborizations in the LH for 21 ePN types exhibit high similarity of the same ePN types across three different animals in dorsal view. See Figure 1-Figure supplement 2 for lateral and posterior view of density maps.
(E) Density maps are used to calculate similarities of ePNs originating in the same glomerulus as well as of different origin. The terminal areas in the LH of ePNs innervating the same glomerulus are stronger correlated than ePNs innervating different glomeruli (Kolmogorov-Smirnov-Test, p = 4.1 10-42).

Manuscript 4
113
Figure 2. The topographic map of the AL is retained in the LH
(A) Density maps of all 37 ePN types labeled by GH146-GAL4 sorted by their similarity of the LH innervation from posterior (red) to anterior (blue; according to Figure 2B). See Figure 2-Figure supplement 1 for lateral and posterior view of density maps.
(B) PCA of terminal fields exhibit an even distribution of overlapping ePN classes in the LH. Color-code (from red to blue) based on the first axis of the PCA (i.e. PC1). The three dimensions of the PCA explain 78% of the variance of terminal fields.
(C) From the AL ePNs (color coded as in (A)) transfer the topographic map to the LH with a tilted and rotated orientation.
(D) Separation of the AL glomeruli according to neighboring terminal fields of ePNs color-coded as in (A).
(E) Terminal fields of ePNs in the LH are highly correlated to the distances of innervated glomeruli in the AL confirming that the topographic map of the AL is retained in the LH (r = 0.29, p = 5 10-14). Abbreviations: AL antennal lobe, CX mushroom body calyx, LH lateral horn, a anterior, d dorsal, l lateral, m medial, p posterior, v ventral
Figure 3. ePNs and iPNs innervating similar areas in the AL target overlapping ar-eas in the LH
(A) Reconstructions of all ePN types labeled by GH146-GAL4 (gray) and the two iPN-populations LH-AM (green) and LH-PM (magenta) labeled by MZ699-GAL4.
(B) Different views of terminal fields of LH-AM and LH-PM iPNs (left) and their corresponding density maps with superimposed outline in dorsal, posterior and lateral view (right).
(C) Density maps of ePNs (gray) with superimposed outline of density maps of iPNs reveals overlap of ePNs either with LH-AM- or LH-PM-iPN types in the LH.
(D) Varying overlap of terminal fields of ePN and iPN types in the LH. Similarity of innervated regions in the LH reflects glomeruli innervation in the AL (represented by black dots).
(E) Representative examples of single ePNs overlapping with LH-PM or LH-AM iPN types.
(F) Correlation of glomerular origin and terminal fields between ePNs and iPNs. PNs of similar AL origin target similar terminal fields, while PNs of different origin do not overlap in the LH (Mann-Whitney-U test, p = 0.004). Box plots give the median (white bold line), quartiles (box), 95% confidence intervals (whiskers),
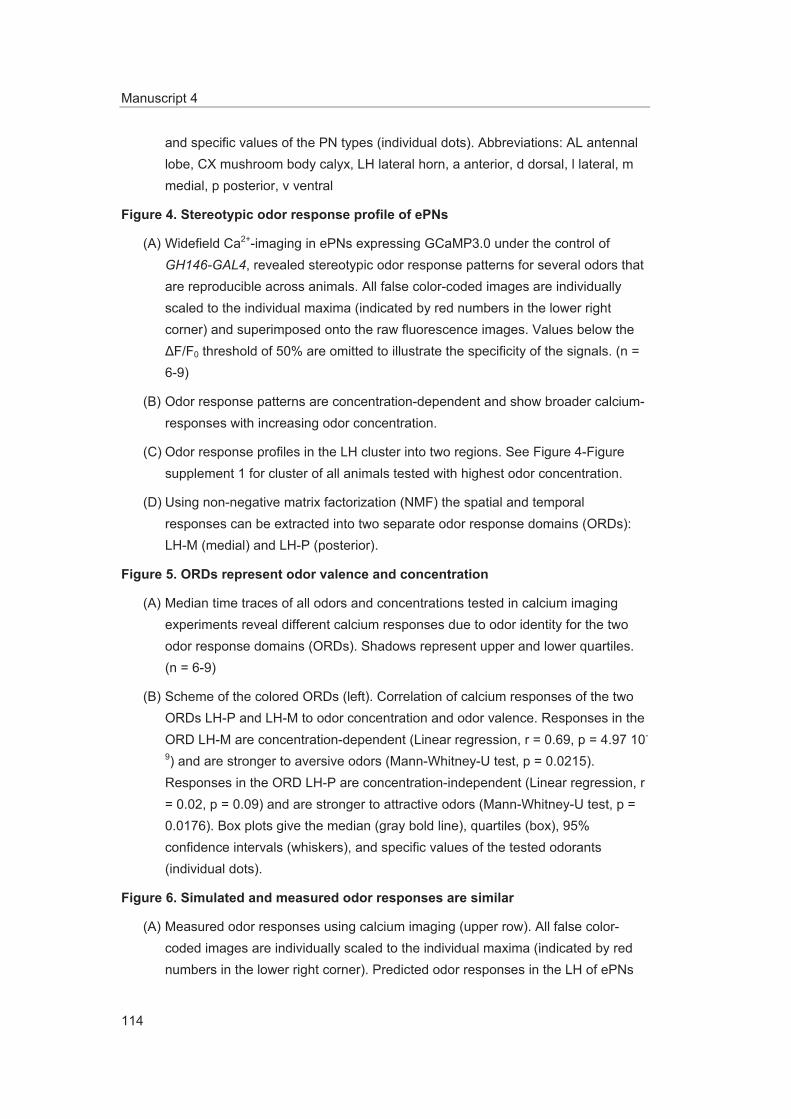
Manuscript 4
114
and specific values of the PN types (individual dots). Abbreviations: AL antennal lobe, CX mushroom body calyx, LH lateral horn, a anterior, d dorsal, l lateral, m medial, p posterior, v ventral
Figure 4. Stereotypic odor response profile of ePNs
(A) Widefield Ca2+-imaging in ePNs expressing GCaMP3.0 under the control of GH146-GAL4, revealed stereotypic odor response patterns for several odors that are reproducible across animals. All false color-coded images are individually scaled to the individual maxima (indicated by red numbers in the lower right corner) and superimposed onto the raw fluorescence images. Values below the
F/F0 threshold of 50% are omitted to illustrate the specificity of the signals. (n = 6-9)
(B) Odor response patterns are concentration-dependent and show broader calcium-responses with increasing odor concentration.
(C) Odor response profiles in the LH cluster into two regions. See Figure 4-Figure supplement 1 for cluster of all animals tested with highest odor concentration.
(D) Using non-negative matrix factorization (NMF) the spatial and temporal responses can be extracted into two separate odor response domains (ORDs): LH-M (medial) and LH-P (posterior).
Figure 5. ORDs represent odor valence and concentration
(A) Median time traces of all odors and concentrations tested in calcium imaging experiments reveal different calcium responses due to odor identity for the two odor response domains (ORDs). Shadows represent upper and lower quartiles. (n = 6-9)
(B) Scheme of the colored ORDs (left). Correlation of calcium responses of the two ORDs LH-P and LH-M to odor concentration and odor valence. Responses in the ORD LH-M are concentration-dependent (Linear regression, r = 0.69, p = 4.97 10-
9) and are stronger to aversive odors (Mann-Whitney-U test, p = 0.0215). Responses in the ORD LH-P are concentration-independent (Linear regression, r = 0.02, p = 0.09) and are stronger to attractive odors (Mann-Whitney-U test, p = 0.0176). Box plots give the median (gray bold line), quartiles (box), 95% confidence intervals (whiskers), and specific values of the tested odorants (individual dots).
Figure 6. Simulated and measured odor responses are similar
(A) Measured odor responses using calcium imaging (upper row). All false color-coded images are individually scaled to the individual maxima (indicated by red numbers in the lower right corner). Predicted odor responses in the LH of ePNs
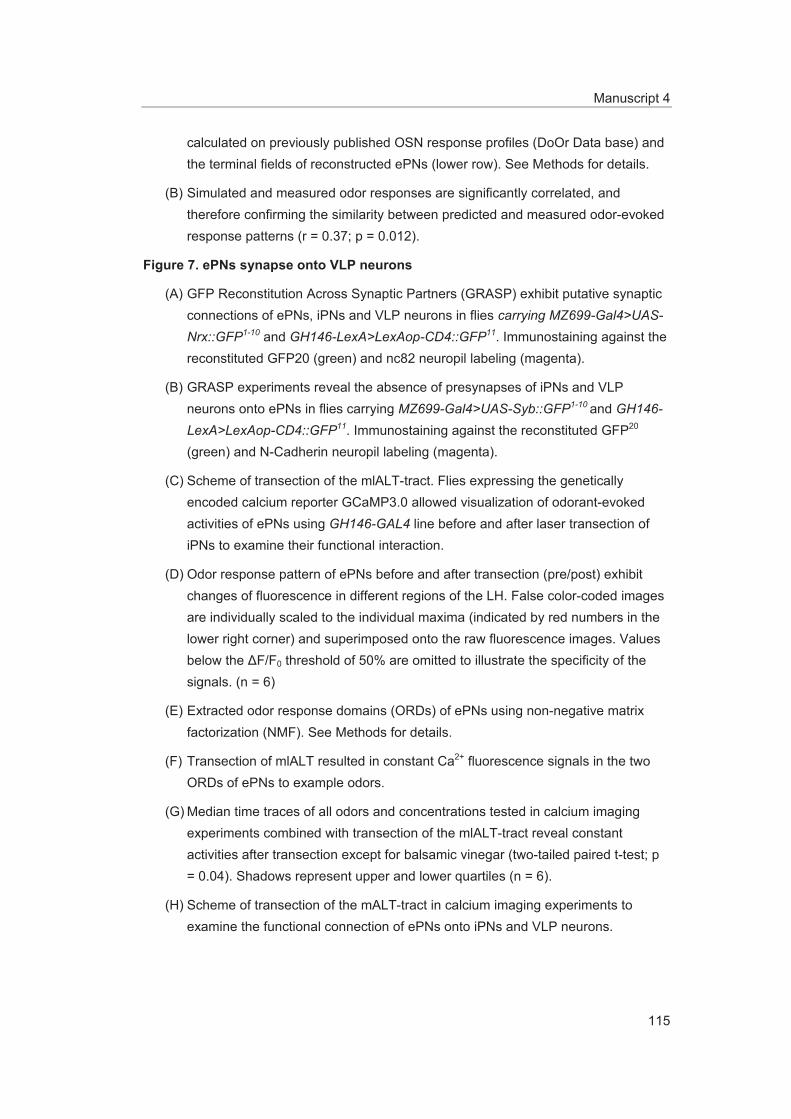
Manuscript 4
115
calculated on previously published OSN response profiles (DoOr Data base) and the terminal fields of reconstructed ePNs (lower row). See Methods for details.
(B) Simulated and measured odor responses are significantly correlated, and therefore confirming the similarity between predicted and measured odor-evoked response patterns (r = 0.37; p = 0.012).
Figure 7. ePNs synapse onto VLP neurons
(A) GFP Reconstitution Across Synaptic Partners (GRASP) exhibit putative synaptic connections of ePNs, iPNs and VLP neurons in flies carrying MZ699-Gal4>UAS-Nrx::GFP1-10 and GH146-LexA>LexAop-CD4::GFP11. Immunostaining against the reconstituted GFP20 (green) and nc82 neuropil labeling (magenta).
(B) GRASP experiments reveal the absence of presynapses of iPNs and VLP neurons onto ePNs in flies carrying MZ699-Gal4>UAS-Syb::GFP1-10 and GH146-LexA>LexAop-CD4::GFP11. Immunostaining against the reconstituted GFP20 (green) and N-Cadherin neuropil labeling (magenta).
(C) Scheme of transection of the mlALT-tract. Flies expressing the genetically encoded calcium reporter GCaMP3.0 allowed visualization of odorant-evoked activities of ePNs using GH146-GAL4 line before and after laser transection of iPNs to examine their functional interaction.
(D) Odor response pattern of ePNs before and after transection (pre/post) exhibit changes of fluorescence in different regions of the LH. False color-coded images are individually scaled to the individual maxima (indicated by red numbers in the lower right corner) and superimposed onto the raw fluorescence images. Values below the F/F0 threshold of 50% are omitted to illustrate the specificity of the signals. (n = 6)
(E) Extracted odor response domains (ORDs) of ePNs using non-negative matrix factorization (NMF). See Methods for details.
(F) Transection of mlALT resulted in constant Ca2+ fluorescence signals in the two ORDs of ePNs to example odors.
(G) Median time traces of all odors and concentrations tested in calcium imaging experiments combined with transection of the mlALT-tract reveal constant activities after transection except for balsamic vinegar (two-tailed paired t-test; p = 0.04). Shadows represent upper and lower quartiles (n = 6).
(H) Scheme of transection of the mALT-tract in calcium imaging experiments to examine the functional connection of ePNs onto iPNs and VLP neurons.

Manuscript 4
116
(I) Odor response patterns of iPNs before and after transection of ePNs (pre/post) of MZ699-GAL4; G-CaMP3.0 flies in widefield Ca2+-imaging. Transection revealed changes of odor response patterns only in the LH-AL region that represents the activity of VLP neurons. All false color-coded images are individually scaled to the individual maxima (indicated by red numbers in the lower right corner) and superimposed onto the raw fluorescence images. Values below the F/F0 threshold of 50% are omitted to illustrate the specificity of the signals. (n = 7)
(J) Extracted ORDs of iPNs using non-negative matrix factorization (NMF). See Methods for details.
(K) Transection of mALT resulted in a significant decrease of Ca2+ fluorescence signals in the LH-AL ORD of iPNs to the tested odors (two-tailed paired t-test; pisoamyl acetate = 0.00042; pbenzaldehyde = 0.00291), while the other two ORDs, LH-PM and LH-AM, remain unaffected.
(L) Median time traces of all odors and concentrations tested in calcium imaging experiments combined with transection of the mALT-tract reveal only for the LH-AL ORD different activities after transection. Shadows represent upper and lower quartiles (n = 7). Abbreviations: AL antennal lobe, CX mushroom body calyx, LH lateral horn, a anterior, d dorsal, l lateral, m medial, p posterior, v ventral, mALT medial antennal lobe tract, mlALT mediolateral antennal lobe tract, VLP ventrolateral protocerebrum.
Figure 8. ORDs in the LH overlap
(A) Scheme of odor response domain (ORD) with outlines of ePNs, iPNs and VLP neurons superimposed on a widefield image (left). All three neuron populations innervate via different tracts the LH. Scheme of the five different ORDs deriving from the three neuron populations (right).
(B) Odor response profiles of several odors reveal functional overlap of ORDs of ePNs, iPNs and VLP neurons.
(C) Functional cluster analysis of ORDs according to their odor response profiles (shown in B). ORDs cluster according to the coding of odor intensity and valence.
(D) Single ORDs differently represent odor intensity or valence or both. Abbreviations: a anterior, d dorsal, l lateral, m medial, p posterior, v ventral, mALT medial antennal lobe tract, mlALT mediolateral antennal lobe tract, lALT lateral antennal lobe tract, VLPb bundle of neurons of the ventrolateral protocerebrum, VLPN ventrolateral protocerebrum neurons.
Figure 1-Figure supplement 1. Stereotypical LH arborizations of all analyzed ePN types
Manuscript 4
117
(A) All registered neurons labeled by photoactivation of the transgenic line +;GH146-GAL4;UAS-C3PA in dorsal, lateral and posterior view. Abbreviations: AL antennal lobe, CX mushroom body calyx, LH lateral horn, a anterior, d dorsal, l lateral, m medial, p posterior, v ventral, mALT medial antennal lobe tract, mlALT mediolateral antennal lobe tract, VLP ventrolateral protocerebrum. Scale bar, 50 μm
(B) Individual representation of all ePN types. Registered ePN types without separated reconstruction of sister neurons and that derive from reconstruction of one animal are shown in gray. Reconstructed sister neurons of registered ePN types that derive from reconstructions of three animals are shown in a different color each. Glomeruli DA1 and VA1v contain also PNs deriving from the ventral soma cluster.
Figure 1-Figure supplement 2. Density maps of the LH in lateral and posterior view
(A+B) Density maps of neuronal arborizations of 21 ePN types for three animals each in lateral and posterior view. Abbreviations: a anterior, d dorsal, l lateral, m medial, p posterior, v ventral
Figure 2-Figure supplement 1. Density maps and ePN clusters
(A) Density maps of neuronal arborizations of all ePN types in dorsal, lateral and posterior view. Color code (red to blue) represents the similarity of ePN density maps according to the first axis of the PCA shown in Figure 2B. Abbreviations: a anterior, d dorsal, l lateral, m medial, p posterior, v ventral
(B) Clustermatrix of all ePN types based on density maps reveals four clusters and the DA1-ePNs. Notably, no clear borders exist: several ePN types are similar to ePN types that are located in a different cluster. For example, VC1 belongs to the fourth cluster (violet) but is also very similar to ePN types in the second cluster (red) such as glomeruli VM7d, VA5 and DC1.
(C) Clustered ePN types in a PCA space confirm the ambiguous separation of innervated LH areas.
(D) Cosine distances of neuronal arborizations of ePN types obtained in vivo (data in this study) are highly correlated to correlation distances of neuronal arborizations of ePN types obtained in vitro (kindly provided by GSXE Jefferis, published in Jefferis 2007) (r = 0.57, p = 3.4 10-36).
Figure 2-Figure supplement 2. Sensilla classes
(A) Pheromone-responsive ePNs (DA1, VA1d and VA1v) are located in the anterior LH in comparison to the remaining ePN types. Abbreviations: AL antennal lobe,
Manuscript 4
118
CX mushroom body calyx, LH lateral horn, a anterior, d dorsal, l lateral, m medial, p posterior, v ventral.
(B) ePN types color-coded according to sensilla classes of corresponding sensory neurons in dorsal, posterior and lateral view.
(C) ePN types color-coded as attractive (cyan; DM4, DM5, and DM2) and aversive (magenta ; D, DA4, DC3, DL1, DL4, and DL5) according to Knaden 2012 in dorsal, posterior and lateral view.
References
Andlauer, T.F., Scholz-Kornehl, S., Tian, R., Kirchner, M., Babikir, H.A., Depner, H., Loll, B., Quentin, C., Gupta, V.K., Holt, M.G., et al. (2014). Drep-2 is a novel synaptic protein important for learning and memory. eLife 3.
Becher, P.G., Flick, G., Rozp dowska, E., Schmidt, A., Hagman, A., Lebreton, S., Larsson, M. C., Hansson, B. S., Piškur, J., Witzgall, P., et al. (2012). Yeast, not fruit volatiles mediate Drosophila melanogaster attraction, oviposition and development. Funct. Ecol. 26, 822-828.
Bhandawat, V., Olsen, S.R., Gouwens, N.W., Schlief, M.L., and Wilson, R.I. (2007). Sensory processing in the Drosophila antennal lobe increases reliability and separability of ensemble odor representations. Nature neuroscience 10, 1474-1482.
Brand, A.H., and Perrimon, N. (1993). Targeted gene expression as a means of altering cell fates and generating dominant phenotypes. Development 118, 401-415.
Cachero, S., Ostrovsky, A.D., Yu, J.Y., Dickson, B.J., and Jefferis, G.S. (2010). Sexual dimorphism in the fly brain. Current biology : CB 20, 1589-1601.
Datta, S.R., Vasconcelos, M.L., Ruta, V., Luo, S., Wong, A., Demir, E., Flores, J., Balonze, K., Dickson, B.J., and Axel, R. (2008). The Drosophila pheromone cVA activates a sexually dimorphic neural circuit. Nature 452, 473-477.
Davis, R.L. (2005). Olfactory memory formation in Drosophila: from molecular to systems neuroscience. Annual review of neuroscience 28, 275-302.
Duistermars, B.J., and Frye, M.A. (2010). Multisensory integration for odor tracking by flying Drosophila: Behavior, circuits and speculation. Communicative & integrative biology 3, 60-63.
Dweck, H.K., Ebrahim, S.A., Farhan, A., Hansson, B.S., and Stensmyr, M.C. (2015a). Olfactory proxy detection of dietary antioxidants in Drosophila. Current biology : CB 25, 455-466.
Manuscript 4
119
Dweck, H.K., Ebrahim, S.A., Thoma, M., Mohamed, A.A., Keesey, I.W., Trona, F., Lavista-Llanos, S., Svatos, A., Sachse, S., Knaden, M., and Hansson, B.S. (2015b). Pheromones mediating copulation and attraction in Drosophila. Proceedings of the National Academy of Sciences of the United States of America 112, E2829-2835.
Ebrahim, S.A., Dweck, H.K., Stokl, J., Hofferberth, J.E., Trona, F., Weniger, K., Rybak, J., Seki, Y., Stensmyr, M.C., Sachse, S., et al. (2015). Drosophila Avoids Parasitoids by Sensing Their Semiochemicals via a Dedicated Olfactory Circuit. PLoS biology 13, e1002318.
Fan, P., Manoli, D.S., Ahmed, O.M., Chen, Y., Agarwal, N., Kwong, S., Cai, A.G., Neitz, J., Renslo, A., Baker, B.S., and Shah, N.M. (2013). Genetic and neural mechanisms that inhibit Drosophila from mating with other species. Cell 154, 89-102.
Feinberg, E.H., Vanhoven, M.K., Bendesky, A., Wang, G., Fetter, R.D., Shen, K., and Bargmann, C.I. (2008). GFP Reconstitution Across Synaptic Partners (GRASP) defines cell contacts and synapses in living nervous systems. Neuron 57, 353-363.
Fiala, A., Spall, T., Diegelmann, S., Eisermann, B., Sachse, S., Devaud, J.M., Buchner, E., and Galizia, C.G. (2002). Genetically expressed cameleon in Drosophila melanogaster is used to visualize olfactory information in projection neurons. Current biology : CB 12, 1877-1884.
Fi ek, M., and Wilson, R.I. (2014). Stereotyped connectivity and computations in higher-order olfactory neurons. Nature neuroscience 17, 280-288.
Fishilevich, E., and Vosshall, L.B. (2005). Genetic and functional subdivision of the Drosophila antennal lobe. Current biology : CB 15, 1548-1553.
Grabe, V., Baschwitz, A., Dweck, H.K., Lavista-Llanos, S., Hansson, B.S., and Sachse, S. (2016). Elucidating the Neuronal Architecture of Olfactory Glomeruli in the Drosophila Antennal Lobe. Cell reports 16, 3401-3413.
Grabe, V., Strutz, A., Baschwitz, A., Hansson, B.S., and Sachse, S. (2015). Digital in vivo 3D atlas of the antennal lobe of Drosophila melanogaster. The Journal of comparative neurology 523, 530-544.
Gupta, N., and Stopfer, M. (2012). Functional analysis of a higher olfactory center, the lateral horn. The Journal of neuroscience : the official journal of the Society for Neuroscience 32, 8138-8148.
Ha, T.S., and Smith, D.P. (2006). A pheromone receptor mediates 11-cis-vaccenyl acetate-induced responses in Drosophila. The Journal of neuroscience : the official journal of the Society for Neuroscience 26, 8727-8733.
Manuscript 4
120
Heimbeck, G., Bugnon, V., Gendre, N., Keller, A., and Stocker, R.F. (2001). A central neural circuit for experience-independent olfactory and courtship behavior in Drosophila melanogaster. Proceedings of the National Academy of Sciences of the United States of America 98, 15336-15341.
Heisenberg, M. (2003). Mushroom body memoir: from maps to models. Nature reviews. Neuroscience 4, 266-275.
Ito, K., Awano, W., Suzuki, K., Hiromi, Y., and Yamamoto, D. (1997). The Drosophila mushroom body is a quadruple structure of clonal units each of which contains a virtually identical set of neurones and glial cells. Development 124, 761-771.
Jefferis, G.S., Potter, C.J., Chan, A.M., Marin, E.C., Rohlfing, T., Maurer, C.R., Jr., and Luo, L. (2007). Comprehensive maps of Drosophila higher olfactory centers: spatially segregated fruit and pheromone representation. Cell 128, 1187-1203.
Karuppudurai, T., Lin, T.-Y., Ting, C.-Y., Pursley, R., Melnattur, Krishna V., Diao, F., White, Benjamin H., Macpherson, Lindsey J., Gallio, M., Pohida, T., and Lee, C.-H. (2014). A Hard-Wired Glutamatergic Circuit Pools and Relays UV Signals to Mediate Spectral Preference in Drosophila. Neuron 81, 603-615.
Kido, A., and Ito, K. (2002). Mushroom bodies are not required for courtship behavior by normal and sexually mosaic Drosophila. Journal of neurobiology 52, 302-311.
Knaden, M., Strutz, A., Ahsan, J., Sachse, S., and Hansson, B.S. (2012). Spatial representation of odorant valence in an insect brain. Cell reports 1, 392-399.
Kohl, J., Ostrovsky, A.D., Frechter, S., and Jefferis, G.S. (2013). A bidirectional circuit switch reroutes pheromone signals in male and female brains. Cell 155, 1610-1623.
Kurtovic, A., Widmer, A., and Dickson, B.J. (2007). A single class of olfactory neurons mediates behavioural responses to a Drosophila sex pheromone. Nature 446, 542-546.
Lai, S.L., Awasaki, T., Ito, K., and Lee, T. (2008). Clonal analysis of Drosophila antennal lobe neurons: diverse neuronal architectures in the lateral neuroblast lineage. Development 135, 2883-2893.
Larsson, M.C., Domingos, A.I., Jones, W.D., Chiappe, M.E., Amrein, H., and Vosshall, L.B. (2004). Or83b encodes a broadly expressed odorant receptor essential for Drosophila olfaction. Neuron 43, 703-714.
Lebreton, S., Trona, F., Borrero-Echeverry, F., Bilz, F., Grabe, V., Becher, P.G., Carlsson, M.A., Nassel, D.R., Hansson, B.S., Sachse, S., and Witzgall, P. (2015). Feeding regulates sex pheromone attraction and courtship in Drosophila females. Scientific reports 5, 13132.
Manuscript 4
121
Lee, D.D., and Seung, H.S. (1999). Learning the parts of objects by non-negative matrix factorization. Nature 401, 788-791.
Li, H., Li, Y., Lei, Z., Wang, K., and Guo, A. (2013). Transformation of odor selectivity from projection neurons to single mushroom body neurons mapped with dual-color calcium imaging. Proceedings of the National Academy of Sciences of the United States of America 110, 12084-12089.
Liang, L., Li, Y., Potter, C.J., Yizhar, O., Deisseroth, K., Tsien, R.W., and Luo, L. (2013). GABAergic projection neurons route selective olfactory inputs to specific higher-order neurons. Neuron 79, 917-931.
Marin, E.C., Jefferis, G.S., Komiyama, T., Zhu, H., and Luo, L. (2002). Representation of the glomerular olfactory map in the Drosophila brain. Cell 109, 243-255.
Min, S., Ai, M., Shin, S.A., and Suh, G.S. (2013). Dedicated olfactory neurons mediating attraction behavior to ammonia and amines in Drosophila. Proceedings of the National Academy of Sciences of the United States of America 110, E1321-1329.
Münch, D., and Galizia, C.G. (2016). DoOR 2.0--Comprehensive Mapping of Drosophila melanogaster Odorant Responses. Scientific reports 6, 21841.
Nassi, J.J., and Callaway, E.M. (2009). Parallel processing strategies of the primate visual system. Nature reviews. Neuroscience 10, 360-372.
Ng, M., Roorda, R.D., Lima, S.Q., Zemelman, B.V., Morcillo, P., and Miesenbock, G. (2002). Transmission of olfactory information between three populations of neurons in the antennal lobe of the fly. Neuron 36, 463-474.
Okada, R., Awasaki, T., and Ito, K. (2009). Gamma-aminobutyric acid (GABA)-mediated neural connections in the Drosophila antennal lobe. The Journal of comparative neurology 514, 74-91.
Olsen, S.R., Bhandawat, V., and Wilson, R.I. (2007). Excitatory interactions between olfactory processing channels in the Drosophila antennal lobe. Neuron 54, 89-103.
Olsen, S.R., Bhandawat, V., and Wilson, R.I. (2010). Divisive normalization in olfactory population codes. Neuron 66, 287-299.
Olsen, S.R., and Wilson, R.I. (2008). Lateral presynaptic inhibition mediates gain control in an olfactory circuit. Nature 452, 956-960.
Parnas, M., Lin, A.C., Huetteroth, W., and Miesenbock, G. (2013). Odor discrimination in Drosophila: from neural population codes to behavior. Neuron 79, 932-944.
Patterson, G.H., and Lippincott-Schwartz, J. (2002). A photoactivatable GFP for selective photolabeling of proteins and cells. Science 297, 1873-1877.
Manuscript 4
122
Potter, C.J., Tasic, B., Russler, E.V., Liang, L., and Luo, L. (2010). The Q system: a repressible binary system for transgene expression, lineage tracing, and mosaic analysis. Cell 141, 536-548.
Root, C.M., Masuyama, K., Green, D.S., Enell, L.E., Nassel, D.R., Lee, C.H., and Wang, J.W. (2008). A presynaptic gain control mechanism fine-tunes olfactory behavior. Neuron 59, 311-321.
Root, C.M., Semmelhack, J.L., Wong, A.M., Flores, J., and Wang, J.W. (2007). Propagation of olfactory information in Drosophila. Proceedings of the National Academy of Sciences of the United States of America 104, 11826-11831.
Ruta, V., Datta, S.R., Vasconcelos, M.L., Freeland, J., Looger, L.L., and Axel, R. (2010). A dimorphic pheromone circuit in Drosophila from sensory input to descending output. Nature 468, 686-690.
Rybak, J., Kuss, A., Lamecker, H., Zachow, S., Hege, H.C., Lienhard, M., Singer, J., Neubert, K., and Menzel, R. (2010). The Digital Bee Brain: Integrating and Managing Neurons in a Common 3D Reference System. Frontiers in systems neuroscience 4.
Schubert, M., Hansson, B.S., and Sachse, S. (2014). The banana code-natural blend processing in the olfactory circuitry of Drosophila melanogaster. Frontiers in physiology 5, 59.
Semmelhack, J.L., and Wang, J.W. (2009). Select Drosophila glomeruli mediate innate olfactory attraction and aversion. Nature 459, 218-223.
Shang, Y., Claridge-Chang, A., Sjulson, L., Pypaert, M., and Miesenbock, G. (2007). Excitatory local circuits and their implications for olfactory processing in the fly antennal lobe. Cell 128, 601-612.
Silbering, A.F., and Galizia, C.G. (2007). Processing of odor mixtures in the Drosophila antennal lobe reveals both global inhibition and glomerulus-specific interactions. The Journal of neuroscience : the official journal of the Society for Neuroscience 27, 11966-11977.
Silbering, A.F., Okada, R., Ito, K., and Galizia, C.G. (2008). Olfactory information processing in the Drosophila antennal lobe: anything goes? The Journal of neuroscience : the official journal of the Society for Neuroscience 28, 13075-13087.
Soelter, J., Schumacher, J., Spors, H., and Schmuker, M. (2014). Automatic segmentation of odor maps in the mouse olfactory bulb using regularized non-negative matrix factorization. NeuroImage 98, 279-288.

Manuscript 4
123
Soucy, E.R., Albeanu, D.F., Fantana, A.L., Murthy, V.N., and Meister, M. (2009). Precision and diversity in an odor map on the olfactory bulb. Nature neuroscience 12, 210-220.
Steck, K., Veit, D., Grandy, R., Badia, S.B., Mathews, Z., Verschure, P., Hansson, B.S., and Knaden, M. (2012). A high-throughput behavioral paradigm for Drosophila olfaction - The Flywalk. Scientific reports 2, 361.
Stensmyr, M.C., Dweck, H.K., Farhan, A., Ibba, I., Strutz, A., Mukunda, L., Linz, J., Grabe, V., Steck, K., Lavista-Llanos, S., et al. (2012). A conserved dedicated olfactory circuit for detecting harmful microbes in Drosophila. Cell 151, 1345-1357.
Stensmyr, M.C., Giordano, E., Balloi, A., Angioy, A.M., and Hansson, B.S. (2003). Novel natural ligands for Drosophila olfactory receptor neurones. The Journal of experimental biology 206, 715-724.
Stocker, R.F., Heimbeck, G., Gendre, N., and de Belle, J.S. (1997). Neuroblast ablation in Drosophila P[GAL4] lines reveals origins of olfactory interneurons. Journal of neurobiology 32, 443-456.
Stocker, R.F., Lienhard, M.C., Borst, A., and Fischbach, K.F. (1990). Neuronal architecture of the antennal lobe in Drosophila melanogaster. Cell and tissue research 262, 9-34.
Strutz, A., Soelter, J., Baschwitz, A., Farhan, A., Grabe, V., Rybak, J., Knaden, M., Schmuker, M., Hansson, B.S., and Sachse, S. (2014). Decoding odor quality and intensity in the Drosophila brain. eLife 3, e04147.
Tanaka, N.K., Awasaki, T., Shimada, T., and Ito, K. (2004). Integration of chemosensory pathways in the Drosophila second-order olfactory centers. Current biology : CB 14, 449-457.
Tanaka, N.K., Endo, K., and Ito, K. (2012). Organization of antennal lobe-associated neurons in adult Drosophila melanogaster brain. The Journal of comparative neurology 520, 4067-4130.
Thoma, M., Hansson, B.S., and Knaden, M. (2014). Compound valence is conserved in binary odor mixtures in Drosophila melanogaster. The Journal of experimental biology 217, 3645-3655.
Tian, L., Hires, S.A., Mao, T., Huber, D., Chiappe, M.E., Chalasani, S.H., Petreanu, L., Akerboom, J., McKinney, S.A., Schreiter, E.R., et al. (2009). Imaging neural activity in worms, flies and mice with improved GCaMP calcium indicators. Nature methods 6, 875-881.
Manuscript 4
124
Vosshall, L.B., Wong, A.M., and Axel, R. (2000). An olfactory sensory map in the fly brain. Cell 102, 147-159.
Wang, J.W., Wong, A.M., Flores, J., Vosshall, L.B., and Axel, R. (2003a). Two-photon calcium imaging reveals an odor-evoked map of activity in the fly brain. Cell 112, 271-282.
Wang, K., Gong, J., Wang, Q., Li, H., Cheng, Q., Liu, Y., Zeng, S., and Wang, Z. (2014). Parallel pathways convey olfactory information with opposite polarities in Drosophila. Proceedings of the National Academy of Sciences of the United States of America 111, 3164-3169.
Wang, Y., Chiang, A.S., Xia, S., Kitamoto, T., Tully, T., and Zhong, Y. (2003b). Blockade of neurotransmission in Drosophila mushroom bodies impairs odor attraction, but not repulsion. Current biology : CB 13, 1900-1904.
Wang, Y., Guo, H.F., Pologruto, T.A., Hannan, F., Hakker, I., Svoboda, K., and Zhong, Y. (2004). Stereotyped odor-evoked activity in the mushroom body of Drosophila revealed by green fluorescent protein-based Ca2+ imaging. The Journal of neuroscience : the official journal of the Society for Neuroscience 24, 6507-6514.
Wilson, R.I., and Laurent, G. (2005). Role of GABAergic inhibition in shaping odor-evoked spatiotemporal patterns in the Drosophila antennal lobe. The Journal of neuroscience : the official journal of the Society for Neuroscience 25, 9069-9079.
Wilson, R.I., Turner, G.C., and Laurent, G. (2004). Transformation of olfactory representations in the Drosophila antennal lobe. Science 303, 366-370.
Wong, A.M., Wang, J.W., and Axel, R. (2002). Spatial representation of the glomerular map in the Drosophila protocerebrum. Cell 109, 229-241.
Xia, S., and Tully, T. (2007). Segregation of odor identity and intensity during odor discrimination in Drosophila mushroom body. PLoS biology 5, e264.
Yaksi, E., and Wilson, R.I. (2010). Electrical coupling between olfactory glomeruli. Neuron 67, 1034-1047.
Yu, J.Y., Kanai, M.I., Demir, E., Jefferis, G.S., and Dickson, B.J. (2010). Cellular organization of the neural circuit that drives Drosophila courtship behavior. Current biology : CB 20, 1602-1614.
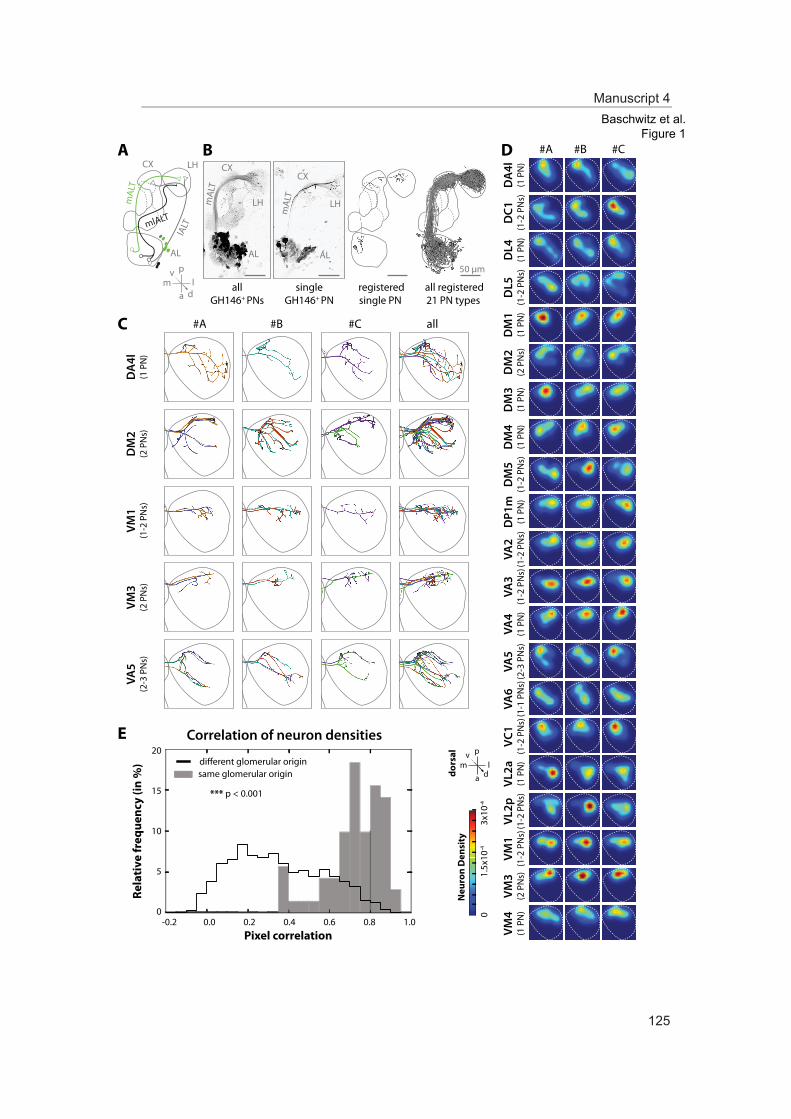
registeredsingle PN
A B
C
D
E
#A #B #C all
#A #B #C
LH
AL
CX
singleGH146+ PN
all registered21 PN types
LH
AL
CX
allGH146+ PNs
DA
4l(1
PN
)VA
5(2
-3 P
Ns)
VM1
(1-2
PN
s)
50 μm
DP1
m(1
PN
)D
C1(1
-2 P
Ns)
VL2a
(1 P
N)
VL2p
(1-2
PN
s)D
L4(1
PN
)D
L5(1
-2 P
Ns)
DA
4l(1
PN
)VA
2(1
-2 P
Ns)
VA3
(1-2
PN
s)VA
4(1
PN
)VA
5(2
-3 P
Ns)
VA6
(1-1
PN
s)VC
1(1
-2 P
Ns)
VM1
(1-2
PN
s)VM
3(2
PN
s)VM
4(1
PN
)D
M5
(1-2
PN
s)D
M4
(1 P
N)
DM
3(1
PN
)D
M2
(2 P
Ns)
DM
1(1
PN
)
Baschwitz et al.Figure 1
3x10
-41.
5x10
-40
Neu
ron
Den
sity
*** p < 0.001
Correlation of neuron densities20
15
10
5
0-0.2 0.0 0.2 0.4 0.6 0.8 1.0
Pixel correlation
Rela
tive
freq
uenc
y (in
%) different glomerular origin
same glomerular origin
lALT
pl
vm
da
mAL
T
mAL
T
DM
2(2
PN
s)VM
3(2
PN
s)
p
lv
mdado
rsal
mlALT
mAL
T
CX LH
AL
Manuscript 4
125
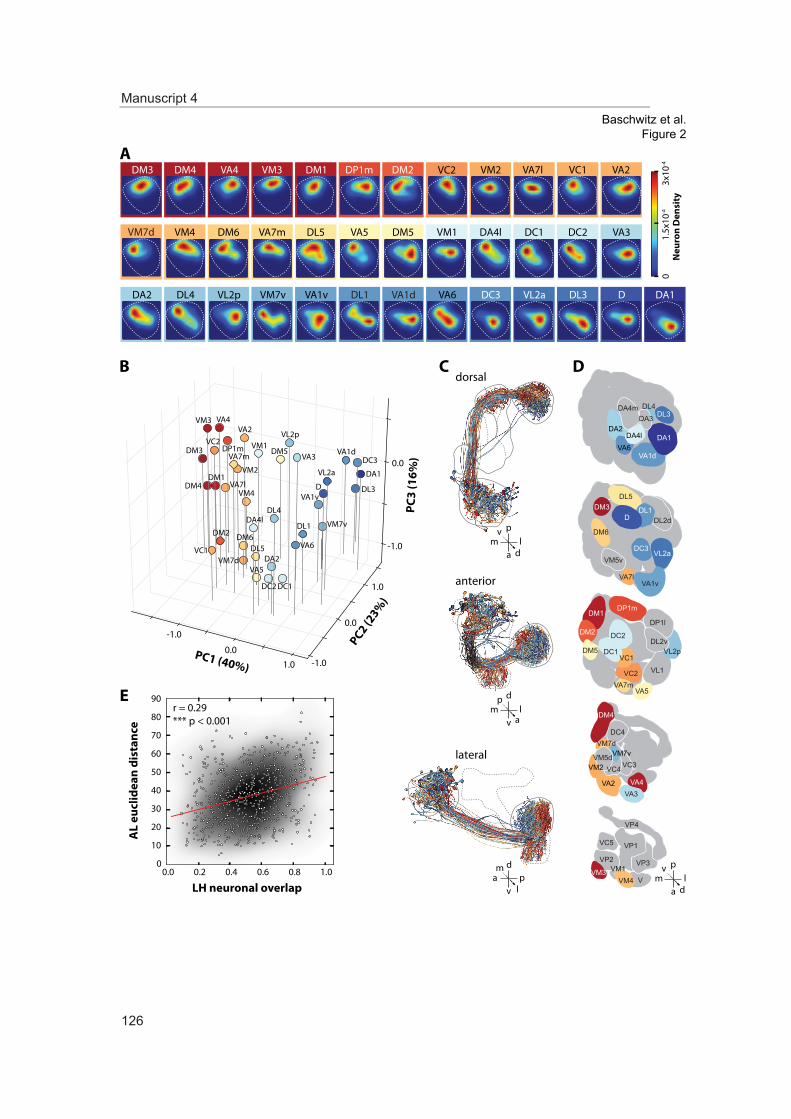
Baschwitz et al.Figure 2
A
DC
3x10
-41.
5x10
-40
Neu
ron
Den
sity
VA1d
VM1
DA1
VM3VA4 DM1DM4
VA3
DA2
DC1DL5
D
VA7l
DC2
DL3
DM6
DM3 DM2DP1m VA2VC1VM2
VM7d VA5 DA4lDM5VM4 VA7m
VC2
VA6VL2pDL4 VL2aVA1v DC3DL1VM7v
pl
vm
da
lp
mav
DA1
VA1d
DA3
DA4l
DA4m
DA2
VA6
DL3DL4
D
DC3
DL1
VM5vVL2a
VA7lVA1v
DM6
DM3DL5
DL2d
DP1l
VL2pDL2v
VL1
DP1mDM1
DM2
DM5
DC2
VA5VA7m
VC2
VC1DC1
DM4
DC4VM7d
VM7v
VM2VM5d
VC3VC4
VA2 VA4VA3
VM1
VP1
VP4
VP2 VP3
VC5
VM3VM4 V
pl
vm
da
d
B
E
PC1 (40%)
PC2 (23%
)
PC3
(16%
)
70
60
50
40
30
20
10
00.0 0.2 0.4 0.6 0.8 1.0
AL
eucl
idea
n di
stan
ce
LH neuronal overlap
90
80r = 0.29*** p < 0.001
VA6
VA5
DA4l
VL2p
DL4
VL2a
VA1v
VC1
DA1
VA3VM1
DA2
DC1
VA7m DC3
VC2
DL1 VM7v
D
VA1d
DC2
DL3
DM2
DM5
VM4
DM3 DP1m
VA2VM3 VA4
DM1DM4
DL5
VM2
VM7d
VA7l
DM6
0.0
-1.0
1.0
0.0
0.0-1.0
-1.0
1.0 anterior
lateral
dorsal
pm
alv
d
Manuscript 4
126
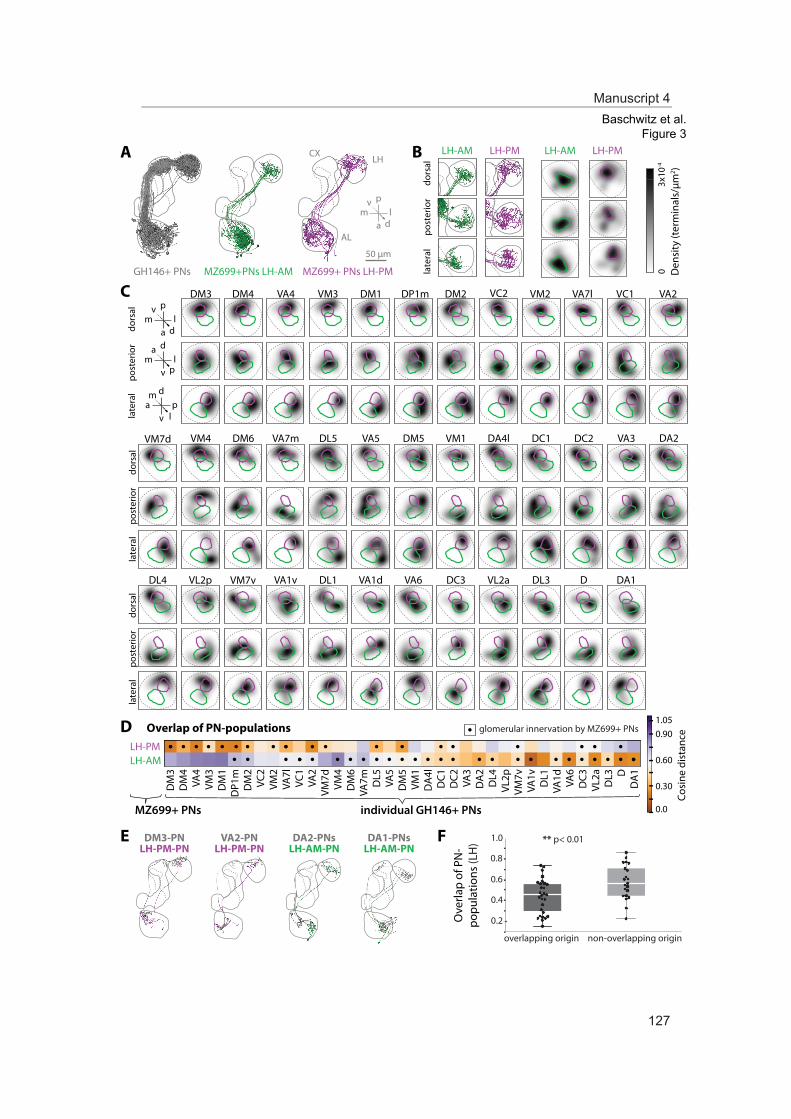
individual GH146+ PNs
Cosi
ne d
ista
nce
1.05
0.30
0.0
Overlap of PN-populations 0.90
0.60
dors
alpo
ster
ior
late
ral
VA1d
VM1
DA1
VM3VA4 DM1DM4
VA3 DA2DC1DL5
D
VA7l
DC2
DL3
DM6
DM3 DM2DP1m VA2VC1VM2
VM7d VA5 DA4lDM5VM4 VA7m
VC2
VA6VL2pDL4 VL2aVA1v DC3DL1VM7v
MZ699+ PNs
DM3-PNLH-PM-PN
3x10
-40
glomerular innervation by MZ699+ PNs
F
Ove
rlap
of P
N-
popu
latio
ns (L
H)
overlapping origin non-overlapping origin
0.2
0.4
1.0
0.8
0.6
** p< 0.01
LH-PMLH-AM
VM3
DM
1
DM
3D
M4
VM4
VA4
DP1
m
VA
2
DM
5
DM
2
DL5
VA5
VC1
VA3
DC1
DA
2
VL2p
DA
4l
VA1v
VA6
VL2a
DL4
VM1
DA
1D
DC2
DC3DL1
DL3
DM
6
VA1d
VA7l
VA7mVC
2VM
2
VM7d
VM7v
Den
sity
(ter
min
als/
μm2 )
pl
vm
da
dp
ma
lv
dl
am
pv
dors
alpo
ster
ior
late
ral
dors
alpo
ster
ior
late
ral
dors
alpo
ster
ior
late
ral
VA2-PNLH-PM-PN
DA2-PNsLH-AM-PN
DA1-PNsLH-AM-PN
MZ699+ PNs LH-PM MZ699+PNs LH-AM
LH
AL
CX
50 μm
GH146+ PNs
LH-PMLH-AMLH-PMLH-AM
pl
vm
da
Baschwitz et al.Figure 3
E
D
C
BA
Manuscript 4
127

A
B
C
D
Baschwitz et al.Figure 4
#A
Extracted ORDs
#B1-
hexa
nol
isoa
myl
acet
ate
bals
amic
vine
gar
cis-
vacc
enyl
acet
ate
2-ph
enet
hyl
acet
ate
1-oc
ten-
3-ol
geos
min
10 -2
10 -6
10 -4
101
64
121
68
99
45
87
73
met
hyl
laur
ate
#C #D
38
92
68
88
55
67
64
78
135
38
63
56
67
81
#E#F
#C #D #E #F#A #B
#A#A
#B#B
#H#H
#G
#G#E
#F#G
00.30.150.0
Dcs
LH-PLH-M
0.0 0.5 Max Max
F/F 0
balsamic vin.1-hexanol
benz
alde
hyde
10-2
isoa
myl
ace
tate
10-2
linal
ool 1
0-2
1-oc
ten-
3-ol
10-2
acet
ophe
none
10-2
buty
rola
cton
e 10
-2
2,3-
buta
nedi
one
10-2
2-ph
enet
hyl a
cet.
10-2
acet
ic a
cid
10-2
ethy
lgua
iaco
l 10-2
1-oc
tano
l 10-2
bals
amic
vin
. 10-2
met
hyl l
aura
te10
-2
cis-
vacc
enyl
ace
t. 10
-2
actin
idin
10-4
geos
min
10-4
Max
Manuscript 4
128
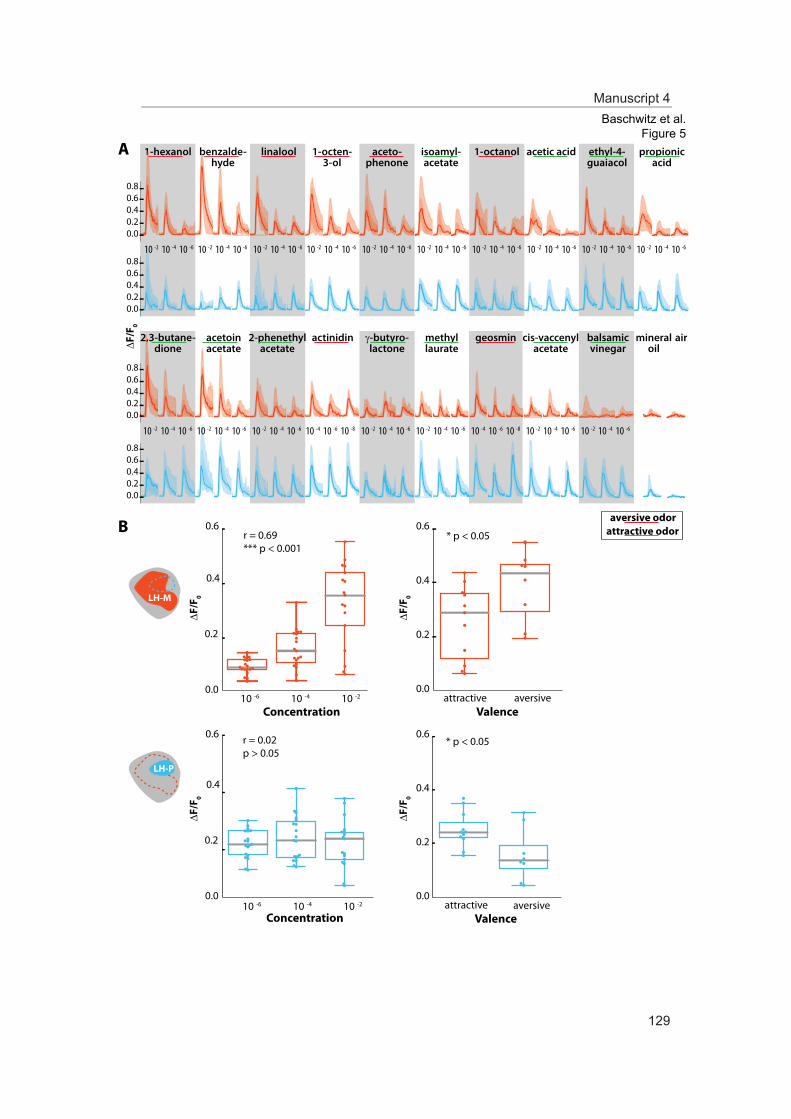
A
B
Baschwitz et al.Figure 5
acetic acid
acetoinacetate
aceto-phenone
actinidin balsamicvinegar
benzalde-hyde
2,3-butane-dione
cis-vaccenylacetate
ethyl-4-guaiacol
mineraloil
airgeosmin-butyro-lactone
1-hexanol isoamyl-acetate
linalool
methyllaurate
1-octen-3-ol
1-octanol propionicacid
2-phenethylacetate
LH-M
LH-P
aversive odorattractive odor
bbyy
2,,
11
0.80.60.40.20.0
0.80.60.40.20.0
0.80.60.40.20.0
0.80.60.40.20.0
10 -2 10 -610 -4 10 -2 10 -610 -410 -2 10 -610 -4 10 -2 10 -610 -4 10 -2 10 -610 -4 10 -2 10 -610 -410 -2 10 -610 -4 10 -2 10 -610 -4 10 -2 10 -610 -4 10 -2 10 -610 -4
10 -2 10 -610 -4 10 -4 10 -810 -610 -2 10 -610 -4 10 -2 10 -610 -4 10 -4 10 -810 -6 10 -2 10 -610 -410 -2 10 -610 -4 10 -2 10 -610 -4 10 -2 10 -610 -4
F/F 0
F/F 0
F/F 0
F/F 0
F/F 0
0.6
0.4
0.2
0.0
Concentration10 -210 -6 10 -4
r = 0.02p > 0.05
0.6
0.4
0.2
0.0
Concentration
r = 0.69*** p < 0.001
10 -210 -6 10 -4
* p < 0.050.6
0.4
0.2
0.0attractive
Valenceaversive
0.6
0.4
0.2
0.0
Valenceaversiveattractive
* p < 0.05
Manuscript 4
129

Simulated odor responses0.5 0.6 0.7 0.8 0.9 1.0
Baschwitz et al.Figure 6
A
104
sim
ulat
edM
easu
red
odor
resp
onse
s 1.0
mea
sure
d
5211586117 1019193 64 119
benzal-dehyde
isoamylacetatelinalool
1-octen-3-ol
acetop-henone
2,3-butane-dione acetic acid1-hexanol
methyllaurate
propionicacid
0.6
0.7
0.8
0.9
F/F0* p<0.01r = 0.37
Correlation of odor responsesB
3x10-41.5x10-40Neuron Density
0 0.5 Max Max
Manuscript 4
130
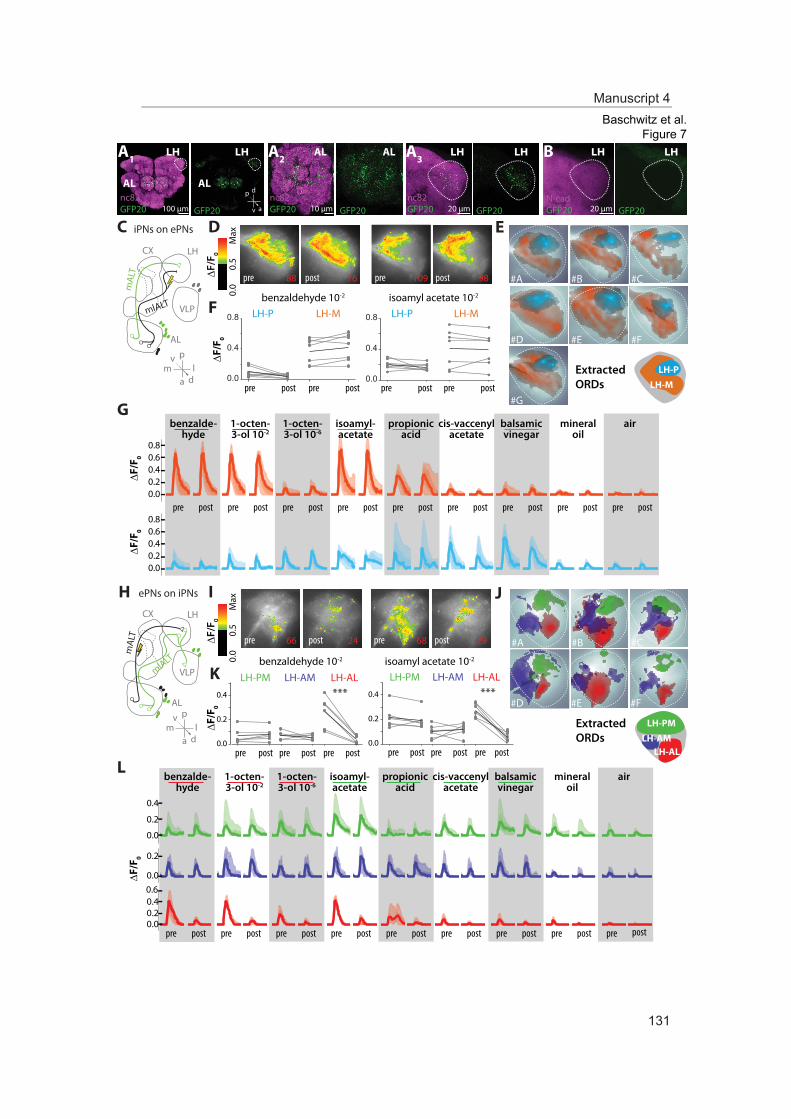
LH-P
LH-M
iPNs on ePNs
*** ***
pre post pre post pre post pre post pre post pre post pre postpre post
1-octen-3-ol 10-6
propionicacid
1-octen-3-ol 10-2
isoamyl-acetate
airmineraloil
cis-vaccenylacetate
benzalde-hyde
balsamicvinegar
postpre
F/F 0
F/F 0
aaa te
0.80.60.40.20.0
0.80.60.40.20.0
pl
vm
da
mlALT
mAL
T
VLP
CX LH
AL
LH-PLH-P LH-MLH-M
D E
F
G
isoamyl acetate 10-2benzaldehyde 10-2
0.0
0.4
0.8
0.0
0.4
0.8
10988 76 98
pre postpre post pre postpre post
postpost prepre
F/F 0
C
H
Baschwitz et al.Figure 7
ePNs on iPNs
pl
vm
da
mlALT
mAL
T
VLP
CX
AL
LH
F/F 0
LH-PM
LH-AMLH-AL
pre post pre post pre post pre post pre post pre post pre post pre postpre post
balsamicvinegar
benzalde-hyde
cis-vaccenylacetate
mineraloil
airisoamyl-acetate
1-octen-3-ol 10-2
propionicacid
1-octen-3-ol 10-6
0.60.40.20.0
0.4
0.2
0.0
0.2
0.0
LH-PMLH-PM LH-AMLH-AM LH-AL LH-AL
I J
K
L
benzaldehyde 10-2 isoamyl acetate 10-2
2466 2968postpre postpre
pre post pre postpre postpre post pre postpre post
F/F 0
0.4
0.2
0.0
0.4
0.2
0.0
#C
#D #E #F
#A #B
#G
#C
#D #E #F
#A #B
ExtractedORDs
ExtractedORDs
0.0
0.5
Max
F/F 0
0.0
0.5
Max
F/F 0
nc82 GFP20 GFP20
LH LH LHB
AL AL
LHAL LHA1LHALA2 A3
N-cadGFP20GFP20
nc82 GFP20 GFP20
nc82 GFP20 GFP20
dp
av100 μm 10 μm 20 μm 20 μm
Manuscript 4
131
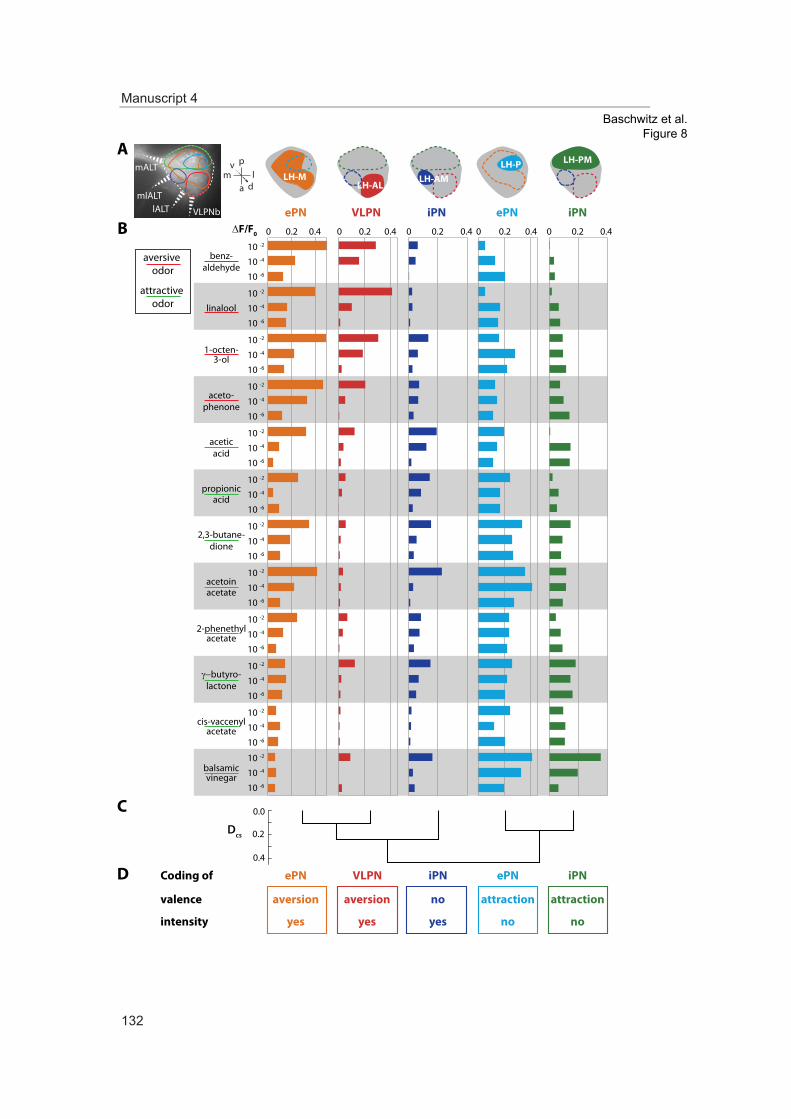
A
B
Baschwitz et al.Figure 8
LH-PLH-M
LH-PM
LH-AMLH-AL
0.4
0.2
0.0
Dcs
0.40.20 0.40.20 0.40.20 0.40.20 0.40.20
10 -2
10 -6
10 -4
10 -2
10 -6
10 -4
10 -2
10 -6
10 -4
10 -2
10 -6
10 -4
10 -2
10 -6
10 -4
10 -2
10 -6
10 -4
10 -2
10 -6
10 -4
10 -2
10 -6
10 -4
10 -2
10 -6
10 -4
10 -2
10 -6
10 -4
10 -2
10 -6
10 -4
10 -2
10 -6
10 -4
balsamicvinegar
cis-vaccenylacetate
2-phenethylacetate
1-octen-3-ol
benz-aldehyde
linalool
aceto-phenone
butyro-lactone
2,3-butane-dione
aceticacid
acetoinacetate
propionicacid
D
C
aversive odor
attractive odor
aversion attractionattractionnoaversion
yes nonoyesyes
ePN ePNiPN iPNVLPN
F/F0
Coding of
valence
intensity
ePN ePNiPN iPNVLPNlALTmlALT
mALT
VLPNb
pl
vm
da
Manuscript 4
132

p
lv
mda
dp
ma
lv
d
la
m
v p
Baschwitz et al.Figure 1 Supplement 1
DA
4l (1
PN
)
DC1
(1-2
PN
s)
DA
1 (1
1 PN
s)
DA
2 (7
PN
s)
D (4
PN
s)D
L1 (3
PN
s)
DC3
(4 P
Ns)
DC2
(3 P
Ns)
DL4
(1 P
N)
DL5
(1-2
PN
s)
DM
1 (1
PN
)
DM
2 (2
PN
s)
DM
3 (1
PN
)
DM
4 (1
PN
)
DM
5 (1
-2 P
Ns)
DP1
m (1
PN
)
VA2
(1-2
PN
s)
VA3
(1-2
PN
s)
VA4
(1 P
N)
VA5
(2-3
PN
s)
VA6
(1-2
PN
s)
VC1
(1-2
PN
s)
VL2a
(1 P
N)
VM1
(1-2
PN
s)
VM3
(2 P
Ns)
VM4
(1 P
N)
VL2p
(1-2
PN
s)
VA1d
(3 P
Ns)
DL3
(6 P
Ns)
DM
6 (3
PN
s)
VA1v
(6 P
Ns)
VA7l
(1 P
N)
VA7m
(3 P
Ns)
VC2
(1-2
PN
s)
VM2
(2-4
PN
s)
VM7d
(3 P
Ns)
VM7v
(2 P
Ns)
dors
al
post
erio
r
late
ral
50 μm
GH
146+
PN
s
AL
CX LH
Manuscript 4
133

#A #B #C
Baschwitz et al.Figure 1 - Figure Supplement 2
3x10-41.5x10-40
Neuron Density
d
pm
alv
d
la
mpvpo
ster
ior
late
ral
post
erio
rla
tera
lpo
ster
ior
late
ral
post
erio
rla
tera
lpo
ster
ior
late
ral
post
erio
rla
tera
lpo
ster
ior
late
ral
post
erio
rla
tera
lpo
ster
ior
late
ral
post
erio
rla
tera
lpo
ster
ior
late
ral
post
erio
rla
tera
l
#A #B #C
post
erio
rla
tera
lpo
ster
ior
late
ral
post
erio
rla
tera
lpo
ster
ior
late
ral
post
erio
rla
tera
lpo
ster
ior
late
ral
post
erio
rla
tera
lpo
ster
ior
late
ral
post
erio
rla
tera
lpo
ster
ior
late
ral
DP1
m(1
PN
)D
C1(1
-2 P
Ns)
VL2a
(1 P
N)
VL2p
(1-2
PN
s)
DL4
(1 P
N)
DL5
(1-2
PN
s)D
A4l
(1 P
N)
VA2
(1-2
PN
s)
VA3
(1-2
PN
s)VA
4(1
PN
)VA
5(2
-3 P
Ns)
VA6
(1-1
PN
s)VC
1(1
-2 P
Ns)
VM1
(1-2
PN
s)VM
3(2
PN
s)VM
4(1
PN
)
DM
5(1
-2 P
Ns)
DM
4(1
PN
)D
M3
(1 P
N)
DM
2(2
PN
s)D
M1
(1 P
N)
Manuscript 4
134

A
3x10
-41.
5x10
-40
VA1d
VM1
DA1
VM3VA4 DM1DM4
VA3 DA2DC1DL5
D
VA7l
DC2
DL3
DM6
DM3 DM2DP1m VA2VC1VM2
VM7d VA5 DA4lDM5VM4 VA7m
VC2
VA6VL2pDL4 VL2aVA1v DC3DL1VM7v
p
lv
mda
d
pm
alv
d
la
mpv
dors
alpo
ster
ior
late
ral
B
Neu
ron
Den
sity
C
D
ePN cosine distance (our data)0.0 0.2 0.4 0.6 0.8 1.0 1.2
0.0
0.2
0.4
0.6
0.8
1.0
1.2
ePN
cor
rela
tion
dis
tanc
e (J
effer
is e
t al.
2007
)
Baschwitz et al.Figure 2 - Figure Supplement 1
Distance matrix ordered by dendrogram Cluster in PCA space
r = 0.57***p = 3.4 x 10-36
Cosine distance0.0 1.0
VA6
VA5
DA4l
VL2p
DL4
VL2a
VA1v
VC1
DA1
VA3VM1
DA2DC1
VA7mDC3VC2
DL1VM7v
D
VA1d
DC2
DL3
DM2
DM5
VM4
DM3
DP1mVA2
VM3 VA4
DM1DM4
DL5
VM2
VM7d
VA7l
DM6
0.0
-1.0
-2.0
0.00.0-1.0
2.0
PC1 (40%)
PC2 (23%
)PC
3 (1
6%)
1.0
1.0
Manuscript 4
135
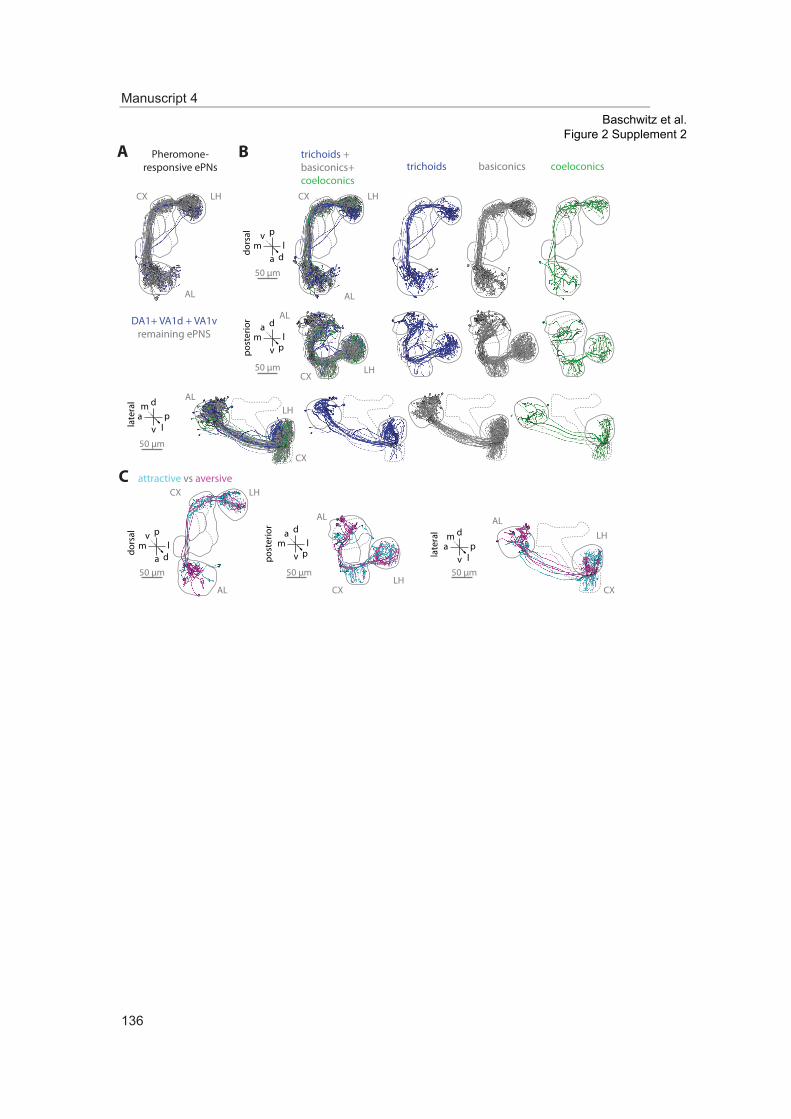
A B
Baschwitz et al.Figure 2 Supplement 2
LH
AL
CX
50 μm
trichoids + basiconics+ coeloconics
pl
vm
da
dp
ma
lv
dl
am
pv
dors
alpo
ster
ior
late
ral AL
50 μm
LH
AL
CX50 μm
LH
AL
CX
Pheromone-responsive ePNs coeloconicsbasiconicstrichoids
LH
CX
DA1+ VA1d + VA1vremaining ePNS
CLH
AL
CXattractive vs aversive
pl
vm
da
dors
al dl
am
pvpost
erio
r
LH
AL
CX
50 μm
dp
ma
lvlate
ral LH
AL
50 μm
CX
50 μm
Manuscript 4
136

General Discussion
137
General Discussion
The aim of this dissertation was the comparative investigation of the morphological and functional characteristics of different neuron populations within the olfactory pathways in the vinegar fly Drosophila melanogaster. This investigation embraced the impact of the different neuron populations on the neuropil structure of the primary olfactory processing center, the antennal lobe (AL), and the secondary olfactory processing center, the lateral horn (LH). Moreover, the functional properties of two types of projection neurons (PNs) were analyzed considering the coding of odor information in the LH.
The examination of the olfactory neural circuitry was enabled by the use of several state-of-the-art techniques including the generation of a new transgenic fly line to label neuro-pil structures in vivo. On the one hand, this neuropil staining permitted the immediate 3D-reconstruction of higher brain centers and the registration of labeled neurons in order to compare their axonal as well as dendritic arborizations (Manuscripts 1 and 4). On the other hand, based on the neuropil labeling an in vivo atlas of the AL was generated for improved and simplified identification of glomeruli (Manuscript 2). We used the atlas to identify the glomeruli innervated by single multiglomerular inhibitory projection neurons (iPNs; Manuscript 1). Furthermore, this atlas simplified the identification of glomeruli of interest to label in vivo all uniglomerular excitatory projection neurons (ePNs) innervating those specific glomeruli (Manuscripts 3 and 4). The in vivo labeling of specific single neu-rons and all neurons innervating distinct glomeruli was performed by photoactivation of the endogenously expressed photoactivatable green fluorescent protein (pa-GFP). 3D-reconstruction and registration of labeled neurons onto a reference brain enabled their thorough morphological examination (Manuscripts 1 and 4). Moreover, functional proper-ties of ePNs and iPNs were examined using wide-field calcium imaging in the LH. The obtained global odor responses were analyzed by applying the improved pattern recogni-tion algorithm non-negative matrix factorization (NMF). Neuronal connections between different neuron populations were investigated by the use of GFP reconstitution across synaptic partners (GRASP). Furthermore, by ablation of distinct neuron populations the functional connectivity was verified (Manuscripts 1 and 4).
Elucidating olfactory pathways within the antennal lobe
The investigation of morphological and physiological properties of the neuron popula-tions of interest as well as their contribution to the formation of neuropil structures is a prerequisite to unravel neural circuits. Nevertheless, morphological analyses are mainly conducted by in vitro techniques as immuno-labeling and in-situ hybridization (Couto et al., 2005; Fishilevich and Vosshall, 2005; Laissue et al., 1999; Rein et al., 2002). In con-trast, physiological analyses comprise a comprehensive collection of in vivo methods like photolesioning, single cell recordings as well as functional imaging (Caron et al., 2013;
General Discussion
138
Chou et al., 2010; Datta et al., 2008; Fiala et al., 2002; Liang et al., 2013; Ng et al., 2002; Ruta et al., 2010; Schubert et al., 2014; Seki et al., 2010; Silbering et al., 2008; Wilson et al., 2004) (Manuscripts 1 and 4). Applying the available in vitro atlases on in vivo func-tional imaging data to map response patterns is challenging since the neuropils underlie unequal geometrical as well as volumetric modifications due to dissection and fixation artefacts (Chiang et al., 2011; Ma et al., 2008). In manuscript 2 we, therefore, developed a genetically encoded fusion protein (END1-2) that is mimicking the in vitro staining with the antibody nc82 to label neuropil structures in vivo (Hofbauer, 1991). We used the ex-pression of END1-2 and the subsequent 3D-reconstruction of confocal brain scans to establish an in vivo atlas (Rybak et al., 2010). Furthermore, the reconstructed in vivo brain enabled us to investigate precisely the impact of the fixation procedure on geomet-ric and volumetric modifications that occur in reconstructed in vitro brains. To reliably assign the identity of glomeruli in our 3D-in vivo atlas we used the labeling of specific chemosensory receptors (CRs) expressed under control of GAL4, and the END1-2 neu-ropil staining (Abuin et al., 2011; Couto et al., 2005; Dobritsa et al., 2003; Fishilevich and Vosshall, 2005; Goldman et al., 2005; Larsson et al., 2004; Vosshall, 2001). First of all, the in vivo labeling of AL glomeruli revealed a volumetric decrease of the AL by 43% in stained in vitro brains. Notably, the difference of individual glomerular volumes ranged from almost no change up to 60% reduction of the size in comparison to the in vitro neu-ropil staining. This non-uniform shrinkage may depend on the different innervation fre-quency as well as the different innervation density by olfactory sensory neurons (OSNs), PNs and local interneurons (LNs) (Ignell et al., 2005)(Manuscript 3). Second, the posi-tions of glomeruli were affected by the transection of the antennal nerve that resulted in changed distances as well as in changed angles between glomeruli pairs. These re-markable differences of geometric and volumetric properties of AL glomeruli obtained in vivo in comparison to the in vitro situation highlights the necessity of an in vivo AL atlas.
The in vivo scans of the AL stained with END1-2 have the same orientation without de-formation of the AL as observed in functional imaging due to the identical preparation. Consequently, our improved AL atlas simplifies the identification of activated glomeruli for the mapping of neuronal activity in functional imaging experiments gained in vivo. In addition, the in vivo neuropil staining enables to assign the innervated AL glomeruli by specific neuron populations without further fixation and staining, i.e. it is less time con-suming. Moreover, the END1-2 staining supports the identification and characterization of innervation patterns in other neuropils than the AL. For example, we compared termi-nal fields of single iPNs in the LH based on 3D-reconstructions of the stained neuropil structures and their subsequent registration onto a reference brain (Manuscript 1). Fur-thermore, the integration of the END1-2 construct in the fly genome permits a neuropil staining and instantaneous neuron specific expression of reporter proteins under control of binary transcription systems.

General Discussion
139
The acquisition of the in vivo AL atlas encouraged us to investigate the basis and the significance of the different sizes and shapes of AL glomeruli. Based on simple averag-ing it was commonly assumed that each glomerulus is innervated by 20 OSNs and 3 PNs but only for few glomeruli the actual numbers are published (Ai et al., 2010; Dobritsa et al., 2003; Gao et al., 2000; Ramaekers et al., 2005; Ruta et al., 2010; Sachse et al., 2007; Vosshall and Stocker, 2007). Only the enormous diversity of glomerular innerva-tion by LNs is comprehensively investigated (Chou et al., 2010; Das et al., 2011; Seki et al., 2010) . Comparison of one OSN type in different Drosophila species revealed an impact of the OSN number on the volume of the innervated glomerulus (Dekker et al., 2006; Linz et al., 2013). To verify this, we investigated quantitatively and qualitatively the neuron populations in the AL as well as their impact on the glomerular volume (Manu-script 3).
OSNs expressing a specific CR were labeled to gain for each OSN type the accurate number of neurons varying from 10 to 65 in males and females. Furthermore, we investi-gated the distribution of all sensilla subtypes on the olfactory organs of the fly according to the expressed CRs. On one hand, this verified the previously published distribution patterns of sensilla subtypes, on the other hand, this confirmed the reliability of our ap-proach to endogenously label OSN types (Benton et al., 2009; de Bruyne et al., 1999; de Bruyne et al., 2001; Fishilevich and Vosshall, 2005; Shanbhag et al., 1999; Silbering et al., 2011; Stocker, 2001; Vosshall et al., 2000).
The number of ePNs innervating individual glomeruli was investigated in flies expressing pa-GFP under control of the enhancer trap line GH146-GAL4, which labels about two-thirds of all ePNs (Datta et al., 2008; Patterson and Lippincott-Schwartz, 2002; Stocker et al., 1997). Photoactivation of each glomerulus revealed numbers varying from one up to ten ePNs per glomerulus. The glomerular innervation frequency by LNs also varied from approximately 57 up to 95% of all LNs (Chou et al., 2010). Those varying numbers of OSNs, ePNs and LNs for different glomeruli already hint at a unique architecture of each single glomerulus. Correlating the glomerular volume with the distinct numbers of OSNs, ePNs and LNs indeed revealed a significant impact of the number of OSNs and ePNs on the volume. When comparing the number of OSNs, ePNs and LNs with each other only ePNs and LNs exhibited a significant inverse correlation, i.e. glomeruli with a high number of ePNs were innervated by few LNs. Interestingly, glomeruli with a high number of ePNs showed responses to odors of considerable ecological relevance. Those include, for example, the glomeruli processing responses to the pheromones 11-cis-vaccenyl acetate (DA1 (Ha and Smith, 2006; Kurtovic et al., 2007) and DL3 (Lebreton et al., 2014)), as well as methyl laurate (VA1d (Dweck et al., 2015b)), or to the aversive cue geosmin emitted by bacteria or mold (DA2 (Stensmyr et al., 2012)). To correlate the number of OSNs, ePNs and LNs of a glomerulus with its odor tuning profile we calculat-ed the lifetime sparseness of olfactory chemoreceptors. To this end, we used available

General Discussion
140
online data (http://neuro.uni-konstanz.de/DoOR/2.0/; (Münch and Galizia, 2016)) and we gained novel data for eleven so far scarcely investigated CRs using single sensillum re-cordings. CRs and the corresponding glomeruli revealing a high lifetime sparseness (i.e. high odor-selectivity) are innervated by many ePNs but by few LNs. This supports that channels for specific odors get less lateral processing and convey reliably via more PNs this important information to the higher brain centers (Hong and Wilson, 2015; Jeanne and Wilson, 2015; Root et al., 2008; Seki et al., 2010). Closer examination of our data indicates that the D-glomerulus innervated by OSNs expressing OR69a may be a further candidate of a channel for specific ecological relevance. The D-glomerulus is innervated by few LNs and four ePNs, which is more than the average of two ePNs. However, the odor tuning profile of OR69a is rather broad. Current investigations suggest for the odor processing channel of the D-glomerulus a combinatorial coding of a putative pheromone and odors emanating from food preferred by Drosophila melanogaster (Lebreton et al., 2017).
Our extensive investigation of the OSN numbers in male and female flies revealed also differences for some OSN types between the sexes that were so far not described. Fur-thermore, sexual differences are noted in the volume of few glomeruli and the number of ePNs. Interestingly, not all dimorphic OSNs and ePNs express the sex-specific fruitless gene, which governs the neural circuitry of courtship (Stockinger et al., 2005). However, the cause and the impact of those sex-dependent quantitive differences on the pro-cessing of odor information as well as the elicited behavior have to be investigated. It is possible that those processing channels exhibiting sex-specific quantitive differences can elicit sex-specific behavior independent of fruitless-expression in the sensory neurons because of their postsynaptic connection to fruitless-positive neurons. For example, it was shown recently that a fruitless-negative processing channel assembles together with higher-order fruitless-positive neurons a neural circuit that prevents interspecies court-ship (Fan et al., 2013). Moreover, dimorphic differences in the number of neuron types may reveal processing channels governing sex-specific behaviors apart from courtship. For example, in the case of OR49a-expressing OSNs the higher number in female flies may be attributed to their relevance in avoiding unsuitable places for oviposition (Ebrahim et al., 2015).
The contribution of iPNs on the glomerular architecture was not investigated in our study due to their complex innervation patterns. Since they innervate glomeruli only sparsely the impact might be low. Besides, our study excluded also the barely investigated atypi-cal PNs that bilaterally innervate the AL or that target higher brain centers additionally to the mushroom body calyx and the LH (Tanaka et al., 2012). Further examination of those types of PNs is necessary to determine their impact on the glomerular architecture. This will help to identify the rationale of why some glomeruli are innervated only by few OSNs despite displaying a huge volume. For example the glomeruli VL1, VL2p and DP1m are
General Discussion
141
almost as big as the pheromone processing glomeruli but are innervated by about 60% less OSNs. Another possibility is that OSNs innervating those glomeruli exhibit a very high amount of synapses that increase the glomerular volume (Acebes and Ferrus, 2001; Mosca and Luo, 2014).
Elucidating olfactory pathways beyond the antennal lobe
In manuscripts 2 and 3 we established a tool for in vivo labeling of the neuropil and sub-sequently applied it to investigate the neuronal architecture of the AL glomeruli. Investi-gations described in manuscripts 1 and 4 focused on the two main populations of projec-tion neurons – multiglomerular inhibitory and uniglomerular excitatory ones. We investi-gated the characteristics of their arborizations, and we examined their functional princi-ples for the parallel convey of odor information to the lateral horn.
The iPNs were so far scarcely investigated regarding their morphological and functional properties. The enhancer trap line MZ699-GAL4 labels about 45 out of the 50 iPNs and almost all of those iPNs are multiglomerular and secrete the neurotransmitter gamma-aminobutyric acid (GABA) (Ito et al., 1997; Lai et al., 2008; Liang et al., 2013; Okada et al., 2009; Parnas et al., 2013). To analyze the glomerular innervations of single iPNs we expressed pa-GFP under control of MZ699-GAL4 and the END1-2 neuropil staining (Datta et al., 2008; Ito et al., 1997; Patterson and Lippincott-Schwartz, 2002; Ruta et al., 2010). In general, labeling all MZ699-positive iPNs revealed an overall sparse innerva-tion of 40 out of the 54 AL glomeruli. This is contradictory to a previous study assigning an innervation of all glomeruli by MZ699-positive iPNs (Tanaka et al., 2012). Those dif-ferences in glomerular innervation can most likely be attributed to the application of dif-ferent methods for the analysis. In comparison to our approach, Tanaka and colleagues used the in vitro immuno-labeling, which substantially enhances the staining but also suffers from fixation artefacts (Manuscript 2). Nevertheless, it seems likely that MZ699-positive iPNs innervate all glomeruli since immuno-labeling enhances the fluorescence of very thin arborizations.
Confocal scans of labeled single neurons were subsequently used for 3D-reconstruction and registration (Rybak et al., 2010). Notably, none of the analyzed iPNs exhibited iden-tical glomerular innervations but in some cases iPNs innervated similar subsets of glo-meruli. Strikingly, the examined iPNs revealed a separated innervation of mainly ventro- and dorsomedial glomeruli or of mainly anterodorsal and lateral glomeruli. These two separated groups innervated in the LH also segregated areas hinting towards a different role in odor processing and further relay to different third-order neurons in the LH. Hence, we analyzed the representation of several odors by iPNs in the LH using wide-field functional imaging of flies expressing the calcium indicator GCaMP3 under control of MZ699-GAL4 (Ito et al., 1997; Tian et al., 2009). Odors elicited responses of varying
General Discussion
142
intensities in three different regions of the LH with concentration-dependent shifts in the response patterns. To analyze these response patterns we conducted NMF that re-vealed odor response domains (ORDs) with similar spatiotemporal odor response pro-files found in all tested animals (Lee and Seung, 1999; Soelter et al., 2014; Soucy et al., 2009). Three ORDs were extracted with one domain in the posterior LH responding to attractive odors, one in the medial LH coding odor concentration and one in the antero-lateral LH representing aversive odors and concentration. The latter domain might also represent the neuronal activity of third-order neurons of the ventrolateral protocerebrum (VLP). Those VLP neurons (VLPNs) are also labeled by the MZ699-GAL4 line and in-nervated the anterior part of the LH. To examine the activity of VLPNs we conducted functional imaging experiments combined with microlesion of either the iPN tract to abol-ish iPN input in the LH or the VLPN tract to abolish VLPN activity. Ablating the iPN tract diminished responses in the posterior and medial odor response domains, whereas re-sponses in the anterolateral domain slightly increased. This reveals that responses in the posterior and medial domain derive only from iPN activity, whereas responses in the an-terolateral domain derive from VLPN activity. Furthermore, this confirms that iPNs inhibit the activity of VLPNs (Liang et al., 2013).
The impact of iPNs on odor-guided behavior was elucidated in the T-maze using flies with silenced iPNs. The loss of inhibition by iPNs led to a reduced attraction to all tested odors and concentrations. Thus iPNs contribute to odor attraction. Notably, glomeruli that are estimated to be responsible for processing of aversive odors were not innervated by MZ699-positive iPNs according to our in vivo labeling (Knaden et al., 2012). However, regarding the described innervation of all glomeruli by MZ699-positive iPNs in vitro those glomeruli may be innervated only weakly (Tanaka et al., 2012). Thus, our analyses re-vealed in the LH a coding of attractive odors and odor concentration as well as a contri-bution to attraction behavior by MZ699-positive iPNs. However, the connection to other lateral horn neurons (LHNs) than to VLPNs as well as the relay of odor valence and in-tensity has to be analyzed in further experiments (see below).
In manuscript 4 we aimed at a morphological and functional investigation of ePNs com-parable to our findings of iPNs: a separation of ePNs in groups representing odor va-lence and intensity. To examine ePNs we used the enhancer trap line GH146-GAL4 that labels about 90 of the estimated 120 ePNs (Stocker et al., 1997).
To compare the innervation patterns in the LH of ePNs and iPNs, we needed in vivo data of ePNs. Available data on the morphology of ePNs consist of in vitro scans of single ePNs. Similar to our results in manuscript 2 that in vitro data suffer from fixation artefacts the comparison of available in vitro data of ePNs with our in vivo data of iPNs was not possible. Therefore, we reconstructed all ePNs in vivo innervating distinct glomeruli ac-quired by photoactivation (Datta et al., 2008; Patterson and Lippincott-Schwartz, 2002;
General Discussion
143
Ruta et al., 2010; Rybak et al., 2010). This way, we could confirm the high stereotypy of ePNs innervating the same glomerulus (Jefferis et al., 2007; Marin et al., 2002; Wong et al., 2002). Additionally, the reconstructions of sister ePNs (i.e. ePNs innervating the same glomerulus in the same animal) revealed that fine arborizations were not identical but similar. Since our data set of ePNs included two more glomeruli and all sister ePNs, a re-examination of their clustering by hierarchical clustering (Jefferis et al., 2007) result-ed in five main groups. However, defining cluster boundaries was ambiguous since the corresponding distance matrix revealed that similarities were not only found for neuron pairs within the same cluster. In a principal component analysis (PCA) the ePNs were evenly distributed without any clustering at all. Notably, the distribution of ePNs in the PCA was highly reminiscent to the distribution of innervated glomeruli in the AL. There-fore, we correlated the spatial distribution of glomeruli in the AL – gained in manuscript 2 – with the spatial distribution of the corresponding ePNs in the LH. This revealed that ePNs innervating neighboring glomeruli in the AL also innervated neighboring areas in the LH. Thus, the topographic map of the AL was retained but rotated in the LH confirm-ing observations in a previous study (Marin et al., 2002). Comparison of the innervation of ePNs and iPNs in the AL and the LH revealed that ePNs and iPNs overlapping in the AL also were overlapping in the LH. Consequently, ePNs and iPNs getting input from the same AL region relayed the odor information to the same region in the LH via two paral-lel pathways.
The representation of odors in the LH was in previous studies analyzed or simulated only for a few odors (Jefferis et al., 2007; Liang et al., 2013; Parnas et al., 2013). To study the global representation of odors in all ePNs we again used wide-field calcium imaging. This revealed two different response patterns that were – by applying NMF – attributed to two ORDs that separately code attractive and aversive odors. Comparing the ORDs of ePNs and iPNs coding attractive odors revealed their spatial overlap. Aversive odors and high odor concentrations were coded in overlapping ORDs of ePNs and VLPNs. In iPNs the odor intensity was coded separately in an ORD that overlapped with the ePN ORD coding aversive odors and odor intensity. The spatial and functional overlap of ORDs in ePNs and iPNs support the segregation of the LH according to odor valence.
In manuscript 1 we verified the connection of iPNs onto VLPNs and that iPNs were not connecting onto ePNs (Liang et al., 2013; Parnas et al., 2013). Since the connection of ePNs onto iPNs and VLPNs was so far not investigated we labeled putative synapses between those three neuron populations using MZ699-GAL4 and GH146-GAL4 lines for the GRASP technique (Feinberg et al., 2008). Indeed, this way we could visualize syn-apses of ePNs onto iPNs and VLPNs in the LH. Notably, this approach could not differ-entiate between synapses of either ePNs and iPNs, or ePNs and VLPNs, or both. In or-der to attribute the labeled synapses to the neuronal partners we performed calcium im-

General Discussion
144
aging experiments combined with microlesion that revealed synaptic connections of ePNs onto VLPNs only.
In conclusion, ePNs and iPNs form a parallel pathway for the transfer of odor information from the same area in the AL to the same LH region, the segregation of the LH accord-ing to odor valence, and the antagonistic connection to the same set of third-order neu-rons of the VLP. Like the parallel pathways in the visual system of mammals and Dro-sophila the two antagonistic PN populations relay in parallel different features of olfactory information to the LH (Nassi and Callaway, 2009; Otsuna et al., 2014). The combinatorial coding of odor quality by ePNs is retained in the topographic map and enables the read-out by LHNs (Fi ek and Wilson, 2014). The concentration-dependent inhibition of postsynaptic neurons via iPNs enhances the discrimination of odors (Parnas et al., 2013). This dual representation of olfactory information may improve the accuracy of the representation of odor valence and intensity. Consequently, our systematic descriptions of the coding of ecological relevance by two antagonistic PN populations permit a deeper understanding of the neural circuitry governing innate behavior in Drosophila melano-gaster.
Future perspectives to unravel the neural circuitry governing innate behavior
To unravel complex neural circuits it is necessary to investigate the morphological and physiological properties of all involved members. An assumption of separated coding areas in the LH for pheromones and food odors has been based solely on separately innervated areas in the LH of PNs coding those different odor classes (Jefferis et al., 2007). However, global functional imaging of iPNs and ePNs revealed a separation of the LH according to the coding of odor valence and intensity. Interestingly, pheromones were represented by both ePNs and iPNs in the odor response domains that responded mainly to attractive odors. This supports the separation of the LH due to coding of aver-sive or attractive stimuli, and not for pheromones versus food odors. It is not clear why responses to the pheromones 11-cis-vaccenyl acetate and methyl laurate were in func-tional imaging not detected in the anterior LH region innervated by DA1- and VA1d-PNs. Although, it was shown that 11-cis-vaccenyl acetate elicits responses in LHNs, which innervate the anterior LH and connect onto DA1-PNs (Kohl et al., 2013). Most likely the responses to pheromones were relayed to the LH by other ePN types additional to DA1- and VA1d-PNs (Lebreton et al., 2015).
Generally, our findings of separated odor representations according to odor valence and intensity in the LH provide an essential progress in analyzing innate behavior. Further analysis of odor processing in the LH, the connections of PNs as well as the transfer of the separated responses according to odor valence and intensity to the different types of
General Discussion
145
third-order neurons are necessary. Of the diverse types of LHNs only few sets were so far examined (Cachero et al., 2010; Fi ek and Wilson, 2014; Jefferis et al., 2007; Kohl et al., 2013; Lai et al., 2008; Ruta et al., 2010; Tanaka et al., 2004; Yu et al., 2010) (Manu-scripts 1 and 4). Several higher brain centers responsible for the processing of e.g. visu-al, auditory and mechanosensory stimuli are connected by LHNs constituting a prerequi-site for the multimodal integration of sensory stimuli (Duistermars and Frye, 2010; Gupta and Stopfer, 2012; Ruta et al., 2010; Tanaka et al., 2004).
The enhancer trap lines MZ699-GAL4 and GH146-GAL4 label not exclusively all iPNs or ePNs thus analyses of odor responses and innervation patterns in AL and LH of missing PNs are necessary. In line with this, further analyses of the remaining VLPNs are neces-sary. This can be accomplished by using different lines of the several thousand newly generated transgenic fly lines (Jenett et al., 2012) or by generating more specific fly lines. Moreover, the development of sophisticated tools like photoconvertable calcium indicators such as GCaMP and GR-GECO (Ai et al., 2015; Hoi et al., 2013), or multicolor functional imaging (Akerboom et al., 2013) will help to analyze the functional connection of different neuron populations. Furthermore, the improvement of optical imaging facili-ties enables the analysis of the activity of specific neuron populations in freely behaving flies (Grover et al., 2016).
In this dissertation I contributed to the knowledge of the connectivity map of odor pro-cessing channels as well as to the odor coding strategies in the AL and the LH. This was accomplished by establishing an in vivo neuropil staining and by generating an in vivo AL atlas based on this staining (Manuscript 2). The application of both innovations improved the comparability of morphological and physiological imaging data (Manuscripts 1 and 4). Furthermore, the quantification of the different neuron types, which innervate individual AL glomeruli, highlighted the uniqueness of each processing channel according to the ratio of the connected neuron types. This ratio is associated with the coding of ecological relevance through the individual processing channels (Manuscript 3). Furthermore, in-vestigations described in this dissertation elucidated the morphological and functional characteristics of projection neurons that relay the processed odor information to the higher brain (Manuscripts 1 and 4). The multiglomerular iPNs constituted two groups that separately innervated the AL and the LH. In comparison, the innervation patterns of uniglomerular ePNs retained the topographic map of the AL in the LH. Both, ePNs and iPNs represented in the LH odor information categorized by odor valence and intensity. Moreover, in the anterior LH ePNs and iPNs synapsed onto and modulated antagonisti-cally a subset of VLPNs. How the odor information of the individual processing channels is conveyed to LHNs and how then an innate odor-guided behavior is elicited will be in-vestigated in the coming decades by the help of existing genetic and technical tools, as well as by those tools in development. Odor-guided behavior can be modulated depend-ing on the internal state of the fly, the context of the perceived odors as well as the fly´s
General Discussion
146
experience (Beshel and Zhong, 2013; Bräcker et al., 2013; Heisenberg, 2015; Lin et al., 2014b; Owald and Waddell, 2015; Root et al., 2011; Su and Wang, 2014). To compre-hensively unravel the neural circuit governing innate behavior it will be necessary to scrutinize these adjustments as well as the interplay of the involved neuron types.
Summary
147
Summary
In its natural environment the vinegar fly Drosophila melanogaster encounters a plethora of different odors. To some odors flies show an innate preference, like to the smell of food or pheromones, or an innate avoidance, like to the smell of predators or contami-nated food. This innate odor-guided behavior is governed by the interplay of several neu-ron populations in the olfactory system. Those neuron populations extract the relevant odor information and thus enable the evaluation of the encountered odors. However, the rationale and significance of the odor processing by different neuron populations onto the elicited innate odor-guided behavior is not fully understood. To unravel the principles of neural circuits Drosophila melanogaster is a versatile model organism due to the gigantic genetic tool box for selective examination of diverse neuron populations.
In this dissertation I aimed at a deeper understanding of the contribution of the individual odor processing channels to innate odor-guided behavior as well as the odor coding strategies. This was accomplished by the use of state-of-the-art in vivo techniques in-cluding a newly generated fly line, establishing an in vivo atlas of the antennal lobe (AL), the labeling of single cells by photoactivation, the 3D-reconstruction and registration of single cells for anatomical comparisons, as well as functional investigations of different neuron populations and the examination of their synaptic connections.
To investigate the glomerular anatomy of the primary olfactory processing center a new fly line was generated for a permanent and endogenous labeling of the neuropil. Based on this labeling an in vivo AL atlas was established (Manuscript 2). The comparative in-vestigation of the neuropil architecture in the in vivo and in vitro situation verified the am-ple influence of the dissection and fixation procedure on the size and the position of glo-meruli. Furthermore, the detailed examination of each of the neuropil subunits of the pri-mary olfactory processing center, the glomeruli, revealed a quantitatively unique innerva-tion by sensory neurons, projection neurons (PNs) and local interneurons (Manuscript 3). Processing channels that code ecological relevance exhibit a lower innervation by modu-latory local interneurons and consequently may be subject to a lower degree of lateral processing. To those channels belong DA1-neurons and VA1d-neurons that process the reception of pheromones, or the DA2-neurons that process the reception of geosmin emitted by toxic microbes.
How odors are represented in the lateral horn (LH) by the two main populations of excita-tory (ePNs) and inhibitory projection neurons (iPNs) was investigated morphologically and physiologically (Manuscripts 1 and 4). This was accomplished by photolabeling with subsequent 3D-reconstruction and registration of single neurons, as well as functional calcium imaging combined with microablation. Both PN populations encode odor valence and intensity in separate regions of the LH. Furthermore, subsets of ePNs and iPNs in-

Summary
148
nervating the same region of the AL also innervate the same region in the LH: conse-quently, they receive the same odor information and transfer it to the same output region. Both neuron populations connect to the same set of third-order neurons of the ven-trolateral protocerebrum but with antagonistic modulation. These findings support the notion of a parallel relay of odor information via two projection neuron populations to the LH that improves the accuracy of the represented odor categorized by its valence and intensity. Furthermore, the characterization of the coding strategies of PNs in the LH and the comparative investigation of different odor processing channels will help to unravel the neural circuitry of innate odor-guided behavior. In addition, this neural circuitry will be deciphered by future studies assigning the connectivity to further neurons of the LH as well as investigating the relay of the coding of odor valence and intensity.
Zusammenfassung
149
Zusammenfassung
Bei der Erkundung der Umgebung offenbart die Essigfliege Drosophila melanogaster eine angeborene Präferenz zu Gerüchen, die Nahrungsquellen signalisieren, genauso wie zu Pheromonen, die von Artgenossen oder Fortpflanzungspartnern sekretiert wer-den. Des Weiteren zeigen Essigfliegen eine instinktive Abneigung gegenüber dem Ge-ruch ihrer Feinde bzw. gegenüber ungenießbarer Nahrung. Dieses angeborene Verhal-ten, ausgelöst durch bestimmte Düfte, wird durch das Zusammenspiel verschiedener Neuronenpopulationen des olfaktorischen Systems reguliert. Die verschiedenen Neuro-nenpopulationen extrahieren relevante Duftinformationen und ermöglichen dadurch die Bewertung der wahrgenommenen Düfte. Dennoch sind die Grundprinzipien und die Be-deutung der Duftverarbeitung durch verschiedene Neuronenpopulationen für das Auslö-sen von angeborenem Verhalten zu Düften noch nicht vollständig verstanden. Zur Un-tersuchung neuronaler Verschaltungen ist Drosophila melanogaster als Modellorganis-mus aufgrund der umfangreichen Möglichkeiten zur selektiven, genetischen Manipulati-on von Neuronenpopulationen vielseitig einsetzbar.
Das Ziel dieser Dissertation war die Entschlüsselung der Beiträge einzelner Neuronen-populationen zur Verarbeitung von Duftinformationen, die relevant für das Auslösen an-geborener Verhalten notwendig ist, sowie die zugrundeliegende Kodierung von Duftin-formationen. Dies wurde mittels modernster Methoden erreicht, welche die Entwicklung einer Fliegenlinie, die Etablierung eines in vivo Atlasses der Gewebestrukturen des pri-mären Geruchszentrums, dem Antennallobus, die photo-optische Markierung einzelner Neurone und deren anatomischer Vergleich durch anschließende 3D-Rekonstruktion und Registrierung sowie die Aktivitätsmessung verschiedener Neuronenpopulationen und deren neuronale Verschaltungen einschließen.
Die Anatomie der glomerulären Gewebestrukturen des primären Geruchszentrums wur-de im lebenden Organismus einer neuen Fliegenlinie, die eine endogene Fluoreszenz-markierung der Gehirnstrukturen ermöglicht, untersucht. Basierend auf dieser Markie-rung wurde ein in vivo Atlas des Antennallobus etabliert (Manuskript 2). Die vergleichen-den, anatomischen Studien der Gehirnstrukturen des primären Geruchszentrums im le-benden Organismus bzw. im präparierten Zustand verdeutlichen die umfangreichen Ein-flüsse der Sezierung und Fixierung auf die Position der Neuropiluntereinheiten, den Glomeruli. Des Weiteren wurde die charakteristische Innervationshäufigkeit sensorischer Neurone, Projektionsneurone und lokaler Interneurone für die einzelnen Glomeruli im primären Geruchszentrum dokumentiert (Manuskript 3). Neuronengruppen zur Verarbei-tung wichtiger sensorischer Informationen der Umwelt weisen eine erhöhte Neuronen-zahl zur Weiterleitung sowie eine geringere Anzahl modulierender lokaler Interneurone auf. Dazu gehört die Informationsverarbeitung von Pheromonen durch Neurone, die sich
Zusammenfassung
150
jeweils in den Glomeruli DA1 und VA1d miteinander verschalten, sowie die Neurone des DA2-Glomerulus zur Verarbeitung des Geruchs toxischer Mikroorganismen.
Die Repräsentation von Duftmerkmalen im höheren Gehirnzentrum, dem lateralen Horn, durch die zwei Hauptgruppen stimulierender und hemmender Projektionsneurone wurde in den Manuskripten 1 und 4 untersucht. Dies erfolgte mittels photo-optischer Markierung von Einzelneuronen und deren anschließende 3D-Rekonstruktion und Registrierung so-wie durch Messung von Neuronenaktivität und deren Weiterleitung. Beide Projektions-neuronenpopulationen kodieren die Valenz und Intensität von Düften in jeweils getrenn-ten Regionen des lateralen Horns. Die stimulierenden und hemmenden Projektionsneu-rone, die dasselbe Areal im primären Gehirnzentrum innervieren, übertragen zur selben Region des höheren Gehirnzentrums dieselbe Duftinformation. Dort verschalten sich die Projektionsneurone mit derselben Gruppe nachgeschalteter Neurone des benachbarten Hirnzentrums, des sogenannten ventrolateralen Protocerebrums. Diese Ergebnisse be-kräftigen die Ansicht einer parallelen Informationsweiterleitung mit Hilfe zweier Projekti-onsneuronenpopulationen zum lateralen Horn zur präziseren Darstellung von Düften kategorisiert in Abhängigkeit ihrer Valenz und Intensität. Die Charakterisierung der Ver-schlüsselungsstrategien von Projektionsneuronen im lateralen Horn sowie die verglei-chende Untersuchung der unterschiedlichen Verarbeitungswege von Düften unterstützt die Aufklärung der neuronalen Schaltkreise, die dem durch bestimmte Gerüche hervor-gerufenen, angeborenen Verhalten zugrunde liegen. Wie die Verschaltung zu Neuronen anderer, benachbarter Hirnregionen aussieht, muss in weiteren Experimenten erfolgen. Dabei ist auf die Kodierung von Valenz und Intensität von Düften ein besonderes Au-genmerk zu richten.
References
151
References
Abuin, L., Bargeton, B., Ulbrich, M.H., Isacoff, E.Y., Kellenberger, S., and Benton, R. (2011). Functional architecture of olfactory ionotropic glutamate receptors. Neuron 69, 44-60.
Acebes, A., and Ferrus, A. (2001). Increasing the number of synapses modifies olfactory perception in Drosophila. The Journal of neuroscience : the official journal of the Society for Neuroscience 21, 6264-6273.
Adams, M.D., Celniker, S.E., Holt, R.A., Evans, C.A., Gocayne, J.D., Amanatides, P.G., Scherer, S.E., Li, P.W., Hoskins, R.A., Galle, R.F., et al. (2000). The genome sequence of Drosophila melanogaster. Science 287, 2185-2195.
Ai, M., Mills, H., Kanai, M., Lai, J., Deng, J., Schreiter, E., Looger, L., Neubert, T., and Suh, G. (2015). Green-to-Red Photoconversion of GCaMP. PloS one 10, e0138127.
Ai, M., Min, S., Grosjean, Y., Leblanc, C., Bell, R., Benton, R., and Suh, G.S. (2010). Acid sensing by the Drosophila olfactory system. Nature 468, 691-695.
Akerboom, J., Carreras Calderon, N., Tian, L., Wabnig, S., Prigge, M., Tolo, J., Gordus, A., Orger, M.B., Severi, K.E., Macklin, J.J., et al. (2013). Genetically encoded calcium indicators for multi-color neural activity imaging and combination with optogenetics. Frontiers in molecular neuroscience 6, 2.
Akerboom, J., Rivera, J.D., Guilbe, M.M., Malave, E.C., Hernandez, H.H., Tian, L., Hires, S.A., Marvin, J.S., Looger, L.L., and Schreiter, E.R. (2009). Crystal structures of the GCaMP calcium sensor reveal the mechanism of fluorescence signal change and aid rational design. The Journal of biological chemistry 284, 6455-6464.
Andlauer, T.F., Scholz-Kornehl, S., Tian, R., Kirchner, M., Babikir, H.A., Depner, H., Loll, B., Quentin, C., Gupta, V.K., Holt, M.G., et al. (2014). Drep-2 is a novel synaptic protein important for learning and memory. eLife 3.
Aso, Y., Hattori, D., Yu, Y., Johnston, R.M., Iyer, N.A., Ngo, T.T., Dionne, H., Abbott, L.F., Axel, R., Tanimoto, H., and Rubin, G.M. (2014a). The neuronal architecture of the mushroom body provides a logic for associative learning. eLife 3, e04577.
Aso, Y., Sitaraman, D., Ichinose, T., Kaun, K.R., Vogt, K., Belliart-Guerin, G., Placais, P.Y., Robie, A.A., Yamagata, N., Schnaitmann, C., et al. (2014b). Mushroom body output neurons encode valence and guide memory-based action selection in Drosophila. eLife 3, e04580.
Babin, A., Kolly, S., Schneider, F., Dolivo, V., Zini, M., and Kawecki, T.J. (2014). Fruit flies learn to avoid odours associated with virulent infection. Biology letters 10, 20140048.
Becher, P.G., Flick, G., Rozp dowska, E., Schmidt, A., Hagman, A., Lebreton, S., Larsson, M. C., Hansson, B. S., Piškur, J., Witzgall, P., et al. (2012). Yeast, not fruit volatiles mediate Drosophila melanogaster attraction, oviposition and development. Funct. Ecol. 26, 822-828.
Begon, M. (1982). Yeasts and Drosophila. The Genetics and Biology of Drosophila (eds M. Ashburner, H. L. Carson & J. Thompson. Academic Press, London. 3a, 345–384.
References
152
Benton, R., Vannice, K.S., Gomez-Diaz, C., and Vosshall, L.B. (2009). Variant ionotropic glutamate receptors as chemosensory receptors in Drosophila. Cell 136, 149-162.
Beshel, J., and Zhong, Y. (2013). Graded encoding of food odor value in the Drosophila brain. The Journal of neuroscience : the official journal of the Society for Neuroscience 33, 15693-15704.
Bhandawat, V., Olsen, S.R., Gouwens, N.W., Schlief, M.L., and Wilson, R.I. (2007). Sensory processing in the Drosophila antennal lobe increases reliability and separability of ensemble odor representations. Nature neuroscience 10, 1474-1482.
Bräcker, L.B., Siju, K.P., Varela, N., Aso, Y., Zhang, M., Hein, I., Vasconcelos, M.L., and Grunwald Kadow, I.C. (2013). Essential role of the mushroom body in context-dependent CO(2) avoidance in Drosophila. Current biology : CB 23, 1228-1234.
Brand, A.H., and Perrimon, N. (1993). Targeted gene expression as a means of altering cell fates and generating dominant phenotypes. Development 118, 401-415.
Budick, S.A., and Dickinson, M.H. (2006). Free-flight responses of Drosophila melanogaster to attractive odors. The Journal of experimental biology 209, 3001-3017.
Butcher, N.J., Friedrich, A.B., Lu, Z., Tanimoto, H., and Meinertzhagen, I.A. (2012). Different classes of input and output neurons reveal new features in microglomeruli of the adult Drosophila mushroom body calyx. The Journal of comparative neurology 520, 2185-2201.
Butenandt, A., and Hecker, E. (1961). Synthese des Bombykols, des Sexual-Lockstoffes des Seidenspinners, und seiner geometrischen Isomeren. Angewandte Chemie 73, 349-416.
Cachero, S., Ostrovsky, A.D., Yu, J.Y., Dickson, B.J., and Jefferis, G.S. (2010). Sexual dimorphism in the fly brain. Current biology : CB 20, 1589-1601.
Caron, S.J., Ruta, V., Abbott, L.F., and Axel, R. (2013). Random convergence of olfactory inputs in the Drosophila mushroom body. Nature 497, 113-117.
Chen, T.W., Wardill, T.J., Sun, Y., Pulver, S.R., Renninger, S.L., Baohan, A., Schreiter, E.R., Kerr, R.A., Orger, M.B., Jayaraman, V., et al. (2013). Ultrasensitive fluorescent proteins for imaging neuronal activity. Nature 499, 295-300.
Chiang, A.S., Lin, C.Y., Chuang, C.C., Chang, H.M., Hsieh, C.H., Yeh, C.W., Shih, C.T., Wu, J.J., Wang, G.T., Chen, Y.C., et al. (2011). Three-dimensional reconstruction of brain-wide wiring networks in Drosophila at single-cell resolution. Current biology : CB 21, 1-11.
Chou, Y.H., Spletter, M.L., Yaksi, E., Leong, J.C., Wilson, R.I., and Luo, L. (2010). Diversity and wiring variability of olfactory local interneurons in the Drosophila antennal lobe. Nature neuroscience 13, 439-449.
Clyne, P.J., Warr, C.G., Freeman, M.R., Lessing, D., Kim, J., and Carlson, J.R. (1999). A novel family of divergent seven-transmembrane proteins: candidate odorant receptors in Drosophila. Neuron 22, 327-338.
Couto, A., Alenius, M., and Dickson, B.J. (2005). Molecular, anatomical, and functional organization of the Drosophila olfactory system. Current biology : CB 15, 1535-1547.
References
153
Das, A., Chiang, A., Davla, S., Priya, R., Reichert, H., Vijayraghavan, K., and Rodrigues, V. (2011). Identification and analysis of a glutamatergic local interneuron lineage in the adult Drosophila olfactory system. Neural systems & circuits 1, 4.
Datta, S.R., Vasconcelos, M.L., Ruta, V., Luo, S., Wong, A., Demir, E., Flores, J., Balonze, K., Dickson, B.J., and Axel, R. (2008). The Drosophila pheromone cVA activates a sexually dimorphic neural circuit. Nature 452, 473-477.
Davis, R.L. (2005). Olfactory memory formation in Drosophila: from molecular to systems neuroscience. Annual review of neuroscience 28, 275-302.
de Belle, J.S., and Heisenberg, M. (1994). Associative odor learning in Drosophila abolished by chemical ablation of mushroom bodies. Science 263, 692-695.
de Bruyne, M., Clyne, P.J., and Carlson, J.R. (1999). Odor coding in a model olfactory organ: the Drosophila maxillary palp. The Journal of neuroscience : the official journal of the Society for Neuroscience 19, 4520-4532.
de Bruyne, M., Foster, K., and Carlson, J.R. (2001). Odor coding in the Drosophila antenna. Neuron 30, 537-552.
Dekker, T., Ibba, I., Siju, K.P., Stensmyr, M.C., and Hansson, B.S. (2006). Olfactory shifts parallel superspecialism for toxic fruit in Drosophila melanogaster sibling, D. sechellia. Current biology : CB 16, 101-109.
Denk, W., Strickler, J.H., and Webb, W.W. (1990). Two-photon laser scanning fluorescence microscopy. Science 248, 73-76.
DiAntonio, A., Burgess, R.W., Chin, A.C., Deitcher, D.L., Scheller, R.H., and Schwarz, T.L. (1993). Identification and characterization of Drosophila genes for synaptic vesicle proteins. The Journal of neuroscience : the official journal of the Society for Neuroscience 13, 4924-4935.
Dobritsa, A.A., van der Goes van Naters, W., Warr, C.G., Steinbrecht, R.A., and Carlson, J.R. (2003). Integrating the molecular and cellular basis of odor coding in the Drosophila antenna. Neuron 37, 827-841.
Duffy, J.B. (2002). GAL4 system in Drosophila: a fly geneticist's Swiss army knife. Genesis 34, 1-15.
Duistermars, B.J., and Frye, M.A. (2010). Multisensory integration for odor tracking by flying Drosophila: Behavior, circuits and speculation. Communicative & integrative biology 3, 60-63.
Dweck, H.K., Ebrahim, S.A., Farhan, A., Hansson, B.S., and Stensmyr, M.C. (2015a). Olfactory proxy detection of dietary antioxidants in Drosophila. Current biology : CB 25, 455-466.
Dweck, H.K., Ebrahim, S.A., Kromann, S., Bown, D., Hillbur, Y., Sachse, S., Hansson, B.S., and Stensmyr, M.C. (2013). Olfactory preference for egg laying on citrus substrates in Drosophila. Current biology : CB 23, 2472-2480.
Dweck, H.K., Ebrahim, S.A., Thoma, M., Mohamed, A.A., Keesey, I.W., Trona, F., Lavista-Llanos, S., Svatos, A., Sachse, S., Knaden, M., and Hansson, B.S. (2015b). Pheromones mediating copulation and attraction in Drosophila. Proceedings of the National Academy of Sciences of the United States of America 112, E2829-2835.
References
154
Ebrahim, S.A., Dweck, H.K., Stokl, J., Hofferberth, J.E., Trona, F., Weniger, K., Rybak, J., Seki, Y., Stensmyr, M.C., Sachse, S., et al. (2015). Drosophila Avoids Parasitoids by Sensing Their Semiochemicals via a Dedicated Olfactory Circuit. PLoS biology 13, e1002318.
Enjin, A., Zaharieva, E.E., Frank, D.D., Mansourian, S., Suh, G.S., Gallio, M., and Stensmyr, M.C. (2016). Humidity Sensing in Drosophila. Current biology : CB 26, 1352-1358.
Fan, P., Manoli, D.S., Ahmed, O.M., Chen, Y., Agarwal, N., Kwong, S., Cai, A.G., Neitz, J., Renslo, A., Baker, B.S., and Shah, N.M. (2013). Genetic and neural mechanisms that inhibit Drosophila from mating with other species. Cell 154, 89-102.
Feinberg, E.H., Vanhoven, M.K., Bendesky, A., Wang, G., Fetter, R.D., Shen, K., and Bargmann, C.I. (2008). GFP Reconstitution Across Synaptic Partners (GRASP) defines cell contacts and synapses in living nervous systems. Neuron 57, 353-363.
Fiala, A., Spall, T., Diegelmann, S., Eisermann, B., Sachse, S., Devaud, J.M., Buchner, E., and Galizia, C.G. (2002). Genetically expressed cameleon in Drosophila melanogaster is used to visualize olfactory information in projection neurons. Current biology : CB 12, 1877-1884.
Fi ek, M., and Wilson, R.I. (2014). Stereotyped connectivity and computations in higher-order olfactory neurons. Nature neuroscience 17, 280-288.
Fishilevich, E., and Vosshall, L.B. (2005). Genetic and functional subdivision of the Drosophila antennal lobe. Current biology : CB 15, 1548-1553.
Frye, M.A., and Dickinson, M.H. (2004). Motor output reflects the linear superposition of visual and olfactory inputs in Drosophila. The Journal of experimental biology 207, 123-131.
Gallio, M., Ofstad, T.A., Macpherson, L.J., Wang, J.W., and Zuker, C.S. (2011). The coding of temperature in the Drosophila brain. Cell 144, 614-624.
Gao, Q., and Chess, A. (1999). Identification of candidate Drosophila olfactory receptors from genomic DNA sequence. Genomics 60, 31-39.
Gao, Q., Yuan, B., and Chess, A. (2000). Convergent projections of Drosophila olfactory neurons to specific glomeruli in the antennal lobe. Nature neuroscience 3, 780-785.
Goldman, A.L., Van der Goes van Naters, W., Lessing, D., Warr, C.G., and Carlson, J.R. (2005). Coexpression of two functional odor receptors in one neuron. Neuron 45, 661-666.
Grabe, V., Baschwitz, A., Dweck, H.K., Lavista-Llanos, S., Hansson, B.S., and Sachse, S. (2016). Elucidating the Neuronal Architecture of Olfactory Glomeruli in the Drosophila Antennal Lobe. Cell reports 16, 3401-3413.
Grabe, V., Strutz, A., Baschwitz, A., Hansson, B.S., and Sachse, S. (2015). Digital in vivo 3D atlas of the antennal lobe of Drosophila melanogaster. The Journal of comparative neurology 523, 530-544.
Grover, D., Katsuki, T., and Greenspan, R.J. (2016). Flyception: imaging brain activity in freely walking fruit flies. Nature methods 13, 569-572.
References
155
Gupta, N., and Stopfer, M. (2012). Functional analysis of a higher olfactory center, the lateral horn. The Journal of neuroscience : the official journal of the Society for Neuroscience 32, 8138-8148.
Ha, T.S., and Smith, D.P. (2006). A pheromone receptor mediates 11-cis-vaccenyl acetate-induced responses in Drosophila. The Journal of neuroscience : the official journal of the Society for Neuroscience 26, 8727-8733.
Hallem, E.A., and Carlson, J.R. (2006). Coding of odors by a receptor repertoire. Cell 125, 143-160.
Hallem, E.A., Ho, M.G., and Carlson, J.R. (2004). The molecular basis of odor coding in the Drosophila antenna. Cell 117, 965-979.
Hansson, B.S., Knaden, M., Sachse, S., Stensmyr, M.C., and Wicher, D. (2010). Towards plant-odor-related olfactory neuroethology in Drosophila. Chemoecology 20, 51-61.
Heimbeck, G., Bugnon, V., Gendre, N., Keller, A., and Stocker, R.F. (2001). A central neural circuit for experience-independent olfactory and courtship behavior in Drosophila melanogaster. Proceedings of the National Academy of Sciences of the United States of America 98, 15336-15341.
Heisenberg, M. (2003). Mushroom body memoir: from maps to models. Nature reviews. Neuroscience 4, 266-275.
Heisenberg, M. (2015). Outcome learning, outcome expectations, and intentionality in Drosophila. Learn Mem 22, 294-298.
Heisenberg, M., Borst, A., Wagner, S., and Byers, D. (1985). Drosophila mushroom body mutants are deficient in olfactory learning. Journal of neurogenetics 2, 1-30.
Hires, S.A., Tian, L., and Looger, L.L. (2008). Reporting neural activity with genetically encoded calcium indicators. Brain cell biology 36, 69-86.
Hofbauer, A. (1991). Eine Bibliothek monoklonaler Antikörper gegen das Gehirn von Drosophila melanogaster. Habilitation thesis. University of Würzburg,Würzburg, Germany.
Hoi, H., Matsuda, T., Nagai, T., and Campbell, R.E. (2013). Highlightable Ca2+ indicators for live cell imaging. Journal of the American Chemical Society 135, 46-49.
Honegger, K.S., Campbell, R.A., and Turner, G.C. (2011). Cellular-resolution population imaging reveals robust sparse coding in the Drosophila mushroom body. The Journal of neuroscience : the official journal of the Society for Neuroscience 31, 11772-11785.
Hong, E.J., and Wilson, R.I. (2015). Simultaneous encoding of odors by channels with diverse sensitivity to inhibition. Neuron 85, 573-589.
Huang, J., Zhang, W., Qiao, W., Hu, A., and Wang, Z. (2010). Functional connectivity and selective odor responses of excitatory local interneurons in Drosophila antennal lobe. Neuron 67, 1021-1033.
Ignell, R., Dekker, T., Ghaninia, M., and Hansson, B.S. (2005). Neuronal architecture of the mosquito deutocerebrum. The Journal of comparative neurology 493, 207-240.
References
156
Ignell, R., Root, C.M., Birse, R.T., Wang, J.W., Nassel, D.R., and Winther, A.M. (2009). Presynaptic peptidergic modulation of olfactory receptor neurons in Drosophila. Proceedings of the National Academy of Sciences of the United States of America 106, 13070-13075.
Ito, K., Awano, W., Suzuki, K., Hiromi, Y., and Yamamoto, D. (1997). The Drosophila mushroom body is a quadruple structure of clonal units each of which contains a virtually identical set of neurones and glial cells. Development 124, 761-771.
Ito, K., and Awasaki, T. (2008). Clonal unit architecture of the adult fly brain. Advances in experimental medicine and biology 628, 137-158.
Jeanne, J.M., and Wilson, R.I. (2015). Convergence, Divergence, and Reconvergence in a Feedforward Network Improves Neural Speed and Accuracy. Neuron 88, 1014-1026.
Jefferis, G.S., Potter, C.J., Chan, A.M., Marin, E.C., Rohlfing, T., Maurer, C.R., Jr., and Luo, L. (2007). Comprehensive maps of Drosophila higher olfactory centers: spatially segregated fruit and pheromone representation. Cell 128, 1187-1203.
Jenett, A., Rubin, G.M., Ngo, T.T., Shepherd, D., Murphy, C., Dionne, H., Pfeiffer, B.D., Cavallaro, A., Hall, D., Jeter, J., et al. (2012). A GAL4-driver line resource for Drosophila neurobiology. Cell reports 2, 991-1001.
Jones, W.D., Cayirlioglu, P., Kadow, I.G., and Vosshall, L.B. (2007). Two chemosensory receptors together mediate carbon dioxide detection in Drosophila. Nature 445, 86-90.
Kandel, E.R., Dudai, Y., and Mayford, M.R. (2014). The molecular and systems biology of memory. Cell 157, 163-186.
Karuppudurai, T., Lin, T.-Y., Ting, C.-Y., Pursley, R., Melnattur, Krishna V., Diao, F., White, Benjamin H., Macpherson, Lindsey J., Gallio, M., Pohida, T., and Lee, C.-H. (2014). A Hard-Wired Glutamatergic Circuit Pools and Relays UV Signals to Mediate Spectral Preference in Drosophila. Neuron 81, 603-615.
Kazama, H., and Wilson, R.I. (2008). Homeostatic matching and nonlinear amplification at identified central synapses. Neuron 58, 401-413.
Kido, A., and Ito, K. (2002). Mushroom bodies are not required for courtship behavior by normal and sexually mosaic Drosophila. Journal of neurobiology 52, 302-311.
Knaden, M., Strutz, A., Ahsan, J., Sachse, S., and Hansson, B.S. (2012). Spatial representation of odorant valence in an insect brain. Cell reports 1, 392-399.
Kohl, J., Ostrovsky, A.D., Frechter, S., and Jefferis, G.S. (2013). A bidirectional circuit switch reroutes pheromone signals in male and female brains. Cell 155, 1610-1623.
Kreher, S.A., Kwon, J.Y., and Carlson, J.R. (2005). The molecular basis of odor coding in the Drosophila larva. Neuron 46, 445-456.
Kurtovic, A., Widmer, A., and Dickson, B.J. (2007). A single class of olfactory neurons mediates behavioural responses to a Drosophila sex pheromone. Nature 446, 542-546.
Kwon, J.Y., Dahanukar, A., Weiss, L.A., and Carlson, J.R. (2007). The molecular basis of CO2 reception in Drosophila. Proceedings of the National Academy of Sciences of the United States of America 104, 3574-3578.

References
157
Lai, S.L., Awasaki, T., Ito, K., and Lee, T. (2008). Clonal analysis of Drosophila antennal lobe neurons: diverse neuronal architectures in the lateral neuroblast lineage. Development 135, 2883-2893.
Lai, S.L., and Lee, T. (2006). Genetic mosaic with dual binary transcriptional systems in Drosophila. Nature neuroscience 9, 703-709.
Laissue, P.P., Reiter, C., Hiesinger, P.R., Halter, S., Fischbach, K.F., and Stocker, R.F. (1999). Three-dimensional reconstruction of the antennal lobe in Drosophila melanogaster. The Journal of comparative neurology 405, 543-552.
Larsson, M.C., Domingos, A.I., Jones, W.D., Chiappe, M.E., Amrein, H., and Vosshall, L.B. (2004). Or83b encodes a broadly expressed odorant receptor essential for Drosophila olfaction. Neuron 43, 703-714.
Leal, W.S. (2013). Odorant reception in insects: roles of receptors, binding proteins, and degrading enzymes. Annual review of entomology 58, 373-391.
Lebreton, S., Borrero-Echeverry, F., Gonzalez, F., Solum, M., Wallin, E., Hedenstroem, E., Hansson, B.S., Gustavsson, A.-L., Bengtsson, M., Birgersson, G., et al. (2017). The Drosophila pheromone Z4-11Al is encoded together with habitat olfactory cues and mediates species-specific communication. bioRxiv.
Lebreton, S., Grabe, V., Omondi, A.B., Ignell, R., Becher, P.G., Hansson, B.S., Sachse, S., and Witzgall, P. (2014). Love makes smell blind: mating suppresses pheromone attraction in Drosophila females via Or65a olfactory neurons. Scientific reports 4, 7119.
Lebreton, S., Trona, F., Borrero-Echeverry, F., Bilz, F., Grabe, V., Becher, P.G., Carlsson, M.A., Nassel, D.R., Hansson, B.S., Sachse, S., and Witzgall, P. (2015). Feeding regulates sex pheromone attraction and courtship in Drosophila females. Scientific reports 5, 13132.
Lee, D.D., and Seung, H.S. (1999). Learning the parts of objects by non-negative matrix factorization. Nature 401, 788-791.
Li, H., Li, Y., Lei, Z., Wang, K., and Guo, A. (2013). Transformation of odor selectivity from projection neurons to single mushroom body neurons mapped with dual-color calcium imaging. Proceedings of the National Academy of Sciences of the United States of America 110, 12084-12089.
Li, Q., and Liberles, S.D. (2015). Aversion and attraction through olfaction. Current biology : CB 25, R120-129.
Liang, L., Li, Y., Potter, C.J., Yizhar, O., Deisseroth, K., Tsien, R.W., and Luo, L. (2013). GABAergic projection neurons route selective olfactory inputs to specific higher-order neurons. Neuron 79, 917-931.
Liang, L., and Luo, L. (2010). The olfactory circuit of the fruit fly Drosophila melanogaster. Science China. Life sciences 53, 472-484.
Lin, A.C., Bygrave, A.M., de Calignon, A., Lee, T., and Miesenbock, G. (2014a). Sparse, decorrelated odor coding in the mushroom body enhances learned odor discrimination. Nature neuroscience 17, 559-568.
Lin, H.H., Lai, J.S., Chin, A.L., Chen, Y.C., and Chiang, A.S. (2007). A map of olfactory representation in the Drosophila mushroom body. Cell 128, 1205-1217.
References
158
Lin, S., Owald, D., Chandra, V., Talbot, C., Huetteroth, W., and Waddell, S. (2014b). Neural correlates of water reward in thirsty Drosophila. Nature neuroscience 17, 1536-1542.
Linz, J., Baschwitz, A., Strutz, A., Dweck, H.K., Sachse, S., Hansson, B.S., and Stensmyr, M.C. (2013). Host plant-driven sensory specialization in Drosophila erecta. Proceedings. Biological sciences / The Royal Society 280, 20130626.
Liu, W.W., and Wilson, R.I. (2013). Glutamate is an inhibitory neurotransmitter in the Drosophila olfactory system. Proceedings of the National Academy of Sciences of the United States of America 110, 10294-10299.
Luo, L., Callaway, E.M., and Svoboda, K. (2008). Genetic dissection of neural circuits. Neuron 57, 634-660.
Ma, Y., Smith, D., Hof, P.R., Foerster, B., Hamilton, S., Blackband, S.J., Yu, M., and Benveniste, H. (2008). In vivo 3D Digital Atlas Database of the Adult C57BL/6J Mouse Brain by Magnetic Resonance Microscopy. Frontiers in neuroanatomy 2, 1.
Marin, E.C., Jefferis, G.S., Komiyama, T., Zhu, H., and Luo, L. (2002). Representation of the glomerular olfactory map in the Drosophila brain. Cell 109, 243-255.
Masters, B.R., So, P.T., and Gratton, E. (1997). Multiphoton excitation fluorescence microscopy and spectroscopy of in vivo human skin. Biophysical journal 72, 2405-2412.
Masuda-Nakagawa, L.M., Tanaka, N.K., and O'Kane, C.J. (2005). Stereotypic and random patterns of connectivity in the larval mushroom body calyx of Drosophila. Proceedings of the National Academy of Sciences of the United States of America 102, 19027-19032.
Matz, M.V., Fradkov, A.F., Labas, Y.A., Savitsky, A.P., Zaraisky, A.G., Markelov, M.L., and Lukyanov, S.A. (1999). Fluorescent proteins from nonbioluminescent Anthozoa species. Nature biotechnology 17, 969-973.
Min, S., Ai, M., Shin, S.A., and Suh, G.S. (2013). Dedicated olfactory neurons mediating attraction behavior to ammonia and amines in Drosophila. Proceedings of the National Academy of Sciences of the United States of America 110, E1321-1329.
Miyawaki, A., Llopis, J., Heim, R., McCaffery, J.M., Adams, J.A., Ikura, M., and Tsien, R.Y. (1997). Fluorescent indicators for Ca2+ based on green fluorescent proteins and calmodulin. Nature 388, 882-887.
Morgan, T.H. (1910). Sex Limited Inheritance in Drosophila. Science 32, 120-122.
Mosca, T.J., and Luo, L. (2014). Synaptic organization of the Drosophila antennal lobe and its regulation by the Teneurins. eLife 3, e03726.
Münch, D., and Galizia, C.G. (2016). DoOR 2.0--Comprehensive Mapping of Drosophila melanogaster Odorant Responses. Scientific reports 6, 21841.
Murthy, M., Fiete, I., and Laurent, G. (2008). Testing odor response stereotypy in the Drosophila mushroom body. Neuron 59, 1009-1023.
Nakai, J., Ohkura, M., and Imoto, K. (2001). A high signal-to-noise Ca(2+) probe composed of a single green fluorescent protein. Nature biotechnology 19, 137-141.

References
159
Nassi, J.J., and Callaway, E.M. (2009). Parallel processing strategies of the primate visual system. Nature reviews. Neuroscience 10, 360-372.
Neuhaus, E.M., Gisselmann, G., Zhang, W., Dooley, R., Stortkuhl, K., and Hatt, H. (2005). Odorant receptor heterodimerization in the olfactory system of Drosophila melanogaster. Nature neuroscience 8, 15-17.
Ng, M., Roorda, R.D., Lima, S.Q., Zemelman, B.V., Morcillo, P., and Miesenbock, G. (2002). Transmission of olfactory information between three populations of neurons in the antennal lobe of the fly. Neuron 36, 463-474.
Okada, R., Awasaki, T., and Ito, K. (2009). Gamma-aminobutyric acid (GABA)-mediated neural connections in the Drosophila antennal lobe. The Journal of comparative neurology 514, 74-91.
Olsen, S.R., Bhandawat, V., and Wilson, R.I. (2007). Excitatory interactions between olfactory processing channels in the Drosophila antennal lobe. Neuron 54, 89-103.
Olsen, S.R., Bhandawat, V., and Wilson, R.I. (2010). Divisive normalization in olfactory population codes. Neuron 66, 287-299.
Olsen, S.R., and Wilson, R.I. (2008a). Cracking neural circuits in a tiny brain: new approaches for understanding the neural circuitry of Drosophila. Trends in neurosciences 31, 512-520.
Olsen, S.R., and Wilson, R.I. (2008b). Lateral presynaptic inhibition mediates gain control in an olfactory circuit. Nature 452, 956-960.
Otsuna, H., Shinomiya, K., and Ito, K. (2014). Parallel neural pathways in higher visual centers of the Drosophila brain that mediate wavelength-specific behavior. Frontiers in neural circuits 8, 8.
Owald, D., and Waddell, S. (2015). Olfactory learning skews mushroom body output pathways to steer behavioral choice in Drosophila. Current opinion in neurobiology 35, 178-184.
Parnas, M., Lin, A.C., Huetteroth, W., and Miesenbock, G. (2013). Odor discrimination in Drosophila: from neural population codes to behavior. Neuron 79, 932-944.
Patterson, G.H., and Lippincott-Schwartz, J. (2002). A photoactivatable GFP for selective photolabeling of proteins and cells. Science 297, 1873-1877.
Pelosi, P., Iovinella, I., Felicioli, A., and Dani, F.R. (2014). Soluble proteins of chemical communication: an overview across arthropods. Frontiers in physiology 5, 320.
Perez-Orive, J., Mazor, O., Turner, G.C., Cassenaer, S., Wilson, R.I., and Laurent, G. (2002). Oscillations and sparsening of odor representations in the mushroom body. Science 297, 359-365.
Potter, C.J., Tasic, B., Russler, E.V., Liang, L., and Luo, L. (2010). The Q system: a repressible binary system for transgene expression, lineage tracing, and mosaic analysis. Cell 141, 536-548.
Ramaekers, A., Magnenat, E., Marin, E.C., Gendre, N., Jefferis, G.S., Luo, L., and Stocker, R.F. (2005). Glomerular maps without cellular redundancy at successive levels of the Drosophila larval olfactory circuit. Current biology : CB 15, 982-992.
References
160
Rein, K., Zockler, M., Mader, M.T., Grubel, C., and Heisenberg, M. (2002). The Drosophila standard brain. Current biology : CB 12, 227-231.
Riemensperger, T., Pech, U., Dipt, S., and Fiala, A. (2012). Optical calcium imaging in the nervous system of Drosophila melanogaster. Biochimica et biophysica acta 1820, 1169-1178.
Robertson, H.M., Warr, C.G., and Carlson, J.R. (2003). Molecular evolution of the insect chemoreceptor gene superfamily in Drosophila melanogaster. Proceedings of the National Academy of Sciences of the United States of America 100 Suppl 2, 14537-14542.
Root, C.M., Ko, K.I., Jafari, A., and Wang, J.W. (2011). Presynaptic facilitation by neuropeptide signaling mediates odor-driven food search. Cell 145, 133-144.
Root, C.M., Masuyama, K., Green, D.S., Enell, L.E., Nassel, D.R., Lee, C.H., and Wang, J.W. (2008). A presynaptic gain control mechanism fine-tunes olfactory behavior. Neuron 59, 311-321.
Root, C.M., Semmelhack, J.L., Wong, A.M., Flores, J., and Wang, J.W. (2007). Propagation of olfactory information in Drosophila. Proceedings of the National Academy of Sciences of the United States of America 104, 11826-11831.
Ruta, V., Datta, S.R., Vasconcelos, M.L., Freeland, J., Looger, L.L., and Axel, R. (2010). A dimorphic pheromone circuit in Drosophila from sensory input to descending output. Nature 468, 686-690.
Rybak, J., Kuss, A., Lamecker, H., Zachow, S., Hege, H.C., Lienhard, M., Singer, J., Neubert, K., and Menzel, R. (2010). The Digital Bee Brain: Integrating and Managing Neurons in a Common 3D Reference System. Frontiers in systems neuroscience 4.
Sachse, S., Rueckert, E., Keller, A., Okada, R., Tanaka, N.K., Ito, K., and Vosshall, L.B. (2007). Activity-dependent plasticity in an olfactory circuit. Neuron 56, 838-850.
Sato, K., Pellegrino, M., Nakagawa, T., Vosshall, L.B., and Touhara, K. (2008). Insect olfactory receptors are heteromeric ligand-gated ion channels. Nature 452, 1002-1006.
Schlief, M.L., and Wilson, R.I. (2007). Olfactory processing and behavior downstream from highly selective receptor neurons. Nature neuroscience 10, 623-630.
Schneider, D., Kasang, G., and Kaissling, K.E. (1968). [Determination of the olfactory threshold of Bombyx mori with tritium-labelled bombycol]. Die Naturwissenschaften 55, 395.
Schubert, M., Hansson, B.S., and Sachse, S. (2014). The banana code-natural blend processing in the olfactory circuitry of Drosophila melanogaster. Frontiers in physiology 5, 59.
Schultzhaus, J.N., Saleem, S., Iftikhar, H., and Carney, G.E. (2016). The role of the Drosophila lateral horn in olfactory information processing and behavioral response. Journal of insect physiology 98, 29-37.
Sejourne, J., Placais, P.Y., Aso, Y., Siwanowicz, I., Trannoy, S., Thoma, V., Tedjakumala, S.R., Rubin, G.M., Tchenio, P., Ito, K., et al. (2011). Mushroom body efferent neurons responsible for aversive olfactory memory retrieval in Drosophila. Nature neuroscience 14, 903-910.

References
161
Seki, Y., Rybak, J., Wicher, D., Sachse, S., and Hansson, B.S. (2010). Physiological and morphological characterization of local interneurons in the Drosophila antennal lobe. Journal of neurophysiology 104, 1007-1019.
Semmelhack, J.L., and Wang, J.W. (2009). Select Drosophila glomeruli mediate innate olfactory attraction and aversion. Nature 459, 218-223.
Shanbhag, S.R., Muller, B., and Steinbrecht, R.A. (1999). Atlas of olfactory organs of Drosophila melanogaster - 1. Types, external organization, innervation and distribution of olfactory sensilla. Int J Insect Morphol 28, 377-397.
Shanbhag, S.R., Muller, B., and Steinbrecht, R.A. (2000). Atlas of olfactory organs of Drosophila melanogaster 2. Internal organization and cellular architecture of olfactory sensilla. Arthropod structure & development 29, 211-229.
Shang, Y., Claridge-Chang, A., Sjulson, L., Pypaert, M., and Miesenbock, G. (2007). Excitatory local circuits and their implications for olfactory processing in the fly antennal lobe. Cell 128, 601-612.
Silbering, A.F., and Galizia, C.G. (2007). Processing of odor mixtures in the Drosophila antennal lobe reveals both global inhibition and glomerulus-specific interactions. The Journal of neuroscience : the official journal of the Society for Neuroscience 27, 11966-11977.
Silbering, A.F., Okada, R., Ito, K., and Galizia, C.G. (2008). Olfactory information processing in the Drosophila antennal lobe: anything goes? The Journal of neuroscience : the official journal of the Society for Neuroscience 28, 13075-13087.
Silbering, A.F., Rytz, R., Grosjean, Y., Abuin, L., Ramdya, P., Jefferis, G.S., and Benton, R. (2011). Complementary function and integrated wiring of the evolutionarily distinct Drosophila olfactory subsystems. The Journal of neuroscience : the official journal of the Society for Neuroscience 31, 13357-13375.
Soelter, J., Schumacher, J., Spors, H., and Schmuker, M. (2014). Automatic segmentation of odor maps in the mouse olfactory bulb using regularized non-negative matrix factorization. NeuroImage 98, 279-288.
Soucy, E.R., Albeanu, D.F., Fantana, A.L., Murthy, V.N., and Meister, M. (2009). Precision and diversity in an odor map on the olfactory bulb. Nature neuroscience 12, 210-220.
Steck, K., Veit, D., Grandy, R., Badia, S.B., Mathews, Z., Verschure, P., Hansson, B.S., and Knaden, M. (2012). A high-throughput behavioral paradigm for Drosophila olfaction - The Flywalk. Scientific reports 2, 361.
Stensmyr, M.C., Dweck, H.K., Farhan, A., Ibba, I., Strutz, A., Mukunda, L., Linz, J., Grabe, V., Steck, K., Lavista-Llanos, S., et al. (2012). A conserved dedicated olfactory circuit for detecting harmful microbes in Drosophila. Cell 151, 1345-1357.
Stensmyr, M.C., Giordano, E., Balloi, A., Angioy, A.M., and Hansson, B.S. (2003). Novel natural ligands for Drosophila olfactory receptor neurones. The Journal of experimental biology 206, 715-724.
Stocker, R.F. (1994). The organization of the chemosensory system in Drosophila melanogaster: a review. Cell and tissue research 275, 3-26.

References
162
Stocker, R.F. (2001). Drosophila as a focus in olfactory research: mapping of olfactory sensilla by fine structure, odor specificity, odorant receptor expression, and central connectivity. Microscopy research and technique 55, 284-296.
Stocker, R.F., Heimbeck, G., Gendre, N., and de Belle, J.S. (1997). Neuroblast ablation in Drosophila P[GAL4] lines reveals origins of olfactory interneurons. Journal of neurobiology 32, 443-456.
Stocker, R.F., Lienhard, M.C., Borst, A., and Fischbach, K.F. (1990). Neuronal architecture of the antennal lobe in Drosophila melanogaster. Cell and tissue research 262, 9-34.
Stockinger, P., Kvitsiani, D., Rotkopf, S., Tirian, L., and Dickson, B.J. (2005). Neural circuitry that governs Drosophila male courtship behavior. Cell 121, 795-807.
Stökl, J., Strutz, A., Dafni, A., Svatos, A., Doubsky, J., Knaden, M., Sachse, S., Hansson, B.S., and Stensmyr, M.C. (2010). A deceptive pollination system targeting drosophilids through olfactory mimicry of yeast. Current biology : CB 20, 1846-1852.
Strutz, A., Soelter, J., Baschwitz, A., Farhan, A., Grabe, V., Rybak, J., Knaden, M., Schmuker, M., Hansson, B.S., and Sachse, S. (2014). Decoding odor quality and intensity in the Drosophila brain. eLife 3, e04147.
Su, C.Y., Menuz, K., and Carlson, J.R. (2009). Olfactory perception: receptors, cells, and circuits. Cell 139, 45-59.
Su, C.Y., and Wang, J.W. (2014). Modulation of neural circuits: how stimulus context shapes innate behavior in Drosophila. Current opinion in neurobiology 29, 9-16.
Suh, G.S., Wong, A.M., Hergarden, A.C., Wang, J.W., Simon, A.F., Benzer, S., Axel, R., and Anderson, D.J. (2004). A single population of olfactory sensory neurons mediates an innate avoidance behaviour in Drosophila. Nature 431, 854-859.
Swarup, S., Williams, T.I., and Anholt, R.R. (2011). Functional dissection of Odorant binding protein genes in Drosophila melanogaster. Genes, brain, and behavior 10, 648-657.
Tanaka, N.K., Awasaki, T., Shimada, T., and Ito, K. (2004). Integration of chemosensory pathways in the Drosophila second-order olfactory centers. Current biology : CB 14, 449-457.
Tanaka, N.K., Endo, K., and Ito, K. (2012). Organization of antennal lobe-associated neurons in adult Drosophila melanogaster brain. The Journal of comparative neurology 520, 4067-4130.
Tanaka, N.K., Tanimoto, H., and Ito, K. (2008). Neuronal assemblies of the Drosophila mushroom body. The Journal of comparative neurology 508, 711-755.
Thoma, M., Hansson, B.S., and Knaden, M. (2014). Compound valence is conserved in binary odor mixtures in Drosophila melanogaster. The Journal of experimental biology 217, 3645-3655.
Tian, L., Hires, S.A., Mao, T., Huber, D., Chiappe, M.E., Chalasani, S.H., Petreanu, L., Akerboom, J., McKinney, S.A., Schreiter, E.R., et al. (2009). Imaging neural activity in worms, flies and mice with improved GCaMP calcium indicators. Nature methods 6, 875-881.
References
163
Tully, T., and Quinn, W.G. (1985). Classical conditioning and retention in normal and mutant Drosophila melanogaster. Journal of comparative physiology. A, Sensory, neural, and behavioral physiology 157, 263-277.
Turner, G.C., Bazhenov, M., and Laurent, G. (2008). Olfactory representations by Drosophila mushroom body neurons. Journal of neurophysiology 99, 734-746.
van der Goes van Naters, W., and Carlson, J.R. (2007). Receptors and neurons for fly odors in Drosophila. Current biology : CB 17, 606-612.
van Thor, J.J. (2009). Photoreactions and dynamics of the green fluorescent protein. Chemical Society reviews 38, 2935-2950.
Venken, K.J., Simpson, J.H., and Bellen, H.J. (2011). Genetic manipulation of genes and cells in the nervous system of the fruit fly. Neuron 72, 202-230.
Vieira, F.G., and Rozas, J. (2011). Comparative genomics of the odorant-binding and chemosensory protein gene families across the Arthropoda: origin and evolutionary history of the chemosensory system. Genome biology and evolution 3, 476-490.
Vinje, W.E., and Gallant, J.L. (2000). Sparse coding and decorrelation in primary visual cortex during natural vision. Science 287, 1273-1276.
Vogt, R.G., Rogers, M.E., Franco, M.D., and Sun, M. (2002). A comparative study of odorant binding protein genes: differential expression of the PBP1-GOBP2 gene cluster in Manduca sexta (Lepidoptera) and the organization of OBP genes in Drosophila melanogaster (Diptera). The Journal of experimental biology 205, 719-744.
Vosshall, L.B. (2001). The molecular logic of olfaction in Drosophila. Chemical senses 26, 207-213.
Vosshall, L.B., Amrein, H., Morozov, P.S., Rzhetsky, A., and Axel, R. (1999). A spatial map of olfactory receptor expression in the Drosophila antenna. Cell 96, 725-736.
Vosshall, L.B., and Stocker, R.F. (2007). Molecular architecture of smell and taste in Drosophila. Annual review of neuroscience 30, 505-533.
Vosshall, L.B., Wong, A.M., and Axel, R. (2000). An olfactory sensory map in the fly brain. Cell 102, 147-159.
Wang, J.W., Wong, A.M., Flores, J., Vosshall, L.B., and Axel, R. (2003a). Two-photon calcium imaging reveals an odor-evoked map of activity in the fly brain. Cell 112, 271-282.
Wang, K., Gong, J., Wang, Q., Li, H., Cheng, Q., Liu, Y., Zeng, S., and Wang, Z. (2014). Parallel pathways convey olfactory information with opposite polarities in Drosophila. Proceedings of the National Academy of Sciences of the United States of America 111, 3164-3169.
Wang, Y., Chiang, A.S., Xia, S., Kitamoto, T., Tully, T., and Zhong, Y. (2003b). Blockade of neurotransmission in Drosophila mushroom bodies impairs odor attraction, but not repulsion. Current biology : CB 13, 1900-1904.
Wang, Y., Guo, H.F., Pologruto, T.A., Hannan, F., Hakker, I., Svoboda, K., and Zhong, Y. (2004). Stereotyped odor-evoked activity in the mushroom body of Drosophila

References
164
revealed by green fluorescent protein-based Ca2+ imaging. The Journal of neuroscience : the official journal of the Society for Neuroscience 24, 6507-6514.
Wicher, D., Schafer, R., Bauernfeind, R., Stensmyr, M.C., Heller, R., Heinemann, S.H., and Hansson, B.S. (2008). Drosophila odorant receptors are both ligand-gated and cyclic-nucleotide-activated cation channels. Nature 452, 1007-1011.
Wilson, R.I., and Laurent, G. (2005). Role of GABAergic inhibition in shaping odor-evoked spatiotemporal patterns in the Drosophila antennal lobe. The Journal of neuroscience : the official journal of the Society for Neuroscience 25, 9069-9079.
Wilson, R.I., Turner, G.C., and Laurent, G. (2004). Transformation of olfactory representations in the Drosophila antennal lobe. Science 303, 366-370.
Wong, A.M., Wang, J.W., and Axel, R. (2002). Spatial representation of the glomerular map in the Drosophila protocerebrum. Cell 109, 229-241.
Xia, S., and Tully, T. (2007). Segregation of odor identity and intensity during odor discrimination in Drosophila mushroom body. PLoS biology 5, e264.
Xu, P., Atkinson, R., Jones, D.N., and Smith, D.P. (2005). Drosophila OBP LUSH is required for activity of pheromone-sensitive neurons. Neuron 45, 193-200.
Yaksi, E., and Wilson, R.I. (2010). Electrical coupling between olfactory glomeruli. Neuron 67, 1034-1047.
Yao, C.A., Ignell, R., and Carlson, J.R. (2005). Chemosensory coding by neurons in the coeloconic sensilla of the Drosophila antenna. The Journal of neuroscience : the official journal of the Society for Neuroscience 25, 8359-8367.
Yao, K.M., Samson, M.L., Reeves, R., and White, K. (1993). Gene elav of Drosophila melanogaster: a prototype for neuronal-specific RNA binding protein gene family that is conserved in flies and humans. Journal of neurobiology 24, 723-739.
Yasuyama, K., and Salvaterra, P.M. (1999). Localization of choline acetyltransferase-expressing neurons in Drosophila nervous system. Microscopy research and technique 45, 65-79.
Yu, J.Y., Kanai, M.I., Demir, E., Jefferis, G.S., and Dickson, B.J. (2010). Cellular organization of the neural circuit that drives Drosophila courtship behavior. Current biology : CB 20, 1602-1614.
Zhao, Y., Araki, S., Wu, J., Teramoto, T., Chang, Y.F., Nakano, M., Abdelfattah, A.S., Fujiwara, M., Ishihara, T., Nagai, T., and Campbell, R.E. (2011). An expanded palette of genetically encoded Ca2+ indicators. Science 333, 1888-1891.
Glossary
165
Glossary
adCL anterodorsal cell cluster
AL antennal lobe
CRs chemosensory receptors
CSPs chemosensory proteins
CX mushroom body calyx
DsRed red fluorescent protein found in the coral Discosoma striata
ELAV embryonic lethal abnormal vision; protein involved in the develop-ment of the central nervous system
END1-2 fusion protein composed of ELAV, n-synaptobrevin and DsRed
GABA gamma-aminobutyric acid
GAL4-UAS yeast binary transcription system, like the Q-system and LexA-LexAop
GECIs genetically encoded calcium (or chloride) indicators
GFP green fluorescent protein
GRASP GFP reconstitution across synaptic partners
ePNs excitatory projection neurons
iPNs inhibitory projection neurons
IRs ionotropic receptors
KCs Kenyon cells
lCL lateral cell cluster
LH lateral horn
LHNs lateral horn neurons
LNs local interneurons
NMF non-negative matrix factorization
n-synaptobrevin neuronal synaptic vesicle protein
OBPs odorant binding proteins
ODEs odor degrading enzymes
Orco olfactory receptor co-receptor (formerly called OR83b)
ORDs odor response domains
ORs olfactory receptors
OSNs olfactory sensory neurons
pa-GFP photoactivatable green fluorescent protein
PCA principal component analysis

Glossary
166
PNs projection neurons
SSR single sensillum recordings
UAS upstream activating sequence
vCL ventral cell cluster
VLP ventrolateral protocerebrum
VLPNs ventrolateral protocerebrum neurons

Declaration of independent assignment
167
Declaration of independent assignment
I declare in accordance with the conferral of the degree of doctor from the School of Bi-
ology and Pharmacy of Friedrich-Schiller-University Jena that the submitted thesis was
written only with the assistance and literature cited in the text.
People who assisted in experiments, data analysis and writing of the manuscripts are
listed as co-authors of the respective manuscripts. I was not assisted by a consultant for
doctorate theses.
The thesis has not been previously submitted whether to the Friedrich-Schiller-
University, Jena or to any other university.
_______________________ _______________________
Place, date Signature
Acknowledgements
168
Acknowledgements
First of all, I want to thank Prof. Bill S. Hansson and Dr. Silke Sachse for giving me the opportunity to do my PhD in that great environment of the “Hansson department”. During the last years I learned under your supervision a lot about the neurobiology of olfaction in insects and the methods to investigate the olfactory system.
I thank the International Max Planck Research School (IMPRS for the exploration of eco-logical interactions with molecular and chemical techniques) for the funding, the great courses offered on soft and hard skills, and the opportunity to meet all those impressive young scientists within the IMPRS.
Dr. Michael Schmuker danke ich für die konstruktiven Beiträge zu den verschiedenen Projekten und den daraus hervorgegangenen Papern sowie als Mitglied in meinen The-sis Committee Meetings.
Ich danke Dr. Jan Sölter für die „Opferung“ seiner wenigen Freizeit, um die morphologi-schen und physiologischen Daten zu analysieren und mir die dazugehörigen bioinforma-tischen Grundlagen (soweit möglich) zu erklären. Seine Ideen und Ratschläge zu den Möglichkeiten der Datenauswertung haben sehr viele tolle Ergebnisse hervorgebracht. - Jan, ich wünsche dir noch einen tollen Urlaub!
For teaching me the dissection of fly brains, the immunohistochemistry, the confocal la-ser scanning microscopy and the reconstruction of neurons and neuropils already during my student assistance I want to thank Dr. Yoichi Seki and Dr. Jürgen Rybak. Further-more, I thank Dr. Sofia Lavista-Llanos for the introduction into and the help with fly ge-netics during the last years.
Bei Dr. Antonia Strutz und Dr. Veit Grabe bedanke ich mich für die Einarbeitung und Unterrichtung in Multiphotonenmikroskopie und funktionellem Imaging sowie für die all-tägliche Unterstützung bei Fragen und Problemen bei meinen Experimenten.
Für die Hilfe im Fliegenlabor, beim Präparieren und vielen weiteren Unterstützungen bei der Laborarbeit, danke ich Silke Trautheim. Ebenso bedanke ich mich bei Regina Stie-ber-Rödiger, Kerstin Weniger, Sylke Dietel-Gläßer, Sabine Kaltofen und Sascha Bucks für die Unterstützung bei Fragen und Problemen im Laboralltag.
Swetlana Laubrich danke ich für die Unterstützung bei administrativen Anliegen.
Für die technische Umsetzung von Versuchsaufbauten und deren kontinuierliche Ent-wicklung bedanke ich mich bei Daniel Veit und dem Werkstattteam. Des Weiteren danke ich dem IT-Department bei der Hilfe zu meinen kleinen und großen Problemen mit Soft-ware, PC & Co.
Acknowledgements
169
I am especially grateful to the members of the research group Olfactory Coding, all Jour-nal Clubbers as well as all former and current members of the “Hansson department”. Thank you for the fruitful discussions on scientific issues and beyond, as well as for the awesome time in this nice multi-cultural working environment with lots of cakes and sweets.
Ein extra Dankeschön geht an PD Dr. Dieter Wicher, Dr. Veit Grabe und Dr. Michael Thoma für die Kommentare zum Skript und besonders die Motivation während der letz-ten Etappe. - Ohne euch hätte ich das ganze wohl nicht mehr fertig gemacht! In line with this I thank Dr. Richard Fandino for the correction of my proper “denglisch“ of the (almost) final version of this dissertation.
Regina, ohne dich wäre ich verhungert oder hätte drei Tage lang immer Dasselbe essen müssen, falls ich mich mal zum Kochen motivieren konnte. Aber zum Glück hast du mich mit Kartoffelbrei & Würstchen-Gulasch (und vielen anderen Leckereien!) aufgepäppelt. Elisa hat diese anspruchsvolle Aufgabe in deiner Elternzeit übernommen, sodass ich die letzte Etappe bis zum Einreichen der Doktorarbeit nicht verhungert bin.
Sascha, Daniel, Veit, Micha, Tom, Christopher, Alex, Roman u.a. danke ich für die zahl-reichen zynischen Kommentare und Gespräche, ohne die ich mich wohl schon längst für verrückt erklärt hätte. In line with this I thank Fabio for sharing with me the view of realism (with a tendency to pessimism and sarcasm). - It was a pleasure for me attending that marvellous time of epic failures!
Elisa+Flosch+Alma, Christopher+Tim, Sina, Fabio, Jan+Frank, Alex+Sinead, Regi+RoRö+ Nora+Niklas, Veit+Franzi+Ida, Ahmed, Lydia, Tom u.a. vielen Dank für die lustigen Stunden bei Movie Nights, Volleyball, Dinner, Spex- und Hat-Vorbereitungen, Christmas Movies, Drachen-boot, Partys u.v.m.
Meiner Familie, Mathias, Maria, Anna, Isa, Gerald und darüber hinaus gilt mein Dank allen namentlich nicht erwähnten Verwandten, Freunden und Bekannten, für die Unter-stützung, Motivation sowie jegliche Ablenkung nach etlichen missglückten Experimenten in den letzten Jahren.
Mathias, die Doktorarbeit ist fertig („yippie yeah“) und du kannst endlich deine XXX ma-chen!
Curriculum Vitae
170
Curriculum Vitae Personal Information
Amelie Baschwitz
Eichendorffweg 2
07745 Jena, Germany
Born May, 9th 1985 in Altenburg (Thüringen), Germany
Education
11.2011 – present PhD student
11.2011 – 11.2014 Stipend of the International Max Planck Research School
Max Planck Institute for Chemical Ecology in Jena, Germany
Department of Evolutionary Neuroethology
Research Group Olfactory coding
Thesis advisors: Prof. Bill S. Hansson, Dr. Silke Sachse, Dr. Mi-chael Schmuker
Thesis Title:
Elucidating the olfactory pathways within and beyond the an-tennal lobe in Drosophila melanogaster
10.2005 - 09.2011 Diploma in Biochemistry
Friedrich – Schiller – University Jena, Germany
Thesis advisors: Prof. Bill S. Hansson, Dr. Silke Sachse
Thesis Title:
Characterization of inhibitory olfactory projection neurons in Drosophila melanogaster
Scientific employment
10.2008 - 03.2011 Student assistent at MPI CE Jena by Dr. Y. Seki
Reconstruction and volume measuring of neurons in Drosophila
Publications
2016 Grabe V., Baschwitz, A., Dweck, H. K. M., Lavista-Llanos, S., Hansson, B. S., Sachse, S.
Elucidating the neuronal architecture of olfactory glomeruli in the Drosophila an-tennal lobe. Cell Reports, 16
Curriculum Vitae
171
2015 Grabe, V., Strutz, A., Baschwitz, A., Hansson, B. S., Sachse, S.
A digital in vivo 3D atlas of the antennal lobe of Drosophila melanogaster. The Journal of Comparative Neurology, 523(3)
2014 Strutz, A., Soelter, J., Baschwitz, A., Farhan, A., Grabe, V., Rybak, J., Knaden, M., Schmuker, M., Hansson, B. S., Sachse, S.
Decoding odor quality and intensity in the Drosophila brain. eLife, 3
2013 Linz, J., Baschwitz, A., Strutz, A., Dweck, H., Sachse, S., Hansson, B. S., Stens-myr, M. C.
Host plant-driven sensory specialization in Drosophila erecta. Proceedings of the Royal Society B: Biological Sciences, 280
Oral Presentations
04.2014 Drosophila als Modellorganismus - Erforschung der Neurobiologie des Rie-chens
Presentation of current research topics in the Department of Evolutionary Neu-roethology and guided tour through the laboratories for pupil of the Goe-theschule Ilmenau
03.2014 Numerical integration of input & output neurons in the primary olfactory center of the fruit fly
13. IMPRS Symposium, MPI for Chemical Ecology, Dornburg, DE
09.2013 Quantitative analysis of the input-output connectivity of the Drosophila anten-nal lobe
13th European Symposium for Insect Taste and Olfaction (ESITO), Villasimi-us, IT
09.2012 Coding of odor valence in neural circuits of Drosophila
Chemical Ecology 2012 Mini-Symposium, Rothamsted, GB
Additional Qualifications
09.2016 Project Management, Speaker: Peter Wagner
09.2016 Time and Self-Management for Scientists, Speaker: Matthias Schwarz-kopf
06.2016 Experimental Design Workshop, Speaker: Andrew Davis
05.2016 Communication - How to Manage Your Supervisors, Speakers: Dr. Alex-ander Schiller, Dr. Daniel Mertens
10.2015 Scientific writing, Speaker: Brian Cusack/Science Craft
03.2015 Gene Safety Project Leader Certificate, Speaker: Monika Wetzker and invited Speakers
Curriculum Vitae
172
07.2014 Introductory workshop on neural and behavioral modeling in Drosophila, Speakers: Prof. Thomas Nowotny, Dr. Ruben Moreno Bote, Dr. Greg Stephens
06.2014 Research Funding - Third Party Grant Proposals, Speaker: Dr. Jan Kellmann
05.2013 Functional imaging of neuronal activity, Speaker: Dr. Silke Sachse
02.2013 Innovative Morphology and Phylogeny, Speaker: Prof. Rolf Beutel
02./03.2013 Introduction into the statistical program R, Speaker: Dr. Grit Kunert
11./12.2012 Frontiers of Chemical Ecology, Speakeren: Dr. Shannon Olsson and invited Speakers
06.2012 Adobe Illustrator, Speaker: Nico Überschaar
03.2012 Multiphoton microscopy: a powerful bioimaging technique, Speaker: Prof. Dr. Rachel Grange
01.2012 How to prepare a scientific poster, Speaker: Dr. Karin Groten
Grants
Travel Grant of the European Science Foundation (ESF) for:
Flies, Worms and Robots: Combining Perspectives on Minibrains and Behaviour,
Sant Feliu de Guixols, Spain, 8 - 13 November 2014
Jena, February 1, 2017
Amelie Baschwitz
Copyright © 2022 FDOKUMEN